
Sensen C.W. (ed.) Handbook of Genome Research, vol. 1 ...
634
-
Upload
khangminh22 -
Category
Documents
-
view
1 -
download
0
Transcript of Sensen C.W. (ed.) Handbook of Genome Research, vol. 1 ...


Handbook of Genome Research. Genomics, Proteomics, Metabolomics, Bioinformatics, Ethical and Legal Issues.Edited by Christoph W. SensenCopyright © 2005 WILEY-VCH Verlag GmbH & Co. KGaA, WeinheimISBN: 3-527-31348-6
Handbook of Genome Research
Edited by
Christoph W. Sensen
Verwendete Mac Distiller 5.0.x Joboptions
Dieser Report wurde automatisch mit Hilfe der Adobe Acrobat Distiller Erweiterung "Distiller Secrets v1.0.5" der IMPRESSED GmbH erstellt. Sie koennen diese Startup-Datei für die Distiller Versionen 4.0.5 und 5.0.x kostenlos unter http://www.impressed.de herunterladen. ALLGEMEIN ---------------------------------------- Dateioptionen: Kompatibilität: PDF 1.3 Für schnelle Web-Anzeige optimieren: Ja Piktogramme einbetten: Ja Seiten automatisch drehen: Nein Seiten von: 1 Seiten bis: Alle Seiten Bund: Links Auflösung: [ 2400 2400 ] dpi Papierformat: [ 481 680 ] Punkt KOMPRIMIERUNG ---------------------------------------- Farbbilder: Downsampling: Nein Komprimieren: Ja Komprimierungsart: ZIP Bitanzahl pro Pixel: 8 Bit Graustufenbilder: Downsampling: Nein Komprimieren: Ja Komprimierungsart: ZIP Bitanzahl pro Pixel: 8 Bit Schwarzweiß-Bilder: Downsampling: Nein Komprimieren: Ja Komprimierungsart: CCITT CCITT-Gruppe: 4 Graustufen glätten: Nein Text und Vektorgrafiken komprimieren: Ja SCHRIFTEN ---------------------------------------- Alle Schriften einbetten: Ja Untergruppen aller eingebetteten Schriften: Nein Wenn Einbetten fehlschlägt: Abbrechen Einbetten: Immer einbetten: [ /Courier-BoldOblique /Helvetica-BoldOblique /Courier /Helvetica-Bold /Times-Bold /Courier-Bold /Helvetica /Times-BoldItalic /Times-Roman /ZapfDingbats /Times-Italic /Helvetica-Oblique /Courier-Oblique /Symbol ] Nie einbetten: [ ] FARBE(N) ---------------------------------------- Farbmanagement: Farbumrechnungsmethode: Farbe nicht ändern Methode: Standard Geräteabhängige Daten: Einstellungen für Überdrucken beibehalten: Ja Unterfarbreduktion und Schwarzaufbau beibehalten: Ja Transferfunktionen: Beibehalten Rastereinstellungen beibehalten: Nein ERWEITERT ---------------------------------------- Optionen: Prolog/Epilog verwenden: Nein PostScript-Datei darf Einstellungen überschreiben: Nein Level 2 copypage-Semantik beibehalten: Ja Portable Job Ticket in PDF-Datei speichern: Ja Illustrator-Überdruckmodus: Ja Farbverläufe zu weichen Nuancen konvertieren: Ja ASCII-Format: Nein Document Structuring Conventions (DSC): DSC-Kommentare verarbeiten: Ja DSC-Warnungen protokollieren: Nein Für EPS-Dateien Seitengröße ändern und Grafiken zentrieren: Ja EPS-Info von DSC beibehalten: Ja OPI-Kommentare beibehalten: Nein Dokumentinfo von DSC beibehalten: Ja ANDERE ---------------------------------------- Distiller-Kern Version: 5000 ZIP-Komprimierung verwenden: Ja Optimierungen deaktivieren: Nein Bildspeicher: 524288 Byte Farbbilder glätten: Nein Graustufenbilder glätten: Nein Bilder (< 257 Farben) in indizierten Farbraum konvertieren: Ja sRGB ICC-Profil: sRGB IEC61966-2.1 ENDE DES REPORTS ---------------------------------------- IMPRESSED GmbH Bahrenfelder Chaussee 49 22761 Hamburg, Germany Tel. +49 40 897189-0 Fax +49 40 897189-71 Email: [email protected] Web: www.impressed.de
Adobe Acrobat Distiller 5.0.x Joboption Datei
<< /ColorSettingsFile () /LockDistillerParams true /DetectBlends true /DoThumbnails true /AntiAliasMonoImages false /MonoImageDownsampleType /Bicubic /GrayImageDownsampleType /Bicubic /MaxSubsetPct 100 /MonoImageFilter /CCITTFaxEncode /ColorImageDownsampleThreshold 1.5 /GrayImageFilter /FlateEncode /ColorConversionStrategy /LeaveColorUnchanged /CalGrayProfile (Dot Gain 20%) /ColorImageResolution 300 /UsePrologue false /MonoImageResolution 1200 /ColorImageDepth 8 /sRGBProfile (sRGB IEC61966-2.1) /PreserveOverprintSettings true /CompatibilityLevel 1.3 /UCRandBGInfo /Preserve /EmitDSCWarnings false /CreateJobTicket true /DownsampleMonoImages false /DownsampleColorImages false /MonoImageDict << /K -1 >> /ColorImageDownsampleType /Bicubic /GrayImageDict << /HSamples [ 2 1 1 2 ] /VSamples [ 2 1 1 2 ] /Blend 1 /QFactor 0.9 >> /CalCMYKProfile (U.S. Web Coated (SWOP) v2) /ParseDSCComments true /PreserveEPSInfo true /MonoImageDepth -1 /AutoFilterGrayImages false /SubsetFonts false /GrayACSImageDict << /HSamples [ 2 1 1 2 ] /VSamples [ 2 1 1 2 ] /Blend 1 /QFactor 0.9 >> /ColorImageFilter /FlateEncode /AutoRotatePages /None /PreserveCopyPage true /EncodeMonoImages true /ASCII85EncodePages false /PreserveOPIComments false /NeverEmbed [ ] /ColorImageDict << /HSamples [ 2 1 1 2 ] /VSamples [ 2 1 1 2 ] /Blend 1 /QFactor 0.9 >> /AntiAliasGrayImages false /GrayImageDepth 8 /CannotEmbedFontPolicy /Error /EndPage -1 /TransferFunctionInfo /Preserve /CalRGBProfile (sRGB IEC61966-2.1) /EncodeColorImages true /EncodeGrayImages true /ColorACSImageDict << /HSamples [ 2 1 1 2 ] /VSamples [ 2 1 1 2 ] /Blend 1 /QFactor 0.9 >> /Optimize true /ParseDSCCommentsForDocInfo true /GrayImageDownsampleThreshold 1.5 /MonoImageDownsampleThreshold 1.5 /AutoPositionEPSFiles true /GrayImageResolution 300 /AutoFilterColorImages false /AlwaysEmbed [ /Courier-BoldOblique /Helvetica-BoldOblique /Courier /Helvetica-Bold /Times-Bold /Courier-Bold /Helvetica /Times-BoldItalic /Times-Roman /ZapfDingbats /Times-Italic /Helvetica-Oblique /Courier-Oblique /Symbol ] /ImageMemory 524288 /OPM 1 /DefaultRenderingIntent /Default /EmbedAllFonts true /StartPage 1 /DownsampleGrayImages false /AntiAliasColorImages false /ConvertImagesToIndexed true /PreserveHalftoneInfo false /CompressPages true /Binding /Left >> setdistillerparams << /PageSize [ 595.276 841.890 ] /HWResolution [ 2400 2400 ] >> setpagedevice
T. Lengauer, R. Mannhold, H. Kubinyi, H. Timmermann (Eds.)
BioinformaticsFrom Genomes to Drugs2 Volumes
2001, ISBN 3-527-29988-2
A.D. Baxevanis, B.F.F. Ouellette (Eds.)
BioinformaticsA Practical Guide to the Analysis of Genes and Proteins
Third Edition
2005, ISBN 0-471-47878-4
C.W. Sensen (Ed.)
Essentials of Genomics and Bioinformatics
2002, ISBN 3-527-30541-6
G. Kahl
The Dictionary of Gene TechnologyGenomics, Transcriptomics, Proteomics
Third edition
2004, ISBN 3-527-30765-6
R.D. Schmid, R. Hammelehle
Pocket Guide to Biotechnology and Genetic Engineering
2003, ISBN 3-527-30895-4
M.J. Dunn, L.B. Jorde, P.F.R. Little, S. Subramaniam (Eds.)
Encyclopedia of Genetics, Genomics, Proteomics and Bioinformatics8 Volume Set
2005, ISBN 0-470-84974-6
H.-J. Rehm, G. Reed, A. Pühler, P. Stadler, C.W. Sensen (Eds.)
BiotechnologyVol. 5b Genomics and Bioinformatics
2001, ISBN 0-527-28328-5
C. Saccone, G. Pesole
Handbook of Comparative GenomicsPrinciples and Methodology
2003, ISBN 0-471-39128-X
J.W. Dale, M. von Schantz
From Genes to GenomesConcepts and Applications of DNA Technology
2002, ISBN 0-471-49783-5
J. Licinio, M.-L. Wong (Eds.)
PharmacogenomicsThe Search for Individualized Therapies
2002, ISBN 3-527-30380-4
Further Titles of Interest
Handbook of Genome Research
Edited byChristoph W. Sensen
Genomics, Proteomics, Metabolomics, Bioinformatics, Ethical and Legal Issues
Edited by
Prof. Dr. Christoph W. SensenUniversity of CalgaryFaculty of Medicine, Biochemistry & Molecular Biology3330 Hospital Drive N.W.Calgary, Alberta T2N 4NICanada
Cover illustration:
Margot van Lindenberg: “Obsessed”, Fabric, 2002
Fascination with the immense human diversity andimmersion in four distinctly different culturesinspired artist Margot van Lindenberg to exploreidentity embedded in the human genome. In her artshe makes reference to various aspects of geneticsfrom microscopic images to ethical issues of bio-engineering. She develops these ideas throughthread and cloth constructions, shadow projectionsand performance work. Margot, who currently livesin Calgary, Alberta, Canada, holds a BFA from theAlberta College of Art & Design in Calgary.
Artist Statement
Obsessed is an image of the DNA molecule, withstrips of colours representing genes. The work refersto the experience of finding particular genes and theobsession that occupies those involved. It can beread either positive or negative, used to establishidentity or refer to the insertion of foreign genes asin bio-engineering. The text speaks of a message, acode: a hidden knowledge as it is intentionally illeg-ible. One can become obsessed with attempts todecipher this information.
The process of construction is part of the conceptualdevelopment of the work. Dyed and found cottonand silk were given texts, then stitched underneathramie, which was cut away to reveal the underlyingcoding. The threadwork refers to the delicate struc-ture of DNA and the raw stages of research and dis-covery in the field of molecular genetics.
All books published by Wiley-VCH are carefully pro-duced. Nevertheless, authors, editors and publisherdo not warrant the information contained in thesebooks, including this book, to be free of errors.Readers are advised to keep in mind that statements,data, illustrations, procedural details or other itemsmay inadvertently be inaccurate.
Library of Congress Card No. applied for
British Library Cataloguing-in-Publication Data: A catalogue record for this book is available from theBritish Library.
Bibliographic information published by Die DeutscheBibliothekDie Deutsche Bibliothek lists this publication in the Deutsche Nationalbibliografie; detailed bibliographic data is available in the Internet at<http://dnb.ddb.de>.
© 2005 WILEY-VCH Verlag GmbH & Co. KGaA,Weinheim
All rights reserved (including those of translationinto other languages). No part of this book may bereproduced in any form – by photoprinting, micro-film, or any other means – nor transmitted or trans-lated into a machine language without written per-mission from the publishers. Registered names,trademarks, etc. used in this book, even when notspecifically marked as such, are not to be consideredunprotected by law.
Printed in the Federal Republic of GermanyPrinted on acid-free paper
Typesetting Detzner Fotosatz, SpeyerPrinting betz-druck GmbH, DarmstadtBinding Litges & Dopf Buchbinderei GmbH, Heppenheim
ISBN-13: 978-3-527-31348-8ISBN-10: 3-527-31348-6
V
Life-sciences research, especially in biology and medicine, has undergone dramaticchanges in the last fifteen years. Completion of the sequencing of the first microbe ge-nome in 1995 was followed by a flurry of activity. Today we have several hundred com-plete genomes to hand, including that of humans, and many more to follow. Althoughgenome sequencing has become almost a commodity, the very optimistic initial expecta-tions of this work, including the belief that much could be learned simply by looking atthe “blueprint” of life, have largely faded into the background.
It has become evident that knowledge about the genomic organization of life formsmust be complemented by understanding of gene-expression patterns and very detailedinformation about the protein complement of the organisms, and that it will take manyyears before major inroads can be made into a complete understanding of life. This hasled to the development of a variety of “omics” efforts, including genomics, proteomics,metabolomics, and metabonomics. It is a typical sign of the times that about four yearsago even a journal called “Omics” emerged.
An introduction to the ever-expanding technology of the subject is a major part of thisbook, which includes detailed description of the technology used to characterize genomicorganization, gene expression patterns, protein complements, and the post-translationalmodification of proteins. The major model organisms and the work done to gain new in-sights into their biology are another central focus of the book. Several chapters are alsodevoted to introducing the bioinformatics tools and analytical strategies which are an in-tegral part of any large-scale experiment.
As public awareness of relatively recent advances in life-science research increases, in-tense discussion has arisen on how to deal with this new research field. This discussion,which involves many groups in society, is also reflected in this book, with several chap-ters dedicated to the social consequences of research and development which utilizes thenew approaches or the data derived from large-scale experiments. It should be clear thatnobody can just ignore this topic, because it has already had direct and indirect effects oneveryone’s day-to-day life.
The new wave of large-scale research might be of huge benefit to humanity in the fu-ture, although in most cases we are still years away from this becoming reality. The pro-mises and dangers of this field must be carefully weighed at each step, and this book triesto make a contribution by introducing the relevant topics that are being discussed not on-ly by scientific experts but by Society’s leaders also.
Handbook of Genome Research. Genomics, Proteomics, Metabolomics, Bioinformatics, Ethical and Legal Issues.Edited by Christoph W. SensenCopyright © 2005 WILEY-VCH Verlag GmbH & Co. KGaA, WeinheimISBN: 3-527-31348-6
Preface
Verwendete Mac Distiller 5.0.x Joboptions
Dieser Report wurde automatisch mit Hilfe der Adobe Acrobat Distiller Erweiterung "Distiller Secrets v1.0.5" der IMPRESSED GmbH erstellt. Sie koennen diese Startup-Datei für die Distiller Versionen 4.0.5 und 5.0.x kostenlos unter http://www.impressed.de herunterladen. ALLGEMEIN ---------------------------------------- Dateioptionen: Kompatibilität: PDF 1.3 Für schnelle Web-Anzeige optimieren: Ja Piktogramme einbetten: Ja Seiten automatisch drehen: Nein Seiten von: 1 Seiten bis: Alle Seiten Bund: Links Auflösung: [ 2400 2400 ] dpi Papierformat: [ 481 680 ] Punkt KOMPRIMIERUNG ---------------------------------------- Farbbilder: Downsampling: Nein Komprimieren: Ja Komprimierungsart: ZIP Bitanzahl pro Pixel: 8 Bit Graustufenbilder: Downsampling: Nein Komprimieren: Ja Komprimierungsart: ZIP Bitanzahl pro Pixel: 8 Bit Schwarzweiß-Bilder: Downsampling: Nein Komprimieren: Ja Komprimierungsart: CCITT CCITT-Gruppe: 4 Graustufen glätten: Nein Text und Vektorgrafiken komprimieren: Ja SCHRIFTEN ---------------------------------------- Alle Schriften einbetten: Ja Untergruppen aller eingebetteten Schriften: Nein Wenn Einbetten fehlschlägt: Abbrechen Einbetten: Immer einbetten: [ /Courier-BoldOblique /Helvetica-BoldOblique /Courier /Helvetica-Bold /Times-Bold /Courier-Bold /Helvetica /Times-BoldItalic /Times-Roman /ZapfDingbats /Times-Italic /Helvetica-Oblique /Courier-Oblique /Symbol ] Nie einbetten: [ ] FARBE(N) ---------------------------------------- Farbmanagement: Farbumrechnungsmethode: Farbe nicht ändern Methode: Standard Geräteabhängige Daten: Einstellungen für Überdrucken beibehalten: Ja Unterfarbreduktion und Schwarzaufbau beibehalten: Ja Transferfunktionen: Beibehalten Rastereinstellungen beibehalten: Nein ERWEITERT ---------------------------------------- Optionen: Prolog/Epilog verwenden: Nein PostScript-Datei darf Einstellungen überschreiben: Nein Level 2 copypage-Semantik beibehalten: Ja Portable Job Ticket in PDF-Datei speichern: Ja Illustrator-Überdruckmodus: Ja Farbverläufe zu weichen Nuancen konvertieren: Ja ASCII-Format: Nein Document Structuring Conventions (DSC): DSC-Kommentare verarbeiten: Ja DSC-Warnungen protokollieren: Nein Für EPS-Dateien Seitengröße ändern und Grafiken zentrieren: Ja EPS-Info von DSC beibehalten: Ja OPI-Kommentare beibehalten: Nein Dokumentinfo von DSC beibehalten: Ja ANDERE ---------------------------------------- Distiller-Kern Version: 5000 ZIP-Komprimierung verwenden: Ja Optimierungen deaktivieren: Nein Bildspeicher: 524288 Byte Farbbilder glätten: Nein Graustufenbilder glätten: Nein Bilder (< 257 Farben) in indizierten Farbraum konvertieren: Ja sRGB ICC-Profil: sRGB IEC61966-2.1 ENDE DES REPORTS ---------------------------------------- IMPRESSED GmbH Bahrenfelder Chaussee 49 22761 Hamburg, Germany Tel. +49 40 897189-0 Fax +49 40 897189-71 Email: [email protected] Web: www.impressed.de
Adobe Acrobat Distiller 5.0.x Joboption Datei
<< /ColorSettingsFile () /LockDistillerParams true /DetectBlends true /DoThumbnails true /AntiAliasMonoImages false /MonoImageDownsampleType /Bicubic /GrayImageDownsampleType /Bicubic /MaxSubsetPct 100 /MonoImageFilter /CCITTFaxEncode /ColorImageDownsampleThreshold 1.5 /GrayImageFilter /FlateEncode /ColorConversionStrategy /LeaveColorUnchanged /CalGrayProfile (Dot Gain 20%) /ColorImageResolution 300 /UsePrologue false /MonoImageResolution 1200 /ColorImageDepth 8 /sRGBProfile (sRGB IEC61966-2.1) /PreserveOverprintSettings true /CompatibilityLevel 1.3 /UCRandBGInfo /Preserve /EmitDSCWarnings false /CreateJobTicket true /DownsampleMonoImages false /DownsampleColorImages false /MonoImageDict << /K -1 >> /ColorImageDownsampleType /Bicubic /GrayImageDict << /HSamples [ 2 1 1 2 ] /VSamples [ 2 1 1 2 ] /Blend 1 /QFactor 0.9 >> /CalCMYKProfile (U.S. Web Coated (SWOP) v2) /ParseDSCComments true /PreserveEPSInfo true /MonoImageDepth -1 /AutoFilterGrayImages false /SubsetFonts false /GrayACSImageDict << /HSamples [ 2 1 1 2 ] /VSamples [ 2 1 1 2 ] /Blend 1 /QFactor 0.9 >> /ColorImageFilter /FlateEncode /AutoRotatePages /None /PreserveCopyPage true /EncodeMonoImages true /ASCII85EncodePages false /PreserveOPIComments false /NeverEmbed [ ] /ColorImageDict << /HSamples [ 2 1 1 2 ] /VSamples [ 2 1 1 2 ] /Blend 1 /QFactor 0.9 >> /AntiAliasGrayImages false /GrayImageDepth 8 /CannotEmbedFontPolicy /Error /EndPage -1 /TransferFunctionInfo /Preserve /CalRGBProfile (sRGB IEC61966-2.1) /EncodeColorImages true /EncodeGrayImages true /ColorACSImageDict << /HSamples [ 2 1 1 2 ] /VSamples [ 2 1 1 2 ] /Blend 1 /QFactor 0.9 >> /Optimize true /ParseDSCCommentsForDocInfo true /GrayImageDownsampleThreshold 1.5 /MonoImageDownsampleThreshold 1.5 /AutoPositionEPSFiles true /GrayImageResolution 300 /AutoFilterColorImages false /AlwaysEmbed [ /Courier-BoldOblique /Helvetica-BoldOblique /Courier /Helvetica-Bold /Times-Bold /Courier-Bold /Helvetica /Times-BoldItalic /Times-Roman /ZapfDingbats /Times-Italic /Helvetica-Oblique /Courier-Oblique /Symbol ] /ImageMemory 524288 /OPM 1 /DefaultRenderingIntent /Default /EmbedAllFonts true /StartPage 1 /DownsampleGrayImages false /AntiAliasColorImages false /ConvertImagesToIndexed true /PreserveHalftoneInfo false /CompressPages true /Binding /Left >> setdistillerparams << /PageSize [ 595.276 841.890 ] /HWResolution [ 2400 2400 ] >> setpagedevice

VI Preface
We would like to thank Dr Andrea Pillmann and the staff of Wiley–VCH in Weinheim,Germany, for the patience they have shown during the preparation of this book. Withouttheir many helpful suggestions it would have been impossible to publish this book.
Christoph W. SensenCalgary, May 2005
VII
Volume 1
Part I Key Organisms 1
1 Genome Projects on Model Organisms 3Alfred Pühler, Doris Jording, Jörn Kalinowski, Detlev Buttgereit, Renate Renkawitz-Pohl, Lothar Altschmied, Antoin Danchin, Agnieszka Sekowska,Horst Feldmann, Hans-Peter Klenk, and Manfred Kröger
1.1 Introduction 31.2 Genome Projects of Selected Prokaryotic Model Organisms 41.2.1 The Gram_ Enterobacterium Escherichia coli 41.2.1.1 The Organism 41.2.1.2 Characterization of the Genome and Early Sequencing Efforts 71.2.1.3 Structure of the Genome Project 71.2.1.4 Results from the Genome Project 81.2.1.5 Follow-up Research in the Postgenomic Era 91.2.2 The Gram+ Spore-forming Bacillus subtilis 101.2.2.1 The Organism 101.2.2.2 A Lesson from Genome Analysis: The Bacillus subtilis Biotope 111.2.2.3 To Lead or to Lag: First Laws of Genomics 121.2.2.4 Translation: Codon Usage and the Organization of the Cell’s Cytoplasm 131.2.2.5 Post-sequencing Functional Genomics: Essential Genes
and Expression-profiling Studies 131.2.2.6 Industrial Processes 151.2.2.7 Open Questions 151.2.3 The Archaeon Archaeoglobus fulgidus 161.2.3.1 The Organism 161.2.3.2 Structure of the Genome Project 171.2.3.3 Results from the Genome Project 181.2.3.4 Follow-up Research 201.3 Genome Projects of Selected Eukaryotic Model Organisms 201.3.1 The Budding Yeast Saccharomyces cerevisiae 201.3.1.1 Yeast as a Model Organism 20
Contents
Handbook of Genome Research. Genomics, Proteomics, Metabolomics, Bioinformatics, Ethical and Legal Issues.Edited by Christoph W. SensenCopyright © 2005 WILEY-VCH Verlag GmbH & Co. KGaA, WeinheimISBN: 3-527-31348-6
Verwendete Mac Distiller 5.0.x Joboptions
Dieser Report wurde automatisch mit Hilfe der Adobe Acrobat Distiller Erweiterung "Distiller Secrets v1.0.5" der IMPRESSED GmbH erstellt. Sie koennen diese Startup-Datei für die Distiller Versionen 4.0.5 und 5.0.x kostenlos unter http://www.impressed.de herunterladen. ALLGEMEIN ---------------------------------------- Dateioptionen: Kompatibilität: PDF 1.3 Für schnelle Web-Anzeige optimieren: Ja Piktogramme einbetten: Ja Seiten automatisch drehen: Nein Seiten von: 1 Seiten bis: Alle Seiten Bund: Links Auflösung: [ 2400 2400 ] dpi Papierformat: [ 481 680 ] Punkt KOMPRIMIERUNG ---------------------------------------- Farbbilder: Downsampling: Nein Komprimieren: Ja Komprimierungsart: ZIP Bitanzahl pro Pixel: 8 Bit Graustufenbilder: Downsampling: Nein Komprimieren: Ja Komprimierungsart: ZIP Bitanzahl pro Pixel: 8 Bit Schwarzweiß-Bilder: Downsampling: Nein Komprimieren: Ja Komprimierungsart: CCITT CCITT-Gruppe: 4 Graustufen glätten: Nein Text und Vektorgrafiken komprimieren: Ja SCHRIFTEN ---------------------------------------- Alle Schriften einbetten: Ja Untergruppen aller eingebetteten Schriften: Nein Wenn Einbetten fehlschlägt: Abbrechen Einbetten: Immer einbetten: [ /Courier-BoldOblique /Helvetica-BoldOblique /Courier /Helvetica-Bold /Times-Bold /Courier-Bold /Helvetica /Times-BoldItalic /Times-Roman /ZapfDingbats /Times-Italic /Helvetica-Oblique /Courier-Oblique /Symbol ] Nie einbetten: [ ] FARBE(N) ---------------------------------------- Farbmanagement: Farbumrechnungsmethode: Farbe nicht ändern Methode: Standard Geräteabhängige Daten: Einstellungen für Überdrucken beibehalten: Ja Unterfarbreduktion und Schwarzaufbau beibehalten: Ja Transferfunktionen: Beibehalten Rastereinstellungen beibehalten: Nein ERWEITERT ---------------------------------------- Optionen: Prolog/Epilog verwenden: Nein PostScript-Datei darf Einstellungen überschreiben: Nein Level 2 copypage-Semantik beibehalten: Ja Portable Job Ticket in PDF-Datei speichern: Ja Illustrator-Überdruckmodus: Ja Farbverläufe zu weichen Nuancen konvertieren: Ja ASCII-Format: Nein Document Structuring Conventions (DSC): DSC-Kommentare verarbeiten: Ja DSC-Warnungen protokollieren: Nein Für EPS-Dateien Seitengröße ändern und Grafiken zentrieren: Ja EPS-Info von DSC beibehalten: Ja OPI-Kommentare beibehalten: Nein Dokumentinfo von DSC beibehalten: Ja ANDERE ---------------------------------------- Distiller-Kern Version: 5000 ZIP-Komprimierung verwenden: Ja Optimierungen deaktivieren: Nein Bildspeicher: 524288 Byte Farbbilder glätten: Nein Graustufenbilder glätten: Nein Bilder (< 257 Farben) in indizierten Farbraum konvertieren: Ja sRGB ICC-Profil: sRGB IEC61966-2.1 ENDE DES REPORTS ---------------------------------------- IMPRESSED GmbH Bahrenfelder Chaussee 49 22761 Hamburg, Germany Tel. +49 40 897189-0 Fax +49 40 897189-71 Email: [email protected] Web: www.impressed.de
Adobe Acrobat Distiller 5.0.x Joboption Datei
<< /ColorSettingsFile () /LockDistillerParams true /DetectBlends true /DoThumbnails true /AntiAliasMonoImages false /MonoImageDownsampleType /Bicubic /GrayImageDownsampleType /Bicubic /MaxSubsetPct 100 /MonoImageFilter /CCITTFaxEncode /ColorImageDownsampleThreshold 1.5 /GrayImageFilter /FlateEncode /ColorConversionStrategy /LeaveColorUnchanged /CalGrayProfile (Dot Gain 20%) /ColorImageResolution 300 /UsePrologue false /MonoImageResolution 1200 /ColorImageDepth 8 /sRGBProfile (sRGB IEC61966-2.1) /PreserveOverprintSettings true /CompatibilityLevel 1.3 /UCRandBGInfo /Preserve /EmitDSCWarnings false /CreateJobTicket true /DownsampleMonoImages false /DownsampleColorImages false /MonoImageDict << /K -1 >> /ColorImageDownsampleType /Bicubic /GrayImageDict << /HSamples [ 2 1 1 2 ] /VSamples [ 2 1 1 2 ] /Blend 1 /QFactor 0.9 >> /CalCMYKProfile (U.S. Web Coated (SWOP) v2) /ParseDSCComments true /PreserveEPSInfo true /MonoImageDepth -1 /AutoFilterGrayImages false /SubsetFonts false /GrayACSImageDict << /HSamples [ 2 1 1 2 ] /VSamples [ 2 1 1 2 ] /Blend 1 /QFactor 0.9 >> /ColorImageFilter /FlateEncode /AutoRotatePages /None /PreserveCopyPage true /EncodeMonoImages true /ASCII85EncodePages false /PreserveOPIComments false /NeverEmbed [ ] /ColorImageDict << /HSamples [ 2 1 1 2 ] /VSamples [ 2 1 1 2 ] /Blend 1 /QFactor 0.9 >> /AntiAliasGrayImages false /GrayImageDepth 8 /CannotEmbedFontPolicy /Error /EndPage -1 /TransferFunctionInfo /Preserve /CalRGBProfile (sRGB IEC61966-2.1) /EncodeColorImages true /EncodeGrayImages true /ColorACSImageDict << /HSamples [ 2 1 1 2 ] /VSamples [ 2 1 1 2 ] /Blend 1 /QFactor 0.9 >> /Optimize true /ParseDSCCommentsForDocInfo true /GrayImageDownsampleThreshold 1.5 /MonoImageDownsampleThreshold 1.5 /AutoPositionEPSFiles true /GrayImageResolution 300 /AutoFilterColorImages false /AlwaysEmbed [ /Courier-BoldOblique /Helvetica-BoldOblique /Courier /Helvetica-Bold /Times-Bold /Courier-Bold /Helvetica /Times-BoldItalic /Times-Roman /ZapfDingbats /Times-Italic /Helvetica-Oblique /Courier-Oblique /Symbol ] /ImageMemory 524288 /OPM 1 /DefaultRenderingIntent /Default /EmbedAllFonts true /StartPage 1 /DownsampleGrayImages false /AntiAliasColorImages false /ConvertImagesToIndexed true /PreserveHalftoneInfo false /CompressPages true /Binding /Left >> setdistillerparams << /PageSize [ 595.276 841.890 ] /HWResolution [ 2400 2400 ] >> setpagedevice
VIII Contents
1.3.1.2 The Yeast Genome Sequencing Project 211.3.1.3 Life with Some 6000 Genes 231.3.1.4 The Yeast Postgenome Era 251.3.2 The Plant Arabidopsis thaliana 251.3.2.1 The Organism 251.3.2.2 Structure of the Genome Project 271.3.2.3 Results from the Genome Project 281.3.2.4 Follow-up Research in the Postgenome Era 291.3.3 The Roundworm Caenorhabditis elegans 301.3.3.1 The Organism 301.3.3.2 The Structure of the Genome Project 311.3.3.3 Results from the Genome Project 321.3.3.4 Follow-up Research in the Postgenome Era 331.3.4 The Fruitfly Drosophila melanogaster 341.3.4.1 The Organism 341.3.4.2 Structure of the Genome Project 351.3.4.3 Results of the Genome Project 361.3.4.4 Follow-up Research in the Postgenome Era 371.4 Conclusions 37
References 39
2 Environmental Genomics: A Novel Tool for Study of UncultivatedMicroorganisms 45Alexander H. Treusch and Christa Schleper
2.1 Introduction: Why Novel Approaches to Study Microbial Genomes? 452.2 Environmental Genomics: The Methodology 462.3 Where it First Started: Marine Environmental Genomics 482.4 Environmental Genomics of Defined Communities: Biofilms and Microbial
Mats 502.5 Environmental Genomics for Studies of Soil Microorganisms 502.6 Biotechnological Aspects 532.7 Conclusions and Perspectives 54
References 55
3 Applications of Genomics in Plant Biology 59Richard Bourgault, Katherine G. Zulak, and Peter J. Facchini
3.1 Introduction 593.2 Plant Genomes 603.2.1 Structure, Size, and Diversity 603.2.2 Chromosome Mapping: Genetic and Physical 613.2.3 Large-scale Sequencing Projects 623.3 Expressed Sequence Tags 643.4 Gene Expression Profiling Using DNA Microarrays 663.5 Proteomics 683.6 Metabolomics 70
IXContents
3.7 Functional Genomics 723.7.1 Forward Genetics 723.7.2 Reverse Genetics 733.8 Concluding Remarks 76
References 77
4 Human Genetic Diseases 81Roger C. Green
4.1 Introduction 814.1.1 The Human Genome Project: Where Are We Now
and Where Are We Going? 814.1.1.1 What Have We Learned? 814.2 Genetic Influences on Human Health 834.3 Genomics and Single-gene Defects 844.3.1 The Availability of the Genome Sequence Has Changed the Way in which
Disease Genes Are Identified 844.3.1.1 Positional Candidate Gene Approach 854.3.1.2 Direct Analysis of Candidate Genes 854.3.2 Applications in Human Health 864.3.2.1 Genetic Testing 864.3.3 Gene Therapy 874.4 Genomics and Polygenic Diseases 874.4.1 Candidate Genes and their Variants 884.4.2 Linkage Disequilibrium Mapping 894.4.2.1 The Hapmap Project 894.4.3 Whole-genome Resequencing 904.5 The Genetic Basis of Cancer 904.5.1 Breast Cancer 914.5.1.1 Cancer Risk in Carriers of BRCA Mutations 924.5.2 Colon Cancer 934.5.2.1 Familial Adenomatous Polyposis 934.5.2.2 Hereditary Non-polyposis Colon Cancer 934.5.2.3 Modifier Genes in Colorectal Cancer 944.6 Genetics of Cardiovascular Disease 944.6.1 Monogenic Disorders 954.6.1.1 Hypercholesterolemia 954.6.1.2 Hypertension 954.6.1.3 Clotting Factors 954.6.1.4 Hypertrophic Cardiomyopathy 954.6.1.5 Familial Dilated Cardiomyopathy 964.6.1.6 Familial Arrhythmias 964.6.2 Multifactorial Cardiovascular Disease 964.7 Conclusions 97
References 98
X Contents
Part II Genomic and Proteomic Technologies 103
5 Genomic Mapping and Positional Cloning, with Emphasis on Plant Science 105Apichart Vanavichit, Somvong Tragoonrung, and Theerayut Toojinda
5.1 Introduction 1055.2 Genome Mapping 1055.2.1 Mapping Populations 1055.2.2 Molecular Markers: The Key Mapping Reagents 1065.2.2.1 RFLP 1075.2.2.2 RAPD 1075.2.2.3 AFLP 1075.2.2.4 SSR 1085.2.2.5 SSCP 1085.2.3 Construction of a Linkage Map 1085.3 Positional Cloning 1105.3.1 Successful Positional Cloning 1105.3.2 Defining the Critical Region 1115.3.3 Refining the Critical Region: Genetic Approaches 1125.3.4 Refining the Critical Region: Physical Approaches 1135.3.5 Cloning Large Genomic Inserts 1145.3.6 Radiation Hybrid Map 1145.3.7 Identification of Genes Within the Refined Critical Region 1155.3.7.1 Gene Detection by CpG Island 1155.3.7.2 Exon Trapping 1155.3.7.3 Direct cDNA Selection 1155.4 Comparative Mapping and Positional Cloning 1155.4.1 Synteny, Colinearity, and Positional Cloning 1165.4.2 Bridging Model Organisms 1175.4.3 Predicting Candidate Genes in the Critical Region 1185.4.4 EST: Key to Gene Identification in the Critical Region 1185.4.5 Linkage Disequilibrium Mapping 1205.5 Genetic Mapping in the Post-genomics Era 1205.5.1 eQTL 121
References 123
6 DNA Sequencing Technology 129Lyle R. Middendorf, Patrick G. Humphrey, Narasimhachari Narayanan, and Stephen C. Roemer
6.1 Introduction 1296.2 Overview of Sanger Dideoxy Sequencing 1306.3 Fluorescence Dye Chemistry 1316.3.1 Fluorophore Characteristics 1326.3.2 Commercial Dye Fluorophores 1326.3.3 Energy Transfer 1366.3.4 Fluorescence Lifetime 137
XIContents
6.4 Biochemistry of DNA Sequencing 1386.4.1 Sequencing Applications and Strategies 1386.4.1.1 New Sequence Determination 1396.4.1.2 Confirmatory Sequencing 1406.4.2 DNA Template Preparation 1406.4.2.1 Single-stranded DNA Template 1406.4.2.2 Double-stranded DNA Template 1406.4.2.3 Vectors for Large-insert DNA 1416.4.2.4 PCR Products 1416.4.3 Enzymatic Reactions 1416.4.3.1 DNA Polymerases 1416.4.3.2 Labeling Strategy 1426.4.3.3 The Template–Primer–Polymerase Complex 1436.4.3.4 Simultaneous Bi-directional Sequencing 1446.5 Fluorescence DNA Sequencing Instrumentation 1446.5.1 Introduction 1446.5.1.1 Excitation Energy Sources 1446.5.1.2 Fluorescence Samples 1456.5.1.3 Fluorescence Detection 1456.5.1.4 Overview of Fluorescence Instrumentation Related to DNA Sequencing 1456.5.2 Information Throughput 1476.5.2.1 Sample Channels (n) 1476.5.2.2 Information per Channel (d) 1476.5.2.3 Information Independence (I) 1486.5.2.4 Time per Sample (t) 1486.5.3 Instrument Design Issues 1486.5.4 Forms of Commercial Electrophoresis used for Fluorescence
DNA Sequencing 1496.5.4.1 Slab Gels 1496.5.4.2 Capillary Gels 1516.5.4.3 Micro-Grooved Channel Gel Electrophoresis 1516.5.5 Non-electrophoresis Methods for Fluorescence DNA Sequencing 1526.5.6 Non-fluorescence Methods for DNA Sequencing 1526.6 DNA Sequence Analysis 1536.6.1 Introduction 1536.6.2 Lane Detection and Tracking 1536.6.3 Trace Generation and Base Calling 1556.6.4 Quality/Confidence Values 1576.7 DNA Sequencing Approaches to Achieving the $1000 Genome 1596.7.1 Introduction 1596.7.2 DNA Degradation Strategy 1616.7.3 DNA Synthesis Strategy 1626.7.4 DNA Hybridization Strategy 1636.7.5 Nanopore Filtering Strategy 164
References 165
XII Contents
7 Proteomics and Mass Spectrometry for the Biological Researcher 181Sheena Lambert and David C. Schriemer
7.1 Introduction 1817.2 Defining the Sample for Proteomics 1847.2.1 Minimize Cellular Heterogeneity, Avoid Mixed Cell Populations 1847.2.2 Use Isolated Cell Types and/or Cell Cultures 1857.2.3 Minimize Intracellular Heterogeneity 1867.2.4 Minimize Dynamic Range 1867.2.5 Maximize Concentration/Minimize Handling 1877.3 New Developments – Clinical Proteomics 1877.4 Mass Spectrometry – The Essential Proteomic Technology 1887.4.1 Sample Processing 1907.4.2 Instrumentation 1917.4.3 MS Bioinformatics/Sequence Databases 1937.5 Sample-driven Proteomics Processes 1957.5.1 Direct MS Analysis of a Protein Digest 1967.5.2 Direct MS–MS Analysis of a Digest 1987.5.3 LC–MS–MS of a Protein Digest 1997.5.4 Multidimensional LC–MS–MS of a Digest (Top-down vs. Bottom-up
Proteomics) 2017.6 Conclusions 204
References 205
8 Proteome Analysis by Capillary Electrophoresis 211Md Abul Fazal, David Michels, James Kraly, and Norman J. Dovichi
8.1 Introduction 2118.2 Capillary Electrophoresis 2128.2.1 Instrumentation 2128.2.2 Injection 2128.2.3 Electroosmosis 2128.2.4 Separation 2138.2.5 Detection 2148.3 Capillary Electrophoresis for Protein Analysis 2158.3.1 Capillary Isoelectric Focusing 2158.3.2 SDS/Capillary Sieving Electrophoresis 2158.3.3 Free Solution Electrophoresis 2178.4 Single-cell Analysis 2188.5 Two-dimensional Separations 2198.6 Conclusions 221
References 222
9 A DNA Microarray Fabrication Strategy for Research Laboratories 223Daniel C. Tessier, Mélanie Arbour, François Benoit, Hervé Hogues, and Tracey Rigby
9.1 Introduction 223
XIIIContents
9.2 The Database 2289.3 High-throughput DNA Synthesis 2309.3.1 Scale and Cost of Synthesis 2309.3.2 Operational Constraints 2319.3.3 Quality-control Issues 2329.4 Amplicon Generation 2329.5 Microarraying 2349.6 Probing and Scanning Microarrays 2349.7 Conclusion 235
References 237
10 Principles of Application of DNA Microarrays 239Mayi Arcellana-Panlilio
10.1 Introduction 23910.2 Definitions 24010.3 Types of Array 24010.4 Production of Arrays 24110.4.1 Sources of Arrays 24110.4.2 Array Content 24210.4.3 Slide Substrates 24210.4.4 Arrayers and Spotting Pins 24310.5 Interrogation of Arrays 24310.5.1 Experimental Design 24410.5.2 Sample Preparation 24610.5.3 Labeling 24710.5.4 Hybridization and Post-hybridization Washes 24910.5.5 Data Acquisition and Quantification 25010.6 Data Analysis 25110.7 Documentation of Microarrays 25410.8 Applications of Microarrays in Cancer Research 25510.9 Conclusion 256
References 257
11 Yeast Two-hybrid Technologies 261Gregor Jansen, David Y. Thomas, and Stephanie Pollock
11.1 Introduction 26111.2 The Classical Yeast Two-hybrid System 26211.3 Variations of the Two-hybrid System 26311.3.1 The Reverse Two-hybrid System 26311.3.2 The One-hybrid System 26411.3.3 The Repressed Transactivator System 26411.3.4 Three-hybrid Systems 26411.4 Membrane Yeast Two-hybrid Systems 26511.4.1 SOS Recruitment System 26611.4.2 Split-ubiquitin System 266
XIV Contents
11.4.3 G-Protein Fusion System 26611.4.4 The Ire1 Signaling System 26811.4.5 Non-yeast Hybrid Systems 26911.5 Interpretation of Two-hybrid Results 26911.6 Conclusion 270
References 271
12 Structural Genomics 273Aalim M. Weljie, Hans J. Vogel, and Ernst M. Bergmann
12.1 Introduction 27312.2 Protein Crystallography and Structural Genomics 27412.2.1 High-throughput Protein Crystallography 27412.2.2 Protein Production 27612.2.3 Protein Crystallization 27812.2.4 Data Collection 27912.2.5 Structure Solution and Refinement 28112.2.6 Analysis 28212.3 NMR and Structural Genomics 28212.3.1 High-throughput Structure Determination by NMR 28212.3.1.1 Target Selection 28212.3.1.2 High-throughput Data Acquisition 28412.3.1.3 High-throughput Data Analysis 28612.3.2 Other Non-structural Applications of NMR 28712.3.2.1 Suitability Screening for Structure Determination 28812.3.2.2 Determination of Protein Fold 28912.3.2.3 Rational Drug Target Discovery and Functional Genomics 29012.4 Epilogue 290
References 292
Volume 2
Part III Bioinformatics 297
13 Bioinformatics Tools for DNA Technology 299Peter Rice
13.1 Introduction 29913.2 Alignment Methods 29913.2.1 Pairwise Alignment 30013.2.2 Local Alignment 30213.2.3 Variations on Pairwise Alignment 30313.2.4 Beyond Simple Alignment 30413.2.5 Other Alignment Methods 30513.3 Sequence Comparison Methods 30513.3.1 Multiple Pairwise Comparisons 307
XVContents
13.4 Consensus Methods 30913.5 Simple Sequence Masking 30913.6 Unusual Sequence Composition 30913.7 Repeat Identification 31013.8 Detection of Patterns in Sequences 31113.8.1 Physical Characteristics 31213.8.2 Detecting CpG Islands 31313.8.3 Known Sequence Patterns 31413.8.4 Data Mining with Sequence Patterns 31513.9 Restriction Sites and Promoter Consensus Sequences 31513.9.1 Restriction Mapping 31513.9.2 Codon Usage Analysis 31513.9.3 Plotting Open Reading Frames 31713.9.4 Codon Preference Statistics 31813.9.5 Reading Frame Statistics 32013.10 The Future for EMBOSS 321
References 322
14 Software Tools for Proteomics Technologies 323David S. Wishart
14.1 Introduction 32314.2 Protein Identification 32414.2.1 Protein Identification from 2D Gels 32414.2.2 Protein Identification from Mass Spectrometry 32814.2.3 Protein Identification from Sequence Data 33214.3 Protein Property Prediction 33414.3.1 Predicting Bulk Properties (pI, UV absorptivity, MW) 33414.3.2 Predicting Active Sites and Protein Functions 33414.3.3 Predicting Modification Sites 33814.3.4 Finding Protein Interaction Partners and Pathways 33814.3.5 Predicting Sub-cellular Location or Localization 33914.3.6 Predicting Stability, Globularity, and Shape 34014.3.7 Predicting Protein Domains 34114.3.8 Predicting Secondary Structure 34214.3.9 Predicting 3D Folds (Threading) 34314.3.10 Comprehensive Commercial Packages 344
References 347
15 Applied Bioinformatics for Drug Discovery and Development 353Jian Chen, ShuJian Wu, and Daniel B. Davison
15.1 Introduction 35315.2 Databases 35315.2.1 Sequence Databases 35415.2.1.1 Genomic Sequence Databases 35415.2.1.2 EST Sequence Databases 355
XVI Contents
15.2.1.3 Sequence Variations and Polymorphism Databases 35615.2.2 Expression Databases 35715.2.2.1 Microarray and Gene Chip 35715.2.2.2 Others (SAGE, Differential Display) 35815.2.2.3 Quantitative PCR 35815.2.3 Pathway Databases 35815.2.4 Cheminformatics 35915.2.5 Metabonomics and Proteomics 36015.2.6 Database Integration and Systems Biology 36015.3 Bioinformatics in Drug-target Discovery 36215.3.1 Target-class Approach to Drug-target Discovery 36215.3.2 Disease-oriented Target Identification 36415.3.3 Genetic Screening and Comparative Genomics in Model Organisms for Target
Discovery 36515.4 Support of Compound Screening and Toxicogenomics 36615.4.1 Improving Compound Selectivity 36715.4.1.1 Phylogeny Analysis 36715.4.1.2 Tissue Expression and Biological Function Implication 36815.4.2 Prediction of Compound Toxicity 36915.4.2.1 Toxicogenomics and Toxicity Signature 36915.4.2.2 Long QT Syndrome Assessment 37015.4.2.3 Drug Metabolism and Transport 37115.5 Bioinformatics in Drug Development 37215.5.1 Biomarker Discovery 37215.5.2 Genetic Variation and Drug Efficacy 37315.5.3 Genetic Variation and Clinical Adverse Reactions 37415.5.4 Bioinformatics in Drug Life-cycle Management (Personalized Drug and Drug
Competitiveness) 37615.6 Conclusions 376
References 377
16 Genome Data Representation Through Images: The MAGPIE/Bluejay System 383Andrei Turinsky, Paul M. K. Gordon, Emily Xu, Julie Stromer, and Christoph W. Sensen
16.1 Introduction 38316.2 The MAGPIE Graphical System 38416.3 The Hierarchical MAGPIE Display System 38616.4 Overview Images 38716.4.1 Whole Project View 38716.5 Coding Region Displays 39116.5.1 Contiguous Sequence with ORF Evidence 39116.5.2 Contiguous Sequence with Evidence 39416.5.3 Expressed Sequence Tags 39416.5.4 ORF Close-up 395
XVIIContents
16.6 Coding Sequence Function Evidence 39616.6.1 Analysis Tools Summary 39616.6.2 Expanded Tool Summary 39716.7 Secondary Genome Context Images 39916.7.1 Base Composition 39916.7.2 Sequence Repeats 40016.7.3 Sequence Ambiguities 40116.7.4 Sequence Strand Assembly Coverage 40216.7.5 Restriction Enzyme Fragmentation 40216.7.6 Agarose Gel Simulation 40316.8 The Bluejay Data Visualization System 40416.9 Bluejay Architecture 40516.10 Bluejay Display and Data Exploration 40716.10.1 The Main Bluejay Interface 40716.10.2 Semantic Zoom and Levels of Details 40816.10.3 Operations on the Sequence 40816.10.4 Interaction with Individual Elements 41016.10.5 Eukaryotic Genomes 41116.11 Bluejay Usability Features 41116.12 Conclusions and Open Issues 413
References 414
17 Bioinformatics Tools for Gene-expression Studies 415Greg Finak, Michael Hallett, Morag Park, and François Pepin
17.1 Introduction 41517.1.1 Microarray Technologies 41617.1.1.1 cDNA Microarrays 41617.1.1.2 Oligonucleotide Microarrays 41717.1.2 Objectives and Experimental Design 41717.2 Background Knowledge and Tools 41917.2.1 Standards 41917.2.2 Microarray Data Management Systems 42017.2.3 Statistical and General Analysis Software 42017.3 Preprocessing 42117.3.1 Image, Spot, and Array Quality 42117.3.2 Gene Level Summaries 42217.3.3 Normalization 42217.4 Class Comparison – Differential Expression 42317.5 Class Prediction 42517.6 Class Discovery 42617.6.1 Clustering Algorithms 42617.6.2 Validation of Clusters 42717.7 Searching for Meaning 428
References 430
XVIII Contents
18 Protein Interaction Databases 433Gary D. Bader and Christopher W. V. Hogue
18.1 Introduction 43318.2 Scientific Foundations of Biomolecular Interaction Information 43418.3 The Graph Abstraction for Interaction Databases 43418.4 Why Contemplate Integration of Interaction Data? 43518.5 A Requirement for More Detailed Abstractions 43518.6 An Interaction Database as a Framework for a Cellular CAD System 43718.7 BIND – The Biomolecular Interaction Network Database 43718.8 Other Molecular-interaction Databases 43918.9 Database Standards 43918.10 Answering Scientific Questions Using Interaction Databases 44018.11 Examples of Interaction Databases 440
References 455
19 Bioinformatics Approaches for Metabolic Pathways 461Ming Chen, Andreas Freier, and Ralf Hofestädt
19.1 Introduction 46119.2 Formal Representation of Metabolic Pathways 46319.3 Database Systems and Integration 46319.3.1 Database Systems 46319.3.2 Database Integration 46519.3.3 Model-driven Reconstruction of Molecular Networks 46619.3.3.1 Modeling Data Integration 46719.3.3.2 Object-oriented Modeling 46919.3.3.3 Systems Reconstruction 47119.4 Different Models and Aspects 47219.4.1 Petri Net Model 47319.4.1.1 Basics 47319.4.1.2 Hybrid Petri Nets 47419.4.1.3 Applications 47619.4.1.4 Petri Net Model Construction 47819.5 Simulation Tools 47919.5.1 Metabolic Data Integration 48119.5.2 Metabolic Pathway Layout 48119.5.3 Dynamics Representation 48219.5.4 Hierarchical Concept 48219.5.5 Prediction Capability 48219.5.6 Parallel Treatment and Development 48219.6 Examples and Discussion 483
References 487
20 Systems Biology 491Nathan Goodman
20.1 Introduction 491
XIXContents
20.2 Data 49220.2.1 Available Data Types 49220.2.2 Data Quality and Data Fusion 49320.3 Basic Concepts 49420.3.1 Systems and Models 49420.3.2 States 49420.3.3 Informal and Formal Models 49520.3.4 Modularity 49520.4 Static Models 49620.4.1 Graphs 49620.4.2 Analysis of Static Models 49820.5 Dynamic Models 49920.5.1 Types of Model 49920.5.2 Modeling Formalisms 50020.6 Summary 50020.7 Guide to the Literature 50120.7.1 Highly Recommended Reviews 50120.7.2 Recommended Detailed Reviews 50220.7.3 Recommended High-level Reviews 502
References 504
Part IV Ethical, Legal and Social Issues 507
21 Ethical Aspects of Genome Research and Banking 509Bartha Maria Knoppers and Clémentine Sallée
21.1 Introduction 50921.2 Types of Genetic Research 50921.3 Research Ethics 51021.4 “Genethics” 51321.5 DNA Banking 51621.5.1 International 51721.1.2 Regional 52021.5.3 National 52121.6 Ownership 52621.7 Conclusion 530
References 532
22 Biobanks and the Challenges of Commercialization 537Edna Einsiedel and Lorraine Sheremeta
22.1 Introduction 53722.2 Background 53822.3 Population Genetic Research and Public Opinion 54022.4 The Commercialization of Biobank Resources 54122.4.1 An Emerging Market for Biobank Resources 542
XX Contents
22.4.2 Public Opinion and the Commercialization of Genetic Resources 54322.5 Genetic Resources and Intellectual Property: What Benefits? For Whom? 54422.5.1 Patents as The Common Currency of the Biotech Industry 54422.5.2 The Debate over Genetic Patents 54522.5.3 Myriad Genetics 54622.5.4 Proposed Patent Reforms 54722.5.5 Patenting and Public Opinion 54822.6 Human Genetic Resources and Benefit-Sharing 54922.7 Commercialization and Responsible Governance of Biobanks 55122.7.1 The Public Interest and the Exploitation of Biobank Resources 55222.7.2 The Role of the Public and Biobank Governance 55322.8 Conclusion 554
References 555
23 The (Im)perfect Human – His Own Creator? Bioethics and Genetics at theBeginning of Life 561Gebhard Fürst
23.1 Life Sciences and the Untouchable Human Being 56323.2 Consequences from the Untouchability of Humans and Human Dignity for
the Bioethical Discussion 56423.3 Conclusion 567
References 570
Part V Outlook 571
24 The Future of Large-Scale Life Science Research 573Christoph W. Sensen
24.1 Introduction 57324.2 Evolution of the Hardware 57424.2.1 DNA Sequencing as an Example 57424.2.2 General Trends 57424.2.3 Existing Hardware Will be Enhanced for more Throughput 57524.2.4 The PC-style Computers that Run most Current Hardware will be Replaced
with Web-based Computing 57524.2.5 Integration of Machinery will Become Tighter 57624.2.6 More and more Biological and Medical Machinery will be “Genomized” 57624.3 Genomic Data and Data Handling 57724.4 Next-generation Genome Research Laboratories 57924.4.1 The Toolset of the Future 57924.4.2 Laboratory Organization 58124.5 Genome Projects of the Future 58224.6 Epilog 583
Subject Index 585
XXI
Lothar AltschmiedInstitute of Plant Genetics and Crop PlantResearch (IPK)Corrensstr. 306466 GaterslebenGermany
Mélanie ArbourMicroArray LaboratoryNational Research Council of CanadaBiotechnology Research Institute6100 Royalmount AvenueMontrealQuebec, H4P 2R2Canada
Mayi Arcellana-PanlilioSouthern Alberta Microarray FacilityUniversity of CalgaryHM 393b3330 Hospital Drive, N.W.CalgaryAlberta, T2N 4N1Canada
Gary D. BaderComputational Biology CenterMemorial Sloan-Kettering Cancer CenterBox 460New York, 10021USA
François BenoitMicroArray LaboratoryNational Research Council of CanadaBiotechnology Research Institute6100 Royalmount AvenueMontrealQuebec, H4P 2R2Canada
Ernst M. BergmannAlberta Synchrotron InstituteUniversity of AlbertaEdmontonAlberta, T6G 2E1Canada
Richard BourgaultDepartment of Biological SciencesUniversity of Calgary2500 University Drive N.W.CalgaryAlberta, T2N 1N4Canada
Detlev ButtgereitFachbereich BiologieEntwicklungsbiologiePhilipps-Universität MarburgKarl-von-Frisch-Straße 8b35043 MarburgGermany
List of Contributors
Handbook of Genome Research. Genomics, Proteomics, Metabolomics, Bioinformatics, Ethical and Legal Issues.Edited by Christoph W. SensenCopyright © 2005 WILEY-VCH Verlag GmbH & Co. KGaA, WeinheimISBN: 3-527-31348-6
Verwendete Mac Distiller 5.0.x Joboptions
Dieser Report wurde automatisch mit Hilfe der Adobe Acrobat Distiller Erweiterung "Distiller Secrets v1.0.5" der IMPRESSED GmbH erstellt. Sie koennen diese Startup-Datei für die Distiller Versionen 4.0.5 und 5.0.x kostenlos unter http://www.impressed.de herunterladen. ALLGEMEIN ---------------------------------------- Dateioptionen: Kompatibilität: PDF 1.3 Für schnelle Web-Anzeige optimieren: Ja Piktogramme einbetten: Ja Seiten automatisch drehen: Nein Seiten von: 1 Seiten bis: Alle Seiten Bund: Links Auflösung: [ 2400 2400 ] dpi Papierformat: [ 481 680 ] Punkt KOMPRIMIERUNG ---------------------------------------- Farbbilder: Downsampling: Nein Komprimieren: Ja Komprimierungsart: ZIP Bitanzahl pro Pixel: 8 Bit Graustufenbilder: Downsampling: Nein Komprimieren: Ja Komprimierungsart: ZIP Bitanzahl pro Pixel: 8 Bit Schwarzweiß-Bilder: Downsampling: Nein Komprimieren: Ja Komprimierungsart: CCITT CCITT-Gruppe: 4 Graustufen glätten: Nein Text und Vektorgrafiken komprimieren: Ja SCHRIFTEN ---------------------------------------- Alle Schriften einbetten: Ja Untergruppen aller eingebetteten Schriften: Nein Wenn Einbetten fehlschlägt: Abbrechen Einbetten: Immer einbetten: [ /Courier-BoldOblique /Helvetica-BoldOblique /Courier /Helvetica-Bold /Times-Bold /Courier-Bold /Helvetica /Times-BoldItalic /Times-Roman /ZapfDingbats /Times-Italic /Helvetica-Oblique /Courier-Oblique /Symbol ] Nie einbetten: [ ] FARBE(N) ---------------------------------------- Farbmanagement: Farbumrechnungsmethode: Farbe nicht ändern Methode: Standard Geräteabhängige Daten: Einstellungen für Überdrucken beibehalten: Ja Unterfarbreduktion und Schwarzaufbau beibehalten: Ja Transferfunktionen: Beibehalten Rastereinstellungen beibehalten: Nein ERWEITERT ---------------------------------------- Optionen: Prolog/Epilog verwenden: Nein PostScript-Datei darf Einstellungen überschreiben: Nein Level 2 copypage-Semantik beibehalten: Ja Portable Job Ticket in PDF-Datei speichern: Ja Illustrator-Überdruckmodus: Ja Farbverläufe zu weichen Nuancen konvertieren: Ja ASCII-Format: Nein Document Structuring Conventions (DSC): DSC-Kommentare verarbeiten: Ja DSC-Warnungen protokollieren: Nein Für EPS-Dateien Seitengröße ändern und Grafiken zentrieren: Ja EPS-Info von DSC beibehalten: Ja OPI-Kommentare beibehalten: Nein Dokumentinfo von DSC beibehalten: Ja ANDERE ---------------------------------------- Distiller-Kern Version: 5000 ZIP-Komprimierung verwenden: Ja Optimierungen deaktivieren: Nein Bildspeicher: 524288 Byte Farbbilder glätten: Nein Graustufenbilder glätten: Nein Bilder (< 257 Farben) in indizierten Farbraum konvertieren: Ja sRGB ICC-Profil: sRGB IEC61966-2.1 ENDE DES REPORTS ---------------------------------------- IMPRESSED GmbH Bahrenfelder Chaussee 49 22761 Hamburg, Germany Tel. +49 40 897189-0 Fax +49 40 897189-71 Email: [email protected] Web: www.impressed.de
Adobe Acrobat Distiller 5.0.x Joboption Datei
<< /ColorSettingsFile () /LockDistillerParams true /DetectBlends true /DoThumbnails true /AntiAliasMonoImages false /MonoImageDownsampleType /Bicubic /GrayImageDownsampleType /Bicubic /MaxSubsetPct 100 /MonoImageFilter /CCITTFaxEncode /ColorImageDownsampleThreshold 1.5 /GrayImageFilter /FlateEncode /ColorConversionStrategy /LeaveColorUnchanged /CalGrayProfile (Dot Gain 20%) /ColorImageResolution 300 /UsePrologue false /MonoImageResolution 1200 /ColorImageDepth 8 /sRGBProfile (sRGB IEC61966-2.1) /PreserveOverprintSettings true /CompatibilityLevel 1.3 /UCRandBGInfo /Preserve /EmitDSCWarnings false /CreateJobTicket true /DownsampleMonoImages false /DownsampleColorImages false /MonoImageDict << /K -1 >> /ColorImageDownsampleType /Bicubic /GrayImageDict << /HSamples [ 2 1 1 2 ] /VSamples [ 2 1 1 2 ] /Blend 1 /QFactor 0.9 >> /CalCMYKProfile (U.S. Web Coated (SWOP) v2) /ParseDSCComments true /PreserveEPSInfo true /MonoImageDepth -1 /AutoFilterGrayImages false /SubsetFonts false /GrayACSImageDict << /HSamples [ 2 1 1 2 ] /VSamples [ 2 1 1 2 ] /Blend 1 /QFactor 0.9 >> /ColorImageFilter /FlateEncode /AutoRotatePages /None /PreserveCopyPage true /EncodeMonoImages true /ASCII85EncodePages false /PreserveOPIComments false /NeverEmbed [ ] /ColorImageDict << /HSamples [ 2 1 1 2 ] /VSamples [ 2 1 1 2 ] /Blend 1 /QFactor 0.9 >> /AntiAliasGrayImages false /GrayImageDepth 8 /CannotEmbedFontPolicy /Error /EndPage -1 /TransferFunctionInfo /Preserve /CalRGBProfile (sRGB IEC61966-2.1) /EncodeColorImages true /EncodeGrayImages true /ColorACSImageDict << /HSamples [ 2 1 1 2 ] /VSamples [ 2 1 1 2 ] /Blend 1 /QFactor 0.9 >> /Optimize true /ParseDSCCommentsForDocInfo true /GrayImageDownsampleThreshold 1.5 /MonoImageDownsampleThreshold 1.5 /AutoPositionEPSFiles true /GrayImageResolution 300 /AutoFilterColorImages false /AlwaysEmbed [ /Courier-BoldOblique /Helvetica-BoldOblique /Courier /Helvetica-Bold /Times-Bold /Courier-Bold /Helvetica /Times-BoldItalic /Times-Roman /ZapfDingbats /Times-Italic /Helvetica-Oblique /Courier-Oblique /Symbol ] /ImageMemory 524288 /OPM 1 /DefaultRenderingIntent /Default /EmbedAllFonts true /StartPage 1 /DownsampleGrayImages false /AntiAliasColorImages false /ConvertImagesToIndexed true /PreserveHalftoneInfo false /CompressPages true /Binding /Left >> setdistillerparams << /PageSize [ 595.276 841.890 ] /HWResolution [ 2400 2400 ] >> setpagedevice

XXII List of Contributors
Jian ChenBristol Myers Squibb PharmaceuticalResearch Institute311 Pennington-Rocky Hill RoadPenningtonNew Jersey, 08534USA
Ming ChenDepartment of Bioinformatics / Medical InformaticsFaculty of TechnologyUniversity of Bielefeld33501 BielefeldGermany
Antoine DanchinInstitut PasteurUnité de Génétique des GénomesBactériensDépartement Structure et Dynamique des Génomes28 rue du Docteur Roux75724 PARIS Cedex 15France
Daniel B. DavisonBristol Myers Squibb Pharmaceutical Research Institute311 Pennington-Rocky Hill RoadPenningtonNew Jersey, 08534USA
Norman J. DovichiDepartment of ChemistryUniversity of WashingtonSeattleWashington, 98195-1700USA
Edna EinsiedelUniversity of Calgary2500 University Drive N.W., SS318CalgaryAlberta, T2N 1N4Canada
Peter J. FacchiniDepartment of Biological SciencesUniversity of Calgary2500 University Drive N.W.CalgaryAlberta, T2N 1N4Canada
Abul FazalDepartment of ChemistryUniversity of WashingtonSeattleWashington, 98195-1700USA
Horst FeldmannAdolf-Butenandt-Institut fürPhysiologische Chemie der Ludwig-Maximilians-UniversitätSchillerstraße 4480336 MünchenGermany
Greg FinakDepartment of BiochemistryMcGill University3775 University StMontrealQuebeck, H3A 2B4Canada
Andreas FreierDepartment of Bioinformatics / Medical InformaticsFaculty of TechnologyUniversity of Bielefeld33501 BielefeldGermany

XXIIIList of Contributors
His Excellency Dr. Gebhard FürstBischof von Rottenburg-StuttgartPostfach 972101 Rottenburg a. N.Germany
Paul GordonUniversity of CalgaryDepartment of Biochemistry andMolecular Biology3330 Hospital Drive N.W.CalgaryAlberta, T2N 4N1Canada
Roger C. GreenFaculty of MedicineMemorial University of NewfoundlandSt. JohnsNewfoundland, A1B3Y1Canada
Michael HallettDepartment of Biochemistry3775 University StMcGill UniversityMontreal, H3A 2B4Canada
Ralf HofestädtDepartment of Bioinformatics / Medical InformaticsFaculty of TechnologyUniversity of Bielefeld33501, BielefeldGermany
Christopher W.V. HogueDept. BiochemistryUniversity of Toronto and the Samuel Lunenfeld Research InstituteMt. Sinai Hospital600 University AvenueToronto, ON M5G 1X5 Canada
Hervé HoguesMicroArray LaboratoryNational Research Council of CanadaBiotechnology Research Institute6100 Royalmount AvenueMontrealQuebec, H4P 2R2Canada
Patrick G. HumphreyLI-COR Inc.4308 Progressive Ave.P.O. Box 4000LincolnNebraska, 68504USA
Gregor JansenDepartment of BiochemistryMcGill University3655 Promenade Sir William OslerMontrealQuebec, H3G 1Y6Canada
Doris JordingFakulät für BiologieLehrstuhl für GenetikUniversität Bielefeld33594 BielefeldGermany
Jörn KalinowskiFakulät für BiologieLehrstuhl für GenetikUniversität Bielefeld33594 BielefeldGermany
Hans-Peter Klenke.gene Biotechnologie GmbHPöckinger Fußweg 7a82340 FeldafingGermany
XXIV List of Contributors
Bartha Maria KnoppersUniversity of Montreal3101, Chemin de la TourMontrealQuebeck, H3C 3J7Canada
James KralyDepartment of ChemistryUniversity of WashingtonSeattleWashington, 98195-1700USA
Manfred KrögerInstitut für Mikro- und MolekularbiologieJustus-Liebig-UniversitätHeinrich-Buff-Ring 26-3235392 GiessenGermany
Sheena LambertDepartment of Biochemistry andMolecular BiologyUniversity of Calgary3330 Hospital Drive N.W.CalgaryAlberta, T2N 4N1Canada
David MichelsDepartment of ChemistryUniversity of WashingtonSeattleWashington, 98195-1700USA
Lyle R. MiddendorfLI-COR Inc.4308 Progressive Ave.P.O. Box 4000LincolnNebraska, 68504USA
Narasimhachari NarayananVisEn Medical, Inc.12B Cabot RoadWoburnMassachusetts, 01801USA
Morag ParkDepartment of BiochemistryMcGill University3775 University St.MontrealQuebec, H3A 2B4Canada
François PepinDepartment of BiochemistryMcGill University3775 University St.MontrealQuebec, H3A 2B4Canada
Stephanie PollockDepartment of BiochemistryMcGill University3655 Promenade Sir William OslerMontrealQuebec, H3G 1Y6Canada
Alfred PühlerFakulät für BiologieLehrstuhl für GenetikUniversität Bielefeld33594 BielefeldGermany
Renate Renkawitz-PohlFachbereich Biologie,EntwicklungsbiologiePhilipps-Universität MarburgKarl-von-Frisch-Straße 8b35043 MarburgGermany

XXVList of Contributors
Peter RiceEuropean Bioinformatics InstituteWellcome Trust Genome CampusHinxtonCambridge, CB10 1SDUK
Tracey RigbyMicroArray LaboratoryNational Research Council of CanadaBiotechnology Research Institute6100 Royalmount AvenueMontrealQuebec, H4P 2R2Canada
Stephen C. RoemerFisher ScientificChemical DivisionOne Reagent LaneFairlawnNew Jersey, 07410USA
Clémentine SalléeUniversity of Montreal3101, chemin de la tourMontrealQuebeck, H3C 3J7Canada
Christa SchleperDepartment of BiologyUniversity of BergenJahnebakken 5Box 78005020 BergenNorway
David C. SchriemerDept. of Biochemistry and Molecular BiologyUniversity of Calgary3330 Hospital Drive N.W.CalgaryAlberta, T”N 4N1Canada
Agnieszka SekowskaInstitut PasteurUnité de Génétique des Génomes BactériensDépartement Structure et Dynamique des Génomes28 rue du Docteur Roux75724 Paris Cedex 15France
Christoph W. SensenFaculty of MedicineSun Center of Excellence for Visual Genome ResearchUniversity of Calgary3330 Hospital Drive NWCalgaryAlberta, T2N 4N1Canada
Lorraine SheremetaHealth Law Institute at the University of AlbertaUniversity of Alberta402 Law CentreEdmontonAlberta, T6G 2H5Canada
Julie StromerUniversity of CalgaryDepartment of Biochemistry andMolecular Biology3330 Hospital Drive NWCalgaryAlberta, T2N 4N1Canada
XXVI List of Contributors
Daniel C. TessierIatroQuest Corporation1000 Chemin du GolfVerdunQuebec, H3E 1H4Canada
David Y. ThomasDepartment of BiochemistryMcGill University3655 Promenade Sir William OslerMontrealQuebec, H3G 1Y6Canada
Theerayut ToojindaRice Gene DiscoveryNational Center for Genetic Engineeringand BiotechnologyKasetsart UniversityKamphangsaenNakorn Pathom, 73140Thailand
Somvong TragoonrungRice Gene DiscoveryNational Center for Genetic Engineeringand BiotechnologyKasetsart UniversityKamphangsaenNakorn Pathom, 73140Thailand
Alexander H. TreuschUniversity of BergenDepartment of BiologyJahnebakken 5Box 78005020 BergenNorway
Andrei TurinskyUniversity of CalgaryDepartment of Biochemistry andMolecular Biology3330 Hospital Drive NWCalgaryAlberta, T2N 4N1Canada
Apichart VanavichitCenter of Excellence for Rice MolecularBreeding and Product DevelopmentNational Center for Agricutural BiotechnologyKasetsart UniversityKamphangsaenNakorn Pathom, 73140Thailand
Hans J. VogelDepartment of Biological SciencesUniversity of CalgaryCalgaryAlberta, T2N 1N4Canada
Aalim M. WeljieChenomx Inc.#800, 10050 - 112 St.EdmontonAlberta, T5K 2J1Canada
David S. WishartDepartments of Biological Sciences andComputing ScienceUniversity of AlbertaEdmontonAlberta, T6G 2E8Canada

XXVIIList of Contributors
Shu Jian WuBristol Myers Squibb PharmaceuticalResearch Institute311 Pennington-Rocky Hill RoadPenningtonNew Jersey, 08534USA
Emily XuDepartment of Biochemistry andMolecular BiologyUniversity of Calgary3330 Hospital Drive N.W.CalgaryAlberta, T2N 4N1Canada
Katherine G. ZulakDepartment of Biological SciencesUniversity of Calgary2500 University Drive N.W.CalgaryAlberta, T2N 1N4Canada

Part IKey Organisms
Handbook of Genome Research. Genomics, Proteomics, Metabolomics, Bioinformatics, Ethical and Legal Issues.Edited by Christoph W. SensenCopyright © 2005 WILEY-VCH Verlag GmbH & Co. KGaA, WeinheimISBN: 3-527-31348-6
Verwendete Mac Distiller 5.0.x Joboptions
Dieser Report wurde automatisch mit Hilfe der Adobe Acrobat Distiller Erweiterung "Distiller Secrets v1.0.5" der IMPRESSED GmbH erstellt. Sie koennen diese Startup-Datei für die Distiller Versionen 4.0.5 und 5.0.x kostenlos unter http://www.impressed.de herunterladen. ALLGEMEIN ---------------------------------------- Dateioptionen: Kompatibilität: PDF 1.3 Für schnelle Web-Anzeige optimieren: Ja Piktogramme einbetten: Ja Seiten automatisch drehen: Nein Seiten von: 1 Seiten bis: Alle Seiten Bund: Links Auflösung: [ 2400 2400 ] dpi Papierformat: [ 481 680 ] Punkt KOMPRIMIERUNG ---------------------------------------- Farbbilder: Downsampling: Nein Komprimieren: Ja Komprimierungsart: ZIP Bitanzahl pro Pixel: 8 Bit Graustufenbilder: Downsampling: Nein Komprimieren: Ja Komprimierungsart: ZIP Bitanzahl pro Pixel: 8 Bit Schwarzweiß-Bilder: Downsampling: Nein Komprimieren: Ja Komprimierungsart: CCITT CCITT-Gruppe: 4 Graustufen glätten: Nein Text und Vektorgrafiken komprimieren: Ja SCHRIFTEN ---------------------------------------- Alle Schriften einbetten: Ja Untergruppen aller eingebetteten Schriften: Nein Wenn Einbetten fehlschlägt: Abbrechen Einbetten: Immer einbetten: [ /Courier-BoldOblique /Helvetica-BoldOblique /Courier /Helvetica-Bold /Times-Bold /Courier-Bold /Helvetica /Times-BoldItalic /Times-Roman /ZapfDingbats /Times-Italic /Helvetica-Oblique /Courier-Oblique /Symbol ] Nie einbetten: [ ] FARBE(N) ---------------------------------------- Farbmanagement: Farbumrechnungsmethode: Farbe nicht ändern Methode: Standard Geräteabhängige Daten: Einstellungen für Überdrucken beibehalten: Ja Unterfarbreduktion und Schwarzaufbau beibehalten: Ja Transferfunktionen: Beibehalten Rastereinstellungen beibehalten: Nein ERWEITERT ---------------------------------------- Optionen: Prolog/Epilog verwenden: Nein PostScript-Datei darf Einstellungen überschreiben: Nein Level 2 copypage-Semantik beibehalten: Ja Portable Job Ticket in PDF-Datei speichern: Ja Illustrator-Überdruckmodus: Ja Farbverläufe zu weichen Nuancen konvertieren: Ja ASCII-Format: Nein Document Structuring Conventions (DSC): DSC-Kommentare verarbeiten: Ja DSC-Warnungen protokollieren: Nein Für EPS-Dateien Seitengröße ändern und Grafiken zentrieren: Ja EPS-Info von DSC beibehalten: Ja OPI-Kommentare beibehalten: Nein Dokumentinfo von DSC beibehalten: Ja ANDERE ---------------------------------------- Distiller-Kern Version: 5000 ZIP-Komprimierung verwenden: Ja Optimierungen deaktivieren: Nein Bildspeicher: 524288 Byte Farbbilder glätten: Nein Graustufenbilder glätten: Nein Bilder (< 257 Farben) in indizierten Farbraum konvertieren: Ja sRGB ICC-Profil: sRGB IEC61966-2.1 ENDE DES REPORTS ---------------------------------------- IMPRESSED GmbH Bahrenfelder Chaussee 49 22761 Hamburg, Germany Tel. +49 40 897189-0 Fax +49 40 897189-71 Email: [email protected] Web: www.impressed.de
Adobe Acrobat Distiller 5.0.x Joboption Datei
<< /ColorSettingsFile () /LockDistillerParams true /DetectBlends true /DoThumbnails true /AntiAliasMonoImages false /MonoImageDownsampleType /Bicubic /GrayImageDownsampleType /Bicubic /MaxSubsetPct 100 /MonoImageFilter /CCITTFaxEncode /ColorImageDownsampleThreshold 1.5 /GrayImageFilter /FlateEncode /ColorConversionStrategy /LeaveColorUnchanged /CalGrayProfile (Dot Gain 20%) /ColorImageResolution 300 /UsePrologue false /MonoImageResolution 1200 /ColorImageDepth 8 /sRGBProfile (sRGB IEC61966-2.1) /PreserveOverprintSettings true /CompatibilityLevel 1.3 /UCRandBGInfo /Preserve /EmitDSCWarnings false /CreateJobTicket true /DownsampleMonoImages false /DownsampleColorImages false /MonoImageDict << /K -1 >> /ColorImageDownsampleType /Bicubic /GrayImageDict << /HSamples [ 2 1 1 2 ] /VSamples [ 2 1 1 2 ] /Blend 1 /QFactor 0.9 >> /CalCMYKProfile (U.S. Web Coated (SWOP) v2) /ParseDSCComments true /PreserveEPSInfo true /MonoImageDepth -1 /AutoFilterGrayImages false /SubsetFonts false /GrayACSImageDict << /HSamples [ 2 1 1 2 ] /VSamples [ 2 1 1 2 ] /Blend 1 /QFactor 0.9 >> /ColorImageFilter /FlateEncode /AutoRotatePages /None /PreserveCopyPage true /EncodeMonoImages true /ASCII85EncodePages false /PreserveOPIComments false /NeverEmbed [ ] /ColorImageDict << /HSamples [ 2 1 1 2 ] /VSamples [ 2 1 1 2 ] /Blend 1 /QFactor 0.9 >> /AntiAliasGrayImages false /GrayImageDepth 8 /CannotEmbedFontPolicy /Error /EndPage -1 /TransferFunctionInfo /Preserve /CalRGBProfile (sRGB IEC61966-2.1) /EncodeColorImages true /EncodeGrayImages true /ColorACSImageDict << /HSamples [ 2 1 1 2 ] /VSamples [ 2 1 1 2 ] /Blend 1 /QFactor 0.9 >> /Optimize true /ParseDSCCommentsForDocInfo true /GrayImageDownsampleThreshold 1.5 /MonoImageDownsampleThreshold 1.5 /AutoPositionEPSFiles true /GrayImageResolution 300 /AutoFilterColorImages false /AlwaysEmbed [ /Courier-BoldOblique /Helvetica-BoldOblique /Courier /Helvetica-Bold /Times-Bold /Courier-Bold /Helvetica /Times-BoldItalic /Times-Roman /ZapfDingbats /Times-Italic /Helvetica-Oblique /Courier-Oblique /Symbol ] /ImageMemory 524288 /OPM 1 /DefaultRenderingIntent /Default /EmbedAllFonts true /StartPage 1 /DownsampleGrayImages false /AntiAliasColorImages false /ConvertImagesToIndexed true /PreserveHalftoneInfo false /CompressPages true /Binding /Left >> setdistillerparams << /PageSize [ 595.276 841.890 ] /HWResolution [ 2400 2400 ] >> setpagedevice
3
1.1
Introduction
Genome research enables the establish-ment of the complete genetic informationof organisms. The first complete genomesequences established were those of prokar-yotic and eukaryotic microorganisms, fol-lowed by those of plants and animals (see,for example, the TIGR web page athttp://www.tigr.org/). The organisms se-lected for genome research were mostlythose which were already important in sci-entific analysis and thus can be regarded asmodel organisms. In general, organismsare defined as model organisms when alarge amount of scientific knowledge hasbeen accumulated in the past. For thischapter on genome projects of model or-ganisms, several experts in genome re-search have been asked to give an overviewof specific genome projects and to report onthe respective organism from their specificpoint of view. The organisms selected in-clude prokaryotic and eukaryotic microor-ganisms, and plants and animals.
We have chosen the prokaryotes Escheri-chia coli, Bacillus subtilis, and Archaeoglobusfulgidus as representative model organisms.The E. coli genome project is described byM. KRÖGER (Giessen, Germany). He givesan historical outline of the intensive re-search on microbiology and genetics of thisorganism, which cumulated in the E. coligenome project. Many of the technologicaltools currently available have been devel-oped during the course of the E. coli ge-nome project. E. coli is without doubt thebest-analyzed microorganism of all. Theknowledge of the complete sequence ofE. coli has confirmed its reputation as theleading model organism of Gram_ eubacte-ria.
A. DANCHIN and A. SEKOWSKA (Paris,France) report on the genome project of theenvironmentally and biotechnologically rel-evant Gram+ eubacterium B. subtilis. Thecontribution focuses on the results andanalysis of the sequencing effort and givesseveral examples of specific and sometimesunexpected findings of this project. Specialemphasis is given to genomic data which
1Genome Projects on Model Organisms
Alfred Pühler, Doris Jording, Jörn Kalinowski, Detlev Buttgereit, Renate Renkawitz-Pohl, Lothar Altschmied, Antoin Danchin, Agnieszka Sekowska, Horst Feldmann, Hans-Peter Klenk, and Manfred Kröger
Handbook of Genome Research. Genomics, Proteomics, Metabolomics, Bioinformatics, Ethical and Legal Issues.Edited by Christoph W. SensenCopyright © 2005 WILEY-VCH Verlag GmbH & Co. KGaA, WeinheimISBN: 3-527-31348-6
4 1 Genome Projects in Model Organisms
support the understanding of general fea-tures such as translation and specific traitsrelevant for living in its general habitat or itsusefulness for industrial processes.
A. fulgidus is the subject of the contribu-tion by H.-P. KLENK (Feldafing, Germany).Although this genome project was startedbefore the genetic properties of the organ-ism had been extensively studied, its uniquelifestyle as a hyperthermophilic and sulfate-reducing organism makes it a model for alarge number of environmentally importantmicroorganisms and species with high bio-technological potential. The structure andresults of the genome project are describedin the contribution.
The yeast Saccharomyces cerevisiae hasbeen selected as a representative eukaryoticmicroorganism. The yeast project is pre-sented by H. FELDMANN (Munich, Germa-ny). S. cerevisiae has a long tradition in bio-technology and a long-term research historyas a eukaryotic model organism per se. Itwas the first eukaryote to be completely se-quenced and has led the way to sequencingother eukaryotic genomes. The wealth ofthe yeast’s sequence information as usefulreference for plant, animal, or human se-quence comparisons is outlined in the con-tribution.
Among the plants, the small cruciferArabidopsis thaliana was identified as theclassical model plant, because of simple cul-tivation and short generation time. Its ge-nome was originally considered to be thesmallest in the plant kingdom and wastherefore selected for the first plant genomeproject, which is described here by L.ALTSCHMIED (Gatersleben, Germany). Thesequence of A. thaliana helped to identifythat part of the genetic information uniqueto plants. In the meantime, other plant ge-nome sequencing projects were started,many of which focus on specific problemsof crop cultivation and nutrition.
The roundworm Caenorhabditis elegansand the fruitfly Drosophila melanogaster havebeen selected as animal models, because oftheir specific model character for higher an-imals and also for humans. The genomeproject of C. elegans is summarized by D.JORDING (Bielefeld, Germany). The contri-bution describes how the worm - despite itssimple appearance - became an interestingmodel organism for features such as neuro-nal growth, apoptosis, or signaling path-ways. This genome project has also provid-ed several bioinformatic tools which arewidely used for other genome projects.
The genome project concerning the fruit-fly D. melanogaster is described by D. BUTT-GEREIT and R. RENKAWITZ-POHL (Marburg,Germany). D. melanogaster is currently thebest-analyzed multicellular organism andcan serve as a model system for featuressuch as the development of limbs, the ner-vous system, circadian rhythms and evenfor complex human diseases. The contribu-tion gives examples of the genetic homolo-gy and similarities between Drosophila andthe human, and outlines perspectives forstudying features of human diseases usingthe fly as a model.
1.2
Genome Projects of Selected ProkaryoticModel Organisms
1.2.1
The Gram_ Enterobacterium Escherichia coli
1.2.1.1
The OrganismThe development of the most recent field ofmolecular genetics is directly connected withone of the best described model organisms,the eubacterium Escherichia coli. There is notextbook in biochemistry, genetics, or micro-biology which does not contain extensive sec-
51.2 Genome Projects of Selected Prokaryotic Model Organisms
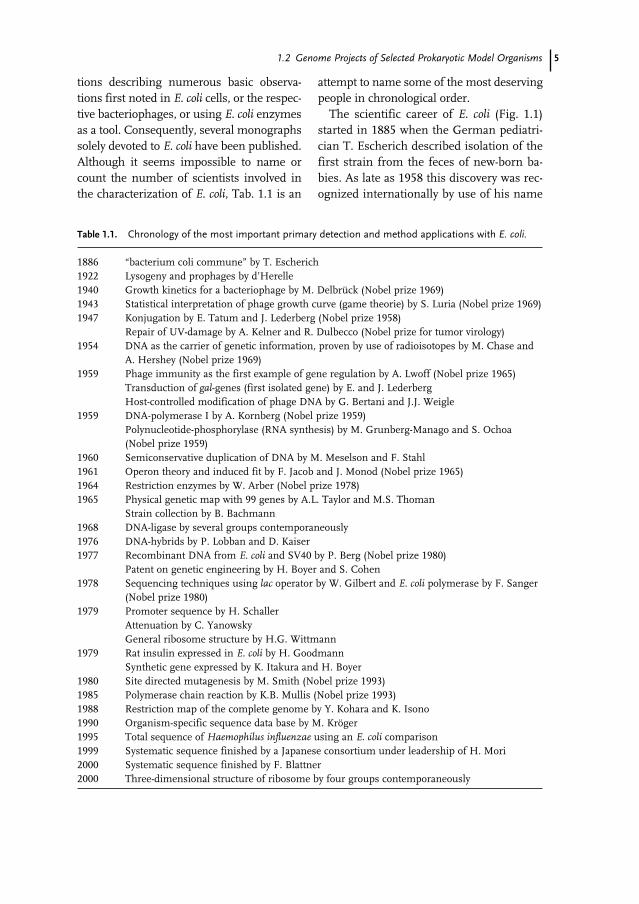
tions describing numerous basic observa-tions first noted in E. coli cells, or the respec-tive bacteriophages, or using E. coli enzymesas a tool. Consequently, several monographssolely devoted to E. coli have been published.Although it seems impossible to name orcount the number of scientists involved inthe characterization of E. coli, Tab. 1.1 is an
attempt to name some of the most deservingpeople in chronological order.
The scientific career of E. coli (Fig. 1.1)started in 1885 when the German pediatri-cian T. Escherich described isolation of thefirst strain from the feces of new-born ba-bies. As late as 1958 this discovery was rec-ognized internationally by use of his name
Table 1.1. Chronology of the most important primary detection and method applications with E. coli.
1886 “bacterium coli commune” by T. Escherich1922 Lysogeny and prophages by d’Herelle1940 Growth kinetics for a bacteriophage by M. Delbrück (Nobel prize 1969)1943 Statistical interpretation of phage growth curve (game theorie) by S. Luria (Nobel prize 1969)1947 Konjugation by E. Tatum and J. Lederberg (Nobel prize 1958)
Repair of UV-damage by A. Kelner and R. Dulbecco (Nobel prize for tumor virology)1954 DNA as the carrier of genetic information, proven by use of radioisotopes by M. Chase and
A. Hershey (Nobel prize 1969)1959 Phage immunity as the first example of gene regulation by A. Lwoff (Nobel prize 1965)
Transduction of gal-genes (first isolated gene) by E. and J. LederbergHost-controlled modification of phage DNA by G. Bertani and J.J. Weigle
1959 DNA-polymerase I by A. Kornberg (Nobel prize 1959)Polynucleotide-phosphorylase (RNA synthesis) by M. Grunberg-Manago and S. Ochoa (Nobel prize 1959)
1960 Semiconservative duplication of DNA by M. Meselson and F. Stahl1961 Operon theory and induced fit by F. Jacob and J. Monod (Nobel prize 1965)1964 Restriction enzymes by W. Arber (Nobel prize 1978)1965 Physical genetic map with 99 genes by A.L. Taylor and M.S. Thoman
Strain collection by B. Bachmann1968 DNA-ligase by several groups contemporaneously1976 DNA-hybrids by P. Lobban and D. Kaiser1977 Recombinant DNA from E. coli and SV40 by P. Berg (Nobel prize 1980)
Patent on genetic engineering by H. Boyer and S. Cohen1978 Sequencing techniques using lac operator by W. Gilbert and E. coli polymerase by F. Sanger
(Nobel prize 1980)1979 Promoter sequence by H. Schaller
Attenuation by C. YanowskyGeneral ribosome structure by H.G. Wittmann
1979 Rat insulin expressed in E. coli by H. GoodmannSynthetic gene expressed by K. Itakura and H. Boyer
1980 Site directed mutagenesis by M. Smith (Nobel prize 1993)1985 Polymerase chain reaction by K.B. Mullis (Nobel prize 1993)1988 Restriction map of the complete genome by Y. Kohara and K. Isono1990 Organism-specific sequence data base by M. Kröger1995 Total sequence of Haemophilus influenzae using an E. coli comparison1999 Systematic sequence finished by a Japanese consortium under leadership of H. Mori2000 Systematic sequence finished by F. Blattner2000 Three-dimensional structure of ribosome by four groups contemporaneously

6 1 Genome Projects in Model Organisms
to classify this group of bacterial strains. In1921 the very first report on virus formationwas published for E. coli. Today we call therespective observation “lysis by bacterio-phages”. In 1935 these bacteriophages be-came the most powerful tool in defining thecharacteristics of individual genes. Becauseof their small size, they were found to beideal tools for statistical calculations per-formed by the former theoretical physicistM. Delbrück. His very intensive and suc-cessful work has attracted many others tothis area of research. In addition, Delbrück’sextraordinary capability to catalyze the ex-change of ideas and methods yielded thelegendary Cold Spring Harbor Phagecourse. Everybody interested in basic genet-ics has attended this famous summercourse or at least came to the respective an-nual phage meeting. This course, whichwas an ideal combination of joy and work,became an ideal means of spreading practi-cal methods. For many decades it was themost important exchange forum for resultsand ideas, and strains and mutants. Soon,the so called “phage family” was formed,which interacted almost like one big labora-tory; for example, results were communicat-ed preferentially by means of preprints. Fi-nally, 15 Nobel prize-winners have theirroots in this summer-school (Tab. 1.1).
The substrain E. coli K12 was first used byE. Tatum as a prototrophic strain. It waschosen more or less by chance from thestrain collection of the Stanford MedicalSchool. Because it was especially easy tocultivate and because it is, as an inhabitantof our gut, a nontoxic organism by defini-tion, the strain became very popular. Be-cause of the vast knowledge already ac-quired and because it did not form fimbri-ae, E. coli K12 was chosen in 1975 at the fa-mous Asilomar conference on biosafety asthe only organism on which early cloningexperiments were permitted [1]. No wonderthat almost all subsequent basic observa-tions in the life sciences were obtained ei-ther with or within E. coli. What started asthe “phage family”, however, dramaticallysplit into hundreds of individual groupsworking in tough competition. As one ofthe most important outcomes, sequencingof E. coli was performed more than once.Because of the separate efforts, the genomefinished only as number seven [2–4]. Theamount of knowledge acquired, however, iscertainly second to none and the way thisknowledge was acquired is interesting, bothin the history of sequencing methods andbioinformatics, and because of its influenceon national and individual pride.
Fig. 1.1 Scanning electron micrograph (SEM) of Escherichia coli cells. (Image courtesy ofShirley Owens, Center for Electron Optics,MSU; found at http://commtechab.msu.edu/sites/dlc-me/zoo/ zah0700.html#top#top)
71.2 Genome Projects of Selected Prokaryotic Model Organisms
Work on E. coli is not finished with com-pletion of the DNA sequence; data will becontinuously acquired to fully characterizethe genome in terms of genetic functionand protein structures [5]. This is very im-portant, because several toxic E. coli strainsare known. Thus research on E. coli hasturned from basic science into appliedmedical research. Consequently, the hu-man toxic strain O157 has been completelysequenced, again more than once (unpub-lished).
1.2.1.2
Characterization of the Genome and Early Sequencing EffortsWith its history in mind and realizing theimpact of the data, it is obvious that an evergrowing number of colleagues worldwideworked with or on E. coli. Consequently,there was an early need for organization ofthe data. This led to the first physical genet-ic map, comprising 99 genes, of any livingorganism, published in by Taylor and Tho-man [6]. This map was improved and wasrefined for several decades by Bach-mann [7] and Berlyn [8]. These researchersstill maintain a very useful collection ofstrains and mutants at Yale University. Onethousand and twenty-seven loci had beenmapped by 1983 [7]; these were used as thebasis of the very first sequence databasespecific to a single organism [4]. As shownin Fig. 2 of Kröger and Wahl [4], sequenc-ing of E. coli started as early as 1967 withone of the first ever characterized tRNA se-quences. Immediately after DNA sequenc-ing had been established numerous labora-tories started to determine sequences oftheir personal interest.
1.2.1.3
Structure of the Genome ProjectIn 1987 Isono’s group published a very in-formative and incredibly exact restriction
map of the entire genome [9]. With the helpof K. Rudd it was possible to locate sequenc-es quite precisely [8, 10]. But only very fewsaw any advantage in closing the some-times very small gaps, and so a worldwidejoint sequencing approach could not be es-tablished. Two groups, one in Kobe, Ja-pan [3] and one in Madison, Wisconsin [2]started systematic sequencing of the ge-nome in parallel, and another laboratory, atHarvard University, used E. coli as a targetto develop new sequencing technology. Sev-eral meetings, organized especially on E.coli, did not result in a unified systematicapproach, thus many genes have been se-quenced two or three times. Although spe-cific databases have been maintained tobring some order into the increasing chaos,even this type of tool has been developedseveral times in parallel [4, 10]. Whenever anew contiguous sequence was published,approximately 75 % had already previouslybeen submitted to the international data-bases by other laboratories. The progress ofdata acquisition followed a classical e-curve,as shown in Fig. 2 of Kröger and Wahl [4].Thus in 1992 it was possible to predict thecompleteness of the sequence for 1997without knowledge of the enormous techni-cal innovations in between [4].
Both the Japanese consortium and thegroup of F. Blattner started early; some peo-ple say they started too early. They sub-cloned the DNA first and used manual se-quencing and older informatic systems. Se-quencing was performed semi-automatical-ly, and many students were employed toread and monitor the X-ray films. When thefirst genome sequence of Haemophilus in-fluenzae appeared in 1995 the science foun-dations wanted to discontinue support ofE. coli projects, which received their grantsupport mainly because of the model char-acter of the sequencing techniques devel-oped.
8 1 Genome Projects in Model Organisms
Three facts and truly international protestconvinced the juries to continue financialsupport. First, in contrast with the othercompletely sequenced organisms, E. coli isan autonomously living organism. Second,when the first complete very small genomesequence was released, even the longestcontiguous sequence for E. coli was alreadylonger. Third, the other laboratories couldonly finish their sequences because the E.coli sequences were already publicly avail-able. Consequently, the two main compet-ing laboratories were allowed to purchaseseveral of the sequencing machines alreadydeveloped and use the shotgun approach tocomplete their efforts. Finally, they finishedalmost at the same time. H. Mori and hiscolleagues included already published se-quences from other laboratories in their se-quence data and sent them to the interna-tional databases on December 28th, 1996 [3]and F. Blattner reported an entirely new se-quence on January 16th, 1997 [2]. They add-ed the last changes and additions as late asOctober, 1998. Very sadly, at the end E. colihad been sequenced almost three times [4].Nowadays, however, most people forgetabout all the other sources and refer to theBlattner sequence.
1.2.1.4
Results from the Genome ProjectWhen the sequences were finally finished,most of the features of the genome were al-ready known. Consequently, people nolonger celebrate the E. coli sequence as amajor breakthrough. At that time everybodyknew the genome was almost completelycovered with genes, although fewer thanhalf had been genetically characterized.Tab. 1.2 illustrates this and shows thecounting differences. Because of this highdensity of genes, F. Blattner and coworkersdefined “gray holes” whenever they found anoncoding region of more than 2 kb [2]. It
was found that the termination of replica-tion is almost exactly opposite to the originof replication. No special differences havebeen found for either direction of replica-tion. Approximately 40 formerly describedgenetic features could not be located or sup-ported by the sequence [4, 8]. On the otherhand, there are several examples of multi-ple functions encoded by the same gene. Itwas found that the multifunctional genesare mostly involved in gene expression andused as a general control factor. M. Riley de-termined the number of gene duplications,which is also not unexpectedly low whenneglecting the ribosomal operons [10].
Everybody is convinced that the real workis starting only now. Several strain differ-ences might be the cause of the deviationsbetween the different sequences available.Thus the numbers of genes and nucleotidesdiffer slightly (Tab. 1.2). Everybody wouldlike to know the function of each of theopen reading frames [5], but nobody has re-ceived the grant money to work on this im-portant problem. Seemingly, other modelorganisms are of more public interest; thusit might well be that research on other or-ganisms will now help our understandingof E. coli, in just the same way that E. coliprovided information enabling understand-ing of them. In contrast with yeast, it is veryhard to produce knock-out mutants. Thus,we might have the same situation in thepostgenomic era as we had before the ge-nome was finished. Several laboratories willcontinue to work with E. coli, they will con-stantly characterize one or the other openreading frame, but there will be no mutualeffort [5]. A simple and highly efficientmethod using PCR products to inactivatechromosomal genes was recently devel-oped [11]. This method has greatly facilitat-ed systematic mutagenesis approaches in E.coli.
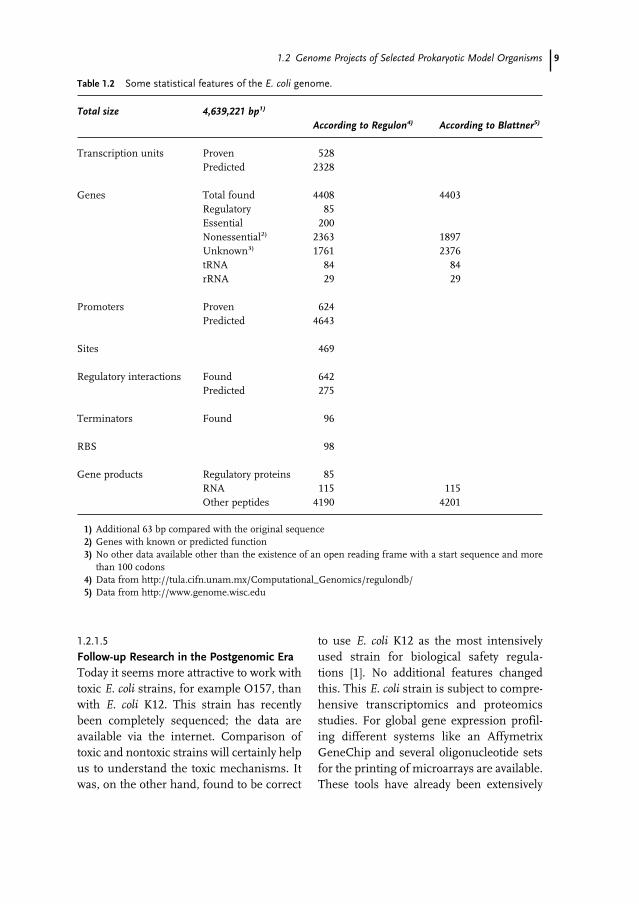
91.2 Genome Projects of Selected Prokaryotic Model Organisms
1.2.1.5
Follow-up Research in the Postgenomic EraToday it seems more attractive to work withtoxic E. coli strains, for example O157, thanwith E. coli K12. This strain has recentlybeen completely sequenced; the data areavailable via the internet. Comparison oftoxic and nontoxic strains will certainly helpus to understand the toxic mechanisms. Itwas, on the other hand, found to be correct
to use E. coli K12 as the most intensivelyused strain for biological safety regula-tions [1]. No additional features changedthis. This E. coli strain is subject to compre-hensive transcriptomics and proteomicsstudies. For global gene expression profil-ing different systems like an AffymetrixGeneChip and several oligonucleotide setsfor the printing of microarrays are available.These tools have already been extensively
Table 1.2 Some statistical features of the E. coli genome.
Total size 4,639,221 bp1)
According to Regulon4) According to Blattner5)
Transcription units Proven 528Predicted 2328
Genes Total found 4408 4403Regulatory 85Essential 200Nonessential2) 2363 1897Unknown3) 1761 2376tRNA 84 84rRNA 29 29
Promoters Proven 624Predicted 4643
Sites 469
Regulatory interactions Found 642Predicted 275
Terminators Found 96
RBS 98
Gene products Regulatory proteins 85RNA 115 115Other peptides 4190 4201
1) Additional 63 bp compared with the original sequence2) Genes with known or predicted function3) No other data available other than the existence of an open reading frame with a start sequence and more
than 100 codons4) Data from http://tula.cifn.unam.mx/Computational_Genomics/regulondb/5) Data from http://www.genome.wisc.edu
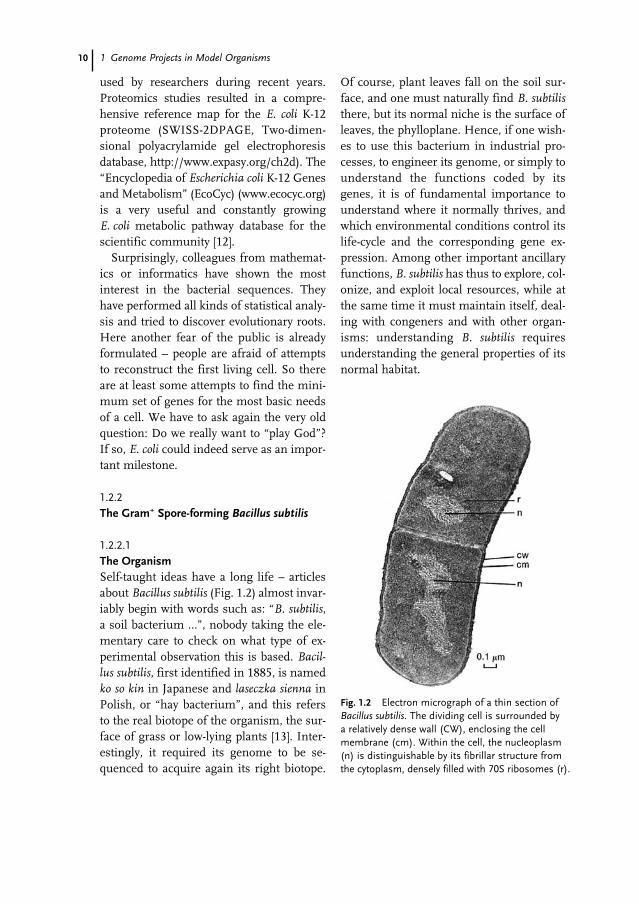
10 1 Genome Projects in Model Organisms
used by researchers during recent years.Proteomics studies resulted in a compre-hensive reference map for the E. coli K-12proteome (SWISS-2DPAGE, Two-dimen-sional polyacrylamide gel electrophoresisdatabase, http://www.expasy.org/ch2d). The“Encyclopedia of Escherichia coli K-12 Genesand Metabolism” (EcoCyc) (www.ecocyc.org)is a very useful and constantly growingE. coli metabolic pathway database for thescientific community [12].
Surprisingly, colleagues from mathemat-ics or informatics have shown the mostinterest in the bacterial sequences. Theyhave performed all kinds of statistical analy-sis and tried to discover evolutionary roots.Here another fear of the public is alreadyformulated – people are afraid of attemptsto reconstruct the first living cell. So thereare at least some attempts to find the mini-mum set of genes for the most basic needsof a cell. We have to ask again the very oldquestion: Do we really want to “play God”?If so, E. coli could indeed serve as an impor-tant milestone.
1.2.2
The Gram+ Spore-forming Bacillus subtilis
1.2.2.1
The OrganismSelf-taught ideas have a long life – articlesabout Bacillus subtilis (Fig. 1.2) almost invar-iably begin with words such as: “B. subtilis,a soil bacterium …”, nobody taking the ele-mentary care to check on what type of ex-perimental observation this is based. Bacil-lus subtilis, first identified in 1885, is namedko so kin in Japanese and laseczka sienna inPolish, or “hay bacterium”, and this refersto the real biotope of the organism, the sur-face of grass or low-lying plants [13]. Inter-estingly, it required its genome to be se-quenced to acquire again its right biotope.
Of course, plant leaves fall on the soil sur-face, and one must naturally find B. subtilisthere, but its normal niche is the surface ofleaves, the phylloplane. Hence, if one wish-es to use this bacterium in industrial pro-cesses, to engineer its genome, or simply tounderstand the functions coded by itsgenes, it is of fundamental importance tounderstand where it normally thrives, andwhich environmental conditions control itslife-cycle and the corresponding gene ex-pression. Among other important ancillaryfunctions, B. subtilis has thus to explore, col-onize, and exploit local resources, while atthe same time it must maintain itself, deal-ing with congeners and with other organ-isms: understanding B. subtilis requiresunderstanding the general properties of itsnormal habitat.
Fig. 1.2 Electron micrograph of a thin section of Bacillus subtilis. The dividing cell is surrounded by a relatively dense wall (CW), enclosing the cell membrane (cm). Within the cell, the nucleoplasm(n) is distinguishable by its fibrillar structure fromthe cytoplasm, densely filled with 70S ribosomes (r).
111.2 Genome Projects of Selected Prokaryotic Model Organisms
1.2.2.2
A Lesson from Genome Analysis: The Bacillus subtilis BiotopeThe genome of B. subtilis (strain 168), se-quenced by a team in European and Japa-nese laboratories, is 4,214,630 bp long(http://genolist.pasteur.fr/SubtiList/). Ofmore than 4100 protein-coding genes, 53 %are represented once. One quarter of the ge-nome corresponds to several gene familieswhich have probably been expanded bygene duplication. The largest family con-tains 77 known and putative ATP-bindingcassette (ABC) permeases, indicating that,despite its large metabolism gene number,B. subtilis has to extract a variety of com-pounds from its environment [14]. In gen-eral, the permeating substrates are un-changed during permeation. Group-trans-fer, in which substrates are modified dur-ing transport, plays an important role in B.subtilis, however. Its genome codes for a va-riety of phosphoenolpyruvate-dependentsystems (PTS) which transport carbohy-drates and regulate general metabolism as afunction of the nature of the supplied car-bon source. A functionally-related catabo-lite repression control, mediated by aunique system (not cyclic AMP), exists inthis organism [15]. Remarkably, apart fromthe expected presence of glucose-mediatedregulation, it seems that carbon sources re-lated to sucrose play a major role, via a verycomplicated set of highly regulated path-ways, indicating that this plant-associatedcarbon supply is often encountered by thebacteria. In the same way, B. subtilis cangrow on many of the carbohydrates synthe-sized by grass-related plants.
In addition to carbon, oxygen, nitrogen,hydrogen, sulfur, and phosphorus are thecore atoms of life. Some knowledge aboutother metabolism in B. subtilis has accumu-lated, but significantly less than in its E. colicounterpart. Knowledge of its genome se-
quence is, however, rapidly changing thesituation, making B. subtilis a model of sim-ilar general use to E. coli. A frameshift mu-tation is present in an essential gene forsurfactin synthesis in strain 168 [16], but ithas been found that including a smallamount of a detergent into plates enabledthese bacteria to swarm and glide extreme-ly efficiently (C.-K. Wun and A. Sekowska,unpublished observations). The first lessonof genome text analysis is thus that B. subti-lis must be tightly associated with the plantkingdom, with grasses in particular [17].This should be considered in priority whendevising growth media for this bacterium,in particular in industrial processes.
Another aspect of the B. subtilis life cycleconsistent with a plant-associated life is thatit can grow over a wide range of differenttemperatures, up to 54–55 °C – an interest-ing feature for large-scale industrial pro-cesses. This indicates that its biosyntheticmachinery comprises control elements andmolecular chaperones that enable this ver-satility. Gene duplication might enable ad-aptation to high temperature, with iso-zymes having low- and high-temperatureoptima. Because the ecological niche of B.subtilis is linked to the plant kingdom, it issubjected to rapid alternating drying andwetting. Accordingly, this organism is veryresistant to osmotic stress, and can growwell in media containing 1 M NaCl. Also,the high level of oxygen concentrationreached during daytime are met with pro-tection systems – B. subtilis seems to haveas many as six catalase genes, both of theheme-containing type (katA, katB, and katXin spores) and of the manganese-containingtype (ydbD, PBX phage-associated yjqC, andcotJC in spores).
The obvious conclusion from these ob-servations is that the normal B. subtilisniche is the surface of leaves [18]. This isconsistent with the old observation that
12 1 Genome Projects in Model Organisms
B. subtilis makes up the major population ofthe bacteria of rotting hay. Furthermore,consistent with the extreme variety of condi-tions prevailing on plants, B. subtilis is anendospore-forming bacterium, makingspores highly resistant to the lethal effectsof heat, drying, many chemicals, and radia-tion.
1.2.2.3
To Lead or to Lag: First Laws of GenomicsAnalysis of repeated sequences in theB. subtilis genome discovered an unexpect-ed feature: strain 168 does not contain in-sertion sequences. A strict constraint on thespatial distribution of repeats longer than25 bp was found in the genome, in contrastwith the situation in E. coli. Correlation ofthe spatial distribution of repeats and theabsence of insertion sequences in the ge-nome suggests that mechanisms aimed attheir avoidance and/or elimination havebeen developed [19]. This observation is par-ticularly relevant for biotechnological pro-cesses in which one has multiplied the copynumber of genes to improve production. Al-though there is generally no predictable linkbetween the structure and function of bio-logical objects, the pressure of natural selec-tion has adapted together gene and geneproducts. Biases in features of predictablyunbiased processes is evidence of prior se-lective pressure. With B. subtilis one ob-serves a strong bias in the polarity of tran-scription with respect to replication: 70 % ofthe genes are transcribed in the direction ofthe replication fork movement [14]. Globalanalysis of oligonucleotides in the genomedemonstrated there is a significant bias notonly in the base or codon composition ofone DNA strand relative to the other, but,quite surprisingly, there is a strong bias atthe level of the amino-acid content of theproteins. The proteins coded by the leadingstrand are valine-rich and those coded by
the lagging strand are threonine and isoleu-cine-rich. This first law of genomics seemsto extend to many bacterial genomes [20]. Itmust result from a strong selection pres-sure of a yet unknown nature, demonstrat-ing that, contrary to an opinion frequentlyheld, genomes are not, on a global scale,plastic structures. This should be taken intoaccount when expressing foreign proteinsin bacteria.
Three principal modes of transfer of ge-netic material – transformation, conjuga-tion, and transduction – occur naturally inprokaryotes. In B. subtilis, transformation isan efficient process (at least in some B. sub-tilis species such as the strain 168) andtransduction with the appropriate carrierphages is well understood.
The unique presence in the B. subtilis ge-nome of local repeats, suggesting Camp-bell-like integration of foreign DNA, is con-sistent with strong involvement of recombi-nation processes in its evolution. Recombi-nation must, furthermore, be involved inmutation correction. In B. subtilis, MutSand MutL homologs occur, presumably forthe purpose of recognizing mismatchedbase pairs [21]. No counterpart of MutH ac-tivity, which would enable the daughterstrand to be distinguished from its parent,has, however, been identified. It is, there-fore, not known how the long-patch mis-match repair system corrects mutations inthe newly synthesized strand. One can spec-ulate that the nicks caused in the daughterstrands by excision of newly misincorporat-ed uracil instead of thymine during replica-tion might provide the appropriate signal.Ongoing fine studies of the distribution ofnucleotides in the genome might substan-tiate this hypothesis.
The recently sequenced genome of thepathogen Listeria monocytogenes has manyfeatures in common with that of the ge-nome of B. subtilis [22]. Preliminary analysis
131.2 Genome Projects of Selected Prokaryotic Model Organisms
suggests that the B. subtilis genome mightbe organized around the genes of coremetabolic pathways, such as that of sulfurmetabolism [23], consistent with a strongcorrelation between the organization of thegenome and the architecture of the cell.
1.2.2.4
Translation: Codon Usage and the Organization of the Cell’s CytoplasmExploiting the redundancy of the geneticcode, coding sequences show evidence ofhighly variable biases of codon usage. Thegenes of B. subtilis are split into three class-es on the basis of their codon usage bias.One class comprises the bulk of the pro-teins, another is made up of genes ex-pressed at a high level during exponentialgrowth, and a third class, with A + T-richcodons, corresponds to portions of the ge-nome that have been horizontally ex-changed [14].
When mRNA threads are emerging fromDNA they become engaged by the lattice ofribosomes, and ratchet from one ribosometo the next, like a thread in a wiredrawingmachine [24]. In this process, nascent pro-teins are synthesized on each ribosome,spread throughout the cytoplasm by the lin-ear diffusion of the mRNA molecule fromribosome to ribosome. If the environmentalconditions change suddenly, however, thetranscription complex must often break up.Truncated mRNA is likely to be a danger-ous molecule because, if translated, itwould produce a truncated protein. Suchprotein fragments are often toxic, becausethey can disrupt the architecture of multi-subunit complexes. A process copes withthis kind of accident in B. subtilis. When atruncated mRNA molecule reaches its end,the ribosome stops translating, and waits. Aspecialized RNA, tmRNA, that is folded andprocessed at its 3′ end like a tRNA andcharged with alanine, comes in, inserts its
alanine at the C-terminus of the nascentpolypeptide, then replaces the mRNA with-in a ribosome, where it is translated asASFNQNVALAA. This tail is a protein tagthat is then used to direct the truncatedtagged protein to a proteolytic complex(ClpA, ClpX), where it is degraded [25].
1.2.2.5
Post-sequencing Functional Genomics: Essential Genes and Expression-profilingStudiesSequencing a genome is not a goal per se.Apart from trying to understand how genesfunction together it is most important, es-pecially for industrial processes, to knowhow they interact. As a first step it wasinteresting to identify the genes essentialfor life in rich media. The European–Japa-nese functional genomics consortium en-deavored to inactivate all the B. subtilisgenes one by one [26]. In 2004, the outcomeof this work are still the first and only resultin which we can list all the essential genesin bacteria. In this genome counting over4100 genes, 271 seem to be essential forgrowth in rich medium under laboratoryconditions (i.e. without being challenged bycompetition with other organisms or bychanging environmental conditions). Mostof these genes can be placed into a few largeand predicable functional categories, for ex-ample information processing, cell enve-lope biosynthesis, shape, division, and en-ergy management. The remaining genes,however, fall into categories not expected tobe essential, for example some Embden–Meyerhof–Parnas pathway genes and genesinvolved in purine biosynthesis. This opensthe perspective that these enzymes can havenovel and unexpected functions in the cell.Interestingly, among the 26 essential genesthat belongs to either “other functions” or“unknown genes” categories, seven belongto or carry the signature for (ATP/)GTP-
14 1 Genome Projects in Model Organisms
binding proteins – several now seem to codefor tRNA modifications [27], but some couldbe in charge of coordination of essentialprocesses listed above, as seems to be truefor eukaryotes. A remarkable outcome ofthis project was the discovery that essentialgenes are grouped along the leading replica-tion strands in the genome [28]. This fea-ture is general and indicates that genes can-not, at least under strong competitive condi-tions, be shuffled randomly in the chromo-some. This has important consequences forgenetic manipulation of organisms of bio-technological interest.
Beside identification of B. subtilis essen-tial genes, the European–Japanese projectproduced an almost complete representa-tive collection of mutants of this bacterium.This collection is freely available to the sci-entific community, in particular for biotech-nology-oriented studies. This strategy is agood example of genome-wide approachesthat would have been unthinkable twodecades ago. The obvious continuation inthis line was the use of transcriptome anal-ysis (identification of all transcripts on DNAarrays under a variety of experimental con-ditions). Several dozen reports appeared inthe literature in those years dealing withdata obtained by this global approach. Withdifferent technical solutions (from commer-cially available macroarrays with radioactivelabeling through custom-made glass micro-arrays with fluorescent labeling) they offeran almost exhaustive point of view at thelevel of transcription answering a givenquestion, assuming particular attention hasbeen devoted to controlling all upstream ex-perimental steps (RNA preparation, cDNAsynthesis) and to making use of well-chosenstatistical analyses. Many reports have beendevoted to the study of heat-shock proteinsbut not much work was devoted to theequally important cold-shock proteins of thebacteria. The two-component system desKR
was recently identified; this regulates ex-pression of des gene coding for desaturase,which participates in cold adaptationthrough membrane lipid modification. Todiscover whether the desKR system is exclu-sively devoted to des regulation or consti-tutes a cold-triggered regulatory system ofglobal relevance, macroarray studiesseemed to be the method of choice [29]. Amajor outcome of this study was, it seemed,that the desKR system controls des gene ex-pression only. Unexpectedly, this work un-covered many novel partners involved incold shock response, with almost half ofthese genes annotated as carrying an un-known function. The categories of genes af-fected by the cold-shock response were, asexpected, the cold shock protein genes thatwere already known, but also heat-shockprotein genes and genes involved in transla-tion machinery, amino acid biosynthesis,nucleoid structure, ABC permeases (for ac-etoin in particular), purine and pyrimidinebiosynthesis and glycolysis, the citric acidcycle, and ATP synthesis. Because these lastcategories are found in most transcriptomestudies, it remains to be seen whether theyare indeed specific to cold shock. Amonggenes of unknown function particularlyinteresting in biotechnology one can men-tion the yplP gene, which codes for a tran-scriptional regulator that belongs to theNtrC/NifA family and which, when inacti-vated, causes a cold-specific late-growthphenotype. However, the exact role of YplPprotein remains to be understood.
An essential complement to transcrip-tome studies is exploration of the bacterialproteome, which gives a detailed look at thebehavior of the final players. Because whatreally counts for a cell is the final level of itsmature proteins, and because many post-transcriptional modifications can alter thefate of mRNA translation products into ma-ture proteins, transcriptome analysis alone
151.2 Genome Projects of Selected Prokaryotic Model Organisms
provides only an approximation of what isgoing to really happen in the cell. Studyingthe proteome expressed under specific con-ditions can help uncover interesting linksbetween different parts of metabolism. Thishas been explored under conditions impor-tant for biotechnology, for example the salt-stress response and iron metabolism [30].This recent work aiming at establishing thenetwork of proteins affected by osmoticstress has shown that B. subtilis cells grow-ing under high-salinity are subjected to ironlimitation, as indicated by the increase ofexpression of several putative iron-uptakesystems (fhuD, fhuB, feuA, ytiY and yfmC)or iron siderophore bacillibactin synthesisand modification genes (dhbABCE). Thederepression of the dhb operon seems to bemore a salt-specific effect than a general os-motic effect, because it is not produced byaddition of iso-osmotic non-ionic osmolites(sucrose or maltose) to the growth medium.Some high-salinity growth-defect pheno-types could, furthermore, be reversed bysupplementation of the medium with ex-cess iron. This work shows that two distinctfactors important in fermentors – iron lim-itation and high-salinity stress – hitherto re-garded as separate growth-limiting factors,are indeed not so separate.
1.2.2.6
Industrial ProcessesBacillus subtilis is generally recognized assafe (GRAS). It is much used industriallyboth for enzyme production and for food-supply fermentation. Riboflavin is derivedfrom genetically modified B. subtilis by useof fermentation techniques. For some timehigh levels of heterologous gene expressionin B. subtilis was difficult to achieve. In con-trast with Gram-negatives, A + T-rich Gram-positive bacteria have optimized transcrip-tion and translation signals; althoughB. subtilis has a counterpart of the rpsA
gene, this organism lacks the function ofthe corresponding ribosomal S1 proteinwhich enables recognition of the ribosome-binding site upstream of the translationstart codons [31]. Traditional techniques(e.g. random mutagenesis followed byscreening; ad hoc optimization of poorly de-fined culture media) are important and willcontinue to be used in the food industry,but biotechnology must now include ge-nomics to target artificial genes that followthe sequence rules of the genome at a pre-cise position, adapted to the genome struc-ture, and to modify intermediary metab-olism while complying with the adaptedniche of the organism, as revealed by its ge-nome. As a complement to standard genet-ic engineering and transgenic technology,knowing the genome text has opened awhole new range of possibilities in food-product development, in particular ena-bling “humanization” of the content of foodproducts (adaptation to the human metab-olism, and even adaptation to sick orhealthy conditions). These techniques pro-vide an attractive means of producinghealthier food ingredients and productsthat are currently not available or are veryexpensive. B. subtilis will remain a tool ofchoice in this respect.
1.2.2.7
Open QuestionsThe complete genome sequence of B. subti-lis contains information that remainsunderutilized in the current predictionmethods applied to gene functions, most ofwhich are based on similarity searches ofindividual genes. In particular, it is nowclear that the order of the genes in the chro-mosome is not random, and that some hotspots enable gene insertion without muchdamage whereas other regions are forbid-den. For production of small molecules onemust use higher-level information on meta-
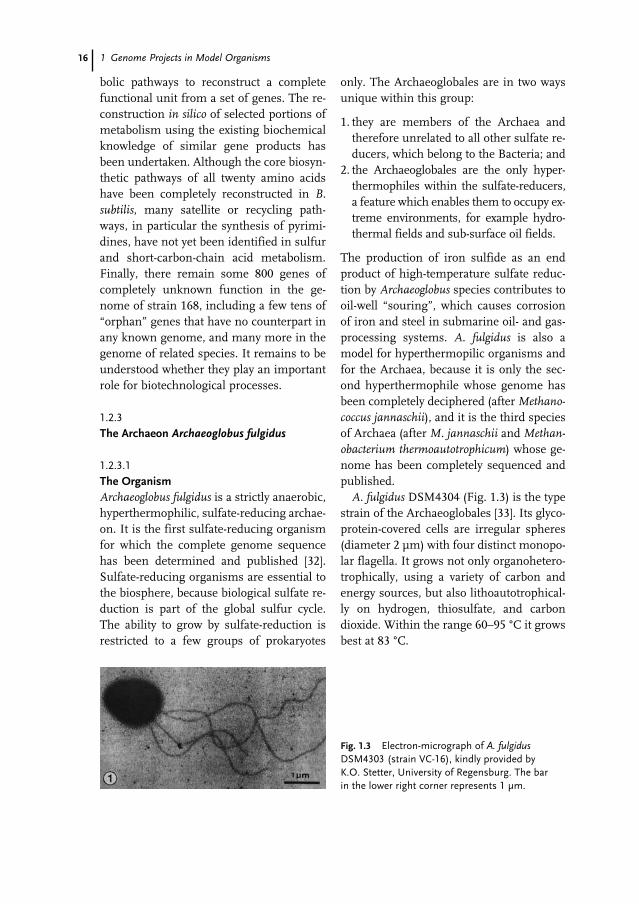
16 1 Genome Projects in Model Organisms
bolic pathways to reconstruct a completefunctional unit from a set of genes. The re-construction in silico of selected portions ofmetabolism using the existing biochemicalknowledge of similar gene products hasbeen undertaken. Although the core biosyn-thetic pathways of all twenty amino acidshave been completely reconstructed in B.subtilis, many satellite or recycling path-ways, in particular the synthesis of pyrimi-dines, have not yet been identified in sulfurand short-carbon-chain acid metabolism.Finally, there remain some 800 genes ofcompletely unknown function in the ge-nome of strain 168, including a few tens of“orphan” genes that have no counterpart inany known genome, and many more in thegenome of related species. It remains to beunderstood whether they play an importantrole for biotechnological processes.
1.2.3
The Archaeon Archaeoglobus fulgidus
1.2.3.1
The OrganismArchaeoglobus fulgidus is a strictly anaerobic,hyperthermophilic, sulfate-reducing archae-on. It is the first sulfate-reducing organismfor which the complete genome sequencehas been determined and published [32].Sulfate-reducing organisms are essential tothe biosphere, because biological sulfate re-duction is part of the global sulfur cycle.The ability to grow by sulfate-reduction isrestricted to a few groups of prokaryotes
only. The Archaeoglobales are in two waysunique within this group:
1. they are members of the Archaea andtherefore unrelated to all other sulfate re-ducers, which belong to the Bacteria; and
2. the Archaeoglobales are the only hyper-thermophiles within the sulfate-reducers,a feature which enables them to occupy ex-treme environments, for example hydro-thermal fields and sub-surface oil fields.
The production of iron sulfide as an endproduct of high-temperature sulfate reduc-tion by Archaeoglobus species contributes tooil-well “souring”, which causes corrosionof iron and steel in submarine oil- and gas-processing systems. A. fulgidus is also amodel for hyperthermopilic organisms andfor the Archaea, because it is only the sec-ond hyperthermophile whose genome hasbeen completely deciphered (after Methano-coccus jannaschii), and it is the third speciesof Archaea (after M. jannaschii and Methan-obacterium thermoautotrophicum) whose ge-nome has been completely sequenced andpublished.
A. fulgidus DSM4304 (Fig. 1.3) is the typestrain of the Archaeoglobales [33]. Its glyco-protein-covered cells are irregular spheres(diameter 2 µm) with four distinct monopo-lar flagella. It grows not only organohetero-trophically, using a variety of carbon andenergy sources, but also lithoautotrophical-ly on hydrogen, thiosulfate, and carbondioxide. Within the range 60–95 °C it growsbest at 83 °C.
Fig. 1.3 Electron-micrograph of A. fulgidusDSM4303 (strain VC-16), kindly provided by K.O. Stetter, University of Regensburg. The bar in the lower right corner represents 1 µm.
171.2 Genome Projects of Selected Prokaryotic Model Organisms
Before genome sequencing very little wasknown about the genomic organization ofA. fulgidus. The first estimate of its genomesize, obtained by use of pulsed field gel elec-trophoresis, was published after final as-sembly of the genome sequences had al-ready been achieved. Because extra-chromo-somal elements are absent from A. fulgidus,it was determined that the genome consistsof only one circular chromosome. Althoughdata about genetic or physical mapping ofthe genome were unknown before the se-quencing project, a small-scale approach tophysical mapping was performed late in theproject for confirmation of the genome as-sembly. Sequences of only eleven genesfrom A. fulgidus had been published beforethe sequencing project started; these cov-ered less than 0.7 % of the genome.
1.2.3.2
Structure of the Genome ProjectThe whole-genome random sequencingprocedure was chosen as sequencing strate-gy for the A. fulgidus genome project. Thisprocedure had previously been applied tofour microbial genomes sequenced at TheInstitute for Genomic Research (TIGR):Haemophilus influenzae, Mycoplasma geni-talium, M. jannaschii, and Helicobacter pylo-ri [34]. Chromosomal DNA for the con-struction of libraries was prepared from aculture derived from a single cell isolated bymeans of optical tweezers and provided byK.O. Stetter. Three libraries were used forsequencing – two plasmid libraries(1.42 kbp and 2.94 kbp insert size) for masssequence production and one large insert ë-library (16.38 kbp insert size) for the ge-nome scaffold. The initial random sequenc-ing phase was performed with these librar-ies until 6.7-fold sequence coverage wasachieved. At this stage the genome was as-sembled into 152 contigs separated by se-quence gaps and five groups of contigs sep-
arated by physical gaps. Sequence gapswere closed by a combined approach of ed-iting the ends of sequence traces and byprimer walking on plasmid- and ë-clonesspanning the gaps. Physical gaps wereclosed by direct sequencing of PCR-frag-ments generated by combinatorial PCR re-actions. Only 0.33 % of the genome (90 re-gions) was covered by only one single se-quence after the gap-closure phase. Theseregions were confirmed by additional se-quencing reactions to ensure a minimumsequence coverage of two for the whole ge-nome. The final assembly consisted of29,642 sequencing runs which cover the ge-nome sequence 6.8-fold.
The A. fulgidus genome project was fi-nanced by the US Department of Energy(DOE) within the Microbial Genome Pro-gram. This program financed several of theearly microbial genome-sequencing pro-jects performed at a variety of genome cen-ters, for example M. jannaschii (TIGR), M.thermoautotrophicum (Genome Therapeu-tics), Aquifex aeolicus (Recombinant BioCa-talysis, now DIVERSA), Pyrobaculum aero-philum (California Institute of Technology),Pyrococcus furiosus (University of Utah), andDeinococcus radiodurans (Uniformed Servic-es University of the Health Sciences). Likethe M. jannaschii project which was startedone year earlier, the A. fulgidus genome wassequenced and analyzed in a collaborationbetween researchers at TIGR and Carl R.Woese and Gary J. Olsen at the Departmentof Microbiology at the University of Illinois,Champaign-Urbana. The plasmid librarieswere constructed in Urbana, whereas the ë-library was constructed at TIGR. Sequenc-ing and assembly was performed at TIGRusing automated ABI sequencers and a TIGRassembler, respectively. Confirmation of theassembly by mapping with large-size re-striction fragments was performed in Urba-na. Open reading frame (ORF) prediction
18 1 Genome Projects in Model Organisms
and identification of functions, and the datamining and interpretation of the genomecontent was performed jointly by both teams.
Coding regions in the final genome se-quence were identified with a combinationof two sets of ORF generated by programsdeveloped by members of the two teams –GeneSmith, by H.O. Smith at TIGR andCRITICA, by G.J. Olsen and J.H. Badger inUrbana. The two sets of ORF identified byGeneSmith and CRITICA were merged intoone consensus set containing all membersof both initial sets. The amino acid sequenc-es derived from the consensus set werecompared with a non-redundant proteindatabase using BLASTX. ORFs shorter than30 codons were carefully inspected for data-base hits and eliminated when there was nosignificant database match. The results ofthe database comparisons were first in-spected and categorized by TIGR’s microbi-al annotation team. This initial annotationdatabase was then further analyzed and re-fined by a team of experts for all major bio-logical role categories.
The sequencing strategy chosen for the A.fulgidus genome project has some advantag-es compared with alternative strategies ap-plied in genome research:1. Given the relatively large set of automated
sequencers available at TIGR, the whole-genome random sequencing procedure ismuch faster than any strategy that in-cludes a mapping step before the se-quencing phase;
2. Within the DOE Microbial Genome Pro-gram the TIGR strategy and the sequenc-ing technology used for the M. jannaschiiand A. fulgidus genome projects proved tobe clearly superior in competition withprojects based on multiplex sequencing(M. thermoautotrophicum and P. furiosus),by finishing two genomes in less timethan the competing laboratories neededfor one genome each; and
3. The interactive annotation with a team ofexperts for the organism and for each bi-ological category ensured a more sophis-ticated final annotation than any auto-mated system could achieve at that time.
1.2.3.3
Results from the Genome ProjectAlthough the initial characterization of thegenome revealed all its basic features, anno-tation of biological functions for the ORFwill continue to be updated for new func-tions identified either in A. fulgidus or forhomologous genes characterized in otherorganisms. The size of the A. fulgidus ge-nome was determined to be 2,178,400 bp,with an average G + C content of 48.5 %.Three regions with low G + C content(<39 %) were identified, two of which en-code enzymes for lipopolysaccharide bio-synthesis. The two regions with the highestG + C content (>53 %) contain the riboso-mal RNA and proteins involved in heme bi-osynthesis. With the bioinformatics toolsavailable when genome characterizationwas complete, no origin of replication couldbe identified. The genome contains onlyone set of genes for ribosomal RNA. OtherRNA encoded in A. fulgidus are 46 species oftRNA, five of them with introns 15–62 bplong, no significant tRNA clusters, 7S RNAand RNase P. All together 0.4 % of the ge-nome is covered by genes for stable RNA.Three regions with short (<49 bp) non-cod-ing repeats (42–60 copies) were identified.All three repeated sequences are similar toshort repeated sequences found in M. jan-naschii [35]. Nine classes of long, coding re-peats (>95 % sequence identity) were iden-tified within the genome, three of themmight represent IS elements, and three oth-er repeats encode conserved hypotheticalproteins found previously in other ge-nomes. The consensus set of ORF contains2436 members with an average length of
191.2 Genome Projects of Selected Prokaryotic Model Organisms
822 bp, similar to M. jannaschii (856 bp),but shorter than in most bacterial genomes(average 949 bp). With 1.1 ORF per kb, thegene density seems to be slightly higherthan in other microbial genomes, althoughthe fraction of the genome covered by pro-tein coding genes (92.2 %) is comparablewith that for other genomes. The elevatednumber of ORF per kbp might be artificial,because of a lack of stop codons in highG + C organisms. Predicted start codons are76 % ATG, 22 % GTG, and 2 % TTG. Nointeins were identified in the genome. Theisoelectric point of the predicted proteins inA. fulgidus is rather low (median pI is 6.3);for other prokaryotes distributions peakbetween 5.5 and 10.5. Putative functionscould be assigned to about half of the pre-dicted ORF (47 %) by significant matchesin database searches. One quarter (26.7 %)of all ORF are homologous to ORF previ-ously identified in other genomes (“con-served hypotheticals”), whereas the remain-ing quarter (26.2 %) of the ORF in A. fulgid-us seem to be unique, without any signifi-cant database match. A. fulgidus contains anunusually large number of paralogous genefamilies: 242 families with 719 members(30 % of all ORF). This might explain whythe genome is larger than most other ar-chaeal genomes (average approximately1.7 Mbp). Interestingly, one third of theidentified families (85 out of 242) have nosingle member for which a biological func-tion could be predicted. The largest familiescontain genes assigned to “energy metab-olism”, “transporters”, and “fatty acid me-tabolism”.
The genome of A. fulgidus is neither thefirst archaeal genome to be sequenced com-pletely nor is it the first genome of a hyper-thermophilic organism. The novelties forboth features had already been reported to-gether with the genome of M. jannas-chii [35]. A. fulgidus is, however, the first sul-
fate-reducing organism whose genome wascompletely deciphered. The next genome ofa sulfate reducer followed almost sevenyears later with that of Desulfotalea psychro-phila, an organism whose optimum growthtemperature is 75 ° lower than that of A. ful-gidus [36]. Model findings in respect of sul-fur and sulfate metabolism were not expect-ed from the genome, because sulfate me-tabolism had already been heavily studiedin A. fulgidus before the genome project.The genes for most enzymes involved insulfate reduction were already published,and new information from the genome con-firmed only that the sulfur oxide reductionsystems in Archaea and Bacteria were verysimilar. The single most exciting finding inthe genome of A. fulgidus was identificationof multiple genes for acetyl-CoA synthaseand the presence of 57 â-oxidation en-zymes. It has been reported that the organ-ism is incapable of growth on acetate [37],and no system for â-oxidation has previous-ly been described in the Archaea. It appearsnow that A. fulgidus can gain energy by deg-radation of a variety of hydrocarbons andorganic acids, because genes for a least fivetypes of ferredoxin-dependent oxidoreduc-tases and at least one lipase were also iden-tified. Interestingly, at about the same timeas the unexpected genes for metabolizingenzymes were identified, it was also report-ed that a close relative of A. fulgidus is ableto grow on olive oil (K. O. Stetter, personalcommunication), a feature that would re-quire the presence of the genes just identi-fied in A. fulgidus. On the other hand, not allgenes necessary for the pathways describedin the organism could be identified. Glu-cose has been described as a carbon sourcefor A. fulgidus [38], but neither an uptake-transporter nor a catabolic pathway for glu-cose could be identified in the genome.There is still a chance that the requiredgenes are hidden in the pool of functionally
20 1 Genome Projects in Model Organisms
uncharacterized ORFs. Other interestingfindings in respect of the biology of A. ful-gidus concern sensory functions and regula-tion of gene expression. A. fulgidus seems tohave complex sensory and regulatory net-works – a major difference from results re-ported for M. jannaschii – consistent with itsextensive energy-producing metabolismand versatile system for carbon utilization.These networks contain more than 55 pro-teins with presumed regulatory functionsand several iron-dependent repressor pro-teins. At least 15 signal-transducing histi-dine kinases were identified, but only nineresponse regulators.
1.2.3.4
Follow-up ResearchAlmost 30 papers about A. fulgidus werepublished between the initial description ofthe organism in 1987 and the genome se-quence ten years later. In the six years sincethe genome was finished A. fulgidus wasmentioned in the title or abstract of morethan 165 research articles. Although func-tional genomics is now a hot topic at manyscientific meetings and discussions, A. ful-gidus seems to be no prime candidate forsuch studies. So far not a single publicationhas dealt with proteomics, transcriptome, orserial mutagenesis in this organism. The re-cently published papers that refer to the A.fulgidus genome sequence fall into three al-most equally represented categories: com-parative genomics, structure of A. fulgidusproteins, and characterization of expressedenzymes. One of the most interesting fol-low up stories is probably that on the flapendonucleases. In October 1998 Hosfield etal. described newly discovered archaeal flapendonucleases (FEN) from A. fulgidus, M.jannaschii and P. furiosus with a structure-specific mechanism for DNA substratebinding and catalysis resembling humanflap endonuclease [39]. In Spring 1999 Lya-
michev et al. showed how FEN could beused for polymorphism identification andquantitative detection of genomic DNA byinvasive cleavage of oligonucleotide pro-bes [40]. In May 2000, Cooksey et al. de-scribed an invader assay based on A. fulgid-us FEN that enables linear signal amplifica-tion for identification of mutatons [41]. Thisprocedure could eventually become impor-tant as a non-PCR based procedure for SNPdetection. The identification of 86 candi-dates for small non-messenger RNA byTang et al. [42] and identification of the un-usual organization of the putative replica-tion origin region by Maisnier-Patin etal. [43] also mark noteworthy progress inour knowledge about the model organismA. fulgidus.
1.3
Genome Projects of Selected EukaryoticModel Organisms
1.3.1
The Budding Yeast Saccharomyces cerevisiae
1.3.1.1
Yeast as a Model OrganismThe budding yeast, Saccharomyces cerevisiae(Fig. 1.4), can be regarded as one of themost important fungal organisms used inbiotechnological processes. It owes itsname to its ability to ferment saccharose,and has served mankind for several thou-sand years in the making of bread and alco-holic beverages. The introduction of yeastas an experimental system dates back to the1930s and has since attracted increasing at-tention. Unlike more complex eukaryotes,yeast cells can be grown on defined mediagiving the investigator complete controlover environmental conditions. The ele-gance of yeast genetics and the ease of ma-nipulation of yeast have substantially con-
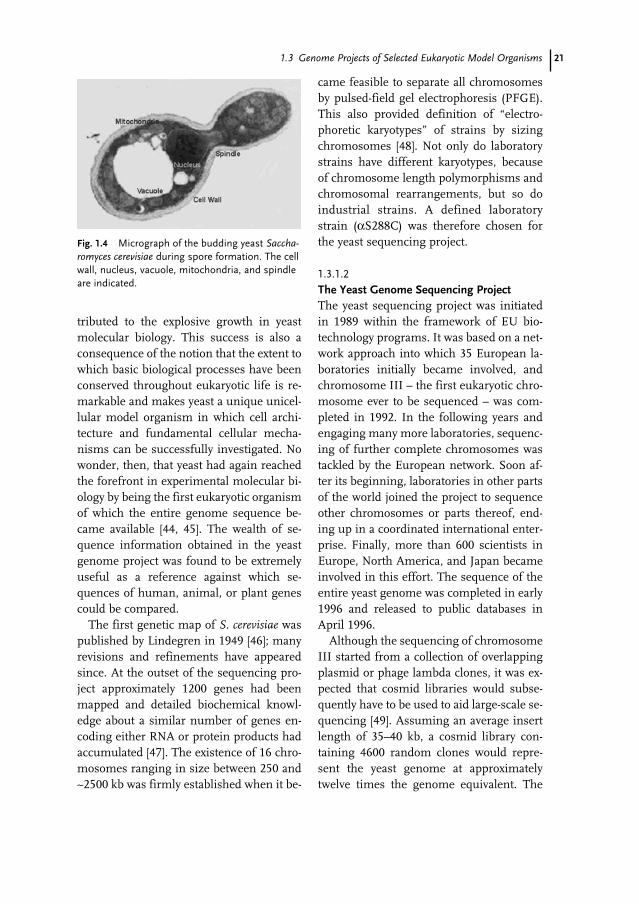
211.3 Genome Projects of Selected Eukaryotic Model Organisms
tributed to the explosive growth in yeastmolecular biology. This success is also aconsequence of the notion that the extent towhich basic biological processes have beenconserved throughout eukaryotic life is re-markable and makes yeast a unique unicel-lular model organism in which cell archi-tecture and fundamental cellular mecha-nisms can be successfully investigated. Nowonder, then, that yeast had again reachedthe forefront in experimental molecular bi-ology by being the first eukaryotic organismof which the entire genome sequence be-came available [44, 45]. The wealth of se-quence information obtained in the yeastgenome project was found to be extremelyuseful as a reference against which se-quences of human, animal, or plant genescould be compared.
The first genetic map of S. cerevisiae waspublished by Lindegren in 1949 [46]; manyrevisions and refinements have appearedsince. At the outset of the sequencing pro-ject approximately 1200 genes had beenmapped and detailed biochemical knowl-edge about a similar number of genes en-coding either RNA or protein products hadaccumulated [47]. The existence of 16 chro-mosomes ranging in size between 250 and~2500 kb was firmly established when it be-
came feasible to separate all chromosomesby pulsed-field gel electrophoresis (PFGE).This also provided definition of “electro-phoretic karyotypes” of strains by sizingchromosomes [48]. Not only do laboratorystrains have different karyotypes, becauseof chromosome length polymorphisms andchromosomal rearrangements, but so doindustrial strains. A defined laboratorystrain (αS288C) was therefore chosen forthe yeast sequencing project.
1.3.1.2
The Yeast Genome Sequencing ProjectThe yeast sequencing project was initiatedin 1989 within the framework of EU bio-technology programs. It was based on a net-work approach into which 35 European la-boratories initially became involved, andchromosome III – the first eukaryotic chro-mosome ever to be sequenced – was com-pleted in 1992. In the following years andengaging many more laboratories, sequenc-ing of further complete chromosomes wastackled by the European network. Soon af-ter its beginning, laboratories in other partsof the world joined the project to sequenceother chromosomes or parts thereof, end-ing up in a coordinated international enter-prise. Finally, more than 600 scientists inEurope, North America, and Japan becameinvolved in this effort. The sequence of theentire yeast genome was completed in early1996 and released to public databases inApril 1996.
Although the sequencing of chromosomeIII started from a collection of overlappingplasmid or phage lambda clones, it was ex-pected that cosmid libraries would subse-quently have to be used to aid large-scale se-quencing [49]. Assuming an average insertlength of 35–40 kb, a cosmid library con-taining 4600 random clones would repre-sent the yeast genome at approximatelytwelve times the genome equivalent. The
Fig. 1.4 Micrograph of the budding yeast Saccha-romyces cerevisiae during spore formation. The cellwall, nucleus, vacuole, mitochondria, and spindleare indicated.
22 1 Genome Projects in Model Organisms
advantages of cloning DNA segments in cos-mids were at hand – clones were found to bestable for many years and the small numberof clones was advantageous in setting up or-dered yeast cosmid libraries or sorting outand mapping chromosome-specific subli-braries. High-resolution physical maps ofthe chromosomes to be sequenced wereconstructed by application of classical map-ping methods (fingerprints, cross-hybridza-tion) or by novel methods developed for thisprogram, for example site-specific chromo-some fragmentation [50] or a high-resolu-tion cross-hybridization matrix, to facilitatesequencing and assembly of the sequences.
In the European network chromosome-specific clones were distributed to the col-laborating laboratories according to ascheme worked out by the DNA coordina-tors. Each contracting laboratory was free toapply sequencing strategies and techniquesof its own provided that the sequences wereentirely determined on both strands andunambiguous readings were obtained. Twoprinciple approaches were used to preparesubclones for sequencing:
1. generation of sublibraries by use of a se-ries of appropriate restriction enzymes orfrom nested deletions of appropriate sub-fragments made by exonuclease III; and
2. generation of shotgun libraries fromwhole cosmids or subcloned fragmentsby random shearing of the DNA.
Sequencing by the Sanger technique was ei-ther performed manually, labeling with[35S]dATP being the preferred method ofmonitoring, or by use of automated devices(on-line detection with fluorescence label-ing or direct blotting electrophoresissystem) following a variety of establishedprocedures. Similar procedures were ap-plied to the sequencing of the chromo-somes contributed by the Sanger laboratoryand by laboratories in the USA, Canada, and
Japan. The American laboratories largelyrelied on machine-based sequencing.
Because of their repetitive substructureand the lack of appropriate restriction sites,the yeast chromosome telomeres were aparticular problem. Conventional cloningprocedures were successful for a few excep-tions only. Telomeres were usually physi-cally mapped relative to the terminal-mostcosmid inserts using the chromosome frag-mentation procedure [50]. The sequenceswere then determined from specific plas-mid clones obtained by “telomere trap clon-ing”, an elegant strategy developed by Louisand Borts [51].
Within the European network, all originalsequences were submitted by the collabo-rating laboratories to the Martinsried Insti-tute of Protein Sequences (MIPS) who act-ed as an informatics center. They were keptin a data library, assembled into progres-sively growing contigs, and, in collaborationwith the DNA coordinators, the final chro-mosome sequences were derived. Qualitycontrols were performed by anonymousresequencing of selected regions and sus-pected or difficult zones (total of 15–20 %per chromosome). Similar procedures wereused for sequence assembly and qualitycontrol in the other laboratories. During re-cent years further quality controls were car-ried and resulted in a nearly absolute accu-racy of the total sequence.
The sequences of the chromosomes weresubjected to analysis by computer algo-rithms, identifying ORF and other geneticentities, and monitoring compositionalcharacteristics of the chromosomes (basecomposition, nucleotide pattern frequen-cies, GC profiles, ORF distribution profiles,etc.). Because the intron splice site/branch-point pairs in yeast are highly conserved,they could be detected by using definedsearch patterns. It was finally found thatonly 4 % of the yeast genes contain (mostly
231.3 Genome Projects of Selected Eukaryotic Model Organisms
short) introns. Centromere and telomereregions, and tRNA genes, sRNA genes, orthe retrotransposons, were sought by com-parison with previously characterized data-sets or appropriate search programs. All pu-tative proteins were annotated by using pre-viously established yeast data and evaluat-ing searches for similarity to entries in thedatabases or protein signatures detected byusing the PROSITE dictionary.
1.3.1.3
Life with Some 6000 GenesWith its 12.8 Mb, the yeast genome is ap-proximately a factor of 250 smaller than thehuman genome. The complete genome se-quence now defines some 6000 ORFswhich are likely to encode specific proteinsin the yeast cell. A protein-encoding gene isfound every 2 kb in the yeast genome, withnearly 70 % of the total sequence consistingof ORF. This leaves only limited space forthe intergenic regions which can bethought to harbor the major regulatory ele-ments involved in chromosome mainte-nance, DNA replication, and transcription.The genes are usually rather evenly distrib-uted among the two strands of the singlechromosomes, although arrays longer thaneight genes that are transcriptionally orient-ed in the same direction can be found even-tually. With a few exceptions, transcribedgenes on complementing strands are notoverlapping, and no “genes-in-genes” areobserved. Although the intergenic regionsbetween two consecutive ORF are some-times extremely short, they are normallymaintained as separate units and not cou-pled for transcription. In “head-to-head”gene arrangements the intervals betweenthe divergently transcribed genes might beinterpreted to mean that their expression isregulated in a concerted fashion involvingthe common promoter region. This, howev-er, seems not to be true for most genes and
seems to be a principle reserved for a fewcases. The sizes of the ORFs vary between100 to more than 4000 codons; less than1 % is estimated to be below 100 codons. Inaddition, the yeast genome contains some120 ribosomal RNA genes in a large tan-dem array on chromosome XII, 40 genesencoding small nuclear RNA (sRNA) and275 tRNA genes (belonging to 43 families)which are scattered throughout the ge-nome. Overall, the yeast genome is remark-ably poor in repeated sequences, except thetransposable elements (Tys) which accountfor approximately 2 % of the genome, and,because of to their genetic plasticity, are themajor source of polymorphisms betweendifferent strains. Finally, the sequences ofnon-chromosomal elements, for examplethe 6 kb of the 2µ plasmid DNA, the killerplasmids present in some strains, and theyeast mitochondrial genome (ca.75 kb),must be considered.
On completion of the yeast genome se-quence it became possible for the first timeto define the proteome of a eukaryotic cell.Detailed information was laid down in in-ventory databases and most of the proteinscould be classified according to function. Itwas seen that almost 40 % of the proteomeconsisted of membrane proteins, and thatan estimated 8 to 10 % of nuclear genes en-code mitochondrial functions. It came as aninitial surprise that no function could be at-tributed to approximately 40 % of the yeastgenes. However, even with the exponentialgrowth of entries in protein databases andthe refinement of in silico analyses, this fig-ure could not be reduced substantially. Thesame was observed for all other genomesthat have since been sequenced. As an expla-nation, we have to envisage that a consider-able portion of every genome is reserved forspecies- or genus-specific functions.
An interesting observation made for thefirst time was the occurrence of regional
24 1 Genome Projects in Model Organisms
variations of base composition with similaramplitudes along the chromosomes. Analy-sis of chromosomes III and XI revealed al-most regular periodicity of the GC content,with a succession of GC rich and GC poorsegments of ~50 kb each. Another interest-ing observation was that the compositionalperiodicity correlated with local gene den-sity. Profiles obtained from similar analysesof chromosomes II and VIII again showedthese phenomena, albeit with less pro-nounced regularity. Similar compositionalvariation has been found along the arms ofother chromosomes, with pericentromericand subtelomeric regions being AT-rich,though spacing between GC-rich peaks isnot always regular. Usually, however, thereis a broad correlation between high GC con-tent and high gene density.
Comparison of all yeast sequences re-vealed there is substantial internal geneticredundancy in the yeast genome, which atthe protein level is approximately 40 %.Whereas an estimate of sequence similarity(at both the nucleotide and the amino acidlevel) is highly predictive, it is still difficult tocorrelate these values with functional redun-dancy. Interestingly, the same phenomenonhas since been observed in all other ge-nomes sequenced. Gene duplications inyeast are of different type. In many instanc-es, the duplicated sequences are confined tonearly the entire coding region of thesegenes and do not extend into the intergenicregions. Thus, the corresponding gene prod-ucts share high similarity in terms of aminoacid sequence, and sometimes are evenidentical, and, therefore, might be function-ally redundant. As suggested by sequencedifferences within the promoter regions ordemonstrated experimentally, however, ex-pression varies. It is possible one gene copyis highly expressed whereas another is poor-ly expressed. Turning on or off expression ofa particular copy within a gene family might
depend on the differentiated status of thecell (for example mating type, sporulation,etc.). Biochemical studies also revealed thatin particular instances “redundant” proteinscan substitute each other, thus accountingfor the observation that large amounts ofsingle-gene disruption in yeast do not im-pair growth or cause “abnormal” pheno-types. This does not imply, however, thatthese “redundant” genes are a priori dis-pensable. Rather they might have arisenfrom the need to help adapt yeast cells toparticular environmental conditions.
Subtelomeric regions in yeast are rich induplicated genes which are of functionalimportance to carbohydrate metabolism orcell-wall integrity, but there is also much va-riety of (single) genes internal to chromo-somes that seem to have arisen from dupli-cations. An even more surprising phenom-enon became apparent when the sequencesof complete chromosomes were comparedwith each other. This revealed 55 large chro-mosome segments (up to 170 kb) in whichhomologous genes are arranged in thesame order, with the same relative tran-scriptional orientations, on two or morechromosomes [52]. The genome has contin-ued to evolve since this ancient duplicationoccurred – genes have been inserted or de-leted, and Ty elements and introns havebeen lost and gained between two sets of se-quences. If optimized for maximum cover-age, up to 40 % of the yeast genome isfound to be duplicated in clusters, not in-cluding Ty elements and subtelomeric re-gions. No observed clusters overlap andintra- and interchromosomal cluster dupli-cations have similar probabilities.
The availability of the complete yeast ge-nome sequence not only provided furtherinsight into genome organization and evo-lution in yeast but also offered a referenceto search for orthologs in other organisms.Of particular interest were those genes that
251.3 Genome Projects of Selected Eukaryotic Model Organisms
are homologs of genes that perform differ-entiated functions in multicellular organ-isms or that might be of relevance to malig-nancy. Comparing the catalog of human se-quences available in the databases with theyeast ORF reveals that more than 30 % ofyeast genes have homologs among humangenes of known function. Approximately100 yeast genes are significantly similar tohuman disease genes [53], and some of thelatter could even be predicted from compar-ison with the yeast genes.
1.3.1.4
The Yeast Postgenome EraIt was evident to anyone engaged in the pro-ject that determination of the entire se-quence of the yeast genome should only beregarded as a prerequisite for functionalstudies of the many novel genes to be de-tected. Thus, a European functional analy-sis network (EUROFAN) was initiated in1995 and similar activities were started inthe international collaborating laboratoriesin 1996. The general goal was to systemati-cally investigate yeast genes of unknownfunction by use of the approaches:1. improved data analysis by computer (in
silico analysis);2. systematic gene disruptions and gene
overexpression;3. analysis of phenotypes under different
growth conditions, for example tempera-ture, pH, nutrients, stress;
4. systematic transcription analysis by con-ventional methods; gene expressionunder different conditions;
5. in situ cellular localization and movementof proteins by the use of tagged proteins(GFP-fusions);
6. analysis of gene expression under differ-ent conditions by 2D gel-electrophoresisof proteins; and
7. complementation tests with genes fromother organisms.
In this context, a most compelling approachis the genome-wide analysis of gene expres-sion profiles by chip technology. High-den-sity micro-arrays of all yeast ORF were thefirst to be successfully used in studying var-ious aspects of a transcriptome [54, 55].Comprehensive and regularly updated in-formation can be found in the yeast Ge-nome Database (http://www.yeastgenome.org).
Now the entire sequence of a laboratorystrain of S. cerevisiae is available, the com-plete sequences of other yeasts of industrialor medical importance are within ourreach. Such knowledge would considerablyaccelerate the development of productivestrains needed in other areas (e.g. Kluyvero-myces, Yarrowia) or the search for novelanti-fungal drugs. It might even be unnec-essary to finish the entire genome if a yeastor fungal genome has substantial syntenywith that of S. cerevisiae. A special programdevoted to this problem, analysis of hemias-comycetes yeast genomes by tag-sequencestudies for the approach of speciationmechanisms and preparation of tools forfunctional genomics, has recently been fi-nalized by a French consortium [56].
In all, the yeast genome project has dem-onstrated that an enterprise like this cansuccessfully be conducted in “small steps”and by teamwork. Clearly, the wealth offresh and biologically relevant informationcollected from yeast sequences and fromfunctional analyses has had an impact onother large-scale sequencing projects.
1.3.2
The Plant Arabidopsis thaliana
1.3.2.1
The OrganismArabidopsis thaliana (Fig. 1.5) is a small cru-ciferous plant of the mustard family firstdescribed by the German physician Johan-
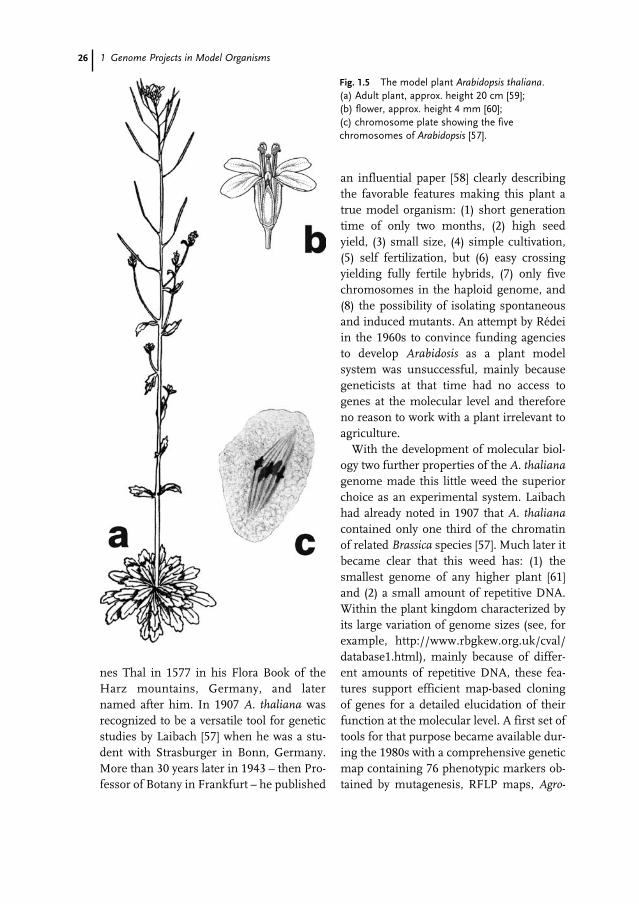
26 1 Genome Projects in Model Organisms
nes Thal in 1577 in his Flora Book of theHarz mountains, Germany, and laternamed after him. In 1907 A. thaliana wasrecognized to be a versatile tool for geneticstudies by Laibach [57] when he was a stu-dent with Strasburger in Bonn, Germany.More than 30 years later in 1943 – then Pro-fessor of Botany in Frankfurt – he published
an influential paper [58] clearly describingthe favorable features making this plant atrue model organism: (1) short generationtime of only two months, (2) high seedyield, (3) small size, (4) simple cultivation,(5) self fertilization, but (6) easy crossingyielding fully fertile hybrids, (7) only fivechromosomes in the haploid genome, and(8) the possibility of isolating spontaneousand induced mutants. An attempt by Rédeiin the 1960s to convince funding agenciesto develop Arabidosis as a plant modelsystem was unsuccessful, mainly becausegeneticists at that time had no access togenes at the molecular level and thereforeno reason to work with a plant irrelevant toagriculture.
With the development of molecular biol-ogy two further properties of the A. thalianagenome made this little weed the superiorchoice as an experimental system. Laibachhad already noted in 1907 that A. thalianacontained only one third of the chromatinof related Brassica species [57]. Much later itbecame clear that this weed has: (1) thesmallest genome of any higher plant [61]and (2) a small amount of repetitive DNA.Within the plant kingdom characterized byits large variation of genome sizes (see, forexample, http://www.rbgkew.org.uk/cval/database1.html), mainly because of differ-ent amounts of repetitive DNA, these fea-tures support efficient map-based cloningof genes for a detailed elucidation of theirfunction at the molecular level. A first set oftools for that purpose became available dur-ing the 1980s with a comprehensive geneticmap containing 76 phenotypic markers ob-tained by mutagenesis, RFLP maps, Agro-
Fig. 1.5 The model plant Arabidopsis thaliana. (a) Adult plant, approx. height 20 cm [59]; (b) flower, approx. height 4 mm [60]; (c) chromosome plate showing the five chromosomes of Arabidopsis [57].
271.3 Genome Projects of Selected Eukaryotic Model Organisms
bacterium-mediated transformation, andcosmid and yeast artificial chromosome(YAC) libraries covering the genome seve-ralfold with only a few thousand clones.
It was soon realized that projects involv-ing resources shared by many laboratorieswould profit from centralized collectionand distribution of stocks and related infor-mation. “The Multinational CoordinatedArabidopsis thaliana Genome Research Pro-ject” was launched in 1990 and, as a result,two stock centers in Nottingham, UK, andOhio, USA, and the Arabidopsis database atBoston, USA [62] were created in 1991.With regard to seed stocks these centerssucceeded an effort already started by Lai-bach in 1951 [59] and continued byRöbbelen and Kranz. The new, additionalcollections of clones and clone libraries pro-vided the basis for the genome sequencingproject later on. With increased use of theinternet at that time the database soon be-came a central tool for data storage and dis-tribution and has ever since served thecommunity as a central one-stop shoppingpoint for information, despite its move toStanford and its restructuring to become“The Arabidopsis Information Resource”(TAIR; http://www.arabidopsis.org).
In subsequent years many research toolswere improved and new ones were added –mutant lines based on insertions of T-DNAand transposable elements were created inlarge numbers, random cDNA clones weresequenced partially, maps became availablefor different types of molecular markersuch as RAPD, CAPS, microsatellites,AFLP, and SNP which were integrated witheach other, recombinant inbred lines wereestablished to facilitate the mapping pro-cess, a YAC library with large inserts andBAC and P1 libraries were constructed,physical maps based on cosmids, YAC, andBAC were built, and tools for their displaywere developed.
1.3.2.2
Structure of the Genome ProjectIn August 1996 the stage was prepared forlarge-scale genome sequencing. At a meet-ing in Washington DC representatives ofsix research consortia from North America,Europe, and Japan launched the “Arabidop-sis Genome Initiative”. They set the goal ofsequencing the complete genome by theyear 2004 and agreed on the strategy, thedistribution of tasks, and guidelines for thecreation and publication of sequence data.The genome of the ecotype Columbia waschosen for sequencing, because all large in-sert libraries had been prepared from thisline and it was one of the most prominentecotypes for all kinds of experiment world-wide besides Landsberg erecta (Ler). Be-cause Ler is actually a mutant isolated froman inhomogeneous sample of the Lands-berg ecotype after X-ray irradiation [63], itwas not suitable to serve as a model ge-nome. The sequencing strategy rested onBAC and P1 clones from which DNA can beisolated more efficiently than from YACand which, on average, contain larger in-serts than cosmids. This strategy was cho-sen even though most attempts to createphysical maps had been based on cosmidand YAC clones at that time and that initialsequencing efforts had employed mostlycosmids. BAC and P1 clones for sequenc-ing were chosen via hybridization to YACand molecular markers of known and wellseparated map positions. Later, informationfrom BAC end sequences and fingerprintand hybridization data, created while ge-nome sequencing was already in progress,were used to minimize redundant sequenc-ing caused by clone overlap. This multina-tional effort has been very fruitful and led tocomplete sequences for two of the fiveArabidopsis chromosomes, chromosomes2 [64] and 4 [65], except for their rDNA re-peats and the heterochromatic regions
28 1 Genome Projects in Model Organisms
around their centromers. The genomic se-quence was completed by the end of theyear 2000, more than three years ahead ofthe original timetable. Sequences of themitochondrial [66] and the plastid ge-nome [67] have also been determined, socomplete genetic information was availablefor Arabidopsis.
1.3.2.3
Results from the Genome ProjectThe sequenced chromosomes have yieldedno surprises with regard to their structuralorganization. With the exception of one se-quenced marker, more than one hundredhave been observed in the expected order.Repetitive elements and repeats of transpos-able elements are concentrated in the heter-ochromatic regions around the centromerswhere gene density and recombination fre-quency are below the average (22 genes/100 kbp, 1 cM/50 - 250 kbp). With a few mi-nor exceptions these average values do notvary substantially in other regions of thechromosomes, which is in sharp contrastwith larger plant genomes [68–70]. In addi-tion, genomes such as that of maize do con-tain repetitive elements and transposonsinterspersed with genes [71], so Arabidopsisis certainly not a model for the structure oflarge plant genomes.
From the sequences available it has beencalculated that the 120 Mbp gene containingpart of the nuclear genome of Arabidopsiscontains approximately 25,000 genes(chr. 2: 4037, chr. 4: 3744 annotatedgenes; [72]), whereas the mitochondrial andplastid genomes carry only 57 and 78 geneson 366,924 and 154,478 bp of DNA, respec-tively. Most of the organellar proteins musttherefore be encoded in the nucleus and aretargeted to their final destinations via N-ter-minal transit peptides. It has recently beenestimated that 10 or 14 % of the nuclear
genes encode proteins located in mitochon-dria or plastids, respectively [73]. Only for afraction of the predicted plastid proteinscould homologous cyanobacterial proteinsbe identified [64, 65]; even so, lateral genetransfer from the endosymbiotic organelleto the nucleus has been assumed to be themain source of organellar proteins. Thesedata indicate that either the large evolution-ary distance between plants and cyanobacte-ria prevents the recognition of orthologsand/or many proteins from other sourcesin the eukaryotic cell have acquired plastidtransit peptides, as suggested earlier on thebasis of Calvin cycle enzymes [74]. A sub-stantial number of proteins without predict-ed transit peptides but with higher homolo-gy to proteins from cyanobacteria than toany other organism have also been recog-nized [64, 65], indicating that plastids, atleast, have contributed a significant part ofthe protein complement of other compart-ments. These data clearly show that plantcells have become highly integrated geneticsystems during evolution, assembled fromthe genetic material of the eukaryotic hostand two endosymbionts [75]. That thissystem integration is an ongoing process isrevealed by the many small fragments ofplastid origin in the nuclear genome [76]and the unexpected discovery of a recentgene-transfer event from the mitochondrialto the nuclear genome. Within the geneti-cally defined centromer of chromosome 2, a270-kbp fragment 99 % identical with themitochondrial genome has been identifiedand its location confirmed via PCR acrossthe junctions with unique nuclearDNA [64]. For a comprehensive list of refer-ences on Arabidopsis thaliana readers are re-ferred to Schmidt [77]. This contributioncites only articles not listed by Schmidt orwhich are of utmost importance to the mat-ters discussed here.
291.3 Genome Projects of Selected Eukaryotic Model Organisms
1.3.2.4
Follow-up Research in the Postgenome EraPotential functional assignments can bemade for up to 60 % of the predicted pro-teins on the basis of sequence comparisons,identification of functional domains andmotifs, and structural predictions. Interest-ingly, 65 % of the proteins have no signifi-cant homology with proteins of the com-pletely sequenced genomes of bacteria,yeast, C. elegans, and D. melanogaster [64],clearly reflecting the large evolutionary dis-tance of the plant from other kingdoms andthe independent development of multicel-lularity accompanied by a large increase ingene number. The discovery of proteinclasses and domains specific for plants, e.g.Ca2+-dependent protein kinases containingfour EF-hand domains [65] or the B3 do-main of ABI3, VP1, and FUS3 [78], and thesignificantly different abundance of severalproteins or protein domains compared withC. elegans or D. melanogaster, for examplemyb-like transcription factors [79], C3HC4ring finger domains, and P450 en-zymes [65], further support this notion. Al-ready the larger number of genes in theArabidopsis genome (approx. 25,000) com-pared with the genomes of C. elegans (ap-prox. 19,000) and D. melanogaster (approx.14,000) seems indicative of different waysof evolving organisms of comparable com-plexity. Currently, the underlying reasonfor this large difference is unclear. It mightsimply reflect a larger proportion of dupli-cated genes, as it does for C. elegans com-pared with D. melanogaster [80]. The largenumber of observed tandem repeats [64, 65]and the large duplicated segments in chro-mosomes 2 and 4, 2.5 Mbp in total, and inchromosomes 4 and 5, a segment contain-ing 37 genes [65], seem to favor this expla-nation. But other specific properties ofplants, for example autotrophism, non-mo-bile life, rigid body structure, continuous
organ development, successive gameto-phytic and sporophytic generations, and,compared with animals, different ways ofprocessing information and responding toenvironmental stimuli and a smaller extentof combinatorial use of proteins, or anycombination of these factors, might alsocontribute to their large number of genes.Functional assignment of proteins is notcurrently sufficiently advanced to enable usto distinguish between all these possibil-ities.
The data currently available indicate thatthe function of many plant genes is differ-ent from those of animals and fungi.Besides the basic eukaryotic machinerywhich was present in the last common an-cestor before endosymbiosis with cyanobac-teria created the plant kingdom, and whichcan be delineated by identification of ortho-logs in eukaryotic genomes [65], all theplant-specific functions must be elucidated.Because more than 40 % of all predictedproteins from the genome of Arabidopsishave no assigned function and many othershave not been investigated thoroughly, thiswill require an enormous effort using dif-ferent approaches. New techniques fromchip-based expression analysis and geno-typing to high-throughput proteomics andprotein–ligand interaction studies and me-tabolite profiling have to be applied in con-junction with identification of the diversitypresent in nature or created via mutagene-sis, transformation, gene knock-out, etc.Because multicellularity was established in-dependently in all kingdoms, it might bewise to sequence the genome of a unicellu-lar plant. Its gene content would help usidentify all the proteins required for cell-to-cell communication and transport of sig-nals and metabolites. To collect, store, eval-uate, and access all the relevant data fromthese various approaches, many of whichhave been performed in parallel and de-
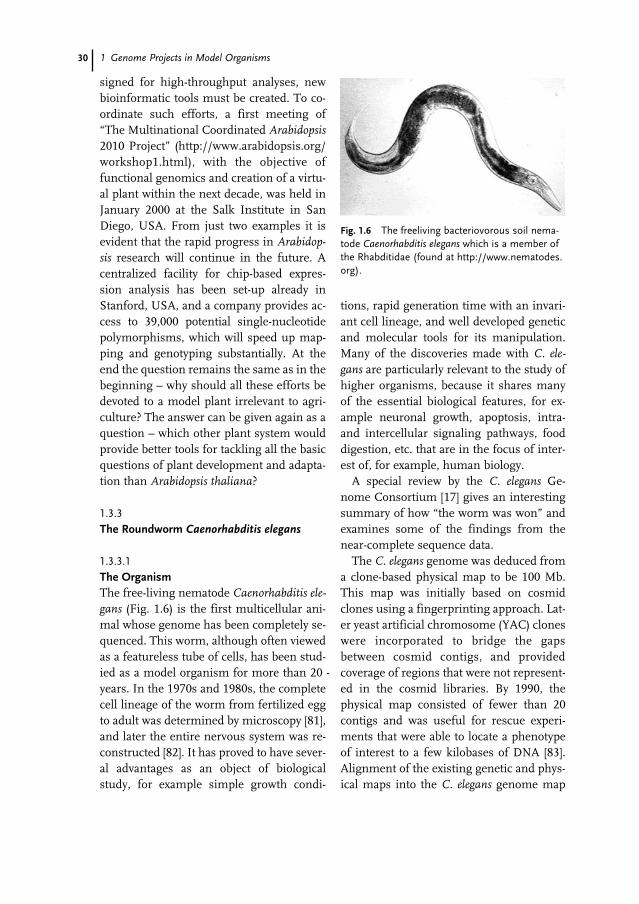
30 1 Genome Projects in Model Organisms
signed for high-throughput analyses, newbioinformatic tools must be created. To co-ordinate such efforts, a first meeting of“The Multinational Coordinated Arabidopsis2010 Project” (http://www.arabidopsis.org/workshop1.html), with the objective offunctional genomics and creation of a virtu-al plant within the next decade, was held inJanuary 2000 at the Salk Institute in SanDiego, USA. From just two examples it isevident that the rapid progress in Arabidop-sis research will continue in the future. Acentralized facility for chip-based expres-sion analysis has been set-up already inStanford, USA, and a company provides ac-cess to 39,000 potential single-nucleotidepolymorphisms, which will speed up map-ping and genotyping substantially. At theend the question remains the same as in thebeginning – why should all these efforts bedevoted to a model plant irrelevant to agri-culture? The answer can be given again as aquestion – which other plant system wouldprovide better tools for tackling all the basicquestions of plant development and adapta-tion than Arabidopsis thaliana?
1.3.3
The Roundworm Caenorhabditis elegans
1.3.3.1
The OrganismThe free-living nematode Caenorhabditis ele-gans (Fig. 1.6) is the first multicellular ani-mal whose genome has been completely se-quenced. This worm, although often viewedas a featureless tube of cells, has been stud-ied as a model organism for more than 20 -years. In the 1970s and 1980s, the completecell lineage of the worm from fertilized eggto adult was determined by microscopy [81],and later the entire nervous system was re-constructed [82]. It has proved to have sever-al advantages as an object of biologicalstudy, for example simple growth condi-
tions, rapid generation time with an invari-ant cell lineage, and well developed geneticand molecular tools for its manipulation.Many of the discoveries made with C. ele-gans are particularly relevant to the study ofhigher organisms, because it shares manyof the essential biological features, for ex-ample neuronal growth, apoptosis, intra-and intercellular signaling pathways, fooddigestion, etc. that are in the focus of inter-est of, for example, human biology.
A special review by the C. elegans Ge-nome Consortium [17] gives an interestingsummary of how “the worm was won” andexamines some of the findings from thenear-complete sequence data.
The C. elegans genome was deduced froma clone-based physical map to be 100 Mb.This map was initially based on cosmidclones using a fingerprinting approach. Lat-er yeast artificial chromosome (YAC) cloneswere incorporated to bridge the gapsbetween cosmid contigs, and providedcoverage of regions that were not represent-ed in the cosmid libraries. By 1990, thephysical map consisted of fewer than 20contigs and was useful for rescue experi-ments that were able to locate a phenotypeof interest to a few kilobases of DNA [83].Alignment of the existing genetic and phys-ical maps into the C. elegans genome map
Fig. 1.6 The freeliving bacteriovorous soil nema-tode Caenorhabditis elegans which is a member ofthe Rhabditidae (found at http://www.nematodes.org).
311.3 Genome Projects of Selected Eukaryotic Model Organisms
was greatly facilitated by cooperation of theentire “worm community”. When the phys-ical map had been nearly completed the ef-fort to sequence the entire genome becameboth feasible and desirable. By that timethis attempt was significantly larger thanany sequencing project before and wasnearly two orders of magnitude more ex-pensive than the mapping effort.
1.3.3.2
The Structure of the Genome ProjectIn 1990 a three-year pilot project for se-quencing 3 Mb of the genome was initiatedas a collaboration between the Genome-Se-quencing Center in St Louis, USA and theSanger Center in Hinxton, UK. Fundingwas obtained from the NIH and the UKMRC. The genome sequencing effort in-itially focused on the central regions of thefive autosomes which were well represent-ed in cosmid clones, because most genesknown at that time were contained in theseregions. At the beginning of the project, se-quencing was still based on standard radio-isotopic methods, with “walking” primersand cosmid clones as templates for the se-quencing reactions. A severe problem ofthis primer-directed sequencing approachon cosmids were, however, multiple prim-ing events because of repetitive sequencesand efficient preparation of sufficient tem-plate DNA. To address these problems thestrategy was changed to a more classic shot-gun sequencing strategy based on cosmidsubclones generally sequenced from uni-versal priming sites in the subcloning vec-tors. Further developments in automationof the sequencing reactions, fluorescent se-quencing methods, improvements in dye-terminator chemistry [84], and the genera-tion of assembly and contig editing pro-grams, led to the phasing out of the instru-ment in favor of four-color, single-lane se-quencing. The finishing phase then used a
more ordered, directed sequencing strategyas well as the walking approach, to closespecific remaining gaps and resolve ambi-guities. Hence, the worm project grew intoa collaboration among C. elegans Sequenc-ing Consortium members and the entireinternational community of C. elegans re-searchers. In addition to the nuclear ge-nome-sequencing effort other researcherssequenced its 15-kb mitochondrial genomeand performed extensive cDNA analysesthat facilitated gene identification.
The implementation of high-throughputdevices and semi-automated methods forDNA purification and sequencing reactionsled to overwhelming success in scaling upof the sequencing. The first 1 Mb thresholdof C. elegans finished genome sequenceswas reached in May 1993. In August 1993,the total had already increased to over2 Mb [85], and by December 1994 over10 Mb of the C. elegans genome had beencompleted. Bioinformatics played an in-creasing role in the genome project. Soft-ware developments made the processing,analysis, and editing of thousands of datafiles per day a manageable task. Indeed,many of the software tools developed in theC. elegans project, for example ACeDB,PHRED, and PHRAP, have become keycomponents in the current approach to se-quencing the human genome.
The 50 Mb mark was passed in August1996. At this point, it became obvious that20 % of the genome was not covered by cos-mid clones, and a closure strategy was im-plemented. For gaps in the central regions,either long-range PCR was used, or a fos-mid library was probed in search of a bridg-ing clone. For the remaining gaps in thecentral regions, and for regions of chromo-somes contained only in YAC, purified YACDNA was used as the starting material forshotgun sequencing. All of these final re-gions have been essentially completed with
32 1 Genome Projects in Model Organisms
the exception of several repetitive elements.The final genome sequence of the worm is,therefore, a composite from cosmids, fos-mids, YAC, and PCR products. The exactgenome size was approximate for a longtime, mainly because of repetitive sequenc-es that could not be sequenced in their en-tirety. Telomeres were sequenced fromplasmid clones provided by Wicky et al. [86].Of twelve chromosome ends, nine havebeen linked to the outermost YAC on thephysical map.
1.3.3.3
Results from the Genome ProjectAnalysis of the approximately 100 Mb of thetotal C. elegans genome revealed nearly20,000 predicted genes, considerably morethan expected before sequencing began [87,88], with an average density of one predict-ed gene per 5 kb. Each gene was estimatedto have an average of five introns and 27 %of the genome residing in exons. The num-ber of genes is approximately three timesthe number found in yeast [89] and approx-imately one-fifth to one-third the numberpredicted for the human genome [17].
Interruption of the coding sequence byintrons and the relatively low gene densitymake accurate gene prediction more chal-lenging than in microbial genomes. Valu-able bioinformatics tools have been devel-oped and used to identify putative codingregions and to provide an initial overview ofgene structure. To refine computer-generat-ed gene structure predictions, the availableEST and protein similarities and the ge-nomic sequence data from the related nem-atode Caenorhabditis briggsae were used forverification. Although approximately 60 %of the predicted genes have been confirmedby EST matches [17, 90], recent analyseshave revealed that many predicted genesneeded corrections in their intron-exonstructures [91].
Similarities to known proteins provide aninitial glimpse into the possible function ofmany of the predicted genes. Wilson [17] re-ported that approximately 42 % of predictedprotein products have cross-phylum match-es, most of which provide putative function-al information [92]. Another 34 % of pre-dicted proteins match other nematode pro-teins only, a few of which have been func-tionally characterized. The fraction of geneswith informative similarities is far less thanthe 70 % observed for microbial genomes.This might reflect the smaller proportion ofnematode genes devoted to core cellularfunctions [89], the comparative lack ofknowledge of functions involved in build-ing an animal, and the evolutionary diver-gence of nematodes from other animals ex-tensively studied so far at the molecular lev-el. Interestingly, genes encoding proteinswith cross-phylum matches were more like-ly to have a matching EST (60 %) than thosewithout cross-phylum matches (20 %). Thisobservation suggested that conserved genesare more likely to be highly expressed, per-haps reflecting a bias for “house-keeping”genes among the conserved set. Alternative-ly, genes lacking confirmatory matchesmight be more likely to be false predictions,although the analyses did not suggest this.
In addition to the protein-coding genes,the genome contains several hundred genesfor noncoding RNA. 659 widely dispersedtransfer RNA genes have been identified,and at least 29 tRNA-derived pseudogenesare present. Forty-four percent of the tRNAgenes were found on the X chromosome,which represents only 20 % of the total ge-nome. Several other noncoding RNA genes,for example those for splicosomal RNA, oc-cur in dispersed multigene families. Sever-al RNA genes are located in the introns ofprotein coding genes, which might indicateRNA gene transposition [17]. Other noncod-ing RNA genes are located in long tandem
331.3 Genome Projects of Selected Eukaryotic Model Organisms
repeat regions; the ribosomal RNA geneswere found solely in such a region at theend of chromosome I, and the 5S RNAgenes occur in a tandem array on chemo-mosome V.
Extended regions of the genome code forneither proteins nor RNA. Among these areregions that are involved in gene regula-tion, replication, maintenance, and move-ment of chromosomes. Furthermore, a sig-nificant fraction of the C. elegans genome isrepetitive and can be classified as either lo-cal repeats (e.g. tandem, inverted, and sim-ple sequence repeats) or dispersed repeats.Tandem and inverted repeats amount to 2.7and 3.6 % of the genome, respectively.These local repeats are distributed non-uni-formly throughout the genome relative togenes. Not surprisingly, only a small per-centage of tandem repeats are found withinthe 27 % of the protein coding genes. Con-versely, the density of inverted repeats ishigher in regions predicted as intergen-ic [17]. Although local repeat structures areoften unique in the genome, other repeatsare members of families. Some repeat fam-ilies have a chromosome-specific bias inrepresentation. Altogether 38 dispersed re-peat families have been recognized. Most ofthese dispersed repeats are associated withtransposition in some form [93], and in-clude the previously described transposonsof C. elegans. In addition to multiple-copyrepeat families, a significant number ofsimple duplications have been observed toinvolve segments that range from hundredsof bases to tens of kilobases. In one in-stance a segment of 108 kb containing sixgenes was duplicated tandemly with onlyten nucleotide differences observedbetween the two copies. In another exam-ple, immediately adjacent to the telomere atthe left end of chromosome IV, an invertedrepeat of 23.5 kb was present, with onlyeight differences found between the two
copies. There are many instances of smallerduplications, often separated by tens of kil-obases or more that might contain a codingsequence. This could provide a mechanismfor copy divergence and the subsequent for-mation of new genes [17].
The GC content is more or less uniformat 36 % throughout all chromosomes, un-like human chromosomes that have differ-ent isochores [94]. There are no localizedcentromers, as are found in most othermetazoa. Instead, the extensive highly re-petitive sequences that are involved in spin-dle attachment in other organisms mightbe represented by some of the many tan-dem repeats found scattered among thegenes, particularly on the chromosomearms. Gene density is also uniform acrossthe chromosomes, although some differ-ences are apparent, particularly between thecenters of the autosomes, the autosomearms, and the X chromosome.
More striking differences become evidenton examination of other features. Both in-verted and tandem repeat sequences aremore frequent on the autosome arms thanin the central regions or on the X chromo-some. This abundance of repeats on thearms is probably the reason for difficultiesin cosmid cloning and sequence comple-tion in these regions. The fraction of geneswith cross-phylum similarities tends to besmaller on the arms as does the fraction ofgenes with EST matches. Local clusters ofgenes also seem to be more abundant onthe arms.
1.3.3.4
Follow-up Research in the Postgenome EraAlthough sequencing of the C. elegans ge-nome has essentially been completed, anal-ysis and annotation will continue and –hopefully – be facilitated by further informa-tion and better technologies as they becomeavailable. The recently completed genome
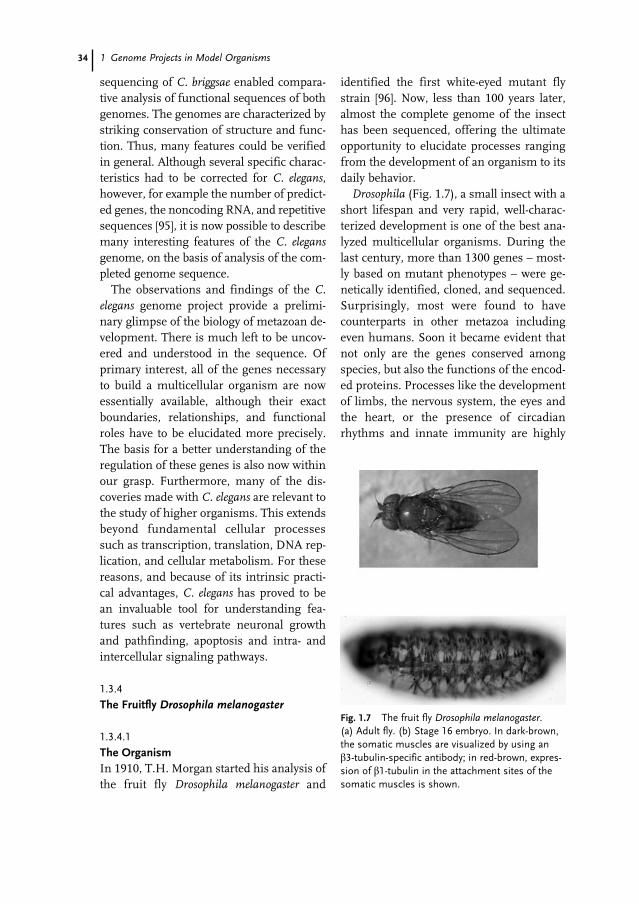
34 1 Genome Projects in Model Organisms
sequencing of C. briggsae enabled compara-tive analysis of functional sequences of bothgenomes. The genomes are characterized bystriking conservation of structure and func-tion. Thus, many features could be verifiedin general. Although several specific charac-teristics had to be corrected for C. elegans,however, for example the number of predict-ed genes, the noncoding RNA, and repetitivesequences [95], it is now possible to describemany interesting features of the C. elegansgenome, on the basis of analysis of the com-pleted genome sequence.
The observations and findings of the C.elegans genome project provide a prelimi-nary glimpse of the biology of metazoan de-velopment. There is much left to be uncov-ered and understood in the sequence. Ofprimary interest, all of the genes necessaryto build a multicellular organism are nowessentially available, although their exactboundaries, relationships, and functionalroles have to be elucidated more precisely.The basis for a better understanding of theregulation of these genes is also now withinour grasp. Furthermore, many of the dis-coveries made with C. elegans are relevant tothe study of higher organisms. This extendsbeyond fundamental cellular processessuch as transcription, translation, DNA rep-lication, and cellular metabolism. For thesereasons, and because of its intrinsic practi-cal advantages, C. elegans has proved to bean invaluable tool for understanding fea-tures such as vertebrate neuronal growthand pathfinding, apoptosis and intra- andintercellular signaling pathways.
1.3.4
The Fruitfly Drosophila melanogaster
1.3.4.1
The OrganismIn 1910, T.H. Morgan started his analysis ofthe fruit fly Drosophila melanogaster and
identified the first white-eyed mutant flystrain [96]. Now, less than 100 years later,almost the complete genome of the insecthas been sequenced, offering the ultimateopportunity to elucidate processes rangingfrom the development of an organism to itsdaily behavior.
Drosophila (Fig. 1.7), a small insect with ashort lifespan and very rapid, well-charac-terized development is one of the best ana-lyzed multicellular organisms. During thelast century, more than 1300 genes – most-ly based on mutant phenotypes – were ge-netically identified, cloned, and sequenced.Surprisingly, most were found to havecounterparts in other metazoa includingeven humans. Soon it became evident thatnot only are the genes conserved amongspecies, but also the functions of the encod-ed proteins. Processes like the developmentof limbs, the nervous system, the eyes andthe heart, or the presence of circadianrhythms and innate immunity are highly
Fig. 1.7 The fruit fly Drosophila melanogaster. (a) Adult fly. (b) Stage 16 embryo. In dark-brown,the somatic muscles are visualized by using an â3-tubulin-specific antibody; in red-brown, expres-sion of â1-tubulin in the attachment sites of thesomatic muscles is shown.
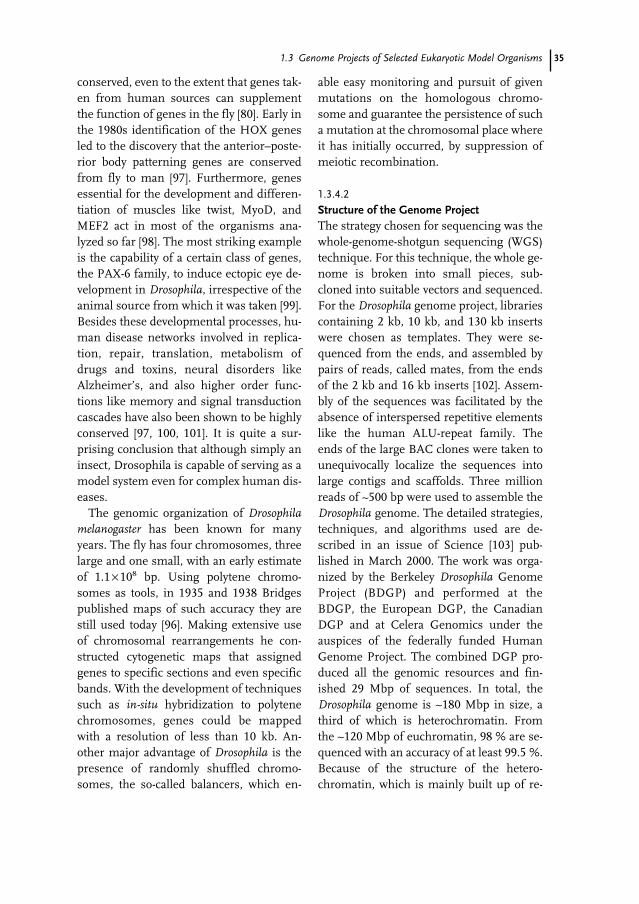
351.3 Genome Projects of Selected Eukaryotic Model Organisms
conserved, even to the extent that genes tak-en from human sources can supplementthe function of genes in the fly [80]. Early inthe 1980s identification of the HOX genesled to the discovery that the anterior–poste-rior body patterning genes are conservedfrom fly to man [97]. Furthermore, genesessential for the development and differen-tiation of muscles like twist, MyoD, andMEF2 act in most of the organisms ana-lyzed so far [98]. The most striking exampleis the capability of a certain class of genes,the PAX-6 family, to induce ectopic eye de-velopment in Drosophila, irrespective of theanimal source from which it was taken [99].Besides these developmental processes, hu-man disease networks involved in replica-tion, repair, translation, metabolism ofdrugs and toxins, neural disorders likeAlzheimer’s, and also higher order func-tions like memory and signal transductioncascades have also been shown to be highlyconserved [97, 100, 101]. It is quite a sur-prising conclusion that although simply aninsect, Drosophila is capable of serving as amodel system even for complex human dis-eases.
The genomic organization of Drosophilamelanogaster has been known for manyyears. The fly has four chromosomes, threelarge and one small, with an early estimateof 1.1 ×10⁸ bp. Using polytene chromo-somes as tools, in 1935 and 1938 Bridgespublished maps of such accuracy they arestill used today [96]. Making extensive useof chromosomal rearrangements he con-structed cytogenetic maps that assignedgenes to specific sections and even specificbands. With the development of techniquessuch as in-situ hybridization to polytenechromosomes, genes could be mappedwith a resolution of less than 10 kb. An-other major advantage of Drosophila is thepresence of randomly shuffled chromo-somes, the so-called balancers, which en-
able easy monitoring and pursuit of givenmutations on the homologous chromo-some and guarantee the persistence of sucha mutation at the chromosomal place whereit has initially occurred, by suppression ofmeiotic recombination.
1.3.4.2
Structure of the Genome ProjectThe strategy chosen for sequencing was thewhole-genome-shotgun sequencing (WGS)technique. For this technique, the whole ge-nome is broken into small pieces, sub-cloned into suitable vectors and sequenced.For the Drosophila genome project, librariescontaining 2 kb, 10 kb, and 130 kb insertswere chosen as templates. They were se-quenced from the ends, and assembled bypairs of reads, called mates, from the endsof the 2 kb and 16 kb inserts [102]. Assem-bly of the sequences was facilitated by theabsence of interspersed repetitive elementslike the human ALU-repeat family. Theends of the large BAC clones were taken tounequivocally localize the sequences intolarge contigs and scaffolds. Three millionreads of ~500 bp were used to assemble theDrosophila genome. The detailed strategies,techniques, and algorithms used are de-scribed in an issue of Science [103] pub-lished in March 2000. The work was orga-nized by the Berkeley Drosophila GenomeProject (BDGP) and performed at theBDGP, the European DGP, the CanadianDGP and at Celera Genomics under theauspices of the federally funded HumanGenome Project. The combined DGP pro-duced all the genomic resources and fin-ished 29 Mbp of sequences. In total, theDrosophila genome is ~180 Mbp in size, athird of which is heterochromatin. Fromthe ~120 Mbp of euchromatin, 98 % are se-quenced with an accuracy of at least 99.5 %.Because of the structure of the hetero-chromatin, which is mainly built up of re-

36 1 Genome Projects in Model Organisms
petitive elements, retrotransposons, rRNAclusters, and some unique sequences, mostof it could not be cloned or propagated inYAC, in contrast with the C. elegans genomeproject [102].
1.3.4.3
Results of the Genome ProjectAs a major result, the number of genes wascalculated to be ~13,600 using a Drosophila-optimized version of the program GE-NIE [100]. Over the last 20 years, 2500 ofthese have already been characterized by thefly community, and their sequences havebeen made available continuously duringthe ongoing of the fly project. The averagedensity is one gene in 9 kb, but ranges fromnone to nearly 30 genes per 50 kbp, and, incontrast with C. elegans, gene-rich regionsare not clustered. Regions of high gene den-sity correlate with G + C-rich sequences.Computational comparisons with knownvertebrate genes have led to both expectedfindings and surprises. So genes encodingthe basic DNA replication machinery areconserved among eukaryotes; especially, allthe proteins known to be involved in recog-nition of the replication start point arepresent as single-copy genes, and the ORC3and ORC6 proteins are closely similar tovertebrate proteins but much different fromthose in yeast and, apparently, even moredifferent from those in the worm. Focusingon chromosomal proteins, the fly seems tolack orthologs to most of the mammalianproteins associated with centromeric DNA,for example the CENP-C/MIF-2 family. Fur-thermore, because Drosophila telomereslack the simple repeats characteristic ofmost eukaryotic telomeres, the known te-lomerase components are absent. Concern-ing gene regulation, RNA polymerase sub-units and co-factors are more closely relatedto their mammalian counterparts than to
yeast; for example, the promoter interactingfactors UBF and TIF-IA are present in Dro-sophila but not in yeast. The overall set oftranscription factors in the fly seems tocomprise approximately 700 members,about half of which are zinc-finger proteins,whereas in the worm only one-third of 500factors belong to this family. Nuclear hor-mone receptors seem to be more rare, be-cause only four new members were detect-ed, bringing the total to 20 compared withmore than 200 in C. elegans. As an exampleof metabolic processes, iron pathway com-ponents were analyzed. A third ferritingene has been found that probably encodesa subunit belonging to cytosolic ferritin, thepredominant type in vertebrates. Two new-ly discovered transferrins are homologs ofthe human melanotransferrin p97, which isof especial interest, because the iron trans-porters analyzed so far in the fly are in-volved in antibiotic response rather than iniron transport. Otherwise, proteins homolo-gous to transferrin receptors seem to be ab-sent from the fly, so the melanotransferrinhomologs might mediate the main insectpathway for iron uptake (all data taken fromAdams et al. [100]). The sequences and thedata compiled are freely available to the sci-entific community on servers in severalcountries (see: http://www.fruitfly.org). Inaddition, large collections of EST (expressedsequence tags), cDNA libraries, and genom-ic resources are available, as are data basespresenting expression patterns of identifiedgenes or enhancer trap lines, for exampleflyview at the University of Münster(http://pbio07.uni-muenster.de), started bythe group of W. Janning. Furthermore, byusing more advanced transcription profil-ing approaches in combination with lowerstringency gene prediction programs, ap-proximately 2000 new genes could be de-tected, according to a recent report [104].
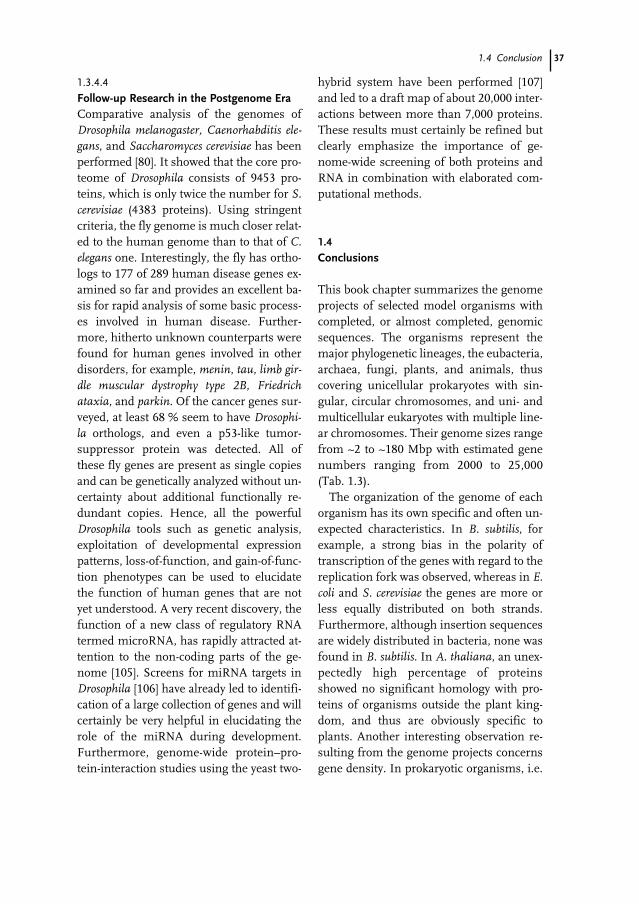
371.4 Conclusion
1.3.4.4
Follow-up Research in the Postgenome EraComparative analysis of the genomes ofDrosophila melanogaster, Caenorhabditis ele-gans, and Saccharomyces cerevisiae has beenperformed [80]. It showed that the core pro-teome of Drosophila consists of 9453 pro-teins, which is only twice the number for S.cerevisiae (4383 proteins). Using stringentcriteria, the fly genome is much closer relat-ed to the human genome than to that of C.elegans one. Interestingly, the fly has ortho-logs to 177 of 289 human disease genes ex-amined so far and provides an excellent ba-sis for rapid analysis of some basic process-es involved in human disease. Further-more, hitherto unknown counterparts werefound for human genes involved in otherdisorders, for example, menin, tau, limb gir-dle muscular dystrophy type 2B, Friedrichataxia, and parkin. Of the cancer genes sur-veyed, at least 68 % seem to have Drosophi-la orthologs, and even a p53-like tumor-suppressor protein was detected. All ofthese fly genes are present as single copiesand can be genetically analyzed without un-certainty about additional functionally re-dundant copies. Hence, all the powerfulDrosophila tools such as genetic analysis,exploitation of developmental expressionpatterns, loss-of-function, and gain-of-func-tion phenotypes can be used to elucidatethe function of human genes that are notyet understood. A very recent discovery, thefunction of a new class of regulatory RNAtermed microRNA, has rapidly attracted at-tention to the non-coding parts of the ge-nome [105]. Screens for miRNA targets inDrosophila [106] have already led to identifi-cation of a large collection of genes and willcertainly be very helpful in elucidating therole of the miRNA during development.Furthermore, genome-wide protein–pro-tein-interaction studies using the yeast two-
hybrid system have been performed [107]and led to a draft map of about 20,000 inter-actions between more than 7,000 proteins.These results must certainly be refined butclearly emphasize the importance of ge-nome-wide screening of both proteins andRNA in combination with elaborated com-putational methods.
1.4
Conclusions
This book chapter summarizes the genomeprojects of selected model organisms withcompleted, or almost completed, genomicsequences. The organisms represent themajor phylogenetic lineages, the eubacteria,archaea, fungi, plants, and animals, thuscovering unicellular prokaryotes with sin-gular, circular chromosomes, and uni- andmulticellular eukaryotes with multiple line-ar chromosomes. Their genome sizes rangefrom ~2 to ~180 Mbp with estimated genenumbers ranging from 2000 to 25,000(Tab. 1.3).
The organization of the genome of eachorganism has its own specific and often un-expected characteristics. In B. subtilis, forexample, a strong bias in the polarity oftranscription of the genes with regard to thereplication fork was observed, whereas in E.coli and S. cerevisiae the genes are more orless equally distributed on both strands.Furthermore, although insertion sequencesare widely distributed in bacteria, none wasfound in B. subtilis. In A. thaliana, an unex-pectedly high percentage of proteinsshowed no significant homology with pro-teins of organisms outside the plant king-dom, and thus are obviously specific toplants. Another interesting observation re-sulting from the genome projects concernsgene density. In prokaryotic organisms, i.e.
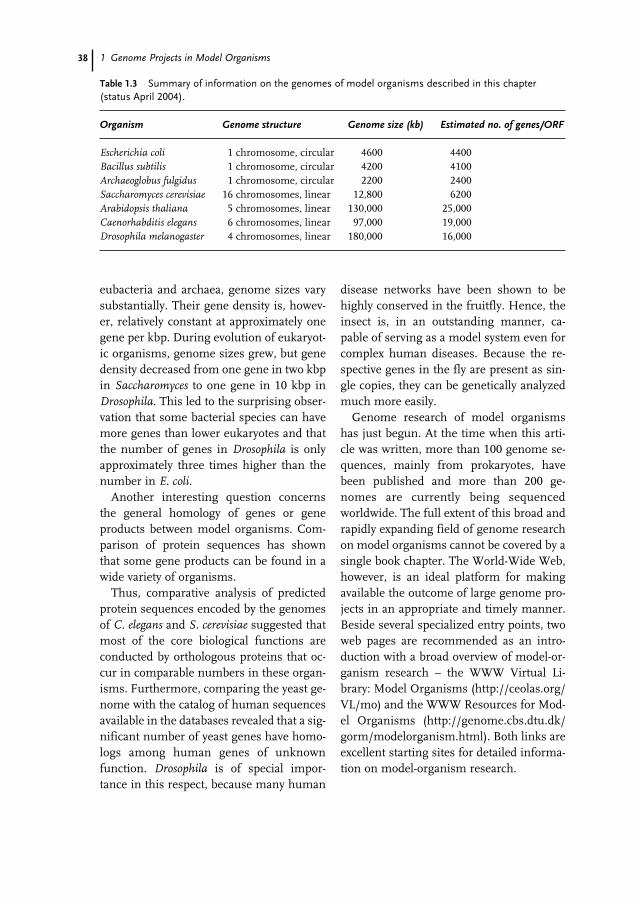
38 1 Genome Projects in Model Organisms
eubacteria and archaea, genome sizes varysubstantially. Their gene density is, howev-er, relatively constant at approximately onegene per kbp. During evolution of eukaryot-ic organisms, genome sizes grew, but genedensity decreased from one gene in two kbpin Saccharomyces to one gene in 10 kbp inDrosophila. This led to the surprising obser-vation that some bacterial species can havemore genes than lower eukaryotes and thatthe number of genes in Drosophila is onlyapproximately three times higher than thenumber in E. coli.
Another interesting question concernsthe general homology of genes or geneproducts between model organisms. Com-parison of protein sequences has shownthat some gene products can be found in awide variety of organisms.
Thus, comparative analysis of predictedprotein sequences encoded by the genomesof C. elegans and S. cerevisiae suggested thatmost of the core biological functions areconducted by orthologous proteins that oc-cur in comparable numbers in these organ-isms. Furthermore, comparing the yeast ge-nome with the catalog of human sequencesavailable in the databases revealed that a sig-nificant number of yeast genes have homo-logs among human genes of unknownfunction. Drosophila is of special impor-tance in this respect, because many human
disease networks have been shown to behighly conserved in the fruitfly. Hence, theinsect is, in an outstanding manner, ca-pable of serving as a model system even forcomplex human diseases. Because the re-spective genes in the fly are present as sin-gle copies, they can be genetically analyzedmuch more easily.
Genome research of model organismshas just begun. At the time when this arti-cle was written, more than 100 genome se-quences, mainly from prokaryotes, havebeen published and more than 200 ge-nomes are currently being sequencedworldwide. The full extent of this broad andrapidly expanding field of genome researchon model organisms cannot be covered by asingle book chapter. The World-Wide Web,however, is an ideal platform for makingavailable the outcome of large genome pro-jects in an appropriate and timely manner.Beside several specialized entry points, twoweb pages are recommended as an intro-duction with a broad overview of model-or-ganism research – the WWW Virtual Li-brary: Model Organisms (http://ceolas.org/VL/mo) and the WWW Resources for Mod-el Organisms (http://genome.cbs.dtu.dk/gorm/modelorganism.html). Both links areexcellent starting sites for detailed informa-tion on model-organism research.
Table 1.3 Summary of information on the genomes of model organisms described in this chapter (status April 2004).
Organism Genome structure Genome size (kb) Estimated no. of genes/ORF
Escherichia coli 1 chromosome, circular 4600 4400Bacillus subtilis 1 chromosome, circular 4200 4100Archaeoglobus fulgidus 1 chromosome, circular 2200 2400Saccharomyces cerevisiae 16 chromosomes, linear 12,800 6200Arabidopsis thaliana 5 chromosomes, linear 130,000 25,000Caenorhabditis elegans 6 chromosomes, linear 97,000 19,000Drosophila melanogaster 4 chromosomes, linear 180,000 16,000
39
1 Berg, P., Baltimore, D., Brenner, S., Roblin,R.O. 3rd, Singer, M.F. (1975), Asilomarconference on recombinant DNA molecules.Science 188, 991–994.
2 Blattner, F.R., Plunkett, G. III, Bloch, C.A.,Perna, N.T., Burland, V. et al. (1997), Thecomplete genome sequence of Escherichia coliK-12, Science 277, 1453–1474.
3 Yamamoto, Y., Aiba, H., Baba, T., Hayashi,K., Inada, T. et al. (1997), Construction of acontiguous 874-kb sequence of the Escherichiacoli -K12 genome corresponding to 50.0–68.8min on the linkage map and analysis of itssequence features. DNA Res. 4, 91–113.
4 Kröger, M., Wahl, R. (1998) Compilation ofDNA sequences of Escherichia coli K12:description of the interactive databases ECDand ECDC, Nucl. Acids Res. 26, 46–49.
5 Thomas, G.H. (1999), Completing the E. coliproteome: a database of gene productscharacterised since completion of the genomesequence, Bioinformatics 15, 860–861.
6 Taylor, A.L., Thoman, M.S. (1964) Thegenetic map of Escherichia coli K-12. Genetics50, 659–677.
7 Bachmann, B.J. (1983) Linkage map ofEscherichia coli K-12, edition 7. Microbiol. Rev.47, 180 –230.
8 Neidhard, F.C. (1996) Escherichia coli andSalmonella typhimurium – Cellular andMolecular Biology, 2nd edn. American Societyfor Microbiology, Washington DC.
9 Kohara, Y., Akiyama, K., Isono, K. (1987), Thephysical map of the whole E. colichromosome: Application of a new strategyfor rapid analysis and sorting of a largegenomic library. Cell 50, 495–508.
10 Roberts, R. (2000) Database issue of NucleicAcids Research, Nucl. Acids Res. 28, 1–382.
11 Datsenko, K.A., Wanner, B.L. (2000), One-step inactivation of chromosomal genes inEscherichia coli K-12 using PCR products.PNAS 97, 6640–6645.
12 Karp, P.D., Riley, M.R., Saier, M., Paulsen,I.T., Collado-Vides, J., Paley, S.M., Pellegrini-Toole, A., Bonavides, C., Gama-Castro, S.(2002), The EcoCyc Database. Nucl. Acids Res.30, 56–58.
13 Sekowska, A. (1999), Une rencontre dumétabolisme du soufre et de l’azote: lemétabolisme des polyamines chez Bacillussubtilis, thesis in Génétique cellulaire etmoléculaire. Versailles-Saint-Quentin:Versailles, France. p. 202.
14 Kunst, F., Ogasawara, N., Moszer, I.,Albertini, A.M., Alloni, G. et al. (1997), Thecomplete genome sequence of the gram-positive bacterium Bacillus subtilis. Nature390, 249–256.
15 Moreno, M.S., Schneider, B.L., Maile, R.R.,Weyler, W., Saier, M.H., Jr. (2001), Cataboliterepression mediated by the CcpA protein inBacillus subtilis: novel modes of regulationrevealed by whole-genome analyses. Mol.Microbiol. 39, 1366–1381.
16 Fabret, C., Quentin, Y., Guiseppi, A., Busuttil,J., Haiech, J., Denizot, F. (1995), Analysis oferrors in finished DNA sequences: thesurfactin operon of Bacillus subtilis as anexample. Microbiology 141, 345–350.
17 Wilson, R.K. (1999), How the worm was won.The C. elegans genome sequencing project.Trends Genet. 15, 51–58.
18 Arias, R.S., Sagardoy, M.A., van Vuurde, J.W.(1999), Spatio-temporal distribution ofnaturally occurring Bacillus spp. and otherbacteria on the phylloplane of soybean underfield conditions. J. Basic Microbiol. 39, 283–292.
References

40 References
19 Rocha, E.P. (2003), DNA repeats lead to theaccelerated loss of gene order in bacteria.Trends Genet. 19, 600–603.
20 Rocha, E.P., Danchin, A., Viari, A. (1999),Universal replication biases in bacteria. Mol.Microbiol. 32, 11–16.
21 Schofield, M.J. and Hsieh, P. (2003), DNAmismatch repair: molecular mechanisms andbiological function. Annu. Rev. Microbiol. 57,579–608.
22 Glaser, P., Frangeul, L., Buchrieser, C.,Rusniok, C., Amend, A. et al. (2001),Comparative genomics of Listeria species.Science 294, 849–852.
23 Rocha, E.P., Sekowska, A., Danchin, A.(2000), Sulphur islands in the Escherichia coligenome: markers of the cell’s architecture?FEBS Lett. 476, 8–11.
24 Danchin, A., Guerdoux-Jamet, P., Moszer, I.,Nitschke, P. (2000), Mapping the bacterial cellarchitecture into the chromosome. Philos.Trans. R. Soc. Lond. B Biol. Sci. 355, 179–190.
25 Gottesman, S., Roche, E., Zhou, Y., Sauer,R.T. (1998), The ClpXP and ClpAP proteasesdegrade proteins with carboxy-terminalpeptide tails added by the SsrA-taggingsystem. Genes Dev. 12, 1338–1347.
26 Kobayashi, K., Ehrlich, S.D., Albertini, A.,Amati, G., Andersen, K.K. et al. (2003),Essential Bacillus subtilis genes. Proc. Natl.Acad. Sci. USA 100, 4678–4683.
27 Soma, A., Ikeuchi, Y., Kanemasa, S.,Kobayashi, K., Ogasawara, N. et al. (2003), AnRNA-modifying enzyme that governs both thecodon and amino acid specificities ofisoleucine tRNA. Mol. Cell. 12, 689–698.
28 Rocha, E.P. and Danchin, A. (2003), Geneessentiality determines chromosomeorganisation in bacteria. Nucleic Acids Res. 31,6570–6577.
29 Beckering, C.L., Steil, L., Weber, M.H.,Volker, U., Marahiel, M.A. (2002),Genomewide transcriptional analysis of the cold shock response in Bacillus subtilis.J. Bacteriol. 184, 6395–6402.
30 Hoffmann, T., Schutz, A., Brosius, M.,Volker, A., Volker, U., Bremer, E. (2002),High-salinity-induced iron limitation inBacillus subtilis. J. Bacteriol. 184, 718–727.
31 Danchin, A. (1997), Comparison between theEscherichia coli and Bacillus subtilis genomessuggests that a major function ofpolynucleotide phosphorylase is to synthesizeCDP. DNA Res. 4, 9–18.
32 Klenk, H.-P., Clayton, R.A., Tomb, J.-F.,White, O., Nelson, K.E. et al. (1997), Thecomplete genome of the hyperthermophilic,sulfate-reducing archaeon Archaeoglobusfulgidus. Nature 390, 364–370.
33 Stetter, K.O. (1988), Archaeoglobus fulgidusgen. nov., sp. nov.: a new taxon of extremelythermophilic archaebacteria. System. Appl.Microbiol. 10, 172–173.
34 Tomb, J.-F., White, O., Kerlavage, A.R.,Clayton, R.A., Sutton, G.G. et al. (1997), The complete genome sequence of the gastricpathogen Heliobacter pylori. Nature 388,539–547.
35 Bult, C.J., White, O., Olsen, G.J., Zhou, L.,Fleischmann, R.D. et al. (1996), Completegenome sequence of the methanogenicarchaeon Methanococcus jannaschii, Science273, 1058–1073.
36 Rabus, R., Ruepp, A., Frickey, T., Rattei, T.,Fartmann, B. et al. (2004), The genome ofDesulfotalea psychrophila, a sulphate-reducing bacterium from permanently coldArctic sediments. Environ. Microbiol., in press.
37 Vorholt, J., Kunow, J., Stetter, K.O., Thauer,R.K. (1995), Enzymes and coenzymes of thecarbon monoxide dehydrogenase pathway forautotrophic CO2 fixation in Archaeoglobuslithotrophicus and the lack of carbon monoxidedehydrogenase in the heterotrophic A.profundus. Arch. Microbiol. 163, 112–118.
38 Stetter KO, Lauerer G, Thomm M, Neuner A(1987) Isolation of extremely thermophilicsulfate reducers: evidence for a novel branchof archaebacteria. Science 236, 822–824.
39 Hosfield, D.J., Frank, G., Weng, Y., Tainer,J.A., Shen, B. (1998), Newly discoveredarchaebacterial flap endonucleases show astructure-specific mechanism for DNAsubstrate binding and catalysis resemblinghuman flap endonuclease-1. J. Biol. Chem.273, 27154–27161.
40 Lyamichev, V., Mast, A.L., Hall, J.G., Prudent,J.R., Kaiser, M.W. et al. (1999),Polymorphism identification and quantitativedetection of genomic DNA by invasivecleavage of oligonucleotide probes. Nat.Biotechnol. 17, 292–296.
41 Cooksey, R.C., Holloway, B.P., Oldenburg,M.C., Listenbee, S., Miller, C.W. (2000),Evaluation of the invader assay, a linear signalamplification method, fro identification ofmutations associated with resistance ofrifampin and isoniazid in Mycobacterium
41References
tuberculosis, Antimicrob. Agents Chemother. 44,1296–1301.
42 Tang, T.H., Bachellerie, J.P. Rozhdestvensky,T., Bortolin, M.L., Huber, H. et al., (2003),Identification of 86 candidates for small non-messenger RNAs from the archaeonArchaeoglobus fulgidus, Proc. Natl. Acad. Sci.USA 99, 7536–7541.
43 Maisnier-Patin, S., Malandrin, L., Birkeland,N.K., Bernander, R. (2002), Chromosomereplication patterns in the hyperthermophiliceuryarchaea Archaeoglobus fulgidus andMethanocaldococcus (Methanococcus) janashii,Mol. Microbiol. 45, 1443–1450.
44 Goffeau, A. Barrell, B.G., Bussey, H., Davis,R.W., Dujon, B. et al. (1996), Life with 6000genes, Science 274, 546–567.
45 Anonymous (1997), Dictionary of the yeastgenome, Nature 387 (suppl.).
46 Lindegren, C.C. (1949) The Yeast Cell, itsGenetics and Cytology. EducationalPublishers, St Louis, MI.
47 Mortimer, R.K., Contopoulou, R., King, J.S.(1992), Genetic and physical maps ofSaccharomyces cerevisiæ, Edition 11. Yeast 8,817–902.
48 Carle, G.F., Olson, M.V. (1985), Anelectrophoretic karyotype for yeast. Proc. Natl.Acad. Sci. USA 82, 3756.
49 Stucka, R., Feldmann, H. (1994), Cosmidcloning of Yeast DNA, in: Molecular Geneticsof Yeast – A Practical Approach (Johnston, J.Ed.) Oxford Univ. Press, pp. 49–64.
50 Thierry, A., Dujon, B. (1992), Nestedchromosomal fragmentation in yeast usingthe meganuclease I-Sce I: a new method forphysical mapping of eukaryotic genomes.Nucleic Acids Res. 20, 5625–5631.
51 Louis, E.J., Borts, R.H. (1995), A complete setof marked telomeres in Saccharomycescerevisiae for physical mapping and cloning.Genetics 139, 125–136.
52 Wolfe, K.H., Shields, D.C. (1997), Molecularevidence for an ancient duplication of theentire yeast genome. Nature 387, 708–713.
53 Foury, F., Roganti, T., Lecrenier, N., Pumelle,B. (1998), Yeast genes and human disease.FEBS Lett. 440, 325–331.
54 DeRisi, J.L., Iyer, V.R., Brown, P.O. (1997),Exploring the metabolic and genetic controlof gene expression on a genomic scale.Science 278, 680–686.
55 Goffeau, A. (2000), Four years of postgenomiclife with 6,000 yeast genes. FEBS Lett. 480,37–41.
56 Feldmann, H. (ed.) (2000), Genolevures:Genomic exploration of thehemiascomycetous yeasts. FEBS Lett. 487, no.1 (http://cbi.labri.fr/genolevures).
57 Laibach, F. (1907). Zur Frage nach derIndividualität der Chromosomen imPflanzenreich. Beih. Bot. Centralblatt, Abt. I,22, 191–210.
58 Laibach, F. (1943) Arabidopsis thaliana (L.)Heynh. als Objekt für genetische undentwicklungsphysiologischeUntersuchungen. Bot. Arch. 44, 439–455.
59 Laibach, F. (1951) Über sommer- undwinterannuelle Rassen von Arabidopsisthaliana (L.) Heynh. Ein Beitrag zur Atiologieder Blütenbildung, Beitr. Biol. Pflanzen 28,173–210.
60 Müller, A. (1961) Zur Charakterisierung derBlüten und Infloreszenzen von Arabidopsisthaliana (L.) Heynh. Die Kulturpflanze 9,364–393.
61 Arumuganathan, K., Earle E.D. (1991),Nuclear DNA content of some importantplant species. Plant Mol. Biol. Rep. 9, 208–218.
62 Cherry, J.M., Cartinhour, S.W., Goodmann,H.M. (1992), AAtDB, an Arabidopsis thalianadatabase. Plant Mol. Biol. Rep. 10, 308–309,409–410.
63 Rédei, G.P. (1992), A heuristic glance at thepast of Arabidopsis genetics, in: Methods inArabidopsis Research (Koncz, C., Chua, N.-H.,Schell, J. Eds.), World Scientific Publishing,Singapore, pp. 1–15.
64 Lin, X., Kaul, S., Rounsley, S., Shea, T.P.,Benito, M.I. et al. (1999), Sequence andanalysis of chromosome 2 of the plantArabidopsis thaliana. Nature 402, 761–768.
65 Mayer, K., Schuller, C., Wambutt, R.,Murphy, G., Volckaert, G. et al. (1999),Sequence and analysis of chromosome 4 ofthe plant Arabidopsis thaliana. Nature 402,769–777.
66 Unseld, M., Marienfeld, J.R., Brandt, P.,Brennicke, A. (1997), The mitochondrialgenome of Arabidopsis thaliana contains 57genes in 366,924 nucleotides. Nature Genet.15, 57–61.
67 Sato, S., Nakamura, Y., Kaneko, T., Asamizu,E., Tabata, S. (1999), Complete structure ofthe chloroplast genome of Arabidopsisthaliana. DNA Res. 6, 283–290.
42 References
68 Gill, K.S., Gill, B.S., Endo, T.R., Taylor, T.(1996a), Identification and high densitymapping of gene-rich regions in thechromosome group 5 of wheat. Genetics 143,1001–1012.
69 Gill, K.S., Gill, B.S., Endo, T.R., Taylor, T.(1996b), Identification and high densitymapping of gene–rich regions in thechromosome group 1 of wheat. Genetics 144,1883–1891.
70 Künzel, G., Korzun, L., Meister, A. (2000),Cytologically integrated physical restrictionfragment length polymorphism maps for thebarley genome based on translocationbreakpoints. Genetics 154, 397–412.
71 SanMiguel, P., Tikhonov, A., Jin, Y.K.,Motchoulskaia, N., Zakharov, D., Melake-Berhan, A., Springer, P.S., Edwards, K.J., Lee,M., Avramova, Z., Bennetzen, J.L. (1996),Nested retrotransposons in the intergenicregions of the maize genome. Science 274765–768.
72 Meyerowitz, E.M. (2000), Today we have thenaming of the parts. Nature 402, 731–732.
73 Emanuelsson, O., Nielsen, H., Brunak, S.,von Heijne, G. (2000), Predicting subcellularlocalization of proteins based on their N-terminal amino acid sequence. J. Mol. Biol.300, 1005–1016.
74 Martin, W., Schnarrenberger, C. (1997), Theevolution of the Calvin cycle from prokaryoticto eukaryotic chromosomes: a case study offunctional redundancy in ancient pathwaysthrough endosymbiosis. Curr. Genet. 32, 1–8.
75 Herrmann, R.G. (2000), Organelle genetics –part of the integrated plant genome. Vortr.Pflanzenzüchtg. 48, 279–296.
76 Bevan, M., Bennetzen, J.L., Martienssen, R.(1998), Genome studies and molecularevolution. Commonalities, contrasts,continuity and change in plant genomes. CurrOpin Plant Biol. 101–102.
77 Schmidt, R. (2000), The Arabidopsis genome.Vortr. Pflanzenzüchtg. 48, 228–237.
78 Suzuki, M., Kao, C.Y., McCarty, D.R. (1997),The conserved B3 domain of VIVIPAROUS1has a cooperative DNA binding activity. PlantCell 9, 799–807.
79 Jin, H., Martin, C. (1999), Multifunctionalityand diversity within the plant MYB-genefamily. Plant Mol. Biol. 41, 577–585.
80 Rubin, G.M., Yandell, M.D., Wortman, J.R.,Gabor Miklos, G.L., Nelson, C.R. et al. (2000),Comparative genomics of eukaryotes. Science287, 2204–2215.
81 Sulston, J. (1988), Cell Lineage; In: TheNematode Caenorhabditis elegans (Wood, W.B.Ed.) pp. 123–155, CSHL Press
82 Chalfie, M., White, J. (1988), The Nervoussystem, In: The Nematode Caenorhabditiselegans (Wood, W.B. Ed.) pp. 337–391, CSHLPress.
83 Coulson, A., Waterston, R., Kiff, J., Sulston,J., Kohara, Y. (1988), Genome linking withyeast artificial chromosomes. Nature 335,184–186.
84 Lee, L.G., Connell, C.R., Woo, S.L., Cheng,R.D., McArdle, B.F., Fuller, C.W., Halloran,N.D., Wilson, R.K. (1992), DNA sequencingwith dye-labeled terminators and T7 DNApolymerase: Effect of dyes and dNTPs onincorporation of dye-terminators, andprobability analysis of termination fragments.Nucleic Acids Res. 20, 2471–2483.
85 Wilson, R., Ainscough, R., Anderson, K.,Baynes, C., Berks, M. et al. (1994), 2.2 Mb ofcontiguous nucleotide sequence fromchromosome III of C. elegans. Nature 368,32–38.
86 Wicky, C., Villeneuve, A.M., Lauper, N.,Codourey, L., Tobler, H., Muller, F. (1996),Telomeric repeats (TTAGGC) are sufficientfor chromosome capping in Caenorhabditiselegans. Proc. Natl. Acad. Sci. USA 93,8983–8988.
87 Herman, R.K. (1988), Genetics, in: TheNematode Caenorhabditis elegans (Wood, W.B.Ed.) pp. 17–45, CSHL Press.
88 Waterston, R., Sulston, J. (1995), The genomeof Caenorhabditis elegans. Proc. Natl. Acad. Sci.USA 92, 10836–10840.
89 Chervitz, S.A., Aravind, L., Sherlock, G., Ball,C.A., Koonin, E.V. et al. (1998), Comparisonof the complete protein sets of worm andyeast: orthology and divergence. Science 282,2022–2027.
90 Stein, L., Sternberg, P., Durbin, R., Thierry-Mieg, J., Spieth, J. (2001), WormBase:network access to the genome and biology ofCaenorhabditis elegans. Nucleic Acids Res. 29,82–86.
43References
91 Reboul, J., Vaglio, P., Rual, J.F., Lamesch, P.,Martinez, M. et al. (2003), C. elegansORFeome version 1.1: experimentalverification of the genome annotation andresource for proteome-scale proteinexpression. Nature Genet. 34, 35–41.
92 Green, P., Lipman, D., Hillier, L., Waterston,R., States, D., Claverie, J.M. (1993), Ancientconserved regions in new gene sequencesand the protein database. Science 259,1711–1716.
93 Smit, A.F. (1996), The origin of interspersedrepeats in the human genome. Curr. Opin.Genet. Dev. 6, 743–748.
94 Bernardi, G. (1995), The human genome:organization and evolutionary history. Annu.Rev. Genet. 29, 445–476.
95 Stein, L.D., Bao, Z., Blasiar, D., Blumenthal,T., Brent, M.R. et al. (2003), The genomesequence of Caenorhabditis briggsae: Aplatform for comparative genomics. PLOSBiology, 1, 166–192.
96 Rubin, G.M., Lewis, E.B. (2000), A briefhistory of Drosophila´s contributions togenome research. Science 287, 2216–2218.
97 Veraksa, A., Del Campo, M., McGinnis, W.(2000), Developmental patterning genes andtheir conserved functions: From modelorganisms to humans. Mol. Genet. Metab. 69,85–100.
98 Zhang, J.M., Chen, L., Krause, M., Fire, A.,Paterson, B.M. (1999), Evolutionaryconservation of MyoD function anddifferential utilization of E proteins. Dev. Biol.208, 465–472.
99 Halder, G., Callaerts, P., Gehring, W. J.(1995), Induction of ectopic eyes by targetedexpression of the eyeless gene in Drosophila.Science 267, 1788–1792.
100 Adams, M.D., Celniker, S.E., Holt, R.A.,Evans, C.A., Gocayne, J.D. et al., (2000), Thegenome sequence of Drosophila melanogaster.Science 287, 2185–2195.
101 Mayford, M., Kandel, E.R. (1999), Geneticapproaches to memory storage. Trends Genet.15, 463–470.
102 Myers, E.W., Sutton, G.G., Delcher, A.L.,Dew, I.M., Fasulo, D.P. et al. (2000), A whole-genome assembly of Drosophila. Science 287,2196–2204.
103 Anonymous (2000) The Drosophila Genome,Science 287, issue 5461.
104 Hild, M., Beckmann, B., Haas, S.A., Koch, B.,Solovyev, V. et al. (2003), An integrated geneannotation and transcriptional profilingapproach towards the full gene content of theDrosophila genome. Genome Biol. 5, R3.
105 Lai Eric C. (2003), microRNAs: Runts of thegenome assert themselves. Curr. Biol. 13,R925–R936.
106 Stark, A., Brennecke, J., Russell, R.B., Cohen,S.M. (2003), Identification of DrosophilamicroRNA targets. PLOS Biology, 1, 397–409.
107 Giot, L., Bader, J.S., Brouwer, C., Chaudhuri,A., Kuang, B. et al. (2003), A proteininteraction map of Drosophila melanogaster.Science 302, 1727–1736.
45
Alexander H. Treusch and Christa Schleper
Abstract
TThe vast majority of microbial species hasnot been cultivated in the laboratory to dateand is, therefore, not easily amenable tophysiological and genomic characteriza-tion. A novel means of addressing thisproblem is the environmental genomic ormetagenomic approach in which whole-community DNA is extracted from environ-mental samples, purified from contaminat-ing substances, and cloned into large DNA-libraries. These libraries can be screenedfor genome fragments of specific lineagesor can be analyzed in large-scale sequenc-ing approaches to gain insights intogenome structure and gene content of spe-cific lineages or even of whole microbialcommunities. Here we summarize themethodology and the information gainedso far from analyses of genome fragmentsof uncultivated microorganisms, alongsidebiotechnological aspects of environmentalgenomics.
2.1
Introduction: Why Novel Approaches to Study Microbial Genomes?
The analysis of prokaryotic genomes hasproven to be a powerful tool for characteriz-ing microorganisms. It paves the way forprediction of physiological pathways andfuels studies on genome structure, horizon-tal gene transfer, and gene regulation.Currently there are more than 160 fullysequenced prokaryotic genomes with morethan 180 in progress [1]. All the organismstargeted with these genome projects can begrown in pure cultures or, for intracellularsymbionts, can be physically separatedfrom their environment. The approximately5000 described species [2], however, repre-sent only a minor fraction of the prokaryot-ic diversity found in natural environ-ments [3]. On the basis of amplification of16S rRNA genes directly from environmen-tal samples, it has be shown that the actualmicrobial diversity is much larger.Sequence determination of the cloned 16SrDNA products and reconstruction of phy-logenetic trees resulted in a large and com-prehensive dataset [4]. Only half of today’sdefined 52 bacterial phyla have cultivatedrepresentatives, the others are represented
Handbook of Genome Research. Genomics, Proteomics, Metabolomics, Bioinformatics, Ethical and Legal Issues.Edited by Christoph W. SensenCopyright © 2005 WILEY-VCH Verlag GmbH & Co. KGaA, WeinheimISBN: 3-527-31348-6
2Environmental Genomics: A Novel Tool for Study of Uncultivated Microorganisms
Verwendete Mac Distiller 5.0.x Joboptions
Dieser Report wurde automatisch mit Hilfe der Adobe Acrobat Distiller Erweiterung "Distiller Secrets v1.0.5" der IMPRESSED GmbH erstellt. Sie koennen diese Startup-Datei für die Distiller Versionen 4.0.5 und 5.0.x kostenlos unter http://www.impressed.de herunterladen. ALLGEMEIN ---------------------------------------- Dateioptionen: Kompatibilität: PDF 1.3 Für schnelle Web-Anzeige optimieren: Ja Piktogramme einbetten: Ja Seiten automatisch drehen: Nein Seiten von: 1 Seiten bis: Alle Seiten Bund: Links Auflösung: [ 2400 2400 ] dpi Papierformat: [ 481 680 ] Punkt KOMPRIMIERUNG ---------------------------------------- Farbbilder: Downsampling: Nein Komprimieren: Ja Komprimierungsart: ZIP Bitanzahl pro Pixel: 8 Bit Graustufenbilder: Downsampling: Nein Komprimieren: Ja Komprimierungsart: ZIP Bitanzahl pro Pixel: 8 Bit Schwarzweiß-Bilder: Downsampling: Nein Komprimieren: Ja Komprimierungsart: CCITT CCITT-Gruppe: 4 Graustufen glätten: Nein Text und Vektorgrafiken komprimieren: Ja SCHRIFTEN ---------------------------------------- Alle Schriften einbetten: Ja Untergruppen aller eingebetteten Schriften: Nein Wenn Einbetten fehlschlägt: Abbrechen Einbetten: Immer einbetten: [ /Courier-BoldOblique /Helvetica-BoldOblique /Courier /Helvetica-Bold /Times-Bold /Courier-Bold /Helvetica /Times-BoldItalic /Times-Roman /ZapfDingbats /Times-Italic /Helvetica-Oblique /Courier-Oblique /Symbol ] Nie einbetten: [ ] FARBE(N) ---------------------------------------- Farbmanagement: Farbumrechnungsmethode: Farbe nicht ändern Methode: Standard Geräteabhängige Daten: Einstellungen für Überdrucken beibehalten: Ja Unterfarbreduktion und Schwarzaufbau beibehalten: Ja Transferfunktionen: Beibehalten Rastereinstellungen beibehalten: Nein ERWEITERT ---------------------------------------- Optionen: Prolog/Epilog verwenden: Nein PostScript-Datei darf Einstellungen überschreiben: Nein Level 2 copypage-Semantik beibehalten: Ja Portable Job Ticket in PDF-Datei speichern: Ja Illustrator-Überdruckmodus: Ja Farbverläufe zu weichen Nuancen konvertieren: Ja ASCII-Format: Nein Document Structuring Conventions (DSC): DSC-Kommentare verarbeiten: Ja DSC-Warnungen protokollieren: Nein Für EPS-Dateien Seitengröße ändern und Grafiken zentrieren: Ja EPS-Info von DSC beibehalten: Ja OPI-Kommentare beibehalten: Nein Dokumentinfo von DSC beibehalten: Ja ANDERE ---------------------------------------- Distiller-Kern Version: 5000 ZIP-Komprimierung verwenden: Ja Optimierungen deaktivieren: Nein Bildspeicher: 524288 Byte Farbbilder glätten: Nein Graustufenbilder glätten: Nein Bilder (< 257 Farben) in indizierten Farbraum konvertieren: Ja sRGB ICC-Profil: sRGB IEC61966-2.1 ENDE DES REPORTS ---------------------------------------- IMPRESSED GmbH Bahrenfelder Chaussee 49 22761 Hamburg, Germany Tel. +49 40 897189-0 Fax +49 40 897189-71 Email: [email protected] Web: www.impressed.de
Adobe Acrobat Distiller 5.0.x Joboption Datei
<< /ColorSettingsFile () /LockDistillerParams true /DetectBlends true /DoThumbnails true /AntiAliasMonoImages false /MonoImageDownsampleType /Bicubic /GrayImageDownsampleType /Bicubic /MaxSubsetPct 100 /MonoImageFilter /CCITTFaxEncode /ColorImageDownsampleThreshold 1.5 /GrayImageFilter /FlateEncode /ColorConversionStrategy /LeaveColorUnchanged /CalGrayProfile (Dot Gain 20%) /ColorImageResolution 300 /UsePrologue false /MonoImageResolution 1200 /ColorImageDepth 8 /sRGBProfile (sRGB IEC61966-2.1) /PreserveOverprintSettings true /CompatibilityLevel 1.3 /UCRandBGInfo /Preserve /EmitDSCWarnings false /CreateJobTicket true /DownsampleMonoImages false /DownsampleColorImages false /MonoImageDict << /K -1 >> /ColorImageDownsampleType /Bicubic /GrayImageDict << /HSamples [ 2 1 1 2 ] /VSamples [ 2 1 1 2 ] /Blend 1 /QFactor 0.9 >> /CalCMYKProfile (U.S. Web Coated (SWOP) v2) /ParseDSCComments true /PreserveEPSInfo true /MonoImageDepth -1 /AutoFilterGrayImages false /SubsetFonts false /GrayACSImageDict << /HSamples [ 2 1 1 2 ] /VSamples [ 2 1 1 2 ] /Blend 1 /QFactor 0.9 >> /ColorImageFilter /FlateEncode /AutoRotatePages /None /PreserveCopyPage true /EncodeMonoImages true /ASCII85EncodePages false /PreserveOPIComments false /NeverEmbed [ ] /ColorImageDict << /HSamples [ 2 1 1 2 ] /VSamples [ 2 1 1 2 ] /Blend 1 /QFactor 0.9 >> /AntiAliasGrayImages false /GrayImageDepth 8 /CannotEmbedFontPolicy /Error /EndPage -1 /TransferFunctionInfo /Preserve /CalRGBProfile (sRGB IEC61966-2.1) /EncodeColorImages true /EncodeGrayImages true /ColorACSImageDict << /HSamples [ 2 1 1 2 ] /VSamples [ 2 1 1 2 ] /Blend 1 /QFactor 0.9 >> /Optimize true /ParseDSCCommentsForDocInfo true /GrayImageDownsampleThreshold 1.5 /MonoImageDownsampleThreshold 1.5 /AutoPositionEPSFiles true /GrayImageResolution 300 /AutoFilterColorImages false /AlwaysEmbed [ /Courier-BoldOblique /Helvetica-BoldOblique /Courier /Helvetica-Bold /Times-Bold /Courier-Bold /Helvetica /Times-BoldItalic /Times-Roman /ZapfDingbats /Times-Italic /Helvetica-Oblique /Courier-Oblique /Symbol ] /ImageMemory 524288 /OPM 1 /DefaultRenderingIntent /Default /EmbedAllFonts true /StartPage 1 /DownsampleGrayImages false /AntiAliasColorImages false /ConvertImagesToIndexed true /PreserveHalftoneInfo false /CompressPages true /Binding /Left >> setdistillerparams << /PageSize [ 595.276 841.890 ] /HWResolution [ 2400 2400 ] >> setpagedevice
46 2 Environmental Genomics: A Novel Tool for Study of Uncultivated Microorganisms
solely by 16S rDNA sequences from envi-ronmental surveys [5]. Although, an impres-sive 112,000 different bacterial rDNA genesare currently found in the public databas-es [6], these still reflect only a minor fractionof the existing diversity. Estimates of thenumber of prokaryotic species living on theplanet range between 1.5 and 14 million [7],with as many as 500,000 living in a singlesoil sample [8].
Cultivation techniques traditionally usedin microbiology for isolation of novel spe-cies have been selective and mostly favoredfast-growing organisms [9, 10]. To over-come such biases, novel approaches haverecently been developed that are based onthe use of low-nutrition media or dilutemedia [11–13] or on the simulation of thenatural environment, abolishing classicalPetri dishes or liquid cultures [14, 15].Although these novel cultivation approach-es have proven successful and have led tothe isolation of several novel species evenfrom phyla that have solely been predictedin 16S rRNA surveys, they will not lead to asufficient analysis of naturally occurringmicroorganisms. How can we access thephysiology of microorganisms that cannotbe cultured in the laboratory but that playpotentially important roles in the environ-ment? Is it possible to study complete natu-rally occurring microbial communities andthe interaction between different species inspecific environments? How can we com-prehensively monitor shifts in microbialcommunities that occur when environmen-tal factors are changed? What is the extentof genomic variation and microheterogen-eity in one microbial species in its environ-ment? Can we exploit the huge number ofuncultivated microorganisms for biotechno-logical applications?
Recent advances in environmentalgenomic studies demonstrate that thisnovel approach has an enormous potential
to address most of these questions, circum-venting the need for cultivation of theorganisms under investigation. Thisapproach can, furthermore, serve as a basisfor functional genomic studies of naturallyoccurring microbial communities.
2.2
Environmental Genomics: The Methodology
Inspired by rapid advances in genomicanalysis of cultivated microorganisms,DeLong and collaborators were the first toapply genomic approaches to uncultivatedmicroorganisms by studying marine plank-tonic and symbiotic crenarchaeota [16–18].The environmental genomic approachdepends on isolation of DNA directly fromthe ecosystem. This DNA is cloned intoEscherichia coli vectors, by procedures quitesimilar to those used in genome projects ofcultivated organisms. The major challengeof the environmental genomic approach isthe purification of the DNA from contami-nating substances that prevent followingmolecular biological methods. This is par-ticularly true for soils, which contain largeand varying amounts of humic substanceslike humic and fulvic acids; these co-purifywith DNA and severely inhibit proceduresused in molecular biology [19]. Humic sub-stances are difficult to separate from DNA,and special procedures had to be developedbefore DNA from soil samples could beused for environmental genomic studies, inparticular when high-molecular-weightDNA was extracted to construct large-insertlibraries [20].
The second challenge is the production oflarge DNA libraries, that must be muchmore complex than those of single organ-isms, and identification of genome frag-ments of distinct organisms therein. Iflarge-insert libraries are used, this can be
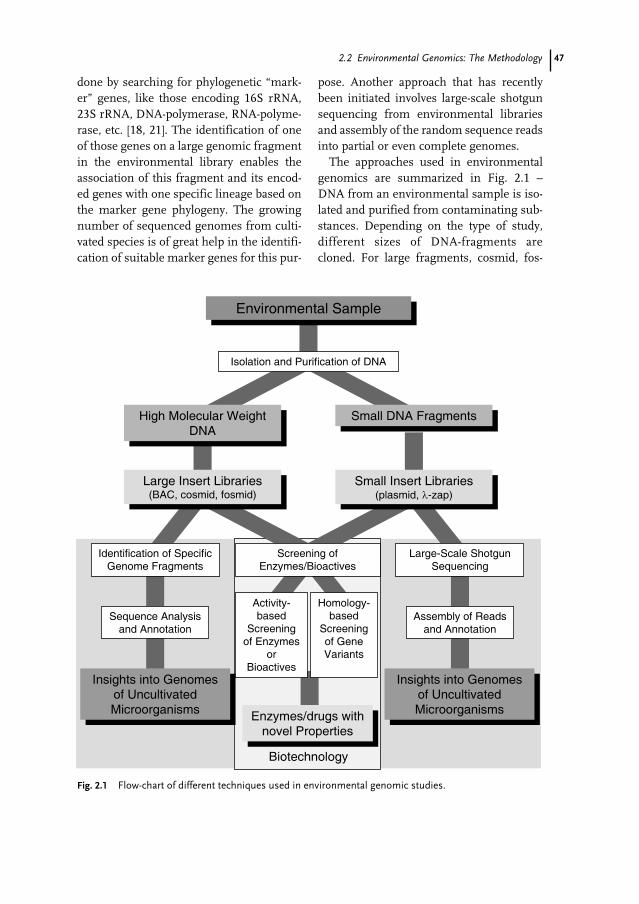
472.2 Environmental Genomics: The Methodology
done by searching for phylogenetic “mark-er” genes, like those encoding 16S rRNA,23S rRNA, DNA-polymerase, RNA-polyme-rase, etc. [18, 21]. The identification of oneof those genes on a large genomic fragmentin the environmental library enables theassociation of this fragment and its encod-ed genes with one specific lineage based onthe marker gene phylogeny. The growingnumber of sequenced genomes from culti-vated species is of great help in the identifi-cation of suitable marker genes for this pur-
pose. Another approach that has recentlybeen initiated involves large-scale shotgunsequencing from environmental librariesand assembly of the random sequence readsinto partial or even complete genomes.
The approaches used in environmentalgenomics are summarized in Fig. 2.1 –DNA from an environmental sample is iso-lated and purified from contaminating sub-stances. Depending on the type of study,different sizes of DNA-fragments arecloned. For large fragments, cosmid, fos-
Fig. 2.1 Flow-chart of different techniques used in environmental genomic studies.
48 2 Environmental Genomics: A Novel Tool for Study of Uncultivated Microorganisms
mid, and BAC vectors are used to generatelarge insert libraries (>30 kb insert size).The libraries are screened for genome frag-ments of uncultivated microorganisms byPCR or hybridization using primers andprobes specific for phylogenetic markergenes. Alternatively, random sequences canbe created from the inserts for the identifi-cation of phylogenetic marker genes in thelarge-insert libraries [22]. Either way, thesequences of the identified genome frag-ments of specifically targeted organismscan subsequently be analyzed and annotat-ed.
Alternatively, small fragments (<10 kb)are cloned into plasmids and are used forlarge-scale shotgun-sequencing approach-es [23, 24]. This novel approach recentlyproved to be a powerful tool, but the majordrawback is the need to assemble thesequences in contigs and scaffolds. In con-trast with the analysis of genomes from cul-tivated species this is a difficult task, notonly because of the enormous number ofdifferent genomes present in the libraries,but also because of the genomic microheter-ogeneity that occurs in populations of singlespecies. Confidence in these sequences willalways be less than in those generated fromlarger genomic fragments.
Large and small insert libraries (oftenalso referred to as “metagenomic” librar-ies [25]) are also very useful for biotechno-logical applications. They can be screenedfor novel enzymes or drugs in two differentways. First, activity-based screening inexpression libraries can lead to identifica-tion of novel gene products. This techniquerelies on the expression of the environmen-tal genes via strong promoters that are locat-ed in the vector of the surrogate host organ-ism or via endogenous promoters encodedon the environmental sequences. Second,homology-based screening is used; in thisdegenerate primers target conserved
regions of the desired enzyme gene forscreening by PCR. After identification,those genes have to be expressed to provetheir activity. The major drawback of thismethod, in contrast with activity-basedscreening, is that “only” variants of knownenzymes and not completely novel ones canbe found. Although for many biotechnolog-ical applications small insert libraries areoften sufficient to search biosynthetic clus-ters of secondary metabolites, for example,large insert libraries are needed.
There are, of course, many different pos-sible applications for the environmentalgenomic approach. Some examples aresummarized in the following sections.
2.3
Where it First Started: Marine Environmental Genomics
The environmental genomic approach wasfirst applied to marine ecosystems. Stein etal. [16] identified a 38.5 kb genomic frag-ment of an uncultivated mesophilic crenar-chaeote within a 3552 clones containingfosmid library (average insert size 40 kb)from marine plankton. It was the firstgenomic information obtained from thisgroup of Archaea, which had been predict-ed only in 16S rRNA surveys. The sametechnology was used to obtain informationabout the uncultivated crenarchaeal symbi-ont Cenarchaeum symbiosum, which wasdiscovered in the marine sponge Axinellamexicana [26]. C. symbiosum DNA-contain-ing clones were identified in a mixed meta-genomic library using the 16S rDNA asmarker. The analyzed sequences gave firstinsights into the genomic structure andprotein-encoding genes of this organismand into the genomic microheterogeneity ofthis species [18]. A gene encoding a B-fami-ly DNA polymerase was expressed in E. coli
492.3 Where it First Started: Marine Environmental Genomics
and its activity at moderate temperaturesproved adaptation of C. symbiosum to themesophilic growth temperatures of its host.This gave an important hint of the existenceof mesophilic crenarchaeota whose cultivat-ed relatives are exclusively extreme thermo-philes [17]. The whole genome of C. symbi-osum is currently being determined [27].
Environmental genomic studies showedtheir full potential for answering ecologicalquestions when Beja et al. [28] discovered anew type of rhodopsin, named proteorho-dopsin, encoded on a 130 kb genomic frag-ment from an uncultivated marine ã-prote-obacterium of the SAR86 group. In bio-chemical characterizations this proteorho-dopsin exhibited the same light-driven elec-tron pumping as the bacteriorhodopsinknown from halophilic archaea. These dataand subsequent studies showed that thereis high diversity within the proteorhodop-sins, including different spectral tuningswhich reflect adaptation to different habi-tats [29]. A local and taxonomic wide distri-bution of proteorhodopsins further impliedthat this novel and so far completely over-looked type of phototrophy plays an impor-tant role in the ocean [30].
Beja et al. also constructed two BAClibraries, comprising 1632 and 4608 clones,with average insert sizes of 60 kb and 80 kb,respectively [21]. In these libraries theyidentified one genomic fragment of aplanktonic euryarchaeote beside severalbacterial genomic fragments (Roseobactergroup, Bacteroidetes group, SAR11, SAR86,SAR116) using group-specific 16S rDNAand 23S rDNA and 16S-ITS-23S operon-specific primers. The 60 kb sequence of themarine euryarchaeotic genomic fragmentwas determined and contained 5S and 23SrRNA genes not linked to those of the 16SrRNA, alongside 38 protein encodinggenes. Identification of crenarchaeal 16SrRNA gene-containing fosmids generated
from microbial biomass of Antarctic sur-face water picoplankton opened the pos-sibility for comparative genomic analyses ofmarine group I crenarchaeal genomic frag-ments [31]. The authors found similaritiesbut also many differences between genomestructure and gene content in their 16SrDNA-containing fragments and thoseidentified in the study of Stein et al. [16] andfrom Cenarchaeum symbiosum [18].Furthermore, the differences between pro-tein-encoding genes and non-codingregions on fosmids with identical 16SrRNA genes indicated the genomic micro-heterogeneity found in this population.Within a cosmid library with 200–250 Mbpof stored DNA from 500-m-deep marineplankton, Lopez-Garcia et al. identified sixgenomic fragments that contained 16SrRNA genes of group II marine euryarchae-ota and one fragment with the 16S rDNA ofa marine group I crenarchaeote [32]. Thecrenarchaeal fragment was completelysequenced and analyzed, revealing poten-tial horizontal gene transfers between eury-and crenarchaeota and between Archaeaand Bacteria.
Recently a large whole-genome shotgun-sequencing project of microbial planktonfrom the Sargasso Sea has delivered morethan 1.045 Gbp of non-redundant sequencefrom this ecosystem [24]. On the basis ofsequence relatedness the authors estimatedthat their data were derived from approxi-mately 1800 different species. Around 25%of the sequence reads could be assembledinto 333 scaffolds spanning 30.9 Mbp withat least 3× coverage, of which 21 scaffoldshad over 14× coverage and 9.35 Mbp ofsequence. Most abundant in their data set,as determined by phylogenetic reconstruc-tions with multiple phylogenetic markers,were sequences from species belonging tothe phylum Proteobacteria, followed bythose belonging to the Cyanobacteria and
50 2 Environmental Genomics: A Novel Tool for Study of Uncultivated Microorganisms
other phyla. Altogether they identified 1.2million genes, including 1164 small sub-unit rRNA genes and 782 genes for newphotorhodopsin-like photoreceptors, show-ing the potential of the shotgun sequencingapproach.
2.4
Environmental Genomics of DefinedCommunities: Biofilms and Microbial Mats
Biofilms and microbial mats are commu-nities whose diversity can reach from a sin-gle species to a multitude of different organ-isms living together in a single habitatattached to a surface [33]. They are found inmany habitats, ranging from human skin,intestinal stems, marine and freshwatersediments to acidic and thermophilic sur-faces. Often the microbial species buildingthe biofilm or mat cannot be cultured separ-ately. In environmental genomic approach-es these communities can be studied with-out laboratory cultivation.
For example, Schmeisser et al. [34] useddifferent strategies to characterize a drink-ing water biofilm growing on rubber-coatedvalves. Beside an inventory of the 16S rDNApresent in the biofilm they did a snapshot-sequencing approach of a small insert met-agenomic library created from mixed DNAof the species occurring in the biofilm.From a cosmid library prepared from thesame DNA the complete sequences of fourclones were determined. This study gaveinitial insights into species composition andsome genome fragments of this biofilm. Noevidence of a potential health risk of the bio-film were found at the DNA- and proteinsequence level.
A large-scale shotgun-sequencing ap-proach on the metagenome of an acid minedrainage biofilm gave deep insight into thecommunity structure and metabolisms of
the different species [23]. Producing over100,000 high-quality sequence reads from asmall insert plasmid library (average insertsize 3.2 kb) enabled the authors to recon-struct near-complete genomes of Leptospi-rillum (group II) and Ferroplasma (type II).In addition, three other genomes were par-tially recovered. On the basis of this com-prehensive data set, potential metabolicpathways of the different species were pre-dicted and information about their carbon,nitrogen, and energy metabolism wasobtained. The population structure of thedifferent species could also be analyzed,because every sequence read stemmedfrom a different individual of the popula-tion. Analysis of single-nucleotide polymor-phisms revealed a mosaic genome structureof the Ferroplasma type II population thatseems to have evolved from three ancestralstrains by homologous recombination.Altogether, the data gave deep insight intothe genomic potential of the biofilm. Thestudy also showed that it is possible toassemble genomes in environmentalgenomic approaches, at least if there areonly few species with low heterogeneity onthe population level and if there are relative-ly similar abundances of the different spe-cies in the environment.
2.5
Environmental Genomics for Studies of Soil Microorganisms
Soils are probably the most diverse ecosys-tems on the planet, with 12,000–18,000 dif-ferent dominant species in one sample, asmeasured by means of DNA–DNA re-asso-ciation kinetics [35]. Taking into accountthe different species frequencies by usingestimates from animal and plant ecologists,one soil sample might even harbor up to500,000 different species if 20,000 common
512.5 Environmental Genomics for Studies of Soil Microorganisms
ones are estimated [8]. With this large diver-sity, environmental genomic approaches insoil might not be suitable for describing thecomplete set of genomes occurring in thosehabitats, but genome fragments of specificgroups can be targeted. The use of soil sam-ples is particularly challenging, becauseDNA preparations from soils are heavilycontaminated with humic substances thattend to bind to nucleic acids and need to bespecifically purified before cloning.Nevertheless, after development of purifica-tion methods, even for high molecularweight DNA, environmental genomicapproaches have proved to be useful for thecharacterization of soil microorganisms.
Although many procedures have beenestablished for purification of DNA fromhumic substances [36–38], most are onlysuitable for the isolation of small DNA frag-ments. On the basis of the procedure ofZhou et al. [36], Rondon et al. [39] devel-oped a method for purifying high-molecu-lar-weight DNA. They constructed two envi-ronmental BAC libraries with 27 kb (3600clones) and 44.5 kb (25,600 clones) averageinsert sizes from soil. Screening resulted inidentification of 16S rRNA gene-containingclones of Proteobacteria, Cytophagales, lowG + C gram positives and Acidobacteria.
Another procedure for removal of humicacids and recovery of high-molecular-weightDNA was developed in our laboratory [20].The key procedure is a two-phase pulse-fieldelectrophoresis, with the first phase contain-ing polyvinylpyrrolidone (PVP) and the sec-ond without PVP. The DNA is purifiedfrom humic substances, that are retardedby the PVP in the first phase and cleanedfrom PVP, that itself inhibits enzymaticreaction, in the second phase. The proce-dure enables isolation of highly pure, high-molecular-weight DNA in large amounts,by minimizing shearing effects. The result-ing environmental fosmid libraries were
used to characterize uncultivated Acidobac-teria and Archaea [20, 22, 40]. Within threelarge insert environmental genomic librar-ies from two different soils, comprisingaltogether 75,678 clones with over 3 Gbp ofstored DNA, 22 genomic fragments belong-ing to species of the phylum Acidobacteriawere identified on the basis of 16S rRNAgenes [40]. Four out of six sequenced frag-ments were placed within group V, and twowithin group III of the Acidobacteria, asdetermined by 16S rDNA comparisons.Sequences of fragments of the differentgroups varied in the G + C content of theirprotein-encoding regions by more than10%, which was in good correlation withtheir phylogenetic placement. Althoughmost encoded proteins could be assigned to“housekeeping” functions, some indicatedspecial traits, e.g. a putative â-1′,2′-glucansynthetase, an intracellular polyhydroxybu-tyrate depolymerase, and an operon withlow but significant similarity to a biosyn-thetic cluster of Streptomyces lincolnensis.Furthermore, a cluster of genes was highlyhomologous and syntenic to a gene clusterfound in species of the Rhizobiales, imply-ing a recent horizontal gene transferbetween these bacterial lineages. Togetherwith a study by Liles et al. [41], who identi-fied and analyzed a 25-kb acidobacterialgenomic fragment within a metagenomicsoil library, these are the first reports ofgenomic information from species of thenovel bacterial phylum Acidobacteria.
The same soil libraries were also charac-terized in a random end-sequencingapproach to compare their content and toidentify biases introduced by the cell lysisand cloning procedures [22]. On the basis of5376 sequence tags of approximately 700 bplength that cover a total of ca. 4 Mbp, weshowed that mostly bacterial and to a muchlesser extent archaeal and eukaryoticgenome fragments (ca. 1% each) had been
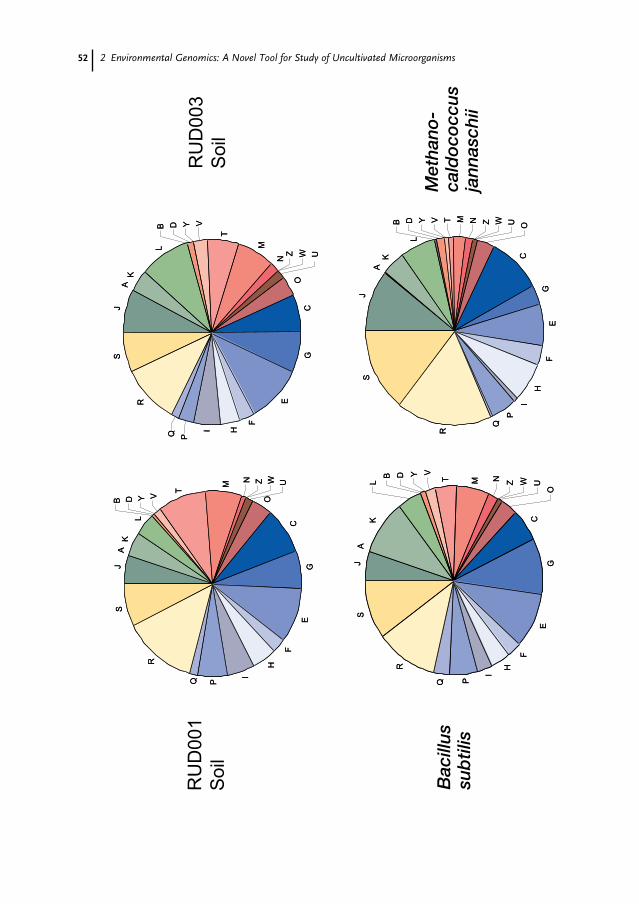
52 2 Environmental Genomics: A Novel Tool for Study of Uncultivated Microorganisms
Met
hano
-ca
ldo
cocc
us
jann
asch
ii
Bac
illus
su
btil
is
532.6 Biotechnological Aspects
captured in the libraries. The diversity ofputative protein-encoding genes, as reflect-ed by their distribution into different COGclusters, was comparable with that encodedin complete genomes of cultivated microor-ganisms (Fig. 2.2). A huge variety ofgenomic fragments had been captured inthe libraries, as seen by comparison withsequences in the public databases and bythe large variation in G + C content. Thestudy dissected differences in the librarieswhich relate to the different ecosystemsanalyzed and to biases introduced by differ-ent DNA preparations. Furthermore, arange of taxonomic marker genes (otherthan 16S rRNA) were identified that ena-bled assignment of genome fragments tospecific lineages. The complete sequencesof two genome fragments identified asbeing affiliated with archaea based on agene encoding a CDC48 homolog and athermosome subunit, respectively, togetherwith a 16S rRNA containing fosmid gavefirst insights into the genomes of unculti-vated crenarchaeota from soil [20, 22].
Together these studies demonstrate thatenvironmental genomic approaches canalso be applied to very diverse microbialpopulations such as those found in soil.Further, not only the most abundant micro-bial groups, e.g. acidobacteria [40], can betargeted with this approach, but also groupsof organisms that occur in relatively lowabundance (<5 %), e.g. mesophilic crenar-chaeota [20, 22].
2.6
Biotechnological Aspects
Environmental genomic libraries can alsoserve as a fruitful resource for biotechnolo-gy. They enable researchers to identifygenes for enzymes with novel propertieswithout the need to cultivate the organisms.Soil habitats are of special interest, becausemany organisms in soils are capable of nat-ural-product biosynthesis. These com-pounds often can be used as antimicrobials,cancer chemotherapeutics, and for immu-nomodulating and other pharmaceuticalapplications [42]. Wang et al. were the firstto show that it is possible to isolate novelmetabolites from soil DNA recombi-nants [43]. Using DNA isolated directlyfrom soil samples by the method ofYap [44], they constructed and screened1000 Streptomyces lividans recombinants toidentify 18 clones that produced smallmolecules of the terragine/norcardaminefamily. Rondon et al. identified clonesexpressing DNAse, antibacterial, lipase andamylase activity [39]. In a cosmid libraryconstructed from soil DNA, Brady et al. [45]identified a blue-colored clone that pro-duced deoxyviolacein and the broad spec-trum antibiotic violacein. The recombinantcosmid harbored the whole gene clustersresponsible for the synthesis of these smallmolecules. The search for antimicrobialsmall molecules was the motivation forMacNeil et al. [42] to construct a BAC
Fig. 2.2 Distribution of BLASTX similaritiesamong different COG categories (clusters oforthogologous genes, A: RNA processing andmodification, B: chromatin structure anddynamics, etc., see www.NCBI.nlm.nih.gov).Datasets are from random sequence tags of twoenvironmental fosmid libraries (RUD001 andRUD003) made from the same ecosystem but withdifferent G + C content, compared with thedistribution of predicted ORF from two complete
microbial genomes, B. subtilis (heterotrophic soilbacterium) and M. jannaschii (autotrophic,hyperthermophilic archaeon). Note that althoughthe soil libraries consist of a mixture of genomesfrom many different microorganisms, thedistribution into COG is similar to that of genomesfrom cultivated microorganisms, demonstratingthat some sort of “average” genome content isrepresented in the environmental libraries (detailsare given elsewhere [22].
54 2 Environmental Genomics: A Novel Tool for Study of Uncultivated Microorganisms
library from soil DNA. Of the resultingclones with an average insert size of 37 kbranging from 5 to 120 kb, 12,000 werepicked and screened for antimicrobial activ-ity. Altogether four clones could be identi-fied, resulting in a hit rate of one antibacte-rial clone per 60 Mbp of soil DNA. One ofthe clones, producing a purple pigment,was further characterized and shown to pro-duce indirubine, an antileukemic drug.Especially for identification of novel bioac-tive compounds Courtois et al. [46] con-structed a 5000-clone library in an Esche-richia coli–Streptomyces lividans shuttle cos-mid vector using DNA extracted from soilmicroorganisms by a Nycodenz density gra-dient. The resulting library was screened byPCR to identify potential polyketide syn-thase gene clusters. Together with activity-based screening at least 13 bioactive com-pound-producing clones could be identi-fied. Many other novel enzymes can beidentified within environmental libraries,for example those needed for 4-hydroxybu-tyrate utilization [47], lipases and esteras-es [48].
2.7
Conclusions and Perspectives
Environmental genomics has proven to be apowerful tool for studying uncultivatedmicroorganisms in marine and soil ecosys-tems and in biofilms. The development of
novel technologies has helped overcomeproblems first encountered, mainly that ofobtaining highly pure and sufficient DNAfor constructing the complex libraries.Although the first studies in environmentalgenomics are very convincing, they alsoshow the limitations of the approach in itscurrent form – the more complex a micro-bial population, the less likely is the recov-ery of whole genomes. Partly-recoveredgenomes give interesting insight but do nottell the whole story. In future studies itmight be interesting to construct biased orfocused libraries in which genome frag-ments of the organisms of interest will beenriched before cloning. With falling costsfor sequencing, shotgun approaches andlarge-scale sequencing efforts will also bemore widely used. Environmental genomicstudies will serve as a basis for studyingactivities of microorganisms in their envi-ronment by using functional genomic tools.High-throughput methods based on DNAarrays have already been applied to environ-mental questions [49]. Beside identificationand genotyping of bacteria [50, 51], popula-tion genetics [52], and the detection andquantification of functional genes in theenvironment [53, 54] are the most promis-ing applications. Together, these approach-es will lay the ground for studying microbi-al physiology, species interactions, and net-works of dependences between organismsin naturally occurring microbial popula-tions.
55
1 www.ncbi.nlm.nih.gov2 DSMZ (2004). Bacterial Nomenclature
Up-to-date [http://www.dsmz.de/bactnom/bactname.htm]
3 Pace, N.R. (1997) A molecular view ofmicrobial diversity and the biosphere. Science276:734–740.
4 Ludwig, W. (1999) http://www.mikrobiologie.tu-muenchen.de/pub/ARB, Department ofmicrobiology, TU-München, Munich.
5 Rappe, M.S., and Giovannoni, S.J. (2003) Theuncultured microbial majority. Annu RevMicrobiol 57:369–394.
6 The Ribosomal Data Base Project II, June2004, http://rdp.cme.msu.edu
7 Palleroni, N.J. (1997) Prokaryotic diversityand the importance of culturing. Antonie VanLeeuwenhoek 72:3–19.
8 Dykhuizen, D.E. (1998) Santa Rosaliarevisited: why are there so many species ofbacteria? Antonie Van Leeuwenhoek 73:25–33.
9 Ferguson, R.L., Buckley, E.N., and Palumbo,A.V. (1984) Response of marinebacterioplankton to differential filtration andconfinement. Appl Environ Microbiol47:49–55.
10 Eilers, H., Pernthaler, J., and Amann, R.(2000) Succession of pelagic marine bacteriaduring enrichment: a close look at cultivation-induced shifts. Appl Environ Microbiol66:4634–4640.
11 Janssen, P.H., Yates, P.S., Grinton, B.E.,Taylor, P.M., and Sait, M. (2002) Improvedculturability of soil bacteria and isolation inpure culture of novel members of thedivisions Acidobacteria, Actinobacteria,Proteobacteria, and Verrucomicrobia. ApplEnviron Microbiol 68:2391–2396.
12 Sait, M., Hugenholtz, P., and Janssen, P.H.(2002) Cultivation of globally distributed soilbacteria from phylogenetic lineagespreviously only detected in cultivation-independent surveys. Environ Microbiol4:654–666.
13 Joseph, S.J., Hugenholtz, P., Sangwan, P.,Osborne, C.A., and Janssen, P.H. (2003)Laboratory cultivation of widespread andpreviously uncultured soil bacteria. ApplEnviron Microbiol 69:7210–7215.
14 Kaeberlein, T., Lewis, K., and Epstein, S.S.(2002) Isolating “uncultivable”microorganisms in pure culture in asimulated natural environment. Science296:1127–1129.
15 Zengler, K., Toledo, G., Rappe, M., Elkins, J.,Mathur, E.J., Short, J.M., and Keller, M.(2002) Cultivating the uncultured. Proc NatlAcad Sci U S A 99:15681–15686.
16 Stein, J.L., Marsh, T.L., Wu, K.Y., Shizuya,H., and DeLong, E.F. (1996) Characterizationof uncultivated prokaryotes: isolation andanalysis of a 40-kilobase-pair genomefragment from a planktonic marine archaeon.J Bacteriol 178:591–599.
17 Schleper, C., Swanson, R.V., Mathur, E.J.,and DeLong, E.F. (1997) Characterization of aDNA polymerase from the uncultivatedpsychrophilic archaeon Cenarchaeumsymbiosum. J Bacteriol 179:7803–7811.
18 Schleper, C., DeLong, E.F., Preston, C.M.,Feldman, R.A., Wu, K.Y., and Swanson, R.V.(1998) Genomic analysis revealschromosomal variation in natural populationsof the uncultured psychrophilic archaeonCenarchaeum symbiosum. J Bacteriol180:5003–5009.
References
56 References
19 Tebbe, C.C., and Vahjen, W. (1993) Inter-ference of humic acids and DNA extracteddirectly from soil in detection and transforma-tion of recombinant DNA from bacteria and ayeast. Appl Environ Microbiol 59:2657–2665.
20 Quaiser, A., Ochsenreiter, T., Klenk, H.P.,Kletzin, A., Treusch, A.H., Meurer, G. et al.(2002) First insight into the genome of anuncultivated crenarchaeote from soil. EnvironMicrobiol 4:603–611.
21 Beja, O., Suzuki, M.T., Koonin, E.V., Aravind,L., Hadd, A., Nguyen, L.P. et al. (2000b)Construction and analysis of bacterialartificial chromosome libraries from a marinemicrobial assemblage. Environ Microbiol2:516–529.
22 Treusch, A.H., Kletzin, A., Raddatz, G.,Ochsenreiter, T., Quaiser, A., Meurer, G. et al.(2004) Characterization of Large-Insert DNALibraries from Soil for EnvironmentalGenomic Studies of Archaea. EnvironMicrobiol 6:970–980.
23 Tyson, G.W., Chapman, J., Hugenholtz, P.,Allen, E.E., Ram, R.J., Richardson, P.M. et al.(2004) Community structure and metabolismthrough reconstruction of microbial genomesfrom the environment. Nature 428:37–43.
24 Venter, J.C., Remington, K., Heidelberg, J.F.,Halpern, A.L., Rusch, D., Eisen, J.A. et al.(2004) Environmental genome shotgunsequencing of the Sargasso Sea. Science304:66–74.
25 Riesenfeld, C.S., Schloss, P.D., Handelsman,J. (2004) Metagenomics: genomic analysis ofmicrobial communities. Annu Rev Genet38:525–552.
26 Preston, C.M., Wu, K.Y., Molinski, T.F., andDeLong, E.F. (1996) A psychrophiliccrenarchaeon inhabits a marine sponge:Cenarchaeum symbiosum gen. nov., sp. nov.Proc Natl Acad Sci U S A 93:6241–6246.
27 DeLong, E. (2003) Oceans of Archaea. ASMNews 69:503–511.
28 Beja, O., Aravind, L., Koonin, E.V., Suzuki,M.T., Hadd, A., Nguyen, L.P. et al. (2000a)Bacterial rhodopsin: evidence for a new typeof phototrophy in the sea. Science289:1902–1906.
29 Beja, O., Spudich, E.N., Spudich, J.L., Leclerc,M., and DeLong, E.F. (2001) Proteorhodopsinphototrophy in the ocean. Nature 411:786–789.
30 de la Torre, J.R., Christianson, L.M., Beja, O.,Suzuki, M.T., Karl, D.M., Heidelberg, J., and
DeLong, E.F. (2003) Proteorhodopsin genesare distributed among divergent marinebacterial taxa. Proc Natl Acad Sci U S A100:12830–12835.
31 Beja, O., Koonin, E.V., Aravind, L., Taylor,L.T., Seitz, H., Stein, J.L. et al. (2002)Comparative genomic analysis of archaealgenotypic variants in a single population andin two different oceanic provinces. ApplEnviron Microbiol 68:335–345.
32 Lopez-Garcia, P., Brochier, C., Moreira, D.,and Rodriguez-Valera, F. (2004) Comparativeanalysis of a genome fragment of anuncultivated mesopelagic crenarchaeotereveals multiple horizontal gene transfers.Environ Microbiol 6:19–34.
33 Guerrero, R., Piqueras, M., and Berlanga, M.(2002) Microbial mats and the search forminimal ecosystems. Int Microbiol 5:177–188.
34 Schmeisser, C., Stockigt, C., Raasch, C.,Wingender, J., Timmis, K.N., Wenderoth,D.F. et al. (2003) Metagenome survey ofbiofilms in drinking-water networks. ApplEnviron Microbiol 69:7298–7309.
35 Torsvik, V., Sorheim, R., and Goksoyr, J.(1996) Total bacterial diversity in soil andsediment communities – a review. J IndMicrobiol 17:170–178.
36 Zhou, J., Bruns, M.A., and Tiedje, J.M. (1996)DNA recovery from soils of diverse composi-tion. Appl Environ Microbiol 62:316–322.
37 Krsek, M., and Wellington, E.M. (1999)Comparison of different methods for theisolation and purification of total communityDNA from soil. J Microbiol Methods 39:1–16.
38 Miller, D.N., Bryant, J.E., Madsen, E.L., andGhiorse, W.C. (1999) Evaluation andoptimization of DNA extraction andpurification procedures for soil and sedimentsamples. Appl Environ Microbiol65:4715–4724.
39 Rondon, M.R., August, P.R., Bettermann,A.D., Brady, S.F., Grossman, T.H., Liles, M.R.et al. (2000) Cloning the soil metagenome: astrategy for accessing the genetic andfunctional diversity of unculturedmicroorganisms. Appl Environ Microbiol66:2541–2547.
40 Quaiser, A., Ochsenreiter, T., Lanz, C.,Schuster, S.C., Treusch, A.H., Eck, J., andSchleper, C. (2003) Acidobacteria form acoherent but highly diverse group within thebacterial domain: evidence from environ-mental genomics. Mol Microbiol 50:563–575.
57References
41 Liles, M.R., Manske, B.F., Bintrim, S.B.,Handelsman, J., and Goodman, R.M. (2003)A census of rRNA genes and linked genomicsequences within a soil metagenomic library.Appl Environ Microbiol 69:2684–2691.
42 MacNeil, I.A., Tiong, C.L., Minor, C., August,P.R., Grossman, T.H., Loiacono, K.A. et al.(2001) Expression and isolation of anti-microbial small molecules from soil DNAlibraries. J Mol Microbiol Biotechnol3:301–308.
43 Wang, G.Y., Graziani, E., Waters, B., Pan, W.,Li, X., McDermott, J. et al. (2000) Novelnatural products from soil DNA libraries in astreptomycete host. Org Lett 2:2401–2404.
44 Yap, W.H., Li, X., Soong, T.W., and Davies, J.(1996) Genetic diversity of soilmicroorganisms assessed by analysis of hsp70(dnaK) sequences. J Ind Microbiol 17:179–184.
45 Brady, S.F., Chao, C.J., Handelsman, J., andClardy, J. (2001) Cloning and heterologousexpression of a natural product biosyntheticgene cluster from eDNA. Org Lett3:1981–1984.
46 Courtois, S., Cappellano, C.M., Ball, M.,Francou, F.X., Normand, P., Helynck, G. et al. (2003) Recombinant environmentallibraries provide access to microbial diversityfor drug discovery from natural products.Appl Environ Microbiol 69:49–55.
47 Henne, A., Daniel, R., Schmitz, R.A., andGottschalk, G. (1999) Construction ofenvironmental DNA libraries in Escherichiacoli and screening for the presence of genesconferring utilization of 4-hydroxybutyrate.Appl Environ Microbiol 65:3901–3907.
48 Henne, A., Schmitz, R.A., Bomeke, M.,Gottschalk, G., and Daniel, R. (2000)
Screening of environmental DNA libraries forthe presence of genes conferring lipolyticactivity on Escherichia coli. Appl EnvironMicrobiol 66:3113–3116.
49 Guschin, D.Y., Mobarry, B.K., Proudnikov,D., Stahl, D.A., Rittmann, B.E., andMirzabekov, A.D. (1997) Oligonucleotidemicrochips as genosensors for determinativeand environmental studies in microbiology.Appl Environ Microbiol 63:2397–2402.
50 Salama, N., Guillemin, K., McDaniel, T.K.,Sherlock, G., Tompkins, L., and Falkow, S.(2000) A whole-genome microarray revealsgenetic diversity among Helicobacter pyloristrains. Proc Natl Acad Sci U S A97:14668–14673.
51 Cho, J.C., and Tiedje, J.M. (2001) Bacterialspecies determination from DNA–DNAhybridization by using genome fragmentsand DNA microarrays. Appl Environ Microbiol67:3677–3682.
52 Chakravarti, A. (1999) Population genetics –making sense out of sequence. Nat Genet21:56–60.
53 Wu, L., Thompson, D.K., Li, G., Hurt, R.A.,Tiedje, J.M., and Zhou, J. (2001)Development and evaluation of functionalgene arrays for detection of selected genes inthe environment. Appl Environ Microbiol67:5780–5790.
54 Taroncher-Oldenburg, G., Griner, E.M.,Francis, C.A., and Ward, B.B. (2003)Oligonucleotide microarray for the study offunctional gene diversity in the nitrogen cyclein the environment. Appl Environ Microbiol69:1159–1171.
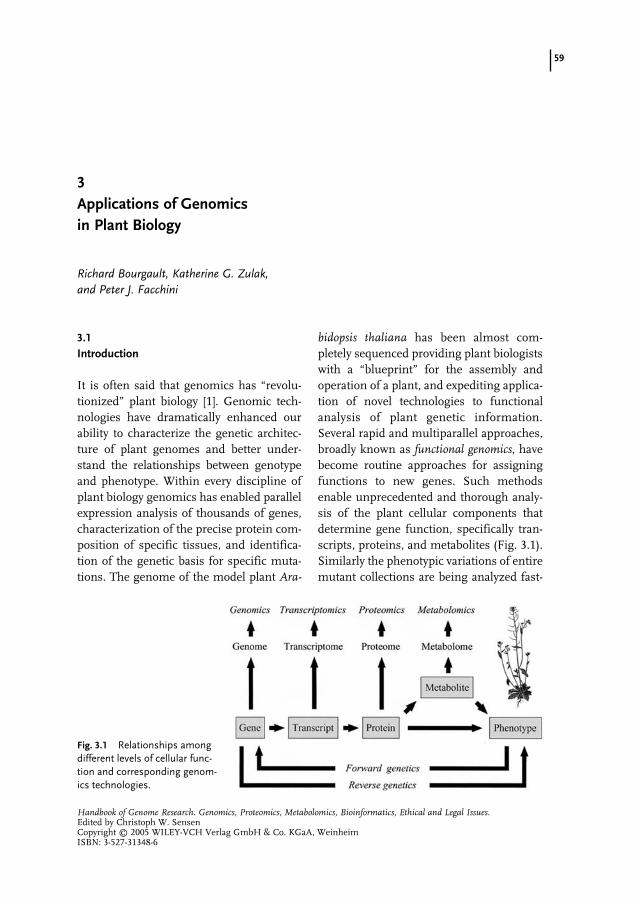
59
Richard Bourgault, Katherine G. Zulak, and Peter J. Facchini
3.1
Introduction
It is often said that genomics has “revolu-tionized” plant biology [1]. Genomic tech-nologies have dramatically enhanced ourability to characterize the genetic architec-ture of plant genomes and better under-stand the relationships between genotypeand phenotype. Within every discipline ofplant biology genomics has enabled parallelexpression analysis of thousands of genes,characterization of the precise protein com-position of specific tissues, and identifica-tion of the genetic basis for specific muta-tions. The genome of the model plant Ara-
bidopsis thaliana has been almost com-pletely sequenced providing plant biologistswith a “blueprint” for the assembly andoperation of a plant, and expediting applica-tion of novel technologies to functionalanalysis of plant genetic information.Several rapid and multiparallel approaches,broadly known as functional genomics, havebecome routine approaches for assigningfunctions to new genes. Such methodsenable unprecedented and thorough analy-sis of the plant cellular components thatdetermine gene function, specifically tran-scripts, proteins, and metabolites (Fig. 3.1).Similarly the phenotypic variations of entiremutant collections are being analyzed fast-
Handbook of Genome Research. Genomics, Proteomics, Metabolomics, Bioinformatics, Ethical and Legal Issues.Edited by Christoph W. SensenCopyright © 2005 WILEY-VCH Verlag GmbH & Co. KGaA, WeinheimISBN: 3-527-31348-6
3Applications of Genomics in Plant Biology
Fig. 3.1 Relationships amongdifferent levels of cellular func-tion and corresponding genom-ics technologies.
Verwendete Mac Distiller 5.0.x Joboptions
Dieser Report wurde automatisch mit Hilfe der Adobe Acrobat Distiller Erweiterung "Distiller Secrets v1.0.5" der IMPRESSED GmbH erstellt. Sie koennen diese Startup-Datei für die Distiller Versionen 4.0.5 und 5.0.x kostenlos unter http://www.impressed.de herunterladen. ALLGEMEIN ---------------------------------------- Dateioptionen: Kompatibilität: PDF 1.3 Für schnelle Web-Anzeige optimieren: Ja Piktogramme einbetten: Ja Seiten automatisch drehen: Nein Seiten von: 1 Seiten bis: Alle Seiten Bund: Links Auflösung: [ 2400 2400 ] dpi Papierformat: [ 481 680 ] Punkt KOMPRIMIERUNG ---------------------------------------- Farbbilder: Downsampling: Nein Komprimieren: Ja Komprimierungsart: ZIP Bitanzahl pro Pixel: 8 Bit Graustufenbilder: Downsampling: Nein Komprimieren: Ja Komprimierungsart: ZIP Bitanzahl pro Pixel: 8 Bit Schwarzweiß-Bilder: Downsampling: Nein Komprimieren: Ja Komprimierungsart: CCITT CCITT-Gruppe: 4 Graustufen glätten: Nein Text und Vektorgrafiken komprimieren: Ja SCHRIFTEN ---------------------------------------- Alle Schriften einbetten: Ja Untergruppen aller eingebetteten Schriften: Nein Wenn Einbetten fehlschlägt: Abbrechen Einbetten: Immer einbetten: [ /Courier-BoldOblique /Helvetica-BoldOblique /Courier /Helvetica-Bold /Times-Bold /Courier-Bold /Helvetica /Times-BoldItalic /Times-Roman /ZapfDingbats /Times-Italic /Helvetica-Oblique /Courier-Oblique /Symbol ] Nie einbetten: [ ] FARBE(N) ---------------------------------------- Farbmanagement: Farbumrechnungsmethode: Farbe nicht ändern Methode: Standard Geräteabhängige Daten: Einstellungen für Überdrucken beibehalten: Ja Unterfarbreduktion und Schwarzaufbau beibehalten: Ja Transferfunktionen: Beibehalten Rastereinstellungen beibehalten: Nein ERWEITERT ---------------------------------------- Optionen: Prolog/Epilog verwenden: Nein PostScript-Datei darf Einstellungen überschreiben: Nein Level 2 copypage-Semantik beibehalten: Ja Portable Job Ticket in PDF-Datei speichern: Ja Illustrator-Überdruckmodus: Ja Farbverläufe zu weichen Nuancen konvertieren: Ja ASCII-Format: Nein Document Structuring Conventions (DSC): DSC-Kommentare verarbeiten: Ja DSC-Warnungen protokollieren: Nein Für EPS-Dateien Seitengröße ändern und Grafiken zentrieren: Ja EPS-Info von DSC beibehalten: Ja OPI-Kommentare beibehalten: Nein Dokumentinfo von DSC beibehalten: Ja ANDERE ---------------------------------------- Distiller-Kern Version: 5000 ZIP-Komprimierung verwenden: Ja Optimierungen deaktivieren: Nein Bildspeicher: 524288 Byte Farbbilder glätten: Nein Graustufenbilder glätten: Nein Bilder (< 257 Farben) in indizierten Farbraum konvertieren: Ja sRGB ICC-Profil: sRGB IEC61966-2.1 ENDE DES REPORTS ---------------------------------------- IMPRESSED GmbH Bahrenfelder Chaussee 49 22761 Hamburg, Germany Tel. +49 40 897189-0 Fax +49 40 897189-71 Email: [email protected] Web: www.impressed.de
Adobe Acrobat Distiller 5.0.x Joboption Datei
<< /ColorSettingsFile () /LockDistillerParams true /DetectBlends true /DoThumbnails true /AntiAliasMonoImages false /MonoImageDownsampleType /Bicubic /GrayImageDownsampleType /Bicubic /MaxSubsetPct 100 /MonoImageFilter /CCITTFaxEncode /ColorImageDownsampleThreshold 1.5 /GrayImageFilter /FlateEncode /ColorConversionStrategy /LeaveColorUnchanged /CalGrayProfile (Dot Gain 20%) /ColorImageResolution 300 /UsePrologue false /MonoImageResolution 1200 /ColorImageDepth 8 /sRGBProfile (sRGB IEC61966-2.1) /PreserveOverprintSettings true /CompatibilityLevel 1.3 /UCRandBGInfo /Preserve /EmitDSCWarnings false /CreateJobTicket true /DownsampleMonoImages false /DownsampleColorImages false /MonoImageDict << /K -1 >> /ColorImageDownsampleType /Bicubic /GrayImageDict << /HSamples [ 2 1 1 2 ] /VSamples [ 2 1 1 2 ] /Blend 1 /QFactor 0.9 >> /CalCMYKProfile (U.S. Web Coated (SWOP) v2) /ParseDSCComments true /PreserveEPSInfo true /MonoImageDepth -1 /AutoFilterGrayImages false /SubsetFonts false /GrayACSImageDict << /HSamples [ 2 1 1 2 ] /VSamples [ 2 1 1 2 ] /Blend 1 /QFactor 0.9 >> /ColorImageFilter /FlateEncode /AutoRotatePages /None /PreserveCopyPage true /EncodeMonoImages true /ASCII85EncodePages false /PreserveOPIComments false /NeverEmbed [ ] /ColorImageDict << /HSamples [ 2 1 1 2 ] /VSamples [ 2 1 1 2 ] /Blend 1 /QFactor 0.9 >> /AntiAliasGrayImages false /GrayImageDepth 8 /CannotEmbedFontPolicy /Error /EndPage -1 /TransferFunctionInfo /Preserve /CalRGBProfile (sRGB IEC61966-2.1) /EncodeColorImages true /EncodeGrayImages true /ColorACSImageDict << /HSamples [ 2 1 1 2 ] /VSamples [ 2 1 1 2 ] /Blend 1 /QFactor 0.9 >> /Optimize true /ParseDSCCommentsForDocInfo true /GrayImageDownsampleThreshold 1.5 /MonoImageDownsampleThreshold 1.5 /AutoPositionEPSFiles true /GrayImageResolution 300 /AutoFilterColorImages false /AlwaysEmbed [ /Courier-BoldOblique /Helvetica-BoldOblique /Courier /Helvetica-Bold /Times-Bold /Courier-Bold /Helvetica /Times-BoldItalic /Times-Roman /ZapfDingbats /Times-Italic /Helvetica-Oblique /Courier-Oblique /Symbol ] /ImageMemory 524288 /OPM 1 /DefaultRenderingIntent /Default /EmbedAllFonts true /StartPage 1 /DownsampleGrayImages false /AntiAliasColorImages false /ConvertImagesToIndexed true /PreserveHalftoneInfo false /CompressPages true /Binding /Left >> setdistillerparams << /PageSize [ 595.276 841.890 ] /HWResolution [ 2400 2400 ] >> setpagedevice
60 3 Applications of Genomics in Plant Biology
er and more efficiently than ever before byuse of reverse genetic approaches. Differentmethods, termed transcriptomics, proteomics,and metabolomics, have evolved into distinctstrategies within the functional genomicsplatform and these approaches have beenfully integrated into field of plant biology(Fig. 3.1). However, the role of genes withunknown functions cannot be fully deter-mined and appreciated by use of a singlegenomic technique. Only consolidation ofinformation collected using differentgenomic tools will facilitate the assignmentof functions to the vast numbers of plantgenes that remain uncharacterized. In thischapter the applications of genomic tech-niques to plant biology are discussed with afocus on the impact of genomics on strate-gies used to investigate development andfunction.
3.2
Plant Genomes
3.2.1
Structure, Size, and Diversity
All living organisms have a unique genomethat can be defined as the full (haploid)complement of genetic informationrequired to build and to maintain a func-tional life form. This genetic information,in the form of DNA, provides the code toproduce the proteins that are involved inprocesses such as cellular metabolism, tran-scription, translation, defense, signaling,growth, protein fate, and transport. Inplants, as in other eukaryotes, protein-cod-ing genes have a coding region flanked byuntranslated regions and can be split intoexons and introns. In contrast with thefunction of prokaryotic operons, in whichthe transcription of multiple genes is often
controlled by a single promoter, each eukar-yotic gene has its own promoter.
Genome structure can be defined as theoverall organization of genes in an organ-ism. Although there are exceptions [22]], inthe vast majority of prokaryotes all genesare contained on a single circular chromo-some, which is relatively small in size (4.6megabasepairs [Mb] for E. coli; 4.2 Mb forBacillus subtillus) [3]. In plants and othereukaryotes, nuclear genes are contained onmuch larger, linear chromosomes, whichvary greatly in number and size from onespecies to another. Fig. 3.2 shows relativegenome sizes in bacteria, yeast, animalsand plants and also illustrates the broadrange of genome size in the animal andplant kingdoms. In addition, many plantshave elevated ploidy levels in which theentire diploid genome (originating frommaternal and paternal sources) is present inmultiple copies. It should be noted that alarger and more complex genome does notnecessarily lead to a more complex organ-ism. Much of the DNA present in plantsand other organisms with large genomes isnon-coding, repetitive DNA, and the totalnumber of expressed genes is not as pro-portionally large as genome size might sug-gest [4]. For example, in rice 42.2 % of the430 Mb genome was found to be in precise20-nucleotide oligomer repeats situated inintergenic regions between genes [5].
In addition to chromosomes in the plantcell nucleus, the plastid (chloroplast) andmitochondrion are organelles that alsocarry their own genetic information. It isimportant to note that both organellesrequire many gene products encoded bynuclear DNA for them to take form and befunctional. The plastid chromosome is inthe form of a closed circle, typically about120–160 kb in size, with genes denselyarranged in an order that is highly con-

613.2 Plant Genomes
served among plants. The mitochondrialchromosome can be circular or linear withgenes being more widely dispersed than inthe plastid. For example, in the Arabidopsismitochondrial genome, coding regionsmake up less than 10 % of the total 367 kbof DNA and encode only 57 identifiedgenes [6]. The size of the mitochondrialgenome also varies greatly from one plantspecies to another. For example, the mito-chondrial genome is 200 kb in Oenotheraspp. and Brassica spp., whereas it is up to2600 kb in muskmelon [7]. This is in con-trast to animal mitochondrial genomes,which are relatively compact (approx.16 kb).
According to the endosymbiont hypothe-sis, the origin of the chloroplast and mito-chondrion arose when an early protoeukar-yotic organism engulfed an ancestral cyano-bacterium and an ancestral α-proteobacteri-um. The photosynthetic cyanobacteriumevolved into the plastid and the α-proteo-bacterium became the mitochondrion.Over the course of time and evolution, mostof the DNA once present in the endosymbi-onts was transferred to the nuclear genomeof the protoeukaryote [7]. This phenome-non has been confirmed by evidence fromgenome sequencing projects on rice andArabidopsis [8].
3.2.2
Chromosome Mapping: Genetic and Physical
The location, or locus, of a specific genewithin a genome can be described by usinga genetic and/or physical map. A geneticlinkage map locates a gene in relation toanother gene or, using more current tech-niques, to a molecular marker on the samechromosome. Genetic mapping is based onthe concept that greater distances betweentwo linked genes create a higher probabilitythat homologous chromatids will cross overin the region between the genes duringmeiosis. This produces a larger proportionof recombinant progeny compared withlimited segregation of linked genes that aresituated closer together. Recombination fre-quency can be measured by observing theco-inheritance of two particular pheno-types, or a phenotype and a molecularmarker. A molecular marker is a site of het-erozygosity for some types of neutral DNAvariation which is not associated with anyphenotypic variation. These variations arecaused by differences in the location ofrestriction enzyme cleavage sites caused bysingle nucleotide changes, or by the pres-ence of a variable number of short, tandemrepeats. One genetic map unit (m.u.), also
Fig. 3.2 Haploid genome size, in basepairs, of different organisms. Most eukar-yotes have haploid genome sizes between1077 and 101111 base pairs of DNA. Plantshave a full spectrum of haploid genomesizes compared with other eukaryotes.
62 3 Applications of Genomics in Plant Biology
called a centimorgan (cM), is defined as thatdistance between genes for which one prod-uct of meiosis out of 100 is recombinant [9].In early plant genetic research, genetic map-ping was conducted by crossing, and/orself-pollinating, heterozygous plants with atype of observable phenotype or mutationthat could be followed in the progeny. Thistype of classical work provided detailedgenetic maps for species such as Arabi-dopsis [10], tomato [11], and corn [12], butthere were large gaps in the genomes towhich no measurable phenotypes could beassigned. High-resolution maps can bemade using molecular markers such asRFLP (restriction fragment length polymor-phisms), SSLP (simple-sequence lengthpolymorphisms), and RAPD (randomlyamplified polymorphic DNA). Dense link-age maps developed using this approachcontinue to facilitate the positional cloningof important genes, enable the genetic dis-section of quantitative trait loci, assist inphylogenetic comparisons between relatedspecies, and provide a critical guide forassembly of accurate physical maps.
A physical map is generated by directlyexamining the physical material of thegenome, that is, its DNA composition.Genomic DNA is isolated, cleaved, andassembled into clones that are manageablein size for examination and manipulation.Very large fragments of DNA (~1 Mb) canbe cloned into yeast vectors termed YAC(yeast artificial chomosomes) whereassmaller fragments can be placed into BAC(bacterial artificial chromosomes), PAC(phage P1-based artificial chromosomes),and TAC (transformation-competent artifi-cial chromosomes). Still smaller fragmentscan be cloned into conventional plasmidDNA vectors. Although different strategiescan be used to actually create the physicalmap, the result is the assembly of clonedfragments into overlapping groups called
contigs. Ultimately, the aim is to representa complete chromosomal segment with anoverlapping set of contigs. Distancesbetween genes or markers can then bedefined in terms of “base pairs” as opposedto the more ambiguous “map unit”, whichis used to describe genetic, rather thanphysical distances. A physical map can thenbe integrated with molecular markers froma genetic map [9].
The highest resolution physical map isone in which the entire genome has beensequenced. By generating cloned fragmentssuch as those described above, high-throughput data can be acquired usingautomated DNA sequencers capable ofreading multiple sequences, often up to800 bp with high confidence. Usingsequence-analysis software the data arescreened for overlapping regions, and theseare used to build large contigs representingan entire chromosome. The sequence datais then submitted to a database, assigned anaccession number and classified into one offour phases of sequence quality. TheNational Institute for BiotechnologyInformation (NCBI; www.ncbi.nlm.nih.gov) defines these phases as: Phase 0 – sin-gle/few pass reads of a single clone (notcontigs); Phase 1 – unfinished, might beunordered, unoriented contigs, with gaps;Phase 2 – unfinished, ordered, orientedcontigs, with or without gaps; and Phase 3 –finished, no gaps (with or without annota-tions). The genome sequencing of severalorganisms has been completed to Phase 3.Currently, the only plant to reach Phase 3for its entire genome is Arabidopsis thalia-na [8].
3.2.3
Large-scale Sequencing Projects
In December 2000 it was widely reportedthat the first plant to have its entire genome
633.2 Plant Genomes
sequenced was the crucifer Arabidopsis [8].The choice of Arabidopsis as the modelplant for this project might have been a sur-prise to observers outside the world of plantbiology, because it is a weed, not a cropplant. The advantages of using Arabidopsisfor genome analysis, however, include itsrelatively small, diploid nuclear genome, acapacity for self-pollination, amenability toout-crossing, a short life cycle, the produc-tion of a large number of progeny, and thesmall physical size of the plant. A wealth ofclassical genetic information was alsoalready available for Arabidopsis. It was pre-dicted that information gleaned from theArabidopsis genome sequence would behelpful in the development of strategies toimprove traits of agronomic value in impor-tant crop species [8].
When the nearly completed Arabidopsissequence data was organized into contigsrepresenting all five chromosomes, the nextmajor task was to identify genes and assignfunction to the gene products. This process,referred to as genome annotation, was per-formed using a combination of algorithmsoptimized with data based on knownArabidopsis gene structures, expressedsequence tags (ESTs), and characterizedproteins. Specific programs used to predictintrons enabled identification of continu-ous open reading frames (ORFs), and geneprediction software programs were used tosuggest the possible function of each geneproduct.
Experiments performed to confirm thequality of annotation showed that 93 % ofthe ESTs matched the predicted ORFs andless than 1 % of the ESTs matched predict-ed non-coding regions; thus, most putativegenes were identified. It was concluded thatthe 125-Mb genome contains 25,498 genesencoding proteins from 11,000 families.The functions of 69 % of the genes wereclassified by sequence similarity to proteins
of known function from all organisms. Thefunctions of only 9 % of the total compli-ment of genes have been determinedexperimentally, however. Approximately30 % of the predicted gene products, someof which are homologous to proteins foundin non-plant species, could not be assignedto a functional category. Predictions basedon signal peptides estimated that about17 % of the gene products are targeted tothe secretory pathway, 11 % to mitochon-dria, and 14 % to the chloroplast. The func-tional category with the highest proportionof all classified gene products was cellularmetabolism (22.5 %), followed by transcrip-tion (16.9 %), plant defense (11.3 %),growth (11.7 %), signaling (10.4 %), proteinfate, intracellular transport, extracellulartransport, and protein synthesis (all <10 %each) [8].
The availability of a nearly completegenome sequence for Arabidopsis enablescomparisons to be made between plantsand other organisms with fully sequencedand annotated genomes. Such comparisonsare advancing our understanding of theevolution and biological function of plantsand other organisms. Comparisons withdiverse organisms such as bacteria, yeast,multicellular eukaryotes, and other plantshave been conducted, and the findings areoccasionally predictable and at other timessurprising. For example, 48–60 % of allgenes involved in protein synthesis havecounterparts in other eukaryotic genomes,reflecting highly conserved gene function.On the other hand, only 8–23 % of Arabi-dopsis proteins involved in transcriptionhave related genes in other eukaryoticgenomes, reflecting more independent evo-lution. Comparisons of Arabidopsis withother plant species are likely to provide themost useful insights toward developingstrategies for crop improvement, which isone reason several other plant species are
64 3 Applications of Genomics in Plant Biology
currently the targets of large-scale sequenc-ing projects.
Crop plants currently selected for large-scale genomic sequencing projects include,soybean, corn, Medicago truncatula, and Ory-za sativa (rice). Of these, the most progresshas been achieved with the cereal crop rice.Rice has been cultivated for more than 9000years and is a major food source for over50 % of the world population. Rice is con-sidered a model system for plant biology,largely because of its compact genome(430 Mb), relative ease of transformation,and evolutionary relationships with otherlarge-genome cereals such as sorghum(750 Mb), corn (2,500 Mb), barley (5000 Mb),and wheat (15,000 Mb). In 2002, the entirerice genome had been sequenced to Phase 2quality [5, 13] and in June 2003 chromo-somes 1, 4, and 10 (out of 12) had beencompleted to the Phase 3 level [14–16]. Onthe basis of the non-overlapping sequencesof the 12 chromosomes at Phase 2, a total of62,435 genes were predicted within a 366-Mb genome (International Rice GenomeSequencing Project – IRGSP 2002; http://rgp.dna.affrc.go.jp/rgp/Dec18_NEWS). Thegroups that have completed chromosomes1, 4, and 10 have all made strong argumentssupporting the need for Phase 3 qualitysequence for all 12 chromosomes. At aFebruary 2004 meeting of the IRGSP it wasconcluded that the consortium was easilyon target to complete the entire genome toPhase 3 quality by December 2004(http://rgp.dna.affrc.go.jp/IRGSP). A four-year, NSF-funded project to annotate theentire rice genome and assemble the datainto a user-friendly format was undertakenin January 2004 by The Institute forGenomics Research (TIGR) (www.tigr.org).
Comparisons showed there is much syn-teny (i.e. gene order and orientation) andgene homology between rice and othercereal genomes [13]. As expected, synteny
with Arabidopsis is limited because of toextensive genome reshuffling since thedivergence of the monocot and dicotplants [15]. At the level of individual genes,however, the similarities are quite pro-nounced. Protein-coding genes on chromo-somes 1, 4, and 10 with significant homo-logs in Arabidopsis comprise 47, 44, and67 % of all genes, respectively. A reversecomparison using draft sequences revealedthat up to 85 % of predicted Arabidopsisgenes have homologs in rice [5, 15]. Dataobtained from these and other large-scalesequencing projects will undoubtedly createnew strategies for improving agronomictraits in cultivated crops that cannot be real-ized by conventional breeding.
3.3
Expressed Sequence Tags
Expressed sequence tag (EST) databasescurrently hold the largest amount of nucle-otide sequences from plant genomes. ESTsare generated by single-pass sequencing ofrandom cDNA and provide a quick, cost-effective method for generating a largeinventory of expressed genes. Because thecomplete sequencing of most plantgenomes is difficult, EST sequencing hasemerged as a robust method of rapidly sam-pling expressed protein-encoding sequenc-es of many plant species. More than 16.1million ESTs are available in the EuropeanMolecular Biology Laboratory (EMBL)sequence database, including over 3.1 mil-lion from more than 200 representativeplant species [17]. Model plant systemssuch as Arabidopsis and crop plants such aswheat, rice, and soybean are most highlyrepresented in current EST databases. Thenearly complete Arabidopsis EST collectionhas been used to refine the annotations ofthe Arabidopsis genome [35], and about
653.3 Expressed Sequence Tags
96 % of all ESTs were mapped back to agenomic locus, enabling improved annota-tion of the genome and verification of ESTclusters and sequence quality.
Large EST collections have also beenused for comparative genomic analysisamong and between different plant fami-lies. EST collections from two members ofthe Solanaceae family, potato and tomato,were found to overlap between 70–80 % ofall cDNAs sequenced [19]. Over 70 % oftomato EST sequences overlap withArabidopsis, a member of the Brassicaceaefamily [20]. Comparison of 11,008 ESTsfrom the order Asparagales (e.g. onion) tothe vast EST collections from plants of theorder Poales (e.g. wheat, barley, corn, andrice) revealed inconsistencies in genomiccharacteristics across the monocots [21].Although onion and rice share 78 % meannucleotide similarity across coding regions,there are significant differences betweencharacteristics such as codon usage, meanGC content, GC distribution, and relativeGC content at each codon position. Thiscomparison indicates that plants of theorder Asparagales are more similar to eudi-cots than to the Poales for the measuredgenomic characteristics.
ESTs have been used to compare geneexpression in plants under different envi-ronmental conditions. Gene expression hasbeen investigated by comparing two ESTdatabases from autumn leaves of field-grown Populus tremuloides (aspen) andgreenhouse-grown plants with young, fullyexpanded leaves [22]. Comparison showedthe young-leaf EST database containedmostly photosynthetically related geneswhereas the autumn leaf library containedan abundance of senescence-induced met-allothionnein genes, in addition to cysteineand aspartic proteases. Plastid protein syn-thesis was also found to be less than 10 %of that in young leaves.
EST analysis has also greatly increasedour understanding of the development andphysiology of plant tissues. Phloem tissuestransport nutrients and other biologicallyactive molecules throughout the plant, yetthe molecular mechanisms involved inphloem function are poorly understood. Aphloem-specific EST collection has beenconstructed using Apium graveolens (celery)as a model [23]. The main categories ofmRNA found in phloem tissues encodedproteins involved in phloem structure,metal homeostasis and distribution, stressresponses, and the degradation or turnoverof proteins. Moreover, several novelphloem-specific genes were discovered, butrequire further characterization.
ESTs have also greatly accelerated therate of gene discovery in plant secondarymetabolic pathways. Mentha x piperita(mint) produces some of the world’s mostvaluable and widely used essential oils. Theflavor and scent compounds found in mintare monoterpenes, which are synthesizedand stored in specialized secretory struc-tures called peltate glandular trichomes. AnEST collection produced specifically fromthese oil gland secretory cells provided arich resource of ESTs related directly toessential oil biosynthesis and transport [24].Over 25 % of the ESTs sequenced representgenes directly involved in essential oilmetabolism. Such databases are promisingtargets for genetic engineering of naturalproduct metabolism in plants. Basil(Ocimum basilicum) produces and storesvolatile oils containing a limited number ofphenylpropanoid compounds within glan-dular trichomes. EST sequencing of ran-domly selected glandular trichome cDNAsrevealed a relatively high representation(i.e. over 25 %) of known phenylpropanoidbiosynthetic genes [25]. Genes related to thebiosynthesis of S-adenosylmethionine, animportant substrate for phenylpropanoid
66 3 Applications of Genomics in Plant Biology
metabolism, were also common. EST analy-sis has thus shown that glandular trichomesare highly specialized structures involved inboth the biosynthesis and storage of impor-tant secondary metabolites. EST sequencinghas also been used to further the discoveryof novel genes involved in the characteristicfloral fragrance of rose [26]. The commer-cial importance of rose petals depends oncompounds involved in their color andscent. A collection of approximately 2100sequences from rose petals led to the dis-covery of several critical genes involved inthe biosynthesis of volatile sesquiterpenes,the main compounds responsible for thecharacteristic floral scent of roses.
3.4
Gene Expression Profiling Using DNA Microarrays
There has been unprecedented growth inpublicly available plant EST collections overthe last few years. For this data to be biolog-ically informative each sequence must beassociated with a precise biological func-tion. DNA microarray analysis has beenused as a high-throughput method to accel-erate the characterization of gene functionsand decipher complex gene expression pat-terns in plant systems. Two types of micro-arrays are commonly used for expressionprofiling in plants – oligonucleotide andDNA fragment-based microarrays. Oligo-nucleotide-based microarrays are produced byusing selected sequences from existing ESTdatabases. Typically, 25-mer to 70-mer oli-gonucleotides are synthesized fromsequences based on these ESTs and printedon chemically coated glass slides using aphotolithographic process. The most widelyavailable and advanced oligonucleotide-based microarrays are available forArabidopsis, and are manufactured by
Affymetrix and by Agilent. Recently, a bar-ley microarray (or GeneChip) containing22,000 different oligonucleotides hasbecome a publicly available new resourcefor cereal crop genomics research [27].DNA fragment-based microarrays are pro-duced by robotically spotting polymerasechain reaction (PCR)-derived cDNA on to achemically coated glass slide. The technolo-gy used to produce DNA fragment-basedmicroarrays is more widely available andless costly; thus, it remains the method ofchoice for non-model plant species. Foreither type of microarray, experiments areperformed by isolating mRNA from two dif-ferent plant or tissue samples; this mRNAis reverse-transcribed to produce cDNA thatincorporates nucleotides conjugated to twodifferent fluorescent dyes, each with aunique excitation and emission spectrum.The dye-labeled cDNA will hybridize to theimmobilized oligonucleotides or DNA frag-ments on the microarray slide. The relativetranscript abundance between the two sam-ples can be determined by measuring theamount of each label hybridized to eachspot. Thus, the expression data of thou-sands of genes can be deduced from oneexperiment.
Microarray analysis is an important toolin the deciphering of biotic and abioticstress-responses in plants. This approachwas used to identify cold-, drought-, high-salinity-, and/or absicisic acid (ABA)-indu-cible genes in rice [28]. By identifying genesinducible under more than one stress con-dition, a complex pattern of cross-talkamong signaling pathways was discovered.Greater cross-talk between signaling path-ways coupled to drought, ABA, and high-salinity stresses was observed, whereas lesscross-talk occurred between cold and ABA,or cold and high-salinity stresses. Compa-rison with Arabidopsis data showed that 51out of 73 stress-induced genes have similar
673.4 Gene Expression Profiling Using DNA Microarrays
functional annotations in Arabidopsis, indi-cating there are both similarities and differ-ences in stress responses between Arabi-dopsis and rice.
Microarray analysis has been used toinvestigate transcript level changes inNicotiana attenuata plants challenged withthe specialist herbivore Manduca sexta, theresults provide insight into the signaling andthe transcriptional basis of plant defenseagainst herbivores [29]. Simultaneous activa-tion of salicylic acid-, ethylene-, cytokinin-,WRKY-, MYB-, and oxylipin signaling path-ways was observed upon herbivore attack.Systemic increases in defense responseswere reciprocated by decreases in photosyn-thetic gene transcript levels, and increases inprotein turnover and carbohydrate metab-olism gene transcripts. Such widespreadchanges in gene expression indicate a majormetabolomic reconfiguration and a highdegree of complexity only detectible usinghigh-throughput genomic approaches.
Microarrays can also be used to analyzechanges in the transcriptome of transgenicplants. Several cold-inducible downstreamgenes of the Arabidopsis DREB1A-CBF3transcription factor were identified byusing microarrays [30]. Transgenic plantsoverexpressing the transcription factorwere hybridized along with a wild-typeplant to identify differentially expressedgenes. Thirty-eight downstream stress-related genes were upregulated in the trans-formed plants along with 20 previouslyunreported novel genes. DREB1A-CBF3was shown to repress the expression ofgenes involved in plant growth and develop-ment, indicating that DREB1A-CBF3 regu-lates a complex network of genes whichcould not be easily identified using tradi-tional methodologies.
Transcriptional profiling has also beenused to further our understanding of basicplant cell biology and physiology. Micro-
array analysis has revealed unique charac-teristics of pollen in Arabidopsis [31]. Pollentubes are used a model to study plant cellgrowth because of their ability to elongatewithout cell division. Little is understood,however, about the genetic basis of pollengermination and pollen tube growth.Comparison of the expression profiles ofhydrated pollen grains and several vegeta-tive tissues revealed 162 genes most abun-dantly expressed in pollen that had previ-ously not been associated with this tissue.The discovery of such genes provide newtargets to enable understanding of thegenetic basis for pollen development andfunction. Microarray analysis can also beused to identify genes differentiallyexpressed in specific cell types. By use oflaser-capture microdissection (LCM) tech-nology, different cell types can be isolatedfrom plant tissues. Total RNA can beextracted from isolated cells (typically 1000to 10,000 cells) and used to reverse tran-scribe labeled cDNA, which can be hybri-dized to a microarray. Several genes weredifferentially expressed in epidermal cellsor vascular tissues of Zea mays (maize) [32].Approximately 250 out of 8800 genes weredifferentially expressed in both tissues.This study demonstrates the feasibility ofusing LCM and microarray analysis to con-duct high-resolution global transcriptionalgene expression analysis in plants.
Microarray analysis has also contributedto our basic understanding of sugar signaltransduction pathways in Arabidopsis [33].Sugar and nitrogen are important plantnutrient signals, yet much remains to beunderstood about the molecular mecha-nisms underlying these critical signalingcomponents. Microarrays were used toinvestigate the effects of glucose and inor-ganic nitrogen on global transcriptionalchanges. Glucose was found to regulate abroad range of genes involved in carbohy-
68 3 Applications of Genomics in Plant Biology
drate metabolism, signal transduction,metabolite transport, and even plant stress-responses. Several ethylene biosyntheticand signal transduction genes wererepressed by glucose, indicating possiblecross-talk between the two signaling path-ways. Glucose was found to interact withnitrogen in the regulation of gene expres-sion, indicating that glucose and nitrogenact both as metabolites and as signalingmolecules.
3.5
Proteomics
The availability of entire genome sequenc-es, EST databases, and gene expression pro-files from a growing number of plant spe-cies provides a solid foundation for theapplication of proteomics to the establish-ment of a strong functional genomics plat-form in plants. Also termed “protein profil-ing”, proteomics is the study of the identifi-cation, function, and regulation of entiresets of proteins in a tissue, cell, or subcellu-lar compartment. Such information is cru-cial to understanding how complex biologi-cal processes occur at a molecular level andhow they differ in various cell types, stagesof development, or environmental condi-tions. Many of the genes identified ingenomic and EST databases encode pro-teins of unknown, hypothetical, or putativefunction; thus, an examination of proteinprofiles is essential to fully integrate thesedata. The definition of proteomics can besubdivided into two specific categories:shotgun or functional approaches [34].Shotgun proteomics involves a qualitativeand/or quantitative survey of all the pro-teins in a sample. In contrast, functionalproteomics uses the same techniques, butfocuses on one, or a few, proteins involvedin a specific process.
Recent years have seen remarkableadvances in the technologies used to con-duct proteomics research. The classical tech-nique involves the use of two-dimensionalgel electrophoresis (2DE) whereby extractedproteins are separated on polyacrylamide gelon the basis of their isoelectric charge andmolecular weight. Individual proteinsappear as spots on the gel and can be rough-ly quantified by measurement of the inten-sity of the spots. The proteins can be identi-fied by excising the spot from the gel, digest-ing the polypeptide into smaller peptidefragments using specific proteases, forexample trypsin, and sequencing the pep-tides directly or analyzing them by use of amass spectrometer (MS). Although thismethod is still useful and widely used it islimited by sensitivity, resolution, and theabundance range of the different proteins inthe sample [18, 34]. For example, abundantproteins dominate the gel whereas lessabundant proteins might not be visible. Newapproaches involve both improved separa-tion methods and advanced detection equip-ment.
Key developments leading to improveddetection of proteins were time-of-flight(TOF) MS and relatively nondestructivemethods for converting proteins into vola-tile ions [18]. Two “soft ionization” meth-ods, matrix-assisted laser-desorption ioniza-tion (MALDI) and electrospray ionization(ESI), have made it possible to analyze largemolecules such as peptides and proteins.Although MALDI-TOF MS is a relativehigh-throughput method compared withESI, the latter is more easily coupled to sep-aration techniques such as liquid chroma-tography (LC) or high-pressure LC (HPLC)[18]. This has provided an attractive alterna-tive to 2DE, because even low-abundanceproteins and insoluble transmembrane pro-teins can be detected [36, 37]. All MS-basedtechniques require a substantial and search-
693.5 Proteomics
able database of predicted proteins, ideallyrepresenting the entire genome. Proteinidentification is possible by comparing thededuced masses of the resolved peptidefragments with the theoretical masses ofpredicted peptides in the database.
Mass spectrometers are restricted in thenumber of ions that can be detected at anypoint in time. Pre-fractionation of proteinson the basis of isolation of specific cell typesor subcellular organelles is often necessaryto reduce the complexity of the sample [38].Another way to fractionate a complex sam-ple is to introduce a combination of chro-matographic techniques before MS analy-sis. This method, referred to as multidi-mensional protein identification technolo-gy (MudPIT) [39], has been used to conducta shotgun survey of metabolic pathways inthe leaves, roots, and developing seeds ofrice [36]. Extracted proteins were firstdigested with a lysine-specific endoproteaseand then with trypsin to generate a complexmixture of peptides. The peptides were frac-tionated on a strong cation exchanger thatwas positioned immediately upstream of areversed-phase column. Peptide fractionswere selectively eluted from the cation-exchange column using stepwise increasesin salt concentration and then separated ona reversed-phase column before mass spec-trometric analysis. Results from theMudPIT analysis were compared withthose obtained by 2DE–MS. Using2DE–MS, protein extracts from leaves,roots, and seeds were found to contain,respectively, 348, 199, and 152 unique pro-teins in each fraction. In contrast, MudPITwas able to identify 867, 1292, and 822unique proteins in leaves, roots, and seeds,demonstrating the superior detection effi-ciency of this technique. A total of 165 pro-teins were, however, detected in 2DE analy-sis only, which supports the complemen-tary nature of the different proteomic tech-
nologies. The proteins were assigned to 16different functional categories, althoughmost (33 %) were unknown. The secondmost abundant functional category (21 %)included proteins involved in primarymetabolism, which is in agreement withthe functional distribution of enzymes pre-dicted from the rice genome project [13]. Of2528 detected proteins, only 189 wereexpressed in all three tissues, with the vastmajority having tissue-specific expressionpatterns [36].
Other shotgun studies involved examina-tion of protein profiles in maize chloro-plasts during the greening of leaf tissueafter de-etiolation [38] and demonstration ofthe high similarity between the profiles ofchloroplast thylakoid lumen proteins of twodifferent species, Arabidopsis and spin-ach [40]. On the basis of the proteins identi-fied strong inferences regarding the signal-ing motifs required to localize proteins inchloroplasts could be made. Although in sil-ico analysis is a valuable tool for predictingthe protein profile of an organelle or subcel-lular compartment, such approaches areerror-prone and require experimental verifi-cation [34, 40].
Using Arabidopsis as a model a functionalproteomic approach was used to identify amembrane binding protein, AnnAt1,involved in osmotic stress response [41].Root microsomal fractions were isolatedfrom plants grown in liquid medium lack-ing, or supplemented with, salt. Theextracts were run on 2DE gels and proteinspots with greater than twofold changes inintensity were characterized by MALDI-TOF MS analysis. One protein, AnnAt1 wasprobably translocated from the cytosol tothe membrane on increased salt exposure.The characterization of AnnAt1 T-DNAmutants coupled to experiments involvingtreatment with ABA, Ca22++, or EGTA sup-ported the hypothesis that AnnAt1 plays a
70 3 Applications of Genomics in Plant Biology
role in ABA-mediated stress response inplants.
Several other very new technologies areavailable for performing proteomic research[18, 42, 43] and some have not been exten-sively employed in plant biology studies.There are new detection methods, proteom-ic technologies are being developed in anarray format, and there is increasing focuson protein–protein interactions, post-trans-lational modification, and elucidation ofthree-dimensional protein structure. Interms of plant science, proteomics is a fieldthat is in its infancy and when it matureswill certainly provide a wealth of evidenceenabling a better understanding of biologi-cal systems in general.
3.6
Metabolomics
Metabolites are the products of interrelatedbiochemical pathways and changes in meta-bolic profiles can be regarded as the ulti-mate response of biological systems togenetic or environmental changes [44].Metabolomics is defined as the systematicsurvey of all the metabolites present in aplant tissue, cell, or subcellular compart-ment under defined conditions, and can befurther subdivided into three categoriesbased on the type of study being performed.Targeted metabolomics involves examinationof the effects of a genetic alteration orchange in environmental conditions on par-ticular metabolites [45]. Sample preparationis focused on isolating and concentratingthe compound of interest to minimizedetection interference from other compo-nents in the original extract. Metabolite pro-filing refers to a qualitative and quantitativeevaluation of metabolite collections, forexample those found in a particular path-way, tissue, or cellular compartment [46].
Finally, metabolic fingerprinting is a high-throughput method that focuses on collect-ing and analyzing data from crude extractsto classify whole samples rather than separ-ating individual metabolites [47, 48].
Gas chromatography (GC)–MS orLC–MS are the tools of choice for generat-ing high-throughput data for identificationand quantification of small-molecular-weight metabolites [47]. Capillary electro-phoresis (CE) is an alternative methodwhich separates particular types of com-pound more efficiently and can be coupledwith MS or other types of detectors. Nuclearmagnetic resonance (NMR), infrared (IR),ultraviolet (UV), and fluorescence spectros-copy can be used as alternative means ofdetection, often in parallel with MS [47].Time-of-flight MS technology has also beenemployed in metabolite analysis and pro-vides a means of high sample-throughput.In the end, a combination of methodsenables analysis of a broad range of metab-olites. The separation and detection strate-gies used in plant metabolomics have beenreviewed in detail [47, 49].
The generation of reproducible andmeaningful metabolomic data requiresgreat care in the acquisition, storage, extrac-tion, and preparation of samples [44]. Thetrue metabolic state of samples must bemaintained and additional metabolic activ-ity or chemical modification after collectionmust be prevented. Depending on the typeof sample and the analysis performed, thiscan be achieved in various ways. The mostcommon strategies are freezing in liquidnitrogen, freeze-drying, and heat denatura-tion to halt enzymatic activity [44].Metabolomic experiments are typically con-ducted by comparing experimental plantspossessing an expected metabolic modifica-tion (i.e. because of introduction of a trans-gene or exposure to a particular treatment)to control plants. Statistically significant
713.6 Metabolomics
changes in metabolite levels attributable toperturbations affecting the experimentalplants are identified. Natural variability inmetabolite levels occurs as part of normalhomeostasis in plants; thus, a high numberof replicates is typically necessary to estab-lish a statistically significant differencebetween experimental and control plants,especially if the differences between metab-olite levels are subtle [47]. The large data-sets and multitude of metabolites requirecomputer-based applications to analyzecomplex metabolomic experiments. Ideally,such systems compile and compare datafrom a variety of separation and detectionsystems (i.e. GC–MS, LC–MS, and NMR)and identify alterations in metabolite lev-els [49]. Ultimately, gene functions can bepredicted or global metabolic profiles asso-ciated with particular biological responsescan be defined. Although such in silicosystems have not yet been developed, mul-tivariate data analysis techniques thatreduce the complexity of datasets andenable more simplified visualization ofmetabolomic results are currently available.These include principle-components analy-sis (PCA), hierarchical clustering analysis(HCA), K-means clustering, and self-orga-nizing maps (SOM) [49].
Considering the natural variability intranscript, protein, and metabolite levels inplants of the same genotype, correlationswithin complex fluctuating biochemicalnetworks can be revealed using PCA andHCA [47, 50]. Metabolic networks wereintegrated with gene expression and pro-tein levels using a novel extraction methodrecently developed whereby RNA, proteinsand metabolites were all extracted from asingle sample [50]. Metabolites were firstextracted in organic and aqueous solvents,after which proteins and RNA were separat-ed using a buffer/phenol extraction.Metabolites were analyzed using GC–TOF
MS resulting in the quantification and iden-tification of 652 compounds. Proteins weresubjected to tryptic digestion, separationusing two-dimensional LC, and detectionby tandem MS. This resulted in the quan-tification and identification of 297 proteinsunder stringent conditions intended toavoid false positives. The RNA extractedwas successfully used in northern-blot anal-ysis with isopropyl malate synthase as a testprobe. The overall extraction process wasapplied to ten independent replicates fromtwo Arabidopsis genotypes, Col2 and C24, tosee if different biochemical phenotypescould be detected and to evaluate generalbiochemical patterns. For each genotype, asubset of the 14 most abundant metaboliteswas integrated with a subset of 22 proteinsand the data were subjected to PCA andHCA. The results of PCA showed that thetwo genotypes were completely separatedinto distinct clusters, meaning that suchanalysis could be used for classification pur-poses. Application of HCA revealed theconservation of some biochemical patternsin both genotypes, including Calvin cycleenzymes and metabolites such as sucroseand fructose. The authors suggest that suchdatasets coupled to quantitative transcriptanalyses could reveal more detailed rela-tionships among metabolites and assigntheir linkage to established functions in bio-chemical networks [50].
Besides basic research in plant biology,metabolomics is also being developed toassess the safety of genetically modified(GM) foods [51]. One major concern aboutthe use of GM foods is that the molecularalterations designed to produce a beneficialtrait could also result in unintentionallyhazardous effects. Because societydemands that producers demonstrate “sub-stantial equivalence” between transgenicand non-transgenic crop plants, metaboliteprofiling is expected to provide a reliable
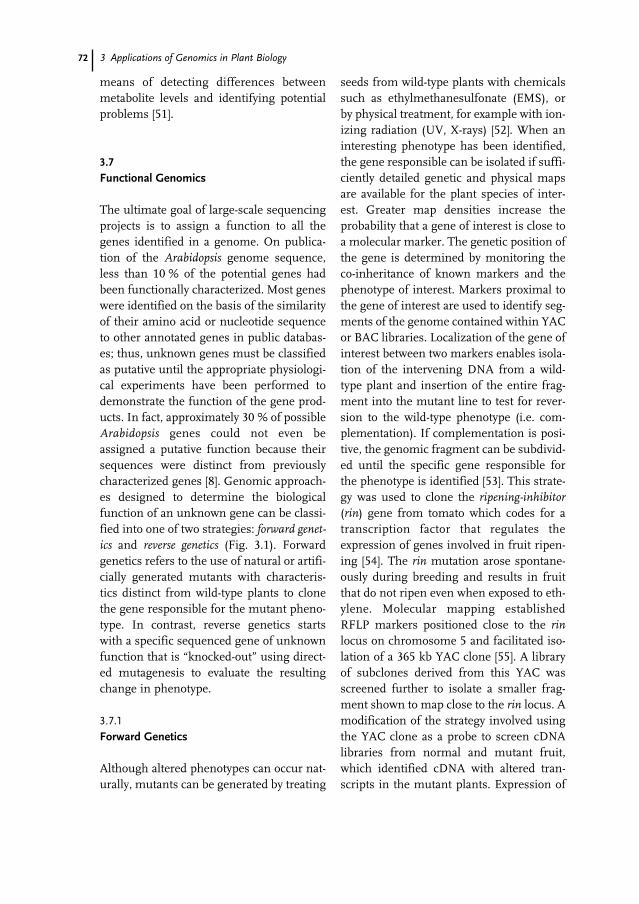
72 3 Applications of Genomics in Plant Biology
means of detecting differences betweenmetabolite levels and identifying potentialproblems [51].
3.7
Functional Genomics
The ultimate goal of large-scale sequencingprojects is to assign a function to all thegenes identified in a genome. On publica-tion of the Arabidopsis genome sequence,less than 10 % of the potential genes hadbeen functionally characterized. Most geneswere identified on the basis of the similarityof their amino acid or nucleotide sequenceto other annotated genes in public databas-es; thus, unknown genes must be classifiedas putative until the appropriate physiologi-cal experiments have been performed todemonstrate the function of the gene prod-ucts. In fact, approximately 30 % of possibleArabidopsis genes could not even beassigned a putative function because theirsequences were distinct from previouslycharacterized genes [8]. Genomic approach-es designed to determine the biologicalfunction of an unknown gene can be classi-fied into one of two strategies: forward genet-ics and reverse genetics (Fig. 3.1). Forwardgenetics refers to the use of natural or artifi-cially generated mutants with characteris-tics distinct from wild-type plants to clonethe gene responsible for the mutant pheno-type. In contrast, reverse genetics startswith a specific sequenced gene of unknownfunction that is “knocked-out” using direct-ed mutagenesis to evaluate the resultingchange in phenotype.
3.7.1
Forward Genetics
Although altered phenotypes can occur nat-urally, mutants can be generated by treating
seeds from wild-type plants with chemicalssuch as ethylmethanesulfonate (EMS), orby physical treatment, for example with ion-izing radiation (UV, X-rays) [52]. When aninteresting phenotype has been identified,the gene responsible can be isolated if suffi-ciently detailed genetic and physical mapsare available for the plant species of inter-est. Greater map densities increase theprobability that a gene of interest is close toa molecular marker. The genetic position ofthe gene is determined by monitoring theco-inheritance of known markers and thephenotype of interest. Markers proximal tothe gene of interest are used to identify seg-ments of the genome contained within YACor BAC libraries. Localization of the gene ofinterest between two markers enables isola-tion of the intervening DNA from a wild-type plant and insertion of the entire frag-ment into the mutant line to test for rever-sion to the wild-type phenotype (i.e. com-plementation). If complementation is posi-tive, the genomic fragment can be subdivid-ed until the specific gene responsible forthe phenotype is identified [53]. This strate-gy was used to clone the ripening-inhibitor(rin) gene from tomato which codes for atranscription factor that regulates theexpression of genes involved in fruit ripen-ing [54]. The rin mutation arose spontane-ously during breeding and results in fruitthat do not ripen even when exposed to eth-ylene. Molecular mapping establishedRFLP markers positioned close to the rinlocus on chromosome 5 and facilitated iso-lation of a 365 kb YAC clone [55]. A libraryof subclones derived from this YAC wasscreened further to isolate a smaller frag-ment shown to map close to the rin locus. Amodification of the strategy involved usingthe YAC clone as a probe to screen cDNAlibraries from normal and mutant fruit,which identified cDNA with altered tran-scripts in the mutant plants. Expression of
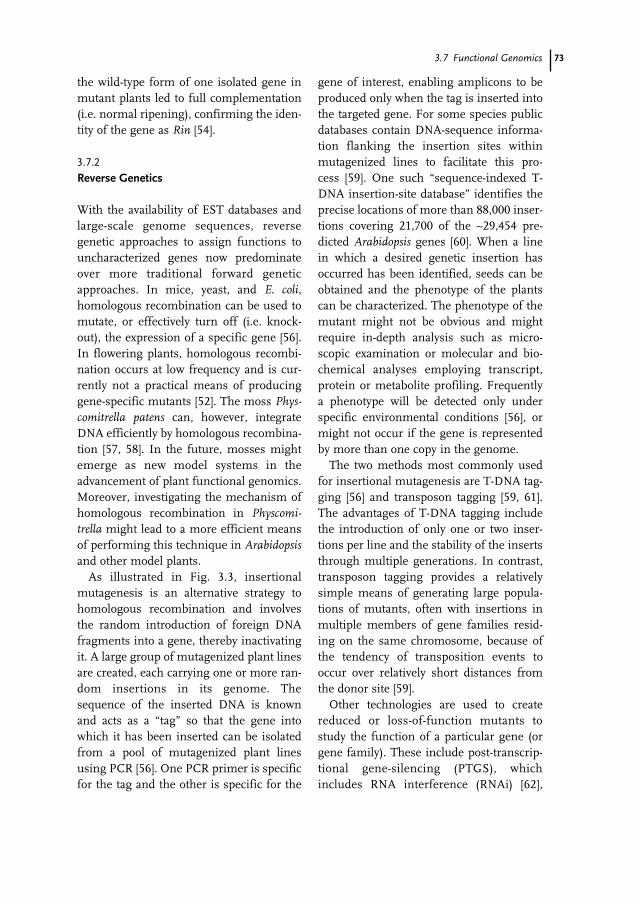
733.7 Functional Genomics
the wild-type form of one isolated gene inmutant plants led to full complementation(i.e. normal ripening), confirming the iden-tity of the gene as Rin [54].
3.7.2
Reverse Genetics
With the availability of EST databases andlarge-scale genome sequences, reversegenetic approaches to assign functions touncharacterized genes now predominateover more traditional forward geneticapproaches. In mice, yeast, and E. coli,homologous recombination can be used tomutate, or effectively turn off (i.e. knock-out), the expression of a specific gene [56].In flowering plants, homologous recombi-nation occurs at low frequency and is cur-rently not a practical means of producinggene-specific mutants [52]. The moss Phys-comitrella patens can, however, integrateDNA efficiently by homologous recombina-tion [57, 58]. In the future, mosses mightemerge as new model systems in theadvancement of plant functional genomics.Moreover, investigating the mechanism ofhomologous recombination in Physcomi-trella might lead to a more efficient meansof performing this technique in Arabidopsisand other model plants.
As illustrated in Fig. 3.3, insertionalmutagenesis is an alternative strategy tohomologous recombination and involvesthe random introduction of foreign DNAfragments into a gene, thereby inactivatingit. A large group of mutagenized plant linesare created, each carrying one or more ran-dom insertions in its genome. Thesequence of the inserted DNA is knownand acts as a “tag” so that the gene intowhich it has been inserted can be isolatedfrom a pool of mutagenized plant linesusing PCR [56]. One PCR primer is specificfor the tag and the other is specific for the
gene of interest, enabling amplicons to beproduced only when the tag is inserted intothe targeted gene. For some species publicdatabases contain DNA-sequence informa-tion flanking the insertion sites withinmutagenized lines to facilitate this pro-cess [59]. One such “sequence-indexed T-DNA insertion-site database” identifies theprecise locations of more than 88,000 inser-tions covering 21,700 of the ~29,454 pre-dicted Arabidopsis genes [60]. When a linein which a desired genetic insertion hasoccurred has been identified, seeds can beobtained and the phenotype of the plantscan be characterized. The phenotype of themutant might not be obvious and mightrequire in-depth analysis such as micro-scopic examination or molecular and bio-chemical analyses employing transcript,protein or metabolite profiling. Frequentlya phenotype will be detected only underspecific environmental conditions [56], ormight not occur if the gene is representedby more than one copy in the genome.
The two methods most commonly usedfor insertional mutagenesis are T-DNA tag-ging [56] and transposon tagging [59, 61].The advantages of T-DNA tagging includethe introduction of only one or two inser-tions per line and the stability of the insertsthrough multiple generations. In contrast,transposon tagging provides a relativelysimple means of generating large popula-tions of mutants, often with insertions inmultiple members of gene families resid-ing on the same chromosome, because ofthe tendency of transposition events tooccur over relatively short distances fromthe donor site [59].
Other technologies are used to createreduced or loss-of-function mutants tostudy the function of a particular gene (orgene family). These include post-transcrip-tional gene-silencing (PTGS), whichincludes RNA interference (RNAi) [62],
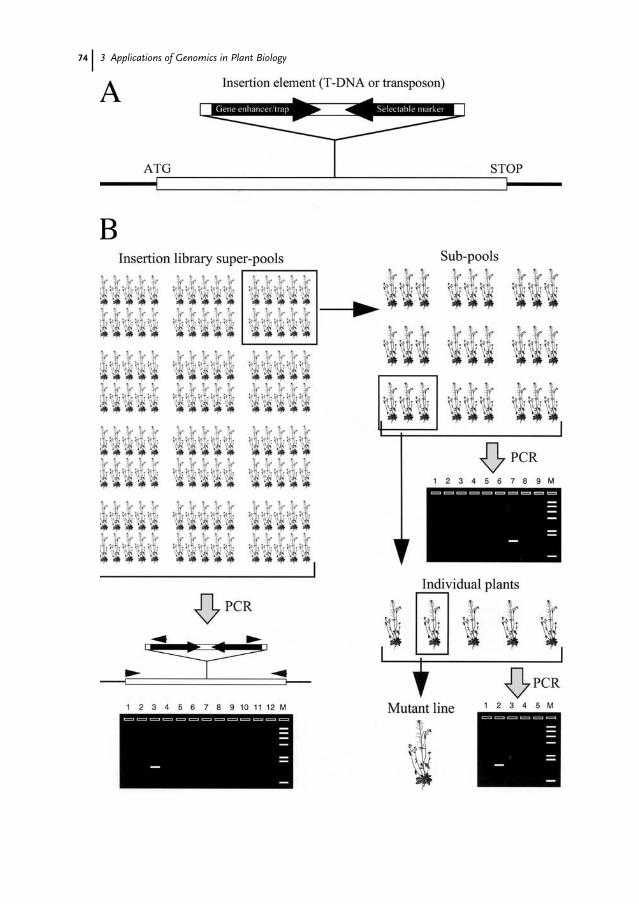
74 3 Applications of Genomics in Plant Biology
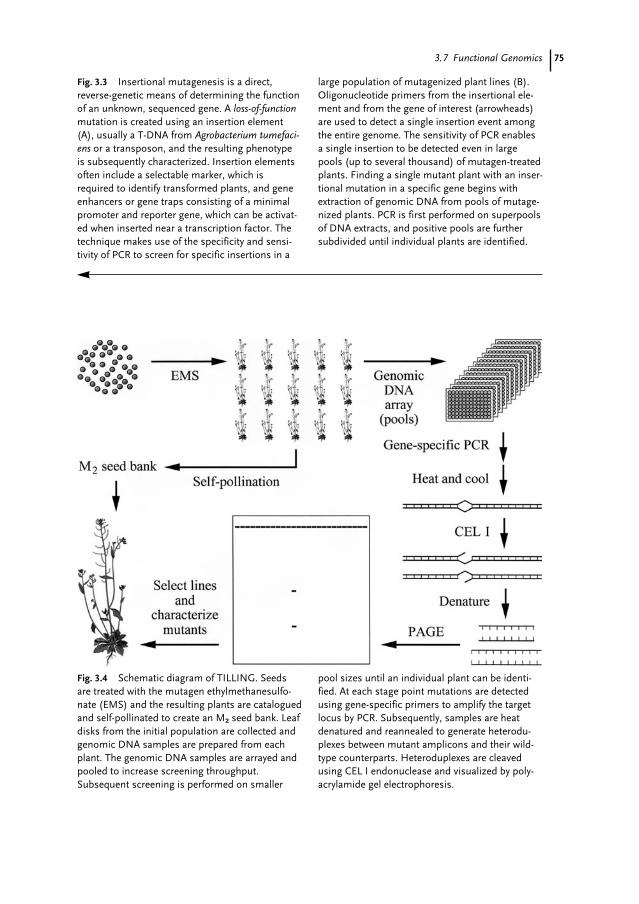
753.7 Functional Genomics
Fig. 3.3 Insertional mutagenesis is a direct,reverse-genetic means of determining the functionof an unknown, sequenced gene. A loss-of-functionmutation is created using an insertion element(A), usually a T-DNA from Agrobacterium tumefaci-ens or a transposon, and the resulting phenotypeis subsequently characterized. Insertion elementsoften include a selectable marker, which isrequired to identify transformed plants, and geneenhancers or gene traps consisting of a minimalpromoter and reporter gene, which can be activat-ed when inserted near a transcription factor. Thetechnique makes use of the specificity and sensi-tivity of PCR to screen for specific insertions in a
large population of mutagenized plant lines (B).Oligonucleotide primers from the insertional ele-ment and from the gene of interest (arrowheads)are used to detect a single insertion event amongthe entire genome. The sensitivity of PCR enablesa single insertion to be detected even in largepools (up to several thousand) of mutagen-treatedplants. Finding a single mutant plant with an inser-tional mutation in a specific gene begins withextraction of genomic DNA from pools of mutage-nized plants. PCR is first performed on superpoolsof DNA extracts, and positive pools are furthersubdivided until individual plants are identified.
Fig. 3.4 Schematic diagram of TILLING. Seedsare treated with the mutagen ethylmethanesulfo-nate (EMS) and the resulting plants are cataloguedand self-pollinated to create an M22 seed bank. Leafdisks from the initial population are collected andgenomic DNA samples are prepared from eachplant. The genomic DNA samples are arrayed andpooled to increase screening throughput.Subsequent screening is performed on smaller
pool sizes until an individual plant can be identi-fied. At each stage point mutations are detectedusing gene-specific primers to amplify the targetlocus by PCR. Subsequently, samples are heatdenatured and reannealed to generate heterodu-plexes between mutant amplicons and their wild-type counterparts. Heteroduplexes are cleavedusing CEL I endonuclease and visualized by poly-acrylamide gel electrophoresis.
76 3 Applications of Genomics in Plant Biology
antisense RNA expression, co-suppressionwith sense RNA, and virus-induced genesilencing [52]. In contrast with insertionalmutagenesis, one of the major advantagesof RNA-mediated gene silencing is its abil-ity to knock out entire gene families, even ifthey are not closely linked physically.Disadvantages include the lack of stable,inheritable phenotype, variable levels ofresidual gene activity, and our poor under-standing of the mechanisms of some gene-silencing phenomena. In contrast to“knock-out” strategies, over-expression of aparticular gene might also provide insighttoward the determination of its function.
A new strategy with broad potential in thedevelopment of high-throughput reversegenetics in plants is TILLING (targeting-induced local lesions in genomes) [63, 64].TILLING uses traditional chemical muta-genesis followed by high-throughputscreening to identify point mutations(Fig. 3.4). Plants derived from mutagenizedseeds are catalogued and self-pollinated tocreate an M22 seed bank. Genomic DNAsamples from each plant are arrayed andpooled to increase screening throughput.Subsequent screening is performed onsmaller pool sizes until an individual plantwith a point mutation in a specific gene ofinterest is identified. The target locus isamplified by PCR using gene-specific prim-ers and the amplicons are heat-denaturedand reannealed to generate heteroduplexesbetween mutant and wild-type amplicons.Heteroduplexes are cleaved using the heter-oduplex-specific CEL I endonuclease andvisualized by polyacrylamide gel electropho-
resis [63, 64]. Ultimately, the phenotype of aplant with the desired mutation can becharacterized. TILLING enables functionalgenomic studies to be conducted on plantspecies that cannot be genetically trans-formed.
3.8
Concluding Remarks
Considering the vast quantity of bioinfor-matic data currently available, the pace atwhich new information is being generated,and the steady stream of new technologiesbeing developed, the future is bright forplant genomics. The development ofgenomic technologies beginning with theemergence of high-throughput, automatedDNA sequencers have been readily appliedto the plant biology field [65]. New technol-ogies for integrating genomic, transcrip-tomic, proteomic, and metabolomic data-sets and advancing functional genomicapproaches in plants continue to be estab-lished. Coupled with the nearly completesequencing and annotation of the Arabidop-sis genome, and the availability of genome-wide knock-out mutants, integrated genom-ic analyses are creating the realistic pos-sibility that unequivocal functions will beassigned to all plant genes in the foresee-able future [1]. Such developments in riceare not far behind, and projects in severalother agronomically important plants are inprogress. Genomics initiatives will contin-ue to provide plant biologists with a wealthof resources for years to come.
77
1 Chory, J., Ecker, J.R., Briggs, S., Caboche, M.,Coruzzi, G.M., et al. (2000), National ScienceFoundation-sponsored workshop report: “The2010 Project.” Functional genomics and thevirtual plant. A blueprint for understandinghow plants are built and how to improvethem, Plant Physiol. 23, 423–426.
2 Choudhary, M., Mackenzie, C., Nereng, K.,Sodergren, E., Weinstock, G. M., et al. (1997),Low-resolution sequencing of Rhodobactersphaeroides 2.4.1(t): Chromosome II is a truechromosome, Microbiology-Uk 143, 3085–3099.
3 Puhler, A., Jording, D., Kalinowski, J.,Buttgereit, D., Renkawitz-Pohl, R., et al.(2002), Genome projects of model organisms,in: Essentials of genomics and bioinformatics.(Sensen, C. W., Ed.), pp. 5–39. Weinheim:Wiley–VCH.
4 Ferl, R., Paul, A.-L. (2000), Genomeorganization and expression, in: Biochemistryand molecular biology of plants. (Buchannan, B.B., Gruissem, W., Jones, R. L., Eds.), pp.312–357. Rockville, Maryland: AmericanSociety of Plant Physiologists.
5 Yu, J., Hu, S., Wang, J., Wong, G. K.-S., Li, S.,et al. (2002), A draft sequence of the ricegenome (Oryza sativa l. Ssp. Indica), Science296, 79–92.
6 Unseld, M., Marienfeld, J. R., Brandt, P.,Brennicke, A. (1997), The mitochondrialgenome of Arabidopsis thaliana contains 57genes in 366,924 nucleotides, Nature Genet.15, 57–61.
7 Sugiura, M., Takeda, Y. (2000), Nucleic acids, in: Biochemistry and molecular biology of plants. (Buchannan, B. B., Gruissem, W.,Jones, R. L., Eds), pp. 260–310. Rockville,Maryland: American Society of PlantPhysiologists.
8 The Arabidopsis Genome Initiative (2000),Analysis of the genome sequence of theflowering plant Arabidopsis thaliana, Nature408, 796–815.
9 Griffiths, A. J. F., Miller, J. H., Suzuki, D. T.,Lewontin, R. C., Gelbart, W. M. (1996). Anintroduction to gentic analysis. New York: W.H. Freeman and Company.
10 Koornneef, M., Vaneden, J., Hanhart, C. J.,Stam, P., Braaksma, F. J., et al. (1983),Linkage map of Arabidopsis thaliana, J.Heredity 74, 265–272.
11 Rick, C. M. (1978), Tomato, ScientificAmerican 239(2), 77.
12 Keim, P., Diers, B. W., Olson, T. C.,Shoemaker, R. C. (1990), RFLP mapping insoybean – association between marker lociand variation in quantitative traits, Genetics126, 735–742.
13 Goff, S. A., Ricke, D., Lan, T. H., Presting, G.,Wang, R. L., et al. (2002), A draft sequence ofthe rice genome (Oryza sativa l. Ssp.japonica), Science 296, 92–100.
14 Sasaki, T., Matsumoto, T., Yamamoto, K.,Sakata, K., Baba, T., et al. (2002), The genomesequence and structure of rice chromosome1, Nature 420, 312–316.
15 Feng, Q., Zhang, Y., Hao, P., Wang, S., Fu,G., et al. (2002), Sequence and analysis of ricechromosome 4, Nature 420, 316–320.
16 The Rice Chromosome 10 SequencingConsortium (2003), In-depth view ofstructure, activity, and evolution of ricechromosome 10, Science 300, 1566–1569.
17 Rudd, S. (2003), Expressed sequence tags:Alternative or complement to whole genomesequences?, Trends Plant Sci. 8, 321–328.
18 Zhu, H., Bilgin, M., Snyder, M. (2003),Proteomics, Annu. Rev. Biochem. 72, 783–812.
References
78 References
19 Ronning, C. M., Stegalkina, S. S., Ascenzi, R.A., Bougri, O., Hart, A. L., et al. (2003),Comparative analyses of potato expressedsequence tag libraries, Plant Physiol. 131,419–429.
20 Van Der Hoeven, R., Ronning, C.,Giovannoni, J., Martin, G., Tanksley, S.(2002), Deductions about the number,organization, and evolution of genes in thetomato genome based on analysis of a largeexpressed sequence tag collection andselective genomic sequencing, Plant Cell 14,1441–1456.
21 Kuhl, J. C., Cheung, F., Yuan, Q., Martin, W.,Zewdie, Y., et al. (2003), A unique set of11,008 onion expressed sequence tags revealsexpressed sequence and genomic differencesbetween the monocot orders Asparagales andPoales, Plant Cell 16, 114–125.
22 Bahalerao, R., Keskitalo, J., Sterky, F.,Erlandsson, R., Bjorkbacka, H., et al. (2003),Gene expression in autumn leaves, PlantPhysiol. 131, 430–442.
23 Vilaine, F., Palauqui, J.-C., Asmselem, J.,Kusiak, C., Lemoine, R., et al. (2003), Towardsdeciphering phloem: A transcriptome analysisof the phloem of Apium graveolens, Plant J. 36,67–81.
24 Lange, B. M., Wildung, M. R., Stauber, E. J.,Sanchez, C., Pouchnik, D., et al. (2000),Probing essential oil biosynthesis andsecretion by functional evaluation ofexpressed sequence tags from mint glandulartrichomes, Proc. Nat. Acad. Sci. USA 97,2934–2939.
25 Gang, D. R., Wang, J., Dudareva, N., Nam, K.H., Simon, J. E., et al. (2001), An investigationof the storage and biosynthesis ofphenylpropenes in sweet basil, Plant Physiol.125, 539–555.
26 Guterman, I., Shalit, M., Menda, N., Piestun,D., Dafny-Yelin, M., et al. (2002), Rose scent:Genomics approach to discovering novelfloral fragrance-related genes, Plant Cell 14,2325–2338.
27 Close, T. J., Wanamaker, S., Caldo, R. A.,Turner, S. M., Ashlock, D. A., et al. (2004), Anew resource for cereal genomics: 22k barleygenechip comes of age, Plant Physiol. 134,960–968.
28 Rabbani, M. A., Maruyama, K., Hiroshi, A.,Khan, A., Katsura, K., et al. (2003),Monitoring expression profiles of rice genesunder cold, drought, and high-salinity stresses
and abscisic acid application using cDNAmicroarray and RNA gel-blot analysis, PlantPhysiol. 133, 1755–1767.
29 Hui, D., Iqbal, J., Lehmann, K., Gase, K.,Saluz, H. P., et al. (2003), Molecularinteractions between the specialist herbavoremanduca sexta (lepidoptera, sphingidae) andits natural host Nicotiana attenuata v.Microarray analysis and furthercharacterization of large-scale changes inherbivore-induced mRNAs, Plant Physiol. 131,1877–1893.
30 Maruyama, K., Sakuma, Y., Kasuga, M., Ito,Y., Seki, M., et al. (2004), Identification ofcold-inducible downstream genes of theArabidopsis dreb1a/cfb3 transcription factorusing two microarray systems, Plant J. 38,982–993.
31 Becker, J. D., Boavida, L. C., Carneiro, J.,Haury, M., Feijo, J. A. (2003), Trans-criptional profiling of Arabidopsis tissuesreveals the unique characteristics of thepollen transcriptome, Plant Physiol. 133,713–725.
32 Nakazono, M., Qui, F., Borsuk, L. A.,Schnable, P. S. (2003), Laser-capture micro-dissection, a tool for the global analysis ofgene expression in specific plant cell types:Identification of genes expressed differen-tially in epidermal cells of vascular tissues ofmaize, Plant Cell 15, 583–596.
33 Price, J., Laxmi, A., St Martin, S. K., Jang, J.-C. (2004), Global transcription profilingreveals multiple sugar signal transductionmechanisms in Arabidopsis, Plant Cell 16,2128–2150.
34 Baginsky, S., Gruissem, W. (2004),Chloroplast proteomics: Potentials andchallenges, J. Exp. Bot. 55, 1213–1220.
35 Zhu, W., Schleuter, S. D., Volker, B. (2003),Refined annotation of the Arabidopsis genomeby complete expressed sequence tag mapping,Plant Physiol. 132, 469–484.
36 Koller, A., Washburn, M. P., Lange, B. M.,Andon, N. L., Deciu, C., et al. (2002),Proteomic survey of metabolic pathways inrice, Proc. Nat. Acad. Sci. USA 99,11969–11974.
37 Ferro, M., Salvi, D., Riviere-Rolland, H.,Vermat, T., Seigneurin-Berny, D., et al.(2002), Integral membrane proteins of thechloroplast envelope: Identification andsubcellular localization of new transporters,Proc. Nat. Acad. Sci. USA 99, 11487–11492.
79References
38 Lonosky, P. M., Zhang, X., Honavar, V. G.,Dobbs, D. L., Fu, A., et al. (2004), Aproteomic analysis of maize chloroplastbiogenesis, Plant Physiol. 134, 560–574.
39 Whitelegge, J. P. (2002), Plant proteomics:Blasting out of a mudpit, Proc. Nat. Acad. Sci.USA 99, 11564–11566.
40 Schubert, M., Petersson, U. A., Haas, B. J.,Funk, C., Schroder, W. P., et al. (2002),Proteome map of the chloroplast lumen ofArabidopsis thaliana, J. Biol. Chem. 277,8354–8365.
41 Lee, S., Lee, E. J., Yang, E. J., Lee, J. E., Park,A. R., et al. (2004), Proteomic identification ofannexins, calcium-dependent membranebinding proteins that mediate osmotic stressand abscisic acid signal transduction inArabidopsis, Plant Cell 16, 1378–1391.
42 Kersten, B., Burkle, L., Kuhn, E. J.,Giavalisco, P., Konthur, Z., et al. (2002),Large-scale plant proteomics, Plant Mol. Biol.48, 133–141.
43 De Hoog, C. L., Mann, M. (2004), Proteomics,Annu. Rev. Genomics Hum. Genet. 5, 267–293.
44 Fiehn, O. (2002), Metabolomics – the linkbetween genotypes and phenotypes, PlantMol. Biol. 48, 155–171.
45 Verdonk, J.C., De Vos, C.H.R., Verhoeven,H.A., Haring, M.A., Van Tunen, A.J., et al.(2003), Regulation of floral scent productionin petunia revealed by targeted metabolomics,Phytochemistry 62, 997–1008.
46 Burns, J., Fraser, P.D., and Bramley, P.M.(2003), Identification and quantification ofcarotenoids, tocopherols and chlorophylls incommonly consumed fruits and vegetables.Phytochemistry 62, 939–947.
47 Weckwerth, W. (2003), Metabolomics in systems biology, Annu. Rev. Plant Biol. 54,669–689.
48 Johnson, H. E., Broadhurst, D., Goodacre, R.,Smith, A. R. (2003), Metabolic fingerprintingof salt-stressed tomatoes, Phytochem. 62,919–928.
49 Sumner, L. W., Mendes, P., Dixon, R. A.(2003), Plant metabolomics: Large-scalephytochemistry in the functional genomicsera, Phytochem. 62, 817–836.
50 Weckwerth, W., Wenzel, K., Fiehn, O. (2004),Process for the integrated extractionidentification, and quantification ofmetabolites, proteins and RNA to reveal theirco-regulation in biochemical networks,Proteomics 4, 78–83.
51 Kuiper, H. A., Kok, E. J., Engel, K. H. (2003),Exploitation of molecular profiling techniquesfor GM food safety assessment, Curr. Opin.Biotech. 14, 238–243.
52 Holtorf, H., Guitton, M. C., Reski, R. (2002),Plant functional genomics, Natur-wissenschaften 89, 235–249.
53 Somerville, C. R. (1993), New opportunities todissect and manipulate plant processes, Phil.Trans. Royal Soc. London Series B-Biol. Sci.339, 199–206.
54 Vrebalov, J., Ruezinsky, D., Padmanabhan,V., White, R., Medrano, D., et al. (2002), AMADS-box gene necessary for fruit ripeningat the tomato ripening-inhibitor (rin) locus,Science 296, 343–346.
55 Giovannoni, J. J., Noensie, E. N., Ruezinsky,D. M., Lu, X. H., Tracy, S. L., et al. (1995),Molecular-genetic analysis of the ripening-inhibitor and non-ripening loci of tomato – afirst step in genetic map-based cloning offruit ripening genes, Mol. Gen. Genet. 248,195–206.
56 Krysan, P. J., Young, J. C., Sussman, M. R.(1999), T-DNA as an insertional mutagen inArabidopsis, Plant Cell 11, 2283–2290.
57 Puchta, H. (2002), Gene replacement byhomologous recombination in plants. PlantMol. Biol. 48:173–182.
58 Hanin, M., Paszkowsky, J. (2003), Plantgenome modification by homologousrecombination. Curr. Opin. Plant Biol. 6,157–162.
59 Parinov, S., Sevugan, M., De Ye, Yang, W.-C.,Kumaran, M., et al. (1999), Analysis offlanking sequences from dissociationinsertion lines: A database for reversegenetics in Arabidopsis, Plant Cell 11,2263–2270.
60 Alonso, J. M., Stepanova, A. N., Leisse, T. J.,Kim, C. J., Chen, H., et al. (2003), Genome-wide insertional mutagenesis of Arabidopsisthaliana, Science 301, 653–657
61 Martienssen, R. A. (1998), Functionalgenomics: Probing plant gene function andexpression with transposons, Proc. Nat. Acad.Sci. USA 95, 2021–2026.
62 Waterhouse, P. M., Helliwell, C. A. (2003), Exploring plant genomes by RNA-induced gene silencing. Nat. Rev. Genet.4:29–38.
63 Henikoff, S., Comai, L. (2003), Single-nucleotide mutations for plant functionalgenomics, Annu. Rev. Plant Biol. 54, 375–401.

80 References
64 Henikoff, S., Till, B. J., Comai, L. (2004),TILLING. Traditional mutagenesis meetsfunctional genomics, Plant Physiol. 135,630–636.
65 Newman, T., De Bruijn, F.J., Green, P.,Keegstra, K., Kende, H., et al. (1994), Genesgalore: a summary of methods for accessingresults from large-scale partial sequencing ofanonymous Arabidopsis cDNA clones. PlantPhysiol. 106, 1241–1255.
81
Roger C. Green
4.1
Introduction
4.1.1
The Human Genome Project: Where Are WeNow and Where Are We Going?
On April 14, 2003 the International HumanGenome Sequencing Consortium an-nounced the successful completion of theHuman Genome Project (HGP) more thantwo years ahead of schedule. That monthalso marked the 50th anniversary of thepublication of Watson and Crick’s NobelPrize-winning description of the structureof DNA [1]. This was a modest two-pagereport that ended with the famous under-statement “It has not escaped our noticethat the specific pairing we have postulatedimmediately suggests a possible copyingmechanism for the genetic material”.
The main effort of the Human GenomeProject has been the production of the ref-erence sequence of the human genome.Since the first version of the sequence wascompleted in June 2000, researchersworked to convert the “draft” sequence intoa “finished” sequence which has less thanone error per 10,000 bases. The finishedsequence covers about 99 % of the human
genome’s gene-containing regions. Theonly remaining gaps involve small regionsthat cannot be sequenced with current tech-nology.
4.1.1.1
What Have We Learned?An unexpected finding to emerge from thesequence of the human genome is that weseem to have far fewer protein-codinggenes than previously suspected – approxi-mately 30,000, compared with a figure ofapproximately 100,000 frequently cited pre-viously. In 2002 the draft sequence of themouse genome was published [2]. We canlearn a lot about ourselves by studying themouse – we have approximately the samenumber of genes as the mouse and othermammals, and now know we have only afew thousand more genes than Arabidopsis,a roadside weed. This is a humbling discov-ery [3].
At least 99 % of mouse genes have a cor-responding gene in humans. The proteinsthat are encoded by these genes are oftenvery similar in mice and humans. It istherefore likely that differences in gene orprotein structure alone cannot account forinterspecies differences (or indeed the dif-ferences between individuals of the same
Handbook of Genome Research. Genomics, Proteomics, Metabolomics, Bioinformatics, Ethical and Legal Issues.Edited by Christoph W. SensenCopyright © 2005 WILEY-VCH Verlag GmbH & Co. KGaA, WeinheimISBN: 3-527-31348-6
4Human Genetic Diseases
Verwendete Mac Distiller 5.0.x Joboptions
Dieser Report wurde automatisch mit Hilfe der Adobe Acrobat Distiller Erweiterung "Distiller Secrets v1.0.5" der IMPRESSED GmbH erstellt. Sie koennen diese Startup-Datei für die Distiller Versionen 4.0.5 und 5.0.x kostenlos unter http://www.impressed.de herunterladen. ALLGEMEIN ---------------------------------------- Dateioptionen: Kompatibilität: PDF 1.3 Für schnelle Web-Anzeige optimieren: Ja Piktogramme einbetten: Ja Seiten automatisch drehen: Nein Seiten von: 1 Seiten bis: Alle Seiten Bund: Links Auflösung: [ 2400 2400 ] dpi Papierformat: [ 481 680 ] Punkt KOMPRIMIERUNG ---------------------------------------- Farbbilder: Downsampling: Nein Komprimieren: Ja Komprimierungsart: ZIP Bitanzahl pro Pixel: 8 Bit Graustufenbilder: Downsampling: Nein Komprimieren: Ja Komprimierungsart: ZIP Bitanzahl pro Pixel: 8 Bit Schwarzweiß-Bilder: Downsampling: Nein Komprimieren: Ja Komprimierungsart: CCITT CCITT-Gruppe: 4 Graustufen glätten: Nein Text und Vektorgrafiken komprimieren: Ja SCHRIFTEN ---------------------------------------- Alle Schriften einbetten: Ja Untergruppen aller eingebetteten Schriften: Nein Wenn Einbetten fehlschlägt: Abbrechen Einbetten: Immer einbetten: [ /Courier-BoldOblique /Helvetica-BoldOblique /Courier /Helvetica-Bold /Times-Bold /Courier-Bold /Helvetica /Times-BoldItalic /Times-Roman /ZapfDingbats /Times-Italic /Helvetica-Oblique /Courier-Oblique /Symbol ] Nie einbetten: [ ] FARBE(N) ---------------------------------------- Farbmanagement: Farbumrechnungsmethode: Farbe nicht ändern Methode: Standard Geräteabhängige Daten: Einstellungen für Überdrucken beibehalten: Ja Unterfarbreduktion und Schwarzaufbau beibehalten: Ja Transferfunktionen: Beibehalten Rastereinstellungen beibehalten: Nein ERWEITERT ---------------------------------------- Optionen: Prolog/Epilog verwenden: Nein PostScript-Datei darf Einstellungen überschreiben: Nein Level 2 copypage-Semantik beibehalten: Ja Portable Job Ticket in PDF-Datei speichern: Ja Illustrator-Überdruckmodus: Ja Farbverläufe zu weichen Nuancen konvertieren: Ja ASCII-Format: Nein Document Structuring Conventions (DSC): DSC-Kommentare verarbeiten: Ja DSC-Warnungen protokollieren: Nein Für EPS-Dateien Seitengröße ändern und Grafiken zentrieren: Ja EPS-Info von DSC beibehalten: Ja OPI-Kommentare beibehalten: Nein Dokumentinfo von DSC beibehalten: Ja ANDERE ---------------------------------------- Distiller-Kern Version: 5000 ZIP-Komprimierung verwenden: Ja Optimierungen deaktivieren: Nein Bildspeicher: 524288 Byte Farbbilder glätten: Nein Graustufenbilder glätten: Nein Bilder (< 257 Farben) in indizierten Farbraum konvertieren: Ja sRGB ICC-Profil: sRGB IEC61966-2.1 ENDE DES REPORTS ---------------------------------------- IMPRESSED GmbH Bahrenfelder Chaussee 49 22761 Hamburg, Germany Tel. +49 40 897189-0 Fax +49 40 897189-71 Email: [email protected] Web: www.impressed.de
Adobe Acrobat Distiller 5.0.x Joboption Datei
<< /ColorSettingsFile () /LockDistillerParams true /DetectBlends true /DoThumbnails true /AntiAliasMonoImages false /MonoImageDownsampleType /Bicubic /GrayImageDownsampleType /Bicubic /MaxSubsetPct 100 /MonoImageFilter /CCITTFaxEncode /ColorImageDownsampleThreshold 1.5 /GrayImageFilter /FlateEncode /ColorConversionStrategy /LeaveColorUnchanged /CalGrayProfile (Dot Gain 20%) /ColorImageResolution 300 /UsePrologue false /MonoImageResolution 1200 /ColorImageDepth 8 /sRGBProfile (sRGB IEC61966-2.1) /PreserveOverprintSettings true /CompatibilityLevel 1.3 /UCRandBGInfo /Preserve /EmitDSCWarnings false /CreateJobTicket true /DownsampleMonoImages false /DownsampleColorImages false /MonoImageDict << /K -1 >> /ColorImageDownsampleType /Bicubic /GrayImageDict << /HSamples [ 2 1 1 2 ] /VSamples [ 2 1 1 2 ] /Blend 1 /QFactor 0.9 >> /CalCMYKProfile (U.S. Web Coated (SWOP) v2) /ParseDSCComments true /PreserveEPSInfo true /MonoImageDepth -1 /AutoFilterGrayImages false /SubsetFonts false /GrayACSImageDict << /HSamples [ 2 1 1 2 ] /VSamples [ 2 1 1 2 ] /Blend 1 /QFactor 0.9 >> /ColorImageFilter /FlateEncode /AutoRotatePages /None /PreserveCopyPage true /EncodeMonoImages true /ASCII85EncodePages false /PreserveOPIComments false /NeverEmbed [ ] /ColorImageDict << /HSamples [ 2 1 1 2 ] /VSamples [ 2 1 1 2 ] /Blend 1 /QFactor 0.9 >> /AntiAliasGrayImages false /GrayImageDepth 8 /CannotEmbedFontPolicy /Error /EndPage -1 /TransferFunctionInfo /Preserve /CalRGBProfile (sRGB IEC61966-2.1) /EncodeColorImages true /EncodeGrayImages true /ColorACSImageDict << /HSamples [ 2 1 1 2 ] /VSamples [ 2 1 1 2 ] /Blend 1 /QFactor 0.9 >> /Optimize true /ParseDSCCommentsForDocInfo true /GrayImageDownsampleThreshold 1.5 /MonoImageDownsampleThreshold 1.5 /AutoPositionEPSFiles true /GrayImageResolution 300 /AutoFilterColorImages false /AlwaysEmbed [ /Courier-BoldOblique /Helvetica-BoldOblique /Courier /Helvetica-Bold /Times-Bold /Courier-Bold /Helvetica /Times-BoldItalic /Times-Roman /ZapfDingbats /Times-Italic /Helvetica-Oblique /Courier-Oblique /Symbol ] /ImageMemory 524288 /OPM 1 /DefaultRenderingIntent /Default /EmbedAllFonts true /StartPage 1 /DownsampleGrayImages false /AntiAliasColorImages false /ConvertImagesToIndexed true /PreserveHalftoneInfo false /CompressPages true /Binding /Left >> setdistillerparams << /PageSize [ 595.276 841.890 ] /HWResolution [ 2400 2400 ] >> setpagedevice
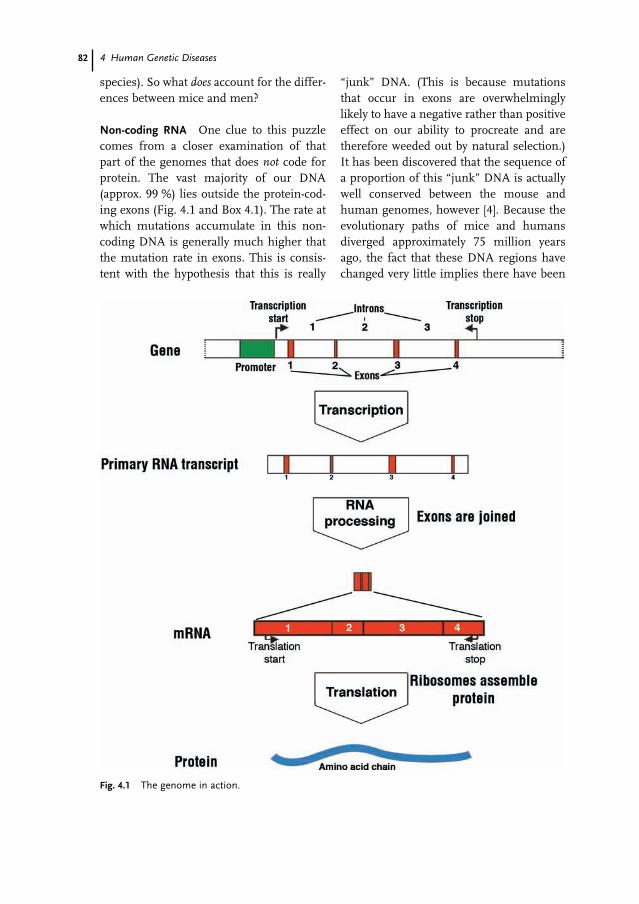
82 4 Human Genetic Diseases
species). So what does account for the differ-ences between mice and men?
Non-coding RNA One clue to this puzzlecomes from a closer examination of thatpart of the genomes that does not code forprotein. The vast majority of our DNA(approx. 99 %) lies outside the protein-cod-ing exons (Fig. 4.1 and Box 4.1). The rate atwhich mutations accumulate in this non-coding DNA is generally much higher thatthe mutation rate in exons. This is consis-tent with the hypothesis that this is really
“junk” DNA. (This is because mutationsthat occur in exons are overwhelminglylikely to have a negative rather than positiveeffect on our ability to procreate and aretherefore weeded out by natural selection.)It has been discovered that the sequence ofa proportion of this “junk” DNA is actuallywell conserved between the mouse andhuman genomes, however [4]. Because theevolutionary paths of mice and humansdiverged approximately 75 million yearsago, the fact that these DNA regions havechanged very little implies there have been
Fig. 4.1 The genome in action.
834.2 Genetic Influences on Human Health
Darwinian selection pressures acting toeliminate mutations in these regions. Inother words, this is not junk DNA after all –it must play an important role.
The conserved nonprotein-coding DNAis found both within introns and in theintergenic DNA [5]. It has been suggestedthat there are tens of thousands of express-ed regions of this type and that non-codingRNA (ncRNA) has a major role in the regu-lation of the expression of the protein-cod-ing genes [4, 6–8]. We know almost nothingabout the function of these RNA genes but,from a human health perspective, it seemsreasonable to assume that if they arerequired for the normal development andfunctioning of human tissues then weshould expect to find diseases associatedwith mutations in these genes. Expect tosee a major effort over the next few years tocharacterize these novel genes and to assesstheir role in maintaining human health.
4.2
Genetic Influences on Human Health
All diseases have a genetic component. Theterm “heritability” is used to define the pro-portion of the causation of a disease – orany other characteristic for that matter –
Box 4.1 What we know about the humangenome
The nuclear genome is about 3 billion bp long.• There are 2 metres of DNA in every
nucleus.• There are 24 distinct chromosomes
– 22 autosomes (arranged in pairs for atotal of 44).
– X chromosome (2 in females, 1 inmales).
• We have about 30,000 protein-codinggenes
• Only 1.5 % of our DNA is in the exons ofprotein-coding genes
• Humans also have tens of thousands ofnon-coding RNA genes.– We have almost no idea of theirfunction.
• The human genome is similar in structureand size to the mouse genome.
• The base sequence of any two humans isabout 99.9 % identical.
• The base sequence of chimpanzee DNA isabout 99 % identical with human DNA.
Box 4.2 Examples of single-gene disorders
Autosomal recessive:
• Cystic fibrosis (CF) is quote common insome populations (1 in 2000 NorthEuropean births). Deficiency of a chloride-transporter protein results in theaccumulation of thick mucus in the lungs;this leads to repeated pulmonaryinfections and eventual pulmonary failure.
• Sickle-cell anemia is a disorder common inindividuals of African heritage.Heterozygous carriers are more resistantto malaria but homozygotes have anabnormal hemoglobin which causes thered blood cells to lyse, especially underconditions of reduced oxygen pressure.
Autosomal dominant:
• Huntington disease is a progressiveneurodegenerative disorder which appearsin mid-life and leads to uncontrolledmovements, loss of intellectual capacity,and emotional disturbance. It is caused byan abnormal increase in a triplet repeatsequence on chromosome 4. There is noeffective treatment. Presymptomatic DNAtesting can show who will develop thedisease later in life, or potentially pass iton to children.
X-linked recessive:
• Duchenne muscular dystrophy is a fairlycommon disorder which, like other X-linked recessive traits, is normallyrestricted to males (1 out of 3500 malebirths). The presence of an abnormalmuscle protein leads to a gradual loss ofmuscle function beginning in infancy.Respiratory failure and pulmonaryinfections usually lead to death before theage of 20.
84 4 Human Genetic Diseases
that has a genetic cause. Traditionally, thestudy of genetics has been focused on dis-eases with a heritability close to 1.0. Theseare the classical inherited (Mendelian) dis-eases which are caused by a mutation in asingle gene that can be vertically transmit-ted from generation to generation. Traitscarried on the autosomes can be dominant– requiring the inheritance of only one copyof the mutant gene – or recessive – when amutated gene must be inherited from bothparents who themselves are usually unaf-fected “carriers”(Box 4.2). Most single-genedefects are rare conditions, but becausethere are several thousand known singlegene disorders their combined incidence isestimated to be approximately 1 in 200births.
4.3
Genomics and Single-gene Defects
The past 15 years have seen major advancesin our understanding of the precise geneticdefects that lead to a large range of single-gene (Mendelian) diseases. The genes andmutations responsible for hundreds ofinherited diseases have been discovered.The genetic basis of many of the more com-mon Mendelian traits has now been eluci-dated – although what is defined as “com-mon” depends very much on the origin ofthe population being studied. There is nowa long list of rare conditions gradually suc-cumbing to the tools of the genomic age.
4.3.1
The Availability of the Genome SequenceHas Changed the Way in which DiseaseGenes Are Identified
The HGP has provided us with the locationand base sequence of most genes, but notall. At this stage however, we still do not
know the function of many genes. From thebase sequence alone we are usually able topredict the amino acid structure of theresulting protein. By comparing the struc-ture of a novel protein to the structure ofknown proteins, we can often make an edu-cated guess about the cellular location andfunctional role of the new protein. Wemight still be ignorant of any role that a par-ticular gene plays in a disease process, how-ever.
By examining the complement of mes-senger RNA (mRNA, Fig. 4.1) produced indifferent tissues, we can determine inwhich range of tissues each gene isexpressed. This can be done by scanningtissue-specific cDNA libraries for specificgene sequences or by using DNA chip tech-nology to examine thousands of genesequences simultaneously [9]. These ap-proaches have greatly facilitated the linkingof genes to diseases. The basic strategy foridentifying the responsible genetic changehas remained largely unaltered and consistsof the steps:
1. Families segregating the disease must beidentified and clinically characterized.
2. Statistical methods are used to identify asmall region of the genome where theoffending gene is located. Such methodsinclude:a. linkage analysisb. linkage disequilibrium mappingc. homozygosity mapping for recessive
traits
3. Searching the genes in the candidateregion for disease-causing mutations.
Although the first two steps remain time-consuming, the third step has been greatlyfacilitated by the knowledge gained fromthe Human Genome Project. For example,the gene responsible for Huntington dis-ease was mapped to the end of chromo-
854.3 Genomics and Single-gene Defects
some 4 in 1983 [10], but it took a further 10years to complete the third step [11]. Nowhowever, when the genetic locus has beenidentified, it can take only a matter of weeksto complete the identification of the gene.
In the pre-genomic era, researcherswould have to painstakingly construct theirown “physical maps” of the candidateregion. This entailed separating and clon-ing hundreds of individual pieces of DNAand could take several years of work.Nowadays the same or better informationcan be obtained with a few “mouse clicks”.As a result, it has been estimated that thecost of cloning (identifying) a single dis-ease-associated gene has dropped from sev-eral million dollars in the early days toapproximately $100,000 today [12].
4.3.1.1
Positional Candidate Gene ApproachWe now have a list – although just howcomplete is still not clear – of all the geneslocated within a candidate region and weknow their “normal” (reference) sequence.As we gain more insight into the functionof these genes, and in which tissues theyare expressed, we are able to select thosethat might plausibly be involved in the dis-ease process we are studying. Eventuallythe gene from an affected person must besequenced and compared with the refer-ence sequence of that gene. If a differencewhich would alter protein function isfound, it must be established that everyaffected person in the family carries thesame mutation, and that the mutation isnot found in unaffected members of thefamily nor in the general population. Thiscombination of genetic mapping followedby examination of candidate genes withinthe region is known as the “positional can-didate” method of locating disease genes.
Occasionally we still discover a gene thathas not previously been recognized by anal-
ysis of the human genome sequence. Forinstance, a gene responsible for hereditarysensory and autonomic neuropathy wasrecently mapped to a fairly small region(just over a million base pairs) of chromo-some 12 which was thought to containseven genes. No disease-causing mutationcould be found in any of these genes, how-ever. Subsequently a novel single-exongene, now termed HSN2, was found, hid-ing within an intron of one of the sevenknown genes [13]. The protein encoded bythis gene bears no resemblance to any otherknown protein.
4.3.1.2
Direct Analysis of Candidate GenesThe main drawback to the positional candi-date method is that it still relies on sometype of preliminary genetic mapping usingfamilies that have a particular disease. Thismapping process is very time-consumingand thus expensive, because it involves col-lecting data from many family membersand accessing hospital records and otherinformation sources. As we develop moreinformation about the human genome, andas technological advances in sequence-iden-tification continue, we might be able tojump past the mapping step altogether inmany cases. We now know the DNAsequence of most genes. We will graduallygain an understanding of the functional sig-nificance of most of these genes. We willhave information about variations in theDNA sequences of the genes within definedpopulations. We will know in which tissues,and possibly under what circumstances,these genes are expressed to produce pro-teins. With this additional information, andwith some knowledge of the underlyingpathophysiology of the disease, it will bepossible to identify the candidate genesmost likely to be involved in a genetic dis-ease. The DNA of candidate genes from
86 4 Human Genetic Diseases
affected patients will then be sequenced tolook for evidence of mutations. With furtherimprovements in DNA sequencing technol-ogy, including use of gene-chip micro-arrays, it will be possible to scan hundredsof candidate genes in a relatively short time.Thus from a number of candidates, one ormore disease-associated genes will be iden-tified. Successes using this approach havealready been published [14, 15].
4.3.2
Applications in Human Health
The discovery of the genetic basis of a dis-ease has several consequences. One that hasimmediate application is the provision ofDNA-based diagnosis and risk assessment.
4.3.2.1
Genetic TestingAs soon as a causative mutation has beendiscovered it is possible to design a simpletest that can detect the presence of thismutation in DNA obtained from a bloodsample or from other tissue. The purpose ofgenetic testing is usually to identify carriersof genetic defects that could predispose thecarrier, or the carrier’s children, to an inher-ited disease. (Less commonly, DNA testingis used to help make a clinical diagnosis, forinstance in sickle-cell disease, hemochro-matosis, or cystic fibrosis.) There are manypossible reasons for conducting a genetictest. For dominant traits it might be to pre-dict who might be susceptible to a diseaselater in life, so that the appropriate interven-tions can take place to prevent or amelioratethe condition. Such interventions mighttake the form of clinical screening pro-grams to detect the disease at an earlystage [16], of prophylactic surgery, or ofpharmaceutical intervention [17, 18]. Forrecessive traits, carrier screening is con-ducted to determine if a couple is at risk of
bearing an affected child, or to determineprenatally the genotype of the fetus. Forconditions in which there is no effectiveintervention, for example Huntington dis-ease, the demand for genetic testing is com-paratively low.
A major obstacle to implementation ofgenetic testing is the occurrence of geneticheterogeneity. An inherited disease canoften be caused by a mutation in any of sev-eral different genes (locus heterogeneity)and usually there will be a large number ofdifferent possible mutations in each gene(allelic heterogeneity). There are also sever-al difficult ethical, social, and legal issuessurrounding the subject of genetic test-ing [19, 20]. Further complications arise ifconsidering testing large groups of the pop-ulation (population screening) [21].
Locus Heterogeneity The extreme exampleof locus heterogeneity is retinitis pigmento-sa, which is a progressive eye disease thatleads to loss of vision. The pattern of inher-itance can be dominant, recessive, or sex-linked. More that 35 chromosomal regionshave been linked to this disease and 30genes have already been identified [22].
Locus heterogeneity often results from adefect in a biochemical pathway thatrequires several different proteins to func-tion properly. Thus a mutation in any oneof several genes has the potential to disruptthe pathway and produce the same diseasephenotype. For example, the most commoninherited form of cancer, hereditary nonpolyposis colon cancer (HNPCC), resultsfrom a defect in one of the DNA-repairsystems within the cell. Several differentproteins are required for this specific repairmechanism to work correctly. It is knownthat HNPCC can result from a mutation inat least five of these proteins, yet the clinicalfeatures are similar in all families [23, 24],so the particular gene involved in each fam-
874.4 Genomics and Polygenic Diseases
ily must be identified before testing is pos-sible.
Allelic Heterogeneity Sickle-cell anemiawas one of the first inherited diseases inwhich the molecular basis was discovered, amutation in the â subunit of hemoglo-bin [25] (Box 4.2). It was subsequentlyfound that a single DNA mutation wasresponsible for virtually all cases, and thatdetection of this mutation could be used toidentify carriers of the sickle-cell trait.Sickle-cell disease seems exceptional in thisregard, however, and there will usually bemany different mutations found in eachgene (allelic heterogeneity). In practice, thismeans that each family could potentiallyhave a different mutation and that the pre-cise mutation in the family must be deter-mined before DNA-based testing can beimplemented. Sometimes a “foundereffect” can be observed in which severalaffected families within a particular region,or possibly in diverse regions, have thesame mutation by virtue of sharing a com-mon ancestor [26–28].
4.3.3
Gene Therapy
As soon as scientists realized that a defec-tive gene could cause a disease, they beganto speculate about the possibility of fixingthe broken gene. About 15 years ago, whenwe actually began to identify and sequencedisease-associated genes, predictions weremade that we would see some kind of genetherapy within several years. This proved tobe wishful thinking. Despite choosing dis-eases where we had a good understandingof the underlying pathophysiology andwhere we could access the critical cell or tis-sue, there have been few real advances ingene therapy of inherited diseases. After adecade of unsuccessful attempts to cure
one form of severe combined immunodefi-ciency disease by using gene therapy,researchers apparently achieved success intreating another genetic type of the samedisease [29, 30]. Sadly however, within a fewyears, two of the ten children treated devel-oped leukemia-like disease [31]. Insertingthe new gene into the patients’ owngenomes had activated a cancer-causinggene that was located nearby. This setbackand the earlier death of another patient in agene-therapy trial [32] has led to a decline ingene-therapy research. Thus treatment ofdefective genes still lies some indetermin-able time in the future. More promisinghowever is the prospect of treating non-inherited diseases using genetic material asthe therapeutic agent [33, 34].
4.4
Genomics and Polygenic Diseases
The terms “polygenic”, “multifactorial” and“complex” are used somewhat interchange-ably to describe diseases that involve chang-es to more than one gene and that, in mostcases, also involve non-genetic (environ-mental) factors. Most of the common dis-eases that afflict the human species can beso classified. The success of the HGP willhave a much greater impact on the elucida-tion of the etiology of common multifactori-al diseases than it will on that of the mono-genic diseases. Sorting out the genetic fac-tors involved in common complex disorderssuch as schizophrenia, obesity, or diabetes,remains a challenging proposition. For anymultifactorial disease we are faced with theneed to identify multiple genes, each pos-sibly having only a small effect on the out-come. It is the combination of mutations inseveral genes – coupled with environmentalfactors – that is responsible for the onset ofthe disease. Indeed even the term “muta-
88 4 Human Genetic Diseases
tion” might not be appropriate to describethe genetic variations involved. Whereas themutation in single-gene diseases often has aprofound effect on the function of theencoded protein and is rare in the generalpopulation, it is likely that the “mutations”in the polygenic diseases will be found toresult in much more subtle changes in pro-tein function and to be much more com-mon. We should, perhaps, use instead theterm “polymorphisms” to describe thesevariations in gene structure. The effects ofthese polymorphic variants on protein func-tion will usually be quantitative rather thanqualitative – for example the binding coeffi-cient of an enzyme–substrate complex orthe affinity of a growth factor for a receptormight be affected.
Offshoots of the HGP might also begin toclarify the role which the variable pene-trance of genetic variants seems to play inthe elusive relationship between genotypeand phenotype in multifactorial diseases.The penetrance of a genetic variant can bedefined as the proportion of individualswho carry such a variant for which a changein phenotype is actually observed. For themutations involved in Mendelian traits thepenetrance is usually high, sometimesapproaching 100 %. In complex diseases,however, the penetrance of any one variant,in isolation, might be low. It has becomeapparent that linkage studies have lowpower to map genes with low penetrance,even for Mendelian traits, and this problemwould be much more serious if attemptingto map genes involved in complex traits byusing linkage analysis.
An alternative method of detecting specif-ic genetic risk factors is by means of associ-ation studies. These studies measure theoccurrence of specific genetic variants inaffected patients and in an unaffected con-trol group. Association studies can be per-formed in several ways.
4.4.1
Candidate Genes and their Variants
The conceptually simplest approach to con-ducting association studies (the “directapproach”) entails testing affected and con-trol populations for the frequency of a spe-cific gene variant which is postulated to bedirectly involved in the disease process. Ifthe variant occurs in the patient populationat a significantly higher frequency one caninfer that this particular genetic variant con-tributes to the onset of the disease. Theopposite may also be true – some variantsmight be protective.
The genome sequences from two individ-uals selected at random from the worldwidepopulation differ by about 0.1 % (1 variantper 1000 bases on average) [35]. The mostcommon type of variation is substitution ofa single base with a different one. It is esti-mated there are more than 10 million suchvariant sites (called single nucleotide poly-morphisms, SNPs) within the humangenome where the rarer allele (variant)occurs at a frequency of at least 1 % in thegeneral population [36, 37]. There will bevery many more alleles that are rarer (lessthan 1 % in the population) but because oftheir rarity, it is unlikely these will have asignificant role in the etiology of commondiseases. It has, however, been estimatedthat out of these ten million SNPs onlyabout 50,000 are likely to result in alteredprotein structure [37]. These are referred toas cSNPs (coding SNPs) and are found inonly the 1.5 % of the genome that forms theexons (Fig. 4.1). The vast majority of SNPsoccur in introns or intergenic regions of thegenome where they are, for the most part,not subject to evolutionary selective pres-sure. There will still be SNPs that occur inregulatory regions that do not alter proteinstructure but which might have a quantita-tive effect on protein expression. These
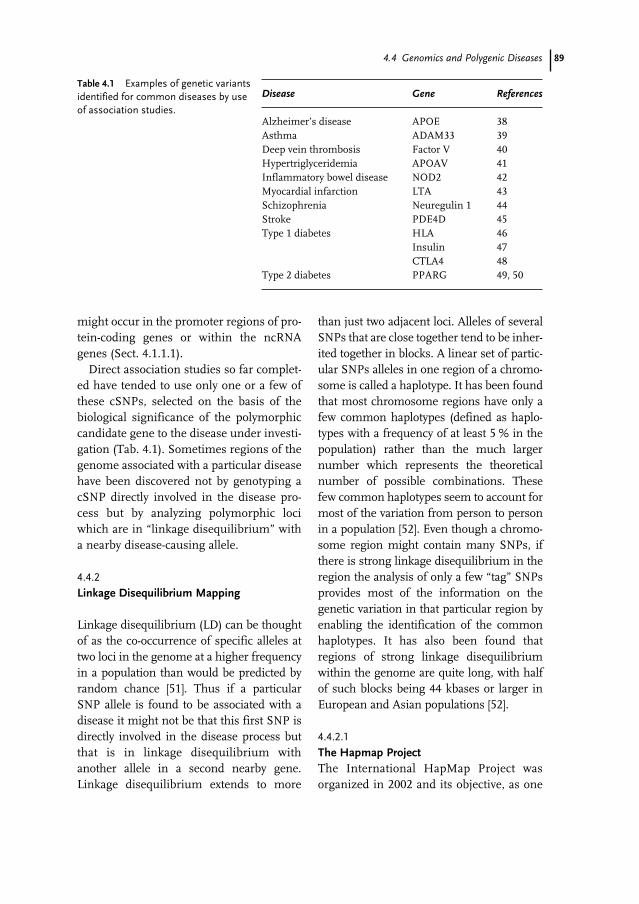
894.4 Genomics and Polygenic Diseases
might occur in the promoter regions of pro-tein-coding genes or within the ncRNAgenes (Sect. 4.1.1.1).
Direct association studies so far complet-ed have tended to use only one or a few ofthese cSNPs, selected on the basis of thebiological significance of the polymorphiccandidate gene to the disease under investi-gation (Tab. 4.1). Sometimes regions of thegenome associated with a particular diseasehave been discovered not by genotyping acSNP directly involved in the disease pro-cess but by analyzing polymorphic lociwhich are in “linkage disequilibrium” witha nearby disease-causing allele.
4.4.2
Linkage Disequilibrium Mapping
Linkage disequilibrium (LD) can be thoughtof as the co-occurrence of specific alleles attwo loci in the genome at a higher frequencyin a population than would be predicted byrandom chance [51]. Thus if a particularSNP allele is found to be associated with adisease it might not be that this first SNP isdirectly involved in the disease process butthat is in linkage disequilibrium withanother allele in a second nearby gene.Linkage disequilibrium extends to more
than just two adjacent loci. Alleles of severalSNPs that are close together tend to be inher-ited together in blocks. A linear set of partic-ular SNPs alleles in one region of a chromo-some is called a haplotype. It has been foundthat most chromosome regions have only afew common haplotypes (defined as haplo-types with a frequency of at least 5 % in thepopulation) rather than the much largernumber which represents the theoreticalnumber of possible combinations. Thesefew common haplotypes seem to account formost of the variation from person to personin a population [52]. Even though a chromo-some region might contain many SNPs, ifthere is strong linkage disequilibrium in theregion the analysis of only a few “tag” SNPsprovides most of the information on thegenetic variation in that particular region byenabling the identification of the commonhaplotypes. It has also been found thatregions of strong linkage disequilibriumwithin the genome are quite long, with halfof such blocks being 44 kbases or larger inEuropean and Asian populations [52].
4.4.2.1
The Hapmap ProjectThe International HapMap Project wasorganized in 2002 and its objective, as one
Disease Gene References
Alzheimer’s disease APOE 38Asthma ADAM33 39Deep vein thrombosis Factor V 40Hypertriglyceridemia APOAV 41Inflammatory bowel disease NOD2 42Myocardial infarction LTA 43Schizophrenia Neuregulin 1 44Stroke PDE4D 45Type 1 diabetes HLA 46
Insulin 47CTLA4 48
Type 2 diabetes PPARG 49, 50
Table 4.1 Examples of genetic variantsidentified for common diseases by useof association studies.
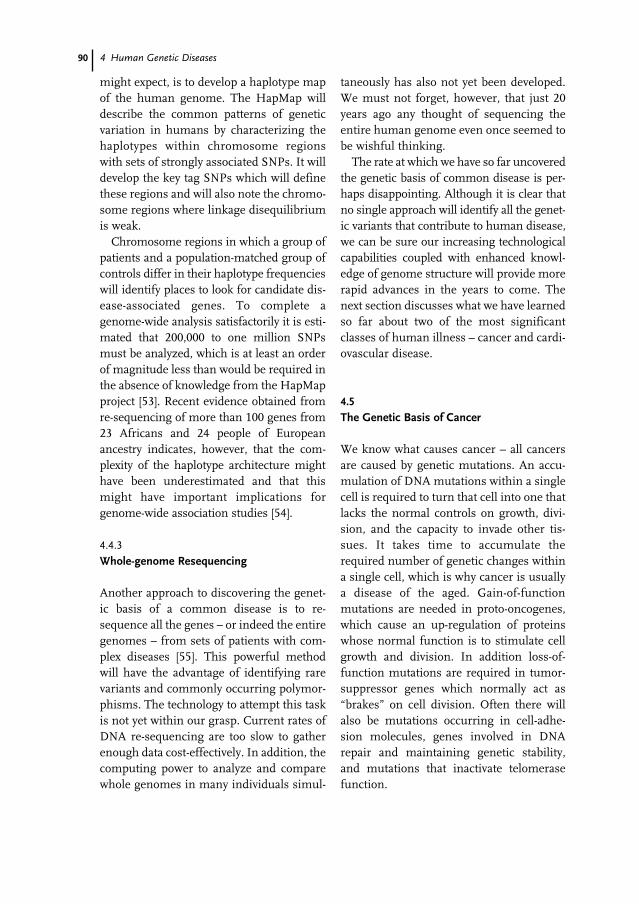
90 4 Human Genetic Diseases
might expect, is to develop a haplotype mapof the human genome. The HapMap willdescribe the common patterns of geneticvariation in humans by characterizing thehaplotypes within chromosome regionswith sets of strongly associated SNPs. It willdevelop the key tag SNPs which will definethese regions and will also note the chromo-some regions where linkage disequilibriumis weak.
Chromosome regions in which a group ofpatients and a population-matched group ofcontrols differ in their haplotype frequencieswill identify places to look for candidate dis-ease-associated genes. To complete agenome-wide analysis satisfactorily it is esti-mated that 200,000 to one million SNPsmust be analyzed, which is at least an orderof magnitude less than would be required inthe absence of knowledge from the HapMapproject [53]. Recent evidence obtained fromre-sequencing of more than 100 genes from23 Africans and 24 people of Europeanancestry indicates, however, that the com-plexity of the haplotype architecture mighthave been underestimated and that thismight have important implications forgenome-wide association studies [54].
4.4.3
Whole-genome Resequencing
Another approach to discovering the genet-ic basis of a common disease is to re-sequence all the genes – or indeed the entiregenomes – from sets of patients with com-plex diseases [55]. This powerful methodwill have the advantage of identifying rarevariants and commonly occurring polymor-phisms. The technology to attempt this taskis not yet within our grasp. Current rates ofDNA re-sequencing are too slow to gatherenough data cost-effectively. In addition, thecomputing power to analyze and comparewhole genomes in many individuals simul-
taneously has also not yet been developed.We must not forget, however, that just 20years ago any thought of sequencing theentire human genome even once seemed tobe wishful thinking.
The rate at which we have so far uncoveredthe genetic basis of common disease is per-haps disappointing. Although it is clear thatno single approach will identify all the genet-ic variants that contribute to human disease,we can be sure our increasing technologicalcapabilities coupled with enhanced knowl-edge of genome structure will provide morerapid advances in the years to come. Thenext section discusses what we have learnedso far about two of the most significantclasses of human illness – cancer and cardi-ovascular disease.
4.5
The Genetic Basis of Cancer
We know what causes cancer – all cancersare caused by genetic mutations. An accu-mulation of DNA mutations within a singlecell is required to turn that cell into one thatlacks the normal controls on growth, divi-sion, and the capacity to invade other tis-sues. It takes time to accumulate therequired number of genetic changes withina single cell, which is why cancer is usuallya disease of the aged. Gain-of-functionmutations are needed in proto-oncogenes,which cause an up-regulation of proteinswhose normal function is to stimulate cellgrowth and division. In addition loss-of-function mutations are required in tumor-suppressor genes which normally act as“brakes” on cell division. Often there willalso be mutations occurring in cell-adhe-sion molecules, genes involved in DNArepair and maintaining genetic stability,and mutations that inactivate telomerasefunction.
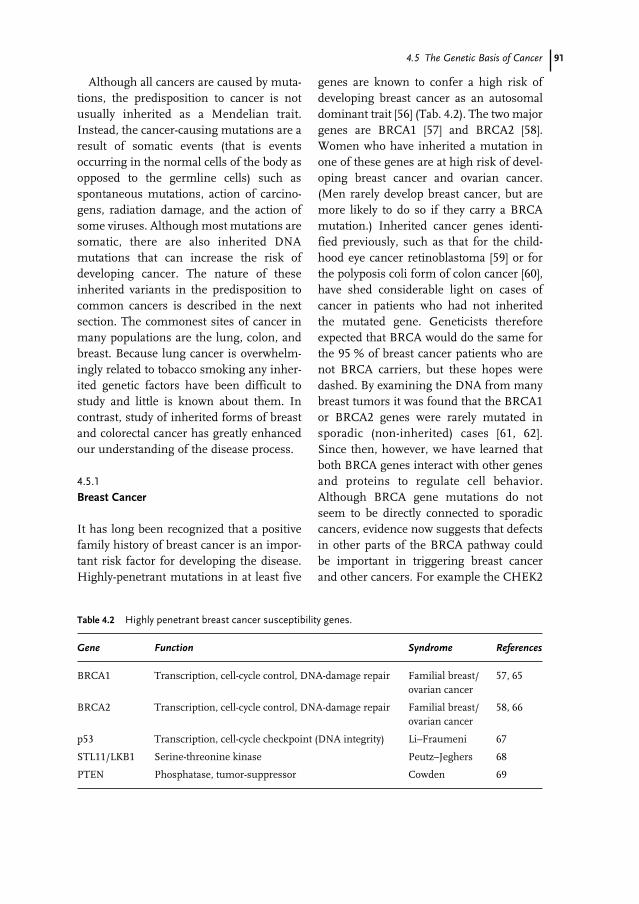
914.5 The Genetic Basis of Cancer
Although all cancers are caused by muta-tions, the predisposition to cancer is notusually inherited as a Mendelian trait.Instead, the cancer-causing mutations are aresult of somatic events (that is eventsoccurring in the normal cells of the body asopposed to the germline cells) such asspontaneous mutations, action of carcino-gens, radiation damage, and the action ofsome viruses. Although most mutations aresomatic, there are also inherited DNAmutations that can increase the risk ofdeveloping cancer. The nature of theseinherited variants in the predisposition tocommon cancers is described in the nextsection. The commonest sites of cancer inmany populations are the lung, colon, andbreast. Because lung cancer is overwhelm-ingly related to tobacco smoking any inher-ited genetic factors have been difficult tostudy and little is known about them. Incontrast, study of inherited forms of breastand colorectal cancer has greatly enhancedour understanding of the disease process.
4.5.1
Breast Cancer
It has long been recognized that a positivefamily history of breast cancer is an impor-tant risk factor for developing the disease.Highly-penetrant mutations in at least five
genes are known to confer a high risk ofdeveloping breast cancer as an autosomaldominant trait [56] (Tab. 4.2). The two majorgenes are BRCA1 [57] and BRCA2 [58].Women who have inherited a mutation inone of these genes are at high risk of devel-oping breast cancer and ovarian cancer.(Men rarely develop breast cancer, but aremore likely to do so if they carry a BRCAmutation.) Inherited cancer genes identi-fied previously, such as that for the child-hood eye cancer retinoblastoma [59] or forthe polyposis coli form of colon cancer [60],have shed considerable light on cases ofcancer in patients who had not inheritedthe mutated gene. Geneticists thereforeexpected that BRCA would do the same forthe 95 % of breast cancer patients who arenot BRCA carriers, but these hopes weredashed. By examining the DNA from manybreast tumors it was found that the BRCA1or BRCA2 genes were rarely mutated insporadic (non-inherited) cases [61, 62].Since then, however, we have learned thatboth BRCA genes interact with other genesand proteins to regulate cell behavior.Although BRCA gene mutations do notseem to be directly connected to sporadiccancers, evidence now suggests that defectsin other parts of the BRCA pathway couldbe important in triggering breast cancerand other cancers. For example the CHEK2
Table 4.2 Highly penetrant breast cancer susceptibility genes.
Gene Function Syndrome References
BRCA1 Transcription, cell-cycle control, DNA-damage repair Familial breast/ 57, 65ovarian cancer
BRCA2 Transcription, cell-cycle control, DNA-damage repair Familial breast/ 58, 66ovarian cancer
p53 Transcription, cell-cycle checkpoint (DNA integrity) Li–Fraumeni 67
STL11/LKB1 Serine-threonine kinase Peutz–Jeghers 68
PTEN Phosphatase, tumor-suppressor Cowden 69
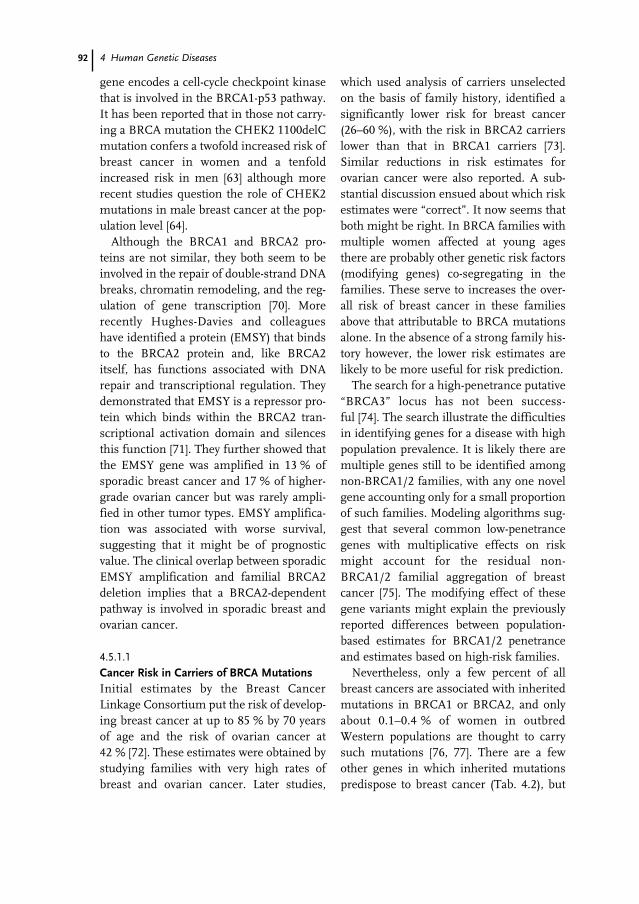
92 4 Human Genetic Diseases
gene encodes a cell-cycle checkpoint kinasethat is involved in the BRCA1-p53 pathway.It has been reported that in those not carry-ing a BRCA mutation the CHEK2 1100delCmutation confers a twofold increased risk ofbreast cancer in women and a tenfoldincreased risk in men [63] although morerecent studies question the role of CHEK2mutations in male breast cancer at the pop-ulation level [64].
Although the BRCA1 and BRCA2 pro-teins are not similar, they both seem to beinvolved in the repair of double-strand DNAbreaks, chromatin remodeling, and the reg-ulation of gene transcription [70]. Morerecently Hughes-Davies and colleagueshave identified a protein (EMSY) that bindsto the BRCA2 protein and, like BRCA2itself, has functions associated with DNArepair and transcriptional regulation. Theydemonstrated that EMSY is a repressor pro-tein which binds within the BRCA2 tran-scriptional activation domain and silencesthis function [71]. They further showed thatthe EMSY gene was amplified in 13 % ofsporadic breast cancer and 17 % of higher-grade ovarian cancer but was rarely ampli-fied in other tumor types. EMSY amplifica-tion was associated with worse survival,suggesting that it might be of prognosticvalue. The clinical overlap between sporadicEMSY amplification and familial BRCA2deletion implies that a BRCA2-dependentpathway is involved in sporadic breast andovarian cancer.
4.5.1.1
Cancer Risk in Carriers of BRCA MutationsInitial estimates by the Breast CancerLinkage Consortium put the risk of develop-ing breast cancer at up to 85 % by 70 yearsof age and the risk of ovarian cancer at42 % [72]. These estimates were obtained bystudying families with very high rates ofbreast and ovarian cancer. Later studies,
which used analysis of carriers unselectedon the basis of family history, identified asignificantly lower risk for breast cancer(26–60 %), with the risk in BRCA2 carrierslower than that in BRCA1 carriers [73].Similar reductions in risk estimates forovarian cancer were also reported. A sub-stantial discussion ensued about which riskestimates were “correct”. It now seems thatboth might be right. In BRCA families withmultiple women affected at young agesthere are probably other genetic risk factors(modifying genes) co-segregating in thefamilies. These serve to increases the over-all risk of breast cancer in these familiesabove that attributable to BRCA mutationsalone. In the absence of a strong family his-tory however, the lower risk estimates arelikely to be more useful for risk prediction.
The search for a high-penetrance putative“BRCA3” locus has not been success-ful [74]. The search illustrate the difficultiesin identifying genes for a disease with highpopulation prevalence. It is likely there aremultiple genes still to be identified amongnon-BRCA1/2 families, with any one novelgene accounting only for a small proportionof such families. Modeling algorithms sug-gest that several common low-penetrancegenes with multiplicative effects on riskmight account for the residual non-BRCA1/2 familial aggregation of breastcancer [75]. The modifying effect of thesegene variants might explain the previouslyreported differences between population-based estimates for BRCA1/2 penetranceand estimates based on high-risk families.
Nevertheless, only a few percent of allbreast cancers are associated with inheritedmutations in BRCA1 or BRCA2, and onlyabout 0.1–0.4 % of women in outbredWestern populations are thought to carrysuch mutations [76, 77]. There are a fewother genes in which inherited mutationspredispose to breast cancer (Tab. 4.2), but
934.5 The Genetic Basis of Cancer
these are much rarer still than families withBRCA mutations. But even if BRCA car-riers are excluded, family history still seemsa very significant risk factor. This meansthat the bulk of genetic variation respon-sible for breast cancer remains to beexplained.
4.5.2
Colon Cancer
There are two well-characterized inheritedcolon cancer syndromes that have madesignificant contributions to our under-standing of colorectal carcinogenesis –familial adenomatous polyposis (FAP),linked to mutations in the APC gene, andhereditary non-polyposis colorectal cancer(HNPCC), which is caused by mutations inone of a number of DNA mismatch repairgenes.
4.5.2.1
Familial Adenomatous PolyposisFamilial adenomatous polyposis (alsoknown as adenomatous polyposis coli) is asyndrome characterized by the occurrenceof multiple – typically more than one hun-dred – adenomatous polyps in the distalregion of the large bowel. These adenomasare pre-malignant neoplasms, one or moreof which invariably progresses into a carci-noma. The trait is inherited in a dominantpattern and the average age at diagnosis ofcolon cancer is in the forties. The polyposisphenotype is easily recognized by sigmoi-doscopy and the penetrance is close to100 %. An atypical or attenuated phenotype(AFAP) is characterized by a smaller andvariable number of polyps, later age at diag-nosis, proximal location in the colon, andreduced penetrance. The attenuated type ismore difficult to diagnose. The APC genewas identified in 1991 [78] and encodes atumor-suppressor protein. Although famil-
ial adenomatous polyposis accounts for lessthan 1 % of all colon tumors, it quicklybecame apparent that the APC gene had acentral role to play in carcinogenesis in gen-eral and in the development of colorectalcarcinoma in particular. Mutations in theAPC gene are found in about 80 % of allcolorectal tumors [79], in about 60 % of ade-nomatous polyps [80] and are early eventsin tumorigenesis [80]. Mutations of APCare also found in tumors occurring at manyother anatomic sites, for example stom-ach [81] and breast [82], but generally at alower frequency than found in colontumors. The APC protein is involved incytoskeletal remodeling, cell–cell adhesionand cell migration [24]. It acts to regulatelevels of â-catenin through the Wnt-signal-ling pathway [83]. The occurrence of APCmutations is a key element in one of themajor models for tumorigenesis, the chro-mosomal instability (CIN) pathway. CINtumors account for about 85 % of all coloncancer and are characterized by abnormal-ities in chromosome number and structure.It is believed the APC protein is importantin the function of the mitotic spindle, whichis derived from elements of the cytoskele-ton. Any derangement of chromosome-spindle interaction has the potential to leadto mis-segregation of the chromosomes andhence to aneuploidy.
4.5.2.2
Hereditary Non-polyposis Colon CancerHereditary non-polyposis colon cancer(HNPCC) is considerably more commonthan FAP but probably accounts for lessthan 5 % of colon tumors. It is probablyunder-diagnosed, because there is nopathognomonic feature and diagnosisdepends on having a significant multi-generation history of colon or othertumors [23]. Other anatomic sites frequent-ly involved include the uterine endometri-
94 4 Human Genetic Diseases
um, stomach, ovary, the renal pelvis, andureter [84]. HNPCC is caused by inheritedmutations in one of a number of mismatchrepair (MMR) genes which code for pro-teins whose function is to repair base-mis-matches in DNA, especially those occurringin regions of simple repeats (mono- or di-nucleotide repeats) [85]. Loss of MMR func-tion leads to a higher rate of accumulationof mutations in other genes which thenleads to carcinogenesis. Tumors fromHNPCC patients are characterized byinstability of their DNA in simple repeats.This is referred to as microsatellite instabil-ity (MSI). MSI is also observed in about15 % of sporadic colon tumors. In most ofthese cases MMR function is lost because ofepigenetic (not inherited) methylation ofthe promoter region of MLH1 which leadsto silencing of the MLH1 gene [86]. Intumors exhibiting MSI a number of geneshave been identified as key targets for muta-tion in their microsatellite regions. Theseinclude the transforming growth factorreceptor type 2 (TGFâRII) [87], insulin-likegrowth factor II receptor (IGFIIR) [88], theantiapoptotic gene Bax [89], the cell-cycleregulator E2F2 [88], and others [24, 90].Mutations in these genes are involved in theprogression of tumorigenesis initiated bydefects in the mismatch repair pathway.
The microsatellite instability (MSI) path-way characterizes approximately 15 % of allcolon tumors and is distinct from the chro-mosomal instability (CIN) pathway whichinvolves APC mutations and is involved inmost colon cancer.
4.5.2.3
Modifier Genes in Colorectal CancerAnalysis of cohorts of twins reveals a rela-tively large effect of heritability for severalforms of cancer (prostate, colorectal, andbreast) suggesting that our current knowl-edge of cancer genetics is limited [76]. This
effect is probably because of a combinationof low-penetrance tumor susceptibilitygenes which are relatively common in thepopulation and might confer a much high-er attributable risk in the general popula-tion than rare mutations in high-pene-trance cancer-susceptibility genes such asBRCA1/2, APC, and the HNPCC genes.The search for these genes is ongoing butsignificant progress might not be achieveduntil large-scale genome-wide associationstudies are conducted as described inSect. 4.4. An example of the results achiev-able can be seen in the combined results ofseveral studies into the role of variants ofthe type 1 TGFâ receptor (TGFBR1). Asindicated in Sect. 4.5.2.2, the TGFâ pathwayhas been implicated in the development ofcolon cancer. Several studies have demon-strated a variant of the TGFBR1 gene whichis seen at increased frequency in a varietycancer patients compared with healthy con-trols. Combined analysis of 12 studiesshows that carriers of the TGFBR1*6A var-iant have a 38 % increased risk of breastcancer, a 41 % increased risk of ovarian can-cer, and a 20 % increased risk of colorectalcancer [91, 92].
4.6
Genetics of Cardiovascular Disease
Cardiovascular disease is the leading causeof morbidity and mortality in most westerncountries. In the United States cardiovascu-lar disease accounts for 39 % of all dea-ths [93]. Although environmental and life-style factors are of major importance in thedevelopment of cardiovascular diseasethere is also a wealth of evidence in supportof a significant genetic component.Understanding the basis whereby a muta-tion in a single gene can cause disease hasappreciably increased our understanding of
954.6 Genetics of Cardiovascular Disease
the pathophysiology of the more commoncomplex cardiovacular diseases.
4.6.1
Monogenic Disorders
4.6.1.1
HypercholesterolemiaElevated low-density lipoprotein (LDL) cho-lesterol is a well-established risk factor forcoronary heart disease. Five monogenic dis-eases leading to hypercholesterolemia havebeen described [94]. The most commontype of familial hypercholesterolemia iscaused by mutation of the LDL receptorgene (LDLR) [95]. The LDL receptor is locat-ed on the surface of a number of cell typesand is important in removing LDL from thecirculation. Individuals inheriting onemutant LDLR gene have total plasma cho-lesterol in the range of 8.7–10 mmol L–1
(desirable level is <5 mmol L–1) and are atsignificantly increased risk of heart disease.Those homozygous for a mutation (twomutant copies) can have cholesterol levelsof 17–30 mmol L–1 and usually have severeatherosclerosis and die in late child-hood [96].
“Familial ligand-defective apolipoproteinB-100 disease” is clinically similar to LDLR-associated familial hypercholesterolemia.Apolipoprotein B-100 is the major proteinfound in LDL and specific mutations in theapo-B protein prevent LDL from binding toLDL receptors and thus elevate LDL choles-terol [97].
4.6.1.2
HypertensionHypertension is another major risk factorin heart disease and stroke. Elevated bloodpressure is highly prevalent in the generalpopulation. Multiple environmental andgenetic factors are involved in the etiologyof hypertension but rare inherited forms of
the disease have been informative. Geneticstudies have identified mutations in eightgenes that cause Mendelian forms of hyper-tension. Given the diverse physiologicalmechanisms for regulating blood pressureit is surprising that all the genes identifiedso far are involved in the renal salt-re-absorption pathway, including genes forglucocorticoid metabolism, glucocorticoidreceptors, and renal ion channels [98].
4.6.1.3
Clotting FactorsGenetic factors affecting blood clotting havebeen studied and a number of prothrombicgene polymorphisms have been descri-bed [99, 100]. The significance of some ofthese variants is still under debate, but aprothrombin variant and a variant of clot-ting factor V (factor V Leiden) are risk fac-tors for venous thrombosis. Factor V Leidenis the most common hereditary blood coag-ulation disorder in the United States and ispresent in 5 % of the Caucasian popula-tion [101]. Factor V Leiden increases therisk of venous thrombosis 3–8-fold for het-erozygous and 30–140-fold for homozygousindividuals [102].
4.6.1.4
Hypertrophic CardiomyopathyHypertrophic cardiomyopathy (HCM) is arelatively common genetic disease, with aprevalence of about 1 in 500 [103], and is animportant cause of disability and death inpatients of all ages, especially sudden car-diac death in young adults. It is inherited asa Mendelian autosomal dominant trait andis caused by mutations in any one of elevengenes, each encoding a protein of the car-diac sarcomere involved in muscle contrac-tion. Three genes are the most commonlyaffected: myosin heavy chain, cardiac tropo-nin T and myosin-binding protein C [104].
96 4 Human Genetic Diseases
4.6.1.5
Familial Dilated CardiomyopathyDilated cardiomyopathy (DCM) is a majorcause of morbidity and mortality and is themost common cause of congestive heartfailure and reason for heart transplant.Familial DCM accounts for more than athird of DCM cases and is clinically andgenetically heterogeneous with a prevalenceof approximately 40 per 100,000 [105, 106].Autosomal dominant DCM is the mostcommon form. Numerous genetic loci havebeen implicated and it seems that DCMresults from mutations that affect elementsof the cell structure that connect the extra-cellular matrix to the nucleus through thesarcolemma, the dystrophin complex, thecytoskeleton, the contractile apparatus, andthe intermediate filaments [105–107].
4.6.1.6
Familial ArrhythmiasArrhythmias are a common feature of thehypertrophic and dilated cardiomyopathiesdescribed in the previous section. Cardiacarrhythmias are also the primary feature ofanother group of heart diseases, however,including the “ion channelopathies” (pri-mary electrical disease without underlyingstructural pathology) and arrhythmogenicright ventricular cardiomyopathy (ARVC).
Brugada Syndrome Brugada Syndrome isnow known to be the same condition as“sudden unexplained death syndrome”(SUDS). There is a characteristic ECG pat-tern and the disease is transmitted as anautosomal dominant trait. So far only onegene has been identified, the SCN5A genethat codes for a subunit of the sodium chan-nel. Only about 20 % of patients have muta-tions in SCN5A and other genetic loci mustalso be involved [106, 108].
Long QT Syndrome Long QT syndrome(LQTS) is characterized by the appearanceof a long QT interval on the ECG and anatypical ventricular tachycardia (Torsadesde pointes). The prevalence is about 1 in5000 and mutations in six ion-channelgenes and a structural protein have beendescribed [109, 110].
Arrhythmogenic Right Ventricular Cardio-myopathy Arrhythmogenic right ventricu-lar cardiomyopathy (ARVC), also calledarrhythmogenic right ventricular dysplasia(ARVD), involves progressive fatty infiltra-tion of the wall of the right ventricle and isassociated with increasing severity ofarrhythmia and sudden cardiac death. Eightchromosomal loci have been implicated withthree genes being identified so far [105, 111].
4.6.2
Multifactorial Cardiovascular Disease
Compared with the number of genes iden-tified in the monogenic cardiac diseasesdescribed above, few genes underlying thecommon forms of cardiovascular diseasehave been identified. The preferred ap-proach to this problem is the associationstudy in which genotypes in cardiacpatients are compared to those of a group ofmatched controls (Sect. 4.4.1). Yamada etal. [112] typed 112 polymorphisms of 71candidate genes in 2819 unrelated myocar-dial infarction (MI) patients and 2242 con-trols. Genes were selected that were poten-tially associated with coronary atherosclero-sis or vasospasm, hypertension, diabetesmellitus, or hyperlipidemia. They foundsignificant associations with polymor-phisms in the connexin 37, plasminogen-activator inhibitor and stromelysin-1 genes.They suggest that determination of the gen-otypes of the three might be used to predictrisk, especially for the stromelysin polymor-
974.7 Conclusions
phism that had an odds ratio of 4.7 inwomen.
Topol et al. [113] typed 72 SNPs from 62candidate genes in 352 patients with famil-ial premature myocardial infarction and in418 controls. Candidate genes were chosenfor their acknowledged role in endothelialcell biology, vascular biology, lipid metab-olism, and the coagulation cascade.Variants in three members of the throm-bospondin protein family could be associat-ed statistically with premature coronaryartery disease.
In a recent study Tobin et al. [114] studied58 SNPs in 35 genes previously implicatedin cardiovascular disease. They also deter-mined 14 six-SNP haplotypes in 16 genes.Two SNPs, in α-adducin and cholesterylester transfer, were each associated with asignificant protective effect on MI (oddsratio 0.73 and 0.82). A specific haplotype inthe paraoxonase 1/paraoxonase 2 genes wasalso protective (odds ratio 0.52). Two apolip-oprotein C III haplotypes were associatedwith an increased risk of MI (odds ratios of1.41 and 1.71).
These studies did not use Bonferroni cor-rections to correct for multiple tests. Aswith any association study of this type, firmconclusions about the significance of theresults must await confirmation from otherresearchers using different populations.Nevertheless, these studies point to thefuture. We should expect larger scale stud-ies, in terms of both numbers of subjectsand numbers of SNPs genotyped. Ultimatelygenome-wide association studies will beconducted using thousands of SNPs arrayedon DNA chips. These future studies willidentify cSNPs or chromosomal regions inlinkage disequilibrium with genes that areassociated with increased or decreased risk.Candidate cSNPs must then be tested inlarge groups of patients and controls in dif-ferent populations of different ethnicities.
4.7
Conclusions
Knowledge gained from the human genomeproject combined with new genomic andproteomic technologies has the capacity totransform the practice of medicine. We willeventually be able to characterize and treatdiseases on a biological and molecular basis,rather than by empiricism. The impact onhuman health might surpass that of antibio-tics in reducing morbidity and increasinglife expectancy. It is difficult to predict thetime it will take to fully implement thesebenefits (remembering the lesson of genetherapy), but it will certainly take longerthan it did for antibiotics. Meanwhile, it isvital to educate the existing cadre of physi-cians and other health-care workers aboutthe implications of the new discoveries, sothey might take the best advantage of subse-quent developments.
It is not unreasonable to imagine that, atsome time in the not too distant future, thestandard practice will be to obtain thesequence of all of the coding DNA in everyindividual’s genome. An individual profileof all known cSNPs and other coding vari-ants could possibly substitute for the com-plete sequence. This information, carriedon a microchip on our health card, willdefine each of us in molecular terms withregard to our disease susceptibilities andour likely response to drug therapy. As onemight imagine, the social and ethical con-siderations of such a capability will be thesubject of considerable discussion and thepublic as a whole will rightly be wary of amove in this direction. A development inthis direction is, however, the logical exten-sion of the human genome project andother technological advances. Thus we havean obligation to educate a wider audienceabout the science and the implications.
It is to be hoped that the philosophicaldiscussions will be able to keep pace withthe speed of our scientific discoveries.
98
1 Watson JD, Crick FHC (1953) Molecularstructure of Nucleic Acids: A Structure forDeoxyribose Nucleic Acid. Nature171:737–738
2 Waterston RH, Lindblad-Toh K, Birney E etal. (2002) Initial sequencing and comparativeanalysis of the mouse genome. Nature420:520–562
3 Arabidopsis Genome Initiative (2000)Analysis of the genome sequence of theflowering plant Arabidopsis thaliana. Nature408:796–815
4 Dermitzakis ET, Reymond A, Scamuffa N etal. (2003) Evolutionary discrimination ofmammalian conserved non-genic sequences(CNGs). Science 302:1033–1035
5 Mattick JS (2003) Challenging the dogma: thehidden layer of non-protein-coding RNAs incomplex organisms. Bioessays 25:930–939
6 Carrington JC, Ambros V (2003) Role ofmicroRNAs in plant and animal development.Science 301:336–338
7 Szymanski M, Barciszewska MZ, Zywicki Met al. (2003) Noncoding RNA transcripts. J.Appl. Genet. 44:1–19
8 Kampa D, Cheng J, Kapranov P et al. (2004)Novel RNAs identified from an in-depthanalysis of the transcriptome of humanchromosomes 21 and 22. Genome Res.14:331–342
9 The Tumor Analysis Best Practices WorkingGroup (2004) Guidelines: Expression profiling– best practices for data generation andinterpretation in clinical trials. Nat. Rev.Genet. 5:229–237
10 Gusella JF, Wexler NS, Conneally PM et al.(1983) A polymorphic DNA markergenetically linked to Huntington’s disease.Nature 306:234–238
11 The Huntington’s Disease CollaborativeResearch Group (1993) A novel genecontaining a trinucleotide repeat that isexpanded and unstable on Huntington’sdisease chromosomes. Cell 72:971–983
12 Halford SE, Rowan AJ, Lipton L et al. (2003)Germline mutations but not somatic changesat the MYH locus contribute to thepathogenesis of unselected colorectal cancers.Am. J. Pathol. 162:1545–1548
13 Lafreniere RG, MacDonald ML, Dube MP etal. (2004) Identification of a Novel Gene(HSN2) Causing Hereditary Sensory andAutonomic Neuropathy Type II through theStudy of Canadian Genetic Isolates. Am. J.Hum. Genet. 74:1064–1073
14 Leach FS, Nicolaides NC, Papadopoulos N etal. (1993) Mutations of a mutS homolog inhereditary nonpolyposis colorectal cancer. Cell75:1215–1225
15 Murphy RT, Mogensen J, Shaw A et al. (2004)Novel mutation in cardiac troponin I inrecessive idiopathic dilated cardiomyopathy.Lancet 363:371–372
16 Bradley BA, Evers BM (1997) Molecularadvances in the etiology and treatment ofcolorectal cancer. Surg. Oncol. 6:143–156
17 Ruschoff J, Wallinger S, Dietmaier W et al.(1998) Aspirin suppresses the mutatorphenotype associated with hereditarynonpolyposis colorectal cancer by geneticselection. Proc. Natl. Acad. Sci. USA95:11301–11306
18 Grann VR, Jacobson JS, Whang W et al.(2000) Prevention with tamoxifen or otherhormones versus prophylactic surgery inBRCA1/2-positive women: a decisionanalysis. Cancer J. Sci. Am. 6:13–20
References
99References
19 Lucassen A, Parker M (2004) Confidentialityand serious harm in genetics – preserving theconfidentiality of one patient and preventingharm to relatives. Eur. J. Hum. Genet.12:93–97
20 Wang C, Gonzalez R, Merajver SD (2004)Assessment of genetic testing and relatedcounseling services: current research andfuture directions. Soc. Sci. Med. 58:1427–1442
21 Godard B, ten Kate L, Evers-Kiebooms G et al.(2003) Population genetic screening program-mes: principles, techniques, practices, andpolicies. Eur. J. Hum. Genet. 11 Suppl.2:S49–S87
22 Hims MM, Diager SP, Inglehearn CF (2003)Retinitis pigmentosa: genes, proteins andprospects. Dev. Ophthalmol. 37:109–125
23 Lynch HT, Lynch JF (2000) Hereditarynonpolyposis colorectal cancer. Semin. Surg.Oncol. 18:305–313
24 Narayan S, Roy D (2003) Role of APC andDNA mismatch repair genes in the develop-ment of colorectal cancers. Mol. Cancer 2:41
25 Ingram VM (1959) Abnormal humanhaemoglobin. III. The chemical differencebetween normal and sickle cell haemo-globins. Biochim. Biophys. Acta 36:402–411
26 Abeliovich D, Kaduri L, Lerer I et al. (1997)The founder mutations 185delAG and5382insC in BRCA1 and 6174delT in BRCA2appear in 60% of ovarian cancer and 30% ofearly-onset breast cancer patients amongAshkenazi women. Am. J. Hum. Genet.60:505–514
27 Petty EM, Green JS, Marx SJ et al. (1994)Mapping the gene for hereditaryhyperparathyroidism and prolactinoma(MEN1Burin) to chromosome 11q: evidencefor a founder effect in patients from New-foundland. Am. J. Hum. Genet. 54:1060–1066
28 Lynch HT, Coronel SM, Okimoto R et al.(2004) A founder mutation of the MSH2 geneand hereditary nonpolyposis colorectal cancerin the United States. JAMA 291:718–724
29 Buckley RH (2000) Gene therapy for humanSCID: Dreams become reality. Nat. Med.6:623–624
30 Cavazzana-Calvo M, Hacein-Bey S, de SaintBG et al. (2000) Gene therapy of humansevere combined immunodeficiency (SCID)-X1 disease . Science 288:669–672
31 Cavazzana-Calvo M, Thrasher A, Mavilio F(2004) The future of gene therapy. Nature427:779–781
32 Marshall E (1999) Gene therapy deathprompts review of adenovirus vector. Science286:2244–2245
33 Gottesman MM (2003) Cancer gene therapy:an awkward adolescence. Cancer Gene Ther.10:501–508
34 Boillee S, Cleveland DW (2004) Gene therapyfor ALS delivers. Trends Neurosci. 27:235–238
35 Cargill M, Altshuler D, Ireland J et al. (1999)Characterization of single-nucleotidepolymorphisms in coding regions of humangenes. Nat. Genet. 22:231–238
36 Reich DE, Gabriel SB, Altshuler D (2003)Quality and completeness of SNP databases.Nat. Genet. 33:457–458
37 Kruglyak L, Nickerson DA (2001) Variation isthe spice of life. Nat. Genet. 27:234–236
38 Strittmatter WJ, Roses AD (1996)Apolipoprotein E and Alzheimer’s disease.Annu. Rev. Neurosci. 19:53–77
39 Van Eerdewegh P, Little RD, Dupuis J et al.(2002) Association of the ADAM33 gene withasthma and bronchial hyperresponsiveness.Nature 418:426–430
40 Dahlback B (1997) Resistance to activatedprotein C caused by the factor VR506Qmutation is a common risk factor for venousthrombosis. Thromb. Haemost. 78:483–488
41 Pennacchio LA, Olivier M, Hubacek JA et al.(2001) An apolipoprotein influencingtriglycerides in humans and mice revealed bycomparative sequencing. Science 294:169–173
42 Hugot JP, Chamaillard M, Zouali H et al.(2001) Association of NOD2 leucine-richrepeat variants with susceptibility to Crohn’sdisease. Nature 411:599–603
43 Ozaki K, Ohnishi Y, Iida A et al. (2002)Functional SNPs in the lymphotoxin-alphagene that are associated with susceptibility tomyocardial infarction. Nat. Genet. 32:650–654
44 Stefansson H, Sigurdsson E, SteinthorsdottirV et al. (2002) Neuregulin 1 and susceptibilityto schizophrenia. Am. J. Hum. Genet.71:877–892
45 Gretarsdottir S, Thorleifsson G, ReynisdottirST et al. (2003) The gene encodingphosphodiesterase 4D confers risk ofischemic stroke. Nat. Genet. 35:131–138
46 Dorman JS, LaPorte RE, Stone RA et al.(1990) Worldwide differences in the incidenceof type I diabetes are associated with aminoacid variation at position 57 of the HLA-DQbeta chain. Proc. Natl. Acad. Sci. USA87:7370–7374
100 References
47 Bell GI, Horita S, Karam JH (1984) Apolymorphic locus near the human insulingene is associated with insulin-dependentdiabetes mellitus. Diabetes 33:176–183
48 Nistico L, Buzzetti R, Pritchard LE et al.(1996) The CTLA-4 gene region ofchromosome 2q33 is linked to, and associatedwith, type 1 diabetes. Belgian DiabetesRegistry. Hum. Mol. Genet. 5:1075–1080
49 Deeb SS, Fajas L, Nemoto M et al. (1998) APro12Ala substitution in PPARgamma2associated with decreased receptor activity,lower body mass index and improved insulinsensitivity. Nat. Genet. 20:284–287
50 Altshuler D, Hirschhorn JN, Klannemark Met al. (2000) The common PPARgammaPro12Ala polymorphism is associated withdecreased risk of type 2 diabetes. Nat. Genet.26:76–80
51 Goldstein DB, Weale ME (2001) Populationgenomics: linkage disequilibrium holds thekey. Curr. Biol. 11:R576–R579
52 Gabriel SB, Schaffner SF, Nguyen H et al.(2002) The structure of haplotype blocks inthe human genome. Science 296:2225–2229
53 Goldstein DB, Ahmadi KR, Weale ME et al.(2003) Genome scans and candidate geneapproaches in the study of common diseasesand variable drug responses. Trends Genet.19:615–622
54 Crawford DC, Carlson CS, Rieder MJ et al.(2004) Haplotype Diversity across 100Candidate Genes for Inflammation, LipidMetabolism, and Blood Pressure Regulationin Two Populations. Am. J. Hum. Genet.74:610–622
55 Dean M (2003) Approaches to identify genesfor complex human diseases: lessons fromMendelian disorders. Hum. Mutat. 22:261–274
56 Martin AM, Weber BL (2000) Genetic andhormonal risk factors in breast cancer. J. Natl.Cancer Inst. 92:1126–1135
57 Miki Y, Swensen J, Shattuck-Eidens D et al.(1994) A strong candidate for the breast andovarian cancer susceptibility gene BRCA1.Science 266:66–71
58 Wooster R, Bignell G, Lancaster J et al. (1995)Identification of the breast cancer susceptibil-ity gene BRCA2. Nature 378:789–792
59 Ponder BAJ (1990) Inherited predisposition tocancer. Trends Genet. 6:213–220
60 Nakamura Y (1993) The role of theadenomatous polyposis coli (APC) gene inhuman cancers. Adv. Cancer Res. 62:65–87
61 Futreal PA, Liu Q, Shattuck-Eidens D et al.(1994) BRCA1 mutations in primary breastand ovarian carcinomas. Science 266:120–122
62 Lancaster JM, Wooster R, Mangion J et al.(1996) BRCA2 mutations in primary breastand ovarian cancers. Nat. Genet. 13:238–240
63 Meijers-Heijboer H, van den OA, Klijn J et al.(2002) Low-penetrance susceptibility to breastcancer due to CHEK2(*)1100delC in non-carriers of BRCA1 or BRCA2 mutations. Nat.Genet. 31:55–59
64 Syrjakoski K, Kuukasjarvi T, Auvinen A et al.(2004) CHEK2 1100delC is not a risk factorfor male breast cancer population. Int. J.Cancer 108:475–476
65 Jhanwar-Uniyal M (2003) BRCA1 in cancer,cell cycle and genomic stability. Front. Biosci.8:s1107–s1117
66 Powell SN, Kachnic LA (2003) Roles of BRCA1and BRCA2 in homologous recombination,DNA replication fidelity and the cellularresponse to ionizing radiation. Oncogene22:5784–5791
67 Yang Y, Li CC, Weissman AM (2004) Regulat-ing the p53 system through ubiquitination.Oncogene 23:2096–2106
68 Bignell GR, Barfoot R, Seal S et al. (1998) Lowfrequency of somatic mutations in the LKB1/Peutz–Jeghers syndrome gene in sporadicbreast cancer. Cancer Res. 58:1384–1386
69 Hanssen AM, Fryns JP (1995) Cowdensyndrome. J. Med. Genet. 32:117–119
70 Venkitaraman AR (2002) Cancersusceptibility and the functions of BRCA1and BRCA2. Cell 108:171–182
71 Hughes-Davies L, Huntsman D, Ruas M et al.(2003) EMSY links the BRCA2 pathway tosporadic breast and ovarian cancer. Cell115:523–535
72 Ford D, Easton DF, Stratton M et al. (1998)Genetic heterogeneity and penetranceanalysis of the BRCA1 and BRCA2 genes inbreast cancer families. The Breast CancerLinkage Consortium. Am. J. Hum. Genet.62:676–689
73 Gradia S, Acharya S, Fishel R (1997) Thehuman mismatch recognition complexhMSH2-hMSH6 functions as a novelmolecular switch. Cell 91:995–1005
74 Thompson D, Szabo CI, Mangion J et al.(2002) Evaluation of linkage of breast cancerto the putative BRCA3 locus on chromosome13q21 in 128 multiple case families from theBreast Cancer Linkage Consortium. Proc.Natl. Acad. Sci. USA 99:827–831
101References
75 Antoniou AC, Pharoah PD, McMullan G et al.(2002) A comprehensive model for familialbreast cancer incorporating BRCA1, BRCA2and other genes. Br. J. Cancer 86:76–83
76 Lichtenstein P, Holm NV, Verkasalo PK et al.(2000) Environmental and heritable factors inthe causation of cancer – analyses of cohortsof twins from Sweden, Denmark, andFinland. N. Engl. J. Med. 343:78–85
77 Peto J, Collins N, Barfoot R et al. (1999)Prevalence of BRCA1 and BRCA2 genemutations in patients with early-onset breastcancer [see comments]. J. Natl. Cancer Inst.91:943–949
78 Groden J, Thliveris A, Samowitz W et al.(1991) Identification and characterization ofthe familial adenomatous polyposis coli gene.Cell 66:589–600
79 Rowan AJ, Lamlum H, Ilyas M et al. (2000)APC mutations in sporadic colorectal tumors:A mutational “hotspot” and interdependenceof the “two hits”. Proc. Natl. Acad. Sci. USA97:3352–3357
80 Powell SM, Zilz N, Beazer-Barclay Y et al.(1992) APC mutations occur early duringcolorectal tumorigenesis. Nature 359:235–237
81 Fang DC, Luo YH, Yang SM et al. (2002)Mutation analysis of APC gene in gastriccancer with microsatellite instability. World J.Gastroenterol. 8:787–791
82 Furuuchi K, Tada M, Yamada H et al. (2000)Somatic mutations of the APC gene inprimary breast cancers. Am. J. Pathol.156:1997–2005
83 Morin PJ, Sparks AB, Korinek V et al. (1997)Activation of beta-catenin-Tcf signaling incolon cancer by mutations in beta-catenin orAPC. Science 275:1787–1790
84 Peltomaki P (2003) Role of DNA mismatchrepair defects in the pathogenesis of humancancer. J. Clin. Oncol. 21:1174–1179
85 Peltomäki P, Lothe RA, Aaltonen LA et al.(1993) Microsatellite instability is associatedwith tumors that characterize the hereditarynon-polyposis colorectal carcinomasyndrome. Cancer Res. 53:5853–5855
86 Menigatti M, Di Gregorio C, Borghi F et al.(2001) Methylation pattern of differentregions of the MLH1 promoter and silencingof gene expression in hereditary and sporadiccolorectal cancer. Genes Chromosomes Cancer31:357–361
87 Lu SL, et al. (2003) Genomic Structure of theTransforming Growth Factor Beta Type IIReceptor Gene and Its Mutations inHereditary Nonpolyposis Colorectal Cancers.Cancer Res. 56:4595–4598
88 Miyaki M, Iijima T, Shiba K et al. (2001)Alterations of repeated sequences in 5’upstream and coding regions in colorectaltumors from patients with hereditarynonpolyposis colorectal cancer and Turcotsyndrome. Oncogene 20:5215–5218
89 Yagi OK, Akiyama Y, Nomizu T et al. (1998)Proapoptotic gene BAX is frequently mutatedin hereditary nonpolyposis colorectal cancersbut not in adenomas. Gastroenterology114:268–274
90 Jeong SY, Shin KH, Shin JH et al. (2003)Microsatellite instability and mutations inDNA mismatch repair genes in sporadiccolorectal cancers. Dis. Colon Rectum46:1069–1077
91 Kaklamani VG, Hou N, Bian Y et al. (2003)TGFBR1*6A and cancer risk: a meta-analysisof seven case-control studies. J. Clin. Oncol.21:3236–3243
92 Pasche B, Kaklamani V, Hou N et al. (2004)TGFBR1*6A and cancer: a meta-analysis of12 case-control studies. J. Clin. Oncol.22:756–758
93 (2003) NHLBI fact book, fiscal year 2003.National Heart, Lung, and Blood Institute,Bethesda, Md.
94 Pullinger CR, Kane JP, Malloy MJ (2003)Primary hypercholesterolemia: genetic causesand treatment of five monogenic disorders.Expert Rev. Cardiovasc. Ther. 1:107–119
95 Heath KE, Gahan M, Whittall RA et al. (2001)Low-density lipoprotein receptor gene (LDLR)world-wide website in familial hyper-cholesterolaemia: update, new features andmutation analysis. Atherosclerosis 154:243–246
96 Soutar AK, Naoumova RP, Traub LM (2003)Genetics, clinical phenotype, and molecularcell biology of autosomal recessivehypercholesterolemia. Arterioscler. Thromb.Vasc. Biol. 23:1963–1970
97 Ceska R, Vrablik M, Horinek A (2000)Familial defective apolipoprotein B-100: alesson from homozygous and heterozygouspatients. Physiol Res. 49 Suppl 1:S125–S130
98 Lifton RP, Gharavi AG, Geller DS (2001)Molecular mechanisms of humanhypertension. Cell 104:545–556
102 References
99 Sykes TC, Fegan C, Mosquera D (2000)Thrombophilia, polymorphisms, and vasculardisease. Mol. Pathol. 53:300–306
100 Kottke-Marchant K (2002) Geneticpolymorphisms associated with venous andarterial thrombosis: an overview. Arch. Pathol.Lab. Med. 126:295–304
101 Zivelin A, Griffin JH, Xu X et al. (1997) Asingle genetic origin for a common Caucasianrisk factor for venous thrombosis. Blood89:397–402
102 Price DT, Ridker PM (1997) Factor V Leidenmutation and the risks for thromboembolicdisease: a clinical perspective. Ann. Intern.Med. 127:895–903
103 Maron BJ, Gardin JM, Flack JM et al. (1995)Prevalence of hypertrophic cardiomyopathy ina general population of young adults.Echocardiographic analysis of 4111 subjectsin the CARDIA Study. Coronary Artery RiskDevelopment in (Young) Adults. Circulation92:785–789
104 Seidman JG, Seidman C (2001) The geneticbasis for cardiomyopathy: from mutationidentification to mechanistic paradigms. Cell104:557–567
105 Franz WM, Muller OJ, Katus HA (2001)Cardiomyopathies: from genetics to theprospect of treatment. Lancet 358:1627–1637
106 Keller DI, Carrier L, Schwartz K (2002)Genetics of familial cardiomyopathies andarrhythmias. Swiss. Med. Wkly. 132:401–407
107 Vatta M, Mohapatra B, Jimenez S et al. (2003)Mutations in Cypher/ZASP in patients withdilated cardiomyopathy and left ventricularnon-compaction. J. Am. Coll. Cardiol.42:2014–2027
108 Priori SG, Napolitano C, Gasparini M et al.(2002) Natural history of Brugada syndrome:insights for risk stratification and manage-ment. Circulation 105:1342–1347
109 Paulussen AD, Gilissen RA, Armstrong M etal. (2004) Genetic variations of KCNQ1,KCNH2, SCN5A, KCNE1, and KCNE2 indrug-induced long QT syndrome patients. J.Mol. Med. 82:182–188
110 Antzelevitch C (2003) Molecular genetics ofarrhythmias and cardiovascular conditionsassociated with arrhythmias. J. Cardiovasc.Electrophysiol. 14:1259–1272
111 Ahmad F (2003) The molecular genetics ofarrhythmogenic right ventricular dysplasia-cardiomyopathy. Clin. Invest. Med. 26:167–178
112 Yamada Y, Izawa H, Ichihara S et al. (2002)Prediction of the risk of myocardial infarctionfrom polymorphisms in candidate genes. N.Engl. J. Med. 347:1916–1923
113 Topol EJ, McCarthy J, Gabriel S et al. (2001)Single nucleotide polymorphisms in multiplenovel thrombospondin genes may be associat-ed with familial premature myocardial infarc-tion. Circulation 104:2641–2644
114 Tobin MD, Braund PS, Burton PR et al.(2004) Genotypes and haplotypes predispos-ing to myocardial infarction: a multilocuscase-control study. Eur. Heart J. 25:459–467

Part IIGenomic and ProteomicTechnologies
Handbook of Genome Research. Genomics, Proteomics, Metabolomics, Bioinformatics, Ethical and Legal Issues.Edited by Christoph W. SensenCopyright © 2005 WILEY-VCH Verlag GmbH & Co. KGaA, WeinheimISBN: 3-527-31348-6
Verwendete Mac Distiller 5.0.x Joboptions
Dieser Report wurde automatisch mit Hilfe der Adobe Acrobat Distiller Erweiterung "Distiller Secrets v1.0.5" der IMPRESSED GmbH erstellt. Sie koennen diese Startup-Datei für die Distiller Versionen 4.0.5 und 5.0.x kostenlos unter http://www.impressed.de herunterladen. ALLGEMEIN ---------------------------------------- Dateioptionen: Kompatibilität: PDF 1.3 Für schnelle Web-Anzeige optimieren: Ja Piktogramme einbetten: Ja Seiten automatisch drehen: Nein Seiten von: 1 Seiten bis: Alle Seiten Bund: Links Auflösung: [ 2400 2400 ] dpi Papierformat: [ 481 680 ] Punkt KOMPRIMIERUNG ---------------------------------------- Farbbilder: Downsampling: Nein Komprimieren: Ja Komprimierungsart: ZIP Bitanzahl pro Pixel: 8 Bit Graustufenbilder: Downsampling: Nein Komprimieren: Ja Komprimierungsart: ZIP Bitanzahl pro Pixel: 8 Bit Schwarzweiß-Bilder: Downsampling: Nein Komprimieren: Ja Komprimierungsart: CCITT CCITT-Gruppe: 4 Graustufen glätten: Nein Text und Vektorgrafiken komprimieren: Ja SCHRIFTEN ---------------------------------------- Alle Schriften einbetten: Ja Untergruppen aller eingebetteten Schriften: Nein Wenn Einbetten fehlschlägt: Abbrechen Einbetten: Immer einbetten: [ /Courier-BoldOblique /Helvetica-BoldOblique /Courier /Helvetica-Bold /Times-Bold /Courier-Bold /Helvetica /Times-BoldItalic /Times-Roman /ZapfDingbats /Times-Italic /Helvetica-Oblique /Courier-Oblique /Symbol ] Nie einbetten: [ ] FARBE(N) ---------------------------------------- Farbmanagement: Farbumrechnungsmethode: Farbe nicht ändern Methode: Standard Geräteabhängige Daten: Einstellungen für Überdrucken beibehalten: Ja Unterfarbreduktion und Schwarzaufbau beibehalten: Ja Transferfunktionen: Beibehalten Rastereinstellungen beibehalten: Nein ERWEITERT ---------------------------------------- Optionen: Prolog/Epilog verwenden: Nein PostScript-Datei darf Einstellungen überschreiben: Nein Level 2 copypage-Semantik beibehalten: Ja Portable Job Ticket in PDF-Datei speichern: Ja Illustrator-Überdruckmodus: Ja Farbverläufe zu weichen Nuancen konvertieren: Ja ASCII-Format: Nein Document Structuring Conventions (DSC): DSC-Kommentare verarbeiten: Ja DSC-Warnungen protokollieren: Nein Für EPS-Dateien Seitengröße ändern und Grafiken zentrieren: Ja EPS-Info von DSC beibehalten: Ja OPI-Kommentare beibehalten: Nein Dokumentinfo von DSC beibehalten: Ja ANDERE ---------------------------------------- Distiller-Kern Version: 5000 ZIP-Komprimierung verwenden: Ja Optimierungen deaktivieren: Nein Bildspeicher: 524288 Byte Farbbilder glätten: Nein Graustufenbilder glätten: Nein Bilder (< 257 Farben) in indizierten Farbraum konvertieren: Ja sRGB ICC-Profil: sRGB IEC61966-2.1 ENDE DES REPORTS ---------------------------------------- IMPRESSED GmbH Bahrenfelder Chaussee 49 22761 Hamburg, Germany Tel. +49 40 897189-0 Fax +49 40 897189-71 Email: [email protected] Web: www.impressed.de
Adobe Acrobat Distiller 5.0.x Joboption Datei
<< /ColorSettingsFile () /LockDistillerParams true /DetectBlends true /DoThumbnails true /AntiAliasMonoImages false /MonoImageDownsampleType /Bicubic /GrayImageDownsampleType /Bicubic /MaxSubsetPct 100 /MonoImageFilter /CCITTFaxEncode /ColorImageDownsampleThreshold 1.5 /GrayImageFilter /FlateEncode /ColorConversionStrategy /LeaveColorUnchanged /CalGrayProfile (Dot Gain 20%) /ColorImageResolution 300 /UsePrologue false /MonoImageResolution 1200 /ColorImageDepth 8 /sRGBProfile (sRGB IEC61966-2.1) /PreserveOverprintSettings true /CompatibilityLevel 1.3 /UCRandBGInfo /Preserve /EmitDSCWarnings false /CreateJobTicket true /DownsampleMonoImages false /DownsampleColorImages false /MonoImageDict << /K -1 >> /ColorImageDownsampleType /Bicubic /GrayImageDict << /HSamples [ 2 1 1 2 ] /VSamples [ 2 1 1 2 ] /Blend 1 /QFactor 0.9 >> /CalCMYKProfile (U.S. Web Coated (SWOP) v2) /ParseDSCComments true /PreserveEPSInfo true /MonoImageDepth -1 /AutoFilterGrayImages false /SubsetFonts false /GrayACSImageDict << /HSamples [ 2 1 1 2 ] /VSamples [ 2 1 1 2 ] /Blend 1 /QFactor 0.9 >> /ColorImageFilter /FlateEncode /AutoRotatePages /None /PreserveCopyPage true /EncodeMonoImages true /ASCII85EncodePages false /PreserveOPIComments false /NeverEmbed [ ] /ColorImageDict << /HSamples [ 2 1 1 2 ] /VSamples [ 2 1 1 2 ] /Blend 1 /QFactor 0.9 >> /AntiAliasGrayImages false /GrayImageDepth 8 /CannotEmbedFontPolicy /Error /EndPage -1 /TransferFunctionInfo /Preserve /CalRGBProfile (sRGB IEC61966-2.1) /EncodeColorImages true /EncodeGrayImages true /ColorACSImageDict << /HSamples [ 2 1 1 2 ] /VSamples [ 2 1 1 2 ] /Blend 1 /QFactor 0.9 >> /Optimize true /ParseDSCCommentsForDocInfo true /GrayImageDownsampleThreshold 1.5 /MonoImageDownsampleThreshold 1.5 /AutoPositionEPSFiles true /GrayImageResolution 300 /AutoFilterColorImages false /AlwaysEmbed [ /Courier-BoldOblique /Helvetica-BoldOblique /Courier /Helvetica-Bold /Times-Bold /Courier-Bold /Helvetica /Times-BoldItalic /Times-Roman /ZapfDingbats /Times-Italic /Helvetica-Oblique /Courier-Oblique /Symbol ] /ImageMemory 524288 /OPM 1 /DefaultRenderingIntent /Default /EmbedAllFonts true /StartPage 1 /DownsampleGrayImages false /AntiAliasColorImages false /ConvertImagesToIndexed true /PreserveHalftoneInfo false /CompressPages true /Binding /Left >> setdistillerparams << /PageSize [ 595.276 841.890 ] /HWResolution [ 2400 2400 ] >> setpagedevice

105
Apichart Vanavichit, Somvong Tragoonrung,and Theerayut Toojinda
5.1
Introduction
Most genetic traits important to agricultureor human diseases are manifested asobservable phenotypes. In many instances,the complexity of the phenotype/genotypeinteraction and the general lack of clearlyidentifiable gene products render the directmolecular cloning approach ineffective, soadditional strategies, for example genomemapping, are more effective means of iden-tifying the gene(s) in question. In the pre-genomic era, use of genome-mappingapproaches required probability statistics toidentify the gene positions, followed bypositional cloning to identify the underly-ing genes. In the post-genomic era, to com-pletely characterize genes of interest, theinitially mapped region of a trait must to benarrowed to a size suitable for positionalcloning and data mining. Strategies forgene identification within the criticalregion have to be applied after the sequenc-ing of a potentially large clone or set ofclones that contains this gene(s). Limitedsuccesses of positional cloning have beenreported for cloning many genes respon-sible for human diseases, including cystic
fibrosis and muscular dystrophy, and plantdisease-resistance genes [1–3].
5.2
Genome Mapping
Genome mapping is used to identify thegenetic location of mutants, or qualitativeand quantitative trait loci (QTL). Linkingthe traits to markers using genetic and fam-ily information of a recombinant popula-tion can identify the gene location. Throughmapping we can discover how many loci areinvolved, where the loci are positioned inthe genome, and what contribution eachallele might make to the trait. To determinerelationships between marker loci and thetarget trait, mapping requires:• segregating populations (genetic stocks),• marker data set(s), and• a phenotypic data set.
5.2.1
Mapping Populations
The crucial requirement for successfulgenome mapping in plant science is thechoice of a suitable segregating population.
Handbook of Genome Research. Genomics, Proteomics, Metabolomics, Bioinformatics, Ethical and Legal Issues.Edited by Christoph W. SensenCopyright © 2005 WILEY-VCH Verlag GmbH & Co. KGaA, WeinheimISBN: 3-527-31348-6
5Genomic Mapping and Positional Cloning, with Emphasis on Plant Science
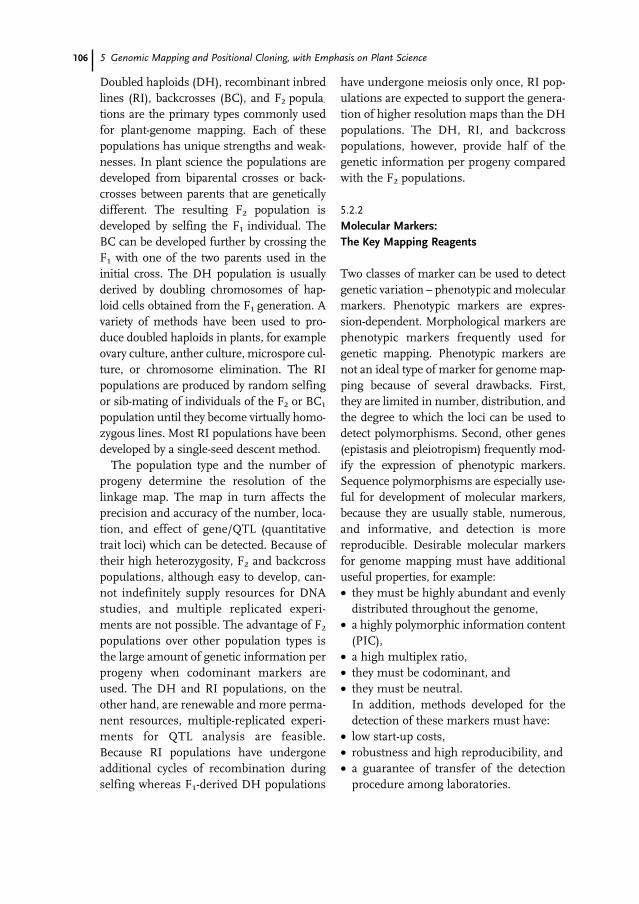
106 5 Genomic Mapping and Positional Cloning, with Emphasis on Plant Science
Doubled haploids (DH), recombinant inbredlines (RI), backcrosses (BC), and F2 popula-
tions are the primary types commonly usedfor plant-genome mapping. Each of thesepopulations has unique strengths and weak-nesses. In plant science the populations aredeveloped from biparental crosses or back-crosses between parents that are geneticallydifferent. The resulting F2 population isdeveloped by selfing the F1 individual. TheBC can be developed further by crossing theF1 with one of the two parents used in theinitial cross. The DH population is usuallyderived by doubling chromosomes of hap-loid cells obtained from the F1 generation. Avariety of methods have been used to pro-duce doubled haploids in plants, for exampleovary culture, anther culture, microspore cul-ture, or chromosome elimination. The RIpopulations are produced by random selfingor sib-mating of individuals of the F2 or BC1
population until they become virtually homo-zygous lines. Most RI populations have beendeveloped by a single-seed descent method.
The population type and the number ofprogeny determine the resolution of thelinkage map. The map in turn affects theprecision and accuracy of the number, loca-tion, and effect of gene/QTL (quantitativetrait loci) which can be detected. Because oftheir high heterozygosity, F2 and backcrosspopulations, although easy to develop, can-not indefinitely supply resources for DNAstudies, and multiple replicated experi-ments are not possible. The advantage of F2
populations over other population types isthe large amount of genetic information perprogeny when codominant markers areused. The DH and RI populations, on theother hand, are renewable and more perma-nent resources, multiple-replicated experi-ments for QTL analysis are feasible.Because RI populations have undergoneadditional cycles of recombination duringselfing whereas F1-derived DH populations
have undergone meiosis only once, RI pop-ulations are expected to support the genera-tion of higher resolution maps than the DHpopulations. The DH, RI, and backcrosspopulations, however, provide half of thegenetic information per progeny comparedwith the F2 populations.
5.2.2
Molecular Markers: The Key Mapping Reagents
Two classes of marker can be used to detectgenetic variation – phenotypic and molecularmarkers. Phenotypic markers are expres-sion-dependent. Morphological markers arephenotypic markers frequently used forgenetic mapping. Phenotypic markers arenot an ideal type of marker for genome map-ping because of several drawbacks. First,they are limited in number, distribution, andthe degree to which the loci can be used todetect polymorphisms. Second, other genes(epistasis and pleiotropism) frequently mod-ify the expression of phenotypic markers.Sequence polymorphisms are especially use-ful for development of molecular markers,because they are usually stable, numerous,and informative, and detection is morereproducible. Desirable molecular markersfor genome mapping must have additionaluseful properties, for example:• they must be highly abundant and evenly
distributed throughout the genome,• a highly polymorphic information content
(PIC),• a high multiplex ratio,• they must be codominant, and• they must be neutral.
In addition, methods developed for thedetection of these markers must have:
• low start-up costs,• robustness and high reproducibility, and• a guarantee of transfer of the detection
procedure among laboratories.
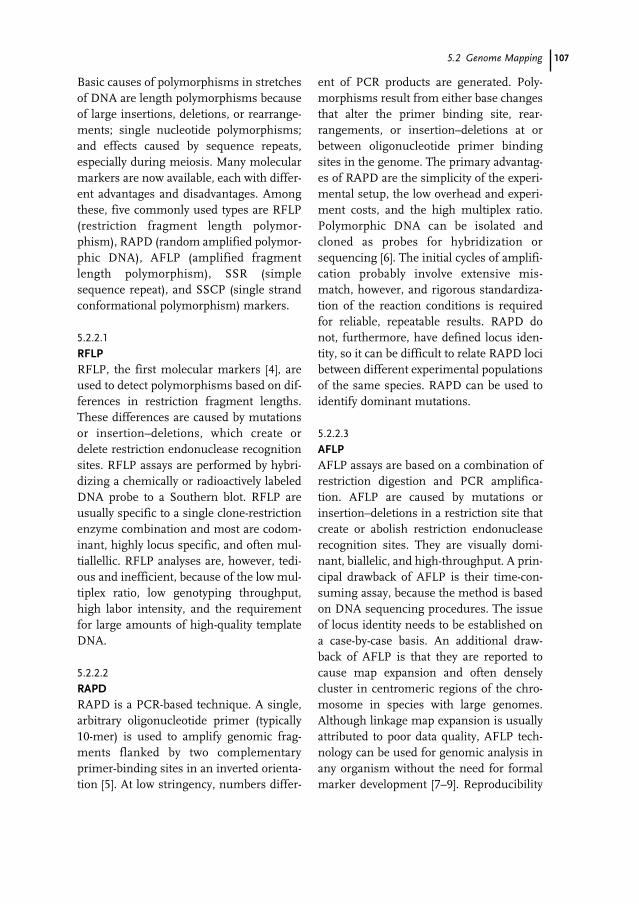
1075.2 Genome Mapping
Basic causes of polymorphisms in stretchesof DNA are length polymorphisms becauseof large insertions, deletions, or rearrange-ments; single nucleotide polymorphisms;and effects caused by sequence repeats,especially during meiosis. Many molecularmarkers are now available, each with differ-ent advantages and disadvantages. Amongthese, five commonly used types are RFLP(restriction fragment length polymor-phism), RAPD (random amplified polymor-phic DNA), AFLP (amplified fragmentlength polymorphism), SSR (simplesequence repeat), and SSCP (single strandconformational polymorphism) markers.
5.2.2.1
RFLPRFLP, the first molecular markers [4], areused to detect polymorphisms based on dif-ferences in restriction fragment lengths.These differences are caused by mutationsor insertion–deletions, which create ordelete restriction endonuclease recognitionsites. RFLP assays are performed by hybri-dizing a chemically or radioactively labeledDNA probe to a Southern blot. RFLP areusually specific to a single clone-restrictionenzyme combination and most are codom-inant, highly locus specific, and often mul-tiallellic. RFLP analyses are, however, tedi-ous and inefficient, because of the low mul-tiplex ratio, low genotyping throughput,high labor intensity, and the requirementfor large amounts of high-quality templateDNA.
5.2.2.2
RAPDRAPD is a PCR-based technique. A single,arbitrary oligonucleotide primer (typically10-mer) is used to amplify genomic frag-ments flanked by two complementaryprimer-binding sites in an inverted orienta-tion [5]. At low stringency, numbers differ-
ent of PCR products are generated. Poly-morphisms result from either base changesthat alter the primer binding site, rear-rangements, or insertion–deletions at orbetween oligonucleotide primer bindingsites in the genome. The primary advantag-es of RAPD are the simplicity of the experi-mental setup, the low overhead and experi-ment costs, and the high multiplex ratio.Polymorphic DNA can be isolated andcloned as probes for hybridization orsequencing [6]. The initial cycles of amplifi-cation probably involve extensive mis-match, however, and rigorous standardiza-tion of the reaction conditions is requiredfor reliable, repeatable results. RAPD donot, furthermore, have defined locus iden-tity, so it can be difficult to relate RAPD locibetween different experimental populationsof the same species. RAPD can be used toidentify dominant mutations.
5.2.2.3
AFLPAFLP assays are based on a combination ofrestriction digestion and PCR amplifica-tion. AFLP are caused by mutations orinsertion–deletions in a restriction site thatcreate or abolish restriction endonucleaserecognition sites. They are visually domi-nant, biallelic, and high-throughput. A prin-cipal drawback of AFLP is their time-con-suming assay, because the method is basedon DNA sequencing procedures. The issueof locus identity needs to be established ona case-by-case basis. An additional draw-back of AFLP is that they are reported tocause map expansion and often denselycluster in centromeric regions of the chro-mosome in species with large genomes.Although linkage map expansion is usuallyattributed to poor data quality, AFLP tech-nology can be used for genomic analysis inany organism without the need for formalmarker development [7–9]. Reproducibility
108 5 Genomic Mapping and Positional Cloning, with Emphasis on Plant Science
and high multiplex ratio make AFLP one oftoday’s standard methods for the character-ization of markers for genome mapping.
5.2.2.4
SSRSSR or microsatellites are tandemly repeat-ed mono-, di-, tri-, tetra-, penta, and hexa-nucleotide motifs. The SSR assay is basedon the PCR amplification of tandem repeatsusing unique flanking DNA sequences asoligonucleotide primers. The polymor-phism among individuals is because of thevariation in the number of repetitive units.SSR are codominant and often multiallellic,which helps to achieve unambiguous iden-tification of alleles. They are also highlyabundant and randomly dispersed through-out most genomes. SSR provide an excel-lent framework for markers with locus iden-tity. They can be multiplexed to achievehigh throughput. A drawback of SSR tech-nology is that the development of SSR islabor intensive and costly. Although SSRare specific for the species they were devel-oped for, the method has now replaced tra-ditional RFLP for generation of many link-age maps, largely because they are techni-cally simple and cheap, consume minuteamounts of DNA, and can be delivered witha rapid turn-around time and high PIC(polymorphic information content) [2, 10].
5.2.2.5
SSCPThe SSCP assay is based on changes in theconformation of single-stranded DNA of aspecific sequence containing mutations orinsertion–deletions under non-denaturingconditions [10–13]. The conformation of thefolded DNA molecule is dependant onintra-molecular interactions. SSCP is one ofthe most sensitive methods for detectingchanges in nucleotide sequences of anentire fragment much larger than 1000 bp.
SSCP assays are usually performed usingheat-denatured DNA on non-denaturingsequencing gels. The strength of this meth-od for genome mapping is its simplicity,multiallellicity, codominance, and locusidentity [14–16]. The development of mark-ers is, however, labor-intensive and costly.SSCP have not yet been automated.
5.2.3
Construction of a Linkage Map
Differences between genetic information inprogenitors can be visualized by usingmarkers based on morphological, protein,or DNA data. Many potential DNA markerssuitable for developing high-density linkagemaps have been established for a variety oforganisms [17–19]. To construct the linkagemap, polymorphic markers are scored onthe random segregating populations. Thedistances and orders of those markers aredetermined on the basis of the frequency ofgenetic recombinations occurring in thepopulation. Because two linked markerstend to be inherited together from genera-tion to generation, the distance betweenmarkers can be estimated from theobserved fraction of recombinations. Mapconstruction basically involves five steps.First, a single-locus analysis, which is a sta-tistical approach used to identify the dataquality using a single-locus genetic model.The ÷2 method is widely used to test themarker segregation according to its expect-ed ratio of the randomly segregating popu-lation. For example, in a BC progeny, eachmarker locus will segregate with a 1:1 ratiofor Aa and aa, a 1:1 ratio for AA and aa inDH and RIL, and a 1:2:1 ratio for AA, Aa,and aa in the F2 generation. A significantdeparture (segregation ratio distortion)from the expected segregation ratio can be asign of a wrong genetic model, low dataquality, or non-random sampling [5]. If the
1095.2 Genome Mapping
segregation ratio of each marker does notdeviate from the expected ratio, the analysiscan proceed to the next step [20]. In the sec-ond step of the map-construction process atwo-locus analysis is used to test for associ-ation or non-independence among themarker alleles located on the same chromo-some. Linkage is usually established by test-ing the independence of the two loci in seg-regating populations. A goodness of fit or alog likelihood ratio has been used to test forindependence of two loci. Recombinationfraction, lod score (base-10 log likelihoodratio), and significant P-values are used ascriteria to infer whether each pair of locibelongs to same linkage group [21, 22].
During the third step, a three-locus anal-ysis is used to determine the ordering of theloci or the linear arrangement of markers ina linkage group. Two methods are used tofind the best locus ordering among thepotential orders in each linkage group, dou-ble crossing-over and two-locus recombina-tion fraction. The order of the three loci canbe determined by finding the least-occur-ring double recombinants. When the dou-ble recombinant classes are identified, theorder of the loci can be determined. Thetwo-locus recombination fraction approachis used to determine the locus order bycomparing the likelihood of the three pos-sible orders. The order associated with thehighest likelihood values is the most likelyorder. The ordering of more than three locican be determined using the maximumlikelihood approach [21, 23, 24].
During the fourth step, a map distance iscalculated. In the process of the linkagemap construction, the recombination frac-tions are mathematically calculated fromdata obtained by mapping of the popula-tion [25]. On the basis of the data obtained,mapping methods are subsequently used toconvert the recombination fraction into themap distance. Different kinds of mapping
function have been proposed. Mappingfunctions work only for specific conditions.There is no universal mapping function.The differences among the commonly usedmapping functions are because of theassumptions about distribution of cross-overs on the genome, crossover interfer-ence, and length of the chromosome seg-ment. Genes or genetic markers are orga-nized in a linear fashion on a map, thustheir relative positions on the map can bequantified additively. If the expected num-ber of crossovers is one per genome seg-ment, the map distance between two genesor genetic markers flanking the segment isdefined as 1 Morgan (M) or 100 centi-Morgans (cM). The commonly used map-ping methods are Morgan’s, Haldane’s, andKosambi’s. Morgan’s mapping method canbe appropriately applied for a smallgenome, which most probably has a smallexpected number of multiple-crossoverscompared with a large genome [26]. As thesize of the genome increases, the expectednumber of multiple-crossovers becomeslarger and the map distance has to beadjusted for multiple-crossovers by use ofHaldane’s mapping method, by assumingthat crossovers occur uniformly (randomly)along the length of the chromosome (in theabsence of crossover interference) [27].Experimental evidence has been found thatcrossover interference exists and crossoversoccur non-randomly in larger genomes.Therefore, Kosambi’s mapping method wasinvented to take into account the crossoverinterference. The rationale for Kosambi’smethod is that crossover interferencedepends on the size of a genome segment.The interference is absent when a segmentis sufficiently large and increases as seg-ment size decreases [28].
The final step in the mapping procedureis linkage map construction. During recentdecades, many approaches have been devel-
110 5 Genomic Mapping and Positional Cloning, with Emphasis on Plant Science
oped for building a multi-locus model. Theleast-squares method was implemented in acomputer package “Joinmap” for genomicmapping. The EM algorithm uses a set ofprocedures for obtaining a maximum likeli-hood estimate. The Lander–Green algo-rithm greatly reduces the computationalcomplexity of obtaining multi-locus recom-bination fractions from traditional appro-aches. This method has been widely imple-mented in computer packages such asMapmaker [29], Gmendel [30], and PGRI.The joint maximum likelihood is a methodto estimate recombination fractions andcrossover interference by simultaneouslyusing a multiplicative model. This algo-rithm has been implemented in the com-puter package “GLIM” which can be used toapply generalized linear regression. Thesimulation approach involves the compari-son of multilocus likelihoods of the datausing different mapping functions. Thisapproach can be used to identify a mappingmethod which fits the data well. It wasimplemented in the computer programLinkage [31].
Although most linkage maps are basedon population sizes ranging from 100 to 200individuals, the study of larger progeniescan help enhance map resolution and esti-mation of map distances [32].
5.3
Positional Cloning
Information about map positions of genes isused to conduct chromosome walking dur-ing positional cloning. In the initial step,flanking markers which are tightly linked tothe target gene must be identified. Thesetightly linked markers are then used asinitial points for the development of thehigh-resolution map around the targetregion, using highly polymorphic content
markers. When the flanking markers arenarrowed down, the next step is to constructa physical map around the target region.The candidate region can subsequently benarrowed down further, sometimes to aregion being covered by a single large insertclone. After characterization of the genes bysequencing, functional analysis by comple-mentation in transformed plants is the mostimportant piece of evidence for the success-ful identification and cloning [33].
5.3.1
Successful Positional Cloning
More than 100 inherited disease genes inhumans have been isolated (http://genome.nhgri.nih.gov/clone/). Significantprogress in positional cloning in plants wasachieved, however, mostly because of thedevelopment of high-density maps andlarge insert libraries in major crops such asrice [19], Arabidopsis [34], tomato [35], andbarley [36]. Two classic examples of geneidentification and location were the cloningof the Pto gene in tomato [2] and the Xa21gene in rice [3]. These genes are responsiblefor resistance against bacterial pathogens.Arabidopsis has become a model plant formap-based cloning, because of the simplic-ity of identification of mutations, compre-hensive genetic and physical maps, and theease of gene transformation. Examples ofdisease-resistance genes from Arabidopsisthat have been cloned include the RPM1gene against P. syringae [37], RPS2 against adifferent strain of P. syringae [38], RPP13against downy mildew fungus [39], Mlo,against broad-spectrum fungal attack inbarley [40], and I2 against fusarium wilt intomato [41]. Other disease-resistance genesthat have been identified are Tm2a againstTMV in tomato [42], Asc against alternariastem cancer in tomato [43], Pi-b against riceblast [44], Pi-ta2 also against rice blast [44],
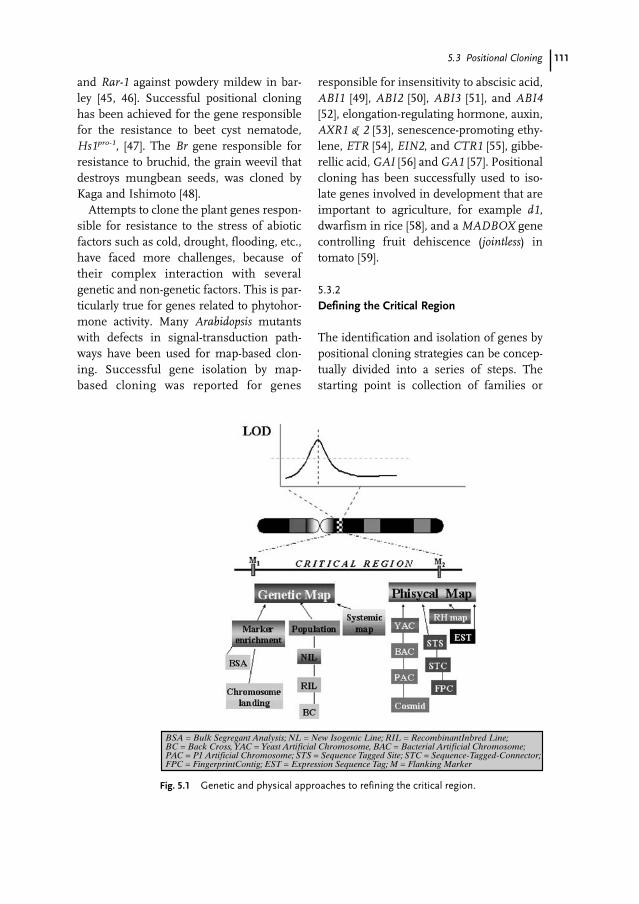
1115.3 Positional Cloning
and Rar-1 against powdery mildew in bar-ley [45, 46]. Successful positional cloninghas been achieved for the gene responsiblefor the resistance to beet cyst nematode,Hs1pro-1, [47]. The Br gene responsible forresistance to bruchid, the grain weevil thatdestroys mungbean seeds, was cloned byKaga and Ishimoto [48].
Attempts to clone the plant genes respon-sible for resistance to the stress of abioticfactors such as cold, drought, flooding, etc.,have faced more challenges, because oftheir complex interaction with severalgenetic and non-genetic factors. This is par-ticularly true for genes related to phytohor-mone activity. Many Arabidopsis mutantswith defects in signal-transduction path-ways have been used for map-based clon-ing. Successful gene isolation by map-based cloning was reported for genes
responsible for insensitivity to abscisic acid,ABI1 [49], ABI2 [50], ABI3 [51], and ABI4[52], elongation-regulating hormone, auxin,AXR1 & 2 [53], senescence-promoting ethy-lene, ETR [54], EIN2, and CTR1 [55], gibbe-rellic acid, GAI [56] and GA1 [57]. Positionalcloning has been successfully used to iso-late genes involved in development that areimportant to agriculture, for example d1,dwarfism in rice [58], and a MADBOX genecontrolling fruit dehiscence (jointless) intomato [59].
5.3.2
Defining the Critical Region
The identification and isolation of genes bypositional cloning strategies can be concep-tually divided into a series of steps. Thestarting point is collection of families or
Fig. 5.1 Genetic and physical approaches to refining the critical region.
BSA = Bulk Segregant Analysis; NL = New Isogenic Line; RIL = RecombinantInbred Line;BC = Back Cross, YAC = Yeast Artificial Chromosome, BAC = Bacterial Artificial Chromosome;PAC = P1 Artificial Chromosome; STS = Sequence Tagged Site; STC = Sequence-Tagged-Connector;FPC = FingerprintContig; EST = Expression Sequence Tag; M = Flanking Marker
112 5 Genomic Mapping and Positional Cloning, with Emphasis on Plant Science
germplasms with defects or special traits ofinterest. After the critical region is identi-fied by flanking markers, usually spanningtens of million base pairs, more refinementis achieved by using additional geneticmarkers that map in the vicinity. The extentto which the map region can be determinedby genetic means depends on the size of thepopulation and the number and informa-tiveness of the genetic markers in theregion. In the ideal case the defective geneswere caused by cytological abnormalities,which immediately establishes the criticalregion containing the defective genes. Ofcritical importance for phenotyping screen-ing limits is the number of progeny that canbe evaluated in the study.
Genetic mapping can be narrowed downto 1–3 cM in optimum examples of humandiseases or as tightly as 0 cM in plants [42,60]. The corresponding physical size, how-ever, can vary widely, because of genomesize and regional and sex-specific differenc-es in recombination rates. In humans, 1 cMtypically corresponds to approximately1–3 Mb. In plants, the physical-to-geneticdistance per 1 cM varies with genome size(e.g. 100 kb in Arabidopsis, 250 kb in rice,1000 kb in maize). In recombination hotspots the physical-to-genetic distance can beparticularly small and such regions havefrequently been associated with gene rich-ness. Choices of strategies for positionalcloning, as illustrated in Fig. 5.1, depend onthe tools available for particular organisms.
5.3.3
Refining the Critical Region: Genetic Approaches
Flanking markers identified in the prelimi-nary map normally are too far to reach thetarget QTL by most large-DNA insert-clon-ing technologies. The generation of more
polymorphic markers within a specificregion can be achieved by genetic or physi-cal means. Recombination events near thetarget gene at a resolution of 0.1 cM canhelp facilitate gene identification.
Positional cloning is laborious and costlyfor organisms for which high-resolutionmaps are not available. An ideal methodwould be to directly isolate region-specificmarkers at high density to identify overlap-ping genomic clones covering the genes ofinterest without generating a genetic mapor performing a chromosome walking pro-cedure. Chromosome landing and pooledprogeny techniques are based on the iden-tity of their chromosomal region of inter-est [61]. In bulk segregant analysis (BSA)pooled progenies are based on their pheno-typic identity. BSA has been successfullyused to isolate markers surrounding themajor loci [43]. BSA has the same advantageas chromosome landing, because there isno requirement for the construction of ahigh-density map. Combined with high-multiplex ratio markers such as AFLP, SSR,and RAPD, BSA and chromosome landingcan reduce the number of DNA samplesnecessary to score thousands of mark-ers [62]. Genetically directed representa-tional difference analysis (GDRDA) usesphenotypic pooling, combined with a sub-tractive method, to specifically isolate mark-ers from a locus of interest [20]. This meth-od was often insufficient to locate specificmarkers in a specific region. RFLP subtrac-tion has been used to isolate large numbersof randomly located RFLP spanning themouse genome [63] and Volvox carteri [64].Three RFLP markers linked to recA at 0 cMhave been isolated by Corrette-Bennett etal. [64], but it is not clear if their methodol-ogy can be applied to plant or animalgenomes in which repetitive sequences andretrotransposons are abundant.
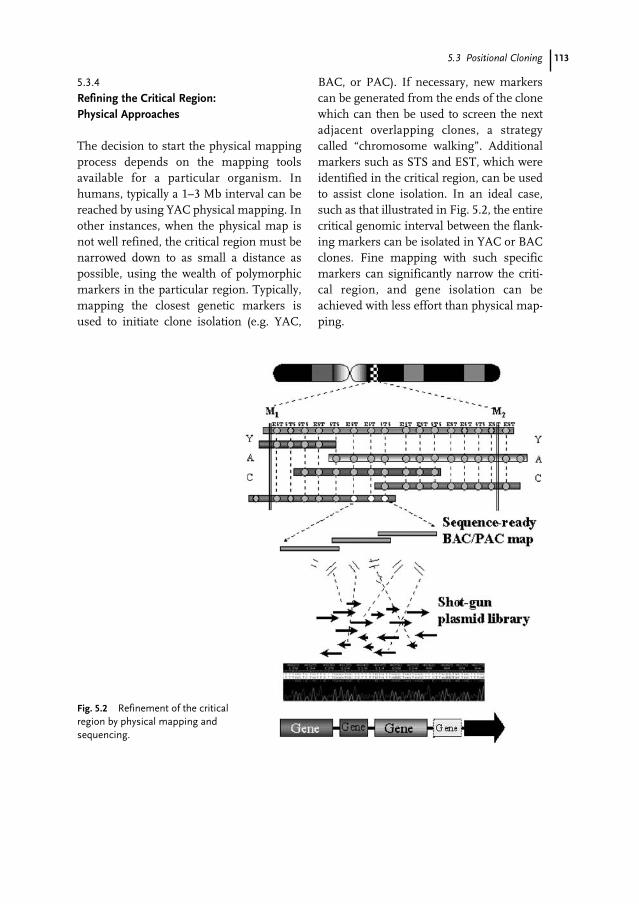
1135.3 Positional Cloning
5.3.4
Refining the Critical Region: Physical Approaches
The decision to start the physical mappingprocess depends on the mapping toolsavailable for a particular organism. Inhumans, typically a 1–3 Mb interval can bereached by using YAC physical mapping. Inother instances, when the physical map isnot well refined, the critical region must benarrowed down to as small a distance aspossible, using the wealth of polymorphicmarkers in the particular region. Typically,mapping the closest genetic markers isused to initiate clone isolation (e.g. YAC,
BAC, or PAC). If necessary, new markerscan be generated from the ends of the clonewhich can then be used to screen the nextadjacent overlapping clones, a strategycalled “chromosome walking”. Additionalmarkers such as STS and EST, which wereidentified in the critical region, can be usedto assist clone isolation. In an ideal case,such as that illustrated in Fig. 5.2, the entirecritical genomic interval between the flank-ing markers can be isolated in YAC or BACclones. Fine mapping with such specificmarkers can significantly narrow the criti-cal region, and gene isolation can beachieved with less effort than physical map-ping.
Fig. 5.2 Refinement of the criticalregion by physical mapping andsequencing.
114 5 Genomic Mapping and Positional Cloning, with Emphasis on Plant Science
5.3.5
Cloning Large Genomic Inserts
Cloning large genomic fragments facilitatesaccess to genes known by map position,physical mapping, and large-scale genomesequencing. The two most powerful cloningvectors are yeast artificial chromosomes(YAC) and bacterial artificial chromosomes(BAC). The development of YAC enablescloning of DNA inserts of more than500 kb [65]. However, cloning in YAC nor-mally generates a large amount of chimer-ism and rearrangements, which limits theusability of this method in physical map-ping and map-based cloning [39, 65–67]. Onthe other hand, BAC, which utilize the E.coli single-copy fertility plasmid (F plasmid)can maintain up to 350 kb inserts with littleor no rearrangement or chimerism [68–71].An alternative to cloning in BAC, the PACsystem is an artificial chromosome vectordeveloped on the basis of bacteriophageP1 [66]. Both BAC and PAC, as comparedwith YAC, have much higher cloning effi-ciencies, improved fidelity, and are easier tohandle. Because of its high stability andease of use, the BAC cloning system hasemerged as the vector of choice for the con-struction of large insert libraries suchhuman [72], bovine [47], Arabidopsis [73],rice [74], and sorghum [75]. To add evenmore capabilities to the BAC system, the T-DNA locus and origin of replication fromAgrobacterium tumefaciens were engineeredinto a binary bacterial artificial chromo-some (BIBAC) vector to make it an idealplant transformation vector with the capac-ity of replicating in both E. coli and A. tume-faciens [27]. The original vectors have subse-quently been modified to improve the trans-formation efficiency by electroporation,cloning features, and selection specific-ity [76]. Rice and wheat genomic librarieswere recently constructed using the
improved BIBAC vector [76]. Using theimproved BIBAC vector, a gene causing fil-amentous flower was isolated [77]. Theentire 150-kb human genomic fragmentwas transferred into tobacco plants [78].Recently, an additional P-lox site has beeninserted into the pBACwich vector to enablesite-specific recombination when using par-ticle bombardment for plant transforma-tion [79]. The cre-lox system was successful-ly used to mediate recombination betweenArabidopsis and Nicotiana tabacum chromo-somal regions [80]. Such improvements cannow be used, with the help of positionalcloning, to understand the function ofgenes.
5.3.6
Radiation Hybrid Map
A radiation hybrid map (RH map) can beconstructed on the basis of radiation-induced breakage between loci. The mapdistance between markers, estimated by thefrequency of chromosome breakage, is pro-portional to the physical distance betweenthe markers. The map resolution is,depending on the amount of radiation used,on average between 100–1000 kb. Unlikephysical maps, RH mapping is more ran-dom, because chromosome breakage doesnot depend on the frequency of restrictionenzymes or a cloning bias. Nonetheless,monomorphic markers such as EST andSTS can be assigned to a RH map. With thehigh resolution achieved by RH mappingand the high density markers, RH mappingis a very powerful tool for positional clon-ing. Positional cloning of hyperekplexia, ahuman autosomal dominant neurologicaldisorder was achieved within 6 weeks afterthe critical region was identified and unre-lated candidate genes were eliminatedusing RH mapping [5]. RH mapping isextremely useful in any chromosomal
1155.4 Comparative Mapping and Positional Cloning
region where recombination is suppressed.Publicly available RH mapping panels havebeen maintained at Genethon (http://www.genethon.fr/genethon_en.html), the White-head Institute (http://www.genome.wi.mit.edu/), and Stanford University (http://shgc-www.stanford.edu/ Mapping/rh).
5.3.7
Identification of Genes Within the Refined Critical Region
The most challenging step in positionalcloning is identification of genes in the crit-ical region. There are strategies for theidentification of genes in large genomicclones such as YAC, BAC, or PAC clones.Ideally the trait is cosegregated with themarker or an EST derived from high-reso-lution mapping. When the critical regioncannot be narrowed down further and noother known marker is available, smallDNA fragments from a YAC or BAC clonescontaining the gene can be used to hybri-dize in the orthologous region in suchsystems as the human/mouse/rat system,Arabidopsis–tomato–Brassica, or the rice/maize/wheat system. Detection of cross-hybridization reveals conserved sequencesbetween these species and, therefore, genesor EST identified in such a syntenic regionare likely to have biological function. Thepresence of CpG islands nearby oftenmarks the 5′ ends of genes and can be sub-sequently used for gene isolation. CpGislands, exon trapping, and direct cDNAselection are complementary approachesthat can be used to identify exons ingenomic sequences.
5.3.7.1
Gene Detection by CpG IslandIts unusual G + C-rich DNA first distin-guished CpG islands from other genomicsequences [38]. More than 60% of human
genes contain CpG islands, both in promot-ers and at least a part of one exon [81].
5.3.7.2
Exon TrappingThe presence of consensus sequences at“splice junctions” enables isolation of adja-cent exons by “exon amplification” or “exontrapping” [82]. Occasionally the entire inter-nal exon can be captured [83]. In a similarfashion, several genes causing human dis-eases have been isolated by trapping theirterminal exons using the poly-A tail sig-nal [84].
5.3.7.3
Direct cDNA SelectionThe candidate genomic clones can be usedeither templates to screen cDNA librariesconstructed from the target tissues or sub-tractive hybridization. Using a methodcalled “direct cDNA selection”, the targetgenomic clones are fixed on an affinitymatrix to capture cDNA by homology-basedhybridization. The success of the methodrelies on the source and quality of thecDNA that are about to be captured. Thegenes can only be captured if they areexpressed in the tissue from which mRNAor cDNA libraries were isolated. Somegenes with low levels of expression orwhich are absent in the target tissue mightbe difficult or impossible to isolate by directcDNA selection.
5.4
Comparative Mapping and Positional Cloning
Comparative mapping combines geneticinformation accumulated from related spe-cies. Usually, linkage maps of each specieshave been constructed with various kinds ofmolecular marker and used independently
116 5 Genomic Mapping and Positional Cloning, with Emphasis on Plant Science
for particular genetic purposes. Com-parisons among maps of related species,using low copy-number sequences as aprobe to hybridize with genomic DNA, indi-cated the substantially conserved orders ofthe DNA sequences among their genomes.This is well documented in the grass family,which diverged ~60 million years ago[85–87]. The mammals including humanand mouse evolved from a common progen-itor ~70 million years ago and are also docu-mented as showing conserved orders ofDNA sequences [88]. The existence of con-served gene orders (colinearity) and contentsin related species indicates that new genesare rarely created within evolutionary timeframes of at least ten million years. Mostnew genes probably arise from gene duplica-tion and/or gene modification of currentlyexisting genes [89]. Colinearity can thereforeenable gene prediction across families andthe extrapolation of mapping data from oneorganism to another. Candidate genes canthus also be easily isolated and predictedfrom species for which well established link-age maps are not available.
5.4.1
Synteny, Colinearity, and Positional Cloning
Rice (430 Mb), maize (3500 Mb), and wheat(16,000 Mb) separated 50–60 million yearsago [90]. Only genes which are extensivelyconservative can be found in orthologousregions which diverged several millionyears ago [58]. Comparative maps have beenconstructed between rice and maize [85],between oat and maize [91], among ricestrains, between wheat and maize based ona common set of cDNA [92], and betweenrice and barley [72, 93]. Being phylogenet-ically 60 million years apart, members ofthe grass family still share extensive synten-ies in a number of regions. Therefore, theidea that the map position of one species
can be used to identify and compare orthol-ogous alleles across species is feasible forgrasses [94, 95].
Comparative mapping in cereals, includ-ing rice, foxtail millet, sugar cane, sor-ghum, maize, Triticeae and oats, revealedsubstantial colinearity when RFLP and ESTmarkers were used. Rice chromosomal seg-ments reconstructed in the context of its rel-ative genome are termed rice linkage seg-ments (RLS) [96]. Among dicots, Arabidop-sis and Brassica species, tomato, and soy-bean, were co-linear (also called macro-syn-theny) to a lesser extent than cereals. Thesynteny between monocots and dicots waslimited.
In positional cloning experiments, micro-colinearity can be extremely useful for clon-ing genes from species with large genomes,such as wheat and maize, using informa-tion from small genome species like ricebased on their synteny. When a 6.5 cMregion in barley’s chromosome 1 contain-ing the barley rust resistance gene Rpg1 wascompared with the 2.5 cM syntenic regionin rice chromosome 6, the order of RFLPmarkers was conserved [72]. In the case ofthe Adh1 locus, composition and arrange-ment of genomic DNA fragments werecompared between maize YAC and sor-ghum BAC clones, containing the ortholo-gous loci [3, 58]. Because of a 75 kb stretchof highly repetitive elements in maize, chro-mosome walking to the Adh1 gene wasmade possible by cross-referencing to thesorghum BAC. In a similar case, syntenywas reported in the sh2-a1 homologousregions among maize, sorghum, and rice,where the distance between the two geneswas 140 kb in maize but only 19 kb in riceand sorghum [97]. These studies reveal thatsmall rearrangements, including frequentinsertions of transposons or retrotranspo-sons can occur without significant rear-rangement of the orthologous region [89].
1175.4 Comparative Mapping and Positional Cloning
Another striking demonstration of col-inearity in the grass family is the genewhich causes dwarfism. The so-called“green revolution” genes were found inwheat (Rht, reduced height), maize (d8,dwarf), and rice (d, dwarf). Sequence com-parison revealed that the Rht and maize d8genes were orthologs of the ArabidopsisGAI, which is the gibberellin-insensitivemutant [98]. Comparative mapping betweenwheat and rice using RFLP markers linkedto Rht-D1b and between rice and maizeusing RFLP markers linked to D8 clearlyshowed colinearity among wheat chromo-some D4, rice chromosome 3, and themaize chromosome 1. Additionally, one ofthe spontaneous rice dwarf mutants, d1,was isolated by positional cloning and wasfound to be an ortholog or the alpha subunitof G-protein, which is related to the GAImutant found in Arabidopsis [60]. The d1mutant, however, was mapped to chromo-some 5. Because at least 54 dwarf mutantshave been identified in rice, at least onemight actually be located in the synthenicregion of chromosome 3. Although compar-ative mapping is a powerful tool for findinggenes in large syntenic regions, extensivegene or segmental duplication in the refer-ence genome can obstruct such comparisonand lead to the false assignment of a synten-ic region.
5.4.2
Bridging Model Organisms
Genomes of model organisms have playeda critical role in the positional cloning ofhuman diseases. Humans and mice are themost extensively mapped mammals. Themap location of more than 3000 genes andsyntenic regions has been identified anddisplayed at http://www3.ncbi.nlm.nih.gov/Homology/. These maps are alsolinked to the MGD (Mouse Genome
Database) and OMIM (Online MendelianInheritance in Man; http://www3.ncbi.nlm.nih.gov/omim), a catalog of humangenes and genetic disorders. To integratemaps of the two different species, type Imarkers such as EST have been the mostuseful tool for anchoring loci during com-parative mapping [99].
The complete genomic sequence andannotated set of genes for budding yeast(http://www.stanford.edu/Saccharomyces)has opened another possibility for the cross-referencing of human genes [100]. Severalhuman disease genes have been cloned inthis way, examples include MDR1, the mul-tidrug-resistance gene in humans, whichencodes a protein required for the phero-mone factor involved in yeast mating [101].The human neurofibromatosis type 1 genecan complement the function of defectiveIRA in yeast [102]. Tremendous conserva-tion of genes still exists between the humanand the fly [103].
Completion of the whole genomesequence of Arabidopsis and rice opens anopportunity to compare more closely twogenomes that diverged approximately 200million years ago. Alignment between189.5 Mb of rice and Arabidopsis revealed4–22 rice orthologs covering 3.2 cM [104].One Arabidopsis contig aligned with two dis-tinct rice physical regions, showing theseare actually duplicated. The concept ofusing genome-cross referencing can beillustrated for genes controlling floweringtime. In Arabidopsis the genes for floweringtime have been cloned and completely char-acterized. In cereals, photoperiod sensitivitycan be related to genes for flowering time inArabidopsis. The barley Ppd-H1 plays amajor role in regulating flowering time inbarley [105]. Located on chromosome 2H,the barley flowering gene was homologouswith the wheat Ppd gene series in the wheatand barley RFLP map. The barley Ppd-H1,
118 5 Genomic Mapping and Positional Cloning, with Emphasis on Plant Science
the homolog of the wheat Ppd genes [106],was located on barley chromosome 2H or inthe vicinity of the junction between theRLS7 and RLS4a [87] flanked by two cDNAat the distal end of rice chromosome 7 [107]where the rice Hd2 was identified [108].Analysis of the Arabidopsis genomicsequence did not identify any region equiv-alent to Hd2 and Ppd-H1 regions of rice andbarley. The cDNA sequence was used tosearch for homologs in the Arabidopsisgenome, but failed to provide candidategenes. This has led to the conclusion thatsignificant colinearity exists among speciesand has been maintained over a long evolu-tionary time.
5.4.3
Predicting Candidate Genes in the Critical Region
The most direct approach to gene identifica-tion in a genomic region involves analysisof DNA sequences. Such a high-qualitysequence will soon be available for human,C. elegans, and Arabidopsis [109], among oth-ers. Taking the human genome project asan example, the availability of the compre-hensive high-resolution map and physicalmap that assembles EST, STC, STS, andSTR into large genomic contigs enableshuman disease genes to be assigned pre-cisely and rapidly to the critical region.When genomic sequences are availablegenes can be predicted more accuratelyusing modern computational tools includ-ing GenScan, GeneMarkHMM, Xgrail, andGlimmer, as illustrated in Fig. 5.3. All thegenes identified by homology or by predic-tion in the critical region can become candi-dates. It is essential to understand howthose candidate genes function. To provethat one of those candidate genes is theresponsible gene, it must be demonstratedthat the mutation in the gene is genetically
associated with the phenotype. At this stagethe availability of single nucleotide poly-morphisms (SNP) will substantially im-prove the rate of mutation discovery in thecandidate genes. Ultimate proof of the can-didate gene requires evidence of a comple-mentation test, however.
5.4.4
EST: Key to Gene Identification in the Critical Region
As sequence-based markers, EST play a cru-cial role in both gene-based physical mapconstruction and candidate gene identifica-tion. In recent years, EST production on amassive scale has been conducted at theInstitute for Genomic Research, TIGR(http://www.tigr.org/), and over 100,000EST have been released by TIGR and othersto be maintained in the “dbEST” database(http://www.ncbi.nlm.nih.gov/dbEST/) atNCBI. Among the largest publicly availableEST collections, more than 500,000 ESThave been produced at Washington Uni-versity in St Louis, supported by Merck andCompany (http://genome.wustl.edu/est/esthmpg.html). Because the current ESTare only 97 % accurate and short, unedited,single-pass reads, they are clustered into“tentative consensus sequences” at TIGR(http://www.tigr.org/) or “uniquegene clus-ters” at NCBI (http://www.ncbi.nlm.nih.gov/UniGene/).
EST have been also produced from organ-isms other than the human. One of the larg-est collections is the 300,000 mouse ESTfunded by the Howard Hughes MedicalInstitute (http://genome.wustl.edu/est/mouse_esthmpg.html). Other model organ-isms are C. elegans (http://ddbj.nig.ac.jp/htmls/c-elegans/html/), Arabidopsis thalia-na (http://genome-www.stanford.edu/Arabidopsis/), rice (http://ww.staff.or.jp/),and Drosophila melanogaster (http://fly2.
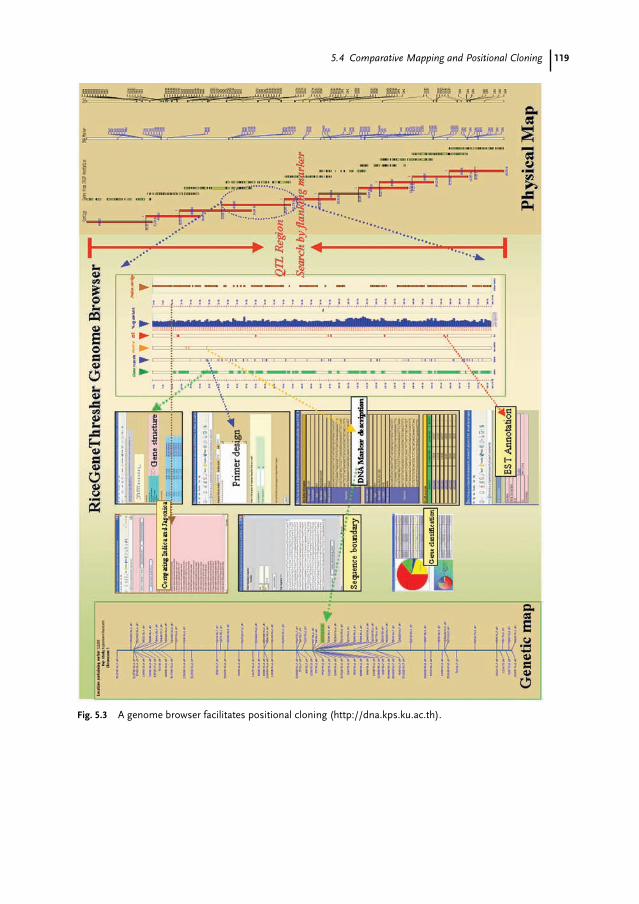
1195.4 Comparative Mapping and Positional Cloning
Fig. 5.3 A genome browser facilitates positional cloning (http://dna.kps.ku.ac.th).
120 5 Genomic Mapping and Positional Cloning, with Emphasis on Plant Science
berkeley.edu/). These homologous ororthologous resources are curated at“HomoloGene” at NCBI (http://www.ncbi.nim.nih.gov/HomoloGene/).
Identification of EST on physical and RHmaps of a critical region can aid immediateidentification of candidate genes and sim-plify the positional cloning of particulargenes by leaping across taxonomic boundar-ies, because of the conserved proteinsequences.
5.4.5
Linkage Disequilibrium Mapping
Genetic variation within coding sequencesis highly conserved and can rarely be detect-ed by length polymorphism. Polymorph-isms corresponding to differences at a sin-gle nucleotide level, which are caused eitherby deletion, insertion, or substitution, arebiallelic in diploids, occurring frequentlyand uniformly in most genomes at roughlyone in every 500–1000 bp. Because genom-ic and EST sequences have increased at anexponential rate in the past few years, SNPdiscovery in coding regions is projected forat least 100,000 markers with the aim ofidentifying and cataloging all human genesand creating more or less complete humanSNP maps. Because SNP residing withincoding regions are rare, these mutationsmight correspond to defects that are asso-ciated with polymorphism at the proteinlevel, diseases, or other phenotypes. Toprove that SNP are associated with a partic-ular disease, haplotype analysis of SNP inthe candidate genes must be conductedamong affected and unaffected individualsfrom the same family. In this case, the sam-ple size must be large enough to reveal sta-tistical differences between the affected andunaffected pools and show a linkage dis-equilibrium. Positional cloning can be moreeffective and less time-consuming if SNP
are used not only to refine the criticalregion but also to confirm the position ofthe real candidate genes.
5.5
Genetic Mapping in the Post-genomics Era
Genome projects can dramatically simplifythe long, tedious process of positional clon-ing. Physical mapping can also be tediousand costly. For most genome projects, BAC-end sequences or sequence tag connectors(STC) from a 10–20 X BAC library can sub-stantially simplify physical map construc-tion. “End walking” can be performed in sil-ico, initiated by several rounds of BLASTsearching of the sequences of flankingmarkers or the next BAC end sequencesagainst the respective BAC-end sequencedatabase until the critical region completelyoverlaps with a BAC contig. In addition, aBAC fingerprint database, in which contigsare being assembled, can be used to con-firm and anchor the genetic map by usingwell-mapped molecular information, asillustrated in Fig. 5.4.
Although there have been several suc-cesses in map-based cloning in many spe-cies, cloning QTL has remained a formid-able task for their small allelic differenceand large environmental effects. Genomictools are available to make genome map-ping more efficient. Abundant molecularmarkers can be developed from availablegenomic sequence, enabling first-passgenome mapping to be done quickly. Fine-scale mapping can be developed to narrowdown QTL regions to as small as 50 kb.
Recent advances in oligonucleotide arraytechnologies have added new opportunitiesto genotype several thousand of genes in asingle array or GeneChip [110]. By hybridiz-ing labeled total genomic DNA to the
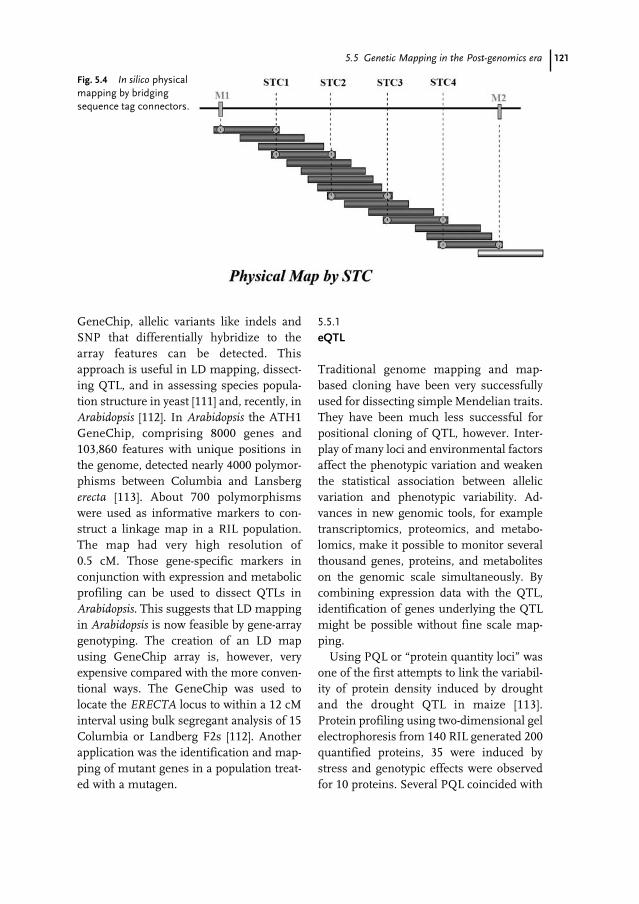
1215.5 Genetic Mapping in the Post-genomics era
GeneChip, allelic variants like indels andSNP that differentially hybridize to thearray features can be detected. Thisapproach is useful in LD mapping, dissect-ing QTL, and in assessing species popula-tion structure in yeast [111] and, recently, inArabidopsis [112]. In Arabidopsis the ATH1GeneChip, comprising 8000 genes and103,860 features with unique positions inthe genome, detected nearly 4000 polymor-phisms between Columbia and Lansbergerecta [113]. About 700 polymorphismswere used as informative markers to con-struct a linkage map in a RIL population.The map had very high resolution of0.5 cM. Those gene-specific markers inconjunction with expression and metabolicprofiling can be used to dissect QTLs inArabidopsis. This suggests that LD mappingin Arabidopsis is now feasible by gene-arraygenotyping. The creation of an LD mapusing GeneChip array is, however, veryexpensive compared with the more conven-tional ways. The GeneChip was used tolocate the ERECTA locus to within a 12 cMinterval using bulk segregant analysis of 15Columbia or Landberg F2s [112]. Anotherapplication was the identification and map-ping of mutant genes in a population treat-ed with a mutagen.
5.5.1
eQTL
Traditional genome mapping and map-based cloning have been very successfullyused for dissecting simple Mendelian traits.They have been much less successful forpositional cloning of QTL, however. Inter-play of many loci and environmental factorsaffect the phenotypic variation and weakenthe statistical association between allelicvariation and phenotypic variability. Ad-vances in new genomic tools, for exampletranscriptomics, proteomics, and metabo-lomics, make it possible to monitor severalthousand genes, proteins, and metaboliteson the genomic scale simultaneously. Bycombining expression data with the QTL,identification of genes underlying the QTLmight be possible without fine scale map-ping.
Using PQL or “protein quantity loci” wasone of the first attempts to link the variabil-ity of protein density induced by droughtand the drought QTL in maize [113].Protein profiling using two-dimensional gelelectrophoresis from 140 RIL generated 200quantified proteins, 35 were induced bystress and genotypic effects were observedfor 10 proteins. Several PQL coincided with
Fig. 5.4 In silico physicalmapping by bridgingsequence tag connectors.
122 5 Genomic Mapping and Positional Cloning, with Emphasis on Plant Science
QTL for drought and ABA responses. Thesewere narrowed down to small regionsapparently involved in regulating the geneexpression of a large number of other genesthroughout the genome when combinedwith the phenotypic data.
By measuring the relative abundance ofmRNA produced by many genes simultane-ously, new technologies such as microar-rays have been used to shed light on regula-tion of gene transcription. cDNA microar-rays have been the prominent method forgene expression analysis in rice [114], bar-ley [115], poplar [116], and strawberry [117].Several reports recently shown that a signif-icant portion of gene expression levels areunder genetic control in different organ-isms. Determination of gene expression lev-els by exploiting segregating populations istermed “eQTL”. Compared with “PQL”,eQTL can lead to higher throughput andgenome coverage. Schadt et al. [118] used amouse gene oligonucleotide microarray tomonitor the gene expression levels of23,574 genes in liver tissues from 111 F2mice constructed from two standard inbredstrains. They found hotspot regions ingenomic DNA that are involved in regulat-ing the expression of many other genes.Increasing numbers of genetic factorsunderlying QTL identified so far were non-coding. Nucleotide variation in the promot-
er or upstream sequence might be respon-sible for eQTL. If this is so, searching onlyfor coding sequences in the candidategenes might fail to identify the causal fac-tors responsible for genetic variation in theQTL. Interpreting noncoding regulatoryvariants poses special problems. Noncodingregulatory sequences might be involved insplicing variation. For example, sequencevariation at a splice junction in the waxylocus was responsible for a QTL responsiblefor variation of the amylose content ofrice [119].
By combining physical maps and globaltranscription data, genome transcriptionmaps can be constructed for Drosophila.Advances in microarray technology, prote-omics, and single-nucleotide polymor-phism genotyping have made it attractive tocorrelate these molecular data with eQTL.Gene-expression levels can also be used toidentify objectively the most promising can-didate genes for complex traits. Because thenumber of candidate genes that physicallyreside in linked regions is often large, itseems appropriate to restrict attention tothose genes in which the expression levelsalso map to the region and show geneticcorrelation with the phenotypes. Studiesthat combine gene product data with genet-ic marker data are the new frontier in dis-secting the genetic basis of QTL.
123
1 Bent AF, Kunke BN, Dahlbeck D, Brown KL,Schinidt R et al. (1994) RPS2 of Arabidopsisthaliana a leucine-rich repeat class of plantdisease resistance gene, Science265:1856–1860
2 Martin GB, Brommonschenkel SH,Chunwongse J, Frary A, Ganal MW et al.(1993) Map-based cloning of a protein kinasegene conferring disease resistance in tomato,Science 262:1432–1436
3 Song WY, Wang GL, Chen LL, Kim HSPi, LYet al. (1995) A receptor kinase-like proteinencoded by the rice disease resistance gene,Xa-21, Science 270:1804–1806
4 Botstein D, White RL, Skolnick M, Davis RW(1980) Construction of a genetic linkage mapin human using restriction fragment lengthpolymorphisms, Am J Hum Genet 32:314–331
5 Warrington JA, Bengtsson U (1994) High-resolution physical mapping of human 5q31-q33 using three methods: Radiation hybridmapping, interphase fluorescence in situhybridization, and pulse-field gelelectrophoresis, Genomics 24:395–398
6 Laroche A., Demeke T, Gaudet DA, PuchalskiB, Frick M, McKenzie R (2000) Developmentof a PCR marker for rapid identification ofthe Bt-10 gene for common bunt resistancein wheat, Genome 43:217–223
7 Huys G, Rigouts L, Chemlal K, Portaels F,Swings J (2000) Evaluation of amplifiedfragment length polymorphism analysis forinter- and intraspecific differentiation ofMycobacterium bovis, M. tuberculosis, and M.ulcerans. J Clin Microbiol 38:3675–3680
8 Mackill DJ, Zhang Z, Redona ED, ColowitPM (1996) Level of polymorphism andgenetic mapping of AFLP markers in rice,Genome 39:969–977
9 Ranamukhaarachchi DG, Kane ME, Guy CL,Li QB (2000) Modified AFLP technique forrapid genetic characterization in plants,Biotechniques 29:858–859, 862–866
10 Orita M, Iwahara H, Kanazava H, Hayashi K,Sekiya T (1989) Detection of polymorphism ofhuman DNA by gel electrophoresis as single-strand conformation polymorphisms, ProcNatl Acad Sci USA 86:2766–2770
11 Fujita K, Silver J (1994) Single-strandconformational polymorphism, PCR MethodsAppl 4:S137–S139
12 Hayashi K (1991) PCR-SSCP A simple andsensitive method for detection of mutation inthe genomic DNA, PCR Methods Appl 1:34–38
13 Hayash K (1992) PCR-SSCP A method fordetection of mutations, GATA 9:73–79
14 Bodenes C, Laigret F, Kremer A (1996)Inheritance and molecular variation of PCR-SSCP fragments in pedunculate oak (Quercusrobur L.), Theor Appl Genet 993:348–354
15 Fukuoka S, Inoue T, Miyao A, Zhong HS,Saki T, Minobe Y (1994) Mapping sequence-tagged sites in rice by single strandconformation polymorphisms, DNA Res1:271–274
16 Urquhart BG, Williams JL (1996) Sequencingof a novel cDNA and mapping to bovinechromosome 3 by single-strand conformationpolymorphism (SSCP), Anim Genet 27:438
17 Cause MA, Fulton TM, Cho YG, et al. (1994)Saturated molecular map of the rice genomebased on an interspecific backcross popula-tion, Genetics 138:1251–1274
18 Heun M, Keneedy AE, Anderson JA et al.(1991) Construction of an RFLP map of barley(Hordeum vulgare L.), Genome 34:437–447
19 Kurata N, Nagamura Y, Yamamoto K,Harushima Y, Sue N et al. (1994) A 300
References
124 References
kilobase interval genetic map of rice including880 expressed sequences, Nature Genet8:365–372
20 Lisitsyn N (1995) Representational differenceanalysis: finding the differences betweengenomes, Trends Genet 11:303–307
21 Liu BH (1998) Statistical Genomics: Linkage,Mapping and QTL Analysis. New York: CRCpress
22 Larsen SO (1979) A general program forestimation of haplotype frequencies frompopulation diploid data, Comput ProgramsBiomed 10:48–54
23 Lathrop GM, Lalouel JM, White RL (1986)Construction of human linkage maps:likelihood calculations for multilocus linkageanalysis, Genet Epidemiol 3:39–52
24 Springer PS, Edwards KJ, Bennetzen JL(1994) DNA class organization on maize Adh1yeast artificial chromosomes, Proc Natl AcadSci USA 87:103–107
25 Huh M (2000) Maximum likelihood vs.minimum chi-square – a general comparisonwith applications to the estimation ofrecombination fractions in two-point linkageanalysis, Genome 43:853–856
26 Morgan TH (1928) The Theory of Genes. NewHeaven, CT: Yale University Press
27 Haldane JBS (1919) The combination oflinkage values and the calculation of distancesbetween the loci of linked factors, J Genet8:299–309
28 Kosambi DD (1944) The estimation of mapdistances from recombination values, AnnEugen 12:172–175
29 Lander ES, Green P, Abrahamson J, BarlowA, Daly MJ et al. (1987) MAP-MAKER: aninteractive computer package for constructingprimary genetic linkage maps of experimentaland natural populations, Genomics 1:174–181
30 Liu BH, Knapp SJ (1990) GMENDEL: aprogram for Mendelian segregation andlinkage analysis of individual or multipleprogeny populations using log–likelihoodratios, J Heredity 81:407
31 Lathrop GM, Lalouel JM (1984) Easycalculation of lod scores and genetic risks onsmall computers, Am J Hum Genet36:460–465
32 Gessler DD, Xu S (1999) Multipoint geneticmapping of quantitative trait loci withdominant markers in outbred populations,Genetica 105:281–291
33 Gibson S, Somerville C (1994) Isolating plantgenes, Trends Biotechnol 12:306–313
34 Kornneef M (1994) Arabidopsis genetics. In:Meyerowitz EM, Somerville CR (Eds)Arabidopsis, Cold Spring Harbor, NY: ColdSpring Harbor Press, pp. 5.89–5.120
35 Tanksley SD, Ganal MW, Prince JP, deVicente MC, Bonierbale MW et al. (1992)High density molecular linkage maps of thetomato and potato genome, Genetics132:1141–1160
36 Sherman JK, Fenwick AL, Namuth DM, Lapi-tan NLV (1995) A barley RFLP map, alignmentof three barley maps and comparisons to Gra-mineae species, Theor Appl Genet 86:705–712
37 Grant MR, Godiard L, Straube E, Ashfield T,Lewald J et al. (1995) Structure of the Arabi-dopsis RPM1 gene enabling dual specificitydisease resistance, Science 296:843–846
38 Bird AP (1987) CpG islands as gene markersin the vertebrate nucleus, Trends Genet3:342–347; Bittner EP, Can C, Gunn N, PinelM, Tor M et al. (1999) Genetic and physicalmapping of the RPP13 locus in Arabidopsis,responsible for specific recognition of severalPeronospora parasitica (downy mildew)isolates Mol Plant Microb Interact 12:792–802
39 Burke DT (1990) YAC cloning options andproblems, GATA 7:94–99
40 Buschges R, Hollricher K, Panstruga R,Simons G, Wolter M et al. (1997) The barleyMlo gene A novel control element of plantpathogen resistance, Cell 88:695–705
41 Simons G, Groenendijk J, Wijbrandi J,Reijans M, Groenen J et al. (1998)Dissectionof the Fusarium I2 gene cluster in tomatoreveals six homologs and one active genecopy, Plant Cell 10:1055–1068
42 Pillen K, Ganal MW, Tanksley SD (1996)Construction of a high-resolution geneticmap and YAC-contigs in the tomato Tm-2aregion, Theor Appl Genet 93:228–233
43 Mesbah LA, Kneppers TJA, Takken FLW,Laurent P, Hille J, Nijkamp HJJ (1999)Genetic and physical analysis of a YAC contigspanning the fungal disease resistance locusAsc of tomato (Lycopersicon esculentum), MolGen Genet 261:50–57
44 Monna L, Miyao A, Zhong HS, Yano M,Iwamoto M et al. (1997) Saturation mappingwith subclones of YACs: DNA markerproduction targeting the rice blast diseaseresistance gene, Pi-b, Theor Appl Genet94:170–176
125References
45 Dietrich RA, Richberg MH, Schmidt R, DeanC, Dang JL (1997) A novel zinc finger proteinis encoded by the Arabidopsis LSD1 gene andfunctions as a negative regulator of plant celldeath, Cell 88:685–694
46 Lahaya T, Shirasu K, Schulze-Lefert P (1998)Chromosome landing at the barley Rar1locus, Mol Gen Genet 260:92–101
47 Cai D, Kleine M, Kifle S, Harloff HJ, SandalNN et al. (1997) Positional cloning of a genefor nematode resistance in sugar beet, Science275:832–834
48 Kaga A., Ishimoto M (1998) Genetic localiza-tion of a bruchid resistance gene and itsrelationship to insecticidal cyclopeptidealkaloids, the vignatic acids, in mungbean(Vigna radiata L. Wilczek), Mol Gen Genet258:378–384
49 Leung J, Bouvier-Durand M, Morris PC,Guerrier D, Chefdor F, Giraudat J (1994)Arabidopsis ABA response gene ABI1:features of a calcium-modulated proteinphosphatase, Science 264:1448–1451
50 Leung J, Merlot S, Giraudat J (1997) TheArabidopsis ABSCISIC ACID-INSENSITIVE2 (ABI2) and (ABI1) genes encoderedundant protein phosphatases 2C involvedin abscisic acid signal transduction, Plant Cell9:759–771
51 Giraudat J, Hauge BM, Valon C, Smalle J,Pacy F, Goodman HM (1992) Isolation of theArabidopsis ABI3 gene by positional cloning.Plant Cell 4:1251–1261
52 Finkelstein RR, Wang ML, Lynch T, Rao S,Goodman HM (1998) The Arabidopsisabscissic acid response locus ABI4 encodesan APETALA2 domain protein, Plant Cell10:1043–1054
53 Leyser HMO, Lincoln CA, Timpte C, LammerD, Turner J, Estelle M (1993) Arabidopsisauxin-resistance gene AXR1 encodes aprotein related to ubiquitin-activating enzymeE1, Nature 364:161–164
54 Chang C, Kwok S, Bleecker A, Meyerowitz E(1993) Arabidopsis ethylene-response geneETR1: Similarity of product to two-component regulators, Science 262:539–544
55 Kieber JJ, Rothenberg M, Roman G,Feldmann KA, Ecker JR (1993) CTR1, anegative regulator of the ethylene responsepathway in Arabidopsis, encodes a member ofthe raf family of protein kinases, Cell72:427–441
56 Peng J, Carol P, Richards DE, King KE, The arabidopsis GAI gene difines a signalpathway that negatively regulates gibberellinresponses, Genes Dev 11:3194–3205
57 Sun TP, Goodman HM, Ausubel FM (1992)Cloning the Arabidopsis GA1 locus bygenomic subtraction, Plant Cell 4:119–128
58 Avramova Z, Tikhonov A, SanMiguel P, JinYK, Liu C, et al. (1996) Gene identification ina complex chromosomal continuum by localgenomic cross-referencing, Plant J 10:1163–1168
59 Mao L, Begum D, Chuang HW, BudimanMA, Szymkowiak EJ et al. (2000) Jointless is aMADS-box gene controlling tomato flowerabscission zone development, Nature406:910–913
60 Ashikari M, Wu J, Yano M, Sasaki T, Yoshi-mura A (1999) Rice gibberellin insensitivedwarf mutant gene Dwarf 1 encodes the alphasubunit of GTP-binding protein Proc NatlAcad Sci USA 96:10284–10289
61 Tanksley SD, Ganal MW, Martin GB (1995)Chromosome landing: a paradigm for map-based gene cloning in plants with largegenomes, Trends Genet 11:63–68
62 Thomas CM, Vos P, Zabeau M, Jones DA,Norcott KA et al. (1995) Identification ofamplified restriction length polymorphism(AFLP) markers tightly linked to the tomatoCf-9 gene for resistance to Cladosporiumfulvum, Plant J 8:785–794
63 Rosemberg M, Przybylska M, Straus D (1994)“RFLP Subtraction”: A method for makinglibraries of polymorphic markers, Proc NatlAcad Sci USA 91:6113–6117
64 Corrette-Bennett J, Rosenberg M, PrzybylskaM, Ananiev E, Straus D (1998) Positionalcloning without a genome map using‘Targeted RFLP Subtraction’ to isolate densemarkers tightly linked to the reg A locus ofVolvox carteri, Nucleic Acids Res 26:1812–1818
65 Burke DT, Carle GF, Olson MV (1987)Cloning of large segments of exogenous DNAinto yeast using artificial-chromosomevectors, Science 236:806–812
66 Green ED, Riethman HC, Dutchik JE, OlsonMV (1991) Detection and characterization ofchimeric yeast artificial-chromosome clones,Genomics 11:658–669
67 Neil DL, Villasante A, Fisher RB, Vetrie D,Cox B, Tyler-Smith C (1990) Structural in-stability of human tandemly repeated DNAsequences cloned in yeast artificial chromo-some vectors, Nucleic Acids Res 18:1421–1428

126 References
68 Cai L, Taylor JF, Wing RA, Gallagher DS,Woo SS, Davis SK (1995) Construction andcharacterization of a bovine bacterial artificialchromosome library, Genomics 29:413–425
69 Jiang J, Gill BS, Wang GL, Ronald PC, WardDC (1995) Metaphase and interphasefluorescence in situ hybridization mapping ofthe rice genome with bacterial artificialchromosomes, Proc Natl Acad Sci USA92:4487–4491
70 Shizuya H, Birren B, Kim UJ, Mancino V,Slepak T et al. (1992) Cloning and stablemaintenance of 300-kilobase-pair fragmentsof human DNA in Escherichia coli using F-factor-based vector, Proc Natl Acad Sci USA89:8794–8797
71 Woo SS, Jiang J, Gill BS, Paterson AH, WingRA (1994) Construction and characterization ofa bacterial artificial chromosome library of Sor-ghum bicolor, Nucleic Acids Res 22:4922–4931
72 Kilian A, Kudrna DA, Kleinhofs A, Yano M,Kurata N et al. (1995) Rice/barley synteny andits application to saturation mapping of thebarley Rpg1 region, Nucleic Acids Res23:2729–2733
73 Choi S, Creelman RA, Mullet JE, Wing RA(1995) Construction and characterization ofbacterial artificial chromosome library ofArabidopsis thaliana, Plant Mol Biol Rep13:124–128
74 Zhang HB, Choi S, Woo SS, Li Z, Wing RA(1996) Construction and characterization oftwo rice bacterial artificial chromosomelibraries from the parents of a permanentrecombinant inbred mapping population, Mol Breeding 2:11–24
75 Williams JGK, Kubelik AR, Livak KJ, RafalshiJA, Tingey SV (1990) DNA polymorphismsamplified by arbitrary primers are useful asgenetic markers, Nucleic Acids Res 18:6531–6535
76 Shibata D, Liu YG (2000) Agrobacterium-mediated plant transformation with largeDNA fragments, Trends Plant Sci 5:354–357
77 Sawa S, Watanabe K, Goto K, Kanaya E,Hayato M, Okada K (1999) FILAMENTOUSFLOWER, a meristem and organ identitygene of Arabidopsis, encodes a protein with azinc finger and HMG-related domains, GenesDev 13:1079–1088
78 Hamilton CM, Frary A, Lewis C, Tanksley SD(1996) Stable transfer of intact high molecularweight DNA into plant chromosomes, ProcNatl Acad Sci USA 93:9975–9979
79 Choi S, Begum D, Koshinsky HODW, WingRA (2000) A new approach for the identifica-tion and cloning of genes the pBACwichsystem using Cre/lox site-specific recombina-tion, Nucleic Acids Res 28:19e
80 Koshinsky HA, Lee E, Ow DW (2000) Cre-loxsite-specific recombination between Arabidop-sis and tobacco chromosomes, Plant J 23:715–722
81 Larsen F, Gunderson G, Lopez R, Prydz H(1992) CpG islands are gene markers inhuman genome, Genomics 13:1095–1107
82 Duyk GM, Kim S, Myers RM, Cox DR (1990)Exon trapping A genetic screen to identifycandidate transcribed sequences in clonedmammalian genomic DNA, Proc Natl AcadSci USA 87:8995–8999
83 Nehls M, Pfeifer D, Boehm T (1994) Exonamplification from complete libraries ofgenomic DNA using a novel phage vectorwith automatic plasmid excision facility:Application to mouse neurofibromatosis-1locus, Oncogene 9:2169–2175
84 Krizman DB, Berget SM (1993) Efficientselection of 3′ terminal exons from vertebrateDNA, Nucleic Acids Res 21:5198–5202
85 Ahn S, Tanksley SD (1993) Comparative mapof the rice and maize genomes. Proc NatlAcad Sci USA 90:7980–7984
86 Guimaraes CT, Sills GR, Sobral BWS (1997)Comparative mapping of Andropogoneae:Saccharum L. (sugarcane) and its relation tosorghum and maize, Proc Natl Acad Sci USA94:14261–14266
87 Van Deynze AE, Nelson JC, Yglesias ES,Harrington SE, Braga DP et al. (1995)Comparative mapping in grasses: Wheatrelationships, Mol Gen Genet 284:744–754
88 Carver EA, Stubbs L (1997) Zooming in onthe human/mouse comparative map:Genome conservation re-examined on a high-resolution scale, Genome Res 7:1123–1137
89 Bennetzen JL (2000) Comparative sequenceanalysis of plant nuclear genomesmicrocolinearity and its many exceptions,Plant Cell 12:1021–1029
90 Moore G, Gale MD, Kurata N, Fravell RB(1993) Molecular analysis of small graincereal genomes: current status and prospects,Biotechnology 11:584–589
91 Ananiev EV, Riera-Lizarazu O, Rines HW,Phillips RL (1997) Oat/maize chromosomeaddition lines A new system for mapping themaize genome, Proc Natl Acad Sci USA94:3524–3529
127References
92 Ahn S, Anderson JA, Sorrells ME, TanksleySD (1993) Homologous relationships of ricewheat and maize chromosomes, Mol GenGenet 241:481–490
93 Dunford RP, Kurata N, Laurie DA, MoneyTA, Minobe Y, Moore G (1995)Conservationof fine-scale DNA marker order in thegenome of rice and the Triticeae, NucleicAcids Res 115:133–138
94 Bennetzen JL, Freeling M (1993) Grasses as asingle genetic system genome compositioncolinearity and compatibility, Trends Genet9:259–261
95 Paterson AH, Lin YR, Li Z, Schertz KF,Doebley JF et al. (1995) Convergentdomestication of cereal crops by independentmutations at corresponding genetic loci,Science 269:1714–1718
96 Moore G, Devos KM, Wang Z, Gale MD(1995) Grasses, line up and form a circle,Curr Biol 5:737–739
97 Chen M, SanMiguel P, Liu CN, de OliveiraAC, Tikhonov A et al. (1997) Microcolinearityin the maize, rice, and sorghum genomes,Proc Natl Acad Sci USA 94:3431–3435
98 Peng J, Richards DE, Hertley NM, Murphy GP,Devos KM et al. (1999) Nature 400:256–261
99 Debry RW, Seldin MF (1996) Human mousehomology relationships, Genomics 33:337–351
100 Bassett Jr DE, Boguski MS, Hieter P (1996)Yeast genes and human disease, Nature379:589
101 Raymond M, Gros P, Whiteway M, ThomasDY (1992) Functional complementation ofyeast ste6 by a mammalian multidrugresistance mdr gene, Science 256:232–235
102 Ballester R, Marchuk D, Boguski M, SaulinoA, Letcher R et al. (1990) The NF1 locusencodes a protein functionally related tomammalian GAP and yeast IRA proteins, Cell 63:851
103 Mounkes LC, Jones RS, Liang BC, Gelbart W,Fuller MT (1992) A Drosophila model forxeroderma pigmentosum and Cockayne’ssyndrome: haywire encodes the fly homologof ERCC3, a human excision repair gene, Cell 71:925
104 Salse J, Piegu B, Cooke R, Delseny M (2002)Synteny between Arabidopsis and rice at thegenome level: a tool to identify conservationin the ongoing rice genome sequencingproject, Nucleic Acids Res 30:2316–2328
105 Laurie DA, Pratchett N, Bezant JH, Snape JW(1995) RFLP mapping of five major genes
and eight quantitative trait loci controllingflowering time in a winter x spring barley(Hordeum vulgare L.) cross, Genome38:575–585
106 Borner A, Korzun V, Worland AJ (1998)Comparative genetic mapping of lociaffecting plant height and development incereals, Euphytical 100:245–248
107 Laurie DA (1997) Comparative genetics oflowering time in cereals, Plant Mol Biol35:167–177
108 Yamamoto T, Kuboki Y, Lin Y, Sasaki T, YanoM (1998) Fine mapping of quantitative traitloci Hd1, Hd2, and Hd3, controlling headingdate of rice, as single Mendelian factors,Theor Appl Genet 97:37–44
109 Rounsley S, Lin X, Ketchum KA (1998) Large-scale sequencing of plant genomes, Curr OpinPlant Biol 1:136–141
110 Hazen SP, Kay SA (2003) Gene arrays are notjust for measuring gene expression, TrendsPlant Sci 8:413–416
111 Winzeler EA et al. (2003) Genetic diversity inyeast assessed with whole-genome oligo-nucleotide arrays, Genetics 163:79–89
112 Borevitz JO et al. (2003) Large-scaleidentification of single-featurepolymorphisms in complex genomes,Genome Res 13:513–523
113 Zivy M, Prioul JL, Cornic G, Westhoff P,Lacroix B, de Vienne D (1995) Characterizingproteins induced by drought in maize andsearch for their QTLs, Proc First Int CongrIntegrated Studies on Drought Tolerance ofHigher Plants, August 31–September 2,Montpellier, France
114 Kawasaki S, Borcher C, Beyholos M, Wang H,Brazille S, Kawai K, Galbraith D, Bohnert HJ(2001) Gene expression profiles during theinitial phase of salt stress in rice, Plant Cell13:889–905
115 Negishi T, Nakanishi H, Yazaki J, KishimotoN, Fujii F, Shimbo K, Yamamoto K, Sakata K,Sasaki T, Kikuchi S et al. (2002) cDNAmicroarray analysis of gene expression duringFe-deficiency stress in barley suggests thatpolar transport of vesicles is implicated inphytosiderophore secretion in Fe-deficientbarley roots, Plant J 30:83–94
116 Hertzberg M, Aspeborg H, Scharder J,Anderson A, Erlandsson R, Blomqvist K,Bhalerao R, Uhlen M, Teeri TT, Lundeberg Jet al. (2001) A transcriptional roadmap towood formation, Proc Natl Acad Sci USA98:14732–14737

128 References
117 Aharoni A, Keizer LC, Bouwmeester HJ, SunZ, Alvarez-Huerta M, Verhoeven HA, Blaas J,van Houwelingen AM, De Vos RC, van derVoet H et al. (2000) Identification of the SAATgene involved in strawberry flavor biogenesisby use of DNA microarrays, Plant Cell12:647–662
118 Schadt EE et al. (2003) The tranginics of geneexpression surveyed in maize, moues andman, Nature 422:297–302
119 Wang ZY, Zheng FQ, Shen GZ, Gao JP,Snustad DP, Li MG, Zhang JL, Hong MM(1995) The anymose content in riceendosperm is related to the post-transcriptional regulation of the Waxy gene,Plant J 7:613–622
129
Lyle R. Middendorf, Patrick G. Humphrey,Narasimhachari Narayanan, and Stephen C. Roemer
6.1
Introduction
DNA sequencing technology is a majorcomponent of the genomics discovery pipe-line. The technology is rooted in the late1960s and early 1970s when efforts weremade to sequence RNA. Nucleotide se-quences of 5S-ribosomal RNA from Escheri-chia coli [1], 16S- and 23S-ribosomal RNA[2], and R17 bacteriophage RNA coding forcoat protein [3] are some early examples ofRNA sequencing. A few years later Sangerreported on the sequencing of bacterio-phage f1 DNA by primed synthesis withDNA polymerase [4, 5]. At the same timeGilbert and Maxam [6] reported the DNAnucleotide sequence of the lac operator.
This pioneering work led to the plus/mi-nus method reported by Sanger and Coul-son [7] which determined nucleotide se-quence on the basis of two approaches:
1. a “minus” system in which four separatesamples of partially double-stranded DNAfragments (containing a “full length” tem-plate “–” strand and random chain exten-sion of an oligonucleotide primer for the
“+” strand) were further incubated withDNA polymerase in the presence of onlythree deoxyribonucleoside triphosphatessuch that synthesis proceeded as far as itcould until the polymerase needed to in-corporate the missing nucleotide of theparticular sample; and
2. a “plus” system in which the four separ-ate samples of partially double-strandedDNA fragments were further incubatedin the presence of only one of the four tri-phosphates and then subjected to exonu-clease activity which degraded the single-stranded overhang of the “-” strand andany double-stranded DNA from its 3′ enduntil it stopped at a residue correspond-ing to the one triphosphate present.
The DNA fragments for both approacheswere then subjected to gel electrophoresisfor length (and thus sequence) determina-tion. One limitation of the plus/minusmethod was that incomplete representationof all possible starting lengths within the in-itial population of the partially double-stranded DNA fragments, perhaps becauseof the sequence context dependency of the
Handbook of Genome Research. Genomics, Proteomics, Metabolomics, Bioinformatics, Ethical and Legal Issues.Edited by Christoph W. SensenCopyright © 2005 WILEY-VCH Verlag GmbH & Co. KGaA, WeinheimISBN: 3-527-31348-6
6DNA Sequencing Technology
Verwendete Mac Distiller 5.0.x Joboptions
Dieser Report wurde automatisch mit Hilfe der Adobe Acrobat Distiller Erweiterung "Distiller Secrets v1.0.5" der IMPRESSED GmbH erstellt. Sie koennen diese Startup-Datei für die Distiller Versionen 4.0.5 und 5.0.x kostenlos unter http://www.impressed.de herunterladen. ALLGEMEIN ---------------------------------------- Dateioptionen: Kompatibilität: PDF 1.3 Für schnelle Web-Anzeige optimieren: Ja Piktogramme einbetten: Ja Seiten automatisch drehen: Nein Seiten von: 1 Seiten bis: Alle Seiten Bund: Links Auflösung: [ 2400 2400 ] dpi Papierformat: [ 481 680 ] Punkt KOMPRIMIERUNG ---------------------------------------- Farbbilder: Downsampling: Nein Komprimieren: Ja Komprimierungsart: ZIP Bitanzahl pro Pixel: 8 Bit Graustufenbilder: Downsampling: Nein Komprimieren: Ja Komprimierungsart: ZIP Bitanzahl pro Pixel: 8 Bit Schwarzweiß-Bilder: Downsampling: Nein Komprimieren: Ja Komprimierungsart: CCITT CCITT-Gruppe: 4 Graustufen glätten: Nein Text und Vektorgrafiken komprimieren: Ja SCHRIFTEN ---------------------------------------- Alle Schriften einbetten: Ja Untergruppen aller eingebetteten Schriften: Nein Wenn Einbetten fehlschlägt: Abbrechen Einbetten: Immer einbetten: [ /Courier-BoldOblique /Helvetica-BoldOblique /Courier /Helvetica-Bold /Times-Bold /Courier-Bold /Helvetica /Times-BoldItalic /Times-Roman /ZapfDingbats /Times-Italic /Helvetica-Oblique /Courier-Oblique /Symbol ] Nie einbetten: [ ] FARBE(N) ---------------------------------------- Farbmanagement: Farbumrechnungsmethode: Farbe nicht ändern Methode: Standard Geräteabhängige Daten: Einstellungen für Überdrucken beibehalten: Ja Unterfarbreduktion und Schwarzaufbau beibehalten: Ja Transferfunktionen: Beibehalten Rastereinstellungen beibehalten: Nein ERWEITERT ---------------------------------------- Optionen: Prolog/Epilog verwenden: Nein PostScript-Datei darf Einstellungen überschreiben: Nein Level 2 copypage-Semantik beibehalten: Ja Portable Job Ticket in PDF-Datei speichern: Ja Illustrator-Überdruckmodus: Ja Farbverläufe zu weichen Nuancen konvertieren: Ja ASCII-Format: Nein Document Structuring Conventions (DSC): DSC-Kommentare verarbeiten: Ja DSC-Warnungen protokollieren: Nein Für EPS-Dateien Seitengröße ändern und Grafiken zentrieren: Ja EPS-Info von DSC beibehalten: Ja OPI-Kommentare beibehalten: Nein Dokumentinfo von DSC beibehalten: Ja ANDERE ---------------------------------------- Distiller-Kern Version: 5000 ZIP-Komprimierung verwenden: Ja Optimierungen deaktivieren: Nein Bildspeicher: 524288 Byte Farbbilder glätten: Nein Graustufenbilder glätten: Nein Bilder (< 257 Farben) in indizierten Farbraum konvertieren: Ja sRGB ICC-Profil: sRGB IEC61966-2.1 ENDE DES REPORTS ---------------------------------------- IMPRESSED GmbH Bahrenfelder Chaussee 49 22761 Hamburg, Germany Tel. +49 40 897189-0 Fax +49 40 897189-71 Email: [email protected] Web: www.impressed.de
Adobe Acrobat Distiller 5.0.x Joboption Datei
<< /ColorSettingsFile () /LockDistillerParams true /DetectBlends true /DoThumbnails true /AntiAliasMonoImages false /MonoImageDownsampleType /Bicubic /GrayImageDownsampleType /Bicubic /MaxSubsetPct 100 /MonoImageFilter /CCITTFaxEncode /ColorImageDownsampleThreshold 1.5 /GrayImageFilter /FlateEncode /ColorConversionStrategy /LeaveColorUnchanged /CalGrayProfile (Dot Gain 20%) /ColorImageResolution 300 /UsePrologue false /MonoImageResolution 1200 /ColorImageDepth 8 /sRGBProfile (sRGB IEC61966-2.1) /PreserveOverprintSettings true /CompatibilityLevel 1.3 /UCRandBGInfo /Preserve /EmitDSCWarnings false /CreateJobTicket true /DownsampleMonoImages false /DownsampleColorImages false /MonoImageDict << /K -1 >> /ColorImageDownsampleType /Bicubic /GrayImageDict << /HSamples [ 2 1 1 2 ] /VSamples [ 2 1 1 2 ] /Blend 1 /QFactor 0.9 >> /CalCMYKProfile (U.S. Web Coated (SWOP) v2) /ParseDSCComments true /PreserveEPSInfo true /MonoImageDepth -1 /AutoFilterGrayImages false /SubsetFonts false /GrayACSImageDict << /HSamples [ 2 1 1 2 ] /VSamples [ 2 1 1 2 ] /Blend 1 /QFactor 0.9 >> /ColorImageFilter /FlateEncode /AutoRotatePages /None /PreserveCopyPage true /EncodeMonoImages true /ASCII85EncodePages false /PreserveOPIComments false /NeverEmbed [ ] /ColorImageDict << /HSamples [ 2 1 1 2 ] /VSamples [ 2 1 1 2 ] /Blend 1 /QFactor 0.9 >> /AntiAliasGrayImages false /GrayImageDepth 8 /CannotEmbedFontPolicy /Error /EndPage -1 /TransferFunctionInfo /Preserve /CalRGBProfile (sRGB IEC61966-2.1) /EncodeColorImages true /EncodeGrayImages true /ColorACSImageDict << /HSamples [ 2 1 1 2 ] /VSamples [ 2 1 1 2 ] /Blend 1 /QFactor 0.9 >> /Optimize true /ParseDSCCommentsForDocInfo true /GrayImageDownsampleThreshold 1.5 /MonoImageDownsampleThreshold 1.5 /AutoPositionEPSFiles true /GrayImageResolution 300 /AutoFilterColorImages false /AlwaysEmbed [ /Courier-BoldOblique /Helvetica-BoldOblique /Courier /Helvetica-Bold /Times-Bold /Courier-Bold /Helvetica /Times-BoldItalic /Times-Roman /ZapfDingbats /Times-Italic /Helvetica-Oblique /Courier-Oblique /Symbol ] /ImageMemory 524288 /OPM 1 /DefaultRenderingIntent /Default /EmbedAllFonts true /StartPage 1 /DownsampleGrayImages false /AntiAliasColorImages false /ConvertImagesToIndexed true /PreserveHalftoneInfo false /CompressPages true /Binding /Left >> setdistillerparams << /PageSize [ 595.276 841.890 ] /HWResolution [ 2400 2400 ] >> setpagedevice
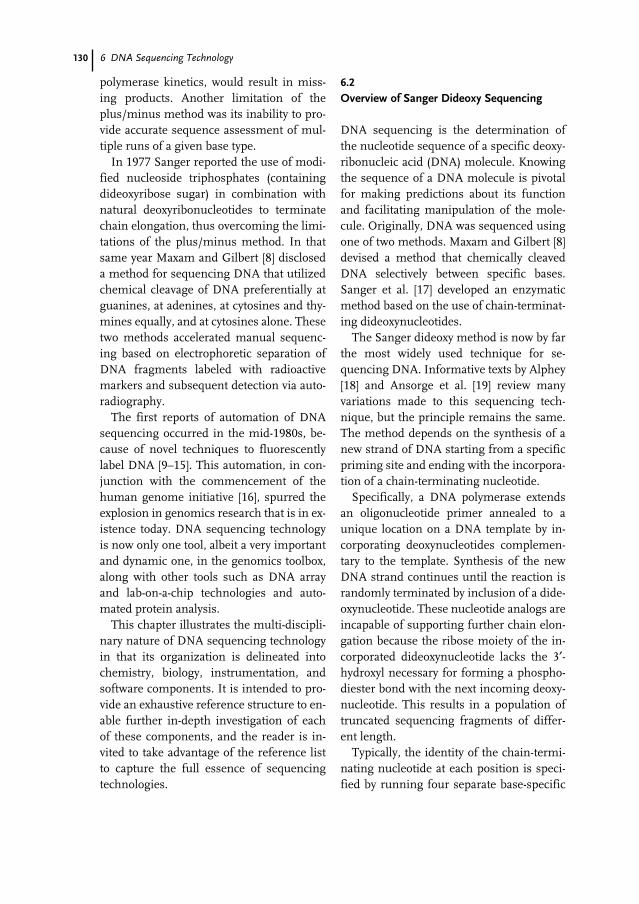
130 6 DNA Sequencing Technology
polymerase kinetics, would result in miss-ing products. Another limitation of theplus/minus method was its inability to pro-vide accurate sequence assessment of mul-tiple runs of a given base type.
In 1977 Sanger reported the use of modi-fied nucleoside triphosphates (containingdideoxyribose sugar) in combination withnatural deoxyribonucleotides to terminatechain elongation, thus overcoming the limi-tations of the plus/minus method. In thatsame year Maxam and Gilbert [8] discloseda method for sequencing DNA that utilizedchemical cleavage of DNA preferentially atguanines, at adenines, at cytosines and thy-mines equally, and at cytosines alone. Thesetwo methods accelerated manual sequenc-ing based on electrophoretic separation ofDNA fragments labeled with radioactivemarkers and subsequent detection via auto-radiography.
The first reports of automation of DNAsequencing occurred in the mid-1980s, be-cause of novel techniques to fluorescentlylabel DNA [9–15]. This automation, in con-junction with the commencement of thehuman genome initiative [16], spurred theexplosion in genomics research that is in ex-istence today. DNA sequencing technologyis now only one tool, albeit a very importantand dynamic one, in the genomics toolbox,along with other tools such as DNA arrayand lab-on-a-chip technologies and auto-mated protein analysis.
This chapter illustrates the multi-discipli-nary nature of DNA sequencing technologyin that its organization is delineated intochemistry, biology, instrumentation, andsoftware components. It is intended to pro-vide an exhaustive reference structure to en-able further in-depth investigation of eachof these components, and the reader is in-vited to take advantage of the reference listto capture the full essence of sequencingtechnologies.
6.2
Overview of Sanger Dideoxy Sequencing
DNA sequencing is the determination ofthe nucleotide sequence of a specific deoxy-ribonucleic acid (DNA) molecule. Knowingthe sequence of a DNA molecule is pivotalfor making predictions about its functionand facilitating manipulation of the mole-cule. Originally, DNA was sequenced usingone of two methods. Maxam and Gilbert [8]devised a method that chemically cleavedDNA selectively between specific bases.Sanger et al. [17] developed an enzymaticmethod based on the use of chain-terminat-ing dideoxynucleotides.
The Sanger dideoxy method is now by farthe most widely used technique for se-quencing DNA. Informative texts by Alphey[18] and Ansorge et al. [19] review manyvariations made to this sequencing tech-nique, but the principle remains the same.The method depends on the synthesis of anew strand of DNA starting from a specificpriming site and ending with the incorpora-tion of a chain-terminating nucleotide.
Specifically, a DNA polymerase extendsan oligonucleotide primer annealed to aunique location on a DNA template by in-corporating deoxynucleotides complemen-tary to the template. Synthesis of the newDNA strand continues until the reaction israndomly terminated by inclusion of a dide-oxynucleotide. These nucleotide analogs areincapable of supporting further chain elon-gation because the ribose moiety of the in-corporated dideoxynucleotide lacks the 3′-hydroxyl necessary for forming a phospho-diester bond with the next incoming deoxy-nucleotide. This results in a population oftruncated sequencing fragments of differ-ent length.
Typically, the identity of the chain-termi-nating nucleotide at each position is speci-fied by running four separate base-specific
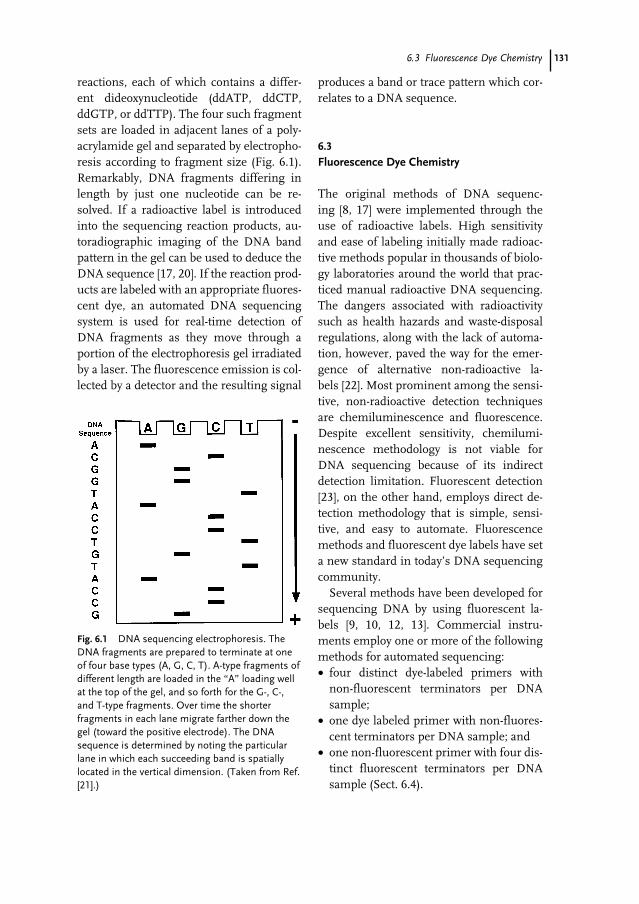
1316.3 Fluorescence Dye Chemistry
reactions, each of which contains a differ-ent dideoxynucleotide (ddATP, ddCTP,ddGTP, or ddTTP). The four such fragmentsets are loaded in adjacent lanes of a poly-acrylamide gel and separated by electropho-resis according to fragment size (Fig. 6.1).Remarkably, DNA fragments differing inlength by just one nucleotide can be re-solved. If a radioactive label is introducedinto the sequencing reaction products, au-toradiographic imaging of the DNA bandpattern in the gel can be used to deduce theDNA sequence [17, 20]. If the reaction prod-ucts are labeled with an appropriate fluores-cent dye, an automated DNA sequencingsystem is used for real-time detection ofDNA fragments as they move through aportion of the electrophoresis gel irradiatedby a laser. The fluorescence emission is col-lected by a detector and the resulting signal
produces a band or trace pattern which cor-relates to a DNA sequence.
6.3
Fluorescence Dye Chemistry
The original methods of DNA sequenc-ing [8, 17] were implemented through theuse of radioactive labels. High sensitivityand ease of labeling initially made radioac-tive methods popular in thousands of biolo-gy laboratories around the world that prac-ticed manual radioactive DNA sequencing.The dangers associated with radioactivitysuch as health hazards and waste-disposalregulations, along with the lack of automa-tion, however, paved the way for the emer-gence of alternative non-radioactive la-bels [22]. Most prominent among the sensi-tive, non-radioactive detection techniquesare chemiluminescence and fluorescence.Despite excellent sensitivity, chemilumi-nescence methodology is not viable forDNA sequencing because of its indirectdetection limitation. Fluorescent detection[23], on the other hand, employs direct de-tection methodology that is simple, sensi-tive, and easy to automate. Fluorescencemethods and fluorescent dye labels have seta new standard in today’s DNA sequencingcommunity.
Several methods have been developed forsequencing DNA by using fluorescent la-bels [9, 10, 12, 13]. Commercial instru-ments employ one or more of the followingmethods for automated sequencing:• four distinct dye-labeled primers with
non-fluorescent terminators per DNAsample;
• one dye labeled primer with non-fluores-cent terminators per DNA sample; and
• one non-fluorescent primer with four dis-tinct fluorescent terminators per DNAsample (Sect. 6.4).
Fig. 6.1 DNA sequencing electrophoresis. TheDNA fragments are prepared to terminate at oneof four base types (A, G, C, T). A-type fragments ofdifferent length are loaded in the “A” loading wellat the top of the gel, and so forth for the G-, C-,and T-type fragments. Over time the shorterfragments in each lane migrate farther down thegel (toward the positive electrode). The DNAsequence is determined by noting the particularlane in which each succeeding band is spatiallylocated in the vertical dimension. (Taken from Ref.[21].)

132 6 DNA Sequencing Technology
This section provides a brief summary ofimportant aspects of the advancement ofthe chemistry of fluorescent dyes for DNAsequencing.
6.3.1
Fluorophore Characteristics
Fluorescence is the emission of light fromelectronically excited fluorophores. An elec-tron of the fluorophore is energized into anexcited orbital by absorption of a photonwhere it is paired with a second electronthat is in the ground-state orbital [23]. Theexcited orbital is one of several vibrationalenergy levels associated with one or moreelectronic energy states. The fluorophore isusually excited into a higher vibrational lev-el of either the first or second electronic en-ergy state. In a very fast process known asinternal conversion the excited moleculefirst relaxes to the lowest vibrational level ofthe first electronic energy state. This is fol-lowed by relaxation to a higher excited vibra-tional ground-state level with emission of aphoton. Because of the multiplicity of vibra-tional levels and electronic levels, the spec-tra of both absorption and emission arepolychromatic and are usually mirror imag-es of each other.
Both the absorption and emission spectraof the fluorophore depend on its chemicalstructure and the environment (solvent, pH,temperature, etc.) of the fluorophore. Thespectral wavelength of fluorescence emis-sion is generally independent of the excita-tion wavelength of the absorbed photons.Because of the rapid initial non-radiative de-cay associated with internal conversion andthe final decay to higher vibrational levels ofthe ground state, however, the energy of theemitted photon is less than that of the ab-sorbed photon. This shifts the fluorescencespectra to longer wavelengths relative to the
absorption spectra and is known as theStokes Shift [24].
6.3.2
Commercial Dye Fluorophores
The physiological response of the humaneye qualitatively defines the visible wave-length region (in nanometers or nm) of theelectromagnetic spectrum. Wavelengthsshorter than, but adjacent to, that of the vis-ible region, are denoted ultraviolet. Wave-lengths longer than, but adjacent to, that ofthe visible region, are denoted near-infra-red. The commercialized fluorescent labelscurrently in use in automated DNA se-quencing are either visible dyes (450–650 nmabsorption and fluorescence range) or near-infrared dyes (650–860 nm absorption andfluorescence range).
The first commercialized near-infrareddyes introduced for automated DNA se-quencing were IRDye 41 and IRDye 40[25–26], (Fig. 6.2). These dyes are from theheptamethine carbocyanine dye family andnominally absorb and fluoresce near 800 nm.IRDye41 was attached to a DNA primer viaa stable thiourea linkage formed by conju-gating the dye to an amino linker located atthe 5′ end of the primer. A phosphorami-dite version (IRDye800, Fig. 6.3) [28] en-ables direct labeling of DNA primers usingan automated DNA synthesizer. For dye-la-beled terminator chemistry, the IRDye 800is attached to bases which are linked to a tri-phosphate through an acyclo bridge (Fig.6.4). The incorporation of this substrate ter-minates DNA chain elongation in a mannersimilar to that achieved by using dideoxynu-cleotides (Sect. 6.4). Dye properties for IR-Dye 40, IRDye 41 and IRDye800 are listedin Tab. 6.1.
Commercialized near-infrared dyes thatabsorb and fluoresce around 650–700 nm
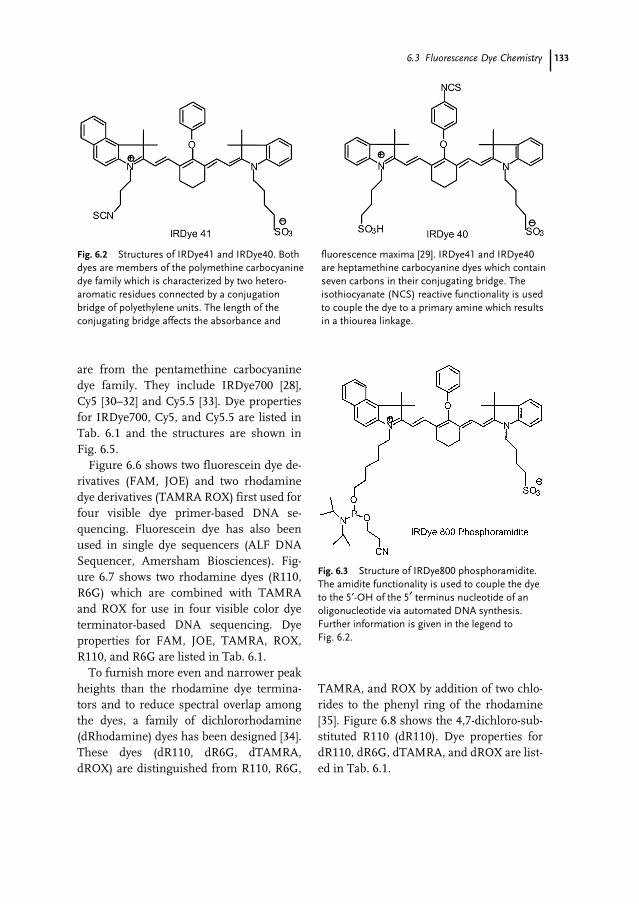
1336.3 Fluorescence Dye Chemistry
are from the pentamethine carbocyaninedye family. They include IRDye700 [28],Cy5 [30–32] and Cy5.5 [33]. Dye propertiesfor IRDye700, Cy5, and Cy5.5 are listed inTab. 6.1 and the structures are shown inFig. 6.5.
Figure 6.6 shows two fluorescein dye de-rivatives (FAM, JOE) and two rhodaminedye derivatives (TAMRA ROX) first used forfour visible dye primer-based DNA se-quencing. Fluorescein dye has also beenused in single dye sequencers (ALF DNASequencer, Amersham Biosciences). Fig-ure 6.7 shows two rhodamine dyes (R110,R6G) which are combined with TAMRAand ROX for use in four visible color dyeterminator-based DNA sequencing. Dyeproperties for FAM, JOE, TAMRA, ROX,R110, and R6G are listed in Tab. 6.1.
To furnish more even and narrower peakheights than the rhodamine dye termina-tors and to reduce spectral overlap amongthe dyes, a family of dichlororhodamine(dRhodamine) dyes has been designed [34].These dyes (dR110, dR6G, dTAMRA,dROX) are distinguished from R110, R6G,
TAMRA, and ROX by addition of two chlo-rides to the phenyl ring of the rhodamine[35]. Figure 6.8 shows the 4,7-dichloro-sub-stituted R110 (dR110). Dye properties fordR110, dR6G, dTAMRA, and dROX are list-ed in Tab. 6.1.
Fig. 6.2 Structures of IRDye41 and IRDye40. Bothdyes are members of the polymethine carbocyaninedye family which is characterized by two hetero-aromatic residues connected by a conjugationbridge of polyethylene units. The length of theconjugating bridge affects the absorbance and
fluorescence maxima [29]. IRDye41 and IRDye40are heptamethine carbocyanine dyes which containseven carbons in their conjugating bridge. Theisothiocyanate (NCS) reactive functionality is usedto couple the dye to a primary amine which resultsin a thiourea linkage.
Fig. 6.3 Structure of IRDye800 phosphoramidite.The amidite functionality is used to couple the dyeto the 5′-OH of the 5′ terminus nucleotide of anoligonucleotide via automated DNA synthesis.Further information is given in the legend toFig. 6.2.
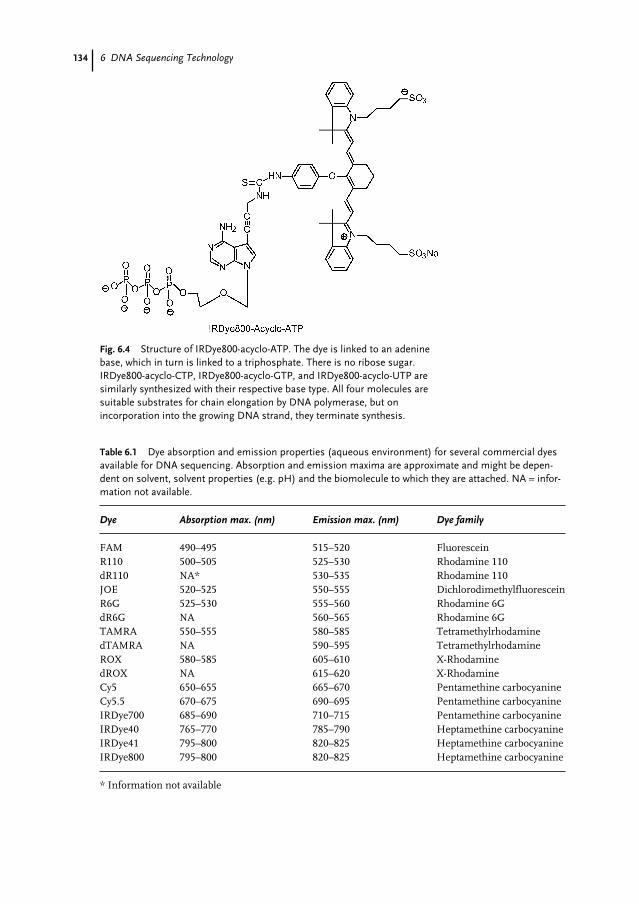
134 6 DNA Sequencing Technology
Fig. 6.4 Structure of IRDye800-acyclo-ATP. The dye is linked to an adeninebase, which in turn is linked to a triphosphate. There is no ribose sugar.IRDye800-acyclo-CTP, IRDye800-acyclo-GTP, and IRDye800-acyclo-UTP aresimilarly synthesized with their respective base type. All four molecules aresuitable substrates for chain elongation by DNA polymerase, but onincorporation into the growing DNA strand, they terminate synthesis.
Table 6.1 Dye absorption and emission properties (aqueous environment) for several commercial dyesavailable for DNA sequencing. Absorption and emission maxima are approximate and might be depen-dent on solvent, solvent properties (e.g. pH) and the biomolecule to which they are attached. NA = infor-mation not available.
Dye Absorption max. (nm) Emission max. (nm) Dye family
FAM 490–495 515–520 FluoresceinR110 500–505 525–530 Rhodamine 110dR110 NA* 530–535 Rhodamine 110JOE 520–525 550–555 DichlorodimethylfluoresceinR6G 525–530 555–560 Rhodamine 6GdR6G NA 560–565 Rhodamine 6GTAMRA 550–555 580–585 TetramethylrhodaminedTAMRA NA 590–595 TetramethylrhodamineROX 580–585 605–610 X-RhodaminedROX NA 615–620 X-RhodamineCy5 650–655 665–670 Pentamethine carbocyanineCy5.5 670–675 690–695 Pentamethine carbocyanineIRDye700 685–690 710–715 Pentamethine carbocyanineIRDye40 765–770 785–790 Heptamethine carbocyanineIRDye41 795–800 820–825 Heptamethine carbocyanineIRDye800 795–800 820–825 Heptamethine carbocyanine
* Information not available
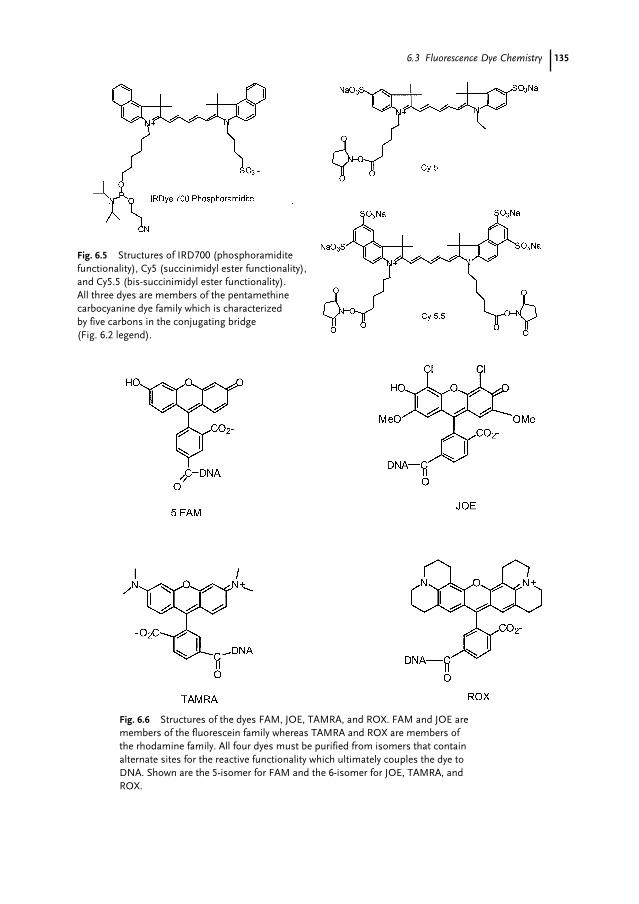
1356.3 Fluorescence Dye Chemistry
Fig. 6.5 Structures of IRD700 (phosphoramiditefunctionality), Cy5 (succinimidyl ester functionality),and Cy5.5 (bis-succinimidyl ester functionality). All three dyes are members of the pentamethinecarbocyanine dye family which is characterized by five carbons in the conjugating bridge (Fig. 6.2 legend).
Fig. 6.6 Structures of the dyes FAM, JOE, TAMRA, and ROX. FAM and JOE aremembers of the fluorescein family whereas TAMRA and ROX are members ofthe rhodamine family. All four dyes must be purified from isomers that containalternate sites for the reactive functionality which ultimately couples the dye toDNA. Shown are the 5-isomer for FAM and the 6-isomer for JOE, TAMRA, andROX.
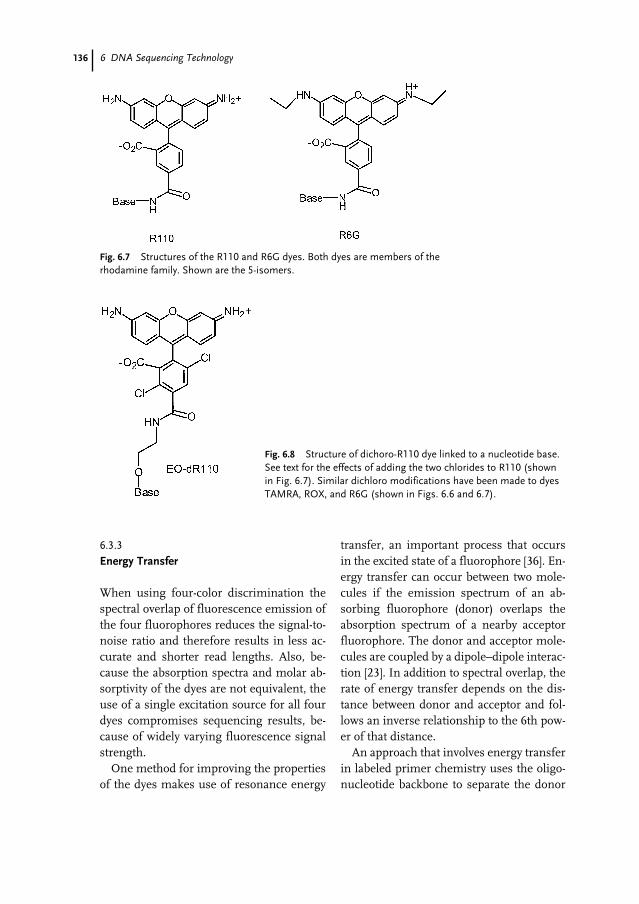
136 6 DNA Sequencing Technology
6.3.3
Energy Transfer
When using four-color discrimination thespectral overlap of fluorescence emission ofthe four fluorophores reduces the signal-to-noise ratio and therefore results in less ac-curate and shorter read lengths. Also, be-cause the absorption spectra and molar ab-sorptivity of the dyes are not equivalent, theuse of a single excitation source for all fourdyes compromises sequencing results, be-cause of widely varying fluorescence signalstrength.
One method for improving the propertiesof the dyes makes use of resonance energy
transfer, an important process that occursin the excited state of a fluorophore [36]. En-ergy transfer can occur between two mole-cules if the emission spectrum of an ab-sorbing fluorophore (donor) overlaps theabsorption spectrum of a nearby acceptorfluorophore. The donor and acceptor mole-cules are coupled by a dipole–dipole interac-tion [23]. In addition to spectral overlap, therate of energy transfer depends on the dis-tance between donor and acceptor and fol-lows an inverse relationship to the 6th pow-er of that distance.
An approach that involves energy transferin labeled primer chemistry uses the oligo-nucleotide backbone to separate the donor
Fig. 6.7 Structures of the R110 and R6G dyes. Both dyes are members of therhodamine family. Shown are the 5-isomers.
Fig. 6.8 Structure of dichoro-R110 dye linked to a nucleotide base.See text for the effects of adding the two chlorides to R110 (shownin Fig. 6.7). Similar dichloro modifications have been made to dyesTAMRA, ROX, and R6G (shown in Figs. 6.6 and 6.7).
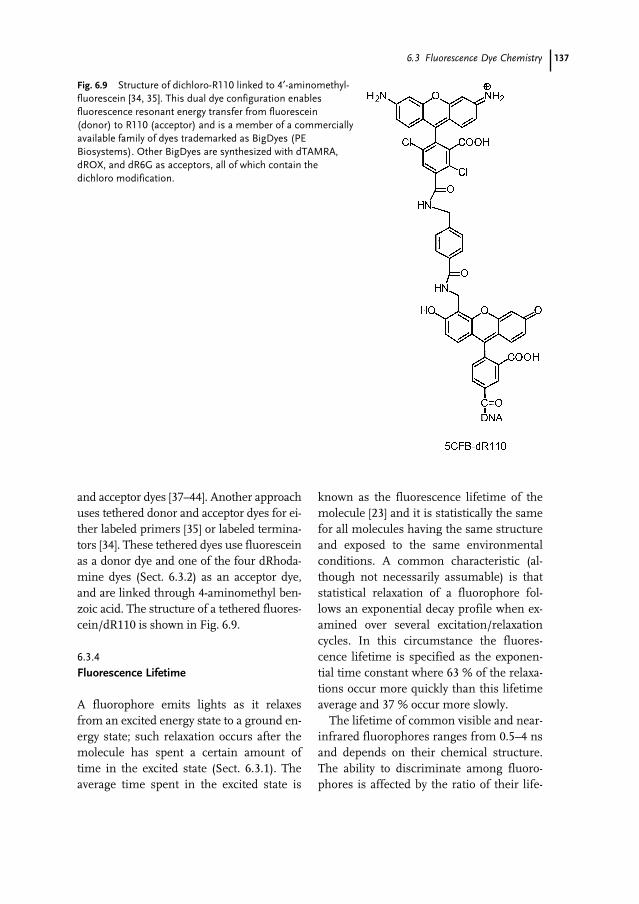
1376.3 Fluorescence Dye Chemistry
and acceptor dyes [37–44]. Another approachuses tethered donor and acceptor dyes for ei-ther labeled primers [35] or labeled termina-tors [34]. These tethered dyes use fluoresceinas a donor dye and one of the four dRhoda-mine dyes (Sect. 6.3.2) as an acceptor dye,and are linked through 4-aminomethyl ben-zoic acid. The structure of a tethered fluores-cein/dR110 is shown in Fig. 6.9.
6.3.4
Fluorescence Lifetime
A fluorophore emits lights as it relaxesfrom an excited energy state to a ground en-ergy state; such relaxation occurs after themolecule has spent a certain amount oftime in the excited state (Sect. 6.3.1). Theaverage time spent in the excited state is
known as the fluorescence lifetime of themolecule [23] and it is statistically the samefor all molecules having the same structureand exposed to the same environmentalconditions. A common characteristic (al-though not necessarily assumable) is thatstatistical relaxation of a fluorophore fol-lows an exponential decay profile when ex-amined over several excitation/relaxationcycles. In this circumstance the fluores-cence lifetime is specified as the exponen-tial time constant where 63 % of the relaxa-tions occur more quickly than this lifetimeaverage and 37 % occur more slowly.
The lifetime of common visible and near-infrared fluorophores ranges from 0.5–4 nsand depends on their chemical structure.The ability to discriminate among fluoro-phores is affected by the ratio of their life-
Fig. 6.9 Structure of dichloro-R110 linked to 4′-aminomethyl-fluorescein [34, 35]. This dual dye configuration enablesfluorescence resonant energy transfer from fluorescein(donor) to R110 (acceptor) and is a member of a commerciallyavailable family of dyes trademarked as BigDyes (PEBiosystems). Other BigDyes are synthesized with dTAMRA,dROX, and dR6G as acceptors, all of which contain thedichloro modification.
138 6 DNA Sequencing Technology
times and the number of photons availableto produce the composite lifetime profilehistogram [45, 46].
The use of energy transfer to enable com-mon excitation of several dyes has been suc-cessfully commercialized (Sect. 6.3.3). Asresearchers examine alternative approachesfor facilitating common excitation and in-creasing the number of available dye choic-es, the exploitation of fluorescence lifetimediscrimination for DNA sequencing showspromising potential, because the lifetime ofa fluorophore is independent of concentra-tion and multiple dyes having overlappingspectral emission can be distinguished[47–54]. Methods for “on-the-fly” lifetimemeasurements of labeled DNA fragmentshave been described for capillary electro-phoresis [55, 56] and slab gel electrophore-sis [57]. Besides enabling common excita-tion, fluorescence lifetime discriminationalso enables the use of common spectral de-tection optics. Both spectral and lifetimediscrimination can be combined in a singledesign to take advantage of the strengths ofeach approach [57, 58].
6.4
Biochemistry of DNA Sequencing
The efficient completion of large DNA se-quencing projects is now a reality, mainlybecause of the development of fluorescence-based dideoxynucleotide sequencing chem-istries coupled with instrumentation for realtime detection of dye-labeled DNA frag-ments during gel electrophoresis (Sect. 6.5).The commercially available automated se-quencers (Sect. 6.5; Tabs. 6.2 and 6.3) canbe divided into two groups on the basis ofthe number of fluorescent dyes used in a se-quencing reaction.
The first type uses the one-dye/four-laneapproach in which the identity of the chain-
terminating nucleotide at each position isdetermined by running four separate reac-tions each of which contains the same fluo-rescent dye but a different dideoxynucleo-tide (ddATP, ddTTP, ddGTP, ddCTP). Thefour completed sequencing reactions areloaded in separate lanes of a slab gel (Sect.6.2, Fig. 6.1), and the automated sequencermust then be able to align the raw data fromall four lanes precisely enough to determinethe correct base sequence (Sect. 6.6.2).
The second type employs the four-dye/one-lane approach in which a single com-bined reaction is performed using a fluores-cent label specific for each of the four dide-oxynucleotides. The combined sequencingreaction can be analyzed in a single gel laneor capillary or microfluidic channel (Sect.6.5.4), and the automated sequencer mustfirst correct for the different mobility of thefour dye-labeled DNA fragment sets beforecalling bases [59].
6.4.1
Sequencing Applications and Strategies
DNA sequencing is a fundamental tech-nique in genome analysis and it has majorapplications which fall into two generalclasses: (1) de novo sequencing of unknownDNA, and (2) resequencing segments ofDNA for which the sequence is alreadyknown. In both classes the DNA to be se-quenced is first cloned into a viral or plas-mid vector, or is part of an amplified PCRfragment (Sect. 6.4.2).
The approach used to sequence unknownDNA is termed the sequencing strategy andit should provide the correct consensus se-quence on both strands of the target DNAusing a minimal number of sequencing reac-tions with minimum overlap (Sect. 6.4.1.1).Large-scale sequencing projects make useof one or more sequencing strategies tocompletely characterize the entire genome
1396.4 Biochemistry of DNA Sequencing
of an organism [60–63], including archaea[64] and the human genome [65, 66]. On theother hand, many laboratories employmethods of resequencing to characterizethe variability of smaller, known DNA seg-ments to find mutations or verify recombi-nant DNA constructs (Sect. 6.4.1.2).
6.4.1.1
New Sequence DeterminationThe selection of a sequencing strategy usu-ally depends on the size of the target DNA.For example, random shotgun sequencingis currently the method used in most large-scale DNA sequencing projects [62, 67]. Inshotgun sequencing a large segment of tar-get DNA (e.g. a medium-sized BAC clone of100–120 kilobases) is randomly fragmentedby physical shearing or enzymatic digestioninto fragment sizes in the range 1 to 5 kilo-bases. These smaller fragments are thensubcloned into bacteriophage M13 or plas-mid vectors (Sects. 6.4.2.1 and 6.4.2.2). Thecloned inserts are sequenced from “univer-sal” primer binding sites in the flankingvector DNA, and the resulting sequence in-formation compiled by computer into con-tiguous sequences (i.e. “contigs”) to reas-semble the original large target DNA.
This method rapidly generates 95 % ofthe desired sequence, but becomes less effi-cient as each subsequent random subcloneis more likely to yield sequence informationalready obtained. Typically, each base in thetarget DNA sequence is read an average offour to six times during this “workingdraft” phase of the shotgun-sequencingproject. Gaps or unresolved regions willstill remain, however, and can be filled inby directed approaches during the “finish-ing” phase of the sequencing project [60,63, 68, 69].
An adaptation of shotgun sequencing,called whole-genome shotgun assembly(WGSA or WGA), avoids the step of “map-
ping” the BAC clones by using advanced as-sembly software to connect the sequencesof random clones from the entire genome,rather than from the smaller BAC clones.In WGSA, DNA sequence reads from clonelibraries of 2 kilobase pairs (kbp), 10 kbp,and 50 kbp are assembled on to a scaffold-like structure to generate a contiguous se-quence [66, 70].
Advantages of shotgun sequencing in-clude no requirement for prior knowledgeof the insert sequence and no limitation onthe size of the starting target DNA. Addi-tionally, a high degree of parallel processingand automation can be implemented dur-ing the initial random phase, with only oneor two oligonucleotide sequencing primersrequired.
Primer walking is a fully directed se-quencing strategy. It provides an efficientway to obtain new sequence informationand is a good choice for the primary se-quencing of small regions (1 to 3 kilobases)of genomic or cDNA clones or as a secon-dary approach to achieve closure and re-solve local ambiguities after an initial shot-gun-sequencing phase. Other approaches,for example the enzymatic nested deletionmethod [71] or transposon insertion [72],have also been used for small-scale de-novosequencing.
The primer-directed method is initiatedby sequencing the target DNA from oneend using a vector-specific standard prim-er [73]. A new walking primer is designedusing the most distant, reliable sequencedata obtained from the first sequencing re-action with the standard primer. This walk-ing primer is then used to sequence thenext unknown section of the DNA tem-plate. Although, in theory, this primer walk-ing process can be repeated many times tosequence extensive tracts of DNA, its use isgenerally limited to smaller projects be-cause the successive rounds of sequence
140 6 DNA Sequencing Technology
analysis, primer design, and primer synthe-sis are too expensive and time-consum-ing [19].
The major benefits of primer walking arethat no subcloning is required, the locationand direction of each sequencing run isknown, and the degree of redundancy need-ed to obtain the final sequence is mini-mized. Moreover, read lengths greater than1000 bases have been reported [74–83] thusreducing the number of walking primersneeded to finish a sequencing project.
6.4.1.2
Confirmatory SequencingThe major purpose of DNA sequencing inmany laboratories is to resequence small re-gions of interest (< 1 kb) using cloned DNAor a PCR product as the template. Rese-quencing is useful for applications such asconfirming plasmid constructs, screeningthe products of site-directed mutagenesisexperiments, or comparing sequences ofwild-type and mutant variants associatedwith genetic disease [84–90]. Because thetarget region has often been characterized,it is possible to design a primer so that thesequence of interest is within 100 to 150bases of the sequencing primer. This willprovide optimum resolution in the raw se-quence data generated by the automatedDNA sequencer, and thus the highest base-calling accuracy that can be obtained(Sect. 6.6).
6.4.2
DNA Template Preparation
In the first step of a Sanger dideoxy se-quencing reaction, the primer is annealedto a single-stranded DNA template (Sect.6.2). DNA in this form can be purified di-rectly from viruses such as bacteriophageM13 which have single-stranded genomes.On the other hand, double-stranded DNA
such as a plasmid vector containing the tar-get insert must first be converted to the sin-gle-stranded form, either by alkali or heatdenaturation, before sequencing [19, 91].
The material presented in this section isintended to serve only as a general guide forpreparing DNA templates. Specific proce-dures and applications can be found in sev-eral molecular biology manuals [19, 92–96].
6.4.2.1
Single-stranded DNA TemplateSeveral variants of the bacteriophage M13were constructed for the purpose of gener-ating DNA template for dideoxy sequenc-ing [97]. The DNA to be sequenced iscloned into the double-stranded replicativeform of the phage, transformed into E. coli,and harvested in large quantity from theculture medium in the form of phage parti-cles containing single-stranded DNA [98].The purified DNA is ideal for sequencing,because it is single-stranded so that no com-plementary strand exists to compete withthe sequencing primer during the anneal-ing step. Moreover, a universal sequencingprimer hybridizes to a complementary por-tion of the phage DNA immediately adja-cent to the multiple cloning site. M13 is stillused extensively for high-throughput se-quencing applications [67].
6.4.2.2
Double-stranded DNA TemplateMany methods have been developed for iso-lation and purification of plasmid DNAfrom bacteria [92]. Generally, the processinvolves five steps: (1) insert foreign (target)DNA into the plasmid vector, (2) transforma suitable bacterial strain with the recombi-nant plasmid, (3) grow the bacterial culture,(4) harvest and lyse bacteria, and (5) purifythe plasmid DNA.
For sequencing applications, double-stranded plasmid DNA containing the tar-
1416.4 Biochemistry of DNA Sequencing
get sequence must be of high purity. Con-taminating salt, RNA, protein, DNAses,and polysaccharides from the host bacteriacan inhibit dideoxy sequencing reactionsand produce a low signal, high background,or spurious bands. Plasmid DNA purifiedthrough a cesium chloride gradient is suit-able for sequencing if residual salt is re-moved from the DNA by ethanol precipita-tion. Commercial plasmid purification kitsusing anion-exchange resins or silica gelmembrane technology are available fromQiagen (Valencia, CA, USA) or PromegaCorp. (Madison, WI, USA) These kits areeasy to use and provide high-quality DNA.
6.4.2.3
Vectors for Large-insert DNACloning vectors capable of replicating largeDNA inserts, such as cosmids (DNA insertswith 35 to 45 kb), P1-derived artificial chro-mosomes (PAC; DNA inserts from 100 to150 kb), and bacterial artificial chromo-somes (BAC; DNA inserts with up to300 kb), have been developed for use in ge-nome mapping and large-scale DNA se-quencing projects [99–101]. These large-in-sert clones can be used to construct sub-clone libraries and are then sequenced bythe shotgun approach [96] (Sect. 6.4.1.1).
It is also important to sequence directlyon these large DNA clones [102, 103]. Se-quence information from the ends of large-insert clones is used in the initial mappingphase of a sequencing project by detectingclones with overlapping sequence. Also,closing gaps and low-quality regions in the“draft” sequence of a large-insert clone canbe accomplished more efficiently by se-quencing directly off of the cosmid or BACclone. This process eliminates the need tofind the specific subclone sequence or togenerate a new subclone library coveringthe gap.
6.4.2.4
PCR ProductsThe polymerase chain reaction (PCR) en-ables a region of DNA located between twodistinct priming sites to be amplified [104].The product of this in vitro nucleic acid am-plification is termed the PCR product. Ifequal amounts of the two primers are used,the PCR product will be a linear double-stranded DNA molecule typically less than3 kb in size which can serve as template forDNA sequencing [94, 105].
The PCR reaction mix contains signifi-cant amounts of reagents such as primers,nucleotides, enzymes, and even unwantedamplified products which must be com-pletely removed from the PCR product be-fore it can be successfully sequenced. Thus,the PCR product should be checked on anagarose gel to verify the presence of a singleband of the expected size. The PCR productis the purified using a commercial PCRpurification kit (e.g. Promega Corp. WizardDNA Clean-Up System) or by PEG precipi-tation [95]. Alternatively, PCR products canbe purified by use of agarose gel [93].
6.4.3
Enzymatic Reactions
6.4.3.1
DNA PolymerasesIn the original Sanger dideoxy sequencingprocedure the Klenow fragment of E. coliDNA polymerase I was used for primer ex-tension/termination reactions. The qualityof the DNA sequence obtained with theSanger method was significantly improvedby the development of a modified T7 DNApolymerase (Sequenase v2.0, United StatesBiochemical, Cleveland, OH, USA andAmersham Biosciences, Piscataway, NJ,USA) which has enhanced processivity anda striking uniformity of termination pat-terns, particularly when manganese ions
142 6 DNA Sequencing Technology
are used as a cofactor [106–108]. Both theKlenow fragment and modified T7 DNApolymerase catalyze the synthesis of DNAsequencing fragments in a single pass asthe enzyme moves along the template DNA.These enzymes are, however, thermolabile,and thus cannot be used in cycle-sequenc-ing procedures which produce an amplifica-tion of signal by repeatedly re-using smallamounts of the template DNA [109, 110].Modified T7 DNA polymerase is effectivefor sequencing difficult regions with re-peats that cause premature “stops” in cycle-sequencing reactions [95].
Cycle-sequencing methods that utilize thethermostable Thermus aquaticus (Taq) DNApolymerase have been developed [109–111].The use of a thermostable DNA polymeraseenables repeated rounds of high temperatureDNA synthesis involving thermal denatura-tion of the double-stranded template DNA,primer annealing, and extension/termina-tion of the reaction products. For each cycle,the amount of product DNA will be roughlyequivalent to the amount of primed tem-plate. A significant benefit of cycle sequenc-ing is, therefore, that only small amounts ofDNA template are required, because thenumber of sequencing reaction products (i.e.“the signal”) is linearly amplified during the20–40 cycles of synthesis. For example,20–30 ng of a small PCR product or 2–3 µg ofa large BAC clone provide sufficient templateDNA to complete a cycle-sequencing reac-tion. Performing the cycle-sequencing reac-tions at elevated temperatures also minimiz-es sequencing artifacts due to secondarystructure in the template DNA.
Originally, the main disadvantage of cyclesequencing was the poor performance of thenative Taq DNA polymerase, which tends toincorporate dideoxynucleotides unevenlycompared with deoxynucleotides. As a result,sequencing patterns generated with theseenzymes were not uniform (i.e. variable peak
heights or band intensities) [112] which re-duced the base calling accuracy in automatedDNA sequencers (Sect. 6.6). However, genet-ically modified thermostable polymeraseswith a high affinity for dideoxynucleotideswere introduced to alleviate this prob-lem [113, 114]. These enzymes, Thermo Se-quenase from Amersham Biosciences andAmpliTaq FS from Applera/Applied Bio-systems (Foster City CA, USA), incorporatedideoxynucleotides at rates similar to deoxy-nucleotides resulting in uniform peakheights and, therefore, longer, more accu-rate, sequence-read lengths. The reduceddiscrimination against dideoxynucleotidesthat has been engineered into ThermoSe-quenase and AmpliTaq FS has also resultedin the greater acceptance of fluorescent dye-labeled terminators (Sect. 6.3.2) as substratesin the enzymatic sequencing reaction [113].
6.4.3.2
Labeling StrategyAutomated DNA sequencing uses fluores-cent dyes (Sect. 6.3) for detection of electro-phoretically resolved DNA fragments. Threemethods are used for labeling DNA se-quencing reaction products:
1. dye-labeled primer sequencing [9, 10] inwhich the fluorescent dye is attached tothe 5′ end of the oligonucleotide primer;
2. dye-labeled terminator sequencing [12,115] in which the fluorophores are at-tached to the dideoxynucleotides or anon-nucleotide terminator [116]; and
3. internal labeling [73, 117, 118] in which adye-labeled deoxynucleotide is incorpo-rated during the synthesis of a new DNAstrand.
Each labeling method has advantages anddisadvantages.
Dye-labeled primer sequencing has bene-fited from the engineered DNA polymerases

1436.4 Biochemistry of DNA Sequencing
which do not discriminate between deoxynu-cleotides and dideoxynucleotides (Sect.6.4.3.1). The sequencing electropherogramsgenerated using these enzymes with dye-primers have very even peak heights whichmakes the base-calling easy and reliable. Sig-nal uniformity also enables heterozygote de-tection to be based on peak heights and thepresence of two bases at the same posi-tion [86]. One disadvantage of the dye-prim-er method is a greater likelihood of increasedbackground level (e.g. spurious bands), be-cause nucleotide chains which terminateprematurely will add to the level of false ter-minations. Also, the four dye/one lane ap-proach for automated sequencing (Sect. 6.4)requires four separate extension reactionsand four dye-labeled primers per template.
The main advantages of dye-terminatorsequencing are convenience, because only asingle extension reaction is required pertemplate, and the synthesis of a dye-labeledprimer is not necessary. In fact, custom un-labeled primers with preferred hybridiza-tion sites can be used with dye-terminatorsand false terminations (i.e. DNA fragmentsterminated with a deoxynucleotide ratherthan a dideoxynucleotide) are not observed,because these products are unlabeled. Fi-nally, sequencing with dye-terminators pro-vides a way to read through most compres-sions. Presumably the large fluorophore atthe 3′ end of the DNA fragment modifies oreliminates the in-gel secondary structurethat causes compressions [95]. The majordisadvantage of dye-terminators is that thepattern of termination varies among DNApolymerases and is less uniform than fordye-labeled primers.
6.4.3.3
The Template–Primer–Polymerase ComplexAn important factor in the relative successof a sequencing reaction is the number oftemplate–primer–polymerase complexes
formed during the course of a sequencingreaction. The formation of this complex isnecessary to produce dye-labeled extensionproducts. A significant number of prob-lems associated with DNA-sequencing reac-tions can be traced to one or more of thesekey elements.
For example, the ability of an oligonu-cleotide primer to bind to the template andinteract with the DNA polymerase is a ma-jor factor in the overall signal strength ofthe reaction. Primers should be designedwith no inverted repeats or homopolymericregions, a base composition of approxi-mately 50 % GC, no primer dimer forma-tion, and one or more G or C residues at the3′ end of primer. These factors affect thestability of the primer–template interactionand thus determine the number of prim-er–template complexes available to theDNA polymerase under a given set of con-ditions. For cycle sequencing with thermo-stable polymerases it is important to designthe primer with an annealing temperatureof at least 50 °C. Lower annealing tempera-tures tend to produce higher backgroundand stops in cycle sequencing.
The amount of DNA template used in thedideoxy sequence reaction needs to be with-in an appropriate range. If the amount oftemplate is too small, few complexes willform and the overall signal level will be toolow for automatic base-calling. Additionally,larger amounts of a lower quality template(e.g. salt contaminant carried over fromDNA preparation) might inhibit the DNApolymerase resulting in lower signal levels.
The most common factors which limit se-quence read length and base-calling accura-cy in automated DNA sequencers are im-pure DNA template, incorrect primer ortemplate concentrations, suboptimumprimer selection and annealing, and poorremoval of unincorporated dye-labeled did-eoxynucleotides.
144 6 DNA Sequencing Technology
6.4.3.4
Simultaneous Bi-directional SequencingSimultaneous bi-directional sequencing(SBS), also termed “doublex” sequencing[117, 119], is a sequencing method in whichboth strands of duplex DNA (plasmid orPCR product) are sequenced simultaneouslyby combining a forward and reverse primer(each labeled with a different fluorescentdye) in the same sequencing reaction. Anautomated DNA sequencing system withdual lasers, such as the LI-COR Model 4300(Lincoln, NE, USA) or the European Molec-ular Biology Laboratory (EMBL, Heidelberg,Germany) two-dye DNA sequencer, can beused for simultaneous detection and analy-sis of both the forward and reverse sequenc-es of a bi-directional reaction [19, 80].
The benefits of the SBS method are three-fold. First, SBS doubles the amount of se-quence information from a single sequenc-ing reaction. Second, because a confirmingsequence can be generated in the same re-action, it is easier to resolve ambiguities inone strand using the sequence of the com-plementary strand. Third, time and reagentconsumption are halved by combining theforward and reverse sequencing reactions.
6.5
Fluorescence DNA Sequencing Instrumentation
6.5.1
Introduction
In principle, there are only three componentsof a fluorescence detection system: (1) the ex-citation energy source; (2) the fluorescentsample; and (3) the fluorescence emission en-ergy detector. In practice, all of these compo-nents are sophisticated subsystems whose de-signs are coordinated to deliver maximum in-formation throughput with optimized signal
versus noise discrimination (to achieve highaccuracy and data quality). A brief discussionof these components is provided here to givean overview of the factors involved in properinstrument design for DNA sequencing. Fora detailed description of general fluores-cence-based instrumentation, a comprehen-sive textbook, for example that by Lakow-icz [23], should be consulted. For a review ofnear-infrared fluorescence instrumentationrefer to Middendorf et al. [120].
6.5.1.1
Excitation Energy SourcesLaser-based excitation has usually been usedfor fluorescence-based DNA sequencing in-strumentation, although Millipore intro-duced a DNA sequencer based on a whitelight source in 1991 [121] (no longer commer-cially available). The most common lasersused in today’s commercial DNA sequencinginstrumentation are the blue/ green argonion laser (488 nm and 514 nm excitationwavelengths) as in early designs from themid-1980s [9–15] and far red or near infraredlaser semiconductor diodes (650 nm,680 nm, and 780 nm excitation wavelengths)[122, 123]. The red helium– neon laser(HeNe, 633 nm), the green frequency-dou-bled solid-state neodymium:yttrium–alumi-num–garnet laser (Nd:YAG, 532 nm), andthe green second harmonic generation laser(SHG, 532 nm, 473 nm) are also used as exci-tation sources for two-dimensional fluores-cence scanners [124] and a green laser(532 nm) also is used in a commercial capil-lary DNA sequencer (Tab. 6.3, MegaBACE).It is necessary to combine proper geometricoptics and spectral filtering to generate ahighly focused excitation source with theproper wavelength necessary for compatibil-ity with the fluorescent sample [13, 15, 120,122, 125–129]. The sample configuration (e.g.slab gels or capillaries) dictates additionalmechanical/optical design criteria.
1456.5 Fluorescence DNA Sequencing Instrumentation
6.5.1.2
Fluorescence SamplesDye properties such as absorption wave-length spectrum, molar absorptivity, fluo-rescence emission wavelength spectrum,fluorescence quantum yield, solubility,stability (e.g. temperature or light), and en-vironmental effects (e.g. pH, quenching,temperature, solvent type) must all be con-sidered when designing a fluorescencesystem. A particular dye property critical toDNA sequencing performance is its electro-phoretic mobility [33, 130–132]. For visiblefluorescence (blue or green excitation), flu-orophores in the fluorescein and rhoda-mine families are most commonly used.For far red or near infrared fluorescence themost common dyes are from the polyme-thine carbocyanine family [28–30, 120, 122,133, 134]. Energy transfer between acceptorand donor dyes has been successfully im-plemented as a strategy to manipulate com-patibility between fluorophore propertiesand excitation sources and to provide moreeven peak heights with greater color separa-tion and therefore improved base call-ing [34, 35, 37–42, 44, 135]. (A more de-tailed discussion of fluorescent dye chemis-try is given in Sect. 6.6.3.)
6.5.1.3
Fluorescence DetectionThree types of detector have been used influorescence DNA sequencing instrumen-tation:
1. photomultiplier tubes (PMT) [9, 10, 12,13, 15, 125, 127–129, 136];
2. charge-coupled detectors (CCD) [137–139];and
3. photodiode detectors (PD), including sili-con-avalanche photodiodes (APD) [120,122, 123].
As for the excitation subsystem, it is neces-sary to combine proper geometric optics,
spectral filtering, and appropriate mechani-cal design to provide high-sensitivity detec-tion in the proper wavelength range asso-ciated with the fluorescent sample.
6.5.1.4
Overview of Fluorescence InstrumentationRelated to DNA SequencingDNA samples for Sanger-based sequencingpurposes [17] (Sects. 6.2 and 6.4) are pre-pared in such a way that they have threemajor attributes:
1. the 5′ end of every DNA fragment withina sample begins with the same primingsequence;
2. each DNA fragment is labeled with a flu-orescent dye (or dye-pair if energy-trans-fer is used) either at or near the 5′ end orattached to the 3′ terminal dideoxynucleo-tide;
3. DNA fragments of different length, buthaving their 3′ terminus ending in a par-ticular base type (A, C, T, or G) are pack-aged into the same signal channel (e.g.they have the same type of fluorescencelabel with one label type for each basetype or they are physically isolated fromfragments terminated at the other basetypes such that a geometric channel canbe used to distinguish base types).
The process of DNA sequencing performsthree functions:
1. maintaining the DNA samples in single-stranded form via a combination of de-naturants in the gel and high tempera-ture (45–70 °C);
2. separation of the DNA fragments on thebasis of their size with single base sizingresolution; and
3. identification of those fragments via fluo-rescence optics at a “finish line” locationwhere adequate separation among frag-ments has occurred.
146 6 DNA Sequencing Technology
To accomplish sizing a sieving gel matrix isprepared and loaded either between twoparallel glass plates (slab gels) or into a glasscapillary or microfluidic channel. Slab-gelmatrices are usually cross-linked polyacryla-mide (4–6 %) whereas capillary gel matricesare non-crosslinked (for example linearpolyacrylamide) [140–143]. The gel thick-ness for slab-gel sandwiches is 0.1–0.4 mm.The gel diameter for capillary gels rangesfrom 50–80 µm.
Both slab and capillary gels accomplishsizing (after the sample has been loadedinto the gel) via a potential gradient appliedacross the ends of the gel. The potential gra-dient drives the negatively charged DNAmolecules through the sieving matrix withthe length of the DNA molecules determin-ing their relative mobility. Each end of thegel is inserted into a running buffer thatalso contains an electrode that enables thepotential gradient across the gel. This volt-age gradient may range from 30–80 V cm–1
for a slab gel and from 50–250 V cm–1 for acapillary gel.
For slab gels it is important to provide amethod for keeping samples separated ingeometric lanes. This is accomplished byone of several methods:
1. a “comb” with multiple teeth is insertedat one end of the slab gel sandwich beforepolymerization of the gel matrix. Afterpolymerization of the gel matrix the combis removed and leaves open wells withinthe gel into which the DNA samples areloaded via a pipette tip;
2. subsequent to gel polymerization, a“sharkstooth” comb is inserted into theend of the slab gel; the sample is loadedwhile the comb remains in place and theteeth of the comb thus separate one sam-ple from another;
3. the sample is loaded into one of severalwells permanently fabricated in the top
edge of one of the glass plates which thenprovides geometric isolation among sam-ples [144]; or
4. the sample is first applied to a thin longmembrane which is then inserted into anair gap located between the two glassplates at one end of the sandwich (wherethe gel matrix has been excluded) [145].
For capillary gels or microfluidic channelgels the individual capillaries/channels en-able isolation of the samples. To load sam-ples into gel capillaries, the loading end ofthe capillary is first submerged in a micro-well containing the sample and the sampleis loaded electrokinetically into the capil-lary. After a brief period of loading this endof the capillary is then submerged into run-ning buffer. Loading samples into micro-fluidic channels involves moving samplesfrom a “loading” microfluidic channel to a“separating” microfluidic channel (detailsare given in Sect. 6.5.4.3).
Detection at the “finish line” is accom-plished by exciting the various electrophore-sis channels either en masse [11, 14,146–151] or one-by-one, by sequential scan-ning or use of discrete sources, with one ormore laser sources [9, 12, 13, 15, 122, 123,127–129, 152]. An optical microscope or in-dividual detectors monitor any emitted fluo-rescence radiation from the sample . Thefinish line is usually located toward one endof the glass-enclosed gel. For capillary elec-trophoresis it is necessary to remove thepolyimide coating of the capillary at the de-tection zone. One embodiment of capillaryelectrophoresis (Tab. 6.3, Model 3700) usesa sheath-flow detection scheme which mon-itors the sample after it leaves the capil-lary [146, 147, 153].
1476.5 Fluorescence DNA Sequencing Instrumentation
6.5.2
Information Throughput
High information throughput is mandatoryfor addressing the accelerating demand forDNA sequencing. For the purpose ofunderstanding the impact of all the factorsaffecting throughput, one can model infor-mation throughput using the following for-mula (reproduced, with kind permissionfrom Kluwer Academic Publishers, fromRef. [120], page 22, formula 1):
Ti = n × d × i/t (1)
where Ti is the information throughput, nthe number of sample channels, d the in-formation data per sample, i the informa-tion independence, and t the time per sam-ple.
6.5.2.1
Sample Channels (n)Different strategies for increasing the num-ber of signal channels include geometric,spectral, temporal, and intensity discrimi-nation. In almost all approaches to DNA se-quencing each base type is assigned to aparticular signal channel, thus requiringfour signal channels per sample. Althoughit is theoretically necessary to have only twosignal channels per DNA sample, use of re-dundant channel information reduces er-rors [128, 154, 155].
The number of geometric channels is re-lated to the number of lanes on a slab gel orthe number of capillaries in a capillary-based DNA sequencer. At the time of thisreview the maximum numbers of geomet-ric channels commercially available are 96lanes for the slab gel configuration and 384lanes for capillary gel configuration (Tabs.6.2 and 6.3), although efforts continue toextend the number of capillaries. Scherer etal. [156] report on a rotary capillary array
system designed to analyze over 1000 se-quencing separations in parallel.
Spectral discrimination using fluorescentdyes with different wavelength properties isubiquitous among commercial DNA se-quencers and the number of dyes used usu-ally ranges from two to four, although fivedyes are sometimes used [157]. There aretwo commercialized approaches to spectraldiscrimination:
1. four dyes per single sample based on theearly work of Smith et al. [9] and Prober etal. [12]; and
2. one dye for all four bases of each sample,but using different dyes for differentsamples [120, 123, 158] that are loadedinto the same geometric lanes.
The latter approach is based on the multi-plex DNA sequencing technique developedby Church and Kieffer-Higgins [159] whichhad its roots in the genomic sequencing ap-proach of Church and Gilbert [160]. Subse-quent to Church’s work there were early re-ports of developing the technique by use offluorescence [117, 119, 161, 162]. Energytransfer among acceptor and donor dyes isanother approach in spectral discriminationdesign [35, 37, 38, 42].
Temporal discrimination based on fluo-rescence lifetime has been investigated inthe research community [47–57], althoughDNA sequencers using this type of discrim-ination are not yet commercially available.
The use of intensity discrimination forDNA sequencing has also been limited tothe research community [128, 163–170].
6.5.2.2
Information per Channel (d)The emphasis on increasing the informa-tion per channel has been manifested in ef-forts to increase base read length [74–83]and the use of confidence values to assess
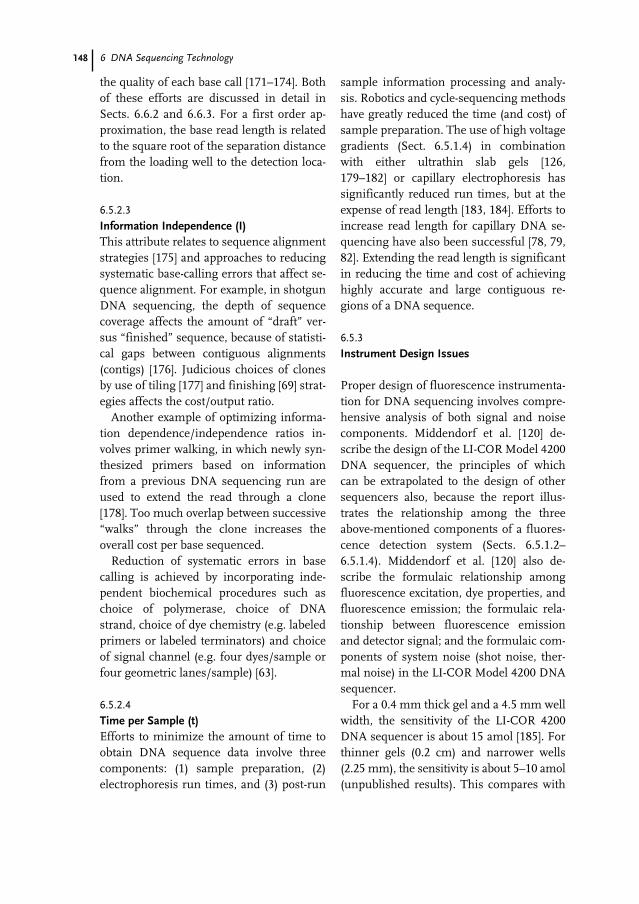
148 6 DNA Sequencing Technology
the quality of each base call [171–174]. Bothof these efforts are discussed in detail inSects. 6.6.2 and 6.6.3. For a first order ap-proximation, the base read length is relatedto the square root of the separation distancefrom the loading well to the detection loca-tion.
6.5.2.3
Information Independence (I)This attribute relates to sequence alignmentstrategies [175] and approaches to reducingsystematic base-calling errors that affect se-quence alignment. For example, in shotgunDNA sequencing, the depth of sequencecoverage affects the amount of “draft” ver-sus “finished” sequence, because of statisti-cal gaps between contiguous alignments(contigs) [176]. Judicious choices of clonesby use of tiling [177] and finishing [69] strat-egies affects the cost/output ratio.
Another example of optimizing informa-tion dependence/independence ratios in-volves primer walking, in which newly syn-thesized primers based on informationfrom a previous DNA sequencing run areused to extend the read through a clone[178]. Too much overlap between successive“walks” through the clone increases theoverall cost per base sequenced.
Reduction of systematic errors in basecalling is achieved by incorporating inde-pendent biochemical procedures such aschoice of polymerase, choice of DNAstrand, choice of dye chemistry (e.g. labeledprimers or labeled terminators) and choiceof signal channel (e.g. four dyes/sample orfour geometric lanes/sample) [63].
6.5.2.4
Time per Sample (t)Efforts to minimize the amount of time toobtain DNA sequence data involve threecomponents: (1) sample preparation, (2)electrophoresis run times, and (3) post-run
sample information processing and analy-sis. Robotics and cycle-sequencing methodshave greatly reduced the time (and cost) ofsample preparation. The use of high voltagegradients (Sect. 6.5.1.4) in combinationwith either ultrathin slab gels [126,179–182] or capillary electrophoresis hassignificantly reduced run times, but at theexpense of read length [183, 184]. Efforts toincrease read length for capillary DNA se-quencing have also been successful [78, 79,82]. Extending the read length is significantin reducing the time and cost of achievinghighly accurate and large contiguous re-gions of a DNA sequence.
6.5.3
Instrument Design Issues
Proper design of fluorescence instrumenta-tion for DNA sequencing involves compre-hensive analysis of both signal and noisecomponents. Middendorf et al. [120] de-scribe the design of the LI-COR Model 4200DNA sequencer, the principles of whichcan be extrapolated to the design of othersequencers also, because the report illus-trates the relationship among the threeabove-mentioned components of a fluores-cence detection system (Sects. 6.5.1.2–6.5.1.4). Middendorf et al. [120] also de-scribe the formulaic relationship amongfluorescence excitation, dye properties, andfluorescence emission; the formulaic rela-tionship between fluorescence emissionand detector signal; and the formulaic com-ponents of system noise (shot noise, ther-mal noise) in the LI-COR Model 4200 DNAsequencer.
For a 0.4 mm thick gel and a 4.5 mm wellwidth, the sensitivity of the LI-COR 4200DNA sequencer is about 15 amol [185]. Forthinner gels (0.2 cm) and narrower wells(2.25 mm), the sensitivity is about 5–10 amol(unpublished results). This compares with
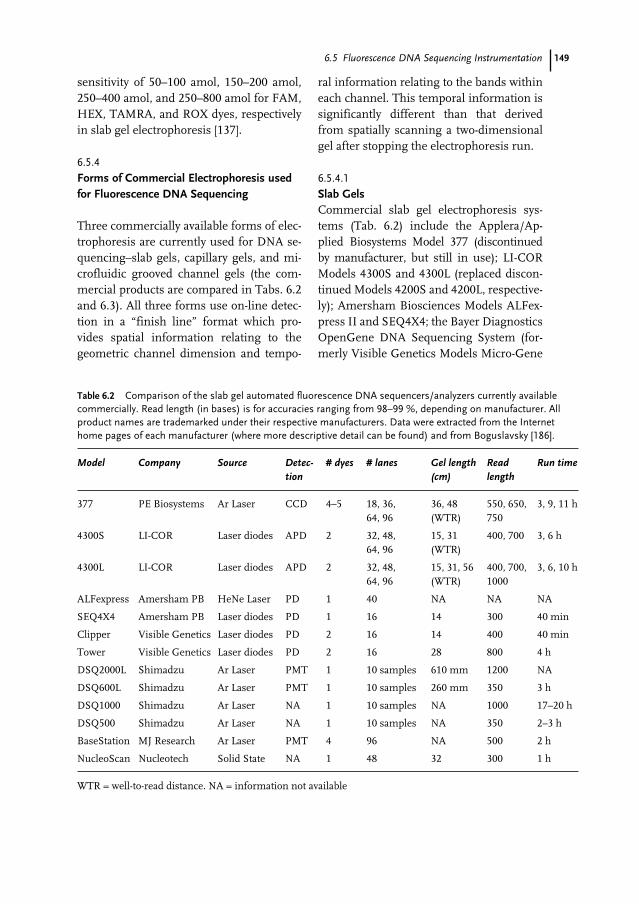
1496.5 Fluorescence DNA Sequencing Instrumentation
sensitivity of 50–100 amol, 150–200 amol,250–400 amol, and 250–800 amol for FAM,HEX, TAMRA, and ROX dyes, respectivelyin slab gel electrophoresis [137].
6.5.4
Forms of Commercial Electrophoresis usedfor Fluorescence DNA Sequencing
Three commercially available forms of elec-trophoresis are currently used for DNA se-quencing–slab gels, capillary gels, and mi-crofluidic grooved channel gels (the com-mercial products are compared in Tabs. 6.2and 6.3). All three forms use on-line detec-tion in a “finish line” format which pro-vides spatial information relating to thegeometric channel dimension and tempo-
ral information relating to the bands withineach channel. This temporal information issignificantly different than that derivedfrom spatially scanning a two-dimensionalgel after stopping the electrophoresis run.
6.5.4.1
Slab GelsCommercial slab gel electrophoresis sys-tems (Tab. 6.2) include the Applera/Ap-plied Biosystems Model 377 (discontinuedby manufacturer, but still in use); LI-CORModels 4300S and 4300L (replaced discon-tinued Models 4200S and 4200L, respective-ly); Amersham Biosciences Models ALFex-press II and SEQ4X4; the Bayer DiagnosticsOpenGene DNA Sequencing System (for-merly Visible Genetics Models Micro-Gene
Table 6.2 Comparison of the slab gel automated fluorescence DNA sequencers/analyzers currently availablecommercially. Read length (in bases) is for accuracies ranging from 98–99 %, depending on manufacturer. Allproduct names are trademarked under their respective manufacturers. Data were extracted from the Internethome pages of each manufacturer (where more descriptive detail can be found) and from Boguslavsky [186].
Model Company Source Detec- # dyes # lanes Gel length Read Run timetion (cm) length
377 PE Biosystems Ar Laser CCD 4–5 18, 36, 36, 48 550, 650, 3, 9, 11 h64, 96 (WTR) 750
4300S LI-COR Laser diodes APD 2 32, 48, 15, 31 400, 700 3, 6 h64, 96 (WTR)
4300L LI-COR Laser diodes APD 2 32, 48, 15, 31, 56 400, 700, 3, 6, 10 h64, 96 (WTR) 1000
ALFexpress Amersham PB HeNe Laser PD 1 40 NA NA NA
SEQ4X4 Amersham PB Laser diodes PD 1 16 14 300 40 min
Clipper Visible Genetics Laser diodes PD 2 16 14 400 40 min
Tower Visible Genetics Laser diodes PD 2 16 28 800 4 h
DSQ2000L Shimadzu Ar Laser PMT 1 10 samples 610 mm 1200 NA
DSQ600L Shimadzu Ar Laser PMT 1 10 samples 260 mm 350 3 h
DSQ1000 Shimadzu Ar Laser NA 1 10 samples NA 1000 17–20 h
DSQ500 Shimadzu Ar Laser NA 1 10 samples NA 350 2–3 h
BaseStation MJ Research Ar Laser PMT 4 96 NA 500 2 h
NucleoScan Nucleotech Solid State NA 1 48 32 300 1 h
WTR = well-to-read distance. NA = information not available
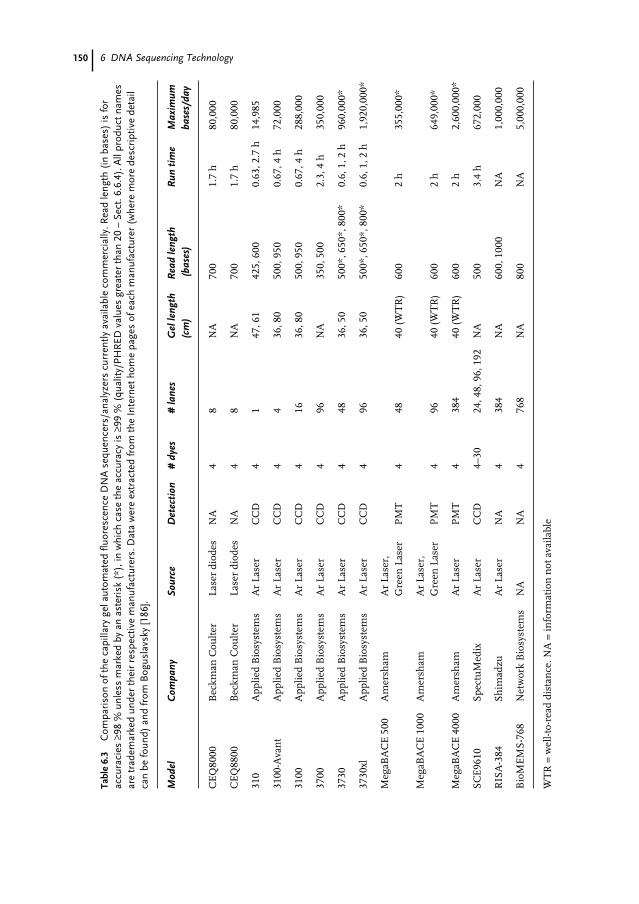
150 6 DNA Sequencing Technology
Tabl
e 6.
3C
ompa
riso
n of
the
capi
llary
gel
aut
omat
ed fl
uore
scen
ce D
NA
seq
uenc
ers/
anal
yzer
s cu
rren
tly a
vaila
ble
com
mer
cial
ly. R
ead
leng
th (
in b
ases
) is
for
accu
raci
es ≥
98%
unle
ss m
arke
d by
an
aste
risk
(*)
, in
whi
ch c
ase
the
accu
racy
is ≥
99%
(qua
lity/
PHR
ED v
alue
s gr
eate
r th
an 2
0 –
Sect
.6.6
.4).
All
prod
uct n
ames
are
trad
emar
ked
unde
r th
eir
resp
ectiv
e m
anuf
actu
rers
. Dat
a w
ere
extr
acte
d fr
om th
e In
tern
et h
ome
page
s of
eac
h m
anuf
actu
rer
(whe
re m
ore
desc
ript
ive
deta
ilca
n be
foun
d) a
nd fr
om B
ogus
lavs
ky [1
86].
Mod
elC
ompa
nySo
urce
Det
ecti
on#
dyes
# la
nes
Gel
leng
th
Rea
d le
ngth
Run
tim
eM
axim
um
(cm
)(b
ases
)ba
ses/
day
CE
Q80
00B
eckm
an C
oult
erLa
ser
diod
esN
A4
8N
A70
01.
7 h
80,0
00
CE
Q88
00B
eckm
an C
oult
erLa
ser
diod
esN
A4
8N
A70
01.
7 h
80,0
00
310
App
lied
Bio
syst
ems
Ar
Lase
rC
CD
41
47, 6
142
5, 6
000.
63, 2
.7 h
14,9
85
3100
-Ava
nt
App
lied
Bio
syst
ems
Ar
Lase
rC
CD
44
36, 8
050
0, 9
500.
67, 4
h72
,000
3100
App
lied
Bio
syst
ems
Ar
Lase
rC
CD
416
36, 8
050
0, 9
500.
67, 4
h28
8,00
0
3700
App
lied
Bio
syst
ems
Ar
Lase
rC
CD
496
NA
350,
500
2.3,
4 h
350,
000
3730
App
lied
Bio
syst
ems
Ar
Lase
rC
CD
448
36, 5
050
0*, 6
50*,
800
*0.
6, 1
, 2 h
960,
000*
3730
xlA
pplie
d B
iosy
stem
sA
r La
ser
CC
D4
9636
, 50
500*
, 650
*, 8
00*
0.6,
1, 2
h1,
920,
000*
Meg
aBA
CE
500
Am
ersh
am
Ar
Lase
r,G
reen
Las
erP
MT
448
40 (W
TR
)60
02
h35
5,00
0*
Meg
aBA
CE
100
0A
mer
sham
A
r La
ser,
Gre
en L
aser
PM
T4
9640
(WT
R)
600
2 h
649,
000*
Meg
aBA
CE
400
0A
mer
sham
A
r La
ser
PM
T4
384
40 (W
TR
)60
02
h2,
600,
000*
SCE
9610
Spec
tuM
edix
Ar
Lase
rC
CD
4–30
24, 4
8, 9
6, 1
92N
A50
03.
4 h
672,
000
RIS
A-3
84Sh
imad
zuA
r La
ser
NA
438
4N
A60
0, 1
000
NA
1,00
0,00
0
Bio
ME
MS-
768
Net
wor
k B
iosy
stem
sN
AN
A4
768
NA
800
NA
5,00
0,00
0
WT
R=
wel
l-to-
read
dis
tan
ce. N
A=
info
rmat
ion
not
ava
ilabl
e
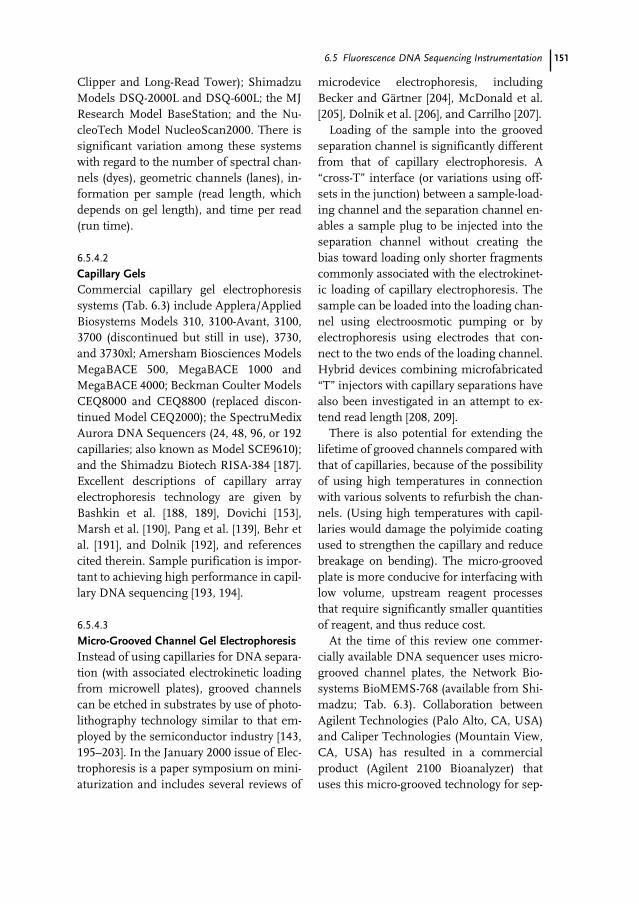
1516.5 Fluorescence DNA Sequencing Instrumentation
Clipper and Long-Read Tower); ShimadzuModels DSQ-2000L and DSQ-600L; the MJResearch Model BaseStation; and the Nu-cleoTech Model NucleoScan2000. There issignificant variation among these systemswith regard to the number of spectral chan-nels (dyes), geometric channels (lanes), in-formation per sample (read length, whichdepends on gel length), and time per read(run time).
6.5.4.2
Capillary GelsCommercial capillary gel electrophoresissystems (Tab. 6.3) include Applera/AppliedBiosystems Models 310, 3100-Avant, 3100,3700 (discontinued but still in use), 3730,and 3730xl; Amersham Biosciences ModelsMegaBACE 500, MegaBACE 1000 andMegaBACE 4000; Beckman Coulter ModelsCEQ8000 and CEQ8800 (replaced discon-tinued Model CEQ2000); the SpectruMedixAurora DNA Sequencers (24, 48, 96, or 192capillaries; also known as Model SCE9610);and the Shimadzu Biotech RISA-384 [187].Excellent descriptions of capillary arrayelectrophoresis technology are given byBashkin et al. [188, 189], Dovichi [153],Marsh et al. [190], Pang et al. [139], Behr etal. [191], and Dolnik [192], and referencescited therein. Sample purification is impor-tant to achieving high performance in capil-lary DNA sequencing [193, 194].
6.5.4.3
Micro-Grooved Channel Gel ElectrophoresisInstead of using capillaries for DNA separa-tion (with associated electrokinetic loadingfrom microwell plates), grooved channelscan be etched in substrates by use of photo-lithography technology similar to that em-ployed by the semiconductor industry [143,195–203]. In the January 2000 issue of Elec-trophoresis is a paper symposium on mini-aturization and includes several reviews of
microdevice electrophoresis, includingBecker and Gärtner [204], McDonald et al.[205], Dolnik et al. [206], and Carrilho [207].
Loading of the sample into the groovedseparation channel is significantly differentfrom that of capillary electrophoresis. A“cross-T” interface (or variations using off-sets in the junction) between a sample-load-ing channel and the separation channel en-ables a sample plug to be injected into theseparation channel without creating thebias toward loading only shorter fragmentscommonly associated with the electrokinet-ic loading of capillary electrophoresis. Thesample can be loaded into the loading chan-nel using electroosmotic pumping or byelectrophoresis using electrodes that con-nect to the two ends of the loading channel.Hybrid devices combining microfabricated“T” injectors with capillary separations havealso been investigated in an attempt to ex-tend read length [208, 209].
There is also potential for extending thelifetime of grooved channels compared withthat of capillaries, because of the possibilityof using high temperatures in connectionwith various solvents to refurbish the chan-nels. (Using high temperatures with capil-laries would damage the polyimide coatingused to strengthen the capillary and reducebreakage on bending). The micro-groovedplate is more conducive for interfacing withlow volume, upstream reagent processesthat require significantly smaller quantitiesof reagent, and thus reduce cost.
At the time of this review one commer-cially available DNA sequencer uses micro-grooved channel plates, the Network Bio-systems BioMEMS-768 (available from Shi-madzu; Tab. 6.3). Collaboration betweenAgilent Technologies (Palo Alto, CA, USA)and Caliper Technologies (Mountain View,CA, USA) has resulted in a commercialproduct (Agilent 2100 Bioanalyzer) thatuses this micro-grooved technology for sep-
152 6 DNA Sequencing Technology
aration of larger DNA fragments but not forDNA sequencing. Other academic and in-dustrial investigation of this technology forDNA sequencing is in progress. Industrialefforts include reports by Agilent and Cali-per [210], CuraGen [211], and PE Bio-systems (Foster City, CA, USA) [212, 213].
6.5.5
Non-electrophoresis Methods for Fluorescence DNA Sequencing
Several techniques for sequencing shortfragments of DNA without use of electro-phoresis have been reported in the litera-ture. The emphasis of several of these lies inthe importance of detecting single nucleo-tide polymorphisms (SNP) for diagnosticapplications. The efforts usually involvemonitoring the extension or removal of the3′ base, one base at a time.
Technology based on the removal of basesfrom the 3′ end has been developed byBrenner and colleagues at Lynx Therapeu-tics [214–219]. This method involves repeat-ed cycles of ligation and cleavage of labeledprobes at the 3′ terminus of target DNA. Asimilar method has been report by Jones[220].
Several groups have investigated themethod of single-base extension for DNAsequencing in which the extended base typeis determined, one at a time, by fluores-cence. Macevicz [221] uses repeated cyclesof ligation whereas others have used rever-sible terminators of polymerase extensionin which the terminators are labeled with adistinct, yet removable, tag for each of thefour base types [222, 223]. The use of photo-cleavable fluorescent nucleotides as rever-sible terminators whereby the photocleav-able linker is attached to nucleotide basehas also been incorporated into a parallelDNA-sequencing chip system [224].
Another ligase method involves the hy-
bridization and subsequent ligation of shortlabeled extension oligonucleotides to aDNA template at a position adjacent to the3′ (or 5′) end of previously hybridized oligo-nucleotides [225]. In this sequencing meth-od, the labeled ligation product is formedwherein the position and type of label incor-porated into the labeled ligation productprovides information concerning the nucle-otide residue in the DNA template withwhich it is base-paired.
A clever version of DNA sequencing bysingle-base extension (called pyrosequenc-ing), that has been commercialized, in-volves the use of pyrophosphate detec-tion [226–234]. Pyrosequencing involvesmeasurement of the absolute amount ofnatural nucleotide incorporation by detect-ing the amount of pyrophosphate releasedon incorporation. The process utilizes afour-enzyme mixture, including DNA poly-merase. The released pyrophosphate is con-verted to adenosine triphosphate (ATP) byATP sulfurylase, which is then sensed byluciferase to generate light. Apyrase is usedto remove unreacted nucleotides.
A non-enzyme-based technique that hasshown utility for resequencing applicationsis sequencing by hybridization [235–238].This technique involves hybridizing a li-brary of short oligonucleotides to a DNAtemplate and mathematically transformingthe hybridization pattern into a sequencebased on the individual sequences of the ol-igonucleotides from the library that actuallyhybridize.
6.5.6
Non-fluorescence Methods for DNA Sequencing
Several non-fluorescence techniques for se-quencing DNA have been investigated, in-cluding matrix-assisted-laser-desorption/ionization–time-of-flight (MALDI–TOF)
1536.6 DNA Sequence Analysis
mass spectrometry [239–243]. The use ofstable non-radioactive isotopes for labelingand detecting bases has been investigatedfor DNA sequencing by mass spectrome-try [244, 245].
6.6
DNA Sequence Analysis
6.6.1
Introduction
The fundamental objective of data analysisis to determine in an automated fashion theDNA sequence from the fluorescence sig-nals in gel electrophoresis generated by theDNA sequence fragments. The perfor-mance metrics of the data analysis softwareare read length, accuracy, and confidencevalues of the resulting sequence. This ischallenging, because of the variation ofquality among multiple electrophoresissamples and runs [246].
One approach to automated sequenceanalysis that depends on minimum varia-tion from one electrophoresis run to an-other requires adherence to rigid biologicaland electrophoresis procedures. This ap-proach enables the implementation of aninflexible model that is relatively intolerantto data variations. If, however, the datacharacteristics lie outside the pre-definedspecifications, the automated analysis per-formance might be significantly compro-mised.
Another approach that requires consider-ably less adherence to such rigid proce-dures is adaptive automation. The algo-rithms dynamically adjust to optimally fitthe data in order to be highly tolerant to thewide variability in data quality [247, 248]. Inaddition to evaluating local sequence prop-erties such as amplitude, peak time, peakwidth, and peak fluorescence spectra, it is
important to understand the interdepen-dence of these properties among neighbor-ing peaks [114, 249–251]. The best resultsfrom automated sequence analysis (longreads, high accuracy, and robust quality) areobtained using a combination of prudent la-boratory quality-control measures andadaptive automation analysis.
During analysis the data generated by thefluorescence signal of the automated DNAsequencer are subjected to multiple pro-cesses. With each intelligent data reductionperformed by the analysis software the dataare further mathematically transformedsuch that the sequence information can bemore readily and more accurately obtained.Major software deliverables of the analysissoftware include: lane detection and track-ing, trace generation, base calling, and qual-ity value generation.
6.6.2
Lane Detection and Tracking
Lane detection and tracking is the processof identifying the lane boundaries of DNAsequencing fragments throughout a com-plete gel image. This process is done auto-matically, but most analysis software pack-ages make provision for optional visual ver-ification and editing (retracking). Lanetracking is required for slab gel-based se-quencers but is not required for capillary-based sequencers (Sect. 6.5.4.2).
Lane tracking is a critical step in the se-quence-determination process, because itsperformance can directly affect the accuracyof the base calls for an entire sample oreven a multi-sample gel run. Lane trackingis challenging when there is a wide range ofsequence-image configurations of differentquality [252]. Characteristics of these differ-ent sequence image configurations includecomb sizes and types, sample loading for-mats, gel sizes, sequence chemistries, and
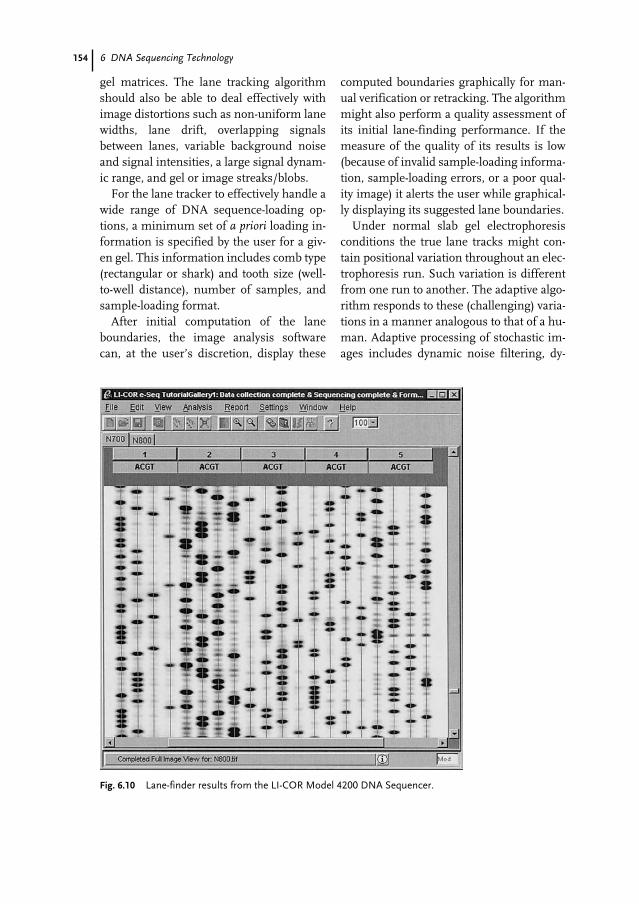
154 6 DNA Sequencing Technology
gel matrices. The lane tracking algorithmshould also be able to deal effectively withimage distortions such as non-uniform lanewidths, lane drift, overlapping signalsbetween lanes, variable background noiseand signal intensities, a large signal dynam-ic range, and gel or image streaks/blobs.
For the lane tracker to effectively handle awide range of DNA sequence-loading op-tions, a minimum set of a priori loading in-formation is specified by the user for a giv-en gel. This information includes comb type(rectangular or shark) and tooth size (well-to-well distance), number of samples, andsample-loading format.
After initial computation of the laneboundaries, the image analysis softwarecan, at the user’s discretion, display these
computed boundaries graphically for man-ual verification or retracking. The algorithmmight also perform a quality assessment ofits initial lane-finding performance. If themeasure of the quality of its results is low(because of invalid sample-loading informa-tion, sample-loading errors, or a poor qual-ity image) it alerts the user while graphical-ly displaying its suggested lane boundaries.
Under normal slab gel electrophoresisconditions the true lane tracks might con-tain positional variation throughout an elec-trophoresis run. Such variation is differentfrom one run to another. The adaptive algo-rithm responds to these (challenging) varia-tions in a manner analogous to that of a hu-man. Adaptive processing of stochastic im-ages includes dynamic noise filtering, dy-
Fig. 6.10 Lane-finder results from the LI-COR Model 4200 DNA Sequencer.
1556.6 DNA Sequence Analysis
namic background subtraction, and patternrecognition. Artificial-intelligence tech-niques for band-feature detection and lane-center determination are also used, includ-ing neural network techniques [253].
The lane-detection process is initiated byreception of the image file and the a prioriload configuration. The image data are fil-tered to remove high-frequency randomnoise and the background image “surface”is characterized according to its topology.Next, band features are detected by patternrecognition algorithms and the locations ofthe band centers are determined. By use ofiterative optimization the band centers arethen partitioned and linked together in as-sociated lane groups. The lane tracker is de-signed to make adjustments dynamicallyfor lane drift but is restrained in making ex-cessive adjustments. The resulting outputof the lane tracker is a multiple set of lanetrack locations from the beginning to theend of the gel image (Fig. 6.10).
6.6.3
Trace Generation and Base Calling
After creating the lane-track information(for slab gels only; not necessary for capil-lary gels), trace data are generated for eachlane and the sequential base locations, orbase calls, are determined. The objective inbase calling is to extend the reading of thebanding pattern as far as possible with thehighest accuracy, in an environment of var-iable gel or image quality [254].
The accuracy of the base-caller software ismostly affected by the quality of the se-quencing reactions [114, 249] and the gelelectrophoresis conditions [180, 255–257].Some of the challenges to accurate basecalling include non-uniformity in band-to-band spacing, variable band spreading,non-uniform band mobility, and overlap-ping (poorly resolved) peaks. Additional po-
tential sources of error include weak or var-iable signal strengths, ghost bands, variableband morphologies (often because of load-ing-well distortions and/or salt gradientsbetween the sample and the running buf-fer), and undesired excess signal artifacts.
For slab gels, the base caller initiallytransforms data within each of the two-di-mensional (2D) image lane tracks into one-dimensional (1D) lane trace profiles. Thisstep is not performed for capillary gels, be-cause the initial data are already formattedas a 1D trace. The 2D image data format as-sociated with slab gels contains additionalinformation, however, that can be utilizedto improve the base calling accuracy. For ex-ample, on reducing the dimensionality ofthe signal, the signal-to-noise ratio is en-hanced in that summing pixel data acrossthe lane width increases the signal linearlybut the noise increases only according tothe square root of the number of pixels. Inaddition, pattern recognition of the full two-dimensional nature of DNA bands assistsin analyzing overlapping bands. Care must,however, be taken in the 2D to 1D transfor-mation process such that no signal infor-mation is lost or that distortions are not in-troduced when creating the 1D trace data.
A primary intra-lane image distortionthat requires correction before dimensionreduction is band tilt (as a result of thermaleffects, non-uniform salt concentrations, orwell-loading errors) [258]. The computer al-gorithm dynamically calculates how muchband tilt is present in each lane and produc-es undistorted lane trace profiles. The re-sulting lane traces are also dynamically cor-rected relative to background signal levels.
A composite sequence trace is then creat-ed by overlaying each of the four associatedbase profiles (A, T, G, and C) [259]. For thepurpose of displaying the composite trace,each base profile is uniquely colored (e.g.red = T, green = A, blue = C, black = G) for
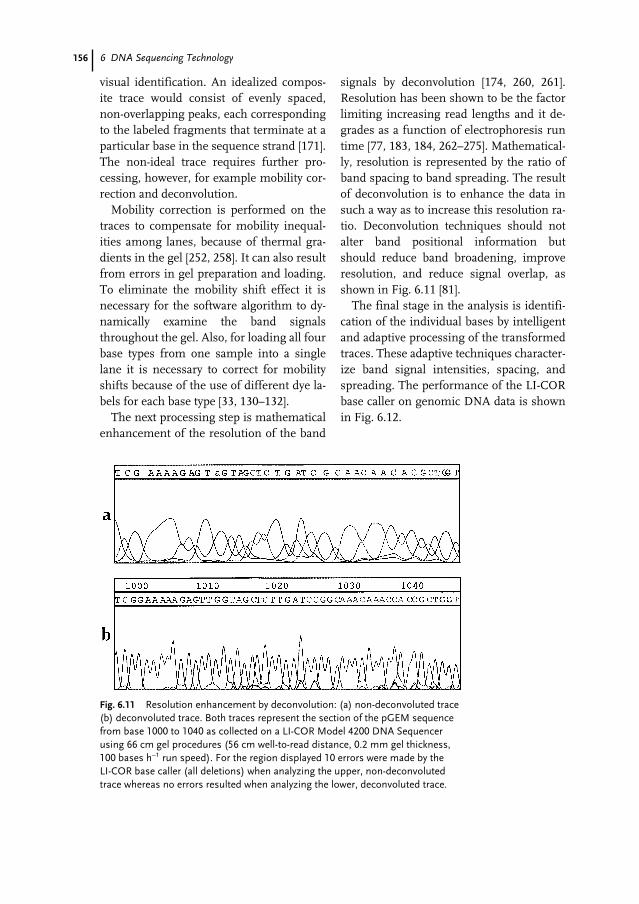
156 6 DNA Sequencing Technology
visual identification. An idealized compos-ite trace would consist of evenly spaced,non-overlapping peaks, each correspondingto the labeled fragments that terminate at aparticular base in the sequence strand [171].The non-ideal trace requires further pro-cessing, however, for example mobility cor-rection and deconvolution.
Mobility correction is performed on thetraces to compensate for mobility inequal-ities among lanes, because of thermal gra-dients in the gel [252, 258]. It can also resultfrom errors in gel preparation and loading.To eliminate the mobility shift effect it isnecessary for the software algorithm to dy-namically examine the band signalsthroughout the gel. Also, for loading all fourbase types from one sample into a singlelane it is necessary to correct for mobilityshifts because of the use of different dye la-bels for each base type [33, 130–132].
The next processing step is mathematicalenhancement of the resolution of the band
signals by deconvolution [174, 260, 261].Resolution has been shown to be the factorlimiting increasing read lengths and it de-grades as a function of electrophoresis runtime [77, 183, 184, 262–275]. Mathematical-ly, resolution is represented by the ratio ofband spacing to band spreading. The resultof deconvolution is to enhance the data insuch a way as to increase this resolution ra-tio. Deconvolution techniques should notalter band positional information butshould reduce band broadening, improveresolution, and reduce signal overlap, asshown in Fig. 6.11 [81].
The final stage in the analysis is identifi-cation of the individual bases by intelligentand adaptive processing of the transformedtraces. These adaptive techniques character-ize band signal intensities, spacing, andspreading. The performance of the LI-CORbase caller on genomic DNA data is shownin Fig. 6.12.
Fig. 6.11 Resolution enhancement by deconvolution: (a) non-deconvoluted trace(b) deconvoluted trace. Both traces represent the section of the pGEM sequencefrom base 1000 to 1040 as collected on a LI-COR Model 4200 DNA Sequencerusing 66 cm gel procedures (56 cm well-to-read distance, 0.2 mm gel thickness,100 bases h–1 run speed). For the region displayed 10 errors were made by the LI-COR base caller (all deletions) when analyzing the upper, non-deconvolutedtrace whereas no errors resulted when analyzing the lower, deconvoluted trace.
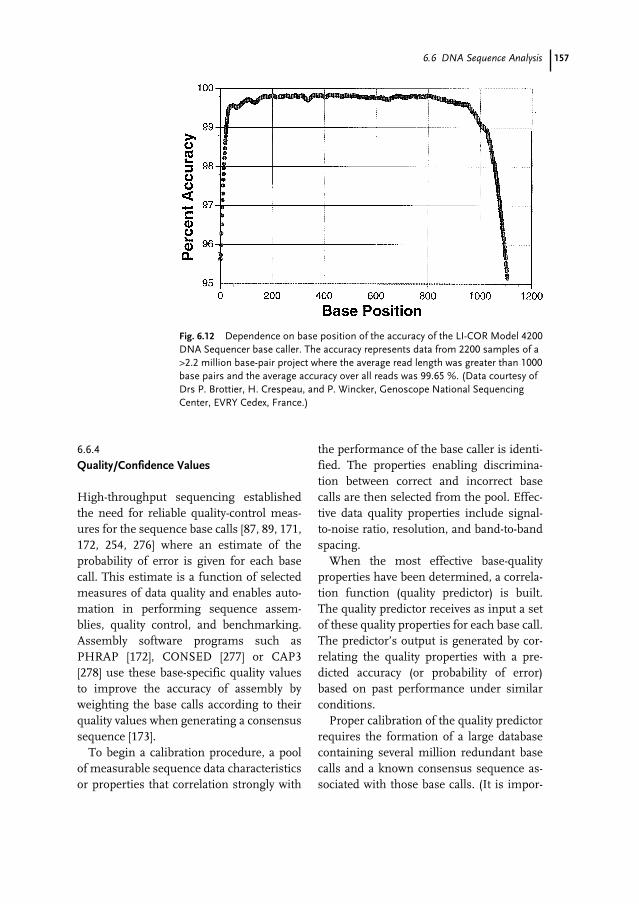
1576.6 DNA Sequence Analysis
6.6.4
Quality/Confidence Values
High-throughput sequencing establishedthe need for reliable quality-control meas-ures for the sequence base calls [87, 89, 171,172, 254, 276] where an estimate of theprobability of error is given for each basecall. This estimate is a function of selectedmeasures of data quality and enables auto-mation in performing sequence assem-blies, quality control, and benchmarking.Assembly software programs such asPHRAP [172], CONSED [277] or CAP3[278] use these base-specific quality valuesto improve the accuracy of assembly byweighting the base calls according to theirquality values when generating a consensussequence [173].
To begin a calibration procedure, a poolof measurable sequence data characteristicsor properties that correlation strongly with
the performance of the base caller is identi-fied. The properties enabling discrimina-tion between correct and incorrect basecalls are then selected from the pool. Effec-tive data quality properties include signal-to-noise ratio, resolution, and band-to-bandspacing.
When the most effective base-qualityproperties have been determined, a correla-tion function (quality predictor) is built.The quality predictor receives as input a setof these quality properties for each base call.The predictor’s output is generated by cor-relating the quality properties with a pre-dicted accuracy (or probability of error)based on past performance under similarconditions.
Proper calibration of the quality predictorrequires the formation of a large databasecontaining several million redundant basecalls and a known consensus sequence as-sociated with those base calls. (It is impor-
Fig. 6.12 Dependence on base position of the accuracy of the LI-COR Model 4200DNA Sequencer base caller. The accuracy represents data from 2200 samples of a>2.2 million base-pair project where the average read length was greater than 1000base pairs and the average accuracy over all reads was 99.65 %. (Data courtesy ofDrs P. Brottier, H. Crespeau, and P. Wincker, Genoscope National SequencingCenter, EVRY Cedex, France.)
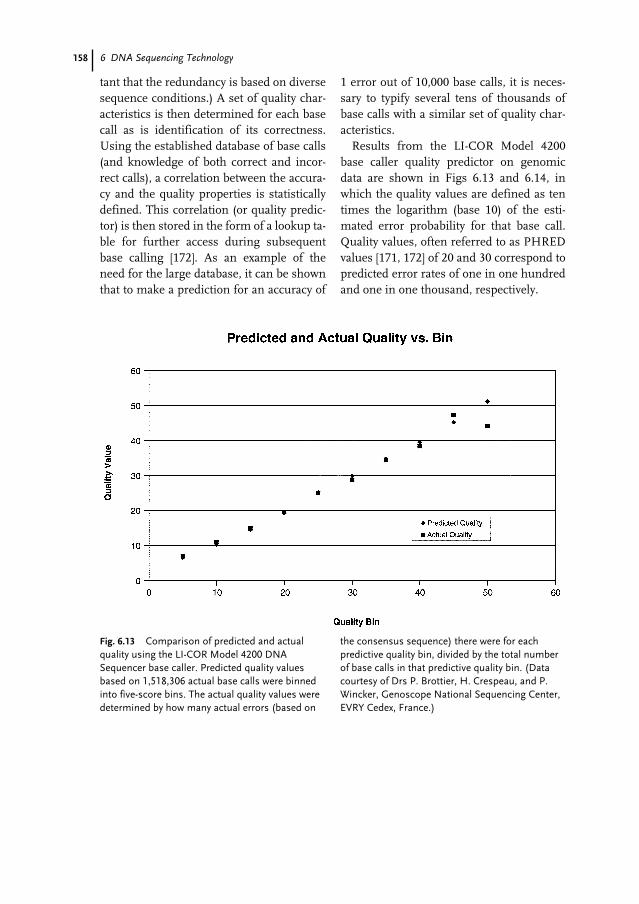
158 6 DNA Sequencing Technology
tant that the redundancy is based on diversesequence conditions.) A set of quality char-acteristics is then determined for each basecall as is identification of its correctness.Using the established database of base calls(and knowledge of both correct and incor-rect calls), a correlation between the accura-cy and the quality properties is statisticallydefined. This correlation (or quality predic-tor) is then stored in the form of a lookup ta-ble for further access during subsequentbase calling [172]. As an example of theneed for the large database, it can be shownthat to make a prediction for an accuracy of
1 error out of 10,000 base calls, it is neces-sary to typify several tens of thousands ofbase calls with a similar set of quality char-acteristics.
Results from the LI-COR Model 4200base caller quality predictor on genomicdata are shown in Figs 6.13 and 6.14, inwhich the quality values are defined as tentimes the logarithm (base 10) of the esti-mated error probability for that base call.Quality values, often referred to as PHREDvalues [171, 172] of 20 and 30 correspond topredicted error rates of one in one hundredand one in one thousand, respectively.
Fig. 6.13 Comparison of predicted and actualquality using the LI-COR Model 4200 DNASequencer base caller. Predicted quality valuesbased on 1,518,306 actual base calls were binnedinto five-score bins. The actual quality values weredetermined by how many actual errors (based on
the consensus sequence) there were for eachpredictive quality bin, divided by the total numberof base calls in that predictive quality bin. (Datacourtesy of Drs P. Brottier, H. Crespeau, and P.Wincker, Genoscope National Sequencing Center,EVRY Cedex, France.)
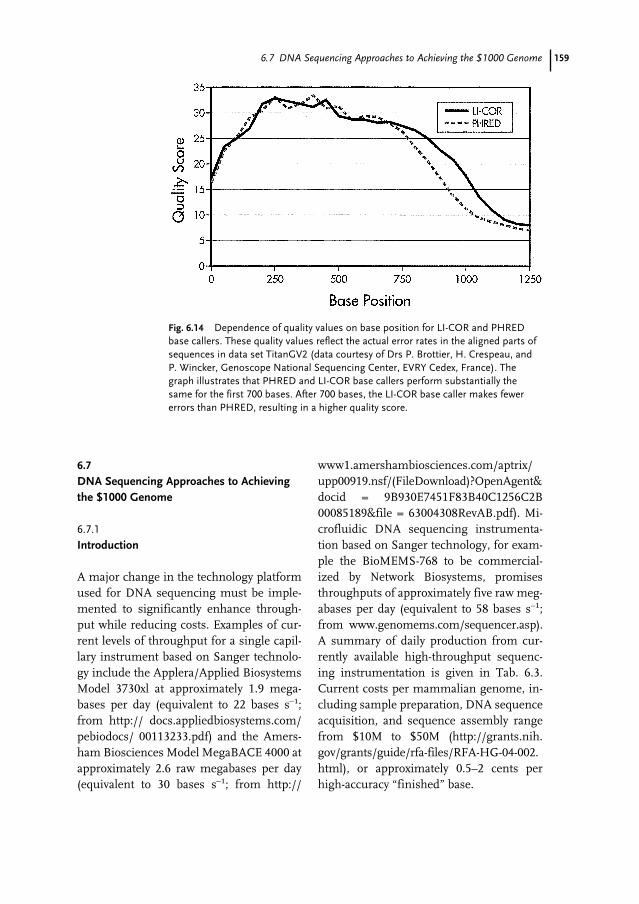
1596.7 DNA Sequencing Approaches to Achieving the $1000 Genome
6.7
DNA Sequencing Approaches to Achievingthe $1000 Genome
6.7.1
Introduction
A major change in the technology platformused for DNA sequencing must be imple-mented to significantly enhance through-put while reducing costs. Examples of cur-rent levels of throughput for a single capil-lary instrument based on Sanger technolo-gy include the Applera/Applied BiosystemsModel 3730xl at approximately 1.9 mega-bases per day (equivalent to 22 bases s–1;from http:// docs.appliedbiosystems.com/pebiodocs/ 00113233.pdf) and the Amers-ham Biosciences Model MegaBACE 4000 atapproximately 2.6 raw megabases per day(equivalent to 30 bases s–1; from http://
www1.amershambiosciences.com/aptrix/upp00919.nsf/(FileDownload)?OpenAgent&docid = 9B930E7451F83B40C1256C2B00085189&file = 63004308RevAB.pdf). Mi-crofluidic DNA sequencing instrumenta-tion based on Sanger technology, for exam-ple the BioMEMS-768 to be commercial-ized by Network Biosystems, promisesthroughputs of approximately five raw meg-abases per day (equivalent to 58 bases s–1;from www.genomems.com/sequencer.asp).A summary of daily production from cur-rently available high-throughput sequenc-ing instrumentation is given in Tab. 6.3.Current costs per mammalian genome, in-cluding sample preparation, DNA sequenceacquisition, and sequence assembly rangefrom $10M to $50M (http://grants.nih.gov/grants/guide/rfa-files/RFA-HG-04-002.html), or approximately 0.5–2 cents perhigh-accuracy “finished” base.
Fig. 6.14 Dependence of quality values on base position for LI-COR and PHREDbase callers. These quality values reflect the actual error rates in the aligned parts ofsequences in data set TitanGV2 (data courtesy of Drs P. Brottier, H. Crespeau, andP. Wincker, Genoscope National Sequencing Center, EVRY Cedex, France). Thegraph illustrates that PHRED and LI-COR base callers perform substantially thesame for the first 700 bases. After 700 bases, the LI-COR base caller makes fewererrors than PHRED, resulting in a higher quality score.
160 6 DNA Sequencing Technology
The ability to sequence a human genomeaccurately in one day would require at leasta throughput of 175,000 bases s–1 (assum-ing a minimum of fivefold redundancy toachieve 99.99 % accuracy). This is morethan a 3000-fold improvement in through-put compared with current approaches. A$1000 5× genome would necessitate cost re-duction of at least four orders of magnitude.Certainly physical limitations such as thoseconsidered by the semiconductor industryas it increases the number of transistors perchip [279, 280] need to be taken into consid-eration as resources are appropriated for theextremely challenging endeavor of increas-ing DNA sequencing throughput by severalorders of magnitude. These assessments in-clude the trade-off between accuracy and in-formation rates as imposed by thermody-namics and modeled using information(communication) theory [281, 282] and therelationship among Heisenberg’s Uncer-tainty Principle, Abbe’s Diffraction Limit,and thermal diffusion [283]. Economic is-sues associated with all components of theDNA sequencing business infrastructure,including shifts in reagent and instrumen-tation commercialization and contract se-quencing factories, also need to be ad-dressed, given the challenge to reduce coststo less than 0.00001cents per raw base in amanner profitable to all enterprises in thesequencing value chain. The practical Bibli-cal advice given by Jesus in Luke 14:28ffwith regard to first assessing the costs –“For which one of you, when he wants to builda tower, does not first sit down and calculatethe cost to see if he has enough to complete it?Otherwise, when he has laid a foundation andis not able to finish, all who observe it begin toridicule him, saying, This man began to buildand was not able to finish.” – becomes as rel-evant as Pierce’s perspective that “from thepoint of view of information theory, the mostinteresting relation between physics and infor-
mation theory lies in the evaluation of the un-avoidable limitations imposed by the laws ofphysics on our ability to communicate”(Ref. [281], page 198) and that “communica-tion theory can be valuable in telling us whatcan’t be accomplished as well as in suggestingwhat can be” (ibid, page 179).
Single-molecule detection (SMD) tech-nologies [284–286] might provide a new lev-el of performance if the potential to signifi-cantly simplify sample preparation, reducereagent consumption, and miniaturize thesequencing engine is successfully fulfilled.The sources of error at the single-moleculelevel are considerably different from thoseof the traditional Sanger approach, becausethe detection of every molecule is impor-tant. For example, photobleaching, fluoro-phore blinking [287], and “dead-on-arrival”fluorophores become relevant considera-tions when using fluorescence SMD. Diffu-sion can also be a major source of error, re-gardless of whether or not the detectionmechanism involves fluorescence. If the er-rors associated with SMD sequencing arestochastic, the amount of over-sampling re-quired to compensate for such errors mighthopefully be reduced to a level that nullifiesany requirements of potential ergodicequivalence between the individual sam-pling approach of SMD sequencing and theensemble sampling approach of Sanger se-quencing. In other words, over-sampling inSanger sequencing results from both theuse of multiple sequence runs and the mul-tiple molecules within an ensemble (band)that comprises a single Sanger-based datapoint. SMD sequencing, by its very nature,can only use multiple sequence runs to pro-vide over-sampling for error reduction. Ifthe current level of over-sampling associat-ed with the multiple molecules within anensemble comprising a single Sanger se-quencing data point is necessary to gener-ate the desired level of accuracy, then a
1616.7 DNA Sequencing Approaches to Achieving the $1000 Genome
smaller amount of molecules in that en-semble would not suffice to represent thetrue statistical behavior and the accuracywould be degraded. If this were so then, bydefinition, ergodic equivalence would re-quire the same amount of samplingbetween the two approaches (Sanger orSMD) to achieve the same level of accuracy,thus negating the main advantage prom-ised by SMD sequencing because of the ex-cessive need for multiple sequence runs.The hope is that the over-sampling current-ly associated with Sanger sequencing is“overkill” and, therefore, that SMD will im-part more information than that providedby the ensemble average [288].
Four biochemistry strategies have beenreported in the scientific literature for DNAsequencing using SMD: (1) DNA degrada-tion, (2) DNA synthesis, (3) DNA hybridiza-tion, and (4) nanopore filtering. The firstthree strategies usually involve fluores-cence detection, whereas the nanopore-fil-tering strategy is predicated on the detec-tion of natural, unlabeled bases. The firstapproaches to DNA sequencing using SMDwere based on the DNA degradation strate-gy whereby individual bases were removedfrom a DNA fragment and their base typewas identified one-by-one. Efforts usingthis approach continue to be reported(Sect. 6.7.2). SMD methods using the DNAsynthesis strategy usually involve using apolymerase to add one nucleotide at a timeto a DNA fragment hybridized to a templatestrand, and then identifying the incorporat-ed base one-by-one. Several variants of thisapproach have been reported (Sect. 6.7.3).Hybridization methods utilize a library ofoligonucleotide probes spatially positionedat unique locations on a target DNA frag-ment so that their positions are assayed atthe single-molecule level (Sect. 6.7.4).Nanopore filtering involves identifying one-by-one each base of a DNA fragment as that
fragment passes through a nanopore (Sect.6.7.5). Additional information (not includedin the references to this chapter) aboutthese methods can be found in the patentliterature and the trade magazine literatureby using internet search engines. Corporatewebsites describing technology not yet ap-pearing in the refereed literature are identi-fied in the text where appropriate.
6.7.2
DNA Degradation Strategy
Early attempts at rapid sequencing of 40 kil-obase or larger fragments of DNA at a rateof 100 to 1000 bases per second have beenexplored by Los Alamos National Laborato-ry (LLNL) [289–291]. Their approach in-volved the concept of fluorescently labelingevery base of a newly synthesized DNAstrand using four types of dye for each ofthe four base types and then attaching theDNA strand to a solid support which ismoved into a flowing sample stream, cleav-ing the labeled 3′ bases one by one with anexonuclease, and finally detecting thecleaved base by using fluorescence detec-tion. More recent progress in demonstrat-ing the feasibility of the LLNL concept wasreported in 2003; in this work one of thefour base types was labeled and detected af-ter exonuclease cleavage [292]. The seminaleffort of the LLNL group set the foundationfor investigating single-molecule detection(SMD) as a technology platform for appre-ciably increasing DNA-sequencing through-put while substantially reducing the cost.
Related research efforts coordinated bythe German Ministry of Education and Re-search (BMBF) and the Swedish NationalBoard for Industrial and Technical Develop-ment (NUTEK) were initially reported in1997 [293] with a comprehensive follow-upcollectively reported in 2001 in a special is-sue of the Journal of Biotechnology (Vol-
162 6 DNA Sequencing Technology
ume 86, Issue 3) and included an editorialand nine articles describing aspects of thesample preparation, biochemistry, micro-fabrication, and detection of this multi-la-boratory endeavor [294–303]. Brakmannand Löbermann describe the step of label-ing of the target DNA [304] and the step ofexonucleolytic degradation of the targetDNA [305] in their investigations of SMDsequencing via degradation. A review of thetwo enzymatic tasks (polymerase and exon-uclease activity) has also been written byBrakmann [306]. Further investigations intothe synthesis of fluorescently labeled nucle-otides and the polymerase-mediated fluo-rescent replacement of bases in a DNAmolecule have been conducted by GnothisSA, a Swiss commercial enterprise [307,308].
Ulmer [309] developed a method for DNAsequencing involving the use of an exonu-clease to cleave from a single DNA strandthe next available single nucleotide on thestrand and then detecting the cleaved nucle-otide by transporting it into a fluorescence-enhancing matrix such that the natural fluo-rescence spectrum of the four nucleotides isexploited to determine the base sequence.To detect the natural fluorescence it wasnecessary to cool the nucleotides to cryogen-ic temperatures.
The use of fluorescence polarization todiscriminate among the four base typescleaved by an exonuclease instead of thespectral discrimination associated with fourdifferent dyes has been investigated by Yanand Myrick [310] as another approach toSMD sequencing via DNA degradation.
6.7.3
DNA Synthesis Strategy
Several groups have investigated DNA se-quencing via DNA synthesis with a varietyof biochemical and optical methods to en-
hance signal-to-background ratios, includ-ing reagent cycling, polymerase residencetime discrimination, electronic charge dis-crimination, fluorescence energy transfer,quenching, photobleaching, evanescentwave excitation, and zero-mode cavity wave-guides and a variety of fluorescence label-ing motifs, including labeling of the nucleo-tide base, sugar, or phosphate and labelingof the polymerase.
One of the more common methods of theDNA synthesis strategy is to use reversibleterminators of DNA synthesis in combina-tion with a step-wise sequencing process in-volving repeated cycles of interrogation(see, for example, www.solexa.com andwww.genovoxx.de). This method involvesincorporation into a growing DNA strand ofa single fluorescently-labeled nucleotidewhich then blocks the polymerase fromadding another base, either because of a ter-minating moiety at the 3′ position of thenewly incorporated nucleotide (e.g. Solexa)or because of steric hindrance between thepolymerase and the fluorescent label (e.g.Genovoxx). The incorporated nucleotide isidentified on the basis of its fluorescencespectrum and then the fluorescent label or3′ block is removed. If the fluorescent dyeremains on the growing strand it must bephoto-deactivated before the next cycle.
A related technology amplifies an individ-ual DNA molecule into one of several se-quence-specific colonies, with each colonylocalized in a unique spatial position withina thin acrylamide gel attached to a micro-scope slide [311]. Each stepwise cycle of in-corporation of a base-labeled nucleotide in-cludes fluorescence removal via either a re-ducing agent acting on a disulfide linkagebetween the fluorophore and the nucleotidebase or the use of near-UV light to break aphotocleaveable linker (see also Refs. [224]and [312]). Even though the fluorescent la-bel is conjugated to the base, it still blocks
1636.7 DNA Sequencing Approaches to Achieving the $1000 Genome
the polymerase from adding more than onenucleotide for a sufficient amount of cycletime to assay which base type was incorpo-rated. In a similar fashion researchers at454 Corporation (www.454.com) start withan individual DNA molecule which is thenPCR-amplified within one of 300,000 mi-crowells containing as little as 39.5 picoliter(pL) and arranged in a honeycomb array[313]. Sequencing is performed within eachwell using the pyrosequencing technology(Sect. 6.5.5) with read lengths up to 100 bas-es [314].
In 2003, the Quake lab at Caltech pub-lished results reporting the first actual de-termination of sequence fingerprints up tofive base pairs in length of individual DNAstrands with single-base resolution [315].DNA templates were anchored on to aquartz slide then combined with a primerand polymerase, with sequencing per-formed by means of cyclic, stepwise intro-duction of base-labeled nucleotides com-bining evanescent excitation, fluorescenceenergy transfer, and photobleaching. Heli-cos BioSciences (www.helicosbio.com) hasstarted to commercialize the Quake tech-nology.
Approaches not based on the stepwisecycling of reversible terminators requiredetection approaches that discriminatebetween excess unincorporated labeled nu-cleotides and the individual nucleotide thathas just been incorporated into the growingDNA strand by the polymerase. An effort atCornell that used zero-mode cavity wave-guides to reduce the detection volume andfluorescence correlation spectroscopy(FCS) for temporal discrimination demon-strated the observation of single moleculeDNA polymerase activity at high (micromo-lar) concentrations of labeled nucleotideswith successful background discrimination[316]. This work is being commercialized byNanofluidics (www.nanofluidics.com). Vi-
sigen Biotechnologies (www.visigenbio.com) is investigating the use of fluores-cence energy transfer between a labeled en-gineered polymerase and the incoming la-beled nucleotide for discriminating againstbulk labeled nucleotides. Mobious Genom-ics (www.mobious.com) is investigating theuse of surface plasmon resonance to detectpolymerase conformation changes as afunction of the particular type of nucleotideincorporated. This approach does not in-volve fluorescence labeling.
6.7.4
DNA Hybridization Strategy
Approaches that use the DNA hybridizationstrategy either move single DNA fragmentsthat contain multiple labeled probes past adetector (US Genomics) or stretch out DNAon a substrate and use two-dimensional de-tection of either labeled probes hybridizedto the DNA or immobilized fragments ofthe DNA after they have been subjected torestriction endonucleases (OpGen). The USGenomics (www.usgenomics.com) technol-ogy involves the nanofabrication of eithernarrow slits [317, 318] or a series of posts[319] to geometrically untangle a linearstring of mostly single-stranded DNA to en-able detection of labeled probes hybridizedto the DNA. The temporal distribution ofthe fluorescence signal generated as theDNA fragment moves past the detector istranslated to spatial information. The tech-nology is currently used for detecting sin-gle-base mutations but might have poten-tial for DNA sequencing. Related technolo-gy for periodically transporting DNA mole-cules through a glass nanopipette(fabricated to have an inner radius of~50 nm by use of a laser-based pipette pull-er) used single molecule fluorescence de-tection to determine the number of mole-cules delivered per voltage pulse [320].
164 6 DNA Sequencing Technology
The approach of OpGen (www.opgen.com) in which DNA is stretched into an un-tangled form for spatially-resolved detectionof restriction fragments lends itself well toDNA mapping [321–325] with the hope thatthe analysis of “DNA molecules bound tochemically modified surfaces” … “can beused as a viable platform to ascertain the se-quences of short nucleotide strings and ulti-mately, complete genomes” (taken from ab-stract of a University Wisconsin–Madisonanalytical seminar, September 24, 2003).
6.7.5
Nanopore Filtering Strategy
In 1996 seminal work on the use of lipid bi-layer membrane channel as nanoporesthrough which single-stranded DNA mole-cules could be translocated was report-ed [326]. This has led to a large number ofefforts to assess the feasibility of using
nanopores for single-molecule DNA se-quencing, many of which have receivedfederal funding (see, for example, http://crisp.cit.nih.gov) but so far with no pub-lished results. Critical to the success of thisstrategy is the ability to resolve the differ-ences between individual bases within thechannel [327, 328]. Other challenges in-clude clogging at the opening of the pore asa result of DNA secondary structure such ashairpin loops, bidirectional movement ofthe DNA within the pore owing to thermaldiffusion, and the formation of robustnanopores, including the possibility of sol-id-state nanopores, rather than the α-hemo-lysin channels most commonly studied[329–336]. The challenges of using nano-pores for DNA sequencing have been re-viewed by Slater et al. (Ref. [337], p. 3883).Detection approaches within the nanoporehave generally been limited to ionic currentmeasurements.
165
1 Brownlee, G.G., Sanger, F. and Barrell, B.G.(1967), Nucleotide sequence of 5S-ribosomalRNA from Escherichia coli, Nature 215,pp. 735–736.
2 Fellner, P. and Sanger, F. (1968), Sequenceanalysis of specific areas of 16S and 23ribosomal RNAs, Nature 219, pp. 236–238.
3 Adams, J.M., Jeppesen, P.G., Sanger, F. andBarrell, B.G. (1969), Nucleotide sequencefrom the coat protein cistron of R17 bacterio-phage RNA, Nature 223, pp. 1009–1014.
4 Sanger, F., Donelson, J.E., Coulson, A.R.,Kossel, H. and Fischer, D. (1973), Use ofDNA polymerase I primed by a syntheticoligonucleotide to determine a nucleotidesequence in phage f1 DNA, Proc. Natl. Acad.Sci. USA 70, pp. 1209–1213.
5 Sanger, F., Donelson, J.E., Coulson, A.R.,Kossel, H. and Fischer, D. (1974), Deter-mination of a nucleotide sequence inbacteriophage f1 DNA by primed synthesiswith DNA polymerase, J. Mol. Biol. 90,pp 315–333.
6 Gilbert, W. and Maxam A. (1973), Thenucleotide sequence of the lac operator, Proc.Natl. Acad. Sci. USA 70, pp. 3581–3584.
7 Sanger, F. and Coulson, A.R. (1975), A rapidmethod for determining sequences in DNAby primed synthesis with DNA polymerase, J.Mol. Biol. 94, pp. 441–448.
8 Maxam, A. M. and Gilbert, W. (1977), A newmethod for sequencing DNA, Proc. Natl.Acad. Sci. U.S.A. 74, pp. 560–564.
9 Smith, L.M., Sanders, J.Z., Kaiser, R.J.,Hughes, P., Dodd, C., Connell, C.R., Heiner, C., Kent, B.H. and Hood, L.E. (1986), Fluorescence detection in automatedDNA sequence analysis, Nature 321, pp. 674–679.
10 Ansorge, W., Sproat, B.S., Stegemann, J. andSchwager, C. (1986), A non-radioactiveautomated method for DNA sequencedetermination, J. Biochem. Biophs. Methods13, pp. 315–323.
11 Ansorge, W., Sproat, B., Stegemann, J.,Schwager, C. and Zenke, M. (1987),Automated DNA sequencing: Ultrasensitivedetection of fluorescent bands duringelectrophoresis, Nucl. Acids Res. 15,4593–4602.
12 Prober, J.M., Trainor, G.L., Dam, R.J., Hobbs,F.W., Robertson, C.W., Zagursky, R.J.,Cocuzza, A.J., Jensen, M.A. and Baumeister,K. (1987), A system for rapid DNA sequenc-ing with fluorescent chain-terminatingdideoxynucleotides, Science 238, pp. 336–341.
13 Brumbaugh, J.A., Middendorf, L.R., Grone,D.L. and Ruth, J.L. (1988), Continuous, on-line, DNA sequencing usingmultifluorescently tagged primers, Proc. Natl.Acad. Sci. USA 85, pp. 5610–5614.
14 Kambara, H., Nishikawa, T., Katayama, Y.and Yamaguchi, T. (1988), Optimization ofparameters in a DNA sequenator usingfluorescence detection, Bio/Technology 6, pp. 816–821.
15 Middendorf, L.R., Brumbaugh, J.A., Grone,D.L., Morgan, C.A. and Ruth, J.L. (1988),Large scale DNA sequencing, AmericanBiotechnology Laboratory 6, pp. 14–22.
16 DeLisi, C. (1988), The human genomeproject, Amer. Sci. 76, pp. 488–493.
17 Sanger, F., Nicklen, S. and Coulson, A.R.(1977), DNA sequencing with chain-terminat-ing inhibitors, Proc. Natl. Acad. Sci. USA 74,pp 5463–5467.
18 Alphey, L. (1997), DNA Sequencing. NewYork: Springer.
References
166 References
19 Ansorge, W., Voss, H. and Zimmermann, J.(1997), DNA Sequencing Strategies. NewYork: John Wiley and Sons.
20 Smith, L.M. (1989), DNA sequence analysis:past, present, and future, Intl. Biotech. Lab. 7,pp. 8–19.
21 Middendorf, L.R., Bruce, J.C., Bruce, R.C.,Eckles, R.D., Roemer, S.C. and Sloniker, G.D.(1993), A versatile infrared laser scanner/electrophoresis apparatus, Proc. SPIE 1885,pp. 423–434.
22 Kessler, C. (Ed) (1992), NonradioactiveLabeling and Detection of Biomolecules,Berlin: Springer.
23 Lakowicz, J. (1999), Instrumentation forFluorescence Spectroscopy, in: Principles ofFluorescence Spectroscopy (Lakowicz, J., Ed.),2nd Ed., pp. 25–61. New York: KluwerAcademic/Plenum Publishers.
24 Stokes, G.G. (1852), On the change ofrefrangibility of light, Phil. Trans. R. Soc.London 142, pp. 463–562.
25 Strekowski, L., Lipowska, M. and Patonay, G.(1992), Facile derivatizations of heptamethinecyanine dyes, Synth. Comm. 22, 2593–2598.
26 Narayanan, N., Little, G., Raghavachari, R.and Patonay, G. (1995), New near infrareddyes for applications in bioanalytical methods,Proc. SPIE 2388, pp. 6–15.
27 Shealy, D. B., Lipowska, M., Lipowski, J., Narayanan, N, Sutter, S., Strekowski, L. andPatonay, G. (1995), Synthesis, chromato-graphic separation, and characterization ofnear-infrared labeled DNA oligomers for usein DNA sequencing, Anal. Chem. 67, pp. 247–251.
28 Narayanan, N., Little, G., Raghavachari, R.,Gibson, J., Lugade, A., Prescott, C., Reiman,K., Roemer, S., Steffens, D., Sutter, S. andDraney, D. (1998), New NIR dyes: Synthesis,spectral properties and applications in DNAanalyses, in: Near-Infrared Dyes for HighTechnology Applications (S. Daehne et al.,Eds.), pp. 141–158. The Netherlands: KluwerAcademic Publishers.
29 Matsuoka, M., Editor (1990), Infrared Absorb-ing Dyes, pp. 19–33, New York: Plenum Press.
30 Mujumdar, R.B., Ernst, L.A., Mujumdar, S.R.and Waggoner, A.L. (1989), Cyanine dyelabeling reagents containing isothiocyanategroups, Cytometry 10, pp. 11–19.
31 Mujumdar, R.B., Ernst, L.A., Mujumdar, S.R.,Lewis, C.J. and Waggoner, A.L. (1993),Cyanine dye labeling reagents:
sulfoindocyanine succinimidyl esters,Bioconjugate Chem. 4, pp. 105–111.
32 Zhu, Z., Chao, J., Yu, H. and Waggoner, A.S.(1994), Directly labeled DNA probes usingfluorescent nucleotides with different lengthlinkers, Nucl. Acids Res. 22, pp. 3418–3422.
33 Tu, O., Knott, T., Marsh, M., Bechtol, K.,Harris, D., Barker, D. and Bashkin, J. (1998),The influence of fluorescent dye structure onthe electrophoretic mobility of end-labeledDNA, Nucl. Acids Res. 26, pp. 2797–2802.
34 Rosenblum, B.B., Lee, L.G., Spurgeon, S.L.,Khan, S.H., Menchen, S.M., Heiner, C.R. andChen, S.M. (1997), New dye-labeledterminators for improved DNA sequencingpatterns, Nucl. Acids Res. 25, pp. 4500–4504.
35 Lee, L.G., Spurgeon, S.L., Heiner, C.R.,Bensen, S.C., Rosenblum, B.B., Menchen,S.M., Graham, R.J., Constantinescu, A.,Upadhya, K.G. and Cassel, J.M. (1997), Newenergy transfer dyes for DNA sequencing,Nucl. Acids Res. 25, pp. 2816–2822.
36 Förster, Th. (1948), Intermolecular energymigration and fluorescence, Ann. Phys.(Leipzig) 2, pp. 55–75.
37 Ju, J., Ruan, C., Fuller, C. W., Glazer, A. N.,and Mathies, R. A., (1995), Fluorescenceenergy transfer dye-labeled primers for DNAsequencing and analysis, , Proc. Natl. Acad.Sci. U.S.A. 92, pp 4347–4351.
38 Ju, J., Kheterpal, I., Scherer, J. R., Ruan, C.,Fuller, C. W., Glazer, A. N. and Mathies, R.A., (1995), Design and synthesis offluorescence energy transfer dye-labeledprimers and their applications for DNAsequencing and analysis, Anal. Biochem. 231,pp 131–140.
39 Ju, J., Glazer, A. N., and Mathies, R. A., (1996),Energy transfer primers: A new fluorescencelabeling paradigm for DNA sequencing andanalysis, Nat. Med. 2, pp 246–249.
40 Hung, S.C., Ju, J., Mathies, R.A. and Glazer,A.N. (1996), Cyanine dyes with highabsorption cross section as donorchromophores in energy transfer primers,Anal. Biochem. 243, pp. 15–27.
41 Hung, S.C., Ju, J., Mathies, R.A. and Glazer,A.N. (1996), Energy transfer primers with 5-or 6-carboxyrhodamine-6G as acceptor chro-mophores, Anal. Biochem. 238, pp. 165–170.
42 Metzker, M.L., Lu, J. and Gibbs, R.A. (1996),Electrophoretically uniform fluorescent dyesfor automated DNA sequencing, Science 271,1420–1422.
167References
43 Hung, S.C., Mathies, R.A. and Glazer, A.N.(1997), Optimization of spectroscopic andelectrophoretic properties of energy transferprimers, Anal. Biochem. 252, pp. 78–88.
44 Hung, S.C., Mathies, R.A. and Glazer, A.N.(1998), Comparison of fluorescence energytransfer primers with different donor–acceptor dye combinations, Anal. Biochem.255, pp. 32–38.
45 Köllner, M. and Wolfrum, J. (1992), Howmany photons are necessary for fluorescence-lifetime measurements?, Chem. Phys. Letters200, pp. 199–204.
46 Köllner, M. (1993), How to find the sensitivitylimit for DNA sequencing based on laser-induced fluorescence, Appl. Optics 32, pp. 806–820.
47 Chang, K., and Force, R. K. (1993), Time-resolved laser induced fluorescence study on dyes used in DNA sequencing, Appl.Spectrosc. 47, pp. 24–29.
48 Han, K.-T., Sauer, M., Schulz, A., Seeger, S.and Wolfrum, J. (1993), Time-resolvedfluorescence studies of labelled nucleosides,Ber. Bunsenges. Phys. Chem. 97, pp. 1728–1730.
49 Sauer, M., Han, K.-T., Ebert, V., Muller, R.,Schulz, A., Seeger, S. and Wolfrum, J. (1994),Design of multiplex dyes for the detection ofdifferent biomolecules, Proc. SPIE 2137, pp. 762–774.
50 Legendre, B. L., Williams, D. C., Soper, S. A.,Erdmann, R., Ortmann, U., and Enderlein, J.(1996), An all solid-state near-infrared time-correlated single photon counting instrumentfor dynamic life-time measurements in DNAsequencing applications, Rev. Sci. Inst. 67,pp. 3984–3989.
51 Soper, S.A., Davidson, Y.Y., Flanagan, J.H.,Legendre, Jr., B.L., Owens, C., Williams, D.C.and Hammers, R.P. (1996), Micro-DNAsequence analysis using capillary electro-phoresis and near-IR fluorescence detection,Proc. SPIE 2680, pp. 235–246.
52 Müller, R., Herten, D., Lieberwirth, U.,Neumann, M., Sauer, M., Schulz, A., Siebert,S., Drexhage, K.H. and Wolfrum, J. (1997),Time-resolved DNA identification in capillarygel electrophoresis with semiconductorlasers, Proc. SPIE 2980, pp. 116–126.
53 Nunnally, B.K., He, H., Li, L.-C., Tucker, S.A.and McGown, L.B. (1997), Characterization ofvisible dyes for four-decay fluorescencedetection in DNA sequencing, Anal. Chem.69, pp. 2392–2397.
54 Flanagan, J.H. Jr., Owens, C.V., Romero, S.E.,Waddell, E., Kahn, S.H., Hammer, R.P. andSoper, S.A. (1998), Near-infrared heavy-atom-modified fluorescent dyes for base-calling inDNA-sequencing applications using temporaldiscrimination, Anal. Chem. 70, pp.2676–2684.
55 Li, L.-C. and McGown, L. B. (1996), On-the-flyfrequency domain fluorescence lifetimedetection in capillary electrophoresis, Anal.Chem. 68, pp. 2737–2743.
56 Li, L.-C., He, H., Nunnally, B. K., andMcGown, L. B. (1997), On-the-flyfluorescence lifetime detection of labeledDNA primers, J. Chromatogr. 695, pp. 85–92.
57 Lassiter, S.J., Stryjewski, W., Legendre, B.L.Jr., Erdmann, R., Wahl, M., Wurm, J.,Peterson, R., Middendorf, L. and Soper, S.A.(2000), Time-resolved fluorescence imagingof slab gels for lifetime base-calling in DNAsequencing applications, Anal. Chem 72, pp. 5373–5382.
58 Prummer, M., Hübner, C.G., Sick, B., Hecht,B., Renn, A. and Wild, U.P. (2000), Single-molecule identification by spectrally andtime-resolved fluorescence detection, Anal.Chem. 72, pp. 443–447.
59 Hawkins, T.L., Du, Z., Halloran, N.D. andWilson, R.K. (1992), Fluorescence chemistriesfor automated primer-directed DNAsequencing, Electrophoresis 13, pp. 552–559.
60 Sulston, J., Du, Z., Thomas, K., Wilson, R.,Hillier, L., Staden, R., Halloran, N., Green, P.,Thierry-Mieg, J., Qiu, L., Dear, S., Coulson,A., Craxton, M., Durbin, R., Berks, M.,Metzstein, M., Hawkins, T., Ainscough, R.and Waterston, R. (1992), The C. elegansgenome sequencing project: a beginning,Nature 356, pp. 37–41.
61 Fleischmann, R.D., Adams, M.D., White O.,Clayton, R.A., Kirkness, E.F., Kerlavage, A.R.,Bult, C.J., Tomb, J., Dougherty, B.A., Merrick,J.M., McKenney, K., Sutton, G., FitzHugh,W., Fields, C., Gocayne, J.D., Scott, J., Shirley,R., Liu, L., Glodek, A., Kelley, J.M., Weidman,J.F., Phillips, C.A., Spriggs, T., Hedblom, E.,Cotton, M.D., Utterback, T.R., Hanna, M.C.,Nguyen, D.T., Saudek, D.M., Brandon, R.C.,Fine, L.D., Fritchman, J.L., Fuhrmann, J.L.,Geoghagen, N.S.M., Gnehm, C.L., McDonald,L.A., Small, K.V., Fraser, C.M., Smith, H.O.and Venter, J.C. (1995), Whole-genomerandom sequencing and assembly ofHaemophilus influenzae Rd, Science 269, pp. 496–512.
168 References
62 Venter, J.C., Adams, M.D., Sutton, G.G.,Kerlavage, A.R., Smith, H.O. andHunkapiller, M. (1998), Shotgun sequencingof the human genome, Science 280, pp.1540–1542.
63 Kukanskis, K.A., Siddiquee, Z., Shohet, R.V.and Garner, H.R. (2000), Mix of sequencingtechnologies for sequence closure: anexample, BioTechniques 28, pp. 630–632, 634.
64 She, Q., et al. (2001), The complete genome ofthe crenarchaeon Sulfolobus solfataricus P2,Proc. Natl. Acad. Sci. U.S.A. 98, pp. 7835–7840.
65 International Human Genome SequencingConsortium (2001), Initial sequencing andanalysis of the human genome, Nature 409,pp. 860–921.
66 Venter, J.C., et al. (2001), The sequence of thehuman genome, Science 291, pp. 1304–1351.
67 Martin-Gallardo, A., Lamerdin, J., andCarrano, A. (1994), Shotgun sequencing, in:Automated DNA Sequencing and Analysis(M.D. Adams et al., Eds.), pp. 37–41. London:Academic Press.
68 Hunkapiller, T., Kaiser, R.J., Koop, B.F. andHood, L. (1991), Large-scale and automatedDNA sequence determination, Science 254,pp. 59–67.
69 Roach, J.C., Siegel, A.F., van den Engh, G.,Trask, B. and Hood, L. (1999), Gaps in theHuman Genome Project, Nature 401,pp.843–845.
70 Istrail, S., et al. (2004), Whole-genomeshotgun assembly and comparison of humangenome assemblies, Proc. Nat. Acad. Sci.U.S.A. 101, pp. 1916–1921.
71 Liu, L.I. and Fleischmann, R.D. (1994),Construction of exonuclease III generatednested deletion sets for rapid DNA sequenc-ing, in: Automated DNA Sequencing andAnalysis (M.D. Adams et al., Eds.), pp.65–70.London: Academic Press.
72 Martin, C.H., Mayeda, C.A., Davis, C.A.,Strathmann, M.P. and Palazzolo, M.J. (1994),Transposon-facilitated sequencing: an effec-tive set of procedures to sequence DNA frag-ments smaller than 4 kb, in: Automated DNASequencing and Analysis (M.D. Adams et al.,Eds.), pp.60–64. London: Academic Press.
73 Voss, H., Wirkner, U., Schwager, C.,Zimmermann, J., Stegemann, J., Hewitt, N.A.and Ansorge, W. (1993), Automated DNAsequencing system resolving 1000 bases withfluorescein-15-dATP as internal label,Methods Mol. Cell. Biol. 3, pp. 153–155.
74 Nishikawa, T. and Kambara, H. (1992), Highresolution-separation of DNA bands byelectrophoresis with a long gel in a fluores-cence-detection DNA sequencer, Electro-phoresis 13, pp. 495–499.
75 Grothues, D., Voss, H., Stegemann, J.,Wiemann, S., Sensen, C., Zimmermann, J.,Schwager, C., Erfle, H., Rupp, T. andAnsorge, W. (1993), Separation of up to 1000bases on a modified A.L.F. DNA sequencer,Nucl. Acids Res. 21, pp. 6042–6044.
76 Zimmermann, J., Wiemann, S., Voss, H.,Schwager, C. and Ansorge, W. (1994),Improved fluorescent cycle sequencingprotocol allows reading nearly 1000 bases,BioTechniques 17, pp. 302–308.
77 Middendorf, L., Gartside, B., Humphrey, P.,Roemer, S., Sorensen, D., Steffens, D. andSutter, S. (1995), Enhanced throughput forinfrared automated DNA sequencing, Proc.SPIE 2386, pp. 66–78.
78 Carrilho, E., Ruiz-Martinez, M.C., Berka, J.,Smirnov, I., Goetzinger, W., Miller, A.W.,Brady, D. and Karger, B.L. (1996), Rapid DNAsequencing of more than 1000 bases per runby capillary electrophoresis using replaceablelinear polyacrylamide solutions, Anal. Chem.19, pp. 3305–3313.
79 Klepárnik, K., Foret, F., Berka, J., Goetzinger,W., Miller, A.W. and Karger, B.L. (1996), Theuse of elevated column temperature to extendDNA sequencing read lengths in capillaryelectrophoresis with replaceable polymermatrices, Electrophoresis 17, 1860–1866.
80 Roemer, S.C, Brumbaugh, K. A., Boveia, V.and Gardner, J. (1997), Simultaneous bi-directional cycle sequencing, Microbial andComparative Genomics 2, pp. 206 (AbstractA-33 only).
81 Roemer, S., Boveia, V., Humphrey, P., Amen,J. and Osterman, H. (1998), Improvements inLong Read Automated Sequencing, Microbialand Comparative Genomics 3, pp. C-67(Abstract A-59 only).
82 Salas-Solano, O., Carrilho, E., Kotlar, L.,Miller, A.W., Goetzinger, W., Sosic, Z. andKarger, B.L. (1998), Routine DNA sequencingof 1000 bases in less than one hour bycapillary electrophoresis with replaceablelinear polyacrylamide solutions, Anal. Chem.70, pp. 3996–4003.
83 Zhou, H., Miller A.W., Sosic, Z., Buchholz,B., Barron A.E., Kotler, L. and Karger, B.L.(2000), DNA sequencing up to 1300 bases in
169References
two hours by capillary electrophoresis withmixed replaceable linear polyacrylamidesolutions, Anal. Chem. 72, pp. 1045–1052.
84 Larder, B.A., Kohli, A., Kellam, P., Kemp,S.D., Kronick, M. and Henfrey, R.D. (1993),Quantitative detection of HIV-1 drugresistance mutations by automated DNAsequencing, Nature 365, pp. 671–673.
85 Kwok, P.Y., Carlson, C., Yager, T.D.,Ankener, W. and Nickerson, D.A. (1994),Comparative analysis of human DNAvariations by fluorescence-based sequencingof PCR products, Genomics 23, pp. 138–144.
86 Perkin–Elmer/ABI (1995), Comparative PCRsequencing manual, Foster City, CA.
87 Nickerson, D.A., Tobe, V.O. and Taylor, S.L.(1997), PolyPhred: automating the detectionand genotyping of single nucleotidesubstitutions using fluorescence-basedresequencing, Nucl. Acids Res. 25, pp. 2745–2751.
88 Plaschke, J., Voss, H., Hahn, M., Ansorge, W.and Schackert, H.K. (1998), Doublexsequencing in molecular diagnosis ofhereditary diseases, BioTechniques 24, pp. 838–841.
89 Rieder, M.J., Taylor, S.L., Tobe, V.O. andNickerson, D.A. (1998), Automating theidentification of DNA variations usingquality-based fluorescence re-sequencing:analysis of the human mitochondrialgenome, Nucl. Acids Res. 26, pp. 967–973.
90 Crawford D.C., Carlson C.S., Rieder M.J.,Carrington D.P., Yi Q., Smith J.D., EberleM.A., Kruglyak L. and Nickerson D.A. (2004),Haplotype diversity across 100 candidategenes for inflammation, lipid metabolism,and blood pressure regulation in twopopulations, Am J Hum Genet. 74, pp. 610–622.
91 Chen, E.Y. and Seeburg, P.H. (1985),Supercoil sequencing: a fast and simplemethod for sequencing plasmid DNA, DNA4, pp. 165–170.
92 Sambrook, J., Fritsch, E.F. and Maniatis, T.(1989), Molecular Cloning, Second Edition.Cold Spring Harbor Laboratory Press.
93 Ausubel, F.M., Brent, R., Kingston, R.E.,Moore, D.D., Seidman, J.G., Smith, J.A. andStruhl, K. (1992), Short Protocols inMolecular Biology. New York: John Wiley andSons.
94 Fanning, S. and Gibbs, R.A. (1997), PCR ingenome analysis, in: Genome Analysis, ALaboratory Manual (B. Birren et al., Eds.), pp. 249–299. Cold Spring Harbor LaboratoryPress.
95 Wilson, R.K. and Mardis, E.R. (1997),Fluorescence-based DNA sequencing, in:Genome Analysis, A Laboratory Manual (B.Birren et al., Eds.), pp. 301–395. Cold SpringHarbor Laboratory Press.
96 Wilson, R.K. and Mardis, E.R. (1997),Shotgun sequencing, in: Genome Analysis, A Laboratory Manual (B. Birren et al., Eds.),pp. 397–454. Cold Spring Harbor LaboratoryPress.
97 Messing, J. (1983), New M13 vectors forcloning, Methods Enzymol. 101, pp. 20–78.
98 Messing, J. and Bankier, A.T. (1989), The useof single-stranded DNA phage in DNASequencing, in: Nucleic Acids Sequencing(C.J. Howe and E.S. Ward, Eds.), pp. 1–36.Oxford: IRL Press.
99 Craxton, M. (1993), Cosmid sequencing, in:Methods in Molecular Biology, Vol. 23 DNASequencing Protocols (H. Griffin, Ed.), pp. 149–167. Totowa: Humana Press.
100 Ioannou, P.A., Amemiya, C.T., Garnes, J.,Kroisel, P.M., Shizuya, H., Chen, C., Batzer,M.A. and de Jong, P.J. (1994), A newbacteriophage P1-derived vector for thepropagation of large human DNA fragments,Nature Genetics 6, pp. 84–89.
101 Shizuya, H., Birren, B., Kim, U.J., Mancino,V., Slepak, T., Tachiiri, T. and Simon, M.(1992), Cloning and stable maintenance of300-kilobase-pair fragments of human DNAin Escherichia coli using an F-factor-basedvector, Proc. Natl. Acad. Sci. USA 89, pp. 8794–8797.
102 Boysen, C., Simon, M.I. and Hood, L. (1997),Fluorescence-based sequencing directly frombacterial and P1-derived artificial chromo-somes, BioTechniques 23, pp. 978–982.
103 Fajas, L., Staels, B. and Auwerx, J. (1997),Cycle sequencing on large DNA templates,BioTechniques 23, pp. 1034–1036.
104 Mullis, K.B. and Faloona, F.A. (1987), Specificsynthesis of DNA in vitro via a polymerase-catalyzed chain reaction, in: Methods inEnzymology (R. Wu, Ed.), pp. 335–350.London: Academic Press.
170 References
105 Innis, M., Gelfand, D., Sninsky, J. and White,T. (1990), PCR Protocols: A Guide to Methodsand Applications. San Diego: Academic Press.
106 Tabor, S. and Richardson, C.C. (1987), DNAsequence analysis with a modifiedbacteriophage T7 DNA polymerase, Proc.Natl. Acad. Sci. USA 84, pp. 4767–4772.
107 Tabor, S. and Richardson, C.C. (1989), Effectof manganese ions on the incorporation ofdideoxynucleotides by bacteriophage T7 DNApolymerase and E. coli DNA polymerase I,Proc. Natl. Acad. Sci. USA 86, pp. 4076–4080.
108 Voss, H., Schwager, C., Kristensen, T.,Duthie, S., Olsson, A., Erfle, H., Stegemann,J., Zimmermann, J. and Ansorge, W. (1989),One-step reaction protocol for automatedDNA sequencing with T7 DNA polymeraseresults in uniform labeling, Methods Mol.Cell. Biol. 1, pp. 155–159.
109 Murray, V. (1989), Improved double-strandedDNA sequencing using the linear polymerasechain reaction, Nucl. Acids Res. 17, pp. 8889.
110 Craxton, M. (1991), Linear amplificationsequencing, a powerful method forsequencing DNA, Methods: a Companion toMethods in Enzymology 3, pp. 20–26.
111 Innis, M.A., Myambo, K.B., Gelfand, D.H.and Brow, M.D. (1988), DNA sequencing withThermus aquaticus DNA polymerase anddirect sequencing of polymerase chainreaction-amplified DNA, Proc. Natl. Acad. Sci.USA 85, pp. 9436–9440.
112 Parker L.T., Deng Q., Zakeri H., Carlson C.,Nickerson D.A. and Kwok P.Y. (1995), Peakheight variations in automated sequencing ofPCR products using Taq dye-terminatorchemistry. BioTechniques 19, pp. 116–121.
113 Reeve, M.A. and Fuller, C.W. (1995), A novelthermostable polymerase for DNAsequencing, Nature 376, pp. 796–797.
114 Parker, L.T., Zakeri, H., Deng, Q., Spurgeon,S., Kwok, P.Y. and Nickerson, D.A. (1996),AmpliTaq DNA polymerase, FS dye-termin-ator sequencing: analysis of peak heightpatterns, BioTechniques 21, pp. 694–699.
115 Lee, L.G., Connell, C.R., Woo, S.L., Cheng,R.D., McArdle, B.F., Fuller, C.W., Halloran,N.D. and Wilson, R.K. (1992), DNAsequencing with dye-labeled terminators andT7 DNA polymerase: effect of dyes anddNTPs on incorporation of dye-terminatorsand probability analysis of terminationfragments, Nucleic Acids Res. 20, pp.2471–2483.
116 Roemer, S., Boveia, V., Buzby, P., DiMeo, J.,Draney, D., Johnson, C., Narayanan, N.,Olive, M., Vanek, M. and Osterman, H.(2000), New dye-labeled acycloterminators forautomated infrared DNA sequencing,Advances in Genome Biology and TechnologyI (Abstract only).
117 Voss, H., Nentwich, U., Duthie, S., Wiemann,S., Benes, V., Zimmermann, J. and Ansorge,W. (1997), Automated cycle sequencing withTaquenase: Protocols for internal labeling,dye primer and “doublex” simultaneoussequencing, BioTechniques 23, pp. 312–318.
118 Steffens, D.L., Jang, G.Y., Sutter, S.L.,Brumbaugh, J.A., Middendorf, L.R.,Muhlegger, K., Mardis, E.R., Weinstock, L.A.and Wilson, R.K. (1995), An infraredfluorescent dATP for labeling DNA, GenomeRes. 5, pp. 393–399.
119 Wiemann, S., Stegemann, J., Grothues, D.,Bosch, A., Estivill, X., Schwager, C.,Zimmermann, J., Voss, H. and Ansorge W.(1995), Simultaneous on-line DNAsequencing on both strands with twofluorescent dyes, Anal. Biochem. 224, pp. 117–121.
120 Middendorf, L., Amen, J., Bruce, R., Draney,D., DeGraff, D., Gewecke, J., Grone, D.,Humphrey, P., Little, G., Lugade, A.,Narayanan, N., Oommen, A., Osterman, H.,Peterson, R., Rada, J., Raghavachari, R. andRoemer, S. (1998), Near-infrared fluorescenceinstrumentation for DNA analysis, in: Near-Infrared Dyes for High TechnologyApplications (S. Daehne et al., Eds.), pp. 21–54. © 1998 Kluwer AcademicPublishers. Printed in the Netherlands.
121 Millipore Corporation (1991), BaseStationAutomated DNA Sequencer, Lit. No. PM016,Bedford, MA.
122 Middendorf, L.R., Bruce, J.C., Bruce, R.C.,Eckles, R.D., Grone, D.L., Roemer, S.C.,Sloniker, G.D., Steffens, D.L., Sutter, S.L.,Brumbaugh, J.A. and Patonay, G. (1992),Continuous, on-line DNA sequencing using aversatile infrared laserscanner/electrophoresis apparatus,Electrophoresis 13, pp. 487–494.
123 Yager, T.D., Baron, L., Batra, R., Bouevitch,A., Chan, D., Chan, K., Darasch, S., Gilchrist,R., Izmailov, A., Lacroix, J.-M., Marchelleta,K., Renfrew, J., Rushlow, D., Steinbach, E.,Ton, C., Waterhouse, P., Zaleski, H., Dunn,J.M. and Stevens, J. (1999), High
171References
performance DNA sequencing, and detectionof mutations and polymorphisms, on theClipper sequencer, Electrophoresis 20, pp.1280–1300.
124 Patton, W.F. (2000), Making blind robots see:the synergy between fluorescent dyes andimaging devices in automated proteomics,BioTechniques 28, pp. 944–957.
125 Swerdlow, H., Zhang, J.Z., Chen, D.Y.,Harke, H.R., Grey, R., Wu, S. and Dovichi,N.J. (1991), Three DNA sequencing methodsusing capillary gel electrophoresis and laser-induced fluorescence, Anal. Chem. 63, pp. 2835–2841.
126 Brumley, Jr., R.L. and Smith, L.M. (1991),Rapid DNA sequencing by horizontalultrathin gel electrophoresis, Nucl. Acids Res.19, pp. 4121–4126.
127 Huang, X.C., Quesada, M.A. and Mathies,R.A. (1992), Capillary array electrophoresisusing laser-excited confocal fluorescencedetection, Anal. Chem. 64, pp. 967–972.
128 Huang, X.C., Quesada, M.A. and Mathies,R.A. (1992), DNA sequencing using capillaryarray electrophoresis, Anal. Chem. 64, pp. 2149–2154.
129 Kheterpal, I., Scherer, J.R., Clark, S.M.,Radharkrishnan, A., Ju, J., Ginther, C.L.,Sensabaugh, G.F. and Mathies, R.A. (1996),DNA sequencing using a four-color confocalfluorescence capillary array scanner,Electrophoresis 17, pp. 1852–1859.
130 Tan, H. and Yeung, E.S. (1997),Characterization of dye-induced mobilityshifts affecting DNA sequencing inpoly(ethylene oxide) sieving matrix,Electrophoresis 18, pp. 2893–2900.
131 O’Brien, K.M., Ironside, M.A., Athanasiou,M.C., Basit, M.A., Evans, G.A. and Garner,H.R. (1998), Correcting data shifts in gel filescreated by Model 377 DNA sequencers,BioTechniques 24, pp. 1002–1003.
132 O’Brien, K.M., Schageman, J.J., Major, T.H.,Evans, G.A. and Garner, H.R. (1998),Improving read lengths by recomputing thematrices of Model 377 DNA sequencers,BioTechniques 24, pp. 1014–1016.
133 Ernst, L.A., Gupta, R.K., Mujumdar, R.B. andWaggoner, A.L. (1989), Cyanine dye labelingreagents for sulfhydryl groups, Cytometry 10,pp. 3–10.
134 Patonay, G. and Antoine, M.D. (1991), Near-infrared fluorogenic labels: New approach toan old problem, Anal. Chem. 63, pp.321A–327A.
135 Glazer, A.N. and Mathies, R.A. (1997),Energy-transfer fluorescent reagents for DNAanalyses, Curr. Opin. Biotechnol. 8, pp. 94–102.
136 Brumley, Jr., R.L. and Luckey, J.A. (1996) Animproved high-throughput DNA fragmentanalyzer employing horizontal ultrathin gelelectrophoresis, Proc. SPIE 2680, pp. 349–361.
137 Nordman, E. and Connell, C. (1996), NewOptical Design for automated DNAsequencer, Proc. SPIE 2680, pp. 290–293.
138 Ueno, K. and Yeung, E.S. (1994),Simultaneous monitoring of DNA fragmentsseparated by electrophoresis in a multiplexedarray of 100 capillaries, Anal. Chem. 66, pp. 1424–1431.
139 Pang, H., Pavski, V. and Yeung, E.S. (1999),DNA sequencing using 96-capillary arrayelectrophoresis, J. Biochem. Biophys.Methods 42, pp. 121–132.
140 Goetzinger, W., Kotler, L., Carrilho, E., Ruiz-Martinez, M.C., Salas-Solano, O. and Karger,B.L. (1998), Characterization of highmolecular mass linear polyacrylamide powderprepared by emulsion polymerization as areplaceable polymer matrix for DNAsequencing by capillary electrophoresis,Electrophoresis 19, pp. 242–248.
141 Heller, C. (1998), Finding a universal lowviscosity polymer for DNA separation (II),Electrophoresis 19, pp. 3114–3127.
142 Barron, A.E. and Zuckermann, R.N. (1999),Review: Bioinspired polymeric materials: in-between proteins and plastics, Curr. Opin.Chem. Biol. 3, pp. 681–687.
143 Schmalzing, D., Koutny, L., Salas-Solano, O.,Adourian, A., Matsudaira, P. and Ehrlich, D.(1999), Review: Recent developments in DNAsequencing by capillary and microdeviceelectrophoresis, Electrophoresis 20, pp.3066–3077, and references 11–15 therein.
144 Kolner, D.E., Mead, D.A. and Smith L.M.(1992), Ultrathin DNA sequencing gels usingmicrotrough vertical electrophoresis plates,BioTechniques 13, pp. 338–339.
145 Erfle, H., Ventzki, R., Voss, H., Rechmann,S., Benes, V., Stegemann, J. and Ansorge, W.(1997), Simultaneous loading of 200 samplelanes for DNA sequencing on vertical andhorizontal, standard and ultrathin gels, Nucl.Acids. Res. 25, pp. 2229–2230.
146 Kambara, H. and Takahashi, S. (1993),Multiple-sheathflow capillary array DNAanalyser, Nature 361, pp. 565–566.
172 References
147 Takahashi, S., Murakami, K., Anazawa, T. andKambara, H. (1994), Multiple sheath-flow gelcapillary-array electrophoresis for multicolorfluorescent DNA detection, Anal. Chem. 66,pp. 1021–1026.
148 Chen, D., Peterson, M.D., Brumley, Jr., R.L.,Giddings, M.C., Buxton, E.C., Westphall, M.,Smith, L. and Smith L.M. (1995), Side excita-tion of fluorescence in ultrathin slab gel elec-trophoresis, Anal. Chem. 67, pp. 3405–3411.
149 Anazawa, T., Takahashi, S. and Kambara, H.(1996), A capillary array gel electrophoresissystem using multiple laser focusing for DNAsequencing, Anal. Chem. 68, pp. 2699–2704.
150 Quesada, M., Dhadwal, H., Fisk, D. andStudier, F.W. (1998), Multi-capillary opticalwaveguides for DNA sequencing,Electrophoresis 19, pp. 1415–1427.
151 Anazawa, T., Takahashi, S. and Kambara, H.(1999), A capillary-array electrophoresissystem using side-entry on-column laserirradiation combined with glass rod lenses,Electrophoresis 20, pp. 539–546.
152 Quesada, M.A., Rye, H.S., Gingrich, J.C.,Glazer, A.N. and Mathies, R.A. (1991), High-sensitivity DNA detection with a laser-excitedconfocal fluorescence gel scanner,BioTechniques 10, pp. 616–625.
153 Dovichi, N.J. (1997), Review: DNA sequencingby capillary electrophoresis, Electrophoresis18, pp. 2393–2399.
154 Nelson, M., VanEtten, J.L. and Grabherr, R.(1992), DNA sequencing of four bases usingthree lanes, Nucl. Acids Res. 20, pp. 1345–1348.
155 Nelson, M., Zhang, Y., Steffens, D.L.,Grabherr, R. and VanEtten, J.L. (1993),Sequencing two DNA templates in fivechannels by digital compression, Proc. Natl.Acad. Sci. USA, pp. 1647–1651.
156 Scherer, J.R., Kheterpal, I., Radhakrishnan,A., Ja, W.W. and Mathies, R.A. (1999), Ultra-high throughput rotary capillary arrayelectrophoresis scanner for fluorescent DNAsequencing and analysis, Electrophoresis 20,pp. 1508–1517.
157 Roque-Biewer, M., Sharaf, M., Taylor, W.,Labrenz, J., Menchen, S. and Tynan, K.(1998), Expanding the capability ofsequencing and fragment analysis by theintroduction of a 5th dye on a multiplecapillary electrophoresis instrument,Microbial and Comparative Genomics 3, pp. C-92 (Abstract C-15 only).
158 Ventzki, R., Stegemann, J., Benes, V.,Rechmann, S. and Ansorge, W. (1998),Simultaneous loading of 200 sample lanes forDNA sequencing on vertical and horizontal,standard and ultrathin gels, Microbial andComparative Genomics 3, pp. C-57 (AbstractA-27 only).
159 Church, G.M. and Kieffer-Higgins, S. (1988),Multiplex DNA sequencing, Science 240, pp. 185–188.
160 Church, G.M. and Gilbert, W. (1984),Genomic sequencing, Proc. Natl. Acad. Sci.USA 81, pp. 1991–1995.
161 Yang, M.M. and Youvan, D.C. (1989), Aprospectus for multispectral-multiplex DNAsequencing, Bio/Technology 7, pp. 576–580.
162 Kambara, H., Nagai, K. and Hayasaka, S.(1991), Real time automated simultaneousdouble-stranded DNA sequencing using two-color fluorophore labeling, Bio/Technology 9,pp. 648–651.
163 Ansorge, W., Voss, H., Wirkner, U.,Schwager, C., Stegemann, J., Pepperkok, R.,Zimmermann, J. and Erfle. J. (1989),Automated Sanger DNA sequencing with onelabel in less than four lanes on gel, J.Biochem. Biophys. Methods 20, pp. 47–52.
164 Ansorge, W., Zimmermann, J., Schwager, C.,Stegemann, J., Erfle, H. and Voss, H. (1990),One label, one tube, Sanger DNA sequencingin one and two lanes on a gel, Nucl. AcidsRes. 18, pp. 3419–3420.
165 Pentoney, Jr., S.L., Konrad, K.D. and Kaye, W.(1992), A single-fluor approach to DNAsequence determination using highperformance capillary electrophoresis,Electrophoresis 13, pp. 467–474.
166 Chen D., Harke, H. and Dovichi, N.J. (1992),Two-label peak-height encoded DNAsequencing by capillary gel electrophoresis:three examples, Nucl. Acids Res. 20, pp. 4873–4880.
167 Starke H.R., Yan, J.Y., Zhange, J.Z.,Mühlegger, K., Effgen, K. and Dovichi, N.J.(1994) Internal fluorescence labeling withfluorescent deoxynucleotides in two-labelpeak-height encoded DNA sequencing bycapillary electrophoresis, Nucl. Acids Res. 22,pp. 3997–4001.
168 Li, Q. and Yeung, E.S. (1995), Simple two-color base-calling schemes for DNAsequencing based on standard four-labelSanger chemistry, Appl. Spect. 49, pp. 1528–1533.
173References
169 Williams, D.C. and Soper, S.A. (1995),Ultrasensitive near-IR fluorescence detectionfor capillary gel electrophoresis and DNAsequencing applications, Anal. Chem. 67, pp. 3427–3432.
170 Negri, R., Costanzo, G., Saladino, R. andDiMauro, E. (1996), One-step, one-lanechemical DNA sequencing by N-Methyl-formamide in the presence of metal ions,BioTechniques 21, pp. 910–917.
171 Ewing, B., Hillier, L., Wendl, M.C. andGreen, P. (1998), Base-calling of automatedsequencer traces using Phred. I. AccuracyAssessment, Genome Res. 8, pp. 175–185.
172 Ewing, B. and Green, P. (1998), Base-callingof automated sequencer traces using Phred.II. Error probabilities, Genome Res. 8, pp. 186–194.
173 Richterich, P. (1998), Estimation of errors in“raw” DNA sequences: A validation study,Genome Res. 8, pp. 251–259.
174 Richterich, P., Humphrey, P. and Amen, J.(1998), Optimization of LI-COR trace files for processing by PHRED and PHRAP,Microbial and Comparative Genomics 3, pp. C-91 (Abstract C-10 only).
175 Gaasterland T. and Sensen, C.W. (1996),Fully automated genome analysis that reflectsuser needs and preferences. A detailedintroduction to the MAGPIE systemarchitecture, Biochimie 78, pp. 302–310.
176 Lander, E.S. and Waterman, M.S. (1988),Genomic mapping by fingerprinting randomclones: a mathematical analysis, Genomics 2,pp.231–239.
177 Batzoglou, S., Berger, B., Mesirov, J. andLander, E.S. (1999), Sequencing a genome by walking with clone-end sequences: A mathematical analysis, Genome Res.9:1163–1174.
178 Voss, H., Wiemann, S., Grothues, D.,Sensen, C., Zimmermann, J., Schwager, C.,Stegemann, J., Erfle, H., Rupp, T. andAnsorge, W. (1993), Automated low-redundancy large-scale DNA sequencing by primer walking, BioTechniques 15, pp. 714–721.
179 Kostichka, A.J., Marchbanks, M.L., Brumley,R.L. Jr., Drossman, H. and Smith, L.M.(1992), High speed automated DNAsequencing in ultrathin slab gels,BioTechnology 10, pp. 78–81.
180 Carninci, P., Volpatti, F. and Schneider, C.(1995), A discontinuous buffer system
increasing resolution and reproducibility inDNA sequencing on high voltage horizontalultrathin-layer electrophoresis,Electrophoresis 16, pp. 1836–1845.
181 Smith, L.M., Brumley, R.L. Jr., Buxton, E.C.,Giddings, M., Marchbanks, M. and Tong, X.(1996), High-speed automated DNA sequenc-ing in ultrathin slab gels, Methods Enzymol.271, pp. 219–237.
182 Yager, T.D., Dunn, J.M. and Stevens, S.K.(1997), High-speed DNA sequencing inultrathin slab gels, Curr. Opin. Biotechnol. 8,pp. 107–113.
183 Luckey, J.A. and Smith, L.M. (1993),Optimization of electric field strength forDNA sequencing in capillary gel electro-phoresis, Anal. Chem. 65, pp. 2841–2850.
184 Yan, J.Y., Best, N., Zhang, J.Z., Ren, H.J.,Jiang, R., Hou, J. and Dovichi, N. (1996), The limiting mobility of DNA sequencingfragments for both cross-linked and non-cross-linked polymers in capillary electro-phoresis: DNA sequencing at 1200 V cm–1,Electrophoresis 17, pp. 1037–1045.
185 McIndoe, R.A., Hood, L. and Baumgartner,R.E. (1996), An analysis of the dynamic rangeand linearity of an infrared DNA sequencer,Electrophoresis 17, pp. 652–658.
186 Boguslavsky, J. (2000), DNA sequencers reachproduction scale, Drug Discovery and Devel-opment Magazine January/February, 36–38.
187 Shibata, K., Itoh, M., Aizawa, K., Nagaoka, S.,Sasaki, N., Carninci, P., Konno, H., Akiyama,J., Nishi, K., Kitsunai, T., Tashiro, H., Itoh, M.,Sumi, N., Ishii, Y., Nakamura, S., Hazama, M.,Nishine, T., Harada, A., Yamamoto, R.,Matsumoto, H., Sakaguchi, S., Ikegami, T.,Kashiwagi, K., Fujiwake, S., Inoue, K. andTogawa, Y. (2000), RIKEN integrated sequenceanalysis (RISA) system – 384-formatsequencing pipeline with 384 multicapillarysequencer, Genome Res. 10, pp. 1757–1771.
188 Bashkin, J.S., Bartosiewicz, M., Roach, D.,Leong, J. Barker, D. and Johnston, R. (1996),Implementation of a capillary array electro-phoresis instrument, J. Cap. Elec. 3, pp. 61–68.
189 Bashkin, J., Marsh, M., Barker, D. andJohnston, R. (1996), DNA sequencing bycapillary electrophoresis with a hydroxy-ethylcellulose sieving buffer, Appl. Theor.Electrophor. 6, pp. 23–28.
190 Marsh, M., Tu, O., Dolnik, V., Roach, D.,Solomon, N., Bechtol, K., Smietana, P.,Wang, L., Li, X., Cartwright, P., Marks, A.,
174 References
Barker, D., Harris, D. and Bashkin, J. (1997),High-throughput DNA sequencing on acapillary array electrophoresis system, J.Capillary Electrophor. 4, pp. 83–89.
191 Behr, S., Mätzig, M., Levin, A., Eickhoff, H.and Heller, C. (1999), A fully automatedmulticapillary electrophoresis device for DNAanalysis, Electrophoresis 20, pp. 1492–1507.
192 Dolnik, V. (1999), Review: DNA sequencingby capillary electrophoresis, J. Biochem.Biophys. Methods 41, pp. 103–119.
193 Ruiz-Martinez, M.C., Salas-Solano, O.,Carrilho, E., Kotler, L. and Karger, B.L. (1998),A sample purification method for rugged andhigh-performance DNA sequencing by capil-lary electrophoresis using replaceable polymersolutions. A. Development of the cleanupprotocol, Anal. Chem. 70, pp. 1516–1527.
194 Salas-Solano, O., Ruiz-Martinez, M.C.,Carrilho, E., Kotler, L. and Karger, B.L. (1998),A sample purification method for rugged andhigh-performance DNA sequencing bycapillary electrophoresis using replaceablepolymer solutions. B. Quantitativedetermination of the role of sample matrixcomponents on sequencing analysis, Anal.Chem. 70, pp. 1528–1535.
195 Woolley, A.T., Sensabaugh, G.F. and Mathies,R.A. (1997), High-speed DNA genotypingusing microfabricated capillary arrayelectrophoresis chips, Anal. Chem. 69, pp. 2181–2186.
196 Schmalzing, D., Adourian, A., Koutny, L.,Ziaugra, L., Matsudaira, P. and Ehrlich, D.(1998), DNA sequencing on microfabricatedelectrophoretic devices, Anal. Chem. 70, pp. 2303–2310.
197 Simpson, P.C., Roach, D., Woolley, A.T.,Thorsen, T., Johnston, R., Sensabaugh, G.F.and Mathies, R.A. (1998), High-throughputgenetic analysis using microfabricated 96-sample capillary array electrophoresismicroplates, Proc. Natl. Acad. Sci. USA 95,pp. 2256–2261.
198 Waters, L.C., Jacobson, S.C., Kroutchinina,N., Khandurina, J., Foote, R.S. and Ramsey,J.M. (1998), Multiple sample PCRamplification and electrophoretic analysis ona microchip, Anal. Chem. 70, pp. 5172–5176.
199 Liu, S., Shi, Y., Ja, W.W. and Mathies, R.A.(1999), Optimization of high-speed DNAsequencing on microfabricated capillaryelectrophoresis channels, Anal. Chem. 71, pp. 566–573.
200 Ramsey, J.M. (1999), The burgeoning powerof the shrinking laboratory, Nat. Biotechnol.17, pp. 1061–1062.
201 Shi, Y., Simpson, P.C., Scherer, J.R., Wexler,D., Skibola, C., Smith M.T. and Mathies, R.A.(1999), Radial capillary array electrophoresismicroplate and scanner for high-performancenucleic acid analysis, Anal. Chem. 71, pp. 5354–5361.
202 Schmalzing, D., Tsao, N., Koutny, L.,Chisholm, D., Srivastava, A., Adourian, A.,Linton, L., McEwan, P., Matsudaira, P. andEhrlich, D. (1999), Toward real-worldsequencing by microdevice electrophoresis,Genome Res. 9, pp. 853–858.
203 Schmalzing, D., Belenky, A., Novotny, M.A.,Koutny, L., Salas-Solano, O., El-Difrawy, S.,Adourian, A., Matsudaira, P. and Ehrlich, D.(2000), Microchip electrophoresis: a methodfor high-speed SNP detection, Nucl. AcidsRes. 28, pp. e43 (electronic article).
204 Becker, H. and Gärtner (2000), Polymermicrofabrication methods for microfluidicanalytical applications, Electrophoresis 21, pp. 12–26.
205 McDonald, J.C., Duffy, D.C., Anderson, J.R.,Chiu, D.T., Wu, H., Schueller, O.J.A. andWhitesides, G.M. (2000), Fabrication ofmicrofluidic systems in poly(dimethyl-siloxane), Electrophoresis 21, pp. 27–40.
206 Dolnik, V., Liu, S. and Jovanovich, S. (2000),Capillary electrophoresis on microchip,Electrophoresis 21, pp. 41–54.
207 Carrilho, E. (2000), DNA sequencing bycapillary array electrophoresis and micro-fabricated array systems, Electrophoresis 21,pp. 55–65.
208 Liu, S. (2003), A microfabricated hybriddevice for DNA sequencing, Electrophoresis24, pp. 3755–3761.
209 Liu, S., Elkin, C. and Kapur, H. (2003),Sequencing of real-world samples using amicrofabricated hybrid device havingunconstrained straight separation channels,Electrophoresis 24, pp. 3762–3768.
210 Mueller, O., Hahnenberger, K., Dittmann,M., Yee, H., Dubrow, R., Nagle, R. and Ilsley,D. (2000), A microfluidic system for high-speed reproducible DNA sizing andquantitation, Electrophoresis 21, pp. 128–134.
211 Simpson, J.W., Ruiz-Martinex, M.C.,Mulhern, G.T., Berka, J., Latimer, D.R., Ball,J.A., Rothberg, J.M. and Went, G.T. (2000), Atransmission imaging spectrograph and
175References
microfabricated channel system for DNAanalysis, Electrophoresis 21, pp. 135–149.
212 Ren, H., Karger, A.E., Oaks, F., Menchen, S.,Slater, G. and Drouin, G. (1999), SeparatingDNA sequencing fragments without a sievingmatrix, Electrophoresis 20, pp. 2501–2509.
213 Backhouse, C., Caamano, M., Oaks, F.,Nordman, E., Carrillo, A., Johnson, B. andBay, S. (2000), DNA sequencing in a mono-lithic microchannel device, Electrophoresis21, pp. 150–156.
214 Brenner, S. (1996), DNA sequencing bystepwise ligation and cleavage, U.S. Patent 5552 278.
215 Brenner, S. (1996), DNA sequencing bystepwise ligation and cleavage, U.S. Patent 5599 675.
216 Brenner, S. (1997), Massively parallelsequencing of sorted polynucleotides, U.S.Patent 5 695 934.
217 Brenner, S. and DuBridge, R.B. (1998), DNAsequencing by stepwise ligation and cleavage,U.S. Patent 5 714 330.
218 Brenner, S., Williams, S.R., Vermaas, E.H.,Storck, T., Moon, K., McCollum, C., Mao, J-I,Luo, S., Kirchner, J.J., Eletr, S., DuBridge,R.B., Burcham, T. and Albrecht, G. (2000), In vitro cloning of complex mixtures of DNAon microbeads: physical separation ofdifferentially expressed cDNAs, Proc. Natl.Acad. Sci. USA 97, pp. 1665–1670.
219 Albrecht, G., Brenner, S., DuBridge, R.B.,Lloyd, D.H. and Pallas, M.C. (2000),Massively parallel signature sequencing byligation of encoded adaptors, U.S. Patent 6013 445.
220 Jones, D.H. (1997), An iterative andregenerative method for DNA sequencing,BioTechniques 22, pp. 938–946.
221 Macevicz, S.C. (1998), DNA sequencing byparallel oligonucleotide extension, U.S.Patent 5 750 341.
222 Canard, B. and Sarfati, R.S. (1994), DNApolymerase fluorescent substrates withreversible 3′-tags, Gene 148, pp. 1–6.
223 Metzker, M.L., Raghavachari, R., Richards, S.,Jacutin, S.E., Civitello, A., Burgess, K. andGibbs, R.A. (1994), Termination of DNAsynthesis by novel 3′-modified-deoxyribo-nucleoside 5′-triphosphates, Nucl. Acids Res.22, pp. 4259–4267.
224 Li, Z., Bai, X., Ruparel, H., Kim, S., Turro,N.J. and Ju, J. (2003), A photocleavablefluorescent nucleotide for DNA sequencing
and analysis, Proc. Natl. Acad. Sci. U.S.A., pp. 414–419.
225 Brennan, T.M. and Heyneker, H.L. (1995),Methods and composition for determiningthe sequence of nucleic acids, U.S. Patent 5403 708.
226 Hyman, E.D. (1988), A new method ofsequencing DNA, Anal. Biochem. 174, pp. 423–436.
227 Nyrén, P. (1987), Enzymatic method forcontinuous monitoring of DNA polymeraseactivity, Anal. Biochem. 167, pp. 235–238.
228 Nyrén, P., Pettersson, B. and Uhlén, M.(1993), Solid phase DNA minisequencing by an enzymatic luminometric inorganicpyrophosphate detection assay, Anal.Biochem. 208, pp. 171–175.
229 Nyrén, P.J. (1996), Apyrase immobilized on paramagnetic beads used to improvedetection limits in bioluminometric ATPmonitoring, J. Biolumin. Chemilumin. 9, pp. 29–34.
230 Ronaghi, M., Karamuhamed, S., Pettersson,B., Uhlén, M. and Nyrén, P. (1996), Real-timeDNA sequencing using detection ofpyrophosphate release, Anal. Biochem. 242,pp. 84–89.
231 Ronaghi, M., Uhlén, M., and Nyrén, P.(1998), A sequencing method based on real-time pyrophosphate, Science 281, pp.363–365.
232 Ronaghi, M., Pettersson, B., Uhlén, M., andNyrén, P. (1998), PCR-introduced loopstructure as primer in DNA sequencing,BioTechniques 25, pp. 876–884.
233 Ronaghi, M., Nygren, M., Lundeberg, J. andNyrén, P. (1999), Analyses of secondarystructures in DNA by pyrosequencing, Anal.Biochem. 267, pp. 65–71.
234 Ahmadian, A., Lundeberg, J., Nyrén, P.,Uhlén, M and Ronaghi, M. (2000), Analysis ofthe p53 tumor suppressor gene by pyro-sequencing, BioTechniques 28, pp. 140–147.
235 Drmanac, R., Labat, I., Brukner, I. andCrkvenjakov, R. (1989), Sequencing ofmegabase plus DNA by hybridization: theoryof the method, Genomics 4, pp. 114–128.
236 Drmanac, R., Drmanac, S., Labat, I.,Crkvenjakov, R., Vicentic, A. and Gemmell,A. (1992), Sequencing by hybridization:towards an automated sequencing of onemillion M13 clones arrayed on membranes,Electrophoresis 13, pp. 566–573.
176 References
237 Drmanac, R., Drmanac, S., Strezoska, Z.,Paunesku, T., Labat, I., Zeremski, M.,Snoddy, J., Funkhouser, W.K., Koop, B.,Hood, L. et al. (1993), DNA sequencedetermination by hybridization: a strategy forefficient large-scale sequencing, Science 260,pp. 1649–1652.
238 Drmanac R. and Drmanac S. (1999), cDNAscreening by array hybridization, MethodsEnzymol. 303, pp. 165–178.
239 Köster, H., Tang, K., Fu, D.-J., Braun, A., vanden Boom, D., Smith, C.L., Cotter, R.J. andCantor, C.R. (1996), A strategy for rapid andefficient DNA sequencing by massspectrometry, Nat. Biotechnol. 14, pp. 1123–1128.
240 Fu, D.J., Tang, K., Braun, A., Reuter, D.,Darnhofer-Demar, B., Little, D.P., O’Donnell,M.J., Cantor, C.R. and Köster, H. (1998),Sequencing exons 5 to 8 of the p53 gene byMALDI-TOF mass spectrometry, Nat.Biotechnol. 16, pp. 381–384.
241 Kirpekar, F., Nordhoff, E., Larsen, L.K.,Kristiansen, K., Roepstorff, P. andHillenkamp, F. (1998), DNA sequenceanalysis by MALDI mass spectrometry, Nucl.Acids Res. 26, pp. 2554–2559.
242 Taranenko, N.I., Allman, S.L., Golovlev, V.V.,Taranenko, N.V., Isola, N.R. and Chen, C.H.(1998), Sequencing DNA using massspectrometry for ladder detection, Nucl. AcidsRes. 26, pp. 2488–2490.
243 Griffin, T.J., Hall, J.G., Prudent, J.R. andSmith, L.M. (1999), Direct genetic analysis bymatrix-assisted laser desorption/ionizationmass spectrometry, Proc. Natl. Acad. Sci. USA96, pp. 6301–6306.
244 Arlinghaus, H.F., Kwoka, M.N., Guo, X.-Q.and Jacobson, K.B. (1997), Multiplexed DNAsequencing and diagnostics by hybridizationwith enriched stable isotope labels, Anal.Chem. 69, pp. 1510–1517.
245 Chen, X., Fei, Z., Smith, L.M., Bradbury, E.M.and Majidi, V. (1999), Stable-isotope-assistedMALDI-TOF mass spectrometry for accuratedetermination of nucleotide compositions ofPCR products, Anal. Chem. 71, pp. 3118–3125.
246 Serpico, S.B. and Vernazza, G. (1987),Problems and prospects in image processingof two-dimensional gel electrophoresis, Opt.Engr. 26, pp. 661–668.
247 Giddings, M.C., Brumley, R.L., Haker, M. andSmith, L.M. (1993), An adaptive object
oriented strategy for base calling in DNAsequence analysis, Nucl. Acids Res. 21, pp. 4530–4540.
248 Giddings, M.C., Severin, J., Westphall, M.,Wu, J. and Smith, L.M. (1998), A softwaresystem for data analysis in automated DNAsequencing, Genome Res. 8, pp. 644–665.
249 Zakeri, H., Amparo, G., Chen, S.M.,Spurgeon, S. and Kwok, P.Y. (1998), Peakheight pattern in dichloro-rhodamine andenergy transfer dye terminator sequencing,BioTechniques 25, pp. 406–410, 412–414.
250 Davies, S., Eizenman, M., Pasupathy, S.,Muller, W. and Slater, G. (1999), Models oflocal behavior of DNA electrophoresis peakparameters, Electrophoresis 20, pp. 1443–1454.
251 Song, J.M. and Yeung, E.S. (2000), Alternativebase-calling algorithm for DNA sequencingbased on four-label multicolor detection,Electrophoresis 21, pp. 807–815.
252 Starita-Geribaldi, M., Houri, A. and Sudaka,P. (1993), Lane distortions in gel electro-phoresis patterns, Electrophoresis 14, pp. 773–781.
253 Golden, J.B. III, Torgersen, D. and Tibbetts,C. (1993), Pattern recognition for automatedDNA sequencing: I. On-line signalconditioning and feature extraction for base-calling, Intelligent Systems for MolecularBiology 1, pp. 136–144.
254 Chen, W.Q. and Hunkapiller, T. (1992),Sequence accuracy of large DNA sequencingprojects, DNA Sequence–J.DNA Sequencingand Mapping 2, pp. 335–342.
255 Swerdlow, H., Dew-Jager, K.E., Brady, K.,Grey, R., Dovichi, N.J. and Gesteland, R.(1992), Stability of capillary gels forautomated sequencing of DNA,Electrophoresis 13, pp. 475–483.
256 Swerdlow, H., Dew-Jager, K. and Gesteland,R.F. (1994), Reloading and stability ofpolyacrylamide slab gels for automated DNAsequencing, BioTechniques 16, pp. 684–685.
257 Desruisseaux, C., Slater, G.W. and Drouin, G.(1998), The gel edge electric field gradients indenaturing polyacrylamide gel electro-phoresis, Electrophoresis 19, pp. 627–634.
258 Koutny, L.B. and Yeung, E.S. (1992),Automated image analysis for distortioncompensation in sequencing gel electro-phoresis, Appl. Spect 46, pp. 136–141.
259 Dear, S. and Staden, R. (1992), A standard fileformat for data from DNA sequencing
177References
instruments, DNA Sequence-J.DNASequencing and Mapping 3, pp. 107–110.
260 Wu, A. and Mislan, D. (1992), AutomatedDNA sequencing: an image processingapproach, Appl. Theor. Electrophor 3, pp. 223–228.
261 Ives, J.T., Gesteland, R.F. and Stockham, T.G.(1994), An automated film reader for DNAsequencing based on homomorphic de-convolution, IEEE Trans. Biomed. Engr. 41,pp, 509–518.
262 Nishikawa, T. and Kambara, H. (1991),Analysis of limiting factors of DNA bandseparation by a DNA sequencer usingfluorescence detection, Electrophoresis 12,pp. 623–631.
263 Sanders, J.Z., Petterson, A.A., Hughes, P.J.,Connell, C.R., Raff, M., Mechen, S., Hood,L.E. and Teplow, D.B. (1991), Imaging as atool for improving length and accuracy ofsequence analysis in automated fluorescence-based DNA sequencing, Electrophoresis 12,pp. 3–11.
264 Aldroubi, A. and Garner, M.M. (1992),Minimal electrophoresis time for DNAsequencing, BioTechniques 13, pp. 620–624.
265 Grossman, P.D., Menchen, S. and Hershey,D. (1992), Quantitative analysis of DNAsequencing electrophoresis, Genet. Anal.Tech. Appl. 9, pp. 9–16.
266 Slater, G.W. and Drouin, G. (1992), Why canwe not sequence thousands of DNA bases ona polyacrylamide gel?, Electrophoresis 13, pp. 574–582.
267 Luckey, J.A., Norris, T.B. and Smith, L.M.(1993), Analysis of resolution in DNAsequencing by capillary gel electrophoresis, J.Phys. Chem. 97, pp. 3067–3075.
268 Luckey, J.A. and Smith, L.M. (1993), A modelfor the mobility of single-stranded DNA incapillary gel electrophoresis, Electrophoresis14, pp. 492–501.
269 Ribeiro, E.A. and Sutherland, J.C. (1993),Resolving power: A quantitative measure ofelectrophoretic resolution, Anal. Biochem.210, pp. 378–388.
270 Slater, G.W. (1993), Theory of bandbroadening for DNA gel electrophoresis andsequencing, Electrophoresis 14, pp. 1–7.
271 Slater, G.W., Mayer, P. and Grossman, P.D.(1995), Diffusion, joule heating, and bandbroadening in capillary gel electrophoresis ofDNA, Electrophoresis 16, pp. 75–83.
272 Fang, Y., Zhang, J.Z., Hou, J.Y., Lu, H. andDovichi, N.J. (1996), Activation energy of theseparation of DNA sequencing fragments indenaturing noncross-linked polyacrylamideby capillary electrophoresis, Electrophoresis17, pp. 1436–1442.
273 Nishikawa, T. and Kambara, H. (1996),Characteristics of single-stranded DNAseparation by capillary gel electrophoresis,Electrophoresis 17, pp. 1476–1484.
274 Weiss, G.H. and Kiefer, J.E. (1997), Someproperties of a measure of resolution in gelelectrophoresis and capillary zone electro-phoresis, Electrophoresis 18, pp. 2008–2011.
275 Guttman, A., Benedek, K. and Kalász (1998),On the separation parameters in DNAsequencing by capillary gel electrophoresis,American Laboratory (April), pp. 63–65.
276 Buetow, K.H., Edmonson, M.N. and Cassidy,A.B. (1999), Reliable identification of largenumbers of candidate SNPs from public ESTdata, Nat. Genet. 21, pp. 323–325.
277 Gordon, D., Abajian, C. and Green, P. (1998),Consed: a graphical tool for sequencefinishing, Genome Res. 8, pp. 195–202.
278 Huang, X. and Madan A. (1999), CAP3: ADNA sequence assembly program, GenomeRes. 9, pp. 868–877.
279 Moore, G.E. (1965), Cramming more com-ponents on to integrated circuits, Electronics38, pp. 114–117.
280 Meindl, J.D., Chen, Q. and Davis, J.A. (2001),Limits on silicon nanoelectronics for terascaleintegration, Science 293, pp. 2044–2049.
281 Pierce, J.R. (1980), An introduction toinformation theory: symbols, signals andnoise, New York: Dover Publications.
282 Lloyd, S. (2000), Ultimate physical limits tocomputation, Nature 406, pp. 1047–1054.
283 Stelzer, E.H.K. and Grill, S. (2000), The un-certainty principle applied to estimate focalspot dimensions, Opt. Commun. 173, pp. 51–56.
284 Dovichi, N.J., Martin, J.C., Jett, J.H., Trkula,M. and Keller, R.A. (1984), Laser-inducedfluorescence of flowing samples as anapproach to single-molecule detection inliquids, Anal. Chem. 56, pp. 348–354.
285 Peck, K., Stryer, L., Glazer, A.N. and Mathies,R.A. (1989), Single-molecule fluorescencedetection: autocorrelation criterion andexperimental realization with phycoerythrin,Proc. Natl. Acad. Sci. U.S.A., pp. 4087–4091.
178 References
286 Mathies, R.A., Peck, K. and Stryer, L. (1990),Optimization of high-sensitivity fluorescencedetection, Anal. Chem. 62, pp. 1786–1791.
287 Kuno, M., Fromm, D.P., Hamann, H.F.,Gallagher, A. and Nesbitt, D.J. (2000),Nonexponential “blinking” kinetics of singleCdSe quantum dots: A universal power lawbehavior, J. Chem. Phys. 112, pp. 3117–3120.
288 Moerner, W.E. and Fromm, D.P. (2003),Methods of single-molecule fluorescencespectroscopy and microscopy, Rev. Sci.Instrum. 74, pp. 3597–3619.
289 Jett, J.H., Keller, R.A., Martin, J.C., Marrone,B.L., Moyzis, R.K., Ratliff, R.L., Seitzinger,N.K., Shera, E.B. and Stewart, C.C. (1989),High-speed DNA sequencing: an approachbased upon fluorescence detection of singlemolecules, J. Biomol. Struct. Dyn. 7, pp. 301–309.
290 Davis, L.M., Fairfield, F.R., Harger, C.A., Jett,J.H., Keller, R.A., Hahn, J.H., Krakowski,L.A., Marrone, B.L., Martin, J.C., Nutter H.L.,et al. (1991), Rapid DNA sequencing basedupon single molecule detection, Genet. Anal.Tech. Appl. 8, pp. 1–7.
291 Harding, J.D. and Keller, R.A. (1992), Review:Single-molecule detection as an approach torapid DNA sequencing, Trends Biotechnol.10, pp. 55–57.
292 Werner, J.H., Cai, H., Jett, J.H., Reha-Krantz,L., Keller, R.A. and Goodwin, P.M. (2003),Progress towards single-molecule DNAsequencing: a one color demonstration, J.Biotech. 102, pp. 1–14.
293 Dörre, K., Brakmann, S., Brinkmeier, M.,Han, K.-T., Riebeseel, K., Schwille, P.,Stephan, J., Wetzel, T., Lapczyna, M., Stuke,M., Bader, R., Hinz, M., Seliger, H., Holm, J.,Eigen, M. And Rigler, R. (1997), Techniquesfor single molecule sequencing, Bioimaging5, pp. 139–152.
294 Rigler, R. and Seela, F. (2001), DNA-Sequencing at the single molecule level, J.Biotechnol. 86, pp. 161.
295 Eggeling, C., Berger, S., Brand, L., Fries, J.R.,Schaffer, J., Volkmer, A. And Seidel, C.A.M.(2001), Data registration and selective single-molecule analysis using multi-parameterfluorescence detection, J. Biotechnol. 86, pp 163–180.
296 Sauer, M., Angerer, B., Ankenbauer, W.,Földes-Papp, Z., Göbel, F., Han, K.-T., Rigler,R., Schulz, A., Wolfrum, J. and Zander, C.(2001), Single molecule DNA sequencing in
submicrometer channels: state of the art and future prospects, J. Biotechnol. 86, pp 181–201.
297 Földes-Papp, Z., Angerer, B., Thyberg, P.,Hinz, M., Wennmalm, S., Ankenbauer, W.,Seliger, H., Holmgren, A. And Rigler, R.(2001), Fluorescently labeled model DNAsequences for exonucleolytic sequencing, J.Biotechnol. 86, pp 203–224.
298 Földes-Papp, Z., Angerer, B., Ankenbauer, W.And Rigler, R. (2001), Fluorescent high-density labeling of DNA: error-freesubstitution for a normal nucleotide, J.Biotechnol. 86, pp 237–253.
299 Dörre, K., Stephan, J., Lapczyna, M., Stuke,M., Dunkel, H. And Eigen, M. (2001) Highlyefficient single molecule detection in micro-structures, J. Biotechnol. 86, pp 225–236.
300 Stephan, J., Dörre, K., Brakmann, S.,Winkler, T., Wetzel, T., Lapczyna, M., Stuke,M., Angerer, B., Ankenbauer, W., Földes-Papp, Z., Rigler, R. and Eigen, M. (2001),Towards a general procedure for sequencingsingle DNA molecules, J. Biotechnol. 86, pp 255–267.
301 Seela, F., Feiling, E., Gross, J., Hillenkamp,F., Ramzaeva, N., Rosemeyer, H. and Zulauf,M. (2001), Fluorescent DNA: the developmentof 7-deazapurine nucleoside triphosphatesapplicable for sequencing at the singlemolecule level, J. Biotechnol. 86, pp 269–279.
302 Hinz, M., Gura, S., Nitzan, B., Margel, S. andSeliger, H. (2001), Polymer support forexonucleolytic sequencing, J. Biotechnol. 86,pp 281–288.
303 Augustin, M.A., Ankenbauer, W. andAngerer, B. (2001), Progress towards single-molecule sequencing: enzymatic synthesis ofnucleotide-specifically labeled DNA, J. Bio-technol. 86, pp 289–301.
304 Brakmann, S. and Löbermann, S. (2001),High-density labeling of DNA: Preparationand characterization of the target material forsingle-molecule sequencing, Angew. Chem.40, pp. 1427–1429.
305 Brakmann, S. and Löbermann, S. (2002), Afurther step towards single-moleculesequencing: Escherichia coli exonuclease IIIdegrades DNA that is fluorescently labeled ateach base pair, Angew. Chem. 41, pp. 3215–3217.
306 Brakmann, S. (2004), Optimal enzymes forsingle-molecule sequencing, Curr. Pharm.Biotech. 5, pp. 119–126.
179References
307 Giller, G., Tasara, T., Angerer, B., Mühlegger,K., Amacker, M. And Winter, H. (2003),Incorporation of reporter molecule-labelednucleotides by DNA polymerases. I. Chemicalsynthesis of various reporter group-labeled 2′-deoxyribonucleoside-5′-triphosphates, Nucl.Acids. Res. 31, pp. 2630–2635.
308 Tasara, T., Angerer, B., Damond, M., Winter,H., Dörhöfer, S., Hübscher, U. and Amacker,M. (2003), Incorporation of reportermolecule-labeled nucleotides by DNA poly-merases. II. High-density labeling of naturalDNA, Nucl. Acids Res. 31, pp. 2636–2646.
309 Ulmer, K.M. (1997), Methods and apparatusfor DNA sequencing, U.S. Patent 5 674 743.
310 Yan, Y. and Myrick, M.L. (2001),Identification of nucleotides with identicalfluorescent labels based on fluorescencepolarization in surfactant solutions, Anal.Chem. 73, pp. 4508–4513.
311 Mitra, R.D., Shendure, J., Olejnik, J.,Krzymansak-Olejnik, E. and Church, G.M.(2003), Fluorescent in situ sequencing onpolymerase colonies, Anal. Biochem. 320, pp. 55–65.
312 Seo, T.S., Bai, X., Ruparel, H., Li, Z., Turro,N.J. and Ju, J. (2004), Photocleavablefluorescent nucleotides for DNA sequencingon a chip constructed by site-specificcoupling chemistry, Proc. Natl. Acad. Sci.U.S.A. 101, pp. 5488–5493.
313 Leamon, J.H., Lee, W.L., Tartaro, K.R., Lanza,J.R., Sarkis, G.J., deWinter, A.D., Berka, J.and Lohman, K.L. (2003), A massively parallelPicoTiterPlate based platform for discretepicoliter-scale polymerase chain reactions,Electrophoresis 24, pp. 3769–3777.
314 Kling, J. (2003), Ultrafast DNA sequencing,Nat. Biotechnol. 21, pp. 1425–1427.
315 Braslavsky, I., Hebert, B., Kartalov, E. AndQuake, S.R. (2003), Sequence informationcan be obtained from single DNA molecules,Proc. Natl. Acad. Sci. U.S.A. 100, pp. 3960–3964.
316 Levene, M.J., Korlach, J., Turner, S.W.,Foquet, M., Craighead, H.G. and Webb,W.W. (2003), Zero-mode waveguides forsingle-molecule analysis at highconcentrations, Science 299, pp. 682–686.
317 Tegenfeldt, J.O., Bakajin, O., Chou, C.-F.,Chan, S.S., Austin, R., Fann, W., Liou, L.,Chan, E., Duke, T. and Cox, E.C. (2001),Near-field scanner for moving molecules,Phys. Rev. Lett. 86, pp. 1378–1381.
318 Tegenfeldt, J.O., Prinz, C., Cao, H., Huang,R.L., Austin, R.H., Chou, S.Y., Cox, E.C. andSturm, J.C. (2004), Micro- and nanofluidicsfor DNA analysis, Anal. Bioanal. Chem. 378,pp. 1678–1692.
319 Jonietz, E. (2002), The personal genomesequencer, Technology Review, November,pp. 76–79.
320 Ying, L., Bruckbauer, A., Rothery, A.M.,Korchev, Y.E. and Klenerman, D. (2002),Programmable delivery of DNA through ananopipet, Anal. Chem. 74, pp. 1380–1385.
321 Cai, W., Aburatani, H., Stanton, V.P. Jr.,Housman, D.E., Wang, Y.K. and Schwartz,D.C. (1995), Ordered restriction endonucleasemaps of yeast artificial chromosomes createdby optical mapping on surfaces, Proc. Natl.Acad. Sci. U.S.A. 92, pp. 5164–5168.
322 Aston, C., Mishra, B. and Schwartz, D.C.(1999), Optical mapping and its potential forlarge-scale sequencing projects, Trends Bio-technol. 17, pp. 297–302.
323 Lim, A., Dimalanta, E.T., Potamousis, K.D.,Yen, G., Apodoca, J., Tao, C., Lin, J., Qi, R.,Skiadas, J., Ramanathan, A., Perna, N.T.,Plunkett, G. 3rd, Burland, V., Mau, B.,Hackett, J., Blattner, F.R., Anantharaman,T.S., Mishra, B. and Schwartz, D.C. (2001),Shotgun optical maps of the wholeEscherichia coli O157:H7 genome, GenomeRes. 11, pp. 1584–1593.
324 Zhou, S., Deng, W., Anantharaman, T.S.,Lim, A., Dimalanta, E.T., Wang, J., Wu, T.,Chunhong, T., Creighton, R., Kile, A.,Kvikstad, E., Bechner, M., Yen, G., Garic-Stankovic, A., Severin, J., Forrest, D.,Runnheim, R., Churas, C., Lamers, C., Perna,N.T., Burland, V., Blattner, F.R., Mishra, B.,Schwartz, D.C. (2002), A whole-genome shot-gun optical map of Yersinia pestis strain KIM,Appl. Environ, Microbiol. 68, pp. 6321–6331.
325 Zhou, S., Kvikstad, E., Kile, A., Severin, J.,Forrest, D., Runnheim, R., Churas, C.,Hickman, J.W., Mackenzie, C., Choudhary,M., Donohue, T., Kaplan, S. and Schwartz,D.C. (2003), Whole-genome shotgun opticalmapping of Rhodobacter sphaeroides strain2.4.1 and its use for whole-genome shotgunsequence assembly, Genome Res. 13, pp. 2142–2151.
326 Kasianowicz, J.J., Brandin, E., Branton, D.and Deamer, D.W. (1996), Characterization ofindividual polynucleotide molecules using amembrane channel, Proc. Natl. Acad. Sci.U.S.A. 93, pp. 13770–13773.
180 References
327 Wang, H. and Branton, D. (2001), Nanoporeswith a spark for single-molecule detection,Nat. Biotechnol. 19, pp. 622–623.
328 Vercoutere, W., Winters-Hilt, S., Olsen, H.,Deamer, D., Haussler, D. and Akeson, M.(2001), Rapid discrimination amongindividual DNA hairpin molecules at single-nucleotide resolution using an ion channel,Nat. Biotechnol. 19, pp. 248–252.
329 Akeson, M., Branton, D., Kasianowicz, J.J.,Brandin, E. and Deamer, D.W. (1999),Microsecond time-scale discriminationamong polycytidylic acid, polyadenylic acid,and polyuridylic acid as homopolymers or assegments within single RNA molecules,Biophys. J. 77, pp. 3227–3233.
330 Meller, A., Nivon, L., Brandin, E.,Golovchenko, J. and Branton, D. (2000), Rapid nanopore discrimination betweensingle polynucleotide molecules, Proc. Natl.Acad. Sci. U.S.A. 97, pp. 1079–1084.
331 Meller, A., Nivon, L. and Branton, D. (2001),Voltage-driven DNA translocations through ananopore, Phys. Rev. Lett. 86, pp. 3435–3438.
332 Meller, A. and Branton, D. (2002), Singlemolecule measurements of DNA transportthrough a nanopore, Electrophoresis 23, pp. 2583–2591.
333 Howorka, S., Cheley, S. and Bayley, H. (2001),Sequence-specific detection of individualDNA strands using engineered nanopores,Nat. Biotechnol. 19, pp. 636–639.
334 Deamer, D.W. and Branton, D. (2002),Characterization of nuclei acids by nanoporeanalysis, Acc. Chem. Res. 35, pp. 817–825.
335 Sauer-Budge, A.F., Nyamwanda, J.A.,Lubensky, D.K. and Branton, D. (2003),Unzipping kinetics of double-stranded DNAin a nanopore, Phys. Rev. Lett. 90, pp. e238101 (Epub).
336 Vercoutere, W.A., Winters-Hilt, S.,DeGuzman, V.S., Deamer, D., Ridino, S.E.,Rodgers, J.T., Olsen, H.E., Marziali, A. andAkeson, M. (2003), Discrimination amongindividual Watson-Crick base pairs at thetermini of single DNA hairpin molecules,Nucl. Acids Res. 31, pp. 1311–1318.
337 Slater, G.W., Desruisseaux, C., Hubert, S.J.,Mercier, J.-F., Labrie, J., Boileau, J., Tessier,F. and Pépin, M.P. (2000), Theory of DNAelectrophoresis: A look at some currentchallenges, Electrophoresis 21, pp. 3873–3887.
181
Sheena Lambert and David C. Schriemer
7.1
Introduction
The concept of the proteome has been withus for approximately 10 years and has madea dramatic impact on how biologicalresearch is conducted. Capabilities andinfluence continue to grow, having had animpact on areas of biological inquiry fromagriculture to zoology [1]. As with any rapid-ly advancing discipline, it becomes difficultto apply a rigorous and widely accepted def-inition. A “historical” definition of prote-ome parallels the definition of the genome.That is, proteome refers to the full set ofproteins expressed in a given organism.Early stages of the discipline thus focusedon sequencing the proteome as a logicalprogression from genomics. It quicklybecame apparent that such a definition ofthe word proteome was dangerously mis-leading because it suggested that a sequenc-ing or mapping effort is, indeed, an essen-tial activity within proteomics. In recentyears there have been fewer attempts todeliver a wholesale catalogue of all proteinsin a given organism. It is illustrative to fol-low the yearly, cumulative citation of thewords “proteome” and “proteomics” in thescientific literature (Fig. 7.1). Although it is
a stretch to suggest that the word “prote-ome” is falling out of favor, it is clear thatthe term does not convey the same research-level utility as the word “proteomics”. Thislatter term is more functional, because itrefers to the processes, methods and instru-mentation used to study aspects of the pro-teome. At the risk of over-interpreting thistrend in citation, it suggests we are still verymuch in the definition and “tool-building”phase of proteomics (interestingly, one seesthe inverse with the terms genome andgenomics). Quite simply, the proteome is amore complex and extensive congregationof biomolecules than the genome, and itscomplete mapping by singular initiatives iswell beyond current capabilities.
Developing a functional definition ofproteomics, reflecting current capabilities, isthus a more useful an undertaking. It canbe defined as the spatio-temporal harvest-ing, identification, and quantitation of allproteins in a given sample, to study a spe-cific biochemical process. Proteomics con-siders the flux in all protein chemical prop-erties postulated to be critical to this process(for example, post-translational modifica-tions). The last five years of effort has led tothe refinement of our expectations – we seegreater utility in targeting proteomics to
Handbook of Genome Research. Genomics, Proteomics, Metabolomics, Bioinformatics, Ethical and Legal Issues.Edited by Christoph W. SensenCopyright © 2005 WILEY-VCH Verlag GmbH & Co. KGaA, WeinheimISBN: 3-527-31348-6
7Proteomics and Mass Spectrometry for the Biological Researcher
07_181_210 25.04.2005 11:02 Uhr Seite 181
Verwendete Mac Distiller 5.0.x Joboptions
Dieser Report wurde automatisch mit Hilfe der Adobe Acrobat Distiller Erweiterung "Distiller Secrets v1.0.5" der IMPRESSED GmbH erstellt. Sie koennen diese Startup-Datei für die Distiller Versionen 4.0.5 und 5.0.x kostenlos unter http://www.impressed.de herunterladen. ALLGEMEIN ---------------------------------------- Dateioptionen: Kompatibilität: PDF 1.3 Für schnelle Web-Anzeige optimieren: Ja Piktogramme einbetten: Ja Seiten automatisch drehen: Nein Seiten von: 1 Seiten bis: Alle Seiten Bund: Links Auflösung: [ 2400 2400 ] dpi Papierformat: [ 481 740 ] Punkt KOMPRIMIERUNG ---------------------------------------- Farbbilder: Downsampling: Nein Komprimieren: Ja Komprimierungsart: ZIP Bitanzahl pro Pixel: 8 Bit Graustufenbilder: Downsampling: Nein Komprimieren: Ja Komprimierungsart: ZIP Bitanzahl pro Pixel: 8 Bit Schwarzweiß-Bilder: Downsampling: Nein Komprimieren: Ja Komprimierungsart: CCITT CCITT-Gruppe: 4 Graustufen glätten: Nein Text und Vektorgrafiken komprimieren: Ja SCHRIFTEN ---------------------------------------- Alle Schriften einbetten: Ja Untergruppen aller eingebetteten Schriften: Nein Wenn Einbetten fehlschlägt: Abbrechen Einbetten: Immer einbetten: [ /Courier-BoldOblique /Helvetica-BoldOblique /Courier /Helvetica-Bold /Times-Bold /Courier-Bold /Helvetica /Times-BoldItalic /Times-Roman /ZapfDingbats /Times-Italic /Helvetica-Oblique /Courier-Oblique /Symbol ] Nie einbetten: [ ] FARBE(N) ---------------------------------------- Farbmanagement: Farbumrechnungsmethode: Farbe nicht ändern Methode: Standard Geräteabhängige Daten: Einstellungen für Überdrucken beibehalten: Ja Unterfarbreduktion und Schwarzaufbau beibehalten: Ja Transferfunktionen: Beibehalten Rastereinstellungen beibehalten: Nein ERWEITERT ---------------------------------------- Optionen: Prolog/Epilog verwenden: Nein PostScript-Datei darf Einstellungen überschreiben: Nein Level 2 copypage-Semantik beibehalten: Ja Portable Job Ticket in PDF-Datei speichern: Ja Illustrator-Überdruckmodus: Ja Farbverläufe zu weichen Nuancen konvertieren: Ja ASCII-Format: Nein Document Structuring Conventions (DSC): DSC-Kommentare verarbeiten: Ja DSC-Warnungen protokollieren: Nein Für EPS-Dateien Seitengröße ändern und Grafiken zentrieren: Ja EPS-Info von DSC beibehalten: Ja OPI-Kommentare beibehalten: Nein Dokumentinfo von DSC beibehalten: Ja ANDERE ---------------------------------------- Distiller-Kern Version: 5000 ZIP-Komprimierung verwenden: Ja Optimierungen deaktivieren: Nein Bildspeicher: 524288 Byte Farbbilder glätten: Nein Graustufenbilder glätten: Nein Bilder (< 257 Farben) in indizierten Farbraum konvertieren: Ja sRGB ICC-Profil: sRGB IEC61966-2.1 ENDE DES REPORTS ---------------------------------------- IMPRESSED GmbH Bahrenfelder Chaussee 49 22761 Hamburg, Germany Tel. +49 40 897189-0 Fax +49 40 897189-71 Email: [email protected] Web: www.impressed.de
Adobe Acrobat Distiller 5.0.x Joboption Datei
<< /ColorSettingsFile () /LockDistillerParams true /DetectBlends true /DoThumbnails true /AntiAliasMonoImages false /MonoImageDownsampleType /Bicubic /GrayImageDownsampleType /Bicubic /MaxSubsetPct 100 /MonoImageFilter /CCITTFaxEncode /ColorImageDownsampleThreshold 1.5 /GrayImageFilter /FlateEncode /ColorConversionStrategy /LeaveColorUnchanged /CalGrayProfile (Dot Gain 20%) /ColorImageResolution 300 /UsePrologue false /MonoImageResolution 1200 /ColorImageDepth 8 /sRGBProfile (sRGB IEC61966-2.1) /PreserveOverprintSettings true /CompatibilityLevel 1.3 /UCRandBGInfo /Preserve /EmitDSCWarnings false /CreateJobTicket true /DownsampleMonoImages false /DownsampleColorImages false /MonoImageDict << /K -1 >> /ColorImageDownsampleType /Bicubic /GrayImageDict << /HSamples [ 2 1 1 2 ] /VSamples [ 2 1 1 2 ] /Blend 1 /QFactor 0.9 >> /CalCMYKProfile (U.S. Web Coated (SWOP) v2) /ParseDSCComments true /PreserveEPSInfo true /MonoImageDepth -1 /AutoFilterGrayImages false /SubsetFonts false /GrayACSImageDict << /HSamples [ 2 1 1 2 ] /VSamples [ 2 1 1 2 ] /Blend 1 /QFactor 0.9 >> /ColorImageFilter /FlateEncode /AutoRotatePages /None /PreserveCopyPage true /EncodeMonoImages true /ASCII85EncodePages false /PreserveOPIComments false /NeverEmbed [ ] /ColorImageDict << /HSamples [ 2 1 1 2 ] /VSamples [ 2 1 1 2 ] /Blend 1 /QFactor 0.9 >> /AntiAliasGrayImages false /GrayImageDepth 8 /CannotEmbedFontPolicy /Error /EndPage -1 /TransferFunctionInfo /Preserve /CalRGBProfile (sRGB IEC61966-2.1) /EncodeColorImages true /EncodeGrayImages true /ColorACSImageDict << /HSamples [ 2 1 1 2 ] /VSamples [ 2 1 1 2 ] /Blend 1 /QFactor 0.9 >> /Optimize true /ParseDSCCommentsForDocInfo true /GrayImageDownsampleThreshold 1.5 /MonoImageDownsampleThreshold 1.5 /AutoPositionEPSFiles true /GrayImageResolution 300 /AutoFilterColorImages false /AlwaysEmbed [ /Courier-BoldOblique /Helvetica-BoldOblique /Courier /Helvetica-Bold /Times-Bold /Courier-Bold /Helvetica /Times-BoldItalic /Times-Roman /ZapfDingbats /Times-Italic /Helvetica-Oblique /Courier-Oblique /Symbol ] /ImageMemory 524288 /OPM 1 /DefaultRenderingIntent /Default /EmbedAllFonts true /StartPage 1 /DownsampleGrayImages false /AntiAliasColorImages false /ConvertImagesToIndexed true /PreserveHalftoneInfo false /CompressPages true /Binding /Left >> setdistillerparams << /PageSize [ 595.276 841.890 ] /HWResolution [ 2400 2400 ] >> setpagedevice
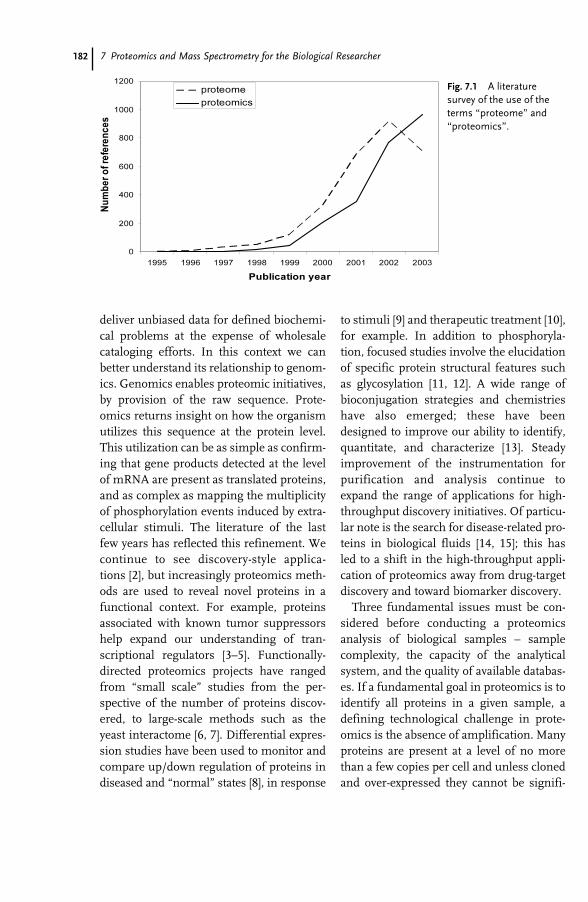
182 7 Proteomics and Mass Spectrometry for the Biological Researcher
deliver unbiased data for defined biochemi-cal problems at the expense of wholesalecataloging efforts. In this context we canbetter understand its relationship to genom-ics. Genomics enables proteomic initiatives,by provision of the raw sequence. Prote-omics returns insight on how the organismutilizes this sequence at the protein level.This utilization can be as simple as confirm-ing that gene products detected at the levelof mRNA are present as translated proteins,and as complex as mapping the multiplicityof phosphorylation events induced by extra-cellular stimuli. The literature of the lastfew years has reflected this refinement. Wecontinue to see discovery-style applica-tions [2], but increasingly proteomics meth-ods are used to reveal novel proteins in afunctional context. For example, proteinsassociated with known tumor suppressorshelp expand our understanding of tran-scriptional regulators [3–5]. Functionally-directed proteomics projects have rangedfrom “small scale” studies from the per-spective of the number of proteins discov-ered, to large-scale methods such as theyeast interactome [6, 7]. Differential expres-sion studies have been used to monitor andcompare up/down regulation of proteins indiseased and “normal” states [8], in response
to stimuli [9] and therapeutic treatment [10],for example. In addition to phosphoryla-tion, focused studies involve the elucidationof specific protein structural features suchas glycosylation [11, 12]. A wide range ofbioconjugation strategies and chemistrieshave also emerged; these have beendesigned to improve our ability to identify,quantitate, and characterize [13]. Steadyimprovement of the instrumentation forpurification and analysis continue toexpand the range of applications for high-throughput discovery initiatives. Of particu-lar note is the search for disease-related pro-teins in biological fluids [14, 15]; this hasled to a shift in the high-throughput appli-cation of proteomics away from drug-targetdiscovery and toward biomarker discovery.
Three fundamental issues must be con-sidered before conducting a proteomicsanalysis of biological samples – samplecomplexity, the capacity of the analyticalsystem, and the quality of available databas-es. If a fundamental goal in proteomics is toidentify all proteins in a given sample, adefining technological challenge in prote-omics is the absence of amplification. Manyproteins are present at a level of no morethan a few copies per cell and unless clonedand over-expressed they cannot be signifi-
Fig. 7.1 A literature survey of the use of theterms “proteome” and“proteomics”.
07_181_210 25.04.2005 11:02 Uhr Seite 182
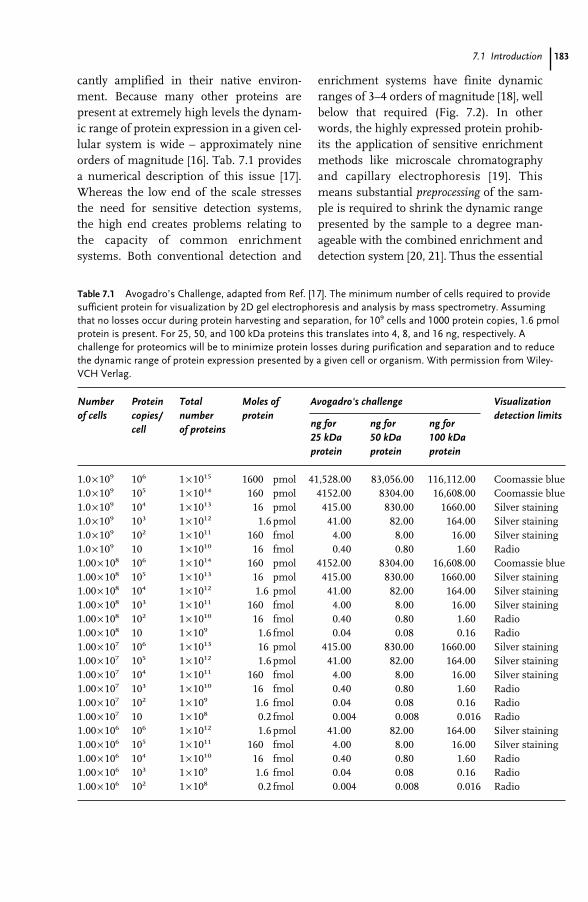
1837.1 Introduction
cantly amplified in their native environ-ment. Because many other proteins arepresent at extremely high levels the dynam-ic range of protein expression in a given cel-lular system is wide – approximately nineorders of magnitude [16]. Tab. 7.1 providesa numerical description of this issue [17].Whereas the low end of the scale stressesthe need for sensitive detection systems,the high end creates problems relating tothe capacity of common enrichmentsystems. Both conventional detection and
enrichment systems have finite dynamicranges of 3–4 orders of magnitude [18], wellbelow that required (Fig. 7.2). In otherwords, the highly expressed protein prohib-its the application of sensitive enrichmentmethods like microscale chromatographyand capillary electrophoresis [19]. Thismeans substantial preprocessing of the sam-ple is required to shrink the dynamic rangepresented by the sample to a degree man-ageable with the combined enrichment anddetection system [20, 21]. Thus the essential
Table 7.1 Avogadro’s Challenge, adapted from Ref. [17]. The minimum number of cells required to providesufficient protein for visualization by 2D gel electrophoresis and analysis by mass spectrometry. Assumingthat no losses occur during protein harvesting and separation, for 109 cells and 1000 protein copies, 1.6 pmolprotein is present. For 25, 50, and 100 kDa proteins this translates into 4, 8, and 16 ng, respectively. Achallenge for proteomics will be to minimize protein losses during purification and separation and to reducethe dynamic range of protein expression presented by a given cell or organism. With permission from Wiley-VCH Verlag.
Number Protein Total Moles of Avogadro’s challenge Visualizationof cells copies/ number protein
ng for ng for ng for detection limits
cell of proteins25 kDa 50 kDa 100 kDaprotein protein protein
1.0×10⁹ 106 1×10¹⁵ 1600 pmol 41,528.000 83,056.000 116,112.000 Coomassie blue1.0×109 105 1×10¹⁴ 160 pmol 4152.000 8304.000 16,608.000 Coomassie blue1.0×109 104 1×10¹³ 16 pmol 415.000 830.000 1660.000 Silver staining1.0×109 103 1×10¹² 1.6 pmol 41.000 82.000 164.000 Silver staining1.0×109 102 1×10¹¹ 160 fmol 4.000 8.000 16.000 Silver staining1.0×109 10 1 ×10¹⁰ 16 fmol 0.400 0.800 1.600 Radio1.00×108 106 1×10¹⁴ 160 pmol 4152.000 8304.000 16,608.000 Coomassie blue1.00×108 105 1×10¹³ 16 pmol 415.000 830.000 1660.000 Silver staining1.00×108 104 1×10¹² 1.6 pmol 41.000 82.000 164.000 Silver staining1.00×108 103 1×10¹¹ 160 fmol 4.000 8.000 16.000 Silver staining1.00×108 102 1×10¹⁰ 16 fmol 0.400 0.800 1.600 Radio1.00×108 10 1 ×10⁹ 1.6 fmol 0.040 0.080 0.160 Radio1.00×107 106 1×10¹³ 16 pmol 415.000 830.000 1660.000 Silver staining1.00×107 105 1×10¹² 1.6 pmol 41.000 82.000 164.000 Silver staining1.00×107 104 1×10¹¹ 160 fmol 4.000 8.000 16.000 Silver staining1.00×107 103 1×10¹⁰ 16 fmol 0.400 0.800 1.600 Radio1.00×107 102 1×10⁹ 1.6 fmol 0.040 0.080 0.160 Radio1.00×107 10 1 ×10⁸ 0.2 fmol 0.004 0.008 0.016 Radio1.00×106 106 1×10¹² 1.6 pmol 41.000 82.000 164.000 Silver staining1.00×106 105 1×10¹¹ 160 fmol 4.000 8.000 16.000 Silver staining1.00×106 104 1×10¹⁰ 16 fmol 0.400 0.800 1.600 Radio1.00×106 103 1×10⁹ 1.6 fmol 0.040 0.080 0.160 Radio1.00×106 102 1×10⁸ 0.2 fmol 0.004 0.008 0.016 Radio
07_181_210 25.04.2005 11:02 Uhr Seite 183
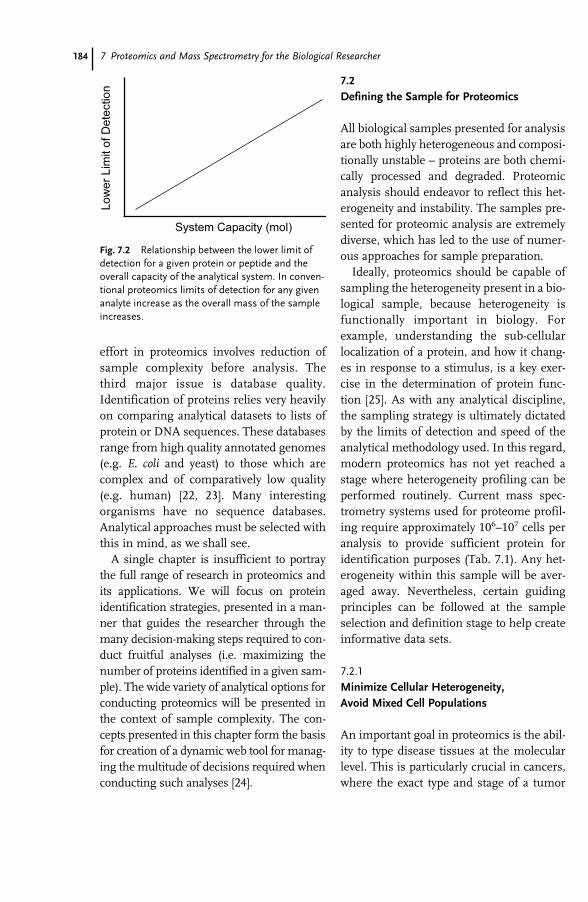
184 7 Proteomics and Mass Spectrometry for the Biological Researcher
effort in proteomics involves reduction ofsample complexity before analysis. Thethird major issue is database quality.Identification of proteins relies very heavilyon comparing analytical datasets to lists ofprotein or DNA sequences. These databasesrange from high quality annotated genomes(e.g. E. coli and yeast) to those which arecomplex and of comparatively low quality(e.g. human) [22, 23]. Many interestingorganisms have no sequence databases.Analytical approaches must be selected withthis in mind, as we shall see.
A single chapter is insufficient to portraythe full range of research in proteomics andits applications. We will focus on proteinidentification strategies, presented in a man-ner that guides the researcher through themany decision-making steps required to con-duct fruitful analyses (i.e. maximizing thenumber of proteins identified in a given sam-ple). The wide variety of analytical options forconducting proteomics will be presented inthe context of sample complexity. The con-cepts presented in this chapter form the basisfor creation of a dynamic web tool for manag-ing the multitude of decisions required whenconducting such analyses [24].
7.2
Defining the Sample for Proteomics
All biological samples presented for analysisare both highly heterogeneous and composi-tionally unstable – proteins are both chemi-cally processed and degraded. Proteomicanalysis should endeavor to reflect this het-erogeneity and instability. The samples pre-sented for proteomic analysis are extremelydiverse, which has led to the use of numer-ous approaches for sample preparation.
Ideally, proteomics should be capable ofsampling the heterogeneity present in a bio-logical sample, because heterogeneity isfunctionally important in biology. Forexample, understanding the sub-cellularlocalization of a protein, and how it chang-es in response to a stimulus, is a key exer-cise in the determination of protein func-tion [25]. As with any analytical discipline,the sampling strategy is ultimately dictatedby the limits of detection and speed of theanalytical methodology used. In this regard,modern proteomics has not yet reached astage where heterogeneity profiling can beperformed routinely. Current mass spec-trometry systems used for proteome profil-ing require approximately 106–107 cells peranalysis to provide sufficient protein foridentification purposes (Tab. 7.1). Any het-erogeneity within this sample will be aver-aged away. Nevertheless, certain guidingprinciples can be followed at the sampleselection and definition stage to help createinformative data sets.
7.2.1
Minimize Cellular Heterogeneity, Avoid Mixed Cell Populations
An important goal in proteomics is the abil-ity to type disease tissues at the molecularlevel. This is particularly crucial in cancers,where the exact type and stage of a tumor
Fig. 7.2 Relationship between the lower limit ofdetection for a given protein or peptide and theoverall capacity of the analytical system. In conven-tional proteomics limits of detection for any givenanalyte increase as the overall mass of the sampleincreases.
07_181_210 25.04.2005 11:02 Uhr Seite 184
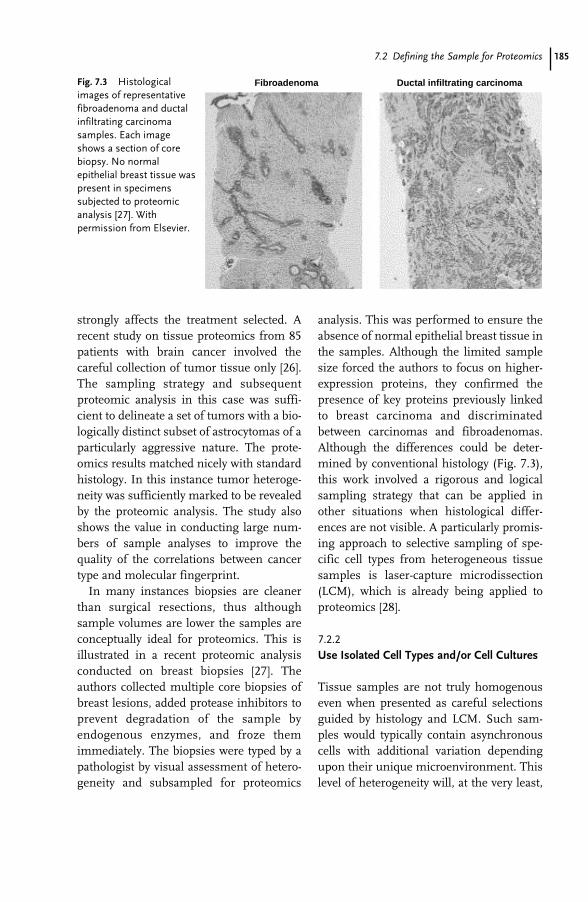
1857.2 Defining the Sample for Proteomics
strongly affects the treatment selected. Arecent study on tissue proteomics from 85patients with brain cancer involved thecareful collection of tumor tissue only [26].The sampling strategy and subsequentproteomic analysis in this case was suffi-cient to delineate a set of tumors with a bio-logically distinct subset of astrocytomas of aparticularly aggressive nature. The prote-omics results matched nicely with standardhistology. In this instance tumor heteroge-neity was sufficiently marked to be revealedby the proteomic analysis. The study alsoshows the value in conducting large num-bers of sample analyses to improve thequality of the correlations between cancertype and molecular fingerprint.
In many instances biopsies are cleanerthan surgical resections, thus althoughsample volumes are lower the samples areconceptually ideal for proteomics. This isillustrated in a recent proteomic analysisconducted on breast biopsies [27]. Theauthors collected multiple core biopsies ofbreast lesions, added protease inhibitors toprevent degradation of the sample byendogenous enzymes, and froze themimmediately. The biopsies were typed by apathologist by visual assessment of hetero-geneity and subsampled for proteomics
analysis. This was performed to ensure theabsence of normal epithelial breast tissue inthe samples. Although the limited samplesize forced the authors to focus on higher-expression proteins, they confirmed thepresence of key proteins previously linkedto breast carcinoma and discriminatedbetween carcinomas and fibroadenomas.Although the differences could be deter-mined by conventional histology (Fig. 7.3),this work involved a rigorous and logicalsampling strategy that can be applied inother situations when histological differ-ences are not visible. A particularly promis-ing approach to selective sampling of spe-cific cell types from heterogeneous tissuesamples is laser-capture microdissection(LCM), which is already being applied toproteomics [28].
7.2.2
Use Isolated Cell Types and/or Cell Cultures
Tissue samples are not truly homogenouseven when presented as careful selectionsguided by histology and LCM. Such sam-ples would typically contain asynchronouscells with additional variation dependingupon their unique microenvironment. Thislevel of heterogeneity will, at the very least,
Fibroadenoma Ductal infiltrating carcinomaFig. 7.3 Histologicalimages of representativefibroadenoma and ductalinfiltrating carcinomasamples. Each imageshows a section of corebiopsy. No normalepithelial breast tissue waspresent in specimenssubjected to proteomicanalysis [27]. Withpermission from Elsevier.
07_181_210 25.04.2005 11:02 Uhr Seite 185
186 7 Proteomics and Mass Spectrometry for the Biological Researcher
affect the expression level of many proteins.Cultured cell lines are useful alternatives,because the variability can be controlled to agreater extent. The benefits of cell lines canbe illustrated by a proteomic study conduct-ed on human T cells [29]. In this work, theauthors carefully cultured and stimulatedCD4+ lymphocytes, and then selectivelypolarized fractions of the culture toward T1helper and T2 helper cells using therequired interleukins. A functional assess-ment of polarization was made before con-ducting a proteomic comparison of expres-sion levels between the differentially stimu-lated fractions. This level of control overgrowth conditions and stimulation promot-ed informative comparisons and helpedidentify differentially expressed proteinswith a minimum of analytical variance. Ingeneral, cell and tissue cultures are excel-lent entry-points into proteomics experi-ments, because sufficiently large samplescan be prepared under controlled conditions.One caution is that evolution and adaptationof the line through numerous passages canalter the significance of the findings. Wholecell proteomics have been particularly suc-cessful in the analysis of lower complexityorganisms such as bacteria and yeast[30–32]. Cultures of these organisms can beprepared in high abundance, with greaterease and compositional homogeneity. Thesmall size of their proteomes make whole-cell proteomic initiatives feasible – forexample recent studies suggest that approx-imately 5000 proteins are expressed at anygiven time in S. cerevisiae [33, 34].
7.2.3
Minimize Intracellular Heterogeneity
Virtually all tissue and whole-cell proteom-ics experiments of the types described abovereflect higher expression-level proteins inthe sample. None of the analytical tech-
niques used in proteomics have the dynam-ic range required for detection of the lowerrange of protein concentration nor do theyoffer empirical evidence of protein localiza-tion. Substantial recent activity in proteom-ics profiling has focused on the analysis ofsubcellular fractions, in an effort to mini-mize the dynamic range problem andrecover some measure of location specific-ity. Not surprisingly, integral membraneand membrane-associated proteins havebeen studied extensively, because of theirsignificance in cell signaling and their highvalue as drug targets [35, 36]. Organellarproteomics of mitochondria [37, 38], thenucleolus [39, 40], and the phagosome [41,42] are examples of some recent initiativesthat have led to new knowledge. A key com-ponent of all these projects was the imple-mentation of fractionation procedures spe-cific for the targeted organelle [17]. Some ofthe work on the analysis of the plasmamembrane has revealed proteins normallyassociated with the mitochondria, thus rais-ing the question of the validity of the associ-ation. Prefractionation procedures are notalways perfect but elegant examples of sub-tractive techniques such those as describedin the work on the proteomics of the nucle-ar membrane [35] suggest ways around cur-rent difficulties. The proteomic analysis oflipid rafts, or membrane microdomains, ismore controversial because of the lack ofconsensus on an enrichment procedure [43].In general, a proper proteomics strategyinvolves a validation step, in which the pro-teins identified in the discovery phase arelocalized more precisely, for example byimmunostaining and microscopy.
7.2.4
Minimize Dynamic Range
Sub-cellular fractionation helps to mini-mize the complexity of the sample intended
07_181_210 25.04.2005 11:02 Uhr Seite 186
1877.3 New Developments – Clinical Proteomics
for proteomic identification and has theadditional benefit of reducing the dynamicrange of protein concentration. Conventio-nal chromatographic or electrophoreticmethods of protein prefractionation havebeen used to reduce the dynamic range fur-ther and, whether this is applied to the pro-teins themselves or their enzymatic digests,results clearly show that prefractionationminimizes the dynamic range in each frac-tion presented for analysis [44]. Becausethese separation methods are based on bulkproperties such as hydrophobicity, chargeand size they tend not to discriminatebetween high-concentration and low-con-centration proteins. Thus, the dynamicrange within fractions is usually, but notalways, compressed. For example, low-abundance proteins with retention proper-ties similar to those of serum albumin willoccur in a fraction with a wide dynamicrange. For this reason multidimensionalseparation techniques such as 2D gel elec-trophoresis and hyphenation of differenttypes of chromatography pervade modernproteomics. An extra dimension of separa-tion can further reduce the dynamic rangeissue.
The problem is significant for unstruc-tured biological fluids such as serum.Recent efforts have focused on extraction ofthe main, high abundance proteins byaffinity chromatography (for albumin, anti-trypsin, hemopexin, etc.) thus enriching theremaining solution for lower-abundanceproteins [45–47]. This minimizes the down-stream sample handling required to identi-fy the proteins. Affinity-based proceduresare also used for selective targeting of pro-teins within complex samples. Proteinchips or arrays based on selective recogni-tion of predetermined proteins are useful frquantitation from such samples [48]. Thesecan be regarded as high-throughput vari-ants of the ubiquitous immunoassay.
Immunoprecipitation of a given proteinand its associated proteins is anothermeans of circumventing the dynamic rangeissue and conveying functional relevance atthe same time. Large-scale interactionmaps have been assembled by using thissample handling procedure [6, 49, 50].More targeted efforts show that the meth-ods are reasonably reproducible but interla-boratory variance is still an issue, as arenonspecific associations [7].
7.2.5
Maximize Concentration/Minimize Handling
Detection systems used in proteomics are“concentration-dependent” rather thanmass-dependent. Sample fractionationtechniques should therefore preserve – orbetter – increase the concentration of therecovered proteins. A final step before iden-tification is usually a preconcentration step,often based on chromatography or electro-phoresis. In short, all the considerationsdiscussed here indicate that substantialsample processing is required to deliverhigh identification power. Proteins arenotoriously unstable in solution outsidetheir biological environment and thus mul-tistep processes tend to compound prob-lems with sample loss as a result of dena-turing, precipitation and adsorption.
7.3
New Developments – Clinical Proteomics
There are new developments in proteomicsthat directly affect the sampling strategyproblem and serve to highlight the techni-cal challenges in the field. Researchers areinvestigating the feasibility of direct sam-pling of tissue using mass spectrometry, so-called “imaging mass spectrometry” [51].The current state of the art supports the
07_181_210 25.04.2005 11:02 Uhr Seite 187
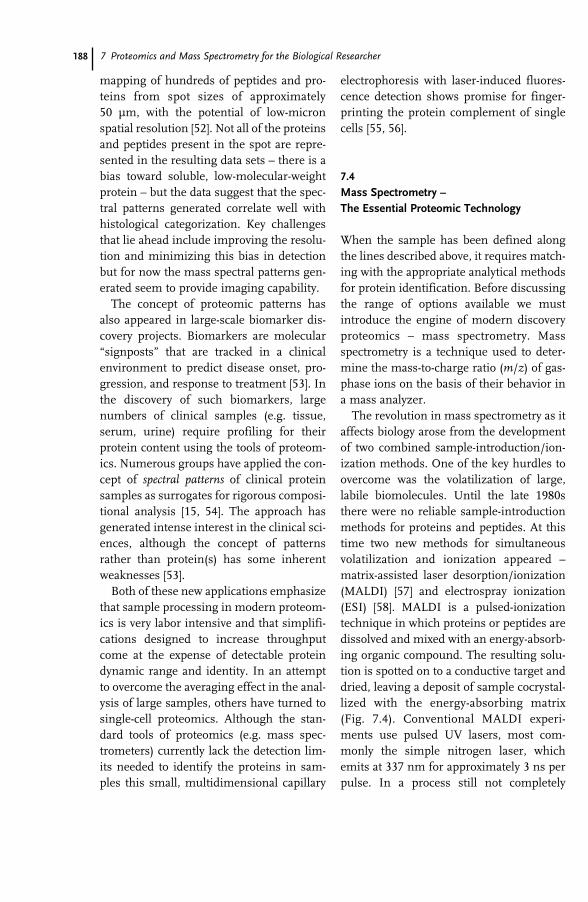
188 7 Proteomics and Mass Spectrometry for the Biological Researcher
mapping of hundreds of peptides and pro-teins from spot sizes of approximately50 µm, with the potential of low-micronspatial resolution [52]. Not all of the proteinsand peptides present in the spot are repre-sented in the resulting data sets – there is abias toward soluble, low-molecular-weightprotein – but the data suggest that the spec-tral patterns generated correlate well withhistological categorization. Key challengesthat lie ahead include improving the resolu-tion and minimizing this bias in detectionbut for now the mass spectral patterns gen-erated seem to provide imaging capability.
The concept of proteomic patterns hasalso appeared in large-scale biomarker dis-covery projects. Biomarkers are molecular“signposts” that are tracked in a clinicalenvironment to predict disease onset, pro-gression, and response to treatment [53]. Inthe discovery of such biomarkers, largenumbers of clinical samples (e.g. tissue,serum, urine) require profiling for theirprotein content using the tools of proteom-ics. Numerous groups have applied the con-cept of spectral patterns of clinical proteinsamples as surrogates for rigorous composi-tional analysis [15, 54]. The approach hasgenerated intense interest in the clinical sci-ences, although the concept of patternsrather than protein(s) has some inherentweaknesses [53].
Both of these new applications emphasizethat sample processing in modern proteom-ics is very labor intensive and that simplifi-cations designed to increase throughputcome at the expense of detectable proteindynamic range and identity. In an attemptto overcome the averaging effect in the anal-ysis of large samples, others have turned tosingle-cell proteomics. Although the stan-dard tools of proteomics (e.g. mass spec-trometers) currently lack the detection lim-its needed to identify the proteins in sam-ples this small, multidimensional capillary
electrophoresis with laser-induced fluores-cence detection shows promise for finger-printing the protein complement of singlecells [55, 56].
7.4
Mass Spectrometry – The Essential Proteomic Technology
When the sample has been defined alongthe lines described above, it requires match-ing with the appropriate analytical methodsfor protein identification. Before discussingthe range of options available we mustintroduce the engine of modern discoveryproteomics – mass spectrometry. Massspectrometry is a technique used to deter-mine the mass-to-charge ratio (m/z) of gas-phase ions on the basis of their behavior ina mass analyzer.
The revolution in mass spectrometry as itaffects biology arose from the developmentof two combined sample-introduction/ion-ization methods. One of the key hurdles toovercome was the volatilization of large,labile biomolecules. Until the late 1980sthere were no reliable sample-introductionmethods for proteins and peptides. At thistime two new methods for simultaneousvolatilization and ionization appeared –matrix-assisted laser desorption/ionization(MALDI) [57] and electrospray ionization(ESI) [58]. MALDI is a pulsed-ionizationtechnique in which proteins or peptides aredissolved and mixed with an energy-absorb-ing organic compound. The resulting solu-tion is spotted on to a conductive target anddried, leaving a deposit of sample cocrystal-lized with the energy-absorbing matrix(Fig. 7.4). Conventional MALDI experi-ments use pulsed UV lasers, most com-monly the simple nitrogen laser, whichemits at 337 nm for approximately 3 ns perpulse. In a process still not completely
07_181_210 25.04.2005 11:02 Uhr Seite 188
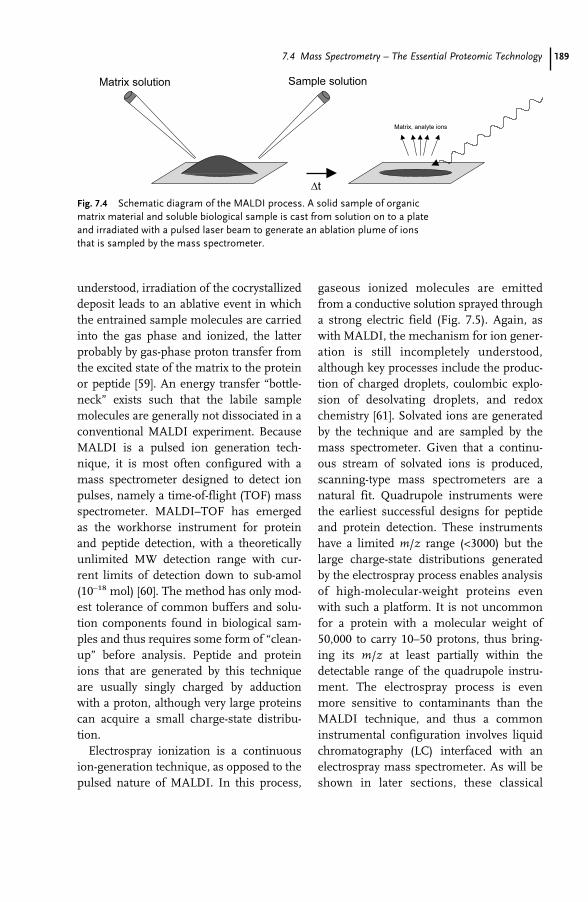
1897.4 Mass Spectrometry – The Essential Proteomic Technology
understood, irradiation of the cocrystallizeddeposit leads to an ablative event in whichthe entrained sample molecules are carriedinto the gas phase and ionized, the latterprobably by gas-phase proton transfer fromthe excited state of the matrix to the proteinor peptide [59]. An energy transfer “bottle-neck” exists such that the labile samplemolecules are generally not dissociated in aconventional MALDI experiment. BecauseMALDI is a pulsed ion generation tech-nique, it is most often configured with amass spectrometer designed to detect ionpulses, namely a time-of-flight (TOF) massspectrometer. MALDI–TOF has emergedas the workhorse instrument for proteinand peptide detection, with a theoreticallyunlimited MW detection range with cur-rent limits of detection down to sub-amol(10–18 mol) [60]. The method has only mod-est tolerance of common buffers and solu-tion components found in biological sam-ples and thus requires some form of “clean-up” before analysis. Peptide and proteinions that are generated by this techniqueare usually singly charged by adductionwith a proton, although very large proteinscan acquire a small charge-state distribu-tion.
Electrospray ionization is a continuousion-generation technique, as opposed to thepulsed nature of MALDI. In this process,
gaseous ionized molecules are emittedfrom a conductive solution sprayed througha strong electric field (Fig. 7.5). Again, aswith MALDI, the mechanism for ion gener-ation is still incompletely understood,although key processes include the produc-tion of charged droplets, coulombic explo-sion of desolvating droplets, and redoxchemistry [61]. Solvated ions are generatedby the technique and are sampled by themass spectrometer. Given that a continu-ous stream of solvated ions is produced,scanning-type mass spectrometers are anatural fit. Quadrupole instruments werethe earliest successful designs for peptideand protein detection. These instrumentshave a limited m/z range (<3000) but thelarge charge-state distributions generatedby the electrospray process enables analysisof high-molecular-weight proteins evenwith such a platform. It is not uncommonfor a protein with a molecular weight of50,000 to carry 10–50 protons, thus bring-ing its m/z at least partially within thedetectable range of the quadrupole instru-ment. The electrospray process is evenmore sensitive to contaminants than theMALDI technique, and thus a commoninstrumental configuration involves liquidchromatography (LC) interfaced with anelectrospray mass spectrometer. As will beshown in later sections, these classical
Fig. 7.4 Schematic diagram of the MALDI process. A solid sample of organicmatrix material and soluble biological sample is cast from solution on to a plateand irradiated with a pulsed laser beam to generate an ablation plume of ionsthat is sampled by the mass spectrometer.
07_181_210 25.04.2005 11:02 Uhr Seite 189
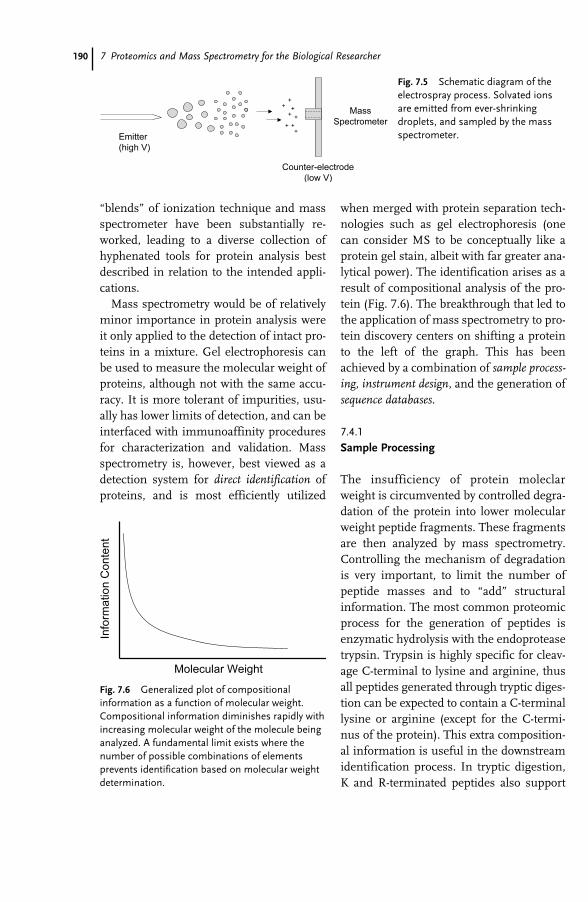
190 7 Proteomics and Mass Spectrometry for the Biological Researcher
“blends” of ionization technique and massspectrometer have been substantially re-worked, leading to a diverse collection ofhyphenated tools for protein analysis bestdescribed in relation to the intended appli-cations.
Mass spectrometry would be of relativelyminor importance in protein analysis wereit only applied to the detection of intact pro-teins in a mixture. Gel electrophoresis canbe used to measure the molecular weight ofproteins, although not with the same accu-racy. It is more tolerant of impurities, usu-ally has lower limits of detection, and can beinterfaced with immunoaffinity proceduresfor characterization and validation. Massspectrometry is, however, best viewed as adetection system for direct identification ofproteins, and is most efficiently utilized
when merged with protein separation tech-nologies such as gel electrophoresis (onecan consider MS to be conceptually like aprotein gel stain, albeit with far greater ana-lytical power). The identification arises as aresult of compositional analysis of the pro-tein (Fig. 7.6). The breakthrough that led tothe application of mass spectrometry to pro-tein discovery centers on shifting a proteinto the left of the graph. This has beenachieved by a combination of sample process-ing, instrument design, and the generation ofsequence databases.
7.4.1
Sample Processing
The insufficiency of protein moleclarweight is circumvented by controlled degra-dation of the protein into lower molecularweight peptide fragments. These fragmentsare then analyzed by mass spectrometry.Controlling the mechanism of degradationis very important, to limit the number ofpeptide masses and to “add” structuralinformation. The most common proteomicprocess for the generation of peptides isenzymatic hydrolysis with the endoproteasetrypsin. Trypsin is highly specific for cleav-age C-terminal to lysine and arginine, thusall peptides generated through tryptic diges-tion can be expected to contain a C-terminallysine or arginine (except for the C-termi-nus of the protein). This extra composition-al information is useful in the downstreamidentification process. In tryptic digestion,K and R-terminated peptides also support
Fig. 7.5 Schematic diagram of theelectrospray process. Solvated ionsare emitted from ever-shrinkingdroplets, and sampled by the massspectrometer.
Fig. 7.6 Generalized plot of compositionalinformation as a function of molecular weight.Compositional information diminishes rapidly withincreasing molecular weight of the molecule beinganalyzed. A fundamental limit exists where thenumber of possible combinations of elementsprevents identification based on molecular weightdetermination.
07_181_210 25.04.2005 11:02 Uhr Seite 190
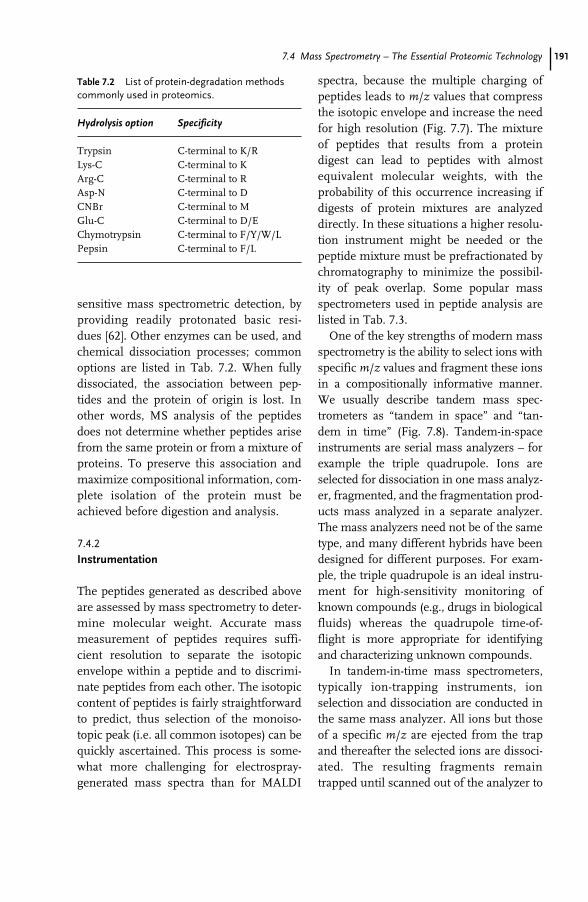
1917.4 Mass Spectrometry – The Essential Proteomic Technology
sensitive mass spectrometric detection, byproviding readily protonated basic resi-dues [62]. Other enzymes can be used, andchemical dissociation processes; commonoptions are listed in Tab. 7.2. When fullydissociated, the association between pep-tides and the protein of origin is lost. Inother words, MS analysis of the peptidesdoes not determine whether peptides arisefrom the same protein or from a mixture ofproteins. To preserve this association andmaximize compositional information, com-plete isolation of the protein must beachieved before digestion and analysis.
7.4.2
Instrumentation
The peptides generated as described aboveare assessed by mass spectrometry to deter-mine molecular weight. Accurate massmeasurement of peptides requires suffi-cient resolution to separate the isotopicenvelope within a peptide and to discrimi-nate peptides from each other. The isotopiccontent of peptides is fairly straightforwardto predict, thus selection of the monoiso-topic peak (i.e. all common isotopes) can bequickly ascertained. This process is some-what more challenging for electrospray-generated mass spectra than for MALDI
spectra, because the multiple charging ofpeptides leads to m/z values that compressthe isotopic envelope and increase the needfor high resolution (Fig. 7.7). The mixtureof peptides that results from a proteindigest can lead to peptides with almostequivalent molecular weights, with theprobability of this occurrence increasing ifdigests of protein mixtures are analyzeddirectly. In these situations a higher resolu-tion instrument might be needed or thepeptide mixture must be prefractionated bychromatography to minimize the possibil-ity of peak overlap. Some popular massspectrometers used in peptide analysis arelisted in Tab. 7.3.
One of the key strengths of modern massspectrometry is the ability to select ions withspecific m/z values and fragment these ionsin a compositionally informative manner.We usually describe tandem mass spec-trometers as “tandem in space” and “tan-dem in time” (Fig. 7.8). Tandem-in-spaceinstruments are serial mass analyzers – forexample the triple quadrupole. Ions areselected for dissociation in one mass analyz-er, fragmented, and the fragmentation prod-ucts mass analyzed in a separate analyzer.The mass analyzers need not be of the sametype, and many different hybrids have beendesigned for different purposes. For exam-ple, the triple quadrupole is an ideal instru-ment for high-sensitivity monitoring ofknown compounds (e.g., drugs in biologicalfluids) whereas the quadrupole time-of-flight is more appropriate for identifyingand characterizing unknown compounds.
In tandem-in-time mass spectrometers,typically ion-trapping instruments, ionselection and dissociation are conducted inthe same mass analyzer. All ions but thoseof a specific m/z are ejected from the trapand thereafter the selected ions are dissoci-ated. The resulting fragments remaintrapped until scanned out of the analyzer to
Table 7.2 List of protein-degradation methodscommonly used in proteomics.
Hydrolysis option Specificity
Trypsin C-terminal to K/RLys-C C-terminal to KArg-C C-terminal to RAsp-N C-terminal to DCNBr C-terminal to MGlu-C C-terminal to D/EChymotrypsin C-terminal to F/Y/W/LPepsin C-terminal to F/L
07_181_210 25.04.2005 11:02 Uhr Seite 191
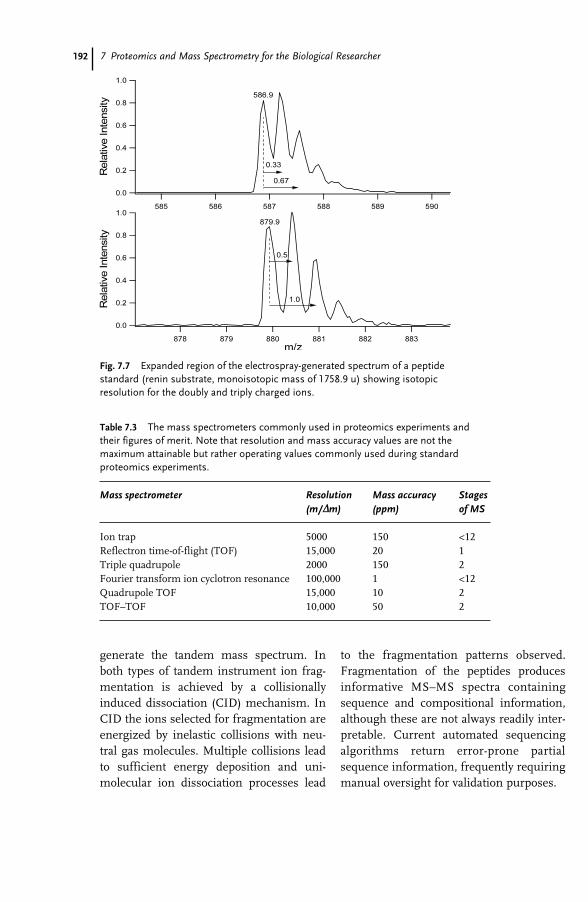
192 7 Proteomics and Mass Spectrometry for the Biological Researcher
generate the tandem mass spectrum. Inboth types of tandem instrument ion frag-mentation is achieved by a collisionallyinduced dissociation (CID) mechanism. InCID the ions selected for fragmentation areenergized by inelastic collisions with neu-tral gas molecules. Multiple collisions leadto sufficient energy deposition and uni-molecular ion dissociation processes lead
to the fragmentation patterns observed.Fragmentation of the peptides producesinformative MS–MS spectra containingsequence and compositional information,although these are not always readily inter-pretable. Current automated sequencingalgorithms return error-prone partialsequence information, frequently requiringmanual oversight for validation purposes.
Fig. 7.7 Expanded region of the electrospray-generated spectrum of a peptidestandard (renin substrate, monoisotopic mass of 1758.9 u) showing isotopicresolution for the doubly and triply charged ions.
Table 7.3 The mass spectrometers commonly used in proteomics experiments andtheir figures of merit. Note that resolution and mass accuracy values are not themaximum attainable but rather operating values commonly used during standardproteomics experiments.
Mass spectrometer Resolution Mass accuracy Stages (m/ÄÄm) (ppm) of MS
Ion trap 5000 150 <12Reflectron time-of-flight (TOF) 15,000 20 1Triple quadrupole 2000 150 2Fourier transform ion cyclotron resonance 100,000 1 <12Quadrupole TOF 15,000 10 2TOF–TOF 10,000 50 2
07_181_210 25.04.2005 11:02 Uhr Seite 192
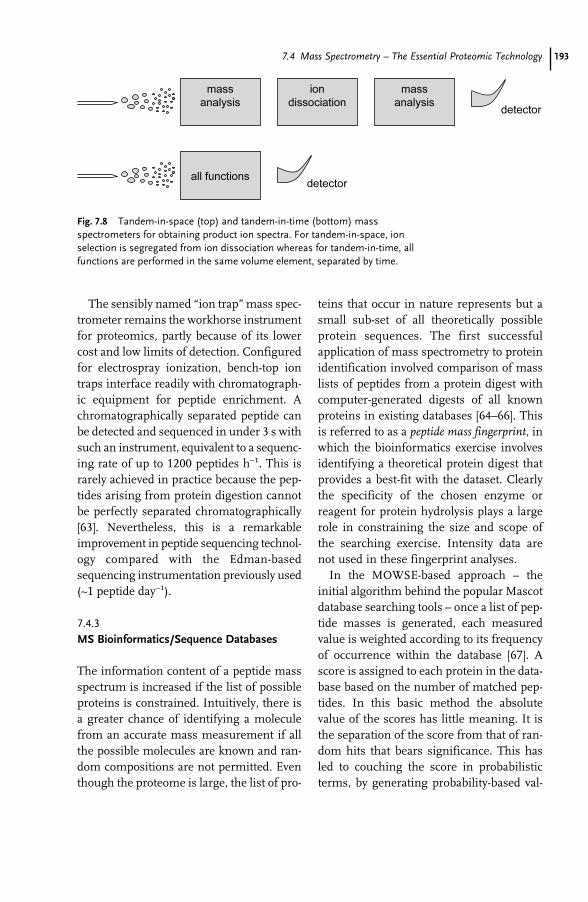
1937.4 Mass Spectrometry – The Essential Proteomic Technology
The sensibly named “ion trap” mass spec-trometer remains the workhorse instrumentfor proteomics, partly because of its lowercost and low limits of detection. Configuredfor electrospray ionization, bench-top iontraps interface readily with chromatograph-ic equipment for peptide enrichment. Achromatographically separated peptide canbe detected and sequenced in under 3 s withsuch an instrument, equivalent to a sequenc-ing rate of up to 1200 peptides h–1. This israrely achieved in practice because the pep-tides arising from protein digestion cannotbe perfectly separated chromatographically[63]. Nevertheless, this is a remarkableimprovement in peptide sequencing technol-ogy compared with the Edman-basedsequencing instrumentation previously used(~1 peptide day–1).
7.4.3
MS Bioinformatics/Sequence Databases
The information content of a peptide massspectrum is increased if the list of possibleproteins is constrained. Intuitively, there isa greater chance of identifying a moleculefrom an accurate mass measurement if allthe possible molecules are known and ran-dom compositions are not permitted. Eventhough the proteome is large, the list of pro-
teins that occur in nature represents but asmall sub-set of all theoretically possibleprotein sequences. The first successfulapplication of mass spectrometry to proteinidentification involved comparison of masslists of peptides from a protein digest withcomputer-generated digests of all knownproteins in existing databases [64–66]. Thisis referred to as a peptide mass fingerprint, inwhich the bioinformatics exercise involvesidentifying a theoretical protein digest thatprovides a best-fit with the dataset. Clearlythe specificity of the chosen enzyme orreagent for protein hydrolysis plays a largerole in constraining the size and scope ofthe searching exercise. Intensity data arenot used in these fingerprint analyses.
In the MOWSE-based approach – theinitial algorithm behind the popular Mascotdatabase searching tools – once a list of pep-tide masses is generated, each measuredvalue is weighted according to its frequencyof occurrence within the database [67]. Ascore is assigned to each protein in the data-base based on the number of matched pep-tides. In this basic method the absolutevalue of the scores has little meaning. It isthe separation of the score from that of ran-dom hits that bears significance. This hasled to couching the score in probabilisticterms, by generating probability-based val-
Fig. 7.8 Tandem-in-space (top) and tandem-in-time (bottom) massspectrometers for obtaining product ion spectra. For tandem-in-space, ionselection is segregated from ion dissociation whereas for tandem-in-time, allfunctions are performed in the same volume element, separated by time.
07_181_210 25.04.2005 11:02 Uhr Seite 193

194 7 Proteomics and Mass Spectrometry for the Biological Researcher
ues indicating the likelihood of a determina-tion arising as a result of a random event[68]. By assigning probability to a hit, theuser can determine the confidence level thatshould be applied. There are numerous var-iants of this approach, but all such finger-printing methods share the following strin-gent requirements to ensure a high successrate:
High database quality (complete proteinlist, low error rate, full knowledge of post-translational modifications). Most databas-es are populated with translated genomicdata of different levels of maintenance andquality. Because these are in a constant stateof improvement, the score reflects the qual-ity of the database as much as it reflects thequality of the dataset. It is not surprisingthat the peptide mass fingerprintingapproach is best suited to bacterial studiesin which the genome is small and com-plete [69]. Identification success ratesapproach 100%. Searches based on humandatabases, however, deliver significantlylower success rates.
High mass-measurement accuracy andsequence coverage for the protein digest.
There is a strong correlation between massaccuracy and the ability to determine anidentity with high confidence [70]. Fig. 7.9indicates the importance of mass accuracyin this context, thus instruments with theability to generate <20 ppm levels arestrongly recommended.
Isolated protein. The presence of two ormore proteins will lead to a list of peptideswith association to the protein of originerased. Although it is possible to search forthe best x proteins in the database toexplain the data, the success rate of thesearch drops. Proteins should be well separ-ated before such experiments to improvethe success of the search.
The peptide mass fingerprinting ap-proach is biased against small proteins, andalthough correction factors can be appliedto avoid overweighting large proteins thereis still a minimum requirement for thelength of the mass list (approximately fivepeptides or more). Many small proteins willnot, on digestion, produce a list of this size.
Tandem MS data sets are richer in thatpeptide sequence can be empirically deter-mined. Manual or computer-assisted inter-
Fig. 7.9 The number of tryptic peptides of nominal mass 1000 present in theGenpept database release 98 (12/96), which contains ~210,000 entries. Tofacilitate assessment of the discriminating power of mass accuracy, the num-ber of peptides was counted in mass windows of four different widths. Onemissed tryptic cleavage was allowed (from Ref. [70]). With permission fromAmerican Chemical Society.
+/– 10 ppm slice
Mass (m/z) – monoisotopic
10,000
1000
.20
1000
.30
1000
.40
1000
.50
1000
.60
1000
.70
1000
.80
Num
ber
of P
eptid
es
MassWindow
(Da)
MassTolerance
(ppm)
� 1 +/– 500
� 0.1 +/– 50
� 0.01 +/– 5
� 0.001 +/– 0.5
1,000
100
10
1
0
07_181_210 25.04.2005 11:02 Uhr Seite 194
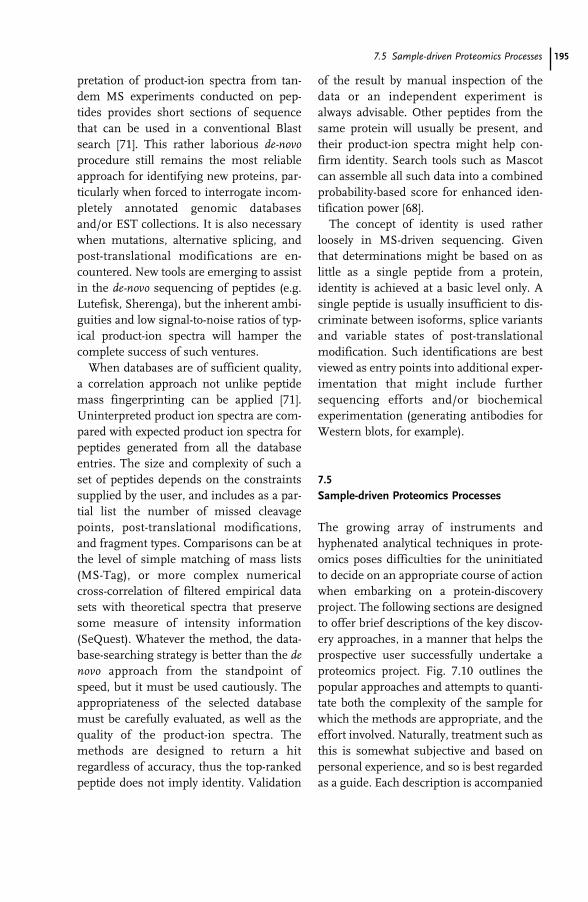
1957.5 Sample-driven Proteomics Processes
pretation of product-ion spectra from tan-dem MS experiments conducted on pep-tides provides short sections of sequencethat can be used in a conventional Blastsearch [71]. This rather laborious de-novoprocedure still remains the most reliableapproach for identifying new proteins, par-ticularly when forced to interrogate incom-pletely annotated genomic databasesand/or EST collections. It is also necessarywhen mutations, alternative splicing, andpost-translational modifications are en-countered. New tools are emerging to assistin the de-novo sequencing of peptides (e.g.Lutefisk, Sherenga), but the inherent ambi-guities and low signal-to-noise ratios of typ-ical product-ion spectra will hamper thecomplete success of such ventures.
When databases are of sufficient quality,a correlation approach not unlike peptidemass fingerprinting can be applied [71].Uninterpreted product ion spectra are com-pared with expected product ion spectra forpeptides generated from all the databaseentries. The size and complexity of such aset of peptides depends on the constraintssupplied by the user, and includes as a par-tial list the number of missed cleavagepoints, post-translational modifications,and fragment types. Comparisons can be atthe level of simple matching of mass lists(MS-Tag), or more complex numericalcross-correlation of filtered empirical datasets with theoretical spectra that preservesome measure of intensity information(SeQuest). Whatever the method, the data-base-searching strategy is better than the denovo approach from the standpoint ofspeed, but it must be used cautiously. Theappropriateness of the selected databasemust be carefully evaluated, as well as thequality of the product-ion spectra. Themethods are designed to return a hitregardless of accuracy, thus the top-rankedpeptide does not imply identity. Validation
of the result by manual inspection of thedata or an independent experiment isalways advisable. Other peptides from thesame protein will usually be present, andtheir product-ion spectra might help con-firm identity. Search tools such as Mascotcan assemble all such data into a combinedprobability-based score for enhanced iden-tification power [68].
The concept of identity is used ratherloosely in MS-driven sequencing. Giventhat determinations might be based on aslittle as a single peptide from a protein,identity is achieved at a basic level only. Asingle peptide is usually insufficient to dis-criminate between isoforms, splice variantsand variable states of post-translationalmodification. Such identifications are bestviewed as entry points into additional exper-imentation that might include furthersequencing efforts and/or biochemicalexperimentation (generating antibodies forWestern blots, for example).
7.5
Sample-driven Proteomics Processes
The growing array of instruments andhyphenated analytical techniques in prote-omics poses difficulties for the uninitiatedto decide on an appropriate course of actionwhen embarking on a protein-discoveryproject. The following sections are designedto offer brief descriptions of the key discov-ery approaches, in a manner that helps theprospective user successfully undertake aproteomics project. Fig. 7.10 outlines thepopular approaches and attempts to quanti-tate both the complexity of the sample forwhich the methods are appropriate, and theeffort involved. Naturally, treatment such asthis is somewhat subjective and based onpersonal experience, and so is best regardedas a guide. Each description is accompanied
07_181_210 25.04.2005 11:02 Uhr Seite 195
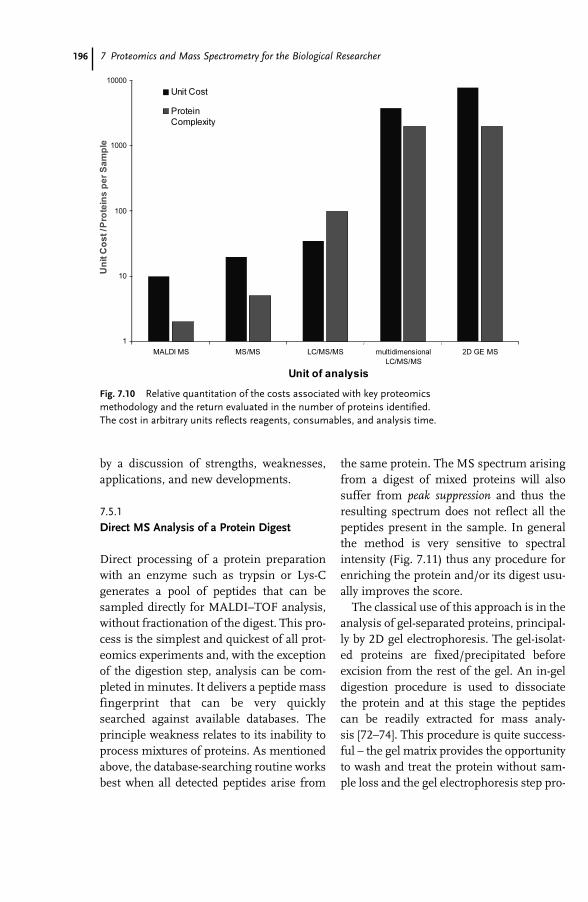
196 7 Proteomics and Mass Spectrometry for the Biological Researcher
by a discussion of strengths, weaknesses,applications, and new developments.
7.5.1
Direct MS Analysis of a Protein Digest
Direct processing of a protein preparationwith an enzyme such as trypsin or Lys-Cgenerates a pool of peptides that can besampled directly for MALDI–TOF analysis,without fractionation of the digest. This pro-cess is the simplest and quickest of all prot-eomics experiments and, with the exceptionof the digestion step, analysis can be com-pleted in minutes. It delivers a peptide massfingerprint that can be very quicklysearched against available databases. Theprinciple weakness relates to its inability toprocess mixtures of proteins. As mentionedabove, the database-searching routine worksbest when all detected peptides arise from
the same protein. The MS spectrum arisingfrom a digest of mixed proteins will alsosuffer from peak suppression and thus theresulting spectrum does not reflect all thepeptides present in the sample. In generalthe method is very sensitive to spectralintensity (Fig. 7.11) thus any procedure forenriching the protein and/or its digest usu-ally improves the score.
The classical use of this approach is in theanalysis of gel-separated proteins, principal-ly by 2D gel electrophoresis. The gel-isolat-ed proteins are fixed/precipitated beforeexcision from the rest of the gel. An in-geldigestion procedure is used to dissociatethe protein and at this stage the peptidescan be readily extracted for mass analy-sis [72–74]. This procedure is quite success-ful – the gel matrix provides the opportunityto wash and treat the protein without sam-ple loss and the gel electrophoresis step pro-
Fig. 7.10 Relative quantitation of the costs associated with key proteomicsmethodology and the return evaluated in the number of proteins identified.The cost in arbitrary units reflects reagents, consumables, and analysis time.
07_181_210 25.04.2005 11:02 Uhr Seite 196
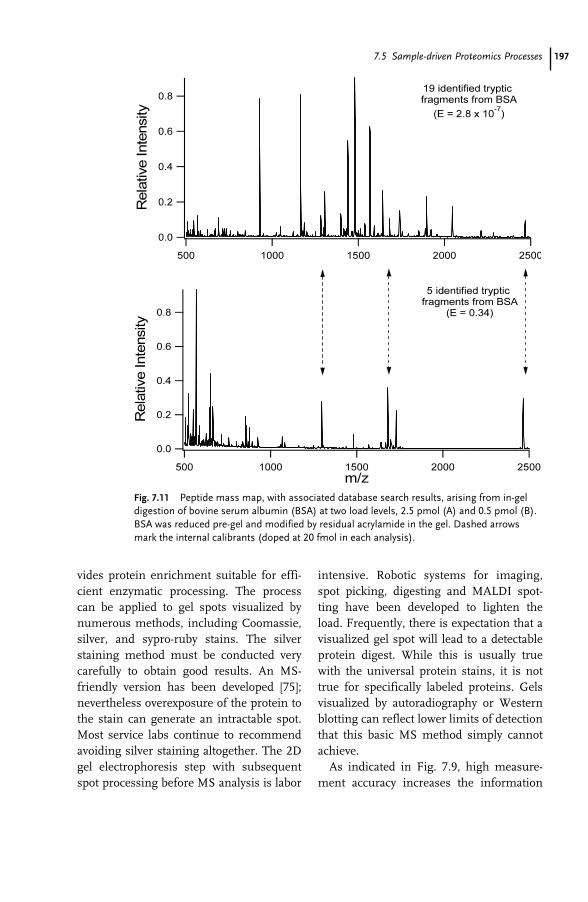
1977.5 Sample-driven Proteomics Processes
vides protein enrichment suitable for effi-cient enzymatic processing. The processcan be applied to gel spots visualized bynumerous methods, including Coomassie,silver, and sypro-ruby stains. The silverstaining method must be conducted verycarefully to obtain good results. An MS-friendly version has been developed [75];nevertheless overexposure of the protein tothe stain can generate an intractable spot.Most service labs continue to recommendavoiding silver staining altogether. The 2Dgel electrophoresis step with subsequentspot processing before MS analysis is labor
intensive. Robotic systems for imaging,spot picking, digesting and MALDI spot-ting have been developed to lighten theload. Frequently, there is expectation that avisualized gel spot will lead to a detectableprotein digest. While this is usually truewith the universal protein stains, it is nottrue for specifically labeled proteins. Gelsvisualized by autoradiography or Westernblotting can reflect lower limits of detectionthat this basic MS method simply cannotachieve.
As indicated in Fig. 7.9, high measure-ment accuracy increases the information
Fig. 7.11 Peptide mass map, with associated database search results, arising from in-geldigestion of bovine serum albumin (BSA) at two load levels, 2.5 pmol (A) and 0.5 pmol (B).BSA was reduced pre-gel and modified by residual acrylamide in the gel. Dashed arrowsmark the internal calibrants (doped at 20 fmol in each analysis).
07_181_210 25.04.2005 11:02 Uhr Seite 197
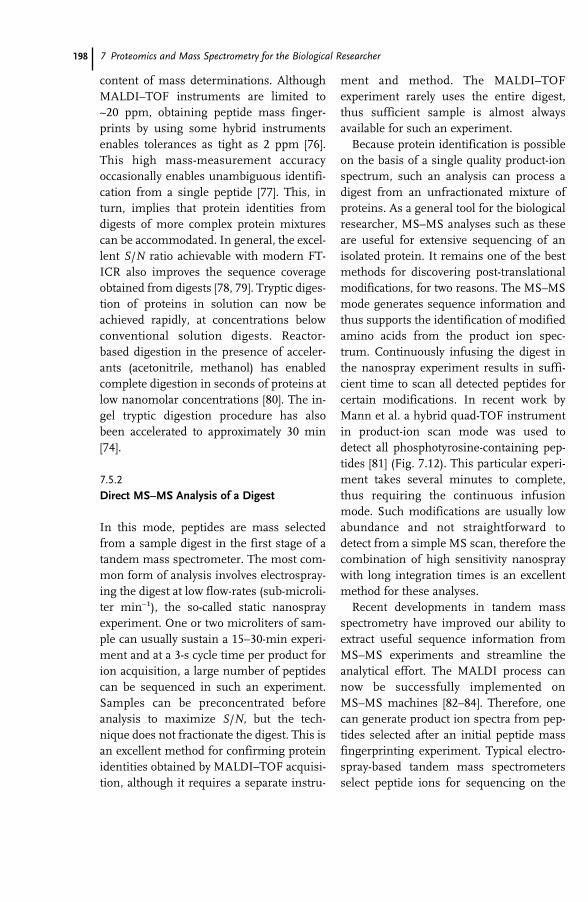
198 7 Proteomics and Mass Spectrometry for the Biological Researcher
content of mass determinations. AlthoughMALDI–TOF instruments are limited to~20 ppm, obtaining peptide mass finger-prints by using some hybrid instrumentsenables tolerances as tight as 2 ppm [76].This high mass-measurement accuracyoccasionally enables unambiguous identifi-cation from a single peptide [77]. This, inturn, implies that protein identities fromdigests of more complex protein mixturescan be accommodated. In general, the excel-lent S/N ratio achievable with modern FT-ICR also improves the sequence coverageobtained from digests [78, 79]. Tryptic diges-tion of proteins in solution can now beachieved rapidly, at concentrations belowconventional solution digests. Reactor-based digestion in the presence of acceler-ants (acetonitrile, methanol) has enabledcomplete digestion in seconds of proteins atlow nanomolar concentrations [80]. The in-gel tryptic digestion procedure has alsobeen accelerated to approximately 30 min[74].
7.5.2
Direct MS–MS Analysis of a Digest
In this mode, peptides are mass selectedfrom a sample digest in the first stage of atandem mass spectrometer. The most com-mon form of analysis involves electrospray-ing the digest at low flow-rates (sub-microli-ter min–1), the so-called static nanosprayexperiment. One or two microliters of sam-ple can usually sustain a 15–30-min experi-ment and at a 3-s cycle time per product forion acquisition, a large number of peptidescan be sequenced in such an experiment.Samples can be preconcentrated beforeanalysis to maximize S/N, but the tech-nique does not fractionate the digest. This isan excellent method for confirming proteinidentities obtained by MALDI–TOF acquisi-tion, although it requires a separate instru-
ment and method. The MALDI–TOFexperiment rarely uses the entire digest,thus sufficient sample is almost alwaysavailable for such an experiment.
Because protein identification is possibleon the basis of a single quality product-ionspectrum, such an analysis can process adigest from an unfractionated mixture ofproteins. As a general tool for the biologicalresearcher, MS–MS analyses such as theseare useful for extensive sequencing of anisolated protein. It remains one of the bestmethods for discovering post-translationalmodifications, for two reasons. The MS–MSmode generates sequence information andthus supports the identification of modifiedamino acids from the product ion spec-trum. Continuously infusing the digest inthe nanospray experiment results in suffi-cient time to scan all detected peptides forcertain modifications. In recent work byMann et al. a hybrid quad-TOF instrumentin product-ion scan mode was used todetect all phosphotyrosine-containing pep-tides [81] (Fig. 7.12). This particular experi-ment takes several minutes to complete,thus requiring the continuous infusionmode. Such modifications are usually lowabundance and not straightforward todetect from a simple MS scan, therefore thecombination of high sensitivity nanospraywith long integration times is an excellentmethod for these analyses.
Recent developments in tandem massspectrometry have improved our ability toextract useful sequence information fromMS–MS experiments and streamline theanalytical effort. The MALDI process cannow be successfully implemented onMS–MS machines [82–84]. Therefore, onecan generate product ion spectra from pep-tides selected after an initial peptide massfingerprinting experiment. Typical electro-spray-based tandem mass spectrometersselect peptide ions for sequencing on the
07_181_210 25.04.2005 11:02 Uhr Seite 198
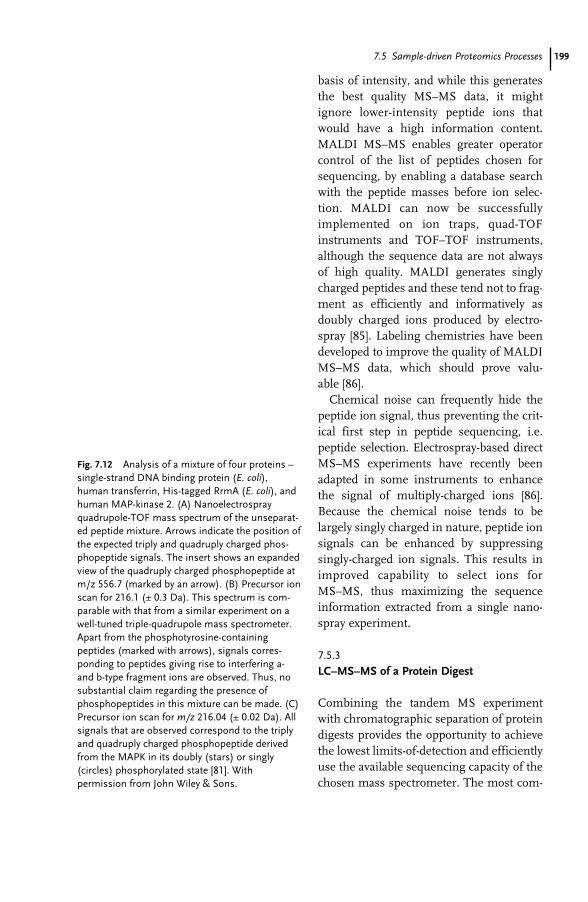
1997.5 Sample-driven Proteomics Processes
basis of intensity, and while this generatesthe best quality MS–MS data, it mightignore lower-intensity peptide ions thatwould have a high information content.MALDI MS–MS enables greater operatorcontrol of the list of peptides chosen forsequencing, by enabling a database searchwith the peptide masses before ion selec-tion. MALDI can now be successfullyimplemented on ion traps, quad-TOFinstruments and TOF–TOF instruments,although the sequence data are not alwaysof high quality. MALDI generates singlycharged peptides and these tend not to frag-ment as efficiently and informatively asdoubly charged ions produced by electro-spray [85]. Labeling chemistries have beendeveloped to improve the quality of MALDIMS–MS data, which should prove valu-able [86].
Chemical noise can frequently hide thepeptide ion signal, thus preventing the crit-ical first step in peptide sequencing, i.e.peptide selection. Electrospray-based directMS–MS experiments have recently beenadapted in some instruments to enhancethe signal of multiply-charged ions [86].Because the chemical noise tends to belargely singly charged in nature, peptide ionsignals can be enhanced by suppressingsingly-charged ion signals. This results inimproved capability to select ions forMS–MS, thus maximizing the sequenceinformation extracted from a single nano-spray experiment.
7.5.3
LC–MS–MS of a Protein Digest
Combining the tandem MS experimentwith chromatographic separation of proteindigests provides the opportunity to achievethe lowest limits-of-detection and efficientlyuse the available sequencing capacity of thechosen mass spectrometer. The most com-
Fig. 7.12 Analysis of a mixture of four proteins –single-strand DNA binding protein (E. coli),human transferrin, His-tagged RrmA (E. coli), andhuman MAP-kinase 2. (A) Nanoelectrosprayquadrupole-TOF mass spectrum of the unseparat-ed peptide mixture. Arrows indicate the position ofthe expected triply and quadruply charged phos-phopeptide signals. The insert shows an expandedview of the quadruply charged phosphopeptide atm/z 556.7 (marked by an arrow). (B) Precursor ionscan for 216.1 (± 0.3 Da). This spectrum is com-parable with that from a similar experiment on awell-tuned triple-quadrupole mass spectrometer.Apart from the phosphotyrosine-containingpeptides (marked with arrows), signals corres-ponding to peptides giving rise to interfering a-and b-type fragment ions are observed. Thus, nosubstantial claim regarding the presence ofphosphopeptides in this mixture can be made. (C)Precursor ion scan for m/z 216.04 (± 0.02 Da). Allsignals that are observed correspond to the triplyand quadruply charged phosphopeptide derivedfrom the MAPK in its doubly (stars) or singly(circles) phosphorylated state [81]. Withpermission from John Wiley & Sons.
07_181_210 25.04.2005 11:02 Uhr Seite 199
200 7 Proteomics and Mass Spectrometry for the Biological Researcher
mon configuration involves small-borereversed phase LC columns with electro-spray-based ion-trap or quad-TOF massspectrometers. To a first approximation,peak concentration scales with the inverseof column diameter. Columns with i.d. aslow as 30 µm are being used, although75 µm is more common. Such systemsrequire flow rates in the sub-µL min–1 rangeand a nanospray configuration. This combi-nation is not the most rugged of systemsand currently requires considerable opera-tor intervention. The key benefits of thesecombinations include enrichment and theability to sequence hundreds of peptides perrun, translating into a capacity for low hun-dreds of protein identifications perLC–MS–MS experiment. Licklider et al.have used the approach to identify proteinsfrom an outer membrane preparation fromPseudomonas aeruginosa [87]. A singleLC–MS–MS run was able to identify morethan one hundred proteins. Such capabilityminimizes the need for exhaustive proteinseparation before analysis – the keystrength of the approach. It achieves a sub-stantial increase in identification powerover the direct MS–MS approach by provid-ing the mass spectrometer additional timefor sequencing. These experiments are con-ducted in a data-dependent fashion; a sur-vey MS scan is first used to identify a pep-tide ion m/z and this is followed by anMS–MS experiment on this ion. By concen-trating a given peptide in a band several sec-onds wide and separating it from others, theinstrument has sufficient time to generate aquality MS–MS spectrum. Thus the effi-ciency of the chromatography used is deter-mined by the MS–MS requirements of themass spectrometer. Coeluting peptides canbe sequenced only if the chromatographicbandwidth is sufficiently broad to enable formore than one sequencing event per cycle.Ultrahigh resolution separation techniques
with bandwidths in the low to sub-secondtimeframe currently cannot be supportedby MS–MS instrumentation.
The range of applications of such asystem is quite enormous, although theycenter principally on protein identifica-tion [88]. Such analyses are not exhaustiveand, because of the finite sequencing capac-ity mentioned above, additional runs of agiven sample should be performed. Newdevelopments in this area center on max-imizing the peak capacity of LC–MS–MSsystems and improving their ruggedness.Ultra-long chromatographic gradients andlong columns for highest separation effi-ciency have recently been applied, for exam-ple to the analysis of D. radiodurans [89, 90].Runs as long as five hours achieve peakcapacities greater than 1000 at flow ratesthat support very sensitive detection. Newmonolithic columns have been developedthat can achieve high efficiency separationsat flow rates higher than with conventionalcolumns; this should lead to shorter analy-sis times [91]. Better quality low-flowpumps have been developed to supportreproducible chromatography; this has ledto the concept of using predicted chromato-graphic retention times as an aid in thedetermination of peptide sequence [92].With the advent of MALDI MS–MS,systems are being developed that couplemicroLC with MALDI spotters [93].Because MS–MS can be implemented with-out the time constraints of electrosprayLC–MS–MS, the hyphenated technique ofLC-MALDI MS–MS should prove quite use-ful. In general, attention to high-perfor-mance LC–MS–MS system developmentfor peptide separation and analysis affordsthe best option for improving the dynamicrange of analysis. Recent work by Smith etal. suggests that FT-ICR-based systems candeliver up to six orders of magnitude [89,90].
07_181_210 25.04.2005 11:02 Uhr Seite 200
2017.5 Sample-driven Proteomics Processes
7.5.4
Multidimensional LC–MS–MS of a Digest(Top-down vs Bottom-up Proteomics)
Two dimensional gel electrophoresis pro-vides the opportunity to separate largenumbers of proteins, and their intercala-tion within the gel matrix enables sampletreatment and cleanup before proteinextraction. Gel-based approaches for bio-molecule separation are but a subset of theavailable fractionation techniques that canbe used to process protein samples beforeto mass spectrometric analysis. A range ofchromatographic methods have beenapplied both to intact protein separationand to separation of protein digests.Compared with gel electrophoresis thesemethods enable more selective retentionbehavior and ease of automation. Proteinseparation by chromatographic means canbe achieved by size exclusion, hydrophobicretention, ion exchange, and a variety ofaffinity-based procedures. These are but afew approaches that share with gel electro-phoresis the means to separate mixtures ofproteins for the purpose of preparing sim-plified samples for subsequent MS analy-sis. As with gel methods, column separa-tion supports clean-up, enrichment, andmaximum dynamic range in the analysis.Additional dimensions of separation havebeen applied at the protein and/or peptidelevel; this has led to a variety of multidi-mensional systems. Typically, protein-based separations (e.g. SEC) would be con-sidered for the first dimension followed byprotein digestion and subsequent reversed-phase separation of peptides for the seconddimension (this latter dimension is theLC–MS–MS discussed above).
The approach has been extended toinclude multidimensional systems for theseparation of wholesale digests of complexprotein mixtures. This “shotgun proteom-
ics” involves predigestion of unseparatedprotein mixtures followed by two dimen-sions of peptide chromatography, usuallystrong cation-exchange followed by reverse-phase [94]. The benefits of this approachover conventional gel-to-MALDI methodsare several: fully automated systems can beassembled for analysis of complex proteinmixtures; more informative sequence dataare generated, and limits of detection areusually lower. The key weakness of theapproach is the scrambling of the proteinsduring digestion. This results in loss ofinformation relating to protein characteris-tics such as intact molecular weight, iso-electric point and relative quantitation –data provided by 2D gel protein separation.Digestion of protein mixtures disallows theassumption that any two peptides arisefrom the same protein, requiring a prob-ability-based assessment of common ori-gin. Dispensing with protein separationmakes it difficult to “drill-down” and obtainadditional protein-specific data (e.g. greatersequence coverage, analysis of post-transla-tional modifications), thus these multidi-mensional systems are best viewed as toolsfor discovery. Relative quantitation can beachieved by use of the method, but specificisotopic labeling steps to generate internalstandards are required to overcome the lowquantitative power of the mass spectrome-ter.
A brief survey of some of the applicationsof multidimensional LC–MS–MS suggeststhe power of the general approach. TheMudPIT (MUltiDimensional ProteinIdentification Technology) method devel-oped by Yates et al. has been applied to fullproteomic analysis of S. cerevisiae lysate,divided into three crude fractions [95]. Anintegrated strong cation-exchange and C18-based reversed phase column was used as afront-end to an ion trap mass spectrometer.Fifteen fractions from the SCX column
07_181_210 25.04.2005 11:02 Uhr Seite 201
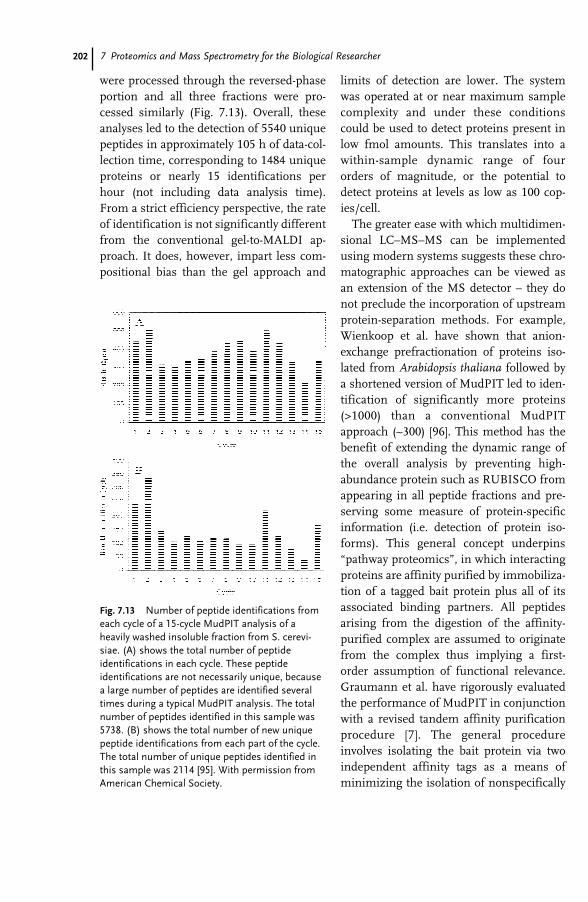
202 7 Proteomics and Mass Spectrometry for the Biological Researcher
were processed through the reversed-phaseportion and all three fractions were pro-cessed similarly (Fig. 7.13). Overall, theseanalyses led to the detection of 5540 uniquepeptides in approximately 105 h of data-col-lection time, corresponding to 1484 uniqueproteins or nearly 15 identifications perhour (not including data analysis time).From a strict efficiency perspective, the rateof identification is not significantly differentfrom the conventional gel-to-MALDI ap-proach. It does, however, impart less com-positional bias than the gel approach and
limits of detection are lower. The systemwas operated at or near maximum samplecomplexity and under these conditionscould be used to detect proteins present inlow fmol amounts. This translates into awithin-sample dynamic range of fourorders of magnitude, or the potential todetect proteins at levels as low as 100 cop-ies/cell.
The greater ease with which multidimen-sional LC–MS–MS can be implementedusing modern systems suggests these chro-matographic approaches can be viewed asan extension of the MS detector – they donot preclude the incorporation of upstreamprotein-separation methods. For example,Wienkoop et al. have shown that anion-exchange prefractionation of proteins iso-lated from Arabidopsis thaliana followed bya shortened version of MudPIT led to iden-tification of significantly more proteins(>1000) than a conventional MudPITapproach (~300) [96]. This method has thebenefit of extending the dynamic range ofthe overall analysis by preventing high-abundance protein such as RUBISCO fromappearing in all peptide fractions and pre-serving some measure of protein-specificinformation (i.e. detection of protein iso-forms). This general concept underpins“pathway proteomics”, in which interactingproteins are affinity purified by immobiliza-tion of a tagged bait protein plus all of itsassociated binding partners. All peptidesarising from the digestion of the affinity-purified complex are assumed to originatefrom the complex thus implying a first-order assumption of functional relevance.Graumann et al. have rigorously evaluatedthe performance of MudPIT in conjunctionwith a revised tandem affinity purificationprocedure [7]. The general procedureinvolves isolating the bait protein via twoindependent affinity tags as a means ofminimizing the isolation of nonspecifically
Fig. 7.13 Number of peptide identifications fromeach cycle of a 15-cycle MudPIT analysis of aheavily washed insoluble fraction from S. cerevi-siae. (A) shows the total number of peptideidentifications in each cycle. These peptideidentifications are not necessarily unique, becausea large number of peptides are identified severaltimes during a typical MudPIT analysis. The totalnumber of peptides identified in this sample was5738. (B) shows the total number of new uniquepeptide identifications from each part of the cycle.The total number of unique peptides identified inthis sample was 2114 [95]. With permission fromAmerican Chemical Society.
07_181_210 25.04.2005 11:02 Uhr Seite 202
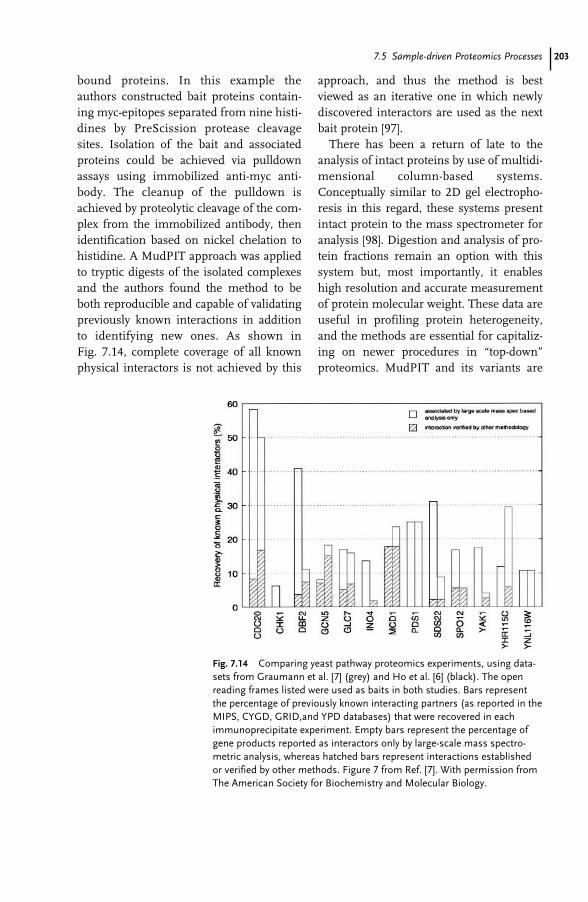
2037.5 Sample-driven Proteomics Processes
bound proteins. In this example theauthors constructed bait proteins contain-ing myc-epitopes separated from nine histi-dines by PreScission protease cleavagesites. Isolation of the bait and associatedproteins could be achieved via pulldownassays using immobilized anti-myc anti-body. The cleanup of the pulldown isachieved by proteolytic cleavage of the com-plex from the immobilized antibody, thenidentification based on nickel chelation tohistidine. A MudPIT approach was appliedto tryptic digests of the isolated complexesand the authors found the method to beboth reproducible and capable of validatingpreviously known interactions in additionto identifying new ones. As shown inFig. 7.14, complete coverage of all knownphysical interactors is not achieved by this
approach, and thus the method is bestviewed as an iterative one in which newlydiscovered interactors are used as the nextbait protein [97].
There has been a return of late to theanalysis of intact proteins by use of multidi-mensional column-based systems.Conceptually similar to 2D gel electropho-resis in this regard, these systems presentintact protein to the mass spectrometer foranalysis [98]. Digestion and analysis of pro-tein fractions remain an option with thissystem but, most importantly, it enableshigh resolution and accurate measurementof protein molecular weight. These data areuseful in profiling protein heterogeneity,and the methods are essential for capitaliz-ing on newer procedures in “top-down”proteomics. MudPIT and its variants are
Fig. 7.14 Comparing yeast pathway proteomics experiments, using data-sets from Graumann et al. [7] (grey) and Ho et al. [6] (black). The openreading frames listed were used as baits in both studies. Bars representthe percentage of previously known interacting partners (as reported in theMIPS, CYGD, GRID,and YPD databases) that were recovered in eachimmunoprecipitate experiment. Empty bars represent the percentage ofgene products reported as interactors only by large-scale mass spectro-metric analysis, whereas hatched bars represent interactions establishedor verified by other methods. Figure 7 from Ref. [7]. With permission fromThe American Society for Biochemistry and Molecular Biology.
07_181_210 25.04.2005 11:02 Uhr Seite 203
204 7 Proteomics and Mass Spectrometry for the Biological Researcher
increasingly referred to as “bottom-up”proteomics in which the first step of theanalysis involves digestion of protein mix-tures. In top-down, protein-specific infor-mation is generated first by analysis of theintact protein, followed by dissociation ofthe protein [99]. Gel-to-MALDI can be con-sidered the earliest form of top-down. Novelmethods for gas-phase dissociation of pro-tein ions such as electron-capture dissocia-tion and in-source decay hold some promisefor dispensing with a digestion step andachieving completely MS-driven identifica-tion [100, 101].
7.6
Conclusions
Proteomics methods and technology aredeveloping at a rapid pace, with each newinnovation providing a new benchmark indetection limit, speed, and reliability. Thedrive to implement these approaches in a
fashion usable by the non-expert in analyti-cal sciences continues. An increasing num-ber of mass spectrometers and associatedsystems are finding their way into conven-tional molecular biology laboratories,implying that some headway is being made.Many proteomics researchers are now turn-ing their attention to issues of data qualityand validation [7, 102]. Quantitating thevalue of the data generated is a seriousissue, because proteomic data is errorprone. Current and emerging databasesneed to reflect this quality issue to avoid thepossibility of spurious biochemical infer-ences. This is a natural progression of thefield that finds its parallel in genomics.Finally, proteomics researchers are pushingthe technology beyond simple identifica-tion. Methods for protein quantitation andcharacterization of the myriad of post-trans-lational modifications are also under devel-opment, with the sheer enormity of the pro-tein world suggesting room for many newapproaches.
07_181_210 25.04.2005 11:02 Uhr Seite 204
205
1 Dunn, M. J. (2001). Proteomics Reviews 2001,IM Publications.
2 Figeys, D. (2003). “Proteomics in 2002: a yearof technical development and wide-rangingapplications.” Anal Chem 75(12):2891–905.
3 Yaneva, M. and P. Tempst (2003). “Affinitycapture of specific DNA-binding proteins formass spectrometric identification.” AnalChem 75(23):6437–48.
4 Camacho-Carvajal, M. M., B. Wollscheid, et al. (2004). “Two-dimensional Bluenative/SDS gel electrophoresis of multi-protein complexes from whole cellularlysates: a proteomics approach.” Mol CellProteomics 3(2):176–82.
5 Himeda, C. L., J. A. Ranish, et al. (2004).“Quantitative proteomic identification of six4as the trex-binding factor in the musclecreatine kinase enhancer.” Mol Cell Biol24(5):2132–43.
6 Ho, Y., A. Gruhler, et al. (2002). “Systematicidentification of protein complexes inSaccharomyces cerevisiae by massspectrometry.” Nature 415(6868):180–3.
7 Graumann, J., L. A. Dunipace, et al. (2004).“Applicability of tandem affinity purificationMudPIT to pathway proteomics in yeast.” MolCell Proteomics 3(3):226–37.
8 Zhang, R., T. L. Tremblay, et al. (2003).“Identification of differentially expressedproteins in human glioblastoma cell lines andtumors.” Glia 42(2):194–208.
9 Stannard, C., V. Soskic, et al. (2003). “Rapidchanges in the phosphoproteome showdiverse cellular responses followingstimulation of human lung fibroblasts withendothelin-1.” Biochemistry 42(47):13919–28.
10 Sinha, P., J. Poland, et al. (2003). “Study ofthe development of chemoresistance in
melanoma cell lines using proteomeanalysis.” Electrophoresis 24(14):2386–404.
11 Hirabayashi, J., Y. Arata, et al. (2001).“Glycome project: concept, strategy andpreliminary application to Caenorhabditiselegans.” Proteomics 1(2):295–303.
12 Kaji, H., H. Saito, et al. (2003). “Lectin affinitycapture, isotope-coded tagging and massspectrometry to identify N-linkedglycoproteins.” Nat Biotechnol 21(6):667–72.
13 Patton, W. F. (2002). “Detection technologiesin proteome analysis.” J Chromatogr B AnalytTechnol Biomed Life Sci 771(1/2):3–31.
14 Melle, C., R. Kaufmann, et al. (2004).“Proteomic profiling in microdissectedhepatocellular carcinoma tissue usingProteinChip technology.” Int J Oncol24(4):885–91.
15 Petricoin, E. F. and L. A. Liotta (2004).“SELDI–TOF-based serum proteomic patterndiagnostics for early detection of cancer.”Curr Opin Biotechnol 15(1):24–30.
16 Patterson, S. D. and R. H. Aebersold (2003).“Proteomics: the first decade and beyond.”Nat Genet 33 Suppl:311–23.
17 Corthals, G. L., V. C. Wasinger, et al. (2000).“The dynamic range of protein expression: achallenge for proteomic research.”Electrophoresis 21(6):1104–15.
18 Patterson, S. D. (2003). “Data analysis – theAchilles heel of proteomics.” Nat Biotechnol21(3):221–2.
19 Ramstrom, M. and J. Bergquist (2004).“Miniaturized proteomics and peptidomicsusing capillary liquid separation and highresolution mass spectrometry.” FEBS Lett567(1):92–5.
20 Lee, C. L., H. H. Hsiao, et al. (2003).“Strategic shotgun proteomics approach for
References
07_181_210 25.04.2005 11:02 Uhr Seite 205
206 References
efficient construction of an expression map oftargeted protein families in hepatoma celllines.” Proteomics 3(12):2472–86.
21 Zhou, M., D. A. Lucas, et al. (2004). “Aninvestigation into the human serum“interactome”.” Electrophoresis 25(9):1289–98.
22 O’Donovan, C., M. J. Martin, et al. (2002).“High-quality protein knowledge resource:SWISS-PROT and TrEMBL.” Brief Bioinform3(3):275–84.
23 Linial, M. (2003). “How incorrect annotationsevolve – the case of short ORFs.” TrendsBiotechnol 21(7):298–300.
24 Baker, C. J. www.sams.ucalgary.ca.25 Feng, Z., L. Kachnic, et al. (2004). “DNA
Damage Induces p53-dependent BRCA1Nuclear Export.” J Biol Chem279(27):28574–84.
26 Iwadate, Y., T. Sakaida, et al. (2004).“Molecular classification and survivalprediction in human gliomas based onproteome analysis.” Cancer Res64(7):2496–501.
27 Bisca, A., C. D’Ambrosio, et al. (2004).“Proteomic evaluation of core biopsyspecimens from breast lesions.” Cancer Lett204(1):79–86.
28 Craven, R. A. and R. E. Banks (2001). “Lasercapture microdissection and proteomics:possibilities and limitation.” Proteomics1(10):1200–4.
29 Rautajoki, K., T. A. Nyman, et al. (2004).“Proteome characterization of human Thelper 1 and 2 cells.” Proteomics 4(1):84–92.
30 Cordwell, S. J. (2002). “Acquisition andarchiving of information for bacterialproteomics: from sample preparation todatabase.” Methods Enzymol 358:207–27.
31 Nilsson, C. L. (2002). “Bacterial proteomicsand vaccine development.” Am JPharmacogenomics 2(1):59–65.
32 Cash, P. (2003). “Proteomics of bacterialpathogens.” Adv Biochem Eng Biotechnol83:93–115.
33 Ghaemmaghami, S., W. K. Huh, et al. (2003).“Global analysis of protein expression inyeast.” Nature 425(6959):737–41.
34 Wohlschlegel, J. A. and J. R. Yates (2003).“Proteomics: where’s Waldo in yeast?” Nature425(6959):671–2.
35 Schirmer, E. C., L. Florens, et al. (2003).“Nuclear membrane proteins with potentialdisease links found by subtractiveproteomics.” Science 301(5638):1380–2.
36 Zhang, W., G. Zhou, et al. (2003). “Affinityenrichment of plasma membrane forproteomics analysis.” Electrophoresis24(16):2855–63.
37 Rabilloud, T., J. M. Strub, et al. (2002).“Comparative proteomics as a new tool forexploring human mitochondrial tRNAdisorders.” Biochemistry 41(1):144–50.
38 McDonald, T. G. and J. E. Van Eyk (2003).“Mitochondrial proteomics. Undercover inthe lipid bilayer.” Basic Res Cardiol98(4):219–27.
39 Ospina, J. K. and A. G. Matera (2002).“Proteomics: the nucleolus weighs in.” CurrBiol 12(1):R29–31.
40 Schuldt, A. (2002). “Proteomics of thenucleolus.” Nat Cell Biol 4(2):E35.
41 Desjardins, M. (2003). “ER-mediatedphagocytosis: a new membrane for newfunctions.” Nat Rev Immunol 3(4):280–91.
42 Taylor, S. W., E. Fahy, et al. (2003). “Globalorganellar proteomics.” Trends Biotechnol21(2):82–8.
43 Foster, L. J., C. L. De Hoog, et al. (2003).“Unbiased quantitative proteomics of lipidrafts reveals high specificity for signalingfactors.” Proc Natl Acad Sci U S A100(10):5813–8.
44 Wu, S. L., H. Amato, et al. (2002). “Targetedproteomics of low-level proteins in humanplasma by LC/MSn: using human growthhormone as a model system.” J Proteome Res1(5):459–65.
45 Haney, P. J., C. Draveling, et al. (2003).“SwellGel: a sample preparation affinitychromatography technology for highthroughput proteomic applications.” ProteinExpr Purif 28(2):270–9.
46 Pieper, R., Q. Su, et al. (2003). “Multi-component immunoaffinity subtractionchromatography: an innovative step towards acomprehensive survey of the human plasmaproteome.” Proteomics 3(4):422–32.
47 Wang, Y. Y., P. Cheng, et al. (2003). “A simpleaffinity spin tube filter method for removinghigh-abundant common proteins orenriching low-abundant biomarkers forserum proteomic analysis.” Proteomics3(3):243–8.
48 Xu, Q. and K. S. Lam (2003). “Protein andChemical Microarrays-Powerful Tools forProteomics.” J Biomed Biotechnol2003(5):257–266.
07_181_210 25.04.2005 11:02 Uhr Seite 206
207References
49 Gavin, A. C., M. Bosche, et al. (2002).“Functional organization of the yeastproteome by systematic analysis of proteincomplexes.” Nature 415(6868):141–7.
50 Gavin, A. C. and G. Superti-Furga (2003).“Protein complexes and proteomeorganization from yeast to man.” Curr OpinChem Biol 7(1):21–7.
51 Stuart, J. N., A. B. Hummon, et al. (2004).“The chemistry of thought: neurotransmittersin the brain.” Anal Chem 76(7):121A–128A.
52 Chaurand, P., S. A. Schwartz, et al. (2004).“Integrating histology and imaging massspectrometry.” Anal Chem 76(4):1145–55.
53 Diamandis, E. P. (2004). “Mass spectrometryas a diagnostic and a cancer biomarkerdiscovery tool: opportunities and potentiallimitations.” Mol Cell Proteomics 3(4):367–78.
54 Mehta, A. I., S. Ross, et al. (2003). “Biomarkeramplification by serum carrier proteinbinding.” Dis Markers 19(1):1–10.
55 Hu, S., Z. Le, et al. (2003). “Cell cycle-dependent protein fingerprint from a singlecancer cell: image cytometry coupled withsingle-cell capillary sieving electrophoresis.”Anal Chem 75(14):3495–501.
56 Hu, S., Z. Le, et al. (2003). “Identification ofproteins in single-cell capillaryelectrophoresis fingerprints based oncomigration with standard proteins.” AnalChem 75(14):3502–5.
57 Karas, M. and F. Hillenkamp (1988). “Laserdesorption ionization of proteins withmolecular masses exceeding 10,000 daltons.”Anal Chem 60(20):2299–301.
58 Fenn, J. B. (2003). “Electrospray wings formolecular elephants (Nobel lecture).” AngewChem Int Ed Engl 42(33):3871–94.
59 Frankevich, V. E., J. Zhang, et al. (2003).“Role of electrons in laserdesorption/ionization mass spectrometry.”Anal Chem 75(22):6063–7.
60 Keller, B. O. and L. Li. (2001). “Detection of25,000 molecules of substance P by MALDI–TOF mass spectrometry and investigationsinto the fundamental limits of detection inMALDI.” J Am Soc Mass Spectrom12(9):1055–1063.
61 Mora, J. F., G. J. Van Berkel, et al. (2000).“Electrochemical processes in electrosprayionization mass spectrometry.” J MassSpectrom 35(8):939–52.
62 Covey, T. R., E. C. Huang, et al. (1991).“Structural characterization of protein tryptic
peptides via liquid chromatography/massspectrometry and collision-induceddissociation of their doubly chargedmolecular ions.” Anal Chem 63(13):1193–200.
63 Peng, J., J. E. Elias, et al. (2003). “Evaluationof multidimensional chromatography coupledwith tandem mass spectrometry (LC–LC–MS–MS) for large-scale protein analysis: theyeast proteome.” J Proteome Res 2(1):43–50.
64 Pucci, P., C. Carestia, et al. (1985). “Proteinfingerprint by fast atom bombardment massspectrometry: characterization of normal andvariant human haemoglobins.” BiochemBiophys Res Commun 130(1):84–90.
65 Cottrell, J. S. (1994). “Protein identification bypeptide mass fingerprinting.” Peptide Res7(3):115–24.
66 Henzel, W. J., C. Watanabe, et al. (2003).“Protein identification: the origins of peptidemass fingerprinting.” J Am Soc Mass Spectrom14(9):931–42.
67 Pappin, D. J. C., P. Hojrup, et al. (1993).“Rapid identification of proteins by peptide-mass fingerprinting.” Curr Biol 3(6):327–332.
68 Perkins, D. N., D. J. Pappin, et al. (1999).“Probability-based protein identification bysearching sequence databases using massspectrometry data.” Electrophoresis20(18):3551–67.
69 Lim, H., J. Eng, et al. (2003). “Identification of2D-Gel Proteins: a comparison ofMALDI/TOF Peptide Mass Mapping tomicroLC–ESI Tandem Mass Spectrometry.” JAm Soc Mass Spectrom 14:957–970.
70 Clauser, K. R., P. Baker, et al. (1999). “Role ofaccurate mass measurement (±10 ppm) inprotein identification strategies employingMS or MS/MS and database searching.” AnalChem 71(14):2871–82.
71 Kinter, M. and N. E. Sherman (2000). ProteinSequencing and Identification using TandemMass Spectrometry. New York, John Wiley &Sons.
72 Aitken, A. and M. Learmonth (2002). “Proteinidentification by in-gel digestion and massspectrometric analysis.” Mol Biotechnol20(1):95–7.
73 Courchesne, P. L., R. Luethy, et al. (1997).“Comparison of in-gel and on-membranedigestion methods at low to sub-pmol levelfor subsequent peptide and fragment-ionmass analysis using matrix-assisted laser-desorption/ionization mass spectrometry.”Electrophoresis 18(3/4):369–81.
07_181_210 25.04.2005 11:02 Uhr Seite 207
208 References
74 Havlis, J., H. Thomas, et al. (2003). “Fast-response proteomics by accelerated in-geldigestion of proteins.” Anal Chem75(6):1300–6.
75 Shevchenko, A., M. Wilm, et al. (1996). “Massspectrometric sequencing of proteins silver-stained polyacrylamide gels.” Anal Chem68(5):850–8.
76 Loboda, A. V., S. Ackloo, et al. (2003). “A high-performance matrix-assisted laserdesorption/ionization orthogonal time-of-flight mass spectrometer with collisionalcooling.” Rapid Commun Mass Spectrom17(22):2508–16.
77 Brock, A., D. M. Horn, et al. (2003). “Anautomated matrix-assisted laserdesorption/ionization quadrupole Fouriertransform ion cyclotron resonance massspectrometer for “bottom-up” proteomics.”Anal Chem 75(14):3419–28.
78 Bruce, J. E., G. A. Anderson, et al. (1999).“High-mass-measurement accuracy and 100%sequence coverage of enzymatically digestedbovine serum albumin from an ESI–FTICRmass spectrum.” Anal Chem 71(14):2595–9.
79 Smith, R. D., G. A. Anderson, et al. (2002).“An accurate mass tag strategy forquantitative and high-throughput proteomemeasurements.” Proteomics 2(5):513–23.
80 Slysz, G. W. and D. C. Schriemer (2003). “On-column digestion of proteins in aqueous-organic solvents.” Rapid Commun MassSpectrom 17(10):1044–50.
81 Steen, H., B. Kuster, et al. (2001). “Detectionof tyrosine phosphorylated peptides byprecursor ion scanning quadrupole TOF massspectrometry in positive ion mode.” AnalChem 73(7):1440–8.
82 Laiko, V. V., S. C. Moyer, et al. (2000).“Atmospheric pressure MALDI/ion trap massspectrometry.” Anal Chem 72(21):5239–43.
83 Yergey, A. L., J. R. Coorssen, et al. (2002). “Denovo sequencing of peptides using MALDI/TOF–TOF.” J Am Soc Mass Spectrom 13(7):784–91.
84 Zhu, X. and I. A. Papayannopoulos (2003).“Improvement in the detection of lowconcentration protein digests on a MALDITOF/TOF workstation by reducing alpha-cyano-4-hydroxycinnamic acid adduct ions.” J Biomol Tech 14(4):298–307.
85 Wysocki, V. H., G. Tsaprailis, et al. (2000).“Mobile and localized protons: a framework
for understanding peptide dissociation.” J Mass Spectrom 35(12):1399–406.
86 Keough, T., M. P. Lacey, et al. (2001).“Atmospheric pressure matrix-assisted laserdesorption/ionization ion trap massspectrometry of sulfonic acid derivatizedtryptic peptides.” Rapid Commun MassSpectrom 15(23):2227–39.
87 Licklider, L. J., C. C. Thoreen, et al. (2002).“Automation of nanoscale microcapillaryliquid chromatography–tandem massspectrometry with a vented column.” AnalChem 74(13):3076–83.
88 Peng, J. and S. P. Gygi (2001). “Proteomics:the move to mixtures.” J Mass Spectrom36(10):1083–91.
89 Shen, Y., N. Tolic, et al. (2004).“Ultrasensitive proteomics using high-efficiency on-line micro-SPE-nanoLC-nanoESI MS and MS/MS.” Anal Chem76(1):144–54.
90 Shen, Y., N. Tolic, et al. (2004). “Nanoscaleproteomics.” Anal Bioanal Chem378(4):1037–45.
91 Barroso, B., D. Lubda, et al. (2003).“Applications of monolithic silica capillarycolumns in proteomics.” J Proteome Res2(6):633–42.
92 Strittmatter, E. F., P. L. Ferguson, et al.(2003). “Proteome analyses using accuratemass and elution time peptide tags withcapillary LC time-of-flight massspectrometry.” J Am Soc Mass Spectrom14(9):980–91.
93 Zhen, Y., N. Xu, et al. (2004). “Developmentof an LC–MALDI method for the analysis ofprotein complexes.” J Am Soc Mass Spectrom15(6):803–22.
94 MacCoss, M. J., W. H. McDonald, et al.(2002). “Shotgun identification of proteinmodifications from protein complexes andlens tissue.” Proc Natl Acad Sci U S A99(12):7900–5.
95 Wolters, D. A., M. P. Washburn, et al. (2001).“An automated multidimensional proteinidentification technology for shotgunproteomics.” Anal Chem 73(23):5683–90.
96 Wienkoop, S., M. Glinski, et al. (2004).“Linking protein fractionation withmultidimensional monolithic reversed-phasepeptide chromatography/mass spectrometryenhances protein identification from complexmixtures even in the presence of abundant
07_181_210 25.04.2005 11:02 Uhr Seite 208

209References
proteins.” Rapid Commun Mass Spectrom18(6):643–50.
97 Seol, J. H., A. Shevchenko, et al. (2001).“Skp1 forms multiple protein complexes,including RAVE, a regulator of V-ATPaseassembly.” Nat Cell Biol 3(4):384–91.
98 Yan, F., A. Sreekumar, et al. (2003). “Proteinmicroarrays using liquid phase fractionationof cell lysates.” Proteomics 3(7):1228–35.
99 Nemeth-Cawley, J. F., B. S. Tangarone, et al.(2003). “Top Down” characterization is acomplementary technique to peptidesequencing for identifying protein species in
complex mixtures.” J Proteome Res 2(5):495–505.
100 Ge, Y., B. G. Lawhorn, et al. (2002). “Topdown characterization of larger proteins(45 kDa) by electron capture dissociationmass spectrometry.” J Am Chem Soc 124(4):672–8.
101 Kelleher, N. L. (2004). “Top-downproteomics.” Anal Chem 76(11):197A–203A.
102 Venable, J. D. and J. R. Yates, 3rd (2004).“Impact of ion trap tandem mass spectravariability on the identification of peptides.”Anal Chem 76(10):2928–37.
07_181_210 25.04.2005 11:02 Uhr Seite 209
211
Md Abul Fazal, David Michels, James Kraly, and Norman J. Dovichi
8.1
Introduction
The human genome contains 3 ×10⁹ baseswith ~30,000 genes. Alternative splicing ofexons results in perhaps 100,000 differentproteins, which undergo post-translationalmodification to generate an unknown num-ber of products. This set of proteins iscalled the proteome [1]. Unlike the genome,which is essentially static and identical ineach cell of an organism, the proteome var-ies from cell-to-cell and changes in re-sponse to the environment and during de-velopment and disease.
Two-dimensional electrophoresis, fol-lowed by mass-spectrometric analysis ofisolated proteins, has been the workhorsetool for proteomics research [2]. The proteinextract is first separated by isoelectric focus-ing, which is performed in either strip ortube format. The isoelectric focusing gel isthen placed at the top of an SDS/PAGE geland proteins are separated on the basis ofsize. The proteins are detected by a stainingprocedure that creates a two-dimensionalset of spots. The location of each spot is de-termined by the protein’s mass and iso-electric point. The intensity of each spot is
related to the amount of the protein presentin the cell extract. Those proteins with inter-esting expression patterns are cut from thegel, digested by a protease, and identified bymass spectrometry and database searching.
More recently, methods have been devel-oped on the basis of digestion of the proteinhomogenate with a protease then liquid-chromatographic separation and mass-spectrometric identification of the peptidefragments. This automated method is par-ticularly useful both for surveying proteinexpression in a sample, as in MudPIT ex-periments, and in determining changes inprotein expression between two states ofthe organism, as in ICAT experiments [3,4]. Neither approach is particularly useful indetermining either the absolute amount ofa protein in a sample or any post-transla-tional modification of the expressed pro-teins, although efforts are in progress to de-termine such information. In most experi-ments proteins are extracted from the lysategenerated from several million cells andperhaps 1000 different proteins are identi-fied.
Proteomic research differs from genomicresearch in one important way. DNA re-search benefits greatly from PCR technolo-
Handbook of Genome Research. Genomics, Proteomics, Metabolomics, Bioinformatics, Ethical and Legal Issues.Edited by Christoph W. SensenCopyright © 2005 WILEY-VCH Verlag GmbH & Co. KGaA, WeinheimISBN: 3-527-31348-6
8Proteome Analysis by Capillary Electrophoresis
Verwendete Mac Distiller 5.0.x Joboptions
Dieser Report wurde automatisch mit Hilfe der Adobe Acrobat Distiller Erweiterung "Distiller Secrets v1.0.5" der IMPRESSED GmbH erstellt. Sie koennen diese Startup-Datei für die Distiller Versionen 4.0.5 und 5.0.x kostenlos unter http://www.impressed.de herunterladen. ALLGEMEIN ---------------------------------------- Dateioptionen: Kompatibilität: PDF 1.3 Für schnelle Web-Anzeige optimieren: Ja Piktogramme einbetten: Ja Seiten automatisch drehen: Nein Seiten von: 1 Seiten bis: Alle Seiten Bund: Links Auflösung: [ 2400 2400 ] dpi Papierformat: [ 481 680 ] Punkt KOMPRIMIERUNG ---------------------------------------- Farbbilder: Downsampling: Nein Komprimieren: Ja Komprimierungsart: ZIP Bitanzahl pro Pixel: 8 Bit Graustufenbilder: Downsampling: Nein Komprimieren: Ja Komprimierungsart: ZIP Bitanzahl pro Pixel: 8 Bit Schwarzweiß-Bilder: Downsampling: Nein Komprimieren: Ja Komprimierungsart: CCITT CCITT-Gruppe: 4 Graustufen glätten: Nein Text und Vektorgrafiken komprimieren: Ja SCHRIFTEN ---------------------------------------- Alle Schriften einbetten: Ja Untergruppen aller eingebetteten Schriften: Nein Wenn Einbetten fehlschlägt: Abbrechen Einbetten: Immer einbetten: [ /Courier-BoldOblique /Helvetica-BoldOblique /Courier /Helvetica-Bold /Times-Bold /Courier-Bold /Helvetica /Times-BoldItalic /Times-Roman /ZapfDingbats /Times-Italic /Helvetica-Oblique /Courier-Oblique /Symbol ] Nie einbetten: [ ] FARBE(N) ---------------------------------------- Farbmanagement: Farbumrechnungsmethode: Farbe nicht ändern Methode: Standard Geräteabhängige Daten: Einstellungen für Überdrucken beibehalten: Ja Unterfarbreduktion und Schwarzaufbau beibehalten: Ja Transferfunktionen: Beibehalten Rastereinstellungen beibehalten: Nein ERWEITERT ---------------------------------------- Optionen: Prolog/Epilog verwenden: Nein PostScript-Datei darf Einstellungen überschreiben: Nein Level 2 copypage-Semantik beibehalten: Ja Portable Job Ticket in PDF-Datei speichern: Ja Illustrator-Überdruckmodus: Ja Farbverläufe zu weichen Nuancen konvertieren: Ja ASCII-Format: Nein Document Structuring Conventions (DSC): DSC-Kommentare verarbeiten: Ja DSC-Warnungen protokollieren: Nein Für EPS-Dateien Seitengröße ändern und Grafiken zentrieren: Ja EPS-Info von DSC beibehalten: Ja OPI-Kommentare beibehalten: Nein Dokumentinfo von DSC beibehalten: Ja ANDERE ---------------------------------------- Distiller-Kern Version: 5000 ZIP-Komprimierung verwenden: Ja Optimierungen deaktivieren: Nein Bildspeicher: 524288 Byte Farbbilder glätten: Nein Graustufenbilder glätten: Nein Bilder (< 257 Farben) in indizierten Farbraum konvertieren: Ja sRGB ICC-Profil: sRGB IEC61966-2.1 ENDE DES REPORTS ---------------------------------------- IMPRESSED GmbH Bahrenfelder Chaussee 49 22761 Hamburg, Germany Tel. +49 40 897189-0 Fax +49 40 897189-71 Email: [email protected] Web: www.impressed.de
Adobe Acrobat Distiller 5.0.x Joboption Datei
<< /ColorSettingsFile () /LockDistillerParams true /DetectBlends true /DoThumbnails true /AntiAliasMonoImages false /MonoImageDownsampleType /Bicubic /GrayImageDownsampleType /Bicubic /MaxSubsetPct 100 /MonoImageFilter /CCITTFaxEncode /ColorImageDownsampleThreshold 1.5 /GrayImageFilter /FlateEncode /ColorConversionStrategy /LeaveColorUnchanged /CalGrayProfile (Dot Gain 20%) /ColorImageResolution 300 /UsePrologue false /MonoImageResolution 1200 /ColorImageDepth 8 /sRGBProfile (sRGB IEC61966-2.1) /PreserveOverprintSettings true /CompatibilityLevel 1.3 /UCRandBGInfo /Preserve /EmitDSCWarnings false /CreateJobTicket true /DownsampleMonoImages false /DownsampleColorImages false /MonoImageDict << /K -1 >> /ColorImageDownsampleType /Bicubic /GrayImageDict << /HSamples [ 2 1 1 2 ] /VSamples [ 2 1 1 2 ] /Blend 1 /QFactor 0.9 >> /CalCMYKProfile (U.S. Web Coated (SWOP) v2) /ParseDSCComments true /PreserveEPSInfo true /MonoImageDepth -1 /AutoFilterGrayImages false /SubsetFonts false /GrayACSImageDict << /HSamples [ 2 1 1 2 ] /VSamples [ 2 1 1 2 ] /Blend 1 /QFactor 0.9 >> /ColorImageFilter /FlateEncode /AutoRotatePages /None /PreserveCopyPage true /EncodeMonoImages true /ASCII85EncodePages false /PreserveOPIComments false /NeverEmbed [ ] /ColorImageDict << /HSamples [ 2 1 1 2 ] /VSamples [ 2 1 1 2 ] /Blend 1 /QFactor 0.9 >> /AntiAliasGrayImages false /GrayImageDepth 8 /CannotEmbedFontPolicy /Error /EndPage -1 /TransferFunctionInfo /Preserve /CalRGBProfile (sRGB IEC61966-2.1) /EncodeColorImages true /EncodeGrayImages true /ColorACSImageDict << /HSamples [ 2 1 1 2 ] /VSamples [ 2 1 1 2 ] /Blend 1 /QFactor 0.9 >> /Optimize true /ParseDSCCommentsForDocInfo true /GrayImageDownsampleThreshold 1.5 /MonoImageDownsampleThreshold 1.5 /AutoPositionEPSFiles true /GrayImageResolution 300 /AutoFilterColorImages false /AlwaysEmbed [ /Courier-BoldOblique /Helvetica-BoldOblique /Courier /Helvetica-Bold /Times-Bold /Courier-Bold /Helvetica /Times-BoldItalic /Times-Roman /ZapfDingbats /Times-Italic /Helvetica-Oblique /Courier-Oblique /Symbol ] /ImageMemory 524288 /OPM 1 /DefaultRenderingIntent /Default /EmbedAllFonts true /StartPage 1 /DownsampleGrayImages false /AntiAliasColorImages false /ConvertImagesToIndexed true /PreserveHalftoneInfo false /CompressPages true /Binding /Left >> setdistillerparams << /PageSize [ 595.276 841.890 ] /HWResolution [ 2400 2400 ] >> setpagedevice
212 8 Proteome Analysis by Capillary Electrophoresis
gy, which enables amplification of specificgenomic regions so that a few copies ofinteresting mRNA or genomic DNA can beamplified to levels that are easily handled.Protein research does not have an analo-gous tool. As a result, protein research re-quires the use of extremely high sensitivityanalytical tools to monitor proteins ex-pressed at low levels.
8.2
Capillary Electrophoresis
Capillary array electrophoresis has provento be a powerful tool for DNA analysis [5].Automated instruments have been com-mercialized and used to sequence the hu-man genome. We believe capillary electro-phoresis can also play a useful role in prote-ome analysis.
8.2.1
Instrumentation
Capillaries are typically 10 to 50 µm innerdiameter, 150 µm outer diameter, and35 cm long. The outside of the capillary iscoated with a thin layer of polymer, usuallypolyimide, which gives the capillaries greatstrength and flexibility. The total volume ofthe capillary is usually less than 1 µL andsample volume is typically a few nanoliters.
Instrumentation for capillary electropho-resis is very simple. It consists of an injectorto introduce sample into the capillary, thecapillary, a detector, and a high-voltage pow-er supply to drive the separation. A comput-er controls injection and automaticallyrecords data. Because of the high voltageemployed for separation, the operator mustbe protected with a safety interlock system.
8.2.2
Injection
Analyte is usually held in a disposable mi-crocentrifuge tube. Injection is performedby dipping the capillary into the sample. Inelectrokinetic injection, a high voltage elec-trode is also placed in contact with the sam-ple, and an electric field is applied to thesample for a few seconds, drawing the pro-tein into the capillary. Electrokinetic injec-tion is biased; the amount of sample inject-ed is proportional to the sample’s velocityduring electrophoresis [6]. More of the fast-er moving analytes are injected than of theslower moving components.
Alternatively, sample can be injected hy-drodynamically by applying pressure to thesample or vacuum to the distal end of thecapillary. Hydrodynamic injection is un-biased; the amount injected is independentof the physical properties of the analyte. Ir-respective of which injection method isused, the sample volume should be lessthan ~0.1 % of the capillary volume to pre-serve separation efficiency.
Conventionally, a few nanoliters of sam-ple is injected on to the capillary. Fortunate-ly, stacking methods developed for capillaryelectrophoresis enable injection of largervolumes of sample without overloading theseparation [7, 8].
8.2.3
Electroosmosis
Electroosmosis is particularly importantwhen separations are performed in uncoat-ed capillaries. Residual silanol groups onthe capillary surface take a negative chargeat neutral or basic pH. These silanol groupsare fixed and do not move on application ofan electric field to the capillary. Electrical
2138.2 Capillary Electrophoresis
neutrality requires that cationic counterions be present in a diffuse cloud very nearthe capillary wall. These cations migrate inan electric field toward the negative elec-trode. The cations draw solvent with them,transporting bulk fluid to the negative elec-trode. This bulk flow is called electroosmo-sis. Unlike pressure-driven flow in chroma-tography, electroosmotic flow velocity isuniform across the capillary lumen, whichminimizes peak broadening so that the sep-aration efficiency is much higher than inliquid chromatography.
During analysis, electrophoresis andelectroosmosis occur simultaneously. Theoverall mobility of an ion is the sum of theelectrophoretic and electroosmotic mobil-ities. Electroosmosis is usually strongerthan electrophoresis, and all components ofa sample will migrate through the capillaryto the detector, with cations migrating first,neutrals second, and anions last.
Electroosmosis can be reduced to negli-gible levels by coating the capillary. Neutralcoating can be chemically bound to the wallby use of either silane or Grignard reac-tions [9]. Dynamic coating relies on thephysical adsorption of, usually, a polymerby the capillary wall; dynamic coatings arenot as robust as chemical coatings but canbe regenerated as needed by successivetreatment with the coating reagent.
8.2.4
Separation
Specific separation methods for proteins arediscussed in Sect. 8.3. Here we present gen-eral information on capillary electrophore-sis separations. The capillary is filled with aseparation buffer, the nature of which deter-mines the separation mechanism. The buf-fer is usually a few millimolar in concentra-tion, although low-ionic-strength zwitter-
ionic buffers can be used at higher concen-tration; it is important not to employ a highionic strength buffer, which suffer from ex-cessive Joule heating.
When the sample has been injected intothe capillary, the sample vial is replacedwith a buffer-filled vial, and an electric fieldis used to separate the components withinthe sample. The narrow diameter of thecapillary minimizes the temperature riseassociated with the electric field. As a result,very high potentials can be applied acrossthe capillary without degradation of the sep-aration as a result of heating. Potentials upto 30,000 V and electric fields exceeding450 V cm–1 are routinely employed. The useof high fields results in rapid and efficientseparations.
Unlike slab gels, on which proteins arevisualized after a fixed run time, capillaryelectrophoresis is a finish-line technique –the proteins are detected after traversing afixed distance. The time necessary for a pro-tein to migrate through the capillary is giv-en by:
t =
where L is the length of the capillary, l is thedistance from the injection end of the capil-lary to the detector, µep is the electrophoret-ic mobility of the analyte, µeof is the electro-osmotic mobility of the buffer, and V is theapplied potential [10]. The separation timeis inversely proportional to the applied po-tential. For post-column detectors, l = L andthe separation time is proportional to thelength of the capillary squared. Separationtime decreases dramatically as capillarylength is shortened. Typical protein separa-tions are completed in less than 15 min,and separations as fast as 60 s have beendemonstrated.
IL
(µeof + µep)V
214 8 Proteome Analysis by Capillary Electrophoresis
8.2.5
Detection
UV absorbance, laser-induced fluorescence,and mass spectrometry are used for proteindetection. UV absorbance measurementsuse the capillary itself as the detection cu-vette. Unfortunately, the relatively short op-tical pathlength across the capillary tends toresult in poor sensitivity in absorbancemeasurements, which must be performedwith relatively high-concentration samples.
Mass spectrometry is usually better suitedto analysis of peptides rather than proteins;sensitivity and mass resolution fall for thehigher-molecular-weight species. Electro-spray ionization is a common interfacebetween capillary electrophoresis and massspectrometry [11]. Electrospray mass spec-trometry has been used with impressive re-sults for detection of peptides separated byisoelectric focusing. Unfortunately, electro-spray is incompatible with capillary separa-tions based on a surfactant. The surfactantdisrupts electrospray ionization and the sur-factant ions tend to contaminate the detec-tor.
Fluorescence detection from native pro-teins requires the use of expensive and tem-peramental lasers that operate in the ultravi-olet portion of the spectrum. Instead, pro-teins are usually labeled with a fluorescentreagent that might be excited with lowercost lasers that operate in the visible or nearinfrared. We find that classic fluorescent re-agents, for example fluorescein isothiocya-nate, are not convenient for protein labelingin capillary electrophoresis. Unreacted re-agent and fluorescent impurities generatean intense background signal that can satu-rate the fluorescence detector and obscurethe signal from labeled proteins. Instead,we prefer the use of fluorogenic reagents[12, 13]. These reagents are nonfluorescent
themselves but produce a highly fluores-cent product on reaction with a primaryamine, such as the å-amine of lysine resi-dues. Because the reagents are nonfluores-cent until they react with the amine, thebackground signal from unreacted reagentdoes not interfere in the measurement. Inparticular, we employ the reagent 3-(2-fu-royl)quinoline-2-carboxaldehyde (FQ) forprotein labeling. Reaction products are ex-cited efficiently in the blue portion of thespectrum. In the work discussed in thischapter we employed either an air-cooledargon ion laser or a solid-state, diodepumped laser, both of which operate at488 nm with 5–10 mW power. Fluorescenceis detected with either a photomultipliertube or a single-photon counting-avalanchephotodiode.
There is a subtle point concerning label-ing chemistry. Lysine is a common aminoacid and there usually are several lysine res-idues in each protein. The labeling reactionseldom goes to completion and a complex amixture of reaction products is formed. Asingle protein with n primary amines canproduce 2n–1 possible fluorescent prod-ucts [14]. For example, ovalbumin has 20 ly-sine residues and a blocked N-terminus, so1,048,575 different products can be generat-ed on reaction with a labeling reagent.These products have different mobilitiesand result in a broad and complex electro-phoresis pattern. Much effort has been de-voted to developing reaction proceduresand buffer systems that minimize the ef-fects of multiple labeling. As we show be-low, the use of an appropriate separationbuffer eliminates the effects of multiple la-beling in SDS/gel and free solution electro-phoresis. Capillary isoelectric focusing re-mains incompatible with fluorescence la-beling technology, however [15].
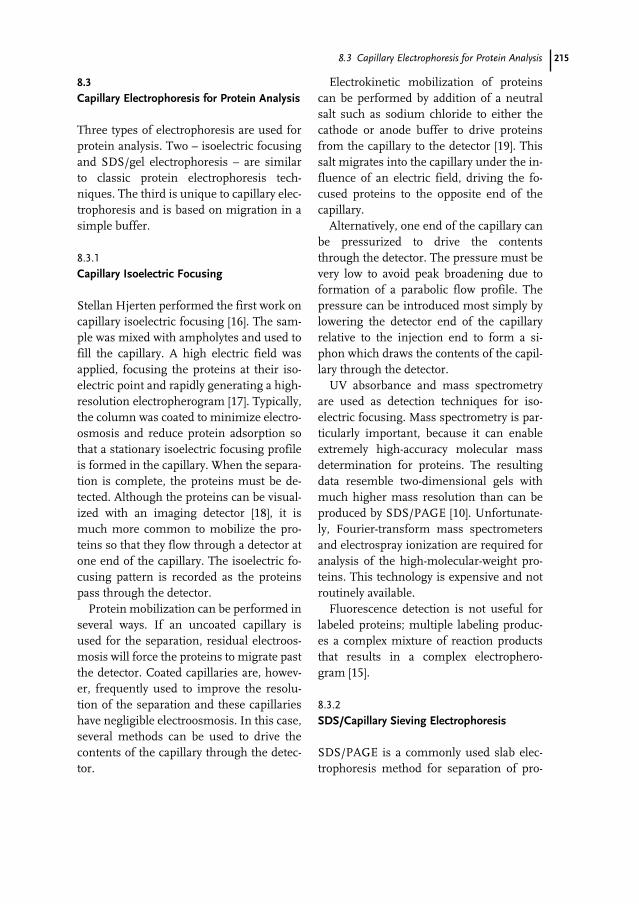
2158.3 Capillary Electrophoresis for Protein Analysis
8.3
Capillary Electrophoresis for Protein Analysis
Three types of electrophoresis are used forprotein analysis. Two – isoelectric focusingand SDS/gel electrophoresis – are similarto classic protein electrophoresis tech-niques. The third is unique to capillary elec-trophoresis and is based on migration in asimple buffer.
8.3.1
Capillary Isoelectric Focusing
Stellan Hjerten performed the first work oncapillary isoelectric focusing [16]. The sam-ple was mixed with ampholytes and used tofill the capillary. A high electric field wasapplied, focusing the proteins at their iso-electric point and rapidly generating a high-resolution electropherogram [17]. Typically,the column was coated to minimize electro-osmosis and reduce protein adsorption sothat a stationary isoelectric focusing profileis formed in the capillary. When the separa-tion is complete, the proteins must be de-tected. Although the proteins can be visual-ized with an imaging detector [18], it ismuch more common to mobilize the pro-teins so that they flow through a detector atone end of the capillary. The isoelectric fo-cusing pattern is recorded as the proteinspass through the detector.
Protein mobilization can be performed inseveral ways. If an uncoated capillary isused for the separation, residual electroos-mosis will force the proteins to migrate pastthe detector. Coated capillaries are, howev-er, frequently used to improve the resolu-tion of the separation and these capillarieshave negligible electroosmosis. In this case,several methods can be used to drive thecontents of the capillary through the detec-tor.
Electrokinetic mobilization of proteinscan be performed by addition of a neutralsalt such as sodium chloride to either thecathode or anode buffer to drive proteinsfrom the capillary to the detector [19]. Thissalt migrates into the capillary under the in-fluence of an electric field, driving the fo-cused proteins to the opposite end of thecapillary.
Alternatively, one end of the capillary canbe pressurized to drive the contentsthrough the detector. The pressure must bevery low to avoid peak broadening due toformation of a parabolic flow profile. Thepressure can be introduced most simply bylowering the detector end of the capillaryrelative to the injection end to form a si-phon which draws the contents of the capil-lary through the detector.
UV absorbance and mass spectrometryare used as detection techniques for iso-electric focusing. Mass spectrometry is par-ticularly important, because it can enableextremely high-accuracy molecular massdetermination for proteins. The resultingdata resemble two-dimensional gels withmuch higher mass resolution than can beproduced by SDS/PAGE [10]. Unfortunate-ly, Fourier-transform mass spectrometersand electrospray ionization are required foranalysis of the high-molecular-weight pro-teins. This technology is expensive and notroutinely available.
Fluorescence detection is not useful forlabeled proteins; multiple labeling produc-es a complex mixture of reaction productsthat results in a complex electrophero-gram [15].
8.3.2
SDS/Capillary Sieving Electrophoresis
SDS/PAGE is a commonly used slab elec-trophoresis method for separation of pro-
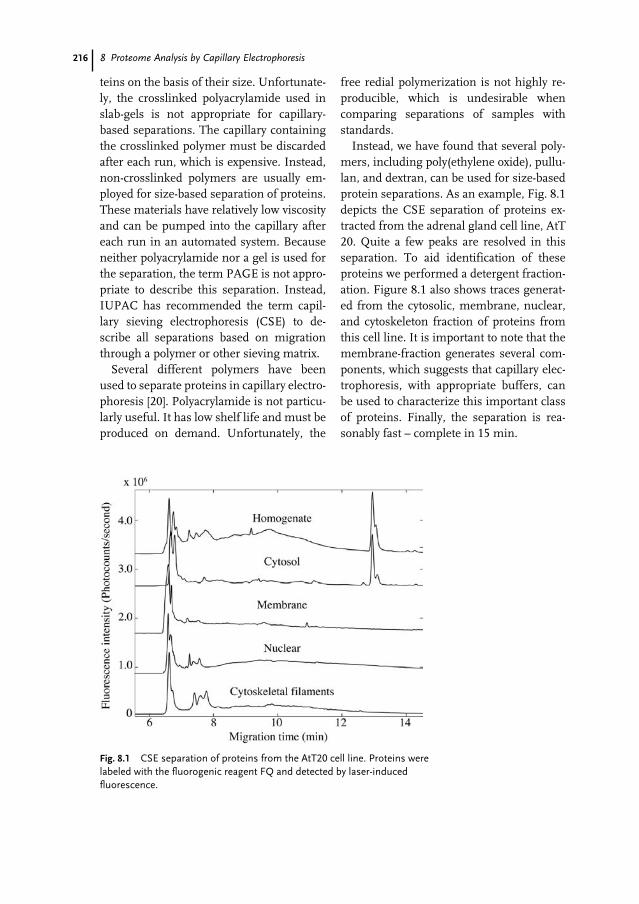
216 8 Proteome Analysis by Capillary Electrophoresis
teins on the basis of their size. Unfortunate-ly, the crosslinked polyacrylamide used inslab-gels is not appropriate for capillary-based separations. The capillary containingthe crosslinked polymer must be discardedafter each run, which is expensive. Instead,non-crosslinked polymers are usually em-ployed for size-based separation of proteins.These materials have relatively low viscosityand can be pumped into the capillary aftereach run in an automated system. Becauseneither polyacrylamide nor a gel is used forthe separation, the term PAGE is not appro-priate to describe this separation. Instead,IUPAC has recommended the term capil-lary sieving electrophoresis (CSE) to de-scribe all separations based on migrationthrough a polymer or other sieving matrix.
Several different polymers have beenused to separate proteins in capillary electro-phoresis [20]. Polyacrylamide is not particu-larly useful. It has low shelf life and must beproduced on demand. Unfortunately, the
free redial polymerization is not highly re-producible, which is undesirable whencomparing separations of samples withstandards.
Instead, we have found that several poly-mers, including poly(ethylene oxide), pullu-lan, and dextran, can be used for size-basedprotein separations. As an example, Fig. 8.1depicts the CSE separation of proteins ex-tracted from the adrenal gland cell line, AtT20. Quite a few peaks are resolved in thisseparation. To aid identification of theseproteins we performed a detergent fraction-ation. Figure 8.1 also shows traces generat-ed from the cytosolic, membrane, nuclear,and cytoskeleton fraction of proteins fromthis cell line. It is important to note that themembrane-fraction generates several com-ponents, which suggests that capillary elec-trophoresis, with appropriate buffers, canbe used to characterize this important classof proteins. Finally, the separation is rea-sonably fast – complete in 15 min.
Fig. 8.1 CSE separation of proteins from the AtT20 cell line. Proteins werelabeled with the fluorogenic reagent FQ and detected by laser-inducedfluorescence.
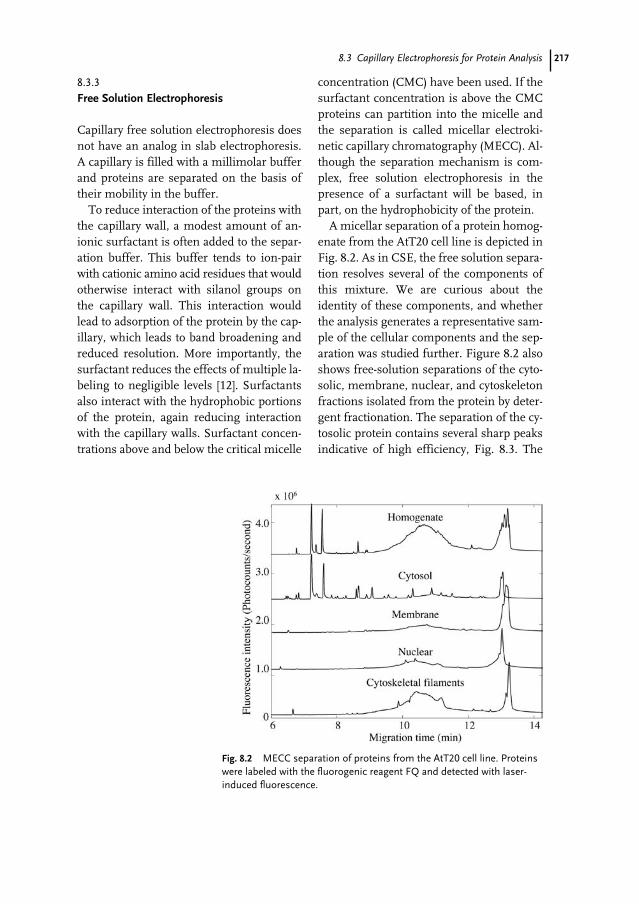
2178.3 Capillary Electrophoresis for Protein Analysis
8.3.3
Free Solution Electrophoresis
Capillary free solution electrophoresis doesnot have an analog in slab electrophoresis.A capillary is filled with a millimolar bufferand proteins are separated on the basis oftheir mobility in the buffer.
To reduce interaction of the proteins withthe capillary wall, a modest amount of an-ionic surfactant is often added to the separ-ation buffer. This buffer tends to ion-pairwith cationic amino acid residues that wouldotherwise interact with silanol groups onthe capillary wall. This interaction wouldlead to adsorption of the protein by the cap-illary, which leads to band broadening andreduced resolution. More importantly, thesurfactant reduces the effects of multiple la-beling to negligible levels [12]. Surfactantsalso interact with the hydrophobic portionsof the protein, again reducing interactionwith the capillary walls. Surfactant concen-trations above and below the critical micelle
concentration (CMC) have been used. If thesurfactant concentration is above the CMCproteins can partition into the micelle andthe separation is called micellar electroki-netic capillary chromatography (MECC). Al-though the separation mechanism is com-plex, free solution electrophoresis in thepresence of a surfactant will be based, inpart, on the hydrophobicity of the protein.
A micellar separation of a protein homog-enate from the AtT20 cell line is depicted inFig. 8.2. As in CSE, the free solution separa-tion resolves several of the components ofthis mixture. We are curious about theidentity of these components, and whetherthe analysis generates a representative sam-ple of the cellular components and the sep-aration was studied further. Figure 8.2 alsoshows free-solution separations of the cyto-solic, membrane, nuclear, and cytoskeletonfractions isolated from the protein by deter-gent fractionation. The separation of the cy-tosolic protein contains several sharp peaksindicative of high efficiency, Fig. 8.3. The
Fig. 8.2 MECC separation of proteins from the AtT20 cell line. Proteinswere labeled with the fluorogenic reagent FQ and detected with laser-induced fluorescence.
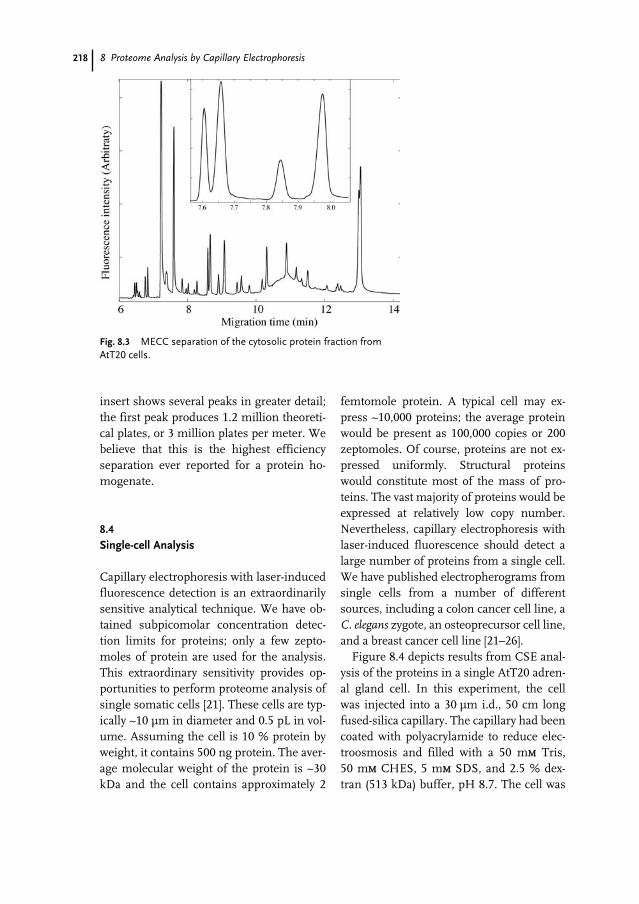
218 8 Proteome Analysis by Capillary Electrophoresis
insert shows several peaks in greater detail;the first peak produces 1.2 million theoreti-cal plates, or 3 million plates per meter. Webelieve that this is the highest efficiencyseparation ever reported for a protein ho-mogenate.
8.4
Single-cell Analysis
Capillary electrophoresis with laser-inducedfluorescence detection is an extraordinarilysensitive analytical technique. We have ob-tained subpicomolar concentration detec-tion limits for proteins; only a few zepto-moles of protein are used for the analysis.This extraordinary sensitivity provides op-portunities to perform proteome analysis ofsingle somatic cells [21]. These cells are typ-ically ~10 µm in diameter and 0.5 pL in vol-ume. Assuming the cell is 10 % protein byweight, it contains 500 ng protein. The aver-age molecular weight of the protein is ~30kDa and the cell contains approximately 2
femtomole protein. A typical cell may ex-press ~10,000 proteins; the average proteinwould be present as 100,000 copies or 200zeptomoles. Of course, proteins are not ex-pressed uniformly. Structural proteinswould constitute most of the mass of pro-teins. The vast majority of proteins would beexpressed at relatively low copy number.Nevertheless, capillary electrophoresis withlaser-induced fluorescence should detect alarge number of proteins from a single cell.We have published electropherograms fromsingle cells from a number of differentsources, including a colon cancer cell line, aC. elegans zygote, an osteoprecursor cell line,and a breast cancer cell line [21–26].
Figure 8.4 depicts results from CSE anal-ysis of the proteins in a single AtT20 adren-al gland cell. In this experiment, the cellwas injected into a 30 µm i.d., 50 cm longfused-silica capillary. The capillary had beencoated with polyacrylamide to reduce elec-troosmosis and filled with a 50 mMM Tris,50 mMM CHES, 5 mMM SDS, and 2.5 % dex-tran (513 kDa) buffer, pH 8.7. The cell was
Fig. 8.3 MECC separation of the cytosolic protein fraction fromAtT20 cells.
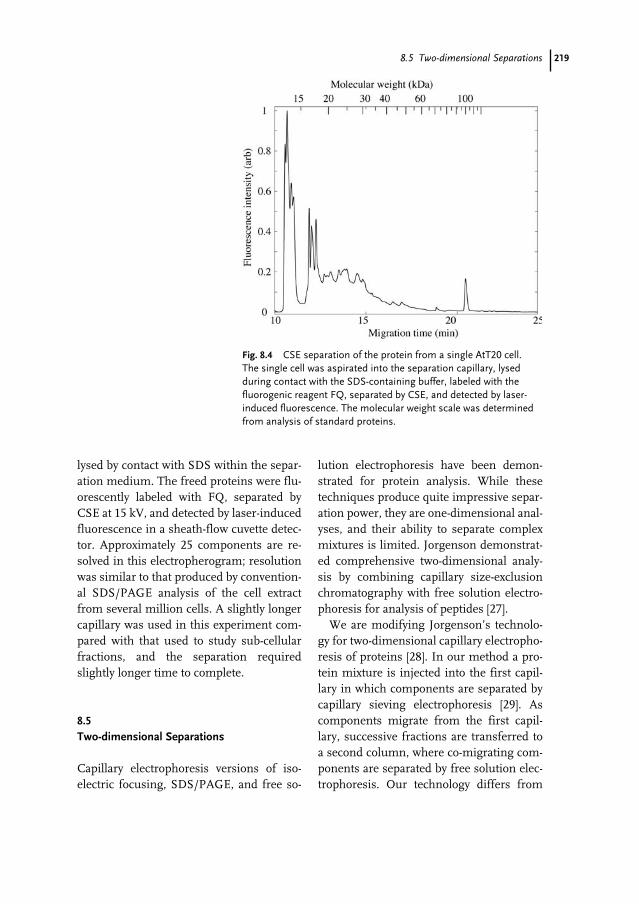
2198.5 Two-dimensional Separations
lysed by contact with SDS within the separ-ation medium. The freed proteins were flu-orescently labeled with FQ, separated byCSE at 15 kV, and detected by laser-inducedfluorescence in a sheath-flow cuvette detec-tor. Approximately 25 components are re-solved in this electropherogram; resolutionwas similar to that produced by convention-al SDS/PAGE analysis of the cell extractfrom several million cells. A slightly longercapillary was used in this experiment com-pared with that used to study sub-cellularfractions, and the separation requiredslightly longer time to complete.
8.5
Two-dimensional Separations
Capillary electrophoresis versions of iso-electric focusing, SDS/PAGE, and free so-
lution electrophoresis have been demon-strated for protein analysis. While thesetechniques produce quite impressive separ-ation power, they are one-dimensional anal-yses, and their ability to separate complexmixtures is limited. Jorgenson demonstrat-ed comprehensive two-dimensional analy-sis by combining capillary size-exclusionchromatography with free solution electro-phoresis for analysis of peptides [27].
We are modifying Jorgenson’s technolo-gy for two-dimensional capillary electropho-resis of proteins [28]. In our method a pro-tein mixture is injected into the first capil-lary in which components are separated bycapillary sieving electrophoresis [29]. Ascomponents migrate from the first capil-lary, successive fractions are transferred toa second column, where co-migrating com-ponents are separated by free solution elec-trophoresis. Our technology differs from
Fig. 8.4 CSE separation of the protein from a single AtT20 cell. The single cell was aspirated into the separation capillary, lysedduring contact with the SDS-containing buffer, labeled with thefluorogenic reagent FQ, separated by CSE, and detected by laser-induced fluorescence. The molecular weight scale was determinedfrom analysis of standard proteins.
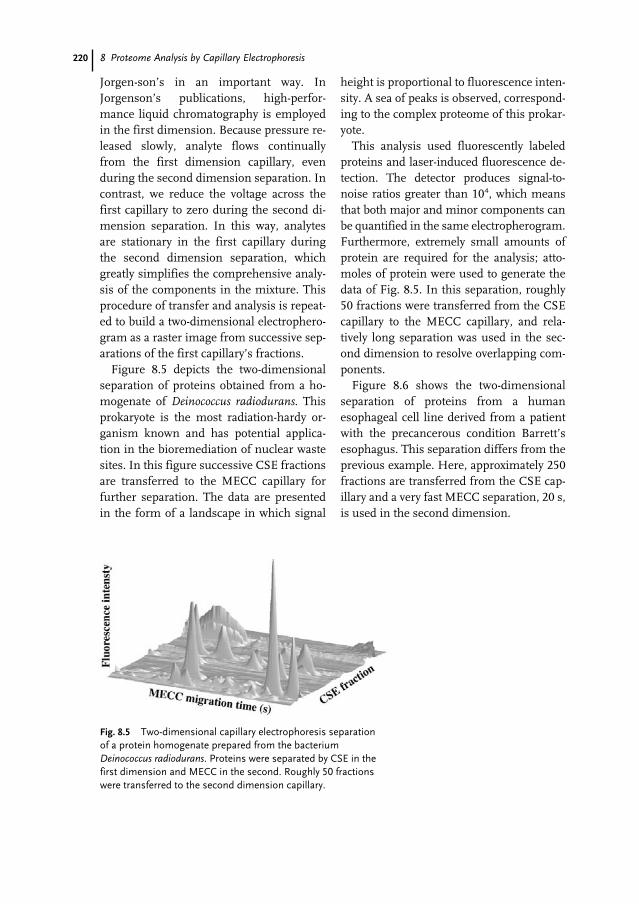
220 8 Proteome Analysis by Capillary Electrophoresis
Jorgen-son’s in an important way. InJorgenson’s publications, high-perfor-mance liquid chromatography is employedin the first dimension. Because pressure re-leased slowly, analyte flows continuallyfrom the first dimension capillary, evenduring the second dimension separation. Incontrast, we reduce the voltage across thefirst capillary to zero during the second di-mension separation. In this way, analytesare stationary in the first capillary duringthe second dimension separation, whichgreatly simplifies the comprehensive analy-sis of the components in the mixture. Thisprocedure of transfer and analysis is repeat-ed to build a two-dimensional electrophero-gram as a raster image from successive sep-arations of the first capillary’s fractions.
Figure 8.5 depicts the two-dimensionalseparation of proteins obtained from a ho-mogenate of Deinococcus radiodurans. Thisprokaryote is the most radiation-hardy or-ganism known and has potential applica-tion in the bioremediation of nuclear wastesites. In this figure successive CSE fractionsare transferred to the MECC capillary forfurther separation. The data are presentedin the form of a landscape in which signal
height is proportional to fluorescence inten-sity. A sea of peaks is observed, correspond-ing to the complex proteome of this prokar-yote.
This analysis used fluorescently labeledproteins and laser-induced fluorescence de-tection. The detector produces signal-to-noise ratios greater than 104, which meansthat both major and minor components canbe quantified in the same electropherogram.Furthermore, extremely small amounts ofprotein are required for the analysis; atto-moles of protein were used to generate thedata of Fig. 8.5. In this separation, roughly50 fractions were transferred from the CSEcapillary to the MECC capillary, and rela-tively long separation was used in the sec-ond dimension to resolve overlapping com-ponents.
Figure 8.6 shows the two-dimensionalseparation of proteins from a humanesophageal cell line derived from a patientwith the precancerous condition Barrett’sesophagus. This separation differs from theprevious example. Here, approximately 250fractions are transferred from the CSE cap-illary and a very fast MECC separation, 20 s,is used in the second dimension.
Fig. 8.5 Two-dimensional capillary electrophoresis separationof a protein homogenate prepared from the bacteriumDeinococcus radiodurans. Proteins were separated by CSE in thefirst dimension and MECC in the second. Roughly 50 fractionswere transferred to the second dimension capillary.
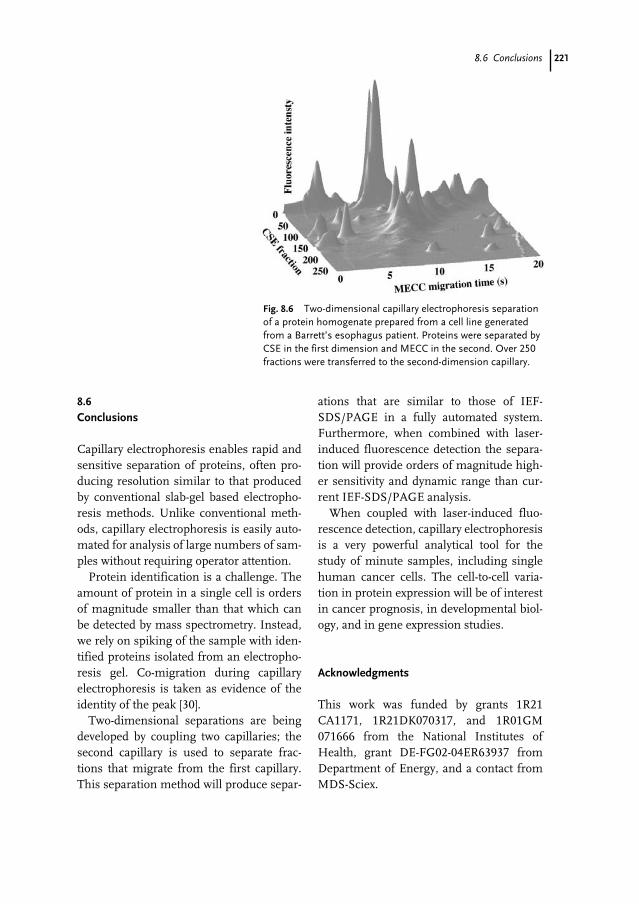
2218.6 Conclusions
8.6
Conclusions
Capillary electrophoresis enables rapid andsensitive separation of proteins, often pro-ducing resolution similar to that producedby conventional slab-gel based electropho-resis methods. Unlike conventional meth-ods, capillary electrophoresis is easily auto-mated for analysis of large numbers of sam-ples without requiring operator attention.
Protein identification is a challenge. Theamount of protein in a single cell is ordersof magnitude smaller than that which canbe detected by mass spectrometry. Instead,we rely on spiking of the sample with iden-tified proteins isolated from an electropho-resis gel. Co-migration during capillaryelectrophoresis is taken as evidence of theidentity of the peak [30].
Two-dimensional separations are beingdeveloped by coupling two capillaries; thesecond capillary is used to separate frac-tions that migrate from the first capillary.This separation method will produce separ-
ations that are similar to those of IEF-SDS/PAGE in a fully automated system.Furthermore, when combined with laser-induced fluorescence detection the separa-tion will provide orders of magnitude high-er sensitivity and dynamic range than cur-rent IEF-SDS/PAGE analysis.
When coupled with laser-induced fluo-rescence detection, capillary electrophoresisis a very powerful analytical tool for thestudy of minute samples, including singlehuman cancer cells. The cell-to-cell varia-tion in protein expression will be of interestin cancer prognosis, in developmental biol-ogy, and in gene expression studies.
Acknowledgments
This work was funded by grants 1R21CA1171, 1R21DK070317, and 1R01GM071666 from the National Institutes ofHealth, grant DE-FG02-04ER63937 fromDepartment of Energy, and a contact fromMDS-Sciex.
Fig. 8.6 Two-dimensional capillary electrophoresis separationof a protein homogenate prepared from a cell line generatedfrom a Barrett’s esophagus patient. Proteins were separated byCSE in the first dimension and MECC in the second. Over 250fractions were transferred to the second-dimension capillary.
222
1 V.C. Wasinger, S.J. Cordwell, A. Cerpa-Poljak,J.X. Yan, A.A. Gooley, M.R. Wilkins, M.W.Duncan, R. Harris, K.L. Williams, I.Humphery-Smith, Electrophoresis 1995, 16,1090–1094.
2 S.C. Hall, S.M. Smith, F.R. Masiarz, V.W. Soo, H.M. Tran, L.B. Epstein, A.L. Burlingame, Proc. Nat. Acad. Sci. (USA) 1993, 90, 1927–1931.
3 S.P. Gygi, B. Rist, S.A. Gerber, F. Turecek,M.H. Gelb, R. Aebersold, Nat. Biotechnol.1999, 17, 994–999.
4 M.P. Washburn, D. Wolters, J.R. Yates, Nat.Biotechnol. 2001, 19, 242–247.
5 J.Z. Zhang, K.O. Voss, D.F. Shaw, K.P. Roos,D.F. Lewis, J. Yan, R. Jiang, H. Ren, J.Y. Hou,Y. Fang, X. Puyang, H. Ahmadzadeh, N.J.Dovichi, Nucleic Acids Res. 1999, 27, e36.
6 X. Huang, M.J. Gordon, R.N. Zare, Anal.Chem. 1988, 60, 375–377.
7 D.S. Burgi, R.L. Chien, Methods Mol. Biol.1996, 52, 211–226.
8 D.S. Burgi, Anal. Chem. 1993, 65, 3726–3729.9 C. Gelfi, M. Curcio, P.G. Righetti, R.
Sebastiano, A. Citterio, H. Ahmadzadeh, N.J.Dovichi, Electrophoresis 1998, 19, 1677–1682.
10 JW. Jorgenson, K.D. Lukacs, Anal. Chem.1981, 53, 1298–1302.
11 P.K. Jensen, L. Pasa-Tolic, G.A. Anderson,J.A. Horner, M.S. Lipton, J.E. Bruce, R.D.Smith, Anal. Chem. 1999, 71, 2076–2084.
12 D.M. Pinto, E.A. Arriaga, D. Craig, J.Angelova, N. Sharma, H. Ahmadzadeh, N.J.Dovichi, C.A. Boulet, Anal Chem. 1997, 69,3015–3021.
13 I.H. Lee, D. Pinto, E.A. Arriaga, Z. Zhang,N.J. Dovichi, Anal. Chem. 1998, 70,4546–4548.
14 J.Y. Zhao, K.C. Waldron, J. Miller, J.Z. Zhang,H.R. Harke, N.J. Dovichi, J. Chromatogr. 1992,608, 239–242.
15 D. Richards, C. Stathakis, R. Polakowski, H.Ahmadzadeh, N.J. Dovichi, J. Chromatogr. A1999, 853, 21–25.
16 S. Hjerten, M.D. Zhu, J. Chromatogr. 1985,346, 265–270.
17 R. Rodriquez-Diaz, T. Wehr, M. Zhu,Electrophoresis 1997, 18, 2134–2144.
18 J. Wu, S.C. Li, A. Watson, J. Chromatogr. A1998, 817, 163–171.
19 X.W. Yao, F.E. Regnier, J. Chromatogr. 1993,632, 185–193.
20 S. Hu, Z. Zhang, L.M. Cook, E. Carpenter,N.J. Dovichi, J. Chromatogr. A. 2000, 895,291–296.
21 Z. Zhang, S. Krylov, E.A. Arriaga, R.Polakowski, N.J. Dovichi, Anal. Chem. 2000,72, 318–322.
22 S. Hu, R. Lee, Z. Zhang, S.N. Krylov, N.J.Dovichi J. Chromatogr. B 2001, 752, 307–310.
23 S. Hu, L. Zhang, L.M. Cook, N.J. Dovichi,Electrophoresis 2001, 22, 3677–3682.
24 S. Hu, J. Jiang, L. Cook, D.P. Richards, L.Horlick, B. Wong, and N.J. Dovichi,Electrophoresis 2002, 23, 3136–3142.
25 S. Hu, L. Zhang, S.N. Krylov, N.J. Dovichi,Anal. Chem. 2003, 75, 3495–3501.
26 S. Hu, D. Michels, M. A. Fazal, C.Ratisoontorn, M.L. Cunningham, N.J.Dovichi, Anal. Chem. 2004, 76, 4044–4049.
27 M.M. Bushey, J.W. Jorgenson, Anal. Chem.1990, 62, 161–167.
28 D. Michels, S. Hu, R. Schoenherr, M.J.Eggertson, N.J. Dovichi, Mol. Cell. Proteomics2002, 1, 69–74.
29 D.A. Michels, S. Hu, K.A. Dambrowitz, M.J.Eggertson, K. Lauterbach, N.J. Dovichi,Electrophoresis 2004, 25, 3098–3105.
30 S. Hu, L. Zhang, R. Newitt, R. Aebersold, J.R.Kraly, M. Jones, N.J. Dovichi, Anal. Chem.2003, 75, 3502–3505.
References
223
Daniel C. Tessier, Mélanie Arbour, François Benoit, Hervé Hogues, and Tracey Rigby
9.1
Introduction
DNA microarrays (also known as DNAchips or gene chips) are a powerful new toolfor the study of gene expression and genet-ic variation. With the availability of increas-ing numbers of completely sequenced ge-nomes, it is now possible to make DNAmicroarrays, on which all the genes of anorganism are represented, enabling simul-taneous assessment of the expression of allthese genes. This technology has lead bio-medical research into a new era of “discov-ery research” that is complementing thetype of “hypothesis-driven research” thathas marked the phenomenal success of mo-lecular biology in the past four decades [1].
Pioneering studies of the chemistry ofnucleic acids some four decades ago [2]showed that mRNA could be measured byhybridization to total bacteriophage DNAfixed on nitrocellulose filters by Coulombicforces. The characteristics of hybridizationof RNA–DNA and DNA–DNA were estab-lished by extensive experimentation both inliquid and on solid supports (typically nitro-
cellulose membranes). The advent of re-striction enzymes enabled the electropho-retic separation of DNA fragments and lo-calization of mRNA to specific regions –Southern blots [3]. The concept of DNAchips arose from the coincidence of a num-ber of technologies, including rapid oligo-nucleotide synthesis and genome sequenc-ing, understanding of the enzymology ofDNA synthesis, and the availability of suchenzymes, robotic methods of arraying, re-finement of DNA chemistry for creatingfluorescent hybridization probes, and theavailability of completely sequenced ge-nomes. Thus these developments com-bined with the evolution of nucleic acid hy-bridization methods led to the realizationthat individual genes arranged separatelyand in order on a solid substrate could beused to monitor all the genes of an organ-ism.
Essentially two techniques are used forproduction of DNA chips. The first employsdirect spatially ordered synthesis of oligo-nucleotides on a solid support (silica) by aprocess called photolithography. This tech-nology, patented by Affymetrix, is reminis-
Handbook of Genome Research. Genomics, Proteomics, Metabolomics, Bioinformatics, Ethical and Legal Issues.Edited by Christoph W. SensenCopyright © 2005 WILEY-VCH Verlag GmbH & Co. KGaA, WeinheimISBN: 3-527-31348-6
9A DNA Microarray Fabrication Strategy for Research Laboratories
Verwendete Mac Distiller 5.0.x Joboptions
Dieser Report wurde automatisch mit Hilfe der Adobe Acrobat Distiller Erweiterung "Distiller Secrets v1.0.5" der IMPRESSED GmbH erstellt. Sie koennen diese Startup-Datei für die Distiller Versionen 4.0.5 und 5.0.x kostenlos unter http://www.impressed.de herunterladen. ALLGEMEIN ---------------------------------------- Dateioptionen: Kompatibilität: PDF 1.3 Für schnelle Web-Anzeige optimieren: Ja Piktogramme einbetten: Ja Seiten automatisch drehen: Nein Seiten von: 1 Seiten bis: Alle Seiten Bund: Links Auflösung: [ 2400 2400 ] dpi Papierformat: [ 481 680 ] Punkt KOMPRIMIERUNG ---------------------------------------- Farbbilder: Downsampling: Nein Komprimieren: Ja Komprimierungsart: ZIP Bitanzahl pro Pixel: 8 Bit Graustufenbilder: Downsampling: Nein Komprimieren: Ja Komprimierungsart: ZIP Bitanzahl pro Pixel: 8 Bit Schwarzweiß-Bilder: Downsampling: Nein Komprimieren: Ja Komprimierungsart: CCITT CCITT-Gruppe: 4 Graustufen glätten: Nein Text und Vektorgrafiken komprimieren: Ja SCHRIFTEN ---------------------------------------- Alle Schriften einbetten: Ja Untergruppen aller eingebetteten Schriften: Nein Wenn Einbetten fehlschlägt: Abbrechen Einbetten: Immer einbetten: [ /Courier-BoldOblique /Helvetica-BoldOblique /Courier /Helvetica-Bold /Times-Bold /Courier-Bold /Helvetica /Times-BoldItalic /Times-Roman /ZapfDingbats /Times-Italic /Helvetica-Oblique /Courier-Oblique /Symbol ] Nie einbetten: [ ] FARBE(N) ---------------------------------------- Farbmanagement: Farbumrechnungsmethode: Farbe nicht ändern Methode: Standard Geräteabhängige Daten: Einstellungen für Überdrucken beibehalten: Ja Unterfarbreduktion und Schwarzaufbau beibehalten: Ja Transferfunktionen: Beibehalten Rastereinstellungen beibehalten: Nein ERWEITERT ---------------------------------------- Optionen: Prolog/Epilog verwenden: Nein PostScript-Datei darf Einstellungen überschreiben: Nein Level 2 copypage-Semantik beibehalten: Ja Portable Job Ticket in PDF-Datei speichern: Ja Illustrator-Überdruckmodus: Ja Farbverläufe zu weichen Nuancen konvertieren: Ja ASCII-Format: Nein Document Structuring Conventions (DSC): DSC-Kommentare verarbeiten: Ja DSC-Warnungen protokollieren: Nein Für EPS-Dateien Seitengröße ändern und Grafiken zentrieren: Ja EPS-Info von DSC beibehalten: Ja OPI-Kommentare beibehalten: Nein Dokumentinfo von DSC beibehalten: Ja ANDERE ---------------------------------------- Distiller-Kern Version: 5000 ZIP-Komprimierung verwenden: Ja Optimierungen deaktivieren: Nein Bildspeicher: 524288 Byte Farbbilder glätten: Nein Graustufenbilder glätten: Nein Bilder (< 257 Farben) in indizierten Farbraum konvertieren: Ja sRGB ICC-Profil: sRGB IEC61966-2.1 ENDE DES REPORTS ---------------------------------------- IMPRESSED GmbH Bahrenfelder Chaussee 49 22761 Hamburg, Germany Tel. +49 40 897189-0 Fax +49 40 897189-71 Email: [email protected] Web: www.impressed.de
Adobe Acrobat Distiller 5.0.x Joboption Datei
<< /ColorSettingsFile () /LockDistillerParams true /DetectBlends true /DoThumbnails true /AntiAliasMonoImages false /MonoImageDownsampleType /Bicubic /GrayImageDownsampleType /Bicubic /MaxSubsetPct 100 /MonoImageFilter /CCITTFaxEncode /ColorImageDownsampleThreshold 1.5 /GrayImageFilter /FlateEncode /ColorConversionStrategy /LeaveColorUnchanged /CalGrayProfile (Dot Gain 20%) /ColorImageResolution 300 /UsePrologue false /MonoImageResolution 1200 /ColorImageDepth 8 /sRGBProfile (sRGB IEC61966-2.1) /PreserveOverprintSettings true /CompatibilityLevel 1.3 /UCRandBGInfo /Preserve /EmitDSCWarnings false /CreateJobTicket true /DownsampleMonoImages false /DownsampleColorImages false /MonoImageDict << /K -1 >> /ColorImageDownsampleType /Bicubic /GrayImageDict << /HSamples [ 2 1 1 2 ] /VSamples [ 2 1 1 2 ] /Blend 1 /QFactor 0.9 >> /CalCMYKProfile (U.S. Web Coated (SWOP) v2) /ParseDSCComments true /PreserveEPSInfo true /MonoImageDepth -1 /AutoFilterGrayImages false /SubsetFonts false /GrayACSImageDict << /HSamples [ 2 1 1 2 ] /VSamples [ 2 1 1 2 ] /Blend 1 /QFactor 0.9 >> /ColorImageFilter /FlateEncode /AutoRotatePages /None /PreserveCopyPage true /EncodeMonoImages true /ASCII85EncodePages false /PreserveOPIComments false /NeverEmbed [ ] /ColorImageDict << /HSamples [ 2 1 1 2 ] /VSamples [ 2 1 1 2 ] /Blend 1 /QFactor 0.9 >> /AntiAliasGrayImages false /GrayImageDepth 8 /CannotEmbedFontPolicy /Error /EndPage -1 /TransferFunctionInfo /Preserve /CalRGBProfile (sRGB IEC61966-2.1) /EncodeColorImages true /EncodeGrayImages true /ColorACSImageDict << /HSamples [ 2 1 1 2 ] /VSamples [ 2 1 1 2 ] /Blend 1 /QFactor 0.9 >> /Optimize true /ParseDSCCommentsForDocInfo true /GrayImageDownsampleThreshold 1.5 /MonoImageDownsampleThreshold 1.5 /AutoPositionEPSFiles true /GrayImageResolution 300 /AutoFilterColorImages false /AlwaysEmbed [ /Courier-BoldOblique /Helvetica-BoldOblique /Courier /Helvetica-Bold /Times-Bold /Courier-Bold /Helvetica /Times-BoldItalic /Times-Roman /ZapfDingbats /Times-Italic /Helvetica-Oblique /Courier-Oblique /Symbol ] /ImageMemory 524288 /OPM 1 /DefaultRenderingIntent /Default /EmbedAllFonts true /StartPage 1 /DownsampleGrayImages false /AntiAliasColorImages false /ConvertImagesToIndexed true /PreserveHalftoneInfo false /CompressPages true /Binding /Left >> setdistillerparams << /PageSize [ 595.276 841.890 ] /HWResolution [ 2400 2400 ] >> setpagedevice
224 3 Nuclear Things
cent of the technology used in the electronicindustry for the fabrication of semiconduc-tors. The density of features displayed ontheir GeneChips can now exceed 500,000 onan area ~1.28 cm2. The other technologyuses post-synthesis arraying of oligonucleo-tides or DNA on solid supports, generallyoptically flat glass slides, using either con-tact printing or ink-jet spotting. There arenumerous variations in the details of bothtechniques but the methods based on post-synthesis arraying are clearly the most ac-cessible to the smaller research lab. Al-though initial experiments used arrayedcDNA and genomic DNA clones on nitro-cellulose or nylon supports and detectionusing 32P or 33P-labeled probes, the recenttechnological improvements mentionedabove and the accessibility of precise array-ing robots have made glass microscopeslides increasingly popular substrates. Forthose familiar with conventional hybridiza-tion literature, the term “probe” was usedfor the species of nucleic acid that carriedthe detection system (usually radioactivity)present in the solution phase. For the sakeof uniformity, this conventional terminolo-gy will be used throughout this chapter.
The main applications of DNA chips andmicroarrays are in gene expression profil-ing [4–8], mutation analysis [9, 10], detec-tion of single-nucleotide polymorphisms(SNP) [11], pharmacogenomics [12], valida-tion of drug targets, identification of taggedbiological strains, and monitoring of micro-bial flora in soil and wastewater. Its poten-tial does not need to be emphasized but thistechnology is not an end in itself, it is, firstand foremost, a quantitative high-through-put method of screening using genetic ma-terial as a target.
Researchers face many hurdles in thecustom fabrication and use of microarrays.
The costs of microarrays are still high, thetechnology for their fabrication is precise,and the conditions for their use and analy-sis are numerous and demanding. Severalcost-effective strategies can, however, beused by either large core facilities or aca-demic centers to make high quality micro-arrays available to researchers at reasonablecost.
In many cases, fabrication of microarraysrequires a source of available cloned cDNAor expressed sequenced tags (EST) for anorganism. These are typically available fromcentral clone repositories or commercialsources (a list of clone providers is given inTab. 9.1). Plasmid DNA can be arrayed di-rectly, but most frequently cloned DNA in-serts are amplified by PCR using commonoligonucleotide primers immediately flank-ing the multiple cloning cassette [13, 15]. Inthis way, although the initial cost of acquir-ing the clones might be high, the cost of ol-igonucleotides is low. An alternative strate-gy is to identify coding regions within ge-nomic DNA, open reading frames (ORF), orexons and to amplify the selected DNA frag-ments using PCR and specific oligonucleo-tide primers. The advantage of this strategyis that for any sequenced genome all identi-fied coding or potentially coding sequencescan be arrayed. This also avoids a probleminherent to EST-based strategies wherebysome transcripts may be extremely rare andabsent from cloned libraries. All gene cop-ies are present equally in genomic DNA.The use of a specific primer pair to amplifya selected gene segment also prevents theundesirable amplification of low-complexitysequence stretches (repeated sequences andpoly(A) tails) from the 3′ untranslated re-gions (3′UTR) of cloned cDNA, which willinvariably contribute to cross-hybridizationof spots on the microarray [16, 17].
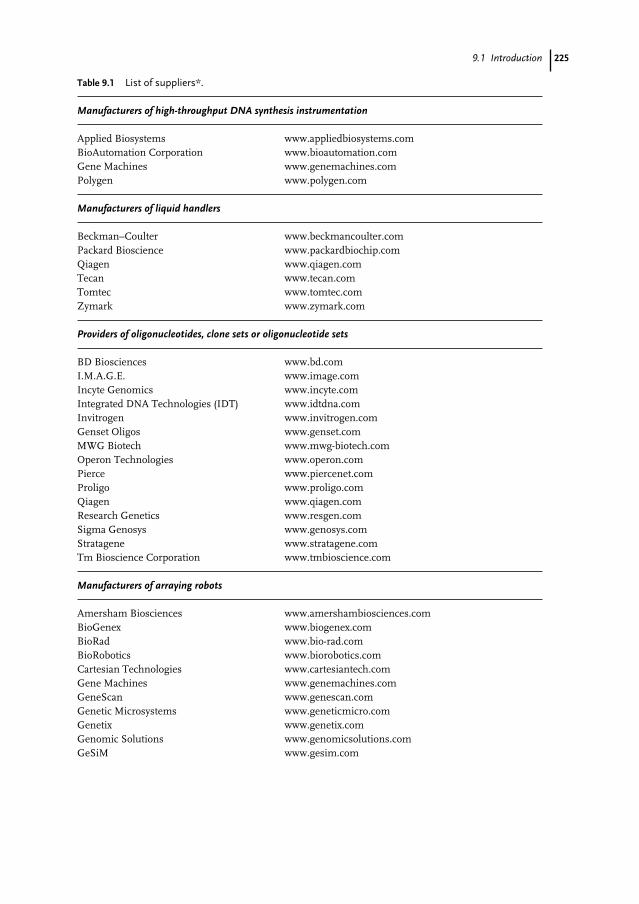
2259.1 Introduction
Table 9.1 List of suppliers*.
Manufacturers of high-throughput DNA synthesis instrumentation
Applied Biosystems www.appliedbiosystems.comBioAutomation Corporation www.bioautomation.comGene Machines www.genemachines.comPolygen www.polygen.com
Manufacturers of liquid handlers
Beckman–Coulter www.beckmancoulter.comPackard Bioscience www.packardbiochip.comQiagen www.qiagen.comTecan www.tecan.comTomtec www.tomtec.comZymark www.zymark.com
Providers of oligonucleotides, clone sets or oligonucleotide sets
BD Biosciences www.bd.comI.M.A.G.E. www.image.comIncyte Genomics www.incyte.comIntegrated DNA Technologies (IDT) www.idtdna.comInvitrogen www.invitrogen.comGenset Oligos www.genset.comMWG Biotech www.mwg-biotech.comOperon Technologies www.operon.comPierce www.piercenet.comProligo www.proligo.comQiagen www.qiagen.comResearch Genetics www.resgen.comSigma Genosys www.genosys.comStratagene www.stratagene.comTm Bioscience Corporation www.tmbioscience.com
Manufacturers of arraying robots
Amersham Biosciences www.amershambiosciences.comBioGenex www.biogenex.comBioRad www.bio-rad.comBioRobotics www.biorobotics.comCartesian Technologies www.cartesiantech.comGene Machines www.genemachines.comGeneScan www.genescan.comGenetic Microsystems www.geneticmicro.comGenetix www.genetix.comGenomic Solutions www.genomicsolutions.comGeSiM www.gesim.com
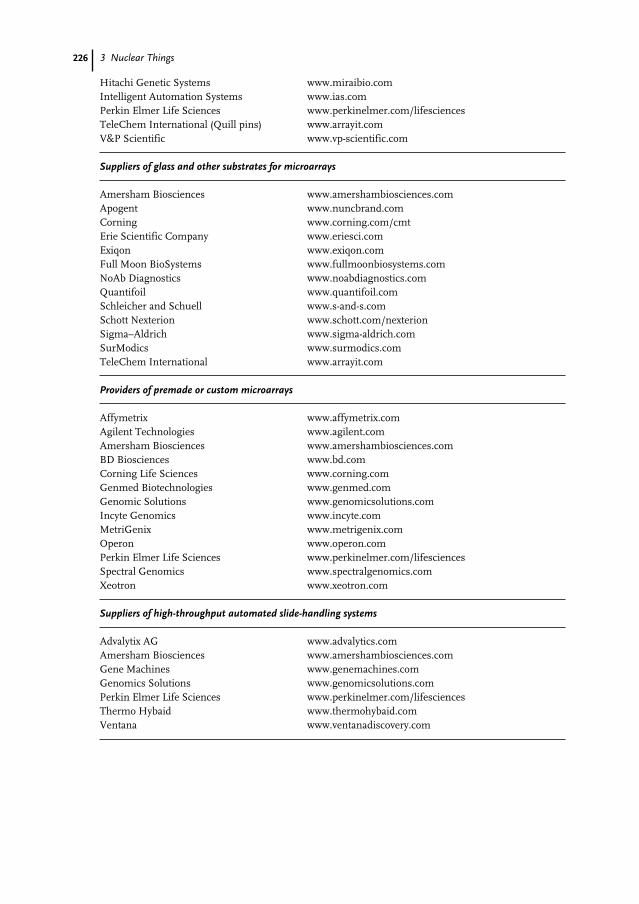
226 3 Nuclear Things
Hitachi Genetic Systems www.miraibio.comIntelligent Automation Systems www.ias.comPerkin Elmer Life Sciences www.perkinelmer.com/lifesciencesTeleChem International (Quill pins) www.arrayit.comV&P Scientific www.vp-scientific.com
Suppliers of glass and other substrates for microarrays
Amersham Biosciences www.amershambiosciences.comApogent www.nuncbrand.comCorning www.corning.com/cmtErie Scientific Company www.eriesci.comExiqon www.exiqon.comFull Moon BioSystems www.fullmoonbiosystems.comNoAb Diagnostics www.noabdiagnostics.comQuantifoil www.quantifoil.comSchleicher and Schuell www.s-and-s.comSchott Nexterion www.schott.com/nexterionSigma–Aldrich www.sigma-aldrich.comSurModics www.surmodics.comTeleChem International www.arrayit.com
Providers of premade or custom microarrays
Affymetrix www.affymetrix.comAgilent Technologies www.agilent.comAmersham Biosciences www.amershambiosciences.comBD Biosciences www.bd.comCorning Life Sciences www.corning.comGenmed Biotechnologies www.genmed.comGenomic Solutions www.genomicsolutions.comIncyte Genomics www.incyte.comMetriGenix www.metrigenix.comOperon www.operon.comPerkin Elmer Life Sciences www.perkinelmer.com/lifesciencesSpectral Genomics www.spectralgenomics.comXeotron www.xeotron.com
Suppliers of high-throughput automated slide-handling systems
Advalytix AG www.advalytics.comAmersham Biosciences www.amershambiosciences.comGene Machines www.genemachines.comGenomics Solutions www.genomicsolutions.comPerkin Elmer Life Sciences www.perkinelmer.com/lifesciencesThermo Hybaid www.thermohybaid.comVentana www.ventanadiscovery.com
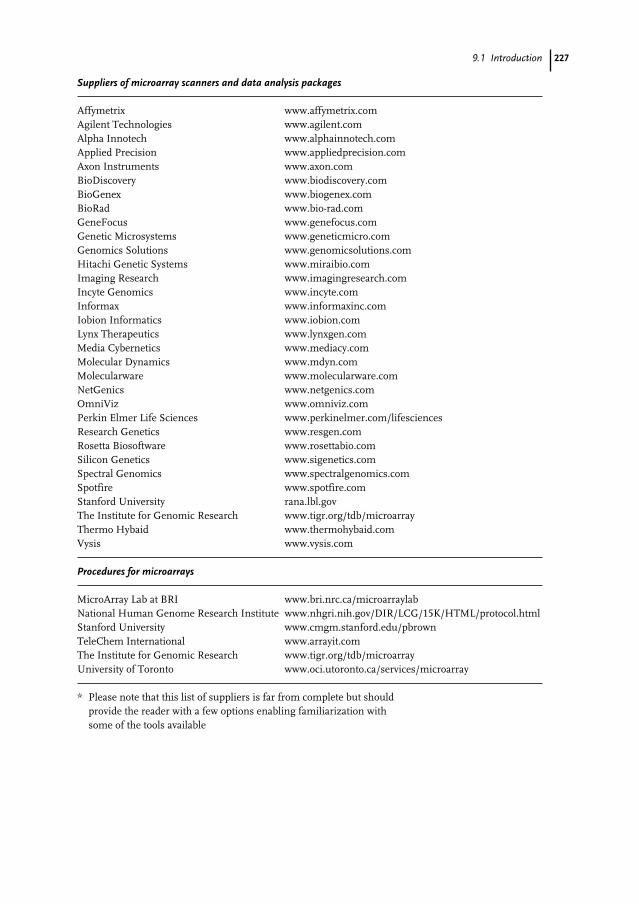
2279.1 Introduction
Suppliers of microarray scanners and data analysis packages
Affymetrix www.affymetrix.comAgilent Technologies www.agilent.comAlpha Innotech www.alphainnotech.comApplied Precision www.appliedprecision.comAxon Instruments www.axon.comBioDiscovery www.biodiscovery.comBioGenex www.biogenex.comBioRad www.bio-rad.comGeneFocus www.genefocus.comGenetic Microsystems www.geneticmicro.comGenomics Solutions www.genomicsolutions.comHitachi Genetic Systems www.miraibio.comImaging Research www.imagingresearch.comIncyte Genomics www.incyte.comInformax www.informaxinc.comIobion Informatics www.iobion.comLynx Therapeutics www.lynxgen.comMedia Cybernetics www.mediacy.comMolecular Dynamics www.mdyn.comMolecularware www.molecularware.comNetGenics www.netgenics.comOmniViz www.omniviz.comPerkin Elmer Life Sciences www.perkinelmer.com/lifesciencesResearch Genetics www.resgen.comRosetta Biosoftware www.rosettabio.comSilicon Genetics www.sigenetics.comSpectral Genomics www.spectralgenomics.comSpotfire www.spotfire.comStanford University rana.lbl.govThe Institute for Genomic Research www.tigr.org/tdb/microarrayThermo Hybaid www.thermohybaid.comVysis www.vysis.com
Procedures for microarrays
MicroArray Lab at BRI www.bri.nrc.ca/microarraylabNational Human Genome Research Institute www.nhgri.nih.gov/DIR/LCG/15K/HTML/protocol.htmlStanford University www.cmgm.stanford.edu/pbrownTeleChem International www.arrayit.comThe Institute for Genomic Research www.tigr.org/tdb/microarrayUniversity of Toronto www.oci.utoronto.ca/services/microarray
* Please note that this list of suppliers is far from complete but should provide the reader with a few options enabling familiarization with some of the tools available
228 3 Nuclear Things
In another strategy for microarray pro-duction, one or more unmodified or amino-modified oligonucleotide sequences of60–80 nucleotides representative of eachcoding region can be arrayed directly on toglass slides. The immediate disadvantage ofthis strategy is the higher cost of oligonu-cleotide synthesis. The growth of large-scalegenomics efforts including microarrays hasfortunately driven the cost of oligonucleo-tides down in recent years. One advantage,however, of oligonucleotide arrays over am-plicon arrays is that the target sequences areshort and can be more easily selected tominimize cross-hybridization to multipleprobe sequences.
The implementation of microarray tech-nology also requires the installation of high-throughput, high-precision instrumenta-tion to carry out the numerous tasks in-volved in the production of the microarrays,and a comprehensive bioinformatics plat-form to support the design, clone tracking,data collection, and analysis aspects of mi-croarrays. In this chapter, we will not ad-dress the issues related to analysis of micro-array data. We will describe instead thepractical implementation of a microarray fa-cility (www.bri.nrc.ca/microarraylab) usingas an example the fabrication of Candida al-bicans cDNA microarrays.
9.2
The Database
Candida albicans is an opportunistic humanfungal pathogen causing systemic and veryoften fatal infections in immuno-compro-mised individuals. The application of mi-croarray technology is a powerful new toolin the study of the mechanism of pathogen-esis, and we were particularly interested inthe molecular events involved in the dimor-phic transition from yeast to hyphae when
Candida albicans is exposed to changes in me-dium composition or environmental condi-tions (see reviews by Whiteway [18], Bermanand Sudbery [19], Cowen et al. [20], Nantel etal. [21], and Enjalbert et al. [22]). The genomeof Candida albicans (strain SC5314) containsapproximately 20 million bases organized ineight pairs of chromosomes. The latest as-sembly of the genome, originally sequencedby Ron Davis (www. sequence.stanford.edu/-group/candida, see acknowledgement in Ref-erences), has now been reduced to a mere266 contigs and 6354 genes (http://genome-www.stanford.edu/fungi/Candida/ and Nan-tel et al., personal communication, www.can-dida.bri.nrc.ca). Open reading frames (ORF)were originally identified using an automatedgenome annotation system called MAGPIE(multipurpose automated genome project in-vestigation environment) [23], but many oth-er programs can now be used to do this. Es-sentially, software tools scan for any of thethree termination codons or STOP codons(TAA, TAG, and TGA) in all six possible read-ing frames and then read the sequence back-wards until they reach an in-frame “ATG” in-itiation codon. These open-reading frames,which represent potential coding regions,were automatically searched against Gen-Bank to identify DNA and/or protein similar-ities.
One of the challenges of chip fabricationis data handling. For this we developed anintegrated bioinformatics platform (www.bri.nrc.ca/bridna) and a set of tools to per-form primer design, assessment of ampli-con quality, tracking of the position of PCRproducts on the chips, and links to dataanalysis packages (Fig. 9.1). The first step inour fabrication process was to select thoseORFs greater than 250 base pairs (>80 ami-no acids) and to identify short unique prim-er sequences (20 nucleotides) within eachORF. For C. albicans only 46 % of the origi-nal 14,400 ORFs identified were greater
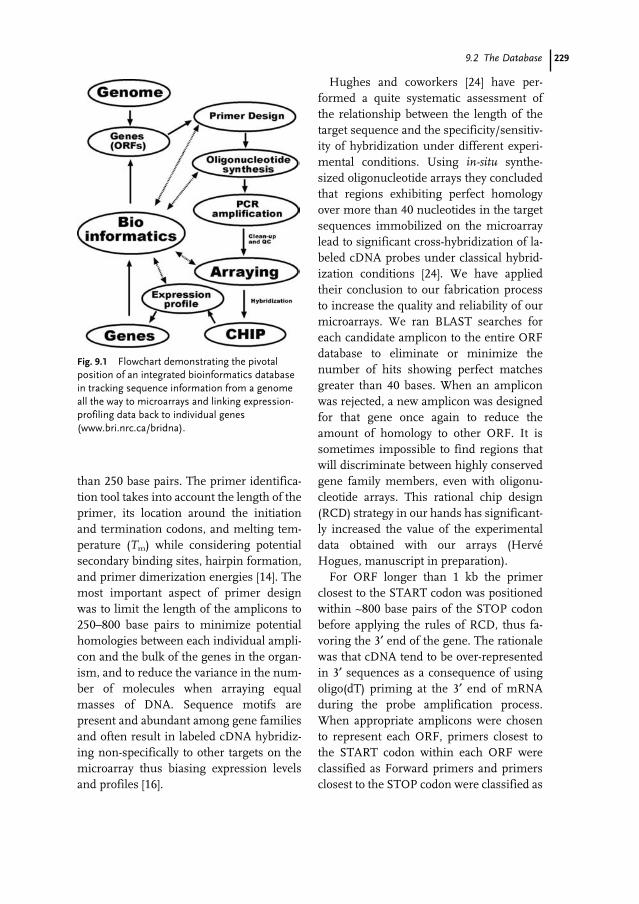
2299.2 The Database
than 250 base pairs. The primer identifica-tion tool takes into account the length of theprimer, its location around the initiationand termination codons, and melting tem-perature (Tm) while considering potentialsecondary binding sites, hairpin formation,and primer dimerization energies [14]. Themost important aspect of primer designwas to limit the length of the amplicons to250–800 base pairs to minimize potentialhomologies between each individual ampli-con and the bulk of the genes in the organ-ism, and to reduce the variance in the num-ber of molecules when arraying equalmasses of DNA. Sequence motifs arepresent and abundant among gene familiesand often result in labeled cDNA hybridiz-ing non-specifically to other targets on themicroarray thus biasing expression levelsand profiles [16].
Hughes and coworkers [24] have per-formed a quite systematic assessment ofthe relationship between the length of thetarget sequence and the specificity/sensitiv-ity of hybridization under different experi-mental conditions. Using in-situ synthe-sized oligonucleotide arrays they concludedthat regions exhibiting perfect homologyover more than 40 nucleotides in the targetsequences immobilized on the microarraylead to significant cross-hybridization of la-beled cDNA probes under classical hybrid-ization conditions [24]. We have appliedtheir conclusion to our fabrication processto increase the quality and reliability of ourmicroarrays. We ran BLAST searches foreach candidate amplicon to the entire ORFdatabase to eliminate or minimize thenumber of hits showing perfect matchesgreater than 40 bases. When an ampliconwas rejected, a new amplicon was designedfor that gene once again to reduce theamount of homology to other ORF. It issometimes impossible to find regions thatwill discriminate between highly conservedgene family members, even with oligonu-cleotide arrays. This rational chip design(RCD) strategy in our hands has significant-ly increased the value of the experimentaldata obtained with our arrays (HervéHogues, manuscript in preparation).
For ORF longer than 1 kb the primerclosest to the START codon was positionedwithin ~800 base pairs of the STOP codonbefore applying the rules of RCD, thus fa-voring the 3′ end of the gene. The rationalewas that cDNA tend to be over-representedin 3′ sequences as a consequence of usingoligo(dT) priming at the 3′ end of mRNAduring the probe amplification process.When appropriate amplicons were chosento represent each ORF, primers closest tothe START codon within each ORF wereclassified as Forward primers and primersclosest to the STOP codon were classified as
Fig. 9.1 Flowchart demonstrating the pivotalposition of an integrated bioinformatics databasein tracking sequence information from a genomeall the way to microarrays and linking expression-profiling data back to individual genes(www.bri.nrc.ca/bridna).
230 3 Nuclear Things
Reverse primers. The production databasewas designed to assign batches of 96 For-ward primers directly to 96-well plates foroligonucleotide synthesis. The Reverseprimers corresponding to the same 96 ORFwere assigned to a second 96-well plate suchthat the Forward/Reverse primer pairswould superimpose well for well for everyORF. This was to facilitate the automationof all the subsequent liquid handling stepsin the production process.
In addition to ORF identification andPCR primer design, the microarray produc-tion database automatically redesigns prim-ers in the case of PCR failures or weakbands. It systematically assigns and tracksthe origin of oligonucleotides and/or ampli-con products from 96-well plates to 384-wellplates all the way to their position on the mi-croarrays and generates a key (XY coordi-nates for every spot) of the genes based onthe spotting method used by the arrayer(number of pins, size of the array, numberof samples, etc.). One key component in anytracking scheme is the use of bar-coding.The large number of samples involved inany genomic/microarray project makes thisprocedure absolutely essential and simpli-fies the quality-control procedures.
9.3
High-throughput DNA Synthesis
Accessibility to high-quality oligonucleotidesat a reasonable cost is an important consider-ation for a microarray fabrication facility. Apreferred approach is to use synthetic oligo-nucleotides to amplify ORF directly from ge-nomic DNA. This latter approach, however,necessitates the synthesis of thousands of ol-igonucleotides per genome, creating a de-mand for a large number of oligonucleotides.
There are also situations in which onemight prefer to use oligonucleotides directly
immobilized on the microarray in prefer-ence to amplicons. For example, when devel-oping diagnostic microarrays for a largenumber of pathogens it is much easier, fast-er, and safer to design oligonucleotides fromavailable genomic sequences than to obtainthe various organisms, culture them to pre-pare genomic DNA under appropriate bio-safety conditions, and prepare the desiredamplicons (a list of providers of oligonucleo-tide sets is given in Tab. 9.1). Another situa-tion is when creating microarrays intendedto distinguish hybridization events betweenvery closely related genes or organisms.Specificity is then of utmost importance todiscriminate subtle polymorphisms.
9.3.1
Scale and Cost of Synthesis
The current technology of oligonucleotidesynthesis, based on automated synthesizersusing solid-phase phosphoramidite chemis-try [25], offers a reasonable solution for thepreparation of large numbers of oligonu-cleotides at a reasonable cost. The scale ofsynthesis is not a problem, inasmuch ascurrent oligonucleotide synthesis technolo-gy generally prepares far more materialthan is normally required for PCR amplifi-cations. As an example, a 5-nmol-scale syn-thesis, small by modern standards, produc-es enough material for 200 PCR reactions,given the usual quantity of 25 pmol per re-action. Even smaller scale could be envis-aged if automated mechanical and fluidicdevices were capable of efficiently deliver-ing very small volumes of reagents and ex-cluding oxygen and moisture from the syn-thesis process.
A 5-nmol synthesis scale is also adequatefor many applications using immobilizedoligonucleotide microarrays, unless largeproduction runs are envisaged. Spottingconcentration for amino-linked oligonu-
2319.3 High-throughput DNA Synthesis
cleotides is in the range 10–25 nmol mL–1
(SurModics/Motorola), so a 5-nmol synthe-sis would provide 200–300 µL sample,enough to print several hundred slides.
Reagent costs alone for oligonucleotidesproduced on modern high-throughput DNAsynthesizers currently lie in the range ofUS $0.05–0.10 per base. This translatesinto a cost per oligonucleotide of betweenUS $1.00–2.00 (for 20 bases). By way of anexample, the oligonucleotide cost for a mi-croarray covering a full bacterial genome(~3000 ORF, ~6000 oligonucleotides) wouldbe between US $7000 and $14,000, assum-ing a 15 % failure rate in the PCR.
9.3.2
Operational Constraints
The operation of a high-throughput DNAsynthesizer capable of producing >500 oli-gonucleotides per day involves handlingsignificant quantities of flammable, corro-sive, highly reactive, and carcinogenic ma-terials. These chemicals are hazardous andshould be handled by a trained chemist.Several of the reagents are also of limitedstability once installed on the synthesizer; achemist must pay careful attention to theirage and condition to maintain the highestquality while simultaneously keeping costsunder control.
An important advantage lies with thosesynthesizers which accept the use of uni-versal synthesis support (controlled-poreglass, CPG). Conventional DNA synthesiz-ers use membranes or CPG columns bear-ing one of the four bases A, C, G, or T. Thisis fine for low numbers of syntheses butwould be intolerable in a 96-well plate for-mat. The time saved and the avoidance ofpossible errors fully justifies the use of theuniversal supports, in which the first baseis added automatically by the synthesizer asopposed to being present on the solid phase.
One commercially available high-throughput oligonucleotide synthesizer isthe LCDR/MerMade (BioAutomation Cor-poration, www.bioautomation.com, a list ofhigh-throughput DNA synthesizers cur-rently commercially available is available inTab. 9.1). The MerMade is a Liquid Chemi-cal Dispensing Robot that was adapted toperform all the operations of DNA synthe-sis using classical phosphoramidite chem-istry [25] in a fully automated fashion. TheMerMade is equipped with a motorized XYtable within a closed argon chamber provid-ing the inert atmosphere necessary for syn-thesis. The XY table can hold up to two fil-ter plates (96-well format) in which a uni-versal control pore glass (CPG) support isloaded to enable solid-phase synthesis ofthe oligonucleotides. The instrument isequipped with computer-controlled valvesto deliver the reagents from the bottles tothe injection heads. The newer generationsof instruments can be set to operate on anyscale of synthesis with minimum adjust-ment. The setup time for synthesis is rou-tinely about 1 h and, depending on the syn-thesis procedure, the MerMade will synthe-size 192 oligonucleotides (two 96-wellplates of 20mers) in as little as 8 h withoutoperator intervention. The yield of fully de-protected oligonucleotides is > 80 % for20mer products. Oligonucleotide productsup to 70 bases can be routinely obtained bymaking minor adjustments to the synthesisprocedures.
Our microarray facility has operated twoLCDR/MerMade synthesizers with goodsuccess since March 2000. Using thesesynthesizers, one operator can produce upto 700 oligonucleotides per day with a suc-cess rate better than 98 %, determined byelectrospray mass spectrometry. The instru-ments have no major flaws and provide agood level of user serviceability, conven-ience, and performance. As alluded to
232 3 Nuclear Things
above, the economics of high-throughputin-house DNA synthesis compared without-sourcing to commercial oligonucleotideproviders are becoming more difficult tojustify.
9.3.3
Quality-control Issues
Quality control of oligonucleotides has al-ways been a difficult problem. Polyacryla-mide gel electrophoresis (PAGE) is inexpen-sive and adequate for small numbers of syn-theses, but far too labor-intensive for dailyproductions of hundreds of oligonucleo-tides. High-performance liquid chromatog-raphy (HPLC) techniques suffer from athroughput problem. To achieve thethroughput the entire procedure wouldhave to be completed in less than 2 min peroligo, which is virtually impossible with ion-exchange chromatography. On the positiveside, HPLC still remains the most suitablemethod for resolution and purification ofn – 1 failure sequences. A similar through-put problem also affects capillary electro-phoresis (CE) methods, although equilibra-tion is more rapid in CE and automatic sam-pling could possibly fulfill the requirement.Many core facilities and commercial provid-ers of oligonucleotides are now using massspectrometry (MALDI–TOF) to determinethe purity and assess the quantity of their ol-igonucleotides; unfortunately, this methodrequires a desalting step, because the saltions and the abundance of impurities affectthe efficacy of electrospray ionization. Wehave recently tested a coupled LC–MSsystem (Agilent 1100 Series LC–MSD) andhave come to realize that because of the or-thogonal spray geometry of the instrument,there is no need to desalt the MerMade-syn-thesized products before MS. Furthermore,we have been able to conduct analyses inless than 1 min per sample thus comfort-
ably achieving the desired throughput of700 samples per day with minimum opera-tor intervention. The products can be sam-pled directly from 96-well plates and the in-strument has precision better than 1 Dal-ton. Oligonucleotide standards are run inparallel for the purpose of quantitation. Werealize, however, that the last three QCmethods (HPLC, CE, and MS) require im-portant infrastructure investments. Hereagain, the economics of out-sourcing tocommercial providers require careful con-sideration.
9.4
Amplicon Generation
Plates (96-wells) containing Forward andReverse PCR primers have been used to setup PCR reactions using Biomek2000and/or Biomek F/X workstations (Beck-man–Coulter; other manufacturers of liq-uid handlers are listed in Tab. 9.1). Candidaalbicans ORFs were amplified directly from100 ng genomic DNA and the ampliconswere purified on 96-well ArrayIt SuperFilterplates (TeleChem/ArrayIt) and/or Multi-Screen FB plates (Millipore) to eliminateunincorporated triphosphates, salts, andprimers. This purification step, althoughnot absolutely necessary [26], significantlyimproves the subsequent binding of theamplified DNA to the glass slides. Afterpurification, the products were analyzed byagarose gel electrophoresis.
We have developed BandCheck, a uniquebioinformatics tool, to assess the quality ofPCR products after agarose gel electropho-resis. It creates a virtual band pattern pre-dicted from the database and this is super-imposed on a digitized TIFF image of theactual gel. The tool enables annotation of 96PCR amplifications in less than 5 min(Fig. 9.2). The tool compensates for anoma-
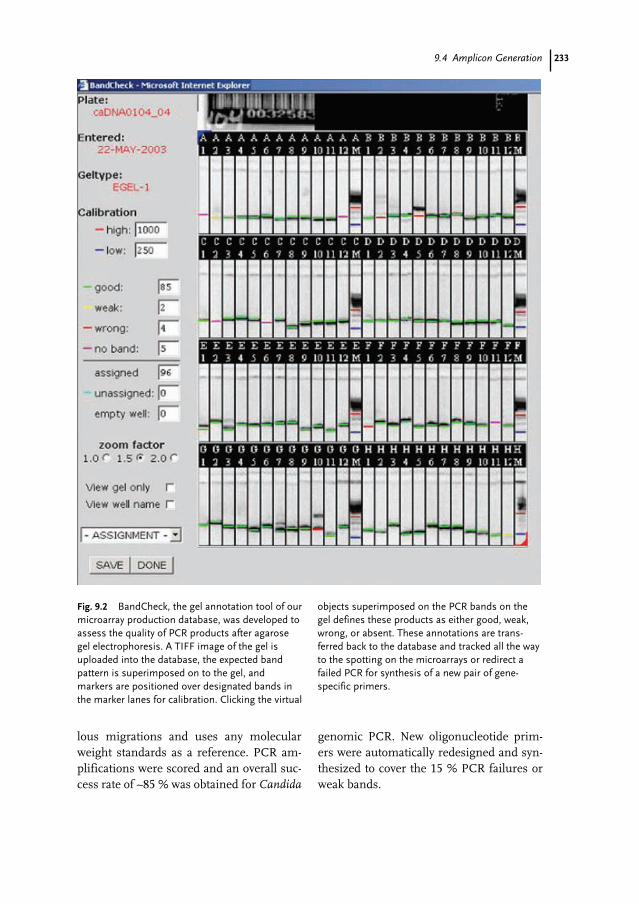
2339.4 Amplicon Generation
lous migrations and uses any molecularweight standards as a reference. PCR am-plifications were scored and an overall suc-cess rate of ~85 % was obtained for Candida
genomic PCR. New oligonucleotide prim-ers were automatically redesigned and syn-thesized to cover the 15 % PCR failures orweak bands.
Fig. 9.2 BandCheck, the gel annotation tool of ourmicroarray production database, was developed toassess the quality of PCR products after agarosegel electrophoresis. A TIFF image of the gel isuploaded into the database, the expected bandpattern is superimposed on to the gel, andmarkers are positioned over designated bands inthe marker lanes for calibration. Clicking the virtual
objects superimposed on the PCR bands on thegel defines these products as either good, weak,wrong, or absent. These annotations are trans-ferred back to the database and tracked all the wayto the spotting on the microarrays or redirect afailed PCR for synthesis of a new pair of gene-specific primers.
234 3 Nuclear Things
Each genomic DNA amplicon was quanti-fied by O.D.260nm and yielded an average of4 µg DNA per 100 µL PCR reaction. Ampli-fied DNA were lyophilized in 96-well V-bot-tom plates and reconstituted in spotting buf-fer at a concentration such that >90 % of allthe products were between 0.1–0.2 µg µL–1.Product from four 96-well plates was thentransferred to 384-well V-bottom plates forspotting. With such yields, a single PCRamplification would be sufficient to print afew thousand slides.
9.5
Microarraying
Many microarraying robots are now avail-able on the market. Contact printing via avariety of pins (solid pins, split pins, pin andring system, glass or quartz tubes) and non-contact ink-jet devices (crystal activated pie-zoelectric or syringe pump and solenoidvalve tips) are among the most popular tech-nology used for applying small volumes oftarget molecules on the surface of the glasssubstrate in an ordered fashion. One con-tact-printing instrument was developed in acollaboration between engineers at the Uni-versity of Toronto and biologists at the On-tario Cancer Institute and is available as theSDDC-2, now known as the ChipWriterPro(Engineering Services, now BioRad; www.esit.com, www.biorad.com; other manufac-turers of arraying robots are listed inTab. 9.1). This particular arrayer is equipp-ed with a print head capable of holding upto 48 pins (TeleChem/ArrayIt, quill pins)and the surface platen enables simultane-ous printing of up to 75 slides. Integratedinside the spotting chamber are a circulat-ing and sonicating waterbath, and a vacuumstation to clean the pins between samplings.The chamber is under a slight positive pres-sure of HEPA-filtered air to minimize dust
and particulate matter. It is also tempera-ture- and humidity-controlled to optimizespot morphology and minimize sampleevaporation in the 96-well or 384-wellsource plates and on the slides. The pins en-able delivery of sub-nanoliter volumes of so-lution at densities exceeding 2500 spotscm–2. This translates into ~30,000 spots on25 ×75 mm2 microscope slides. Spottingbuffer and slide surface chemistry are keyaspects of successful printing and later hy-bridization of microarrays. We have foundthat 50 % DMSO (occasionally with 0.05 %SDS for smoother spot morphology) con-tributes to some denaturation of the DNAthus increasing the number of single-stranded molecules available for hybridiza-tion [13]. DNA solutions stored in DMSObuffer are, moreover, less prone to evapora-tion, because of the intrinsic hygroscopicproperties of this solvent. Although thereare now many vendors of derivatized glassand other substrates for microarrays (Tab.9.1), we opted for the CMT-GAPS slides(Corning) for our cDNA microarrays. Theseaminopropyltrimethoxysilane-coated glassslides in concert with a DMSO spotting buf-fer have been the most consistent in ourhands giving more uniform spot morpholo-gy, better signal intensity and lower back-ground.
9.6
Probing and Scanning Microarrays
A typical transcription profiling microarrayexperiment is designed to compare a testcondition and an experimental condition.To illustrate a classical example, total ormRNA is extracted and purified from bio-logical samples, and cDNA are synthesizedin vitro using reverse transcriptase to incor-porate a specific fluorescently labeled nucle-otide analogue [27] corresponding to the
2359.7 Conclusion
test condition (e.g. Cyanine3) and anotherfor the experimental condition (e.g. Cya-nine5). The use of multi-color fluorescentlabels enables simultaneous analysis of twoor more biological samples or states in asingle experiment. After the reverse tran-scriptase reaction, fluorescently labeledcDNA are purified to eliminate unincorpo-rated fluorescent dye and left to hybridizewith the surface of the microarray in a vol-ume rarely exceeding 100 µL. Cover slipsor, especially, sealable contraptions areused to prevent dehydration of the probeand the entire arrangement is placed in ahumid chamber for the duration of the hy-bridization. When hybridization is com-plete, unreacted probe is washed from thesurface of the glass slide and the hybridizedprobe molecules are visualized by fluores-cence scanning. Detailed procedures forprobe preparation and clean-up, prehybrid-ization, hybridization, and washes havebeen given by Nelson and Denny [28] andHegde et al. [13].
Commercial kits for indirect labeling ofcDNA using aminoallyl derivatives of nucle-otides (Stratagene) or tyramide signal am-plification (TSA) (Perkin–Elmer Life Scienc-es [29]) and chemical labeling (AmershamBiosciences, Kreatech, Panvera) have provid-ed solutions to obtaining probes with higherspecific activity and thus more sensitive de-tection of low-abundance mRNA. Linear am-plification of mRNA based on the Eberwinemethod is also very efficient, because re-searchers are constantly reducing the num-ber of cells in their starting biological materi-al (Refs. [30] and [31] and Arcturus).
CCD cameras and confocal scanning de-vices from different instrument companiesare currently being used for microarrayscanning (Tab. 9.1). Light emitted by the ex-cited fluorophores on the surface of theslide is converted into an electrical signal bya photomultiplier tube and captured by a
detector. Confocal scanning devices such asthe ScanArray from Perkin–Elmer Life Sci-ences (www.perkinelmer.com; other manu-facturers of scanning instruments are listedin Tab. 9.1) are capable of scanning at 5-µmresolution. All these instruments enablequantitation of fluorescent emissions fromthe different spots on the microarray. Irre-spective of the scanning instrument used,four settings should be adjusted to controlsignal intensity and enable the detection oflow-intensity spots: focus, scanning speed,laser power, and sensitivity of the photo-multiplier tube (PMT). For each spot in themicroarray corresponding to a differentgene or coding region the quantitation soft-ware automatically compares and identifiesthe induced and repressed genes betweenthe control and experimental conditions.Linking the data obtained from microarrayscans to gene IDs is probably the most cru-cial aspect of the bioinformatics platformwe have developed. Data collection, normal-ization and analysis are topics of their ownand are beyond the scope of this chapter.Complete discussions and review articlesare available elsewhere [13, 32, 33].
9.7
Conclusion
Microarrays have had a significant impacton the way genome research is organizedand performed. The wider impact of thistechnology is limited by the cost of the com-mercial microarrays currently available andthe relatively few species for which arraysare available. We show here that it is a fea-sible and cost-effective for even small labor-atories to set up and produce high-qualitycustom microarrays in-house for their fa-vorite genome. The keys to this flexibilityare the ability to synthesize or have accessto large numbers of high-quality oligonu-

236 3 Nuclear Things
cleotides at reasonable cost and to have anintegrated informatics platform to tracksamples throughout the quality-controlsteps.
Acknowledgements
The authors would like to acknowledge thecontributions of Drs Roland Brousseau, BillCrosby, and David Y. Thomas for their vi-
sion and guidance in the original set-up ofthe MicroArray Lab at BRI in 1999. Thispaper was published as NRCC publicationnumber 42991. Sequence data for Candidaalbicans were obtained from the StanfordDNA Sequencing and Technology Centerwebsite at www-sequence.stanford.edu/-group/candida. Sequencing of Candida albi-cans was accomplished with the support ofthe NIDR and the Burroughs WellcomeFund.
237
1 Ramsay, G. (1998). DNA chips: State-of-the-art. Nat. Biotechnol. 16: 40–53.
2 Nygaard, A.P. and Hall, B.D. (1964). Forma-tion and properties of RNA–DNA complexes.J. Mol. Biol. 9:125–142.
3 Southern, E.M. (1975). Detection of specificsequences among DNA fragments separatedby gel electrophoresis. J. Mol. Biol.98:503–517.
4 Schena, M., Shalon, D., Davis, R.W. andBrown, P.O. (1995). Quantitative monitoringof gene expression patterns with a comple-mentary DNA microarray. Science270:467–470.
5 Schena, M. and Shalon, D. (1996). Parallelhuman genome analysis: microarray-basedexpression monitoring of 1000 genes. Proc.Natl. Acad. Sci. USA 93:10614–10619.
6 Lockhart, D.J., Dong, H., Bynre, M.C.Follettie, M.T., Gallo, M.V., Chee, M.S.,Mittmann, M., Wang, C., Kobayashi, M.,Horton, H. and Brown, E.L. (1996).Expression monitoring by hybridization tohigh-density oligonucleotide arrays. Nat.Biotechnol. 14:1675–1680.
7 DeRisi, J., Penland, L., Brown, P.O., Bittner,M.L., Meltzer, P.S., Ray, M., Chen, Y., Su,Y.A. and Trent, J.M. (1996). Use of a cDNAmicroarray to analyze gene expressionpatterns in human cancer. Nat. Genet.14:457–460.
8 Heller, R.A., Schena, M., Chai, A., Shalon, D.,Bedilion, T., Gilmore, J., Woolley, D.E. andDavis, R.W. (1997). Discovery and analysis ofinflammatory disease-related genes usingcDNA microarrays. Proc. Natl. Acad. Sci.USA 94:2150–2155.
9 Chee, M., Yang, R., Hubbell, E., Berno, A.,Huang, X.C., Stern, D., Winkler, J., Lockhart,
D.J., Morris, M.S. and Fodor, S.P. (1996).Accessing genetic information with high-density DNA arrays. Science 274:610–614.
10 Cronin, M.T., Fucini, R.V., Kim, S.M.,Masino, R.S., Wespi, R.M. and Miyada, C.G.(1996). Cystic fibrosis mutation detection byhybridization to light-generated DNA probearrays. Hum. Mutat. 7:244–255.
11 Wang, D.G., Fan, J.B., Siao, C.J., Berno, A.,Young, P., Sapolsky, R., Ghandour, G.,Perkins, N., Winchester, E., Spencer, J.,Kruglyak, L., Stein, L., Hsie, L., Topaloglou,T., Hubbell, E., Robinson, E., Mittmann, M.,Morris, M.S., Shen, N., Kilburn, D., Rioux, J.,Nusbaum, C., Rozen, S., Hudson, T.J.,Lander, E.S. et al. (1998). Large-scaleidentification, mapping, and genotyping ofsingle-nucleotide polymorphisms in thehuman genome. Science 280:1077–1082.
12 Schena, M. and Davis, R.W. (1999). Genes,genomes and chips. In DNA Microarrays: APractical Approach. Ed. M. Schena. OxfordUniversity Press, New York. pp. 1–16.
13 Hegde, P., Qi, R., Abernathy, K., Gay, C.,Dharap, S., Gaspard, R., Earle-Hughes, J.,Snesrud, E., Lee, N. and Quackenbush, J.(2000). A concise guide to cDNA microarrayanalysis. Biotechniques 29:548–562.
14 Gordon, P.M. and Sensen, C.W. (2004).Osprey: a comprehensive tool employingnovel methods for the design ofoligonucleotides for DNA sequency andmicroarrays. Nucleic Acids Res. e133.
15 Gaspard, R., Dharap, S., Malek, J., Qi, R. andQuackenbush, J. (2001). Optimized growthconditions for direct amplification of cDNAclone inserts from culture. Biotechniques31:35–36.
References
238 References
16 Evertsz, E.M. Au-Young, J., Ruvolo, M.V. Lim,A.C. and Reynolds, M.A. (2001).Hybridization cross-reactivity withinhomologous gene families on glass cDNAmicroarrays. Biotechniques 31:1182–1192.
17 Murray, A.E., Lies, D., Nealson, K., Zhou, J.and Tiedje, J.M. (2001). DNA/DNA hybridiza-tion to microarrays reveals gene-specific dif-ferences between closely related microbialgenomes. Proc. Natl. Acad. Sci. USA98:9853–9858.
18 Whiteway, M. (2000). Transcriptional controlof cell type and morphogenesis in Candidaalbicans. Curr. Opin. Microbiol. 3:582–588.
19 Berman, J. and Sudbery, P.E. (2002). Candidaalbicans: A molecular revolution built onlessons from budding yeast. Nat. Rev. Genet.3:918–930.
20 Cowen, L.E., Nantel, A., Whiteway, M.S.,Thomas, D.Y., Tessier, D.C., Kohn, L.M. andAnderson, J.B. (2002). Population genomicsof drug resistance in Candida albicans. Proc.Natl. Acad. Sci. USA 99:9284–9289.
21 Nantel, A., Dignard, D., Bachewich, C.,Harcus, D., Marcil, A., Bouin, A.-P., Sensen,C.W., Hogues, H., van het Hoog, M., Gordon,P., Rigby, T., Benoit, F., Tessier, D.C.,Thomas, D.Y. and Whiteway, M. (2002).Transcription profiling of Candida albicanscells undergoing the yeast to hyphaltransition. Mol. Biol. Cell 13:3452–3465.
22 Enjalbert, B., Nantel, A. and Whiteway, M.(2003). Stress-induced gene expression inCandida albicans: Absence of a general stressresponse. Mol. Biol. Cell 14:1460–1467.
23 Gaasterland, T. and Sensen, C.W. (1996).MAGPIE: Using multiple tools for automatedgenome interpretation. Trends Genet.12:76–78
24 Hughes, T.R., Mao, M., Jones, A.R.,Burchard, J., Marton, M.J., Shannon, K.W.,Lefkowitz, S.M., Ziman, M., Schelter, J.M.,Meyer, M.R., Kobayashi, S., Davis, C., Dai, H.,He, Y.D., Stephaniants, S.B., Cavet, G.,Walker, W.L., West, A., Coffey, E.,Shoemaker, D.D., Stoughton, R., Blanchard,A.P., Friend, S.H. and Linsley, P.S. (2001).
Expression profiling using microarraysfabricated by an ink-jet oligonucleotidesynthesizer. Nat. Biotechnol. 19:342–347.
25 Caruthers, M.H., Barone, A.D., Beaucage,S.L., Dodds, D.R., Fisher, E.F., McBride, L.J.,Matteucci, M., Stabinsky, Z. and Tang, J.Y.(1987). Chemical synthesis of deoxyoligo-nucleotides by the phosphoramidite method.Methods Enzymol. 154:287–313.
26 Diehl, F., Beckmann, B., Kellner, N., Hauser,N.C., Diehl, S. and Hoheisel, J.D. (2002).Manufacturing DNA microarrays fromunpurified PCR products. Nucleic Acids Res.30:e79.
27 Mujumdar, R.B., Ernst, L.A., Mujumdar, S.R.,Lewis, C.J. and Waggoner, A.S. (1993).Cyanine dye labeling reagents: sulfoindo-cyanine succinimidyl esters. Bioconj. Chem.4:105–111.
28 Nelson, S.F. and Denny, C.T. (1999).Representational differences analysis andmicroarray hybridization for efficient cloningand screening of differentially expressedgenes. In DNA Microarrays: A PracticalApproach. Ed. M. Schena. Oxford UniversityPress, New York. pp. 43–58.
29 Heiskanen, M.A., Bittner, M.L., Chen, Y.,Khan, J., Adler, K.E., Trent, J.M. and Meltzer,P.S. (2000). Detection of gene amplificationby genomic hybridization to cDNAmicroarrays. Cancer Res. 15:799–802.
30 Phillips, J. and Eberwine, J.H. (1996).Antisense RNA Amplification: A linearamplification method for analyzing themRNA population from single living cells.Methods 10:283–288.
31 Wang, E., Miller, L.D., Ohnmacht, G.A., Liu,E.T. and Marincola, F.M. (2000). High-fidelitymRNA amplification for gene profiling. 2000.Nat. Biotechnol. 18:457–459.
32 Eisen, M.B., Spellman, P.T., Brown, P.O. andBostein, D. (1998). Cluster analysis anddisplay of genome-wide expression patterns.Proc. Natl. Acad. Sci. USA 95:14863–14868.
33 Eisen, M.B. and Brown, P.O. (1999). DNAarrays for analysis of gene expression.Methods Enzymol. 303:179–205.
239
Mayi Arcellana-Panlilio
10.1
Introduction
The completion of the Human GenomeProject with the release of “… >98 % of thegene-containing part of the human se-quence finished to 99.99 % accuracy … “ inApril 2003 [1] poses the challenge of puttingthis newfound information to work, to de-fine how these sequences function. Al-though the traditional approach to biologicalquestions has been to survey a relativelysmall number of genes at a time, it has longbeen recognized that genes act in concertwith other genes, and often in separate di-mensions of time and space. These molecu-lar interactions are therefore best studiedwithin the framework of the entire genome.The logistical challenges of this global ap-proach are being overcome with the devel-opment of new tools, such as those providedby microarray technology, which can enablethe analysis of thousands of genes in parallelby specific hybridization to a miniaturized,orderly array of DNA fragments. Becausethe human genome might comprise fewerthan 40,000 protein-coding genes, well with-in the current capacity of a single array, elu-cidating the functional roles of all thesegenes becomes surprisingly attainable.
Since their first reported application in1995 to analyze gene expression in Arabi-dopsis [2], microarrays have become a majorinvestigative tool in life-science research.The numbers of publications retrieved by a“microarrays” keyword search of PubMedfrom 1995 to 2004 are plotted in Fig. 10.1;the figure shows the publication boom thattook off in 1999 and continues apace. In late2001, papers on protein (133 papers total bymid-2004), tissue (54 papers total), wholecell (12 papers total), and carbohydrate(7 papers total) arrays started to appear, sug-gesting diversification and broadening ofthe basic technology to encompass theinterrogation of array elements other thannucleic acids. DNA microarrays, which con-stitute >95 % of all array papers to date, arethe focus of this review.
The main objectives of this chapter are:
1. to discuss the principles of DNA microar-ray technology;
2. to describe how arrays are made and howthey are used, focusing on the two-colorinterrogation of printed arrays and theiranalysis; and
3. to cite examples of how the technologyhas been used to address issues relevantto cancer research.
Handbook of Genome Research. Genomics, Proteomics, Metabolomics, Bioinformatics, Ethical and Legal Issues.Edited by Christoph W. SensenCopyright © 2005 WILEY-VCH Verlag GmbH & Co. KGaA, WeinheimISBN: 3-527-31348-6
10Principles of Application of DNA Microarrays
Verwendete Mac Distiller 5.0.x Joboptions
Dieser Report wurde automatisch mit Hilfe der Adobe Acrobat Distiller Erweiterung "Distiller Secrets v1.0.5" der IMPRESSED GmbH erstellt. Sie koennen diese Startup-Datei für die Distiller Versionen 4.0.5 und 5.0.x kostenlos unter http://www.impressed.de herunterladen. ALLGEMEIN ---------------------------------------- Dateioptionen: Kompatibilität: PDF 1.3 Für schnelle Web-Anzeige optimieren: Ja Piktogramme einbetten: Ja Seiten automatisch drehen: Nein Seiten von: 1 Seiten bis: Alle Seiten Bund: Links Auflösung: [ 2400 2400 ] dpi Papierformat: [ 481 680 ] Punkt KOMPRIMIERUNG ---------------------------------------- Farbbilder: Downsampling: Nein Komprimieren: Ja Komprimierungsart: ZIP Bitanzahl pro Pixel: 8 Bit Graustufenbilder: Downsampling: Nein Komprimieren: Ja Komprimierungsart: ZIP Bitanzahl pro Pixel: 8 Bit Schwarzweiß-Bilder: Downsampling: Nein Komprimieren: Ja Komprimierungsart: CCITT CCITT-Gruppe: 4 Graustufen glätten: Nein Text und Vektorgrafiken komprimieren: Ja SCHRIFTEN ---------------------------------------- Alle Schriften einbetten: Ja Untergruppen aller eingebetteten Schriften: Nein Wenn Einbetten fehlschlägt: Abbrechen Einbetten: Immer einbetten: [ /Courier-BoldOblique /Helvetica-BoldOblique /Courier /Helvetica-Bold /Times-Bold /Courier-Bold /Helvetica /Times-BoldItalic /Times-Roman /ZapfDingbats /Times-Italic /Helvetica-Oblique /Courier-Oblique /Symbol ] Nie einbetten: [ ] FARBE(N) ---------------------------------------- Farbmanagement: Farbumrechnungsmethode: Farbe nicht ändern Methode: Standard Geräteabhängige Daten: Einstellungen für Überdrucken beibehalten: Ja Unterfarbreduktion und Schwarzaufbau beibehalten: Ja Transferfunktionen: Beibehalten Rastereinstellungen beibehalten: Nein ERWEITERT ---------------------------------------- Optionen: Prolog/Epilog verwenden: Nein PostScript-Datei darf Einstellungen überschreiben: Nein Level 2 copypage-Semantik beibehalten: Ja Portable Job Ticket in PDF-Datei speichern: Ja Illustrator-Überdruckmodus: Ja Farbverläufe zu weichen Nuancen konvertieren: Ja ASCII-Format: Nein Document Structuring Conventions (DSC): DSC-Kommentare verarbeiten: Ja DSC-Warnungen protokollieren: Nein Für EPS-Dateien Seitengröße ändern und Grafiken zentrieren: Ja EPS-Info von DSC beibehalten: Ja OPI-Kommentare beibehalten: Nein Dokumentinfo von DSC beibehalten: Ja ANDERE ---------------------------------------- Distiller-Kern Version: 5000 ZIP-Komprimierung verwenden: Ja Optimierungen deaktivieren: Nein Bildspeicher: 524288 Byte Farbbilder glätten: Nein Graustufenbilder glätten: Nein Bilder (< 257 Farben) in indizierten Farbraum konvertieren: Ja sRGB ICC-Profil: sRGB IEC61966-2.1 ENDE DES REPORTS ---------------------------------------- IMPRESSED GmbH Bahrenfelder Chaussee 49 22761 Hamburg, Germany Tel. +49 40 897189-0 Fax +49 40 897189-71 Email: [email protected] Web: www.impressed.de
Adobe Acrobat Distiller 5.0.x Joboption Datei
<< /ColorSettingsFile () /LockDistillerParams true /DetectBlends true /DoThumbnails true /AntiAliasMonoImages false /MonoImageDownsampleType /Bicubic /GrayImageDownsampleType /Bicubic /MaxSubsetPct 100 /MonoImageFilter /CCITTFaxEncode /ColorImageDownsampleThreshold 1.5 /GrayImageFilter /FlateEncode /ColorConversionStrategy /LeaveColorUnchanged /CalGrayProfile (Dot Gain 20%) /ColorImageResolution 300 /UsePrologue false /MonoImageResolution 1200 /ColorImageDepth 8 /sRGBProfile (sRGB IEC61966-2.1) /PreserveOverprintSettings true /CompatibilityLevel 1.3 /UCRandBGInfo /Preserve /EmitDSCWarnings false /CreateJobTicket true /DownsampleMonoImages false /DownsampleColorImages false /MonoImageDict << /K -1 >> /ColorImageDownsampleType /Bicubic /GrayImageDict << /HSamples [ 2 1 1 2 ] /VSamples [ 2 1 1 2 ] /Blend 1 /QFactor 0.9 >> /CalCMYKProfile (U.S. Web Coated (SWOP) v2) /ParseDSCComments true /PreserveEPSInfo true /MonoImageDepth -1 /AutoFilterGrayImages false /SubsetFonts false /GrayACSImageDict << /HSamples [ 2 1 1 2 ] /VSamples [ 2 1 1 2 ] /Blend 1 /QFactor 0.9 >> /ColorImageFilter /FlateEncode /AutoRotatePages /None /PreserveCopyPage true /EncodeMonoImages true /ASCII85EncodePages false /PreserveOPIComments false /NeverEmbed [ ] /ColorImageDict << /HSamples [ 2 1 1 2 ] /VSamples [ 2 1 1 2 ] /Blend 1 /QFactor 0.9 >> /AntiAliasGrayImages false /GrayImageDepth 8 /CannotEmbedFontPolicy /Error /EndPage -1 /TransferFunctionInfo /Preserve /CalRGBProfile (sRGB IEC61966-2.1) /EncodeColorImages true /EncodeGrayImages true /ColorACSImageDict << /HSamples [ 2 1 1 2 ] /VSamples [ 2 1 1 2 ] /Blend 1 /QFactor 0.9 >> /Optimize true /ParseDSCCommentsForDocInfo true /GrayImageDownsampleThreshold 1.5 /MonoImageDownsampleThreshold 1.5 /AutoPositionEPSFiles true /GrayImageResolution 300 /AutoFilterColorImages false /AlwaysEmbed [ /Courier-BoldOblique /Helvetica-BoldOblique /Courier /Helvetica-Bold /Times-Bold /Courier-Bold /Helvetica /Times-BoldItalic /Times-Roman /ZapfDingbats /Times-Italic /Helvetica-Oblique /Courier-Oblique /Symbol ] /ImageMemory 524288 /OPM 1 /DefaultRenderingIntent /Default /EmbedAllFonts true /StartPage 1 /DownsampleGrayImages false /AntiAliasColorImages false /ConvertImagesToIndexed true /PreserveHalftoneInfo false /CompressPages true /Binding /Left >> setdistillerparams << /PageSize [ 595.276 841.890 ] /HWResolution [ 2400 2400 ] >> setpagedevice
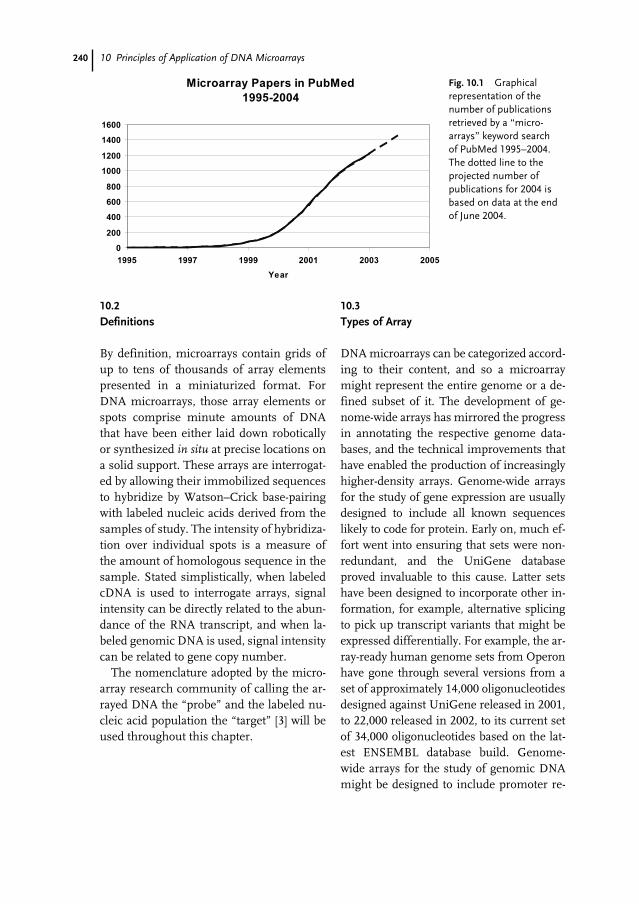
240 10 Principles of Application of DNA Microarrays
10.2
Definitions
By definition, microarrays contain grids ofup to tens of thousands of array elementspresented in a miniaturized format. ForDNA microarrays, those array elements orspots comprise minute amounts of DNAthat have been either laid down roboticallyor synthesized in situ at precise locations ona solid support. These arrays are interrogat-ed by allowing their immobilized sequencesto hybridize by Watson–Crick base-pairingwith labeled nucleic acids derived from thesamples of study. The intensity of hybridiza-tion over individual spots is a measure ofthe amount of homologous sequence in thesample. Stated simplistically, when labeledcDNA is used to interrogate arrays, signalintensity can be directly related to the abun-dance of the RNA transcript, and when la-beled genomic DNA is used, signal intensitycan be related to gene copy number.
The nomenclature adopted by the micro-array research community of calling the ar-rayed DNA the “probe” and the labeled nu-cleic acid population the “target” [3] will beused throughout this chapter.
10.3
Types of Array
DNA microarrays can be categorized accord-ing to their content, and so a microarraymight represent the entire genome or a de-fined subset of it. The development of ge-nome-wide arrays has mirrored the progressin annotating the respective genome data-bases, and the technical improvements thathave enabled the production of increasinglyhigher-density arrays. Genome-wide arraysfor the study of gene expression are usuallydesigned to include all known sequenceslikely to code for protein. Early on, much ef-fort went into ensuring that sets were non-redundant, and the UniGene databaseproved invaluable to this cause. Latter setshave been designed to incorporate other in-formation, for example, alternative splicingto pick up transcript variants that might beexpressed differentially. For example, the ar-ray-ready human genome sets from Operonhave gone through several versions from aset of approximately 14,000 oligonucleotidesdesigned against UniGene released in 2001,to 22,000 released in 2002, to its current setof 34,000 oligonucleotides based on the lat-est ENSEMBL database build. Genome-wide arrays for the study of genomic DNAmight be designed to include promoter re-
Fig. 10.1 Graphicalrepresentation of thenumber of publicationsretrieved by a “micro-arrays” keyword search of PubMed 1995–2004.The dotted line to theprojected number ofpublications for 2004 isbased on data at the endof June 2004.
24110.4 Production of Arrays
gions and intervening sequences to addressissues of gene regulation. The establishedmethod of chromatin immunoprecipitationto investigate DNA protein interactions, forexample, has been combined with microar-rays to identify novel targets of transcrip-tion factors [4].
Focused arrays are not designed to in-clude the entire genome, and the genes orsequences included largely depends on thequestion being addressed. Thus, there arearrays to study specific pathways or genenetworks, such as for apoptosis, oncogenes,and tumor suppressors (evaluated inRef. [5]), and arrays of a specific cell type ortissue, such as the Colonochip designed tostudy colorectal cancer [6]. Focused arraysmight also be designed to be part of a multi-tiered approach to studying gene expres-sion, where their function becomes less as ameans of discovery as an efficient means ofvalidating initial results obtained on larger,more comprehensive arrays.
10.4
Production of Arrays
DNA microarrays are often categorized ac-cording to the technology platform used toproduce them. The underlying concept ofDNA microarrays has been, and continuesto be, interpreted and realized in myriadways, leading to the development of differ-ent platforms, each with its own strengthsand weaknesses (reviewed in Ref. [7]).
10.4.1
Sources of Arrays
The DNA spots on a microarray are pro-duced either by synthesis in situ or by depo-sition of pre-synthesized product. DNA syn-thesis in situ methods (e.g. Affymetrix’sphotolithography [8] and Agilent’s inkjet
technology [9]) have largely been within thepurview of commercial companies. Rigor-ous production and quality assurance pro-cedures ensure delivery of commercial ar-rays of consistently high quality. OngoingR&D efforts ensure optimum design of theDNA content, and continued technologicaladvancement enables the production of in-creasingly higher-density arrays. All ofthese come at a cost, however, which is notlost on prospective users. Predictably, aca-demic pricing packages are wrought to woothe reluctant researcher. A highly success-ful strategy has been to involve the researchcommunity in the development of new ar-rays, giving birth to various consortia of la-boratories that generate potentially usefulinformation for themselves while providingcompanies with invaluable input.
For academic or government laboratorieswishing to produce their own arrays, an op-tion is to adopt the array printing methodol-ogy pioneered by the Brown laboratory ofStanford University (http://cmgm.stan-ford.edu/pbrown/mguide/index.html). Therobotic deposition of nano amounts of pre-synthesized 60–70mer oligonucleotides orDNA fragments generated by PCR or byplasmid insert purification produces arraysthat can be of very high quality at relativelylow cost. Compared with commerciallyavailable arrays, perhaps the greatest advan-tage of spotted arrays is their flexibility,which can facilitate the rapid iteration of ex-periments, especially when testing specifichypotheses [10]. The sequences spotted andthe number, whether or not there are repli-cate spots, and how the array is laid out aresome of the design features that can bemodified to suit experimental objectives.Production volume can be tailored to a spe-cific demand, and can easily be adjusted torespond to changes. In the Southern Alber-ta Microarray Facility at the University ofCalgary, for instance, we have produced
242 10 Principles of Application of DNA Microarrays
custom arrays according to the specificationthat the oligos be arranged on the array ac-cording to their genomic location, and thetiming of delivery of those printed arrayshas matched the researcher’s needs.
Although hardly ever intimately involvedwith array production per se, users do well tobe acquainted with the process, especiallyhow production conditions can affect thequality of arrays. Details of the manufactureof spotted microarrays are discussed else-where in this volume (Chapt. 9) and whatfollows is a discussion of pertinent aspects.
10.4.2
Array Content
The choice of the type of DNA to print isfundamental. Longer stretches of DNA suchas obtained from PCR amplification ofcDNA clones produce robust hybridizationsignals. Because of their length, however,they are more forgiving of mismatches,which can affect specificity. When the finestdiscrimination is required, as when assess-ing single-nucleotide changes, short oligo-nucleotides (24–30 nt) are in order. Some-what paradoxically, specificity can some-times be problematic in very short oligos,and designing several to represent a singlegene has been a means of circumventingthis problem. Long oligonucleotides(50–70 nt) afford an excellent compromisebetween signal strength and specific-ity [11–13] and their use has increased inpopularity among academic core facilities.
Needless to say, the design of the oligonu-cleotides is extremely important, and re-quires a fair amount of expertise and capitaloutlay for proper validation. Choosing oli-gos corresponding to the 3′ untranslated re-gions (3′ UTR) increases the likelihood oftheir being specific [14]. For a different rea-son, designing oligos close to the 3′ end
might also boost signal intensity. This hasto do with how labeling can be affected bythe efficiency of RNA reverse transcriptionprimed by oligo dT. Because the oligonu-cleotides are meant to be assayed in parallelon the array, under identical conditions oftime, temperature, and salt concentration,their hybridization characteristics (e.g. theirTm, or melting temperature) should be assimilar as possible. They should not havesecondary structures or runs of identicalnucleotides that could attenuate hybrid-for-mation with their labeled complement. La-boratories may design and validate oligonu-cleotides themselves or purchase pre-de-signed sets from commercial sources.
10.4.3
Slide Substrates
Glass microscope slides are the solid sup-port of choice, and they should be coatedwith a substrate that favors binding of theDNA. The earliest substrates used were po-ly-lysine or aminopropylethoxysilane, estab-lished slide coatings for in-situ hybridiza-tion studies of gene expression. The need toaddress data quality has led to the develop-ment of new substrates on atomically flat(and sometimes even mirrored) slide sur-faces with the promise of better DNA reten-tion and minimum background for highersignal-to-noise ratios. Different versions ofsilane, amine, epoxy, and aldehyde sub-strates, which attach DNA by either ionicinteraction or covalent bond formation,have become commercially available (e.g.see www.arrayit.com). The commercial ar-rays industry has seen the development ofproprietary substrates to provide unique ad-vantages, such as the highly efficient hybrid-ization kinetics afforded by Amersham’sthree-dimensional Code Link surface,which the company uses for their own ar-
24310.5 Interrogationn of Arrays
rays and offers for sale as a slide substrate(http://www5.amershambiosciences.com/).Laboratories that print arrays inevitablymake their choices based on empirical dataof how well substrates perform in their ownhands.
10.4.4
Arrayers and Spotting Pins
The physical process of delivering the DNAto pre-determined coordinates on the arrayinvolves spotting pens or pins carried on aprint head that is controlled in three dimen-sions by gantry robots with sub-micron pre-cision. Although 30,000 features of ~90 µmdiameter can easily be spotted on a25 mm× 75 mm slide, specification sheetsfrom pin manufacturers (e.g. www.array-it.com/ and www.genetix.com/) report max-imum spotting densities of over 100,000features per slide for their newest pin de-signs. Improvements in arraying systemshave included shorter printing times andlonger periods of “walk-away” operation.Arrayers are invariably installed within con-trolled-humidity cabinets to maintain anoptimum environment for printing.
From the user’s perspective, arrays mustbe reliably consistent in quality from theoutset. One has enough to deal with withouthaving to worry about whether a particularspot on an array is what the array lay-out filesays it is, or that today’s array is missingseveral grids. It is ridiculously obvious thatthese should never become an issue for theuser, because if they do, confidence in thesupplier (and in extreme cases, even trust inthe technology) is significantly eroded. Hav-ing said all this, however, the responsibilityfor making good use of well-made arraysrests ultimately on the user.
10.5
Interrogation of Arrays
Soon after arriving on the scientific scene,microarrays were recognized as a potential-ly powerful tool for the post-genomic era,and it became a priority of every major re-search institution to have the capability ofrunning microarray experiments. At themost basic level, this entails gaining accessto pre-made arrays and an array scanner toacquire data from the arrays after hybridiza-tion. Although this model works for individ-ual laboratories, even this is not an inexpen-sive proposition, and it does not provide theoption to custom print arrays for specificneeds. The core technology laboratory mod-el, with the ability to print arrays and to runexperiments and acquire data, maximizesthe use of resources, making arrays, materi-als, and specialized equipment, and techni-cal and analytical support, available to re-searchers. At the University of Calgary, sci-entists in the Faculty of Medicine led themicroarray initiative, and with establish-ment funds from a private donor, the Alber-ta Cancer Board, and the Alberta HeritageFoundation for Medical Research, theSouthern Alberta Microarray Facility(SAMF) opened its doors in 2001. Coretechnology laboratories in Canada are listedon the website of the Woodgett lab at theUniversity of Toronto (http://kinase.uhn-res.utoronto.ca/CanArrays.html). Althoughthere are sites such as BioChipNet (http://www.biochipnet.de) that seek to maintain aworldwide directory of companies and insti-tutions involved in microarrays, the mostcurrent listing of microarray facilities with aweb presence can be retrieved by using aglobal search engine.
Given the burgeoning supply of pre-madearrays and technical services that will evendo the microarray experiments for clients,
244 10 Principles of Application of DNA Microarrays
becoming a user of the technology is easierthan ever. Whether it is wiser than ever isthe important issue, which every prospec-tive user must think about and consider ad-visedly with regard to his or her specific re-search objectives. The question becomes:Are microarrays the best way to find outwhat I want to know?
10.5.1
Experimental Design
Well before the first animal is killed the ex-perimental design for a microarray studyhas to be in place. In practical terms, thegoal is to determine the type of array to run,how many, and which sample(s) will be hy-bridized to each slide to obtain meaningfuldata amenable to statistical analysis, uponwhich sound conclusions can be drawn. Un-less one is well versed in statistics and therecent developments in statistical methodsto deal with microarrays, it would be wise toconsult a statistician with this expertise, andto do so early on (i.e. not to wait until afterthe data deluge) [15]. Smyth and coau-thors [16] offer an excellent overview of themany statistical issues in microarrays.
An important aspect of experimental de-sign is deciding how to minimize variation,which can be thought of as occurring inthree layers: biological variation, technicalvariation, and measurement error [17]. Theeasy answer to dealing with variation is rep-lication, but to make the best use of avail-able resources it is important to know whatto replicate and how many replicates to ap-ply, which will depend on the primary objec-tives of the experiment. Thus, if the ques-tion pertains to determining the effects of atreatment on gene expression in a type of tu-mor in mice, for instance, it would be morevaluable to test many mice (biological repli-cates) a few times than a few mice manytimes (technical replicates). In the latter ex-
periment precision would be very high, andprobably true for the few mice being tested.It is less certain how true that informationwould be of mouse tumors in general.
Usually, arrays containing inserts ofcDNA clones or long oligonucleotides (e.g.,from Agilent) are amenable to hybridizationwith two differently labeled samples at thesame time to the same array, whereas shortoligo (25–30 nt) arrays, including those fromAffymetrix and Amersham, are hybridizedto single samples. Exceptions to this are the60mer Expression Arrays from Applied Bio-systems (www.appliedbiosystems.com/) towhich single samples are hybridized.
Hybridization of two samples to the sameslide is made possible by labeling each sam-ple with a chemically distinct fluorescenttag. The ideal tags to use for these two-colormicroarray experiments would behave thesame in every way, except that they wouldfluoresce at wavelengths well separated onthe spectrum to prevent cross talk. In thereal world, however, the fluorescent tagscurrently in widest use (i.e. Cy 3 and Cy5),behave unequally in ways besides their opti-mum excitation wavelength, introducing adye bias that should be dealt with in the ex-perimental design. Although running dye-swap experiments has become routine, do-ing so immediately doubles the number ofarrays required. There might be more effi-cient ways of dealing with dye bias, such asestimating and correcting for bias by ex-tracting data from a pair of split-control mi-croarrays, where control RNA is split, la-beled with Cy3 and Cy5, and combined onthe same array [18]. Dobbin and coau-thors [19] suggest that balanced experimen-tal designs obviate the need to run dyeswaps for every sample pair. Labeling proce-dures are discussed in greater detail in thenext section.
Although having two samples hybridiz-ing to a slide might add a level of complexity
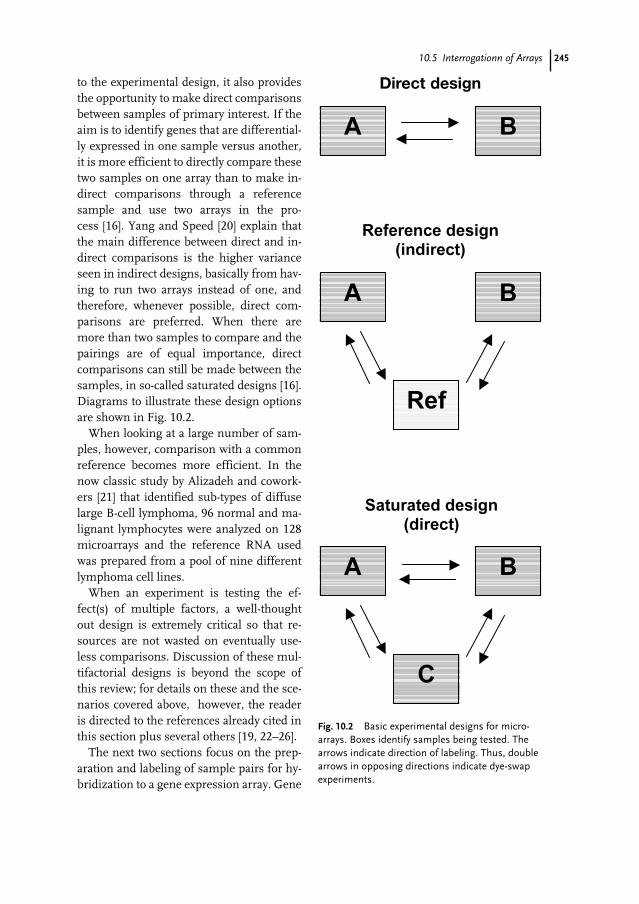
24510.5 Interrogationn of Arrays
to the experimental design, it also providesthe opportunity to make direct comparisonsbetween samples of primary interest. If theaim is to identify genes that are differential-ly expressed in one sample versus another,it is more efficient to directly compare thesetwo samples on one array than to make in-direct comparisons through a referencesample and use two arrays in the pro-cess [16]. Yang and Speed [20] explain thatthe main difference between direct and in-direct comparisons is the higher varianceseen in indirect designs, basically from hav-ing to run two arrays instead of one, andtherefore, whenever possible, direct com-parisons are preferred. When there aremore than two samples to compare and thepairings are of equal importance, directcomparisons can still be made between thesamples, in so-called saturated designs [16].Diagrams to illustrate these design optionsare shown in Fig. 10.2.
When looking at a large number of sam-ples, however, comparison with a commonreference becomes more efficient. In thenow classic study by Alizadeh and cowork-ers [21] that identified sub-types of diffuselarge B-cell lymphoma, 96 normal and ma-lignant lymphocytes were analyzed on 128microarrays and the reference RNA usedwas prepared from a pool of nine differentlymphoma cell lines.
When an experiment is testing the ef-fect(s) of multiple factors, a well-thoughtout design is extremely critical so that re-sources are not wasted on eventually use-less comparisons. Discussion of these mul-tifactorial designs is beyond the scope ofthis review; for details on these and the sce-narios covered above, however, the readeris directed to the references already cited inthis section plus several others [19, 22–26].
The next two sections focus on the prep-aration and labeling of sample pairs for hy-bridization to a gene expression array. Gene
Fig. 10.2 Basic experimental designs for micro-arrays. Boxes identify samples being tested. Thearrows indicate direction of labeling. Thus, doublearrows in opposing directions indicate dye-swapexperiments.
Direct design
246 10 Principles of Application of DNA Microarrays
expression is measured in terms of the rela-tive abundance of RNA, and reverse tran-scription of the RNA into cDNA enables theincorporation of fluorescent label whose in-tensity can be measured and related to tran-script abundance.
10.5.2
Sample Preparation
In its allocation of resources, the experi-mental design will identify the sources ofRNA for the samples that will be hybridizedto a microarray. Those sources may be tis-sue culture cells, biopsies, or tissues of cer-tain pathology. Each of these presents itsown set of challenges where the isolation ofRNA is concerned. Obtaining pure, intactRNA in the sense of its being free fromDNA or protein contamination is certainlyimportant and should never be discounted.There is, however, another layer of puritythat must be emphasized, and that is the ho-mogeneity of the RNA source itself as de-fined by the biological question being asked.When an experiment seeks to compare nor-mal tissue and tumor, the normal RNAshould be prepared from normal tissue, andthe tumor RNA from tumor tissue. But tis-sue can be comprised of many different celltypes and be very heterogeneous. Thus, un-less cell type is the essence of the question,it should not be the reason for differencespicked up by an experiment. Even so-calledtumor samples can contain normal cells,and it becomes important to know howmuch of a tumor is really tumor, and to de-cide whether to go with the bulk tissue inhand or to isolate portions of interest with ascalpel or specific cells with laser capturemicrodissection [27, 28].
Although the preparation of RNA hasbeen facilitated in recent years by the devel-opment of RNA isolation kits, basic princi-ples and caveats set forth in early literature
(for example Ref. [29]) remain true. Becauseof its chemical nature, RNA is notoriouslyprone to degradation by ribonuclease (-RNase) activity, and so a main concern ofany laboratory doing RNA work is keepingthese RNases at bay. The pancreatic RNasesare particularly problematic, because theyare ubiquitous and also extremely stable,working within a wide range of pH valuesand needing no cofactors. Their hardinessis legendary – a method of ensuring thatRNase A for digestion of bacterial RNA inDNA plasmid preps is free from DNase ac-tivity involves boiling for 10 to 30 min [30].The RNase A simply renatures after heatingand so regains its activity.
The most widely used method of isolatingRNA is based on the guanidinium thiocya-nate–phenol–chloroform extraction proce-dure developed by Chomczynski and Sac-chi [31]. Cultured cells instantly lyse due tothe chaotropic action of the “TRI reagent”and undegraded RNA of high purity is ex-tracted with relative ease. RNA from tissuesamples is best obtained by quickly homog-enizing the sample in the presence of atleast a tenfold volume excess of reagent be-fore proceeding to the separation of theaqueous and the organic phases. The RNApartitions into the aqueous phase, and be-cause of the acidic pH of the extraction mix-ture, the DNA preferentially goes to theinterphase. The quality of the RNA can beassessed by gel electrophoresis to visualizethe ribosomal bands, which should migrateas sharp bands with intensities that vary rel-ative to each other according to their expect-ed abundance ratio. Aberrant intensity ra-tios, laddering, and/or smearing of the ribo-somal bands suggest that the RNA is de-graded and therefore ill-suited for use in anexperiment. With the development of lab-on-a-chip technology, instruments, for ex-ample the Agilent 2100 bioanalyzer, capableof assessing quality and quantity of RNA
24710.5 Interrogationn of Arrays
(and DNA, proteins, and other materials)have become available as a viable alternativeto gel electrophoresis.
To ascertain that the RNA in a sample iswhat is being tested in a microarray experi-ment, any genomic DNA that might havecome through the RNA-isolation processshould be removed enzymatically withDNase that is free of RNase contamination.The DNase itself must then be inactivatedor it will begin to degrade the cDNA productof reverse transcription in the succeedingsteps. Although phenol–chloroform extrac-tion reliably removes DNase [32], it reducesthe overall yield of RNA.
The amount of RNA required per hybrid-ization ranges from as little as 2–5 µg totalRNA for short oligonucleotide arrays to10–25 µg total RNA for spotted cDNA andlong oligonucleotide arrays [7]. This re-quirement for microgram amounts of start-ing RNA can sometimes be difficult to meetas when dealing with tissue biopsies or sin-gle cells harvested from laser-capture mi-crodissection.
In these circumstances it becomes neces-sary to amplify the RNA in the sample to ob-tain adequate amounts for labeling and hy-bridization to an array. In the linear amplifi-cation method of Eberwine and col-leagues [33–35], the RNA is reverse tran-scribed in the presence of oligo-dT to whichthe T7 RNA polymerase promoter sequencehas been added. The second strand is thensynthesized and the double stranded mole-cule becomes amenable to in-vitro tran-scription by T7 RNA polymerase to producelarge amounts of complementary RNA(cRNA) that can be labeled directly or fur-ther amplified. The earliest paper [33] re-ports an 80-fold molar amplification afterone round; the latest procedures claim mi-crogram yields from starting amounts of aslittle as 1–5 ng [36]. Valid concerns about fi-delity and reproducibility of RNA amplifica-
tion [37–40] have led to entirely rational rec-ommendations that samples for compari-son be amplified using identical proce-dures.
10.5.3
Labeling
Although there are ways of labeling theRNA itself, such as by attaching fluoro-phores to the N-7 position of guanine resi-dues [41], reverse transcription into cDNAprovides stable material to work with that,in principle, is a faithful representation ofthe RNA population in the sample. ThecDNA product can then be labeled either di-rectly or indirectly.
In the direct labeling procedure, fluores-cently labeled nucleotide is incorporatedinto the cDNA product as it is being synthe-sized [2, 42]. As expected, the efficiency ofincorporation for the labeled nucleotide islower than for the unlabeled nucleotide,and labeling frequency cannot be predictedsimply from concentration ratios. More per-tinent to the issue of running two-color ex-periments, however, is that a difference inthe steric hindrance conferred by differentlabel moieties causes some labeled nucleo-tides to be more efficiently used than oth-ers, producing a dye bias in which one sam-ple is labeled at a higher level overall thanthe other. Thus, Cy3-nucleotide tends to beincorporated at a higher frequency thanCy5. Surprisingly, this does not necessarilytranslate into a “better” labeled target. In-deed, Cy3-labeled cDNA tends to give high-er background on an array compared to theCy5, which might be indicative of prema-turely terminated products sticking nonspe-cifically to the slide. The reported observa-tion that Taq polymerase terminates chainextension next to a Cy-labeled nucleotide, sothat a higher frequency of label incorpora-tion results in shorter products [43], lends
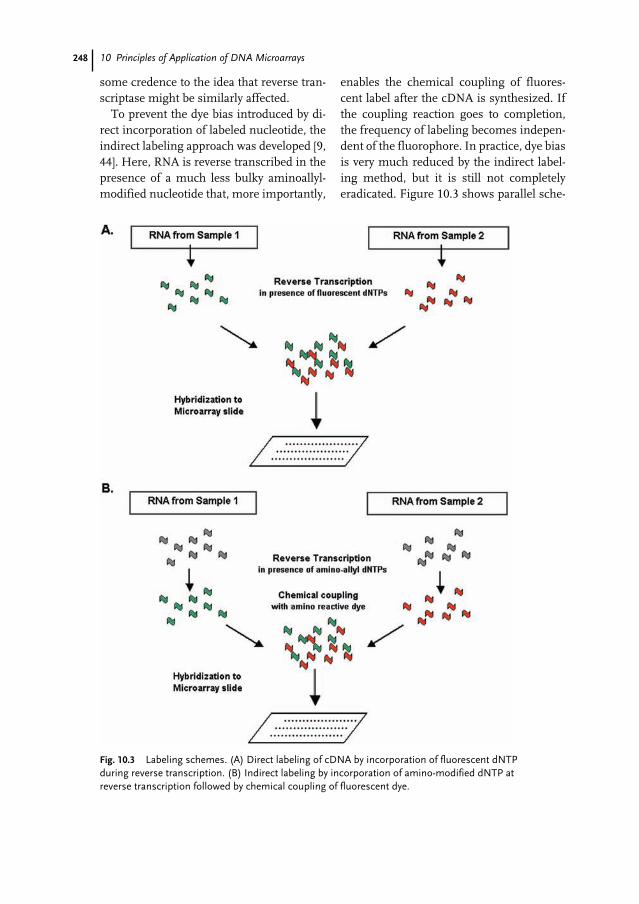
248 10 Principles of Application of DNA Microarrays
some credence to the idea that reverse tran-scriptase might be similarly affected.
To prevent the dye bias introduced by di-rect incorporation of labeled nucleotide, theindirect labeling approach was developed [9,44]. Here, RNA is reverse transcribed in thepresence of a much less bulky aminoallyl-modified nucleotide that, more importantly,
enables the chemical coupling of fluores-cent label after the cDNA is synthesized. Ifthe coupling reaction goes to completion,the frequency of labeling becomes indepen-dent of the fluorophore. In practice, dye biasis very much reduced by the indirect label-ing method, but it is still not completelyeradicated. Figure 10.3 shows parallel sche-
Fig. 10.3 Labeling schemes. (A) Direct labeling of cDNA by incorporation of fluorescent dNTPduring reverse transcription. (B) Indirect labeling by incorporation of amino-modified dNTP atreverse transcription followed by chemical coupling of fluorescent dye.
24910.5 Interrogationn of Arrays
ma for direct and indirect labeling of targetcDNA for hybridization.
cRNA from RNA amplification proce-dures can be labeled with biotinylated ribo-nucleotides during in-vitro transcription ofthe double-stranded cDNA with T7 RNApolymerase [45]. Interestingly, Cy-nucleo-tides are not used because they are not goodsubstrates for the RNA polymerase. To lim-it the effects of secondary structure it is cus-tomary to fragment the labeled cRNA be-fore hybridization.
Exploring alternatives to Cy3 and Cy5 isworthwhile. Though historically Cy3 andCy5 have been the fluorophores of choice,other options (such as the Alexa dyes fromMolecular Probes) are becoming availablethat have similar excitation and emissioncharacteristics, greater stability against pho-to-bleaching, and higher resistance toquenching artifacts.
10.5.4
Hybridization and Post-hybridization Washes
The hybridization step is literally whereeverything comes together. Printing the ar-rays, preparing and labeling the samples,all lead to this point where the labeledmolecules find their complement sequenc-es on the array and form double strandedhybrids strong enough to withstand strin-gent washes meant to put asunder nonspe-cific matches.
As in the hybridization of classical South-ern and Northern blots, the objective is tofavor the formation of hybrids and the re-tention of those which are specific. Thus,the labeled samples are applied to the mi-croarray in the presence of high-salt buffersto neutralize repulsive forces between thenegatively charged nucleic acid strands. Ex-ogenous DNA (e.g. salmon sperm and C0t-1DNA) reduces background by blocking are-as of the slide with a general affinity for nu-
cleic acid or by titrating out labeled sequenc-es that are nonspecific. Denhardt’s reagent(containing equal parts of Ficoll, polyvinyl-pyrrolidone, and bovine serum albumin) isalso used as blocking agent. Detergents, forexample dodecyl sodium sulfate (betterknown as SDS), reduce surface tension andimprove mixing, while helping to lowerbackground.
Temperature is an important factor thatcan be manipulated during hybridizationand post-hybridization washes of microar-rays, and here again much can be learnedfrom what has already been established forNorthern or Southern blots. It is valuable tohave an understanding of melting tempera-ture of a duplex, or Tm, which is the temper-ature at which half of the molecules aredouble-stranded while the other half are“melted” or are in separate, single strands.It is useful even to know the ramificationsof the equation defining the Tm of a duplex(longer than 50 bp) as:
Tm = 81.5° + 16.6 log M + 0.41 (mole frac-tion G + C) – 500/L –0.62 (% formamide)
showing the dependence of Tm on themonovalent cation concentration (M,mol L–1), the base composition (expressedas the mole fraction of G + C), the length ofthe duplex (L), and the percentage of forma-mide present [46]. One begins to see why wehybridize at higher salt concentrations (topromote hybrid formation), and why we useformamide (to enable hybridization at low-er, gentler temperatures).
Knowing that mispairing of bases tendsto reduce Tm by approximately one degreefor every percentage mismatch explainswhy increasing the temperature will causenonspecific hybrids to fall apart first, andwhy washing arrays in low salt will favor theretention of true hybrids.
It should be noted, however, that these re-lationships were derived for systems wherethe probe was a single molecule of known
250 10 Principles of Application of DNA Microarrays
length and base composition, and the saltand formamide were in the soup where theprobe would seek its immobilized target. Inmicroarrays, there is not just one probe butthousands, and it is the probe that is station-ary, and the target free. Thankfully, theprobes, by definition, are of known lengthand composition, and therefore individualTm values can be calculated for each probe.
Perhaps the greatest advantage offered byarrays of long oligonucleotides as opposedto PCR-amplified inserts of cDNA cloneslies in being able to design long oligonucleo-tides such that they are of equal length andsimilar base composition, so that they havevery similar Tm values. Working with whatis basically a “collective Tm” maximizes thebenefits of manipulating temperature, saltconcentrations, and formamide. When anarray is made up of probes with a widerange of Tm values, a certain low salt con-centration might indeed cause mismatchedhybrids to fall apart, but it may also melttrue hybrids that happen to be shorter orhave a higher A + T content, and so havelower Tm values.
An aspect of microarray hybridizationworth clarifying is the question of whichproduct is in excess, the labeled target or theimmobilized probe, to qualify it as followingpseudo-first-order kinetics. For microarraysto be useful as a means of quantifying ex-pression, the target has to be in limitingamounts, and the probe must be in suffi-cient excess as to remain virtually un-changed even after hybridization. In a two-color experiment there is the added compli-cation of having two differently labeled tar-gets vying for the same probe. Here, it is im-portant to ensure competitive hybridizationso that the concentration ratio of hybrids ac-curately reflect the initial concentration ra-tio of the targets, that is, the initial ratio ofthe mRNA transcripts in the two samples.Wang and coworkers [47] show that if the
hybridization kinetics of the two labeled tar-gets are different the observed concentra-tion ratio of the hybrids becomes a functionof the amount of probe on the array, whichwould lead to spurious expression ratioswhen the amount of probe is limiting. If,however, the amount of probe is in excess,the effect of unequal rate constants is mini-mized.
10.5.5
Data Acquisition and Quantification
When the washes are complete and theslides have been spun dry, the “wet work” ofa microarray experiment is done, and all thedata that experiment is capable of giving areset. The results, as it were, are ripe for thepicking. For microarrays these are 16-bitTIFF (tagged image file format) images,worth tens of millions of bytes each, ac-quired using array scanners typicallyequipped with lasers to excite the fluoro-phores at specific wavelengths and photo-multiplier tubes (PMT) to detect the emittedlight. The choice of array scanners has wid-ened substantially since 1999, when a sur-vey by the Association of Biomolecular Re-source Facilities (http://www.abrf.org)found only two major players in the scannermarket, accounting for nearly two-thirds ofall scanners used by microarray laborato-ries [48]. A technology review from Bow-tell’s group [49] lists nine manufacturersand over a dozen scanner models with dif-ferent resolution and sensitivity, and differ-ent laser and excitation ranges. The mostbasic models offer excitation and detectionof the two most commonly used fluoro-phores (Cy3 and Cy5) whereas higher-endmodels might enable excitation at severalwavelengths, dynamic focus, linear dynam-ic range over several orders of magnitude,and options for high-throughput scanning.
The objective of the scanning procedure
25110.6 Data Analysis
is to obtain the “best” image, where the bestis not necessarily the brightest but is themost faithful representation of the data onthe slide. The conditions within a user’scontrol to achieve this goal are the intensityof the light used to excite the fluorophores(laser power) and the sensitivity of detection(as set by PMT gain). The scans should pickup the bright spots and those that are not sobright, and be able to tell the difference.Theoretically, a 16-bit image can have inten-sities ranging from 0 to 65,535 (216 – 1) [50],and one will often see such a range of rawvalues; what is crucial, however, is the line-arity of that range of values when related toactual amounts of fluorescent label on aspot, and ultimately to gene expression.
Spot saturation, where intensity valueshave basically hit the ceiling, is a problemthat is dealt with by reducing laser power,which in turn might lead to loss of data atthe low end. Low intensity spots can be ex-cited to emit a measurable signal by manip-ulating laser power and PMT. Increasingsensitivity at the level of detection, however,also tends to increase background, whichcan flatten signal-to-noise ratios. Thus, set-ting scanning conditions becomes an exer-cise in optimization, and the wider the line-ar range of the image acquisition system,the greater the latitude available for adjust-ment.
Scanners invariably come with softwarefor image analysis, although stand-aloneimage analysis packages are available. Dataextraction from the image involves severalsteps: (1) gridding or locating the spots onthe array; (2) segmentation or assignmentof pixels either to foreground (true signal)or background; and (3) intensity extractionto obtain raw values for foreground andbackground associated with each spot (re-viewed in Ref. [51]). Subtracting the back-ground intensity from the foregroundyields the spot intensity that can be used to
calculate intensity ratios that are the first ap-proximation of relative gene expression.
When the dynamic range of the samplesthemselves exceeds that of the instrument,the dynamic range of the data can be ex-panded by using a merging algorithm tostitch together two scans taken at differentsensitivities to obtain an extended, coherentset [52]. The calculations deal with the clip-ping of data at saturation and the setting ofcertain values below a threshold to zero, aprocess called “quantization” by Garcia dela Nava and coworkers [52], but referred toas “flooring” by others (such as in Ref. [50]).
The notion of boundaries within whichthe data necessarily sit by virtue of their be-ing based on 16-bit information is devel-oped in a rather neat fashion by the Quack-enbush group in their paper exploring howthe fact that intensity values must be from20 to 216 actually constricts the possiblerange of log ratios that can be obtained froman experiment [50]. An interesting upshotof their analysis was identification of an op-timum range of net intensities (between 210
and 212, or 1024 and 4096, respectively),where the dynamic range for fold change ishighest, and where useful data capable ofvalidation will probably be found.
10.6
Data Analysis
Because Chapt. 17 in this volume deals spe-cifically with data analysis issues in micro-arrays, the discussion here will focus on es-sentials and rationale. Not counting whatcould be a long period of sample collection,as with the laser-capture microdissection ofsingle cells from tissue sections that couldtake weeks or months, the labeling, hybrid-ization, washing, and scanning of microar-rays are processes that have short turn-around times. When the quantified datafrom the images are obtained, typically in
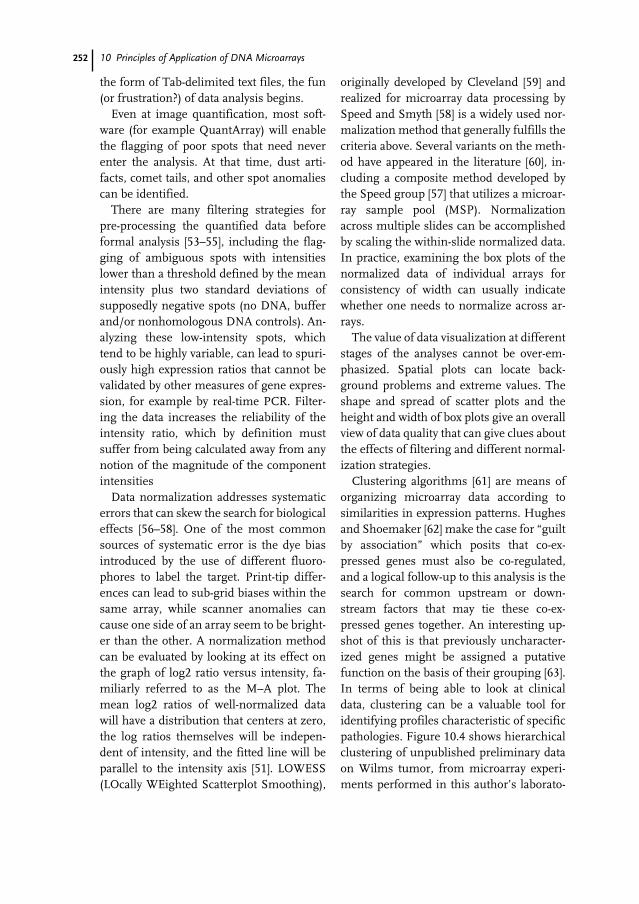
252 10 Principles of Application of DNA Microarrays
the form of Tab-delimited text files, the fun(or frustration?) of data analysis begins.
Even at image quantification, most soft-ware (for example QuantArray) will enablethe flagging of poor spots that need neverenter the analysis. At that time, dust arti-facts, comet tails, and other spot anomaliescan be identified.
There are many filtering strategies forpre-processing the quantified data beforeformal analysis [53–55], including the flag-ging of ambiguous spots with intensitieslower than a threshold defined by the meanintensity plus two standard deviations ofsupposedly negative spots (no DNA, bufferand/or nonhomologous DNA controls). An-alyzing these low-intensity spots, whichtend to be highly variable, can lead to spuri-ously high expression ratios that cannot bevalidated by other measures of gene expres-sion, for example by real-time PCR. Filter-ing the data increases the reliability of theintensity ratio, which by definition mustsuffer from being calculated away from anynotion of the magnitude of the componentintensities
Data normalization addresses systematicerrors that can skew the search for biologicaleffects [56–58]. One of the most commonsources of systematic error is the dye biasintroduced by the use of different fluoro-phores to label the target. Print-tip differ-ences can lead to sub-grid biases within thesame array, while scanner anomalies cancause one side of an array seem to be bright-er than the other. A normalization methodcan be evaluated by looking at its effect onthe graph of log2 ratio versus intensity, fa-miliarly referred to as the M–A plot. Themean log2 ratios of well-normalized datawill have a distribution that centers at zero,the log ratios themselves will be indepen-dent of intensity, and the fitted line will beparallel to the intensity axis [51]. LOWESS(LOcally WEighted Scatterplot Smoothing),
originally developed by Cleveland [59] andrealized for microarray data processing bySpeed and Smyth [58] is a widely used nor-malization method that generally fulfills thecriteria above. Several variants on the meth-od have appeared in the literature [60], in-cluding a composite method developed bythe Speed group [57] that utilizes a microar-ray sample pool (MSP). Normalizationacross multiple slides can be accomplishedby scaling the within-slide normalized data.In practice, examining the box plots of thenormalized data of individual arrays forconsistency of width can usually indicatewhether one needs to normalize across ar-rays.
The value of data visualization at differentstages of the analyses cannot be over-em-phasized. Spatial plots can locate back-ground problems and extreme values. Theshape and spread of scatter plots and theheight and width of box plots give an overallview of data quality that can give clues aboutthe effects of filtering and different normal-ization strategies.
Clustering algorithms [61] are means oforganizing microarray data according tosimilarities in expression patterns. Hughesand Shoemaker [62] make the case for “guiltby association” which posits that co-ex-pressed genes must also be co-regulated,and a logical follow-up to this analysis is thesearch for common upstream or down-stream factors that may tie these co-ex-pressed genes together. An interesting up-shot of this is that previously uncharacter-ized genes might be assigned a putativefunction on the basis of their grouping [63].In terms of being able to look at clinicaldata, clustering can be a valuable tool foridentifying profiles characteristic of specificpathologies. Figure 10.4 shows hierarchicalclustering of unpublished preliminary dataon Wilms tumor, from microarray experi-ments performed in this author’s laborato-
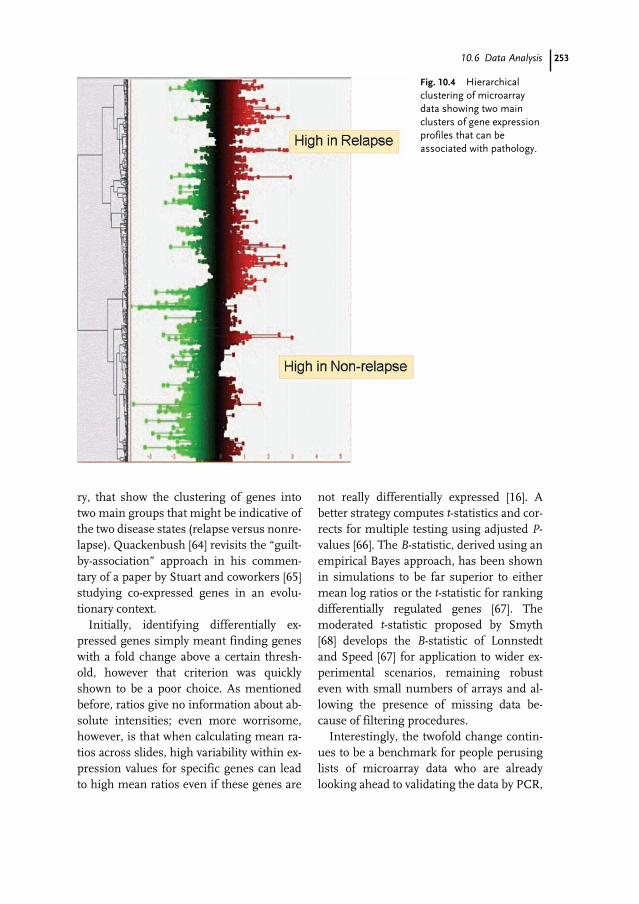
25310.6 Data Analysis
ry, that show the clustering of genes intotwo main groups that might be indicative ofthe two disease states (relapse versus nonre-lapse). Quackenbush [64] revisits the “guilt-by-association” approach in his commen-tary of a paper by Stuart and coworkers [65]studying co-expressed genes in an evolu-tionary context.
Initially, identifying differentially ex-pressed genes simply meant finding geneswith a fold change above a certain thresh-old, however that criterion was quicklyshown to be a poor choice. As mentionedbefore, ratios give no information about ab-solute intensities; even more worrisome,however, is that when calculating mean ra-tios across slides, high variability within ex-pression values for specific genes can leadto high mean ratios even if these genes are
not really differentially expressed [16]. Abetter strategy computes t-statistics and cor-rects for multiple testing using adjusted P-values [66]. The B-statistic, derived using anempirical Bayes approach, has been shownin simulations to be far superior to eithermean log ratios or the t-statistic for rankingdifferentially regulated genes [67]. Themoderated t-statistic proposed by Smyth[68] develops the B-statistic of Lonnstedtand Speed [67] for application to wider ex-perimental scenarios, remaining robusteven with small numbers of arrays and al-lowing the presence of missing data be-cause of filtering procedures.
Interestingly, the twofold change contin-ues to be a benchmark for people perusinglists of microarray data who are alreadylooking ahead to validating the data by PCR,
Fig. 10.4 Hierarchicalclustering of microarraydata showing two mainclusters of gene expressionprofiles that can beassociated with pathology.
254 10 Principles of Application of DNA Microarrays
which is a method based on the exponentialdoubling of product. However, fold changehas become more of a secondary criterion toselect candidates for follow-up from a list ofgenes ranked according to more reliablemeasures of differential expression.
For details of the statistics of microarraydata analysis, the reader is strongly advisedto refer to the original literature cited above,and when strange formulae prove daunting,to consult persons with statistical expertise.
An encouraging development in this are-na is the availability of open source soft-ware, three examples of which are reviewedby Dudoit and coauthors [69] – the statisticalanalysis tools written in R through the Bio-conductor project (http://www.bioconduc-tor.org), the Java-based TM4 softwaresystem from The Institute for Genomic Re-search (http://www.tigr.org/software), andBASE, the Web-based system developed atLund University (http://base.thep.lu.se).
Referring to microarray hybridization ex-periments as “interrogations” sounds ratherhigh-handed, conjuring images of arrays be-ing cross-examined under a glaring lamp inan otherwise darkened room. And yet, asscientific jargon, it is amazingly intuitive.Microarray experiments do ask questions,with unsurpassed multiplicity, and it is notjust a matter of being able to ask many ques-tions all at once, but that the data itself canbe rigorously interrogated.
After finding groups of genes with similarexpression, by use of clustering and othercomputational techniques [70], and after dif-ferentially expressed genes are identified,further study of the data is needed if one isto make the journey back to the larger ques-tion that prompted the experiments in thefirst place. Thus, at this stage of the analysis,the objective is to uncover pathways, func-tions, or processes that might help makesense of the expression patterns and genegroupings observed. The Gene Ontology
Consortium [71], which has sought to devel-op a common vocabulary applicable acrosseukaryotes to describe biological processes,molecular functions, and cellular compo-nents, has greatly facilitated the annotationof genes and therefore their assignment tospecific ontologies. Tools such as Onto-Ex-press [72] can be used to retrieve functionalprofiles and estimate the statistical signifi-cance of selecting certain genes from a giv-en array as being differentially expressed.
10.7
Documentation of Microarrays
The adage that good science is documentedscience has never been truer or more neces-sary than when pertaining to microarrays.Printing arrays depend on careful and accu-rate documentation of the flow of materialsfrom freezer or cupboard through the manysteps of the process. Any changes to the ar-ray design, the materials, and the process,must be recorded. Fortunately, there aresoftware packages that track DNA contentthrough various stages of the printing pro-cess (e.g. from www.biodiscovery.com/).
Efforts to standardize the documentationof microarray hybridization experimentshave been spearheaded by the MicroarrayGene Expression Data Society (MGED;http://www.mged.org) with the establish-ment of MIAME, which describes the Mini-mum information about a microarray experi-ment that will enable unambiguous interpre-tation of the data, and the experiment to berepeated in other hands. The MIAME check-list at http://www.mged.org/Workgroups/MIAME/miame_checklist.html specifies thevarious bits of information required. In theoriginal proposal published in 2001 [73], theminimum information was classified into sixsections:
25510.8 Applications of Microarrays in Cancer Research
1. experimental design: the set of hybridiza-tion experiments as a whole
2. array design: each array used and eachelement (spot, feature) on the array
3. samples: samples used, extract prepara-tion and labeling
4. hybridizations: procedures and condi-tions
5. measurements: images, quantificationand specifications
6. normalization controls: types, values, andspecifications
The following year, MGED wrote an openletter to the scientific journals urging theadoption of MIAME standards to microar-ray papers for publication [74]. Thus, micro-array papers published today will invariablyhave links to databases that contain the MI-AME information and all the raw data.
10.8
Applications of Microarrays in Cancer Research
The enormous potential of applying micro-array technology to the study of human biol-ogy was first glimpsed with the publicationof the paper by Schena and coworkers in1996 [75] examining the effects of heatshock on Jurkat cells using a human cDNAarray of just over a thousand genes. Laterthat same year the first microarray paperanalyzing gene expression in human cancerappeared [42]; since then over 2500 articleson cancer and microarrays have been pub-lished. The sustained interest in using mi-croarrays to study cancer attests to the suit-ability of microarrays as a tool to answer themost pressing challenges of cancer.
Although diagnosis and prognosis as-sessments of cancer typically rely heavily onhistopathological data, no matter how finethe data they are inadequate to explain, for
instance, why two children with stage IWilms tumors that have very similar histo-logical features and are virtually indistin-guishable under the microscope will experi-ence opposite clinical outcomes after treat-ment. The working hypothesis would bethat these tumors must not have been assimilar as previously thought. And becausethey are so outwardly similar, the differenc-es between them must be subtle, though ev-idently far-reaching.
In the above scenario, several issues thatchallenge cancer management can be iden-tified: correctly classifying or sub-classify-ing tumors, understanding tumorigenesisand tumor progression, predicting re-sponse to treatment, and predicting clinicaloutcome.
Acute myeloid leukemia (AML) and acutelymphoblastic leukemia (ALL) are leukemiasubtypes that are managed using differenttreatments, and so it is important they becorrectly diagnosed. In their landmarkstudy Golub and colleagues [76] used asupervised learning approach to identify asubset of genes expressed differentiallybetween AML and ALL that could act as aclass predictor for correct classification ofunknown leukemia samples with an accura-cy greater than 85 %. Yeoh and cowork-ers [77] examined pediatric-ALL and identi-fied distinct expression profiles characteris-tic of the known subtypes while gaining in-sight into the biology of each. More impres-sively, gene expression profiles of 7 and 20genes were able to discriminate between re-lapse and remission in two pediatric-ALLsubtypes, earmarking those patients athigher risk of relapse for more intense ther-apy. A study of expression profiles of diffuselarge B-cell lymphoma (DLBCL) revealedtwo molecularly distinct types, one with apattern reminiscent of germinal B-cells andthe other of activated B-cells [21], and whatis interesting is that patients with tumors
256 10 Principles of Application of DNA Microarrays
expressing genes with the germinal B-cellpattern had significantly better rates of sur-vival over those with the activated B-cell pat-tern. More examples of the application ofmicroarrays to tumor classification can befound in the primary literature and in a re-cent review [78].
Microarrays have also been used to identi-fy tumor markers that can be diagnostic orprognostic, or that can act as drug targets.Gene expression profiles of bladder cancercell lines [79] reveal that expression of celladhesion molecules E-cadherin, zyxin, andmoesin are associated with tumor stage andgrade (P < 0.05). Interestingly, moesin ex-pression is associated with survival witheven higher significance (P = 0.01).
10.9
Conclusion
To say that microarrays have revolutionizedscience is not mere hyperbole. It is obviousfrom the wealth of literature that has accu-mulated in the short decade since their firstappearance that microarrays have changedthe way science is done. Never before had itbeen possible to even think of doing some ofthe experiments that have now almost be-come routine. Not that they were neverthought of. The steep publication curvewould suggest the ideas have been there allthe time. All that was needed was a meansto realize them. Microarrays were the door.
So what is on the other side? The publica-tion flood has abated somewhat, for severalreasons. It is not because less is being done.Rather, more is being required, which is asit should be for a field that is maturing intoone that will actually make strides towardfulfilling its promise.
There are those who will say the bloomhas gone from the rose, that microarrays arenot all they have been cracked up to be. It istrue that reality has set in for the microarrayfield. Far from losing heart, however, the re-search community has risen to the chal-lenge. When else has science been accom-plished with the input of such a diversity ofexpertise as to unite basic scientists, doc-tors, engineers, statisticians, and computerscientists? When else has it been possible(or even required) that methods, materials,and raw data be fully disclosed? Such freeflow of information can only be good for thescience, and the microarray communityshould be lauded for taking the initiative.
With the completion of the Human Ge-nome Project (HGP), attention has rightlyshifted to building on the blueprint andeventually fulfilling the project’s promise ofbeing beneficial to humankind. This loftygoal provided impetus to the Human Ge-nome Project and motivates the natural pro-gression beyond the sequencing of the hu-man genome towards identifying genefunctions and interactions in various con-texts of time and space, in health or disease,in order to understand the workings of thehuman organism.
257
1 Collins FS, Morgan M, Patrinos A (2003) TheHuman Genome Project: lessons from large-scale biology. Science, 300, 286–290.
2 Schena M, Shalon D, Davis RW, Brown PO(1995) Quantitative monitoring of geneexpression patterns with a complementaryDNA microarray. Science, 270, 467–470.
3 Phimister B (1999) Going global. Nat Genet,21, 1.
4 Weinmann AS, Yan PS, Oberley MJ, HuangTH, Farnham PJ (2002) Isolating humantranscription factor targets by couplingchromatin immunoprecipitation and CpGisland microarray analysis. Genes Dev, 16,235–244.
5 Draghici S, Khatri P, Shah A, Tainsky MA(2003) Assessing the functional bias ofcommercial microarrays using the onto-compare database. Biotechniques, Suppl,55–61.
6 Takemasa I, Higuchi H, Yamamoto H,Sekimoto M, Tomita N, Nakamori S, MatobaR, Monden M, Matsubara K (2001)Construction of preferential cDNAmicroarray specialized for human colorectalcarcinoma: molecular sketch of colorectalcancer. Biochem Biophys Res Commun, 285,1244–1249.
7 Hardiman G (2004) Microarray platforms –comparisons and contrasts.Pharmacogenomics, 5, 487–502.
8 Fodor SP, Read JL, Pirrung MC, Stryer L, LuAT, Solas D (1991) Light-directed, spatiallyaddressable parallel chemical synthesis.Science, 251, 767–773.
9 Hughes TR, Mao M, Jones AR, Burchard J,Marton MJ, Shannon KW, Lefkowitz SM,Ziman M, Schelter JM, Meyer MR, KobayashiS, Davis C, Dai H, He YD, Stephaniants SB,
Cavet G, Walker WL, West A, Coffey E,Shoemaker DD, Stoughton R, Blanchard AP,Friend SH, Linsley PS (2001) Expressionprofiling using microarrays fabricated by anink-jet oligonucleotide synthesizer. NatBiotechnol, 19, 342–347.
10 Ochs MF, Godwin AK (2003) Microarrays incancer: research and applications.Biotechniques, Suppl, 4–15.
11 Kane MD, Jatkoe TA, Stumpf CR, Lu J,Thomas JD, Madore SJ (2000) Assessment ofthe sensitivity and specificity ofoligonucleotide (50mer) microarrays. NucleicAcids Res, 28, 4552–4557.
12 Tiquia SM, Wu L, Chong SC, Passovets S, XuD, Xu Y, Zhou J (2004) Evaluation of 50-meroligonucleotide arrays for detecting microbialpopulations in environmental samples.Biotechniques, 36, 664–670, 672, 674–675.
13 Wang HY, Malek RL, Kwitek AE, Greene AS,Luu TV, Behbahani B, Frank B, QuackenbushJ, Lee NH (2003) Assessing unmodified 70-mer oligonucleotide probe performance onglass-slide microarrays. Genome Biol, 4, R5.
14 Chen H, Sharp BM (2002) Oliz, a suite of Perlscripts that assist in the design of microarraysusing 50mer oligonucleotides from the 3′ un-translated region. BMC Bioinformatics, 3, 27.
15 Tilstone C (2003) DNA microarrays: vitalstatistics. Nature, 424, 610–612.
16 Smyth G, Yang Y, Speed T (2003) Statisticalissues in cDNA microarray data analysis. In:Functional Genomics: Methods andProtocols. Vol. 224 (eds. M Brownstein, AKhodursky), pp 111–136. Humana Press,Totowa, NJ.
17 Churchill GA (2002) Fundamentals ofexperimental design for cDNA microarrays.Nat Genet, 32 Suppl, 490–495.
References

258 References
18 Rosenzweig BA, Pine PS, Domon OE, MorrisSM, Chen JJ, Sistare FD (2004) Dye biascorrection in dual-labeled cDNA microarraygene expression measurements. EnvironHealth Perspect, 112, 480–487.
19 Dobbin K, Shih JH, Simon R (2003) Statisticaldesign of reverse dye microarrays.Bioinformatics, 19, 803–810.
20 Yang YH, Speed T (2002) Design issues forcDNA microarray experiments. Nat RevGenet, 3, 579–588.
21 Alizadeh AA, Eisen MB, Davis RE, Ma C,Lossos IS, Rosenwald A, Boldrick JC, Sabet H,Tran T, Yu X, Powell JI, Yang L, Marti GE,Moore T, Hudson J, Jr., Lu L, Lewis DB,Tibshirani R, Sherlock G, Chan WC, GreinerTC, Weisenburger DD, Armitage JO, WarnkeR, Levy R, Wilson W, Grever MR, Byrd JC,Botstein D, Brown PO, Staudt LM (2000)Distinct types of diffuse large B-celllymphoma identified by gene expressionprofiling. Nature, 403, 503–511.
22 Glonek GF, Solomon PJ (2004) Factorial andtime course designs for cDNA microarrayexperiments. Biostatistics, 5, 89–111.
23 Townsend JP (2003) Multifactorialexperimental design and the transitivity ofratios with spotted DNA microarrays. BMCGenomics, 4, 41.
24 Kerr MK (2003) Design considerations forefficient and effective microarray studies.Biometrics, 59, 822–828.
25 Simon R, Radmacher MD, Dobbin K (2002)Design of studies using DNA microarrays.Genet Epidemiol, 23, 21–36.
26 Dobbin K, Simon R (2002) Comparison ofmicroarray designs for class comparison andclass discovery. Bioinformatics, 18,1438–1445.
27 Burgess JK, Hazelton RH (2000) Newdevelopments in the analysis of geneexpression. Redox Rep, 5, 63–73.
28 Simone NL, Bonner RF, Gillespie JW,Emmert-Buck MR, Liotta LA (1998) Laser-capture microdissection: opening themicroscopic frontier to molecular analysis.Trends Genet, 14, 272–276.
29 Arcellana-Panlilio MY, Schultz GA (1993)Analysis of messenger RNA. MethodsEnzymol, 225, 303–328.
30 Ausubel FM (1995) Short protocols inmolecular biology : a compendium ofmethods from Current protocols in molecularbiology. Wiley, New York.
31 Chomczynski P, Sacchi N (1987) Single-stepmethod of RNA isolation by acidguanidinium thiocyanate–phenol–chloroformextraction. Anal Biochem, 162, 156–159.
32 Naderi A, Ahmed AA, Barbosa-Morais NL,Aparicio S, Brenton JD, Caldas C (2004)Expression microarray reproducibility isimproved by optimising purification steps inRNA amplification and labelling. BMCGenomics, 5, 9.
33 Van Gelder RN, von Zastrow ME, Yool A,Dement WC, Barchas JD, Eberwine JH (1990)Amplified RNA synthesized from limitedquantities of heterogeneous cDNA. Proc NatlAcad Sci USA, 87, 1663–1667.
34 Eberwine J, Yeh H, Miyashiro K, Cao Y, NairS, Finnell R, Zettel M, Coleman P (1992)Analysis of gene expression in single liveneurons. Proc Natl Acad Sci USA, 89,3010–3014.
35 Kacharmina JE, Crino PB, Eberwine J (1999)Preparation of cDNA from single cells andsubcellular regions. Methods Enzymol, 303,3–18.
36 Bowtell D, Sambrook J (2003) DNAmicroarrays : a molecular cloning manual.Cold Spring Harbor Laboratory Press, ColdSpring Harbor, NY.
37 Puskas LG, Zvara A, Hackler L, Jr., VanHummelen P (2002) RNA amplificationresults in reproducible microarray data withslight ratio bias. Biotechniques, 32,1330–1334, 1336, 1338, 1340.
38 Zhao H, Hastie T, Whitfield ML, Borresen-Dale AL, Jeffrey SS (2002) Optimization andevaluation of T7 based RNA linearamplification protocols for cDNA microarrayanalysis. BMC Genomics, 3, 31.
39 Attia MA, Welsh JP, Laing K, Butcher PD,Gibson FM, Rutherford TR (2003) Fidelityand reproducibility of antisense RNAamplification for the study of gene expressionin human CD34+ haemopoietic stem andprogenitor cells. Br J Haematol, 122, 498–505.
40 Li Y, Li T, Liu S, Qiu M, Han Z, Jiang Z, Li R,Ying K, Xie Y, Mao Y (2004) Systematiccomparison of the fidelity of aRNA, mRNAand T-RNA on gene expression profiling usingcDNA microarray. J Biotechnol, 107, 19–28.
41 van Gijlswijk RP, Talman EG, Janssen PJ,Snoeijers SS, Killian J, Tanke HJ, HeetebrijRJ (2001) Universal Linkage System: versatilenucleic acid labeling technique. Expert RevMol Diagn, 1, 81–91.
259References
42 DeRisi J, Penland L, Brown PO, Bittner ML,Meltzer PS, Ray M, Chen Y, Su YA, Trent JM(1996) Use of a cDNA microarray to analysegene expression patterns in human cancer.Nat Genet, 14, 457–460.
43 Zhu Z, Waggoner AS (1997) Molecularmechanism controlling the incorporation offluorescent nucleotides into DNA by PCR.Cytometry, 28, 206–211.
44 Randolph JB, Waggoner AS (1997) Stability,specificity and fluorescence brightness ofmultiply-labeled fluorescent DNA probes.Nucleic Acids Res, 25, 2923–2929.
45 Tamayo P, Slonim D, Mesirov J, Zhu Q,Kitareewan S, Dmitrovsky E, Lander ES,Golub TR (1999) Interpreting patterns ofgene expression with self-organizing maps:methods and application to hematopoieticdifferentiation. Proc Natl Acad Sci USA, 96,2907–2912.
46 Wahl GM, Berger SL, Kimmel AR (1987)Molecular hybridization of immobilizednucleic acids: theoretical concepts andpractical considerations. Methods Enzymol,152, 399–407.
47 Wang Y, Wang X, Guo SW, Ghosh S (2002)Conditions to ensure competitivehybridization in two-color microarray: atheoretical and experimental analysis.Biotechniques, 32, 1342–1346.
48 Grills G, Griffin C, Lilley K, Massimi A, BaoY, VanEe J (2000) 1999/2000 ABRFMicroarray Research Group Study. The Stateof the Art of Microarray Analysis: A Profile ofMicroarray Laboratories. The Association ofBiomolecular Resource Facilities.
49 Holloway AJ, van Laar RK, Tothill RW,Bowtell DD (2002) Options available – fromstart to finish – for obtaining data from DNAmicroarrays II. Nat Genet, 32 Suppl, 481–489.
50 Sharov V, Kwong KY, Frank B, Chen E,Hasseman J, Gaspard R, Yu Y, Yang I,Quackenbush J (2004) The limits of log-ratios. BMC Biotechnol, 4, 3.
51 Leung YF, Cavalieri D (2003) Fundamentalsof cDNA microarray data analysis. TrendsGenet, 19, 649–659.
52 Garcia de la Nava J, Van Hijum S, Trelles O(2004) Saturation and QuantizationReduction in Microarray Experiments usingTwo Scans at Dierent Sensitivities. StatisticalApplications in Genetics and MolecularBiology, 3, Article 11.
53 Tseng GC, Oh MK, Rohlin L, Liao JC, WongWH (2001) Issues in cDNA microarrayanalysis: quality filtering, channelnormalization, models of variations andassessment of gene effects. Nucleic AcidsRes, 29, 2549–2557.
54 Yang MC, Ruan QG, Yang JJ, Eckenrode S,Wu S, McIndoe RA, She JX (2001) Astatistical method for flagging weak spotsimproves normalization and ratio estimatesin microarrays. Physiol Genomics, 7, 45–53.
55 Wang X, Hessner MJ, Wu Y, Pati N, Ghosh S(2003) Quantitative quality control inmicroarray experiments and the applicationin data filtering, normalization and falsepositive rate prediction. Bioinformatics, 19,1341–1347.
56 Quackenbush J (2002) Microarray datanormalization and transformation. NatGenet, 32 Suppl, 496–501.
57 Yang YH, Dudoit S, Luu P, Lin DM, Peng V,Ngai J, Speed TP (2002) Normalization forcDNA microarray data: a robust compositemethod addressing single and multiple slidesystematic variation. Nucleic Acids Res, 30,e15.
58 Smyth GK, Speed T (2003) Normalization ofcDNA microarray data. Methods, 31, 265–273.
59 Cleveland WS (1979) Robust locally weightedregression and smoothing scatterplots. J AmStat Assoc, 74, 829–836.
60 Cui X, Kerr MK, Churchill GA (2003)Transformations of cDNA microarray data.Statistical Applications in Genetics andMolecular Biology, 2, Article 4.
61 Eisen MB, Spellman PT, Brown PO, BotsteinD (1998) Cluster analysis and display ofgenome-wide expression patterns. Proc NatlAcad Sci USA, 95, 14863–14868.
62 Hughes TR, Shoemaker DD (2001) DNAmicroarrays for expression profiling. CurrOpin Chem Biol, 5, 21–25.
63 Hughes TR, Marton MJ, Jones AR, RobertsCJ, Stoughton R, Armour CD, Bennett HA,Coffey E, Dai H, He YD, Kidd MJ, King AM,Meyer MR, Slade D, Lum PY, Stepaniants SB,Shoemaker DD, Gachotte D, Chakraburtty K,Simon J, Bard M, Friend SH (2000)Functional discovery via a compendium ofexpression profiles. Cell, 102, 109–126.
64 Quackenbush J (2003) Genomics.Microarrays – guilt by association. Science,302, 240–241.
260 References
65 Stuart JM, Segal E, Koller D, Kim SK (2003) Agene-coexpression network for globaldiscovery of conserved genetic modules.Science, 302, 249–255.
66 Dudoit S, Yang YH, Callow MJ, Speed TP(2002) Statistical methods for identifyingdifferentially expressed genes in replicatedcDNA microarray experiments. StatisticaSinica, 12, 111–139.
67 Lonnstedt I, Speed TP (2002) Replicatedmicroarray data. Statistica Sinica, 12, 31–46.
68 Smyth GK (2003) Linear models andempirical Bayes methods for assessingdifferential expression in microarrayexperiments. Statistical Applications inGenetics and Molecular Biology, 3, Article 3.
69 Dudoit S, Gentleman RC, Quackenbush J(2003) Open source software for the analysisof microarray data. Biotechniques, Suppl,45–51.
70 Quackenbush J (2001) Computational analysisof microarray data. Nat Rev Genet, 2, 418–427.
71 Ashburner M, Ball CA, Blake JA, Botstein D,Butler H, Cherry JM, Davis AP, Dolinski K,Dwight SS, Eppig JT, Harris MA, Hill DP,Issel-Tarver L, Kasarskis A, Lewis S, MateseJC, Richardson JE, Ringwald M, Rubin GM,Sherlock G (2000) Gene ontology: tool for theunification of biology. The Gene OntologyConsortium. Nat Genet, 25, 25–29.
72 Draghici S, Khatri P, Martins RP, OstermeierGC, Krawetz SA (2003) Global functionalprofiling of gene expression. Genomics, 81,98–104.
73 Brazma A, Hingamp P, Quackenbush J,Sherlock G, Spellman P, Stoeckert C, Aach J,Ansorge W, Ball CA, Causton HC,Gaasterland T, Glenisson P, Holstege FC,Kim IF, Markowitz V, Matese JC, ParkinsonH, Robinson A, Sarkans U, Schulze-KremerS, Stewart J, Taylor R, Vilo J, Vingron M(2001) Minimum information about amicroarray experiment (MIAME)-towardstandards for microarray data. Nat Genet, 29,365–371.
74 Ball CA, Sherlock G, Parkinson H, Rocca-Sera P, Brooksbank C, Causton HC, CavalieriD, Gaasterland T, Hingamp P, Holstege F,Ringwald M, Spellman P, Stoeckert CJ, Jr.,Stewart JE, Taylor R, Brazma A,Quackenbush J (2002) The underlyingprinciples of scientific publication.Bioinformatics, 18, 1409.
75 Schena M, Shalon D, Heller R, Chai A,Brown PO, Davis RW (1996) Parallel humangenome analysis: microarray-basedexpression monitoring of 1000 genes. ProcNatl Acad Sci USA, 93, 10614–10619.
76 Golub TR, Slonim DK, Tamayo P, Huard C,Gaasenbeek M, Mesirov JP, Coller H, LohML, Downing JR, Caligiuri MA, BloomfieldCD, Lander ES (1999) Molecular classificationof cancer: class discovery and class predictionby gene expression monitoring. Science, 286,531–537.
77 Yeoh EJ, Ross ME, Shurtleff SA, WilliamsWK, Patel D, Mahfouz R, Behm FG,Raimondi SC, Relling MV, Patel A, Cheng C,Campana D, Wilkins D, Zhou X, Li J, Liu H,Pui CH, Evans WE, Naeve C, Wong L,Downing JR (2002) Classification, subtypediscovery, and prediction of outcome inpediatric acute lymphoblastic leukemia bygene expression profiling. Cancer Cell, 1,133–143.
78 Hampton GM, Frierson HF (2003)Classifying human cancer by analysis of geneexpression. Trends Mol Med, 9, 5–10.
79 Sanchez-Carbayo M, Socci ND,Charytonowicz E, Lu M, Prystowsky M,Childs G, Cordon-Cardo C (2002) Molecularprofiling of bladder cancer using cDNAmicroarrays: defining histogenesis andbiological phenotypes. Cancer Res, 62,6973–6980.
261
Gregor Jansen, David Y. Thomas, and Stephanie Pollock
11.1
Introduction
More than 100 genomic sequences havenow been completed and multitudes of ge-nome sequencing projects are in progress.Major developments in DNA sequencingtechnology have enabled the rapid acquisi-tion of high-quality genome sequence data.The assignment of function has lagged farbehind sequencing and methods havechiefly relied on bioinformatics. Compari-son of total genomes and the inference ofgene function by identification of orthologsis a well established procedure, but even inthe most completely annotated genomes(for example that of Saccharomyces cerevi-siae) there are approximately 25 % of ORFsthat do not yet have a possible function as-signed. The magnitude of the task of obtain-ing a complete understanding of the func-tion of a protein can be appreciated by theenormous number of publications on sin-gle proteins, for example 31,793 publica-tions on p53 and 88,496 that mention Ras.Thus, beyond a first assignment of enzy-matic or cellular function there is a vastamount to be learnt before a knowledge ofthe function of a protein is complete. Even
initial assignment of the proteins is, cur-rently, a major challenge, however. Bioin-formatics approaches are powerful, but arelimited by the experimental data available,and high-throughput methods such as ge-nome-wide gene deletions or siRNA geneknock-downs, still need extensive further ex-perimental analysis. Another genome-wideanalytical approach uses DNA microarrays.The global analysis of gene expression pro-files after a variety of experimental changeshas provided many clues about the functionof proteins and their associated pathways.
A different approach to establishing pro-tein function is to find their interactionpartners. Protein–protein interactions arefound for most proteins, and partners thatinteract are expected to participate in thesame cellular process, thus providing cluesto the function of unknown interaction part-ners. Many techniques have been developedto study protein–protein interactions. Theseinclude traditional biochemical methodssuch as co-purification, and coimmunopre-cipitation to identify the members of pro-tein complexes. This approach usually re-quires complex and specific optimization ofthe experimental setup, however. Recently,new proteomics-based strategies have been
Handbook of Genome Research. Genomics, Proteomics, Metabolomics, Bioinformatics, Ethical and Legal Issues.Edited by Christoph W. SensenCopyright © 2005 WILEY-VCH Verlag GmbH & Co. KGaA, WeinheimISBN: 3-527-31348-6
11Yeast Two-hybrid Technologies
Verwendete Mac Distiller 5.0.x Joboptions
Dieser Report wurde automatisch mit Hilfe der Adobe Acrobat Distiller Erweiterung "Distiller Secrets v1.0.5" der IMPRESSED GmbH erstellt. Sie koennen diese Startup-Datei für die Distiller Versionen 4.0.5 und 5.0.x kostenlos unter http://www.impressed.de herunterladen. ALLGEMEIN ---------------------------------------- Dateioptionen: Kompatibilität: PDF 1.3 Für schnelle Web-Anzeige optimieren: Ja Piktogramme einbetten: Ja Seiten automatisch drehen: Nein Seiten von: 1 Seiten bis: Alle Seiten Bund: Links Auflösung: [ 2400 2400 ] dpi Papierformat: [ 481 680 ] Punkt KOMPRIMIERUNG ---------------------------------------- Farbbilder: Downsampling: Nein Komprimieren: Ja Komprimierungsart: ZIP Bitanzahl pro Pixel: 8 Bit Graustufenbilder: Downsampling: Nein Komprimieren: Ja Komprimierungsart: ZIP Bitanzahl pro Pixel: 8 Bit Schwarzweiß-Bilder: Downsampling: Nein Komprimieren: Ja Komprimierungsart: CCITT CCITT-Gruppe: 4 Graustufen glätten: Nein Text und Vektorgrafiken komprimieren: Ja SCHRIFTEN ---------------------------------------- Alle Schriften einbetten: Ja Untergruppen aller eingebetteten Schriften: Nein Wenn Einbetten fehlschlägt: Abbrechen Einbetten: Immer einbetten: [ /Courier-BoldOblique /Helvetica-BoldOblique /Courier /Helvetica-Bold /Times-Bold /Courier-Bold /Helvetica /Times-BoldItalic /Times-Roman /ZapfDingbats /Times-Italic /Helvetica-Oblique /Courier-Oblique /Symbol ] Nie einbetten: [ ] FARBE(N) ---------------------------------------- Farbmanagement: Farbumrechnungsmethode: Farbe nicht ändern Methode: Standard Geräteabhängige Daten: Einstellungen für Überdrucken beibehalten: Ja Unterfarbreduktion und Schwarzaufbau beibehalten: Ja Transferfunktionen: Beibehalten Rastereinstellungen beibehalten: Nein ERWEITERT ---------------------------------------- Optionen: Prolog/Epilog verwenden: Nein PostScript-Datei darf Einstellungen überschreiben: Nein Level 2 copypage-Semantik beibehalten: Ja Portable Job Ticket in PDF-Datei speichern: Ja Illustrator-Überdruckmodus: Ja Farbverläufe zu weichen Nuancen konvertieren: Ja ASCII-Format: Nein Document Structuring Conventions (DSC): DSC-Kommentare verarbeiten: Ja DSC-Warnungen protokollieren: Nein Für EPS-Dateien Seitengröße ändern und Grafiken zentrieren: Ja EPS-Info von DSC beibehalten: Ja OPI-Kommentare beibehalten: Nein Dokumentinfo von DSC beibehalten: Ja ANDERE ---------------------------------------- Distiller-Kern Version: 5000 ZIP-Komprimierung verwenden: Ja Optimierungen deaktivieren: Nein Bildspeicher: 524288 Byte Farbbilder glätten: Nein Graustufenbilder glätten: Nein Bilder (< 257 Farben) in indizierten Farbraum konvertieren: Ja sRGB ICC-Profil: sRGB IEC61966-2.1 ENDE DES REPORTS ---------------------------------------- IMPRESSED GmbH Bahrenfelder Chaussee 49 22761 Hamburg, Germany Tel. +49 40 897189-0 Fax +49 40 897189-71 Email: [email protected] Web: www.impressed.de
Adobe Acrobat Distiller 5.0.x Joboption Datei
<< /ColorSettingsFile () /LockDistillerParams true /DetectBlends true /DoThumbnails true /AntiAliasMonoImages false /MonoImageDownsampleType /Bicubic /GrayImageDownsampleType /Bicubic /MaxSubsetPct 100 /MonoImageFilter /CCITTFaxEncode /ColorImageDownsampleThreshold 1.5 /GrayImageFilter /FlateEncode /ColorConversionStrategy /LeaveColorUnchanged /CalGrayProfile (Dot Gain 20%) /ColorImageResolution 300 /UsePrologue false /MonoImageResolution 1200 /ColorImageDepth 8 /sRGBProfile (sRGB IEC61966-2.1) /PreserveOverprintSettings true /CompatibilityLevel 1.3 /UCRandBGInfo /Preserve /EmitDSCWarnings false /CreateJobTicket true /DownsampleMonoImages false /DownsampleColorImages false /MonoImageDict << /K -1 >> /ColorImageDownsampleType /Bicubic /GrayImageDict << /HSamples [ 2 1 1 2 ] /VSamples [ 2 1 1 2 ] /Blend 1 /QFactor 0.9 >> /CalCMYKProfile (U.S. Web Coated (SWOP) v2) /ParseDSCComments true /PreserveEPSInfo true /MonoImageDepth -1 /AutoFilterGrayImages false /SubsetFonts false /GrayACSImageDict << /HSamples [ 2 1 1 2 ] /VSamples [ 2 1 1 2 ] /Blend 1 /QFactor 0.9 >> /ColorImageFilter /FlateEncode /AutoRotatePages /None /PreserveCopyPage true /EncodeMonoImages true /ASCII85EncodePages false /PreserveOPIComments false /NeverEmbed [ ] /ColorImageDict << /HSamples [ 2 1 1 2 ] /VSamples [ 2 1 1 2 ] /Blend 1 /QFactor 0.9 >> /AntiAliasGrayImages false /GrayImageDepth 8 /CannotEmbedFontPolicy /Error /EndPage -1 /TransferFunctionInfo /Preserve /CalRGBProfile (sRGB IEC61966-2.1) /EncodeColorImages true /EncodeGrayImages true /ColorACSImageDict << /HSamples [ 2 1 1 2 ] /VSamples [ 2 1 1 2 ] /Blend 1 /QFactor 0.9 >> /Optimize true /ParseDSCCommentsForDocInfo true /GrayImageDownsampleThreshold 1.5 /MonoImageDownsampleThreshold 1.5 /AutoPositionEPSFiles true /GrayImageResolution 300 /AutoFilterColorImages false /AlwaysEmbed [ /Courier-BoldOblique /Helvetica-BoldOblique /Courier /Helvetica-Bold /Times-Bold /Courier-Bold /Helvetica /Times-BoldItalic /Times-Roman /ZapfDingbats /Times-Italic /Helvetica-Oblique /Courier-Oblique /Symbol ] /ImageMemory 524288 /OPM 1 /DefaultRenderingIntent /Default /EmbedAllFonts true /StartPage 1 /DownsampleGrayImages false /AntiAliasColorImages false /ConvertImagesToIndexed true /PreserveHalftoneInfo false /CompressPages true /Binding /Left >> setdistillerparams << /PageSize [ 595.276 841.890 ] /HWResolution [ 2400 2400 ] >> setpagedevice
262 11 Yeast Two-hybrid Technologies
used to determine the composition of com-plexes and to establish interaction networks.For example, a recent large-scale approachused affinity tagging and mass spectroscopyto study protein–protein interactions inyeast [1, 2]. So far this method has been lim-ited, because it requires the target organismto be amenable to genetic manipulation.
The yeast two-hybrid system is an excel-lent means of high throughput detection ofprotein–protein interactions for any organ-ism. Yeast two-hybrid systems detect notonly members of known complexes, butalso weak or transient interactions. Theyhave been shown to be robust and adaptableto automation. In addition, protein expres-sion in yeast can provide the important pro-tein modifications necessary for stabilityand proper folding, but not available in bac-teria or in vitro. Interaction screening can beperformed with random cDNA librariesfrom any organism or involve robotics withgrids of predefined clones. Over the lastdecade a variety of two-hybrid technologieshave been developed, enabling study of abroad range of proteins, including mem-brane proteins. To date, the yeast two-hybridsystem has been widely used for determina-tion of protein interaction networks withindifferent organisms such as Helicobacterpylori (bacterium) [3], Saccharomyces cere-visiae (yeast) [4, 5], Caenorhabditis elegans(worm) [6], and Drosophila melanogaster(fly) [7].
11.2
The Classical Yeast Two-hybrid System
The yeast two-hybrid system was developedby Fields and Song [8] and variations of thisare the most widely used two-hybrid system.It makes use of the modular organizationfound in many transcription factors thathave a DNA-binding (DB) domain and acti-
vation domains (AD) that can function inde-pendently, but controlled transcriptional ac-tivity that can be reconstituted when the in-dependent domains are fused to two pro-teins that interact. The original system wasbased on the reconstitution of the DB andAD domains of the yeast transcription fac-tor Gal4p. Fusions of these domains, theDB usually termed the bait and AD the prey,are made to proteins of interest and theinteraction of bait and prey via the fusedproteins brings the separated domains intoproximity. This reconstitutes a complexwith the ability to bind to specific upstreamactivating sequences (UAS) in the promoterregion of target genes and to specifically ac-tivate their transcription (Fig. 11.1A). In asimilar system, the E. coli DNA-binding pro-tein LexAp and the independent B42pstrong activation domain have also beenused [9]. The power of the system is that theUAS that is recognized by the DB can beplaced to control the transcription of select-able or detectable reporter genes. A com-monly used reporter gene contains the spe-cific UAS for either Gal4p or LexAp in thepromoter region of LacZ and interactionsare monitored by well characterized andsensitive colorimetric assays. Other reportergenes such as HIS3, ADE2 and URA3 areused and report interactions by conferringgrowth under selective conditions. Theyeast two-hybrid system has been used togenerate large-scale interaction maps, butalso to define the domains and individualamino acid residues involved the interac-tion. Occasionally results obtained from theyeast two-hybrid system have been corrobo-rated by structural studies [10].
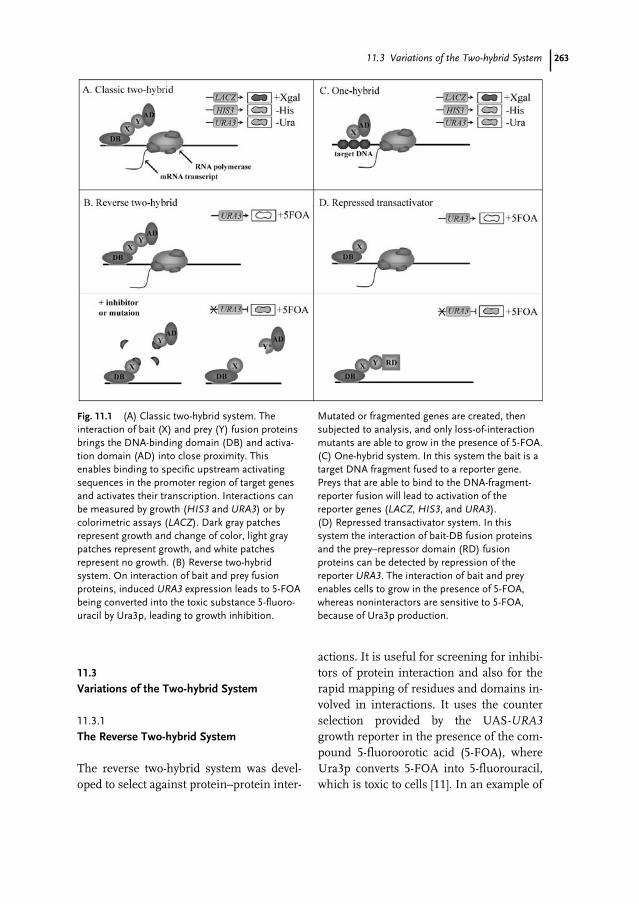
26311.3 Variations of the Two-hybrid System
11.3
Variations of the Two-hybrid System
11.3.1
The Reverse Two-hybrid System
The reverse two-hybrid system was devel-oped to select against protein–protein inter-
actions. It is useful for screening for inhibi-tors of protein interaction and also for therapid mapping of residues and domains in-volved in interactions. It uses the counterselection provided by the UAS-URA3growth reporter in the presence of the com-pound 5-fluoroorotic acid (5-FOA), whereUra3p converts 5-FOA into 5-fluorouracil,which is toxic to cells [11]. In an example of
Fig. 11.1 (A) Classic two-hybrid system. Theinteraction of bait (X) and prey (Y) fusion proteinsbrings the DNA-binding domain (DB) and activa-tion domain (AD) into close proximity. Thisenables binding to specific upstream activatingsequences in the promoter region of target genesand activates their transcription. Interactions canbe measured by growth (HIS3 and URA3) or bycolorimetric assays (LACZ). Dark gray patchesrepresent growth and change of color, light graypatches represent growth, and white patchesrepresent no growth. (B) Reverse two-hybridsystem. On interaction of bait and prey fusionproteins, induced URA3 expression leads to 5-FOAbeing converted into the toxic substance 5-fluoro-uracil by Ura3p, leading to growth inhibition.
Mutated or fragmented genes are created, thensubjected to analysis, and only loss-of-interactionmutants are able to grow in the presence of 5-FOA.(C) One-hybrid system. In this system the bait is atarget DNA fragment fused to a reporter gene.Preys that are able to bind to the DNA-fragment-reporter fusion will lead to activation of thereporter genes (LACZ, HIS3, and URA3). (D) Repressed transactivator system. In thissystem the interaction of bait-DB fusion proteinsand the prey–repressor domain (RD) fusionproteins can be detected by repression of thereporter URA3. The interaction of bait and preyenables cells to grow in the presence of 5-FOA,whereas noninteractors are sensitive to 5-FOA,because of Ura3p production.
264 11 Yeast Two-hybrid Technologies
this technique the genes for proteins in aknown interaction are mutated and the cellsselected on 5-FOA, where only loss-of-inter-action mutants are able to grow (Fig. 11.1B).This approach, together with in-vivo recom-bination techniques simplifies the mappingof domains and interaction surfaces. Othercounter-selectable reporters such as cyclo-heximide resistance have been incorporatedinto reverse two-hybrid systems [12].
11.3.2
The One-hybrid System
One-hybrid systems are used for identifica-tion of DNA-binding proteins that can bindto a DNA fragment of interest, for example aUAS in a promoter region. The “bait” in thissystem is a DNA sequence placed upstreamof a reporter gene. Fusion libraries, inwhich the preys with potential DNA bindingactivity are fused to a known activation do-main, are used. Preys that are able to bind tothe DNA-fragment-reporter fusion lead toactivation of the reporter (Fig. 11.1C). Theyeast one-hybrid system has been used toidentify a yeast origin of replication bindingprotein [13]. The system has been further re-fined to identify proteins that interfere withknown DNA–protein interactions by intro-duction of the counter-selectable reporterURA3 (reverse one-hybrid) [11].
11.3.3
The Repressed Transactivator System
Transcriptional activators are not usuallyused for two-hybrid studies, because of theirability to auto-activate the reporter geneswithout having to interact with a bait fusionprotein. To overcome this limitation, the re-pressed transactivator system (RTA) usesthe general transcriptional repressor Tup1p.Tup1p participates with Mig1p and other co-factors in the presence of glucose to repress
the transcription of genes containing up-stream repressing sequences in their pro-moters. Like transcriptional activators, thetranscriptional repressor domain (RD)alone has been shown to be sufficient toconfer repression on a URSglucose-lexA fu-sion reporter. In the RTA system the inter-action of the bait Gal4p-DBfusion proteinsand the prey Tup1p-RD fusion proteins canbe detected by the repression of the Gal4p-dependent reporter URA3. The interactionof bait and prey allows cells to grow in thepresence of 5-FOA, whereas noninteractorsare sensitive to 5-FOA, because of the in-creased Ura3p expression caused by the au-toactivating bait-transcription-factor fusionprotein (Fig. 11.1D) [14].
11.3.4
Three-hybrid Systems
In the three-hybrid system the interaction ofbait and prey protein requires the presenceof a third interacting molecule to form acomplex. The third interacting moleculecan be a protein used with a nuclear local-ization and it acts as a bridge between baitand prey to cause transcriptional activation.The bridging effect might be provided byinteracting with both bait and prey at thesame time or by forming an intact interac-tion surface in combination with one part-ner that enables the second partner to bind(Fig. 11.2). This system has been used toshow the ternary complex formation of EGF,GRB2, and SOS [15]. Reporter gene activa-tion only occurs in the presence of all threeproteins, but combination of any two pro-teins is inactive. The expression of a thirdprotein can also be used in a reverse two-hy-brid approach by preventing the interactionbetween bait and prey by competition.
In the RNA three-hybrid system the thirdinteracting component expressed is a bi-functional RNA (Fig. 11.2). This system has
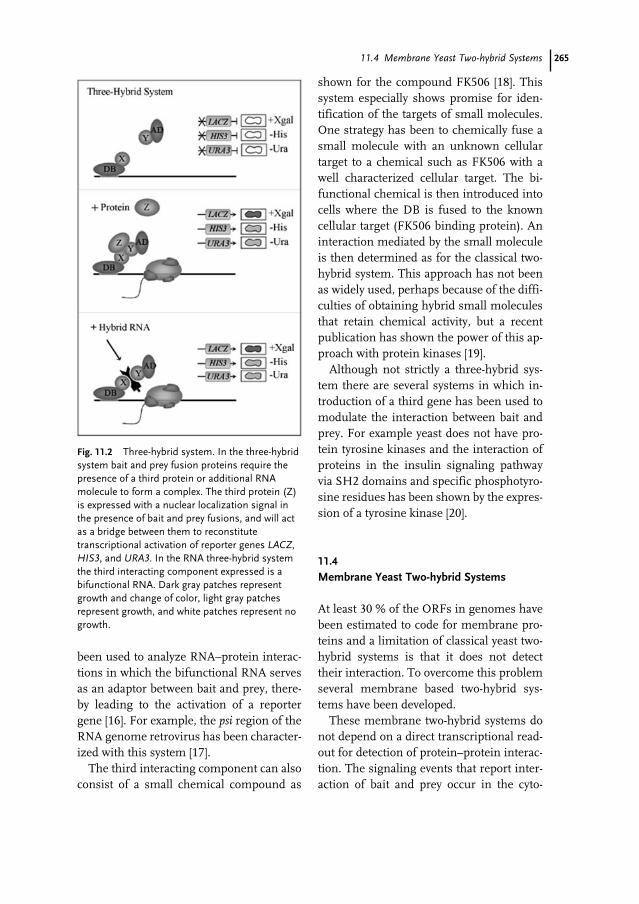
26511.4 Membrane Yeast Two-hybrid Systems
been used to analyze RNA–protein interac-tions in which the bifunctional RNA servesas an adaptor between bait and prey, there-by leading to the activation of a reportergene [16]. For example, the psi region of theRNA genome retrovirus has been character-ized with this system [17].
The third interacting component can alsoconsist of a small chemical compound as
shown for the compound FK506 [18]. Thissystem especially shows promise for iden-tification of the targets of small molecules.One strategy has been to chemically fuse asmall molecule with an unknown cellulartarget to a chemical such as FK506 with awell characterized cellular target. The bi-functional chemical is then introduced intocells where the DB is fused to the knowncellular target (FK506 binding protein). Aninteraction mediated by the small moleculeis then determined as for the classical two-hybrid system. This approach has not beenas widely used, perhaps because of the diffi-culties of obtaining hybrid small moleculesthat retain chemical activity, but a recentpublication has shown the power of this ap-proach with protein kinases [19].
Although not strictly a three-hybrid sys-tem there are several systems in which in-troduction of a third gene has been used tomodulate the interaction between bait andprey. For example yeast does not have pro-tein tyrosine kinases and the interaction ofproteins in the insulin signaling pathwayvia SH2 domains and specific phosphotyro-sine residues has been shown by the expres-sion of a tyrosine kinase [20].
11.4
Membrane Yeast Two-hybrid Systems
At least 30 % of the ORFs in genomes havebeen estimated to code for membrane pro-teins and a limitation of classical yeast two-hybrid systems is that it does not detecttheir interaction. To overcome this problemseveral membrane based two-hybrid sys-tems have been developed.
These membrane two-hybrid systems donot depend on a direct transcriptional read-out for detection of protein–protein interac-tion. The signaling events that report inter-action of bait and prey occur in the cyto-
Fig. 11.2 Three-hybrid system. In the three-hybridsystem bait and prey fusion proteins require thepresence of a third protein or additional RNAmolecule to form a complex. The third protein (Z)is expressed with a nuclear localization signal inthe presence of bait and prey fusions, and will actas a bridge between them to reconstitutetranscriptional activation of reporter genes LACZ,HIS3, and URA3. In the RNA three-hybrid systemthe third interacting component expressed is abifunctional RNA. Dark gray patches representgrowth and change of color, light gray patchesrepresent growth, and white patches represent nogrowth.
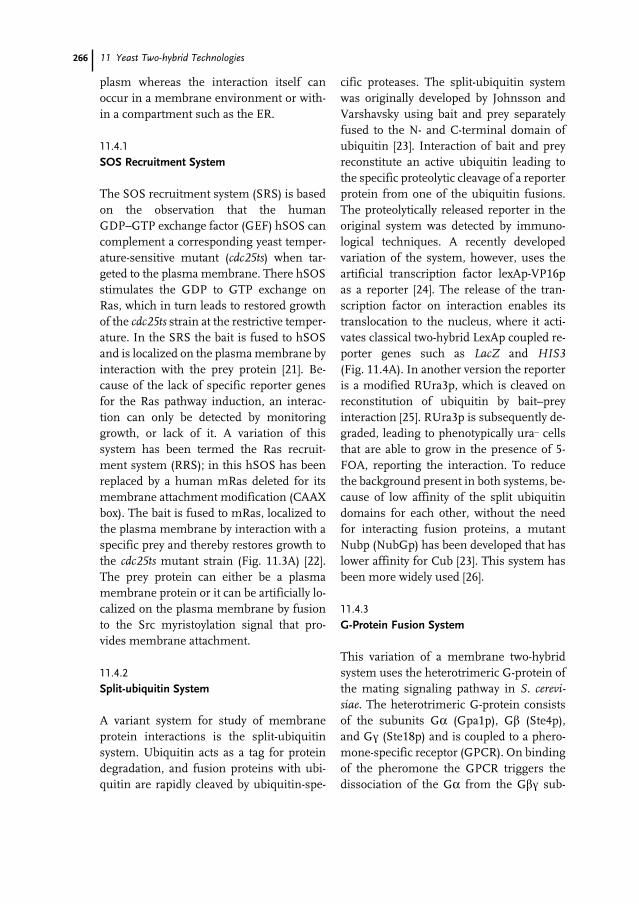
266 11 Yeast Two-hybrid Technologies
plasm whereas the interaction itself canoccur in a membrane environment or with-in a compartment such as the ER.
11.4.1
SOS Recruitment System
The SOS recruitment system (SRS) is basedon the observation that the humanGDP–GTP exchange factor (GEF) hSOS cancomplement a corresponding yeast temper-ature-sensitive mutant (cdc25ts) when tar-geted to the plasma membrane. There hSOSstimulates the GDP to GTP exchange onRas, which in turn leads to restored growthof the cdc25ts strain at the restrictive temper-ature. In the SRS the bait is fused to hSOSand is localized on the plasma membrane byinteraction with the prey protein [21]. Be-cause of the lack of specific reporter genesfor the Ras pathway induction, an interac-tion can only be detected by monitoringgrowth, or lack of it. A variation of thissystem has been termed the Ras recruit-ment system (RRS); in this hSOS has beenreplaced by a human mRas deleted for itsmembrane attachment modification (CAAXbox). The bait is fused to mRas, localized tothe plasma membrane by interaction with aspecific prey and thereby restores growth tothe cdc25ts mutant strain (Fig. 11.3A) [22].The prey protein can either be a plasmamembrane protein or it can be artificially lo-calized on the plasma membrane by fusionto the Src myristoylation signal that pro-vides membrane attachment.
11.4.2
Split-ubiquitin System
A variant system for study of membraneprotein interactions is the split-ubiquitinsystem. Ubiquitin acts as a tag for proteindegradation, and fusion proteins with ubi-quitin are rapidly cleaved by ubiquitin-spe-
cific proteases. The split-ubiquitin systemwas originally developed by Johnsson andVarshavsky using bait and prey separatelyfused to the N- and C-terminal domain ofubiquitin [23]. Interaction of bait and preyreconstitute an active ubiquitin leading tothe specific proteolytic cleavage of a reporterprotein from one of the ubiquitin fusions.The proteolytically released reporter in theoriginal system was detected by immuno-logical techniques. A recently developedvariation of the system, however, uses theartificial transcription factor lexAp-VP16pas a reporter [24]. The release of the tran-scription factor on interaction enables itstranslocation to the nucleus, where it acti-vates classical two-hybrid LexAp coupled re-porter genes such as LacZ and HIS3(Fig. 11.4A). In another version the reporteris a modified RUra3p, which is cleaved onreconstitution of ubiquitin by bait–preyinteraction [25]. RUra3p is subsequently de-graded, leading to phenotypically ura_ cellsthat are able to grow in the presence of 5-FOA, reporting the interaction. To reducethe background present in both systems, be-cause of low affinity of the split ubiquitindomains for each other, without the needfor interacting fusion proteins, a mutantNubp (NubGp) has been developed that haslower affinity for Cub [23]. This system hasbeen more widely used [26].
11.4.3
G-Protein Fusion System
This variation of a membrane two-hybridsystem uses the heterotrimeric G-protein ofthe mating signaling pathway in S. cerevi-siae. The heterotrimeric G-protein consistsof the subunits Gα (Gpa1p), Gâ (Ste4p),and Gã (Ste18p) and is coupled to a phero-mone-specific receptor (GPCR). On bindingof the pheromone the GPCR triggers thedissociation of the Gα from the Gâã sub-
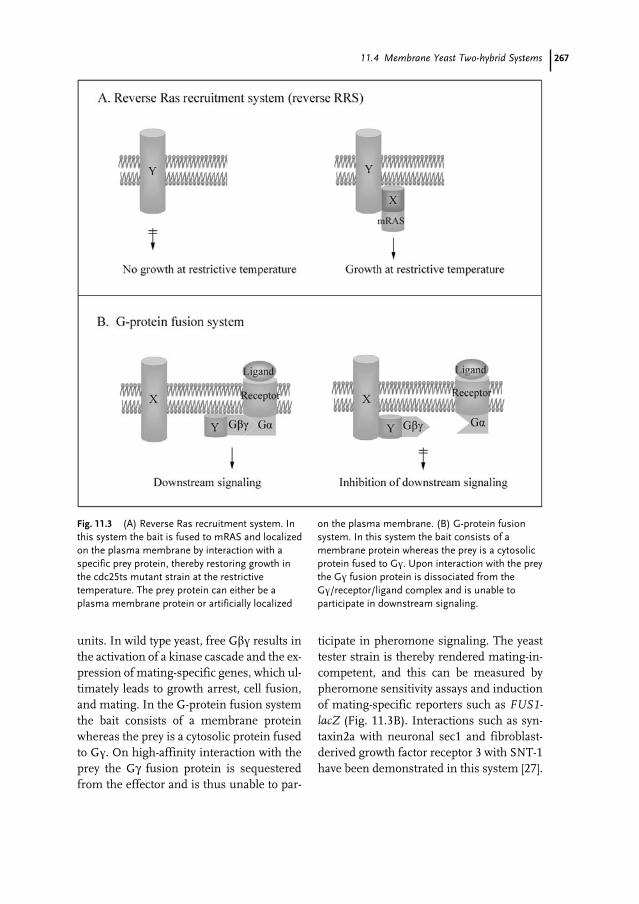
26711.4 Membrane Yeast Two-hybrid Systems
units. In wild type yeast, free Gâã results inthe activation of a kinase cascade and the ex-pression of mating-specific genes, which ul-timately leads to growth arrest, cell fusion,and mating. In the G-protein fusion systemthe bait consists of a membrane proteinwhereas the prey is a cytosolic protein fusedto Gã. On high-affinity interaction with theprey the Gγ fusion protein is sequesteredfrom the effector and is thus unable to par-
ticipate in pheromone signaling. The yeasttester strain is thereby rendered mating-in-competent, and this can be measured bypheromone sensitivity assays and inductionof mating-specific reporters such as FUS1-lacZ (Fig. 11.3B). Interactions such as syn-taxin2a with neuronal sec1 and fibroblast-derived growth factor receptor 3 with SNT-1have been demonstrated in this system [27].
Fig. 11.3 (A) Reverse Ras recruitment system. Inthis system the bait is fused to mRAS and localizedon the plasma membrane by interaction with aspecific prey protein, thereby restoring growth inthe cdc25ts mutant strain at the restrictivetemperature. The prey protein can either be aplasma membrane protein or artificially localized
on the plasma membrane. (B) G-protein fusionsystem. In this system the bait consists of amembrane protein whereas the prey is a cytosolicprotein fused to Gã. Upon interaction with the preythe Gã fusion protein is dissociated from theGã/receptor/ligand complex and is unable toparticipate in downstream signaling.
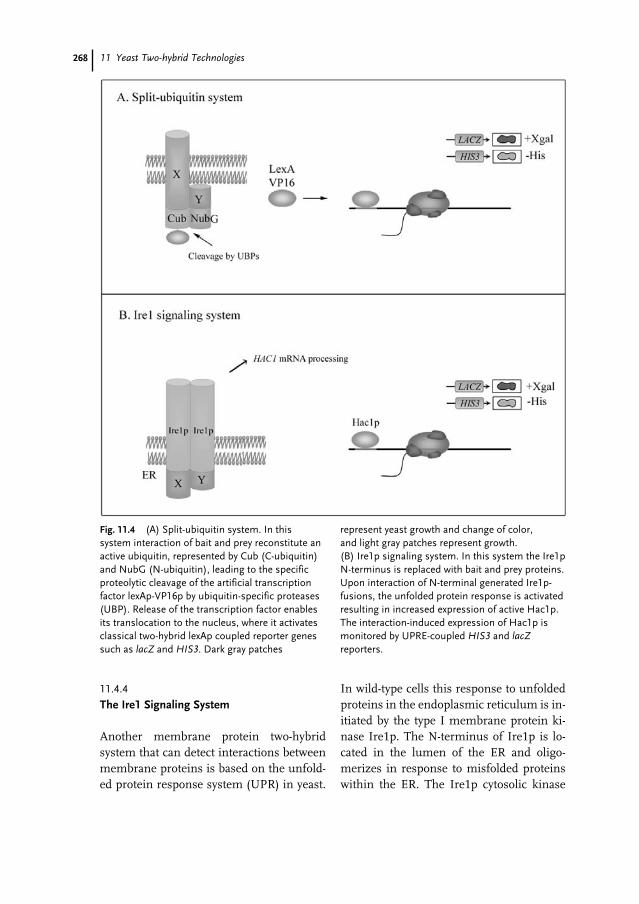
268 11 Yeast Two-hybrid Technologies
11.4.4
The Ire1 Signaling System
Another membrane protein two-hybridsystem that can detect interactions betweenmembrane proteins is based on the unfold-ed protein response system (UPR) in yeast.
In wild-type cells this response to unfoldedproteins in the endoplasmic reticulum is in-itiated by the type I membrane protein ki-nase Ire1p. The N-terminus of Ire1p is lo-cated in the lumen of the ER and oligo-merizes in response to misfolded proteinswithin the ER. The Ire1p cytosolic kinase
Fig. 11.4 (A) Split-ubiquitin system. In thissystem interaction of bait and prey reconstitute anactive ubiquitin, represented by Cub (C-ubiquitin)and NubG (N-ubiquitin), leading to the specificproteolytic cleavage of the artificial transcriptionfactor lexAp-VP16p by ubiquitin-specific proteases(UBP). Release of the transcription factor enablesits translocation to the nucleus, where it activatesclassical two-hybrid lexAp coupled reporter genessuch as lacZ and HIS3. Dark gray patches
represent yeast growth and change of color, and light gray patches represent growth. (B) Ire1p signaling system. In this system the Ire1pN-terminus is replaced with bait and prey proteins.Upon interaction of N-terminal generated Ire1p-fusions, the unfolded protein response is activatedresulting in increased expression of active Hac1p.The interaction-induced expression of Hac1p ismonitored by UPRE-coupled HIS3 and lacZreporters.
26911.5 Interpretation of Two-hybrid Results
domains transphosphorylate on dimeriza-tion and then activate the endoribonucleasedomain present at the C-termini of theIre1p. This nuclease can then specificallycleave the mRNA of the UPR transcription-al activator Hac1p and this nonspliceoso-mal mechanism is completed by tRNA li-gase. The intron within HAC1 mRNA hasbeen shown to attenuate the translation ofunspliced HAC1 mRNA, and its removalleads to upregulation of the expression ofgenes involved in the UPR by binding ofHac1p to unfolded protein response ele-ments (UPRE) in the promoter regions oftarget genes. On interaction of N-terminalgenerated Ire1p-fusions (replacing theIre1p N-terminus with bait and prey) theUPR is activated, resulting in the increasedexpression of active Hac1p. The interaction-induced expression of Hac1p is monitoredby UPRE-coupled growth and LacZ report-ers (Fig. 11.4B). The system has been usedto demonstrate epitope–antibody interac-tions [28] and the interaction between theER chaperones Calnexin and ERp57, in-cluding the mapping of their specific inter-action domains [29].
11.4.5
Non-yeast Hybrid Systems
Two-hybrid strategies have also been ap-plied to organisms other than yeast. A num-ber of mammalian two-hybrid systems havebeen created by using a protein fragmentcomplementation assay (PCA). The PCAsystems are based on protein–protein inter-actions that are coupled to the refolding ofenzymes from fragments, and the reconsti-tution of enzyme activity is used to detectthe interaction. These include the â-galac-tosidase complementation assay in which â-galactosidase activity is restored by interact-ing fragments in an otherwise â-galactosi-dase-defective cell line [30]. In another PCA-
based two-hybrid method two separatedfragments of the enzyme dihydrofolate re-ductase (DHFR) are used and interactingbait and prey fused to the fragments will re-store enzyme activity [31]. The PCA strategyhas also been used to split the enzyme â-lac-tamase and interaction of bait and preyfused to the fragments leads to restored en-zyme activity which can be measured in acolorimetric assay [32]. In general, PCAsystems enable quantification and real timemonitoring of protein–protein interactionsand with rapid advances in imaging tech-nology have great promise for a wide varietyof applications.
11.5
Interpretation of Two-hybrid Results
Yeast two-hybrid systems have seen wide ap-plication both in the study of specific inter-actions and in the construction of interac-tion networks (interactomes). Whereas theauthenticity of specific interactions is oftensupported by other data obtained from ge-netic and biochemical experiments, evi-dence for interaction networks relies on in-direct methods.
Typically specific interactions that havebeen found by use of yeast two-hybridsystems are confirmed by a variety of bio-chemical methods including coimmuno-precipitation. An advantage of the two-hy-brid systems are that they enable the rapiddelimitation of independently interactingdomains and guide construction of peptidesthat can be used as competitors of the inter-action of the proteins in vitro [29]. One par-ticularly powerful genetic approach hasbeen to use the two-hybrid system to selectmutations in one partner that reduce inter-action and obtain compensating mutationsin the other partner to define interaction do-mains. In some notable cases structural
270 11 Yeast Two-hybrid Technologies
studies have shown that these genetic find-ings are reflected in interacting domainsand residues [10, 29].
Two-hybrid systems can also create arti-facts, termed “false positives” and “falsenegatives”. The nature of false positives islikely to be different for some of the variantsof the two-hybrid system, but can be basical-ly defined as reporter gene activation with-out the presence of a specific interactionbetween bait and prey. For classical two-hy-brid systems self-activating baits are fre-quently observed because of activation ofthe reporters above threshold level by bait-like transcription factors. In addition muta-tions in the host cell can lead to unspecificactivation of the reporters. Another possibil-ity is that bait and prey fusions might inter-fere with host metabolism, leading tochanged viability under selective conditions.Another source of false positives is that two-hybrid libraries often contain proteins offunction homologous to that of proteinsused for the selection of interactions. Ran-dom cDNA libraries also contain small pep-tides with high content of charged amino ac-ids that can act as artificial activation do-mains. Strategies to detect or exclude falsepositives involve the use of multiple report-ers, the switch of bait and prey fusions, andtwo-hybrid independent methods such ascoimmunoprecipitations for verification ofobserved protein–protein interactions. Nev-ertheless, it should be kept in mind thateven after careful verification it is possiblethat the observed interaction is nonethelessnot biologically relevant and the interactionhas been artificially created by the two-hy-brid localization of bait and prey.
False negatives are, by definition, interac-tions that cannot be detected using two-hy-
brid methods. These are thought to occur asa result of steric hindrance between fusionproteins that prevents the reconstitution ofthe activity needed to induce reporters. Mis-folding, degradation of the fusion protein,absent post-translational modifications, andmislocalization of bait or prey are other pos-sible reasons for the generation of false neg-atives. For example, in the classical two-hy-brid system the interaction has to occur inthe nucleus to be able to generate the tran-scriptional readout. Another source of falsenegatives is large-scale two-hybrid screensthat generally use PCR amplified genes, in-troduced into bait and prey vectors by in-vi-vo homologous recombination. The result-ing recombinants are usually not sequence-verified, because of to the large number ofclones, but potentially contain mutations orframe shifts that prevent interactions andtherefore appear as false negatives.
11.6
Conclusion
In the 15 years since its introduction theyeast two-hybrid system has seen remark-ably widespread adoption for a variety of us-es. It has been shown to be remarkably ro-bust and has now been used for construc-tion of interactomes of soluble proteinsfrom a variety of organisms. The develop-ment of new two-hybrid systems that candetect interaction of membrane proteinsthat have previously proved recalcitrant tomany established techniques is especiallypowerful and will enable the completion ofgenome interactomes.
271
1 Ho, Y., Gruhler, A., Heilbut, A., Bader, G.D.,Moore, L., Adams, S.L., Millar, A., Taylor, P.,Bennett, K., Boutilier, K. et al. (2002) Nature,415, 180–183.
2 Gavin, A.C., Bosche, M., Krause, R., Grandi,P., Marzioch, M., Bauer, A., Schultz, J., Rick,J.M., Michon, A.M., Cruciat, C.M. et al.(2002) Nature, 415, 141–147.
3 Rain, J.C., Selig, L., De Reuse, H., Battaglia,V., Reverdy, C., Simon, S., Lenzen, G., Petel,F., Wojcik, J., Schachter, V. et al. (2001)Nature, 409, 211–215.
4 Uetz, P., Giot, L., Cagney, G., Mansfield,T.A., Judson, R.S., Knight, J.R., Lockshon, D.,Narayan, V., Srinivasan, M., Pochart, P. et al.(2000) Nature, 403, 623–627.
5 Ito, T., Chiba, T., Ozawa, R., Yoshida, M.,Hattori, M. and Sakaki, Y. (2001) Proc NatlAcad Sci USA, 98, 4569–4574.
6 Walhout, A.J., Sordella, R., Lu, X., Hartley,J.L., Temple, G.F., Brasch, M.A., Thierry-Mieg, N. and Vidal, M. (2000) Science, 287,116–122.
7 Uetz, P. and Pankratz, M.J. (2004) NatBiotechnol, 22, 43–44.
8 Fields, S. and Song, O. (1989) Nature, 340,245–246.
9 Gyuris, J., Golemis, E., Chertkov, H. andBrent, R. (1993) Cell, 75, 791–803.
10 Clark, K.L., Dignard, D., Thomas, D.Y. andWhiteway, M. (1993) Mol Cell Biol, 13, 1–8.
11 Vidal, M., Brachmann, R.K., Fattaey, A.,Harlow, E. and Boeke, J.D. (1996) Proc NatlAcad Sci USA, 93, 10315–10320.
12 Leanna, C.A. and Hannink, M. (1996) NucleicAcids Res, 24, 3341–3347.
13 Li, J.J. and Herskowitz, I. (1993) Science, 262,1870–1874.
14 Hirst, M., Ho, C., Sabourin, L., Rudnicki, M.,Penn, L. and Sadowski, I. (2001) Proc NatlAcad Sci USA, 98, 8726–8731.
15 Zhang, J. and Lautar, S. (1996) Anal Biochem,242, 68–72.
16 SenGupta, D.J., Zhang, B., Kraemer, B.,Pochart, P., Fields, S. and Wickens, M. (1996)Proc Natl Acad Sci USA, 93, 8496–8501.
17 Evans, M.J., Bacharach, E. and Goff, S.P.(2004) J Virol, 78, 7677–7684.
18 Licitra, E.J. and Liu, J.O. (1996) Proc Natl AcadSci USA, 93, 12817–12821.
19 Becker, F., Murthi, K., Smith, C., Come, J.,Costa-Roldan, N., Kaufmann, C., Hanke, U.,Degenhart, C., Baumann, S., Wallner, W. etal. (2004) Chem Biol, 11, 211–223.
20 O’Neill, T.J., Craparo, A. and Gustafson, T.A.(1994) Mol Cell Biol, 14, 6433–6442.
21 Aronheim, A., Zandi, E., Hennemann, H.,Elledge, S.J. and Karin, M. (1997) Mol CellBiol, 17, 3094–3102.
22 Broder, Y.C., Katz, S. and Aronheim, A.(1998) Curr Biol, 8, 1121–1124.
23 Johnsson, N. and Varshavsky, A. (1994) ProcNatl Acad Sci USA, 91, 10340–10344.
24 Stagljar, I., Korostensky, C., Johnsson, N. andte Heesen, S. (1998) Proc Natl Acad Sci USA,95, 5187–5192.
25 Wittke, S., Lewke, N., Muller, S. andJohnsson, N. (1999) Mol Biol Cell, 10,2519–2530.
26 Wang, B., Pelletier, J., Massaad, M.J.,Herscovics, A. and Shore, G.C. (2004) MolCell Biol, 24, 2767–2778.
27 Ehrhard, K.N., Jacoby, J.J., Fu, X.Y., Jahn, R.and Dohlman, H.G. (2000) Nat Biotechnol, 18,1075–1079.
28 Urech, D.M., Lichtlen, P. and Barberis, A.(2003) Biochim Biophys Acta, 1622, 117–127.
References

272 References
29 Pollock, S., Kozlov, G., Pelletier, M.F.,Trempe, J.F., Jansen, G., Sitnikov, D.,Bergeron, J.J., Gehring, K., Ekiel, I. andThomas, D.Y. (2004) Embo J, 23, 1020–1029.
30 Rossi, F., Charlton, C.A. and Blau, H.M.(1997) Proc Natl Acad Sci USA, 94, 8405–8410.
31 Remy, I. and Michnick, S.W. (1999) Proc NatlAcad Sci USA, 96, 5394–5399.
32 Galarneau, A., Primeau, M., Trudeau, L.E.and Michnick, S.W. (2002) Nat Biotechnol, 20,619–622.
273
Aalim M. Weljie, Hans J. Vogel, and Ernst M. Bergmann
12.1
Introduction
The completion of various genome-se-quencing efforts has made it apparent thatgenomics can only offer a glimpse at theblueprint of life. In order to fully under-stand the physiology of any biologicalsystem, from the simple bacteria with rela-tively small genomes, to the complex plantsand humans with very large genomes, weneed to know what specific proteins are ex-pressed in what cells, at what times andhow these interact with each other. This hascreated a need for the burgeoning field ofproteomics. In parallel a need arose for bet-ter understanding of proteins at a molecu-lar level; the original objective of structuralgenomics, also known as structural prote-omics, was to solve as many protein struc-tures as possible in an attempt to identifythe complete protein “fold-space”. By hav-ing examples of all protein folds in the pro-tein database it would then be possible toderive homology models for any protein.
Broad-based structural genomics initiativeshave been established to achieve this ambi-tious goal, all relying on synchrotron pro-tein crystallography and high-resolutionNMR (nuclear magnetic resonance) spec-troscopy to generate the 3D structures. Inthis chapter we will discuss the technical ad-vances that were necessary to enable proteincrystallography and solution NMR to movetoward becoming high-throughput tech-niques capable of dealing with the expectedonslaught of requests for detailed structuralinformation. Throughout this chapter wewill also review the current status of thestructural genomics field. It should becomeapparent to the reader that the field is mov-ing away from simply filling in the fold-space, and that attention has been shiftingmore towards “functional genomics”, i.e.defining the role of unknown gene productsby identifying the ligands and other part-ners they interact with. Clearly these devel-opments also have a large impact on ration-al drug design using proteins as potentialtargets.
Handbook of Genome Research. Genomics, Proteomics, Metabolomics, Bioinformatics, Ethical and Legal Issues.Edited by Christoph W. SensenCopyright © 2005 WILEY-VCH Verlag GmbH & Co. KGaA, WeinheimISBN: 3-527-31348-6
12Structural Genomics
Verwendete Mac Distiller 5.0.x Joboptions
Dieser Report wurde automatisch mit Hilfe der Adobe Acrobat Distiller Erweiterung "Distiller Secrets v1.0.5" der IMPRESSED GmbH erstellt. Sie koennen diese Startup-Datei für die Distiller Versionen 4.0.5 und 5.0.x kostenlos unter http://www.impressed.de herunterladen. ALLGEMEIN ---------------------------------------- Dateioptionen: Kompatibilität: PDF 1.3 Für schnelle Web-Anzeige optimieren: Ja Piktogramme einbetten: Ja Seiten automatisch drehen: Nein Seiten von: 1 Seiten bis: Alle Seiten Bund: Links Auflösung: [ 2400 2400 ] dpi Papierformat: [ 481 680 ] Punkt KOMPRIMIERUNG ---------------------------------------- Farbbilder: Downsampling: Nein Komprimieren: Ja Komprimierungsart: ZIP Bitanzahl pro Pixel: 8 Bit Graustufenbilder: Downsampling: Nein Komprimieren: Ja Komprimierungsart: ZIP Bitanzahl pro Pixel: 8 Bit Schwarzweiß-Bilder: Downsampling: Nein Komprimieren: Ja Komprimierungsart: CCITT CCITT-Gruppe: 4 Graustufen glätten: Nein Text und Vektorgrafiken komprimieren: Ja SCHRIFTEN ---------------------------------------- Alle Schriften einbetten: Ja Untergruppen aller eingebetteten Schriften: Nein Wenn Einbetten fehlschlägt: Abbrechen Einbetten: Immer einbetten: [ /Courier-BoldOblique /Helvetica-BoldOblique /Courier /Helvetica-Bold /Times-Bold /Courier-Bold /Helvetica /Times-BoldItalic /Times-Roman /ZapfDingbats /Times-Italic /Helvetica-Oblique /Courier-Oblique /Symbol ] Nie einbetten: [ ] FARBE(N) ---------------------------------------- Farbmanagement: Farbumrechnungsmethode: Farbe nicht ändern Methode: Standard Geräteabhängige Daten: Einstellungen für Überdrucken beibehalten: Ja Unterfarbreduktion und Schwarzaufbau beibehalten: Ja Transferfunktionen: Beibehalten Rastereinstellungen beibehalten: Nein ERWEITERT ---------------------------------------- Optionen: Prolog/Epilog verwenden: Nein PostScript-Datei darf Einstellungen überschreiben: Nein Level 2 copypage-Semantik beibehalten: Ja Portable Job Ticket in PDF-Datei speichern: Ja Illustrator-Überdruckmodus: Ja Farbverläufe zu weichen Nuancen konvertieren: Ja ASCII-Format: Nein Document Structuring Conventions (DSC): DSC-Kommentare verarbeiten: Ja DSC-Warnungen protokollieren: Nein Für EPS-Dateien Seitengröße ändern und Grafiken zentrieren: Ja EPS-Info von DSC beibehalten: Ja OPI-Kommentare beibehalten: Nein Dokumentinfo von DSC beibehalten: Ja ANDERE ---------------------------------------- Distiller-Kern Version: 5000 ZIP-Komprimierung verwenden: Ja Optimierungen deaktivieren: Nein Bildspeicher: 524288 Byte Farbbilder glätten: Nein Graustufenbilder glätten: Nein Bilder (< 257 Farben) in indizierten Farbraum konvertieren: Ja sRGB ICC-Profil: sRGB IEC61966-2.1 ENDE DES REPORTS ---------------------------------------- IMPRESSED GmbH Bahrenfelder Chaussee 49 22761 Hamburg, Germany Tel. +49 40 897189-0 Fax +49 40 897189-71 Email: [email protected] Web: www.impressed.de
Adobe Acrobat Distiller 5.0.x Joboption Datei
<< /ColorSettingsFile () /LockDistillerParams true /DetectBlends true /DoThumbnails true /AntiAliasMonoImages false /MonoImageDownsampleType /Bicubic /GrayImageDownsampleType /Bicubic /MaxSubsetPct 100 /MonoImageFilter /CCITTFaxEncode /ColorImageDownsampleThreshold 1.5 /GrayImageFilter /FlateEncode /ColorConversionStrategy /LeaveColorUnchanged /CalGrayProfile (Dot Gain 20%) /ColorImageResolution 300 /UsePrologue false /MonoImageResolution 1200 /ColorImageDepth 8 /sRGBProfile (sRGB IEC61966-2.1) /PreserveOverprintSettings true /CompatibilityLevel 1.3 /UCRandBGInfo /Preserve /EmitDSCWarnings false /CreateJobTicket true /DownsampleMonoImages false /DownsampleColorImages false /MonoImageDict << /K -1 >> /ColorImageDownsampleType /Bicubic /GrayImageDict << /HSamples [ 2 1 1 2 ] /VSamples [ 2 1 1 2 ] /Blend 1 /QFactor 0.9 >> /CalCMYKProfile (U.S. Web Coated (SWOP) v2) /ParseDSCComments true /PreserveEPSInfo true /MonoImageDepth -1 /AutoFilterGrayImages false /SubsetFonts false /GrayACSImageDict << /HSamples [ 2 1 1 2 ] /VSamples [ 2 1 1 2 ] /Blend 1 /QFactor 0.9 >> /ColorImageFilter /FlateEncode /AutoRotatePages /None /PreserveCopyPage true /EncodeMonoImages true /ASCII85EncodePages false /PreserveOPIComments false /NeverEmbed [ ] /ColorImageDict << /HSamples [ 2 1 1 2 ] /VSamples [ 2 1 1 2 ] /Blend 1 /QFactor 0.9 >> /AntiAliasGrayImages false /GrayImageDepth 8 /CannotEmbedFontPolicy /Error /EndPage -1 /TransferFunctionInfo /Preserve /CalRGBProfile (sRGB IEC61966-2.1) /EncodeColorImages true /EncodeGrayImages true /ColorACSImageDict << /HSamples [ 2 1 1 2 ] /VSamples [ 2 1 1 2 ] /Blend 1 /QFactor 0.9 >> /Optimize true /ParseDSCCommentsForDocInfo true /GrayImageDownsampleThreshold 1.5 /MonoImageDownsampleThreshold 1.5 /AutoPositionEPSFiles true /GrayImageResolution 300 /AutoFilterColorImages false /AlwaysEmbed [ /Courier-BoldOblique /Helvetica-BoldOblique /Courier /Helvetica-Bold /Times-Bold /Courier-Bold /Helvetica /Times-BoldItalic /Times-Roman /ZapfDingbats /Times-Italic /Helvetica-Oblique /Courier-Oblique /Symbol ] /ImageMemory 524288 /OPM 1 /DefaultRenderingIntent /Default /EmbedAllFonts true /StartPage 1 /DownsampleGrayImages false /AntiAliasColorImages false /ConvertImagesToIndexed true /PreserveHalftoneInfo false /CompressPages true /Binding /Left >> setdistillerparams << /PageSize [ 595.276 841.890 ] /HWResolution [ 2400 2400 ] >> setpagedevice
274 12 Structural Genomics
12.2
Protein Crystallography and Structural Genomics
12.2.1
High-throughput Protein Crystallography
Protein crystallography remains the pre-dominant means of providing detailedstructural information about biological mac-romolecules [1–3]. As such it plays an im-portant role in all structural and functionalgenomics initiatives that endeavor to solvethe structures of proteins at the atomic level.Most of the large – national and internation-al – structural genomics projects combineprotein crystallography projects with com-plimentary techniques, including high reso-lution NMR spectroscopy, cryo electron mi-croscopy, and small-angle X-ray scattering,for elucidation of protein structures [4].
Several large-scale structural genomicsinitiatives aimed at elucidating a completeset of three-dimensional structures for thegene products of entire organisms haveevolved as a consequence of successful ge-nome sequencing efforts [5, 6]. The feasibil-ity of these projects did, however, also de-pend on the timely availability of newly de-veloped methods in protein crystallography.The two most important advances were thedevelopment of cryogenic data collectionand multiple wavelengths anomalous dis-persion (MAD) phasing [7–10]. The firstmethod was developed by Hope and othersin the late eighties to prevent radiation dam-age to protein crystals by high intensity X-rays [7, 8, 11]. It involves capturing andmounting a protein crystal in a drop of liq-uid inside a slightly larger fiber loop. Cryo-genic data collection has become the stan-dard method used by crystallographers. Ithas greatly facilitated progress in the fieldand enabled the utilization of powerful newthird-generation synchrotron X-ray sources
[12–14]. It was also a prerequisite for thewidespread use of MAD phasing, which re-quires very large data sets and long data-col-lection times [9]. MAD phasing was devel-oped by Hendrickson and others in thenineteen eighties. Since then it has becomethe preferred and most widely used methodfor phasing and solving novel protein crys-tal structures. MAD phasing relies on thewavelength-dependent differences in inten-sities introduced by a few anomalously scat-tering atoms [10]. The most commonly usedelement for MAD phasing is Se, which is in-troduced in the form of seleno-methioninein the protein via specific expression sys-tems [15]. It has long been accepted that thisis a nonperturbing substitution in proteins.
Other technological developments alsocontributed to a revolution in the field ofprotein crystallography. Amongst thesewere new computational methods and newX-ray detectors [9, 12, 16]. Developmentsoutside the field itself led to phenomenaladvances in molecular genetics that mademany more proteins available through clon-ing and expression – powerful and afford-able computers and third-generation syn-chrotron X-ray sources with dedicated ex-perimental stations for protein crystallogra-phy. As a consequence of all these recent de-velopments protein crystallography hasreached a point were determination of thecrystal structure of a protein can be accom-plished in days or even hours once a goodquality crystal has been obtained. Thisprogress in the field was a prerequisite tosupport the concept of large-scale structuralgenomics efforts. Since the inception of theworldwide structural genomics initiatives afew years ago these are now, in turn, con-tributing to developments in protein crystal-lography methods [17].
Substantial structural genomics effortsare in progress in North America, Europe,and Japan [18–20]. Most notable in North
27512.2 Protein Crystallography and Structural Genomics
America are the nine NIH/NIGMS-fundedpilot projects and some smaller Canadianinitiatives. A major Welcome Trust fundedproject to elucidate human protein struc-tures is based both in the UK and Canada.Major European projects include the Pro-teinstrukturfabrik in Berlin and SPINE(centered in Oxford). A large-scale Japaneseproject is headquartered in Yokohama atthe RIKEN Institute. All of these centershave ambitious goals to solve thousands ofprotein structures within the next few years;to be able to fulfill these goals it will be nec-essary for almost all centers to increasetheir current output and efficiency. As ofthe time of writing this chapter, early 2004,structural genomics efforts worldwide havecontributed approximately 1000 or so struc-tures to the database of known proteinstructures. Obviously the impact of these ef-forts is just now starting to become signifi-cant. Many of the major national and inter-national structural genomics efforts haveinitially focused on developing methodsand procedures for high-throughput struc-ture determination and initially appliedthese methods to pilot projects.
Commercial structural genomics effortsare designed with the goal of discoveringand developing novel drugs [2, 20]. Structu-ral and functional genomics initially help toidentify and characterize suitable drug tar-gets. Beyond doubt, the outcome of thestructural genomics efforts will help identi-fy thousands of novel drug targets. Themethods and technologies developed forstructural genomics can then be used to im-prove lead compounds for drugs. The latterprocess requires the determination of doz-ens or hundreds of crystal structures of adrug target, usually a protein, complexedwith modified versions of the lead com-pound. This process requires close coopera-tion and communication between pharma-cologists, medicinal chemists, and structu-
ral biologists. The process benefits greatlyfrom the high-throughput methods andprocesses developed by the structural ge-nomics initiatives [21].
The process of determining the structureof a target protein by X-ray crystallographyrequires several steps [1, 17]. The gene mustbe cloned into a suitable vector and ex-pressed. The protein must be available insufficient quantity and in soluble form fromthe expression system. Subsequently it hasto be purified. The purified protein mustthen be crystallized and the crystals must beof sufficient size and quality to enable re-cording of an X-ray diffraction pattern. Dif-fraction data must be collected at a synchro-tron X-ray source. The structure must final-ly be solved, refined, and analyzed. Some ofthese steps are more difficult and time-con-suming than others and the process can failfor individual proteins at any step along theway. The first results from the worldwidestructural genomics projects show thatstructures of only five to twenty percent ofthe gene products that have been targetedcan be completed in an initial round. Attri-tion occurs at all the individual steps of theprocess. Figure 12.1 shows the success sta-tistics from several of the NIH/NIGMS-funded structural genomics efforts as ofSpring 2004. The success rate has increasedsince the onset of these initiatives [19].
The most difficult steps during determi-nation of a protein crystal structure are cur-rently the expression and purification of theprotein and the preparation of suitable,well-diffracting crystals [18]. It has becomerare that solution of the structure fails afterX-ray diffraction data have been collectedfrom a crystal. The phasing, solution, andrefinement of a crystal structure used to bea major research effort but has become aroutine procedure once a set of diffractiondata from a protein crystal containing anom-alously scattering atoms has been collected.
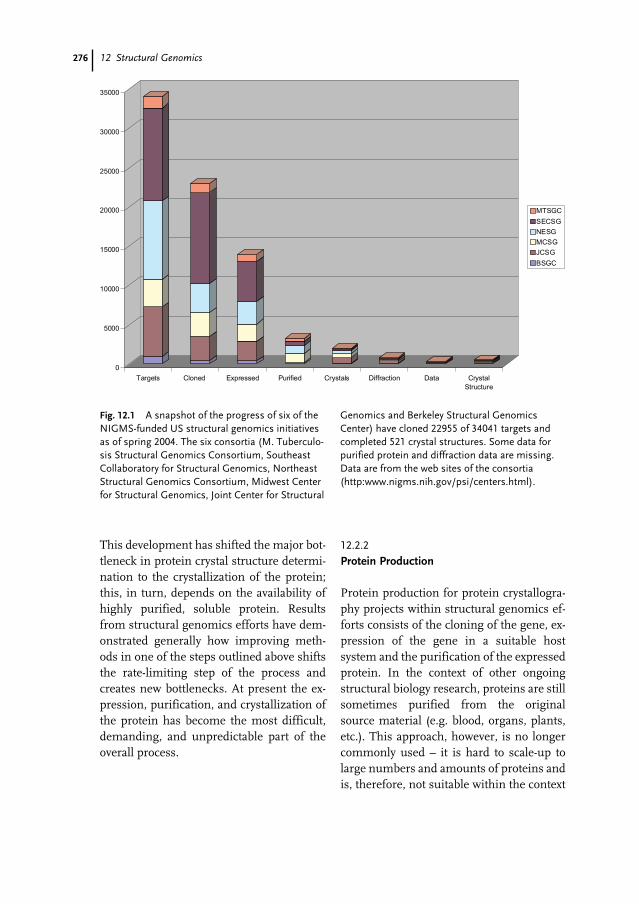
276 12 Structural Genomics
This development has shifted the major bot-tleneck in protein crystal structure determi-nation to the crystallization of the protein;this, in turn, depends on the availability ofhighly purified, soluble protein. Resultsfrom structural genomics efforts have dem-onstrated generally how improving meth-ods in one of the steps outlined above shiftsthe rate-limiting step of the process andcreates new bottlenecks. At present the ex-pression, purification, and crystallization ofthe protein has become the most difficult,demanding, and unpredictable part of theoverall process.
12.2.2
Protein Production
Protein production for protein crystallogra-phy projects within structural genomics ef-forts consists of the cloning of the gene, ex-pression of the gene in a suitable hostsystem and the purification of the expressedprotein. In the context of other ongoingstructural biology research, proteins are stillsometimes purified from the originalsource material (e.g. blood, organs, plants,etc.). This approach, however, is no longercommonly used – it is hard to scale-up tolarge numbers and amounts of proteins andis, therefore, not suitable within the context
Fig. 12.1 A snapshot of the progress of six of theNIGMS-funded US structural genomics initiativesas of spring 2004. The six consortia (M. Tuberculo-sis Structural Genomics Consortium, SoutheastCollaboratory for Structural Genomics, NortheastStructural Genomics Consortium, Midwest Centerfor Structural Genomics, Joint Center for Structural
Genomics and Berkeley Structural GenomicsCenter) have cloned 22955 of 34041 targets andcompleted 521 crystal structures. Some data forpurified protein and diffraction data are missing.Data are from the web sites of the consortia(http:www.nigms.nih.gov/psi/centers.html).
27712.2 Protein Crystallography and Structural Genomics
of high-throughput projects. The cloningand expression of the gene in question havetherefore become prerequisites for moststructural biology research on specific geneproducts.
The cloning of the genes in the context ofa large structural genomics effort employsas much as possible standard, modular, andflexible procedures and automation [22]. Itis desirable to design a clone so that it canbe utilized with several different expressionsystems (bacteria, insect cells, yeast, in-vitrosystems) without the need for much addi-tional work [22]. Furthermore, it is desirableto have the flexibility to express the clonewith different affinity tags or as differentconstructs. Unfortunately it is not predict-able a priori which construct will give thebest chance of successful expression andpurification for any given protein [23]. Ami-no- and carboxy-terminal histidine tags,glutathione S-transferase tags, maltosebinding protein and thioredoxin fusion pro-teins have all been used successfully. Manystructural genomics efforts therefore simul-taneously produce clones and expressionsystems of several different constructs, tomaximize the possibility of successful ex-pression and purification. The most popu-lar expression systems are still bacterial,most notably Escherichia coli. Insect cells arethe preferred choice for proteins that can-not be expressed in bacteria, because of a re-quirement for post-translational modifica-tions. In-vitro expression systems are notyet in widespread use but they are gainingin popularity [24]. One of their main advan-tages is the possibility of adding specific de-tergents, chaperones, metal ions, or other li-gands, as required, to improve the foldingand stability of the expressed protein. In-vi-tro expression systems also provide an op-portunity to test and optimize expressionconditions, initially on a small test scale,and they are relatively easy to automate.
Purification of the target proteins is bestaccomplished in a single step by use of af-finity chromatography. More complex pur-ification schemes are usually not applicablewithin the context of the high-throughputnature of structural genomics efforts andare almost impossible to automate. Becausethe choice of the affinity tag that will be suc-cessful and optimum for any given proteincannot be rationalized a priori, the cloningof the target gene in a flexible vector and theexpression of several constructs with differ-ent affinity tags can be critical for successduring this stage. Nevertheless, protein pro-duction is still a difficult step for many pro-teins and for some it can turn into the mostdifficult bottleneck. Many proteins cannotbe over-expressed, or expressed at all, with-out at least optimization of the conditionswithin the context of the correct expressionsystem. Others can be expressed but appearin an insoluble form or are misfolded. Pro-teins that are insoluble, often in the form ofinclusion bodies, can sometimes be rena-tured. If renaturing of the insoluble proteinis possible it might help with the purifica-tion, because the inclusion bodies are sim-ple to separate from the remainder of thecell extract. Solubilization is, however, notpossible with all insoluble proteins. Consid-erable research efforts have been directedtoward finding methods to solubilize theseproteins. Attempts have been made tochange the solubility of a protein by randomor systematic mutation or directed evolu-tion [23]. Several of these methods arepromising but none has been generally suc-cessful with every protein tested. Thesemethods also require considerable addition-al effort. Purification by affinity chromatog-raphy often produces protein that is ade-quately pure for biophysical or structuralstudies and, if anything, requires only onemore additional purification step, such assize-exclusion chromatography. The affinity
278 12 Structural Genomics
tag can be removed from the purified pro-tein or not. Whether or not it is detrimentalto crystallization again depends on the indi-vidual protein. Many structural genomicsprojects attempt protein crystallization in-itially with the affinity tag still attached;some use both forms of the purified proteinfor initial crystallization trials, with andwithout affinity tag. Removal of the affinitytag is usually accomplished via a specificproteolytic cleavage site that was included inthe construct for the gene. TEV protease andfactor X are often used for this purpose, be-cause they have a relatively narrow specific-ity, hence reducing the risk of proteolyticcleavage of the desired protein itself.
The purity of the final product of the pur-ification procedure must be analytically con-firmed by chromatography, electrophoresis,mass spectroscopy, or a combination ofthese methods [22, 23]. Dynamic light scat-tering is also a method frequently used bycrystallographers to determine the homoge-neity of the protein in solution [25].
12.2.3
Protein Crystallization
Determination of the crystal structures ofproteins by X-ray crystallography requiresthe preparation of high quality single crys-tals of sufficient size. The advent of newpowerful X-ray sources in the form of third-generation synchrotrons has made it pos-sible to obtain X-ray diffraction patterns thatare sufficient to solve a structure from crys-tals that are less than 100 µm, or even lessthan 50 µm, in size. This greatly reduces thetime and effort required to crystallize a pro-tein and solve its crystal structure.
The crystallization of proteins remains,however, a trial-and-error process that is diffi-cult to rationalize [18, 23, 26, 27]. Crystals aregrown from small drops, usually a few micro-liters or less, of an aqueous solution that is
buffered and of defined ionic strength andprotein concentration. It also contains a pre-cipitant such as a species of polyethylene gly-col or a salt. Ammonium sulfate is still one ofthe most widely and successfully used pre-cipitants in protein crystallography. The crys-tallization drops are equilibrated against alarger reservoir containing a higher concen-tration of the precipitant. As the crystalliza-tion drop equilibrates, eventually reachingthe precipitant concentration of the reser-voir, the protein concentration increases un-til the protein comes out of solution, underthe right conditions in the form of crystals.Several different crystallization methods arein use, hanging drop vapor diffusion, sitting-drop vapor diffusion, micro batch under oil,and micro dialysis, among others [18, 25, 27].For the purpose of structural genomics in-itiatives the most commonly used method issitting-drop vapor diffusion [21, 27]. This isprobably the method that is the most flexibleand easiest to automate.
The initial crystallization conditions for aprotein are found by screening a range ofconditions, for example sample pH, ionicstrength, protein and precipitant concentra-tion, and often small concentrations of addi-tives. Screening procedures currently in useemploy between 48 and up to 1536 differentconditions. Duplicate experiments are usu-ally performed at several different con-trolled temperatures (e.g. 4 °C, 14 °C and20 °C). Typically several hundred crystalliza-tion conditions are tested in initial screen-ing for a new protein. The crystallizationdrops are then observed and monitored forseveral days or weeks to identify potentialcrystals. Some proteins yield diffractionquality single crystals even in the initialscreening, others produce very small crys-tals or crystals of poor quality. In the lattercircumstance the crystallization conditionsmust be improved by fine screening of pH,ionic strength, and precipitant concentra-
27912.2 Protein Crystallography and Structural Genomics
tion around the conditions of the initialscreening. Additional techniques employedat this stage are seeding and additives. Opti-mization of the initial crystallization condi-tions can be a difficult and time-consumingprocess. These steps are difficult to auto-mate and can become a bottleneck in struc-tural genomics initiatives.
Most proteins that can be expressed insoluble form and purified to homogeneitycan also be crystallized. Proteins that can beobtained in very pure and soluble form butfail to crystallize completely are rare. Amore difficult problem can be to improvethe crystallization conditions to the pointwere the crystals are large enough and ofsufficient quality. If no crystals are obtainedfor a protein from initial screening of sever-al hundred or even thousand conditions, itis probably advisable to analyze carefullythe expression and purification of the pro-tein. There might be minor impurities orcontamination, the protein might aggregateand form different oligomers in solution, orthe protein may be unstable over time. Dif-ferent expression constructs of the sameprotein behave differently and should betested independently.
Crystallization of proteins within structu-ral genomics initiatives is, today, usuallyfully automated [17, 21, 25]. Liquid han-dling robots have been adapted to performthe setup of crystals screening and subse-quent fine screening. This is not only fasterand more cost-efficient but also more reli-able than performing these experiments byhand. Liquid-handling robots are much bet-ter at producing hundreds of very smallcrystallization drops than any human. Thisis particularly true for experiments in thesub-microliter range that are becoming thestandard for screening of crystallizationconditions [28].
Structural genomics initiatives have con-tributed a great deal to the automation of
protein crystallization. Almost all the stepsin the process of producing protein crystalsfrom cloning to crystallization have beenautomated and these robotic technologiesare now widely available [21, 25]. This in-cludes even the screening of the crystalliza-tion drops by automated microscopes. Soft-ware to automate analysis of the imagesfrom these microscope systems is being de-veloped, but currently the reliability of theautomatic analysis is such that some hu-man observation is still required [29].
Another contribution to the developmentof protein crystallography by the world’sstructural genomics initiatives will be thedata accumulating from the crystallizationtrials, especially the success of the screen-ing methods. Screening for crystallizationconditions is currently a trial-and-error pro-cess that cannot be rationalized a priori. Thedata currently being accumulated from thelarge number of crystallization trials of theworldwide structural genomics initiatives,both positive and negative, will be very valu-able in providing a better rationale for thisprocess. Initial data from some of the struc-tural genomics initiatives already suggestthat some of the conditions commonly usedfor crystallization screening procedures areredundant, and how others can be im-proved [30].
12.2.4
Data Collection
Data collection from protein crystals ideallyrequires access to a beamline in a third-gen-eration synchrotron dedicated to macromo-lecular crystallography as an X-ray source [9,12, 14]. These X-ray sources are brilliant andtunable, enable data collection in the short-est possible time, at the best possible resolu-tion, and are capable of collecting severalwavelengths for MAD phasing, if required.The development of these beamlines in the
280 12 Structural Genomics
last ten years has greatly helped to facilitatedetermination of the structure of proteinsby crystallography. Many of the individualstructures of biological macromoleculesthat have been published recently could nothave been completed without access to mod-ern beamlines.
Before data collection, crystals are har-vested from the crystallization drop with asmall fiber loop, ideally matched to the sizeof the crystal, and immediately cooled tonear liquid nitrogen temperature by plung-ing the loop and crystal into liquid nitrogenor mounting it in a stream of cold nitrogengas [7, 8, 11]. A stream of gaseous nitrogenonly a few degrees warmer than liquid nitro-gen then cools the crystal during the datacollection. The protein crystal is surroundedin the loop by a drop of the mother liquorfrom which it was harvested. An additivethat can act as an antifreeze needs to bepresent in the mother liquor (20–30 %glycerol or ethylene glycol are commonlyused). As a consequence of the rapid coolingand the additive the crystal is maintained ina solid glass-like state. Formation of crystal-line ice would result in the destruction ofthe protein crystal. The process of harvest-ing and mounting the crystals has not yetbeen successfully automated. Alternativemounting procedures have been developedbut the loop mount is the most commonlyused. Research efforts are directed towardprocedures that would enable direct mount-ing of the crystal in the container or capil-lary where it was grown, because it would bean advantage not to have to manipulate thecrystal. Older methods in which the crystalwas mounted at room temperature inside asealed glass capillary have become obsoletefor anything but some very specialized ex-periments.
The loop-mounting of protein crystals en-ables long-term storage of these crystalsunder liquid nitrogen, In fact they are usual-
ly shipped at liquid nitrogen temperature tosynchrotron facilities for data collection. Atthe synchrotron facilities the crystals aremounted in the X-ray beam by robotic sam-ple-mounting systems [17]. The develop-ment of these robotic sample-mountingsystems for data collection was one of themost tangible early technologies resultingfrom structural genomics initiatives. Theirdevelopment was driven by the need formore efficient use of expensive and over-subscribed beam time at synchrotron facil-ities for structural biology. Combined withthe requisite software development this hasled to a situation where data collection fromprotein crystals is almost completely auto-mated and can be controlled remotely. Twoprocesses necessary for data collection havenot been automated successfully at the timeof writing. One is capture of the crystals inthe mounting loop. This still has to be doneby a researcher looking through a micro-scope. The other is the centering of theloop-mounted crystals in the X-ray beam.The latter step requires identification of thecrystal mounted in the loop, which can bedifficult. Imaging systems are capable ofidentifying and centering the loop but a reli-able method for picking out the crystal itselfhas remained elusive. To circumvent thisproblem it is possible to screen crystals bysimply centering the loop and tuning thesize of the X-ray beam to the size of theloop. This is not ideal for collection of qual-ity data for which, ideally, the beam ismatched to the size of the crystal. Neverthe-less, progress in the automation of data col-lection from protein crystals has been dra-matic and led to much more efficient use ofsynchrotron beam time for protein crystal-lography [17].
Development of software and powerfulbut affordable computers has also contrib-uted to the current situation in which it ispossible to analyze and process the X-ray

28112.2 Protein Crystallography and Structural Genomics
diffraction data from protein crystals veryquickly and with little or no user interven-tion. Very user-friendly and automated soft-ware can today provide completely pro-cessed X-ray diffraction data within min-utes of the completion of the experi-ment [16, 20, 31, 32]. In favorable cases it iseven possible to solve protein crystal struc-tures while data collection is still inprogress [32].
12.2.5
Structure Solution and Refinement
Most of the structural targets of structuralgenomics initiatives are unique structureswhich do not have any known closely relat-ed structural homologues [4, 18]. This ne-cessitates solving the structure by experi-mental phasing methods. As already men-tioned, nowadays by far the most commonmethod of phasing novel protein structuresis MAD phasing. MAD phasing requiresthe presence of heavier atoms with spectro-scopic absorption edges in the hard X-rayregion of the spectrum, and an X-ray sourcethat can be tuned to the wavelength of theseedges. It utilizes the wavelength-dependentdifferences in intensities introduced by afew anomalously scattering atoms (Se, Br,Zn, Fe, Ga, Cu, Hg, Ir, Au, Pb, Lu, Yb havebeen used, among others) to derive an in-itial set of phases for a crystal structurefrom the position of these atoms. Ideally, itrequires collecting entire data sets at each oftwo or three wavelengths, at least one beingat an X-ray absorption edge of the elementused. Because data collection for a MAD ex-periment takes three times longer and de-cay of the X-ray diffraction, induced by radi-ation damage to the crystal, is very detri-mental to the resulting phases and the ex-periment, cryogenic data collection is es-sential. The most commonly used elementfor MAD phasing is Se in the form of the
nonperturbing seleno-methionine, whichcan be readily introduced into the proteinvia specific expression systems [15]. MADphasing has considerable advantages overmost other crystallographic phasing meth-ods still in use for protein structures. Mostimportantly MAD phasing provides themost accurate, unbiased experimental phas-es from a single crystal. MAD phasing hasalso enabled further automation of the solu-tion of protein crystal structures. If there areno major problems with the crystal or the X-ray diffraction data and the crystal diffractsto at least reasonable resolution, currentsoftware packages can provide nearly com-plete protein structures with little or no us-er intervention and starting from a goodMAD data set. This will increasingly placethe emphasis within a structural project onthe preparation of good crystals, which, inturn, requires paying careful attention to ex-pression and purification of the protein.
Almost all crystal structures still requiresome input from an experienced scientist atthe stage of crystallographic refinement [1].Details of the water structure, multiple orunusual conformations, or the presence ofunusual ligands, that are present in almostall protein crystal structures, cannot bemodeled accurately by automated proce-dures. These final details still require sever-al iterations of analysis, if necessary manualfitting and refinement. Because the input tothis procedure has, most often, become analmost complete good-quality model, thetime required has shortened to weeks oreven days from, usually, several months ofwork by an experienced crystallographerwhich has enabled the ambitious futuregoals of the structural genomics initiatives.
Despite all the progress some crystallo-graphic projects will remain serious chal-lenges. Membrane proteins remain a moredifficult proposition because the proteinsare generally difficult to express, purify, and
282 12 Structural Genomics
crystallize [33]. The procedures employedfor membrane proteins are not completelynovel and different; the proteins are justmore difficult to handle. Expression, purifi-cation, and crystallization require the addi-tion of detergents and additives, specializedexpression systems, and pose the additionalproblem of screening for the right detergentconditions.
Other proteins that provide a more seri-ous challenge are cellular proteins fromhigher organisms that cannot be expressedeasily in bacterial systems, because of the re-quirement for chaperone-mediated foldingor covalent modifications. In-vitro expres-sion systems might help in some of thesecases [24].
12.2.6
Analysis
As increasing numbers of protein crystalstructures are being determined and are be-coming available, the considerable data basebeing accumulated by the structural genom-ics initiatives contains not only structural in-formation but also information about ex-pression, purification, and crystallization ofproteins. Detailed analysis of the structuresand the data bases will not only enhance ourunderstanding of macromolecular structurebut also, eventually, provide a rational strat-egy for preparation of purified proteins andsuccess in crystallization. In the develop-ment of a rational basis for protein purifica-tion and crystallization, to replace thescreening of suitable conditions, the nega-tive outcome of many experiments forms anequally important part of the data base. Thedata that are accumulated by the worldwidestructural genomics efforts will dramaticallyimprove our understanding of proteins justas the data base of atomic resolution struc-tures enhances our understanding of mac-romolecular structure.
12.3
NMR and Structural Genomics
12.3.1
High-throughput Structure Determination by NMR
Structural genomics has had an obvious im-pact on the development of software and in-strumentation for high-throughput NMR.Through a variety of structural genomicsprojects registered with http://targetdb.pbd.org, NMR has proven to be a robust tool fordetermination of high-resolution struc-tures, with almost 20–25 % of all structuressolved to date being determined by NMRspectroscopy. Typical NMR structures andcrystal structures for the protein calmodulinare shown in Fig. 12.2. The two experimen-tal techniques can often be complementarywith NMR frequently having a better chanceat analyzing more flexible protein systemsand X-ray techniques being more directlyapplicable to more rigid proteins that formwell-diffracting crystals. It should be notedthat although solid-state NMR has muchpromise in this field, particularly with re-gard to membrane-associated proteins [34],the scope of this section will be limited tohigh-resolution solution NMR and structu-ral genomics. Emphasis will also be givenon providing the reader with a basic over-view of this topic, as most aspects of the roleof NMR in structural genomics have beenwell reviewed recently [35–39].
12.3.1.1
Target SelectionAs with X-ray crystallography, target selec-tion is the most important step for success-ful structure determination by NMR. Thetwo most important factors which affect tar-get selection for NMR spectroscopic analy-sis are the size of the protein and the abilityto label the proteins with NMR-active stable
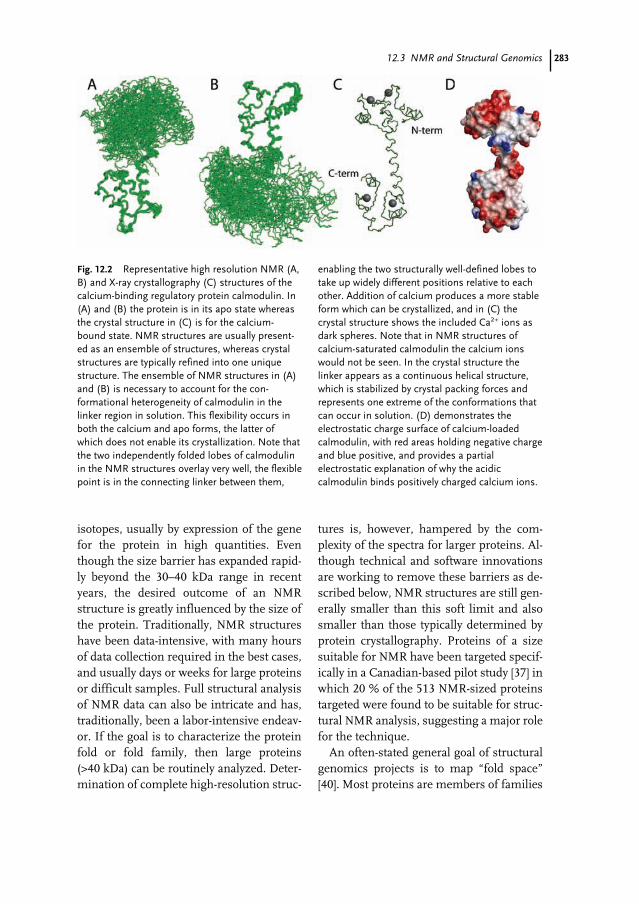
28312.3 NMR and Structural Genomics
isotopes, usually by expression of the genefor the protein in high quantities. Eventhough the size barrier has expanded rapid-ly beyond the 30–40 kDa range in recentyears, the desired outcome of an NMRstructure is greatly influenced by the size ofthe protein. Traditionally, NMR structureshave been data-intensive, with many hoursof data collection required in the best cases,and usually days or weeks for large proteinsor difficult samples. Full structural analysisof NMR data can also be intricate and has,traditionally, been a labor-intensive endeav-or. If the goal is to characterize the proteinfold or fold family, then large proteins(>40 kDa) can be routinely analyzed. Deter-mination of complete high-resolution struc-
tures is, however, hampered by the com-plexity of the spectra for larger proteins. Al-though technical and software innovationsare working to remove these barriers as de-scribed below, NMR structures are still gen-erally smaller than this soft limit and alsosmaller than those typically determined byprotein crystallography. Proteins of a sizesuitable for NMR have been targeted specif-ically in a Canadian-based pilot study [37] inwhich 20 % of the 513 NMR-sized proteinstargeted were found to be suitable for struc-tural NMR analysis, suggesting a major rolefor the technique.
An often-stated general goal of structuralgenomics projects is to map “fold space”[40]. Most proteins are members of families
Fig. 12.2 Representative high resolution NMR (A,B) and X-ray crystallography (C) structures of thecalcium-binding regulatory protein calmodulin. In(A) and (B) the protein is in its apo state whereasthe crystal structure in (C) is for the calcium-bound state. NMR structures are usually present-ed as an ensemble of structures, whereas crystalstructures are typically refined into one uniquestructure. The ensemble of NMR structures in (A)and (B) is necessary to account for the con-formational heterogeneity of calmodulin in thelinker region in solution. This flexibility occurs inboth the calcium and apo forms, the latter ofwhich does not enable its crystallization. Note thatthe two independently folded lobes of calmodulinin the NMR structures overlay very well, the flexiblepoint is in the connecting linker between them,
enabling the two structurally well-defined lobes totake up widely different positions relative to eachother. Addition of calcium produces a more stableform which can be crystallized, and in (C) thecrystal structure shows the included Ca2+ ions asdark spheres. Note that in NMR structures ofcalcium-saturated calmodulin the calcium ionswould not be seen. In the crystal structure thelinker appears as a continuous helical structure,which is stabilized by crystal packing forces andrepresents one extreme of the conformations thatcan occur in solution. (D) demonstrates theelectrostatic charge surface of calcium-loadedcalmodulin, with red areas holding negative chargeand blue positive, and provides a partialelectrostatic explanation of why the acidiccalmodulin binds positively charged calcium ions.
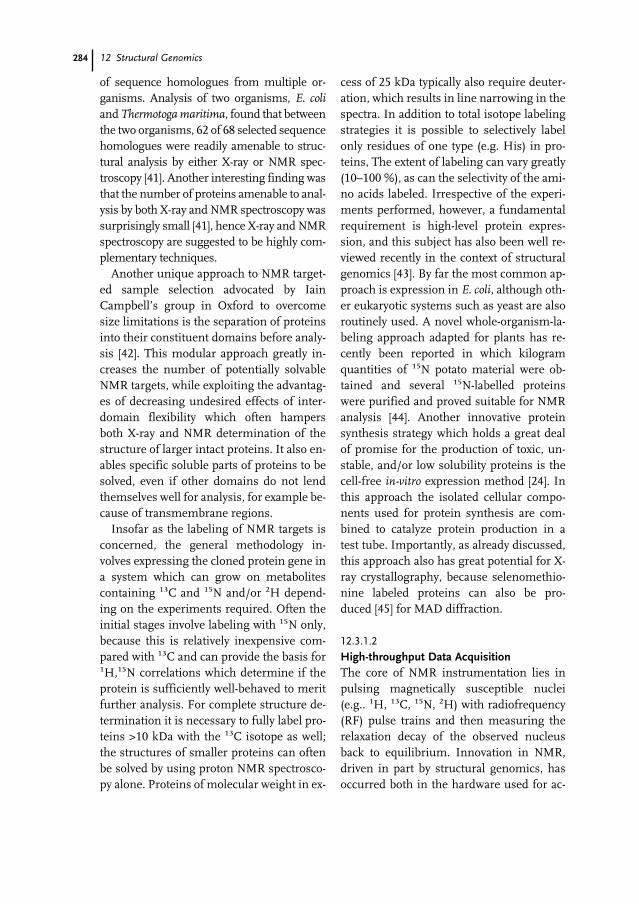
284 12 Structural Genomics
of sequence homologues from multiple or-ganisms. Analysis of two organisms, E. coliand Thermotoga maritima, found that betweenthe two organisms, 62 of 68 selected sequencehomologues were readily amenable to struc-tural analysis by either X-ray or NMR spec-troscopy [41]. Another interesting finding wasthat the number of proteins amenable to anal-ysis by both X-ray and NMR spectroscopy wassurprisingly small [41], hence X-ray and NMRspectroscopy are suggested to be highly com-plementary techniques.
Another unique approach to NMR target-ed sample selection advocated by IainCampbell’s group in Oxford to overcomesize limitations is the separation of proteinsinto their constituent domains before analy-sis [42]. This modular approach greatly in-creases the number of potentially solvableNMR targets, while exploiting the advantag-es of decreasing undesired effects of inter-domain flexibility which often hampersboth X-ray and NMR determination of thestructure of larger intact proteins. It also en-ables specific soluble parts of proteins to besolved, even if other domains do not lendthemselves well for analysis, for example be-cause of transmembrane regions.
Insofar as the labeling of NMR targets isconcerned, the general methodology in-volves expressing the cloned protein gene ina system which can grow on metabolitescontaining 13C and 15N and/or 2H depend-ing on the experiments required. Often theinitial stages involve labeling with 15N only,because this is relatively inexpensive com-pared with 13C and can provide the basis for1H,15N correlations which determine if theprotein is sufficiently well-behaved to meritfurther analysis. For complete structure de-termination it is necessary to fully label pro-teins >10 kDa with the 13C isotope as well;the structures of smaller proteins can oftenbe solved by using proton NMR spectrosco-py alone. Proteins of molecular weight in ex-
cess of 25 kDa typically also require deuter-ation, which results in line narrowing in thespectra. In addition to total isotope labelingstrategies it is possible to selectively labelonly residues of one type (e.g. His) in pro-teins, The extent of labeling can vary greatly(10–100 %), as can the selectivity of the ami-no acids labeled. Irrespective of the experi-ments performed, however, a fundamentalrequirement is high-level protein expres-sion, and this subject has also been well re-viewed recently in the context of structuralgenomics [43]. By far the most common ap-proach is expression in E. coli, although oth-er eukaryotic systems such as yeast are alsoroutinely used. A novel whole-organism-la-beling approach adapted for plants has re-cently been reported in which kilogramquantities of 15N potato material were ob-tained and several 15N-labelled proteinswere purified and proved suitable for NMRanalysis [44]. Another innovative proteinsynthesis strategy which holds a great dealof promise for the production of toxic, un-stable, and/or low solubility proteins is thecell-free in-vitro expression method [24]. Inthis approach the isolated cellular compo-nents used for protein synthesis are com-bined to catalyze protein production in atest tube. Importantly, as already discussed,this approach also has great potential for X-ray crystallography, because selenomethio-nine labeled proteins can also be pro-duced [45] for MAD diffraction.
12.3.1.2
High-throughput Data AcquisitionThe core of NMR instrumentation lies inpulsing magnetically susceptible nuclei(e.g.. 1H, 13C, 15N, 2H) with radiofrequency(RF) pulse trains and then measuring therelaxation decay of the observed nucleusback to equilibrium. Innovation in NMR,driven in part by structural genomics, hasoccurred both in the hardware used for ac-
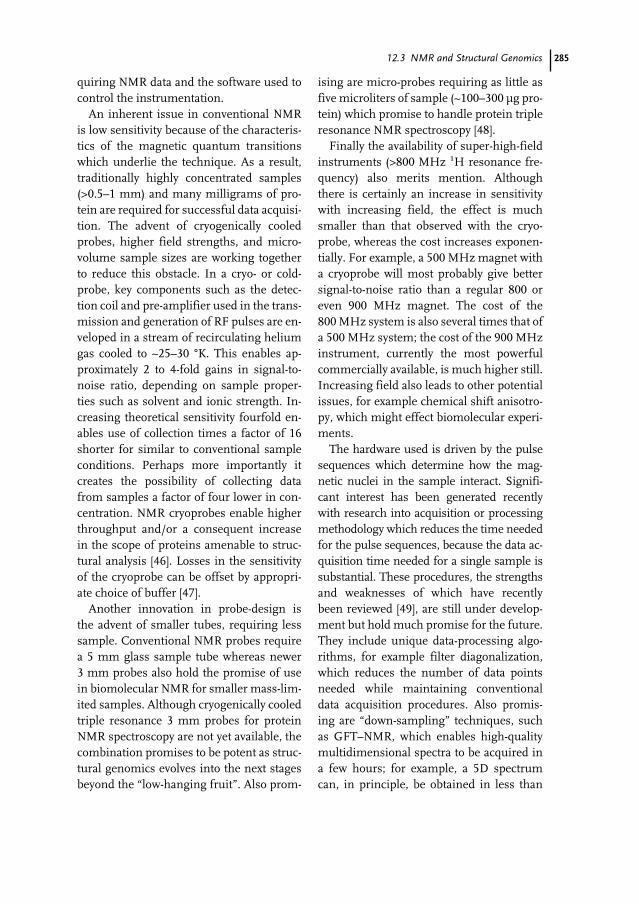
28512.3 NMR and Structural Genomics
quiring NMR data and the software used tocontrol the instrumentation.
An inherent issue in conventional NMRis low sensitivity because of the characteris-tics of the magnetic quantum transitionswhich underlie the technique. As a result,traditionally highly concentrated samples(>0.5–1 mm) and many milligrams of pro-tein are required for successful data acquisi-tion. The advent of cryogenically cooledprobes, higher field strengths, and micro-volume sample sizes are working togetherto reduce this obstacle. In a cryo- or cold-probe, key components such as the detec-tion coil and pre-amplifier used in the trans-mission and generation of RF pulses are en-veloped in a stream of recirculating heliumgas cooled to ~25–30 °K. This enables ap-proximately 2 to 4-fold gains in signal-to-noise ratio, depending on sample proper-ties such as solvent and ionic strength. In-creasing theoretical sensitivity fourfold en-ables use of collection times a factor of 16shorter for similar to conventional sampleconditions. Perhaps more importantly itcreates the possibility of collecting datafrom samples a factor of four lower in con-centration. NMR cryoprobes enable higherthroughput and/or a consequent increasein the scope of proteins amenable to struc-tural analysis [46]. Losses in the sensitivityof the cryoprobe can be offset by appropri-ate choice of buffer [47].
Another innovation in probe-design isthe advent of smaller tubes, requiring lesssample. Conventional NMR probes requirea 5 mm glass sample tube whereas newer3 mm probes also hold the promise of usein biomolecular NMR for smaller mass-lim-ited samples. Although cryogenically cooledtriple resonance 3 mm probes for proteinNMR spectroscopy are not yet available, thecombination promises to be potent as struc-tural genomics evolves into the next stagesbeyond the “low-hanging fruit”. Also prom-
ising are micro-probes requiring as little asfive microliters of sample (~100–300 µg pro-tein) which promise to handle protein tripleresonance NMR spectroscopy [48].
Finally the availability of super-high-fieldinstruments (>800 MHz 1H resonance fre-quency) also merits mention. Althoughthere is certainly an increase in sensitivitywith increasing field, the effect is muchsmaller than that observed with the cryo-probe, whereas the cost increases exponen-tially. For example, a 500 MHz magnet witha cryoprobe will most probably give bettersignal-to-noise ratio than a regular 800 oreven 900 MHz magnet. The cost of the800 MHz system is also several times that ofa 500 MHz system; the cost of the 900 MHzinstrument, currently the most powerfulcommercially available, is much higher still.Increasing field also leads to other potentialissues, for example chemical shift anisotro-py, which might effect biomolecular experi-ments.
The hardware used is driven by the pulsesequences which determine how the mag-netic nuclei in the sample interact. Signifi-cant interest has been generated recentlywith research into acquisition or processingmethodology which reduces the time neededfor the pulse sequences, because the data ac-quisition time needed for a single sample issubstantial. These procedures, the strengthsand weaknesses of which have recentlybeen reviewed [49], are still under develop-ment but hold much promise for the future.They include unique data-processing algo-rithms, for example filter diagonalization,which reduces the number of data pointsneeded while maintaining conventionaldata acquisition procedures. Also promis-ing are “down-sampling” techniques, suchas GFT–NMR, which enables high-qualitymultidimensional spectra to be acquired ina few hours; for example, a 5D spectrumcan, in principle, be obtained in less than
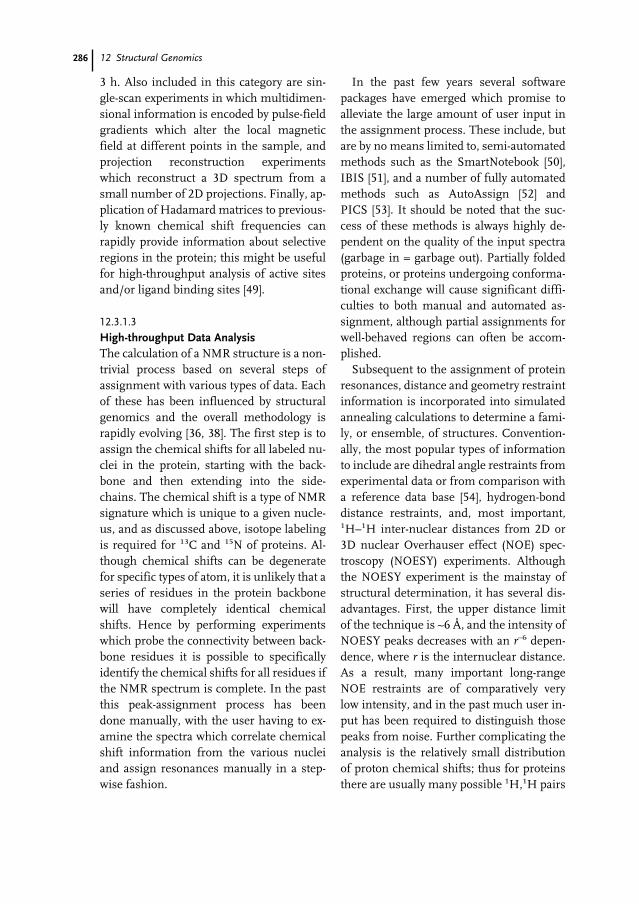
286 12 Structural Genomics
3 h. Also included in this category are sin-gle-scan experiments in which multidimen-sional information is encoded by pulse-fieldgradients which alter the local magneticfield at different points in the sample, andprojection reconstruction experimentswhich reconstruct a 3D spectrum from asmall number of 2D projections. Finally, ap-plication of Hadamard matrices to previous-ly known chemical shift frequencies canrapidly provide information about selectiveregions in the protein; this might be usefulfor high-throughput analysis of active sitesand/or ligand binding sites [49].
12.3.1.3
High-throughput Data AnalysisThe calculation of a NMR structure is a non-trivial process based on several steps ofassignment with various types of data. Eachof these has been influenced by structuralgenomics and the overall methodology israpidly evolving [36, 38]. The first step is toassign the chemical shifts for all labeled nu-clei in the protein, starting with the back-bone and then extending into the side-chains. The chemical shift is a type of NMRsignature which is unique to a given nucle-us, and as discussed above, isotope labelingis required for 13C and 15N of proteins. Al-though chemical shifts can be degeneratefor specific types of atom, it is unlikely that aseries of residues in the protein backbonewill have completely identical chemicalshifts. Hence by performing experimentswhich probe the connectivity between back-bone residues it is possible to specificallyidentify the chemical shifts for all residues ifthe NMR spectrum is complete. In the pastthis peak-assignment process has beendone manually, with the user having to ex-amine the spectra which correlate chemicalshift information from the various nucleiand assign resonances manually in a step-wise fashion.
In the past few years several softwarepackages have emerged which promise toalleviate the large amount of user input inthe assignment process. These include, butare by no means limited to, semi-automatedmethods such as the SmartNotebook [50],IBIS [51], and a number of fully automatedmethods such as AutoAssign [52] andPICS [53]. It should be noted that the suc-cess of these methods is always highly de-pendent on the quality of the input spectra(garbage in = garbage out). Partially foldedproteins, or proteins undergoing conforma-tional exchange will cause significant diffi-culties to both manual and automated as-signment, although partial assignments forwell-behaved regions can often be accom-plished.
Subsequent to the assignment of proteinresonances, distance and geometry restraintinformation is incorporated into simulatedannealing calculations to determine a fami-ly, or ensemble, of structures. Convention-ally, the most popular types of informationto include are dihedral angle restraints fromexperimental data or from comparison witha reference data base [54], hydrogen-bonddistance restraints, and, most important,1H–1H inter-nuclear distances from 2D or3D nuclear Overhauser effect (NOE) spec-troscopy (NOESY) experiments. Althoughthe NOESY experiment is the mainstay ofstructural determination, it has several dis-advantages. First, the upper distance limitof the technique is ~6 Å, and the intensity ofNOESY peaks decreases with an r–6 depen-dence, where r is the internuclear distance.As a result, many important long-rangeNOE restraints are of comparatively verylow intensity, and in the past much user in-put has been required to distinguish thosepeaks from noise. Further complicating theanalysis is the relatively small distributionof proton chemical shifts; thus for proteinsthere are usually many possible 1H,1H pairs
28712.3 NMR and Structural Genomics
which could give rise to a particular NOEcorrelation based on chemical shift alone.
The advent of structural genomics hasseen a significant progression in algorithmsfor automated structure determination, ofwhich several representative methods willbe mentioned here. All of the programs cur-rently in popular use are iterative, meaningthat an initial guess from either a homolo-gous starting structure or chemical shiftsalone is used to generate the initial restraintlist, along with other experimental distanceand geometry information as described inthe preceding paragraph. By successive iter-ations of simulated annealing and energyminimization the criteria used for selectionof the “acceptable” NOE distance restraintsis slowly narrowed until a reasonable struc-tural family remains which most closely fitsthe data. The major implementations are inARIA [55] and CANDID/CYANA [56] whichuse the global fold from previous iterationsto guide the results of subsequent itera-tions. A new algorithm has recently beenpublished which tracks instead individualNOE peaks and provides greater flexibilityin deciding which NOE should be used inthe course of the calculation [57]. Anothermethod, not yet widely available at the timeof writing, but which promises to move for-ward the structural calculation process, isRADAR from Professor Kurt Wuthrich’s la-boratory. This is a combination of the previ-ously published ATNOS algorithm [58] andCANDID [56] programs which promises toautomatically perform pick peaking andcomplete structural calculations.
Another important experimental advanceis the introduction of residual dipolarcouplings (RDC) as additional restraints instructure calculations [59]. In this class ofexperiments the sample of interest is placedin some type of alignment medium (e.g. bi-celles, phage, polyacrylamide gels), which
permits a small amount of ordering of theprotein molecules and prevents completelyrandom tumbling. The ordering results in adefined relationship among all the bondvectors, and an alignment tensor can be de-fined from which long-range relationshipscan be determined. This type of long-rangerestraint, combined with sparse NOE data,significantly reduces the overall time re-quired for complete structure determina-tion. In addition, RDC can be used for othertypes of classification and in the initial as-signment phase, as described in the nextsection. Finally it should be mentioned inthis section that sometimes additional re-straints can be obtained from paramagneticmetal ions bound to metalloproteins [60].As with RDC, these long-range restraintssubstantially improve the structure of theprotein calculated on the basis of NOE dataalone.
12.3.2
Other Non-structural Applications of NMR
Although structure determination is cur-rently the most obvious application of NMRin structural genomics, there is a whole hostof related non-structural applications ofNMR. These range from pre-structuralcharacterization of the extent to which theprotein is folded, and rapidly determiningthe protein fold family, to establishing themerits of pursuing structural characteriza-tion. Perhaps the most important role NMRwill play in the future is in the post-structu-ral characterization of proteins of unknownfunction, thereby bridging the gap betweenstructural and functional genomics. NMR isa very powerful tool for performing ligandand/or drug screening, and for elucidatingthe complex chemical dynamic and ex-change characteristics of proteins.
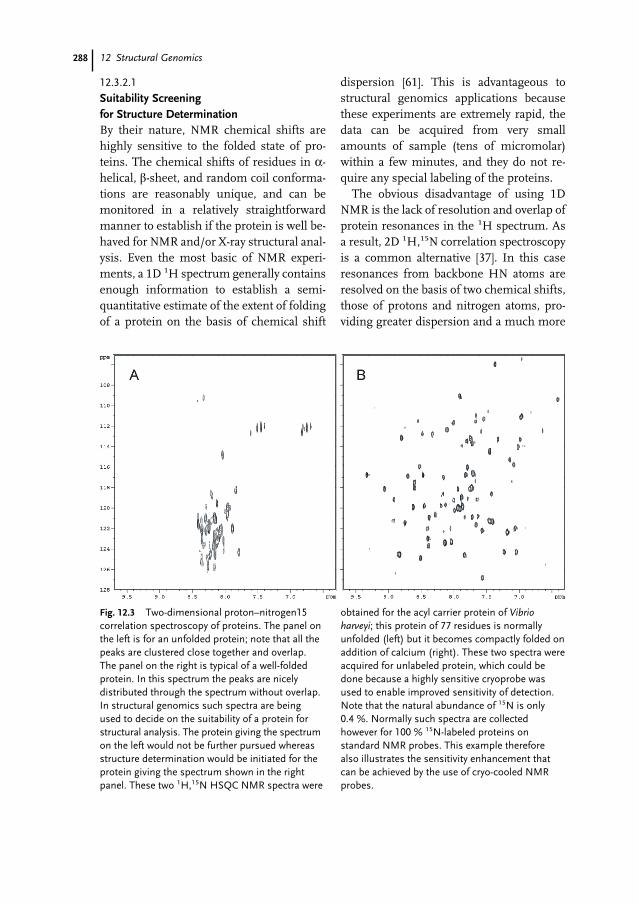
288 12 Structural Genomics
12.3.2.1
Suitability Screening for Structure DeterminationBy their nature, NMR chemical shifts arehighly sensitive to the folded state of pro-teins. The chemical shifts of residues in α-helical, â-sheet, and random coil conforma-tions are reasonably unique, and can bemonitored in a relatively straightforwardmanner to establish if the protein is well be-haved for NMR and/or X-ray structural anal-ysis. Even the most basic of NMR experi-ments, a 1D 1H spectrum generally containsenough information to establish a semi-quantitative estimate of the extent of foldingof a protein on the basis of chemical shift
dispersion [61]. This is advantageous tostructural genomics applications becausethese experiments are extremely rapid, thedata can be acquired from very smallamounts of sample (tens of micromolar)within a few minutes, and they do not re-quire any special labeling of the proteins.
The obvious disadvantage of using 1DNMR is the lack of resolution and overlap ofprotein resonances in the 1H spectrum. Asa result, 2D 1H,15N correlation spectroscopyis a common alternative [37]. In this caseresonances from backbone HN atoms areresolved on the basis of two chemical shifts,those of protons and nitrogen atoms, pro-viding greater dispersion and a much more
Fig. 12.3 Two-dimensional proton–nitrogen15correlation spectroscopy of proteins. The panel onthe left is for an unfolded protein; note that all thepeaks are clustered close together and overlap.The panel on the right is typical of a well-foldedprotein. In this spectrum the peaks are nicelydistributed through the spectrum without overlap.In structural genomics such spectra are beingused to decide on the suitability of a protein forstructural analysis. The protein giving the spectrumon the left would not be further pursued whereasstructure determination would be initiated for theprotein giving the spectrum shown in the rightpanel. These two 1H,15N HSQC NMR spectra were
obtained for the acyl carrier protein of Vibrioharveyi; this protein of 77 residues is normallyunfolded (left) but it becomes compactly folded onaddition of calcium (right). These two spectra wereacquired for unlabeled protein, which could bedone because a highly sensitive cryoprobe wasused to enable improved sensitivity of detection.Note that the natural abundance of 15N is only0.4 %. Normally such spectra are collectedhowever for 100 % 15N-labeled proteins onstandard NMR probes. This example thereforealso illustrates the sensitivity enhancement thatcan be achieved by the use of cryo-cooled NMRprobes.
28912.3 NMR and Structural Genomics
dramatic visual clue about the extent of fold-ing of the protein (Fig. 12.3). The proteinmust be expressed in the presence of 15N la-beled metabolites, and it is usually purifiedbefore screening. If the quantity of proteinmaterial is reasonably high, hundreds ofmicromolar, data acquisition time will stillbe within tens of minutes for 2D acquisi-tion. In an intriguing structural genomicsscreening approach, purification has beenshown as optional, because the entire celllysate can be screened provided only theprotein of interest is expressed with labeledmetabolites [62]. An advantage of screeningby either 1D or 2D NMR is that a rapid testis available to search for conditions underwhich the protein might be folded, for ex-ample the presence of metal ions or cofac-tors (Fig. 12.3). This is important especiallyas structural genomics moves into the nextstages where easily solved proteins are outof the way (the low-hanging fruit), and onlymore challenging targets remain.
12.3.2.2
Determination of Protein FoldNMR spectroscopy promises to play a sig-nificant role in the rapid classification offold families and the rapid determination ofprotein folds. The former is desirable as amethod to identify novel folds or determineconvergent structural evolution from pro-teins of different function. One of the statedaims of structural genomics projects is thecompletion, or near completion of “protein-fold space” [40]. Recently Prestegard’s labhas presented a method by which unas-signed 1H,15N RDC can be used to classifyproteins into protein families [63]. Suchdata are relatively simple to acquire, andshould it prove successful in large-scale pro-jects, this will be a major step forward to-ward selecting unique and previously un-known protein folds.
Besides furnishing information on ho-mology with other proteins of known struc-ture, NMR is also a powerful tool for deter-mining protein fold, equivalent to low-reso-lution structures. These methods have beenwell reviewed recently in the context ofstructure-based drug design [64]. The com-bination of 1H/13C/15N chemical shifts ofthe protein backbone provides a highly reli-able measure of secondary structure, andaddition of RDC information provides in-formation about the orientation of the sec-ondary structure elements. Several groupshave shown that homology modeling is dra-matically more successful when this infor-mation is incorporated into structural calcu-lations [65, 66]. Particularly striking is an ex-ample of the N-terminal domain of apo-cal-modulin, a primarily helical protein whichis similar in secondary structure to the Ca2+-calmodulin form, although the orientationof the helices is significantly different. A ho-mology model of apo-CaM based on theCa2+ form has a root-mean square deviation(rmsd) of 4.2 Å from the NMR-determinedstructure, which drops to 1.0 Å when RDCare incorporated [65]. The incorporation ofRDC data has been further extended intoab-initio protein structure prediction withthe program Rosetta [67], which is usefulfor prediction of protein folds for sequenceswith no known analogs.
One disadvantage of the approaches list-ed above for fold determination is the needto assign NMR resonances before incorpo-rating them in structural calculations. Al-though this is a relatively rapid step, it is stillrate-limiting in terms of high throughputstructural proteomics. An intriguing, re-cently suggested solution to this problem isan algorithm designed to use unassignedNMR data [68] combined with the Rosettaprogram. Although success is not yet suffi-ciently reliable for completely hands-off
290 12 Structural Genomics
analysis, the concept promises much to beexcited about.
12.3.2.3
Rational Drug Target Discovery and Functional GenomicsDrug discovery is the most commercially lu-crative medium-term gain evident fromstructural genomics projects. The sameprinciples used for drug discovery are oftenapplied to “functional genomics”, or at-tempting to understand the function of un-known genes and proteins. The reader is re-ferred to several recent publications [64,69–72] which describe the relationshipbetween structural genomics and drug dis-covery; NMR contributions to this field arebriefly outlined here. Study of structure–ac-tivity relationships (SAR) by NMR was firstintroduced by Fesik’s group who linked twocompounds that bound to a 15N-labelledprotein [73]. The result was a super-ligandcompound which bound with nanomolar af-finity, derived from two predecessors whichbound with micromolar affinity. This is anexample of protein-based screening where-by the protein NMR resonances are moni-tored and a large number of potential tar-gets can be screened simultaneously to de-tect binding. Such screening can also bedone using a protein with 13C-labelled meth-yl groups, which can be detected with veryhigh sensitivity, and might be more sensi-tive than screening with an 15N-labelled pro-tein because sidechains are more often in-volved in ligand binding than the proteinbackbone [74]. In an interesting twist, an-other pharmaceutical group has shown thatby selective labeling of amino acids multipleproteins can be simultaneously monitoredby NMR, thereby increasing the screeningefficiency [75].
Screening by monitoring protein reso-nances is useful because specific sitesand/or residues from the protein can be
identified as binding areas for potential li-gands. Ideally, however, this requires largequantities of labeled protein with resonanc-es assigned, which can be a non-trivial step.An alternate approach is monitoring poten-tial ligand resonances by NMR whilescreening with relatively small amounts ofunlabelled protein. The methods of thisclass are predicated on the different physio-chemical properties of large and smallmolecules when observed by NMR, includ-ing relaxation rates, diffusion characteris-tics, and the ability to selectively transfermagnetization [70, 71]. These methods gen-erally work for ligands which bind in themicromolar to millimolar range, althoughcompetition experiments will provide infor-mation about tighter binding ligands.Besides the obvious advantages of smallerprotein quantity, this approach is not re-stricted to analysis of proteins which pro-vide reasonable NMR spectra, and hencepotential problems such as protein size andchemical exchange, which complicate pro-tein spectra, are non-issues when monitor-ing ligand resonances. It is also worth men-tioning that the use of 19F-labelled sub-strates for competition experiments hasshown great promise for biochemicalscreening, with the obvious advantage ofthere being no background 1H signals to fil-ter out [76].
12.4
Epilogue
Although the full impact of the public struc-tural genomics efforts is yet to be realized itseems clear that many more distinct proteinstructures will become available in the nearfuture. In the first instance this will providemuch better appreciation of the extent ofthe protein fold-space. It has, however, alsooften been suggested that a protein struc-
29112.4 Epilogue
ture can be directly related to its function.Unfortunately the relationship betweenprotein fold and protein function is rathercomplex [77, 78]. It is well known that manyproteins can have a similar fold, yet havequite different functions, this is well docu-mented for the versatile TIM-barrel motifstructures for example. Likewise some pro-teins carry out closely related functions orenzymatic reactions, yet can have very dif-ferent folds, as illustrated by the proteinasestrypsin and subtilisin. It will therefore benecessary to start looking for specific func-tional sites on the protein by use of a varietyof computational approaches. Programs arenow available for identification of such po-tential sites by mapping the most conservedresidues in large groups of homologousproteins. In this fashion it has been pos-sible to identify enzyme active sites or DNA-binding sites, for example [77, 78]. It has al-so been suggested that that one could at-tempt to dock all known metabolites on to anovel protein using commonly used com-putational computer docking approach-es [71]. When a group of potential ligandshas been identified in this fashion, theyhave to be confirmed experimentally byNMR-based screening procedures, as de-scribed above.
In the near future it will be possible toview simultaneously the 3D structures of allthe enzymes involved in one metabolicpathway. An early glimpse of the structuresof all the enzymes involved in the glycolyticpathway reveals that unique insights can beobtained in this manner [79]. Also, becausemany of the early structural genomics trialprojects were focused on bacteria, our
knowledge of bacterial protein structureshas been already increased significantly in arelatively short time. This has enabled re-searchers to make comparisons betweenthe different classes of protein superfoldsfor different genomes [80]. The lessonslearned from these simpler organisms can,however, also be extended directly to hu-mans, because many protein functions arethe same and homologous proteins can beidentified and modeled [81]. In this regard itshould be noted that methodologies foridentifying sequence- and structure-basedhomologs continue to improve [82]. Never-theless , it should be realized that homologymodels of proteins, particularly those ob-tained with low levels of sequence identity(<30 %), might give an overall fold that isclose to correct but is not sufficiently pre-cise to enable drug design or an under-standing of enzyme mechanisms [79].
Finally we would like to point out that atthis time our understanding of the “ligand-space” is also incomplete. Although manymajor metabolites have been known andcharacterized for a long time, new ones thatare often present only in small amountscontinue to be discovered. This is particu-larly true for a variety of drug metabolites,that will continue to appear as new drugsenter the market. Fortunately many metab-olomics or metabonomics projects areaimed at identifying the complete metabo-lome in organisms ranging from bacteria tohumans and plants [83–85]. These initia-tives might have to be completed before wecan understand the roles of all the gene-products that are coded for by the genomes.
292
1 Rupp B (2003) High throughput protein crys-tallography. In: Proteomics (Edwards A, Ed)Marcel Dekker.
2 Goodwill KE, Tennant MG, Stevens RC (2001)High-throughput X-ray crystallography forstructure based drug design. Drug DiscoveryToday 6:S113–S118.
3 Stevens RC (2000) High-throughput proteincrystallization. Curr Opin Struct Biol5:558–563.
4 Stevens RC, Yokoyama S, Wilson IA (2000)Global efforts in structural genomics. Science294:89–92.
5 Bentley DR (2004) Genomes for medicine.Nature 429:440–445.
6 Venter GC, et al (2001) The sequence of thehuman genome. Science 291:1304–1351.
7 Hope H (1990) Crystallography of biologicalmacromolecules at ultra-low temperatures.Annu Rev Biophys Biophys Chem19:107–126.
8 Garman EF, Mitchell TR (1997) Macromolec-ular cryocrystallography. J Appl Crystallogr30:211–237.
9 Hendrickson W, (2000) Synchrotron Crystal-lography. Trends Biochem Sci 25:637–643.
10 Ogata CM (1998) MAD phasing grows up. Na-ture Struct Biol Suppl 5:638–640.
11 Rodgers DW (2001) Cryo-crystallography tech-niques and devices. Intl Tables Crystallogra-phy F:202–208.
12 Sweet R (2000) The technology that enablessynchrotron structural biology. Nature StructBiol Suppl 5:654–656.
13 Garman E, Nave C (2002) Radiation damageto crystalline biological molecules: currentviews. J Synchrotron Rad 9:327–328.
14 Garman E (1999) Cool data: quantity ANDquality. Acta Cryst D55:1641–1653.
15 Doublie S, Carter C (1992) Preparation of sel-enomethionyl protein crystals. In: Crystalliza-tion of nucleic acids and proteins (Ducruix A,Giege R, Eds) Oxford University Press.
16 Lamzin VS, Perrakis A (2000) Current state ofautomated crystallographic data analysis. Na-ture Struct Biol 7:979–981.
17 Abola E, Kuhn P, Earnest T, Stevens RC(2000) Automation of X-ray crystallography.Nature Struct Biol Suppl 7:973–977.
18 Hui R, Edwards A (2003) High-throughputprotein crystallization. J. Struct. Biol.142:154–161.
19 Norvell JC, Zapp-Machalek A (2000) Structu-ral genomics programs at the US National In-stitute of General Medical Sciences. NatureStruct. Biol Suppl. 7:931.
20 Harris TE, (2001) The commercial use ofstructural genomics. Drug Discovery Today6:1148.
21 Hosfield D, Palan J, Hilgers M, Scheibe D,McRee DE, Stevens RC (2003) A fully inte-grated protein crystallization platform forsmall-molecule drug discovery. J. Struct. Biol.142:207–217.
22 Goulding CW, Perry LJ (2003) Protein pro-duction in E. coli for structural studies by X-ray crystallography. J Struct Biol 142:133–143.
23 Dale GE, Oefner C, D’Arcy A (2003) The pro-tein as a variable in protein crystallization. JStruct Biol 142:88–97.
24 Kigawa T, Yabuki T, Yoshida Y, Tsustui M,Ito Y, Shibata T, Yokoyama S (1999) Cell-freeproduction and stable-isotope labeling of mil-ligram quantities of protein. FEBS Lett.442:14–19.
25 Wilson, WW (2003) Light-scattering as a diag-nostic for protein crystal growth – A practicalapproach. J. Struct. Biol 142:56–65.
References
293References
26 Luft JR, Collins RJ, Fehrman NA, LauricellaAM, Veatch CK, DeTitta GT (2003) A deliber-ate approach to screening for initial crystal-lization conditions of biological macromole-cules. J. Struct. Biol. 142:170–179.
27 DeLucas LJ, Bray TL, Nagy L, McCombs D,Chernov N, Hamrick D, Cosenza L, Belgovs-kiy A, Stoops B, Chait A (2003) Efficient pro-tein crystallization. J. Struct. Biol.142:188–206.
28 Cusack S, Belrhali H, Bram A, BurghammerM, Perrakis A, Riekel C (1998) Small is beau-tiful: protein micro-crystallography. NatureStruct Biol Suppl 5:634–647.
29 Spraggon G, Lesley SA, Kreusch A, PriestleJP (2002) Computational analysis of crystal-lization trials. Acta Cryst D58:1915–1923.
30 Adams PD, Grosse-Kunstleve RW, Hung LW,Ioerger TR, McCoy AJ, Moriarty NW, ReadRJ, Sacchettini JC, Sauter NK, Terwilliger TC(2002) PHENIX: building new software forautomated crystallographic structure determi-nation. Acta Cryst D58:1948–1954.
31 Winn MD, Ashton AW, Briggs PJ, BallardCC, Patel P (2002) Ongoing developments inCCP4 for high-throughput structure determi-nation. Acta Cryst D58:1929–1936.
32 Holton J, Alber T (2004) Automated proteincrystal structure determination using ELVES.Proc Natl Acad Sci USA 101:1537–1542.
33 Loll PJ (2003) Membrane Protein structuralbiology: the high-throughput challenge. J.Struct. Biol. 142: 144–153.
34 Luca S, Heise H, Baldus M (2003). High-reso-lution solid-state NMR applied to polypep-tides and membrane proteins. Acc Chem Res36:858–865.
35 Montelione GT, Zheng D, Huang YJ, Gunsal-us KC, Szyperski T (2000). Protein NMRspectroscopy in structural genomics. NatStruct Biol 7 Suppl:982–985.
36 Kennedy MA, Montelione GT, ArrowsmithCH, Markley JL (2002). Role for NMR instructural genomics. J Struct Funct Genomics2:155–169.
37 Yee A, Chang X, Pineda-Lucena A, Wu B, Se-mesi A, Le B, Ramelot T, Lee GM, Bhatta-charyya S, Gutierrez P, Denisov A, Lee CH,Cort JR, Kozlov G, Liao J, Finak G, Chen L,Wishart D, Lee W, McIntosh LP, Gehring K,Kennedy MA, Edwards AM, Arrowsmith CH(2002). An NMR approach to structural prote-omics. Proc Natl Acad Sci U S A99:1825–1830.
38 Prestegard JH, Valafar H, Glushka J, Tian F(2001). Nuclear magnetic resonance in the eraof structural genomics. Biochemistry40:8677–8685.
39 Norin M, Sundstrom M (2002). Structuralproteomics: lessons learnt from the early casestudies. Farmaco 57:947–951.
40 Vitkup D, Melamud E, Moult J, Sander C(2001). Completeness in structural genomics.Nat Struct Biol 8:559–566.
41 Savchenko A, Yee A, Khachatryan A, SkarinaT, Evdokimova E, Pavlova M, Semesi A,Northey J, Beasley S, Lan N, Das R, GersteinM, Arrowmith CH, Edwards AM (2003).Strategies for structural proteomics of prokar-yotes: Quantifying the advantages of studyingorthologous proteins and of using both NMRand X-ray crystallography approaches. Proteins50:392–399.
42 Staunton D, Owen J, Campbell ID (2003).NMR and structural genomics. Acc Chem Res36:207–214.
43 Yokoyama S (2003). Protein expressionsystems for structural genomics and proteom-ics. Curr Opin Chem Biol 7:39–43.
44 Ippel JH, Pouvreau L, Kroef T, Gruppen H,Versteeg G, van den PP, Struik PC, van Mier-lo CP (2004). In vivo uniform (15)N-isotopelabeling of plants: using the greenhouse forstructural proteomics. Proteomics 4:226–234.
45 Kigawa T, Yamaguchi-Nunokawa E, KodamaK, Matsuda T, Yabuki T, Matsuda N, IshitaniR, Nureki O, Yokoyama S (2002). Selenome-thionine incorporation into a protein by cell-free synthesis. J Struct Funct Genomics2:29–35.
46 Monleon D, Colson K, Moseley HN, AnklinC, Oswald R, Szyperski T, Montelione GT(2002). Rapid analysis of protein backboneresonance assignments using cryogenicprobes, a distributed Linux-based computingarchitecture, and an integrated set of spectralanalysis tools. J Struct Funct Genomics2:93–101.
47 Kelly AE, Ou HD, Withers R, Dotsch V(2002). Low-conductivity buffers for high-sen-sitivity NMR measurements. J Am Chem Soc124:12013–12019.
48 Peti W, Norcross J, Eldridge G, O’Neil-John-son M (2004). Biomolecular NMR using a mi-crocoil NMR probe – new technique for thechemical shift assignment of aromatic sidechains in proteins. J Am Chem Soc126:5873–5878.
294 References
49 Freeman R, Kupce E (2003). New methods forfast multidimensional NMR. J Biomol NMR27:101–113.
50 Slupsky CM, Boyko RF, Booth VK, Sykes BD(2003). Smartnotebook: a semi-automated ap-proach to protein sequential NMR resonanceassignments. J Biomol NMR 27:313–321.
51 Hyberts SG, Wagner G (2003). IBIS – a toolfor automated sequential assignment of pro-tein spectra from triple resonance experi-ments. J Biomol NMR 26:335–344.
52 Moseley HN, Sahota G, Montelione GT(2004). Assignment validation software suitefor the evaluation and presentation of proteinresonance assignment data. J Biomol NMR28:341–355.
53 Malmodin D, Papavoine CH, Billeter M(2003). Fully automated sequence-specific res-onance assignments of hetero-nuclear proteinspectra. J Biomol NMR 27:69–79.
54 Cornilescu G, Delaglio F, Bax A (1999). Pro-tein backbone angle restraints from searchinga database for chemical shift and sequencehomology. J Biomol NMR 13:289–302.
55 Linge JP, Habeck M, Rieping W, Nilges M(2003). ARIA: automated NOE assignmentand NMR structure calculation. Bioinformatics19:315–316.
56 Herrmann T, Guntert P, Wuthrich K (2002).Protein NMR structure determination withautomated NOE assignment using the newsoftware CANDID and the torsion angle dy-namics algorithm DYANA. J Mol Biol319:209–227.
57 Kuszewski J, Schwieters CD, Garrett DS, ByrdRA, Tjandra N, Clore GM (2004). CompletelyAutomated, Highly Error-Tolerant Macromo-lecular Structure Determination from Multidi-mensional Nuclear Overhauser EnhancementSpectra and Chemical Shift Assignments. JAm Chem Soc 126:6258–6273.
58 Herrmann T, Guntert P, Wuthrich K (2002).Protein NMR structure determination withautomated NOE-identification in the NOESYspectra using the new software ATNOS. J Bio-mol NMR 24:171–189.
59 Lipsitz RS, Tjandra N (2004). Residual dipolarcouplings in NMR structure analysis. AnnuRev Biophys Biomol Struct 33:387–413.
60 Baig I, Bertini I, Del Bianco C, Gupta YK, LeeYM, Luchinat C, Quattrone A (2004). Para-magnetism-based refinement strategy for thesolution structure of human alpha-parvalbu-min. Biochemistry 43:5562–5573.
61 Rehm T, Huber R, Holak TA (2002). Applica-tion of NMR in structural proteomics: screen-ing for proteins amenable to structural analy-sis. Structure (Camb ) 10:1613–1618.
62 Galvao-Botton LM, Katsuyama AM, GuzzoCR, Almeida FC, Farah CS, Valente AP(2003). High-throughput screening of structu-ral proteomics targets using NMR. FEBS Lett552:207–213.
63 Valafar H, Prestegard JH (2003). Rapid clas-sification of a protein fold family using a sta-tistical analysis of dipolar couplings. Bioinfor-matics 19:1549–1555.
64 Powers R (2002). Applications of NMR tostructure-based drug design in structural ge-nomics. J Struct Funct Genomics 2:113–123.
65 Chou JJ, Li S, Bax A (2000). Study of confor-mational rearrangement and refinement ofstructural homology models by the use of het-eronuclear dipolar couplings. J Biomol NMR18:217–227.
66 Meiler J, Peti W, Griesinger C (2000). Dipo-Coup: A versatile program for 3D-structurehomology comparison based on residual di-polar couplings and pseudocontact shifts. JBiomol NMR 17:283–294.
67 Rohl CA, Baker D (2002). De novo determina-tion of protein backbone structure from resid-ual dipolar couplings using Rosetta. J AmChem Soc 124:2723–2729.
68 Meiler J, Baker D (2003). Rapid protein folddetermination using unassigned NMR data.Proc Natl Acad Sci U S A 100:15404–15409.
69 Mueller L, Montelione GT (2002). Structuralgenomics in pharmaceutical design. J StructFunct Genomics 2:67–70.
70 Stockman BJ, Dalvit C (2002). NMR screen-ing techniques in drug discovery and drug de-sign. Progress in Nuclear Magnetic ResonanceSpectroscopy 41:187–231.
71 Parsons L, Orban J (2004). Structural genom-ics and the metabolome: combining computa-tional and NMR methods to identify target li-gands. Curr Opin Drug Discovery Dev 7:62–68.
72 Buchanan SG (2002). Structural genomics:bridging functional genomics and structure-based drug design. Curr Opin Drug Discov De-vel 5:367–381.
73 Shuker SB, Hajduk PJ, Meadows RP, FesikSW (1996). Discovering high-affinity ligandsfor proteins: SAR by NMR. Science274:1531–1534.
295References
74 Hajduk PJ, Meadows RP, Fesik SW (1999).NMR-based screening in drug discovery. QRev Biophys 32:211–240.
75 Zartler ER, Hanson J, Jones BE, Kline AD,Martin G, Mo H, Shapiro MJ, Wang R, WuH, Yan J (2003). RAMPED-UP NMR: multi-plexed NMR-based screening for drug discov-ery. J Am Chem Soc 125:10941–10946.
76 Dalvit C, Fagerness PE, Hadden DT, SarverRW, Stockman BJ (2003). Fluorine-NMR ex-periments for high-throughput screening:theoretical aspects, practical considerations,and range of applicability. J Am Chem Soc125:7696–7703.
77 Whisstock JC, Lesk AM (2003). Prediction ofprotein function from protein sequence andstructure. Q Rev Biophys 36:307–340.
78 Jones S, Thornton JM (2004). Searching forfunctional sites in protein structures. CurrOpin Chem Biol 8:3–7.
79 Erlandsen H, Abola EE, Stevens RC (2000).Combining structural genomics and enzy-mology: completing the picture in metabolicpathways and enzyme active sites. Curr OpinStruct Biol 10:719–730.
80 Frishman D (2003). What we have learnedabout prokaryotes from structural genomics.OMICS 7:211–224.
81 Matte A, Sivaraman J, Ekiel I, Gehring K, JiaZ, Cygler M (2003). Contribution of structuralgenomics to understanding the biology of Es-cherichia coli. J Bacteriol 185:3994–4002.
82 Goldsmith-Fischman S, Honig B (2003).Structural genomics: computational methodsfor structure analysis. Protein Sci12:1813–1821.
83 Pelczer I (2003). Structural biology, ligandbinding, metabomics – the changing face ofhigh-field, high-resolution NMR spectrosco-py. Theochem 666/667:499–505.
84 Nicholson JK, Connelly J, Lindon JC, HolmesE (2002). Metabonomics: a platform for study-ing drug toxicity and gene function. Nat RevDrug Discov 1:153–161.
85 Sumner LW, Mendes P, Dixon RA (2003).Plant metabolomics: large-scale phytochemis-try in the functional genomics era. Phytochem-istry 62:817–836. .

Part IIIBioinformatics
Verwendete Mac Distiller 5.0.x Joboptions
Dieser Report wurde automatisch mit Hilfe der Adobe Acrobat Distiller Erweiterung "Distiller Secrets v1.0.5" der IMPRESSED GmbH erstellt. Sie koennen diese Startup-Datei für die Distiller Versionen 4.0.5 und 5.0.x kostenlos unter http://www.impressed.de herunterladen. ALLGEMEIN ---------------------------------------- Dateioptionen: Kompatibilität: PDF 1.3 Für schnelle Web-Anzeige optimieren: Ja Piktogramme einbetten: Ja Seiten automatisch drehen: Nein Seiten von: 1 Seiten bis: Alle Seiten Bund: Links Auflösung: [ 2400 2400 ] dpi Papierformat: [ 481 680 ] Punkt KOMPRIMIERUNG ---------------------------------------- Farbbilder: Downsampling: Nein Komprimieren: Ja Komprimierungsart: ZIP Bitanzahl pro Pixel: 8 Bit Graustufenbilder: Downsampling: Nein Komprimieren: Ja Komprimierungsart: ZIP Bitanzahl pro Pixel: 8 Bit Schwarzweiß-Bilder: Downsampling: Nein Komprimieren: Ja Komprimierungsart: CCITT CCITT-Gruppe: 4 Graustufen glätten: Nein Text und Vektorgrafiken komprimieren: Ja SCHRIFTEN ---------------------------------------- Alle Schriften einbetten: Ja Untergruppen aller eingebetteten Schriften: Nein Wenn Einbetten fehlschlägt: Abbrechen Einbetten: Immer einbetten: [ /Courier-BoldOblique /Helvetica-BoldOblique /Courier /Helvetica-Bold /Times-Bold /Courier-Bold /Helvetica /Times-BoldItalic /Times-Roman /ZapfDingbats /Times-Italic /Helvetica-Oblique /Courier-Oblique /Symbol ] Nie einbetten: [ ] FARBE(N) ---------------------------------------- Farbmanagement: Farbumrechnungsmethode: Farbe nicht ändern Methode: Standard Geräteabhängige Daten: Einstellungen für Überdrucken beibehalten: Ja Unterfarbreduktion und Schwarzaufbau beibehalten: Ja Transferfunktionen: Beibehalten Rastereinstellungen beibehalten: Nein ERWEITERT ---------------------------------------- Optionen: Prolog/Epilog verwenden: Nein PostScript-Datei darf Einstellungen überschreiben: Nein Level 2 copypage-Semantik beibehalten: Ja Portable Job Ticket in PDF-Datei speichern: Ja Illustrator-Überdruckmodus: Ja Farbverläufe zu weichen Nuancen konvertieren: Ja ASCII-Format: Nein Document Structuring Conventions (DSC): DSC-Kommentare verarbeiten: Ja DSC-Warnungen protokollieren: Nein Für EPS-Dateien Seitengröße ändern und Grafiken zentrieren: Ja EPS-Info von DSC beibehalten: Ja OPI-Kommentare beibehalten: Nein Dokumentinfo von DSC beibehalten: Ja ANDERE ---------------------------------------- Distiller-Kern Version: 5000 ZIP-Komprimierung verwenden: Ja Optimierungen deaktivieren: Nein Bildspeicher: 524288 Byte Farbbilder glätten: Nein Graustufenbilder glätten: Nein Bilder (< 257 Farben) in indizierten Farbraum konvertieren: Ja sRGB ICC-Profil: sRGB IEC61966-2.1 ENDE DES REPORTS ---------------------------------------- IMPRESSED GmbH Bahrenfelder Chaussee 49 22761 Hamburg, Germany Tel. +49 40 897189-0 Fax +49 40 897189-71 Email: [email protected] Web: www.impressed.de
Adobe Acrobat Distiller 5.0.x Joboption Datei
<< /ColorSettingsFile () /LockDistillerParams true /DetectBlends true /DoThumbnails true /AntiAliasMonoImages false /MonoImageDownsampleType /Bicubic /GrayImageDownsampleType /Bicubic /MaxSubsetPct 100 /MonoImageFilter /CCITTFaxEncode /ColorImageDownsampleThreshold 1.5 /GrayImageFilter /FlateEncode /ColorConversionStrategy /LeaveColorUnchanged /CalGrayProfile (Dot Gain 20%) /ColorImageResolution 300 /UsePrologue false /MonoImageResolution 1200 /ColorImageDepth 8 /sRGBProfile (sRGB IEC61966-2.1) /PreserveOverprintSettings true /CompatibilityLevel 1.3 /UCRandBGInfo /Preserve /EmitDSCWarnings false /CreateJobTicket true /DownsampleMonoImages false /DownsampleColorImages false /MonoImageDict << /K -1 >> /ColorImageDownsampleType /Bicubic /GrayImageDict << /HSamples [ 2 1 1 2 ] /VSamples [ 2 1 1 2 ] /Blend 1 /QFactor 0.9 >> /CalCMYKProfile (U.S. Web Coated (SWOP) v2) /ParseDSCComments true /PreserveEPSInfo true /MonoImageDepth -1 /AutoFilterGrayImages false /SubsetFonts false /GrayACSImageDict << /HSamples [ 2 1 1 2 ] /VSamples [ 2 1 1 2 ] /Blend 1 /QFactor 0.9 >> /ColorImageFilter /FlateEncode /AutoRotatePages /None /PreserveCopyPage true /EncodeMonoImages true /ASCII85EncodePages false /PreserveOPIComments false /NeverEmbed [ ] /ColorImageDict << /HSamples [ 2 1 1 2 ] /VSamples [ 2 1 1 2 ] /Blend 1 /QFactor 0.9 >> /AntiAliasGrayImages false /GrayImageDepth 8 /CannotEmbedFontPolicy /Error /EndPage -1 /TransferFunctionInfo /Preserve /CalRGBProfile (sRGB IEC61966-2.1) /EncodeColorImages true /EncodeGrayImages true /ColorACSImageDict << /HSamples [ 2 1 1 2 ] /VSamples [ 2 1 1 2 ] /Blend 1 /QFactor 0.9 >> /Optimize true /ParseDSCCommentsForDocInfo true /GrayImageDownsampleThreshold 1.5 /MonoImageDownsampleThreshold 1.5 /AutoPositionEPSFiles true /GrayImageResolution 300 /AutoFilterColorImages false /AlwaysEmbed [ /Courier-BoldOblique /Helvetica-BoldOblique /Courier /Helvetica-Bold /Times-Bold /Courier-Bold /Helvetica /Times-BoldItalic /Times-Roman /ZapfDingbats /Times-Italic /Helvetica-Oblique /Courier-Oblique /Symbol ] /ImageMemory 524288 /OPM 1 /DefaultRenderingIntent /Default /EmbedAllFonts true /StartPage 1 /DownsampleGrayImages false /AntiAliasColorImages false /ConvertImagesToIndexed true /PreserveHalftoneInfo false /CompressPages true /Binding /Left >> setdistillerparams << /PageSize [ 595.276 841.890 ] /HWResolution [ 2400 2400 ] >> setpagedevice
299
Peter Rice
13.1
Introduction
Other chapters in this book concentrate onthe underlying technologies. This chaptercovers the essentials of using bioinformat-ics tools to analyze DNA sequences. The ex-amples are drawn from the open-sourceEMBOSS sequence-analysis package [1] de-veloped over the past few years by the a coreteam of developers on the Hinxton Ge-nome Campus and many contributors fromthe bioinformatics community.
The nature of DNA sequence data haschanged substantially over the years sinceDNA sequencing became a common labor-atory method. The earliest sequences cov-ered just one gene of interest, either from abacterial clone or from a cDNA clone. Thesequences were finished to a reasonablestandard, and at 1500 bases on averagewere an ideal size for analysis by computer.During the early 1990s, EST sequencingprojects led to a vast increase in the numberof short, single-read sequences with higherror rates both for single base substitu-tions and for single base insertions or dele-tions. These proved especially difficult foralignment methods. In recent years wehave seen massive growth in the release of
large clones and complete genomes, so thatthe databases also contain many sequencesof 100 kb or larger. These also lead to majorproblems for computer methods. Thischapter will illustrate some of the solutionsthat have been applied to these new se-quence-analysis problems.
For DNA sequence analysis, the mainmethods can be divided into those based onalignment and those based on patternmatching.
13.2
Alignment Methods
Sequence alignment assumes there are oneor more other sequences that can be com-pared with our starting sequence. The mostobvious example is a search of the sequencedatabases, where we look for any otherknown sequence that has some similarity toours, in other words one that can be alignedto it. Having found other sequences thatcould be similar, we can align them to ourstarting sequence either one at a time (pair-wise alignment) or all together (multiplealignment).
A graphical display of the matches be-tween two sequences is often a good start-
Handbook of Genome Research. Genomics, Proteomics, Metabolomics, Bioinformatics, Ethical and Legal Issues.Edited by Christoph W. SensenCopyright © 2005 WILEY-VCH Verlag GmbH & Co. KGaA, WeinheimISBN: 3-527-31348-6
13Bioinformatics Tools for DNA Technology
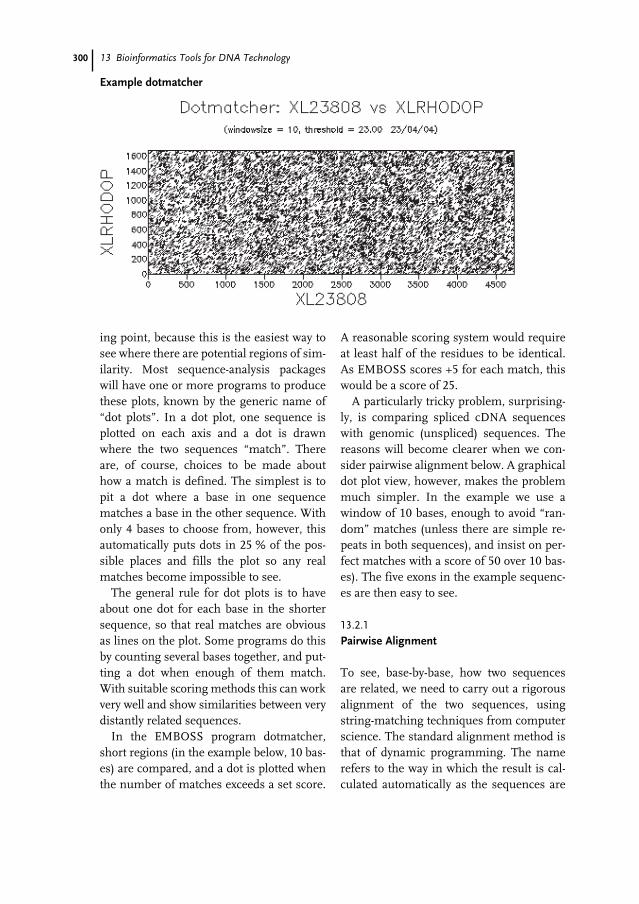
300 13 Bioinformatics Tools for DNA Technology
ing point, because this is the easiest way tosee where there are potential regions of sim-ilarity. Most sequence-analysis packageswill have one or more programs to producethese plots, known by the generic name of“dot plots”. In a dot plot, one sequence isplotted on each axis and a dot is drawnwhere the two sequences “match”. Thereare, of course, choices to be made abouthow a match is defined. The simplest is topit a dot where a base in one sequencematches a base in the other sequence. Withonly 4 bases to choose from, however, thisautomatically puts dots in 25 % of the pos-sible places and fills the plot so any realmatches become impossible to see.
The general rule for dot plots is to haveabout one dot for each base in the shortersequence, so that real matches are obviousas lines on the plot. Some programs do thisby counting several bases together, and put-ting a dot when enough of them match.With suitable scoring methods this can workvery well and show similarities between verydistantly related sequences.
In the EMBOSS program dotmatcher,short regions (in the example below, 10 bas-es) are compared, and a dot is plotted whenthe number of matches exceeds a set score.
A reasonable scoring system would requireat least half of the residues to be identical.As EMBOSS scores +5 for each match, thiswould be a score of 25.
A particularly tricky problem, surprising-ly, is comparing spliced cDNA sequenceswith genomic (unspliced) sequences. Thereasons will become clearer when we con-sider pairwise alignment below. A graphicaldot plot view, however, makes the problemmuch simpler. In the example we use awindow of 10 bases, enough to avoid “ran-dom” matches (unless there are simple re-peats in both sequences), and insist on per-fect matches with a score of 50 over 10 bas-es). The five exons in the example sequenc-es are then easy to see.
13.2.1
Pairwise Alignment
To see, base-by-base, how two sequencesare related, we need to carry out a rigorousalignment of the two sequences, usingstring-matching techniques from computerscience. The standard alignment method isthat of dynamic programming. The namerefers to the way in which the result is cal-culated automatically as the sequences are
Example dotmatcher
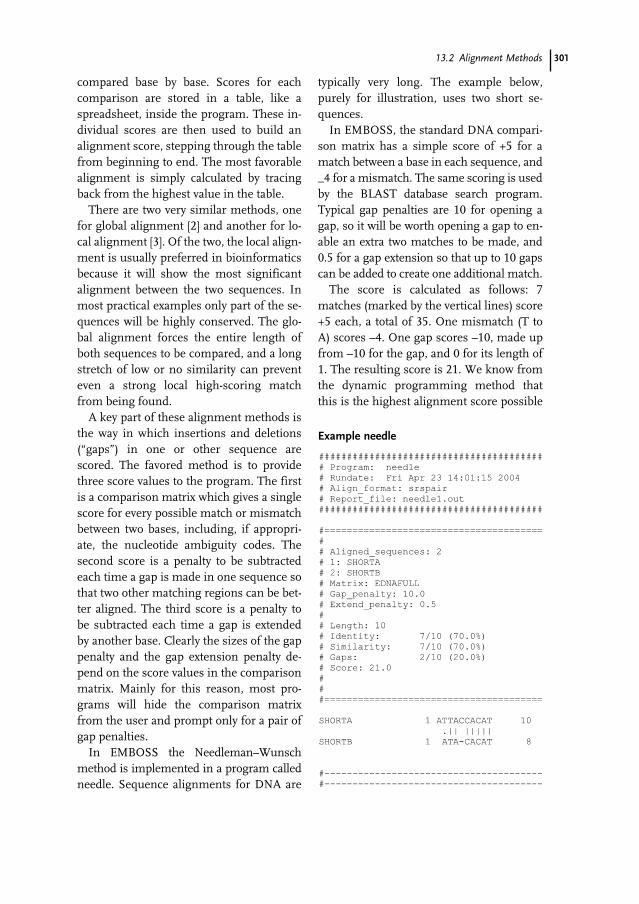
30113.2 Alignment Methods
compared base by base. Scores for eachcomparison are stored in a table, like aspreadsheet, inside the program. These in-dividual scores are then used to build analignment score, stepping through the tablefrom beginning to end. The most favorablealignment is simply calculated by tracingback from the highest value in the table.
There are two very similar methods, onefor global alignment [2] and another for lo-cal alignment [3]. Of the two, the local align-ment is usually preferred in bioinformaticsbecause it will show the most significantalignment between the two sequences. Inmost practical examples only part of the se-quences will be highly conserved. The glo-bal alignment forces the entire length ofboth sequences to be compared, and a longstretch of low or no similarity can preventeven a strong local high-scoring matchfrom being found.
A key part of these alignment methods isthe way in which insertions and deletions(“gaps”) in one or other sequence arescored. The favored method is to providethree score values to the program. The firstis a comparison matrix which gives a singlescore for every possible match or mismatchbetween two bases, including, if appropri-ate, the nucleotide ambiguity codes. Thesecond score is a penalty to be subtractedeach time a gap is made in one sequence sothat two other matching regions can be bet-ter aligned. The third score is a penalty tobe subtracted each time a gap is extendedby another base. Clearly the sizes of the gappenalty and the gap extension penalty de-pend on the score values in the comparisonmatrix. Mainly for this reason, most pro-grams will hide the comparison matrixfrom the user and prompt only for a pair ofgap penalties.
In EMBOSS the Needleman–Wunschmethod is implemented in a program calledneedle. Sequence alignments for DNA are
typically very long. The example below,purely for illustration, uses two short se-quences.
In EMBOSS, the standard DNA compari-son matrix has a simple score of +5 for amatch between a base in each sequence, and_4 for a mismatch. The same scoring is usedby the BLAST database search program.Typical gap penalties are 10 for opening agap, so it will be worth opening a gap to en-able an extra two matches to be made, and0.5 for a gap extension so that up to 10 gapscan be added to create one additional match.
The score is calculated as follows: 7matches (marked by the vertical lines) score+5 each, a total of 35. One mismatch (T toA) scores –4. One gap scores –10, made upfrom –10 for the gap, and 0 for its length of1. The resulting score is 21. We know fromthe dynamic programming method thatthis is the highest alignment score possible
Example needle
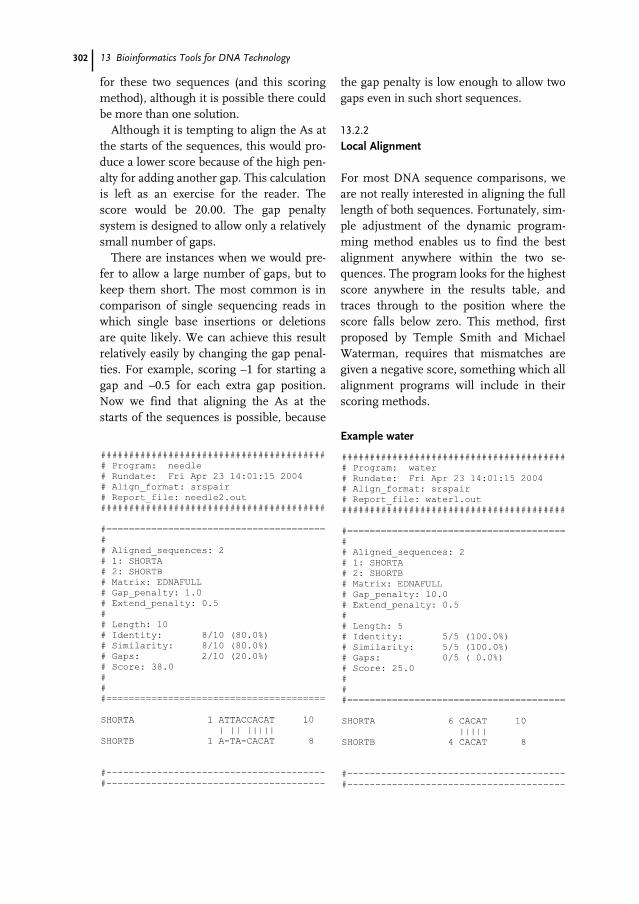
302 13 Bioinformatics Tools for DNA Technology
for these two sequences (and this scoringmethod), although it is possible there couldbe more than one solution.
Although it is tempting to align the As atthe starts of the sequences, this would pro-duce a lower score because of the high pen-alty for adding another gap. This calculationis left as an exercise for the reader. Thescore would be 20.00. The gap penaltysystem is designed to allow only a relativelysmall number of gaps.
There are instances when we would pre-fer to allow a large number of gaps, but tokeep them short. The most common is incomparison of single sequencing reads inwhich single base insertions or deletionsare quite likely. We can achieve this resultrelatively easily by changing the gap penal-ties. For example, scoring –1 for starting agap and –0.5 for each extra gap position.Now we find that aligning the As at thestarts of the sequences is possible, because
the gap penalty is low enough to allow twogaps even in such short sequences.
13.2.2
Local Alignment
For most DNA sequence comparisons, weare not really interested in aligning the fulllength of both sequences. Fortunately, sim-ple adjustment of the dynamic program-ming method enables us to find the bestalignment anywhere within the two se-quences. The program looks for the highestscore anywhere in the results table, andtraces through to the position where thescore falls below zero. This method, firstproposed by Temple Smith and MichaelWaterman, requires that mismatches aregiven a negative score, something which allalignment programs will include in theirscoring methods.
Example water
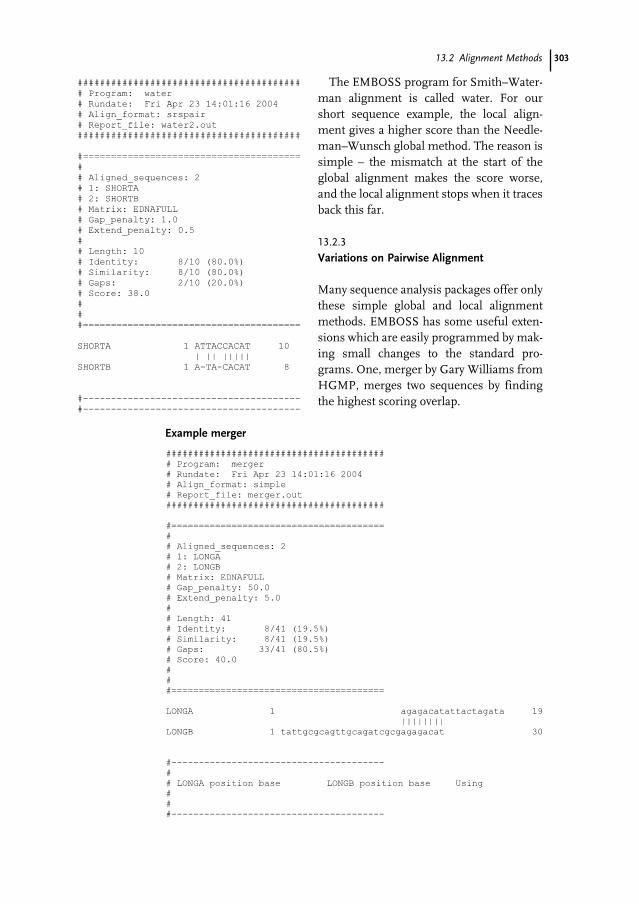
30313.2 Alignment Methods
The EMBOSS program for Smith–Water-man alignment is called water. For ourshort sequence example, the local align-ment gives a higher score than the Needle-man–Wunsch global method. The reason issimple – the mismatch at the start of theglobal alignment makes the score worse,and the local alignment stops when it tracesback this far.
13.2.3
Variations on Pairwise Alignment
Many sequence analysis packages offer onlythese simple global and local alignmentmethods. EMBOSS has some useful exten-sions which are easily programmed by mak-ing small changes to the standard pro-grams. One, merger by Gary Williams fromHGMP, merges two sequences by findingthe highest scoring overlap.
Example merger
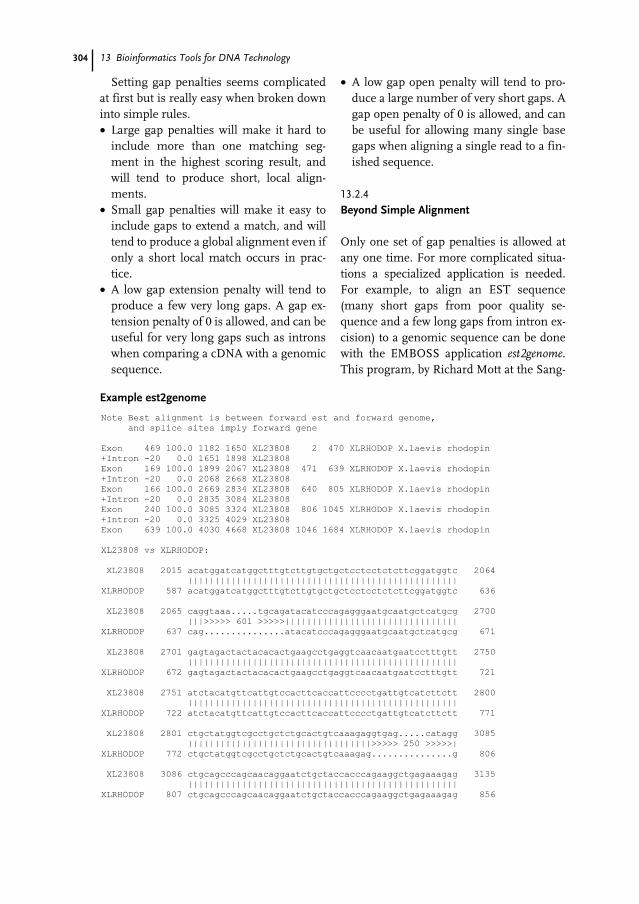
304 13 Bioinformatics Tools for DNA Technology
Setting gap penalties seems complicatedat first but is really easy when broken downinto simple rules.• Large gap penalties will make it hard to
include more than one matching seg-ment in the highest scoring result, andwill tend to produce short, local align-ments.
• Small gap penalties will make it easy toinclude gaps to extend a match, and willtend to produce a global alignment even ifonly a short local match occurs in prac-tice.
• A low gap extension penalty will tend toproduce a few very long gaps. A gap ex-tension penalty of 0 is allowed, and can beuseful for very long gaps such as intronswhen comparing a cDNA with a genomicsequence.
• A low gap open penalty will tend to pro-duce a large number of very short gaps. Agap open penalty of 0 is allowed, and canbe useful for allowing many single basegaps when aligning a single read to a fin-ished sequence.
13.2.4
Beyond Simple Alignment
Only one set of gap penalties is allowed atany one time. For more complicated situa-tions a specialized application is needed.For example, to align an EST sequence(many short gaps from poor quality se-quence and a few long gaps from intron ex-cision) to a genomic sequence can be donewith the EMBOSS application est2genome.This program, by Richard Mott at the Sang-
Example est2genome
30513.3 Sequence Comparison Methods
er Center [4], includes splice site consensussequences and two different gap-scoringsystems for introns and exons.
One problem with the dynamic program-ming method is that it does not scale tolarge sequences. It uses a comparison tableto match each base of each sequence. For atypical bacterial gene or cDNA readingframe this could be 1000 bases in each se-quence, or 1,000,000 possible comparisons.As the sequences grow longer this quicklybecomes too big a problem to fit in thecomputer’s memory or to be computed in areasonable time.
For large sequences, for example BACclones or complete genomes, a short cut isneeded. One of the most common is to lookonly at localized ungapped alignments bycomparing the two sequences in shortstretches and then looking for ways to ex-tend the match region but without allowinggaps, so the problem is far easier to com-pute. Where a gap appears in a long regionof similarity the expectation is that therewill be two ungapped matches reported.Even so, too many gaps will make matchesimpossible to detect.
A particularly rapid way of finding localungapped matches is to look for “words” incommon between two sequences [5]. Onesequence is converted to a list of all possiblesequences of, for example, six bases andeach of these is then sought in the secondsequence. Where there is a match, theneighboring bases can be checked to findwhether the match can be extended. It isthen very easy to look for clusters of highscores and to report the best matches. Se-quences of up to complete bacterial ge-nome size can be compared in a few sec-onds by this method. For increased speedand flexibility, some programs build a com-plete index of the words and look up the val-ues instead of computing them each timethe program runs. This can take a lot of
disk space and a lot of time when the indi-ces are calculated).
Multiple alignment is known to be a diffi-cult problem. Clearly, the dynamic program-ming method used for aligning two se-quences is not practical for more. Just threesequences of 1000 bases each would need1,000,000,000 comparisons to be made andstored. Instead the problem is usually brok-en down into a series of pairwise matcheswhich are combined to produce a final align-ment [6].
13.2.5
Other Alignment Methods
To use all possible alignments, there areother methods. The most popular currentlyis to create a hidden Markov model(HMM) [7] which “learns” the characteris-tics of a set of sequences, including themost significant similarities between them.By aligning the original sequences to theHMM we can get a sequence alignment,and by searching a sequence database withthe HMM we can search for new sequencesto add to the alignment. HMM have beenvery successfully used for protein domainanalysis (Pfam) and have also been appliedto gene prediction in bacteria as a pattern-matching method (see below).
13.3
Sequence Comparison Methods
An alternative to full alignment of two se-quences is to search for common patternsbetween them. One of the fastest to calcu-late is the occurrence of long subsequences(“k-tuples” or “words”).
We start again with dot plot methods.The EMBOSS dottup program calculatesword matches between two sequences anddisplays them on a dot plot. The first step is
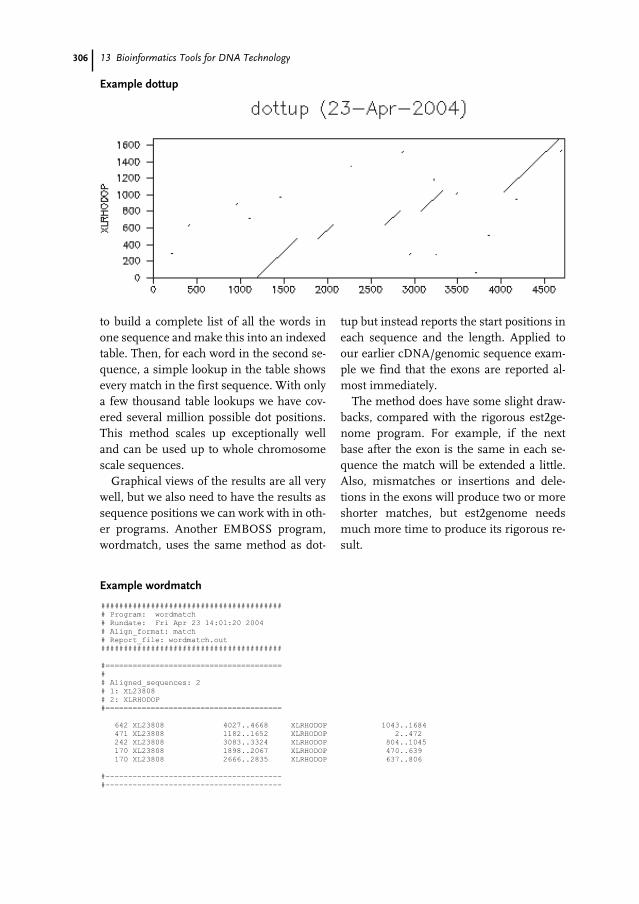
306 13 Bioinformatics Tools for DNA Technology
to build a complete list of all the words inone sequence and make this into an indexedtable. Then, for each word in the second se-quence, a simple lookup in the table showsevery match in the first sequence. With onlya few thousand table lookups we have cov-ered several million possible dot positions.This method scales up exceptionally welland can be used up to whole chromosomescale sequences.
Graphical views of the results are all verywell, but we also need to have the results assequence positions we can work with in oth-er programs. Another EMBOSS program,wordmatch, uses the same method as dot-
tup but instead reports the start positions ineach sequence and the length. Applied toour earlier cDNA/genomic sequence exam-ple we find that the exons are reported al-most immediately.
The method does have some slight draw-backs, compared with the rigorous est2ge-nome program. For example, if the nextbase after the exon is the same in each se-quence the match will be extended a little.Also, mismatches or insertions and dele-tions in the exons will produce two or moreshorter matches, but est2genome needsmuch more time to produce its rigorous re-sult.
Example dottup
Example wordmatch
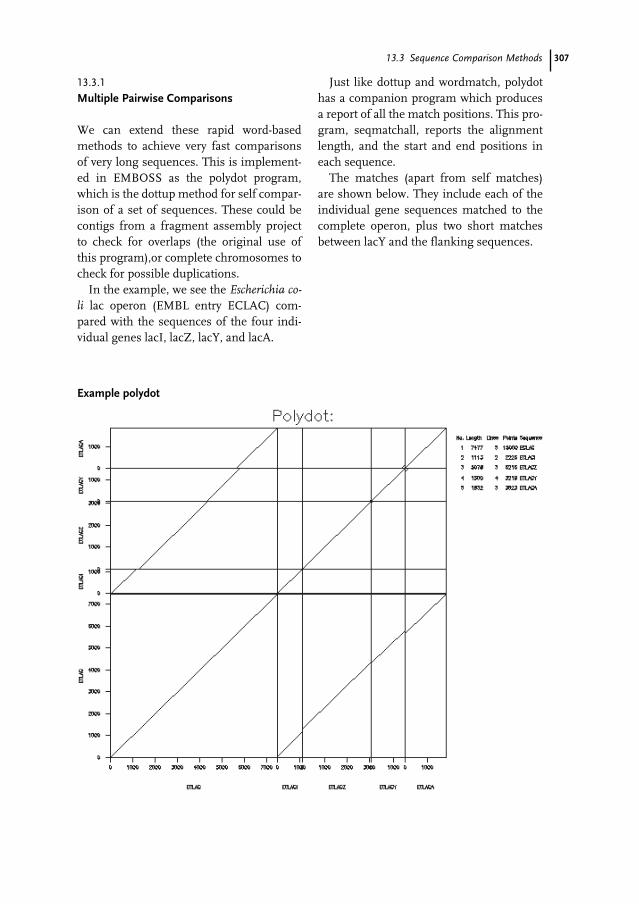
30713.3 Sequence Comparison Methods
13.3.1
Multiple Pairwise Comparisons
We can extend these rapid word-basedmethods to achieve very fast comparisonsof very long sequences. This is implement-ed in EMBOSS as the polydot program,which is the dottup method for self compar-ison of a set of sequences. These could becontigs from a fragment assembly projectto check for overlaps (the original use ofthis program),or complete chromosomes tocheck for possible duplications.
In the example, we see the Escherichia co-li lac operon (EMBL entry ECLAC) com-pared with the sequences of the four indi-vidual genes lacI, lacZ, lacY, and lacA.
Just like dottup and wordmatch, polydothas a companion program which producesa report of all the match positions. This pro-gram, seqmatchall, reports the alignmentlength, and the start and end positions ineach sequence.
The matches (apart from self matches)are shown below. They include each of theindividual gene sequences matched to thecomplete operon, plus two short matchesbetween lacY and the flanking sequences.
Example polydot
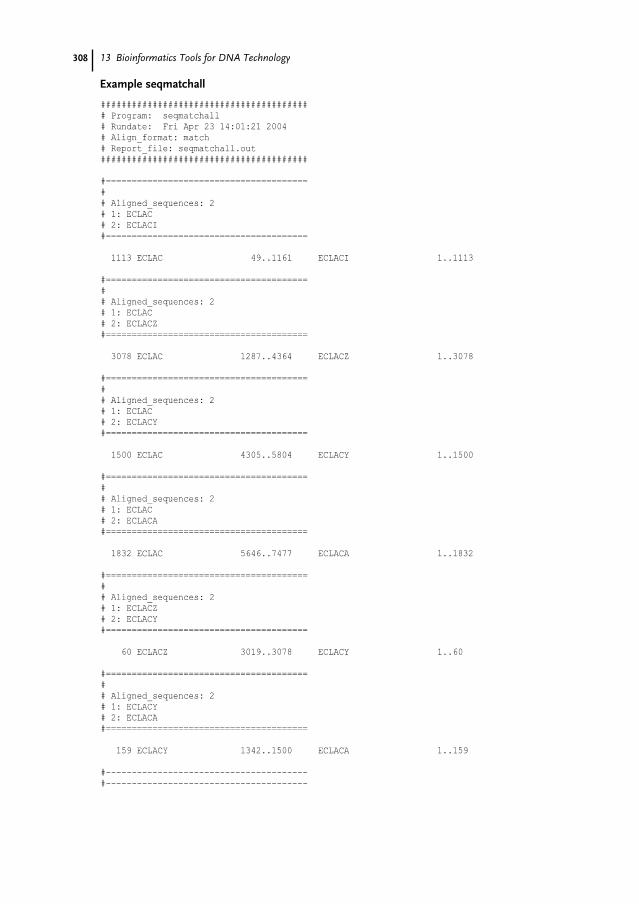
308 13 Bioinformatics Tools for DNA Technology
Example seqmatchall
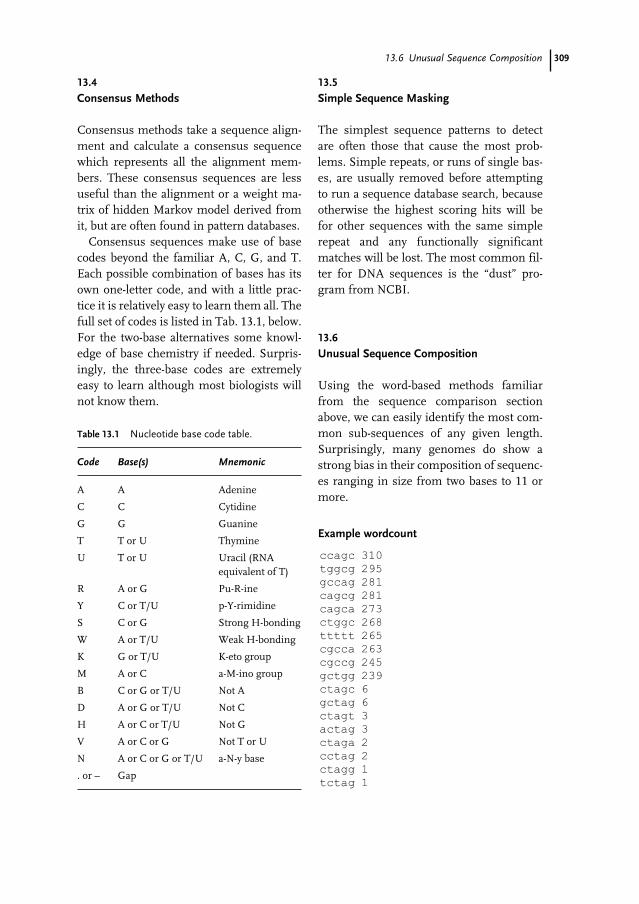
30913.6 Unusual Sequence Composition
13.4
Consensus Methods
Consensus methods take a sequence align-ment and calculate a consensus sequencewhich represents all the alignment mem-bers. These consensus sequences are lessuseful than the alignment or a weight ma-trix of hidden Markov model derived fromit, but are often found in pattern databases.
Consensus sequences make use of basecodes beyond the familiar A, C, G, and T.Each possible combination of bases has itsown one-letter code, and with a little prac-tice it is relatively easy to learn them all. Thefull set of codes is listed in Tab. 13.1, below.For the two-base alternatives some knowl-edge of base chemistry if needed. Surpris-ingly, the three-base codes are extremelyeasy to learn although most biologists willnot know them.
13.5
Simple Sequence Masking
The simplest sequence patterns to detectare often those that cause the most prob-lems. Simple repeats, or runs of single bas-es, are usually removed before attemptingto run a sequence database search, becauseotherwise the highest scoring hits will befor other sequences with the same simplerepeat and any functionally significantmatches will be lost. The most common fil-ter for DNA sequences is the “dust” pro-gram from NCBI.
13.6
Unusual Sequence Composition
Using the word-based methods familiarfrom the sequence comparison sectionabove, we can easily identify the most com-mon sub-sequences of any given length.Surprisingly, many genomes do show astrong bias in their composition of sequenc-es ranging in size from two bases to 11 ormore.
Table 13.1 Nucleotide base code table.
Code Base(s) Mnemonic
A A Adenine
C C Cytidine
G G Guanine
T T or U Thymine
U T or U Uracil (RNAequivalent of T)
R A or G Pu-R-ine
Y C or T/U p-Y-rimidine
S C or G Strong H-bonding
W A or T/U Weak H-bonding
K G or T/U K-eto group
M A or C a-M-ino group
B C or G or T/U Not A
D A or G or T/U Not C
H A or C or T/U Not G
V A or C or G Not T or U
N A or C or G or T/U a-N-y base
. or – Gap
Example wordcount
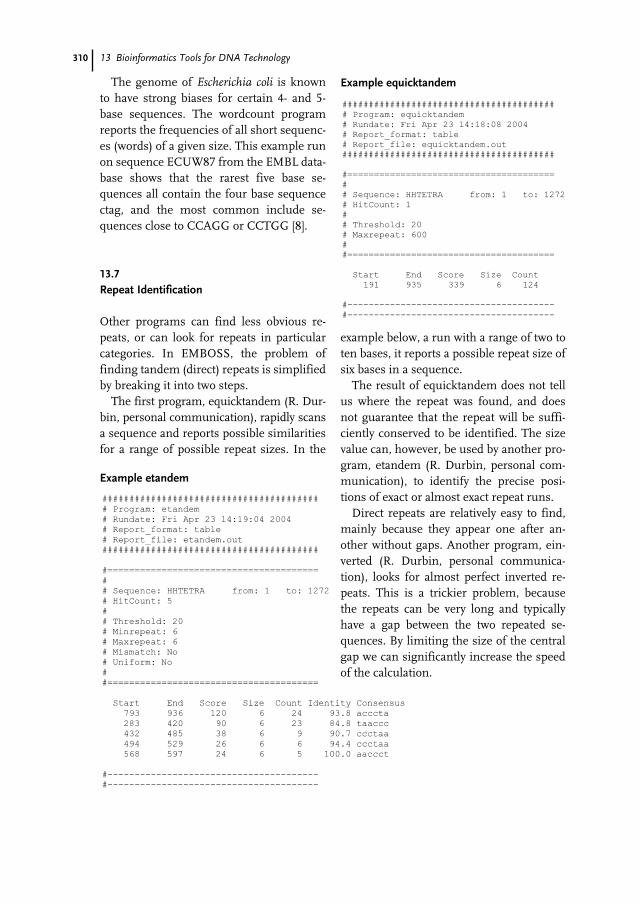
310 13 Bioinformatics Tools for DNA Technology
The genome of Escherichia coli is knownto have strong biases for certain 4- and 5-base sequences. The wordcount programreports the frequencies of all short sequenc-es (words) of a given size. This example runon sequence ECUW87 from the EMBL data-base shows that the rarest five base se-quences all contain the four base sequencectag, and the most common include se-quences close to CCAGG or CCTGG [8].
13.7
Repeat Identification
Other programs can find less obvious re-peats, or can look for repeats in particularcategories. In EMBOSS, the problem offinding tandem (direct) repeats is simplifiedby breaking it into two steps.
The first program, equicktandem (R. Dur-bin, personal communication), rapidly scansa sequence and reports possible similaritiesfor a range of possible repeat sizes. In the
Example equicktandem
Example etandem
example below, a run with a range of two toten bases, it reports a possible repeat size ofsix bases in a sequence.
The result of equicktandem does not tellus where the repeat was found, and doesnot guarantee that the repeat will be suffi-ciently conserved to be identified. The sizevalue can, however, be used by another pro-gram, etandem (R. Durbin, personal com-munication), to identify the precise posi-tions of exact or almost exact repeat runs.
Direct repeats are relatively easy to find,mainly because they appear one after an-other without gaps. Another program, ein-verted (R. Durbin, personal communica-tion), looks for almost perfect inverted re-peats. This is a trickier problem, becausethe repeats can be very long and typicallyhave a gap between the two repeated se-quences. By limiting the size of the centralgap we can significantly increase the speedof the calculation.
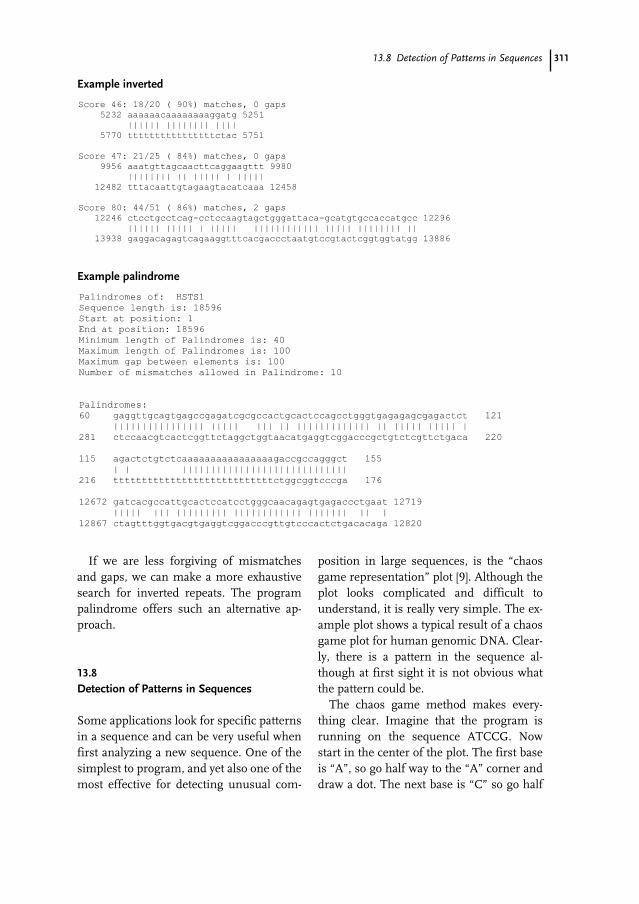
31113.8 Detection of Patterns in Sequences
If we are less forgiving of mismatchesand gaps, we can make a more exhaustivesearch for inverted repeats. The programpalindrome offers such an alternative ap-proach.
13.8
Detection of Patterns in Sequences
Some applications look for specific patternsin a sequence and can be very useful whenfirst analyzing a new sequence. One of thesimplest to program, and yet also one of themost effective for detecting unusual com-
position in large sequences, is the “chaosgame representation” plot [9]. Although theplot looks complicated and difficult tounderstand, it is really very simple. The ex-ample plot shows a typical result of a chaosgame plot for human genomic DNA. Clear-ly, there is a pattern in the sequence al-though at first sight it is not obvious whatthe pattern could be.
The chaos game method makes every-thing clear. Imagine that the program isrunning on the sequence ATCCG. Nowstart in the center of the plot. The first baseis “A”, so go half way to the “A” corner anddraw a dot. The next base is “C” so go half
Example inverted
Example palindrome
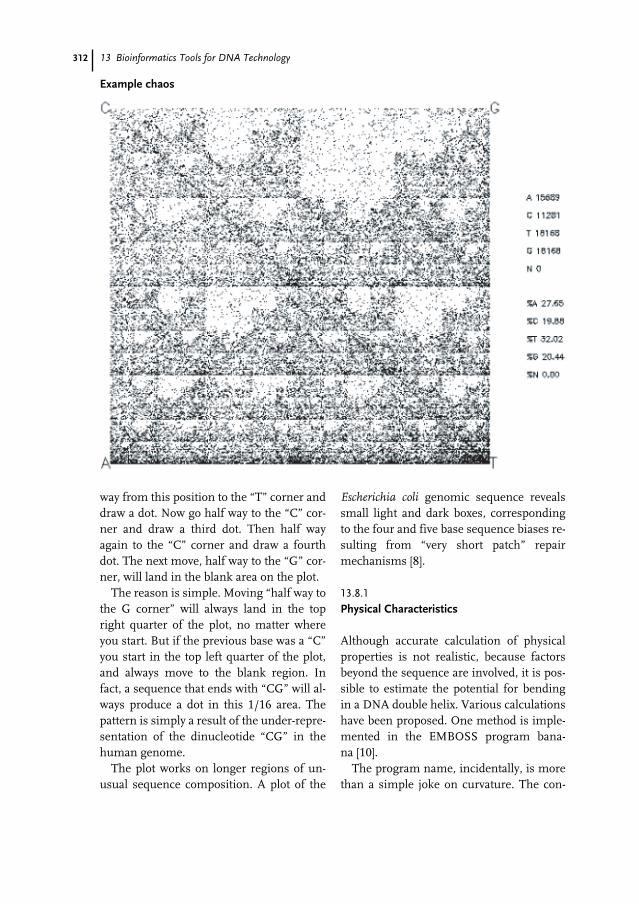
312 13 Bioinformatics Tools for DNA Technology
way from this position to the “T” corner anddraw a dot. Now go half way to the “C” cor-ner and draw a third dot. Then half wayagain to the “C” corner and draw a fourthdot. The next move, half way to the “G” cor-ner, will land in the blank area on the plot.
The reason is simple. Moving “half way tothe G corner” will always land in the topright quarter of the plot, no matter whereyou start. But if the previous base was a “C”you start in the top left quarter of the plot,and always move to the blank region. Infact, a sequence that ends with “CG” will al-ways produce a dot in this 1/16 area. Thepattern is simply a result of the under-repre-sentation of the dinucleotide “CG” in thehuman genome.
The plot works on longer regions of un-usual sequence composition. A plot of the
Escherichia coli genomic sequence revealssmall light and dark boxes, correspondingto the four and five base sequence biases re-sulting from “very short patch” repairmechanisms [8].
13.8.1
Physical Characteristics
Although accurate calculation of physicalproperties is not realistic, because factorsbeyond the sequence are involved, it is pos-sible to estimate the potential for bendingin a DNA double helix. Various calculationshave been proposed. One method is imple-mented in the EMBOSS program bana-na [10].
The program name, incidentally, is morethan a simple joke on curvature. The con-
Example chaos
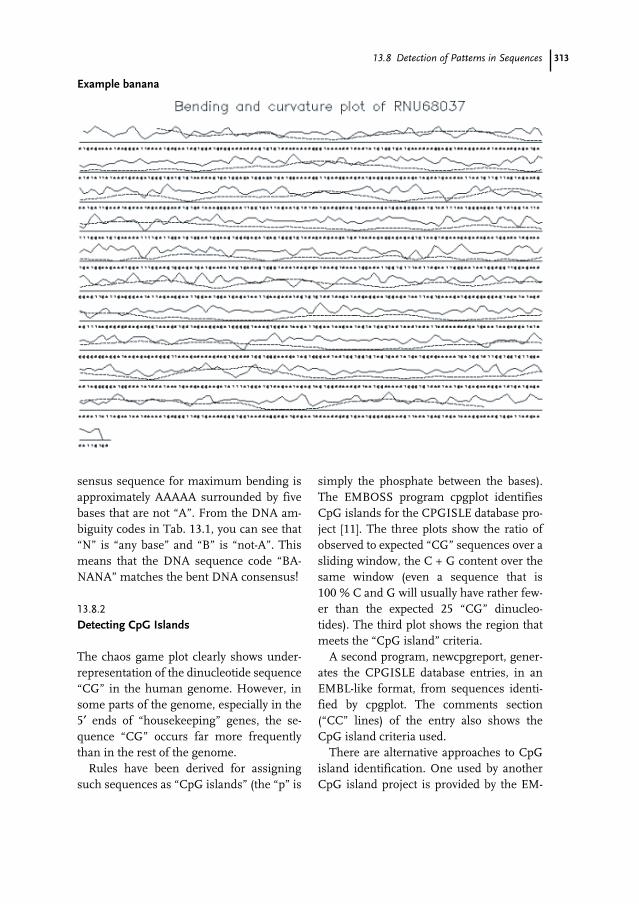
31313.8 Detection of Patterns in Sequences
sensus sequence for maximum bending isapproximately AAAAA surrounded by fivebases that are not “A”. From the DNA am-biguity codes in Tab. 13.1, you can see that“N” is “any base” and “B” is “not-A”. Thismeans that the DNA sequence code “BA-NANA” matches the bent DNA consensus!
13.8.2
Detecting CpG Islands
The chaos game plot clearly shows under-representation of the dinucleotide sequence“CG” in the human genome. However, insome parts of the genome, especially in the5′ ends of “housekeeping” genes, the se-quence “CG” occurs far more frequentlythan in the rest of the genome.
Rules have been derived for assigningsuch sequences as “CpG islands” (the “p” is
simply the phosphate between the bases).The EMBOSS program cpgplot identifiesCpG islands for the CPGISLE database pro-ject [11]. The three plots show the ratio ofobserved to expected “CG” sequences over asliding window, the C + G content over thesame window (even a sequence that is100 % C and G will usually have rather few-er than the expected 25 “CG” dinucleo-tides). The third plot shows the region thatmeets the “CpG island” criteria.
A second program, newcpgreport, gener-ates the CPGISLE database entries, in anEMBL-like format, from sequences identi-fied by cpgplot. The comments section(“CC” lines) of the entry also shows theCpG island criteria used.
There are alternative approaches to CpGisland identification. One used by anotherCpG island project is provided by the EM-
Example banana
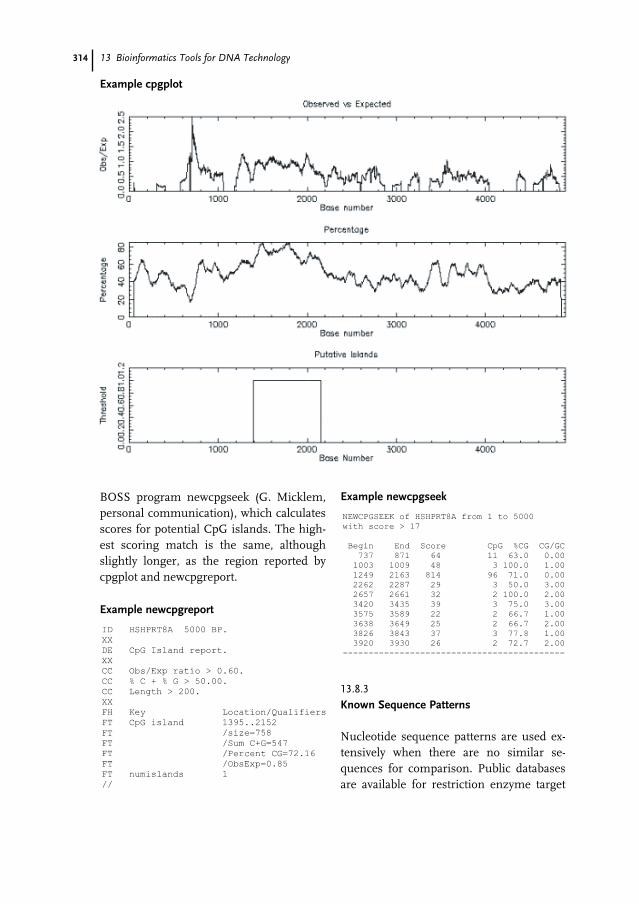
314 13 Bioinformatics Tools for DNA Technology
BOSS program newcpgseek (G. Micklem,personal communication), which calculatesscores for potential CpG islands. The high-est scoring match is the same, althoughslightly longer, as the region reported bycpgplot and newcpgreport.
13.8.3
Known Sequence Patterns
Nucleotide sequence patterns are used ex-tensively when there are no similar se-quences for comparison. Public databasesare available for restriction enzyme target
Example cpgplot
Example newcpgreport
Example newcpgseek
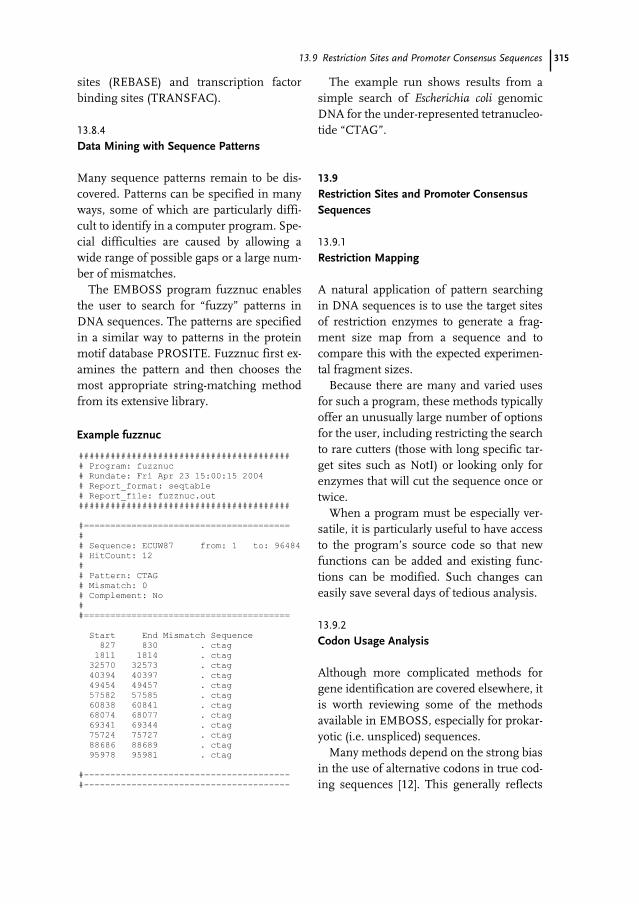
31513.9 Restriction Sites and Promoter Consensus Sequences
sites (REBASE) and transcription factorbinding sites (TRANSFAC).
13.8.4
Data Mining with Sequence Patterns
Many sequence patterns remain to be dis-covered. Patterns can be specified in manyways, some of which are particularly diffi-cult to identify in a computer program. Spe-cial difficulties are caused by allowing awide range of possible gaps or a large num-ber of mismatches.
The EMBOSS program fuzznuc enablesthe user to search for “fuzzy” patterns inDNA sequences. The patterns are specifiedin a similar way to patterns in the proteinmotif database PROSITE. Fuzznuc first ex-amines the pattern and then chooses themost appropriate string-matching methodfrom its extensive library.
The example run shows results from asimple search of Escherichia coli genomicDNA for the under-represented tetranucleo-tide “CTAG”.
13.9
Restriction Sites and Promoter ConsensusSequences
13.9.1
Restriction Mapping
A natural application of pattern searchingin DNA sequences is to use the target sitesof restriction enzymes to generate a frag-ment size map from a sequence and tocompare this with the expected experimen-tal fragment sizes.
Because there are many and varied usesfor such a program, these methods typicallyoffer an unusually large number of optionsfor the user, including restricting the searchto rare cutters (those with long specific tar-get sites such as NotI) or looking only forenzymes that will cut the sequence once ortwice.
When a program must be especially ver-satile, it is particularly useful to have accessto the program’s source code so that newfunctions can be added and existing func-tions can be modified. Such changes caneasily save several days of tedious analysis.
13.9.2
Codon Usage Analysis
Although more complicated methods forgene identification are covered elsewhere, itis worth reviewing some of the methodsavailable in EMBOSS, especially for prokar-yotic (i.e. unspliced) sequences.
Many methods depend on the strong biasin the use of alternative codons in true cod-ing sequences [12]. This generally reflects
Example fuzznuc
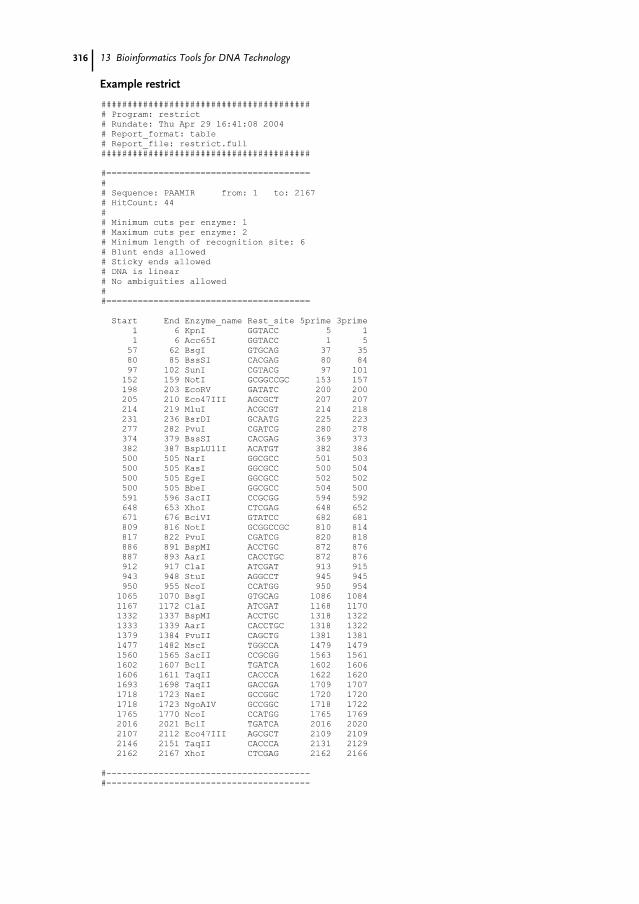
316 13 Bioinformatics Tools for DNA Technology
Example restrict
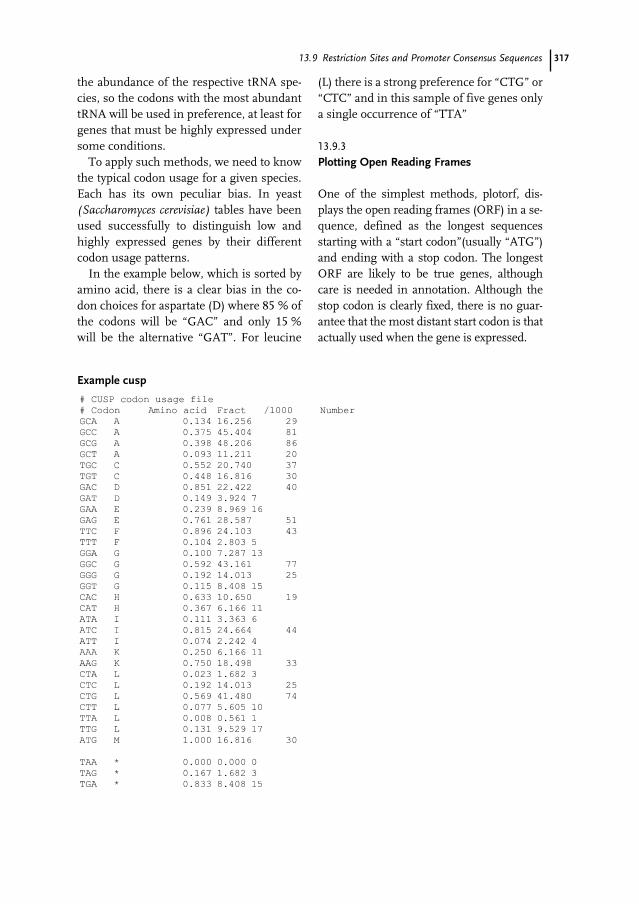
31713.9 Restriction Sites and Promoter Consensus Sequences
the abundance of the respective tRNA spe-cies, so the codons with the most abundanttRNA will be used in preference, at least forgenes that must be highly expressed undersome conditions.
To apply such methods, we need to knowthe typical codon usage for a given species.Each has its own peculiar bias. In yeast(Saccharomyces cerevisiae) tables have beenused successfully to distinguish low andhighly expressed genes by their differentcodon usage patterns.
In the example below, which is sorted byamino acid, there is a clear bias in the co-don choices for aspartate (D) where 85 % ofthe codons will be “GAC” and only 15 %will be the alternative “GAT”. For leucine
(L) there is a strong preference for “CTG” or“CTC” and in this sample of five genes onlya single occurrence of “TTA”
13.9.3
Plotting Open Reading Frames
One of the simplest methods, plotorf, dis-plays the open reading frames (ORF) in a se-quence, defined as the longest sequencesstarting with a “start codon”(usually “ATG”)and ending with a stop codon. The longestORF are likely to be true genes, althoughcare is needed in annotation. Although thestop codon is clearly fixed, there is no guar-antee that the most distant start codon is thatactually used when the gene is expressed.
Example cusp
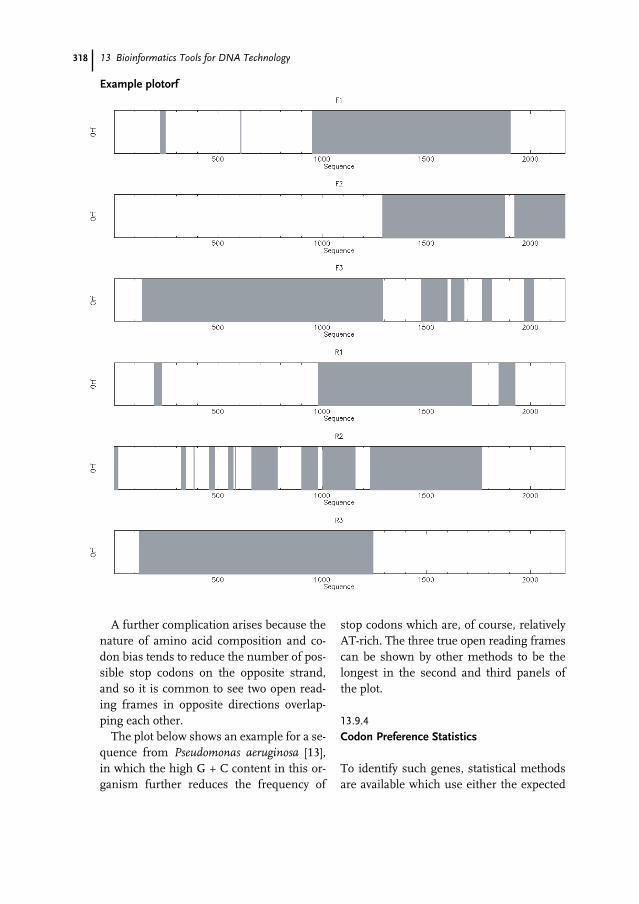
318 13 Bioinformatics Tools for DNA Technology
A further complication arises because thenature of amino acid composition and co-don bias tends to reduce the number of pos-sible stop codons on the opposite strand,and so it is common to see two open read-ing frames in opposite directions overlap-ping each other.
The plot below shows an example for a se-quence from Pseudomonas aeruginosa [13],in which the high G + C content in this or-ganism further reduces the frequency of
stop codons which are, of course, relativelyAT-rich. The three true open reading framescan be shown by other methods to be thelongest in the second and third panels ofthe plot.
13.9.4
Codon Preference Statistics
To identify such genes, statistical methodsare available which use either the expected
Example plotorf

31913.9 Restriction Sites and Promoter Consensus Sequences
codon usage table or, more crudely, thebiased base composition of the third (wob-ble) base position in each codon.
For codon usage, the EMBOSS programsyco (synonymous codons) plots the Gribs-kov statistic [12] over a sequence in each ofthe three possible reading frames. The ex-ample sequence is the same as that in theplotorf example above.
If a codon usage table is not available, orfor some species in which the codon bias is
weak, statistical analysis of the third baseposition offers a practical alternative meth-od. The example below is for the same Pseu-domonas aeruginosa sequence, in which thehigh G + C content leads to a speciallystrong third position bias reflected in thegeneral rule “if any base can be C or G thenit will be.”
Example syco
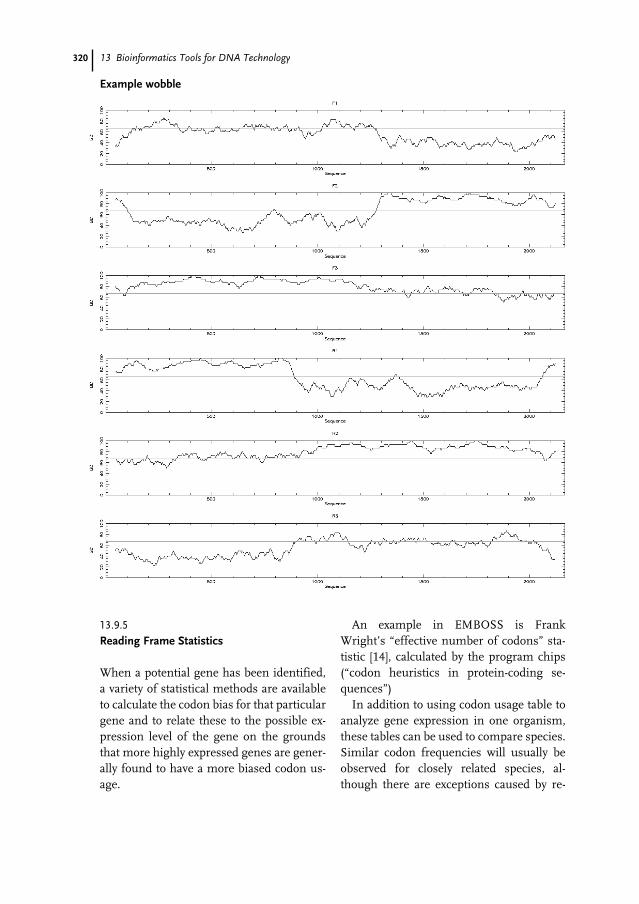
320 13 Bioinformatics Tools for DNA Technology
13.9.5
Reading Frame Statistics
When a potential gene has been identified,a variety of statistical methods are availableto calculate the codon bias for that particulargene and to relate these to the possible ex-pression level of the gene on the groundsthat more highly expressed genes are gener-ally found to have a more biased codon us-age.
An example in EMBOSS is FrankWright’s “effective number of codons” sta-tistic [14], calculated by the program chips(“codon heuristics in protein-coding se-quences”)
In addition to using codon usage table toanalyze gene expression in one organism,these tables can be used to compare species.Similar codon frequencies will usually beobserved for closely related species, al-though there are exceptions caused by re-
Example wobble
32113.10 The Future for EMBOSS
cent changes in GC content, and by recenthorizontal transfer of DNA. These methodscan be used, for example, to identify DNAor viral origin in bacterial genomes.
The program codcmp compares two co-don usage tables, and calculates statistics toindicate their degree of difference.
The EMBOSS collaborators made plansto make all the programs available under asmany different user interfaces as possible.Already in the first phase of the project (upto the end of the year 2000) we had volun-teers who added EMBOSS to Web interfac-es such as Pise from the Institut Pasteur,and W2H from the German Cancer Re-search Center (DKFZ – the German EMB-net node http://www.de.embnet.org/). Webinterfaces make the EMBOSS programsavailable to any user with a web browser,through access to a central service site thatcan install the databases and maintain theprograms – something that EMBnet siteshave many years of experience in providingto most of the major countries of the world.
Meanwhile, the EMBOSS core developersproduced a graphical user interface calledJemboss, and also collaborated with com-mercial software companies to provide EM-BOSS under proprietary interfaces, for ex-ample SRS.
An exciting new area in bioinformatics isthe emergence of “web services” using theSOAP protocol. EMBOSS has been adoptedby several such projects, including my-Grid [15] SoapLab [16] and Taverna [17]which builds EMBOSS-based web servicesinto workflows.
The programs will also continue to devel-op. In the area of sequence analysis we areadding more input and output data types,and rewriting the program output to give aset of user-selectable report formats; thesewill make the processing of EMBOSS out-put and the interconnection of the pro-grams much easier in the next release.
EMBOSS is also extending beyond puresequence analysis, with groups interestedin the fields of protein structure and phylo-genetics (to give just two examples). Withhelp from the bioinformatics communitythe future continues to look very interestingindeed.
Example chips
Example codcmp
13.10
The Future for EMBOSS
The EMBOSS project is an open source ef-fort, which means that all the source code ismade freely available for everyone to shareand develop further. The home of the pro-ject is now shared by the European Bioin-formatics Institute (http://www.ebi.ac.uk/),and the Human Genome Mapping Project(HGMP) Resource Center http://www.hgmp.mrc.ac.uk/ in Hinxton, next door tothe Sanger Center where the project started.
The programs were designed to be run as“commands” by simply typing the programname and answering a series of questions.It was always clear that for many users thiswould not be enough, and also that few us-ers would, in practice, agree on the best ap-proach to take.
322
1 Rice, P., Longden, I., and Bleasby, A. (2000)EMBOSS: The European Molecular BiologyOpen Software Suite http://www.emboss.org/and http://emboss.sourceforge.net/ TrendsGenet. 16:276–277.
2 Needleman, S.B. and Wunsch, C.D. (1970) Ageneral method applicable to the search forsimilarities in the amino acid sequence of twoproteins. J. Mol. Biol. 48:443–453.
3 Smith, T.F. and Waterman, M.S. (1981)Identification of common molecularsubsequences. J. Mol. Biol. 147:195–197.
4 Mott, R.F. (1997) Est_genome: a program toalign spliced DNA sequences to unsplicedgenomic DNA. Comput. Appl. Biosci. 13:477–478.
5 Wilbur, W.J. and Lipman, D.J. (1983)Improved tools for biological sequencecomparison. Proc. Nat. Acad. Sci. USA80:726–730.
6 Thompson, J.D., Higgins, D.G. and Gibson,T.J. (1994) CLUSTAL W: improving thesensitivity of progressive multiple sequencealignment through sequence weighting,positions-specific gap penalties and weightmatrix choice. Nucleic Acids Res.22:4673–4680.
7 Durbin, R., Eddy, S., Krogh, A., andMitchison, G. (1998) Biological SequenceAnalysis, Cambridge University Press, UK.
8 Merkl, R., Kroeger, M., Rice, P., and Fritz, H.-J. (1992) Statistical evaluation andbiological interpretation of non-randomabundance in the E. coli K-12 genome of tetra-and pentanucleotide sequences related to VSPDNA mismatch repair. Nucleic Acids Res.20:1657–1662.
9 Jeffrey, H.J. (1990) Chaos game representa-tion of gene structure. Nucleic Acids Res.18:2163–2170.
10 Goodsell, D.S. and Dickerson, R.E. (1994)Bending and Curvature Calculations in B-DNA. Nucleic Acids Res. 22:5497–5503.
11 Larsen, F., Gundersen, G., Lopez, R., Prydz,H. (1992) CpG islands as gene markers in thehuman genome. Genomics 13:105–107.
12 Gribskov, M., Devereux, J., and Burgess, R.R.(1984) The codon preference plot: graphicanalysis of protein coding sequences andprediction of gene expression. Nucleic AcidsRes. 12:539–549.
13 Lowe, N., Rice, P.M., and Drew, R.E.(1989)Nucleotide sequence of the aliphatic amidaseregulator gene of Pseudomonas aeruginosa.FEBS Lett. 246:39–43.
14 Wright, F. (1990) The ‘effective number ofcodons’ used in a gene. Gene 87:23–29.
15 Stevens, R., Robinson, A., and Goble, C.A.(2003) myGrid: Personalised Bioinformaticson the Information Gridhttp://www.mygrid.org.uk/ Bioinformatics 19(Suppl. 1):i302–i304.
16 Senger, M., Rice, P., and Oinn, T. (2003)Soaplab – a unified Sesame door to analysistools. In: Cox, S.J. (Ed.) Proc. UK e-Science,All Hands Meeting 2003, pp. 509–513, ISBN1-904425-11-9.
17 Oinn, T., Addis, M., Ferris, J., Marvin, D.,Greenwood, M., Carver, T., Wipat, A., and Li,P. (2004) Taverna: A tool for the compositionand enactment of bioinformatics workflows.Bioinformatics J., in press.
References
323
David S. Wishart
14.1
Introduction
At the time of this writing there are morethan 250 fully sequenced organisms, in-cluding more than 200 different species ofbacteria and more than two dozen differenteukaryotes such as yeast, rice, nematodes,fruit flies, pufferfish, rodents (mice andrats), and humans [1]. It is likely that withintwo more years complete sets of gene andprotein sequences will be known for an-other 200–300 organisms including mostkey agricultural animals and plants and allremaining laboratory animals [2, 3]. It isclear that the challenge over the comingdecades will be to connect all those proteinsequences with their respective actions andto translate that understanding into new ap-proaches for management or treatment ofdisease, diagnosis of medical conditions,monitoring of drug interactions, improve-ment of crop yields, or enhancement of thequality of our environment.
Key to translating this raw biological datato practical knowledge will be our ability torecognize or detect patterns occurring with-in this data [4]. This is where bioinformaticsis important. Bioinformatics plays a vitalrole in all areas of proteomics (the study of
proteins and their interactions) by provid-ing the software tools that help sort, store,analyze, visualize, and extract importantpatterns from raw proteomic data. Compu-tational tools such as correlational analysis,multiparametric fitting, dynamic program-ming, artificial intelligence, neural net-works and hidden Markov models are criti-cal for revealing many of the hidden pat-terns and relationships in sequence, 2D gel,or mass spectrometric (MS) data. Comple-menting these tools is a growing array ofqueryable databases containing protein se-quences, pre-calculated mass fragmentdata, 2D gel images, 3D structures, proteininteraction partners, biochemical pathwaysand functional sites that provide the critical“prior knowledge” necessary for extractingadditional information from unprocessedexperimental data.
In previous chapters on protein and DNAtechnology we have seen how raw proteinsequence data, isoelectric points, and pep-tide mass fingerprints can be acquired. Inthis chapter we will see how these raw datacan be transformed into useful biochemicalknowledge. In particular, we will show howbioinformatics tools can be used to facilitateprotein identification and characterization
Handbook of Genome Research. Genomics, Proteomics, Metabolomics, Bioinformatics, Ethical and Legal Issues.Edited by Christoph W. SensenCopyright © 2005 WILEY-VCH Verlag GmbH & Co. KGaA, WeinheimISBN: 3-527-31348-6
14Software Tools for Proteomics Technologies
324 14 Software Tools for Proteomics Technologies
using 2D gel, MS, and unprocessed proteinsequence data. This chapter will be dividedinto two sections. The first is concernedwith describing the software tools and algo-rithms that can facilitate protein identifica-tion from 2D gels, mass spectrometric, orprotein sequence data. The second will de-scribe the bioinformatics tools and databas-es that can be used to predict the functions,locations, and properties of the proteinsidentified. Particular emphasis will beplaced on describing freely available Webtools or software packages that have beenpublished in the scientific literature.
14.2
Protein Identification
Unfortunately for us, proteins do not comewith name tags. They also occur in extreme-ly complex matrixes, usually with other pro-teins that look and behave almost identically.Indeed, the only way to uniquely identify aprotein is to carefully separate it and pains-takingly determine its sequence or preciselymeasure its mass. Consequently proteinidentification is an inherently difficult pro-cess that requires close interplay between ex-perimental and computational techniques[5, 6]. The experimental techniques providethe raw data and the computational tech-niques convert those raw data into a usableprotein name or a data bank accession num-ber. These computational tools all rely on acommon theme – they identify proteins bylooking for close matches (in mass, in se-quence, or in 2D gel position) with previous-ly identified proteins. In this way proteinidentification is facilitated by making use ofvast stores of previously accumulated knowl-edge about the two million proteins alreadystudied. In this section we will review threemethods of protein identification and theirassociated software tools:
1. identification by 2D gel spot position;2. identification by mass spectrometry; and3. identification by sequence data.
14.2.1
Protein Identification from 2D Gels
Despite predictions of its imminent de-mise, 1D and 2D gel electrophoresis is, andwill probably continue to be, an essentialcornerstone of proteomics research. No oth-er low-cost technology has comparable reso-lution or sensitivity for protein separationand display. Indeed, as we have seen fromChapt. 7, 2D gel electrophoresis enablesprecise and reproducible separation of up to10,000 different proteins. With the intro-duction of IEF “ultra-zoom” gels [7] to im-prove resolution, the commercialization ofpre-poured immobilized pH gradient (IPG)to improve consistency, and the develop-ment of multicolored, multiplexed DIGE [8]to enable rapid and robust in-gel compari-sons, it is probable that 2D gels will be withus for a very long time. Continuing techni-cal advances and the rapidly growing use of2D gels in proteomics has led to the devel-opment of several excellent software toolsand an increasing number of valuable 2Dgel databases to facilitate protein identifica-tion, quantification, and annotation. Al-though most 2D gel analysis software isvery image-oriented, the fact that thesepackages can be used to measure physicalproperties (pI and MW), to quantify proteincopy numbers, and to identify proteinsmakes them a key part of the standard bio-informatics tool chest.
Several popular, commercial softwarepackages are available for facilitating digitalgel analysis, including Melanie 4 (Gene-Bio), Phoretix 2D (Phoretix), ImageMaster2D (Amersham), PDQuest (BioRad), Del-ta2D (DeCodon), and Gellab II+ (Scanalyt-ics) (Tab. 14.1). All six packages have an im-
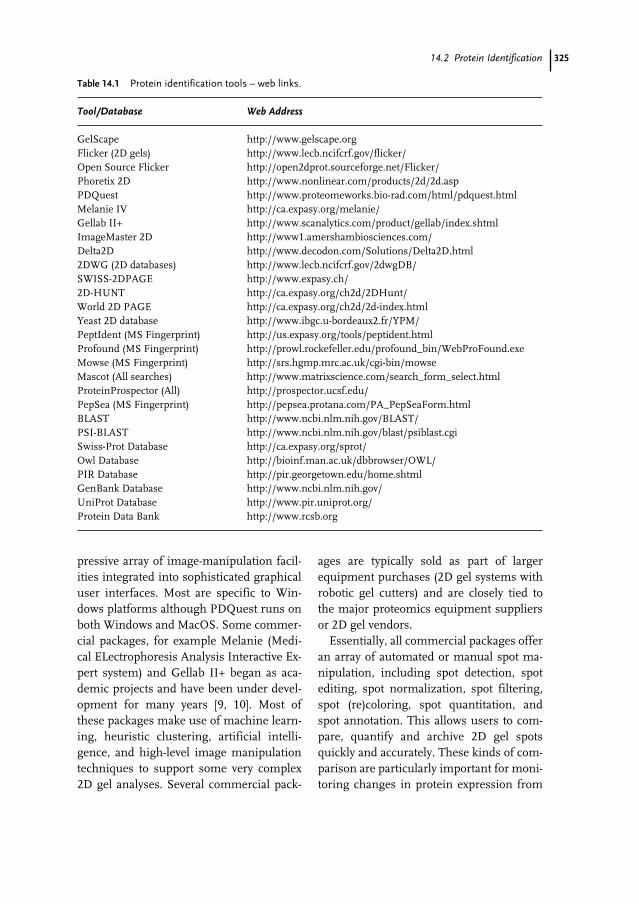
32514.2 Protein Identification
pressive array of image-manipulation facil-ities integrated into sophisticated graphicaluser interfaces. Most are specific to Win-dows platforms although PDQuest runs onboth Windows and MacOS. Some commer-cial packages, for example Melanie (Medi-cal ELectrophoresis Analysis Interactive Ex-pert system) and Gellab II+ began as aca-demic projects and have been under devel-opment for many years [9, 10]. Most ofthese packages make use of machine learn-ing, heuristic clustering, artificial intelli-gence, and high-level image manipulationtechniques to support some very complex2D gel analyses. Several commercial pack-
ages are typically sold as part of largerequipment purchases (2D gel systems withrobotic gel cutters) and are closely tied tothe major proteomics equipment suppliersor 2D gel vendors.
Essentially, all commercial packages offeran array of automated or manual spot ma-nipulation, including spot detection, spotediting, spot normalization, spot filtering,spot (re)coloring, spot quantitation, andspot annotation. This allows users to com-pare, quantify and archive 2D gel spotsquickly and accurately. These kinds of com-parison are particularly important for moni-toring changes in protein expression from
Table 14.1 Protein identification tools – web links.
Tool/Database Web Address
GelScape http://www.gelscape.orgFlicker (2D gels) http://www.lecb.ncifcrf.gov/flicker/Open Source Flicker http://open2dprot.sourceforge.net/Flicker/Phoretix 2D http://www.nonlinear.com/products/2d/2d.aspPDQuest http://www.proteomeworks.bio-rad.com/html/pdquest.htmlMelanie IV http://ca.expasy.org/melanie/Gellab II+ http://www.scanalytics.com/product/gellab/index.shtmlImageMaster 2D http://www1.amershambiosciences.com/Delta2D http://www.decodon.com/Solutions/Delta2D.html2DWG (2D databases) http://www.lecb.ncifcrf.gov/2dwgDB/SWISS-2DPAGE http://www.expasy.ch/2D-HUNT http://ca.expasy.org/ch2d/2DHunt/World 2D PAGE http://ca.expasy.org/ch2d/2d-index.htmlYeast 2D database http://www.ibgc.u-bordeaux2.fr/YPM/PeptIdent (MS Fingerprint) http://us.expasy.org/tools/peptident.htmlProfound (MS Fingerprint) http://prowl.rockefeller.edu/profound_bin/WebProFound.exeMowse (MS Fingerprint) http://srs.hgmp.mrc.ac.uk/cgi-bin/mowseMascot (All searches) http://www.matrixscience.com/search_form_select.htmlProteinProspector (All) http://prospector.ucsf.edu/PepSea (MS Fingerprint) http://pepsea.protana.com/PA_PepSeaForm.htmlBLAST http://www.ncbi.nlm.nih.gov/BLAST/PSI-BLAST http://www.ncbi.nlm.nih.gov/blast/psiblast.cgiSwiss-Prot Database http://ca.expasy.org/sprot/Owl Database http://bioinf.man.ac.uk/dbbrowser/OWL/PIR Database http://pir.georgetown.edu/home.shtmlGenBank Database http://www.ncbi.nlm.nih.gov/UniProt Database http://www.pir.uniprot.org/Protein Data Bank http://www.rcsb.org
326 14 Software Tools for Proteomics Technologies
gel to gel or from experiment to experiment.In addition to individual spot manipulation,whole gel manipulations such as rotating,overlaying, referencing, “synthesizing” andaveraging are typically supported in mostcommercial packages. This is done to facili-tate inter-gel comparison and to calibrategels to pI and molecular weight standards.Calibration is particularly important for 2Dgels if one wishes to extract accurate molec-ular weight or pI information for proteinidentification.
No matter how careful one is in casting orrunning a 2D gel, there is usually some in-ter-gel variability. The ability to stretch orshrink certain gel regions (or even entiregels) is, therefore, often necessary to enabledirect comparisons. Techniques called spotmatching, “landmarking”, and image “warp-ing” are available in most programs to en-able this kind of forced matching. Whenthis kind of image transformation has beencompleted most commercial packages en-able additional gels to be overlaid, subtract-ed, alternately flashed (flickered), or color-contrasted to identify significant changes orsignificant spots.
In addition to the commercial 2D gelpackages, there is a small but growing col-lection of high quality freeware packages for1D and 2D gel analysis including Gel-Scape [11] and Flicker [12, 13]. Both packag-es are written in Java and both are freelyavailable either as stand-alone applicationsor as platform-independent servlets/appletsthat can be readily accessed over the web(Tab. 14.1). The use of web-server technolo-gy enables users to access, share, or distrib-ute gel images and gel data in an interactive,platform-independent manner. GelScape(Fig. 14.1) supports many of the featuresfound in commercial, stand-alone gel-analy-sis packages including interactive spotmarking and annotation, spot integration,gel warping, image resizing, HTML image
mapping, gel (pH/MW) gridding, automat-ed spot picking and integration, transparentimage overlaying, rubber-band zooming,image recoloring, image reformatting, andgel image and gel annotation data storagein compliance with Federated Gel Data-base [14] requirements. Although not quiteas feature-rich as GelScape, the Flicker app-let is, nevertheless, quite useful for trans-forming (warping, rotating, etc.) and visual-izing pairs of 2D gels so that the gel of inter-est can be easily compared with a pre-exist-ing gel obtained from the Web. Flicker’sname comes from the fact that the programenables gel images to be switched on andoff (“flickered”) to facilitate visual compari-son. Flicker was recently rewritten as astand-alone, open source java application(Tab. 14.1). This has led to significant per-formance and feature improvements overthe original applet version.
Protein identification by use of 2D gelscan be achieved in any number of ways,whether by pI/MW measurements, West-ern blotting (if an antibody is known), or32P detection (if the protein of interest isknown to be phosphorylated). Often, how-ever, the best method for protein identifica-tion by visual comparison with previouslyannotated gels from databases [12, 15–17].Over the past 25 years, thousands of 2D gelshave been run on cell extracts of many dif-ferent organisms and human tissues. Manyof these gels have been analyzed and theirprotein spots identified by microsequenc-ing or mass spectrometry. These carefullyannotated gels have been deposited in morethan 30 different “federated” 2D gel data-bases (for example SWISS-2D PAGE orWebGel) with the intention that others whomight be studying similar systems can usethese standardized, annotated gel images tooverlay with their own gels and rapidlyidentify proteins of interest.
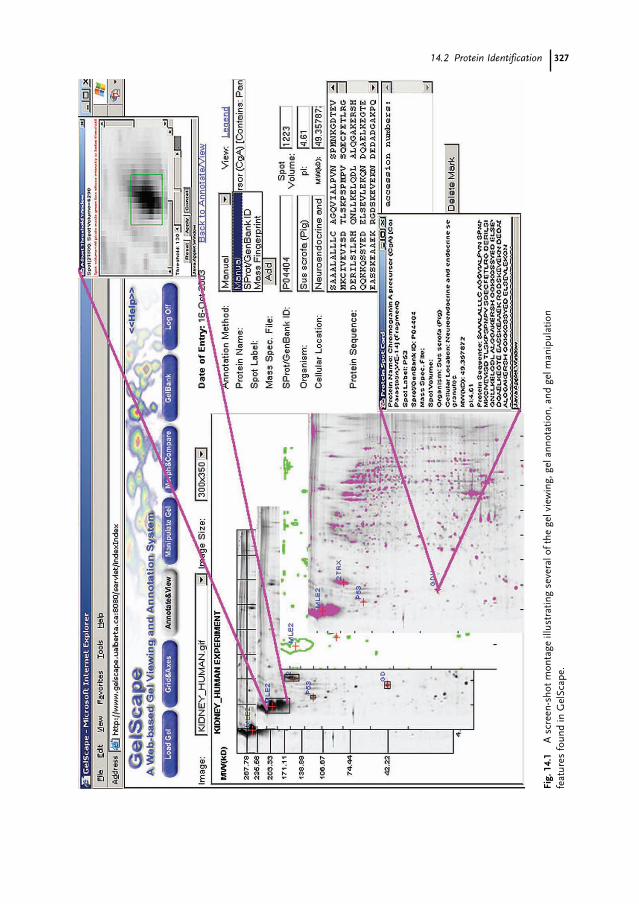
32714.2 Protein Identification
Fig.
14.1
A s
cree
n-sh
ot m
onta
ge il
lust
ratin
g se
vera
l of t
he g
el v
iew
ing,
gel
ann
otat
ion,
and
gel
man
ipul
atio
nfe
atur
es fo
und
in G
elSc
ape.
328 14 Software Tools for Proteomics Technologies
Many of these gels and gel databases canbe found on the internet via WORLD-2-DPAGE or 2D-HUNT (Tab. 14.1) simply bytyping an organism or protein name. For in-stance, suppose you decided to study S. ce-revisiae under anaerobic conditions. By run-ning a 2D gel of the proteins expressedunder anaerobic conditions, you can saveliterally months of effort by comparing thegel with the fully annotated S. cerevisiae 2Dgel (grown under aerobic conditions) foundat http://www.ibgc.u-bordeaux2.fr/YPM/.By using a freeware package like GelScape,or more sophisticated commercial packag-es, it should be possible to visually trans-form the two gels, overlay them and identifynearly 400 yeast proteins or protein frag-ments in less than an hour. Quantificationof the differences in expression might takeonly a few more hours. Indeed, the objectiveof setting up these federated 2D gel databas-es is to avoid costly or repetitive efforts thatonly lead to re-identification of previouslymapped or previously known proteins. Theutility of 2D gel databases is bound to growas more gels are collected and as more spotsare progressively identified in laboratoriesaround the world. Indeed, one might opti-mistically predict that some time in the not-too-distant future, mass spectrometry andmicro-sequencing will no longer be neededto routinely identify protein gel spots, be-cause all detectable spots will have been an-notated and archived in a set of Web-access-ible 2D gel databases.
Much remains to be done before this vi-sion becomes reality, however. 2D gel spotpatterns are highly dependent on the meth-ods used to isolate and prepare the initialprotein mixture [15]. Consequently, individ-uals wishing to perform gel database com-parisons must take into account such vari-ables as the protein fraction isolated, howthe sample was prepared, and how the gelwas run. Even if sample preparation issues
are eventually clarified, continuing prob-lems concerning 2D gel database mainte-nance and updates will persist. Indeed,most publicly available annotated 2D gelsrepresent incomplete “best efforts” of a sin-gle graduate student rather than collective,sustained efforts arising from multiple labs.If the concept of 2D gel databases and datasharing is going to succeed, it will need awell-funded central repository (for examplethe NCBI or EBI) and open-minded fund-ing agencies to support sustained gel anno-tation contributions from the whole scien-tific community. The recent introduction ofXML- (extensible markup language) basedprocedures to help standardize 2D gel datasharing is an encouraging step in this direc-tion [18].
In the future it is probable that other sep-aration and display techniques, for example2D HPLC, tandem capillary electrophoresis(Chapt. 8), and protein chips [5] will gaingreater prominence in functional prote-omics. The resolution and separation re-producibility of these techniques suggestthat similar database comparison methods(e.g. elution profile analysis) could eventu-ally enable proteins to be identified withoutthe need for MS or microsequencing analy-sis.
14.2.2
Protein Identification from Mass Spectrometry
Recent advances in mass spectrometry haveled to a paradigm shift in the way peptidesand proteins are identified [19, 20]. In par-ticular, the introduction of “soft” ionizationtechniques (electrospray and MALDI), cou-pled with substantial improvements in massaccuracy (~2 ppm), resolution (MS–MS) andsensitivity (femtomoles) have made the rap-id, high throughput identification of pep-tides and proteins almost routine [5, 21].
32914.2 Protein Identification
Key to making this shift possible has beenthe development of bioinformatics softwarethat enables direct correlation of biomolec-ular MS data with protein sequence data-bases. Two kinds of MS bioinformatics soft-ware exist:1. software for identifying proteins from
peptide mass fingerprints; and2. software for identifying peptides or pro-
teins directly from uninterpreted tandem(MS–MS) mass spectra.
Peptide mass fingerprinting (PMF) was de-veloped in the early 1990s as a means of un-ambiguously identifying proteins from pro-teolytic fragments [22–24]. Specifically, if apure protein is digested with a protease (forexample trypsin) that cuts at predictable lo-cations the result will be a peptide mixturecontaining a unique collection of between10 and 50 different peptides, each with adifferent or characteristic mass. Runningthis mixture on a modern ESI or MALDI in-strument will lead to a mass spectrum withdozens of peaks corresponding to the mass-es of each of these peptides. Because no twoproteins are likely to share the same set ofconstituent peptides, this mixture is called apeptide mass fingerprint or PMF. By com-paring the observed masses of the mixturewith predicted peptide masses derived fromall known protein sequences it is theoreti-cally possible to identify the protein ofinterest (providing the protein has beenpreviously sequenced). Specifically, in thecourse of performing a mass fingerprintsearch, database sequences are theoretically“cleaved” using known protease-cuttingrules, the resulting hypothetical peptidemasses are calculated and the whole pro-tein is ranked according to the number ofexact (or near exact) cleavage fragmentmatches made to the observed set of pep-tide masses. The sequence with the highestnumber and quality of matches is usually
selected as the most likely candidate (anoutline is given in Fig. 14.2).
There are nearly a dozen different typesof mass fingerprinting software availablefor protein identification. Although someare sold as commercial products, most arefreely available over the Web (a partial list-ing is given in Tab. 14.1). Nearly all of thepackages enable the user to select a proteindatabase (OWL, Swiss-Prot or NCBI-nr), asource organism (to limit the search), acleavage enzyme (trypsin is the most com-mon), a cleavage tolerance (one missedcleavage per peptide is usual), a mass toler-ance (0.1 amu is typical), and a mass type(average or monoisotopic). Most of thesevalues are pre-selected as defaults in thesubmission form and do not normally needto be changed. All packages expect users toenter a list of masses (with at least two deci-mal point accuracy) read from the MS spec-trum before launching the search. On mostdays a Web search result can be returnedwithin 10–20 s.
Key to performing any successful peptidemass fingerprint search is to start with themost accurate masses possible. Internallycalibrated mono-isotopic standards are es-sential. If one is very confident in the massaccuracy, restricting the mass tolerance set-ting to less than 0.1 amu will usually im-prove the specificity of the search. Restrict-ing the size or scope of the database tosearch is also wise. The organism beingstudied is usually known, so it is best to se-lect only the portion of the protein databasewith protein sequences from the presump-tive source organism (or very closely relatedorganisms). It is not (yet) a good idea tosearch through translated EST databases,because they have too many sequencing er-rors and contain only partial protein se-quence information.
As a general rule one should try to use asmany mass values as possible when per-
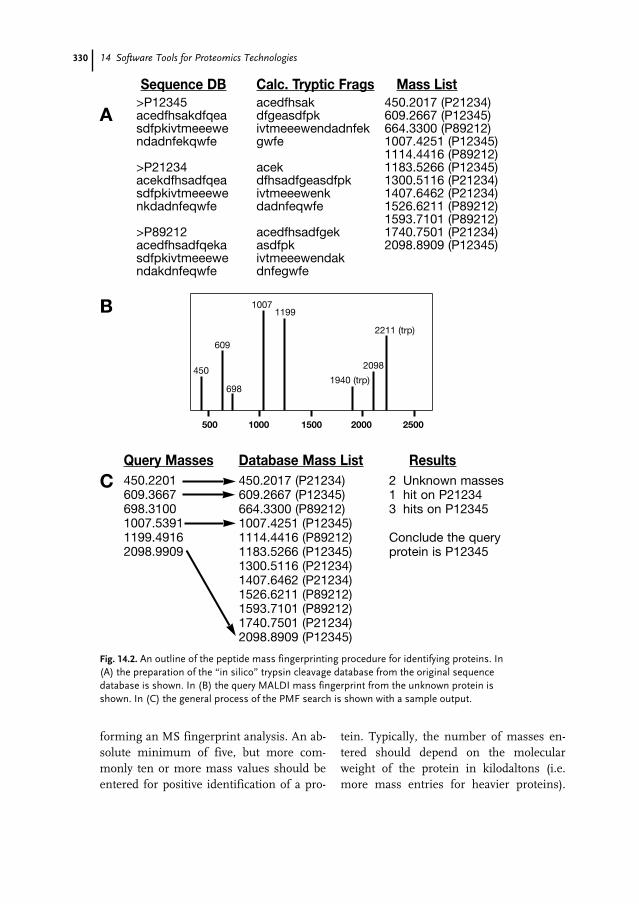
450
609
698
1007
500 1000 1500 2000 2500
1199
2211 (trp)
2098
1940 (trp)
330 14 Software Tools for Proteomics Technologies
forming an MS fingerprint analysis. An ab-solute minimum of five, but more com-monly ten or more mass values should beentered for positive identification of a pro-
tein. Typically, the number of masses en-tered should depend on the molecularweight of the protein in kilodaltons (i.e.more mass entries for heavier proteins).
Fig. 14.2. An outline of the peptide mass fingerprinting procedure for identifying proteins. In(A) the preparation of the “in silico” trypsin cleavage database from the original sequencedatabase is shown. In (B) the query MALDI mass fingerprint from the unknown protein isshown. In (C) the general process of the PMF search is shown with a sample output.
A
Sequence DB
Query Masses Database Mass List Results
Calc. Tryptic Frags Mass List
B
C
>P12345acedfhsakdfqeasdfpkivtmeeewendadnfekqwfe
>P21234acekdfhsadfqeasdfpkivtmeeewenkdadnfeqwfe
>P89212acedfhsadfqekasdfpkivtmeeewendakdnfeqwfe
450.2201609.3667698.31001007.53911199.49162098.9909
450.2017 (P21234)609.2667 (P12345)664.3300 (P89212)1007.4251 (P12345)1114.4416 (P89212)1183.5266 (P12345)1300.5116 (P21234)1407.6462 (P21234)1526.6211 (P89212)1593.7101 (P89212)1740.7501 (P21234)2098.8909 (P12345)
2 Unknown masses1 hit on P212343 hits on P12345
Conclude the queryprotein is P12345
acedfhsakdfgeasdfpkivtmeeewendadnfekgwfe
acekdfhsadfgeasdfpkivtmeeewenkdadnfeqwfe
acedfhsadfgekasdfpkivtmeeewendakdnfegwfe
450.2017 (P21234)609.2667 (P12345)664.3300 (P89212)1007.4251 (P12345)1114.4416 (P89212)1183.5266 (P12345)1300.5116 (P21234)1407.6462 (P21234)1526.6211 (P89212)1593.7101 (P89212)1740.7501 (P21234)2098.8909 (P12345)

33114.2 Protein Identification
The need for so much mass data is primari-ly to compensate for the noise inherent inexperimental MS data. Indeed, it is not un-common to have up to half of all predictedpeptide peaks absent from any given MSfingerprint spectrum along with any num-ber of additional peaks arising from con-taminating proteins. Consequently, one isusually quite content to obtain coverage(the fraction of predicted peptide massesclosely matching observed peptide masses)of only 40–50 %. It is very rare to see a per-fect match or 100 % coverage.
Because of the experimental noise asso-ciated with MS data, analysis of peptide fin-gerprint searches is not always easy nor is italways reliable. Some of the common com-plications include:1. disappearance of key peaks as a result of
non-specific ion suppression;2. appearance of extra peaks from protease
(trypsin) autolysis;3. appearance of peaks from post-transla-
tional or artifactual chemical modifica-tion;
4. appearance of peaks from non-specificcleavage, or from contaminating proteas-es; and
5. appearance of peaks from contaminatingimpurities, contaminating homologs orsplice variants.
Because of these complications, the issue ofhow to score and rank peptide mass match-es is actually quite critical to the perfor-mance and reliability of peptide mass fin-gerprint software. Most early fingerprintingprograms used simple heuristic scoringschemes and arbitrary cut-offs to select can-didate sequences. More recent programssuch as Profound [25] use Bayesian statis-tics and posterior probabilities to rank data-base candidates. Some of the latest pro-grams take at least some of the complica-tions listed above into account and allow
secondary searches with so-called “orphan”masses. Mascot [26] is one program whichuses a probabilistic model similar to an ex-pectation or E-value to rank sequences. Theuse of probabilities enables better estima-tion of significance (which guards againstfalse positives) and it also enables scores tobe compared with those from other types ofsearch algorithm (such as BLAST). Irre-spective of the advantages and disadvantag-es of individual programs, it is usually agood idea to run at least two different pep-tide mass fingerprinting programs andcombine the results. This serves as a formof “signal averaging” and potentially reduc-es the occurrence of errors arising from al-gorithmic or database limitations in anysingle program.
Because peptide mass fingerprinting doesnot always work, for unambiguous proteinidentification there has been increasingemphasis on using tandem mass spectrom-eters equipped with collision-induced disso-ciation (CID) cells to provide more preciseand interpretable peptide data. SEQUEST[27, 28], ProteinProspector [29], and Mas-cot [26] are three software packages that canbe used to analyze tandem mass data ofpeptide fragments. These programs takeuninterpreted tandem mass spectral data(i.e. the actual spectrum or peak lists), per-form sequence database searches and iden-tify probable peptides or protein matches.Typically these programs work by first scan-ning the protein databases for potentialmatches with the precursor peptide ionthen ranking the candidate peptides on thebasis of their predicted similarity (ion conti-nuity, intensity, etc.) to the observed frag-ment ion masses. After this screening stepa model MS–MS spectrum for each candi-date peptide is generated and then com-pared, scored, and ranked with the observedMS–MS spectrum using correlational orprobabilistic analysis. As with peptide mass
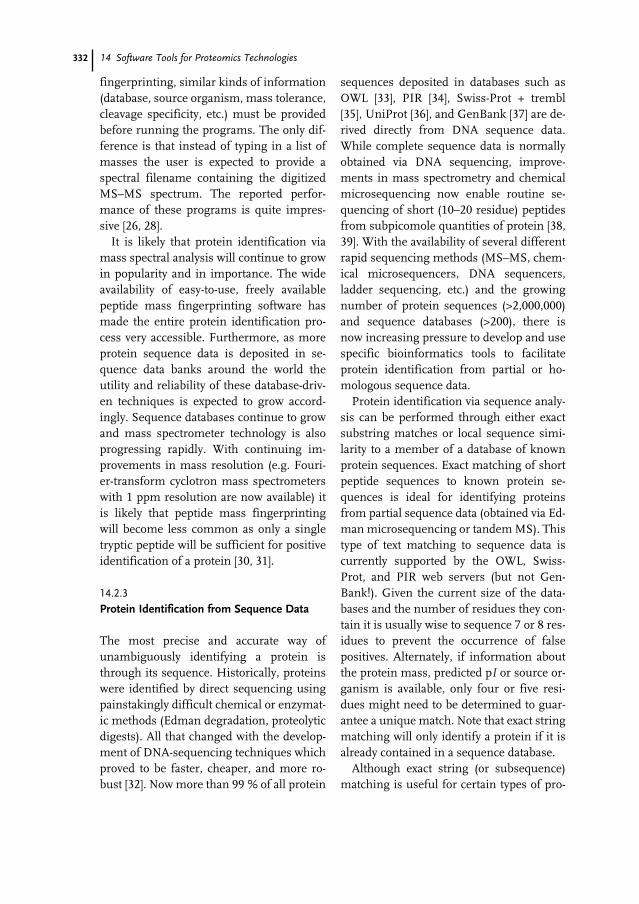
332 14 Software Tools for Proteomics Technologies
fingerprinting, similar kinds of information(database, source organism, mass tolerance,cleavage specificity, etc.) must be providedbefore running the programs. The only dif-ference is that instead of typing in a list ofmasses the user is expected to provide aspectral filename containing the digitizedMS–MS spectrum. The reported perfor-mance of these programs is quite impres-sive [26, 28].
It is likely that protein identification viamass spectral analysis will continue to growin popularity and in importance. The wideavailability of easy-to-use, freely availablepeptide mass fingerprinting software hasmade the entire protein identification pro-cess very accessible. Furthermore, as moreprotein sequence data is deposited in se-quence data banks around the world theutility and reliability of these database-driv-en techniques is expected to grow accord-ingly. Sequence databases continue to growand mass spectrometer technology is alsoprogressing rapidly. With continuing im-provements in mass resolution (e.g. Fouri-er-transform cyclotron mass spectrometerswith 1 ppm resolution are now available) itis likely that peptide mass fingerprintingwill become less common as only a singletryptic peptide will be sufficient for positiveidentification of a protein [30, 31].
14.2.3
Protein Identification from Sequence Data
The most precise and accurate way ofunambiguously identifying a protein isthrough its sequence. Historically, proteinswere identified by direct sequencing usingpainstakingly difficult chemical or enzymat-ic methods (Edman degradation, proteolyticdigests). All that changed with the develop-ment of DNA-sequencing techniques whichproved to be faster, cheaper, and more ro-bust [32]. Now more than 99 % of all protein
sequences deposited in databases such asOWL [33], PIR [34], Swiss-Prot + trembl[35], UniProt [36], and GenBank [37] are de-rived directly from DNA sequence data.While complete sequence data is normallyobtained via DNA sequencing, improve-ments in mass spectrometry and chemicalmicrosequencing now enable routine se-quencing of short (10–20 residue) peptidesfrom subpicomole quantities of protein [38,39]. With the availability of several differentrapid sequencing methods (MS–MS, chem-ical microsequencers, DNA sequencers,ladder sequencing, etc.) and the growingnumber of protein sequences (>2,000,000)and sequence databases (>200), there isnow increasing pressure to develop and usespecific bioinformatics tools to facilitateprotein identification from partial or ho-mologous sequence data.
Protein identification via sequence analy-sis can be performed through either exactsubstring matches or local sequence simi-larity to a member of a database of knownprotein sequences. Exact matching of shortpeptide sequences to known protein se-quences is ideal for identifying proteinsfrom partial sequence data (obtained via Ed-man microsequencing or tandem MS). Thistype of text matching to sequence data iscurrently supported by the OWL, Swiss-Prot, and PIR web servers (but not Gen-Bank!). Given the current size of the data-bases and the number of residues they con-tain it is usually wise to sequence 7 or 8 res-idues to prevent the occurrence of falsepositives. Alternately, if information aboutthe protein mass, predicted pI or source or-ganism is available, only four or five resi-dues might need to be determined to guar-antee a unique match. Note that exact stringmatching will only identify a protein if it isalready contained in a sequence database.
Although exact string (or subsequence)matching is useful for certain types of pro-
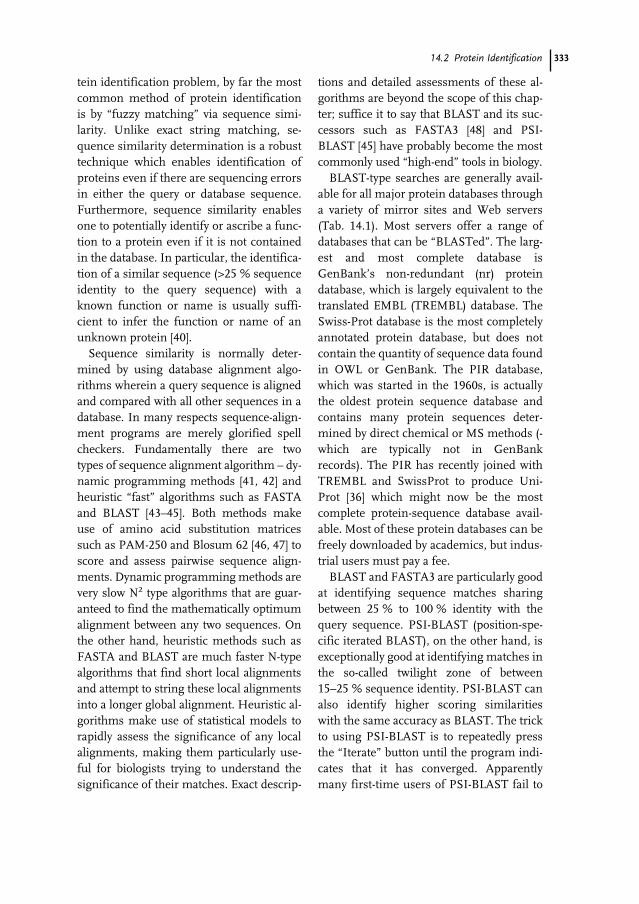
33314.2 Protein Identification
tein identification problem, by far the mostcommon method of protein identificationis by “fuzzy matching” via sequence simi-larity. Unlike exact string matching, se-quence similarity determination is a robusttechnique which enables identification ofproteins even if there are sequencing errorsin either the query or database sequence.Furthermore, sequence similarity enablesone to potentially identify or ascribe a func-tion to a protein even if it is not containedin the database. In particular, the identifica-tion of a similar sequence (>25 % sequenceidentity to the query sequence) with aknown function or name is usually suffi-cient to infer the function or name of anunknown protein [40].
Sequence similarity is normally deter-mined by using database alignment algo-rithms wherein a query sequence is alignedand compared with all other sequences in adatabase. In many respects sequence-align-ment programs are merely glorified spellcheckers. Fundamentally there are twotypes of sequence alignment algorithm – dy-namic programming methods [41, 42] andheuristic “fast” algorithms such as FASTAand BLAST [43–45]. Both methods makeuse of amino acid substitution matricessuch as PAM-250 and Blosum 62 [46, 47] toscore and assess pairwise sequence align-ments. Dynamic programming methods arevery slow N2 type algorithms that are guar-anteed to find the mathematically optimumalignment between any two sequences. Onthe other hand, heuristic methods such asFASTA and BLAST are much faster N-typealgorithms that find short local alignmentsand attempt to string these local alignmentsinto a longer global alignment. Heuristic al-gorithms make use of statistical models torapidly assess the significance of any localalignments, making them particularly use-ful for biologists trying to understand thesignificance of their matches. Exact descrip-
tions and detailed assessments of these al-gorithms are beyond the scope of this chap-ter; suffice it to say that BLAST and its suc-cessors such as FASTA3 [48] and PSI-BLAST [45] have probably become the mostcommonly used “high-end” tools in biology.
BLAST-type searches are generally avail-able for all major protein databases througha variety of mirror sites and Web servers(Tab. 14.1). Most servers offer a range ofdatabases that can be “BLASTed”. The larg-est and most complete database isGenBank’s non-redundant (nr) proteindatabase, which is largely equivalent to thetranslated EMBL (TREMBL) database. TheSwiss-Prot database is the most completelyannotated protein database, but does notcontain the quantity of sequence data foundin OWL or GenBank. The PIR database,which was started in the 1960s, is actuallythe oldest protein sequence database andcontains many protein sequences deter-mined by direct chemical or MS methods (-which are typically not in GenBankrecords). The PIR has recently joined withTREMBL and SwissProt to produce Uni-Prot [36] which might now be the mostcomplete protein-sequence database avail-able. Most of these protein databases can befreely downloaded by academics, but indus-trial users must pay a fee.
BLAST and FASTA3 are particularly goodat identifying sequence matches sharingbetween 25 % to 100 % identity with thequery sequence. PSI-BLAST (position-spe-cific iterated BLAST), on the other hand, isexceptionally good at identifying matches inthe so-called twilight zone of between15–25 % sequence identity. PSI-BLAST canalso identify higher scoring similaritieswith the same accuracy as BLAST. The trickto using PSI-BLAST is to repeatedly pressthe “Iterate” button until the program indi-cates that it has converged. Apparentlymany first-time users of PSI-BLAST fail to
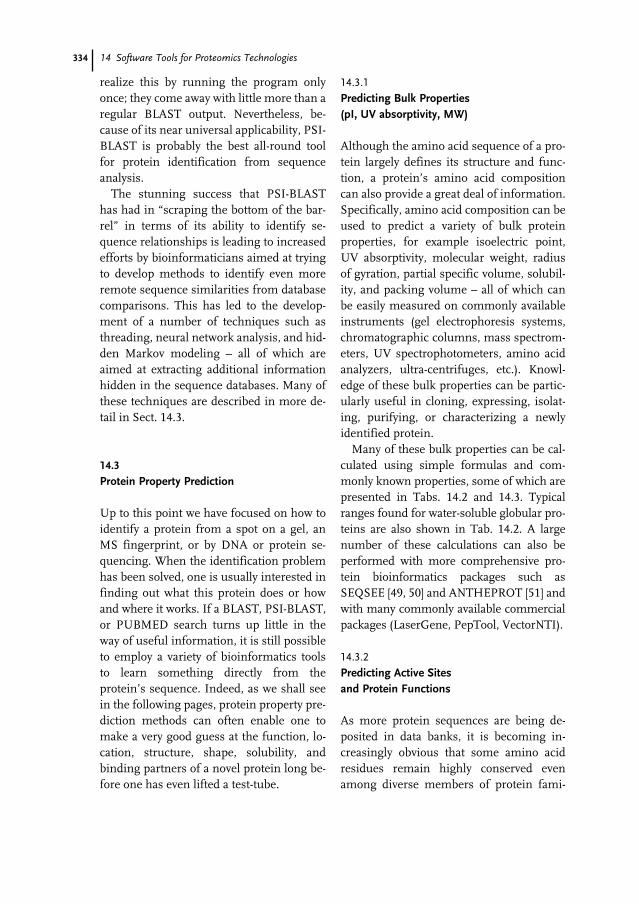
334 14 Software Tools for Proteomics Technologies
realize this by running the program onlyonce; they come away with little more than aregular BLAST output. Nevertheless, be-cause of its near universal applicability, PSI-BLAST is probably the best all-round toolfor protein identification from sequenceanalysis.
The stunning success that PSI-BLASThas had in “scraping the bottom of the bar-rel” in terms of its ability to identify se-quence relationships is leading to increasedefforts by bioinformaticians aimed at tryingto develop methods to identify even moreremote sequence similarities from databasecomparisons. This has led to the develop-ment of a number of techniques such asthreading, neural network analysis, and hid-den Markov modeling – all of which areaimed at extracting additional informationhidden in the sequence databases. Many ofthese techniques are described in more de-tail in Sect. 14.3.
14.3
Protein Property Prediction
Up to this point we have focused on how toidentify a protein from a spot on a gel, anMS fingerprint, or by DNA or protein se-quencing. When the identification problemhas been solved, one is usually interested infinding out what this protein does or howand where it works. If a BLAST, PSI-BLAST,or PUBMED search turns up little in theway of useful information, it is still possibleto employ a variety of bioinformatics toolsto learn something directly from theprotein’s sequence. Indeed, as we shall seein the following pages, protein property pre-diction methods can often enable one tomake a very good guess at the function, lo-cation, structure, shape, solubility, andbinding partners of a novel protein long be-fore one has even lifted a test-tube.
14.3.1
Predicting Bulk Properties (pI, UV absorptivity, MW)
Although the amino acid sequence of a pro-tein largely defines its structure and func-tion, a protein’s amino acid compositioncan also provide a great deal of information.Specifically, amino acid composition can beused to predict a variety of bulk proteinproperties, for example isoelectric point,UV absorptivity, molecular weight, radiusof gyration, partial specific volume, solubil-ity, and packing volume – all of which canbe easily measured on commonly availableinstruments (gel electrophoresis systems,chromatographic columns, mass spectrom-eters, UV spectrophotometers, amino acidanalyzers, ultra-centrifuges, etc.). Knowl-edge of these bulk properties can be partic-ularly useful in cloning, expressing, isolat-ing, purifying, or characterizing a newlyidentified protein.
Many of these bulk properties can be cal-culated using simple formulas and com-monly known properties, some of which arepresented in Tabs. 14.2 and 14.3. Typicalranges found for water-soluble globular pro-teins are also shown in Tab. 14.2. A largenumber of these calculations can also beperformed with more comprehensive pro-tein bioinformatics packages such asSEQSEE [49, 50] and ANTHEPROT [51] andwith many commonly available commercialpackages (LaserGene, PepTool, VectorNTI).
14.3.2
Predicting Active Sites and Protein Functions
As more protein sequences are being de-posited in data banks, it is becoming in-creasingly obvious that some amino acidresidues remain highly conserved evenamong diverse members of protein fami-
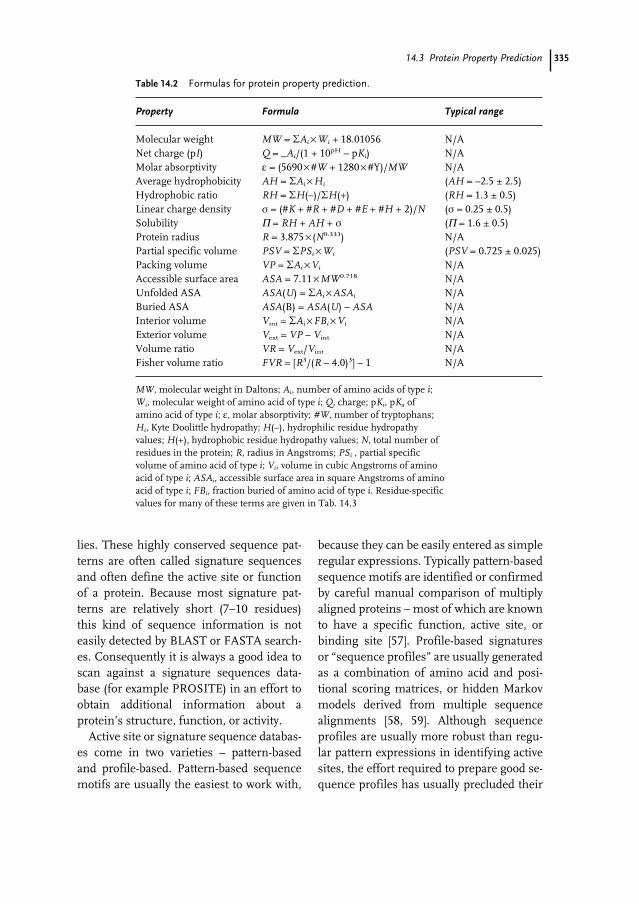
33514.3 Protein Property Prediction
lies. These highly conserved sequence pat-terns are often called signature sequencesand often define the active site or functionof a protein. Because most signature pat-terns are relatively short (7–10 residues)this kind of sequence information is noteasily detected by BLAST or FASTA search-es. Consequently it is always a good idea toscan against a signature sequences data-base (for example PROSITE) in an effort toobtain additional information about aprotein’s structure, function, or activity.
Active site or signature sequence databas-es come in two varieties – pattern-basedand profile-based. Pattern-based sequencemotifs are usually the easiest to work with,
because they can be easily entered as simpleregular expressions. Typically pattern-basedsequence motifs are identified or confirmedby careful manual comparison of multiplyaligned proteins – most of which are knownto have a specific function, active site, orbinding site [57]. Profile-based signaturesor “sequence profiles” are usually generatedas a combination of amino acid and posi-tional scoring matrices, or hidden Markovmodels derived from multiple sequencealignments [58, 59]. Although sequenceprofiles are usually more robust than regu-lar pattern expressions in identifying activesites, the effort required to prepare good se-quence profiles has usually precluded their
Table 14.2 Formulas for protein property prediction.
Property Formula Typical range
Molecular weight MW = ÓAi ×Wi + 18.01056 N/ANet charge (pI) Q = _Ai/(1 + 10pH – pKi) N/AMolar absorptivity å = (5690 ×#W + 1280×#Y)/MW N/AAverage hydrophobicity AH = ÓAi ×Hi (AH = –2.5 ± 2.5)Hydrophobic ratio RH = ÓH(–)/ÓH(+) (RH = 1.3 ± 0.5)Linear charge density ó = (#K + #R + #D + #E + #H + 2)/N (ó = 0.25 ± 0.5)Solubility Π = RH + AH + ó (Π = 1.6 ± 0.5)Protein radius R = 3.875× (N0.333) N/APartial specific volume PSV = ÓPSi × Wi (PSV = 0.725 ± 0.025)Packing volume VP = ÓAi × Vi N/AAccessible surface area ASA = 7.11× MW0.718 N/AUnfolded ASA ASA(U) = ÓAi ×ASAi N/ABuried ASA ASA(B) = ASA(U) – ASA N/AInterior volume Vint = ÓAi ×FBi ×Vi N/AExterior volume Vext = VP – Vint N/AVolume ratio VR = Vext/Vint N/AFisher volume ratio FVR = [R3/(R – 4.0)3] – 1 N/A
MW, molecular weight in Daltons; Ai, number of amino acids of type i;Wi, molecular weight of amino acid of type i; Q, charge; pKi, pKa ofamino acid of type i; å, molar absorptivity; #W, number of tryptophans;Hi, Kyte Doolittle hydropathy; H(–), hydrophilic residue hydropathyvalues; H(+), hydrophobic residue hydropathy values; N, total number ofresidues in the protein; R, radius in Angstroms; PSi , partial specificvolume of amino acid of type i; Vi, volume in cubic Angstroms of aminoacid of type i; ASAi, accessible surface area in square Angstroms of aminoacid of type i; FBi, fraction buried of amino acid of type i. Residue-specificvalues for many of these terms are given in Tab. 14.3
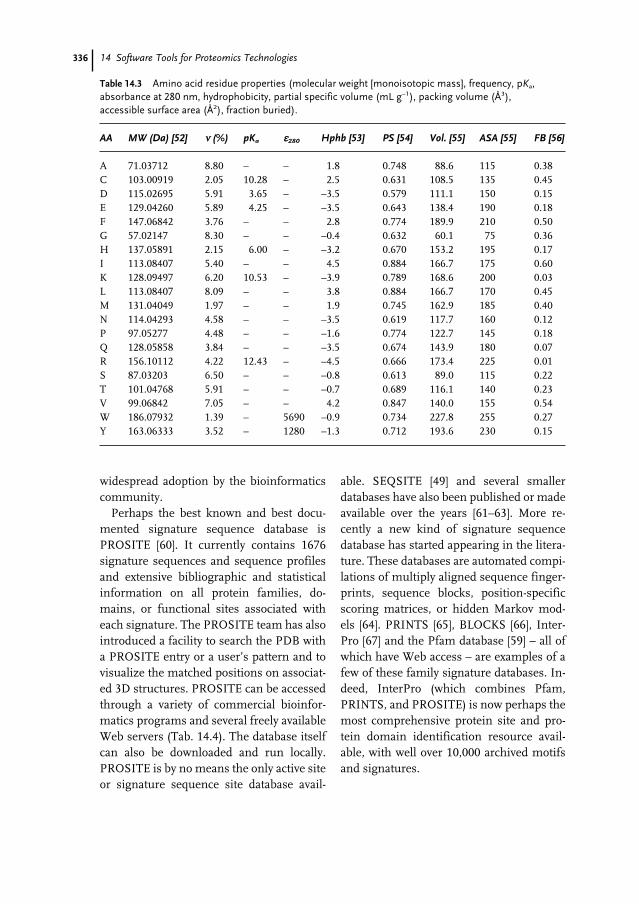
336 14 Software Tools for Proteomics Technologies
widespread adoption by the bioinformaticscommunity.
Perhaps the best known and best docu-mented signature sequence database isPROSITE [60]. It currently contains 1676signature sequences and sequence profilesand extensive bibliographic and statisticalinformation on all protein families, do-mains, or functional sites associated witheach signature. The PROSITE team has alsointroduced a facility to search the PDB witha PROSITE entry or a user’s pattern and tovisualize the matched positions on associat-ed 3D structures. PROSITE can be accessedthrough a variety of commercial bioinfor-matics programs and several freely availableWeb servers (Tab. 14.4). The database itselfcan also be downloaded and run locally.PROSITE is by no means the only active siteor signature sequence site database avail-
able. SEQSITE [49] and several smallerdatabases have also been published or madeavailable over the years [61–63]. More re-cently a new kind of signature sequencedatabase has started appearing in the litera-ture. These databases are automated compi-lations of multiply aligned sequence finger-prints, sequence blocks, position-specificscoring matrices, or hidden Markov mod-els [64]. PRINTS [65], BLOCKS [66], Inter-Pro [67] and the Pfam database [59] – all ofwhich have Web access – are examples of afew of these family signature databases. In-deed, InterPro (which combines Pfam,PRINTS, and PROSITE) is now perhaps themost comprehensive protein site and pro-tein domain identification resource avail-able, with well over 10,000 archived motifsand signatures.
Table 14.3 Amino acid residue properties (molecular weight [monoisotopic mass], frequency, pKa, absorbance at 280 nm, hydrophobicity, partial specific volume (mL g–1), packing volume (Å3), accessible surface area (Å2), fraction buried).
AA MW (Da) [52] íí (%) pKa åå280 Hphb [53] PS [54] Vol. [55] ASA [55] FB [56]
A 71.03712 8.80 – – 1.8 0.748 88.6 115 0.38C 103.00919 2.05 10.28 – 2.5 0.631 108.5 135 0.45D 115.02695 5.91 3.65 – –3.5 0.579 111.1 150 0.15E 129.04260 5.89 4.25 – –3.5 0.643 138.4 190 0.18F 147.06842 3.76 – – 2.8 0.774 189.9 210 0.50G 57.02147 8.30 – – –0.4 0.632 60.1 75 0.36H 137.05891 2.15 6.00 – –3.2 0.670 153.2 195 0.17I 113.08407 5.40 – – 4.5 0.884 166.7 175 0.60K 128.09497 6.20 10.53 – –3.9 0.789 168.6 200 0.03L 113.08407 8.09 – – 3.8 0.884 166.7 170 0.45M 131.04049 1.97 – – 1.9 0.745 162.9 185 0.40N 114.04293 4.58 – – –3.5 0.619 117.7 160 0.12P 97.05277 4.48 – – –1.6 0.774 122.7 145 0.18Q 128.05858 3.84 – – –3.5 0.674 143.9 180 0.07R 156.10112 4.22 12.43 – –4.5 0.666 173.4 225 0.01S 87.03203 6.50 – – –0.8 0.613 89.0 115 0.22T 101.04768 5.91 – – –0.7 0.689 116.1 140 0.23V 99.06842 7.05 – – 4.2 0.847 140.0 155 0.54W 186.07932 1.39 – 5690 –0.9 0.734 227.8 255 0.27Y 163.06333 3.52 – 1280 –1.3 0.712 193.6 230 0.15
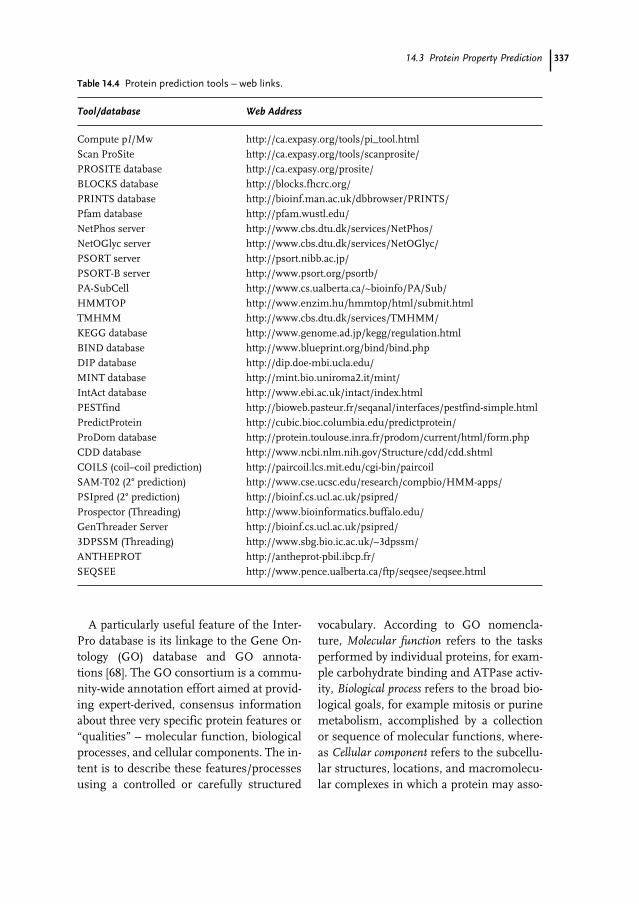
33714.3 Protein Property Prediction
A particularly useful feature of the Inter-Pro database is its linkage to the Gene On-tology (GO) database and GO annota-tions [68]. The GO consortium is a commu-nity-wide annotation effort aimed at provid-ing expert-derived, consensus informationabout three very specific protein features or“qualities” – molecular function, biologicalprocesses, and cellular components. The in-tent is to describe these features/processesusing a controlled or carefully structured
vocabulary. According to GO nomencla-ture, Molecular function refers to the tasksperformed by individual proteins, for exam-ple carbohydrate binding and ATPase activ-ity, Biological process refers to the broad bio-logical goals, for example mitosis or purinemetabolism, accomplished by a collectionor sequence of molecular functions, where-as Cellular component refers to the subcellu-lar structures, locations, and macromolecu-lar complexes in which a protein may asso-
Table 14.4 Protein prediction tools – web links.
Tool/database Web Address
Compute pI/Mw http://ca.expasy.org/tools/pi_tool.htmlScan ProSite http://ca.expasy.org/tools/scanprosite/PROSITE database http://ca.expasy.org/prosite/BLOCKS database http://blocks.fhcrc.org/PRINTS database http://bioinf.man.ac.uk/dbbrowser/PRINTS/Pfam database http://pfam.wustl.edu/NetPhos server http://www.cbs.dtu.dk/services/NetPhos/NetOGlyc server http://www.cbs.dtu.dk/services/NetOGlyc/PSORT server http://psort.nibb.ac.jp/PSORT-B server http://www.psort.org/psortb/PA-SubCell http://www.cs.ualberta.ca/~bioinfo/PA/Sub/HMMTOP http://www.enzim.hu/hmmtop/html/submit.htmlTMHMM http://www.cbs.dtu.dk/services/TMHMM/KEGG database http://www.genome.ad.jp/kegg/regulation.htmlBIND database http://www.blueprint.org/bind/bind.phpDIP database http://dip.doe-mbi.ucla.edu/MINT database http://mint.bio.uniroma2.it/mint/IntAct database http://www.ebi.ac.uk/intact/index.htmlPESTfind http://bioweb.pasteur.fr/seqanal/interfaces/pestfind-simple.htmlPredictProtein http://cubic.bioc.columbia.edu/predictprotein/ProDom database http://protein.toulouse.inra.fr/prodom/current/html/form.phpCDD database http://www.ncbi.nlm.nih.gov/Structure/cdd/cdd.shtmlCOILS (coil–coil prediction) http://paircoil.lcs.mit.edu/cgi-bin/paircoilSAM-T02 (2° prediction) http://www.cse.ucsc.edu/research/compbio/HMM-apps/PSIpred (2° prediction) http://bioinf.cs.ucl.ac.uk/psipred/Prospector (Threading) http://www.bioinformatics.buffalo.edu/GenThreader Server http://bioinf.cs.ucl.ac.uk/psipred/3DPSSM (Threading) http://www.sbg.bio.ic.ac.uk/~3dpssm/ANTHEPROT http://antheprot-pbil.ibcp.fr/SEQSEE http://www.pence.ualberta.ca/ftp/seqsee/seqsee.html
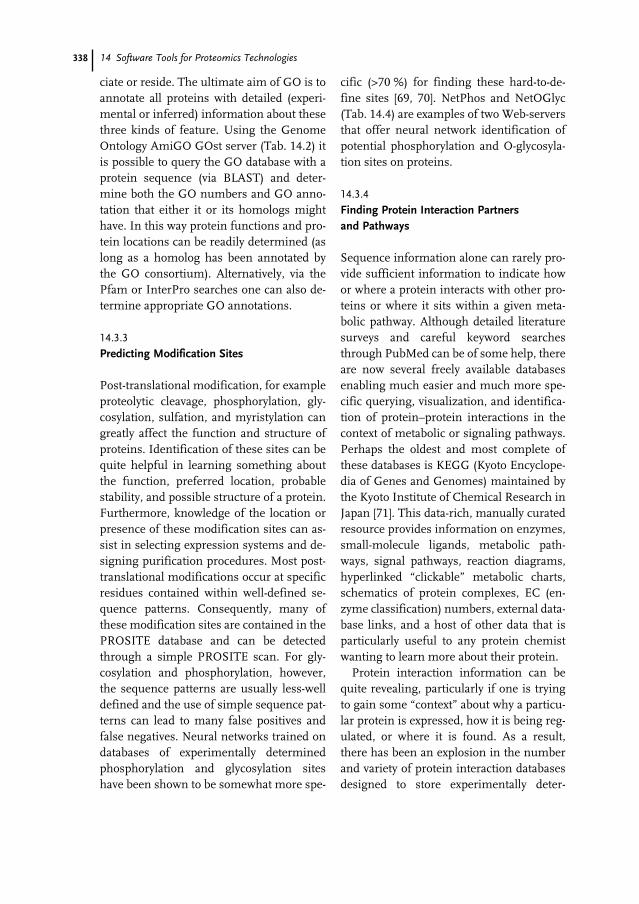
338 14 Software Tools for Proteomics Technologies
ciate or reside. The ultimate aim of GO is toannotate all proteins with detailed (experi-mental or inferred) information about thesethree kinds of feature. Using the GenomeOntology AmiGO GOst server (Tab. 14.2) itis possible to query the GO database with aprotein sequence (via BLAST) and deter-mine both the GO numbers and GO anno-tation that either it or its homologs mighthave. In this way protein functions and pro-tein locations can be readily determined (aslong as a homolog has been annotated bythe GO consortium). Alternatively, via thePfam or InterPro searches one can also de-termine appropriate GO annotations.
14.3.3
Predicting Modification Sites
Post-translational modification, for exampleproteolytic cleavage, phosphorylation, gly-cosylation, sulfation, and myristylation cangreatly affect the function and structure ofproteins. Identification of these sites can bequite helpful in learning something aboutthe function, preferred location, probablestability, and possible structure of a protein.Furthermore, knowledge of the location orpresence of these modification sites can as-sist in selecting expression systems and de-signing purification procedures. Most post-translational modifications occur at specificresidues contained within well-defined se-quence patterns. Consequently, many ofthese modification sites are contained in thePROSITE database and can be detectedthrough a simple PROSITE scan. For gly-cosylation and phosphorylation, however,the sequence patterns are usually less-welldefined and the use of simple sequence pat-terns can lead to many false positives andfalse negatives. Neural networks trained ondatabases of experimentally determinedphosphorylation and glycosylation siteshave been shown to be somewhat more spe-
cific (>70 %) for finding these hard-to-de-fine sites [69, 70]. NetPhos and NetOGlyc(Tab. 14.4) are examples of two Web-serversthat offer neural network identification ofpotential phosphorylation and O-glycosyla-tion sites on proteins.
14.3.4
Finding Protein Interaction Partners and Pathways
Sequence information alone can rarely pro-vide sufficient information to indicate howor where a protein interacts with other pro-teins or where it sits within a given meta-bolic pathway. Although detailed literaturesurveys and careful keyword searchesthrough PubMed can be of some help, thereare now several freely available databasesenabling much easier and much more spe-cific querying, visualization, and identifica-tion of protein–protein interactions in thecontext of metabolic or signaling pathways.Perhaps the oldest and most complete ofthese databases is KEGG (Kyoto Encyclope-dia of Genes and Genomes) maintained bythe Kyoto Institute of Chemical Research inJapan [71]. This data-rich, manually curatedresource provides information on enzymes,small-molecule ligands, metabolic path-ways, signal pathways, reaction diagrams,hyperlinked “clickable” metabolic charts,schematics of protein complexes, EC (en-zyme classification) numbers, external data-base links, and a host of other data that isparticularly useful to any protein chemistwanting to learn more about their protein.
Protein interaction information can bequite revealing, particularly if one is tryingto gain some “context” about why a particu-lar protein is expressed, how it is being reg-ulated, or where it is found. As a result,there has been an explosion in the numberand variety of protein interaction databasesdesigned to store experimentally deter-
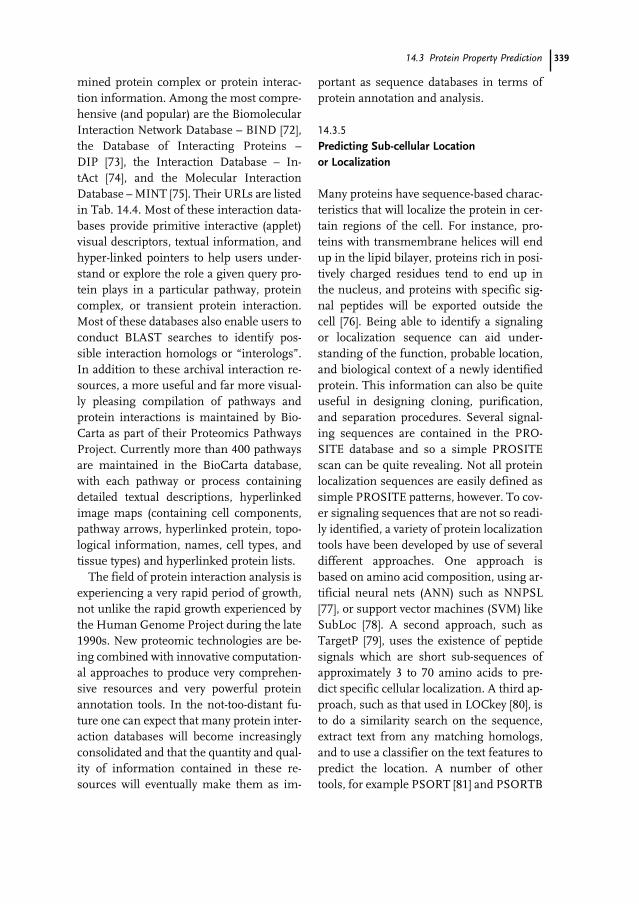
33914.3 Protein Property Prediction
mined protein complex or protein interac-tion information. Among the most compre-hensive (and popular) are the BiomolecularInteraction Network Database – BIND [72],the Database of Interacting Proteins –DIP [73], the Interaction Database – In-tAct [74], and the Molecular InteractionDatabase – MINT [75]. Their URLs are listedin Tab. 14.4. Most of these interaction data-bases provide primitive interactive (applet)visual descriptors, textual information, andhyper-linked pointers to help users under-stand or explore the role a given query pro-tein plays in a particular pathway, proteincomplex, or transient protein interaction.Most of these databases also enable users toconduct BLAST searches to identify pos-sible interaction homologs or “interologs”.In addition to these archival interaction re-sources, a more useful and far more visual-ly pleasing compilation of pathways andprotein interactions is maintained by Bio-Carta as part of their Proteomics PathwaysProject. Currently more than 400 pathwaysare maintained in the BioCarta database,with each pathway or process containingdetailed textual descriptions, hyperlinkedimage maps (containing cell components,pathway arrows, hyperlinked protein, topo-logical information, names, cell types, andtissue types) and hyperlinked protein lists.
The field of protein interaction analysis isexperiencing a very rapid period of growth,not unlike the rapid growth experienced bythe Human Genome Project during the late1990s. New proteomic technologies are be-ing combined with innovative computation-al approaches to produce very comprehen-sive resources and very powerful proteinannotation tools. In the not-too-distant fu-ture one can expect that many protein inter-action databases will become increasinglyconsolidated and that the quantity and qual-ity of information contained in these re-sources will eventually make them as im-
portant as sequence databases in terms ofprotein annotation and analysis.
14.3.5
Predicting Sub-cellular Location or Localization
Many proteins have sequence-based charac-teristics that will localize the protein in cer-tain regions of the cell. For instance, pro-teins with transmembrane helices will endup in the lipid bilayer, proteins rich in posi-tively charged residues tend to end up inthe nucleus, and proteins with specific sig-nal peptides will be exported outside thecell [76]. Being able to identify a signalingor localization sequence can aid under-standing of the function, probable location,and biological context of a newly identifiedprotein. This information can also be quiteuseful in designing cloning, purification,and separation procedures. Several signal-ing sequences are contained in the PRO-SITE database and so a simple PROSITEscan can be quite revealing. Not all proteinlocalization sequences are easily defined assimple PROSITE patterns, however. To cov-er signaling sequences that are not so readi-ly identified, a variety of protein localizationtools have been developed by use of severaldifferent approaches. One approach isbased on amino acid composition, using ar-tificial neural nets (ANN) such as NNPSL[77], or support vector machines (SVM) likeSubLoc [78]. A second approach, such asTargetP [79], uses the existence of peptidesignals which are short sub-sequences ofapproximately 3 to 70 amino acids to pre-dict specific cellular localization. A third ap-proach, such as that used in LOCkey [80], isto do a similarity search on the sequence,extract text from any matching homologs,and to use a classifier on the text features topredict the location. A number of othertools, for example PSORT [81] and PSORTB
340 14 Software Tools for Proteomics Technologies
[82], combine a variety of individual predic-tors such as hidden Markov models andnearest-neighbor classifiers to predict pro-tein localization. A new approach has re-cently been described which combines ma-chine learning methods with the text analy-sis approach pioneered by LOCkey to pre-dict subcellular localization [83]. Accordingto the authors, the PA SubCell server seemsto be more accurate and much more com-prehensive than any other method de-scribed to date, with an average accuracygreater than 90 % (approx. 10 % better thanmost other tools) and a level of coverage thatis 3–5 times greater in terms of the numberof sequences or types of organism it canhandle. A listing of some of the better sub-cellular localization Web servers is given inTab. 14.4.
In addition to these subcellular predictionservers, one might also employ a variety ofother programs to identify those proteinsthat localize to the cell membrane (whichaccount for up to 30 % of all proteins) andwhich parts of the protein are actually in-serted into the membrane. Transmembranehelix prediction was done historically by us-ing hydropathy or hydrophobicity plots [53,84]. This graphical technique often provedto be inconsistent and unreliable, however.The introduction of neural network-basedapproaches and hidden Markov modelscombined with multiple sequence align-ments (or evolutionary information) hasgreatly improved the quality and reliabilityof transmembrane helix prediction [85]. Al-though some groups have claimed predic-tion accuracies in excess of 95 % [86], morerecent, independent assessments indicatethat membrane helix prediction is approxi-mately 75–80 % accurate [87], with the besttools generally being HMMTOP [85] andTMHMM [88]. Even with this “reduced” lev-el of accuracy, identification of membraneproteins and membrane spanning locations
is probably one of the more robust and reli-able predictive methods in all of bioinfor-matics. Interestingly, although transmem-brane helices are quite predictable, trans-membrane beta-sheets (as found in porins)are not. This problem continues to be oneof the unmet challenges in membrane pro-tein sequence analysis. A list of URLs forseveral membrane spanning predictionWeb servers is given in Tab. 14.4.
14.3.6
Predicting Stability, Globularity, and Shape
Before cloning or expressing a protein orprotein fragment, obviously one would liketo know whether it will be soluble, stable,and globular. Although crude predictorsbased on average hydrophobicity, localizedhydrophobicity, hydrophobic ratios, chargedensity, and secondary structure are avail-able, prediction of protein solubility and ex-pressibility is still on rather shaky gro-und [89, 90]. Some general rules or equa-tions are provided in Tab. 14.2, but these,too, are only approximate. Nevertheless, asmore data from different structural prote-omics efforts around the globe are com-piled and analyzed, a clearer idea is beingobtained about the key sequence/propertyfeatures that determine the likelihood ofsuccessful, high-yield expression. One ex-ample of a protein sequence feature that de-termines stability is the so-called PEST se-quence [91]. Eukaryotic proteins with intra-cellular half-lives of less than 2 h are oftenfound to contain regions rich in proline,glutamic acid, serine, and threonine (P, E, Sand T). These PEST regions are usuallyflanked by clusters of positively chargedamino acids. Identification of PEST se-quences in proteins can therefore be a veryimportant consideration in any protein ex-pression project. At least one PEST webserver (Tab. 14.4) is available for identifica-
34114.3 Protein Property Prediction
tion of PEST sequences using a standardset of pattern-based rules. Similar informa-tion about intracellular protein lifetimescan be extracted using the N-end rule forprotein ubiquitination [92].
The propensity of a protein to fold into aparticular shape or to fold into a globule canalso be predicted. Indeed, as far back as1964 a very simple but elegant procedurewas developed to predict the shape andglobularity of proteins on the basis of sim-ple packing rules, hydrophobicity, and ami-no acid volumes [93]. Specifically, if the cal-culated volume ratio for a given protein(Tabs. 14.2 and 14.3) is slightly greater thanthe theoretical Fisher volume ratio, the pro-tein probably forms a soluble monomer. Ifthe calculated volume ratio is much greaterthan the Fisher volume ratio, the proteinprobably does not form a compact globularstructure (i.e. it is filamentous or unfolded).This procedure, with a few modifications,has been implemented in both the SEQSEEand PepTool software packages [49, 50]. Amore sophisticated approach to solubil-ity/globularity prediction has been devel-oped by Burkhard Rost. This techniqueuses evolutionary information, neural net-works, and predicted protein accessibility todetermine whether or not a protein willform a globular domain. The PredictPro-tein Web server [94], listed in Tab. 14.4, pro-vides this domain prediction service with ahost of other predictions (secondary struc-ture, accessibility, disulfide bonds, trans-membrane helices, coiled-coil regions, andstructural switch regions).
14.3.7
Predicting Protein Domains
Larger proteins will tend to fold into struc-tures containing multiple domains. Typical-ly domains are defined as contiguousstretches of 100–150 amino acids with a
globular fold or function distinct from otherparts of the protein. Many eukaryotic pro-teins are composed of multiple sub-units ordomains, each having a different function ora different fold. If one can identify (by se-quence analysis) the location or presence ofwell-folded, well-defined domains, it is oftenpossible to gain greater understanding ofnot only the probable function but also theevolutionary history of a protein. The iden-tification of domains can, furthermore, of-ten enable one to “decompose” a proteininto smaller parts to facilitate cloning andexpression and to increase the likelihoodthat the protein, or parts of it, can be studiedby X-ray or NMR techniques.
As with active-site identification, domainidentification is typically performed by us-ing comparisons or alignments to knowndomains. Several databases are now avail-able, including Pfam [59], the conserved do-main database or CDD [95], and Prodom[96, 97] (all have their URLs listed in Tab.14.4). These represent compilations of pro-tein domains that have been identified bothmanually and automatically through multi-ple sequence alignments and hierarchicalclustering algorithms. All three databasescan achieve quick and reliable identificationof most globular protein domains, with CDDresults being returned in many BLASTsearches performed through the NCBI web-site. The CDD and Pfam both provide directlinks to the domain’s 3D structure. Someprotein domains seem to defy routine iden-tification, however. For example, special-ized software had to be developed to aididentification of coiled-coil domains, withtheir nondescript sequence character andnon-globular nature [98]. Several coiled-coilprediction services are also available overthe Web (Tab. 14.4). Another very useful,but unpublished, website (http://www.mshri.on.ca/pawson/domains.html main-tained by Dr Tony Pawson’s laboratory) pro-
342 14 Software Tools for Proteomics Technologies
vides detailed descriptions, pictures, andstructures of dozens of known protein–pro-tein interaction domains.
14.3.8
Predicting Secondary Structure
The primary structure (the sequence) deter-mines both the secondary structure (helicesand beta-strands) and the tertiary structure(the 3D fold) of a protein. In principle, ifyou know a protein’s sequence, you shouldbe able to predict both its structure andfunction. Prediction of secondary structureis one way of gaining insight into the prob-able folds, expected domain structure, andpossible functions of proteins [99, 100]. Be-cause secondary structure is more con-served than primary structure, prediction ofsecondary structure might also be used tofacilitate remote homolog detection or pro-tein fold recognition [101].
Prediction of secondary structure hasbeen under development for more than 30years. As a consequence, many differenttechniques are available with widely varyingaccuracy and utility. The simplest approach-es are statistical [102] wherein intrinsicprobabilities of amino acids being in helicesand beta-strands are simply averaged overdifferent window sizes. Amino acid seg-ments with the highest local scores for aparticular secondary structure are then as-signed to that structure. Secondary struc-ture usually depends on more than just av-eraged conformational preferences of indi-vidual amino acids, however. Sequence pat-terns, positional preferences, long-rangeeffects, and pairwise interactions are alsoimportant. To account for these effectsmore sophisticated predictive approacheshave had to be developed. These include in-formation theoretical or Bayesian probabil-istic approaches [103]; stereochemical meth-
ods [104]; nearest-neighbor or databasecomparison techniques [105]; and neuralnetwork approaches [106]. Typically thesemethods achieve a three-state (helix, sheet,coil) accuracy of between 55 % (for the sim-plest statistical methods) to 65 % (for thebest neural network or nearest-neighbor ap-proaches) for water-soluble globular pro-teins.
A significant improvement in the accura-cy of prediction of secondary structure oc-curred in the early 1990s with the introduc-tion of combined approaches that integrat-ed multiple sequence alignments (i.e. evo-lutionary information) with neural networkpattern-recognition methods [107]. This in-novation enabled the accuracy of predictionof secondary structure to be improved tobetter than 72 %. Similar efforts aimed atintegrating evolutionary information withnearest-neighbor approaches also led tocomparable improvements in prediction ac-curacy [108]. Most recently, integration ofbetter database-searching methods (PSI-BLAST) has enabled the accuracy of predic-tion of protein secondary structure to ap-proach 77 % [100, 109]. Many of these “newand improved” methods for prediction ofsecondary structure are now freely availableover the Web (Tab. 14.4).
Given their wide availability and muchimproved reliability, predictions of secon-dary structure should now be regarded asintegral components of any standard pro-tein sequence analysis. With steady, incre-mental improvements in prediction accura-cy occurring every one or two years, it islikely that secondary structure predictionwill soon achieve an accuracy in excess of80 %. At this level of accuracy it might bepossible to use secondary structure predic-tions as starting points for 3D structure pre-diction.
34314.3 Protein Property Prediction
14.3.9
Predicting 3D Folds (Threading)
Threading is a protein-fold recognition orstructure prediction technique that got itsname because it conceptually resembles themethod used to thread electrical cablesthrough a conduit. Specifically threadinginvolves placing or threading an amino acidsequence on to a database of different sec-ondary or tertiary structures (pseudo-con-duits). As the sequence is fed through eachstructure its fit or compatibility to thatstructure is evaluated by using a heuristicpotential [110]. This evaluation might beachieved quickly by using an empirical “en-ergy” term or some measure of packing ef-ficiency or secondary structure propensity.In this way it is possible to assess whichprotein sequences are compatible with thegiven backbone fold. While one wouldclearly expect that those sequences homolo-gous to the original template sequenceshould fit best, it has been found that thisapproach can occasionally reveal that someseemingly unrelated sequences can also fitinto previously known folds. The proteinleptin (the hormone responsible for obes-ity) is one interesting and early example ofhow successful threading can be in struc-ture and function prediction. Standardthreading techniques were able to showthat leptin was a helix-like cytokine long be-fore any confirmatory X-ray structure hadbeen determined or biological receptorshad been found [111].
Two approaches to threading are used.One, 3D threading, is classified as a dis-tance-based method (DBM). The other, 2Dthreading, is classified as a prediction-based method (PBM). 3D threading wasfirst described in the early 1980s [112] andthen “rediscovered” about 10 years later[113–115] when the concept of heuristic po-
tential functions matured. 3D threadinguses distance-based or profile-based [116]energy functions and technically resemblesthe “pipe” threading description given earli-er. In 3D threading, coordinates corre-sponding to the hypothesized protein foldare actually calculated and the energy func-tions evaluated on the basis of these 3D co-ordinates.
Just like 3D threading, 2D threading wasfirst described in the mid-1980s [117] thenrediscovered in the mid 1990s [101, 118,119] when the reliability of secondary struc-ture predictions began to improve. Ratherthan relying on 3D coordinates to evaluatethe quality of a fold, 2D threading actuallyuses secondary structure (hence the name2D) as the primary evaluation criterion. In-deed, 2D threading is based on the simpleobservation that secondary structure ismore conserved than primary structure (se-quence). Therefore, proteins that have lostdetectable similarity at the sequence level,could still be expected to maintain somesimilarity at the secondary structure level.
Over the past few years 2D threading hasmatured so that secondary structure, sol-vent accessibility and sequence informationcan now be used in the evaluation process.The advantage that 2D threading has over3D threading is that all this structural infor-mation can be encoded into a 1D string ofsymbols (i.e. a pseudo sequence). This en-ables the use of standard sequence compar-ison tools, for example dynamic program-ming, for rapid comparison of a query se-quence and/or secondary structure withmembers of a database of sequences andsecondary structures. Consequently, 2Dthreading is 10 to 100 times faster than dis-tance-based 3D threading and seems to givecomparable (and occasionally even better)results than 3D threading. The fact that the2D threading algorithm is relatively simple
344 14 Software Tools for Proteomics Technologies
to understand and to implement has led tothe development of a number of freely avail-able 2D threading servers (Tab. 14.4).
Typically the best 2D threading methodsscore between 30 and 40 % when workingwith “minimal” databases. If the structuraldatabases are expanded to include morethan one related fold representative, the per-formance can be as high as 70–75 %. As al-ready mentioned, 2D threading performsabout as well as 3D threading; it is, however,much faster, and easier to implement. It isgenerally thought that if 2D threading ap-proaches could improve their secondarystructure prediction accuracy and includemore information about the “coil” state(such as approximate dihedral angles) theneven further performance gains could be re-alized. Similarly, if initial 2D threading pre-dictions could be verified using 3D thread-ing checks (post-threading analysis) andfurther tested by looking at other biochemi-cal information (species of origin, knownfunction, ligand contacts, binding partners)additional improvements should be possible.
14.3.10
Comprehensive Commercial Packages
Commercial packages can offer an attractivealternative to many of the specialized or sin-gle-task analyses offered over the Web. Inparticular, these commercial tools integratesophisticated graphical user interfaces(GUI) with a wide range of well-tested ana-lytical functions, databases, plotting tools,and well-maintained user-support systemsto make most aspects of protein sequenceanalysis simpler, speedier, and “safer” thanis possible with Web-based tools. Commer-cial packages also have their disadvantages,however. Most are quite expensive ($1000–$3000) and most do not offer the range oreven the currency of analytical functionsavailable via the Web. Furthermore, most
commercial packages are very platform-spe-cific, i.e. they run only on certain types ofcomputer or with a specific operatingsystem. This is not a limitation for Web-based tools, as most are platform indepen-dent.
The first commercial packages appearedin the mid 1980s and over the past 20 yearsthey have evolved and improved substantial-ly. Most packages integrate both protein andDNA sequence analysis into a single “suite”,although some companies have opted tocreate separate protein-specific modules.Most commercial packages offer a fairlystandard set of protein analysis tools includ-ing:1. bulk property calculations (molecular
weight, pI);2. physicochemical property plotting (hy-
drophobicity, flexibility, hydrophobic mo-ments);
3. antigenicity prediction;4. sequence motif searching or identifica-
tion;5. secondary structure prediction;6. database searching (internet or local);7. alignment and comparison tools (dot-
plots or multiple alignment);8. plotting or publication tools; and9. multiformat (GenBank, EMBL, Swiss-
Prot, PIR) sequence input/output.
It would be impossible to review all thecommercial packages here, but a brief sum-mary of some of the more popular tools isgiven below.
Accelerys (www.accelerys.com) offersperhaps the widest range of protein analysistools including the GCG Wisconsin pack-age (UNIX), Discovery Studio Gene (Win-dows), and MacVector (MacOS). The Wis-consin package, with its new graphicalinterfaces (SeqWeb, SeqLab, and DS Gene),is one of the most comprehensive and wide-ly distributed bioinformatics packages in
34514.3 Protein Property Prediction
the world. It offers an impressive array ofstandard tools and some very good motif-detection routines (Meme) and sophisticat-ed sequence profiling algorithms. With lit-erally dozens of protein-analysis tools, theGCG Wisconsin package is much morecomplete than either Discovery StudioGene or MacVector. The interface and user-friendliness of GCG are still well behind in-dustry standards, however.
DNAstar (www.dnastar.com) produces ahighly acclaimed multi-component suitecalled LaserGene (MacOS, Windows). Theprotein sequence-analysis module (Prote-an) has a well-conceived GUI and an arrayof sophisticated plotting and visualizationtools. In addition to the usual analyticaltools the Protean module also offers somevery innovative facilities for synthetic pep-tide design, linear structure display, andSDS PAGE gel simulation. Unfortunately,Protean does not offer the usual sequencecomparison or alignment tools typicallyfound in most comprehensive packages. In-stead these must be obtained by purchasinga second stand-alone module called Mega-lign.
Informax (www.informaxinc.com),through its parent company Invitrogen,produces and distributes a very popularpackage called Vector NTI (Windows, Ma-cOS). Although the emphasis is clearly onDNA analysis, the Vector NTI package alsooffers a modestly comprehensive set of pro-tein tools presented in an easy-to-use GUI.Vector NTI supports most standard proteinanalytical functions and, as with many com-mercial packages, offers integrated internetconnectivity to Entrez, PubMed, andBLAST. Vector NTI also supports a good,interactive 3D molecular visualization tooland a number of interesting property evalu-ation functions to calculate free energies,polarity, refractivity, and sequence com-plexity.
BioTools (www.biotools.com) producesperhaps the most comprehensive and leastexpensive (<$200) protein-analysis packag-es. Its platform-independent (Windows,MacOS, UNIX) protein analysis suite iscalled PepTool. As with most other com-mercial packages, PepTool supports all ofthe major protein analytical functions andoffers a particularly broad range of statisti-cal and property prediction tools. In addi-tion to being the only package to offer uni-versal platform compatibility, PepTool alsohas a particularly logical, easy-to-learn inter-face with web connectivity to most majorprotein databases. Most recently PepToolhas included a comprehensive 3D structurevisualization and modeling module whichadds considerably to its utility and ease-of-use.
A question often asked by both noviceand experienced users is: Should I chooseexpensive commercial packages or should Istick with freely available Web tools? Thereis no straightforward answer. If one is look-ing for the latest analytical tool or best-per-forming prediction algorithm, the Web isalmost always the best place to find it. If,however, high-quality plotting, graphing, orrendering is important (for papers or pres-entations) one often has to turn to commer-cial packages. Helical wheels, colored mul-tiple alignments, overlaid or stacked plots,annotated graphs, graphical secondarystructure assignments, etc., are examples ofimages that cannot yet be rendered (well)on the Web. For many commercial biotechfirms, security, uniformity, and reliabilityare particularly important and so onceagain, commercial packages – with theirresident databases, uniform interfaces, andreliable user-support – are definitely thetools of choice.
Irrespective of one’s decision to choosefreeware or commercial software, one thingshould be clear – without access to the tools

346 14 Software Tools for Proteomics Technologies
or database described here, we would trulybe “lost” in a blizzard of biological data. Bio-logical science and, particularly, protein sci-ence has definitely entered the computerage.
Acknowledgments
The author wishes to acknowledge GenomeCanada and the Protein Engineering Net-work of Centers of Excellence (PENCE) forfinancial support.
347
1 Genome News Network (April, 2004)http://www.genomenewsnetwork.org/sequenced_genomes/genome_guide_p1.shtml.
2 Green, E.D.(2001) Strategies for thesystematic sequencing of complex genomes,Nat Rev Genet. 2, 573–583.
3 Broder, S., Venter, J.C. (2000) Sequencing theentire genomes of free-living organisms: thefoundation of pharmacology in the newmillennium, Annu. Rev. Pharmacol. Toxicol.40, 97–132.
4 Giometti, C.S. (2003) Proteomics andbioinformatics, Adv. Protein Chem. 65,353–369.
5 Zhu, H., Bilgin, M., Snyder, M. (2003)Proteomics, Annu. Rev. Biochem. 72,783–812.
6 Gevaert, K., Vandekerckhove, J. (2000)Protein identification methods in proteomics,Electrophoresis 21, 1145–1154.
7 Hoving, S., Gerrits, B., Voshol, H., Muller,D., Roberts, R.C., van Oostrum, J. (2002)Preparative two-dimensional gelelectrophoresis at alkaline pH using narrowrange immobilized pH gradients, Proteomics2, 127–134.
8 Von Eggeling, F., Gawriljuk, A., Fiedler, W.,Ernst, G., Claussen, U., Klose, J., Romer, I.(2001) Fluorescent dual colour 2D-protein gelelectrophoresis for rapid detection ofdifferences in protein pattern with standardimage analysis software, Int. J. Mol. Med. 8,373–377.
9 Appel, R., Hochstrasser, D., Roch, C., Funk,M., Muller, A.F., Pellegrini, C. (1988)Automatic classification of two-dimensionalgel electrophoresis pictures by heuristicclustering analysis: a step toward machinelearning, Electrophoresis 9, 136–142.
10 Appel, R.D., Vargas, J.R., Palagi, P.M.,Walther, D., Hochstrasser, D.F. (1997)Melanie II – a third-generation softwarepackage for analysis of two-dimensionalelectrophoresis images, Electrophoresis. 18,2735–2748.
11 Young, N., Chang, Z., Wishart, D.S. (2004)GelScape: a web-based server for interactivelyannotating, manipulating, comparing andarchiving 1D and 2D gel images,Bioinformatics, 20, 976–978.
12 Lemkin, P.F., Thornwall, G. (1999) Flickerimage comparison of 2-D gel images forputative identification using the 2DWG meta-database, Mol. Biotechnol. 12, 159–172.
13 Lemkin, P.F., Thornwall, G. (2002) Flickerimage comparison of 2-D gel images over theInternet. John Walker (ed) The ProteinProtocols Handbook, pp197–214.
14 Appel, R.D., Bairoch, A., Sanchez, J.C.,Vargas, J.R., Golaz, O., Pasquali, C.,Hochstrasser, .D.F. (1996) Federated two-dimensional electrophoresis database: asimple means of publishing two-dimensionalelectrophoresis data, Electrophoresis 17,540–546.
15 Celis, J.E., Ostergaard, M., Jensen, N.A.,Gromova, I., Rasmussen, H.H., Gromov, P.(1998) Human and mouse proteomicdatabases: novel resources in the proteinuniverse, FEBS Lett. 430, 64–72.
16 Lemkin, P.F., Myrick, J.M., Lakshmanan, Y.,Shue, M.J., Patrick, J.L., Hornbeck, P.V.,Thornwall, G., Partin, A.W. (1999)Exploratory data analysis groupware forqualitative and quantitative electrophoretic gelanalysis over the Internet-WebGel,Electrophoresis 20, 3492–3507.
References
348 References
17 Hoogland, C., Sanchez, J.C., Tonella, L., Binz,P.A., Bairoch, A., Hochstrasser, D.F., Appel,R.D. (2000) The 1999 SWISS-2DPAGEdatabase update, Nucleic Acids Res. 28,286–288.
18 Stanislaus, R., Jiang, L.H., Swartz, M., Arthur,J., Almeida, J.S. (2004) An XML standard forthe dissemination of annotated 2D gelelectrophoresis data complemented with massspectrometry results, BMC Bioinformatics 5,9.
19 Ashcroft, A.E. (2003) Protein and peptideidentification: the role of mass spectrometryin proteomics, Nat. Prod. Rep. 20, 202–215.
20 Yates, J.R. (2000) Mass spectrometry. Fromgenomics to proteomics, Trends Genet. 16,5–8.
21 Kislinger, T., Emili, A. (2003) Going global:protein expression profiling using shotgunmass spectrometry, Curr. Opin. Mol. Ther. 5,285–293.
22 Pappin, D.J.C., Hojrup, P., Bleasby, A.J.(1993) Rapid identification of proteins bypeptide-mass fingerprinting, Curr. Biology 3,327–332.
23 Yates, J.R., Speicher, S., Griffin, P.R.,Hunkapiller, T. (1993) Peptide mass maps – ahighly informative approach to proteinidentification, Anal. Biochem. 214, 397–408.
24 Mann, M., Hojrup, P., Roepstorff, P. (1993)Use of mass spectrometric molecular weightinformation to identify proteins in sequencedatabases, Biol Mass Spectrom. 22, 338–345.
25 Zhang, W., Chait, B.T. (1995) Proc. 43rdASMS Conf. Mass Spectrometry and AlliedTopics, Atlanta, Georgia.
26 Perkins, D.N., Pappin, D.J., Creasy, D.M.,Cottrell, J.S. (1999) Probability-based proteinidentification by searching sequencedatabases using mass spectrometry data,Electrophoresis 20, 3551–3567.
27 Eng, J.K., McCormack, A.L., Yates, J.R. (1994)An approach to correlate tandem mass-spectral data of peptides with amino-acidsequences in a protein database, J. Am. Soc.Mass. Spectrom. 5, 976–989.
28 Yates, J.R., Eng, J.K., Glauser, K.R.,Burlingame, A.L. (1996) Search of sequencedatabases with uninterpreted high-energycollision-induced dissociation spectra ofpeptides, J. Am. Soc. Mass Spectrom. 7,1089–1098.
29 Clauser, K. R., Baker P. R., Burlingame, A. L.(1999) Role of accurate mass measurement( ± 10 ppm) in protein identification strategiesemploying MS or MS/MS and databasesearching. Analytical Chemistry, 71,2871–2875.
30 Bergquist, J. (2003) FTICR mass spectrometryin proteomics, Curr. Opin. Mol. Ther. 5,310–314.
31 Goodlett, D.R., Bruce, J.E., Anderson, G.A.,Rist, B., Pasa-Tolic, L., Fiehn, O., Smith, R.D.,Aebersold, R. (2000) Protein identificationwith a single accurate mass of a cysteine-containing peptide and constrained databasesearching, Anal. Chem. 72, 1112–1118.
32 Sanger, F., Air, G.M., Barrell, B.G., Brown,N.L., Coulson, A.R., Fiddes, C.A., Hutchison,C.A., Slocombe, P.M., Smith, M. (1977)Nucleotide sequence of bacteriophage phiX174 DNA, Nature 265, 687–695.
33 Bleasby, A.J., Akrigg, D., Attwood, T.K. (1994)OWL – a non-redundant composite proteinsequence database, Nucleic Acids Res. 22,3574–3577.
34 Wu, C.H., Yeh, L.S., Huang, H., Arminski, L.,Castro-Alvear, J., Chen, Y., Hu, Z., Kourtesis,P., Ledley, R.S., Suzek, B.E., Vinayaka, C.R.,Zhang, J., Barker, W.C. (2003) The ProteinInformation Resource, Nucleic Acids Res. 31,345–347.
35 Boeckmann, B., Bairoch, A., Apweiler, R.,Blatter, M.C., Estreicher, A., Gasteiger, E.,Martin, M.J., Michoud, K., O’Donovan, C.,Phan, I., Pilbout, S., Schneider, M. (2003) TheSWISS-PROT protein knowledgebase and itssupplement TrEMBL in 2003, Nucleic AcidsRes. 31, 365–370.
36 Apweiler, R., Bairoch, A., Wu, C.H., Barker,W.C., Boeckmann, B., Ferro, S., Gasteiger E,,Huang. H,, Lopez, R., Magrane, M., Martin,M.J., Natale, D.A., O’Donovan, C., Redaschi,N., Yeh, L.S. (2004) UniProt: the UniversalProtein knowledgebase, Nucleic Acids Res. 32Database issue:D115–119.
37 Benson, D.A., Karsch-Mizrachi, I., Lipman,D.J., Ostell, J., Wheeler, D.L. (2004) GenBank:update, Nucleic Acids Res. 32, Databaseissue:D23–26.
38 Shevchenko, A., Wilm, M., Mann, M. (1997)Peptide sequencing by mass spectrometry forhomology searches and cloning of genes, J.Protein Chem. 16, 481–490.
349References
39 Raska, C.S., Parker, C.E., Sunnarborg, S.W.,Pope, R.M., Lee, D.C., Glish, G.L., Borchers,C.H. (2003) Rapid and sensitive identificationof epitope-containing peptides by directmatrix-assisted laser desorption/ionizationtandem mass spectrometry of peptidesaffinity-bound to antibody beads, J. Am. Soc.Mass Spectrom. 14, 1076–1085.
40 Doolittle, R.F., Bork, P. (1993) Evolutionarilymobile modules in proteins, Sci. Am. 269,50–56.
41 Needleman, S.B., Wunsch, C. (1970) Ageneral method applicable to the search forsimilarities in the amino acid sequence of twoproteins, J. Mol. Biol. 48, 443–453.
42 Smith, T.F., Waterman, M.S. (1981)Identification of common molecularsubsequences, J. Mol. Biol. 47, 195–197.
43 Pearson, W.R. and Lipman, D.J. (1988)Improved tools for biological sequencecomparison, Proc. Natl. Acad. Sci. USA 85,2444–2448.
44 Altschul, S.F., Gish, W., Miller, W., Myers,E.W., Lipman, D.J. (1990) Basic localalignment search tool, J. Mol. Biol., 215,403–410.
45 Altschul, S. F., Madden, T.L., Schaffer, A.A.,Zhang, J., Zhang, Z., Miller, W., Lipman, D.J.(1997) Gapped BLAST and PSI-BLAST: a newgeneration of protein database searchprograms, Nucleic Acids Res. 25, 3389–3402.
46 Dayhoff, M.O., Barker, W.C., Hunt, L.T.(1983) Establishing homologies in proteinsequences, Methods Enzymol. 91, 534–545.
47 Henikoff, S., Henikoff, J.G. (1992) Aminoacid substitution matrices from proteinblocks, Proc. Natl. Acad. Sci. USA 89,10915–10919.
48 Pearson, W.R. (2000) Flexible sequencesimilarity searching with the FASTA3program package, Methods Mol. Biol. 132,185–219.
49 Wishart, D.S., Boyko, R.F., Willard, L.,Richards, F.M., Sykes, B.D. (1994) SEQSEE: a comprehensive program suite for proteinsequence analysis, Comput. Appl. Biosci. 10,121–132.
50 Wishart, D.S., Stothard, P., Van Domselaar,G.H. (2000) PepTool and GeneTool: platform-independent tools for biological sequenceanalysis, Methods Mol. Biol. 132, 93–113.
51 Deleage, G., Combet, C., Blanchet, C.,Geourjon, C. (2001) ANTHEPROT: anintegrated protein sequence analysis software
with client/server capabilities, Comput. Biol.Med. 31, 259–267.
52 Biemann, K. (1990) Appendix 6. Mass valuesfor amino acid residues in peptides in:Methods in Enzymology (McCloskey, J. A.,Ed.) Vol. 193, pp. 888. San Diego: AcademicPress.
53 Kyte, J., Doolittle, R.F. (1982) A simplemethod for displaying the hydropathiccharacter of a protein, J. Mol. Biol. 157,105–132.
54 Zamayatnin, A.A. (1972) Protein volume insolution, Prog. Biophys. Mol. Biol. 24,107–123.
55 Richards, F.M. (1977) Areas, volumes,packing and protein structure, Annu. Rev.Biophys. Bioeng. 6, 151–175.
56 Chothia, C. (1976) The nature of theaccessible and buried surfaces in proteins, J.Mol. Biol. 105, 1–14.
57 Bairoch, A. (1991) PROSITE: A dictionary ofsites and patterns in proteins, Nucleic AcidsRes. 19, 2241–2245.
58 Gribskov, M., McLachlan, A.D., Eisenberg, D.(1987) Profile analysis: detection of distantlyrelated proteins, Proc. Natl. Acad. Sci. USA84, 4355–4358.
59 Bateman, A., Coin, L., Durbin, R., Finn, R.D.,Hollich, V., Griffiths-Jones, S., Khanna, A.,Marshall, M., Moxon, S., Sonnhammer, E.L.,Studholme, D.J., Yeats, C., Eddy, S.R. (2004)The Pfam protein families database, NucleicAcids Res. 32, Database issue:D138–141.
60 Hulo, N., Sigrist, C.J., Le Saux, V.,Langendijk-Genevaux, P.S., Bordoli, L.,Gattiker, A., De Castro, E., Bucher, P.,Bairoch, A. (2004) Recent improvements tothe PROSITE database, Nucleic Acids Res. 32,Database issue:D134–137.
61 Hodgman, T.C. (1989) The elucidation ofprotein function by sequence motif analysis,Comput. Appl. Biosci. 5, 1–13.
62 Seto, Y., Ikeuchi, Y., Kanehisa, M. (1990)Fragment peptide library for classificationand functional prediction for proteins,Proteins: Struct. Funct. Genet. 8, 341–351.
63 Ogiwara, A., Uchiyama, I. Seto, Y., Kanehisa,M. (1992) Construction of a dictionary ofsequence motifs that characterize groups ofrelated proteins, Protein Engineering 5,479–488.
64 Hofmann, K. (2000) Sensitive proteincomparisons with profiles and hiddenMarkov models. Brief. Bioinform. 1, 167–178.
350 References
65 Attwood, T.K., Bradley, P., Flower, D.R.,Gaulton, A., Maudling, N., Mitchell, A.L.,Moulton, G., Nordle, A., Paine, K., Taylor, P.,Uddin, A., Zygouri, C. (2003) PRINTS and itsautomatic supplement, preprints, NucleicAcids Res. 31, 400–402.
66 Henikoff, S., Henikoff, J.G. (1991) Automatedassembly of protein blocks for databasesearching, Nucl. Acids Res. 19, 6565–6572.
67 Mulder, N.J., Apweiler, R., Attwood, T.K.,Bairoch, A., Barrell, D., Bateman, A., Binns,D., Biswas, M., Bradley, P., Bork, P., Bucher,P., Copley, R.R., Courcelle, E., Das, U.,Durbin, R., Falquet, L., Fleischmann, W.,Griffiths-Jones, S., Haft, D., Harte, N., Hulo,N., Kahn, D., Kanapin, A., Krestyaninova, M.,Lopez, R., Letunic, I., Lonsdale, D.,Silventoinen, V., Orchard, S.E., Pagni, M.,Peyruc, D., Ponting, C.P., Selengut, J.D.,Servant, F., Sigrist, C.J., Vaughan, R.,Zdobnov, E.M. (2003) The InterPro Database,2003 brings increased coverage and newfeatures, Nucleic Acids Res. 31, 315–318.
68 Harris, M.A., Clark, J., Ireland, A., Lomax .J,Ashburner, M., Foulger, R., Eilbeck, K., Lewis,S., Marshall, B., Mungall, C., Richter, J.,Rubin, G.M,, Blake, J.A., Bult, C., Dolan, M.,Drabkin, H., Eppig, J.T., Hill, D.P., et al. GeneOntology Consortium. (2004) The GeneOntology (GO) database and informaticsresource, Nucleic Acids Res. 32, Databaseissue:D258–261.
69 Blom, N., Gammeltoft, S., Brunak, S. (1999)Sequence and structure-based prediction ofeukaryotic protein phosphorylation sites, J.Mol. Biol. 294, 1351–1362.
70 Hansen, J.E., Lund, O., Tolstrup, N., Gooley,A.A., Williams, K.L., Brunak, S. (1998)NetOglyc: prediction of mucin type O-glycosylation sites based on sequence contextand surface accessibility, Glycoconj. J. 15,115–130.
71 Kanehisa, M., Goto, S., Kawashima, S.,Okuno, Y., Hattori, M. (2004) The KEGGresource for deciphering the genome, NucleicAcids Res. 32, Database issue:D277–280.
72 Bader, G.D., Betel, D., Hogue, C.W. (2003)BIND: the Biomolecular Interaction NetworkDatabase, Nucleic Acids Res. 31, 248–250.
73 Salwinski, L., Miller, C.S., Smith, A.J., Pettit,F.K., Bowie, J.U., Eisenberg, D. (2004) TheDatabase of Interacting Proteins: 2004
update. Nucleic Acids Res. 32, Databaseissue:D449–451.
74 Hermjakob, H., Montecchi-Palazzi, L.,Lewington, C., Mudali, S., Kerrien, S.,Orchard, S., Vingron, M., Roechert, B.,Roepstorff, P., Valencia, A., Margalit, H.,Armstrong, J., Bairoch, A., Cesareni, G.,Sherman, D., Apweiler, R.(2004) IntAct: anopen source molecular interaction database.Nucleic Acids Res. 32, Databaseissue:D452–455.
75 Zanzoni, A., Montecchi-Palazzi, L.,Quondam, M., Ausiello, G., Helmer-Citterich,M., Cesareni, G. (2002) MINT: a MolecularINTeraction database, FEBS Lett. 513,135–140.
76 Nielsen, H., Brunak. S., von Heijne, G. (1999)Machine learning approaches for theprediction of signal peptides and otherprotein sorting signals, Protein Eng. 12, 3–9.
77 Reinhardt, A., Hubbard, T. (1998) Usingneural networks for prediction of thesubcellular location of proteins, Nucleic AcidsRes. 26, 2230–2236.
78 Hua, S., Sun, Z. (2001) Support vectormachine approach for protein subcellularlocalization prediction, Bioinformatics 17,721–728.
79 Emanuelsson, O., Nielsen, H., Brunak, S.,von Heijne, G. (2000) Predicting subcellularlocalization of proteins based on their N-terminal amino acid sequence, J. Mol. Biol.300, 1005–1016.
80 Nair, R., Rost, B. (2002) Inferring subcellularlocalization through automated lexicalanalysis, Bioinformatics 18, S78–S86.
81 Horton, P., Nakai, K. (1997) Better predictionof protein cellular localization sites with the knearest neighbor classifier, Intell. Syst. Mol.Biol. 5, 147–152.
82 Gardy, J.L., Spencer, C., Wang, K., Ester, M.,Tusnády, G.E., Simon, I., Hua, S., deFays, K.,Lambert, C., Nakai, K., Brinkman, F.S.L.(2003) PSORT-B: Improving proteinsubcellular localization prediction for Gram-negative bacteria. Nucleic Acids Res. 31,3613–3617.
83 Lu, Z., Szafron, D., Greiner, R., Lu, P.,Wishart, D.S., Poulin, B., Anvik, J.,Macdonell, C., Eisner, R. (2004), Predictingsubcellular localization using machine-learned classifiers in proteome analyst,Bioinformatics 20, 547–556.
351References
84 Engelman, D.M., Steitz, T.A., Goldman, A.(1986) Identifying non-polar transbilayerhelices in amino acid sequences of membraneproteins, Annu. Rev. Biophys. Biophys. Chem.15, 321–353.
85 Tusnady, G.E., Simon, I. ( 2001) TheHMMTOP transmembrane topologyprediction server, Bioinformatics 17, 849–850.
86 Rost, B., Casadio, R., Fariselli, P., Sander, C.(1995) Transmembrane helices predicted at95 % accuracy, Protein Sci. 4, 521–33.
87 Chen, C.P., Kernytsky, A., Rost, B. (2002)Transmembrane helix predictions revisited.Protein Sci. 11, 2774–2791.
88 Krogh, A., Larsson, B., von Heijne, G.,Sonnhammer, E.L. (2001) Predictingtransmembrane protein topology with ahidden Markov model: application tocomplete genomes, J. Mol. Biol. 305, 567–580.
89 Wilkinson, D.L., Harrison, R.G. (1991)Predicting the solubility of recombinantproteins in Escherichia coli, Biotechnology 9,443–448.
90 Bertone, P., Kluger, Y., Lan, N., Zheng, D.,Christendat, D., Yee, A., Edwards, A.M.,Arrowsmith, C.H., Montelione, G.T.,Gerstein, M. (2001) SPINE: an integratedtracking database and data mining approachfor identifying feasible targets in high-throughput structural proteomics, NucleicAcids Res. 29, 2884–2898.
91 Rechsteiner, M., Rogers, S.W. (1996) PESTsequences and regulation by proteolysis,Trends. Biochem. Sci. 21, 267–271.
92 Bachmair, A., Finley, D., Varshavsky, A.(1986) In vivo half-life of a protein is afunction of its amino-terminal residue,Science 234, 179–186.
93 Fisher, H.F. (1964) A limiting law relating thesize and shape of protein molecules to theircomposition, Proc. Natl. Acad. Sci. 51,1285–1291.
94 Rost, B., Liu, J. (2003) The PredictProteinserver, Nucleic Acids Res. 31, 3300–3304.
95 Marchler-Bauer, A., Panchenko, A.R.,Shoemaker, B.A., Thiessen, P.A., Geer, L.Y.,Bryant, S.H. (2002) CDD: a database ofconserved domain alignments with links todomain three-dimensional structure. NucleicAcids Res. 30, 281–283.
96 Corpet, F., Servant, F., Gouzy, J., Kahn, D.(2000) ProDom and ProDom-CG: tools forprotein domain analysis and whole genomecomparisons, Nucleic Acids Res. 28, 267–269.
97 Servant, F., Bru, C., Carrere, S., Courcelle, E.,Gouzy, J., Peyruc, D., Kahn, D. (2002)ProDom: automated clustering ofhomologous domains, Brief Bioinform. 20023, 246–251.
98 Lupas, A. (1996) Prediction and analysis ofcoiled-coil structures, Methods Enzymol. 266,513–525.
99 Deleage, G., Blanchet, C., Geourjon, C. (1997)Protein structure prediction. Implications forthe biologist, Biochimie 79, 681–686.
100 Edwards, Y.J., Cottage, A. (2003)Bioinformatics methods to predict proteinstructure and function. A practical approach.Mol. Biotechnol. 23, 139–166.
101 Rost, B., Schneider, R., Sander, C. (1997)Protein fold recognition by prediction-basedthreading, J. Mol. Biol. 270, 471–480.
102 Chou, P.Y., Fasman, G.D. (1974) Predictionof protein conformation. Biochemistry, 13,222–245.
103 Garnier, J., Ogusthorpe, D.J., Robson, B.(1978) Analysis of the accuracy andimplementation of simple methods forpredicting the secondary structure of globularproteins, J. Mol. Biol., 120, 97–120.
104 Lim, V.I. (1974) Algorithms for prediction ofhelices and beta-structural regions in globularproteins, J. Mol. Biol. 88, 873–894.
105 Levin, J.M., Robson, B., Garnier, J. (1986) Analgorithm for secondary structuredetermination in proteins based on sequencesimilarity, FEBS Lett. 205, 303–308.
106 Qian, N., Sejnowski, T.J. (1988) Predictingthe secondary structure of globular proteinsusing neural network models, J. Mol. Biol.202, 865–884.
107 Rost, B. (1996) PHD: Predicting one-dimensional protein structure by profile-based neural networks, Methods Enzymol.266, 525–539.
108 Levin, J.M. (1997) Exploring the limits ofnearest neighbour secondary structureprediction, Protein Engineering, 10, 771–776.
109 Jones, D.T. (1999) Protein secondarystructure prediction based on position-specific scoring matrices, J. Mol. Biol. 292,195–202.
110 Godzik, A. (2003) Fold recognition methods.Methods Biochem. Anal. 44, 525–546.
111 Madej, T., Boguski, M.S., Bryant, S.H. (1995)Threading analysis suggests that the obesegene product may be a helical cytokine, FEBSLett. 373, 13–18.
112 Novotny, J., Bruccoleri, R., Karplus, M. (1984)An analysis of incorrectly folded proteinmodels. Implications for structurepredictions, J. Mol. Biol. 177, 787–818.
113 Jones, D.T., Taylor, W.R., Thornton, J.M.(1992) A new approach to protein foldrecognition, Nature 358, 86–89.
114 Sippl, M.J., Weitckus, S. (1992) Detection ofnative-like models for amino acid sequencesof unknown 3D structure, Proteins 13,258–271.
115 Bryant, S.H., Lawrence, C.E. (1993) Anempirical energy function for threading aprotein sequence through a folding motif,Proteins 5, 92–112.
116 Bowie, J.U., Luthy, R., Eisenberg, D. (1991) Amethod to identify protein sequences that foldinto a known 3-dimensional structure,Science 253, 164–170.
117 Sheridan, R.P., Dixon, J.S., Venkataraghavan,R. (1985) Generating plausible protein foldsby secondary structure similarity, Int. J. Pept.Protein Res. 25, 132–143.
118 Fischer, D., Eisenberg, D. (1996) Protein foldrecognition using sequence-derivedpredictions, Protein Sci. 5, 947–955.
119 Russel, R.B., Copely, R.R., Barton, G.J. (1996)Protein fold recognition by mappingpredicted secondary structures, J. Mol. Biol.259, 349–365.
352 References
353
Jian Chen, ShuJian Wu, and Daniel B. Davison
15.1
Introduction
Bioinformatics is an evolving research fieldthat incorporates disciplines from biology,mathematics, and computer science. Biolo-gy is the central pillar in bioinformatics –the audience and users of bioinformaticsare experimental or theoretical biologists.The data resources for bioinformatics arebiological experimental data. The outputdata from bioinformatics are meant to helpsolve biological problems. Mathematics andstatistics are required to develop sophisti-cated algorithms to model biological dataand to deduce hypotheses from biologicaldata. Computer science is an essential toolin bioinformatics. Efficient software pro-grams have been developed to implementthe mathematical algorithms. Databaseshave been established to store and queryvast amounts of biological data. High-powersupercomputers are used to execute soft-ware programs and database queries to gen-erate biological hypothesis. In recent yearsthere has been an expansion of organismgenome-sequencing projects in both aca-demic and industrial environments. Withprogress in genome sequencing, biologicalstudies on those organisms are also expand-
ing enormously. Because of the capacity ofbioinformatics to manage a vast amount ofdata from different biological disciplinesand to perform data mining to generate bio-logical hypothesis, it has been increasinglyapplied in research and development in thepharmaceutical industry.
In this review we focus on biological as-pects of bioinformatics. After a descriptivesummary of the different biological databas-es we investigate how bioinformatics can beapplied to these different biological databas-es to facilitate target identification and drugdevelopment in the pharmaceutical industry.
15.2
Databases
Completion of the human genome projecthas resulted in an explosion of sequence-based databases. The public domain HumanGenome Project and the private sector Cele-ra have both published their versions of thecomplete human genome. To support genefindings and functional study of the genomeproject, expression sequence tagged (EST)sequences have been generated in a high-throughput manner with the new focus ofobtaining full-length cDNA sequences of all
Handbook of Genome Research. Genomics, Proteomics, Metabolomics, Bioinformatics, Ethical and Legal Issues.Edited by Christoph W. SensenCopyright © 2005 WILEY-VCH Verlag GmbH & Co. KGaA, WeinheimISBN: 3-527-31348-6
15Applied Bioinformatics for Drug Discovery and Development
Verwendete Mac Distiller 5.0.x Joboptions
Dieser Report wurde automatisch mit Hilfe der Adobe Acrobat Distiller Erweiterung "Distiller Secrets v1.0.5" der IMPRESSED GmbH erstellt. Sie koennen diese Startup-Datei für die Distiller Versionen 4.0.5 und 5.0.x kostenlos unter http://www.impressed.de herunterladen. ALLGEMEIN ---------------------------------------- Dateioptionen: Kompatibilität: PDF 1.3 Für schnelle Web-Anzeige optimieren: Ja Piktogramme einbetten: Ja Seiten automatisch drehen: Nein Seiten von: 1 Seiten bis: Alle Seiten Bund: Links Auflösung: [ 2400 2400 ] dpi Papierformat: [ 481 680 ] Punkt KOMPRIMIERUNG ---------------------------------------- Farbbilder: Downsampling: Nein Komprimieren: Ja Komprimierungsart: ZIP Bitanzahl pro Pixel: 8 Bit Graustufenbilder: Downsampling: Nein Komprimieren: Ja Komprimierungsart: ZIP Bitanzahl pro Pixel: 8 Bit Schwarzweiß-Bilder: Downsampling: Nein Komprimieren: Ja Komprimierungsart: CCITT CCITT-Gruppe: 4 Graustufen glätten: Nein Text und Vektorgrafiken komprimieren: Ja SCHRIFTEN ---------------------------------------- Alle Schriften einbetten: Ja Untergruppen aller eingebetteten Schriften: Nein Wenn Einbetten fehlschlägt: Abbrechen Einbetten: Immer einbetten: [ /Courier-BoldOblique /Helvetica-BoldOblique /Courier /Helvetica-Bold /Times-Bold /Courier-Bold /Helvetica /Times-BoldItalic /Times-Roman /ZapfDingbats /Times-Italic /Helvetica-Oblique /Courier-Oblique /Symbol ] Nie einbetten: [ ] FARBE(N) ---------------------------------------- Farbmanagement: Farbumrechnungsmethode: Farbe nicht ändern Methode: Standard Geräteabhängige Daten: Einstellungen für Überdrucken beibehalten: Ja Unterfarbreduktion und Schwarzaufbau beibehalten: Ja Transferfunktionen: Beibehalten Rastereinstellungen beibehalten: Nein ERWEITERT ---------------------------------------- Optionen: Prolog/Epilog verwenden: Nein PostScript-Datei darf Einstellungen überschreiben: Nein Level 2 copypage-Semantik beibehalten: Ja Portable Job Ticket in PDF-Datei speichern: Ja Illustrator-Überdruckmodus: Ja Farbverläufe zu weichen Nuancen konvertieren: Ja ASCII-Format: Nein Document Structuring Conventions (DSC): DSC-Kommentare verarbeiten: Ja DSC-Warnungen protokollieren: Nein Für EPS-Dateien Seitengröße ändern und Grafiken zentrieren: Ja EPS-Info von DSC beibehalten: Ja OPI-Kommentare beibehalten: Nein Dokumentinfo von DSC beibehalten: Ja ANDERE ---------------------------------------- Distiller-Kern Version: 5000 ZIP-Komprimierung verwenden: Ja Optimierungen deaktivieren: Nein Bildspeicher: 524288 Byte Farbbilder glätten: Nein Graustufenbilder glätten: Nein Bilder (< 257 Farben) in indizierten Farbraum konvertieren: Ja sRGB ICC-Profil: sRGB IEC61966-2.1 ENDE DES REPORTS ---------------------------------------- IMPRESSED GmbH Bahrenfelder Chaussee 49 22761 Hamburg, Germany Tel. +49 40 897189-0 Fax +49 40 897189-71 Email: [email protected] Web: www.impressed.de
Adobe Acrobat Distiller 5.0.x Joboption Datei
<< /ColorSettingsFile () /LockDistillerParams true /DetectBlends true /DoThumbnails true /AntiAliasMonoImages false /MonoImageDownsampleType /Bicubic /GrayImageDownsampleType /Bicubic /MaxSubsetPct 100 /MonoImageFilter /CCITTFaxEncode /ColorImageDownsampleThreshold 1.5 /GrayImageFilter /FlateEncode /ColorConversionStrategy /LeaveColorUnchanged /CalGrayProfile (Dot Gain 20%) /ColorImageResolution 300 /UsePrologue false /MonoImageResolution 1200 /ColorImageDepth 8 /sRGBProfile (sRGB IEC61966-2.1) /PreserveOverprintSettings true /CompatibilityLevel 1.3 /UCRandBGInfo /Preserve /EmitDSCWarnings false /CreateJobTicket true /DownsampleMonoImages false /DownsampleColorImages false /MonoImageDict << /K -1 >> /ColorImageDownsampleType /Bicubic /GrayImageDict << /HSamples [ 2 1 1 2 ] /VSamples [ 2 1 1 2 ] /Blend 1 /QFactor 0.9 >> /CalCMYKProfile (U.S. Web Coated (SWOP) v2) /ParseDSCComments true /PreserveEPSInfo true /MonoImageDepth -1 /AutoFilterGrayImages false /SubsetFonts false /GrayACSImageDict << /HSamples [ 2 1 1 2 ] /VSamples [ 2 1 1 2 ] /Blend 1 /QFactor 0.9 >> /ColorImageFilter /FlateEncode /AutoRotatePages /None /PreserveCopyPage true /EncodeMonoImages true /ASCII85EncodePages false /PreserveOPIComments false /NeverEmbed [ ] /ColorImageDict << /HSamples [ 2 1 1 2 ] /VSamples [ 2 1 1 2 ] /Blend 1 /QFactor 0.9 >> /AntiAliasGrayImages false /GrayImageDepth 8 /CannotEmbedFontPolicy /Error /EndPage -1 /TransferFunctionInfo /Preserve /CalRGBProfile (sRGB IEC61966-2.1) /EncodeColorImages true /EncodeGrayImages true /ColorACSImageDict << /HSamples [ 2 1 1 2 ] /VSamples [ 2 1 1 2 ] /Blend 1 /QFactor 0.9 >> /Optimize true /ParseDSCCommentsForDocInfo true /GrayImageDownsampleThreshold 1.5 /MonoImageDownsampleThreshold 1.5 /AutoPositionEPSFiles true /GrayImageResolution 300 /AutoFilterColorImages false /AlwaysEmbed [ /Courier-BoldOblique /Helvetica-BoldOblique /Courier /Helvetica-Bold /Times-Bold /Courier-Bold /Helvetica /Times-BoldItalic /Times-Roman /ZapfDingbats /Times-Italic /Helvetica-Oblique /Courier-Oblique /Symbol ] /ImageMemory 524288 /OPM 1 /DefaultRenderingIntent /Default /EmbedAllFonts true /StartPage 1 /DownsampleGrayImages false /AntiAliasColorImages false /ConvertImagesToIndexed true /PreserveHalftoneInfo false /CompressPages true /Binding /Left >> setdistillerparams << /PageSize [ 595.276 841.890 ] /HWResolution [ 2400 2400 ] >> setpagedevice
354 15 Applied Bioinformatics for Drug Discovery and Development
genes in the genome. Comparison of ge-nomes from different individuals reveals se-quence variations and single nucleotidepolymorphism. Completion of the humangenome project enables systematic study ofgene expression in body tissues and diseasestates. Gene expression and functional studylink genes to biological pathways, shiftingthe focus of the next generation of databasesfrom gene centric to pathway centric. Pro-teins are the functional units of biologicalpathways. Sequencing of the human ge-nome and recent advance in protein analy-sis tools have greatly advanced the field ofproteomics. Study of metabolic pathwaysand their by-products gives rise to metabo-nomic databases. The ultimate goal ofscreening and developing small compoundsagainst disease targets in the pharmaceuti-cal industry requires the field of chemin-formatics to manage chemical compoundsand to explore the structural relationshipbetween proteins and compounds.
The expansion of databases in both num-ber and content provides both excitementand challenge to the scientific community.On the one hand scientists can have accessto databases of different disciplines; on theother hand effective use of the different data-bases requires sophisticated data manipula-tion. In this section we provide brief sum-maries of these different databases andshow how bioinformatics could be used toperform data mining on these databases. Atthe end of the chapter we will discuss theuse of bioinformatics to integrate differenttypes of data and to study biological systems.
15.2.1
Sequence Databases
15.2.1.1
Genomic Sequence DatabasesThe completion of human genome projectmarked a significant milestone in molecular
biology [1, 2]. It opens the possibility of iden-tifying genes and the mechanisms respon-sible for all human diseases. Besides the hu-man genome, those of other species, for ex-ample Drosophila melanogaster [3], Rattus nor-vegicus [4], Mus musculus [5], Caenorhabditiselegans [6] have been sequenced. Althoughcompletion of the human genome was cele-brated with much fanfare, the importance ofcompleting the genome sequencing andanalysis of other model organisms, and com-mon pathogens, should not be overlooked.Model organisms like the mouse, rat, anddog are important disease models uponwhich we rely to develop disease and treat-ment models. Genome sequencing of patho-gens such as Staphylococcus aureus, severeacute respiratory syndrome (SARS) Corona-virus [7] enables us to develop drugs and vac-cines to treat pathogen-born diseases. Fur-thermore, comparison of the genomes of dif-ferent species would facilitate the process ofidentifying genes and their functions. Someimportant facts about genome size and esti-mated gene number are listed in Tab. 15.1for selected organisms.
Published genome sequences can befound in GenBank in the US [12], in theEMBL Data Library in the UK [13], and inthe DNA Data Bank of Japan (DDBJ) [14].These are regarded as the most comprehen-sive public databases for nucleotide se-quences and supporting bibliographic andbiological annotations. All three databasescontain publicly available DNA and proteinsequences, obtained mostly from individuallaboratories and large-scale sequencing fa-cilities. The three databases exchange infor-mation daily to ensure their content is up-to-date. Another good resource for genomesequences is the Institute for Genome Re-search (TIGR) [15], which performs its owngenome sequencing and analysis.
There are many online bioinformatic re-sources enabling genome data to be viewed
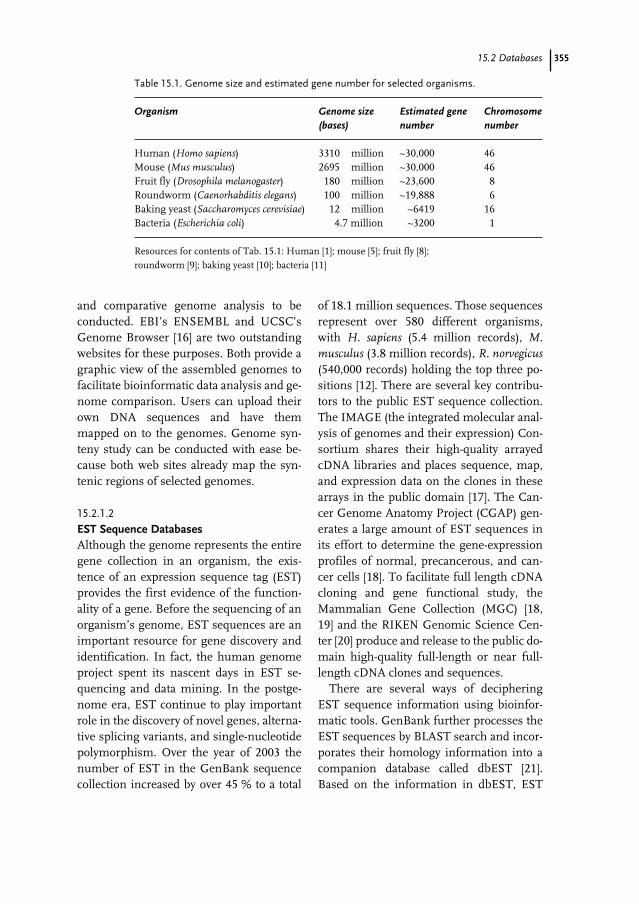
35515.2 Databases
and comparative genome analysis to beconducted. EBI’s ENSEMBL and UCSC’sGenome Browser [16] are two outstandingwebsites for these purposes. Both provide agraphic view of the assembled genomes tofacilitate bioinformatic data analysis and ge-nome comparison. Users can upload theirown DNA sequences and have themmapped on to the genomes. Genome syn-teny study can be conducted with ease be-cause both web sites already map the syn-tenic regions of selected genomes.
15.2.1.2
EST Sequence DatabasesAlthough the genome represents the entiregene collection in an organism, the exis-tence of an expression sequence tag (EST)provides the first evidence of the function-ality of a gene. Before the sequencing of anorganism’s genome, EST sequences are animportant resource for gene discovery andidentification. In fact, the human genomeproject spent its nascent days in EST se-quencing and data mining. In the postge-nome era, EST continue to play importantrole in the discovery of novel genes, alterna-tive splicing variants, and single-nucleotidepolymorphism. Over the year of 2003 thenumber of EST in the GenBank sequencecollection increased by over 45 % to a total
of 18.1 million sequences. Those sequencesrepresent over 580 different organisms,with H. sapiens (5.4 million records), M.musculus (3.8 million records), R. norvegicus(540,000 records) holding the top three po-sitions [12]. There are several key contribu-tors to the public EST sequence collection.The IMAGE (the integrated molecular anal-ysis of genomes and their expression) Con-sortium shares their high-quality arrayedcDNA libraries and places sequence, map,and expression data on the clones in thesearrays in the public domain [17]. The Can-cer Genome Anatomy Project (CGAP) gen-erates a large amount of EST sequences inits effort to determine the gene-expressionprofiles of normal, precancerous, and can-cer cells [18]. To facilitate full length cDNAcloning and gene functional study, theMammalian Gene Collection (MGC) [18,19] and the RIKEN Genomic Science Cen-ter [20] produce and release to the public do-main high-quality full-length or near full-length cDNA clones and sequences.
There are several ways of decipheringEST sequence information using bioinfor-matic tools. GenBank further processes theEST sequences by BLAST search and incor-porates their homology information into acompanion database called dbEST [21].Based on the information in dbEST, EST
Table 15.1. Genome size and estimated gene number for selected organisms.
Organism Genome size Estimated gene Chromosome (bases) number number
Human (Homo sapiens) 3310 million ~30,000 46Mouse (Mus musculus) 2695 million ~30,000 46Fruit fly (Drosophila melanogaster) 180 million ~23,600 8Roundworm (Caenorhabditis elegans) 100 million ~19,888 6Baking yeast (Saccharomyces cerevisiae) 12 million ~6419 16Bacteria (Escherichia coli) 4.7 million ~3200 1
Resources for contents of Tab. 15.1: Human [1]; mouse [5]; fruit fly [8]; roundworm [9]; baking yeast [10]; bacteria [11]
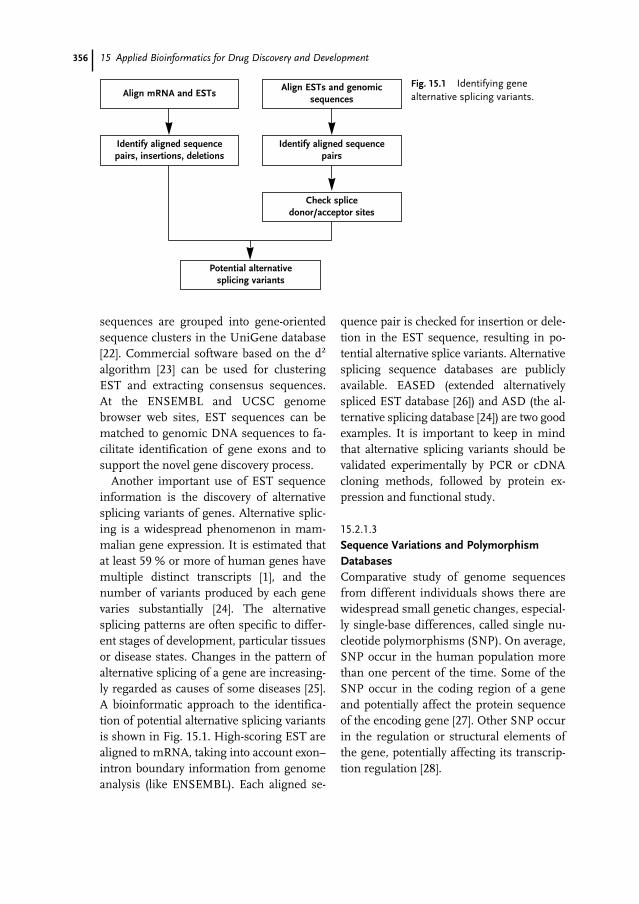
356 15 Applied Bioinformatics for Drug Discovery and Development
sequences are grouped into gene-orientedsequence clusters in the UniGene database[22]. Commercial software based on the d2
algorithm [23] can be used for clusteringEST and extracting consensus sequences.At the ENSEMBL and UCSC genomebrowser web sites, EST sequences can bematched to genomic DNA sequences to fa-cilitate identification of gene exons and tosupport the novel gene discovery process.
Another important use of EST sequenceinformation is the discovery of alternativesplicing variants of genes. Alternative splic-ing is a widespread phenomenon in mam-malian gene expression. It is estimated thatat least 59 % or more of human genes havemultiple distinct transcripts [1], and thenumber of variants produced by each genevaries substantially [24]. The alternativesplicing patterns are often specific to differ-ent stages of development, particular tissuesor disease states. Changes in the pattern ofalternative splicing of a gene are increasing-ly regarded as causes of some diseases [25].A bioinformatic approach to the identifica-tion of potential alternative splicing variantsis shown in Fig. 15.1. High-scoring EST arealigned to mRNA, taking into account exon–intron boundary information from genomeanalysis (like ENSEMBL). Each aligned se-
quence pair is checked for insertion or dele-tion in the EST sequence, resulting in po-tential alternative splice variants. Alternativesplicing sequence databases are publiclyavailable. EASED (extended alternativelyspliced EST database [26]) and ASD (the al-ternative splicing database [24]) are two goodexamples. It is important to keep in mindthat alternative splicing variants should bevalidated experimentally by PCR or cDNAcloning methods, followed by protein ex-pression and functional study.
15.2.1.3
Sequence Variations and PolymorphismDatabasesComparative study of genome sequencesfrom different individuals shows there arewidespread small genetic changes, especial-ly single-base differences, called single nu-cleotide polymorphisms (SNP). On average,SNP occur in the human population morethan one percent of the time. Some of theSNP occur in the coding region of a geneand potentially affect the protein sequenceof the encoding gene [27]. Other SNP occurin the regulation or structural elements ofthe gene, potentially affecting its transcrip-tion regulation [28].
Align mRNA and ESTsAlign ESTs and genomic
sequences
Identify aligned sequence pairs, insertions, deletions
Identify aligned sequence pairs
Check splice donor/acceptor sites
Potential alternative splicing variants
Fig. 15.1 Identifying genealternative splicing variants.
35715.2 Databases
SNP and other DNA polymorphisms canhave three major effects on human diseas-es. Although only a very small number ofhuman diseases are caused by genetic varia-tions within a single gene, the occurrenceof DNA polymorphism contributes to aperson’s genetic predisposition to develop-ing a disease. For example, SNP in theCAPN10 gene locus have been found to bestrongly associated with the onset of type IIdiabetes [29]. The occurrence of SNP andDNA polymorphism can also confer sus-ceptibility or resistance to a disease and de-termine its severity or progression. SNPand DNA polymorphism can also deter-mine how an individual responds to drugtherapy, from drug absorption to drug me-tabolism and adverse drug effects. For ex-ample, polymorphism in cytochromeCYP2D6 protein is known to affect the dis-position and anti-tussive effect of dextrome-thorphan in humans [30]. It is also associat-ed with the efficacy and tolerance of thecholesterol-lowering drug simvastatin [31],and with nicotine metabolism in smokers[32]. Polymorphisms in other target genes,for example â2-adrenoceptor targeted by al-buterol and CETP (cholesterol ester trans-fer protein) targeted by pravastatin havebeen shown to have a profound effect on anindividual’s drug response [33, 34].
The dbSNP from the National Center forBiotechnology Information (NCBI) is thelargest public SNP database. Records in thedbSNP are cross-referenced to other infor-mation resources, for example PubMed, Lo-cusLink, and GenBank. HGVbase is an-other curated resource describing humanDNA variation and phenotype relationships[35]. Besides SNP information, HGVbasealso contains current progress in the hu-man heliotype mapping project [36], provid-ing a foundation for combining genotypesand haplotypes into a functional unit forstudy of the correlation between sequence
variations and phenotypes. In recent yearsSNP have become important tools in genet-ic association studies to identify genes af-fecting susceptibility to diseases.
Non-synonymous SNP are implicated inhuman disease processes because they havethe potential to affect a protein’s sequence,structure, and function. With genome se-quencing and high-throughput predictionof protein 3D structure, structure assign-ment information for genes within com-plete genomes are becoming available[37–39]. TopoSNP is a database that com-bines non-synonymous SNP with 3D struc-tures to facilitate understanding of SNP indisease processes [40]. The assignment ofSNP on to 3D protein structures greatly fa-cilitates the study of protein structure–func-tion relationships.
15.2.2
Expression Databases
With completion of the sequencing of thehuman genome and that of other organ-isms, and identification of genes insideeach genome, the immediate next challengeis to discover where and when these genesare expressed. The expression of genes isprecisely controlled spatially and tempo-rary. In addition, as already discussed, dif-ferent splice variants of a gene could be ex-pressed in different tissues and develop-ment stages. Changes in gene-expressionprofile could be the cause or result of thedevelopment of a disease. Gene-expressionprofile changes could thus be used to pre-dict and monitor disease progress.
15.2.2.1
Microarray and Gene ChipSeveral high-throughput methods can beused to define the transcriptome (expressionprofiles of all genes in an organism). Affyme-trix short oligonucleotide-based DNA chip,
358 15 Applied Bioinformatics for Drug Discovery and Development
cDNA probe-based glass slide DNA microar-ray, quantitative PCR (Taqman PCR), and se-rial analysis of gene expression (SAGE) arethe most commonly used methods. Advance-ment of technology in all these methods hasenabled them to contribute significantly tothe study of gene-expression profiles.
The National Cancer Institute (NCI) spon-sors the Cancer Genome Anatomy Project(CGAP), which aims to determine the gene-expression profiles of normal, pre-cancer,and cancer cells, leading eventually to im-proved detection, diagnosis, and treatmentof the patient. It initiated the Human Tran-scriptome Project (HTP) in 2001 to generatea complete collection of transcribed ele-ments of the human genome. Public Expres-sion Profiling Resource (PEPR) is anotherpublicly available resource for human,mouse, and rat Affymetrix GeneChip ex-pression profiles [41]. Through bioinformat-ic methods, the Gene Expression Database(GXD) [42] integrates with other mouse ge-nome informatics (MGI) databases, placingthe gene-expression information in the con-text of mouse genetic, genomic, and pheno-typic information. Integration of databaseinformation enables scientists to gain in-sight into the molecular aspects of tissueand disease development.
15.2.2.2
Others (SAGE, Differential Display)Serial analysis of gene expression (SAGE) isanother well-established technique forgene-expression profiling [43]. It uses shortoligonucleotide tags to define expressedmRNA from target genes. Ligation of thetags into long concatemers and their se-quencing result in the qualitative and quan-titative gene-expression profile of a particu-lar tissue. The serial analysis of gene expres-sion (SAGE) web site enables users to queryexpression profile information from mousetissues and cell lines [44].
15.2.2.3
Quantitative PCRTranscription profiling results from high-throughput profiling analysis must usuallybe verified by quantitative PCR methods.Taqman quantitative PCR is a reliablemethod for independent study of the ex-pression of genes. Gene-specific primer de-sign is a key step in obtaining reliable resultfrom quantitative PCR study. PrimerBank[45] is an online database that contains ap-proximately 180,000 PCR primers for ap-proximately 40,000 genes from the humanand mouse. The primers are designed withvigorous statistical algorithms and havebeen used for successful profiling of geneexpression.
Bioinformatics provides the tools for per-forming database integration of expressionprofiling data from EST databases, DNAchip and microarray databases, and Taq-man quantitative PCR experiment data.This integration process could be used toproduce a gene-expression body map whichprovides important insight into the biologi-cal function of a gene and its involvementin disease development.
15.2.3
Pathway Databases
Proteins function by participating in one ormore biological pathways. Traditionally,elucidation of biological pathways was per-formed by classic biochemical and geneticstudies. Completion of the sequencing of thegenomes of numerous organisms makes itpossible to construct biological pathways byuse of computational methods. Transcrip-tion profiling studies also provide powerfulassistance to pathway construction, becausegenes in the same pathway tend to havecoordinated expression changes. Pathwaydatabases and their associated software arebecoming increasingly critical in under-
35915.2 Databases
standing and simulating the higher-orderbiological activity of a cell or an organism.
Two of the major pathway databases in thepublic domain are BioCYC and KEGG (Kyo-to Encyclopedia of Genes and Genomes).Both databases provide electronic referencesto pathways and genomes, enabling scien-tists to visualize from gene to biochemicalreaction to complete biochemical pathways.Two of the major components of BioCYCare MetaCYC and EcoCYC, carefully curateddatabases with contents derived from bio-medical research. EcoCYC [46] contains datafrom the E. coli K12 strain microorganism.MetaCYC [47] is a nonredundant metabolicpathway database containing pathways frommany organisms. The KEGG database incor-porates genome projects, pathway databases,biochemical compounds, and reactions toenable computational prediction of higher-level complexity of cellular processes and or-ganism behavior [48].
The rise and expansion of pathway data-bases signal a critical shift in the bioinfor-matic database paradigm. Proteins are nolonger viewed as a simple collection of indi-vidual gene products. Instead, they are or-ganized in pathways and networks repre-senting their biological roles. The functionof a gene is no longer just a description ofthe activity a single enzyme. A collection ofinformation is required to describe thefunction of a the gene – when and wherethe gene is expressed, the other gene prod-ucts it interacts with, which pathways it be-longs to, how changes in gene sequenceand expression affect the multiple pathwaysits product belongs to, and, ultimately, thephysiology of the human body.
15.2.4
Cheminformatics
Chemical compounds have been the holygrail of pharmaceutical companies. Tradi-
tionally chemistry and genomics are twodifferent approaches to a problem. With ge-nomics expanding into protein structures,biochemical reactions, and pathways, thelink between chemistry and genomics be-comes increasing critical for informationsynergy in pharmaceutical companies.Cheminformatics is about cross-referenc-ing, and about access to biological andchemical data.
A pioneer in cheminformatics is the Na-tional Cancer Institute’s 60 cell-line anti-cancer drug screen study [49]. The studyscreened the ability of ~70,000 compoundsto kill or inhibit the growth of a panel of 60human tumor cell lines. Data mining analy-sis was performed using correlation analy-sis algorithms to study the sensitivity to thecompounds of these cell lines and thou-sands of molecular targets [50]. Biologicalactivity data and 3D-structure data of thecompounds are interconnected in theseanalyses to identify potential novel anti-can-cer compounds.
A good example of the application ofcheminformatics in drug discovery and de-velopment is the SMART-IDEA (structuremodeling and analysis research tool-integrat-ed data for experimental analysis) project inthe pharmaceutical company Bristol– MyersSquibb. SMART-IDEA has an innovative in-formation management capability and en-ables research scientists to deposit, retrieve,and analyze chemical and biological dataabout chemical compounds. More impor-tantly, it enables drug-discovery scientists tosimultaneously test compounds in multipleexperiments and then to use that multidi-mensional data to refine the characteristicsof experimental drug compounds. The suc-cess of this cheminformatics platformearned it the 21st Century AchievementAward from ComputerWorld magazine in2002.

360 15 Applied Bioinformatics for Drug Discovery and Development
15.2.5
Metabonomics and Proteomics
Metabonomics is an emerging disciplinethat systematically explores biofluid compo-sition using NMR-pattern-recognition tech-nology to associate target organ toxicity withNMR spectral patterns and identifies novelsurrogate markers of toxicity. Metabonomicreports generated using NMR spectroscopyof urine and blood serum are increasinglyavailable in the public domain for market-ing drugs [51]. The Consortium for Metabo-nomic Toxicology (COMET) was recentlyformed by six pharmaceutical companiesand Imperial College of Science, Technolo-gy, and Medicine, London, UK. The goal ofCOMET is to create a comprehensive me-tabonomic database containing NMR datafor a wide range of model toxins and drugs,and to develop multivariate statistical mod-els for prediction of the toxicity of candidatedrugs [52]. In the private sector, start-upcompanies such as Metabometrix (http://www.metabometrix.com/) are developingnew ways of using NMR technology to diag-nose disease and to predict drug efficacyand toxicity.
Proteomics could be defined as a researchfield that involves the large-scale identifica-tion, characterization, and quantitation ofproteins expressed in a cell line, tissue, or or-ganism under given conditions. Proteomicsis a powerful approach that integrates recenttechnological advances in high-throughputprotein separation, mass spectrometry (MS),genomic database, and bioinformatics to ad-dress important physiological and medicalquestions. There are several proteomicsdatabases in the public domain. For exam-ple, OPD maintained by the University ofTexas (http://bioinformatics.icmb.utexas.edu/OPD/), is a public database for storingand disseminating mass spectrometry-based proteomics data. The database cur-
rently contains ~ 400,000 spectra from ex-periments on four different organisms –Homo sapiens, Escherichia coli, Saccharomy-ces cerevisiae, and Mycobacterium smegmatis.Proteomics is playing a key role in noveldrug-target discovery, biomarker identifica-tion, toxicogenomic study, and many otherspharmaceutical processes [53].
15.2.6
Database Integration and Systems Biology
As discussed above, with completion of thehuman genome project vast amounts ofbiological research data, on the scale of thegenome, are being generated, covering allaspects of biology – sequence, expression,proteins, pathways, and metabolism. Ex-pansion of biological data on this gargantu-an scale leads to a proliferation of “omics”.For example, the now “classic” genomicsincludes data from DNA sequencing, cDNAcloning, expression profiling, gene knockouts, and RNA interference. Proteomicsconsists of protein characterization and bio-marker identification. Metabonomics in-cludes the identification and validation ofbiomarkers using NMR, proteomics andother techniques. Data from these and oth-er “omics” are used to build signal-trans-duction pathways and metabolism path-ways. Systems biology is defined as the pro-cess of using the different “omics” to con-struct and analyze biological pathways toprovide a high-level view of the effects ofbiological molecules and chemical com-pounds on cells, tissues, organs and wholeorganisms. Bioinformatics data manage-ment has been shifting from gene-centric topathway-centric. The integration of chemi-cal information provides a new challenge tobioinformatics. To make sense to researchscientists different kinds of data from dif-ferent data resources must be integrated.Many of the database resources discussed
36115.2 Databases
above are beginning to implement data in-tegration and collection to enable users tocross-reference data. In addition, data min-ing software is being provided to performin-depth cross-database analysis. One ex-ample is the EnsMart system from the Eu-ropean Bioinformatics Institute, which pro-vides a generic data storage for rapid andflexible querying of large sets of biologicaldata and integration with third-party dataand tools [54]. Users can group and refinebiological data according to many criteria,including cross-species analyses (genomesynteny), disease links, sequence variations(SNP and alternative splicing), and expres-sion patterns.
One immediate challenge to data integra-tion and systems biology is to identify acommon denominator among differentkinds of data. The development of ontolo-gies as annotation standards provides ameans of interpreting domains of knowl-edge and facilitates cross-discipline com-munication. The Gene Ontology (GO) pro-ject is a collaborative effort to address twoaspects of information integration – provid-ing consistent descriptors for gene prod-ucts in different databases and standardiz-ing classifications for sequences and se-quence features [55]. Gene ontology hasbeen used for data integration in many ma-jor data repositories.
The ultimate goal of applied bioinformat-ics is to integrate information and datasources from a variety of experiments, bothactual and computational. Doing so helps touncover non-obvious relationships betweengenes and to cross-validate information fromseparate sources. In addition, by looking atthe union of multiple sources one can coverlarger parts of the genome [56]. Expansionof data integration enables scientists to hy-pothesize and examine the topology of bio-logical networks, leading to a systematic ap-proach to the study of biology [57].
On the other hand, errors in some meas-urements could be compounded whencombined with errors from other technolo-gies. For example, block effects in high-throughput and sensitive measurements,for example expression profiling and me-tabonomics, are of particular concern. Vig-orous statistics in experiment design anddata analysis could help reduce some ofthese errors.
Two approaches are used when perform-ing data integration and systems biologystudy. The global approach is to measure allgenes and all proteins by use of high-throughput facilities with global capabil-ities. Strong computer infrastructure andglobal tools have been developed to acquire,integrate, analyze, and model differenttypes of biological data. Large-scale datastorage has been developed to perform datamining. Good examples of this approachare the ENSEMBL project in EBI [54] andthe processes in the Institute for SystemsBiology [58]. This kind of “university-style”approach is essential for advancing the stateof the art of data integration and systemsbiology, but is of little relevance to industri-al problems.
The focus approach (industrial-style) todata integration and systems biology is toperform high-throughput studies of a limit-ed set of genes and proteins of therapeuticinterest to companies. It is tightly coupledto the goal of identifying new chemical andbiological entities for therapeutic purposes.High-throughput facilities with company-wide capabilities are established to generatedata from DNA sequencing, expressionprofiling, proteomics, metabonomics, toxi-cogenomics, and pharmacogenetics. Pow-erful computer infrastructure is also estab-lished. Instead of internal development ofglobal tools, commercial tools are acquiredand used to perform data mining. In thismodel, massive data storage is not used. In-
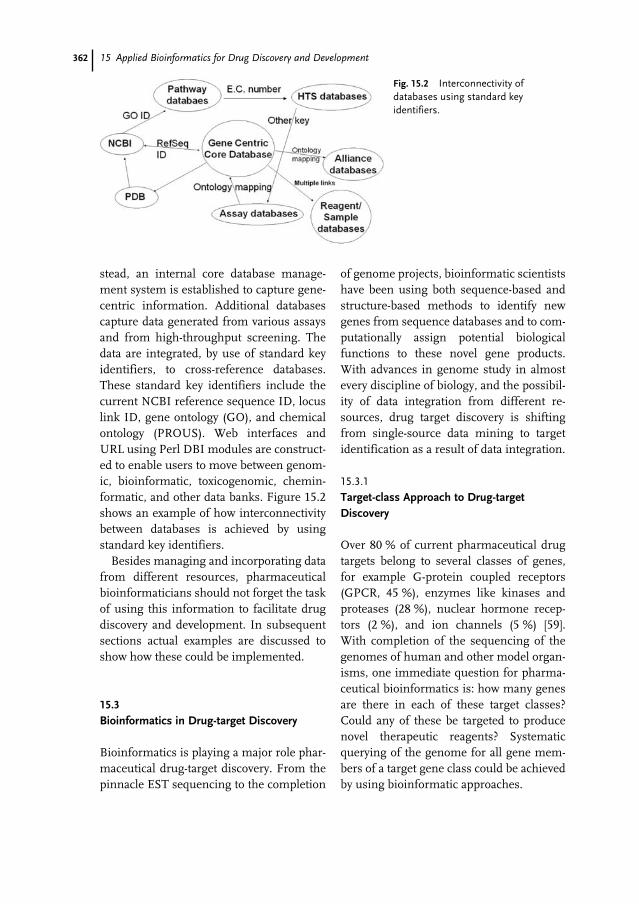
362 15 Applied Bioinformatics for Drug Discovery and Development
stead, an internal core database manage-ment system is established to capture gene-centric information. Additional databasescapture data generated from various assaysand from high-throughput screening. Thedata are integrated, by use of standard keyidentifiers, to cross-reference databases.These standard key identifiers include thecurrent NCBI reference sequence ID, locuslink ID, gene ontology (GO), and chemicalontology (PROUS). Web interfaces andURL using Perl DBI modules are construct-ed to enable users to move between genom-ic, bioinformatic, toxicogenomic, chemin-formatic, and other data banks. Figure 15.2shows an example of how interconnectivitybetween databases is achieved by usingstandard key identifiers.
Besides managing and incorporating datafrom different resources, pharmaceuticalbioinformaticians should not forget the taskof using this information to facilitate drugdiscovery and development. In subsequentsections actual examples are discussed toshow how these could be implemented.
15.3
Bioinformatics in Drug-target Discovery
Bioinformatics is playing a major role phar-maceutical drug-target discovery. From thepinnacle EST sequencing to the completion
of genome projects, bioinformatic scientistshave been using both sequence-based andstructure-based methods to identify newgenes from sequence databases and to com-putationally assign potential biologicalfunctions to these novel gene products.With advances in genome study in almostevery discipline of biology, and the possibil-ity of data integration from different re-sources, drug target discovery is shiftingfrom single-source data mining to targetidentification as a result of data integration.
15.3.1
Target-class Approach to Drug-target Discovery
Over 80 % of current pharmaceutical drugtargets belong to several classes of genes, for example G-protein coupled receptors(GPCR, 45 %), enzymes like kinases andproteases (28 %), nuclear hormone recep-tors (2 %), and ion channels (5 %) [59].With completion of the sequencing of thegenomes of human and other model organ-isms, one immediate question for pharma-ceutical bioinformatics is: how many genesare there in each of these target classes?Could any of these be targeted to producenovel therapeutic reagents? Systematicquerying of the genome for all gene mem-bers of a target gene class could be achievedby using bioinformatic approaches.
Fig. 15.2 Interconnectivity ofdatabases using standard keyidentifiers.
36315.3 Bioinformatics in Drug-target Discovery
Sequence-based-homology searching isthe classical approach to finding genes of afamily. It is based on the observation thathomology (evolutionary relationship) canbe inferred from sequence similarity. Thereare several ways of performing sequence-based homology-searching. The Smith–Wa-terman algorithm [60] is the most sensitivesearch method, because of its mathematicalcompleteness. Its drawback of being ex-tremely time-consuming can be overcomeby adaptation of the algorithm on special-ized supercomputer chips supplied by com-panies like TimeLogic and Compugen. Theheuristic search algorithms of BLAST (ba-sic local alignment and search tool) [61] andFASTA [62] provide much faster but lesssensitive searches. The position-specific-it-erated BLAST (PSI-BLAST) algorithm [63]takes advantage of multiple sequence align-ment from its first-pass search results togenerate a sequence profile, and continuesthe similarity search using the profile togenerate new homologous hits. This meth-od greatly improves the sensitivity ofBLAST searches.
It has been shown that profile-based simi-larity searches can reveal gene structure orfunction that would not be seen by simplepair-wise sequence alignment [64]. Profile-based hidden Markov model (PFAM HMM)methods take advantage of biological multi-ple sequence alignments and the statisticalmathematics models of hidden Markov mod-els to reveal statistically significant sequencesignatures in biological sequences. The Pfamdatabase [65] contains a collection of over7000 HMM models covering proteins withboth known and unknown biological func-tion. Two popular profile HMM programs,HMMER and SAM, are widely used to buildHMM models from multiple sequence align-ment and to use the HMM models to searchsequence databases for genes that containthese HMM domains [66].
Nucleotides and amino acids of a geneproduct only represent its linear one-di-mensional information. The biological ac-tivity of a gene product results from its de-fined three-dimensional structural form.Both RNA and proteins can only functionproperly when correctly structurally folded.The functional portions of proteins, like thecatalytic sites of proteases and kinases, havevery well defined structure conformation.In molecular evolution, protein structuresare often much more conserved than nucle-otide or amino acid sequences. In addition,convergent evolution often leads to proteinssharing very similar three-dimensionalstructures despite different nucleotide oramino acid sequences, for example estro-gen-interacting proteins [67]. Conversely,one could use the defined three-dimension-al structure signature of, for example, theserine protease catalytic site, to perform ahomology search against the whole genomestructure model database [39] to identify se-rine proteases from the genome. A compu-tational facility has been implemented inthe Oak Ridge National Laboratory [68] forprotein structure prediction and genomeanalysis.
Genes of a target class often contain oneor more conserved signatures or domains.A combination of the above sequence, pro-file, and structure-based search methodstends to produce the most complete set ofsearch results. A non-redundant distillationof the search results would simplify thecharacterization process. For example, 518kinase genes in the human genome havebeen identified by using a combination ofeukaryotic protein kinase HMM profilesand PSI-BLAST methods [69]. The applica-tion of bioinformatics in target-class genediscovery can thus quickly identify all fami-ly members of a target class to facilitatepharmaceutical target identification.
364 15 Applied Bioinformatics for Drug Discovery and Development
15.3.2
Disease-oriented Target Identification
In comparison with high throughput ge-nome gene-discovery strategy, a new trendin target discovery is being developed to usedatabase integration to perform disease-oriented target identification. Completionof the sequencing of the human genomeand use of sophisticated bioinformaticstools in sequence, profile, and structure-based homology search have led to the rapiddiscovery of many novel genes. Novel genediscovery does not, however, translate line-arly into novel drug target discovery. One ofthe major bottlenecks in drug-target discov-ery is the process of target validation, whichstill mostly relies on low-throughput bench-top in-vitro and in-vivo experiments. The dis-ease-oriented approach to target identifica-tion has the advantage of using one set oftarget validation experiments to validate asmaller set of novel target candidates.
One key to successful disease-orientedtarget identification is to focus on disease-specific pathways. Another key is to inte-grate data from different resources. As al-ready discussed, integration of data fromdifferent resources has the advantage of re-ducing noise and cross-validation of datapoints. Taking the intersection of multipledata resources can greatly reduce the num-ber of genes that must be further validatedby functional study. Let us use an exampleto illustrate how this strategy could be im-plemented.
Osteoporosis is major health problemthat affects over 25 million people in theUnited States. This disease increases apatient’s susceptibility to bone fracture andcauses enormous human suffering, loss ofproductivity, death, and health-care costs inexcess of $10 billion [70]. The disease is theresult of loss of balanced action of bone-forming osteoblasts and bone-resorbing os-
teoclasts. Mature osteoclasts develop fromhematopoietic stem cells via the monocyte-macrophage lineage whereas mature osteo-blasts develop from mesenchymal stemcells. Treatment of osteoporosis thus entailsof stimulation of osteoblast differentiation/function and suppression of osteoclast dif-ferentiation/function. Because of the verydifferent lineages of osteoclasts and osteo-blasts, attempts to discover the genes in-volved in osteoporosis should examine thetwo pathways separately. In-vitro cell-diffe-rentiation experiments could be set up tocollect RNA samples from both progenitorsand mature osteoclasts. DNA chip [71] andglass slide microarray experiments [72]have been performed to identify genes thatare up- or down-regulated during osteoclastdifferentiation. To obtain osteoclast-specificgenes, other cell types that could arise fromthe same development lineage, for examplemonocytes and macrophages, are used ascontrols to subtract non-osteoclast specificgenes. A subset of osteoclast-specific geneswhose expression levels are changed duringosteoclast differentiation could be obtainedby means of these experiments.
Human genetic studies have identifiedmany loci in human chromosomes that arelinked to bone diseases. For example, a hu-man autosomal recessive osteoporosis genehas been mapped to chromosome 11q13[73] and another osteoporosis disease, typeII Albers–Schonberg disease, to chromo-some 16p13.3 [74]. With the complete hu-man genome one could quickly identify allthe putative genes beneath these bone dis-ease linked chromosomal regions. Intersec-tion of this pool of genes with the genesidentified by means of the transcriptionprofiling experiments described abovecould further reduce the disease gene can-didates. The CLCN7 chloride channel geneand the α subunit of apical vH+-ATPasewere identified by means of this data inte-
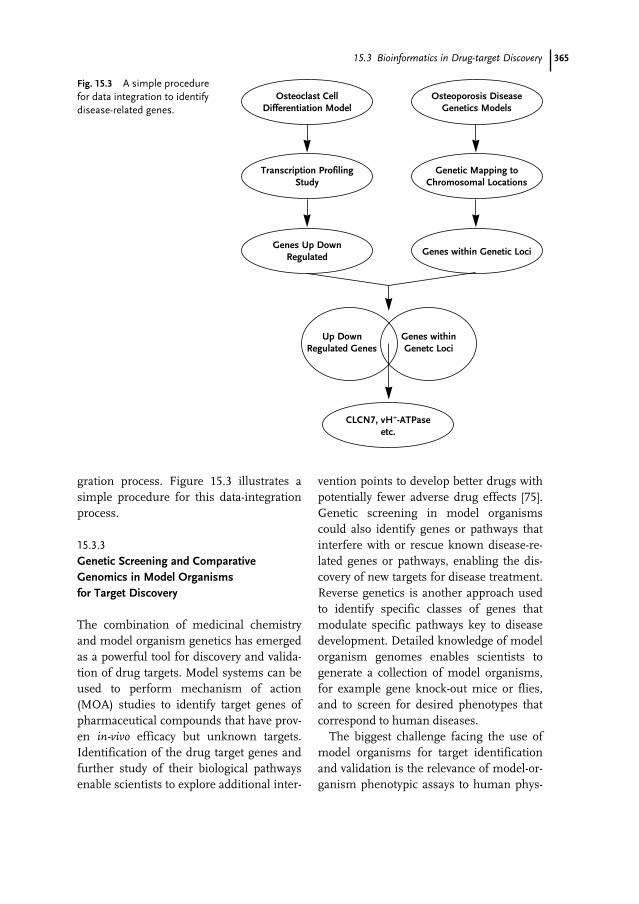
36515.3 Bioinformatics in Drug-target Discovery
gration process. Figure 15.3 illustrates asimple procedure for this data-integrationprocess.
15.3.3
Genetic Screening and Comparative Genomics in Model Organisms for Target Discovery
The combination of medicinal chemistryand model organism genetics has emergedas a powerful tool for discovery and valida-tion of drug targets. Model systems can beused to perform mechanism of action(MOA) studies to identify target genes ofpharmaceutical compounds that have prov-en in-vivo efficacy but unknown targets.Identification of the drug target genes andfurther study of their biological pathwaysenable scientists to explore additional inter-
vention points to develop better drugs withpotentially fewer adverse drug effects [75].Genetic screening in model organismscould also identify genes or pathways thatinterfere with or rescue known disease-re-lated genes or pathways, enabling the dis-covery of new targets for disease treatment.Reverse genetics is another approach usedto identify specific classes of genes thatmodulate specific pathways key to diseasedevelopment. Detailed knowledge of modelorganism genomes enables scientists togenerate a collection of model organisms,for example gene knock-out mice or flies,and to screen for desired phenotypes thatcorrespond to human diseases.
The biggest challenge facing the use ofmodel organisms for target identificationand validation is the relevance of model-or-ganism phenotypic assays to human phys-
Osteoclast CellDifferentiation Model
Osteoporosis DiseaseGenetics Models
Transcription ProfilingStudy
Genetic Mapping toChromosomal Locations
Genes Up Down Regulated
CLCN7, vH+-ATPase etc.
Genes within Genetic Loci
Up Down Regulated Genes
Genes within Genetc Loci
Fig. 15.3 A simple procedure for data integration to identifydisease-related genes.
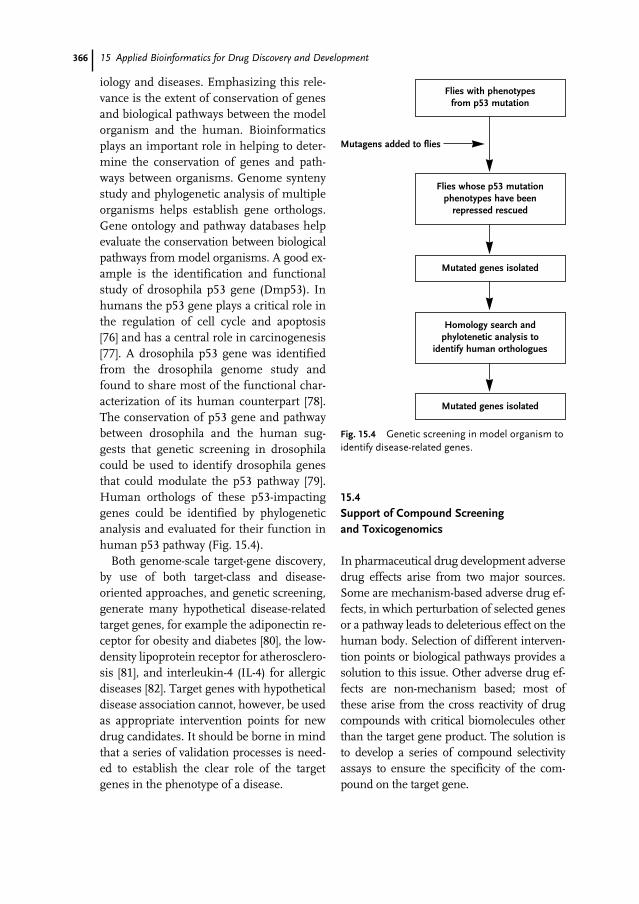
366 15 Applied Bioinformatics for Drug Discovery and Development
iology and diseases. Emphasizing this rele-vance is the extent of conservation of genesand biological pathways between the modelorganism and the human. Bioinformaticsplays an important role in helping to deter-mine the conservation of genes and path-ways between organisms. Genome syntenystudy and phylogenetic analysis of multipleorganisms helps establish gene orthologs.Gene ontology and pathway databases helpevaluate the conservation between biologicalpathways from model organisms. A good ex-ample is the identification and functionalstudy of drosophila p53 gene (Dmp53). Inhumans the p53 gene plays a critical role inthe regulation of cell cycle and apoptosis[76] and has a central role in carcinogenesis[77]. A drosophila p53 gene was identifiedfrom the drosophila genome study andfound to share most of the functional char-acterization of its human counterpart [78].The conservation of p53 gene and pathwaybetween drosophila and the human sug-gests that genetic screening in drosophilacould be used to identify drosophila genesthat could modulate the p53 pathway [79].Human orthologs of these p53-impactinggenes could be identified by phylogeneticanalysis and evaluated for their function inhuman p53 pathway (Fig. 15.4).
Both genome-scale target-gene discovery,by use of both target-class and disease-oriented approaches, and genetic screening,generate many hypothetical disease-relatedtarget genes, for example the adiponectin re-ceptor for obesity and diabetes [80], the low-density lipoprotein receptor for atherosclero-sis [81], and interleukin-4 (IL-4) for allergicdiseases [82]. Target genes with hypotheticaldisease association cannot, however, be usedas appropriate intervention points for newdrug candidates. It should be borne in mindthat a series of validation processes is need-ed to establish the clear role of the targetgenes in the phenotype of a disease.
15.4
Support of Compound Screening and Toxicogenomics
In pharmaceutical drug development adversedrug effects arise from two major sources.Some are mechanism-based adverse drug ef-fects, in which perturbation of selected genesor a pathway leads to deleterious effect on thehuman body. Selection of different interven-tion points or biological pathways provides asolution to this issue. Other adverse drug ef-fects are non-mechanism based; most ofthese arise from the cross reactivity of drugcompounds with critical biomolecules otherthan the target gene product. The solution isto develop a series of compound selectivityassays to ensure the specificity of the com-pound on the target gene.
Fig. 15.4 Genetic screening in model organism toidentify disease-related genes.
Flies with phenotypes from p53 mutation
Flies whose p53 mutation phenotypes have been
repressed rescued
Homology search and phylotenetic analysis to
identify human orthologues
Mutated genes isolated
Mutagens added to flies
Mutated genes isolated
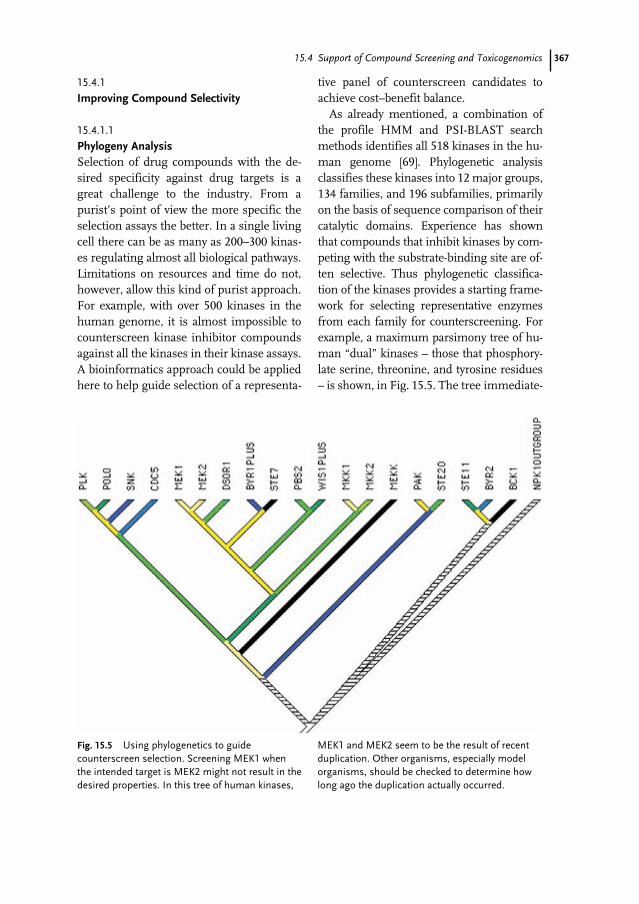
36715.4 Support of Compound Screening and Toxicogenomics
15.4.1
Improving Compound Selectivity
15.4.1.1
Phylogeny AnalysisSelection of drug compounds with the de-sired specificity against drug targets is agreat challenge to the industry. From apurist’s point of view the more specific theselection assays the better. In a single livingcell there can be as many as 200–300 kinas-es regulating almost all biological pathways.Limitations on resources and time do not,however, allow this kind of purist approach.For example, with over 500 kinases in thehuman genome, it is almost impossible tocounterscreen kinase inhibitor compoundsagainst all the kinases in their kinase assays.A bioinformatics approach could be appliedhere to help guide selection of a representa-
tive panel of counterscreen candidates toachieve cost–benefit balance.
As already mentioned, a combination ofthe profile HMM and PSI-BLAST searchmethods identifies all 518 kinases in the hu-man genome [69]. Phylogenetic analysisclassifies these kinases into 12 major groups,134 families, and 196 subfamilies, primarilyon the basis of sequence comparison of theircatalytic domains. Experience has shownthat compounds that inhibit kinases by com-peting with the substrate-binding site are of-ten selective. Thus phylogenetic classifica-tion of the kinases provides a starting frame-work for selecting representative enzymesfrom each family for counterscreening. Forexample, a maximum parsimony tree of hu-man “dual” kinases – those that phosphory-late serine, threonine, and tyrosine residues– is shown, in Fig. 15.5. The tree immediate-
Fig. 15.5 Using phylogenetics to guidecounterscreen selection. Screening MEK1 whenthe intended target is MEK2 might not result in thedesired properties. In this tree of human kinases,
MEK1 and MEK2 seem to be the result of recentduplication. Other organisms, especially modelorganisms, should be checked to determine howlong ago the duplication actually occurred.
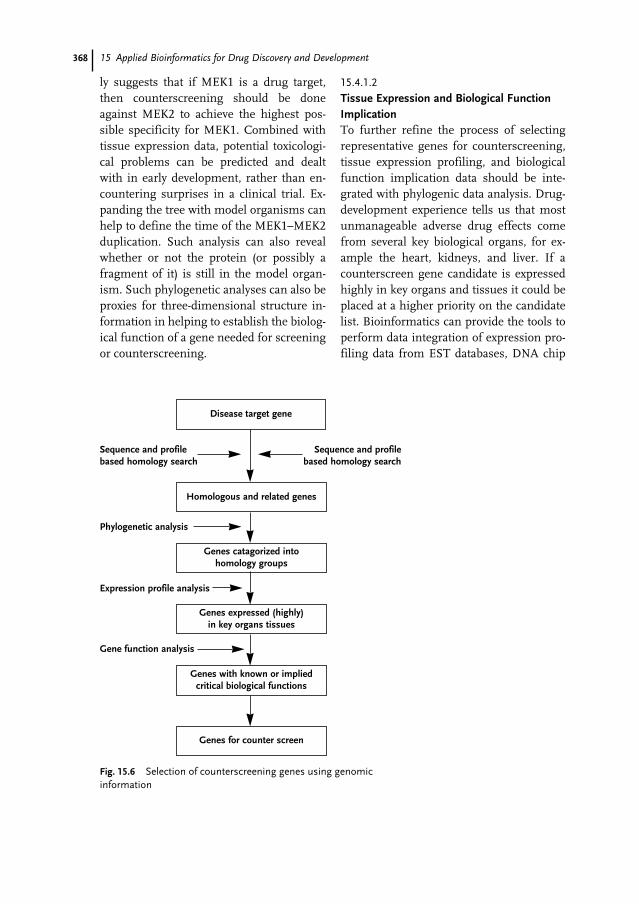
368 15 Applied Bioinformatics for Drug Discovery and Development
ly suggests that if MEK1 is a drug target,then counterscreening should be doneagainst MEK2 to achieve the highest pos-sible specificity for MEK1. Combined withtissue expression data, potential toxicologi-cal problems can be predicted and dealtwith in early development, rather than en-countering surprises in a clinical trial. Ex-panding the tree with model organisms canhelp to define the time of the MEK1–MEK2duplication. Such analysis can also revealwhether or not the protein (or possibly afragment of it) is still in the model organ-ism. Such phylogenetic analyses can also beproxies for three-dimensional structure in-formation in helping to establish the biolog-ical function of a gene needed for screeningor counterscreening.
15.4.1.2
Tissue Expression and Biological FunctionImplicationTo further refine the process of selectingrepresentative genes for counterscreening,tissue expression profiling, and biologicalfunction implication data should be inte-grated with phylogenic data analysis. Drug-development experience tells us that mostunmanageable adverse drug effects comefrom several key biological organs, for ex-ample the heart, kidneys, and liver. If acounterscreen gene candidate is expressedhighly in key organs and tissues it could beplaced at a higher priority on the candidatelist. Bioinformatics can provide the tools toperform data integration of expression pro-filing data from EST databases, DNA chip
Fig. 15.6 Selection of counterscreening genes using genomicinformation
Disease target gene
Sequence and profile based homology search
Sequence and profilebased homology search
Phylogenetic analysis
Expression profile analysis
Gene function analysis
Homologous and related genes
Genes catagorized into homology groups
Genes expressed (highly) in key organs tissues
Genes with known or implied critical biological functions
Genes for counter screen
36915.4 Support of Compound Screening and Toxicogenomics
and microarray databases, and Taqmanquantitative PCR experiment data. Thisdata integration and data-mining processcould be used to produce a gene-expressionbody map. Such a gene-expression bodymap would provide important insight into agene’s physiological function and facilitatethe counterscreen gene-selection process.Figure 15.6 illustrates such a scheme for se-lecting appropriate counterscreening genesto achieve desired compound specificity.
Another key piece of information thatshould be integrated into the counterscreengene selection process is the biological func-tion implication of genes. For novel genesand for less characterized genes, their puta-tive biological function could be implied viaa data integration process. Strong homologywith genes or domains of known biologicalfunction implies the novel gene could havesimilar biological activity. Co-regulation of agene’s expression profile with genes in acertain biological pathway suggests the genemight belong to or interact with that biolog-ical pathway. Phenotypes from geneticstudy in model organisms in which a genehas been deleted also suggest the biologicalfunction of the gene. Bioinformatic integra-tion and interrogation of these data couldcontribute significantly to the process ofcounterscreen gene selection.
15.4.2
Prediction of Compound Toxicity
In pharmaceutical industries, a rationalstrategy for increasing the efficiency and re-ducing the cost of R&D is to reduce the rateof attrition in the costly late stages such asphases I, II, and III of clinical trials by in-creasing the rate of attrition in the less cost-ly, early stages, for example the discoveryand pre-clinical stages [83]. The main ap-proach toward this involves early detectionof the potential toxicity of lead compounds.
15.4.2.1
Toxicogenomics and Toxicity SignatureTraditional compound toxicity evaluationhad to use multiple concentrations and timepoints in several lengthy animal studies,which was time-consuming and labor-in-tense. Today, development of novel ap-proaches for high-throughput screening forcompound toxicity is a major goal in thedrug-development process. In the past fewyears the genomics approach for predictivetoxicology is becoming a promising and ma-ture technology [84] and a new discipline,“toxicogenomics”, denoting the merging oftoxicology with technology that has been de-veloped, together with bioinformatics, toidentify and quantify global gene expressionchanges, is becoming an active researchfield. It is a new aspect of drug developmentand risk assessment which promises to gen-erate a wealth of information toward in-creased understanding of the molecularmechanisms that lead to drug toxicity andefficacy [85].
Gene expression profiling by means ofDNA or protein chips has been shown to bean important means of rapidly identifyingchemical toxicity issues [86]. More recently,databases containing profiles of compoundsfor which toxicological and pathologicalendpoints are well characterized have beendeveloped by the US National Institute ofEnvironmental Health Sciences (NIEHS,http://www.niehs.nih.gov/nct/) [87]. In theprivate sector several toxicogenomics com-panies are building data warehouses inwhich results from thousands of expressionarray and molecular pharmacology experi-ments, in which cells and organisms aresystematically treated with drugs and drug-related compounds, are deposited and cu-rated (Iconix Pharmaceuticals, http://www.iconixpharm.com/index.php; Gene LogicInc., http://www.genelogic.com/).
370 15 Applied Bioinformatics for Drug Discovery and Development
The assumption of toxicogenomics is thatcells or tissues exposed to drugs have specif-ic patterns, called signatures, of expressedgenes or proteins and that signatures gener-ated by new drugs can be compared withsignatures of drugs with well-known toxicityto predict potential toxicological issues withthe new drugs [88]. Bioinformatics is play-ing a key role in data analysis and data min-ing to identify compound toxicity signaturefrom these high-throughput studies. Theuse of gene-expression data from chip tech-nologies for classification and predictivepurposes has been widely demonstrated inmany research fields [89, 90]. Many statisti-cal algorithms tailored to large-volume dataanalysis have been developed and imple-mented. For example, linear discriminantanalysis (LDA), genetic algorithm (GA), andK-nearest neighbors (KNN) have been usedto predict compound safety signatures us-ing DNA microarray data [86]. Principal-component analysis (PCA) has been used toexamine the hepatotoxicity of bromoben-zene [91].
15.4.2.2
Long QT Syndrome AssessmentDrug-induced long QT syndrome (LQTS), adisorder of cardiac rhythm in which suffer-ers, who can be otherwise healthy, are sub-ject to a risk of arrhythmia or even suddencardiac death, has been regarded as a criticalside-effect of numerous drugs [92] and inthe past decade the single most commoncause of withdrawal or restriction of the useof drugs that have already been marketedhas been the occurrence of drug-inducedLQTS [93]. Today, QT interval prolongationis regarded as a major safety concern byworldwide drug-regulatory bodies, and earlydetection of new compounds with this un-desirable side effect has become an impor-tant objective for pharmaceutical compa-nies [94]. Any compounds associated with
LQTS should ideally be identified at an ear-ly stage of drug discovery, e.g. the pre-clini-cal phase.
Although many drugs have been associat-ed with LQTS, it appears that only a smallsubset of individuals is at increased risk ofarrhythmia and that a significant compo-nent of this risk is genetically determined.Many studies conclude that the humanhERG gene responsible for the normal ac-tion repolarization in the heart is associatedmechanistically with the risk of LQTS forpharmaceutical agents from a wide varietyof drug classes [95]. Population geneticsand genomics studies found that many mu-tations in the hERG gene were identified infamilies suffering from drug-induced LQTS[96]. Moreover, many missense SNP wererecently identified in the human hERGgene experimentally or computationally [97,98]. Some of these missense SNP werefound to significantly change the biologicalfunction of the channel [99–101]. Severalcomputational algorithms have been usedto predict the affinity of compounds for thehERG channel and hence to identify theirpotential cardiotoxicity. Some computation-al models have an observed-versus-predict-ed correlation r2 = 0.86, which is very im-pressive [102, 103].
Besides numerous mutations and poly-morphisms, extensive bioinformatic stud-ies have also found that human hERG hasat least three isoforms derived from alterna-tive splice variants that result in different C-or N-termini of the protein. The expressionpattern and function of these isoforms aredifferent [104, 105]. Finally, a few reportsdiscuss the expression regulation of humanhERG; bioinformatics can play an impor-tant role in characterizing regulatory ele-ments within the hERG-promoter regionand in understanding how sequence varia-tions with these elements affect the func-tion of the gene and drug-induced LQTS.
37115.4 Support of Compound Screening and Toxicogenomics
LQTS can also be induced by the muta-tions or polymorphisms of other ion-chan-nel genes, for example the KQT-like volt-age-gated potassium channel-1 (KCNQ1),alpha polypeptide of voltage-gated sodiumchannel type V (SCN5A), and potassiumvoltage-gated channel subfamily E mem-bers 1 (KCNE1) and 2 (KCNE2). It shouldbe noted that several dozen mutations havealso been reported throughout the codingregion of these genes in different ethnicgroups, thus indicating remarkable geneticheterogeneity [106, 107]. Future bioinfor-matic studies in this field will be essentialfor more accurate prediction of compoundcardiac liability issues in the early stage ofdrug discovery.
15.4.2.3
Drug Metabolism and TransportThe in-vivo response to a chemical com-pound or drug treatment is a very complexand highly dynamic process that involvesmany steps. As many as 50 proteins such asmetabolizing enzymes and transportersparticipate in the pharmacodynamic re-sponse to drugs. Interestingly, many genescoding for such proteins contain polymor-phisms that alter the activity or the level ofexpression of the encoded proteins [108].Thus, response to a drug by a given individ-ual reflects the interaction of multiple vari-able genetic factors that cause importantvariations in drug metabolism, distribu-tion, and toxicity.
Metabolism in the liver is a major path-way for the elimination of drugs in the bile.Metabolizing enzymes in the liver can beclassified into two groups, phase I andphase II enzymes [109]. Phase I metab-olism is undertaken mostly by cytochromeP450 isoenzymes (CYP), the most impor-tant enzymes involved in the biotransfor-mation of drugs and other xenobiotics. Ap-proximately 80 different forms of P450 have
been characterized in humans [110].Among them, CYP2C9, CYP2D6, andCYP3A4 account for 60–70 % of all phase Imetabolic biotransformation of drugs [111].In the past decade many SNP, mutations,and splice variants in the coding region ofthese genes have been characterized in dif-ferent ethnic groups, and some significant-ly affect the enzymatic activity of the pro-teins [112]. In collaboration with scientistsin the field of protein-structure research, bi-oinformatics could be used for further in-vestigation of how sequence variations af-fect the substrate-recognition sites of theenzymes and could, in silico, predict how se-quence variations impact on enzymatic ac-tivity both qualitatively or quantitatively.Neural network computing and machinelearning algorithms have been used to pre-dict drug metabolism by CYP enzymes andenzyme isoforms [113].
Often, however, coding variants are in-sufficient to explain the large inter-individ-ual variation of CYP enzyme activity. Theseobservations have prompted many investi-gators to seek other causal polymorphismsincluding intronic mutations, splicing sig-nature deletions/insertions, and exon skip-ping [114]. In recent years, several researchgroups have started to investigate regula-tion of the expression of these CYP genes. Ithas long been known that the expressionlevel of some CYP genes ranges from 1 to20-fold in different ethnic groups. This ex-pression variation might be partly derivedfrom the variability of regulatory regionswithin a gene promoter, and a novel poly-morphic enhancer was identified recentlyin human CYP3A4 [115]. This polymor-phism inserts TGT between –11,129 and–11,128 bp of the human CYP3A4 promot-er and results in 36 % reduction of CYP3A4enhancer activity.
With the tremendous progress made bythe SNP Consortium (http://snp.cshl.org/)
372 15 Applied Bioinformatics for Drug Discovery and Development
and the completion of the human, mouse,and rat genomes, SNP data analysis andcomparative genomics could be used tostudy the regulatory regions of these genes.The assumption behind this approach isthat critical regulatory elements within agene promoter might be conserved acrossspecies. For example, a novel enhancer ofbrain expression near the apoE gene clusterwas recently identified by comparative ge-nomics [116]. Future bioinformatic studiesof sequence variations of these phase I en-zymes will uncover more interesting find-ings and enable understanding of inter-in-dividual variation of drug metabolism in theliver.
Besides huge variability of the phase I en-zymes, there are many inter-individual varia-tions of the phase II enzymes. These phase IIenzymes, for example uridine diphosphateglucuronosyltransferase 1A1 (UGT1A1),NAT2, and thiopurine S-methyltransferase(TPMT), play key roles in conjugating me-tabolites from phase I to enhance their ex-cretion in urine or bile. Mutations and poly-morphisms of UGT1A1, NAT2, and TPMTenzymes have all been reported in differentethic groups [117]. These variations alter theenzymatic activity of these proteins in drugmetabolism and even lead to severe toxicityof the drug in some patients.
Finally, many sequence variations of drugtransporters such as organic anion-transport-ing polypeptides (OATP), organic aniontransporters (OAT), organic cation transport-ers (OCT), and multidrug-resistance proteins(MDR) have been reported. These geneticpolymorphisms might be one of the key de-terminants of inter-individual and intereth-nic variability in drug absorption, disposi-tion, distribution, and excretion [118, 119].Extensive bioinformatic research in this areais urgent needed in drug discovery.
15.5
Bioinformatics in Drug Development
Drug discovery and development is a risky,expensive and time-consuming process ofabout 10–12 years [120]. It is estimated thatapproximately 20 % of the research budgetis spent in the drug-discovery phase and ap-proximately 80 % in the drug-developmentphase. In the past decade, bioinformaticshas played a pivotal role in novel drug-targetdiscovery. Although many pharmaceuticalsand biotechnology companies have numer-ous gene targets on which to perform theirresearch, successfully moving researchfrom drug discovery into drug developmentand, further, into the market is the ultimategoal for all drug companies. In the past fewyears bioinformatics has being applied tothe different stages of drug development,including biomarker discovery, evaluationof drug efficacy, prediction of clinical ad-verse reactions, and even the life-cycle ofdrug management.
15.5.1
Biomarker Discovery
According to the FDA’s definition, a bio-marker is a characteristic, for example bloodpressure, CD4 count, or enzymatic activity,that is objectively measured and evaluated asan indicator of normal biological, pathogen-ic, or pharmacological response to a thera-peutic intervention [121]. At the genomic lev-el, changes in the level of mRNA or proteinexpression are markers that could be used tomonitor patients’ responses to a drug.
Genomic and proteomic methods offerincreased opportunities for biomarker iden-tification and development in the differentfields of drug research, especially antitumorresearch. Drug resistance in cancer thera-peutics is a very common observation inclinical practice. Effective treatment for can-
37315.5 Bioinformatics in Drug Development
cer requires not only the discovery of newdrugs with antitumor activity, but alsoknowledge of the most accurate way of pre-dicting patents’ response to drugs. The re-cent development of DNA microarrayswhich enable simultaneous measurementof the expression levels of thousands ofgenes raises the possibility of statisticallyunbiased, genome-wide approach on thegenetic basis of drug response. A recentstudy measured the expression levels of6817 genes in a panel of 60 human cancer-cell lines (the NCI-60) and found that geneexpression signatures obtained by a statisti-cal supervised algorithm could be used todetermine the chemosensitivity profiles ofthousands of chemical compounds. The re-sult suggested that, at least for a subset ofcompounds, genomic approaches to chem-osensitivity prediction are feasible [122]. Bi-oinformatics is playing a key role in bio-marker identification with regard to data in-tegration and collection, data analysis, andmining of genomic and proteomic data[123, 124].
15.5.2
Genetic Variation and Drug Efficacy
Although drugs are designed and pre-scribed on a population basis, each patientis an individual. In principle, bioinformat-ics can be used to study drug efficacy. It hasbeen reported that 30 % of patients takingstatins, 35 % of patients taking beta-block-ers, and up to 50 % of patients taking tricy-clic antidepressants do not respond to phar-macological intervention [125]. It is estimat-ed that 85 % of patients’ response to drugsdepends on genetic variations. “If it werenot for the great variability among individu-als medicine might as well be a science andnot an art.” The thoughts of Sir William Os-ler in 1892 reflect the view of medicine overthe past 100 years [126]. Discovering varia-
tions in response is extremely important inmedical practice. Genetic variants might bebecause of polymorphisms such as SNP,mutations, insertions, deletions, or alterna-tive splice variants, of a drug target gene ordrug metabolizing enzymes and drug trans-porters (The last of these has been dis-cussed in Sect. 15.3.2). Knowing whether apatient will respond is important so that thebest treatment can be given immediatelyand because of the high cost of some treat-ments and potential severe side effects ofdrugs.
Most drugs interact with specific targetproteins to exert their pharmacological ef-fects. These target proteins could be GPCR,transcription factors, or ion-channel pro-teins. Genetic variation of the drug-interac-tive site on a target protein might directlyaffect the drug’s efficacy. For example,acute promyelocytic leukemia (APL) is char-acterized by a specific 15;17 chromosomaltranslocation which generates the PML/RAR chimeric gene [127]. Although all-trans-retinoic acid (RA) is a highly effectiveagent that induces complete remission in ahigh proportion of APL patients by induc-ing terminal differentiation of APL cells[128], RA resistance in APL treatment hasrecently been a serious clinical problem indifferentiation-inducing therapy. A groupof Japanese scientists found that a novelpoint mutation in the ligand-binding do-main of the RAR portion (Arg611) of thechimeric PML/RAR gene led to RA resis-tance in APL patients by sequencing thePML/RAR chimeric gene in several APLcell lines established from RA-resistant pa-tients. This mutation significantly reducesthe sensitivity of tumor cells to RA [129].
Sequence variations in the regulatory re-gion of a gene can indirectly affect a drug’sefficacy. 5-Lipoxygenase (ALOX5) is an en-zyme required for the production of boththe cysteinyl leukotrienes and leukotriene
374 15 Applied Bioinformatics for Drug Discovery and Development
B4 [130]. ALOX5 activity therefore partiallydetermines the level of bronchoconstrictorleukotrienes present in the airways. Phar-macological inhibition of ALOX5 activityhas been used to control the symptoms ofasthma in some patient populations but isnot effective for every asthma patient [131].Previous studies found that DNA sequencevariants in the core promoter of ALOX5 areassociated with diminished promoter-re-porter activity in tissue culture; in particu-lar, an Sp-1 binding motif (–GGGCGG–) lo-cated about 100 bp upstream from the ATGstart site of ALOX5 is highly polymorphic,with three to six tandem repeats, five beingthe most common, identified in Caucasiansand African Americans [132, 133]. It wasfound that five repeats of the Sp-1 bindingsite significantly reduced transcription ofALOX5 mRNA, and hence fewer leuko-trienes were produced. Reduced clinical re-sponse to the ALOX5 antagonist ABT-761was observed in patients harboring the mu-tant promoter [134].
Finally, cyclooxygenase isozyme COX-3,an alternative splice variant of COX-1, ishighly expressed in canine cerebral cortex.This variant retains the first intron in itsmRNA and hence introduces insertion of30–34 amino acids; depending on the mam-malian species it was found to be inhibitedby acetaminophen and other analgesic/anti-pyretic drugs [135]. It is believed that inhibi-tion of COX-3 might be a primary centralmechanism by which these drugs reducepain and possibly fever.
In the past few years bioinformatics hasbeen widely applied in the field of pharma-cogenomics, to enable understanding of theimpacts of sequence variations on drug po-tency and efficacy.
15.5.3
Genetic Variation and Clinical Adverse Reactions
In numerous instances, the optimum dos-age of clinically useful drugs is limited byvariability in the way individuals respond tothese drugs. Genetic variations play keyroles in determining the optimum dose of adrug for an individual patient while avoid-ing adverse drug reactions (ADR) becauseof inappropriate dosage. For instance, thedaily doses required to treat patients vary asmuch as twentyfold for the antithromboticdrug warfarin, and as much as fortyfold forthe antihypertensive drug propanolol [136].These genetic factors could be sequencepolymorphisms of target genes, drug me-tabolizing enzymes, or transporters. Thelast two have already been mentioned.
The efficacious effect of warfarin on anti-thrombosis is substantially limited becauseof the risk of triggering hemorrhage. Genet-ic variants associated with the metabolismof warfarin by cytochrome P450 CYP2C9have specific implications on untoward ef-fects. It is found that for patients withCYP2C9*3 mutations an initial dose of 5 mgwarfarin causes an increase in the interna-tional normalized ratio and significant riskof bleeding [137]. Recently, the long-soughtwarfarin target, vitamin K epoxide reductasecomplex subunit 1 (VKORC1), was identi-fied and cloned by two independent groups[138, 139]. Mutations in this reductase werealso found to cause warfarin resistance andmultiple coagulation factor deficiency type 2.Carefully examining the genomic structureof VKORC1 on the NCBI human genomebuild 34 (August 2003, http://www.ncbi.nlm.nih.gov/IEB/Research/Acembly/av.cgi?c=locusid&org=9606&l=79001) foundthe gene maps on chromosome16p11.2. Al-though it covers only 4.87 kb, the gene con-
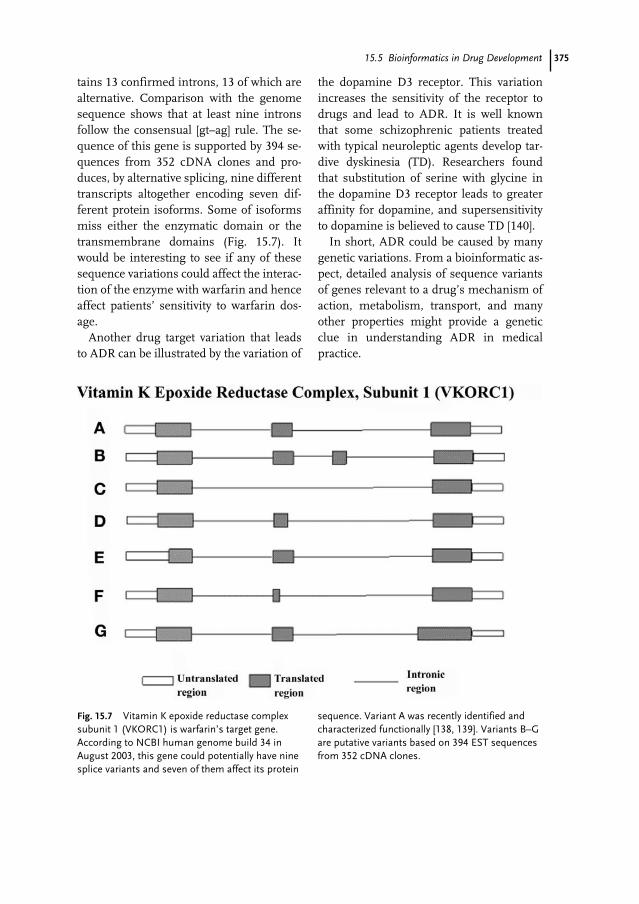
37515.5 Bioinformatics in Drug Development
tains 13 confirmed introns, 13 of which arealternative. Comparison with the genomesequence shows that at least nine intronsfollow the consensual [gt–ag] rule. The se-quence of this gene is supported by 394 se-quences from 352 cDNA clones and pro-duces, by alternative splicing, nine differenttranscripts altogether encoding seven dif-ferent protein isoforms. Some of isoformsmiss either the enzymatic domain or thetransmembrane domains (Fig. 15.7). Itwould be interesting to see if any of thesesequence variations could affect the interac-tion of the enzyme with warfarin and henceaffect patients’ sensitivity to warfarin dos-age.
Another drug target variation that leadsto ADR can be illustrated by the variation of
the dopamine D3 receptor. This variationincreases the sensitivity of the receptor todrugs and lead to ADR. It is well knownthat some schizophrenic patients treatedwith typical neuroleptic agents develop tar-dive dyskinesia (TD). Researchers foundthat substitution of serine with glycine inthe dopamine D3 receptor leads to greateraffinity for dopamine, and supersensitivityto dopamine is believed to cause TD [140].
In short, ADR could be caused by manygenetic variations. From a bioinformatic as-pect, detailed analysis of sequence variantsof genes relevant to a drug’s mechanism ofaction, metabolism, transport, and manyother properties might provide a geneticclue in understanding ADR in medicalpractice.
Fig. 15.7 Vitamin K epoxide reductase complexsubunit 1 (VKORC1) is warfarin’s target gene.According to NCBI human genome build 34 inAugust 2003, this gene could potentially have ninesplice variants and seven of them affect its protein
sequence. Variant A was recently identified andcharacterized functionally [138, 139]. Variants B–Gare putative variants based on 394 EST sequencesfrom 352 cDNA clones.
376 15 Applied Bioinformatics for Drug Discovery and Development
15.5.4
Bioinformatics in Drug Life-cycle Management (Personalized Drug and DrugCompetitiveness)
In drug life-cycle management, post-mar-keting surveillance and pharmacovigilanceare becoming very important. The ultimategoal of these activities is to prevent or tominimize the occurrence of ADR. ManyADR appear only after the marketed drug isused by large numbers of heterogeneouspatients. Many drugs have been withdrawnin recent decades because of severe ADR.Although these ADR might not be observedduring phase II and III clinical trials, whenthe drugs are marketed and used in a muchlarger patient population, problems withrare or long-term ADR begin to appear. Forexample, in 1997, manufacturers had towithdraw the fenfluramines from the mar-ket after study results linked their use withvalvular heart disease in some obese pa-tients [141]. It is imperative for drug makersto investigate the exact relationship betweendrug activity/toxicity and genetic polymor-phisms so additional caution can be takenwhen a drug is administrated to “at- risk”patient groups.
Given the completeness of the human ge-nome project and the technical availabilityof high-throughput sequence variation de-tection and gene-expression profiling, bio-informatics could use statistical algorithmsto identify important genetic variations as-sociated with or responsible for the ADR.For example, two studies have revealed anassociation between the HLAB*5701 poly-morphism and a hypersensitivity reaction(HSR) to the anti-HIV reverse transcriptaseinhibitor abacavir [142, 143]. This result canbe used in clinical monitoring and manage-ment of hypersensitivity reactions amongpatients receiving abacavir. Development ofdatabases of genetic profiles associated with
ADR has recently been proposed [144]. Thisinitiative will make genetics or genomics-related ADR more predictable if adequatestatistical power is available. Incorporationof genomics data into a pharmacoepidemi-ology database was, in fact, also proposedthree years ago as a means of identifying ge-netic risk factors and correlating them withthe corresponding drug responses [145]. Bio-informatics is facilitating database integra-tion of these two distinct research disci-plines.
15.6
Conclusions
Although the origins of the discipline goback to the late 1960s [146, 147], the impor-tance of bioinformatics became apparent inthe 1990s as a direct result of the human ge-nome project. In the past decade the rolesof bioinformatics in the pharmaceutical in-dustry have changed profoundly, from se-quence analysis and gene identification inthe early days to systemic database integra-tion, data mining, prediction of compoundtoxicity, and evaluation of drug efficacy andadverse reactions currently. Figure 15.8summarizes the impacts of bioinformaticson the different stages of drug discoveryand development. The more we understandbiology and medicine, the more importantis the iterative and integrative study of bio-logical systems as systems. Modern drug re-search certainly has to use a systemic ap-proach to study the global effects of novelchemical compounds on the human body,to maximize the efficacy and minimize theside effects of a drug. It is a great opportu-nity and also a large challenge for bioinfor-matics to integrate and to analyze data fromsequence-oriented, macrostructure-oriented,pathway-oriented, and patient-oriented stud-ies and hence to facilitate drug discovery.
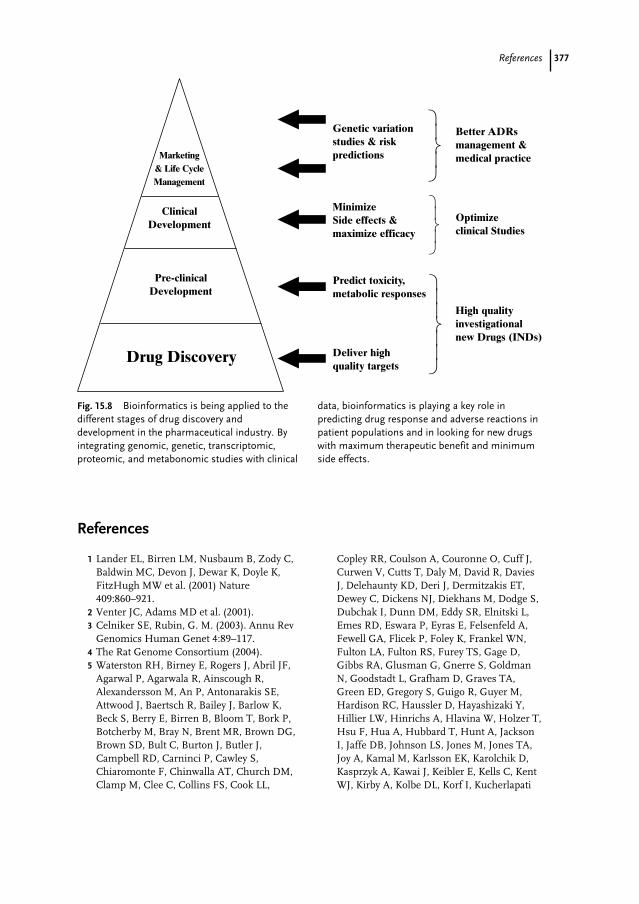
377References
1 Lander EL, Birren LM, Nusbaum B, Zody C,Baldwin MC, Devon J, Dewar K, Doyle K,FitzHugh MW et al. (2001) Nature409:860–921.
2 Venter JC, Adams MD et al. (2001). 3 Celniker SE, Rubin, G. M. (2003). Annu Rev
Genomics Human Genet 4:89–117.4 The Rat Genome Consortium (2004). 5 Waterston RH, Birney E, Rogers J, Abril JF,
Agarwal P, Agarwala R, Ainscough R,Alexandersson M, An P, Antonarakis SE,Attwood J, Baertsch R, Bailey J, Barlow K,Beck S, Berry E, Birren B, Bloom T, Bork P,Botcherby M, Bray N, Brent MR, Brown DG,Brown SD, Bult C, Burton J, Butler J,Campbell RD, Carninci P, Cawley S,Chiaromonte F, Chinwalla AT, Church DM,Clamp M, Clee C, Collins FS, Cook LL,
Copley RR, Coulson A, Couronne O, Cuff J,Curwen V, Cutts T, Daly M, David R, DaviesJ, Delehaunty KD, Deri J, Dermitzakis ET,Dewey C, Dickens NJ, Diekhans M, Dodge S,Dubchak I, Dunn DM, Eddy SR, Elnitski L,Emes RD, Eswara P, Eyras E, Felsenfeld A,Fewell GA, Flicek P, Foley K, Frankel WN,Fulton LA, Fulton RS, Furey TS, Gage D,Gibbs RA, Glusman G, Gnerre S, GoldmanN, Goodstadt L, Grafham D, Graves TA,Green ED, Gregory S, Guigo R, Guyer M,Hardison RC, Haussler D, Hayashizaki Y,Hillier LW, Hinrichs A, Hlavina W, Holzer T,Hsu F, Hua A, Hubbard T, Hunt A, JacksonI, Jaffe DB, Johnson LS, Jones M, Jones TA,Joy A, Kamal M, Karlsson EK, Karolchik D,Kasprzyk A, Kawai J, Keibler E, Kells C, KentWJ, Kirby A, Kolbe DL, Korf I, Kucherlapati
Fig. 15.8 Bioinformatics is being applied to thedifferent stages of drug discovery anddevelopment in the pharmaceutical industry. Byintegrating genomic, genetic, transcriptomic,proteomic, and metabonomic studies with clinical
data, bioinformatics is playing a key role inpredicting drug response and adverse reactions inpatient populations and in looking for new drugswith maximum therapeutic benefit and minimumside effects.
Better ADRs management &medical practice
Genetic variation studies & riskpredictions
MinimizeSide effects &maximize efficacy
Predict toxicity,metabolic responses
Deliver highquality targets
High qualityinvestigationalnew Drugs (INDs)
Optimizeclinical Studies
ClinicalDevelopment
Marketing& Life CycleManagement
Pre-clinicalDevelopment
Drug Discovery u
u
u
u
u ieyet
ieeyeet
ieyet
References
378
RS, Kulbokas EJ, Kulp D, Landers T, Leger JP,Leonard S, Letunic I, Levine R, Li J, Li M,Lloyd C, Lucas S, Ma B, Maglott DR, MardisER, Matthews L, Mauceli E, Mayer JH,McCarthy M, McCombie WR, McLaren S,McLay K, McPherson JD, Meldrim J,Meredith B, Mesirov JP, Miller W, Miner TL,Mongin E, Montgomery KT, Morgan M, MottR, Mullikin JC, Muzny DM, Nash WE, NelsonJO, Nhan MN, Nicol R, Ning Z, Nusbaum C,O’Connor MJ, Okazaki Y, Oliver K, Overton-Larty E, Pachter L, Parra G, Pepin KH,Peterson J, Pevzner P, Plumb R, Pohl CS,Poliakov A, Ponce TC, Ponting CP, Potter S,Quail M, Reymond A, Roe BA, Roskin KM,Rubin EM, Rust AG, Santos R, Sapojnikov V,Schultz B, Schultz J, Schwartz MS, SchwartzS, Scott C, Seaman S, Searle S, Sharpe T,Sheridan A, Shownkeen R, Sims S, Singer JB,Slater G, Smit A, Smith DR, Spencer B,Stabenau A, Stange-Thomann N, Sugnet C,Suyama M, Tesler G, Thompson J, TorrentsD, Trevaskis E, Tromp J, Ucla C, Ureta-VidalA, Vinson JP, Von Niederhausern AC, WadeCM, Wall M, Weber RJ, Weiss RB, WendlMC, West AP, Wetterstrand K, Wheeler R,Whelan S, Wierzbowski J, Willey D, WilliamsS, Wilson RK, Winter E, Worley KC, WymanD, Yang S, Yang SP, Zdobnov EM, Zody MC,Lander ES; Mouse Genome SequencingConsortium (2002) Nature 420:520–562.
6 Consortium, T. C. E. S. (1998). Science282:2012–2018.
7 Zeng FY, Chan CWM et al. (2003). Exp BiolMed 228:866–873.
8 Celniker S, Wheeler D et al. (2002). GenomeBiol (Research) 3:0079.1–0079.14.
9 Harris TW, Chen N et al. (2004) Nucl AcidsRes 32:D411–D417.
10 Goffeau A, Barrell BG et al. (1996) Science274:546–567.
11 Blattner FR, Plunkett G III et al. (1997)Science 277:1453–1462.
12 Benson DA, Karsch-Mizrachi I et al. (2004)Nucl Acids Res 32:D23–D26.
13 Stoesser G, Baker W et al. (2003) Nucl AcidsRes 31:17–22.
14 Miyazaki S, Sugawara H et al. (2004) NuclAcids Res 32:D31–D34.
15 Peterson JD, Umayam LA et al. (2001) NuclAcids Res 29:123–125.
16 Karolchik, D, Baertsch, R et al. (2003) NuclAcids Res 31:51–54.
17 Lennon G, Auffray C et al. (1996) Genomics33:151–152.
18 Strausberg RL, Buetow KH et al. (2000)Trends Genet 16:103–106.
19 Mammalian Gene Collection ProgramTeam*, Strausberg RL et al. (2002) PNAS99:16899–16903.
20 Furuno M, Kasukawa T et al. (2003) GenomeRes 13:1478–1487.
21 Boguski M, Lowe T et al. (1993) Nat Genet4:332–333.
22 Wheeler DL, Church DM et al. (2003) NuclAcids Res 31:28–33.
23 Burke J, Davison D et al. (1999) Genome Res9:1135–1142.
24 Thanaraj TA, Stamm S et al. (2004) NuclAcids Res 32:D64–D69.
25 Faustino NA, Cooper TA (2003) Genes Dev17:419–437.
26 Pospisil H, Herrmann A et al. (2004) NuclAcids Res 32:D70–D74.
27 Yoshida AH, Ikawa M (1994) Proc Natl AcadSci USA 81:258–261.
28 Jaruzelska J, Abadie V et al. (1995) J BiolChem 270:20370–20375.
29 Cox NJ, Hayes MG et al. (2004) Diabetes53:S19–S25.
30 Capon DB, Kerry F, Mikus N, Danz G,Somogyi C (1996) Clin Pharmacol Ther60:295–307.
31 Mulder AvL, Bon HJ, van den Bergh MA,Touw FA, Neef DJ, Vermes C (2001) ClinPharmacol Ther 70:546–551.
32 Caporaso NL, Audrain C, Boyd J, Main NR,Issaq D, Utermahlan HJ, Falk B, Shields RT(2001) Cancer Epidemiol Biomarkers Prev10:261–263.
33 Martinez FD, Graves PE et al. (1997) J ClinInvest 100:3184–3188.
34 Kuivenhoven JA, Jukema JW et al. (1998) NEngl J Med 338:86–93.
35 Fredman D, Munns G et al. (2004) Nucl AcidsRes 32, D516–D519.
36 Gabriel SB, Schaffner SF et al. (2002) Science296:2225–2229.
37 Gaasterland T, Sczyrba A et al. (2000)Genome Res 10:502–510.
38 Buchan DWA, Rison SCG et al. (2003) NuclAcids Res 31:469–473.
39 McGuffin LJ, Street SA et al. (2004) NuclAcids Res 32:D196–D199.
40 Stitziel NO, Binkowski TA et al. (2004) NuclAcids Res 32:D520–D522.
379References
41 Chen J, Zhao P et al. (2004) Nucl Acids Res32:D578–D581.
42 Hill DP, Begley DA et al. (2004) Nucl AcidsRes 32:D568–D571.
43 Velculescu VE, Zhang L et al. (1995) Science270:484–487.
44 Divina P, Forejt J (2004) Nucl Acids Res32:D482–D483.
45 Wang X, Seed B (2003) Nucl Acids Res31:e154.
46 Karp PD, Riley M et al. (2002) Nucl Acids Res30:56–58.
47 Krieger CJ, Zhang P et al. (2004) Nucl AcidsRes 32:D438–D442.
48 Kanehisa M, Goto S et al. (2004) Nucl AcidsRes 32:D277–D280.
49 Weinstein JN, Myers TG et al. (1997) Science275:343–349.
50 Fang XS, Zhang L, Wang H (2004) J ChemInf Comput Sci 44:249–257.
51 Mortishire-Smith RJ, Skiles GL, LawrenceJW, Spence S, Nicholls AW, Johnson BA,Nicholson JK (2004) Use of metabonomics toidentify impaired fatty acid metabolism as themechanism of a drug-induced toxicity. ChemRes Toxicol 17:165–173.
52 Lindon JC, Nicholson JK, Holmes E, Antti H,Bollard ME, Keun H, Beckonert O, EbbelsTM, Reily MD, Robertson D, Stevens GJ,Luke P, Breau AP, Cantor GH, Bible RH,Niederhauser U, Senn H, Schlotterbeck G,Sidelmann UG, Laursen SM, Tymiak A, Car BD, Lehman-McKeeman L, Colet JM,Loukaci A, Thomas C (2003) On temporaryissues in toxicology the role of metabonomicsin toxicology and its evaluation by theCOMET project. Toxicol App1 Pharmacol15:137–146.
53 He Q-Y, Chiu J-F (2003) Proteomics inbiomarker discovery and drug development. JCell Biochem 89:868–886.
54 Kasprzyk A, Keefe D et al. (2004) GenomeRes. 14:160–169.
55 Gene Ontology Consortium (2004) NuclAcids Res 32:D258–D261.
56 Gerstein M, Lan N et al. (2002) Science295:284–287.
57 Ge H, Walhout AJM et al. (2003) TrendsGenet 19:551–560.
58 Hood LGD (2003) Nature 421:444–448.59 Drews J u r (2000) Science 287:1960–1964.60 Smith TW (1981) J Mol Biol 147:195–197.61 Altschul SF, Gish W et al. (1990) J Mol Biol
215:403–410.
62 Pearson WL (1988) Proc Natl Acad Sci USA85:2444–2448.
63 Altschul S, Madden T et al. (1997) Nucl AcidsRes 25:3389–3402.
64 Eddy S (1998) Bioinformatics 14:755–763.65 Bateman A., Birney E et al. (2002) Nucl Acids
Res 30:276–280.66 Madera M, Gough J (2002) Nucl Acids Res
30:4321–4328.67 Nahoum V, Gangloff A et al. (2003) FASEB J
17:1334–1336.68 Shah M, Passovets S et al. (2003)
Bioinformatics 19:1985–1996.69 Manning G, Whyte DB et al. (2002) Science
298:1912–1934.70 Chopra A (2000) J Am Osteopath Assoc
100:S1–S4.71 Ishida N, Hayashi K et al. (2002) J Biol Chem
277:41147–41156.72 Rho JA., Socci CR, Merkov ND, Kim L, So N,
Lee H, Takami O, Brivanlou M, Choi AH(2002) DNA Cell Biol 21:541–549.
73 Heaney C, Shalev H et al. (1998) Hum MolGenet 7:1407–1410.
74 Cleiren E, Benichou O et al. (2001) Hum MolGenet 10:2861–2867.
75 Matthews DJ, Kopczynski J (2001) DrugDiscovery Today 6:141–149.
76 Giaccia AJ, Kastan MB (1998) Genes Dev12:2973–2983.
77 Hainaut P, Hernandez T et al. (1998) NuclAcids Res 26:205–213.
78 Ollmann MYL, Di Como CJ, Karim F, BelvinM, Robertson S, Whittaker K, Demsky M,Fisher WW, Buchman A, Duyk G, FriedmanL, Prives C, Kopczynski C (2001) Cell101:91–101.
79 Lee C-Y, Clough EA et al. (2003) Current Biol.13:350–357.
80 Yamauchi TK, Ito J, Tsuchida Y, Yokomizo A,Kita T, Sugiyama S, Miyagishi T, Hara M,Tsunoda K, Murakami M, Ohteki K, UchidaT, Takekawa S, Waki S, Tsuno H, ShibataNH, Terauchi Y, Froguel Y, Tobe P, KoyasuK, Taira S, Kitamura K, Shimizu T, Nagai T,Kadowaki R (2003) Nature 423:762–769.
81 Hussain MM, Strickland DK et al. (1999)Annu Rev Nutr 19:141–172.
82 Chouchane LS, Bousaffara I, El Kamel R, Sfar A, Ismail MT (1999) Int Arch AllergyImmunol 120:50–55.
83 Schmid EF, Smith DA (2004) Is pharm-aceutical R&D just a game of chance or canstrategy make a difference? Drug DiscovToday 9:18–26.
380 References
84 Morgan KT (2004) Gene expression analysisreveals chemical-specific profiles. Toxicol Sci67:155–156.
85 Guerreiro N, Staedtler F, Grenet O, Kehren J,Chibout SD (2003) Toxicogenomics in drugdevelopment. Toxicol Pathol 31:471–479.
86 Hamadeh HK, Bushel PR, Jayadev S, DiSorboO, Bennett L, Li L, Tennant R, Stoll R, Barrett,JC, Paules, RS, Blanchard K, Afshari CA(2002) Prediction of compound signatureusing high density gene expression profiling.Toxicol Sci 67:232–240.
87 Waters MD, Olden K, Tennant RW (2003)Toxicogenomic approach for assessingtoxicant-related disease. Mutat Res544:415–424.
88 Whittaker PA (2003) What is the relevance ofbioinformatics to pharmacology. Trends inPharmacol Sci 24:434–439.
89 Golub et al. 199990 Perou et al. 200091 Heijne WH, Stierum RH, Slijper M, van
Bladeren PJ, van Ommen B (2003)Toxicogenomics of bromobenzenehepatotoxicity: a combined transcriptomicsand proteomics approach. BiochemPharmacol 65:857–875.
92 Viskin S (1999) Long QT syndromes andtorsade de pointes. Lancet 354:1625–1633.
93 Lasser KE, Allen PD, Woolhandler SJ,Himmelstein DU, Wolfe SM, Bor DH (2002)Timing of new black box warnings andwithdrawals for prescription medications.JAMA 287:2215–2220.
94 Crumb W, Cavero I (1999) Pharm Sci TechnolToday 2:270–280.
95 Keseru GM (2003) Prediction of hERGpotassium channel affinity by traditional andhologram QSAR methods. Bioorg Med ChemLetters 13:2773–2775.
96 Splawski I, Shen J, Timothy KW, LehmannMH, Priori S, Robinson JL, Moss AJ,Schwartz PJ, Towbin JA, Vincent GM,Keating MT (2000) Spectrum of mutations inlong-QT syndrome genes. KVLQT1, HERG,SCN5A, KCNE1, and KCNE2. Circulation102:1178–1185.
97 Larsen LA, Andersen PS, Kanters J, SvendsenIH, Jacobsen JR, Vuust J, Wettrell G,Tranebjaerg L, Bathen J, Christiansen M(2001) Screening for mutations andpolymorphisms in the genes KCNH2 andKCNE2 encoding the cardiac HERG/MiRP1ion channel: implications for acquired and
congenital long Q-T syndrome. Clin Chem47:1390–1395.
98 Lees-Miller JP, Duan Y, Teng GQ, ThorstadK, Duff HJ (2004) Novel gain-of-functionmechanism in K(+) channel-related long-QTsyndrome: altered gating and selectivity in theHERG1 N629D mutant. Circ Res 86:507–513.
99 Laitinen P, Fodstad H, Piippo K, Swan H,Toivonen L, Viitasalo M, Kaprio J, Kontula K(2000) Survey of the coding region of theHERG gene in long QT syndrome reveals sixnovel mutations and an amino acid poly-morphism with possible phenotypic effects.Hum Mutat 15:580–581.
100 Pietila E, Fodstad H, Niskasaari E, LaitinenPJ, Swan H, Savolainen M, Kesaniemi YA,Kontula K, Huikuri HV (2003) Associationbetween HERG K897T polymorphism andQT interval in middle-aged Finnish women. J Am Coll Cardiol 40:511–514.
101 Anson BD, Ackerman MJ, Tester DJ, WillML, Delisle BP, Anderson CL, January CT(2004) Molecular and functional character-ization of common polymorphisms in HERG(KCNH2) potassium channels. Am J PhysiolHeart Circ Physiol [Epub ahead of print].
102 Wilson AG, White AC, Mueller RA (2003)Role of predictive metabolism and toxicitymodeling in drug discovery – a summary ofsome recent advancements. Curr Opin DrugDiscov Devel 6:123–128.
103 Beresford AP, Segall M, Tarbit MH (2004) Insilico prediction of ADME properties: are wemaking progress? Curr Opin Drug DiscovDevel 7:36–42.
104 Shoeb F, Malykhina AP, Akbarali HI (2003)Cloning and functional characterization ofthe smooth muscle ether-a-go-go-related geneK+ channel. Potential role of a conservedamino acid substitution in the S4 region. J Biol Chem 278:2503–2514.
105 Crociani O, Guasti L, Balzi M, Becchetti A,Wanke E, Olivotto, M, Wymore RS, ArcangeliA (2003) Cell cycle-dependent expression ofHERG1 and HERG1B isoforms in tumorcells. J Biol Chem 278:2947–2955.
106 Priori SG, Barhanin J, Hauer RNW (1999)Genetic and molecular basis of cardiacarrhythmias: impact on clinical management.Part I and II. Circulation 99:518–528.
107 Paulussen AD, Gilissen RA, Armstrong M,Doevendans PA, Verhasselt P, Smeets HJ,Schulze-Bahr E, Haverkamp W, Breithardt G,Cohen N, Aerssens J (2004) Genetic
381References
variations of KCNQ1, KCNH2, SCN5A,KCNE1, and KCNE2 in drug-induced longQT syndrome patients. J Mol Med82:182–188.
108 Pirmohamed M, Park BK (2001) Geneticsusceptibility to adverse drug reactions.Trends Pharmacol Sci 22:298–305.
109 Rushmore TH, Kong AN (2001) Pharmaco-genomics, regulation and signaling pathwaysof phase I and II drug metabolizing enzymes.Curr Drug Metab 3:481–490.
110 Nelson DR (1998) Cytochrome P450nomenclature. Methods Mol Biol 107:15–24.
111 Ingelman-Sundberg M, Oscarson M,McLellan RA (1999) Polymorphic humancytochrome P450 enzymes: an opportunityfor individualized drug treatment. TrendsPharmacol Sci 20:342–349.
112 Ingelman-Sundberg M, Oscarson M (2002)Human CYP allele database: submissioncriteria procedures and objectives. MethodsEnzymol 357:28–36.
113 Vermeulen NP (2003) Prediction of drugmetabolism: the case of cytochrome P4502D6. Curr Top Med Chem 3:1227–1239.
114 Lamba JK, Lin YS, Schuetz EG, Thummel KE(2002) Genetic contribution to variablehuman CYP3A-mediated metabolism. AdvDrug Deliv Rev 54:1271–1294.
115 Matsumura K, Saito T, Takahashi Y, Ozeki T,Kiyotani K, Fujieda M, Yamazaki H, KunitohH, Kamataki T (2004) Identification of a novelpolymorphic enhancer of the human CYP3A4gene. Mol Pharmacol 65:326–334.
116 Zheng P, Pennacchio LA, Le Goff W, RubinEM, Smith JD (2004) Identification of a novelenhancer of brain expression near the apoEgene cluster by comparative genomics.Biochim Biophys Acta 1676:41–50.
117 Evans WE, Relling MV (1999) Pharmacogen-omics: translating functional genomics intorational therapeutics. Science 286:487–491.
118 Tirona RG, Kim RB (2002) Pharmacogenom-ics of organic anion-transporting polypeptides(OATP). Adv Drug Deliv Rev 54:1343–1352.
119 Marzolini C, Paus E, Buclin T, Kim RB (2004)Polymorphisms in human MDRI (P-glyco-protein): recent advances and clinicalrelevance. Clin Pharmacol Ther 75:13–33.
120 Kuhlmann J (1999) Alternative strategies indrug development: clinical pharmacologicalaspects. Int J Clin Pharmacol Ther 37:575–583.
121 Savage DR (2003) FDA guidance onpharmacogenomics data submission. Nature Rev Drug Dis 2:937–938.
122 Staunton JE, Slonim DK, Coller HA, TamayoP, Angelo MJ, Park J, Scherf U, Lee JK,Reinhold WO, Weinstein JN, Mesirov JP,Lander ES, Golub TR (2001) Chemosensitivityprediction by transcription by transcriptionalprofiling. Proc Natl Acad Sci USA 98:10787–10792.
123 Agrawal D, Chen T, Irby R, Quackenbush J,Chambers AF, Szabo M, Cantor A, CoppolaD, Yeatman TJ (2003) Osteopontin identifiedas colon cancer tumor progression marker. C R Biol 326:1041–1043.
124 Yeatman TJ (2003) The future of cancermanagement: translating the genome,transcriptome, and proteome. Ann SurgOncol 10:7–14.
125 Tanne JH (1998) The new word in designerdrugs. British Med J 316:1930.
126 Roses AD (2000) Pharmacogenetics and thepractice of medicine. Nature 405:857–865.
127 de The H, Chomienne C, Lanotte M, Degos L,Dejean A (1990) The t(15;17) translocation ofacute promyelocytic leukaemia fuses theretinoic acid receptor alpha gene to a noveltranscribed locus. Nature 347:558–561.
128 Huang ME, Ye YC, Chen SR, Chai JR, Lu JX,Zhoa L, Gu LJ, Wang ZY (1988) Use of all-trans retinoic acid in the treatment of acutepromyelocytic leukemia. Blood 72:567–572.
129 Takayama N, Kizaki M, Hida T, Kinjo K,Ikeda Y (2001) Novel mutation in thePML/RARalpha chimeric gene exhibitsdramatically decreased ligand-binding activityand confers acquired resistance to retinoicacid in acute promyelocytic leukemia. ExpHematol 29:864–872.
130 Samuelsson B, Dahlen SE, Lindgren JA,Rouzer CA, Serhan CN (1987) Leukotrienesand lipoxins: structures, biosynthesis, andbiological effects. Science 237:1171–1176.
131 Drazen JM, Israel E, Obyrne PM (1999)Treatment of asthma with drugs modifyingthe leukotriene pathway. N Engl J Med340:197–206.
132 In KH, Asano K, Beier D, Grobholz J, FinnPW, Silverman EK, Silverman ES, Collins T,Fischer AR, Keith TP, Serino K, Kim SW,DeSanctis GT, Yandava C, Pillari A, Rubin P,Kemp J, Israel E, Busse W, Ledford D,Murray JJ, Segal A, Tinkleman D, Drazen JM
(1997) Naturally occurring mutations in thehuman 5-lipoxygenase gene promoter thatmodify transcription factor binding andreporter gene transcription. J Clin Invest99:1130–1137.
133 Silverman ES, Du J, De Sanctis GT, RadmarkO, Samuelsson B, Drazen JM, Collins T(1998) Egr-1 and Sp1 interact functionallywith the 5-lipoxygenase promoter and itsnaturally occurring mutants. Am J Respir CellMol Biol 19:316–323.
134 Drazen JM, Yandava CN, Dube L, SzczerbackN, Hippensteel R, Pillari A, Israel E, SchorkN, Silverman ES, Katz DA, Drajesk J (1999)Pharmacogenetic association between ALOX5promoter genotype and the response to anti-asthma treatment. Nat Genet 22:168–170.
135 Chandrasekharan NV, Dai H, Roos KL,Evanson NK, Tomsik J, Elton TS, SimmonsDL (2002) COX-3, a cyclooxygenase-1 variantinhibited by acetaminophen and otheranalgesic/antipyretic drugs: cloning,structure, and expression. Proc Natl Acad SciUSA 99:13926–13931.
136 Lu AY (1998) Drug-metabolism researchchallenges in the new millennium: individualvariability in drug therapy and drug safety.Drug Metab Dispos 26:1217–1222.
137 Palkimas MP, Skinner HM, Gandhi PJ,Gardner AJ (2003) Polymorphism inducedsensitivity to warfarin: a review of theliterature. J Thromb Thrombolysis 15:205–212.
138 Rost S, Fregin A, Ivaskevicius V, ConzelmannE, Hortnagel K, Pelz HJ, Lappegard K,Seifried E, Scharrer I, Tuddenham EG, MullerCR, Strom TM, Oldenburg J (2004) Mutationsin VKORC1 cause warfarin resistance andmultiple coagulation factor deficiency type 2.Nature 427:537–541.
139 Li T, Chang CY, Jin DY, Lin PJ, Khvorova A,Stafford DW (2004) Identification of the genefor vitamin K epoxide reductase. Nature427:541–544.
140 Basile VS, Masellis M, Badri F, Paterson AD,Meltzer HY, Lieberman JA, Potkin SG,Macciardi F, Kennedy JL (1999) Association ofthe MscI polymorphism of the dopamine D3receptor gene with tardive dyskinesia inschizophrenia. Neuropsychopharmacology21:17–27.
141 Wangsness M (2000) Pharmacologicaltreatment of obesity. Past, present, andfuture. Minn Med 83:21–26.
142 Mallal S, Nolan D, Wit C, Masel G, MartinAM, Moore C, Sayer D, Castley A, MamotteC, Maxwell D, James I, Christiansen FT(2002) Association between presence of HLA-B*5701, HLA-DR7, and HLA-DQ3 andhypersensitivity to HIV-1 reverse-transcriptase inhibitor abacavir. Lancet359:727–732.
143 Hetherington S, Hughes AR, Mosteller M,Shortino D, Baker KL, Spreen W, Lai E,Davies K, Handley A, Dow DJ, Fling ME,Stocum M, Bowman C, Thurmond LM, RosesAD (2002) Genetic variations in HLA-Bregion and hypersensitivity reactions toabacavir. Lancet 359:1121–1122.
144 Brazell C, Freeman A, Mosteller M (2002)Maximizing the value of medicines byincluding pharmacogenetic research in drugdevelopment and surveillance. Br J ClinPharmacol 53:224–231.
145 Jones JK (2001) Harmacogenetics andpharmacoepidemiology. PharmacoepidemiolDrug Saf 10:457–461.
146 Dayhoff MO (1969) Computer analysis ofprotein evolution. Sci Am 221:86–95.
147 Rybak B (1978) A program for teaching bio-informatics. Biosci Commun 4:158–159.
383
Andrei Turinsky, Paul M. K. Gordon, Emily Xu,Julie Stromer, and Christoph W. Sensen
16.1
Introduction
Graphical display systems for complex data,which can be used to analyze what wouldotherwise be overwhelming amounts ofdata, are becoming increasingly importantin many scientific fields. Molecular biologyand genomics are key areas for this phe-nomenon, because of the continually in-creasing complexity and number of ge-nome databases and analysis tools. In 1996,Gaasterland and Sensen introduced a sys-tem for automated analysis of biological se-quences, called MAGPIE (multipurpose au-tomated genome project investigation envi-ronment) [1]. This tool-integration systemexecutes and integrates the analysis frommultiple bioinformatics tools into an easilyinterpretable form. A typical microbial ge-nome has up to 1000 open reading frames(ORFs) per megabase of genome sequence.MAGPIE typically runs 20 tools on a ge-nome, if each tool results in hits against 100database entries (which is not an uncom-mon number), approximately two millionpieces of evidence would need to be record-ed and mapped along a megabase of ge-nome sequence. When dealing with this
amount of information, the saying “a pic-ture is worth a thousand words” is certainlyvery true.
MAGPIE has been used for the analysisof complete genomes, genome DNA frag-ments, EST, proteins, and protein frag-ments. Initially, all MAGPIE output was intabular format, but the need for rich visualrepresentations of genome analyses be-came evident early on. MAGPIE summariz-es information about evidence supportingfunctional assignments for genes, informa-tion about regulatory elements in genomesequences, including promoters, termina-tors and, Shine Dalgarno sequences, meta-bolic pathways, and the phylogenetic distri-bution of genes. MAGPIE sorts and ranksthe evidence by strength and is able to dis-play the level of confidence associated withdatabase search results.
MAGPIE was the first genome analysisand annotation system to add graphical rep-resentations to the results. On the basis ofcontinual user feedback from a variety of in-stallations, the images have been refinedover time, allowing annotators to processthe quantity of relevant information quicklyand efficiently. Because MAGPIE has oneof the most comprehensive graphical capa-
Handbook of Genome Research. Genomics, Proteomics, Metabolomics, Bioinformatics, Ethical and Legal Issues.Edited by Christoph W. SensenCopyright © 2005 WILEY-VCH Verlag GmbH & Co. KGaA, WeinheimISBN: 3-527-31348-6
16Genome Data RepresentationThrough Images: The MAGPIE/Bluejay System
Verwendete Mac Distiller 5.0.x Joboptions
Dieser Report wurde automatisch mit Hilfe der Adobe Acrobat Distiller Erweiterung "Distiller Secrets v1.0.5" der IMPRESSED GmbH erstellt. Sie koennen diese Startup-Datei für die Distiller Versionen 4.0.5 und 5.0.x kostenlos unter http://www.impressed.de herunterladen. ALLGEMEIN ---------------------------------------- Dateioptionen: Kompatibilität: PDF 1.3 Für schnelle Web-Anzeige optimieren: Ja Piktogramme einbetten: Ja Seiten automatisch drehen: Nein Seiten von: 1 Seiten bis: Alle Seiten Bund: Links Auflösung: [ 2400 2400 ] dpi Papierformat: [ 481 680 ] Punkt KOMPRIMIERUNG ---------------------------------------- Farbbilder: Downsampling: Nein Komprimieren: Ja Komprimierungsart: ZIP Bitanzahl pro Pixel: 8 Bit Graustufenbilder: Downsampling: Nein Komprimieren: Ja Komprimierungsart: ZIP Bitanzahl pro Pixel: 8 Bit Schwarzweiß-Bilder: Downsampling: Nein Komprimieren: Ja Komprimierungsart: CCITT CCITT-Gruppe: 4 Graustufen glätten: Nein Text und Vektorgrafiken komprimieren: Ja SCHRIFTEN ---------------------------------------- Alle Schriften einbetten: Ja Untergruppen aller eingebetteten Schriften: Nein Wenn Einbetten fehlschlägt: Abbrechen Einbetten: Immer einbetten: [ /Courier-BoldOblique /Helvetica-BoldOblique /Courier /Helvetica-Bold /Times-Bold /Courier-Bold /Helvetica /Times-BoldItalic /Times-Roman /ZapfDingbats /Times-Italic /Helvetica-Oblique /Courier-Oblique /Symbol ] Nie einbetten: [ ] FARBE(N) ---------------------------------------- Farbmanagement: Farbumrechnungsmethode: Farbe nicht ändern Methode: Standard Geräteabhängige Daten: Einstellungen für Überdrucken beibehalten: Ja Unterfarbreduktion und Schwarzaufbau beibehalten: Ja Transferfunktionen: Beibehalten Rastereinstellungen beibehalten: Nein ERWEITERT ---------------------------------------- Optionen: Prolog/Epilog verwenden: Nein PostScript-Datei darf Einstellungen überschreiben: Nein Level 2 copypage-Semantik beibehalten: Ja Portable Job Ticket in PDF-Datei speichern: Ja Illustrator-Überdruckmodus: Ja Farbverläufe zu weichen Nuancen konvertieren: Ja ASCII-Format: Nein Document Structuring Conventions (DSC): DSC-Kommentare verarbeiten: Ja DSC-Warnungen protokollieren: Nein Für EPS-Dateien Seitengröße ändern und Grafiken zentrieren: Ja EPS-Info von DSC beibehalten: Ja OPI-Kommentare beibehalten: Nein Dokumentinfo von DSC beibehalten: Ja ANDERE ---------------------------------------- Distiller-Kern Version: 5000 ZIP-Komprimierung verwenden: Ja Optimierungen deaktivieren: Nein Bildspeicher: 524288 Byte Farbbilder glätten: Nein Graustufenbilder glätten: Nein Bilder (< 257 Farben) in indizierten Farbraum konvertieren: Ja sRGB ICC-Profil: sRGB IEC61966-2.1 ENDE DES REPORTS ---------------------------------------- IMPRESSED GmbH Bahrenfelder Chaussee 49 22761 Hamburg, Germany Tel. +49 40 897189-0 Fax +49 40 897189-71 Email: [email protected] Web: www.impressed.de
Adobe Acrobat Distiller 5.0.x Joboption Datei
<< /ColorSettingsFile () /LockDistillerParams true /DetectBlends true /DoThumbnails true /AntiAliasMonoImages false /MonoImageDownsampleType /Bicubic /GrayImageDownsampleType /Bicubic /MaxSubsetPct 100 /MonoImageFilter /CCITTFaxEncode /ColorImageDownsampleThreshold 1.5 /GrayImageFilter /FlateEncode /ColorConversionStrategy /LeaveColorUnchanged /CalGrayProfile (Dot Gain 20%) /ColorImageResolution 300 /UsePrologue false /MonoImageResolution 1200 /ColorImageDepth 8 /sRGBProfile (sRGB IEC61966-2.1) /PreserveOverprintSettings true /CompatibilityLevel 1.3 /UCRandBGInfo /Preserve /EmitDSCWarnings false /CreateJobTicket true /DownsampleMonoImages false /DownsampleColorImages false /MonoImageDict << /K -1 >> /ColorImageDownsampleType /Bicubic /GrayImageDict << /HSamples [ 2 1 1 2 ] /VSamples [ 2 1 1 2 ] /Blend 1 /QFactor 0.9 >> /CalCMYKProfile (U.S. Web Coated (SWOP) v2) /ParseDSCComments true /PreserveEPSInfo true /MonoImageDepth -1 /AutoFilterGrayImages false /SubsetFonts false /GrayACSImageDict << /HSamples [ 2 1 1 2 ] /VSamples [ 2 1 1 2 ] /Blend 1 /QFactor 0.9 >> /ColorImageFilter /FlateEncode /AutoRotatePages /None /PreserveCopyPage true /EncodeMonoImages true /ASCII85EncodePages false /PreserveOPIComments false /NeverEmbed [ ] /ColorImageDict << /HSamples [ 2 1 1 2 ] /VSamples [ 2 1 1 2 ] /Blend 1 /QFactor 0.9 >> /AntiAliasGrayImages false /GrayImageDepth 8 /CannotEmbedFontPolicy /Error /EndPage -1 /TransferFunctionInfo /Preserve /CalRGBProfile (sRGB IEC61966-2.1) /EncodeColorImages true /EncodeGrayImages true /ColorACSImageDict << /HSamples [ 2 1 1 2 ] /VSamples [ 2 1 1 2 ] /Blend 1 /QFactor 0.9 >> /Optimize true /ParseDSCCommentsForDocInfo true /GrayImageDownsampleThreshold 1.5 /MonoImageDownsampleThreshold 1.5 /AutoPositionEPSFiles true /GrayImageResolution 300 /AutoFilterColorImages false /AlwaysEmbed [ /Courier-BoldOblique /Helvetica-BoldOblique /Courier /Helvetica-Bold /Times-Bold /Courier-Bold /Helvetica /Times-BoldItalic /Times-Roman /ZapfDingbats /Times-Italic /Helvetica-Oblique /Courier-Oblique /Symbol ] /ImageMemory 524288 /OPM 1 /DefaultRenderingIntent /Default /EmbedAllFonts true /StartPage 1 /DownsampleGrayImages false /AntiAliasColorImages false /ConvertImagesToIndexed true /PreserveHalftoneInfo false /CompressPages true /Binding /Left >> setdistillerparams << /PageSize [ 595.276 841.890 ] /HWResolution [ 2400 2400 ] >> setpagedevice
384 16 Genome Data Representation Through Images: The MAGPIE/Bluejay System
bilities, we will use MAGPIE as the exampleof genome annotation supported by imag-ing. We describe the meaning of the variousimages, the algorithms used to create them,and the data types from which they are de-rived. MAGPIE mainly produces precom-puted results which are stored on the serverside. On request, the information is servedover the Internet.
The MAGPIE image types reflect the factthat sequence data is stored and presentedin a hierarchical manner. A MAGPIE pro-ject usually consists of, but is not limited to,related sequences of an organism. To makebrowsing and data maintenance easy, se-quences are organized into logical groups.For example, all sequences from a singleclone are normally placed in one group, be-cause they will be joined as sequencing pro-gresses, or all ESTs from a tissue could begrouped together. Although it is convenientfor the user to subdivide datasets, there isno limit on the number of sequences in agroup, because some EST sets have 50,000sequences in a group, which MAGPIE pagi-nated for Web browsers. The images pre-sented in this text are from the Sulfolobussolfataricus P2 sequencing project [2]. Thisproject was chosen as the example becauseit includes all the graphical representationswhich can be produced by MAGPIE. Thecomplete Sulfolobus MAGPIE project isavailable at http://magpie.ucalgary.ca/mag-pie/Sulfolobus_solfataricus_P2/private/.An analysis of all publicly available ge-nomes and several EST sets can be accessedthrough http://magpie.ucalgary.ca.
The MAGPIE images can be classifiedinto three categories – representation of evi-dence, summary of genome features, andbiochemical assay simulation, which sup-ports the design of follow-up experiments.We discuss how these images aid the re-searcher in genome sequencing and annota-tion through pattern recognition and infor-
mation filtering and how they can be used tosupport the validation of genome data.
In 1999 we began to work on a more ad-vanced system, called Bluejay, which is ca-pable of integrating many types of genomedata. The system is Java-based and capableof handling plain text and XML data sourc-es. Using exported MAGPIE XML data andXML documents served by other providersit is capable of handling any genome, eventhe human genome. Bluejay is an extremelyflexible system, which can be configured bythe users to display any level of detail neces-sary to answer complex questions, in a waythat HTML views such as MAGPIE simplycannot.
16.2
The MAGPIE Graphical System
The MAGPIE user interface, which was in-itially implemented with a Web-based dis-play that supported text and table output,has been developed over time into a Web-based graphical display system. As de-scribed previously [1], the tools used inMAGPIE include, but are not limited to, theFastA [3] family of programs (including theprotein fragment analysis tools fastf andtfastf ), the BLAST [4] family of programs(ungapped, gapped, and Position SpecificIterative), BLOCKS [5], ProSearch [6], Gen-scan [7], Glimmer [8], GeneMark [9], ParacelGeneMatcher (http://www.paracel.com/),and Decypher TimeLogic (http://www.timelogic. com/). To link image representationsto alignments, individual tool “hits” andother related information, the original tooloutputs (e.g. BLAST of BLOCKS responses)are stored as HTML files after data process-ing. Hit length and scores are extracted dur-ing the response processing using dedicat-ed parsers. The hits are sorted into user-de-fined confidence levels.
38516.2 The MAGPIE Graphical System
The parts of the modular computer codeused for the MAGPIE input and output aremodules for Web standards written in thePerl5 (http://www.perl.com) programminglanguage: HTML (Hypertext Markup Lan-guage), CGI (Common Gateway Interface),and PNG (Portable Network Graphics). Thetext reporting system is based on a combi-nation of pre-computed HTML pages andCGI programs producing HTML dynami-cally. A graphics library module calledGD.pm (http://stein.cshl.org/WWW/soft-ware/GD), which is dynamically loaded intothe Perl5 system, is used to generate theMAGPIE graphics. GD.pm provides func-tionality for drawing and filling lines, basicgeometric shapes, and arbitrary polygonson a two-dimensional canvas. The canvascan be translated into a Web browser-read-able form such as PNG. The drawing func-tions, when applied to linearly encoded datasuch as DNA or proteins, lend themselvesto particular succinct representations. Rul-ers, along which features are positioned,are drawn as straight lines. Simple ticks(small lines perpendicular to the ruler) gen-erally represent position-specific featuresthat occur frequently, e.g. stop codons.Unique polygons that occupy more spaceare used for position-specific features,which occur less frequently, e.g. promotersites. Data that cover a range, e.g. openreading frames, are displayed as boxes.These boxes may be subdivided when addi-tional information needs to be encoded.
MAGPIE’s graphics fulfill three mainneeds in a genome project once data is col-lected – display of the genome features at dif-ferent levels of detail in the genome context,evaluation of the evidence supporting afeature’s functional annotation, and qualitycontrol. Four types of information are usedto generate images in MAGPIE – user pref-erences, sequence information, data fromboth external tool output and internal analy-
sis, and manual user annotations (verifica-tions). User-based annotations are stored astext files, usually created via the Web inter-face, but they can also be imported from filesusing standards such as GenBank flat for-mat or the General Feature Format (http://www.sanger.ac.uk/Software/formats/GFF/).User-configurable visualization parameters(e.g. the bases-per-pixel scale and the maxi-mum image width) are stored in plain textconfiguration files, similar to the previouslydescribed [1] configuration files for confi-dence level criteria and other configurableparts of MAGPIE. By default, images inMAGPIE are defined with a maximumwidth of 1000 pixels. This enables land-scape mode printing of the images on 8.5n×11n paper.
Although most data in MAGPIE is hierar-chical and stored as text files, cross-refer-encing of equivalent sequence identifiers isdone using binary Berkeley Database Man-ager (DBM) files. This exception to text-filestorage enables rapid execution of text-based searches for sequence descriptionsand identifiers.
The graphical reporting system inMAGPIE has two distinct user-configurablemodes: static or dynamic, respectively. Inthe static graphical mode all images are pre-computed for viewing after the analysis isfinished. This requires considerable diskspace, but it is computationally and tempo-rally efficient when the sequence and analy-ses do not change much, e.g. when a com-pletely finished genome is analyzed. In thedynamic mode, images are created on de-mand, using the data extracted from theanalysis. Although this requires more adhoc computation, it is appropriate when theunderlying sequences or the analyses arefrequently updated, for example in an ongo-ing genome-sequencing project.
Two key features for viewing data in con-text are hierarchical representation of the
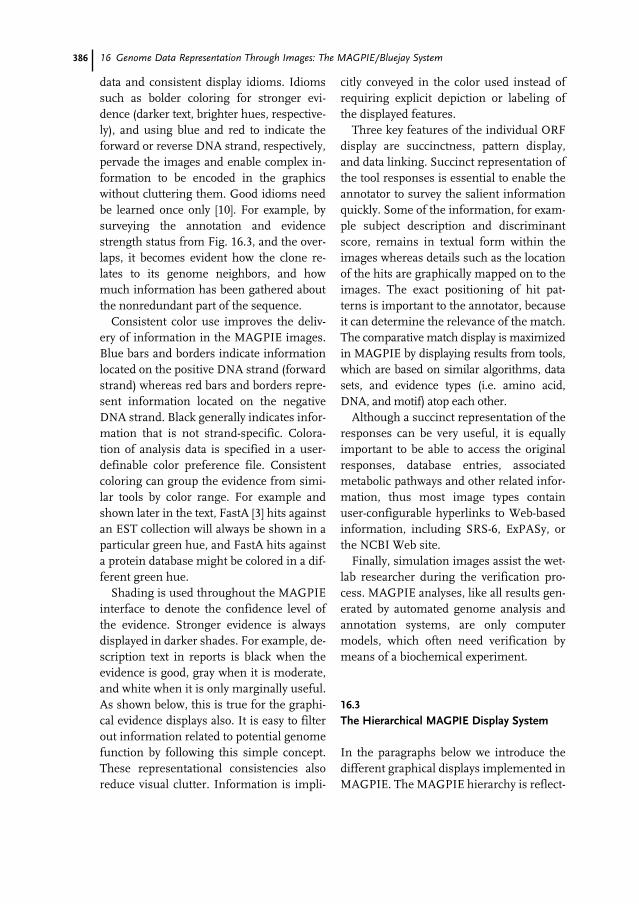
386 16 Genome Data Representation Through Images: The MAGPIE/Bluejay System
data and consistent display idioms. Idiomssuch as bolder coloring for stronger evi-dence (darker text, brighter hues, respective-ly), and using blue and red to indicate theforward or reverse DNA strand, respectively,pervade the images and enable complex in-formation to be encoded in the graphicswithout cluttering them. Good idioms needbe learned once only [10]. For example, bysurveying the annotation and evidencestrength status from Fig. 16.3, and the over-laps, it becomes evident how the clone re-lates to its genome neighbors, and howmuch information has been gathered aboutthe nonredundant part of the sequence.
Consistent color use improves the deliv-ery of information in the MAGPIE images.Blue bars and borders indicate informationlocated on the positive DNA strand (forwardstrand) whereas red bars and borders repre-sent information located on the negativeDNA strand. Black generally indicates infor-mation that is not strand-specific. Colora-tion of analysis data is specified in a user-definable color preference file. Consistentcoloring can group the evidence from simi-lar tools by color range. For example andshown later in the text, FastA [3] hits againstan EST collection will always be shown in aparticular green hue, and FastA hits againsta protein database might be colored in a dif-ferent green hue.
Shading is used throughout the MAGPIEinterface to denote the confidence level ofthe evidence. Stronger evidence is alwaysdisplayed in darker shades. For example, de-scription text in reports is black when theevidence is good, gray when it is moderate,and white when it is only marginally useful.As shown below, this is true for the graphi-cal evidence displays also. It is easy to filterout information related to potential genomefunction by following this simple concept.These representational consistencies alsoreduce visual clutter. Information is impli-
citly conveyed in the color used instead ofrequiring explicit depiction or labeling ofthe displayed features.
Three key features of the individual ORFdisplay are succinctness, pattern display,and data linking. Succinct representation ofthe tool responses is essential to enable theannotator to survey the salient informationquickly. Some of the information, for exam-ple subject description and discriminantscore, remains in textual form within theimages whereas details such as the locationof the hits are graphically mapped on to theimages. The exact positioning of hit pat-terns is important to the annotator, becauseit can determine the relevance of the match.The comparative match display is maximizedin MAGPIE by displaying results from tools,which are based on similar algorithms, datasets, and evidence types (i.e. amino acid,DNA, and motif) atop each other.
Although a succinct representation of theresponses can be very useful, it is equallyimportant to be able to access the originalresponses, database entries, associatedmetabolic pathways and other related infor-mation, thus most image types containuser-configurable hyperlinks to Web-basedinformation, including SRS-6, ExPASy, orthe NCBI Web site.
Finally, simulation images assist the wet-lab researcher during the verification pro-cess. MAGPIE analyses, like all results gen-erated by automated genome analysis andannotation systems, are only computermodels, which often need verification bymeans of a biochemical experiment.
16.3
The Hierarchical MAGPIE Display System
In the paragraphs below we introduce thedifferent graphical displays implemented inMAGPIE. The MAGPIE hierarchy is reflect-
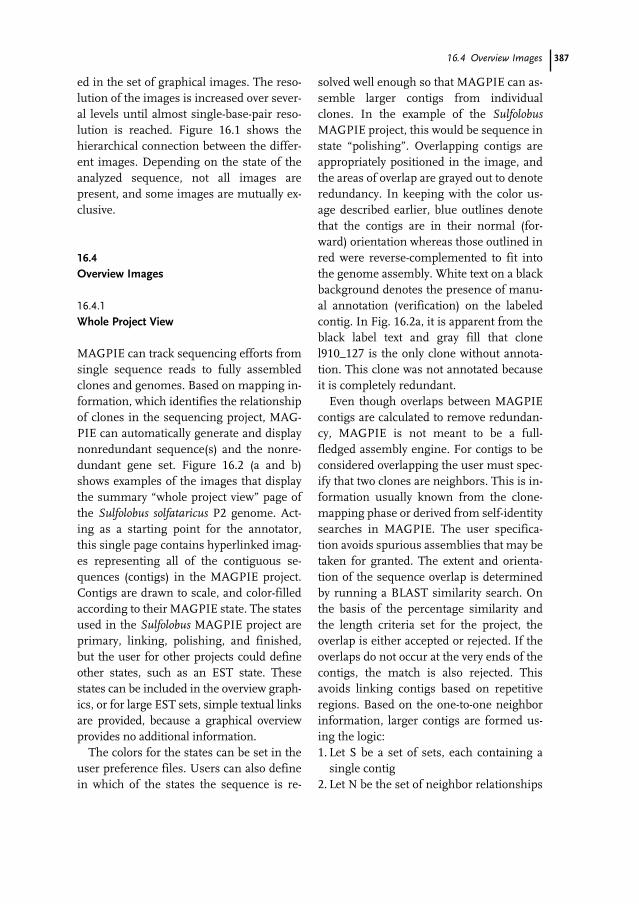
38716.4 Overview Images
ed in the set of graphical images. The reso-lution of the images is increased over sever-al levels until almost single-base-pair reso-lution is reached. Figure 16.1 shows thehierarchical connection between the differ-ent images. Depending on the state of theanalyzed sequence, not all images arepresent, and some images are mutually ex-clusive.
16.4
Overview Images
16.4.1
Whole Project View
MAGPIE can track sequencing efforts fromsingle sequence reads to fully assembledclones and genomes. Based on mapping in-formation, which identifies the relationshipof clones in the sequencing project, MAG-PIE can automatically generate and displaynonredundant sequence(s) and the nonre-dundant gene set. Figure 16.2 (a and b)shows examples of the images that displaythe summary “whole project view” page ofthe Sulfolobus solfataricus P2 genome. Act-ing as a starting point for the annotator,this single page contains hyperlinked imag-es representing all of the contiguous se-quences (contigs) in the MAGPIE project.Contigs are drawn to scale, and color-filledaccording to their MAGPIE state. The statesused in the Sulfolobus MAGPIE project areprimary, linking, polishing, and finished,but the user for other projects could defineother states, such as an EST state. Thesestates can be included in the overview graph-ics, or for large EST sets, simple textual linksare provided, because a graphical overviewprovides no additional information.
The colors for the states can be set in theuser preference files. Users can also definein which of the states the sequence is re-
solved well enough so that MAGPIE can as-semble larger contigs from individualclones. In the example of the SulfolobusMAGPIE project, this would be sequence instate “polishing”. Overlapping contigs areappropriately positioned in the image, andthe areas of overlap are grayed out to denoteredundancy. In keeping with the color us-age described earlier, blue outlines denotethat the contigs are in their normal (for-ward) orientation whereas those outlined inred were reverse-complemented to fit intothe genome assembly. White text on a blackbackground denotes the presence of manu-al annotation (verification) on the labeledcontig. In Fig. 16.2a, it is apparent from theblack label text and gray fill that clonel910_127 is the only clone without annota-tion. This clone was not annotated becauseit is completely redundant.
Even though overlaps between MAGPIEcontigs are calculated to remove redundan-cy, MAGPIE is not meant to be a full-fledged assembly engine. For contigs to beconsidered overlapping the user must spec-ify that two clones are neighbors. This is in-formation usually known from the clone-mapping phase or derived from self-identitysearches in MAGPIE. The user specifica-tion avoids spurious assemblies that may betaken for granted. The extent and orienta-tion of the sequence overlap is determinedby running a BLAST similarity search. Onthe basis of the percentage similarity andthe length criteria set for the project, theoverlap is either accepted or rejected. If theoverlaps do not occur at the very ends of thecontigs, the match is also rejected. Thisavoids linking contigs based on repetitiveregions. Based on the one-to-one neighborinformation, larger contigs are formed us-ing the logic:1. Let S be a set of sets, each containing a
single contig2. Let N be the set of neighbor relationships
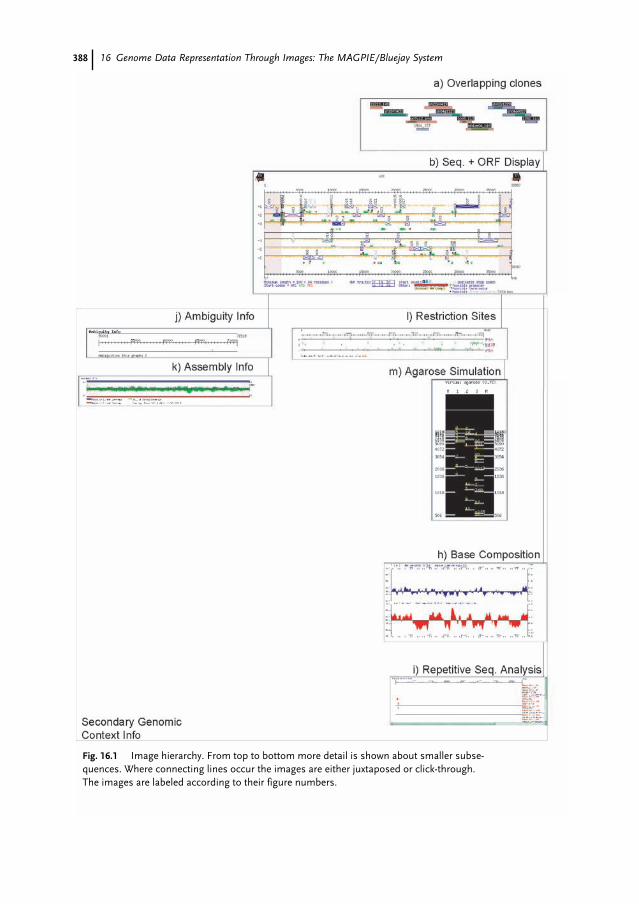
388 16 Genome Data Representation Through Images: The MAGPIE/Bluejay System
Fig. 16.1 Image hierarchy. From top to bottom more detail is shown about smaller subse-quences. Where connecting lines occur the images are either juxtaposed or click-through.The images are labeled according to their figure numbers.
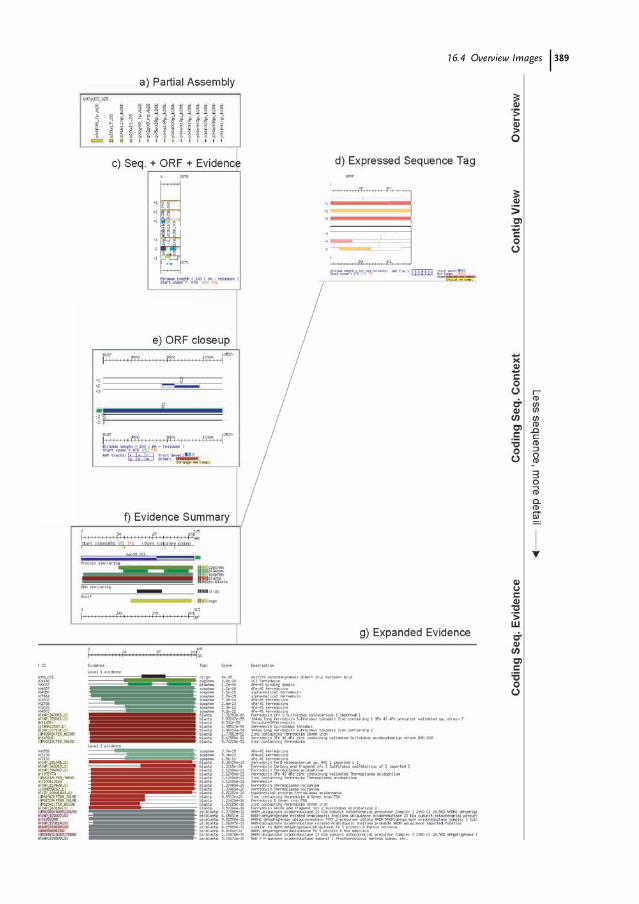
38916.4 Overview Images
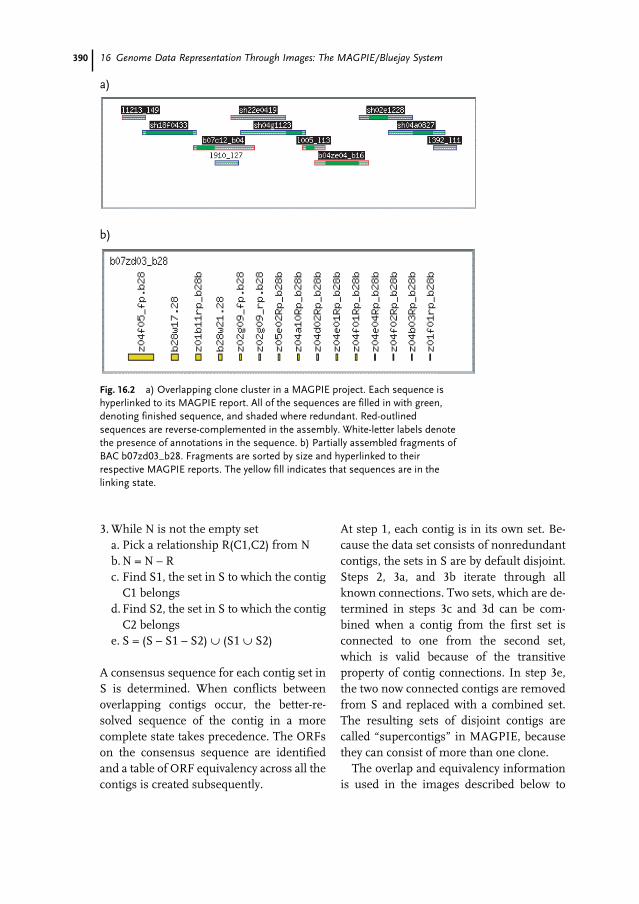
390 16 Genome Data Representation Through Images: The MAGPIE/Bluejay System
3. While N is not the empty seta. Pick a relationship R(C1,C2) from Nb. N = N – Rc. Find S1, the set in S to which the contig
C1 belongsd. Find S2, the set in S to which the contig
C2 belongse. S = (S – S1 – S2) ∪ (S1 ∪ S2)
A consensus sequence for each contig set inS is determined. When conflicts betweenoverlapping contigs occur, the better-re-solved sequence of the contig in a morecomplete state takes precedence. The ORFson the consensus sequence are identifiedand a table of ORF equivalency across all thecontigs is created subsequently.
At step 1, each contig is in its own set. Be-cause the data set consists of nonredundantcontigs, the sets in S are by default disjoint.Steps 2, 3a, and 3b iterate through allknown connections. Two sets, which are de-termined in steps 3c and 3d can be com-bined when a contig from the first set isconnected to one from the second set,which is valid because of the transitiveproperty of contig connections. In step 3e,the two now connected contigs are removedfrom S and replaced with a combined set.The resulting sets of disjoint contigs arecalled “supercontigs” in MAGPIE, becausethey can consist of more than one clone.
The overlap and equivalency informationis used in the images described below to
Fig. 16.2 a) Overlapping clone cluster in a MAGPIE project. Each sequence ishyperlinked to its MAGPIE report. All of the sequences are filled in with green,denoting finished sequence, and shaded where redundant. Red-outlinedsequences are reverse-complemented in the assembly. White-letter labels denotethe presence of annotations in the sequence. b) Partially assembled fragments ofBAC b07zd03_b28. Fragments are sorted by size and hyperlinked to theirrespective MAGPIE reports. The yellow fill indicates that sequences are in thelinking state.
a)
b)
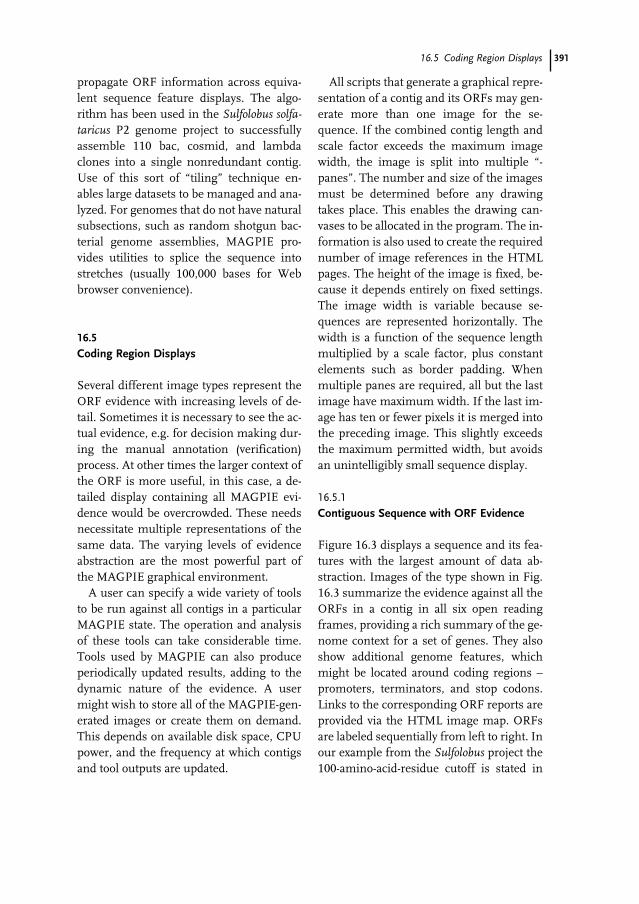
39116.5 Coding Region Displays
propagate ORF information across equiva-lent sequence feature displays. The algo-rithm has been used in the Sulfolobus solfa-taricus P2 genome project to successfullyassemble 110 bac, cosmid, and lambdaclones into a single nonredundant contig.Use of this sort of “tiling” technique en-ables large datasets to be managed and ana-lyzed. For genomes that do not have naturalsubsections, such as random shotgun bac-terial genome assemblies, MAGPIE pro-vides utilities to splice the sequence intostretches (usually 100,000 bases for Webbrowser convenience).
16.5
Coding Region Displays
Several different image types represent theORF evidence with increasing levels of de-tail. Sometimes it is necessary to see the ac-tual evidence, e.g. for decision making dur-ing the manual annotation (verification)process. At other times the larger context ofthe ORF is more useful, in this case, a de-tailed display containing all MAGPIE evi-dence would be overcrowded. These needsnecessitate multiple representations of thesame data. The varying levels of evidenceabstraction are the most powerful part ofthe MAGPIE graphical environment.
A user can specify a wide variety of toolsto be run against all contigs in a particularMAGPIE state. The operation and analysisof these tools can take considerable time.Tools used by MAGPIE can also produceperiodically updated results, adding to thedynamic nature of the evidence. A usermight wish to store all of the MAGPIE-gen-erated images or create them on demand.This depends on available disk space, CPUpower, and the frequency at which contigsand tool outputs are updated.
All scripts that generate a graphical repre-sentation of a contig and its ORFs may gen-erate more than one image for the se-quence. If the combined contig length andscale factor exceeds the maximum imagewidth, the image is split into multiple “-panes”. The number and size of the imagesmust be determined before any drawingtakes place. This enables the drawing can-vases to be allocated in the program. The in-formation is also used to create the requirednumber of image references in the HTMLpages. The height of the image is fixed, be-cause it depends entirely on fixed settings.The image width is variable because se-quences are represented horizontally. Thewidth is a function of the sequence lengthmultiplied by a scale factor, plus constantelements such as border padding. Whenmultiple panes are required, all but the lastimage have maximum width. If the last im-age has ten or fewer pixels it is merged intothe preceding image. This slightly exceedsthe maximum permitted width, but avoidsan unintelligibly small sequence display.
16.5.1
Contiguous Sequence with ORF Evidence
Figure 16.3 displays a sequence and its fea-tures with the largest amount of data ab-straction. Images of the type shown in Fig.16.3 summarize the evidence against all theORFs in a contig in all six open readingframes, providing a rich summary of the ge-nome context for a set of genes. They alsoshow additional genome features, whichmight be located around coding regions –promoters, terminators, and stop codons.Links to the corresponding ORF reports areprovided via the HTML image map. ORFsare labeled sequentially from left to right. Inour example from the Sulfolobus project the100-amino-acid-residue cutoff is stated in
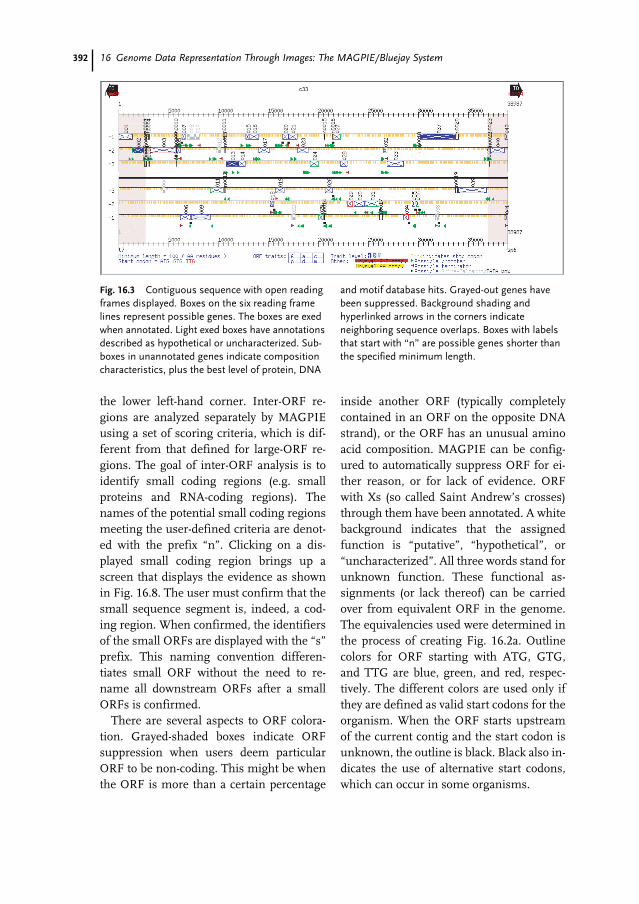
392 16 Genome Data Representation Through Images: The MAGPIE/Bluejay System
the lower left-hand corner. Inter-ORF re-gions are analyzed separately by MAGPIEusing a set of scoring criteria, which is dif-ferent from that defined for large-ORF re-gions. The goal of inter-ORF analysis is toidentify small coding regions (e.g. smallproteins and RNA-coding regions). Thenames of the potential small coding regionsmeeting the user-defined criteria are denot-ed with the prefix “n”. Clicking on a dis-played small coding region brings up ascreen that displays the evidence as shownin Fig. 16.8. The user must confirm that thesmall sequence segment is, indeed, a cod-ing region. When confirmed, the identifiersof the small ORFs are displayed with the “s”prefix. This naming convention differen-tiates small ORF without the need to re-name all downstream ORFs after a smallORFs is confirmed.
There are several aspects to ORF colora-tion. Grayed-shaded boxes indicate ORFsuppression when users deem particularORF to be non-coding. This might be whenthe ORF is more than a certain percentage
inside another ORF (typically completelycontained in an ORF on the opposite DNAstrand), or the ORF has an unusual aminoacid composition. MAGPIE can be config-ured to automatically suppress ORF for ei-ther reason, or for lack of evidence. ORFwith Xs (so called Saint Andrew’s crosses)through them have been annotated. A whitebackground indicates that the assignedfunction is “putative”, “hypothetical”, or“uncharacterized”. All three words stand forunknown function. These functional as-signments (or lack thereof) can be carriedover from equivalent ORF in the genome.The equivalencies used were determined inthe process of creating Fig. 16.2a. Outlinecolors for ORF starting with ATG, GTG,and TTG are blue, green, and red, respec-tively. The different colors are used only ifthey are defined as valid start codons for theorganism. When the ORF starts upstreamof the current contig and the start codon isunknown, the outline is black. Black also in-dicates the use of alternative start codons,which can occur in some organisms.
Fig. 16.3 Contiguous sequence with open readingframes displayed. Boxes on the six reading framelines represent possible genes. The boxes are exedwhen annotated. Light exed boxes have annotationsdescribed as hypothetical or uncharacterized. Sub-boxes in unannotated genes indicate compositioncharacteristics, plus the best level of protein, DNA
and motif database hits. Grayed-out genes havebeen suppressed. Background shading andhyperlinked arrows in the corners indicateneighboring sequence overlaps. Boxes with labelsthat start with “n” are possible genes shorter thanthe specified minimum length.

39316.5 Coding Region Displays
ORFs not validated by a user are split intothree by two isometric blocks. These blockscan be colored to indicate the presence andstrength of certain evidence. This is indicat-ed in the “ORF traits” section of the Fig.16.3 legend. The blocks in the upper halfdenote calculated sequence characteristics.Blocks “f” and “a” indicate on/off traits. Ablue “f” block denotes that the codon usagein the ORF fits a chi-square distribution testfor frequencies observed in this organism.A blue “a” block denotes that the purine (A+ G) composition of this ORF is greaterthan 50 %. This is known to be an indicatorof a likelihood of good coding for many pro-karyotes [2]. For organisms with a (G + C)% greater or smaller than 50 %, the “c”block in the upper right corner of the blockrepresents another indicator of coding se-quence, (G + C) % codon compensation.Calculation of this term is based on thethird (and to a lesser extent second) posi-tion codon wobble. Compensation at confi-dence level 1 occurs when the combinedfrequency of (G + C) % compensation ishighest in the third base of the codons. ForLevel 2 the second base (G + C) % compen-sation is the highest, followed by the com-pensation for the third base of the codons.
The blocks in the lower half denote data-base search results and the level of confi-dence in three levels, level one indicatingthe strongest evidence. The colors for thethree levels are blue, cyan, and gray, respec-tively. The lower half trait levels are deter-mined by comparing extracted similarityanalysis scores with the user-specified crite-ria. The “p” block indicates the highest levelof protein similarity found through thedatabase searches. The “d” block indicatesthe highest level of DNA similarity found.The “m” block indicates the best level of se-quence motifs found (e.g. scored Prositehits). After learning the representationscheme, the annotator can quickly see the
nature and strength of coding indicators forall ORFs in a sequence.
Other indicators for transcription includeShine–Dalgarno motifs [11], promoters, andterminators. These features are displayed inthe appropriate reading frame as small blackrectangles, green triangles, and red side-ways Ts, respectively. In keeping with repre-sentational consistency, the candidate withthe highest score for each of these featuresaround any ORF is colored a darker shade.Shine–Dalgarno motifs are found by match-ing a user-defined subsequence, which rep-resents the reverse complement of the 3′end of the organism’s 16s rRNA molecule.Promoter and terminator searching areavailable for archaeal DNA sequences (Gor-don and Sensen, unpublished work).
Stop codons are marked with orange tickswithin the reading frames. The location ofstop codons is determined while the imageis being created, as follows. In each forwardtranslation frame the search for the nextstop codon begins at the first in-frame baserepresented by the next pixel, thus increas-ing the calculation efficiency without sacri-ficing information in the display. For exam-ple, if a stop codon is found at base 23, andeach pixel represents fifty bases, the searchfor the next stop codon in that frame startsat base 51. This is because 51 is the first in-frame triplet in the next pixel, representingthe {51,100} range. By not repeatedly draw-ing stop ticks in the same pixel, no render-ing effort is wasted. Another display short-cut is to search for the reverse complementsof the stop codons on the forward strand inthe same manner when rendering the nega-tive DNA strand. Finding stop codon re-verse complements saves the effort of re-verse complementing the whole sequenceand inverting the information again forgraphical rendering.
On the ends of the lower ruler, labels canbe added to indicate information about the
394 16 Genome Data Representation Through Images: The MAGPIE/Bluejay System
priming sites, which are flanking the insertof the clone. In Fig. 16.3 it is shown that theinsert is in sp6 to t7 orientation. The infor-mation about the ends of a clone is stored inthe configuration file that defines the clonerelationship.
The image also displays the overlapsbetween contigs, which were determinedduring the generation of Fig. 16.2 (a and b).Overlaps are denoted with arrows in theupper left and right hand corners of the im-age. The extent and orientation of the over-laps is indicated by the shading of the back-ground between the upper and lower rulersin the blue (for forward orientation of theneighbor) or red (for reverse complementorientation of the neighbor).
16.5.2
Contiguous Sequence with Evidence
Figure 16.4 shows an example of a contigu-ous sequence display, with evidence. Imagesof this type are similar in layout to the imageshown in Fig. 16.3, reducing the user’slearning curve. This type of image is usedwhen the sequence is in a primary or linkingstate, i.e. when multiple sequencing errorsand ambiguities might still exist in the se-quence. The key difference between Figs.16.3 and 16.4 is that evidence in Fig. 16.4 isnot abstracted into ORF traits. Evidence isdisplayed at its absolute position on theDNA strand. Figure 16.5 demonstrates theusefulness of this display. The cyan (level 2)and blue (level 1) evidence is on the –2 DNAstrand, and a frameshift at the 3′ end of thesequence is likely, because of the neighbor-ing ORF on the –3 strand. Higher ranked ev-idence always appears above lower rankedevidence. In this way, the more pertinent in-formation is displayed in the limited screenarea available. The evidence markings arehyperlinked to the pattern matches andalignments which they represent. The ORFs
are linked to a Fig. 16.8 view of the evidencethat falls within the same boundaries on thesame DNA strand.
These images can also be used to findpreviously unrecognized assembly over-laps. To identify potential overlaps, a MAG-PIE sequence database search of each con-tig against all contigs in the project is per-formed, and self-matches of contigs aresuppressed in the subsequent analysis. Anymatches potentially mating two contigs arethen visible. This kind of informationwould not be represented in Fig. 16.3.
16.5.3
Expressed Sequence Tags
ESTs (Fig. 16.5) are displayed in a mannervery similar to primary and linking se-quences from a genome project, because
Fig. 16.4 Contiguous sequence with open readingframes and evidence displayed. Evidence andORFs are displayed in their frames and locations.This facilitates easy recognition of frameshifts andpartial genes. Other characteristics are the sameas in Fig. 16.3.
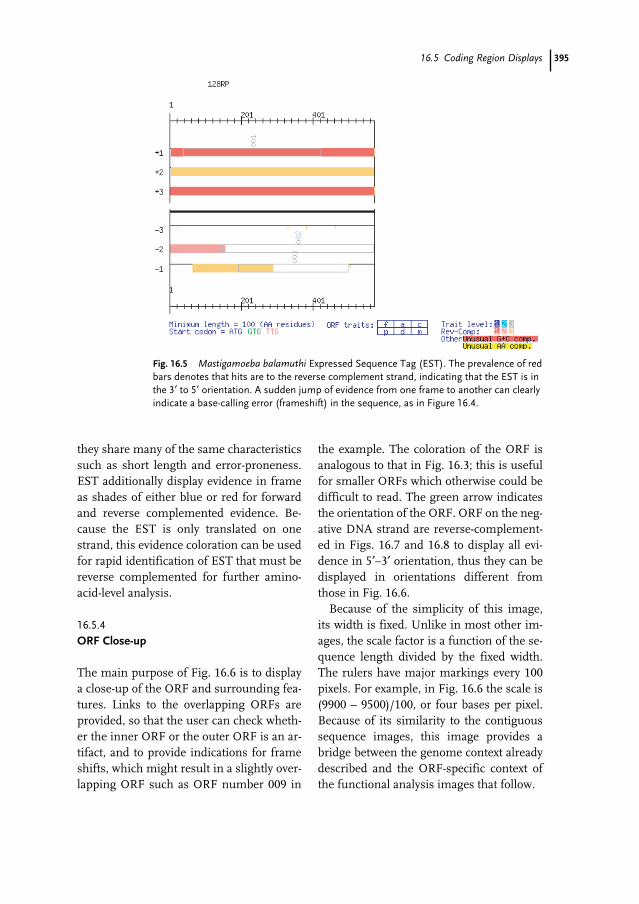
39516.5 Coding Region Displays
they share many of the same characteristicssuch as short length and error-proneness.EST additionally display evidence in frameas shades of either blue or red for forwardand reverse complemented evidence. Be-cause the EST is only translated on onestrand, this evidence coloration can be usedfor rapid identification of EST that must bereverse complemented for further amino-acid-level analysis.
16.5.4
ORF Close-up
The main purpose of Fig. 16.6 is to displaya close-up of the ORF and surrounding fea-tures. Links to the overlapping ORFs areprovided, so that the user can check wheth-er the inner ORF or the outer ORF is an ar-tifact, and to provide indications for frameshifts, which might result in a slightly over-lapping ORF such as ORF number 009 in
the example. The coloration of the ORF isanalogous to that in Fig. 16.3; this is usefulfor smaller ORFs which otherwise could bedifficult to read. The green arrow indicatesthe orientation of the ORF. ORF on the neg-ative DNA strand are reverse-complement-ed in Figs. 16.7 and 16.8 to display all evi-dence in 5′–3′ orientation, thus they can bedisplayed in orientations different fromthose in Fig. 16.6.
Because of the simplicity of this image,its width is fixed. Unlike in most other im-ages, the scale factor is a function of the se-quence length divided by the fixed width.The rulers have major markings every 100pixels. For example, in Fig. 16.6 the scale is(9900 – 9500)/100, or four bases per pixel.Because of its similarity to the contiguoussequence images, this image provides abridge between the genome context alreadydescribed and the ORF-specific context ofthe functional analysis images that follow.
Fig. 16.5 Mastigamoeba balamuthi Expressed Sequence Tag (EST). The prevalence of redbars denotes that hits are to the reverse complement strand, indicating that the EST is inthe 3′ to 5′ orientation. A sudden jump of evidence from one frame to another can clearlyindicate a base-calling error (frameshift) in the sequence, as in Figure 16.4.
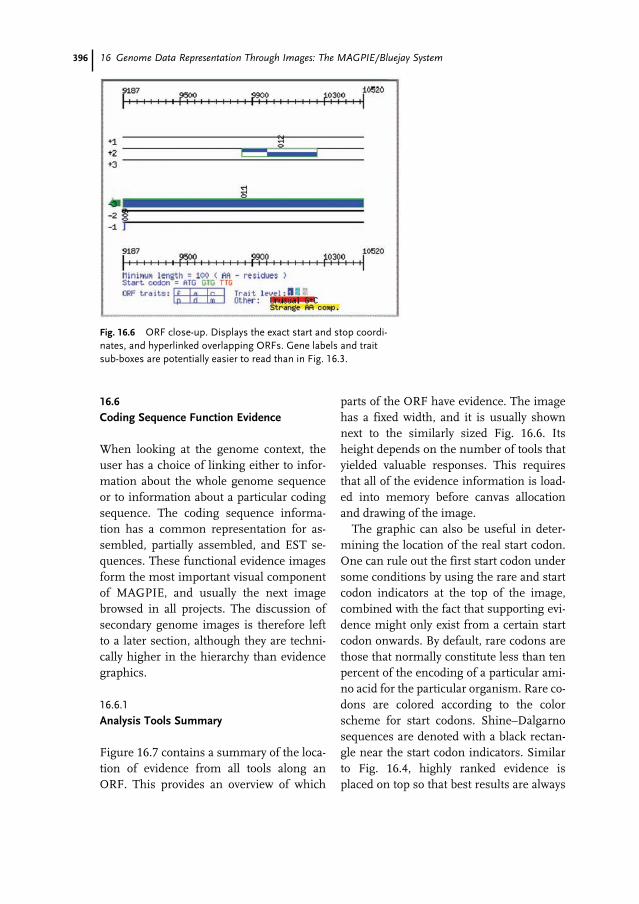
396 16 Genome Data Representation Through Images: The MAGPIE/Bluejay System
16.6
Coding Sequence Function Evidence
When looking at the genome context, theuser has a choice of linking either to infor-mation about the whole genome sequenceor to information about a particular codingsequence. The coding sequence informa-tion has a common representation for as-sembled, partially assembled, and EST se-quences. These functional evidence imagesform the most important visual componentof MAGPIE, and usually the next imagebrowsed in all projects. The discussion ofsecondary genome images is therefore leftto a later section, although they are techni-cally higher in the hierarchy than evidencegraphics.
16.6.1
Analysis Tools Summary
Figure 16.7 contains a summary of the loca-tion of evidence from all tools along anORF. This provides an overview of which
parts of the ORF have evidence. The imagehas a fixed width, and it is usually shownnext to the similarly sized Fig. 16.6. Itsheight depends on the number of tools thatyielded valuable responses. This requiresthat all of the evidence information is load-ed into memory before canvas allocationand drawing of the image.
The graphic can also be useful in deter-mining the location of the real start codon.One can rule out the first start codon undersome conditions by using the rare and startcodon indicators at the top of the image,combined with the fact that supporting evi-dence might only exist from a certain startcodon onwards. By default, rare codons arethose that normally constitute less than tenpercent of the encoding of a particular ami-no acid for the particular organism. Rare co-dons are colored according to the colorscheme for start codons. Shine–Dalgarnosequences are denoted with a black rectan-gle near the start codon indicators. Similarto Fig. 16.4, highly ranked evidence isplaced on top so that best results are always
Fig. 16.6 ORF close-up. Displays the exact start and stop coordi-nates, and hyperlinked overlapping ORFs. Gene labels and traitsub-boxes are potentially easier to read than in Fig. 16.3.
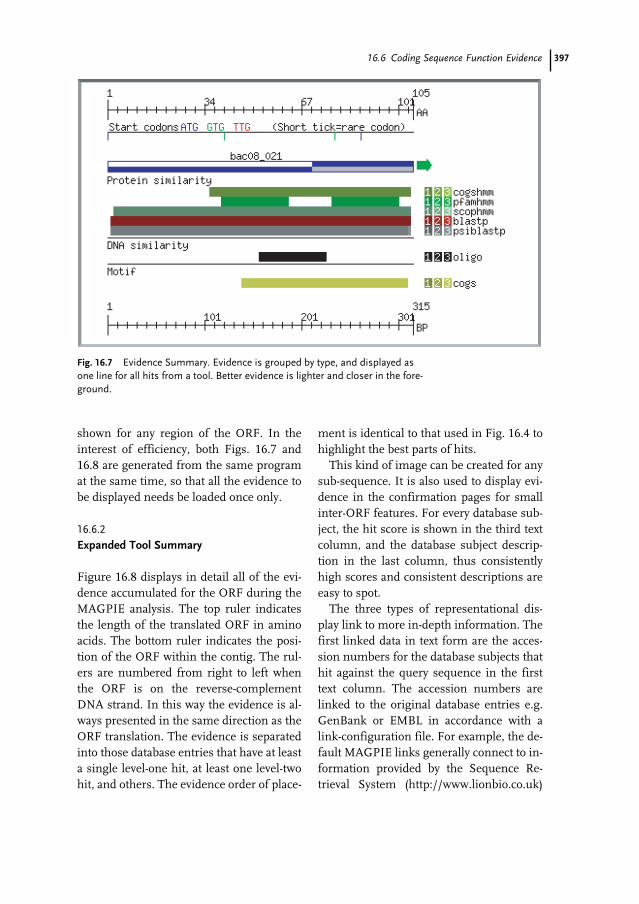
39716.6 Coding Sequence Function Evidence
shown for any region of the ORF. In theinterest of efficiency, both Figs. 16.7 and16.8 are generated from the same programat the same time, so that all the evidence tobe displayed needs be loaded once only.
16.6.2
Expanded Tool Summary
Figure 16.8 displays in detail all of the evi-dence accumulated for the ORF during theMAGPIE analysis. The top ruler indicatesthe length of the translated ORF in aminoacids. The bottom ruler indicates the posi-tion of the ORF within the contig. The rul-ers are numbered from right to left whenthe ORF is on the reverse-complementDNA strand. In this way the evidence is al-ways presented in the same direction as theORF translation. The evidence is separatedinto those database entries that have at leasta single level-one hit, at least one level-twohit, and others. The evidence order of place-
ment is identical to that used in Fig. 16.4 tohighlight the best parts of hits.
This kind of image can be created for anysub-sequence. It is also used to display evi-dence in the confirmation pages for smallinter-ORF features. For every database sub-ject, the hit score is shown in the third textcolumn, and the database subject descrip-tion in the last column, thus consistentlyhigh scores and consistent descriptions areeasy to spot.
The three types of representational dis-play link to more in-depth information. Thefirst linked data in text form are the acces-sion numbers for the database subjects thathit against the query sequence in the firsttext column. The accession numbers arelinked to the original database entries e.g.GenBank or EMBL in accordance with alink-configuration file. For example, the de-fault MAGPIE links generally connect to in-formation provided by the Sequence Re-trieval System (http://www.lionbio.co.uk)
Fig. 16.7 Evidence Summary. Evidence is grouped by type, and displayed asone line for all hits from a tool. Better evidence is lighter and closer in the fore-ground.
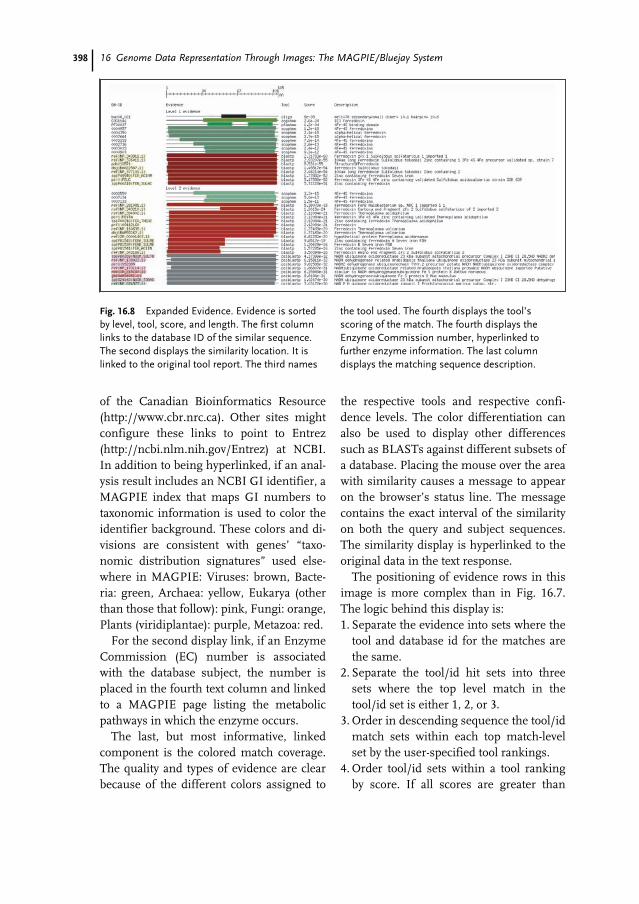
398 16 Genome Data Representation Through Images: The MAGPIE/Bluejay System
of the Canadian Bioinformatics Resource(http://www.cbr.nrc.ca). Other sites mightconfigure these links to point to Entrez(http://ncbi.nlm.nih.gov/Entrez) at NCBI.In addition to being hyperlinked, if an anal-ysis result includes an NCBI GI identifier, aMAGPIE index that maps GI numbers totaxonomic information is used to color theidentifier background. These colors and di-visions are consistent with genes’ “taxo-nomic distribution signatures” used else-where in MAGPIE: Viruses: brown, Bacte-ria: green, Archaea: yellow, Eukarya (otherthan those that follow): pink, Fungi: orange,Plants (viridiplantae): purple, Metazoa: red.
For the second display link, if an EnzymeCommission (EC) number is associatedwith the database subject, the number isplaced in the fourth text column and linkedto a MAGPIE page listing the metabolicpathways in which the enzyme occurs.
The last, but most informative, linkedcomponent is the colored match coverage.The quality and types of evidence are clearbecause of the different colors assigned to
the respective tools and respective confi-dence levels. The color differentiation canalso be used to display other differencessuch as BLASTs against different subsets ofa database. Placing the mouse over the areawith similarity causes a message to appearon the browser’s status line. The messagecontains the exact interval of the similarityon both the query and subject sequences.The similarity display is hyperlinked to theoriginal data in the text response.
The positioning of evidence rows in thisimage is more complex than in Fig. 16.7.The logic behind this display is:1. Separate the evidence into sets where the
tool and database id for the matches arethe same.
2. Separate the tool/id hit sets into threesets where the top level match in thetool/id set is either 1, 2, or 3.
3. Order in descending sequence the tool/idmatch sets within each top match-levelset by the user-specified tool rankings.
4. Order tool/id sets within a tool rankingby score. If all scores are greater than
Fig. 16.8 Expanded Evidence. Evidence is sortedby level, tool, score, and length. The first columnlinks to the database ID of the similar sequence.The second displays the similarity location. It islinked to the original tool report. The third names
the tool used. The fourth displays the tool’sscoring of the match. The fourth displays theEnzyme Commission number, hyperlinked tofurther enzyme information. The last columndisplays the matching sequence description.
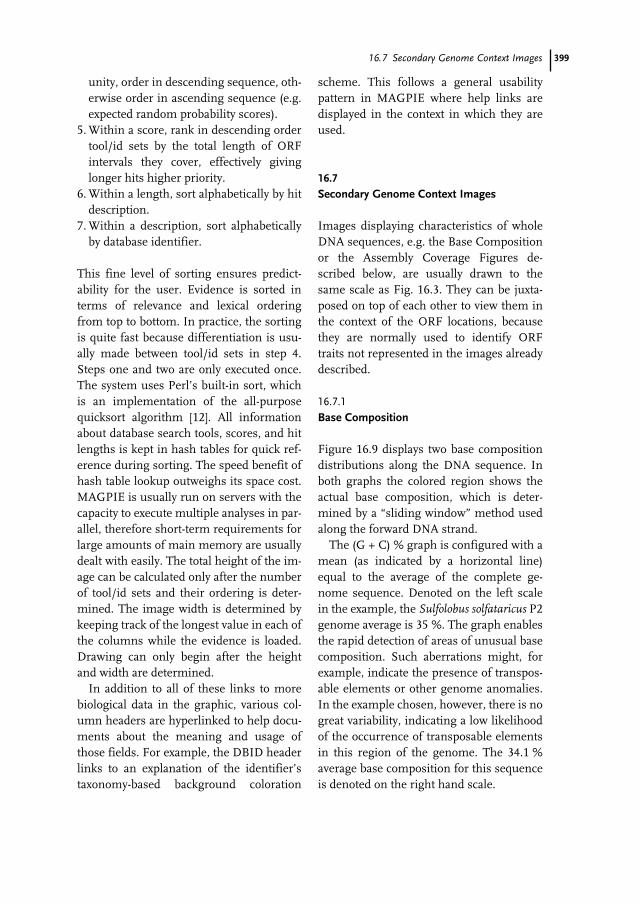
39916.7 Secondary Genome Context Images
unity, order in descending sequence, oth-erwise order in ascending sequence (e.g.expected random probability scores).
5. Within a score, rank in descending ordertool/id sets by the total length of ORFintervals they cover, effectively givinglonger hits higher priority.
6. Within a length, sort alphabetically by hitdescription.
7. Within a description, sort alphabeticallyby database identifier.
This fine level of sorting ensures predict-ability for the user. Evidence is sorted interms of relevance and lexical orderingfrom top to bottom. In practice, the sortingis quite fast because differentiation is usu-ally made between tool/id sets in step 4.Steps one and two are only executed once.The system uses Perl’s built-in sort, whichis an implementation of the all-purposequicksort algorithm [12]. All informationabout database search tools, scores, and hitlengths is kept in hash tables for quick ref-erence during sorting. The speed benefit ofhash table lookup outweighs its space cost.MAGPIE is usually run on servers with thecapacity to execute multiple analyses in par-allel, therefore short-term requirements forlarge amounts of main memory are usuallydealt with easily. The total height of the im-age can be calculated only after the numberof tool/id sets and their ordering is deter-mined. The image width is determined bykeeping track of the longest value in each ofthe columns while the evidence is loaded.Drawing can only begin after the heightand width are determined.
In addition to all of these links to morebiological data in the graphic, various col-umn headers are hyperlinked to help docu-ments about the meaning and usage ofthose fields. For example, the DBID headerlinks to an explanation of the identifier’staxonomy-based background coloration
scheme. This follows a general usabilitypattern in MAGPIE where help links aredisplayed in the context in which they areused.
16.7
Secondary Genome Context Images
Images displaying characteristics of wholeDNA sequences, e.g. the Base Compositionor the Assembly Coverage Figures de-scribed below, are usually drawn to thesame scale as Fig. 16.3. They can be juxta-posed on top of each other to view them inthe context of the ORF locations, becausethey are normally used to identify ORFtraits not represented in the images alreadydescribed.
16.7.1
Base Composition
Figure 16.9 displays two base compositiondistributions along the DNA sequence. Inboth graphs the colored region shows theactual base composition, which is deter-mined by a “sliding window” method usedalong the forward DNA strand.
The (G + C) % graph is configured with amean (as indicated by a horizontal line)equal to the average of the complete ge-nome sequence. Denoted on the left scalein the example, the Sulfolobus solfataricus P2genome average is 35 %. The graph enablesthe rapid detection of areas of unusual basecomposition. Such aberrations might, forexample, indicate the presence of transpos-able elements or other genome anomalies.In the example chosen, however, there is nogreat variability, indicating a low likelihoodof the occurrence of transposable elementsin this region of the genome. The 34.1 %average base composition for this sequenceis denoted on the right hand scale.

400 16 Genome Data Representation Through Images: The MAGPIE/Bluejay System
As previously mentioned, the red purine(A + G) composition graph can be used formany species to predict the strand contain-ing the coding sequence. Lined up againstFig. 16.3, ORFs that are most probably non-coding can be detected. When the purinecomposition is greater than 50 %, the codingORFs are probably on the positive strand.They are likely to be on the negative strandwhen the composition is much below 50 %.
The composition percentages are smoothedout by calculating averages with a slidingwindow of 500 base pairs. When each pixelrepresents 50 base pairs on the scale, andthe window for composition averaging is500, we can use the previous five pixels’ to-tals (50/pixel × 5 pixels = 250 bases) and thenext five pixels’ totals for each plotted pixelcolumn to calculate the current average. Ateach pixel column, we add a new total anddiscard the total for the first pixel column inthe sliding window. Calculating the averageat any location requires only averaging 10numbers. Otherwise, in our example, 500
would need to be averaged at the sequenceends where the look-ahead and memoryabout the values for previous columns donot exist. To avoid invading white space, theaverage peak is truncated when it is outsidethe user-defined scale ranges.
16.7.2
Sequence Repeats
Figure 16.10 indicates the portions of thesequence that are repeated in the project.MAGPIE calculates families of repeated se-quences sharing a minimum number ofcontiguous bases. By default, the minimumnumber is twenty. Repeats are sorted intofamilies of matching subsequences, whichare further sorted by size in descending or-der. The matching sequence name is in theleft right hand column whereas the locationand size of the match are displayed as filledboxes under the ruler. Red, blue, and greenboxes represent forward, reverse comple-ment, and complement matches.
Fig. 16.9 Base Compositions. Average A + G and G + C compositions arecalculated using a sliding window of 500 bases. The moving average is displayedas a filled graph, both above and below the centerline average. Unusual G + Cmight indicate the presence of transposable elements. Majority A + G indicatescoding strand in many organisms.
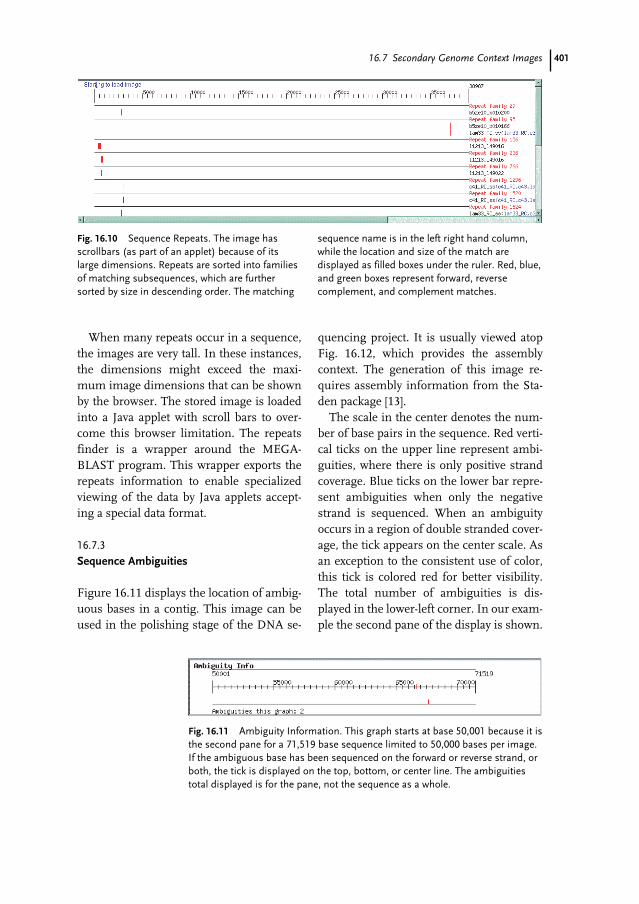
40116.7 Secondary Genome Context Images
When many repeats occur in a sequence,the images are very tall. In these instances,the dimensions might exceed the maxi-mum image dimensions that can be shownby the browser. The stored image is loadedinto a Java applet with scroll bars to over-come this browser limitation. The repeatsfinder is a wrapper around the MEGA-BLAST program. This wrapper exports therepeats information to enable specializedviewing of the data by Java applets accept-ing a special data format.
16.7.3
Sequence Ambiguities
Figure 16.11 displays the location of ambig-uous bases in a contig. This image can beused in the polishing stage of the DNA se-
quencing project. It is usually viewed atopFig. 16.12, which provides the assemblycontext. The generation of this image re-quires assembly information from the Sta-den package [13].
The scale in the center denotes the num-ber of base pairs in the sequence. Red verti-cal ticks on the upper line represent ambi-guities, where there is only positive strandcoverage. Blue ticks on the lower bar repre-sent ambiguities when only the negativestrand is sequenced. When an ambiguityoccurs in a region of double stranded cover-age, the tick appears on the center scale. Asan exception to the consistent use of color,this tick is colored red for better visibility.The total number of ambiguities is dis-played in the lower-left corner. In our exam-ple the second pane of the display is shown.
Fig. 16.10 Sequence Repeats. The image hasscrollbars (as part of an applet) because of itslarge dimensions. Repeats are sorted into familiesof matching subsequences, which are furthersorted by size in descending order. The matching
sequence name is in the left right hand column,while the location and size of the match aredisplayed as filled boxes under the ruler. Red, blue,and green boxes represent forward, reversecomplement, and complement matches.
Fig. 16.11 Ambiguity Information. This graph starts at base 50,001 because it isthe second pane for a 71,519 base sequence limited to 50,000 bases per image.If the ambiguous base has been sequenced on the forward or reverse strand, orboth, the tick is displayed on the top, bottom, or center line. The ambiguitiestotal displayed is for the pane, not the sequence as a whole.
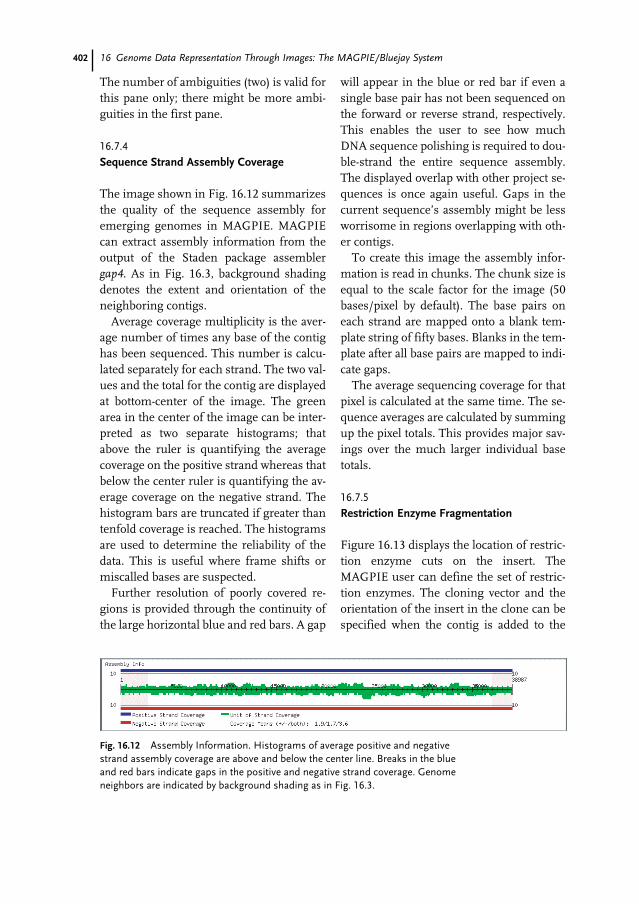
402 16 Genome Data Representation Through Images: The MAGPIE/Bluejay System
The number of ambiguities (two) is valid forthis pane only; there might be more ambi-guities in the first pane.
16.7.4
Sequence Strand Assembly Coverage
The image shown in Fig. 16.12 summarizesthe quality of the sequence assembly foremerging genomes in MAGPIE. MAGPIEcan extract assembly information from theoutput of the Staden package assemblergap4. As in Fig. 16.3, background shadingdenotes the extent and orientation of theneighboring contigs.
Average coverage multiplicity is the aver-age number of times any base of the contighas been sequenced. This number is calcu-lated separately for each strand. The two val-ues and the total for the contig are displayedat bottom-center of the image. The greenarea in the center of the image can be inter-preted as two separate histograms; thatabove the ruler is quantifying the averagecoverage on the positive strand whereas thatbelow the center ruler is quantifying the av-erage coverage on the negative strand. Thehistogram bars are truncated if greater thantenfold coverage is reached. The histogramsare used to determine the reliability of thedata. This is useful where frame shifts ormiscalled bases are suspected.
Further resolution of poorly covered re-gions is provided through the continuity ofthe large horizontal blue and red bars. A gap
will appear in the blue or red bar if even asingle base pair has not been sequenced onthe forward or reverse strand, respectively.This enables the user to see how muchDNA sequence polishing is required to dou-ble-strand the entire sequence assembly.The displayed overlap with other project se-quences is once again useful. Gaps in thecurrent sequence’s assembly might be lessworrisome in regions overlapping with oth-er contigs.
To create this image the assembly infor-mation is read in chunks. The chunk size isequal to the scale factor for the image (50bases/pixel by default). The base pairs oneach strand are mapped onto a blank tem-plate string of fifty bases. Blanks in the tem-plate after all base pairs are mapped to indi-cate gaps.
The average sequencing coverage for thatpixel is calculated at the same time. The se-quence averages are calculated by summingup the pixel totals. This provides major sav-ings over the much larger individual basetotals.
16.7.5
Restriction Enzyme Fragmentation
Figure 16.13 displays the location of restric-tion enzyme cuts on the insert. TheMAGPIE user can define the set of restric-tion enzymes. The cloning vector and theorientation of the insert in the clone can bespecified when the contig is added to the
Fig. 16.12 Assembly Information. Histograms of average positive and negativestrand assembly coverage are above and below the center line. Breaks in the blueand red bars indicate gaps in the positive and negative strand coverage. Genomeneighbors are indicated by background shading as in Fig. 16.3.
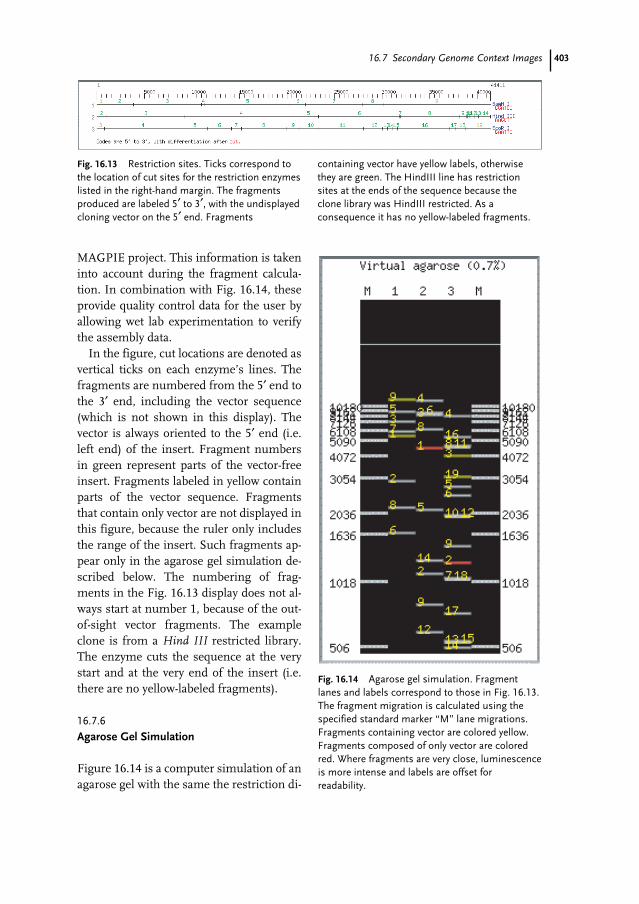
40316.7 Secondary Genome Context Images
MAGPIE project. This information is takeninto account during the fragment calcula-tion. In combination with Fig. 16.14, theseprovide quality control data for the user byallowing wet lab experimentation to verifythe assembly data.
In the figure, cut locations are denoted asvertical ticks on each enzyme’s lines. Thefragments are numbered from the 5′ end tothe 3′ end, including the vector sequence(which is not shown in this display). Thevector is always oriented to the 5′ end (i.e.left end) of the insert. Fragment numbersin green represent parts of the vector-freeinsert. Fragments labeled in yellow containparts of the vector sequence. Fragmentsthat contain only vector are not displayed inthis figure, because the ruler only includesthe range of the insert. Such fragments ap-pear only in the agarose gel simulation de-scribed below. The numbering of frag-ments in the Fig. 16.13 display does not al-ways start at number 1, because of the out-of-sight vector fragments. The exampleclone is from a Hind III restricted library.The enzyme cuts the sequence at the verystart and at the very end of the insert (i.e.there are no yellow-labeled fragments).
16.7.6
Agarose Gel Simulation
Figure 16.14 is a computer simulation of anagarose gel with the same the restriction di-
Fig. 16.13 Restriction sites. Ticks correspond tothe location of cut sites for the restriction enzymeslisted in the right-hand margin. The fragmentsproduced are labeled 5′ to 3′, with the undisplayedcloning vector on the 5′ end. Fragments
containing vector have yellow labels, otherwisethey are green. The HindIII line has restrictionsites at the ends of the sequence because theclone library was HindIII restricted. As aconsequence it has no yellow-labeled fragments.
Fig. 16.14 Agarose gel simulation. Fragmentlanes and labels correspond to those in Fig. 16.13.The fragment migration is calculated using thespecified standard marker “M” lane migrations.Fragments containing vector are colored yellow.Fragments composed of only vector are coloredred. Where fragments are very close, luminescenceis more intense and labels are offset forreadability.
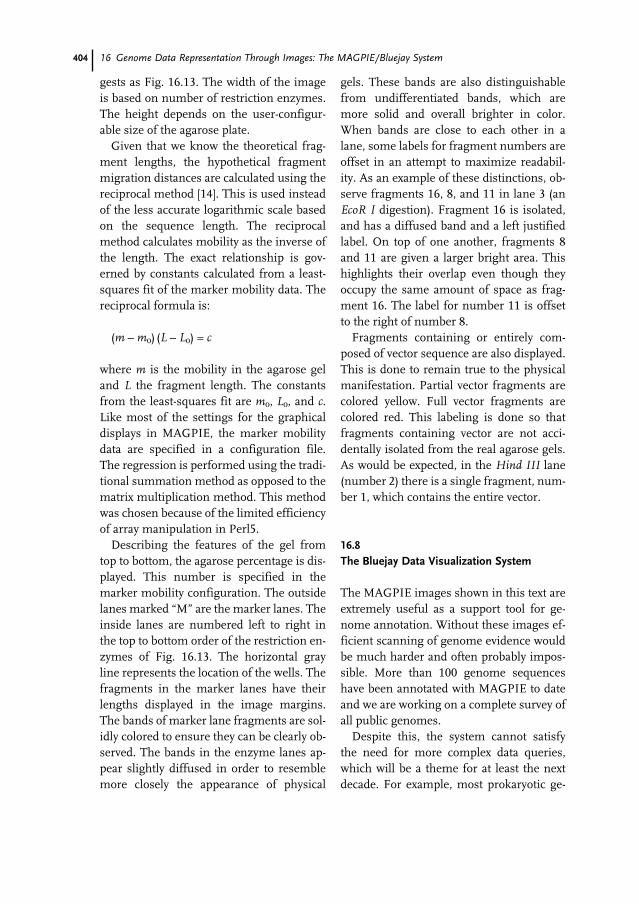
404 16 Genome Data Representation Through Images: The MAGPIE/Bluejay System
gests as Fig. 16.13. The width of the imageis based on number of restriction enzymes.The height depends on the user-configur-able size of the agarose plate.
Given that we know the theoretical frag-ment lengths, the hypothetical fragmentmigration distances are calculated using thereciprocal method [14]. This is used insteadof the less accurate logarithmic scale basedon the sequence length. The reciprocalmethod calculates mobility as the inverse ofthe length. The exact relationship is gov-erned by constants calculated from a least-squares fit of the marker mobility data. Thereciprocal formula is:
(m – m0) (L – L0) = c
where m is the mobility in the agarose geland L the fragment length. The constantsfrom the least-squares fit are m0, L0, and c.Like most of the settings for the graphicaldisplays in MAGPIE, the marker mobilitydata are specified in a configuration file.The regression is performed using the tradi-tional summation method as opposed to thematrix multiplication method. This methodwas chosen because of the limited efficiencyof array manipulation in Perl5.
Describing the features of the gel fromtop to bottom, the agarose percentage is dis-played. This number is specified in themarker mobility configuration. The outsidelanes marked “M” are the marker lanes. Theinside lanes are numbered left to right inthe top to bottom order of the restriction en-zymes of Fig. 16.13. The horizontal grayline represents the location of the wells. Thefragments in the marker lanes have theirlengths displayed in the image margins.The bands of marker lane fragments are sol-idly colored to ensure they can be clearly ob-served. The bands in the enzyme lanes ap-pear slightly diffused in order to resemblemore closely the appearance of physical
gels. These bands are also distinguishablefrom undifferentiated bands, which aremore solid and overall brighter in color.When bands are close to each other in alane, some labels for fragment numbers areoffset in an attempt to maximize readabil-ity. As an example of these distinctions, ob-serve fragments 16, 8, and 11 in lane 3 (anEcoR I digestion). Fragment 16 is isolated,and has a diffused band and a left justifiedlabel. On top of one another, fragments 8and 11 are given a larger bright area. Thishighlights their overlap even though theyoccupy the same amount of space as frag-ment 16. The label for number 11 is offsetto the right of number 8.
Fragments containing or entirely com-posed of vector sequence are also displayed.This is done to remain true to the physicalmanifestation. Partial vector fragments arecolored yellow. Full vector fragments arecolored red. This labeling is done so thatfragments containing vector are not acci-dentally isolated from the real agarose gels.As would be expected, in the Hind III lane(number 2) there is a single fragment, num-ber 1, which contains the entire vector.
16.8
The Bluejay Data Visualization System
The MAGPIE images shown in this text areextremely useful as a support tool for ge-nome annotation. Without these images ef-ficient scanning of genome evidence wouldbe much harder and often probably impos-sible. More than 100 genome sequenceshave been annotated with MAGPIE to dateand we are working on a complete survey ofall public genomes.
Despite this, the system cannot satisfythe need for more complex data queries,which will be a theme for at least the nextdecade. For example, most prokaryotic ge-
40516.9 Bluejay Architecture
nomes are circular in nature, a feature notdisplayed in any of the MAGPIE graphics.Although the administrator can configureparticular features of the MAGPIE graph-ics, there are severe limits to the flexibility.For example, a graphical display of a querylike: “Display all the tRNA coding genesand the tRNA-synthetase coding genes in agenome and show potential relationshipsbetween the two gene sets” cannot beserved by the static MAGPIE environment.Refinement of the displays and the additioninput forms for eukaryotic features [15] inMAGPIE will continue as more analysisand genome annotation is performed, butthe technology used for the implementa-tion of MAGPIE limits the system to pre-computed graphical outputs with little pos-sibility of variation.
A key to the development of more flexiblesystems is the use of the extensible markuplanguage (XML) format, addition of Java-based display tools, and incorporation ofscalable vector graphics (SVG) into the tool-kit. MAGPIE is now capable of exportingXML-formatted information about genomefeatures. This enables the rendering ofMAGPIE information by XML-compliantclients, which have more display options,enabling more or less indefinite viewingpossibilities for genome data.
The system capable of using XML-for-matted information is called Bluejay [16].Bluejay is a Java-based genome-visualiza-tion system which enables the user to cus-tomize the types of information displayed,zoom dynamically into the data, and per-form queries like that described above. Weconsider systems like Bluejay to be the nextstep to a genome display environment thatwill enable genome researchers of the fu-ture to perform the in silico biology envis-aged for the 21st century.
16.9
Bluejay Architecture
The Bluejay system is designed as aclient–server architecture. Any XML-basedserver, including MAGPIE, and TIGR orGenBank services, can be used as input forthe client. In addition a proxy server, in-stalled at the Sun Center of Excellence forVisual Genomics in Calgary enables utiliza-tion of non-XML based data sources, whichare reformatted to XML by the proxy server.
The Java-based client provides the userinterface to the Bluejay system. It is de-signed with the look and feel of a Webbrowser, creating an interactive visual mod-el for biological sequences. The display isdynamic and highly customizable, with se-quence landmark sites, annotations, and re-lated information available for visual explo-ration. Most image elements are linked toexternal bioinformatics sources, for exam-ple MAGPIE gene-annotation pages and BI-OMOBY services [17]. The visual model ofthe sequence thus serves as a backbone formapping other relevant data, which canthen be explored in a rich genome context.Bluejay supports several levels of visual ma-nipulation – sequence-wide operations,queries based on selected functional catego-ries, and exploration of individual elements.
One of the best practices in software de-velopment is design for change. The Blue-jay architecture facilitates this practicethrough modularity and extensive supportof open standards. The development ofBluejay focuses on two tasks – creation ofthe core Bluejay package, and making itsuitable for interaction with publicly avail-able software. External software is eitherplugged directly into the Bluejay as a com-ponent to implement the desired function-ality, or accessed remotely using open stan-dards and protocols. The key enabling tech-
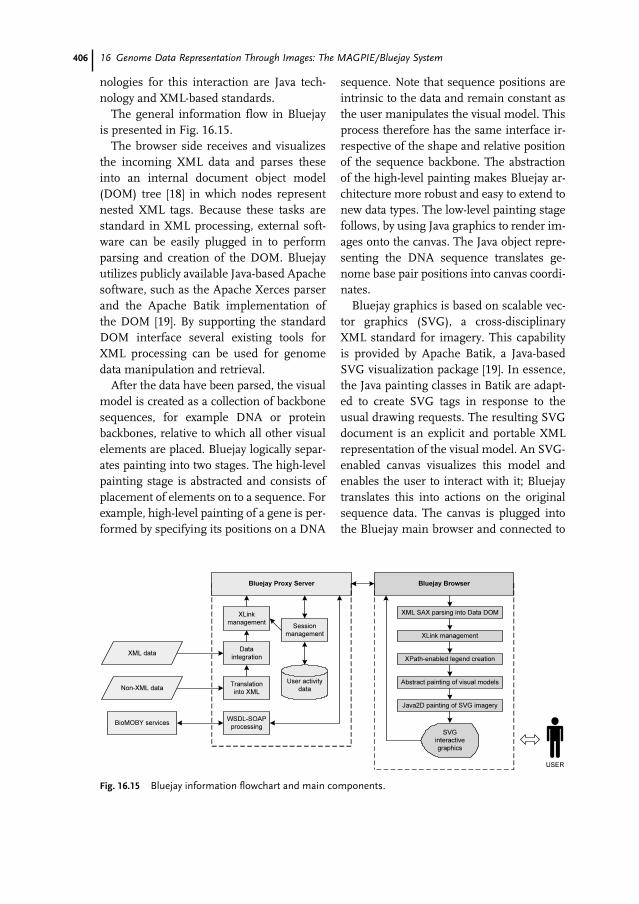
406 16 Genome Data Representation Through Images: The MAGPIE/Bluejay System
nologies for this interaction are Java tech-nology and XML-based standards.
The general information flow in Bluejayis presented in Fig. 16.15.
The browser side receives and visualizesthe incoming XML data and parses theseinto an internal document object model(DOM) tree [18] in which nodes representnested XML tags. Because these tasks arestandard in XML processing, external soft-ware can be easily plugged in to performparsing and creation of the DOM. Bluejayutilizes publicly available Java-based Apachesoftware, such as the Apache Xerces parserand the Apache Batik implementation ofthe DOM [19]. By supporting the standardDOM interface several existing tools forXML processing can be used for genomedata manipulation and retrieval.
After the data have been parsed, the visualmodel is created as a collection of backbonesequences, for example DNA or proteinbackbones, relative to which all other visualelements are placed. Bluejay logically separ-ates painting into two stages. The high-levelpainting stage is abstracted and consists ofplacement of elements on to a sequence. Forexample, high-level painting of a gene is per-formed by specifying its positions on a DNA
sequence. Note that sequence positions areintrinsic to the data and remain constant asthe user manipulates the visual model. Thisprocess therefore has the same interface ir-respective of the shape and relative positionof the sequence backbone. The abstractionof the high-level painting makes Bluejay ar-chitecture more robust and easy to extend tonew data types. The low-level painting stagefollows, by using Java graphics to render im-ages onto the canvas. The Java object repre-senting the DNA sequence translates ge-nome base pair positions into canvas coordi-nates.
Bluejay graphics is based on scalable vec-tor graphics (SVG), a cross-disciplinaryXML standard for imagery. This capabilityis provided by Apache Batik, a Java-basedSVG visualization package [19]. In essence,the Java painting classes in Batik are adapt-ed to create SVG tags in response to theusual drawing requests. The resulting SVGdocument is an explicit and portable XMLrepresentation of the visual model. An SVG-enabled canvas visualizes this model andenables the user to interact with it; Bluejaytranslates this into actions on the originalsequence data. The canvas is plugged intothe Bluejay main browser and connected to
Fig. 16.15 Bluejay information flowchart and main components.
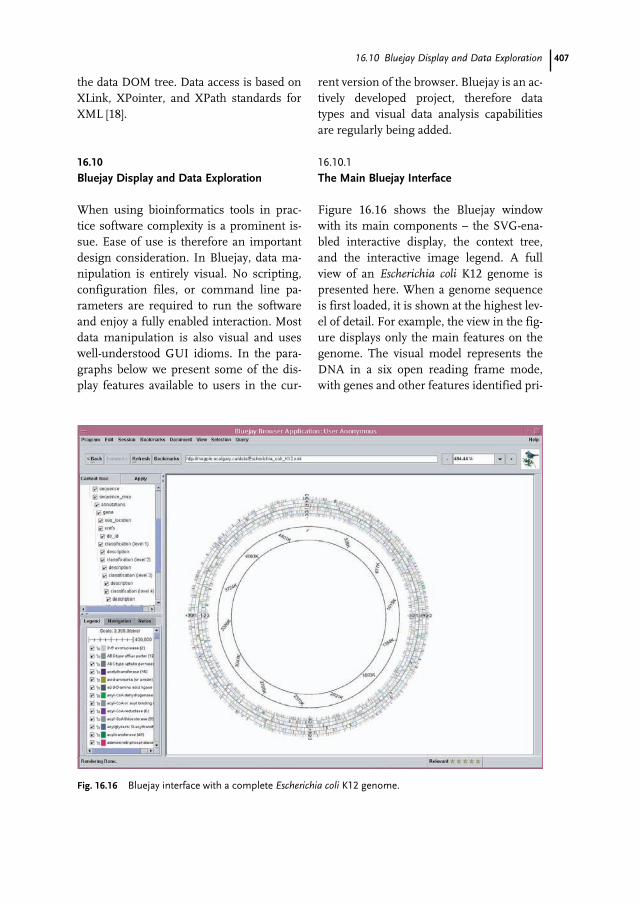
40716.10 Bluejay Display and Data Exploration
the data DOM tree. Data access is based onXLink, XPointer, and XPath standards forXML [18].
16.10
Bluejay Display and Data Exploration
When using bioinformatics tools in prac-tice software complexity is a prominent is-sue. Ease of use is therefore an importantdesign consideration. In Bluejay, data ma-nipulation is entirely visual. No scripting,configuration files, or command line pa-rameters are required to run the softwareand enjoy a fully enabled interaction. Mostdata manipulation is also visual and useswell-understood GUI idioms. In the para-graphs below we present some of the dis-play features available to users in the cur-
rent version of the browser. Bluejay is an ac-tively developed project, therefore datatypes and visual data analysis capabilitiesare regularly being added.
16.10.1
The Main Bluejay Interface
Figure 16.16 shows the Bluejay windowwith its main components – the SVG-ena-bled interactive display, the context tree,and the interactive image legend. A fullview of an Escherichia coli K12 genome ispresented here. When a genome sequenceis first loaded, it is shown at the highest lev-el of detail. For example, the view in the fig-ure displays only the main features on thegenome. The visual model represents theDNA in a six open reading frame mode,with genes and other features identified pri-
Fig. 16.16 Bluejay interface with a complete Escherichia coli K12 genome.
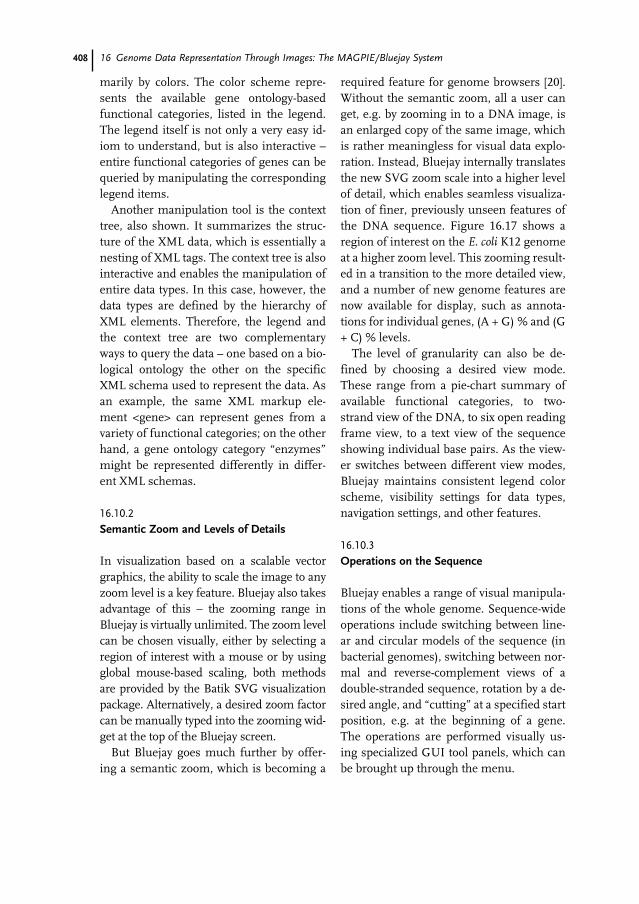
408 16 Genome Data Representation Through Images: The MAGPIE/Bluejay System
marily by colors. The color scheme repre-sents the available gene ontology-basedfunctional categories, listed in the legend.The legend itself is not only a very easy id-iom to understand, but is also interactive –entire functional categories of genes can bequeried by manipulating the correspondinglegend items.
Another manipulation tool is the contexttree, also shown. It summarizes the struc-ture of the XML data, which is essentially anesting of XML tags. The context tree is alsointeractive and enables the manipulation ofentire data types. In this case, however, thedata types are defined by the hierarchy ofXML elements. Therefore, the legend andthe context tree are two complementaryways to query the data – one based on a bio-logical ontology the other on the specificXML schema used to represent the data. Asan example, the same XML markup ele-ment <gene> can represent genes from avariety of functional categories; on the otherhand, a gene ontology category “enzymes”might be represented differently in differ-ent XML schemas.
16.10.2
Semantic Zoom and Levels of Details
In visualization based on a scalable vectorgraphics, the ability to scale the image to anyzoom level is a key feature. Bluejay also takesadvantage of this – the zooming range inBluejay is virtually unlimited. The zoom levelcan be chosen visually, either by selecting aregion of interest with a mouse or by usingglobal mouse-based scaling, both methodsare provided by the Batik SVG visualizationpackage. Alternatively, a desired zoom factorcan be manually typed into the zooming wid-get at the top of the Bluejay screen.
But Bluejay goes much further by offer-ing a semantic zoom, which is becoming a
required feature for genome browsers [20].Without the semantic zoom, all a user canget, e.g. by zooming in to a DNA image, isan enlarged copy of the same image, whichis rather meaningless for visual data explo-ration. Instead, Bluejay internally translatesthe new SVG zoom scale into a higher levelof detail, which enables seamless visualiza-tion of finer, previously unseen features ofthe DNA sequence. Figure 16.17 shows aregion of interest on the E. coli K12 genomeat a higher zoom level. This zooming result-ed in a transition to the more detailed view,and a number of new genome features arenow available for display, such as annota-tions for individual genes, (A + G) % and (G+ C) % levels.
The level of granularity can also be de-fined by choosing a desired view mode.These range from a pie-chart summary ofavailable functional categories, to two-strand view of the DNA, to six open readingframe view, to a text view of the sequenceshowing individual base pairs. As the view-er switches between different view modes,Bluejay maintains consistent legend colorscheme, visibility settings for data types,navigation settings, and other features.
16.10.3
Operations on the Sequence
Bluejay enables a range of visual manipula-tions of the whole genome. Sequence-wideoperations include switching between line-ar and circular models of the sequence (inbacterial genomes), switching between nor-mal and reverse-complement views of adouble-stranded sequence, rotation by a de-sired angle, and “cutting” at a specified startposition, e.g. at the beginning of a gene.The operations are performed visually us-ing specialized GUI tool panels, which canbe brought up through the menu.
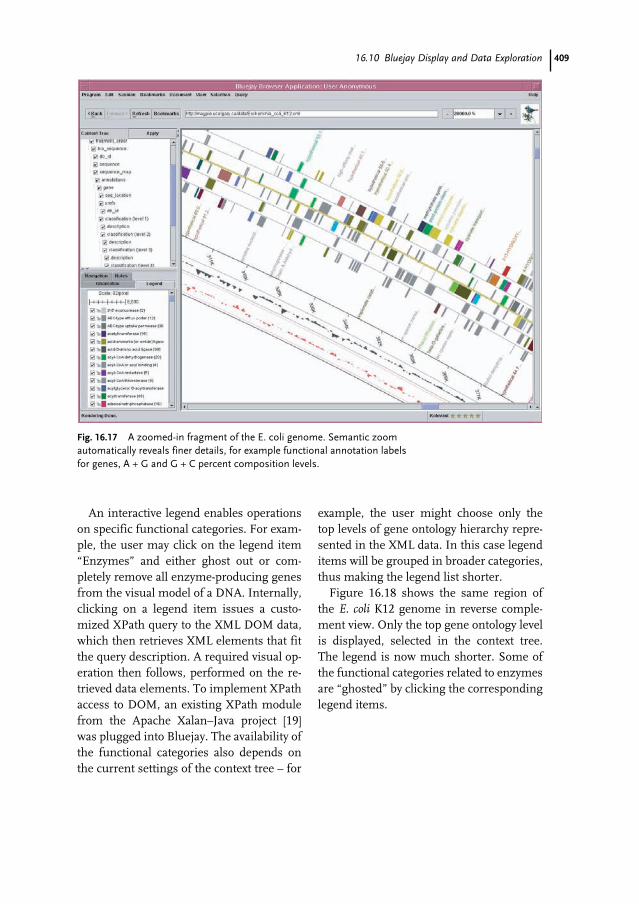
40916.10 Bluejay Display and Data Exploration
An interactive legend enables operationson specific functional categories. For exam-ple, the user may click on the legend item“Enzymes” and either ghost out or com-pletely remove all enzyme-producing genesfrom the visual model of a DNA. Internally,clicking on a legend item issues a custo-mized XPath query to the XML DOM data,which then retrieves XML elements that fitthe query description. A required visual op-eration then follows, performed on the re-trieved data elements. To implement XPathaccess to DOM, an existing XPath modulefrom the Apache Xalan–Java project [19]was plugged into Bluejay. The availability ofthe functional categories also depends onthe current settings of the context tree – for
example, the user might choose only thetop levels of gene ontology hierarchy repre-sented in the XML data. In this case legenditems will be grouped in broader categories,thus making the legend list shorter.
Figure 16.18 shows the same region ofthe E. coli K12 genome in reverse comple-ment view. Only the top gene ontology levelis displayed, selected in the context tree.The legend is now much shorter. Some ofthe functional categories related to enzymesare “ghosted” by clicking the correspondinglegend items.
Fig. 16.17 A zoomed-in fragment of the E. coli genome. Semantic zoomautomatically reveals finer details, for example functional annotation labels for genes, A + G and G + C percent composition levels.
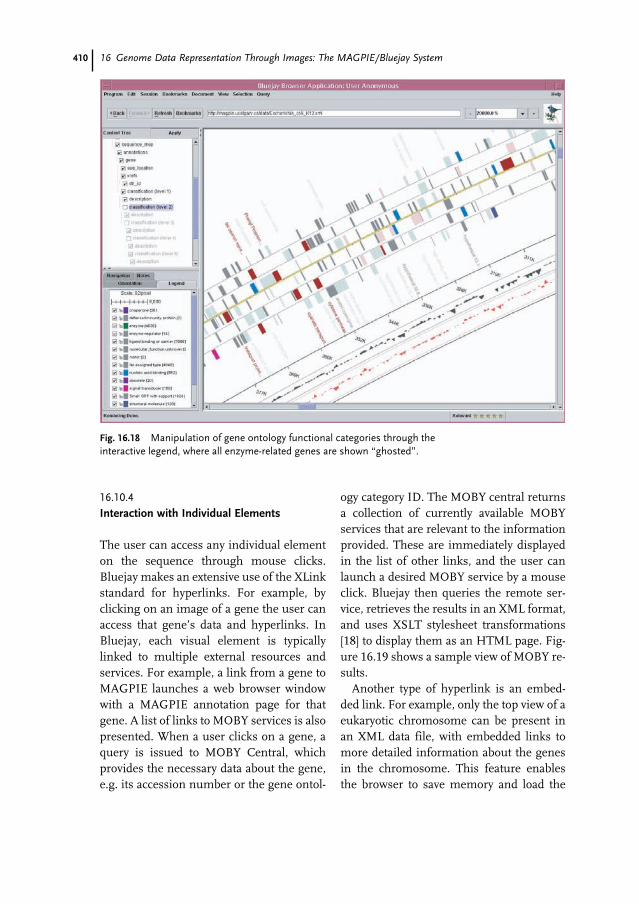
410 16 Genome Data Representation Through Images: The MAGPIE/Bluejay System
16.10.4
Interaction with Individual Elements
The user can access any individual elementon the sequence through mouse clicks.Bluejay makes an extensive use of the XLinkstandard for hyperlinks. For example, byclicking on an image of a gene the user canaccess that gene’s data and hyperlinks. InBluejay, each visual element is typicallylinked to multiple external resources andservices. For example, a link from a gene toMAGPIE launches a web browser windowwith a MAGPIE annotation page for thatgene. A list of links to MOBY services is alsopresented. When a user clicks on a gene, aquery is issued to MOBY Central, whichprovides the necessary data about the gene,e.g. its accession number or the gene ontol-
ogy category ID. The MOBY central returnsa collection of currently available MOBYservices that are relevant to the informationprovided. These are immediately displayedin the list of other links, and the user canlaunch a desired MOBY service by a mouseclick. Bluejay then queries the remote ser-vice, retrieves the results in an XML format,and uses XSLT stylesheet transformations[18] to display them as an HTML page. Fig-ure 16.19 shows a sample view of MOBY re-sults.
Another type of hyperlink is an embed-ded link. For example, only the top view of aeukaryotic chromosome can be present inan XML data file, with embedded links tomore detailed information about the genesin the chromosome. This feature enablesthe browser to save memory and load the
Fig. 16.18 Manipulation of gene ontology functional categories through theinteractive legend, where all enzyme-related genes are shown “ghosted”.
41116.11 Bluejay Usability Features
data faster. When the user zooms to a high-er level of detail, the embedded links are ac-tivated (Bluejay supports activation of linksboth on load and on request). The detailedinformation is then fetched in by the proxyand inserted into the visual model, so thatfiner gene features become available fordisplay and analysis.
The XLink standard enables such ad-vanced features as multiple outgoing linksoriginating from the same element, in-bound and third-party links, and linkbase li-braries, which are external resource filesthat define collections of links. Some of thisbehavior is mandated by the XLink stan-dard while other behavior is application-specific. Bluejay recognizes, extracts, andactivates XLinks from the incoming data toother genome data and web services. Archi-tecturally the XLink module acts as an op-tional SAX-compliant filter on top of a SAX-
compliant XML parser (for example ApacheXerces) and extracts all relevant XLinks intoa link pool [21]. Bluejay’s internal structuresthen handle dynamic link recognition andactivation. The uses of XLinks in Bluejaywill probably be expanded to the tasks ofvisual integration of data and services.
16.10.5
Eukaryotic Genomes
Visual manipulation of eukaryotic genomesis very similar to that for prokaryotic ge-nomes, but the visual model becomes morecomplex. The eukaryotic display dependson the specific XML scheme, thereforeBluejay contains specialized Java painterclasses for each supported scheme. Figure16.20 shows the visual display of the Arabi-dopsis thaliana genome in Bluejay, encodedin TIGR XML. This XML format defines arange of XML elements to describe the eu-karyotic genome structure. A transcription-al unit (TU) is a top element colored accord-ing to the functional category. It contains agene MODEL element (blue outline) thatdescribes coding and noncoding structuresof a splicing isoform. The MODEL encodesseveral mRNA EXONS (shown in black).Protein coding portions of exons (CDS, out-lined in green) and untranslated regions(UTR, outlined in red) are also shown.Bluejay display follows the general struc-ture of the TIGR XML format specificationsbut enhances the view with color-coded in-formation and interactive behavior of indi-vidual elements.
16.11
Bluejay Usability Features
Usability is an important design issue in bi-oinformatics, and several usability featuresin Bluejay enhance interaction with the
Fig. 16.19 A sample of data returned by aBioMOBY service after a user’s visual query fromthe main Bluejay interface.
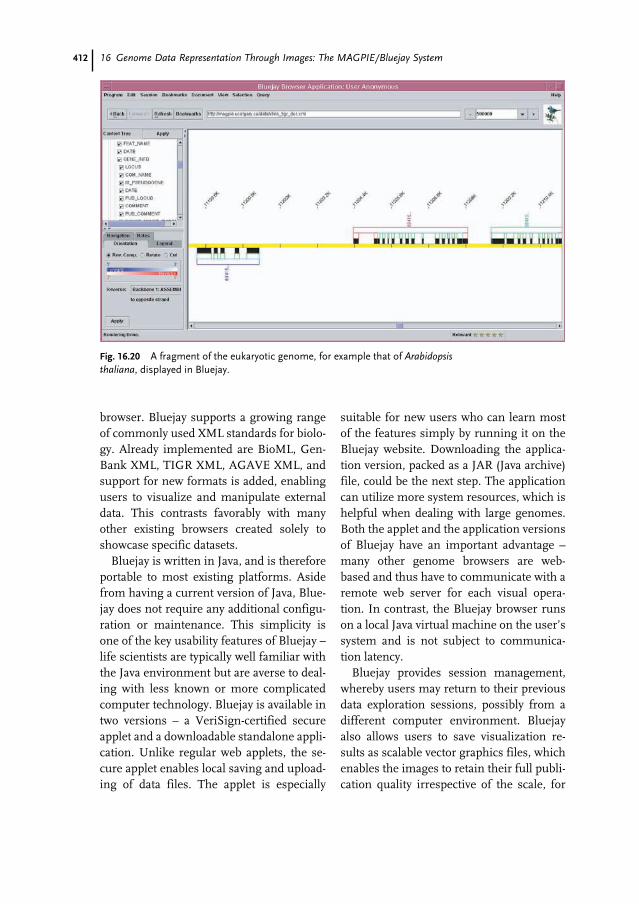
412 16 Genome Data Representation Through Images: The MAGPIE/Bluejay System
browser. Bluejay supports a growing rangeof commonly used XML standards for biolo-gy. Already implemented are BioML, Gen-Bank XML, TIGR XML, AGAVE XML, andsupport for new formats is added, enablingusers to visualize and manipulate externaldata. This contrasts favorably with manyother existing browsers created solely toshowcase specific datasets.
Bluejay is written in Java, and is thereforeportable to most existing platforms. Asidefrom having a current version of Java, Blue-jay does not require any additional configu-ration or maintenance. This simplicity isone of the key usability features of Bluejay –life scientists are typically well familiar withthe Java environment but are averse to deal-ing with less known or more complicatedcomputer technology. Bluejay is available intwo versions – a VeriSign-certified secureapplet and a downloadable standalone appli-cation. Unlike regular web applets, the se-cure applet enables local saving and upload-ing of data files. The applet is especially
suitable for new users who can learn mostof the features simply by running it on theBluejay website. Downloading the applica-tion version, packed as a JAR (Java archive)file, could be the next step. The applicationcan utilize more system resources, which ishelpful when dealing with large genomes.Both the applet and the application versionsof Bluejay have an important advantage –many other genome browsers are web-based and thus have to communicate with aremote web server for each visual opera-tion. In contrast, the Bluejay browser runson a local Java virtual machine on the user’ssystem and is not subject to communica-tion latency.
Bluejay provides session management,whereby users may return to their previousdata exploration sessions, possibly from adifferent computer environment. Bluejayalso allows users to save visualization re-sults as scalable vector graphics files, whichenables the images to retain their full publi-cation quality irrespective of the scale, for
Fig. 16.20 A fragment of the eukaryotic genome, for example that of Arabidopsisthaliana, displayed in Bluejay.
41316.12 Conclusions and Open Issues
example, preserving finest details in wall-size posters of genomes.
16.12
Conclusions and Open Issues
The analysis and annotation of genomeshas progressed so much over the last tenyears that it is almost time to put this issueto rest. Many tools exist which are capableof handling the task, and their flexibility, asshown in the Bluejay example, is enabling
execution of complex queries and the dis-play the results in many different ways.
The next step is to connect genome infor-mation to gene expression, Proteomics andother large scale life sciences results. Thebetter analysis engines for this kind of ex-periment recognize the value of genomeannotation and connect to the existingknowledge base. The task for the next fewyears will be to fully integrate the entireknowledge space and provide meaningfulvisual representations of the results.

414
1 Gaasterland T., Sensen C.W. (1996) Fullyautomated genome analysis that reflects userneeds and preferences – a detailedintroduction to the MAGPIE systemarchitecture. Biochimie 78, 302–310.
2 Charlebois R.L., Gaasterland T., Ragan M.A.,Doolittle W.F., Sensen C.W. (1996) TheSulfolobus solfataricus P2 genome project.FEBS Letters 389, 88–91.
3 Pearson W.R., Lipman D.J. (1988) Improvedtools for biological sequence comparison.Proc. Natl Acad. Sci. USA 85, 2444–2448.
4 Altschul S.F., Madden T.L., Schäffer A.A.,Zhang J., Zhang Z., Miller W., Lipman D.J.(1997) Gapped BLAST and PSI-BLAST: a newgeneration of protein database searchprograms. Nucleic Acids Res. 25, 3389–3402.
5 Henikoff S., Henikoff J.G., Pietrokovski S.(1999) Blocks+: A non-redundant database ofprotein alignment blocks derived frommultiple compilations. Bioinformatics 15,471–479.
6 Kolakowski L.F. Jr., Leunissen J.A.M., SmithJ.E. (1992) ProSearch: fast searching ofprotein sequences with regular expressionpatterns related to protein structure andfunction. Biotechniques 13, 919–921.
7 Burge C., Karlin S. (1997) Prediction ofcomplete gene structures in human genomicDNA. J. Mol. Biol. 268, 78–94.
8 Salzberg S., Delcher A., Kasif S., White O.(1998) Microbial gene identification usinginterpolated Markov models. Nucleic AcidsRes. 26, 544–548.
9 Borodovsky M., McIninch J. (1993)GeneMark: Parallel Gene Recognition forboth DNA Strands. Comput. Chem. 17,123–133.
10 Cooper A. (1995) About Face: The Essentialsof User Interface Design. IDG Books World-wide, Foster City, CA, USA.
11 Shine J., Dalgarno L. (1974) The 3′-terminalsequence of Escherichia coli 16S ribosomalRNA: complementarity to nonsense tripletsand ribosome binding sites. Proc. Natl Acad.Sci. USA, 71, 1342–1346.
12 Hoare C.A.R. (1962) Quicksort. Comput. J. 5,10–15.
13 Staden R., Beal K.F., Bonfield J.K. (1998) TheStaden Package, 1998. Comput. Methods Mol.Biol. 132, 115–130.
14 Schaffer H.E., Sederoff R.R. (1981) Leastsquares fit of DNA fragment length to gelmobility. Anal. Biochem. 115, 113–122.
15 Gaasterland T., Sczyrba A., Thomas E.,Aytekin-Kurban G., Gordon P., Sensen C.W(2000) MAGPIE/EGRET Annotation of the2.9 Mb Drosophila melanogaster ADH Region.Genome Res. 10, 502–510.
16 Gordon P., Sensen C.W. (1999) Bluejay: ABrowser for Linear Units in Java. Proc. 13thAnnu. Int. Symp. High Performance ComputingSystems and Applications, pp. 183–194.
17 Wilkinson MD, Links M (2002) BioBIOMOBY:an open source biological web services propo-sal. Brief Bioinform. Dec 3(4):331–341.
18 World Wide Web Consortium (W3C),http://www.w3.org.
19 Apache Software Foundation,http://www.apache.org.
20 Loraine AE, Helt GA. (2002) Visualizing thegenome: techniques for presenting humangenome data and annotations. BMCBioinformatics, 3(1):19.
21 Simple API for XML,http://www.saxproject.org.
References
415
Greg Finak, Michael Hallett, Morag Park, and François Pepin
17.1
Introduction
Microarrays have certainly generated a tre-mendous amount of excitement over thepast decade. The ability to interrogate ex-pression levels on a genome-wide scale hasopened up broad new experimental pos-sibilities. The noise and bias seemingly in-herent to gene expression data, the largequantity of data, and the difficulties asso-ciated with interpreting results have neces-sitated improvements in the underlyingbiotechnology, statistical methods, andcomputational tools. Some understandingof each of these areas is necessary for theeffective design and performance of ex-periments involving microarrays. It is hardto believe there are many researchers with,a priori, a deep understanding of so manydiverse fields.
The purpose of this chapter is to providean intuitive description of the major prob-lems and challenges that must be ad-dressed throughout the course of gene ex-pression analyses. Our exposition focuseson existing bioinformatics tools and strate-gies that the reader can explore in more de-tail independently. In lieu of providing a
complete bibliography of related work, wefocus on a few important references we feelare most useful for developing the skillsand computational infrastructure necessaryfor research in this area. With the properbackground, these references should besufficient for the reader to gain a workingknowledge of these frameworks.
We begin by providing a sketch of micro-array technology. Beyond this intuitionhowever, we do not explore the underlyingbiotechnology, construction, or laboratoryprocedures of microarrays – we refer thereader elsewhere [1]. The organization ofthe rest of the chapter follows the progressof a typical microarray project. We discussissues concerning experimental design andexplain the sources of error in experiments.Section 17.2 gives an outline of microarraystandards, commonly used database sys-tems, and general-purpose analysis packag-es. Particularly for large-scale microarrayprojects, these tools form the “backbone” ofthe computational infrastructure. Section17.3 covers many of the fundamental prob-lems and solutions associated with the data-acquisition phase of individual microarrayhybridization and the normalization of thedata. Readers lacking a basic knowledge of
Handbook of Genome Research. Genomics, Proteomics, Metabolomics, Bioinformatics, Ethical and Legal Issues.Edited by Christoph W. SensenCopyright © 2005 WILEY-VCH Verlag GmbH & Co. KGaA, WeinheimISBN: 3-527-31348-6
17Bioinformatics Tools for Gene-expression Studies
Verwendete Mac Distiller 5.0.x Joboptions
Dieser Report wurde automatisch mit Hilfe der Adobe Acrobat Distiller Erweiterung "Distiller Secrets v1.0.5" der IMPRESSED GmbH erstellt. Sie koennen diese Startup-Datei für die Distiller Versionen 4.0.5 und 5.0.x kostenlos unter http://www.impressed.de herunterladen. ALLGEMEIN ---------------------------------------- Dateioptionen: Kompatibilität: PDF 1.3 Für schnelle Web-Anzeige optimieren: Ja Piktogramme einbetten: Ja Seiten automatisch drehen: Nein Seiten von: 1 Seiten bis: Alle Seiten Bund: Links Auflösung: [ 2400 2400 ] dpi Papierformat: [ 481 680 ] Punkt KOMPRIMIERUNG ---------------------------------------- Farbbilder: Downsampling: Nein Komprimieren: Ja Komprimierungsart: ZIP Bitanzahl pro Pixel: 8 Bit Graustufenbilder: Downsampling: Nein Komprimieren: Ja Komprimierungsart: ZIP Bitanzahl pro Pixel: 8 Bit Schwarzweiß-Bilder: Downsampling: Nein Komprimieren: Ja Komprimierungsart: CCITT CCITT-Gruppe: 4 Graustufen glätten: Nein Text und Vektorgrafiken komprimieren: Ja SCHRIFTEN ---------------------------------------- Alle Schriften einbetten: Ja Untergruppen aller eingebetteten Schriften: Nein Wenn Einbetten fehlschlägt: Abbrechen Einbetten: Immer einbetten: [ /Courier-BoldOblique /Helvetica-BoldOblique /Courier /Helvetica-Bold /Times-Bold /Courier-Bold /Helvetica /Times-BoldItalic /Times-Roman /ZapfDingbats /Times-Italic /Helvetica-Oblique /Courier-Oblique /Symbol ] Nie einbetten: [ ] FARBE(N) ---------------------------------------- Farbmanagement: Farbumrechnungsmethode: Farbe nicht ändern Methode: Standard Geräteabhängige Daten: Einstellungen für Überdrucken beibehalten: Ja Unterfarbreduktion und Schwarzaufbau beibehalten: Ja Transferfunktionen: Beibehalten Rastereinstellungen beibehalten: Nein ERWEITERT ---------------------------------------- Optionen: Prolog/Epilog verwenden: Nein PostScript-Datei darf Einstellungen überschreiben: Nein Level 2 copypage-Semantik beibehalten: Ja Portable Job Ticket in PDF-Datei speichern: Ja Illustrator-Überdruckmodus: Ja Farbverläufe zu weichen Nuancen konvertieren: Ja ASCII-Format: Nein Document Structuring Conventions (DSC): DSC-Kommentare verarbeiten: Ja DSC-Warnungen protokollieren: Nein Für EPS-Dateien Seitengröße ändern und Grafiken zentrieren: Ja EPS-Info von DSC beibehalten: Ja OPI-Kommentare beibehalten: Nein Dokumentinfo von DSC beibehalten: Ja ANDERE ---------------------------------------- Distiller-Kern Version: 5000 ZIP-Komprimierung verwenden: Ja Optimierungen deaktivieren: Nein Bildspeicher: 524288 Byte Farbbilder glätten: Nein Graustufenbilder glätten: Nein Bilder (< 257 Farben) in indizierten Farbraum konvertieren: Ja sRGB ICC-Profil: sRGB IEC61966-2.1 ENDE DES REPORTS ---------------------------------------- IMPRESSED GmbH Bahrenfelder Chaussee 49 22761 Hamburg, Germany Tel. +49 40 897189-0 Fax +49 40 897189-71 Email: [email protected] Web: www.impressed.de
Adobe Acrobat Distiller 5.0.x Joboption Datei
<< /ColorSettingsFile () /LockDistillerParams true /DetectBlends true /DoThumbnails true /AntiAliasMonoImages false /MonoImageDownsampleType /Bicubic /GrayImageDownsampleType /Bicubic /MaxSubsetPct 100 /MonoImageFilter /CCITTFaxEncode /ColorImageDownsampleThreshold 1.5 /GrayImageFilter /FlateEncode /ColorConversionStrategy /LeaveColorUnchanged /CalGrayProfile (Dot Gain 20%) /ColorImageResolution 300 /UsePrologue false /MonoImageResolution 1200 /ColorImageDepth 8 /sRGBProfile (sRGB IEC61966-2.1) /PreserveOverprintSettings true /CompatibilityLevel 1.3 /UCRandBGInfo /Preserve /EmitDSCWarnings false /CreateJobTicket true /DownsampleMonoImages false /DownsampleColorImages false /MonoImageDict << /K -1 >> /ColorImageDownsampleType /Bicubic /GrayImageDict << /HSamples [ 2 1 1 2 ] /VSamples [ 2 1 1 2 ] /Blend 1 /QFactor 0.9 >> /CalCMYKProfile (U.S. Web Coated (SWOP) v2) /ParseDSCComments true /PreserveEPSInfo true /MonoImageDepth -1 /AutoFilterGrayImages false /SubsetFonts false /GrayACSImageDict << /HSamples [ 2 1 1 2 ] /VSamples [ 2 1 1 2 ] /Blend 1 /QFactor 0.9 >> /ColorImageFilter /FlateEncode /AutoRotatePages /None /PreserveCopyPage true /EncodeMonoImages true /ASCII85EncodePages false /PreserveOPIComments false /NeverEmbed [ ] /ColorImageDict << /HSamples [ 2 1 1 2 ] /VSamples [ 2 1 1 2 ] /Blend 1 /QFactor 0.9 >> /AntiAliasGrayImages false /GrayImageDepth 8 /CannotEmbedFontPolicy /Error /EndPage -1 /TransferFunctionInfo /Preserve /CalRGBProfile (sRGB IEC61966-2.1) /EncodeColorImages true /EncodeGrayImages true /ColorACSImageDict << /HSamples [ 2 1 1 2 ] /VSamples [ 2 1 1 2 ] /Blend 1 /QFactor 0.9 >> /Optimize true /ParseDSCCommentsForDocInfo true /GrayImageDownsampleThreshold 1.5 /MonoImageDownsampleThreshold 1.5 /AutoPositionEPSFiles true /GrayImageResolution 300 /AutoFilterColorImages false /AlwaysEmbed [ /Courier-BoldOblique /Helvetica-BoldOblique /Courier /Helvetica-Bold /Times-Bold /Courier-Bold /Helvetica /Times-BoldItalic /Times-Roman /ZapfDingbats /Times-Italic /Helvetica-Oblique /Courier-Oblique /Symbol ] /ImageMemory 524288 /OPM 1 /DefaultRenderingIntent /Default /EmbedAllFonts true /StartPage 1 /DownsampleGrayImages false /AntiAliasColorImages false /ConvertImagesToIndexed true /PreserveHalftoneInfo false /CompressPages true /Binding /Left >> setdistillerparams << /PageSize [ 595.276 841.890 ] /HWResolution [ 2400 2400 ] >> setpagedevice
416 17 Bioinformatics Tools for Gene-expression Studies
statistics are, again, referred elsewhere [2].Section 17.4 discusses the fundamentalproblem of reliably finding differentially ex-pressed genes between two or more classes.Sections 17.5, 17.6, and 17.7 cover in detailmany of the common questions, approach-es, and tools used to analyze gene-expres-sion data. Readers who are interested intechniques from statistical machine learn-ing are referred to Hastie et al. [3].
17.1.1
Microarray Technologies
There are many types of microarrays includ-ing DNA and protein arrays. For gene ex-pression studies the most commonly usedtechnology is the DNA microarray. DNAmicroarrays (referred to as simply microar-rays or arrays) are assays for estimating theamount of different species of mRNA tran-scripts present in a sample. The underlyingassumption of this technology is that thenumber of mRNA transcripts present is agood approximation of the level of expres-sion of the corresponding gene. Typically,in a microarray experiment total RNA is ex-tracted from the specimen and isolated. ThemRNA is then reverse transcribed to a formof labeled DNA referred to as a target.
A microarray consists of a solid surface towhich strands of DNA are attached in specif-ic, pre-defined features. Microarrays can con-tain hundreds of thousands of such features.Each strand of DNA is referred to as a probeand consists of either short oligonucleotidesor (full length) cDNA. Millions of copies ofone species of probe are placed in a singlefeature. The ordered nature of the microar-ray enables us to associate a feature with aknown species of mRNA from the specimen.
Under appropriate experimental condi-tions, the targets hybridize to probes on thearray when the target and probe share suffi-cient sequence complementarity. This is re-
ferred to as hybridization. Ideally, probes arechosen so that exactly one target from themRNA of the specimen will hybridize tothat probe and so that the strength of thetarget–probe hybridization is sufficientlystrong. After this hybridization, each loca-tion on the microarray should containprobes that have hybridized with their cor-responding targets and the number of suchprobe–target hybrids should be proportion-al to the level of expression of the gene rep-resented by that probe. Because targets arelabeled (that is, they fluoresce), the intensityof each feature can be measured and the re-sulting value provides an estimate of ex-pression for the associated gene.
Each step in this procedure is extremelyimportant and crucial to the success of anexperiment. Procedures change accordingto the nature and goals of a particular experi-ment [1] and are very dependent on the spe-cific microarray platform in use. The twomain microarray platforms are cDNA mi-croarrays and high-density oligonucleotidemicroarrays (for example, Affymetrix Gene-Chips). We describe each of these briefly.
17.1.1.1
cDNA MicroarraysWith cDNA microarrays, mRNA is reverse-transcribed to complementary DNA(cDNA) and then labeled fluorescently.cDNA microarrays consist of DNA probesrobotically printed on a glass slide in fea-tures (termed spots). Robotic printers havemultiple pins that “spot” the glass slide si-multaneously. This effectively partitions theslide into a set of rectangular grids, eachserviced by one pin. Each such partition isreferred to as a pin group. cDNA microarrayhybridizations are almost always dual-labelhybridizations.
In other words, two cDNA samples are la-beled with different fluorescent dyes. Theseare typically Cy3 (green) and Cy5 (red). For
41717.1 Introduction
example, the two samples might corre-spond to mRNA from healthy tissue andmRNA from a tumor. Both samples are si-multaneously applied to the glass slide. Thedifferentially labeled targets competitivelyhybridize to their corresponding probes onthe array. The intensities of both the redand green channels are read independentlyand a red to green ratio (R/G) is producedfor each probe. The underlying assumptionis that this ratio is proportional to the rela-tive amount of each gene present in the redand green samples.
17.1.1.2
Oligonucleotide MicroarraysThese microarrays use oligonucleotideprobes that are synthesized on a siliconchip by lithography. Samples are washedover the array during the hybridizationstep. Probes are short oligonucleotides oflength 25 bp. Short probes tend to have asmaller hybridization potential with targetswhen compared with the hybridization po-tential of the longer probes used in cDNAarray platforms. To compensate for poorbinding affinity and potential cross-hybrid-ization between probes, Affymetrix uses aso-called probe pair. The first element ofthis probe pair is the perfect match oligonu-cleotide that corresponds to a complemen-tary 25-mer in the exon of a gene. The sec-ond element is the mismatch oligonucleo-tide. This is identical to the perfect matchprobe with the exception of the middle(13th) base. Intuitively, the purpose of themismatch probe is to control experimentalvariability due to nonspecific binding ofmRNA from other parts of the genome.Each feature (termed a cell) of an oligonu-cleotide array contains millions of copies ofa single species of probe. Whereas it iscommon in most cDNA microarray plat-forms to represent each gene by one probe,oligonucleotide microarrays use between
11 and 16 probes to represent each gene(Fig. 17.1). (Therefore, a set of 11 to 16 cellsis dedicated to one specific gene.) Last,whereas cDNA microarray hybridizationsare dual-labeled, some oligonucleotide ar-rays are single-labeled. In other words, asingle sample is hybridized against one oli-gonucleotide array at a time and the inten-sity of fluorescence of the probes is an abso-lute measure of the amount of a targetpresent.
There are several other microarray plat-forms, for example that of Agilent Technol-ogies (Palo Alto, CA, USA), which combineaspects of cDNA and oligonucleotide ar-rays. In the Agilent system oligonucleotidesare spotted on a glass slide by ink jet tech-nology but remain dual-label systems. Oc-casionally the software and analysis strate-gies discussed throughout this chapter canbe used in these alternative settings with lit-tle or no modification. One should, howev-er, be extremely careful and not assume thisto be true without experimental evidence.
17.1.2
Objectives and Experimental Design
The number of different applications of mi-croarrays is growing rapidly. Gene profilingvia microarrays involves determining thefunction of genes under specific conditions.Similarly, microarrays have enabled ge-nome-wide class comparisons. Several stud-ies in the literature have identified genesthat are consistently differentially expressedbetween two or more classes. There are sev-eral classic examples for various types ofcancer in which comparison is betweennormal versus tumor versus metastaticspecimens. Such approaches hope to findthe complete set of genes that differentiatebetween cellular states and shed light onthe underlying differences between theseclasses at the molecular level. Class predic-
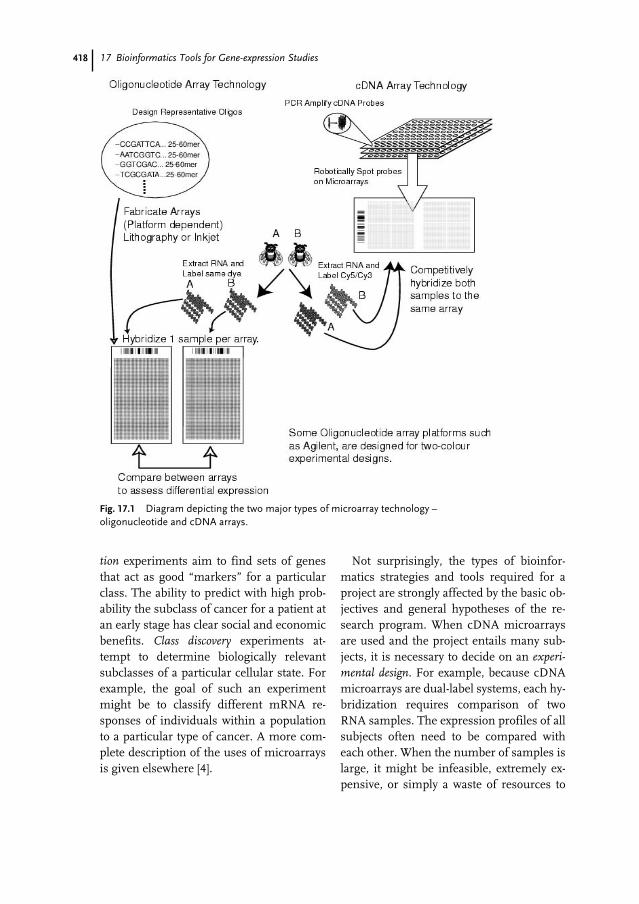
418 17 Bioinformatics Tools for Gene-expression Studies
tion experiments aim to find sets of genesthat act as good “markers” for a particularclass. The ability to predict with high prob-ability the subclass of cancer for a patient atan early stage has clear social and economicbenefits. Class discovery experiments at-tempt to determine biologically relevantsubclasses of a particular cellular state. Forexample, the goal of such an experimentmight be to classify different mRNA re-sponses of individuals within a populationto a particular type of cancer. A more com-plete description of the uses of microarraysis given elsewhere [4].
Not surprisingly, the types of bioinfor-matics strategies and tools required for aproject are strongly affected by the basic ob-jectives and general hypotheses of the re-search program. When cDNA microarraysare used and the project entails many sub-jects, it is necessary to decide on an experi-mental design. For example, because cDNAmicroarrays are dual-label systems, each hy-bridization requires comparison of twoRNA samples. The expression profiles of allsubjects often need to be compared witheach other. When the number of samples islarge, it might be infeasible, extremely ex-pensive, or simply a waste of resources to
Fig. 17.1 Diagram depicting the two major types of microarray technology –oligonucleotide and cDNA arrays.
41917.2 Background Knowledge and Tools
perform hybridizations comparing everypair of subjects directly. Several alternativedesigns have been proposed in the litera-ture including the reference design, the bal-anced block design, and the loop design. Thistopic is discussed in more detail elsewhere[5].
The most challenging design phase deci-sions are due to the sources of variation.These include but are not limited to:1. intra-gene variation (differences between
intensities of probes representing thesame gene);
2. intra-array variation (systematic differ-ences between intensities of probes rep-resenting different genes on the microar-ray);
3. inter-sample variation (different expres-sion levels for a gene over different RNAsamples from the same specimen);
4. inter-specimen variation (different ex-pression levels for a gene over differentspecimens from the same subject); and
5. inter-subject (different expression levelsfor a gene among subjects within thesame class).
Sources 1–3 are usually considered differ-ent forms of technical variability and can beaddressed by performing additional hybrid-izations, consistent laboratory procedures,and via the normalization tools describedbelow. Several strategies are used to esti-mate the number of replicates. One particu-larly useful tool is the S-PLUS implementa-tion [6]. Further information about thesestatistical frameworks is available [7].Sources 4 and 5 are different forms of bio-logical variability and are considered moredifficult to address. We note that at poten-tially every step of a microarray experiment(from the manufacture of the array itselfthrough to the image analysis necessary toextract intensities) bias is introduced intoour measurements. For example, in cDNA
arrays bias arises because of differencesbetween physical properties such as the rateof incorporation and rate of decay of thedye. Tools and strategies to address issuesof bias are discussed below.
17.2
Background Knowledge and Tools
This section describes the basic computa-tional infrastructure and tools needed formicroarray experiments.
17.2.1
Standards
The multitude of different microarray plat-forms has given rise to a series of inter-op-erability problems. The basic question hereis how to describe gene expression data sothat researchers (and software) can shareand compare this information seamlessly.A step in the right direction is the minimuminformation about a microarray experiment(MIAME) standard [8]. The purpose of MI-AME is to state explicitly all relevant infor-mation required to unambiguously defineand reproduce a microarray experiment.Several journals are now requiring that mi-croarray data be made available in this stan-dard before articles presenting the data areallowed to appear. MIAME is built by themicroarray gene expression data (MGED,http://www.mged.org) society and is basedon their microarray ontology.
Although MIAME describes the informa-tion which needs to be documented, it doesnot standardize the format of this descrip-tion. The microarray gene expression markuplanguage (MAGE-ML) [9] addresses thisneed. MAGE-ML is based on XML and is astandard way of representing informationrelated to microarrays. For example, if de-tails regarding an expression experiment
420 17 Bioinformatics Tools for Gene-expression Studies
are expressed in MAGE-ML, they can be di-rectly imported into databases such as Ar-rayExpress (EBI), GEO (NCBI), and yMGV.
The microarray gene expression object model(MAGE-OM) provides an object model rep-resentation of microarray expression datathat facilitates the exchange of microarrayinformation between different software sys-tems and organizations. Objects can betranslated automatically to and from theMAGE-ML data format. A list of microarrayrepositories can be found at http://www.nslij-genetics.org/.
17.2.2
Microarray Data Management Systems
Because of the size and complexity of mi-croarray data, they are typically stored in arelational database. Commercial databasescan be quite expensive but for many pro-jects open source efforts such as MySQLand postgresql suffice. Projects such asBioPerl (http://www.bioperl.org), RmySQL,and general languages such as Python andPerl can be used to transfer data betweenthe database and analysis software.
There are several publicly available andMIAME-compliant databases tailored formicroarrays including bioarray software envi-ronment (BASE) [10]. In addition to a rela-tional database for microarray data and aweb-based graphical user interface that canbe installed locally, BASE includes a labora-tory information management system (LIMS).LIMS enable individual hybridizations to betracked through all phases from samplepreparation to analysis of data. When a pro-ject involves many hybridizations and manyindividuals, LIMS become invaluable. Theweb site http://genome-www5.stanford.edu/resources/regtech.shtml maintains an up-to-date list of additional efforts in this direc-tion.
17.2.3
Statistical and General Analysis Software
A cornerstone to any microarray project is aset of tools to perform general statisticalanalyses (for example, t-tests, filtering) andmore general microarray analyses (for ex-ample, clustering, time series analyses).Many open source systems address theseneeds. We highly recommend the statisticalprogramming language R [11] (http://cran.r-project.org), an open source version of thecommercial package S-Plus. Although thereis a substantial learning overhead, fluencyin R gives researchers a high-quality and ro-bust set of statistical and graphical packagesthat can be tailored to specific needs, and,moreover, the Bioconductor project is de-veloped in R. The mandate of the project isto provide a complete toolbox for analysisand comprehension of genome data. Theproject encourages users to build upon ex-isting modules and make the enhancedfunctionality available to the community.Currently, release 1.5 of BioConductor con-tains some 96 packages addressing issuesfrom microarray preprocessing and nor-malization for several different microarrayplatforms to techniques for finding diffe-rentially expressed genes, visualization clas-sification, and class prediction. Subprojectsaim to produce graphical user interfaces forvarious packages within R and Bioconduc-tor.
For researchers who do not want to investthe time learning R or who do not need theflexibility that it offers, there are severalgeneral-purpose microarray analysis pack-ages with well-developed graphical userinterfaces. For example, open source pack-ages such as ArrayViewer (http://www.tigr.org/software/), TM4 (http://www.tigr.org/software/tm4/), and MAExplorer (http://maexplorer.sourceforge.net/) provide func-
42117.3 Preprocessing
tionality for normalization/clustering, andsupport tailored database access. It is be-yond the scope of this chapter to cover allthe commercial packages available. It is im-portant to note, however, that there is muchvariance in the quality and completeness offunctionality offered by these systems, andnot all systems provide flexible methods forcommunicating with a database system.This is a particularly salient point if micro-array projects involve many hybridizationsand other types of data beyond gene-expres-sion measurements.
17.3
Preprocessing
This section describes the “low-level” tech-niques and software associated with thedata-acquisition phase of a microarray ex-periment. The first step – quality control –is arguably the most important aspect of asuccessful microarray experiment. Thereare three principal areas – image quality,spot quality, and array quality. The next stepis to compute a summary of the expressionlevel of a gene when multiple probes areused. Last, arrays must be normalized to re-move bias and to enable inter-array compar-ison.
17.3.1
Image, Spot, and Array Quality
The quality of the image is judged by thepresence/absence of many sources of noiseincluding imaging artifacts, dust, scratches,or misprinted features on the original array.Given the importance of quality control,any microarray analysis should begin withvisual inspection of the scanned image toassess overall quality. Most statistical pack-ages provide routines to visualize log trans-formed expression values.
The evaluation of spot quality involvesseveral steps including (1) gridding, (2) seg-mentation, (3) feature extraction, and (4)background correction. Gridding involves thelocalization of features in the image. Manycommercial image-analysis packages auto-mate the process by locating features on thearray provided by the manufacturer thatspecify the position, diameter, and distancebetween the features on the array (thismakes the software microarray platform-de-pendent). Segmentation involves discern-ing background regions from foregroundregions. Feature extraction is the process ofsummarizing the pixel intensities for eachfeature on the array and converting theseintensities to measures of RNA abundance.This process usually considers a ratio offoreground to (local) background inten-sities. Depending on the platform, themethodology of background correction varies.
Array-level quality control is aimed atidentifying arrays that have hybridization,labeling, manufacturing, or scanning prob-lems. The final estimates of quality arelargely a function of the number of prob-lems identified with the array. Some plat-forms, however, for example Affymetrix,contain spiked controls with known levelsof concentration providing an additionalmeans of judging quality.
Many packages are available for perform-ing feature extraction from cDNA arrays;the choice of software can significantly af-fect results [12]. A well-maintained list oftools is located at http://www.genomic-shome.com. With oligonucleotide arrayssuch as the Affymetrix GeneChip platform,image analysis is performed by AffymetrixMicroArray Suite (MAS) software. Increas-ing efforts outside Affymetrix are beingmade to address these problems [13] andseveral packages are available in R/Bio-conductor. Agilent’s software (http://www.
422 17 Bioinformatics Tools for Gene-expression Studies
chem.agilent.com) is quite complete withsolid outlier detection schemes.
17.3.2
Gene Level Summaries
When multiple probes are used to representthe same gene, it is necessary to convert theindividual intensity measurements into oneexpression level for the gene. This is espe-cially true for the Affymetrix GeneChip plat-form. The expression summary for Gene-Chip arrays contained in the MAS packagehas evolved over recent years. Several sum-mary measures of expression have beenproposed including average difference, Tu-key biweight, model based expression index(MBEI), and robust multichip average(RMA) [13]. MBEI (available in dChip, [14])uses both perfect match and mismatchprobes, and models a baseline probe pair re-sponse with a multiplicative increase be-cause of the mismatch probes, plus a multi-plicative increase due to the perfect matchprobes, plus a random error term. RMA is acombination of normalization techniquesand a model that accounts for inter-probevariability, background, and random error.GCRMA improves upon RMA by correctingfor hybridization differences caused byprobe GC content. This improves perfor-mance for probes with low intensity levels[15].
17.3.3
Normalization
Normalization of microarrays involves cor-recting for different sources of systematicbias. These effects can interfere with andmask the biological variability that one isinterested in measuring. Normalization isalso aimed at making hybridizations “com-parable”. The basic assumption behind allnormalization techniques is that most of
the genes on a microarray will not show anydifferential expression.
A principle analogous with Occam’s ra-zor should be applied when normalizingmicroarray data. It is, in general, better tounder-normalize than to over-normalizethe data. If an array is difficult to normalize,it might be best to verify that the experi-ment was performed properly, and repeat itif necessary. Including a bad array in ananalysis can spoil the whole batch if one isnot careful.
Often, a linear transformation will be in-sufficient, and the data will show non-lineareffects. These non-linear effects might bebecause of differences in the quantum effi-ciency of the fluors, differential dye incor-poration, print tip effects, or plate effects.Dye effects are typified by stronger fluores-cence in the green (Cy3) channel, especiallyvisible at the low intensity end in an MAplot (intensity vs. log ratio).
Such non-linearity can be corrected by avariety of techniques, including lowess (lo-cally weighted sum of squares) regressionof the log ratio on the average intensity, andvariants thereof. For an excellent in-depthtreatment of normalization for two-colormicroarrays, we recommend Yang et al. [16].
Spatial bias is another source of systemat-ic variability that can result from uneven hy-bridization or washing. Such effects areusually visible in the raw image file. Somenormalization packages, for exampleSNOMAD (available online) and YASMA(available in R), correct for spatial biases byfitting a loess surface to the average inten-sity, or log ratios, over the row and columncoordinates of the array [17, 18].
To deal with heteroscedastic variance, anovel generalized log transformation wasdeveloped concurrently by the groups ofRocke and Huber. The transformation iscalibrated from the data to produce expres-sion measures with constant variance
42317.4 Class Comparison – Differential Expression
across the whole range of fluorescence in-tensities. The algorithm is implemented inthe package VSN for the Bioconductor pro-ject [19].
To make arrays comparable, some formof scaling between them might sometimesbe required. The median absolute deviation(MAD) scaling outlined in Yang et al. is themost commonly applied. This scaling en-sures that the distribution of log-ratios onall arrays has the same interquartile range[16].
GeneChip arrays are subject to slightlydifferent consideration when it comes tonormalization. Currently, the leading tech-nique is RMA. RMA is a series of differentsteps and goes beyond gene level summar-ies. It also involves background estimationand a fit of an additive model on the logscale that accounts for probe specific ef-fects.
17.4
Class Comparison – Differential Expression
Perhaps the simplest type of microarray ex-periment is to search for sets of genes thatare differentially expressed between two ormore predefined classes. For example, wemight be interested in finding all genes thatare significantly over or under-expressed intumor tissue compared with normal tissue.Identification of differently expressed geneswith known function can lead to insightinto the biological differences between theclasses. Alternatively, this method mightenable us to identify differently expressedgenes for further study.
Initial strategies for detecting differentlyexpressed genes between two classes arestraightforward (Fig. 17.2). Essentially theyinvolve two-sample comparison of the dif-ferences between mean log expression ofthe classes. This is nothing more than a t-
test or its nonparametric analogs. Whenmore than two classes are involved, F-statis-tics and nonparametric analogs can be ap-plied. Almost all gene expression and statis-tics software contain routines for perform-ing these analyses.
At least three problems are associatedwith such simple tests. First, within-classvariation of expression and the magnitudeof different expression tend to be gene spe-cific. This necessitates the use of methodsthat weigh inter-class variation againstintra-class variation. Second, if we decideon a P-value of α and test n genes in thismanner, we expect, under the null hypothe-sis that no genes are differently expressed,α×n false positives. For α = 0.01 and n =10,000, this gives 100 false positives. Be-cause it is common for these sets of distin-guished genes to be further interrogated byuse of (costly) low-throughput techniques,for example Southern blotting and RT-PCR,it is important to minimize the number offalse positives. Third, such univariate gene-by-gene tests of different expression ignoreimportant underlying dependencies betweengene expression levels. Because all genesare measured by the same device (and aretherefore subject to the same sources of er-ror) and the genes are related by complexunderlying biological networks (and there-fore expression levels are not independent),it makes sense to apply joint estimationtechniques.
Standard statistical approaches to ad-dressing these concerns include Bonferronior Fisher’s LSD adjustments to P-value cal-culations. More advanced sampling strate-gies have been proposed [20] although suchstrategies require a relatively large numberof samples. The ArrayAnalyzer software (inS-PLUS) provides an alternative strategycalled local pooled error (this algorithm isalso available in R). The intuition is to poolvariance estimates for genes with similar
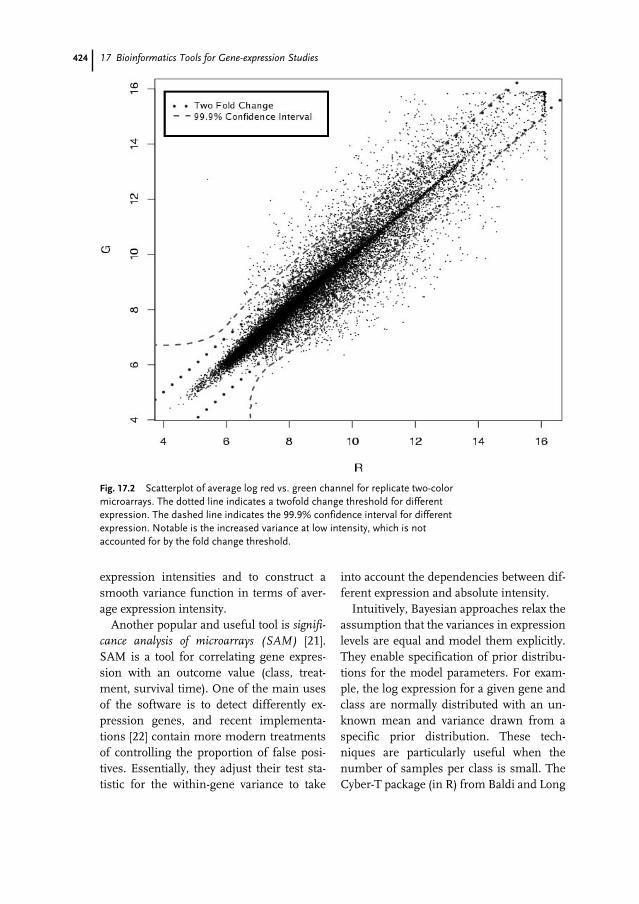
424 17 Bioinformatics Tools for Gene-expression Studies
expression intensities and to construct asmooth variance function in terms of aver-age expression intensity.
Another popular and useful tool is signifi-cance analysis of microarrays (SAM) [21].SAM is a tool for correlating gene expres-sion with an outcome value (class, treat-ment, survival time). One of the main usesof the software is to detect differently ex-pression genes, and recent implementa-tions [22] contain more modern treatmentsof controlling the proportion of false posi-tives. Essentially, they adjust their test sta-tistic for the within-gene variance to take
into account the dependencies between dif-ferent expression and absolute intensity.
Intuitively, Bayesian approaches relax theassumption that the variances in expressionlevels are equal and model them explicitly.They enable specification of prior distribu-tions for the model parameters. For exam-ple, the log expression for a given gene andclass are normally distributed with an un-known mean and variance drawn from aspecific prior distribution. These tech-niques are particularly useful when thenumber of samples per class is small. TheCyber-T package (in R) from Baldi and Long
Fig. 17.2 Scatterplot of average log red vs. green channel for replicate two-colormicroarrays. The dotted line indicates a twofold change threshold for differentexpression. The dashed line indicates the 99.9% confidence interval for differentexpression. Notable is the increased variance at low intensity, which is notaccounted for by the fold change threshold.
42517.5 Class Prediction
[23] provides an implementation of thisstrategy that enables users to provide abroad prior distribution for the mean of ex-pression for genes. Within-class variabilityis estimated as a weighted combination ofthe within-class variability of the distin-guished genes and the estimated within-class variability of genes with similar ex-pression levels.
Using an empirical Bayes approach,Efron [24] present a framework that esti-mates the probability that a gene is differ-ently expressed whilst avoiding the need tospecify distributions on the parameters. Es-sentially, means and variances are deter-mined empirically as a mixture of two dis-tributions; the first models differently ex-pressed genes and the second models non-differently expressed genes. The EBarrays(in R) empirical Bayes approach [25] sharesmany similarities to the Efron [24] system.Smyth et al. developed a hierarchy-basedmodel called linear models for microarrayanalysis (Limma) (in Bioconductor) for anarbitrary number of samples [26, 27].
17.5
Class Prediction
Class prediction methods in microarrayanalysis are aimed at discovering subsets ofgenes that can best distinguish betweentwo or more classes of sample. These tech-niques have been widely applied to discrim-inate between different classes of leukemiaor between tumor and normal breast tissue,and for prognostic prediction. A wide varie-ty of statistical techniques is available forclass prediction, including LDA (linear dis-criminant analysis), weighted voting, near-est-neighbor classifiers, support vector ma-chines, neural nets, and Bayesian methods.At the center of all of these methods is theissue of feature selection. The goal is to se-
lect a subset of features (genes) that bestdistinguish between known classes and pre-dict well new, unseen samples.
Numerous prediction methods are avail-able. Class prediction methods generally re-quire some form of pre-selection of genesto limit the noise present in microarraydata. The usual approach is to select geneswith different expression between the class-es being compared. Linear and quadraticdiscriminant analysis (LDA and QDA) arewell-known classification methods [28].LDA and QDA can take into account corre-lation between the genes, whereas diagonallinear or quadratic discriminant analysis as-sume independence.
A well-known variant of diagonal lineardiscriminant analysis is Golub’s weightedvoting method, a restricted form of a naïveBayes classifier [29]. This method calculatesthe correlation of each gene vector with an“ideal” expression profile between twoclasses of sample. The correlation for agene is defined as the difference betweenthe mean expression of each class, dividedby the sum of the standard deviations foreach class. Permutation testing can identifygenes with statistically significant correla-tion. The top n significantly correlated (andanti-correlated) genes are selected for use inthe predictor. Classification is performedon unseen samples by having each genecast a vote according to a discriminant func-tion. The sum of the votes for a sample willbe either positive or negative, indicatingthat the sample belongs to one class or theother.
As with support vector machines (SVM),a common technique is to perform a di-mensionality reduction. This reduces thevector of expression values for a sample to asingle scalar through a weighted combina-tion of the elements. The differencesbetween methods lie in how those weightsare calculated. In each case, the weights are
426 17 Bioinformatics Tools for Gene-expression Studies
selected to maximize or minimize some tar-get function. SVM use kernel functions thatreduce the sample vector into a simpler ker-nel. The algorithm then finds a hyperplanethat separates the classes and maximizesthe distance between the instances and thehyperplane.
Nearest neighbor classification requiresone to select a distance metric to measurethe similarity of expression profiles. Thechoice of distance metric can have a dramat-ic impact on the results of nearest neighbor.Correlation or Euclidean distances are mostcommonly employed. The k-nearest neigh-bors method calculates the distance fromthe expression profile to be classified to eve-ry sample of known class. The k nearest pro-files are selected and the unknown sampleis classified to the majority vote.
PAM (prediction analysis for microar-rays) is a variant of the nearest centroidmethod. Nearest centroids classifies un-known samples by their distance from thecentroids of samples in known classes.PAM modifies this methodology by calcu-lating “shrunken” centroids that give higherweight to genes with low variance within aclass. For further details, we recommendTibshirani et al. [30].
The question of prediction error arises inany classification situation. In microarrayanalysis there are often insufficient samplesto furnish an explicit training and test data-set. To assess the accuracy of a classifierthat has been trained on the entire dataset,the classic methods of cross validation orbootstrapping can be applied. Both involveseparation of the data into training and test-ing sets. A new classifier is trained on thetraining data and tested on the testing data.Because the classifier has not seen the test-ing data, this is an unbiased test of its abilityto classify unknown data. Bootstrap estima-tion of prediction error involves samplingdata with replacement from the original
data set and performing feature selectionand training on that sampled data. Thisclassifier is used to predict the class of thedata not present in the training set for thatiteration. This procedure is repeated formany iterations and an overall predictionerror can be estimated.
Most of these algorithms can be found inadd-on packages for R and in most softwarepackages.
17.6
Class Discovery
17.6.1
Clustering Algorithms
It is often informative to try to discoverunderlying, unknown classes in microarraydata. For example one may want to searchfor classes of cancer with a particularly inva-sive phenotype. Several methods are usedfor this purpose; the most popular tech-niques are possibly k-means clustering,hierarchical clustering, self-organizingmaps (SOM), and principal componentanalysis (PCA). A good review of these tech-niques can be found elsewhere [31].
The goal of clustering is to organize simi-lar sample data together. Microarray data istypically clustered in any of two dimen-sions. Either the gene or the array dimen-sion can be clustered according to somemeasure of similarity. Clustering can beperformed independently on both the ar-rays and the genes, enabling one to see bothgenes with similar expression profilesacross arrays, and arrays that have underly-ing similarities across genes (Fig. 17.3).
Clustering on both genes and arrays si-multaneously can sometimes show caseswhere a subset of genes have similar behav-ior in a subset of the arrays. The bicluster-ing algorithms introduced by Cheng and
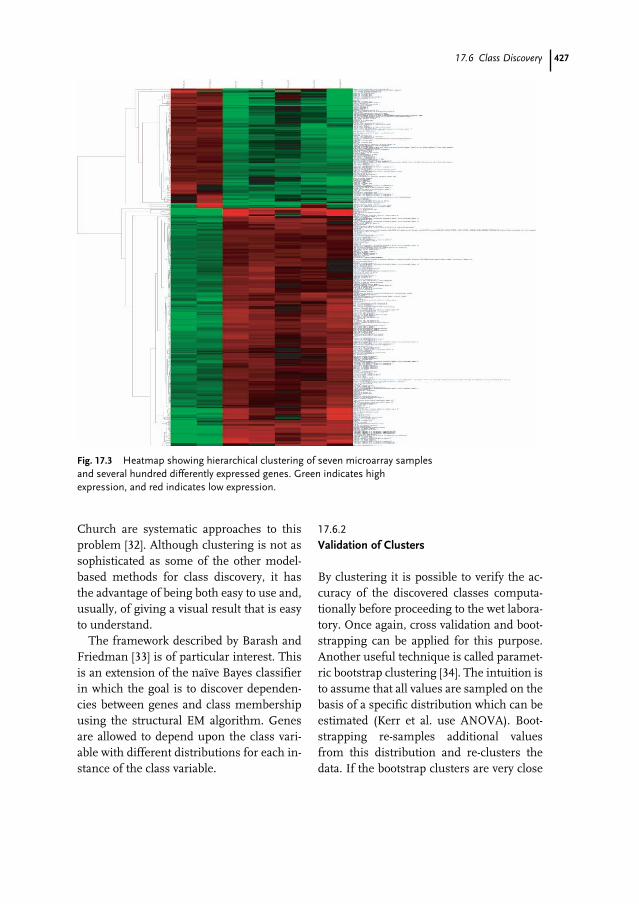
42717.6 Class Discovery
Church are systematic approaches to thisproblem [32]. Although clustering is not assophisticated as some of the other model-based methods for class discovery, it hasthe advantage of being both easy to use and,usually, of giving a visual result that is easyto understand.
The framework described by Barash andFriedman [33] is of particular interest. Thisis an extension of the naïve Bayes classifierin which the goal is to discover dependen-cies between genes and class membershipusing the structural EM algorithm. Genesare allowed to depend upon the class vari-able with different distributions for each in-stance of the class variable.
17.6.2
Validation of Clusters
By clustering it is possible to verify the ac-curacy of the discovered classes computa-tionally before proceeding to the wet labora-tory. Once again, cross validation and boot-strapping can be applied for this purpose.Another useful technique is called paramet-ric bootstrap clustering [34]. The intuition isto assume that all values are sampled on thebasis of a specific distribution which can beestimated (Kerr et al. use ANOVA). Boot-strapping re-samples additional valuesfrom this distribution and re-clusters thedata. If the bootstrap clusters are very close
Fig. 17.3 Heatmap showing hierarchical clustering of seven microarray samplesand several hundred differently expressed genes. Green indicates highexpression, and red indicates low expression.
428 17 Bioinformatics Tools for Gene-expression Studies
to the original cluster, this might indicatethe cluster is stable.
17.7
Searching for Meaning
It commonly occurs in gene-expression ex-periments that our analysis produces a setof “distinguished genes”. This set might,for example, represent a list of differentlyexpressed genes between two classes, or alist of genes found to be co-expressed overmany experimental conditions. Irrespectiveof the origins of such a set, we are ofteninterested in determining possible relation-ships between its members. The hope, ofcourse, is that there is some underlying pat-tern or classification that leads to biologicalinsight into why the genes in this particularset are in fact differently expressed or showco-expression. There are now several toolsfor exploring such questions.
The first such approach involves “map-ping” the distinguished set of genes on tothe gene ontology (GO). The mandate of theGO project [35] is to enumerate all biologi-cal objects and the relationships amongthese objects. These categories are recur-sively refined into more specific compo-nents, processes, and functions. Each geneis mapped on to one or more categories de-pending on the specific level of knowledgeabout the particular gene. Software such asOntoMiner [36] and GoMiner [37] enable us-ers to map sets of distinguished genes ontothis hierarchy in a graphical manner. At thevisual level, the user can determine if somecategory has a surprising number of genesmapped to it. These applications also pro-vide routines for estimating the significanceof the over-representation (or, under-repre-sentation) of categories.
Although GO continues to expand its on-tology into new domains and organisms,
the main disadvantage of such approachesis its incompleteness in respect of some bi-ological domains and for some organisms.It is common that the list of genes map tovery broad, generic categories that lead tolittle insight. When genes from some or-ganisms are not contained in GO or are cat-egorized in very broad terms, the user mustrely on sequence similarity (for example,BLAST) of these genes to better classifythem.
In a manner similar to the use of GO, asecond approach maps distinguished setsof genes to metabolic pathways [38]. For or-ganisms like yeast, for which there are well-developed databases of metabolic networks,and signaing pathway such tools can workquite well. Occasionally one can readily seethat specific pathways tend to contain manymember enzymes that are differently ex-pressed over one or more mRNA expres-sion experiments. This might lead to morespecific hypotheses regarding the signifi-cance of the distinguished set of genes.
Several tools for exploring mRNA expres-sion data with known protein–DNA andprotein–protein interaction databases havenow appeared in the literature. Cytoscape[39] is currently one of the better knowntools. The underlying assumption is thatprotein expression levels are well correlatedwith mRNA expression levels; the intuitionis to map expression data on to the proteininteraction network. This approach canyield important insights into the proteincomplexes perturbed in a given experimentand establish functional roles for the distin-guished genes.
When co-regulation of a set of distin-guished genes is suspected, because of pat-terns of co-expression of the genes, severaltools can be used to identify common mo-tifs in the regulatory regions of these genes.These common motifs presumably corre-spond to binding sites of transcription fac-
42917.7 Searching for Meaning
tors regulating the genes. Finding suchcommon motifs can lend credence to thehypothesis of a biological role for the clus-ter, as opposed to members in a commoncluster by chance. Several tools can be usedto explore such questions, including IN-CLUSive [40]. The framework of the proce-dure introduced by Segal et al. [41] com-bines the search for transcription factorbinding sites with the construction of clus-ters via gene expression data in a Bayesiansetting. In a series of papers these authorsprogressively develop a framework that in-tegrates many (heterogeneous) types of dataincluding mRNA expression data, bindingsite motifs, cell-cycle information and so-
called “ChIP on Chip” data via a Bayesiannetwork. Their results for yeast suggest thatthis approach is powerful and the coherentstatistical framework enables further typesof data to be incorporated easily. The down-side of such techniques, however, is thatthey are somewhat unproven for higher-or-der Eukaryotic organisms and there is ageneral lack of tools available for non-ex-perts. Although there are general-purposetools for Bayesian networks, these tools arestill somewhat inaccessible to researcherswithout explicit knowledge in this area.Efforts such as BIAS (http://www.mcb.mcgill.ca/~bias) [42] promise to offer opensource tools soon.
430
1 Schena M (2002) Microarray analysis. JohnWiley and Sons, New Jersey
2 Wasserman LA (2004) All of Statistics.Springer, New York
3 Hastie T, Tibshirani R, Friedman J (2003) TheElements of Statistical Learning. Springer,New York
4 Kohane IS, Kho A, Butte AJ (2002)Microarrays for Integrative Genomics(Computational Molecular Biology). MITPress, London
5 Yang YH, Speed T (2003) Design and analysisof comparative microarray experiments. In:Speed TP (Ed) Statistical Analysis of GeneExpression Microarray Data. Chapman andHall/RCR, pp. 35–92
6 Pan W, Lin J, Le CT (2002) How manyreplicates of arrays are required to detect geneexpression changes in microarrayexperiments? A mixture model approach.Genome Biol 3(5):1–10
7 Yang MCK, Yang JJ, McIndoe RA, She JX(2003) Microarray experimental design: powerand sample size considerations. PhysiolGenomics 16(1):24–28
8 Brazma A, Hingamp P, Quackenbush J,Sherlock G, Spellman P, Stoeckert C, Aach J,Ansorge W, Ball CA, Causton HC,Gaasterland T, Glenisson P, Holstege FC,Kim IF, Markowitz V, Matese JC, ParkinsonH, Robinson A , Sarkans U, Schulze-KremerS, Stewart J, Taylor R, Vilo J, Vingron M(2001) Minimum information about amicroarray experiment (MIAME)-towardstandards for microarray data. Nat Genet29(4):365–371
9 Spellman PT, Miller M, Stewart J, Troup C,Sarkans U, Chervitz S, Bernhart D, SherlockG, Ball C, Lepage M, Swiatek M, Marks WL,
Goncalves J, Markel S, Iordan D, ShojatalabM, Pizarro A, White J, Hubley R, Deutsch E,Senger M, Aronow BJ, Robinson A, BassettD, Stoeckert CJ, Brazma A (2002) Design andimplementation of microarray geneexpression markup language (MAGE-ML).Genome Biol 3(9):1-0046.9
10 Saal LH, Troein C, Vallon-Christersson J,Gruvberger S, Borg A, Peterson C (2002)BioArray Software Environment (BASE): aplatform for comprehensive managementand analysis of microarray data. Genome Biol15:3(8)
11 Ihaka R, Gentleman R (1996) R: A languagefor data analysis and graphics. J ComputGraph Stat 5(3):299–314
12 Kamberova G, Shah S (2002) DNA ArrayImage Analysis: Nuts and Bolts. IndependentPublishers
13 Irizarry, RA, Hobbs, B, Collin, F, Beazer-Barclay, YD, Antonellis, KJ, Scherf, U, Speed,TP (2003) Exploration, normalization, andsummaries of high density oligonucleotidearray probe level data. Biostatistics.4(2):249–264
14 Li C, Wong WH (2001) Model-based analysisof oligonucleotide arrays: expression indexcomputation and outlier detection. Proc NatlAcad Sci USA. 98(1):31–36
15 Wu Z, Irizarry RA (2004) Stochastic modelsinspired by hybridization theory for shortoligonucleotide arrays, In: Gusfield D,Bourne P, Istrail S, Pevzner P, Waterman M(Eds) 8th Annu Int Conf ComputationalMolecular Biology (RECOMB ’04), pp 98–106
16 Yang YH, Dudoit S, Luu P, Lin DM, Peng V,Ngai J, Speed TP (2002) Normalization forcDNA microarray data: a robust compositemethod addressing single and multiple slide
References
431References
systematic variation. Nucleic Acids Res.30(4):e15
17 Colantuoni C, Henry G, Zeger S, Pevsner J(2002) SNOMAD (Standardization andNOrmalization of MicroArray Data): web-accessible gene expression data analysis.Bioinformatics 18(11):1540–1541.
18 Wernisch L, Kendall SL, Soneji S, WietzorrekA, Parish T, Hinds J, Butcher PD, Stoker NG.(2003) Analysis of whole-genome microarrayreplicates using mixed models.Bioinformatics 19(1):53–61
19 Huber W, von Heydebreck A, Sultmann H,Poustka A, Vingron M (2002) Variancestabilization applied to microarray datacalibration and to the quantification ofdifferential expression. Bioinformatics 18Suppl 1:S96–S104
20 Dudoit S, Speed TP (2000) A score test for thelinkage analysis of qualitative andquantitative traits based on identity bydescent data from sib-pairs. Biostatistics1(1):1–26
21 Tusher VG, Tibshirani R, Chu G (2001)Significance analysis of microarrays appliedto the ionizing radiation response. Proc NatlAcad Sci USA. 24;98(9):5116–5121
22 Storey JC, Tibshirani, R (2003) SAMthresholding and false discovery rates fordetecting differential gene expression in DNAmicroarrays. In: Parmigiani G, Garrett ES,Irizarry RA, Zeger SL (Eds) The Analysis ofGene Expression Data, Springer, New York,NY, pp 272–290
23 Baldi P, Long AD (2001) A Bayesianframework for the analysis of microarrayexpression data: regularized t-test andstatistical inferences of gene changes.Bioinformatics 17:509–519
24 Efron B (2003) Robbins, empirical Bayes andmicroarrays. Ann Stat 31:366–378
25 Newton MA, Kendziorski CM, Parametricempirical Bayes methods for microarrays. In:Parmigiani G, Garrett ES, Irizarry RA, ZegerSL (Eds) The Analysis of Gene ExpressionData, Springer, New York, NY, pp 254–271
26 Smyth GK (2004) Linear models andempirical Bayes methods for assessingdifferential expression in microarrayexperiments. Stat Appl Genet Mol Biol3(1):Article 3
27 Lönnstedt I, Speed TP (2002) Replicatedmicroarray data. Stat Sinica 12:31–46
28 Hastie T, Tibshirani, R, Friedman J (2001)Linear methods for classification. In: TheElements of Statistical Learning. Springer,New York, NY, pp 79–114
29 Golub TR, Slonim DK, Tamayo P, Huard C,Gaasenbeek M, Mesirov JP, Coller H, LohML, Downing JR, Caligiuri MA, BloomfieldCD, Lander ES (1999) Molecular classificationof cancer: class discovery and class predictionby gene expression monitoring. Science286(5439):531–537
30 R, Hastie T, Narasimhan B, Chu G. (2002)Diagnosis of multiple cancer types byshrunken centroids of gene expression. ProcNatl Acad Sci USA. 99(10):6567–6572
31 Quackenbush J (2001) Computationalanalysis of microarray data. Nat Rev Genet2(6):418–427
32 Cheng Y, Church GM (2000) Biclustering ofexpression data. Proc Int Conf Intell Syst MolBiol 8:93–103
33 Barash Y, Friedman N (2002) Context-specificBayesian clustering of gene expression data. JComput Biol 9(2):169–191
34 Kerr MK, Churchill GA (2001) Bootstrappingcluster analysis: assessing the reliability ofconclusions from microarray experiments.Proc Natl Acad Sci USA 98(16):8961–8965
35 Ashburner M, Ball CA, Blake JA, Botstein D,Butler H, Cherry JM, Davis AP, Dolinski K,Dwight SS, Eppig JT, Harris MA, Hill DP,Issel-Tarver L, Kasarskis A, Lewis S, MateseJC, Richardson JE, Ringwald M, Rubin GM,Sherlock G (2003) Gene ontology: tool for theunification of biology. The gene ontologyconsortium. Nat Genet. 25(1):25–29
36 Draghici S, Khatri P, Bhavsar P, Shah A,Krawetz S, Tainsky M (2003) Onto-Tools, Thetoolkit of the modern biologist: Onto-Express,Onto-Compare, Onto-Design and Onto-Translate. Nucleic Acids Res31(13):3775–3781
37 Zeeberg B, Feng W, Wang G, Wang M, FojoA, Sunshine M, Narasimhan S, Kane DW,Reinhold W, Lababidi S, Bussey K, Riss J,Barrett JC, Weinstein J (2003) GoMiner: Aresource for biological interpretation ofgenomic and proteomic data. Genome Biol4(4):R28
38 Bouton CM, Pevsner J (2002) DRAGONView: information visualization for annotatedmicroarray data. Bioinformatics18(2):323–324

432 References
39 Shannon P, Markiel A, Ozier O, Baliga NS,Wang JT, Ramage D, Amin N, SchwikowskiB, Ideker T (2003) Cytoscape: a softwareenvironment for integrated models ofbiomolecular interaction networks. GenomeRes 13(11):2498–2504
40 Thijs G, Moreau Y, De Smet F, Mathys J,Lescot M, Rombauts S, Rouze P, De Moor B,Marchal K (2002) INCLUSive: integratedclustering, upstream sequence retrieval andmotif sampling. Bioinformatics 18(2):331–332
41 Segal E, Barash Y, Simon I, Friedman N,Koller D (2002) From promoter sequence toexpression: A probabilistic framework in:Proc. 6th Int. Conf. on Research inComputational Molecular Biology(RECOMB), Washington, DC
42 Finak G, Goding N, Hallett M, Pepin F,Rajabi Z, Srivastava V, Tang Z (2004) BIAS: bioinformatics integrated applicationsoftware. Bioinformatics (advanced access)
433
Gary D. Bader and Christopher W. V. Hogue
18.1
Introduction
Given estimates based on the draft se-quence of the human genome [1, 2] ofbetween 30,000 to 80,000 human genes, itis apparent that a minority of these genesencode conventional metabolic enzymes ortranscription–translation apparatus. Se-quencing of the genomes of metazoansand, more specifically, vertebrates has un-covered large numbers of complex multi-domain proteins, many containing interact-ing modules, such as SH3 domains, whichgenerally bind proline-rich protein regions.The complexity of the DNA blueprint isaugmented exponentially when one consid-ers the possibility that these multi-domainproteins could bind to several other biomol-ecules either simultaneously or at differentpoints in the cell cycle or in different celltypes. A molecular interaction is a specificbinding event resulting from atomic-levelphysicochemical forces [3]. Multiple bind-ing events among many different proteinsin a cell form “interaction networks”. Thesenetworks form conventional signaling cas-cades, classical metabolic pathways, tran-scription activation complexes, vesiclemechanisms, and cellular growth and diffe-
rentiation systems, indeed all of the sys-tems that make cells work [4].
The ultimate manifestation of gene func-tion is through intermolecular interactions.It is impossible to disentangle the mechan-istic description of the function of a biomol-ecule from a description of other moleculeswith which it interacts. One of the bestforms of the annotation of a gene’s func-tion, from the perspective of a machine-readable archive, is information linkingspecific molecular interactions together, aninteraction database. Thus, interactions, de-fining molecular function, and interactiondatabases are critical components as wemove toward complete and dynamic func-tional description of the cell at a molecularlevel of detail. Interaction databases are es-sential to the future of bioinformatics as anew science. In this review, what can beachieved through integration of currentinteraction information into a commonframework is broadly considered, and anumber of databases that contain interac-tion information are examined.
Handbook of Genome Research. Genomics, Proteomics, Metabolomics, Bioinformatics, Ethical and Legal Issues.Edited by Christoph W. SensenCopyright © 2005 WILEY-VCH Verlag GmbH & Co. KGaA, WeinheimISBN: 3-527-31348-6
18Protein Interaction Databases
Verwendete Mac Distiller 5.0.x Joboptions
Dieser Report wurde automatisch mit Hilfe der Adobe Acrobat Distiller Erweiterung "Distiller Secrets v1.0.5" der IMPRESSED GmbH erstellt. Sie koennen diese Startup-Datei für die Distiller Versionen 4.0.5 und 5.0.x kostenlos unter http://www.impressed.de herunterladen. ALLGEMEIN ---------------------------------------- Dateioptionen: Kompatibilität: PDF 1.3 Für schnelle Web-Anzeige optimieren: Ja Piktogramme einbetten: Ja Seiten automatisch drehen: Nein Seiten von: 1 Seiten bis: Alle Seiten Bund: Links Auflösung: [ 2400 2400 ] dpi Papierformat: [ 481 680 ] Punkt KOMPRIMIERUNG ---------------------------------------- Farbbilder: Downsampling: Nein Komprimieren: Ja Komprimierungsart: ZIP Bitanzahl pro Pixel: 8 Bit Graustufenbilder: Downsampling: Nein Komprimieren: Ja Komprimierungsart: ZIP Bitanzahl pro Pixel: 8 Bit Schwarzweiß-Bilder: Downsampling: Nein Komprimieren: Ja Komprimierungsart: CCITT CCITT-Gruppe: 4 Graustufen glätten: Nein Text und Vektorgrafiken komprimieren: Ja SCHRIFTEN ---------------------------------------- Alle Schriften einbetten: Ja Untergruppen aller eingebetteten Schriften: Nein Wenn Einbetten fehlschlägt: Abbrechen Einbetten: Immer einbetten: [ /Courier-BoldOblique /Helvetica-BoldOblique /Courier /Helvetica-Bold /Times-Bold /Courier-Bold /Helvetica /Times-BoldItalic /Times-Roman /ZapfDingbats /Times-Italic /Helvetica-Oblique /Courier-Oblique /Symbol ] Nie einbetten: [ ] FARBE(N) ---------------------------------------- Farbmanagement: Farbumrechnungsmethode: Farbe nicht ändern Methode: Standard Geräteabhängige Daten: Einstellungen für Überdrucken beibehalten: Ja Unterfarbreduktion und Schwarzaufbau beibehalten: Ja Transferfunktionen: Beibehalten Rastereinstellungen beibehalten: Nein ERWEITERT ---------------------------------------- Optionen: Prolog/Epilog verwenden: Nein PostScript-Datei darf Einstellungen überschreiben: Nein Level 2 copypage-Semantik beibehalten: Ja Portable Job Ticket in PDF-Datei speichern: Ja Illustrator-Überdruckmodus: Ja Farbverläufe zu weichen Nuancen konvertieren: Ja ASCII-Format: Nein Document Structuring Conventions (DSC): DSC-Kommentare verarbeiten: Ja DSC-Warnungen protokollieren: Nein Für EPS-Dateien Seitengröße ändern und Grafiken zentrieren: Ja EPS-Info von DSC beibehalten: Ja OPI-Kommentare beibehalten: Nein Dokumentinfo von DSC beibehalten: Ja ANDERE ---------------------------------------- Distiller-Kern Version: 5000 ZIP-Komprimierung verwenden: Ja Optimierungen deaktivieren: Nein Bildspeicher: 524288 Byte Farbbilder glätten: Nein Graustufenbilder glätten: Nein Bilder (< 257 Farben) in indizierten Farbraum konvertieren: Ja sRGB ICC-Profil: sRGB IEC61966-2.1 ENDE DES REPORTS ---------------------------------------- IMPRESSED GmbH Bahrenfelder Chaussee 49 22761 Hamburg, Germany Tel. +49 40 897189-0 Fax +49 40 897189-71 Email: [email protected] Web: www.impressed.de
Adobe Acrobat Distiller 5.0.x Joboption Datei
<< /ColorSettingsFile () /LockDistillerParams true /DetectBlends true /DoThumbnails true /AntiAliasMonoImages false /MonoImageDownsampleType /Bicubic /GrayImageDownsampleType /Bicubic /MaxSubsetPct 100 /MonoImageFilter /CCITTFaxEncode /ColorImageDownsampleThreshold 1.5 /GrayImageFilter /FlateEncode /ColorConversionStrategy /LeaveColorUnchanged /CalGrayProfile (Dot Gain 20%) /ColorImageResolution 300 /UsePrologue false /MonoImageResolution 1200 /ColorImageDepth 8 /sRGBProfile (sRGB IEC61966-2.1) /PreserveOverprintSettings true /CompatibilityLevel 1.3 /UCRandBGInfo /Preserve /EmitDSCWarnings false /CreateJobTicket true /DownsampleMonoImages false /DownsampleColorImages false /MonoImageDict << /K -1 >> /ColorImageDownsampleType /Bicubic /GrayImageDict << /HSamples [ 2 1 1 2 ] /VSamples [ 2 1 1 2 ] /Blend 1 /QFactor 0.9 >> /CalCMYKProfile (U.S. Web Coated (SWOP) v2) /ParseDSCComments true /PreserveEPSInfo true /MonoImageDepth -1 /AutoFilterGrayImages false /SubsetFonts false /GrayACSImageDict << /HSamples [ 2 1 1 2 ] /VSamples [ 2 1 1 2 ] /Blend 1 /QFactor 0.9 >> /ColorImageFilter /FlateEncode /AutoRotatePages /None /PreserveCopyPage true /EncodeMonoImages true /ASCII85EncodePages false /PreserveOPIComments false /NeverEmbed [ ] /ColorImageDict << /HSamples [ 2 1 1 2 ] /VSamples [ 2 1 1 2 ] /Blend 1 /QFactor 0.9 >> /AntiAliasGrayImages false /GrayImageDepth 8 /CannotEmbedFontPolicy /Error /EndPage -1 /TransferFunctionInfo /Preserve /CalRGBProfile (sRGB IEC61966-2.1) /EncodeColorImages true /EncodeGrayImages true /ColorACSImageDict << /HSamples [ 2 1 1 2 ] /VSamples [ 2 1 1 2 ] /Blend 1 /QFactor 0.9 >> /Optimize true /ParseDSCCommentsForDocInfo true /GrayImageDownsampleThreshold 1.5 /MonoImageDownsampleThreshold 1.5 /AutoPositionEPSFiles true /GrayImageResolution 300 /AutoFilterColorImages false /AlwaysEmbed [ /Courier-BoldOblique /Helvetica-BoldOblique /Courier /Helvetica-Bold /Times-Bold /Courier-Bold /Helvetica /Times-BoldItalic /Times-Roman /ZapfDingbats /Times-Italic /Helvetica-Oblique /Courier-Oblique /Symbol ] /ImageMemory 524288 /OPM 1 /DefaultRenderingIntent /Default /EmbedAllFonts true /StartPage 1 /DownsampleGrayImages false /AntiAliasColorImages false /ConvertImagesToIndexed true /PreserveHalftoneInfo false /CompressPages true /Binding /Left >> setdistillerparams << /PageSize [ 595.276 841.890 ] /HWResolution [ 2400 2400 ] >> setpagedevice
434 18 Protein Interaction Databases
18.2
Scientific Foundations of Biomolecular Interaction Information
Interaction information is based on the ex-perimental observation of a specific interac-tion between two or more molecules. For thepurposes of this discussion, natural, biologi-cal molecules spanning the entire range ofbiochemistry are spoken of, including pro-teins, nucleic acids, carbohydrates, andsmall molecules, both organic and inorganicand even light. Interaction informationcould also be considered for genes, as in asynthetic lethal genetic interaction, althoughthis interaction is less direct. Interaction in-formation is an inference that two or moremolecules have a preferred specific affinityfor each other, within a living organism, andthat inference is based on experimental evi-dence using conventional experimental mo-lecular and cell biology techniques.
The number of experimental types thatcan provide this evidence is large. Primaryinteraction experiments can be broadly de-scribed as being based on direct observationof two molecules directly interacting or of ameasurable phenomenon directly related tothat interaction. This might be in vivo, forexample a yeast two-hybrid assay, or in vitroas in a fluorescence polarization experimentusing purified reagents in a cuvette. Experi-mental genetic evidence provides anothertype of information. For example a tandemgene knockout in an organism might causea particular phenotype to appear, for exam-ple a growth defect or lethality. This pheno-typic readout provides evidence that the twogenes are involved in pathways affecting thephenotype, and might imply molecularinteraction between the two gene productsor that the two genes act in redundant path-ways. These data are indirect and possiblydependent on other genes in the back-ground of the experimental system. None-
theless all this information is important inhelping us to understand gene and proteinfunction in dynamic molecular interactionnetworks. Storage of primary interactiondata in a common machine-readable ar-chive, as is currently done for gene se-quence and molecular structure informa-tion, would give us a tremendous resourcefor research biology and data retrieval.
Interaction databases should, ideally,contain information in the form of a corre-lated pair or group of molecules, some linkto the experimental evidence that led to theinteraction, and machine-readable informa-tion about what experimental interactiondata are known. For example, did the inter-acting molecules undergo a chemicalchange during the interaction? Was thebinding reversible? What are the kineticand thermodynamic data, if they weremeasured in the experiment? Were theforms of the molecules in the experimentwild type or mutated variants? What are thebinding sites on the molecules?
18.3
The Graph Abstraction for Interaction Databases
Consider the collection of molecules in acell as a graph. Each molecule is a vertex ornode, and each interaction is an edge. Clas-sical bioinformatics databases hold proteinsequence, DNA sequence, and small mole-cule chemistry databases, i.e. collectivelyhold molecules which are the vertices ofthis graph. In contrast, the ideal interactiondatabase will hold the edge information –which two molecules come together, underwhich cellular conditions, location andstage, how they interact, and what happensto them in the course of the interaction.This concept is referred to as the graph-the-ory abstraction for interaction databases. It
43518.5 A Requirement for More Detailed Abstractions
is a powerful data abstraction as it simpli-fies the underlying concepts and allows oneto apply algorithms that are well under-stood from the field of computer science tothe larger problems of data mining and vis-ualization. Having a clear picture of a gen-eral graph abstraction for interaction data-bases is the key to the integration of datainto a universal framework.
Nodes in a graph do not have to representsingle parts of a cell; a single node can repre-sent multiple related parts. For example, aprotein and its orthologs could be represent-ed by one node in a graph of a metabolicpathway. The graph would thus correspondto a generalized pathway across more thanone organism. Edges in graphs can have di-rection from cell-signal information flow(e.g. from cell surface to nucleus) or fromchemical action direction (e.g. kinase phos-phorylates a protein substrate). Nodes andedges can be assigned a weight that could bemapped from information in a database. Forinstance, a node could be assigned a higherweight if it is a larger protein and this couldbe translated as a larger node in a graph vis-ualization system. An edge can be assigned aweight based on the confidence in an inter-action. This probability value could be de-rived from a function of the type and num-ber of experiments that were performed toconclude that two molecules interact.
The Biomolecular Interaction NetworkDatabase (BIND) [5–7] seeks to create adatabase of interaction information arounda generalized graph theory abstraction ofinteraction data.
18.4
Why Contemplate Integration of Interaction Data?
In building the BIND data model, a proto-typing approach was pursued, which is very
different from the way many biologicaldatabases are created. A comprehensivedata model was designed that enabled inter-action information to be represented in amachine-readable format, spanning all typeof molecular interaction, including protein,RNA, DNA and small molecules and the bi-ochemical reactions, complexes and path-ways they are involved in. The BIND dataspecification was created in accordancewith the NCBI ASN.1 architectural model[8] and the NCBI software developmenttoolkit for implementing early versions ofthe BIND database and its tools. A substan-tial amount of time was spent focusing ondesigning the data model for BIND, con-templating the way molecular interactionand molecular mechanism informationwould be stored, from inferences as broadas a genetic experiment to as precise as theatomic level of detail found in a crystalstructure of an interacting complex. The hy-pothesis was that there is a plausible uni-versal computer readable description ofmolecular interactions and mechanismsthat can suffice to drive whole cell visualiza-tion, simulation and data-retrieval services.The design phase involved asking ourselvesand others questions such as: What datashould be represented? What abstractionsshould be used? How can interactions bedescribed together with chemical altera-tions to the interacting molecules? The out-come of this hypothesis testing exercise isdescribed in detail in the BIND specifica-tion [5].
18.5
A Requirement for More Detailed Abstractions
Molecular interaction data must be ab-stractly represented so that computationscan be performed and data maintained in a
436 18 Protein Interaction Databases
machine-readable archive more easily. Thisis a simple idea with an analogy in biologi-cal sequence information. Biopolymermolecules, DNA and proteins, are abstract-ed for the computer as strings of letters.This information tells us nothing about theconformation or structure of the molecule,just its composition and biopolymer se-quence. The IUPAC single letter code forDNA and for amino acids are abstractionsthat contain sufficient information to recon-struct chemical bonding information, pro-vided that a standard form of the biopoly-mer is being represented, and not a phos-phorylated, methylated or otherwise modi-fied form.
One cannot imagine a database of cellularbiomolecular assembly instructions withoutfirst having an enumeration of the contentsof the cell, the biomolecular parts list. Se-quence databases only partially fulfill thisparts list requirement, because precise in-formation about post-translational modifi-cation of biopolymers is not encoded. Also,small molecules such as metabolites are notincluded in sequence databases. To encodeexact information about biomolecules, onemust have the capacity to describe the bio-polymer both as a sequence and as an atom-and-bonds representation, the chemicalgraph.
A chemical graph description of a biomol-ecule is sufficient to recreate the atoms,bonds and chirality of the molecule, butwithout specifying the exact location of theatoms in 3D space. In other words, a chem-ical graph is an atomic structure without co-ordinate information. A chemical graphdata abstraction exists within the NCBIMMDB data specification and database ofmolecular structure information [9]. Thisspecification is the only example of a chem-ical graph based structure abstraction, and acomplete chemical structure might be en-coded in MMDB without knowing a single
X,Y,Z atom coordinate. Neither the PDB(protein database) nor the newer mmCIFmolecular structure file format has a chem-ical graph data structure that can describethe complete chemistry of a molecule with-out atomic coordinate information [10].
Sequence alphabet abstractions havebeen invaluable in bioinformatics, havingenabled all computer-based sequence analy-sis. This would have been very difficult tocompute had an exact database of atomsand bonds making up each biopolymer se-quence been chosen as the abstraction.While this information might bog down se-quence comparison, it is required for amore precise record of the chemical state ofa biopolymer after post-translational chang-es. These chemical states, once accessiblethrough a precise database query, are im-portant to have recorded, because they formthe control points for uncounted pathwaysand mechanisms for cellular regulation.
Abstractions are rarely universally appli-cable for all kinds of computation. As com-puting power increases, abstractions can beexpanded in detail to fulfill the require-ments of more kinds of computation. So farthere has been resistance against expandingthe abstractions of sequence information tomore complete descriptions like a chemicalgraph, but it is clear these will be requiredto describe large and important parts of mo-lecular biology such as phosphorylation,carbohydrate or lipid modification, and oth-er post-translational changes upon whichmany molecular mechanisms depend.
Interaction databases can be contemplat-ed now because it has been demonstratedthat computer infrastructure can keep upwith genomic information. The representa-tional models selected must, however, becarefully chosen so that they not precludecomputation that might be required in fu-ture research. It might be time to find anabstraction that can accommodate the most
43718.7 BIND – The Biomolecular Interaction Network Database
complete description for molecular infor-mation one can imagine. With adequatestandard data representations for mole-cules that are unambiguous for the purpos-es of general computation, specifying se-quences, structures, and small moleculechemistry, it should be possible to moveahead with annotation of molecular func-tion in a very complete fashion. Withoutthis, machine-readable descriptions ofknowledge will be ambiguous and will belimited in the precision which biologicalsimulation, visualization, and data-miningtools will require.
18.6
An Interaction Database as a Framework for a Cellular CAD System
To achieve the goal of a computing andsoftware system that can achieve whole-cellsimulation, something like a CAD (comput-er-aided design) system must be built. CADsystems are used in engineering, for exam-ple, in the design of electronic circuitry. Inbiology, such a system could be used forrepresentation and possible design of cellu-lar circuitry. Unlike engineering, the bio-logical CAD system could be used back-wards as a reverse-engineering tool to en-able understanding of the complexity of cel-lular life. This system would have a detailedrepresentation of biochemistry sufficient toenable output of a data description of asnapshot of a living cell to a simulation,data-mining, or visualization system. In en-gineering, CAD systems are database-driv-en software, and the utility of a particularCAD system is proportional to the contentof its database of parts, the symbols used todescribe electronic components. Likewise,a biological CAD system will require a com-plete list of parts as an integrated softwareand database system. The fragmentation in
the Bioinformatics parts list communitymust obviously be resolved to achieve sucha list [11]. Federated databases with highlylatent network interconnections and impre-cise data models will not suffice for largecellular information systems. Interactionand parts information is best stored as anintegrated system to meet the data de-mands of whole-cell simulation, visualiza-tion, and data mining. Overall, such a sys-tem requires a formal data model for mo-lecular interactions that enables good ab-straction of the data with precise comput-ability without sacrificing the complexity ofthe information. The emergence of a stan-dard will enable diverse groups to collabo-rate and work towards their common goalsmore efficiently.
18.7
BIND – The Biomolecular Interaction Network Database
The Biomolecular Interaction NetworkDatabase (BIND, http://bind.ca) has beendesigned as a system for storage of biomo-lecular interactions with the positive attrib-utes of an interaction database discussedabove. BIND is a web-based database sys-tem that is based on a data model written inASN.1 (abstract syntax notation, http://asn1.elibel.tm.fr/). ASN.1 is a hierarchicaldata description language used by the NCBIto describe all of the data in PubMed, Gen-Bank, MMDB, and other NCBI resources[12]. ASN.1 is also used extensively in air-traffic-control systems, international tele-communications, and Internet securityschemes. The advantages of ASN.1 com-pared with other computer readable datadescription languages such as XML includebeing strongly typed and having an efficientcross-platform binary encoding schemethat saves space and CPU resources when
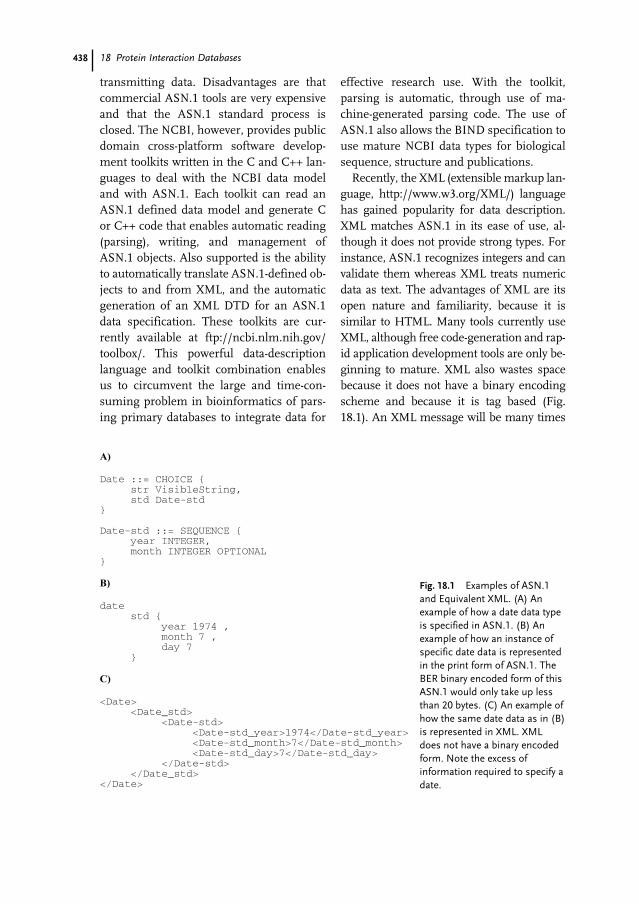
438 18 Protein Interaction Databases
transmitting data. Disadvantages are thatcommercial ASN.1 tools are very expensiveand that the ASN.1 standard process isclosed. The NCBI, however, provides publicdomain cross-platform software develop-ment toolkits written in the C and C++ lan-guages to deal with the NCBI data modeland with ASN.1. Each toolkit can read anASN.1 defined data model and generate Cor C++ code that enables automatic reading(parsing), writing, and management ofASN.1 objects. Also supported is the abilityto automatically translate ASN.1-defined ob-jects to and from XML, and the automaticgeneration of an XML DTD for an ASN.1data specification. These toolkits are cur-rently available at ftp://ncbi.nlm.nih.gov/toolbox/. This powerful data-descriptionlanguage and toolkit combination enablesus to circumvent the large and time-con-suming problem in bioinformatics of pars-ing primary databases to integrate data for
effective research use. With the toolkit,parsing is automatic, through use of ma-chine-generated parsing code. The use ofASN.1 also allows the BIND specification touse mature NCBI data types for biologicalsequence, structure and publications.
Recently, the XML (extensible markup lan-guage, http://www.w3.org/XML/) languagehas gained popularity for data description.XML matches ASN.1 in its ease of use, al-though it does not provide strong types. Forinstance, ASN.1 recognizes integers and canvalidate them whereas XML treats numericdata as text. The advantages of XML are itsopen nature and familiarity, because it issimilar to HTML. Many tools currently useXML, although free code-generation and rap-id application development tools are only be-ginning to mature. XML also wastes spacebecause it does not have a binary encodingscheme and because it is tag based (Fig.18.1). An XML message will be many times
Fig. 18.1 Examples of ASN.1and Equivalent XML. (A) Anexample of how a date data typeis specified in ASN.1. (B) Anexample of how an instance ofspecific date data is representedin the print form of ASN.1. TheBER binary encoded form of thisASN.1 would only take up lessthan 20 bytes. (C) An example ofhow the same date data as in (B)is represented in XML. XMLdoes not have a binary encodedform. Note the excess ofinformation required to specify adate.
43918.9 Database Standards
larger than a binary encoded ASN.1 mes-sage. Recently, the XML Schema standard(http://www.w3.org/XML/Schema) has be-come popular and partially solves some ofthe problems of XML, such as lack of strongtypes. A wide range of commercial andopen-source developer community supportis available, thus XML Schema can be re-garded as a replacement of ASN.1.
The BIND data specification describes bi-omolecular interaction, molecular complex,and molecular pathway data. Both geneticand physical interactions can be stored.Chemical reactions, photochemical activa-tion, and conformational changes can bedescribed down to the atomic level of detail.Everything from small molecule biochemis-try to signal transduction is abstracted insuch a way that graph theory methods canbe used for data mining. The database canbe used to study networks of interactions, tomap pathways across taxonomic branches,and to generate models for kinetic simula-tions. The database can be visually navigat-ed using a Java applet and queried using atext search or the BLAST against BIND ser-vice. BIND is an open effort; all records arein the public domain and source code forthe project is made freely available underthe GNU Public License. Users are encour-aged to submit their favorite interactions.BIND has been used to manage and auto-matically discover new knowledge residingin large yeast protein–protein and geneticinteraction networks in Saccharomyces cerev-isiae determined using mass spectrometry,phage-display, yeast two-hybrid, and roboti-cized synthetic lethal screens. Recently, alarge curation effort run by the non-profitBlueprint Initiative has been developed tokeep BIND up-to-date with the growingamount of published molecular and geneticinteraction data.
18.8
Other Molecular-interaction Databases
Most molecular interaction data resides inthe scientific literature, in unstructuredtext, tables, and figures in thousands of pa-pers in molecular and cellular biology. It iscurrently impossible to retrieve informationfrom this archive using computational toolssuch as natural language query methodswith the accuracy required by scientists.Many databases currently available, mainlyover the Internet, contain interaction infor-mation, although most of these databasesare not focused on storing biomolecularinteractions. Most of these databases aresmall and have very select niches of interac-tion information, for example, the restric-tion enzyme database REBase [13] main-tained by New England Biolabs, while notan interaction database per se does containinteractions between restriction enzymesand the specific patterns of DNA that theyrecognize and cleave. These protein–DNAinteractions satisfy the node and edge cri-terion of the graph abstraction of interac-tion data and are thus a very valuable sourceof information.
18.9
Database Standards
The pathway informatics community hasrecently started to develop common data-ex-change formats. The PSI (Proteomics Stan-dards Initiative) has developed the first ver-sion of an XML-based format for exchang-ing protein–protein interactions, called PSI-MI (PSI molecular interactions) [14]. Thedata model of the format is simple, contain-ing an “interaction” record comprising a setof proteins that interact, an experimentalconditions-controlled vocabulary, and infor-mation about publication references and
440 18 Protein Interaction Databases
protein features, for example binding sitesand post-translational modification sites.The BIND, DIP, HPRD, MINT, and IntActdatabases make their data available fordownload as PSI-MI files. Also network vis-ualization tools, for example Cytoscape [15],can read and write PSI-MI-formatted XML.
An effort, called BioPAX, involving theBIND, EcoCyc, and WIT databases, amongothers, to develop an XML-based format forexchanging full pathways is nascent andmight be available by the time this book ispublished (http://www.biopax.org).
18.10
Answering Scientific Questions Using Interaction Databases
The main purpose of building a computa-tional infrastructure, such as an integratedmolecular-interaction database, is to use itto answer scientific questions. For example,many of the protein–protein interactions ofmacromolecular signaling complexes aremediated by domains that function as rec-ognition modules to bind specific peptidesequences found in their partner proteins[16]. SH3, WW, and EVH1 domains bind toproline-rich peptides [17–19], EH domainsbind to peptides containing the NPF motif[20, 21], and SH2 and FHA domains bind topeptides phosphorylated at Tyr and Thr, re-spectively [22, 23]. For particular moduleswithin the same family, specificity is deter-mined by critical residues in the bindingpartner flanking the core peptide motif [24,25]. A major challenge is to construct pro-tein–protein interaction networks in whichevery module within the predicted prote-ome of a sequenced organism is linked toits cognate partner.
In budding yeast, the network of interac-tions mediated by SH3 domains has beenmapped [26]. Yeast two-hybrid and phage
display screens were used to gather proteininteraction information about the 28 SH3domains in 24 different proteins in theyeast proteome. Two-hybrid methods areknown to have a high false-positive rate forinteraction determination, and phage dis-play results in a binding motif that can onlybe indirectly used to predict protein–pro-tein interactions by scanning the yeast pro-teome for the binding motif for each SH3domain. Conveniently, these two indepen-dently derived protein–protein interactionnetworks have orthogonal error profiles,thus an intersection of the networks shouldcontain higher-quality interactions than arefound by each method separately (Fig.18.2). This was found to be true by compar-ing the intersection network to a gold stan-dard and was shown to be statistically sig-nificant compared with a random model ofthe overlap procedure [26]. Throughout thiswork, an interaction database was used toorganize the experimental information andwas used as a base to build tools that per-formed the intersection, the random model,and the network visualization (Fig. 18.2)enabling this particular scientific questionto be answered more efficiently.
18.11
Examples of Interaction Databases
Examination of the literature and the Inter-net results in a large and varied list of data-bases that contain interaction informationcovering proteins, DNA, RNA, and smallmolecules. In fact, over 100 Internet-access-ible interaction-related databases have beencatalogued in the pathway resource list(http://www.cbio.mskcc.org/prl). The num-ber of projects indicates the importance ofthis data. The variety of data representationand file formats, data architecture, and li-cense agreements is, however, a daunting
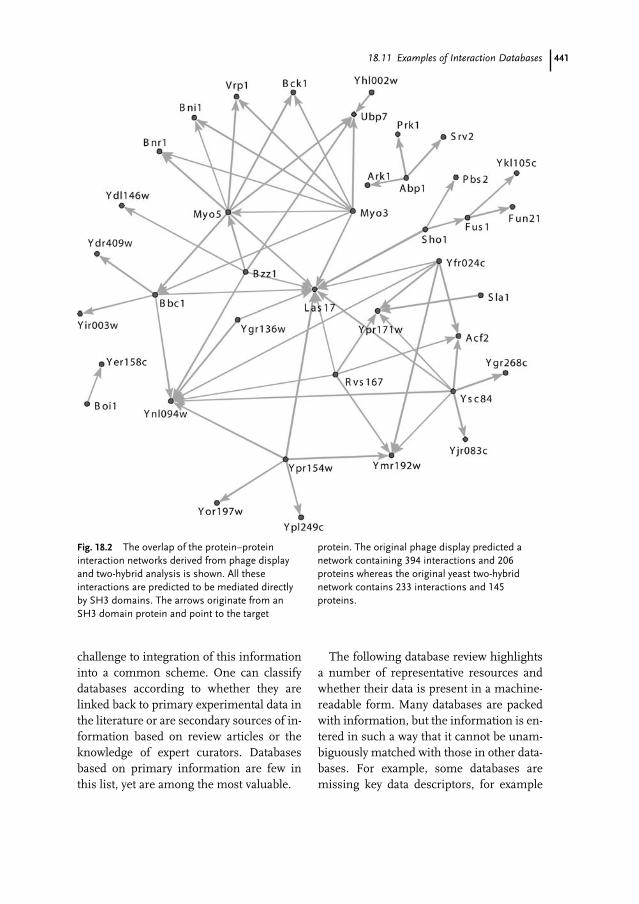
44118.11 Examples of Interaction Databases
challenge to integration of this informationinto a common scheme. One can classifydatabases according to whether they arelinked back to primary experimental data inthe literature or are secondary sources of in-formation based on review articles or theknowledge of expert curators. Databasesbased on primary information are few inthis list, yet are among the most valuable.
The following database review highlightsa number of representative resources andwhether their data is present in a machine-readable form. Many databases are packedwith information, but the information is en-tered in such a way that it cannot be unam-biguously matched with those in other data-bases. For example, some databases aremissing key data descriptors, for example
Fig. 18.2 The overlap of the protein–proteininteraction networks derived from phage displayand two-hybrid analysis is shown. All theseinteractions are predicted to be mediated directlyby SH3 domains. The arrows originate from anSH3 domain protein and point to the target
protein. The original phage display predicted anetwork containing 394 interactions and 206proteins whereas the original yeast two-hybridnetwork contains 233 interactions and 145proteins.
442 18 Protein Interaction Databases
sequence accession numbers, CAS chemi-cal compound numbers, PubMed identifi-ers for publication references, or unambig-uous taxonomy information when datafrom multiple organisms are present. Thislimits the usefulness of the information, be-cause it is difficult to tie it to other knowl-edge, which is required on a large scale if itis to be mined and more broadly under-stood. It is critical that these projects movetoward sound database principles when de-scribing data such that it can be manipulat-ed unambiguously and precisely by comput-er. Where possible, the primary referenceand license terms of the database to aca-demic and industrial users of the data is list-ed to aid future data integrators whenchoosing databases to import into a datawarehouse.
aMAZEURL: http://www.amaze.ulb.ac.be/Refs. [27, 28]
The aim of the aMAZE is to describe metab-olism, gene regulation, molecular transport,and signal transduction. aMAZE is basedon a formal object-oriented data model thatwill be integrated with CORBA. The data-base is chemical reaction-based, was startedby describing metabolic pathways only, andwas seeded from data from BRENDA [29].aMAZE uses a graph abstraction for theinteraction data and can describe chemicalreactions and pathways. This has enabledpathway-finding and visualization tools tobe implemented.
Aminoacyl-tRNA Synthetase DatabaseURL: http://rose.man.poznan.pl/aars/index.htmlRef. [30]
Contains aminoacyl-tRNA synthetase(AARS) sequences for many organisms.This database is simply a sequence collec-tion, but collated pairs of AARS + tRNA can
be used to create RNA–protein interactionrecords. The database is freely availableover the web.
ASEdb (Alanine Scanning EnergeticsDatabase)URL: http://www.asedb.orgRef. [31]
ASEdb is a database of protein side-chaininteraction energetics determined by ala-nine-scanning mutagenesis; it is curatedmanually by a single group. The database isnot very large, but does provide valuable in-formation on proteins binding with othermolecules, mainly other proteins. This isderived from alanine scanning mutagenesisfollowed by a measurement of the changein free energy of binding that the mutationcaused. The database is web-based and textsearchable, but only contains a few special-ized database fields.
BBID (Biological Biochemical ImageDatabase)URL: http://bbid.grc.nia.nih.gov/Ref. [32]
The BBID is a searchable database of imag-es from publications about cellular path-ways and other biological relationships. Itfocuses on signal-transduction pathways.The molecules in the figures and the publi-cations from which the figures are taken areindexed in a database that enables searchingof the figures. Although molecular interac-tion information is available in the figures, itis not extracted in a machine-readable form,thus BBID remains a human reference onlyand is not machine-readable.
BindingDB (The Binding Database)URL: http://www.bindingdb.org/Refs. [33–35]
BindingDB is a public, web-based databasecontaining kinetic and thermodynamicbinding constants for interacting biomole-
44318.11 Examples of Interaction Databases
cules. The data are only from isothermal ti-tration calorimetry and enzyme-inhibitionexperimental methods, but may includedata from other methods in the future. Thedatabase is rigorously designed and imple-mented using the latest database technolo-gy. The search interface is very advancedand even enables searching for small mole-cules that are similar to an input structure.Although it does contain information aboutbiomolecular interactions, the data specifi-cation is focused on binding constant infor-mation and experimental method descrip-tion for two specific methods.
BiocartaURL: http://www.biocarta.com/
Biocarta is a commercial website whichprovides manually created clickable path-way maps for signal transduction as a re-source for the scientific community, al-though the purpose of the site is to sell re-agents. The presence of a standard set ofsymbols to represent various different pro-tein components of pathways make thepathway maps clear and easy to under-stand. Proteins are linked to many differentprimary databases including PubMed, Gen-Bank, OMIM, Unigene [36], KEGG,SWISS-PROT [37], and Genecard. Compa-nies can sponsor genes and links to com-mercially available reagents are present. Bi-ocarta invites volunteer users to supplypathways as figures, and Biocarta thencreates clickable linked maps and makesthem available via the web. The data modelis not public and the database has not beenpublished in peer-reviewed literature.
Biocatalysis/Biodegradation DatabaseURL: http://www.labmed.umn.edu/umbbd/Ref. [38]
The UM-BBD contains data about microbi-al biocatalytic reactions and biodegradation
pathways primarily for xenobiotic, chemicalcompounds. Approximately 140 pathways,over 915 reactions, 860 compounds, 580 en-zymes, and 330 microorganisms are cur-rently represented. The data model is chem-ical reaction-based with graph abstractionfor pathways. Graph abstraction enables the“Generate a pathway starting from this re-action” function. PDB files for some of thesmall molecules are available. Graphics(clickable GIFs) are available for the differ-ent pathways. The work is funded by sever-al organizations and is free to all users.Data are entered on a volunteer basis andrecords contain literary references to Pub-Med.
BRENDAURL: http://www.brenda.uni-koeln.de/Refs. [29, 39]
BRENDA is a database of enzymes. It isbased on EC number and contains muchinformation about each particular enzymeincluding reaction and specificity, enzymestructure, post-translational modification,isolation/preparation, stability and crossreferences to structure databanks. Informa-tion about a chemical reaction is extensive,but some of it is in free-text form and thusis not machine-readable. The database iscopyright and is free to academics. Com-mercial users must obtain a license.
BRITE (Biomolecular Reaction pathwaysfor Information Transfer and Expression)URL: http://www.genome.ad.jp/brite/
BRITE is a database of binary relationshipsbased on the KEGG system. It contains pro-tein–protein interactions, enzyme–enzymerelations from KEGG, sequence similarity,expression similarity, and positional corre-lations of genes on the genome. The data-base mentions that it is based on graph the-ory, but no path-finding tools are present.
444 18 Protein Interaction Databases
BRITE contains some cell cycle-controllingpathways that have now been incorporatedinto KEGG.
COMPEL (Composite Regulatory Elements)URL: http://compel.bionet.nsc.ru/Ref. [40]
Contains protein–DNA and protein–proteininteractions for Composite Regulatory Ele-ments (CRE) affecting gene transcription ineukaryotes including the positions on theDNA to which the protein binds. The data-base is organized in a fielded flat-file formatand provides links to TRANSFAC. The datamodel does not use a graph theory abstrac-tion. In January 1999 COMPEL 3.0 con-tained 178 composite elements. A profes-sional version is available for purchase.
COPE (Cytokines Online Pathfinder Encyclopedia)URL: http://www.copewithcytokines.de/
COPE is an encyclopedia of cytokines andrelated biological terms. COPE provides afree-text textbook-like entry describing eachof the many terms and a dictionary for termdefinitions. Protein and other biomolecularinteractions relating to the terms in the en-cyclopedia are described. The database canbe browsed and searched using keywordsbut contains no formal data model and isthus not natively machine-readable.
CSNDB (Cell Signaling NetworksDatabase)URL: http://geo.nihs.go.jp/csndb/Ref. [41]
CSNDB contains cell-signaling-pathway in-formation for Homo sapiens. It has a datamodel that is specific to cell-signaling onlyand is constructed on ACeDB [42]. It isbased both on interactions and reactions,and stores information mainly as unstruc-tured text in fields within a structured
record. The data model is sound and somefields contain controlled vocabulary. An ex-tensive graph theory abstraction is present.It is probably one of the first databases touse a simple graph theory abstraction sinceits first publication in 1998. It can limit thegraph to a specific organ and can mask sub-trees for this feature. Fields have been add-ed as they are needed and the system is notgeneral. CSNDB contains interesting phar-macological fields for drugs, for exampleIC50. The database can represent proteins,complexes, and small molecules. It is linkedto PubMed and TRANSFAC. TRANSFACrecently imported the CSNDB to seed itsTRANSPATH database of regulatory path-ways that link with transcription factors. Anextensive license agreement limits corpo-rate use. Free to academics. Funded by theJapanese National Institute of Health Sci-ences.
Curagen PathcallingURL: http://curatools.curagen.com/
The commercial Curagen Pathcalling pro-gram visualizes information from high-throughput yeast two-hybrid screening ofthe yeast genome along with other yeast pro-tein–protein interaction from the literature.It contains only protein–protein interac-tions. Pathcalling uses a graph theory ab-straction that enables the use of a Java appletto visually navigate the database. Each pro-tein may be linked to SGD [43], GenBank, orSWISS-PROT. Because it is proprietary, thedatabase does not make any of its informa-tion, software, or data model available.
DIP (Database of Interacting Proteins)URL: http://dip.doe-mbi.ucla.eduRef. [44]
The DIP database stores only protein–pro-tein interactions. It is based on a binaryinteraction scheme for representing inter-actions and uses a graph abstraction for its
44518.11 Examples of Interaction Databases
tools. A visual navigation tool is present.DIP does not use a formal grammar for itsdata specification. The DIP data model en-ables the description of the interacting pro-teins, the experimental methods used to de-termine the interaction, the dissociationconstant, the amino acid residue ranges ofthe interaction site, and references for theinteraction. DIP contains over 40,000 pro-tein–protein interactions representing ap-proximately 110 different organisms. Aca-demic users may register to download thedatabase for free if they agree to the click-through license. Commercial users mustcontact DIP for a license.
DRC (Database of Ribosomal Cross-links)URL: http://www.mpimg-berlin-dahlem.mpg.de/~ag_ribo/ag_brimacombe/drcRef. [45]
This database keeps a collection of all pub-lished cross-linking data for the E. coli ribo-some. This is a database of hand-curateddBASE IV files with a web interface (last up-dated March 7th, 1998). Possibilities of ma-chine-parsing of the database seem limited,because the field data are non-standardizedand meant to be human-readable only.
DPInteractURL: http://arep.med.harvard.edu/dpinteract/Ref. [46]
DPInteract is a curated relational databaseof E. coli DNA binding proteins and theirtarget genes. It provides BLASTN searchingfor DNA and has links to SWISS-PROT, Ec-oCyc, PubMed, and Prosite [47]. The data-base is text-based with a limited data spec-ification. Interestingly, position-specificmatrices are available to describe the DNAbinding motif. Records are organized byprotein structure family (e.g. Helix–turn–
helix family proteins). Updating of the data-base continued from 1993–1997 and hasnow stopped. The database is copyright, butis freely available over the web and containsinformation about 55 E. coli DNA-bindingproteins with known binding sites.
EcoCyc (and MetaCyc)URL: http://biocyc.org/Ref. [48]
EcoCyc is a database (freely available to aca-demics) that contains metabolic and signal-ing pathways from E. coli. EcoCyc is one ofthe oldest pathway databases. It is based onan object-oriented data model. Chemical re-actions are used to describe the data, whichis intuitive in this case, because EcoCyc’smain goal is to catalog metabolic pathwaysfrom E. coli. It is currently being retrofittedto deal with protein–protein interactions incell-signaling pathways, although data arestill described using a chemical reactionscheme. The fields of this database aremostly free-text based. All types of moleculefrom small molecules to molecular com-plexes can be represented and small mole-cule structures are present for common me-tabolites. EcoCyc uses a graph abstractionmodel that has enabled pathway traversingand visualization tools to be written. EcoCyccontains interactions of proteins with pro-teins and small molecules. MetaCyc con-tains EcoCyc and also pathways from over150 other organisms. BioCyc was recentlycreated to contain EcoCyc, MetaCyc, andcomputationally derived pathway databasesfor recently sequenced genomes, similar tothe WIT project.
EMP (Enzymes and Metabolic PathwaysDatabase)URL: http://www.empproject.com/Ref. [49]
EMP is an enzyme database that is chemi-cal reaction-based. It stores information as
446 18 Protein Interaction Databases
detailed as chemical reaction and km. Over300 fields are stored as semi-structured textthat might enable most of the database to beeasily machine-readable. The database ispart of the WIT project and can also be ac-cessed from the WIT system. GIF and SVGimages of many pathways are available andthe project is heavily curated. Recently thisproject underwent a major website reorgan-ization and is now very user friendly andeasily searchable. Some source code is avail-able for the project via a CVS server and thedatabase is freely available over the web.
ENZYMEURL: http://www.expasy.ch/enzyme/Ref. [50]
This database contains enzyme, substrate,product and cofactor information for over4200 enzymes. It has been a crucial resourcefor metabolic databases including EcoCyc. Itis chemical reaction-based. This database canbe translated to an interaction model bybreaking down the chemical reactions intosubstrate–enzyme, product–enzyme, and co-factor–enzyme groups. ENZYME links toBRENDA, EMP/PUMA, WIT, and KEGG.The database is free and is run by the not-for-profit Swiss Institute of Bioinformatics.There are no restrictions on its use by anyinstitutions as long as its content is notmodified in any way.
FIMM (Functional Molecular Immunology)URL: http://sdmc.krdl.org.sg:8080/fimm/Ref. [51]
The FIMM database contains informationabout functional immunology. It is primari-ly not an interaction database but containsinformation about major histocompatibilitycomplex (MHC)/human leukocyte antigen(HLA) associated peptides, antigens, anddiseases. The database contains informa-tion about more than 1400 peptides and al-most 1400 HLA records at time of writing.
It is linked to GenBank, SWISS-PROT,MHCPEP, OMIM, and PubMed, amongothers. This data provides records of pro-tein–peptide interactions that are importantimmunologically and some records containHLA class I structure models. The databaseis provided “as-is” by Kent Ridge DigitalLabs in Singapore.
FlyNetsRef. [52]
FlyNets is now defunct, but originallystored information about molecular interac-tions (protein–DNA, protein–RNA, andprotein–protein interactions) and geneticinteraction networks in the fruit fly, Dro-sophila melanogaster, focusing on develop-mental pathways. Information was linkedto PubMed and FlyBase. Version 3.0 wasavailable in May 1999 and contained 200interactions. FlyNets was based on a graphabstraction and provided a visual graph nav-igation tool to draw networks from the data-base.
GeneNet (Genetic Networks)URL: http://wwwmgs.bionet.nsc.ru/systems/mgl/genenet/Refs. [53, 54]
GeneNet describes genetic regulatory net-works from gene through cell to organismlevel using a chemical reaction based for-malism, i.e. substrates, entities affectingcourse of reaction and products. The data-base is based on a formal object-orienteddata model. GeneNet contains 23 gene net-work diagrams and over 1000 genetic inter-actions (termed relations in GeneNet) froma variety of organisms including Homo sapi-ens. The database is current and is regularlyupdated. Visual tools are present for exam-ining and querying the pathway data in thecontext of a simple diagram of a cell, but areplagued by network latency problems thatcan prevent complete loading.
44718.11 Examples of Interaction Databases
GeNet (Gene Networks Database)URL: http://www.csa.ru/Inst/gorb_dep/inbios/genet/genet.htmRef. [55]
GeNet curates genetic regulatory networksfor a few example species. It provides Javavisualization tools for the genetic networks.The database contains extensive informa-tion about each example network in free-text form. This database is not machine-readable, although is a good genetic interac-tion resource.
GRID (General Repository for Interac-tion Datasets)URL: http://biodata.mshri.on.ca/gridRef. [56]
GRID, or the general repository for interac-tion datasets, contains protein–protein andgenetic interactions, currently for buddingyeast (Saccharomyces cerevisiae), YeastGRID,fruit fly (Drosophila melanogaster), FlyGRID,and Caenorhabditis elegans, WormGRID.GRID is actively being expanded and otherspecies might be available in the near fu-ture. GRID provides a simple summary ofeach interaction along with gene names,gene ontology (GO) annotation, and the ex-perimental system used to determine theinteraction. A network visualization toolcalled Osprey is also available for visualiz-ing, browsing, and analyzing the interac-tion networks of the various GRIDs.
HIV Molecular Immunology DatabaseURL: http://hiv-web.lanl.gov/immunology/index.htmlRef. [57]
This database contains information aboutbinding events between HIV and the im-mune system including HIV epitope andantibody binding sites that could providedata for an interaction database. HLA bind-ing motifs are included and enable predic-
tion of HLA–peptide interactions. This in-formation is freely available from thedatabase’s FTP site.
HPRD (Human Protein Reference Data-base)URL: http://hprd.orgRef. [58]
HPRD, or the human protein reference data-base, is a recently released database of hu-man proteins, but also contains a significantamount of information about protein– pro-tein interactions. Information about the do-main and region of interaction, if available,is present, as is the type of experiment per-formed to detect the interaction. Expression,domain architecture, and post-translationalmodifications are also curated for each pro-tein. Several curated pathways created fromthe interaction data are available as images.HPRD data can be browsed and searched bya number of common database fields and byBLAST over the Web. Data are freely avail-able to academics in the PSI-MI format butcommercial users require a license.
HOX ProURL: http://www.iephb.nw.ru/hoxproRef. [59]
The main purpose of this database is to pro-vide a curated human-readable resource forhomeobox genes. It also stores extensive in-formation about genetic regulatory net-works of homeobox genes for a few modelorganisms. Clickable pictures and a Javaapplet are available for visualizing the net-works. The visualization system is the sameas that used for GeNet.
InBase (The Intein Database)URL: http://www.neb.com/neb/inteins.htmlRef. [60]
The main purpose of this database is as acurated resource for protein splicing. The
448 18 Protein Interaction Databases
database contains descriptions of intein pro-teins (self-catalytic proteins) that are goodexamples of intramolecular interactions.The database records are present in a ma-chine-readable format. Each record could beused by an interaction database to generateintramolecular interaction records contain-ing chemical reaction description using in-formation about the mechanism of proteinsplicing present on the InBase website.
IndigoURL: http://195.221.65.10:1234/Indigo/
Indigo contains information about codonusage, operons, gene neighbors, and meta-bolic pathways for Escherichia coli and Bacil-lus subtilis. The metabolic pathway informa-tion contains information about enzymaticreactions and can be accessed using click-able images in a Java applet. Enzyme namesin the pathway map are linked back to pri-mary sequence databases.
IntActURL: http://www.ebi.ac.uk/intactRef. [61]
IntAct is a relatively new database of freelyavailable protein interactions maintained bythe European Bioinformatics Institute(EBI). An initial implementation availablefrom mid-2003 focuses on protein–proteininteractions collected from large-scale pub-lished studies and some literature. It en-ables searching by protein name and brows-ing using a graphical network interface.One difference between the IntAct datamodel and those of many other pro-tein–protein interaction databases is thatinteractions are not necessarily binary, butrather are sets. The advantage of using setsto store interactions is that they can repre-sent certain types of protein complex datawhere information is not known about theexact physical interactions in the complex,but only that the set of proteins co-purifies.
Representing information this way has be-come more important since the release oflarge-scale biochemical co-purificationstudies [62, 63]. Data are available in thePSI-MI XML format.
InteractRef. [64]
Interact is an object-oriented protein–pro-tein-interaction database based on Java andthe POET database (www.poet.com) that isnow defunct. It has a formal data-modelthat describes interactions, molecular com-plexes and genetic interactions. It stores in-formation about experimental methods andis based on an object-oriented descriptionof proteins and genes. The database doesnot provide other details about the interac-tion and the underlying description ofgenes and proteins is simplified comparedwith that of GenBank. The database is notpublicly available, but the object-orienteddesign approach has been described in theliterature. The database contains over 1000interactions.
ICBS (Inter-Chain Beta-Sheets)URL: http://www.igb.uci.edu/servers/icbs/Ref. [65]
ICBS contains protein–protein interactionsmediated by beta-sheets taken from thePDB database. The database contains over3600 PDB structures that contain proteincomplexes mediated by this type of interac-tion. Basic information about each PDB fileis provided, as is detailed physical andstructural information about the beta sheetsat the interaction interface. This database issimilar to MMDBind, but is a more highlycurated subset.
JenPepURL: http://www.jenner.ac.uk/JenPep/Ref. [66]
44918.11 Examples of Interaction Databases
JenPep is a peptide binding database thatcontains more than 8000 peptide–proteininteractions for MHC Class I, II, CD8, andCD4 T cells and TAP (transport of antigen)complex. All information in JenPep, for ex-ample IC50 and peptide origin, is frompublished experiments. Peptide epitopescan be searched over the web using a sim-ple query interface.
KEGG (Kyoto Encyclopedia of Genes andGenomes)URL: http://www.genome.ad.jp/kegg/Ref. [67]
KEGG depicts many known metabolicpathways and some regulatory pathways formany different species as graphical dia-grams that are manually drawn and updat-ed. Each of the metabolic pathway drawingsis intended to represent all chemically fea-sible pathways for a given system. As such,these pathways are abstractions on to whichenzymes and substrates from specific or-ganisms can be mapped. KEGG stores reac-tions mediated by each enzyme in the data-base and these are linked to from the path-way maps. The database is machine-read-able, except for the pathway diagrams. Eachenzyme entry contains a substrate and aproduct field that can be used to translatebetween the chemical reaction descriptionscheme and a binary interaction scheme.The KEGG project distributes all databasesfreely for academics via FTP. KEGG is oneof the best freely available resources ofmetabolic and small molecule information(the LIGAND database).
Kohn Molecular Interaction MapsURL: http://discover.nci.nih.gov/kohnk/interaction_maps.htmlRef. [68]
Kohn molecular maps are one researcher’sattempt to create a standard for represent-ing biochemical pathways and molecular
interactions using a symbolic language sim-ilar to electronic circuit diagrams. Kohncreated detailed maps of the mammaliancell-cycle control and DNA repair systemsas examples. The maps are pictures onlyand thus are not machine-readable, al-though they do have a grid system as in nor-mal street maps. A separate annotation listis provided that enables mapping of mole-cules from the list of the map using the co-ordinate system. The ideas represented inthese maps are useful for further researchon pathway visualization systems and thefirst two maps provide a resource for manu-al extraction of molecular interaction infor-mation.
MDB (Metalloprotein Database)URL: http://metallo.scripps.edu/Ref. [69]
MDB contains the metal-binding sites fromentries in the PDB database. The databaseis based on open-source software and isfreely available. The data are present downto the atomic level of detail. An extensiveJava applet is available to query and exam-ine the data in detail. Ad-hoc queries of thedatabase using SQL are available and toolsare being developed to predict a metal bind-ing site in a given protein structure.
MHCPEPURL: http://wehih.wehi.edu.au/mhcpep/Ref. [70]
MHCPEP is a database containing over13,000 peptide sequences known to bindMHC molecules compiled from the litera-ture and from direct submissions. It hasnot been updated since mid-1998. Althoughthis database is not a typical interactiondatabase, it provides peptide–protein inter-action information relevant to immunolo-gy. The database is freely available via FTPin a text-based machine-readable format.
450 18 Protein Interaction Databases
MINT (Molecular-interaction database)URL: http://mint.bio.uniroma2.it/mint/Ref. [71]
MINT is a database of molecular interac-tions gathered from the literature and man-ually input. Apart from a simple relationalscheme for storage of set relationshipsamong proteins, MINT can store some pro-tein post-translational modifications, ex-periments, cellular location, pathways, andcomplexes. MINT contains more than42,000 protein interactions and only a hand-ful of complexes. An extensive graph ab-straction is present which enables the use ofa graphical Java viewer for the interactions.Interestingly, the size of the molecules isrepresented relative to each other in the vis-ualization, so heavier proteins are drawn aslarger circles.
MIPS Comprehensive Yeast GenomeDatabaseURL: http://mips.gsf.de/proj/yeast/Ref. [72]
The MIPS comprehensive yeast genomedatabase (CYGD) summarizes currentknowledge about the more than 6200 ORFencoded by the yeast genome. This databaseis similar to SGD and YPD and is not pri-marily an interaction database. The MIPScenter, however, makes available large ta-bles for direct protein–protein interactionsand genetic interactions in yeast free fordownload at http://mips.gsf.de/proj/yeast/tables/interaction/index.html. Each interac-tion contains an experimental method usedand, usually, a literature reference. Manual-ly created clickable pathway maps are alsoavailable for a variety of metabolic and regu-latory pathways in yeast. The MIPS yeast ge-nome database uses a relational model, butmost fields use unstructured text. For exam-ple, the experimental method used to deter-mine the interaction field is unstructured
and the same experimental type can be rep-resented in many different ways. Althoughthis makes the database difficult to parsewith a computer, the CYGD is an extremelyuseful resource for yeast protein–proteininteraction information. Recently, MIPShas made available a protein–protein inter-action, complex, and genetic interactionquery tool for searching this data.
MMDB (Molecular Modeling Database)URL: http://www.ncbi.nlm.nih.gov/Structure/Ref. [73]
This database is an NCBI resource that con-tains all the data in the PDB database inASN.1 form. The MMDB validates all PDBfile information and describes all atomiclevel detail data explicitly and in a formalmachine-readable manner. Although thisdatabase is not an interaction database, itdoes contain atomic level detail of molecu-lar interactions present in some recordsthat describe molecular complexes. Se-quence linkage is improved and MMDB isreadily accessed by machine-readable meth-ods that can obtain information about mo-lecular interactions. MMDB is in the publicdomain and all software and data are freelyavailable to academics or corporations.
NetBiochemURL: http://medlib.med.utah.edu/NetBiochem/NetWelco.htm
NetBiochem is primarily an education re-source that focuses on teaching detailed bi-ochemistry of specific metabolic pathways,for example fatty acid metabolism, at thelevel of an introductory biochemistry courseat a university. There is no formal datamodel, but the available pathways representa good collection of different ways of pre-senting biochemical pathway data to an un-trained audience. This site would, there-fore, be useful as a resource for curators to
45118.11 Examples of Interaction Databases
enter data into a molecular-interaction data-base and as a source of ideas for pathway-visualization research.
ooTFD (Object Oriented TranscriptionFactors Database)URL: http://www.ifti.org/Ref. [74]
The ooTFD contains information on tran-scription factors from a variety of organ-isms, including transcription factor bind-ing sites on DNA and transcription factormolecular complex information. Thus itcontains protein–DNA and protein–proteininteractions. The database is based on a for-mal machine-readable object-oriented for-mat and is available in numerous forms.The database contains thousands of sitesand transcription factors and is freely avail-able (including software) from http://ncbi.nlm.nih.gov/repository/TFD/.
ORDB (Olfactory Receptor Database)URL: http://senselab.med.yale.eduRef. [75]
The ORDB is primarily a database of se-quences of olfactory receptor proteins. Itcontains a section on small molecule li-gands that bind to olfactory receptors.About 100 ligand–protein interactions arepresent in the database with about 130small molecules. Structures of these smallmolecules are also available, in the associat-ed OdorDB.
PATIKA (Pathway Analysis Tool for Inte-gration and Knowledge Acquisition)URL: http://www.patika.org/Ref. [76]
PATIKA is a combination of a Java pathwaymodeling tool and an object-oriented path-way database. A data specification ispresent using a state and transition notionfor pathway descriptions. This data modelcombines elements from BIND, EcoCyc,
and Petri Nets. Interestingly, the data mod-el allows multiple levels of abstraction toenable the description of cellular eventswhen not all of the details are known. Forinstance, a transition can describe thechange of one state to another and that statecan be very detailed chemically or can be avery general cellular state. The Java tool en-ables one to build pathways and query thedatabase remotely over the Internet. Thedata model is currently quite simple and isonly designed to store human pathway in-formation.
PhosphoBaseURL: http://www.cbs.dtu.dk/databases/PhosphoBase/Ref. [77]
This database contains information on ki-nases and phosphorylation sites. The phos-phorylation sites are stored with kinetic in-formation and references for each kinase.Although this is not an interaction databasedirectly, information is present about pro-tein–protein interactions involved in cellsignaling and their chemistry. A neural net-work-based phosphorylation site-predictiontool has recently been made available.
PIMRider (Protein Interaction Map –Hybrigenics)URL: http://pim.hybrigenics.com/
PIMRider is a graphical Java applet-basedprotein interaction network visualizationtool driven by a database of protein–proteininteractions. All interactions have been de-termined using the sequence fragment (do-main)-based two-hybrid screen experimen-tal approach by the Hybrigenics company.All of the data and the data model are pro-prietary and only partially publicly available.The PIM database contains information onHelicobacter pylori, HIV (human immuno-deficiency virus), HCV (hepatitis C virus)and Homo sapiens.
452 18 Protein Interaction Databases
PIMdb (Drosophila Protein InteractionMap Database)URL: http://proteome.wayne.edu/PIMproject1.html
PIMdb is a collection of two-hybrid generat-ed protein–protein interactions for Drosoph-ila melanogaster. A single laboratory is gen-erating these data, which are currently un-published. A simple binary interaction datamodel is used to store the information. Cur-rently, PIMdb does not make available anyquery tools, but is rather just a manuallycreated list of experimental results from oneacademic research group. Without peer re-view, the quality of the data is in question.The group asks to be contacted if any oftheir data are used for other projects.
ProChart (Axcell)URL: http://www.axcellbio.com/products.asp
The ProChart database is sold by Axcell Bio-sciences and contains proprietary data onprotein–protein interactions garnered usingAxcell’s proprietary experimental methods.No part of the database or data model ispublicly accessible or has been published.
ProNet (Myriad Genetics)
This commercial database provides pro-tein–protein interaction information to thepublic from Myriad Genetics proprietaryhigh-throughput yeast two-hybrid systemfor human proteins and from published lit-erature. Each protein record describes inter-acting proteins and a Java applet is availablefor navigating the database. The databasestores only protein-interaction informationwith links to primary sequence databasesand PubMed. It uses a graph abstraction todisplay the interactions. The database is ful-ly proprietary and has not been published.
REBASEURL: http://rebase.neb.comRef. [13]
REBASE is a comprehensive database of in-formation about restriction enzymes and re-lated proteins, for example methylases. Al-though it is not an interaction database, re-striction enzymes and methylases partici-pate in specific DNA–protein interactions.REBASE describes the enzyme and the rec-ognition site, and thus can be used to createbinary interaction records with chemical ac-tions. Useful links are present to commer-cially available enzymes. REBASE is freelyavailable to the academic community inmany different formats.
RelibaseURL: http://relibase.ebi.ac.uk/Ref. [78]
Relibase is a software query tool that enablespowerful searches to be conducted on PDBentries containing protein–ligand interac-tions, where a ligand is anything that is not aprotein. DNA and RNA are also consideredligands, but are ignored in searches. Thepurpose of Relibase is to help examine smallmolecules, for example therapeutics, thatare currently in the PDB as binding to pro-teins. Full crystal structure and binding sitesof ligands are available. The database can besearched by text, sequence, SMILES strings,and 2D/3D small molecule structures. TheRelibase project is currently run by the Cam-bridge Crystallographic Data Centre, whichmakes the tool available over the web.
RegulonDBURL: http://www.cifn.unam.mx/Computational_Genomics/regulondb/Ref. [79, 80]
RegulonDB is mainly an E. coli operon data-base, although it does contain protein–DNAinteractions (e.g. ribosome binding sitesand promoters) and protein complexes. Thedatabase is free for non-commercial use.Commercial users require a license.
45318.11 Examples of Interaction Databases
SELEX_DBURL: http://wwwmgs.bionet.nsc.ru/mgs/systems/selex/Ref. [81]
SELEX_DB is a curated resource that storesexperimental data for functional site se-quences obtained by using SELEX-like ran-dom sequence pool technologies to studyinteractions. The database contains interac-tions, including binding sites, between ran-dom DNA sequences and various types ofligand, most of which are proteins. It isavailable over the web and via SRS and therecords are available in a machine-readableflat-file format.
SoyBaseURL: http://soybase.ncgr.org/
SoyBase is an ACeDB [42] database thatcontains information about the soybean, in-cluding metabolism. Metabolic pathwaysare based on a chemical reaction abstrac-tion. SoyBase contains over 850 automati-cally generated diagrams of metabolic path-ways covering over 1500 enzymes and morethan 1200 metabolites. Clicking on an en-zyme or ligand on the diagram triggers aquery for that molecule in the database.SoyBase is based on a formal machine-readable data model, as is any AceDB in-stallation, and is available over the web.
SPAD (Signaling Pathways Database)URL: http://www.grt.kyushu-u.ac.jp/eny-doc/
SPAD provides clickable image maps for ahandful of pathways. Clicking on an ele-ment of the pathway diagram links to se-quence information of the protein or gene.Protein–protein and protein–DNA interac-tions are covered with regard to signaltransduction. The database does not have aformal data model. SPAD has not been up-dated since 1998 but still gives useful over-views of the pathways it contains.
SPIN-PP (Surface Properties of Inter-faces – Protein–Protein Interfaces)URL: http://trantor.bioc.columbia.edu/cgi-bin/SPIN/
SPIN-PP is a database of all protein–proteininterfaces in the PDB. Molecular surfaces areorganized in a taxonomy based on surfacecurvature, electrostatic potential, sequencevariability, and hydrophobicity. SPIN-PP con-tains 855 protein–protein interfaces and issearchable by PDB code and the varioussurface structural properties listed above.Surfaces of interest can be viewed using theGRASS server [82]. The database does notseem to have been updated regularly since1999, but is freely available.
STKE (Signal Transduction KnowledgeEnvironment)URL: http://www.stke.org/Ref. [83]
STKE is a curated resource for signal-trans-duction information. It provides a manuallycreated clickable picture of various signaltransduction pathways linked to primarydatabase, the Connections Map. The datamodel is based on an upstream and down-stream components view, which is a graphabstraction. Database fields are unstruc-tured and thus are not machine-readable.STKE is available via a paid subscription toScience magazine.
SYFPEITHIURL: http://www.uni-tuebingen.de/uni/kxi/Ref. [84]
SYFPEITHI is a database of MHC ligandsand peptide motifs. It contains over 3500peptide sequences known to bind class I andclass II MHC molecules. All entries havebeen compiled from the literature. Althoughthis database is not a typical interaction data-base, it provides peptide–protein interactioninformation relevant to immunology.
454 18 Protein Interaction Databases
TRANSFACURL: http://www.gene-regulation.com/Ref. [85]
TRANSFAC is a database of transcriptionfactors containing genomic binding sitesand DNA-binding profiles. As such, it is nota typical interaction database, but it doescontain protein–DNA interactions. A tran-scription factor DNA-binding site predic-tion tool is available. TRANSFAC is avail-able via license.
TRANSPATHURL: http://transfac.gbf.de/TRANSFAC/Ref. [85]
TRANSPATH is an effort underway atTRANSFAC to link regulatory pathways totranscription factors. The database is basedon a chemical reaction view of interactionsand contains a strong graph abstraction.Graph algorithms have been implementedto enable navigation of the data. The data-base can describe regulatory pathways, theircomponents, and the cellular locations ofthose components. It can store informationabout various species. TRANSPATH in-cludes all of the data from the CSNDB andit is obvious that TRANSPATH is usinggraph theory ideas from the CSNDB.TRANSPATH is available via license.
TRRD (Transcription Regulatory RegionsDatabase)URL: http://wwwmgs.bionet.nsc.ru/mgs/dbases/trrd4/Ref. [86]
TRRD contains information about regulato-ry regions including over 3600 transcriptionfactor binding sites (DNA–protein interac-tions). This database is very similar toTRANSFAC. It is freely available over theweb via an SRS database interface.
WIT (What Is There?)URL: http://wit.mcs.anl.gov/WIT2Ref. [87]
WIT is a database project whose purpose isto reconstruct metabolic pathways in newlysequenced genomes by comparing predict-ed proteins with proteins in known meta-bolic networks. Predicted metabolic net-works are stored in a chemical reaction-based scheme with a graph abstraction. Allinformation in the database can be queriedand pathways can be viewed as a computer-generated diagram which is hyper-linkedback to the database.
YPD (Yeast Proteome Database – IncyteGenomics)URL: https://www.incyte.com/proteome/index.htmlRef. [88]
This proprietary commercial curated prote-ome database from Incyte contains exten-sive information about all known proteinsin yeast. Extensive data about protein inter-actions, molecular complexes, and subcel-lular location is present. Most of the data-base fields are free-form text, but there isenough structure in the data model to makeit amenable to machine reading of pro-tein–protein interaction information. Incytealso makes available other proteomes forother model organisms including Caeno-rhabditis elegans and Human, but YPD isthe most completely annotated in the Prote-ome BioKnowledge Library. All of Incyte’sproteome databases are proprietary and areavailable on a subscription basis.
Acknowledgements
GB thanks his supervisor Chris Sander forsupport during the writing of this chapterupdate. The original chapter was written inthe laboratory of Christopher Hogue for thefirst edition of this book.
455
1 Lander ES, Linton LM, Birren B, Nusbaum C,Zody MC, Baldwin J, Devon K, Dewar K,Doyle M, FitzHugh W, Funke R, Gage D,Harris K, Heaford A, Howland J, Kann L,Lehoczky J, LeVine R, McEwan P, McKernanK, Meldrim J, Mesirov JP, Miranda C, MorrisW, Naylor J, Raymond C, Rosetti M, SantosR, Sheridan A, Sougnez C, Stange-ThomannN, Stojanovic N, Subramanian A, Wyman D,Rogers J, Sulston J, Ainscough R, Beck S,Bentley D, Burton J, Clee C, Carter N,Coulson A, Deadman R, Deloukas P,Dunham A, Dunham I, Durbin R, French L,Grafham D, Gregory S, Hubbard T,Humphray S, Hunt A, Jones M, Lloyd C,McMurray A, Matthews L, Mercer S, Milne S,Mullikin JC, Mungall A, Plumb R, Ross M,Shownkeen R, Sims S, Waterston RH,Wilson RK, Hillier LW, McPherson JD,Marra MA, Mardis ER, Fulton LA, ChinwallaAT, Pepin KH, Gish WR, Chissoe SL, WendlMC, Delehaunty KD, Miner TL, DelehauntyA, Kramer JB, Cook LL, Fulton RS, JohnsonDL, Minx PJ, Clifton SW, Hawkins T,Branscomb E, Predki P, Richardson P,Wenning S, Slezak T, Doggett N, Cheng JF,Olsen A, Lucas S, Elkin C, Uberbacher E,Frazier M, et al. (2001) Initial sequencing andanalysis of the human genome. Nature409:860–921
2 Venter JC, Adams MD, Myers EW, Li PW,Mural RJ, Sutton GG, Smith HO, Yandell M,Evans CA, Holt RA, Gocayne JD, AmanatidesP, Ballew RM, Huson DH, Wortman JR,Zhang Q, Kodira CD, Zheng XH, Chen L,Skupski M, Subramanian G, Thomas PD,Zhang J, Gabor Miklos GL, Nelson C, BroderS, Clark AG, Nadeau J, McKusick VA, ZinderN, Levine AJ, Roberts RJ, Simon M, SlaymanC, Hunkapiller M, Bolanos R, Delcher A,
Dew I, Fasulo D, Flanigan M, Florea L,Halpern A, Hannenhalli S, Kravitz S, Levy S,Mobarry C, Reinert K, Remington K, Abu-Threideh J, Beasley E, Biddick K, Bonazzi V,Brandon R, Cargill M, ChandramouliswaranI, Charlab R, Chaturvedi K, Deng Z, Di F, V,Dunn P, Eilbeck K, Evangelista C, GabrielianAE, Gan W, Ge W, Gong F, Gu Z, Guan P,Heiman TJ, Higgins ME, Ji RR, Ke Z,Ketchum KA, Lai Z, Lei Y, Li Z, Li J, Liang Y,Lin X, Lu F, Merkulov GV, Milshina N,Moore HM, Naik AK, Narayan VA, Neelam B,Nusskern D, Rusch DB, Salzberg S, Shao W,Shue B, Sun J, Wang Z, Wang A, Wang X,Wang J, Wei M, Wides R, Xiao C, Yan C, et al.(2001) The sequence of the human genome.Science 291:1304–1351
3 Jones S, Thornton JM (1996) Principles ofprotein–protein interactions. Proc. Natl. Acad.Sci. USA 93:13–20
4 Pawson T, Nash P (2003) Assembly of cellregulatory systems through proteininteraction domains. Science 300:445–452
5 Bader GD, Hogue CW (2000) BIND – a dataspecification for storing and describingbiomolecular interactions, molecularcomplexes and pathways. Bioinformatics.16:465–477
6 Bader GD, Donaldson I, Wolting C, OuelletteBF, Pawson T, Hogue CW (2001) BIND – TheBiomolecular Interaction Network Database.Nucleic Acids Res. 29:242–245
7 Bader GD, Betel D, Hogue CW (2003) BIND:the Biomolecular Interaction NetworkDatabase. Nucleic Acids Res. 31:248–250
8 Ostell J, Kans JA (1998) The NCBI DataModel. In: Baxevanis AD, Ouellette BF (eds)Bioinformatics, a Practical Guide to theAnalysis of Genes and Proteins. John Wiley &Sons, p 121–144
References
456 References
9 Wang Y, Addess KJ, Geer L, Madej T,Marchler-Bauer A, Zimmerman D, Bryant SH(2000) MMDB: 3D structure data in Entrez.Nucleic Acids Res. 28:243–245
10 Berman HM, Westbrook J, Feng Z, GillilandG, Bhat TN, Weissig H, Shindyalov IN,Bourne PE (2000) The Protein Data Bank.Nucleic Acids Res. 28:235–242
11 Stein L (2002) Creating a bioinformaticsnation. Nature 417:119–120
12 Benson DA, Karsch-Mizrachi I, Lipman DJ,Ostell J, Wheeler DL (2003) GenBank. NucleicAcids Res. 31:23–27
13 Roberts RJ, Vincze T, Posfai J, Macelis D(2003) REBASE: restriction enzymes andmethyltransferases. Nucleic Acids Res31:418–420
14 Hermjakob H, Montecchi-Palazzi L, Bader G,Wojcik J, Salwinski L, Ceol A, Moore S,Orchard S, Sarkans U, von Mering C,Roechert B, Poux S, Jung E, Mersch H, KerseyP, Lappe M, Li Y, Zeng R, Rana D, NikolskiM, Husi H, Brun C, Shanker K, Grant SG,Sander C, Bork P, Zhu W, Pandey A, BrazmaA, Jacq B, Vidal M, Sherman D, Legrain P,Cesareni G, Xenarios I, Eisenberg D, SteipeB, Hogue C, Apweiler R (2004) The HUPOPSI’s molecular interaction format – acommunity standard for the representation ofprotein interaction data. Nat Biotechnol22:177–183
15 Shannon P, Markiel A, Ozier O, Baliga NS,Wang JT, Ramage D, Amin N, SchwikowskiB, Ideker T (2003) Cytoscape: a softwareenvironment for integrated models ofbiomolecular interaction networks. GenomeRes 13:2498–2504
16 Pawson T, Scott JD (1997) Signaling throughscaffold, anchoring, and adaptor proteins.Science 278:2075–2080
17 Cesareni G, Panni S, Nardelli G, Castagnoli L(2002) Can we infer peptide recognitionspecificity mediated by SH3 domains? FEBSLett 513:38–44
18 Fedorov AA, Fedorov E, Gertler F, Almo SC(1999) Structure of EVH1, a novel proline-richligand-binding module involved incytoskeletal dynamics and neural function.Nat Struct Biol 6:661–665
19 Macias MJ, Wiesner S, Sudol M (2002) WWand SH3 domains, two different scaffolds torecognize proline-rich ligands. FEBS Lett513:30–37
20 de Beer T, Hoofnagle AN, Enmon JL, BowersRC, Yamabhai M, Kay BK, Overduin M (2000)Molecular mechanism of NPF recognition byEH domains. Nat Struct Biol 7:1018–1022
21 Salcini AE, Confalonieri S, Doria M, SantoliniE, Tassi E, Minenkova O, Cesareni G, PelicciPG, Di Fiore PP (1997) Binding specificityand in vivo targets of the EH domain, a novelprotein–protein interaction module. GenesDev 11:2239–2249
22 Moran MF, Koch CA, Anderson D, Ellis C,England L, Martin GS, Pawson T (1990) Srchomology region 2 domains direct protein–protein interactions in signal transduction.Proc Natl Acad Sci U S A 87:8622–8626
23 Durocher D, Jackson SP (2002) The FHAdomain. FEBS Lett 513:58–66
24 Paoluzi S, Castagnoli L, Lauro I, Salcini AE,Coda L, Fre S, Confalonieri S, Pelicci PG, DiFiore PP, Cesareni G (1998) Recognitionspecificity of individual EH domains ofmammals and yeast. Embo J 17:6541–6550
25 Panni S, Dente L, Cesareni G (2002) In VitroEvolution of Recognition Specificity Mediatedby SH3 Domains Reveals Target RecognitionRules. J Biol Chem 277:21666–21674
26 Tong AH, Drees B, Nardelli G, Bader GD,Brannetti B, Castagnoli L, Evangelista M,Ferracuti S, Nelson B, Paoluzi S, QuondamM, Zucconi A, Hogue CW, Fields S, Boone C,Cesareni G (2002) A combined experimentaland computational strategy to define proteininteraction networks for peptide recognitionmodules. Science 295:321–324
27 van Helden J, Naim A, Lemer C, Mancuso R,Eldridge M, Wodak SJ (2001) From molecularactivities and processes to biological function.Brief. Bioinform. 2:81–93
28 Lemer C, Antezana E, Couche F, Fays F,Santolaria X, Janky R, Deville Y, Richelle J,Wodak SJ (2004) The aMAZE LightBench: aweb interface to a relational database ofcellular processes. Nucleic Acids Res 32Database issue:D443–D448
29 Schomburg I, Chang A, Schomburg D (2002)BRENDA, enzyme data and metabolicinformation. Nucleic Acids Res. 30:47–49
30 Szymanski M, Barciszewski J (2000)Aminoacyl-tRNA synthetases database Y2K.Nucleic Acids Res. 28:326–328
31 Thorn KS, Bogan AA (2001) ASEdb: a data-base of alanine mutations and their effects onthe free energy of binding in proteininteractions. Bioinformatics. 17:284–285
457References
32 Becker KG, White SL, Muller J, Engel J (2000)BBID: the biological biochemical imagedatabase. Bioinformatics 16:745–746
33 Chen X, Lin Y, Gilson MK (2001) Thebinding database: Overview and user’s guide.Biopolymers 61:127–141
34 Chen X, Liu M, Gilson MK (2001)BindingDB: a web-accessible molecularrecognition database. Comb. Chem. HighThroughput Screen. 4:719–725
35 Chen X, Lin Y, Liu M, Gilson MK (2002) TheBinding Database: data management andinterface design. Bioinformatics. 18:130–139
36 Wheeler DL, Church DM, Federhen S, LashAE, Madden TL, Pontius JU, Schuler GD,Schriml LM, Sequeira E, Tatusova TA,Wagner L (2003) Database resources of theNational Center for Biotechnology. NucleicAcids Res. 31:28–33
37 Boeckmann B, Bairoch A, Apweiler R, BlatterMC, Estreicher A, Gasteiger E, Martin MJ,Michoud K, O’Donovan C, Phan I, Pilbout S,Schneider M (2003) The SWISS-PROTprotein knowledgebase and its supplementTrEMBL in 2003. Nucleic Acids Res31:365–370
38 Ellis LB, Hershberger CD, Bryan EM,Wackett LP (2001) The University ofMinnesota Biocatalysis/BiodegradationDatabase: emphasizing enzymes. NucleicAcids Res. 29:340–343
39 Schomburg I, Chang A, Hofmann O, EbelingC, Ehrentreich F, Schomburg D (2002)BRENDA: a resource for enzyme data andmetabolic information. Trends Biochem. Sci.27:54–56
40 Kel-Margoulis OV, Romashchenko AG,Kolchanov NA, Wingender E, Kel AE (2000)COMPEL: a database on composite regulatoryelements providing combinatorialtranscriptional regulation. Nucleic Acids Res.28:311–315
41 Takai-Igarashi T, Nadaoka Y, Kaminuma T(1998) A database for cell signaling networks.J. Comput. Biol. 5:747–754
42 Eeckman FH, Durbin R (1995) ACeDB andmacace. Methods Cell Biol. 48:583–605
43 Dwight SS, Harris MA, Dolinski K, Ball CA,Binkley G, Christie KR, Fisk DG, Issel-TarverL, Schroeder M, Sherlock G, Sethuraman A,Weng S, Botstein D, Cherry JM (2002)Saccharomyces Genome Database (SGD)provides secondary gene annotation using theGene Ontology (GO). Nucleic Acids Res.30:69–72
44 Xenarios I, Salwinski L, Duan XJ, Higney P,Kim SM, Eisenberg D (2002) DIP, theDatabase of Interacting Proteins: a researchtool for studying cellular networks of proteininteractions. Nucleic Acids Res. 30:303–305
45 Baranov PV, Kubarenko AV, Gurvich OL,Shamolina TA, Brimacombe R (1999) TheDatabase of Ribosomal Cross-links: anupdate. Nucleic Acids Res. 27:184–185
46 Robison K, McGuire AM, Church GM (1998)A comprehensive library of DNA-binding sitematrices for 55 proteins applied to thecomplete Escherichia coli K-12 genome. J.Mol. Biol. 284:241–254
47 Hofmann K, Bucher P, Falquet L, Bairoch A(1999) The PROSITE database, its status in1999. Nucleic Acids Res. 27:215–219
48 Karp PD, Riley M, Saier M, Paulsen IT,Collado-Vides J, Paley SM, Pellegrini-Toole A,Bonavides C, Gama-Castro S (2002) TheEcoCyc Database. Nucleic Acids Res.30:56–58
49 Selkov E, Basmanova S, Gaasterland T,Goryanin I, Gretchkin Y, Maltsev N,Nenashev V, Overbeek R, Panyushkina E,Pronevitch L, Selkov E, Jr., Yunus I (1996)The metabolic pathway collection from EMP:the enzymes and metabolic pathwaysdatabase. Nucleic Acids Res. 24:26–28
50 Bairoch A (2000) The ENZYME database in2000. Nucleic Acids Res. 28:304–305
51 Schonbach C, Koh JL, Sheng X, Wong L,Brusic V (2000) FIMM, a database offunctional molecular immunology. NucleicAcids Res. 28:222–224
52 Sanchez C, Lachaize C, Janody F, Bellon B,Roder L, Euzenat J, Rechenmann F, Jacq B(1999) Grasping at molecular interactions andgenetic networks in Drosophila melanogasterusing FlyNets, an Internet database. NucleicAcids Res. 27:89–94
53 Kolpakov FA, Ananko EA, Kolesov GB,Kolchanov NA (1998) GeneNet: a genenetwork database and its automatedvisualization. Bioinformatics. 14:529–537
54 Kolpakov FA, Ananko EA (1999) Interactivedata input into the GeneNet database.Bioinformatics. 15:713–714
55 Serov VN, Spirov AV, Samsonova MG (1998)Graphical interface to the genetic networkdatabase GeNet. Bioinformatics. 14:546–547
56 Breitkreutz BJ, Stark C, Tyers M (2003) TheGRID: the General Repository for InteractionDatasets. Genome Biol. 4:R23
458 References
57 Korber B, Brander C, Haynes B, Koup R,Moore J, Walker B (1998) HIV MolecularImmunology Database 1998. TheoreticalBiology and Biophysics Group, Los AlamosNational Laboratory, Los Alamos, NM
58 Peri S, Navarro JD, Amanchy R, KristiansenTZ, Jonnalagadda CK, Surendranath V,Niranjan V, Muthusamy B, Gandhi TK,Gronborg M, Ibarrola N, Deshpande N,Shanker K, Shivashankar HN, Rashmi BP,Ramya MA, Zhao Z, Chandrika KN, PadmaN, Harsha HC, Yatish AJ, Kavitha MP,Menezes M, Choudhury DR, Suresh S, GhoshN, Saravana R, Chandran S, Krishna S, Joy M,Anand SK, Madavan V, Joseph A, Wong GW,Schiemann WP, Constantinescu SN, HuangL, Khosravi-Far R, Steen H, Tewari M,Ghaffari S, Blobe GC, Dang CV, Garcia JG,Pevsner J, Jensen ON, Roepstorff P,Deshpande KS, Chinnaiyan AM, Hamosh A,Chakravarti A, Pandey A (2003) Developmentof Human Protein Reference Database as aninitial platform for approaching systemsbiology in humans. Genome Res13:2363–2371
59 Spirov AV, Bowler T, Reinitz J (2000) HOXPro: a specialized database for clusters andnetworks of homeobox genes. Nucleic AcidsRes. 28:337–340
60 Perler FB (2000) InBase, the Intein Database.Nucleic Acids Res. 28:344–345
61 Hermjakob H, Montecchi-Palazzi L,Lewington C, Mudali S, Kerrien S, Orchard S,Vingron M, Roechert B, Roepstorff P,Valencia A, Margalit H, Armstrong J, BairochA, Cesareni G, Sherman D, Apweiler R (2004)IntAct: an open source molecular-interactiondatabase. Nucleic Acids Res 32:D452–D455
62 Ho Y, Gruhler A, Heilbut A, Bader GD,Moore L, Adams SL, Millar A, Taylor P,Bennett K, Boutilier K, Yang L, Wolting C,Donaldson I, Schandorff S, Shewnarane J, VoM, Taggart J, Goudreault M, Muskat B,Alfarano C, Dewar D, Lin Z, Michalickova K,Willems AR, Sassi H, Nielsen PA, RasmussenKJ, Andersen JR, Johansen LE, Hansen LH,Jespersen H, Podtelejnikov A, Nielsen E,Crawford J, Poulsen V, Sorensen BD,Matthiesen J, Hendrickson RC, Gleeson F,Pawson T, Moran MF, Durocher D, Mann M,Hogue CW, Figeys D, Tyers M (2002)Systematic identification of protein complexesin Saccharomyces cerevisiae by massspectrometry. Nature 415:180–183
63 Gavin AC, Bosche M, Krause R, Grandi P,Marzioch M, Bauer A, Schultz J, Rick JM,Michon AM, Cruciat CM, Remor M, HofertC, Schelder M, Brajenovic M, Ruffner H,Merino A, Klein K, Hudak M, Dickson D,Rudi T, Gnau V, Bauch A, Bastuck S, HuhseB, Leutwein C, Heurtier MA, Copley RR,Edelmann A, Querfurth E, Rybin V, DrewesG, Raida M, Bouwmeester T, Bork P,Seraphin B, Kuster B, Neubauer G, Superti-Furga G (2002) Functional organization of theyeast proteome by systematic analysis ofprotein complexes. Nature 415:141–147
64 Eilbeck K, Brass A, Paton N, Hodgman C(1999) INTERACT: an object orientedprotein–protein interaction database.Ismb.:87–94
65 Baisnee PF, Pollastri G, Pecout Y, Nowick J,Baldi P (2002) ICBS: A Database ofProtein–Protein Interactions Mediated byInterchain Beta-Sheet Formation. 10thInternational Conference on IntelligentSystems for Molecular Biology (ISMB)
66 Blythe MJ, Doytchinova IA, Flower DR (2002)JenPep: a database of quantitative functionalpeptide data for immunology. Bioinformatics.18:434–439
67 Kanehisa M, Goto S, Kawashima S, Okuno Y,Hattori M (2004) The KEGG resource fordeciphering the genome. Nucleic Acids Res32 Database issue:D277–D280
68 Kohn KW (1999) Molecular interaction mapof the mammalian cell cycle control and DNArepair systems. Mol. Biol. Cell 10:2703–2734
69 Castagnetto JM, Hennessy SW, Roberts VA,Getzoff ED, Tainer JA, Pique ME (2002)MDB: the Metalloprotein Database andBrowser at The Scripps Research Institute.Nucleic Acids Res. 30:379–382
70 Brusic V, Rudy G, Harrison LC (1998)MHCPEP, a database of MHC-bindingpeptides: update 1997. Nucleic Acids Res.26:368–371
71 Zanzoni A, Montecchi-Palazzi L, QuondamM, Ausiello G, Helmer-Citterich M, CesareniG (2002) MINT: a Molecular-interactiondatabase. FEBS Lett. 513:135–140
72 Mewes HW, Frishman D, Guldener U,Mannhaupt G, Mayer K, Mokrejs M,Morgenstern B, Munsterkotter M, Rudd S,Weil B (2002) MIPS: a database for genomesand protein sequences. Nucleic Acids Res.30:31–34
459References
73 Wang Y, Anderson JB, Chen J, Geer LY, HeS, Hurwitz DI, Liebert CA, Madej T, MarchlerGH, Marchler-Bauer A, Panchenko AR,Shoemaker BA, Song JS, Thiessen PA,Yamashita RA, Bryant SH (2002) MMDB:Entrez’s 3D-structure database. Nucleic AcidsRes. 30:249–252
74 Ghosh D (2000) Object-oriented transcriptionfactors database (ooTFD). Nucleic Acids Res.28:308–310
75 Crasto C, Marenco L, Miller P, Shepherd G(2002) Olfactory Receptor Database: ametadata-driven automated population fromsources of gene and protein sequences.Nucleic Acids Res. 30:354–360
76 Demir E, Babur O, Dogrusoz U, Gursoy A,Nisanci G, Cetin-Atalay R, Ozturk M (2002)PATIKA: an integrated visual environmentfor collaborative construction and analysis ofcellular pathways. Bioinformatics.18:996–1003
77 Kreegipuu A, Blom N, Brunak S (1999)PhosphoBase, a database of phosphorylationsites: release 2.0. Nucleic Acids Res.27:237–239
78 Hendlich M, Bergner A, Gunther J, Klebe G(2003) Relibase: design and development of adatabase for comprehensive analysis ofprotein–ligand interactions. J Mol Biol326:607–620
79 Salgado H, Santos-Zavaleta A, Gama-CastroS, Millan-Zarate D, Diaz-Peredo E, Sanchez-Solano F, Perez-Rueda E, Bonavides-MartinezC, Collado-Vides J (2001) RegulonDB (version3.2): transcriptional regulation and operonorganization in Escherichia coli K-12. NucleicAcids Res. 29:72–74
80 Salgado H, Gama-Castro S, Martinez-AntonioA, Diaz-Peredo E, Sanchez-Solano F, Peralta-Gil M, Garcia-Alonso D, Jimenez-Jacinto V,Santos-Zavaleta A, Bonavides-Martinez C,Collado-Vides J (2004) RegulonDB (version4.0): transcriptional regulation, operonorganization and growth conditions inEscherichia coli K-12. Nucleic Acids Res 32Database issue:D303–D306
81 Ponomarenko JV, Orlova GV, Frolov AS,Gelfand MS, Ponomarenko MP (2002)SELEX_DB: a database on in vitro selectedoligomers adapted for recognizing naturalsites and for analyzing both SNPs and site-directed mutagenesis data. Nucleic Acids Res.30:195–199
82 Nayal M, Hitz BC, Honig B (1999) GRASS: aserver for the graphical representation andanalysis of structures. Protein Sci. 8:676–679
83 Gough NR, Ray LB (2002) Mapping cellularsignaling. Sci. STKE. 2002:EG8
84 Rammensee H, Bachmann J, Emmerich NP,Bachor OA, Stevanovic S (1999) SYFPEITHI:database for MHC ligands and peptidemotifs. Immunogenetics 50:213–219
85 Wingender E, Chen X, Fricke E, Geffers R,Hehl R, Liebich I, Krull M, Matys V, MichaelH, Ohnhauser R, Pruss M, Schacherer F,Thiele S, Urbach S (2001) The TRANSFACsystem on gene expression regulation.Nucleic Acids Res. 29:281–283
86 Kolchanov NA, Ignatieva EV, Ananko EA,Podkolodnaya OA, Stepanenko IL, MerkulovaTI, Pozdnyakov MA, Podkolodny NL,Naumochkin AN, Romashchenko AG (2002)Transcription Regulatory Regions Database(TRRD): its status in 2002. Nucleic Acids Res.30:312–317
87 Overbeek R, Larsen N, Pusch GD, D’SouzaM, Selkov E, Jr, Kyrpides N, Fonstein M,Maltsev N, Selkov E (2000) WIT: integratedsystem for high-throughput genomesequence analysis and metabolicreconstruction. Nucleic Acids Res 28:123–125
88 Costanzo MC, Crawford ME, Hirschman JE,Kranz JE, Olsen P, Robertson LS, SkrzypekMS, Braun BR, Hopkins KL, Kondu P,Lengieza C, Lew-Smith JE, Tillberg M,Garrels JI (2001) YPD, PombePD andWormPD: model organism volumes of theBioKnowledge library, an integrated resourcefor protein information. Nucleic Acids Res.29:75–79

461
Ming Chen, Andreas Freier, and Ralf Hofestädt
19.1
Introduction
In living organisms metabolism is neces-sary to sustain life and for reproduction.Metabolism, defined as the sum of all thechemical transformations taking place in acell or organism, occurs in a series of en-zyme-catalyzed reactions that constitutemetabolic pathways [1]. To survive andgrow, cells must be able to reproduce thewhole cell and replace its constituent parts,and to perform a varying range of chemicalfunctions. To perform these chemical func-tions the cell uses biomolecules called pro-teins, which are encoded in the DNA. DNAis a long, threadlike molecule with theshape of a double helix, made up of con-nected subunits called nucleotides. The se-quences of DNA that code for proteins arecalled genes. To synthesize a protein from agene the DNA must first be transcribedinto RNA. When the RNA has been copied,proteins can be produced from the se-quence in a process called translation. Aprotein is made up of amino acids. For eachamino acid there is at least one correspond-ing triplet of nucleotides, called a codon.During the translation process, the strand
of RNA is read in frames of length three,each time adding an amino acid to thegrowing protein sequence. The proteinswhich carry out the functions of breakingdown and synthesizing new biochemicalsare called enzymes, each of which usuallycatalyzes only one type of reaction. We canthen have a series of reactions. Many mole-cules involved in one reaction can also befound in other reactions in which the mole-cules act as substrate, activator, or repres-sor, thus forming a densely connected, in-tricate and precisely regulated reaction net-work. Thousands of enzyme-catalyzed reac-tions occur every second in a living cell. Thenetwork of reactions is very large and com-plex. This metabolic network enables livingorganisms to synthesize, interconvert, andbreakdown molecules required by the cell.
Some genes code for proteins that turnother genes on and off. Groups of thesegenes constitute networks with complex be-havior. These networks control other geneswhose protein products catalyze specific bi-ochemical reactions, and the small mole-cules that are substrates or products ofthese reactions can in turn activate or deac-tivate proteins that control transcription ortranslation. For this reason gene regulation
Handbook of Genome Research. Genomics, Proteomics, Metabolomics, Bioinformatics, Ethical and Legal Issues.Edited by Christoph W. SensenCopyright © 2005 WILEY-VCH Verlag GmbH & Co. KGaA, WeinheimISBN: 3-527-31348-6
19Bioinformatics Approaches for Metabolic Pathways
Verwendete Mac Distiller 5.0.x Joboptions
Dieser Report wurde automatisch mit Hilfe der Adobe Acrobat Distiller Erweiterung "Distiller Secrets v1.0.5" der IMPRESSED GmbH erstellt. Sie koennen diese Startup-Datei für die Distiller Versionen 4.0.5 und 5.0.x kostenlos unter http://www.impressed.de herunterladen. ALLGEMEIN ---------------------------------------- Dateioptionen: Kompatibilität: PDF 1.3 Für schnelle Web-Anzeige optimieren: Ja Piktogramme einbetten: Ja Seiten automatisch drehen: Nein Seiten von: 1 Seiten bis: Alle Seiten Bund: Links Auflösung: [ 2400 2400 ] dpi Papierformat: [ 481 680 ] Punkt KOMPRIMIERUNG ---------------------------------------- Farbbilder: Downsampling: Nein Komprimieren: Ja Komprimierungsart: ZIP Bitanzahl pro Pixel: 8 Bit Graustufenbilder: Downsampling: Nein Komprimieren: Ja Komprimierungsart: ZIP Bitanzahl pro Pixel: 8 Bit Schwarzweiß-Bilder: Downsampling: Nein Komprimieren: Ja Komprimierungsart: CCITT CCITT-Gruppe: 4 Graustufen glätten: Nein Text und Vektorgrafiken komprimieren: Ja SCHRIFTEN ---------------------------------------- Alle Schriften einbetten: Ja Untergruppen aller eingebetteten Schriften: Nein Wenn Einbetten fehlschlägt: Abbrechen Einbetten: Immer einbetten: [ /Courier-BoldOblique /Helvetica-BoldOblique /Courier /Helvetica-Bold /Times-Bold /Courier-Bold /Helvetica /Times-BoldItalic /Times-Roman /ZapfDingbats /Times-Italic /Helvetica-Oblique /Courier-Oblique /Symbol ] Nie einbetten: [ ] FARBE(N) ---------------------------------------- Farbmanagement: Farbumrechnungsmethode: Farbe nicht ändern Methode: Standard Geräteabhängige Daten: Einstellungen für Überdrucken beibehalten: Ja Unterfarbreduktion und Schwarzaufbau beibehalten: Ja Transferfunktionen: Beibehalten Rastereinstellungen beibehalten: Nein ERWEITERT ---------------------------------------- Optionen: Prolog/Epilog verwenden: Nein PostScript-Datei darf Einstellungen überschreiben: Nein Level 2 copypage-Semantik beibehalten: Ja Portable Job Ticket in PDF-Datei speichern: Ja Illustrator-Überdruckmodus: Ja Farbverläufe zu weichen Nuancen konvertieren: Ja ASCII-Format: Nein Document Structuring Conventions (DSC): DSC-Kommentare verarbeiten: Ja DSC-Warnungen protokollieren: Nein Für EPS-Dateien Seitengröße ändern und Grafiken zentrieren: Ja EPS-Info von DSC beibehalten: Ja OPI-Kommentare beibehalten: Nein Dokumentinfo von DSC beibehalten: Ja ANDERE ---------------------------------------- Distiller-Kern Version: 5000 ZIP-Komprimierung verwenden: Ja Optimierungen deaktivieren: Nein Bildspeicher: 524288 Byte Farbbilder glätten: Nein Graustufenbilder glätten: Nein Bilder (< 257 Farben) in indizierten Farbraum konvertieren: Ja sRGB ICC-Profil: sRGB IEC61966-2.1 ENDE DES REPORTS ---------------------------------------- IMPRESSED GmbH Bahrenfelder Chaussee 49 22761 Hamburg, Germany Tel. +49 40 897189-0 Fax +49 40 897189-71 Email: [email protected] Web: www.impressed.de
Adobe Acrobat Distiller 5.0.x Joboption Datei
<< /ColorSettingsFile () /LockDistillerParams true /DetectBlends true /DoThumbnails true /AntiAliasMonoImages false /MonoImageDownsampleType /Bicubic /GrayImageDownsampleType /Bicubic /MaxSubsetPct 100 /MonoImageFilter /CCITTFaxEncode /ColorImageDownsampleThreshold 1.5 /GrayImageFilter /FlateEncode /ColorConversionStrategy /LeaveColorUnchanged /CalGrayProfile (Dot Gain 20%) /ColorImageResolution 300 /UsePrologue false /MonoImageResolution 1200 /ColorImageDepth 8 /sRGBProfile (sRGB IEC61966-2.1) /PreserveOverprintSettings true /CompatibilityLevel 1.3 /UCRandBGInfo /Preserve /EmitDSCWarnings false /CreateJobTicket true /DownsampleMonoImages false /DownsampleColorImages false /MonoImageDict << /K -1 >> /ColorImageDownsampleType /Bicubic /GrayImageDict << /HSamples [ 2 1 1 2 ] /VSamples [ 2 1 1 2 ] /Blend 1 /QFactor 0.9 >> /CalCMYKProfile (U.S. Web Coated (SWOP) v2) /ParseDSCComments true /PreserveEPSInfo true /MonoImageDepth -1 /AutoFilterGrayImages false /SubsetFonts false /GrayACSImageDict << /HSamples [ 2 1 1 2 ] /VSamples [ 2 1 1 2 ] /Blend 1 /QFactor 0.9 >> /ColorImageFilter /FlateEncode /AutoRotatePages /None /PreserveCopyPage true /EncodeMonoImages true /ASCII85EncodePages false /PreserveOPIComments false /NeverEmbed [ ] /ColorImageDict << /HSamples [ 2 1 1 2 ] /VSamples [ 2 1 1 2 ] /Blend 1 /QFactor 0.9 >> /AntiAliasGrayImages false /GrayImageDepth 8 /CannotEmbedFontPolicy /Error /EndPage -1 /TransferFunctionInfo /Preserve /CalRGBProfile (sRGB IEC61966-2.1) /EncodeColorImages true /EncodeGrayImages true /ColorACSImageDict << /HSamples [ 2 1 1 2 ] /VSamples [ 2 1 1 2 ] /Blend 1 /QFactor 0.9 >> /Optimize true /ParseDSCCommentsForDocInfo true /GrayImageDownsampleThreshold 1.5 /MonoImageDownsampleThreshold 1.5 /AutoPositionEPSFiles true /GrayImageResolution 300 /AutoFilterColorImages false /AlwaysEmbed [ /Courier-BoldOblique /Helvetica-BoldOblique /Courier /Helvetica-Bold /Times-Bold /Courier-Bold /Helvetica /Times-BoldItalic /Times-Roman /ZapfDingbats /Times-Italic /Helvetica-Oblique /Courier-Oblique /Symbol ] /ImageMemory 524288 /OPM 1 /DefaultRenderingIntent /Default /EmbedAllFonts true /StartPage 1 /DownsampleGrayImages false /AntiAliasColorImages false /ConvertImagesToIndexed true /PreserveHalftoneInfo false /CompressPages true /Binding /Left >> setdistillerparams << /PageSize [ 595.276 841.890 ] /HWResolution [ 2400 2400 ] >> setpagedevice
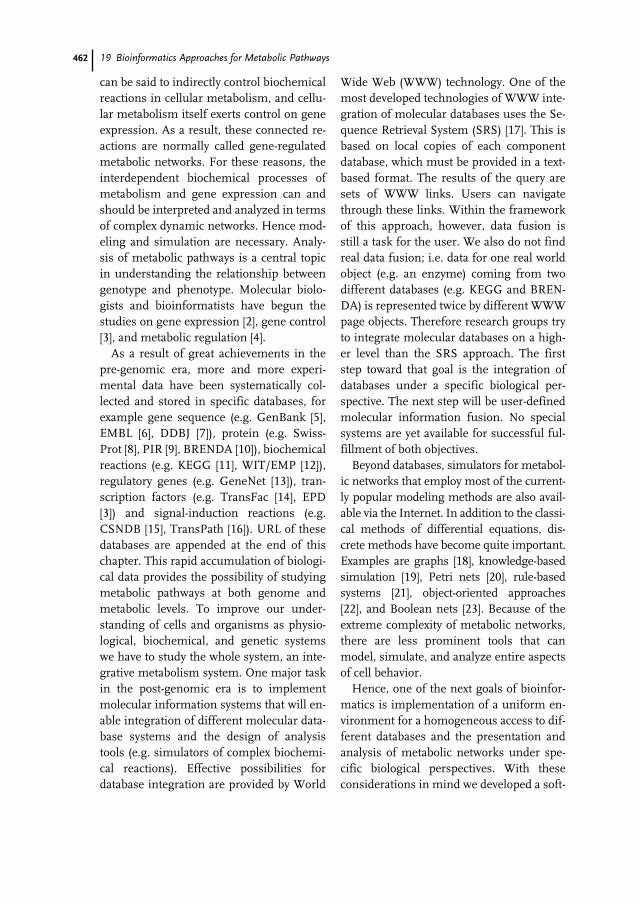
462 19 Bioinformatics Approaches for Metabolic Pathways
can be said to indirectly control biochemicalreactions in cellular metabolism, and cellu-lar metabolism itself exerts control on geneexpression. As a result, these connected re-actions are normally called gene-regulatedmetabolic networks. For these reasons, theinterdependent biochemical processes ofmetabolism and gene expression can andshould be interpreted and analyzed in termsof complex dynamic networks. Hence mod-eling and simulation are necessary. Analy-sis of metabolic pathways is a central topicin understanding the relationship betweengenotype and phenotype. Molecular biolo-gists and bioinformatists have begun thestudies on gene expression [2], gene control[3], and metabolic regulation [4].
As a result of great achievements in thepre-genomic era, more and more experi-mental data have been systematically col-lected and stored in specific databases, forexample gene sequence (e.g. GenBank [5],EMBL [6], DDBJ [7]), protein (e.g. Swiss-Prot [8], PIR [9], BRENDA [10]), biochemicalreactions (e.g. KEGG [11], WIT/EMP [12]),regulatory genes (e.g. GeneNet [13]), tran-scription factors (e.g. TransFac [14], EPD[3]) and signal-induction reactions (e.g.CSNDB [15], TransPath [16]). URL of thesedatabases are appended at the end of thischapter. This rapid accumulation of biologi-cal data provides the possibility of studyingmetabolic pathways at both genome andmetabolic levels. To improve our under-standing of cells and organisms as physio-logical, biochemical, and genetic systemswe have to study the whole system, an inte-grative metabolism system. One major taskin the post-genomic era is to implementmolecular information systems that will en-able integration of different molecular data-base systems and the design of analysistools (e.g. simulators of complex biochemi-cal reactions). Effective possibilities fordatabase integration are provided by World
Wide Web (WWW) technology. One of themost developed technologies of WWW inte-gration of molecular databases uses the Se-quence Retrieval System (SRS) [17]. This isbased on local copies of each componentdatabase, which must be provided in a text-based format. The results of the query aresets of WWW links. Users can navigatethrough these links. Within the frameworkof this approach, however, data fusion isstill a task for the user. We also do not findreal data fusion; i.e. data for one real worldobject (e.g. an enzyme) coming from twodifferent databases (e.g. KEGG and BREN-DA) is represented twice by different WWWpage objects. Therefore research groups tryto integrate molecular databases on a high-er level than the SRS approach. The firststep toward that goal is the integration ofdatabases under a specific biological per-spective. The next step will be user-definedmolecular information fusion. No specialsystems are yet available for successful ful-fillment of both objectives.
Beyond databases, simulators for metabol-ic networks that employ most of the current-ly popular modeling methods are also avail-able via the Internet. In addition to the classi-cal methods of differential equations, dis-crete methods have become quite important.Examples are graphs [18], knowledge-basedsimulation [19], Petri nets [20], rule-basedsystems [21], object-oriented approaches[22], and Boolean nets [23]. Because of theextreme complexity of metabolic networks,there are less prominent tools that canmodel, simulate, and analyze entire aspectsof cell behavior.
Hence, one of the next goals of bioinfor-matics is implementation of a uniform en-vironment for a homogeneous access to dif-ferent databases and the presentation andanalysis of metabolic networks under spe-cific biological perspectives. With theseconsiderations in mind we developed a soft-
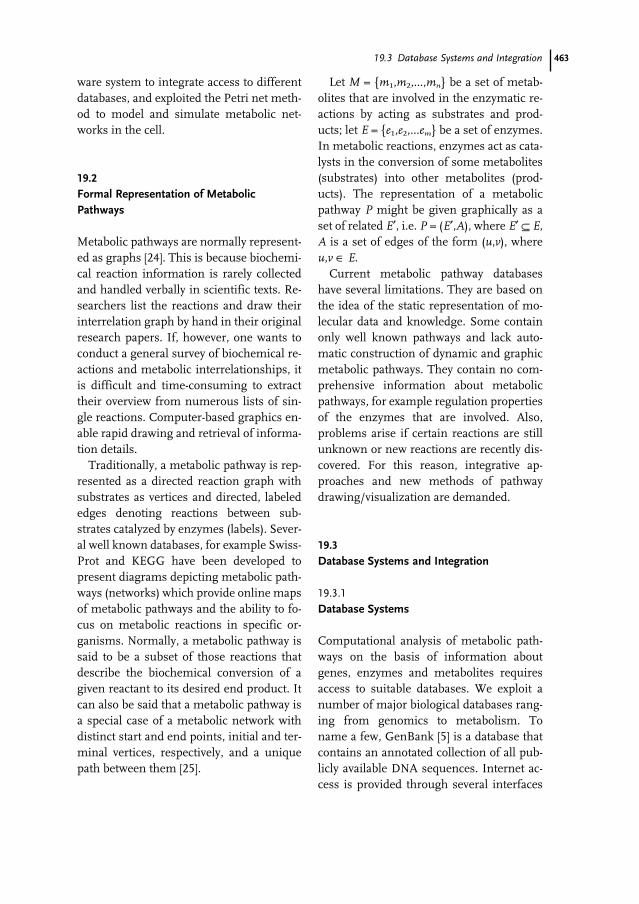
46319.3 Database Systems and Integration
ware system to integrate access to differentdatabases, and exploited the Petri net meth-od to model and simulate metabolic net-works in the cell.
19.2
Formal Representation of Metabolic Pathways
Metabolic pathways are normally represent-ed as graphs [24]. This is because biochemi-cal reaction information is rarely collectedand handled verbally in scientific texts. Re-searchers list the reactions and draw theirinterrelation graph by hand in their originalresearch papers. If, however, one wants toconduct a general survey of biochemical re-actions and metabolic interrelationships, itis difficult and time-consuming to extracttheir overview from numerous lists of sin-gle reactions. Computer-based graphics en-able rapid drawing and retrieval of informa-tion details.
Traditionally, a metabolic pathway is rep-resented as a directed reaction graph withsubstrates as vertices and directed, labelededges denoting reactions between sub-strates catalyzed by enzymes (labels). Sever-al well known databases, for example Swiss-Prot and KEGG have been developed topresent diagrams depicting metabolic path-ways (networks) which provide online mapsof metabolic pathways and the ability to fo-cus on metabolic reactions in specific or-ganisms. Normally, a metabolic pathway issaid to be a subset of those reactions thatdescribe the biochemical conversion of agiven reactant to its desired end product. Itcan also be said that a metabolic pathway isa special case of a metabolic network withdistinct start and end points, initial and ter-minal vertices, respectively, and a uniquepath between them [25].
Let M = {m1,m2,...,mn} be a set of metab-olites that are involved in the enzymatic re-actions by acting as substrates and prod-ucts; let E = {e1,e2,...em} be a set of enzymes.In metabolic reactions, enzymes act as cata-lysts in the conversion of some metabolites(substrates) into other metabolites (prod-ucts). The representation of a metabolicpathway P might be given graphically as aset of related E′, i.e. P = (E′,A), where E′ ⊆ E,A is a set of edges of the form (u,v), whereu,v ∈ E.
Current metabolic pathway databaseshave several limitations. They are based onthe idea of the static representation of mo-lecular data and knowledge. Some containonly well known pathways and lack auto-matic construction of dynamic and graphicmetabolic pathways. They contain no com-prehensive information about metabolicpathways, for example regulation propertiesof the enzymes that are involved. Also,problems arise if certain reactions are stillunknown or new reactions are recently dis-covered. For this reason, integrative ap-proaches and new methods of pathwaydrawing/visualization are demanded.
19.3
Database Systems and Integration
19.3.1
Database Systems
Computational analysis of metabolic path-ways on the basis of information aboutgenes, enzymes and metabolites requiresaccess to suitable databases. We exploit anumber of major biological databases rang-ing from genomics to metabolism. Toname a few, GenBank [5] is a database thatcontains an annotated collection of all pub-licly available DNA sequences. Internet ac-cess is provided through several interfaces
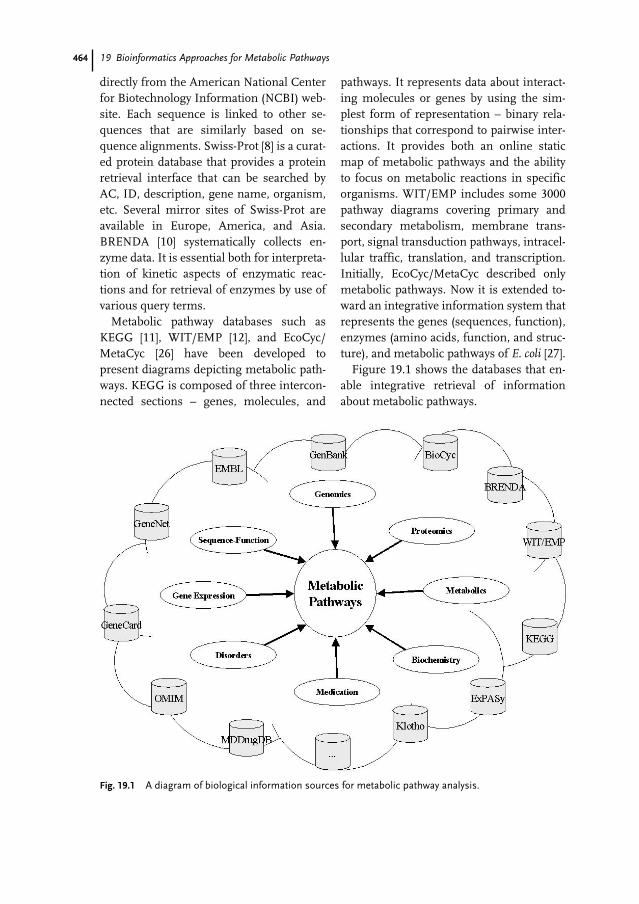
464 19 Bioinformatics Approaches for Metabolic Pathways
directly from the American National Centerfor Biotechnology Information (NCBI) web-site. Each sequence is linked to other se-quences that are similarly based on se-quence alignments. Swiss-Prot [8] is a curat-ed protein database that provides a proteinretrieval interface that can be searched byAC, ID, description, gene name, organism,etc. Several mirror sites of Swiss-Prot areavailable in Europe, America, and Asia.BRENDA [10] systematically collects en-zyme data. It is essential both for interpreta-tion of kinetic aspects of enzymatic reac-tions and for retrieval of enzymes by use ofvarious query terms.
Metabolic pathway databases such asKEGG [11], WIT/EMP [12], and EcoCyc/MetaCyc [26] have been developed topresent diagrams depicting metabolic path-ways. KEGG is composed of three intercon-nected sections – genes, molecules, and
pathways. It represents data about interact-ing molecules or genes by using the sim-plest form of representation – binary rela-tionships that correspond to pairwise inter-actions. It provides both an online staticmap of metabolic pathways and the abilityto focus on metabolic reactions in specificorganisms. WIT/EMP includes some 3000pathway diagrams covering primary andsecondary metabolism, membrane trans-port, signal transduction pathways, intracel-lular traffic, translation, and transcription.Initially, EcoCyc/MetaCyc described onlymetabolic pathways. Now it is extended to-ward an integrative information system thatrepresents the genes (sequences, function),enzymes (amino acids, function, and struc-ture), and metabolic pathways of E. coli [27].
Figure 19.1 shows the databases that en-able integrative retrieval of informationabout metabolic pathways.
Fig. 19.1 A diagram of biological information sources for metabolic pathway analysis.
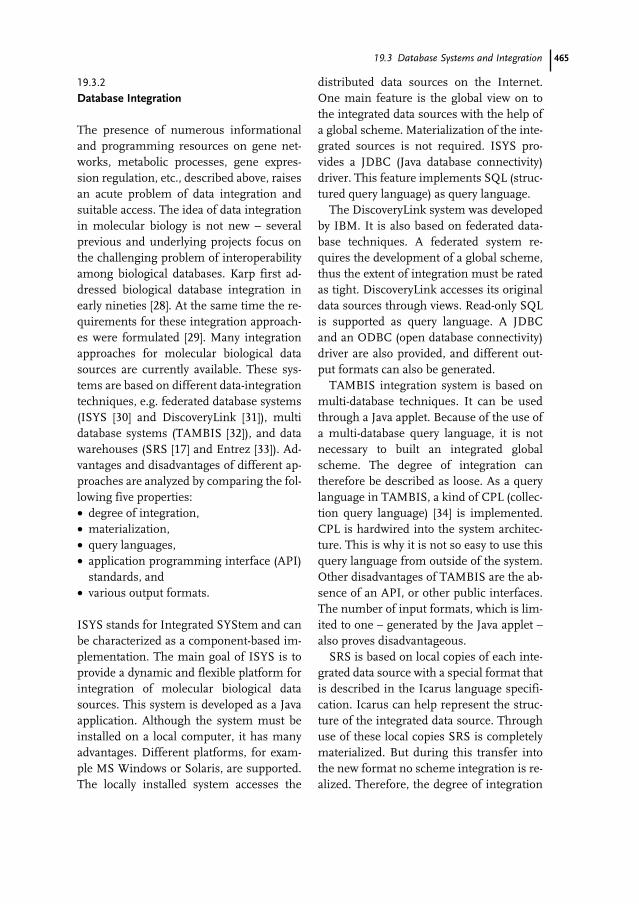
46519.3 Database Systems and Integration
19.3.2
Database Integration
The presence of numerous informationaland programming resources on gene net-works, metabolic processes, gene expres-sion regulation, etc., described above, raisesan acute problem of data integration andsuitable access. The idea of data integrationin molecular biology is not new – severalprevious and underlying projects focus onthe challenging problem of interoperabilityamong biological databases. Karp first ad-dressed biological database integration inearly nineties [28]. At the same time the re-quirements for these integration approach-es were formulated [29]. Many integrationapproaches for molecular biological datasources are currently available. These sys-tems are based on different data-integrationtechniques, e.g. federated database systems(ISYS [30] and DiscoveryLink [31]), multidatabase systems (TAMBIS [32]), and datawarehouses (SRS [17] and Entrez [33]). Ad-vantages and disadvantages of different ap-proaches are analyzed by comparing the fol-lowing five properties:• degree of integration,• materialization,• query languages,• application programming interface (API)
standards, and• various output formats.
ISYS stands for Integrated SYStem and canbe characterized as a component-based im-plementation. The main goal of ISYS is toprovide a dynamic and flexible platform forintegration of molecular biological datasources. This system is developed as a Javaapplication. Although the system must beinstalled on a local computer, it has manyadvantages. Different platforms, for exam-ple MS Windows or Solaris, are supported.The locally installed system accesses the
distributed data sources on the Internet.One main feature is the global view on tothe integrated data sources with the help ofa global scheme. Materialization of the inte-grated sources is not required. ISYS pro-vides a JDBC (Java database connectivity)driver. This feature implements SQL (struc-tured query language) as query language.
The DiscoveryLink system was developedby IBM. It is also based on federated data-base techniques. A federated system re-quires the development of a global scheme,thus the extent of integration must be ratedas tight. DiscoveryLink accesses its originaldata sources through views. Read-only SQLis supported as query language. A JDBCand an ODBC (open database connectivity)driver are also provided, and different out-put formats can also be generated.
TAMBIS integration system is based onmulti-database techniques. It can be usedthrough a Java applet. Because of the use ofa multi-database query language, it is notnecessary to built an integrated globalscheme. The degree of integration cantherefore be described as loose. As a querylanguage in TAMBIS, a kind of CPL (collec-tion query language) [34] is implemented.CPL is hardwired into the system architec-ture. This is why it is not so easy to use thisquery language from outside of the system.Other disadvantages of TAMBIS are the ab-sence of an API, or other public interfaces.The number of input formats, which is lim-ited to one – generated by the Java applet –also proves disadvantageous.
SRS is based on local copies of each inte-grated data source with a special format thatis described in the Icarus language specifi-cation. Icarus can help represent the struc-ture of the integrated data source. Throughuse of these local copies SRS is completelymaterialized. But during this transfer intothe new format no scheme integration is re-alized. Therefore, the degree of integration
466 19 Bioinformatics Approaches for Metabolic Pathways
can be characterized as loose. SRS runs on aWeb-server and is accessible via any Web-browser. An HTML interface for data quer-ies is provided and the system can be quer-ied by constructing special URLs. But noquery languages, for example SQL or OQL(object query language), are supported. SRSalso offers a C-API. Different output for-mats are possible (HTML or ACSII text).One problem with result presentation inSRS is the need to parse the outputs for afurther computer-based processing. The ab-sence of any scheme integration is also adisadvantage of the SRS system.
Similar to SRS is the Entrez system. Thissystem integrates only data sources of NCBI.No materialization of the integrated sourcesis realized. Entrez uses views onto the origi-nal sources. Consequently, scheme integra-tion could not be established. Therefore, thedegree of integration can be classified asloose. Statements used with SRS to querythe system are completely transferable toEntrez. There are no standard query lan-guages, no standardized API, or other inter-face standards like JDBC. HTML is the onlyinterface provided. Another Entrez feature isthe manual construction of special URLs.Various output formats prove to be useful.These include HTML or ASCII text, andXML and ASN.1 files. The greatest disadvan-tage of the Entrez approach is the restrictednumber of integrated data sources (onlyNCBI internal data sources) and the lack of
support of query languages. In contrast, thevarious output formats, primarily XML, areadvantageous for the use of this system.
19.3.3
Model-driven Reconstruction of MolecularNetworks
Molecular databases provide collected andstructured information about molecular ob-jects. Our approach (Fig. 19.2) aims at theintegrative and model-driven reconstruc-tion of molecular networks, whereby infor-mation from databases is used mostly auto-matically and interactively to support theprocess of systems modeling. Data integra-tion is used to overcome the problems ofdistribution and heterogeneity. In general,information about objects of our molecularmodel is spread over several databases. Ob-ject fusion is used to merge all informationabout every object into unique objects. Ac-cess to different databases and databasemanagement systems (DBMS) thus in-volves structural, syntactic, and semanticproblems which must be solved in order toprovide homogeneous access.
Biological knowledge is needed in thesecond step to model networks conceptual-ly. The modeler identifies recent types ofobject and process appearing in the biologi-cal model to create a conceptual model ofthe system under study. Conceptual modelsonly contain design principles without con-
Fig. 19.2 Model-driven reconstruction of molecular networks.
46719.3 Database Systems and Integration
crete objects or processes. All informationavailable from databases will be integratedinto the conceptual model and relativelycomplex networks will be created automati-cally. Finally, models are extracted andstudied in detail afterwards. Extraction ap-plies methods to filter specific informationfor the modelling of systems, e.g. the flowof material and parameters.
19.3.3.1
Modeling Data IntegrationIn practice, integrative modeling requireslocal availability of data. Thus, data integra-tion applied to molecular databases resultsin ad-hoc integrated databases, which aredatabases merging data collected from sev-eral databases called data sources. Media-tor-based integration has been implement-ed and applied in the past [35] to overcomethe heterogeneity of data sources. In orderto integrate and collect molecular objectsinto integrated databases, we implement atechnique similar to object fusion [36].
Each model contains an integrated data-base storing information about all elementsof the model. Data sources and integrateddatabases are both represented by databasetables. For each type of element in the mod-el a corresponding table in the integrateddatabase has to be defined.
A table is a relation r (R )⊆A1 ×A2 ×…×An,where the factors Ai define the type of eachcolumn. To integrate tuples from datasources, the modeling of mappingsbetween corresponding tables at both sitesis required. Each mapping defines the wayhow to reconstruct tables of the integrateddatabase from tables of a given data source.Let T be a set of tables in the model, D a setof datasources and Q a set of database quer-ies. A mapping m: T × D → Q is valid, if foreach element ((t,d),q) ∈ M the query q(d) de-livers a relation with the schema R of thecorresponding table. The number of map-
pings that has to be modeled depends onthe overlap of information in the data sourc-es. The modeling of separate mappings foreach source enables us to flexibly add andremove datasources.
After the specification of mappings weuse them as rules to automatically constructthe relations of the model. In the first step,the mappings are translated into a queryplan. A plan is an ordered sequence of quer-ies, which are then sent to a mediator ordirectly to the related data sources. Fig. 19.3illustrates the process of fusing the resultsets. Because the schema of the result setequals the schema of the corresponding ta-ble in the model, we are able to fuse themusing the union operation. Using this oper-ation, identical tuples from different datasources will be removed automatically.
Depending on the content, merging allinformation about a type of object usingone relation will consume a lot of memory.To avoid this, each relation only exists virtu-ally. As explained in the next section, weuse an object-oriented model to store thefused information as objects.
To give an example, we briefly explain thedefinition of mappings for enzymes asdrawn in Fig. 19.4. A table “Enzyme” dis-played in the left part of the mapping willcollect different information about en-zymes. On the right side we see tables of asingle data source containing related infor-mation. What we have to do is to definerules connecting each property of “Enzyme”with corresponding elements of the source.In short, such combinations of different ta-bles are possible, if at least all tables of amapping can be joined transitively together.
Actually, connected data sources and thebiological background change over time.Furthermore, the specification of mappingsreflecting the user’s point of view cannot becomputed automatically. Modeling data in-tegration is required and it consists in:
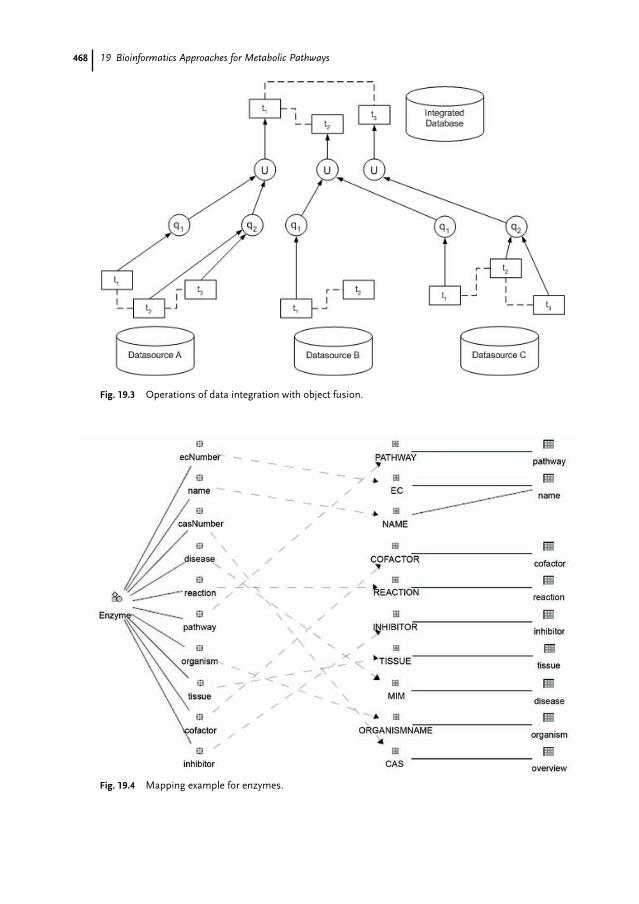
468 19 Bioinformatics Approaches for Metabolic Pathways
Fig. 19.4 Mapping example for enzymes.
Fig. 19.3 Operations of data integration with object fusion.
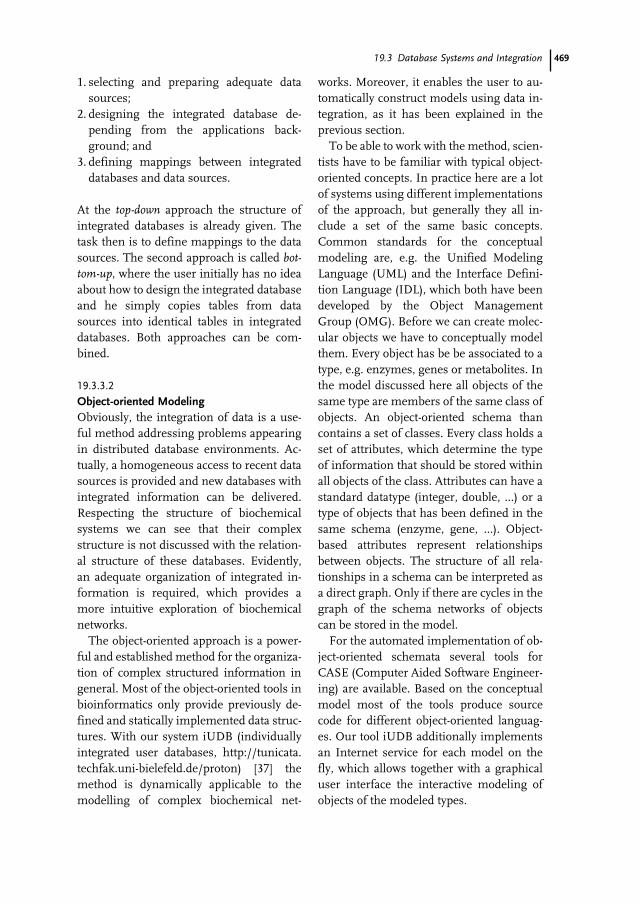
46919.3 Database Systems and Integration
1. selecting and preparing adequate datasources;
2. designing the integrated database de-pending from the applications back-ground; and
3. defining mappings between integrateddatabases and data sources.
At the top-down approach the structure ofintegrated databases is already given. Thetask then is to define mappings to the datasources. The second approach is called bot-tom-up, where the user initially has no ideaabout how to design the integrated databaseand he simply copies tables from datasources into identical tables in integrateddatabases. Both approaches can be com-bined.
19.3.3.2
Object-oriented ModelingObviously, the integration of data is a use-ful method addressing problems appearingin distributed database environments. Ac-tually, a homogeneous access to recent datasources is provided and new databases withintegrated information can be delivered.Respecting the structure of biochemicalsystems we can see that their complexstructure is not discussed with the relation-al structure of these databases. Evidently,an adequate organization of integrated in-formation is required, which provides amore intuitive exploration of biochemicalnetworks.
The object-oriented approach is a power-ful and established method for the organiza-tion of complex structured information ingeneral. Most of the object-oriented tools inbioinformatics only provide previously de-fined and statically implemented data struc-tures. With our system iUDB (individuallyintegrated user databases, http://tunicata.techfak.uni-bielefeld.de/proton) [37] themethod is dynamically applicable to themodelling of complex biochemical net-
works. Moreover, it enables the user to au-tomatically construct models using data in-tegration, as it has been explained in theprevious section.
To be able to work with the method, scien-tists have to be familiar with typical object-oriented concepts. In practice here are a lotof systems using different implementationsof the approach, but generally they all in-clude a set of the same basic concepts.Common standards for the conceptualmodeling are, e.g. the Unified ModelingLanguage (UML) and the Interface Defini-tion Language (IDL), which both have beendeveloped by the Object ManagementGroup (OMG). Before we can create molec-ular objects we have to conceptually modelthem. Every object has be be associated to atype, e.g. enzymes, genes or metabolites. Inthe model discussed here all objects of thesame type are members of the same class ofobjects. An object-oriented schema thancontains a set of classes. Every class holds aset of attributes, which determine the typeof information that should be stored withinall objects of the class. Attributes can have astandard datatype (integer, double, …) or atype of objects that has been defined in thesame schema (enzyme, gene, …). Object-based attributes represent relationshipsbetween objects. The structure of all rela-tionships in a schema can be interpreted asa direct graph. Only if there are cycles in thegraph of the schema networks of objectscan be stored in the model.
For the automated implementation of ob-ject-oriented schemata several tools forCASE (Computer Aided Software Engineer-ing) are available. Based on the conceptualmodel most of the tools produce sourcecode for different object-oriented languag-es. Our tool iUDB additionally implementsan Internet service for each model on thefly, which allows together with a graphicaluser interface the interactive modeling ofobjects of the modeled types.
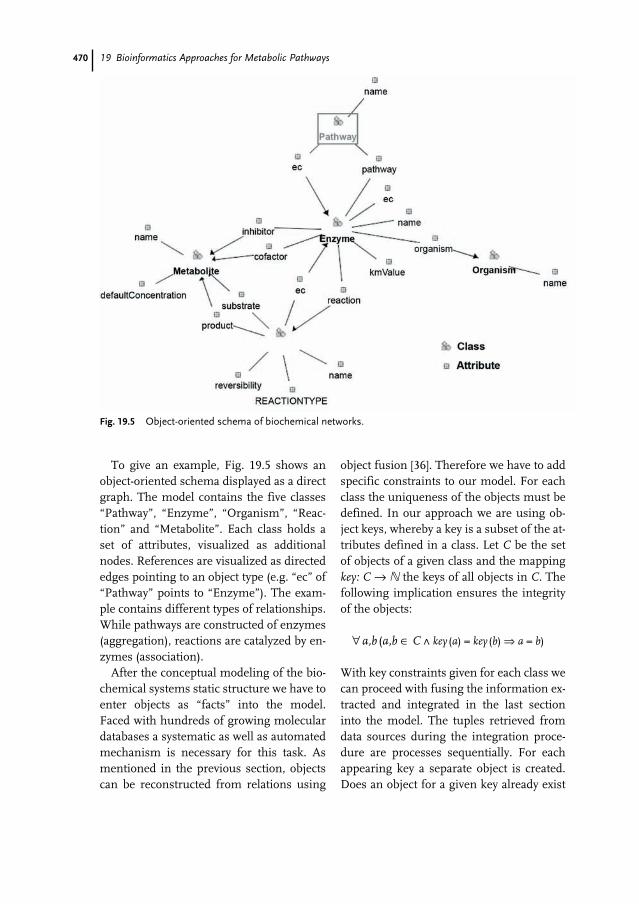
470 19 Bioinformatics Approaches for Metabolic Pathways
To give an example, Fig. 19.5 shows anobject-oriented schema displayed as a directgraph. The model contains the five classes“Pathway”, “Enzyme”, “Organism”, “Reac-tion” and “Metabolite”. Each class holds aset of attributes, visualized as additionalnodes. References are visualized as directededges pointing to an object type (e.g. “ec” of“Pathway” points to “Enzyme”). The exam-ple contains different types of relationships.While pathways are constructed of enzymes(aggregation), reactions are catalyzed by en-zymes (association).
After the conceptual modeling of the bio-chemical systems static structure we have toenter objects as “facts” into the model.Faced with hundreds of growing moleculardatabases a systematic as well as automatedmechanism is necessary for this task. Asmentioned in the previous section, objectscan be reconstructed from relations using
object fusion [36]. Therefore we have to addspecific constraints to our model. For eachclass the uniqueness of the objects must bedefined. In our approach we are using ob-ject keys, whereby a key is a subset of the at-tributes defined in a class. Let C be the setof objects of a given class and the mappingkey: C → � the keys of all objects in C. Thefollowing implication ensures the integrityof the objects:
∀a,b (a,b ∈ C%key (a) = key (b) ⇒ a = b)
With key constraints given for each class wecan proceed with fusing the information ex-tracted and integrated in the last sectioninto the model. The tuples retrieved fromdata sources during the integration proce-dure are processes sequentially. For eachappearing key a separate object is created.Does an object for a given key already exist
Fig. 19.5 Object-oriented schema of biochemical networks.
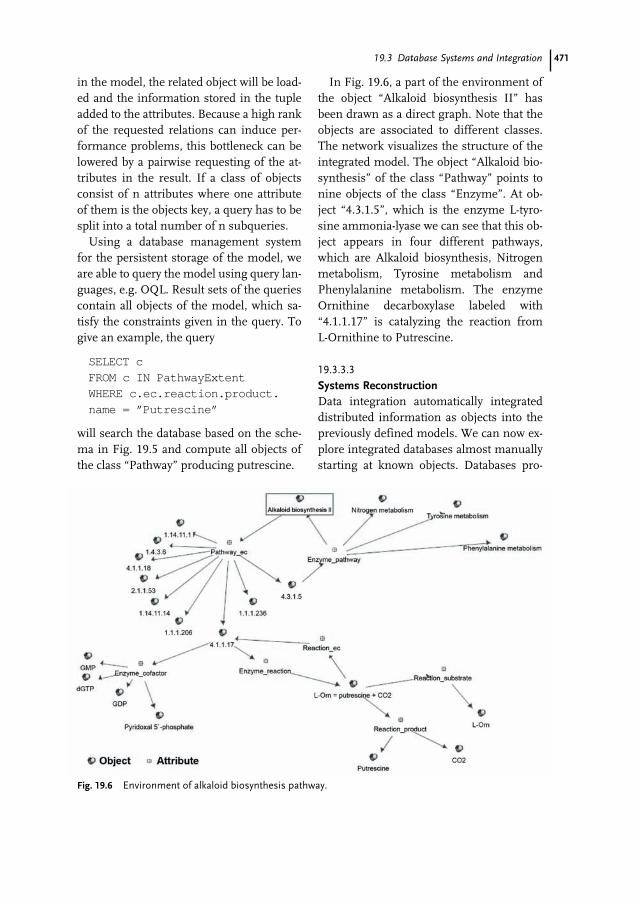
47119.3 Database Systems and Integration
in the model, the related object will be load-ed and the information stored in the tupleadded to the attributes. Because a high rankof the requested relations can induce per-formance problems, this bottleneck can belowered by a pairwise requesting of the at-tributes in the result. If a class of objectsconsist of n attributes where one attributeof them is the objects key, a query has to besplit into a total number of n subqueries.
Using a database management systemfor the persistent storage of the model, weare able to query the model using query lan-guages, e.g. OQL. Result sets of the queriescontain all objects of the model, which sa-tisfy the constraints given in the query. Togive an example, the query
SELECT cFROM c IN PathwayExtentWHERE c.ec.reaction.product.name = ”Putrescine”
will search the database based on the sche-ma in Fig. 19.5 and compute all objects ofthe class “Pathway” producing putrescine.
In Fig. 19.6, a part of the environment ofthe object “Alkaloid biosynthesis II” hasbeen drawn as a direct graph. Note that theobjects are associated to different classes.The network visualizes the structure of theintegrated model. The object “Alkaloid bio-synthesis” of the class “Pathway” points tonine objects of the class “Enzyme”. At ob-ject “4.3.1.5”, which is the enzyme L-tyro-sine ammonia-lyase we can see that this ob-ject appears in four different pathways,which are Alkaloid biosynthesis, Nitrogenmetabolism, Tyrosine metabolism andPhenylalanine metabolism. The enzymeOrnithine decarboxylase labeled with“4.1.1.17” is catalyzing the reaction from L-Ornithine to Putrescine.
19.3.3.3
Systems ReconstructionData integration automatically integrateddistributed information as objects into thepreviously defined models. We can now ex-plore integrated databases almost manuallystarting at known objects. Databases pro-
Fig. 19.6 Environment of alkaloid biosynthesis pathway.
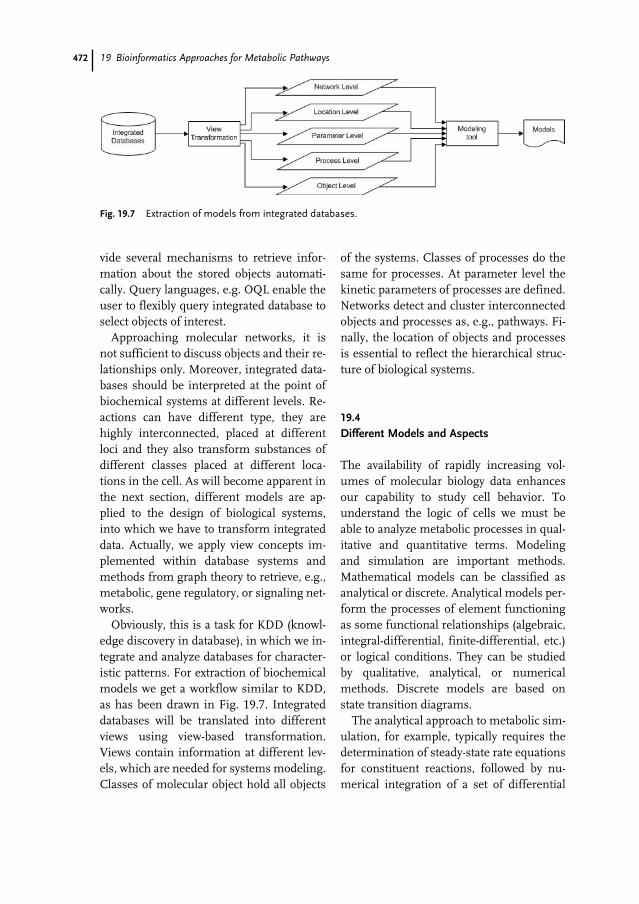
472 19 Bioinformatics Approaches for Metabolic Pathways
vide several mechanisms to retrieve infor-mation about the stored objects automati-cally. Query languages, e.g. OQL enable theuser to flexibly query integrated database toselect objects of interest.
Approaching molecular networks, it isnot sufficient to discuss objects and their re-lationships only. Moreover, integrated data-bases should be interpreted at the point ofbiochemical systems at different levels. Re-actions can have different type, they arehighly interconnected, placed at differentloci and they also transform substances ofdifferent classes placed at different loca-tions in the cell. As will become apparent inthe next section, different models are ap-plied to the design of biological systems,into which we have to transform integrateddata. Actually, we apply view concepts im-plemented within database systems andmethods from graph theory to retrieve, e.g.,metabolic, gene regulatory, or signaling net-works.
Obviously, this is a task for KDD (knowl-edge discovery in database), in which we in-tegrate and analyze databases for character-istic patterns. For extraction of biochemicalmodels we get a workflow similar to KDD,as has been drawn in Fig. 19.7. Integrateddatabases will be translated into differentviews using view-based transformation.Views contain information at different lev-els, which are needed for systems modeling.Classes of molecular object hold all objects
of the systems. Classes of processes do thesame for processes. At parameter level thekinetic parameters of processes are defined.Networks detect and cluster interconnectedobjects and processes as, e.g., pathways. Fi-nally, the location of objects and processesis essential to reflect the hierarchical struc-ture of biological systems.
19.4
Different Models and Aspects
The availability of rapidly increasing vol-umes of molecular biology data enhancesour capability to study cell behavior. Tounderstand the logic of cells we must beable to analyze metabolic processes in qual-itative and quantitative terms. Modelingand simulation are important methods.Mathematical models can be classified asanalytical or discrete. Analytical models per-form the processes of element functioningas some functional relationships (algebraic,integral-differential, finite-differential, etc.)or logical conditions. They can be studiedby qualitative, analytical, or numericalmethods. Discrete models are based onstate transition diagrams.
The analytical approach to metabolic sim-ulation, for example, typically requires thedetermination of steady-state rate equationsfor constituent reactions, followed by nu-merical integration of a set of differential
Fig. 19.7 Extraction of models from integrated databases.
47319.4 Different Models and Aspects
equations describing fluxes in the metab-olism. The feasibility of the analytical ap-proach is, however, limited by the extent towhich the metabolic processes of interesthave been characterized. For most metabol-ic pathways either we are unaware of all thesteps involved or we lack rate constants foreach step. This lack of information pre-cludes the use of the mathematical ap-proach to describe the process. Even whenreaction rates are known, differential equa-tions incur great computational costs. Ana-lytical representations, such as differentialequations, lack the robustness required tohandle partial and uncertain knowledge. Inaddition, because analytical simulationsmodel relatively similar structures over rel-atively similar temporal intervals, interleavesimulations are highly constrained.
The discrete-event approach can providedeclarative representations for both thestructures in the domain and the processesthat act on these structures. Most impor-tantly, discrete-event simulations providenatural support for qualitative representa-tion and reasoning techniques, which offerexplicit treatment of causality. The graphi-cal model of Kohn and Letzkus [18], whichenables discussion of metabolic regulationprocesses, is representative of the class ofgraph theoretical approaches. They expand-ed the graph theory by a specific functionthat enables modeling of dynamic process-es. In this case, the approach of Petri nets isa new method. Reddy et al. [20, 38] present-ed the first application of Petri nets in mo-lecular biology. In recent years, more appli-cations of Petri net methodology to meta-bolic pathway modeling and simulation ap-peared. The following section exploresvarious aspects of modeling biochemicalpathways using Petri nets. The interest andpotential of Petri nets to help understand-ing of complex biological processes is re-flected.
19.4.1
Petri Net Model
19.4.1.1
BasicsSince the nineteen-sixties, when the Petrinet was first introduced and formally de-fined by Petri [39], the Petri net and its con-cepts have been extended and developed,and both the theory and the applications ofthis model have flourished. In contrast tonaive graph, the Petri net is a graph orient-ed design, specification, simulation andverification language. It offers a formal wayof representing the structure of a discreteand/or event system, simulating its behav-ior, and drawing certain types of generalconclusions about the properties of the sys-tem. Because of their good properties intheoretical analysis, practical modeling, andgraphical visualization of concurrent sys-tems, Petri nets, especially high-level Petrinets, are widely used in work-flows, flexiblemanufacturing, operations research, rail-way networks, defense systems, telecom-munications, the Internet, commerce andtrading, and biological systems.
Petri nets are conceptually simple: theyconsist of places, transitions, and arcs. Eachplace has a non-negative number of tokens.A transition is enabled if the number of tok-ens exceeds the weights of the arcs connect-ing the places. A definition of the ordinaryPetri net is given below [40, 41]:
Definition 1 An ordinary Petri net is a 3-tu-ple, PN = (P,T,F) with:
P = {p1,p2,…,pm} is a non-empty, finite setof places, drawn as circles;T = {t1,t2,…,tn} is a non-empty, finite set oftransitions, drawn as bars;P ∩ T = ∅ and P ∪ T ≠ ∅;F ⊆ (P × T ) ∪ (T × P) is a non-empty, fi-nite set of arcs, connecting places to transi-tions or transitions to places but never twoplaces or two transitions.
474 19 Bioinformatics Approaches for Metabolic Pathways
The ordinary Petri net contains structuralelements only. To define dynamic Petri netsand their firing rules, we need some termi-nology to identify special sets of places andtransitions and the concept of markings.
Definition 2 Pre- and Post-Sets
The pre-set ºti of a transition ti ∈ T containsall places that are connected to ti via a directed arc from the place to the transition:ºti = {p ∈ P:(p, ti) ∈ F}. The elements of ºti
are often called input places.
The post-set tiº of a transition ti ∈ T con-tains all places that are connected to ti via adirected arc from the transition to the place:tiº = {p ∈ P:(ti, p) ∈ F}. The elements of tiºare often called output places.The pre-set pi and post-set pi of a place pi ∈P are defined in the same way:ºpi = {t ∈ T:(t, pi) ∈ F}piº = {t ∈ T:(pi, t) ∈ F}
Definition 3 MarkingA marking of a Petri net is a mappingM:P → N, that assigns a finite non-negativeinteger number of tokens to each place of theordinary Petri net. M0:P → � is the initialmarking.
State changes are carried out by firing ena-bled transitions. In an ordinary Petri net, atransition is enabled when all its input placeshave at least one token. When an enabledtransition t is fired, a token is removed fromeach input place of t and a token is added toeach output place of t. This gives a new state.
19.4.1.2
Hybrid Petri NetsOrdinary Petri net models do not have suchfunctions as quantitative aspects, so thereare some extension of Petri nets that cansupport dynamic change, task migration,super imposition of various levels of activ-
ities and the notion of mode of operations.Various extensions of PN, such as (stochas-tic) timed PNs [42, 43], colored PNs [44],predicate/transition nets [45] and hybrid PN[41], enable qualitative and/or quantitativeanalysis of resource utilization, effect offailures, and throughput rate. Hofestädt[46] also presented an extension formaliza-tion, a self-modified Petri net, which en-ables quantitative modeling of regulatorybiochemical networks. We exploit the meth-odology of hybrid Petri net to model generegulated metabolic networks in the cell, ex-plain the importance of sustaining core re-search, and identify promising opportu-nities for future research.
Herewith a brief description of hybrid Pe-tri nets is presented as the following context.
Definition 4 A hybrid Petri net is a sextupleQ = (P, T, Pre, Post, h, M) such that:
P = {p1, p2,...,pn} is a not empty, finite set ofplaces;T = {t1, t2,...,tm} is a not empty, finite set oftransitions;P ∩ T = ∅, i.e. the sets P and T are dis-jointed;h:P ∪ T → {D, C} , called “hybrid func-tion”, indicates for every node whether it is adiscrete node (sets PD and TD) or a continu-ous node (sets PC and TC);Pre:P × T → �+ or N, is the input incidencemapping (�+ denotes the set of positive realnumbers, including zero, and N denotes theset of natural numbers);Post:P × T → � + or N is the output inci-dence mapping;M:P → + or � is the marking.
We denote by M(t) = (m1t, m2
t,...,mnt) the vec-
tor which associates with each place of P itsmarking at the instant t. M0 = M(t0) = (m1
0,m2
0,...,mn0) is the initial marking. At any
time the present marking M is the sum oftwo markings Mr and Mn, where Mr is the
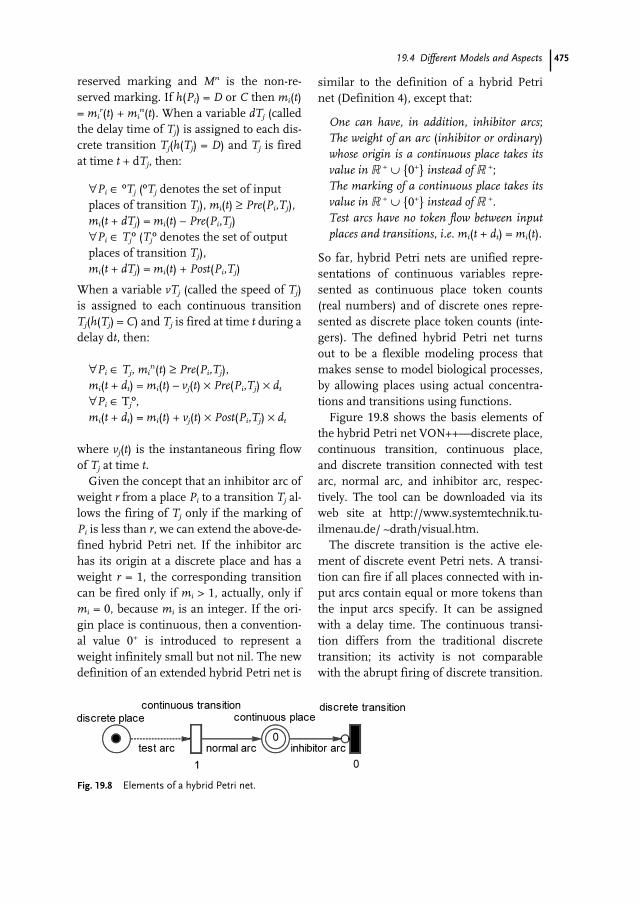
47519.4 Different Models and Aspects
reserved marking and Mn is the non-re-served marking. If h(Pi) = D or C then mi(t)= mi
r(t) + min(t). When a variable dTj (called
the delay time of Tj) is assigned to each dis-crete transition Tj(h(Tj) = D) and Tj is firedat time t + dTj, then:
∀Pi ∈ ºTj (ºTj denotes the set of inputplaces of transition Tj), mi(t) ≥ Pre(Pi,Tj),mi(t + dTj) = mi(t) – Pre(Pi,Tj)∀Pi ∈ Tjº (Tjº denotes the set of outputplaces of transition Tj),mi(t + dTj) = mi(t) + Post(Pi,Tj)
When a variable vTj (called the speed of Tj)is assigned to each continuous transitionTj(h(Tj) = C) and Tj is fired at time t during adelay dt, then:
∀Pi ∈ Tj, min(t) ≥ Pre(Pi,Tj),
mi(t + dt) = mi(t) – vj(t) × Pre(Pi,Tj) × dt
∀Pi ∈ Tjº,mi(t + dt) = mi(t) + vj(t) × Post(Pi,Tj) × dt
where vj(t) is the instantaneous firing flowof Tj at time t.
Given the concept that an inhibitor arc ofweight r from a place Pi to a transition Tj al-lows the firing of Tj only if the marking ofPi is less than r, we can extend the above-de-fined hybrid Petri net. If the inhibitor archas its origin at a discrete place and has aweight r = 1, the corresponding transitioncan be fired only if mi > 1, actually, only ifmi = 0, because mi is an integer. If the ori-gin place is continuous, then a convention-al value 0+ is introduced to represent aweight infinitely small but not nil. The newdefinition of an extended hybrid Petri net is
similar to the definition of a hybrid Petrinet (Definition 4), except that:
One can have, in addition, inhibitor arcs; The weight of an arc (inhibitor or ordinary)whose origin is a continuous place takes itsvalue in � + ∪ {0+} instead of � +;The marking of a continuous place takes itsvalue in � + ∪ {0+} instead of � +.Test arcs have no token flow between inputplaces and transitions, i.e. mi(t + dt) = mi(t).
So far, hybrid Petri nets are unified repre-sentations of continuous variables repre-sented as continuous place token counts(real numbers) and of discrete ones repre-sented as discrete place token counts (inte-gers). The defined hybrid Petri net turnsout to be a flexible modeling process thatmakes sense to model biological processes,by allowing places using actual concentra-tions and transitions using functions.
Figure 19.8 shows the basis elements ofthe hybrid Petri net VON++—discrete place,continuous transition, continuous place,and discrete transition connected with testarc, normal arc, and inhibitor arc, respec-tively. The tool can be downloaded via itsweb site at http://www.systemtechnik.tu-ilmenau.de/ ~drath/visual.htm.
The discrete transition is the active ele-ment of discrete event Petri nets. A transi-tion can fire if all places connected with in-put arcs contain equal or more tokens thanthe input arcs specify. It can be assignedwith a delay time. The continuous transi-tion differs from the traditional discretetransition; its activity is not comparablewith the abrupt firing of discrete transition.
Fig. 19.8 Elements of a hybrid Petri net.
476 19 Bioinformatics Approaches for Metabolic Pathways
The firing speed assigned to a continuoustransition describes its firing behavior andcan be constant or a function, i.e. transportof tokens according to v (t), in Fig. 19.8, v (t)= 1. However, the rate of bioprocesses is notdefined within a Petri net, it should be spec-ified separately. In most chemical systemsthe rate of processes (transitions) can be de-fined by the mass action law. The rate ofchange in the number of tokens (or concen-tration) is proportional to the number oftokens (or concentration) in all starting plac-es. In biochemistry, the most commonlyused expression that relates the rate of en-zyme-catalyzed formation of a product tosubstrate concentration is the Michaelis–Menten equation, which is given as v =vmaxS/(Km + S). Such enzyme reactions arecharacterized by two properties, Vmax andKm, and biochemists are interested in deter-mining these experimentally. Fortunately,some public biological databases such asBRENDA are available to provide enzyme-reaction data collected from research litera-ture.
19.4.1.3
ApplicationsAfter early application to modeling metabol-ic pathways [20, 47], Petri nets as new toolsand terms for modeling and simulating bio-logical information systems have been in-vestigated more and more. Reddy et al. [48]then presented an example of the combinedglycolytic and pentose phosphate pathwayof the erythrocyte cell to illustrate the con-cepts of the methodology. However, the re-actions and other biological processes weremodeled as discrete events and it was notpossible to simulate the kinetic effect.Hofestädt [46] investigated a formalizationshowing that different classes of conditionscan be interpreted as gene, proteins, or en-zymes, and cell communication and alsopresented the formalization of self-modified
Petri nets, which enable the quantitativemodeling of regulatory biochemical net-works. Chen [49] introduced the use of hy-brid Petri nets (HPN) for expressing glycol-ysis metabolic pathways. Using this ap-proach the quantitative modeling of meta-bolic networks is also possible. Koch et al.[50] extended the Reddy’s model by takinginto account reversible reactions and timedependencies. Kueffener [51] exploited theknowledge available in current metabolicdatabases for functional predictions and theinterpretation of expression data on the lev-el of complete genomes, and described thecompilation of BRENDA, ENZYME, andKEGG into individual Petri nets and unifiedPetri nets. Goss [52] and Matsuno [53] usedPetri nets to model gene regulatory net-works by using stochastic Petri nets (SPN)and HPN, respectively. In the DFG work-shop “Modeling and Simulation MetabolicNetwork” 2000, participants also discussedthe applications and perspective of Petrinets [54]. Genrich et al. [55] discussed exe-cutable Petri net models for the analysis ofmetabolic pathways. Heiner et al. [56] stud-ied the analysis and simulation of steadystates in metabolic pathways with Petrinets. Srivastava et al. [57] also exploited aSPN model to simulate the σ32 stress cir-cuit in E. coli. Oliveira et al. [58] developedthe mathematical machinery for construc-tion of an algebraic-combinatorial model toconstruct an oriented matroid representa-tion of biochemical pathways. Peleg [59]combined the best aspects of two models—Workflow/Petri net and a biological conceptmodel. The Petri net model enables verifi-cation of formal properties and qualitativesimulation of the Workflow model. Theytested their model by representing malariaparasites invading host erythrocytes, andcomposed queries, in five general classes,to discover relationships among processesand structural components. Recently, a spe-
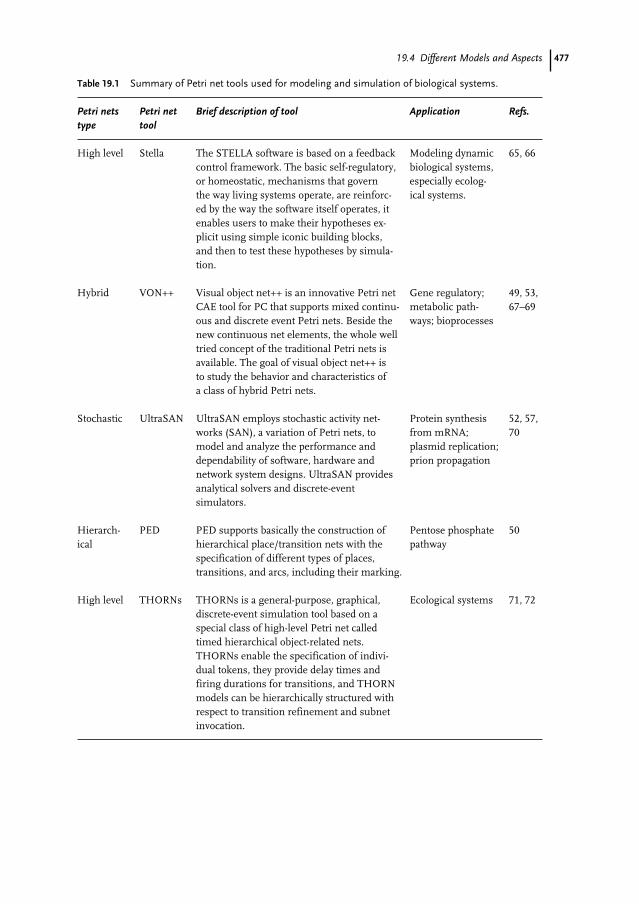
47719.4 Different Models and Aspects
Table 19.1 Summary of Petri net tools used for modeling and simulation of biological systems.
Petri nets Petri net Brief description of tool Application Refs.type tool
High level Stella The STELLA software is based on a feedback Modeling dynamic 65, 66control framework. The basic self-regulatory, biological systems,or homeostatic, mechanisms that govern especially ecolog-the way living systems operate, are reinforc- ical systems.ed by the way the software itself operates, it enables users to make their hypotheses ex-plicit using simple iconic building blocks, and then to test these hypotheses by simula-tion.
Hybrid VON++ Visual object net++ is an innovative Petri net Gene regulatory; 49, 53,CAE tool for PC that supports mixed continu- metabolic path- 67–69ous and discrete event Petri nets. Beside the ways; bioprocessesnew continuous net elements, the whole well tried concept of the traditional Petri nets is available. The goal of visual object net++ is to study the behavior and characteristics of a class of hybrid Petri nets.
Stochastic UltraSAN UltraSAN employs stochastic activity net- Protein synthesis 52, 57,works (SAN), a variation of Petri nets, to from mRNA; 70model and analyze the performance and plasmid replication;dependability of software, hardware and prion propagationnetwork system designs. UltraSAN provides analytical solvers and discrete-event simulators.
Hierarch- PED PED supports basically the construction of Pentose phosphate 50ical hierarchical place/transition nets with the pathway
specification of different types of places, transitions, and arcs, including their marking.
High level THORNs THORNs is a general-purpose, graphical, Ecological systems 71, 72discrete-event simulation tool based on a special class of high-level Petri net called timed hierarchical object-related nets. THORNs enable the specification of indivi-dual tokens, they provide delay times and firing durations for transitions, and THORN models can be hierarchically structured with respect to transition refinement and subnet invocation.
478 19 Bioinformatics Approaches for Metabolic Pathways
cial issue on “Petri nets for Metabolic Net-works” has appeared in ISB journal [60]. Itcovers topological analysis of metabolic net-works based on Petri net theory [61], qualita-tive analysis of steady states in metabolicpathways [62], hybrid Petri net modelingand simulation [63], and introduction of thehybrid functional Petri net (HFPN) [64].
Table 19.1 presents a summary of the Pe-tri net tools used to model biological sys-tems. Most publications presented theirmodels based only on a general Petri nettool utilization. These publications are notlisted in the table. More Petri net tools canbe found at http://www.daimi.au.dk/Petri-Nets/tools/quick.html.
So far, the intuitively understandablegraphical notation and the representation ofmultiple independent dynamic entitieswithin a system makes Petri nets the modelof choice, because they are highly suitablefor modeling and simulation of metabolicnetworks.
19.4.1.4
Petri Net Model ConstructionAlthough many Petri net tools are available,most import and/or export Petri net dia-
grams in a binary file format which poorlysupports the possibility of making diagramsdistributed in multiple format files; lessmention constructing a net from a text for-mat file. That means it is impossible to ex-tract data from biology databases and con-struct a Petri net model automatically. For-tunately, several Petri net tools such as PNK(http://www.informatik.hu-berlin.de/top/pnk/), Renew (http://www.renew.de/), andCPN (http://www.daimi.aau.dk/CPnets/)have been equipped with an XML-based fileformat. The XML-based Petri net inter-change format standardization that consistsof a Petri net markup language (PNML) anda set of document type definitions (DTD) orXSL schemes has been released and intend-ed to be adopted.
To present a Petri net model automaticallyfrom biology databases, we developed anXSLT file to convert the original XML sourcefile from our metabolic pathway data storedin an Oracle system into the desired XMLformat that can be executed by the RenewXML parser. Figure 19.9 shows the automat-ic layout of Petri net model with Renew.
Although the above-mentioned Petri netXML standards are available, they have their
Table 19.1 Continued
Petri nets Petri net Brief description of tool Application Refs.type tool
High level Design/ Design/CPN supports CPN models with Glycolysis 51, 55,CPN complex data types (color sets) and complex
data manipulations (arc expressions and guards). The functional programming language Standard ML enables the software package to support hierarchical CP-nets and generate a model from the data extracted from databases. 73
Functional GON/ Genomic object net is an environment for Biopathways; 64, 74,Cell simulating and representing biological cell development 75Illustrator systems. The Commercialized version of
GON is named Cell Illustrator (CI).
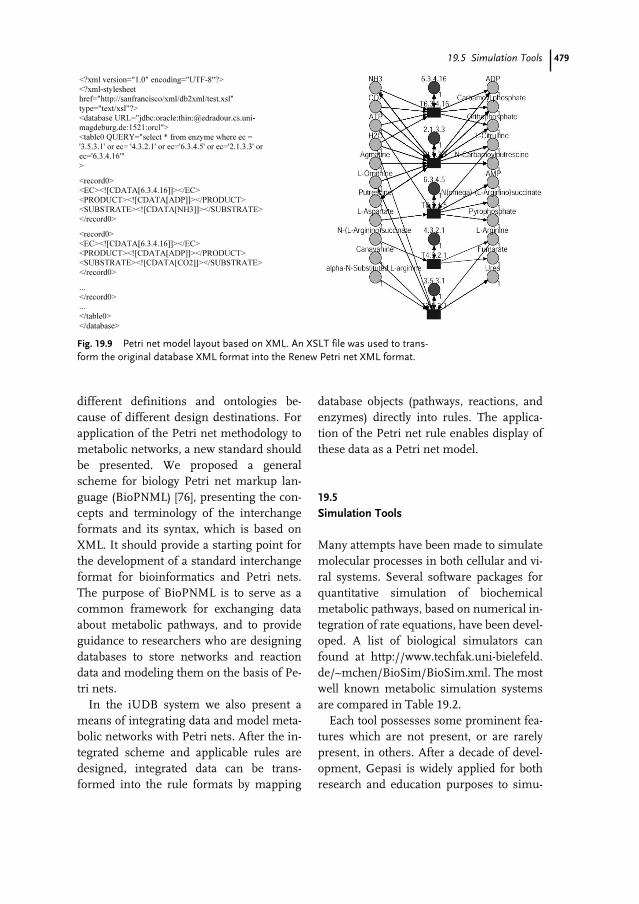
47919.5 Simulation Tools
different definitions and ontologies be-cause of different design destinations. Forapplication of the Petri net methodology tometabolic networks, a new standard shouldbe presented. We proposed a generalscheme for biology Petri net markup lan-guage (BioPNML) [76], presenting the con-cepts and terminology of the interchangeformats and its syntax, which is based onXML. It should provide a starting point forthe development of a standard interchangeformat for bioinformatics and Petri nets.The purpose of BioPNML is to serve as acommon framework for exchanging dataabout metabolic pathways, and to provideguidance to researchers who are designingdatabases to store networks and reactiondata and modeling them on the basis of Pe-tri nets.
In the iUDB system we also present ameans of integrating data and model meta-bolic networks with Petri nets. After the in-tegrated scheme and applicable rules aredesigned, integrated data can be trans-formed into the rule formats by mapping
database objects (pathways, reactions, andenzymes) directly into rules. The applica-tion of the Petri net rule enables display ofthese data as a Petri net model.
19.5
Simulation Tools
Many attempts have been made to simulatemolecular processes in both cellular and vi-ral systems. Several software packages forquantitative simulation of biochemicalmetabolic pathways, based on numerical in-tegration of rate equations, have been devel-oped. A list of biological simulators canfound at http://www.techfak.uni-bielefeld.de/~mchen/BioSim/BioSim.xml. The mostwell known metabolic simulation systemsare compared in Table 19.2.
Each tool possesses some prominent fea-tures which are not present, or are rarelypresent, in others. After a decade of devel-opment, Gepasi is widely applied for bothresearch and education purposes to simu-
Fig. 19.9 Petri net model layout based on XML. An XSLT file was used to trans-form the original database XML format into the Renew Petri net XML format.
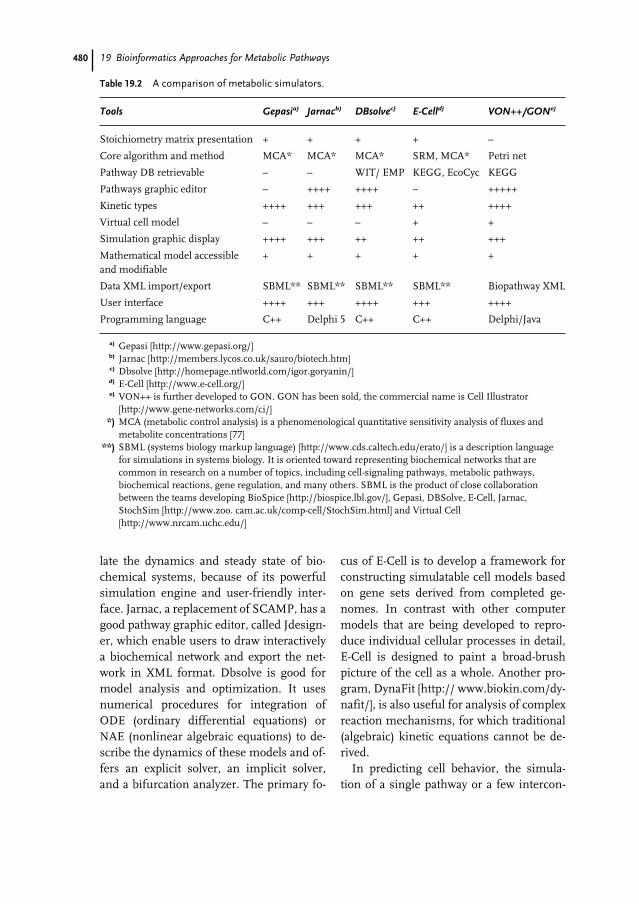
480 19 Bioinformatics Approaches for Metabolic Pathways
late the dynamics and steady state of bio-chemical systems, because of its powerfulsimulation engine and user-friendly inter-face. Jarnac, a replacement of SCAMP, has agood pathway graphic editor, called Jdesign-er, which enable users to draw interactivelya biochemical network and export the net-work in XML format. Dbsolve is good formodel analysis and optimization. It usesnumerical procedures for integration ofODE (ordinary differential equations) orNAE (nonlinear algebraic equations) to de-scribe the dynamics of these models and of-fers an explicit solver, an implicit solver,and a bifurcation analyzer. The primary fo-
cus of E-Cell is to develop a framework forconstructing simulatable cell models basedon gene sets derived from completed ge-nomes. In contrast with other computermodels that are being developed to repro-duce individual cellular processes in detail,E-Cell is designed to paint a broad-brushpicture of the cell as a whole. Another pro-gram, DynaFit [http:// www.biokin.com/dy-nafit/], is also useful for analysis of complexreaction mechanisms, for which traditional(algebraic) kinetic equations cannot be de-rived.
In predicting cell behavior, the simula-tion of a single pathway or a few intercon-
Table 19.2 A comparison of metabolic simulators.
Tools Gepasia) Jarnacb) DBsolvec) E-Celld) VON++/GONe)
Stoichiometry matrix presentation + + + + –
Core algorithm and method MCA* MCA* MCA* SRM, MCA* Petri net
Pathway DB retrievable – – WIT/ EMP KEGG, EcoCyc KEGG
Pathways graphic editor – ++++ ++++ – +++++
Kinetic types ++++ +++ +++ ++ ++++
Virtual cell model – – – + +
Simulation graphic display ++++ +++ ++ ++ +++
Mathematical model accessible + + + + +and modifiable
Data XML import/export SBML** SBML** SBML** SBML** Biopathway XML
User interface ++++ +++ ++++ +++ ++++
Programming language C++ Delphi 5 C++ C++ Delphi/Java
a) Gepasi [http://www.gepasi.org/]b) Jarnac [http://members.lycos.co.uk/sauro/biotech.htm]c) Dbsolve [http://homepage.ntlworld.com/igor.goryanin/]d) E-Cell [http://www.e-cell.org/]e) VON++ is further developed to GON. GON has been sold, the commercial name is Cell Illustrator
[http://www.gene-networks.com/ci/]*) MCA (metabolic control analysis) is a phenomenological quantitative sensitivity analysis of fluxes and
metabolite concentrations [77]**) SBML (systems biology markup language) [http://www.cds.caltech.edu/erato/] is a description language
for simulations in systems biology. It is oriented toward representing biochemical networks that arecommon in research on a number of topics, including cell-signaling pathways, metabolic pathways,biochemical reactions, gene regulation, and many others. SBML is the product of close collaborationbetween the teams developing BioSpice [http://biospice.lbl.gov/], Gepasi, DBSolve, E-Cell, Jarnac,StochSim [http://www.zoo. cam.ac.uk/comp-cell/StochSim.html] and Virtual Cell[http://www.nrcam.uchc.edu/]
48119.5 Simulation Tools
nected pathways can be useful when thepathways being studied are relatively isolat-ed from other biochemical processes. In re-ality, however, even the simplest and mostwell studied pathways, for example glycoly-sis, can exhibit complex behavior becauseof connectivity. In fact, the more intercon-nections between different parts of a sys-tem, the harder it becomes to predict howthe system will react. Moreover, simula-tions of metabolic pathways alone cannotaccount for the longer time-scale effects ofprocesses such as gene regulation, cell divi-sion cycle, and signal transduction. Whensystems reach a certain size they will be-come unmanageable and non-understand-able without decomposition into modules(hierarchical models) or presentation ofgraphs. Moreover, modeling and simula-tion of large-scale metabolic networks re-quires intensive data integration. In thissense, tools mentioned above seem to beweak.
In comparison, Petri nets capture the ba-sic aspects of concurrent systems of metab-olism both conceptually and mathematical-ly. The major advantages of Petri nets aregraphical modeling representation andsound mathematical background; thesemake it possible to analyze and validate thequalitative and quantitative behavior of aPetri net system, enable clear description ofconcurrency and long experience in bothspecification and analysis of parallel sys-tems, and enable description of a Petri netmodel on different levels of abstraction(hierarchical models). In addition, the de-velopment of computer technology enablesPetri net tools to have more friendly inter-faces and the possibility of standard dataimport/export support.
The requirements of a biology-specificPetri net tool are discussed in the followingparagraphs.
19.5.1
Metabolic Data Integration
At present a Petri net tool that can processdata integration is still missing. Coupledwith the data integration techniques dis-cussed above it is possible to construct anintegrative model out of various data sourc-es. Another possibility is to use standarddata format. XML is already a standard forstoring and transferring data. Many biologi-cal databases such as Transpath and MPWhave already considered using the tech-nique or are doing so now. The intendedsoftware should support XML import andexport, link to internal and external relateddatabases of genes, enzymes, reactions,kinetics, organisms, compartments, andinitial values of (ODE-NAE) systems.BioPNML is intended to be a standard.
With the complete annotated sequence ofa genome we can, moreover, generatedrafts of the organism’s metabolic net-works. For the next generation of metabolicmodels, which will probably be integratedwith genome databases, it should be pos-sible to include fields containing informa-tion on the evidence for particular values,e.g. evidence codes in gene ontology [http://www.geneontology.org/doc/GO.evidence.html].
19.5.2
Metabolic Pathway Layout
Structural knowledge of a physical systemis the foundation of a simulation. Petri netrepresentation is a type of object-orientedrepresentation. It can present a structure ofmetabolic pathways naturally. The metabol-ic pathway editor tends to be based on Petrinet methodology. In addition, Petri netscan be executed and the dynamic behaviorobserved graphically. When the model be-comes very large, however, e.g. for a whole
482 19 Bioinformatics Approaches for Metabolic Pathways
cell model, computation time and space in-crease exponentially.
19.5.3
Dynamics Representation
Dynamics representation is critical to thesuccess of a simulation. To build a quantita-tive model, kinetic properties of enzyme-catalyzed reactions involved in pathwaysshould be outlined. Traditionally, ODE andNAE models, for example Michaelis–Men-ten kinetic models, are used to simulatemetabolic reactions. Different types of en-zyme kinetics (Michaelis–Menten equation,reversible mass action kinetics equation, al-losteric inhibition equation, etc.) and initialparameter values can, in part, be obtainedfrom databases and the literature. Other-wise, a user-defined model should be builtas E-Cell and Gepasi do. Nevertheless, a Pe-tri net-based simulation system still candeal with bioprocesses as discrete-event orsemi-quantitative models when the re-quired kinetic data are unavailable.
19.5.4
Hierarchical Concept
Hierarchical biochemical systems are bio-chemical systems that consist of multiplemodules that are not connected by a com-mon mass flux, but communicate onlythrough regulatory interactions. The mod-els of a virtual cell should contain metabolicpathways and the levels of transcription andtranslation, and so on. Reactions in differ-ent compartments require hierarchicalmodel representation. E-Cell models per-form this technique very well. With maturemathematical support, Petri nets also canhandle it and at the same time it enablesstructural reduction of the Petri net, be-cause otherwise the state space of Petri netstructure will be very large in graphs.
19.5.5
Prediction Capability
Because metabolism is far less well under-stood than a manufactured system, biologi-cal simulations often yield highly uncertainresults. For this reason a bifurcation analyz-er or a fuzzy analyzer should be included inthe software, as Dbsolve does. Also, becauseconcentration values of metabolites withina cell fluctuate within a normal range; pre-arrangement of such data in the software isnecessary.
The pathway simulator is also able to pre-dict pathways and find alternative pathwaysfrom several known biochemical reactions.Each reaction is thermodynamically fea-sible, i.e. ∆G is equal to or less than zero. Itcan calculate thermodynamic characteris-tics. Otherwise, the requirements forcoupling of reactions (combined with ATPutilization) should be checked and any twocoupled reactions must proceed via a com-mon intermediate. The reversibility of onereaction is determined and displayed incase abnormal situations occur, eventhough metabolite flow tends to be unidi-rectional.
19.5.6
Parallel Treatment and Development
After many years of development, quantita-tive modeling can now be handled by Petrinets. They have a mature mathematical al-gorithm and can solve NAE and ODE andstoichiometric matrices. But biochemicalsystems are also rich in time scales andthus require sophisticated methods for thenumerical solution of the differential equa-tions that describe them. Especially in virtu-al cell modeling and simulation, paralleltreatment of these equations during simu-lation is of importance, yet difficult toachieve. When, moreover, we consider oth-
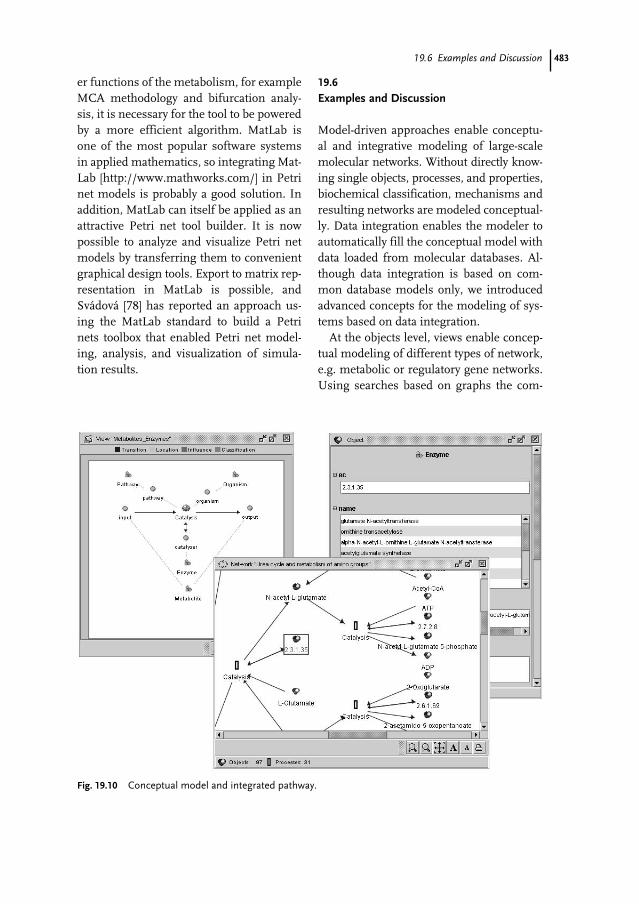
48319.6 Examples and Discussion
er functions of the metabolism, for exampleMCA methodology and bifurcation analy-sis, it is necessary for the tool to be poweredby a more efficient algorithm. MatLab isone of the most popular software systemsin applied mathematics, so integrating Mat-Lab [http://www.mathworks.com/] in Petrinet models is probably a good solution. Inaddition, MatLab can itself be applied as anattractive Petri net tool builder. It is nowpossible to analyze and visualize Petri netmodels by transferring them to convenientgraphical design tools. Export to matrix rep-resentation in MatLab is possible, andSvádová [78] has reported an approach us-ing the MatLab standard to build a Petrinets toolbox that enabled Petri net model-ing, analysis, and visualization of simula-tion results.
19.6
Examples and Discussion
Model-driven approaches enable conceptu-al and integrative modeling of large-scalemolecular networks. Without directly know-ing single objects, processes, and properties,biochemical classification, mechanisms andresulting networks are modeled conceptual-ly. Data integration enables the modeler toautomatically fill the conceptual model withdata loaded from molecular databases. Al-though data integration is based on com-mon database models only, we introducedadvanced concepts for the modeling of sys-tems based on data integration.
At the objects level, views enable concep-tual modeling of different types of network,e.g. metabolic or regulatory gene networks.Using searches based on graphs the com-
Fig. 19.10 Conceptual model and integrated pathway.
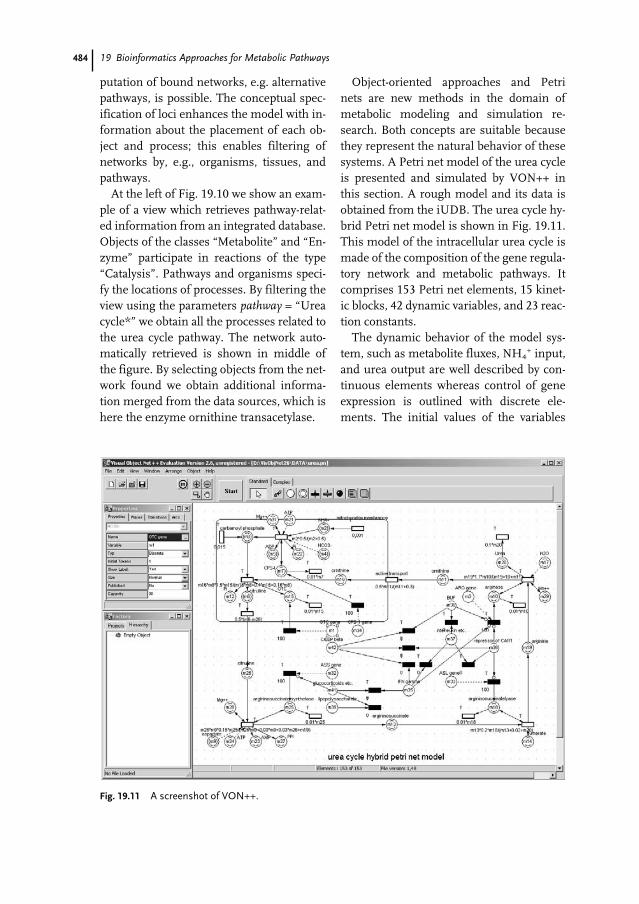
484 19 Bioinformatics Approaches for Metabolic Pathways
putation of bound networks, e.g. alternativepathways, is possible. The conceptual spec-ification of loci enhances the model with in-formation about the placement of each ob-ject and process; this enables filtering ofnetworks by, e.g., organisms, tissues, andpathways.
At the left of Fig. 19.10 we show an exam-ple of a view which retrieves pathway-relat-ed information from an integrated database.Objects of the classes “Metabolite” and “En-zyme” participate in reactions of the type“Catalysis”. Pathways and organisms speci-fy the locations of processes. By filtering theview using the parameters pathway = “Ureacycle*” we obtain all the processes related tothe urea cycle pathway. The network auto-matically retrieved is shown in middle ofthe figure. By selecting objects from the net-work found we obtain additional informa-tion merged from the data sources, which ishere the enzyme ornithine transacetylase.
Object-oriented approaches and Petrinets are new methods in the domain ofmetabolic modeling and simulation re-search. Both concepts are suitable becausethey represent the natural behavior of thesesystems. A Petri net model of the urea cycleis presented and simulated by VON++ inthis section. A rough model and its data isobtained from the iUDB. The urea cycle hy-brid Petri net model is shown in Fig. 19.11.This model of the intracellular urea cycle ismade of the composition of the gene regula-tory network and metabolic pathways. Itcomprises 153 Petri net elements, 15 kinet-ic blocks, 42 dynamic variables, and 23 reac-tion constants.
The dynamic behavior of the model sys-tem, such as metabolite fluxes, NH4
+ input,and urea output are well described by con-tinuous elements whereas control of geneexpression is outlined with discrete ele-ments. The initial values of the variables
Fig. 19.11 A screenshot of VON++.
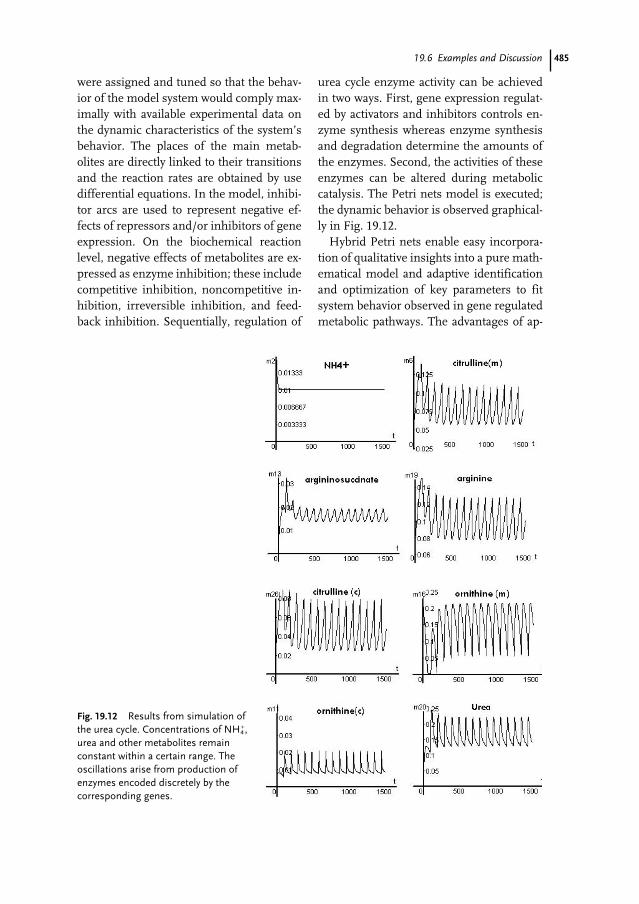
48519.6 Examples and Discussion
were assigned and tuned so that the behav-ior of the model system would comply max-imally with available experimental data onthe dynamic characteristics of the system’sbehavior. The places of the main metab-olites are directly linked to their transitionsand the reaction rates are obtained by usedifferential equations. In the model, inhibi-tor arcs are used to represent negative ef-fects of repressors and/or inhibitors of geneexpression. On the biochemical reactionlevel, negative effects of metabolites are ex-pressed as enzyme inhibition; these includecompetitive inhibition, noncompetitive in-hibition, irreversible inhibition, and feed-back inhibition. Sequentially, regulation of
urea cycle enzyme activity can be achievedin two ways. First, gene expression regulat-ed by activators and inhibitors controls en-zyme synthesis whereas enzyme synthesisand degradation determine the amounts ofthe enzymes. Second, the activities of theseenzymes can be altered during metaboliccatalysis. The Petri nets model is executed;the dynamic behavior is observed graphical-ly in Fig. 19.12.
Hybrid Petri nets enable easy incorpora-tion of qualitative insights into a pure math-ematical model and adaptive identificationand optimization of key parameters to fitsystem behavior observed in gene regulatedmetabolic pathways. The advantages of ap-
Fig. 19.12 Results from simulation ofthe urea cycle. Concentrations of NH4
+,urea and other metabolites remainconstant within a certain range. Theoscillations arise from production ofenzymes encoded discretely by thecorresponding genes.
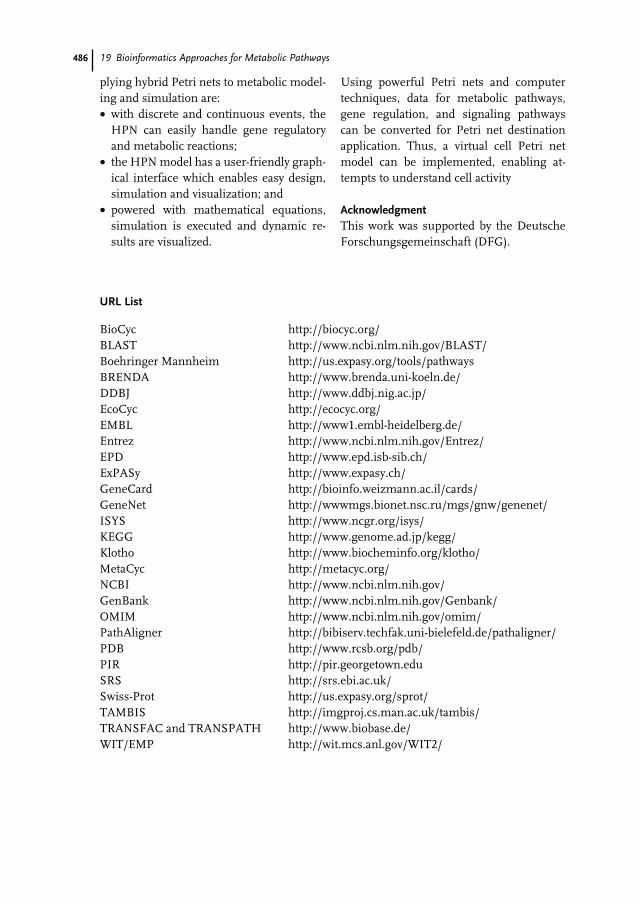
486 19 Bioinformatics Approaches for Metabolic Pathways
plying hybrid Petri nets to metabolic model-ing and simulation are:• with discrete and continuous events, the
HPN can easily handle gene regulatoryand metabolic reactions;
• the HPN model has a user-friendly graph-ical interface which enables easy design,simulation and visualization; and
• powered with mathematical equations,simulation is executed and dynamic re-sults are visualized.
Using powerful Petri nets and computertechniques, data for metabolic pathways,gene regulation, and signaling pathwayscan be converted for Petri net destinationapplication. Thus, a virtual cell Petri netmodel can be implemented, enabling at-tempts to understand cell activity
AcknowledgmentThis work was supported by the DeutscheForschungsgemeinschaft (DFG).
URL List
BioCyc http://biocyc.org/BLAST http://www.ncbi.nlm.nih.gov/BLAST/Boehringer Mannheim http://us.expasy.org/tools/pathwaysBRENDA http://www.brenda.uni-koeln.de/DDBJ http://www.ddbj.nig.ac.jp/EcoCyc http://ecocyc.org/EMBL http://www1.embl-heidelberg.de/Entrez http://www.ncbi.nlm.nih.gov/Entrez/EPD http://www.epd.isb-sib.ch/ExPASy http://www.expasy.ch/GeneCard http://bioinfo.weizmann.ac.il/cards/GeneNet http://wwwmgs.bionet.nsc.ru/mgs/gnw/genenet/ISYS http://www.ncgr.org/isys/KEGG http://www.genome.ad.jp/kegg/Klotho http://www.biocheminfo.org/klotho/MetaCyc http://metacyc.org/NCBI http://www.ncbi.nlm.nih.gov/GenBank http://www.ncbi.nlm.nih.gov/Genbank/OMIM http://www.ncbi.nlm.nih.gov/omim/PathAligner http://bibiserv.techfak.uni-bielefeld.de/pathaligner/PDB http://www.rcsb.org/pdb/PIR http://pir.georgetown.eduSRS http://srs.ebi.ac.uk/Swiss-Prot http://us.expasy.org/sprot/TAMBIS http://imgproj.cs.man.ac.uk/tambis/TRANSFAC and TRANSPATH http://www.biobase.de/WIT/EMP http://wit.mcs.anl.gov/WIT2/
487
1 Lehninger AL, Nelson DL, Cox MM (1993)Principles of biochemistry. 2nd ed., NewYork, pp 360
2 Schlitt T, Palin K, Rung J, Dietmann S, LappeM, Ukkonen E, Brazma A (2003) From GeneNetworks to Gene Function. GenomeResearch 13:2577–2587
3 Schmid CD, Praz V, Delorenzi M, Périer R,Bucher P (2004) The Eukaryotic PromoterDatabase EPD: the impact of in silico primerextension. Nucleic Acids Res. 32:D82–D85
4 Gibson DM, Harris RA (2002) Metabolicregulation in mammals. Taylor and Francis,London
5 Benson DA, Karsch-Mizrachi I, Lipman DJ,Ostell J, Wheeler DL (2004) GenBank:update. Nucleic Acids Res. 32(1):D23–D26
6 Kulikova T, Aldebert P, Althorpe N, Baker W,Bates K, Browne P, van den Broek A,Cochrane G, Duggan K, Eberhardt R,Faruque N, Garcia-Pastor M, Harte N, KanzC, Leinonen R, Lin Q, Lombard V, Lopez R,Mancuso R, McHale M, Nardone F,Silventoinen V, Stoehr P, Stoesser G, TuliMA, Tzouvara K, Vaughan R, Wu D, Zhu W,Apweiler R (2004) The EMBL NucleotideSequence Database. Nucleic Acids Res.32(1):D27–D30
7 Miyazaki S, Sugawara H, Ikeo K, Gojobori T,Tateno Y (2004) DDBJ in the stream ofvarious biological data. Nucleic Acids Res.32(1):D31–D34
8 Boeckmann B, Bairoch A, Apweiler R (2003)The SWISSPROTprotein knowledgebase andits supplement TrEMBL in 2003. NucleicAcids Res. 31(1):365–370
9 McGarvey PB, Huang H, Barker WC, OrcuttBC, Garavelli JS, Srinivasarao GY, Yeh LS,Xiao C, Wu CH (2000) PIR: a new resourcefor bioinformatics.
Bioinformatics16(3):290–29110 Schomburg I, Chang A, Schomburg D (2002)
BRENDA, enzyme data and metabolicinformation. Nucleic Acids Res. 30(1):47–49
11 Kanehisa M, Goto S, Kawashima S (2002) TheKEGG databases at GenomeNet. NucleicAcids Res. 30(1):42–46
12 Overbeek R, Larsen N, Pusch GD (2000) WIT:integrated system for high-throughputgenome sequence analysis and metabolicreconstruction. Nucleic Acids Res.28(1):123–125
13 Kolchanov NA, Nedosekina EA, Ananko EA,Likhoshvai VA, Podkolodny NL, RatushnyAV, Stepanenko IL, Podkolodnaya OA,Ignatieva EV, Matushkin YG (2002) GeneNetdatabase: description and modeling of genenetworks. In Silico Biol. 2(2):97–110
14 Wingender E, Chen X, Hehl R, Karas H,Liebich I, Matys V, Meinhardt T, Pruss M,Reuter I, Schacherer F (2000) TRANSFAC: anintegrated system for gene expressionregulation. Nucleic Acids Res. 28(1):316–319
15 Takai-Igarashi T, Kaminuma T (1999) APathway Finding System for the CellSignaling Networks Database. In SilicoBiology 1:129–146
16 Schacherer F, Choi C, Gotze U, Krull M,Pistor S, Wingender E (2001) TheTRANSPATH signal transduction database: aknowledge base on signal transductionnetworks. Bioinformatics 17(11):1053–1057
17 Etzold T, Ulyanow A, Argos P (1996) SRS:Information Retrieval System for MolecularBiology Data Banks. Methods Enzymol.266:114–128
18 Kohn MC, Letzkus W (1983) A Graph-theoretical Analysis of Metabolic Regulation.Journal of Theoretical Biology 100(2):293–304
References
488 References
19 Brutlag DL, Galper AR, Millis DH (1992)Knowledge-Based Simulation of DNAMetabolism: Prediction of Action andEnvisionment of Pathways, in: ArtificialIntelligence and Molecular Biology (Hunter L.Ed). MIT Press, Cambridge, MA.
20 Reddy VN, Mavrovouniotis ML, Liebman MN(1993) Petri Net Representation in MetabolicPathways, in: Proceedings First InternationalConference on Intelligent Systems forMolecular Biology, AAAI Press, Menlo Park,pp 328–336
21 Hofestädt R, Meinecke F (1995) Interactivemodelling and simulation of biochemicalnetworks. Computers in Biology andMedicine 25:321–334
22 Ellis LB, Speedie SM, McLeish R (1998)Representing metabolic pathway information:an object-oriented approach. Bioinformatics14(9):803–806
23 Akutsu T, Miyano S, Kuhara S (2000)Inferring qualitative relations in geneticnetworks and metabolic pathways.Bioinformatics 16(8):727–734
24 Michal G (1993) Biochemical Pathways.Boehringer, Mannheim, Penzberg
25 Forst VC, Schulten K (199) Evolution ofmetabolisms: a new method for thecomparison of metabolic pathways usinggenomics information. J. Comput. Biol.6:343–360
26 Karp DP, Riley M, Paley SM (2002) TheMetaCyc Database. Nucleic Acids Res.30(1):59–61
27 Karp PD, Riley M, Paley SM, Pellegrini-TooleA, Krummenacker M (1999) EcoCyc:Encyclopedia of Escherichia coli Genes andMetabolism. Nucl. Acids Res. 27(1):50–53
28 Karp PD (1995) A Strategy for DatabaseInteroperation. J. Comput. Biol. 2:573–586
29 Davidson SB, Overton C, Buneman P (1995)Challenges in Integrating Biological DataSources. J. Comput. Biol. 2:557–572
30 Siepel A, Farmer A, Tolopko A, Zhuang M,Mendes P, Beavis W, Sobral B (2001) ISYS: adecentralized, component-based approach tothe integration of heterogeneousbioinformatics resources. Bioinformatics17:83–94
31 Haas LM, Schwarz PM, Kodali P, Kotlar E,Rice JE, Swope WC (2001) DiscoveryLink: Asystem for integrated access to life sciencesdata sources. IBM Systems Journal40:489–511
32 Stevens R, Baker P, Bechhofer S, Ng G,Jacoby A, Paton NW, Goble CA, Brass A(2000). TAMBIS: Transparent Access toMultiple Bioinformatics Information Sources.Bioinformatics 16:184–185
33 Tatusova TA, Karsch-Mizrachi L, Ostell JA(1999) Complete genomes in WWW Entrez:data representation and analysis.Bioinformatics 15:536–543
34 Davidson SB, Overton C, Tannen V, Wong L(1997) BioKleisli: a digital library forbiomedical researchers. International Journalon Digital Libraries 1:36–53
35 Freier A, Hofestädt R, Lange M, Scholz U,Stephanik A (2002) BioDataServer: A SQL-based service for the online integration of lifescience data. In Silico Biology 2(2):37–57
36 Papakonstantinou Y, Abiteboul S, Garcia-Molina H (1996) Object fusion in mediatorsystems, in: 22nd Conference on Very LargeData Bases (Vijayaraman TM, Buchmann AP,Mohan C, Sarda NL Ed) Bombay, India,Morgan Kaufmann
37 Freier A, Hofestädt R, Lange M (2003) iUDB:An object-oriented system for modelling,integration and analysis of gene controlledmetabolic networks. In Silico Biology3(1/2):215–227
38 Reddy VN, Mavrovouniotis ML, Liebman MN(1994) Modeling Biological Pathways: ADiscrete-Event Systems Approach inMolecular Modeling. in: ACS SymposiumSeries, Vol. 576 (Kumosinski TF, LiebmanMN, Ed), Washington DC, pp 221–234
39 Petri CA (1962) Kommunikation mitAutomaten, Dissertation, Institut fürInstrumentelle Mathematik, Schriften desIIM Nr. 2, Bonn
40 Reisig W (1986) Petri Netze. Springer,Heidelberg
41 David R, Alla H (1992) Petri Nets and Grafcet– Tools for Modeling Discrete Event Systems.Prentice Hall
42 Wang J (1998) Timed Petri Nets: Theory andApplication. Kluwer Academic Publishers,Boston
43 Wang J, Jin C, Deng Y (1999) Performanceanalysis of traffic networks based onstochastic timed Petri net models, in: Proc.5th Int. Conf. on Engineering of ComplexComputer Systems, Las Vegas, pp 77–85
44 Kurt J (1997) Coloured Petri Nets – BasicConcepts, Analysis Methods and PracticalUse. 2nd edition, Springer, Berlin
489References
45 Genrich HJ (1987) Predicate/Transition Nets,in: Lecture Notes in Computer Science, vol254: Petri Nets: Central Models and TheirProperties, Advances in Petri Nets (Brauer W,Reisig W, Rozenberg G Ed), Bad Honnef,Springer, pp 207–247
46 Hofestädt R, Thelen S (1998) Quantitativemodeling of biochemical networks. In SilicoBiology 1(1):39–53
47 Hofestädt R (1994) A petri net application ofmetabolic processes. Journal of SystemAnalysis Modelling and Simulation16:113–122
48 Reddy VN, Liebman MN, Mavrovouniotis ML(1996) Qualitative analysis of biochemicalreaction systems. Comput Biol. Med.26(1):9–24
49 Chen M (2000) Modelling the glycolysismetabolism using hybrid petri nets. in: DFG-Workshop – Modellierung und simulationmetabolischer netzwerke, Mai 19–20,Magdeburg, Germany, pp 25–26
50 Koch I, Schuster S, Heiner M (1999)Simulation and analysis of metabolicnetworks by time_dependent Petri nets, in:Proceedings of the German Conference onBioinformatics GCB ’99, Oct 4–6, Hanover,Germany
51 Kueffner R, Zimmer R, Lengauer T (2000)Pathway Analysis in Metabolic Databases viaDifferential Metabolic Display (DMD).Bioinformatics 16(9):825–836
52 Goss PJE, Peccoud J (1999) Analysis of theStabilizing Effect of Rom on the GeneticNetwork Controlling ColE1 plasmidreplication. Pacific Symposium onBiocomputing, pp 65–76
53 Matsuno H, Doi A, Nagasaki M, Miyano S(2000) Hybrid Petri net Representation ofGene Regulatory Network. PacificSymposium on Biocomputing, pp 341–352
54 Hofestädt R, Lautenbach K, Lange M (2000)Proc. Modellierung und SimulationMetabolischer Netzwerke, DFG-Workshop,Magdeburg, Germany
55 Genrich H, Kueffner R, Voss K (2001)Executable Petri Net Models for the Analysisof Metabolic Pathways. International Journalon Software Tools for Technology Transfer3(4):394–404
56 Heiner M, Koch I, Voss K (2001) Analysisand simulation of steady states in metabolicpathways with Petri nets, in: CPN ’01 – ThirdWorkshop and Tutorial on Practical Use of
Coloured Petri Nets and the CPN Tools,University of Aarhus, Denmark, pp 15–34
57 Srivastava R, Peterson MS, Bentley WE (2001)Stochastic kinetic analysis of the Escherichiacoli stress circuit using σ32-targetedantisense. Biotechnology Bioengineering75(1):120–129
58 Oliveira JS, Bailey CG, Jones-Oliveira JB,Dixon DA (2001) An Algebraic-CombinatorialModel for the Identification and Mapping ofBiochemical Pathways. Bulletin ofMathematical Biology 63(6):1163–1196
59 Peleg M, Yeh I, Altman RB (2002) Modellingbiological processes using workflow and PetriNet models. Bioinformatics 18(6):825–837
60 Hofestädt R (2003) Petri nets and thesimulation of metabolic networks. In SilicoBiol. 3(3):321–322
61 Zevedei-Oancea I, Schuster S (2003)Topological analysis of metabolic networksbased on Petri net theory. In Silico Biol.3(3):323–345
62 Voss K, Heiner M, Koch I (2003) Steady stateanalysis of metabolic pathways using Petrinets. In Silico Biol. 3(3):367–387
63 Chen M, Hofestadt R (2003) QuantitativePetri net model of gene regulated metabolicnetworks in the cell. In Silico Biol.3(3):347–365
64 Matsuno H, Tanaka Y, Aoshima H, Doi A,Matsui M, Miyano S (2003) Biopathwaysrepresentation and simulation on hybridfunctional Petri net. In Silico Biol.3(3):389–404
65 Ruth M, Hannon B (1997) Modeling dynamicbiological systems. Springer, New York
66 Goldberg Elaine,http://mvhs1.mbhs.edu/mvhsproj/CellResp/cell_table.html
67 Doi A, Drath R, Nagasaki M, Matsuno H,Yamino S (1999) Protein DynamicsObservations of Lambda Phage by HybridPetri Net. Genome Informatics 10:217–218
68 Matsuno H, Doi A, Drath R, Miyano S (2001)Genomic Object Net: Basic Architecture forRepresenting and Simulating Biopathways,in: RECOMB ’01
69 Chen M (2002) Modelling and Simulation ofMetabolic Networks: Petri Nets Approach andPerspective, in: Proc. ESM 2002, 16thEuropean Simulation Multiconference, June3–5, Darmstadt, Germany, pp 441–444
70 Goss PJE, Peccoud J (1998) QuantitativeModeling of Stochastic Systems in Molecular
490 References
Biology by Using Stochastic Petri Nets. Proc.Natl. Acad. Sci. USA, pp 6750–6755
71 Gronewold A, Sonnenschein M (1997)Asynchronous Layered Cellular Automata forthe Structured Modeling of EcologicalSystems, in: 9th European SimulationSymposium (ESS ’97), SCS, pp 286–290
72 Gronewold A, Sonnenschein M (1998)Event–based Modelling of Ecological Systemswith Asynchronous Cellular Automata.Ecological Modeling 108:37–52
73 Voss K (2000) Ausführbare Petrinetz Modellezur Simulation Metabolischer Pfade, in: DFG-Workshop, Modellierung und SimulationMetabolischer Netzwerke, 2000, Mai 19–20,Magdeburg, Germany, pp 11–13
74 Matsuno H, Murakami R, Yamane R,Yamasaki N, Fujita S, Yoshimori H, Miyano S(2003) Boundary formation by notch signalingin Drosophila multicellular systems:
experimental observations and a genenetwork modeling by Genomic Object Net.Pacific Symposium on Biocomputing, pp152–163
75 Nagasaki M, Doi A, Matsuno H, Miyano S(2003) Genomic Object Net: a platform formodeling and simulating biopathways.Applied Bioinformatics 2(3):181–184
76 Chen M, Freier A, Köhler J, Rüegg A (2002)The Biology Petri Net Markup Language. In:Lecture Notes in Informatics (Desel J, WeskeM, Ed), Proc. Promise 2002, Oct. 9–11,Potsdam, Germany, Vol. 21:150–161
77 Fell D (1992) Metabolic control analysis: asurvey of its theoretical and experimentaldevelopment. Biochem. J. 286:313–330
78 Svádová M, Hanzalek Z (2000) MatlabToolbox for Petri nets, in: INOVACE 2000,Praha: Asociace inova_ního podnikání _R,pp. 15–20
491
Nathan Goodman
20.1
Introduction
Numerous definitions of systems biologyare offered in the literature and on the web.TheFreeDictionary.com has a good generaldefinition: “Systems biology is an academicfield that seeks to integrate biological dataas an attempt to understand how biologicalsystems function. By studying the relation-ships and interactions between variousparts of a biological system … it is hopedthat an understandable model of the wholesystem can be developed.” Although thisdefinition could be applied to many areas ofbiology, the term as commonly used is lim-ited to work in molecular biology.
Systems biology is a young, interdiscipli-nary field with fluid boundaries. The litera-ture is vast, duplicative, and unwieldy. For-tunately, excellent reviews have been pub-lished from various points of view whichprovide good introduction to the primaryliterature. This chapter includes a guide tothese reviews in lieu of inline citations. Sys-tems biology rests on analyses of large-scaledatasets – gene expression, protein–proteininteractions, gene–phenotype relationships,and many others – individually or in combi-nation. These datasets provide a global view
of the system under study, albeit incom-plete and imperfect. As a first step, investi-gators use these data to study the generalproperties of the system. A more ambitiousgoal is to construct mathematical modelsthat explain how the system works and pre-dict its response to experimental or naturalperturbations. Several next steps are pos-sible. Some investigators study the modelsthemselves, looking for general patternsand properties that reveal biological in-sights. Others work on better modelingmethods. Yet others proceed to test themodels’ predictions using classical labora-tory methods. A more far-reaching strategyis to refine and expand the models throughadditional rounds of large-scale data gener-ation and data analysis. Taken to this level,the practice of systems biology becomes aniterative process in which researchers ana-lyze large-scale datasets to devise models,analyze the models to make predictions,and conduct further large-scale experi-ments to test the predictions and refine themodels. Few studies have reached this level,but this is the vision expounded by manyleaders in the field.
Because of the emphasis on large-scaledata sets and experimentation, the methodsof systems biology cannot be applied in all
Handbook of Genome Research. Genomics, Proteomics, Metabolomics, Bioinformatics, Ethical and Legal Issues.Edited by Christoph W. SensenCopyright © 2005 WILEY-VCH Verlag GmbH & Co. KGaA, WeinheimISBN: 3-527-31348-6
20Systems Biology
Verwendete Mac Distiller 5.0.x Joboptions
Dieser Report wurde automatisch mit Hilfe der Adobe Acrobat Distiller Erweiterung "Distiller Secrets v1.0.5" der IMPRESSED GmbH erstellt. Sie koennen diese Startup-Datei für die Distiller Versionen 4.0.5 und 5.0.x kostenlos unter http://www.impressed.de herunterladen. ALLGEMEIN ---------------------------------------- Dateioptionen: Kompatibilität: PDF 1.3 Für schnelle Web-Anzeige optimieren: Ja Piktogramme einbetten: Ja Seiten automatisch drehen: Nein Seiten von: 1 Seiten bis: Alle Seiten Bund: Links Auflösung: [ 2400 2400 ] dpi Papierformat: [ 481 680 ] Punkt KOMPRIMIERUNG ---------------------------------------- Farbbilder: Downsampling: Nein Komprimieren: Ja Komprimierungsart: ZIP Bitanzahl pro Pixel: 8 Bit Graustufenbilder: Downsampling: Nein Komprimieren: Ja Komprimierungsart: ZIP Bitanzahl pro Pixel: 8 Bit Schwarzweiß-Bilder: Downsampling: Nein Komprimieren: Ja Komprimierungsart: CCITT CCITT-Gruppe: 4 Graustufen glätten: Nein Text und Vektorgrafiken komprimieren: Ja SCHRIFTEN ---------------------------------------- Alle Schriften einbetten: Ja Untergruppen aller eingebetteten Schriften: Nein Wenn Einbetten fehlschlägt: Abbrechen Einbetten: Immer einbetten: [ /Courier-BoldOblique /Helvetica-BoldOblique /Courier /Helvetica-Bold /Times-Bold /Courier-Bold /Helvetica /Times-BoldItalic /Times-Roman /ZapfDingbats /Times-Italic /Helvetica-Oblique /Courier-Oblique /Symbol ] Nie einbetten: [ ] FARBE(N) ---------------------------------------- Farbmanagement: Farbumrechnungsmethode: Farbe nicht ändern Methode: Standard Geräteabhängige Daten: Einstellungen für Überdrucken beibehalten: Ja Unterfarbreduktion und Schwarzaufbau beibehalten: Ja Transferfunktionen: Beibehalten Rastereinstellungen beibehalten: Nein ERWEITERT ---------------------------------------- Optionen: Prolog/Epilog verwenden: Nein PostScript-Datei darf Einstellungen überschreiben: Nein Level 2 copypage-Semantik beibehalten: Ja Portable Job Ticket in PDF-Datei speichern: Ja Illustrator-Überdruckmodus: Ja Farbverläufe zu weichen Nuancen konvertieren: Ja ASCII-Format: Nein Document Structuring Conventions (DSC): DSC-Kommentare verarbeiten: Ja DSC-Warnungen protokollieren: Nein Für EPS-Dateien Seitengröße ändern und Grafiken zentrieren: Ja EPS-Info von DSC beibehalten: Ja OPI-Kommentare beibehalten: Nein Dokumentinfo von DSC beibehalten: Ja ANDERE ---------------------------------------- Distiller-Kern Version: 5000 ZIP-Komprimierung verwenden: Ja Optimierungen deaktivieren: Nein Bildspeicher: 524288 Byte Farbbilder glätten: Nein Graustufenbilder glätten: Nein Bilder (< 257 Farben) in indizierten Farbraum konvertieren: Ja sRGB ICC-Profil: sRGB IEC61966-2.1 ENDE DES REPORTS ---------------------------------------- IMPRESSED GmbH Bahrenfelder Chaussee 49 22761 Hamburg, Germany Tel. +49 40 897189-0 Fax +49 40 897189-71 Email: [email protected] Web: www.impressed.de
Adobe Acrobat Distiller 5.0.x Joboption Datei
<< /ColorSettingsFile () /LockDistillerParams true /DetectBlends true /DoThumbnails true /AntiAliasMonoImages false /MonoImageDownsampleType /Bicubic /GrayImageDownsampleType /Bicubic /MaxSubsetPct 100 /MonoImageFilter /CCITTFaxEncode /ColorImageDownsampleThreshold 1.5 /GrayImageFilter /FlateEncode /ColorConversionStrategy /LeaveColorUnchanged /CalGrayProfile (Dot Gain 20%) /ColorImageResolution 300 /UsePrologue false /MonoImageResolution 1200 /ColorImageDepth 8 /sRGBProfile (sRGB IEC61966-2.1) /PreserveOverprintSettings true /CompatibilityLevel 1.3 /UCRandBGInfo /Preserve /EmitDSCWarnings false /CreateJobTicket true /DownsampleMonoImages false /DownsampleColorImages false /MonoImageDict << /K -1 >> /ColorImageDownsampleType /Bicubic /GrayImageDict << /HSamples [ 2 1 1 2 ] /VSamples [ 2 1 1 2 ] /Blend 1 /QFactor 0.9 >> /CalCMYKProfile (U.S. Web Coated (SWOP) v2) /ParseDSCComments true /PreserveEPSInfo true /MonoImageDepth -1 /AutoFilterGrayImages false /SubsetFonts false /GrayACSImageDict << /HSamples [ 2 1 1 2 ] /VSamples [ 2 1 1 2 ] /Blend 1 /QFactor 0.9 >> /ColorImageFilter /FlateEncode /AutoRotatePages /None /PreserveCopyPage true /EncodeMonoImages true /ASCII85EncodePages false /PreserveOPIComments false /NeverEmbed [ ] /ColorImageDict << /HSamples [ 2 1 1 2 ] /VSamples [ 2 1 1 2 ] /Blend 1 /QFactor 0.9 >> /AntiAliasGrayImages false /GrayImageDepth 8 /CannotEmbedFontPolicy /Error /EndPage -1 /TransferFunctionInfo /Preserve /CalRGBProfile (sRGB IEC61966-2.1) /EncodeColorImages true /EncodeGrayImages true /ColorACSImageDict << /HSamples [ 2 1 1 2 ] /VSamples [ 2 1 1 2 ] /Blend 1 /QFactor 0.9 >> /Optimize true /ParseDSCCommentsForDocInfo true /GrayImageDownsampleThreshold 1.5 /MonoImageDownsampleThreshold 1.5 /AutoPositionEPSFiles true /GrayImageResolution 300 /AutoFilterColorImages false /AlwaysEmbed [ /Courier-BoldOblique /Helvetica-BoldOblique /Courier /Helvetica-Bold /Times-Bold /Courier-Bold /Helvetica /Times-BoldItalic /Times-Roman /ZapfDingbats /Times-Italic /Helvetica-Oblique /Courier-Oblique /Symbol ] /ImageMemory 524288 /OPM 1 /DefaultRenderingIntent /Default /EmbedAllFonts true /StartPage 1 /DownsampleGrayImages false /AntiAliasColorImages false /ConvertImagesToIndexed true /PreserveHalftoneInfo false /CompressPages true /Binding /Left >> setdistillerparams << /PageSize [ 595.276 841.890 ] /HWResolution [ 2400 2400 ] >> setpagedevice
492 20 Systems Biology
situations. A prerequisite is having an ex-perimental system that is amenable to large-scale experimentation. This generallymeans working with a system that can bereadily perturbed in numerous ways andinterrogated using global methods. To getstarted without spending a lot of time andmoney, it is desirable to work with experi-mental systems for which baseline datasetshave already been collected.
Most systems biology research to date hasstudied simple model organisms. Yeast isfar and away the most widely used model.There is also considerable work on prokar-yotes – including E. coli and an archeon Ha-lobacterium – and a smattering of work onworm, fly, and sea urchin. Research on hu-man and mammalian models is limited,and is generally small scale, preliminary innature, or peripheral to studies of simplerorganisms.
Systems biology emerged from the con-fluence of three trends. First is the contin-ued success of molecular biology in charac-tering the genes and proteins involved in bi-ological processes, and the organization ofthese elements into pathways of increasingscope and complexity. Second is the grow-ing success of mathematical modelers indevising pathway models that can be ana-lyzed and simulated. Third, and most press-ing, is the explosion in methods for large-scale data production, starting with theramp-up of DNA sequencing in the early1990s and continuing with technologies formeasuring gene expression, protein–pro-tein interactions, gene–phenotype relation-ships, and many others. The traditionalmodels of molecular biology have been un-able to cope effectively with the flood ofdata. Many investigators simply cherry pickthe best bits for further study, leaving mostof the data untouched on the tree. “Best” inthis setting usually meant players – genes orproteins – that can be readily connected to
existing pathways, or else there would be noway to interpret the findings – to “tell a sto-ry” as the saying goes.
Systems biology is an attempt to rescuethe data left behind by traditional methods,to let the data tell the story with the help ofsophisticated data analysis. It is simultane-ously an evolutionary extension of estab-lished approaches and a radical new way ofdoing biology.
20.2
Data
20.2.1
Available Data Types
Systems biology has a voracious appetite fordata and works with many kinds of dataproduced in many different ways.
The foundation is data generated bylarge-scale data-production methods and in-cludes:
• genome and gene sequences;
• gene expression profiles generally frommicroarrays and, to a lesser extent, SAGE;
• protein–protein interactions from yeasttwo-hybrid and affinity purification meth-ods;
• gene–phenotype relationships andgene–gene interactions from large-scalegene-deletion projects and, increasingly,from RNA interference;
• protein–DNA interactions from ChIP-chip;
• protein identification and abundancefrom mass spectroscopy; and
• sub-cellular protein localization datafrom systematic imaging studies.
As new data productions methods come on-line, additional data types will come into use.
49320.2 Data
These laboratory methods are augmentedby data produced by large-scale computa-tional analysis. This includes:
• predictions of transcription factor bind-ing sites;
• identification of binding domains in pro-tein sequences;
• predictions of binding domains from em-pirically determined or computed threedimensional protein structures
• functional clustering of genes and pro-teins through text mining of the litera-ture,
and many others.Biological interpretation of large-scale
datasets requires connection of novel datato known biological “truth”. The connec-tion comes from manually curated datasetsproduced by experts. Examples includegene annotation databases, lists of knowntranscription factor binding sites, curatedpathways, and data from small scale pro-tein–protein interaction experiments thatare manually extracted from the literature.These curated datasets are occasionallyquite large and greatly expand the dataavailable from large-scale experiments.
20.2.2
Data Quality and Data Fusion
Many large-scale datasets suffer from higherror rates. Error rates have been studiedextensively for protein–protein interactiondata from yeast. Large-scale datasets pro-duced by different laboratories using simi-lar methods have been compared, as havedatasets produced by the same or differentlaboratories using different methods, spe-cifically yeast two-hybrid vs. affinity purifi-cation. Other studies have compared large-scale datasets with interactions reported inthe literature or with known protein com-
plexes. The conclusion is that 50% or moreof reported interactions are false, and thatmany known interactions are not detectedeven under conditions that favor their de-tection. There are fewer studies of otherdata types, but the general consensus is thatall high-throughput data are suspect. Nosingle data point can be believed.
To draw valid inferences from such error-prone data, it is necessary to combine mul-tiple data points, preferably from differentsources. Combining data in this way is acentral theme of systems biology.
Another line of study is to assess the con-cordance of different data types, for exam-ple protein–protein interaction vs. gene ex-pression data. Of course, one would not ex-pect perfect agreement in such instances,because each data type measures a differentaspect of the system. But, if the concordancewere too low, it would call into question thebasic premise of combining multiple datatypes to overcome the errors in each.
Some research in this area is descriptive,and seeks to characterize data quality andconcordance, whereas other work is pre-scriptive and aims to devise ways of improv-ing the situation. The latter includes workon statistical methods for assessing thequality of individual data points, making itpossible to filter the dataset and select datawhich are most reliable. It also includeswork on methods for combining multipledata types to create a reliable merged data-set.
Merging of multiple data types to pro-duce a more reliable dataset is a majortheme in systems biology. Remarkably,there is no standard term for this in thefield. Most often, it goes by the banal labelof data integration, a very generic term thatrefers to any activity in which data frommultiple sources is combined. A betterterm, I think, is data fusion. This is a termborrowed from the field of remote sensing

494 20 Systems Biology
where it refers to the process of combiningmultiple incomplete data streams to yield amore comprehensive view of remote phe-nomena.
20.3
Basic Concepts
20.3.1
Systems and Models
The term system is very general. Two stan-dard definitions are, “an assemblage of in-ter-related elements comprising a unifiedwhole” (from TheFreeDictionary.com), and“a group of interacting, interrelated, orinterdependent elements forming a com-plex whole” (from Dictionary.com). Thesedefinitions are hardly limiting, becauseeverything in the universe, with the excep-tion of elementary particles, is composed ofinteracting or inter-related parts. This in-cludes everything in biology. The real mean-ing of the term comes from usage: when wecall something a system, the connotation isthat we intend to study the whole in termsof its parts and their inter-relationships, andthe properties we intend to study arise fromnon-trivial interactions among the parts.
A model is “an abstract or theoretical rep-resentation of a phenomenon” (from TheF-reeDictionary.com) that represents some as-pects of reality and ignores others. A goodmodel represents those aspects that are sig-nificant for the problem at hand and ig-nores all others.
A simple model of a biological systemmight represent the proteins encoded by thegenome of an organism, potential physicalinteractions among those proteins deter-mined by means of large-scale yeast two-hy-brid experiments, and estimates of proteinabundance measured by gene expressionmicroarray experiments. Obviously, this
model is a gross simplification of reality.Such simplification is the essence of model-ing.
Systems have static properties that do notchange and dynamic properties that do. Dy-namic properties can vary over any dimen-sion of interest, including time, space, ex-perimental condition, genetic background,disease state, etc. In our simple example,static properties include the proteins them-selves (because we are working with a sin-gle organism) and the protein–proteininteractions (because yeast two-hybrid ex-periments are usually performed under ge-neric baseline conditions). The dynamicproperties are the gene-expression levels,assuming these experiments are conductedover a range of time points or experimentalconditions.
20.3.2
States
The state of a system (more precisely, thestate of a system model) is the ensemble ofits dynamic properties at one point in themultidimensional space over which theseproperties vary. In the example of the pre-ceding section, the state is simply a gene ex-pression profile for one time point and ex-perimental condition. The totality of all pos-sible states for a system is called its state-space.
Most biological systems are homeostatic,meaning that if the system is unperturbed, itwill remain in a single state or, more typical-ly, will travel among a set of related states.The state or set of states is a stable region ofthe state space. When the system is per-turbed, it might deviate temporarily from thestable region and then return, or travel to anew stable region, or become unstable andfluctuate between widely separated states.
An important goal in analyzing biologicalsystems is to understand the control mecha-
49520.3 Basic Concepts
nisms that keep the system in the appropri-ate stable region or that guide the systemfrom one stable region to another.
20.3.3
Informal and Formal Models
In biology as traditionally practiced, mostmodels are informal and are intended tocommunicate ideas among fellow scien-tists. Ideker and Hood explain it well [1]:“Conventionally, a biological model beginsin the mind of the individual researcher, asa proposed mechanism to account for someexperimental observations. Often, the re-searchers represent their ideas by sketchinga diagram using pen and paper. This dia-gram is a tremendous aid in thinking clear-ly about the model, in predicting possibleexperimental outcomes, and in conveyingthe model to others. Not surprisingly, dia-grammatic representations form the basisof the vast majority of models discussed injournal articles, textbooks, and lectures.”
In systems biology, the models are for-mal (i.e. mathematical) and can be analyzedand simulated rigorously. It is importantthat these models be intelligible to the sys-tems biologists who work with them, butthere is no pretense that the models willmake sense to traditionally trained scien-tists.
The construction of a formal model is adifficult balancing act which must accom-modate the conflicting demands of realismand tractability. As a model representsmore aspects of the real phenomenon, it be-comes more complex and more difficult tostudy. On the other hand, if the model isnot sufficiently realistic, the conclusionsdrawn from it might be biologically mean-ingless. In words attributed to Albert Ein-stein, “Make everything as simple as pos-sible, but not simpler.” A further constraintis the availability of data: there is little point
in modeling an aspect of biological realityfor which no data are available except, per-haps, for theoretical purposes.
20.3.4
Modularity
A module is a portion of a model that is rea-sonably self-contained. The elements with-in a module can be highly inter-related, butthere should be relatively few connectionsbetween elements of different modules. Amodel that is modular can be decomposedinto smaller units – the modules – whichcan be understood more or less indepen-dently. Modules can be formed from staticor dynamic aspects of a model. Modules inbiological systems include structures, forexample protein complexes, organelles, andmembranes, and processes and pathways.
A modular model can be hierarchical withlow-level modules serving as buildingblocks for higher-level modules. Thus, theribosome (a protein complex) is a compo-nent of translation (a process), and transla-tion is a component of numerous cellularactivities, e.g. proliferation. Hierarchicalmodularity is an essential design principlefor human-engineered systems withoutwhich large systems would be unintelligibleeven to their designers.
It is self evident that biological systemsare modular and hierarchical at least insome respects. At the bottom of the hierar-chy are genes, proteins, and other mole-cules. Next are direct interactions amongthese elements, for example, physical pro-tein–protein interactions or the binding of aprotein (transcription factor) to DNA for thepurpose of regulating the expression of agene. These direct interactions are orga-nized into less direct, but still local, phe-nomena such as protein complexes andgroups of co-regulated genes (sometimescalled transcription modules or regulons).
496 20 Systems Biology
These local interactions are organized intohigher-level modules that implement partic-ular processes, e.g. transcription or trans-port, and these processes are combined toachieve cellular functions, e.g. proliferation.
There is growing evidence that hierarchi-cal modularity is pervasive in biological sys-tems and is a fundamental property ofevolved systems. A key goal is to discoverthe hierarchical modularity that underliesphenomena of interest. Whether or not na-ture is hierarchical, models of large biologi-cal systems must almost certainly be hierar-chical. This is because models are human-engineered and must be intelligible to theresearchers who develop them.
20.4
Static Models
Static system models address structural as-pects of the system – the parts and how theyare related. Static models can also considerstates in isolation, for example to derive re-lationships between gene-expression levelsfor different genes at one time point and ex-perimental condition, or to identify groupsof genes whose expression levels are co-reg-ulated across conditions. Static models aremuch simpler than dynamic ones, andmuch of the work in the field to date hasfocused on these.
20.4.1
Graphs
Graphs have become the mathematical for-malism of choice for static models in sys-tems biology (Fig. 20.1). A graph can be vis-ualized as a diagram consisting of dots, andlines connecting the dots. The dots arecalled nodes or vertices, and lines are callededges or arcs. Edges can be undirected (usual-ly drawn as an arrowless line) or directed
(usually drawn as a line with an arrowhead).Graphs in which all edges are directed aresometimes called networks. It is possible toattach additional information (called labels)to the nodes and edges. The density of agraph is the ratio of edges to nodes.
In a model of protein–protein interactiondata the nodes would represent proteinsand the edges would indicate which pro-teins interact. In the undirected case thetwo endpoints are symmetric – an edgefrom protein A to protein B would indicatethat A interacts with B and that B interactswith A. Directed edges are able to representasymmetric relationships, for example todistinguish between the bait and prey pro-teins in a yeast two-hybrid experiment.Edge labels can be used to indicate the kindor strength of evidence that supports theinteraction.
Graphs can naturally represent all kindsof pairwise interaction data or relation-ships. For example, data telling which pro-teins regulate which genes can be repre-sented by a graph in which each node repre-sents both a gene and its protein product(this is biologically sloppy, but remember itis just a model), and a edge from node A tonode B means that protein A regulates geneB. Gene expression data from knockout ex-periments can be represented by a graphwhose nodes represent genes, and an edgefrom gene A to gene B means that knockingout A affects the expression of B. Geneswith correlated expression patterns can berepresented by a graph whose nodes repre-sent genes, and whose edges indicate whichgenes have highly correlated profiles.
It is possible to combine multiple graphsto analyze multiple data types simultaneous-ly. Merging all the graphs from the exampleabove yields a graph indicating which pro-teins interact, which proteins regulate whichgenes, which genes affect the expression ofother genes, and which genes have similar
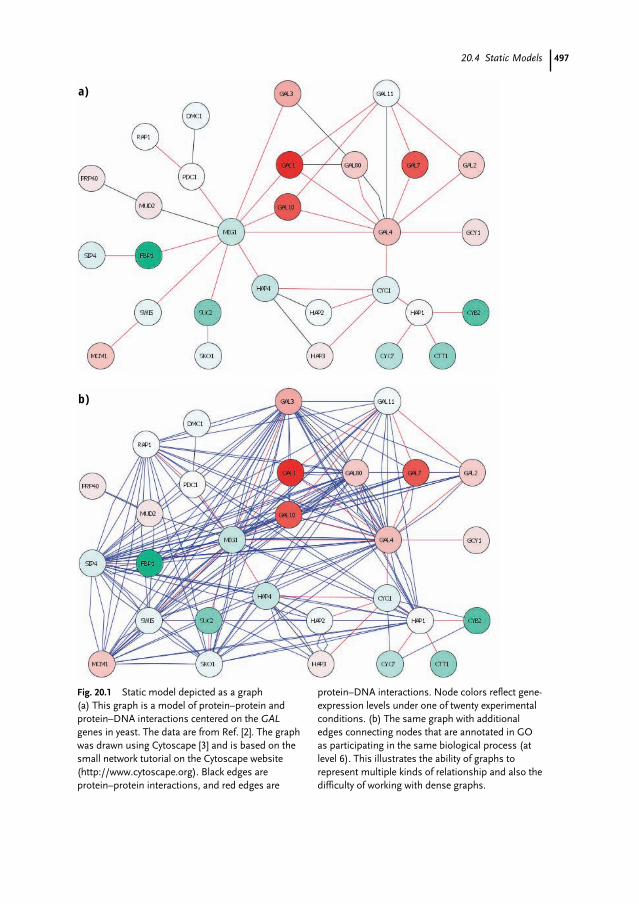
49720.4 Static Models
a)
b)
Fig. 20.1 Static model depicted as a graph (a) This graph is a model of protein–protein andprotein–DNA interactions centered on the GALgenes in yeast. The data are from Ref. [2]. The graphwas drawn using Cytoscape [3] and is based on thesmall network tutorial on the Cytoscape website(http://www.cytoscape.org). Black edges areprotein–protein interactions, and red edges are
protein–DNA interactions. Node colors reflect gene-expression levels under one of twenty experimentalconditions. (b) The same graph with additionaledges connecting nodes that are annotated in GOas participating in the same biological process (atlevel 6). This illustrates the ability of graphs torepresent multiple kinds of relationship and also thedifficulty of working with dense graphs.
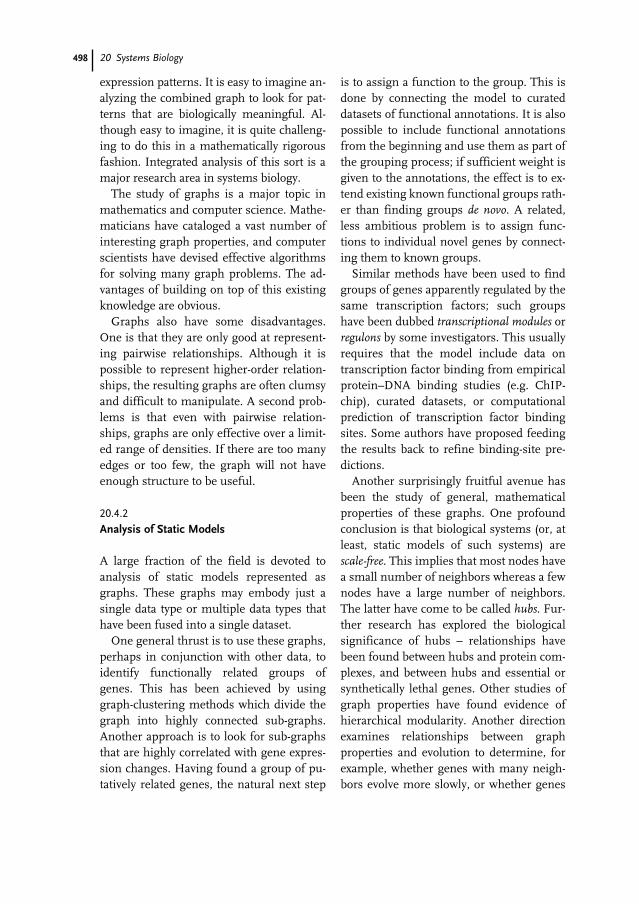
498 20 Systems Biology
expression patterns. It is easy to imagine an-alyzing the combined graph to look for pat-terns that are biologically meaningful. Al-though easy to imagine, it is quite challeng-ing to do this in a mathematically rigorousfashion. Integrated analysis of this sort is amajor research area in systems biology.
The study of graphs is a major topic inmathematics and computer science. Mathe-maticians have cataloged a vast number ofinteresting graph properties, and computerscientists have devised effective algorithmsfor solving many graph problems. The ad-vantages of building on top of this existingknowledge are obvious.
Graphs also have some disadvantages.One is that they are only good at represent-ing pairwise relationships. Although it ispossible to represent higher-order relation-ships, the resulting graphs are often clumsyand difficult to manipulate. A second prob-lems is that even with pairwise relation-ships, graphs are only effective over a limit-ed range of densities. If there are too manyedges or too few, the graph will not haveenough structure to be useful.
20.4.2
Analysis of Static Models
A large fraction of the field is devoted toanalysis of static models represented asgraphs. These graphs may embody just asingle data type or multiple data types thathave been fused into a single dataset.
One general thrust is to use these graphs,perhaps in conjunction with other data, toidentify functionally related groups ofgenes. This has been achieved by usinggraph-clustering methods which divide thegraph into highly connected sub-graphs.Another approach is to look for sub-graphsthat are highly correlated with gene expres-sion changes. Having found a group of pu-tatively related genes, the natural next step
is to assign a function to the group. This isdone by connecting the model to curateddatasets of functional annotations. It is alsopossible to include functional annotationsfrom the beginning and use them as part ofthe grouping process; if sufficient weight isgiven to the annotations, the effect is to ex-tend existing known functional groups rath-er than finding groups de novo. A related,less ambitious problem is to assign func-tions to individual novel genes by connect-ing them to known groups.
Similar methods have been used to findgroups of genes apparently regulated by thesame transcription factors; such groupshave been dubbed transcriptional modules orregulons by some investigators. This usuallyrequires that the model include data ontranscription factor binding from empiricalprotein–DNA binding studies (e.g. ChIP-chip), curated datasets, or computationalprediction of transcription factor bindingsites. Some authors have proposed feedingthe results back to refine binding-site pre-dictions.
Another surprisingly fruitful avenue hasbeen the study of general, mathematicalproperties of these graphs. One profoundconclusion is that biological systems (or, atleast, static models of such systems) arescale-free. This implies that most nodes havea small number of neighbors whereas a fewnodes have a large number of neighbors.The latter have come to be called hubs. Fur-ther research has explored the biologicalsignificance of hubs – relationships havebeen found between hubs and protein com-plexes, and between hubs and essential orsynthetically lethal genes. Other studies ofgraph properties have found evidence ofhierarchical modularity. Another directionexamines relationships between graphproperties and evolution to determine, forexample, whether genes with many neigh-bors evolve more slowly, or whether genes
49920.5 Dynamic Models
and their neighbors co-evolve. Some au-thors have explored evolutionary processesthat can give rise to systems with the ob-served properties.
20.5
Dynamic Models
Dynamic models are concerned with howsystems change over time, space, experi-mental condition, disease state, or other di-mension of interest. Like a static model, adynamic model starts by defining the partsand how they are inter-related. It then addsa definition of the allowable states the mod-el can occupy (in other words, the state-space), and a set of transition rules that pre-scribe how the state at one point is trans-formed into the state at another point. Deri-vation of these rules is a difficult problemthat is central to systems biology.
Research in dynamic modeling follows alogical progression. The first step is to de-velop mathematical formalisms for express-ing models. Next these formalisms are usedto create models for specific systems ofinterest. Finally the models are studied (bymathematical analysis or simulation) togain biological insight.
In systems biology at present these stepstend to be tightly linked. The same researchgroups often do all three activities, and fre-quently a single paper will introduce a newformalism, describe a new model, and re-port some biological conclusions. There hasbeen little systematic or rigorous compari-son of formalisms or models. The net effectis that the field is littered with a large num-ber of modeling formalisms and models,each used by one or a few groups, with littlerationale for deciding which are best. Thesituation should be rectified as the field ma-tures, but it is hard to say how quickly thiswill happen.
20.5.1
Types of Model
Dynamic models are classified into fourbroad biological categories. Metabolic path-ways produce the substances required forcellular functioning. Signal transductionpathways transmit and transform informa-tion, for example, to communicate a signalfrom the cell surface to the nucleus. Generegulatory networks control the pattern ofgene expression to keep the cell in a stableregion of the state space or guide the sys-tem from one stable region to another. Gen-eral regulatory networks combine all of these.
Metabolic pathways are the mainstay ofclassical research on mathematical model-ing of biological systems. In these models,the parts are enzymes and metabolites. Theinter-relationships are enzymatic reactionsthat consume input metabolites and pro-duce output metabolites. The states are con-centrations of metabolites. The transitionrules are rate equations or other means thatspecify the effect of each reaction as a func-tion of the concentrations of its input andoutput metabolites.
In systems biology, gene regulatory net-works are a major focus. In these models,the parts are genes and their encoded pro-teins which most models treat as one andthe same thing. The inter-relationships in-dicate which proteins (transcription factors)regulate the expression of which genes andmight include protein–protein relation-ships that can be used to deduce connec-tions that close the loop from genes back totranscription factors. The states are gene-expression levels which also serve as surro-gates for protein abundance. The transitionrules specify how expression levels at onepoint in time affect expression levels at alater time.
500 20 Systems Biology
20.5.2
Modeling Formalisms
Dynamic modeling formalisms are diverse.Some are mechanistic and directly encodereactions or regulatory events, for example“protein A binds B activating C which travelsto the nucleus and enables the expression ofgene D”. Others express functional relation-ships and say things like “proteins A and Bare required to activate expression of geneD”. Yet others are quantitative and describehow the abundance of molecules at onepoint in time affects the abundance at thenext point in time. Many are graph-based.Most formalisms are designed to enable au-tomatic inference of models from data, butsome are intended for manual use, to enablean expert to hand-craft a model. Most are de-signed to be studied using simulation, butsome also enable mathematical analysis.
Modeling formalisms differ in the natureof the states that are allowed. The most gen-eral models allow states to be continuous; insuch models, expression levels would berepresented as real numbers. The other ex-treme is Boolean models which permiton/off values only. In between are modelswith discrete, but multi-valued, states. Thisincludes qualitative models in which statesare categories like high, medium, and low,and stochastic models in which states areintegers. Stochastic models can directly rep-resent the number of molecules availablefor various reactions; this can be importantfor modeling activities that involve smallnumbers of molecules.
Another aspect is the nature of the transi-tion rules. These can be deterministic anddefine unequivocally how one state is trans-formed into the next, or probabilistic anddefine distributions of next states. Themathematical framework for expressing thetransition rules can also vary. Some exam-ples are differential equations, difference
equations, Boolean logic, general mathe-matical or computational logic, and Baye-sian or other probabilistic networks.
20.6
Summary
Systems biology, like most science, is driv-en by data. The foundation is data generat-ed by large-scale data-production methodsaugmented by large computationally de-rived datasets. Biological interpretationcomes from manually curated datasets pro-duced by experts, some of which are quitelarge and greatly expand the data availablefrom large-scale experiments. The field canbe expected to embrace new data sourcesand data types as they become available.
Large-scale datasets are often plagued byhigh error rates, and a major theme in sys-tems biology is coping with these errors.The usual solution is to combine multipledata sources and data types to produce amore reliable dataset, a process we termdata fusion.
The main activity in systems biology ismodeling of biological systems. A model isan abstraction of reality that represents as-pects that are significant for the problem athand and ignores all others. Models in biol-ogy have traditionally been informal andserve to communicate ideas among fellowscientists. In systems biology, the modelsare formal (i.e. mathematical) and can beanalyzed and simulated rigorously.
Static models represent the structure of asystem – the parts of the system and theirinter-relationships. Graphs have emerged asthe mathematical formalism of choice forstatic models in systems biology. Graphscan naturally represent all kinds of pairwiserelationships, and a huge body of existingmathematical and computer science re-search on graphs can be exploited directly.
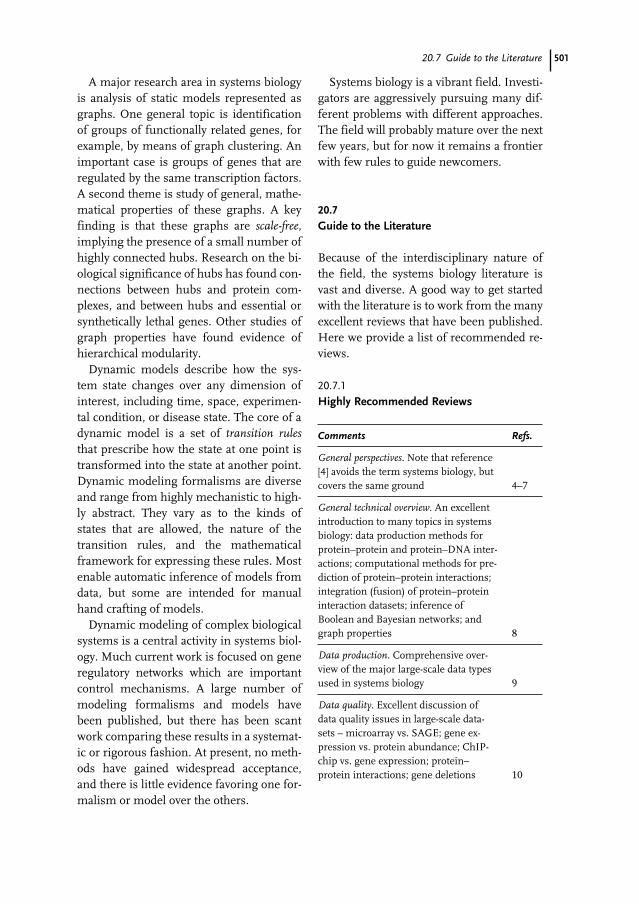
50120.7 Guide to the Literature
A major research area in systems biologyis analysis of static models represented asgraphs. One general topic is identificationof groups of functionally related genes, forexample, by means of graph clustering. Animportant case is groups of genes that areregulated by the same transcription factors.A second theme is study of general, mathe-matical properties of these graphs. A keyfinding is that these graphs are scale-free,implying the presence of a small number ofhighly connected hubs. Research on the bi-ological significance of hubs has found con-nections between hubs and protein com-plexes, and between hubs and essential orsynthetically lethal genes. Other studies ofgraph properties have found evidence ofhierarchical modularity.
Dynamic models describe how the sys-tem state changes over any dimension ofinterest, including time, space, experimen-tal condition, or disease state. The core of adynamic model is a set of transition rulesthat prescribe how the state at one point istransformed into the state at another point.Dynamic modeling formalisms are diverseand range from highly mechanistic to high-ly abstract. They vary as to the kinds ofstates that are allowed, the nature of thetransition rules, and the mathematicalframework for expressing these rules. Mostenable automatic inference of models fromdata, but some are intended for manualhand crafting of models.
Dynamic modeling of complex biologicalsystems is a central activity in systems biol-ogy. Much current work is focused on generegulatory networks which are importantcontrol mechanisms. A large number ofmodeling formalisms and models havebeen published, but there has been scantwork comparing these results in a systemat-ic or rigorous fashion. At present, no meth-ods have gained widespread acceptance,and there is little evidence favoring one for-malism or model over the others.
Systems biology is a vibrant field. Investi-gators are aggressively pursuing many dif-ferent problems with different approaches.The field will probably mature over the nextfew years, but for now it remains a frontierwith few rules to guide newcomers.
20.7
Guide to the Literature
Because of the interdisciplinary nature ofthe field, the systems biology literature isvast and diverse. A good way to get startedwith the literature is to work from the manyexcellent reviews that have been published.Here we provide a list of recommended re-views.
20.7.1
Highly Recommended Reviews
Comments Refs.
General perspectives. Note that reference [4] avoids the term systems biology, but covers the same ground 4–7
General technical overview. An excellent introduction to many topics in systems biology: data production methods for protein–protein and protein–DNA inter-actions; computational methods for pre-diction of protein–protein interactions; integration (fusion) of protein–protein interaction datasets; inference of Boolean and Bayesian networks; and graph properties 8
Data production. Comprehensive over-view of the major large-scale data types used in systems biology 9
Data quality. Excellent discussion of data quality issues in large-scale data-sets – microarray vs. SAGE; gene ex-pression vs. protein abundance; ChIP-chip vs. gene expression; protein–protein interactions; gene deletions 10
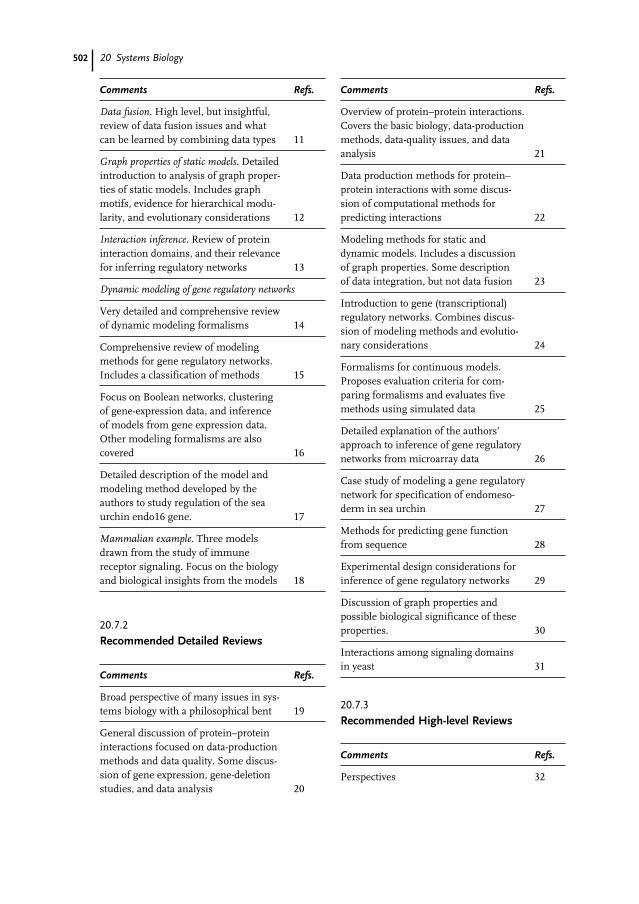
502 20 Systems Biology
Comments Refs.
Data fusion. High level, but insightful, review of data fusion issues and what can be learned by combining data types 11
Graph properties of static models. Detailed introduction to analysis of graph proper-ties of static models. Includes graph motifs, evidence for hierarchical modu-larity, and evolutionary considerations 12
Interaction inference. Review of protein interaction domains, and their relevance for inferring regulatory networks 13
Dynamic modeling of gene regulatory networks
Very detailed and comprehensive review of dynamic modeling formalisms 14
Comprehensive review of modeling methods for gene regulatory networks. Includes a classification of methods 15
Focus on Boolean networks, clustering of gene-expression data, and inference of models from gene expression data. Other modeling formalisms are also covered 16
Detailed description of the model and modeling method developed by the authors to study regulation of the sea urchin endo16 gene. 17
Mammalian example. Three models drawn from the study of immune receptor signaling. Focus on the biology and biological insights from the models 18
20.7.2
Recommended Detailed Reviews
Comments Refs.
Broad perspective of many issues in sys-tems biology with a philosophical bent 19
General discussion of protein–protein interactions focused on data-production methods and data quality. Some discus-sion of gene expression, gene-deletion studies, and data analysis 20
Comments Refs.
Overview of protein–protein interactions. Covers the basic biology, data-production methods, data-quality issues, and data analysis 21
Data production methods for protein–protein interactions with some discus-sion of computational methods for predicting interactions 22
Modeling methods for static and dynamic models. Includes a discussion of graph properties. Some description of data integration, but not data fusion 23
Introduction to gene (transcriptional) regulatory networks. Combines discus-sion of modeling methods and evolutio-nary considerations 24
Formalisms for continuous models. Proposes evaluation criteria for com-paring formalisms and evaluates five methods using simulated data 25
Detailed explanation of the authors’ approach to inference of gene regulatory networks from microarray data 26
Case study of modeling a gene regulatory network for specification of endomeso-derm in sea urchin 27
Methods for predicting gene function from sequence 28
Experimental design considerations for inference of gene regulatory networks 29
Discussion of graph properties and possible biological significance of these properties. 30
Interactions among signaling domains in yeast 31
20.7.3
Recommended High-level Reviews
Comments Refs.
Perspectives 32
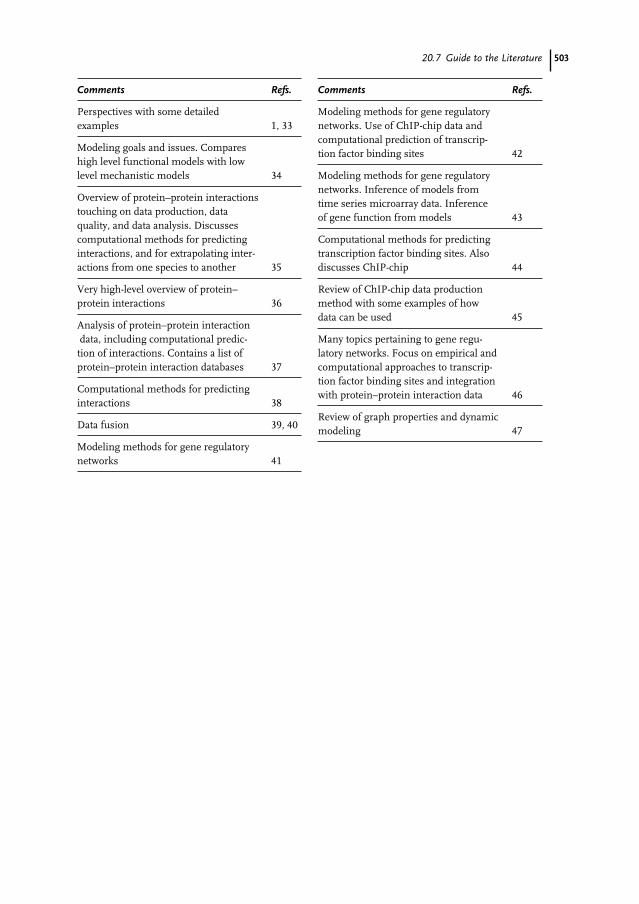
50320.7 Guide to the Literature
Comments Refs.
Perspectives with some detailed examples 1, 33
Modeling goals and issues. Compares high level functional models with low level mechanistic models 34
Overview of protein–protein interactions touching on data production, data quality, and data analysis. Discusses computational methods for predicting interactions, and for extrapolating inter-actions from one species to another 35
Very high-level overview of protein–protein interactions 36
Analysis of protein–protein interactiondata, including computational predic-tion of interactions. Contains a list of protein–protein interaction databases 37
Computational methods for predicting interactions 38
Data fusion 39, 40
Modeling methods for gene regulatory networks 41
Comments Refs.
Modeling methods for gene regulatory networks. Use of ChIP-chip data and computational prediction of transcrip-tion factor binding sites 42
Modeling methods for gene regulatory networks. Inference of models from time series microarray data. Inference of gene function from models 43
Computational methods for predicting transcription factor binding sites. Also discusses ChIP-chip 44
Review of ChIP-chip data production method with some examples of how data can be used 45
Many topics pertaining to gene regu-latory networks. Focus on empirical and computational approaches to transcrip-tion factor binding sites and integration with protein–protein interaction data 46
Review of graph properties and dynamic modeling 47
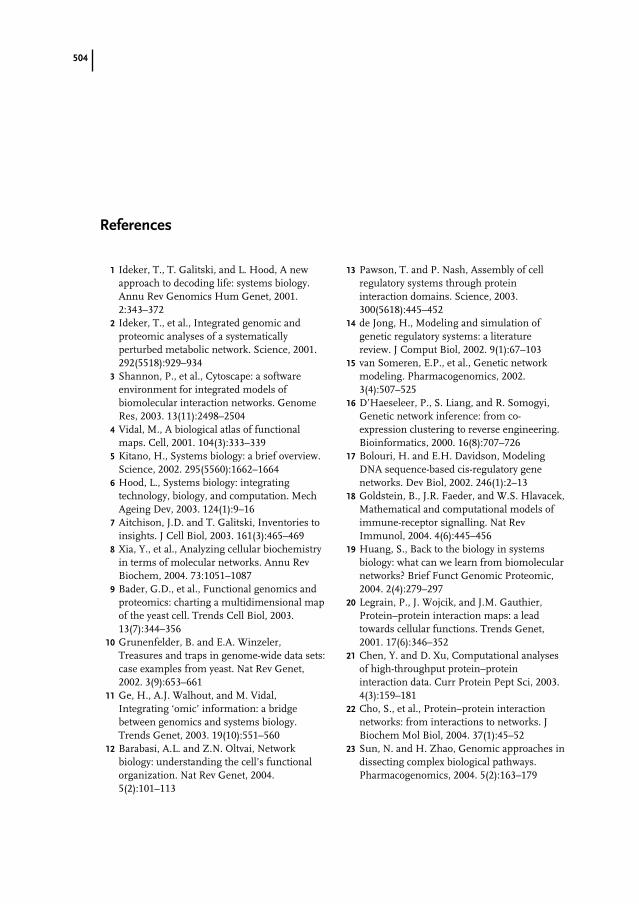
504
1 Ideker, T., T. Galitski, and L. Hood, A newapproach to decoding life: systems biology.Annu Rev Genomics Hum Genet, 2001.2:343–372
2 Ideker, T., et al., Integrated genomic andproteomic analyses of a systematicallyperturbed metabolic network. Science, 2001.292(5518):929–934
3 Shannon, P., et al., Cytoscape: a softwareenvironment for integrated models ofbiomolecular interaction networks. GenomeRes, 2003. 13(11):2498–2504
4 Vidal, M., A biological atlas of functionalmaps. Cell, 2001. 104(3):333–339
5 Kitano, H., Systems biology: a brief overview.Science, 2002. 295(5560):1662–1664
6 Hood, L., Systems biology: integratingtechnology, biology, and computation. MechAgeing Dev, 2003. 124(1):9–16
7 Aitchison, J.D. and T. Galitski, Inventories toinsights. J Cell Biol, 2003. 161(3):465–469
8 Xia, Y., et al., Analyzing cellular biochemistryin terms of molecular networks. Annu RevBiochem, 2004. 73:1051–1087
9 Bader, G.D., et al., Functional genomics andproteomics: charting a multidimensional mapof the yeast cell. Trends Cell Biol, 2003.13(7):344–356
10 Grunenfelder, B. and E.A. Winzeler,Treasures and traps in genome-wide data sets:case examples from yeast. Nat Rev Genet,2002. 3(9):653–661
11 Ge, H., A.J. Walhout, and M. Vidal,Integrating ‘omic’ information: a bridgebetween genomics and systems biology.Trends Genet, 2003. 19(10):551–560
12 Barabasi, A.L. and Z.N. Oltvai, Networkbiology: understanding the cell’s functionalorganization. Nat Rev Genet, 2004.5(2):101–113
13 Pawson, T. and P. Nash, Assembly of cellregulatory systems through proteininteraction domains. Science, 2003.300(5618):445–452
14 de Jong, H., Modeling and simulation ofgenetic regulatory systems: a literaturereview. J Comput Biol, 2002. 9(1):67–103
15 van Someren, E.P., et al., Genetic networkmodeling. Pharmacogenomics, 2002.3(4):507–525
16 D’Haeseleer, P., S. Liang, and R. Somogyi,Genetic network inference: from co-expression clustering to reverse engineering.Bioinformatics, 2000. 16(8):707–726
17 Bolouri, H. and E.H. Davidson, ModelingDNA sequence-based cis-regulatory genenetworks. Dev Biol, 2002. 246(1):2–13
18 Goldstein, B., J.R. Faeder, and W.S. Hlavacek,Mathematical and computational models ofimmune-receptor signalling. Nat RevImmunol, 2004. 4(6):445–456
19 Huang, S., Back to the biology in systemsbiology: what can we learn from biomolecularnetworks? Brief Funct Genomic Proteomic,2004. 2(4):279–297
20 Legrain, P., J. Wojcik, and J.M. Gauthier,Protein–protein interaction maps: a leadtowards cellular functions. Trends Genet,2001. 17(6):346–352
21 Chen, Y. and D. Xu, Computational analysesof high-throughput protein–proteininteraction data. Curr Protein Pept Sci, 2003.4(3):159–181
22 Cho, S., et al., Protein–protein interactionnetworks: from interactions to networks. JBiochem Mol Biol, 2004. 37(1):45–52
23 Sun, N. and H. Zhao, Genomic approaches indissecting complex biological pathways.Pharmacogenomics, 2004. 5(2):163–179
References
505References
24 Babu, M.M., et al., Structure and evolution oftranscriptional regulatory networks. CurrOpin Struct Biol, 2004. 14(3):283–291
25 Wessels, L.F., E.P. van Someren, and M.J.Reinders, A comparison of genetic networkmodels. Pac Symp Biocomput, 2001:508–519
26 van Someren, E.P., L.F. Wessels, and M.J.Reinders, Linear modeling of geneticnetworks from experimental data. Proc IntConf Intell Syst Mol Biol, 2000. 8:355–366
27 Davidson, E.H., D.R. McClay, and L. Hood,Regulatory gene networks and the propertiesof the developmental process. Proc Natl AcadSci U S A, 2003. 100(4):1475–1480
28 Gabaldon, T. and M.A. Huynen, Prediction ofprotein function and pathways in the genomeera. Cell Mol Life Sci, 2004. 61(7-8):930–944
29 Stark, J., et al., Reconstructing genenetworks: what are the limits? Biochem SocTrans, 2003. 31(Pt 6):1519–1525
30 Alm, E. and A.P. Arkin, Biological networks.Curr Opin Struct Biol, 2003. 13(2):193–202
31 Yu, J.W. and M.A. Lemmon, Genome-wideanalysis of signaling domain function. CurrOpin Chem Biol, 2003. 7(1):103–109
32 Hood, L., Leroy Hood expounds theprinciples, practice and future of systemsbiology. Drug Discov Today, 2003.8(10):436–438
33 Herrgard, M.J., M.W. Covert, and B.O.Palsson, Reconstruction of microbialtranscriptional regulatory networks. CurrOpin Biotechnol, 2004. 15(1):70–77
34 Ideker, T. and D. Lauffenburger, Buildingwith a scaffold: emerging strategies for high-to low-level cellular modeling. TrendsBiotechnol, 2003. 21(6):255–262
35 Bork, P., et al., Protein interaction networksfrom yeast to human. Curr Opin Struct Biol,2004. 14(3):292–299
36 Tucker, C.L., J.F. Gera, and P. Uetz, Towardsan understanding of complex proteinnetworks. Trends Cell Biol, 2001.11(3):102–106
37 Salwinski, L. and D. Eisenberg,Computational methods of analysis ofprotein–protein interactions. Curr OpinStruct Biol, 2003. 13(3):377–382
38 Valencia, A. and F. Pazos, Computationalmethods for the prediction of proteininteractions. Curr Opin Struct Biol, 2002.12(3):368–373
39 Gerstein, M., N. Lan, and R. Jansen,Proteomics. Integrating interactomes.Science, 2002. 295(5553):284–287
40 Wei, G.H., D.P. Liu, and C.C. Liang, Chartinggene regulatory networks: strategies,challenges and perspectives. Biochem J, 2004.381(Pt 1):1–12
41 Brazhnik, P., A. de la Fuente, and P. Mendes,Gene networks: how to put the function ingenomics. Trends Biotechnol, 2002.20(11):467–472
42 Futcher, B., Transcriptional regulatorynetworks and the yeast cell cycle. Curr OpinCell Biol, 2002. 14(6):676–683
43 Dewey, T.G., From microarrays to networks:mining expression time series. Drug DiscovToday, 2002. 7(20 Suppl):S170–S175
44 Li, H. and W. Wang, Dissecting thetranscription networks of a cell usingcomputational genomics. Curr Opin GenetDev, 2003. 13(6):611–616
45 Wyrick, J.J. and R.A. Young, Decipheringgene expression regulatory networks. CurrOpin Genet Dev, 2002. 12(2):130–136
46 Pennacchio, L.A. and E.M. Rubin, Genomicstrategies to identify mammalian regulatorysequences. Nat Rev Genet, 2001. 2(2):100–109
47 Monk, N.A., Unravelling Nature’s networks.Biochem Soc Trans, 2003. 31(Pt 6):1457–1461

Part IVEthical, Legal and Social Issues
Verwendete Mac Distiller 5.0.x Joboptions
Dieser Report wurde automatisch mit Hilfe der Adobe Acrobat Distiller Erweiterung "Distiller Secrets v1.0.5" der IMPRESSED GmbH erstellt. Sie koennen diese Startup-Datei für die Distiller Versionen 4.0.5 und 5.0.x kostenlos unter http://www.impressed.de herunterladen. ALLGEMEIN ---------------------------------------- Dateioptionen: Kompatibilität: PDF 1.3 Für schnelle Web-Anzeige optimieren: Ja Piktogramme einbetten: Ja Seiten automatisch drehen: Nein Seiten von: 1 Seiten bis: Alle Seiten Bund: Links Auflösung: [ 2400 2400 ] dpi Papierformat: [ 481 680 ] Punkt KOMPRIMIERUNG ---------------------------------------- Farbbilder: Downsampling: Nein Komprimieren: Ja Komprimierungsart: ZIP Bitanzahl pro Pixel: 8 Bit Graustufenbilder: Downsampling: Nein Komprimieren: Ja Komprimierungsart: ZIP Bitanzahl pro Pixel: 8 Bit Schwarzweiß-Bilder: Downsampling: Nein Komprimieren: Ja Komprimierungsart: CCITT CCITT-Gruppe: 4 Graustufen glätten: Nein Text und Vektorgrafiken komprimieren: Ja SCHRIFTEN ---------------------------------------- Alle Schriften einbetten: Ja Untergruppen aller eingebetteten Schriften: Nein Wenn Einbetten fehlschlägt: Abbrechen Einbetten: Immer einbetten: [ /Courier-BoldOblique /Helvetica-BoldOblique /Courier /Helvetica-Bold /Times-Bold /Courier-Bold /Helvetica /Times-BoldItalic /Times-Roman /ZapfDingbats /Times-Italic /Helvetica-Oblique /Courier-Oblique /Symbol ] Nie einbetten: [ ] FARBE(N) ---------------------------------------- Farbmanagement: Farbumrechnungsmethode: Farbe nicht ändern Methode: Standard Geräteabhängige Daten: Einstellungen für Überdrucken beibehalten: Ja Unterfarbreduktion und Schwarzaufbau beibehalten: Ja Transferfunktionen: Beibehalten Rastereinstellungen beibehalten: Nein ERWEITERT ---------------------------------------- Optionen: Prolog/Epilog verwenden: Nein PostScript-Datei darf Einstellungen überschreiben: Nein Level 2 copypage-Semantik beibehalten: Ja Portable Job Ticket in PDF-Datei speichern: Ja Illustrator-Überdruckmodus: Ja Farbverläufe zu weichen Nuancen konvertieren: Ja ASCII-Format: Nein Document Structuring Conventions (DSC): DSC-Kommentare verarbeiten: Ja DSC-Warnungen protokollieren: Nein Für EPS-Dateien Seitengröße ändern und Grafiken zentrieren: Ja EPS-Info von DSC beibehalten: Ja OPI-Kommentare beibehalten: Nein Dokumentinfo von DSC beibehalten: Ja ANDERE ---------------------------------------- Distiller-Kern Version: 5000 ZIP-Komprimierung verwenden: Ja Optimierungen deaktivieren: Nein Bildspeicher: 524288 Byte Farbbilder glätten: Nein Graustufenbilder glätten: Nein Bilder (< 257 Farben) in indizierten Farbraum konvertieren: Ja sRGB ICC-Profil: sRGB IEC61966-2.1 ENDE DES REPORTS ---------------------------------------- IMPRESSED GmbH Bahrenfelder Chaussee 49 22761 Hamburg, Germany Tel. +49 40 897189-0 Fax +49 40 897189-71 Email: [email protected] Web: www.impressed.de
Adobe Acrobat Distiller 5.0.x Joboption Datei
<< /ColorSettingsFile () /LockDistillerParams true /DetectBlends true /DoThumbnails true /AntiAliasMonoImages false /MonoImageDownsampleType /Bicubic /GrayImageDownsampleType /Bicubic /MaxSubsetPct 100 /MonoImageFilter /CCITTFaxEncode /ColorImageDownsampleThreshold 1.5 /GrayImageFilter /FlateEncode /ColorConversionStrategy /LeaveColorUnchanged /CalGrayProfile (Dot Gain 20%) /ColorImageResolution 300 /UsePrologue false /MonoImageResolution 1200 /ColorImageDepth 8 /sRGBProfile (sRGB IEC61966-2.1) /PreserveOverprintSettings true /CompatibilityLevel 1.3 /UCRandBGInfo /Preserve /EmitDSCWarnings false /CreateJobTicket true /DownsampleMonoImages false /DownsampleColorImages false /MonoImageDict << /K -1 >> /ColorImageDownsampleType /Bicubic /GrayImageDict << /HSamples [ 2 1 1 2 ] /VSamples [ 2 1 1 2 ] /Blend 1 /QFactor 0.9 >> /CalCMYKProfile (U.S. Web Coated (SWOP) v2) /ParseDSCComments true /PreserveEPSInfo true /MonoImageDepth -1 /AutoFilterGrayImages false /SubsetFonts false /GrayACSImageDict << /HSamples [ 2 1 1 2 ] /VSamples [ 2 1 1 2 ] /Blend 1 /QFactor 0.9 >> /ColorImageFilter /FlateEncode /AutoRotatePages /None /PreserveCopyPage true /EncodeMonoImages true /ASCII85EncodePages false /PreserveOPIComments false /NeverEmbed [ ] /ColorImageDict << /HSamples [ 2 1 1 2 ] /VSamples [ 2 1 1 2 ] /Blend 1 /QFactor 0.9 >> /AntiAliasGrayImages false /GrayImageDepth 8 /CannotEmbedFontPolicy /Error /EndPage -1 /TransferFunctionInfo /Preserve /CalRGBProfile (sRGB IEC61966-2.1) /EncodeColorImages true /EncodeGrayImages true /ColorACSImageDict << /HSamples [ 2 1 1 2 ] /VSamples [ 2 1 1 2 ] /Blend 1 /QFactor 0.9 >> /Optimize true /ParseDSCCommentsForDocInfo true /GrayImageDownsampleThreshold 1.5 /MonoImageDownsampleThreshold 1.5 /AutoPositionEPSFiles true /GrayImageResolution 300 /AutoFilterColorImages false /AlwaysEmbed [ /Courier-BoldOblique /Helvetica-BoldOblique /Courier /Helvetica-Bold /Times-Bold /Courier-Bold /Helvetica /Times-BoldItalic /Times-Roman /ZapfDingbats /Times-Italic /Helvetica-Oblique /Courier-Oblique /Symbol ] /ImageMemory 524288 /OPM 1 /DefaultRenderingIntent /Default /EmbedAllFonts true /StartPage 1 /DownsampleGrayImages false /AntiAliasColorImages false /ConvertImagesToIndexed true /PreserveHalftoneInfo false /CompressPages true /Binding /Left >> setdistillerparams << /PageSize [ 595.276 841.890 ] /HWResolution [ 2400 2400 ] >> setpagedevice
509
Bartha Maria Knoppers and Clémentine Sallée
21.1
Introduction
Genetic research is increasingly used tocover a wide range of research activity. Thisactivity extends from classical research intodiseases following Mendelian patterns ofinheritance, to the search for genetic riskfactors in common diseases, to the more re-cent interest in pharmacogenomics and, fi-nally, to the actual need for studies of nor-mal genetic variation across entire popula-tions. This all-encompassing nature of theterm genetic research would not be so prob-lematic were it not for the fact that corre-sponding distinctions (if necessary) cannotbe found in ethical norms applied to evalu-ate such research. To address this issue weneed to understand the ethical concernsraised by the different types of genetic re-search. Beginning with a overview of thetypes of genetic research (Sect. 21.2), wethen proceed to an introduction to the eth-ics norms of research in general (Sect.21.3), before analyzing their further elab-oration in genetic research (Sect. 21.4). Par-ticular attention will then be paid to theproblems raised by DNA banking (Sect.21.5), with the conclusion focusing on theissue of ownership of the samples in an in-
creasingly commercial environment (Sect.21.6). Finally, the term “human genetic re-search databases” will be used to cover allsystematic collections of stored tissue sam-ples used in genetic research whether ob-tained during medical care or specificallyfor research.
21.2
Types of Genetic Research
The Human Genome Project, which identi-fied 3 billion DNA base pairs, offered scien-tists an invaluable source of genetic infor-mation – the nearly complete sequencemap of the human genome. Further pro-jects such as the SNP consortium, aimingto identify single-nucleotide polymor-phisms and the International HapMap con-sortium, which seeks to draw a haplotypemap of the human genome (ancestralblocks of SNPs), are furthering researchers’understanding of genetics and genomics.The parallel development of biotechnologyand bio-informatics has enabled access toadvanced tools for data storage and analy-sis. As a result, the focus of medicine andgenetic research has shifted from diagnosis(symptomatic medicine with the study of
Handbook of Genome Research. Genomics, Proteomics, Metabolomics, Bioinformatics, Ethical and Legal Issues.Edited by Christoph W. SensenCopyright © 2005 WILEY-VCH Verlag GmbH & Co. KGaA, WeinheimISBN: 3-527-31348-6
21Ethical Aspects of Genome Research and Banking
510 21 Ethical Aspects of Genome Research and Banking
single-gene disorders and their manifesta-tion), to prevention and individualized med-icine (asymptomatic medicine and pharma-cogenomics). This change of emphasis hasbeen accompanied by increased reliance onhuman genetic research databases, diversenot only in their nature but also in theirscale and duration (e.g. Refs. [1, 2]).
Incredible progress has been achieved inour ability to discover and develop diagnos-tic tests for hereditary, single-gene disor-ders, and the possibility of predicting mor-bidity and mortality. The same progress hasnot been made in the treatment of theseconditions. These conditions are, however,prime candidates for gene therapy research.Often inherited not only through familiesbut also through racial and ethnic lines,these latter features, and the quasi-certaintyof expression have led to the development ofethical guidelines and legislation sensitiveto both potential discrimination and to thepossibility of stigmatization by associationRef. [3] (Sect. 21.4).
Understanding the role of genetic factorsin common conditions such as hyperten-sion, cancer, and diabetes is more complex.Other than perhaps rare forms of these con-ditions that follow familial patterns, theirexpression is often determined by the inter-play of environmental, socio-economic, cul-tural, and other influences. This posesinterdisciplinary challenges to reviews ofethics, to say nothing of determining the ap-propriateness of legislation in this area.
Pharmacogenomics is seeking to under-stand the role of genetic variation (polymor-phisms) in individual response (e.g., toxic-ity, efficacy, dosage, etc.) and requires theexpansion of epidemiology studies to entirepopulations (whether ill, at-risk, or not) toenable understanding of genetic diversity(e.g. Ref. [4]).
Population genetics research holds muchpromise. It poses new ethical challenges
and requires frameworks adapted to itsunique scale and purpose. Interestingly,most population studies of genetic variationdo not require identifying medical informa-tion but rather seek to use coded, double-coded, or anonymized DNA samples andassociated data (Sect. 21.5).
Across this spectrum then, from certain-ty, to probabilistic percentages in commondiseases, to individual susceptibility, to thecoded or anonymized sample, the possibil-ity of applying uniform ethical criteria isunlikely. The same difficulties might not bepresent, however, in the application of thelarger ethical framework governing bio-medical research generally.
21.3
Research Ethics
The last few years have seen the adoption ofnumerous international, regional, national,and professional codes which govern, makerecommendations, or draw guidelines for bi-omedical research generally, or for more spe-cific areas such as health or genetic researchand genomic databases. Reports by nationalethics committees questioning the need toestablish, regulate and govern national popu-lation human genetic research databaseshave also been published – see, e.g., Refs.[5–8] (International), Ref. [9] (Regional), andRefs. [10–12] (National). This proliferationand specialization of laws and policies haveposed international, regional and nationalchallenges to possible harmonization.
While internationally, some consensushas been achieved on the broad general eth-ical principles pertaining to biomedical andgenetic research, the multiplicity of stan-dards and rules and the variability of the vo-cabulary used to describe the same reality isdetrimental to research workers. This iseven more worrisome in an era of height-
51121.3 Research Ethics
ened data and knowledge sharing and inwhich there is a desperate need for in-creased international collaboration. Har-monization is a priority for the internation-al circulation of data (access and transfer)and cooperation between countries, re-searchers and/or clinicians, as well as inter-national organizations. The Council forInternational Organizations of Medical Sci-ences states that “the challenge to interna-tional research ethics is to apply universalethical principles to biomedical research ina multicultural world with a multiplicity ofhealth-care systems and considerable varia-tion in standards of heath care” (Ref. [5], In-troduction). Likewise, the Secretary-Gener-al of the United Nations Economic and So-cial Council affirms that:
“… despite the existence of numerous declar-ations, guiding principles and codes dealingwith the issue of genetic data, the changingconditions of genetic research call for the es-tablishment of an international instrumentthat would enable States to agree on ethicalprinciples, which they would then have totranspose into their legislation (Ref. [13],para. 44, p. 11).”
Nationally, countries are submerged in amyriad of rules with various systems andapproaches existing in parallel. This createsconfusion, overlap, conflicts, or even areaslacking regulation. There is no comprehen-sive or coherent legal and/or ethical frame-work regulating tissue or genetic research(e.g. Refs. [2, 14]). For instance, in Francethe National Consultative Ethics Commit-tee for Health and Life Science notes that:
“… neither the collection of elements, tissues,cells, etc. of human origin, nor the study ofthe genetic characteristics of an individual,nor the establishment of computerized files,nor the processing of the resulting informa-tion, are unregulated activities, on the con-trary, several systems co-exist so that the prob-lems are approached from different angleswhich ignore each other (Ref. [1] (France)).”
The US National Bioethics Advisory Com-mission has also emphasized this state ofdisorganization [15]. Indeed, in the US, fed-eral regulations (privacy legislation, regula-tion by the Food and Drug Administration,Common Law rules), and state laws all findapplication (e.g. Ref. [14]). Harmonizationon both the national and international are-na is thus considered a fundamental issuefor national ethics committees (see, e.g.,The 3rd Global summit of National Bioeth-ics Commissions, Imperial College, London,UK, Sept. 20–21, 2000; Ref. [1] (France)).They are, furthermore, calling for the im-plementation of a “new regulatory frame-work” addressing more specifically the is-sue of tissue banking or population geneticresearch databases – see, e.g., Refs. [11] (Is-rael) and [16] (Singapore).
Globalization, the explosion of new tech-nologies, the North–South divide, sensitiv-ity to differing cultural and religious world-views and to the lessons learned from thebiodiversity debate make such harmoniza-tion difficult but not impossible. The realtest might well be that of ensuring that notonly the public sector but also the privatesector (which is the largest source of fund-ing), abide by a future international ap-proach. The other challenge relates to anendemic problem, that of proper on-goingoversight.
It is interesting to note that there is agrowing recognition of the need to involvethe public and professionals in the draftingof harmonized ethical frameworks for re-search and banking, the latter havingshown their concern and interest with theadoption of policies (e.g. Ref. [14]). For ex-ample, the Singapore Bioethics AdvisoryCommittee recommends that:
“ … given the background of a rapidly shift-ing and evolving body of ethics, legal rulesand opinion governing human tissue re-search and banking in the leading scientific
512 21 Ethical Aspects of Genome Research and Banking
jurisdictions, we recommend that a continu-ing professional and public dialog be initiatedtowards: setting the principles which shouldguide the conduct of tissue banking againstthe background of evolving consensus onthese principles in the leading scientific juris-dictions … This dialog should be undertakenwith a view towards ensuring the harmoniza-tion of our laws with accepted internationalbest practice and consensus on relevant legaldoctrines and principles such as being devel-oped in the leading jurisdiction around theworld.” (Ref. [16], rec. 13.6 and 13.7; see, also,Ref. [17], art. 28, Ref. [18], rec. 9, Ref. [19],sect. 3.5, and Ref. [10], rec. 1).”
Following the adoption of the NurembergCode (1946–1949) [20], of the Helsinki Dec-laration [21], and more recently of theCIOMS guidelines [5], the main tenets of re-search ethics are both integrated into the bio-medical world and yet evolving. The mostcommon elements include respect for priva-cy and autonomy through the process of in-formed consent and choice, the right to with-draw, and the protection of the vulnerable.
The last decade has seen the emergenceof new issues and additional elements suchas: community consent, right not to know,commercialization, statutory regulation ofclinical trials, benefit-sharing, inclusive-ness, equitable access to research trials andbenefits, and free flow of information.There is also a much greater specificity inthat particular areas or groups of personsare singled out, for example those sufferingfrom mental disorders, HIV/AIDS, fetuses,deceased individuals, persons deprived ofliberty, and the disabled. Moreover, as al-ready mentioned, frameworks are being de-veloped for particular areas such as organtransplantation, reproductive technologies,stem cells, tissue banking, genetic or ge-nomic databases, etc. (e.g. Refs. [14, 22]).
The adoption of the European Conven-tion on Biomedicine and Human Rights
[17] illustrates the difficulty of finding com-mon principles and positions when tech-nologies are already well-entrenched anddifferent countries have adopted legislation.For example, no agreement could initiallybe reached in the Convention on embryo re-search, an area where guidance is requirednow stem cell and therapeutic cloning tech-niques are promising new breakthroughs.Only in 2001 was the Additional Protocol onthe Prohibition of Cloning Human Beings[23] finally added to the Convention. OnSeptember 7, 2000, the European Parlia-ment narrowly passed a resolution (237 vs.230 votes with 43 abstentions) condemningthe deliberate creation of embryos for thera-peutic cloning [24]. The same difficultyfinding consensus will no doubt hold truein the actual elaboration of specific proto-cols pursuant to the Convention or Europe-an resolution on, for example, stem-cell re-search, or the attempt to adopt a council de-cision amending decision 2002/834/EC onthe specific program for research, techno-logical, development and demonstration:“Integrating and strengthening the Europe-an research area” [25].
The Convention [17] is, however, notablein its broadening of the inclusion criteriagoverning incompetent adults and children.Rather than excluding them from biomedi-cal research in the absence of direct benefit,the Convention would permit inclusionwith the consent of the legal representativeeven if the benefits were only indirect, thatis, for persons of the same age and condi-tion (art.17). The same principle was up-held by the Council for International Or-ganizations of Medical Sciences providedthe research is of minimal risk and is scien-tifically and ethically justified; such justifi-cation must be overriding when the re-search presents a risk that is more thanminimal (Ref. [5], guideline 9). This wasfurther upheld by the World Health Organ-
51321.4 “Genethics”
ization when addressing the inclusion ofvulnerable individuals in genetic databases(Ref. [19], para. 4.3). In short, the evolutionof biomedical ethics in human research ingeneral has received wider acceptance. Isthe same true for the field of bioethics andgenetics [22]?
21.4
“Genethics”
At the international level, UNESCO adopt-ed the Universal Declaration on the Hu-man Genome and Human Rights in 1997[26]. The Declaration is prospective in na-ture. It embraces the concepts of humandignity and the diversity of the genome asthe common heritage of humanity, of non-commodification, of the need for interna-tional solidarity, and of concern over tech-nologies such as germ-line interventionsthat could affect future generations (art.24). It specifically prohibits human repro-ductive cloning (art. 11).
The proliferation of genetic/genomicdatabases over the last decade, and the de-velopment of genetic research using suchresources have prompted international or-ganizations to implement a set of guidingprinciples with regard to the collection, pro-cessing, use, and storage of genetic infor-mation [7], and/or the management of ge-netic [19] or genomic databases [8]. Thesetexts reaffirm the principles embodied inthe Universal Declaration on the HumanGenome and Human Rights. They assertthe communal value of genetic data or data-bases and insist on the fundamental natureof the principles of human dignity, solidar-ity, equality, justice and on the need for re-search to be carried out transparently andresponsibly. UNESCO’s International Dec-laration on Human Genetic Data aims to“… ensure the respect of human dignity and
protection of human rights and fundamen-tal freedoms in the collection, processing,use and storage of human genetic data, hu-man proteomic data and of the biologicalsamples from which they are derived …”(art. 1a).
The WHO embraces “… the pursuit ofhuman well-being, the quality of humandignity, including fundamental humanrights and the principle of nondiscrimina-tion, the principle of respect for persons, in-cluding the imperatives of beneficence andnonmaleficence and the principle of respectfor individual autonomy …” (Sect. 2.2) asprimary guiding values; it also specifies that“… accepted principles regarding personalinformation and human rights apply also togenetic information.” It acknowledges,however, the western philosophical under-tone of the report and the principles en-dorsed, and recommends the examinationof other perspectives.
Both these documents, while warningagainst the risk of discrimination and stig-matization, insist on the need to avoid ge-netic determinism or exceptionalism whichcould ensue from the current scientific andpublic focus on genetics and genomics (re-ducing individuals to their genetic charac-teristics and distinguishing genetic infor-mation from other health information evenwhen not justified, thus creating “genetic”specificity) (Ref. [7], arts. 3 and 7(a) and Ref.[19], Preface; see also Ref. [4], art. 33). Final-ly, the Human Genome Organization, pro-moting the free flow of data and fair andequal sharing of research benefits, holdshuman genomic databases to be global pub-lic goods, i.e. goods “… whose scope extendsworldwide, are enjoyable by all with nogroups excluded, and, when consumed byone individual are not depleted for others…” [8]. These international instrumentsthen, come at the beginning of a technologyand hopefully will serve to guide national
514 21 Ethical Aspects of Genome Research and Banking
approaches, thus ensuring a minimum ofharmonization.
Also anticipatory in nature and 10 yearsin the making, the 1998 European Directiveon the Legal Protection of BiotechnologicalInventions [27], not only a clarifies (if notratifies) existing trends but also innovates.The Directive reaffirms the nonpatentabilityof human genes in their natural state and,under the umbrella of public policy (an eth-ical filter also found in the European PatentConvention), prohibits techniques such ashuman cloning and germ-line intervention(art. 5(2)). The preamble (“recital”), whilenot having legal force, requires that a patentapplication for an invention using humanbiological material must be “… from a per-son who has had the opportunity of express-ing free and informed consent thereto, inaccordance with national law …” (para. 26).This means that, at a minimum, partici-pants in genetic research and banking mustbe notified of the possibility of eventualcommercialization. In the absence of theDirective’s implementation into “nationallaw”, however, its impact will be weakened.(see, also, Ref. [18]).
It is interesting to note that both interna-tional and regional instruments arestrengthening barriers to access by thirdparties (e.g. insurers, employers, education-al institutions). This is achieved either im-plicitly by limiting the purposes for whichgenetic information and/or tests can beused or with the adoption of express provi-sions circumscribing access to information(biological material, data derived, and re-sults). Notable in this regard is the Europe-an Convention on Human Rights and Bio-medicine [17] mentioned earlier, which, inconfining genetic testing to health purposes(art. 12), effectively limits requests for test-ing by insurers and employers (see also,Data Protection Working Party, Ref. [28].p.7, which would enable genetic tests to be
used by insurers and employers only in themost exceptional situations). International-ly, the collection, processing, use and stor-age of human genetic and proteomic datacan only be undertaken for purposes of di-agnosis and health care, research (medicaland scientific), forensic medicine, and in-vestigations subject to certain exceptions,and “… any other purpose consistent withthe Universal Declaration on the HumanGenome and Human Rights and the inter-national law of human rights …” (Ref. [7],arts. 1 and 5). Furthermore, access by thirdparties to identifiable genetic, proteomic in-formation and samples is proscribed exceptwhen consent of the individual has been se-cured or where provided for by nationallaws within the limits of important publicinterests (art. 14b). Similarly the WorldHealth Organization recommends that par-ties “… concerned with their own financialgain …” not be allowed access to geneticdata or databases (Ref. [19] Sect. 6.1).
A significant development is the creationof a right not to know alongside the moretraditional right to know one’s own geneticinformation. Adopted by the Convention onHuman Rights and Biomedicine under arti-cle 10(2), it has been ascertained in laterinternational and regional documents (see,e.g., internationally, Ref. [7] art. 10 and Ref.[19] rec. 16; and, regionally, Ref. [9] art.18(iii) and Ref. [28] arts. 12(3) and 12(4)).This right to decide whether or not to be in-formed is not absolute. It is subject to thedata being identifiable, to the limitationslaid down by law in the interests of publichealth, and to the results being individualand not just general (on return of resultssee, e.g., Ref. [4] art. 34, Ref. [19] rec. 8(Quebec), and Ref. [10] rec. 6) The right notto know, an expression of the individualright to autonomy, remains uncertain inscope because it implies the providing ofinformation in order for consent to be in-
51521.4 “Genethics”
formed as well as limits in such informa-tion not to impact on the decision of the in-dividual not to be informed.
As emphasized by the World Health Or-ganization “… in circumstances wherethere is no evidence of what an individualwould want to know, it is not possible toseek to advance their autonomy by askingthem if they would wish to know, for to doso is to indicate that there is, indeed, some-thing to know, and thereby any possibleharm will have been caused.” It thus pro-poses a list of factors to be taken into ac-count and weighed before an individual isapproached, one of which is the vague” …question of how the individual might be af-fected if subjected to unwarranted informa-tion, and whether the individual has ex-pressed any views on receiving informationof this kind” (Ref. [19], rec. 16).
The right not to be informed becomesmore controversial when applicable to ge-netic relatives, as established by UNESCO’sDeclaration on Genetic Data (art. 10), asthey have not voluntarily and in an in-formed way decided to be subjected to test-ing or to participate in research. The man-ner in which this right will be implementedbears examination.
Correlative to the recognition of a rightnot to know is the development of a new ex-ception for professional disclosure to at-riskfamily members of serious preventable ortreatable conditions where the patient re-fuses to do so. This emerging duty to warn,subject, in critical situations, to ethical ap-proval, has been adopted by many interna-tional instruments. This is the position ofthe 1998 Proposed International Guide-lines of WHO [29], of the 1998 HUGOStatement on DNA Sampling: Control andAccess [30] of the ESHG [31], of the 2003UNESCO Declaration on Genetic Data [7],and of the 2003 WHO Genetic Databasesreport and recommendations [19]. Thus,
this ethical duty is not only an option for cli-nicians but is also applicable in the researchor banking context, and thus creates an on-going ethical obligation for the research-er/banker as new tests become available.The existence of an ethical duty to warn is,however, sometimes opposed nationally byproponents of a strict notion of confiden-tiality in the patient/subject–clinician/re-searcher relationship (see infra. 5.3 (Fran-ce) [1]).
Finally, another change in international“genethics” is the attempt to move awayfrom traditional, categorical, wholesale pro-hibitions in the area of cloning and germ-line therapy. Although the International Bi-oethics Committee of UNESCO in its pe-nultimate draft had agreed to keep the Uni-versal Declaration on the Human Genomeand Human Rights [17] free from mentionof any specific technology, the aim being toguarantee its viability over time and its uni-versality and to strengthen the impact ofconcepts such as human diversity and dig-nity, prohibitions were added by representa-tives of governments as a condition of ap-proval. Indeed, governmental representa-tives who were convened to approve theCommittee’s final draft sought (political?)refuge in inserting “technique-specific”prohibitions in the Declaration with regardto human cloning and germ-line therapy asmentioned earlier. Currently, an interna-tional declaration on human cloning is be-ing discussed at the United Nations. Themain point of contention is its scope, thatis, whether it is to be limited to reproductivecloning or include therapeutic cloning. Itbears noting that the WHO in both its 1998Proposed International Guidelines [29], its1999 Draft Guidelines on Bioethics [32],and its resolution on Ethical, Scientific andSocial Implications of Cloning in HumanHealth [33] distinguishes between the dif-ferent types of cloning. Both WHO and
516 21 Ethical Aspects of Genome Research and Banking
HUGO [30] prohibit human reproductivecloning but encourage relevant research inthe field of therapeutic cloning and stem-cell research. This is instructive in the bank-ing context where, as we shall see, formerly,wholesale proclamations about DNA as“person” or as “property” have ultimatelyproved secondary to the need to ensure per-sonal control, irrespective of the legal qual-ification and without impact as regardscommercialization.
21.5
DNA Banking
The last fifteen years have seen tremendousupheaval and uncertainty in the world ofDNA banking and research. Indeed, 1995saw the hitherto unfettered access by re-searchers to archived samples come to ahalt with the report of an NIH study groupon informed consent for genetic researchon stored tissue samples suggesting thatproof of consent to research was requiredeven for samples already stored during rou-tine medical care [34]. Although, in general,the ethical and legal norms governing bank-ing had been moving toward a more in-formed choice approach with options in thecase of samples provided in the researchcontext per se, the implementation of thisapproach would effectively have halted thelargest “source” of DNA samples for geneticresearch to say nothing of epidemiologicalor public health research (even if the latterwished to use only anonymized samples)(e.g. Refs. [35, 36]). This conservative posi-tion was followed by a myriad of contradic-tory positions around the world.
Five years later, in May 2000, the UK’sRoyal College of Physicians Committee onEthical Issues in Medicine published its rec-ommendations on Research based on Ar-chived Information and Samples [37] and
the circle seemed closed. Indeed, the Com-mittee did not consider unethical the secon-dary “unconsented-to” use for research ofbiological samples obtained during clinicalcare (e.g. “left-over”), post-mortem exam-ination, or research, provided certain condi-tions were met and anonymization oc-curred at the earliest stage possible; theminimum level of anonymization beingthat which precludes identification of theindividual from the research [37]. This re-port, even though to be welcomed for adopt-ing a more liberal approach to research,could, however, be regarded today as inade-quate when applied to human genetic re-search databases or “biobanks”, because an-onymization might not always be welcome.Biobanks differ from traditional hypothesis-driven genetic research using stored sam-ples and data, notably, in their fundamentalnature, that of “resources” for researchers.As a consequence, it is impossible to en-compass all possible uses when they are es-tablished, because they aim to store sam-ples and data indefinitely.
In 2004, the German National EthicsCouncil published its opinion on “Biobankson Research” [38], closing the discussion onthe ethical principles that should govern theestablishment of biobanks that started withthe adoption of a joint statement by theFrench and German National Ethics Com-mittees in 2003 [12]. In that statement, bothCommittees concluded that “… despitesome differences, there is a need in bothFrance and Germany, to elaborate a newregulatory framework covering collection,conservation, processing, and utilization ofthe elements and data assembled in bio-banks, and the development of researchprotection of individuals … “
Balancing patients rights, through re-spect for the most fundamental ethical prin-ciples, and freedom of research, throughthe adoption of a practical and sensible ap-
51721.5 DNA Banking
proach, the opinion of the German Nation-al Ethics Council goes further than existingnorms pertaining to biobanking. Recogniz-ing the need for archived samples (obtainedfor diagnosis and treatment) to remainavailable for further use while respectingconsent requirements, they hold that a“form-based” broad consent should be ob-tained at the time of collection (regulatoryproposal 2). They further conclude that con-sent requirements can be waived whensamples and data are anonymized, or evencoded (“pseudonymized”) provided re-searchers do not have access to the code,the data protection officer being respon-sible for ensuring respect for privacy re-quirements (regulatory proposal 3). Accord-ing to German data-protection legislation,even where no “precautionary consent” wassecured, consent can be waived for researchon data and samples in a personalized formwhen donors’ interests are outweighed bythe scientific importance of the researchand the research cannot proceed otherwiseor can proceed only at too high a cost, anddisproportionate efforts. However, the con-sent of the individual should be obtained ifpossible (regulatory proposal 4). Finally, forbiobanks created for research purposes,consent can be general as to the type of re-search and length of storage, the informa-tion provided to the donors being limited to“… personal risks to the donor arising di-rectly in connection with the use of samplesand data in biobanks …” and not extendingto more general risks such as those of dis-crimination or stigmatization (regulatoryproposals 5, 6, 9, and 12). All research pro-jects intending to use a biobank ought,however, to receive prior ethical approval(regulatory proposal 17).
Where does this position stand relative tointernational norms or that of other coun-tries? To answer that question we will ex-amine the varying responses in the period
1995–2004 with respect to samples alreadyarchived which were obtained during medi-cal care, and then samples obtained for re-search but where other research is now pro-posed.
It should be mentioned at the outset thatperhaps more confusing than the plethoraof contradictory positions is that of the ter-minology used. Only terms such as “identi-fied”, “nominative”, or “personally identi-fied” are understandable by all. In contrast,“identifiable”, “traceable”, or “pseudonym-ized”, “proportional”, or “reasonable” ano-nymity are used interchangeably with theterms “coded” or “double-coded”, and theterm “anonymous” (i.e. never had any iden-tifiers, such as specimens found on archeo-logical sites) is often confused with “ano-nymized.”
For the purpose of clarity, we use theterm “anonymized” (e.g., originally identi-fied or coded/identifiable/traceable/pseu-donymized to include clinical or demo-graphic data but now stripped except forclinical or demographic data) and the term“coded” or “double-coded” (e.g., identifiableonly by breaking the unique code or the twounique codes given the sample). We will ex-amine international (Sect. 21.5.1) and re-gional (Sect. 21.5.2) positions on “medicalcare” samples and then on research sam-ples before turning to the positions of par-ticular countries (Sect. 21.5.3).
21.5.1
International
Prior to the beginning of this century, withthe notable exception of the Human Ge-nome Organization’s 1998 Statement onDNA Sampling: Control and Access [30],international statements and guidelines onthe ethics of genetic research failed to ad-dress the specific issue of archived samplesoriginating from medical care, the context

518 21 Ethical Aspects of Genome Research and Banking
of medical care being largely left to individ-ual countries. This was regrettable for manyreasons, the major one being the extremedifficulty, if not impossibility, of fulfillingthe ethical obligation of international collab-oration due to the lack of international guid-ance and harmonization. Acknowledgingthe value of such archived material and in-formation, the impracticability in many cas-es of obtaining renewed consent, and theharm that could be caused to individualswho could be “… faced with an unwarrantedapproach with information that they mightnot wish to know …” (Ref. [19], sect. 4.4),international instruments are beginning toinclude limited exceptions to the traditionalneed for renewed informed consent. At aminimum, ethical committees can dispenseresearchers with consent requirements forstudies on anonymized samples and data.
While in its 1998 Proposed InternationalGuidelines the World Health Organizationdid not take a position on left-over or “aban-doned” samples except to say that “… speci-mens that could be useful to families in thefuture should be saved and should be avail-able …” (Ref. [29], Tab. 10, guideline 10), itspecifically addressed the issue of archivedmaterial in its 2003 report on genetic data-bases. The latter enables the use of suchmaterial (e.g. “… pre-existing health records,specific health disorder databases or physi-cal samples that have been retained …”),when anonymized and provided no futureidentification is possible of the “sample’ssource” notably through research results(Ref. [19], rec. 10).
HUGO [30], CIOMS [5], and UNESCO [7]have adopted an even less restrictive ap-proach, enabling stored samples and data tobe used not only in an anonymized but alsoin a coded form, provided certain conditionsare met. For example, the Human GenomeOrganization Ethics Committee held in1998 that:
“Routine samples, obtained during medicalcare and stored may be used for research if:there is a general notification of such a poli-cy, the patient has not objected, and the sam-ples obtained during medical care and storedbefore notification of such a policy may beused for research if the sample has been ano-nymized prior to use (Ref. [30], rec. 2).”
In the same way, the Council for Interna-tional Organizations of Medical Sciences,in its 2002 ethical guidelines for biomedicalresearch, states that consent requirementscan be waived if individuals are notified andtheir confidentiality or anonymity is pro-tected. However, it holds that “… waiver ofinformed consent is to be regarded as un-common and exceptional, and must in allcases be approved by an ethical review com-mittee …” (Ref. [5], guideline 4). It furtherdecides that such a committee can waivesome or all the requirements of informedconsent only for studies that pose minimalrisks, are expected to yield significant bene-fits, and could not realistically or reasonablytake place were consent requirements to beimposed (impracticability). The guidelinesconsider that prior opting out must be re-spected, except in situations of public emer-gencies, and that reluctance or refusal toparticipate is not sufficient to establish im-practicability (Commentary under guide-line 4).
Finally, UNESCO’s 2003 InternationalDeclaration on Human Genetic Data leavesto national legislation the task of imple-menting the specific conditions pertainingto the secondary use of samples and datacollected in the course of medical care (Ref.[7], art.16). Nevertheless, it holds that re-search can be undertaken without consentif the information is anonymized (“… irre-trievably unlinked to an identifiable individ-ual …”) or when consent cannot be ob-tained, provided proper ethical oversight oc-curs (art. 16b). Waiver of informed consent
51921.5 DNA Banking
might also be warranted when an impor-tant public interest is at stake, assumingfundamental human rights are respected(art. 16a).
With regard to samples and data collectedfor a specific research project that are to beused subsequently for other research pur-poses, similar waivers are contemplated(e.g. Ref. [30] rec. 3, and Ref. [7] art. 16). TheCouncil for International Organizations ofMedical Sciences specifies that subsequentresearch be circumscribed by the originalconsent, and that any conditions specifiedin that initial assent apply equally to secon-dary uses (Ref. [5] Commentary on guide-line 4). It affirms the critical need for antic-ipation of future uses when samples anddata are first collected. Thus, investigatorsshould, during the original consent pro-cess, inform potential participants aboutany foreseen secondary uses, privacy pro-tection, or destruction procedures that willbe implemented, and of their rights to re-quest destruction of any material or infor-mation they deem sensitive, or to opt out(Commentary on guideline 4; see also, e.g.,for genetic databases, Ref. [19] rec. 6). Asfor biological samples and data collected aspart of clinical care, however, elements ofinformed consent can be waived by an ethi-cal review committee in exceptional circum-stances (Guideline 4 and its attached com-mentaries). UNESCO’s 2003 Declaration onHuman Genetic Data holds that, healthemergencies excepted, secondary uses in-compatible with the conditions set out inthe initial consent form cannot proceedwithout a renewed consent (Ref. [7] art. 16).
Turning to consent procedures pertain-ing to the collection of new research sam-ples, it is worth outlining the emergence ofthe notion of well-informed generalized orbroad consent to future research, particu-larly adapted to large-scale longitudinal ge-netic studies on variation using human ge-
netic research databases. Broad consent,sometimes called “authorization”, has not,however, become the principle, but ratheran acceptable exception for certain types ofresearch, if it is justified both scientificallyand ethically and certain criteria are met.
As early as 1998, and in stark oppositionto the more conservative positions of thetime, the World Health Organization’s Pro-posed International Guidelines (Ref. [29]Tab. 10, guideline 10) maintained that “… ablanket informed consent that would allowuse of a sample in future projects is themost efficient approach …” (Tab.10). Thiswas somewhat tempered by the assertionthat “… genetic samples from individualsmust be handled with respect, should betaken only after the consent is obtained,and, should be used only as stated in thedocument …” (p. 4). In its 2003 report ongenetic databases [19], the World HealthOrganization reaffirms the possibility for alimited “… blanket consent for future re-search …” when data and samples are ano-nymized. Referring to large-scale popula-tion human genetic databases, it insists onthe need for strong ethical justification todeviate from traditional consent require-ments. A certain number of criteria mustbe satisfied with regard to the expected ben-efits, privacy protection, and education ofthe public (Ref. [19] rec. 14).
The Human Genome Organization de-fines informed consent for research as in-cluding “… notification of uses (actual or fu-ture), or opting out, or, in some cases, blan-ket consent …” (Ref. [8] rec. 4). Finally, theConsortium on Pharmacogenetics is of theopinion that some flexibility should be al-lowed for in consent forms, consent to a “…range of related studies over time …” beinga reasonable policy under certain circum-stances (Ref. [4] Research B).
In conclusion, the international effortsundertaken to differentiate between data
520 21 Ethical Aspects of Genome Research and Banking
and samples that are anonymized, coded, oridentified should be emphasized and wel-comed. These distinctions affect the ruleswhich apply to secondary uses of data andsamples, publication of results, transfer andtrans-border exchange of information, andrights to withdraw, to name but a few. Fur-thermore, UNESCO’s 2003 Declaration onHuman Genetic Data holds that “… humangenetic data and human proteomic datashould not be kept in a form which allowsthe data subject to be identified for anylonger than is necessary for achieving thepurposes for which they were collected orsubsequently processed …” (Ref. [7] art. 14e).The World Health Organization, acknowl-edging the value of anonymization with re-gard to participants’ privacy, requires the an-onymization process to be scrutinized by anethics committee, a necessary intermediaryto ensure its legitimacy and maintain ade-quate standards (Ref. [19] sect. 4.2. and rec.7). Finally, the Consortium on Pharmacoge-netics assesses the advantages and draw-backs of anonymization compared with cod-ing or double-coding, stating its preferencefor the latter (Ref. [4] Research F).
Regrettably, however, as mentioned earli-er, the terminology used to describe sam-ples and data is rather confusing. The re-sulting complexity undermines possibleharmonization, especially when new con-cepts such as reasonable or proportional an-onymity are introduced by the WHO (Ref.[19] para. 4.2).
21.1.2
Regional
At the regional level, other than upholdingthe need for informed consent for all medi-cal interventions including research, theCouncil of Europe’s Convention on HumanRights and Biomedicine [17] provides littleguidance on genetic research with regard to
either archived samples left over after clini-cal care or research samples. Article 22maintains that: “… when in the course of anintervention any part of a human body is re-moved, it might be stored and used for pur-poses other than that for which it was re-moved only if this is done in conformitywith appropriate information and consentprocedures.” No definition of what is con-sidered appropriate can be found in theConvention, because it is left to the discre-tion of national states.
Guidance can, however, be found in theEuropean Society of Human Genetics(ESHG) 2001 Recommendations on DataStorage and DNA Banking [39] and in theCouncil of Europe Proposal for an Instru-ment on the Use of Archived Human Bio-logical Materials in Biomedical Research [9].
These texts do not specifically refer tosamples left-over from clinical care butrather to archived samples or existing col-lections in general. The ESHG recommen-dations are notable in that they distinguishexisting collections based on the degree ofidentifiability of the samples and data andthe length of storage [39]. The Society con-siders that consent requirement can bewaived when samples are anonymized (rec.9), and, provided it is approved by an ethicscommittee, in situations where the collec-tion can be considered as abandoned (“oldcollections”) (rec. 14). For collections ofcoded information, although, in principle,re-consent of participants for new studies isnecessary, ethics review committees canwaive the requirement for such consentwhen re-contact is impracticable and thestudy poses minimal risks (rec. 12). Finally,post-mortem uses of samples are subject tothe donor’s advance wishes (rec.13). In theabsence of any known wishes, use of thosesamples should be regulated, a policy of un-fettered use not being ethically justified(rec.13).
52121.5 DNA Banking
In contrast, the Council of Europe doesnot allow re-consent to be waived whenstored biological clinical material and dataare to be used subsequently for research(Ref. [9] art. 14). Consent can, however, beeither implicit or explicit depending on theintrusiveness of the study and the previousdirectives of the donor (art. 16). Individualsenjoy the right to withhold their samplefrom certain future research uses of theirsample and the right to consent to subse-quent procedures (art. 15.1). Finally, post-mortem uses or uses of data from individu-als unable to consent have to meet satisfac-tory information and consent measures(art. 17). However, the Steering Committeeon Bioethics (CIOB) working party on Re-search on stored Human Biological Materi-al held that this draft proposal did not applyto biobanks for resarch in the future butonly to specific research projects (Ref. [64]).The Council of Europe and the ESHG bothinsist on the need to differentiate data ac-cording to their degree of identifiability. Onthe one hand, the Council of Europe propo-sal holds that the decision to use coded,identified or linked anonymized human bi-ological material or personal data “… shallbe justified by the needs of the research …”(Ref. [9] art. 9). On the other hand, the Eu-ropean Society of Human Genetics ex-plains that while anonymization is accept-able for “… sample and information sharingfor research purposes with minimum risk…” maintaining identifiability as protectedby coding is valuable and advisable becauseit “… will permit more effective biomedicalresearch and the possibility of re-contactingthe subject when a therapeutic option be-comes available …” (Ref. [39] recs.10 and 11).
Only the ESHG document explicitly ad-dresses the issue of consent for new collec-tions. It retains the fundamental principlesof ethics committee’ oversight and in-formed consent for “… all types of DNA
banking …” (Ref. [39] rec. 3). While notmentioning blanket consent, it contem-plates the possibility of obtaining consentfor broad research uses, the consequencebeing that individuals need not be re-con-tacted although they are to be kept in-formed and are to be given the possibility toexpress their desire to withdraw (rec. 8). Al-though international documents urgegroups, communities, and populations tobecome involved in the discussion sur-rounding the establishment of large-scalepopulation human genetic research data-bases, the ESHG goes one step further re-quiring additional consent “… at a grouplevel through its cultural appropriate au-thorities …” for population studies (rec. 15).This latter consent bears examination. Howit will be implemented in practice remainsto be seen. Indeed, it might prove difficultto define what would amount to an ade-quate community or group consent, whatamount of opposition would result in thestudy not being undertaken, and the conse-quences as far as other rights, notably thatof withdrawal, are concerned.
21.5.3
National
Before 2000, most countries did not distin-guish between clinical or archived researchsamples nor had positions on the issue ofother uses. As a consequence, in the ab-sence of a new and explicit consent, valuablearchived material collected in the course ofclinical care or research was not exploitablefor purposes other than those outlined inthe original protocol. Although today thisdistinction is not always made, several docu-ments have addressed the issue – e.g. Refs.[40] (Australia) and [16] (Singapore).
We are, furthermore, witnessing a spe-cialization of laws and ethical guidelineswith the drafting of legal instruments ad-
522 21 Ethical Aspects of Genome Research and Banking
dressing the specific issue of human genet-ic research databases or biobanks, and thegrowing recognition of the ethical validity ofbroad or general consent to genetic researchor banking.
As a preliminary comment, as previouslymentioned, it should be noted that nationaljurisdictions are insisting on the need to in-volve the public in any debate related to theestablishment of populational or commu-nity-based human genetic research databas-es to ensure both transparency and accep-tance of the project, and to address the con-cerns thus voiced – e.g. Refs. [41] (para. 2)and [42] (USA), Ref. [1] (France); Ref. [10]rec.1 (Quebec), and Ref. [16] rec.13.17 (Sin-gapore). It is recommended that public in-volvement take the form of public consulta-tion or engagement mechanisms. While notconstituting “consent” per se, it is advocatedthat strong opposition could jeopardize aproject’s lifespan. What remains to be seen,however, is the amount of public objectionthat will prevent the establishment of a hu-man genetic research database.
With regard to tissues primarily collectedfor therapeutic, diagnosis purposes or socalled “left-over” tissue, the need for a newconsent for further use in research isstrongly emphasized, waiver of consent, asa principle, not being ethically justified. Asoutlined by the Singapore Bioethics Adviso-ry Ethics Committee “… clinicians shouldnot assume that tissues left over after diag-nosis or research can be used for researchwithout consent …” (Ref. [16] rec. 13.13).The Australian Law Reform Commissionfurther states that “… it is easier to arguethat consent should be waived for researchpurposes than for research on tissue origi-nally collected for other purposes (therapeu-tic or diagnostic). In the latter case … re-search is an unrelated secondary purpose[not] within expectations of the individualconcerned …” (Ref. [40] para. 15.5). In stark
contradiction with the principles men-tioned, the Icelandic Act on Biobanks allowssamples taken for clinical purposes to bestored in the absence of any objections fromthe donor – Ref. [43] art 3 (Iceland). Thiscontroversial presumed consent is depen-dent upon information being posted inmedical institutions. However, similar pro-visions of the Health Sector Database Acthave been held unconstitutional by the Ice-landic Supreme Court and the existing de-code biobank has obtained explicit consentfrom all the participants. Ref. [65]. Despitethe established principle of informed con-sent, some documents do allow for the un-consented-to further use of left-over tissuesfor ethically approved research proceduresif the information is anonymized (e.g. Ref.[44] rec. 5.9 (UK)) or when the intended useis incidental to the original purpose (e.g.Ref. [16] para. 8.8 (Singapore)). To avoidconfusion when faced with archived tissuecollected primarily for therapeutic or diag-nostic purposes, it is also recommendedthat individuals be required to consent intwo separate forms to the diagnostic or ther-apeutic act on the one hand, and to the stor-age of residual tissues and further use forresearch at the time of collection on the oth-er hand – e.g. Ref. [44] rec. 6.2 (UK) andRef. [16] para. 8.9 (Singapore).
In general, national jurisdictions are be-coming less reluctant to allow for the pos-sibility of deviating from the traditionalprinciple of explicit re-consent for futureuse of samples collected for a specific re-search purpose. For instance, Australia’s1999 National Statement on Ethical Con-duct in Research Involving Humans [45]“normally” calls for informed consent fromdonors of archived samples (princ. 15.7).Yet, the possibility of waiver by an ethicscommittee for the obtaining of another con-sent is foreseen in the context of researchsamples (princ. 15.6). Indeed:
52321.5 DNA Banking
“ … an HREC (Human Research Ethics Com-mittee) may sometimes waive, with or with-out conditions, the requirement of consent.In determining whether consent may bewaived or waived subject to conditions, anHREC may take into account:
• the nature of any existing consent relatingto the collection and storage of the sample;
• the justification presented for seekingwaiver of consent including the extent towhich it is impossible or difficult or intru-sive to obtain specific consent;
• the proposed arrangements to protect pri-vacy including the extent to which it is pos-sible to de-identify the sample;
• the extent to which the proposed researchposes a risk to the privacy or well-being ofthe individual;
• whether the research proposal is an exten-sion of, or closely related to, a previouslyapproved research project;
• the possibility of commercial exploitationof derivatives of the samples; and
• the relevant statutory provisions.” (princ.15.8)
In 2003, the Australian Law Reform Com-mission approved of such an exception tothe principle of informed consent, furtherrecommending the HREC “… report annu-ally to the Australian Health Ethics Com-mittee (AHEC) with respect to human ge-netic research proposals for which waiver ofconsent has been granted under the Nation-al Statement …” to ensure transparency andaccountability (Ref. [40] rec. 15-1). It mustbe remembered that traditionally, waiver ofinformed consent for secondary use of ar-chived samples and data for research weredependent on identifiability (anonymiza-tion), the impracticability of obtaining con-temporary consent, the minimum risk ofthe contemplated study, and the approval ofa research ethics committee (e.g. Ref. [46] p.88 (The Netherlands)), or for public safetyreasons. As underlined by the AustralianLaw Reform Commission and the Austra-
lian Health Ethics Committee [47], whatamounts to “impracticability” needs furtherdefinition and explanation (Australian LawReform Commission, Australian HealthEthics Committee, 2003, prop. 12-2).
Turning to consent to new collections forresearch and more particularly consent forinclusion in human genetic research data-bases, national jurisdictions seems to bemoving toward recognition of broad con-sent procedures. As stated by the FrenchNational Consultative Ethics Committee:
“ … these alterations to the notion of individ-ual consent rests on the notion that the massof information and connected data have infact only acquired value for those participat-ing because they are assembled and cross-matched for a great many people. They grad-ually constitute an asset which is detachedfrom the person who has supplied an ele-ment of his/her body, the only value of whichis the common use that progress has madepossible … “(Ref. [1] p. 5 (France)).
To take but a few examples, the JapaneseBioethics Committee of the Council for Sci-ence and Technology in its FundamentalPrinciples of Research on the Human Ge-nome [48] mentions that:
“ … if a participant consents to provide a re-search sample for a genome analysis in a par-ticular research project and, at the sametime, anticipates and consents to the use ofthe same sample in other genome analysesor related medical research, the researchsample may be use for ‘studies aimed at oth-er purposes’ …” (princ. 8.1.a)
(see, also, (U.S.A.) Council of Regional Net-works for Genetic Services, [49], which didnot exclude blanket consent for samples ob-tained by the medical profession). The Ger-man Senate Commission on Genetic Re-search goes even further [50]. Supportingthe need for less stringent consent proce-dures for epidemiological and genetic re-search, it considers that:
524 21 Ethical Aspects of Genome Research and Banking
“ … in principle … decisions taken in a delib-erate state of ignorance and uncertainty canbe an expression of the donor’s right to self-determination …” (p. 46).
They conclude that:
“ … consequently, no overriding objectionscan be raised to a consent phrased in generalterms which does not specify all possible usesof specimens and data, or even to an all en-compassing blanket authorization …” (p. 46).
However, some jurisdictions remain faith-ful to traditional requirements and specificconsent and re-consent must be obtainedfor any further use not contemplated in theoriginal consent form (Ref. [51] Chapt. 3,Sect. 5 (Sweden)).
In short, on the national level, three posi-tions typify the move away from the strictrule of requiring a new consent for otheruses of samples. The first is that of requir-ing ethics review when foreseeing the pos-sibility of either anonymizing or coding thesample without going back to the sourceprovided there is only minimum risk andconfidentiality is ensured (e.g. Ref. [15] rec.9f (USA); Refs. [45] and [47] proposal 15-1(Australia); and Ref. [52], 10.2 (UK)). Thesecond requires ethics review but samplesmust always be anonymized (an optionfound in older documents: e.g. Ref. [46](The Netherlands); Ref. [53] (USA); and Ref.[54] (Canada)). Finally, the third eschewsthe automatic exclusion of “blanket con-sents” to future research (e.g. Ref. [16] para.8.11 (Singapore) and Ref. [50] pp. 46–47(Germany)). Indeed, members of the Na-tional Bioethics Commission of the UnitedStates would allow the use of “coded materi-als” for any kind of future study without fur-ther specification as to what kind of re-search, or the need for further consent, oreven anonymization (Ref. [15] rec.9). Cod-ing raises, however, other issues such asthat of recontact should subsequent find-ings become clinically significant.
The advantages and drawbacks of ano-nymization and coding are outlined by theFrench and German National Ethics Com-mittees [12]. They both:
“ … are in any case aware of the difficultiesarising out of two antagonistic viewpoints asregard free informed consent: on the onehand, the best interest of patients and theprotection of their personal data, in the nameof which one might be tempted to erase asquickly as possible the link between biologi-cal material, corresponding information, andan identified individual; on the other handthere is scientific interest which justifies thepossibility of being able to locate the personconcerned so as to correlate his/her particu-lar circumstances to new results. The personconcerned may also wish to access these newresults” (p. 38).
Indeed, the advantage of coded samples isthat clinical data can be added over timeand so remain scientifically viable. The dis-advantage for researchers over time is thatat a certain point in time the combination ofresearch and clinical knowledge will be-come significant enough to have medicalimportance in the situation where preven-tion or treatment is available. This in turncalls into question the right to know/not toknow and in failing to discharge it, the dutyto warn.
The National Bioethics Advisory Com-mission of the United States has recom-mended that in this “exceptional” circum-stance (of clinical significance) recontactand disclosure should occur (Ref. [15] Rec.14). Similarly, other jurisdictions have rec-ognized a right to know (and not to know)to research participants. Although the rightto know is unconditional in some countries(e.g. Ref. [55] paras. 11, 12 (Estonia)), mostethics committees advocate a much morecircumscribed or cautious approach. Theright to know is thus not automatically ap-plicable, but depends on the seriousness of
52521.5 DNA Banking
the condition (significant clinical value), theexistence of an available cure and the avail-ability of genetic counseling (e.g. Ref. [52]sect. 8.1 and 8.2 (UK) and Ref. [50] sect. 5.3,p. 36 (Germany)).
While adapted to a clinical setting or asingle-purpose or specific research, theright to know (and not to know) might nev-ertheless be ill-suited when applied to large-scale population human genetic researchdatabases, in light of the nature of the re-search (genetic variation), the limitedamount of personal information collectedand the absence of a clinical setting to con-vey the results. As outlined by the UK Bio-bank Ethics and Governance Framework:
“ … it is questionable whether telling partici-pants the results of measurements would beuseful to them, as the data would be commu-nicated outside of a clinical setting andwould not have been evaluated in the contextof the full medical record or knowledge ofmedication or other treatment. The signifi-cance of the observations might not be clearand the research staff will not be in a positionto interpret the implications. Further itwould not be constructive and might beharmful to provide information but not inter-pretation, counseling or support …” (Ref. [56]comment I.B.3).
This absence of a personal right to know isbalanced by the fact that “… researchers willregularly share data out of respect for theparticipation of the population … “(rec. 6) inaccordance with the principle of reciprocity(Ref. [10] (Canada)). This commonly takesthe form of periodic publication of generalaggregated results that will not enableparticipants’ identification (see, also, Ref.[16] para. 13.1.8 (Singapore)).
In the same vein as the right to know, onthe issue of access by relatives to informa-tion arising out of research (once again notapplicable to large-scale human genetic re-search databases), Japan’s Bioethics Com-
mittee of the Council for Science and Tech-nology holds that:
“ … in case the genetic information obtainedby research may lead to an interpretation thata portion of the genetic characteristics of theparticipant is or, is supposed to be, connectedto the etiology of a disease, this interpretationmay be disclosed to his/her blood relativesfollowing authorization by the Ethics Com-mittee only if a preventive measure or curehas already been established for the diseasein question” (princ. 15.2) (Ref. [48] (Japan)).
The conditions under which such a duty towarn arises, and its scope, are still uncer-tain. The Australian Law Reform Commis-sion [47] would uphold it in situationswhere the threat to the life or health of therelative is not imminent but where the in-formation disclosed would be relevant inlight of the high risk to develop the diseaseand provided the family member’s right notto know is given full consideration. Further-more, it argues that “… in some circum-stances … a health professional has a posi-tive ‘duty to warn’ third parties – even if do-ing so would infringe the patient’s confi-dentiality” (21.45) (Ref. [47] Chapt. 21, andrecommendations). The existence of a dutyto warn in violation of a patient’s right toconfidentiality remains controversial, how-ever. For instance, the French NationalConsultative Ethics Committee for Healthand Life Sciences holds that “… medicalconfidentiality must be observed as regardsto (sic) third parties including family mem-bers” (Ref. [57] (France)). The Council is ofthe opinion that the duty to reveal any infor-mation lies with the individual, the non-communication of critical findings not con-stituting grounds for finding physiciancriminally liable (Ref. [58] (France)).
The scientific advantage of coded sam-ples has to be weighed against the emer-gence of such ongoing obligations that maybe eventually adopted in national legisla-
526 21 Ethical Aspects of Genome Research and Banking
tion. Even if such obligations could be fore-seen in part by asking research participantsin advance whether they would want to berecontacted or not in the event of medicallysignificant findings, what is the longevity orvalidity of an anticipatory “yes” or “no”? Nodoubt, the courts will settle this latter ques-tion and in the meantime the option shouldbe presented. If not, automatic communica-tion of at-risk information to participantsmight run foul of the emerging right not toknow and yet, on failure to do so, of anemerging duty to warn!
To conclude this section on banking, thefollowing comments can be made with re-gard to the issue of other uses without ob-taining another explicit consent:
1. the wholesale prohibition against bothgeneral/blanket consent to future unspec-ified uses of research samples and againstthe use of left-over samples from medicalcare without a specific consent is increas-ingly nuanced;
2. the automatic anonymization of samplesas the expedient solution to ethical and le-gal quandaries is being re-examined andcoding is emerging as the preferred op-tion in many situations;
3. a distinction is more clearly drawnbetween refusal of access to third partiessuch as insurers or employers and the le-gitimate need (in prescribed circumstanc-es) for communication to blood relatives;
4. discussion is required on the issue of re-contact and communication of results inthe situation of other research that yieldsmedically relevant information; and
5. the specificity of population human ge-netic research databases should be clearlyestablished and a harmonized set of prin-ciples developed; in relation to this partic-ular type of genetic research the role ofthe public should be clearly defined.
Underlying these difficult choices is the ul-timate question – to whom does the DNAbelong in this commercialized research en-vironment ?
21.6
Ownership
Intimately linked to the issue of ownershipis that of the legal status of human geneticmaterial. Even though this issue is one ofprinciple, surprisingly a different legal stat-us – person or property – has not had a con-comitant impact on the ultimate issue, thatof control of access by the individual over itsuse by others.
Internationally, regionally, and national-ly, all the legal and ethical instruments ac-knowledge the sensitivity and special statusof genetic material. This results from its in-dividual but also familial and communalnature, and foreseen and potential valueand significance (e.g. Ref. [7] art. 4a (Inter-national), Ref. [59] sect. 7 (Canada)). Tradi-tional legal categories (property or person)cannot account for the allegedly unique na-ture of genetic information. A sui generis ap-proach has been suggested as more appro-priate (e.g. Ref. [60], and Ref. [59] sect. 7.4(Canada)).
Internationally, there is increasing recog-nition and confirmation that, at the level ofspecies, the human genome is the commonheritage of humanity (e.g. Refs. [61] and [26]art.1 internationally) and that human genet-ic research databases are global public re-sources [8]. In contrast with common mis-understanding, the notion of “common her-itage of humanity” means that, at the collec-tive level, like outer space and the sea, noindividual exclusive appropriation is pos-sible by nation states. Other characteristicsof this approach include peaceful and re-sponsible international stewardship or cus-
52721.6 Ownership
todianship with a view to future generationsand equitable access. In the absence of abinding international treaty (UNESCO’sDeclaration and HUGO’s positions beingonly proclamatory in nature), it remains tobe seen if this concept will come to legallybinding fruition.
This position, however, is particularly im-portant in that it serves to place new se-quences and information that fail to meetthe strict conditions of patenting or copy-right into the public domain. While patent-ing is not the subject of this chapter, both apersonal or property approach to DNA sam-ples would theoretically require a specificpersonal consent to eventual patenting. In-deed, whether the DNA sample has the stat-us of “person” or property, consent must beobtained, or at a minimum notification ofpatenting, as mentioned under the 1998European Directive (Ref. [27] para. 26). Atthe international level, then, this position infavor of both the common heritage level ofthe collective human genome and that ofpersonal control over individual samplesand information has slowly been consoli-dated.
The last few years have seen the emer-gence of a new concept in the internationalarena, that of benefit-sharing. This ap-proach largely initiated by HUGO andadopted by UNESCO and WHO, is gradual-ly taking hold in industry. It mandates rec-ognition of the participation and contribu-tion of participating individuals, popula-tions, and communities. Founded on no-tions of justice, solidarity and equity, itupholds the common heritage approachand so encourages the “giving-back” by re-searchers or commercial entities (HumanGenome Organization [8]). This return ofbenefit “… to the society as a whole and theinternational community …” (UNESCO [7]art. 19) accrues to the participating individ-uals or group to which they belong (for in-
stance WHO [19] rec. 19), to healthcare ser-vices notably through the resulting avail-ability of new prevention and diagnostictools and treatments proceeding from re-search, the research community, and also todeveloping countries that do not possessthe means and techniques to adequatelycollect and process data in their own territo-ry (for instance UNESCO [7] art. 19; see alsomore specifically with regards to developingcountries, CIOMS [5] guidelines 10 and 20).
Turning to the regional level, the “gift”language of a decade ago, was replaced with“source,” and “owner”, only to return in thefollowing years (e.g., ESHG [31]). Althoughmentioning the traditional gift relationshipas worthy of consideration, however, theEuropean Society of Human Genetics in itsData Storage and DNA Banking of Biomed-ical Research [39] adopts the position thatownership and access agreements shouldbe private and not regulated by legislation.It upholds the principle according to which,unless anonymized and thus abandoned,samples and data should remain under thecontrol of the individual, with the investiga-tor and processor acting as custodians.Interestingly, it affirms that in determiningintellectual property rights due considera-tion should be paid to the notion of benefitsharing (art. 27).
In general, the language of gift is notfound in international instruments, the for-mer emphasizing the common heritageconcept (Human Genome Organization[61]) or the notion of “general property” or“public domain” (Human Genome Organ-ization [8]), thus obviating the issue of stat-us, excluding private ownership by the “do-nor”, and concentrating on “shared goods.”One exception to this trend is, however,worth mentioning – the World Health Or-ganization position on Genetic Databases:Assessing the Benefits and the Impact onHuman and Patient Rights [19]. Promoting
528 21 Ethical Aspects of Genome Research and Banking
the protection of individual interests andrights, the World Health Organizationmaintains, similarly to the European Soci-ety of Human Genetics, that individualsshould remain the primary controllers oftheir genetic information. Such control isnot, however, unfettered, but subject to theinformation bring identifiable. In contrastto the general return to “gift” language, itrecommends that
“ … serious consideration should be given torecognizing property rights for individuals intheir own body samples and genetic informa-tion derived from those samples …”
while ensuring that
“ … some kind of benefit will ultimately be re-turned, either to the individual from whomthe materials were taken, or to the generalclass of person to which that individual be-longs …” (rec.19).
The European Convention [17] mirroringboth UNESCO and WHO, limits itself toprohibiting financial gain by stating “… thehuman body and its parts shall not, as such,give rise to financial gain …” (art. 21), thus,indirectly, eschewing a property approach.This principled proscription of financialgain is reiterated specifically in the contextof archived human biological material andpersonal data used in biomedical research inits 2002 Proposal on Archived Biological Ma-terials [9]. The Proposal further maintainsthat “… research on human biological mate-rials and personal data shall be undertakenif this is done in conformity with appropri-ate consent procedures …” (art. 14). Thisspecific consent to further use of storedsamples and data for research includes con-sent to eventual commercialization as theparticipant must be informed of “… any fore-seeable commercial uses of materials anddata, including the research results.” Finally,the Council of Europe in its 2001, Recom-mendation 1512 – Protection of the HumanGenome by the Council of Europe, adoptsthe notion of the human genome as the
“common heritage of mankind” in order tolimit patenting rights, urging member statesto change “… the basis of patent law in theinternational fora …” (Ref. [18] rec. II (vi)).
At the national level, it should be stated atthe outset that payment to a research partic-ipant for time and inconvenience or cost re-covery by the researcher or institution (bothbeing minimal in the case of DNA sam-pling) neither affords the status of propertyto a sample nor undermines the notion ofgift. Furthermore, the notion of gift, whileobviously involving transfer, might not nec-essarily create immediate property rights ofthe researcher. Indeed, in the absence of in-tellectual property which could be affordedto any invention, increasingly we will seethat the researcher–banker is described as acustodian. This is both a real and symbolicstatement. Real, in that the current com-plex, private-public funding of research in-volves multiple economic partners in anyeventual profits from patenting. Symbolic,in that the researchers involved can bebench scientists or clinician-researchersand so may be both simple guardians andfiduciaries of the samples for the researchparticipants or patients and their families.
The “nonownership” language of mostnational legal and ethical documents is sub-ject to some exceptions, notably with regardto population human genetic research data-bases. In Estonia, by virtue of paragraph 15of the Human Gene Research Act [55] own-ership rights of samples and uncoded infor-mation are vested with the bank’s chief pro-cessor. In the United Kingdom, UK Bio-bank Limited, the biobank legal entity, willbe the legal owner of both the database andthe sample collection (Ref. [56] part. II. sect.A). However, in both cases, these owner-ship rights are circumscribed, and it ap-pears that the so-called “owners” of thebanks act as traditional custodians enjoyingcertain rights over the samples and data.The chief processor in Estonia is prohibited
52921.6 Ownership
from transferring his rights or the writtenconsent of gene donors. In the UnitedKingdom, the Ethics and GovernanceFramework specifies that UK Biobank Lim-ited will act as the steward of the resource;it will not exercise all the rights akin to own-ership (e.g. selling the samples), and willensure that the public good is being served.This position is in accordance with theMedical Research Council Operational andEthical Guidelines on Human Tissue andBiological Samples for Research, which hasplaced the onus on the custodian of a tissuecollection to manage access to sampleswhich are seen as gifts (Sect. 21.4.1) [52]. Itsdefinition of custodianship “… impliessome rights to decide how the samples areused and by whom, and also responsibilityfor safeguarding the interests of the donor…” (Ref. [52] glossary).
In contrast and surprisingly, Iceland,with its controversial presumed consent tothe storage and use of health data, extendsthe notion of “nonownership” to any com-pany licensed by the Government to do re-search on accompanying samples:
“The licensee shall not be counted as theowner of the biological samples, but hasrights over them, with the limitations laiddown by law, and is responsible for theirhandling being consistent with the provi-sions of the Act and of government directivesbased on it. The licensee may thus not passthe biological samples to another party, noruse them as collateral for financial liabilities,and they are not subject to attachment fordebt.” (Ref. [43] art. 10).
Interestingly, at the national level, the no-tion of benefit-sharing is acknowledged asworthy of consideration in relation to hu-man genetic research databases, this beingthe result of their large commercial poten-tial, and possible abuse by commercial en-tities and biased researchers. The FrenchConseil Consultatif National d’Éthiquepour les Sciences de la Vie et de la Santé
and the German Nationaler Ethikrat [12], ina joint statement on the necessity to pro-mote a public debate on the establishmentof national biobanks or “biolibraries”, arguethat the concept of benefit-sharing that hasarisen on the international forum should bestudied in depth. They support the sharingof benefits (rather than profits or advantag-es) with the population as a whole, and thenonmarketability of the human body and itsparts, proscribing any right to financial re-turn to individual participants (Ref. [12] art.39–40).
The German National Ethics Council, inits recent opinion on “Biobanks for Re-search,” confirmed this earlier position byholding that although individual donorsshould not benefit from the research, “…benefit sharing at a level higher than that ofthe individual, in the form of voluntary con-tributions to welfare funds, is conceivableand desirable …” (Ref. [38] regulatory pro-posal 30).
Similarly in Canada, “… population re-search should promote the attribution ofbenefits to the population …” and not belimited to those who participated (Ref. [10]rec.7). In Israel, the sharing of benefits isseen as primordial both to ensure the partic-ipation of private individuals in the researchand to attract investment (Ref. [11] para. 15).
In contrast, the German Research Foun-dation, although considering voluntaryagreements on benefit-sharing as “… wel-come policy decisions …” does not believethat researchers have an ethical or moralobligation to do so, the question of benefitsand their allocation not bearing any particu-lar significance and importance in the fieldof genetics. They argue that:
“ … such a line of argumentation (the ab-sence of any benefit-sharing policy, morespecifically to donors) would equally ques-tion the fairness of national and internationalpublic policy which governs private-sector in-dustry, fiscal policy, national and global
530 21 Ethical Aspects of Genome Research and Banking
health policies. There is no objective justifica-tion for describing, in the public debate, thedistribution of potential benefits derivedfrom research based on gene data as a specif-ic problem … Provided adequate donor priva-cy is ensured, investors need not have a ‘-guilty conscience,’ nor do they have any spe-cial ‘redistribution obligations’ …” (Ref. [50]art. 48-49).
In short, with regard to human genetic ma-terial (in general), the language of “dona-tion” prevalent in the countries of civiliantradition (e.g. Ref. [62] (Quebec)), has alsobeen adopted in common law jurisdictions(e.g. Ref. [16] (Singapore)). In the UnitedStates, even those American states that haveadopted the Genetic Privacy Act [36] havenot included the original articles on theproperty rights of the “source”. Theoretical-ly, the implementation of this approachwould have given every “source-owner” anopportunity to sell and/or bargain for a per-centage of eventual profits (if any).
The result of all this debate and of in-creased commercialization of genetic re-search, is that most, if not all, consent formsnow inform research participants of eventu-al commercialization and possible profits(and the policy concerning their sharing).Ultimately, with the exception of existingand future population human genetic re-search databases, for which sharing of bene-fits with the population as a whole is con-templated, it is usually universities, re-search institutes, and/or commercial en-tities that maintain human genetic researchdatabases and share in any profits thatmight ensue (e.g. Ref. [63]).
21.7
Conclusion
Genetic research has moved to the forefrontof the bioethics debate in the last few years.
This is, in part, the consequence of thegrowing public interest in understandingthe role of genetic factors in common dis-eases and in benefiting from drugs tailoredto individual genetic susceptibility. Ethicalframeworks have started to make the corre-sponding shift from an emphasis on mono-genic diseases and the stigma they carry tothe “normalization” of genetic factors incommon diseases. This is especially impor-tant as the study of normal genetic variation(diversity) requires large population humangenetic research databases. Paralleled “nor-malization” of the treatment of DNA sam-ples and genetic information with increasedprotection when necessary will also have tobe made.
Two issues have been the primary focusof this chapter as an example of the ethicalissues surrounding genetic research andDNA sampling – consent (with its relatedquestions) and commercialization. We haveseen that the issue of consent is increasing-ly characterized and stratified by the originof the sample (medical or research), the de-gree of identifiability of the information ac-companying the sample, and the issue ofsecondary uses. A more sensible and realis-tic approach is being adopted with regard toconsent procedures, with the freedom of re-searchers on the one hand and the protec-tion of participants on the other being bet-ter balanced. Furthermore the need to dis-tinguish between coded and anonymizedsamples has been recognized; the scientificand personal value of the former being fa-vored over the low-risk of possible socioeco-nomic discrimination of the latter. Increas-ingly, participants want to be “coded” andfollowed-up over time and be offered thatchoice over time. This will also be requiredwhen the emerging rights to know, not toknow, and correlative duty to warn are fullyshaped. From the standpoint of research-ers, anonymized samples might lose their
53121.7 Conclusion
scientific utility over time considering theabsence of ongoing clinical information.Researchers might also come to favor cod-ing, because the issue of recontact is beingclarified.
On the issue of commercialization of re-search, some clarification has been forth-coming in that raw sequences with no spe-cific or substantial utility are seen as beingin the public domain and not patentable perse. The issue of benefit-sharing raises thepossibility of balancing the legitimate re-turn on investment (profit-making) withconcerns with equity, justice and reciproc-ity for participating individuals, families,communities, and populations. The pros-pect of personal benefit by research sub-jects is being largely limited to ensuringclear renunciation of any interest in poten-tial monetary profit including intellectualproperty. The next step will consist in clar-ification of the role and responsibility to beplayed by the researcher, the private or pub-lic institution, the governance and ethicsstructure (if applicable), and the industry.The possibility of conflicts of interest is realand actual where the researcher is not onlya clinician but also the custodian of the
sample and has a financial interest in theresearch.
As we move from gene mapping to geneor protein function, there is a need tounderstand normal genetic variation anddiversity. This requires the participation oflarge populations. The lessons learned inthe last fifteen years, specifically the need tonot only respect personal values and choic-es in the control of and access to DNA sam-ples in genetic research but also to clearlycommunicate its goals without necessarilyemphasizing general vague risks, shouldserve to direct the next decade. Transparen-cy, ongoing communication and public en-gagement strategies will do much to ensurepublic trust in the noble goals of genetic re-search and hopefully, reduce the “stigma”of the term “genetic”.
Acknowledgments
The authors would like to acknowledge thecontributions of Madelaine Saginur andKurt Wong, Research Assistants at the Cen-tre de recherche en droit public, Universitéde Montréal. Research completed to May 5,2004.
532
1 (France) National Consultative EthicsCommittee for Health and Life Sciences(2003), Ethical Issues Raised by Collections ofBiological Material and Associated Informa-tion Data: “Biobanks,” “Biolibraries,” Opinion77, Paris, March 20, 2003, Official site of theCCNE, http://www.ccne-ethique.fr/english/pdf/avis077.pdf (date accessed: April 13, 2004)
2 Robertson, J.A. (2003), Ethical and LegalIssues in Genetic Biobanking, in Knoppers,B.M.K., ed., Populations and Genetics: Legaland Socio-Ethical Perspectives (MartinusNijhoff, Leiden, 2003)
3 Collins, F.S. (1999), Shattuck Lecture –Medical and Societal Consequences of theHuman Genome Project (July 1, 1999), N.Engl. J. Med. 341, 28
4 Consortium on Pharmacogenetics (2002),Pharmacogenetics : Ethical and RegulatoryIssues in Research and Clinical Practice, April2002, http://www.firstgenetic.net/latest_news/article_16.pdf (date accessed: April 15,2004)
5 Council for International Organizations ofMedical Sciences (2002), International EthicalGuidelines for Biomedical Research InvolvingHuman Subjects, Geneva, November 2002,Official site of the CIOMS,http://www.cioms,ch/frame_guidelines_nov_2002.htm (date accessed: April 14, 2004)
6 World Medical Association (2002),Declaration on Ethical Considerationsregarding Health Databases, Washington,October 6, 2002, Official site of the WMA,http://www.wma.net/e/policy/d1.htm (dateaccessed: April 13, 2004)
7 United Nations Educational, Scientific andCultural Organization (2003), InternationalDeclaration on Human Genetic Data, Geneva,
October 16, 2003, Official site of UNESCO,http://portal.unesco.org/shs/en/file_download.php/6016a4bea4c293a23e913de638045ea9Declaration_en.pdf (date accessed: April 14,2003)
8 Human Genome Organization (2002),Statement on Human Genomic Databases,London, December 2002, Official site ofHUGO, http://www.hugo-international.org/hugo/HEC_Dec02.html (date accessed: April13, 2004)
9 Council of Europe (Steering Committee onBioethics) (2002), Proposal for an Instrumenton the Use of Archived Human BiologicalMaterials in Biomedical Research, Strasbourg,October 17, 2002,http://www.doh.gov.uk/tissue/instrbiomatproposal.pdf (date accessed: April 13, 2004)
10 (Quebec/Canada) Network of Applied GeneticMedicine (2003), Statement of Principles onthe Ethical Conduct of Human GeneticResearch Involving Populations, Montreal,January 1, 2003, Official site of the RMGA,http://www.rmga.qc.ca/en/index.htm (dateaccessed: April 14 2004)
11 (Israel) Bioethics Advisory Committee of theIsrael Academy of Sciences and Humanities(2002), Population-Based Large-ScaleCollections of DNA Samples and Databasesof genetic Information, Jerusalem, December2002,http://www.weizmann.ac.il/bioethics/PDF/Finalized_DNA_Bank_Full.pdf (date accessed:April 14, 2004)
12 (France and Germany) Comité ConsultatifNational d’Éthique pour les Sciences de la Vieet de la Santé, Nationaler Ethikrat (2003),Ethical Issues raised by Collections of Bio-logical Material and Associated Information
References
533References
Data: “biobanks,” “Biolibraries,” JointDocument, in National Consultative EthicsCommittee for Health and Life Sciences(2003), Ethical Issues raised by collections ofbiological material and associated informa-tion data: “biobanks,” “biolibraries,” Opinion77, March 20, 2003, Official site of the CCNE,http://www.ccne-ethique.fr/english/pdf/avis077.pdf (accessed:April 13, 2004)
13 United Nations Economic and Social Council(2003), Report of the Secretary-General onInformation and Comments Received fromGovernments and Relevant InternationalOrganizations and Functional Commissionspursuant to Council Resolution 2001/39,Geneva, June 11, 2003, Official site of theUN, http://www.un.org/esa/coordination/ecosoc/Genetic.privacy.pdf (date accessed:April 14, 2004)
14 Baeyens, A.J., Hakiman, R., Aamodt, R.,Spatz, A., (2003) The Use of Human Bio-logical Samples in Research: A Comparisonof the Laws in the United Sates and Europe,Bio-Science Law Review (September 24,2003), Bio-Law Science Review, http://atlas.pharmalicensing.com/features/disp/1064164853_3f6dddf5630a1 (date accessed: April 13,2004)
15 (U.S.A.) National Bioethics AdvisoryCommission (NBAC) (1999), ResearchInvolving Human Biological Materials:Ethical Issues and Policy Guidance, Vol. I.,Report and Recommendations of theNational Bioethics Advisory Commission,Rockville, Maryland, August 1999, http://bioethics.georgetwon.edu/nbac/hbm.pdf(date accessed: April 13, 2004)
16 (Singapore) Bioethics Advisory Committee(2002), Human Tissue Research, Singapore,November 2002, Official site of the BioethicsCommittee, http://www.bioethics-singapore.org/resources/reports2.html (date accessed:May 4, 2004)
17 Council of Europe (1997), Convention for theProtection of Human Rights and Dignity ofthe Human Being with Regard to the Applica-tion of Biology and Medicine, Oviedo, April 4,1997, (1997), Int. Dig. Health Leg. 48, 99,Official site of the Council of Europe,http://conventions.coe.int/Treaty/EN/cadreprincipal.htm (date accessed: April 15,2004)
18 Council of Europe (Parliamentary Assembly)(2001), Recommendation 1512 (2001),Protection of the Human Genome by theCouncil of Europe, 2001, Official site of theEuropean Council, http://assembly.coe.int/Documents/AdoptedText/ta01/erec1512.htm(date accessed: April 15, 2004)
19 World Health Organization (EuropeanPartnership on Patients’ Rights and Citizens’Empowerment) (2003), Genetic Databases –Assessing the Benefits and the Impact onHuman Rights and Patient Rights, Geneva,2003, http://www.law.ed.ac.uk/ahrb/publications/online/whofinalreport.rtf (dateaccessed: April 15, 2004)
20 The Nuremberg Code (1946–1949), Trials ofhe War Criminals before the NurembergMilitary Tribunals under Control Council LawNo. 10, October 1946–April 1949, Vol. 2,pp.181–182. Washington, D.C.: US Govern-ment Printing Office, 1949
21 World Medical Association (1964, 1975, 1983,1989, 1996, 2000, 2002), Declaration ofHelsinki, Recommendations GuidingPhysicians in Biomedical Research InvolvingHuman Subjects, World Medical Assembly,1964, 1975, 1983, 1989, 1996, 2000, 2002),Official site of the World Medical Association,http://www.wma.net/e/policy/b3.htm (dateaccessed: April 13, 2004)
22 Le Bris, S., Knoppers, B.M., Luther, L. (1997),International Bioethics, Human Genetics andNormativity, Houston Law Rev. 33, 1363
23 Council of Europe (2001), Additional Protocolto the Convention for the Protection ofHuman Rights and Dignity of the HumanBeing with regards to the Application ofBiology and Medicine on the Prohibition ofCloning Human Beings, Paris, January 12,1998 (opening for signature), March 1, 2001(entry into force), Official site of the EuropeanCouncil, http://conventions.coe.int/Treaty/en/Treaties/Word/168.doc (date accessed:April 14, 2004)
24 European Parliament (2000), EuropeanParliament Resolution on Human CloningB5-0710, 0753 and 0753/2000, Official site ofthe European Parliament, http://www.europarl.eu.int/comparl/tempcom/genetics/links/b5_0710_en.pdf (date accessed: April 15,2004)
25 Commission of the European Communities(2003), Amended Proposal for a CouncilDecision Amending Decision 2002/834/EC
534 References
on the Specific Programme for Research,Technological Development and Demonstra-tion: “Integrating and Strengthening theEuropean Research Area” (2002–2006)(presented by the Commission pursuant toArticle 2509 (2) of the EC Treaty), Brussels,November 26, 2003, , COM (2003)749 final-2003/0151 (CNS), Official site of the Eur-Lex,http://europa.eu.int/eur-lex/en/com/pdf/2003/com2003_0749en01.pdf (date accessed:April 22, 2004)
26 United Nations Educational, Scientific andCultural Organization (International BioethicsCommittee) (1997), Universal Declaration onthe Human Genome and Human Rights,Paris, November 11, 1997, Official site of theUNESCO, http://www.unesco.org/shs/human_rights/hrbc.htm (date accessed: April13, 2004)
27 European Parliament (1998), Directive98/44/EC of the European Parliament and ofthe Council of 6 July 1999 on the LegalProtection of Biotechnological Inventions(July 30, 1998) L 213 Official Journal of theEuropean Communities p.13, Official site ofthe European Union, http://europa.eu.int/eur-lex/pri/en/oj/dat/1998/l_213/l_21319980730en00130021.pdf (date accessed:April 15, 2004)
28 (European Union) European Advisory Bodyon Data Protection and Privacy (2004),Working Document on Genetic Data,Brussels, March 17, 2004, Official site of theEuropean Commission, http://europa.eu.int/comm/internal_market/privacy/docs/wpdocs/2004/wp91_en.pdf (date accessed: April 14,2004)
29 World Health Organization (1998), ProposedInternational Guidelines on Ethical Issues inMedical Genetic and Genetic Services, Reportof a WHO Meeting on Ethical Issues inMedical Genetics, Geneva, December 15 and16, 1997, Official site of the World HealthOrganization, http://whqlibdoc.who.int/hq/1998/WHO_HGN_GL_ETH_98.1.pdf (dateaccessed: April 20, 2004)
30 Human Genome Organization (1998),Statement on DNA Sampling: Control andAccess (February 1998) 6: 1 Genome Digest 8,http ://www.gene.ucl.ac.uk/hugo/sampling.html (date accessed: April 15, 2004)
31 European Society of Human Genetics (Publicand Professional Policy Committee) (2000),Population Genetic Screening Programmes:
Technical, Social and Ethical Issues,Recommendations of the European Society ofHuman Genetics, July 2000, Official site ofthe European Society of Human Genetics,http://www.eshg.org/ESHGscreeningrec.pdf(date accessed: April 20, 2004)
32 World Health Organization (1999), DraftWorld Health Organization (WHO)Guidelines on Bioethics, May 1999,http://www.nature.com/wcs/b23a.html (dateaccessed: April 20, 2004)
33 World Health Organization (1998), Resolu-tion WHA51.10 on Ethical, Scientific andSocial Implications of Cloning in HumanHealth, Geneva, May 16, 1998, Official site ofthe WHO, http://www.who.int/gb/EB_WHA/PDF/WHA51/ear10.pdf (date accessed: April20, 2004)
34 Clayton, E.W., Steinberg, K.K., Khoury, M.J.et al. (1995), Informed Consent for GeneticResearch on Stored Genetic Samples, JAMA274, 1786
35 Knoppers, B. M. and Laberge (1995), C.M.“Research and Stored Tissues – Persons asSources, Samples as Persons?” (1995) 274JAMA 1806
36 Knoppers, B.M., Hirtle, M., Lormeau, S.,Laberge, C., Laflamme, M. (1998), Control ofDNA Samples and Information, Genomics50, 385
37 (U.K.) Royal College of Physicians (1999),Research based on archived information andsamples. Recommendations from the RoyalCollege of Physicians Committee on EthicalIssues in Medicine, Journal of the RoyalCollege of Physicians, London, May–June1999, 33(3) 264
38 (Germany) German National EthicsCommittee (Nationaler Ethikrat) (2004),Biobanks for research, Opinion (available inEnglish at [email protected])
39 European Society of Human Genetics (2001),Data Storage and DNA Banking for Bio-medical Research: Technical, Social andEthical Issues, Birmingham, November 2001,official site of the ESHG,http://www.eshg.org/ESHGDNAbankingrec.pdf (date accessed: April 15, 2004)
40 (Australia) Australian Law ReformCommission (2003), ALRC 96 : EssentiallyYours : The Protection of Human GeneticInformation in Australia, Sydney, May 2003,http://www.austlii.edu.au/other/alrc/publications/reports/96/ (date accessed: April 26,2004)
535References
41 (U.S.A.) American Medical Association(2002), E-2.079 Safeguards in the Use of DNADatabanks in Genomic Research, Chicago,June 2002, Official site of the AmericanAssociation, http://www.ama-assn.org/ama1/pub/upload/mm/369/ceja_opinion_2a02.pdf(date accessed: April 20, 2004)
42 (U.S.A.) Coriell Institute for MedicalResearch (Coriell Cell Repositories) (2003),Policy fort eh Responsible Collection, Storageand Research use of samples from namedPopulations for the NIGMS Human GeneticCell Repository, March 10, 2003 (last update),Official site of the Coriell Institute, http://locus.umdnj.edu/nigms/comm/submit/collpolicy.html (date accessed: May 5, 2004)
43 (Iceland) Iceland Minister of Health andSocial Security (2000), Act on Biobanks, no.110-2000, Iceland, May 13, 2000, http://www.raduneyti.is/interpro/htr/htr.nsf/pages/Act-biobanks (date accessed: May 5, 2004)
44 (U.K.) The Royal College of Pathologists(2000), Guidelines for the Retention ofTissues and Organs at Post-MortemExamination, London, March 2000, Officialsite of the Royal College of Pathologists,http://www.rcpath.org/resources/pdf/tissue_retention.pdf (date accessed: May 5, 2004)
45 (Australia) National Health and MedicalResearch Council (1999a), NationalStatement on Ethical Conduct in ResearchInvolving Humans, Australia, 1999, Officialsite of the NHMRC,http://www.health.gov.au/nhmrc/publications/pdf/e35.pdf (date accessed: April 26, 2004)
46 (Netherlands) Health Research Council of theNetherlands (1994), Proper Use of HumanTissue, The Hague, January 1994, publicationn°1994/01, for the executive summary seeEuropean Commission (Quality of LifeProgramme) (2001), Survey on Opinionsfrom National Ethics Committees or SimilarBodies, Public Debates and NationalLegislations in Relation to Biobanks,Brussels, May 2001, Official site of theEuropean Union, http://europa.eu.int/comm/research/biosociety/pdf/catalogue_biobanks.pdf (date accessed: April 22, 2004) at17–19
47 (Australia) Australian Law ReformCommission, Australian health EthicsCommittee (2003), Joint Inquiry into theProtection of Human Genetic Information,February 2003,Official site of the Office of the
federal Privacy Commissioner, http://www.privacy.gov.au/publications/genesub03.doc(date accessed: May 5, 2004)
48 (Japan) Council for Science and Technology(Bioethics Committee) (2000), FundamentalPrinciples of Research on the HumanGenome, Japan, June 14, 2000, Official site of the Council for Science and Technology,http://www.sta.go.jp/shimon/cst/rinri/pri00614.html (date accessed: April 15, 2004)
49 (U.S.A.) Council of Regional Network forGenetic Services (1997), Issues in the Use ofArchived Specimens for Genetic Research,Points to Consider, Albany, New York(January 1997)
50 (Germany) Deutsche Forschungsgemein-schaft, Senate Commission on GeneticResearch (2003), Predictive Genetic Diagnosis– Scientific Background, Practical and SocialImplementation, Bonn, March 27, 2003,Official site of the Senate Commission,http://www.dfg.de/aktuelles_presse/reden_stellungnahmen/2003/download/predictive_genetic_diagnosis.pdf (date accessed: May 5,2004)
51 (Sweden) Ministry of Health and SocialAffairs (2002), Biobanks [Health Care] Act(2002:297), Sweden, May 23, 2002, http://www.jus.umu.se/Elsagen/Biobanks%20%5BHealth%20Care%5D%20Act%202004-01-01.doc (date accessed: May 5, 2004)
52 (U.K.) Medical Research Council (2001),Human Tissue and Biological Samples forUse in Research: Operational and EthicalGuidelines Issued by the Medical ResearchCouncil. London, April 2001, Official site ofthe MRC, http://www.mrc.ac.uk/pdf-tissue_guide_fin.pdf (date accessed: April 29, 2004)
53 (U.S.A.) American Society of HumanGenetics (1996), American Society of HumanGenetics Statement on Informed Consent forGenetic Research, Am. J. Hum. Genet. 59,471
54 (Canada) Medical Research Council ofCanada, Natural Science and EngineeringResearch Council of Canada, Social Scienceand Humanities Research Council of Canada(1998), Tri-Council Policy Statement – EthicalConduct for Research Involving Humans,Canada, August 1998 (with 2000 and 2002updates), Official site of the Tri-Council,http://www.pre.ethics.gc.ca/english/pdf/TCPS%20June2003_E.pdf (date accessed: April19, 2004)
536 References
55 (Estonia) Estonian Parliament (2000), HumanGene Research Act, December 13, 2000,http://www.legaltext.ee/text/en/X50010.htm(date accessed: May 5, 2004)
56 (U.K.) UK Biobank (2003), Ethics andGovernance Framework, Draft for Comment,London, September 24, 2003, Official site ofUK Biobank, http://www.ukbiobank.ac.uk/documents/egf-comment-version.doc (dateaccessed: May 5, 2004)
57 (France) National Consultative EthicsCommittee for Health and Life Sciences(1995), Opinion and Recommendations on“Genetics and Medicine: from Prediction toPrevention”, Opinion 46, Paris, October 30,1995, Official site of the CCNE, http://www.ccne-ethique.fr/english/pdf/avis046.pdf (dateaccessed: April 20, 2004)
58 (France) Consultative Ethics Committee forHealth and Life Sciences (2003), Regardingthe Obligation to Disclose Genetic Informa-tion of Concern to the Family in the event ofMedical Necessity, Paris, April 24, 2003,Official site of the CCNE, http://www.ccne-ethique.fr/english/pdf/avis076.pdf (dateaccessed: April 20, 2004)
59 (Canada) Pullman D., Latus A. (2003), PolicyImplications of Commercial Human GeneticResearch in Newfoundland and Labrador,Prepared for the Newfoundland and LabradorDepartment of Health and CommunityServices, January 2003, http://www.nlcahr.mun.ca/dwnlds/DP_Final_%20Report.pdf(date accessed: May 5, 2004)
60 Litman, M., Robertson, B.M. (1996), TheCommon Law Status of Genetic Material inKnoppers, B.M., Caulfield, T. and Kinsella,
T.D., eds., Legal Rights and Human GeneticMaterial (Toronto: Edmond Montgomery,1996) 51
61 Human Genome Organization (1996),Statement on the Principled Conduct ofGenetic Research (May 1996) 3: 2 GenomeDigest 2, http ://www.gene.ucl.ac.uk/hugo/conduct.htm (date accessed: April 15, 2004)
62 (Canada) Network of Applied GeneticMedicine (2000), Statement of Principles:Human Genomic Research, Montreal,Quebec, April 2000, http://www.rmga.qc.ca/en/index.htm (date accessed: April 20, 2004)
63 Knoppers, B.M. (2003), ed., Populations andGenetics: Legal and Socio-Ethical Perspectives(Martinus Nijhoff, Leiden, 2003)
64 Steering Committee on Bioethics – WorkingParty on Reseach on Stored Humanbiological Material (2004) Abstract of the 26thMeeting of the CDBI, March 16–19, 2004,official site of the Council of Europe, http://www.col.int/T/E/Legal%5FAffairs/Legal%5Fco%20operation/Bioethics/CDBI/08abstract_mtg26.asp#TopOfPage (date accessed: April20, 2004)
65 (Iceland) The Icelandic Supreme Court,Ragnhildur Gudmundsdottir vs. The State ofIceland, Case No. 151/2003, available on theMannvernd Website, http://www.mannvernd.is/english/. See also Ministry of Health andSoocial Security, Act on a Health SectorDatabase no 139/1998, 1998–1999, availablethrough the Mannvernd Website, http://www.mannvernd.is/english/ (date accessed:April 20, 2004). See also deCODE genetics,http://www.decode.com (date accessed: April20, 2004)
537
Edna Einsiedel and Lorraine Sheremeta
22.1
Introduction
From prehistoric times mankind has dem-onstrated an interest in and understandingof the principles and practice of genetic sci-ence. Historically, the development of agri-culture and the cultivation of plants and an-imals for domestic and for commercial useis evidence of this interest. Greek philoso-phers including Hippocrates, Aristotle, andPlato wrote about the passing of humantraits from generation to generation, notingthat some are dominant and passed directlyfrom parent to child [1]. Embedded in thishistory are humanity’s hopes and fears, itsnoblest and most horrific aspirations.
With the mapping of the human genome[2, 3] there is optimism that society willbenefit profoundly from innovations stem-ming from the Human Genome Project(HGP). The next major challenge for theHGP is to translate this knowledge into tan-gible health benefits [4]. A series of techno-logical advances, including high-through-put DNA sequencing methods, improvedmodes of data storage and new bioinfor-matics tools will enable the translation ofscience to clinical practice. It is expectedthat analysis of data procured in large-scale
studies of population genetics will enableresearchers to gain a better understandingof the genetic bases of disease, hereditarytransmission patterns, and gene–environ-ment interactions that are implicated incomplex diseases such as heart disease, dia-betes, multiple sclerosis, and Alzheimer’sdisease [5, 6]. Such studies depend on large-scale population genetic research – often in-volving many thousands of research partici-pants – and requiring national and interna-tional collaboration [7].
Population genetic research can be basedeither on previously collected and storedbiological samples or on the creation of new(and often very large) repositories. We usethe term “biobank” to describe a collectionof physical specimens from which DNA canbe derived, the data that have been derivedfrom DNA samples, or both. This paper fo-cuses on the issues relevant to prospectivelycollected population genetic biobanks thatwill be used for translational and basic sci-entific research and for clinical research.We assume such collections will be perma-nent in nature.
As with other technological advances,there are attendant risks and benefits asso-ciated with population genetic research. De-spite the optimism that human health and
Handbook of Genome Research. Genomics, Proteomics, Metabolomics, Bioinformatics, Ethical and Legal Issues.Edited by Christoph W. SensenCopyright © 2005 WILEY-VCH Verlag GmbH & Co. KGaA, WeinheimISBN: 3-527-31348-6
22Biobanks and the Challenges of Commercialization
Verwendete Mac Distiller 5.0.x Joboptions
Dieser Report wurde automatisch mit Hilfe der Adobe Acrobat Distiller Erweiterung "Distiller Secrets v1.0.5" der IMPRESSED GmbH erstellt. Sie koennen diese Startup-Datei für die Distiller Versionen 4.0.5 und 5.0.x kostenlos unter http://www.impressed.de herunterladen. ALLGEMEIN ---------------------------------------- Dateioptionen: Kompatibilität: PDF 1.3 Für schnelle Web-Anzeige optimieren: Ja Piktogramme einbetten: Ja Seiten automatisch drehen: Nein Seiten von: 1 Seiten bis: Alle Seiten Bund: Links Auflösung: [ 2400 2400 ] dpi Papierformat: [ 481 680 ] Punkt KOMPRIMIERUNG ---------------------------------------- Farbbilder: Downsampling: Nein Komprimieren: Ja Komprimierungsart: ZIP Bitanzahl pro Pixel: 8 Bit Graustufenbilder: Downsampling: Nein Komprimieren: Ja Komprimierungsart: ZIP Bitanzahl pro Pixel: 8 Bit Schwarzweiß-Bilder: Downsampling: Nein Komprimieren: Ja Komprimierungsart: CCITT CCITT-Gruppe: 4 Graustufen glätten: Nein Text und Vektorgrafiken komprimieren: Ja SCHRIFTEN ---------------------------------------- Alle Schriften einbetten: Ja Untergruppen aller eingebetteten Schriften: Nein Wenn Einbetten fehlschlägt: Abbrechen Einbetten: Immer einbetten: [ /Courier-BoldOblique /Helvetica-BoldOblique /Courier /Helvetica-Bold /Times-Bold /Courier-Bold /Helvetica /Times-BoldItalic /Times-Roman /ZapfDingbats /Times-Italic /Helvetica-Oblique /Courier-Oblique /Symbol ] Nie einbetten: [ ] FARBE(N) ---------------------------------------- Farbmanagement: Farbumrechnungsmethode: Farbe nicht ändern Methode: Standard Geräteabhängige Daten: Einstellungen für Überdrucken beibehalten: Ja Unterfarbreduktion und Schwarzaufbau beibehalten: Ja Transferfunktionen: Beibehalten Rastereinstellungen beibehalten: Nein ERWEITERT ---------------------------------------- Optionen: Prolog/Epilog verwenden: Nein PostScript-Datei darf Einstellungen überschreiben: Nein Level 2 copypage-Semantik beibehalten: Ja Portable Job Ticket in PDF-Datei speichern: Ja Illustrator-Überdruckmodus: Ja Farbverläufe zu weichen Nuancen konvertieren: Ja ASCII-Format: Nein Document Structuring Conventions (DSC): DSC-Kommentare verarbeiten: Ja DSC-Warnungen protokollieren: Nein Für EPS-Dateien Seitengröße ändern und Grafiken zentrieren: Ja EPS-Info von DSC beibehalten: Ja OPI-Kommentare beibehalten: Nein Dokumentinfo von DSC beibehalten: Ja ANDERE ---------------------------------------- Distiller-Kern Version: 5000 ZIP-Komprimierung verwenden: Ja Optimierungen deaktivieren: Nein Bildspeicher: 524288 Byte Farbbilder glätten: Nein Graustufenbilder glätten: Nein Bilder (< 257 Farben) in indizierten Farbraum konvertieren: Ja sRGB ICC-Profil: sRGB IEC61966-2.1 ENDE DES REPORTS ---------------------------------------- IMPRESSED GmbH Bahrenfelder Chaussee 49 22761 Hamburg, Germany Tel. +49 40 897189-0 Fax +49 40 897189-71 Email: [email protected] Web: www.impressed.de
Adobe Acrobat Distiller 5.0.x Joboption Datei
<< /ColorSettingsFile () /LockDistillerParams true /DetectBlends true /DoThumbnails true /AntiAliasMonoImages false /MonoImageDownsampleType /Bicubic /GrayImageDownsampleType /Bicubic /MaxSubsetPct 100 /MonoImageFilter /CCITTFaxEncode /ColorImageDownsampleThreshold 1.5 /GrayImageFilter /FlateEncode /ColorConversionStrategy /LeaveColorUnchanged /CalGrayProfile (Dot Gain 20%) /ColorImageResolution 300 /UsePrologue false /MonoImageResolution 1200 /ColorImageDepth 8 /sRGBProfile (sRGB IEC61966-2.1) /PreserveOverprintSettings true /CompatibilityLevel 1.3 /UCRandBGInfo /Preserve /EmitDSCWarnings false /CreateJobTicket true /DownsampleMonoImages false /DownsampleColorImages false /MonoImageDict << /K -1 >> /ColorImageDownsampleType /Bicubic /GrayImageDict << /HSamples [ 2 1 1 2 ] /VSamples [ 2 1 1 2 ] /Blend 1 /QFactor 0.9 >> /CalCMYKProfile (U.S. Web Coated (SWOP) v2) /ParseDSCComments true /PreserveEPSInfo true /MonoImageDepth -1 /AutoFilterGrayImages false /SubsetFonts false /GrayACSImageDict << /HSamples [ 2 1 1 2 ] /VSamples [ 2 1 1 2 ] /Blend 1 /QFactor 0.9 >> /ColorImageFilter /FlateEncode /AutoRotatePages /None /PreserveCopyPage true /EncodeMonoImages true /ASCII85EncodePages false /PreserveOPIComments false /NeverEmbed [ ] /ColorImageDict << /HSamples [ 2 1 1 2 ] /VSamples [ 2 1 1 2 ] /Blend 1 /QFactor 0.9 >> /AntiAliasGrayImages false /GrayImageDepth 8 /CannotEmbedFontPolicy /Error /EndPage -1 /TransferFunctionInfo /Preserve /CalRGBProfile (sRGB IEC61966-2.1) /EncodeColorImages true /EncodeGrayImages true /ColorACSImageDict << /HSamples [ 2 1 1 2 ] /VSamples [ 2 1 1 2 ] /Blend 1 /QFactor 0.9 >> /Optimize true /ParseDSCCommentsForDocInfo true /GrayImageDownsampleThreshold 1.5 /MonoImageDownsampleThreshold 1.5 /AutoPositionEPSFiles true /GrayImageResolution 300 /AutoFilterColorImages false /AlwaysEmbed [ /Courier-BoldOblique /Helvetica-BoldOblique /Courier /Helvetica-Bold /Times-Bold /Courier-Bold /Helvetica /Times-BoldItalic /Times-Roman /ZapfDingbats /Times-Italic /Helvetica-Oblique /Courier-Oblique /Symbol ] /ImageMemory 524288 /OPM 1 /DefaultRenderingIntent /Default /EmbedAllFonts true /StartPage 1 /DownsampleGrayImages false /AntiAliasColorImages false /ConvertImagesToIndexed true /PreserveHalftoneInfo false /CompressPages true /Binding /Left >> setdistillerparams << /PageSize [ 595.276 841.890 ] /HWResolution [ 2400 2400 ] >> setpagedevice

538 22 Biobanks and the Challenges of Commercialization
well being will ultimately be improved as aresult of population genetic research, nu-merous ethical, legal and social concernshave been raised. For example, concernsabout the role of informed consent [8–10],the relevance of community or group con-sent [11, 12], ownership of human biologicalmaterials [13–15], privacy and confidentiality[16–19], genetic discrimination and stigmati-zation [20–22], and eugenics [23–25] are of-ten raised. Researchers focusing on the“ethical, legal, and social” issues (ELSI) ofthe HGP have commented extensively onthese topics. Numerous professional organ-izations, including the Human Genome Or-ganization (HUGO), the United NationsEducational, Scientific and Cultural Organ-ization (UNESCO) and the Council forInternational Organizations of Medical Sci-ences (CIOMS) have issued guidance docu-ments and policy statements relevant tothese topics.
The issues raised by large-scale biobankprojects are particularly relevant to thosecountries that have biobanks, and to otherslike Canada that are considering launchingsuch an initiative. The Canadian LifelongHealth Initiative is at the planning stage. Itis expected to be a two-pronged populationgenetic research initiative comprising theCanadian National Birth Cohort and theLongitudinal Study on Aging (Canadian In-stitutes of Health Research, CIHR). Thestated purpose of the studies is to facilitatethe analysis of “… the role and interaction ofdifferent genetic and environmental expo-sures involved in the human developmentand aging processes over the life course, themulti-factorial causes and evolution of com-mon diseases and the utilization of healthcare services …“ [26]. The infrastructure anddata will provide the resource platform fromwhich Canadian (and other) scientists candraw. Promoters of the project expect thatthe CLHI will “… place Canada at the fore-
front of modern health research and helpattract and retain the best investigators andtrainees.”
The two Canadian projects expected tocomprise the CLHI are similar to, thoughnot identical to, projects already com-menced or planned in Iceland (www.de-code.com), Estonia (www.geenivaramu.ee),and the United Kingdom (www.ukbio-bank.ac.uk). There are many important les-sons to be gleaned from studying theseplanned or existing projects, and from expe-rience in the United States with private-sec-tor biobanks. In this chapter we focus spe-cifically on issues arising from the commer-cialization of human genetic informationderived from population genetic researchand its implications for society. The issueswe consider include funding arrangements,allocation of research benefits, public opin-ion and the role of public engagement, andethical implications for the responsible gov-ernance of biobanks.
22.2
Background
The 20th Century has seen an exponentialincrease in the rate of technological devel-opment. The HGP, although initially pre-dicting that the sequencing of the humangenome would take fifteen years, was com-pleted under budget and more than threeyears ahead of schedule. The HGP sparkedan interest in elucidating the functions ofgenes. Large-scale population genetics re-search initiatives are aimed at uncoveringgene–environment interactions implicatedin a variety of complex human diseases. Ashift has occurred in medical genetics awayfrom traditional linkage analysis that focus-es on specific heritable conditions, impact-ing relatively small numbers of affected in-dividuals and their families, to population
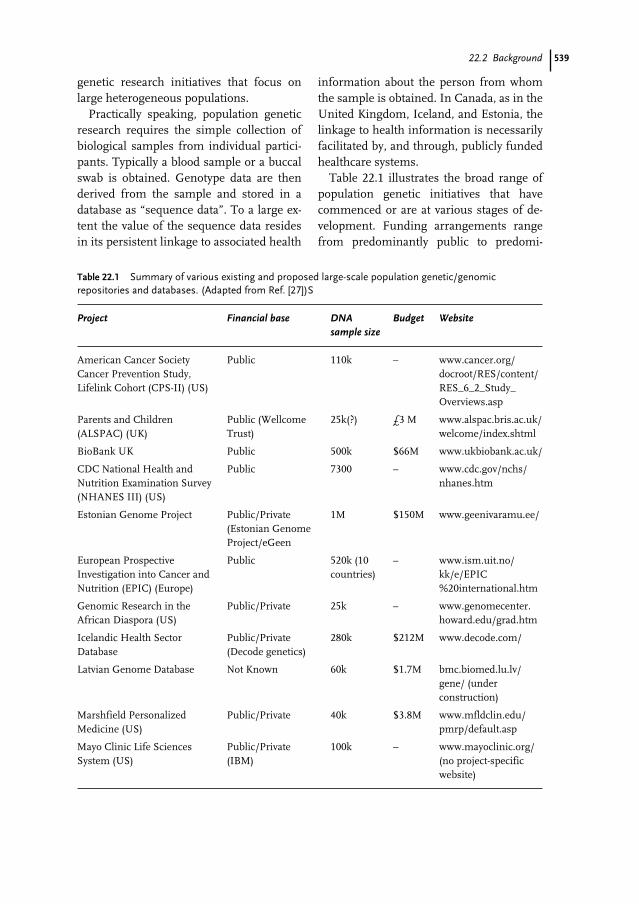
53922.2 Background
genetic research initiatives that focus onlarge heterogeneous populations.
Practically speaking, population geneticresearch requires the simple collection ofbiological samples from individual partici-pants. Typically a blood sample or a buccalswab is obtained. Genotype data are thenderived from the sample and stored in adatabase as “sequence data”. To a large ex-tent the value of the sequence data residesin its persistent linkage to associated health
information about the person from whomthe sample is obtained. In Canada, as in theUnited Kingdom, Iceland, and Estonia, thelinkage to health information is necessarilyfacilitated by, and through, publicly fundedhealthcare systems.
Table 22.1 illustrates the broad range ofpopulation genetic initiatives that havecommenced or are at various stages of de-velopment. Funding arrangements rangefrom predominantly public to predomi-
Table 22.1 Summary of various existing and proposed large-scale population genetic/genomic repositories and databases. (Adapted from Ref. [27])S
Project Financial base DNA Budget Websitesample size
American Cancer Society Public 110k – www.cancer.org/Cancer Prevention Study, docroot/RES/content/Lifelink Cohort (CPS-II) (US) RES_6_2_Study_
Overviews.asp
Parents and Children Public (Wellcome 25k(?) £3 M www.alspac.bris.ac.uk/(ALSPAC) (UK) Trust) welcome/index.shtml
BioBank UK Public 500k $66M www.ukbiobank.ac.uk/
CDC National Health and Public 7300 – www.cdc.gov/nchs/Nutrition Examination Survey nhanes.htm(NHANES III) (US)
Estonian Genome Project Public/Private 1M $150M www.geenivaramu.ee/(Estonian Genome Project/eGeen
European Prospective Public 520k (10 – www.ism.uit.no/Investigation into Cancer and countries) kk/e/EPIC Nutrition (EPIC) (Europe) %20international.htm
Genomic Research in the Public/Private 25k – www.genomecenter.African Diaspora (US) howard.edu/grad.htm
Icelandic Health Sector Public/Private 280k $212M www.decode.com/Database (Decode genetics)
Latvian Genome Database Not Known 60k $1.7M bmc.biomed.lu.lv/gene/ (under construction)
Marshfield Personalized Public/Private 40k $3.8M www.mfldclin.edu/Medicine (US) pmrp/default.asp
Mayo Clinic Life Sciences Public/Private 100k – www.mayoclinic.org/ System (US) (IBM) (no project-specific
website)
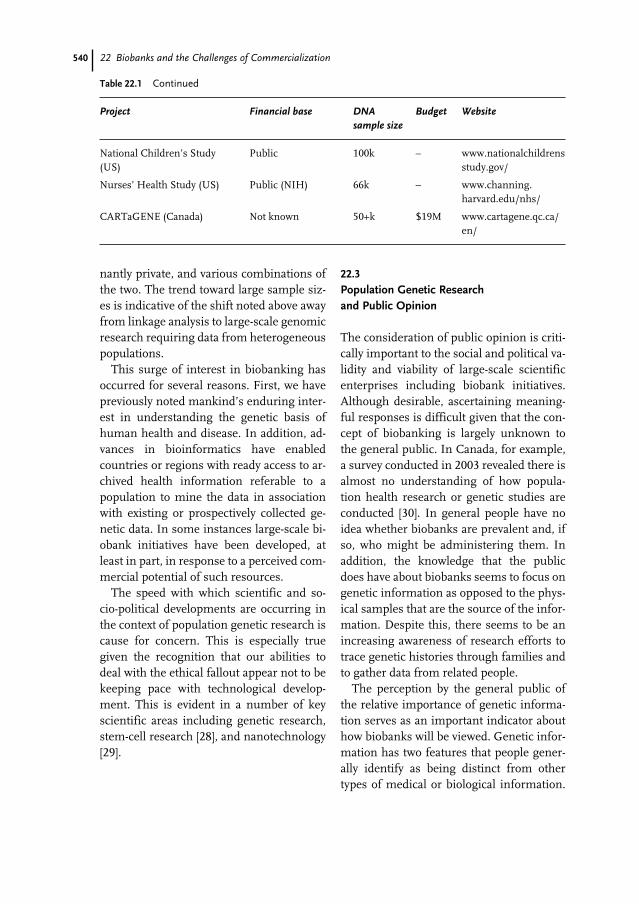
540 22 Biobanks and the Challenges of Commercialization
nantly private, and various combinations ofthe two. The trend toward large sample siz-es is indicative of the shift noted above awayfrom linkage analysis to large-scale genomicresearch requiring data from heterogeneouspopulations.
This surge of interest in biobanking hasoccurred for several reasons. First, we havepreviously noted mankind’s enduring inter-est in understanding the genetic basis ofhuman health and disease. In addition, ad-vances in bioinformatics have enabledcountries or regions with ready access to ar-chived health information referable to apopulation to mine the data in associationwith existing or prospectively collected ge-netic data. In some instances large-scale bi-obank initiatives have been developed, atleast in part, in response to a perceived com-mercial potential of such resources.
The speed with which scientific and so-cio-political developments are occurring inthe context of population genetic research iscause for concern. This is especially truegiven the recognition that our abilities todeal with the ethical fallout appear not to bekeeping pace with technological develop-ment. This is evident in a number of keyscientific areas including genetic research,stem-cell research [28], and nanotechnology[29].
22.3
Population Genetic Research and Public Opinion
The consideration of public opinion is criti-cally important to the social and political va-lidity and viability of large-scale scientificenterprises including biobank initiatives.Although desirable, ascertaining meaning-ful responses is difficult given that the con-cept of biobanking is largely unknown tothe general public. In Canada, for example,a survey conducted in 2003 revealed there isalmost no understanding of how popula-tion health research or genetic studies areconducted [30]. In general people have noidea whether biobanks are prevalent and, ifso, who might be administering them. Inaddition, the knowledge that the publicdoes have about biobanks seems to focus ongenetic information as opposed to the phys-ical samples that are the source of the infor-mation. Despite this, there seems to be anincreasing awareness of research efforts totrace genetic histories through families andto gather data from related people.
The perception by the general public ofthe relative importance of genetic informa-tion serves as an important indicator abouthow biobanks will be viewed. Genetic infor-mation has two features that people gener-ally identify as being distinct from othertypes of medical or biological information.
Table 22.1 Continued
Project Financial base DNA Budget Websitesample size
National Children’s Study Public 100k – www.nationalchildrens(US) study.gov/
Nurses’ Health Study (US) Public (NIH) 66k – www.channing.harvard.edu/nhs/
CARTaGENE (Canada) Not known 50+k $19M www.cartagene.qc.ca/en/
54122.4 The Commercialization of Biobank Resources
First, it is imbued with a predictive qualityfor the health of the individual from whichthe sample is derived. Second, although di-rectly referable to a particular individual,genetic information has implications forfamily members. Public opinion in favor ofgreater protection for genetic informationis related to a belief that genetic informa-tion is somehow unique and should be af-forded greater protection than other typesof health information [31].
Public views are also modulated by theintended uses for which genetic informa-tion is collected. Canadians are usuallyquite open to research uses of genetic infor-mation – especially where the focus is tofind cures for genetic diseases [32]. Cana-dians seem to be more willing than Euro-peans for genetic information to be used incriminal investigations and health research.Over 70 % of Canadians support develop-ment of DNA testing technologies for crim-inal investigations versus 45 % of Euro-peans [33].
It is also important to note that there aresignificant cross-cultural variations con-cerning the acceptable uses of genetic tech-nologies. An international survey asked re-spondents in a number of countries wheth-er “parents should be allowed to use genetechnology to design a baby to satisfy theirpersonal, cultural, or aesthetic desires”. Thepercentages of those who said they disap-proved ranged from 97 % in Denmark, 92% in the UK, and 87 % in the US to 76 % inMexico, 67 % in Taiwan, and 53 % in Tur-key (www.genetics-and-society.org/analy-sis/opinion/summary.html).
Understanding the evolution of publicopinion and the reasons for those opinionsin the context of population genetic re-search is a critical first step in assessing theacceptable uses to which the highly sensi-tive and personal data contained in bio-banks can be put. It is also essential to con-
sider the opinions, values, and priorities ofthe public when designing the necessaryand most appropriate governance struc-tures to ensure that the research partici-pants are protected, the potential benefitsfor society are maximized, and that com-mercial involvement is appropriately man-aged and aligned with society’s interests.With regard to this last point, efforts tocreate biobanks and to exploit them for re-search and commercial drug developmenthave not been without controversy [34–36].We now turn to consideration of the chal-lenges associated with commercializationof biobank resources.
22.4
The Commercialization of Biobank Resources
A major objective of population genetic re-search is the development of beneficial andmarketable preventative, diagnostic andtherapeutic products. From this perspec-tive, commercialization of the results of ge-netic research is both necessary and desir-able. Commercialization is the means bywhich socially useful innovations are devel-oped into products that are marketed andused in society. The commercial process isa complex, iterative process that requires in-novation, research and development (in-cluding clinical trials), product develop-ment, market definition and analysis, regu-latory approval, and post-approval market-ing. The commercial process is frequentlyviewed simply as business interactions –with profit-seeking the primary motivator,and attention to ethical issues as a detractorfrom profit. In reality, corporate actors arebecoming increasingly aware that to main-tain public trust, they must devote resourc-es (including time, energy, and money) toconsideration and solution of ethical issues
542 22 Biobanks and the Challenges of Commercialization
[37]. Companies that fail to consider rele-vant ethical issues and fail to behave as re-sponsible corporate citizens face the risk ofmarket failure.
Of necessity, the private sector is assum-ing a greater role in earlier stages of thecommercial trajectory in the biotechnologysector. Industry is increasingly involved inperforming and funding basic and transla-tional research. The private sector performsmuch of the research and development re-quired as part of the drug and medical de-vice approval processes. Government fund-ing of research remains significant and fre-quently provides the initial incentive thatspurs the innovative and commercial pro-cesses. Identification and promotion by gov-ernment of innovation strategies that focuson biotechnology and information technolo-gy justify the supportive role of governmentin funding research and in providing sup-port to researchers – in both the public andprivate sectors. The implications of this in-creased intermingling of academia and in-dustry continue to be a dominant theme inmedical, legal, bioethics, and policy litera-ture [38–42].
In the context of human genetic and ge-nomic research, the blurring of the privateand public sectors has stirred controversy.Specific concerns have been raised, includ-ing the following:
1. the commercial process will inevitablylead to the undesirable commodificationof the human body;
2. the commercialization process (and thepatenting process specifically) will resultin academic secrecy and unwillingness tocollaborate on research efforts that are po-tentially commercializable;
3. commercial pressures will result in thepremature implementation of new tech-nologies in the marketplace (i.e., beforethe clinical, ethical, legal, and social is-
sues have been appropriately considered);and
4. intellectual property (especially patents)might adversely and unduly hinder pa-tient access to new technologies.
We specifically consider the role and per-ceptions of intellectual property in the com-mercialization of human genetic research.
22.4.1
An Emerging Market for Biobank Resources
Developments in genetic technology havemade human biological materials and thegenetic information derived from them in-creasingly valuable as raw materials for bio-medical research. Biomaterials can provideinsight into biological processes that cannotbe gleaned from other sources. Molecularprofiling and clinical validation of specificbiological targets necessitates high-qualityhuman biological materials and relevantclinical information from hundreds or eventhousands of individuals. Accordingly, acommercial market for human biologicalmaterials has emerged [43, 44]. Notably, “…the number of high-volume tissue bankingefforts around [the US] has gone from “ahandful” 10 years ago to thousands today…“ [44]. Firms established for this purposein the US include, among others, Ardais(www.ardais.com), Asterand (www.asterand.com), DNA Sciences (substantially all assetspurchased by Genaissance Pharmaceuti-cals, online at www.dna.com), First GeneticTrust (www.firstgenetic.net), GenomicsCollaborative (www.genomicsinc.com), andTissueInformatics (www.tissueinformat-ics.com, now www.paradigmgenetics.com).
The corporate history of DNA Sciences,an applied genetics firm with headquartersin Fremont California, provides an exampleof the potential problems associated withthe commercialization of human genetic
54322.4 The Commercialization of Biobank Resources
materials and associated clinical data. Thecompany was described as “… a large-scaleconsumer-focused, Internet-based researchinitiative designed to discover the linksbetween genetics and common diseases.”[45]. As part of its business efforts, DNASciences created the “Gene Trust” – a bio-bank to facilitate genomic research. It solic-ited biological samples from donors overthe internet who were asked to assist in thecommon fight against human genetic dis-eases. More than 10,000 samples were ob-tained by DNA Sciences [45] before it wasforced to sell off all of its assets, includingthe Gene Trust, to Genaissance Pharma-ceuticals in an effort to avoid bankruptcy[46]. Although Genaissance opted againstcontinuation of the Gene Trust for businessreasons, this case raises important issuesabout the commodification of biomaterialsand the appropriate governance of biobanks[47]. Questions remain as to whether thesamples and associated data should be de-stroyed, whether the samples could be re-sold, and whether the donors who offeredtheir samples to the Gene Trust face ongo-ing risks that their genetic data might be atsome point used against their interests.This situation highlights a particular needto examine legal options that could be usedto protect donor-participants in genetic andgenomic research. Specific legal mecha-nisms including legal trusts might be use-ful in the protection of donor interests vis avis public or private biobank entities [48,49].
22.4.2
Public Opinion and the Commercializationof Genetic Resources
In addition to private biobank initiatives, lo-cal, national, and regional governments areincreasingly entering the “business” of bio-
banking. In virtually all of the initiativesthat have been widely reported, the issue ofcommercial gain has been a contentious is-sue. For example, in Iceland serious con-cerns have been raised over the grant of anexclusive license to deCODE Genetics to ex-ploit the national Health Sector Databasefor profit [34, 50]. In the United Kingdom,public consultations in preparation for UKBiobank have revealed public concerns overany commercial involvement in Biobank.One study sponsored by the Human Genet-ics Commission revealed the Britishpublic’s strong preference that databasesshould not be owned or controlled by com-mercial interests and that products devel-oped through the initiative should be pub-licly owned [51].
In Canada, public opinion data suggestthat, although the public generally supportsbiotechnology and the development of thebiotech sector, there are serious reserva-tions about certain aspects of commercial-ization and ownership of human geneticmaterial. For example, among Canadiansthere seems to be deep resistance to theidea that biobanks could sell genetic data toother parties – even if informed consent isobtained [32]. In the Canadian context thismight be more indicative of a judgmentagainst the role of profit in association withhealthcare than a considered decision aboutthe particular circumstances of the use ofgenetic information. On the whole, howev-er, studies of opinion in several countriessuggest the public generally lacks trust incorporate participants in biomedical re-search [52]. This is certainly true in Canadawhere it has been determined that “… med-ical researchers are far more trusted to dowhat is right and are given more latitude intheir ability to access personal informa-tion.” [32].
544 22 Biobanks and the Challenges of Commercialization
22.5
Genetic Resources and Intellectual Property:What Benefits? For Whom?
It is hoped that research on banked sampleswill lead to commercializable diagnosticand therapeutic products. Typically, a re-searcher who discovers a disease genemight seek to file a patent application overthe gene and its specific uses in diagnosisand/or therapy. Who, ultimately, should beentitled to benefit from research discoveriesof this nature? Although an inventor has alegal right to obtain intellectual propertyprotection of his or her invention, when apatentable invention depends on donatedbiological samples, novel ethical issuesemerge. What are and what ought to be theproper limits of “patentable subject mat-ter”? Should the sequencing and identifica-tion of a gene sequence implicated in specif-ic biological processes be construed as an“invention”? Are individuals or commu-nities that participate in population geneticresearch entitled to share in any benefitsarising from the use of their biological ma-terial? If not, should they be so entitled? Dothe benefits that patents bestow on societyoutweigh the anticompetitive behavior theymight also inspire? What is the actual rela-tionship between patenting and innovation?
22.5.1
Patents as The Common Currency of the Biotech Industry
In essence, patents are contractual agree-ments made between an inventor and thestate. The ultimate objective of patent stat-utes and the intellectual property regime isto benefit society. By granting market exclu-sivity for a limited period (typically 20years), patents provide inventors with an op-portunity to recoup their research and de-
velopment costs and to enjoy a period oftime to exploit their inventions commercial-ly without infringing competition. In re-turn, the state is provided with an enablingdescription of the invention, sufficiently de-tailed to allow a person skilled in the art towork the invention. Descriptions of all in-ventions, including gene sequence listings,are made publicly available in patent data-bases at a specified time after filing. Accord-ingly, patent databases are valuable reposi-tories of technical information to whichothers in academia or industry can turn tostimulate their own innovative efforts. Therationale underlying publication is that du-plication will be avoided and improvementson the state of the art are promoted.
In the pharmaceutical industry and in thelife sciences, in which research and devel-opment costs are high and the likelihood ofdeveloping a product that will generate rev-enues is small, patent applications andgranted patents are seen to be critically im-portant to industrial success. Patents, someargue, ensure the development of necessarydrugs and medical devices that would notbe developed in the absence of patents[53–56]. Patents and patent applicationshave become the de facto currency of the bi-otech industry. The unsettling reality is thatwe do not understand the impact of patentson the economy or on society more broadly[57]. Questions persist about the overall ef-fect of patents on innovation and social wel-fare in the life sciences and other industrialsectors. Allan Greenspan, Chairman of theUnited States Federal Reserve Board has re-cently questioned whether “… we are strik-ing the right balance in our protection of in-tellectual property rights …“ and whetherthe protection is “… sufficiently broad to en-courage innovation but not so broad as toshut down follow-on innovation.” [58].
54522.5 Genetic Resources and Intellectual Property: What Benefits? For Whom?
22.5.2
The Debate over Genetic Patents
The extent to which industry has embracedgene patenting has caused much consterna-tion. In 2001, Robert Cook-Deegan and Ste-phen McCormack reported in Science mag-azine that more than 25,000 DNA-basedpatents had been issued in the US by theend of 2000 [59]. The intense scientific fo-cus on, and public investment in, the HGPcombined with the sharp increase in therate of genetic sequence patenting (includ-ing whole gene sequences, EST, and SNP)stimulated much debate about the relativebenefits and risks of genetic patenting [60].Over the past several years numerous com-mentaries and reports suggesting a varietyof reforms, both inside and outside patentlaw, have been promulgated by internation-al agencies, research institutes, non-govern-mental organizations, government agen-cies, and individual academics around theworld [61–65].
Despite the frequently heralded benefits ofpatents, their utility in the field of geneticsand genomics remains contested. In an oft-cited paper, published in Science magazine,on the effects of patents on innovation in bi-omedical research, Michael Heller and Re-becca Eisenberg describe the “tragedy of theanticommons” wherein a scarce resource isprone to under use when multiple ownerseach have a right to exclude others and noone has an effective privilege of use [66, 67].In conclusion, the authors warn that:
“… privatization must be more carefully de-ployed if it is to serve the public goals of bio-medical research. Policy makers should seekto ensure coherent boundaries of upstreampatents and to minimize restrictive licensingpractices that interfere with downstreamproduct development. Otherwise, more up-stream rights may lead paradoxically to feweruseful products for improving humanhealth.” [66]
Although it is accepted that genes, includ-ing human genes, are patentable subjectmatter in most, if not all jurisdictions, thedebate continues to rage about the ethicalappropriateness of patentability. In its re-port on gene patenting, The Nuffield Coun-cil on Bioethics aptly concluded on thispoint that:
“… exclusive rights awarded for a limited pe-riod are, in the main, defensible and that thepatent system has in general worked to thebenefit of the people. Nonetheless, we con-sider that in the particular case of patentsthat assert property rights over DNA, consid-eration should be given to whether the bal-ance between public and private interests hasbeen fairly struck [63].”
A growing body of data tends to supportHeller and Eisenberg’s thesis. It has, for ex-ample, been shown that transaction costsresulting from high licensing fees and roy-alties might deter laboratories from provid-ing genetic tests [68, 69]. In France, an eco-nomic study of the cost-effectiveness of ge-netic testing strategies including BRCA1/2testing showed that the latter had the high-est average cost per mutation detected. Theauthors of this study conclude that thebroad scope of the patent inhibits health-care systems from choosing the most effi-cient testing strategy [70]. There is evidenceof these same effects in Canada. Thoughthese specific concerns seem valid, cautionmust be applied in presuming that the ef-fects are, in sum, negative.
At least one commentator has taken issuewith the approach taken by Heller and Ei-senberg and argues that many of the prob-lems described in a series of papers au-thored by Eisenberg and Rai [66, 71–74]would be worse if patents were not available[75]. Patents, argues Kieff, increase outputby increasing both input and efficiency and,although not perfect, they are the best op-tion and they act to ensure that biological
546 22 Biobanks and the Challenges of Commercialization
research will be funded, to some extent,through the private sector. Similarly, anOECD report published in 2002 entitled“Genetic Inventions, Intellectual PropertyRights and Licensing Practices” concludesthat:
“… the available evidence does not suggest asystematic breakdown in the licensing of ge-netic inventions. The few examples used to il-lustrate theoretical economic and legal con-cerns related to the potential for the over-frag-mentation of patent rights, blocking patents,uncertainty due to dependency and abusivemonopoly positions appear anecdotal and arenot supported by existing economic studies[65].”
More research in this area is clearly needed.Several studies sponsored by the NationalInstitutes of Health in the US aim to pro-vide evidence that will enable rigorous as-sessment of the impact of university-heldgene patents [76, 77]. Without clear evi-dence that a problem exists, or without aclear understanding of an identified prob-lem, attempts to fix the system seem ill-ad-vised. The case of Myriad Genetics is fre-quently cited as justification for patent re-form.
22.5.3
Myriad Genetics
Around the world, numerous patents havebeen granted to Myriad Genetics over twogenes – BRCA1 and BRCA2 – associatedwith familial breast and ovarian cancer. My-riad has been harshly criticized for failing tobroadly license testing methods covered byits patents. In hindsight, the decision to re-fuse to broadly license its patented genetictesting methods might have been a poorbusiness decision – if for no reason otherthan that it has become a public relationsdisaster. The practice itself is not inherently
wrong or immoral and, in fact, many firmsacross a variety of industrial sectors employsimilar business strategies.
The problem for Myriad lies in the factthat the genetic testing services it seeks topromote are of profound interest to individ-uals who require testing. In addition, incountries with publicly funded healthcaresystems, monopolistic business practicesand pricing can adversely impact the abilityof the state to provide healthcare services.This reality seems to account for the relativeenthusiasm shown by countries like Franceand Canada in opposing Myriad’s monopo-ly. For example, as a result of the Myriadpatents the cost of BRCA1 and BRCA2 test-ing in Canada increased from $1000–1500to $3850 per test. In response to the priceincrease, provincial Ministries of Health inCanada were forced to make tough deci-sions over whether or not to publicly fundtesting in their province. To our knowledge,Quebec is the only Canadian province to of-fer the service to its residents through Myri-ad Genetics. Other provinces tacitly arguethat Myriad’s patents are invalid and contin-ue to provide potentially infringing testingin defiance of the Myriad patents. To date,legal action has not been commenced byMyriad against a single Canadian provincedespite continued testing.
On this same issue, headlines were madein Europe and around the world on May 18,2004, when the Opposition Division of theEuropean Patent Office granted an appealagainst Myriad Genetics over patent EP699754 for a “Method for Diagnosing a Pre-disposition for Breast and Ovarian Cancer”[78, 79]. As a prelude to this decision severalnotices of opposition were filed at the EPOagainst Myriad Genetics. In France, a no-tice of joint opposition was filed by the In-stitute Curie, the Assistance Publique-Hop-itaux de Paris, and the Institute Gustave
54722.5 Genetic Resources and Intellectual Property: What Benefits? For Whom?
Roussy. The initiative was supported by theFrench Hospital Federation, the FrenchMinistries of Public Health and Research,and the European Parliament. Further no-tices of opposition were filed by a group ledby the Belgian Society of Human Geneticsand the genetics societies of Denmark, Ger-many, and the United Kingdom [80, 81].Myriad’s patent was challenged on the basisthat there was no sufficient inventive stepand that the patent application failed to dis-close a sufficient description of the inven-tion. It is important to note that patent lawsin Canada and the United States provide nosimilar summary opposition procedure thatcan be used to challenge issued patents.Rather, the validity of patents must be test-ed in costly patent-infringement litigation.
Ultimately, the patent at issue was revokedon the basis that the invention claimed bythe applicant was not inventive. Opponentsof the patent had uncovered discrepanciesbetween the sequence described in the in-itial application filed in 1994 and in the pat-ent granted in 2001. The correct sequencewas only filed by Myriad after the same se-quence had already been published by an-other party and had thus become part of the“prior art”. Myriad has until the end of thisyear to appeal the decision. An earlier deci-sion of the EPO Opposition Division inFebruary of this year struck down anotherof Myriad’s patents relating to BRCA2, be-cause the charity Cancer Research UK hadfiled a patent application on the gene first[78]. Myriad faces two additional oppositionhearings in 2005 relating to others of itsgranted patents [78, 79]. Although these de-cisions continue to make headlines and areseen by many as moral victories against in-dustry writ large, it remains unclear howmuch weight the ethical concerns over genepatenting potentially hold.
22.5.4
Proposed Patent Reforms
Largely in response to the concerns overgene patents and the patenting of higherlife forms, academics have called for sub-stantial reform of patent laws. A variety ofchanges have been recommended; these in-clude:
• creating a statutory definition of “patent-able subject matter” that includes or ex-cludes certain biotechnological inven-tions;
• adding an “ordre public” or moralityclause to the Patent Act;
• adding a statutory opposition proceduresimilar to that which exists in Europe(and which has been successful thus farin striking down two of Myriad Genetics’breast cancer patents);
• creating a narrow compulsory licensingregime that would facilitate access by oth-ers to key patented technologies; and
• creating a specialized court to ensure thatonly judges with expertise in technologyand patent law can hear intellectual prop-erty cases.
Of these recommendations, the adoption ofan “ordre public” or morality clause is themost contentious. In effect, such a clausewould enable patent examiners (or an ap-pointed ethics panel or other agreed uponruling body) to determine the patentabilityof inventions on the basis of morality [82].Gold and Caulfield recommend the crea-tion of an independent, transparent and re-sponsible tribunal made up of specialists inethics, research, and economics with thepower to suspend or withhold patents incertain limited circumstances. The authorsenvisage a mechanism that “… avoids de-lays in the patent-granting process, that
548 22 Biobanks and the Challenges of Commercialization
leaves ethical decisions to specialists andthat prevents frivolous complaints againstpatentees.” On this issue, the Canadian Bio-technology Advisory Committee (CBAC) al-ternatively recommends the status quo bemaintained and that:
“… social and ethical considerations raisedspecifically by biotechnology should continueto be addressed primarily outside the PatentAct. While some proposals have been madeto modify the Patent Act (see Annex D), theexisting range of mechanisms available to re-strict or prevent activities determined to besocially or morally undesirable, is quite exten-sive. If new limits are required, it will bemore effective at present to modify or expandcurrent regulations than to introduce a com-pletely new mechanism into the Patent Act[83].”
Whatever steps countries opt to take withrespect to their patent laws, the issuesraised by patenting in the life sciences willinevitably continue to be debated.
Allowing patents over human biologicalmaterials, including human genetic materi-al, is frequently criticized on the basis that itwill create a demand for such materials andwill increase the likelihood that individualswill be inappropriately exploited [84]. Al-though the connection between patents andcommodification of the human body hasbeen explored in the context of gene patent-ing, to date, the debate has had little impacton patent policy. Indeed, it is important tocritically consider whether or not patent lawor procedure is the correct forum for ad-dressing morality [85]. It might well be thatregulation of specific uses of patented prod-ucts or processes is a better approach. Webelieve it is important to recognize the rela-tive values inherent in human biologicalmaterials, human life, and the patent sys-tem in promoting the development of prod-ucts and processes that could benefit soci-ety. Importantly, the potential of significant
benefits accruing to society as a result of thepatent system should not be lightly dis-counted without solid evidence to the con-trary.
22.5.5
Patenting and Public Opinion
Public perceptions on patenting in the fieldof biotechnology are diverse. A variety ofgroups in Japan, including the public andscientists, were asked whether “peopleshould be able to obtain patents and copy-rights” with regard to new plant varieties,new animal varieties, existing plant/animalgenes and existing human genes. Supportfor patenting fell among both groups as thefocus moved from new plant and animal va-rieties to patenting existing plant/animaland human genes [86]. This hostility towardpatenting genetic material already in exis-tence was also evident among members ofthe New Zealand public [87].
The Canadian public strongly supportsthe mapping of the human genome and,with the success of this enterprise, hasshown increased support for the idea of pat-enting genes. Concerns have been raised,however, about the possibility of patentsdriving up prices of medical products andreducing accessibility. Most Canadians as-sociate genome research with these prod-ucts and have indicated in a national surveythat equality of access should be the pri-mary guiding principle in commercializa-tion, including patenting of the products[88]. Another concern is the patenting ofhigher life forms. Half of Canadians whowere asked about patenting of the Harvardmouse said they were “not very comfort-able” or “not at all comfortable” with theearlier Court of Appeal decision to grant apatent on the mouse [88].
Swedish perceptions of commercializinggenetic information reveal similar concerns
54922.6 Human Genetic Resources and Benefit-Sharing
[89]. Assessment of responses to commer-cializing technology made it clear that al-though respondents had little concern overcommercializing information technology,gene technology posed serious concernsabout “ethics”, chief among which was theidea of commercializing such information[89].
22.6
Human Genetic Resources and Benefit-Sharing
In addition to specific concerns about pat-enting, concerns are frequently raised thatthe process of commercialization in thefield of genomics has the potential to en-courage inequitable distribution of the ben-efits (and burdens) of technology [90]. In re-sponse to this potential, the concept of ben-efit-sharing has emerged in the internation-al law arena. Although conceived in therealm of international law, the principlesare useful in the context of population ge-netic research initiatives at national, region-al, and community levels [47].
The human genome is a unique naturalresource and one that has qualities thatmight appropriately render it a “commonheritage” resource [91–93]. In addition, ge-nomic information has qualities that haveled some to argue it should be characterizedas a “global public good” [94, 95]. The effectof characterizing the human genome inthese ways is to morally, if not legally,oblige researchers and exploiters to pro-mote the equitable sharing of the resourceand of the information gleaned from use ofthe resource. The justification for benefit-sharing in the context of non-human genet-ic material is logically extendable to humangenetic material [47]. Currently there seemsto be a clear ethical imperative that de-mands benefit-sharing in the context of hu-
man genetic research and a nascent legalobligation to do the same.
Despite the lack of a fully crystallized le-gal obligation to share benefits in the con-text of human genetic research it is a topicthat has sparked discussion amongst schol-ars in law, medicine, philosophy, and bio-ethics [11, 48, 96–99]. Benefits are definedbroadly to ensure that many types of gain(not necessarily limited to financial gain)are distributed equitably – to the research-ers and industry partners who transform re-search findings into products and services,the international research community, thepatients, communities and populationswho participate in the research process, andto society in general. The often forgottencorollary is that if the benefits are to be con-sidered shareable, so ought the burdens.On reflection, benefit-sharing seems to bebest conceived as a means to effect distribu-tive justice in circumstances where there isevidence that distributive justice is lackingunder an existing regime. The concept is re-medial and flexible and might vary dramati-cally from project to project. Fairness is thekey consideration when developing a bene-fit-sharing strategy.
The Convention on Biological Diversity[100] and the associated Bonn Guidelines[101], which apply to nonhuman geneticmaterials, elucidate requirements for bene-fit-sharing arrangements that must be em-ployed in that context. Details of benefit-sharing agreements are not strictly deter-mined by the Bonn Guidelines. Rather, theguidelines simply suggest that a variety oftypes of benefit might form part of a bene-fit-sharing agreement. Table 22.2 provides anonexhaustive characterization of mone-tary, nonmonetary, and hybrid benefits thatmight be considered and included in a ben-efit-sharing agreement.
Benefit-sharing mechanisms typicallycontemplate the equitable distribution of
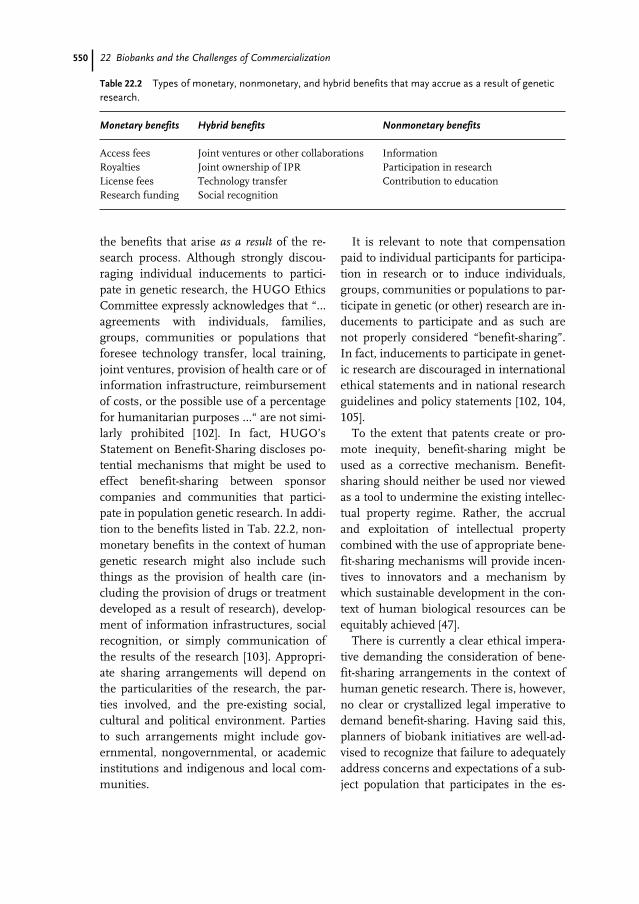
550 22 Biobanks and the Challenges of Commercialization
the benefits that arise as a result of the re-search process. Although strongly discou-raging individual inducements to partici-pate in genetic research, the HUGO EthicsCommittee expressly acknowledges that “…agreements with individuals, families,groups, communities or populations thatforesee technology transfer, local training,joint ventures, provision of health care or ofinformation infrastructure, reimbursementof costs, or the possible use of a percentagefor humanitarian purposes …“ are not simi-larly prohibited [102]. In fact, HUGO’sStatement on Benefit-Sharing discloses po-tential mechanisms that might be used toeffect benefit-sharing between sponsorcompanies and communities that partici-pate in population genetic research. In addi-tion to the benefits listed in Tab. 22.2, non-monetary benefits in the context of humangenetic research might also include suchthings as the provision of health care (in-cluding the provision of drugs or treatmentdeveloped as a result of research), develop-ment of information infrastructures, socialrecognition, or simply communication ofthe results of the research [103]. Appropri-ate sharing arrangements will depend onthe particularities of the research, the par-ties involved, and the pre-existing social,cultural and political environment. Partiesto such arrangements might include gov-ernmental, nongovernmental, or academicinstitutions and indigenous and local com-munities.
It is relevant to note that compensationpaid to individual participants for participa-tion in research or to induce individuals,groups, communities or populations to par-ticipate in genetic (or other) research are in-ducements to participate and as such arenot properly considered “benefit-sharing”.In fact, inducements to participate in genet-ic research are discouraged in internationalethical statements and in national researchguidelines and policy statements [102, 104,105].
To the extent that patents create or pro-mote inequity, benefit-sharing might beused as a corrective mechanism. Benefit-sharing should neither be used nor viewedas a tool to undermine the existing intellec-tual property regime. Rather, the accrualand exploitation of intellectual propertycombined with the use of appropriate bene-fit-sharing mechanisms will provide incen-tives to innovators and a mechanism bywhich sustainable development in the con-text of human biological resources can beequitably achieved [47].
There is currently a clear ethical impera-tive demanding the consideration of bene-fit-sharing arrangements in the context ofhuman genetic research. There is, however,no clear or crystallized legal imperative todemand benefit-sharing. Having said this,planners of biobank initiatives are well-ad-vised to recognize that failure to adequatelyaddress concerns and expectations of a sub-ject population that participates in the es-
Table 22.2 Types of monetary, nonmonetary, and hybrid benefits that may accrue as a result of geneticresearch.
Monetary benefits Hybrid benefits Nonmonetary benefits
Access fees Joint ventures or other collaborations InformationRoyalties Joint ownership of IPR Participation in researchLicense fees Technology transfer Contribution to educationResearch funding Social recognition
55122.7 Commercialization and Responsible Governance of Biobanks
tablishment of biobank resources – includ-ing the sharing of benefits – might result intotal failure of such initiatives. Prospective-ly planned and implemented benefit-shar-ing arrangements can be used to foster andmaintain public trust in the commercialprocess and to enable the long-term viabil-ity of biobank initiatives.
22.7
Commercialization and Responsible Governance of Biobanks
Governance refers to “… those processes bywhich human organizations, whether pri-vate, public or civic, steer themselves …“[106]. It is “… the process whereby societiesor organizations make their important deci-sions, determine whom they involve in theprocess, and how they render account …“[107]. In the context of biobanking, govern-ance issues arise in and between organiza-tions, including public and private institu-tions, sponsor companies, regulatory agen-cies, research ethics boards, researchers, re-search participants, and the general public.The roles assumed by these different insti-tutions and agencies, how they interact, thedecisions they make, and how they relate tothe stakeholders are all part of the govern-ance mix.
The governance of biobanks plays a keyrole in ensuring accountability and inbuilding and maintaining the requisitepublic trust. To do this, the various institu-tional structures and procedures implicatedin the governance processes and the inter-relationships between the governing en-tities must be clearly articulated. Biobanksrequire participation, cooperation, andoversight from numerous entities includ-ing research ethics boards, data protectionbodies (or privacy commissioners), profes-sional associations, and regulatory agencies.
The need to develop oversight mechanismsthat are independent of the management ofsuch an enterprise has been stressed [108,109]. For example, the Biobank UK website(http://www.biobank.ac.uk/ethics.htm) pro-vides that:
“The Funders [of Biobank UK] have commit-ted to the establishment of an Ethics andGovernance Council (EGC) to act as an inde-pendent guardian of the project’s Ethics andGovernance Framework and to advise theBoard of Directors on the conformance of theUK Biobank’s activities within this Frame-work and the interests of participants and thepublic.”
Tools for governance also include the appli-cable law, policy, and ethical norms. Apressing question that remains is whethercurrently available governance tools ade-quately address the concerns that arise inthe context of biobanking. Are the existingtools sufficiently adaptable or are othertools including legislation, regulations, andpolicy statements that are specific to bio-banks needed? When considering the ap-propriateness of the current governanceframework, public concerns about commer-cial involvement and the potential misuseof genetic information cannot be underesti-mated. With the increasing trend to collec-tion and use of genetic information, in-stances of misuse could also potentially in-crease unless measures are taken to ensurethe integrity of population genetic research,providing an appropriate balance betweenencouraging innovative research, protect-ing research participants, and providingbeneficial outcomes to society.
Given the focus of research on human ge-netics and genomics and the trend towardestablishment of biobank resources, thereis an urgent need for development of guid-ance documents that can be used by re-search ethics boards and private industry.Canada’s Tri-Council Policy Statement
552 22 Biobanks and the Challenges of Commercialization
[105] provides insufficient guidance to eth-ics boards charged with ethical review of bi-obank projects. Specifically, guidance onthe applicability of privacy law and consentoptions that might exist in the context ofpopulation genetic research needs to be de-veloped for each jurisdiction. It is possiblethat existing regulatory frameworks mighthave to be changed to accommodate ge-nomic research. What is needed is an openand accountable regulatory framework thatincorporates the legal and ethical normsgoverning research on human subjects andthe evolving ethical norms of corporate gov-ernance. In considering what such a frame-work might look like, the following ques-tions are relevant and require substantialconsideration:
• Who can or should own or control a pop-ulation genetic biobank?
• How is access to biobank resources grant-ed? To whom? Under what conditions?
• Should population genetic research beconsidered more akin to communitarianpublic health research or to traditional au-tonomy-driven human subject research?
• If more akin to public health research,how might this characterization affect thegovernance framework?
• How should the interests of the commu-nity or population and the interests of theresearch participants be represented inany commercial agreements that flowfrom biobanking?
• Can the commercialization of productsand services developed from populationgenetic research be simultaneously pro-moted and aligned with the best interestsof society?
• Is there an emerging legal obligation thatwould require the incorporation of bene-fit-sharing mechanisms into populationgenetic initiatives?
• How might benefit-sharing arrange-ments be implemented? In what circum-stances are such arrangements neces-sary?
Given the overall lack of experience in creat-ing and managing biobank resources andthe emerging appreciation of what might beaccomplished as a result of genomic re-search, answers to some of these questionscan be garnered only through practical ex-perience. However, proactive considerationof the issues known to be implicated in theestablishment of large scale population ge-netic initiatives is necessary and might en-courage the development of innovative ap-proaches to biobank governance. The chal-lenges presented by large-scale biobank in-itiatives suggest that what might berequired is a legislative framework that en-sures that the governance of such initiativesproceed in the public interest. It has beenargued for the UK Biobank that self-regula-tory mechanisms are no longer sufficient inthe face of erosion of public confidence andtrust [108].
22.7.1
The Public Interest and the Exploitation of Biobank Resources
As noted previously, the main objective ofpopulation genetic research is to developnew methods to prevent, diagnose, andtreat human disease. It is inevitable that pri-vate industry will be involved in the processand that it will seek to accumulate intellec-tual property rights over innovations. Thekey is to effectively align the needs of indus-try with the needs of the broader researchcommunity and with the populations thatenable such research. Numerous concernshave arisen in the context of the commer-cialization of genetic research, not least ofwhich is the potential adverse effect on pub-
55322.7 Commercialization and Responsible Governance of Biobanks
lic trust. Although the public is generallysupportive of genetic research there is a realrisk that over-emphasis of the commercialaspect will result in a backlash against pop-ulation genetic research and the commer-cial products developed as a result of the re-search.
In Iceland, for example, DeCode Genet-ics was granted an exclusive license to de-velop and exploit a Health Sector Database[34, 50]. On this point, harsh criticism hasbeen levied against the Icelandic govern-ment for entering a bad deal on behalf of itscitizens. For example, Professor Greelynotes that:
“With the sale or lease of other assets of spec-ulative value such as oil and gas deposits, thegovernment typically keeps a financial inter-est in the output, often in the form of royal-ties. This share of the risk may limit theamount initially paid for the concession orlease, but it guarantees that government willshare proportionately in a successful enter-prise. Iceland has neither negotiated for asubstantial initial payment nor a continuinginterest. Its arrangement with DeCODE mayturn out to be very one-sided [50].”
Similarly, in a paper that is highly skepticalof the commercial focus of the IcelandicHealth Sector Database, Merz et al. con-clude that:
“The major ethical concerns posed by theHSD [the Icelandic Health Sector Database]arise because its primary purpose is com-mercial, and only secondarily does it supportlegitimate governmental operations. Thereare simply too many provisions of the overallproject that serve DeCODE’s interests andnot those of the government or individual cit-izens.” [34].
The Icelandic model, the authors argue, “…provides an informative counterexamplethat must be critically examined by othersconsidering similar ventures.” Although, inthe end, pure public funding might be an
unattainable ideal, an appropriate balancemight be struck between public and privatefunders. Establishment of collaborativeconsortia of public and private companiesthat prevents unfair monopolistic behavioris one such possibility.
22.7.2
The Role of the Public and Biobank Governance
It is important that the general public beprovided information about how biobankenterprises are funded, the expected bene-fits for the community or society, how therisks are managed, and the role of the initia-tive in the national innovation agenda. Re-search participants should be specifically in-formed about the foreseeable uses of theirbiological sample or associated data, con-sent conditions for future research access orsecondary uses of the data, the potential forcommercialization, specific informationabout how privacy and confidentiality will bemaintained, storage conditions, and projectmaintenance and oversight [110]. Any bene-fit-sharing arrangements with individualsand/or the community at large, should thesebe relevant, must also be clearly articulated.
The need for the public to understandand to participate in the governance ar-rangements of biobanks cannot be over-em-phasized. We have described governance asthe processes by which decisions are madeand how accountability, legitimacy and pub-lic trust are maintained. Although the needfor public consultation and ongoing debateand dialog are recognized, efforts to addressthe need have not, to date, been adequate.To address this need a complement of inno-vative and flexible tools including publicopinion surveys, focus group analysis, stake-holder consultation, community consulta-tion, and web-based consultations must bedeveloped. In addition, tools to educate the
554 22 Biobanks and the Challenges of Commercialization
public (including media and professionals)about genetic and genomic research mustbe developed. Ongoing research into the ef-fectiveness of these tools is essential.
Public trust in research depends on theability of governments to appropriatelymanage the research, development, andmarketing phases of the commercial pro-cess. Developments in large-scale popula-tion genetic research point to a need to implement public education strategies to in-form people about the purpose of popula-tion genetic research, the risks to partici-pants, and the necessary role of private in-dustry in the commercialization process.They also point to a need to develop reliabledata-protection safeguards and liberal ac-cess mechanisms so that valuable researchcan proceed. This liberalization must onlyoccur, however, in the context of robustsafeguards and oversight mechanisms tominimize the potential risks to researchsubjects, many of which are both unknownand unknowable.
22.8
Conclusion
Failure to apply the highest scientific, legaland ethical standards to biobank initiativeswill inevitably undermine public trust andconfidence in science and in the down-stream products of such research [111]. Es-tablishing and maintaining integrity over aproject’s planning and research/use phasesis critical. Errors made in the development
of the Icelandic health sector database areinstructive. On this topic, one commentatornotes that:
“… the procedural haste, the refusal to solicitthe opinions of foreign experts (who havegreater experience with industry/sci-ence/ethics conflicts), the unwillingness totake domestic criticism into account, the po-liticized and partisan debate in the case, thecrude oversimplifications in the discussionsand controversies over the biological process-es basic to the inheritance of disease, thepower of private interests, the plebiscitarianlegitimation procedures in a case of subtleethical, social and scientific controversy, allthis is bound to raise a lot of misgivings, tosay the least. It does not augur well for thesearch for consensual solutions of ethicalconflicts in vulnerable domains of sociallife.” [112].
The planners of new biobank initiativesshould take every opportunity to learn fromboth the positive and negative experiencesthat others have encountered in the plan-ning of existing biobank projects. It is nec-essary to understand the characteristics ofthe participating population, the opinion ofthe relevant public, and the specific regula-tory environment in which the biobank willoperate. Planners must pay close attentionto the complex ethical concerns that sur-round the commercialization of researchand the patenting of genetic material. Bene-fit-sharing arrangements, specifically tail-ored to particular initiatives, might be usedto solidify the requisite public trust and en-able the long-term success of biobank initia-tives.
555
1 Lorentz, C. P., Wieben, E., Tefferi, A.,Whiteman, D., Dewald G. (2002) Primer onmedical genomics: history of genetics andsequencing of the human genome, MayoClin. Proc. 77, 773–782.
2 Venter, J. C. et al. (2001), The Sequence of theHuman Genome, Science 291, 1304–1351.
3 Lander, E. S. et al., (2001), Initial Sequencingand analysis of the human genome, Nature409, 860–921.
4 Collins, F., Green, E. D., Guttmacher, A.,Guyer, M. S. (2003), A vision for the future ofgenomics research: a blueprint for thegenomic era, Nature 422, 1–13.
5 Chakravarti, A. (1999), Population Genetics –Making Sense out of Sequence, Nat. Genet.21(1 Suppl.), 56–60.
6 Bentley, D. R. (2004), Genomes for medicine,Nature 429, 440–445.
7 Collins, F. S. (2004), The case for a USprospective cohort study of genes andenvironment, Nature 429, 475–477.
8 Beskow, L. M., et al. (2001), InformedConsent for Population-Based ResearchInvolving Genetics, JAMA 286, 2315–2351.
9 Caulfield, T. (2002),Gene Banks and BlanketConsent, Nat. Rev. Genet. 3, 577.
10 Deschenes, M., Cardinal, G., Knoppers B. M.,Glass, K. C. (2001), Human GeneticsResearch DNA Banking and Consent: AQuestion of ‘Form’?, Clin. Genet. 59,221–239.
11 Weijer, C., (2000), Benefit Sharing and OtherProtections for Communities in GeneticResearch Clin. Genet. 58, 367–368.
12 Weijer, C., Goldsand, G., Emanuel, E. J.(1999), Protecting Communities in Research:Current Guidelines and Limits ofExtrapolation, Nat. Genet. 23, 275–280.
13 Harrison, C. H. (2002), Neither Moore northe Market: Alternative Models forCompensating Contributors of HumanTissue, Am. J. L. and Med. 28, 77–106.
14 Gold, E. R. (1996), Body Parts: PropertyRights and the Ownership of HumanBiological Materials, Georgetown UniversityPress.
15 Litman, M., Robertson, G. (1996), TheCommon Law Status of Genetic Material, in:Knoppers, B. M., Caulfield, T., Kinsella, T. D.,(Eds.), Legal Rights and Human GeneticMaterial, pp. 51–84, Emond MontgomeryPublications Ltd.
16 Human Genetics Commission (2002), InsideInformation: Balancing Interests in the Useof Personal Genetic Data.
17 Robertson, J. A. (1999), Privacy Issues inSecond Stage Genomics, Jurimetrics 40,59–77.
18 Gostin, L. O., Hodge, J. G., (1999), GeneticPrivacy and the Law: An End to GeneticExceptionalism, Jurimetrics 40, 21–58.
19 Annas, G. J. (1993), Privacy Rules for DNADatabanks: Protecting Coded ‘Future Diaries’,JAMA 270, 2346–2350.
20 Greely, H. T. (1997), The Control of GeneticResearch: Involving the ‘Groups Between’,Hous. L. Rev. 33, 1397–1430.
21 Juengst, E. T. (1998), Group Identity andHuman Diversity: Keeping Biology Straightfrom Culture, Am. J. Hum. Genet. 63,673–677.
22 Markel, H. (1992), The Stigma of Disease:Implications of Genetic Screening, Am. J.Med. 93, 209–215.
23 Wertz, D. C., Fletcher, J. C. (1998), Ethicaland Social Issues in Prenatal Sex Selection: ASurvey of Geneticists in 37 Nations, Soc. Sci.and Med. 46, 255–273.
References
556 References
24 Anonymous (1995), Western Eyes on China’sEugenics Law, Lancet 346, 131.
25 Wertz, D. C. (2002), Did Eugenics Ever Die?Nat. Rev. Genet. 3, 408.
26 Canadian Institutes of Health Research(CHIR) (2004), The Canadian Lifelong Health Initiative, online: CIHR <http://www.cihr-irsc.gc.ca/e/strategic/18542.shtml>.
27 Kaiser, J. (2002), Population Databases Boom,from Iceland to the U.S., Science 298,1158–1161 (on p. 1159).
28 Caulfield, T., Sheremeta, L., Daar, A. S. (2003)Somatic Cell Nuclear Transfer – How ScienceOutpaces the Law, Nat. Biotech. 21, 969–970.
29 Mnyusiwalla, A., Daar, A. S., Singer, P. A.(2003) ‘Mind the Gap’: Science and Ethics inNanotechnology, Nanotechnology 14,R9–R13.
30 Pollara and Earnscliffe Research andCommunications (2003), Public OpinionResearch into Biotechnology Issues in theUnited States and Canada, 8th Wave,Biotechnology Assistant Deputy MinisterCoordinating Committee.
31 Pollara and Earnscliffe Research andCommunications, (2001), Public OpinionResearch into Biotechnology Issues, 5thWave, Report prepared for the CanadianBiotechnology Advisory Committee.
32 Pollara and Earnscliffe Research andCommunications (2003), Public OpinionResearch into Genetic Privacy Issues,Biotechnology Assistant Deputy MinisterCoordinating Committee [GIP 2003].
33 Earnscliffe Research and Communications,Secondary Opinion Research intoBiotechnology Issues, Report to CanadianBiotechnology Secretariat, Genome Canada,Dec 2003.
34 Merz, J. F., McGee, G. E., Sankar, P. (2004)Iceland Inc.?: On the Ethics of CommercialPopulation Genomics, Soc. Sci. and Med. 58,1201–1209;
35 Høyer, K., Lynoe, N. (2004), Is InformedConsent a Solution to Contractual Problems?A Comment on the Article: Iceland Inc.?: Onthe Ethics of Commercial PopulationGenomics 58 Soc. Sci. and Med. 58, 1211.
36 Pinto, A. M. (2002), Corporate Genomics:DeCode’s Efforts at Disease Mapping inIceland for the Advancement of Science andProfits, U. Ill. J.L. Tech. and Pol’y 2002:2,467–496.
37 Dashefsky, R. (2003), The high road tosuccess: how investing in ethics enhancescorporate objectives, J. Biolaw and Business6:3 [no pagination].
38 Blumenthal, D., Causino, N., Campbell, E.(1996), Relationships between academicinstitutions and industry in the life sciences –an industry survey, NEJM 334, 368–373.
39 Blumenthal, D. (2003a), Academic–industrialRelationships in the Life Sciences, NEJM 349,2452–2459.
40 Blumenthal, D. (2003b), Conflict of Interestin Biomedical Research, Health Matrix 12,377–392.
41 Campbell, E., Louis, K. S., Blumenthal, D.(1998), Looking a gift horse in the mouth:corporate gifts supporting life sciencesresearch, JAMA 279, 995–999.
42 Blumenthal, D. (1996), Ethics issues inacademic-industry relationships in the lifesciences: the continuing debate, Acad. Med.71, 1291–1296.
43 Anderlik, M.R. (2003), Commercial Biobanksand Genetic Research: Banking withoutChecks? in: Knoppers, B. M. (Ed.) Popula-tions and Genetics: Legal and Socio-EthicalPerspectives, pp. 345–373, Martinus NijhoffPublishers.
44 Paxton, A. (2003), Brisk Trade in Tissue forProteomics and Genomics Research, online:College of American Pathologists<www.cap.org/apps/docs/cap_today/feature_stories/biorepositories.html>.
45 DNA Sciences (2001), DNA Sciences Inc.Registers 10,000 Gene Trust Participants inLess than One Year, online: BioSpace<www.biospace.com/ccis/news_story.cfm?StoryID=5705915&full=1>.
46 Genaissance Pharmaceuticals (12 May 2003),Genaissance Pharmaceuticals’ Acquisition ofSubstantially All of the Assets of DNASciences Is Approved, Press Release, online:Genaissance Pharmaceuticals <www.dna.com/investor/archive_releases03.html>.
47 Sheremeta, L., Knoppers, B. M. (2004),Beyond the rhetoric: Population Genetics andBenefit Sharing, Health L. J. 11, 89–117.
48 Winickoff, D. E., Winickoff, R. N. (2003), TheCharitable Trust as a Model for GenomicBiobanks, NEJM 349,1180–1184.
49 Ashburn, T. T., Wilson, S. K., Eisenstein, B. I.(2000), Human Tissue Research in theGenomic Era of Medicine, Arch. Intern. Med.160, 3377–3384.
557References
50 Greely, H. T. (2000), Iceland’s Plan forGenomics Research: Facts and Implications,Jurimetrics 40, 153–190.
51 Human Genetics Commission, (2000),Report to the Human Genetics Commissionon public attitudes to the uses of humangenetic information, online: <http://www.hgc.gov.uk/business_publications_public_attitudes.pdf>.
52 Einsiedel, E. (2003) Whose genes, whose safe,how safe? Publics’ and professionals’ views ofbiobanks, Unpublished Paper, commissionedby the Canadian Biotechnology AdvisoryCommittee, April 2003.
53 Bale, H. E. Jr. (1996), Patent Protection inPharmaceutical Innovation, Int’l J.L. andPolitics 29, 95–101.
54 Kolker, K. L. (1997), Patents in thePharmaceutical Industry, Patent World 88,34–37.
55 Mossinghoff G. J., Kuo, V. S. (1998), WorldPatent System Circa 20XX A.D., JPTOS 80,523–554.
56 Levin, R. C., Klevorick, A. K., Nelson, R. R.,Winter, S. G. (1987), Appropriating thereturns from industrial research anddevelopment, Brookings Paper on EconomicActivity 3, 783–831.
57 Sheremeta, L., Gold, E. R., Caulfield, T.(2003), Harmonizing Commercialisation andGene Patent Policy With Other Social Goalsin: Knoppers, B. M. (Ed.) Populations andGenetics: Legal and Socio-EthicalPerspectives, pp. 423–452, Martinus NijhoffPublishers.
58 Greenspan, A. (27 February 2004),Intellectual Property Rights, Lecturepresented to the Stanford University Institutefor Economic Policy Research EconomicSummit, Stanford, California, online: FederalReserve<http://www.federalreserve.gov/boarddocs/speeches/2004/200402272/default.htm>.
59 Cook-Deegan, R. M., McCormack, S. J. (2001)Patents, Secrecy, and DNA, Science 293, 217.
60 Doll, J. (1998), The patenting of DNA,Science 280, 689–690.
61 Merrill S. A., Levin, R. C., Myers, M. B. (Eds.)(2004), Patent System for the 21st Century(Prepublication Copy), National AcademiesPress, online: NAP <www.nap.edu/books/0309089107/html/>.
62 Ontario, Ministry of Health, (2002) Genetics,Testing and Gene Patenting: Charting New
Territory in Healthcare, online: OntarioMinistry of Health <www.health.gov.on.ca/english/public/pub/ministry_reports/geneticsrep02/genetics.html>.
63 Nuffield Council on Bioethics (2002), TheEthics of Patenting DNA.
64 Australia Law Reform Commission (2004)Gene Patenting and Human Health,Discussion Paper 68, online: ALRC<www.austlii.edu.au/au/other/alrc/publications/dp/68/>.
65 Organisation for Economic Co-Operation andDevelopment (2002), Genetic Inventions,Intellectual Property Rights and LicensingPractices: Evidence and Policies, online:OECD <www.oecd.org/dataoecd/42/21/2491084.pdf>.
66 Heller, M.A., Eisenberg, R. (1998), Canpatents deter innovation? The anticommonsin biomedical research, Science 280, 698–701.
67 Heller, M. (1998), The Tragedy of theAnticommons: Property in Transition fromMarx to Markets, Harv. L. Rev. 111, 622–688.
68 Henry, M. R., Cho, M. K., Weaver, M. A.,Merz, J. F. (2003) A pilot survey on thelicensing of DNA inventions, J. L. Med. andEthics 31, 442–449.
69 Cho, M. K., Illangasekare, S., Weaver, M. A.,Leonard, D. G., Merz, J. F. (2003) Effects ofpatents and licenses on the provision ofclinical genetic testing services, J. Mol. Diagn.5, 3–8.
70 Sevilla, C., Julian-Reynier, C., Eisinger, F.,Stopa-Lyonnet, D., Bressac-de Paillerets, B.H., Obol, H., Moatti, J. (2003), The impact ofgene patents on the cost-effective delivery ofcare: the case of BRCA1 genetic testing, Int. J.Tech. Assessment in health care 19, 287–300.
71 Eisenberg, R. S. (1987), Proprietary Rightsand the Norms of Science in BiotechnologyResearch, Yale L. J. 177–231.
72 Eisenberg, R. S. (1989), Patents and theprogress of science: Exclusive rights andexperimental use, Chicago L. Rev. 56,1017–1086.
73 Eisenberg, R. S. (1996), Public research andprivate development: patent and technologytransfer in government sponsored research,Va. L. Rev. 82, 1663–1727.
74 Rai, A. K. (1999), Regulating ScientificResearch: Intellectual Property Rights and theNorms of Science, Nw. U.L. Rev. 94, 77–152.
75 Kieff, F. S. (2001) Facilitating ScientificResearch: Intellectual Property Rights and the

558 References
Norms of Science – A Response to Rai andEisenberg, Nw. U. L. Rev. 95, 691–706.
76 Malakoff, D., (2004), NIH Roils Academe withAdvice on Licensing DNA Patents, Science303, 1757–1758.
77 Cook-Deegan, R., Walters, L., Pressman, L.,Pau, D., McCormack, S., Gatchalian, J.,Burges, R. (2002) Preliminary Data on U.S.DNA-Based Patents and Preliminary Plans fora Survey of Licensing Practices in: Knoppers,B. M. (Ed.) Populations and Genetics: Legaland Socio-Ethical Perspectives, pp. 453–471,Martinus Nijhoff Publishers.
78 Coghlan, A. (2004), Europe RevokesControversial Gene Patent, New Scientist,online: New Scientist.com <www.newscientist.com/news/print.jsp?id=ns99995016>.
79 Abbot, A. (2004), Clinicians Win Fight toOverturn Patent for Breast-Cancer Gene,Nature 429, 329.
80 Wadman, M. (2001), Testing Time for GenePatent as Europe Rebels, Nature 413, 443.
81 Institute Curie (2004), The European PatentOffice has revoked the Myriad GeneticsPatent, Press Release, online: <www.curie.fr/upload/presse/190504_gb.pdf>.
82 Gold, E.R., Caulfield T., (2002) The MoralTollbooth: A Method that Makes Use of thePatent System to Address Ethical Concerns inBiotechnology, Lancet 359 2268–2270.
83 Canadian Biotechnology Advisory Committee(2002), Patenting of Higher Life Forms andRelated Issues, online: <http://cbac-cccb.ic.gc.ca/epic/internet/incbac-cccb.nsf/en/ah00188e.html>.
84 Andrews, L., Nelkin, B. (2001), Body Bazaar:The Market for Human Tissue in theBiotechnology Age, Crown Publishers.
85 Crespi, R. S. (2003), Patenting and Ethics – ADubious Connection, J. Pat. and TrademarkOff. Soc’y 85, 31–47.
86 Macer, D. R. J. (1992) Public acceptance ofhuman gene therapy and perceptions ofhuman genetic manipulation, Human GeneTherapy 3, 511–518.
87 Couchman, P.K. and Fink-Jensen, K. (1990)Public Attitudes to Genetic Engineering inNew Zealand – DSIR Crop Research Report138, Christchurch: Department of Scientificand Industrial Research.
88 Pollara and Earnscliffe Research and Com-munications (1999), Public Opinion Researchinto Biotechnology Issues, 3rd Wave.
89 Høyer, K. (2002), Conflicting notions ofpersonhood in genetic research,Anthropology today 18:5, 9–13.
90 World Health Organization, AdvisoryCommittee on Health Research (2002),Genomics and World Health, Genomics andWorld Health.
91 Knoppers, B. M. (1991), Human Dignity andGenetic Heritage: A Study Paper, Law ReformCommission of Canada.
92 Baslar, K. (1998) The Concept of theCommon Heritage of Mankind, MartinusNijhoff Publishers.
93 Spectar, J. M. (2001), The Fruit of the HumanGenome Tree: Cautionary Tales aboutTechnology, Investment and the Heritage ofMankind, Loy. L.A. Int’l and Comp. L.J. 23,1–40.
94 Thorsteinsdottir, H., Daar, A. S., Smith, R.D., Singer, P. A. (2003) Genomics Knowledge,in: Smith, R., Beablehole, R., Woodward, D.,Drager, N. (Eds.) Global Public Goods forHealth, pp. 137–158, Oxford University Press.
95 Varmus, H. (2002), Genomic Empowerment:The Importance of Public Databases, Nat.Genet. 32:3, 3.
96 Berg, K. (2001), The ethics of benefit sharing,Clin. Genet. 59, 240–243.
97 Pullman, D., Latus, A. (2003), Clinical trials,genetic add-ons, and the question of benefit-sharing, Lancet 362, 242–244.
98 Kent, H. (2000) Benefits of Genetic ResearchMust be Shared, International GenomeOrganization Warns, CMAJ 162, 1736–1737.
99 Nicol, D., Otolowski, M., Chalmers, D. (2001),Consent, Commercialization and Benefit-Sharing, J. L. and Med 9, 80–94.
100 United Nations (1992), Convention onBiological Diversity, 31 I.L.M. 818.
101 United Nations (2002), The Bonn Guidelineson Access to Genetic Resources and Fair andEquitable Sharing of the Benefits Arising outof their Utilization, UN Doc UNEP/CBD/COP/6/20, online: Convention on BiologicalDiversity <www.biodiv.org/decisions/default.asp?m=cop-06&d=24>.
102 HUGO (1996), Statement on the PrincipledConduct of Genetic Research.
103 HUGO (2000), Statement on Benefit Sharing.104 Council for International Organizations of
Medical Sciences (CIOMS), (2002)International Ethical Guidelines forBiomedical Research Involving HumanSubjects, online: <www.cioms.ch/frame_guidelines_nov_2002>.
559References
105 Medical Research Council, Natural Sciencesand Engineering Research Council of Canadaand the Social Sciences and HumanitiesResearch Council of Canada (1998), Tri-Council Policy Statement on Ethical Conductfor Research Involving Humans.
106 MacDonald, M. (2000), The Governance ofHealth Research Involving Human Subjects,Executive Summary, online: Law Commis-sion of Canada <www.lcc.gc.ca/en/themes/gr/hrish/macdonald/macdonald_main.asp>.
107 Graham, J., Amos, B., Plumptre T. (2003),Principles for good governance in the 21stcentury, Policy Brief No. 15, Institute onGovernance, Ottawa.
108 Kaye, J., Martin, P. (2000), Safeguards forresearch using large scale DNA collections,BMJ 321, 1146–1149.
109 Cardinal, G., Deschenes, M. (2003), Survey-ing the Population Biobankers, in: Knoppers,B. M. (Ed.) Populations and Genetics: Legaland Socio-Ethical Perspectives, pp. 37–94,Martinus Nijhoff Publishers.
110 People Science and Policy Ltd. Biobank UK: AQuestion of Trust. A Consultation Exploringand Addressing Questions of Public Trust.London, UK: Medical Research Council,Wellcome Trust <www.ukbiobank.ac.uk/documents/consultation.pdf>.
111 Lowrance, W. W. (2001), The Promise ofHuman Genetic Databases: High Ethical aswell as Scientific Standards are Needed, BMJ322, 1009–1010.
112 Edelstein, W. (1998) The Responsible Practiceof Science: Remarks About the CrossPressures of Scientific Progress and theEthics of Research, online: Mannvernd<www.mannvernd.is/english/articles/we.twim.html>.
561
Gebhard Fürst
I would like to introduce you to my thoughtsabout a topic the importance of which forour time cannot be underestimated. Sincecloning of the sheep Dolly, and as a resultof other related news, or as a result of directconfrontation with the topic, many peopleare challenged by the questions which arisefrom new discoveries and technology in thefield of biotechnology. All of us now have tobe more responsible for our actions thanever before. This responsibility needs stan-dards and guidelines.
German Bundespresident Johannes Raumade an impressive and clear statement atthe conference “Ethics and Disability” inDecember 2003. He also defined the scope:
“For the first time in the history of mankindthe question arises, if we should make use ofthe option to change the human being andredesign man genetically. I can understandthat many people are fascinated by the newpossibilities opened by gene analysis andgene technology. If we discuss which pos-sibilities we should utilize and which not theissue is not first and foremost about scientif-ic and technical questions. We have to cometo a qualitative decision. We have to decide,which technological possibilities can bematched with our value system, and whichcannot [1].”
The key question is defined by the abovestatement. In view of current developmentsin gene technology and biomedicine, far-reaching changes in culture and civilizationcan be expected. Never before did we knowso much, never before were we as capableas today. But do we want to know every-thing that we might be able to know? Andshould we do, or are we allowed to do,everything we could do, or might be able toachieve?
I represent the German Catholic Confer-ence of Bishops on the German NationalEthics Advisory Board, which has the man-date to represent the ethical questions andarguments regarding life sciences to theGerman government. Life sciences include,among others, biosciences and agriculturalsciences, and bioinformatics, biomedicine,and pharmacy. The life sciences will deepenour knowledge about humans dramaticallyand therefore raise many expectations,hopes and fears. New scientific findingsthus require examination if their utilizationcan be justified ethically [2].
I would like to mention a few examples todemonstrate that these thoughts are notspeculative generalizations: In Korea a nu-cleus which was removed from a cell of a
Handbook of Genome Research. Genomics, Proteomics, Metabolomics, Bioinformatics, Ethical and Legal Issues.Edited by Christoph W. SensenCopyright © 2005 WILEY-VCH Verlag GmbH & Co. KGaA, WeinheimISBN: 3-527-31348-6
23The (Im)perfect Human – His Own Creator? Bioethics and Genetics at the Beginning of Life
Verwendete Mac Distiller 5.0.x Joboptions
Dieser Report wurde automatisch mit Hilfe der Adobe Acrobat Distiller Erweiterung "Distiller Secrets v1.0.5" der IMPRESSED GmbH erstellt. Sie koennen diese Startup-Datei für die Distiller Versionen 4.0.5 und 5.0.x kostenlos unter http://www.impressed.de herunterladen. ALLGEMEIN ---------------------------------------- Dateioptionen: Kompatibilität: PDF 1.3 Für schnelle Web-Anzeige optimieren: Ja Piktogramme einbetten: Ja Seiten automatisch drehen: Nein Seiten von: 1 Seiten bis: Alle Seiten Bund: Links Auflösung: [ 2400 2400 ] dpi Papierformat: [ 481 680 ] Punkt KOMPRIMIERUNG ---------------------------------------- Farbbilder: Downsampling: Nein Komprimieren: Ja Komprimierungsart: ZIP Bitanzahl pro Pixel: 8 Bit Graustufenbilder: Downsampling: Nein Komprimieren: Ja Komprimierungsart: ZIP Bitanzahl pro Pixel: 8 Bit Schwarzweiß-Bilder: Downsampling: Nein Komprimieren: Ja Komprimierungsart: CCITT CCITT-Gruppe: 4 Graustufen glätten: Nein Text und Vektorgrafiken komprimieren: Ja SCHRIFTEN ---------------------------------------- Alle Schriften einbetten: Ja Untergruppen aller eingebetteten Schriften: Nein Wenn Einbetten fehlschlägt: Abbrechen Einbetten: Immer einbetten: [ /Courier-BoldOblique /Helvetica-BoldOblique /Courier /Helvetica-Bold /Times-Bold /Courier-Bold /Helvetica /Times-BoldItalic /Times-Roman /ZapfDingbats /Times-Italic /Helvetica-Oblique /Courier-Oblique /Symbol ] Nie einbetten: [ ] FARBE(N) ---------------------------------------- Farbmanagement: Farbumrechnungsmethode: Farbe nicht ändern Methode: Standard Geräteabhängige Daten: Einstellungen für Überdrucken beibehalten: Ja Unterfarbreduktion und Schwarzaufbau beibehalten: Ja Transferfunktionen: Beibehalten Rastereinstellungen beibehalten: Nein ERWEITERT ---------------------------------------- Optionen: Prolog/Epilog verwenden: Nein PostScript-Datei darf Einstellungen überschreiben: Nein Level 2 copypage-Semantik beibehalten: Ja Portable Job Ticket in PDF-Datei speichern: Ja Illustrator-Überdruckmodus: Ja Farbverläufe zu weichen Nuancen konvertieren: Ja ASCII-Format: Nein Document Structuring Conventions (DSC): DSC-Kommentare verarbeiten: Ja DSC-Warnungen protokollieren: Nein Für EPS-Dateien Seitengröße ändern und Grafiken zentrieren: Ja EPS-Info von DSC beibehalten: Ja OPI-Kommentare beibehalten: Nein Dokumentinfo von DSC beibehalten: Ja ANDERE ---------------------------------------- Distiller-Kern Version: 5000 ZIP-Komprimierung verwenden: Ja Optimierungen deaktivieren: Nein Bildspeicher: 524288 Byte Farbbilder glätten: Nein Graustufenbilder glätten: Nein Bilder (< 257 Farben) in indizierten Farbraum konvertieren: Ja sRGB ICC-Profil: sRGB IEC61966-2.1 ENDE DES REPORTS ---------------------------------------- IMPRESSED GmbH Bahrenfelder Chaussee 49 22761 Hamburg, Germany Tel. +49 40 897189-0 Fax +49 40 897189-71 Email: [email protected] Web: www.impressed.de
Adobe Acrobat Distiller 5.0.x Joboption Datei
<< /ColorSettingsFile () /LockDistillerParams true /DetectBlends true /DoThumbnails true /AntiAliasMonoImages false /MonoImageDownsampleType /Bicubic /GrayImageDownsampleType /Bicubic /MaxSubsetPct 100 /MonoImageFilter /CCITTFaxEncode /ColorImageDownsampleThreshold 1.5 /GrayImageFilter /FlateEncode /ColorConversionStrategy /LeaveColorUnchanged /CalGrayProfile (Dot Gain 20%) /ColorImageResolution 300 /UsePrologue false /MonoImageResolution 1200 /ColorImageDepth 8 /sRGBProfile (sRGB IEC61966-2.1) /PreserveOverprintSettings true /CompatibilityLevel 1.3 /UCRandBGInfo /Preserve /EmitDSCWarnings false /CreateJobTicket true /DownsampleMonoImages false /DownsampleColorImages false /MonoImageDict << /K -1 >> /ColorImageDownsampleType /Bicubic /GrayImageDict << /HSamples [ 2 1 1 2 ] /VSamples [ 2 1 1 2 ] /Blend 1 /QFactor 0.9 >> /CalCMYKProfile (U.S. Web Coated (SWOP) v2) /ParseDSCComments true /PreserveEPSInfo true /MonoImageDepth -1 /AutoFilterGrayImages false /SubsetFonts false /GrayACSImageDict << /HSamples [ 2 1 1 2 ] /VSamples [ 2 1 1 2 ] /Blend 1 /QFactor 0.9 >> /ColorImageFilter /FlateEncode /AutoRotatePages /None /PreserveCopyPage true /EncodeMonoImages true /ASCII85EncodePages false /PreserveOPIComments false /NeverEmbed [ ] /ColorImageDict << /HSamples [ 2 1 1 2 ] /VSamples [ 2 1 1 2 ] /Blend 1 /QFactor 0.9 >> /AntiAliasGrayImages false /GrayImageDepth 8 /CannotEmbedFontPolicy /Error /EndPage -1 /TransferFunctionInfo /Preserve /CalRGBProfile (sRGB IEC61966-2.1) /EncodeColorImages true /EncodeGrayImages true /ColorACSImageDict << /HSamples [ 2 1 1 2 ] /VSamples [ 2 1 1 2 ] /Blend 1 /QFactor 0.9 >> /Optimize true /ParseDSCCommentsForDocInfo true /GrayImageDownsampleThreshold 1.5 /MonoImageDownsampleThreshold 1.5 /AutoPositionEPSFiles true /GrayImageResolution 300 /AutoFilterColorImages false /AlwaysEmbed [ /Courier-BoldOblique /Helvetica-BoldOblique /Courier /Helvetica-Bold /Times-Bold /Courier-Bold /Helvetica /Times-BoldItalic /Times-Roman /ZapfDingbats /Times-Italic /Helvetica-Oblique /Courier-Oblique /Symbol ] /ImageMemory 524288 /OPM 1 /DefaultRenderingIntent /Default /EmbedAllFonts true /StartPage 1 /DownsampleGrayImages false /AntiAliasColorImages false /ConvertImagesToIndexed true /PreserveHalftoneInfo false /CompressPages true /Binding /Left >> setdistillerparams << /PageSize [ 595.276 841.890 ] /HWResolution [ 2400 2400 ] >> setpagedevice
562 23 The (Im)perfect Human – His Own Creator? Bioethics and Genetics at the Beginning of Life
twelve year-old boy, was implanted into a fe-male rabbit oocyte, which first had its ownnucleus removed: the utopic vision of a chi-mera between human and animal mightsoon be realized. In the United States, twodeaf lesbian women ordered, through con-scious selection of a deaf sperm donor, anembryo, which – as planned – developedinto a deaf child. The children are not al-lowed to be different from those who or-dered them.
Reproduction technology now makes itpossible for a child to can have five parents:biological parents, social parents, and thesurrogate mother who carries the embryo. Itcannot be predicted which influence thesepossibilities might have for the child. A lastexample, as spectacular as it is recent, wasthe bold announcements of the AmericanRaelian sect, who claimed to have givenbirth to the first cloned children.
It is now demonstrated that “… all, whoplayed down the dramatic of the can do de-lusion are caught in a naïve attitude towardsprogress”. Right now, it is most probablethat the announced births of the first clonedhumans are not genuine, as distinguishedscientists assured me that it would be im-possible to clone a human being.
But technical limitations like this have of-ten been overcome in the past. The prob-ability that cloned children will be disabledor will develop diseases later in life is great;the risk that cloning technology will be fur-ther perverted by dictators and other egoma-niacs is obvious. In view of all these risks,the creation of a human clone is an “unsur-passable cynicism”. It shows what sciencewithout ethical orientation is capable of.The common outrage [about human clon-ing] was great and many political and cleri-cal organizations distanced themselvesstrongly from the idea and asked for aworldwide ban of reproductive cloning. Ialso want to emphasize that German re-
searchers are unanimous in their view thattherapeutic and reproductive cloning are in-evitably connected. During “therapeutic”cloning a patient is cloned with the goal ofbreeding a microscopic embryo whichbears replacement tissue. During “repro-ductive” cloning, the embryo is implantedinto the mother. Both techniques are there-fore identical in their most important steps.Scientists advancing therapeutic cloningthus create the know how for the cloning ofbabies [3].
It is essential to create an internationalban of all forms of human cloning. Thisfirst point is very important to me – the pos-sibility of cloning humans not only posesnew challenges for politics. It is society as awhole, reflecting on dreams, wishes andideals, which creates the request for humancloning. With all sympathy for particularsituations, I would like to mention as an ex-ample the wish of infertile couples for achild at any cost. Another example is theegomaniac individualism of those whowould like to see themselves replicated. Fi-nally I would like to mention certain imagi-nations of eternal life, which are not found-ed in scripture, but based on the promisesof biotechnology [3].
Please allow me to once again cite fromthe talk of Bundespresident Johannes Rau:to “… hold on to …” moral standards “… isnot always easy at a time when we are ex-posed every day to the message that itshould be our goal to stay young forever, be-come more beautiful, and never sick, andstay productive indefinitely. Too manyinternalize these slogans without reflectionor bad feelings, although they could seewith open eyes that this picture of mankindhas nothing to do with reality …” [1].
56323.1 Life Sciences and the Untouchable Human Being
23.1
Life Sciences and the Untouchable HumanBeing
I would first like to question the term “lifesciences” critically, because I believe it usu-ally is based on a simplistic, positivisticunderstanding of “life” and that because ofthis, predeterminations are made alreadywhen the term is used, which have far-reaching implications for the context.
The church therefore has to assert herconvictions about human beings, life, anddignity, and social, economical, and politi-cal order in the discourse of society. Thechurch understands herself as the advocateof humanity and the untouchable humanbeing. This is implicated by the Christianbelief that life is more than just a biologicalfact, because God created man in his ownimage. In addition, “non-theological” rea-soning also leads to the realization that hu-man dignity is intrinsic to humans, solelybased on being human, and cannot be regu-lated by law. It is therefore important forme to state that we do not just represent amoral standpoint internal to theology or thechurch. “We are the group, which advocatesthat human dignity has to be protected bylaw and the constitution right from the be-ginning. Therefore we are the best alley ofthe law of the land [4].” The German Bun-despresident Rau has also made an unam-biguous statement about this:
“There is a debate since a while, which at-tempts to distinguish between human dig-nity on one side and the protection of humanlife on the other side. But if human life at anearly stage is denied human dignity, so thatthere can be a consideration of legal issues,the goals of the constitution are neglected.Legal considerations cannot replace basicethical considerations.Human dignity, which for good reasons isplaced at the beginning of the opening chap-ter of our constitution, is inseparable fromthe obligation to protect human life.” [1].
In this context, the principle of human dig-nity, in which the untouchable human be-ing, including the bodily existence, is an-chored, forms not only the foundation ofthe democratic constitution, but is also thebasis for a broad consensus within society.
This dimension of the untouchable,which defines the human being, is nowthreatened with being replaced in favor ofsecondary goals – this has been pointed outmany times by the catholic church. Doesn’ta human being get torn apart in the conflictof playing God, judging over life and deathon one hand, and on the other hand valuinghumans so low that human life becomesonly biomaterial, which can be utilized?“We would rob ourselves of our humanity,if we would attempt to improve ourselves byour own power. The imperfect belongs tohuman nature and human creation [4].”The perfect human, who becomes his owncreator, is a dangerous utopia, which mightsoon lead to classification of humans intodifferent categories of perfect and imper-fect, of the especially well created and valu-able and in contrast the unworthy andavoidable. In view of the complexity of thequestions, further reflection is necessary todetermine how to act in any particular case.The first question deals with the justifica-tion of the goals: Can the road which leadsto the objective be morally justified? Ofgreat importance also is estimation of theconsequences of genetic activities – whatbenefit can be expected and what damagemight result?
“I want to emphasize that the church is notaverse to science and research. On the con-trary: we request from the researchers tomake every effort to find therapies for themajor diseases of our time.All technologies, which do not endanger ordestroy human life even in the early stagesare ethically justified [4].”
The church is not against progress, but hasa positive attitude towards life. Therefore,
564 23 The (Im)perfect Human – His Own Creator? Bioethics and Genetics at the Beginning of Life
she supports gene technology and bio medi-cine, as long as human dignity is recog-nized and protected; but she cannot abstainfrom pointing out the dangers and conse-quences resulting from such activity. Genet-ics and gene technology can have large ben-efits, but they can also come back to hauntpeople. This happens when they try openly,or secretly, to create a new human being.This creature quickly becomes an idol, atwhose altar human sacrifices are made. Inour country children with Down’s syn-drome, elsewhere girls because of their gen-der, today children with genetic defects, to-morrow those who lack intelligence, beauty,or simply chances for success [5].
The refusal of people to accept them-selves as an image of God or, in otherwords, to accept the untouchability of hu-mans, creates a wearing and destructive un-happiness and hands over humanity to theperfectionism of our own ideals withoutprotection. In what kind of society, and withwhat kind of ideals, do we want to live?Shouldn’t we have the goal
“ … to live in a society, which utilizes scientif-ic progress, without being handed over to it,which is conscientious on an every day basisthat differences are part of human life andthat nobody can be excluded because they aredifferent?” [1].
On the other hand, it is questionable if onecan preserve the untouchability of humans,if one denies or ignores the fact that humansare created in the image of God. On the slip-pery slope of constant movement and push-ing the borders of mankind, it is no longersufficient to find fulfillment, we have to findand recreate ourselves. To realize that we areGod’s creation and created in His image, en-ables us humans to accept ourselves in ourhuman dignity. This attitude allows humansto grow beyond themselves without havingto show off [5]. Human dignity cannot beearned, it is also impossible to loose. We
cannot assign dignity and therefore we alsocannot deny it either. Dignity is preassignedand must not be touched. Dignity also can-not be made dependant on criteria for per-formance, happiness or social compatibilitydefined by third parties.
23.2
Consequences from the Untouchability of Humans and Human Dignity for the Bioethical Discussion
Human dignity and being human cannotbe separated, because the development ofhumans and being human are a continuousprocess, which spans from the fusion of theegg and the sperm, over the embryonicphase to birth, over childhood to being anadult, to illness, dying, and death. In hu-man development there is neither from thescientific nor the anthropological view areal and evident break, independent fromjudgment calls. The key question of the de-bate is always the same – is the embryo al-ready a human being? When does life be-gin, which is always also personal life? Doesit begin, as defined in German law to pro-tect embryos, from 1991, and in the Ger-man law on stem cells, from 2002, at theearliest possible time, i.e. the creation of thegamete, resulting from the fusion of the nu-clei, or later? Is it entitled from the begin-ning to be protected by human dignity, or isit just a “mass of cells”, and therefore a non-personal thing, or at the most a being onthe level of an animal which can be madean object of research for “important” causesand therefore can be traded if needed andkilled in the process?
According to German law for the protec-tion of embryos, the embryo is protectedfrom the beginning, according to criminallaw (§218) only after embedding in the uter-us (approximately the 10th day). In neither
56523.2 Consequences from the Untouchability of Humans and Human Dignity for the Bioethical Dis-
is the embryo judged as being owned by themother, or as a thing. Therefore human life(embryos) and ownership of it are incom-patible.
The blurring of the border between thingand person is what makes biotechnologyand research on stem cells so dangerous forus. Even a four-celled or eight-celled stageis not only potential but already real. On theother hand are they currently existing hu-mans also (hopefully) still capable of devel-opment, and therefore have not yet realizedtheir full potential. Nobody would denythem their existence and human dignity be-cause of this fact.
German minister of justice Brigitte Zy-pries questioned in her talk at the Hum-boldt University in Berlin exactly this fact.According to Zypries the embryo, whichwas created in a test tube, is not “just anymass of cells”, with which we can do as welike. But it is questionable to her, if it hashuman dignity, as defined in article 1 of theconstitution, because it cannot develop intoa human on its own, because this would re-quire a woman. The minister therefore dis-tinguishes between the basic right to live,which she will also concede to the embryo,which was created in a test tube, and the ba-sic right to human dignity, which in heropinion can only be assigned to a child inthe womb. Mrs. Zypries enters dangerousterritory – the environmental conditions arenecessary, but not essential, for the embryoto be a human being. The womb does notcreate new potential for the embryo. Also,the remark that human dignity requires“essential elements”, the possibility for“self responsibility” and “self-determinedorganization of life” is a risky thesis – se-verely disabled people, patients in a comaor suffering from dementia caused by oldage mostly cannot organize their lives inthe self-determined way defined by the jus-tice minister.
The embryo is a human being and an in-dividual person right from the beginning –there is a lack of arguments for stepwiseprotection, because there is no moment inthe development where one could definethat the embryo becomes a human being.Also, therefore, there are not first and sec-ond-class embryos, and it is wrong to distin-guish between embryos worthy of protec-tion and those that are not, as the Germanjustice minister attempts. It is not possibleto assign human dignity to the unborn lifein the womb and deny it to the artificiallycreated embryo. The only possibility of notbecoming unfocused is to accept the par-allelism of the beginning of life and humandignity.
Human dignity is an expression of themeaning of life, which cannot be a meansto achieve other goals, but is an end in it-self. Freedom of research and the search forhealth can only be a goal as long as humandignity is not touched. No human being hasthe right to ask for a cure at the cost of thelife of another human being. Freedom ofresearch and the search for health can onlybe a goal as long as human dignity is nottouched. If the embryo is created in vitroand discarded after diagnosis, it is usedsolely as a means for other goals, the end initself is ignored. Therefore a weightingbetween the right to live for an embryo andthe expected advantages from research,which uses embryos “for the benefit of oth-ers” is unacceptable. The formula “Em-bryos have to be killed, so that already bornhumans can survive” is proven untenable,even if it is used to in an attempt to justifyresearch using human embryos and em-bryonic stem cells with the immense prom-ises to find cures. To make a lasting contri-bution to the development of our society,medical and genetic research first and fore-most have to be used to secure human lifeand improve the quality of life. From a
566 23 The (Im)perfect Human – His Own Creator? Bioethics and Genetics at the Beginning of Life
Christian point of view, this goal is ethicallylegitimate and desirable. But at the sametime, we always have to be aware that re-search has to be conducted hand in handwith responsibilities toward society and thateven a “high ranking goal” like “healthylife” cannot be pursued at all cost.
The church does not try to defend a nos-talgic view of life here, rather one based onthe moral principles of the age of enlighten-ment, and views with great concern that es-pecially in so-called modern and enlight-ened societies these principles are ques-tioned and become available in view of eco-nomical equations. From a Christian andhumanistic point of view objections mustbe raised if embryos are to be “wasted” forresearch purposes. The language used givesaway a lot about our society: The idea of pro-creation is superimposed with the associa-tion of “industrial production”. Anyone whotalks in this way about the creation andtransmission of human life is in danger ofdealing with the results of “production ofhumans” in a similar way to manufacturedgoods or “biomaterials”, and to assign theseal “worthy to live” to specific embryos andto condemn others to extermination. Ourlanguage already gives a lot away. We haveto live up to human dignity and cannot con-fuse this with what is often called, withoutmuch thought, the value or diminished val-ue of human life [5].
Scientific and technological experiments,especially in medicine and pharmacy, haveto be proven to be for the benefit of humans,including future generations. The principleof human dignity implies that the humanbeing has to be the goal and purpose of allsocial and scientific development, but cannever be used as a means for any goal. It hasto be demonstrated why something is donein research and application and not why itshould not be done, or that it might be use-ful some time in the future and might not be
harmful. Again, we deal here with the wish-es and dreams of our society for health,cures, and the perfect life. Especially fromthe church’s point of view caution has to bedemonstrated here. Christian belief pre-vents us dreaming that anything is doableand prevents visions of salvation which areconnected to technical achievements [2].Christian belief can also provide orientationin cases of morally questionable goals andmorally wrong means which are used toachieve goals. Health cannot be guaranteed,not even through pre-implantation geneticdiagnosis or the breeding of replacementorgans for humans. In the end, we remainfinite beings who will eventually pass awayand therefore are ailing humans who gener-ally become sick and without question willdie.
Let me interject a remark, which demon-strates how fast some promises in medicineand biotechnology become obsolete. TheTV Show “Report aus Mainz” (06.10.2003)reported ground-breaking results which tre-mendously reduced the potential of stemcell research. We all still remember howmuch interest there was at the beginning of2003 in the debate about stem cell research.Medical researchers, people working onethical aspects, and politicians dealt withthis topic and almost everyone had raisedhopes that this would get us closer to heal-ing severe diseases like Parkinson’s or mul-tiple sclerosis. A laboratory in Cologne im-planted embryonic stem cells into live andhealthy mice. Fourteen days later the scien-tists at the Max Planck Institute in Colognediscovered rapidly developing tumors in theanimals. The tumors in the brain of themice mean a fiasco for stem cell research-ers. This is because the same biologicalrules apply to the implanting of mouse cellsinto mouse brains as to the transfer of hu-man cells between humans. Destruction in-stead of a cure. With regard to the promis-
56723.3 Conclusion
ing, but ethically controversial, research onembryonic stem cells the results from Co-logne mean it is currently not possible toexclude the possibility that embryonic stemcells applied to humans could cause cancer.The philosopher and ethics researcherHonnefelder, Bonn, Germany, comment-ed:
“I believe that we have learned in the last twodecades, that we have to be careful with boldannouncements. Research is always difficult,and the discovery of useful opportunities isalways connected to the potential for side-ef-fects and averse effects.”
The example mentioned above seems to besignificant to me for the basic problems re-lated to biotechnology and related medicalresearch. Very often the debates are ham-pered by unfounded promises for cures anda complete lack of understanding of theshort-term and long-term consequences ofthe new technology.
As already mentioned, the language usedis an indicator of the developments – in thesame way as “therapeutic cloning” is not anew therapy, but means the breeding ofhuman biomaterials, pre-implantation di-agnostics is not much help for childlesscouples, but means the prevention and se-lection of the diseased and disabled. It is acontradiction in itself if research and devel-opment, which is supposed to be for thebenefit of humans, “consumes” human lifein the process. In other words, in the sameway that any human has the right to be notonly the product of the art of genetic engi-neering, but the child of his or her parents,conversely parenthood does not mean justthe creation of an heir with especially wor-thy features, but is an expression of a moraland social relationship. Humans are fa-thered and not created. A child is not aware, which can be returned when it devel-ops defects. It is a cruel imposition for anyhuman to have to live with the knowledge
that they have been selected for detailedpromising criteria and are expected to de-velop accordingly.
23.3
Conclusion
My remarks are central points for an ethicalorientation in questions of biological andmedical research and its application. Letme, at the end, close the circle by relatingmy experiences with the current politicaldiscussion. Everyone is asked to participate– every citizen, (especially) the scientists,teachers, students, artists, and all who par-ticipate in coming to conclusions in our so-ciety and culture, so that we can derive a re-sponsible opinion on central bio-ethicalquestions. The catholic church has alwaysand repeatedly in the last few years askedfor a broad and transparent discussion ofthese questions. This discussion has begunin the meantime and we, including myself,welcome this development.
Another point is also very important –ethics cannot be delegated to ethics centers,national ethics advisory boards or ethicscommittees in clinics or elsewhere. Nobodycan be substituted on the topic of ethical re-sponsibility. In the meantime, this is alsoshown in the work at the National EthicsAdvisory Board in Berlin – this board (likesimilar boards elsewhere) is in no positionto simply give a green or red light in re-sponse to certain questions. The NationalEthics Advisory Board is no legislative in-strument. It does not work like a trafficlight, where red means stop, green meansgo, and yellows means to cross quickly. It isimportant to collect all technical informa-tion and the ethical and moral arguments toenable those who carry autonomous re-sponsibility to come to a solid conclusion.The perceived benefits of gene technology
568 23 The (Im)perfect Human – His Own Creator? Bioethics and Genetics at the Beginning of Life
lead some to visions that everything is do-able, and others to a complete rejection,both extremes are wrong. We have to devel-op high sensitivity and moral competence.The goals and methods of gene technology,which can be ethically justified have to besupported; improper goals must be under-stood and we should not believe everythingthat is promised, nor should we do every-thing that is possible. It is especially impor-tant to preserve human dignity, the basicright to life and untouchability, and therights of self determination and personalrights, and therefore support a culture oflife. Such a culture of life requires a categor-ical imperative, to always keep the humanperspective in mind. For the scientists thismeans, for example, weighing the chancesand risks of a research topic in a responsiblemanner, carefully calculating the risks andfully disclosing the activities. Our parlia-ments are asked to recognize the complex-ity, the dimension of the risk, the effects onthe future and the ethical implications ofgene technology by drafting appropriatelaws.
Let me conclude with remarks about thetitle of my paper. It was inspired by an ex-hibit in the German Hygiene Museum inDresden about disabled people in our soci-ety. The title of the exhibit was “The(im)perfect human being”, in which the syl-lable “im” was enclosed in brackets in thesame way as in the title I chose. In a certainsense, the basic lines of argument are sum-marized in this title as I have shown in mydiscussion. The “imperfect” is, of course, onthe one hand connected to human history.Humans are characterized by their historyand tradition, they carry the traces of time,of their ancestors, nobody begins life at ab-solute zero – inheritance is always part ofthe baggage. Imperfect: on the other handthe title tries to establish humans to be non-perfect in the sense of beings with short-
falls. The title therefore points to the olddream of humans, told in so many sciencefiction films, and which now seems to be-come reality through gene technology. Thebiotechnology boom and the fantasiesabout what may now be possible, increasethe enormous pressure on society to be nor-mal, or even better, perfect. Humans dreamabout loosing imperfections, ugliness, dis-eases, and disabilities. The double meaningof the “imperfect human” leads to a dramat-ic culmination: The stars of cinema, televi-sion, or magazines, create new dreams forhumanity – and new images of the humanbeing. Through the ideals of our time, forexample beauty and health, ability to per-form and enjoy, autonomy, and rationality,humans are exposed to enormous pressureto be perfect. Categories, which form ourunderstanding of life create the measure forthe self-realization of humans at the sametime. Enormous promises for cures fromresearch and medicine put the individualunder enormous pressure, which mighteven kill. Nobel laureate Heinrich Böll (lit-erature) wrote prophetic-sounding wordsyears ago:
“I prefer even the worst Christian world overa perfect god-less world, because the Chris-tian world gives room to those, which no god-less world allows for: the crippled and sick,old and weak. And beyond room, the Chris-tian world gives love to those who seem to beof no use to the god-less world.”
My title also reminds us of the messagewhich Christians, as followers of Jesus ofNazareth, represent in this world – every-thing must done to support the imperfecthuman, create room for those that do notmatch any of the norms, dedicated love andsympathy for the humans at the fringes. Letus fight for a world in which human beings,as imperfect as we might be, have a home.Instead of attempting to create more perfecthumans and re-create them, let us acknowl-

56923.3 Conclusion
edge the imperfect, because standardiza-tion for impeccable beauty and definedspecifications will strangle us soon. My fi-nal plea is therefore of special importance.All who are involved in church and society
with a better understanding of the prob-lems discussed above are asked to accompa-ny the progress of life sciences with respon-sibility, sensitivity, and critical-constructiveengagement.
570
1 Rau J (2003) Talk at the Conference Ethicsand Disability, cited from KNA, 8.12.2003.
2 Wort der Deutschen Bischofskonferenz(DB69) zu Fragen der Gentechik undBiomedizin (2001): Der Mensch: sein eigenerSchöpfer.
3 Schwägerl C (2002) Auf dem Weg zum Klon-kind. Frankfurter Allgemeine Zeitung2.12.2002.
4 Interview with Bishop Fürst (2002)PURmagazin 04/2002:16.
5 Kamphaus F (2002) Der neue Mensch. Nichtsuchen, finden. Frankfurter AllgemeineZeitung 27.11.2002.
References

Part VOutlook
Verwendete Mac Distiller 5.0.x Joboptions
Dieser Report wurde automatisch mit Hilfe der Adobe Acrobat Distiller Erweiterung "Distiller Secrets v1.0.5" der IMPRESSED GmbH erstellt. Sie koennen diese Startup-Datei für die Distiller Versionen 4.0.5 und 5.0.x kostenlos unter http://www.impressed.de herunterladen. ALLGEMEIN ---------------------------------------- Dateioptionen: Kompatibilität: PDF 1.3 Für schnelle Web-Anzeige optimieren: Ja Piktogramme einbetten: Ja Seiten automatisch drehen: Nein Seiten von: 1 Seiten bis: Alle Seiten Bund: Links Auflösung: [ 2400 2400 ] dpi Papierformat: [ 481 680 ] Punkt KOMPRIMIERUNG ---------------------------------------- Farbbilder: Downsampling: Nein Komprimieren: Ja Komprimierungsart: ZIP Bitanzahl pro Pixel: 8 Bit Graustufenbilder: Downsampling: Nein Komprimieren: Ja Komprimierungsart: ZIP Bitanzahl pro Pixel: 8 Bit Schwarzweiß-Bilder: Downsampling: Nein Komprimieren: Ja Komprimierungsart: CCITT CCITT-Gruppe: 4 Graustufen glätten: Nein Text und Vektorgrafiken komprimieren: Ja SCHRIFTEN ---------------------------------------- Alle Schriften einbetten: Ja Untergruppen aller eingebetteten Schriften: Nein Wenn Einbetten fehlschlägt: Abbrechen Einbetten: Immer einbetten: [ /Courier-BoldOblique /Helvetica-BoldOblique /Courier /Helvetica-Bold /Times-Bold /Courier-Bold /Helvetica /Times-BoldItalic /Times-Roman /ZapfDingbats /Times-Italic /Helvetica-Oblique /Courier-Oblique /Symbol ] Nie einbetten: [ ] FARBE(N) ---------------------------------------- Farbmanagement: Farbumrechnungsmethode: Farbe nicht ändern Methode: Standard Geräteabhängige Daten: Einstellungen für Überdrucken beibehalten: Ja Unterfarbreduktion und Schwarzaufbau beibehalten: Ja Transferfunktionen: Beibehalten Rastereinstellungen beibehalten: Nein ERWEITERT ---------------------------------------- Optionen: Prolog/Epilog verwenden: Nein PostScript-Datei darf Einstellungen überschreiben: Nein Level 2 copypage-Semantik beibehalten: Ja Portable Job Ticket in PDF-Datei speichern: Ja Illustrator-Überdruckmodus: Ja Farbverläufe zu weichen Nuancen konvertieren: Ja ASCII-Format: Nein Document Structuring Conventions (DSC): DSC-Kommentare verarbeiten: Ja DSC-Warnungen protokollieren: Nein Für EPS-Dateien Seitengröße ändern und Grafiken zentrieren: Ja EPS-Info von DSC beibehalten: Ja OPI-Kommentare beibehalten: Nein Dokumentinfo von DSC beibehalten: Ja ANDERE ---------------------------------------- Distiller-Kern Version: 5000 ZIP-Komprimierung verwenden: Ja Optimierungen deaktivieren: Nein Bildspeicher: 524288 Byte Farbbilder glätten: Nein Graustufenbilder glätten: Nein Bilder (< 257 Farben) in indizierten Farbraum konvertieren: Ja sRGB ICC-Profil: sRGB IEC61966-2.1 ENDE DES REPORTS ---------------------------------------- IMPRESSED GmbH Bahrenfelder Chaussee 49 22761 Hamburg, Germany Tel. +49 40 897189-0 Fax +49 40 897189-71 Email: [email protected] Web: www.impressed.de
Adobe Acrobat Distiller 5.0.x Joboption Datei
<< /ColorSettingsFile () /LockDistillerParams true /DetectBlends true /DoThumbnails true /AntiAliasMonoImages false /MonoImageDownsampleType /Bicubic /GrayImageDownsampleType /Bicubic /MaxSubsetPct 100 /MonoImageFilter /CCITTFaxEncode /ColorImageDownsampleThreshold 1.5 /GrayImageFilter /FlateEncode /ColorConversionStrategy /LeaveColorUnchanged /CalGrayProfile (Dot Gain 20%) /ColorImageResolution 300 /UsePrologue false /MonoImageResolution 1200 /ColorImageDepth 8 /sRGBProfile (sRGB IEC61966-2.1) /PreserveOverprintSettings true /CompatibilityLevel 1.3 /UCRandBGInfo /Preserve /EmitDSCWarnings false /CreateJobTicket true /DownsampleMonoImages false /DownsampleColorImages false /MonoImageDict << /K -1 >> /ColorImageDownsampleType /Bicubic /GrayImageDict << /HSamples [ 2 1 1 2 ] /VSamples [ 2 1 1 2 ] /Blend 1 /QFactor 0.9 >> /CalCMYKProfile (U.S. Web Coated (SWOP) v2) /ParseDSCComments true /PreserveEPSInfo true /MonoImageDepth -1 /AutoFilterGrayImages false /SubsetFonts false /GrayACSImageDict << /HSamples [ 2 1 1 2 ] /VSamples [ 2 1 1 2 ] /Blend 1 /QFactor 0.9 >> /ColorImageFilter /FlateEncode /AutoRotatePages /None /PreserveCopyPage true /EncodeMonoImages true /ASCII85EncodePages false /PreserveOPIComments false /NeverEmbed [ ] /ColorImageDict << /HSamples [ 2 1 1 2 ] /VSamples [ 2 1 1 2 ] /Blend 1 /QFactor 0.9 >> /AntiAliasGrayImages false /GrayImageDepth 8 /CannotEmbedFontPolicy /Error /EndPage -1 /TransferFunctionInfo /Preserve /CalRGBProfile (sRGB IEC61966-2.1) /EncodeColorImages true /EncodeGrayImages true /ColorACSImageDict << /HSamples [ 2 1 1 2 ] /VSamples [ 2 1 1 2 ] /Blend 1 /QFactor 0.9 >> /Optimize true /ParseDSCCommentsForDocInfo true /GrayImageDownsampleThreshold 1.5 /MonoImageDownsampleThreshold 1.5 /AutoPositionEPSFiles true /GrayImageResolution 300 /AutoFilterColorImages false /AlwaysEmbed [ /Courier-BoldOblique /Helvetica-BoldOblique /Courier /Helvetica-Bold /Times-Bold /Courier-Bold /Helvetica /Times-BoldItalic /Times-Roman /ZapfDingbats /Times-Italic /Helvetica-Oblique /Courier-Oblique /Symbol ] /ImageMemory 524288 /OPM 1 /DefaultRenderingIntent /Default /EmbedAllFonts true /StartPage 1 /DownsampleGrayImages false /AntiAliasColorImages false /ConvertImagesToIndexed true /PreserveHalftoneInfo false /CompressPages true /Binding /Left >> setdistillerparams << /PageSize [ 595.276 841.890 ] /HWResolution [ 2400 2400 ] >> setpagedevice
573
Christoph W. Sensen
24.1
Introduction
Genome research is a very rapidly evolvingfield, making it hard just to keep up with allthe emerging developments. Although pre-dicting several years into the future is es-sentially impossible, on the basis of currenttrends we can at least try to project some fu-ture developments. The final chapter of thisbook is an attempt to do that, and, as withall predictions, might well generate somecontroversy. To predict what might happenin the next few years, it is worth looking atthe past and extrapolating from the pace ofprevious developments. Reviewing some ofthe other chapters in this book, it becomesevident that nothing in the field of genomeresearch is really new – it only takes a muchlarger-scale, automated, and integrated ap-proach to biochemistry, biology and molec-ular medicine. Almost all the technologyand techniques were in use before the ad-vent of genome research, only on a smallerscale and with less automation.
Two developments were crucial for theemergence of genome research. The firstdevelopment was laser technology, whichenabled environmentally friendly versionsof several existing technologies. For exam-
ple, the use of radioactivity for DNA se-quencing has all but been abandoned in fa-vor of fluorescent biochemistries. Lasershave “invaded” many aspects of the molecu-lar biology laboratory, they are part of auto-mated DNA sequencers, high density DNAarray scanners, MALDI mass spectrome-ters, and confocal microscopes to name buta few. The development was that of thecomputer. Computers and the internet haveplayed a major role in the development ofgenome research. All major machines in amolecular biology laboratory are connectedto computers, and often the data collectionsystem is directly coupled to a laser-baseddetector. At the same time, data exchangein the genome research world is almostcompletely computer-based. “It is on theweb.” is now a common notion and theinterface that is provided through webbrowsers is considered the major work en-vironment for many scientific analyses. Ge-nomic databases are shared through theweb, to the point that all new data are en-tered into web-accessible databases on adaily basis, often before publication. Manylarge-scale projects are now conducted asinternational collaborations, there is even anew word for this – collaboratory.
Handbook of Genome Research. Genomics, Proteomics, Metabolomics, Bioinformatics, Ethical and Legal Issues.Edited by Christoph W. SensenCopyright © 2005 WILEY-VCH Verlag GmbH & Co. KGaA, WeinheimISBN: 3-527-31348-6
24The Future of Large-Scale LifeScience Research
574 24 The Future of Large-Scale Life Science Research
A typical genome project involves manyindividuals. This is a dramatic change fromthe pre-genomic era when most molecularbiological publications included from two tofive authors. The large size of the laborato-ries involved in genome research has result-ed in new modes of operation, often moreor less along the lines of a factory operation.Tasks are distributed in a defined way, al-lowing few degrees of freedom for an indi-vidual. We can easily predict that this trendwill continue, making single-author publi-cations more or less a “thing of the past”.
24.2
Evolution of the Hardware
Hardware for genome research has devel-oped at an astonishing rate. It is impossibleto predict details of future machine develop-ments, but we see several trends where newapproaches might emerge in the near fu-ture. The following paragraphs containspeculations about some of these trends.
24.2.1
DNA Sequencing as an Example
As an example of the potential for future de-velopment, we would like to look at auto-mated DNA sequencing. Whereas it wasquite good to obtain 1000 to 2000 base pairs(bp) of raw sequence per day from a radioac-tive DNA-sequencing gel, today’s capillarysequencers can produce up to 1,000,000 bpper machine in the same time. A combina-tion of robotics, which enables up to six au-tomated machine loads per day, 384 capil-lary machines, enhancements in biochem-istry that enable the labeling of DNA frag-ments, and automation of data processinghas resulted in this increased throughput.Radioactive sequencing gels all had to beanalyzed more or less manually whereas
today’s data can be assembled automatical-ly, enabling the researcher to spend most ofthe time on data analysis. DNA sequencinglaboratories are well on the way toward re-sembling the “Ford Model-T factory”.
In addition to the improvements de-scribed above, there is certainly also roomfor improvement in DNA separation tech-nology. The DNA-sequencing reaction typi-cally can cover more than 2000 bp whereasdetection systems can only use between 500and 1200 bp. Use of more sophisticated sep-aration strategies and better detection sys-tems could lead to another two to fourfoldincrease in DNA sequence production on asingle device, without any changes to the bi-ochemistry.
Further enhancements of DNA sequenc-ing can be predicted if the shortcomings ofacrylamide-based separation can be over-come. The DNA polymerases used for DNAsequencing today are selected for efficiencyin the first 2000 bp. If a separation technol-ogy with a much longer separation rangecould be established, it is easy to foreseethat DNA sequencing could see another or-der-of-magnitude increase, because the bio-chemistry could then be adjusted to accom-modate the new technical possibilities. Rou-tine future DNA sequencing reactionscould yield readouts many thousands ofbase pairs long.
24.2.2
General Trends
The DNA sequencing example above high-lights some general trends we can see oc-curring right now. Some of these generaltrends are discussed in more detail in theparagraphs below and in much more detailin other chapters in this book. In Germany,we have a saying: “Das Bessere ist der Feinddes Guten”, which translates as: “The betteris the enemy of the good”. There will be a
57524.2 Evolution of the Hardware
continuation of gradual updates and up-grades, that result in dramatic enhance-ments of performance, and completely newapproaches that will outperform knowntechnology by orders of magnitude. Whilegeneral laboratory technology, e.g. spectro-photometers, liquid chromatography equip-ment, and the like have a useful lifetime ofmany years, this will probably not be truefor some genome research-related hard-ware, which will need replacement at amuch faster pace because of unforeseeablejumps in technology development. Thisprobably will not pose a major threat orproblem to genome research, because onlyapproximately 10 to 15% of the total cost ofa genome project is related to hardware.Even with the current level of automation,most of the expense in a Genome project isrelated to consumables and human labor.In future, the human component will beeven further reduced by increased automa-tion.
24.2.3
Existing Hardware Will be Enhanced for more Throughput
Almost none of the machines currentlyused in genome research are stretched totheir physical limits. Single-photon detec-tion systems, which can dramatically in-crease the detection sensitivity of genomeresearch hardware and bring the resolutionto the theoretical physical limit, higher-den-sity data processing (many devices still de-tect only on the 8-bit or 16-bit level), andfaster data-processing strategies can beused to enhance current technology. Somesystems, e.g. DNA sequencers and high-density DNA arrays can be scaled, whichhas been shown through the developmentof 384 capillary sequencers, which have re-placed models with 96 capillaries, or an in-crease of the number of spots on gene
chips. Separation-based machines (e.g. se-quencing gels or protein gels) have seensome improvements in capability over time.They might be replaced by other technologythat enables higher resolution. The crucialmake or break for the establishment of acompletely new technology will always bethe cost factor. Even if a new concept wereproven to be technically superior, it still hasto compete on production cost. At the endof the day, it does not really matter how dataare produced, as long as the data quality iscomparable.
24.2.4
The PC-style Computers that Run most Current Hardware will be Replaced withWeb-based Computing
One of the biggest problems in molecularbiology and genome research laboratoriestoday is that most machines are operatedwith the help of a PC-style computer. Cur-rently, there are almost as many differentoperating systems in use (from MacOS toLinux to Windows) as there are machinesand today it is not unusual to see all of theseoperating systems in the same laboratory.This situation causes several problems. ThePC-style computers age quickly and requirehigh levels of system maintenance. For ex-ample, it was quite difficult to networkmany of the original ABI DNA sequencingmachines using TCP/IP networks, whichhave now become the standard, requiringmajor computer upgrades to achieve the in-tegration. A typical sequencing machine,for example, might last 10 years, making itnecessary to replace the controlling PC twoto three times to keep up with the pace ofdevelopment.
To address the problems of PC-style com-puters, we predict that client–server modelswill replace the stand-alone systems cur-rently in use. Thin clients that collect the
576 24 The Future of Large-Scale Life Science Research
data and post them to the web will be com-plemented by platform-independent analy-sis software that can be executed on largeservers or the latest workstations. An earlyexample of this approach was the LiCor4200 Global system (Chapt. 6). Data collec-tion on the LiCor 4200 Global system is per-formed by a Linux-based Netwinder thinclient, which operates an Apache web serverfor data access. Users can control and mon-itor this kind of machine from any webbrowser (e.g. Netscape or Internet Explor-er). The analysis software for the LiCor 4200is written in the Java programming lan-guage, making it platform-independent,thus enabling execution on any Java ena-bled platform. LiCor has now adopted thistechnology for their entire machine line.Other manufacturers at least have web serv-ers built into their systems, which allowsthem to offer their client software throughthe internet.
24.2.5
Integration of Machinery will Become Tighter
In the past, laboratories have operated manydevices that could not directly “talk” to eachother. Incompatible operating systems andthe lack of data exchange possibilities pre-vented a high degree of automation. We seeattempts to change this, machines from dif-ferent manufacturers are starting to “speakthe same language”. Interestingly, this doesnot necessarily mean that all machinesunderstand a common, standardized dataformat, instead they are capable of export-ing and importing results generated by oth-er devices. For example, spectrophotome-ters have become capable of exporting datasheets that can be imported into pipettingrobots, saving time in the setup of PCR re-actions. Sequence assembly programs can“pick” DNA sequencing primers and exportthe lists to oligonucleotide synthesizers,
saving the time of retyping them before oli-gonucleotide synthesis. Laboratories arestarting to build more and more “assemblylines” for genome research and, logically,the trend for integration and data exchangewill continue. International standards bod-ies are now working on the definition ofdata standards for molecular biology andgenome research. One example is the devel-opment of the MIAME (minimum informa-tion about microarray experiment) standard(http://www.mged.org/Workgroups/MIAME/miame.html), a joint development betweenacademia and several industrial partners,which is now generally used for gene-chipdata.
24.2.6
More and more Biological and Medical Machinery will be “Genomized”
The initial “genome research toolkit” con-sisted mainly of machines for DNA sequenc-ing. The next add-on of major machinerywas proteomics-related mass spectrometers,followed by machinery for expression stud-ies, including DNA high-density arrayersand DNA chip readers. As more and moreaspects of biological, biochemical, biophysi-cal and medical research are automated, wecan expect more and more of the mostlymanual devices used today to be automatedand developed further for high throughput.With the complete blueprints of organismsat hand, it is logical that the current set ofgenome research tools will be expanded byin-vivo and in-vitro studies of organelles,cells, organs, and organisms. Microscopyequipment, and imaging equipment in gen-eral, will be part of the genome researchtoolkit of the future. Physiological researchwill be increasingly automated to achieve alevel of throughput that enables study of theglobal biological system rather than a singleaspect. Structural aspect of molecules will
57724.3 Genomic Data and Data Handling
become increasingly important to genomeresearch, protein crystallization factoriesmight emerge to enable a dramatic increasein the throughput of protein structure de-termination. The latter will be a prerequi-site for efficient use of synchrotron facil-ities for determination of protein structure.
The lessons learned by automating proce-dures in the molecular biology laboratorywill certainly be applied in the integrationand automation of an increasing number ofbiological techniques. Although there havebeen some attempts to create fully automat-ed laboratories, we predict there will alwaysbe a human factor in the laboratory.Manned space flight, even though consid-ered dangerous and costly, and thus notfeasible, is still a major factor today and weexpect that high-tech genome-research la-boratories will develop under similar con-straints.
24.3
Genomic Data and Data Handling
Bioinformatics is the “glue” that connectsthe different genome research experiments.The role of computer-based analysis andmodeling cannot be overestimated. Cur-rently, several hundred genome research-related databases exist. Many of these data-bases are updated daily and growing expo-nentially. New databases are being createdat an enormous pace, as more and differentexperiments are added to the collectedworks of genome research. It is completelyimpossible to host all genomic data on per-sonal computers or workstations; thus,there is a requirement for high perfor-mance computing environments in everyserious genome research effort. We predictthat in the future the computational infra-structure for most bioinformatics laborato-ries will be organized as a client–server
model. This will address the performanceissue that comes with the exponentiallygrowing data environment, while control-ling computer maintenance aspects andthus the major cost of the computational in-frastructure.
To date, computer chip development hasbeen according to Moore’s law (which pre-dicts that the computing power of a CPUdoubles approximately every 18 months)and genomic data have been produced at arate that could be accommodated with thecurrent computer advancements. It is con-ceivable that the pace of computer develop-ment and genomic data production will inthe future lose this synchronization, caus-ing problems with the amount of data thatmust be handled. The likelihood of thisseems small, however, because there areother large-scale databases (e.g. astronomi-cal databases or weather data) that aremuch more extensive than all the genomicdata under consideration.
In addition to scaling current computa-tional environments, an increasing amountof dedicated hardware is being developedthat can assist genome research. The goalfor future bioinformatics environmentsshould be to provide real-time analysis envi-ronments. We are certainly far away fromthis goal today, but as more systems like theParacel GeneMatcher (http://www.paracel.com) or TimeLogic Decypher boards (http://www.timelogic.com), which accelerate data-base searches by up to a factor of 1000, en-ter the market, they are poised to revolu-tionize the computational environment.
Networking between genome research la-boratories is a basic requirement for thesuccess of any genome project, thus biolog-ical and genome research applications havebeen a major application domain for the de-velopment of advanced networking strate-gies. For example, the Canadian Bioinfor-matics Resource, CBR-RBC (http://www.
578 24 The Future of Large-Scale Life Science Research
cbr.nrc.ca) is the major test bed for new net-working developments in Canada. Thetrend to establish advanced networking con-nections in genome research laboratorieswill continue and ultimately all these labora-tories will be connected to broad-band sys-tems. Distributed computational infrastruc-ture has been established in many genomeprojects and efforts are in progress to createnation-wide bioinformatics networks in sev-eral countries, including European coun-tries and Canada. Of special importance tothese efforts are computational GRIDs; sev-eral countries in Europe, the United Statesof America, and Canada are now establish-ing dedicated bioinformatics GRID archi-tectures. The ultimate goal of these activ-ities is to offer powerful distributed compu-tational environments to users who do notneed to know anything about their particu-lar architecture but can use all resources asif reside on their own machine.
A rather new development is the estab-lishment of web services (http://biomo-by.org). Similar to a GRID, these servicesenable users to use a large number of ser-vices without particular knowledge abouttheir physical location or details of their in-stallation. We expect many software packag-es to integrate either GRID technology orweb services into their functionality withinthe next few years.
Almost all current databases are initiallyorganized as ASCII flat files, with no rela-tional database infrastructure to supportthem. Data access is currently handledthrough web-based database integrationsystems such as ENTREZ and SRS, or tool-integration systems such as MAGPIE (http://magpie.ucalgary.ca) or PEDANT (http://pedant.gsf.de) In these examples, reformat-ting of the original data into standardizedHTML files creates the illusion for the userthat they are dealing with a single database.HTML has been accepted as the main work-
ing environment for biologists because webbrowsers (e.g. Netscape and Internet Explor-er) enable a platform-independent graphicalview of results from genome analyses.
The use of HTML for biological and med-ical data is certainly very limited, becauseHTML was originally designed for text files,rather than data files. Several approachesare currently being pursued to create amore standardized approach to genome re-search-related data. The most promisingcandidate seems to be the XML language.XML is an extendable web language, newdata types and display modes can easily beintroduced into the system. Many currentASCII flat-file databases are also being pro-vided in XML format, even Medline now of-fers a XML formatting option. Genomicsdata browsers of the future will be XMLcompatible, enabling multiple views of thesame data without the need for the refor-matting of the dataset or reprogramming ofthe display interface (Chapt. 16).
Similar to HTML and XML, multidimen-sional imaging data, for example from con-focal microscopy, serial section electron mi-croscopy, functional medical resonance im-aging or micro-computer tomography ex-periments, need standards to make themwidely accessible. Two formats are quitecommon, VRML (the virtual reality markuplanguage) and the commercial OBJ format.Both formats can be read by many softwarepackages. In the last couple of years Java 3Dhas been added to the fold. Java 3D can im-port VRML and OBJ files (and a large num-ber of other formats). It has been alreadyused for a wide variety of tasks, includingthe software operating the Mars rovers(http://www.sun.com/aboutsun/media/features/mars.html) and in oil exploration.Many multi-dimensional display units, in-cluding CAVE automated virtual reality en-vironments have now been adapted to Java3D technology, enabling bioinformaticians
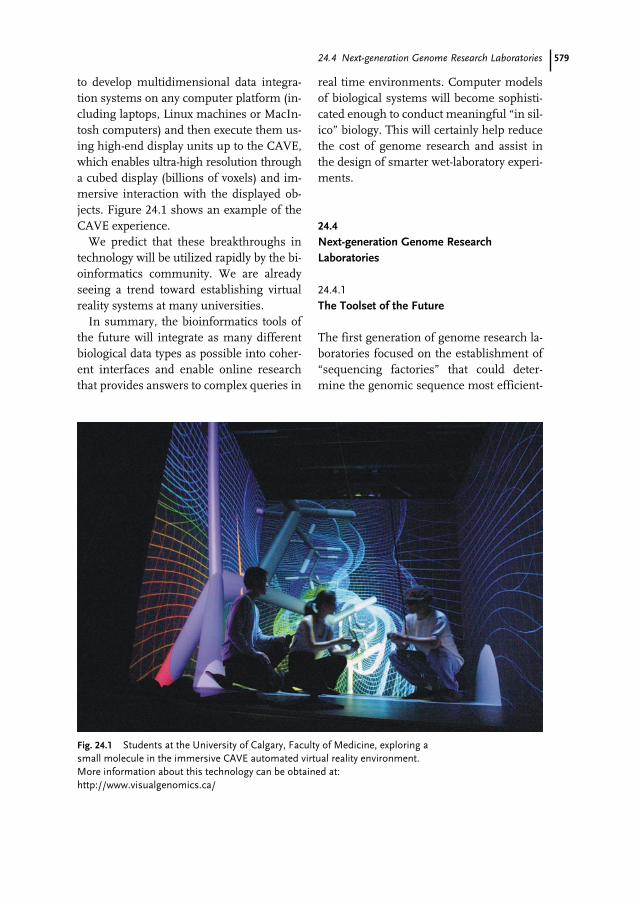
57924.4 Next-generation Genome Research Laboratories
to develop multidimensional data integra-tion systems on any computer platform (in-cluding laptops, Linux machines or MacIn-tosh computers) and then execute them us-ing high-end display units up to the CAVE,which enables ultra-high resolution througha cubed display (billions of voxels) and im-mersive interaction with the displayed ob-jects. Figure 24.1 shows an example of theCAVE experience.
We predict that these breakthroughs intechnology will be utilized rapidly by the bi-oinformatics community. We are alreadyseeing a trend toward establishing virtualreality systems at many universities.
In summary, the bioinformatics tools ofthe future will integrate as many differentbiological data types as possible into coher-ent interfaces and enable online researchthat provides answers to complex queries in
real time environments. Computer modelsof biological systems will become sophisti-cated enough to conduct meaningful “in sil-ico” biology. This will certainly help reducethe cost of genome research and assist inthe design of smarter wet-laboratory experi-ments.
24.4
Next-generation Genome Research Laboratories
24.4.1
The Toolset of the Future
The first generation of genome research la-boratories focused on the establishment of“sequencing factories” that could deter-mine the genomic sequence most efficient-
Fig. 24.1 Students at the University of Calgary, Faculty of Medicine, exploring asmall molecule in the immersive CAVE automated virtual reality environment.More information about this technology can be obtained at:http://www.visualgenomics.ca/
580 24 The Future of Large-Scale Life Science Research
ly. Initially, many of the sequencing pro-jects, e.g. the European yeast genome pro-ject, were set up in a distributed fashion.This proved to be almost unworkable, be-cause the entire project depended on theslowest partner. Thus, most recent projectsinvolve relatively few partners of equal capa-bilities. This has led to the development ofvery large laboratories in industry and aca-demia that are capable of producing up tohundreds of megabases of finished se-quence per year. Examples of such develop-ment are the Wellcometrust Sanger Insti-tute in Cambridge, UK (http://www.sanger.ac.uk), the Genome Sequencing Center atWashington University in St Louis (http://www.genome.wustl.edu/gsc/), the forma-tion of TIGR in Maryland (http://www.tigr.org/) and companies such as HumanGenome Sciences (http://www.hgsi.com/).
The exceptions to the rule that genomicDNA sequencing is conducted in large-scalelaboratories are projects in developingcountries, which are just entering the field.Projects in these countries are sometimesconducted in a set-up similar to the Europe-an yeast project, but even here a concentra-tion eventually takes place which restrictsgenome research funding to the more ad-vanced laboratories. The trend to larger andlarger DNA sequencing laboratories hasprobably peaked, because the existing labor-atories are capable of handling any through-put necessary. It can be expected that most,if not all, DNA sequencing in future will becontracted to these large-scale laboratories,similar to film-processing laboratories inthe photographic sector before the advent ofdigital photography.
Over time it has become apparent thatmuch of the DNA sequence produced in-itially stays meaningless. Many of the poten-tial genes that are identified through genesearching algorithms do not match any en-tries in the public databases, thus no func-
tion can be assigned to them. Without func-tional assignment the true goal of any Ge-nome project, which is to understand howgenomes are organized, and how the organ-ism functions, cannot be achieved. It is alsonot possible to protect any intellectual prop-erty derived from the genomic sequence ifthe function of the molecule is not known(Chapt. 21). The logical consequence is thatmany genome laboratories today are tryingto diversify and broaden their toolset.
Proteomics was the first addition to thegenomic toolset and is also a very rapidlyevolving field. Today, many expressed pro-teins can be identified via the 2D-gel–massspectrometry route (Chapt. 7), but there arestill many limitations that make it impos-sible to obtain and examine a complete pro-teome. Proteins that occur in very smallquantities in a cell, and proteins that arerarely expressed can elude current detectionmethods. Separation techniques have limi-tations which are difficult to overcome (e.g.membrane proteins and 2D protein gels). Itis to be expected that new proteomics-relat-ed techniques and approaches will be intro-duced at a fast pace. Protein chips and newseparation techniques that will bypass 2D-gel systems will be introduced and will helpto advance protein studies dramatically. Atthe same time, current technologies willconstantly be improved. As an example, wehave seen the development of dedicatedMS–MS-ToF systems coupled to a MALDIfront-end. More and more dedicated tech-nology for large-scale characterization ofproteins can be expected within the nextfew years. The large-scale study of proteinswill ultimately reach the same level as thelarge-scale study of DNA molecules today.
Expression studies (macro arrays, high-density arrays, chips) have become a verypopular addition to the genomic toolset(Chapt. 11). The major bottleneck for thistechnology is still the computer analysis
58124.4 Next-generation Genome Research Laboratories
component, especially with regard to nor-malization of the data, which has not yetfully caught up with the establishment ofthe hardware for this technology. We expectit will be seamless in the future to go froman RNA extraction to functional analysis ofthe DNA array or DNA chip experiment.Whereas today’s chip readers are about thesize of a medium-sized printer, we expectintegrated handheld devices will be devel-oped over time; these will enable field test-ing with diagnostic chips, returning resultsinstantaneously.
Certain organisms, for example yeast,Caenorhabditis elegans, and mice are beingsubjected to intense knockout studies togain insight into the function of as manygenes as possible. This technology is notwithout pitfalls, because the knockout ofmany genes does not cause any “visible” ef-fect, whereas the knockout of other genes islethal to the organism, which causes greatdifficulty in interpretation of the functionof these genes. Moreover, most of the char-acteristics of an organism are derived fromthe actions of several genes. We predict thatthis technology will not be applied widelyoutside the current model systems, becauseof the cost and the sometimes uninterpret-able results. More promising is the develop-ment of knock-down technologies usingsiRNA and related methods. These technol-ogies are already widely used and we expectthis trend to continue.
For many years, researchers have at-tempted to use structural information to de-duce the function of proteins (Chapt. 12).Most of these attempts have been unsuc-cessful, yet we predict there will be a betterchance of deduction of function from struc-ture in the future, because then the entiredataset (many complete genomes, and allbiologically relevant folds) will be known.This knowledge can then be used to predictthe function of a similar gene with much
more accuracy. “Structure mining” projectsattempting to determine all biologically rel-evant structures are currently in progress,and even though this process is tedious andslow, it is likely that within the next five toten years these efforts will be successful.
Although it will certainly be possible toidentify the function of many genes usingthe technology mentioned above, existingtechnology in other fields will need to be ap-plied to genome research in innovativeways, and entirely new technologies willhave to be added to existing biological, bio-chemical, and medical tools, to gain a com-plete understanding of the function of allgenes in the context of the living organism.
Imaging technologies are a prime candi-date for systems that must be added to thecurrent tool to furnish three dimensionaldata and time-related information aboutprocesses in cells, organs, and organisms.Automation has started to “invade” the mi-croscopy sector, assisted by laser technologythat enables micromanipulations unheardof twenty years ago. Today, automated mi-croinjection, optical tweezers, and confocalmicroscopes that can be switched to high-speed imaging, shooting thousands of im-ages per second are reality. Flow cytometryis now capable of screening hundreds ofthousand of cells per minute, sorting candi-date cells with desired features in an axenicmanner. This equipment will soon be intro-duced to genome research to enable the lo-cation of elements in a cell, monitor themover time, and create the input for more re-alistic computer models of life (virtual cell).
24.4.2
Laboratory Organization
There will probably be three types of ge-nome research laboratory in the future:• large-scale factories dedicated to specific
techniques;
582 24 The Future of Large-Scale Life Science Research
• integrated genome-research laboratories;and
• laboratories that coordinate data produc-tion rather than produce data.
Large scale factories will continue to exist.The advantage of lower production cost thatcomes with the scale and integration level ofthese operations will justify their existencefor a long time. It is crucial to understandthat most of these factories will do most oftheir business based on contracts with otherparties. The terms of these contracts (i.e.who owns the rights to the data) have beenand will be the issue that determines thesuccess of such a factory. Most of theselarge-scale factories are dedicated entirely toa particular technology. We predict that newlarge scale technology will lead to the rise offurther “factories” built around certain ex-pertise, rather than being internalized bythe existing laboratories.
Most medium-scale genome research la-boratories of the future will be tightly inte-grated units that employ as many differenttechniques as possible on a large scale, tofurnish a “complete” picture that helps tobuild more precise models of how cellsfunction. This is the logical consequence ofthe lessons learned from first generation ge-nome-research laboratories. Developmentin this direction is probably best describedwith Leroy Hood’s term “systems biology”.The integrated laboratories will not neces-sarily have to produce any data on a largescale; they might, for example, collaboratewith factory-style operations for large-scaledata collection in most of their projects. Thecrucial aspect of an integrated laboratory isthe computer setup. The bioinformatics in-frastructure of a “systems biology” laborato-ry must be quite large and sophisticated andtherefore capable of handling and integrat-ing many different data types into coherentmodels. “Systems biology” laboratories will
thus employ large bioinformatics develop-ment teams that can provide custom soft-ware solutions to address research and de-velopment needs.
We envisage the emergence of a new typeof laboratory without any capability to pro-duce data, but rather a coordination officewith data-analysis capability. This kind oflaboratory will outsource all wet-laboratoryactivity to third parties, resulting very lowoverheads and high flexibility, because sucha laboratory can always draw on the latesttechnology by choosing the right partners.Many start-up companies have begun towork this way, at least for part of their activ-ity, and large pharmaceutical companiesare now outsourcing many of their genome-research-related activity.
The risk in this arrangement is almostcompletely on the side of the data producer.This is an area in which governments willhave to involve themselves in genome re-search and development, because many ofthe risks in high technology environmentsare hard to calculate and will probably notinitially be assumed by industry. The coun-tries most involved in genome research to-day all have large Government programs toaddress this need and almost certainly thisinvolvement will have to continue for theforeseeable future.
24.5
Genome Projects of the Future
As already mentioned, the goal of genomeresearch is to obtain the “blueprint” of anorganism to understand how it is organizedand how it functions. To achieve this goal,genome projects of the future will have tobecome truly integrated. Connecting all thedifferent bits and pieces available in manylocations around the world is certainly oneof the major challenges for future genome
58324.6 Epilog
research. To facilitate this, data will have tobe available instantaneously. Already DNAsequences are often produced under the“Bermuda agreement”, which calls for post-ing of new data to the web immediately af-ter data generation. Complete openness be-fore publication is certainly a new approachin biological and medical research. The no-tion that only complex data analysis leads tonew insights and that any particular datatype in itself remains meaningless withoutconnection to all the other types of data isbecoming increasingly established.
Genome research will focus increasinglyon biological questions. Almost 20 years af-ter the first plastid genomes were complete-ly sequenced in Japan, there are still certaingenes in plastids, which have no identifiedfunction. This can certainly be attributed tothe fact that much of the plastid genome re-search stopped when these genomes werereleased, because of the false notion thatnow “the work was done”. The real workstarts with completion of the sequencing ofthe genome and it might never stop be-cause of the complexity of biological sys-tems.
A key factor in the continuation of ge-nome research will be the public perceptionand level of acceptance of this kind of re-search. Scientists have not yet been verysuccessful in two key areas – education ofthe public about ongoing activity and evalu-ation of basic science using ethical criteria.Companies have been perceived as creating“Frankenfoods” that are potentially harm-ful rather than better products that servemankind. News such as that released in2003 by the American Raelian sect that thefirst humans might have been cloned haveshocked and outraged the general public.Molecular biology experiments are very dif-ferent from atomic research, because theycan be conducted almost anywhere with lit-tle effort and thus it is quite hard to exercise
control. Future genome projects will haveto employ higher standards for evaluationof ethical aspects of the research. A moreintense discussion with the public, and bet-ter education of the public, are absolutelynecessary to generate the consensus neededfor continued support. All parts of societyhave to be involved in the discussion(Chapt. 23) and the legislature has to reactquickly as new technology emerges.
The openness asked for between scien-tists in order to address the goals of genomeresearch should be a starting point for rela-tionships with the general public. If every-one has free access to the data, public con-trol can be exercised more readily than in asecretive environment. Much of today’s ge-nome research is funded with tax dollars;this is an easily forgotten but very impor-tant fact. The openness being requestedshould certainly not go as far as to conflictwith the protection of intellectual property,but the general approaches to genome re-search science should be common knowl-edge and certain approaches should be out-lawed because they do not lead to improve-ments acceptable to our society.
24.6
Epilog
One of the most frequently asked questionsin genome research is: “ How long is ge-nome sequencing going to last?”. Genomesequencing will be around for a very longtime to come. The sequencing process hasbecome so affordable that it is feasible tocompletely characterize a genome to an-swer very few initial scientific questions.Genomic data are now typically shared withthe entire scientific community. Unlikemany other biological data the genomic se-quence is a fixed item, new technology willnot help to improve it further, and a com-
584 24 The Future of Large-Scale Life Science Research
plete genome of good quality is thereforethe true end product of the sequencing pro-cess. In addition to sequencing individualgenomes, scientists are now characterizingcomplete ecosystems by DNA sequencing.“Environmental genomics” will be used togain insights into the large part of any habi-tat, which cannot be cultured. This ap-proach is another reason why DNA se-quencing will not only persist, but increase.
Several million different species occur onearth today, and each individual organismhas a genotype that is different from anyother individual. Comparative genome re-search will lead to many new insights intothe organization of life. Knowledge aboutthe diversity of life will lead to new productsand cures for diseases at an unprecedentedpace. The need to characterize genomic datawill therefore be almost endless (Chapt. 2).
In a related research field, in study of thephylogeny of species, many thousand 18SrDNA sequences have been obtained todate, even though the basic dataset thatcould answer most questions had been gen-erated more than 10 years ago. Today, prob-ably more 18S rDNA sequences get pro-duced in a week than in all of 1994. While ittook many years to produce the first 5SrDNA sequence, today this technology isstandard in any sequencing laboratoryaround the world.
The almost endless possibilities of ge-nome research are very exciting for all of usinvolved in this kind of research, but alsopose challenges every day, which go far be-yond the laboratory that we usually work in.This keeps us going through the enormousefforts that it takes to complete any large-scale genome project.
585
AA. fulgidus see Archaeoglobus fulgidusA. thaliana see Arabidopsis thalianaabandoned samples 518Abbe’s Diffraction Limit, DNA sequencing 160ABC see ATP-binding cassette permeasesABI1 gene 111ABI3 gene 111ABI4 gene 111academic secrecy, commercialization of biobank
resources 542acceptable uses of genetic technologies 541access by third parties, genetic information 514accountability 551ACeDB 31acetyl-CoA synthase 19Acidobacter, model organisms 51acute lymphoblastic leukemia 255acute myeloid leukemia 255acute promyelocytic leukemia 373adaptive automation, DNA sequencing 153additives, protein crystallography 278–279adenomatous polyposis coli 93Adh1 locus 116adiponectin receptor 366adverse drug effects 366, 368affinity tagging 262, 277Affymetrix 223, 357, 417, 421AFLP see amplified fragment length
polymorphismagarose gel simulation, MAGPIE 403AGAVE XML 412age of enlightment 566Agilent Technologies 417, 421AHEC 523Albers-Schonberg disease, type II 364albuterol 357alignment, Bioinformatics 301–302Alkaloid biosynthesis 471allelic heterogeneity, human genome 87
ALOX5 373– activity 374alternative splicing 240aMAZE 442AmiGO GOst server 337amino-modified oligonucleotide sequences 228Aminoactyl-tRNA Synthetase Database 442amplicon, DNA microarrays 229, 232–234amplified fragment length polymorphism 107analysis of intact proteins 203analytic models 472anion-exchange prefractionation, Mass
Spectrometry 202anion transporters 372anion-transporting polypeptides 372AnnAt1, plants 69anomalous dispersion, multiple wavelength 274anonymization process, samples 520anonymized samples, DNA 510, 517ANTHEPROT 334anti-cancer drug screen study, Bioinformatics 359antiapopotic gene 94antimicrobials 53antisense RNA expression 76Apache – Batik 406– software, JAVA-based 406– Xalan-Java 409– Xerces 406APC – gene 93– protein 93Apium graveolens, model organisms 64apo-calmodulin 289Aquifex aeolicus, model organisms 17Arabidopsis thaliana 4– comprehensive genetic map 26– duplicated segments 29– favorable feature 26
Handbook of Genome Research. Genomics, Proteomics, Metabolomics, Bioinformatics, Ethical and Legal Issues.Edited by Christoph W. SensenCopyright © 2005 WILEY-VCH Verlag GmbH & Co. KGaA, WeinheimISBN: 3-527-31348-6
Subject Index
Verwendete Mac Distiller 5.0.x Joboptions
Dieser Report wurde automatisch mit Hilfe der Adobe Acrobat Distiller Erweiterung "Distiller Secrets v1.0.5" der IMPRESSED GmbH erstellt. Sie koennen diese Startup-Datei für die Distiller Versionen 4.0.5 und 5.0.x kostenlos unter http://www.impressed.de herunterladen. ALLGEMEIN ---------------------------------------- Dateioptionen: Kompatibilität: PDF 1.3 Für schnelle Web-Anzeige optimieren: Ja Piktogramme einbetten: Ja Seiten automatisch drehen: Nein Seiten von: 1 Seiten bis: Alle Seiten Bund: Links Auflösung: [ 2400 2400 ] dpi Papierformat: [ 481 680 ] Punkt KOMPRIMIERUNG ---------------------------------------- Farbbilder: Downsampling: Nein Komprimieren: Ja Komprimierungsart: ZIP Bitanzahl pro Pixel: 8 Bit Graustufenbilder: Downsampling: Nein Komprimieren: Ja Komprimierungsart: ZIP Bitanzahl pro Pixel: 8 Bit Schwarzweiß-Bilder: Downsampling: Nein Komprimieren: Ja Komprimierungsart: CCITT CCITT-Gruppe: 4 Graustufen glätten: Nein Text und Vektorgrafiken komprimieren: Ja SCHRIFTEN ---------------------------------------- Alle Schriften einbetten: Ja Untergruppen aller eingebetteten Schriften: Nein Wenn Einbetten fehlschlägt: Abbrechen Einbetten: Immer einbetten: [ /Courier-BoldOblique /Helvetica-BoldOblique /Courier /Helvetica-Bold /Times-Bold /Courier-Bold /Helvetica /Times-BoldItalic /Times-Roman /ZapfDingbats /Times-Italic /Helvetica-Oblique /Courier-Oblique /Symbol ] Nie einbetten: [ ] FARBE(N) ---------------------------------------- Farbmanagement: Farbumrechnungsmethode: Farbe nicht ändern Methode: Standard Geräteabhängige Daten: Einstellungen für Überdrucken beibehalten: Ja Unterfarbreduktion und Schwarzaufbau beibehalten: Ja Transferfunktionen: Beibehalten Rastereinstellungen beibehalten: Nein ERWEITERT ---------------------------------------- Optionen: Prolog/Epilog verwenden: Nein PostScript-Datei darf Einstellungen überschreiben: Nein Level 2 copypage-Semantik beibehalten: Ja Portable Job Ticket in PDF-Datei speichern: Ja Illustrator-Überdruckmodus: Ja Farbverläufe zu weichen Nuancen konvertieren: Ja ASCII-Format: Nein Document Structuring Conventions (DSC): DSC-Kommentare verarbeiten: Ja DSC-Warnungen protokollieren: Nein Für EPS-Dateien Seitengröße ändern und Grafiken zentrieren: Ja EPS-Info von DSC beibehalten: Ja OPI-Kommentare beibehalten: Nein Dokumentinfo von DSC beibehalten: Ja ANDERE ---------------------------------------- Distiller-Kern Version: 5000 ZIP-Komprimierung verwenden: Ja Optimierungen deaktivieren: Nein Bildspeicher: 524288 Byte Farbbilder glätten: Nein Graustufenbilder glätten: Nein Bilder (< 257 Farben) in indizierten Farbraum konvertieren: Ja sRGB ICC-Profil: sRGB IEC61966-2.1 ENDE DES REPORTS ---------------------------------------- IMPRESSED GmbH Bahrenfelder Chaussee 49 22761 Hamburg, Germany Tel. +49 40 897189-0 Fax +49 40 897189-71 Email: [email protected] Web: www.impressed.de
Adobe Acrobat Distiller 5.0.x Joboption Datei
<< /ColorSettingsFile () /LockDistillerParams true /DetectBlends true /DoThumbnails true /AntiAliasMonoImages false /MonoImageDownsampleType /Bicubic /GrayImageDownsampleType /Bicubic /MaxSubsetPct 100 /MonoImageFilter /CCITTFaxEncode /ColorImageDownsampleThreshold 1.5 /GrayImageFilter /FlateEncode /ColorConversionStrategy /LeaveColorUnchanged /CalGrayProfile (Dot Gain 20%) /ColorImageResolution 300 /UsePrologue false /MonoImageResolution 1200 /ColorImageDepth 8 /sRGBProfile (sRGB IEC61966-2.1) /PreserveOverprintSettings true /CompatibilityLevel 1.3 /UCRandBGInfo /Preserve /EmitDSCWarnings false /CreateJobTicket true /DownsampleMonoImages false /DownsampleColorImages false /MonoImageDict << /K -1 >> /ColorImageDownsampleType /Bicubic /GrayImageDict << /HSamples [ 2 1 1 2 ] /VSamples [ 2 1 1 2 ] /Blend 1 /QFactor 0.9 >> /CalCMYKProfile (U.S. Web Coated (SWOP) v2) /ParseDSCComments true /PreserveEPSInfo true /MonoImageDepth -1 /AutoFilterGrayImages false /SubsetFonts false /GrayACSImageDict << /HSamples [ 2 1 1 2 ] /VSamples [ 2 1 1 2 ] /Blend 1 /QFactor 0.9 >> /ColorImageFilter /FlateEncode /AutoRotatePages /None /PreserveCopyPage true /EncodeMonoImages true /ASCII85EncodePages false /PreserveOPIComments false /NeverEmbed [ ] /ColorImageDict << /HSamples [ 2 1 1 2 ] /VSamples [ 2 1 1 2 ] /Blend 1 /QFactor 0.9 >> /AntiAliasGrayImages false /GrayImageDepth 8 /CannotEmbedFontPolicy /Error /EndPage -1 /TransferFunctionInfo /Preserve /CalRGBProfile (sRGB IEC61966-2.1) /EncodeColorImages true /EncodeGrayImages true /ColorACSImageDict << /HSamples [ 2 1 1 2 ] /VSamples [ 2 1 1 2 ] /Blend 1 /QFactor 0.9 >> /Optimize true /ParseDSCCommentsForDocInfo true /GrayImageDownsampleThreshold 1.5 /MonoImageDownsampleThreshold 1.5 /AutoPositionEPSFiles true /GrayImageResolution 300 /AutoFilterColorImages false /AlwaysEmbed [ /Courier-BoldOblique /Helvetica-BoldOblique /Courier /Helvetica-Bold /Times-Bold /Courier-Bold /Helvetica /Times-BoldItalic /Times-Roman /ZapfDingbats /Times-Italic /Helvetica-Oblique /Courier-Oblique /Symbol ] /ImageMemory 524288 /OPM 1 /DefaultRenderingIntent /Default /EmbedAllFonts true /StartPage 1 /DownsampleGrayImages false /AntiAliasColorImages false /ConvertImagesToIndexed true /PreserveHalftoneInfo false /CompressPages true /Binding /Left >> setdistillerparams << /PageSize [ 595.276 841.890 ] /HWResolution [ 2400 2400 ] >> setpagedevice
586 Subject Index
– functional genomics 30– Genome Initiative 27– model organisms 25, 59, 110, 239, 411– plant-specific functions 29– potential functional assignments 29– repeats of transposeable elements 28– repetitive elements 28– sequencing strategy 27– stock centers 27– tandem repeats 29archaea 16– halophilic 49Archaeoglobales 16Archaeoglobus fulgidus, model organisms 3– carbon source 19– characterization of the genome 18– electron-micrograph 16– gene density 19– genes for RNA 18– genome size 17– iron sulfide 16– IS elements 18– isoelectric point 19– long coding repeats 18– minimum sequence coverage 17– non-coding repeats 18– paralogous gene families 19– putative functions 19– regions with low G+C content 18– regulatory networks 20– research articles 20– sensory networks 20– sequencing strategy 18– sulfate reduction 19archived human biological material 528Ardais 542argon ion laser 144ARIA 287Aristotle 537array printing methodology, DNA microarrays
241array scanners, DNA microarrays 250ArrayAnalyzer 423arrayers, DNA microarrays 243ArrayExpress 420ArrayIt SuperFilter plates 232ArrayViewer 420arrhythmias, familial 96arrhythmogenic right ventricular cardiomyopathy
96artifcicial neural nets 339artificial intelligence 323Asc gene 110ASCII text 466
ASD 356ASEdb 442Asilomar conference 6ASN.1 466– tools 438Asparagales, model organisms 64assembly lines, genome research 576Assistance Publique-Hopitaux de Paris 546association studies 88Asterand 542at-risk information, automatic communication
526ATH1 GeneChip 121ATNOS 287ATP-binding cassette permeases 11attrition, protein crystallography 275Australian Health Ethics Committee 523Australian Law Reform Commission 522–523AutoAssign 286automated microscopes 279automated sequencers, DNA sequencing 138automatic communication of at-risk information
526autonomic neuropathy 85autosomes 84– Caenorhabditis elegans 31average difference 422award, 21st Century Achievement Award 359AXR1 gene 111
BB-cell lymphoma – diffuse large 255– large diffuse 245B-statistics 253B. subtilis see Bacillus subtilisBAC see bacterial artificial chromosomesBAC fingerprint database 120Bacillus subtilis, model organisms 3, 10, 448– cold shock response 14– collection of mutants 14– Electron micrograph 10– enzyme production 15– food products, humanization 15– foodsupply fermentation 15– functional genomics 13–15– gene classes 13– gene families 11– genes of completely unknown function 16– genome 11– hay bacterium 10– humanization of the content of food products
15– iron metabolism 15
587Subject Index
– leading replication strands 14– macriarray studies 14– natural selection 12– normal habitat 10– order of the genes 15– osmotic stress 11– proteome 14– replication 12– saltstress response 15– strain 168 12– traditional techniques 15– transcription 14– transformation 12– truncated tagged protein, Bacillus subtilis 13backcrosses 106bacterial artificial chromosomes 62, 114bacteriophage f1 DNA 129bacteriophage RNA 129bait and prey proteins 203, 496band tilt, DNA sequencing 155BandCheck 232banking 509barley, model organisms 110, 122BASE 254, 420base calling, DNA sequencing 155–156bases – individual, DNA sequencing 156– mispairing 249Bayesian probabilistic approaches 331, 342, 424BBID 442BDGP see Drosophila Genome Projectbeamlines 279Belgian Society of Human Genetics 547benefit-sharing 512– genetic material 527– genetic resources 549benefits, non-monetary 550bermuda agreement 583beta-blockers 373bi-directional sequencing, simultaneous, DNA
sequencing 144Bias 429BIBAC vector 114biclustering algorithms 426bifurcation analyzer 482BIND 338, 435– data model 435– database standards 439–440– domains 440– see also Biomolecular Interaction Network
Databasebinding protein, FK506 265BindingdB 442bio-ethical questions 567
Biobank UK 551Biobanks 516, 537–559– ethical concerns 538– for Research 529– governance 551, 553–554– initiatives, viability 551– legal concerns 538– linkage to health information 539– risk and benefits 537– social concerns 538BioCarta 339, 443Biocatalysis/Biodegredation Database 443biochemical essay simulation, Bioinformatics
384biochemical systems, hierarchical 482BioChipNet 243bioconductor project 254, 420BioCYC 359, 445bioethical discussion 564biofilm 50– acid mine drainage 50– drinking water 50Bioinformatics 299–322– 2D gel analysis software 324– 2D threading 343– 3D threading 343– alignment methods 299–305– alternative splicing variants 356– anti-cancer drug screen study 359– applied 353–381– assembly engine 387– bending in a DNA double helix 312– Berkeley Database Manager 385– biochemical essay simulation 384– Caenorhabditis elegans 31– cheminformatics 359– codon preference statsistics 318– codon usage analysis 315– coiled-coil domains 341– coloration of analysis data 386– consensus methods 309– CpG islands 313– data mining software 361– database alignment algorithms 333– databases 353–362– detection of patterns 311– disease-oriented target identification 364–365– display idioms 386– DNA comparison matrix 301– domain identification 341– dot plots 300– drug-target discovery 362– dynamic programming 305– EST sequence database 355–356
588 Subject Index
– evidence 384– exact substring matches 332– expression database 357–358– fuzzy matching 332– gaps 301– General Feature Format 385– genome features 384– global alignment 301– globularity 340– graphical display systems 383– helical wheels 345– hidden Markov model 305, 334– k-tuples 305– local alignment 301–303– local sequence similarity 332– localized ungapped alignments 305– MAGPIE hierarchy 386– manual user annotations 385– Mass Spectrometry 193–195– metabonomic database 354– microarray databases 369– modular computer code 385– Needleman-Wunsch 301– neural network analysis 334– nucleotide sequence pattern 314– one-letter-code 309– open reading frame 317–318– open source effort 321– pairwise alignment 300– panes 391– pathway databases 358– pattern display 386– pharmacoepidemology database 376– polymorphism databases 356–357– precomputed results 384– profile-based similarity searching 363– Proteomics database 360– reading frame statistics 320–321– repeat identification 310– representation of the responses 386– restriction mapping 315– scoring methods 300– sequence based homology searching 363– sequence databases 354– sequence variations 356–357– shape 340– similarity 299– simple-sequence masking 309–309– Smith-Waterman alignment 303– splice site consenus sequences 305– spliced cDNA sequences 300– stability 340– standard key identifiers 362– static graphical mode 385
– substitution matrices 333– threading 334, 342– tilting technique 391– transmembrane helices 339– transmembrane helics prediction 340– two dimensional canvas 385– user preferences 385– XML data 384– XML documents 384BioJava 420biological material, ownership 538biological samples, forseeable uses 553Biology, in silicio 579biomarker discovery 372–373– projects 188biomaterials, commodification 543BioML 412BIOMOBY 405Biomolecular Interaction Network Database
437–439BioPAX 440BioPerl 420BioPNML 478biopsies 185biosynthesis, natural-product 53biotech industry, currency 544biotechnology programs, EU 21BioTools 345bladder cancer 256blanket conset, DNA banking 524blanket conset 521BLAST 331, 333, 345, 384– database search program 301– search 195Blattner, F. 7BLOCKS 336, 384blood clotting 95blotting, Western 326Bluejay 384, 404–405– applet 412– application 412– architecture 405–407– context tree 408– core 405– data exploration 407– document object model 406– eurokariotic genomes 411– individual elements 410–411– information flow 406– interactive legend 409– interface 407–408– operations on the sequences 408– semantic zoom 408– usable features 411

589Subject Index
– XLink standard 411Blueprint 583bodily existence 563Bonferroni 423Bonn Guidelines 549Boolean models 500Boolean nets 462bootom-up approach 469bootstrap clustering, parametric 427Br gene 111brain cancer 185Brassica – genome project 27– model organisms 26, 61BRCA families 92BRCA1 91, 546BRCA1/2 545BRCA2 91, 546breast biopsies 185breast cancer 91–93Breast Cancer Linkage consortium 92BRENDA 443, 462Bristol-Myers Squibb 359BRITE 443bronchoconstrictor leukotrienes 374brugada syndrome 96budding yeast, model organisms 440bulk segregant analysis 112
CC. elegans see Caenorhabditis elegansCAE tool, Petri net tools 477Caenorhabditis briggsae, model organisms 32Caenorhabditis elegans 4– autosomes 31– Bioinformatics 31– cell lineage 30– conserved genes 32– GC content 33– gene prediction 32– genome project 31– model organisms 29–30, 37, 218, 262, 354,
447, 581– nervous systems 30– physical map 30– postgenome era 33– predicted genes 32– predicted protein products 32– repeat families 33– RNA genes 32– tandem repeat regions 32–33calmodulin 282Calvin cycle enzymes, plants 71Campbell-like integration of foreign DNA 12
Canada’s Tri-Council Policy Statement 551Canadian Bioinformatics Resource 398, 577Canadian Biotechnology Advisory Committee
548Canadian DPG 35Canadian Lifelong Initiative 538Canadian National Birth Cohort 538cancer 90–94, 255–256, 567cancer genes 37Cancer Genome Anatomy Project 355, 358Cancer Research UK 547CANDID 287Candida albicans, model organisms 228capillary electrophoresis 70, 183, 211–222, 232– capillaries 212– capillary sieving electrophoresis 215–216– cell-to-cell variation 221– critical micelle concentration 217– detection 214– detection limits 218– dextran 216– electrokinetic injection 212– electroosmosis 212–213, 215– electrophoresis 213– fluorescence detection 214– fluorogenetic reagents 214– free solution electrophoresis 217–218– high fields 213– high-molecular-weight proteins 215– high-performance liquid chromatography 220– hydrodynamic injection 212– injection 212– instrumentation 212– isoelectric focusing 215– labeling chemistry 214– mass spectrometry 214– micellar separation 217– non-crosslinked polymers 216– poly(ethylene oxide) 216– pressurized 215– pullulan 216– separation 213–214– separation buffer 214– separation time 213– sheath-flow cuvette detector 219– single-cell analysis 218–219– spiking of the sample 221– surfactant 214– tandem 328– two-dimensional separations 219–220– UV absorbance 214capillary gels, DNA sequencing 146, 151capillary sieving electrophoresis, capillary
electrophoresis 215
590 Subject Index
carbon source, Archaeoglobus fulgidus 19carcinogens 91cardiac troponin T 95cardiomyopathy – arrhythmogenic right ventricular 96– familial dilated 96cardiovascular disease 94–97– multifactorial 96carrier screening, human genome 86CAS chemical compound numbers 442catalase genes 11cation transporters 372CAVE automated virtual reality environments
578CBAC 548CCD cameras, DNA microarrays 235CDD 341cDNA, microarrays 416cDNA sequences – full-length 353– spliced 300CE see capillary electrophoresiscell behavior 472cell-cycle regulator 94cell-free in-vitro expression 284cell lineage, Caenorhabditis elegans 30cellular CAD system 437Cenarchaeum symbiosum, model organisms 48centi-Morgan 62, 109central bio-ethical questions 567CGI 385chain-terminating nucleotide, DNA sequencing
130chaos game representation 311chaotropic action 246chaperone-mediated folding 282chaperones, molecular 11CHEK2 91chemical cleavage, DNA sequencing 130chemical compound numbers 442chemical graph description 436chemical noise, mass spectrometry 199chemical shifts 286, 288– peak-assignment process 286childhood eye cancer retinoblastoma 91children, cloned 562chimera 562chimerism 114ChIP on Chip 429ChipWriterPro 234cholesterol ester transfer protein 357Christian point of view 566chromatin immunoprecipitation 241chromatin remodeling 92
chromatographic gradients, ultra-long, massspectrometry 200
chromatography 187– microscale 183chromosomal instability 93chromosome – mitochondrial 61– plastid 60chromosome landing 112CID see collisionally induced dissociationCIHR 538CIN see chromosomal instability– tumors 93CIOMS 518, 538– guidelines 512class discovery, microarrays 418class prediction, microarrays 418, 425–426client-server models 575clinical care, sample collection 519clinical trial 368clinical validation 542cloned children 562cloned DNA, DNA microarrays 224cloning, genes, structural genomics 277cloning vectors, DNA sequencing 141clotting factor V 95clustering algorithms 252– microarrays 426cM see centi-Morganco-suppression with sense RNA 76codcmp 321Code Link surface, DNA microarrays 242coded, DNA banking 517coding repeats, Archaeoglobus fulgidus 18codomiant markers 106codon preference statsistics, Bioinformatics 318codon statistics 320codon usage analysis, Bioinformatics 315coeluting peptides, mass spectrometry 200cold shock response, Bacillus subtilis 14Cold Spring Harbor Phage course 6colinearity 116collaboratory 573collisionally induced dissociation 192colon cancer 91, 93–94colorectal cancer 91columns, mass spectrometry 200COMET 360commercial gain, biobank resources 543commercial process 541commercial structural genomics 275commercialization 537– of biobank resources 541–543– of research 531
591Subject Index
– of biomaterials 543common heritage concept, genetic material 527common heritage of humanity, genetic material
526common heritage resource 549community consent 512comparative genome research 365–366, 584comparative mapping 115comparison, DNA microarrays 245COMPEL 444complementation 72complementation test 118complete genome sequences 3– sequence gaps 17– shotgun approach 8– whole-genome random sequencing 17complex dynamic networks 462Compugen 363compund toxicity 369–372Computer World Magazine 359confidence values, DNA sequencing 157confidentiality, Biobanks 553confocal scanning devices, DNA microarrays 235connexin gene 37, 96consensus methods, Bioinformatics 309consent 517– for new collections 521– forms 530consequences of genetic activities 563conserved gene orders, positional mapping 116Consortium on Pharmacogenetics 519contact printing 234– DNA microarrays 224contaminating proteins, Proteomics 330contigs 48, 62continuous infusion mode 198controlled humidity cabinets, DNA microarrays
243Convention on Biological Diversity 549coordination office 582COPE 444CORBA 442corn, model organisms 64Corona virus, model organisms 354correlation analysis 323correlation spectroscopy, 2D 288cosmid libraries, Saccharomyces cerevisiae 21cosmid vector 54Coulombic forces 223Council for International Organizations of
Medical Sciences 511–512, 518–519Council of Europe 521Council of Regional Networks for Genetic
Services 523
COX-1 374CpG islands 115CPGISLE database 313cpgplot 313CPL 465CPN 478crenarchaeota 46– mesophilic 53criminal investigations 541CRITICA 18critical micelle concentration, capillary
electrophoresis 217crop improvement 63cryogenic data collection 274cryogenically cooled probes, high-resolution
solution NMR 285crystallization conditions 278crystallography, protein 273–274CSNDB 444, 462cSNP 88CTR1 gene 111cultivation techniques 46cultured cell lines 186Curagen Pathcalling 444cures for genetic diseases 541currency of the biotech industry 544cuvette detector 219CYANA 287cyanobacteria 28, 50Cyber-T-package 424cycle-sequencing, DNA sequencing 142cyclooxygenase isozyme COX-3 374cyclotron mass spectrometer 332CYP see cytochrome P450 isoenzymesCYP genes, regulation of the expression 371CYP2C9 371CYP2C9*3 mutations 374CYP2D6 371CYP3A4 371cystic fibrosis 86cytochrome P450 isoenzymes 371Cytophagales 51Cytoscape 428, 440
DDarwinian selection, human genome 83data collection system 573data fusion 462data integration 483Data normalization 252data-protection safeguards, biobanks 553Data Protection Working Party 514data reduction, intelligent, DNA sequencing 153data warehouse 465
592 Subject Index
database alignment algorithms, Bioinformatics333
database extension 470database scheme 470databases – Bioinformatics 353–362– genome research 577dbEST 118Dbsolve 479, 482DDBJ 462dead-on-arrival fluorophores, DNA sequencing
160deceased individuals 512Declaration on Genetic Data 515deCODE Genetics 543deconvolution, DNA sequencing 156Decypher TimeLogic 384degradation strategy 161–162Deinococcus radiodurans, model organisms 17,
220Delbrück, M. 6deletion method, nested, DNA sequencing 139Delta2D 324Denhardt’s regent 249density lipoprotein receptor 366deoxyviolacein 53Design/CPN, Petri net tools 478Desulfotalea psychrophilia, model organisms 19detection limits, capillary electrophoresis 218deuteration, high-resolution solution NMR 284dextran, capillary electrophoresis 216dextrometorphan 357diabetes 87diagnostics, pre-implantation 567dideoxy method, DNA sequencing 130differential equations 482differentially expressed proteins 186diffuse large B-cell lymphoma 245, 255DIGE, multicolored multiplexed 324digestion, reactor-based, Proteomics 198dihedral angle restraints 286DIP 338, 440, 444direct cDNA selection 115direct labeling procedure, DNA microarrays 247disabled 512Discovery Link 465discovery research 223Discovery Studio Gene 344discrete-event approach 473discrete models 472discrimination 513disease-oriented target identification,
Bioinformatics 364disease-related proteins 182
disorders, mental 512dispersion, anomalous 274dissociation, collisionally induced 192Distributed computational infrastructure 578DMSO, DNA microarrays 234DNA – arrays 54– banking 509, 516– based diagnosis 86– based patents 545– breaks, double-strand 92– comparison matrix, Bioinformatics 301– Data Bank of Japan 354– degradation strategy, single molecule detection
161–162– double helix, bending 312– high-molecular-weight, purifying 51– horizontal transfer 321– hybridization strategy, single molecule
detection 163–164– re-sequencing, human genome 90– replication machinery, basic, Drosophila
melanogaster 36– sciences 542– seperation technology 574– sequence analysis 153–158– sequencers 575DNA microarrays 223, 261– amplicon 229– amplicon generation 232–234– application 239–260– array content 242– array printing methodology 241– array scanners 250– arrayers 243– background 247, 249– CCD cameras 235– cloned DNA 224– Code Link surface 242– commercial array industry 242– confocal scanning devices 235– contact printing 224– controlled humidity cabinets 243– data analysis 251– data aquisition 250–251– data extraction 251– data handling 228– database 228–230– definition 240– design of the oligonucleotides 242– direct comparison 245– direct labeling procedure 247– DMSO 234– documentation 254
593Subject Index
– dye bias 244– experimental design 244–246– fabrication 224– fabrication strategy 223–238– flagging of amibigious spots 252– fluorescent tags 244– forward primers 229– genome-wide arrays 240– glass microscope slides 224– high variability within expression values 253– hybridization 235, 244– hybridization kinetics 250– hybridization step 249– indirect comparison 245– indirect labeling method 248– ink-jet spotting 224– inkjet technology 241– instrumentation 228– labeling 247– long oligonucleotide 250– main application 224– melting temperature 249– microarraying robots 234– mismatched hybrids 250– mispairing of bases 249– multi-color fluorescent labels 235– obtaining pure intact RNA 246– oligonucleotide arrays 229– PCR failures 230– photolithography 223, 241– post-synthesis arraying 224– pre-made arrays 243– probe 240– probing 234– production 241–243– quantitation software 235– reagent costs 231– reverse primers 230– sample preparation 246– scanning 234– slide substrates 242–243– spatially ordered synthesis 223– specifity 242– spot saturation 251– spotting concentration 230– spotting pins 243– target 240– TIFF images 250– unmodified or amino-modified oligonucleotide
sequences 228– user of the technology 244– variation 244DNA sequencing 574– Abbe’s Diffraction Limit 160
– acrylamide gel 131– adaptive automation 153– AmpliTaq 142– applications 138–140– automated 131– automated sequencers 138– automation 130– background level 143– band tilt 155– base calling 155–156– biochemistry 138–144– by hybridization 152– capillary gels 146, 151– cDNA see cDNA sequences– chain-terminating nucleotide 130– chemical cleavage 130– cloning vectors 141– compressions 143– confidence values 157– Cy5 133– Cy5.5 133– cycle-sequencing 142– daily production 159– de novo sequencing 138– dead-on-arrival fluorophores 160– deconvolution 156– detectors 146– dideoxy method 130– double-stranded DNA template 140–141– dR110 133– dR6G 133– dROX 133– dTAMRA 133– dye-labeled primer sequencing 142– dye-labeled terminator sequencing 142– electroosmotic pumping 151– energy transfer 138– excitation energy sources 144– FAM 133– fluorescein dye 133– fluorescence detection 145– fluorescence dye chemistry 131–138– fluorescence lifetime 137–138– fluorescence lifetime discrimination 138– fluorescence samples 145– fluorescent detection 131– fluorophore blinking 160– fluorophore characteristics 132– forms of electrophoresis 149– four dye/one-lane approach 138– four-color discrimination 136– gel matrix 146– Heisenberg’s Uncertainity Principle 160– identification of the individual bases 156
594 Subject Index
– information independence 148– information per channel 147–148– information througput 147–148– instrument design 148–149– instrumentation 144–153– intelligent data reduction 153– internal labeling 142– IRDye40 132– IRDye41 132– IRDye700 133– IRDye800 132– JOE 133– labeled terminators 137– labeling strategy 142–143– lane detection 153– lane trace profiles 155– lane tracker 154– large insert clones 141– microfluidic channel gels 146– micro-grooved channel gel electrophoresis 151– mobility correction 156– modified nucleoside triphosphates 130– multiplex DNA sequencing 147– nanopore filtering 161– nested deletion method 139– non-electrophoresis methods 152– non-fluorescence methods 152–156– oligonucleotide primer 143– one-dye/four-lane approach 138– PCR products 141– PCR purification kit 141– photobleaching 160– PHRED values 158– plasmid purification kit 141– plus/minus method 129– polymerases 141–142– potential gradient 146– primer walking 139– quality predictor 157– R110 133– R6G 133– random shotgun sequencing 139– removal bases 152– resequencing 138, 140– ROX 133– sample channels 147– Sequenase v2.0 141– simultaneous bi-directional sequencing 144– single stranded DNA template 140– single-base extension 152– single-molecule detector 160– slab gels 146, 149–151– spectral wavelength of fuorescent emission
132
– Stokes Shift 132– strategies 138–140– TAMRA 133– Taq DNA polymerase 142– template 143– template preparation 140–141– template-primer-polymerase complex 143– tethered donor and aceptor dye 137– thermal diffusion 160– Thermo Sequenase 142– time per sample 148– trace generation 155–156– tracking 153– transposon insertion 139– universal sequencing primer 140– whole-genome shotgun assembly 139DNA sequencing technology 129DNA synthesis, high-throughput 230–232, 575DNA synthesis strategy, single molecule detection
162–163DNA template – DNA sequencing 143– double-stranded, DNA sequencing 140–141– preparation, DNA sequencing 140–141– single stranded, DNA sequencing 140DNase 247– activity 246DNAstar 344Dolly 561domain identification, Bioinformatics 341domains, SH33 433dopamine D3 receptor 375dot plots, Bioinformatics 300dot-tup 306dotmatcher 300double-coded, DNA banking 517double recombinants 109double-strand DNA breaks 92double-stranded DNA template, DNA sequencing
140–141doubled haploids 106Down’s syndrome 564DPG see Drosophila Genome ProjectDPInteract 445Draft Guidellines on Bioethics 515DRC 445Drosophila melanogaster 4– basic DNA replication machinery 36– gene regulation 36– genetic analysis 37– Genome Project 35– genomic organization 35– genomic resources 36– heterochromatin 35
595Subject Index
– HOX genes 35– model organisms 29, 34, 37, 262, 354, 446– mutant phenotypes 34– number of genes 36– protein-protein interaction studies 37– sequencing 35– transcription factors 36– transferrins 36drug design, structure based 289drug effects, adverse 366, 368drug efficacy 373drug life-cycle management 376drug resistance 372drug target 368drug-target discovery 372DS Gene 344DTD 478dual-labeled, microarrays 417dust 309duty to warn 525dye bias, DNA microarrays 244DynaFit 480dynamic light scattering 278dynamic models – mathematical formalism 499– systems biology 499dynamic Petri nets 473dynamic programming 323dynamic representation 481–481
EE-cadherin 256E-Cell 480, 482E. coli see Escherichia coliEASED 356EBarrays 425Eberwine method 235EC see Enzyme ComissionEcoCyc 10, 440, 445EcoCyc/MetaCyc 464EcoCYG 359ecosystem 49– marine 48Edman degradation 332effective number of codons statistics 320EIN2 gene 111einverted 310electrokinetic injection, capillary electrophoresis
212electroosmosis, capillary electrophoresis
212–213, 215electroosmotic pumping, DNA sequencing 151electrophoresis 213– capillary 183, 211–222, 328
– capillary sieving 215– DNA sequencing 149– free solution 217– gel 187– gel, DNA sequencing 151– two-phase 51electrophoretic karyotypes, Saccharomyces
cerevisiae 21electrospray ionization 68, 214– mass spectrometry 189Embden-Meyerhof-Parnas pathway genes 13EMBL 397, 462– see also European Molecular Biology
LaboratoryEMBL Data Library 354EMBOSS 299embryo, planed 562embryo research 512embryonic stem cells 565EMP 445EMSY 92endosymbiont hypothesis 61ENSEMBL 355, 361– database 240EnsMArt 361Entrez 345, 398, 465, 578environmental genomics 45–57, 584environmental surveys 46enzymatic processing, Proteomics 197ENZYME 446, 476Enzyme Comission 398enzymes 461– metabolic 433– production, Bacillus subtilis 15– with novel properties 53EPD 462epidemology studies 510EPO Opposition Division 547eQTL 121equicktandem 310Escherich, T. 5Escherichia coli, model organisms 3, 284, 307,
448, 476, 492– K12 6, 359, 407–408– minimum set of genes 10– nontoxic strains 9– O157 7– physical genetic map 7– restriction map 7– systematic sequencing 7– toxic strains 9ESHG 515, 520ESI see electrospray ionizationEST, plants see expressed sequence tag
596 Subject Index
EST databases 329est2genome 304, 306Estonia 524– biobanks 538etandem 310eternal life 562ethical aspects, genome research 509ethical fallout, biobanks 540ethical framework , tissue or genetic research
511ethical guidelines 510ethical issues 544ethical norms 509ethical obligation of international collaboration
518ethical principles, general 510Ethics and Governance Framework 528ethics committee 510, 520ethics review 524ETR gene 111EU biotechnology programs 21eubacterium 4eukaryotic genomes, counterparts, plants 63eukaryotic organisms, evolution 38European Parliament 547EUROFAN 25eurokariotic genomes, Bluejay 411European Bioinformatics Institute 321European Convention on Biomedicine and
Human Rights 512European DGP 35European Directive 527European Directive on the Legal Protection of
Biotechnological Inventions 514European Molecular Biology Laboratory 64– see also EMBLEuropean Patent Convention 514European Patent Office 546European Society of Human Genetics 520European yeast genome project 580European Convention on Human Rights and
Biomedicine 520exception for professional disclosure 515exon trapping 115ExPASy 386experimental design – DNA microarrays 244– microarrays 417–419expressed sequence tag 64expression, cell-free 284expression levels 500expression profiles 418expression systems 277– insect cells 277
extensible markup language 405– see also XMLextreme thermophiles 49
FF plasmid 114F2 population 106factor V Leiden 95factories, large scale 582faktor X 278false positives, microarrays 423familial adenomatous polyposis 93familial arrhythmias 96familial dilated cardiomyopathy 96FAP see familial adenomatous polyposisFASTA 333, 384federated database systems 437, 465fenfluramines 376fermentation, foodsupply, Bacillus subtilis 15fetuses 512filtering strategy, nanopore 164FIMM 446First Genetic Trust 542Fisher volume ratio 341Fisher’s LSD adjustments 423FK506 binding protein 265flagging of amibigious spots, DNA microarrays
252flap endonucleases 20Flicker 326flow cytometry 581fluorescein dye, DNA sequencing 133fluorescence detection, capillary electrophoresis
214fluorescence dye chemistry, DNA sequencing
131fluorescence energy transfer, single molecule
detection 163fluorescent biochemistries 573fluorescent labels, multi-color 235fluorescent tags, DNA microarrays 244fluorogenetic reagents, capillary electrophoresis
214fluorophore blinking, DNA sequencing 160fluorophore characteristics, DNA sequencing
132fly, model organisms 492FlyNets 446flyview 36fold-space 283– protein 273Food and Drug Administration 511foreign DNA, Campbell-like integration 12formamide 249
597Subject Index
forseeable uses, biological samples 553forward genetics, plants 72forward primers, DNA microarrays 229founder effect 87four-color discrimination, DNA sequencing 136Fourier-transform cyclotron mass spectrometer
332fractionation procedures, Proteomics 186frameshift mutation 11Frankenfoods 583free solution electrophoresis, capillary
electrophoresis 217–218Freedom of Research 565French Conseil Consultatif National d’Éthique
pour les Sciences de la Vie et de la Santé 529French Hospital Federation 547French Ministries of Public Health an Research
547French National Consultative Ethics Committee
523French National Consultative Ethics Committee
for Health and Life Sciences 525frequency doubled solid-state
neodymium:yttrium-aluminum-garnet laser144
FT-ICR 198full-length cDNA sequences 353functional assignment 580functional genomics – Bacillus subtilis 13– consortium 13– plants 72future, life science research 573–584fuzznuc 315fuzzy analyzer 482
GG-protein coupled receptors 362G-protein fusion system 266–267GA1 gene 111GAI gene 111gain-of-function 90Gal4p 262b-galactosidase complementation assay 269gamete 564gas chromatography 70gas phase, mass spectrometry 189GC see gas chromatographyGC content – Caenorhabditis elegans 33– periodicity, Saccharomyces cerevisiae 24GCC Wisconsin package 344GD.pm 385gel electrophoresis
– 2D 187– DNA sequencing 151Gellab II+ 324gels – DNA sequencing 146– Proteomics 324, 326GelScape 326Genaissance Pharmaceuticals 542GenBank 332, 354, 397, 462– XML 412gene classes, Bacillus subtilis 13gene clusters, polyketide synthase 54gene deletions, genome-wide 261gene density, Archaeoglobus fulgidus 19gene duplication 11– Saccharomyces cerevisiae 24Gene Expresseion Database 358gene expression 415– body map 369– plants 64, 66gene families – Bacillus subtilis 11– paralogous, Archaeoglobus fulgidus 19gene knockout, tandem 434Gene Logic 369Gene Ontology 361, 428, 481Gene Ontology Consortium 254Gene Ontology database 336gene orders, conserved, positional mapping 116gene orthologs 366gene prediction, Caenorhabditis elegans 32gene profiling 417gene regulation 461– Drosophila melanogaster 36gene regulatory networs 499gene silencing, virus-induced 76gene therapy 87gene therapy research 510gene transfers, horizontal 49gene variation 373GeneChip 120– Affymetrix 9– microarrays 9GeneMark 118, 384GeneNet 446, 462general ethical principles 510genes 111– catalase 11– cloning 277– human 433– minimum set 10– multifunctional 8– sh2-al 116– stress-induced, plants 66
598 Subject Index
genes controlling flowering time 117genes of completely unknown function, Bacillus
subtilis 16GeneScan 118, 384GeneSmith 18GeNet 447genethics 513–516Genethon 115genetic activities, consequences 563genetic algorithm 370genetic analysis, Drosophila melanogaster 37genetic basis of human health and disease 540genetic discrimination and stigmazation 538genetic diseases, cures 541genetic heterogeneity 86genetic information 540– implications for family members 541– misuse 551– predictive quality 541genetic initiatives, large scale population 552genetic linkage map 61genetic map – comprehensive, Arabidopsis thaliana 26– Saccharomyces cerevisiae 21genetic map unit 61genetic mapping 120–122genetic material, special status 526genetic predisposition 357Genetic Privacy Act 530genetic redundancy, internal, Saccharomyces
cerevisiae 24genetic research 509, 540– ethical framework 511– participation 550genetic risk factors 509genetic screening 365–366genetic technologies, acceptable use 541genetic testing, human genome 86genetically directed representational difference
analysis 112genetically modified foods 71GeneTrust 543GENIE 36genome – $1000 159–164– Bacillus subtilis 11– partly-recovered 54genome annotation, plants 63Genome Browser 355genome characterization, Archaeoglobus fulgidus
18genome features, Bioinformatics 384genome-mapping approaches 105genome project
– Brassica 27– Caenorhabditis elegans 31– human see humangenome research 573– comparative 584– ethical aspects 509genome research-related hardware 575genome sequences, complete 3Genome Sequencing Center 580genome size, Archaeoglobus fulgidus 17genome structure, mosaic 50genome synteny study 366genome-wide arrays, DNA microarrays 240genome-wide gene deletions 261genomic microheterogeneity 48genomic resources, Drosophila melanogaster 36Genomics – comparative 365–366– environmental 584Genomics Collaborative 542GEO 420Gepasi 479germ-line interventions 513German Catholic Conference of Bishops 561German Hygiene Museum 568German National Ethics Advisory Board 561German National Ethics Council 516German Nationaler Ethikrat 529German Research Foundation 529German Senate Commission on Genetic
Research 523GFT-NMR 285gift relationship, genetic material 527Gilbert 129GLIM 110Glimmer 118, 384global public good, genetic resources 549glucose, plants 67glycosylation 182Gmendel 110GNU Public License 439GO see Gene Ontology databaseGO annotations 336– biological processes 337– cellular component 337– molecular function 337gobalization 511God 564Golub’s weighted voting method 425GoMiner 428GON Cell Illustrator, Petri net tools 478governance of biobanks 551government funding 542GPCR 373
599Subject Index
graph abstraction 434–435– edges 435– nodes 435graph-clustering methods 498graph description, chemical 436graph theoretical approach 473graphical user interface 344graphs 462, 496–498– metabolic networks 463GRAS 15gray holes 8green revolution genes 117Gribskov statistic 319GRID 447, 578group consent, biobanks 538growth factor 94GSRMA 422
H1H-1H inter-nuclear distance 286Hac1p 269Haemophilus influenzae, model organisms 17Haldane’s mapping method 109halophilic archaea 49hanging-drop vapor diffusion 278haplotype 89– analysis 120– map see human genomeHAPMap consortium 509hapmap project 89–90hardware, genome research-related 575Harmonization 511harmonized ethical frameworks 511Harvard mouse 548hash tables 399hay bacterium 10health card 97health emergencies 519Health Sector Database, Icelandic 553Heisenberg’s Uncertainity Principle, DNA
sequencing 160Heliobacter pylori, model organisms 17, 262, 451,
492helium-neon laser 144Helsinki Declaration 512hemiascomycete yeast genomes 25hempchromatosis 86hereditary non polyposis colon cancer 86, 93hereditary sensory and autonomic neuropathy
85hERG gene, expression pattern 370heritability 83heterochromatin, Drosophila melanogaster 35heuristic scoring schemes 331
HGP 537HGVbase 357hidden Markov models 323, 336– Bioinformatics 305, 334hierarchical biochemical systems 482hierarchical clustering 252, 426high-density DNA arrays 575high-level protein expression 284high-molecular-weight DNA, purifying 51high-molecular-weight proteins, capillary
electrophoresis 215high performance computing 577high-performance liquid chromatography 220high-resolution maps, plants 62high resolution NMR 273high-resolution solution NMR 282– cryogenically cooled probes 285– deuteration 284– hardware 285– labeling 284– micro-probes 285– relaxation decay 284– signal-to-noise ratio 285– size barrier 283– soluble parts of proteins 284– super-high-field instruments 285– target selection 282–283high-throughput DNA synthesis 230–232– hardware 575– operational constraints 231– quality-control 232– scale and cost of synthesis 230–231– synthesizers 231high-throughput facilities 361high-volume tissue banking efforts 542Hinxton Genome Campus 299Hippocrates 537histidine kinases 20HIV Molecular Immunilogy Database 447HIV/AIDS 512HLAB*5701 polymorphism 376HMMER 363HMMTOP 340HNPCC see hereditary non-polyposis colorectal
cancerholes, gray 8homeostatic 494HomoloGene 120homologs – MutL 12– MutS 12horizontal gene transfers 49horizontal transfer of DNA 321Howard Hughes Medical Institute 118
600 Subject Index
HOX genes, Drosophila melanogaster 35HOX Pro 447HPLC 232HPRD 440, 447HREC 522Hs1/pro-1 gene 111HSN2 85HTML 385, 438HTML interface 466hubs 498HUGO 538– Ethics Committee 550– Statement on DNA Sampling: Control and
Access 515human, perfect 563human biological material, ownership 538human body, undesirable commodification 542human cancercell lines 373human clone 562human dignity 513, 563human disease networks 35human diseases 357human genes 433– homologs, Saccharomyces cerevisiae 25human genetic databases 519Human Genetics Commission 543human genome 538– allelic heterogeneity 87– altered proteine structure 88– carrier screening 86– Darwinian selection 83– DNA re-sequencing 90– genetic testing 86– haplotype map 90– inherited diseases 84– linkage disequilibrium 89– locus heterogeneity 86– multifactorial diseases 87– mutations 82– non-coding RNA 82– polygenic diseases 87– polymorphisms 88– protection 528– protein coding genes 81– reference sequence 81– risk assessment 86– spontaneous mutations 91– tissue-specific cDNA libraries 84– variant sites 88Human Genome Mapping Project 321Human Genome Organization 513Human Genome Project 81, 339, 509, 537Human Genome Sciences 580human heliotype mapping project 357
human neurofibromatosis type 1 gene 117human reproduction cloning 513Human Research Ethics Committee 522human rights 513Human Transcriptome Project 358Humboldt University 565humic substances 46Huntington disease 84hybrid Petri nets 474hybridization – DNA microarrays 235– DNA sequencing 152– kinetics, DNA microarrays 250– strategy 163–164hydrodynamic injection, capillary electrophoresis
212hydrogen-bond distance restraints 286hypercolesterolemia 95hyperekplexia 114hypertension 95hyperthermophilic organism 19hypertrophic cardiomyopathy 95hypothesis driven research 223
II2 gene 110Icarus language 465ICAT experiments 211ICBS 448Iceland, biobanks 538Icelandic Action Biobanks 522Icelandic Health Sector Database 553Iconix Pharmaceutals 369IFF ultra-zoom gels 324IMAGE Consortium 355ImageMAster 2D 324imaging mass spectrometry 187imaging technologies 581immediate property rights, genetic material 528in-gel digestion procedure 196in silicio biology 579in-vitro expression 277InBase 447INCLUSive 429Incyte 454Indigo 448indirect labeling method, DNA microarrays 248individual bases, identification, DNA sequencing
156individualized medicine 510informal consent, blanket 519Informax 345infrared laser semiconductor diodes 144infusion mode, continuous, mass spectrometry
601Subject Index
198inherited diseases, human genome 84injection, capillary electrophoresis 212ink-jet devices 234ink-jet spotting, DNA microarrays 224inkjet technology, DNA microarrays 241insect cells, expression systems 277insertional mutagenesis 73Institut Curie 546Institute for Systems Biology 361Institute Gustave Roussy 546insulin like growth factor II receptor 94IntAct 338, 440, 448intact proteins, analysis 203intact RNA, DNA microarrays 246integrated handheld devices 581integrative metabolism system 462intellectual property, genetic resources 544–551inter-gel comparison, Proteomics 326Interact 448interaction, protein-protein 496interaction database 433–434, 440interaction information – abstraction 435–437– specific affinity 434interaction networks 433interaction screening 262intergenic regions, Saccharomyces cerevisiae 23Interleukin 4 366International Bioethics Committee 515international collaboration, etical obligation 518international declaration on human cloning 515International Declaration on Human Genetic
Data 518international stewardship, genetic material 526interologs 339InterPro 336introns 375– Saccharomyces cerevisiae 23inducements to participate in genetic research
550ion-channel proteins 373ion trap, mass spectrometry 193ion-trapping, mass spectrometry 191ionisation, mass spectrometry 188IRDye, DNA sequencing 132Ire1 signaling system 268–269iron dependend repressor proteins 20iron metabolism, Bacillus subtilis 15IS elements, Archaeoglobus fulgidus 18isoelectric focusing, capillary electrophoresis 215isoelectric point, Archaeoglobus fulgidus 19isoenzymes 371Israel 529
ISYS 465iUDB 469IUPAC single letter code 436
JJapanese Bioethics Committee of the Council for
Science and Technology 523Jarnac 479Java 3D 578Java applet 439Java application 465JAVA-based Apache software 406Java programming language 576JDBC 465JDesigner 479Jemboss 321JenPep 448JOIN operations 467Jurkat cells 255
kk-means clustering 426K-nearest neighbors 370k-tuples, Bioinformatics 305karyotypes, electrophoretic, Saccharomyces
cerevisiae 21KCNE1 371KCNE2 371KCNQ1 see KQT-like voltage-gated potassium
channel-1KDD 472KEGG 338, 359, 449, 462kinases 363, 367– phylogenetic classification 367Kluyveromyces, model organisms 25knockout 73knockout experiments 496knowledge-based simulation 462Kohn Molecular Interaction Maps 449Kosambi’s mapping method 109KQT-like voltage-gated potassium channel-1 371Kyoto Institute of Chemical Research 338
LL-tyrosine ammonia-lyase 471lab-on-a-chip technology 246labeling, DNA microarrays 247–248labeling chemistry, capillary
electrophoresis 214labeling strategy, DNA sequencing 142–143laboratory organization 581lane detection, DNA sequencing 153lane trace profiles, DNA sequencing 155lane tracker, DNA sequencing 154
602 Subject Index
large B-cell lymphoma, diffuse 245large-scale computational analysis 493large-scale data production 492large-scale database 491large-scale factories 582large-scale interaction maps 262large-scale population genetic initiatives 552laser 144laser-capture microdissection 67, 185laser technology 573LaserGene 334, 344LC columns, mass spectrometry 200LC-MS 232LCDR/MerMade 231LCM see laser-capture microdissectionLDA 425LDL receptor gene 95LDLR gene 95left-over samples 518legal trusts 543leptin 343leukemia – lymphoblastic 255– myeloid 255– promyelocytic 373leukemia-like disease 87LexAp 262licensing fees 545LiCor 4200 Global system 576lifetime discrimination, fluorescence, DNA
sequencing 138Limma 425LIMS 420linear amplification method 247linear discriminant analysis 370linkage disequilibrium mapping 120linkage map – algorithm 110– construction 108– distance between markers 108– DNA markers 108– map construction 109– map distance 109– single-locus analysis 108– three-locus analysis 109– two-locus analysis 109linkage segments, rice 116lipoprotein receptor 3665-Lipoxygenase 373liquid chromatography, mass spectrometry 189liquid handling robots 279Listeria monocytogenes, model organisms 12liver, metabolism 371local sequence similarity, Bioinformatics 332
localized ungapped alignments, Bioinformatics305
LOCkey 339locus heterogeneity, human genome 86LocusLink 357log ratio, regreession 422long coding repeats, Archaeoglobus fulgidus 18long oligonucleotide, DNA microarrays 250long-patch mismatch repair system 12long QT syndrome 96long-term viability of biobank initiatives 551Longitudinal Study on Aging 538loss-of-function 90loss-of-interaction mutants 264LOWESS 252, 422lung cancer 91Lutefisk 195lymphoblastic leukemia, acute 255
MM. jannaschii see Methanococcus jannaschiiM. thermoautotrophicum see Methanobacterium
thermoautotrophicumMacVector 344MAD phasing 274, 281– cryogenic data collection 281– software packages 281MADBOX gene 111MAExplorer 420MAGE-ML 419MAGE-OM 420MAGPIE 228, 383, 578– agarose gel simulation 403– analysis tools summary 396–367– Assembly Coverage 399, 402– Base Composition 399– coding region displays 391–395– contiguous sequence 394– expanded tool summary 397–399– expressed sequence tags 394–395– function evidence 396–399– inter-ORF regions 392– manual annotation 387– marker mobility data 404– ORF close-up 395– ORF coloration 392– ORF evidence 391–394– ORF traits 393– overlapping contigs 390– poorly covered regions 402– potential overlaps 394– purine composition 400– rare codons 396– repeats 400–401
603Subject Index
– restriction enzyme cuts 402– sequence ambiguities 401– similarity display 398– states 387– stop codons 393– vector sequence 404– whole project view 387maize, model organisms 28malaria parasites, model organisms 476MALDI 580– see also matrix assisted laser-desorption
ionizationMALDI-TOF 152– mass spectrometry 189MALDI-TOF MS 68Mammalian Gene Collection 355map expansion 107map unit, genetic 61Mapmaker 110marine ecosystems 48marine plankton 48marker genes 47– taxonomic 53market exclusivity, genetic resources 544Markov model, hidden 305, 323, 336markup language, Petri nets 478Martinsried Institute of Protein Sequences 22Mascot 331Mascot database searching tools 193mass action law 475mass fingerprinting, Proteomics 329mass spectrometer, cyclotron 332mass spectrometric analysis 211mass spectrometry 181–209– anion-exchange prefractionation 202– Bioinformatics 193–195– capillary electrophoresis 214– chemical noise 199– coeluting peptides 200– collisionally induced dissociation 192– continuous infusion mode 198– databases 194– electrospray ionization 189– fully automated systems 201– gas phase 189– instrumentation 191–193– ion trap 193– ion trapping 191– ionisation 188– LC-MS-MS 199–200– liquid chromatography 189– lower-intensity peptide ions 199– m/z values 191– MALDI 188
– MALDI-TOF 189– monolithic columns 200– MS-MS analyses 198– MS-tag 195– multidimensional LC-MC-MS 201–204– peak suppression 196– peptide analysis 191– protein-degradation methods 191– Proteomics 328– quadrupole instruments 189– quad-TOF instruments 199– revised tandem affinity purification procedure
202– sample introduction methods 188– sample processing 190–191– small-bore reverded phase LC columns 200– tandem in space 191– tandem in time 191– tandem MS data sets 194– time of flight 189– TOF 189– TOF-TOF-instruments 199– triple quadrupole 191– ultra-long chromatographic gradients 200mass spectroscopy 262mathematical modelers 492MatLab 482matrix assisted laser-desorption ionization 68mats, microbial 50Max Plank Institute in Cologne 566Maxam 129MBEI 422MCA methodology 482MDB 449MDR see multidrug-resistance proteinsMDR1 gene 117Medicago trunculata, model organisms 64medical genetics 538Medical Research Council Operationsl and Ethical
Guidelines on Human Tissue and BiologicalSamples for Research 529
medicine, individualized 510– see also pharmacogenomicsMedline 578MEGABLAST 401Melanie 4 324melting temperature, DNA microarrays 249membrane proteins 282membrane yeast two-hybrid systems 265–269Meme 344Mendelain patterns 509Mendelian diseases 84mental disorders 512merging algorithm 251
604 Subject Index
mesophilic crenarchaeota 53metabolic data integration 481–481metabolic enzymes 433metabolic fingerprinting, plants 70metabolic networks 461– graphs 463metabolic pathway 354, 461–490, 499– conceptual model 469– database 463– database integration 465–472– database systems 463–465– direct reaction graph 463– editor 481– online maps 463– secondary, plants 64metabolism in the liver 371metabolism pathways 360metabolite fluxes 484metabolite profiling, plants 70metabolomics 291– plants 70Metabometrix 360metabonomics 291, 360MetaCyc 445MetaCYG 359metagenomic 45metagenomic libraries 48metazoan development 34Methanobacterium thermoautotrophicum, model
organisms 16–17Methanococcus jannaschii, model organisms
16–17MGD see Mouse Genome DatabaseMGED 254, 419MHCPEP 449MIAME 254, 419, 576mice, model organisms 581micellar separation, capillary electrophoresis 217micelle concentration, critical 217Michaelis-Menten equation 476micro batch under oil 278micro dialysis 278Microarray Gene Expression Data Society 254microarray sample pool 252MicroArray Suite 421microarray technologies 416–417microarraying robots, DNA microarrays 234microarrays 415– apot quality 421– array-level quality 421– cDNA 416–417– class comparison 423–425– class discovery 418– class prediction 418, 425–426
– clustering algorithms 426–428– data management 420– design phase 419– differently expressed genes 423– dual-labeled 417– experimental design 417–419– false positives 423– feature selection 425– gene level summaries 422– general analysis 420–421– image quality 421–422– noise 425– normalization 422–423– oligonucleotide group 417– pin group 416– preprocessing 421– robust mulitchip average 422– scaling 423– searching for meaning 428–429– significant analysis 424– single-labeled 417– spatial bias 422– standards 419–420– validation of clusters 427– within-class variation 423microbial communities 46Microbial Genome Program 17microbial mats 50microdissection, laser-capture 185microfluidic channel gels,
DNA sequencing 146microheterogeneity, genomic 48microorganisms, uncultivated 48microRNA 37microsatellite instability pathway 94microscale chromatography 183microscopy equipment 576Ministries of Health in Canada 546MINT 338, 440, 450MIPS see Martinsried Institute of Protein
SequencesMIPS Comprehensive Yeast Genome Database
450mismatch repair genes 94mismatch repair system, long-patch 12mismatched hybrids, DNA microarrays 250mispairing of bases, DNA microarrays 249mitochondrial chromosome 61mitochondrial genome 61mitochondrion 60MLH1 94mmCIF 436MMDB 450MMR see mismatch repair genes
605Subject Index
MMR function 94mobility correction, DNA sequencing 156MOBY CENTRAL 410model organisms 3– Apium graveolens 64– Aquifex aeolicus 17– Arabidopsis 63, 110, 239– Arabidopsis thaliana 4, 25, 59, 411– Archaeoglobus fulgidus 3– Asparagales 64– Bacillus subtilis 3, 448– barley 110, 122– Brassica 26– Brassica spp. 61– budding yeast 117, 440– Caenorhabditis briggsae 32– Caenorhabditis elegans 4, 29–30, 37, 218, 262,
354, 447, 581– Candida albicans 228– Cenarchaeum symbiosum 48– comparative analysis 38– corn 64– Corona virus 354– Deinococcus radiodurans 17, 220– Desulfotalea psychrophilia 19– Drosophila melanogaster 4, 29, 34, 37, 262, 354,
446– Escherichia coli 3, 284, 307, 448, 476, 492– Escherichia coli K12 359, 407–408– evolution of eukaryotic organisms 38– fly 492– Haemophilus influenzae 7, 17– Heliobacter pylori 17, 262, 451, 492– Kluyveromyces 25– Listeria monocytogenes 12– maize 28– malaria parasites 476– Medicago trunculata 64– Methanobacterium thermoautotrophicum 16–17– Methanococcus jannaschii 16–17– mice 581– Mus musculus 81, 354– Mycoplasma genitalium 17– Myobacterium smegmatis 360– Nicotiana attenuata 67– Ocimum basilicum 64– Oenothera 61– Oryza sativa 64– Physcomitrella patens 73– Populus tremuloides 64, 122– Pseudomonas aeruginosa 200, 318– Pyrobaculum aerophilum 17– Pyrococcus furiosus 17– Rattus norvegicus 354
– rice 60, 122– Saccharomyces cerevisiae 20, 37, 201, 261–262,
317, 327, 439– sea urchin 492– soybean 64– spinach 69– Staphylococcus aureus 354– strawberry 122– Streptomyces lincolnensis 51– Streptomyces lividans 53– Sulfolobus solfataricus P2 384, 399– Thermotoga maritima 284– tomato 110– Vibrio harvey 288– worm 492– Yarrowia 25– yeast 8, 428, 492modified nucleoside triphosphates, DNA
sequencing 130moesin 256molecular biology 492molecular chaperones 11molecular evolution 363molecular markers 61, 106–108molecular networks – conceptual models 466– data integration 467– model extraction 471–472– model-driven reconstruction 466molecular profiling 542mono-isotopic standards, Proteomics 329monocots, plants 64monolithic columns, mass spectrometry 200moral competence 568morality clause, genetic patents 547Morgan 109Morgan’s mapping method 109Mori, H. 8morphological markers 106mosaic genome structure 50mounting, protein crystallography 280Mouse Genome Database 117MPW 481MS-MS-ToF 580MudPIT see Multidimensional Protein
Identification TechnologyMudPIT experiments 211mulitchip average, microarrays 422multi-color fluorescent labels, DNA microarrays
235multi database systems 465multicellularity 30multicolored multiplexed DIGE 324multidimensional protein identification 69
606 Subject Index
Multidimensional Protein IdentificationTechnology 201
multidrug-resistance proteins 372multifactorial cardiovascular disease 96multifactorial diseases, human genome 87multifunctional genes 8multiparametric fitting 323multiple wavelength anomalous dispersion 274multiplexed DIGE, multicolored 324Mus musculus, model organisms 354mutagenesis, insertional 73mutant phenotypes, Drosophila melanogaster 34mutants, collection, Bacillus subtilis 14mutations 90– frameshift 11– human genome 82MutL homologs 12MutS homologs 12Mycoplasma genitalium, model organisms 17myeloid leukemia, acute 255myGrid 321Myobacterium smegmatis, model organisms 360myosin-binding protein C 95myosin heavy chain 95Myriad Genetics 546MySQL 420
NNAE 479, 482naive Bayes classifier 427naive graph 473nanopore filtering, DNA sequencing 161nanopore filtering strategy, single molecule
detection 164nanospray experiment, static, Proteomics 198nanotechnology, biobanks 540National Bioethics Commission of the United
States 524– see also NCBINational Institute for Biotechnology Information
62National Institute of Environmental Health
Sciences 369National Institute of Health 546national jurisdiction, DNA banking 522National Statement on Ethical Conduct in
Research Involving Humans 522natural-product biosynthesis 53natural selection, Bacillus subtilis 12NCBI 62, 118– see also National Institute for Biotechnology
InformationNCBI ASN.1 435NCBI GI identifier 398
NCBI MMDB data specification 436NCBI-nr 329NCBL 398nearest neighbor classification 426Needleman-Wunsch, Bioinformatics 301nervous systems, Caenorhabditis elegans 30NetBiochem 450NetOGlyc 338NetPhos 338Netwinder 576networks, metabolic 461, 463networks of objects 469neural network analysis, Bioinformatics 334neural networks 323– Proteomics 338newcpgreport 313newcpgseek 314Nicotiana attenuata, model organisms 67NIH study group 516NMR 70– determination of protein fold 289– post-structural characterization 287– pre-structural characterization 287– protein crystallography 282–290– suitability screening 288–289– see also nuclear magnetic resonanceNNPSI 339NOESY 286non-coding repeats, Archaeoglobus fulgidus 18non-coding RNA, human genome 82non-crosslinked polymers, capillary
electrophoresis 216non-electrophoresis methods, DNA sequencing
152non-fluorescence methods, DNA sequencing
152–156non-messenger RNA, small 20non-monetary benefits, genetic resources 550non-yeast hybrid systems, yeast two-hybrid system
269nonownership language, genetic material 528nontoxic strains, Escherichia coli 9normalization, microarrays 422normalization of the treatment of DNA 530norms, ethical 509Northern blots 249NtrC/NifA family 14NubGp 266nuclear magnetic resonance 70, 273– see also NMRnuclease 269nucleoside triphosphates, modified, DNA
sequencing 130
607Subject Index
nucleotide, chain-terminating, DNA sequencing130
nucleotide sequence pattern, Bioinformatics314–315
Nuffield Council on Bioethics 545Nuremberg Code 512
OOak Ridge National Laboratory 363OAT see organic anion-transportersOATP see organic anion-transporting
polypeptidesobesity 87OBJ 578object fusion 466–467object oriented concepts 469object oritented approaches 462Occam’s razor 422Ocimum basilicum, model organisms 64OCT see organic cation transportersODBC 465ODE 479, 482ODE-NAE 481OECD report 546Oenothera, model organisms 61oil gland secretory cells, plants 64oligonucleotide arrays, DNA microarrays 229oligonucleotide group, microarrays 417oligonucleotide primer, DNA sequencing 143oligonucleotide sequences, DNA microarrays
228oligonucleotides – bias 12– design, DNA microarrays 242– long 250OMG 469OMIM see Online Mendelian Inheritance In
Manone-hybrid system 264Online Mendelian Inheritance In Man 117Onto-Express 254ontologies 361, 428OntoMiner 428ooTFD 451open source effort, Bioinformatics 321open source software 254operation UNION 468optical tweezers 17OQL 466, 470Oracle 478ORDB 451ordre public, genetic patents 547organ transplantation 512organic anion transporters 372
organic anion-transporting polypeptides 372organic cation transporters 372ornithine decarboxylase 471Oryza sativa, model organisms 64osmotic stress, Bacillus subtilis 11osteoblasts 364osteoclasts 364osteoporosis 364osteoporosis gene 364ovarian cancer 92OWL 329, 332ownership, genetic material 526ownership of human biological material 538b-oxidation enzymes 19
PP450 isoenzymes 371p53 261– gene 366PA SubCell server 339PAC see phage P1-based artificial chromosomesPAGE 232PAM 426Paracel GeneMatcher 384, 577paralogous gene families, Archaeoglobus fulgidus
19parametric bootstrap clustering 427paraoxonase 1 / paraoxonase 2 gene 97Parkinsons’s disease 566partly-recovered genomes 54patent databases 544patent-infringment ligitation 547patent law 545patent policy 548patent reforms 547–548patenting 527patenting of higher life forms 548patents – DNA based 545– genetic resources 544pathway 93– metabolic 461–490pathway genes, Embden-Meyerhof-Parnas 13patient access to new technologies 542patients confidentiality 525patients rights 516PATIKA 451pattern-based – Proteomics 335– sequence motifs 335patterns, detection 311PC-style computers 575PCR failures, DNA microarrays 230
608 Subject Index
PCR methods, quantitative 358PCR products, DNA sequencing 141PDB 436PDQuest 324–325peak suppression, mass spectrometry 196PED, Petri net tools 477PEDANT 578penetrance 88pentose phosphate pathway 476peptide analysis, mass spectrometry 191peptide ions, mass spectrometry 199peptide mass fingerprinting 193– Proteomics 328peptides – coeluting, mass spectrometry 200– short, Proteomics 332PepTool 334, 341, 345perfect human 563perfect life 566Perl5 385personal information 513personal life 564personal rights 568PEST sequence 340Petri net model 473–479– virtual cell 486Petri nets 451, 462– applications 476– colored 474– examples 483– firing speed 475– hybrid 474– markup language 478– model construction 478– modules 481– self modified 474– simulation tools 479–483– times 474– tools 477Pfam 341– database 336PGRL 110phage display 441–454phage family 6phage P1-based artificial chromosomes 62Pharmacogenomics 509pharmacovigilance 376phasing, protein crystallography 281phenotyping screening limits, positional cloning
112Phloem tissues, plants 64Phoretix 2D 324PhosphoBase 451phosphoenolpyruvate-dependent systems 11
phosphorylation 182, 436photobleaching, DNA sequencing 160photolithography, DNA microarrays 223, 241photoperiod sensitivity 117PHRAB 31PHRED 31, 158phylloplane 10phylogenetic analysis 366phylogenetic classification, kinases 367phylogenetic markers 49phylogenetic reconstructions 49Physcomitrella patens, model organisms 73physical genetic map, Escherichia coli 7physiological research 576Pi-h gene 110Pi-ta2 gene 110pI/MW measurements 326picoplancton 49PICS 286PIMdb 452PIMRider 451pin group, microarrays 416pipetting robots 576PIR 332, 462Pise 321plankton, marine 48plants – AnnAt1 69– barley microarray 66– Calvin cycle enzymes 71– counterparts in other eukaryotic genomes 63– defense against herbivores 67– elevated ploidy levels 60– EST 64– forward genetics 72– functional genomics 72– gene expression 64, 66– genes in rice 66– genome annotation 63– genome structure 60– glucose 67– greening of leaf tissue 69– high-resolution maps 62– loss-of-function mutants 73– metabolic fingerprinting 70– metabolite profiling 70– metabolomics 70– monocots 64– multidimensional protein identification 69– multivariate data analysis 71– oil gland secretory cells 64– Phloem tissues 64– physical map 62– pollen 67
609Subject Index
– preperation of samples 70– primary metabolism 69– protein profiling 68– Proteomics 68– putative gene 63– reverse genetics 73– rice genome 64– ripening-inhibitor 72– rose petals 65– secondary metabolic pathways 64– secretory pathway 63– sequence-indexed T-DNA insertion-site
database 73– stress-induced genes 66– sugar signal transduction 67– synteny 64– TILLING 76plasmid DNA vectors 62plasmid purification kit, DNA sequencing 141plasminogene-activator inhibitor gene 96plasmon resonance, surface 163plastid 60plastid chromosome 60plastid genomes 583plastid transit peptides 28Plato 537ploidy levels, elevated, plants 60plus/minus method, DNA sequencing 129PML/RAR chimeric gene 373PNG 385PNK 478PNML 478pollen, plants 67poly(ethylene oxide), capillary electrophoresis
216polydot 307polygenic diseases, human genome 87polyketide synthase gene clusters 54polymers, non-crosslinked 216polymorphisms 107– human genome 88– single-nucleotide 50polypeptides, anion-transporting 372polyposis phenotype 93pooled progeny 112poplar, model organisms 122population genetic research 537population studies 521Populus tremuloides, model organisms 64position-specific scoring matreices 336positional candidate method 85positional cloning 105, 110–115– analysis of DNA sequences 118– critical region 111
– genes in the critical region 115– genetic approaches 112– model organisms 117– phenotyping screening limits 112– physical approaches 113– region-specific markers 112positional mapping – comparative maps 116– conserved gene orders 116post-mortem use of samples 520post-synthesis arraying, DNA microarrays 224post-transcriptional gene-silencing 73post-transitional changes 436post-translational modifications 181postgenome era 8– Caenorhabditis elegans 33– Saccharomyces cerevisiae 25potassium channel 371Ppd genes 118pre-implantation diagnostics 567precipitant 278preconcentration step, Proteomics 187PredictProtein Web server 341prefractionation – anion-exchange 202– protein 187premature implementation of new technologies
542presumed consent to the storage and use of
health data 529prices of medical products 548primary interaction experiments 434primary metabolism, plants 69primer identification tool 229primer walking, DNA sequencing 139PrimerBank 358principal-component analysis 370, 426principle of reciprocity 525PRINTS 336prior art, Myriad Genetics 547privacy, biobanks 553privacy and confidentiality 538private-public funding of research, genetic
material 528pro-creation 566probe – cryogenically cooled 285– DNA 416– DNA microarrays 234, 240ProChart 452Prodom 341profound 331Prohibition of Cloning Human Beings 512prokaryotic diversity 45
610 Subject Index
prokaryotic genomes 404promoters 383promyelocytic leukemia, acute 373ProNET 452propanolol 374property rights for individuals, genetic material
528Proposal on Archived Biological Materials 528PROSITE 315, 393protases 363Protean 344Protection of the Human Genome by the Council
of Europe 528protein chips 328, 580protein coding genes, human genome 81protein crystallazation, structural genomics 278protein crystallization factories 577protein crystallography 273–274– additives 278–279– algorithms 287– attrition 275– automation of data collection 280– data base 282– data collection 279–281– expression 279– harvesting 280– mounting 280– mounting loop 280– NMR 282–290– phasing methods 281– removal of the affinity tag 278– robotic sample-mounting systems 280– seeding 279– seleno-methionine 274– serious challanges 281– well-diffracting crystals 275– X-ray detectors 274– X-ray diffraction data 280protein-degradation methods, mass spectrometry
191protein domains, predicting, Proteomics 341protein expression 284protein fold, determination, NMR 289protein fold-space 273protein identification 324–334– multidimensional, plants 69protein interaction, Proteomics 338protein interaction databases 433–459protein prefractionation 187protein production, structural genomics 276protein products, predicted, Caenorhabditis elegans
32protein profiling, plants 68protein-protein interactions 261, 496
protein quantity loci 121protein structures 273ProteinProspector 331proteins 203– bait and prey 496– disease-related 182– high-molecular-weight 215– purification 277– repressor, iron dependend 20– soluble parts 284– truncated tagged, Bacillus subtilis 13Proteobacteria 49proteolytic digests 332proteome 181– Bacillus subtilis 14– cumulative citation 181– historical definition 181Proteomics 10, 181–209, 273, 323–351, 413– 2D gel databases 328– analysis of subcellular fractions 186– bottom-up 204– clinical 187–188– complex samples 187– contaminating proteins 330– database quality 184– direct ms analysis 196–198– direct sequencing 332– dynamic range 187– enzymatic processing 197– experimental noise 330– Federated 2D gel databases 326– Federated Gel Database requirements 326– fractionation procedures 186– functional definition 181– fundamental issues 182– hyphenated tools 190– inter-gel comparison 326– interlaboratory variance 187– internally calibrated mono-isotopic standards
329– low-micron spatial resolution 188– mass fingerprinting software 329– mass spectrometry 328– ms fingerprint analysis 329– neural networks 338– pattern-based sequence motifs 335– peptide mass fingerprinting 328– plants 68– post-translated modification 338– preconcentration step 187– predicting 3D folds 342– predicting active sites 334–337– predicting bulk properties 334– predicting protein domains 341
611Subject Index
– predicting secondary structure 341–342– protein identification from 2D gels 324–328– protein interaction databases 338– protein interaction information 338– protein property prediction 334–345– reactor-based digestion 198– reduction of sample complexity 184– relationship to genomics 182– sample-driven 195–204– samples 184– sequence databases 332– sequence of short peptides 332– shotgun 201– signature sequences 334– silver staining method 197– single-cell 188– software tools 324– spectral patterns 188– spot (re)coloring 325– spot annotation 325– spot detection 325– spot editing 325– spot filtering 325– spot normalization 325– spot quantitation 325– static nanospray experiment 198– Sub-cellular location 339– validation step 186– whole cell 186– whole gel manipulations 326proteorhodopsin 49proto-oncogenes 90pseudomized 517Pseudomonas aeruginosa, model organisms 200,
318PSI 439PSI-BLAST 333PSIBLAST 342PSIMI 439PSORT 339PTS see phosphoenolpyruvate-dependent
systemspublic confidence and trust 552public consultation, biobanks 553Public Expression Profiling Resource 358public health research 516public involvement 522public opinion 540–541– genetic patents 548–549– genetic resources 543– genetic technologies 541public perception 583public trust 551– biobanks 553
PubMed 334, 345– identifiers 442pulldown assays 203pullulan, capillary electrophoresis 216purification, target protein, structural genomics
277purification procedure, mass spectrometry 202purifying high-molecular-weight DNA 51putative functions, Archaeoglobus fulgidus 19putative gene, plants 63Pyrobaculum aerophilum, model organisms 17Pyrococcus furiosus, model organisms 17pyrosequencing 152
QQDA 425QTL see qualitative and quantitative trait lociquadratic discriminant analysis 425quadrupole instruments, mass spectrometry 189qualitative and quantitative trait loci 105quality, microarrays 421QuantArray 252quantization 251Quebec 530– Myriad Genetics 546query languages 470quicksort algorithm 399
RR17 bacteriophage RNA 129RADAR 287radiation damage 91radiation hybrid map 114–115radioactive sequenzing 574Raelian sect 562random amplified polymorphic DNA 107random selfing 106random sequencing, complete genome sequences
17random shotgun sequencing, DNA sequencing
139randomply amplified polymorphic DNA 62RAPD see random amplified polymorphic DNARar-1 gene 111Ras 261rate constants 472rational drug design 273rational drug target discovery 290– alternate approach 290Rattus norvegicus, model organisms 354reactor-based digestion, Proteomics 198real-time analysis environments 577REBASE 315, 439, 452receptors 366
612 Subject Index
– G-protein coupled 362recombinant inbred lines 106regression, log ratio 422regulatory framework, biobanks 552regulatory networks 499– Archaeoglobus fulgidus 20RegulonDB 452regulons 498relationships with the general public, scientists
583relaxation decay, high-resolution solution NMR
284Relibase 452renal salt-reabsorption pathway 95Renew 478repair – mechanism 312– of double-strand DNA breaks 92repeat families, Caenorhabditis elegans 33repetitive DNA 60replication – Bacillus subtilis 12– termination of 8replication strands, leading, Bacillus subtilis 14repressed transactivator system 264repressor proteins, iron dependend 20repressor Tup1p, transcriptional 264reproductive cloning 562reproductive technologies 512research ethics 510resequencing, DNA sequencing 138, 140residual dipolar couplings 287restriction fragment length polymorphism 62,
107– see also RFLPrestriction map, Escherichia coli 7restriction mapping, Bioinformatics 315retinitis pigmentosa 86retrotransposons 116reverse genetic approaches 60, 365– plants 73reverse primers, DNA microarrays 230reverse two-hybrid system 263–264RFLP 62– see also restriction fragment length
polymorphismRH map 114rhodopsin 49ribonuclease 246ribosomal RNA 129– Saccharomyces cerevisiae 2316S-ribosomal RNA 12923S-ribosomal RNA 1295S-ribosomal RNA 129
rice – genes, plants 64, 66– model organisms 60, 122rice dwarf mutants, spontaneous 117rice linkage segments 116right not to know 512right to live 565right to withold 521rigth to know 514RIKEN Genomic Science Center 275, 355ripening-inhibitor, plants 72risk assessment, human genome 86risk factors, genetic 509risk of market failure 542RmySQL 420RNA – genes, Archaeoglobus fulgidus 18– intact 246– non-messenger 20RNA expression, antisense 76RNA genes, Caenorhabditis elegans 32RNA interference 73RNA isolation kits 246RNase 247robotic sample-mounting systems, protein
crystallography 280robots – liquid handling 279– microarraying 234– pippeting 576rose petals, plants 66Rosetta 289Royal College of Physicians Committee on Ethical
Issues in Medicine 516Rpg1 gene 116RPM1 gene 110RPP13 gene 110RUBISCO 202ruke-based systems 462
SS-PLUS implementation 419Saccharomyces cerevisiae– analysis by computer algorithms 22– ancient duplication 24– chromosome III 21– classical mapping methods 22– cosmid libraries 21– electrophoretic karyotypes 21– experimental system 20– gene duplications 24– gene expression profiles 25– genes 23– genetic map 21

613Subject Index
– homologs among human genes 25– in silicio analysis 23– intergenic regions 23– internal genetic redundancy 24– introns 23– Micrograph 21– model organisms 20, 37, 201, 261–262, 317,
327, 439– non-chromosomal elements 23– periodicity of the GC content 24– postgenome era 25– ribosomal RNA genes 23– sequencing strategies 22– subtelomeric regions 24– telomeres 22– transposeable elements 23SAGE 358saltstress response, Bacillus subtilis 15SAM 363, 424sample channels, DNA sequencing 147sample complexity, reduction, Proteomics 184sample-mounting systems, robotic 280sample preparation, DNA microarrays 246sample processing, mass spectrometry 190–191samples, post-mortem use 520Sanger 129Sanger Center 31, 321Sanger dideoxy sequencing 130sbSNP 357scaffolds 48scalable vector graphics 405–406scale-free graphs 501scaling, microarrays 423SCAMP 479ScanArray 235scanning, DNA microarrays 234scanning devices, confocal 235scheme integration 466schizophrenia 87scientific importance of the research 517scoring methods, Bioinformatics 300screening, genetic 365–366screening limits, phenotyping 112sea urchin, model organisms 492searching, Bioinformatics 363second harmonic generation laser 144secretory cells, oil gland 64segments, duplicated, Arabidopsis thaliana 29segregating population 105selection – Darwinian 83– direct cDNA 115– natural, Bacillus subtilis 12seleno-methionine, protein crystallography 274
SELEX-DB 453self determination 568self-determined organization of life 565self-modified Petri nets 476self-organizating maps 426self responsibility 565selfing 106sense RNA, co-suppression 76sensory networks, Archaeoglobus fulgidus 20separation buffer, capillary electrophoresis 214separation time, capillary electrophoresis 213separations, two-dimensional, capillary
electrophoresis 219–220SeqLab 344seqmatchall 307SEQSEE 334, 341SEQSITE 336sequence accession numbers 442sequence coverage, minimum, Archaeoglobus
fulgidus 17sequence databases – Bioinformatics 354– Proteomics 332sequence gaps, complete genome sequences 17sequence motifs 229– pattern-based, Proteomics 335sequence pattern, nucleotide 314–315sequence polymorphisms 106Sequence Retrieval System 397, 462– see also SRSsequence variations 354sequencers, DNA 575sequences – amino-modified oligonucleotide 228– cDNA see cDNA sequences– complete genome see complete genome
sequences– oligonucleotide 228– PEST 340– Shine Dalgarno 383– signature 334– splice site consenus 305– spliced cDNA 300– tentative consensous 118– unmodified oligonucleotide 228– vector 404sequencing – Drosophila melanogaster 35– Proteomics 332– random sequencing primer, universal, DNA sequencing
140sequencing strategy – Arabidopsis thaliana 27
614 Subject Index
– Archaeoglobus fulgidus 18– Saccharomyces cerevisiae 22SEQUEST 331SeqWeb 344severe acute respiratory syndrome 354severe ADR 376sh2-a1 gene 116SH3 domains 433shearing effects 51sheath-flow cuvette detector, capillary
electrophoresis 219Sherenga 195Shine-Dalgarno motifs 383, 393short peptides, sequence, Proteomics 332shuttle cosmid vector 54sib-mating 106sickle-cell disease 86–87signal averaging 331signal-to-noise ratio, high-resolution solution
NMR 285signal-transduction pathways 360, 499signature sequences, Proteomics 334silver staining method, Proteomics 197simple-sequence length polymorphisms 62simulators for metabolic networks 462simultaneous bi-directional sequencing, DNA
sequencing 144simvastatin 357Singapore Bioethics Advisory Ethics Committee
522single-base extension, DNA sequencing 152single-cell analysis, capillary electrophoresis
218–219single-gene defects 84single-gene disorders 510single-labeled, microarrays 417single-locus analysis, linkage map 108single molecule detection – DNA degradation strategy 161–162– DNA hybridization strategy 163–164– DNA sequencing 160– DNA synthesis strategy 162–163– fluorescence energy transfer 163– nanopore filtering strategy 164– surface plasmon resonance 163single-nucleotide polymorphisms 50, 88, 152,
354, 356single sequence repeat 107single strand conformational polymorphism 107single stranded DNA template 140siRNA 581siRNA gene knock-downs 261sitting-drop vapor diffusion 278slab gels, DNA sequencing 146, 149–151
slide substrates, DNA microarrays 242–243small-bore reverded phase LC columns, mass
spectrometry 200small non-messenger RNA 20SMART-IDEA 359SmartNotebook 286Smith, H. O. 18Smith-Waterman algorithm 363Smith-Waterman alignment,
Bioinformatics 303SNOMAD 422SNP see single nucleotide polymorphismsSNP Consortium 371, 509SNP data analysis 372SoapLab 321soil libraries 51soil sample 50solid state laser 144solid state NMR 282solubilization 277SOS recruitment system 266Southern Alberta Microarry Facility 241Southern blots 223SoyBase 453soybean, model organisms 64SPAD 453spatial blots 252spatial resolution, low-micron, Proteomics 188special status of genetic material 526spectral patterns, Proteomics 188spectrophotometers 576spectroscopy – fluorescence 70– infrared 70– ultraviolet 70SPIN-PP 453spinach, model organisms 69splice site consenus sequences, Bioinformatics
305spliced cDNA sequences, Bioinformatics 300split-ubiquitin system 266spontaneous rice dwarf mutants 117sporadic colon tumors 94spots – amibigious 252– Proteomics 325spotting concentration, DNA microarrays 230spotting pins, DNA microarrays 243SQL 465SRS 465, 578– see also Sequence Retrieval SystemSRS-6 386SSCP see single strand conformational
polymorphism
615Subject Index
SSLP see simple-sequence lengthpolymorphisms
SSR see single sequence repeatStaden package 402standards and guidelines, biotechnology 561Stanford Medical School 6Stanford University 115Staphylococcus aureus, model organisms 354start-up companies 582Statement on DNA Sampling: Control and Access
517static models, systems biology 498static nanospray experiment, Proteomics 198static system models 496statins 373statistical programming language R 420steady-state rate equations 472Stella, Petri net tools 477stem cell research 516, 540, 566stem cells 512– embryonic 565Stetter, K. O. 17stigmatization 513stigmatization by association 510STKE 453stochastic models 500stoichiometric matrices 482Stokes Shift, DNA sequencing 132STOP codons 228strains – nontoxic, Escherichia coli 9– toxic, Escherichia coli 9strawberry, model organisms 122Streptomyces lincolnensis, model organisms 51Streptomyces lividans, model organisms 53stress, osmotic, Bacillus subtilis 11stromelysin-1 gene 96structural characterization, NMR 287structural genomics – cloning of the genes 277– commercial 275– correct expression system 277– efforts 274– projects 274– protein crystallazation 278–279– protein production 276– purification of the target protein 277structure based drug design 289structure mining 581stuctural genomics 273–295subcellular fractions, analysis, Proteomics 186SubLoc 339substitution matrices, Bioinformatics 333
subtelomeric regions, Saccharomyces cerevisiae 24sugar signal transduction, plants 67suitability screening, NMR 288sulfate-reducing organism 16sulfate reduction, Archaeoglobus fulgidus 19Sulfolobus solfataricus P2, model organisms 384,
399super-high-field instruments, high-resolution
solution NMR 285support vector machines 339, 425surface plasmon resonance, single molecule
detection 163surfactant, capillary electrophoresis 214surveys, environmental 46sustainable development, genetic resources 550SVG see scalable vector graphicsSVM see support vector machinesSWISS-2D PAGE 326SWISS-2DPAGE 10Swiss-Prot 329, 332, 462synchrotron protein crystallography 273synchrotron x-ray sources, third generation 274synteny 116– plants 64synthesis, spatially ordered 223synthesis strategy 162–163SYPEITHI 453systematic sequencing, Escherichia coli 7Systems Biology 491–505, 582– analysis of static models 498–499– basic concepts 494– combining data 493– combining multiple data types 493– connection 493– control mechanisms 494– data fusion 493– data types 492–493– definition 360– diagrammatic representations 495– dynamic models 499–500– dynamic properties 494– error rates 493– experimental system 492– hierarchical modularity 495– interactions 493– mathematical models 491– modeling formalisms 500– models 495– modularity 495–496– simple model 494– states 494– static properties 494systems modeling 472

616 Subject Index
TT-DNA tagging 73t-statistics 253TAC see transformation-competent artificial
chromosomestagged protein, truncated, Bacillus subtilis 13tagging – T-DNA 73– transposon 73tagSNP 90TAIR see The Arabidopsis Information ResourceTAMBIS 465tandem – in space, mass spectrometry 191– in time, mass spectrometry 191tandem capillary electrophoresis 328tandem gene knockout 434tandem repeat regions, Caenorhabditis elegans 32tandem repeats 29tardive dyskinesia 375target 416– DNA microarrays 240target protein, purification 277target validation 364TargetP 339Tatum, E. 6Taverna 321taxonomic marker genes 53TD see tardive dyskinesia telomeres, Saccharomyces cerevisiae 22template-primer-polymerase complex, DNA
sequencing 143tentative consensus sequences 118termination of replication 8terminators 383TEV protease 278TGFBR1 gene 94Thal, Johannes 25–26The Arabidopsis Information Resource 27therapeutic cloning 512, 516, 562thermophiles, extreme 49Thermotoga maritima, model organisms 284thing and person blurring 565thiopurine S-methyltransferase 372third generation synchrotron x-ray sources 274THORNs, Petri net tools 477three-hybrid system 264three-locus analysis, linkage map 109throughput, hardware for DNA synthesis 575TIGR 17, 118, 580TIGR XML 412TIM-barrel motif 291time of flight, mass spectrometry 68, 189TimeLogic 363, 577
tissue banking 512tissue research, ethical framework 511TissueInformatics 542Tm2a gene 110TM4 420TM4 software 254TMHMM 340TMV gene 110TOF see time of flighttomato, model organisms 110tools to educate the public, biobanks 553top-down approach 468TopoSNP 357toxic strains, Escherichia coli 9toxicity, compound 369–372toxicity signatures 369–370toxicogenomics 366–372– optimum dosage 374– signatures 370TPMT see thiopurine S-methyltransferase trace generation, DNA sequencing 155–156tracking, DNA sequencing 153transaction costs 545transactivator system, repressed 264transcription complex 13transcription factors 373, 428, 499– Drosophila melanogaster 36– yeast 262transcription-translation apparatus 433transcriptional modules 498transcriptional repressor Tup1p 264transcriptome 357TRANSFAC 315, 444, 454, 462transferrins, Drosophila melanogaster 36transformation-competent artificial chromosomes
62transforming growth factor receptor type 2 94transgenic plants 67transit peptides, plastid 28translation 461translational research 542TRANSPATH 444, 454, 462, 481transposeable elements, repeats, Arabidopsis
thaliana 28transposons 116– insertion, DNA sequencing 139– tagging 73trapping, exon 115TREMBL 332–333tricyclic antidepressants 373triple quadrupole, mass spectrometry 191TRRD 454truncated tagged protein, Bacillus subtilis 13trust in corporate participants 543
617Subject Index
trypsin 190Tukey biweight 422tumor-suppressor genes 90tumor suppressors 182Tup1p, transcriptional repressor 264two-dimensional electrophoresis 211two-dimensional separations, capillary
electrophoresis 219–220two-locus analysis, linkage map 109two-phase electrophoresis 51type 1 TGF/Beta receptor 94type II Albers-Schonberg disease 364
UUAS-URA3 growth reporter 263Ubiquitin 266UDB system 479UGTA1A1 see uridine diphosphate
glucuronosyltransferase 1A1UK Biobank Ethics and Governance Framework
525UK Biobank Limited 528–529ultra-zoom gels, IFF 324UltraScan, Petri net tools 477unassigned 1H,15N RDC 289uncultivated microorganisms 48undesirable commodification of the human body
542UNESCO 513, 538– Declaration on Genetic Data 515ungapped alignments, localized 305UniGene database 240UniProt 332–333United Kingdom, biobanks 538United States, biobanks 538Universal Declaration on the Human Genome
and Human Rights 513universal sequencing primer, DNA sequencing
140University of Calgary 243unmodified oligonucleotide sequences 228untouchable human being 563unwarranted information 515urea cycle 485– pathway 484uridine diphosphate glucuronosyltransferase 1A1
372US National Bioethics Advisory Comission 511UV absorbance, capillary electrophoresis 214
Vvalidation step, Proteomics 186vapor diffusion 278vector, shuttle cosmid 54
vector sequence, MAGPIE 404VectorNTI 334vectors, plasmid DNA 62very short patch repair mechanism 312Vibrio harvey, model organisms 288view concepts 472violacein 53virtual cell 482– Petri net model 486virtual reality environments, automated 578virus-induced gene silencing 76vitamin K epoxide reductase complex subunit 1
374VKORC1 374VON++, Petri net tools 477VRML 578
WW2H 321warfarin 374Washington University in St. Louis 118, 580water 303Watson-Crick base-pairing 240web-based computing 575web services 578WebGel 326well-diffracting crystals, protein crystallography
275Wellcometrust Sanger Institute 580Western blotting 326Whitehead Institute 115WHO 513WHO Genetic Databases report and
recommandations 515whole cell visualization 435whole gel manipulations, Proteomics 326whole-genome shotgun assembly, DNA
sequencing 139Wilms tumors 255WIT 440, 454WIT/EMP 462Woese, Carl R. 17wordcount 310wordmatch 306World-2-DPAGE 327World Health Organization 512worm, model organisms 492
XX-ray crystallography 275X-ray detectors, protein crystallography 274X-ray sources, synchrotron 274Xgrail 118XLink standard, Bluejay 411
618 Subject Index
XML 438, 466– see also extensible markup languageXML language 578XML Schema 439XSL schemes 478XSLT stylesheet 410
YYAC see yeast artificial chromosomeYarrowia, model organisms 25YASMA 422yeast, model organisms 428, 492yeast artificial chromosomes 62, 114yeast genomes, hemiascomycetes 25yeast interactome 182
yeast transcription factor Gal4p 262yeast two-hybrid network 441yeast two-hybrid system 261–272– bait 262– classical 262– false negatives 270– false positives 270– interpretation 269–270– non-yeast hybrid systems 269– prey 262yMGV 420YPD 454
Zzyxin 256