Immunobiology Handbook
112
World-Class Quality | Superior Customer Support | Outstanding Value BioLegend is ISO 9001:2008 and ISO 13485:2003 Certified Immunobiology Handbook Immunobiology Handbook 02-0015-00
-
Upload
khangminh22 -
Category
Documents
-
view
0 -
download
0
Transcript of Immunobiology Handbook

World-Class Quality | Superior Customer Support | Outstanding Value
BioLegend is ISO 9001:2008 and ISO 13485:2003 Certified
Immunobiology Handbook
Imm
unobiology Handbook
02-0015-00

Customer Service: 858-768-5800
2
Table of ContentsIntroduction .........................................................................................3Build a Better Multicolor Flow Cytometry Assay ..........5Multicolor Panel Balance .................................................................................. 5Instrument Specifications ................................................................................ 5Balance Antigen Expression vs. Fluorophore Brightness ..................... 6Overview of the Different Fluorophore Families Useful as Antibody Conjugates ...................................................................... 6Protein-Based Fluorophores and their Tandems ..................................... 8Brilliant Violet™ Fluorophores ......................................................................... 9How to Organize a Balanced Panel ............................................................... 10
Fluorophores and Spectra Poster ...........................................16Buffers for Flow Cytometry ........................................................19Cytokine and Chemokine Buffers .................................................................. 19Intranuclear and Transcription Factor Staining ........................................ 19True-Nuclear™ Transcription Factor Staining Buffer Set ....................... 20Phospho-site Specific Staining ....................................................................... 21Non-specific Monocyte Staining ................................................................... 22Fc Receptor Non-specific Binding ................................................................. 23
Dendritic Cell, Monocyte, and Macrophage Biology Poster .......................................................................................................24Cell Health, Cell Cycle and Proliferation ............................27Live/Dead Status Assessed through Membrane Permeability ........... 27Cell Vitality Indication through Esterase-dependent Probes .............. 29Apoptosis Indicators .......................................................................................... 29Proliferation ........................................................................................................... 30BrdU Nucleotide Analogs and Ki-67 as Additional Indicators of Apoptosis ............................................................... 30Microplate Assays for Proliferation ............................................................... 31Mitochondrial Health and Respiration ........................................................ 32Cell Permeant Nucleic Acid Stains and Cell Cycle Analysis ............................................................................................... 33
Mechanisms of Cell Death Poster ..........................................34Antibodies for Non-Human Primate (NHP) Research ..................................................................................37Innate Immunity Poster................................................................42Biofunctional Antibodies .............................................................45LEAF™, Ultra-LEAF™, and GoInVivo™, BioLegend’s Biofunctional Antibody Brands ........................................... 46Applications in Immunotherapy Research ................................................ 47GoInVivo™ in Melanoma Cancer Mouse Models ..................................... 49
Cancer Immunoediting Poster ................................................52Cell Separation ...................................................................................55Separation Based on Adherence ................................................................... 55Separation Based on Density .......................................................................... 56Antibody Binding Strategies ........................................................................... 57MojoSort™, BioLegend’s Unique Magnetic Separation Reagents ......................................................................................... 58Applications .......................................................................................................... 58
Chemokine Receptor Biology Poster ...................................60
MHC Multimers ................................................................................63What is an MHC Multimer, and How Do You Use It? ............................. 63MHC Restriction, Allele Frequency and Distribution ............................. 63How Does It Work? ............................................................................................. 66Applications .......................................................................................................... 66How to Boost the Signal when Working with Low Affinity TCRs ....... 67
Applications of Mass Cytometry .............................................70Imaging the Immune System ..................................................74Widefield vs. Confocal Microscopy .............................................................. 74Chromogenic vs. Fluorescent Imaging Methods ................................... 74Reagents for Chromogenic IHC ..................................................................... 75Multicolor Microscopy ....................................................................................... 75Secondary Reagents .......................................................................................... 75Nucleic Acid Stains ............................................................................................. 76Mitochondrial Localization Probes ............................................................... 76Flash Phalloidin™ NIR 647, Red 594 and Green 488 .............................................................................................................. 76Tips and Tricks for the Best Images ............................................................... 77
Neurodegeneration Poster .........................................................78Neuroinflammation ........................................................................81Microglia ................................................................................................................. 81Astrocytes .............................................................................................................. 82Oligodendrocytes ............................................................................................... 82Complement System (CS) Activation in Alzheimer’s Disease ............. 83Demyelination in Multiple Sclerosis (MS) ................................................... 84Microglia-mediated Neuroinflammation in Parkinson’s Disease ....... 85
Neuroinflammation Poster .........................................................86Web Tools ..............................................................................................89Featured Web Tools ............................................................................................ 89
Protocols ................................................................................................92Cell Surface Immunofluorescence Staining Protocol ............................ 92Cell Surface Immunofluorescent Staining of Whole Blood ................. 93Ki-67 Staining Protocol...................................................................................... 93Intracellular Flow Cytometry Staining Protocol ....................................... 94Anti-BrdU Staining Using DNAse with Surface And Fluorescent Proteins ................................................................................. 95Intracellular Staining with True-Phos™ Perm Buffer In Cell Suspensions Protocol ........................................................................... 96Th17 Polarization of Mouse CD4+ Cells ....................................................... 97Treg Polarization of Mouse CD4+ Cells ........................................................ 97Th1 Polarization of Mouse CD4+ Cells Protocol ........................................................................................................ 98T Cell Activation with Anti-CD3 Antibodies Protocol - Human .......... 98Immunohistochemistry Protocol for Frozen Sections ........................... 99Immunofluorescence Microscopy Protocol .............................................. 100Immunohistochemistry Protocol for Paraffin-Embedded Sections .......................................................................... 100MojoSort™ Nanobeads Regular Protocol ................................................... 102MojoSort™ Nanobeads No-wash Protocol ................................................. 103MojoSort™ Isolation Kits Regular Protocol ................................................ 104MojoSort™ Isolation Kits No-wash Protocol .............................................. 105MojoSort™ Negative Selection Columns Protocol .................................. 106MojoSort™ Positive Selection Columns Protocol .................................... 107Flex-T™ Tetramer and Cell Staining Protocol ............................................. 109
biolegend.com
3
IntroductionImmunobiology can be defined as the study of immune cells and the immune system, understanding their roles in health and disease. BioLegend is proud to provide this handbook to serve as a quick reference and guide regarding techniques and applications relevant to Immunobiology.
From flow cytometry to magnetic cell separation to cell imaging, BioLegend is a global leader in providing research reagents and support for the bioresearch community. This handbook covers a number of critical topics for immunobiology research, including flow cytometry panel design, cell health and proliferation, biofunctional antibodies, imaging, and much more. We also present commonly used protocols for immune research, as well as images of our popular immune pathway posters.
Visit our Immunobiology page at: biolegend.com/immunobiology.
Our technical team is always willing find the answers you need, so don’t hesitate to contact us at: [email protected].

Customer Service: 858-768-5800
4
Multicolor Flow Cytometry
MulticolorFlow
Cytometry

biolegend.com
5
Build a Better Multicolor Flow Cytometry AssayThe foundation of a successful multicolor flow assay is good planning and step-by-step optimization. Assays involving four to six fluorescent colors are not very complicated to construct or analyze, since the reagents chosen will be the brightest available with the least spectral spillover. Many researchers want greater than six colors, maximizing the number of markers due to limited sample volume or to see the interconnectivity of many parameters simultaneously. The task of increasing the number of markers in a multicolor panel requires that a set of guiding principles be followed, to ensure that sensitivity and statistical consistency are maintained between sample and day. As the number of markers increases, and thus the number of colors with overlapping spectra, so do the complexities of experiment and analysis. You can minimize aberrations associated with poor assay planning, lack of prior antibody titration optimization, and inadequate use of appropriate controls to ensure confidence in the resulting data set.
In addition to the information provided here, please refer to: biolegend.com/multicolor_staining
Multicolor Panel Balance1. Know your instrument specifications, including which excitation lasers, laser wattages, filter
widths and wavelengths are set-up on on your machine.
2. Consider the expression level of the antigens you’d like to detect in the experiment and how they might change with donor, sample type or stimulation condition.
3. Understand any endogenous biological considerations that may influence your results.
4. Understand the spectra, brightness, stability and all other pros/cons associated with different fluorophores and reagents employed.
5. Optimize the assay and include appropriate controls to help with analysis.
Instrument SpecificationsKnow Your Instrument!
Consult your flow cytometry core facility on which laser lines are available on each instrument and the filter specifications for each active photomultiplier tube (PMT) on the instrument you choose. Most instruments suitable for >10 color flow cytometry do not have a single fixed configuration. Figure 1 is just one example of a common filter configuration for the violet 405 nm laser used to detect the Brilliant Violet™ family of fluorophores.
A
B
C
D
F
H
E
G
BV711™
710/50685LP
595LP550LP
750LP630LP
570LP
610/20525/40
780/60
660/20
585/42
450/
50
BV605™
BV510™
BV785™
BV650™
BV570™
BV421™
405 nm
Figure 1. A typical octagon configuration off the 405nm violet laser suitable to detect the Brilliant Violet™ fluorophores.
Brilliant Violet™, Brilliant Violet 421™, BV421™, Brilliant Violet 510™, BV510™, Brilliant Violet 570™, BV570™, Brilliant Violet 605™, BV605™, Brilliant Violet 650™, and BV650™ Brilliant Violet 711™, BV711™, Brilliant Violet 785™, BV785™ are trademarks of Sirigen Group Ltd.

Customer Service: 858-768-5800
6
Balance Antigen Expression vs. Fluorophore Brightness1. Prior to choosing a particular fluorophore/antibody combination, determine the expression
level of the antigen you wish to detect. If the expression level is entirely unknown, reserve the brightest fluorophores for this antibody to ensure the best chance of lower limit detection and dynamic range of expression.
For expression of common markers on human immune cell types, go to: biolegend.com/protein_expression
2. Just as important as the common abundance of antigen is an understanding of how a disease state, exogenous treatment or stimulation may affect antigen expression. A good example is CD4: although it is abundant in both mouse and human peripheral blood, CD4 is downregulated with PMA/Ionomycin treatment.
Overview of the Different Fluorophore Families Useful as Antibody ConjugatesThere are three families of fluorescent molecules routinely employed in antibody-based cellular assays: simple organic molecules, proteins and fluorescent polymers. Simple organic fluorophores like the Alexa Fluors®, Pacific Blue™, and FITC are small molecular weight chemical structures between 350D-1200 kD. Due to their small size, there are many of them conjugated to a single antibody to increase the total brightness potential of that antibody. How many fluorophores are conjugated to a single antibody is called the degree of labeling or Fluorophore to Protein (F:P) ratio. Because of their size, there is a limitation as to how much excitation energy each fluorophore can absorb. This value is called the extinction coefficient (EC). Depending on its environment and solvent, the fluorophore will exhibit a certain efficiency with which it transfers energy between the excited and emitted state called the quantum efficiency (QE) or quantum yield (QY).
Based on these three major factors, when we consider the total brightness the researcher will be able to derive from a single antibody, it follows this sort of equation:
Brightness of Antibody= Degree of Labeling (DOL) × (EC of fluorophore × QY of fluorophore)
The sensitivity with which you are able to detect that fluorescently labeled antibody (Ab) in situ then also becomes dependent on how many primary antibodies will detect the antigen (Ag), the abundance of those antigens on a cell or within a pixel minus the autofluorescence and background from the reagents associated with labeling cells and tissues from many origins. So, in a practical sense, the useful signal and lower limit sensitivity that a researcher will detect to image or quantify is more accurately depicted as:
Sensitivity in situ=[Brightness of Antibody × (# Abs per Ag × # Ags)] - (autofluorescence + reagent non-specific staining)
Refer to Table 1, the fluorophore staining index chart, to match the potential abundance of the antigen in your assay with an appropriately bright fluorophore relevant to the application and instrument to be used. Here, every fluorophore was conjugated to an anti-mouse CD19 antibody (clone 2D1) to construct an accurate ranking based on staining index calculated by (MFI+ - MFI-)/ (2xSD MFI-). Staining index in this instance can be influenced by laser wattage and filter widths which we’ve listed in this table; thus, rankings will vary slightly between manufacturers. Rankings like this should only be used for reference purposes.
Figure 2. Left plot shows cells without stimulation and right plot shows cells stimulated for six hours with PMA and Ionomycin. Cells were analyzed 2 days post fixation.

biolegend.com
7
Table 1. Staining Index and Fluorophore Brightness
Fluorophore Ex (nm) Max
Em (nm) Max
Filter Used Brightness Histogram
PE 565 575 585/20 5
PE/Cy5 565 670 660/20 5
APC 650 660 660/20 5
PE/Dazzle™ 594 565 610 610/20 5
Brilliant Violet 421™ 405 421 450/50 5
PE/Cy7 565 774 780/60 4
Brilliant Violet 605™ 405 603 610/20 4
Brilliant Violet 711™ 405 711 710/50 4
Alexa Fluor® 647 650 668 660/20 4
Brilliant Violet 650™ 405 645 660/20 4
Brilliant Violet 785™ 405 785 780/60 3
Brilliant Violet 510™ 405 510 510/50 3
Brilliant Violet 570™ 405 570 585/42 3
Alexa Fluor® 488 495 519 530/30 3
PerCP/Cy5.5 482 690 695/40 2
APC/Cy7 650 774 780/60 2
Pacific Blue™ 410 455 450/50 2
FITC 493 525 530/30 2
APC/Fire™ 750 650 787 780/60 2
Alexa Fluor® 700 696 719 720/45 1
PerCP 482 675 695/40 1
Brighter fluorophores are not always better fluorophores. For example, PE/Cy5 is very bright, but has significant cross-beam excitation by the 633nm/red laser and thus emits strongly into the APC or Alexa Fluor® 647 channel. FITC, on the other hand, is not a very bright fluorophore, however it emits into a channel that experiences little spillover from other fluorophores and is available commercially conjugated to an abundance of antibodies. Staining index is just a tool to help guide you in balancing a panel.
For more information on fluorophore brightness, visit: biolegend.com/brightness_index

Customer Service: 858-768-5800
8
Protein-Based Fluorophores and their TandemsDue to their large size, protein-based fluorophores like phycoerythrin (PE: ~240 kD) and allophycocyanin (APC: 105 kD) are conjugated to antibodies at a 1:1 or 1:2 ratio respectively. In order to increase the multiplexing ability of fluorescent assays like flow cytometry, tandem fluorophores were created to diversify the spectral options available. Tandem fluorophores are two fluorescent molecules in a FRET (Förster or fluorescence resonance energy transfer) relationship, where the fluorophore capable of absorbing and transmitting the most energy at the shorter wavelength can donate that energy to an array of different kinds of acceptor molecules. A donor fluorophore, such as APC, PE, PerCP or BV421™, is excited by its particular optimal excitation source, and upon resonating that energy, transfers it to an acceptor such as Cy7 in the APC/Cy7 tandem. In this instance, the APC/Cy7 tandem is excited at the excitation peak for APC, which is 650 nm. However, while in its excited state, a single phycobilin, which is the actual fluorescent molecular subunit embedded within the APC protein, will donate its electronic energy directly to the Cy7 within a proximity of 10-80 Å (angstroms), causing an emission at the peak of Cy7, which is 775 nm. FRET is rarely 100% efficient in a tandem and a certain amount of energy will still be populated in the emission channel of the donor fluorophore and thus require some compensation be applied. For this reason and also due to the harsher and longer lasting exposure to light and photobleaching that fluorophores experience in microscopy applications, tandem fluorophores are also not recommended for imaging.
The stability of these tandems is of paramount importance for consistency in brightness and spectral spillover/compensation. For example, APC/Cy7 is known to have issues in its stability to light exposure, temperature and different fixative conditions. This is why alternatives like the APC/Fire™ 750 have effectively replaced APC/Cy7 in multicolor assays.
Learn more about APC/Fire™ 750 at: biolegend.com/apc-fire750
Figure 4. APC/Fire™ 750 is significantly more temperature stable versus APC/Cy7. Within 20 days of the vial of antibody being left at room temperature in the dark, there begins a significant increase in compensation with APC/Cy7. The temperature stability results were generated using the Veri-Cells™ PBMC, a lyophilized human PBMC product that effectively removes donor-dependent variation in staining for comparisons like this. Cells were stained for 15 minutes at room temperature in cell staining buffer.
Unstained cells
APC/Fire™ 750
APC/Cy7
Figure 5. APC/Fire™ 750 also exhibits less unwanted non-specific binding to monocytes than APC/Cy7. Here monocytes are gated and the MFI- population in the APC/Cy7 emission channel is monitored for any change in non-specific binding. More data is shown on this phenomenon and how to block it in the section on buffers for flow cytometry, specifically the True-Stain Monocyte Blocker™.
Figure 3. Human whole blood was stained for 20 min with CD3 (SK7) conjugates of APC/Fire™ 750, APC/Cy7, APC-H7, or APC-eFluor® 780 at each manufacturer's recommended optimal dilution, followed by RBC lysis and wash steps. Histograms were gated on lymphocyte populations based on forward and side scatter.
No Antibody
APC/Fire™ 750
APC/Cy7
APC-H7
APC-eFluor® 780

biolegend.com
9
Figure 6. Frozen C57BL/6 mouse spleen was fixed, blocked, and stained with anti-mouse CD169 (clone 3D6.112) Alexa Fluor® 594 (red), anti-mouse B220 (clone RA3-6B2) BV510™ (purple), anti-mouse Ly6G (clone 1A8) Alexa Fluor® 647 (green), anti-mouse CD4 (clone GK1.5) Alexa Fluor® 488 (yellow), and anti-mouse CD8a (clone 53-6.7) BV421™ (aqua).
Brilliant Violet™ FluorophoresA relatively new family of fluorescent polymers, called the Brilliant Violet™ fluorophores, has enabled multicolor fluorescent applications in both flow cytometry and microscopy. These polymers have a very high extinction coefficient, around 2.5x10⁶ M-1cm-1 for Brilliant Violet 421™ compared to PE which is around 2x10⁶ M-1cm-1. The Brilliant Violet™ fluorophores provide very bright options with the widest diversity of emissions off of a single laser compared to any other reagent. Tandem fluorophores of Brilliant Violet 421™ give rise to Brilliant Violet 570™, Brilliant Violet 605™, Brilliant Violet 650™, Brilliant Violet 711™ and Brilliant Violet 785™. Each of their specific excitation and emission characteristics are outlined in the Staining Index table as well as the Fluorophores for Flow Cytometry poster.
Brilliant Violet 510™ is also a non-tandem organic polymer, similar to BV421™. However, BV510™ has unique spectral characteristics similar to AmCyan and Horizon V500™ and is also a brighter alternative to either of these fluorophores. BV421™ and BV510™ now enable the application of 5 color microscopy applications using directly conjugated antibodies. On a standard widefield microscope equipped with excitation and emission filter sets optimally matched to each of these fluorophores, simultaneous 5 color labeling with BV421™, BV510™, Alexa Fluor® 488, Alexa Fluor® 594 and Alexa Fluor® 647 is possible.
For more information on Brilliant Violet™ fluorophores and their applications in imaging, visit: biolegend.com/brilliantviolet and biolegend.com/microscopy

Customer Service: 858-768-5800
10
How to Organize a Balanced PanelIdentify and organize your targets into three tiers:
• Primary tier antigens: These markers do not change between parallel panels and are often, but not always, expressed at high levels. When they are expressed abundantly, they should be dedicated to dimmer fluorophores, such as Alexa Fluor® 700, BV510™, BV570™, APC/Cy7 and APC/Fire™ 750.
Examples: basic cell surface phenotypic markers like CD4, CD8, CD14, CD56, CD11c, etc.
• Secondary tier antigens: These markers are necessary for further subset phenotyping, but may change somewhat between parallel panels. Expression levels tend to be much more variable and are typically appropriate for moderately bright fluorophores like BV650™, BV711™, BV785™, FITC, Alexa Fluor® 488 and PerCP/Cy5.5.
Examples: activation or exhaustion markers, cytokines and chemokine receptors
• Tertiary tier antigens or “wish list” markers: These markers are often the most important question you are asking in the assay and may have widely variable or completely unknown expression levels or patterns. So, for the detection of these antigens, we want to save the brightest fluorophores like BV421™, BV605™, PE, PE/Dazzle™ 594, APC, Alexa Fluor® 647 and PE/Cy7.
Examples: transcription factors, phospho-specific antibodies and homemade hybridomas.
Optimize and Control
Interpreting experimental results is as important as obtaining the data to support solid conclusions. To make accurate observations, every experiment should contain the proper types of controls. For flow cytometry, at least three basic types of controls should be included: instrument controls, specificity controls, and biological controls. In many situations, one control can serve multiple purposes. Instrument controls are those that will help set up or confirm the instrument parameters, or even calibrate the machine. Specificity controls are those designed to help distinguish a true positive signal from the negative, even when its distribution is affected by spreading error after compensation is applied, or false positive signals due to non-specific binding. In other words, these are the controls that help determine the specific signal detected with a given reagent. They are used to properly set gates to define positive or negative populations for specific markers. Biological controls are used when a stimulation, knockout or disease state requires a normal state control to guide gating strategies in determining true positive signal from artifact, i.e., stimulated or treated cells, knockout cells and other relevant samples.
105
104
103
0
0 103 104 105
CD8 BV785™
CD4
BV65
0™
105
104
103
102
0
0 102 103 104 105
CD45RO FITC
CD45
RA B
V570
™
105
104
103
102
0
0 103 104 105
CD25 BV421™
FoxP
3 A
lexa
Flu
or®
647
Primary Tier Secondary Tier Tertiary Tier
Figure 7. An example of typical fluorophore/antibody combinations organized into tiers of the panel construction.

biolegend.com
11
100
200
300
00 103 104 105
Comp-PerCP-Cy5-5-A
Nor
mal
ized
To M
ode
500
1.5K
1.0K
00 103 104 105
Comp-PerCP-Cy5-5-A
Coun
t
Blue = Unstained mouse splenocytesRed = CD69 single stained mouse splenocytes from activation modelBlack=compensation beads labeled with CD69 PerCP/Cy5.5
Figure 8. The plot on the left demonstrates an instance where the single stained biological control is inadequate for use as a compensation control, since there are not sufficient negative (non-activated) events to accurately populate an MFI- peak. The plot on the right is the same experiment with the same antibody labeled to compensation beads that can capture an antibody raised in armenian hamster. The caution with compensation beads is that it is easy to accidentally cause the MFI+ peak to become off-scale due to over-labeling the compensation bead at the voltage determined to be ideal for the experimental assay. The voltage should be tuned to suit the assay, not to accommodate the overly bright compensation bead.
Instrument Controls
Requirements to set up a balanced experiment vary from instrument to instrument, but regardless of the specific condition, two parameters must be properly qualified: the photomultiplier tube (PMT) voltage and compensation needed between the multiple fluorophores used.
1. PMT Voltage Controls: While the most common strategy to set up PMT voltages is the use of an unstained sample, this approach doesn’t fit all situations. For example, when analyzing markers that dramatically upregulate their expression after certain treatments, the positive signal may be so high that the entire population could be off scale if the voltage is relatively high. In such cases, it will be useful to have single color stained cells to verify the signal is measurable and on-scale. Calibration beads are very important for ensuring consistent performance of the cytometer. However, the recommended voltages, especially for the violet laser, often do not correlate with the abundance of signal in the assay or the brightness of the fluorophore.
2. Compensation Controls: Compensation controls need to be used every time you run an assay to ensure accuracy. Although either compensation beads or single stained biological controls can be used to apply compensation, beads have the advantage of ease in staining, total abundance of events, and sufficient representation of both the negative and positive populations necessary to populate the compensation algorithm accurately. It is very important to use the same antibodies as were used in the assay, especially if the antibodies are conjugated to tandem fluorophores. This is because tandem fluorophores, for example APC/Cy7, are sensitive to the light, temperature and fixatives they endure while the sample is being stained. For example, in the section regarding buffers useful for flow cytometry, there is an example of an increase in compensation of APC/Cy7 into the APC channel on fresh cells versus those that have been fixed with transcription factor staining buffers. Thus, whether single stained beads or cells are used as the compensation control, for greatest accuracy, they should endure the same light, temperature and solvent exposure as was applied to the fully stained sample.

Customer Service: 858-768-5800
12
Specificity Controls
After selecting PMT voltages and properly compensating all the channels used, samples can be acquired. Depending on the requirements of the experiment, it may be necessary to define one or more gates around the population or cell subsets of interest.
1. Fluorescence Minus One (FMO) Controls: FMO controls are a gating control that involves the addition of all the antibody conjugates in a panel except one marker. When overlaid with a fully stained panel, it provides a guide to where to gate the population relevant to the marker omitted from the FMO. So, simply, FMO controls are gating controls that become important in multicolor staining scenarios where there is an additive degree of spectral spillover widening the distribution of some populations that are not reflective of any change in actual antigen expression or distribution. FMOs also help you keep an eye on the consistent performance of your antibodies, especially tandem conjugates, to help identify the culprit should any problems arise that might create artifacts or confusion about the results.
2. Isotype Controls: Isotype controls are important if you suspect or are unsure of a source of non-specific binding. A good example of appropriate isotype control usage is on cell types that patrol and scavenge the biological environment, like monocytes and macrophages. It’s important to provide evidence that a signal you deem positive is indeed not an artifact with any propensity to non-specifically bind. In a multicolor assay of 10 colors or more, the isotype control can be incorporated into what would have been the FMO control for that marker.
Biological ControlsCertain scenarios require controls that go beyond qualifying the instrument and the assay performance. For example, as mentioned above, certain treatments may cause a dramatic change in the signal detected with certain antibodies or reagents. Stimulated cells or cells from infected tissues may have different properties than unstimulated or non-infected cells. These samples may have higher background fluorescence, or may induce a higher non-specific antibody binding. In such cases, the best control could be the single or fully stained, or even unstained treated sample. Likewise, it may be important to have a reference value when quantifying certain cells, to be sure the results are accurate. In this regard, BioLegend Veri-Cells™ provide an excellent tool to verify assay performance.
Learn more about Flow Cytometry controls at: biolegend.com/flow_controls
Figure 9. In this example, FMOs for both CD14 BV605™ (Orange) and CD16 APC/Cy7 (Blue) are overlaid on top of the fully stained sample (Red). By using the edges of the FMOs as a guide (for example, where the edge of the CD16 APC/Cy7 staining ends on the APC/Cy7 axis), it is much easier to accurately elicit the CD16 lo from the CD16- and CD16hi populations, identifying classical, intermediate and non-classical monocyte populations.
105
104
103
102
0
0 102 103 104 105
CD16 APC-Cy7 CD16 APC-Cy7
CD14
BV6
05™
CD14
BV6
05™
105
104
103
102
0
0 102 103 104 105
Figure 10. In this example, instead of entirely negating the CD11c PE/Cy5 in the FMO, the isotype control (Blue) replaced the antibody, ensuring that the cells that fall into the gate for myeloid dendritic cells (Red) are not the result of non-specific binding. Isotype controls should be purchased from the same manufacturer as the primary antibody and used at exactly the same concentration as the primary antibody.
105
104
103
102
0
0 102 103 104 105
CD11c PE-Cy5
HLA
-DR
PE-C
F594
CD11c PE-Cy5
HLA
-DR
PE-C
F594
105
104
103
102
0
0 102 103 104 105

biolegend.com
13
1. Autofluorescence controls: Different cell types and tissues have varying levels of inherent fluorescence. Major sources of autofluorescence include NADH, riboflavin, metabolic cofactors, the crosslinking of primary amines by paraformaldehyde, and certain biological structures (e.g., mitochondria, lysosomes). These proteins and molecules are more easily excited at lower wavelengths (i.e., from the UV, violet, and blue lasers) and will emit at a wide range of 300-600 nm, which overlaps with several common fluorophores like BV421™, Pacific Blue™, and FITC. Myeloid cell lineages tend to be particularly autofluorescent. Furthermore, stimulating cells can cause them to become more metabolically active, producing more autofluorescent proteins, vitamins, and cofactors. An unstained control sample is helpful in delineating how much autofluorescence populates your channel of interest.
2. Stimulation Controls: Background signal can change when you stimulate samples, potentially affecting population resolution. For example, PMA stimulation can cause a decrease in surface CD4 expression in T cells while also increasing the level of autofluorescence in short wavelength emission channels with the production of autofluorescent molecules. Alternative gating strategies may have to be used (i.e., CD3+, CD8-, CD56- events) or the intracellular detection of CD4.
3. Cell number controls/positive staining controls: In some cases, it will be necessary to include a biological control to verify that the percentage or absolute number of cells in a defined gate is accurate. It may also be needed to verify that the experimental set up is correct and working properly by verifying the detection of certain cell markers. In these cases, BioLegend Veri-Cells™ are extremely convenient and useful. Veri-Cells™ are lyophilized cells validated for multiple cell markers that have exceptional stability and exhibit a scatter profile similar to freshly isolated cells.
Figure 14. Veri-Cells™ CD4-Low PBMC are specially formulated to contain a lower frequency of CD4+ cells, similar to that observed in patients with CD4 immunodeficiency. Left plot shows normal values of CD4, right plot shows Veri-Cells CD4-Low PBMC.
Figure 12. When cells are stimulated, they can produce vitamins and metabolic cofactors that often exhibit autofluorescence in channels excited off the violet and blue lasers.
SSC-
ABV421™
Full panel
IL-17A unstim
FMO IL-17A BV421™
Figure 11. Histograms do not fully reflect the origin of the fluorescence and the distribution of the populations. Drawing a diagonal gate around the GFP positive population in the dot plot (rather than the histogram) more accurately defines the GFP positive population. Figure provided by Jennifer Wilshire, Ph.D.
Figure 13. Unlike Veri-Cells™ PBMC and CD4-Low PBMC, Veri-Cells™ Leukocytes contain neutrophil and eosinophil populations. These cells can be used as controls or reference material to monitor expression of granulocyte markers such as CD15 and CD16. The preserved scatter profile demonstrates excellent performance.

Customer Service: 858-768-5800
14
Veri-Cells™ PBMC and Veri-Cells™ Leukocytes have been verified with BioLegend's LEGENDScreen™ Human Cell Screening (PE) kit. The tables below summarize the markers that render positive signal.
Table 2. Veri-Cells™ PBMC verified markers.
Marker Clone Marker Clone Marker Clone Marker Clone
CD1c L161 CD45 HI30 CD99 HCD99 CD279 EH12.2H7
CD1d 51.1 CD45RA HI100 CD100 A8 CD284 HTA125
CD2 RPA-2.10 CD45RB MEM-55 CD101 BB27 CD290 3C10C5
CD3 HIT3a CD45RO UCHL1 CD102 CBR-IC2/2 CD298 LNH-94
CD4 RPA-T4 CD46 TRA-2-10 CD116 4H1 CD300e UP-H2
CD5 UCHT2 CD47 CC2C6 CD122 TU27 CD300F UP-D2
CD6 BL-CD6 CD48 BJ40 CD123 6H6 CD314 1D11
CD7 CD7-6B7 CD49d 9F10 CD124 G077F6 CD319 162.1
CD8a HIT8a CD49e NKI-SAM-1 CD126 UV4 CD328 6-434
CD9 HI9a CD49f GoH3 CD127 A019D5 CD335 9E2
CD11a HI111 CD50 CBR-IC3/1 CD132 TUGh4 CD337 P30-15
CD11b ICRF44 CD52 HI186 CD134 Ber-ACT35 (ACT35)
CD352 NT-7
CD11b CBRM1/5 CD53 HI29 CD148 A3 CD354 TREM-26
CD11c 3.9 CD54 HA58 CD154 24-31 β2-microglobulin 2M2
CD13 WM15 CD55 JS11 CD156c SHM14 C3aR hC3aRZ8
CD14 M5E2 CD56 HCD56 CD158a/h HP-MA4 CLEC12A 50C1
CD16 3G8 CD57 HCD57 CD158b DX27 CX3CR1 2A9-1
CD18 TS1/18 CD58 TS2/9 CD158e1 DX9 FcRL6 2H3
CD19 HIB19 CD59 p282 (H19) CD161 HP-3G10 HLA-A,B,C W6/32
CD20 2H7 CD61 VI-PL2 CD162 KPL-1 HLA-A2 BB7.2
CD21 Bu32 CD63 H5C6 CD163 GHI/61 HLA-DQ HLADQ1
CD22 HIB22 CD64 10.1 CD164 67D2 HLA-DR L243
CD23 EBVCS-5 CD69 FN50 CD165 SN2 (N6-D11) HLA-E 3D12
CD24 ML5 CD73 AD2 CD172a SE5A5 HVEM 122
CD26 BA5b CD74 LN2 CD172b B4B6 IgD IA6-2
CD27 O323 CD79b CB3-1 CD172g LSB2.20 IgM MHM-88
CD28 CD28.2 CD81 5A6 CD180 MHR73-11 Integrin β7 FIB504
CD29 TS2/16 CD82 ASL-24 CD182 5E8/CXCR2 NKp80 5D12
CD31 WM59 CD84 CD84.1.21 CD196 G034E3 Siglec-9 K8
CD32 FUN-2 CD85 MKT5.1 CD197 G043H7 TCR gamma/delta B1
CD33 WM53 CD85d 42D1 CD200 OX-104 TCR Vβ13.2 H132
CD35 E11 CD85 GHI/75 CD200R OX-108 TCR Vβ23 αHUT7
CD36 5-271 CD86 IT2.2 CD226 11A8 TCR α/β IP26
CD38 HIT2 CD87 VIM5 CD229 Hly-9.1.25 TCR Vβ8 JR2 (JR.2)
CD39 A1 CD88 S5/1 CD244 C1.7 TCR Vβ9 MKB1
CD40 HB14 CD89 A59 CD268 11C1 TCR Vδ2 B6
CD41 HIP8 CD93 VIMD2 CD271 ME20.4 TCR Vγ9 B3
CD42b HIP1 CD94 DX22 CD272 MIH26 TCR Vα7.2 3C10
CD43 CD43-10G7 CD95 DX2 CD277 BT3.1
CD44 BJ18 CD97 VIM3b CD278 C398.4A

biolegend.com
15
Table 3. Veri-Cells™ Leukocytes verified markers.
Marker Clone Marker Clone Marker Clone Marker Clone
β2-microglobulin 2M2 CD35 E11 CD85j GHI/75 CD245 DY12
CD1c L161 CD38 HIT2 CD86 IT2.2 CD263 DJR3
CD1d 51.1 CD39 A1 CD87 VIM5 CD268 11C1
CD2 RPA-2.10 CD40 HB14 CD88 S5/1 CD278 C398.4A
CD3 HIT3a CD43 CD43-10G7 CD89 A59 CD279 (PD-1) EH12.2H7
CD4 RPA-T4 CD44 BJ18 CD8a HIT8a CD284 HTA125
CD5 UCHT2 CD45 HI30 CD94 DX22 CD298 LNH-94
CD6 BL-CD6 CD45RA HI100 CD95 DX2 CD300e UP-H2
CD10 HI10a CD45RB MEM-55 CD97 VIM3b CD300F UP-D2
CD11a HI111 CD45RO UCHL1 CD99 HCD99 CD314 1D11
CD11b ICRF44 CD47 CC2C6 CD101 BB27 CD319 162.1
CD13 WM15 CD48 BJ40 CD102 CBR-IC2/2 CD328 6-434
CD14 M5E2 CD49d 9F10 CD116 4H1 CD335 9.00E+02
CD15 W6D3 CD49e NKI-SAM-1 CD122 TU27 CD337 P30-15
CD15 (SSEA-1) MC-480 CD50 CBR-IC3/1 CD127 A019D5 CD354 TREM-26
CD16 3G8 CD52 HI186 CD132 TUGh4 CLEC12A 50C1
CD18 TS1/18 CD53 HI29 CD141 M80 CX3CR1 2A9-1
CD19 HIB19 CD55 JS11 CD155 SKII.4 DcR1 (TRAIL-R3) DJR3
CD20 2H7 CD56 HCD56 CD156c SHM14 Galectin-3 (Mac-2) Gal397
CD21 Bu32 CD57 HCD57 CD161 HP-3G10 HLA-A,B,C W6/32
CD22 HIB22 CD58 TS2/9 CD163 GHI/61 HLA-DQ HLADQ1
CD23 EBVCS-5 CD59 p282 (H19) CD164 67D2 HLA-DR L243
CD24 ML5 CD64 10.1 CD172a/b SE5A5 IgD IA6-2
CD26 BA5b CD66a/c/e ASL-32 CD172b B4B6 LTβR 31G4D8
CD27 O323 CD66b G10F5 CD172g LSB2.20 NKp80 5D12
CD28 CD28.2 CD7 CD7-6B7 CD180 MHR73-11 Siglec-9 K8
CD29 TS2/16 CD74 LN2 CD197 G043H7 TCR α/β IP26
CD31 WM59 CD81 5A6 CD200 OX-104 TCR gamma/delta B1
CD32 Fun-2 CD82 ASL-24 CD226 11A8 TCR Vδ2 B6
CD33 WM53 CD84 CD84.1.21 CD244 C1.7 Vγ9 B3
Learn more at: biolegend.com/veri-cells

Customer Service: 858-768-5800
16
Fluorophores and Spectra PosterAs the number of parameters able to be discriminated from one another increases in flow cytometry and microscopy platforms, there is a driving need to diversify the spectral characteristics of fluorophores. This is best achieved when we can draw from a diverse array of different fluorescent chemistries and molecules like semiconductors, fluorescent polymers, proteins and even the simple organic fluorophores we have been using for decades. Together, they create a repertoire of tools that we can use to mix and match in the optimization of a solid multicolor panel.
biolegend.com04-0008-01Interactive Spectra Analyzer: biolegend.com/spectraanalyzer
Histograms represent emission spectra only
Contact BioLegendUS & Canada Toll-Free: 1.877.246.5343 (877-BIOLEGEND)International: 1.858.768.5800Fax: 1.877.455.9587email: [email protected], [email protected]
US Headquarters:San Diego, CA 92121

17
biolegend.com
biolegend.com04-0008-01Interactive Spectra Analyzer: biolegend.com/spectraanalyzer
Histograms represent emission spectra only
Contact BioLegendUS & Canada Toll-Free: 1.877.246.5343 (877-BIOLEGEND)International: 1.858.768.5800Fax: 1.877.455.9587email: [email protected], [email protected]
US Headquarters:San Diego, CA 92121

Customer Service: 858-768-5800
18
Customer Service: 858-768-5800
18
Buffers and Blocking Solutions
Buffers and Blocking Solutions
biolegend.com
1919
Buffers for Flow CytometryThe quality and optimization of sample preparation is integral to clear and consistent, internally reproducible results. In flow cytometry, this includes blocking buffers to reduce the effects caused by different sources of non-specific binding, as well as fixation and permeabilization buffers, each specially formulated for either intracellular soluble cytokine staining or intranuclear targets like transcription factors.
Cytokine and Chemokine BuffersCytokines and Chemokines can be proteins, peptides or glycoproteins that are critical signaling molecules. The cytokine profile of a cell indicates a potentially wide variety of functions, whether it be a proinflammatory immune response, chemotaxis, or developmental cues in embryogenesis. Retaining soluble proteins and cytokines in order to be able to identify that function can be a challenge. A strong cross-linking fixative solution will ensure the best chance of retention, while a lighter permeabilization method will allow antibodies access to the cytoplasm, but not to other membrane-bound compartments. Cytokine buffers are not formulated to be optimal for transcription factors or any intranuclear proteins, though, since these targets are optimally detected with an opposite balance of fixation and permeabilization agents.
Cell Activation Cocktail (With Brefeldin A) 423303 | 423304
Cell Activation Cocktail (Without Brefeldin A) 423301 | 423302
Cell Staining Buffer 420201
Fixation Buffer 420801
Fluorofix™ Buffer 422101
Cyto-Last™ Buffer 422501
Intracellular Staining Permeabilization Buffer (10x) 421002
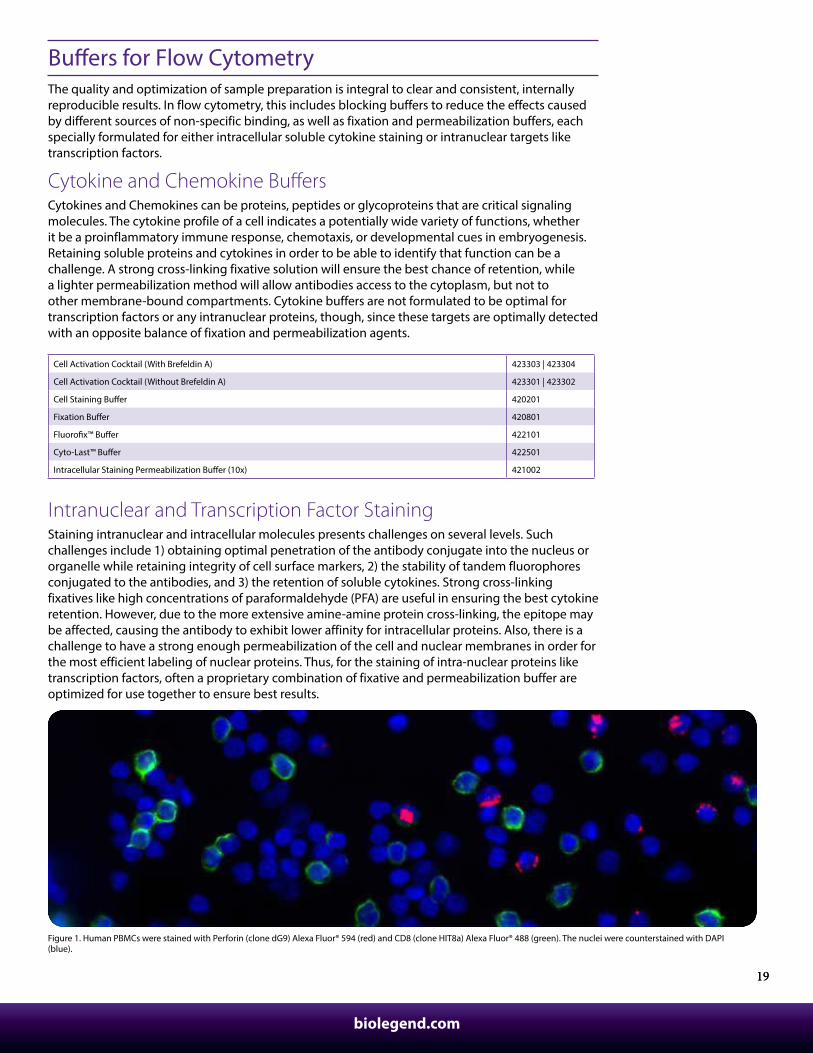
Intranuclear and Transcription Factor StainingStaining intranuclear and intracellular molecules presents challenges on several levels. Such challenges include 1) obtaining optimal penetration of the antibody conjugate into the nucleus or organelle while retaining integrity of cell surface markers, 2) the stability of tandem fluorophores conjugated to the antibodies, and 3) the retention of soluble cytokines. Strong cross-linking fixatives like high concentrations of paraformaldehyde (PFA) are useful in ensuring the best cytokine retention. However, due to the more extensive amine-amine protein cross-linking, the epitope may be affected, causing the antibody to exhibit lower affinity for intracellular proteins. Also, there is a challenge to have a strong enough permeabilization of the cell and nuclear membranes in order for the most efficient labeling of nuclear proteins. Thus, for the staining of intra-nuclear proteins like transcription factors, often a proprietary combination of fixative and permeabilization buffer are optimized for use together to ensure best results.
biolegend.com
Figure 1. Human PBMCs were stained with Perforin (clone dG9) Alexa Fluor® 594 (red) and CD8 (clone HIT8a) Alexa Fluor® 488 (green). The nuclei were counterstained with DAPI (blue).

Customer Service: 858-768-5800
20
True-Nuclear™ Transcription Factor Staining Buffer SetWe formulated our True-Nuclear™ Transcription Factor buffer set based on the best possible combination of buffer components that produced optimal staining results. Dramatic performance improvements are observed in two distinct instances. When comparing T-bet BV421™ conjugates using either the True-Nuclear™ Buffer or another nuclear staining buffer (Figure 2), there is a significantly improved separation between positive values compared to background.
Secondly, the True-Nuclear™ buffer also enabled signal detection with clones that previously produced undetectable signal due to poor penetration, like anti-mouse Blimp-1 (Figure 3) and anti-FoxP3 BV421™.
Figure 3. BALB/c spleen cells were cultured for four days in presence of LPS. Previously, Blimp-1 Alexa Fluor® 647 wasn’t able to positively stain cells when used with a previous nuclear staining buffer. With True-Nuclear™ Transcription Factor Buffer Set, cells were first stained with CD45R/B220 PE, followed by fixation, permeabilization, and staining with rat IgG2a, κ Alexa Fluor® 647 isotype control (Left) or Blimp-1 (clone 5E7) Alexa Fluor® 647 (Right). Data shown was gated on live cells using Zombie Aqua™ fixable viability dye.
Figure 4. Cells were labeled with an APC/Cy7 antibody conjugate and changes in compensation of APC/Cy7 into the APC channel was assessed after exposure to True-Nuclear™, a previous formulation of nuclear staining buffer or cells unfixed as a control.
Figure 2. Intracellular staining of T-bet in human PBMCs using either the True-Nuclear Buffer or a previous formulation of nuclear staining buffer.
Another significant advantage of this buffer is its reduced effect on scatter properties of the cells and on the degradation of tandem fluorophores like APC/Cy7, which are are particularly susceptible to fixatives when compared post-fixation with live, unstained cells. Both the use of the True-Nuclear™ buffer and the use of APC/Fire™ 750 in lieu of APC/Cy7 can help minimize damage done to the integrity of the tandem fluorophore when first doing cell surface staining with an antibody prior to the fix/perm protocol for transcription factor staining.
Fresh, unfixed cells True-Nuclear™ fixed cells Other nuclear buffer fixed cells
CompensationAPC-APC/Cy717.3%
CompensationAPC-APC/Cy721.9%
CompensationAPC-APC/Cy744.5%
True-Nuclear™ Buffer Other Nuclear Staining Buffer
Rat I
gG2a
k A
lexa
Flu
or®
647
Blim
p-1
(5E7
) Ale
xa F
luor
® 64
7
CD45R/B220 PECD45R/B220 PE

biolegend.com
21
Phospho-site Specific StainingSite-specific post-translational modification is one of the mechanisms for modifying the function of proteins. These protein modifications allow for the regulation of an array of signal transduction pathways and are involved in a myriad of cell processes, from cell health and cell cycle to synaptogenesis and modulation of neurotransmitter release. Phosphorylation generally activates, deactivates or modifies the function of a protein. For research applications, the detection of specific phosphorylation sites can be challenging, since phosphorylation can be a very transient state, whereby dephosphorylation can occur quickly. Methanol and ethanol are preferred to amine-crosslinking fixatives like PFA or formalin in order to quickly capture the phosphorylated state, while also permeabilizing the cell by solubilizing the plasma membrane, thus allowing for detection with antibodies. This can be problematic for other proteins, especially cell surface antigens and also protein-based fluorophores like PE, APC and PerCP that become denatured upon exposure to alcohol-based fixatives. Optimization of this assay is required to best understand which antigens and which fluorophores are appropriate to use before or after fixation.
View more phospho reagents at: biolegend.com/phospho
Figure 5. HeLa cells were fixed with Fixation Buffer (Cat No. 420801), permeabilized with cold True-Phos™ Perm Buffer (Cat No. 425401), then Figure A is intracellularly stained with DAPI (Cat No. 422801) and mouse IgG1,k Alexa Fluor® 647 isotype control . Figure B is intracellularly stained with DAPI and anti-p-H2A.X Ser139 (clone 2F3) Alexa Fluor® 647. Figure C is intracellularly stained with DAPI and anti-p-histone H3 Ser28 (clone HTA28) Alexa Fluor® 647. Figure D is intracellularly stained with DAPI and anti-p-histone H3 Ser10 (clone 11D8) Alexa Fluor® 647.
A. isotype control
Ale
xa F
luor
® 64
7
Ale
xa F
luor
® 64
7
Ale
xa F
luor
® 64
7
Ale
xa F
luor
® 64
7
DAPI DAPI
DAPI DAPI
C. p-histone H3 Ser28 D. p-histone H3 Ser10
B. p-H2A.X Ser139
* Mouse only
TRAF6
TRAF6
TRAF6
EndocytosedTLR4
TLR7/8
TLR11orTLR13
TLR9
CpGDNA
ssRNAdsRNA
TLR3
TRIF TRIFTRAM RIP1
RIP1
23srRNA
TIRAP
Pro�lin
TLR12Homodimer
TLR11/12Heterodimer
TRAF3
TRAF3
TRAF3
IKKεTBK-1
Proteosomal Degradation
Ubiquitin
Ubiquitin
RICK/RIP2
RICK/RIP2
Procaspase-1
Procaspase-1
Caspase-1
Pro IL-1βPro IL-18
IL-1β IL-18 In�ammationPyroptosis
NLRP3
NOD1
NOD2
Ubiquitin
IKKβ
IKKβ
NF-κB
NF-κB
NF-κBActivation
MAPKActivation NF-κB
NF-κB
NF-κB
IKKα
IKKβ
IKKγ/NEMO
IKKα
IKKα
AP-1 Activation
TBK1
STING
pol III Viral DNA
5' Triphosphorylated dsRNA
STING
IntracellularBacteria
Proin�ammatoryCytokines/Chemokines
Cyclic Dinucleotides
NEMO
IRAK1 IRAK2
IRAK4
LPS
TIRAPMyD88
MyD88
MyD88
?
Lipopeptides
Flagella
TLR5
TLR10TLR2
TLR2
TLR1/6
CD14
CD14
TLR4/MD2
TRAF6
IRAK1 IRAK2
IRAK4IRAK1 IRAK2
IRAK4 TAB2/3
TAB2/3MuramylDipeptide
Endocytosed BacteriaDAMPsPore-forming toxinsCalcium In�ux?
γ-D-glutamyl-mesodiaminopimelic acid
TAK1
TAK1
TAB1
TAB1
TAB2/3
IRF7
ASC
AIM2
ASC
Foreign dsDNA
JAK Tyk
STAT1
STAT2
TRF9
ISGF3
IFNStimulatedGenes
Type 1 IFNReceptor
Type 1 IFNs
MAVS Aggregation
Dimerization
TRIM25
Riplet RNF135
K63 Polyubiquitination
Heterotetramer Formation
RIG-I
IRF7
Type 1IFNs
IRF3
IRF3
IRF3
IL-15RANTESCXCL10
IL-1βIL-6IL-10IL-16iNOSTNF-αGM-CSFMIP-1αMIP-1βMCP-1RANTES
TAK1
TAB1
c-Jun
JNK
p50p60
RelA
c-Fas AP-1
AP-1
CREB
CREB
p38/MAPK
ParasiteParasite
BacteriaBacteria
BacteriaBacteria
BacteriaBacteria
VirusVirus
VirusVirus
NucleusNucleus
In�ammasomeFormationIn�ammasomeFormation
MitochondriaMitochondria
EndoplasmicReticulumEndoplasmicReticulum
©BioLegend, Inc. 2016
Innate Immune Signaling
biolegend.com
EndosomesEndosomes
Toll - Like Receptor LigandsToll - Like Receptor Ligands
TLR1 - Triacetylated lipopeptidesTLR2 - Glycolipids, lipopeptides lipoproteinsTLR3 - Double-stranded RNATLR4 - Lipopolysaccharide, heat shock proteins, �brinogenTLR5 - FlagellinTLR6 - Diacyl lipopeptidesTLR7 - Single-stranded RNATLR8 - Single-stranded RNA (Human) Imidazoquinoline, poly T oligonucleotides (Mouse)
TLR9 - Unmethylated CpG DNA, haemozoinTLR10 - ? TLR11* - Flagellin, pro�linTLR12* - Pro�lin
Contact BioLegendUS & Canada Toll-Free: 1.877.246.5343 (877-BIOLEGEND)International: 1.858.768.5800Fax: 1.877.455.9587email: [email protected], [email protected]
04-0069-00
US Headquarters:San Diego, CA 92121 Interactive Poster: biolegend.com/innate_signaling_poster
We would like to thank Dr. Glen Barber of the University of Miami Miller School of Medicine
for his contributions to this poster.

Customer Service: 858-768-5800
22
Customer Service: 858-768-5800
22
Non-specific Monocyte StainingMonocytes and macrophages have a scavenging function in the immune system, looking for fragments of viruses and bacteria to phagocytose, digest and present on their surface for activation of an immune response. Sometimes this function can dispose these cell subsets to non-specific binding when performing an immunoassay. Specifically, an area of concern in flow cytometry is the non-specific binding of particular cyanine-derived fluorophores like the acceptor dyes Cy5 in the PE/Cy5 tandem, Cy7 in the PE/Cy7 and APC/Cy7 tandem fluorophores, and the acceptor fluorophore in the tandem PE/Dazzle™ 594.
True-Stain Monocyte Blocker™ is a proprietary formulation that effectively blocks this fluorophore-dependent non-specific binding without activating or affecting cell health and function. It will, however, significantly improve the stringency and accuracy of multicolor staining applications in flow cytometry.
CD3 APC/Cy7 No Blocker
CD3 APC/Cy7 True-Stain Monocyte Blocker™
CD3 PE/Cy7 No Blocker
CD3 PE/Cy7 True-Stain Monocyte Blocker™
CD3 PE/Cy5 No Blocker
CD3 PE/Cy5 True-Stain Monocyte Blocker™
Figure 6. Plots along the top were stained without the True-Stain Monocyte Blocker™. The plots along the bottom were stained in the presence of True-Stain Monocyte Blocker™. The red gate indicates the cells involved in the non-specific binding of monocytes.

biolegend.com
2323
Fc Receptor Non-specific BindingHuman Fc receptors (FcR) are expressed on a variety of cells, including monocytes, granulocytes, B-cells and dendritic cells. The purpose of the Fc receptor is to bind to antibodies that might have attached to antigens and help internalize this complex. Cells with FcR expression can sometimes give false positive results in immunofluorescent staining due to binding of the Fc region of the detection antibody for the assay. Human TruStain FcX™ is specially formulated for blocking the FcR-involved unwanted staining without interfering with antibody-mediated specific staining of human cells. It is compatible with downstream flow cytometric staining of anti-human CD16 (clone 3G8), CD32 (clone FUN-2), and CD64 (clone 10.1) antibodies.
Mouse FcR-related non-specific staining caused by B cells, monocytes/macrophages, NK cells, granulocytes, mast cells, and dendritic cells can be blocked with BioLegend TruStain fcX™ (anti-mouse CD16/32) antibody.
Learn more at: biolegend.com/fixation
Choose your buffers at: biolegend.com/flow_buffers
Buffers for Flow Cytometry Cat. No.
Cell Staining Buffer 420201
RBC Lysis Buffer (10x) 420301
RBC Lysis/Fixation Solution (10X) 422401
Fixation Buffer 420801
True-Nuclear™ Transcription Factor Buffer Set 424401
True-Phos™ Perm Buffer 425401
Human TruStain fcX™ (Fc Receptor Blocking Solution) 422301 | 422302
TruStain fcX™ (anti-mouse CD16/32) antibody 101319 | 101320
True-Stain Monocyte Blocker™ 426101 | 426102 | 426103
Figure 7. Human TruStain FcX™ treated (filled histograms) or non-treated (open histograms) THP-1 cells stained with anti-human HLA-DR PE (red) or an isotype control (IgG2a PE, blue) mAbs. Note: non-treated cells show false-negative HLA-DR staining due to high binding of mouse IgG2a isotype.
biolegend.com

Customer Service: 858-768-5800
24
Dendritic Cell, Monocyte, and Macrophage Biology PosterMonocytes originate in the bone marrow and can extravasate into tissues and differentiate into dendritic cells or macrophages, depending on the stimuli. These cells have key roles in pathogen killing and antigen presentation to bridge the gap between innate and adaptive immunity. Macrophages can become M1 or M2-polarized, which are generally considered proinflammatory and anti-inflammatory states respectively. They can also aid in wound repair. Dendritic cells are regarded as the better antigen presenting cell of the two, and can be classified as either classical or plasmacytoid dendritic cells. Phenotyping these myeloid cells can often prove to be very difficult, as they share several markers, and marker expression may change depending on tissue location.

25
biolegend.com

Customer Service: 858-768-5800
26
Cell Health
Cell Health, Cell Cycle
and Proliferation

biolegend.com
27
Cell Health, Cell Cycle and Proliferation Cell health, proliferation and cell cycle are ubiquitous applications in every specialty within cell biology, from immunology to cancer biology to neuroscience. In every tissue, there are responses to cellular injury that lead to inflammation and necrosis or apoptosis, cellular trafficking and proliferation to tissue regeneration. Probes to assess these different facets of cell health can be based on antibody detection of specific proteins expressed in cell cycle or apoptosis, for example. There are also non-antibody based chemical probes available that may demonstrate cell permeability or mitochondrial polarization as indicators of cell health using a chemical mechanism inherent to the probe itself.
Live/Dead Status Assessed through Membrane PermeabilityThe simplest and most commonly used method of determining live/dead status of unfixed cells is an impermeant nucleic acid stain. Impermeant nucleic acid stains only gain entrance to the cell if membrane integrity is compromised. Dead cells will stain brightly and live cells will not stain at all. Since some nucleic acid stains can start to stain late stage apoptotic cells, the best impermeant nucleic acid stains for dead cells are Propidium Iodide, Helix NP™ Blue, Helix NP™ Green, and Helix NP™ NIR.
Cell Type Suitability Sample Suitability Application Fixation
Chemical Probe Cat. No Imaging Equivalent Channel
Live Dead/ Fixed Tissue Cell Culture/ Single Cells
Flow Cytometry
Microscopy Retention with PFA Treatment
Helix NP™ Blue 425305 Coumarin, BV421™ Nucleus • • • • •
Helix NP™ Green 425303 FITC Nucleus • • • • •
Helix NP™ NIR 425301 Alexa Fluor® 647, APC Nucleus • • • • •
DRAQ7™ 424001 Alexa Fluor® 700, APC/Cy7 Nucleus • • • • •
Propidium Iodide 421301 PE/Cy5, PE/Dazzle™ 594 Nucleus • • • • •
Figure 1. One day old C57 mouse splenocytes were stained with Helix NP™ NIR (filled histogram). Cells alone, without Helix NP™ NIR staining, are also shown (open histogram).
Figure 2. Whole frozen mouse brain slice, stained with Helix NP™ NIR (blue) and Flash Phalloidin™ Red (red).
Customer Service: 858-768-5800
28
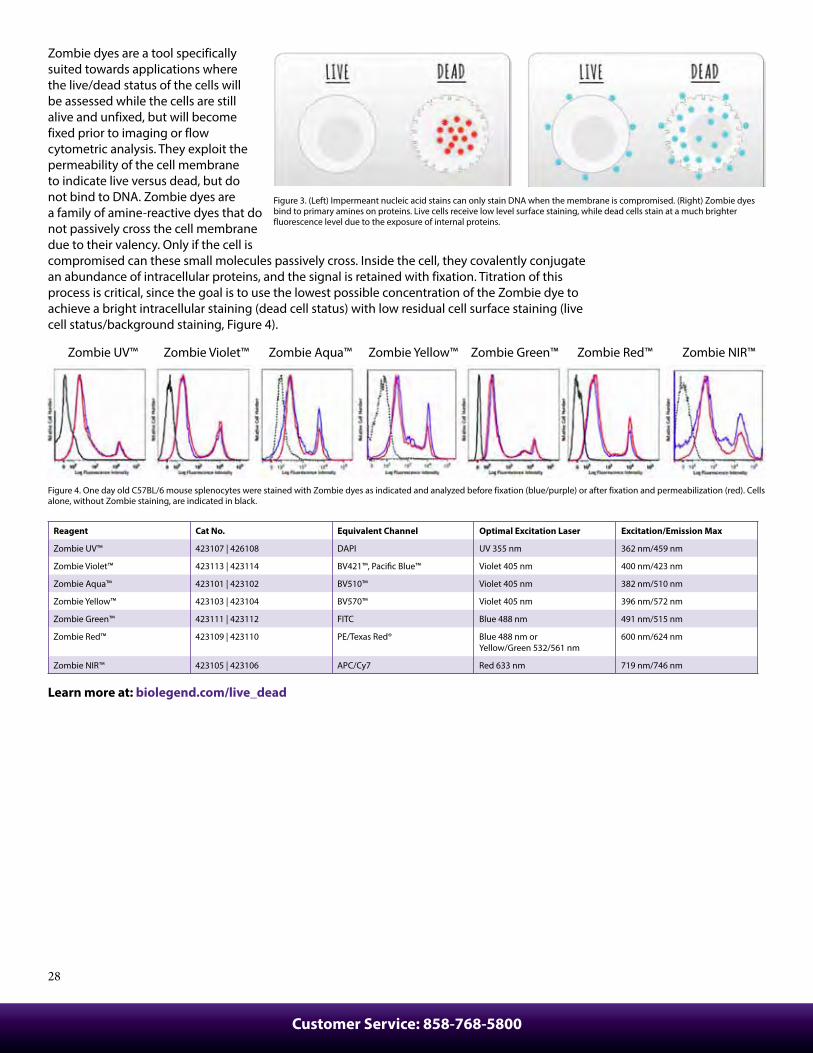
Zombie dyes are a tool specifically suited towards applications where the live/dead status of the cells will be assessed while the cells are still alive and unfixed, but will become fixed prior to imaging or flow cytometric analysis. They exploit the permeability of the cell membrane to indicate live versus dead, but do not bind to DNA. Zombie dyes are a family of amine-reactive dyes that do not passively cross the cell membrane due to their valency. Only if the cell is compromised can these small molecules passively cross. Inside the cell, they covalently conjugate an abundance of intracellular proteins, and the signal is retained with fixation. Titration of this process is critical, since the goal is to use the lowest possible concentration of the Zombie dye to achieve a bright intracellular staining (dead cell status) with low residual cell surface staining (live cell status/background staining, Figure 4).
Zombie UV™ Zombie Violet™ Zombie Aqua™ Zombie Yellow™ Zombie Green™ Zombie Red™ Zombie NIR™
Figure 4. One day old C57BL/6 mouse splenocytes were stained with Zombie dyes as indicated and analyzed before fixation (blue/purple) or after fixation and permeabilization (red). Cells alone, without Zombie staining, are indicated in black.
Reagent Cat No. Equivalent Channel Optimal Excitation Laser Excitation/Emission Max
Zombie UV™ 423107 | 426108 DAPI UV 355 nm 362 nm/459 nm
Zombie Violet™ 423113 | 423114 BV421™, Pacific Blue™ Violet 405 nm 400 nm/423 nm
Zombie Aqua™ 423101 | 423102 BV510™ Violet 405 nm 382 nm/510 nm
Zombie Yellow™ 423103 | 423104 BV570™ Violet 405 nm 396 nm/572 nm
Zombie Green™ 423111 | 423112 FITC Blue 488 nm 491 nm/515 nm
Zombie Red™ 423109 | 423110 PE/Texas Red® Blue 488 nm or Yellow/Green 532/561 nm
600 nm/624 nm
Zombie NIR™ 423105 | 423106 APC/Cy7 Red 633 nm 719 nm/746 nm
Learn more at: biolegend.com/live_dead
Figure 3. (Left) Impermeant nucleic acid stains can only stain DNA when the membrane is compromised. (Right) Zombie dyes bind to primary amines on proteins. Live cells receive low level surface staining, while dead cells stain at a much brighter fluorescence level due to the exposure of internal proteins.

biolegend.com
29
Cell Vitality Indication through Esterase-dependent ProbesCell vitality can be assessed with probes that enter cells passively (such as CFDA-SE, Tag-it Violet™, Calcein-AM or Calcein Violet-AM). Inside the cell, esterase activity cleaves acetoxymethyl ester (AM) or diacetate (DA) groups from the probe, resulting in a charged fluorescent molecule that is retained by the intact membrane of the cell. Fluorescence intensity indicates the amount of esterase activity, which is dependent on the cell and its health status. Healthy cells will have a variable but strong conversion of the esterase substrate (Figure 6, left). Apoptotic and necrotic cells will exhibit lower esterase activity than healthy cells (Figure 6, right) and dead cells will have even less, since only a small residual amount of leftover esterase may have been retained.
Apoptosis IndicatorsThe most commonly used indicator of apoptosis, Annexin V, stains phosphatidylserine (PS) residues that have been translocated to the cell surface during the early to middle stages of apoptosis. However, it will also stain the intracellular-facing PS due to the loss of membrane integrity in death. Therefore, an impermeant nucleic acid stain or other marker of cell death must be employed to distinguish cells dying from apoptosis from those dead from necrosis. Apoptotic cells can also allow entrance of certain otherwise impermeant nucleic acid stain at late stages, namely DAPI and 7-AAD, so choosing the right dead cell indicator and also assessing multiple markers for different characteristics is important.
Biot
in
Paci
fic B
lue™
BV42
1™
BV51
0™
BV57
0™
BV60
5™
BV65
0™
BV71
1™
BV78
5™
FITC
Ale
xa F
lour
® 48
8
Ale
xa F
lour
® 59
4
PCP/
Cy5.
5
PE PE/D
azzl
e™
PE/C
y5
PE/C
y7
Ale
xa F
lour
® 64
7
APC
Ale
xa F
lour
® 70
0
APC
/Cy7
APC
/Fir
e™ 7
50
Annexin V • • • • • • • • •
Annexin V Kits and Buffer Reagents Cat. No
Annexin V Binding Buffer 422201
Pacific Blue™ Annexin V Apoptosis Detection kit with PI 640928
APC Annexin V Apoptosis Detection kit with PI 640932
Pacific Blue™ Annexin V Apoptosis Detection kit with 7-AAD 640926
APC Annexin V Apoptosis Detection kit with 7-AAD 640930
Figure 5. Acetoxymethyl ester side chains mask the charge of the small organic fluorophore, allowing it to passively cross the cell membrane. Intracellular esterases will cleave the side chains when cells are metabolically healthy. Once the charge of the fluorophore is released, it will be passively retained by the cell. For a longer term retention, some probes also contain chloromethyl or succinimidyl ester side chains to covalently cross-link either cysteine or lysine residues respectively on intracellular proteins.
SYTO
X™ R
ed
SYTO
X™ R
ed
Calcein Violet-AMCalcein Violet-AMFigure 6. Fresh (left) or day-old C57BL/6 splenocytes (right) were stained with 0.01 µM Calcein Violet-AM and a cell-impermeant nucleic acid dye, SYTOX™ Red (colored). Black figure represents unstained splenocytes.

Customer Service: 858-768-5800
30
ProliferationAs a cell divides, the resultant single cell will have half the fluorescent intensity of its parent cell (Figure 8). How long the signal persists depends on the length of the experiment or how fast the cells are dividing. Higher concentrations of these probes can be toxic as they interfere with protein function. As such, titration of the dye is very important. CFDA-SE and Tag-it Violet™ are retained in cells they have labeled upon fixation with paraformaldehyde to enable downstream antibody labeling for flow cytometry and imaging applications.
Cell Type Suitability Sample Suitability Application Fixation
Chemical Probe Cat. No Imaging Equivalent Channel
Live Dead/ Fixed Tissue Cell Culture/ Single Cells
Flow Cytometry
Microscopy Retention with PFA Treatment
Calcein-AM 425201 FITC Cytoplasm • • • •
Calcein Violet-AM 425203 BV421™ Cytoplasm • • • •
CFDA-SE 423801 FITC Cytoplasm • • • • • •
Tag-it Violet™ 425101 BV421™ Cytoplasm • • • • • •
BrdU Nucleotide Analogs and Ki-67 as Additional Indicators of ApoptosisBrdU (bromodeoxyuridine) assays are another method of labeling proliferating cells. In culture or in vivo, BrdU is a nucleotide analog that can be fed to cells in culture media or via direct injection into an animal to be incorporated into the newly replicating DNA of dividing cells. The BrdU pulse time depends on the mitogen or the rate of cell division. This reveals which of the cells achieved division during the time of the BrdU pulse. While it will not give information about how many times a cell divided or the fate of all of the resultant daughter cells, it is a single cell flow cytometry application. Thus, additional parameters can be assessed on each cell, such as DNA content, phenotype of each cell or transcriptional factors, and regulators that might have differentially responded to the mitogen. As this application requires an anti-BrdU antibody, samples must be fixed and permeabilized for the antibody to gain access to the DNA for imaging.
An antibody-based method of detecting proliferating cells post-fixation is Ki-67, a nuclear protein involved in ribosomal RNA transcription. Expression occurs diffusely in the nucleus during the active phases of the cell cycle, G1, S and G2 phases, whereas in M phase or mitosis, the protein becomes localized to the surface of chromosomes. Ki-67 is not detectable in G0 or resting phase.
Figure 9. C57BL/6 mouse frozen intestine section was fixed, permeabilized, and blocked. Then the section was stained with anti-Ki-67 (clone 11F6) Alexa Fluor® 647 (red) and anti-E-cadherin (clone DECMA-1) Alexa Fluor® 594 (green) overnight at 4°C. Nuclei were counterstained with DAPI (blue). The image was captured with a 20X objective.
Figure 7. Mouse spleen 72 hours after adoptive transfer of Tag-it Violet™-labeled splenocytes (purple). Nucleated cells are stained with DRAQ5™ (red).
Figure 8. Mouse splenocytes stained with Tag-it Violet™ without stimulation (left) or subsequently stimulated with ConA and IL-2 for 4 days (right).

biolegend.com
31
NADNADP
NADHNADPH
1-Methoxy PMS
TetraZ
Formazan
Live cell
Figure 11. TetraZ™ produces a water soluble dye upon reduction in the presence of an electron mediator. Electrons are provided by cellular dehydrogenases, which transform tetrazolium salt into a colored product, formazan. The amount of formazan produced is directly proportional to the number of live cells.
Figure 10. HEL cell line was pulsed with (left) or without (right) BrdU for 1 hour and then stained with anti-BrdU (clone 3D4) Alexa Fluor® 647 antibody. Cells were subsequently stained with 1 µg of DAPI for DNA analysis.
Ant
ibod
y
Clon
e
Puri
fied
Biot
in
Paci
fic B
lue™
BV42
1™
BV51
0™
BV57
0™
BV60
5™
BV65
0™
BV71
1™
BV78
5™
FITC
Ale
xa F
lour
® 48
8
Ale
xa F
lour
® 59
4
PerC
P/Cy
5.5
PE PE/D
azzl
e™ 5
94
PE/C
y5
PE/C
y7
Ale
xa F
lour
® 64
7
APC
Ale
xa F
lour
® 70
0
APC
/Cy7
APC
/Fir
e™ 7
50
BrdU 3D4 • • • • •
BrdU Bu20a • • • •
BrdU MoBU-1 • •
Ki-67 ms/hu
11F6 • • • •
Ki-67 ms 16A8 • • • • • • • • • • • •
Bromodeoxyuridine (BrdU) Cat. No. 423401
Phase-Flow™ FITC BrdU Kit 370704
Phase-Flow™ Alexa Fluor® 647 BrdU Kit 370706
Microplate Assays for ProliferationFor time point assays, a microplate assay can be performed to give a broader view of the proliferation of cultured cells. Resazurin (Deep Blue Cell Viability™) and tetrazolium salt (TetraZ™ Cell Counting Kit) are probes that become fluorescent upon metabolic activation. The relative fluorescence units of the microplate reader are plotted on a standard curve against number of live cells to give an overall view of rate of proliferation. Ideally, they should be paired with an impermeant nucleic acid stain to indicate the number of dead cells. Permeant nucleic acid stains can render a total cell count.
0.4
0.5
0.6
0.7
0.8
0.9
1
1.1
1.2
0.00001 0.0001 0.001 0.01 0.1 1 10
OD4
50
[mTPO], ng/mL
TetraZ™MTS
Figure 12. Recombinant mouse thrombopoietin (mTPO) induces proliferation of M0-7e cells in a dose-dependent manner. TetraZ™ was added for the last 16 hours of a 72 hour stimulation. The plate was read at 450 nm in a plate reader.

Customer Service: 858-768-5800
32
Death Receptor 6(TNFRSF21)
TWEAK-R (TNFRSF12A/Fn14)
Decoy Receptor 2 (TNFRSF10D/TRAIL-R4)
Zombie DyesPropidium Iodide (PI)7-Amino-Actinomycin (7-AAD)
Decoy TRAIL Receptor R1 (TNFRSF23)Decoy TRAIL Receptor R2 (TNFRSF22)Decoy Receptor 1 (TNFRSF10C/TRAIL-R3)
Decoy Receptor 3 (TNFRSF6B)
TWEAK (TNFSF12)
TWEAK (TNFSF12)
TRAIL (TNFSF10)
PI
BAT1, TIM-4
CD36
TLR RIPK1
RIPK3
Necrosome
RIPK1
PKR
MLKL
FLIP
DAI
Necrosulfonamide
IFN
JAK-STAT
Virus
TRIFCaspase 8
NLRC4
Cytosolic Bacteria
Cholera toxin B,Gram-negative bacteria
Intracellular LPS
FlagellinType 3 SecretionSystem Rods/Needles
Caspase 4, 5, 11
Caspase Oligomerization
Pyroptosis
Pore formationCell swellingLysis
HMGB1ATPIL-1αLactose dehydrogenase
?
NLRP3
ASCASC FocusFormation
AIM2
Procaspase 1
In�ammasome
Caspase 1
IL-1β, IL-18
FADD
FADDTRADD
Necrostatin 1
De novotranscription
Bacterial DNA
Death Receptor
Extracellular ATP Bacterial pore-forming toxins Monosodium urate crystalsCholesterol crystals
oxLDL
ICAM3?CD14
MER
GAS6
7-AAD
Sphingosine-1-Phosphate
NucleotidesATP, UTP
T
C
G
A
P2y2
PANX1
Sphingosine-1Phosphate Receptor
Lysophosphocholine
G2A?
Phosphatidylserine
TRAIL (TNFSF10)
TRAIL (TNFSF10)
RAIDD
Caspase-2 PIDDosome
PIDD-CC
APAF1
AIF, Endo G
smac/diabloHtra 2/Omi
Target Molecule Cleavage(Actin, DNA, Nuclear Lamins)
Bax, BakCytochrome C
BH3 Only Protein Activation
Bax, Bak Oligomerization
Bcl-2 Bcl-2-xL, MCL-1
p53
SevereDNA Damage
TRAIL (TNFSF10)
FAS-L(TNFSF6/CD178)
FAS-L (TNFSF6/CD178)
Osteoprotegerin (TNFRSF11B)
Phosphatidylserine
Phosphatidylserine (PS)
Phospholipids
Caspase 3,7
CDC50
Actomysin Contraction
ROCK1
Annexin V
NF-kB
Zombie DyesNH2
NH2
Ca2+
Lactoferrin
CD31
CD46CD47
Neutrophil Recruitment
FAS (TNFRSF6/CD95)
Death Domain
Death Inducing Signaling Complex (DISC)
TNF RI (TNFRSF1A)TNF RII (TNFRSF1B)
Death Receptor 4 (TNFRSF10A/TRAIL-R1)Death Receptor 5 (TNFRSF10B/TRAIL-R2)
Death Receptor 3 (TNFRSF25, APO-3)
TNF-α
TRAF1
TRAF2
FADD
FADD
FADD
FADD
Procaspase 8,10
Procaspase 8,10
Caspase 8,10
Caspase 3
CAD
ICAD
ICADDegradation
Caspase 9
Caspase 3
Caspase 6
Xkr8Scramblase
ATP11CFlippase
Caspase 7
XIAP
XIAP
XIAP
Procaspase 3
Procaspase 6
Procaspase 7
Procaspase 2
Caspase 2
Procaspase 9
Membrane PermeabilityDisruption
ROS GenerationDNA Fragmentation
Procaspase 3
Bid
t-Bid
TRADD
TRADDTRADD
TRADD
RIP1
RIP1
CIAP1/2K63 Ubiquitination
K63 UbiquitinRemoval
RIP1
FLIP
RIP1
TRAF5
TRAF 3
?
Bcl-2 Superfamily Caspases
Keep-Out SignalKeep-Out Signal
Don’t Eat Me SignalsDon’t Eat Me Signals
Eat-Me SignalsEat-Me Signals
Outer Lea�et PS ExposureEat-Me Signal
Outer Lea�et PS ExposureEat-Me Signal
Find-Me Signals Find-Me Signals
Endoplasmic Reticulum StressDNA DamageSurvival Factor Loss
Chemotaxis, EngulfmentChemotaxis, Engulfment
Membrane Rupture Membrane Rupture
IntracellularIntracellular
ExtracellularExtracellular
BlebbingBlebbing
Cytoskeletal Rearrangement, EngulfmentCytoskeletal Rearrangement, Engulfment
DNA FragmentationDNA Fragmentation MitochondriaMitochondria
ApoptosomeApoptosome
Apoptotic CellApoptotic Cell
PhagocytePhagocyte
Cell SurvivalProliferationCell SurvivalProliferation
04-0051-00
©BioLegend, Inc. 2014
Mechanisms of Cell Death
biolegend.com
Macrophage Monocyte NeutrophilDendritic Cell Fibroblast Mast Cell
Pro-apoptotic Anti-apoptoticBax Bid BCL-2 A1Bok BikBak
BCL-XL BLFL-1
Bim
Noxa BCL-W BCL-B
Bad
Puma MCL-1
InitiatorCaspase 2 Caspase 3 Caspase 1Caspase 8 Caspase 6 Caspase 4Caspase 9 Caspase 7 Caspase 5Caspase 10
P
Contact BioLegendUS & Canada Toll-Free: 1.877.246.5343 (877-BIOLEGEND)International: 1.858.768.5800Fax: 1.877.455.9587email: [email protected], [email protected]
US Headquarters:San Diego, CA 92121Interactive Poster: biolegend.com/celldeath
We would like to thank Dr. Douglas Green, St. Jude Children's Research Hospital, for his contributions to this poster.
Customer Service: 858-768-5800
32
Mitochondrial Health and RespirationMitochondrial respiration and the respiration/polarization of the mitochondrial membrane are also indicators of cell health. Probes like MitoSpy™ Orange CMTMRos and MitoSpy™ Red CMXRos are live cell-permeant fluorogenic probes that localize to the mitochondrial membrane based on their strong polarization in healthy, respiring cells. The most common application of MitoSpy™ probes is simple mitochondrial localization in live cells for imaging applications. However, when used in conjunction with other probes for cell health, like Annexin V, Calcein-AM, or impermeant nucleic acid stains, the neutralization of potential across the mitochondrial membrane can be one of the first indications that a cell is entering apoptosis.
Figure 14. Human T-cell leukemia cell line, Jurkat, was treated for five hours with LEAF™ purified anti-CD95 (clone EOS9.1), then stained with an impermeant nucleic acid stain, Annexin V APC, and MitoSpy™ Orange CMTMRos. Data shown was gated on live cells.
Cell Type Suitability Sample Suitability Application Fixation
Chemical Probe Cat. No. Imaging Equivalent Channel
Live Dead/ Fixed Tissue Cell Culture/ Single Cells
Flow Cytometry
Microscopy Retention with PFA Treatment
MitoSpy™ Green FM 424805 | 424806 FITC Mitochondria • • • •
MitoSpy™ Orange CMTMRos 424803 | 424804 Alexa Fluor® 555, PE Mitochondria • • • • •
MitoSpy™ Red CMXRos 424801 | 424802 Alexa Fluor® 594 Mitochondria • • • • •
Learn more at: biolegend.com/mitospy
Figure 13. NIH3T3 cells were stained with MitoSpy™ Red CMXRos (red) then fixed with 1% PFA and permeabilized with 1X True Nuclear™ Perm Buffer. Then the cells were stained with Flash Phalloidin™ NIR 647 (green) and counterstained with DAPI (blue).

biolegend.com
33
Death Receptor 6(TNFRSF21)
TWEAK-R (TNFRSF12A/Fn14)
Decoy Receptor 2 (TNFRSF10D/TRAIL-R4)
Zombie DyesPropidium Iodide (PI)7-Amino-Actinomycin (7-AAD)
Decoy TRAIL Receptor R1 (TNFRSF23)Decoy TRAIL Receptor R2 (TNFRSF22)Decoy Receptor 1 (TNFRSF10C/TRAIL-R3)
Decoy Receptor 3 (TNFRSF6B)
TWEAK (TNFSF12)
TWEAK (TNFSF12)
TRAIL (TNFSF10)
PI
BAT1, TIM-4
CD36
TLR RIPK1
RIPK3
Necrosome
RIPK1
PKR
MLKL
FLIP
DAI
Necrosulfonamide
IFN
JAK-STAT
Virus
TRIFCaspase 8
NLRC4
Cytosolic Bacteria
Cholera toxin B,Gram-negative bacteria
Intracellular LPS
FlagellinType 3 SecretionSystem Rods/Needles
Caspase 4, 5, 11
Caspase Oligomerization
Pyroptosis
Pore formationCell swellingLysis
HMGB1ATPIL-1αLactose dehydrogenase
?
NLRP3
ASCASC FocusFormation
AIM2
Procaspase 1
In�ammasome
Caspase 1
IL-1β, IL-18
FADD
FADDTRADD
Necrostatin 1
De novotranscription
Bacterial DNA
Death Receptor
Extracellular ATP Bacterial pore-forming toxins Monosodium urate crystalsCholesterol crystals
oxLDL
ICAM3?CD14
MER
GAS6
7-AAD
Sphingosine-1-Phosphate
NucleotidesATP, UTP
T
C
G
A
P2y2
PANX1
Sphingosine-1Phosphate Receptor
Lysophosphocholine
G2A?
Phosphatidylserine
TRAIL (TNFSF10)
TRAIL (TNFSF10)
RAIDD
Caspase-2 PIDDosome
PIDD-CC
APAF1
AIF, Endo G
smac/diabloHtra 2/Omi
Target Molecule Cleavage(Actin, DNA, Nuclear Lamins)
Bax, BakCytochrome C
BH3 Only Protein Activation
Bax, Bak Oligomerization
Bcl-2 Bcl-2-xL, MCL-1
p53
SevereDNA Damage
TRAIL (TNFSF10)
FAS-L(TNFSF6/CD178)
FAS-L (TNFSF6/CD178)
Osteoprotegerin (TNFRSF11B)
Phosphatidylserine
Phosphatidylserine (PS)
Phospholipids
Caspase 3,7
CDC50
Actomysin Contraction
ROCK1
Annexin V
NF-kB
Zombie DyesNH2
NH2
Ca2+
Lactoferrin
CD31
CD46CD47
Neutrophil Recruitment
FAS (TNFRSF6/CD95)
Death Domain
Death Inducing Signaling Complex (DISC)
TNF RI (TNFRSF1A)TNF RII (TNFRSF1B)
Death Receptor 4 (TNFRSF10A/TRAIL-R1)Death Receptor 5 (TNFRSF10B/TRAIL-R2)
Death Receptor 3 (TNFRSF25, APO-3)
TNF-α
TRAF1
TRAF2
FADD
FADD
FADD
FADD
Procaspase 8,10
Procaspase 8,10
Caspase 8,10
Caspase 3
CAD
ICAD
ICADDegradation
Caspase 9
Caspase 3
Caspase 6
Xkr8Scramblase
ATP11CFlippase
Caspase 7
XIAP
XIAP
XIAP
Procaspase 3
Procaspase 6
Procaspase 7
Procaspase 2
Caspase 2
Procaspase 9
Membrane PermeabilityDisruption
ROS GenerationDNA Fragmentation
Procaspase 3
Bid
t-Bid
TRADD
TRADDTRADD
TRADD
RIP1
RIP1
CIAP1/2K63 Ubiquitination
K63 UbiquitinRemoval
RIP1
FLIP
RIP1
TRAF5
TRAF 3
?
Bcl-2 Superfamily Caspases
Keep-Out SignalKeep-Out Signal
Don’t Eat Me SignalsDon’t Eat Me Signals
Eat-Me SignalsEat-Me Signals
Outer Lea�et PS ExposureEat-Me Signal
Outer Lea�et PS ExposureEat-Me Signal
Find-Me Signals Find-Me Signals
Endoplasmic Reticulum StressDNA DamageSurvival Factor Loss
Chemotaxis, EngulfmentChemotaxis, Engulfment
Membrane Rupture Membrane Rupture
IntracellularIntracellular
ExtracellularExtracellular
BlebbingBlebbing
Cytoskeletal Rearrangement, EngulfmentCytoskeletal Rearrangement, Engulfment
DNA FragmentationDNA Fragmentation MitochondriaMitochondria
ApoptosomeApoptosome
Apoptotic CellApoptotic Cell
PhagocytePhagocyte
Cell SurvivalProliferationCell SurvivalProliferation
04-0051-00
©BioLegend, Inc. 2014
Mechanisms of Cell Death
biolegend.com
Macrophage Monocyte NeutrophilDendritic Cell Fibroblast Mast Cell
Pro-apoptotic Anti-apoptoticBax Bid BCL-2 A1Bok BikBak
BCL-XL BLFL-1
Bim
Noxa BCL-W BCL-B
Bad
Puma MCL-1
InitiatorCaspase 2 Caspase 3 Caspase 1Caspase 8 Caspase 6 Caspase 4Caspase 9 Caspase 7 Caspase 5Caspase 10
P
Contact BioLegendUS & Canada Toll-Free: 1.877.246.5343 (877-BIOLEGEND)International: 1.858.768.5800Fax: 1.877.455.9587email: [email protected], [email protected]
US Headquarters:San Diego, CA 92121Interactive Poster: biolegend.com/celldeath
We would like to thank Dr. Douglas Green, St. Jude Children's Research Hospital, for his contributions to this poster.
33
Cell Permeant Nucleic Acid Stains and Cell Cycle AnalysisCellular division for any cell type is dependent on the inherent function, location, and response of cells to repair, apoptosis, or death. To divide, cells must duplicate a copy of their DNA, increase mitochondrial density, and assemble/synthesize microtubules during interphase. G2 is a checkpoint stage of interphase where the cell has two sets of dsDNA and must commit to mitosis. Mitosis is the actual division stage where two daughter cells are created. There can be symmetrical or asymmetrical division, depending on the cell and tissue type. Mitosis can be further subdivided into prophase, metaphase, anaphase, and telophase as the nucleus undergoes division and chromatids are pulled away from one another. After mitosis, the cell will undergo the G0/G1 phase, when the cells rest to become ready for the next round of replication.
Learn more at: biolegend.com/cell_health_proliferation
biolegend.com
Figure 15. During G0/G1, S, and G2 phases, some fluorogenic nucleic acid stains selectively bind dsDNA stoichiometrically to give measurements of DNA mass based on fluorescence intensity. Cell-permeant nucleic acid stains can be used in instances where cells will be analyzed live. Propidium Iodide, DAPI, DRAQ5™, DRAQ7™, CytoPhase™ Violet, Helix NP™ NIR and Helix NP™ Green can all be used to stain fixed cells for cell cycle analysis. However, only CytoPhase™ Violet and DRAQ5™ can be used to assess DNA content of live cells.
Helix NP™ NIR
Figure 18. C57BL/6 mouse thymus cells were fixed using 70% chilled ethanol. The cells were incubated for one hour at -20°C, washed, then stained with Helix NP™ NIR at 5 µM.
DRAQ5™
Figure 17. Live C57BL/6 mouse bone marrow cells were stained with DRAQ5™.
CytoPhase™ Violet
Figure 16. Live Ramos cells treated with CytoPhase™ Violet dye for 90 minutes at 37°C.

Customer Service: 858-768-5800
34
Mechanisms of Cell Death PosterCell proliferation and activation are necessary; properly controlling how a cell dies is also important. This is because a cell’s contents, if spilled into the environment, can cause an inflammatory response. As such, the process of apoptosis helps to package off and partition parts of a dying cell. This can be sparked by the engagement of certain TNF receptors and caspase activation. Intracellular infection can also trigger pyroptosis, which is a highly inflammatory form of programmed cell death that typically results in cell lysis, spilling the cell’s contents. Necroptosis is a programmed form of cell death usually activated in response to viral threats, as it operates independently of any caspase inhibitors a virus might employ. This process, however, can also result in membrane rupture.
Death Receptor 6(TNFRSF21)
TWEAK-R (TNFRSF12A/Fn14)
Decoy Receptor 2 (TNFRSF10D/TRAIL-R4)
Zombie DyesPropidium Iodide (PI)7-Amino-Actinomycin (7-AAD)
Decoy TRAIL Receptor R1 (TNFRSF23)Decoy TRAIL Receptor R2 (TNFRSF22)Decoy Receptor 1 (TNFRSF10C/TRAIL-R3)
Decoy Receptor 3 (TNFRSF6B)
TWEAK (TNFSF12)
TWEAK (TNFSF12)
TRAIL (TNFSF10)
PI
BAT1, TIM-4
CD36
TLR RIPK1
RIPK3
Necrosome
RIPK1
PKR
MLKL
FLIP
DAI
Necrosulfonamide
IFN
JAK-STAT
Virus
TRIFCaspase 8
NLRC4
Cytosolic Bacteria
Cholera toxin B,Gram-negative bacteria
Intracellular LPS
FlagellinType 3 SecretionSystem Rods/Needles
Caspase 4, 5, 11
Caspase Oligomerization
Pyroptosis
Pore formationCell swellingLysis
HMGB1ATPIL-1αLactose dehydrogenase
?
NLRP3
ASCASC FocusFormation
AIM2
Procaspase 1
In�ammasome
Caspase 1
IL-1β, IL-18
FADD
FADDTRADD
Necrostatin 1
De novotranscription
Bacterial DNA
Death Receptor
Extracellular ATP Bacterial pore-forming toxins Monosodium urate crystalsCholesterol crystals
oxLDL
ICAM3?CD14
MER
GAS6
7-AAD
Sphingosine-1-Phosphate
NucleotidesATP, UTP
T
C
G
A
P2y2
PANX1
Sphingosine-1Phosphate Receptor
Lysophosphocholine
G2A?
Phosphatidylserine
TRAIL (TNFSF10)
TRAIL (TNFSF10)
RAIDD
Caspase-2 PIDDosome
PIDD-CC
APAF1
AIF, Endo G
smac/diabloHtra 2/Omi
Target Molecule Cleavage(Actin, DNA, Nuclear Lamins)
Bax, BakCytochrome C
BH3 Only Protein Activation
Bax, Bak Oligomerization
Bcl-2 Bcl-2-xL, MCL-1
p53
SevereDNA Damage
TRAIL (TNFSF10)
FAS-L(TNFSF6/CD178)
FAS-L (TNFSF6/CD178)
Osteoprotegerin (TNFRSF11B)
Phosphatidylserine
Phosphatidylserine (PS)
Phospholipids
Caspase 3,7
CDC50
Actomysin Contraction
ROCK1
Annexin V
NF-kB
Zombie DyesNH2
NH2
Ca2+
Lactoferrin
CD31
CD46CD47
Neutrophil Recruitment
FAS (TNFRSF6/CD95)
Death Domain
Death Inducing Signaling Complex (DISC)
TNF RI (TNFRSF1A)TNF RII (TNFRSF1B)
Death Receptor 4 (TNFRSF10A/TRAIL-R1)Death Receptor 5 (TNFRSF10B/TRAIL-R2)
Death Receptor 3 (TNFRSF25, APO-3)
TNF-α
TRAF1
TRAF2
FADD
FADD
FADD
FADD
Procaspase 8,10
Procaspase 8,10
Caspase 8,10
Caspase 3
CAD
ICAD
ICADDegradation
Caspase 9
Caspase 3
Caspase 6
Xkr8Scramblase
ATP11CFlippase
Caspase 7
XIAP
XIAP
XIAP
Procaspase 3
Procaspase 6
Procaspase 7
Procaspase 2
Caspase 2
Procaspase 9
Membrane PermeabilityDisruption
ROS GenerationDNA Fragmentation
Procaspase 3
Bid
t-Bid
TRADD
TRADDTRADD
TRADD
RIP1
RIP1
CIAP1/2K63 Ubiquitination
K63 UbiquitinRemoval
RIP1
FLIP
RIP1
TRAF5
TRAF 3
?
Bcl-2 Superfamily Caspases
Keep-Out SignalKeep-Out Signal
Don’t Eat Me SignalsDon’t Eat Me Signals
Eat-Me SignalsEat-Me Signals
Outer Lea�et PS ExposureEat-Me Signal
Outer Lea�et PS ExposureEat-Me Signal
Find-Me Signals Find-Me Signals
Endoplasmic Reticulum StressDNA DamageSurvival Factor Loss
Chemotaxis, EngulfmentChemotaxis, Engulfment
Membrane Rupture Membrane Rupture
IntracellularIntracellular
ExtracellularExtracellular
BlebbingBlebbing
Cytoskeletal Rearrangement, EngulfmentCytoskeletal Rearrangement, Engulfment
DNA FragmentationDNA Fragmentation MitochondriaMitochondria
ApoptosomeApoptosome
Apoptotic CellApoptotic Cell
PhagocytePhagocyte
Cell SurvivalProliferationCell SurvivalProliferation
04-0051-00
©BioLegend, Inc. 2014
Mechanisms of Cell Death
biolegend.com
Macrophage Monocyte NeutrophilDendritic Cell Fibroblast Mast Cell
Pro-apoptotic Anti-apoptoticBax Bid BCL-2 A1Bok BikBak
BCL-XL BLFL-1
Bim
Noxa BCL-W BCL-B
Bad
Puma MCL-1
InitiatorCaspase 2 Caspase 3 Caspase 1Caspase 8 Caspase 6 Caspase 4Caspase 9 Caspase 7 Caspase 5Caspase 10
P
Contact BioLegendUS & Canada Toll-Free: 1.877.246.5343 (877-BIOLEGEND)International: 1.858.768.5800Fax: 1.877.455.9587email: [email protected], [email protected]
US Headquarters:San Diego, CA 92121Interactive Poster: biolegend.com/celldeath
We would like to thank Dr. Douglas Green, St. Jude Children's Research Hospital, for his contributions to this poster.

35
biolegend.com
Death Receptor 6(TNFRSF21)
TWEAK-R (TNFRSF12A/Fn14)
Decoy Receptor 2 (TNFRSF10D/TRAIL-R4)
Zombie DyesPropidium Iodide (PI)7-Amino-Actinomycin (7-AAD)
Decoy TRAIL Receptor R1 (TNFRSF23)Decoy TRAIL Receptor R2 (TNFRSF22)Decoy Receptor 1 (TNFRSF10C/TRAIL-R3)
Decoy Receptor 3 (TNFRSF6B)
TWEAK (TNFSF12)
TWEAK (TNFSF12)
TRAIL (TNFSF10)
PI
BAT1, TIM-4
CD36
TLR RIPK1
RIPK3
Necrosome
RIPK1
PKR
MLKL
FLIP
DAI
Necrosulfonamide
IFN
JAK-STAT
Virus
TRIFCaspase 8
NLRC4
Cytosolic Bacteria
Cholera toxin B,Gram-negative bacteria
Intracellular LPS
FlagellinType 3 SecretionSystem Rods/Needles
Caspase 4, 5, 11
Caspase Oligomerization
Pyroptosis
Pore formationCell swellingLysis
HMGB1ATPIL-1αLactose dehydrogenase
?
NLRP3
ASCASC FocusFormation
AIM2
Procaspase 1
In�ammasome
Caspase 1
IL-1β, IL-18
FADD
FADDTRADD
Necrostatin 1
De novotranscription
Bacterial DNA
Death Receptor
Extracellular ATP Bacterial pore-forming toxins Monosodium urate crystalsCholesterol crystals
oxLDL
ICAM3?CD14
MER
GAS6
7-AAD
Sphingosine-1-Phosphate
NucleotidesATP, UTP
T
C
G
A
P2y2
PANX1
Sphingosine-1Phosphate Receptor
Lysophosphocholine
G2A?
Phosphatidylserine
TRAIL (TNFSF10)
TRAIL (TNFSF10)
RAIDD
Caspase-2 PIDDosome
PIDD-CC
APAF1
AIF, Endo G
smac/diabloHtra 2/Omi
Target Molecule Cleavage(Actin, DNA, Nuclear Lamins)
Bax, BakCytochrome C
BH3 Only Protein Activation
Bax, Bak Oligomerization
Bcl-2 Bcl-2-xL, MCL-1
p53
SevereDNA Damage
TRAIL (TNFSF10)
FAS-L(TNFSF6/CD178)
FAS-L (TNFSF6/CD178)
Osteoprotegerin (TNFRSF11B)
Phosphatidylserine
Phosphatidylserine (PS)
Phospholipids
Caspase 3,7
CDC50
Actomysin Contraction
ROCK1
Annexin V
NF-kB
Zombie DyesNH2
NH2
Ca2+
Lactoferrin
CD31
CD46CD47
Neutrophil Recruitment
FAS (TNFRSF6/CD95)
Death Domain
Death Inducing Signaling Complex (DISC)
TNF RI (TNFRSF1A)TNF RII (TNFRSF1B)
Death Receptor 4 (TNFRSF10A/TRAIL-R1)Death Receptor 5 (TNFRSF10B/TRAIL-R2)
Death Receptor 3 (TNFRSF25, APO-3)
TNF-α
TRAF1
TRAF2
FADD
FADD
FADD
FADD
Procaspase 8,10
Procaspase 8,10
Caspase 8,10
Caspase 3
CAD
ICAD
ICADDegradation
Caspase 9
Caspase 3
Caspase 6
Xkr8Scramblase
ATP11CFlippase
Caspase 7
XIAP
XIAP
XIAP
Procaspase 3
Procaspase 6
Procaspase 7
Procaspase 2
Caspase 2
Procaspase 9
Membrane PermeabilityDisruption
ROS GenerationDNA Fragmentation
Procaspase 3
Bid
t-Bid
TRADD
TRADDTRADD
TRADD
RIP1
RIP1
CIAP1/2K63 Ubiquitination
K63 UbiquitinRemoval
RIP1
FLIP
RIP1
TRAF5
TRAF 3
?
Bcl-2 Superfamily Caspases
Keep-Out SignalKeep-Out Signal
Don’t Eat Me SignalsDon’t Eat Me Signals
Eat-Me SignalsEat-Me Signals
Outer Lea�et PS ExposureEat-Me Signal
Outer Lea�et PS ExposureEat-Me Signal
Find-Me Signals Find-Me Signals
Endoplasmic Reticulum StressDNA DamageSurvival Factor Loss
Chemotaxis, EngulfmentChemotaxis, Engulfment
Membrane Rupture Membrane Rupture
IntracellularIntracellular
ExtracellularExtracellular
BlebbingBlebbing
Cytoskeletal Rearrangement, EngulfmentCytoskeletal Rearrangement, Engulfment
DNA FragmentationDNA Fragmentation MitochondriaMitochondria
ApoptosomeApoptosome
Apoptotic CellApoptotic Cell
PhagocytePhagocyte
Cell SurvivalProliferationCell SurvivalProliferation
04-0051-00
©BioLegend, Inc. 2014
Mechanisms of Cell Death
biolegend.com
Macrophage Monocyte NeutrophilDendritic Cell Fibroblast Mast Cell
Pro-apoptotic Anti-apoptoticBax Bid BCL-2 A1Bok BikBak
BCL-XL BLFL-1
Bim
Noxa BCL-W BCL-B
Bad
Puma MCL-1
InitiatorCaspase 2 Caspase 3 Caspase 1Caspase 8 Caspase 6 Caspase 4Caspase 9 Caspase 7 Caspase 5Caspase 10
P
Contact BioLegendUS & Canada Toll-Free: 1.877.246.5343 (877-BIOLEGEND)International: 1.858.768.5800Fax: 1.877.455.9587email: [email protected], [email protected]
US Headquarters:San Diego, CA 92121Interactive Poster: biolegend.com/celldeath
We would like to thank Dr. Douglas Green, St. Jude Children's Research Hospital, for his contributions to this poster.

Customer Service: 858-768-5800
36
Non-Human Primate (NHP) Research
Non-Human Primate (NHP)
Research

biolegend.com
37
Antibodies for Non-Human Primate (NHP) ResearchLEGENDScreen™ is a high-throughput assay that contains 332 PE conjugated anti-human monoclonal antibodies and isotype controls packaged as one lyophilized antibody per well in a 96-well plate. This presentation makes it much easier to stain single cell suspensions from any source, be it cell lines or dissociated whole tissues. As non-human primates have more than 90% genetic homology with humans, it would be reasonable to project that many anti-human antibodies will have cross-reactivity with different primates, including species such as cynomolgus, macaque, rhesus, baboon and African green monkey. By co-staining the cells with CD66, CD3, CD11b, CD20, and CD7 in complementary fluorophore conjugates to the PE conjugated antibodies in the LEGENDScreen™, researchers from Garry Nolan’s lab were able to deduce not just that cells are staining positively for the marker in PE, but which cell population expressed it and to what degree. This was the backbone gating scheme applied to phenotype each population: T-cells (SSC-lo/CD66-
, CD3+), B-cells (SSC-lo/CD66-, CD20+), NK cells (SSC-lo/CD66-, CD3-/CD20-/CD7+), monocytes (CD7-/ CD11b+), and granulocytes (SSC-hi/CD66+, CD7-). Using the expression pattern of human cells as a reference, they found many differences in both reactivity and expression pattern.
For example, Figure 1 shows CD2 staining on gated T-cells. Human T-cells are 100% positive for CD2. All of the non-human primates tested also show a strong positive staining, but there remains a small subset of CD2 negative cells. Both baboon and African green monkey show different staining patterns with greater variability of percentage of positive T-cells, and in the case of African green monkey, a larger population of CD2 negative cells. Whether these differences are a reflection of the affinity of this clone to the epitopes of CD2 expressed in these primates or an indication of the actual expression pattern of CD2 in these primates would need to be further assessed. LEGENDScreen™ is an excellent screening tool, giving direction as to which antigens might be interesting for further “deep dive” analysis. Table 1 lists the subsets of cells the antibody stains positively versus the appropriate isotype control and in which primate. To explore the level of expression on each cell type, please visit our webpage for the most comprehensive results and interactive plots for each antibody: biolegend.com/NHP.
We thank Zachary B Bjornson, Gabriella K Fragiadakis, Matthew H Spitzer, Deepthi Madhireddy and Garry P Nolan from the Stanford University School of Medicine for sharing their data.
Figure 1.

Customer Service: 858-768-5800
38
Antibody Clone Human Cyno Rhesus Baboon AGM
CD1a HI149 T G
CD1b SN13 (K5-1B8)
T G M T G
CD1c L161 B M B M B M B M B
CD1d 51.1 B MG G
CD2 RPA-2.10 TN BTN BTN BTNM BTN
CD3 HIT3a T
CD4 RPA-T4 T M T
CD5 UCHT2 BT G
CD6 BL-CD6 BTN G
CD7 CD7-6B7 TN
CD8a HIT8a TN
CD9 HI9a TMG BTNMG BTNMG BTNMG BTNMG
CD10 HI10a BTN G MG G MG G
CD11a HI111 BTNMG M TN NM
CD11b CBRM1/5 BT G
CD11b ICRF44 BTNMG B NMG BTNMG B NMG BTNMG
CD11c 3.9 B MG B M B B M
CD13 WM15 T MG T MG
CD14 M5E2 BT MG MG MG G
CD15 W6D3 MG
CD16 3G8 BTNMG TNM TNM TNM N
CD18 TS1/18 BTNMG
CD19 HIB19 B B
CD20 2H7 B B B B N B
CD21 Bu32 BT B B B
CD22 HIB22 B
CD23 EBVCS-5
CD24 ML5 BTNMG
CD25 BC96 BTN T
CD26 BA5b TN
CD27 O323 BTN BTN BTN BTNM BTN
CD28 CD28.2 TN T T T T
CD29 TS2/16 BTNMG BTNMG BTNMG BTNMG BTNMG
CD30 BY88
CD31 WM59 BTNMG BTNMG BTNMG BTNMG BTNMG
CD32 FUN-2 BTNMG BT MG BTNMG BTNMG B MG
CD33 WM53 NMG
CD34 581
CD35 E11 BT MG BT MG BT MG B G
CD36 5-271 BTNMG
CD38 HIT2 BTNMG
CD39 A1 BTNMG BTNMG MG BTNMG B MG
CD40 HB14 B NM B M B B B M
CD41 HIP8 BTNMG BTNMG BTNMG BTNMG BTNMG
CD42b HIP1 BTNMG
CD43 CD43-10G7 BT MG T G T T MG
CD44 BJ18 BTNMG BTNMG BTNMG BTNMG BTN G
Antibody Clone Human Cyno Rhesus Baboon AGM
CD45 HI30 BT MG
CD45RA HI100 BT M
CD45RB MEM-55 BTNM BTNMG BTNM BTNM BTN
CD45RO UCHL1 T
CD46 TRA-2-10 BTNMG
CD47 CC2C6 BTNMG BTNMG BTNMG BTNMG BTNMG
CD48 BJ40 BTNMG B M B MG B M BTNMG
CD49a TS2/7 TNMG TN T T G TN
CD49c ASC-1 BTN
CD49d 9F10 BTNMG BTNMG BTNMG BTNMG BTNMG
CD49e NKI-SAM-1 TNMG TNMG TNMG BTNMG BTNMG
CD49f GoH3 BTNMG BTNMG BTNMG BTNMG BTNMG
CD50 CBR-IC3/1 BTNMG TNM TNMG
CD51 NKI-M9
CD51,CD61 23C6 B M T M
CD52 HI186 BTNMG M M
CD53 HI29 BTNMG
CD54 HA58 BTNMG
CD55 JS11 BTNMG G G G
CD56 HCD56 N NM NM NM N
CD57 HCD57 N
CD58 TS2/9 BTNMG BTNMG BTNMG BTNMG BTNMG
CD59 p282 (H19) BTNMG BTNMG BTNMG BTNMG
CD61 VI-PL2 BTNMG BTNMG BTNMG BTNMG BTNMG
CD62E HAE-1f
CD62L DREG-56 BTNMG
CD62P AK4
CD63 H5C6 BTNMG BTNMG BTNMG BTNMG BTNMG
CD64 10.1 MG MG NMG MG MG
CD66a/c/e ASL-32 G
CD66b G10F5 G
CD69 FN50 TNM TN TN G B N
CD70 113-16 T
CD71 CY1G4 BTNM
CD73 AD2 BT G TN TN G
CD74 LN2 BT MG B M B MG B M BT MG
CD79b CB3-1 BTNMG T G G T G T M
CD80 2D10 BTN
CD81 5A6 BTNMG T M BT M BT MG BTNMG
CD82 ASL-24 BTNMG T G T G T G
CD83 HB15e T G T BT M BT
CD84 CD84.1.21 BTNMG BTNMG BTNMG BTNMG BTNMG
CD85 17G10.2
CD85 GHI/75 BTNMG
CD85 MKT5.1 T MG MG MG G G
CD85d 42D1 T MG
CD85h 24 MG G
CD85k ZM4.1 M
B=B-cellsT=T-cellsN=NK cells
M= monocytesG= granulocytes
Table 1. Cell Subsets of Primates that Stain Positively by Antibody in LEGENDScreen™ Assay

biolegend.com
39
Antibody Clone Human Cyno Rhesus Baboon AGM
CD86 IT2.2 BT MG B M B MG BT MG BT MG
CD87 VIM5 T MG MG BTNMG MG NMG
CD88 S5/1 BTNMG G T
CD89 A59 NMG NMG NMG MG T G
CD90 5E10 T BTNMG BTNMG BTNMG BTNMG
CD93 VIMD2 M MG MG TNMG TNMG
CD94 DX22 TN T G T T
CD95 DX2 BTNMG BTNMG BTNMG BTNMG BTNMG
CD96 NK92.39 TN G
CD97 VIM3b BTNMG B
CD99 HCD99 BT MG TN T T MG
CD100 A8 BTNMG BTNM BTNM BTNMG BTNM
CD101 BB27 BT MG T MG BTNMG T MG MG
CD102 CBR-IC2/2 BTNMG BTNMG BTNM BTNM BTNMG
CD103 Ber-ACT8
CD104 58XB4
CD105 43A3 NM
CD106 STA
CD107a H4A3 BTNMG T G BTN BT MG BTNMG
CD108 MEM-150 B NM B B B B
CD109 W7C5 TNM NM TN
CD111 R1.302 N
CD112 TX31 T MG
CD114 LMM741 NMG G
CD115 9-4D2-1E4 G G TN G M T G
CD116 4H1 T MG T
CD117 104D2 N
CD119 GIR-208 BTNMG BTNMG BTNMG BTNMG BTNMG
CD122 TU27 TN N N N N
CD123 6H6 B NM
CD124 G077F6 B
CD126 UV4 TNMG T M T T T
CD127 A019D5 TN T T TN T
CD129 AH9R7 TN TN T G
CD131 1C1 B MG MG MG MG G
CD132 TUGh4 BTNMG MG G T MG
CD134 Ber-ACT35 (ACT35)
T
CD135 BV10A4H2
CD137 4B4-1
CD138 DL-101 TNMG T G T MG T G
CD140a 16A1
CD140b 18A2 MG G N T G T MG
CD141 M80 MG M MG
CD143 5-369 T G
CD144 BV9
CD146 SHM-57 BTNMG MG BTNMG T MG
CD148 A3 BTNMG
CD150 A12 (7D4) BT BT BT BTN BT
CD152 L3D10
Antibody Clone Human Cyno Rhesus Baboon AGM
CD154 24-31 BTNMG
CD155 SKII.4 NMG
CD156c SHM14 BTNMG BTNMG BTNMG BTNMG BTNMG
CD158a/h HP-MA4 N N N G
CD158b DX27 N
CD158d mAb 33 (33)
TN G
CD158e1 DX9 N
CD158f UP-R1 T MG
CD161 HP-3G10 TNMG TN TNM TNMG N
CD162 KPL-1 BTNMG BTNMG BTNMG BTNMG BTNMG
CD163 GHI/61 M MG MG G
CD164 67D2 BTNMG BTNMG BTNMG BTNMG BTNMG
CD165 SN2 (N6-D11)
BTNMG BTNMG B BTNMG BTNMG
CD166 3A6 BTNMG BTNMG BT MG BT MG BTNMG
CD167a 51D6
CD169 7-239
CD170 1A5 NMG
CD172a SE5A5 T MG T MG TNMG MG MG
CD172b B4B6 MG N
CD172g LSB2.20 T G MG TNMG TNMG MG
CD178 NOK-1 G MG
CD179a HSL96 M T
CD179b HSL11 BT M
CD180 MHR73-11 B M B M B M B M B M
CD181 8F1/CXCR1 TNMG
CD182 5E8/CXCR2 NMG
CD183 G025H7 BTNMG BTNMG BTNM BTNMG BTNMG
CD184 12G5 BTNMG BTNMG BTNMG BTNMG BTNMG
CD193 5E8 T M
CD195 T21/8 BTNMG T MG MG T M T MG
CD196 G034E3 BTNM BTN G BTN BTN BTNMG
CD197 G043H7 BT G BT BT BTN BT
CD200 OX-104 BT G BT B
CD200R OX-108 BTNMG BT MG
CD201 RCR-401
CD202b 33.1 (Ab33)
CD203c NP4D6 M
CD205 HD30 G BT MG T MG T MG TNMG
CD206 15-2
CD207 10E2
CD209 9E9A8
CD210 3F9 BTNMG BTNM M BTN BTNMG
CD213a2 SHM38 T G T
CD215 JM7A4 T G T G TN G T G T G
CD218a H44 TNMG N TN TN TN G
CD220 B6.220 M MG M M MG
CD221 1H7/CD221
TNMG T MG T BTN G N G
CD226 11A8 BTNMG BTNMG BTNMG BTNMG BTNMG

Customer Service: 858-768-5800
40
Antibody Clone Human Cyno Rhesus Baboon AGM
CD229 HLy-9.1.25 BTN
CD231 SN1a (M3-3D9)
T G G T T
CD235ab HIR2 T B
CD243 UIC2 BTNMG T T
CD244 C1.7 TNM
CD245 DY12 TNMG M TN M
CD252 11C3.1 G T G
CD253 RIK-2 TN G N
CD254 MIH24 G
CD255 CARL-1 T T
CD257 T7-241 BT MG T G TN G T MG BT MG
CD258 T5-39 TN
CD261 DJR1 G T T
CD262 DJR2-4 (7-8)
T MG
CD263 DJR3 G
CD266 ITEM-1 T
CD267 1A1 B B B B B
CD268 11C1 BT BT M B BT MG BT MG
CD271 ME20.4 N TNM TNM BTNM TNM
CD272 MIH26 BT G
CD273 24F.10C12 T G TNM TNM T M M
CD274 29E.2A3 BTNMG T G N G T MG BTNMG
CD275 9F.8A4 B
CD276 MIH42 TN G N N TN
CD277 BT3.1 BTNMG B B BTNM BTN
CD278 C398.4A TN T T T T
CD279 EH12.2H7 T T T T T
CD282 TL2.1 B MG
CD284 HTA125 T M
CD286 TLR6.127 MG
CD290 3C10C5 B B
CD294 BM16 MG
CD298 LNH-94 BTNMG BTNMG BTNMG BTNMG BTNMG
CD300e UP-H2 M
CD300F UP-D2 M
CD301 H037G3 BT MG T MG BT MG BT MG
CD303 201A
CD304 12C2
CD307e 509f6 B
CD314 1D11 TN G TN TN TN N
CD317 RS38E BTNMG BTNMG BTNM BTNMG BTNMG
CD318 CUB1
CD319 162.1 BTNM G
CD324 67A4
CD325 8C11 G
CD326 9C4
Antibody Clone Human Cyno Rhesus Baboon AGM
CD328 6-434 NMG
CD334 4FR6D3
CD335 9E2 N
CD336 P44-8 G
CD337 P30-15 N N N N N
CD338 5D3
CD340 24D2
CD344 CH3A4A7 TNMG G TN G
CD351 TX61 N G
CD352 NT-7 BTNMG T MG T G T
CD354 TREM-26 TNMG MG T G MG G
CD355 Cr24.1
CD357 621 TNMG T G TN G T G T MG
CD360 2G1-K12 BTNM BTNM BTNM BTNM B NM
4-1BB Ligand 5F4 TNMG T G TN T G TNMG
C3aR hC3aRZ8 TNMG
C5L2 1D9-M12 TNMG BTNMG BTNMG BTNMG BTNMG
CCR10 6588-5 BTNMG B MG BTNMG BT MG BT MG
CLEC12A 50C1 MG
CLEC9A 8F9
CX3CR1 2A9-1 TNMG MG G M
CXCR7 8F11-M16
Delta Opioid Receptor
DOR7D2A4
DLL1 MHD1-314
DLL4 MHD4-46
DR3 JD3
EGFR AY13
erbB3 1B4C3
FcRL4 413D12
FcεRIα AER-37 (CRA-1)
M M M M
Galectin-9 9M1-3 T G BT G BT G T
GARP 7B11
HLA-A2 BB7.2
HLA-A,B,C W6/32 BTNMG BTNMG BTNMG BTNMG BTNMG
HLA-DQ HLADQ1 B
HLA-DR L243 BTNM B MG BTNMG BTNMG BTNMG
HLA-E 3D12 BTNMG
HLA-G 87G B MG T MG M
HVEM 122 BTNMG BTNMG BTNM BTNMG BTNMG
IFN-γ R b chain
2HUB-159 T MG G T T T MG
IgD IA6-2 B
IgG1, κ Isotype Ctrl
MOPC-21
IgG1, κ Isotype Ctrl
RTK2071
B=B-cellsT=T-cellsN=NK cells
M= monocytesG= granulocytes
Table 1. Cell Subsets of Primates that Stain Positively by Antibody in LEGENDScreen™ Assay

biolegend.com
41
Antibody Clone Human Cyno Rhesus Baboon AGM
IgG2a, κ Isotype Ctrl
MOPC-173
IgG2a, κ Isotype Ctrl
RTK2758
IgG2b, κ Isotype Ctrl
MPC-11
IgG2b, κ Isotype Ctrl
RTK4530
IgG3,k Isotype Ctrl
MG3-35
IgG Isotype Ctrl
HTK888
Ig light chain κ
MHK-49 B MG G
Ig light chain λ
MHL-38 B M B MG B MG B MG
IgM MHM-88 B NMG B MG B NMG BTNMG BTNMG
IgM, κ Isotype Ctrl
MM-30
IgM, κ Isotype Ctrl
RTK2118
IL-28RA MHLICR2a
Integrin α9β1 Y9A2 MG G N N N G
integrin β5 AST-3T G
Integrin β7 FIB504 BTNMG BTNM BTNMG BTNMG BTNMG
Jagged 2 MHJ2-523 N
LAP TW4-6H10 M MG M T M
Lymphotoxin β Receptor
31G4D8 MG M M BT MG
Mac-2 Gal397 T G T G T G T G
MAIR-II TX45 T G T T T G
MICA/MICB 6D4
MSC W7C6 T T T G T M T
MSC,NPC W4A5 BT MG T G BTNMG BT MG BT MG
NKp80 5D12 N TN TNM TNM TN
Notch 1 MHN1-519 N
Notch 2 MHN2-25 M M
Notch3 MHN3-21
Notch 4 MHN4-2
NPC 57D2 T
Please Inquire 2H3 N B
Podoplanin NC-08
Pre-BCR HSL2 MG M M
PSMA LNI-17
Siglec-10 5G6 B M MG
Siglec-8 7C9 N
Siglec-9 K8 NMG
SSEA-1 MC-480 G
SSEA-3 MC-631 B
SSEA-4 MC-813-70 MG G G
SSEA-5 8E11 T T
SUSD2 W3D5 B TN BT MG
SUSD2 W5C5 N TNM G BTNMG
Antibody Clone Human Cyno Rhesus Baboon AGM
TCR gamma/delta
B1 TNMG T TN TN T
TCR Vα24-Jα18
6B11
TCR Vα7.2 3C10 T
TCR Vβ13.2 H132
TCR Vβ23 αHUT7
TCR Vβ8 JR2 (JR.2)
TCR Vβ9 MKB1
TCR Vδ2 B6
TCR α/β IP26 T
Tim-1 1D12 N G
Tim-3 F38-2E2 N
Tim-4 9F4
TLT-2 MIH61
TNAP W8B2 G G B MG B G
TRA-1-60-R TRA-1-60-R
TRA-1-81 TRA-1-81 N
TSLPR 1B4 M
Vγ9 B3
β2-microglobulin
2M2 BT MG B N B B B
Learn more about LEGENDScreen™ at: biolegend.com/legendscreen
Bacteria
Goblet Cells Paneth Cells
Injury
Cell Proliferation,Injury Repair
MucusReplenishment
MucusReplenishment
Macrophage
Macrophage
Macrophage
Di�erentiation
Activation TNF-α, NO
TNF-α / NO (Nitric Oxide)-Producing Cell
MonocyteRecruitment
Dendritic CellRecruitment
NK Cell Recruitment
CCL2, 3, 5, 7
IL-1β, IL-12, IL-18, TNF-α
NK Cell
IL-12
IFN-γ
Virus
Fungi
Parasite
ParasiteBacteria
COX2
PGE2
IL-13
IL-25 IL-33TSLP
MucusProduction
Innate Lymphoid Cell
Eccrine Gland
Eccrine Epithelial Cells
Maturation
TNF-α,Histamine
IgE-MediatedDegranulation
AntigenPresentation/Costimulation
Distribution ThroughSweat: Cathelicidins,Dermcidin
Injury
Injury
Bacterial Lysis
Desquamation
ROS, ATP
IL-1β, TNF-α
Mast Cell
CD11cCD80 CD86 MHC II CLRs NLRs TLRs
CD23 CD117 CD203c FcεRIα
CD11b CD15 CD66c Mouse:Gr-1
CD3- CD11b- CD11c- B220- CD49b-
CD45 CD90 CD127
CD49b CD56 CD122 CD314 (NKG2D) CD335 (NKp46) CD336 (NKp44)
AAM:Arginase Ym-1 RELMαMouse:F4/80
Classic:CD68 CD14 CLRs NLRs TLRs
CD3- CD11b- CD19- CD49b-
Human:CD123 CD303Mouse:B220 Ly6C CD317
β-Defensins
Allergens
Allergens
Pathogen Killing and Shedding, Barrier Function
In�ammation,Anti-MicrobialResponses
Pathogen Elimination
ROS/NOS PhagosomalDigestion
Phagocytosis
Phagosome Phagosome
Apoptosis
TLRs, NLRs, CLRs, Other Intracellular Receptors
TLRs, NLRs, CLRs, Other Intracellular Receptors
Antigen Presentation,Costimulation, IL-12
Dendritic CellMaturation
Dendritic Cell
ROSNOS
IL-13
MucusProduction
Glycans
Lipids
Dendritic Cell
Dendritic Cell
Dendritic Cell
IL-13
Larvae Control
Innate Lymphoid Cell
MucusProduction
Eosinophils,Basophils, Mast Cells
Antigen Presentation
Alarmins,IL-4, TSLP
ROS/NOS
CLRs and TLRs
TLRs and FcεRs
CXCL8 (IL-8)/KCCCL3
CLRs , TLRs
LarvaeControl
ROSNOS
Chitins, Proteases, Secreted Products
IL-25 IL-33TSLP
?
?
Alternative Activated Macrophage (AAM)Arginase+, Ym-1+, RELMα+
Neutrophil Recruitment
Neutrophil
Degranulation
Pathogen Killing
α-DefensinsCathepsinsElastaseLysozyme
IL-6
CX3CL1
PerforinGranzyme B
IFN-γ
Dendritic Cell
Dendritic Cell Plasmacytoid Dendritic Cell (pDC)
Natural Killer (NK) Cell Macrophage Mast Cell Neutrophil Innate Lymphoid Cell
Mature Dendritic Cell
Antigen Presentation and Activation of Adaptive Immunity
Other “Eat Me” Signals
Tumor Control
NK CellActivation
NK Cells
Antibody-Dependent Cell-Mediated Cytotoxicity (ADCC)
TumorGrowth Inhibition
pDC Maturation/Activation
Regulatory FunctionsModulation of Cytokine ProductionDendritic Cell Maturation
NK Cell Activation Anti-Viral Functions
Infected Cell Killing
Antigen Presentation
Antigen Presentation
IFN-α
Virus
IFN-α
TLR7, 9
Fibroblast
RLR, DNA Sensors
Tumor Killing
Tumor Cells
NET (Neutrophil Extracellular Trap)
Pathogen Containmentand Damage
MucinsAnti-Microbial Moleculesα-DefensinsAngiogenin-4Reg3γ
Innate immune mechanisms of cancer promotionInnate immune mechanisms of cancer promotion
Th2 and Th22ResponseTh2 and Th22Response
Th2 ResponseTh2 Response
Cytotoxic T LymphocytesCytotoxic T Lymphocytes
Th1 and Th17 ResponseTh1 and Th17 Response
04-0029-00
Tumor -AssociatedMacrophages (TAM)
Tumor Cell Survival and Proliferation
Myeloid-DerivedSuppressor Cell (MDSC)
Inhibition ofTumor Proliferation
CCL3,4,5,20CXCL12
TNF-α IFN-γActivation
IL-12IL-15IL-18
αvβ5LCD36LTRAIL-R
αvβ5CD36TRAIL
NKp44, 46TRAILNKG2DNKG2DNKp30
? TRAIL-R MULT1 MICA/B B7-H6
©BioLegend, Inc. 2013
Innate Immunity
biolegend.comTLR: Toll-like receptorNLR: NOD-like receptorCLR: C-type lectin receptorRLR: RIG-I-like receptor
Contact BioLegendUS & Canada Toll-Free: 1.877.246.5343 (877-BIOLEGEND)International: 1.858.768.5800Fax: 1.877.455.9587email: [email protected], [email protected]
US Headquarters:San Diego, CA 92121Interactive Poster: biolegend.com/innateimmunity
We would like to thank Dr. Ruslan M. Medzhitov of the Yale School of Medicine for his contributions to this poster.

Customer Service: 858-768-5800
42
Innate Immunity PosterThe innate immune system serves as your first line of security when pathogens attempt to breach your defenses. This involves anatomical barriers such as your skin and stomach acid. Cells like natural killer cells, dendritic cells, macrophages, and neutrophils can recognize pathogens and eliminate them by phagocytosis or induce the adaptive arm of immunity. In certain situations, even tumor cells can be destroyed if natural killer cells are able to detect the downregulation of common surface markers.
Bacteria
Goblet Cells Paneth Cells
Injury
Cell Proliferation,Injury Repair
MucusReplenishment
MucusReplenishment
Macrophage
Macrophage
Macrophage
Di�erentiation
Activation TNF-α, NO
TNF-α / NO (Nitric Oxide)-Producing Cell
MonocyteRecruitment
Dendritic CellRecruitment
NK Cell Recruitment
CCL2, 3, 5, 7
IL-1β, IL-12, IL-18, TNF-α
NK Cell
IL-12
IFN-γ
Virus
Fungi
Parasite
ParasiteBacteria
COX2
PGE2
IL-13
IL-25 IL-33TSLP
MucusProduction
Innate Lymphoid Cell
Eccrine Gland
Eccrine Epithelial Cells
Maturation
TNF-α,Histamine
IgE-MediatedDegranulation
AntigenPresentation/Costimulation
Distribution ThroughSweat: Cathelicidins,Dermcidin
Injury
Injury
Bacterial Lysis
Desquamation
ROS, ATP
IL-1β, TNF-α
Mast Cell
CD11cCD80 CD86 MHC II CLRs NLRs TLRs
CD23 CD117 CD203c FcεRIα
CD11b CD15 CD66c Mouse:Gr-1
CD3- CD11b- CD11c- B220- CD49b-
CD45 CD90 CD127
CD49b CD56 CD122 CD314 (NKG2D) CD335 (NKp46) CD336 (NKp44)
AAM:Arginase Ym-1 RELMαMouse:F4/80
Classic:CD68 CD14 CLRs NLRs TLRs
CD3- CD11b- CD19- CD49b-
Human:CD123 CD303Mouse:B220 Ly6C CD317
β-Defensins
Allergens
Allergens
Pathogen Killing and Shedding, Barrier Function
In�ammation,Anti-MicrobialResponses
Pathogen Elimination
ROS/NOS PhagosomalDigestion
Phagocytosis
Phagosome Phagosome
Apoptosis
TLRs, NLRs, CLRs, Other Intracellular Receptors
TLRs, NLRs, CLRs, Other Intracellular Receptors
Antigen Presentation,Costimulation, IL-12
Dendritic CellMaturation
Dendritic Cell
ROSNOS
IL-13
MucusProduction
Glycans
Lipids
Dendritic Cell
Dendritic Cell
Dendritic Cell
IL-13
Larvae Control
Innate Lymphoid Cell
MucusProduction
Eosinophils,Basophils, Mast Cells
Antigen Presentation
Alarmins,IL-4, TSLP
ROS/NOS
CLRs and TLRs
TLRs and FcεRs
CXCL8 (IL-8)/KCCCL3
CLRs , TLRs
LarvaeControl
ROSNOS
Chitins, Proteases, Secreted Products
IL-25 IL-33TSLP
?
?
Alternative Activated Macrophage (AAM)Arginase+, Ym-1+, RELMα+
Neutrophil Recruitment
Neutrophil
Degranulation
Pathogen Killing
α-DefensinsCathepsinsElastaseLysozyme
IL-6
CX3CL1
PerforinGranzyme B
IFN-γ
Dendritic Cell
Dendritic Cell Plasmacytoid Dendritic Cell (pDC)
Natural Killer (NK) Cell Macrophage Mast Cell Neutrophil Innate Lymphoid Cell
Mature Dendritic Cell
Antigen Presentation and Activation of Adaptive Immunity
Other “Eat Me” Signals
Tumor Control
NK CellActivation
NK Cells
Antibody-Dependent Cell-Mediated Cytotoxicity (ADCC)
TumorGrowth Inhibition
pDC Maturation/Activation
Regulatory FunctionsModulation of Cytokine ProductionDendritic Cell Maturation
NK Cell Activation Anti-Viral Functions
Infected Cell Killing
Antigen Presentation
Antigen Presentation
IFN-α
Virus
IFN-α
TLR7, 9
Fibroblast
RLR, DNA Sensors
Tumor Killing
Tumor Cells
NET (Neutrophil Extracellular Trap)
Pathogen Containmentand Damage
MucinsAnti-Microbial Moleculesα-DefensinsAngiogenin-4Reg3γ
Innate immune mechanisms of cancer promotionInnate immune mechanisms of cancer promotion
Th2 and Th22ResponseTh2 and Th22Response
Th2 ResponseTh2 Response
Cytotoxic T LymphocytesCytotoxic T Lymphocytes
Th1 and Th17 ResponseTh1 and Th17 Response
04-0029-00
Tumor -AssociatedMacrophages (TAM)
Tumor Cell Survival and Proliferation
Myeloid-DerivedSuppressor Cell (MDSC)
Inhibition ofTumor Proliferation
CCL3,4,5,20CXCL12
TNF-α IFN-γActivation
IL-12IL-15IL-18
αvβ5LCD36LTRAIL-R
αvβ5CD36TRAIL
NKp44, 46TRAILNKG2DNKG2DNKp30
? TRAIL-R MULT1 MICA/B B7-H6
©BioLegend, Inc. 2013
Innate Immunity
biolegend.comTLR: Toll-like receptorNLR: NOD-like receptorCLR: C-type lectin receptorRLR: RIG-I-like receptor
Contact BioLegendUS & Canada Toll-Free: 1.877.246.5343 (877-BIOLEGEND)International: 1.858.768.5800Fax: 1.877.455.9587email: [email protected], [email protected]
US Headquarters:San Diego, CA 92121Interactive Poster: biolegend.com/innateimmunity
We would like to thank Dr. Ruslan M. Medzhitov of the Yale School of Medicine for his contributions to this poster.

43
biolegend.com
Bacteria
Goblet Cells Paneth Cells
Injury
Cell Proliferation,Injury Repair
MucusReplenishment
MucusReplenishment
Macrophage
Macrophage
Macrophage
Di�erentiation
Activation TNF-α, NO
TNF-α / NO (Nitric Oxide)-Producing Cell
MonocyteRecruitment
Dendritic CellRecruitment
NK Cell Recruitment
CCL2, 3, 5, 7
IL-1β, IL-12, IL-18, TNF-α
NK Cell
IL-12
IFN-γ
Virus
Fungi
Parasite
ParasiteBacteria
COX2
PGE2
IL-13
IL-25 IL-33TSLP
MucusProduction
Innate Lymphoid Cell
Eccrine Gland
Eccrine Epithelial Cells
Maturation
TNF-α,Histamine
IgE-MediatedDegranulation
AntigenPresentation/Costimulation
Distribution ThroughSweat: Cathelicidins,Dermcidin
Injury
Injury
Bacterial Lysis
Desquamation
ROS, ATP
IL-1β, TNF-α
Mast Cell
CD11cCD80 CD86 MHC II CLRs NLRs TLRs
CD23 CD117 CD203c FcεRIα
CD11b CD15 CD66c Mouse:Gr-1
CD3- CD11b- CD11c- B220- CD49b-
CD45 CD90 CD127
CD49b CD56 CD122 CD314 (NKG2D) CD335 (NKp46) CD336 (NKp44)
AAM:Arginase Ym-1 RELMαMouse:F4/80
Classic:CD68 CD14 CLRs NLRs TLRs
CD3- CD11b- CD19- CD49b-
Human:CD123 CD303Mouse:B220 Ly6C CD317
β-Defensins
Allergens
Allergens
Pathogen Killing and Shedding, Barrier Function
In�ammation,Anti-MicrobialResponses
Pathogen Elimination
ROS/NOS PhagosomalDigestion
Phagocytosis
Phagosome Phagosome
Apoptosis
TLRs, NLRs, CLRs, Other Intracellular Receptors
TLRs, NLRs, CLRs, Other Intracellular Receptors
Antigen Presentation,Costimulation, IL-12
Dendritic CellMaturation
Dendritic Cell
ROSNOS
IL-13
MucusProduction
Glycans
Lipids
Dendritic Cell
Dendritic Cell
Dendritic Cell
IL-13
Larvae Control
Innate Lymphoid Cell
MucusProduction
Eosinophils,Basophils, Mast Cells
Antigen Presentation
Alarmins,IL-4, TSLP
ROS/NOS
CLRs and TLRs
TLRs and FcεRs
CXCL8 (IL-8)/KCCCL3
CLRs , TLRs
LarvaeControl
ROSNOS
Chitins, Proteases, Secreted Products
IL-25 IL-33TSLP
?
?
Alternative Activated Macrophage (AAM)Arginase+, Ym-1+, RELMα+
Neutrophil Recruitment
Neutrophil
Degranulation
Pathogen Killing
α-DefensinsCathepsinsElastaseLysozyme
IL-6
CX3CL1
PerforinGranzyme B
IFN-γ
Dendritic Cell
Dendritic Cell Plasmacytoid Dendritic Cell (pDC)
Natural Killer (NK) Cell Macrophage Mast Cell Neutrophil Innate Lymphoid Cell
Mature Dendritic Cell
Antigen Presentation and Activation of Adaptive Immunity
Other “Eat Me” Signals
Tumor Control
NK CellActivation
NK Cells
Antibody-Dependent Cell-Mediated Cytotoxicity (ADCC)
TumorGrowth Inhibition
pDC Maturation/Activation
Regulatory FunctionsModulation of Cytokine ProductionDendritic Cell Maturation
NK Cell Activation Anti-Viral Functions
Infected Cell Killing
Antigen Presentation
Antigen Presentation
IFN-α
Virus
IFN-α
TLR7, 9
Fibroblast
RLR, DNA Sensors
Tumor Killing
Tumor Cells
NET (Neutrophil Extracellular Trap)
Pathogen Containmentand Damage
MucinsAnti-Microbial Moleculesα-DefensinsAngiogenin-4Reg3γ
Innate immune mechanisms of cancer promotionInnate immune mechanisms of cancer promotion
Th2 and Th22ResponseTh2 and Th22Response
Th2 ResponseTh2 Response
Cytotoxic T LymphocytesCytotoxic T Lymphocytes
Th1 and Th17 ResponseTh1 and Th17 Response
04-0029-00
Tumor -AssociatedMacrophages (TAM)
Tumor Cell Survival and Proliferation
Myeloid-DerivedSuppressor Cell (MDSC)
Inhibition ofTumor Proliferation
CCL3,4,5,20CXCL12
TNF-α IFN-γActivation
IL-12IL-15IL-18
αvβ5LCD36LTRAIL-R
αvβ5CD36TRAIL
NKp44, 46TRAILNKG2DNKG2DNKp30
? TRAIL-R MULT1 MICA/B B7-H6
©BioLegend, Inc. 2013
Innate Immunity
biolegend.comTLR: Toll-like receptorNLR: NOD-like receptorCLR: C-type lectin receptorRLR: RIG-I-like receptor
Contact BioLegendUS & Canada Toll-Free: 1.877.246.5343 (877-BIOLEGEND)International: 1.858.768.5800Fax: 1.877.455.9587email: [email protected], [email protected]
US Headquarters:San Diego, CA 92121Interactive Poster: biolegend.com/innateimmunity
We would like to thank Dr. Ruslan M. Medzhitov of the Yale School of Medicine for his contributions to this poster.

Customer Service: 858-768-5800
44
Biofunctional Antibodies
Biofunctional Antibodies

biolegend.com
45
Biofunctional AntibodiesAntibodies are essential components of the immune system, playing a critical role in the immune response against pathogens. They are glycoproteins that belong to the immunoglobulin superfamily. Produced by B cells, they can be expressed in the cell membrane, constituting the B cell receptor, or secreted by plasma cells to reach sites of infection.
Antibodies are complex molecules. Classical mammalian antibodies consist of two heavy chains and two light chains. There are also several types of both chains, which play a role in the recognition of the antibody by several surface cell receptors (Fc receptors) and other immune molecules. The amino terminal end of both chains defines the region that recognizes and binds other molecules, referred to as antigens.
The ultimate goal of antibodies is to help in the elimination of these antigens, and the pathogens from which they originate. Thus, the function of antibodies can be generally divided into:
1) Cross-linking (agglutination)
2) Complement activation
3) Opsonization
4) Antibody-dependent cell-mediated cytotoxicity
5) Neutralization
Figure 1. Summary of antibody functions. Specific types of antibodies may be more effective at mediating some of these effector functions.
Protective Mechanism of Binding Antibodies to Antigens
Enhances phagocytosis and reduces number of infectious units to be dealt with
Coating antigen with antibody enhances phagocytosis
Antibodies attached to target cell cause destruction by non-specific immune system cells
Lysis of Microbes
AntibodiesB cell
Microbe
Bacteria
Phagocyte
Virus BacteriumToxin
Complement ActivationCross Linking
Opsonization
Neutralization
Blocks adhesion of Microbes and Toxins to cell surface
AntIbody-dependent cell-mediated cytotoxicity

Customer Service: 858-768-5800
46
Given the biological properties of antibodies, they have been widely used both in research and clinical applications. Their high specificity allows for accurate recognition of single targets and their effector functions facilitate unique applications such as intracellular signaling activation or cell depletion. Thus, when referring to technical application, a biofunctional antibody can be defined as an antibody that can either mimic or interrupt the natural biological effects associated with ligand-receptor interaction, or have a biological effect on a target cell or molecule. Biofunctional antibodies are thus preferred in functional in vitro or in vivo studies. Antibodies without a functional effect are instead preferred for phenotypic characterization or experiments where cells should not respond to the antibody treatment.
LEAF™, Ultra-LEAF™, and GoInVivo™, BioLegend’s Biofunctional Antibody Brands When designing experiments where the use of antibodies for in vitro and in vivo treatment is required, there are factors that need to be tightly controlled. Variables such as endotoxin content, stabilizers, preservatives and any other additives can be confounding factors that are undesirable in the experimental outcome or readout. Thus, antibodies intended for functional assays should be formulated accordingly.
LEAF™ stands for Low Endotoxin, Azide-Free, and as the name indicates, these antibodies do not contain azide in the formulation, which is commonly used as an anti-microbial agent. They also do not contain any carrier protein or other additives; they are provided in PBS. Ultra-LEAF™ antibodies follow a similar concept; the difference is in the content of endotoxin guaranteed, which is ten times lower.
GoInVivo™ antibodies go several steps further, guaranteeing endotoxin less than 1.0 EU/mg of protein, very low aggregation, bulk sizes up to 1 gram, and testing for the presence of pathogens. The following table summarizes the features of these three brands.
Table 1. Summary of key features of LEAF™, Ultra-LEAF™, and GoInVivo™ antibodies.
Feature LEAF™ Ultra-LEAF™ GoInVivo™
Purity Assessed by SDS-PAGE. Guarantee purity >95%
Assessed by SDS-PAGE. Guarantee purity >95%
Assessed by SDS-PAGE. Guarantee purity >95%
Protein Integrity Yes, by SDS-PAGE and IEF Yes, by SDS-PAGE and IEF Yes, by SDS-PAGE and IEF
Quality Control Assessed by SDS-PAGE. Guarantee purity >95%
Each lot is quality-tested by flow cytometry
Each lot is quality-tested by flow cytometry
Azide Free Yes Yes Yes
In vitro and in vivo applications Yes Yes Yes
Validation LEAF™ antibodies are functionally tested for limited targets
Ultra-LEAF™ antibodies are functionally tested for selected targets only
Most GoInVivo™ antibodies are validated by functional assays.
Endotoxin <100 EU/mg <10 EU/mg <1EU/mg
Aggregation Not Tested Not Tested Low aggregation, < 3%
Pathogen test Not Tested Not Tested All GoInVivo™ antibodies are pathogen free as tested by qPCR for up to 20 pathogens, and several Mycoplasma species.
Learn more at: biolegend.com/LEAF and biolegend.com/goinvivo
a. Agonistic Antibody
b. Antagonistic Antibody
Cell Death
Post-receptor signaling
c. Co-agonistic Antibody
d. Cross talk with cytokine receptor signaling
e. Activation of complement cascade
f. Activation of Fc receptor
g. Receptor Internalization
h. No functional e�ect
NaturalLigand
Receptor
C1q
FcReceptor
C1r
C1s
ReceptorSpeci�cAntibody
CytokineReceptor
Cytokine
Figure 2. The different effects of biofunctional antibodies.

biolegend.com
47
Applications in Immunotherapy ResearchWe have an extensive portfolio of biofunctional antibodies, and they have been widely used by the scientific community. Validation of the GoInVivo™ product line is particularly rigorous due to the scale of production and additional controls required. An important group of GoInVivo™ antibodies are clones with verified activity against important molecules of the immune system called immune checkpoints. Immune checkpoints are heavily involved in cancer development.
The progression of cancer is a complex process in which the physiological balance of the organism tilts towards dysregulation. Indeed, the term cancer encompasses a collection of related diseases that can start almost anywhere in the body. As a natural process, the cells in an organism grow and divide, giving rise to new cells as needed to replace compromised cells or cells that have died. When abnormal cells that should be eliminated survive, or divide without control, a localized tumor (in a mass of tissue for example) or cancer condition starts to evolve (in blood for example).
As our understanding of the disease improves, better and more efficient tools to combat it are developed. That is the case of immunotherapy. As its name indicates, immunotherapy is focused in manipulating the immune system to combat the disease using the body’s natural immune response. The process of eliciting a T-cell mediated immune response, either to eliminate a foreign antigen or an abnormally proliferating cell, is also associated with mechanisms of self-regulation that ensure this immune response doesn’t grow out of control. These regulatory mechanisms are largely controlled by the immune checkpoint molecules. Tumor cells engage these receptors to skew the immune response towards suppression, facilitating tumor cell proliferation without control by relevant cells or factors from the immune system. By targeting these molecules with monoclonal antibodies, it is possible to promote an activated state in T cells, inducing a sustained response against the cancer cells. Several drugs have been developed and approved by the FDA(1).
In Vitro Data
BioLegend also has a unique set of biofunctional antibodies, developed by our R&D department. That is the case with anti-mouse CX3CR1, clone SA011F11. CX3CR1 is a 40 kD, G-protein coupled receptor, with seven transmembrane regions. CX3CR1 is expressed by several cell types, including monocytes, NK cells, a subset of T cells, and glial cells (within the brain). It is involved in cell recruitment during inflammation and participates in cell adhesion and extravasation from blood vessels. Its ligand is CX3CL1, also known as fractalkine or neurotactin, and it has been described as coreceptor for HIV1, as well as playing a role in mucosal immunity (2), atherosclerosis (3), and neurological disorders (4), among others. Figure 4 shows in vitro blocking activity of clone SA011F11.
In addition, we routinely validate bioactivity of GoInVivo™ antibodies in vitro. Antibodies that have been validated include anti-human and anti-mouse CD152 (clones L3D10, 9H10).
Figure 4. Ultra-LEAF™ Purified anti-mouse CX3CR1 antibody inhibits the chemotaxis induced by mouse CX3CL1 (50 ng/mL, BioLegend Cat. No. 583402) on BA/F3 mouse CX3CR1 transfected cells in a dose dependent manner with an ED50 = 0.05 – 0.15 µg/mL.
Figure 3. Illustration of some immune checkpoint molecules.
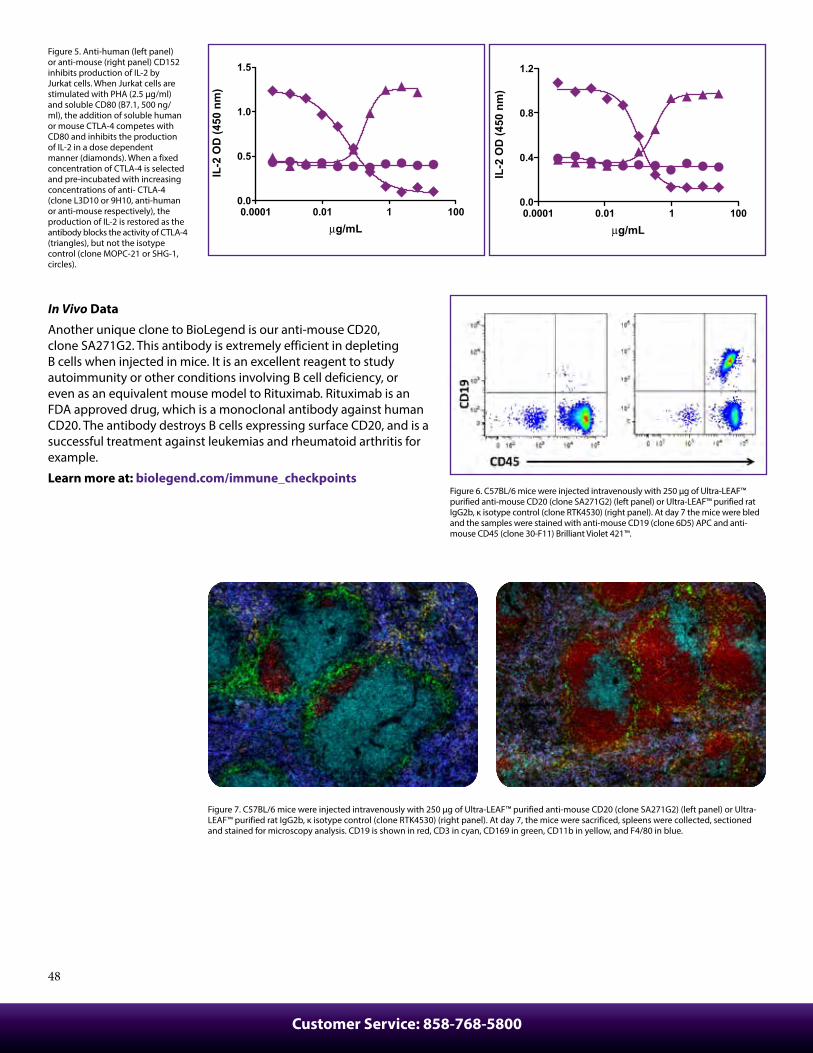
Customer Service: 858-768-5800
48
Figure 5. Anti-human (left panel) or anti-mouse (right panel) CD152 inhibits production of IL-2 by Jurkat cells. When Jurkat cells are stimulated with PHA (2.5 µg/ml) and soluble CD80 (B7.1, 500 ng/ml), the addition of soluble human or mouse CTLA-4 competes with CD80 and inhibits the production of IL-2 in a dose dependent manner (diamonds). When a fixed concentration of CTLA-4 is selected and pre-incubated with increasing concentrations of anti- CTLA-4 (clone L3D10 or 9H10, anti-human or anti-mouse respectively), the production of IL-2 is restored as the antibody blocks the activity of CTLA-4 (triangles), but not the isotype control (clone MOPC-21 or SHG-1, circles).
In Vivo Data
Another unique clone to BioLegend is our anti-mouse CD20, clone SA271G2. This antibody is extremely efficient in depleting B cells when injected in mice. It is an excellent reagent to study autoimmunity or other conditions involving B cell deficiency, or even as an equivalent mouse model to Rituximab. Rituximab is an FDA approved drug, which is a monoclonal antibody against human CD20. The antibody destroys B cells expressing surface CD20, and is a successful treatment against leukemias and rheumatoid arthritis for example.
Learn more at: biolegend.com/immune_checkpoints
0.0001 0.01 1 1000.0
0.5
1.0
1.5
µg/mLIL
-2 O
D (4
50 n
m)
0.0001 0.01 1 1000.0
0.4
0.8
1.2
µg/mL
IL-2
OD
(450
nm
)Figure 6. C57BL/6 mice were injected intravenously with 250 µg of Ultra-LEAF™ purified anti-mouse CD20 (clone SA271G2) (left panel) or Ultra-LEAF™ purified rat IgG2b, κ isotype control (clone RTK4530) (right panel). At day 7 the mice were bled and the samples were stained with anti-mouse CD19 (clone 6D5) APC and anti-mouse CD45 (clone 30-F11) Brilliant Violet 421™.
Figure 7. C57BL/6 mice were injected intravenously with 250 µg of Ultra-LEAF™ purified anti-mouse CD20 (clone SA271G2) (left panel) or Ultra-LEAF™ purified rat IgG2b, κ isotype control (clone RTK4530) (right panel). At day 7, the mice were sacrificed, spleens were collected, sectioned and stained for microscopy analysis. CD19 is shown in red, CD3 in cyan, CD169 in green, CD11b in yellow, and F4/80 in blue.

biolegend.com
49
GoInVivo™ in Melanoma Cancer Mouse ModelsGoInVivo™ antibodies are an excellent tool for in vivo research as well, and they are specially formulated and tested to minimize variability and side effects when added to cell cultures or injected into animal models. To study the effect of anti-mouse PD-L1 (clone 10F.9G2) in a melanoma cancer mouse model, B16F10 melanoma cells were injected into the flanks of BALB/c mice, and the animals received 200 μg intraperitoneally every 3 days of either isotype control or anti-mouse PD-L1 antibodies. After 14 days, the animals were sacrificed, lymphoid organs and serum were collected, and the remaining tumor was excised. Lymphocytes were phenotyped by flow cytometry, serum was screened for cytokines and chemokines using LEGENDplex™.
Figure 8. Animals treated with anti-PD-L1(clone 10F.9G2) (left panel) show an activated phenotype as compared to animals treated with isotype control antibody (clone RTK4530) (right panel). Dot plots show live splenocytes (7-AAD-).
Figure 9. Bar graphs show the cytokine and chemokine profile of animals treated with anti-PD-L1 (black bars) or isotype control (orange bars). Interestingly, PD-L1 injection promotes T helper differentiation cytokine production (top panel, IFN-γ and TNF-α, Th1 profile, IL-9, Th9 profile, IL-22, Th22 profile) at the same time that downregulates systemic production of potent pro-inflammatory cytokines (middle panel). Likewise, PD-L1 treated animals are also able to produce important chemokines that help recruit relevant cells to fight the tumor cells. Bars represent 5 animals per group. Cytokines and chemokines in serum samples were measured using BioLegend’s multiplex assay LEGENDplex™. * p ≤ 0.05, ** p ≤ 0.01.
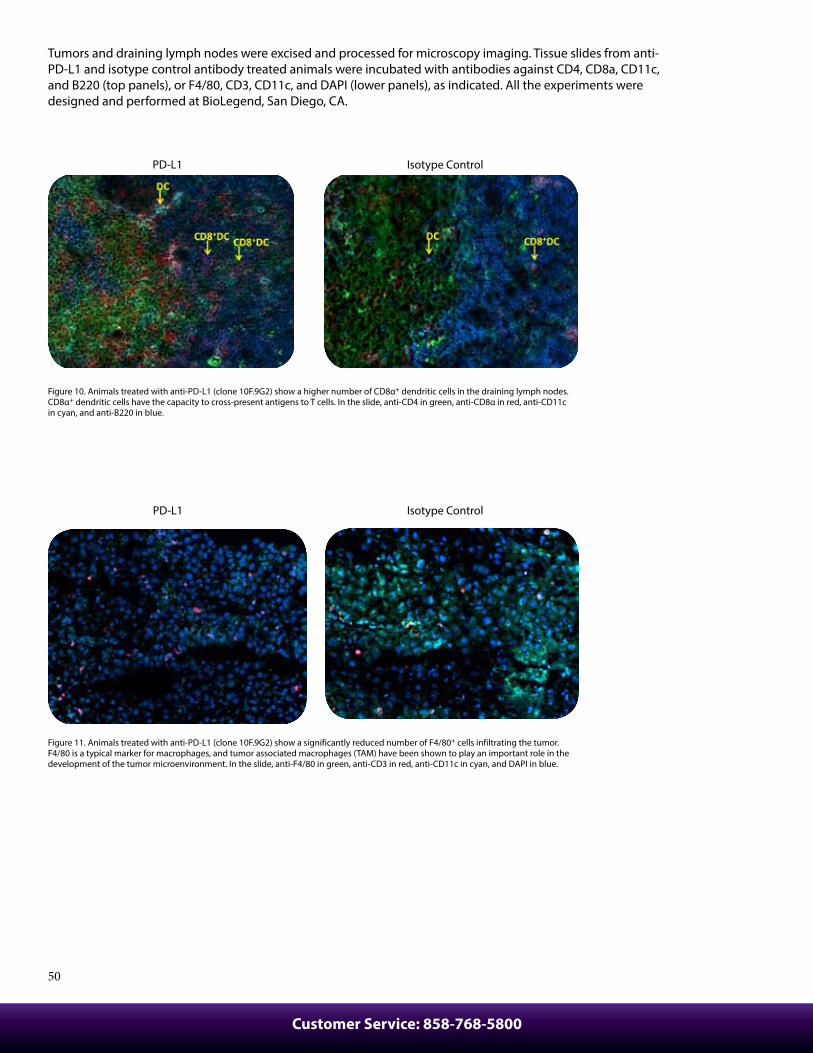
Customer Service: 858-768-5800
50
Figure 10. Animals treated with anti-PD-L1 (clone 10F.9G2) show a higher number of CD8α+ dendritic cells in the draining lymph nodes. CD8α+ dendritic cells have the capacity to cross-present antigens to T cells. In the slide, anti-CD4 in green, anti-CD8α in red, anti-CD11c in cyan, and anti-B220 in blue.
Figure 11. Animals treated with anti-PD-L1 (clone 10F.9G2) show a significantly reduced number of F4/80+ cells infiltrating the tumor. F4/80 is a typical marker for macrophages, and tumor associated macrophages (TAM) have been shown to play an important role in the development of the tumor microenvironment. In the slide, anti-F4/80 in green, anti-CD3 in red, anti-CD11c in cyan, and DAPI in blue.
Isotype Control
Isotype Control
PD-L1
PD-L1
Tumors and draining lymph nodes were excised and processed for microscopy imaging. Tissue slides from anti-PD-L1 and isotype control antibody treated animals were incubated with antibodies against CD4, CD8a, CD11c, and B220 (top panels), or F4/80, CD3, CD11c, and DAPI (lower panels), as indicated. All the experiments were designed and performed at BioLegend, San Diego, CA.

biolegend.com
51
In a similar series of experiments, B16F10 melanoma cells that express the SIYRYYGL model peptide (VSV Nucleoprotein 498–505) were injected into the flanks of C57BL/6 mice, and three groups of animals received 100 μg of anti-mouse PD-L1 (clone 10F.9G2) intraperitoneally. The first group received one injection at day 7 after implant. The second group received injections at days 7, 10, 13. The third group received four doses at days 7, 10, 13, and 16 after tumor implant.
At day 10 after implant (one antibody treatment at day 7), splenocytes were harvested and IFN-γ-producing cells were quantified (Figure 12). At day 14 after implant (three antibody doses administered), T cells from the tumor (TIL) and spleen were FACS sorted, stimulated, and the cytokine profile was measured (not shown). At day 24 after implant (four antibody treatments), tumor growth was evaluated, along with phenotyping of immune cells (Figure 13). Experiments were performed in collaboration with Thomas Gajewski’s lab (The University of Chicago).
In conclusion, biofunctional antibodies do not only show their potential as immunotherapeutic tools as already well documented (5, 6), they are also essential tools to dissect the molecular and cellular changes that lead to antibody-mediated tumor control.
Learn more about GoInVivo™ at: biolegend.com/goinvivo
References1. Ito A, et al. 2015. Biomed Res Int. 2015:6054782. Niess JH. 2010. Gut Microbes. 1(6):3963. Gautier EL, et al. 2009. Arterioscler Thromb Vasc Biol. 29(10):14124. Chen P, et al. 2016. Biomed Res Int. 2016:80909185. Shin DS and Ribas A. 2015. Curr Opin Immunol. 33:236. Cook AM, et al. 2016. Curr Opin Immunol. 39:23
Figure 12. Splenocytes are harvested at day 10 post-implant and stimulated with SIYRYYGL peptide at 160 nM (12h ON, 37°C). Left panel shows an ELISPOT picture, right panel shows a bar graph summarizing the number of positive cells. Blue bar indicates isotype control treatment and yellow bar indicates anti-PD-L1 treatment.
Isotype PD-L1
Figure 13. Panel A shows percentage of SIYRYYGL-specific TIL, as detected by MHC pentamers. Panel B shows number of CD8α+ dendritic cells in the tumor. Panel C shows tumor growth. Blue bars indicate isotype control treatment and yellow bars indicate anti-PD-L1 treatment.
SIY
Pent
amer
14.8
CD8
% o
f CD
8+ TIL
15
10
5
0
A B C
600
400
200
0Num
ber o
f MH
C II+ CD
11c+ CD
8α+ c
ells
7 10 12 14 17 19 240
100
200
300
Tum
orA
rea
(mm
2 )

Customer Service: 858-768-5800
52
Cancer Immunoediting PosterCancer is one of the most daunting and challenging areas of study, but our understanding develops as research progresses. Recently, Cancer Immunoediting has gained credence as the theory that the immune system is capable of both protecting the body from tumors and promoting tumor growth by selecting for tumors of low immunogenicity. This process consists of the 3 E’s: Elimination, Equilibrium, and Escape. Elimination is the first phase and is initiated by the innate arm of immunity, which can then call on its adaptive counterpart. If a tumor is eliminated, the process ends without progressing to the other steps. Equilibrium occurs when tumors persist and experience immunological pressure from the body that is able to contain, but not destroy it. While some tumor cells may be destroyed in this step, others with advantageous mutations may survive. Having found ways to circumvent or elude the immune system, tumor cells will then enter the Escape phase. Allowed to grow unchecked, these tumor cells may then be detectable as clinical malignancies.
Normal Cell
Normal Cell
Tumor Cell
Dormant Tumor Cell
Necrotic Tumor
ImpairNK, CD8+ T Cell,γ/δ T Cell Response
Impair NK, CD8 T Cell Response
MICA/B
HLA-G,E
Soluble CD83
Angiogenesis
VEGF, M-CSF, IL-1β,IL-6
Soluble PDL1 Reduce T Cell Proliferation
Impair T Cell E�ectors
Immunosuppression
Fas Ligand
Apoptosis of Tumor-Speci�c E�ectors
Epigenetic SilencingLoss of IFN-γR Signaling
CarcinogensInherited DefectsRadiationVirusesChronic In�ammation
Cancer TherapiesAdaptive T Cell TransferMonoclonal AntibodiesAntibody Drug ConjugatesDCs/Peptide Vaccines
Immune Exhaustion or InhibitionTumor-Cell VariantsGenetic and Epigenetic ChangesResistance to Immune DetectionTumor Maintained Chronically
Rae-1(Mouse)MICA/B(Human)
Genetic Instability and /or Immune Selection
Danger SignalsUric AcidECM ProductsHeat Shock ProteinsType 1 IFNs
Immune EditorsIFN-α/βIFN-γIL-12TNF-αPerforinTRAILChemokines
CD4+T Cell
CD4+T Cell
CD8+T Cell
CD8+T Cell
CD8+T Cell
Dendritic Cell
Dendritic Cell
NKCell
NKT Cell
M1 Macrophage
γ/δT CellTCR
??
NKG2Dγ/δT Cell
Tumor Microenvironment
Bone Marrow
Release of MDSC into Peripheral Blood
(Tumor Derived)
MDSC Maturation
Di�erentiation
Recruitment
Recruitment
Lymph Nodes
MDSC
MDSC
VISTA
MDSC
MDSC
MDSC
M2 Macrophage
pDC(Plasmacytoid DC)
iDC(Immature DC)
Immature DC
TGF-βIL-10
pSTAT3FOXP3
MDSCCMPHPC
NOS2ROSRNOSArg1
MDSC Dendritic Cell
T Cell Deletionor Anergy,Apoptosis
T Cell Deletionor Anergy, Apoptosis
IL-4IL-13GM-CSF
IL-4IL-13GM-CSFTGF-β
IL-4IL-13
Arg1 IL-4IL-10IL-13TGF-β
B7-1
B7-1
B7-1
CTLA-4
T E�ectorApoptosis
IL-6VEGFM-CSFIL-1βPGE2
IL-6VEGF
GM-CSFCSF-1
CCL2CCL12CXCL5
IL-2IL-10IFN-α
NOS2NORNOS
Arg1NOS2NORNOS
COX2PGE2
Arg1R-NOSL-Arginine
Tumor Cell
Tumor-DerivedFactors
Treg CD8+T Cell
CD8+T Cell
Galectin
Tumor-DerivedSoluble FactorsIDO
MHC Class I MoleculeIFN-γ ResponseCCL27(Cutaneous Tumors)CD80PDL1
NKCell
Tregs in Tumor Escape CheckpointsTregs in Tumor Escape Checkpoints
Tumor Sculpting
Immunosuppression
Immunosuppression
Tumor Escape
E�ector Cell(NK Cell, Monocyte, Macrophage)
TRAIL
CD91
IL-12
CD4+T Cell
CD8+E�ector T Cell
CD8+T Cell
Proliferating Cancer Cells
Help
FasL
Fas
FcR
CD4+ T CellDi�erentiation Dendritic Cell
CD8α+Dendritic Cell
PDL1
PDL1
PDL1
PD-1
(Molecular Shield)
E�ector Cell Elimination, Anergy, Apoptosis
Angiogenesis
Partial Tumor Destruction
PolyploidTumor Cell
Other “Eat Me” Signals
ADCC
KillingKilling
Killing
Phagocytosis
TRAILR
TRAILR
TRAILR
TRAIL
Fas
FasL
IL-12
IL-12
IL-12R
TCR
CD1d
TRAIL
NKT Cell
NK Cell
NOSROS
IL-1TNF-α
IL-2
IL-4IL-5IL-6IL-10IL-13
CD36L
Calreticulin
LDLReceptorrelated protein
CD36
TCR
MHCII
TCR
CD28CD137
GITR
OX40
MHCI
ανβ5L
ανβ5
M1 Macrophage
Th1
Th2
IFN-γ
IFN-γ
IFN-γ
IFN-γ
IFN-γTNF-α (Cytostatic)
IFN-γ
IFN-γ
IFN-γ
IFN-γ IFN-γR
Tumor-Reactive Antibodies
(β-actin, HSP, Cytokeratin)
ImmunosuppressionImmunosuppression
Tumor Destruction(Host Protection)Tumor Destruction(Host Protection)
Tumor Antigen
Opsonization, Complement, ADCC
Oxidative BurstRelease of IL-1, TNF-α, Cytotoxicity
Tumor AntigenPresentation
AntigenPresentation
Dendritic Cell
Dendritic Cell
Granulocyte
Macrophage, Dendritic Cell Engul�ng HSP-Peptide ComplexVia CD91
Perforin Granzyme
Tumor AntigenCross-Presentation
NKG2D
NKG2DLs
Tumor-In�ltrating B Cell
04-0017-01
CD8+Treg
Th3/Tr1
Treg
APC
APC
CD80/CD86
CD73
CD39ATP
AMP
Adenosine
AdenosineReceptor
AdenosineReceptor
Enhanced TregActivity
CD80CD86
CTLA4
+
IDOCCL22
IDOSOCS1Arginase
IDO
IDO
Tryptophan
Immunosuppression
TGF-βIL-10
PGE2
GangliosidesGalectin1/9
E�ector T Cell
E�ector T Cell
Antigen Uptake
FOXP3
Treg
Treg
IL-10TGF-βIDOCOX2PGE2Immunosuppressive Molecule
APC Dysfunction/T-Cell Anergy
IL-12MHCCD80CD86
CD4+CD25+CTLA4+GITR+
IL-10TGF-β
T CellApoptosis and Anergy
MetabolizedTryptophan
pDC
T E�ector
Macrophage, Dendritic Cell(Tolerogenic)
+
+
+
pSTAT3VEGFLXR-L
IL-13TGF-β
CD4+CD25T Cell
Cancer Recognition/EliminationCancer Recognition/Elimination Shedding of Tumor Recognition Antigens Shedding of Tumor Recognition Antigens
MDSC-Induced ImmunosuppressionMDSC-Induced Immunosuppression
Treg
HSP-Peptide Complex
The 3 E’s of Cancer ImmunoeditingThe 3 E’s of Cancer Immunoediting
Contact BioLegendUS & Canada Toll-Free: 1.877.246.5343 (877-BIOLEGEND)International: 1.858.768.5800Fax: 1.877.455.9587email: [email protected], [email protected]
US Headquarters:San Diego, CA 92121
CD205CD209CD273MHC Class II
CD11bCD11cCD80CD83CD86
CD49bCD56CD122CD314 (NKG2D)CD335 (NKp46)
CD4CD183Tim-3T-bet
CD4CD193CD194CD294Tim-1
CD4CD25FOXP3CD127low
Activation:GARPLAP (TGF-β)
Human:CD33CD11bCD14neg
Mouse:CD11bGR-1
Dendritic Cell Natural Killer Cell Th1 Cell Th2 Cell Treg Cell MDSC
biolegend.comWe would like to thank Dr. Robert Schreiber of Washington University - School of Medicine for his contributions to this poster.
Interactive Poster: biolegend.com/cancerimmunoediting
©BioLegend, Inc. 2014
Cancer Immunoediting

53
biolegend.com
Normal Cell
Normal Cell
Tumor Cell
Dormant Tumor Cell
Necrotic Tumor
ImpairNK, CD8+ T Cell,γ/δ T Cell Response
Impair NK, CD8 T Cell Response
MICA/B
HLA-G,E
Soluble CD83
Angiogenesis
VEGF, M-CSF, IL-1β,IL-6
Soluble PDL1 Reduce T Cell Proliferation
Impair T Cell E�ectors
Immunosuppression
Fas Ligand
Apoptosis of Tumor-Speci�c E�ectors
Epigenetic SilencingLoss of IFN-γR Signaling
CarcinogensInherited DefectsRadiationVirusesChronic In�ammation
Cancer TherapiesAdaptive T Cell TransferMonoclonal AntibodiesAntibody Drug ConjugatesDCs/Peptide Vaccines
Immune Exhaustion or InhibitionTumor-Cell VariantsGenetic and Epigenetic ChangesResistance to Immune DetectionTumor Maintained Chronically
Rae-1(Mouse)MICA/B(Human)
Genetic Instability and /or Immune Selection
Danger SignalsUric AcidECM ProductsHeat Shock ProteinsType 1 IFNs
Immune EditorsIFN-α/βIFN-γIL-12TNF-αPerforinTRAILChemokines
CD4+T Cell
CD4+T Cell
CD8+T Cell
CD8+T Cell
CD8+T Cell
Dendritic Cell
Dendritic Cell
NKCell
NKT Cell
M1 Macrophage
γ/δT CellTCR
??
NKG2Dγ/δT Cell
Tumor Microenvironment
Bone Marrow
Release of MDSC into Peripheral Blood
(Tumor Derived)
MDSC Maturation
Di�erentiation
Recruitment
Recruitment
Lymph Nodes
MDSC
MDSC
VISTA
MDSC
MDSC
MDSC
M2 Macrophage
pDC(Plasmacytoid DC)
iDC(Immature DC)
Immature DC
TGF-βIL-10
pSTAT3FOXP3
MDSCCMPHPC
NOS2ROSRNOSArg1
MDSC Dendritic Cell
T Cell Deletionor Anergy,Apoptosis
T Cell Deletionor Anergy, Apoptosis
IL-4IL-13GM-CSF
IL-4IL-13GM-CSFTGF-β
IL-4IL-13
Arg1 IL-4IL-10IL-13TGF-β
B7-1
B7-1
B7-1
CTLA-4
T E�ectorApoptosis
IL-6VEGFM-CSFIL-1βPGE2
IL-6VEGF
GM-CSFCSF-1
CCL2CCL12CXCL5
IL-2IL-10IFN-α
NOS2NORNOS
Arg1NOS2NORNOS
COX2PGE2
Arg1R-NOSL-Arginine
Tumor Cell
Tumor-DerivedFactors
Treg CD8+T Cell
CD8+T Cell
Galectin
Tumor-DerivedSoluble FactorsIDO
MHC Class I MoleculeIFN-γ ResponseCCL27(Cutaneous Tumors)CD80PDL1
NKCell
Tregs in Tumor Escape CheckpointsTregs in Tumor Escape Checkpoints
Tumor Sculpting
Immunosuppression
Immunosuppression
Tumor Escape
E�ector Cell(NK Cell, Monocyte, Macrophage)
TRAIL
CD91
IL-12
CD4+T Cell
CD8+E�ector T Cell
CD8+T Cell
Proliferating Cancer Cells
Help
FasL
Fas
FcR
CD4+ T CellDi�erentiation Dendritic Cell
CD8α+Dendritic Cell
PDL1
PDL1
PDL1
PD-1
(Molecular Shield)
E�ector Cell Elimination, Anergy, Apoptosis
Angiogenesis
Partial Tumor Destruction
PolyploidTumor Cell
Other “Eat Me” Signals
ADCC
KillingKilling
Killing
Phagocytosis
TRAILR
TRAILR
TRAILR
TRAIL
Fas
FasL
IL-12
IL-12
IL-12R
TCR
CD1d
TRAIL
NKT Cell
NK Cell
NOSROS
IL-1TNF-α
IL-2
IL-4IL-5IL-6IL-10IL-13
CD36L
Calreticulin
LDLReceptorrelated protein
CD36
TCR
MHCII
TCR
CD28CD137
GITR
OX40
MHCI
ανβ5L
ανβ5
M1 Macrophage
Th1
Th2
IFN-γ
IFN-γ
IFN-γ
IFN-γ
IFN-γTNF-α (Cytostatic)
IFN-γ
IFN-γ
IFN-γ
IFN-γ IFN-γR
Tumor-Reactive Antibodies
(β-actin, HSP, Cytokeratin)
ImmunosuppressionImmunosuppression
Tumor Destruction(Host Protection)Tumor Destruction(Host Protection)
Tumor Antigen
Opsonization, Complement, ADCC
Oxidative BurstRelease of IL-1, TNF-α, Cytotoxicity
Tumor AntigenPresentation
AntigenPresentation
Dendritic Cell
Dendritic Cell
Granulocyte
Macrophage, Dendritic Cell Engul�ng HSP-Peptide ComplexVia CD91
Perforin Granzyme
Tumor AntigenCross-Presentation
NKG2D
NKG2DLs
Tumor-In�ltrating B Cell
04-0017-01
CD8+Treg
Th3/Tr1
Treg
APC
APC
CD80/CD86
CD73
CD39ATP
AMP
Adenosine
AdenosineReceptor
AdenosineReceptor
Enhanced TregActivity
CD80CD86
CTLA4
+
IDOCCL22
IDOSOCS1Arginase
IDO
IDO
Tryptophan
Immunosuppression
TGF-βIL-10
PGE2
GangliosidesGalectin1/9
E�ector T Cell
E�ector T Cell
Antigen Uptake
FOXP3
Treg
Treg
IL-10TGF-βIDOCOX2PGE2Immunosuppressive Molecule
APC Dysfunction/T-Cell Anergy
IL-12MHCCD80CD86
CD4+CD25+CTLA4+GITR+
IL-10TGF-β
T CellApoptosis and Anergy
MetabolizedTryptophan
pDC
T E�ector
Macrophage, Dendritic Cell(Tolerogenic)
+
+
+
pSTAT3VEGFLXR-L
IL-13TGF-β
CD4+CD25T Cell
Cancer Recognition/EliminationCancer Recognition/Elimination Shedding of Tumor Recognition Antigens Shedding of Tumor Recognition Antigens
MDSC-Induced ImmunosuppressionMDSC-Induced Immunosuppression
Treg
HSP-Peptide Complex
The 3 E’s of Cancer ImmunoeditingThe 3 E’s of Cancer Immunoediting
Contact BioLegendUS & Canada Toll-Free: 1.877.246.5343 (877-BIOLEGEND)International: 1.858.768.5800Fax: 1.877.455.9587email: [email protected], [email protected]
US Headquarters:San Diego, CA 92121
CD205CD209CD273MHC Class II
CD11bCD11cCD80CD83CD86
CD49bCD56CD122CD314 (NKG2D)CD335 (NKp46)
CD4CD183Tim-3T-bet
CD4CD193CD194CD294Tim-1
CD4CD25FOXP3CD127low
Activation:GARPLAP (TGF-β)
Human:CD33CD11bCD14neg
Mouse:CD11bGR-1
Dendritic Cell Natural Killer Cell Th1 Cell Th2 Cell Treg Cell MDSC
biolegend.comWe would like to thank Dr. Robert Schreiber of Washington University - School of Medicine for his contributions to this poster.
Interactive Poster: biolegend.com/cancerimmunoediting
©BioLegend, Inc. 2014
Cancer Immunoediting

Customer Service: 858-768-5800
54
Cell Separation
Cell Separation

biolegend.com
55
Cell SeparationThe isolation of a specific cell population from a complex sample has become a common lab procedure. Cell separation is indeed a very powerful tool that has greatly contributed to the expansion of biomedical research and clinical applications, and continues to help push the boundaries of scientific discoveries.
Thus far, several techniques have been developed to separate cells. They are based either on the physicochemical properties of the cells, or on their phenotype as defined by specific molecules that they express. These techniques can be classified thus as adherence, density, or antibody binding based. This chapter reviews these three methodologies, emphasizing BioLegend’s system, MojoSort™. The information is also focused on research reagents.
Separation Based on AdherenceThis is probably the simplest way to separate cells. It is based on the capacity of the cells of interest to adhere to a specific material, and utilize that to decant unwanted cells (or strip the solution of the cells that adhere). Two classical examples of this method are the isolation of dental pulp stromal cells from digested dental pulp (1), and isolation of human monocytes from whole blood (2).
The main benefit of this approach is its simplicity, and it is also probably the most economical method to separate cells. The main disadvantage is a complete lack of specificity, as it relies on the capacity of the cells of interest to adhere, and, to some extent, their capacity to proliferate relatively quickly.
Organ
Seeding
Cell Attachmentand Proliferation
Single Cell Suspension
Enzymatic Digestion
Mechanical Disruption
Figure 1. Diagram showing cell separation by adherence to plastic. The tissue is disrupted to yield a single cell suspension followed by seeding onto the adherent surface. The cells are cultured and adhere to the surface.

Customer Service: 858-768-5800
56
Separation Based on DensityThis method is based on the use of different separation media with specific density, followed by centrifugation. By modifying the density of media and the angular speed, it is possible to sediment some cells while others remain in the interface between the separation media and the cell suspension. This method is particularly useful to separate blood cells for example, although it can also be applied to cells obtained from solid organs (3).
This is also a relatively simple method, and doesn’t require technically challenging equipment. However, specificity is also the main issue as the cells are separated based on physical properties, and different cell types may have similar density.
Figure 2. Diagram showing whole blood cell separation using a density gradient centrifugation protocol. Blood is diluted with saline buffer and carefully layered over the medium in a conical tube, avoiding disturbing the interphase. Following centrifugation, at the appropriate speed and no braking, well defined phases can be observed; 1 – plasma, 2 – interphase with mononuclear cells, 3 – centrifugation medium and 4 – erythrocytes and granulocytes. The cells of interest can be aspirated from the interphase.
Centrifugation
1
2
3
4

biolegend.com
57
Antibody Binding StrategiesMethods that take advantage of the specificity of the antibodies are based on their capacity to selectively bind molecules expressed by the cells of interest. The two most commonly used antibody-based techniques are Fluorescence-Activated Cell Sorting (FACS) and magnetic cell sorting.
Fluorescence-Activated Cell Sorting
This technique is a specialized form of flow cytometry that uses fluorophore-conjugated antibodies to separate cells. A cell suspension runs through an instrument that detects the signal emitted by the fluorophores attached to the cells. After the cells are properly identified, they are separated using several mechanisms. For example, the flow stream can be broken into droplets small enough that they contain only one cell. The droplets are then electrically charged, and they can be deflected to collection tubes based on their electrical charge. Alternatively, the cells may be separated by the use of micro channels and valves (4).
Magnetic Cell Separation
Separation of cells based on magnetic fields utilizes the same antibody-based principle. However, the antibody (or binding) molecules in this case are conjugated to magnetic particles, not fluorophores. After the cells are labeled with the antibody-magnetic particle conjugate, the sample is applied to the magnetic field which will attract the labeled cells. Depending on whether the labeled or unlabeled fraction is kept for downstream analysis, these two strategies are commonly known as positive or negative selection (5).
Sample
Sheath Fluid
Electromagnets
NegativeSample
PositiveSample
Laser
Charge
Fluid Droplet
Detector
FSC
SSC
Size of Healthy/Dead Cells
Fluorescent/Granularity
Fluorescent Dye90°
Detector
++++++
––––––
++++++
––––––
–
–
Figure 3. Schematics representing a classical droplet FACS system.
Figure 4. Illustration representing a classical magnetic separation principle. A) The cells are incubated with antibodies conjugated to magnetic particles. B) A magnetic field attracts the cells that have the conjugates bound. C) After washing or decanting the liquid, the cells of interest remain in the container. They can be retrieved by removing them from the magnetic field.

Customer Service: 858-768-5800
58
Both techniques have advantages and disadvantages if compared side by side. Below is a summary of key features.
FACS Magnetic separation
Complexity Higher Lower
Cost Higher Lower
Specificity High High
Need of specialized staff Yes No
Multi marker sorting Yes Limited
Simultaneous sorting Yes Limited
Table 1. Side by side comparison of key futures of FACS and magnetic cell separation
Both methods offer high specificity, ensured by the antibodies. However, FACS is an expensive approach as it needs a complex instrument, and often dedicated personnel. Although there are some automatic systems developed for magnetic separation, these machines are less costly than flow cytometry sorters, and in general do not required specialized staff to operate them.
MojoSort™, BioLegend’s Unique Magnetic Separation Reagents BioLegend has recently developed a unique separation platform to separate cells based on magnetic particles. Our reagents have the unique property of being able to separate cells using both stand-alone magnets and high gradient magnetic columns. Our magnetic particles can be used either with our magnets (figure 5) or with separation columns that are commercially available.
Figure 5. MojoSort™ magnets. Left panel shows a magnet that can accommodate a 12 x 75 mm tube. Right panel shows a magnet that can accommodate a 17 x 100 mm tube. MojoSort™ Nanobeads and Kits can also be used with separation columns.
ApplicationsBoth positive and negative selected cells using MojoSort™ can be used for in vitro and in vivo applications after isolation. Using our MojoSort™ Mouse CX3CR1 Selection Kit, we enriched CX3CR1+ cells from mouse bone marrow, and differentiated them in vitro into Dendritic Cell and Macrophage-like cells. Following differentiation, the cells were stimulated with TLR agonists, and their surface phenotype was analyzed, as well as the cytokine profile. We also injected them in recipient C57BL/6 mice, and tracked the CFSE labeled CX3CR1+ cells, detecting them back in the bone marrow 72 hours after injection.
In Vitro Data
A single cell suspension from C57BL/6 bone marrow was depleted of Ly6G+ cells using anti-Ly6G magnetic nanobeads, followed by positive selection of CX3CR1 cells using anti-mouse CX3CR1 biotin antibody and Streptavidin conjugated MojoSort™ Nanobeads.
Figure 6. Surface phenotype of CX3CR1+ isolated cells cultured with GM-CSF (A) or GM-CSF and IL-4 (B). The cells develop a macrophage- or dendritic cell-like phenotype and respond after LPS and CpG stimulation.
A B

biolegend.com
59
Figure 7. Chemokine expression of CX3CR1+ isolated cells cultured with GM-CSF alone (left panel) or GM-CSF and IL-4 (right panel) after stimulation with either LPS (black bars) or CpG (orange bars). The cells show a well-defined chemokine expression pattern, distinct to each cell type. The bars indicate fold increase over unstimulated control cells. Cytokine and chemokine levels in cell culture supernatants were measured using BioLegend’s multiplex assay LEGENDplex™.
Figure 8. Cytokine expression of CX3CR1+ isolated cells cultured with GM-CSF alone (left panel) or GM-CSF and IL-4 (right panel) after stimulation with either LPS (black bars) or CpG (orange bars). The cells show a well-defined cytokine expression pattern, distinct to each cell type. The bars indicate fold increase over unstimulated control cells. Cytokine and chemokine levels in cell culture supernatants were measured using BioLegend’s multiplex assay LEGENDplex™.
In Vivo Data
A single cell suspension from C57BL/6 bone marrow was depleted of Ly6G+ cells using anti-Ly6G magnetic nanobeads, followed by positive selection of CX3CR1 cells using anti-mouse CX3CR1 biotin antibody and Streptavidin conjugated MojoSort™ Nanobeads. CX3CR1+ cells were then labeled with CFSE and injected back into a C57BL/6 recipient mouse. CFSE positive cells were tracked in the bone marrow of recipient animals.
In conclusion, cells isolated using MojoSort™, including positive selection, can be used for multiple applications. The isolated cells have preserved functionality and intact physiological activities.
References1. Raoof M, et al. 2014. Dent Res J. 11(2): 2442. Wahl LM, et al. 2006. Curr Protoc Immunol. Chapter 7:Unit 7.6A3. Liu W et al. 2011. Proteomics. 11(17):35564. Shapiro HM. 2005. Practical Flow Cytometry5. Battye FL and Shortman K. 1991. Curr Opin Immunol. 3(2):238
Learn more at: biolegend.com/mojosort
Figure 9. CFSE+ cells are detected in the bone marrow of recipient animals 72 hours after cells transfer. CFSE+CX3CR+ cells were gated of CD11b+ cells.

Customer Service: 858-768-5800
60
Chemokine Receptor Biology PosterChemokines are specialized cytokines that induce cell movement, better known as chemotaxis. Chemokines can serve a variety of functions, drawing cells in to investigate an injury site, and maintaining homeostasis by recruiting cells to areas of development (e.g., T cell progenitors moving to the thymus for growth and development). Certain viruses, like HIV, are capable of using chemokine receptors as points of entry in T cells or dendritic cells. Tumor cells can also take advantage of chemokines by recruiting regulatory T cells to dampen inflammatory responses. They may also produce oxysterols to prevent the recruitment of immune cells and create chemokines like CXCL12 to promote angiogenesis and metastasis.
HOMEOSTASIS
Atypical
Tumor Defense
Metastasis/Angiogenesis
Chemokine Receptor Signaling
CANCER
INFLAMMATION
VIROLOGYHIV Entry
Periphery
Thymus Cortex Medulla
Chemokine Sink
Immune Tolerance
Rolling Neutrophil
Blood Vessel
PSGL-1
CXCR4
CCR7 CCR9
CCL25
Endothelium
T Progenitor
T Progenitor
Brain: CXCL12, CXCL14
Bone Marrow: CXCL12
Secondary Lymphoid Tissues
T cell ZoneFollicle
CXCL13
CXCL17
CCR9
α4β7+ T cell
CXCR5
CXCR5B cell
T cell
B cell
T cell
CCL21
CCR7
CCL19
HEV
Bone Marrow
Bone MarrowNiche
Specialized Stromal Cells
Endothelium
Blood
CXCL12
CXCR4CD34+ HSC
G-CSF
CXCR4
CCR7 CCR9
Lungs: CXCL12, CXCL17
Small Intestine: CCL25, CXCL17
Small Intestine
Lymph Nodes: CCL19, CCL21, CXCL13
Spleen: CCL19, CCL21, CXCL13Liver: CXCL13
Skin: CCL27, CXCL14
Skin
CCL27
Dermal Cells
CCR10
CLA+ T cell
Egress
Sphingosine-1-Phosphate Receptor
Tumor Cells
Tumor Cells
Oxysterols
CXCL1, CXCL8
Tumor Cell Proliferation
CCR7, 10CCL28
CXCR4
CXCR4
CXCL12
Block Recruitment of Dendritic Cells,Lymphocytes
Treg Recruitment
Upregulation of Chemokine Receptors
Hypothetical Primary Tumor Site
Chemokine Receptor
Chemokine
Extracellular
Membrane
Intracellular
G Proteins
PLCβ2, PLD, PKC
STK’s, Ras
Arrestin, PLCβ2
Respiratory BurstGranule Release
Cytoskeletal RemodelingShape ChangeFirm Adhesion
Receptor Internalization/Desensitization
VEGF
Angiogenesis
Blood Vessel
Recruitment
Hypothetical Secondary Tumor Site
Mature CD4+ or CD8+ Naïve T Cell
Negative Selection
Cortico-medullaryJunction
CD4+ or CD8+
Single PositiveThymocyte
CXCR4+, CCR7+, CCR9+
CD4-CD8- Thymocyte
CCR7+, CCR9+
CD4+CD8+ Thymocyte
Positive Selection
CCL21CCL19P-Selectin
Sphingosine-1-Phosphate GradientCXCR1, 2
Endothelium
IFN-γCXCL8TNF-αIL-1
CXCL8
CXCR4HIV
T Cell
CCR5
CCR5HIV
HIV
CD4
CD4
CD4
Macrophage
Macrophage
Dendritic Cell
Chemokine Gradient
Injury, Infection
Epithelium
Pro-in� ammatory Cytokines
CCR2
Reduced Recruitment
CCL2Chemokine Sequestration
CCL5
US28
CXCL14
CXCR7
CXCR6
CXCR5
CXCR4
XCR1
CX3CR1
DUFFY
D6
ECRF3
US28
UL12
E1KSHV
CCR1
CCR2
CCR3
CCR4
CCR5
CCR7
CXCR3
CXCR2
CXCR1
CCR6
CCR7
CCR8CCR9 CCR10
?
?
?
?
CCL18CCL27, 28CCL25CCL1, 4
CCL19, 21
CCL20
CXCL6, 8
CXCL1, 8CCL2, 5
CCL2, 3, 5, 7
CXCL1, 2, 3, 5, 6, 7, 8
CXCL9, 10, 11
CCL19, 21
CCL3, 4, 5, 8, 14
CCL2, 3, 517, 22
CCL3, 4, 5, 714, 15, 16
CCL5, 7, 11, 13, 14, 15, 24, 26
CCL2, 7, 812, 13
CXCL1, 8, 10, 12
CCL11
CCL2, 3, 4, 5
CCL2, 3, 4, 5, 7
CXCL1, 5, 7
CCL26, CX3CL1
XCL 1,2
CXCL12
CXCL13
CXCL16
CXCL11, 12
CXCL17
Immunosuppression
Viral CCL1, 2, 3 CCR4 CCR8
Treg, Th2 Recruitment
Kaposi Sarcoma Virus
Immunosuppression
Immunosuppression
Cytomegalovirus
Endothelial Cell
E-Selectin
CXCL8ICAM-1LFA-1
Tissue
CCR2CCR3
CCR8CXCR6
CXCR7CX3CR1
Chemokine NomenclatureCXCL1: GRO1, GROα, MGSA, NAP3,SCYB1, MGSA-α
CXCL2: CINC-2α, GRO2, GROβ,GROB, MGSA-β, MIP2
CXCL3: GRO3, GRO-γ, MGSA-γ, MIP-2β, SCYB3
CXCL4: PF-4
CXCL5: ENA-78, LIX
CXCL6: SCYB6, GCP 2, CKA-3
CXCL7: NAP-2
CXCL8: IL-8
CXCL9: CMK, MIG, SCYB9
CXCL10: IP-10
CXCL11: I-TAC
CXCL12: SDF-1
CXCL13: BCA-1, BLC
CXCL14: BRAK, Bokeline
CXCL15: LUNGKINE, SCYB15
CXCL16: SCYB16, SR-PSOX
CXCL17: DMC, VEGF Co-regulated Chemokine 1
CX3CL1: Fractalkine, Neurotactin
XCL1: Lymphotactin, ATAC, SCM-1α
XCL2: SCM-1β
CCL1: I-309, TCA-3, SCYA1
CCL2: MCP-1, MCAF, JE
CCL3: MIP-1α
CCL4: MIP-1β, ACT-2, H400
CCL5: RANTES
CCL6: C10, MRP1
CCL7: MCP-3, MARC
CCL8: MCP-2, HC14
CCL9: CCL10, MRP-2, MIP-1γ, CCF18
CCL11: Eotaxin, Eotaxin 1
CCL12: MCP-5
CCL13: MCP-4
CCL14: HCC-1, HCC-3, MCIF, NCC2
CCL15: MIP-1δ, MIP 5, MRP-2B, NCC3, HCC-2
CCL16: HCC-4, LEC, LCC-1
CCL17: TARC, ABCD 2
CCL18: DC-CKA1, PARC, MIP-4, AMAC-1
CCL19: ELC, MIP-3β, Exodus-3
CCL20: LARC, MIP-3α, Exodus-1
CCL21: SLC, 6Ckine, Exodus-2
CCL22: MDC, ABCD 1
CCL23: MIP-3, CKb-8, MPIF-1
CCL24: MPIF-2, Eotaxin-2, CKβ-6
CCL25: TECK, CKβ-15
CCL26: Eotaxin-3
CCL27: CTACK, ESKine, ILC, Skinkine
CCL28: MEC, CCK1
T Helper Cell ExpressionTh1: CCR5, CXCR3
Th2: CCR3, 4, 8; CXCR5
Th17: CCR4, 6
Th22: CCR4, 6, 10
Tfh: CXCR5
Treg: CCR2, 4, 5, 6, 8-10; CXCR4-6
Cell ExpressionHematopoietic Stem Cells: CXCR4
Naïve T Cells: CCR7, CXCR4
B Cells: CCR7, CXCR4, 5; CX3CR1
Macrophages: CCR1, 2, 5; CXCR1, 4
Dendritic Cells: CCR1, 2, 5, 6, 7; CXCR1, 2, 4
Natural Killer Cells: CCR2, 4, 5, 8; CXCR1, 3, 4; CX3CR1
Neutrophils: CCR1; CXCR1, 2, 4
Basophils: CCR1-4, CXCR4
Eosinophils: CCR3, CXCR4
Mast Cells: CCR1, 3, 4, 5; CXCR1-4
Endothelial Cells: CCR1-4; CXCR1-4
Epithelial Cells: CCR1-8; CXCR1, 4
Tumor Metastasis
CCR7: Breast, Melanoma, Head and Neck, Colorectal, Chronic Lymphocytic Leukemia, Stomach, Non-Hodgkin’s Lymphoma, T Cell Leukemia
CCR9: Melanoma
CCR10: Melanoma
CXCR3: Acute Lymphoblastic Leukemia
CXCR4: Breast, Ovarian, Prostate, Pancreatic, Melanoma, Oesophageal, Non-small Cell Lung, Head and Neck, Bladder, Colorectal, Osteosarcoma, Neuroblastoma, Acute Lymphoblastic Leukemia, Chronic Lymphocytic Leukemia, Stomach
CXCR5: Head and Neck Cancer
Other Reported HIV Co-Receptors
Chemokine Receptor Biology
Interactive Poster: biolegend.com/chemokinebiologyWe would like to thank Dr. Albert Zlotnik, University of California, Irvine for his contributions to this poster.
9727 Paci� c Heights Blvd. San Diego, CA 92121 | Email: [email protected]
US & Canada Toll-Free: 1.877.246.5343 (877-BIOLEGEND) | International: 1.858.768.5800
CCR7
CCL27, CXCL14
Dendritic Cell
04-0021-00
CCL25
biolegend.com

61
biolegend.com
HOMEOSTASIS
Atypical
Tumor Defense
Metastasis/Angiogenesis
Chemokine Receptor Signaling
CANCER
INFLAMMATION
VIROLOGYHIV Entry
Periphery
Thymus Cortex Medulla
Chemokine Sink
Immune Tolerance
Rolling Neutrophil
Blood Vessel
PSGL-1
CXCR4
CCR7 CCR9
CCL25
Endothelium
T Progenitor
T Progenitor
Brain: CXCL12, CXCL14
Bone Marrow: CXCL12
Secondary Lymphoid Tissues
T cell ZoneFollicle
CXCL13
CXCL17
CCR9
α4β7+ T cell
CXCR5
CXCR5B cell
T cell
B cell
T cell
CCL21
CCR7
CCL19
HEV
Bone Marrow
Bone MarrowNiche
Specialized Stromal Cells
Endothelium
Blood
CXCL12
CXCR4CD34+ HSC
G-CSF
CXCR4
CCR7 CCR9
Lungs: CXCL12, CXCL17
Small Intestine: CCL25, CXCL17
Small Intestine
Lymph Nodes: CCL19, CCL21, CXCL13
Spleen: CCL19, CCL21, CXCL13Liver: CXCL13
Skin: CCL27, CXCL14
Skin
CCL27
Dermal Cells
CCR10
CLA+ T cell
Egress
Sphingosine-1-Phosphate Receptor
Tumor Cells
Tumor Cells
Oxysterols
CXCL1, CXCL8
Tumor Cell Proliferation
CCR7, 10CCL28
CXCR4
CXCR4
CXCL12
Block Recruitment of Dendritic Cells,Lymphocytes
Treg Recruitment
Upregulation of Chemokine Receptors
Hypothetical Primary Tumor Site
Chemokine Receptor
Chemokine
Extracellular
Membrane
Intracellular
G Proteins
PLCβ2, PLD, PKC
STK’s, Ras
Arrestin, PLCβ2
Respiratory BurstGranule Release
Cytoskeletal RemodelingShape ChangeFirm Adhesion
Receptor Internalization/Desensitization
VEGF
Angiogenesis
Blood Vessel
Recruitment
Hypothetical Secondary Tumor Site
Mature CD4+ or CD8+ Naïve T Cell
Negative Selection
Cortico-medullaryJunction
CD4+ or CD8+
Single PositiveThymocyte
CXCR4+, CCR7+, CCR9+
CD4-CD8- Thymocyte
CCR7+, CCR9+
CD4+CD8+ Thymocyte
Positive Selection
CCL21CCL19P-Selectin
Sphingosine-1-Phosphate GradientCXCR1, 2
Endothelium
IFN-γCXCL8TNF-αIL-1
CXCL8
CXCR4HIV
T Cell
CCR5
CCR5HIV
HIV
CD4
CD4
CD4
Macrophage
Macrophage
Dendritic Cell
Chemokine Gradient
Injury, Infection
Epithelium
Pro-in� ammatory Cytokines
CCR2
Reduced Recruitment
CCL2Chemokine Sequestration
CCL5
US28
CXCL14
CXCR7
CXCR6
CXCR5
CXCR4
XCR1
CX3CR1
DUFFY
D6
ECRF3
US28
UL12
E1KSHV
CCR1
CCR2
CCR3
CCR4
CCR5
CCR7
CXCR3
CXCR2
CXCR1
CCR6
CCR7
CCR8CCR9 CCR10
?
?
?
?
CCL18CCL27, 28CCL25CCL1, 4
CCL19, 21
CCL20
CXCL6, 8
CXCL1, 8CCL2, 5
CCL2, 3, 5, 7
CXCL1, 2, 3, 5, 6, 7, 8
CXCL9, 10, 11
CCL19, 21
CCL3, 4, 5, 8, 14
CCL2, 3, 517, 22
CCL3, 4, 5, 714, 15, 16
CCL5, 7, 11, 13, 14, 15, 24, 26
CCL2, 7, 812, 13
CXCL1, 8, 10, 12
CCL11
CCL2, 3, 4, 5
CCL2, 3, 4, 5, 7
CXCL1, 5, 7
CCL26, CX3CL1
XCL 1,2
CXCL12
CXCL13
CXCL16
CXCL11, 12
CXCL17
Immunosuppression
Viral CCL1, 2, 3 CCR4 CCR8
Treg, Th2 Recruitment
Kaposi Sarcoma Virus
Immunosuppression
Immunosuppression
Cytomegalovirus
Endothelial Cell
E-Selectin
CXCL8ICAM-1LFA-1
Tissue
CCR2CCR3
CCR8CXCR6
CXCR7CX3CR1
Chemokine NomenclatureCXCL1: GRO1, GROα, MGSA, NAP3,SCYB1, MGSA-α
CXCL2: CINC-2α, GRO2, GROβ,GROB, MGSA-β, MIP2
CXCL3: GRO3, GRO-γ, MGSA-γ, MIP-2β, SCYB3
CXCL4: PF-4
CXCL5: ENA-78, LIX
CXCL6: SCYB6, GCP 2, CKA-3
CXCL7: NAP-2
CXCL8: IL-8
CXCL9: CMK, MIG, SCYB9
CXCL10: IP-10
CXCL11: I-TAC
CXCL12: SDF-1
CXCL13: BCA-1, BLC
CXCL14: BRAK, Bokeline
CXCL15: LUNGKINE, SCYB15
CXCL16: SCYB16, SR-PSOX
CXCL17: DMC, VEGF Co-regulated Chemokine 1
CX3CL1: Fractalkine, Neurotactin
XCL1: Lymphotactin, ATAC, SCM-1α
XCL2: SCM-1β
CCL1: I-309, TCA-3, SCYA1
CCL2: MCP-1, MCAF, JE
CCL3: MIP-1α
CCL4: MIP-1β, ACT-2, H400
CCL5: RANTES
CCL6: C10, MRP1
CCL7: MCP-3, MARC
CCL8: MCP-2, HC14
CCL9: CCL10, MRP-2, MIP-1γ, CCF18
CCL11: Eotaxin, Eotaxin 1
CCL12: MCP-5
CCL13: MCP-4
CCL14: HCC-1, HCC-3, MCIF, NCC2
CCL15: MIP-1δ, MIP 5, MRP-2B, NCC3, HCC-2
CCL16: HCC-4, LEC, LCC-1
CCL17: TARC, ABCD 2
CCL18: DC-CKA1, PARC, MIP-4, AMAC-1
CCL19: ELC, MIP-3β, Exodus-3
CCL20: LARC, MIP-3α, Exodus-1
CCL21: SLC, 6Ckine, Exodus-2
CCL22: MDC, ABCD 1
CCL23: MIP-3, CKb-8, MPIF-1
CCL24: MPIF-2, Eotaxin-2, CKβ-6
CCL25: TECK, CKβ-15
CCL26: Eotaxin-3
CCL27: CTACK, ESKine, ILC, Skinkine
CCL28: MEC, CCK1
T Helper Cell ExpressionTh1: CCR5, CXCR3
Th2: CCR3, 4, 8; CXCR5
Th17: CCR4, 6
Th22: CCR4, 6, 10
Tfh: CXCR5
Treg: CCR2, 4, 5, 6, 8-10; CXCR4-6
Cell ExpressionHematopoietic Stem Cells: CXCR4
Naïve T Cells: CCR7, CXCR4
B Cells: CCR7, CXCR4, 5; CX3CR1
Macrophages: CCR1, 2, 5; CXCR1, 4
Dendritic Cells: CCR1, 2, 5, 6, 7; CXCR1, 2, 4
Natural Killer Cells: CCR2, 4, 5, 8; CXCR1, 3, 4; CX3CR1
Neutrophils: CCR1; CXCR1, 2, 4
Basophils: CCR1-4, CXCR4
Eosinophils: CCR3, CXCR4
Mast Cells: CCR1, 3, 4, 5; CXCR1-4
Endothelial Cells: CCR1-4; CXCR1-4
Epithelial Cells: CCR1-8; CXCR1, 4
Tumor Metastasis
CCR7: Breast, Melanoma, Head and Neck, Colorectal, Chronic Lymphocytic Leukemia, Stomach, Non-Hodgkin’s Lymphoma, T Cell Leukemia
CCR9: Melanoma
CCR10: Melanoma
CXCR3: Acute Lymphoblastic Leukemia
CXCR4: Breast, Ovarian, Prostate, Pancreatic, Melanoma, Oesophageal, Non-small Cell Lung, Head and Neck, Bladder, Colorectal, Osteosarcoma, Neuroblastoma, Acute Lymphoblastic Leukemia, Chronic Lymphocytic Leukemia, Stomach
CXCR5: Head and Neck Cancer
Other Reported HIV Co-Receptors
Chemokine Receptor Biology
Interactive Poster: biolegend.com/chemokinebiologyWe would like to thank Dr. Albert Zlotnik, University of California, Irvine for his contributions to this poster.
9727 Paci� c Heights Blvd. San Diego, CA 92121 | Email: [email protected]
US & Canada Toll-Free: 1.877.246.5343 (877-BIOLEGEND) | International: 1.858.768.5800
CCR7
CCL27, CXCL14
Dendritic Cell
04-0021-00
CCL25
biolegend.com

Customer Service: 858-768-5800
62
MHC Multimers
MHCMultimers

biolegend.com
63
MHC Multimers The immune system is tasked with an extremely important function, the protection of the entire organism and elimination of unwanted entities, whether that is a pathogen, a cell that has become cancerous, or another insult. In most cases, an effective immune reaction involves the development of a strong T-cell mediated response. This is defined by the interaction between antigen presenting cells (APCs) and T cells, through the Major Histocompatibility Complex (MHC) and the T cell receptor (TCR) (1).
What is an MHC Multimer, and How Do You Use It? MHC molecules in APCs present a peptide to a T cell that recognizes this peptide. The interaction between the MHC molecules and the TCR is weak. However, multimerization of soluble MHC significantly extends the interaction, by effectively increasing the avidity of the MHC for the TCR. By simultaneously incorporating a fluorescently labeled backbone, the MHCs will maintain a more stable binding by interacting with several TCRs, thus making the multimer useful for flow cytometry detection of antigen-specific T cells. The first paper describing multimerization of peptide/MHC molecules to identify antigen specific T cells was published in 1996, by Altman et al (2). The publication opened an entire new field in immunology research, and used streptavidin as the primary backbone to construct an MHC tetramer conjugated to a fluorophore.
In general, antigen-specific T cell responses can be characterized by functional assays. This includes proliferation assays, chromium-based cytotoxicity assays, Ca2+ flux assays, and more commonly, cytokine detection assays such as ELISPOT and intracellular cytokine flow cytometry staining. However, most of these functional assays do not combine the specificity and quantification capabilities of flow cytometry MHC tetramer staining; nor can they be used to characterize the response at a single cell level (3).
MHC Restriction, Allele Frequency and DistributionThere are several classes of MHC molecules. They are paired with the type of T cell that will recognize them. Class I molecules will stimulate CD8+ T cells and class II molecules will stimulate CD4+ T cells. Thus, to be able to effectively stimulate T cells, APCs must present an appropriate peptide in its matching MHC molecule to the corresponding T cell. Figure 1 summarizes this matching system.
T cell
MHC Restriction
TCR
X
MHCa MHCb MHCa
TCRTCR
Antigen-presenting cell Antigen-presenting cell Antigen-presenting cell
T cell T cell
Recognition No Recognition No Recognition
X Y
Figure 1. MHC restriction is driven by the fact that TCRs will only engage in a productive interaction if both the peptide and the MHC molecule are suited to match. The illustration shows class I molecules as an example. X and Y represent peptides.

Customer Service: 858-768-5800
64
The MHC molecules are extremely polymorphic, even in inbred laboratory animals. When staining samples to identify antigen-specific T cells with MHC multimers, it is then important to know which alleles are recognized by the T cells. Table 1 shows the worldwide frequency of the 25 most frequent Class I HLA- A, B, and C alleles.
Allele North America Australia Europe North-East Asia
South-East Asia
South America Oceania Sub-Saharan Africa
North Africa
A*24:02 31.17 25.93 6.65 8.79 22.01 1.46 36.72 1.17
C*03:04 19.75 0.92 5.77 4.55 3.89 17.90 0.00 2.91
A*02:01 17.34 12.72 27.22 11.34 6.38 22.08 6.14 9.84
B*40:02 15.94 16.87 0.80 7.24 3.55 7.59 6.43 0.17 1.10
C*04:01 14.95 26.05 10.10 8.84 5.87 15.94 10.25 12.93
B*35:01 13.47 0.12 5.93 5.92 2.11 1.30 0.63 4.46 3.31
C*02:02 11.64 0.13 2.18 0.00 0.08 7.77
C*07:02 10.16 5.63 15.89 7.76 18.92 32.75 21.11 4.40
A*02:06 10.09 0.00 0.08 7.18 5.22 0.00 2.82 0.09
B*48:01:01 9.39 0.12 0.05 3.55 4.43 0.22 3.92
B*27:05 9.08 0.12 2.80 3.16 0.22 0.31
A*31:01:02:01 6.80 1.60 2.65 6.99 2.15 35.83 1.81 0.77 2.16
A*24:02:01:01 6.50 0.00 1.56 7.56 6.28 11.04 1.61 0.37 2.16
C*01:02 5.94 24.61 2.77 13.52 13.31 3.06 7.79 0.40
B*15:01 5.47 0.37 3.59 0.00 1.35 0.22 0.16 0.45
C*15:02 5.25 16.49 0.87 4.82 2.32 3.71 5.94 0.30
A*68:01:02:01 4.93 0.00 1.37 0.66 0.03 8.13 0.20 0.14 1.44
C*07:01 4.68 1.18 5.30 2.28 1.49 0.00 1.43 13.07 0.00
B*51:01:01:01 4.46 0.00 1.54 9.47 1.15 0.22 0.94 0.43 2.94
B*51:01 4.39 0.12 3.59 2.30 1.74 0.16 1.73 1.47
B*27:03 4.23 0.77 0.37
A*68:01 3.81 0.12 1.09 0.09 0.85
C*06:02:01:01 3.77 0.92 9.13 8.57 1.39 0.22 1.43 14.56
C*08:01 3.77 0.13 0.06 7.63 12.82 0.00 17.83 0.76
C*03:03 3.54 7.20 5.64 9.77 6.26 10.26 2.05 1.06
A*01:01 3.51 2.22 16.41 2.84 0.70 0.21 1.01 5.26 12.59
Table 1. Frequency of the most common class I HLA alleles worldwide. Alleles are organized according to their frequency in North America. Empty cells represent unavailable data. Data collected from the NCBI dbMHC database (https://www.ncbi.nlm.nih.gov/projects/gv/mhc/ihwg.cgi?cmd=PRJOV&ID=9).

biolegend.com
65
These maps provide an approximate graphical representation of the distribution of the most common A, B, and C alleles (A*24:02, B*40:02, C*03:04).
After the seminal work done by Altman et al., a number of commercially available MHC tetramers have helped advance research in this field. The NIH also funded and maintains a core facility to make sure the reagents are available to the scientific community (http://tetramer.yerkes.emory.edu/). However, most of these multimers are available with a fixed “specificity.” In other words, MHC monomers or tetramers are offered pre-loaded with a specific peptide that has most likely been previously characterized by a research group.
To overcome this issue, and facilitate the development of high-throughput assay systems in which T cell responses against a multitude of epitopes can be analyzed, a collaborative effort between Sanquin (http://www.sanquin.nl/) and The Netherlands Cancer Institute (https://www.nki.nl/) resulted in the development of a technology that allows for “specificity” exchange within the same allele. In other words, a reagent was developed in which an irrelevant peptide loaded onto the MHC molecule can be swapped for another peptide of interest after being exposed to ultraviolet (UV) light. This new peptide is the new “specificity,” if we interpret it as the part of the reagent that determines the specificity of the T cell receptor to which the tetramer will bind. To compare this with antibodies as an example, it would be equivalent to having a monoclonal antibody that could switch the binding region to recognize a different target by simply exposing it to UV light. This revolutionary technology has added incredible flexibility to the research of antigen-specific T cell response, and BioLegend is offering it under the brand name Flex-T™.
Figure 2. Geographical distribution of A*24:02, B*40:02, and C*03:04 alleles. The data is based on Lancaster A.K. et al. (4), and accessible here: http://www.pypop.org/popdata/2008/byfreq-A.php.

Customer Service: 858-768-5800
66
How Does It Work?Flex-T™ utilizes a UV-exchangeable system. MHC monomers are loaded with a peptide that can be degraded by the use of a UV light source. This allows for a peptide exchange when the UV irradiation is done in the presence of the peptide of interest (which is not UV-labile). This flexibility facilitates the screening of virtually any peptide of interest with enough affinity for the MHC allele that it is loaded onto.
ApplicationsMHC tetramers are among the best tools available to characterize a specific T cell response. Applications include any research field that benefits from monitoring antigen-specific T cells, including, but not limited to vaccine research, identification of neoepitopes in cancer research, and immunotherapy.
To increase the resolution when detecting antigen specific T cells with MHC tetramers and simultaneously improve the specificity of the assay, it is recommended that a two color staining strategy with the same allele/peptide combination be used.
Based on the unique properties of our systems, an ELISA to evaluate the peptide exchange has been developed. This can further be used to screen multiple peptides and have an idea about the affinity by which the peptide binds the MHC molecules.
Figure 4. A) CD8+ T Cells previously gated on lymphocytes (FSC vs SSC) and 7-AAD negative events, the exclusion cocktail contains Alexa Fluor® 700 anti- CD4, CD19, CD14, and CD16. B) Antigen-specific CD8+ T Cells, gated as described, detected with Flex-T™ tagged with PE and APC. HLA-A*11:01 Flex-T™ is loaded with EBV peptide (IVTDFSVIK).
Figure 5. The bar graph shows peptide exchange of HLA-A*11:01 allele. Monomers were irradiated with UV light in the presence of positive (Pos), negative (Neg), and p21 (EBV RVRAYTYSK) peptides, or no peptide (UV only). ELISA signal was normalized using the Pos control well.
Figure 3. Diagram depicting peptide exchange and tetramerization of Flex-T™ MHC monomers. 1) UV-labile peptide loaded MHC monomer is mixed with the peptide of interest. 2) The UV light will degrade the labile peptide and the peptide of interest, which is not UV sensitive, replaces it. 3) Tetramerization occurs by incubating the MHC monomers loaded with the exchanged peptide with fluorophore-labeled streptavidin. 4) Identification of antigen-specific T cells can be achieved with the newly assembled tetramer and co-stained with conjugated antibodies.

biolegend.com
67
In addition, when using MHC multimers to study antigen-specific T cells, each MHC/peptide detects only a small fraction of T cells that are specific for that peptide. Thus, for a large screening of several specificities, a proportionally large volume of blood or sample will be needed. To address this issue, an excellent strategy is to use a "combinatorial color coding" system (5). The method consists of assigning a unique two-color code to each tetramer/peptide of interest. Two tetramers tagged with different colors will bind to the TCRs, yielding a specific T cell that can be detected in two channels in a flow cytometer. By analyzing the double positive cells, it is possible to identify the peptide that those cells are recognizing.
The number of tetramer/peptide combinations that can be used simultaneously depends on how many fluorophores are used to assemble the tetramers. For example, using 5 different streptavidin-fluorophore conjugates allows for 10 unique two-color combinations (light blue region, table 2). Using 6 conjugates, the codes expand to 15 (light red region, table 2). The codes increase as the number of conjugates increase. Thus, as the number of colors used increase, more specificities can be covered and less sample is required. The cost of the reagents is much lower using this strategy.
How to Boost the Signal when Working with Low Affinity TCRsThe TCR-peptide/MHC affinity required for tetramer binding exceeds that required for T cell activation. This affinity threshold difference means that tetramer staining may underestimate the frequency of functional T cells (6). This issue may be more relevant when the technique is used to study self-reactive T cells, such as those occurring in autoimmunity or cancer, which tend to express low affinity TCRs. For example, it has been documented that viral antigens have significantly higher affinity than cancer-related antigens, in the context of HLA-A2 (7). Likewise, conventional tetramer staining seemed to be insufficient to detect all functional T cells, compared to an autologous tumor killing assays (8).
Table 2. Possible combinations of two-color codes depend on the number of Streptavidin-fluorophore conjugates used to generate the tetramer/peptide complex (5).
Figure 6. Diagram illustrating the use of combinatorial color coding (5).

Customer Service: 858-768-5800
68
How to Improve the Signal to Detect Difficult T Cell Clones?
1) Use bright fluorophores. Three great choices to construct bright tetramers include the use of streptavidin conjugated to PE, APC and BV421™. As with any other marker that is poorly expressed, detection by flow cytometry benefits greatly from the use of bright fluorophores.
2) Using protein kinase inhibitors (PKI). Successful use of MHC multimers relies on the capacity of the reagent to bind multiple TCRs, simultaneously. Density of TCRs and availability on the cell surface are key factors to a bright signal. After engaging the cognate antigen, TCRs may be internalized (9), an event that could affect the detection using MHC multimers. TCR internalization can be inhibited using PKI such as desatanib, resulting in a significantly enhanced staining (10).
3) Signal amplification. Another approach to bring up those low affinity T cell clones is the use of conjugated antibodies with the same fluorophore as the one conjugated to the tetramer. For example, if using a PE-tetramer, it is possible to use an anti-PE antibody conjugated to PE as well to boost the signal. This approach has been successfully used to detect ILA1 T cells that recognize the peptide ILAKFLHEL with very low affinity. ILA1 T cells can be easily distinguished from regular PBMCs (which contain T cell clones with higher affinity for the same peptide) using ILAKFLHEL tetramers conjugated to PE, followed by PE conjugated anti-PE antibody staining (11).
In conclusion, MHC multimers are emerging as an essential tool to characterize specific T cell responses. MHC monomers with the capacity to swap the cognate peptide are bringing a lot more flexibility to this research field. Making the technology widely available will definitely help spread the applications and utility of antigen-specific T cell identification.
References1. Rossjohn J et al. 2015. Annu Rev Immunol. 33:1692. Altman JD, et al. 1996. Science. 274(5284):943. Phetsouphanh C et al. 2015. Int J Mol Sci. 16(8):188784. Lancaster AK et al. 2007. Tissue Antigens. 1:1925. Hadrup SR et al. 2009. Nat Methods. 6(7):5206. Laugel B et al. 2007. J Biol Chem. 282(33):237997. Aleksic M et al. 2012. Eur J Immunol. 42(12):31748. Dolton G et al. 2014. Clin Exp Immunol. 177(1):479. Valitutti S et al. 1995. Nature. 375(6527):14810. Lissina A et al. 2009. J Immunol Methods. 340(1):1111. Tungatt K et al. 2015. J Immunol. 194(1):463
Learn more about MHC antigen peptides: biolegend.com/antigen_peptides
Discover Flex-T™ at: biolegend.com/flex-t
Figure 7. Mouse spleen cells were labeled with PBS57-loaded mouse CD1d tetramer bound to Streptavidin- BV421™, -PE, or -Pacific Blue™. The data shows optimal staining with BV421™ when comparing equivalent tetramer concentrations. Data provided by Dr. Rick Willis, Emory/Yerkes.

biolegend.com
69
Applications of Mass Cytometry
Applications of Mass
Cytometry

Customer Service: 858-768-5800
70
Applications of Mass CytometryMass Cytometry, also known as CyTOF®, is a unique single cell analysis platform that can enable the quantitation of 100 antigens on the same set of cells, using antibodies labeled with heavy metal ion tags like lanthenides. Although the applications of the technology are similar to flow cytometry, the platform itself is not. The cells labeled with metal ion tagged antibodies are delivered to the instrument in a single cell suspension. Each cell interrogates a laser that atomizes the cells, releasing each heavy metal ion held by each antibody into a detection array. Similar to how a mass spectrometer is able to capture and quantitate each element comprising a protein, the CyTOF® instrument detects the number of each heavy metal ion, relating a value of total abundance. The strong advantage of CyTOF® is that most elements only have a very small range of isotopic mass. For example, when a Terbium ion is detected, a mass deviance of +/- 4 might be detected from oxidized/reduced states around an atomic mass of 65. This is much more limited than the range of distribution around the entire spectrum of a fluorophore like FITC, where the peak emission may be greatest at 520 nm, but the emission spectrum begins at 480 nm and finishes around 620 nm. It’s theoretically possible to detect 100 different metal ions simultaneously because of this tight detection range of atomic mass in CyTOF®.
BioLegend offers antibodies ready to conjugate with the MaxPar® isotope labeling kits. They are at the right concentration and purity to make conjugating your own antibodies as easy as possible in your panel optimization. One application recently applying our antibodies and Veri-Cells™ PBMC products is from the lab of Dr. Adeeb Rahman at Mt. Sinai School of Medicine. He labeled the lyophilized Veri-Cells™ PBMC product with a combination of 19 antibodies, each conjugated to different metal isotopes on three different days over a 6 week period, to test the reproducibility of the reagents and the instrument as a control.
CyTOF® and MaxPar® are registered trademarks of Fluidigm.
Figure 1. Using a clustering algorithm called viSNE, Figure 1 demonstrates the different major cell subset populations defined by the markers indicated in the legend in Figure 2 below.
Figure 2 indicates the population frequencies of 4-5 replicate samples on each day (Week 0, Week 2 or Week 6) with a coefficient of variance across all populations and timepoints to be <9%.
Figure 3. Applying the Jensen-Shannon (JS) divergence method between paired viSNE plots for each replicate sample, the divergence was found to be an average of 0.02.
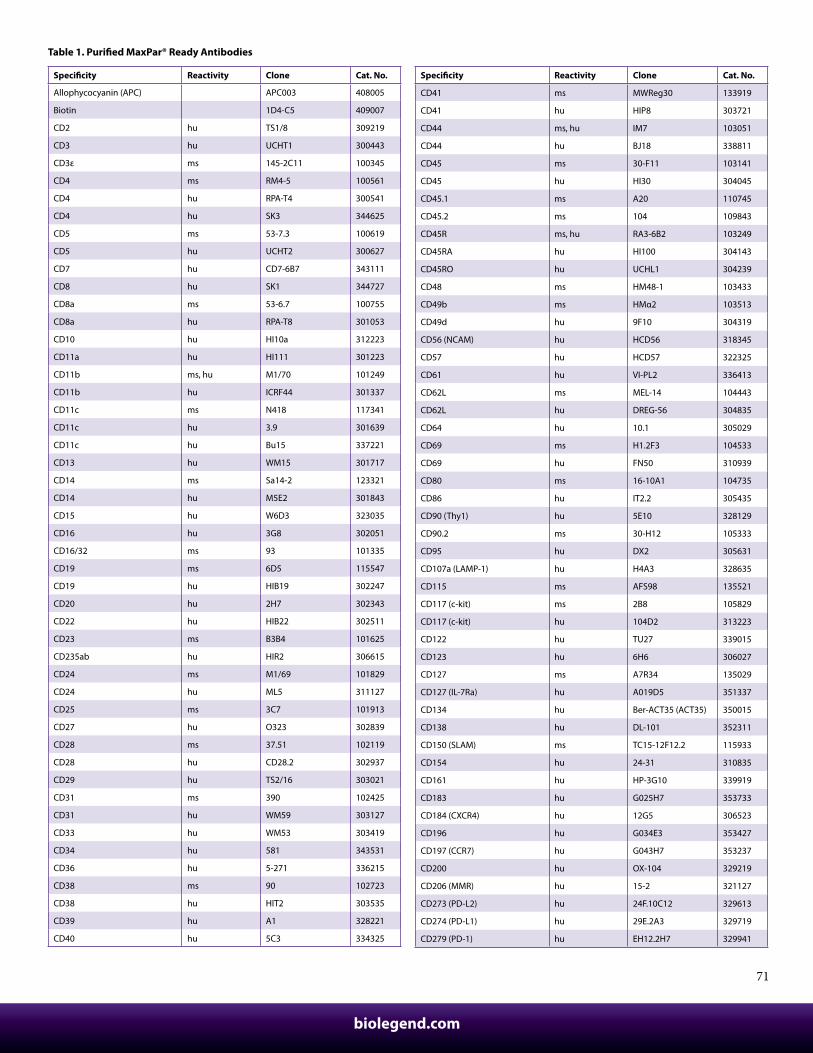
biolegend.com
71
Specificity Reactivity Clone Cat. No.
Allophycocyanin (APC) APC003 408005
Biotin 1D4-C5 409007
CD2 hu TS1/8 309219
CD3 hu UCHT1 300443
CD3ε ms 145-2C11 100345
CD4 ms RM4-5 100561
CD4 hu RPA-T4 300541
CD4 hu SK3 344625
CD5 ms 53-7.3 100619
CD5 hu UCHT2 300627
CD7 hu CD7-6B7 343111
CD8 hu SK1 344727
CD8a ms 53-6.7 100755
CD8a hu RPA-T8 301053
CD10 hu HI10a 312223
CD11a hu HI111 301223
CD11b ms, hu M1/70 101249
CD11b hu ICRF44 301337
CD11c ms N418 117341
CD11c hu 3.9 301639
CD11c hu Bu15 337221
CD13 hu WM15 301717
CD14 ms Sa14-2 123321
CD14 hu M5E2 301843
CD15 hu W6D3 323035
CD16 hu 3G8 302051
CD16/32 ms 93 101335
CD19 ms 6D5 115547
CD19 hu HIB19 302247
CD20 hu 2H7 302343
CD22 hu HIB22 302511
CD23 ms B3B4 101625
CD235ab hu HIR2 306615
CD24 ms M1/69 101829
CD24 hu ML5 311127
CD25 ms 3C7 101913
CD27 hu O323 302839
CD28 ms 37.51 102119
CD28 hu CD28.2 302937
CD29 hu TS2/16 303021
CD31 ms 390 102425
CD31 hu WM59 303127
CD33 hu WM53 303419
CD34 hu 581 343531
CD36 hu 5-271 336215
CD38 ms 90 102723
CD38 hu HIT2 303535
CD39 hu A1 328221
CD40 hu 5C3 334325
Specificity Reactivity Clone Cat. No.
CD41 ms MWReg30 133919
CD41 hu HIP8 303721
CD44 ms, hu IM7 103051
CD44 hu BJ18 338811
CD45 ms 30-F11 103141
CD45 hu HI30 304045
CD45.1 ms A20 110745
CD45.2 ms 104 109843
CD45R ms, hu RA3-6B2 103249
CD45RA hu HI100 304143
CD45RO hu UCHL1 304239
CD48 ms HM48-1 103433
CD49b ms HMα2 103513
CD49d hu 9F10 304319
CD56 (NCAM) hu HCD56 318345
CD57 hu HCD57 322325
CD61 hu VI-PL2 336413
CD62L ms MEL-14 104443
CD62L hu DREG-56 304835
CD64 hu 10.1 305029
CD69 ms H1.2F3 104533
CD69 hu FN50 310939
CD80 ms 16-10A1 104735
CD86 hu IT2.2 305435
CD90 (Thy1) hu 5E10 328129
CD90.2 ms 30-H12 105333
CD95 hu DX2 305631
CD107a (LAMP-1) hu H4A3 328635
CD115 ms AFS98 135521
CD117 (c-kit) ms 2B8 105829
CD117 (c-kit) hu 104D2 313223
CD122 hu TU27 339015
CD123 hu 6H6 306027
CD127 ms A7R34 135029
CD127 (IL-7Ra) hu A019D5 351337
CD134 hu Ber-ACT35 (ACT35) 350015
CD138 hu DL-101 352311
CD150 (SLAM) ms TC15-12F12.2 115933
CD154 hu 24-31 310835
CD161 hu HP-3G10 339919
CD183 hu G025H7 353733
CD184 (CXCR4) hu 12G5 306523
CD196 hu G034E3 353427
CD197 (CCR7) hu G043H7 353237
CD200 hu OX-104 329219
CD206 (MMR) hu 15-2 321127
CD273 (PD-L2) hu 24F.10C12 329613
CD274 (PD-L1) hu 29E.2A3 329719
CD279 (PD-1) hu EH12.2H7 329941
Table 1. Purified MaxPar® Ready Antibodies

Customer Service: 858-768-5800
72
Specificity Reactivity Clone Cat. No.
CD303 hu 201A 354215
CD326 (Ep-CAM) ms G8.8 118223
CD326 (Ep-CAM) hu 9C4 324229
CD335 ms 29A1.4 137625
CD366 (Tim-3) hu F38-2E2 345019
F4/80 ms BM8 123143
FcεRIα ms MAR-1 134321
Fluorescein (FITC) FIT-22 408305
GM-CSF hu BVD2-21C11 502315
Histone H3 pSer28 hu HTA28 641007
HLA-DR hu L243 307651
I-A/I-E ms M5/114.15.2 107637
IFN-γ ms XMG1.2 505843
IFN-γ hu B27 506521
Ig light chain k hu MHK-49 316527
Ig light chain λ hu MHL-38 316619
IgD ms 11-26c.2a 405737
IgD hu IA6-2 348235
IgM ms RMM-1 406527
IgM hu MHM-88 314527
IL-2 ms JES6-5H4 503835
IL-2 hu MQ1-17H12 500339
IL-4 ms 11B11 504129
Specificity Reactivity Clone Cat. No.
IL-4 hu MP4-25D2 500829
IL-5 ms, hu TRFK5 504309
IL-6 ms MP5-20F3 504509
IL-6 hu MQ2-13A5 501115
IL-10 ms JES5-16E3 505029
IL-10 hu JES3-9D7 501423
IL-17A ms TC11-18H10.1 506935
IL-17A hu BL168 512331
IL-21 hu 3A3-N2 513009
Ki-67 hu Ki-67 350523
Ly-6A/E (Sca-1) ms D7 108135
Ly-6C ms HK1.4 128039
Ly-6G ms 1A8 127637
Ly-6G/Ly-6C (Gr-1) ms RB6-8C5 108449
NK-1.1 ms PK136 108743
Notch 3 hu MHN3-21 345407
PD-1 (CD279) ms RMP1-30 109113
Phycoerythrin (PE) PE001 408105
T-bet ms, hu 4B10 644825
TCR-β chain ms H57-597 109235
TER-119 ms TER-119 116241
TNF-α ms MP6-XT22 506335
TNF-α hu MAb11 502941
Purified MaxPar® Ready Antibodies (Continued)

biolegend.com
73
Imaging the Immune System
Imaging the Immune System

Customer Service: 858-768-5800
74
Imaging the Immune SystemImaging applications in immunology give spatial information, from receptors clustered at the cell surface to proteins localized within subcellular compartments, each with a particular function or indication of cellular health in a single cell culture or an intricately connected network of cells comprising a tissue. BioLegend has both antibodies and chemical non-antibody probes to suit many interesting biological questions that are well suited for the unique microscopes available to researchers.
Widefield vs. Confocal Microscopy Widefield microscopy is the most common and accessible imaging platform. Historically, widefield microscopes relied on a mercury arc lamp as the primary excitation source, and excitation and emission filters to choose specific wavelengths of light to be matched to the reagent combination. It is becoming increasingly common to now also have white light excitation sources like a Tungsten-Halogen bulb that more evenly covers the entire usable spectrum rather than the principal lines of excitation common to mercury and metal halide sources. There are many modifications that can be made to a widefield scope that may increase sensitivity or resolution, or enable a particular advanced imaging modality. Widefield scopes rely on a diverse combination of excitation, emission filters and dichroic mirrors. You should optimize these for the reagents desired.
In contrast, confocal microscopy does not employ barrier filters. Confocality is a technique to focus a laser beam on a particular point of a focal plane aimed at reducing background excitation and scattered light while increasing optical resolution. Lasers are focused light at a particular wavelength and thus, reagents are chosen based on this. The width of the emitted light allowed to hit the PMT (photomultiplier tube) can often be “tuned” digitally, based on what is ideal for that particular spectral fingerprint. The use of lasers for illumination is both a strength and weakness, since the strength of the laser output can photobleach a fluorescent molecule quite quickly. Employing antifade is imperative to retaining signal for practical imaging applications. However, the strength of confocal is the ability to focus that small beam of light to only a small area within the x, y, and z axes of the sample, thus also allowing for 3-D reconstruction of a tissue sample.
Figure 1. Excitation source spectra courtesy of Zeiss.
Chromogenic vs. Fluorescent Imaging Methods Chromogenic detection methods are advantageous because a signal can be amplified simply by extending the amount of time and substrate in the reaction. Also, it does not require sophisticated instruments for detection, only a microscope with phase contrast. Horseradish peroxidase (HRP) detection can, however, be accompanied by endogenous background associated with cellular peroxidase activity, non-specific signal, and is only typically used to image a single marker at a time.
Fluorescent detection, on the other hand, allows visualization of multiple markers at a time, albeit most commonly through the use of discrete excitation sources optimal for each fluorophore. Fluorescent detection introduces the opportunity for advanced imaging applications as well, like live-cell imaging, multiphoton imaging, super-resolution microscopy, FLIM and FRET, just to name a few. Each of these techniques has their own additional advantages over standard widefield microscopy platforms. Sensitivity can be a limitation of fluorescence microscopy at certain wavelengths, especially reagents that emit in the range of 350-450 nm. However, the intensity of emission can be modulated through varying enzymatic and immunologic amplification techniques, the use of higher sensitivity instrumentation, and near-infrared emitting fluorophores that can be used to escape the range most affected by autofluorescence.
Figure 2. Staining of CX3CR1 (8E10.D9) on formalin fixed paraffin embedded human brain.

biolegend.com
75
Reagents for Chromogenic IHCChromogenic detection methods have a long history in histology and pathology applications. There are chromogenic stains like H&E (hematoxylin and eosin), where the basophilic hemalum stains nuclei blue, and the acidophilic eosin stains primarily the cytoplasm of cells or red blood cells in the tissue varying degrees of pink to red. Also commonly used in chromogenic IHC (immunohistochemistry) are antibodies or streptavidin covalently attached with HRP or Alkaline phosphatase, that convert a substrate like DAB or BCIP/NBT, respectively. These enzymes catalyze their substrates, leaving a deposit of color where the antibody has attached to the cell or tissue.
BioLegend offers reagents for HRP detection, including:
• ACUITYAdvanced Biotin Free Polymer Detection kits
• Ultra-Streptavidin (USA) HRP Detection Kits
• Retrieve-All Antigen Unmasking System
A full list of our IHC detection reagents can be seen at: biolegend.com/ihc_detection_reagents
Figure 5. Paraffin embedded human prostate tissue was stained with anti-CD44 Alexa Fluor® 594 (red), purified anti-human CD107b (HB4) antibody followed by anti-mouse IgG Alexa Fluor® 488 secondary antibody (green) and DAPI (blue).
Secondary ReagentsAmplification is often required in imaging applications. One way to increase the likelihood of success when imaging a target is to amplify the primary intended signal without raising the background signal. In addition, amplifying a signal can also decrease the amount of exposure time, limiting the spillover of other fluors into your channel of interest. For these purposes, we provide many Alexa Fluor® and DyLight™ dye conjugated secondary reagents.
See our secondary reagents: biolegend.com/lg-second-step-1610
Figure 4. Mouse spleen section stained with anti-B220 BV510™ (green), anti-CD3 BV421™ (red), anti-F4/80 Alexa Fluor® 488 (purple), and anti-CD169 Alexa Fluor® 647 (yellow) antibodies. Image obtained with a Zeiss LSM 780 confocal microscope with spectral unmixing applied.
Zeiss LSM 780 (confocal)
Figure 3. Mouse spleen section stained with anti-B220 BV510™ (green), anti-CD3 BV421™ (blue), anti-F4/80 Alexa Fluor® 488 (purple), and anti-CD169 Alexa Fluor® 647 (red) antibodies. Image obtained with an Olympus IX73 inverted microscope and optimized filter sets.
Olympus IX83 (widefield)
Multicolor Microscopy

Customer Service: 858-768-5800
76
Nucleic Acid StainsPermeant and impermeant nucleic acid stains are an excellent tool for visualizing the location and number of cells in a sample and providing spatial context for the antigens of interest. In a live-cell imaging application, an impermeant nucleic acid stain like Helix NP™ Blue, Green or NIR can be paired with a permeant nucleic acid stain like DAPI, CytoPhase™ Violet or DRAQ5™ to assess the live to dead cell ratio.
• DRAQ5™ (Cat. No. 424101)• DRAQ7™ (Cat. No. 424001)• DAPI (Cat. No. 422801)• Helix NP™ NIR (Cat. No. 425301)• Helix NP™ Green (Cat. No. 425303)• Helix NP™ Blue (Cat. No. 425305)• CytoPhase™ Violet (Cat. No. 425701)• Propidium Iodide (Cat. No. 421301)Learn more at: biolegend.com/cell_health_proliferation
Mitochondrial Localization ProbesFluorogenic chemical reagents that are attracted to the polarization of the mitochondrial membrane make ideal probes for imaging the mitochondrial localization in microscopy and assessing cellular health based on mitochondrial respiration in flow cytometry. Initially, the cells must be live while labeling, getting excellent signal at low concentrations. However, MitoSpy™ probes containing a chloromethyl group (CM), like MitoSpy™ Orange CMTMRos and MitoSpy™ Red CMXRos, can be retained with an aldehyde-based fixative when incubated at higher concentrations of the probe in order to be combined with intracellular antibody detection. MitoSpy™ Green FM is mitochondrial potential independent and is useful for mitochondrial localization in live cells and has also been indicated for use in mitochondrial mass assessment in flow cytometry. If the sample will be fixed right away, like a tissue slice, it’s better to use antibodies against mitochondrial localized proteins like HSP60 and Cytochrome C.
• MitoSpy™ Green FM (Cat. No. 424805 | 424806)• MitoSpy™ Orange CMTMRos (Cat. No. 424803 | 424804)• MitoSpy™ Red CMXRos (Cat. No. 424801 | 424802)• Anti-Cytochrome C conjugated to Alexa Fluor® 488, Alexa Fluor®
594, Alexa Fluor® 647 and Biotin.• Anti-HSP60 purified (Cat. No. 681502)• Anti-VDAC1 purified (Cat. No. 820701)To learn more about MitoSpy: biolegend.com/mitospy
Figure 7. HeLa cells stained with MitoSpy™ Orange (yellow), fixed and permeabilized with 4% PFA and 0.1% Triton X-100 and stained with Cytochrome C Alexa Fluor® 647 (red) and DAPI (blue).
Figure 8. HeLa cells were stained with CD171 Alexa Fluor® 594 (red), Flash Phalloidin NIR™ 647 (green) and DAPI (blue).
Flash Phalloidin™ NIR 647, Red 594 and Green 488 Phalloidin is a bicyclic peptide found in death cap mushrooms that binds very tightly to F-actin, preventing its depolymerization in living cells. In cellular imaging, fluorescently conjugated phalloidins are useful for imaging the fine filaments of actin, providing structural and volumetric context to the cell.
• Flash Phalloidin™ Green 488 (Cat. No. 424201)• Flash Phalloidin™ Red 594 (Cat. No. 424203)• Flash Phalloidin™ NIR 647 (Cat. No. 424205)
Figure 6. HeLa cells were stained with anti-cytokeratin (pan reactive) Alexa Fluor® 647 (red), Helix NP™ Green (green) and Flash Phalloidin™ Red 594 (blue).

biolegend.com
77
Tips and Tricks for the Best ImagesGenerating the best image involves many factors, all dependent on what is ideal for imaging the marker of interest in its biological context. Here are some questions to ask yourself when choosing the right reagents and instruments.
1. Number of Targets
It’s possible to do a 4 color imaging experiment with relative ease in both confocal and widefield microscopy. With information about the spectrum of each fluorophore, you can make choices about optimal filter selection to minimize spectral spillover resulting from fluorophores with overlapping excitation and emission spectra. Above 5 colors, a microscope employing spectral detection becomes useful to unmix the spectral spillover.
Also, if using antibodies for detection, problems can arise with the species-dependence of the primary and secondary antibody combination. Ideally, the use of directly labeled antibodies or haptens like biotin/streptavidin can help.
2. Fluorophore Combinations with Overlapping Spectra
In instances where fluorophores are excited by other wavelengths and have some spillover of their emission into a neighboring filter, the spillover is usually suboptimal strength and results in a weak haze of background. However, one tip when using fluors where one spills into the other is to make sure the two antibodies are not imaged on markers that co-localize. For example, image one on a marker in the nucleus and the other at the cell surface, when possible. Also, make sure the fluorophore that is spilling over into the neighbor filter is on the less abundant antigen.
3. GFP or a Fluorescent Protein Variant
Fluorescent proteins do not survive exposure to methanol or acetone. If the GFP signal was present prior to fixation but signal is lost upon fixation, check to see if the paraformaldehyde was reconstituted with the help of methanol. If the fixative can’t be changed to be organic solvent-free, anti-GFP antibodies can be employed to recover the GFP signal.
4. Instrument Choice
The instrument is made to be an ideal tool for the biological question, not the reverse. The better you understand the goal of the image, the better you can match the application to the instrument.
Do I want to image tissue thicker than 10 µm?
→ Confocal or Multiphoton Microscopy
Do I want to image more than 4 colors on a cell sample?
→ Spectral Unmixing
Do I want to reconstruct the sample in 3D? → Confocal or ApoTome
What level of resolution is desired/required?
→ Deconvolution, Structured Illumination, STED or PALM
Do I want to demonstrate colocalization/binding or bioactivity in live cells?
→ FRET or FLIM
5. Sensitivity
Ultimately, once your biological application is matched to the right microscope and imaging condition, the reagents are the last variable in ensuring high sensitivity. Sensitivity is a balance between the signal strength and non-specific staining/autofluorescence/background. There is not much we can do about the biological autofluorescence endogenous in certain tissues, like brain, liver, lung, etc. However, employing an appropriately complex blocking step, for example serum instead of BSA or milk, prior to adding antibodies can ensure a minimal amount of non-specific binding. If streptavidin is used and the tissue will be fixed and permeabilized, an endogenous biotin-blocking kit can prevent the biotin found naturally in mitochondria from binding the streptavidin. However, these are application-specific blocking requirements.
The use of directly conjugated primary antibodies may not exhibit the same signal strength as the use of secondary antibodies, but they are associated with less background staining. Often, antigens you want to detect are not abundant enough for detection with conjugated primary antibodies. In that event, you need to employ secondary antibodies or other amplification methods. Another option is to use biotin and streptavidin or other hapten-based amplification methods. If these methods fail, the last resort is to use enzymatic amplification kits like tyramide signal amplification (TSA) kits. The more antibodies or enzymes employed in amplifying the signal, the higher the residual background will be as well. It’s a fine balance between signal amplification and background reduction.
6. Antifade
Finally, mounting media containing antifade is required for the maintenance of signal strength. All organic fluorophores photobleach, a process where reactive oxygen species created in the process of imaging attack the structure of the fluorophores, irreversibly neutralizing their ability to fluoresce. Using antifade is more difficult when the cells are imaged live, since any antifade scavenges oxygen from the media, thus suffocating the cells. This is why regenerating signal, like proteins expressing GFP, are desirable for long-term, live-cell imaging.

Customer Service: 858-768-5800
78
Neurodegeneration PosterThis poster provides a general overview of common cellular pathways that are altered in neurodegenerative disorders with protein misfolding and aggregation as a central hallmark of disease pathology. Aberrant protein homeostasis as a result of impairments in the Ubiquitin Proteasome System or failure in autophagy-mediated protein clearance leads to accumulation and aggregation of misfolded proteins. Conversely, misfolded proteins may interfere with or disrupt the function of the cellular clearance machinery leading to their abnormal intracellular levels, favoring the formation/accumulation of toxic oligomeric and fibrillar species, and deposition into what eventually become larger toxic aggregates. Mitochondrial dysfunction leading to alterations in mitochondrial dynamics, redox imbalance and the production of reactive oxygen species is another key contributing factor to the development of disease. Oxidative stress-induced neurodegeneration is likely acting as a nexus between aberrant protein clearance and mitochondrial function. Persistent neurotoxic insults lead to excessive inflammatory responses with potential to damage and destroy neurons.

79
biolegend.com

Customer Service: 858-768-5800
80
Neuroinflammation
Neuroinflammation

biolegend.com
81
NeuroinflammationNeuroinflammation refers to the inflammation of the nervous tissue and is often initiated as a response to a variety of insults, such as traumatic brain injury or infections. Neuroinflammation is a common component of many neurodegenerative disorders, including Alzheimer’s (AD) and Parkinson’s (PD) diseases. Production of toxic protein aggregates and/or metabolites in these disorders is often associated with chronic inflammation and sustained activation of resident brain immune cells. This inflammatory response ultimately leads to the production of inflammatory molecules, recruitment of peripheral immune cells, disruption of the blood-brain barrier (BBB) and amplification of the immune response. Glial cells, which include microglia, oligodendrocytes, and astrocytes, are essential mediators of neuroinflammation in the central nervous system (CNS).
MicrogliaMicroglia cells are known as the resident macrophages in the CNS. They account for 10-15% of all cells found within the brain. Microglia actively survey their domain to perform housekeeping functions such as cleaning up cellular debris. These cells are very plastic and can undergo structural and morphological changes to meet the needs of their environment. Under normal conditions, microglia are found in a ramified state where they have long branching processes and a small cell body. These branches are highly sensitive to physiological alterations in their surroundings such as foreign material and damaged or dying cells. Therefore, using their processes, microglia are able to search and identify immune threats and maintain homeostasis in the CNS. Microglia can rapidly transform into a reactive form under unhealthy conditions and respond to the injury or threat by undergoing key morphological changes. In this state, they thicken and retract their processes, take on an amoeboid shape and become phagocytic. These morphological changes are also accompanied by secretion of inflammatory molecules such as cytokines and chemokines which help microglia communicate with astrocytes and peripheral immune cells.
Microglia can play a dual role in neuroinflammation, depending on the nature and duration of the insult. Acute neurotoxic insults trigger the production of anti-inflammatory factors that will eventually lead to the removal of the insult, cellular repair and regeneration, and resolution of inflammation. On the other hand, chronic neurotoxic insults, often associated with neurodegenerative disorders, lead to persistent inflammatory responses that would culminate in a variety of responses, such as aberrant synaptic pruning, axonal demyelination and degeneration, and eventual loss of neurons.
Figure 1. Schematic representation of neurons and glial cell in the brain.
Figure 2. Immunofluorescent staining of purified anti‐P2RY12 antibody (clone S16007D) on PFA-fixed frozen mouse brain tissue.

Customer Service: 858-768-5800
82
AstrocytesAstrocytes are the most abundant glial cell type in the brain, accounting for 20 to 40% of all glial cells. Astrocytes are commonly known as possessing a star-shaped morphology with fine, elaborate processes. These cells perform many functions, such as providing metabolic support for neurons (e.g., produce and secrete glutamine and lactate), as well as rapidly removing excess neurotransmitter (e.g., glutamate) released into the synaptic cleft to protect neurons against neurotoxicity. In addition, astrocytes help in the maintenance of the BBB integrity and permeability by projecting astrocytic endfeet to encircle and cover endothelial cells of the blood vessel.
Similar to microglia, depending on the context and duration of the insult, astrocytes can exacerbate the inflammatory reactions and mediate tissue damage or dampen the immune reaction and promote tissue repair. They do so by secreting a variety of bioactive molecules, such as cytokines and chemokines. Furthermore, the function of astrocytes in the maintenance of the BBB has significant implications during inflammation, as dysfunction of astrocytes may lead to BBB disruption and favor the infiltration of peripheral immune cells and molecules into the CNS.
OligodendrocytesOligodendrocytes (ODs) are a type of glial cell with many functions in the CNS. These cells contribute to neuroplasticity and provide trophic support to neurons by producing factors such as glial cell-line derived neurotrophic factor (GDNF). One of the predominant functions of ODs is to produce myelin sheaths to insulate segments of neuronal axons. The myelin sheath enables high velocity signal transduction and is essential for the propagation of action potentials along the axon. Each OD can extend its processes to multiple axons and has a great capacity to rapidly renew its myelin sheaths. As a result, ODs have a high metabolic rate and are highly vulnerable to oxidative stress. The latter is also partly due to relatively low levels of anti-oxidative enzymes in ODs.
As mentioned earlier, microglia produce various pro-inflammatory mediators. These molecules can induce bystander damage to their neighboring glial cells and neurons. As a consequence of their high metabolic activity, oligodendrocytes are more susceptible to these factors and respond by producing poor quality myelin, which may ultimately lead to the loss of OD-neuron connections and axon degeneration. Damaged ODs can also initiate pathways of cell death, which can further activate microglia and amplify the inflammatory cascade.
Figure 3. IHC staining of anti-GFAP antibody (clone SMI 24) on on formalin fixed, paraffin embedded (FFPE) rat brain tissue.
Figure 4. IHC staining of anti-Myelin Basic Protein antibody (clone SMI 94) on FFPE human cerebellum.

biolegend.com
83
Figure 5. Common markers used to identify glial cells and neurons.
Complement System (CS) Activation in Alzheimer’s DiseaseSynapse loss is a common feature of Alzheimer’s disease (AD) and often correlates with cognitive dysfunction and decline. Recent studies suggest deregulation of the complement cascade, which plays an essential role in innate and adaptive immune response, as a contributing factor leading to chronic inflammation and neurodegeneration observed in AD. Supporting evidence demonstrates localization of a full range of complement proteins, from C1q to C5b-9 (membrane attack complex), with amyloid deposits as a prominent feature of AD lesions (1). Notably, mRNA levels of complement components are upregulated in the affected brain regions of AD patients (2). Research has shown that amyloid-beta (Aβ) aggregates can initiate antibody-independent complement activation by binding to C1q and C3b (1). Furthermore, Aβ deposits are frequently surrounded by reactive microglia and astrocytes, which are capable of producing complement proteins as well as phagocytosing and degrading Aβ (3). These inflammatory responses appear to initially play a protective role by removing Aβ deposits. However, the continuous generation of Aβ aggregates leads to persistent complement activation and sustained inflammation that is detrimental to neuron health in the brain.
Synapse Loss
Healthy Brain Early Stage AD
C1q
C1q
CR3CR3
CR3
CR3
C3
C3
C3C3
Late Stage AD
Microglial processessurvey synapses
Microgliosis and neuronaldegeneration
Engulfment of synaptic elements
Aβ oligomers
Figure 6. Schematic representation of synapse loss and neuron degeneration in AD caused by interactions between Aβ, components of the complement system and microglia. In early stages of AD, continuous production of Aβ oligomers leads to complement activation (C1q and C3), engulfment and elimination of synapses by microglia. Aberrant activation of complement and microglia coupled to excessive synapse loss are contributing factors that ultimately lead to neuron degeneration in later stages of AD.

Customer Service: 858-768-5800
84
Demyelination in Multiple Sclerosis (MS)Oligodendrocytes play a central role in the pathogenesis of a variety of disorders, including multiple sclerosis. MS is an inflammatory disease that is caused by the destruction of myelin sheaths and demyelination of axons. Evidence suggests that infiltration of myelin-specific CD4+ T cells into the CNS initiates a cascade that leads to degeneration and death of myelin-producing ODs, resulting in demyelination, neuronal axon damage, and degeneration (4). Secretion of a variety of cytokines and chemokines by astrocytes may modulate the recruitment and infiltration of peripheral immune cells, including CD4+ T cells promoting degeneration of ODs. Furthermore, loss of astrocytic endfeet encircling blood vessels contributes to lesion development and BBB disruption, a hallmark of MS progression (4). Studies have also described a role for astrocytes as inhibitors of myelination. Oligodendrocytes are derived from OD progenitor cells (OPCs), which have the capacity to continually proliferate, migrate and differentiate into myelin-producing ODs in the healthy brain. Under disease conditions such as in MS, OPCs lose their ability to respond to myelin damage and fail to re-myelinate axons. Astrocyte-derived factors such as endothelin-1 have been shown to play a crucial role in the inhibition of OPC recruitment and differentiation after OD injury (4).
Neuron Degenerationin MS
Neuron a�ected by MS
DemyelinationOligodendrocyte
Myelin Sheath
Damage to myelin
Figure 7. Neuron demyelination and axon degeneration are events associated with multiple sclerosis.

biolegend.com
85
Abnormal LLRK2 activity orLLRK2 mutations
Rami�ed Microglia
Pro-in�ammatory
Reactive Microglia
Figure 8. Abnormal LRRK2 activity affects microglia function by inducing pro-inflammatory phenotype in these cells, exacerbating the inflammatory responses, and ultimately leading to neuronal loss observed in PD.
Microglia-mediated Neuroinflammation in Parkinson’s DiseaseNeuroinflammation is a prominent feature of Parkinson’s disease (PD) and can contribute to disease progression through loss of dopaminergic (DA) neurons in the substantia nigra (SN) of the brain. Elevated levels of pro-inflammatory cytokines and extensive proliferation of reactive microglia around dopaminergic neurons have been detected in the SN area of post-mortem brains from PD patients (5). Notably, microglia are enriched in SN compared to other regions of the brain. These findings, coupled to reduced antioxidant capacity and enhanced sensitivity of neurons to pro-inflammatory molecules, support a role for microglia-mediated DA degeneration in PD.
The leucine-rich repeat kinase 2 (LRRK2) protein may act as a mediator of inflammation through cytokine signaling and microglia-mediated pro-inflammatory responses. Mutations in the LRRK2 gene are the most common cause of familial PD. LRRK2 is a multi-functional protein with ubiquitous expression; its mRNA and protein levels are highly expressed in immune cells, as well as glial cells and neurons (5). However, recent findings indicate the presence of LRRK2 splice variants in the brain, with neurons and astrocytes expressing a different variant than microglia, suggesting a differential function for this protein in various cell types (6). In line with these observations, lipopolysaccharide (LPS)-induced inflammation in mice was associated with upregulation of LRRK2 protein expression and activity in microglia (7). Furthermore, down-regulation of microglial LRRK2 protein expression attenuated LPS-induced inflammatory responses through pro-inflammatory cytokine signaling. Interestingly, gene expression profiling of microglia from mice that over-express LRRK2 R1441G, a disease-associated mutation, revealed an expression profile corresponding to reactive and pro-inflammatory phenotype under normal, unstimulated condition (5). These findings combined indicate a role for LRRK2 in cellular pathways that induce inflammation, and that LRRK2 dysfunction may exacerbate microglial pro-inflammatory responses that would ultimately lead to neurodegeneration. References1. Shen Y, et al. 2013. Transl Neurodegener. 2: 21.2. Ysojima K, et al. 1999. Am J Pathol. 154(3): 927.3. Serrano-Pozo A, et al. 2011. Cold Spring Harb Perspect Med.1(1): a006189.4. Domingues SH, et al. 2016. Front Cell Dev Biol.4:71.5. Russo I, et al. 2014. J. Neuroinflammation. 11:52.6. Giesert F, et al. 2013. PLosD One. 8(5): e63778.7. Moehle MS, et al. 2012. J. Neurosci. 32(5):1602.
Learn more at: biolegend.com/neuroscience

Customer Service: 858-768-5800
86
Neuroinflammation PosterThis poster covers different aspects of brain inflammation in response to neurotoxic insults. Neuroinflammation is a common feature of many diseases of the central nervous system (CNS), including neurodegenerative disorders. A combination of responses from neurons, microglia, astrocytes and peripheral immune cells, along with cytokines, chemokines and complement system constitute the basis for neuroinflammation. Chronic neurotoxic insults often lead to persistent pro-inflammatory responses such as over-activation of the complement system and result in aberrant synaptic pruning, axonal demyelination and degeneration. Acute neurotoxic insults, on the other hand, can trigger the production of anti-inflammatory factors such as cytokines and chemokines by the microglia, astrocytes and peripheral immune cells. These factors lead to the removal of neurotoxic insults, cellular repair and regeneration, and resolution of inflammation. A balance between pro- and anti-inflammatory responses determines whether the integrity of the blood brain barrier is maintained or disrupted, hence limiting the infiltration of peripheral immune cells into the brain, which in turn can dampen or amplify the inflammatory signals, leading to cell death or resolution of inflammation.
Blood-Brain Barrier
Neural Stem Cells
Neural Stem Cells
Complement Proteins
InjurySite Injury
SiteInduce In�ammation &Immune Cell RecruitmentIL-8, MCP-1, IL-6, IL-1β, RANTES
MCP-1, RANTES, IL-6, IL-17A, IL-17F, IFN-α
Protein Aggregates Acute Brain InjuryGenetic Risk Factors Aging Pathogens
IL-10, TGF-β,IL-4, IL-13
Axonal Remodeling Neural RepairNeurotrophic Factor Release
Debris Clearance Via Phagocytosis
Misfolded/AggregatedProteins, Cell Debris
Migration towards lesionNeurogenesis Neuronal Replacement
MMP-9, TNF-α, MCP-1, IL-1β, IL-8
Pro-apoptotic CytokinesIFN-γ, TNF-α
IFN-γ, TNF-α
IFN-γ,TNF-α
MMP-2, MMP-9, ROS
IL-8, MCP-1, MIP1α & β, RANTES
IL-6, TNF-α, IL-1β
PericyteEndothelial Cells
AngiogenesisNeovascularizationECM ReconstructionSDF1, VEGF,MCP-1, IGF1, FGF2
SDF1, VEGF,MCP-1, IGF1, FGF2
Reactive Astrocyte
Reactive Astrocyte
Astrocyte
Reactive Astrocyte
Reactive AstrocyteReactive
Astrocyte
Reactive Astrocyte
Astrocyte/Glial Scar
Arg1: ECM Reconstruction & Tissue Repair
AstrocyteNeuron
Neuron Neuron
Complement Sheddingand Activation
Diseased Neuron
Protein Aggregate
Complement Binding
Complement Binding
AutoantibodyBinding
Microglia & AstrocyteActivation
ComplementExpression & Secretion
Neuron
Autoantibodies
Circulating Autoantibody
Circulating Autoantibody
Cytotoxic Cytokines
Complement
Chemotaxis,Phagocytosis, Cell Lysis
Microglia
Pro-in�ammatory Anti-in�ammatory
Rami�ed State
T Cell T Cell
T Cell
Cytokines,Chemokines
T Cell
Invading Pathogens
B Cell
B Cell
B Cell B Cell MonocyteMonocyte
Monocyte
Monocyte
Monocyte
Synapse
CRCR
CR
C1q
C3b
C3
Protein X
MCP-1, IL-6, TNF-α, IL-1β, IL-17A, IL-17F
Oligodendrocytes
Neurotrophic Support
Anti-in�ammatoryCytokines
Cytokines
Reactive Microglia
Reactive Microglia
Reactive Microglia
Reactive Microglia
Reactive Microglia
Reactive Microglia
Reactive Microglia
Reactive Microglia
Reactive Microglia
Reactive Microglia
Reactive Microglia
Oxidative StressOxidative Stress
ApoptosisApoptosis
Suppression of NeurogenesisSuppression of Neurogenesis
BBB Disruption Immune Cell In�ltrationBBB Disruption Immune Cell In�ltration
Activated T CellActivated T Cell
Neuron DeathNeuron Death
Neuron DeathNeuron Death
04-0079-00
©BioLegend, Inc. 2016
Neuroin�ammation
biolegend.com
DAMPs(Damage-associated Molecular Patterns) (Damage-associated Molecular Patterns) DAMPs(Damage-associated Molecular Patterns) PAMPs(Pathogen-associated Molecular Patterns) (Pathogen-associated Molecular Patterns) PAMPs(Pathogen-associated Molecular Patterns)
T Cell ResponsesT Cell Responses
T Cell ResponsesT Cell Responses
Astrocyte ProliferationAstrocyte Proliferation
Neuron SurvivalNeuron Survival
Pro-in�ammatory Anti-in�ammatory
Contact BioLegendUS & Canada Toll-Free: 1.877.246.5343 (877-BIOLEGEND)International: 1.858.768.5800Fax: 1.877.455.9587email: [email protected], [email protected]
US Headquarters:San Diego, CA 92121Interactive Poster: biolegend.com/neuroin�ammation
We would like to thank Prof. Dr. Michael Schlossmacher of the University of Ottawa, Canada for his contributions to this poster.

87
biolegend.com
Blood-Brain Barrier
Neural Stem Cells
Neural Stem Cells
Complement Proteins
InjurySite Injury
SiteInduce In�ammation &Immune Cell RecruitmentIL-8, MCP-1, IL-6, IL-1β, RANTES
MCP-1, RANTES, IL-6, IL-17A, IL-17F, IFN-α
Protein Aggregates Acute Brain InjuryGenetic Risk Factors Aging Pathogens
IL-10, TGF-β,IL-4, IL-13
Axonal Remodeling Neural RepairNeurotrophic Factor Release
Debris Clearance Via Phagocytosis
Misfolded/AggregatedProteins, Cell Debris
Migration towards lesionNeurogenesis Neuronal Replacement
MMP-9, TNF-α, MCP-1, IL-1β, IL-8
Pro-apoptotic CytokinesIFN-γ, TNF-α
IFN-γ, TNF-α
IFN-γ,TNF-α
MMP-2, MMP-9, ROS
IL-8, MCP-1, MIP1α & β, RANTES
IL-6, TNF-α, IL-1β
PericyteEndothelial Cells
AngiogenesisNeovascularizationECM ReconstructionSDF1, VEGF,MCP-1, IGF1, FGF2
SDF1, VEGF,MCP-1, IGF1, FGF2
Reactive Astrocyte
Reactive Astrocyte
Astrocyte
Reactive Astrocyte
Reactive AstrocyteReactive
Astrocyte
Reactive Astrocyte
Astrocyte/Glial Scar
Arg1: ECM Reconstruction & Tissue Repair
AstrocyteNeuron
Neuron Neuron
Complement Sheddingand Activation
Diseased Neuron
Protein Aggregate
Complement Binding
Complement Binding
AutoantibodyBinding
Microglia & AstrocyteActivation
ComplementExpression & Secretion
Neuron
Autoantibodies
Circulating Autoantibody
Circulating Autoantibody
Cytotoxic Cytokines
Complement
Chemotaxis,Phagocytosis, Cell Lysis
Microglia
Pro-in�ammatory Anti-in�ammatory
Rami�ed State
T Cell T Cell
T Cell
Cytokines,Chemokines
T Cell
Invading Pathogens
B Cell
B Cell
B Cell B Cell MonocyteMonocyte
Monocyte
Monocyte
Monocyte
Synapse
CRCR
CR
C1q
C3b
C3
Protein X
MCP-1, IL-6, TNF-α, IL-1β, IL-17A, IL-17F
Oligodendrocytes
Neurotrophic Support
Anti-in�ammatoryCytokines
Cytokines
Reactive Microglia
Reactive Microglia
Reactive Microglia
Reactive Microglia
Reactive Microglia
Reactive Microglia
Reactive Microglia
Reactive Microglia
Reactive Microglia
Reactive Microglia
Reactive Microglia
Oxidative StressOxidative Stress
ApoptosisApoptosis
Suppression of NeurogenesisSuppression of Neurogenesis
BBB Disruption Immune Cell In�ltrationBBB Disruption Immune Cell In�ltration
Activated T CellActivated T Cell
Neuron DeathNeuron Death
Neuron DeathNeuron Death
04-0079-00
©BioLegend, Inc. 2016
Neuroin�ammation
biolegend.com
DAMPs(Damage-associated Molecular Patterns) (Damage-associated Molecular Patterns) DAMPs(Damage-associated Molecular Patterns) PAMPs(Pathogen-associated Molecular Patterns) (Pathogen-associated Molecular Patterns) PAMPs(Pathogen-associated Molecular Patterns)
T Cell ResponsesT Cell Responses
T Cell ResponsesT Cell Responses
Astrocyte ProliferationAstrocyte Proliferation
Neuron SurvivalNeuron Survival
Pro-in�ammatory Anti-in�ammatory
Contact BioLegendUS & Canada Toll-Free: 1.877.246.5343 (877-BIOLEGEND)International: 1.858.768.5800Fax: 1.877.455.9587email: [email protected], [email protected]
US Headquarters:San Diego, CA 92121Interactive Poster: biolegend.com/neuroin�ammation
We would like to thank Prof. Dr. Michael Schlossmacher of the University of Ottawa, Canada for his contributions to this poster.

Customer Service: 858-768-5800
88
Web Tools
Web Tools

biolegend.com
89
Web ToolsBioLegend is dedicated to providing useful web resources to make your research easier, more efficient, and more reproducible. Our Web Tools page provides an extensive set of useful tools covering a selection of applications such as flow cytometry, western blotting, ELISA, and microscopy. We also have an array of searchable libraries that aggregate useful information, such as our Publication Library, Product Reviews Library, Video Library, and much more. For those who need mobile information, we provide over 15 apps for iPhone and Android phones.
Find all of our web tools at: biolegend.com/webtoolstab.
Also find our extensive selection of Technical Protocols at: biolegend.com/technical_protocols.
Our technical team is always willing find the answers you need, so don’t hesitate to contact us at: [email protected].
Featured Web ToolsFluorescence Spectra Analyzer, biolegend.com/spectraanalyzer
BioLegend’s Fluorescence Spectra Analyzer is useful for the analysis of excitation and emission spectra of commonly used fluorophores for flow cytometry. View data for over 90 unique fluorophores and dyes. Custom create your filters and customize the plot colors to your liking.
Multicolor Panel Selector, biolegend.com/panelselector
BioLegend's Multicolor Panel Selector tool is designed to help you find the right products for your multicolor flow cytometry experiments. View the detailed instructions for using the Panel Selector and guidelines for constructing an optimized panel below the Panel Selector.
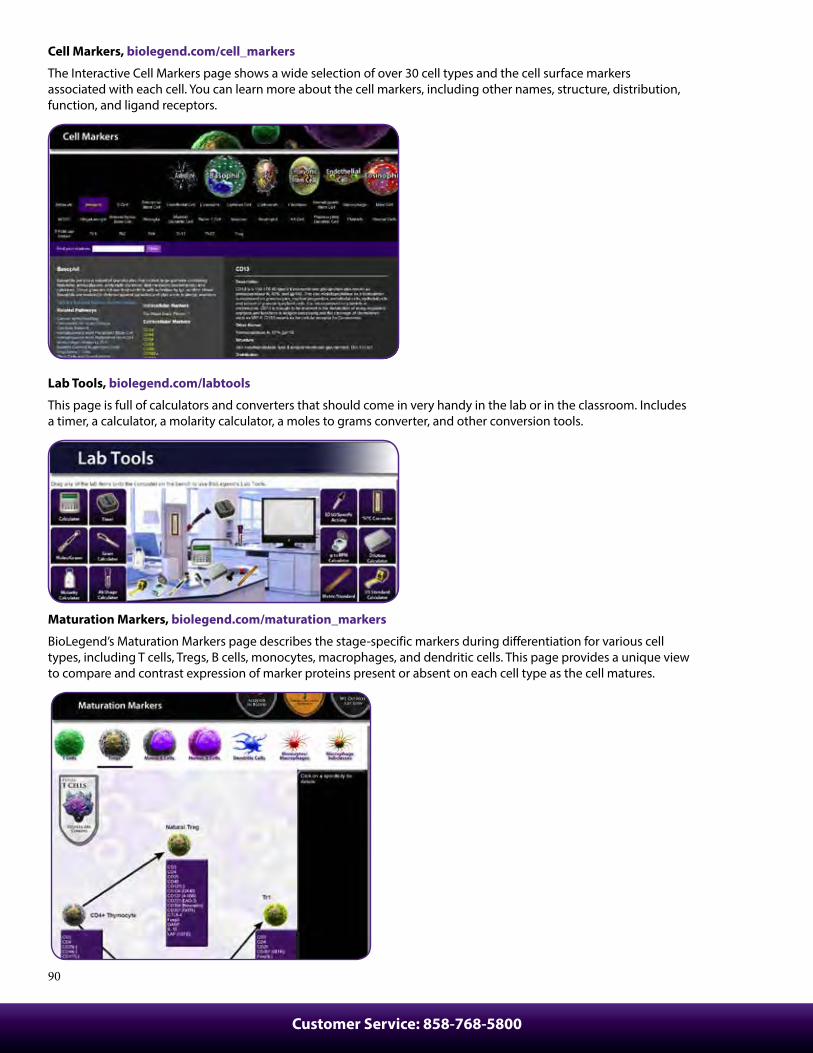
Customer Service: 858-768-5800
90
Cell Markers, biolegend.com/cell_markers
The Interactive Cell Markers page shows a wide selection of over 30 cell types and the cell surface markers associated with each cell. You can learn more about the cell markers, including other names, structure, distribution, function, and ligand receptors.
Lab Tools, biolegend.com/labtools
This page is full of calculators and converters that should come in very handy in the lab or in the classroom. Includes a timer, a calculator, a molarity calculator, a moles to grams converter, and other conversion tools.
Maturation Markers, biolegend.com/maturation_markers
BioLegend’s Maturation Markers page describes the stage-specific markers during differentiation for various cell types, including T cells, Tregs, B cells, monocytes, macrophages, and dendritic cells. This page provides a unique view to compare and contrast expression of marker proteins present or absent on each cell type as the cell matures.

biolegend.com
91
Protocols
Protocols

Customer Service: 858-768-5800
92
Protocols
Cell Surface Immunofluorescence Staining ProtocolReagent List
Cell Staining Buffer (BioLegend Cat. No. 420201)
Red Cell Lysis Buffer (BioLegend Cat. No. 420301)
7-AAD Viability Staining Solution (BioLegend Cat. No. 420403)
TruStain FcX™ (anti-CD16/32, BioLegend Cat. No. 101319)
Human TruStain FcX™ (Fc Receptor Blocking Solution, BioLegend Cat. No. 422301)
Protocol Steps
Harvest Tissue or Cells:
1. Obtain desired tissue (e.g., spleen, lymph node, thymus, bone marrow) and prepare a single cell suspension in Cell Staining Buffer (BioLegend Cat. No. 420201). If using in vitro stimulated cells, simply resuspend previously activated cultures in Cell Staining Buffer and proceed to Step 2.
2. Add Cell Staining Buffer up to ~15 mL and centrifuge at 350 x g for 5 minutes, discard supernatant.
Lyse Red Cells:
3. If necessary (e.g., spleen), dilute 10X Red Blood Cell (RBC) Lysis Buffer (BioLegend Cat. No. 420301) to 1X working concentration with DI water and resuspend pellet in 3 mL 1X RBC Lysis Buffer. Incubate on ice for 5 minutes.
4. Stop cell lysis by adding 10 mL Cell Staining Buffer to the tube. Centrifuge for 5 minutes at 350 x g and discard supernatant.
5. Repeat wash as in step 2.
6. Count viable cells and resuspend in Cell Staining Buffer at 5-10 x 106 cells/mL and distribute 100 µL/tube of cell suspension (5-10 x 105 cells/tube) into 12 x 75 mm plastic tubes.
Block Fc-Receptors:
7. Reagents that block Fc receptors may be useful for reducing nonspecific immunofluorescent staining. In the mouse, TruStain fcX™ (anti-mouse CD16/32) Antibody specific for FcγR III/II (BioLegend Cat. No. 101319, clone 93) can be used to block nonspecific staining of antibodies. In this case, block Fc receptors by pre-incubating cells with 1.0 µg of TruStain fcX™ (anti-mouse CD16/32) Antibody per 106 cells in a 100 µL volume for 5-10 minutes on ice.
8. In humans, cells can be pre-incubated with 5 µL of Human TruStain FcX™ (Fc Receptor Blocking Solution, BioLegend Cat. No. 422301) per 100 µL of cell suspension for 5-10 minutes at room temperature. In the absence of an effective/available blocking antibody, an alternative approach is to pre-block cells with excess irrelevant purified Ig from the same species and same isotype as the antibodies used for immunofluorescent staining.
Note: Mouse TruStain fcX contains antibodies directed against CD16/32 (via the Fab portion of the antibody), while Human TruStain contains specialized human IgG that bind to Fc receptors via the Fc portion of the antibodies. Human TruStain is compatible with flow cytometric staining with anti-human CD16 (clone 3G8), CD32 (clone FUN-2), and CD64 (clone 10.1) antibodies.
Cell-Surface Staining with Antibody:
9. Add appropriately conjugated fluorescent, biotinylated, or purified primary antibodies at predetermined optimum concentrations (e.g., anti-CD3-FITC, anti-CD4-Biotin, and anti-CD8-APC) and incubate on ice for 15-20 minutes in the dark.
10. Wash 2X with at least 2 mL of Cell Staining Buffer by centrifugation at 350 x g for 5 minutes.
11. If using a purified primary antibody, resuspend pellet in residual buffer and add previously determined optimum concentrations of anti-species immunoglobulin fluorochrome conjugated secondary antibody (e.g., FITC anti-mouse Ig) and incubate on ice in the dark for 15-20 minutes.
12. Repeat step 9.
13. Resuspend cell pellet in 0.5 mL of Cell Staining Buffer and add 5 µL (0.25 µg)/million cells of 7-AAD Viability Staining Solution (BioLegend Cat. No. 420403) to exclude dead cells.
Note: BioLegend recommends using the Spectra Analyzer to decide compatibility with other fluors.
14. Incubate on ice for 3-5 minutes in the dark.
15. Analyze with a Flow Cytometer.
Note: If you are unable to immediately read your samples on a cytometer, keep them shielded from light and in a refrigerator set at 4-8°C. The samples should be resuspended in Cell Staining Buffer. Note that samples should not remain in a fixation buffer for extended periods of time as this can affect fluor conformation and fluorescence.
For complete list of Protocols, visit: biolegend.com/technical_protocols

biolegend.com
93
Cell Surface Immunofluorescent Staining of Whole BloodReagent List
Cell Staining Buffer (BioLegend Cat. No. 420201)
Red Cell Lysis Buffer (BioLegend Cat. No. 420301)
7-AAD Viability Staining Solution (BioLegend Cat. No. 420403)
TruStain FcX™ (anti-CD16/32, BioLegend Cat. No. 101319)
Human TruStain FcX™ (Fc Receptor Blocking Solution, BioLegend Cat. No. 422301)
Protocol Steps
Harvest Tissue or Cells:
1. Add predetermined optimum concentrations of desired fluorochrome conjugated, biotinylated, or purified primary antibodies to 100 µL of anti-coagulated whole blood.
2. Incubate at room temperature for 15-20 minutes in the dark.
3. Dilute 10X Red Blood Cell (RBC) Lysis Buffer (BioLegend Cat. No. 420301) to 1X working concentration with DI water. Warm to room temperature prior to use. Add 2 mL of 1X RBC lysis solution to whole blood/antibody mixture. Incubate at room temperature for 10 minutes.
4. Centrifuge at 350 x g for 5 minutes, discard the supernatant.
5. Wash 1X with at least 2 mL of Cell Staining Buffer by centrifugation at 350 x g for 5 minutes.
6. If using a purified primary antibody, resuspend pellet in residual buffer and add a previously determined optimum concentration of anti-species immunoglobulin fluorochrome conjugated secondary antibody (e.g., FITC anti-mouse Ig) and incubate in the dark for 15-20 minutes.
7. If using a biotinylated primary antibody, resuspend cell pellet in residual buffer and add a previously determined optimum concentration of fluorochrome conjugated Streptavidin (SAv) reagent (e.g., SAv-PE, BioLegend Cat. No. 405204) and incubate for 15-20 minutes in the dark.
8. Repeat step 5.
9. Resuspend cells in 0.5 mL Cell Staining Buffer or 0.5 mL 2% paraformaldehyde-PBS fixation buffer.
Tip: For gentler fixation (particularly with tandem fluors), FluoroFix™ Buffer (Cat. No. 422101) may be used.
10. Analyze with a Flow Cytometer.
Note: If you are unable to immediately read your samples on a cytometer, keep them shielded from light and in a refrigerator set at 4-8°C. The samples should be resuspended in Cell Staining Buffer. Note that samples should not remain in a fixation buffer for extended periods of time as this can affect fluor conformation and fluorescence.
Ki-67 Staining ProtocolProtocol Steps
1. Prepare 70% Ethanol and chill to -20°C
Tip: Do not freeze ethanol for long-term storage.
2. Prepare target cells of interest and wash 2X with PBS, centrifuging at 350 x g for 5 minutes.
3. Discard supernatant and loosen the cell pellet by vortexing.
4. Add 3 mL cold 70% ethanol drop by drop to the cell pellet while vortexing.
5. Continue vortexing for 30 seconds and then incubate at -20°C for 1 hour.
6. Wash 3X with BioLegend's Cell Staining Buffer (Cat. No. 420201) and then resuspend the cells at the concentration of 0.5-10 x 106/mL.
7. Mix 100 µL cell suspension with proper fluorochrome-conjugated Ki-67 antibody and incubate at room temperature in the dark for 30 minutes.
8. Wash 2X with BioLegend's Cell Staining Buffer and then resuspend in 0.5 mL cell staining buffer for flow cytometric analysis.
Tip: Based on customer testing, Ki-67 staining is not recommended with our True-Nuclear™ Transcription Factor Buffer Set.

Customer Service: 858-768-5800
94
Intracellular Flow Cytometry Staining ProtocolApplication Notes
1. Activated cell populations can be prepared from in vivo-stimulated tissues or from in vitro-stimulated cultures (e.g., antigen-specific activation or mitogen-induced). For cytokine and chemokine detection, it is critical to include a protein transport inhibitor such as brefeldin A (BioLegend Cat. No. 420601) or monensin (BioLegend Cat. No. 420701) in the last 4-6 hours of cell culture activation. The cells can be suspended and distributed to 12 x 75 mm plastic tubes or microwell plates for immunofluorescent staining. For details on stimulation methods, please see our stimulation guide for cytokines/chemokines: (www.biolegend.com/media_assets/support_protocol/BioLegend_StimulationGuide_101711.pdf)
2. Different cytokines/chemokines have different production peaks. In order to obtain optimal staining signals, the stimulation conditions for each stimulant need to be optimized.
3. Some antibodies recognizing native cell surface markers may not bind to fixed/denatured antigens. For this reason, it is recommended that staining of cell surface antigens be done with live, unfixed cells PRIOR to fixation/permeabilization and staining of intracellular targets. Altering the procedure such that cells are fixed prior to staining of cell surface antigens requires that paraformaldehyde-denatured antigen reactive antibody clones be empirically identified. You can also take a look at our Fixation Webpage (biolegend.com/fixation) to get an idea of how epitopes stain after fixation with 4% PFA. Please note that the ability to stain post-fixation depends on the fluor, antigen expression, and several other factors.
Reagents
Cell Staining Buffer (BioLegend Cat. No. 420201)
Monensin (BioLegend Cat. No. 420701)
RBC Lysis Buffer (BioLegend Cat. No. 420301)
Brefeldin A (BioLegend Cat. No. 420601)
Fixation Buffer (BioLegend Cat. No. 420801)
Intracellular Staining Perm Wash Buffer (BioLegend Cat. No. 421002)
Cyto-Last™ Buffer (BioLegend Cat. No. 422501)
Procedure
Fixation:
1. If staining intracellular antigens (e.g., IFN-γ or IL-4), first perform cell surface antigen staining as described in BioLegend’s Cell Surface Immunofluorescence Staining Protocol, then fix cells in 0.5 mL/tube Fixation Buffer in the dark for 20 minutes at room temperature.
Tip: For gentler fixation (particularly with tandem fluors), FluoroFix™ Buffer (Cat. No. 422101) can be used
2. Centrifuge at 350 x g for 5 minutes, discard supernatant.
3. To put the experiment “on hold” at this point for future staining and analysis, wash cells 1x with Cell Staining Buffer. Resuspend cells in Cell Staining Buffer and store cells at 4°C (short term) or in 90% FCS/10% DMSO forstorage at -80°C (long term, for fixed cells without surface antigen staining). Alternatively, cells can be kept in Cyto-Last™ Buffer for the storage of cytokineproducing cells for up to two weeks. The frequencies of cytokine-producing cells present in activated human PBMC cultures can vary widely due to donor variability. Therefore, cryopreserved cells from a single donor are useful for longitudinal studies.
Permeabilization:
4. Dilute 10X Intracellular Staining Perm Wash Buffer to 1X in DI water.
5. Resuspend fixed cells in Intracellular Staining Perm Wash Buffer and centrifuge at 350 x g for 5-10 minutes.
6. Repeat step 5 twice.
Intracellular Staining:
7. Resuspend fixed/permeabilized cells in residual Intracellular Staining Perm Wash Buffer and add a predetermined optimum concentration of fluorophore-conjugated antibody of interest (e.g., PE anti-IFN-γ) or an appropriate negative control for 20 minutes in the dark at room temperature.
8. Wash 2x with 2 mL of Intracellular Staining Perm Wash Buffer and centrifuge at 350 x g for 5 minutes.
9. If primary intracellular antibody is biotinylated, it will be necessary to perform fluorophore conjugated Streptavidin incubations and subsequent washes in Intracellular Staining Perm Wash Buffer.
10. Resuspend fixed and intracellularly labeled cells in 0.5 mL Cell Staining Buffer and analyze with appropriate controls.
Tip: To confirm specific anti-cytokine staining, a blocking experiment is recommended in which cells are fixed/permeabilized then preincubated with an excess amount of unlabeled anti-cytokine antibody and/or the recombinant cytokine of interest is preincubated with fluorophore-conjugated anti-cytokine antibody before its addition to the cells.
Activation and Intracellular Staining of Whole Blood
11. Dilute heparinized whole blood 1:1 with sterile appropriate tissue culture medium.
Tip: For details on stimulation methods, please see our stimulation guide for cytokines/chemokines: (www.biolegend.com/media_assets/support_protocol/BioLegend_StimulationGuide_101711.pdf )
12. At this stage, in vitro cellular stimulation by either antigen or mitogen can be performed. If intending to stain intracellular cytokines or chemokines (e.g., IFN-γ or IL-4), addition of an efficient protein transport inhibitor such

biolegend.com
95
as brefeldin A or monensin is critical. After addition of a suitable cellular activator, aliquot 200 µL of the whole blood cell suspension into 12 x 75 mm plastic tubes and incubate for 4-6 hours in 5% CO2 at 37°C.
13. Add 2 mL of 1X Red Blood Cell Lysis Buffer and incubate for 5-10 minutes at room temperature
14. Centrifuge at 350 x g for 5 minutes and discard the supernatant
15. Wash cells 1X with Cell Staining Buffer and perform cell surface immunofluorescent staining as described above.
16. Fix, permeabilize, and stain intracellular antigens as described above.
Flow Cytometric Analysis:
Set PMT voltage and compensation using cell surface staining controls. Set quadrant markers based on blocking controls, isotype controls, or unstained cells. For proper flow cytometric analysis, cells stained by this method should be inspected by light microscopy and/or flow light scatter pattern to confirm that they are well dispersed. Bivariate dot plots or probability contour plots can be generated upon data analysis to display the frequencies of and patterns by which individual cells coexpress certain levels of cell surface antigen and intracellular cytokine proteins.
Related Information:Assenmacher, M., et al. 1994. Eur. J. Immunol. 24:1097.Elson, L.H., et al. 1995. J. Immunol. 1995.154:4294.Jung T, et al. 1993. J. Immunol. Methods 159:197.Prussin C., et al. 1995. J. Immunol. Methods 188:117.Vikingsson A., et al. 1994. J. Immunol. Methods 173:219.
Anti-BrdU Staining Using DNAse with Surface and Fluorescent ProteinsNote: We offer two protocols here, depending on what your
experiment requires. Ethanol treatment is usually harsher toward any other fluors or fluorescent proteins that may be present in your sample. As such, the DNAse method may be gentler under those conditions.
Protocol Steps
Anti-BrdU Staining Using DNAse with Surface and Fluorescent Proteins:
1. Pulse actively dividing cells with BrdU (in vitro, cell culture media can be pulsed by adding 10-40 µM of BrdU for 1-2 hours).
2. Harvest cells and centrifuge for 5 minutes at 1200-1500 rpm (200-300 x g).
3. Wash cells in Cell Staining Buffer (Cat. No. 420201) and centrifuge for 5 minutes at 1200-1500 rpm (200-300 x g). Discard supernatant.
4. Aliquot 5 x 10⁵ -1 x 10⁶ cells per 12 x 75mm tube
5. Optional: Stain cells for surface antigens if required, utilizing the Cell Surface Immunofluorescence Staining Protocol.
6. Wash cells by adding 1 mL of Cell Staining Buffer to each tube and centrifuging for 5 minutes at 1200-1500 rpm (200-300 x g). Discard supernatant.
7. Fix cells by adding 100 µL of 4% paraformaldehyde at room temperature for 20-30 minutes.
8. Wash cells by repeating step 6 twice.
Optional: Cells can be stored in FACS buffer at 4°C for up to 72 hrs)
9. Permeabilize cells by adding 500 µL of 0.5% Triton-X 100 in PBS for 15 minutes at room temperature.
10. Wash cells by repeating step 6 twice.
11. Treat cells with 20 µg of DNAse (Cat. No. D4513, Sigma-Aldrich) diluted in DPBS with calcium and magnesium to each tube and incubate at 37°C for 1 hour.
12. Wash cells by repeating step 6 twice.
13. Add 50 µL of Cell Staining Buffer to each tube then add the recommended concentration of antiBrdU antibody to each tube. Incubate for 20 minutes at room temperature in the dark.
14. Repeat step 6.
15. Stain DNA by adding 1 µg of either 7-AAD (Cat. No. 420403) or DAPI (Cat. No. 422801). Wait for 5 minutes prior to acquiring samples on flow cytometer.
Note: Adding a 7-AAD or DAPI stain allows you to analyze total DNA content and provides the characteristic horseshoe flow cytometric staining pattern when compared against BrdU. This helps identify the different phases of the cell cycle.
Customer Service: 858-768-5800
96
Intracellular Staining with True-Phos™ Perm Buffer in Cell Suspensions ProtocolProtocol Steps
Buffer Preparation:
1. Warm Fixation Buffer (BioLegend Cat 420801). For each 1 x 10⁶ cells, aliquot 0.5 mL of buffer and warm to 37°C.
2. Chill True-Phos™ Perm Buffer to -20°C. For each 1 x 10⁶ cells, aliquot 1.0 mL of True-Phos™ Perm Buffer and chill to -20°C.
Sample Preparation:
3. Prepare a single cell suspension with the sample of interest (Human PBMC, splenocytes, cell lines, etc).
Tips: Prepare two aliquots, Negative control: untreated, Positive control: treated with stimuli.
Incubate the cells with the appropriate stimuli, at the suitable temperature and time.
4. Fix the cells immediately after treatment by adding an equal volume of pre-warmed Fixation Buffer. Gently pipette to ensure thorough mixing.
5. Incubate at 37°C for 15 minutes to ensure cells are properly fixed.
6. Centrifuge cells at 350 x g at room temperature for 5 minutes, decant supernatant, vortex to resuspend cell pellet.
Staining with Specific Antibodies:
7. Add sufficient Cell Staining Buffer to wash the cells (approximately 2 mL for each 1 x 10⁶ cells, BioLegend Cell Staining Buffer recommended, Cat. No. 420201), centrifuge at 350 x g at room temperature for 5 minutes and decant supernatant. Repeat, for a total of two washes.
8. Gently pipette cells using residual volume to resuspend cell pellet.
Note: If cells are not fully resuspended, True-Phos™ Perm Buffer addition will cause significant cell loss.
9. While vortexing, permeabilize cells by adding pre-chilled True-Phos™ Perm Buffer. Example: 10 x 106 cells should be permeabilized with 10 mL of pre-chilled True-Phos™ Perm Buffer.
10. Incubate at -20°C for 60 minutes to ensure cells are properly permeabilized.
11. Centrifuge cells at 1000 x g at room temperature for 5 minutes, decant supernatant, vortex to resuspend cell pellet.
12. Add sufficient Cell Staining Buffer to wash the cells, centrifuge cells at 1000 x g at room temperature for 5 minutes, decant supernatant. Repeat, for a total of two washes.
13. Resuspend the cells in Cell Staining Buffer at a concentration of 10 x 106 cells/mL.
14. Transfer 100 µL (or 1 x 10⁶ cells) to a 12 x 75mm tube.
15. Add antibody cocktail(s) to appropriate tubes, vortex to mix, and incubate for 30 minutes at room temperature in the dark.
16. Add 2 mL of Cell Staining Buffer, centrifuge cells at 1000 x g at room temperature for 5 minutes, decant supernatant. Repeat, for a total of two washes.
17. Resuspend cells in approximately 500 µL of Cell Staining Buffer and analyze with a flow cytometer.

biolegend.com
97
Th17 Polarization of Mouse CD4+ CellsReagent List
Sterile PBS
Cell culture medium (IMDM supplemented with 10% FBS)
Sterile plastic petri dishes
RBC Lysis Buffer (Cat. No. 420301)
Anti-mouse CD3ε, clone 145-2C11 (LEAF™ format, Cat. No. 100314)
Anti-mouse CD28, clone 37.51, (LEAF™ format, Cat. No. 102112)
Anti-mouse IFN-γ, clone XMG1.2, (LEAF™ format, Cat. No. 505812)
Mouse MojoSort™ CD4 T-cell Isolation Kit (Cat. No. 480005)
Anti-mouse IL-4, clone 11B11, (LEAF™ format, Cat. No. 504108)
Recombinant mouse IL-6 (carrier-free) (Cat. No. 575704)
Recombinant mouse IL-23 (carrier-free) (Cat. No. 589002)
Recombinant human TGF-β1 (carrier-free) (Cat. No. 580702)
Brefeldin A (Cat. No. 420601)
Monensin Solution (Cat. No. 420701)
PMA (Phorbol 12-myristate 13-acetate) (e.g., Cat. No. P8139 from Sigma)
Ionomycin (e.g., Cat. No. I0634 from Sigma)
Protocol Steps
Isolation of CD4+ Cells From Lymph Nodes:
1. Harvest lymph nodes (superficial cervical, mandibular, axillary, inguinal, and mesenteric) from mice.
2. Tease lymph nodes through a sterile 70 µm nylon cell strainer to obtain single-cell suspensions in complete IMDM containing 10% FCS (complete medium).
3. Resuspend cells in complete medium and use your favorite method to isolate CD4+ cells. Consider using our MojoSort™ Mouse CD4 T Cell Isolation Kit.
Th17 Polarization of CD4+ Cells:
4. On day 0, coat 60 x 15mm of plastic petri dishes with anti-mouse CD3ε, clone 145-2C11 (5 µg/mL). Incubate at 37°C for 2 hours or 4°C overnight. Aseptically decant antibody solution from the plate. Wash plate 3 times with sterile PBS. Discard liquid.
5. Plate CD4+ cells at 10 x 106 at 5 mL/dish. Culture cells for 4 days in the presence of anti-mouse CD28, clone 37. 51 (5 µg/mL), recombinant mouse IL-6 (50 ng/mL), recombinant human TGF-β1 (1ng/mL), recombinant mouse IL-23 (5 ng/mL), anti-mouse IL-4 (10 µg/mL), and anti-mouse IFN-γ (10 µg/mL).
6. On day 3, slowly add 5 mL of fresh media, along with the same concentration of antibodies/cytokines as used on day 0.
7. On day 4, wash cells once and then restimulate in complete medium with 500 ng/mL PMA and 500 ng/mL ionomycin, in the presence of Brefeldin A (If you are looking for IL-21 production, use monensin) for 4-5 hours.
8. After harvesting, the cells are ready for staining.
Tip: Recombinant human TGF-β is effective for stimulating mouse cells.
Treg Polarization of Mouse CD4+ CellsReagent List
Sterile PBS
Cell culture medium (RPMI 1640 supplemented with 10% FBS)
Sterile 12-well plate
RBC Lysis Buffer (Cat. No. 420301)
Anti-mouse CD3ε, clone 145-2C11 (LEAF™ format, Cat. No. 100314)
Anti-mouse CD28, clone 37.51, (LEAF™ format, Cat. No. 102112)
Recombinant human TGF-β1 (carrier-free) (Cat. No. 580702)
Recombinant mouse IL-2 (carrier-free) (Cat. No. 575402)
Mouse MojoSort™ CD4 T-cell Isolation Kit (Cat. No. 480005)
Protocol Steps
Isolation of CD4+ Cells From Lymph Nodes:
1. Harvest lymph nodes (superficial cervical, mandibular, axillary, inguinal, and mesenteric) from mice.
2. Tease lymph nodes through a sterile 70 µm nylon cell strainer to obtain single-cell suspensions in complete RPMI containing 10% FCS (complete medium).
3. Resuspend cells in complete medium and use your favorite method to isolate CD4+ cells. Consider using our MojoSort™ Mouse CD4 T Cell Isolation Kit.
Th17 Polarization of CD4+ Cells:
4. On day 0, coat 12-well plate with anti-mouse CD3ε, clone 145-2C11 (3 µg/mL). Incubate at 37°C for 2 hours or 4°C overnight. Aseptically decant antibody solution from the plate. Wash plate 3 times with sterile PBS. Discard liquid.
5. Plate CD4+ cells at 1.0 x 10⁶ at 1 mL/well. Culture cells for 5 days at 37°C, 5% CO2, in the presence of anti-mouse CD28, clone 37.51 (3 µg/mL), recombinant mouse IL-2 (5ng/mL), and recombinant human TGF-β1 (5ng/mL).
6. On day 3, if media is yellow, add 2 mL/well of fresh media.
7. On day 5, after harvesting, the cells are ready for staining.
Note: Recombinant human TGF-β is effective for stimulating mouse cells.

Customer Service: 858-768-5800
98
Th1 Polarization of Mouse CD4+ Cells ProtocolReagent List
Sterile PBS
Cell culture medium (RPMI 1640 supplemented with 10% FBS)
Sterile 12-well plate
Sterile 6-well plate
RBC Lysis Buffer (Cat. No. 420301)
Anti-mouse CD3ε, clone 145-2C11 (LEAF™ format, Cat. No. 100314)
Ionomycin (e.g., Cat. No. I0634 from Sigma)
Mouse MojoSort™ CD4 T-cell Isolation Kit (Cat. No. 480005)
Anti-mouse CD28, clone 37.51, (LEAF™ format, Cat. No. 102112)
Anti-mouse IL-4, clone 11B11, (LEAF™ format, Cat. No. 504108)
Recombinant mouse IL-2 (carrier-free) (Cat. No. 575402)
Recombinant mouse IL-12 (p70) (carrier-free) (Cat. No. 577002)
Monensin Solution (Cat. No. 420701)
PMA (Phorbol 12-myristate 13-acetate) (e.g., Cat. No. P8139 from Sigma)
Protocol Steps
Isolation of CD4+ Cells From Lymph Nodes:
1. Harvest lymph nodes (superficial cervical, mandibular, axillary, inguinal, and mesenteric) from mice.
2. Tease lymph nodes through a sterile 70 µm nylon cell strainer to obtain single-cell suspensions in complete RPMI containing 10% FCS (complete medium).
3. Resuspend cells in complete medium and use your favorite method to isolate CD4+ cells. Consider using our Mojosort™ Mouse CD4 T Cell Isolation Kit.
Th1 Polarization of CD4+ Cells:
4. On day 0, coat 12-well plate with anti-mouse CD3ε, clone 145-2C11 (3 µg/mL). Incubate at 37°C for 2 hours or 4°C overnight. Aseptically decant antibody solution from the plate. Wash plate 3 times with sterile PBS. Discard liquid.
5. Plate CD4+ cells at 1.0 x 10⁶ at 1 mL/well. Culture cells for 5 days at 37°C, 5% CO2, in the presence of anti-mouse CD28, clone 37.51 (3 µg/mL), anti-mouse IL-4, clone 11B11 (10 µg/mL), recombinant mouse IL-2 (5 ng/mL), and recombinant mouse IL-12 (10 ng/mL).
6. On day 3, if media is yellow, add 2 mL/well of fresh media.
7. On day 5, wash cells once and then restimulate in complete media with 50 ng/mL PMA, 1 µg/mL ionomycin and 10 µL monensin (1000x), in a 6-well plate in incubator at 37°C for 5 hours.
8. After harvesting, the cells are ready for staining.
T Cell Activation with Anti-CD3 Antibodies Protocol - HumanReagent List
Sterile PBS
Anti-human CD3 Antibody: Clone UCHT1 (LEAF™ format, Cat. No. 300413; Ultra-LEAF™ format, Cat. No. 300437)
Anti-human CD3 Antibody: Clone OKT3 (LEAF™ format, Cat. No. 317303; Ultra-LEAF™ format, Cat. No. 317325)
Note: Soluble forms of LEAF™ purified UCHT1 (1 µg/mL) or LEAF™ purified HIT3a (0.01 - 0.1 µg/mL) may be used to activate T cells from PBMC cell populations.
Anti-human CD3 Antibody: Clone HIT3a (LEAF™ format, Cat. No. 300313; Ultra-LEAF™ format, Cat. No. 300331)
Cell culture medium (e.g., RPMI-1640 or IMDM supplemented with 10% FBS and 2 mM L-glutamine)
Sterile single-cell suspension of Ficoll-Hypaque-purified peripheral blood mononuclear cells, isolated T cells, or T cell subsets
96-well flat-bottom tissue culture plates with lids (e.g., Costar® Cat. No. 3596)
Protocol Steps
Method:
1. Prepare a 10 µg/mL solution of anti-CD3 (clone UCHT1, OKT3, or HIT3a) in sterile PBS.
2. Dispense 50 µL of the antibody solution to each microwell of the 96-well assay plate. For the unstimulated control wells, add 50 µL of sterile PBS.
3. Seal plate. Incubate at 37°C for 2 hours or 4°C overnight.
4. Aseptically decant antibody solution from the microwell plate.
5. Wash plate microwells 3 times with sterile PBS. Discard liquid.
6. Prepare single cell suspension of cells of interest in supplemented cell culture medium to 1-2 x 10⁶/mL.
7. Aliquot 200 µL cell suspension into plate microwells. Cover with lid. Incubate at 37°C in 5% CO2 and 100% humidity for 3 days.

biolegend.com
99
Immunohistochemistry Protocol for Frozen SectionsIntroduction
The following is a general procedure guide for preparation and staining of acetone-fixed frozen tissues using a purified, unconjugated primary antibody, biotinylated secondary antibody and streptavidin-horseradish peroxidase (Sav-HRP) and DAB detection system. Because each antigen differs in terms of requirement for fixation, amplification step, etc., it is not possible to write an inclusive protocol that will work for all antigens. The user must determine optimal conditions for each antigen of interest. Many protocols for staining individual antigens, as well as useful tips and troubleshooting guides for immunohistochemistry, can be found at the IHC World web site (ihcworld.com).
Protocol Steps
Prepare frozen tissue sections (steps 1-8):
1. Place a freshly dissected tissue block (< 5 mm thick) on to a pre-labeled tissue base mold.
2. Cover the entire tissue block with cryo-embedding media (e.g., OCT).
3. Slowly place the base mold containing the tissue block into liquid nitrogen till the entire tissue block is submerged into liquid nitrogen to ensure tissue is frozen completely.
4. Store the frozen tissue block at -80°C until ready for sectioning.
5. Transfer the frozen tissue block to a cryotome cryostat (e.g., -20°C) prior to sectioning and allow the temperature of the frozen tissue block to equilibrate to the temperature of the cryotome cryostat.
6. Section the frozen tissue block into a desired thickness (typically 5-10 µm) using the cryotome.
7. Place the tissue sections onto glass slides suitable for immunohistochemistry (e.g., Superfrost).
8. Dry the tissue sections overnight at room temperature. Sections can be stored in a sealed slide box at -80°C for later use.
Immunostain frozen tissue sections (steps 9-28):
9. Fix the tissue sections with a suitable fixative. One of the commonly used fixation methods for frozen tissue sections is to immerse the slides in pre-cooled acetone (-20°C) for 10 min.
10. Pour off the fixative and allow acetone to evaporate from the tissue sections for < 20 min at room temperature.
11. Rinse the slides in 300 mL of 10mM phosphate buffered saline (PBS) at a neutral pH for 2 changes, 5 min each.
12. Incubate the slides in 0.3% H2O2 solution in PBS at room temperature for 10 min to block endogenous peroxidase activity.
13. Rinse the slides in 300 mL PBS for 2 changes, 5 min each.
14. Optional: Add 100 µL blocking buffer (e.g., 10% fetal bovine serum in PBS) onto the sections of the slides and incubate in a humidified chamber at room temperature for 1 hour.
15. Drain off the blocking buffer from the slides.
16. Apply 100 µL an appropriately diluted primary antibody (in antibody dilution buffer, e.g., 0.5% bovine serum albumin in PBS) to the sections on the slides and incubate in a humidified chamber for 1 hour at room temperature or overnight at 4°C.
17. Rinse the slides in 300 mL PBS for 2 changes, 5 min each.
18. Apply 100 µL an appropriately diluted biotinylated secondary antibody (using the antibody dilution buffer) to the sections on the slides and incubate in a humidified chamber at room temperature for 30 min.
19. Rinse the slides in 300 mL PBS for 2 changes, 5 min each.
20. Add 100 µL pre-diluted Sav-HRP conjugates (using the antibody dilution buffer) to the sections on the slides and incubate in a humidified chamber at room temperature for 30 min (keep protected from light).
21. Rinse the slides in 300 mL PBS for 2 changes, 5 min each.
22. Apply 100 µL DAB substrate solution (freshly made just before use: 0.05% DAB - 0.015% H2O2 in PBS) to the sections on the slides to reveal the color of the antibody staining. Allow the color development for < 5 min until the desired color intensity is reached.
Caution: DAB is a suspected carcinogen. Handle with care. Wear gloves, lab coat and eye protection.
23. Wash slides in 300 mL PBS for 2 changes 5 min each.
24. Optional: Counterstain slides by immersing sides in Hematoxylin (e.g., Gill's Hematoxylin) for 1-2 min.
25. Rinse the slides in running tap water for > 15 min.
26. Dehydrate the tissue slides through 4 changes of alcohol (95%, 95%, 100% and 100%), 5 min each.
27. Clear the tissue slides in 3 changes of xylene and coverslip using mounting solution (e.g., Permount). The mounted slides can be stored at room temperature permanently.
28. Observe the color of the antibody staining in the tissue sections under microscopy.

Customer Service: 858-768-5800
100
Immunofluorescence Microscopy ProtocolReagent List
Chamber slides or cover slips
Fixation solution: 4% Paraformaldehyde, in PBS
Permeablization solution: 0.5% Triton X-100 in PBS
Antibody dilution solution: 5% FBS in PBS
Protocol Steps
Sample Preparation:
1. Grow cultured cells on cover slips or chamber slides overnight, or add appropriate amount of cells to poly-L-lysine coated chamber slides and incubate at least 30 minutes at 37°C, at the time of fixation cells should be ~50% confluent.
2. Rinse cells briefly in PBS.
3. Fix cells by incubation with 4% Paraformaldehyde, in PBS for 15 minutes at room temperature.
4. Rinse three times in PBS, 5 minutes each time.
5. Add 0.5% Triton X-100 in PBS and incubate at room temperature for three to five minutes.
6. Rinse three times in PBS, 5 minutes each time.
Sample Blocking:
7. Block samples in 5% FBS in PBS at room temperature for one hour.
Sample Staining:
8. Dilute the primary antibody to the recommended concentration/dilution in 5% FBS/PBS.
9. Add 200 µL per well (8 wells) to the chamber slides and incubate two to three hours at room temperature or overnight at 4°C.
10. Rinse three times in PBS, 5 minutes each time.
Note: If using primary antibodies directly conjugated with fluorochrome, then skip to step 14.
11. Prepare fluorochrome-conjugated secondary antibody in 5% FBS/PBS according to the recommended manufacturer specification data sheet, and add 200 µL per well (8 wells) to the chamber slides.
12. Incubate the samples for one hour, at room temperature, in the dark.
13. Rinse three times in PBS, 5 minutes each time.
14. Coverslip with anti-fade mounting medium.
15. Seal slides with nail polish.
Immunohistochemistry Protocol for Paraffin-Embedded SectionsProtocol Steps
Prepare formalin-fixed, paraffin-embedded tissue sections (steps 1-8):
1. Fix freshly dissected tissue (less than 3 mm thick) with 10% formalin or other fixatives for 24-48 hour at room temperature. Caution: Formalin is a suspect carcinogen. It can cause eye, skin, and respiratory tract irritation. It should be handled in a hood.
2. Rinse the tissue with running tap water for 1 hour.
3. Dehydrate the tissue through 70%, 80%, 95% alcohol, 45 min each, followed by 3 changes of 100% alcohol, 1 hour each.
4. Clear the tissue through 2 changes of xylene, 1 hour each.
5. Immerse the tissue in 3 changes of paraffin, 1 hour each.
6. Embed the tissue in a paraffin block. The paraffin tissue block can be stored at room temperature for years.
7. Section the paraffin-embedded tissue block at 5-8 µm thickness on a microtome and float in a 40°C water bath containing distilled water.
8. Transfer the sections onto glass slides suitable for immunohistochemistry (e.g., Superfrost Plus). Allow the slides to dry overnight and store slides at room temperature until ready for use.
Immunostain formalin-fixed, paraffin-embedded tissue sections (steps 9-29):
9. Deparaffinize slides in 2 changes of xylene, 5 min each.
10. Transfer slides to 100% alcohol, for 2 changes, 3 min each, and then transfer once through 95%, 70% and 50% alcohols respectively for 3 min each.
11. Block endogenous peroxidase activity by incubating sections in 3% H2O2 solution in methanol at room temperature for 10 min to block endogenous peroxidase activity.
12. Rinse in 300 mL of PBS for 2 changes, 5 min each.
13. Optional: Perform antigen retrieval to unmask the antigenic epitope. The most commonly used antigen retrieval is a citrate buffer method. Arrange the slides in a staining container. Pour 300 mL of 10mM citrate buffer, pH 6.0 into the staining container and incubate it at 95-100°C for 10 min (optimal incubation time should be determined by user). Remove the staining container to room temperature and allow the slides to cool for 20 min.
14. Rinse slides in 300 mL PBS for 2 changes, 5 min each.
15. Optional: Add 100 µL blocking buffer (e.g., 10% fetal bovine serum in PBS) onto the sections of the slides and incubate in a humidified chamber at room temperature for 1 hour.
16. Drain off the blocking buffer from the slides.

biolegend.com
101
17. Apply 100 µL appropriately diluted primary antibody (in antibody dilution buffer, e.g., 0.5% bovine serum albumin in PBS) to the sections on the slides and incubate in a humidified chamber at room temperature for 1 hour.
18. Wash the slides in 300 mL PBS for 2 changes 5 min each.
19. Apply 100 µL appropriately diluted biotinylated secondary antibody (using the antibody dilution buffer) to the sections on the slides and incubate in a humidified chamber at room temperature for 30 min.
20. Wash slides in 300 mL PBS for 2 changes, 5 min each.
21. Apply 100 µL appropriately diluted Sav-HRP conjugates (using the antibody dilution buffer) to the sections on the slides and incubate in a humidified chamber at room temperature for 30 min (keep protected from light).
22. Wash slides in 300 mL PBS for 2 changes, 5 min each.
23. Apply 100 µL DAB substrate solution (freshly made just before use: 0.05% DAB - 0.015% H2O2 in PBS) to the sections on the slides to reveal the color of antibody staining. Allow the color development for less than 5 min until the desired color intensity is reached. Caution: DAB is a suspect carcinogen. Handle with care. Wear gloves, lab coat and eye protection.
24. Wash slides in 300 mL PBS for 3 changes 2 min each.
25. Optional: Counterstain slides by immersing sides in Hematoxylin (e.g., Gill's Hematoxylin) for 1-2 min.
26. Rinse the slides in running tap water for more than 15 min.
27. Dehydrate the tissue slides through 4 changes of alcohol (95%, 95%, 100% and 100%), 5 min each.
28. Clear the tissue slides in 3 changes of xylene and coverslip using mounting solution (e.g., Permount). The mounted slides can be stored at room temperature permanently.
29. Observe the color of the antibody staining in the tissue sections under microscopy.
General Tips & FAQ
FAQ:
Do I need to perform antigen retrieval on my formalin-fixed, paraffin-embedded samples prior to staining?
In most cases, this is true. Antigen retrieval helps both the accessibility of the antibody to the tissue and also counteracts the fixation effects on the recognized epitopes. Not all antibodies indicated for use in IHC-P were validated at BioLegend, therefore be sure to check the application reference for the method of antigen retrieval utilized by the lab that validated that application.
Can antibody X be used for immunohistochemistry? What concentration do I use?
Typical concentrations of monoclonal antibodies for use in IHC are from 5-25 µg/mL. Polyclonal antibodies can be used at a range of 1-10 µg/mL. While we do not test for IHC application in house, we will indicate on the datasheet if an antibody has been published for use in this application. In addition, you can do a literature search with the clone name and immunohistochemistry/paraffin/frozen to see what the protocol details are.
Tips: For initial experiments, the user must titrate primary and secondary reagents so that staining with the secondary antibody alone yields no background while staining with primary and secondary antibodies yields strong, specific staining.
Take care to ensure that slides do not dry out by incubating with sufficient volumes and/or in a humidified chamber (such as 926301).

Customer Service: 858-768-5800
102
MojoSort™ Nanobeads Regular ProtocolReagent List
MojoSort™ Buffer (5X) (Cat. No. 480017)
MojoSort™ Magnet (Cat. No. 480019) or compatible magnetic separation system
Adjustable pipettes
70 µm filters (one per sample)
5 mL (12 x 75 mm) polypropylene tubes
Reagents for sample preparation
Reagents and instruments (Flow cytometer) to determine yield and purity
Important Note:
MojoSort™ magnetic particles can be used with other commercially available magnetic separators, both free standing magnets and column-based systems. Because MojoSort™ protocols are optimized for the MojoSort™ separator; the protocols may need to be adjusted for other systems. Please contact BioLegend Technical Service ([email protected]) for more information and guidance. We do not recommend using MojoSort™ particles for BD’s IMag™ or Life Technologies’ DynaMag™.
Product Description and Procedure Summary:
The cells targeted by the Nanobeads are either selected or depleted by incubating your sample with the directly conjugated magnetic particles. The magnetically labeled fraction is retained by the use of a magnetic separator. After collection of the targeted cells, downstream applications include functional assays, gene expression, phenotypic characterization, etc.
Protocol Steps:
This procedure is optimized for the isolation of 107 to 2 x 10⁸ cells per tube. If working with fewer than 107 cells, keep volumes as indicated for 107 cells. For best results, optimize the conditions to your specific cell number and tissue. Prepare fresh MojoSort™ Buffer solution by diluting the 5X concentrate with sterile distilled water. Scale up volumes if using 14 mL tubes and Magnet, and place the tube in the magnet for 10 minutes.
1. Prepare cells from your tissue of interest without lysing erythrocytes.
2. In the final wash of your sample preparation, resuspend the cells in MojoSort™ Buffer by adding up to 4 mL in a 5 mL (12 x 75 mm) polypropylene tube.
Note: Keep MojoSort™ Buffer on ice throughout the procedure.
3. Filter the cells with a 70 µm cell strainer, centrifuge at 300 x g for 5 minutes, and resuspend in an appropriate volume of MojoSort™ Buffer. Count and adjust the cell concentration to 1 x 10⁸ cells/mL.
4. Aliquot 100 µL of cell suspension (107 cells) into a new tube.
5. Resuspend the beads by vortexing, maximum speed, 5 touches. Add 10 µL of Nanobeads, mix well and incubate on ice for 15 minutes. Scale up the volume accordingly if separating more cells. For example, add 100 µL for 1 x 10⁸ cells. When working with less than 107 cells, use indicated volumes for 107 cells.
6. Add MojoSort™ Buffer up to 4 mL and centrifuge the cells at 300 x g for 5 minutes.
7. Resuspend the cells in 3 mL of MojoSort™ Buffer. Optional: Take an aliquot before placing the tube in the magnet to monitor purity and yield.
8. Place the tube in the magnet for 5 minutes.
9. Pour out the liquid. Resuspend the labeled cells in appropriate amount of buffer.
10. Repeat steps 7-9 on the labeled fraction 2 more times, for a total of 3 magnetic separations.
Optional: Take a small aliquot to monitor purity and yield. If desired, pool the unlabeled fractions and process simultaneously with the positive labeled cells when assessing purity and yield.
Chart Protocol
Application Notes: To use this product in magnetic separation columns, a titration of the Nanobeads should be performed. Optimal concentration for magnetic separation columns is lot-specific. Please contact BioLegend Technical Service ([email protected]) for further assistance on how to use MojoSort™ Nanobeads in magnetic separation columns.

biolegend.com
103
MojoSort™ Nanobeads No-wash ProtocolReagent List
MojoSort™ Buffer (5X) (Cat. No. 480017)
MojoSort™ Magnet (Cat. No. 480019 | 480020) or compatible magnetic separation system
Adjustable pipettes
70 µm filters (one per sample)
5 mL (12 x 75 mm) or 14 mL (17 x 100 mm) polypropylene tubes
Reagents for sample preparation
Reagents and instruments (Flow cytometer) to determine yield and purity
Important Note:
MojoSort™ magnetic particles can be used with other commercially available magnetic separators, both free standing magnets and column-based systems. Because MojoSort™ protocols are optimized for the MojoSort™ separator; the protocols may need to be adjusted for other systems. Please contact BioLegend Technical Service ([email protected]) for more information and guidance. We do not recommend using MojoSort™ particles for BD’s IMag™ or Life Technologies’ DynaMag™.
Product Description and Procedure Summary:
The cells targeted by the Nanobeads are either selected or depleted by incubating the sample with the directly conjugated magnetic particles. The magnetically labeled fraction is retained by the use of a magnetic separator. After collection of the targeted cells, downstream applications include functional assays, gene expression, phenotypic characterization, etc.
Protocol Steps
Note: This protocol has been optimized to remove washing steps after nanobeads incubation, resulting in a shorter and more convenient protocol. This procedure is optimized for the isolation of 107 to 2 x 10⁸ cells per tube. If working with fewer than 107 cells, keep volumes as indicated for 107 cells. For best results, optimize the conditions to your specific cell number and tissue. Prepare fresh MojoSort™ Buffer solution by diluting the 5X concentrate with sterile distilled water. Scale up volumes if using 14 mL tubes and Magnet, and place the tube in the magnet for 10 minutes.
1. Prepare cells from your tissue of interest without lysing erythrocytes.
2. In the final wash of your sample preparation, resuspend the cells in MojoSort™ Buffer by adding up to 4 mL in a 5 mL (12 x 75 mm) polystyrene tube.
Note: Keep MojoSort™ Buffer on ice throughout the procedure.
3. Filter the cells with a 70µm cell strainer, centrifuge at 300 x g for 5 minutes, and resuspend in an appropriate volume of MojoSort™ Buffer. Count and adjust the cell concentration to 1 x 10⁸ cells/mL.
4. Aliquot 100 µL of cell suspension (107 cells) into a new tube.
5. Resuspend the beads by vortexing, maximum speed, 5 touches. Add 10 µL of Nanobeads, mix well and incubate on ice for 15 minutes. Scale up the volume accordingly if separating more cells. For example, add 100 µL for 1 x 10⁸ cells. When working with less than 107 cells, use indicated volumes for 107 cells.
6. Resuspend the cells in 3 mL of MojoSort™ Buffer. Optional: Take an aliquot before placing the tube in the magnet to monitor purity and yield.
7. Place the tube in the magnet for 5 minutes.
8. Pour out the liquid. Resuspend labeled cells in appropriate buffer.
9. Repeat steps 6-8 on the labeled fraction 2 more times, for a total of 3 magnetic separations.
Optional: Take a small aliquot to monitor purity and yield. If desired, pool the unlabeled fractions and process simultaneously with the positive labeled cells when assessing purity and yield.
Chart Protocol
Application Notes: To use this product in magnetic separation columns, a titration of the Nanobeads should be performed. Optimal concentration for magnetic separation columns is lot-specific. Please contact BioLegend Technical Service ([email protected]) for further assistance on how to use MojoSort™ Nanobeads in magnetic separation columns.
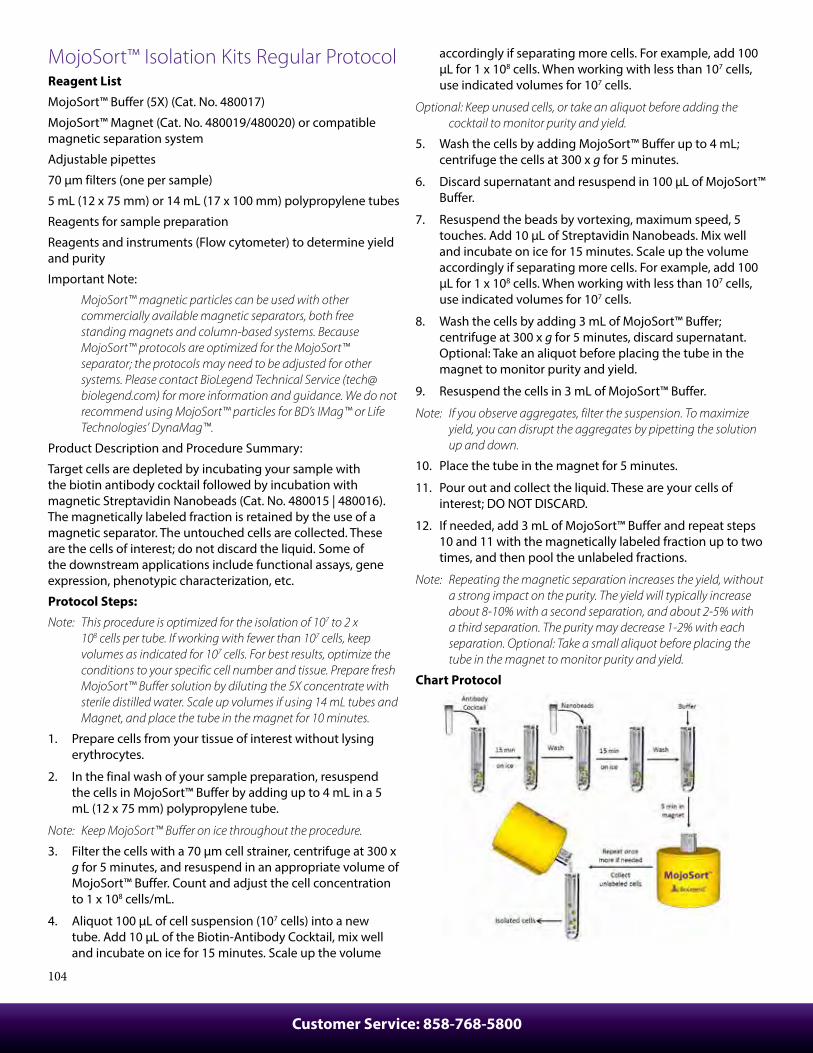
Customer Service: 858-768-5800
104
MojoSort™ Isolation Kits Regular ProtocolReagent List
MojoSort™ Buffer (5X) (Cat. No. 480017)
MojoSort™ Magnet (Cat. No. 480019/480020) or compatible magnetic separation system
Adjustable pipettes
70 µm filters (one per sample)
5 mL (12 x 75 mm) or 14 mL (17 x 100 mm) polypropylene tubes
Reagents for sample preparation
Reagents and instruments (Flow cytometer) to determine yield and purity
Important Note:
MojoSort™ magnetic particles can be used with other commercially available magnetic separators, both free standing magnets and column-based systems. Because MojoSort™ protocols are optimized for the MojoSort™ separator; the protocols may need to be adjusted for other systems. Please contact BioLegend Technical Service ([email protected]) for more information and guidance. We do not recommend using MojoSort™ particles for BD’s IMag™ or Life Technologies’ DynaMag™.
Product Description and Procedure Summary:
Target cells are depleted by incubating your sample with the biotin antibody cocktail followed by incubation with magnetic Streptavidin Nanobeads (Cat. No. 480015 | 480016). The magnetically labeled fraction is retained by the use of a magnetic separator. The untouched cells are collected. These are the cells of interest; do not discard the liquid. Some of the downstream applications include functional assays, gene expression, phenotypic characterization, etc.
Protocol Steps:
Note: This procedure is optimized for the isolation of 107 to 2 x 10⁸ cells per tube. If working with fewer than 107 cells, keep volumes as indicated for 107 cells. For best results, optimize the conditions to your specific cell number and tissue. Prepare fresh MojoSort™ Buffer solution by diluting the 5X concentrate with sterile distilled water. Scale up volumes if using 14 mL tubes and Magnet, and place the tube in the magnet for 10 minutes.
1. Prepare cells from your tissue of interest without lysing erythrocytes.
2. In the final wash of your sample preparation, resuspend the cells in MojoSort™ Buffer by adding up to 4 mL in a 5 mL (12 x 75 mm) polypropylene tube.
Note: Keep MojoSort™ Buffer on ice throughout the procedure.
3. Filter the cells with a 70 µm cell strainer, centrifuge at 300 x g for 5 minutes, and resuspend in an appropriate volume of MojoSort™ Buffer. Count and adjust the cell concentration to 1 x 10⁸ cells/mL.
4. Aliquot 100 µL of cell suspension (107 cells) into a new tube. Add 10 µL of the Biotin-Antibody Cocktail, mix well and incubate on ice for 15 minutes. Scale up the volume
accordingly if separating more cells. For example, add 100 µL for 1 x 10⁸ cells. When working with less than 107 cells, use indicated volumes for 107 cells.
Optional: Keep unused cells, or take an aliquot before adding the cocktail to monitor purity and yield.
5. Wash the cells by adding MojoSort™ Buffer up to 4 mL; centrifuge the cells at 300 x g for 5 minutes.
6. Discard supernatant and resuspend in 100 µL of MojoSort™ Buffer.
7. Resuspend the beads by vortexing, maximum speed, 5 touches. Add 10 µL of Streptavidin Nanobeads. Mix well and incubate on ice for 15 minutes. Scale up the volume accordingly if separating more cells. For example, add 100 µL for 1 x 10⁸ cells. When working with less than 107 cells, use indicated volumes for 107 cells.
8. Wash the cells by adding 3 mL of MojoSort™ Buffer; centrifuge at 300 x g for 5 minutes, discard supernatant. Optional: Take an aliquot before placing the tube in the magnet to monitor purity and yield.
9. Resuspend the cells in 3 mL of MojoSort™ Buffer.
Note: If you observe aggregates, filter the suspension. To maximize yield, you can disrupt the aggregates by pipetting the solution up and down.
10. Place the tube in the magnet for 5 minutes.
11. Pour out and collect the liquid. These are your cells of interest; DO NOT DISCARD.
12. If needed, add 3 mL of MojoSort™ Buffer and repeat steps 10 and 11 with the magnetically labeled fraction up to two times, and then pool the unlabeled fractions.
Note: Repeating the magnetic separation increases the yield, without a strong impact on the purity. The yield will typically increase about 8-10% with a second separation, and about 2-5% with a third separation. The purity may decrease 1-2% with each separation. Optional: Take a small aliquot before placing the tube in the magnet to monitor purity and yield.
Chart Protocol

biolegend.com
105
Application Notes:
To use this product in magnetic separation columns, a titration of the Nanobeads should be performed. Optimal concentration for magnetic separation columns is lot-specific. Please contact BioLegend Technical Service ([email protected]) for further assistance on how to use MojoSort™ Nanobeads in magnetic separation columns.
MojoSort™ Isolation Kits No-wash ProtocolReagent List
MojoSort™ Buffer (5X) (Cat. No. 480017)
MojoSort™ Magnet (Cat. No. 480019 | 480020) or compatible magnetic separation system
Adjustable pipettes
70 µm filters (one per sample)
5 mL (12 x 75 mm) or 14 mL (17 x 100 mm) polypropylene tubes
Reagents for sample preparation
Reagents and instruments (Flow cytometer) to determine yield and purity
Important Note:
MojoSort™ magnetic particles can be used with other commercially available magnetic separators, both free standing magnets and column-based systems. Because MojoSort™ protocols are optimized for the MojoSort™ separator; the protocols may need to be adjusted for other systems. Please contact BioLegend Technical Service ([email protected]) for more information and guidance. We do not recommend using MojoSort™ particles for BD’s IMag™ or Life Technologies’ DynaMag™.
Product Description and Procedure Summary:
Target cells are depleted by incubating the sample with the biotin antibody cocktail followed by incubation with magnetic Streptavidin Nanobeads (Cat. No. 480015 | 480016). The magnetically labeled fraction is retained by the use of a magnetic separator. The untouched cells are collected. These are the cells of interest; do not discard the liquid. Some of the downstream applications include functional assays, gene expression, phenotypic characterization, etc.
Protocol Steps:
Note: This protocol has been optimized to remove washing steps after antibody cocktail and nanobeads incubations, resulting in a shorter and more convenient protocol. This procedure is optimized for the isolation of 107 to 2 x 10⁸ cells per tube. If working with fewer than 107 cells, keep volumes as indicated for 107 cells. For best results, optimize the conditions to your specific cell number and tissue. Prepare fresh MojoSort™ Buffer solution by diluting the 5X concentrate with sterile distilled water. Scale up volumes if using 14 mL tubes and Magnet, and place the tube in the magnet for 10 minutes.
1. Prepare cells from your tissue of interest without lysing erythrocytes.
2. In the final wash of your sample preparation, resuspend the cells in MojoSort™ Buffer by adding up to 4 mL in a 5 mL (12 x 75 mm) polypropylene tube.
Note: Keep MojoSort™ Buffer on ice throughout the procedure.
3. Filter the cells with a 70µm cell strainer, centrifuge at 300 x g for 5 minutes, and resuspend in an appropriate volume of MojoSort™ Buffer. Count and adjust the cell concentration to 1 x 10⁸ cells/mL.
4. Aliquot 100 µL of cell suspension (107 cells) into a new tube. Add 10 µL of the Biotin-Antibody Cocktail, mix well and incubate on ice for 15 minutes. Scale up the volume accordingly if separating more cells. For example, add 100 µL for 1 x 10⁸ cells. When working with less than 107 cells, use indicated volumes for 107 cells.
Optional: Take an aliquot before adding the cocktail to monitor purity and yield.
5. Resuspend the beads by vortexing, maximum speed, 5 touches. Without washing, add 10 µL of Streptavidin Nanobeads. Mix well and incubate on ice for 15 minutes. Scale up the volume accordingly if separating more cells. For example, add 100 µL for 1 x 10⁸ cells. When working with less than 107 cells, use indicated volumes for 107 cells.
6. Add 3 mL of MojoSort™ Buffer.
Note: If you observe aggregates, filter the suspension. To maximize yield, you can disrupt the aggregates by pipetting the solution up and down.
7. Place the tube in the magnet for 5 minutes.
8. Pour out and collect the liquid. These are your cells of interest; DO NOT DISCARD.
9. If needed, add 3 mL of MojoSort™ Buffer and repeat steps 7 and 8 with the magnetically labeled fraction up to two times, and then pool the unlabeled fractions.
Note: Repeating the magnetic separation increases the yield, without a strong impact on the purity. The yield will typically increase about 8-10% with a second separation, and about 2-5% with a third separation. The purity may decrease 1-2% with each separation.
Optional: Take a small aliquot before placing the tube in the magnet to monitor purity and yield. Keep unused cells to be used as control or other applications if needed.
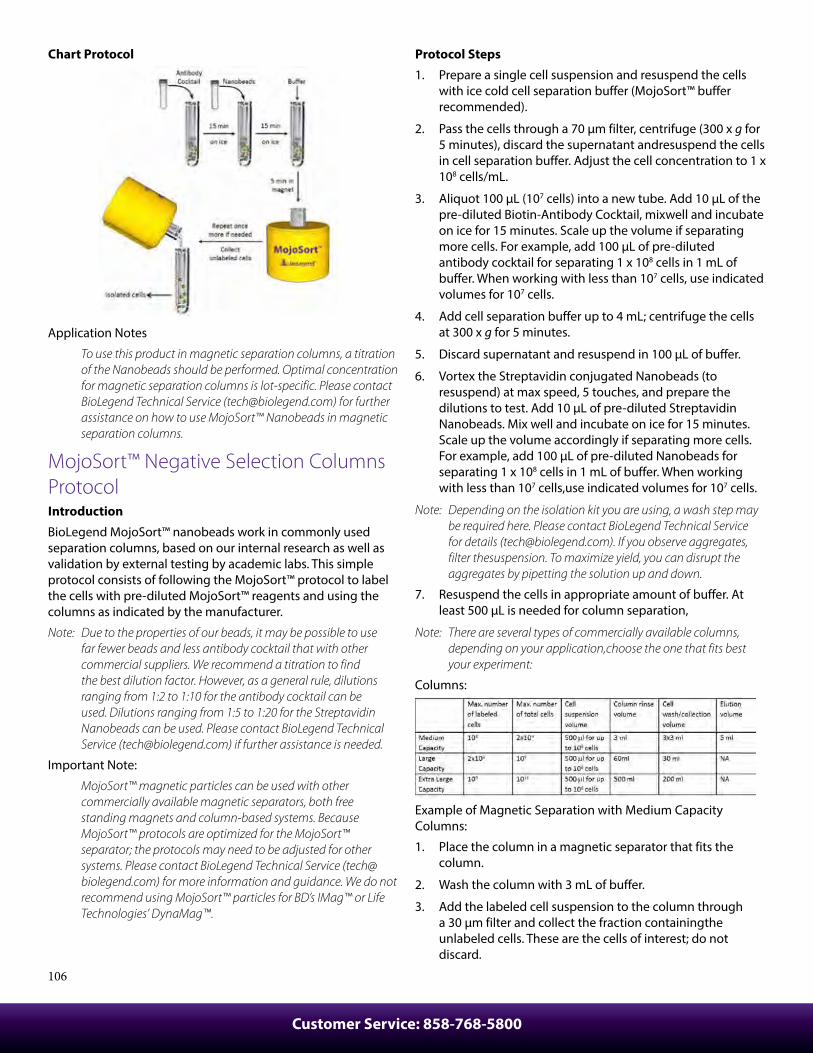
Customer Service: 858-768-5800
106
Chart Protocol
Application Notes
To use this product in magnetic separation columns, a titration of the Nanobeads should be performed. Optimal concentration for magnetic separation columns is lot-specific. Please contact BioLegend Technical Service ([email protected]) for further assistance on how to use MojoSort™ Nanobeads in magnetic separation columns.
MojoSort™ Negative Selection Columns ProtocolIntroduction
BioLegend MojoSort™ nanobeads work in commonly used separation columns, based on our internal research as well as validation by external testing by academic labs. This simple protocol consists of following the MojoSort™ protocol to label the cells with pre-diluted MojoSort™ reagents and using the columns as indicated by the manufacturer.
Note: Due to the properties of our beads, it may be possible to use far fewer beads and less antibody cocktail that with other commercial suppliers. We recommend a titration to find the best dilution factor. However, as a general rule, dilutions ranging from 1:2 to 1:10 for the antibody cocktail can be used. Dilutions ranging from 1:5 to 1:20 for the Streptavidin Nanobeads can be used. Please contact BioLegend Technical Service ([email protected]) if further assistance is needed.
Important Note:
MojoSort™ magnetic particles can be used with other commercially available magnetic separators, both free standing magnets and column-based systems. Because MojoSort™ protocols are optimized for the MojoSort™ separator; the protocols may need to be adjusted for other systems. Please contact BioLegend Technical Service ([email protected]) for more information and guidance. We do not recommend using MojoSort™ particles for BD’s IMag™ or Life Technologies’ DynaMag™.
Protocol Steps
1. Prepare a single cell suspension and resuspend the cells with ice cold cell separation buffer (MojoSort™ buffer recommended).
2. Pass the cells through a 70 µm filter, centrifuge (300 x g for 5 minutes), discard the supernatant andresuspend the cells in cell separation buffer. Adjust the cell concentration to 1 x 10⁸ cells/mL.
3. Aliquot 100 µL (107 cells) into a new tube. Add 10 µL of the pre-diluted Biotin-Antibody Cocktail, mixwell and incubate on ice for 15 minutes. Scale up the volume if separating more cells. For example, add 100 µL of pre-diluted antibody cocktail for separating 1 x 10⁸ cells in 1 mL of buffer. When working with less than 107 cells, use indicated volumes for 107 cells.
4. Add cell separation buffer up to 4 mL; centrifuge the cells at 300 x g for 5 minutes.
5. Discard supernatant and resuspend in 100 µL of buffer.
6. Vortex the Streptavidin conjugated Nanobeads (to resuspend) at max speed, 5 touches, and prepare the dilutions to test. Add 10 µL of pre-diluted Streptavidin Nanobeads. Mix well and incubate on ice for 15 minutes. Scale up the volume accordingly if separating more cells. For example, add 100 µL of pre-diluted Nanobeads for separating 1 x 10⁸ cells in 1 mL of buffer. When working with less than 107 cells,use indicated volumes for 107 cells.
Note: Depending on the isolation kit you are using, a wash step may be required here. Please contact BioLegend Technical Service for details ([email protected]). If you observe aggregates, filter thesuspension. To maximize yield, you can disrupt the aggregates by pipetting the solution up and down.
7. Resuspend the cells in appropriate amount of buffer. At least 500 µL is needed for column separation,
Note: There are several types of commercially available columns, depending on your application,choose the one that fits best your experiment:
Columns:
Example of Magnetic Separation with Medium Capacity Columns:
1. Place the column in a magnetic separator that fits the column.
2. Wash the column with 3 mL of buffer.
3. Add the labeled cell suspension to the column through a 30 µm filter and collect the fraction containingthe unlabeled cells. These are the cells of interest; do not discard.

biolegend.com
107
4. Wash the column 3 times with 3 mL of buffer and collect the fraction containing the untouched cells. Combine with the collected fraction from step 3.
5. If desired, the labeled cells can be collected by taking away the column from the magnet and place it on a tube. Then add 5 mL of buffer and flush out the magnetically labeled fraction with a plunger or supplied device. The labeled cells may be useful as staining controls, to monitor purity/yield, or other purposes.
Representative Data
Flow Cytometry. High purity and yield. "After Isolation" plots show purified population of interest using pre-diluted MojoSort™ reagents in separation columns.
Kit Purity Yield
Mouse CD4 T Cell Isolation Kit 95.7% 85%
Electron Microscopy. CD4+ T cells isolated with MojoSort™ CD4 T Cell Isolation Kit using columns do not display particles in the cell surface. Image is representative of 36 different cells.
CD4+ T cells isolated with MojoSort™ CD4 T Cell Isolation Kit using separation columns.
General Tips & FAQ
What dilution of the reagents shall I use?
Dilutions are lot-dependent please; contact [email protected] for recommended dilution.
MojoSort™ Positive Selection Columns ProtocolIntroduction
BioLegend MojoSort™ nanobeads work in commonly used separation columns, based on our internal research as well as validation by external testing by academic labs. This simple protocol consists of following the MojoSort™ protocol to label the cells with pre-diluted MojoSort™ reagents and using the columns as indicated by the manufacturer.
Note: Due to the properties of our beads, it may be possible to use far fewer beads than with other commercial suppliers. We recommend a titration to find the best dilution factor. However, as a general rule, dilutions ranging from 1:3 to 1:20 for the Nanobeads can be used. Please contact BioLegend Technical Service ([email protected]) if further assistance is needed.
Important Note:
MojoSort™ magnetic particles can be used with other commercially available magnetic separators, both free standing magnets and column-based systems. Because MojoSort™ protocols are optimized for the MojoSort™ separator; the protocols may need to be adjusted for other systems. Please contact BioLegend Technical Service ([email protected]) for more information and guidance. We do not recommend using MojoSort™ particles for BD’s IMag™ or Life Technologies’ DynaMag™.
Protocol Steps
1. Prepare a single cell suspension and resuspend the cells with ice cold cell separation buffer (MojoSort™ buffer is recommended).
2. Pass the cells through a 70 µm filter, centrifuge (300 x g for 5 minutes), discard the supernatant and resuspend the cells in cell separation buffer. Adjust the cell concentration to 1 x 10⁸ cells/mL.
3. Aliquot 100 µL (107 cells) into a new tube.
4. Vortex the antibody-conjugated Nanobeads (to resuspend) at max speed, 5 touches, and prepare the dilutions to test. Add 10 µL of pre-diluted conjugated Nanobeads. Mix well and incubate on ice for 15 minutes. Scale up the volume accordingly if separating more cells. For example, add 100 µL of pre-diluted Nanobeads for 1 x 10⁸ cells. When working with less than 107 cells, use indicated volumes for 107 cells.
Note: Depending on the conjugated nanobead you are using, a wash step may be required here. Please contact BioLegend Technical Service for details ([email protected]).
5. Resuspend the cells in appropriate amount of buffer. At least 500 µL is needed for column separation.
Note: There are several types of commercially available columns, depending on your application, choose the one that fits best your experiment:
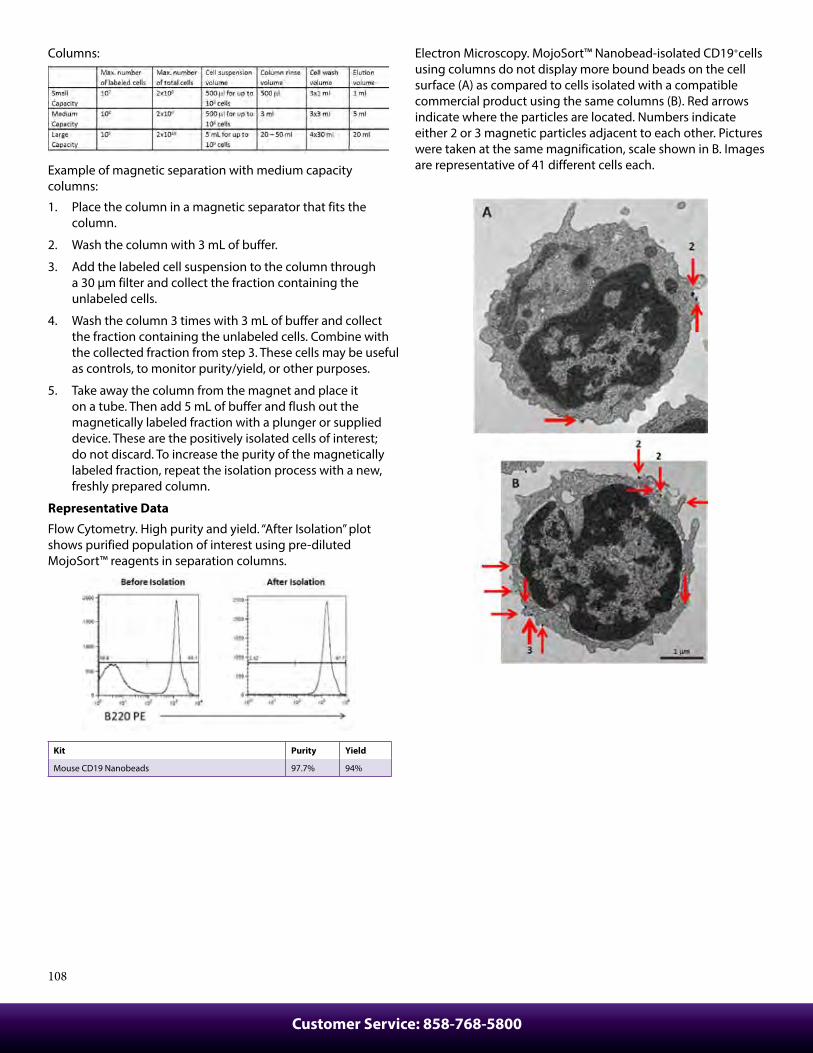
Customer Service: 858-768-5800
108
Columns:
Example of magnetic separation with medium capacity columns:
1. Place the column in a magnetic separator that fits the column.
2. Wash the column with 3 mL of buffer.
3. Add the labeled cell suspension to the column through a 30 µm filter and collect the fraction containing the unlabeled cells.
4. Wash the column 3 times with 3 mL of buffer and collect the fraction containing the unlabeled cells. Combine with the collected fraction from step 3. These cells may be useful as controls, to monitor purity/yield, or other purposes.
5. Take away the column from the magnet and place it on a tube. Then add 5 mL of buffer and flush out the magnetically labeled fraction with a plunger or supplied device. These are the positively isolated cells of interest; do not discard. To increase the purity of the magnetically labeled fraction, repeat the isolation process with a new, freshly prepared column.
Representative Data
Flow Cytometry. High purity and yield. “After Isolation” plot shows purified population of interest using pre-diluted MojoSort™ reagents in separation columns.
Kit Purity Yield
Mouse CD19 Nanobeads 97.7% 94%
Electron Microscopy. MojoSort™ Nanobead-isolated CD19+cells using columns do not display more bound beads on the cell surface (A) as compared to cells isolated with a compatible commercial product using the same columns (B). Red arrows indicate where the particles are located. Numbers indicate either 2 or 3 magnetic particles adjacent to each other. Pictures were taken at the same magnification, scale shown in B. Images are representative of 41 different cells each.

biolegend.com
109
Flex-T™ Tetramer and Cell Staining ProtocolBackground
Using UV-induced peptide exchange, MHC/peptide monomers can be generated with conditional Flex-T™ monomers that harbor peptides of interest in their binding grooves. These new MHC monomers are subsequently multimerized using streptavidin-fluorophore conjugates. The resulting Flex-T™ reagents can be used for staining antigen-specific T cells and flow cytometric analysis. In humans, the MHC molecules are called HLA (Human Leukocyte Antigen).
Reagent List
Phosphate buffered saline pH 7.4, 10X concentrate (PBS, BioLegend Cat. 926201)
Peptide Flex-T™ monomer UVX
DMSO (e.g., Sigma-Aldrich Cat. No. D5879)
50mM D-Biotin (e.g., Thermo Fisher, Cat. No. B20656)
10% (w/v) NaN3 (e.g., Sigma, Cat. No. S2002)
Fluorophore-conjugated Streptavidin (BioLegend Cat. No. 405203 | 405207 | 405225 or equivalent)
Cell Staining Buffer (BioLegend Cat. No. 420201 or equivalent)
96-well Polystyrene Microplate, U-shape (e.g., Falcon Cat. No. 353077) or 5 mL, 12 x 75mm tubes (e.g., Falcon Cat. No. 352008)
Plate sealers (BioLegend Cat. No. 423601)
1.5 mL tubes (e.g., Eppendorf Cat. No. 022364111)
Equipment
UV lamp, long-wave UV, 366 nm, 8 Watts (For example, CAMAG Cat. No. 022.9115, or Ultraviolet Crosslinker CL-1000L)
Incubator (37°C)
Centrifuge capable of accommodating microtiter plates and tubes
Single and multichannel pipettes capable of accurate delivery of variable volumes, and pipette tips
Tips: DMSO can be used to dissolve the peptides. However, do not exceed an end concentration of 10% (v/v) in the exchange reaction.
Avoid repeated freeze-thawing.
The Flex-T™/peptide solution needs to be kept on ice in the dark as much as possible. Do not work in front of a window.
The use of short-wavelength (254 nm) or broad-band UV lamps is detrimental to MHC complexes.
Centrifuge all vials before use (1 minute 3000 x g at 4°C).
Protocol Steps
Peptide Exchange:
1. Bring all reagents to 0°C by putting them on ice.
2. Dilute 10mM stock solutions of peptides of choice to 400 µM by mixing 5 µL of peptide stock solution with 120 µL PBS, and keep on ice.
3. Add 20 µL diluted peptide (400 µM) and 20 µL peptide Flex-T™ monomer UVX (200 µg/mL) into 96-well U bottom plate. Mix by pipetting up and down.
4. Seal the plate; centrifuge at 3300 x g for 2 minutes at 4°C to collect the liquid down.
5. Remove the seal; put the plate on ice and illuminate with UV light for 30 minutes (the distance of the UV lamp to the samples should be 2-5 cm).
6. Seal the plate; incubate for 30 minutes at 37°C in the dark.
7. To evaluate the efficiency of the peptide exchange, follow the Protocol for HLA class I ELISA to evaluate peptide exchange.
Generation of Tetramers:
8. Transfer 30 µL of peptide-exchanged monomer into a new plate, then add 3.3 µL of conjugated streptavidin, mix by pipetting up-and-down. Incubate on ice in the dark for 30 minutes. This is enough for about 15 tests.
Note: BioLegend fluorophore-conjugated streptavidin products are recommended. For 30 µL of exchanged Flex-T™ monomer, we suggest to use 3. 3 µL of BioLegend PE-streptavidin (Cat. No. 405203) or APC- streptavidin (Cat. No. 405207). For BV421™-streptavidin conjugate (Cat. No. 405225), use 1. 3 µL. For optimal reaction with other fluorophore-conjugated streptavidin products, ensure that the monomer:streptavidin conjugate has a 6:1 molar ratio.
(For our full list of Streptavidin conjugates, visit: biolegend.com/streptavidin_conjugates. Note that purified, biotinylated, HRP, MojoSort™, and Ultra Streptavidin (USA) kits are not recommended for this procedure.)
9. During the incubation, prepare blocking solution by adding 1. 6 µL 50 mM D-Biotin and 6 µL 10% (w/v) NaN3 to 192. 4 µL PBS, mix by vortexing. After the incubation, add 2.4 µL of blocking solution and pipette up-and-down to stop the reaction.
10. Seal the plate and incubate at 2-8°C overnight (or on ice for 30 minutes in the dark).
Tip: We recommend Flex-T™ to be assembled with two different streptavidin conjugates in separate reactions. This allows for two-color staining with the same tetramer allele, ensuring the highest specificity.

Customer Service: 858-768-5800
110
Cell Staining and Flow Cytometric Analysis:
11. Prepare cells of interest.
12. Prior to performing staining, centrifuge the plate at 3300 x g for 5 minutes at 4°C. Keep on ice in the dark.
13. Add 2 x 10⁶ cells to a 96-well U-bottom plate or 12 x 75 mm tubes. Adjust volume to 200 µL with Cell Staining Buffer. Add 2 µL per sample of Flex-T™ complex prepared in Steps 7-9, mix and incubate on ice in the dark for 30 minutes.
14. If co-staining with surface antibodies, prepare the antibody cocktail based on optimal staining concentration of each reagent. Incubate for 30 minutes on ice in the dark.
15. Wash the cells with Staining Buffer two times. Resuspend cells with Staining Buffer.
16. Acquire the samples with a flow cytometer and appropriate settings within 2 hours.
Tip: A titration of the Flex-T™ is recommended for optimal performance.
Representative Data:
A) CD8+ T Cells, previously gated on lymphocytes (FSC vs SSC) and 7-AAD negative events, were stained with FITC anti-CD8a and an exclusion cocktail containing Alexa Fluor® 700 anti-CD4, CD19, CD14, and CD16.
B) Antigen specific CD8+ T Cells, gated as described, were detected with Flex-T™ tagged with PE and APC. HLA-A*11:01 Flex-T™ was loaded with an EBV peptide (IVTDFSVIK).
Chart Protocol

biolegend.com
111

Contact BioLegend
Customer Service:
US & Canada Toll-Free: 1.877.246.5343 (877-BIOLEGEND)
International: 1.858.768.5800
Fax: 1.877.455.9587
email: [email protected]
Technical Service:
US & Canada Toll-Free: 1.877.273.3103
International: 1.858.768.5801
email: [email protected]
Headquarters:
BioLegend
9727 Pacific Heights Blvd.
San Diego, CA 92121
USA
International Offices
Europe:BioLegend4B Highgate Business Centre 33 Greenwood PlaceLondon NW5 1LBUnited KingdomTel: +44 (0) 20 3475 3880 Fax: +44 (0) 20 3318 3271email Inquiries: [email protected] Technical Support: [email protected]
Japan:BioLegend8F, SB bldg., 1-4-6, Nezu, Bunkyo-ku, Tokyo113-0031, JapanTel: +81-3-3823-9071Fax: +81-3-3823-9072email: [email protected] biolegend.com/jp
For complete worldwide ordering details, visit: biolegend.com
BioLegend is ISO 9001:2008 and ISO 13485:2003 Certified