Sense of Community in New Zealand Neighbourhoods: A Multi-Level Model Predicting Social Capital
11
New Zealand Journal of Psychology Vol. 42, No. 1, 2013 • 36 • Nikhil K. Sengupta, Nils Luyten, Lara M. Greaves, Danny Osborne, Andrew Robertson, Gavin Armstrong & Chris G. Sibley R esearch in community psychology has identified Sense of Community (SoC) as an important predictor of well-being (McNeill, Kreuter, & Subramanian, 2006). SoC is a core component of social capital, and can be defined as “the sense that one was part of a readily supportive network of relationships upon which one could depend” (Saranson, 1974, p. 1). For example, Berry and Welsh (2010) found that SoC had a unique positive relation with both psychological and physical well-being in a representative sample of 11,709 Australians. This effect could not be explained by gender, age, indigenous status, education, responsibility for dependents, paid work, living alone or poverty. Similarly, in an analysis of 117,569 Dutch residents in 10,381 neighbourhoods, Sense of Community in New Zealand Neighbourhoods: A Multi-Level Model Predicting Social Capital van Hooijdonk, Droomers, Deerenberg, Mackenbach, and Kunst (2008) reported that neighbourhoods with a high SoC had lower mortality risks for cancer and suicide compared to neighbourhoods with a low SoC, controlling for gender, age, marital status, ethnic origin and place of residence. There are a number of ways in which SoC is thought to promote wellbeing. First, the social support accrued through high SoC can enable the fulfilment of the basic need to belong (Baumeister & Leary, 1995). Second, SoC may promote increased physical and mental health by facilitating increased health-related behaviours and promoting better access to services and amenities (e.g., more relevant information obtained through an extensive social network; Kawachi and Berkman 2000, 2001). Increasing people’s SoC may have measurable and substantial economic benefits across society by decreasing the down-stream burden that low levels of SoC cause on various outcomes, such as, for example, reduced financial strain on the healthcare system resulting from net increased population health. Given its importance in promoting wellbeing, community psychologists have studied SoC in a great variety of community types, such those based on sexual orientation (McLaren, Gomez, Bailey, & Van Der Horst, 2007), nationality (Bathum & Baumann, 2007) and organizational membership (Hughey, Peterson, Lowe, & Oprescu, 2008). Empirical research on these effects in the New Zealand context is scarce. Closer to home, available research does indicate that feelings of connection and satisfaction with one’s community and society are linked with subjective wellbeing for both Pacific peoples (Manuela & Sibley, in press) and for Māori (Houkamau & Sibley, 2010, 2011). However, most SoC research, both that in New Zealand and overseas, has tended to focus on individuals within particular neighbourhoods (Prezza, Amici, Roberti, & Tedeschi, 2001). Research examining the contribution that different objective neighbourhood- level factors have on residents’ SoC, as well as the use of appropriate multi-level modelling techniques, remains scarce (for important exceptions, see Comstock et al., 2010; Flaherty & Brown, 2010; Long & Perkins, 2007; Sampson, 1988). Our study aims to contribute to Feeling like one belongs and is accepted in meaningful social groups has been reliably linked to wellbeing and health-related outcomes in numerous studies. Given the importance of belongingness as a form of social capital, we developed and evaluated a broad-scale Multilevel Random Coefficient Model predicting residents’ sense of community (belongingness in the community) in a large nationally representative telephone sample of New Zealanders (N = 6631). Our model integrated both neighbourhood-level characteristics (e.g., regional deprivation and the proportion of smokers) and person-level characteristics (e.g., income, perceptions of local community problems, age and engagement in sports) within a single unified framework. We organized these variables into two conceptual categories that are either (a) costly (or entirely unfeasible) to change or (b) feasible to change. By contrasting these various features within a single unified model with a multi- level structure, we provide base-rate information which can aid in informing policy decisions regarding the most readily applicable (and possibly cost- effective) methods for improving residents’ sense of community. Our model identified the following feasible methods of increasing social capital within New Zealand communities: (a) reducing noise pollution, (b) increasing and promoting participation in local sports teams, and (c) increasing the diversity and appreciation of the local arts scene. Nikhil K. Sengupta, University of Auckland Nils Luyten, Katholieke Universiteit Leuven Lara M. Greaves, University of Auckland Danny Osborne, University of Auckland Andrew Robertson, Colmar Brunton Gavin Armstrong, Wellington City Council Chris G. Sibley, University of Auckland
Transcript of Sense of Community in New Zealand Neighbourhoods: A Multi-Level Model Predicting Social Capital

New Zealand Journal of Psychology Vol. 42, No. 1, 2013• 36 •
Nikhil K. Sengupta, Nils Luyten, Lara M. Greaves, Danny Osborne, Andrew Robertson, Gavin Armstrong & Chris G. Sibley
Research in community psychology has identified Sense of Community
(SoC) as an important predictor of well-being (McNeill, Kreuter, & Subramanian, 2006). SoC is a core component of social capital, and can be defined as “the sense that one was part of a readily supportive network of relationships upon which one could depend” (Saranson, 1974, p. 1). For example, Berry and Welsh (2010) found that SoC had a unique positive relation with both psychological and physical well-being in a representative sample of 11,709 Australians. This effect could not be explained by gender, age, indigenous status, education, responsibility for dependents, paid work, living alone or poverty. Similarly, in an analysis of 117,569 Dutch residents in 10,381 neighbourhoods,
Sense of Community in New Zealand Neighbourhoods:
A Multi-Level Model Predicting Social Capital
van Hooijdonk, Droomers, Deerenberg, Mackenbach, and Kunst (2008) reported that neighbourhoods with a high SoC had lower mortality risks for cancer and suicide compared to neighbourhoods with a low SoC, controlling for gender, age, marital status, ethnic origin and place of residence.
There are a number of ways in which SoC is thought to promote wellbeing. First, the social support accrued through high SoC can enable the fulfilment of the basic need to belong (Baumeister & Leary, 1995). Second, SoC may promote increased physical and mental health by facilitating increased health-related behaviours and promoting better access to services and amenities (e.g., more relevant information obtained through an extensive social network; Kawachi
and Berkman 2000, 2001). Increasing people’s SoC may have measurable and substantial economic benefits across society by decreasing the down-stream burden that low levels of SoC cause on various outcomes, such as, for example, reduced financial strain on the healthcare system resulting from net increased population health.
Given its importance in promoting wellbeing, community psychologists have studied SoC in a great variety of community types, such those based on sexual orientation (McLaren, Gomez, Bailey, & Van Der Horst, 2007), nationality (Bathum & Baumann, 2007) and organizational membership (Hughey, Peterson, Lowe, & Oprescu, 2008). Empirical research on these effects in the New Zealand context is scarce. Closer to home, available research does indicate that feelings of connection and satisfaction with one’s community and society are linked with subjective wellbeing for both Pacific peoples (Manuela & Sibley, in press) and for Māori (Houkamau & Sibley, 2010, 2011). However, most SoC research, both that in New Zealand and overseas, has tended to focus on individuals within particular neighbourhoods (Prezza, Amici, Roberti, & Tedeschi, 2001). Research examining the contribution that different objective neighbourhood-level factors have on residents’ SoC, as well as the use of appropriate multi-level modelling techniques, remains scarce (for important exceptions, see Comstock et al., 2010; Flaherty & Brown, 2010; Long & Perkins, 2007; Sampson, 1988).
Our study aims to contribute to
Feeling like one belongs and is accepted in meaningful social groups has been reliably linked to wellbeing and health-related outcomes in numerous studies. Given the importance of belongingness as a form of social capital, we developed and evaluated a broad-scale Multilevel Random Coefficient Model predicting residents’ sense of community (belongingness in the community) in a large nationally representative telephone sample of New Zealanders (N = 6631). Our model integrated both neighbourhood-level characteristics (e.g., regional deprivation and the proportion of smokers) and person-level characteristics (e.g., income, perceptions of local community problems, age and engagement in sports) within a single unified framework. We organized these variables into two conceptual categories that are either (a) costly (or entirely unfeasible) to change or (b) feasible to change. By contrasting these various features within a single unified model with a multi-level structure, we provide base-rate information which can aid in informing policy decisions regarding the most readily applicable (and possibly cost-effective) methods for improving residents’ sense of community. Our model identified the following feasible methods of increasing social capital within New Zealand communities: (a) reducing noise pollution, (b) increasing and promoting participation in local sports teams, and (c) increasing the diversity and appreciation of the local arts scene.
Nikhil K. Sengupta, University of AucklandNils Luyten, Katholieke Universiteit Leuven
Lara M. Greaves, University of AucklandDanny Osborne, University of Auckland
Andrew Robertson, Colmar BruntonGavin Armstrong, Wellington City Council
Chris G. Sibley, University of Auckland

• 37 •New Zealand Journal of Psychology Vol. 42, No. 1, 2013
Sense of Community
this literature by identifying both person-level and neighbourhood-level predictors of SoC in the New Zealand context. Person-level predictors are those aspects of the individual that predict why some people develop a higher SoC than others who live in neighbourhoods with similar characteristics. Neighbourhood-level predictors, in contrast, are the contextual variables that explain why some neighbourhoods develop into thriving communities whereas others do not. To do this, we analyse a large-scale national sample that combines person-level data from over 6000 New Zealand inhabitants with meshblock-level data on neighbourhood characteristics (New Zealand has a total population of roughly 4.4 million). Person-level data were obtained from self-reports of demographics, levels of participation in community activities and attitudes towards various aspects of the neighbourhood. These reflect manifest measures relating to people themselves, their demographics, their experiences, and their opinions of social issues. Neighbourhood-level data were obtained from census information for each mesh-block area unit. These therefore reflect aspects of the neighbourhoods people live in, a direct indictor of their surrounding context and community.
Our second aim is to extend the available information for policy makers about which characteristics of individuals (and their neighbourhoods) may be ripe for interventions designed to increase the SoC in New Zealand (and possibly in other Western nations). To this end, we make an important theoretical distinction, at both levels of analysis, between factors that can be assumed to be feasible for policy interventions, versus those that would be costly, impractical, or otherwise unfeasible to target for interventions. At the individual level, attitudes towards various aspects of the community and participation in group activities can be seen as amenable to change, whereas demographic characteristics such as gender, age and income are not. At the neighbourhood level, the availability of recreational spaces can be improved through policy initiatives, whereas the levels of income inequality may be relatively less changeable through
standard policy-based interventions.
Previous research on person- and neighbourhood-level predictors of SoC
To understand what predicts SoC we must take into account aspects of the individual and aspects of the neighbourhood in which the individual resides. Examples of person-level predictors of SoC are residents’ age, ethnicity, gender, education, income, their attitudes and perception towards membership in local community clubs. Most of the research addressing these predictors has involved small-scale comparative studies of two or more towns or neighbourhoods. This broad body of international research generally indicates that that person-level factors such as years of residence, trust in the government, number of children and living with a spouse are all positively correlated with person-level SoC (Prezza, et al., 2001; Prezza, Pacilli, Barbaranelli, & Zamporri, 2009).
In one of the few large-scale surveys on person-level SoC, Young, Russell and Powers (2004) investigated 9445 elderly Australian women’s SoC. SoC was measured at the person-level using items that inquired about the willingness to help neighbours, the amount of neighbourhood trust and respect, the quality of friendships, the extent of common interests and the willingness to move. Results indicated that SoC was lower for separated and divorced women compared to married, widowed and never married women. An increased ease of managing on one’s existing income was also positively associated with SoC, as were years of residence and the amount of regular physical activity that people engage in.
It is possible that neighbourhood-level variables (e.g., availability of local parks, level of material deprivation versus affluence, accessibility to public transport, neighbourhood ethnic diversity) also affect peoples’ SoC. Volker, Flap and Lindenberg (2007) proposed four broad neighbourhood-level conditions that might facilitate the creation of SoC. These are (a) that the neighbourhood has meeting places, (b) that neighbours are, given their resources and interests, motivated to invest in local relationships, (c) that neighbours have few relations
outside of the neighbourhood, and (d) that neighbours are mutually interdependent. The authors indexed mutual interdependence by matching Dutch zip codes to identify the extent to which members of the community lived within easy walking distance of one another, as well as whether or not these neighbourhoods contained physical barriers to communication. Analysing data from 1,007 Dutch neighbourhood residents, their results indicated that all four neighbourhood-level conditions contributed to the community formation of Dutch neighbourhoods. That said, interdependence among neighbours had the strongest impact on community creation relative to the remaining three neighbourhood-level conditions.
Smaller-scale comparative studies have also shown that SoC tends to be higher in neighbourhoods with more parks (Kim & Kaplan, 2004) and neighbourhoods with a higher walkability (Leyden, 2003), which likely relates to the increased promotion of both social connections between people and the increased ease at promoting an active lifestyle.
T o s u m u p , n u m e r o u s neighbourhood-level predictors of SoC have been identified in the literature, most of which relate to variables that either separately or jointly reflect variation in the social connections between people and the ease with which neighbourhood-level conditions promote an active lifestyle. Numerous individual-level factors (i.e., characteristics of the individual) have also been identified as key correlates of SoC. For our purposes, many of these demographic variables represent important covariates that are not in and of themselves of practical importance. This is because such variables are unfeasible targets for social policies designed to increase people’s SoC.
Overview of the present researchIn the present paper, we document
a multilevel model capitalizing on the rich and nationally representative data garnered from telephone interviews conducted across New Zealand. This allows us to uniquely model the relative contribution that feasible and unfeasible characteristics of both the individual and his/her neighbourhood have on overall levels of SoC. Examples of feasible

New Zealand Journal of Psychology Vol. 42, No. 1, 2013• 38 •
Nikhil K. Sengupta, Nils Luyten, Lara M. Greaves, Danny Osborne, Andrew Robertson, Gavin Armstrong & Chris G. Sibley
features are: group activities in the local region, use of public transport, and the perception of local social issues (e.g., graffiti and noise pollution). Examples of unfeasible features are: regional deprivation versus affluence, the proportion of smokers in the local region, household ownership, income and education.
By simultaneously assessing these various features in a single model, our analyses provide policy makers with reliable information on the relative benefits of implementing policies aimed at improving SoC by targeting any of the predictors in our model. Our model can be used, for example, to provide base-rate information regarding the relative SoC ‘pay-off’ (or predicted increase in SoC) that will result from a change in factors such as (a) reducing the perceived level of noise pollution in one’s neighbourhood, (b) increasing access to public transport, (c) increasing access to sports teams, or (d) improving the diversity of the local arts scene, to name but a few.
MethodParticipants
Participants were 6631 members of the New Zealand population sampled as part of the 2008 Quality of Life Study (QoLS). The study sampled a total of 8155 people. We limited our analyses to the 81% of the sample who provided complete data and were over 18 years of age. The majority of missing data was due to non-reports for household income.
The sample ana lyzed he re comprised 3444 women and 3187 men. Participants’ mean age was 45.83 years (SD = 16.62). In terms of ethnicity, 5311 participants identified as NZ European, 842 identified as Māori, 334 identified as being of Pacific Nations ancestry, 593 identified with an Asian ethnic group, and 82 were coded as other/unreported (ethnic group categories were not mutually exclusive, as some participants selected multiple ethnic group memberships). The mean household income of people in the sample was $NZ 79,481 (SD = 49,323).
Sampling strategy The QoLS is a telephone interview
jointly funded by the Ministry of Social
Development and the Territorial Local Authorities of the 12 major cities in New Zealand. The 2008 QoLS was conducted between 16th July and 28th October 2008. The response rate was 37%. Full details regarding the QoLS sampling procedure and interview items are provided in the Quality of Life 2008 Survey National Report (2009). Participants over 18 years of age were selected from a version of the New Zealand electoral roll with tele-matched linking to residential phone numbers. The QoLS sampled 500 people from each of the 12 major cities of New Zealand and a further 2000 residents from outside the city regions (56% of the New Zealanders live within the 12 city regions).
The sampling strategy included quotas that were within 2% of national proportions based on 2006 census data for gender, ethnicity and age range. Booster samples of area units with a high number of ethnic minority peoples were included in order to meet the ethnic group sampling quota. Sampling 500 people within each region introduced a specific sample bias, as it allowed each region to have an equal weight in overall population estimates, when the proportion of people in each region of the country differs substantially. To correct for this, all analyses applied a weighting factor adjusting for sampling bias introduced by deliberately sampling equal numbers of people from different regions, given that the different regions and cities of New Zealand differ in population size. This weighting procedure was derived specifically for this paper and applied to the final sample analyzed here (see Appendix for details). The use of this weighting procedure thus allowed us to estimate model parameters that should represent the national average had a random sample been conducted across regions (rather than within regions).
Interview procedure Participants were mailed a pre-
notification letter and then phoned within two weeks of being sent the letter and invited to complete the interview (allowing three days for letter arrival). Several attempts were made to contact participants and, once initial contact had been made, a maximum of eight attempts were made to re-contact participants at a time suitable for the
interview. Interviews took an average of 20.3 minutes to complete.
Person-level measuresSense of Community (SoC) was
measured by asking participants to rate, on a scale of 1 to 5, how strongly they agreed with the following statements: “It's important to me to feel a sense of community with people in my local neighbourhood” and “I feel a sense of community with others in my local neighbourhood.” Responses to these two items were strongly positively correlated and were averaged to give an overall measure of SoC (r(6629) = .63, p <.01) (M = 3.78, SD =.91).
Felt loneliness was measured by asking participants to rate their “feelings of loneliness and isolation” on a scale from 1 (most of the time) to 5 (never) (M = .98, SD = .14). Participation in sports, church and voluntary community work were assessed by asking people “Thinking now about the social networks and groups you may be part of. Do you belong to any of the following?” The three options of interest were nested within a larger set of social network questions.
Attitudes toward public transport were assessed by asking participants to evaluate the following five aspects of public transport in their local region: affordability, safety, accessibility, frequency of usage and reliability. Each item was rated on a scale from 1 (strongly disagree) to 5 (strongly agree). These five items were strongly inter-correlated (r = .52; Cronbach’s α = .84) and were averaged to give an overall scale score of attitudes toward public transport (M = 1.90, SD = 2.01).
Attitudes toward the accessibility of local parks were indexed by asking participants to rate “how easy or difficult is it for you to get to a local park or other green space in [your local region]” on a scale from 1 (very difficult) to 5 (very easy) (M = 3.73, SD = 1.03). Attitudes toward the diversity of the local arts scene were assessed by asking participants to rate their agreement with the statement “The area where I live has a culturally rich and diverse arts scene” on a scale from 1 (strongly disagree) to 5 (strongly agree) (M = 4.61, SD = .78).
Feelings of safety in the local community were indexed by asking

• 39 •New Zealand Journal of Psychology Vol. 42, No. 1, 2013
Sense of Community
participants “how safe or unsafe you would feel in the following situations...” The situations were: “Walking alone in your neighborhood after dark”, “In your city centre during the day” and “In your city centre after dark.” Feelings of safety in each situation were rated on a scale from 1 (very unsafe) to 4 (very safe). Ratings of these three situations were highly inter-correlated (r = .46; Cronbach’s α = .71) and were averaged to give an overall scale score of feelings of safety in the local community (M = 3.21, SD = .51). This scale has been previously validated using QoL data by Sibley et al. (in press).
Perceptions of local problems were assessed by asking participants “have any of the following been a problem in [participant’s local region] over the last twelve months?” The items examined were: “Air pollution”, “Water pollution including pollution in streams, rivers, lakes and in the sea”, “Noise pollution”, “Rubbish or litter lying on the streets”, “Graffiti or tagging” and “Dangerous driving including drink driving and speeding.” Responses were dummy coded 0 (not seen as a local problem) and 1 (seen as a local problem). The proportion of people who thought that these issues had been a problem in their local area over the previous year were as follows: air pollution (17.9%), water pollution (35.1%), noise pollution (30.7%), rubbish (47.5%), graffiti (67.7%), dangerous driving (69.5%).
Regional factorsStatistics New Zealand separates
the country into 1787 Census Area Units. The mean resident population of these area units is 2253 (SD = 1587), although some area units in remote regions have extremely few people living in them. Statistics New Zealand provides detailed aggregate census information about the demographic characteristics of people residing in these areas, and we employed this information in our model predicting participants’ SoC. The participants in the QoLS (N = 6631) were nested within 1277 Census Area Units, with a little over five people on average sampled per area unit (M = 5.19, SD = 5.46, range 1-40). We extracted neighbourhood-level measures of median age, the proportion of residents in a marital relationship and the proportion of
smokers in the neighbourhood. We also employed the NZDep2006 index of regional deprivation as a broad indicator of the Socio-Economic Status of each region.
The NZDep2006 assigns a ranked decile score from 1 (most affluent) to 10 (most impoverished) to each area unit (White, Gunston, Salmond, Atkinson, & Crampton, 2008). These deprivation scores are based on a Principal Components Analysis of the following nine variables from the census (in weighted order): proportion of adults who received a means-tested benefit, household income, proportion who do not own their home, proportion of single-parent families, proportion who are unemployed, proportion who lack qualifications, proportion of household crowding, proportion with no telephone access, and proportion with no car access. The mean NZDep2006 score in our sample of 1277 Census Area Units was 5.48 (SD = 2.89).
Data AnalysesWe constructed a Multilevel
Random Coefficient Model (MRCM) where participants (n = 6,631) were nested within Census Area Units (n = 1,277). Our use of MRCM allowed us to adjust for possible non-independence arising because people living in the same area unit may share more features in common, on average, than they do with people living in other unit areas. We estimated the intercept as a random effect which allowed the intercepts for SoC to vary across areas. The random effect for the intercept was significant indicating that, as expected, mean levels of SoC differed across regions (χ2(1271) = 1985.14, p < .01, τ2 = .03, σ2 = .65). Given the small number of people sampled per area unit (M = 5.19 people per area unit), we treated all slopes as fixed. Our MRCM model explored the extent to which various area-level and participant-level variables uniquely contributed to predicting participant’s SoC. We refer the reader to Raudenbush and Bryk (2002) for a review of the technical basis of MRCM, and Christ, Sibley and Wagner (2012) for a recent review of MRCM applied to the social sciences.
ResultsThe resu l t s o f our MRCM
predicting SoC are presented in Table 1. The model included two broad conceptual classes of variables: features and covariates that are unfeasible to change (which included both area-level and person-level variables), and features that are feasible to change (which included person-level variables such as felt loneliness, attitudes toward characteristics of the local region, and perceptions of local problems). A key strength of our model was that, given the large sample size, we had adequate statistical power to consider all of these variables within a unified model, and thus examine the unique concurrent effect of each variable on SoC while simultaneously controlling for all other predictors.
We focus solely on unstandardized beta coefficients in our MRCM. The b coefficients in Table 1 can be interpreted in the same way as unstandardized coefficients in a normal (fixed-effects) multiple regression, where the coefficient represents the extent to which each one-unit change in the predictor variable would lead to a corresponding x-unit change in the outcome variable, in this case SoC. Again, the model provides the predicted effects of each predictor variable on SoC controlling for all other predictors (i.e., the unique effect of each predictor holding all other variables in the model constant).
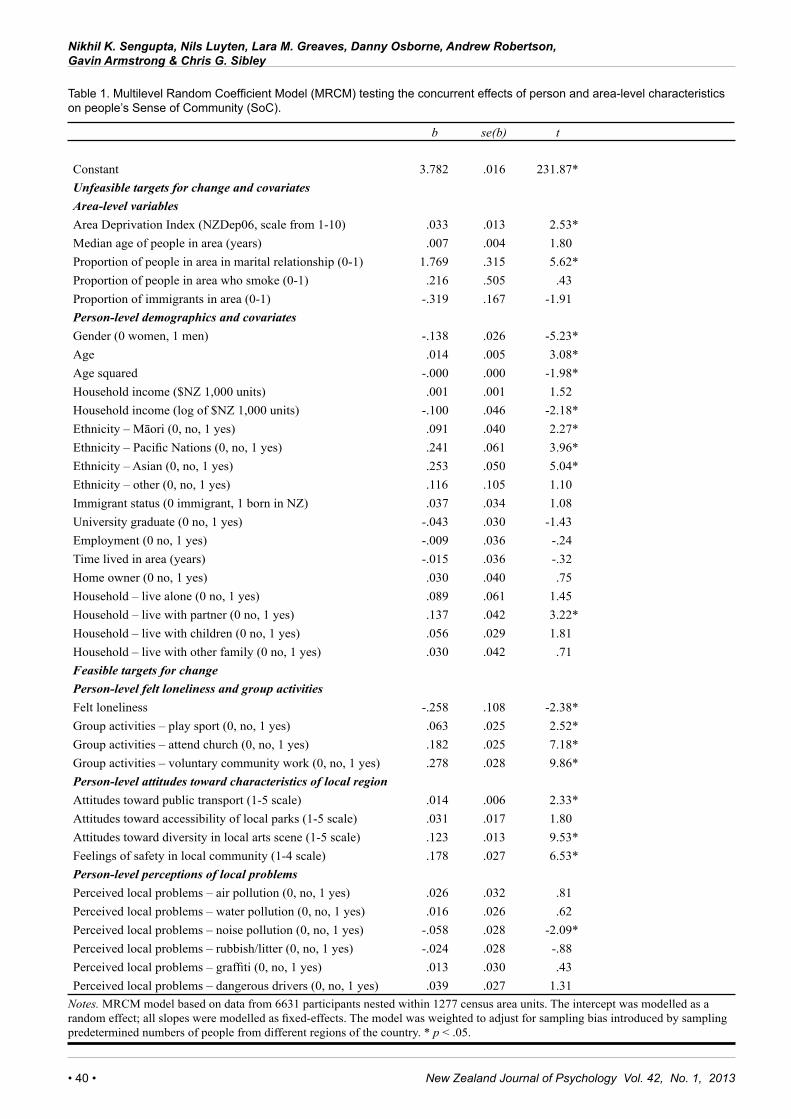
As shown in Table 1 , two neighbourhood-level variables emerged as significant predictors of SoC: level of objective deprivation and the proportion of married people in the neighbourhood. Higher area-level deprivation was associated with higher SoC (b = .033, SE = .013) and neighbourhoods with a greater proportion of people in marital relationships were also higher in SoC (b = 1.769, SE = .315). Several demographic factors also significantly predicted SoC, including gender, age, household income, ethnicity and cohabitation with a partner. Men were higher on SoC than women (b = -.138, SE = .026), older people were higher on SoC than younger people (b = .014, SE = .005). Māori (b = .091, SE = .040), Pacific (b = .241, SE = .061) and Asian people (b = .253, SE = .050) were all higher on SoC than New Zealand Europeans/Pākehā.
New Zealand Journal of Psychology Vol. 42, No. 1, 2013• 40 •
Nikhil K. Sengupta, Nils Luyten, Lara M. Greaves, Danny Osborne, Andrew Robertson, Gavin Armstrong & Chris G. Sibley
b se(b) t
Constant 3.782 .016 231.87*Unfeasible targets for change and covariatesArea-level variablesArea Deprivation Index (NZDep06, scale from 1-10) .033 .013 2.53*Median age of people in area (years) .007 .004 1.80Proportion of people in area in marital relationship (0-1) 1.769 .315 5.62*Proportion of people in area who smoke (0-1) .216 .505 .43Proportion of immigrants in area (0-1) -.319 .167 -1.91Person-level demographics and covariatesGender (0 women, 1 men) -.138 .026 -5.23*Age .014 .005 3.08*Age squared -.000 .000 -1.98*Household income ($NZ 1,000 units) .001 .001 1.52Household income (log of $NZ 1,000 units) -.100 .046 -2.18*Ethnicity – Māori (0, no, 1 yes) .091 .040 2.27*Ethnicity – Pacific Nations (0, no, 1 yes) .241 .061 3.96*Ethnicity – Asian (0, no, 1 yes) .253 .050 5.04*Ethnicity – other (0, no, 1 yes) .116 .105 1.10Immigrant status (0 immigrant, 1 born in NZ) .037 .034 1.08University graduate (0 no, 1 yes) -.043 .030 -1.43Employment (0 no, 1 yes) -.009 .036 -.24Time lived in area (years) -.015 .036 -.32Home owner (0 no, 1 yes) .030 .040 .75Household – live alone (0 no, 1 yes) .089 .061 1.45Household – live with partner (0 no, 1 yes) .137 .042 3.22*Household – live with children (0 no, 1 yes) .056 .029 1.81Household – live with other family (0 no, 1 yes) .030 .042 .71Feasible targets for change Person-level felt loneliness and group activitiesFelt loneliness -.258 .108 -2.38*Group activities – play sport (0, no, 1 yes) .063 .025 2.52*Group activities – attend church (0, no, 1 yes) .182 .025 7.18*Group activities – voluntary community work (0, no, 1 yes) .278 .028 9.86*Person-level attitudes toward characteristics of local regionAttitudes toward public transport (1-5 scale) .014 .006 2.33*Attitudes toward accessibility of local parks (1-5 scale) .031 .017 1.80Attitudes toward diversity in local arts scene (1-5 scale) .123 .013 9.53*Feelings of safety in local community (1-4 scale) .178 .027 6.53*Person-level perceptions of local problems Perceived local problems – air pollution (0, no, 1 yes) .026 .032 .81Perceived local problems – water pollution (0, no, 1 yes) .016 .026 .62Perceived local problems – noise pollution (0, no, 1 yes) -.058 .028 -2.09*Perceived local problems – rubbish/litter (0, no, 1 yes) -.024 .028 -.88Perceived local problems – graffiti (0, no, 1 yes) .013 .030 .43Perceived local problems – dangerous drivers (0, no, 1 yes) .039 .027 1.31
Table 1. Multilevel Random Coefficient Model (MRCM) testing the concurrent effects of person and area-level characteristics on people’s Sense of Community (SoC).
Notes. MRCM model based on data from 6631 participants nested within 1277 census area units. The intercept was modelled as a random effect; all slopes were modelled as fixed-effects. The model was weighted to adjust for sampling bias introduced by sampling predetermined numbers of people from different regions of the country. * p < .05.

• 41 •New Zealand Journal of Psychology Vol. 42, No. 1, 2013
Sense of Community
Household income was negatively associated with SoC (b = -.100, SE = .046). Thus, when statistically adjusting for all other factors in our unified model, poorer people tended to experience a greater SoC. Regional deprivation was also positively associated with SoC, independent of income, showing this same effect. These variables are relatively unfeasible to change via simple public policy remedies and, therefore, represent important covariates in our model.
In terms of features of the individual and local community that are feasible to change via public policy, three classes of variables predicted SoC: social support and involvement in group activities, attitudes towards the local region and perceptions of local problems. Those who experienced higher levels of social support (indexed in terms of lower levels of felt loneliness) were higher on SoC (b = .258, SE = .108), as were those who played in a local sports team (b = .063, SE = .025), attended church (b = .182, SE = .025) and volunteered in their communities (b = .278, SE = .028). In terms of attitudes towards the local region, more positive perceptions of public transport in the region (b = .014, SE = .006), positive appraisals of the local arts scene (b = .123, SE = .013) and feelings of safety in the community (b = .178, SE = .027) were associated with higher levels of SoC. Finally, only one aspect of local problems was significantly associated with SoC. A higher perception of noise pollution in one’s community predicted significantly lower SoC (b = -.058, SE = .028). This means that when targeting interventions to improve SoC, allowing people greater opportunity to participate in group activities, improving the diversity of a community’s arts scene, improving public transport and reducing noise pollution may be effective strategies worth considering.
DiscussionFeeling like one belongs and is
accepted in meaningful social groups has been reliably linked to wellbeing and health-related outcomes in numerous studies (see Baumeister & Leary, 1995). Given the importance of belongingness as a form of social capital, we developed and evaluated a broad-scale multi-level
model predicting residents’ SoC in a large nationally representative telephone sample of New Zealanders. Our model included both neighbourhood-level characteristics and person-level characteristics as predictors of SoC. We organized these variables into two conceptual categories, those representing unfeasible targets for change and those representing potentially feasible targets for change. We discuss each of these classes of predictor below.
Unfeasible targets for changeIn terms of area-level variables,
our model indicated that people living in areas that were higher in level of deprivation experienced significantly greater levels of SoC. The b coefficient of .033 for this effect, as reported in Table 1, can be interpreted as follows. For each one-unit increase in the deprivation of the region (keeping in mind that this index ranged from 1-10), the model predicted a corresponding .033 unit increase, on average, in participants levels of SoC (which were rated on a scale from 1-5). Put another way, this implies that the difference in SoC for participants living in the most affluent regions of New Zealand would be .33 units lower, on average, than those living in the most deprived regions (as .033 x 10 = .33). The model thus indicates that people living in poorer regions may feel a deeper sense of connection to one another within their local neighbourhood. This is an important effect to control for when seeking to identify other predictors of SoC, as it allowed us to be more confident that we had ruled out the possibility that other significant predictors may in fact have been driven by their covariation with regional levels of deprivation.
The proportion of people in the region who were in marital relationships was the only other area-level variable that significantly predicted SoC. As shown in Table 1, participants living in regions where a high number of people were married reported a higher level of SoC. It is also equally important to emphasize the variables which were not uniquely associated with SoC. For instance, the proportion of immigrants in the local region was unrelated to SoC. This suggests that it is not the case that increased diversity in the local
region has a detrimental effect on SoC. This null effect is inconsistent with the discourse that opposes immigration based on the concern that increasing levels of diversity comes at the expense of peoples’ sense of community and cohesion in their local region.
Our model predicting SoC also included a host of other person-level demographic factors. These refer to aspects of the individual that are not readily amenable to change, but that constitute arguably important controls when making inferences about the extent to which other, more malleable, aspects of people and their environment relate to SoC. As shown in Table 1, men were lower in SoC than women and older people were higher in SoC (an effect that was qualified by a negatively accelerating exponential function, as indicated by the significant effect for the square of age). People with a lower household income also reported higher levels of SoC, which mirrored the effect of regional deprivation. Māori, Pacific and Asian peoples all reported higher levels of SoC than New Zealand Europeans, and people who lived with their romantic partner also reported higher levels of SoC.
The finding that people on lower incomes and those living in more deprived areas have a higher SoC might seem counterintuitive. It could be argued that the increased resources of affluent neighbourhoods should allow for higher quality interactions between neighbours, thereby enhancing their SoC. However, it is also possible that people living in more affluent neighbourhoods are more physically disconnected from each other, due to the lower population density in such areas. Further, people in deprived areas might be more dependent on one another for meeting their material needs than people in affluent areas. Sengupta et al. (2012) reported that income is strongly associated with one’s perceived ability to meet one’s basic needs in a large sample of New Zealanders. According to Volker et al.’s (2007) theoretical framework, mutual interdependence between neighbours is a crucial determinant of SoC. Indeed, their analysis revealed that this characteristic of neighbourhoods was the strongest predictor of SoC. Therefore, a greater degree of dependence on one’s

New Zealand Journal of Psychology Vol. 42, No. 1, 2013• 42 •
Nikhil K. Sengupta, Nils Luyten, Lara M. Greaves, Danny Osborne, Andrew Robertson, Gavin Armstrong & Chris G. Sibley
neighbours in deprived areas and among people with lower incomes might account for our finding that relative poverty is associated with higher SoC.
It is also interesting to note the relatively fixed aspects of people that were not significantly related to SoC. Whether people owned their own home was not uniquely associated with SoC (keeping in mind that the model controlled for related variables such as regional deprivation and income). The time that participants had lived in the region was also unrelated to SoC, as was educational status (whether or not people had a university degree) and whether or not they were born in New Zealand.
Feasible targets for changeThe analysis of person-level felt
loneliness and group activities identified a number of significant predictors of SoC that might be amenable to change though intervention or targeted social policies. People who reported lower levels of felt loneliness reported a greater SoC. What is particularly important, however, is that our model indicated that when controlling for felt loneliness in general, playing sports, attending church, and taking part in voluntary community organizations all significantly predicted an increased level of SoC.
We necessarily focused on all effects in terms of actual units of predicted change in our outcome SoC. The model predicts, for example, that controlling for all other variables, playing sports on a local team would predict a .063 increase in SoC. The unstandardized coefficient of .063 thus represents the mean difference in SoC experienced by those who played sport versus those who did not, when statistically adjusting for all other variables in the model. A coefficient of .063 may seem small in absolute terms, but recall that SoC was scored on a 4-unit scale ranging from 1-5. This therefore indicates that simply by playing sport, people report an increase of roughly 1.6% in their total possible SoC score (.063/4 = .016). The provision of increased opportunities for people to participate in local sports teams may be one of the most easily implemented interventions for increasing SoC identified by our model.
Similarly, those who attended Church were, when adjusting for all other factors in the model, an average of .182 units higher in SoC than those who did not. This finding replicates a reliable and robust link between religious faith and increased subjective wellbeing resulting from social capital. For instance, in the New Zealand context, research indicates that those who attended Church more frequently reported a greater sense of felt belongingness (Sibley & Bulbulia, 2013). Recent research in the New Zealand context also emphasizes the complex role that religious faith and integration within religious networks may play in promoting subjective wellbeing more generally. In a recent New Zealand study, Sibley and Bulbulia (2012) documented longitudinal evidence showing that those social costs of losing one’s religious faith may be more pronounced than the costs of gaining or maintaining religious faith. In an analysis of nationally representative longitudinal data collected before and after the Christchurch earthquakes, they showed that those who were (a) affected by the earthquakes and (b) who also lost their faith showed a steep decrease in their reported health relative to others. Those who maintained their faith, or who were non-religious throughout this period showed comparable levels of subjective health in 2009 before the Christchurch earthquakes and after them in late 2011. These results indicate that, in the face of highly stressful and life changing events, it is those who have lost their faith that may be driving the observed difference in the subjective wellbeing of religious versus non-religious people. We suspect that this occurs because people who lose their faith may lose both a core part of their social network and also simultaneously experience an increase in epistemic uncertainty. The loss of core aspects of one’s social network and way of making sense of the world are both factors which may corrode one’s subjective wellbeing. And both may take some time to adjust to and seek alternatives for.
Our model also highlights key attitudes toward characteristics of the local region that are linked to increases in SoC. While these measures were indexed using participants’ attitude ratings rather than objective
characteristics of the community, they nevertheless provide information about aspects of the local region that should be relatively easy to alter in order to increase SoC (insofar as one can also change corresponding attitudes toward these features to mirror improvements in infrastructure and service). For instance, our analysis indicates that increasing the ease and accessibility of public transport has a strong positive effect on SoC. Feelings of safety in the local community were also strongly predictive of SoC. In addition, perceptions of the vibrancy and diversity of the local arts scene was strongly positively predictive of SoC. The unstandardized coefficient of .123 for this latter effect indicates that each one-unit increase in positive perceptions of the diversity of the local arts scene predicts a corresponding .123 unit increase in SoC. This is a reasonably strong effect in real terms (keeping in mind that SoC was scored on a scale from 1-5) and indicates that increased investment in local arts may be a cost-effective intervention that has downstream effects on participants’ SoC.
Finally, our model also documented the extent to which perceiving various local problems was related to SoC. The model indicated that perceiving noise pollution, that is, the extent to which loud and invasive noise was seen as a problem in one’s local community, was significantly associated with SoC. The substantive importance of this effect is emphasized by the fact that perceptions of graffiti, drunk drivers, and litter, were not significantly associated with participants’ SoC. When it comes to predicting how integrated and identified people feel within their local community, it seems that the presence of continued noxious noise, most likely noise that invades homes and interrupts sleep, is more important in determining SoC than perceptions of many other local problems relating to litter or pollution. This highlights perhaps the single most obvious and cost-effective means of improving SoC in local New Zealand communities: increasing monitoring and enforcement of noise pollution in areas where this is perceived to be a problem will increase residents’ SoC by an average of .058. This is reasonably small in terms of the entire scale range of

• 43 •New Zealand Journal of Psychology Vol. 42, No. 1, 2013
Sense of Community
SoC, but we stress that this is one single and presumably easily affected social issue (via enforcement and possibly also other means) that has a real and significant link with residents’ SoC at a (one would presume) reasonably low cost for most communities.
Seemingly small improvements in SoC, or social capital in general, should not be taken for granted. Indeed, Putnam’s (1995, 2000) influential work on the surprising decline in social capital during the latter half of the 20th century indicates that decreases in feelings of social connectedness correspond with a number of socially-relevant outcomes. Specifically, social capital is inversely associated with macro-level indicators of the prevalence of violent crime, students’ performance on standardized tests, age-adjusted rates of mortality, and even rates of tax evasion. In contrast, social capital is positively associated with satisfaction with one’s life and health (which, as indicated earlier, affects the larger social structure by decreasing medical expenses for the community). Thus, small improvements in SoC may have substantial implications for society.
Caveats and limitationsWe took advantage of a previously
collected government dataset to test our model. Because of this, we were necessarily limited to examining person-level variables using the measures included in the available dataset. Many of these were single items or very short scales. For example, our SoC measure only assessed one aspect of SoC, a construct which has been measured using multi-dimensional scales in other research (e.g. Long & Perkins, 2007). Future research might benefit from a more fine-grained analysis of predictors of different facets of SoC. Nonetheless, we would point out that scale reliabilities were acceptable for all our short-scale measures. Furthermore, despite these limitations in measurement, our study provides a novel contribution to the literature in that it is one of only a small handful of large and nationally representative samples to examine both neighbourhood and person-level correlates of SoC, and thus complements previous research developing similar models in other nations (e.g., Long & Perkins, 2007; see also Dallago et al.
,2009). Our study is the first of which we are aware to build a substantial predictive multi-level model of SoC in the New Zealand context. This provides a valuable addition to the research corpus by providing an additional data point in the exploration of SoC across cultures and nations. As the recent call to arms for cross-cultural validation by Henrich, Heine, and Norenzayan (2010) stresses, replication and extension of predictive models should be prioritized if we are to develop a unified and systematic framework across a broad spectrum of areas of psychology. This includes community psychology.
Finally, it should be recognized that our data are cross-sectional in nature. As such, while we treated SoC as the dependent or outcome variable, caution is needed when inferring causal direction based on our predictive model. It may be, for instance, that a greater sense of SoC promotes people to engage more in their local community by joining sports teams, or attending church. However, with regard to many of the other variables in our model, it is difficult to see how SoC might exert a reverse causal effect on our predictor variables. For instance, we consider it unlikely that SoC would affect perceptions of local social problems; the reverse direction, in which perceptions of social problems, such as noise pollution, lead to change in SoC seems far more likely. The cross-sectional nature of our data should nevertheless be kept in mind by analysts seeking to apply our model to implement policy change.
ConclusionsSense of community is an important
predictor of well-being and civic engagement (see Putnam, 2000). By identifying the various personal and neighbourhood-level determinants of SoC, our paper marks an important first step in understanding how SoC might be increased in the New Zealand context. In focussing on targetable characteristics, our work has considerable applied value to policy makers seeking to improve SoC. In sum, our model identified that improvements in noise pollution, local community sports, and diversity in the local arts scene are likely features of the individual and local community that can be legitimately targeted by local and
national government to promote unique (and reasonably-sized) improvements in residents’ sense of community. All three of these factors would seem to be (reasonably) easy to improve relative to other factors, and, critically, do not involve the change or promotion of a specific ideology or value system (as would policies promoting increased attendance at Church, for example).
AcknowledgementsPreparation of this manuscript was
funded by a University of Auckland ECREA (#3626075) grant awarded to Chris Sibley. The data analyzed in this manuscript was collected as part of a research project jointly funded by the New Zealand Ministry of Social Development and the Territorial Local Authorities of the 12 major cities in New Zealand.
ReferencesBathum, M. E., & Baumann, L. C. (2007).
A sense of community among immigrant Latinas. Family and Community Health, 30, 167-177.
Baumeister, R. F., & Leary, M. R. (1995). The need to belong: desire of interpersonal attachments as a fundamental human motivation. Psychological Bulletin, 117, 497-529.
Berry, H. L., & Welsh, J. A. (2010). Social capital and health in Australia: An overview from the household, income and labour dynamics in Australia survey. Social Science and Medicine, 70, 588-596.
Christ, O., Sibley, C. G., & Wagner, U. (2012). Multilevel modeling in personality and social psychology (pp. 239-260). In K. Deaux & M. Snyder (Eds.), The Oxford Handbook of Personality and Social Psychology. Oxford: Oxford University Press.
Comstock, N., Miriam Dickinson, L., Marshall, J.A., Soobader, M.-J., Turbin, M.S., Buchenau, M., & Litt, J. S. (2010). Neighbourhood attachment and its correlates: exploring neighbourhood conditions, collective efficacy and gardening. Journal of Environmental Psychology, 30, 435-442.
Dallago, L., Perkins, D.D., Santinello, M., Boyce, W., Molcho, M., & Morgan, A. (2009). Adolescent place attachment, social capital, and perceived safety: A comparison of 13 countries. American Journal of Community Psychology, 44, 148-160.

New Zealand Journal of Psychology Vol. 42, No. 1, 2013• 44 •
Nikhil K. Sengupta, Nils Luyten, Lara M. Greaves, Danny Osborne, Andrew Robertson, Gavin Armstrong & Chris G. Sibley
Flaherty, J., & Brown, R.B. (2010). A multilevel systemic model of community attachment: Assessing the relative importance of the community and individual levels. American Journal of Sociology, 116, 503-542.
Henrich, J., Heine, S. J., & Norenzayan, A. (2010). The weirdest people in the world. Behavioral and Brain Sciences, 33, 61-83.
Groves, R. M., Fowler, F. J., Couper, M. P., Lepkowski, J. M., Singer, E., & Tourangeau, R. (2004). Survey methodology. New Jersey: Wiley.
Houkamau, C. A., & Sibley, C. G. (2010). The Multi-Dimensional Model of Māori Identity and Cultural Engagement. New Zealand Journal of Psychology, 39, 8-28.
Houkamau, C. A., & Sibley, C. G. (2011). Māori cultural efficacy and subjective well-being: a psychological model and research agenda. Social Indicators Research, 103, 379-398.
Hughey, J., Peterson, N. A., Lowe, J. B., & Oprescu, F. (2008). Empowerment and sense of community: Clarifying their relationship in community organizations. Health Education and Behavior, 35, 651-663.
Kawachi, I., & Berkman, L. (2000). Social cohesion, social capital, and health. In L. Berkman, & I. Kawachi (Eds.), Social Epidemiology. New York: Oxford University Press.
Kawachi, I., & Berkman, L. F. (2001). Social ties and mental health. Journal of Urban Health-Bulletin of the New York Academy of Medicine, 78, 458-467.
Kim, J., & Kaplan, R. (2004). Physical and psychological factors in sense of community - New urbanist Kentlands and nearby orchard village. Environment and Behavior, 36, 313-340.
Leyden, K. M. (2003). Social capital and the built environment: The importance of walkable neighborhoods. American Journal of Public Health, 93, 1546-1551.
Long, D. A., & Perkins, D. D. (2007). Community social and place predictors of sense of community: a multilevel and longitudinal analysis. Journal of Community Psychology, 35, 563-581.
Manuela, S., & Sibley, C. G. (in press). The Pacific Identity and Wellbeing Scale (PIWBS): A culturally-appropriate self-report measure for Pacific peoples in New Zealand. Social Indicators Research.
McLaren, S., Gomez, R., Bailey, M., & Van Der Horst, R. K. (2007). The association of depression and sense of belonging with suicidal ideation among older adults: Applicability of resiliency models. Suicide and Life-Threatening Behavior,
37, 89-102.McNeill, L. H., Kreuter, M. W., &
Subramanian, S. V. (2006). Social environment and physical activity: A review of concepts and evidence. Social Science and Medicine, 63, 1011-1022.
Perkins, D. D., & Long, D. A. (2002). Neighborhood sense of community and social capital: A multi-level analysis in Psychological Sense of Community: Research, Applications, and Implications (pp. 291-318). New York: Kluwer Academic/Plenum Publ.
Putnam, R. D. (1995). Tuning in, tuning out: The strange disappearance of social capital in America. PS: Political Science and Politics, 28(4), 664-683. doi: 10.2307/420517
Putnam, R. D. (2000). Bowling alone: The collapse and revival of American community. New York, NY: Simon & Schuster.
Prezza, M., Amici, M., Roberti, T., & Tedeschi, G. (2001). Sense of community referred to the whole town: Its relations with neighbouring, loneliness, life satisfaction, and area of residence. Journal of Community Psychology, 29, 29-52.
Prezza, M., Pacilli, M. G., Barbaranelli, C., & Zamporri, E. (2009). The MTSOCS: A multidimensional sense of community scale for local communities. Journal of Community Psychology, 37, 305-326.
Quality of Life 2008 Survey National Report (2009). Nielsen: New Zealand.
Raudenbush, S. W., & Bryk, A. S. (2002). Hierarchical Linear Models (2nd ed.). Newbury Park, CA: Sage Publications.
Sampson, R.J. (1988). Local friendship ties and community attachment in mass society: A multilevel systemic model. American Sociological Review, 53, 766-779.
Sarason, S. B. (1974). The psychological sense of community: Prospects for a community psychology. San Francisco: Jossey-Bass.
Sengupta, N. K., Osborne, D., Houkamau, C. A., Hoverd, W. J., Wilson, M. S., Greaves, L. M., … & Sibley, C. G. (2012). How much happiness does money buy? Income and subjective wellbeing in New Zealand. New Zealand Journal of Psychology, 41, 21-34.
Sibley, C. G., & Bulbulia, J. (2012). Faith after an earthquake: a longitudinal study of religion and perceived health before and after the 2011 Christchurch New Zealand earthquake. PLoS ONE, 7, e49648.
Sibley, C. G., & Bulbulia, J. (2013). Healing those who need healing: how religious
practice affects social belonging. Journal for the Cognitive Science of Religion, 1, 29-45.
Sibley, C. G., Duckitt, J., Bergh, R., Osborne, D., Perry, R., Asbrock, F., Robertson, A., Armstrong, G., & Wilson, M. S., Barlow, F. K. (in press). A dual process model of attitudes toward immigration: person x residential area effects in a national sample. Political Psychology.
van Hooijdonk, C., Droomers, M., Deerenberg, I. M., Mackenbach, J. P., & Kunst, A. E. (2008). The diversity in associations between community social capital and health per health outcome, population group and location studied. International Journal of Epidemiology, 37, 1384-1392.
Volker, B., Flap, H., & Lindenberg, S. (2007). When are neighbourhoods communities? Community in Dutch neighbourhoods. European Sociological Review, 23, 99-114.
Young, A. F., Russell, A., & Powers, J. R. (2004). The sense of belonging to a neighbourhood: can it be measured and is it related to health and well being in older women? Social Science and Medicine, 59, 2627-2637.
White, P., Gunston, J., Salmond, G., Atkinson, J., & Crampton, P. (2008). Atlas of Socio-economic Deprivation in New Zealand. Public Health Intelligence Occasional Bulletin, 50. Ministry of Health: Wellington.
Corresponding Author:Chris SibleySchool of PsychologyThe University of AucklandPrivate Bag 92 019Auckland, New [email protected]
© This material is copyright to the New Zealand Psychological Society. Publication does not necessarily reflect the views of the Society.

• 45 •New Zealand Journal of Psychology Vol. 42, No. 1, 2013
Sense of Community
Appendix: Sample Weighting ProcedureTo estimate representative population proportions, we applied a post-stratification weight that adjusted for sample bias
across regions. Details on how to apply post-stratification sample weighting procedures are provided in Groves, Fowler, Couper, Lepkowski, and Tourangeau (2004). The weighting factor adjusting for region is expressed in Equation (1.0):
Sample Weighti = Wi * + c (1.0)
where c was a constant value added to the weight for each participant so that the average weight across participants was 1.00. The weighting value for a given demographic factor, Wi, was defined as a ratio of the known proportion of the adult population in a given region of the country, Pi-pop, relative to the sampled proportion with complete data included in our analysis, Pi-sample as in Equation (2.0). Population estimates used to calculate these weights were based on 2006 New Zealand Census data.
Wi = Pi-pop / Pi-sample (2.0)
Sample and population proportions for each demographic variable on which sample weights were based are presented in the table below.
Region of New ZealandN providing
completed data for analysis
Prop. of Sample(Pi-sample)
Prop of Nation(Pi-pop)
Weighting factor (Wi)
Rodney District 385 0.06 0.02 0.31
North Shore City 356 0.06 0.05 0.84
Waitakere City 361 0.06 0.05 0.83
Auckland City 345 0.06 0.10 1.73
Manukau City 380 0.06 0.08 1.25
Hamilton City 353 0.06 0.03 0.51
Tauranga City 404 0.07 0.03 0.44
Porirua City 386 0.06 0.01 0.15
Hutt City 375 0.06 0.02 0.32
Wellington City 354 0.06 0.05 0.84
Christchurch City 362 0.06 0.09 1.48
Dunedin City 345 0.06 0.03 0.52
Other Regions 1552 0.26 0.44 1.69

New Zealand Journal of Psychology Vol. 42, No. 1, 2013• 46 •
Z:\2013\Advertising\March\NZPS Journal, March 2013.doc
INTERACTIVE DRAWING THERAPY ADVERTISEMENT - NEW ZEALAND ¼ A4 size (93mm wide x 130mm deep) Interactive Drawing Therapy limited P O Box 47 419, Ponsonby Auckland 1144, New Zealand email: [email protected] Ph +64 9 3764789 Fax: +64 9 3764759 NZPS Journal, March 2013 ¼ Page NZPS
Interactive Drawing Therapy (IDT)
IDT FOUNDATION COURSE TRAINING 2013
Contact the IDT Office – [email protected] for a list of course dates and locations
www.InteractiveDrawingTherapy.com IDT Foundation course are fully accredited to earn P.D. points
Agency in-house training on request
“Working with imagery and metaphor to unlock inner resourcefulness”