Semantic approach for pre-assessment of environmental indicators in Industrial Symbiosis
13
Semantic approach for pre-assessment of environmental indicators in Industrial Symbiosis Nikolaos Trokanas * , Franjo Cecelja, Tara Raafat Centre for Process & Information Systems Engineering, Faculty of Engineering & Physical Sciences, University of Surrey, Guildford GU2 7XH, United Kingdom article info Article history: Received 26 September 2013 Received in revised form 17 December 2013 Accepted 18 December 2013 Available online xxx Keywords: Industrial symbiosis Performance Metrics Semantics Ontologies Knowledge modelling abstract Industrial Symbiosis (IS) is a growingly accepted paradigm for processing waste into material, energy and water with benefits to participants measured by economic, environmental and social gains. Despite of some attempts to quantify them no unified metrics or methods for calculating concomitant indicators have been proposed. This paper presents a systemisation of IS relevant environmental metrics and a semantic approach based on knowledge modelling using ontologies to facilitate “a priori” calculation of respective indicators. The approach and metrics are presented and verified with a case study. Ó 2013 Elsevier Ltd. All rights reserved. 1. Introduction Industrial Symbiosis (IS) is a growingly accepted paradigm for processing waste into material, energy and water with benefits to participants measured by economic, environmental and social gains. Although the practice of IS has demonstrated the need for evaluating these benefits either in the process of screening of impending options or monitoring the operation of symbiotic net- works, and despite of some attempts to quantify them (Van Berkel, 2010; Mattila et al., 2010; Berkel et al., 2009), no unified metrics or methods for calculating concomitant indicators has been proposed (Eckelman and Chertow, 2009; Jacobsen, 2006a). Consequently, evaluation of IS networks performance has been identified as deficient (Martin et al., 2012). It is especially so for assessment of environmental performance (Eckelman and Chertow, 2009). Along the same line, the existence of such metrics is not only anticipated to have impact on further promotion and advancement of IS practice, but also on ameliorating the screening process and serving as a useful decision-making tool for participation. As identified by (Kraines et al., 2005) and (Grant et al., 2010), Information and Communication Technologies (ICT) in general and semantic technologies in particular have the potential to improve the IS process and also to evaluate their performance. So far, ICT have been used to organise data about IS (Hepp, 2006), to store data and to enable its querying and retrieval (Phillips et al., 2005) or to simply enable the IS matching process by supporting the decision- making process (Chertow, 2000). In general, ICT have been identi- fied as useful tools for enabling Industrial Ecology (Zapico et al., 2010). However, certain limitations of currently used ICT have been identified; they heavily focus on the expert that facilitates the synergy rather than on the participants (Grant et al., 2010); they mainly support the process after the input/output match- ing and hence after the IS synergies have been established (Cecelja et al., 2014) and with minimum or no indication on their potential; the lack of standardised classifications (Trokanas et al., 2013). It has been identified that use of tacit knowledge is perhaps one of possible solutions to overcome these limitations. The first IS support ICT system addressing the challenge of tacit knowledge is the DIET system based on production rules (Grant et al., 2010) the production of which has stopped (Allen, 2004). Perhaps better solution is in using tacit knowledge implemented in the form of ontologies, as reported by (Cecelja et al., 2014). The respective eSymbiosis system offers a possibility to focus on participants and their resources, a comparative ease to implement standardised * Corresponding author. E-mail addresses: [email protected], [email protected] (N. Trokanas). Contents lists available at ScienceDirect Journal of Cleaner Production journal homepage: www.elsevier.com/locate/jclepro 0959-6526/$ e see front matter Ó 2013 Elsevier Ltd. All rights reserved. http://dx.doi.org/10.1016/j.jclepro.2013.12.046 Journal of Cleaner Production xxx (2013) 1e13 Please cite this article in press as: Trokanas, N., et al., Semantic approach for pre-assessment of environmental indicators in Industrial Symbiosis, Journal of Cleaner Production (2013), http://dx.doi.org/10.1016/j.jclepro.2013.12.046
-
Upload
independent -
Category
Documents
-
view
2 -
download
0
Transcript of Semantic approach for pre-assessment of environmental indicators in Industrial Symbiosis

lable at ScienceDirect
Journal of Cleaner Production xxx (2013) 1e13
Contents lists avai
Journal of Cleaner Production
journal homepage: www.elsevier .com/locate/ jc lepro
Semantic approach for pre-assessment of environmental indicatorsin Industrial Symbiosis
Nikolaos Trokanas*, Franjo Cecelja, Tara RaafatCentre for Process & Information Systems Engineering, Faculty of Engineering & Physical Sciences, University of Surrey, Guildford GU2 7XH, United Kingdom
a r t i c l e i n f o
Article history:Received 26 September 2013Received in revised form17 December 2013Accepted 18 December 2013Available online xxx
Keywords:Industrial symbiosisPerformanceMetricsSemanticsOntologiesKnowledge modelling
* Corresponding author.E-mail addresses: [email protected], n.trokan
0959-6526/$ e see front matter � 2013 Elsevier Ltd.http://dx.doi.org/10.1016/j.jclepro.2013.12.046
Please cite this article in press as: Trokanas, NJournal of Cleaner Production (2013), http:/
a b s t r a c t
Industrial Symbiosis (IS) is a growingly accepted paradigm for processing waste into material, energy andwater with benefits to participants measured by economic, environmental and social gains. Despite ofsome attempts to quantify them no unified metrics or methods for calculating concomitant indicatorshave been proposed. This paper presents a systemisation of IS relevant environmental metrics and asemantic approach based on knowledge modelling using ontologies to facilitate “a priori” calculation ofrespective indicators. The approach and metrics are presented and verified with a case study.
� 2013 Elsevier Ltd. All rights reserved.
1. Introduction
Industrial Symbiosis (IS) is a growingly accepted paradigm forprocessing waste into material, energy and water with benefits toparticipants measured by economic, environmental and socialgains. Although the practice of IS has demonstrated the need forevaluating these benefits either in the process of screening ofimpending options or monitoring the operation of symbiotic net-works, and despite of some attempts to quantify them (Van Berkel,2010; Mattila et al., 2010; Berkel et al., 2009), no unified metrics ormethods for calculating concomitant indicators has been proposed(Eckelman and Chertow, 2009; Jacobsen, 2006a). Consequently,evaluation of IS networks performance has been identified asdeficient (Martin et al., 2012). It is especially so for assessment ofenvironmental performance (Eckelman and Chertow, 2009). Alongthe same line, the existence of such metrics is not only anticipatedto have impact on further promotion and advancement of ISpractice, but also on ameliorating the screening process and servingas a useful decision-making tool for participation.
As identified by (Kraines et al., 2005) and (Grant et al., 2010),Information and Communication Technologies (ICT) in general andsemantic technologies in particular have the potential to improve
[email protected] (N. Trokanas).
All rights reserved.
., et al., Semantic approach fo/dx.doi.org/10.1016/j.jclepro.2
the IS process and also to evaluate their performance. So far, ICThave been used to organise data about IS (Hepp, 2006), to store dataand to enable its querying and retrieval (Phillips et al., 2005) or tosimply enable the IS matching process by supporting the decision-making process (Chertow, 2000). In general, ICT have been identi-fied as useful tools for enabling Industrial Ecology (Zapico et al.,2010). However, certain limitations of currently used ICT havebeen identified;
� they heavily focus on the expert that facilitates the synergyrather than on the participants (Grant et al., 2010);
� they mainly support the process after the input/output match-ing and hence after the IS synergies have been established(Cecelja et al., 2014) and with minimum or no indication ontheir potential;
� the lack of standardised classifications (Trokanas et al., 2013).
It has been identified that use of tacit knowledge is perhaps oneof possible solutions to overcome these limitations. The first ISsupport ICT system addressing the challenge of tacit knowledge isthe DIET system based on production rules (Grant et al., 2010)the production of which has stopped (Allen, 2004). Perhaps bettersolution is in using tacit knowledge implemented in the form ofontologies, as reported by (Cecelja et al., 2014). The respectiveeSymbiosis system offers a possibility to focus on participants andtheir resources, a comparative ease to implement standardised
r pre-assessment of environmental indicators in Industrial Symbiosis,013.12.046

Fig. 3. Excerpt of the domain ontology.
N. Trokanas et al. / Journal of Cleaner Production xxx (2013) 1e132
(and other) classifications (Trokanas et al., 2013), as well asassessment of IS synergies prior to their operation as demonstratedin Section 3.
In this paper we propose systemisation of IS relevant environ-mental metrics and a semantic approach based on knowledgemodelling using ontologies to facilitate “a priori” calculation ofrespective indicators. Metrics are classified to reflect the current ISpractice and concomitant environmental targets. The environ-mental indicators, however, are calculated from explicit knowledgeembedded in IS domain ontology in the form of properties char-acterising materials, waste streams and processing technologiesparticipating in IS. The indicators are calculated during the stage ofscreening of IS options, more precisely during the input/outputmatching of participating resources (companies) (Raafat et al.,2013a,b). The outcome is used for ranking the options by envi-ronmental relevance and hence for making decisions. The proposedapproach was verified using real-life IS data from the municipalityof Viotia in Greece.
2. Semantic approach to Industrial Symbiosis
Input/Output (I/O) matching is the key to formation of IS net-works, hence to the IS process (Raafat et al., 2012), through whichprocess industries try to identify ways to improve their resourceefficiency and minimise their waste production (Cecelja et al.,2014). The use of semantic technologies in IS practice facilitatesthe automation of I/O matching. Semantics in general and ontol-ogies in particular allow for integration of tacit and explicitknowledge and its use for I/O matching. More rigorously, resourcesparticipating in IS, namely waste and processing technologies, aredescribed semantically in the form of ontology with entitiescharacterised by properties relevant to IS practice (explicitknowledge) and the knowledge about IS process (tacit knowledge)(Raafat et al., 2013a,b; Trokanas et al., 2012). While tacit knowl-edge is embedded in ontology structure, including subsumption,object properties and respective restrictions on object properties,explicit knowledge is acquired during the registration of partici-pating resources when concept properties, the data properties, arepopulated by respective values. The data properties includeoperational, environmental and economic characteristics. Duringthe matching process both tacit and explicit knowledge are used(Trokanas et al., 2013) to identify basic and the most commonlyused one-to-one networks in the form of direct link between twoparticipants i and j (Fig. 1), but also complex networks includingmore participants (Fig. 2).
Integrated together, tacit and explicit knowledge enable i)supplementing missing data by default values determined fromprior IS experience and expertise, and ii) inferring new knowledge.As tacit knowledge, we define knowledge that stems from experi-ence. In the case of IS, it covers associations between differentwaste types or materials, alternative uses for certain materials andjargon terminology, among others. As explicit knowledge, wedefine knowledge that can be easily conveyed. In the case of IS, itcovers physical and chemical properties of materials, quantities,
Fig. 1. Direct link.
Fig. 2. Complex link.
Please cite this article in press as: Trokanas, N., et al., Semantic approach foJournal of Cleaner Production (2013), http://dx.doi.org/10.1016/j.jclepro.2
conversion rates and others. For example, in the case of a pro-cessing technology additional inputs or outputs can be inferred andin the case of resources information about the composition of awaste can be inferred.
3. IS domain ontology
The IS domain ontology (Fig. 3) is implemented as a con-ceptualisation of the IS domain with three main streams repre-senting it, namely Resource, Technology and Role, along with therespective properties. Note here that names adopted for thestreams and concepts in the ontology are self-explanatory.
Within IS practice the Resource stream (Fig. 4) acts as the pointof reference for synergy identification. It refers to materials, waste,energy, products, and water that a participant provides or requires.
Fig. 4. An excerpt of the resources classification.
r pre-assessment of environmental indicators in Industrial Symbiosis,013.12.046

Fig. 6. An excerpt of the role module.
N. Trokanas et al. / Journal of Cleaner Production xxx (2013) 1e13 3
In the domain ontology the concept Resource is further classifiedinto four sub-streams: i) ResourcebySource_EWC, ii) ResourcebyType,iii) ResourcebyProducts and iv) ResourcebyCharacteristic (Trokanaset al., 2012). The ResourceBySource sub-stream is based on theexisting European Waste Catalogue (EWC) (European Commission,2000) which classifies waste by their source e a combination ofindustry and process information. It is worth mentioning that allwaste producers in the European Union (EU) are required by law toprovide information based on this catalogue. Concepts of this sub-stream are related to the ResourceByType sub-stream via the objectproperty hasComposite. The ResourceByType sub-stream includesthree main concepts, as illustrated in Fig. 4, with the key aspectbeing the Materials classification which is used as a commonreference for similarity calculation (Trokanas et al., 2013). Thismeans that most of the concepts of the domain ontology aresomehow linked to the Materials classification (Fig. 7). TheResourceByProducts sub-stream is based on an existing productclassification (UN, 2008). The concepts ResourceByProducts arelinked to the ResourceByType sub-stream as well. Lastly, theResourceByCharacteristic sub-stream includes concepts that arecharacterised by relevant properties, e.g. combustible and biode-gradable resources. Concepts in this sub-stream are concepts thatbelong to other sub-streams and are reclassified by their properties.
The stream Technology (Fig. 5) represents processing technologiesincluding storage and transportation services. The classification ofprocessing technologies, which corresponds to the resource classi-fication, includes classifications by industry (TechnologyByIndustry),type (TechnologyByType), input (TechnologyByInput) and character-istics (TechnologyByCharacteristic) of the technologies. Each tech-nology is further characterised by its requirements and otherproperties. Each technology is also characterised by its inputs andoutputs in terms of materials and by-products. Other characteristicsinclude energy requirements and emissions (Raafat et al., 2013a,b).
The stream Role (Fig. 6) represents types of users involved in ISprocess, including ResourceProvider, ResourceConsumer andSolutionProvider.
The properties, as shown in Fig. 7, represent additional infor-mation which complement the IS domain. This information in-cludes economic, operational and environmental properties. In theIS domain ontology, properties are modelled as object and dataproperties used to enable the identification of symbiotic networks.They also enable modelling of processing technologies andcomposition of waste, implemented by restriction on properties.The example in Fig. 7, demonstrates property used to define theinput of a technology (Technology canProcess Resource) and itsinverse property (Resource canBeProcessedBy Technology). It alsodemonstrates the properties that link different types of roles(ResourceProducer and SolutionProvider) to Resources (haResource,canUse) and Technologies (hasSolution).
Restrictions on properties allow for more granulated modellingof tacit and explicit knowledge about resources and processingtechnologies. Restrictions are processed by the inference engine
Fig. 5. An excerpt of the tec
Please cite this article in press as: Trokanas, N., et al., Semantic approach foJournal of Cleaner Production (2013), http://dx.doi.org/10.1016/j.jclepro.2
and hence support ontology reclassification. More precisely, byprocessing restrictions new knowledge is generated. In relation tothe IS process, restrictions enable I/O matching by defining linksbetween instances of resource, processing technologies and withthe reference to the classification of materials. The example inFig. 8, demonstrates the use of restrictions for technology model-ling. In specific, it defines that all PETProduction technologies musthave a link to the concept Bauxite through the canProcess objectproperty.
In addition, restrictions on object properties are used to modeldefault values for data type properties when actual value is notavailable, i.e. the user did not provide it, as shown in Fig. 9. This inturn allows for calculation of relevant metrics and respectiveindicators.
4. Performance metrics
Following the implementation of semantically supportedautomation of IS practice, as explained in Section 3 and reportedby (Raafat et al., 2013a,b), we employ the same technologies topre-assess environmental effects of symbiotic networks. Se-mantic technologies address the erraticism and unpredictabilityof waste and processing technologies by allowing for modellingof explicit and tacit knowledge. The use of ontologies offers astandardised description of nonstandard and off-spec resourcesin a machine understandable format. This description is used as acommon reference to describe resources and processing tech-nologies, thus enabling automated I/O matching (Trokanas et al.,2013).
The pre-assessment of a synergy serves as an incentive forparticipation in IS. In this work we propose a methodology ofcalculating indicators based on environmental metrics, as shown inFig. 10. In order to quantify environmental effects, hence to enablecomparison between options, all respective indicators are aggre-gated into a single quantity, the IS environmental indicator.
The proposed metrics are selected as a compromise betweencomplexity (more metrics can be introduced, i.e. emission ofother gasses including green-house-gasses (GHG) in general orhealth effects and social perception) and effectiveness in ISpractice, and along some previous studies (Chertow andLombardi, 2005; Jacobsen, 2006b; Martin and Eklund, 2011;
hnology classification.
r pre-assessment of environmental indicators in Industrial Symbiosis,013.12.046

Fig. 7. An excerpt of the ontology demonstrating some of the properties.
Fig. 9. An example of restrictions on data type properties from the Propylene concept.
N. Trokanas et al. / Journal of Cleaner Production xxx (2013) 1e134
Martin et al., 2012; Mattila et al., 2012) and current practice in IS(Cecelja et al., 2013). Still, the proposed framework allows forfurther expansion.
4.1. Embodied carbon
Embodied carbon ECnetwork (in kgCO2) is calculated from theexchange of resources between participants i and j (Fig. 1) as:
Fig. 8. An example of restriction on object property.
Please cite this article in press as: Trokanas, N., et al., Semantic approach for pre-assessment of environmental indicators in Industrial Symbiosis,Journal of Cleaner Production (2013), http://dx.doi.org/10.1016/j.jclepro.2013.12.046

Fig. 10. IS environmental metrics.
N. Trokanas et al. / Journal of Cleaner Production xxx (2013) 1e13 5
ECnetwork ¼Xnres
i;j
�Qi;j*ECRði;jÞ
�(1)
where Qi,j is the quantity exchanged between participants i and j,ECR(i,j) is the embodied carbon for the type of resource R exchangedbetween i and j and nres represents the number of different resourcesexchanged in the network. In the ontology, the data property has-Quantity is used for the quantity Qi,j defined by the user and the dataproperty hasEmbodiedCarbon is used for embodied carbon ECR(i,j)which is determined from default values predefined in the domainontology with the use of restrictions. More precisely, the restrictionused for defining the embodied carbon values is ‘Resource
hasEmbodiedCarbon has Value’, where Value is the specific value foreach resource, as demonstrated by an example in Fig. 9 (Hammondand Jones, 2008; ICIS, 2013; Eurostat, 2013).
Taking into account the carbon dioxide credit price COP2, exc-
tracted from the CO2 Price property, as formed in the boundaries ofthe carbon exchange scheme, the Embodied Carbon of the symbi-otic network ECnetwork is converted to the cost ECC as:
ECC ¼ ECnetwork*COP2 (2)
4.2. Virgin materials
Saving of virgin materials occurs when a raw material input isreplaced by a by-product or a recycled material input. The amountof saved virginmaterials VMS is calculated as the sum of committedresource capacities Ci,j of participants i and j in the synergy as:
VMS ¼Xnin
i;j
Ci;j (3)
where nin, is the number of inputs involved in the synergy. Thisindicator is calculated from the side of the participant that receives
Fig. 11. Annotations for
Please cite this article in press as: Trokanas, N., et al., Semantic approach foJournal of Cleaner Production (2013), http://dx.doi.org/10.1016/j.jclepro.2
a resource for processing. Therefore and for the purpose of thisindicator, every exchange is defined by the input.
The amount of the materials saved is converted to financialsavings VMFS using the prices of the feedstock FP used beforeestablishing a symbiotic synergy and the resources RP used in thesymbiotic synergy to replace that feedstock:
VMFS ¼Xnin
i;j
Ci;j*�FPi;j � RPi;j
�(4)
Saving of 0 is in the case when the two prices are equal whichindicates that either the new resource is not a by-product/waste orthat the user already uses waste thus no new saving occurs.
Themain inputs aremodelled in the IS domain ontology conceptTechnology (Fig. 5) in the form of restrictions. An example of usingrestrictions to define Bauxite as the input of PET processing tech-nologies is given in Fig. 8. The value for capacity Ci,j is extractedfrom the hasQuantity data property. Using annotations, a singleproperty hasQuantity is used for both quantities and capacities(Fig. 11). The FPi,j and RPi,j variables are extracted from the has-FeedstockPrice and hasResourcePrice data properties, respectively, asdefined for each concept using restriction on data properties(Fig. 9).
4.3. Landfill diversion
The landfill diversion metric LDS applies in cases where a by-product/waste is re-used instead of being disposed in landfill. It isassumed that all symbiotic synergies fulfil this condition and it iscalculated as the sum of the exchanged quantities Qi,j betweenparticipants i and j (Fig. 1). Landfill diversion metric is calculated ina similar way to the metric virgin materials saved. However, notboth of these metrics occur in all cases. In addition, IS aims inproducing benefits to all participants and it is the full benefit thatneeds to be assessed, therefore both of thesemetrics are used in thecalculations as:
LDS ¼Xnres
i;j
Qi;j (5)
where nres is the number of resources exchanged in a synergy.Landfill diversion savings metric is converted to financial gainsLDFS by accounting for the disposal cost DC, the price of theresource RP and the landfill tax LT:
LDFS ¼Xnres
i;j
Qi;j*�DCi;j þ RPi;j þ LT
�(6)
In the domain ontology the information needed for the calcu-lation of landfill diversion are extracted from the data properties
customised service.
r pre-assessment of environmental indicators in Industrial Symbiosis,013.12.046

Fig. 12. CO2 and landfill tax predefined values.
Table 1kg CO2 for transportation modes.
Transportation mode Transportation factor (kg CO2 per vehicle km)
LGV (<3.5t) 0.272HGV (3.5te7.5t) 0.563HGV (7.5te17t) 0.747All HGVs average (default) 0.906Rail 0.021
N. Trokanas et al. / Journal of Cleaner Production xxx (2013) 1e136
hasQuantity (Fig. 11) for the quantity Q, hasResourcePrice (Fig. 9) forthe price of resource RP, hasDisposalCost (Fig. 9) for the disposal costDC and landfillTax for the landfill tax LT where the landfill tax valueis predefined as it normally depends on environment (country)where IS operates (Fig. 12).
4.4. Transportation
Transportation is considered in the same way as a processingtechnology enabling geographical dislocation. The impact oftransportation TI is calculated from the distance li,j, between theparticipants i and j, the kgCO2 per km*tonne of emission representedby the transportation impact factor TFi,j and quantity Qi,j of theexchanged resources. Haversine Formula (Equation (7)e(11)) isused for calculating the distance between the participants forwhich the latitude lati and longitude loni of the participants areextracted from the geo: lat and geo: long data properties of reusedwgs84_pos1 ontology:
Dlon ¼ lonj � loni (7)
Dlat ¼ latj � lati (8)
a ¼ ðsinðDlat=2ÞÞ2 þ cosðlatiÞ*cos�latj
�*ðsinðDlon=2ÞÞ2 (9)
c ¼ 2*atan2� ffiffiffi
ap
;ffiffiffiffiffiffiffiffiffiffiffiffi1� a
p �(10)
li;j ¼ R*c (11)
where, R is the radius of the earth.
TI ¼Xnsyn
i;j
TFi;j*li;j*Qi;j (12)
Here, TF is the kg CO2/tonne km value modelled in the ontologyby the hasTransportationFactor data property (Table 1) and the
ENVI ¼Xpairs
i¼0
ðwECC*ECCÞ � ðwVMFS*VMFSÞ � ðwLDFS*LDFSÞ þ ðwTFI*TFIÞ þ ðwECFI*ECFIÞPwi
(16)
quantity Qi,j of the exchanged resources between participants andnsyn is the number of pairwise exchanges in the network. Thefinancial gains or costs of transportation TFI are calculated from thecredit price of COP
2 as (DEFRA, 2012):
TFI ¼ TI*COP2 (13)
1 http://www.w3.org/2003/01/geo/wgs84_pos#.
Please cite this article in press as: Trokanas, N., et al., Semantic approach foJournal of Cleaner Production (2013), http://dx.doi.org/10.1016/j.jclepro.2
where LGV and HGV stand for Light and Heavy Goods Vehicle,respectively.
4.5. Environmental effects of energy consumption
The energy consumption is calculated only for energy consumedby processing technologies involved in the symbiosis and takinginto account environmental energy tags for six different types ofenergy (in kg CO2 per KWh), as shown in Table 2 (DEFRA, 2012).
The energy types are linked to the carbon content values CCi,j bythe has CO2 Content data property property in the domainontology. The total kg CO2 environmental effect of energy used ECIfor processes involved is calculated as the sum of the kg CO2 foreach energy type used multiplied by the quantity Qi,j of exchangedresources and assuming linear dependency:
ECI ¼Xnen
i;j
�Qi;j*CCi;j
�(14)
where nen, is the number of different types of energy used. Inmajority of cases in practice only a few different types of energy areinvolved. The environmental cost of consumed energy ECFI iscalculated from the credit price of carbon dioxide COP
2 (from theCO2 Price data property in the domain ontology) as:
ECFI ¼ ECI*COP2 (15)
4.6. Aggregated environmental impact
The environmental indicators, including costs and savings, areaggregated into a single metric, the weighted environmentalimpact ENVI, as the weighted average
Here wECC, wVMFS, wLDFS, wTFI, and wECFI are weighting factorsfor each type of indicator which reflect the current IS practice butalso allow for user to specify priorities. More precisely, users canchoose the priority of each metric by assigning a weighting factorbetween 1 and 5, which correspond to normalised values 0.2, 0.4,0.6, 0.8 and 1.0. Minimum weighting factor is 0.2, thus noweighting factor is completely ignored. The use of default valuesfor weighting factors aims in reducing the uncertainty stemmingfrom user involvement by not allowing the use of extreme valuesthat can lead to misleading results. Future implementations willinclude optimisation of environmental impact of each synergy.
r pre-assessment of environmental indicators in Industrial Symbiosis,013.12.046
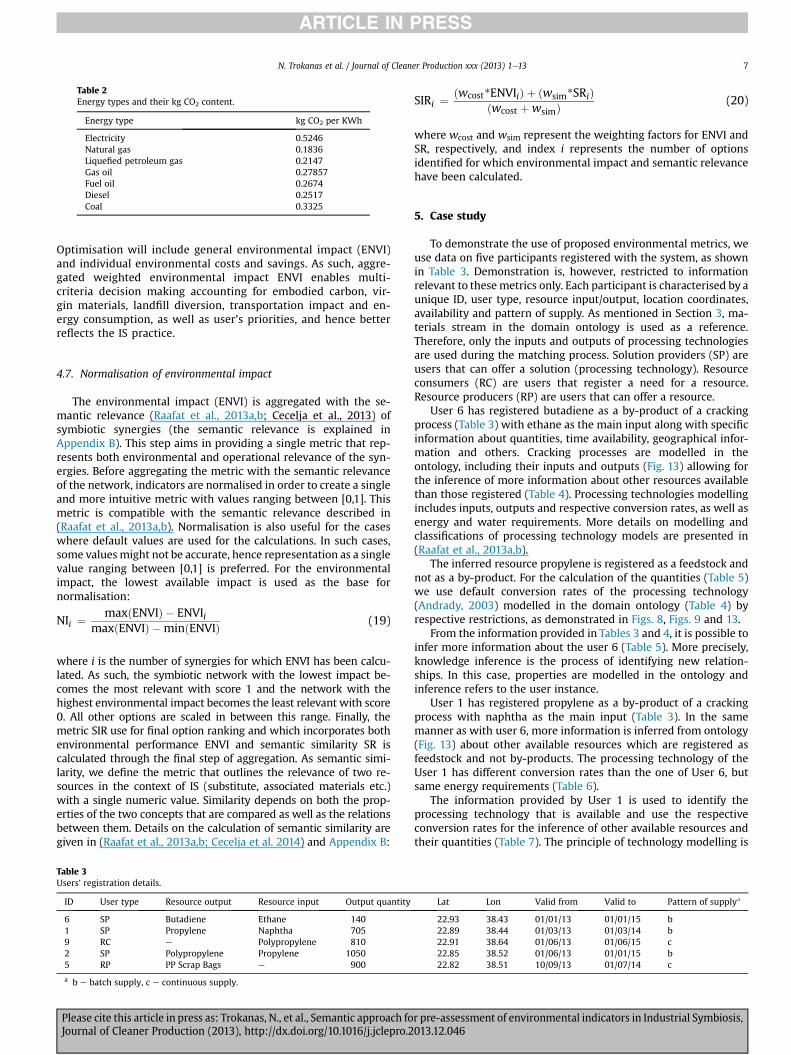
Table 2Energy types and their kg CO2 content.
Energy type kg CO2 per KWh
Electricity 0.5246Natural gas 0.1836Liquefied petroleum gas 0.2147Gas oil 0.27857Fuel oil 0.2674Diesel 0.2517Coal 0.3325
N. Trokanas et al. / Journal of Cleaner Production xxx (2013) 1e13 7
Optimisation will include general environmental impact (ENVI)and individual environmental costs and savings. As such, aggre-gated weighted environmental impact ENVI enables multi-criteria decision making accounting for embodied carbon, vir-gin materials, landfill diversion, transportation impact and en-ergy consumption, as well as user’s priorities, and hence betterreflects the IS practice.
4.7. Normalisation of environmental impact
The environmental impact (ENVI) is aggregated with the se-mantic relevance (Raafat et al., 2013a,b; Cecelja et al., 2013) ofsymbiotic synergies (the semantic relevance is explained inAppendix B). This step aims in providing a single metric that rep-resents both environmental and operational relevance of the syn-ergies. Before aggregating the metric with the semantic relevanceof the network, indicators are normalised in order to create a singleand more intuitive metric with values ranging between [0,1]. Thismetric is compatible with the semantic relevance described in(Raafat et al., 2013a,b). Normalisation is also useful for the caseswhere default values are used for the calculations. In such cases,some valuesmight not be accurate, hence representation as a singlevalue ranging between [0,1] is preferred. For the environmentalimpact, the lowest available impact is used as the base fornormalisation:
NIi ¼maxðENVIÞ � ENVIi
maxðENVIÞ �minðENVIÞ (19)
where i is the number of synergies for which ENVI has been calcu-lated. As such, the symbiotic network with the lowest impact be-comes the most relevant with score 1 and the network with thehighest environmental impact becomes the least relevant with score0. All other options are scaled in between this range. Finally, themetric SIR use for final option ranking and which incorporates bothenvironmental performance ENVI and semantic similarity SR iscalculated through the final step of aggregation. As semantic simi-larity, we define the metric that outlines the relevance of two re-sources in the context of IS (substitute, associated materials etc.)with a single numeric value. Similarity depends on both the prop-erties of the two concepts that are compared as well as the relationsbetween them. Details on the calculation of semantic similarity aregiven in (Raafat et al., 2013a,b; Cecelja et al. 2014) and Appendix B:
Table 3Users’ registration details.
ID User type Resource output Resource input Output quantity
6 SP Butadiene Ethane 1401 SP Propylene Naphtha 7059 RC e Polypropylene 8102 SP Polypropylene Propylene 10505 RP PP Scrap Bags e 900
a b e batch supply, c e continuous supply.
Please cite this article in press as: Trokanas, N., et al., Semantic approach foJournal of Cleaner Production (2013), http://dx.doi.org/10.1016/j.jclepro.2
SIRi ¼ðwcost*ENVIiÞ þ ðwsim*SRiÞ
ðwcost þwsimÞ (20)
where wcost and wsim represent the weighting factors for ENVI andSR, respectively, and index i represents the number of optionsidentified for which environmental impact and semantic relevancehave been calculated.
5. Case study
To demonstrate the use of proposed environmental metrics, weuse data on five participants registered with the system, as shownin Table 3. Demonstration is, however, restricted to informationrelevant to thesemetrics only. Each participant is characterised by aunique ID, user type, resource input/output, location coordinates,availability and pattern of supply. As mentioned in Section 3, ma-terials stream in the domain ontology is used as a reference.Therefore, only the inputs and outputs of processing technologiesare used during the matching process. Solution providers (SP) areusers that can offer a solution (processing technology). Resourceconsumers (RC) are users that register a need for a resource.Resource producers (RP) are users that can offer a resource.
User 6 has registered butadiene as a by-product of a crackingprocess (Table 3) with ethane as the main input along with specificinformation about quantities, time availability, geographical infor-mation and others. Cracking processes are modelled in theontology, including their inputs and outputs (Fig. 13) allowing forthe inference of more information about other resources availablethan those registered (Table 4). Processing technologies modellingincludes inputs, outputs and respective conversion rates, as well asenergy and water requirements. More details on modelling andclassifications of processing technology models are presented in(Raafat et al., 2013a,b).
The inferred resource propylene is registered as a feedstock andnot as a by-product. For the calculation of the quantities (Table 5)we use default conversion rates of the processing technology(Andrady, 2003) modelled in the domain ontology (Table 4) byrespective restrictions, as demonstrated in Figs. 8, Figs. 9 and 13.
From the information provided in Tables 3 and 4, it is possible toinfer more information about the user 6 (Table 5). More precisely,knowledge inference is the process of identifying new relation-ships. In this case, properties are modelled in the ontology andinference refers to the user instance.
User 1 has registered propylene as a by-product of a crackingprocess with naphtha as the main input (Table 3). In the samemanner as with user 6, more information is inferred from ontology(Fig. 13) about other available resources which are registered asfeedstock and not by-products. The processing technology of theUser 1 has different conversion rates than the one of User 6, butsame energy requirements (Table 6).
The information provided by User 1 is used to identify theprocessing technology that is available and use the respectiveconversion rates for the inference of other available resources andtheir quantities (Table 7). The principle of technology modelling is
Lat Lon Valid from Valid to Pattern of supplya
22.93 38.43 01/01/13 01/01/15 b22.89 38.44 01/03/13 01/03/14 b22.91 38.64 01/06/13 01/06/15 c22.85 38.52 01/06/13 01/01/15 b22.82 38.51 10/09/13 01/07/14 c
r pre-assessment of environmental indicators in Industrial Symbiosis,013.12.046

Fig. 13. Ethane cracking modelling.
Table 4Knowledge modelled in the domain ontology for ethane cracking.
Input Conversion rate Output Energy quantity (MJ/kg) Water (kg)
Ethane 1.11% Propylene 3.53 2980.00% Ethylene 41.0514.00% Butadiene 21.38
Table 5Inferred information for user 6 in Table 3.
Output Input quantity Output quantity Energy in KWh
Propylene 1000 11.1 784.44Ethylene 1000 800 9122.22Butadiene 1000 140 4751.11
N. Trokanas et al. / Journal of Cleaner Production xxx (2013) 1e138
demonstrated in Figs. 8 and 13 with more details on the integrationof processing technologies provided by (Raafat et al., 2013a,b). Inboth cases, ethylene is the main product and for that it is assumedthat ethylene is not available, unless the user explicitly registers itas a resource.
The performance of the identified symbiotic networks (Fig.14) isevaluated by summing the impacts of all the synergies in thenetwork. In this case study calculation focuses on the identifiedsymbiotic networks for the request of polypropylene given by theregistration of user 9 which is a resource consumer and whichneeds 810 tonnes of polypropylene along with the other detailsgiven in Table 3. Excluding the information about energy con-sumption, Table 8 shows the explicit information used for thecalculation of the environmental indicators according to therequest from user 9.
Two synergies are identified as possible solutions for thisrequest. Since the request originated by user 9, the matching al-gorithm follows a backward chaining approach. The first step (Step1 in Fig. 14), involves the supply of polypropylene to the requestor.Semantic matching takes into account both the tacit knowledgewhich is inherent in the structure of the domain ontology (Fig. 8)and explicit information which is either provided by the user ormodelled in the ontology as default values (Fig. 9). The results of thematching are presented in Table 9 and the details on the calculationof semantic matching are given in Appendix B.
The second step (Step 2 in Fig. 14), involves the supply of pro-pylene for the production of polypropylene in order to satisfy theinitial request. Results are presented in Table 10. The similarityvalues are later aggregated with the environmental indicators asdescribed in Section 4.7.
Propylene is available from the cracking process registered bythe users 1 and 6 (Table 3). More details on backward matching are
Please cite this article in press as: Trokanas, N., et al., Semantic approach foJournal of Cleaner Production (2013), http://dx.doi.org/10.1016/j.jclepro.2
given in Appendix C. The embodied carbon of propylene is 1.35 kgCO2/kg (Fig. 9). The satisfied capacities for the two synergies differsignificantly, leading to a high variance between the two metrics.By observing Equations (1) and (2) we get respective quantities as:
Q1�2 ¼ 11 tonnes
Q6�2 ¼ 705 tonnes
Therefore, the two embodied carbon metrics are
EC1�2 ¼ 14850kg CO2
EC6�2 ¼ 951750 kg CO2
The same metric is calculated for the second pair. The embodiedcarbon for Polypropylene is 3.9 kg CO2/kg (Table 8). The embodied
r pre-assessment of environmental indicators in Industrial Symbiosis,013.12.046

Table 6Cracking process (naphtha input).
Input Conversion rate Output Energy quantity(MJ/kg)
Water (kg)
Naphtha 14.10% Propylene 3.53 2930.00% Ethylene 41.054.50% Butadiene 21.38
Table 7Inferred information for user 1.
Output Input quantity Output quantity Energy in KWh
Propylene 5000 705 784.44Ethylene 5000 1500 9122.22Butadiene 5000 225 4751.11
N. Trokanas et al. / Journal of Cleaner Production xxx (2013) 1e13 9
carbon for the scrap bags is significantly lower (1.8 kg CO2/kg) sinceit will be reused. In both cases the full capacities of requests aresatisfied.
Q2�9 ¼ 810 tonnes
Q5�9 ¼ 810 tonnes
The EC metrics are then calculated according to Equation (1) as:
EC2�9 ¼ 3159000 kg CO2
EC5�9 ¼ 1458000kg CO2
The metrics of all the synergies are aggregated to create a singleEC metric for each possible path. In this case, there are threepossible options. The first two involve a symbiotic network whilethe third involves a single synergy (Table 11). The EC metric isconverted into a cost ECC using the credit price for CO2 (£3.72)which is predefined in the domain ontology.
To calculate the virgin materials saved VMS and its corre-sponding financial metric VMFS, the capacities that are satisfied bya by-product need to be calculated first and according to Equations(3) and (4):
C1�2 ¼ 11:1 tonnes
C6�2 ¼ 0 tonnes
Therefore,
VMS1�2 ¼ 11:1 tonnes
VMS6�2 ¼ 0 tonnes
Fig. 14. Identified sym
Please cite this article in press as: Trokanas, N., et al., Semantic approach foJournal of Cleaner Production (2013), http://dx.doi.org/10.1016/j.jclepro.2
The materials saved financial metric is calculated using theprices of the feedstock FP and the resources RP (by-products) asmodelled in the domain ontology and illustrated in Fig. 9:
VMFS1�2 ¼ 11:1*ð1000� 845Þ ¼ £6470:5
VMFS6�2 ¼ 0
In the samemanner, the VMS and VMFS are calculated for the allother resource exchanges in the network. In the case where aresource is not replaced with a by-product, VMFS ¼ 0.
VMFS2�9 ¼ 810*ð1810� 1810Þ ¼ £0
VMFS5�9 ¼ 810*ð1810� 600Þ ¼ £980100
The virgin materials saved indicators for each of the networksare given in Table 12.
The landfill diversion savings indicator LDS and its financialcounterpart LDFS are calculated according to Equations (5) and (6).The former is calculated from the quantities of by-products that areused instead of being disposed in landfill:
LDS1�2 ¼ 11 tonnes
LDS6�2 ¼ 0
LDS2�9 ¼ 0
LDS5�9 ¼ 810 tonnes
For the financial indicator LDFS shown in Table 13, the abovevalues are converted using the disposal cost, price and landfill tax,as described in Section 4.3. Default data for this calculation areextracted from the restrictions on properties in Fig. 12 and Table 8.
LDFS1�2 ¼XResource
i
Q1�2*�DCpropylene þ RPpropylene þ LT
�
The metric is calculated in the same way for all synergies.
LDFS1�2 ¼ 11*1064 ¼ £11704
LDFS6�2 ¼ 0
LDFS2�9 ¼ 0
LDFS5�9 ¼ 810*ð600þ 35þ 64Þ ¼ £ 566190
biotic networks.
r pre-assessment of environmental indicators in Industrial Symbiosis,013.12.046

Table 8Information used in calculations.
ID User type Resource output Resource input Output quantity Embodied carbon FP RP DC LT
6 SP Propylene Ethane 11.1 1.35 1000 845 43 641 SP Propylene Naphtha 705 1.35 43 649 RC e Polypropylene 810 18102 SP Polypropylene Propylene 1050 3.9 1810 30 645 RP PP Scrap Bags e 900 1.8 600 30 64
N. Trokanas et al. / Journal of Cleaner Production xxx (2013) 1e1310
The impact of transportation, hence the transportation factor,depends on the mode of transport. In the case where the user hasnot provided explicit information regarding the mode of trans-portation, we use the average for HGVs calculated in vehicle*kmbasis. Air and water transportation are not considered due to thelocal nature of Industrial Symbiosis. By observing Equation (7)e(13), the impact of the transportation is:
TI1�2 ¼ TF1�2*distance1�2*Q1�2 ¼ 0:906*13:15*11
¼ 131:05 kg CO2
TI6�2 ¼ 5780:50kg CO2
TI2�9 ¼ 10369:44kg CO2
TI5�9 ¼ 11991:27kg CO2
The TFI (Table 14) is calculated using the CO2 credit price inEquation (13).
The energy consumption indicators ECI and ECFI apply only tothe symbiotic networks that involve a processing technology. Giventhe details in Table 2 and by observing Equation (14), we get:
ECI1�2 ¼ 9780520 kg CO2
ECI2�9 ¼ 203124kg CO2
Table 9Matching polypropylene request.
Request Matched Similarity Quantity
Polypropylene PP 810PP 0.8509 1050PP Scrap Bags 0.3089 900
Table 10Matching propylene request.
Request Matched Similarity Quantity
Propylene 1060.61Propylene 0.8749 705Propylene 0.7417 11.1
Table 11EC and ECC metrics.
Network EC (kg CO2) ECC (£)
1-2-9 3,173,850 11,806,7226-2-9 4,110,750 15,291,9905-9 1,458,000 5,423,760
Please cite this article in press as: Trokanas, N., et al., Semantic approach foJournal of Cleaner Production (2013), http://dx.doi.org/10.1016/j.jclepro.2
ECI6�2 ¼ 11582880 kg CO2
ECI5�9 ¼ 0kg CO2
The financial counterpart is calculated again by accounting theCO2 credit price and according to Equation (15). The results for allthe symbiotic networks are given in Table 15.
ECFI1�2 ¼ £36383:53
ECFI2�9 ¼ £755:621
ECFI6�2 ¼ £43088:31
ECFI5�9 ¼ 0
After all the aspects of the environmental impact and savingshave been calculated, they are aggregated to provide a singleenvironmental metric, as shown in Table 16.
Given the results described in Table 16 and by observing equa-tion (16), the aggregated ENVI indicator is calculated (Table 17). Allweighting factors wECC, wVMFS, wLDFS, wTFI, and wECFI are here setto 1.
This aggregated metric ENVI is then normalised by observingEquation (19) in order to conform to the semantic relevance score(Table 18).
Eventually, the semantic relevance and impact score areaggregated (Table 19), and according to Equation (20) with resultsare presented to the user as a single score for each option. In currentimplementation, the default values for the weighting factors used
Table 12VMS and VMFS metrics.
Network VMS VMFS (£)
1-2-9 11.1 6470.56-2-9 0 05-9 810 980,100
Table 13LDFS metric.
Network LDFS (£)
1-2-9 11,7046-2-9 05-9 566,190
Table 14TFI metric.
Network TFI (£)
1-2-9 21,990.976-2-9 60,077.785-9 44,607.52
r pre-assessment of environmental indicators in Industrial Symbiosis,013.12.046

Table 15ECFI metric.
Network ECFI (£)
1-2-9 37,139.156-2-9 79,471.845-9 0
Table 16Environmental metrics.
Network ECFI (£) TFI(£) LDFS (£) VMFS (£) ECC (£)
1-2-9 37,139.15 21,990.97 11,704 6470.5 11,806,7226-2-9 79,471.84 60,077.78 0 0 15,291,9905-9 0 44,607.52 566,190 980,100 5,423,760
Table 17ENVI metric.
Network ENVI
1-2-9 2,369,5366-2-9 3,086,3085-9 784,415.5
Table 18Aggregated and normalised impact score.
Network ENVI NI
1-2-9 2,369,536 0.316-2-9 3,086,308 0.005-9 784,415.5 1.00
Table 19Final semantic relevance score.
Network SR NI SIR
1-2-9 0.7963 0.31 0.606-2-9 0.8629 0.00 0.515-9 0.3089 1.00 0.58
N. Trokanas et al. / Journal of Cleaner Production xxx (2013) 1e13 11
in the aggregation are wcost ¼ 0.4 and wsim ¼ 0.6. They have beenestablished through experience from current IS practice. However,the participants have the option to alter the weighting factors ac-cording to their priorities.
Based on the results in Table 19, available options are re-rankedin terms of environmental and semantic relevance SIR. The option1-2-9 has the highest score (0.60), option 5-9 comes second with ascore of 0.58 and lastly, option 6-2-9 has the lowest SIR score of0.51. If the user had set environmental performance as a priority bysetting higher weighting factor for the NI (Table 19), option 5-9would have come first with SIR ¼ 0.72 (for wcost ¼ 0.6 andwsim ¼ 0.4).
4. Conclusions
The use of a single metric supports an intuitive way for com-parison of symbiotic networks. By transforming all impacts into acost IS performance is made more relevant to the user. The pro-posed metric can be further enhanced by other metrics trans-formed into a cost, such as toxicity, hazardousness and the socialperception of environmental effects which are currentlyinvestigated.
It is apparent that the results depend on the weighting factorsprovided by the user. Yet, the use of weighting factors in the
Please cite this article in press as: Trokanas, N., et al., Semantic approach foJournal of Cleaner Production (2013), http://dx.doi.org/10.1016/j.jclepro.2
aggregation of proposed metrics and respective indicators providehigher flexibility, more customised results and better reflection ofcurrent IS practice. The system is easily customisable to addresscertain environmental issues of an area by using predefinedweighting factors.
This approach has been successfully implemented in the webplatform described in (Cecelja et al., 2014). It has been in operationand tested by a high number of companies in Viotia, Greece.
Appendix A. NomenclatureIS Industrial SymbiosisICT Information and Communication TechnologiesI/O Input/OutputEC Embodied carbon of the symbiotic networkQi,j Quantity of resource exchanged between industries i and jECR(i,j) Embodied carbon of resource exchanged between
industries i and j (extracted from the has EmbodiedCarbon data type property)
ECC Embodied carbon cost for the symbiotic networkCOP
2 Price of CO2 as formed in the boundaries of carbonexchange scheme
VMS The amount of virgin materials savedVMFS VMS transformed into a financial metric (savings)FPi,j The price of the feedstock that is replaced by a resource
between industries i and jRPi,j Price of resource exchanged between industries i and jCj,i Capacity of industry j satisfied by industry i (for resource
consumers and solution providerse linked to hasQuantityproperty)
LDS The amount of waste diverted from landfillLDFS LDS converted to a financial metric (savings)DCi,j Disposal cost for resource exchanged between industries i
and jLT Landfill tax for regionlon Longitudelat LatitudeTI Transportation impactTFi,j Transportation factor between industries i and jTFI Transportation Impact in financial terms (cost)ECI Energy consumption impactCC Carbon content of energy typeECFI Energy consumption financial impact (cost)ENVI Total environmental impact of symbiotic synergyNInetworks
i Normalised impact of network imin(Ii) The minimum impact of all available option for symbiotic
networkswECC Weighting factor for ECCwVMFS Weighting factor for VMFSwLDFS Weighting factor for LDFSwTFI Weighting factor for TFIwECFI Weighting factor for ECFIwcost Weighting factor for environmental impactwsim Weighting factor for semantic similarityPP PolypropyleneSR Semantic relevanceSIR A metric aggregating the semantic similarity and the
impact of the networksnsyn The number of pairwise exchanges in the symbiotic
networknin The number of inputs involved in the symbiotic networknres The number of resources exchanged in the symbiotic
networknen The number of different types of energy required in a
symbiotic networkli,j The physical distance between users i and j
r pre-assessment of environmental indicators in Industrial Symbiosis,013.12.046

N. Trokanas et al. / Journal of Cleaner Production xxx (2013) 1e1312
Appendix B. Semantic matching
The semantic matching is used to establish the technologicalrelevance between IS participants and respective resources andhence to enable formation of IS networks. The matching algorithm(Raafat et al., 2013a,b) is designed using a multi-level approach(Figure B1); i) elimination level (E), ii) resourcematching level (RM)and iii) the aggregation level (A). The resource matching level itselfcontains three phases, including graph modelling (GM), distancemeasurement (DM) and property matching (PM).
The inputs of the matching process include the domainontology, the registered industries’ semantic profiles and the re-questor’s semantic profile. The output of the matching is a set ofsimilarity measures between the request and the matched profilesof registered participants.
Figure B.1The multi-level matching process
Figure C.1Chain matching
The process of elimination is introduced to minimise redundantmatching and hence to computationally speed up the process.Three metrics have been introduced for the elimination phase: i)elimination based on user’s role, ii) elimination based on the natureof the resource in terms of hazardousness, and iii) eliminationbased on availability of resource.
The resourcematching (Figure B1) calculates a semantic similaritymeasure over the resource classification of the domain ontology. Se-mantic similarity between resources is quantified by the distancemeasurementhCk betweenrespectiveconceptsandthrough thevectorsimilarity hVk of resource properties associated with this phase. Thewhole process is performed in three phases, namelyGraphModelling(GM), Distance Measurement (DM) and Property Matching (PM).
The Distance Measurement (DM) phase measures the similaritybetween the type of the resources specified as the input and outputof the resource provider and the solution provider using the graphmodel of the ontology. The distance is measured using the shortestpath algorithm for distance measurement which operates over anydirected graph model. Modified Dijkstra shortest path algorithm isused as the foundation of distance measurement between resourcetypes showing the dissimilarity degree between two nodes whichis then normalized and converted into a similarity measure.
The distance d0ðSIi ; SICÞ between two classes is calculated as thedissimilarity function and the similarity measure hCk , is thencalculated using the normalized dissimilarity d0. Normalization ofthe dissimilarity ranges the value to an interval of real numbersbetween 0 and 1 and is calculated by dividing the dissimilaritymeasure over the longest logical path between the two nodes.Using the normalized dissimilarity measure the similarity degree isa number between 0 and 1 with 1 being maximum similarity and0 representing no similarity:
Please cite this article in press as: Trokanas, N., et al., Semantic approach foJournal of Cleaner Production (2013), http://dx.doi.org/10.1016/j.jclepro.2
hCk ¼ �1� d0
�
In the Property Matching phase the properties characterizingthe resource and industry are matched. Only industries which passa threshold similarity at the Distance measurement (DM) phase areconsidered. The threshold t is application dependent and can beadjusted to optimize results of matching taking into account ap-plication’s requirements. The property matching is performed byusing a node based similarity measure, the vector space modelling(VSM). Vector space modelling allows for measuring the similaritybetween two vectors in an n-dimension space and it can be adaptedto account for attributes of nodes with no limitations to type ornumber of attributes and therefore allows comparison of resourcesby several properties. Similarity is calculated as an average of the
cosine similarity measure ðhV ;ck Þ and the similarity measure calcu-
lated using Euclidean distance ðhV ;Ek Þ.
hVk ¼�hV ;ck þ hV ;Ek
�.2
The results of the matching phases distance measurement (DM)and property matching (PM) are aggregated at the third level of themulti-level matching algorithm and using the fuzzy weightedaverage.
hk ¼ ahCk þ bhVkaþ b
Where a and b are weighting parameters; in the currentimplementation we use a ¼ 0.6 and b ¼ 0.4 to reflect IS practice.
Appendix C. Backward matching
Chain matching (Raafat et al., 2013a,b) expands direct matchingbetween two industries by introducing additional participants in thenetwork which play the role of enablers, mediating linear relation-ships. The concept of enabler refers to a process or technology thatbreaks the linear relationship of a direct match and provides accessto alternative solutions. The enabler is capable of processing aresource and producing an output which matches the targeted inputof the request. The chaining is integrated by a backward matchingwith resource consumers playing the role of a requestor, as shown inFigure C1. The resource consumer (which can itself be a solutionprovider) places a request for a type of resource as input. In the casewhere there is no direct match available or to broaden the identifiedsynergy possibilities, an intermediate solution provider will act as anenabler. The backward matching performs two direct matching be-tween the resource consumer and the enabler, and then between theenabler and the resource provider. The final similarity between theresource consumer and the resource provider is calculated as ag-gregation of the similarities between each direct match in the chain.
r pre-assessment of environmental indicators in Industrial Symbiosis,013.12.046

N. Trokanas et al. / Journal of Cleaner Production xxx (2013) 1e13 13
References
Allen, D.T., 2004. An industrial ecology: material flows and engineering design. In:Sustainable Development in Practice: Case Studies for Engineers and Scientists,p. 283.
Andrady, A.L., 2003. Plastics and the Environment. Wiley. com.Berkel, R.V., Fujita, T., Hashimoto, S., Fujii, M., 2009. Quantitative assessment of
urban and Industrial Symbiosis in Kawasaki, Japan. Environ. Sci. Technol. 43 (5),1271e1281.
Cecelja, F., Raafat, T., Trokanas, N., Innes, S., Smith, M., Yang, A., Zorgios, Y.,Korkofygas, A., Kokossis, A., 2014. e-Symbiosis: technology-enabled support forIndustrial Symbiosis targeting SMEs and innovation. J. Clean. Prod. vol. toappear.
Chertow, M.R., Lombardi, D.R., 2005. Quantifying economic and environmentalbenefits of co-located firms. Environ. Sci. Technol. 39 (17), 6535e6541.
Chertow, M.R., 2000. Industrial Symbiosis: literature and taxonomy. Annu. Rev.Energy Environ. 25 (1), 313e337.
DEFRA, 2012. The 2012 Guidelines to Defra and DECC’s Greenhouse Gas (GHG)Conversion Factors for Company Reporting. Department for Environment, Food& Rural Affairs, UK.
Eckelman, M.J., Chertow, M.R., 2009. Quantifying life cycle environmental benefitsfrom the reuse of industrial materials in Pennsylvania. Environ. Sci. Technol. 43(7), 2550e2556.
European Commission, 2000. Commission Decision 2000/532/EC replacing Deci-sion 94/3/EC establishing a list of wastes pursuant to Article 1 (a) of CouncilDirective 75/442/EEC on waste and Council Decision 94/904/EC establishing alist of hazardous waste pursuant to Article 1(4) of Council Directive 91/689/EECon hazardous waste. Off. J. Eur. Commun., 3e24.
Eurostat, E., 2013. Material Prices for Recyclates [Homepage of Eurostat] [Online].Available: http://epp.eurostat.ec.europa.eu/portal/page/portal/waste/waste_related_topics/material_prices_recyclates [2013, 12.14].
Grant, G.B., Seager, T.P., Massard, G., Nies, L., 2010. Information and communicationtechnology for Industrial Symbiosis. J. Industrial Ecol. 14 (5), 740e753.
Hammond, G., Jones, C., 2008. Inventory of Carbon & Energy: ICE, SustainableEnergy Research Team. Department of Mechanical Engineering, University ofBath.
Hepp, M., 2006. Products and services ontologies: a methodology for derivingOWL ontologies from industrial categorization standards. In: InternationalJournal on Semantic Web and Information Systems (IJSWIS), 2, 1, pp. 72e99.IGI Global.
ICIS, E, 2013. 09/01/2013-last Update, Chemicals Prices, News and Analysis[Homepage of ICIS] [Online]. Available: https://www.icis.com/chemicals/ [2013,12/14].
Please cite this article in press as: Trokanas, N., et al., Semantic approach foJournal of Cleaner Production (2013), http://dx.doi.org/10.1016/j.jclepro.2
Jacobsen, N.B., 2006a. Industrial Symbiosis in Kalundborg, Denmark: a quantitativeassessment of economic and environmental aspects. J. Industrial Ecol. 10 (1e2),239e255.
Jacobsen, N.B., 2006b. Industrial Symbiosis in Kalundborg, Denmark: a quantitativeassessment of economic and environmental aspects. J. Indust. Ecol. 10 (1e2),239e255.
Kraines, S., Batres, R., Koyama, M., Wallace, D., Komiyama, H., 2005. Internet-basedintegrated environmental assessment using ontologies to share computationalmodels. J. Indust. Ecol. 9 (3), 31e50.
Martin, M., Eklund, M., 2011. Improving the environmental performance of biofuelswith Industrial Symbiosis. Biomass Bioener. 35 (5), 1747e1755.
Martin, M., Svensson, N., Fonseca, J., Eklund, M., 2012. Who Gets the Benefits? AnApproach for Assessing the Environmental Performance of Industrial Symbiosis.Greening of Industry 2012: Support your future today.
Mattila, T., Lehtoranta, S., Sokka, L., Melanen, M., Nissinen, A., 2012. Methodologicalaspects of applying life cycle assessment to industrial symbioses. J. Indust. Ecol.16 (1), 51e60.
Mattila, T.J., Pakarinen, S., Sokka, L., 2010. Quantifying the total environmentalimpacts of an Industrial Symbiosis e a comparison of process-, hybrid andinput � output life cycle assessment. Environ. Sci. Technol. 44 (11), 4309e4314.
Phillips, C., Swindells, N., Moreno, A., Masoni, P., 2005. Co-operation and standardsfor life cycle assessment data in Europe e project report. In: CASCADE. GTC2-2000-33005.
Raafat, T., Trokanas, N., Cecelja, F., Bimi, X., 2013a. An ontological approach towardsenabling processing technologies participation in Industrial Symbiosis. Comput.Chem. Eng. 59, 33e46.
Raafat, T., Cecelja, F., Yang, A., Trokanas, N., 2012. Semantic support for IndustrialSymbiosis process. In: 22nd European Symposium on Computer Aided ProcessEngineering, p. 452.
Raafat, T., Trokanas, N., Cecelja, F., Bimi, X., 2013b. An ontological approach towardsenabling processing technologies participation in Industrial Symbiosis. Comput.Chem. Eng. no. 0.
Trokanas, N., Raafat, T., Cecelja, F., Kokossis, A., 2013. OFIS e ontological framework forIndustrial Symbiosis. In: Computer Aided Chemical Engineering. 23rd EuropeanSymposium on Computer Aided Process Engineering, vol. 32, pp. 523e528.
Trokanas, N., Raafat, T., Cecelja, F., Kokossis, A., Yang, A., 2012. Semantic Formalismfor Waste and Processing Technology Classifications Using Ontology Models.Manuscript submitted for publication to Escape.
UN, 2008. Central Product Classification (CPC) Ver.2. United Nations.Van Berkel, R., 2010. Quantifying sustainability benefits of industrial symbioses.
J. Indust. Ecol. 14 (3), 371e373.Zapico, J.L., Brandt, N., Turpeinen, M., 2010. Environmental metrics. J. Indust. Ecol. 14
(5), 703e706.
r pre-assessment of environmental indicators in Industrial Symbiosis,013.12.046