
Self-Directed Learning in Problem ... - DigitalCommons@USU
219
Utah State University Utah State University DigitalCommons@USU DigitalCommons@USU All Graduate Theses and Dissertations Graduate Studies 5-2012 Self-Directed Learning in Problem-Based Learning Versus Self-Directed Learning in Problem-Based Learning Versus Traditional Lecture-Based Learning: A Meta-Analysis Traditional Lecture-Based Learning: A Meta-Analysis Heather M. Leary Utah State University Follow this and additional works at: https://digitalcommons.usu.edu/etd Part of the Education Commons Recommended Citation Recommended Citation Leary, Heather M., "Self-Directed Learning in Problem-Based Learning Versus Traditional Lecture-Based Learning: A Meta-Analysis" (2012). All Graduate Theses and Dissertations. 1173. https://digitalcommons.usu.edu/etd/1173 This Dissertation is brought to you for free and open access by the Graduate Studies at DigitalCommons@USU. It has been accepted for inclusion in All Graduate Theses and Dissertations by an authorized administrator of DigitalCommons@USU. For more information, please contact [email protected].
-
Upload
khangminh22 -
Category
Documents
-
view
1 -
download
0
Transcript of Self-Directed Learning in Problem ... - DigitalCommons@USU

Utah State University Utah State University
DigitalCommons@USU DigitalCommons@USU
All Graduate Theses and Dissertations Graduate Studies
5-2012
Self-Directed Learning in Problem-Based Learning Versus Self-Directed Learning in Problem-Based Learning Versus
Traditional Lecture-Based Learning: A Meta-Analysis Traditional Lecture-Based Learning: A Meta-Analysis
Heather M. Leary Utah State University
Follow this and additional works at: https://digitalcommons.usu.edu/etd
Part of the Education Commons
Recommended Citation Recommended Citation Leary, Heather M., "Self-Directed Learning in Problem-Based Learning Versus Traditional Lecture-Based Learning: A Meta-Analysis" (2012). All Graduate Theses and Dissertations. 1173. https://digitalcommons.usu.edu/etd/1173
This Dissertation is brought to you for free and open access by the Graduate Studies at DigitalCommons@USU. It has been accepted for inclusion in All Graduate Theses and Dissertations by an authorized administrator of DigitalCommons@USU. For more information, please contact [email protected].
SELF-DIRECTED LEARNING IN PROBLEM-BASED LEARNING VERSUS
TRADITIONAL LECTURE-BASED LEARNING: A META-ANALYSIS
by
Heather M. Leary
A dissertation submitted in partial fulfillment of the requirements for the degree
of
DOCTOR OF PHILOSOPHY
in
Instructional Technology and Learning Sciences
Approved: Andrew Walker, Ph.D. Wendy Holliday, Ph.D. Major Professor Committee Member Mimi Recker, Ph.D. Brett E. Shelton, Ph.D. Committee Member Committee Member Karl White, Ph.D. Mark R. McLellan, Ph.D. Committee Member Vice President for Research and Dean of the School of Graduate Studies
UTAH STATE UNIVERSITY
Logan, Utah
2012

ii
Copyright © Heather M. Leary 2012
All Rights Reserved

iii
ABSTRACT
Self-Directed Learning in Problem-Based Learning Versus Traditional
Lecture-Based Learning: A Meta-Analysis
by
Heather M. Leary, Doctor of Philosophy
Utah State University, 2012
Major Professor: Dr. Andrew Walker Department: Instructional Technology and Learning Sciences
Problem-based learning is a student-centered, inquiry-based approach that builds
problem-solving skills. Reviews of problem-based learning, as compared to traditional
lecture-based learning, report modest positive gains in cognitive outcomes. Many meta-
analyses have been conducted to analyze the effectiveness of problem-based learning, but
none have examined self-directed learning in the context of problem-based learning. The
purpose of this study was to conduct a meta-analysis across all disciplines examining the
extent to which problem-based learning engenders self-directed learning compared to a
lecture-based approach.
This study used a random effects model meta-analysis using 75 outcomes from 38
studies. Results indicated a statistically significant, z(74) = 7.11, p = 0.01, overall
medium effect size (g = 0.45) favoring problem-based learning. A test of heterogeneity
indicated genuine variance across outcomes (Q = 559.57, df = 74, p < 0.01). Subgroup

iv
analyses indicate positive effect sizes for the four components of self-directed learning
with two being statistically significant: personal autonomy, g = 0.51, z(47) = 6.4, p =
0.01, and independent pursuit of learning, g = 0.66, z(2) = 3.49, p = 0.01. Two emergent
subgroups were also examined. From the 23 subgroup components, 12 reported
statistically significant effect size estimates above 0. Findings and conclusions provided
the first synthesis of conative and affective outcomes in problem-based learning by
specifically analyzing self-directed learning. From this synthesis, practitioners learn that
problem-based learning promotes conative and affective skills in self-directed learning.
(218 pages)

v
PUBLIC ABSTRACT
Self-Directed Learning in Problem-Based Learning versus Traditional
Lecture-Based Learning: A Meta-Analysis
by
Heather M. Leary, Doctor of Philosophy
Utah State University, 2012
Problem-based learning is an approach to education and learning that focuses on students investigating problems, rather than being directly instructed by teachers. Reviews, also called meta-analyses, comparing traditional lecture-based learning to problem-based learning report modest positive learning gains in student cognitive outcomes. Many meta-analyses have been conducted to analyze the effectiveness of problem-based learning, but none examine the extent of self-directed learning in problem-based learning. The purpose of this study was to conduct a meta-analysis across all disciplines (medicine, education, business, history, etc.) while examining self-directed learning in problem-based learning.
This study used a random effects model meta-analysis using 75 outcomes from 38
studies. A test of heterogeneity indicated genuine variance across outcomes (Q = 559.57, df = 74, p < 0.01), supporting the use of a random effects model. Results indicated a statistically significant overall medium effect size, g = 0.45, z(74) = 7.11, p = 0.01, favoring problem-based learning over traditional lecture-based learning, indicating an expert is likely to detect differences through casual observation while a nonexpert might see them is if looking closely. Subgroup analyses indicate positive effect sizes for the four components of self-directed learning with two being statistically significant.
Findings and conclusions provided the first synthesis of noncognitive outcomes
in problem-based learning by specifically analyzing self-directed learning. From this synthesis, practitioners learn that problem-based learning promotes noncognitive skills in self-directed learning.

vi
DEDICATION
To God; for inspiring and leading me.

vii
ACKNOWLEDGMENTS
My doctoral journey has been supported by many mentors, family members, and
friends. Everyone has assisted me in different ways, inspiring me to learn more about
myself and to continue forward. I would like to thank each of the following.
My major professor, Andy Walker, for his support, guidance, patience,
inspiration, expectations, and belief in me that never wavered.
My committee members who supported and challenged me always: Mimi
Recker, Brett Shelton, Wendy Holliday, and Karl White.
My amazing colleagues in the Merrill-Cazier Library who always believed in
me and supported my choices.
My amazing children, Serin and Sonora, for their kindness, hugs, laughter,
patience, forgiveness, enthusiasm, incredible imaginations, and inspiration.
My husband, Whitney, for his patience and support during his own trials.
My younger sister, Rosemarie, for always being there.
My parents and siblings, for always believing in me and continually
supporting me.
My dear friends, Deonne, Kristy, and Melynda, for unbelievable sustenance in
mind, body, and spirit.
My Heavenly Father for His guidance to begin and complete my journey,
while supporting my efforts the entire way with an eye towards the future.
Thank you for everything.
Heather M. Leary

viii
CONTENTS
Page
ABSTRACT ................................................................................................................... iii PUBLIC ABSTRACT ................................................................................................... v DEDICATION ............................................................................................................... vi ACKNOWLEDGMENTS ............................................................................................. vii LIST OF TABLES ......................................................................................................... x LIST OF FIGURES ....................................................................................................... xii CHAPTER I. INTRODUCTION .......................................................................................... 1 Problem Statement .......................................................................................... 4 Purpose and Objectives ................................................................................... 5 Research Questions ......................................................................................... 6 II. LITERATURE REVIEW ............................................................................... 7 Problem-Based Learning ................................................................................ 7 Theoretical Framework ................................................................................... 21 Relationship to Prior Work ............................................................................. 22 III. METHODOLOGY ......................................................................................... 23 Research Questions ......................................................................................... 23 Research Design .............................................................................................. 23 Research Method ............................................................................................ 25 IV. RESULTS ....................................................................................................... 49 Publication Bias .............................................................................................. 50 Research Question One ................................................................................... 52 Subgroup Effects ............................................................................................. 53 Research Question Two .................................................................................. 54 Research Question Three ................................................................................ 56

ix
Page
Research Question Four .................................................................................. 68 Summary ......................................................................................................... 75 V. DISCUSSION ................................................................................................. 76 Overview of Study Purpose and Methods ...................................................... 76 Findings and Discussion ................................................................................. 76 Limitations ...................................................................................................... 83 Conclusions ..................................................................................................... 84 Future Research .............................................................................................. 86 REFERENCES .............................................................................................................. 87 APPENDICES ............................................................................................................... 97 Appendix A: Previous Meta-Analyses Table and Empirical Studies ........... 98 Appendix B: Initial and Final Coding Scheme Elements ............................. 115 Appendix C: Original Data ........................................................................... 123 Appendix D: Data Cleaning Procedures ....................................................... 130 Appendix E: Forest Plot and Table of Individual Outcome Results for Overall Summary Effect ......................................................... 132 Appendix F: SDL Tables ............................................................................. 138 Appendix G: Study Quality Tables............................................................... 142 Appendix H: Discipline Tables .................................................................... 177 Appendix I: Process/Outcome Tables ......................................................... 183 Appendix J: Traditional Tables ................................................................... 187 VITA .............................................................................................................................. 192

x
LIST OF TABLES
Table Page 1. Reliability Coefficient, Krippendorff’s Alpha for the Coding Scheme Elements ............................................................................................................. 33 2. Examples of Process Versus Outcome Oriented Questions .............................. 36 3. Labels and Definitions of Problem-Based Learning from Barrow’s Taxonomy with Four Additional Labels (shown in italics) .............................. 39 4. Example Statements for Process and Outcome ................................................. 43 5. Self-Directed Learning Components Group Heterogeneity .............................. 55 6. Study Design Components Group Heterogeneity .............................................. 58 7. Testing Within-Group Heterogeneity ................................................................ 59 8. Statistical Regression Within-Group Heterogeneity .......................................... 60 9. History Within-Group Heterogeneity ................................................................ 61 10. Differential Selection Within-Group Heterogeneity .......................................... 62 11. Experimental Mortality Within-Group Heterogeneity ....................................... 63 12. Limited Description Within-Group Heterogeneity ............................................ 64 13. Multiple Treatment Within-Group Heterogeneity ............................................. 66 14. Experimenter Effect Within-Group Heterogeneity ............................................ 66 15. Validity Within-Group Heterogeneity ............................................................... 67 16. Validity Within-Group Heterogeneity ............................................................... 69 17. Discipline Group Heterogeneity ........................................................................ 70 18. Process and Outcome Group Heterogeneity ...................................................... 72 19. Traditional Words and Phrases Group Heterogeneity ....................................... 74

xi
Table Page 20. Outcome Sample Size (N) for Three Threats to Internal Validity with Plausible (scale = 2) and by Itself (scale = 3) Could Explain Most or All Observed Results ......................................................................................... 80 A1. Previous Meta-Analyses and Empirical Studies Included in Them (Indicated by an X) ............................................................................................ 99 B1. Initial and Final Coding Scheme Elements ........................................................ 116 C1. Original Data ...................................................................................................... 124 E1. Overall Summary Effect Results for Each Outcome ......................................... 135 F1. Personal Autonomy Component Hedges’ g with NTreatment, NControl, and Lower and Upper Confidence Intervals ............................................................. 139 F2. Self-Management in Learning Component Hedges’ g with NTreatment, NControl, and Lower and Upper Confidence Intervals ...................................................... 140 F3. Independent Pursuit of Learning Component Hedges’ g with NTreatment, NControl, and Lower and Upper Confidence Intervals ......................................... 141 F4. Learner Control of Instruction Component Hedges’ g with NTreatment, NControl, and Lower and Upper Confidence Intervals ......................................... 141 G1. Research Design: Quasi-Experimental Component Hedges’ g with NTreatment, NControl, and Lower and Upper Confidence Intervals ......................... 143 G2. Research Design: Group Random Cmponent Hedges’ g with NTreatment, NControl, and Lower and Upper Confidence Intervals ......................................... 145 G3. Research Design: Random Component Hedges’ g with NTreatment, NControl, and Lower and Upper Confidence Intervals ...................................................... 145 G4. Internal Validity: History Component, Scale = 0, Hedges’ g with NTreatment, NControl, and Lower and Upper Confidence Intervals ......................................... 146 G5. Internal Validity: History Component, Scale = 1, Hedges’ g with NTreatment, NControl, and Lower and Upper Confidence Intervals ......................................... 148 G6. Internal Validity: History Component, Scale = 2, Hedges’ g with NTreatment, NControl, and Lower and Upper Confidence Intervals ......................................... 148

xii
Table Page G7. Internal Validity: Testing Component, Scale = 0, Hedges’ g with NTreatment, NControl, and Lower and Upper Confidence Intervals ......................................... 149 G8. Internal Validity: Testing Component, Scale = 1, Hedges’ g with NTreatment, NControl, and Lower and Upper Confidence Intervals ......................................... 151 G9. Internal Validity: Statistical Regression Component, Scale = 0, Hedges’ g with NTreatment, NControl, and Lower and Upper Confidence Intervals ................. 152 G10. Internal Validity: Statistical Regression Component, Scale = 1, Hedges’ g with NTreatment, NControl, and Lower and Upper Confidence Intervals ................. 154 G11. Internal Validity: Differential Selection Component, Scale = 0, Hedges’ g with NTreatment, NControl, and Lower and Upper Confidence Intervals ................. 155 G12. Internal Validity: Differential Selection Component, Scale = 1, Hedges’ g with NTreatment, NControl, and Lower and Upper Confidence Intervals ................. 156 G13. Internal Validity: Differential Selection Component, Scale = 2, Hedges’ g with NTreatment, NControl, and Lower and Upper Confidence Intervals ................. 157 G14. Internal Validity: Experimental Mortality Component, Scale = 0, Hedges’ g with NTreatment, NControl, and Lower and Upper Confidence Intervals ................. 158 G15. Internal Validity: Experimental Mortality Component, Scale = 1, Hedges’ g with NTreatment, NControl, and Lower and Upper Confidence Intervals ................. 160 G16. Internal Validity: Experimental Mortality Component, Scale = 2, Hedges’ g with NTreatment, NControl, and Lower and Upper Confidence Intervals ................. 160 G17. Internal Validity: Experimental Mortality Component, Scale = 3, Hedges’ g with NTreatment, NControl, and Lower and Upper Confidence Intervals ................. 161 G18. External Validity: Limited Descriptiony Component, Scale = 2, Hedges’ g with NTreatment, NControl, and Lower and Upper Confidence Intervals ................. 162 G19. External Validity: Limited Descriptiony Component, Scale = 1, Hedges’ g with NTreatment, NControl, and Lower and Upper Confidence Intervals ................. 163 G20. External Validity: Limited Descriptiony Component, Scale = 0, Hedges’ g with NTreatment, NControl, and Lower and Upper Confidence Intervals ................. 164

xiii
Table Page G21. External Validity: Multiple Treatment Component, Scale = 0, Hedges’ g with NTreatment, NControl, and Lower and Upper Confidence Intervals ................. 165 G22. External Validity: Multiple Treatment Component, Scale = 1, Hedges’ g with NTreatment, NControl, and Lower and Upper Confidence Intervals ................. 167 G23. External Validity: Multiple Treatment Component, Scale=2, Hedges’ g with NTreatment, NControl, and Lower and Upper Confidence Intervals ................. 167 G24. External Validity: Experimenter Effect Component, Scale = 1, Hedges’ g with NTreatment, NControl, and Lower and Upper Confidence Intervals ................. 168 G25. External Validity: Experimenter Effect Component, Scale = 0, Hedges’ g with NTreatment, NControl, and Lower and Upper Confidence Intervals ................. 169 G26. Validity: Scale = Strong, Hedges’ g with NTreatment, NControl, and Lower and Upper Confidence Intervals ........................................................................ 171 G27. Validity: Scale = Attempt, Hedges’ g with NTreatment, NControl, and Lower and Upper Confidence Intervals ........................................................................ 171 G28. Validity: Scale=None, Hedges’ g with NTreatment, NControl, and Lower and Upper Confidence Intervals ............................................................................... 172 G29. Reliability: Scale = Strong, Hedges’ g with NTreatment, NControl, and Lower and Upper Confidence Intervals ........................................................................ 174 G30. Reliability: Scale = Attempt, Hedges’ g with NTreatment, NControl, and Lower and Upper Confidence Intervals ........................................................................ 174 G31. Reliability: Scale = None, Hedges’ g with NTreatment, NControl, and Lower and Upper Confidence Intervals ........................................................................ 175 H1. Science Component Hedges’ g with NTreatment, NControl, and Lower and Upper Confidence Intervals ............................................................................... 178 H2. Medical Education Component Hedges’ g with NTreatment, NControl, and Lower and Upper Confidence Intervals ............................................................. 179 H3. Social Science Component Hedges’ g with NTreatment, NControl, and Lower and Upper Confidence Intervals ........................................................................ 180

xiv
Table Page H4. Medical-Other Component Hedges’ g with NTreatment, NControl, and Lower and Upper Confidence Intervals ........................................................................ 180 H5. Other Component Hedges’ g with NTreatment, NControl, and Lower and Upper Confidence Intervals .......................................................................................... 181 H6. Business Component Hedges’ g with NTreatment, NControl, and Lower and Upper Confidence Intervals ............................................................................... 181 H7. Teacher Education Component Hedges’ g with NTreatment, NControl, and Lower and Upper Confidence Intervals ............................................................. 181 H8. Engineering Component Hedges’ g with NTreatment, NControl, and Lower and Upper Confidence Intervals ............................................................................... 182 I1. Process Component Hedges’ g with NTreatment, NControl, and Lower and Upper Confidence Intervals ............................................................................... 184 I2. Outcome Component Hedges’ g with NTreatment, NControl, and Lower and Upper Confidence Intervals ............................................................................... 186 J1. Traditional Component Hedges’ g with NTreatment, NControl, and Lower and Upper Confidence Intervals ............................................................................... 188 J2. Lecture-Based Component Hedges’ g with NTreatment, NControl, and Lower and Upper Confidence Intervals ........................................................................ 189 J3. Multiple Component Hedges’ g with NTreatment, NControl, and Lower and Upper Confidence Intervals ............................................................................... 190 J4. Teacher-Guided Learning Component Hedges’ g with NTreatment, NControl, and Lower and Upper Confidence Intervals ...................................................... 190 J5. Control Component Hedges’ g with NTreatment, NControl, and Lower and Upper Confidence Intervals ............................................................................... 190 J6. Missing Component Hedges’ g with NTreatment, NControl, and Lower and Upper Confidence Intervals ............................................................................... 191

xv
LIST OF FIGURES
Figure Page 1. Example of a symmetrical (A) and an asymmetrical (B) funnel plot ................ 50 2. Funnel plot of standard error and Hedges’ g with 95% confidence limits ........ 52 3. Forest plot of summary effect size point estimates reported as Hedges’ g, and 95% confidence intervals for the four components of self-directed learning with the overall summary effect point estimate and 95% confidence interval ............................................................................................. 55 4. Forest plot showing a point estimate summary effect sizes reported as Hedges’ g, and 95% confidence intervals for study design components with the overall effect size point estimate and 95% confidence interval ........... 57 5. Forest plot showing summary effects sizes reported as Hedges’ g, and 95% confidence intervals for the degree to which testing is present as an internal threat to validity with the overall effect size point estimate and 95% confidence interval .................................................................................... 59 6. Forest plot showing summary effects sizes reported as Hedges’ g, and 95% confidence intervals for the degree to which statistical regression is present as an internal threat to validity with the overall effect size point estimate and 95% confidence interval ...................................................... 60 7. Forest plot showing summary effects sizes reported as Hedges’ g, and 95% confidence intervals for the degree to which history is present as an internal threat to validity with the overall effect size point estimate and 95% confidence interval .............................................................................. 61 8. Forest plot showing summary effects sizes reported as Hedges’ g, and 95% confidence intervals for the degree to which differential selection is present as an internal threat to validity with the overall effect size point estimate and 95% confidence interval ...................................................... 62 9. Forest plot showing summary effects sizes reported as Hedges’ g, and 95% confidence intervals for the degree to which experimental mortality is present as an internal threat to validity with the overall effect size point estimate and 95% confidence interval ...................................................... 63

xvi
Figure Page 10. Forest plot showing summary effects sizes reported as Hedges’ g, and 95% confidence intervals for the degree to which limited description is present as an external threat to validity with the overall effect size point estimate and 95% confidence interval ............................................................... 64 11. Forest plot showing summary effects sizes reported as Hedges’ g, and 95% confidence intervals for the degree to which multiple treatment is present as an external threat to validity with the overall effect size point estimate and 95% confidence interval ............................................................... 65 12. Forest plot showing summary effects sizes reported as Hedges’ g, and 95% confidence intervals for the degree to which experimenter effect is present as an external threat to validity with the overall effect size point estimate and 95% confidence interval ............................................................... 66 13. Forest plot showing summary effects sizes reported as Hedges’ g, and 95% confidence intervals for the degree to which instrument validity is present as an external threat to validity with the overall effect size point estimate and 95% confidence interval ............................................................... 67 14. Forest plot showing summary effects sizes reported as Hedges’ g, and 95% confidence intervals for the degree to which instrument reliability is present as an external threat to validity with the overall effect size point estimate and 95% confidence interval ...................................................... 68 15. Forest plot of summary effect size point estimates reported as Hedges’ g by discipline with overall effect size point estimate and 95% confidence interval ............................................................................................................... 69 16. Forest plot of process and outcome mean effect size point estimates reported as Hedges’ g and 95% confidence intervals with overall effect size point estimate and 95% confidence interval ............................................... 71 17. Forest plot showing traditional words and phrases summary effect sizes reported as Hedges’ g and 95% confidence intervals with overall effect size point estimate and 95% confidence intervals ............................................. 73 E1. Forest plot for individual outcome results for overall summary effect ............. 134

CHAPTER I
INTRODUCTION
Problem-based learning (PBL) is described throughout the literature as an inquiry
based approach to learning that is student centered and provides the means for gaining
problem solving and life-long learning skills (Becker & Maunsaiyat, 2004; Blumberg,
2000; Chen, Chang, & Chiang, 2001). PBL begins with the presentation of an ill-
structured problem to be solved that has potentially multiple solutions. Teachers act as
facilitators throughout the process, guiding learners with meta-cognitive questions, and
learners actively construct knowledge by defining learning goals, seeking information to
build upon prior knowledge, reflecting on the learning process, and participating in active
group collaboration (Barrows, 1998). The majority of problem-based learning research
and practice is in medical education but it recently has branched out into all disciplines
(Savery, 2006; Walker & Leary, 2009).
Empirical research on problem-based learning has been reviewed through meta-
analysis, a form of quantitative research where the subjects analyzed are studies. The
purpose of meta-analysis is to evaluate, compare, and analyze a series of studies rather
than looking at them individually to gain an understanding of the magnitude of
similarities and differences in reported outcomes (Borenstein, Hedges, Higgins, &
Rothstein, 2009; Glass, 1976). Meta-analyses have become a standard means to
systematically review empirical literature. Many meta-analyses report positive effect
sizes favoring problem-based learning or showing that it performs just as well as
traditional learning in the cognitive domain (Albanese & Mitchell, 1993; Vernon &

2
Blake, 1993; Walker & Leary, 2009). Less is known through meta-analytic reviews about
the affective and conative outcomes associated with life-long learning and self-directed
learning skills. Different influences on problem-based learning, discipline involved
(Walker & Leary, 2009) and aspects of study quality (Belland,Walker, Leary, Kuo, &
Can, 2010; Dochy, Segers, Van den Bossche, & Gijbels, 2003), have been addressed in
recent meta-analyses.
Problem-based learning is often compared to a traditional learning control group.
Traditional learning is primarily known as a presentation of materials by an instructor.
Learning is teacher centered, with the instructor delivering materials in a lecture based
format to passive learners. Textbooks are often the primary source for content and written
examinations are used as the typical mode of assessment. Traditional learning has also
been called didactic, conventional, and teacher-guided teaching.
Learning encompasses three domains and problem-based learning mentions them
in its process and learning goal expectations. The cognitive domain is centered on
understanding knowledge, thinking, problem solving, and mental skills in a learning
environment (Bruning, Schraw, Norby, & Ronning, 2004). It often follows the steps of
knowledge acquisition to comprehension, application, analysis, synthesis and evaluation.
In educational settings, students are expected to prove they can solve problems and think
critically as well as use previous knowledge and learning strategies when confronting
new learning situations (Bloom, 1980; Bransford, Brown, & Cocking, 2000). Overall, the
domain focuses on what is learned.
Beyond the cognitive aspect of learning, how students react to and manage their

3
emotions and attitudes in educational settings is important. The affective domain focuses
on feelings, emotions, attitudes, values, and awareness about learning. It encompasses the
passion and feelings that accompany a learning experience (Krathwohl, Bloom, & Masia,
1973). Students approach learning situations from many view points, which includes
many emotions and attitudes, including anxiety and the value they place on the situation.
All of these fuel how the student approaches the learning condition, signaling that the
affective domain plays a role in educational settings and outcomes (Bohlin, 1998;
Krathwohl et al., 1973).
The conative domain focuses on the activation of behavior or actions in learning.
It underscores the willingness and desire to learn, concerned with volition, directed
efforts, and follow-through (Huitt & Cain, 2005). Here behavioral intentions activate,
often based on the feelings and attitudes found in the affective domain. In this domain, a
students’ attitude of willingness for learning can impact how much they listen and
participate (Bohlin, 1998; Krathwohl et al., 1973). Metacognition is intertwined with the
cognitive, affective, and conative domains. This area of learning is concerned with
knowledge, understanding, and regulatory skills for thinking in any learning domain. It is
the knowledge and recognition of the learning process (Mayer, 2001), which is a primary
element of the problem-based learning educational goals.
Even though the cognitive domain is the most heavily researched of the learning
domains, the affective and conative domains, along with metacognition, are important
components of learning (Bruning et al., 2004; Illeris, 2004). All three domains, plus
metacognition, shape outcomes that depend on and are influenced by many factors,

4
including the instructional approach, content, and learning context (Bohlin, 1998). When
balanced well, these domains create a holistic learning experience, with the potential to
improve learners’ knowledge gains, self-directed learning, and life-long learning skills.
This meta-analysis focuses on self-directed learning, one aspect of problem-based
learning. Self-directed learning concentrates on learning discovery and understanding
individualized learning processes. It is concerned with enhancing the ability of a learner
to take control of their learning, to foster transformational learning, and to promote social
interaction for gaining access and perspectives on information. According to Candy
(1991), self-directed learning is characterized along four dimensions (a) personal
autonomy, (b) willingness to manage self-learning, (c) learner control or organization of
instruction, and (d) seeking natural or noninstitutional opportunities for learning. Self-
directed learning is also known as independent learning, self-instruction, self-study, and
discovery learning (Guglielmino, 1977).
Problem Statement
Reviews of problem-based learning, as compared to traditional lecture-based
learning, report modest yet positive gains in cognitive outcomes. Since its inception,
many meta-analyses have been conducted to analyze the effectiveness of PBL (Albanese
& Mitchell, 1993; Dochy et al., 2003; Kalaian, Mullan, & Kasim, 1999; Vernon & Blake,
1993; Walker & Leary, 2009). Many of these reviews focus on outcomes in the cognitive
domain and the predominant research discipline, medical education. They report that
PBL is superior to traditional lecture based instruction when assessing student skills

5
(Dochy et al., 2003) or when assessing an understanding of a principle that links to a
concept (Gijbels, Dochy, Van den Bossche, & Segers, 2005). In clinical and faculty
evaluations, PBL students perform just as well and sometimes better than students in
traditional lecture based settings (Albanese & Mitchell, 1993).
Several reviews have shown positive gains in affective and conative outcomes
such as motivation, student satisfaction, and self-directed learning (Albanese & Mitchell,
1993; Vernon & Blake, 1993). Although some claim that affective and conative outcomes
should develop through the use of PBL (Albanese, 2000; Hmelo-Silver, 2009) no one has
documented the extent of these outcomes through a systematic review. Previous meta-
analyses have only reported on these outcomes through narrative review and individual
study effect sizes (Albanese & Mitchell, 1993; Vernon & Blake, 1993), not cumulative
measures of effect size. Despite many reviews over the last 17 years, there is still a need
for a systematic review of the affective and conative outcomes in problem-based learning
(Hmelo-Silver, 2009).
Purpose and Objectives
The purpose of this study is to conduct a meta-analysis across all disciplines,
expanding beyond but including medical education, examining the extent to which
problem-based learning engenders the affective and conative outcome of self-directed
learning in comparison to a lecture-based learning approach. This is a manageable first
step in gaining a better understanding of the conative and affective domains in problem-
based learning and will contribute to a more comprehensive understanding of problem-

6
based learning.
Research Questions
Based on the purpose and objectives of this work, the following research
questions were asked.
1. To what extent does problem-based learning promote self-directed learning
when compared to lecture based approaches?
2. To what extent do the components of self-directed learning (personal
autonomy, self-management in learning, independent pursuit of learning, learner control
of instruction) influence outcomes when compared to lecture based approaches?
3. To what extent does study quality influence the measure of student self-
directed learning skills levels?
4. To what extent does discipline influence the measure of student self-directed
learning skills levels?

7
CHAPTER II
LITERATURE REVIEW
Problem-Based Learning
PBL originated in the 1960s at McMaster University Medical School in response
to low enrollment and general student dissatisfaction with the educational experience
(Barrows, 1996). It is now used in many disciplines and educational contexts (Savery,
2006; Savery & Duffy, 1995; Walker & Leary, 2009), even with some success as a
practical strategy in K12 education (Ertmer & Simons, 2006). Over the years, institutions
have implemented PBL in various ways, altering the approach to meet their own
particular needs in terms of delivery method or general educational approach (Eng,
2000). PBL is most generally known as a student centered approach to learning that
originates with an authentic and ill-structured problem (Barrows, 1996).
Throughout the literature, problem-based learning is described as an inquiry based
approach that is student centered and builds problem solving skills (Becker &
Maunsaiyat, 2004; Blumberg, 2000; Chen et al., 2001). Students in a PBL approach
actively construct knowledge by defining learning goals, seeking information to add to
their prior knowledge to improve their understanding of the problem, assessing the
learning process, and participating in active collaboration with others (Beachey, 2004).
As problem-based learning continues to spread outside of medical education, it is
important to understand the modifications (if any) that have been made to Barrow’s
original form of problem-based learning. For the purposes of this work, problem-based

8
learning is defined as follows (Barrows, 1996; Savery, 2006).
A student-centered approach where students gradually assume more
responsibility for their learning. They identify and carry out the direction of
the learning, key issues to follow, clear up ambiguities and find the resources
needed to solve the problem (Becker & Maunsaiyat, 2004; Blumberg, 2000;
Chen et al., 2001; Kassebaum, Averbach, & Fryer, 1991; Kong, Li, Wang,
Sun, & Zhang, 2009).
Students are presented with authentic, ill-structured problems or scenarios to
solve, where the process of solving the problem takes priority over the answer
they choose (Abraham, Vinod, Kamath, Asha, & Ramnarayan, 2008; Kong et
al., 2009). Authenticity of problems provides “real world” and cross-
disciplinary experience.
Instructors take the role of a tutor or facilitator. They guide the learning by
asking students metacognitive questions about their problem-solving and
provide just-in-time instruction as needed; thus students are constructing
knowledge for themselves (Arambula-Greenfield, 1996; Becker &
Maunsaiyat, 2004).
Students work in small groups, usually no larger than nine people, in a
collaborative/cooperative learning environment (Becker & Maunsaiyat, 2004;
Kong et al., 2009).
Existing Reviews
There has been a great deal of prior analysis on the PBL literature, enough to

9
warrant a synthesis of existing meta-analytic review (Strobel & van Barneveld, 2009).
Previous meta-analyses on PBL have shown positive gains in cognitive outcomes
(Albanese & Mitchell, 1993; Dochy et al., 2003; Gijbels et al., 2005; Kalaian et al., 1999;
Vernon & Blake, 1993; Walker & Leary, 2009). The previous reviews overwhelmingly
include and report on studies only in medical education, with more recent reviews
beginning to include studies outside medical education. From these analyses, a time
period of empirical studies used covers from 1970-2007. Generally, these analyses report
PBL students outperform their traditional counterparts in assessment of knowledge
principles and application, problem-solving, and self-directed learning with traditional
students outperforming PBL students on basic knowledge assessments.
Many of the early analyses employ an outdated technique of vote counting that is
often used when an effect size cannot be calculated. This technique attempts to
characterize the direction of the outcome reported as either positive (for PBL), negative
(against PBL), or equal (no difference between PBL and traditional). More recent reviews
(Dochy et al., 2003; Gijbels et al., 2005; Walker & Leary, 2009) include empirical studies
outside medical education but are still including studies that compare only traditional to
PBL. These reviews have varying results that are showing a trend towards positive effect
sizes in favor of PBL. Unfortunately, the only attempt to differentiate among empirical
studies for quality was done by Dochy and colleagues, examining aspects like internal
threats to validity. Subsequent meta-analyses have focused only on weighted effect sizes
to address study quality.
Expanding on previous work, a recent meta-analysis examined the impact of tutor

10
training, tutor content expertise, and research study design on student cognitive outcomes
(Walker & Leary, 2009). Results indicate that a study’s design is a significant factor in
predicting outcomes. Higher positive effect sizes are found in PBL when a true random
research design is used. These meta-analyses have shown modest, positive statistical
gains for cognitive outcomes for PBL as compared to traditional lecture-based learning.
Initial meta-analyses used statistical and narrative reporting (Albanese &
Mitchell, 1993; Vernon & Blake, 1993) and showed that PBL was almost exclusively
used in medical education studies, the discipline where PBL originated. Only a handful of
studies examined PBL in other disciplines at the time of these initial meta-analyses. As
more disciplines and educational settings (e.g., higher education, K12) began
experimenting with PBL, it became necessary to review the outcomes reported in these
subsequent studies. Dochy and colleagues (2003) compared outcomes from studies of
additional disciplines. The most recent published PBL meta-analysis by Walker and
Leary (2009) draws from a wide range of disciplines, providing a more comprehensive
understanding of outcomes in the cognitive domain. Their findings report problem-based
learning is being used in more disciplines and positively impacting learning. Based on the
range of disciplines with cognitive PBL outcomes, an updated affective or conative
review will need to cover a broad spectrum of disciplines.
Some meta-analyses have explored aspects of study quality, which can include
research design, internal validity, and validity and reliability of a measure, as a measure
of student learning. Belland and colleagues (2010) reported findings for study quality in
terms of research design (Shadish & Meyers, 2001) where random (g = 0.46) and quasi-

11
experimental designs (g = 0.30) have mid-range significant effect sizes indicating higher
quality design provide a better picture for student learning outcomes. Dochy and
colleagues (2003) also discussed study quality in terms of research design reporting
similar findings of improved student knowledge with a higher design (i.e., random).
Meta-analysis has its critics. As described by Glass (2000), some argue that a
meta-analysis is meaningless because it is a comparison of very different things (e.g.,
apples to oranges). In the problem-based learning literature that could include different
subject areas, assessing different forms of self-directed learning. For both Glass and for
this research, that is precisely what makes the effort worthwhile; the ability to examine
the extent to which these variations correspond with systematic differences in effect
sizes. The “Flat Earth” criticism (Glass, 2000) has similar roots, positing that a blanket
summary of inherently complex variations and variability in multiple studies will not
accurately represent the complexity of an area of inquiry. This can be addressed by
looking for patterns in the summary effects and tests for heterogeneity, and describing
those patterns rather than relying on just an overall summary effect.
Narrative portions of prior reviews have examined both affective and conative
outcomes such as motivation, student satisfaction, and self-directed learning skills
(Albanese & Mitchell, 1993; Vernon & Blake, 1993). Both reviews found faculty and
students tended to enjoy PBL more than traditionally taught lecture based courses.
Students in the PBL treatments showed improvements in their interest, attitude, and
behavior with respect to learning. Albanese and Mitchell found that PBL students
exhibited different study behaviors when compared to a traditional lecture based

12
environment, including an increase in studying for deep meaning and understanding as
well as for the “sheer joy” (p. 61) of learning. Students in PBL curricula were more likely
to study by reflecting on the material, and they tended to have a more positive orientation
toward the content and process of learning. Vernon and Blake (1993) found that PBL
students had positive attitudes toward their programs. The outcomes from these meta-
analyses report findings within the scope of the affective and conative domains of
learning. When problem-based learning outcomes (like those mentioned above) are
combined and synthesized with cognitive outcomes, they supply a good indication that
PBL is promoting a broad range of student learning outcomes on a positive level.
Both Albanese and Mitchell (1993) and Vernon and Blake (1993), however,
lacked a sufficient number of studies to engage in a full systematic review of the
available research for the conative and affective domains. They were conducted before
problem-based learning expanded into various disciplines, so they focused almost
exclusively on medical education. These efforts are in need of extension, to incorporate a
systematic review of the robust set of findings subsequently published and include studies
conducted outside the field of medical education.
Problem-Based Learning Goals
Two prominent authors in the literature provide detailed definitions for the
learning objectives and goals in problem-based learning. Barrows’ (1986) educational
objectives were rooted in medical education, while Hmelo-Silver’s (2009) definitions
were more recent and take into consideration the movement of problem-based learning
into more disciplines. Barrows reported the goals as:

13
1. Structuring of knowledge for use in clinical contexts
2. Developing an effective clinical reasoning process
3. Development of effective self-directed learning skills
4. Increased motivation for learning
Hmelo-Silver defined the goals of problem-based learning as:
1. Constructing flexible knowledge
2. Developing effective problem-solving skills
3. Developing life-long learning skills (self-directed learning)
4. Being a good collaborator
5. Becoming intrinsically motivated
Among the educational objectives and goals listed, both authors include the cognitive,
affective, and conative domains.
Cognitive. In terms of cognitive goals, both authors share common ground with
some variations. They recognize that knowledge is at the heart of cognition and that
problem-based learning should improve student knowledge. Barrows (1986) wrote that
the structuring of knowledge for use in clinical contexts focuses on information recall and
application. The development of an effective clinical reasoning process complements the
acquisition of structured knowledge. In contrast with structured knowledge, clinical
reasoning involves developing problem-solving skills through practice. Students
construct their reasoning process through generating a hypothesis, information seeking,
analysis, synthesis, and making decisions while acquiring information. Both goals
emphasize the application of knowledge in context. Students are expected to gain

14
knowledge, recall that knowledge, and use it when necessary. With a slightly different
take on the cognitive goals of PBL, Hmelo-Silver (2009) emphasized constructing
flexible knowledge for long-term memory. Cognition integrates and assembles
information from many disciplines and stores that knowledge in long-term memory
where it can be used as prior knowledge in future learning. Developing effective
problem-solving skills involves the ability to appropriately apply metacognitive and
reasoning skills.
Affective and conative. Each author includes motivation and a general idea of
self-directed learning in their definitions of PBL learning goals, with some variations.
Motivation is a strong element in the conative domains and helps fuel learning in the
cognitive domain. It is fitting that both authors agree that motivation is an essential part
of PBL. Problem-based learning can increase motivation for learning through the
challenge of solving problems coupled with the perceived relevance of work with
learning. Perceived relevance is central to the affective domain, with learner’s placing
value on the content and context of the learning. Hmelo-Silver (2009) referred to
motivation as being an intrinsic element that involves students working on a task for their
satisfaction or interest and determining what is engaging or that the goal is important.
Right in line with Barrows, her definition also includes the attitudes and values a student
places on the learning.
For Barrows, the development of effective self-directed learning skills includes
self-assessment so that the student understands their personal learning needs and where to
find and use appropriate information for problem-solving. This general definition of self-

15
directed learning includes elements in both the affective and conative domains. He is
implying that two characteristics in the affective domain, knowing what a student values
in learning and recognizing their attitude toward learning, and a student’s directed efforts
from the conative domain will be promoted in a problem-based learning environment.
Hmelo-Silver described the development of lifelong learning skills, which includes meta-
cognitive and self-regulated learning skills. Students must know what they do and do not
know. They need to set goals and be able to identify their knowledge gaps, strategize how
to reach their goals, implement the plan, and assess if they have reached their goal. Her
description includes a mixture of items in the cognitive, affective and conative domains.
She emphasizes student goal setting so they know what to focus on and the degree of
value the goal has for them. She also stresses the need to consciously carry out tasks,
knowing how to direct efforts, and following-through with goals. Hmelo-Silver included
one more learning goal, becoming a good collaborator in small groups, which
encompasses all aspects of working in a group. It involves establishing common ground,
negotiation, resolutions, actions, agreement, and requires open communication for all
members. This goal incorporates the items of caring, valuing, attitudes, actions,
willingness, directed efforts, and the desire to assume responsibility, all of which are part
of the affective and conative domains.
Between the two authors, there is overlap in their definition of problem-based
learning goals with both placing value and implying PBL promotes learning outcomes in
the cognitive, affective, and conative domains. According to Krathwohl and colleagues
(1973), all domains are important for effective learning and each plays an important role

16
in student outcomes. Research shows that learning encompasses cognition,
metacognition, the affective and conative domains (Martin & Briggs, 1986). Although it
is important to study them individually, they should also be synthesized together as none
of them should be singled out as more central to learning than another (Bloom, 1980;
Bruning et al., 2004; Krathwohl et al., 1973; Mayer, 2001). Together they provide
learners with the opportunity to receive and use knowledge, motivation to gain
knowledge (Anderson, Greeno, Reder, & Simon, 2000; Lave & Wenger, 2006; Smith &
Ragan, 1999), and the skills to understand their own learning (Duell, 1986).
A wider range of outcomes need to be examined to better understand the
effectiveness of PBL. The most recent meta-analysis of cognitive PBL research (Walker
& Leary, 2009) contains 87 studies and 206 outcomes. Assuming a similar amount of
affective and conative literature is available, a comprehensive review would be far too
ambitious for the scope of this study. To make the task more manageable, this research
will focus on self-directed learning. Self-directed learning is featured in the PBL goals as
described by both Hmelo-Silver (2009) and Barrows (1986), as a process and outcome in
PBL, and encompasses both the affective and conative domains.
Traditional Lecture-Based Learning
Studies of problem-based learning literature often describe a comparison control
group as either traditional or lecture based but rarely provide details or a solid definition
of traditional learning. When comparing a problem-based learning treatment to a
traditional control it is important to understand the differences between the two
approaches to make meaningful comparisons (Berkson, 1993; Colliver, 2000). As part of

17
the pilot study, information was gathered from the empirical studies to examine how
traditional learning was explained and to provide a better general definition of traditional
learning.
Traditional lecture-based learning (Arambula-Greenfield, 1996; Blumberg &
Eckenfels, 1988; Deretchin & Contant, 1999; Hsieh & Knight, 2008; Mantri, Dutt, Gupta,
& Chitkara, 2008; Moore, 1991; Sanderson, 2008) or didactic instruction (Abraham et al.,
2008; Brunton, Morrow, Hoad-Reddick, McCord, & Wilson, 2000; Shelton & Smith,
1998; Tolnai, 1991) has been practiced for many years in education. This type of learning
is teacher-centered (Blumberg, 2000; Kassebaum et al., 1991; Reich et al., 2006; Tarhan
& Acar, 2007; Vernon, 1994) rather than student-centered, with the teacher delivering the
instruction (Matthews, 2004) to a passive audience of students (Arambula-Greenfield,
1996) who listen but are not required to respond. Textbooks are often the primary source
for content (Sungur & Tekkaya, 2006) and exams (Arambula-Greenfield, 1996;
Sundblad, Sigrell, John, & Lindkvist, 2002) are the typical mode of assessment.
For the purposes of this review, studies needed to compare a problem-based
learning treatment to a traditional learning control group. Traditional learning can mean
many things, but is generally known as a lecture based approach. Studies that used terms
such as traditional, lectured based, or didactic were included, but the coding scheme
allowed for emergent terms to be used that described a traditional control group. Since
the definition of the traditional lecture based control group is often withheld from studies,
additional information explaining the control was noted and added to the definition of
traditional learning as it emerged from the empirical studies.

18
Cognitive, Affective, and Conative Domains
The cognitive domain is widely associated with Bloom’s (1980) taxonomy where
learning builds upon each step, beginning with knowledge and moving to comprehension,
application, analysis, synthesis and evaluation. Historically, cognitive psychology
focused only on the cognitive domain, but that has recently changed and the field of
psychology is encompassing more areas of research, including the affective and conative
domains, to advocate active learning and to view students more holistically (Bruning et
al., 2004).
The affective domain also builds upon the early work of Bloom (1980), where he
and his co-authors concentrate on a learner’s sensitivity to certain phenomena (Krathwohl
et al., 1973). This domain involves feelings, emotions, attitudes, values, and awareness
about learning. Krathwohl and colleagues provided a taxonomy of categories including
receiving (awareness, interest), responding (acknowledging potential value,
appreciating), valuing (attitudes), organizing (attitude adjustment), and characterization
(change in attitude or values). Affect, in general, encompasses the passion and feelings
that accompany learning. The conative domain, in contrast, is concerned with the
activation of the behavior or actions of learning (Huitt & Cain, 2005). There are many
terms that comprise this domain, including goals, directed efforts, follow-through, self-
direction, and self-regulation. The conative domain strives to activate internal intentions.
Cognition looks at what is learned, the affective domain emphasizes feelings about what
is learned and the learning experience, while the conative domain underscores a
willingness and desire to learn.
19
Metacognition is knowledge, understanding, and regulatory skills for thinking as
part of cognitive, affective, or conative experiences (Mayer, 2001). This is an important
area for cognitive outcomes in knowledge development and cognitive behavior
modification. Metacognition also provides a means for building and recognizing affective
or conative elements, for instance self-regulation and value for learning. Learners with
meta-cognitive skills are able to discern and monitor their knowledge and know when
they are not understanding a concept, making metacognition essential to cognitive,
affective, and conative effectiveness (Mayer, 2001). Although it is not part of this
research, it is important to note that metacognition has a role across all three domains and
is mentioned by Barrows (1986) as well as Hmelo-Silver (2009) as an element promoted
by problem-based learning.
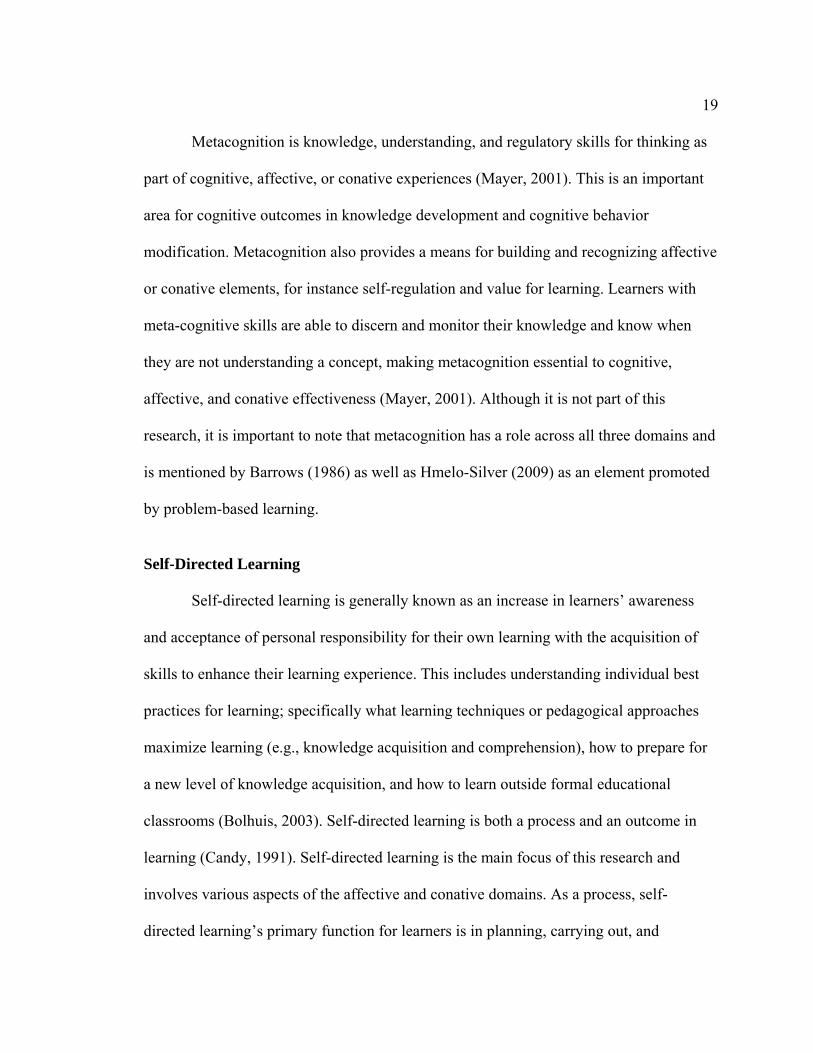
Self-Directed Learning
Self-directed learning is generally known as an increase in learners’ awareness
and acceptance of personal responsibility for their own learning with the acquisition of
skills to enhance their learning experience. This includes understanding individual best
practices for learning; specifically what learning techniques or pedagogical approaches
maximize learning (e.g., knowledge acquisition and comprehension), how to prepare for
a new level of knowledge acquisition, and how to learn outside formal educational
classrooms (Bolhuis, 2003). Self-directed learning is both a process and an outcome in
learning (Candy, 1991). Self-directed learning is the main focus of this research and
involves various aspects of the affective and conative domains. As a process, self-
directed learning’s primary function for learners is in planning, carrying out, and

20
evaluating learning experiences while they are experiencing the learning; conversely, as
an outcome, self-directed learning functions as an acquired skill where the learner can
acknowledge with confidence the ability to, in the future, apply the skills learned while
continuing to engage in and refine the self-directed learning skills (Knowles, 1975;
Merriam, Caffarella, & Baumgartner, 2007). Beginning with and building upon the work
of Houle (1988), Knowles (1970, 1975), and Tough (1978, 1979), self-directed learning
purports that people can indeed learn on their own without instructional interventions
while discovering their own learning process. Research on self-directed learning
increased dramatically in the 1970s when scholars began investigating the characteristics
and attributes associated with someone who is self-directed, how to harness the goals of
self-direction for improved learning, and how to assess, teach, and identify self-direction
in learning (Grow, 1991; Guglielmino, 1977; Oddi, 1986).
There are three goals associated with self-directed learning: (a) to enhance the
ability of learners to be self-directed in their learning, (b) to foster transformational
learning (process of reflection and awareness that leads to changes), and (c) to promote
emancipated and social action learning (Brockett & Hiemstra, 1991; Brookfield, 1985;
Knowles, 1970; Mezirrow, 1985, 1990; Tough, 1978, 1979). There are many models and
theoretical formulations for explaining and categorizing the attributes of self-directed
learning (Candy, 1991; Garrison, 1997; Grow, 1991; Guglielmino, 1977; Oddi, 1986).
The main characteristics from these models and scales include motivation, self-
monitoring, self-management, interest, commitment, and self-evaluation. For the purpose
of this research, self-directed learning is defined broadly as assuming responsibility for

21
learning while recognizing the following items in regard to learning: value placed on
learning, attitudes towards learning, motivations, willingness, and actions.
Theoretical Framework
Several frameworks were considered with careful consideration of how well they
support the purpose of this research. Sugrue (1995) laid out a solid theoretical framework
for categorizing cognitive and meta-cognitive outcomes that has been used with previous
PBL meta-analyses (Gijbels et al., 2005; Walker & Leary, 2009). Although it is a well-
known framework, it does not align well with self-directed learning, making it unsuitable
for this research. Bloom (1980) provided a widely used taxonomy for assessing cognitive
outcomes as well as a subsequent affective taxonomy (Krathwohl et al., 1973) for
learning. Although Bloom’s affective taxonomy aligned well with the topic of affective
and conative outcomes, a framework is needed that supports research on self-directed
learning specifically.
In Smith, Dollase, and Boss (2003) a set of nine abilities is introduced to assess
student performance in a PBL curriculum. The context for all nine abilities is framed
deeply within medical education making it unusable for the wide range of disciplines
covered in this research. In 2000, Blumberg embarked on a literature review focusing on
self-directed learning skills fostered by PBL. Within this context he used a conceptual
framework developed by Candy (1991) to categorize and model self-directed learning
skills. Blumberg used three components from Candy to create an organizing framework
that touches on the affective and conative elements of PBL proposed by Barrows (1986)

22
and Hmelo-Silver (2009). But the framework does not provide the breadth and depth
needed for assessing self-directed learning. It focuses more on high-level affective and
conative elements. Since Blumberg (2000) did not provide a workable framework, the
original work of Candy (1991) was selected. Candy represents one among many models
of self-directed learning (Garrison, 1997; Grow, 1991; Guglielmino, 1977; Oddi, 1986).
Candy’s framework provides four dimensions for self-directed learning (a) personal
autonomy, (b) self-management in learning, (c) the independent pursuit of learning, and
(d) learner-control of instruction. Of the available frameworks, Candy represented the
best alignment with the self-directed learning goals of PBL as described by Barrows
(1986) and Hmelo-Silver (2009).
Relationship to Prior Work
The author has participated in and conducted three previous works involving
problem-based learning and meta-analysis as both a coauthor and a lead author (Belland
et al., 2010; Walker & Leary, 2009). Each meta-analysis has provided a basis for
understanding and performing meta-analyses in the area of PBL, including use of the
Sugrue (1995) framework, determining appropriate search terms, a sense of the scope of
the available literature, an understanding of how to calculate Cohen’s d from a variety of
inputs, approaches to controlling variance (n weights and conversion to Hedges’ g;
Cooper, 1989), point estimate comparison (based on z-scores), appropriate ANOVA
analyses, meta regression, and examination of bias through funnel plots and classic
failsafe N (Borenstein et al., 2009).
23
CHAPTER III
METHODOLOGY
Research Questions
The following research questions are addressed in support of the stated research
purpose.
1. To what extent does problem-based learning promote self-directed learning
when compared to lecture based approaches?
2. To what extent do the components of self-directed learning (personal
autonomy, self-management in learning, independent pursuit of learning, learner control
of instruction) influence student outcomes when compared to lecture-based
approaches?
3. To what extent does study quality influence the measure of student self-
directed learning skills levels?
4. To what extent does discipline influence student self-directed learning skills
levels?
Research Design
A random effects meta-analysis is used to answer the above research questions.
Alternative meta-analysis models, fixed-effects and mixed-effects, were considered but
as the studies included in this analysis vary in many ways (e.g., sample, research design),
it was not meaningful to treat them as coming from the same population. Based on that

24
rational, both fixed-effects models and mixed-effects models were eschewed. The
random effects model choses subgroup analysis assumed variation both across and
between studies (Borenstein et al., 2009). Meta-analysis is considered by some to be a
form of primary quantitative research where the subject analyzed is a study (Cooper &
Hedges, 1994). Meta-analysts select, analyze, and create a detailed report on a very
specific portion of the literature with the intent of measuring the magnitude of similarities
and differences in outcomes (Borenstein et al., 2009; Cooper & Hedges, 1994). The
purpose is to evaluate a series of studies as a body of evidence rather than looking at
them individually. Study outcomes are placed on a common scale such as Cohen’s d or
Hedges’ g for comparison and analysis. When there is a wide variation in precision of
effect size estimates and to correct for the slight bias (overestimate of the effect size) of
d, Cohen’s d is converted to Hedges’ g (Cooper, 1989).
Heterogeneity refers to the dispersion of the effect size from study to study
(Borenstein et al., 2009) and examines the null hypothesis that the true dispersion of
studies is 0 (evaluating the same effect). Assessing and understanding the nature of the
heterogeneity provides details for interpreting genuine versus spurious variance. This
requires both a measure of the magnitude and the level of uncertainty (Borenstein et al.,
2009). The Q-statistic and corresponding p value provide a significance test of
uncertainty focused on proving the viability of the null hypothesis. It is dependent on the
number of studies, and generally a large and significant Q value represents wide
dispersion and relative variance across studies. Conversely though, a small and
nonsignificant Q value is not evidence that effect sizes are consistent. The proportion of

25
observed variance, I2, also known as the degree of inconsistency across studies, reflects
real differences in the effect size. The test reports the amount of variance on a relative
scale from 0% to 100%, interpreted at 25% (low), 50% (medium), and 75% (high)
(Higgins, Thompson, Deeks, & Altman, 2003). As I2 approaches 0 the variance is more
spurious. As it moves away from 0, it is evident that some of the variance is real
(Borenstein et al., 2009).
Research Method
Literature Search
The search for studies began with primary studies already included in existing
meta-analyses and literature reviews (Albanese & Mitchell, 1993; Dochy et al., 2003;
Gijbels et al., 2005; Kalaian et al., 1999; Vernon & Blake, 1993; Walker & Leary, 2009).
See Appendix A for a list of empirical studies included in the existing meta-analyses. A
thorough search was then conducted in the electronic databases Education Resources
Information Center (ERIC), PsychInfo, Education Full Text, Google Scholar,
Communications of the ACM, CiteSeer, and Digital Dissertations looking for empirical
studies that fit the inclusion criteria. Search terms included PBL, problem-based learning,
self-directed learning, motivation, evaluation, affective, conative, attitude(s), satisfaction,
self-efficacy, and interest. Finally, reference lists of studies included in the meta-analysis
and key articles, like Blumberg (2000) and Hmelo-Silver (2009), were also searched for
possible studies to include.

26
Inclusion and Exclusion Criteria
To understand the meta-analysis process and afford replication success, Cooper
and Hedges (1994) noted that it is important to be transparent with inclusion and
exclusion criteria. To be included in the meta-analysis, each study had to meet the
following basic criteria.
1. Compare a problem-based learning treatment group to a traditional lecture
control group. Problem-based learning is determined by the use of a case or problem in
the instruction and student centered (Barrows, 1986). If these elements were not reported
in the study, then to be included the work must cite key literature such as Barrows (1986),
Hmelo-Silver (2009), Vernon and Blake (1993), or previous problem-based learning
meta-analyses (Albanese & Mitchell, 1993; Dochy et al., 2003; Gijbels et al., 2005;
Vernon & Blake, 1993; Walker & Leary, 2009). Traditional learning is based on the
words and explanation used in the article (i.e., traditional, didactic, lecture-based).
2. Use authentic problems or scenarios in the problem-based learning treatment.
3. Report self-directed learning in terms of process and/or outcome.
4. Report enough quantitative data to calculate a standardized mean difference
effect size.
Search Findings
At the conclusion of the search process, 81 studies were identified and 32 met the
basic inclusion criteria. Of the 49 studies that were excluded, 15 either did not report any
quantitative results, or enough to calculate an effect size, one did not explain the PBL
treatment and did not cite key literature, eight did not report any self-directed learning

27
outcomes, 24 did not compare a problem-based learning treatment to traditional lecture
control, and one was a review rather than an empirical study.
Pilot
Before the full meta-analysis was conducted, a pilot study was conducted to
assess the feasibility and refine the proposed procedures for the meta-analysis.
Specifically, goals included determining the number of available studies and refining the
inclusion and exclusion criteria as well as the coding scheme. From this search, 81
empirical studies were selected and analyzed to determine the definitions used in the
studies for problem-based learning, traditional learning, and self-directed learning in an
effort to develop a standard definition of each for this research. The preliminary search of
the literature and subsequent analyses of the articles showed that a full meta-analysis
focusing on the process and outcomes of self-directed learning could be conducted to
provide a richer understanding in the context of problem-based learning.
Coding scheme. The coding scheme was built on a previous analysis of cognitive
outcomes (Walker & Leary, 2009). To remain open to the evolution of the coding scheme
criteria, the author used the study literature to identify emerging coding scheme criteria as
themes that had not been discovered previously were recognized. Appendix B presents
the initial coding scheme and final coding scheme to show and compare the changes
made as a result of the pilot study. The initial coding scheme criteria included (if an
element was missing, it was coded as missing):
Citation: APA in-text style citation.
EffectName: Short form as close to what authors characterize as the outcome.

28
Use of the name of the measure is used when possible. Summary scores are
reported unless individual items cover material specific to SDL outcomes or
SDL outcome categories.
TreatmentName: Name of the treatment group. Used as a quality assurance
check so the same data from different studies are not coded multiple times.
ControlName: Name of the control group. Used as a check and balance so the
same data from different studies are not coded multiple times.
CollectionYear: Year of data collection. If multiple years or year spans are
provided use the median year. Used as a check and balance so the same data
from different studies are not coded multiple times.
InstitutionName: Name of the institution study took place; fallback is lead
authors’ institution. Used as a check and balance so the same data from
different studies are not coded multiple times.
Discipline: Subject or discipline under study. This includes medical education,
teacher education, allied health (e.g., nursing), science, engineering, business,
social science, and other (Walker & Leary, 2009). In instances where a
business class is being taught to teachers, this would be placed in teacher
education. If a discipline does not fit into this list, but is found in a significant
number of outcomes, a new category will be created.
SDL: As defined by Candy’s (1991)framework, self-directed learning
includes: personal autonomy (reflective, self-aware, confident, exercises
freedom of choice, will to follow through, self-discipline), self-management

29
in learning (methodical, logical, curious, flexible, persistent, responsible,
developed information seeking and retrieval skills), the independent pursuit
of learning (interdependent, interpersonally competent, self-sufficient, shaped
through interactions with others, has social aspects), and learner-control of
instruction (knowledge and skill with learning process, evaluating, learning
for self-knowledge, develop standards of performance). These are determined
through descriptions of the outcomes provided in each study.
SDL Process/Outcome: Determine if the effect is an outcome or a process.
StudyDesign: random (includes group randomized if unit of analysis is
appropriate or accounted for), group random (more than two intact
classrooms randomly assigned to treatment and control, but unit of analysis is
students), quasi-experimental (if something other than a nonequivalent
control group design-such as the use of two intact classes or cohorts).
EffectSize: Effect sizes are calculated using data provided in the article. Top
priority for calculating this is given to means, standard deviations, and sample
size. Preference is given to change scores or ANCOVA over a post-test only if
available. As needed a p value threshold is used as a specific estimate, for
example p < .05 will be treated as p=.05 (Shadish & Haddock, 1994). Effect
sizes are calculated using ESFree found at http://itls.usu.edu/~aewalker/
esfree/.
NTreatment: Number of people in the treatment group.
NControl: Number of people in the control group.

30
AttritionTreatment: Percentage of people who are dropped (someone who was
recruited for the study but did not complete it) in the treatment group.
AttritionControl: Percentage of people who are dropped (someone who was
recruited for the study but did not complete it) in the control group.
Quality of Study: Each threat is coded on whether they are present or not.
History (largely if the treatment and control were at different times),
Maturation (physiological changes in participants leading to improved
performance), Testing (change scores where pre-/post- are similar and close
together), Instrumentation (change scores where nature of the instrument
changes from pre- to post-), Statistical regression (change scores where
higher scoring students move down toward the mean while lower scoring
student move up towards the mean), Differential Selection (any nonrandom
assignment; if there is a history threat do not select this), Experimental
Mortality (if <10% for either treatment or control do not include).
External validity: ATI (self-selection into treatment), Limited Description
(of the PBL treatment), Multiple treatment (subjects exposed to more than
one treatment), Experimenter effect (where a single instructor is used).
Validity: For instrument used in study. Strong (report their own validity
information for this sample. If they say they pilot tested that is not enough
unless they mention activities related to validity), Attempt (report what other
people have done), None (didn't address it at all).
Reliability: For instrument used in study. Strong (reporting on their own

31
sample: Cronbach’s alpha, ICC scores, Cohen’s Kappa, test-retest reliability,
interrater reliability, intrarater reliability), Attempt (what other people have
done, report own reliability from a prior sample), None (didn’t address it at
all).
Notes: Anything the coder feels is necessary to add to the coding or questions
about the coding.
Piloting the coding scheme. Six studies were randomly selected from the
included studies and coded by two researchers (the author and her advisor) to test the
coding scheme reliability. The researchers individually coded the six articles, one at a
time, and met after coding each article to come to consensus as well as identify needed
revisions in the coding scheme. As a result of the consensus meetings, the coding scheme
was refined with six categories added. From the six studies mentioned above, 17
outcomes were established, showing the feasibility of the full review.
Reliability analysis. During the coding process, both researchers had instances of
poor granularity choices where the outcome they coded needed to be expanded into two
outcomes (not granular enough) or collapsed from two to one outcome (too granular),
along with an outcome being added because it was not coded or removed completely. As
a result reliability was based on 14 outcomes identified independently by both coders
before the final 17 consensus outcomes. In cases where interrater reliability was poor, the
coding scheme underwent substantive revisions.
Krippendorff’s Alpha was used for the reliability analysis of the coding elements
and was conducted and analyzed by the author. Like Cohen’s Kappa (1960) or an

32
intraclass correlation (Shrout & Fleiss, 1979), this technique measures the agreement
between two or more coders (Hayes & Krippendorff, 2007; Krippendorff, 2007). Unlike
Kappa or intraclass correlation (each assuming either nominal or interval data
respectively), Krippendorff’s Alpha is robust enough to calculate the reliability
coefficient of ordinal, interval, ratio, and nominal data. As the data for this work is mixed
(interval, nominal, scale), using one robust and appropriate analysis allows for a
parsimonious presentation of results. Krippendorff’s Alpha measures the agreement
levels between two raters on a scale from negative one to positive one. Perfect agreement
is found with a score of one. A score of 0 indicates poor agreement at a level similar to
randomly generated scores. Anything below 0 indicates potential disagreement or less
then the level of agreement that would be found with purely random ratings (Hayes &
Krippendorff, 2007; Krippendorff, 2007). For this pilot work, the two raters were
comfortable with moderate or higher Krippendorff alpha scores (0.6 and above) for the
coding elements. Elements that fall below this threshold have been revised for single rater
coding. Table 1 indicates the coding scheme element and corresponding Alpha
coefficient.
Of the nominal data, one element had the strongest agreement possible (study
design), with two in a midrange (SDL and PBL definition), while four had very low
reliability (discipline, process/outcome, validity, reliability). As a result of the low first
pass reliability, validity, and process/outcome were revised during the pilot phase coding.
The only scale element, effect size, had high reliability. The interval data had four
elements (maturation, instrumentation, statistical regression, and ATI) with the strongest

33
Table 1
Reliability Coefficient, Krippendorff’s Alpha for the Coding Scheme Elements
Coding scheme element Krippendorff’s alpha Nature of the data
Discipline -0.02 Nominal
SDL 0.46 Nominal
Process/outcome -0.25 Nominal
Study design 1.00 Nominal
Validity -0.04 Nominal
Reliability -0.04 Nominal
Pbl definition 0.45 Nominal
Effect size 0.83 Scale
Retention -0.06 Interval
N treatment 0.78 Interval
N control 0.99 Interval
Attrition treatment -0.02 Interval
Attrition control 0.09 Interval
History -0.15 Interval
Maturation 1.00 Interval
Testing -0.08 Interval
Instrumentation 1.00 Interval
Statistical regression 1.00 Interval
Differential selection 0.29 Interval
Experimental mortality 0.23 Interval
Aptitude treatment interaction 1.00 Interval
Limited description 0.08 Interval
Multiple treatment 0.77 Interval
Experimenter effect 0.72 Interval
Note. Nature of the data is also included.
agreement possible. Four others showed high reliability (N treatment, N control, multiple
treatment, and experimenter effect). The low reliability score for retention is most likely
due to an oversight of rater one, where the value of the missed data is 150 months.
Attrition reliability scores, which are also low, are also most likely due to an oversight of
rater one and history, differential selection, and experimental mortality, the value

34
judgment of degree of plausible threat was again refined through the process.
Coding scheme changes. Appendix B shows the initial coding scheme and the
final coding scheme after refinements were made from the pilot work. The two raters
addressed concerns with the initial coding scheme, which are reflected in the final coding
scheme. Those concerns centered on items which showed low reliability scores during
the pilot phase. As a result of the pilot, six additions were made to the coding scheme: (1)
full citation, (2) PBL definition, (3) traditional words, (4) traditional definition, (f)
process/outcome, and (6) effect size calculation. One and six are minor additions
allowing for unique identification and reconstruction of calculations, while number 2, 3,
4, and 5 are more substantive additions to the final coding scheme that will assist in data
analysis. The definition of PBL emerged from the elements of PBL present in the article
and is based on Barrows (1986) problem-based learning taxonomy. During the course of
pilot coding it was learned that Barrows’ taxonomy did not have representations of all
possible permutation levels of student centeredness. There were to be some missing
levels and a need for generic levels. Missing levels that were added included: (1) lecture-
based partial problem, with lecture material presented by the instructor before a partial
problem; and (2) lecture-based full problem, with lecture material presented by the
instructor before a full problem. Generic levels included: (1) generic PBL, where
problem-based learning is used but not enough information is provided to make
distinctions in Barrows’ taxonomy and (2) generic PBL with lecture, where problem-
based learning is used with lectures and not enough information is provided to make
distinctions in Barrows’ taxonomy. Traditional words are the individual words used to

35
represent traditional learning (lecture, traditional, didactic, etc.) as pulled directly from
each article and traditional definition represents any explanation from the authors on
what those words truly mean. The element process/outcome emerged from the studies
coded and reflects the difference between measuring the level of self-directedness present
during the implementation of the treatment versus self-directed learning as an outcome
after the treatment was concluded.
Kassebaum and colleagues (1991), Kong and colleagues (2009), and Smits and
colleagues (2003) were primary research pilot studies instrumental in developing the
nuances between these two areas. From the studies raters differentiated between
outcomes, which rely on cumulative or summative ideas for learning (i.e., end of learning
lessons or skills) with potentially transferable properties, and processes which are about
the steps, design, or factors of learning, the characterization of the intervention, and
progression in thought processes. Initially this element was based primarily on when
measurement occurred. But from Kassebaum and colleagues, it became evident that this
was not enough, as some measurement occurred after the intervention but asked
participants to reflect on their experience during the PBL activity. In the end the element
depends on the questions asked of learners (Table 2).
There were several small, clarifying changes made to discipline, study design,
Ntreatment, Ncontrol, validity, and reliability. In the element of discipline, allied health
was changed to medical-other as it was chosen as a more appropriate label; in study
design information for historical classes (where they compare classes taught different
years) was added to group random; for the N and attrition on treatment and control, it

36
Table 2
Examples of Process Versus Outcome Oriented Questions
Process Outcome
Cases keep me engaged I can see myself being engaged with similar problems
Cases stimulate my interest After the instruction I find myself interested in this topic
During the instruction I am asked to take charge of my own learning
I am prepared to take charge of my own learning
To be successful, I have to be more self-directed during this class than normal.
I find that I am now more self-directed than I used be.
I look forward to each class If I had an opportunity to repeat this experience I would.
was important to pay attention to the degrees of freedom in the statistical tests reported,
which may differ from a description of the sample; in the area of attempt under validity
and reliability, vague reporting of author’s own work was added and refers to nonspecific
language about testing an instrument. For example, a survey being field tested or refined
before being fully administrated (Peters, Greenberger-Rosovsky, Crowder, Block, &
Moore, 2000).
Larger refinements were made to SDL, internal validity, and external validity.
Within SDL, the raters determined from the pilot work that it was important to first
specifically categorize the effect reported (i.e., logic, which is part of self-efficacy and
fits into self-management in learning). If that is not possible, then categorization should
be general (i.e., self-efficacy, which is part of learner-control of instruction). Refinement
is important for placing effects consistently in SDL categories. Determining the level of
granularity for an effect depends on the context of the questions asked (referring to
process/outcome). For internal validity (which was renamed quality of study) and

37
external validity, changes were made to the element presentation. Initially these elements
were to be coded as being present or not present. The final coding scheme represents
them by looking at the degree to which the elements are present, characterized as:
0 = not a plausible threat to the study’s internal/external validity
1 = potential minor problem in attributing the observed effect to the treatment;
by itself not likely to account substantial portion of observed results
2 = plausible alternative explanation which by itself could account for
substantial amount of the observed results
3 = by itself could explain most or all of the observed results
This is a judgment from the rater determined by the information given in the original
article and required the raters to constantly read the definitions associated with the
numbers to make judgments.
Summary. The reasons for conducting pilot work before going forward into a full
meta-analysis were to investigate the feasibility of conducting a meaningful meta-
analysis. An estimate of the number of studies and potential outcomes was needed to
justify moving forward as well as progressing through an emergent categorization of the
self-directed learning and traditional definition criteria. By initially testing and refining
the coding scheme the criteria definitions and what was being reported in the literature
became clearer, providing groundwork for a more reliable and meaningful coding scheme
and full meta-analysis.
Full Meta-Analysis
Moving forward from the pilot work, an additional search of the literature was

38
performed, based on the literature search parameters used in the pilot work, to capture
any newly published or available works. Six additional empirical studies were identified
that fit the inclusion criteria (see pilot), bringing the total number of included studies
from 32 to 38 with a total of 75 outcomes. One researcher coded the remaining 32
studies. As the full meta-analysis builds from the pilot work, the methods of conducting
the final phase of this research use the refined coding scheme for data collection.
Final coding scheme. During the pilot work, the coding scheme was refined and
expanded based on some emergent ideas in the literature (see Table 3). The final coding
scheme included:
In-text Citation: APA in-text style citation
Full Citation: Full APA citation
EffectName: Short form as close to what authors characterize as the outcome.
Use of the name of the measure is used when possible. Summary scores are
reported unless subscales cover material specific to the PBL intervention.
TreatmentName: Use best name to describe treatment group. Used as a quality
assurance check so the same data from different studies are not coded multiple
times.
ControlName: Use best name to describe control group. Used as a check and
balance so the same data from different studies are not coded multiple times.
CollectionYear: Year of data collection. If multiple years or year spans are
provided use the median year. Used as a check and balance so the same data
from different studies are not coded multiple times.

Table
Labelswith F
PBL la
Lecturcases
Case-b
Case m
Modifbased
Proble
Closed(reiterproble
Lecturpartia
Lecturproble
Gener
Generlecture
3
s and DefiniFour Additio
abel
re-based
based lectures
method
fied case-
em-based
d-loop rative) em-based
re-based l problem
re-based full em
ric PBL
ric PBL with e
itions of Proonal Labels
Expanded defin
Teacher-directpresented a sumthrough lecturedemonstrate th
Teacher-directpresented inforcase histories bmaterial to be c
Partially studenwhere the studcase vignette fopreparation forfacilitates the s
Student-directeon inquiry actiproblem simulamedical school
Student-directepresented full pfree inquiry of guides for explproblem to acti
An extension oself-directed stinformation theas it was initialreasoning.
Teacher-directgiven a partial by the teacher.
Teacher-directgiven full probthe teacher.
When a generilearning is givecan be assignedprovided in the
When a generilearning is giveinvolved in the
oblem-Based (shown in it
nition
ed learning whermmary of facts aes followed by a he lecture conten
ed learning wherrmation through before a lecture. covered in the le
nt and teacher dient is presented
for study and reser class discussionsubsequent class
ed learning wherons when initialation (most oftenls using problem
ed learning wherproblem simulat
f the problem. Teloration and evalivate prior know
of the problem-btudy. Students evey found and retlly given to eval
ed learning wherproblem simula
ed learning wherblem simulation a
c explanation ofen and none of thd (based on the ie publication).
c explanation ofen, but it is cleare learning.
d Learning frtalics)
ere the student is about the problema case vignette tont relevance.
ere the student is case vignettes oCases highlight
ecture.
irected learning with a full case earch in n. The teacher s discussion.
re students decidlly given a partian used in new
m-based learning
re students are tions allowing foeachers are usualluation of the
wledge.
based label with valuate turn to the problluate their
ere students are ation after a lectu
ere students are after a lecture by
f problem-based he above labels information
f problem-based r that lectures we
rom Barrow
Sequence
m
o
or t
or
de al
g).
or lly
a
lem
ure
y
No seque
ere No seque
’s Taxonomy
e
ence
ence
39
y

In
fa
da
Di
ed
en
in
tea
sig
PB
lea
co
pr
on
lec
pr
pa
wi
The ca
Ca
rep
Fu
stitutionNam
llback is lea
ata from diff
iscipline: Su
ducation, tea
ngineering, b
stances whe
acher educat
gnificant num
BL Definitio
arning; prefe
oded accordi
roblem, (2) th
ne and two. B
ctures, case
roblem-based
artial proble
ith lecture. V
ase or proble
ase history o
presented by
ull problem s
me: Name of
d authors’ in
ferent studies
ubject or disc
acher educa
business, so
re a busines
tion. If a disc
mber of outc
n: definition
erably the de
ng to Barrow
he level of s
Barrows has
method, mo
d. This resea
ms, lecture-b
Visual repres
em:
or case vigne
y a filled circ
simulation (f
f the instituti
nstitution. U
s are not cod
cipline under
ation, medic
ocial science
s class is bei
cipline does
comes, a new
n provided by
efinition the
ws (1986) va
student vs. te
six distinct
dified case-b
arch contribu
based full pr
sentations ar
ette: provide
cle
(free-inquiry)
ion in which
Used as a che
ded multiple
r study. This
cal other (e.
e, and other
ing taught to
not fit into t
w category is
y the author
author(s) is
ariables and
eacher direct
labels: lectu
based, probl
utes four new
roblems, gen
re taken from
es a summary
): Students n
h the study to
eck and balan
times.
s includes m
g., nursing,
(Walker & L
o teachers, th
this list but i
s created.
r(s) of proble
using for th
symbols (1)
ted, and (3) t
ure-based ca
lem-based, c
w labels: lec
neric PBL, a
m Barrows (1
y of facts ab
need to assem
ook place,
nce so the sa
medical
dental), scie
Leary, 2009)
his is placed
is found in a
em-based
heir study. Th
) the case/
the sequence
ases, case-ba
closed-loop
cture-based
and generic P
1986).
bout the prob
mble import
40
ame
ence,
). In
in
a
his is
e of
ased
PBL
blem;
tant

fa
Pa
stu
cir
Studen
Te
in
St
th
Pa
sh
Tr
di
tea
Tr
th
SD
in
fre
at
(m
in
cts for the ca
artial proble
udent decide
rcle
nt directed v
eacher direc
formation to
udent direct
e guidance o
artially stude
hared respon
raditional W
dactic, lectu
aching, and
raditional de
e article to d
DL: As defin
cludes: pers
eedom of ch
titudes, satis
methodical, l
formation se
ase; represen
em simulatio
es on where t
versus teache
ted learning
o be learned;
ted learning:
of a tutor/fac
ent and teac
sibility; repr
Words: Words
ure-based, tea
more-all em
efinition: Exp
define what t
ned by Candy
sonal autono
hoice, will to
sfaction, mot
ogical, curio
eeking and r
nted by an em
on: Between
to assemble
er directed:
g: Teacher de
; represented
: Student dec
cilitator; repr
her directed
resented by a
s used to rep
acher-center
mergent)
panded expl
they used for
y’s framewo
omy (reflect
follow throu
tivation), sel
ous, flexible,
etrieval skill
mpty circle
one and thre
more facts;
ecides the am
d by a filled
cides the dir
resented by a
d: Comprom
a half filled
present tradit
red, directed
lanation of th
r traditional
ork (1991), s
tive, self-aw
ugh, self-dis
lf-managem
, persistent, r
ls), the indep
ee, some fac
represented
mount and se
square
rection of the
an empty sq
mise between
square
tional learnin
d learning, co
he traditiona
learning
self-directed
ware, confiden
scipline, self
ment in learn
responsible,
pendent pu
cts provides a
d by a half fil
equence of
e learning w
quare
one and two
ng (tradition
onventional
al words use
learning
nt, exercises
f-determinati
ning
developed
rsuit of lear
41
and
lled
with
o, a
nal,
d in
s
ion,
rning

42
(interdependent, interpersonally competent, self-sufficient, shaped through
interactions with others, has social aspects), and learner-control of
instruction (knowledge and skill with learning process, evaluating, learning
for self-knowledge, develop standards of performance, self-efficacy,
metacognition). These will be determined through descriptions of the
outcomes provided in each study.
Process/Outcome: Determine if the effect is a measure of process (measuring
the level of self-directed learning present in the instruction, focus is on the
instruction/procedure, formative) or outcome (measuring the students level or
ability to engage in self-directed learning after the instruction, focus is on
productivity, summative). This is more about the questions being asked (see
Table 4 for examples of statements for process and outcome). In the absence
of data, code as missing. There is a majority rule here: judgment about what is
happening during the intervention or judgment about the results of the
intervention. Process is the procedure or a feature of the intervention (ex.
group size), while outcome is productivity of the program (Smits et al., 2003).
StudyDesign: random (includes group randomized if unit of analysis is
appropriate or accounted for), group random (more than two intact
classrooms randomly assigned (more than two) to treatment and control, but
unit of analysis is students; historical classes: where one is one year and one is
another), quasi-experimental (if something like a nonequivalent control
group design—such as the use of two intact classes or cohorts).

43
Table 4
Example Statements for Process and Outcome
Process Outcome
Cases keep me engaged I can see myself being engaged with similar problems
Cases stimulate my interest After the instruction I find myself interested in this topic
During the instruction I am asked to take charge of my own learning
I am prepared to take charge of my own learning
To be successful, I have to be more self-directed during this class than normal.
I was encouraged to be self-directed. I find that I am now more self-directed than I used be.
I look forward to each class I would like to repeat the experience
EffectSize: Effect sizes are calculated using data provided in the article. Top
priority for calculating this is given to means, standard deviations, and sample
size. Preference is given to change scores or ANCOVA over a posttest only if
available. As needed, a p value threshold is used as a specific estimate, for
example p < 0.05 will be treated as p = 0.05 (Shadish & Haddock, 1994).
Effect sizes will be calculated using ESFree found at http://itls.usu.edu/
~aewalker/esfree/.
EffectSizeCalculation: Shows how the effect size was calculated.
Retention: In months, after the treatment is completed
NTreatment: Number of people in the treatment group; pay close attention to
degrees of freedom in a t test, ANOVA or F test.
NControl: Number of people in the control group; pay close attention to
degrees of freedom in a t test, ANOVA or F test.

44
AttritionTreatment: Percentage of people who are dropped (someone who was
recruited for the study but did not complete it) in the treatment group.
AttritionControl: Percentage of people who are dropped (someone who was
recruited for the study but did not complete it) in the control group.
Quality of Study: Each threat is coded on the degree to whether they are
present or not using this scale: 0 = not a plausible threat to the study’s
internal validity, 1= potential minor problem in attributing the observed effect
to the treatment; by itself not likely to account substantial portion of observed
results, 2 = plausible alternative explanation which by itself could account for
substantial amount of the observed results, 3 = by itself could explain most or
all of the observed results. History (largely if the treatment and control were
at different times), Maturation (physiological changes in participants leading
to improved performance), Testing (change scores where pre-/post- are
similar and close together), Instrumentation (change scores where nature of
the instrument changes from pre- to post-), Statistical regression (change
scores where higher scoring students move down toward the mean while
lower scoring student move up towards the mean), Differential Selection
(any nonrandom assignment; if there is a history threat do not select this),
Experimental Mortality (if <10% for either treatment or control do not
include, need to see explanation of why people dropped to code degree).
External validity: Each of these threats are coded on the degree to whether
they are present or not using this scale: 0 = not a plausible threat to the

45
study’s external validity, 1= potential minor problem in attributing the
observed effect to the treatment; by itself not likely to account substantial
portion of observed results, 2 = plausible alternative explanation which by
itself could account for substantial amount of the observed results, 3 = by
itself could explain most or all of the observed results. There are results
favoring the PBL or the traditional, the validity in question could be a
possibility of why there were or were not differences between the groups. ATI
([aptitude treatment interaction] self-selection into treatment), Limited
Description (of the PBL treatment), Multiple treatment (subjects exposed to
more than one treatment), Experimenter effect (where a single instructor is
used).
Validity: For instrument used in study. Strong (report their own validity
information for this sample. If they say they pilot tested that is not enough
unless they mention activities related to validity), Attempt (report what other
people have done, have loose reporting or nonspecific reporting of their own
pilot work), None (did not address it at all).
Reliability: For instrument used in study. Strong (reporting on their own
sample: cronbach's alpha, ICC scores, Cohen’s Kappa, test-retest reliability,
interrater reliability, intrarater reliability), Attempt (what other people have
done, report own reliability from a prior sample or nonspecific reporting of
their own), None (did not address it at all).
Notes: Anything the rater feels is necessary to add to the coding or questions

46
about the coding.
Most notable from the final coding scheme is the inclusion of additional definitions for
problem-based learning (lecture-based partial problem, lecture-based full problem,
generic PBL, and generic PBL with lecture) that appeared to be missing from Barrows’
taxonomy, expanded definitions for self-directed learning, definitions for process versus
outcome in problem-based learning, and the inclusion of words used to describe the
traditional control groups.
Data analysis. In preparation for data analysis, the collected data (Appendix C)
was cleaned. The effect size estimates were placed on a z scale to catch any outliers. A
single outlier was found (g = 5.97) in Lieberman, Stroup-Benham, Peel, and Camp
(1997) that went beyond the -3 to +3 range. The estimate was adjusted to a z score of +3
by dropping it down (g = 2.81). The traditional words criteria were collapsed into broad
terms and phrases. The criterion was emergent from the literature and based on the words
and phrases used in the empirical study describing the control group. The words and
phrases were condensed from 18 groups to six groups (a) control, (b) lecture-based, (c)
missing, (d) multiple, (e) teacher-guided learning, and (f) traditional with the purpose of
categorizing the words and phrases broadly while emphasizing specific words like
“lecture” or “teacher.” Words or phrases that included “conventional” or “traditional
model” were grouped into “traditional,” “lecture” or “traditional lecture” were moved
into “lecture-based,” and those with multiple words (e.g., conventional teaching, didactic,
lectures) were grouped as “multiple.” Appendix D discloses the full extent of the data
cleaning process.

47
The self-directed learning framework elements of personal autonomy, self-
management in learning, independent pursuit of learning, and learner-control of
instruction, were subjectively assigned to either the conative or affective domain. Based
on the general concepts behind the conative domain (agents for behavioral change and
activation or action) and the affective domain (feelings, awareness, and attitudes), the
words used to describe the self-directed learning elements guided the assignment into the
domains. The conative domain included all four self-directed learning elements:
Personal autonomy (reflective, freedom of choice, self-discipline, will to
follow through)
Self-management in learning (methodical, logical, flexible, persistent,
responsible)
Independent pursuit of learning (interdependent, self-sufficient, interactions,
social)
Learner-control of instruction (skill with learning process, self-knowledge,
standards of performance)
The affective domain included three of the self-directed learning elements:
Personal autonomy (self-aware, confident, attitudes, satisfaction)
Self-management in learning (curious)
Learner-control of instruction (self-efficacy)
Interestingly, three of the self-directed learning elements include aspects of both
domains. But self-management in learning and learner-control of instruction has a
stronger presence in the conative domain. Assignment of self-directed learning elements

48
to a domain will be used in interpreting results.
A weighted summary effect is calculated to compare self-directed learning skills
between problem-based learning and traditional lecture based students across all studies,
along with a test for heterogeneity. To test for heterogeneity, first its existence must be
determined. One method is using a Cochrane’s chi-square (χ2) or Q-statistic. The Q-
statistic follows a χ2distribution determined by the degrees of freedom and p value.
Second, both a measure of the magnitude and the level of uncertainty (Borenstein et al.,
2009) must be identified. Magnitude is either the degree of true variation, or between-
study variance, on the scale of the effect measure T or the degree of inconsistency I2,
reported as a percentage. High overall heterogeneity shifts the focus of analysis of the
results to groups and summary effect patterns. To address subgroup components and
factors in research questions 2, 3, and 4, summary effects are run on each component or
factor addressed in the question with a test of heterogeneity. In addition, a series of z-
score differences were calculated to determine if any subgroups were significantly
different than 0 (no differences) or whether subgroups were significantly different than
each other.

49
CHAPTER IV
RESULTS
This chapter reports the results of a random effects meta-analysis on self-directed
learning using 75 outcomes from 38 studies, with overall subjects NControl = 9,927 and
NTreatment = 3,972). To answer the four proposed research questions and keep the scope of
this research manageable, not all of the variables from the coding scheme were used in
the analyses. In-text citation, effect size, Ntreatment, and Ncontrol were used for all meta-
analysis calculations with discipline, sdl, and study design added for subgroup analyses.
Two more variables, traditional words and process/outcome, with potentially significant
results were also analyzed.
To answer research question one, an overall effect size was calculated along with
point estimates for each outcome and a test of heterogeneity. An analysis of subgroups
was used to answer research questions 2, 3, and 4 and includes overall effect sizes with
between and within differences in subgroups and outcomes through tests of
heterogeneity. Heterogeneity tests assist in understanding the dispersion and patterns
associated with the effect sizes. All analyzes were prepared using Stata statistical
software version 11. Effect size estimates are reported using Hedges’ g and the alpha
level for all questions is set at 0.05. Throughout the findings, positive effect sizes indicate
differences in favor of problem-based learning, where negative effect sizes favor
traditional learning.

li
ad
to
b
st
(B
In
ac
ou
co
F
Public
ikely to be pu
ddressed in a
o identify an
ook chapters
tudies with l
Borenstein e
To ass
n general, stu
ccessible, wh
utcomes. In
onfidence in
Figure 1. Exa
cation bias, t
ublished rath
a meta-analy
nd potentially
s, and other
large effects
et al., 2009).
sess the prob
udies with u
hich forms a
funnel plots
ntervals. Not
ample of a sy
P
the phenome
her than stud
ysis. It is crit
y include unp
studies that
sizes and us
blem of publ
unfavorable o
a bias in met
s, point estim
te that the y a
ymmetrical (
Publication
enon that stu
dies reportin
tical that an
published stu
report lower
sually smalle
lication bias
or nonsignifi
ta-analysis re
mates are dist
axis is invert
(A) and an a
Bias
udies with hi
ng small or n
extensive lit
tudies, disser
r effect sizes
er sample siz
, a funnel pl
icant results
esearch towa
tributed arou
rted, with 0 a
asymmetrica
igh effect siz
negative effe
terature sear
rtations, con
s. Additional
zes should b
ot is created
tend to not b
ards signific
und the mea
at the top. Th
al (B) funnel
zes are more
ct sizes, mus
rch is conduc
nference pape
lly, attention
be noted
d (see Figure
be published
cantly positiv
an and 95%
hus studies w
plot.
50
e
st be
cted
ers,
n to
e 1).
d and
ve
with

51
smaller standard errors (typically larger N) are near the top and those with larger standard
error (typically smaller N) are spread out near the bottom. Funnel plots that portray an
absence of bias have a symmetrical distribution about the mean effect size (plot A in
Figure 1) with studies falling mostly within the 95% confidence interval as well as along
the range of standard error, while increased risk of publication bias is found with
asymmetrical plots showing gaps in point estimates near the middle and lower left areas
(plot B in Figure 1) where studies with smaller or negative effect sizes would reside. To
assess the problem of larger effects in small studies, an Egger’s test of significance is run.
Figure 2 shows a symmetrical funnel plot for this research, indicating a low
probability of publication bias. The studies are distributed and found along the standard
error (y axis) and mostly within the confidence interval (although some are outside it).
Studies included in this analysis are nine dissertations and two papers presented at
conferences. Several book chapters and more conference proceedings were retrieved
during the literature search and assessed for inclusion, but did not fit the inclusion
criteria. The dissertations and conference papers used in this meta-analysis are similar
and different from the published journal articles used. Published journals articles usually
go through a peer review and editing process before they are published. Dissertations are
reviewed by a committee of people acting similarly to a peer review process. Although
this process is indeed different as it is not blind and often the reviewers have invested a
large amount of time assisting the student with the work, making them close to the work.
Conference papers are different from published journal articles as some conferences
provide a peer review process for submissions and some do not. Overall, the author is

F
co
re
su
p
su
g
A
Figure 2. Fun
onfident thro
elatively low
uggesting no
To an
romote self-
ummary effe
= 0.45, CIlo
According to
nnel plot of s
ough the lite
w. A nonsign
o small study
swer researc
directed lea
ect was calcu
ower = 0.33, C
Cohen (198
standard erro
erature search
nificant Egge
y effect.
Rese
ch question o
rning when
ulated using
CIupper = 0.58
88), a small e
or and Hedg
h and the fun
er’s test (Bor
earch Quest
one, to what
compared to
N = 75 outc
8, favoring p
effect size of
es’ g with 95
nnel plot tha
renstein et al
tion One
t extent does
o lecture bas
comes. An ov
problem-base
f 0.2 indicate
5% confiden
at publication
l., 2009) wa
problem-ba
sed approach
verall summ
ed learning w
es difference
nce limits.
n bias is
s run (p = 0.
ased learning
hes, a pooled
mary effect si
was reported
es are notice
52
.76)
g
d
ize of
d.
eable

53
by an expert, where in a larger effect size of 0.8 a casual observer will notice differences.
The overall effect size reported here is medium, indicating an expert is likely to detect
differences through casual observation while a nonexpert might see them is if looking
closely. A z score to determine the positive or negative significance of the reported
overall effect size in relation to an effect size of 0 reported, z(74) = 7.11, p = 0.01,
indicating a positively significant overall effect size. A forest plot and table of point
estimates, treatment N, control N, and confidence intervals for each outcome are in
Appendix E.
A test of heterogeneity, Q = 559.57, df = 74, p < 0.01, indicates genuine
heterogeneity with wide dispersion. Supporting the nature of variance across studies, a
large ratio of heterogeneity (I2 = 86.80%) notes the observed variance is real. This
supports the conclusion of high variability across studies, warranting a closer look at
study features through subgroup analysis.
Subgroup Effects
To address the extent different subgroups impact outcomes, the mean effect for
each subgroup was calculated along with a z score examining the magnitude and
statistical significance of the effect size. Subgroup examination addresses whether studies
are assessing the same true effect size, differences between studies along with the
proportion of real differences due to heterogeneity, and the extent and significance
between subgroups. In meta-analysis, examining the between study differences among
subgroups is similar to an analysis of variance (ANOVA) in a primary research study

54
(Borenstein et al., 2009).
Research Question Two
To what extent do the components of self-directed learning (personal autonomy,
self-management in learning, independent pursuit of learning, and learner control of
instruction) influence outcomes when compared to lecture based approaches? To answer
research question two, the analyses outlined above were computed. All figures and tables
report data from smallest to largest effect size while including the overall effect size. All
four components report mean effects in favor of problem-based learning, with two of the
components personal autonomy, g = 0.51, z(47) = 6.4, p = 0.01, and independent pursuit
of learning, g = 0.66, z(2) = 3.49, p = 0.01, reporting point estimates above the overall
mean effect and statistically greater than lecture-based learning. The other two subgroups
learner-control of instruction, g = 0.28, z(17) = 1.81, p = 0.07, and self-management in
learning, g = 0.35, z(5) = 1.88, p = 0.06, result in nonsignificant, but positive summary
effects. Figure 3 confirms learner-control of instruction and self-management in learning
is not statistically significant as confidence intervals drop below 0. Effect sizes, treatment
N, control N, and confidence intervals for each SDL component are in Appendix F.
A test for within group differences results in learner-control of instruction (Q =
108.43, df = 17, p < 0.01), personal autonomy (Q = 406.66, df = 47, p < 0.01), and self-
management in learning (Q = 28, df = 5, p < 0.01) reporting the presence of statistically
significant heterogeneity (Table 5). Independent pursuit of learning has very low within-
group heterogeneity (Q = 3.84, df = 2, p < 0.15) and is not statistically significant. As the

F9ovnu
T
S
L
S
P
I
O
Figure 3. For5% confidenverall summumber of ou
Table 5
Self-Directed
Self-direct
Learner-contro
Self-managem
Personal auton
Independent pu
Overall
rest plot of sunce intervals
mary effect poutcomes in ea
d Learning C
ed learning com
ol of instruction
ment in learning
nomy
ursuit of learni
ummary effes for the fouroint estimateach compon
Components G
mponent
n
g
ing
ect size poinr componente and 95% cent.
Group Heter
N
18
6
48
3
75
nt estimates rts of self-direconfidence in
rogeneity
Qwithin
108.43
28
406.66
3.84
559.57
reported as Hected learninnterval. N rep
df p val
17 0.0
5 0.0
47 0.0
2 0.1
74 0.0
Hedges’ g, ang with the presents the
lue I2
01 84.30
01 82.10
01 88.40
5 47.90
01 86.80
55
and
0%
0%
0%
0%
0%
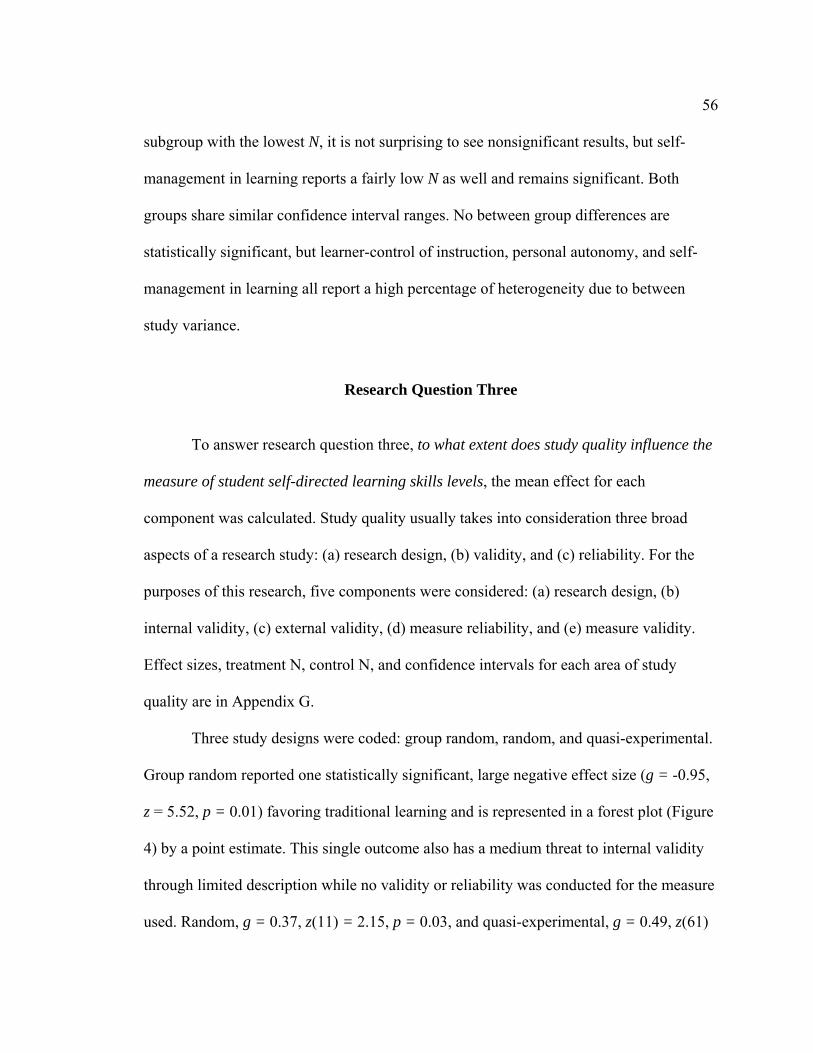
56
subgroup with the lowest N, it is not surprising to see nonsignificant results, but self-
management in learning reports a fairly low N as well and remains significant. Both
groups share similar confidence interval ranges. No between group differences are
statistically significant, but learner-control of instruction, personal autonomy, and self-
management in learning all report a high percentage of heterogeneity due to between
study variance.
Research Question Three
To answer research question three, to what extent does study quality influence the
measure of student self-directed learning skills levels, the mean effect for each
component was calculated. Study quality usually takes into consideration three broad
aspects of a research study: (a) research design, (b) validity, and (c) reliability. For the
purposes of this research, five components were considered: (a) research design, (b)
internal validity, (c) external validity, (d) measure reliability, and (e) measure validity.
Effect sizes, treatment N, control N, and confidence intervals for each area of study
quality are in Appendix G.
Three study designs were coded: group random, random, and quasi-experimental.
Group random reported one statistically significant, large negative effect size (g = -0.95,
z = 5.52, p = 0.01) favoring traditional learning and is represented in a forest plot (Figure
4) by a point estimate. This single outcome also has a medium threat to internal validity
through limited description while no validity or reliability was conducted for the measure
used. Random, g = 0.37, z(11) = 2.15, p = 0.03, and quasi-experimental, g = 0.49, z(61)

Fgpco
=
in
p
6
S
z(
=
es
in
w
w
v
tr
in
Figure 4. For, and 95% cooint estimateomponent.
= 7.62, p = 0
n favor of pr
Group
oint. Random
1, p < 0.01)
ignificant be
(11) = -5.41
= -7.85, p = 0
stimate. The
Addre
nstrumentati
were consider
which the thr
alidity, 1 ind
reatment (by
ndicates a pl
rest plot showonfidence ine and 95% c
.01, research
roblem-based
p random do
m (Q = 89.8
both report
etween group
, p = 0.01, a
0.01, studies
e proportion
essing threat
on, statistica
red. These e
eat was pres
dicates a pot
y itself not lik
ausible alter
wing a pointntervals for sconfidence in
h designs bot
d learning an
es not report
89, df = 11, p
statistically
p difference
and as well a
s showing hi
of heterogen
ts to internal
al regression
elements wer
sent, where 0
tential minor
kely to accou
rnative expla
t estimate sustudy design nterval. N rep
th reported s
nd hover clo
t any within
p < 0.01) and
significant w
s were found
as group rand
igher effect s
neity due to b
validity: his
n, differential
re coded on a
0 is not a pla
r problem in
unt substant
anation whic
ummary effeccomponents
presents the
statistically s
ose to the ove
n heterogenei
d quasi-expe
within-group
d between g
dom and qua
sizes than th
between stu
story, matura
al selection, a
a scale of 0 t
ausible threat
attributing t
tial portion o
ch by itself c
ct sizes repos with the ovnumber of o
significant m
erall mean e
ity as it has o
erimental (Q
p heterogene
group random
asi-experime
he single grou
udy variance
ation, testing
and experim
to 3 to indic
at to the study
the observed
of observed r
could accoun
orted as Hedgverall effect outcomes in
mean effect s
ffect.
only one dat
Q = 393.10, d
eity (Table 6
m and random
ental, z(61)
up random p
was also hig
g,
mental mortal
cate the degre
y’s internal
d effect to th
results), 2
nt for substan
57
ges’ size each
sizes
ta
df =
6).
m,
point
gh.
lity
ee to
he
ntial

58
Table 6
Study Design Components Group Heterogeneity
Study design component N Qwithin df p-value I2
Group random 1 -- -- -- --
Random 12 89.89 11 0.01 87.80%
Quasi-experimental 62 393.10 61 0.01 84.50%
Overall 75 559.57 74 0.01 86.80%
amount of observed results, and 3 by itself could explain most or all observed results.
No plausible threats for scale = 0 were indicated for maturation or
instrumentation. These two threats to internal validity are not accountable for any of the
observed results. Testing indicated 73 no plausible threats for scale = 0, g = 0.45, z(72) =
6.94, p = 0.01, and two potentially minor problems for scale = 1, g = 0.72, z(1) = 1.17, p
= 0.24. Testing is not a major threat that could account for the observed results as the
outcomes stayed within the lower numbers on the 0-3 scale (see Figure 5).
Statistically significant within-group heterogeneity was observed for scale = 0 (Q
= 552.45, df = 72, p < 0.01) and scale = 1 (Q = 6.99, df = 1, p < 0.01). There were no
statistically significant differences between groups (see Table 7).
Statistical regression, like testing, indicated no major threats to internal validity
with 69 nonplausible threats for scale = 0, g = 0.44, z(68) = 6.57, p = 0.01, and 6
potentially minor problems for scale = 1, g = 0.66, z(6) = 3.59, p = 0.01. Statistical
regression is not a major threat that could account for the observed results as the
outcomes stayed within the lower numbers on the 0-3 scale (see Figure 6).

Fcovre T
T
T
0
O
=
st
g
z(
z(
Figure 5. Foronfidence inalidity with epresents the
Table 7
Testing Withi
Testing scale
0
1
Overall
Statist
= 550.22, df =
tatistically si
Histor
= -0.26, z(3
(57) = 5.89,
(12) = 5.46,
rest plot showntervals for ththe overall e
e number of
in-Group He
N
73
2
75
tically signif
= 68, p < 0.0
ignificant di
ry indicated
3) = 1.46, p =
p = 0.01, an
p = 0.01 (se
wing summahe degree toeffect size pooutcomes in
eterogeneity
Qwithin
552.45
6.99
559.57
ficant within
01), and scal
fferences be
4 outcomes
= 0.14, with
nd 13 with p
ee Figure 7).
ary effects sio which testinoint estimaten each compo
n df
5 72
1
7 74
n-group heter
le = 1 (Q = 8
etween group
with plausib
h 58 nonplau
otentially m
.
izes reportedng is presente and 95% coonent.
p value
0.01
0.01
0.01
rogeneity w
8.10, df = 5,
ps (see Table
ble alternativ
usible threats
minor problem
d as Hedges’t as an internonfidence in
I2
87.00%
83.70%
86.80%
as observed
p < 0.01). T
e 8).
ve explanatio
s for scale =
ms for scale
’ g, and 95%nal threat to nterval. N
for scale = 0
There were n
ons for scale
0, g = 0.45,
= 1, g = 0.6
59
%
0 (Q
no
e = 2,
64,

FcothN
T
S
S0
O
df
n
d
v
al
n
p
Figure 6. Foronfidence inhreat to valid
N represents t
Table 8
Statistical Reg
Statistical regr0 1 Overall
Within
df = 57, p < 0
onsignifican
ifferences w
Differ
alidity on th
lternative ex
onplausible
otentially m
rest plot showntervals for thdity with thethe number o
gression Wi
ession scale
n-group hete
0.01) and sca
nt and no out
were found fo
rential select
he higher end
xplanations f
threats for s
inor problem
wing summahe degree to
e overall effeof outcomes
thin-Group H
N 69
6 75
erogeneity re
ale = 1 (Q =
tcomes on le
or scale 0 an
tion, like his
d of the 0-3 s
for scale = 2,
cale = 0, g =
ms for scale =
ary effects sio which statisect size points in each com
Heterogenei
Qwithin 550.22
8.10 559.57
eports signif
86.33, df =
evel 3 (see T
d 2, z(60) =
story, has out
scale. It has
, g = 0.48, z
= 0.35, z(30)
= 1, g = 0.53
izes reportedstical regrest estimate an
mponent.
ity
df p68
5 74
ficant results
12, p < 0.01
Table 9). Sign
4.24, p = 0.
tcomes that
7 outcomes
(6) = 3.19, p
) = 2.82, p =
3, z(26) = 7.
d as Hedges’ssion is presend 95% conf
p value 0.01 80.01 30.01 8
s for scale =
1) with scale
nificant betw
.01.
report intern
that indicate
p = 0.01, wi
= 0.01, and 3
.24, p = 0.01
’ g, and 95%ent as an intfidence inter
I2 87.60% 38.20% 86.80%
0 (Q = 435.
e = 2
ween group
nal threats to
e plausible
th 31
37 with
1 (see Figure
60
% ternal rval.
.59,
o
e 8).

Fcovre
T
H
H
20
O
sc
in
z(
af
sc
=
Figure 7. Foronfidence inalidity with epresents the
Table 9
History Withi
History scale
2 0 1 Overall
Within
cale (see Tab
For th
ndicate plaus
(2) = 1.33, p
ffects scale =
cale = 0, g =
= 0.42, z(19)
rest plot showntervals for ththe overall e
e number of
in-group het
N
4 58 13 75
n-group hete
ble 10). No s
he final threa
sible alternat
p = 0.18, six
= 3, g = 0.40
= 0.43, z(45)
= 3.59, p =
wing summahe degree toeffect size pooutcomes in
terogeneity
Qwithin
3.35435.59
86.33559.57
erogeneity re
significantly
at to internal
tive explana
that by them
0, z(5) = 2.5
= 5.67, p =
0.01, threat
ary effects sio which histooint estimaten each compo
n df
5 3 9 57 3 12 7 74
eports signif
y significant
validity, exp
ations for the
mselves coul
, p = 0.01, w
0.01, or pot
ts (see Figure
izes reportedory is presene and 95% coonent.
p value
0.34 0.01 0.01 0.01
ficant results
between gro
perimental m
e observed re
ld account fo
with 66 outco
tentially min
e 9).
d as Hedges’nt as an internonfidence in
I2
10.30% 86.90% 83.10% 86.80%
s for all three
oup differenc
mortality, thr
esults; scale
or most of th
omes reporti
nor problems
’ g, and 95%nal threat to
nterval. N
e parts on th
ces were fou
ree outcome
= 2, g = 1.0
he observed
ing no plaus
s for scale =
61
%
he
und.
es
07,
sible
1, g

FcothN
T
D
D
02
O
(s
li
w
tr
Figure 8. Foronfidence inhreat to valid
N represents t
Table 10
Differential S
Differential sel
0 2 1 Overall
Signif
see Table 11
Extern
imited descri
was coded on
reatment inte
rest plot showntervals for thdity with thethe number o
Selection Wit
lection scale
ficant within
) with no sig
nal validity i
iption, (c) m
n the degree
eraction repo
wing summahe degree to
e overall effeof outcomes
thin-group h
N
31 7
37 75
n-group heter
gnificant bet
includes fou
multiple treatm
to which it w
orted no thre
ary effects sio which diffeect size points in each com
heterogeneity
Qwithin
334.68 17.73
179.89 559.57
rogeneity wa
tween group
ur componen
ment, and (d
was present i
eats for all st
izes reported
erential select estimate an
mponent.
y
df p
30 6
36 74
as found for
p differences
nts: (a) aptitu
d) experimen
in the empir
tudies.
d as Hedges’ction is presend 95% conf
p value
0.01 90.01 660.01 800.01 86
r all four deg
.
ude treatmen
nter effect. E
rical study. A
’ g, and 95%ent as an intefidence inter
I2
1.00% 6.20% 0.00% 6.80%
grees of pres
nt interaction
Each compon
Aptitude
62
% ernal rval.
ence
n, (b)
nent
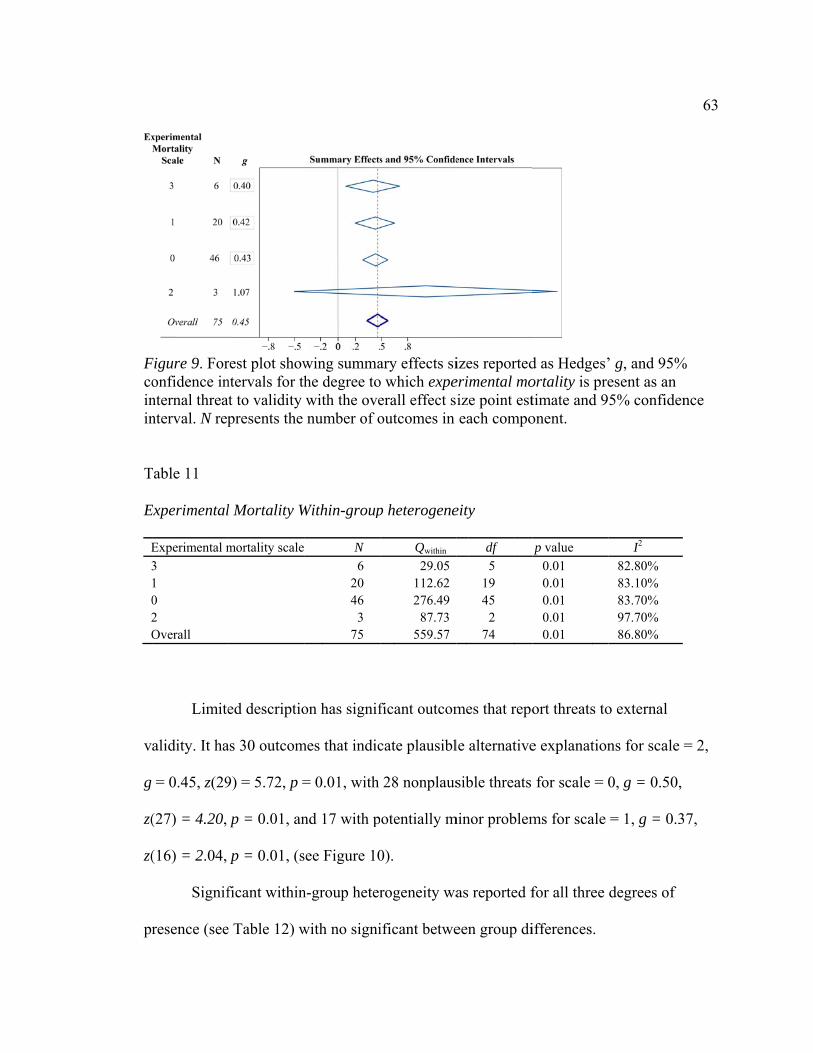
Fcoinin
T
E
E
3
02O
v
g
z(
z(
pr
Figure 9. Foronfidence innternal threanterval. N rep
Table 11
Experimental
Experimental m
3 1 0 2 Overall
Limite
alidity. It ha
= 0.45, z(29
(27) = 4.20,
(16) = 2.04,
Signif
resence (see
rest plot showntervals for tht to validity presents the
l Mortality W
mortality scale
ed descriptio
as 30 outcom
9) = 5.72, p =
p = 0.01, an
p = 0.01, (s
ficant within
e Table 12) w
wing summahe degree towith the ovenumber of o
Within-group
N
6 20 46
3 75
on has signif
mes that indic
= 0.01, with
nd 17 with p
see Figure 10
n-group heter
with no signi
ary effects sio which expeerall effect soutcomes in
p heterogene
Qwithin
29.05112.62276.49
87.73559.57
ficant outcom
cate plausibl
28 nonplaus
otentially m
0).
rogeneity wa
ificant betwe
izes reportederimental moize point esteach compo
eity
df
5 19 45
2 74
mes that repo
le alternative
sible threats
minor problem
as reported f
een group di
d as Hedges’ortality is pretimate and 9onent.
p value
0.01 0.01 0.01 0.01 0.01
ort threats to
e explanation
for scale = 0
ms for scale
for all three
ifferences.
’ g, and 95%esent as an 5% confiden
I2
82.80% 83.10% 83.70% 97.70% 86.80%
o external
ns for scale =
0, g = 0.50,
= 1, g = 0.3
degrees of
63
%
nce
= 2,
7,

FcothN
T
L
L
20O
v
z(
4
al
Figure 10. Foonfidence inhreat to valid
N represents t
Table 12
imited Desc
Limited descri1 2 0 Overall
Multip
alidity. Both
(58) = 6.44,
.49, p = 0.01
lternative ex
orest plot shontervals for thdity with thethe number o
ription With
ption scale
ple treatmen
h of these ou
p = 0.01, an
1. For scale
xplanations a
owing summhe degree to
e overall effeof outcomes
hin-group he
N 17 30 28 75
nt reports two
utcomes indic
nd potentiall
= 2, g = 0.41
are reported
mary effects so which limitect size points in each com
terogeneity
Qwithin 195.79 197.73 163.96 559.57
o significant
cate nonplau
ly minor prob
1, z(9) = 1.54
(see Figure
sizes reporteted descriptit estimate an
mponent.
df p-v16 0.29 0.27 0.74 0.
t outcomes th
usible threats
blems for sc
4, p = 0.12,
11).
ed as Hedgesion is presennd 95% conf
value .01 91.01 85.01 83.01 86
hat report th
s for scale =
cale = 1, g =
10 nonsigni
s’ g, and 95%nt as an exterfidence inter
I2 1.80% 5.30% 3.50% 6.80%
hreats to exte
= 0, g = 0.44
0.63, z(5) =
ficant plausi
64
% rnal rval.
ernal
,
=
ible

FcothN
pr
th
sc
(s
w
re
(a
Figure 11. Foonfidence inhreat to valid
N represents t
Signif
resence (see
Exper
hreats for sca
cale = 1, g =
Signif
see Table 14
Validi
were also cod
eporting vali
attempt), or n
orest plot shontervals for thdity with thethe number o
ficant within
e Table 13) w
rimenter effe
ale = 0, g =
= 0.59, z(15)
ficant within
4) with no sig
ity and reliab
ded as part o
idity (strong
not addressin
owing summhe degree to
e overall effeof outcomes
n-group heter
with no signi
ect reports tw
0.42, z(58) =
=3.32, p =
n-group heter
gnificant bet
bility reporti
f study quali
), reporting w
ng validity a
mary effects so which multect size points in each com
rogeneity wa
ificant betwe
wo significan
= 6.11, p = 0
0.001 (see F
rogeneity wa
tween group
ing of the in
ity. Each ou
what others
at all (none).
sizes reportetiple treatmet estimate an
mponent.
as reported f
een group di
nt outcomes
0.01, and po
Figure 12).
as found for
p differences
nstruments us
utcome was c
have done w
.
ed as Hedgesent is presentnd 95% conf
for two of th
ifferences.
that indicate
otentially min
r the two deg
.
sed in the em
coded for the
with the sam
s’ g, and 95%t as an externfidence inter
he degrees of
e nonplausib
nor problem
grees of pres
mpirical stud
eir own effor
me instrument
65
% nal
rval.
f
ble
ms for
ence
dies
rts of
t

T
M
M20
O
FcothN
T
E
E0
O
Table 13
Multiple Trea
Multiple treatm2 0 1 Overall
Figure 12. Foonfidence inhreat to valid
N represents t
Table 14
Experimenter
Experimenter e0 1 Overall
atment Withi
ment scale
orest plot shontervals for thdity with thethe number o
r Effect With
effect scale
in-group het
N 10 59
6 75
owing summhe degree to
e overall effeof outcomes
hin-group he
N 59 16 75
terogeneity
Qwithin 74.95
454.47 11.92
559.57
mary effects so which expeect size points in each com
eterogeneity
Qwithin 479.20
77.34 559.57
df p va9 0.0
58 0.05 0.0
74 0.0
sizes reporteerimenter efft estimate an
mponent.
df p-va58 0.015 0.074 0.0
alue 01 88.01 87.03 58.01 86.
ed as Hedgesfect is presennd 95% conf
alue 01 87.01 80.01 86.
I2 .00% .20% .00% .80%
s’ g, and 95%nt as an exterfidence inter
I2 .90% .60% .80%
66
% rnal
rval.

n
1
an
FcothN
T
V
VA
NO
Two s
one, g = 0.5
Signif
5) with no si
Reliab
nd none, g =
Figure 13. Foonfidence inhreat to valid
N represents t
Table 15
Validity of W
Validity scale Attempt Strong None Overall
scale compon
0, z(56) = 6
ficant within
ignificant be
bility reports
= 0.50, z(55)
orest plot shontervals for thdity with thethe number o
Within-group
N 4
14 57 75
nents for val
6.74, p = 0.0
n-group heter
etween group
s two scale c
) = 6.51, p =
owing summhe degree to
e overall effeof outcomes
heterogenei
Qwithin 42.58 79.49
427.22 559.57
lidity, strong
1, are statisti
rogeneity wa
p differences
components,
0.01, are st
mary effects so which instrect size points in each com
ty
df p v3 0
13 056 074 0
g, g = 0.37, z
ically signif
as found for
s.
strong, g =
tatistically si
sizes reporterument validt estimate an
mponent.
value 0.01 90.01 80.01 80.01 8
z(13) = 3.01
ficant (see Fi
r all three sca
0.40, z(16) =
ignificant (se
ed as Hedgesdity is presennd 95% conf
I2 93.00% 83.60% 86.90% 86.80%
1, p = 0.003,
igure 13).
ales (see Tab
= 3.78, p =
ee Figure 14
s’ g, and 95%nt as an exterfidence inter
67
, and
ble
0.01,
4.
% rnal rval.

Fcoexin
1
se
(F
b
b
0
m
ov
0
0
Figure 14. Foonfidence inxternal threanterval. N rep
Signif
6) with no si
To an
elf-directed l
Figure 15). A
ased learnin
ased learnin
.66, z(2) = 4
medical-other
verall summ
.59, z(4) = 1
.39, z(4) = 1
orest plot shontervals for that to validitypresents the
ficant within
ignificant be
swer researc
learning skil
All but the d
g. Science re
g and traditi
4.03, p = 0.0
r, g = 0.38, z
mary effect si
.09, p = 0.2
.17, p = 0.24
owing summhe degree to
y with the ovnumber of o
n-group heter
etween group
Rese
ch question f
lls levels, su
iscipline of s
eports basica
ional learnin
1, medical e
z(21) = 4.15,
ize favoring
8, teacher ed
4, and busin
mary effects so which instrerall effect soutcomes in
rogeneity wa
p differences
arch Questi
four, to what
ummary effec
science repo
ally no signi
ng, g = -0.01
education, g
, p = 0.01, h
problem-ba
ducation, g =
ness, g = 0.19
sizes reporte
rument reliabsize point esteach compo
as found for
s.
ion Four
t extent does
cts for each
ort an effect
ificant differ
, z(7) = 0.02
= 0.60, z(28
have effect si
sed learning
= 0.44, z(1) =
9, z(1) = 0.9
ed as Hedgesbility is prestimate and 9
onent.
r all three sca
s discipline i
discipline ar
size in favor
rence betwee
2, p = 0.97. E
8) = 6.82, p =
izes larger th
g; while socia
= 1.26, p = 0
8, p = 0.33,
s’ g, and 95%sent as an 95% confide
ales (see Tab
influence stu
re reported
r of problem
en problem-
Engineering
= 0.01, and
han the medi
al science, g
0.21, other, g
all report
68
%
nce
ble
udent
m-
, g =
ium
g =
g =

T
V
VA
NO
Fdre
sm
th
re
in
Table 16
Validity With
Validity scale Attempt Strong None Overall
Figure 15. Foiscipline witepresents the
mall effect s
hese compon
esulting on a
ntervals for e
in-group het
N 3
16 56 75
orest plot of th overall effe number of
izes that are
nents are not
a loss of pow
each discipli
terogeneity
Qwithin 8.95
63.77 462.80 559.57
summary effect size poinoutcomes in
not signific
t statistically
wer. Effect si
ine are in Ap
df p2
15 55 74
ffect size point estimate a
n each discip
cantly greater
y significant
izes, treatme
ppendix H.
p value 0.01 0.01 0.01 0.01
int estimatesand 95% conpline.
r than traditi
could be acc
ent N, contro
I2 77.70% 76.50% 88.10% 86.80%
s reported asnfidence inte
ional learnin
counted for w
ol N, and con
Hedges’ g berval. N
ng. One reaso
with small N
nfidence
69
by
on
N’s,

70
The six disciplines of science, medical education, social science, medical-other,
other, and teacher education are statistically significant for within-group heterogeneity
(Table 17). Business and engineering are not statistically significant and have low
proportions of heterogeneity accounting for between study variance with very low
dispersion of true effects. Interestingly, business and engineering have low N, teacher
education also has a low N but still reports significant differences within studies.
Between group differences are statistically significant for business (g = 0.19) and
medical education (g = 0.60) with z(30) = -1.99, p = 0.05, science (g = -0.01) and
medical education (g = 0.60) with z(36) = -1.98, p = 0.05, as well as science (g = -0.01)
and engineering (g = 0.66) with z(10) = -1.98, p = 0.05. Differences between the groups
can be accounted for in the direction of favoring or not favoring problem-based learning.
Additional Subgroups
Although not part of the initial research questions or coding scheme for this Table 17
Discipline Group Heterogeneity
Discipline N Qwithin df p value I2
Science 8 77.04 7 0.01 90.90%
Business 2 0.58 1 0.45 0.00%
Medical-other 22 50.47 21 0.01 58.40%
Other 5 21.57 4 0.01 81.50%
Teacher education 2 4.93 1 0.03 79.70%
Social science 4 30.09 3 0.01 90.00%
Medical education 29 290.70 28 0.01 90.40%
Engineering 3 2.43 2 0.30 17.70%
Overall 75 559.57 74 0.01 86.80%

re
co
pr
in
P
u
o
th
p
in
ef
p
Fas9
esearch, two
oncept of ga
roblem-base
nvolves the d
Process and
Proce
sing self-dir
f self-directi
he studied le
otentially be
This s
nfluence and
ffects for pro
= 0.01, nex
Figure 16. Fos Hedges’ g 5% confiden
areas emerg
aining self-di
ed learning v
description o
Outcome
ss for self-di
rected learnin
ion in the int
arning envir
e transferred
subgroup add
d measure stu
ocess, g = 0.
xt to the over
orest plot of and 95% co
nce interval.
ged from the
irected learn
versus the sk
of the traditio
irected learn
ng skills whi
tervention. W
ronment or w
to another l
dresses the e
udent self-di
47, z(50) =
rall effect siz
process and onfidence int
N represent
e literature th
ning skills as
kills a studen
onal learning
ning in probl
ile in the me
While outcom
what the stud
earning opp
extent to whi
irected learn
5.50, p = 0.0
ze. Both favo
outcome me
tervals with ots the numbe
hat warrant e
s part of the i
nt walks awa
g compariso
lem-based le
ethod of lear
me refers to
dent walks a
ortunity or e
ich the proce
ning. Figure
01, and outc
or problem-b
ean effect sioverall effec
er of outcom
examination
intervention
ay with (outc
on group.
earning refer
rning. It is ab
a skill to be
away with th
environment
ess and outc
16 shows the
come, g = 0.4
based learnin
ize point estict size point
mes in each su
n. First is the
n (process) of
come) and se
rs to gaining
bout the amo
used outsid
at could
t.
omes of lear
e summary
44, z(23) = 5
ng over
imates reporestimate and
ubgroup.
71
f
econd
and
ount
de of
rning
5.44,
rted d

72
traditional learning, have almost identical effect sizes almost equal to overall mean effect.
Effect sizes, treatment N, control N, and confidence intervals for the process and outcome
components are in Appendix I.
Within-group heterogeneity reports statistically significant results for both groups
(Table 18). Of the heterogeneity due to between study variance, process reports a large
amount of 89.70% and outcome a medium value of 69.10%, even though there is no
statistically significant differences between groups. It is interesting how similar the
results are for both groups given the disparate nature of each kind of outcome.
Traditional Words and Phrases
The words and phrases describing the comparison group in the original 38
empirical studies form this subgroup and its components. All of the words and phrases
were taken directly from them and during the data cleaning process they were collapsed
and grouped together with similar words. The full extent of this grouping is in Appendix
D. The subgroup attempts to understand how the words and phrases describing the
comparison group influence self-directed learning. Figure 17 details the summary effect
size point estimates and confidence intervals for the components. Three of the
Table 18
Process and Outcome Group Heterogeneity
Subgroup N Q df p-value I2
Process 51 484.98 50 0.01 89.70%
Outcome 24 74.53 23 0.01 69.10%
Overall 75 559.57 74 0.01 86.80%

Freesco
co
3
si
w
an
an
m
gu
Figure 17. Foeported as Hstimate and omponent.
omponents,
.52, p = 0.01
ignificant me
was not dropp
nalysis findi
Contr
nd multiple r
making them
uided learnin
orest plot shoHedges’ g and
95% confide
missing, g =
1, and traditi
edium effect
ped from the
ings (Belland
ol (g = 0.12
reported a m
nonsignifica
ng reported
owing traditd 95% confience interval
= 0.68, z(3) =
ional, g = 0.
t sizes above
e analysis as
d et al., 2010
, z = 0.72, p
medium effec
ant in their f
a medium ra
tional wordsdence intervls. N represe
= 3.61, p = 0
47, z(43) =
e the overall
missing info
0; Walker &
= 0.47) repo
ct range effe
favor of prob
ange negativ
s and phrasevals with oveents the num
0.01, lecture
6.18, p = 0.0
l mean effect
formation ha
& Leary, 2009
orted a low r
ect, but the co
blem-based l
ve single poin
es summary eerall effect s
mber of outco
e-based, g =
01, all repor
t. The comp
as previously
9).
range single
onfidence in
learning. Wh
nt estimate (
effect sizes ize point
omes in each
0.52, z(18) =
rt statistically
onent of mis
y impacted m
point estima
ntervals cros
hile teacher-
(g = -0.55, z
73
h
=
y
ssing
meta-
ate
s 0,
-
=

74
2.84, p = 0.01) significantly favoring traditional learning. The one component of teacher-
guided learning could mingle with aspects of problem-based learning making it quite
different from the other components, which appear to be quite similar. Effect sizes,
treatment N, control N, and confidence intervals for the traditional word and phrase
components are in Appendix J.
This subgroup of traditional words and phrases reports large and statistically
significant within-group heterogeneity for traditional (Q = 368.06, df = 43, p < 0.01),
lecture-based (Q = 1122.24, df = 18, p < 0.01), and multiple (Q = 27.92, df = 5, p < 0.01;
see Table 19). Missing is not significant and the test cannot be run for teacher-guided
learning and control as they have only one data point. Between group heterogeneity
confirms that teacher-guided learning is different from the other components as its
between group heterogeneity is statistical significant with all of the other components.
But this is based on one point. It could be attributed to the differences in N or the
directionality of the effect size. The single point estimate of control reports differences
Table 19
Traditional Words and Phrases Group Heterogeneity
Component N Qwithin df p-value I2
Teacher guided-learning 1 -- -- -- --
Multiple 6 27.92 5 0.01 82.10%
Control 1 -- -- -- --
Traditional 44 368.06 43 0.01 88.30%
Lecture-based 19 1122.24 18 0.01 85.30%
Missing 4 0.88 3 0.83 0.00%
Overall 75 559.57 74 0.01 86.80%

75
between missing, z(4) = -2.22, p < 0.03, and traditional, z(44) = -2.00, p < 0.05, with
differences attributed to N or magnitude of effect size.
Summary
Overall, from 38 studies reporting 75 outcomes, the summary effect size (g =
0.45) was positive in favor of problem-based learning. The magnitude of heterogeneity
throughout is large (I2 = 86.80%) indicating real variance and genuine rather than random
differences across outcomes. A high magnitude of heterogeneity warrants further
explanation of differences through subgroup analysis. Self-directed learning reported a
medium to high range subgroup heterogeneity, while study quality reported high range
heterogeneity, and discipline reporting a large range from low to high. Process and
outcome had medium to high heterogeneity with traditional words, like discipline,
reporting a large range from low to high. From the 23 subgroup components, 12 (more
than half) reported statistically significant effect size estimates above 0. Between-group
significance was reported between 12 groups.
76
CHAPTER V
DISCUSSION
This chapter provides a summary of findings from the data analysis. The results
discuss self-directed learning, comparisons with past meta-analyses, and calls for
additional research. Limitations and future research are presented.
Overview of Study Purpose and Methods
The purpose of this research was to conduct a meta-analysis across all disciplines
examining the extent to which problem-based learning engenders the affective and
conative outcome of self-directed learning in comparison to a lecture-based learning
approach. It is a first step in gaining a better understanding of the conative and affective
domains in problem-based learning and is another step for a more comprehensive
understanding of problem-based learning. A random effects model meta-analysis was
used to address the research questions and focused on summary effect sizes while looking
at differences within and between studies and subgroups.
Findings and Discussion
Research Question One
Research question one is, to what extent does problem-based learning promote
self-directed learning when compared to lecture based approaches? Overall a medium
effect size (g = 0.45, CIlower = 0.33, CIupper = 0.58) reported that problem-based learning
promotes self-directed learning skills that would be visible easily by an expert and

77
noticeable to a casual observer. In comparison to previous meta-analyses focused on
cognitive outcomes (Belland et al., 2010; Dochy et al., 2003; Gijbels et al., 2005; Walker
& Leary, 2009), most have reported low but positive effect sizes favoring problem-based
learning. As claims have been made throughout the literature that problem-based learning
does promote self-directed learning skills, having evidence to support this paralleled with
positive cognitive claims is positive for future problem-based learning research and
practice.
Research Question Two
Research question two is, to what extent do the components of self-directed
learning (personal autonomy, self-management in learning, independent pursuit of
learning, learner control of instruction) influence student outcomes when compared to
lecture based approaches? Results indicate that personal autonomy (being reflective,
self-aware, confident, and self-disciplined) is associated with positive effects in favor of
PBL as it reports a medium effect size and a tight confidence interval with a large (N =
48) number of outcomes. Independent pursuit of learning (self-sufficient, interdependent,
interpersonally competent) reports as a strong positive component favoring PBL, but is
limited with a small N = 3. Small sample sizes within a component are suspect to
potentially misleading or overinflated data and require careful interpretation along with
further research.
To account for the differences in significance, the number of outcomes included
in each component contributed to large confidence intervals, resulting in learner-control
of instruction (N = 18) and self-management in learning (N = 6) being nonsignificant as

78
they had low effect sizes. According to the assignment of these components into the
conative and affective domain, learner-control of instruction and self-management in
learning have elements in both domains with the majority fitting into conative, suggesting
that a potential mixture of conative with a small amount of the affective does not support
high impact levels on student learning. Where, independent pursuit of learning with a
small number of outcomes fits solely into the conative domain and reports a very high
effect size. Interestingly, personal autonomy, which includes a fairly equal number of
elements in the affective and conative domain, also performs well. This implies that an
even distribution of elements in the self-directed learning subgroup of the two domains
could potentially promote specific learning outcomes.
Research Question Three
Research question three is, to what extent does study quality influence the
measure of student self-directed learning skills levels? This question focuses on the area
of research design (Shadish & Meyers, 2001), internal validity, external validity,
instrument validity, and instrument reliability. Previous meta-analyses report positive
cognitive outcomes favoring PBL for random designs and as study design moves away
from being truly random (i.e., quasi-experimental, group random, historical) the effect
sizes diminish (Belland et al., 2010; Dochy et al., 2003). Similar to previous work, this
meta-analysis reports random and quasi-experimental designs with positive effects
favoring problem-based learning, but fails to report random designs as superior. Even
though it is only one point estimate, and thus results are suspect to potential inflation of
results due to small sample size, this research reports a negative effect for group random

79
aligning with previous analyses reporting this design unfavorably (Belland et al., 2010;
Dochy et al., 2003). In general, study design does impact the confidence in the reliability
of student outcomes when studies are designed well.
Further, threats to internal validity impact the confidence of the reliability and
interpretation of data. The majority of outcomes coded in this meta-analysis reported no
(scale = 0) or low (scale = 1) plausible threats to the internal validity of the empirical
studies. Caution should be taken when interpreting results that show a lack of precision.
One to be specifically noted is scale = 2 for experimental mortality (N = 3, g = 1.07, p =
ns). Although the effect size is large, this outcome suffers from a low sample size and is
nonsignificant.
Across internal validity, three threats stood out with plausible (scale = 2) and even
by themselves (scale = 3) explanations for observed results (a) history, (b) differential
selection, and (c) experimental mortality. Table 20 indicates the number of outcomes (N)
and which threat they are associated with. The two studies reporting in the scale 3 column
violate the threats to internal validity for experimental mortality, with Distlehorst,
Dawson, and Klamen (2009) reporting 48-70% mortality and low-high effect sizes,
dependent on the outcome; while Baturay and Bay (2010) also reported high mortality
(53-74%) with low effect sizes for the outcomes. Those studies in the scale 2 column
under experimental mortality also reported large percentages of attrition and interestingly
report large positive and negative effect sizes. This data can thus be loosely interpreted
that experimental mortality has an impact, positively and negatively, on the effect sizes
for various outcomes and the two studies reporting a threat on the scale of 3 should

80
Table 20
Outcome Sample Size (N) for Three Threats to Internal Validity with Plausible (scale =
2) and by Itself (scale = 3) Could Explain Most or All Observed Results
Threat to internal validity Scale 2 Scale 2 citation(s) Scale 3 Scale 3 citation(s)
History 4 Sundblad et al. (2002) 0 n/a
Differential selection 7 Reich et al. (2006); Vernon, Campbell & Dally (1992); Kassebaum et al. (1991)
0 n/a
Experimental mortality 3 Hesterberg (2005); Schlett et al. (2010); Lieberman et al. (1997)
6 Baturay & Bay (2010); Distlehorst et al. (2009)
potentially be withdrawn from the analysis to discover if they impact the overall effect
size and quality of the meta-analysis.
For the studies violating differential selection and history, their effect sizes are
small (e.g., -0.01) and medium (-0.66). As noted above, the studies reporting threats to
internal validity with a scale of 2, could potentially be removed from the meta-analysis to
understand their impact on the overall effect size, better understanding how the quality of
a study and outcomes impact this meta-analysis.
Threats to external validity on scale of 2 were reported for limited description (N
= 30) and multiple treatment (N = 10). For those studies and outcomes falling within the
problem of limited description, the potential impact of additional data or better
explanations of the study could highly impact the overall outcomes of this (and other)
meta-analyses, driving home the need to have rich data reported in empirical studies. The
studies reporting violations with multiple treatment could potentially impact the overall
outcomes of this work through the mixing of definitions and research designs, impacting

81
the teaching and learning students receive.
Instrument validity and reliability were coded for the reporting in the empirical
studies the level of testing of validity and reliability (none, attempt, strong). Interestingly,
reporting that an author calculated the validity and reliability of their instrument (strong)
resulted here in a small/medium effect sizes (N = 14, g = 0.37 for validity and N = 16, g =
0.40 for reliability), while reporting nothing about the testing of the instrument (none)
resulted from this meta-analysis the same medium effect sizes for both validity and
reliability (g = 0.50, N = 57 for validity and N = 56 for reliability). This presents a
conundrum for understanding the results due partially to the fact that testing may have
been conducted on instruments just not reported in the studies. When authors relied on
previous testing (attempt) of the instruments, nonsignificant effect sizes are reported;
validity (N = 4, g = 0.09); reliability (N = 3, g = -0.15). Caution for the interpretation of
these results must also be taken as they rely on small sample sizes. For both validity and
reliability, understanding how both components factor into understanding study quality is
difficult and does not present any easy answers, but does call for more information to be
reported in empirical studies (hopefully factoring out the none category).
Research Question Four
Research question four is, to what extent does discipline influence student self-
directed learning skills levels? This research, not surprisingly, reports positive effects for
medical education and medical-other. Like previous analyses where 75% of more than
200 outcomes fell into these two disciplines (Walker & Leary, 2009), this meta-analysis
too sees medical education and medial-other as the majority disciplines. The disciplines

82
that perform well for self-directed learning outcomes versus cognitive outcomes from
previous work are different. Walker and Leary (2009) reported teacher education as
having the highest effect where this work reports engineering having the highest effect. In
addition to having a higher overall effect size, this research reports discipline level
differences as well. It is clear that more work is needed to understand self-directed
learning skills in problem-based learning according to discipline.
Additional Subgroups
In the results section two additional subgroups were analyzed, process/outcome
and traditional words and phrases. The process of gaining self-directed learning skills in a
problem-based intervention versus using these skills in a new context after the
intervention warrants further exploration outside the context of self-directed learning.
This research reports that process and outcome perform similarly even though they
examine two different sides of self-directed learning. In part, understanding process and
outcome may be a window into the alignment between treatment fidelity and outcomes.
In general, across all studies the level of self-directed learning that students report within
the intervention (process) is the same as their reported ability to engage in self-directed
learning as a result of the intervention (outcome). Self-directed learning as an outcome
introduces the idea of learning transfer and skills beyond a single intervention.
Understanding how the process works to promote the outcome would be a very
interesting next step in the research.
The words used to describe the comparison group have the potential to be
important for interpreting results when comparing problem-based learning to something

83
else. Colliver (2000) argued that the differences between a problem-based learning
treatment is not necessarily all that different than the traditional control and Berkson
(1993) believed that the differences between these groups would diminish over time. Just
as much as there are variations in the definitions of problem-based learning, the words
and phrases that describe the traditional control group vary as well. There are no big
differences reported here. The largest between group differences come from a single
point estimate that potentially mingles with problem-based learning ideas already. The
three groups (traditional, lecture-based, and missing) that are statistically significant
include missing data where no conclusions can be drawn, other than it is important to
report as much data as possible when disseminating research; and traditional and lecture-
based are often found together as one or seen individually, emphasizing again the
variability of these descriptions. Knowing that self-directed learning skills report a
positive medium effect size when compared to a traditional lecture-based control group,
perhaps answering the call by Hmelo-Silver (2009) to engage in syntheses beyond
comparisons of problem-based learning with traditional learning should be considered.
Limitations
As with all research, meta-analysis has limitations. The first is meta-analysis
itself. Due to the strict inclusion criteria it is analyzing only a small slice of the
quantitative literature. In this study particularly, the literature is limited to studies that
compare a problem-based learning treatment to a control group. As noted in the findings,
a richer understanding of all results would be accomplished through an expansion of this

84
research in regard to inclusion criteria. The next limitation is the empirical literature
being analyzed. Results are only as good as the data that is reported in the literature.
Missing or incomplete data (e.g., not enough explanation to be assigned to a category)
hinder the results and interpretation. The majority of the data collection was conducted by
one researcher which can result in missed information.
Conclusions
Problem-based learning has shown positive gains in cognitive outcomes
(Albanese & Mitchell, 1993; Dochy et al., 2003; Gijbels et al., 2005; Kalaian et al., 1999;
Vernon & Blake, 1993; Walker & Leary, 2009) and has been implemented mostly in
medical education. Higher education, K12 education, and others are now using problem-
based learning more (Savery, 2006; Savery & Duffy, 1995; Walker & Leary, 2009). This
meta-analysis provides the first synthesis of conative and affective outcomes in problem-
based learning by specifically analyzing self-directed learning. The synthesis answers the
recent call by Hmelo-Silver (2009) to better understand self-directed learning in problem-
based learning. This study begins the steps of filling in some large gaps in the scholarly
literature for problem-based learning.
This work supports the claims that problem-based learning promotes aspects of
self-directed learning. Understanding these details is important for both practical and
scholarly work. Researchers now have a clearer idea of what areas of problem-based
learning still need to be explored. Recommendations to practitioners about which
affective and/or conative outcomes are particularly well aligned with problem-based

85
learning add practical significance to this research.
Practical Significance
From this analysis, practitioners can learn that problem-based learning does
promote conative and affective skills in self-directed learning. If a practitioner is
weighing the options for using PBL and wants to promote more self-directed learning
skills, this research provides evidence that students will gain self-directed skills so using
PBL could be worth it. Particularly, students will potentially acquire better skills in self-
awareness, self-discipline, motivation, being reflective, social, and interactive. Outside of
medical education, engineering performs well, with social science, other, and business
reporting positive outcomes. Practitioners can be confident that students will begin to
gain some self-directed learning skills when engaging in problem-based learning and will
potentially use them in other contexts.
Research Significance
Albanese (2000) believed that problem-based learning would report higher gains
in the affective domain than the cognitive domain. Barrows (1986) and Hmelo-Silver
(2009) both claimed self-directed learning skills are part of and gained with problem-
based learning. This analysis reports an overall effect size of g = 0.45 for self-directed
learning, which is a medium sized effect where an expert will begin to detect differences
through casual observation and a nonexpert might see differences if looking closely.
Compared to the small effect of g = 0.13 for cognitive outcomes, the effect here is
substantially larger.

86
Researchers now know that more research needs to be conducted and is warranted
in regard to self-directed learning. Specifically, the results of this meta-analysis adds to
the knowledge base on problem-based learning and needs additional work in the four
components of self-directed learning and the different disciplines. It should also be
evident which type of research design potentially yields better study results.
Future Research
From this research, future work includes an exploration of process and outcome in
problem-based learning through refining what is meant by these two areas and exploring
them more broadly in the literature. This will include qualitative findings and broader
inclusion criteria done in a meta-synthesis fashion. A similar in-depth exploration of the
self-directed learning components will also be conducted.
Future work to more fully understand the affective and conative domains in self-
directed learning, an exploration of the literature in a meta-synthesis model will be
conducted. This allows for the inclusion of qualitative data that can provide rich
information.

87
REFERENCES
Abraham, R. R., Vinod, P., Kamath, M. G., Asha, K., & Ramnarayan, K. (2008).
Learning approaches of undergraduate medical students to physiology in a non-PBL- and partially PBL-oriented curriculum. Advances in Physiology Education, 32(1), 35-37. doi:10.1152/advan.00063.2007
*Akinoglu, O., & Tandogan, R. O. (2007). The effects of problem-based active learning in science education on students' academic achievement, attitude, and concept learning. Eurasia Journal of Mathematics, Science & Technology Education, 3(1), 71-81.
Albanese, M. (2000). Problem-based learning: Why curricula are likely to show little effect on knowledge and clinical skills. Medical Education, 34, 729-738.
Albanese, M., & Mitchell, S. (1993). Problem-based learning: A review of literature on its outcomes and implementation issues. Academic Medicine, 68(1), 52-81.
*Anderson, J. (2007). Effect of problem-based learning on knowledge acquisition, knowledge retention, and critical thinking ability of agriculture students in urban schools (Unpublished doctoral dissertation). University of Missouri, Columbia, MO.
Anderson, J. R., Greeno, J. G., Reder, L. M., & Simon, H. A. (2000). Perspectives on learning, thinking, and activity. Educational Researcher, 29(4), 11-13.
Arambula-Greenfield, T. (1996). Implementing Problem-based learning in a college science class. Journal of College Science Teaching, 26(1), 26-30.
*Baragona, M. (2009). Multiple intelligences and alternative teaching strategies: The effects on student academic achievement, conceptual understanding, and attitude (Unpublished docotral dissertation). The University of Mississippi, Oxford, MS.
Barrows, H. S. (1986). A taxonomy of problem-based learning methods. Medical Education, 20(6), 481-6.
Barrows, H. S. (1996). Problem-based learning in medicine and beyond: A brief overview. New Directions for Teaching & Learning, 68, 3-12.
Barrows, H. (1998). The essentials of problem-based learning. Journal of Dental Education, 62(9), 630-633.
* Indicates studies used in this research.

88
Barrows, H. S., & Tamblyn, R. M. (1976). An evaluation of problem-based learning in small groups utilizing a simulated patient. Journal of Medical Education, 51, 52-54.
*Baturay, M. H., & Bay, O. F. (2010). The effects of problem-based learning on the classroom community perceptions and achievement of web-based education students. Computers & Education, 55(1), 43-52.
*Beachey, W. D. (2004). A comparison of problem-based learning and traditional curricula in baccalaureate respiratory therapy education (Doctoral dissertation, The University of North Dakota). Retrieved from http://proquest.umi.com /pqdweb?did=885623581&Fmt=7&clientId=1652&RQT=309&VName=PQD
Becker, K. H., & Maunsaiyat, S. (2004). A comparison of students' achievement and attitudes between constructivist and traditional classroom environments in Thailand vocational electronics programs. Journal of Vocational Education Research, 29(2), 133-153.
Belland, B., Walker, A., Leary, H., Kuo, Y., & Can, G. (2010, May). A meta-analysis of problem-based learning corrected for attenuation, and accounting for internal threats. Paper presented at the American Education Research Association annual meeting, Denver, CO.
Berkson, L. (1993). Problem-based learning: Have the expectations been met? Academic Medicine, 68(10 Suppl.), S79-88.
*Bligh, J., Lloyed-Jones, G., & Smith, G. (2000). Early effects of a new problem-based clinically oriented curriculum on students' perceptions of teaching. Medical Education, 34, 487-489.
Bloom, B. S. (1980). Taxonomy of educational objectives, handbook I: The cognitive domain. New York, NY: McKay.
Blumberg, P. (2000). Evaluating the evidence that problem-based learners are self-directed learners: A review of the literature. In D. H. Evensen & E. E. Hmelo (Eds.), Problem-based learning: A research perspective on learning interactions (pp. 199-226). Mahwah, NJ: Erlbaum.
Blumberg, P., & Eckenfels, E. (1988). A comparison of student satisfaction with their preclinical environment in a traditional and a problem based curriculum. Proceedings of the Annual Conference on Research in Medical Education, 27, 60-65.
Bohlin, R. M. (1998, October). The affective domain: A model of learner-instruction interactions. Paper presented at the Association for Educational Communications and Technology, St. Louis, MO.

89
Bolhuis, S. (2003). Towards process-oriented teaching for self-directed lifelong learning: a multidimensional perspective. Learning and Instruction, 13(3), 327-347. doi:10.1016/S0959-4752(02)00008-7
Borenstein, M., Hedges, L. V., Higgins, J. P. T., & Rothstein, H. R. (2009). Introduction to meta-analysis. Chichester, UK: Wiley.
*Bragg, J., & Evans, R. (2005, December). The effects of problem-based learning on student engagement and motivation. Paper presented at the Wake University School of Education Annual Research Forum, Winston-Salem, NC.
Bransford, J. D., Brown, A. L., & Cocking, R. R. (Eds.). (2000). How people learn: Brain, mind, experience, and school. Washington, DC: National Academy Press.
Brockett, R. G., & Hiemstra, R. (1991). Self-direction in learning: Perspectives in theory, research, and practice. New York, NY: Routledge. Retrieved from http://www-distance.syr.edu/sdlindex.html
Brookfield, S. (1985). Self-directed learning: A critical review of research. New Directions for Continuing Education, 25, 5-16.
Bruning, R. H., Schraw, G. J., Norby, M. M., & Ronning, R. R. (2004). Cognitive Psychology and instruction (4th ed.). Upper Saddle River, NJ: Pearson Merril Prentice Hall.
Brunton, P. A., Morrow, L. A., Hoad-Reddick, G., McCord, J. F., & Wilson, N. H. (2000). Students' perceptions of seminar and lecture-based teaching in restorative dentistry. European Journal of Dental Education: Official Journal of the Association for Dental Education in Europe, 4(3), 108-111.
Candy, P. C. (1991). Self-direction for lifelong learning. San Francisco, CA: Jossey-Bass.
Chen, S. K., Chang, H. F., & Chiang, C. P. (2001). Group learning factors in a problem-based course in oral radiology. Dento Maxillo Facial Radiology, 30(2), 84-87. doi:10.1038/sj/dmfr/4600577
Cohen, J. (1960). A coefficient of agreement for nominal scales. Educational & Psychological Measurement, 20(1), 37-46.
Cohen, J. (1988). Statistical power analysis for the behavioral sciences (Vol. 2). Hillsdale, NJ: Earlbaum.
Colliver, J. A. (2000). Effectiveness of problem-based learning curricula: Research and theory. Academic Medicine, 75(3), 259-266.
90
Cooper, H. (1989). Integrating research: A guide for literature reviews (Vol. 2). Newbury Park, CA: Sage.
Cooper, H., & Hedges, L. (1994). The handbook of research synthesis. New York, NY: Sage.
*Dehkordi, A. H., & Heydarnejad, M. S. (2008). The impact of problem-based learning and lecturing on the behavior and attitudes of Iranian nursing students. A randomised controlled trial. Danish Medical Bulletin, 55(4), 224-226.
Deretchin, L. F., & Contant, C. F. (1999). Learning behaviors in a mixed traditional and problem-based learning curriculum. Education for Health: Change in Learning & Practice (Taylor & Francis Ltd), 12(2), 169-179.
Dietrich, A. J., Moore-West, M., Palmateer, D. R., Radebaugh, J., Reed, S., & Clauson, B. (1990). Adapting problem-based learning to a traditional curriculum: Teaching about prevention. Family Practice Research Journal, 10(1), 65-73.
*Distlehorst, L. H., Dawson, B. K., & Klamen, D. L. (2009). Supervisor and self-ratings of graduates from a medical school with a problem-based learning and standard curriculum track. Teaching & Learning in Medicine, 21(4), 291-298. doi:10.1080/10401330903228364
Dochy, F., Segers, M., Van den Bossche, P., & Gijbels, D. (2003). Effects of problem-based learning: a meta-analysis. Learning and Instruction: The Journal of the European Association for Research on Learning and Instruction, 13(5), 533-568.
Duell, O. K. (1986). Metacognitive skills. In G. D. Phye & T. Andre (Eds.), Cognitive classroom learning (pp. 205-239). Orlando, FL: Academic.
Eng, C. S. (2000). Problem-based learning—Educational tool or philosophy. Retrieved from http://www-eng.tp.edu.sg/pbl_sweeeng.pdf
Ertmer, P. A., & Simons, K. D. (2006). Jumping the PBL implementation hurdle: Supporting the efforts of K-12 teachers. The Interdisciplinary Journal of Problem-Based Learning, 1(1), 40-54.
Garrison, D. R. (1997). Self-directed learning: Toward a comprehensive model. Adult Education Quarterly, 48(1), 18-33.
Gijbels, D., Dochy, F., Van den Bossche, P., & Segers, M. (2005). Effects of problem-based learning: A meta-analysis from the angle of assessment. Review of Educational Research, 75(1), 27-61.
Glass, G. V. (1976). Primary, secondary, and meta-analysis of research. Educational Researcher, 5(10), 3-8.
91
Glass, G. V. (2000). Meta-qnalysis at 25. http://www.gvglass.info/papers/meta25.html
Grow, G. O. (1991). Teaching learners to be self-directed. Adult Education Quarterly, 41(3), 125-149.
Guglielmino, L. M. (1977). What is the Self-Directed Learning Readiness Scale? Retrieved from http://www.lpasdlrs.com/main.html
*Gurpinar, E., Alimoglu, M. K., Mamakli, S., & Aktekin, M. (2010). Can learning style predict student satisfaction with different instruction methods and academic achievement in medical education? Advances in Physiology Education, 34(4), 192-196.
Hayes, A. F., & Krippendorff, K. (2007). Answering the call for a standard reliability measure for coding data. Communication Methods and Measures, 1, 77-89.
*Hesterberg, L. J. (2005). Evaluation of a problem-based learning practice course: Do self-efficacy, critical thinking, and assessment skills improve? Retrieved from http://proquest.umi.com/pqdweb?did=862925331&Fmt=7&clientId=1652&RQT=309&VName=PQD
Higgins, J. P. T., Thompson, S. G., Deeks, J. J., & Altman, D. G. (2003). Measuring inconsistency in meta-analyses. British Medical Journal, 327(7414), 557 -560. doi:10.1136/bmj.327.7414.557
Hmelo-Silver, C. E. (2009, June). What do we know about problem-based learning? Current status and future prospects. Paper presented at the International PBL Symposium, Singapore.
Houle, C. O. (1988). The inquiring mind (2nd ed.). Madison, WI: University of Wisconsin Press.
Hsieh, C., & Knight, L. (2008). Problem-based learning for engineering students: An evidence-based comparative study. The Journal of Academic Librarianship, 34(1), 25-30. doi:10.1016/j.acalib.2007.11.007
Huitt, W., & Cain, S. (2005). An overview of the conative domain. Retrieved from http://teach.valdosta.edu/whuitt/brilstar/chapters/conative.doc
*Hwang, S. Y., & Kim, M. J. (2006). A comparison of problem based learning and lecture-based learning in an adult health nursing course. Nurse Education Today, 26, 315-321.
Illeris, K. (2004). Transformative learning in the perspective of a comprehensive learning theory. Journal of Transformative Education, 2(2), 79-89.
92
Kalaian, H. A., Mullan, P. B., & Kasim, R. M. (1999). What can studies of problem-based learning tell us? Synthesizing and modeling PBL effects on National Board of medical Examination Performance: Hierarchical linear modeling meta-analytic approach. Advances in Health Sciences Education, 4(3), 209-221.
*Kassebaum, D. K., Averbach, R. E., & Fryer, G. E. (1991). Student preference for a case-based vs. lecture instructional format. Journal of Dental Education, 55, 781-784.
*Kaufman, D. M., & Mann, K. V. (1996). Comparing students' attitudes in a problem-based and conventional curricula. Academic Medicine, 71, 1096-1099.
Knowles, M. S. (1970). The modern practice of adult education: Andragogy versus pedagogy. New York, NY: Cambridge.
Knowles, M. S. (1975). Self-directed learning: A guide for learners and teachers. New York, NY: Association.
*Kong, J., Li, X., Wang, Y., Sun, W., & Zhang, J. (2009). Effect of digital problem-based learning cases on student learning outcomes in opthalmology courses. Archives of Opthalmology, 127(9), 1211-1214.
*Konings, K. D., Wiers, R. W., van de Wiel, M. W. J., & Schmidt, H. G. (2005). Problem-based learning as a valuable educational method for physically disabled teenagers? The discrepancy between theory and practice. Journal of Developmental and Physical Disabilities, 17(2), 107-117.
Krathwohl, D. R., Bloom, B. S., & Masia, B. B. (1973). Taxonomy of educational objectives, the classification of educational goals. Handbook II: Affective domain. New York, NY: McKay.
Krippendorff, K. (2007). Computing Krippendorff's alpha reliability. Retrieved from http://repository.upenn.edu/asc_papers/43
*Lancaster, C., Bradley, E., Smith, I. K., Chessman, A., Stroup-Benham, C. A., & Camp, M. G. (1997). The effect of PBL on students' perceptions of learning environment. Academic Medicine, 72(10), S10-S12.
Lave, J., & Wenger, E. (2006). Situated learning: Legitimate peripheral participation. Cambridge, UK: Cambridge University Press.
*Lesperance, M. (2008). The effects of problem based learning (PBL) on students' critical thinking skills (Unpublished doctoral dissertation). The University of North Carolina at Greensboro, Greensboro, NC.

93
*Lieberman, S. A., Stroup-Benham, C. A., Peel, J. L., & Camp, M. G. (1997). Medical student perception of the academic environment: A prospective comparison of traditional and problem-based curricula. Academic Medicine, 72(10), S13-S15.
*Lin, C., Lu, M., Chung, C., & Yang, C. (2010). A comparison of problem-based learning and conventional teaching in nursing ethics education. Nursing Ethics, 17(3), 373-382. doi:10.1177/0969733009355380
*Mantri, A., Dutt, S., Gupta, J. P., & Chitkara, M. (2008). Design and evaluation of a PBL-based course in analog electronics. IEEE Transactions on Education, 51(4), 432-438.
Martin, B. L., & Briggs, L. J. (1986). The affective and cognitive domains: Integration for instruction and research. Englewood Cliffs, NJ: Educational Technology.
*Matthews, B. (2004). The effects of direct and problem-based learning instruction in an undergraduate introductory engineering graphics course (Unpublished doctoral dissertation). North Carolina State University, Raleigh, NC.
Mayer, R. E. (2001). Cognitive, metacognitive, and motivational aspects of problem solving. In H. J. Hartman (Ed.), Metacognition in learning and instruction: Theory, research and practice (pp. 87-101). London, UK: Kluwer.
McGee, M. R. (2003). A comparison of traditional learning and problem-based learning in pharmacology education for athletic training students (Doctoral dissertation). The University of North Carolina at Greensboro. Retrieved from http://proquest.umi.com/pqdweb?did=765154841&Fmt=7&clientId=1652&RQT=309&VName=PQD
Merriam, S. B., Caffarella, R. S., & Baumgartner, L. M. (2007). Learning in adulthood: A comprehensive guide (3rd ed.). San Francisco, CA: Wiley.
Mezirrow, J. (1985). A critical theory of self-directed learning. New Directions for Adult Continuing Education, 25, 17-30.
Mezirrow, J. (1990). Conclusion: Toward transformative learning and emancipatory education. In J. Mezirow (Ed.), Fostering critical reflection in adulthood: A guide to transformative and emancipatory learning (pp. 354-376). San Francisco, CA: Jossey-Bass.
Moore, G. T. (1991). The effect of compulsory participation of medical students in problem-based learning. Medical Education, 25(2), 140-143.
*Newble, D. I., & Clarke, R. M. (1986). The approaches to learning of students in a traditional and in an innovative problem-based medical school. Medical Education, 20(4), 267-273.

94
Oddi, L. F. (1986). Development and validation of an instrument to identify self-directed continuing learners. Adult Education Quarterly, 36(2), 97-107.
*Ozturk, C., Muslu, G. K., & Dicle, A. (2008). A comparison of problem-based and traditional education on nursing students' critical thinking dispositions. Nurse Education Today, 28(5), 627-632
*Padmaraju, K. (2008). Authentic classroom problems and effect on self-efficacy scores of pre-service teachers (Unpublished doctoral dissertation). Indiana State University, Terre Haute, IN.
*Peters, A., Greenberger-Rosovsky, R., Crowder, C., Block, S., & Moore, G. T. (2000). Long-term outcomes of the new pathway program at Harvard Medical School: A randomized controlled trial. Academic Medicine, 75(5), 470-479.
*Reich, S., Simon, J. F., Ruedinger, D., Shortall, A., Wichmann, M., & Frankenberger, R. (2006). Evaluation of two different teaching concepts in dentistry using computer technology. Advances in Health Sciences Education, 12(3), 321-329. doi:10.1007/s10459-006-9004-8
Sanderson, H. (2008). Comparison of problem based learning and traditional lecture instruction on critical thinking, knowledge, and application of strength and conditioning (Unpublished doctoral dissertation). The University of North Carolina at Greensboro, Greensboro, NC.
Savery, J. R. (2006). Overview of problem-based learning: Definitions and distinctions. The Interdisciplinary Journal of Problem-based Learning, 1(1), 9-20.
Savery, J. R., & Duffy, T. M. (1995). Problem-based learning: An instructional model and its constructivist framework. Educational Technology, 35(5), 31-38.
*Schlett, C. L., Doll, H., Dahmen, J., Polacsek, O., Federkeil, G., Fischer, M. R., … Butzlaff, M. (2010). Job requirements compared to medical school education: differences between graduates from problem-based learning and conventional curricula. BMC Medical Education, 10, 1-8.
*Semerci, N. (2006). The effect of problem-based learning on the critical thinking of students in the intellectual and ethical develoment unit. Social Behavior & Personality: An International Journal, 34(9), 1127-1136.
*Sevening, D., & Baron, M. (2002). A comparison of traditional teaching methods and problem-based learning in an addiction studies class. Journal of Teaching in the Addictions, 1(2), 27-42.

95
Shadish, W. R., & Haddock, C. K. (1994). Combining estimates of effect size. In H. Cooper & L. V. Hedges (Eds.), The handbook of research synthesis (pp. 261-281). New York, NY: Sage.
Shadish, W. R., & Meyers, D. (2001). Campbell collaboration research design policy brief. Retrieved from http://www.campbellcollaboration.org/resources/research/ Methods_Policy_Briefs.php
Shelton, J. B., & Smith, R. F. (1998). Problem-based learning in analytical science undergraduate teaching. Research in Science & Technological Education, 16(1), 19-29. doi:10.1080/0263514980160102.
Shrout, P. E., & Fleiss, J. L. (1979). Intraclass correlations: Uses in assessing reliability. Psychological Bulletin, 86(2), 420-428.
Smith, S. R., Dollase, R. H., & Boss, J. A. (2003). Assessing students’ performances in a competency-based curriculum. Academic Medicine, 78(1), 97-107.
Smith, P., & Ragan, T. (1999). Instructional design. New York, NY: Wiley.
*Smits, P., de Buisonje, C. D., Verbeek, J. H., van Dijk, F. J., Metz, J. C., & ten Cate, O. J. (2003). Problem-based learning versus lecture-based learning in postgraduate medical education. Scandinavian Journal of Work, Environment & Health, 29(4), 280-287.
Strobel, J., & van Barneveld, A. (2009). When is PBL more effective? A meta-synthesis of meta-analyses comparing PBL to conventional classrooms. Interdisciplinary Journal of Problem-based Learning, 3(1), 44-58.
Sugrue, B. (1995). A theory-based framework for assessing domain-specific problem solving ability. Educational Measurement: Issues & Practice, 14(3), 29-36.
*Sundblad, G., Sigrell, B., John, L. K., & Lindkvist, C. (2002). Students' evaluation of a learning method: A comparison between problem-based learning and more traditional methods in a specialist university training programme in psychotherapy. Medical Teacher, 24(3), 268-272.
*Sungur, S., & Tekkaya, C. (2006). Effects of problem-based learning and traditional instruction on self-regulated learning. Journal of Educational Research, 99(5), 307-317.
Tarhan, L., & Acar, B. (2007). Problem-based learning in an eleventh grade chemistry class: ‘factors affecting cell potential’. Research in Science & Technological Education, 25(3), 351-369. doi:10.1080/02635140701535299.

96
Tolnai, S. (1991). Continuing medical education and career choice among graduates of problem-based and traditional curricula. Medical Education, 25(5), 414-420.
Tough, A. (1978). Major learning efforts: Recent research and future directions. Adult Education, 28(4), 250-263.
Tough, A. (1979). The adult's learning projects: A fresh approach to theory and practice in adult learning (2nd ed.). Toronto, Canada: Ontario Institute for Studies in Education.
*Vazquez, M. F. (2008). Problem-based learning and its influence on college preparation knowledge, motivation, & self-efficacy in high school students (Unpublished doctoral dissertation). University of Southern California, Los Angeles, CA.
Vernon, D. T. (1994). Tutor evaluation of problem-based learning in behavioral sciences courses. Teaching and Learning in Medicine, 6(2), 91-95.
Vernon, D. T., & Blake, R. L. (1993). Does problem-based learning work? A meta-analysis of evaluative research. Academic Medicine, 68(7), 550-563.
*Vernon, D. T., Campbell, J. D., & Dally, J. C. (1992). Problem-based learning in two behavioral sciences courses at the University of Missouri-Columbia. Academic Medicine, 67(5), 349-350.
Walker, A., & Leary, H. (2009). A problem based learning meta analysis: Differences across problem types, implementation types, disciplines, and assessment levels. Interdisciplinary Journal of Problem Based Learning, 3(1), 12-43.
*Wang, J., Zhang, W., Qin, L., Zhao, J., Zhang, S., Gu, J., & Zhou, C. (2010). Problem-based learning in regional anatomy education at Peking University. Anatomical Sciences Education, 3(3), 121-126.
*Williams, D.C., Hemstreet, S., Liu, M., & Smith, V.D. (1998, June). Examining how middle school students use problem-based learning software. Paper presented at the 10th Annual Meeting of the World Conference on Educational Multimedia and Hypermedia & World Conference on Educational Telecommunications, Freiburg, Germany.
*Yang, S. P. (2002). Problem-based learning on the world wide web in an undergraduate kinesiology class: An integrative approach to education (Unpublished master's thesis). University of New Brunswick, New Brunswick, Canada.

97
APPENDICES

98
Appendix A
Previous Meta-Analyses Table and Empirical Studies

99
Table A1
Previous Meta-Analyses and Empirical Studies Included in Them (Indicated by an X)
Author(s) (year)
Albanese & Mitchell (1993)
Vernon & Blake (1993)
Kalain et al. (1999)
Dochy et al. (2003)
Gijbels et al. (2005)
Walker & Leary (2009)
Aaron et al. (1998) X X X
Akinoglu & Tandogan (2007) X
Albano et al. (1996) X X
Al-Haddad & Jayawickramarajah (1991) X
Alleyne et al. (2002) X
Antepohl & Herzig (1997) X X X
Anthepol & Herzig (1999) X X X
Baca et al. (1990) X X
Barrows & Tamblyn (1976) X X X X
Beachy (2004) X
Bickley et al. (1990) X X X X
Blake & Parkinson (1998) X
Block & Moore (1994) X X X
Block et al. (1993) X
Blumberg & Echenfels (1988) X X
Boshuizen et al. (1993) X X
Bouchard (2004) X
Bovee & Gran (2000) X
Bridgham et al. (1991) X X
Ceconi (1996) X
Chan et al. (1999) X
Chang (2001) X
Cheaney & Ingebritsen (2005) X
Cheany (2005) X
Claessen & Boshuizen (1985) X
Coulson (2005) X
Derry et al. (2006) X
Dietrich et al. (1990) X
Distlehorst & Robbs (1998) X X X
Dods (1997) X
Doig & Werner (2000) X
Donner & Bickley (1990) X X X
Doucet et al. (1996) X X
Doucet et al. (1998) X X X
(table continues)

100
Author(s) (year)
Albanese & Mitchell (1993)
Vernon & Blake (1993)
Kalain et al. (1999)
Dochy et al. (2003)
Gijbels et al. (2005)
Walker & Leary (2009)
Dyke et al. (2001) X
Eisenstadt et al. (1990) X X X X X
Enarson & Cariaga-Lo (2001) X
Farquhar et al. (1986) X X X X
Farr et al. (2005) X
Finch (1999) X X X
Gallagher & Stepien (1996) X
Goodman et al. (1991) X X X X X
Gordon et al. (2001) X
Grol et al. (1989) X
Gulsecen & Kubat (2006) X
Heale et al. (1988) X X X
Herring & Evans (2005) X
Hesterberg (2005) X
Hmelo et al. (1997) X X X
Hmelo (1998) X X X
Hoffman et al. (2006) X
Imbos & Verwijnen (1982) X X
Imbos et al. (1984) X X X
Jones et al. (1984) X X X X X X
Kassebaum et al. (1991) X X
Kaufman & Mann (1998) X
Kaufman et al. (1989) X X X X X
Kennedy (2007) X
LeJeune (2002) X
Lewis & Tamblyn (1987) X X X X
Login et al. (1997) X
Lyons (2006) X
Martenseon et al. (1985) X X X
Matthews (2004) X
Maxwell et al. (2005) X
McGee (2003) X
Mennin et al. 1993) X X X
Mergendoller et al. (2000) X
Mergendoller et al. (2006) X
Moore et al (1994) X X
Moore et al. (1990) X
Moore (1991) X
(table continues)

101
Author(s) (year)
Albanese & Mitchell (1993)
Vernon & Blake (1993)
Kalain et al. (1999)
Dochy et al. (2003)
Gijbels et al. (2005)
Walker & Leary (2009)
Moore-West et al. (1985) X X X
Moore-West et al. (1989) X
Morgan et al. (1977) X X X X
Murray-Harvey & Slee (2000) X
Neufeld & Sibley (1989) X X
Neufeld et al. (1989) X X
Nolte et al. (1988) X X
Nolte (1985) X
Patel et al. (1990) X X X
Phelan et al. (1993) X
Polanco et al. (2001) X
Polglase et al. (1989) X X
Post & Drop (1990) X X
Prince et al. (2003) X
Rich et al. (2005) X
Richards & Cariaga (1993) X
Richards et al. (1996) X X X
Roberston (2005) X
Santos-Gomez et al. (1990) X X X X X
Saunders et al. (1990) X X X X X
Saye & Brush (1999) X
Schmidt et al. (1996) X X
Schuwirth (1996) X X X
Schwartz et al. (1992) X
Schwartz et al. (1992) X
Schwartz et al. (1994) X
Schwartz et al. (1997) X X
Sevening & Baron (2002) X
Shelton & Smith (1998) X
Shin et al. (1993) X
Shoffner & Dalton (1998) X
Shuler & Fincham (1998) X
Smits et al. (2003) X
Son & Van Sickle (2000) X X X
Tans et al. ( 1986) X X
Tolani (1991) X
Tomczak (1991) X
Usoh (2003) X
(table continues)

102
Author(s) (year)
Albanese & Mitchell (1993)
Vernon & Blake (1993)
Kalain et al. (1999)
Dochy et al. (2003)
Gijbels et al. (2005)
Walker & Leary (2009)
Van Duijn (2004) X
van Hessen & Verwijnen (1990) X X
Verhoeven et al. (1998) X X X
Vernon et al. (1992) X
Vernon (1994) X
Verwijnen et al. (1990) X X X X
Visser (2002) X
Walton et al. (1997) X
Ward & Lee (2004) X
Washington et al. (1998) X
Whifield et al. (2002) X
Williams et al (1998) X
Willis (2002) X
Woodward & Ferrier (1982) X
Woodward et al. (1981) X X
Woodward et al. (1988) X
Woodward et al. (1990) X
Woodward (1990) X X
Yang (2002) X
103
References for Empirical Studies Included In Previous Meta-Analyses
Aaron, S., Crocket, J., Morrish, D., Basualdo, C., Kovithavongs, T., Mielke, B., & Cook, D. (1998). Assessment of exam performance after change to problem-based learning: Differential effects by question type. Teaching-and-Learning-in-Medicine, 10(2), 86–91.
Akinoglu, O., & Tandogan, R. (2007). The eff ects of problem-based active learning in science education on students’ academic achievement, attitude and concept learning. Eurasia Journal of Mathematics, Science & Technology Education, 3(1), 71-81.
Albano, M. G., Cavallo, F., Hoogenboom, R., Magni, F., Majoor, G., Mananti, F., Schuwirth, L., Stiegler, I., & Van Der Vleuten, C. (1996). An international comparison of knowledge levels of medical students: The Maastricht Progress Test. Medical Education, 30, 239–245.
Al-Haddad, M. K. & Jayawickramarajah, P. T. (1991). Problem-based curriculum: Outcome evaluation. Medical Teacher, 13, 273-279.
Alleyne, T., Shirley, A., Bennett, C., Addae, J., Walrond, E., West, S. et al. (2002). Problem-based compared with traditional methods at the faculty of Medical Sciences, University of the West Indies: A model study. Medical Teacher, 24(3), 273-279.
Antepohl, W., & Herzig, S. (1997). Problem-based learning supplementing in the course of basic pharmacology-results and perspectives from two medical schools. Naunyn-Schmiedeberg’s Archives of Pharmacology, 355, R18.
Antepohl, W., & Herzig, S. (1999). Problem-based learning versus lecture-based learning in a course of basic pharmacology: A controlled, randomized study. Medical Education, 33(2), 106–113.
Baca, E., Mennin, S. P., Kaufman, A., & Moore-West, M. (1990). Comparison between a problem-based, community-oriented track and a traditional track within one medical school. In Z. M. Nooman, H. G. Schmidt, & E. S. Ezzat (Eds.), Innovation in medical education: An evaluation of its present status (pp. 9–26). New York: Springer.
Barrows, H. S. & Tamblyn, R. M. (1976). An Evaluation of Problem-based Learning in Small Groups Utilizing a Simulated Patient. Journal of Medical Education, 51, 52-54.
Beachey, W. D. (2004). A comparison of problem-based learning and traditional curricula in baccalaureate respiratory therapy education. Unpublished dissertation, The University of North Dakota.
104
Bickley, H., Donner, R. S., Walker, A. N., & Tift, J . P. (1990). Pathology Education in a Problem-based Medical Curriculum. Teach. Learn. Med, 2(1), 38-41.
Blake, R., & Parkison, L. (1998). Faculty Evaluation of the Clinical Performances of Students in a problem-based learning curriculum. Teaching & Learning in Medicine, 10(2), 69-73.
Block, S. D., & Moore, G. T. (1994). Project evaluation. In D. C. Tosteson, S. J. Adelstein, & S. T. Carver (Eds.), New pathways to medical education: Learning to learn at Harvard Medical School. Cambridge, MA: Harvard University Press.
Block, S. D., Style, C. B., and Moore, G. T. (1993). Can We Teach Humanism? A Randomized Controlled Trial Evaluating the Acquisition of Humanistic Knowledge, Attitudes, and Skills in The New Pathway at Harvard Medical School. [Unpublished]
Blumberg, P., & Eckenfels, E. (1988). A comparison of student satisfaction with their preclinical environment in a traditional and a problem based curriculum. Proc Annu Conf Res Med Educ, 27, 60–65.
Boshuizen, H. P. A., Schmidt, H. G., & Wassamer, A. (1993). Curriculum style and the integration of biomedical and clinical knowledge. In P. A. J. Bouhuys, H. G. Schmidt, & H. J. M. van Berkel (Eds.),Problem-based learning as an educational strategy (pp. 33–41). Maastricht: Network Publications.
Bouchard, G. J. (2004). The eff ect of a problem-based learning curriculum on performance on the Physician Assistant National Certifying Examination. Unpublished doctoral dissertation, Seton Hall University, College of Education and Human Services.
Bovee, M., & Gran, D. (2000). Comparison of two teaching methods in a chiropractic clinical
science course. Journal Of Allied Health, 29(3), 157-160.
Bridgham, R., Solomon, D., & Haf, J. (1991). The Effect of Curriculum Era on NBME Part I Outcomes in a Problem-based versus a Traditional Curriculum Track. In Proceedings of the Thirtieth Annual Conference on Research in Medical Education. Acad. Med., 66, Supplement (September), S82-S84.
Ceconi, A. (2006). Influence of problem-based learning instruction on decision-making skills in respiratory therapy students. Unpublished Dissertation, Seton Hall University.

105
Chan, D. H., Leclair, K., & Kaczorowski, J. (1999). Problem-based small-group learning via the Internet among community family physicians: a randomized controlled trial. Computers In Medical Practice, 16(3), 54-58.
Chang, C. (2001). Comparing the impacts of a problem-based computer assisted instruction and the direct interactive teaching method on student science achievement. Journal of Science Education and Technology, 10(2), 147-153.
Cheaney, J. (2005). Problem-based learning in an on-line biotechnology course. Unpublished dissertation, Iowa State University.
Cheaney, J., & Ingebritsen, T. (2005). Problem-based learning in an online course: A case study. International Review of Research in Open and Distance Learning, 6(3), 1-18.
Claessen, H. G. & Boshuizen, H. P. (1985). Recall of Medical Information by Students and Doctors. Medical Education, 19, 61-67.
Coulson, R. L. (1983). Problem-based student-centered learning of the cardiovascular system using the problem-based learning module (P.B.L.M.). The Physiologist, 26(4), 220-224.
Derry, S., Hmelo-Silver, C., Nagarajan, A., Chernobilsky, E., & Beitzel, B. (2006). Cognitive transfer revisited: Can we exploit new media to solve old problems on a large scale? Journal of Educational Computing Research, 35(2), 145-162.
Dietrich, A. J. et al. (1990). Adapting Problem-based Learning to a Traditional Curriculum: Teaching about Prevention. Family Practice, 10(1), 65-73.
Distlehorst, L. H., & Robbs, R. S. (1998). A comparison of problem-based learning and standard curriculum students: Three years of retrospective data. Teaching and Learning in Medicine, 10(3), 131–137.
Dods, R. F. (1997). An action research study of the effectiveness of problem-based learning in promoting the acquisition and retention of knowledge. Journal for the Education of the Gifted, 20(4), 423-437.
Doig, K., & Werner, E. (2000). The marriage of lecture-based curriculum and problem-based learning: Are the off spring vigorous? Medical Teacher, 22(2), 173-178.
Donner, R. S. & Bickley, H. (1990). Problem-based Learning: An Assessment of its Feasibility and Cost. Human Pathology, 21, 881-885.
Doucet, M. D., Purdy, R. A., Kaufman, D. M., & Langille, D. B. (1998). Comparison of problem-based learning and lecture format in continuing medical education on headache diagnosis and management. Medical Education, 32(6), 590–596.

106
Dyke, P., Jamrozik, K., & Plant, A. (2001). A randomized trial of a problem-based learning approach for teaching epidemiology. Academic Medicine, 76(4), 373-379.
Eisenstaedt, R. S., Barry, W. E., & Glanz, K. (1990). Problem-based Learning: Cognitive Retention and Cohort Traits of Randomly Selected Participants and Decliners. In Research in Medical Education. Acad. Moo. 65, Supplement (September):Sll-SI2.
Enarson, C., & Cariaga-Lo, L. (2001). Infl uence of curriculum type on student performance in the United States Medical Licensing Examination Step 1 and Step 2 exams: problem-based learning vs. lecture-based curriculum. Medical Education, 35(11), 1050-1055.
Farquhar, L. J., Haf, J., & Kotabe, K. (1986). Effect of Two Preclinical Curricula on NBME Part I Examination Performance. Journal of Medical Education, 61, 368- 373.
Farr, C., Ownbey, S., Branson, D., Cao, H., & Starr, C. (2005). Multimedia and Problem-Based Instruction in the Textiles Laboratory. Clothing & Textiles Research Journal, 23(4), 360-367.
Finch, P. M. (1999). The effect of problem-based learning on the academic performance of students studying pediatric medicine in Ontario. Medical Education, 33(6), 411–417.
Gallagher, S., & Stepien, W. (1996). Content acquisition in problem-based learning: Depth versus breadth in American Studies. Journal for the Education of the Gifted, 19(3), 257-275.
Goodman, L. J. et al. (1991). An Experiment in Medical Education: A Critical Analysis Using Traditional Criteria. JAMA, 265, 2373-2376.
Gordon, P. R., Rogers, A. M., Comfort, M., Gavula, N., & McGee, B. P. (2001). A taste of problem-based learning increases achievement of urban minority middle-school students. Educational Horizons, 79(4), 171-175.
Grol, R., Mokkink, H., Helsper-Lucas, A., Tielens, V., & Bulte, J. (1989). Effects of the Vocational Training of General Practice Consultation Skills and Medical Performance. Medical Education, 23, 512-521.
Gulseçen, S., & Kubat, A. (2006). Teaching ICT to teacher candidates using PBL: A qualitative and quantitative evaluation. Educational Technology & Society, 9(2), 96-106.

107
Heale, J. et al. (1988). A Randomized Controlled Trial Assessing the Impact of Problem-based Versus Didactic Teaching Methods in CME. In Research in Medical Education, 1988: Proceedings of the Twenty-Seventh Annual Conference, pp. 72-77. Washington, DC: Association of American Medical Colleges.
Herring, S. M., & Evans, R. (2005, December). The effects of problem-based learning on students understanding of animal behavior. Studies in Teaching: 2005 Research Digest. Paper presented at the Presented at Annual Research Forum, Winston-Salem, North Carolina.
Hesterberg, L. J. (2005). Evaluation of a problem-based learning practice course: Do self-efficacy, critical thinking, and assessment skills improve? Unpublished dissertation, University of Kentucky.
Hmelo, C. E. (1998). Problem-based learning: Effects on the early acquisition of cognitive skill in medicine. The Journal of the Learning Sciences, 7, 173–236.
Hmelo, C. E., Gotterer, G. S., & Bransford, J. D. (1997). A theory-driven approach to assessing the cognitive effects of PBL. Instructional Science, 25, 387–408.
Hoff man, K., Hosokawa, M., Blake Jr., R. L., Headrick, L., & Johnson, G. (2006). Problem-based learning outcomes: Ten years of experience at the University of Missouri-Columbia School of Medicine. Academic Medicine, 81(7), 617-625.
Imbos, T., & Verwijnen, G. M. (1982). Voortgangstoetsing aan de medische faculteit Maastricht [Progress testing on the Faculty of Medicine of Maastricht]. in Dutch In H. G. Schmidt (Ed.), Probleemgestuurd Onderwijs: Bijdragen tot onderwijsresearchdagen 1981 (pp. 45–56). Stichting voor Onderzoek van het Onderwijs.
Imbos, T. Drukker, J., van Mameren, H., & Verwijnen, M. (1984). The Growth in Knowledge of Anatomy in Problem-based Curriuculum. In Tutorials in Problem Based Learning, H. G. Schmidt (ed.), pp. 106-115. Assen, The Netherlands: VanGorcum.
Jones, J. W., Bieber, L. L., Echt, R, Scheifley, V., & Ways, P. O. (1984). A Problem-based Curriculum-Ten Years of Experience. In Tutorials in Problem-based Learning, H. G. Schmidt and M. L. de Voldern (eds.), pp. 181-198. Maastricht, The Netherlands: Van Gorcum, Assen.
Kassebaum, D. K., Averbach, R. E., & Fryer, G. E. (1991). Student preference for a case-based vs. lecture instructional format. J Dent Educ, 55(12), 781–784.
Kaufman, A. et al. (1989). The New Mexico Experiment: Educational Innovation and Institutional Change. Academic Medicine, 64, 285-294.

108
Kaufman, D. M., & Mann, K. V. (1998). Comparing achievement on the Medical Council of Canada Qualifying Examination part I of students in conventional and problem-based learning curricula. Academic Medicine, 73(11), 1211-1213.
Kennedy, S. J. (2007). Learning and transfer compared in two teaching methods: Online problem-based learning and the traditional lecture method. Unpublished doctoral dissertation, Capella University.
LeJeune, N. (2002). Problem-based learning instruction versus traditional instruction on selfdirected learning, motivation, and grades of undergraduate computer science students. Unpublished doctoral dissertation, University of Colorado at Denver.
Lewis, K. E. & Tamblyn, R. M. (1987). The Problem-based Learning Approach in Bacalaureate Nursing Education: How Effective is It? Nurs. Pap., 19(2), 17-26.
Login, G., Ransil, B., Meyer, M., Truong, N., Donoff , R., & McArdle, P. (1997). Assessment of preclinical problem-based learning versus lecture-based learning. Journal of Dentistry Education, 61(6), 473-479.
Lyons, E. B. (2006). Examining the effects of problem-based learning on the critical thinking skills of associate degree nursing students in a Southeastern community college. Unpublished doctoral dissertation, Mississippi State University.
Martenson, D., Eriksson, H., & Ingelman-Sundberg, M. (1985). Medical chemistry: Evaluation of active and problem-oriented teaching methods. Medical Education, 19, 34–42.
Matthews, B. (2004). The eff ects of direct and problem-based learning instruction in an undergraduate introductory engineering graphics course. Unpublished doctoral dissertation, North Carolina State University.
Maxwell, N., Mergendoller, J., & Bellisimo, Y. (2005). Problem-based learning and high school macroeconomics: A comparative study of instructional methods. Journal of Economic Education, 36(4), 315-331.
McGee, M. R. (2003). A comparison of traditional learning and problem-based learning in pharmacology education for athletic training students. Unpublished doctoral dissertation, The University of North Carolina at Greensboro.
Mennin, S. P., Friedman, M., Skipper, B., Kalishman, S., & Snyder, J. (1993). Performances on the NMBE I, II, III by medical students in the problem-based learning and conventional tracks at the University of New Mexico. Academic Medicine, 68, 616–624.

109
Mergendoller, J., Maxwell, N., & Bellisimo, Y. (2000). Comparing problem-based learning and traditional instruction in high school economics. Journal of Educational Research, 93(6), 374-382.
Mergendoller, J., Maxwell, N., & Bellisimo, Y. (2006). The effectiveness of problem-based instruction: A comparative study of instructional methods and student characteristics. The Interdisciplinary Journal of Problem-based Learning, 1(2), 49-69.
Moore, G. T. (1991). The effect of compulsory participation of medical students in problem-based learning. Medical Education, 25(2), 140–143.
Moore, G. T., Block, S. D., Briggs-Style, C., & Mitchell, R. (1994). The influence of the New Pathway curriculum on Harvard medical students. Academic Medicine, 69, 983–989.
Moore, G. T., Block, S., & Mitchell, R. (1990). A Randomized Controlled Trial Evaluating the Impact of the New Pathway Curriculum at Harvard Medical School. Report to the Fund for the Improvement of Post-Secondary Education. [Unpublished report] Cambridge, Massachusetts: Harvard Medical School.
Moore-West, M. Harrington, D. L., Mennin, S. P., Kaufman, A. & Skipper, B. J. (1989). Distress and Attitudes Toward the Learning Environment: Effects of a Curriculum Innovation. Teach. Learn. Med., 1, 151-157.
Moore-West, M. & O'Donnell, M. J. (1985). Program Evaluation. In Implementing Problem-Based Medical Education: Lessons from Successful Innovations. A. Kaufman (ed.) pp.180-206. New York: Springer Publishing Company.
Morgan, H. R. (1977). A Problem-oriented Independent Studies Programme in Basic Medical Sciences. Medical Education, 11, 394-398.
Murray-Harvey, R., & Slee, P. (2000, December 4-6). Problem based learning in teacher education: Just the beginning! Paper presented at the Australian Association for Research in Education, Sydney.
Neufeld, V., & Sibley, J. (1989). Evaluation of health sciences education programs: Program and student assessment at McMaster University. In H. G. Scmidt, M. Lipkinjr, M. W. Vries, & J. M. Greep (Eds.), New directions for medical education: Problem-based learning and community-oriented medical education (pp. 165–179). New-York: Springer Verlag.
Neufeld, V. R, Woodward, C. A., and MacLeod, S. M. (1989). The McMaster M.D. Program: A Case Study of Renewal in Medical Education. Acad. Med. 64:423-432.

110
Nolte, J. A. (1986). A Problem-solving Approach to Teaching Basic Sciences: A Final Report. [Unpublished report to the national Fund for Medical Education, grant #DM12/85].
Nolte, J., Eller, P., and Ringel, S. P. (1988). Shifting toward Problem-based Learning in a Medical School Neurobiology Course. In Research in Medical Education,1988: Proceedings of the Twenty-Seventh Annual Conference, pp. 66-71.Washington, D.C.: Association of American Medical Colleges.
Patel, V. L., Groen, G. J., & Norman, G. R. (1991). Effects of conventional and problem-based medical curricula on problem-solving. Academic Medicine, 66, 380–389.
Phelan, S. T., Jackson, J. R., & Berner, E. S. (1993). Comparison of problem-based and traditional education on student performance in the obstetrics and gynecology clerkship. Obstetrics and Gynecology, 82(1), 159-161.
Polanco, R., Calderon, P., & Delgado, F. (2001). Effects of a problem-based learning program on engineering students' academic achievements, skill development and attitudes in a Mexican university. Paper presented at the Annual Meeting of the American Educational Research Association, Seattle, WA.
Polglase, R. F., Parish, D. C. Buckley, R. L., Smith, R. W., & Joiner, T. A. (1989). Problem-based ACLS Instruction: A Model Approach for Undergraduate Emergency Medical Education. Ann. Emerg. Med., 18, 997-1000.
Post, G. J., & Drop, M. J. (1990). Perceptions of the Content of the Medical Curriculum at the Medical Faculty in Maastricht: A Comparison with Traditional Curricula in the Netherlands. In Innovation in Medical Education: An Evaluation of Its Present Status, Z. M. Nooman, H. G. Schmidt, and E. S. Ezzat (eds.), pp. 64-75. New York: Springer Publishing Company.
Prince, K., van Mameren, H., Hylkema, N., Drukker, J., Scherpbier, A., & Van Der Vleuten, C. P. M. (2003). Does problem-based learning lead to deficiencies in basic science knowledge? An empirical case on anatomy. Medical Education, 37(1), 15-21.
Rich, K. R., Keim, R. G., & Shuler, C. F. (2005). Problem-based learning versus traditional educational methodology: a comparison of preclinical and clinical periodontics performance. Journal of Dental Education, 69(9), 649-662.
Richards, B.F., & Cariaga, L.D. (1993). A Comparison between Students in Problem-Based and Traditional Curricula at the same medical school: Preparing for the NBME Part I. Medical Education, 27, 130–136.

111
Richards, B. F., Ober, P., Cariaga-Lo, L., Camp, M. G., Philp, J., McFarlane, M., Rupp, R., & Zaccaro, D. J. (1996). Rating of students’ performances in a third-year internal medicine clerkship: A comparison between problem-based and lecture-based curricula. Academic Medicine, 71(2), 187–189.
Robertson, C. L. (2005). Development and transfer of higher order thinking skills in pilots. Unpublished dissertation, Capella University.
Santos·Gomez, L., Kalishman, S., Rezler, A., Skipper B., and Mennin, S. P. (1990). Residency Performance of Graduates from a Problem-based and a Conventional Curriculum. Medical Education, 24(4), 366-375.
Saunders, N. A., McIntosh. J., McPherson, J., & Engel, C. E. (1990). A Comparison between University of Newcastle and University of Sydney Final-year Students: Knowledge and Competence. In Innovation in Medical Education: An Evaluation of Its Present Status, Z. M. Nooman, H. G. Schmidt, and K S. Ezzat (eds.), pp. 50-63. New York: Springer Publishing Company.
Saye, J. W., & Brush, T. (1999). Student engagement with social issues in a multimedia-supported learning environment. Theory and Research in Social Education, 27(4), 472-504.
Schmidt, H. G., Machiels-Bongaerts, M., Hermans, H., ten Cate, T. J., Venekamp, R., & Boshuizen, H. P. A. (1996). The development of diagnostic competence: Comparison of a problem-based, an integrated, and a conventional medical curriculum. Academic Medicine, 71, 658–664.
Schuwirth, L. W. T., Verhoeven, B. H., Scherpbier, A. J. J. A., Mom, E. M. A., Cohen-Schotanus, J., van Rossum, H. J. M. et al. (1999). An Inter- and Intra-University Comparison with Short Case-Based Testing. Advances in Health Sciences Education, 4, 233-244.
Schwartz, R. W., Burgett, J. E., Blue, A. V., Donnelly, M. B., & Sloan, D. A. (1997). Problem-based learning and performance-based testing: Effective alternatives for undergraduate surgical education and assessment of student performance. Medical Teacher, 19, 19–23.
Schwartz, R. W., Donnelly, M. B., Nash, P. P., Johnson, S. B., Young, B., & Griffen, W. O., Jr. (1992). Problem-based learning: An effective educational method for a surgery clerkship. The Journal of Surgical Research, 53(4), 326-330.
Schwartz, R. W., Donnelly, M. B., Nash, P. P., & Young, B. (1992). Developing students' cognitive skills in a problem-based surgery clerkship. Academic Medicine, 67(10), 694-696.

112
Schwartz, R. W., Donnelly, M. B., Sloan, D. A., & Young, B. (1994). Knowledge gain in a problem-based surgery clerkship. Academic Medicine, 69(2), 148-151.
Sevening, D., & Baron, M. (2002). A comparison of traditional teaching methods and problem-based learning in an addiction studies class. Journal of Teaching in the Addictions, 1(2), 27-42.
Shelton, J. B., & Smith, R. F. (1998). Problem-based learning in analytical science undergraduate teaching. Research in Science and Technological Education, 16(1), 19-30.
Shin, J., Haynes, B., & Johnston, M. (1993). Effect of problem-based, self-directed undergraduate education on life-long learning. Journal of the Canadian Medical Association, 148(6), 969-976.
Shoffner, M. B., & Dalton, D. W. (1998). Effects of Problem-Based, Networked Hypermedia, and Cooperative Strategies on Visual Literacy Instruction. Paper presented at the National Convention of the Association for Educational Communications and Technology (AECT), St. Louis, MO, February 18-22.
Shuler, C. F., & Fincham, A. G. (1998). Comparative achievement on National Dental Board Examination Part I between dental students in problem-based learning and traditional educational tracks. Journal of Dental Education, 62(9), 666-670.
Smits, P., de Buisonje, C. D., Verbeek, J. H., van Dijk, F. J., Metz, J. C., Cate, O. J. (2003). Problem-based learning versus lecture-based learning in postgraduate medical education. Scandinavian Journal of Work, Environment & Health, 29(4), 280-287.
Son, B., & Van Sickle, R. L. (2000). Problem-solving instruction and students’ acquisition, retention and structuring of economics knowledge. Journal of Research and Development in Education, 33(2), 95–105.
Tans, R. W., Schmidt, H. G., Schade-Hoogeveen, B. E. J., & Gijselaers, W. H. (1986). Sturing van het onderwijsleerproces door middel van problemen: een veldexperiment [Guiding the learning process by means of problems: A field experiment]. Tijdschrift voor Onderwijsresearch, 11, 35–46.
Tolnai, S. (1991). Continuing Medical Education and Career Choice among Graduates of Problem-based and Traditional Curricula. Medical Education, 25, 414-420.
Tomczak, R. L. (1991). The eff ects of problem-based learning on National Board scores, clinical evaluations and residency selection of medical students. Unpublished doctoral dissertation, Drake University.
113
Usoh, I. I. (2003). An investigation into the effectiveness of problem-based learning in an engineering technology program at Nashville State Technical Community College. Unpublished doctoral dissertation, Tennessee State University.
Van Duijn, A. J. (2004). Clinical performance of physical therapy students in problem-based, mixed-model, and traditional curricula. Unpublished doctoral dissertation, University of Central Florida.
Van Hessen, P. A. W., & Verwijnen, G. M. (1990). Does problem-based learning provide other knowledge. In W. Bender, R. J. Hiemstra, A. J. J. A. Scherpbier, & R. P. Zwierstra (Eds.), Teaching and assessing clinical competence (pp. 446–451). Groningen: Boekwerk Publications.
Vernon, D. T. (1994). Tutor evaluation of problem-based learning in behavioral sciences courses. Teaching and Learning in Medicine, 6(2), 91–95.
Vernon, D. T. A., Campbell, J. D., & Dally, J. C. (1992). Problem-based Learning in Two Behavioral Sciences Courses at the University of Missouri-Columbia. Academic Medicine, 67, 349-350.
Verhoeven, B. H., Verwijnen, G. M., Scherpbier, A. J. J. A., Holdrinet, R. S. G., Oeseburg, B., Bulte, J. A., & Van Der Vleuten, C. P. M. (1998). An analysis of progress test results of PBL and nonPBL students. Medical Teacher, 20(4), 310–316.
Verwijnen, M., Van der Vleuten. C .. & Imbos. T. (1990). A Comparison of an Innovative Medical School with Traditional Schools: An Analysis in the Cognitive Domain. In Innovation in Medical Education: An Evaluation of Its Present Status. Z. M. Nooman, H. G. Schmidt, and E. S. Ezzat (eds.), pp. 40-49. New York: Springer Publishing Company.
Visser, Y. (2002, May). Effects of problem-based and lecture-based instructional strategies on problem solving performance and learner attitudes in a high school genetics class. Paper presented at the Annual Meeting of the American Educational Research Association, New Orleans.
Walton, J., Clark, D., & Glick, N. (1997). An outcomes assessment of a hybrid-PBL course in treatment planning. Journal of Dental Education, 61(4), 361-367.
Ward, J., & Lee, C. (2004). Teaching Strategies for FCS: Student Achievement in Problem-Based Learning Versus Lecture-Based Instruction. Journal of Family and Consumer Sciences, 96(1), 73-76.
Washington, E., Tysinger, J., Snell, L., & Palmer, L. (1998). Implementing Problem-based Learning in a Family Medicine Clerkship. Family Medicine Journal, 30(10), 720-726.
114
Whitfi eld, C., Mauger, E., Zwicker, J., & Lehman, E. (2002). Diff erences between students in problem-based and lecture-based curricula measured by clerkship performance ratings at the beginning of the third year. Teaching and Learning in Medicine, 14(4), 211-217.
Williams, D. C., Hemstreet, S., Liu, M., & Smith, V. D. (1998, June 10-25). Examining how middle school students use problem-based learning software. Paper presented at the 10th Annual World Conference on Educational Multimedia and Hypermedia & World Conference on Educational Telecommunications, Freiburg, Germany.
Willis, S. (2002). Problem-based learning in a general psychology course. Journal of General Education, 51(4), 282-291.
Woodward, C. A. & Ferrier, B. M. (1982). Perspectives of Graduates Two or Five Years After Graduation from a Three-Year Medical School. J. Med. Educ., 57, 294-302.
Woodward, C. A., McAuley, R. G., & Ridge, H. (1981). Unravelling the Meaning of Global Comparative Ratings of Interns. In Research in Medical Education. 1981: Proceeding, 01 the Twentieth Annual Conference, pp. 149-154. Washington, DC: Association of American Medical Colleges.
Woodward, C. A., Ferrier, B. M., Cohen. M., & Goldsmith. C. (1990). A Comparison of the Practice Patterns or General Practitioners and Family Physician Graduating from McMaster and Other Ontario Medical Schools. Teach. Learn. Med., 2(2), 79-88.
Woodward, C. A. (l990). Monitoring an Innovation in Medical Education: The McMaster Experience. In Innovation in Medical Education: An Evaluation of Its Present Status, Z. M. Nooman, H. G. Schmidt, and E. S. Ezzat (Eds.), pp. 27-39. New York: Springer Publishing Company.
Woodward, C., Ferrier, B. M., Goldsmith, C., & Cohen, M. (1988). Billing Patterns of General Practitioners and Family Physicians in Ontario: A Comparison of Graduates of McMaster Medical School with Graduates of Other Ontario Medical Schools. In Research in Medical Education, 1988: Proceedings 01 the Twenty-Seventh Annual Conference, pp. 276- 281. Washington, D.C.: Association of American Medical Colleges.
Yang, S. (2002). Problem-based learning on the World Wide Web in an undergraduate kinesiology class: An integrative approach to education. Unpublished doctoral dissertation, The University of New Brunswick.

115
Appendix B
Initial and Final Coding Scheme Elements

116
Table B1
Initial and Final Coding Scheme Elements
Initial coding scheme Final coding scheme
Citation: APA in-text style citation In-text Citation: APA in-text style citation
n/a Full Citation: Full APA citation
EffectName: Short form as close to what authors characterize as the outcome. Use of the name of the measure is used when possible. Summary scores are reported unless individual items cover material specific to SDL outcomes or SDL outcome categories.
EffectName: Short form as close to what authors characterize as the outcome. Use of the name of the measure is used when possible. Summary scores are reported unless subscales cover material specific to the PBL intervention.
TreatmentName: : Name of the treatment group. Used as a quality assurance check so the same data from different studies are not coded multiple times.
TreatmentName: Use best name to describe treatment group. Used as a quality assurance check so the same data from different studies are not coded multiple times.
ControlName: Name of the control group. Used as a check and balance so the same data from different studies are not coded multiple times.
ControlName: Use best name to describe control group. Used as a check and balance so the same data from different studies are not coded multiple times.
CollectionYear: Year of data collection. If multiple years or year spans are provided use the median year. Used as a check and balance so the same data from different studies are not coded multiple times.
CollectionYear: Year of data collection. If multiple years or year spans are provided use the median year. Used as a check and balance so the same data from different studies are not coded multiple times.
InstitutionName: Name of the institution study took place, fallback is lead authors’ institution. Used as a check and balance so the same data from different studies are not coded multiple times.
InstitutionName: Name of the institution study took place, fallback is lead authors’ institution. Used as a check and balance so the same data from different studies are not coded multiple times.
Discipline: Subject or discipline under study. This includes medical education, teacher education, allied health (e.g., nursing), science, engineering, business, social science, and other (Walker & Leary, 2009). In instances where a business class is being taught to teachers, this would be placed in teacher education. If a discipline does not fit into this list, but is found in a significant number of outcomes, a new category will be created.
Discipline: Subject or discipline under study. This includes medical education, teacher education, medical other (e.g., nursing, dental), science, engineering, business, social science, and other (Walker & Leary, 2009). In instances where a business class is being taught to teachers, this is placed in teacher education. If a discipline does not fit into this list but is found in a significant number of outcomes, a new category is created.
(table continues)

I
n
Initial coding s
n/a
scheme Final codin
PBL Definproblem-bauthor(s) ito Barrowlevel of stuof one andbased casecase-basedThis reseapartial proPBL, and grepresenta The case o Case h
facts afilled c
Full pneed tcase; r
Partiasome wherea half
Student di Teach
amounlearne
Studendirectia tutorsquare
Partiabetweresponsquare
ng scheme
nition: definitiobased learning;is using for thes (1986) variabudent vs. teachd two. Barrowses, case-based d, problem-bas
arch contributesoblems, lecturegeneric PBL w
ations are taken
or problem:
history or caseabout the problcircle
problem simulato assemble imrepresented by
al problem simfacts provides
e to assemble mf filled circle
irected versus t
her directed leant and sequenced; represented
nt directed learion of the learnr/facilitator; repe
ally student andeen one and twonsibility; repree
on provided by preferably the
eir study. This ibles 1) the caseher directed ands has six distinc
d lectures, case sed, closed-loos four new labee-based full pro
with lecture. Vin from Barrow
e vignette: provlem; represente
ation (free-inqumportant facts foy an empty circ
ulation: Betweand student de
more facts; repr
teacher directe
arning: Teachece of informatiod by a filled squ
rning: Studentning with the gpresented by a
d teacher direco, a shared sented by a hal
(
y the author(s) e definition theis coded accorde/problem 2) thd 3) the sequenct labels: lecturmethod, modif
op problem-basels: lecture-basoblems, generiisual s (1986).
vides a summared by a
uiry): Students for the le
een one and threcides on resented by
d:
er decides the on to be uare
t decides the guidance of an empty
cted: Comprom
lf filled
table contin
117
of e ding he nce re-fied sed. sed ic
ry of
ree,
mise
ues)

I
n
Initial coding s
n/a
scheme Final codin
PBL Label
Lecture-based cases
Case-based lectures
Case method
Modified case-based
Problem-based
Closed-loop (reiterative) problem-based
Lecture-based partial problem
Lecture-based full problem
Generic PBL
Generic PBLwith lecture
Traditionalearning (tcentered, dmore-all e
ng scheme
Expanded defin
Teacher-directestudent is presenfacts about the plectures followedemonstrate therelevance.
Teacher-directestudent is presenthrough case vigbefore a lecturematerial to be c
d Partially studenlearning where with a full case study and researclass discussionthe subsequent
Student-directedstudents decide when initially gsimulation (mosmedical schoolslearning).
Student-directedstudents are presimulations alloof the problem. guides for exploof the problem tknowledge.
An extension oflabel with a selfStudents evaluafound and returwas initially givreasoning.
Teacher-directestudents are givsimulation afterteacher.
Teacher-directestudents are givsimulation afterteacher.
L When a genericproblem-based none of the aboassigned (basedprovided in the
L When a genericproblem-based is clear that lectthe learning.
al Words: Wortraditional, diddirected learnin
emergent)
nition
ed learning where thented a summary of problem through ed by a case vignette e lecture content
ed learning where thented information gnettes or case histor
e. Cases highlight covered in the lecture
nt and teacher directethe student is presenor case vignette for
arch in preparation fon. The teacher facilitaclass discussion.
d learning where on inquiry actions
given a partial problemst often used in new s using problem-base
d learning where esented full problem owing for free inquiry
Teachers are usuallyoration and evaluatioto activate prior
f the problem-based f-directed study. ate information they rn to the problem as iven to evaluate their
ed learning where ven a partial problem r a lecture by the
ed learning where ven full problem r a lecture by the
c explanation of learning is given andve labels can be
d on the information publication).
c explanation of learning is given, butures were involved i
rds used to reprdactic, lecture-bng, convention
(
Sequence
e
to
e
ries
e.
d nted
or ates
m
ed
y y on
it
d No sequence
ut it in
No sequence
resent traditionbased, teacher-nal teaching, an
table contin
118
nal -nd
ues)

119
Initial coding scheme Final coding scheme
n/a Traditional Definition: Expanded explanation of the traditional words used in the article to define what they used for traditional learning
SDL: As defined by Candy’s framework (1991), self-directed learning includes: personal autonomy (reflective, self-aware, confident, exercises freedom of choice, will to follow through, self-discipline), self-management in learning (methodical, logical, curious, flexible, persistent, responsible, developed information seeking and retrieval skills), the independent pursuit of learning (interdependent, interpersonally competent, self-sufficient, shaped through interactions with others, has social aspects), and learner-control of instruction (knowledge and skill with learning process, evaluating, learning for self-knowledge, develop standards of performance). These are determined through descriptions of the outcomes provided in each study.
SDL: As defined by Candy’s framework (1991), self-directed learning includes: personal autonomy (reflective, self-aware, confident, exercises freedom of choice, will to follow through, self-discipline, self-determination, attitudes, satisfaction, motivation), self-management in learning (methodical, logical, curious, flexible, persistent, responsible, developed information seeking and retrieval skills), the independent pursuit of learning (interdependent, interpersonally competent, self-sufficient, shaped through interactions with others, has social aspects), and learner-control of instruction (knowledge and skill with learning process, evaluating, learning for self-knowledge, develop standards of performance, self-efficacy, metacognition). These will be determined through descriptions of the outcomes provided in each study.
SDL Process/Outcome: Determine if the effect is an outcome or a process.
Process/Outcome: Determine if the effect is a measure of process (measuring the level of self-directed learning present in the instruction, focus is on the instruction/ procedure, formative) or outcome (measuring the students level or ability to engage in self-directed learning after the instruction, focus is on productivity, summative). This is more about the questions being asked. In the absence of data, code as missing. There is a majority rule here: judgment about what is happening during the intervention or judgment about the results of the intervention. Process is the procedure or a feature of the intervention (ex. group size), while outcome is productivity of the program (Smits et al., 2003).
Process Outcome Cases keep me engaged I can see myself being engaged
with similar problems Cases stimulate my interest
After the instruction I find myself interested in this topic
During the instruction I am asked to take charge of my own learning
I am prepared to take charge of my own learning
To be successful, I have to be more self-directed during this class than normal.
I was encouraged to be self-directed. I find that I am now more self-directed than I used be.
I look forward to each class
I would like to repeat the experience
(table continues)
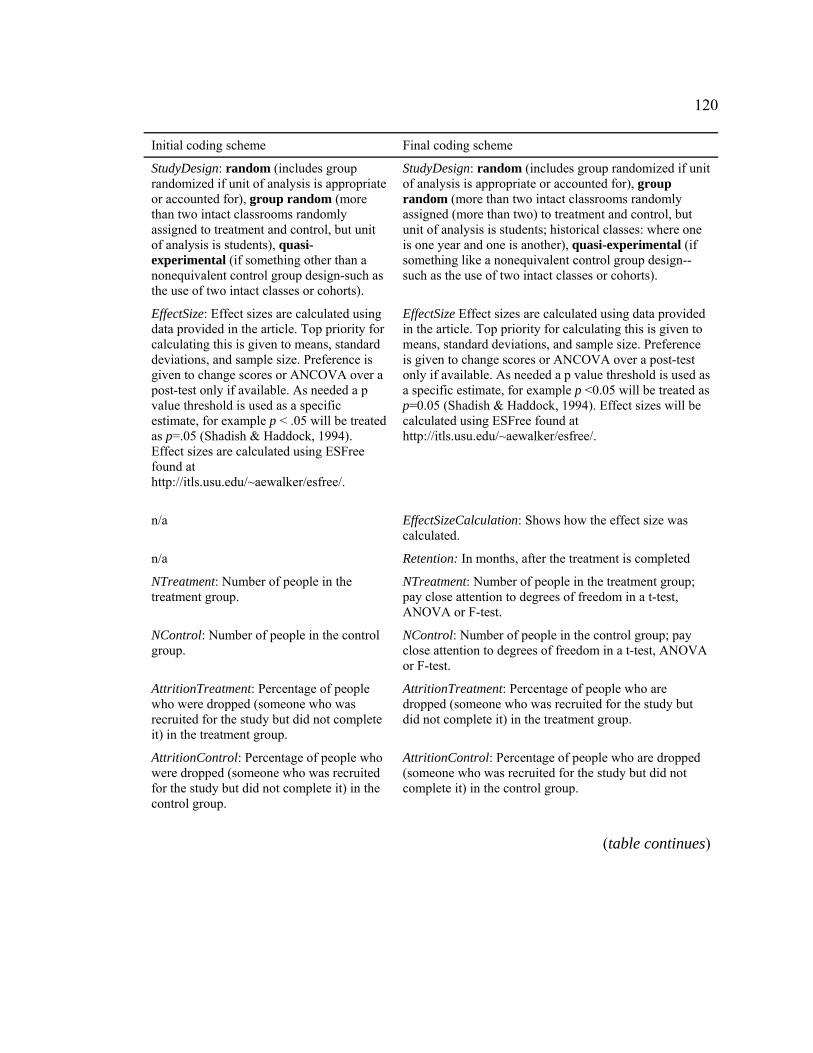
120
Initial coding scheme Final coding scheme
StudyDesign: random (includes group randomized if unit of analysis is appropriate or accounted for), group random (more than two intact classrooms randomly assigned to treatment and control, but unit of analysis is students), quasi-experimental (if something other than a nonequivalent control group design-such as the use of two intact classes or cohorts).
StudyDesign: random (includes group randomized if unit of analysis is appropriate or accounted for), group random (more than two intact classrooms randomly assigned (more than two) to treatment and control, but unit of analysis is students; historical classes: where one is one year and one is another), quasi-experimental (if something like a nonequivalent control group design--such as the use of two intact classes or cohorts).
EffectSize: Effect sizes are calculated using data provided in the article. Top priority for calculating this is given to means, standard deviations, and sample size. Preference is given to change scores or ANCOVA over a post-test only if available. As needed a p value threshold is used as a specific estimate, for example p < .05 will be treated as p=.05 (Shadish & Haddock, 1994). Effect sizes are calculated using ESFree found at http://itls.usu.edu/~aewalker/esfree/.
EffectSize Effect sizes are calculated using data provided in the article. Top priority for calculating this is given to means, standard deviations, and sample size. Preference is given to change scores or ANCOVA over a post-test only if available. As needed a p value threshold is used as a specific estimate, for example p <0.05 will be treated as p=0.05 (Shadish & Haddock, 1994). Effect sizes will be calculated using ESFree found at http://itls.usu.edu/~aewalker/esfree/.
n/a EffectSizeCalculation: Shows how the effect size was calculated.
n/a Retention: In months, after the treatment is completed
NTreatment: Number of people in the treatment group.
NTreatment: Number of people in the treatment group; pay close attention to degrees of freedom in a t-test, ANOVA or F-test.
NControl: Number of people in the control group.
NControl: Number of people in the control group; pay close attention to degrees of freedom in a t-test, ANOVA or F-test.
AttritionTreatment: Percentage of people who were dropped (someone who was recruited for the study but did not complete it) in the treatment group.
AttritionTreatment: Percentage of people who are dropped (someone who was recruited for the study but did not complete it) in the treatment group.
AttritionControl: Percentage of people who were dropped (someone who was recruited for the study but did not complete it) in the control group.
AttritionControl: Percentage of people who are dropped (someone who was recruited for the study but did not complete it) in the control group.
(table continues)

121
Initial coding scheme Final coding scheme
Threats to Internal Validity: Each of these threats are coded on whether they are present or not. History (largely if the treatment and control were at different times), Maturation (physiological changes in participants leading to improved performance), Testing (change scores where pre-/post- are similar and close together), Instrumentation (change scores where nature of the instrument changes from pre- to post-), Statistical regression (change scores where higher scoring students move down toward the mean while lower scoring student move up towards the mean), Differential Selection (any nonrandom assignment; if there is a history threat do not select this), Experimental Mortality (if <10% for either treatment or control do not include).
Quality of Study: Each threat is coded on the degree to whether they are present or not using this scale: 0=not a plausible threat to the study’s internal validity, 1=potential minor problem in attributing the observed effect to the treatment; by itself not likely to account substantial portion of observed results, 2=plausible alternative explanation which by itself could account for substantial amount of the observed results, 3=by itself could explain most or all of the observed results. History (largely if the treatment and control were at different times), Maturation (physiological changes in participants leading to improved performance), Testing (change scores where pre-/post- are similar and close together), Instrumentation (change scores where nature of the instrument changes from pre- to post-), Statistical regression (change scores where higher scoring students move down toward the mean while lower scoring student move up towards the mean), Differential Selection (any nonrandom assignment; if there is a history threat do not select this), Experimental Mortality (if <10% for either treatment or control do not include, need to see explanation of why people dropped to code degree).
External validity: ATI (self-selection into treatment), Limited Description (of the PBL treatment), Multiple treatment (subjects exposed to more than one treatment), Experimenter effect (where a single instructor is used).
External validity: Each of these threats are coded on the degree to whether they are present or not using this scale: 0=not a plausible threat to the study’s external validity, 1=potential minor problem in attributing the observed effect to the treatment; by itself not likely to account substantial portion of observed results, 2=plausible alternative explanation which by itself could account for substantial amount of the observed results, 3=by itself could explain most or all of the observed results. There are results favoring the PBL or the traditional, the validity in question could be a possibility of why there were or were not differences between the groups. ATI ([aptitude treatment interaction] self-selection into treatment), Limited Description (of the PBL treatment), Multiple treatment (subjects exposed to more than one treatment), Experimenter effect (where a single instructor is used).
Validity: For instrument used in study. Strong (report their own validity information for this sample. If they say they pilot tested that is not enough unless they mention activities related to validity), Attempt (report what other people have done), None (didn't address it at all).
Validity: For instrument used in study. Strong (report their own validity information for this sample. If they say they pilot tested that is not enough unless they mention activities related to validity), Attempt (report what other people have done, have loose reporting or nonspecific reporting of their own pilot work), None (didn't address it at all).
(table continues)

122
Initial coding scheme Final coding scheme
Reliability: For instrument used in study. Strong (reporting on their own sample: cronbach's alpha, ICC scores, Cohen's Kappa, test-retest reliability, inter-rater reliability, intra-rater reliability), Attempt (what other people have done, report own reliability from a prior sample), None (didn't address it at all).
Reliability: For instrument used in study. Strong (reporting on their own sample: cronbach's alpha, ICC scores, Cohen's Kappa, test-retest reliability, inter-rater reliability, intra-rater reliability), Attempt (what other people have done, report own reliability from a prior sample or nonspecific reporting of their own), None (didn't address it at all).
Notes: Anything the rater feels is necessary to add to the coding or questions about the coding.
Notes: Anything the rater feels is necessary to add to the coding or questions about the coding.

123
Appendix C
Original Data

Tab
le C
1
Ori
gina
l Dat
a
In-t
ext c
itat
ion
Eff
ectN
ame
N
Tre
atm
ent
N
Con
trol
Dis
cipl
ine
PB
L d
efin
itio
nT
radi
tion
al w
ords
S
DL
P
roce
ss/o
utco
me
Stu
dy d
esig
n E
S
(Aki
nogl
u &
T
ando
gan,
200
9)
atti
tude
sca
le p
ost-
test
25
25
sc
ienc
e cl
osed
-loo
p pr
oble
m b
ased
tr
adit
iona
l te
achi
ng m
etho
ds
pers
onal
aut
onom
ypr
oces
s ra
ndom
0.
66
(And
erso
n, 2
007)
W
atso
n-G
lase
r C
riti
cal
Thi
nkin
g A
ppra
isal
54
56
ot
her
case
met
hod
teac
her-
guid
ed
lear
ning
se
lf-m
anag
emen
t in
lear
ning
pr
oces
s qu
asi-
expe
rim
enta
l -0
.55
(Bar
agon
a, 2
009)
S
MT
SL
46
46
sc
ienc
e ge
neri
c P
BL
w
ith
lect
ures
le
ctur
e le
arne
r-co
ntro
l of
inst
ruct
ion
proc
ess
quas
i-ex
peri
men
tal
-0.1
2
(Bat
uray
& B
ay,
2010
) se
lf-e
ffic
acy
scal
e 25
19
bu
sine
ss
mod
ifie
d ca
se-
base
d tr
adit
iona
l mod
el
lear
ner
cont
rol o
f in
stru
ctio
n pr
oces
s qu
asi-
expe
rim
enta
l 0.
01
(Bat
uray
& B
ay,
2010
) co
mm
unit
y sc
ale
33
35
busi
ness
m
odif
ied
case
-ba
sed
trad
itio
nal m
odel
in
depe
nden
t pu
rsui
t of
lear
ning
pr
oces
s qu
asi-
expe
rim
enta
l 0.
31
(Bea
chey
, 200
4)
stud
ent o
vera
ll (
qual
ity,
sa
tisf
acti
on, a
ttit
ude)
52
36
m
edic
al
othe
r ge
neri
c P
BL
co
nven
tion
al
curr
icul
a pe
rson
al a
uton
omy
proc
ess
quas
i-ex
peri
men
tal
0.58
(Bea
chey
, 200
4)
empl
oyer
ove
rall
(qu
alit
y,
sati
sfac
tion
, att
itud
e)
29
36
med
ical
ot
her
gene
ric
PB
L
conv
enti
onal
cu
rric
ula
pers
onal
aut
onom
you
tcom
e qu
asi-
expe
rim
enta
l 0.
11
(Bli
gh, L
loye
d-Jo
nes,
& S
mit
h,
2000
)
over
all s
atif
acti
on
137
149
med
ical
ed
ucat
ion
gene
ric
PB
L
trad
itio
nal,
conv
enti
onal
pe
rson
al a
uton
omy
proc
ess
quas
i-ex
peri
men
tal
0.27
(Bra
gg &
Eva
ns,
2005
) m
otiv
atio
n (m
easu
red
thro
ugh
on ta
sk b
ehav
ior)
75
75
sc
ienc
e ca
se m
etho
d tr
adit
iona
l pe
rson
al a
uton
omy
proc
ess
grou
p ra
ndom
-0
.95
(Deh
kord
i &
Hey
darn
eja,
200
8)
atti
tude
20
20
m
edic
al
othe
r m
odif
ied
case
-ba
sed
trad
itio
nal l
ectu
re
pers
onal
aut
onom
ypr
oces
s qu
asi-
expe
rim
enta
l 1.
09
(Dis
tleh
orst
, D
awso
n,&
Kla
men
, 20
09)
self
-dir
ecte
d le
arni
ng h
abit
s su
rvey
(1s
t pos
t-gr
adua
te y
ear
supe
rvis
or)
100
221
med
ical
ge
neri
c P
BL
st
anda
rd
curr
icul
um
pers
onal
aut
onom
you
tcom
e qu
asi-
expe
rim
enta
l 0.
12
(Dis
tleh
orst
, D
awso
n, &
Kla
men
, 20
09)
self
-dir
ecte
d le
arni
ng h
abit
s su
rvey
(1s
t pos
t-gr
adua
te y
ear
self
)
83
163
med
ical
ge
neri
c P
BL
st
anda
rd
curr
icul
um
pers
onal
aut
onom
you
tcom
e qu
asi-
expe
rim
enta
l 0.
91
(tab
le c
onti
nues
)
124

In-t
ext c
itat
ion
Eff
ectN
ame
N
Tre
atm
ent
N
Con
trol
Dis
cipl
ine
PB
L d
efin
itio
nT
radi
tion
al w
ords
S
DL
P
roce
ss/o
utco
me
Stu
dy d
esig
n E
S
(Dis
tleh
orst
et a
l.,
2009
) se
lf-d
irec
ted
lear
ning
hab
its
surv
ey (
3rd
post
-gra
duat
e ye
ar s
uper
viso
r)
95
200
med
ical
ge
neri
c P
BL
st
anda
rd
curr
icul
um
pers
onal
aut
onom
you
tcom
e qu
asi-
expe
rim
enta
l 0.
17
(Dis
tleh
orst
et a
l.,
2009
) se
lf-d
irec
ted
lear
ning
hab
its
surv
ey (
3rd
post
-gra
duat
e ye
ar s
elf)
68
136
med
ical
ge
neri
c P
BL
st
anda
rd
curr
icul
um
pers
onal
aut
onom
you
tcom
e qu
asi-
expe
rim
enta
l 0.
76
(Gur
pina
r,
Ali
mog
lu, M
amak
li,
& A
ktek
in, 2
010)
I fe
el m
ysel
f in
com
fort
in
this
met
hod
(con
fide
nce)
(t
able
2)
176
176
med
ical
ge
neri
c P
BL
tr
adit
iona
l pe
rson
al a
uton
omy
proc
ess
quas
i-ex
peri
men
tal
0.08
(Gur
pina
r et
al.,
20
10)
Kno
wle
dge
and
skil
ls g
aine
d w
ill c
ontr
ibut
e to
pro
fess
iona
l li
fe a
chie
vem
ents
(ta
ble
2)
176
176
med
ical
ge
neri
c P
BL
tr
adit
iona
l le
arne
r-co
ntro
l of
inst
ruct
ion
outc
ome
quas
i-ex
peri
men
tal
0.67
(Gur
pina
r et
al.,
20
10)
I le
arn
bett
er in
this
met
hod
176
176
med
ical
ge
neri
c P
BL
tr
adit
iona
l se
lf-m
anag
emen
t in
lear
ning
pr
oces
s qu
asi-
expe
rim
enta
l 0.
55
(Gur
pina
r et
al.,
20
10)
mot
ivat
ion
to le
arn
176
176
med
ical
ge
neri
c P
BL
tr
adit
iona
l pe
rson
al a
uton
omy
proc
ess
quas
i-ex
peri
men
tal
0.91
(Gur
pina
r et
al.,
20
10)
gene
ral s
atis
fact
ion
176
176
med
ical
ge
neri
c P
BL
tr
adit
iona
l pe
rson
al a
uton
omy
proc
ess
quas
i-ex
peri
men
tal
0.35
(Hes
terb
erg,
200
5)
FP
SE
sel
f-ef
fica
cy p
ostt
est
33
30
soci
al
scie
nce
gene
ric
PB
L
trad
itio
nal
lear
ner-
cont
rol o
f in
stru
ctio
n pr
oces
s qu
asi-
expe
rim
enta
l -0
.77
(Hw
ang
& K
im,
2006
) at
titu
de
35
36
med
ical
ot
her
case
met
hod
lect
ure
pers
onal
aut
onom
ypr
oces
s qu
asi-
expe
rim
enta
l 0.
39
(Hw
ang
& K
im,
2006
) m
otiv
atio
n 35
36
m
edic
al
othe
r ca
se m
etho
d le
ctur
e pe
rson
al a
uton
omy
proc
ess
quas
i-ex
peri
men
tal
0.64
(Kas
seba
um,
Ave
rbac
h, &
Fry
er,
1991
)
Item
s 1,
2,4,
7 17
17
m
edic
al-
othe
r le
ctur
e-ba
sed
part
ial c
ase
conv
enti
onal
le
ctur
e pe
rson
al a
uton
omy
proc
ess
quas
i-ex
peri
men
tal
1.17
(Kas
seba
um,
Ave
rbac
h, &
Fry
er,
1991
)
Item
3
17
17
med
ical
-ot
her
lect
ure-
base
d pa
rtia
l cas
e co
nven
tion
al
lect
ure
inde
pend
ent
purs
uit o
f le
arni
ng
proc
ess
quas
i-ex
peri
men
tal
1.13
(Kas
seba
um,
Ave
rbac
h, &
Fry
er,
1991
)
Item
s 5,
6,8
17
17
med
ical
-ot
her
lect
ure-
base
d pa
rtia
l cas
e co
nven
tion
al
lect
ure
lear
ner
cont
rol o
f in
stru
ctio
n ou
tcom
e qu
asi-
expe
rim
enta
l 1.
19
(tab
le c
onti
nues
)
125

In-t
ext c
itat
ion
Eff
ectN
ame
N
Tre
atm
ent
N
Con
trol
Dis
cipl
ine
PB
L d
efin
itio
nT
radi
tion
al w
ords
S
DL
P
roce
ss/o
utco
me
Stu
dy d
esig
n E
S
(Kau
fman
& M
ann,
19
96)
atti
tude
s: s
tim
ulat
ing
and
enjo
yabl
e 72
52
m
edic
al
gene
ric
PB
L
conv
enti
onal
pe
rson
al a
uton
omy
proc
ess
quas
i-ex
peri
men
tal
0.98
(Kau
fman
& M
ann,
19
96)
atti
tude
s: in
form
atio
n an
d ex
peri
ence
s fu
ndam
enta
l to
my
futu
re r
ole
as a
phy
sici
an
72
52
med
ical
ge
neri
c P
BL
co
nven
tion
al
lear
ner
cont
rol o
f in
stru
ctio
n ou
tcom
e qu
asi-
expe
rim
enta
l 0.
35
(Kau
fman
& M
ann,
19
96)
atti
tude
s: e
nthu
sias
m
74
72
med
ical
ge
neri
c P
BL
co
nven
tion
al
pers
onal
aut
onom
ypr
oces
s qu
asi-
expe
rim
enta
l 0.
96
(Kon
g et
al.,
200
9)
Sat
isfa
ctio
n 60
30
m
edic
al
educ
atio
n
prob
lem
-bas
edco
nven
tion
al
teac
hing
, did
acti
c m
odel
, lec
ture
s
pers
onal
aut
onom
yP
roce
ss
rand
om
1.20
(Kon
ings
et a
l.,
2005
) se
lf-e
ffic
acy
scal
e po
stte
st
15
14
soci
al
scie
nce
gene
ric
PB
L
trad
itio
nal
lear
ner-
cont
rol o
f in
stru
ctio
n pr
oces
s qu
asi-
expe
rim
enta
l 1.
06
(Kon
ings
et a
l.,
2005
) m
otiv
atio
n po
stte
st
15
14
soci
al
scie
nce
gene
ric
PB
L
trad
itio
nal
pers
onal
aut
onom
ypr
oces
s qu
asi-
expe
rim
enta
l 0.
88
(Lan
cast
er e
t al.,
19
97)
flex
ibil
ity
56
285
med
ical
ge
neri
c P
BL
le
ctur
e-ba
sed
self
-man
agem
ent
in le
arni
ng
proc
ess
quas
i-ex
peri
men
tal
0.50
(Lan
cast
er e
t al.,
19
97)
stud
ent i
nter
acti
on
56
285
med
ical
ge
neri
c P
BL
le
ctur
e-ba
sed
inde
pend
ent
purs
uit o
f le
arni
ng
proc
ess
quas
i-ex
peri
men
tal
0.73
(Lan
cast
er e
t al.,
19
97)
mea
ning
ful l
earn
ing
expe
rien
ces
56
285
med
ical
ge
neri
c P
BL
le
ctur
e-ba
sed
pers
onal
aut
onom
ypr
oces
s qu
asi-
expe
rim
enta
l 1.
05
(Les
pera
nce,
200
8)
self
-man
agem
ent (
1, 2
, 3, 5
, 9)
9
9 m
edic
al-
othe
r ca
se m
etho
d tr
adit
iona
l lec
ture
se
lf-m
anag
emen
t in
lear
ning
ou
tcom
e qu
asi-
expe
rim
enta
l 0.
45
(Les
pera
nce,
200
8)
lear
ner
cont
rol (
4, 7
, 11)
9
9 m
edic
al-
othe
r ca
se m
etho
d tr
adit
iona
l lec
ture
le
arne
r co
ntro
l of
inst
ruct
ion
outc
ome
quas
i-ex
peri
men
tal
0.91
(Les
pera
nce,
200
8)
lear
ner
cont
rol (
6, 8
) 9
9 m
edic
al-
othe
r ca
se m
etho
d tr
adit
iona
l lec
ture
le
arne
r co
ntro
l of
inst
ruct
ion
proc
ess
quas
i-ex
peri
men
tal
1.52
(Les
pera
nce,
200
8)
pers
onal
aut
onom
y (1
0)
9 9
med
ical
-ot
her
case
met
hod
trad
itio
nal l
ectu
re
pers
onal
aut
onom
you
tcom
e qu
asi-
expe
rim
enta
l -0
.26
(Lie
berm
an e
t al.,
19
97)
posi
tive
lear
ning
exp
erie
nce
24
106
med
ical
ge
neri
c P
BL
tr
adit
iona
l pe
rson
al a
uton
omy
proc
ess
quas
i-ex
peri
men
tal
5.97
(Lin
, Lu,
Chu
ng, &
Y
ang,
201
0)
Sat
isfa
ctio
n w
ith
teac
hing
m
ethh
od
72
70
med
ical
ot
her
prob
lem
-bas
edco
nven
tion
al
teac
hing
pe
rson
al a
uton
omy
proc
ess
rand
om
0.27
(tab
le c
onti
nues
)
126

In-t
ext c
itat
ion
Eff
ectN
ame
N
Tre
atm
ent
N
Con
trol
Dis
cipl
ine
PB
L d
efin
itio
nT
radi
tion
al w
ords
S
DL
P
roce
ss/o
utco
me
Stu
dy d
esig
n E
S
(Lin
et a
l., 2
010)
S
atis
fact
ion
wit
h se
lf-
mot
ivat
ed le
arni
ng
72
70
med
ical
ot
her
prob
lem
-bas
edco
nven
tion
al
teac
hing
pe
rson
al a
uton
omy
proc
ess
rand
om
0.46
(Man
tri e
t al.,
200
8)
conf
iden
t in
tran
sfer
ing
skil
ls
lear
nede
d to
oth
er s
ubje
cts
21
107
engi
neer
ing
mod
ifie
d ca
se-
base
d tr
adit
iona
l le
arne
r-co
ntro
l of
inst
ruct
ion
outc
ome
rand
om
0.66
(Man
tri e
t al.,
200
8)
enjo
y at
tend
ing
clas
s 21
10
7 en
gine
erin
g m
odif
ied
case
-ba
sed
trad
itio
nal
pers
onal
aut
onom
ypr
oces
s ra
ndom
0.
92
(Mat
thew
s, 2
004)
se
lf-e
ffic
acy
post
test
24
24
en
gine
erin
g m
odif
ied
case
-ba
sed
trad
itio
nal
pers
onal
aut
onom
you
tcom
e qu
asi-
expe
rim
enta
l 0.
33
(New
ble
& C
lark
e,
1986
) in
trin
sic
mot
ivat
ion
1st y
ears
63
97
m
edic
al
gene
ric
PB
L
trad
itio
nal
pers
onal
aut
onom
you
tcom
e qu
asi-
expe
rim
enta
l 0.
78
(New
ble
& C
lark
e,
1986
) in
trin
sic
mot
ivat
ion
3rd
year
s 46
10
4 m
edic
al
gene
ric
PB
L
trad
itio
nal
pers
onal
aut
onom
you
tcom
e qu
asi-
expe
rim
enta
l 0.
82
(New
ble
& C
lark
e,
1986
) in
trin
sic
mot
ivat
ion
fina
l yea
r 44
43
m
edic
al
gene
ric
PB
L
trad
itio
nal
pers
onal
aut
onom
you
tcom
e qu
asi-
expe
rim
enta
l 0.
56
(Ozt
urk,
Mus
lu, &
D
icle
, 200
8)
crit
ical
thin
king
52
95
m
edic
al
othe
r ge
neri
c P
BL
tr
adit
iona
l se
lf-m
anag
emen
t in
lear
ning
pr
oces
s qu
asi-
expe
rim
enta
l 0.
43
(Pad
mar
aju,
200
8)
self
-eff
icac
y qu
esti
onna
ire
72
72
teac
her
educ
atio
n pr
oble
m-b
ased
cont
rol
lear
ner-
cont
rol o
f in
stru
ctio
n pr
oces
s ra
ndom
0.
12
(Pet
ers
et a
l., 2
000)
ta
ble
1 le
arne
r co
ntro
l (x2
) 45
43
m
edic
al
educ
atio
n ge
neri
c w
ith
lect
ure
trad
itio
nal l
ectu
res
lear
ner
cont
rol o
f in
stru
ctio
n ou
tcom
e ra
ndom
0.
60
(Pet
ers
et a
l., 2
000)
ta
ble
3 R
espo
nden
ts’
mea
n ra
ting
of
thei
r fa
cult
y’s
infl
uenc
e on
thei
r cu
rren
t th
inki
ng (
x1)
42
46
med
ical
ed
ucat
ion
gene
ric
wit
h le
ctur
e tr
adit
iona
l lec
ture
s pe
rson
al a
uton
omy
outc
ome
rand
om
0.45
(Pet
ers
et a
l., 2
000)
ta
ble
3 R
espo
nden
ts’
mea
n ag
reem
ent w
ith
the
stat
emen
t th
at th
ere
is a
bet
ter
way
to
lear
n in
the
firs
t tw
o ye
ars
of
med
ical
sch
ool t
han
the
way
th
ey le
arne
d (x
1)
50
49
med
ical
ed
ucat
ion
gene
ric
wit
h le
ctur
e tr
adit
iona
l lec
ture
s pe
rson
al a
uton
omy
proc
ess
rand
om
0.88
(Rei
ch, 2
007)
as
sess
cou
rse
in g
ener
al
(att
itud
e)
47
50
med
ical
ot
her
case
met
hod
conv
enti
onal
te
achi
ng
pers
onal
aut
onom
ypr
oces
s qu
asi-
expe
rim
enta
l 0.
18
(tab
le c
onti
nues
)
127

In-t
ext c
itat
ion
Eff
ectN
ame
N
Tre
atm
ent
N
Con
trol
Dis
cipl
ine
PB
L d
efin
itio
nT
radi
tion
al w
ords
S
DL
P
roce
ss/o
utco
me
Stu
dy d
esig
n E
S
(Rei
ch, 2
007)
m
otiv
atio
n 47
50
m
edic
al
othe
r ca
se m
etho
d co
nven
tion
al
teac
hing
pe
rson
al a
uton
omy
proc
ess
quas
i-ex
peri
men
tal
0.25
(Rei
ch, 2
007)
sa
tisf
acti
on
47
50
med
ical
ot
her
case
met
hod
conv
enti
onal
te
achi
ng
pers
onal
aut
onom
you
tcom
e qu
asi-
expe
rim
enta
l -0
.01
(Sch
lett
et a
l., 2
010)
in
depe
nden
t lea
rnin
g 10
1 47
20
med
ical
ge
neri
c P
BL
co
nven
tion
al
curr
icul
um
pers
onal
aut
onom
ypr
oces
s qu
asi-
expe
rim
enta
l 1.
16
(Sem
erci
, 200
6)
crit
ical
thin
king
sca
le
30
30
teac
her
educ
atio
n ca
se m
etho
d tr
adit
iona
l pe
rson
al a
uton
omy
proc
ess
quas
i-ex
peri
men
tal
0.83
(Sev
enin
g &
Bar
on,
2002
) le
ctur
e/st
uden
t 17
17
so
cial
sc
ienc
e ca
se m
etho
d tr
adit
iona
l pe
rson
al a
uton
omy
proc
ess
quas
i-ex
peri
men
tal
1.39
(Sm
its
et a
l., 2
003)
sa
tisf
acti
on
51
49
med
ical
ed
ucat
ion
prob
lem
-bas
edtr
adit
iona
l lec
ture
-ba
sed
lear
ning
pe
rson
al a
uton
omy
proc
ess
rand
om
-0.7
5
(Sm
its
et a
l., 2
003)
sa
tisf
acti
on f
ollo
w-u
p 46
45
m
edic
al
educ
atio
n pr
oble
m-b
ased
trad
itio
nal l
ectu
re-
base
d le
arni
ng
pers
onal
aut
onom
ypr
oces
s ra
ndom
-0
.88
(Sun
dbla
d et
al.,
20
02)
pers
onal
aut
onom
y (t
able
2)
21
15
med
ical
-ot
her
prob
lem
-bas
edtr
adit
iona
l, co
nven
tion
al
lect
ures
pers
onal
aut
onom
you
tcom
e qu
asi-
expe
rim
enta
l 0.
13
(Sun
dbla
d et
al.,
20
02)
know
ledg
e (t
able
1)
21
16
med
ical
-ot
her
prob
lem
-bas
edtr
adit
iona
l, co
nven
tion
al
lect
ures
lear
ner
cont
rol o
f in
stru
ctio
n ou
tcom
e qu
asi-
expe
rim
enta
l -0
.67
(Sun
dbla
d et
al.,
20
02)
theo
reti
cal p
art (
tabl
e 1)
21
16
m
edic
al-
othe
r pr
oble
m-b
ased
trad
itio
nal,
conv
enti
onal
le
ctur
es
pers
onal
aut
onom
ypr
oces
s qu
asi-
expe
rim
enta
l -0
.08
(Sun
dbla
d et
al.,
20
02)
know
ledg
e pa
rt (
tabl
e 2)
21
15
m
edic
al-
othe
r pr
oble
m-b
ased
trad
itio
nal,
conv
enti
onal
le
ctur
es
lear
ner
cont
rol o
f in
stru
ctio
n ou
tcom
e qu
asi-
expe
rim
enta
l -0
.45
(Sun
gur
& T
ekka
ya,
2006
) M
SL
Q p
ostt
est-
self
-eff
icac
y 30
31
sc
ienc
e ge
neri
c P
BL
tr
adit
iona
l le
arne
r-co
ntro
l of
inst
ruct
ion
proc
ess
quas
i-ex
peri
men
tal
-1.4
3
(Sun
gur
& T
ekka
ya,
2006
) M
SL
Q p
ostt
est-
crit
ical
th
inki
ng
30
31
scie
nce
gene
ric
PB
L
trad
itio
nal
lear
ner-
cont
rol o
f in
stru
ctio
n pr
oces
s qu
asi-
expe
rim
enta
l 0.
89
(Sun
gur
& T
ekka
ya,
2006
) M
SL
Q p
ostt
est-
met
acog
niti
ve
self
-reg
ulat
ion
30
31
scie
nce
gene
ric
PB
L
trad
itio
nal
self
-man
agem
ent
in le
arni
ng
proc
ess
quas
i-ex
peri
men
tal
0.75
(tab
le c
onti
nues
)
128

In-t
ext c
itat
ion
Eff
ectN
ame
N
Tre
atm
ent
N
Con
trol
Dis
cipl
ine
PB
L d
efin
itio
nT
radi
tion
al w
ords
S
DL
P
roce
ss/o
utco
me
Stu
dy d
esig
n E
S
(Vaz
quez
, 200
8)
self
-eff
icac
y fo
r le
arni
ng a
nd
perf
orm
ance
-fir
st
adm
inis
trat
ion
11
22
othe
r (c
olle
ge
prep
)
gene
ric
PB
L
mis
sing
le
arne
r-co
ntro
l of
inst
ruct
ion
proc
ess
quas
i-ex
peri
men
tal
0.56
(Vaz
quez
, 200
8)
self
-eff
icac
y fo
r le
arni
ng a
nd
perf
orm
ance
-thi
rd
adm
inis
trat
ion
11
22
othe
r (c
olle
ge
prep
)
gene
ric
PB
L
mis
sing
le
arne
r-co
ntro
l of
inst
ruct
ion
proc
ess
quas
i-ex
peri
men
tal
0.71
(Vaz
quez
, 200
8)
task
val
ue-f
irst
adm
inis
trat
ion
11
22
othe
r (c
olle
ge
prep
)
gene
ric
PB
L
mis
sing
pe
rson
al a
uton
omy
outc
ome
quas
i-ex
peri
men
tal
0.99
(Vaz
quez
, 200
8)
task
val
ue-t
hird
ad
min
istr
atio
n 11
22
ot
her
(col
lege
pr
ep)
gene
ric
PB
L
mis
sing
pe
rson
al a
uton
omy
outc
ome
quas
i-ex
peri
men
tal
0.53
(Ver
non,
Cam
pbel
l, &
Dal
ly, 1
992)
at
titu
des
144
144
med
ical
ge
neri
c P
BL
tr
adit
iona
l pe
rson
al a
uton
omy
proc
ess
quas
i-ex
peri
men
tal
0.36
(Wan
g et
al.,
201
0)
sati
sfac
tion
87
86
m
edic
al
lect
ure-
base
d pa
rtia
l pr
oble
m
trad
itio
nal
pers
onal
aut
onom
ypr
oces
s qu
asi-
expe
rim
enta
l 0.
56
(Wil
liam
s,
Hem
stre
et, L
iu, &
S
mit
h, 1
998)
atti
tude
s 82
17
sc
ienc
e m
odif
ied
case
-ba
sed
trad
itio
nal
pers
onal
aut
onom
ypr
oces
s qu
asi-
expe
rim
enta
l 0.
14
(Yan
g, 2
002)
th
ough
full
ness
que
stio
nnai
re
19
18
scie
nce
lect
ure-
base
d pa
rtia
l pr
oble
m
trad
itio
nal
pers
onal
aut
onom
ypr
oces
s qu
asi-
expe
rim
enta
l 0.
09
129

130
Appendix D
Data Cleaning Procedures

131
Data Cleaning Procedures
Added unique identifier (uid) column, sequentially numbered 1-75.
In UID 9, changed treatment 150 to treatment/control 75 each (allows chi-square to be used in analyses).
Replaced missing with blank cell for numeric data (in collection year, attrition control, attrition treatment).
Left missing in traditional definition.
UID 72 under experimental mortality changed from missing to 0.
Under the discipline variable, replaced several medical other with medical-other labels (11 total), replaced other (college prep) with other (4 total), replaced medical with medical education.
Under the traditional words variable replaced conventional teaching with traditional, replaced conventional curricula with traditional, replaced lecture with lecture-based, replaced conventional teaching, didactic model, lectures with multiple, traditional model with traditional, replaced traditional teaching method with traditional, replaced traditional lecture(s) with lecture-based, replaced standard curriculum with traditional, replaced conventional lecture with lecture-based, replaced conventional with traditional, replaced traditional lecture-based with lecture-based.
Replaced learner control of instruction with learner-control of instruction in sdl variable.
Placed effect size estimates on z-scale to bring outliers into range of -3 to +3.

132
Appendix E
Forest Plot and Table of Individual Outcome Results
for Overall Summary Effect

133
Forest plot and table of individual outcome results for overall summary effect.
The forest plot (FigureE1) on the next page shows point estimates for all outcomes and
the overall summary effect with 95% confidence intervals. Point estimates are
represented by squares with confidence intervals extending from each side. Overall effect
size and confidence intervals represented by the blue triangle, with the apex as the point
estimate and diamond points as confidence interval points. The red dashed line indicates
the overall effect size. The x axis refers to low (.2), medium (.5), and high (.8) effect
sizes.

Fig
ure
E1.
For
est p
lot f
or in
divi
dual
out
com
e re
sult
s fo
r ov
eral
l sum
mar
y ef
fect
.
134
gp
y

135
Table E1
Overall Summary Effect Results for Each Outcome (Ordered by Hedges’ g with in-text study citation, N for treatment and control, and upper and lower confidence intervals.)
Study in-text citation g NTreatment NControl CILower CIUpper
(Sungur & Tekkaya, 2006) -1.42 30 31 -1.97 -0.86
(Bragg & Evans, 2005) -0.95 75 75 -1.29 -0.61
(Smits et al., 2003) -0.87 46 45 -1.30 -0.44
(Hesterberg, 2005) -0.76 33 30 -1.27 -0.25
(Smits et al., 2003) -0.75 51 49 -1.15 -0.34
(Sundblad et al., 2002) -0.66 21 16 -1.32 0.01
(Anderson, 2007) -0.55 54 56 -0.93 -0.17
(Sundblad et al., 2002) -0.44 21 15 -1.10 0.23
(Lesperance, 2008) -0.25 9 9 -1.16 0.66
(Baragona, 2009) -0.12 46 46 -0.52 0.29
(Sundblad et al., 2002) -0.08 21 16 -0.72 0.56
(Reich, 2007) -0.01 47 50 -0.40 0.39
(Baturay & Bay, 2010) 0.01 25 19 -0.59 0.60
(Gurpinar et al., 2010) 0.08 176 176 -0.13 0.30
(Yang, 2002) 0.091 19 18 -0.55 0.73
(Beachey, 2004) 0.11 29 36 -0.37 0.6
(Padmaraju, 2008) 0.12 72 72 -0.21 0.45
(Distlehorst, Dawson, & Klamen, 2009) 0.12 100 221 -0.11 0.36
(Sundblad et al., 2002) 0.13 21 15 -0.53 0.79
(Williams et al., 1998) 0.14 82 17 -0.39 0.66
(Distlehorst, Dawson, & Klamen, 2009) 0.17 95 200 -0.07 0.42
(Reich, 2007) 0.18 47 50 -0.22 0.58
(Reich, 2007) 0.25 47 50 -0.15 0.65
(Lin, Lu, Chung, Yan, 2010) 0.27 72 70 -0.06 0.60
(Bligh, Lloyed-Jones, & Smith, 2000) 0.27 137 149 0.04 0.51
(Baturay & Bay, 2010) 0.30 33 35 -0.17 0.78
(Matthews, 2004) 0.32 24 24 -0.24 0.89
(Gurpinar et al., 2010) 0.35 176 176 0.14 0.56
(Kaufman & Mann, 1999) 0.35 72 52 -0.01 0.71
(Vernon, Campbell, & Dally, 1992) 0.36 144 144 0.13 0.59
(Hwang & Kim, 2006) 0.39 35 36 -0.08 0.85
(Lesperance, 2008) 0.43 9 9 -0.49 1.34
(table continues)

136
Study in-text citation g NTreatment NControl CILower CIUpper
(Ozturk et al., 2008) 0.43 52 95 0.09 0.77
(Peters et al., 2000) 0.45 42 46 0.024 0.87
(Lin et al., 2010) 0.46 72 70 0.13 0.79
(Lancaster et al., 1997) 0.50 56 285 0.21 0.79
(Vazquez, 2008) 0.52 11 22 -0.21 1.25
(Gurpinar et al., 2010) 0.54 176 176 0.33 0.76
(Vazquez, 2008) 0.55 11 22 -0.18 1.27
(Newble & Clarke, 1986) 0.55 44 43 0.13 0.98
(Wang et al., 2010) 0.56 87 86 0.25 0.86
(Beachey, 2004) 0.58 52 36 0.15 1.01
(Peters et al., 2000) 0.59 45 43 0.17 1.02
(Hwang & Kim, 2006) 0.63 35 36 0.16 1.11
(Akinoglu & Tandogan, 2007) 0.65 25 25 0.09 1.22
(Mantri et al., 2008) 0.66 21 107 0.19 1.13
(Gurpinar et al., 2010) 0.67 176 176 0.45 0.88
(Vazquez, 2008) 0.69 11 22 -0.05 1.42
(Lancaster et al., 1997) 0.72 56 285 0.43 1.02
(Sungur & Tekkaya, 2006) 0.74 30 31 0.23 1.26
(Distlehorst, Dawson, & Klamen, 2009) 0.76 68 136 0.46 1.06
(Newble & Clarke, 1986) 0.77 63 97 0.44 1.10
(Newble & Clarke, 1986) 0.82 46 104 0.46 1.17
(Semerci, 2006) 0.82 30 30 0.29 1.34
(Konings, Wiers, van de Wiel, & Schmidt, 2005) 0.86 15 14 0.11 1.61
(Lesperance, 2008) 0.87 9 9 -0.08 1.82
(Peters et al., 2000) 0.87 50 49 0.46 1.28
(Sungur & Tekkaya, 2006) 0.88 30 31 0.35 1.40
(Distlehorst, Dawson, & Klamen, 2009) 0.91 83 163 0.63 1.10
(Mantri et al., 2008) 0.91 21 107 0.43 1.39
(Gurpinar et al., 2010) 0.91 176 176 0.69 1.13
(Kaufman & Mann, 1999) 0.95 74 72 0.61 1.29
(Vazquez, 2008) 0.97 11 22 0.22 1.72
(Kaufman & Mann, 1999) 0.97 72 52 0.60 1.35
(Konings et al., 2005) 1.03 15 14 0.27 1.80
(Lancaster et al., 1997) 1.05 56 285 0.75 1.34
(Dehkordi et al., 2008) 1.07 20 20 0.41 1.73
(Kassebaum, Averbach, & Fryer, 1991) 1.10 17 17 0.39 1.82
(Kassebaum, Averbach, & Fryer, 1991) 1.14 17 17 0.42 1.86
(table continues)

137
Study in-text citation g NTreatment NControl CILower CIUpper
(Kassebaum, Averbach, & Fryer, 1991) 1.16 17 17 0.44 1.88
(Schlett et al., 2010) 1.16 101 4720 0.96 1.36
(Kong et al., 2009) 1.10 60 30 0.72 1.66
(Sevening & Baron, 2002) 1.36 17 17 0.62 2.10
(Lesperance, 2008) 1.45 9 9 0.43 2.48
(Lieberman et al., 1997) 2.81 24 106 2.25 3.37
Pooled ES, total N and confidence interval limits 0.45 3972 9927 0.33 0.58

138
Appendix F
SDL Tables
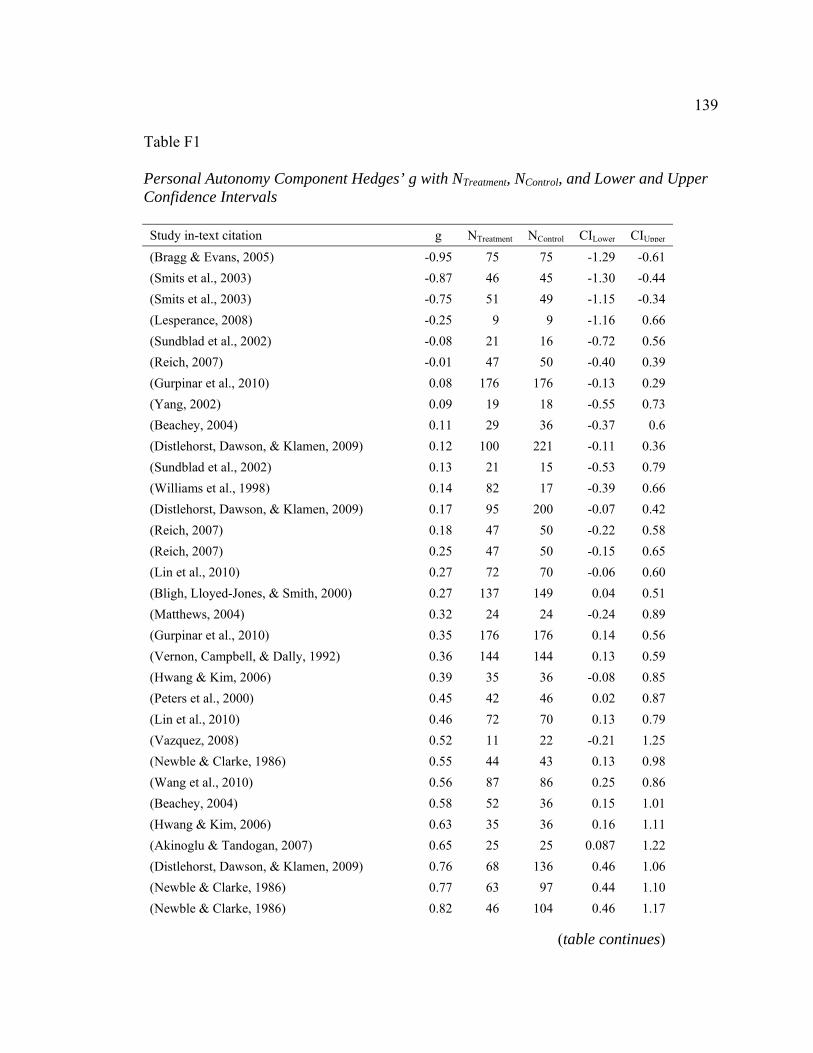
139
Table F1
Personal Autonomy Component Hedges’ g with NTreatment, NControl, and Lower and Upper Confidence Intervals Study in-text citation g NTreatment NControl CILower CIUpper
(Bragg & Evans, 2005) -0.95 75 75 -1.29 -0.61
(Smits et al., 2003) -0.87 46 45 -1.30 -0.44
(Smits et al., 2003) -0.75 51 49 -1.15 -0.34
(Lesperance, 2008) -0.25 9 9 -1.16 0.66
(Sundblad et al., 2002) -0.08 21 16 -0.72 0.56
(Reich, 2007) -0.01 47 50 -0.40 0.39
(Gurpinar et al., 2010) 0.08 176 176 -0.13 0.29
(Yang, 2002) 0.09 19 18 -0.55 0.73
(Beachey, 2004) 0.11 29 36 -0.37 0.6
(Distlehorst, Dawson, & Klamen, 2009) 0.12 100 221 -0.11 0.36
(Sundblad et al., 2002) 0.13 21 15 -0.53 0.79
(Williams et al., 1998) 0.14 82 17 -0.39 0.66
(Distlehorst, Dawson, & Klamen, 2009) 0.17 95 200 -0.07 0.42
(Reich, 2007) 0.18 47 50 -0.22 0.58
(Reich, 2007) 0.25 47 50 -0.15 0.65
(Lin et al., 2010) 0.27 72 70 -0.06 0.60
(Bligh, Lloyed-Jones, & Smith, 2000) 0.27 137 149 0.04 0.51
(Matthews, 2004) 0.32 24 24 -0.24 0.89
(Gurpinar et al., 2010) 0.35 176 176 0.14 0.56
(Vernon, Campbell, & Dally, 1992) 0.36 144 144 0.13 0.59
(Hwang & Kim, 2006) 0.39 35 36 -0.08 0.85
(Peters et al., 2000) 0.45 42 46 0.02 0.87
(Lin et al., 2010) 0.46 72 70 0.13 0.79
(Vazquez, 2008) 0.52 11 22 -0.21 1.25
(Newble & Clarke, 1986) 0.55 44 43 0.13 0.98
(Wang et al., 2010) 0.56 87 86 0.25 0.86
(Beachey, 2004) 0.58 52 36 0.15 1.01
(Hwang & Kim, 2006) 0.63 35 36 0.16 1.11
(Akinoglu & Tandogan, 2007) 0.65 25 25 0.087 1.22
(Distlehorst, Dawson, & Klamen, 2009) 0.76 68 136 0.46 1.06
(Newble & Clarke, 1986) 0.77 63 97 0.44 1.10
(Newble & Clarke, 1986) 0.82 46 104 0.46 1.17
(table continues)
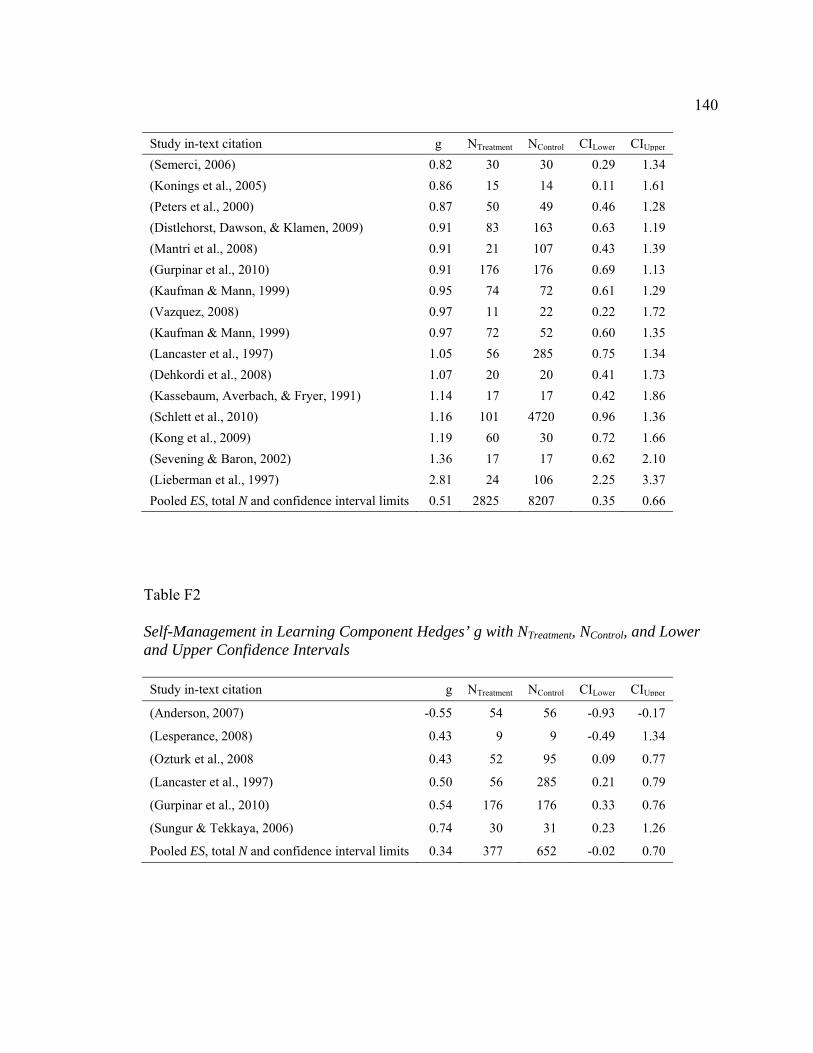
140
Study in-text citation g NTreatment NControl CILower CIUpper
(Semerci, 2006) 0.82 30 30 0.29 1.34
(Konings et al., 2005) 0.86 15 14 0.11 1.61
(Peters et al., 2000) 0.87 50 49 0.46 1.28
(Distlehorst, Dawson, & Klamen, 2009) 0.91 83 163 0.63 1.19
(Mantri et al., 2008) 0.91 21 107 0.43 1.39
(Gurpinar et al., 2010) 0.91 176 176 0.69 1.13
(Kaufman & Mann, 1999) 0.95 74 72 0.61 1.29
(Vazquez, 2008) 0.97 11 22 0.22 1.72
(Kaufman & Mann, 1999) 0.97 72 52 0.60 1.35
(Lancaster et al., 1997) 1.05 56 285 0.75 1.34
(Dehkordi et al., 2008) 1.07 20 20 0.41 1.73
(Kassebaum, Averbach, & Fryer, 1991) 1.14 17 17 0.42 1.86
(Schlett et al., 2010) 1.16 101 4720 0.96 1.36
(Kong et al., 2009) 1.19 60 30 0.72 1.66
(Sevening & Baron, 2002) 1.36 17 17 0.62 2.10
(Lieberman et al., 1997) 2.81 24 106 2.25 3.37
Pooled ES, total N and confidence interval limits 0.51 2825 8207 0.35 0.66
Table F2
Self-Management in Learning Component Hedges’ g with NTreatment, NControl, and Lower and Upper Confidence Intervals Study in-text citation g NTreatment NControl CILower CIUpper
(Anderson, 2007) -0.55 54 56 -0.93 -0.17
(Lesperance, 2008) 0.43 9 9 -0.49 1.34
(Ozturk et al., 2008 0.43 52 95 0.09 0.77
(Lancaster et al., 1997) 0.50 56 285 0.21 0.79
(Gurpinar et al., 2010) 0.54 176 176 0.33 0.76
(Sungur & Tekkaya, 2006) 0.74 30 31 0.23 1.26
Pooled ES, total N and confidence interval limits 0.34 377 652 -0.02 0.70

141
Table F3
Independent Pursuit of Learning Component Hedges’ g with NTreatment, NControl, and Lower and Upper Confidence Intervals Study in-text citation g NTreatment NControl CILower CIUpper
(Baturay & Bay, 2010) 0.30 33 35 -0.17 0.78
(Lancaster et al., 1997) 0.73 56 285 0.43 1.02
(Kassebaum, Averbach, & Fryer, 1991) 1.10 17 17 0.39 1.82
Pooled ES, total N and confidence interval limits 0.66 106 337 0.29 1.03
Table F4
Learner Control of Instruction Component Hedges’ g with NTreatment, NControl, and Lower and Upper Confidence Intervals Study in-text citation g NTreatment NControl CILower CIUpper
(Sungur & Tekkaya, 2006) -1.42 30 31 -1.97 -0.86
(Hesterberg, 2005) -0.76 33 30 -1.27 -0.25
(Sundblad et al., 2002) -0.66 21 16 -1.32 0.01
(Sundblad et al., 2002) -0.44 21 15 -1.10 0.23
(Baragona, 2009) -0.12 46 46 -0.52 0.29
(Baturay & Bay, 2010) 0.01 25 19 -0.59 0.60
(Padmaraju, 2008) 0.12 72 72 -0.21 0.45
(Kaufman & Mann, 1999) 0.35 72 52 -0.01 0.71
(Vazquez, 2008) 0.55 11 22 -0.18 1.27
(Peters et al., 2000) 0.59 45 43 0.17 1.02
(Mantri et al., 2008) 0.66 21 107 0.19 1.13
(Gurpinar et al., 2010) 0.67 176 176 0.45 0.88
(Vazquez, 2008) 0.69 11 22 -0.05 1.42
(Lesperance, 2008) 0.87 9 9 -0.08 1.82
(Sungur & Tekkaya, 2006) 0.88 30 31 0.35 1.40
(Konings et al., 2005) 1.03 15 14 0.27 1.80
(Kassebaum, Averbach, & Fryer, 1991) 1.16 17 17 0.44 1.89
(Lesperance, 2008) 1.45 9 9 0.43 2.48
Pooled ES, total N and confidence interval limits 0.28 664 731 -0.02 0.58

142
Appendix G
Study Quality Tables
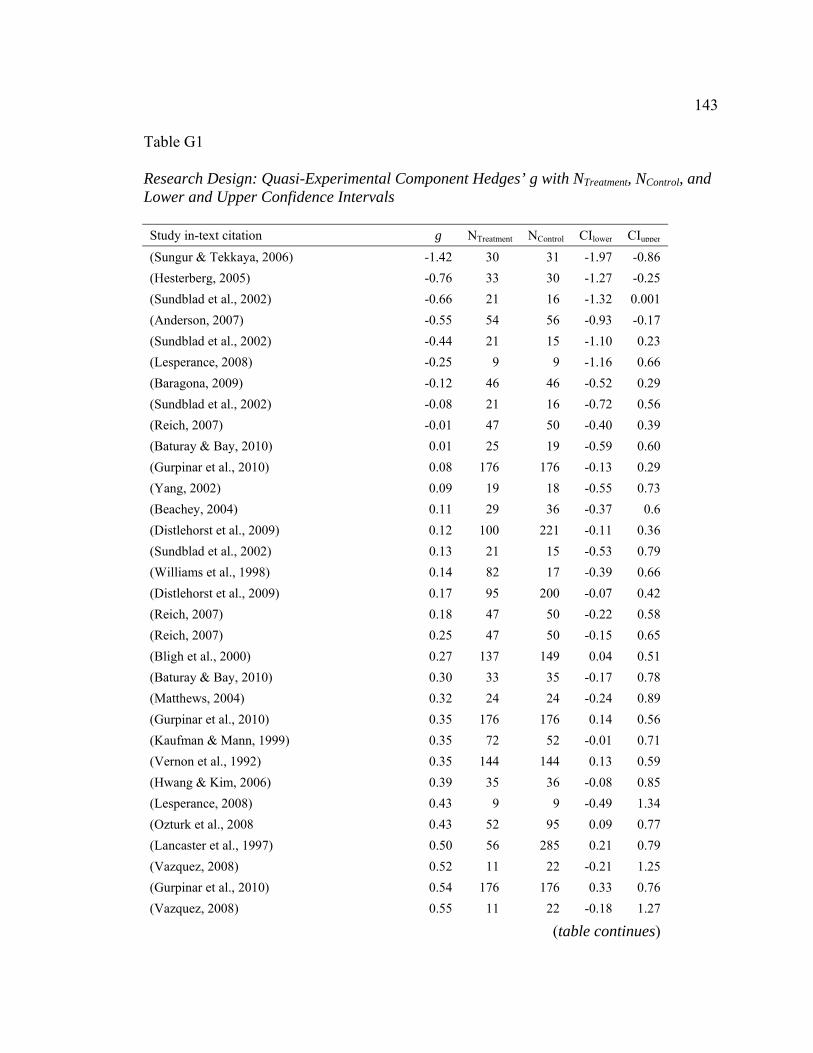
143
Table G1
Research Design: Quasi-Experimental Component Hedges’ g with NTreatment, NControl, and Lower and Upper Confidence Intervals Study in-text citation g NTreatment NControl CIlower CIupper
(Sungur & Tekkaya, 2006) -1.42 30 31 -1.97 -0.86
(Hesterberg, 2005) -0.76 33 30 -1.27 -0.25
(Sundblad et al., 2002) -0.66 21 16 -1.32 0.001
(Anderson, 2007) -0.55 54 56 -0.93 -0.17
(Sundblad et al., 2002) -0.44 21 15 -1.10 0.23
(Lesperance, 2008) -0.25 9 9 -1.16 0.66
(Baragona, 2009) -0.12 46 46 -0.52 0.29
(Sundblad et al., 2002) -0.08 21 16 -0.72 0.56
(Reich, 2007) -0.01 47 50 -0.40 0.39
(Baturay & Bay, 2010) 0.01 25 19 -0.59 0.60
(Gurpinar et al., 2010) 0.08 176 176 -0.13 0.29
(Yang, 2002) 0.09 19 18 -0.55 0.73
(Beachey, 2004) 0.11 29 36 -0.37 0.6
(Distlehorst et al., 2009) 0.12 100 221 -0.11 0.36
(Sundblad et al., 2002) 0.13 21 15 -0.53 0.79
(Williams et al., 1998) 0.14 82 17 -0.39 0.66
(Distlehorst et al., 2009) 0.17 95 200 -0.07 0.42
(Reich, 2007) 0.18 47 50 -0.22 0.58
(Reich, 2007) 0.25 47 50 -0.15 0.65
(Bligh et al., 2000) 0.27 137 149 0.04 0.51
(Baturay & Bay, 2010) 0.30 33 35 -0.17 0.78
(Matthews, 2004) 0.32 24 24 -0.24 0.89
(Gurpinar et al., 2010) 0.35 176 176 0.14 0.56
(Kaufman & Mann, 1999) 0.35 72 52 -0.01 0.71
(Vernon et al., 1992) 0.35 144 144 0.13 0.59
(Hwang & Kim, 2006) 0.39 35 36 -0.08 0.85
(Lesperance, 2008) 0.43 9 9 -0.49 1.34
(Ozturk et al., 2008 0.43 52 95 0.09 0.77
(Lancaster et al., 1997) 0.50 56 285 0.21 0.79
(Vazquez, 2008) 0.52 11 22 -0.21 1.25
(Gurpinar et al., 2010) 0.54 176 176 0.33 0.76
(Vazquez, 2008) 0.55 11 22 -0.18 1.27
(table continues)

144
Study in-text citation g NTreatment NControl CIlower CIupper
(Newble & Clarke, 1986) 0.55 44 43 0.13 0.98
(Wang et al., 2010) 0.56 87 86 0.25 0.86
(Beachey, 2004) 0.58 52 36 0.15 1.01
(Hwang & Kim, 2006) 0.63 35 36 0.16 1.11
(Gurpinar et al., 2010) 0.67 176 176 0.45 0.88
(Vazquez, 2008) 0.69 11 22 -0.05 1.42
(Lancaster et al., 1997) 0.73 56 285 0.43 1.02
(Sungur & Tekkaya, 2006) 0.74 30 31 0.23 1.26
(Distlehorst et al., 2009) 0.76 68 136 0.46 1.06
(Newble & Clarke, 1986) 0.77 63 97 0.44 1.10
(Newble & Clarke, 1986) 0.82 46 104 0.46 1.17
(Semerci, 2006) 0.82 30 30 0.29 1.34
(Konings et al., 2005) 0.86 15 14 0.11 1.61
(Lesperance, 2008) 0.87 9 9 -0.09 1.82
(Sungur & Tekkaya, 2006) 0.88 30 31 0.35 1.40
(Distlehorst et al., 2009) 0.91 83 163 0.63 1.19
(Gurpinar et al., 2010) 0.91 176 176 0.69 1.13
(Kaufman & Mann, 1999) 0.95 74 72 0.61 1.29
(Vazquez, 2008) 0.97 11 22 0.22 1.72
(Kaufman & Mann, 1999) 0.97 72 52 0.60 1.35
(Konings et al., 2005) 1.03 15 14 0.27 1.80
(Lancaster et al., 1997) 1.05 56 285 0.75 1.34
(Dehkordi et al., 2008) 1.07 20 20 0.41 1.73
(Kassebaum et al., 1991) 1.10 17 17 0.39 1.82
(Kassebaum et al., 1991) 1.14 17 17 0.42 1.86
(Kassebaum et al., 1991) 1.16 17 17 0.44 1.88
(Schlett et al., 2010) 1.16 101 4720 0.96 1.36
(Sevening & Baron, 2002) 1.36 17 17 0.62 2.10
(Lesperance, 2008) 1.45 9 9 0.43 2.48
(Lieberman et al., 1997) 2.81 24 106 2.25 3.37
Pooled ES, total N and confidence interval limits 0.49 3320 9139 0.37 0.62

145
Table G2
Research Design: Group Random Cmponent Hedges’ g with NTreatment, NControl, and Lower and Upper Confidence Intervals Study in-text citation g NTreatment NControl CIlower CIupper
(Bragg & Evans, 2005) -0.95 75 75 -1.29 -0.61
Pooled ES, total N and confidence interval limits -0.95 75 75 -1.29 -0.61
Table G3
Research Design: Random Component Hedges’ g with NTreatment, NControl, and Lower and Upper Confidence Intervals Study in-text citation g NTreatment NControl CIlower CIupper
(Smits et al., 2003) -0.87 46 45 -1.30 -0.44
(Smits et al., 2003) -0.75 51 49 -1.15 -0.34
(Padmaraju, 2008) 0.12 72 72 -0.21 0.45
(Lin et al., 2010) 0.27 72 70 -0.06 0.60
(Peters et al., 2000) 0.45 42 46 0.024 0.87
(Lin et al., 2010) 0.46 72 70 0.13 0.79
(Peters et al., 2000) 0.59 45 53 0.17 1.02
(Akinoglu & Tandogan, 2007) 0.65 25 25 0.09 1.22
(Mantri et al., 2008 0.66 21 107 0.18 1.13
(Peters et al., 2000) 0.87 50 49 0.46 1.28
(Mantri et al., 2008 0.91 21 107 0.43 1.39
(Kong et al., 2009) 1.19 60 30 0.72 1.66
Pooled ES, total N and confidence interval limits 0.37 577 713 0.03 0.71

146
Table G4
Internal Validity: History Component, Scale = 0, Hedges’ g with NTreatment, NControl, and Lower and Upper Confidence Intervals Study in-text citation g NTreatment NControl CIlower CIupper
(Sungur & Tekkaya, 2006) -1.42 30 31 -1.97 -0.86
(Bragg & Evans, 2005) -0.95 75 75 -1.29 -0.61
(Smits et al., 2003) -0.87 46 45 -1.30 -0.44
(Hesterberg, 2005) -0.76 33 30 -1.27 -0.25
(Smits et al., 2003) -0.75 51 49 -1.15 -0.34
(Anderson, 2007) -0.55 54 56 -0.93 -0.17
(Lesperance, 2008) -0.25 9 9 -1.16 0.66
(Baragona, 2009) -0.12 46 46 -0.52 0.29
(Reich, 2007) -0.01 47 50 -0.40 0.39
(Baturay & Bay, 2010) 0.01 25 19 -0.59 0.60
(Gurpinar et al., 2010) 0.08 176 176 -0.13 0.29
(Yang, 2002) 0.09 19 18 -0.55 0.73
(Beachey, 2004) 0.11 29 36 -0.37 0.60
(Padmaraju, 2008) 0.12 72 72 -0.21 0.45
(Williams et al., 1998) 0.14 82 17 -0.39 0.66
(Reich, 2007) 0.18 47 50 -0.22 0.58
(Reich, 2007) 0.25 47 50 -0.15 0.65
(Lin et al., 2010) 0.27 72 70 -0.06 0.60
(Baturay & Bay, 2010) 0.30 33 35 -0.17 0.78
(Matthews, 2004) 0.32 24 24 -0.24 0.89
(Gurpinar et al., 2010) 0.35 176 176 0.14 0.56
(Vernon et al., 1992) 0.36 144 144 0.13 0.59
(Lesperance, 2008) 0.43 9 9 -0.49 1.34
(Ozturk et al., 2008) 0.43 52 95 0.09 0.77
(Peters et al., 2000) 0.45 42 46 0.02 0.87
(Lin et al., 2010) 0.46 72 70 0.13 0.79
(Lancaster et al., 1997) 0.50 56 285 0.21 0.79
(Vazquez, 2008) 0.52 11 22 -0.21 1.25
(Gurpinar et al., 2010) 0.54 176 176 0.33 0.76
(Vazquez, 2008) 0.55 11 22 -0.18 1.27
(Newble & Clarke, 1986) 0.55 44 43 0.13 0.98
(Beachey, 2004) 0.58 52 36 0.15 1.01
(Peters et al., 2000) 0.59 45 43 0.17 1.02
(Akinoglu & Tandogan, 2007) 0.65 25 25 0.09 1.22
(table continues)

147
Study in-text citation g NTreatment NControl CIlower CIupper (Mantri et al., 2008) 0.66 21 107 0.19 1.13
(Gurpinar et al., 2010) 0.67 176 176 0.45 0.88
(Vazquez, 2008) 0.69 11 22 -0.05 1.42
(Lancaster et al., 1997) 0.73 56 285 0.43 1.02
(Sungur & Tekkaya, 2006) 0.74 30 31 0.23 1.26
(Newble & Clarke, 1986) 0.77 63 97 0.44 1.10
(Newble & Clarke, 1986) 0.82 46 104 0.46 1.17
(Semerci, 2006) 0.82 30 30 0.29 1.34
(Konings et al., 2005) 0.856 15 14 0.11 1.61
(Lesperance, 2008) 0.87 9 9 -0.08 1.82
(Peters et al., 2000) 0.87 50 49 0.46 1.28
(Sungur & Tekkaya, 2006) 0.88 30 31 0.35 1.40
(Mantri et al., 2008) 0.91 21 107 0.43 1.39
(Gurpinar et al., 2010) 0.91 176 176 0.69 1.13
(Vazquez, 2008) 0.97 11 22 0.22 1.72
(Konings et al., 2005) 1.03 15 14 0.27 1.80
(Lancaster et al., 1997) 1.05 56 285 0.75 1.34
(Dehkordi et al., 2008) 1.07 20 20 0.41 1.73
(Kassebaum et al., 1991) 1.10 17 17 0.39 1.82
(Kassebaum et al., 1991) 1.14 17 17 0.42 1.86
(Kassebaum et al., 1991) 1.16 17 17 0.44 1.88
(Kong et al., 2009) 1.19 60 30 0.72 1.66
(Lesperance, 2008) 1.45 9 9 0.43 2.48
(Lieberman et al., 1997) 2.81 24 106 2.25 3.37
Pooled ES, total N and confidence interval limits 0.45 2912 3925 0.30 0.60

148
Table G5
Internal Validity: History Component, Scale = 1, Hedges’ g with NTreatment, NControl, and Lower and Upper Confidence Intervals Study in-text citation g NTreatment NControl CIlower CIupper
(Distlehorst et al., 2009) 0.12 100 221 -0.11 0.36
(Distlehorst et al., 2009) 0.17 95 200 -0.07 0.42
(Bligh et al., 2000) 0.27 138 149 0.04 0.51
(Kaufman & Mann, 1999) 0.35 72 52 -0.01 0.71
(Hwang & Kim, 2006) 0.39 35 36 -0.08 0.85
(Wang et al., 2010) 0.56 87 86 0.25 0.86
(Hwang & Kim, 2006) 0.63 35 36 0.16 1.11
(Distlehorst et al., 2009) 0.76 68 136 0.46 1.06
(Distlehorst et al., 2009) 0.91 83 163 0.63 1.19
(Kaufman & Mann, 1999) 0.95 74 72 0.61 1.29
(Kaufman & Mann, 1999) 0.97 72 52 0.60 1.35
(Schlett et al., 2010) 1.16 101 4720 0.96 1.36
(Sevening & Baron, 2002) 1.36 17 17 0.62 2.10
Pooled ES, total N and confidence interval limits 0.64 977 5940 0.41 0.87
Table G6
Internal Validity: History Component, Scale = 2, Hedges’ g with NTreatment, NControl, and Lower and Upper Confidence Intervals Study in-text citation g NTreatment NControl CIlower CIupper
(Sundblad et al., 2002) -0.66 21 16 -1.32 0.00
(Sundblad et al., 2002) -0.44 21 15 -1.10 0.23
(Sundblad et al., 2002) -0.08 21 16 -0.72 0.56
(Sundblad et al., 2002) 0.13 21 15 -0.53 0.79
Pooled ES, N total and confidence interval limits -0.26 84 62 -0.61 0.09

149
Table G7
Internal Validity: Testing Component, Scale = 0, Hedges’ g with NTreatment, NControl, and Lower and Upper Confidence Intervals Study in-text citation g NTreatment NControl CIlower CIupper
(Sungur & Tekkaya, 2006) -1.42 30 31 -1.97 -0.86
(Bragg & Evans, 2005) -0.95 75 75 -1.29 -0.61
(Smits et al., 2003) -0.87 46 45 -1.30 -0.44
(Hesterberg, 2005) -0.76 33 30 -1.27 -0.25
(Smits et al., 2003) -0.75 51 49 -1.15 -0.34
(Sundblad et al., 2002) -0.66 21 16 -1.32 0.00
(Anderson, 2007) -0.55 54 56 -0.93 -0.17
(Sundblad et al., 2002) -0.44 21 15 -1.10 0.23
(Lesperance, 2008) -0.25 9 9 -1.16 0.66
(Baragona, 2009) -0.12 46 46 -0.52 0.29
(Sundblad et al., 2002) -0.08 21 16 -0.72 0.56
(Reich, 2007) -0.01 47 50 -0.40 0.39
(Baturay & Bay, 2010) 0.01 25 19 -0.59 0.60
(Gurpinar et al., 2010) 0.08 176 176 -0.13 0.29
(Yang, 2002) 0.09 19 18 -0.55 0.73
(Beachey, 2004) 0.11 29 36 -0.37 0.60
(Padmaraju, 2008) 0.12 72 72 -0.21 0.45
(Distlehorst et al., 2009) 0.12 100 221 -0.11 0.36
(Sundblad et al., 2002) 0.13 21 15 -0.53 0.79
(Distlehorst et al., 2009) 0.17 95 100 -0.07 0.42
(Reich, 2007) 0.18 47 50 -0.22 0.58
(Reich, 2007) 0.25 47 50 -0.15 0.65
(Lin et al., 2010) 0.27 72 70 -0.06 0.60
(Bligh et al., 2000) 0.27 137 149 0.04 0.51
(Baturay & Bay, 2010) 0.30 33 35 -0.17 0.78
(Matthews, 2004) 0.32 24 24 -0.24 0.89
(Gurpinar et al., 2010) 0.35 176 17 0.14 0.56
(Kaufman & Mann, 1996) 0.35 72 52 -0.01 0.71
(Vernon et al., 1992) 0.36 144 144 0.13 0.59
(Hwang & Kim, 2006) 0.39 35 36 -0.08 0.85
(Lesperance, 2008) 0.43 9 9 -0.49 1.34
(Ozturk et al., 2008) 0.43 52 95 0.09 0.77
(table continues)

150
Study in-text citation g NTreatment NControl CIlower CIupper
(Peters et al., 2000) 0.45 42 46 0.02 0.87
(Lin et al., 2010) 0.46 72 70 0.13 0.79
(Lancaster et al., 1997) 0.50 56 285 0.21 0.79
(Vazquez, 2008) 0.52 11 22 -0.21 1.25
(Gurpinar et al., 2010) 0.54 176 176 0.33 0.76
(Vazquez, 2008) 0.55 11 22 -0.18 1.27
(Newble & Clarke, 1986) 0.55 44 43 0.13 0.98
(Wang et al., 2010) 0.56 87 86 0.25 0.86
(Beachey, 2004) 0.58 52 36 0.15 1.01
(Peters et al., 2000) 0.59 45 43 0.17 1.02
(Hwang & Kim, 2006) 0.63 35 36 0.16 1.11
(Akinoglu & Tandogan, 2009) 0.65 25 25 0.09 1.22
(Mantri et al., 2008) 0.66 21 107 0.19 1.13
(Gurpinar et al., 2010) 0.67 176 176 0.45 0.88
(Vazquez, 2008) 0.69 11 22 -0.05 1.42
(Lancaster et al., 1997) 0.73 56 285 0.43 1.02
(Sungur & Tekkaya, 2006)006) 0.74 30 31 0.23 1.26
(Distlehorst et al., 2009) 0.76 68 136 0.46 1.06
(Newble & Clarke, 1986) 0.77 63 97 0.44 1.10
(Newble & Clarke, 1986) 0.82 46 104 0.46 1.17
(Semerci, 2006) 0.82 30 30 0.29 1.34
(Konings et al., 2005) 0.86 15 14 0.11 1.61
(Lesperance, 2008) 0.87 9 9 -0.08 1.82
(Peters et al., 2000) 0.87 50 49 0.46 1.28
(Sungur & Tekkaya, 2006) 0.88 30 31 0.35 1.40
(Distlehorst et al., 2009) 0.91 83 163 0.63 1.19
(Mantri et al., 2008) 0.91 21 107 0.43 1.39
(Gurpinar et al., 2010) 0.91 176 176 0.69 1.13
(Kaufman & Mann, 1996) 0.95 74 72 0.61 1.29
(Vazquez, 2008) 0.97 11 22 0.22 1.72
(Kaufman & Mann, 1996) 0.97 72 52 0.60 1.35
(Konings et al., 2005) 1.03 15 14 0.27 1.80
(Lancaster et al.,1997) 1.05 56 285 0.75 1.34
(Dehkordi et al., 2008) 1.07 20 20 0.41 1.73
(Kassebaum et al., 1991) 1.10 17 17 0.39 1.82
(Kassebaum et al., 1991) 1.14 17 17 0.42 1.86
(Kassebaum et al., 1991) 1.16 17 17 0.44 1.88
(table continues)

151
Study in-text citation g NTreatment NControl CIlower CIupper
(Schlett et al., 2010) 1.16 101 4720 0.96 1.36
(Kong et al., 2009) 1.19 60 30 0.72 1.66
(Lesperance, 2008) 1.45 9 9 0.43 2.48
(Lieberman et al., 1997) 2.81 24 106 2.25 3.37
Pooled ES, total N and confidence interval limits 0.45 3873 9634 0.32 0.57
Table G8
Internal Validity: Testing Component, Scale = 1, Hedges’ g with NTreatment, NControl, and Lower and Upper Confidence Intervals Study in-text citation g NTreatment NControl CIlower CIupper
(Williams et al., 1998) 0.14 82 17 -0.39 0.66
(Sevening & Baron, 2002) 1.36 17 17 0.62 2.10
Pooled ES, total N and confidence interval limits 0.72 99 34 -0.48 1.91

152
Table G9
Internal Validity: Statistical Regression Component, Scale = 0, Hedges’ g with NTreatment, NControl, and Lower and Upper Confidence Intervals Study in-text citation g NTreatment NControl CIlower CIupper
(Sungur & Tekkaya, 2006) -1.42 30 31 -1.97 -0.86
(Bragg & Evans, 2005) -0.95 75 75 -1.29 -0.61
(Smits et al., 2003) -0.87 46 45 -1.30 -0.44
(Hesterberg, 2005) -0.76 33 30 -1.27 -0.25
(Smits et al., 2003) -0.75 51 49 -1.15 -0.34
(Sundblad et al., 2002) -0.66 21 16 -1.32 0.00
(Anderson, 2007) -0.55 54 56 -0.93 -0.17
(Sundblad et al., 2002) -0.44 21 15 -1.10 0.23
(Lesperance, 2008) -0.25 9 9 -1.16 0.66
(Baragona, 2009) -0.12 46 46 -0.52 0.29
(Sundblad et al., 2002) -0.08 21 16 -0.72 0.56
(Reich, 2007) -0.01 47 50 -0.40 0.39
(Baturay & Bay, 2010) 0.01 25 19 -0.59 0.60
(Gurpinar et al., 2010) 0.08 176 176 -0.13 0.29
(Yang, 2002) 0.09 19 18 -0.55 0.73
(Beachey, 2004) 0.11 29 36 -0.37 0.60
(Padmaraju, 2008) 0.12 72 72 -0.21 0.45
(Distlehorst et al., 2009) 0.12 100 221 -0.11 0.36
(Sundblad et al., 2002) 0.13 21 15 -0.53 0.79
(Distlehorst et al., 2009) 0.17 95 200 -0.07 0.42
(Reich, 2007) 0.18 47 50 -0.22 0.58
(Reich, 2007) 0.25 47 50 -0.15 0.65
(Lin et al., 2010) 0.27 72 70 -0.06 0.60
(Bligh et al., 2000) 0.27 137 149 0.04 0.51
(Baturay & Bay, 2010) 0.30 33 35 -0.17 0.78
(Matthews, 2004) 0.32 24 24 -0.24 0.89
(Gurpinar et al., 2010) 0.35 176 176 0.14 0.56
(Kaufman & Mann, 1996) 0.35 72 52 -0.01 0.71
(Vernon et al., 1992) 0.36 144 144 0.13 0.59
(table continues)

153
Study in-text citation g NTreatment NControl CIlower CIupper
(Hwang & Kim, 2006) 0.39 35 36 -0.08 0.85
(Lesperance, 2008) 0.43 9 9 -0.49 1.34
(Ozturk et al., 2008) 0.43 52 95 0.09 0.77
(Peters et al., 2000) 0.45 42 46 0.02 0.87
(Lin et al., 2010) 0.46 72 70 0.13 0.79
(Lancaster et al., 1997) 0.50 56 285 0.21 0.79
(Gurpinar et al., 2010) 0.54 176 176 0.33 0.76
(Newble & Clarke, 1986) 0.55 44 43 0.13 0.98
(Wang et al., 2010) 0.56 87 86 0.25 0.86
(Beachey, 2004) 0.58 52 36 0.15 1.01
(Peters et al., 2000) 0.59 45 43 0.17 1.02
(Hwang & Kim, 2006) 0.63 35 36 0.16 1.11
(Akinoglu & Tandogan, 2009) 0.65 25 25 0.09 1.22
(Mantri et al., 2008) 0.66 21 107 0.19 1.13
(Gurpinar et al., 2010) 0.67 176 176 0.45 0.88
(Lancaster et al., 1997) 0.73 56 285 0.43 1.02
(Sungur & Tekkaya, 2006) 0.74 30 31 0.23 1.26
(Distlehorst et al., 2009) 0.76 68 136 0.46 1.06
(Newble & Clarke, 1986) 0.77 63 97 0.44 1.10
(Newble & Clarke, 1986) 0.82 46 104 0.46 1.17
(Semerci, 2006) 0.82 30 30 0.29 1.34
(Konings et al., 2005) 0.86 15 14 0.11 1.61
(Lesperance, 2008) 0.87 9 9 -0.08 1.82
(Peters et al., 2000) 0.87 50 49 0.46 1.28
(Sungur & Tekkaya, 2006) 0.88 30 31 0.35 1.40
(Distlehorst et al., 2009) 0.91 83 163 0.63 1.19
(Mantri et al., 2008) 0.91 21 107 0.43 1.39
(Gurpinar et al., 2010) 0.91 176 176 0.69 1.13
(Kaufman & Mann, 1996) 0.95 72 52 0.61 1.29
(Kaufman & Mann, 1996) 0.97 72 52 0.60 1.35
(Konings et al., 2005) 1.03 15 14 0.27 1.80
(Lancaster et al., 1997) 1.05 56 285 0.75 1.34
(Dehkordi et al., 2008) 1.07 20 20 0.41 1.73
(table continues)
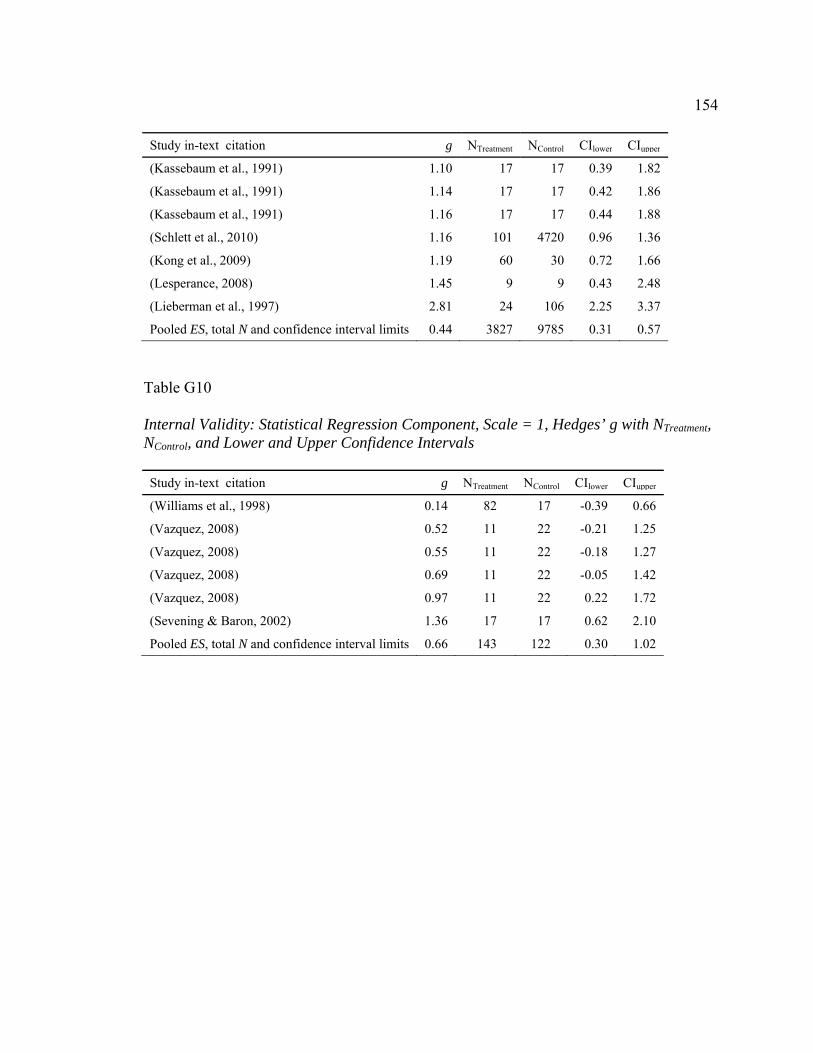
154
Study in-text citation g NTreatment NControl CIlower CIupper
(Kassebaum et al., 1991) 1.10 17 17 0.39 1.82
(Kassebaum et al., 1991) 1.14 17 17 0.42 1.86
(Kassebaum et al., 1991) 1.16 17 17 0.44 1.88
(Schlett et al., 2010) 1.16 101 4720 0.96 1.36
(Kong et al., 2009) 1.19 60 30 0.72 1.66
(Lesperance, 2008) 1.45 9 9 0.43 2.48
(Lieberman et al., 1997) 2.81 24 106 2.25 3.37
Pooled ES, total N and confidence interval limits 0.44 3827 9785 0.31 0.57
Table G10
Internal Validity: Statistical Regression Component, Scale = 1, Hedges’ g with NTreatment, NControl, and Lower and Upper Confidence Intervals Study in-text citation g NTreatment NControl CIlower CIupper
(Williams et al., 1998) 0.14 82 17 -0.39 0.66
(Vazquez, 2008) 0.52 11 22 -0.21 1.25
(Vazquez, 2008) 0.55 11 22 -0.18 1.27
(Vazquez, 2008) 0.69 11 22 -0.05 1.42
(Vazquez, 2008) 0.97 11 22 0.22 1.72
(Sevening & Baron, 2002) 1.36 17 17 0.62 2.10
Pooled ES, total N and confidence interval limits 0.66 143 122 0.30 1.02

155
Table G11
Internal Validity: Differential Selection Component, Scale = 0, Hedges’ g with NTreatment, NControl, and Lower and Upper Confidence Intervals Study In-text Citation g NTreatment NControl CIlower CIupper
(Bragg & Evans, 2005) -0.95 75 75 -1.29 -0.61
(Smits et al., 2003) -0.87 46 45 -1.30 -0.44
(Hesterberg, 2005) -0.76 33 30 -1.27 -0.25
(Smits et al., 2003) -0.75 51 49 -1.15 -0.34
(Sundblad et al., 2002) -0.66 21 16 -1.32 0.00
(Anderson, 2007) -0.55 54 56 -0.93 -0.17
(Sundblad et al., 2002) -0.44 21 15 -1.10 0.23
(Sundblad et al., 2002) -0.08 21 16 -0.72 0.56
(Padmaraju, 2008) 0.12 72 72 -0.21 0.45
(Distlehorst et al., 2009) 0.12 100 221 -0.11 0.36
(Sundblad et al., 2002) 0.13 21 15 -0.53 0.79
(Distlehorst et al., 2009) 0.17 95 200 -0.07 0.42
(Lin et al., 2010) 0.27 72 70 -0.06 0.60
(Matthews, 2004) 0.32 24 24 -0.24 0.89
(Kaufman & Mann, 1996) 0.35 72 52 -0.01 0.71
(Hwang & Kim, 2006) 0.39 35 36 -0.08 0.85
(Peters et al., 2000) 0.45 42 46 0.02 0.87
(Lin et al., 2010) 0.46 72 70 0.13 0.79
(Peters et al., 2000) 0.59 45 43 0.17 1.02
(Hwang & Kim, 2006) 0.63 35 36 0.16 1.11
(Akinoglu & Tandogan, 2009) 0.65 25 25 0.09 1.22
(Mantri et al., 2008) 0.66 21 107 0.19 1.13
(Distlehorst et al., 2009) 0.76 68 136 0.46 1.06
(Peters et al., 2000) 0.87 50 49 0.46 1.28
(Distlehorst et al., 2009) 0.91 83 163 0.63 1.19
(Mantri et al., 2008) 0.91 21 107 0.43 1.39
(Kaufman & Mann, 1996) 0.95 74 72 0.61 1.29
(Kaufman & Mann, 1996) 0.97 72 52 0.60 1.35
(Dehkordi et al., 2008) 1.07 20 20 0.41 1.73
(Kong et al., 2009) 1.19 60 30 0.72 1.66
(Lieberman et al., 1997) 2.81 24 106 2.25 3.37
Pooled ES, total N and confidence interval limits 0.35 1525 2054 0.11 0.59

156
Table G12
Internal Validity: Differential Selection Component, Scale=1, Hedges’ g with NTreatment, NControl, and Lower and Upper Confidence Intervals Study in-text citation g NTreatment NControl CIlower CIupper
(Sungur & Tekkaya, 2006) -1.42 30 31 -1.97 -0.86
(Lesperance, 2008) -0.25 9 9 -1.16 0.66
(Baragona, 2009) -0.12 46 46 -0.52 0.29
(Baturay & Bay, 2010) 0.01 25 19 -0.59 0.60
(Gurpinar et al., 2010) 0.08 176 176 -0.13 0.29
(Yang, 2002) 0.09 19 18 -0.55 0.73
(Beachey, 2004) 0.11 29 36 -0.37 0.60
(Williams et al., 1998) 0.14 82 17 -0.39 0.66
(Bligh et al., 2000) 0.27 137 149 0.04 0.51
(Baturay & Bay, 2010) 0.30 33 35 -0.17 0.78
(Gurpinar et al., 2010) 0.35 176 176 0.14 0.56
(Lesperance, 2008) 0.43 9 9 -0.49 1.34
(Ozturk et al., 2008) 0.43 52 95 0.09 0.77
(Lancaster et al., 1997) 0.50 56 285 0.21 0.79
(Vazquez, 2008) 0.52 11 22 -0.21 1.25
(Gurpinar et al., 2010) 0.54 176 176 0.33 0.76
(Vazquez, 2008) 0.55 11 22 -0.18 1.27
(Newble & Clarke, 1986) 0.55 44 43 0.13 0.98
(Wang et al., 2010) 0.56 87 86 0.25 0.86
(Beachey, 2004) 0.58 52 36 0.15 1.01
(Gurpinar et al., 2010) 0.67 176 176 0.45 0.88
(Vazquez, 2008) 0.69 11 22 -0.05 1.42
(Lancaster et al., 1997) 0.73 56 285 0.43 1.02
(Sungur & Tekkaya, 2006) 0.74 30 31 0.23 1.26
(Newble & Clarke, 1986) 0.77 63 97 0.44 1.10
(Newble & Clarke, 1986) 0.82 46 104 0.46 1.17
(Semerci, 2006) 0.82 30 30 0.29 1.34
(Konings et al., 2005) 0.86 15 14 0.11 1.61
(Lesperance, 2008) 0.87 9 9 -0.08 1.82
(Sungur & Tekkaya, 2006) 0.88 30 31 0.35 1.40
(Gurpinar et al., 2010) 0.91 176 176 0.69 1.13
(table continues)

157
Study in-text citation g NTreatment NControl CIlower CIupper
(Vazquez, 2008) 0.97 11 22 0.22 1.72
(Konings et al., 2005) 1.03 15 14 0.27 1.80
(Lancaster et al., 1997) 1.05 56 285 0.75 1.34
(Schlett et al., 2010) 1.16 101 4720 0.96 1.36
(Sevening & Baron, 2002) 1.36 17 17 0.62 2.10
(Lesperance, 2008) 1.45 9 9 0.43 2.48
Pooled ES, total N and confidence interval limits 0.53 2111 7528 0.39 0.67
Table G13
Internal Validity: Differential Selection Component, Scale = 2, Hedges’ g with NTreatment, NControl, and Lower and Upper Confidence Intervals Study in-text citation g NTreatment NControl CIlower CIupper
(Reich, 2007) -0.01 47 50 -0.40 0.39
(Reich, 2007) 0.18 47 50 -0.22 0.58
(Reich, 2007) 0.25 47 50 -0.15 0.65
(Vernon et al., 1992) 0.36 144 144 0.13 0.59
(Kassebaum et al., 1991) 1.10 17 17 0.39 1.82
(Kassebaum et al., 1991) 1.14 17 17 0.42 1.86
(Kassebaum et al., 1991) 1.16 17 17 0.44 1.88
Pooled ES, total N and confidence interval limits 0.48 336 345 0.19 0.77

158
Table G14
Internal Validity: Experimental Mortality Component, Scale = 0, Hedges’ g with NTreatment, NControl, and Lower and Upper Confidence Intervals Study in-text citation g NTreatment NControl CIlower CIupper
(Sungur & Tekkaya, 2006) -1.42 30 31 -1.97 -0.86
(Bragg & Evans, 2005) -0.95 75 75 -1.29 -0.61
(Sundblad et al., 2002) -0.66 21 16 -1.32 0.00
(Anderson, 2007) -0.55 54 56 -0.93 -0.17
(Sundblad et al., 2002) -0.44 21 15 -1.10 0.23
(Baragona, 2009) -0.12 46 46 -0.52 0.29
(Sundblad et al., 2002) -0.08 21 16 -0.72 0.56
(Reich, 2007) -0.01 47 50 -0.40 0.39
(Gurpinar et al., 2010) 0.08 176 176 -0.13 0.29
(Yang, 2002) 0.09 19 18 -0.55 0.73
(Beachey, 2004) 0.11 29 36 -0.37 0.60
(Sundblad et al., 2002) 0.13 21 15 -0.53 0.79
(Reich, 2007) 0.18 47 50 -0.22 0.58
(Reich, 2007) 0.25 47 50 -0.15 0.65
(Lin et al., 2010) 0.27 72 70 -0.06 0.60
(Matthews, 2004) 0.32 24 24 -0.24 0.89
(Gurpinar et al., 2010) 0.35 176 176 0.14 0.56
(Vernon et al., 1992) 0.36 144 144 0.13 0.59
(Hwang & Kim, 2006) 0.39 35 36 -0.08 0.85
(Lin et al., 2010) 0.46 72 70 0.13 0.79
(Lancaster et al., 1997) 0.50 56 285 0.21 0.79
(Vazquez, 2008) 0.52 11 22 -0.21 1.25
(Gurpinar et al., 2010) 0.54 176 176 0.33 0.76
(Vazquez, 2008) 0.55 11 22 -0.18 1.27
(Wang et al., 2010) 0.56 87 86 0.25 0.86
(Beachey, 2004) 0.58 52 36 0.15 1.01
(Hwang & Kim, 2006) 0.63 35 36 0.16 1.11
(Akinoglu & Tandogan, 2009) 0.65 25 25 0.09 1.22
(Gurpinar et al., 2010) 0.67 176 176 0.45 0.88
(Vazquez, 2008) 0.69 11 22 -0.05 1.42
(Lancaster et al., 1997) 0.73 56 285 0.43 1.02
(Sungur & Tekkaya, 2006) 0.74 30 31 0.23 1.26
(table continues)

159
Study in-text citation g NTreatment NControl CIlower CIupper
(Semerci, 2006) 0.82 30 30 0.29 1.34
(Konings et al., 2005) 0.86 15 14 0.11 1.61
(Peters et al., 2000) 0.87 50 49 0.46 1.28
(Sungur & Tekkaya, 2006) 0.88 30 31 0.35 1.40
(Gurpinar et al., 2010) 0.91 176 176 0.69 1.13
(Vazquez, 2008) 0.97 11 22 0.22 1.72
(Konings et al., 2005)) 1.03 15 14 0.27 1.80
(Lancaster et al., 1997) 1.05 56 285 0.75 1.34
(Dehkordi et al., 2008) 1.07 20 20 0.41 1.73
(Kassebaum et al., 1991) 1.10 17 17 0.39 1.82
(Kassebaum et al., 1991) 1.14 17 17 0.42 1.86
(Kassebaum et al., 1991) 1.16 17 17 0.44 1.88
(Kong et al., 2009) 1.19 60 30 0.72 1.66
(Sevening & Baron, 2002) 1.36 17 17 0.62 2.10
Pooled ES, total N and confidence interval limits 0.43 2434 3111 0.28 0.58

160
Table G15
Internal Validity: Experimental Mortality Component, Scale = 1, Hedges’ g with NTreatment, NControl, and Lower and Upper Confidence Intervals Study in-text citation g NTreatment NControl CIlower CIupper
(Smits et al., 2003) -0.87 46 45 -1.30 -0.44
(Smits et al., 2003) -0.75 51 49 -1.15 -0.34
(Lesperance, 2008) -0.25 9 9 -1.16 0.66
(Padmaraju, 2008) 0.12 72 72 -0.21 0.45
(Williams et al., 1998) 0.14 82 17 -0.39 0.66
(Bligh et al., 2000) 0.27 137 149 0.04 0.51
(Kaufman & Mann, 1996) 0.35 72 52 -0.01 0.71
(Lesperance, 2008) 0.43 9 9 -0.49 1.34
(Ozturk et al., 2008) 0.43 52 95 0.09 0.77
(Peters et al., 2000) 0.45 42 46 0.02 0.87
(Newble & Clarke, 1986) 0.55 44 43 0.13 0.98
(Peters et al., 2000) 0.59 45 43 0.17 1.02
(Mantri et al., 2008) 0.66 21 107 0.19 1.13
(Newble & Clarke, 1986) 0.77 63 97 0.44 1.10
(Newble & Clarke, 1986) 0.82 46 104 0.46 1.17
(Lesperance, 2008) 0.87 9 9 -0.08 1.82
(Mantri et al., 2008) 0.91 21 107 0.43 1.39
(Kaufman & Mann, 1996) 0.95 74 72 0.61 1.29
(Kaufman & Mann, 1996) 0.97 72 52 0.60 1.35
(Lesperance, 2008) 1.45 9 9 0.43 2.48
Pooled ES, total N and confidence interval limits 0.42 976 1186 0.19 0.66
Table G16
Internal Validity: Experimental Mortality Component, Scale = 2, Hedges’ g with NTreatment, NControl, and Lower and Upper Confidence Intervals Study in-text citation g NTreatment NControl CIlower CIupper
(Hesterberg, 2005) -0.76 33 30 -1.27 -0.25
(Schlett et al., 2010) 1.16 101 4720 0.96 1.36
(Lieberman et al., 1997) 2.81 24 196 2.25 3.37
Pooled ES, total N and confidence interval limits 1.07 158 4946 -0.51 2.65

161
Table G17
Internal Validity: Experimental Mortality Component, Scale = 3, Hedges’ g with NTreatment, NControl, and Lower and Upper Confidence Intervals Study In-text Citation g NTreatment NControl CIlower CIupper
(Baturay & Bay, 2010) 0.01 25 19 -0.59 0.60
(Distlehorst et al., 2009) 0.12 100 221 -0.11 0.36
(Distlehorst et al., 2009) 0.17 95 200 -0.07 0.42
(Baturay & Bay, 2010) 0.30 33 35 -0.17 0.78
(Distlehorst et al., 2009) 0.76 68 136 0.46 1.06
(Distlehorst et al., 2009) 0.91 83 163 0.63 1.19
Pooled ES, total N and confidence interval limits 0.40 404 774 0.09 0.71

162
Table G18
External Validity: Limited Descriptiony Component, Scale = 2, Hedges’ g with NTreatment, NControl, and Lower and Upper Confidence Intervals Study In-text Citation g NTreatment NControl CIlower CIupper
(Bragg & Evans, 2005) -0.95 75 75 -1.29 -0.61
(Hesterberg, 2005) -0.76 33 30 -1.27 -0.25
(Baturay & Bay, 2010) 0.01 25 19 -0.59 0.60
(Gurpinar et al., 2010) 0.08 176 176 -0.13 0.29
(Beachey, 2004) 0.11 29 36 -0.37 0.60
(Distlehorst et al., 2009) 0.12 100 221 -0.11 0.36
(Distlehorst et al., 2009) 0.17 95 200 -0.07 0.42
(Bligh et al., 2000) 0.27 137 149 0.04 0.51
(Baturay & Bay, 2010) 0.30 33 35 -0.17 0.78
(Gurpinar et al., 2010) 0.35 176 176 0.14 0.56
(Kaufman & Mann, 1996) 0.35 72 52 -0.01 0.71
(Vernon et al., 1992) 0.36 144 144 0.13 0.59
(Ozturk et al., 2008) 0.43 52 95 0.09 0.77
(Lancaster et al., 1997) 0.50 56 285 0.21 0.79
(Vazquez, 2008) 0.52 11 22 -0.21 1.25
(Gurpinar et al., 2010) 0.54 176 176 0.33 0.76
(Vazquez, 2008) 0.55 11 22 -0.18 1.27
(Beachey, 2004) 0.58 52 36 0.15 1.01
(Gurpinar et al., 2010) 0.67 176 176 0.45 0.88
(Vazquez, 2008) 0.69 11 22 -0.05 1.42
(Lancaster et al., 1997) 0.73 56 285 0.43 1.02
(Distlehorst et al., 2009) 0.76 68 136 0.46 1.06
(Konings et al., 2005) 0.86 15 14 0.11 1.61
(Distlehorst et al., 2009) 0.91 83 163 0.63 1.19
(Gurpinar et al., 2010) 0.91 176 176 0.69 1.13
(Kaufman & Mann, 1996) 0.95 74 72 0.61 1.29
(Vazquez, 2008) 0.97 11 22 0.22 1.72
(Kaufman & Mann, 1996) 0.97 72 52 0.60 1.35
(Konings et al., 2005)) 1.03 15 14 0.27 1.80
(Lancaster et al., 1997) 1.05 56 285 0.75 1.34
Pooled ES, total N and confidence interval limits 0.46 2266 3366 0.30 0.61

163
Table G19
External Validity: Limited Descriptiony Component, Scale = 1, Hedges’ g with NTreatment, NControl, and Lower and Upper Confidence Intervals Study In-text Citation g NTreatment NControl CIlower CIupper
(Sungur & Tekkaya, 2006) -1.42 30 31 -1.97 -0.86
(Smits et al., 2003) -0.87 46 45 -1.30 -0.44
(Smits et al., 2003) -0.75 51 49 -1.15 -0.34
(Baragona, 2009) -0.12 46 46 -0.52 0.29
(Yang, 2002) 0.09 19 18 -0.55 0.73
(Williams et al., 1998) 0.14 82 17 -0.39 0.66
(Peters et al., 2000) 0.45 42 46 0.02 0.87
(Newble & Clarke, 19 0.55 44 43 0.13 0.98
(Peters et al., 2000) 0.59 45 43 0.17 1.02
(Sungur & Tekkaya, 2006) 0.74 30 31 0.23 1.26
(Newble & Clarke, 1986) 0.77 63 97 0.44 1.10
(Newble & Clarke, 1986) 0.82 46 104 0.46 1.17
(Peters et al., 2000) 0.87 50 49 0.46 1.28
(Sungur & Tekkaya, 2006) 0.88 30 32 0.35 1.40
(Dehkordi et al., 2008) 1.07 20 20 0.41 1.73
(Schlett et al., 2010) 1.16 101 4720 0.96 1.36
(Sevening & Baron, 2002) 1.36 17 17 0.62 2.10
Pooled ES, total N and confidence interval limits 0.37 732 5377 0.01 0.73

164
Table G20
External Validity: Limited Descriptiony Component, Scale = 0, Hedges’ g with NTreatment, NControl, and Lower and Upper Confidence Intervals Study In-text Citation g NTreatment NControl CIlower CIupper
(Sundblad et al., 2002) -0.66 21 16 -1.32 0.00
(Anderson, 2007) -0.55 54 56 -0.93 -0.17
(Sundblad et al., 2002) -0.44 21 15 -1.10 0.23
(Lesperance, 2008) -0.25 9 9 -1.16 0.66
(Sundblad et al., 2002) -0.08 21 16 -0.72 0.56
(Reich, 2007) -0.01 46 50 -0.40 0.39
(Padmaraju, 2008) 0.12 72 72 -0.21 0.45
(Sundblad et al., 2002) 0.13 21 15 -0.53 0.79
(Reich, 2007) 0.18 47 50 -0.22 0.58
(Reich, 2007) 0.25 47 50 -0.15 0.65
(Lin et al., 2010) 0.27 72 70 -0.06 0.60
(Matthews, 2004) 0.32 24 24 -0.24 0.89
(Hwang & Kim, 2006) 0.39 35 3 6.00 0.85
(Lesperance, 2008) 0.43 9 9 -0.49 1.34
(Lin et al., 2010) 0.46 72 70 0.13 0.79
(Wang et al., 2010) 0.56 87 86 0.25 0.86
(Hwang & Kim, 2006) 0.63 35 36 0.16 1.11
(Akinoglu & Tandogan, 2009) 0.65 25 25 0.09 1.22
(Mantri et al., 2008) 0.66 21 107 0.19 1.13
(Semerci, 2006) 0.82 30 30 0.29 1.34
(Lesperance, 2008) 0.87 9 9 -0.08 1.82
(Mantri et al., 2008) 0.91 21 107 0.43 1.39
(Kassebaum et al., 1991) 1.10 17 17 0.39 1.82
(Kassebaum et al., 1991) 1.14 17 17 0.42 1.86
(Kassebaum et al., 1991) 1.16 17 17 0.44 1.88
(Kong et al., 2009) 1.19 60 30 0.72 1.66
(Lesperance, 2008) 1.45 9 9 0.43 2.48
(Lieberman et al., 1997) 2.81 24 106 2.25 3.37
Pooled ES, total N and confidence interval limits 0.50 943 1121 0.27 0.74

165
Table G21
External Validity: Multiple Treatment Component, Scale = 0, Hedges’ g with NTreatment, NControl, and Lower and Upper Confidence Intervals Study In-text Citation g NTreatment NControl CIlower CIupper
(Sungur & Tekkaya, 2006) -1.42 30 31 -1.97 -0.86
(Bragg & Evans, 2005) -0.95 75 75 -1.29 -0.61
(Hesterberg, 2005) -0.76 33 30 -1.27 -0.25
(Sundblad et al., 2002) -0.66 21 16 -1.32 0.00
(Anderson, 2007) -0.55 54 56 -0.93 -0.17
(Sundblad et al., 2002) -0.44 21 15 -1.10 0.23
(Baragona, 2009) -0.12 46 46 -0.52 0.29
(Sundblad et al., 2002) -0.08 21 16 -0.72 0.56
(Reich, 2007) -0.01 47 50 -0.40 0.39
(Baturay & Bay, 2010) 0.01 25 19 -0.59 0.60
(Gurpinar et al., 2010) 0.08 176 176 -0.13 0.29
(Yang, 2002) 0.09 19 18 -0.55 0.73
(Padmaraju, 2008) 0.12 72 72 -0.21 0.45
(Distlehorst et al., 2009) 0.12 100 221 -0.11 0.36
(Sundblad et al., 2002) 0.13 21 15 -0.53 0.79
(Williams et al., 1998) 0.14 82 17 -0.39 0.66
(Distlehorst et al., 2009) 0.17 95 200 -0.07 0.42
(Reich, 2007) 0.18 47 50 -0.22 0.58
(Reich, 2007) 0.25 47 50 -0.15 0.65
(Lin et al., 2010) 0.27 72 70 -0.06 0.60
(Bligh et al., 2000) 0.27 137 149 0.04 0.51
(Baturay & Bay, 2010) 0.30 33 35 -0.17 0.78
(Matthews, 2004) 0.32 24 24 -0.24 0.89
(Gurpinar et al., 2010) 0.35 176 176 0.14 0.56
(Kaufman & Mann, 1996) 0.35 72 52 -0.01 0.71
(Hwang & Kim, 2006) 0.39 35 36 -0.08 0.85
(Ozturk et al., 2008) 0.43 52 95 0.09 0.77
(Lin et al., 2010) 0.46 72 70 0.13 0.79
(Lancaster et al., 1997) 0.50 56 285 0.21 0.79
(Vazquez, 2008) 0.52 11 22 -0.21 1.25
(Gurpinar et al., 2010) 0.54 176 176 0.33 0.76
(Vazquez, 2008) 0.55 11 22 -0.18 1.27
(Newble & Clarke, 1986) 0.55 44 43 0.13 0.98
(table continues)

166
Study In-text Citation g NTreatment NControl CIlower CIupper
(Wang et al., 2010) 0.56 87 86 0.25 0.86
(Hwang & Kim, 2006) 0.63 35 36 0.16 1.11
(Akinoglu & Tandogan, 2009) 0.65 25 25 0.09 1.22
(Mantri et al., 2008) 0.66 21 107 0.19 1.13
(Gurpinar et al., 2010) 0.67 176 176 0.45 0.88
(Vazquez, 2008) 0.69 11 22 -0.05 1.42
(Lancaster et al., 1997) 0.73 56 285 0.43 1.02
(Sungur & Tekkaya, 2006) 0.74 30 31 0.23 1.26
(Distlehorst et al., 2009) 0.76 68 136 0.46 1.06
(Newble & Clarke, 1986) 0.77 63 97 0.44 1.10
(Newble & Clarke, 1986) 0.82 46 104 0.46 1.17
(Semerci, 2006) 0.82 30 30 0.29 1.34
(Konings et al., 2005)) 0.86 15 14 0.11 1.61
(Sungur & Tekkaya, 2006) 0.88 30 31 0.35 1.40
(Distlehorst et al., 2009) 0.91 83 163 0.63 1.19
(Mantri et al., 2008) 0.91 21 107 0.43 1.39
(Gurpinar et al., 2010) 0.91 176 176 0.69 1.13
(Kaufman & Mann, 1996) 0.95 74 72 0.61 1.29
(Vazquez, 2008) 0.97 11 22 0.22 1.72
(Kaufman & Mann, 1996) 0.97 72 52 0.60 1.35
(Konings et al., 2005)) 1.03 15 14 0.27 1.80
(Lancaster et al., 1997) 1.05 56 285 0.75 1.34
(Dehkordi et al., 2008) 1.07 20 20 0.41 1.73
(Schlett et al., 2010) 1.16 101 4720 0.96 1.36
(Sevening & Baron, 2002) 1.36 17 17 0.62 2.10
(Lieberman et al., 1997) 2.81 24 106 2.25 3.37
Pooled ES, total N and confidence interval limits 0.45 3366 9362 0.31 0.58

167
Table G22
External Validity: Multiple Treatment Component, Scale = 1, Hedges’ g with NTreatment, NControl, and Lower and Upper Confidence Intervals Study in-text citation g NTreatment NControl CIlower CIupper
(Beachey, 2004) 0.11 29 36 -0.37 0.60
(Peters et al., 2000) 0.45 42 46 0.02 0.87
(Beachey, 2004) 0.58 52 26 0.15 1.01
(Peters et al., 2000) 0.59 45 43 0.17 1.02
(Peters et al., 2000) 0.87 50 49 0.46 1.28
(Kong et al., 2009) 1.19 60 30 0.72 1.66
Pooled ES, N total and Confidence Interval Limits 0.64 278 230 0.36 0.91
Table G23
External Validity: Multiple Treatment Component, Scale=2, Hedges’ g with NTreatment, NControl, and Lower and Upper Confidence Intervals Study In-text Citation g NTreatment NControl CIlower CIupper
(Smits et al., 2003) -0.87 46 46 -1.30 -0.44
(Smits et al., 2003) -0.75 51 49 -1.15 -0.34
(Lesperance, 2008) -0.25 9 9 -1.16 0.66
(Vernon et al., 1992) 0.36 144 144 0.13 0.59
(Lesperance, 2008) 0.43 9 9 -0.49 1.34
(Lesperance, 2008) 0.87 9 9 -0.08 1.82
(Kassebaum et al., 1991) 1.10 17 17 0.39 1.82
(Kassebaum et al., 1991) 1.14 17 17 0.42 1.86
(Kassebaum et al., 1991) 1.16 17 17 0.44 1.88
(Lesperance, 2008) 1.45 9 9 0.43 2.48
Pooled ES, total N and confidence interval limits 0.41 328 326 -0.11 0.93

168
Table G24
External Validity: Experimenter Effect Component, Scale = 1, Hedges’ g with NTreatment, NControl, and Lower and Upper Confidence Intervals Study in-text citation g NTreatment NControl CIlower CIupper
(Sungur & Tekkaya, 2006) -1.42 30 31 -1.97 -0.86
(Lesperance, 2008) -0.25 9 9 -1.16 0.66
(Yang, 2002) 0.09 19 18 -0.55 0.73
(Williams et al., 1998) 0.14 82 17 -0.39 0.66
(Lesperance, 2008) 0.43 9 9 -0.49 1.34
(Akinoglu & Tandogan, 2009) 0.65 25 25 0.09 1.22
(Mantri et al., 2008) 0.66 21 107 0.19 1.13
(Sungur & Tekkaya, 2006) 0.74 30 31 0.23 1.26
(Lesperance, 2008) 0.87 9 9 -0.08 1.82
(Sungur & Tekkaya, 2006) 0.88 30 31 0.35 1.40
(Mantri et al., 2008) 0.91 21 107 0.43 1.39
(Kassebaum et al., 1991) 1.10 17 17 0.39 1.82
(Kassebaum et al., 1991) 1.14 17 17 0.42 1.86
(Kassebaum et al., 1991) 1.16 17 17 0.44 1.88
(Kong et al., 2009) 1.19 60 30 0.72 1.66
(Lesperance, 2008) 1.45 9 9 0.43 2.48
Pooled ES, total N and confidence interval limits 0.60 405 484 0.25 0.95

169
Table G25
External Validity: Experimenter Effect Component, Scale = 0, Hedges’ g with NTreatment, NControl, and Lower and Upper Confidence Intervals Study in-text citation g NTreatment NControl CIlower CIupper
(Bragg & Evans, 2005) -0.95 75 75 -1.29 -0.61
(Smits et al., 2003) -0.87 46 45 -1.30 -0.44
(Hesterberg, 2005) -0.76 33 30 -1.27 -0.25
(Smits et al., 2003) -0.75 51 49 -1.15 -0.34
(Sundblad et al., 2002) -0.66 21 16 -1.32 0.00
(Anderson, 2007) -0.55 54 56 -0.93 -0.17
(Sundblad et al., 2002) -0.44 21 15 -1.10 0.23
(Baragona, 2009) -0.12 46 46 -0.52 0.29
(Sundblad et al., 2002) -0.08 21 16 -0.72 0.56
(Reich, 2007) -0.01 47 50 -0.40 0.39
(Baturay & Bay, 2010) 0.01 35 19 -0.59 0.60
(Gurpinar et al., 2010) 0.08 176 176 -0.13 0.29
(Beachey, 2004) 0.11 39 36 -0.37 0.60
(Padmaraju, 2008) 0.12 72 72 -0.21 0.45
(Distlehorst et al., 2009) 0.12 100 221 -0.11 0.36
(Sundblad et al., 2002) 0.13 21 15 -0.53 0.79
(Distlehorst et al., 2009) 0.17 95 200 -0.07 0.42
(Reich, 2007) 0.18 47 50 -0.22 0.58
(Reich, 2007) 0.25 47 50 -0.15 0.65
(Lin et al., 2010) 0.27 72 70 -0.06 0.60
(Bligh et al., 2000) 0.27 137 149 0.04 0.51
(Baturay & Bay, 2010) 0.30 33 35 -0.17 0.78
(Matthews, 2004) 0.32 24 24 -0.24 0.89
(Gurpinar et al., 2010) 0.35 176 176 0.14 0.56
(Kaufman & Mann, 1996) 0.35 72 52 -0.01 0.71
(Vernon et al., 1992) 0.36 144 144 0.13 0.59
(Hwang & Kim, 2006) 0.39 35 36 -0.08 0.85
(Ozturk et al., 2008) 0.43 52 95 0.09 0.77
(Peters et al., 2000) 0.45 42 46 0.02 0.87
(Lin et al., 2010) 0.46 72 70 0.13 0.79
(Lancaster et al., 1997) 0.50 56 285 0.21 0.79
(Vazquez, 2008) 0.52 11 22 -0.21 1.25
(Gurpinar et al., 2010) 0.54 176 176 0.33 0.76
(Vazquez, 2008) 0.55 11 22 -0.18 1.27
(table continues)

170
Study in-text citation g NTreatment NControl CIlower CIupper
(Newble & Clarke, 1986) 0.55 44 43 0.13 0.98
(Wang et al., 2010) 0.56 87 86 0.25 0.86
(Beachey, 2004) 0.58 52 36 0.15 1.01
(Peters et al., 2000) 0.59 45 43 0.17 1.02
(Hwang & Kim, 2006) 0.63 35 36 0.16 1.11
(Gurpinar et al., 2010) 0.67 176 176 0.45 0.88
(Vazquez, 2008) 0.69 11 22 -0.05 1.42
(Lancaster et al., 1997) 0.73 56 285 0.43 1.02
(Distlehorst et al., 2009) 0.76 68 136 0.46 1.06
(Newble & Clarke, 1986) 0.77 53 97 0.44 1.10
(Newble & Clarke, 1986) 0.82 46 104 0.46 1.17
(Semerci, 2006) 0.82 30 30 0.29 1.34
(Konings et al., 2005)) 0.86 15 14 0.11 1.61
(Peters et al., 2000) 0.87 50 49 0.46 1.28
(Distlehorst et al., 2009) 0.91 83 163 0.63 1.19
(Gurpinar et al., 2010) 0.91 176 176 0.69 1.13
(Kaufman & Mann, 1996) 0.95 74 72 0.61 1.29
(Vazquez, 2008) 0.97 11 22 0.22 1.72
(Kaufman & Mann, 1996) 0.97 72 52 0.60 1.35
(Konings et al., 2005)) 1.03 15 14 0.27 1.80
(Lancaster et al., 1997) 1.05 56 285 0.75 1.34
(Dehkordi et al., 2008) 1.07 20 20 0.41 1.73
(Schlett et al., 2010) 1.16 101 4720 0.96 1.36
(Sevening & Baron, 2002) 1.36 17 17 0.62 2.10
(Lieberman et al., 1997) 2.81 24 106 2.25 3.37
Pooled ES, total N and confidence interval limits 0.42 3577 9443 0.29 0.55

171
Table G26
Validity: Scale = Strong, Hedges’ g with NTreatment, NControl, and Lower and Upper Confidence Intervals Study in-text citation g NTreatment NControl CIlower CIupper
(Hesterberg, 2005) -0.76 33 30 -1.27 -0.25
(Anderson, 2007) -0.55 54 56 -0.93 -0.17
(Baturay & Bay, 2010) 0.01 25 19 -0.59 0.60
(Lin et al., 2010) 0.27 72 70 -0.06 0.60
(Bligh et al., 2000) 0.27 137 149 0.04 0.51
(Baturay & Bay, 2010) 0.30 33 35 -0.17 0.78
(Peters et al., 2000) 0.45 42 46 0.02 0.87
(Lin et al., 2010) 0.46 72 70 0.13 0.79
(Lancaster et al., 1997) 0.50 56 285 0.21 0.79
(Peters et al., 2000) 0.59 45 42 0.17 1.02
(Lancaster et al., 1997) 0.73 56 285 0.43 1.02
(Semerci, 2006) 0.82 30 30 0.29 1.34
(Peters et al., 2000) 0.87 50 49 0.46 1.28
(Lancaster et al., 1997) 1.05 56 285 0.75 1.34
Pooled ES, total N and confidence interval limits 0.37 761 1451 0.13 0.61
Table G27
Validity: Scale = Attempt, Hedges’ g with NTreatment, NControl, and Lower and Upper Confidence Intervals Study in-text citation g NTreatment NControl CIlower CIupper
(Sungur & Tekkaya, 2006) -1.42 30 31 -1.97 -0.86
(Padmaraju, 2008) 0.12 72 72 -0.21 0.45
(Sungur & Tekkaya, 2006) 0.74 30 31 0.23 1.26
(Sungur & Tekkaya, 2006) 0.88 30 31 0.35 1.40
Pooled ES, total N and confidence interval limits 0.09 162 165 -0.80 0.97

172
Table G28
Validity: Scale=None, Hedges’ g with NTreatment, NControl, and Lower and Upper Confidence Intervals Study in-text citation g NTreatment NControl CIlower CIupper
(Bragg & Evans, 2005) -0.95 75 75 -1.29 -0.61
(Smits et al., 2003) -0.87 46 45 -1.30 -0.44
(Smits et al., 2003) -0.75 51 49 -1.15 -0.34
(Sundblad et al., 2002) -0.66 21 16 -1.32 0.00
(Sundblad et al., 2002) -0.44 21 15 -1.10 0.23
(Lesperance, 2008) -0.25 9 9 -1.16 0.66
(Baragona, 2009) -0.12 46 46 -0.52 0.29
(Sundblad et al., 2002) -0.08 21 16 -0.72 0.56
(Reich, 2007) -0.01 47 50 -0.40 0.39
(Gurpinar et al., 2010) 0.08 176 176 -0.13 0.29
(Yang, 2002) 0.09 19 18 -0.55 0.73
(Beachey, 2004) 0.11 29 36 -0.37 0.60
(Distlehorst et al., 2009) 0.12 100 221 -0.11 0.36
(Sundblad et al., 2002) 0.13 21 15 -0.53 0.79
(Williams et al., 1998) 0.14 82 17 -0.39 0.66
(Distlehorst et al., 2009) 0.17 95 200 -0.07 0.42
(Reich, 2007) 0.18 47 50 -0.22 0.58
(Reich, 2007) 0.25 47 50 -0.15 0.65
(Matthews, 2004) 0.32 24 24 -0.24 0.89
(Gurpinar et al., 2010) 0.35 176 176 0.14 0.56
(Kaufman & Mann, 1996) 0.35 72 52 -0.01 0.71
(Vernon et al., 1992) 0.36 144 144 0.13 0.59
(Hwang & Kim, 2006) 0.39 35 36 -0.08 0.85
(Lesperance, 2008) 0.43 9 9 -0.49 1.34
(Ozturk et al., 2008) 0.43 52 95 0.09 0.77
(Vazquez, 2008) 0.52 11 22 -0.21 1.25
(Gurpinar et al., 2010) 0.54 176 176 0.33 0.76
(Vazquez, 2008) 0.55 11 22 -0.18 1.27
(Newble & Clarke, 1986) 0.55 44 43 0.13 0.98
(Wang et al., 2010) 0.56 87 86 0.25 0.86
(Beachey, 2004) 0.58 52 36 0.15 1.01
(Hwang & Kim, 2006) 0.63 35 36 0.16 1.11
(table continues)

173
Study in-text citation g NTreatment NControl CIlower CIupper
(Akinoglu & Tandogan, 2009) 0.65 25 25 0.09 1.22
(Mantri et al., 2008) 0.66 21 107 0.19 1.13
(Gurpinar et al., 2010) 0.67 176 176 0.45 0.88
(Vazquez, 2008) 0.69 11 22 -0.05 1.42
(Distlehorst et al., 2009) 0.76 68 136 0.46 1.06
(Newble & Clarke, 1986) 0.77 63 97 0.44 1.10
(Newble & Clarke, 1986) 0.82 46 104 0.46 1.17
(Konings et al., 2005)) 0.86 15 14 0.11 1.61
(Lesperance, 2008) 0.87 9 9 -0.08 1.82
(Distlehorst et al., 2009) 0.91 83 163 0.63 1.19
(Mantri et al., 2008) 0.91 21 107 0.43 1.39
(Gurpinar et al., 2010) 0.91 176 176 0.69 1.13
(Kaufman & Mann, 1996) 0.95 74 72 0.61 1.29
(Vazquez, 2008) 0.97 11 22 0.22 1.72
(Kaufman & Mann, 1996) 0.97 72 52 0.60 1.35
(Konings et al., 2005)) 1.03 15 14 0.27 1.80
(Dehkordi et al., 2008) 1.07 20 20 0.41 1.73
(Kassebaum et al., 1991) 1.10 17 17 0.39 1.82
(Kassebaum et al., 1991) 1.14 17 17 0.42 1.86
(Kassebaum et al., 1991) 1.16 17 17 0.44 1.88
(Schlett et al., 2010) 1.16 101 4720 0.96 1.36
(Kong et al., 2009) 1.19 60 30 0.72 1.66
(Sevening & Baron, 2002) 1.36 17 17 0.62 2.10
(Lesperance, 2008) 1.45 9 9 0.43 2.48
(Lieberman et al., 1997) 2.81 24 106 2.25 3.37
Pooled ES, total N and confidence interval limits 0.50 3049 8310 0.35 0.65

174
Table G29
Reliability: Scale = Strong, Hedges’ g with NTreatment, NControl, and Lower and Upper Confidence Intervals Study In-text Citation g NTreatment NControl CIlower CIupper
(Anderson, 2007) -0.55 54 56 -0.93 -0.17
(Baragona, 2009) -0.12 46 4 6.00 0.29
(Reich, 2007) -0.01 47 50 -0.40 0.39
(Reich, 2007) 0.18 47 50 -0.22 0.58
(Reich, 2007) 0.25 47 50 -0.15 0.65
(Lin et al., 2010) 0.27 72 70 -0.06 0.60
(Kaufman & Mann, 1996) 0.35 72 52 -0.01 0.71
(Hwang & Kim, 2006) 0.39 35 36 -0.08 0.85
(Ozturk et al., 2008) 0.43 52 5 0.09 0.77
(Lin, Lu, Chung, Yan 0.46 72 70 0.13 0.79
(Hwang & Kim, 2006) 0.63 35 36 0.16 1.11
(Akinoglu & Tandogan, 2009) 0.65 25 25 0.09 1.22
(Semerci, 2006) 0.82 30 30 0.29 1.34
(Kaufman & Mann, 1996) 0.95 74 72 0.61 1.29
(Kaufman & Mann, 1996) 0.97 72 52 0.60 1.35
(Dehkordi et al., 2008) 1.07 20 20 0.41 1.73
Pooled ES, total N and confidence interval limits 0.40 800 678 0.19 0.61
Table G30
Reliability: Scale = Attempt, Hedges’ g with NTreatment, NControl, and Lower and Upper Confidence Intervals Study in-text citation g NTreatment NControl CIlower CIupper
(Hesterberg, 2005) -0.76 33 30 -1.27 -0.25
(Padmaraju, 2008) 0.12 72 72 -0.21 0.45
(Williams et al., 1998) 0.14 82 17 -0.39 0.66
Pooled ES, total N and confidence interval limits -0.15 187 119 -0.70 0.39

175
Table G31
Reliability: Scale = None, Hedges’ g with NTreatment, NControl, and Lower and Upper Confidence Intervals Study in-text citation g NTreatment NControl CIlower CIupper
(Sungur & Tekkaya, 2006) -1.42 30 31 -1.97 -0.86
(Bragg & Evans, 2005) -0.95 75 75 -1.29 -0.61
(Smits et al., 2003) -0.87 46 45 -1.30 -0.44
(Smits et al., 2003) -0.75 51 49 -1.15 -0.34
(Sundblad et al., 2002) -0.66 21 16 -1.32 0.00
(Sundblad et al., 2002) -0.44 21 15 -1.10 0.23
(Lesperance, 2008) -0.25 9 9 -1.16 0.66
(Sundblad et al., 2002) -0.08 21 16 -0.72 0.56
(Baturay & Bay, 2010) 0.01 25 19 -0.59 0.60
(Gurpinar et al., 2010) 0.08 176 176 -0.13 0.29
(Yang, 2002) 0.09 19 18 -0.55 0.73
(Beachey, 2004) 0.11 20 36 -0.37 0.60
(Distlehorst et al., 2009) 0.12 100 221 -0.11 0.36
(Sundblad et al., 2002) 0.13 21 15 -0.53 0.79
(Distlehorst et al., 2009) 0.17 95 200 -0.07 0.42
(Bligh et al., 2000) 0.27 137 149 0.04 0.51
(Baturay & Bay, 2010) 0.30 33 35 -0.17 0.78
(Matthews, 2004) 0.32 24 24 -0.24 0.89
(Gurpinar et al., 2010) 0.35 176 176 0.14 0.56
(Vernon et al., 1992) 0.36 144 144 0.13 0.59
(Lesperance, 2008) 0.43 9 9 -0.49 1.34
(Peters et al., 2000) 0.45 42 46 0.02 0.87
(Lancaster et al., 1997) 0.50 56 285 0.21 0.79
(Vazquez, 2008) 0.52 11 22 -0.21 1.25
(Gurpinar et al., 2010) 0.54 176 176 0.33 0.76
(Vazquez, 2008) 0.55 11 22 -0.18 1.27
(Newble & Clarke, 1986) 0.55 44 43 0.13 0.98
(Wang et al., 2010) 0.56 87 86 0.25 0.86
(Beachey, 2004) 0.58 52 36 0.15 1.01
(Peters et al., 2000) 0.59 45 43 0.17 1.02
(Mantri et al., 2008) 0.66 21 107 0.19 1.13
(Gurpinar et al., 2010) 0.67 176 176 0.45 0.88
(table continues)

176
Study in-text citation g NTreatment NControl CIlower CIupper
(Vazquez, 2008) 0.69 11 22 -0.05 1.42
(Lancaster et al., 1997) 0.73 56 285 0.43 1.02
(Sungur & Tekkaya, 2006) 0.74 30 31 0.23 1.26
(Distlehorst et al., 2009) 0.76 68 136 0.46 1.06
(Newble & Clarke, 1986) 0.77 63 97 0.44 1.10
(Newble & Clarke, 1986) 0.82 46 104 0.46 1.17
(Konings et al., 2005)) 0.86 15 14 0.11 1.61
(Lesperance, 2008) 0.87 9 9 -0.08 1.82
(Peters et al., 2000) 0.87 50 49 0.46 1.28
(Sungur & Tekkaya, 2006) 0.88 30 31 0.35 1.40
(Distlehorst et al., 2009) 0.91 83 163 0.63 1.19
(Mantri et al., 2008) 0.91 21 107 0.43 1.39
(Gurpinar et al., 2010) 0.91 176 176 0.69 1.13
(Vazquez, 2008) 0.97 11 22 0.22 1.72
(Konings et al., 2005)) 1.03 15 14 0.27 1.80
(Lancaster et al., 1997) 1.05 56 285 0.75 1.34
(Kassebaum et al., 1991) 1.10 17 17 0.39 1.82
(Kassebaum et al., 1991) 1.14 17 17 0.42 1.86
(Kassebaum et al., 1991) 1.16 17 17 0.44 1.88
(Schlett et al., 2010) 1.16 101 4720 0.96 1.36
(Kong et al., 2009) 1.19 60 30 0.72 1.66
(Sevening & Baron, 2002) 1.36 17 17 0.62 2.10
(Lesperance, 2008) 1.45 9 9 0.43 2.48
(Lieberman et al., 1997) 2.81 24 106 2.25 3.37
Pooled ES, total N and confidence interval limits 0.50 2976 8998 0.35 0.65

177
Appendix H
Discipline Tables
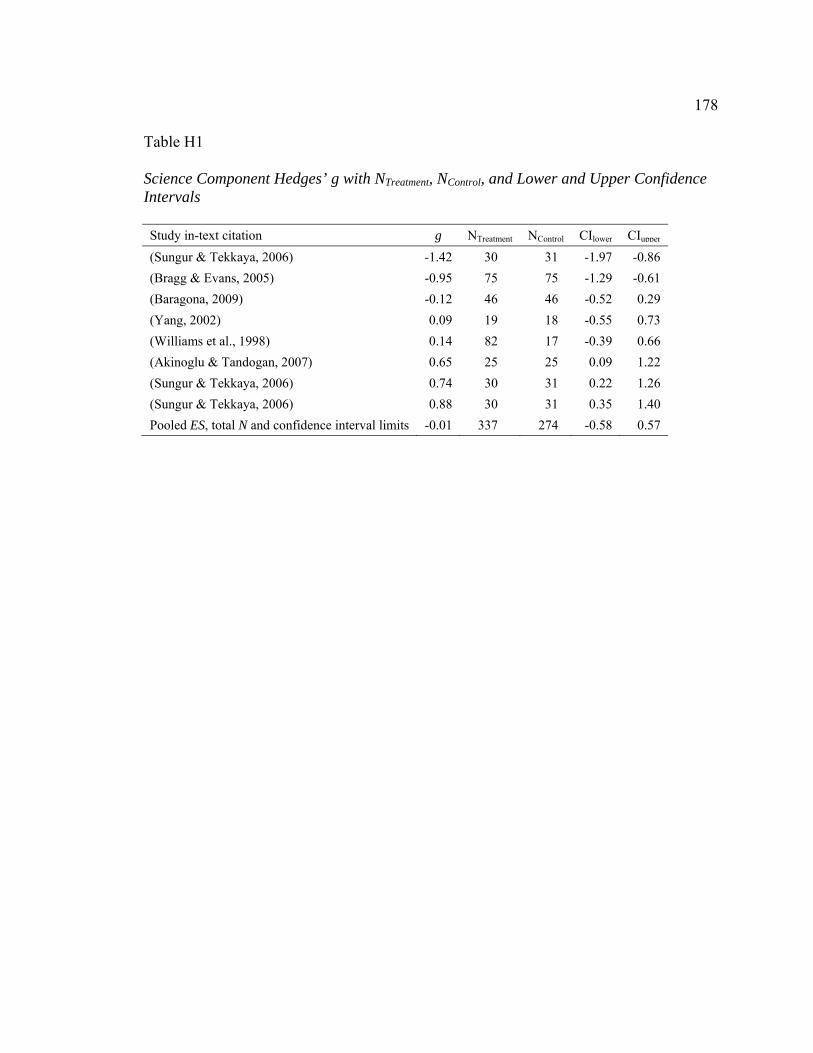
178
Table H1
Science Component Hedges’ g with NTreatment, NControl, and Lower and Upper Confidence Intervals Study in-text citation g NTreatment NControl CIlower CIupper
(Sungur & Tekkaya, 2006) -1.42 30 31 -1.97 -0.86
(Bragg & Evans, 2005) -0.95 75 75 -1.29 -0.61
(Baragona, 2009) -0.12 46 46 -0.52 0.29
(Yang, 2002) 0.09 19 18 -0.55 0.73
(Williams et al., 1998) 0.14 82 17 -0.39 0.66
(Akinoglu & Tandogan, 2007) 0.65 25 25 0.09 1.22
(Sungur & Tekkaya, 2006) 0.74 30 31 0.22 1.26
(Sungur & Tekkaya, 2006) 0.88 30 31 0.35 1.40
Pooled ES, total N and confidence interval limits -0.01 337 274 -0.58 0.57
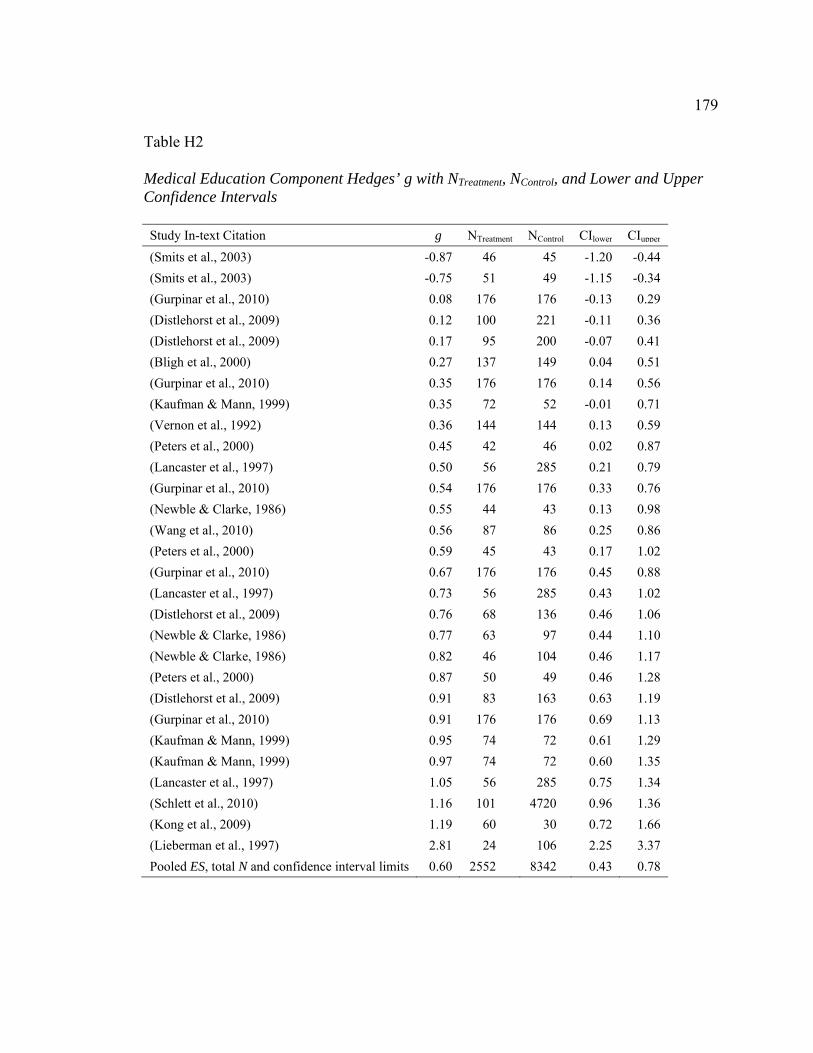
179
Table H2
Medical Education Component Hedges’ g with NTreatment, NControl, and Lower and Upper Confidence Intervals Study In-text Citation g NTreatment NControl CIlower CIupper
(Smits et al., 2003) -0.87 46 45 -1.20 -0.44
(Smits et al., 2003) -0.75 51 49 -1.15 -0.34
(Gurpinar et al., 2010) 0.08 176 176 -0.13 0.29
(Distlehorst et al., 2009) 0.12 100 221 -0.11 0.36
(Distlehorst et al., 2009) 0.17 95 200 -0.07 0.41
(Bligh et al., 2000) 0.27 137 149 0.04 0.51
(Gurpinar et al., 2010) 0.35 176 176 0.14 0.56
(Kaufman & Mann, 1999) 0.35 72 52 -0.01 0.71
(Vernon et al., 1992) 0.36 144 144 0.13 0.59
(Peters et al., 2000) 0.45 42 46 0.02 0.87
(Lancaster et al., 1997) 0.50 56 285 0.21 0.79
(Gurpinar et al., 2010) 0.54 176 176 0.33 0.76
(Newble & Clarke, 1986) 0.55 44 43 0.13 0.98
(Wang et al., 2010) 0.56 87 86 0.25 0.86
(Peters et al., 2000) 0.59 45 43 0.17 1.02
(Gurpinar et al., 2010) 0.67 176 176 0.45 0.88
(Lancaster et al., 1997) 0.73 56 285 0.43 1.02
(Distlehorst et al., 2009) 0.76 68 136 0.46 1.06
(Newble & Clarke, 1986) 0.77 63 97 0.44 1.10
(Newble & Clarke, 1986) 0.82 46 104 0.46 1.17
(Peters et al., 2000) 0.87 50 49 0.46 1.28
(Distlehorst et al., 2009) 0.91 83 163 0.63 1.19
(Gurpinar et al., 2010) 0.91 176 176 0.69 1.13
(Kaufman & Mann, 1999) 0.95 74 72 0.61 1.29
(Kaufman & Mann, 1999) 0.97 74 72 0.60 1.35
(Lancaster et al., 1997) 1.05 56 285 0.75 1.34
(Schlett et al., 2010) 1.16 101 4720 0.96 1.36
(Kong et al., 2009) 1.19 60 30 0.72 1.66
(Lieberman et al., 1997) 2.81 24 106 2.25 3.37
Pooled ES, total N and confidence interval limits 0.60 2552 8342 0.43 0.78

180
Table H3
Social Science Component Hedges’ g with NTreatment, NControl, and Lower and Upper Confidence Intervals Study In-text Citation g NTreatment NControl CIlower CIupper
(Hesterberg, 2005) -0.76 33 30 -1.27 -0.25
(Konings et al., 2005) 0.86 15 14 0.11 1.61
(Konings et al., 2005) 1.03 15 14 0.27 1.80
(Sevening & Baron, 2002) 1.36 17 17 0.62 2.10
Pooled ES, total N and confidence interval limits 0.60 80 75 -0.48 1.68
Table H4
Medical-Other Component Hedges’ g with NTreatment, NControl, and Lower and Upper Confidence Intervals Study In-text Citation g NTreatment NControl CIlower CIupper
(Sundblad et al., 2002) -0.66 21 16 -1.32 0.01
(Sundblad et al., 2002) -0.44 21 16 -1.10 0.23
(Lesperance, 2008) -0.25 9 9 -1.16 0.66
(Sundblad et al., 2002) -0.08 21 16 -0.72 0.56
(Reich, 2007) -0.01 47 50 -0.40 0.39
(Beachey, 2004) 0.11 29 36 -0.37 0.60
(Sundblad et al., 2002) 0.13 21 15 -0.53 0.79
(Reich, 2007) 0.18 47 50 -0.22 0.58
(Reich, 2007) 0.25 47 50 -0.15 0.65
(Lin et al., 2010) 0.27 72 70 -0.06 0.60
(Hwang & Kim, 2006) 0.39 35 36 -0.08 0.85
(Lesperance, 2008) 0.43 9 9 -0.49 1.34
(Ozturk et al., 2008) 0.43 52 95 0.09 0.77
(Lin et al., 2010) 0.46 72 70 0.13 0.79
(Beachey, 2004) 0.58 52 36 0.15 1.01
(Hwang & Kim, 2006) 0.63 35 36 0.16 1.11
(Lesperance, 2008) 0.87 9 9 -0.08 1.82
(Dehkordi et al., 2008) 1.07 20 20 0.41 1.73
(Kassebaum et al., 1991) 1.10 17 17 0.38 1.82
(Kassebaum et al., 1991) 1.14 17 17 0.42 1.86
(Kassebaum et al., 1991) 1.16 17 17 0.44 1.88
(Lesperance, 2008) 1.45 9 9 0.43 2.48
Pooled ES, total N and confidence interval limits 0.38 679 698 0.20 0.55
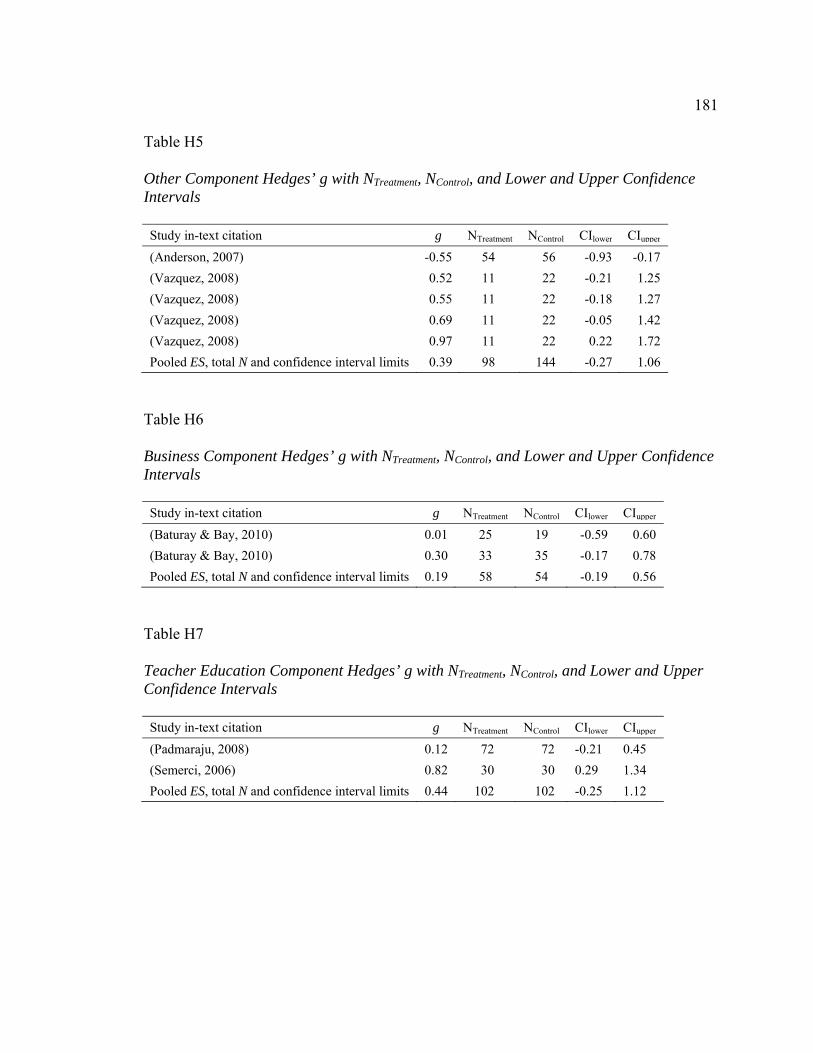
181
Table H5
Other Component Hedges’ g with NTreatment, NControl, and Lower and Upper Confidence Intervals Study in-text citation g NTreatment NControl CIlower CIupper
(Anderson, 2007) -0.55 54 56 -0.93 -0.17
(Vazquez, 2008) 0.52 11 22 -0.21 1.25
(Vazquez, 2008) 0.55 11 22 -0.18 1.27
(Vazquez, 2008) 0.69 11 22 -0.05 1.42
(Vazquez, 2008) 0.97 11 22 0.22 1.72
Pooled ES, total N and confidence interval limits 0.39 98 144 -0.27 1.06
Table H6
Business Component Hedges’ g with NTreatment, NControl, and Lower and Upper Confidence Intervals Study in-text citation g NTreatment NControl CIlower CIupper
(Baturay & Bay, 2010) 0.01 25 19 -0.59 0.60
(Baturay & Bay, 2010) 0.30 33 35 -0.17 0.78
Pooled ES, total N and confidence interval limits 0.19 58 54 -0.19 0.56
Table H7
Teacher Education Component Hedges’ g with NTreatment, NControl, and Lower and Upper Confidence Intervals Study in-text citation g NTreatment NControl CIlower CIupper
(Padmaraju, 2008) 0.12 72 72 -0.21 0.45
(Semerci, 2006) 0.82 30 30 0.29 1.34
Pooled ES, total N and confidence interval limits 0.44 102 102 -0.25 1.12

182
Table H8
Engineering Component Hedges’ g with NTreatment, NControl, and Lower and Upper Confidence Intervals Study in-text citation g NTreatment NControl CIlower CIupper
(Matthews, 2004) 0.321 24 24 -0.244 0.886
(Mantri et al., 2008) 0.661 21 107 0.187 1.134
(Mantri et al., 2008) 0.911 21 107 0.431 1.39
Pooled ES, total N and confidence interval limits 0.658 66 238 0.338 0.978

183
Appendix I
Process/Outcome Tables

184
Table I1
Process Component Hedges’ g with NTreatment, NControl, and Lower and Upper Confidence Intervals Study in-text citation g NTreatment NControl CIlower CIupper
(Sungur & Tekkaya, 2006) -1.42 30 31 -1.97 -0.86
(Bragg & Evans, 2005) -0.95 75 75 -1.29 -0.61
(Smits et al., 2003) -0.87 46 45 -1.30 -0.44
(Hesterberg, 2005) -0.76 33 30 -1.27 -0.25
(Smits et al., 2003) -0.75 51 49 -1.15 -0.34
(Anderson, 2007) -0.55 54 56 -0.93 -0.17
(Baragona, 2009) -0.12 46 46 -0.52 0.29
(Sundblad et al., 2002) -0.08 21 16 -0.72 0.56
(Baturay & Bay, 2010) 0.01 25 19 -0.59 0.60
(Gurpinar et al., 2010) 0.08 176 176 -0.13 0.29
(Yang, 2002) 0.09 19 18 -0.55 0.73
(Padmaraju, 2008) 0.12 72 72 -0.21 0.45
(Williams et al., 1998) 0.14 82 17 -0.39 0.66
(Reich, 2007) 0.18 47 50 -0.22 0.58
(Reich, 2007) 0.25 47 50 -0.15 0.65
(Lin et al., 2010) 0.27 72 70 -0.06 0.60
(Bligh et al., 2000) 0.27 137 149 0.04 0.51
(Baturay & Bay, 2010) 0.30 33 35 -0.17 0.78
(Gurpinar et al., 2010) 0.35 176 176 0.14 0.56
(Vernon et al., 1992) 0.36 144 144 0.13 0.59
(Hwang & Kim, 2006) 0.39 35 36 -0.08 0.85
(Ozturk et al., 2008) 0.43 52 95 0.09 0.77
(Lin et al., 2010) 0.46 72 70 0.13 0.79
(Lancaster et al., 1997) 0.50 56 285 0.21 0.79
(Gurpinar et al., 2010) 0.54 176 176 0.33 0.76
(Vazquez, 2008) 0.55 11 22 -0.18 1.27
(Wang et al., 2010) 0.56 87 86 0.25 0.86
(Beachey, 2004) 0.58 52 36 0.15 1.01
(Hwang & Kim, 2006) 0.63 35 36 0.16 1.11
(Akinoglu & Tandogan, 2007) 0.65 25 25 0.09 1.22
(Vazquez, 2008) 0.69 11 22 -0.05 1.42
(Lancaster et al., 1997) 0.73 56 285 0.43 1.02
(table continues)

185
Study in-text citation g NTreatment NControl CIlower CIupper
(Sungur & Tekkaya, 2006) 0.74 30 31 0.23 1.26
(Semerci, 2006) 0.82 30 30 0.29 1.34
(Konings et al., 2005) 0.86 15 14 0.11 1.61
(Peters et al., 2000) 0.87 50 49 0.46 1.28
(Sungur & Tekkaya, 2006) 0.88 30 31 0.35 1.40
(Mantri et al., 2008)) 0.91 21 107 0.43 1.39
(Gurpinar et al., 2010) 0.91 176 176 0.69 1.13
(Kaufman & Mann, 1999)9) 0.95 74 72 0.61 1.29
(Kaufman & Mann, 1999) 0.97 72 52 0.60 1.35
(Konings et al., 2005) 1.03 15 14 0.27 1.80
(Lancaster et al., 1997) 1.05 56 285 0.75 1.34
(Dehkordi & Heydarnejad, 2008) 1.07 20 20 0.41 1.73
(Kassebaum et al., 1991) 1.10 17 17 0.39 1.82
(Kassebaum et al., 1991) 1.14 17 17 0.42 1.86
(Schlett et al., 2010) 1.16 101 4720 0.96 1.36
(Kong et al., 2009) 1.19 60 30 0.72 1.66
(Sevening & Baron, 2002) 1.36 17 17 0.62 2.10
(Lesperance, 2008) 1.45 9 9 0.43 2.48
(Lieberman et al., 1997) 2.81 24 106 2.25 3.37
Pooled ES, total N and confidence interval limits 0.47 2888 8295 0.30 0.63

186
Table I2
Outcome Component Hedges’ g with NTreatment, NControl, and Lower and Upper Confidence Intervals Study in-text citation g NTreatment NControl CIlower CIupper
(Sundblad et al., 2002) -0.66 21 16 -1.32 0.00
(Sundblad et al., 2002) -0.44 21 15 -1.10 0.23
(Lesperance, 2008) -0.25 9 9 -1.16 0.66
(Reich, 2007) -0.01 47 50 -0.40 0.39
(Beachey, 2004) 0.11 29 36 -0.37 0.60
(Distlehorst et al., 2009) 0.12 100 221 -0.11 0.36
(Sundblad et al., 2002) 0.13 21 15 -0.53 0.79
(Distlehorst et al., 2009) 0.17 95 200 -0.07 0.42
(Matthews, 2004) 0.32 24 24 -0.24 0.89
(Kaufman & Mann, 1999) 0.35 72 52 -0.01 0.71
(Lesperance, 2008) 0.43 9 9 -0.49 1.34
(Peters et al., 2000) 0.45 42 46 0.02 0.87
(Vazquez, 2008) 0.52 11 22 -0.21 1.25
(Newble & Clarke, 1986) 0.55 44 43 0.13 0.98
(Peters et al., 2000) 0.59 45 43 0.17 1.02
(Mantri et al., 2008) 0.66 21 107 0.19 1.13
(Gurpinar et al., 2010) 0.67 176 176 0.45 0.88
(Distlehorst et al., 2009) 0.76 68 136 0.46 1.06
(Newble & Clarke, 1986) 0.77 63 97 0.44 1.10
(Newble & Clarke, 1986) 0.82 46 104 0.46 1.17
(Lesperance, 2008) 0.87 9 9 -0.08 1.82
(Distlehorst et al., 2009) 0.91 83 163 0.63 1.19
(Vazquez, 2008) 0.97 11 22 0.22 1.72
(Kassebaum, Averbach, & Fryer, 1991) 1.16 17 17 0.44 1.88
Pooled ES, total N and confidence interval limits 0.44 1084 1632 0.28 0.60

187
Appendix J
Traditional Tables

188
Table J1
Traditional Component Hedges’ g with NTreatment, NControl, and Lower and Upper Confidence Intervals Study in-text citation g NTreatment NControl CIlower CIupper
(Sungur & Tekkaya, 2006) -1.42 30 31 -1.97 -0.86
(Bragg & Evans, 2005) -0.95 75 75 -1.29 -0.61
(Hesterberg, 2005) -0.76 33 30 -1.27 -0.25
(Reich, 2007) -0.01 47 50 -0.40 0.39
(Baturay & Bay, 2010) 0.01 25 19 -0.59 0.60
(Gurpinar et al., 2010) 0.08 176 176 -0.13 0.30
(Yang, 2002) 0.09 19 18 -0.55 0.73
(Beachey, 2004) 0.11 29 36 -0.37 0.60
(Distlehorst et al., 2009) 0.12 100 221 -0.11 0.36
(Williams et al., 1998) 0.14 82 17 -0.39 0.66
(Distlehorst et al., 2009) 0.17 95 200 -0.07 0.42
(Reich, 2007) 0.18 47 50 -0.22 0.58
(Reich, 2007) 0.25 47 50 -0.15 0.65
(Lin et al., 2010) 0.27 72 70 -0.06 0.60
(Baturay & Bay, 2010) 0.30 33 35 -0.17 0.78
(Matthews, 2004) 0.32 24 24 -0.24 0.89
(Gurpinar et al., 2010) 0.35 176 176 0.14 0.56
(Kaufman & Mann, 1999) 0.35 72 52 -0.01 0.71
(Vernon et al., 1992) 0.36 144 144 0.13 0.59
(Ozturk et al., 2008) 0.43 52 95 0.09 0.77
(Lin et al., 2010) 0.46 72 70 0.13 0.80
(Gurpinar et al., 2010) 0.54 176 176 0.33 0.76
(Newble & Clarke, 1986) 0.55 44 43 0.13 0.98
(Wang et al., 2010) 0.56 87 86 0.25 0.86
(Beachey, 2004) 0.58 52 36 0.15 1.01
(Akinoglu & Tandogan, 2007) 0.65 25 25 0.09 1.22
(Mantri et al., 2008) 0.66 21 107 0.19 1.13
(Gurpinar et al., 2010) 0.67 176 176 0.45 0.88
(Sungur & Tekkaya, 2006) 0.74 30 31 0.23 1.26
(Distlehorst et al., 2009) 0.76 68 136 0.46 1.06
(Newble & Clarke, 1986) 0.77 63 97 0.44 1.10
(Newble & Clarke, 1986) 0.82 46 104 0.46 1.17
(table continues)

189
Study in-text citation g NTreatment NControl CIlower CIupper
(Semerci, 2006) 0.82 30 30 0.29 1.34
(Konings et al., 2005) 0.86 15 14 0.12 1.61
(Sungur & Tekkaya, 2006) 0.88 30 31 0.35 1.40
(Distlehorst et al., 2009) 0.91 83 163 0.63 1.19
(Mantri et al., 2008) 0.91 21 107 0.43 1.39
(Gurpinar et al., 2010) 0.91 176 176 0.69 1.13
(Kaufman & Mann, 1999) 0.95 74 72 0.61 1.29
(Kaufman & Mann, 1999) 0.97 72 52 0.60 1.35
(Konings et al., 2005) 1.03 15 14 0.27 1.80
(Schlett et al., 2010) 1.16 101 4720 0.96 1.36
(Sevening & Baron, 2002) 1.36 17 17 0.62 2.10
(Lieberman et al., 1997) 2.81 24 106 2.25 3.37
Pooled ES, total N and confidence interval limits 0.49 2896 8158 0.33 0.64
Table J2
Lecture-Based Component Hedges’ g with NTreatment, NControl, and Lower and Upper Confidence Intervals Study in-text citation g NTreatment NControl CIlower CIupper
(Smits et al., 2003) -0.87 46 45 -1.30 -0.44 (Smits et al., 2003) -0.75 51 49 -1.15 -0.34 (Lesperance, 2008) -0.25 9 9 -1.16 0.66 (Baragona, 2009) -0.12 46 46 -0.52 0.29 (Hwang & Kim, 2006) 0.39 35 36 -0.08 0.85 (Lesperance, 2008) 0.43 9 9 -0.49 1.34 (Peters et al., 2000) 0.45 42 46 0.02 0.87 (Lancaster et al., 1997) 0.50 56 285 0.21 0.79 (Peters et al., 2000) 0.60 45 43 0.17 1.02 (Hwang & Kim, 2006) 0.63 35 36 0.16 1.11 (Lancaster et al., 1997) 0.73 56 285 0.43 1.02 (Lesperance, 2008) 0.87 9 9 -0.08 1.82 (Peters et al., 2000) 0.87 50 49 0.46 1.28 (Lancaster et al., 1997) 1.05 56 285 0.75 1.34 (Dehkordi et al., 2008) 1.07 20 20 0.41 1.73 (Kassebaum et al., 1991) 1.10 17 17 0.39 1.82 (Kassebaum et al., 1991) 1.14 17 17 0.42 1.86 (Kassebaum et al., 1991) 1.16 17 17 0.44 1.88 (Lesperance, 2008) 1.45 9 9 0.43 2.48 Pooled ES, total N and confidence interval limits 0.52 625 1312 0.23 0.81

190
Table J3
Multiple Component Hedges’ g with NTreatment, NControl, and Lower and Upper Confidence Intervals Study in-text citation g NTreatment NControl CIlower CIupper
(Sundblad et al., 2002) -0.66 21 16 -1.32 0.00
(Sundblad et al., 2002) -0.44 21 15 -1.10 0.23
(Sundblad et al., 2002) -0.08 21 16 -0.72 0.56
(Sundblad et al., 2002) 0.13 21 15 -0.53 0.79
(Bligh et al., 2000) 0.27 137 149 0.04 0.51
(Kong et al., 2009) 1.19 60 30 0.72 1.66
Pooled ES, total N and confidence interval limits 0.11 281 241 -0.38 0.60
Table J4
Teacher-Guided Learning Component Hedges’ g with NTreatment, NControl, and Lower and Upper Confidence Intervals Study in-text citation g NTreatment NControl CIlower CIupper
(Anderson, 2007) -0.55 54 56 -0.93 -0.17
Pooled ES, total N and confidence interval limits -0.55 54 56 -0.93 -0.17
Table J5
Control Component Hedges’ g with NTreatment, NControl, and Lower and Upper Confidence Intervals Study in-text citation g NTreatment NControl CIlower CIupper
(Padmaraju, 2008) 0.119 72 72 -0.21 0.45
Pooled ES, total N and confidence interval limits 0.119 72 72 -0.21 0.45

191
Table J6
Missing Component Hedges’ g with NTreatment, NControl, and Lower and Upper Confidence Intervals Study in-text citation g NTreatment NControl CIlower CIupper
(Vazquez, 2008) 0.52 11 22 -0.21 1.25
(Vazquez, 2008) 0.54 11 22 -0.18 1.27
(Vazquez, 2008) 0.69 11 22 -0.05 1.42
(Vazquez, 2008) 0.97 11 22 0.22 1.72
Pooled ES, total N and confidence interval limits 0.68 44 88 0.31 1.04
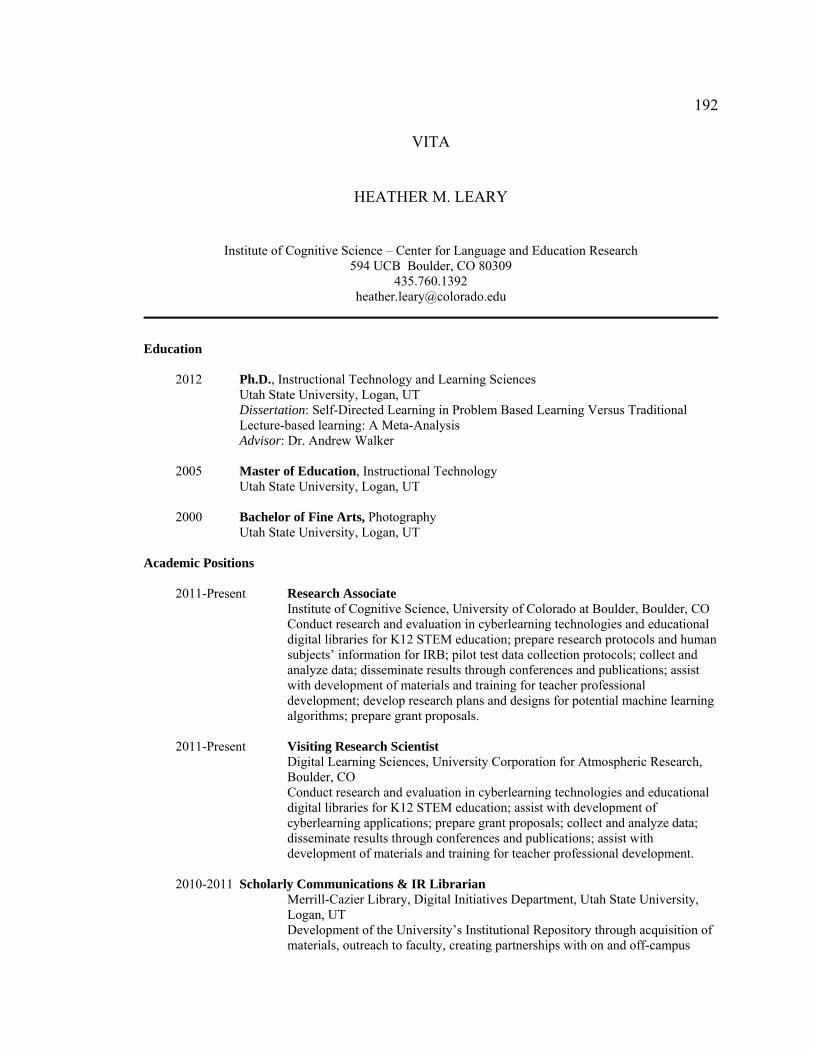
192
VITA
HEATHER M. LEARY
Institute of Cognitive Science – Center for Language and Education Research 594 UCB Boulder, CO 80309
435.760.1392 [email protected]
Education
2012 Ph.D., Instructional Technology and Learning Sciences Utah State University, Logan, UT
Dissertation: Self-Directed Learning in Problem Based Learning Versus Traditional Lecture-based learning: A Meta-Analysis Advisor: Dr. Andrew Walker
2005 Master of Education, Instructional Technology Utah State University, Logan, UT 2000 Bachelor of Fine Arts, Photography Utah State University, Logan, UT
Academic Positions
2011-Present Research Associate
Institute of Cognitive Science, University of Colorado at Boulder, Boulder, CO Conduct research and evaluation in cyberlearning technologies and educational digital libraries for K12 STEM education; prepare research protocols and human subjects’ information for IRB; pilot test data collection protocols; collect and analyze data; disseminate results through conferences and publications; assist with development of materials and training for teacher professional development; develop research plans and designs for potential machine learning algorithms; prepare grant proposals.
2011-Present Visiting Research Scientist
Digital Learning Sciences, University Corporation for Atmospheric Research, Boulder, CO Conduct research and evaluation in cyberlearning technologies and educational digital libraries for K12 STEM education; assist with development of cyberlearning applications; prepare grant proposals; collect and analyze data; disseminate results through conferences and publications; assist with development of materials and training for teacher professional development.
2010-2011 Scholarly Communications & IR Librarian Merrill-Cazier Library, Digital Initiatives Department, Utah State University, Logan, UT Development of the University’s Institutional Repository through acquisition of materials, outreach to faculty, creating partnerships with on and off-campus

193
entities, training contributors, evaluating use, and maintaining the site; Oversee the procedures, policies, copyright, and standards governing the site; Collection development for the Department of Instructional Technology & Learning Sciences; Research, scholarship, and creative activities; Service.
2006-2011 Research Assistant
DL Connect, TPC, Last Mile Grants, Department of Instructional Technology & Learning Sciences, Utah State University, Logan, UT Participate in curriculum design and teaching of teacher professional development workshops on a tool called the Instructional Architect (IA). Collect & analyze data, write articles, and present research at conferences. Specific responsibilities are in the creation and testing of a review rubric for IA projects.
2008-2010 Institutional Repository/Digital Imaging Coordinator
Merrill-Cazier Library, Digital Initiatives Department, Utah State University, Logan, UT Overall management of the Digital Commons, marketing to faculty, article copyright clearance, and coordinating of collections for the University’s Institutional Repository. Overseeing operations of digital darkroom and imaging.
2006-2007 Research Assistant
New Faculty Grant, Dept. of Instructional Technology & Learning Sciences, Utah State University, Logan, UT Participated with my advisor on a problem based learning meta-analysis. Responsibilities included searching for articles to include in meta-analysis, coding articles, running data, analyzing & interpreting data, article writing.
2004-2008 Digital Library Assistant
Merrill-Cazier Library, Digital Initiatives Department Utah State University, Logan, UT
Responsibilities included creation and coordination of digital collections, scanning, web design, uploading content to the web, and student employees.
2003-2004 Cataloging Assistant
Merrill-Cazier Library, Cataloging Department Utah State University, Logan, UT
Responsibilities included retrospective cataloging of Government Documents, liason duties between Cataloging and Government Documents, cataloging newly acquired Government Documents.
Awards & Honors
2011 Outstanding Research Assistant Department of Instructional Technology & Learning Sciences, Utah State University, Logan, UT
2009 Lee W. Cochran Intern
One of 5 graduate students selected for the ECT Internship held at the 2009 Association for Educational Communications & Technology annual conference, October 27-31, Louisville, Kentucky
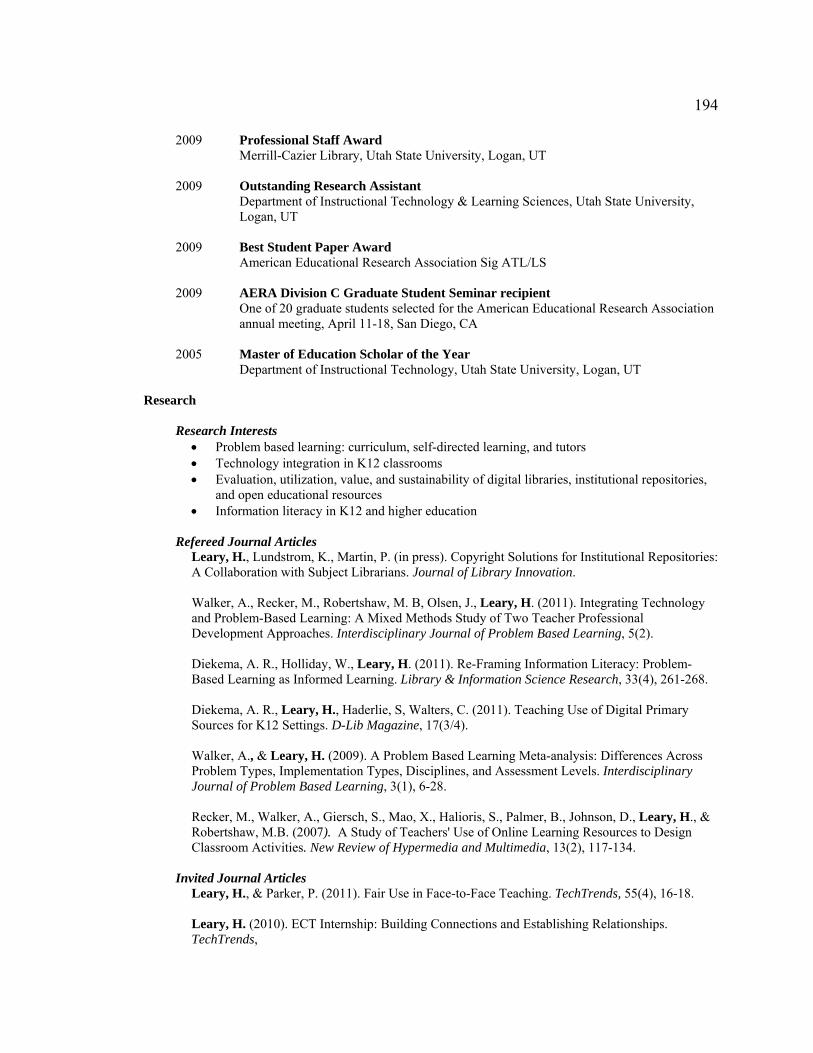
194
2009 Professional Staff Award Merrill-Cazier Library, Utah State University, Logan, UT 2009 Outstanding Research Assistant
Department of Instructional Technology & Learning Sciences, Utah State University, Logan, UT
2009 Best Student Paper Award American Educational Research Association Sig ATL/LS 2009 AERA Division C Graduate Student Seminar recipient
One of 20 graduate students selected for the American Educational Research Association annual meeting, April 11-18, San Diego, CA
2005 Master of Education Scholar of the Year Department of Instructional Technology, Utah State University, Logan, UT
Research
Research Interests Problem based learning: curriculum, self-directed learning, and tutors Technology integration in K12 classrooms Evaluation, utilization, value, and sustainability of digital libraries, institutional repositories,
and open educational resources Information literacy in K12 and higher education
Refereed Journal Articles
Leary, H., Lundstrom, K., Martin, P. (in press). Copyright Solutions for Institutional Repositories: A Collaboration with Subject Librarians. Journal of Library Innovation. Walker, A., Recker, M., Robertshaw, M. B, Olsen, J., Leary, H. (2011). Integrating Technology and Problem-Based Learning: A Mixed Methods Study of Two Teacher Professional Development Approaches. Interdisciplinary Journal of Problem Based Learning, 5(2). Diekema, A. R., Holliday, W., Leary, H. (2011). Re-Framing Information Literacy: Problem-Based Learning as Informed Learning. Library & Information Science Research, 33(4), 261-268. Diekema, A. R., Leary, H., Haderlie, S, Walters, C. (2011). Teaching Use of Digital Primary Sources for K12 Settings. D-Lib Magazine, 17(3/4). Walker, A., & Leary, H. (2009). A Problem Based Learning Meta-analysis: Differences Across Problem Types, Implementation Types, Disciplines, and Assessment Levels. Interdisciplinary Journal of Problem Based Learning, 3(1), 6-28. Recker, M., Walker, A., Giersch, S., Mao, X., Halioris, S., Palmer, B., Johnson, D., Leary, H., & Robertshaw, M.B. (2007). A Study of Teachers' Use of Online Learning Resources to Design Classroom Activities. New Review of Hypermedia and Multimedia, 13(2), 117-134.
Invited Journal Articles Leary, H., & Parker, P. (2011). Fair Use in Face-to-Face Teaching. TechTrends, 55(4), 16-18. Leary, H. (2010). ECT Internship: Building Connections and Establishing Relationships. TechTrends,

195
54(5), 13. Leary, H., & Parker, P. (2010). Author rights: Knowing is More than Half the Battle. TechTrends, 54(3).
Refereed Book Chapters Leary, H., Giersch, S., Walker, A., Recker, M. (2011). Developing and Using a Review Rubric to Assess Learning Resource Quality in Education Digital Libraries. In Sulieman Bani-Ahmad (Ed), Experiences and Future of Digital Libraries. InTech. Robertshaw, M.B., Walker, A., Recker, M., Leary, H. & Sellers, L. (2010). Experiences in the Field: The Evolution of a Teacher Technology Professional Development Model. In Myint Swe Khine & Issa M. Saleh (Eds.), New science of learning: Cognition, computers, and collaboration in education. New York: Springer. Robertshaw, M.B., Leary, H., Walker, A., Bloxham, K., & Recker, M. (2009). Reciprocal Mentoring “In the Wild”: A Retrospective, Comparative Case Study of ICT Teacher Professional Development. In E. Stacey (Ed.) Effective Blended Learning Practices: Evidence-Based Perspectives in ICT-Facilitated Education (pp. 280-297). Melbourne: IGI Global Press.
Manuscripts Under Review
Walker, A., Recker, M., Ye, L., Robertshaw, M. B., Sellers, L., Leary, H. (under review). Comparing Technology-Related Teacher Professional Development Designs: A multilevel study of teacher and student impacts. Wetzler, P., Bethard, S., Danesh, S., Leary, H., Zhao, J., Butcher, K., Martin, J. H., Sumner, T. (under review). Characterizing and Predicting the Multi-faceted Nature of Quality in Educational Web Resources.
Manuscripts In Progress Leary, H., Walker, A., Shelton, B. E., Fitt, M. H. Tutor Background and Tutor Training as Moderators of Student Learning: A PBL Meta-Analysis. Belland, B., Walker, A., Olsen, M. W., Leary, H. Impact of Scaffolding Characteristics and Study Quality on Learner Outcomes in STEM Education: A meta-analysis.
Fitt, M. H., Walker, A., & Leary, H. Assessing the Quality of Doctoral Dissertation Literature Reviews in Instructional Technology. Leary, H., Shelton, B. E., Walker, A. Rich Visual Media Meta-Analyses for Learning: An approach at meta-synthesis.
Belland, B., Walker, A., Leary, H. A Meta-analysis of Problem-based Learning Corrected for Attenuation, and Accounting for Internal Threats.
Conference Proceedings
Leary, H., Recker, M., Walker, A., Wetzler, P., Sumner, T., Martin, J. (2011). Automating Open Educational Resources Assessments: A Machine Learning Generalization Study. In proceedings of the Joint Conference on Digital Libraries, New York: ACM. Leary, H., Giersch, S., Walker, A., & Recker, M. (2009). Developing a Review Rubric for Learning Resources in Digital Libraries. In proceedings of the Joint Conference on Digital Libraries, New York: ACM.

196
Leary, H., & Wiley, D. (2008). What Web 2.0 can Teach the Open Education Movement. In proceedings of the Open Education Conference, Logan, Utah.
Giersch, S., Leary, H., Palmer, B., & Recker, M. (2008). Supporting Meaningful Learning with Online Resources: Developing a Review Process. In proceedings of the Open Education Conference, Logan, Utah.
Robertshaw, M.B., Bloxham, K., Walker, A., Leary, H., & Recker, M. (2008). Teacher as Designers of Online and Open Educational Resources: An empirical examination of professional development for re-use. In proceedings of the Open Education Conference, Logan, Utah.
Giersch, S. Leary, H., Palmer, B., & Recker, M. (2008). Developing a Review Process for Online Resources. In proceedings of the Joint Conference on Digital Libraries, New York: ACM.
Presentations
Leary, H., Walker, A., Shelton, B. E. (2012, April). Self-Directed Learning in Problem-Based Learning: A meta-analysis. Presentation at the American Educational Research Association, Vancouver, Canada. Belland, B., Walker, A., Olsen, M. W., Leary, H. (2012, April). Impact of Scaffolding Characteristics and Study Quality on Learner Outcomes in STEM Education: A meta-analysis. Presentation at the American Educational Research Association, Vancouver, Canada. Walker, A., Recker, M., Ye, L., Sellers, L., Leary, H., Robertshaw, M. B. (2012, April). Comparing Technology-Related Teacher Professional Development Designs: A multilevel study of teacher and student impacts. Presentation at the American Educational Research Association, Vancouver, Canada. Leary, H., & Parker, P. (2011, November). Fair Use, the TEACH Act and Open Educational Resources for Your Classroom. Presentation at the Association for Educational Communications and Technology international convention, Jacksonville, FL. Sellers, L., & Leary, H. (2011, November). School Librarians and Technology: Integrating Online Resources for Teaching. Presentation at the Association for Educational Communications and Technology international convention, Jacksonville, FL. Walker, A., Recker, M., Robertshaw, M. B., Olsen, J., & Sellers, L., Leary, H., Kuo, Y. (2011, April). Designing For Problem Based Learning: A Comparative Study Of Technology Professional Development. Paper presentation at the American Educational Research Association, New Orleans, LA. Recker, M., Leary, H., Walker, A., Diekema, A. R., Wetzler, P., Sumner, T., Martin, J. (2011, April). Modeling Teacher Ratings of Online Resources: A Human-Machine Approach to Quality. Paper presentation at the American Educational Research Association, New Orleans, LA.
Leary, H. (2010, November). A Sustainability Model for Populating DigitalCommons@USU. Innovation Fair presentation at SPARC Digital Repositories, Baltimore, MD. Correia, A., Kim, Y., Lockee, B., Miller, P., Smaldino, S., Young, P.1 (2010, October). Empowering Women Leadership in the Field of Educational Technology. Presidential presentation
1 Organized and facilitated by 2009 ECT Interns: Evrim Baran, Abigail Hawkins, Nari Kim, Heather Leary, Eunjung Oh

197
at the Association for Educational Communications and Technology international convention, Anaheim, CA. Diekema, A. R., Holliday, W., Leary, H. (2010, October). Scaffolding Information Literacy with Problem-Based Learning in an Asynchronous Online Environment. Paper presentation at the Association for Educational Communications and Technology international convention, Anaheim, CA. Leary, H., Shelton, B. E., Walker, A. (2010, May). Rich Visual Media Meta-Analyses for Learning: An Approach at Meta-Synthesis. Roundtable discussion at the American Education Research Association annual meeting, Denver, CO. Belland, B., Walker, A., Leary, H., Kuo, Y. & Can, G. (2010, May). A Meta-Analysis of Problem-Based Learning Corrected for Attenuation, and Accounting for Internal Threats. Paper presentation at the American Education Research Association annual meeting, Denver, CO. Walker, A., Recker, M., Leary, H., Robertshaw, M. B. (2010, May). Incorporating Technology and Problem-Based Learning: Professional Development for K-12 Teachers. Paper presentation at the American Education Research Association annual meeting, Denver, CO. Leary, H., Diekema, A. R., Walters, C., Haderlie, S. (2010, May). Using Online Resources to Enhance Reference and Instruction. Presentation at the Utah Library Association annual conference, St. George, UT. Leary, H., Williams, R., Dunshee, P., Elinky, M., Rollins, K., Clement, S. (2010, May). Conferences, Exhibits, Open Houses, Oh My! Panel presentation at the Utah Library Association annual conference, St. George, UT. Leary, H., Walker, A., Fitt, M. H., Shelton, B. (2009, October). Expert Versus Novice Tutors: Impacts on Student Outcomes in Problem Based Learning. Paper presentation at the Association for Educational Communications and Technology international convention, Louisville, KY. Leary, H., Fitt, M. H., & Wiley, D. (2009, October). Web 2.0 and the Open Education Movement: Transforming Learning in Higher Education. Paper presentation at the Association for Educational Communications and Technology international convention, Louisville, KY. Robertshaw, M. B., Walker, A., & Leary, H. (2009, October). Putting the School Librarian Back in the Digital Library. Presentation at the Library & Information Technology Association National Forum, Salt Lake City, UT. Leary, H., Shelton, B., Jensen, M. (2009, October). Beyond Research: OpenCourseWare in the Institutional Repository. Presentation at the Library & Information Technology Association National Forum, Salt Lake City, UT. Walters, C., Leary, H., Diekema, A., & Haderlie, S. (2009, October). Using Digital Primary Sources for Teaching K-12. Presentation at the Utah Educational Association conference, Murray, UT. Leary, H., & Shelton, B. (2009, August). Integrating an OpenCourseWare and Institutional Repository. Presentation at the Open Education Conference, Vancouver, BC.

198
Leary, H., Walker, A., & Fitt, M. H. (2009, April). Expert Versus Novice Tutors: Impacts on Students Outcomes in Problem Based Learning2. Roundtable discussion at the American Education Research Association annual meeting, San Diego, CA. Fitt, M. H., Walker, A., Leary, H., Bloxham, K., Barton, R., & Gurrell, S. (2009, April). Understanding the Written Components of the Doctoral Experience. Paper presentation at the American Education Research Association annual meeting, San Diego, CA. Leary, H., Holliday, W., & Diekema, A. (2009, April). Teaching Information Literacy with Authentic Problems. Presentation at the Utah Library Association annual conference, Sandy, UT.
Alvord, T., Leary, H., & Williams, R. (2009, April). FolkBistro: USU’s Folklore Podcasts. Presentation at the Utah Library Association annual conference, Sandy, UT. Haderlie, S., Walters, C., Leary, H., & Diekema, A. (2009, March). Using Digital Primary Sources to Enhance Teaching and Learning. Presentation at the Utah Educational Library Media Association conference, Ogden, Utah.
Robertshaw, M. B., Leary, H., & Bloxham, K. (2008, November). Reciprocal Mentoring and
Technological Pedagogical Content Knowledge: An Emerging Model of Technology Professional Development for K-12 Teachers. Presentation at the Association for Educational Communication and Technology international convention, Orlando, FL.
Parker, P. & Leary, H. (2008, November). Intellectual Property Committee Update: The Use of
Open Content and Open Licensing in Education. Roundtable discussion at the Association for Educational Communication and Technology international convention, Orlando, FL.
Leary, H., Robertshaw, M.B., Walker, A., & Bloxham, K. (2008, April/May). Crossing Paths to
Connect Educators and Learners with Online Resources. Presentation at the Utah Library Association/Mountain Plains Library Association conference, Salt Lake City, UT.
Williams, R., Walters, C., & Leary, H. (2008, April/May). Sound Collaboration: Creating an Oral
History Digital Collection from Scratch. Presentation at the Utah Library Association/Mountain Plains Library Association conference, Salt Lake City, UT.
Leary, H., Robertshaw, M.B., & Bloxham, K. (2008, Feb/March). The Instructional Architect: A
Blueprint for Connecting Teachers and Students to Online Resources. Presentation at the Utah Coalition for Educational Technology annual conference, Salt Lake City, UT.
Walker, A., & Leary, H. (2008, March). A Problem-based Learning Meta-analysis: Differences
Across Problem Types, Implementation Types, Disciplines, and Educational Levels. Paper presentation at the American Educational and Research Association annual conference, New York, NY.
Robertshaw, M. B., Leary, H., Gardner, J. & Bentley, J. (2007, November). Listening to the
Librarians: Lessons from a 5-year Program Evaluation. Presentation at the American Evaluation Association conference, Baltimore, MD.
Walker, A., & Leary, H. (2007, October). Problem-based learning: A Meta-analytic Review of
Problem and Implementation Types Across Disciplines and Educational Levels. Paper presentation at the Association for Educational Communications and Technology international
2 Winning paper of the 2009 AERA Sig ATL/LS Best Student Paper

199
convention, Anaheim, CA.
Johnson, D., Walker, A., Leary, H., & Robertshaw, B. (2007, March). Connecting Teachers and Learners with Online Resources. Presentation at the Utah Coalition for Educational Technology annual conference, Murray, UT.
Leary, H. (2007, April). Lessons Learned: Coding a Meta-analytic Review of Problem Based
Learning Literature. Annual Graduate Research Symposium, Utah State University, Logan, UT. Grants Funded Grants
Funding Agency
PI Co-PI Title Funding Program
Amount Funding Period
Library of Congress
Cheryl Walters
Heather Leary Anne Diekema Sheri Haderlie
Teaching with Primary Sources
Regional Teaching with Primary Sources
$10,000 2009
Library Services and Technology Act
John Walters
Heather Leary Map Printing for Patrons
Technology $7,500 2004
Submitted Grants
Funding Agency
PI Co-PI Title Funding Program
Amount Funding Period
National Science Foundation
Tamara Sumner
Steven Bethard Heather Leary (Collaborators: Holly Devaul, Mimi Recker, Anne Diekema, Kirsten Butcher)
DIP: Collaborative Research: OPERA: Open Educational Resources Assessments
Cyberlearning: Development and Integration
$692,885 2012-2015
Institute of Museum and Library Services
Anne Diekema
Heather Leary
Creating 21st Century Learners: An online module to stimulate active learning, critical thinking, and knowledge building
National Leadership Grants
$48,320 2012-2014

200
Teaching Invited Lectures
Leary, H. (Fall 2010). National & Local Digital Libraries and an Online Technology Tool for Teaching. Presented a lecture to graduate students in INST 5000/6060 at Utah State University on various digital libraries, copyright considerations, and the Instructional Architect. Leary, H. & Walters, C. (Spring 2009). National & Local Digital Libraries and an Online Technology Tool for Teaching. Presented a lecture to graduate students in INST 5030/6030 at Utah State University on the Library of Congress, Mountain West, and Utah State digital libraries along with an introduction to the Instructional Architect. Leary, H. (Fall 2008). National & Local Digital Libraries and an Online Technology Tool for Teaching. Presented a lecture to graduate students in INST 5000/6060 at Utah State University on the Library of Congress, Mountain West, and Utah State digital libraries along with an introduction to the Instructional Architect. Leary, H. (Fall 2007). The Instructional Architect. Presented a lecture to graduate students in INST 5000/6060 at Utah State University on the Instructional Architect.
Workshops
Recker, M., Walker, A., Leary, H., Sellers, L., Robertshaw, M. B. (Fall 2010). Introduction to the Instructional Architect. Teacher professional development workshop focusing on the Instructional Architect, inquiry based learning, and the evaluation of online educational resources for the integration of online resources in the classroom. Davis County School District, Farmington, UT. Recker, M., Walker, A., Leary, H., Sellers, L., Robertshaw, M. B. (Fall 2009/Spring 2010). Introduction to the Instructional Architect. Teacher professional development workshop focusing on the Instructional Architect, inquiry based learning, and the evaluation of online educational resources for the integration of online resources in the classroom. Cache County School District, North Logan, UT. Walters, C., Leary, H., Diekema, A., Haderlie, S. (Summer 2009). Teaching with Primary Sources. Teacher and school library media specialist professional development workshop focusing on primary sources in the Library of Congress, Mountain West Digital Library and Utah State University Digital Library; tool for archiving and presenting primary sources in the classroom. Utah State University, Logan, UT. Recker, M., Walker, A., Leary, H., Sellers, L., Robertshaw, M. B. (Spring 2009). Introduction to the Instructional Architect. Teacher professional development workshop focusing on the Instructional Architect, inquiry based learning, and the evaluation of online educational resources for the integration of online resources in the classroom. Cache County School District, North Logan, UT. Recker, M., Walker, A., Leary, H., Sellers, L., Robertshaw, M. B. (Fall 2008). Introduction to the Instructional Architect. Teacher professional development workshop focusing on the Instructional Architect and inquiry based learning for the integration of online educational resources in the classroom. Cache County School District, North Logan, UT. Bloxham, K., & Leary, H. (Summer 2008). A review of the Instructional Architect. School library media specialists review and introduction to advanced features of the Instructional Architect. Utah State University, Logan, UT.

201
Johnson, D., Walker, A., Palmer, B., Leary, H., Robertshaw, M. B. (Spring 2007). Introducing the Instructional Architect to K5 teachers. Teacher professional development technology workshop to introduce the Instructional Architect for the integration of online educational resources in the classroom. Edith Bowen Laboratory School, Logan, UT.
Leary, H. (Spring 2005). Introduction to software programs. Series of workshops for academic librarians on the basics of Photoshop Elements, Word, Excel, and PowerPoint. The intent was to prepare them for helping patrons use the programs in a newly created Information Commons. Utah State University, Logan, UT.
Instructional Materials Developed
Leary, H., Holliday, W., & Diekema, A. (2008). Information Literacy. Design and development of an information literacy course module for students at Utah State University. The course was created as html pages for easy importing into Blackboard and reuse of the material. Leary, H., Bloxham, K., & Recker, M. (2008). Instructional Architect online course module. Redesign of the Instructional Architect online course module. The course was created as html pages for easy importing into Blackboard and reuse of the material.
Leary, H., & Giersch, S. (2008). The Instructional Architect review rubric. Design and development of an evaluation rubric for online educational resources, specifically Instructional Architect projects. It was created for classroom teachers to use to inform their designing and evaluation of IA projects.
Recker, M., Walker, A., Johnson, D., Robertshaw, M. B., Leary, H., Bloxham, K., & Sellers, L. (2007-present). The Instructional Architect. Design and development of progressive professional development workshop materials for teaching the Instructional Architect. Leary, H. (2005). Introduction to software programs. Designed and developed materials for a series of workshops for academic librarians on Photoshop Elements, Word, Excel, and Powerpoint. Courses were delivered face-to-face with supplemental Camtasia videos.
Service
Journal Reviewing 2012-Present, Research Section, Educational Technology Research & Development 2010 Guest reviewer, American Educational Research Journal 2009 Guest reviewer, Journal of the Learning Sciences
Conference Proposal Reviewing
2012 International Conference of the Learning Sciences 2009 American Educational Research Association, Sig PBL
Utah State University
Graduate Student Associations 2009-2010 Communications Officer, Instructional Technology Student Association 2007-2010 Department Representative, Instructional Technology & Learning Sciences
department to the Graduate Student Senate

202
2007-2008 Secretary, Instructional Technology Student Association Committee Memberships
2009-2011 Copyright Committee, Merrill-Cazier Library 2008-2011 Institutional Repository Advisory Committee, Chair, Merrill-Cazier Library 2004-2009 Digital Library Advisory Committee, Merrill-Cazier Library 2008 Student representative on faculty search committee, Dept. of Instructional
Teachnology & Learning Sciences 2005 Graphic designer search committee, Faculty Assistance Center for Teaching
Conferences
2010 Facilitator, Association for Educational Communications & Technology Conference, Anaheim, California
2010 Volunteer, Utah Library Association Conference, St. George, Utah 2009 Organizer, Institutional Repositories: Disseminating, Promoting, and
Preserving Scholarship conference, September 20, 2009, Utah State University, Logan, Utah
2006-2008 Volunteer, Open Education Conference, Logan, Utah
External Leadership Positions
2009-present Member, Association for Educational Communications & Technology History and Archives Committee
2009-present Member, Association for Educational Communications & Technology
Intellectual Property Committee 2009-2011 Liaison, Utah State University Institutional Repository liaison with the
Utah Academic Library Consortium
Professional Memberships American Educational Research Association (AERA) Association for Educational Communications and Technology (AECT) International Society of the Learning Sciences (ISLS)
Honor Society Memberships
Golden Key National Honor Society, 2008-Present Phi Kappa Phi, 2005-Present