
1910 From US Census Reports - DigitalCommons@USU
53
Utah State University Utah State University DigitalCommons@USU DigitalCommons@USU All Graduate Plan B and other Reports Graduate Studies 5-1971 On Human, Economic, Natural Resources for the state of Utah On Human, Economic, Natural Resources for the state of Utah From 1870- 1910 From U.S. Census Reports From 1870- 1910 From U.S. Census Reports Daniel J. Ringle Utah State University Follow this and additional works at: https://digitalcommons.usu.edu/gradreports Part of the History Commons Recommended Citation Recommended Citation Ringle, Daniel J., "On Human, Economic, Natural Resources for the state of Utah From 1870- 1910 From U.S. Census Reports" (1971). All Graduate Plan B and other Reports. 631. https://digitalcommons.usu.edu/gradreports/631 This Report is brought to you for free and open access by the Graduate Studies at DigitalCommons@USU. It has been accepted for inclusion in All Graduate Plan B and other Reports by an authorized administrator of DigitalCommons@USU. For more information, please contact [email protected].
-
Upload
khangminh22 -
Category
Documents
-
view
1 -
download
0
Transcript of 1910 From US Census Reports - DigitalCommons@USU

Utah State University Utah State University
DigitalCommons@USU DigitalCommons@USU
All Graduate Plan B and other Reports Graduate Studies
5-1971
On Human, Economic, Natural Resources for the state of Utah On Human, Economic, Natural Resources for the state of Utah
From 1870- 1910 From U.S. Census Reports From 1870- 1910 From U.S. Census Reports
Daniel J. Ringle Utah State University
Follow this and additional works at: https://digitalcommons.usu.edu/gradreports
Part of the History Commons
Recommended Citation Recommended Citation Ringle, Daniel J., "On Human, Economic, Natural Resources for the state of Utah From 1870- 1910 From U.S. Census Reports" (1971). All Graduate Plan B and other Reports. 631. https://digitalcommons.usu.edu/gradreports/631
This Report is brought to you for free and open access by the Graduate Studies at DigitalCommons@USU. It has been accepted for inclusion in All Graduate Plan B and other Reports by an authorized administrator of DigitalCommons@USU. For more information, please contact [email protected].

ON HUMAN, ECONOMIC, AND NATURAL RESOURCES FOR THE STATE OF UTAH
FROM 1870-1910 FROM U.S. CENSUS REPORTS
by
Daniel J. Ringle
Report No. 2 submitted in partial fulfillment of the r equirements for the degree
of
MASTER OF SCIENCE
in
History
Plan B
UTAH STATE UNIVERSITY Logan, Utah
1971

TABLE OF CONTENTS
INTRODUCTORY STATEMENT
HISTORICAL BACKGROUND .
POPULATION IN UTAH, 1870-1910
AGRICULTURE IN UTAH, 1870-1910
MINING IN UTAH, 1870-1910
TABLES
MANUFACTURING IN UTAH, 1870-1910
INDUSTRIAL STRUCTURE OF UTAH, 1870-1910
RAILROADS IN UTAH, 1870-1910
CONCLUSIONS .
BIBLIOGRAPHY
Page
2
3
5
9
17
22
32
39
43
45
47

INTRODUCTORY STATEMENT
Many have called attention to the wealth of historical data buried in
the decennial compilations of census reports conducted by the United States
government since 1790. Many distinguished studies have been made utilizing
these data . Surely a concentrated study of the reports for a limited area
over a span of time will yield either new insights or verifications for
established views. The purpose of this report is to provide a general
summary of and analysis of the human, economic, and natural resources of
Utah from 1870 to 1910, based on the data of the United States census report s.
Many problems are associated with the use of statistics and the census
reports. Procedures changed from decade to decade. Census reporters inter
preted their instructions differently. Wherever apparent procedural differ
ences have been observed, they are noted.
The main purpose of this report is to describe quantitatively conditions
in Utah, 1870 to 1910, as far as possible from the data selected mainly from
the United States census repor ts. The main areas to be considered are popu
lation, agriculture, mining, manufacturing, industry, and railroads.
would like to extend my appreciation to Professors Joel E. Ricks, J.
Duncan Brite, and S. George Ellsworth, of the History faculty of Utah State
University, for their assistance and encouragement in preparing this paper.

HISTORICAL BACKGROUND, 1847-1870
On July 24, 1847, Mormon pioneers led by Brigham Young entered the Great
Salt Lake Valley. The Mormons rapidly established settlements in the most
desirable locations in Utah and neighboring areas, including Idaho, Wyoming,
Colorado, New Mexico, Arizona, and California. By 1877 about 300 settlements
had been founded under Young's direction.
Sustaining this rapid colonial expansion, agriculture was the major
occupation. In the absence of cash, not a plentiful item, agricultural
products were exchanged for the other necessities of life. Mormon settlers
supplied emigrants on their way to the California gold fields, army units
stationed in Utah at Camp Floyd and Camp Douglas, and neighboring mining
camps in the 1870s.
Self-sufficiency was an ideal as well as a practical necessity and
most manufacturing was in the home. It was not until the transportation
problem was solved that home products could be transported to outside
markets in exchange for manufactured goods. Freighting trains supplied
this need for years, but it was the completion of the transcontinental
railroad in 1869 that radically changed the economic patterns of Utah.
The Mormons migrated to Utah to find isolation and religious freedom.
However, friction began to develop between federal territorial officials and
the Mormons. Since the federal officials reported that the Mormons were
rebellious and of treasonable nature, an army was dispatched to Utah in 1857.
Through the efforts of Thomas Kane and others, an open war was averted. The
army moved into Utah and established Camp Floyd in 1858. This army was re
called in 1860 because of the Civil War. However relations between Mormons
and non-Mormons continued to be strained and Colonel Patrick E. Connor with
300 California volunteers were sent to Utah in 1862 to keep an eye on the
Mormons and to control the Indians.
Colonel Connor distrusted the authoritarianism of the Mormon Church and
wanted to induce sufficient gentile migration to thwart Mormon ambitions.
Agriculture was not the solution as the Mormons held virtually all suitable

4
land. However in mining, he saw potentialities because Brigham Young had
stiffled mining initiatives, except in coal, iron, and lead, to keep out the
gentiles. Precious metals lay untouched, even if found; therefore, Colonel
Connor granted his men leave to prospect the mountains. His men located and
began development of many of Utah's richest ore deposits. The completion of
the transcontinental railroad in 1869 led to a mining boom.
Indian wars between 1847 and 1870 were bloody encounters with deaths on
both sides. The most notable of these wars was the Black Hawk War, 1865-68,
during which a number of central Utah settlements were abandoned, scores of
people killed, and thousands of cattle and horses lost.
In December 1848 the Mormon leaders petitioned the federal government for
the creation of a territorial government. While awaiting the federal govern-
ment to act, the Mormons established the State of Deseret as a provisional
government with a constitution. The State of Deseret included within its
boundaries virtually all of what is now Utah and Nevada, the greater part of
Arizona, portions of Idaho, Wyoming, Colorado, Oregon, New Mexico, and Cali-
fornia. In 1850, Congress rejected the State of Deseret and created the
Territory of Utah with smaller boundaries. Future actions of Congress continu-
ally pared down the territory to its present dimensions. Utah was denied
statehood until 1896.
The completion of the transcontinental railroad in 1869 ended Utah's
geographic isolation, making possible the development of mining, manufactur-
ing, and encouraging the inflow of non-Mormons. This marked a new era in
Utah for agriculture, mining, and manufacturing. Eastern goods and capital
could now be brought into Utah and eastern and western markets would provide
stimulus for growth and markets for the products of agriculture, mining, and
manufacturing.!
lAmong the standard, recent general accounts of Utah history in the nineteenth century are the following: Utah, ~ Guide !£ the State (New York: Hastings House, Publishers, cl954), 3-153; Nels Anderson, Desert Saints, The ~Frontier in Utah (Chicago: The University of Chicago Press, cl966); Leonard J. Arrington, Great Basin Kingdom: An Economic History of the Latter~ Saints, 1830-1900 (Cambridge, Mass.: Harvard University Press, 1958); Andrew Love Neff, History of Utah, 1847 !£ 1869 (Salt Lake City, Utah: The
Deseret News Press, cl940).

5
POPULAT ION IN UTAH, 1870-1910
Utah was organized as a territory in 1850. The census report of 1850
showed the territory had almost 12,000 residents. For the period 1870-1910,
the population increased over four times--86,786 to 373,361.2
Four facto r s seem to have influenced Utah's population growth:
(1) religion, (2) migration to and from the state, (3) economic changes,
and (4) birth and death rates.
Religious and Migration factors.
The Church of Jesus Christ of Latter-day Saints, commonly called Mormon,
encouraged its converts to migrate to Utah. The Church established funds and
methods to encourage and help its converts to migrate. The completion of
the first transcontinental railroad in 1869 and subsequent completion of
railroads in Utah provided the means by which the converts could migrate
faster and more economically .
The foreign migration from Europe to Utah was especially heavy. In
1870, 30,702 of a population of 56,084, or about 55%, were immigrants.3
In 1880, 43,994 of 99,969, or approximately 44%, were Eu r opean immigrants.4
By 1890 it was 53,064 of a population of 154,841, or about 34%.5 The per
centage cont inued to decrease to about 25 in 1900 and 22 in 1910.6
2u.s., Department of the Interior, Census Office,~ Compendium of the Ninth Census, 1870, 9, 18-20 (hereafter cited as Compendium, 1870). U.S., Department of Commerce, Bureau of the Census, Thirteenth Census of the United States, 1910, Vol. I, Population, General Report and Analysis, 863-89 (hereafter cited as Census, 1910, I, Po pulation).
3compendium, 1870, 376.
4u.s., Department of the Interior, Census Office, Compendium of the Tenth Census, 1880, 332 (hereafter cited as Compendium, 1880).
5u.s. , Department of the Interior, Census Office , Compendium of the El even t h Census of the United State s, 1890, Part I, Population, 332 (hereafter ci ted as Compendium, 1890 , I, Population).
6u.s., Department of the Interior, Census Office, Twelfth Census of the United States, 1900, Vol. I , Population Part 1, 482 (hereafter c ited as Census, 1900, I, Population).

England was the largest contributor of foreign-born with about a two
to one ratio over all other foreign countries. In 1870, 16,073 of 30,702
immigrants were from England . ? This ratio decreased proportionately with
the ratio of foreign-bo rn over native-born. England was the larger contri-
6
butor because missionary activities were more concentrated and successful in
that country.
The census reports also reflect migrations of people within the conti-
nental United States into Utah, although these were not as large as the
European due to the lesser missionary activities in the United States. The
unfavorable climate and geography of Utah would have discouraged some people
from migrating into and staying in the area; however the strong religious
ties of the Church led Mormon converts t o stay.
The practice of polygamy by the Mormons in Utah should be considered
as a part of the religious factor for population increases. The census
reports enumerate the number of dwellings in Utah, but do not reflect whether
they may have been supported by one individual male. Since sources vary as
to the percentage of married men who practiced polygamy, there is not an
accurate method of determining the number of dwellings to each male; however ,
the number of persons under twenty-one years of age may be a clue. This
number was 79,355 of a total population of 143,963 in 18808 and 106,549 of
207,905 in 1890 . Using the number of persons under twenty-one along with
Utah's high birth rate, it is probable that polygamy may have been a factor
in the population growth rate. Stanley s . Ivins states that the birth rate
for monogamous f amilies was 8.0 children per female and 5.9 children per
female in polygamous families. These statistics could infer that polygamy
may not have been too much of a factor.9
7u.s., Dep artment of Commerce, Bureau of the Census, Thirteenth Census £i the United States, 1910, Vol. III, Population, Reports E.Y_ the States, Nebraska- Wyoming, 480 (hereafter cited as Census, 1910, III, Population of Nebraska-Wyoming) . Compendium, 1870, 376, 396-97 , 540-41.
8compendium, 1890, I, Population, 448-89.
9census, 1900, I, Population, 96-7, 206. Stanley S. Ivins, "Notes on Mormon Polygamy," The Western Humanities Review, X (Summer 1956), 236-37.

Economic Factor.
The transcontinental railroad provided impetus to the mining of precious
metals and coal in the 1870s and 1880s. There was an increase of people from
the eastern mining states of Pennsylvania, Virginia, and West Virginia. This
increase is reflected in the totals from these three states; in 1870, 1602;
in 1880, 2087; in 1890, 3189; in 1900, 3471; and in 1910, 4397.10 The
significant increase from 1900 to 1910 likely resulted from building smelters
to produce copper from low grade ore.ll
Increased immigration from Colorado resulted from the lack of new mining
strikes there and the development of smelting operations in Utah. The census
reported immigration of 41 people in 1870, none in 1880, 772 in 1890, 2,131
in 1900, and 4,340 in 1910.12
For the same reasons a similar pattern was re f lected for Nevada. The
census reported immigration of 37 people in 1870, 347 to 587 for 1880 to
1890, and 950 in 1900 to 1,192 in 1910.13
Other economic factors for migration were the pioneer spirit of the
American people, the loss of soil fertility in some of the eastern states,
and the panic of 1873. Those people that would have come to Utah for the
reasons cited above would also have been stimulated by religious motivation
and the desire to remain in "Zion."
Migration to Utah from all other states showed a steady increase during
this forty year period. There were exceptions for some ten year periods;
lOu.s., Department of the Interior, Census Office, Tenth Census of the United States, 1880, [Vol. I], Statistics of Population, 464-69 (hereafter cited as Census, 1880, I, Population). Compendium, 1870, 378-82. Compendium, 1890, I, Population, 560-63. Census, 1900, I, Population, 686-89. Census, 1910, III, Population of Nebraska-Wyoming, 730-34.
llDaniel C. Jackling introduced this idea to eastern financeers.
12compendium, 1870, 383-87. Census, 1880, I, Population, 470-75. Compendium, 1890, I, Population, 564-67. Census, 1900, I, Population, 732-35. Census, 1910, III, Population of Nebraska-Wyoming, 734-38.
13compendium, 1870, 383-87. Census, 1880, I, Population , 470 - 75 . Compendium , 1890, I, Population, 564-67. Census, 1900, I, Population, 732-35. Census, 1910, III, Population of Nebraska-Wyoming, 734-38.

however, i n 1910, all states except Maine and New Hampshire showed an
increase over the reports for 1900. Migration from New England was less
heavy than other regions in the United States, perhaps because of the
heavier development of manufacturing in the New England region.
Birth and Death Ra te Factor.
Utah was among the highest for birth rate and among the lowest for
death rate in the United States. This is based upon the birth rates fo r
1910 and 19 20 and death rate for 1910. 14 It is estimated that these
figures repres ent an average for 1870-1910. Utah's birth rate in 1910
was 30.7 and 31.2 in 1920 per thousand population--substantially higher
than the national rate of 27.5 per thousand population in 1920.15 Utah's
death rate in 1910 was 10.8 per thousand population as compared with the
national rate of 14.7 per thousand population. 16
This combination of a high birth rate and low death rate (excess of
births over deaths) would cause a substantial increase. This factor along
with other factors previously mentioned was important in Utah ' s population
growth.
8
l4The United States Book.£!. Facts, Statistics, and Information for 1969 (New York: Washington Square Press, 1969), 48, states that birth stat istics for which rates could be determined were not reported until 1915.
151969 Statistical Abs tract of Utah, Bureau of Economic and Bus iness Research, Divis i on of Economic Development and Resear ch Center for Economic and Communi t y Development (Salt Lake City, Utah: University of Utah, 1969), 32, states that birth rates on national l evel were not available fo r year 1910.
161969 Statis t ical Abst r act of Utah, 32 .

AGRICULTURE IN UTAH, 1870-1910
From 1847, agriculture in Utah was the major foundation of the state's
economy. Farming (the raising of crops and livestock) is often listed as
a principal way of life.
The agricultural history of Utah can be divided into four periods.
9
The first began with the arrival of the Mormon pioneers in 1847 and continued
until the completion of the first transcontinental railroad in 1869, and
second starting in 1870 and continuing until 1910. A third period began to
emerge in the mid 1890s and continued until the end of the Great Depression
or the outbreak of World War II in 1939. A fourth period began with World
War II and continues till the present. The second period, 1870-1910, is
di scus sed in this paper, with appropriate remarks referring to the other
three periods.
The first period was characterized by an isolated, well-organized,
fai rly self-sufficient economy, governed by a Church oriented society. It
was based on irrigation agriculture which supported a village-type industry.
The second period, 1870-1910, was built around two economies, largely
separate and distinct. One was agricultural and the other was mining. The
agricultural economy was a Church commonwealth characterized by organization,
unity, and spirit of permanence and independence. The mining economy con
sisted of several hundred mining districts, almost exclusively populated by
non-Mormons, who were speculative and dependent upon eastern capital for
financing. Emerging during this period was a commercial type of manufactur
ing replacing the village-type. This manufacturing can be further character
i zed by the economic leadership passing from the agricultural valleys and
scattered mining districts to industrial and business communities such as
Salt Lake City. In the beginning the Mormon Church had been the predominate
influence in promoting economic development; now outside entrepreneurs with
scientists and engineers were becoming more significant. This brought about
a mutual interdependence of farmers, miners, and businessmen in developing a
unified economy.
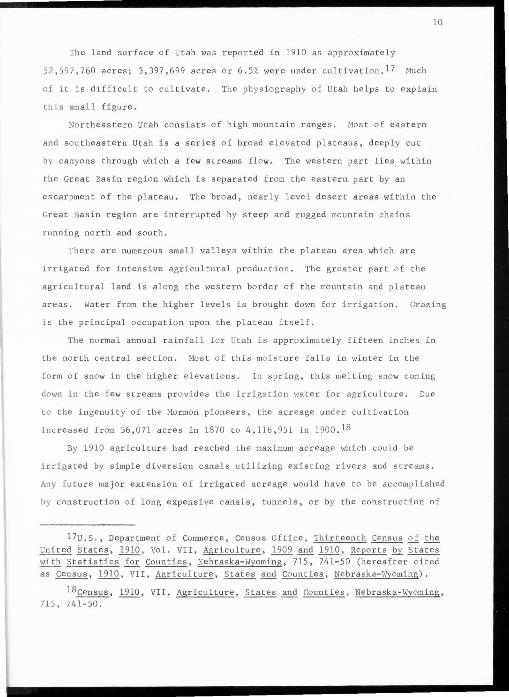
The land surface of Utah was reported in 1910 as approximately
52, 597,760 acres; 3,397,699 acres or 6.5% were under cultivation.l7 Much
10
of it is difficult to cultivate. The physiography of Utah helps to explain
thls small figure.
Nor theastern Utah consists of high mountain ranges. Most of eastern
and southeastern Utah is a series of broad elevated plateaus, deeply cut
by canyons through which a f ew streams flow. The western part lies within
the Great Basin region which is separated from the eastern part by an
escarpment of the plateau. The broad, nearly level desert areas within the
Great Basin region are interrupted by steep and rugged mountain chains
running north and south.
There are numerous small valleys within the plateau area which are
i rrigated for intensive agricultural production. The greater part of the
agricultural land is along the western border of the mountain and plateau
areas. Water from the higher levels is brought down for irrigation. Grazing
i s the principal occupation upon the plateau itself.
The normal annual rainfall for Utah is approximately fifteen inches in
the north central section . Most of this moisture falls in winter in the
form of snow in the higher elevations. In spring, this melting snow coming
down in the few streams provides the irrigation water for agriculture. Due
t o the ingenuity of the Mormon pioneers, the acreage under cultivation
increased from 56,071 acres in 1870 to 4,116,951 in 1900.18
By 1910 agriculture had reached the maximum acreage which could be
irrigated by simple diversion canals utilizing existing rivers and streams.
Any future major extension of irrigated acreage would have to be accomplished
by construction of long expensive canals, tunnels, or by the construction of
17u.s . , Department of Commerce, Census Office, Thirteenth Census of the United States, 1910 , Vol. VII, Agriculture, 1909 and 1910, Reports Qy States ~ Stat is tics for Counties, Nebraska-Wyoming, 715, 741-50 (hereafter cited as Census, 1910, VII, Agricul t ure, States and Counties, Nebraska- Wyoming).
18census, 1910, VII, Agriculture, States and Counties, Nebraska-Wyoming, 71 5, 741-50.

storage reservoirs. Mastery of the art of dry farming added to the total
acreage under cultivation. The amount of acreage cu ltivated in 1900 was
4,116,951 as compared to 3,397,699 acres in 1910.19 This decline was due
to the reclassification of large grazing areas by the census takers.
The valuation of farms in 1910 was $99.5 million as compared t o $40 .1
11
million in 1900 for a 145 percent increase. The increase in valuation from
1890 to 1900 was 40 percent.20 The large increase in farm valuation from
1900 to 1910 was due to the commercialization of mining and manufacturing
which required a larger market for agricultural products. This plus the
availability of transportation increased the farm valuation.
Commercial Crops.
Information in Tab le I indicates that Utah's agriculture became more
specialized during the period 18 70-1910, especially from the 1890s. This
specialization was in the production of products which were best suited to
Utah's soil and climate. These products were exchanged for outside products
which could be imported more efficiently and cheaper than they could be
home manufactured or produced. The evidence of Utah's growing commercializa-
tion in agriculture is shown in Table I.
Further information in Table I indicates that Utah ' s agriculture was
becoming more diversified revolving around the production of feed for
livestock, food for the home, and increasing volume of some items (wheat,
barley, sugar beets and fruit) for exports.
A general characteristic of the crops listed in Table I is that
approximately 33% of the crops are of cereal type, approximately 40% are
hay and forage, 17% are fruits and vegetables, while sugar beets make up
10% of the production.
l9census, 1910, VII, Agriculture, States and Counties, Nebraska-Wyoming, 715, 741-50.
20u.s., Department of the Interior, Census Office, Twelfth Census of the United States, 1900, Vol. VI, Agriculture, Part II, Crops and Irrigation, 2, 154, 558, 624, 673, 688, 704-13 (hereafter cited as Census, 1900, VI,
Agricu lture , II, Crops and Irrigation) . ~, 1910, VII, Agriculture, States and Counties, Nebraska-Wyoming, 715, 741-50.

Production of many crops including corn, oats, and barley and some
wheat go to the livestock industry. (see Table II to note the increase
in livestock production.)
All crops listed in Table I increased each decade in production
12
except Indian corn which decreased from 1880 to 1890 and from 1900 to 1910.
A plausable explanation of these decreases may be that more land went into
production of cash crops and perhaps crop failure for the Indian corn due
to an early frost or a short growing season. Much of the increase in
specific crop production is tied with the cattle production (see Table III).
The most significant crop development was the launching of the sugar
beet industry. This crop was first reported in 1900 and would later become
one of the better cash crops for the farmer.
The Mormons had attempted sugar manufacture from sugar beet s in the
1850s but without success. The sugar beets had been grown successfully,
but there was failure at the factory. Now success had come through improved
chemistry and manufacturing processes, a protective tariff, and business and
farme r organiza tion and cooperation .
Orchard and small fruit production d i d not become a cash crop in Utah
as experienced today, but the increase from the first reports in 1900 to
1910 would indicate the beginning of a commercial stage. The doubling and
tripling of the production can be attributed to improved transportation
facilities to markets in the western United States and home consumption.
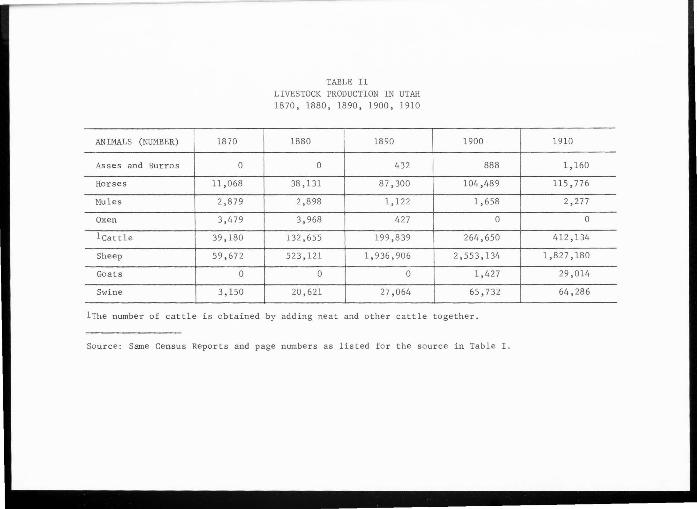
Lives tock Production.
A list of Ut ah's livesto ck production is shown in Tables II, II I, IV,
and V. Utah's big four livestock industries were cattle, dairying, sheep,
and poultry. The poult r y industry shows a beginning in 1880 with a big
i ncrease in 1900. The cattle indu s try showed the biggest gains in two
different periods--about a 400% increase in the decade before 1880 and
almost 60% in the decade before 1910. The first gain was because of the
completion of the transcontinental railroad in 1869 and the second was due
to the beginning of the meat packing industry. Comments will be made later
about o th er animals in the livestock industries.

l3
Acreage Increase.
The number of farms increased from 9,462 in 1880 (not reported in 1870)
to 216,676 by 1910. 21 The increase in acreage from 1870 to 1910 was specta
cular. The acreage was 56,078 in 1870, 135,533 in 1880, 1,323,705 in 1890,
4,116,951 in 1900, and 3,397,646 in 1910. 22 The large increase from 1890-1900
was mainly the amount of grazing land classified as farm land. The decrease
of acreage from 1900-1910 was due to the method of reporting . Reclassifica
tion in 1910 removed large grazing ranches from the farm category.23
Sheep Production.
In comparison with cattle production, 132,655 in 1880 and 264,650 in
1900 sheep production increases were tremendous. (see Table II). The
number of sheep increased from 523,121 in 1880 to 1,936,906 by 1890, and
2,553,134 by 1900. This coincides with the increase in pounds of wool
production--973,246 pounds in 1880 to 10,827,323 pounds in 1900 (see Table
V) which accounted for almost one-half of the total valuation in 1900. The
decrease in sheep production from 1900-1910 was because the federal
government withdrew grazing lands in order to set aside some eight million
acres comprising forest reserves.24 One consideration for establishing the
forest reserves was the apparent overgrazing by the sheep.
2lcompendium, 1870, 688-711. Census, 1910, VIII, Agriculture, States and Counties, Ne braska-Wyoming, 715, 741-50.
22compendium, 1870, 688-711. Compendium, 1880, 650, 685, 730, 738-41, 820-34, 912-15. U.S., Department of the Interior, Census Office, Eleventh Census of the United States, 1890, (Vol. I], Report on the Statistics of Agriculture, 73-83, 108-17, 188, 218, 498 , 537 (hereafter cited as Census, 1890, I, Agriculture). ~' 1900, VI, Agriculture, II, Crops and Irrigation, 2, 154, 558, 624, 668-73, 704-13. Census, 1910, VII, Agriculture, States and Counties, Nebraska-Wyoming, 75, 750.
23census, 1890, I, Agriculture, 73-83, 108-17, 188, 218, 498, 537. Census, 1900, VI, Agriculture, II, Crops and Irrigation, 2, 154, 558, 624, 668-73, 704-13.
24Leonard J. Arrington, "The Commercialization of Utah's Economy: Trends and Development from Statehood to 1910," (Utah State University, 1964), 186.

Goat Production.
Goats were first reported in the census of 1910--1,425 animals with a
va luation of $2,702.00 (see Tables II & V). The number of goats in 1910
was 29,014 with a valuation of $79,057.00 . Apparently this tremendous
increase in both numbers and valuation was because of an increased market
for goat hai r as 409 pounds wer e reported in 1900 and 44,708 in 1910 (see
Table III). The increase may be correlated with the decrease in sheep
production between 1900-1910. Some of the sheepmen may have turned to
goat raising and goat hair production to supplement their income.
Swine Production.
14
The number of swine increased steadily from 1870 to 1900 with a slight
decrease in 1910. The valuation for swine was first reported in 1910 (see
lables II and V). The increase from 3,150 swine in 1870 to 20,621 by 1880
may have been in response to the completion of the transcontinental railroad
in 1869 making it possible to transport livestock to eastern and western
markets. Utah's network of railroads further made it possible for more
farmers to share in the livestock productions as they could more readily
utilize the railroad. The development of the meat packing industries was
also partly responsible for the increase in swine production from 1890-1900.
The slight decrease in number of swine from 1900-1910 could have been caused
by a decline in the market due to the panic of 1907.
Cattle Industry.
The cattle industry began to show more than normal growth in the late
1890s because five slaughter and packing houses were reported in 1900. There
was considerable expansion in the cattle industry between 1900- 1910 as indi
cated by 12 slaughter and packing houses repor t ed in 1910 (see Table VIII).
It is noted that the gallons of milk produced did not increase with the
cattle production, but decreased. A reason for this decrease was tha t a
bulk of the cattle was being raised fo r local meat ll ackint, industry and export
out of the state.
Horses, Mules, and Oxen .
It is noted that Utah's 4,000 oxen reported in 1880 were not reported
in 1900. A reason for oxen not being reported was probably due to them being

replaced and disposed of in favor of the horse and mule fo r agriculture .
Oxen are very slow in movement as compared to other animals used in farm
work. The number of horses increased proportionately as agriculture grew
to support Utah 's population growth and the demands of outside markets.
15
Some of Utah's horses were sold to the British Army for use in the Boer War . 25
Since the number of mules increased very little, it is evident that the horse
'tvas preferred over the mule as a farm animal.
Poultry Production.
Chicken production was the only fowl reported by the census until 1910
(see Table IV), and it had been increasing steadily and probably was only
for home consumption.
The number of chickens reported in 1910, 673,662, could have been
consumed by 373,353 people reported for the same period. The census reports
do not indicate whether this was the total raised, or the total at the time
the census was taken. This probably was total on hand and did not reflect
those shipped to markets or home consumed. There is no way to de t ermine
how many of the 18,297 reported as other fowls may have been turkeys. However,
this probably was the beginning of a future thriving turkey production in Utah.
Perhaps the poultry industry did not grow as rapidly as others in the
livestock industries because of the long distances to markets. Even with
railroad transportation, poultry has a tendency not to survive long shipments.
Dairy Products.
Utah's thriving milk industry was launched in the 1890s (Table III) . The
milk production increased from 8.7 million gallons in 1880 to 25.1 million
gallons by 1900 with a decrease to 20.5 million gallons in 1910. This
decrease in milk production along with the decrease in pounds of butter and
cheese can be explained by the census takers' methods of reporting. The
number of farms reported in 1910 was 18,524 while 15,802 actually reported
25oeseret News, (Salt Lake City, Utah), December 14, 1907, 30-31.

16
dairy products . Dairy products reported in 1900 were estimates made by the
census takers compared to actual production reported in 19lo.26
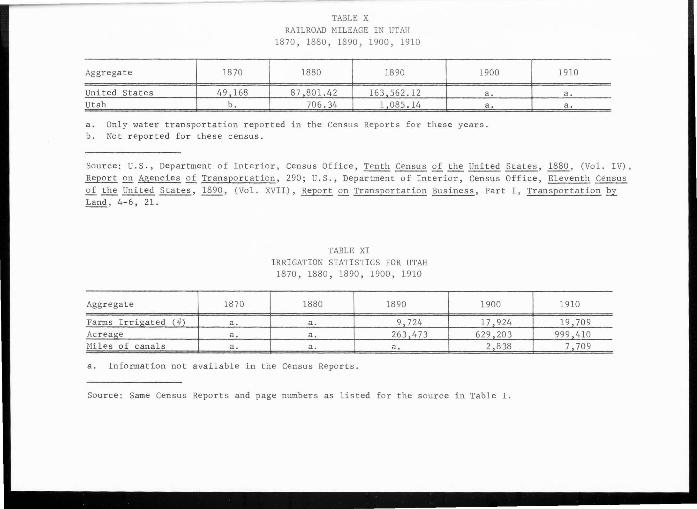
Agriculture and Irrigation.
Large agricultural production per acre in Utah is dependent upon
irrigation. Table XI shows irrigation growth by number of farms, acreage,
and miles of canals.
Irrigation began with the arrival of the pioneers in July 1847 when
they diverted City Creek to flood the hard dry land for plowing and to
water newly planted crops.
The census statistics provide only meager information on miles of
canals, first reported in 1900 as 2,838 miles. By 1910, the mileage had
increased to 7,709 miles.
Irrigation's importance to agriculture is shown by the increase in
number of farms, acreage, and production. The number of farms doubled
from 1880 to 1890 with irrigated acreage increasing approximately two and
one-half times for the same period. Increases in agricultural production
is shown by combining the total bushels produced of oats, barley, Indian corn,
wheat, Irish potatoes, and orchard fruits (see Table I for individual totals) .
The totals in bushels are 1,122,542 for 1870; 2,541,260 for 1880; 3,051,389
for 1890; 6,233,297 for 1900; and 13,753,766 for 1910.
These increases in number of farms, acreage, miles of canals, and
production coincides with the building of railroads which provided trans
portation to eastern and western markets and population growth.
26census, 1910, VI, Agriculture, II, Crops and Irrigation, 27.

17
MINING IN UTAH, 1870-1910
While agriculture played a basic and primary role in the economic life
of Utah from the beginning, mining was also known from the beginning. The
Spanish had mines in Utah and the Mormons early sought coal, iron, and lead
to help them in their drive for a self-sufficient life. Even so, there was
official discouragement of mining associated with precious metals and a
major emphasis was placed on agriculture.
Utah's mining industry for this report can be divided into three
periods, the first or pioneer period from 1847-1870, second period from
1870 to 1890, and third period from 1890 to 1910. Subsequent periods show
a continued increase in mining development and mineral production particularly
in copper as a result of increased eastern capital and the processing of
low-grade copper ore. Table VI will be used to discuss much of Utah's mining
development and growth.
First period: 1847-1870 (Pioneer mining).
Although the census figures used for this report show nothing for the
years 1850-1870, it is necessary to discuss this period as a background for
the second period.
The pioneer leaders , on arriving in Utah, discouraged individual pros
pecting for minerals, particularly gold and silver, because agricultural
development was critically necessary for survival. Further, discovery of
precious metals was discouraged to forestall an i nflux of persons hostile
to the pioneer objective of a homogeneous community.
Development of minerals and metals needed for home industry was,
however, actively pursued under the direction of the pioneer leaders. Iron
ore deposits were discovered by Parley P. Pratt in Iron County in 1850.
1hese were the subject of active, but unsuccessful, attempts to produce iron.
Salt was recovered from the Great Salt Lake shortly after arrival in the
valley in 1847. Building stone, sand, and gravel, clay, and limestone for
lime were used abundant ly in homes and public building construction.
In 1854 the territorial legislature offered $1,000 for the first
d i scovery of commercial coal within forty miles of Salt Lake City. By

1863 coal was being mined at Coalville, Utah. Lead mines began to be
developed as early as 1863, but were unprofitable because transportation
was inefficient and expensive.
Active search for minerals and metals which could be mined and sent
to markets outside the pioneer communities was begun in 1863 by the
California Volun teers under Colonel Patrick E. Connor. Finding little
need to protect the Overland mail and telegraph lines and hoping to find
some means to pry loose Mormon control on Utah, Colonel Connor encouraged
his personne l to prospect in the mountains adjacent t o Salt Lake valley.
The first claim was located in September 1863, and Connor and others
organized the West Mountain Mining District.
18
Similar discoveries of ore rapidly followed in the two Cottonwood
canyons, American Fork, Rush Valley near Stockton, Park City, Tintic, and
elsewhere. Following these discoveries, mining di s tricts were organized.
However , mining was done on a small scale and many places closed due to the
lack of transportation.
Pr ospectors from 1864 to 1866 discovered many lead, silver, gold, and
copper deposits. There followed the organization of companies which dug
shafts and tunnels to develop the ore, and constructed some small smelters.
These efforts resulted in failure primarily because of the great distance
to markets and high cost of transportation. By the end of 1866, most
profitable efforts had ceased, and it was not until the completion of the
railroad in 1869 and the subsequent r oute of the Utah Central Rail r oad to
Salt Lake City with other connecting lines that mining developed .
Second Period of Mining Develo pment in Utah: 1870-1890.
During this period the st imulus to the mining industry was the comple
tion of the transcontinental railroad in 1869, and the subsequent railroad
line to Salt Lake City in 1870. By the completion of the railroad in 1869,
the major discoveries of mineral deposits had been the out croppings fo und
by the prospectors . These discoveries had little value until they could be
mined, milled, smelted, transported, and sold to repay costs and yield a
profi t to investors.

19
In 1870 the product value was reported to be one and one-half millions,
or several times the value of the preceding year. Lead and copper production
accounted for approximately one-third of the total value. 27 The railroads
made possible the development of ores less valuable than gold and silver as
markets were available. By 1872, Utah produced 45.5% of the nation's lead
supply, 25% of the copper, 13.7% of silver, and one-half percent of gold, all
of which was valued at 5.8 million dollars. This production grew to 11.6
million dollars by 189o.28
The major coal, copper, iron, lead, zinc, and other mineral deposits
had been discovered by the completion of the railroad to Utah in 1869.
However these mineral and metal discoveries had little immediate value because
there was no market demand which is necessary to justify investments to equip
the mines, pay wages, buy supplies, and furnish profits.
As markets materialized and grew over the years, the demand for Utah's
metals increased thus providing incentive to mining development. Table VI
reflects the mining operation increases for this period. The increase in
product value from 1890-1900 was small probably because of the silver issues
of that time. Too, the situation for silver production was not enhanced by
the panic of 1907-08.
Third Period of Utah's Mining Development: 1880-1910.
The third period of Utah's mining development was the beginning of
domination of the industry by copper and coal. Gold and silver were still
very valuable, but were leveling off as indicated by Table VI. The most
spectacular increase was in copper production from 1.45 million to 8.43
million by 1910. Coal production increased from $377,456 in 1890 to $4.11
million dollars by 1910. With the advent of railroad transportation from
the 1870s other metals could be transported from the state in sufficient
27El Roy Nelson, Utah's Economic Patterns (Salt Lake City: University of Utah, 1956), 81.
28Nelson, Utah's Economic Patterns, 81.

amounts to make mining of them more profitable. In addition to coal and
copper, such minerals and metals as placer gold, asphaltum, bituminous
rock, iron, limestone, sandstone, gypsum, and clay became a part of the
mining development. Hith the mining of these metals and minerals, gold
and silver continued to be important in the product value but only as a
by-product of these metals .
The copper ore shipments from the underground mines in the Highland
Boy area of the Bingham Canyon in the 1890s were the beginning of copper
operation which is the most important mining operation in Utah today.29
Another era in copper production was begun soon after the turn of the
century by Daniel C. Jackling. He saw the possibilities of low grade
20
porphyry copper ore which created new resources out of ore previously
considered worthless.30 This new process caused the underground copper
mining at Bingham Canyon to be turned into an open-pit production miracle.31
The coal industry in Utah was a significant foundation for other
industries such as iron and steel. Its increase in production has kept
pace with the development of other industries within Utah. Utah's rail-
road system made it possible to transport coal from the mines to the
milling and manufacturing areas.
The history of Utah' s coal industry began in 1850 at Coalville, Summit
County. Coal was hauled into Salt Lake by wagons from the 1850s until the
1880s. It was difficult and expensive because of the rough terrain in
Par leys Canyon. Coal was discovered in Sanpete County in 1854, but was
utilized onl y in limited amounts because of transportation costs.
29Arrington, "The Cotmnercialization of Utah's Economy ... ," 24.
30 porphyr y is an ingeneous rock which due to the rate of its cooling, has relatively conspicuous crystals set in a fine-grained or glassy ground mass.
31Arrington, "The Commercialization of Utah 's Economy " 25-27.

The coal famine in Utah was not alleviated by the railroad in 1869
because the Un ion Pacific Railroad brought coal from its own fields at
Rock Springs, Wyoming, t o Ogden. This famine continued until the mines
in Carbon County were opened with the completion of the Denver and Rio
Grande Railroad in the 1880s.
21
Coal was the impelling force for the construction of a railroad up
Parleys Canyon from Salt Lake. In 1879, the Utah Eastern Ra ilroad Company
built a railroad from Coalville to Park City and the Union Pacific completed
a line from Echo to Park City. The completion of the Rio Grande from
Carbon County to Salt Lake City in 1882 ended the coal famine in Utah.3 2
The amount of coal produced in the 1880s was relatively small with a
product value of $33,645. During the next decade it increased ten-fold to
$377,456. The coal production increased thirty-fold by 1900 and about two
and a quarter times by 1910 (Table VI). These increases were largely the
result of adequate transportation (railroads) which could now better supply
the needs of Utah's population growth and development of mining, smelting,
and manufacturing.
The pioneers established Utah's first salt industry within a few days
after their arrival in the Salt Lake Valley by building large vats on the
lake shore. The shore brine was boiled in these vats to produce the salt
needed by the pioneers.33 The population growth and its demand for condiments
and preservatives also increased the demand for salt production. Table VI
shows the salt production increases which were necessary to keep pace with
the population growth.
32Nelson, Utah's Economic Patterns, 131 .
33Nelson, Utah's Economic Patterns, 164-65.

ITEM
Oats (bushels)
Barley (bushels)
Indian Corn (bushels)
Wheat (bushels)
I r ish Pota t oes (bushels)
Sugar Beets (tons)
Hay (tons)
lorchard Fruits (bushels)
2small Fruit s (quarts)
TABLE I AGRICULTURAL PRODUCTION IN UTAH
1870, 1880, 1890, 1900, 1910
1870 1880 1890 1900
65,650 418 , 082 597,947 1,436' 225
49,117 217 ,140 163,328 252 ,140
95,557 163,342 84,760 250,029
588,473 1,169,199 1,515,465 3,413,470
323,645 573,497 519,497 1,483,570
0 0 0 85,914
27 ,305 92,7 53 301,901 850,092
0 0 170,392 397,863
0 0 0 1,694,330
lrncludes apples, peaches, pears .
2rncludes apricots, cherr ies, strawberries.
1910
3,221,209
891,471
169,688
3,943,910
2 ,409,093
413,946
1 , 015,913
633,739
3,118,395
Source: U.S., Department of Interior, Census Office,~ Compendium of the Ninth Census, 1870, 688 - 98, 700 -11 : U.S., Department of Interior; Census Office, Compendium of the Tenth Census, 1880, 650 - 87, 732-41, 830-34; U.S., Department of Interior, Eleventh Census of the United States, 1890, (Vol . I), Report~ Statistics of Agriculture, 73-75, 108-15, 117, 122, 498, 537; U.S., Department of Interior, Census Office, Twelfth Census of the United States, 1900, Agriculture, Part I, Farms, Livestock and Animal Products, 2, 144, 588, 590-51, 633; U.S., Department of Interior, Census Office, Twelfth Census of the United States, 1900, (Vol. VI), Agriculture, Part II, Crops and Irrigation, 153, 214, 216, 328-29, 261, 430, 437-38, 617-18, 620-21, 542; U.S., Department of Commerce, Census Office, Thirteenth Census of the United States, 1910, (Vol. VIII), Agriculture, 1909 and 1910, Reports .£y State s with Stat i stics for Counties, Nebraska- Wyoming, 57 - 76, 741-50.
ANIMALS (NUMBER) 1870
Ass e s and Burros 0
Hor s e s 11,068
Mul es 2,879
Oxen 3 , 479
lcattle 39,180
Sheep 59 , 672
Goats 0
Swine 3 , 150
TABLE I I LIVESTOCK PRODUCTION IN UTAH 1870, 1880, 1890, 1900, 1910
1880 1890
0 432
38,131 87,300
2,898 1,122
3,968 427
132,655 199,839
523,121 1 , 936,906
0 0
20,621 27,064
1900
888
104 , 489
1, 658
0
264,650
2,553,134
1 , 427
65,732
lThe numb e r of ca t t l e is obtained by add i ng neat and o t her ca t tle together.
Sour ce : Same Census Repor ts and page numbers as listed for the source i n Table I.
1910
1 , 160
115 , 776
2 , 277
0
412,134
1 , 827,180
29,014
64 , 286

PRODUCE ITEM 1870
lMilk (gals . ) 0
But ter (pounds) 310 , 335
Cheese (pound s) 69,603
Wool (pounds) 109,018
Goat Hair (pounds) 0
1M ilk pr oduced.
TABLE III LIVESTOCK PRODUCE IN UTAH
1870, 1880, 1890, 1900, 1910
1880 1890
0 8,614 , 694
1,052 , 903 1,759,354
126,727 163,539
973,246 9,685 , 513
0 0
Source: Same Census Reports and page numbers as listed in Table I.
POULTRY 1870
Chicken s ( If ) 0
lather Fowl s (if) 0
TABLE IV POULTRY IN UTAH
1870, 1880, 1890, 1900, 1910
1880 1890
214,733 279,983
0 0
lrncludes Ducks, Geese, Turkeys, Guinea Fowls, Pigeons, Pea Fowls.
1900
25,124,042
2,812 , 122
169 , 251
10,877,323
409
1900
534,842
0
Source: Same Census Reports and page numbers as listed for source for Table I.
1910
20 ,486 , 317
2 , 497,366
84 , 102
12,102,000
44,708
1910
673,662
18,279

VALUE (DOLLARS) 1870
Horses a.
Mules a.
Oxen a.
Cattle, Nea t a.
Cattle, Other a.
Sheep a.
Goats a.
Swine a.
Total 2,149,814
TABLE V LIVESTOCK VALUATION IN UTAH
1870, 1880, 1890, 1900, 1910
1880 1890
a. a.
a. a.
a. a.
a. a.
a. a.
a. a.
a. a.
a. a.
3' 306,638 6,613,830
a. Not listed in the census reports.
1900
a.
a.
a.
a.
7,152,844
10,256,488
2,702
a .
21,175,867
Source: Same Census Reports and page numbers as listed for source for Table I.
1910
9,999,835
217,277
a.
2,586,544
6,362,158
8,634,735
79,057
445,653
30,997,377

Aggregate
Copper No. of Mines
TABLE VI SUMMARY OF MINERALS PRODUCED IN UTAH
1870 , 1880, 1890, 1900, 1910
1870 1880 1890
a. 2 a. No. of employees a. llO a.
1900
l3 538
Produ ct value ($) a. a . a. l 459 192 Gold and Silver
No. of Mines a. a. 66 83 No. of employees a. a . 3,206 361 Product value a. a. 9 544 680 8 500 904
Lead and Zinc No. of Mines a. a. a. a. No. of employees a. a. 367 a. Product value a. a . 763 329 530 800
Coal No. of Mines 6 6 ll 39 No. of employees 25 91 565 l ,643 Product value a. 33 645 377 456 l 797 454
Salt No. of establish. l lO I 9 5 No. of employees 2 73 180 59 Product value 789 60 128 144 300 139 488
All others
I No. of mines a. a. a . 38 No. of employees a. a. a. 333 Product value a. a . a. a.
Aggregate Totals
I 6 1 I No. of Mines 18 86 178 No. of employees I 27 . 264
I 4,318 2' 934
Product value I 780 93 773 ll 681 019 12 328 350 a. Information not available in census reports.
1910
24 3,554
8 432 099
ll7 4,182
8 541 522
a. a. a.
22 3,263
4 lll 987
9 56
183 843
502 2,361
285 216
674 13,416
24 lll 987
b . All others include: placer gold, asphaltum, Bitamenous rock, iron, limestone, sandstone, gypsum, and clay.
Source: U.S., Department of Interior, census Office, Ninth Census of the United States, 1870, (Vol. III), Statistics of the Wealth and Industry of the United States, 765, 788; U.S ., Department of Interior, Census Office, Tenth Census of the United States, 1880, (Vol. XV), Report£.!:!. Mining Industries of the United States , XXXI, 676; U.S., Department of Interior, Census Office, Eleventh Census of the United States, 1890, (Vol. XIV), Report£.!:!. Mineral Industries, 59-60, 94-5, 347, 597, 603, 608, 69 9; U.S., Department of Commerce and Labor, Census Office, Special Report Mines and Quarries, 1902, 6, 57, 158-61; U.S., Department of Commerce, Bureau of the Census, Thirteenth Census of the United States, 1910, (Vol. XI), Mines and Quarries, 1909, General Report and Analysis, 22 , 158-61.

I TEM
Numbe r of es tab lishments
Numbe r of wage earners
To t al wages in dollars
Product value in dollars ----- -
TABLE VII MANUFACTURING IN UTAH
1870, 1880, 1890, 1900, 1910
1870 1880 1890
533 640 531
1 , 534 2,4 95 4,983
395,365 858,863 2,191,265
2,343,019 4,324,992 8,911 ,047
1900 1910
575 749
5,413 14,133
2 ,760, 522 8,400,000
21, 156,183 61,989,277
Source: U.S. , Department of Interior, Census Office, Ninth Census of the United States, 1870, (Vol. III), Statistics of the Wealth and Industry £i the United States, 392-93, 574- 75; U.S., Department of Interior, Census Office, Tenth Census £i the United States, 1880, (Vol. II), Report on Manufacture s, 89; U. S., Department of Interior, Census Office, Eleventh Census of the United States, 1890, (Vol. XI), Report~
Manufacturing Industries, 8, 604-8; U. S., Department of Interior, Census Office , Twelfth Census of the United States, 1900, (Vol. VII), Manu factures, Part I, United States~ Industries, 3; U. S., Department of Interior, Census Office, Twelfth Census of the United States, 1900, (Vol. VIII), Manufactures, Par t II, States and Territories, 19, 887 - 95; U.S., Department of Commerce, Bureau of Census, Thirteenth Census of the United~' 1910, (Vol. VIII), Manufactur es, 1909, General Report and Analysis, 31; U.S., Department of Commerce and Labor, Bureau of Census, Thirteenth Census of the United States, 1910, (Vol. IX), Manufactures, 1909, Reports~ States, with Statistics for Principal Cities, 1226- 41.
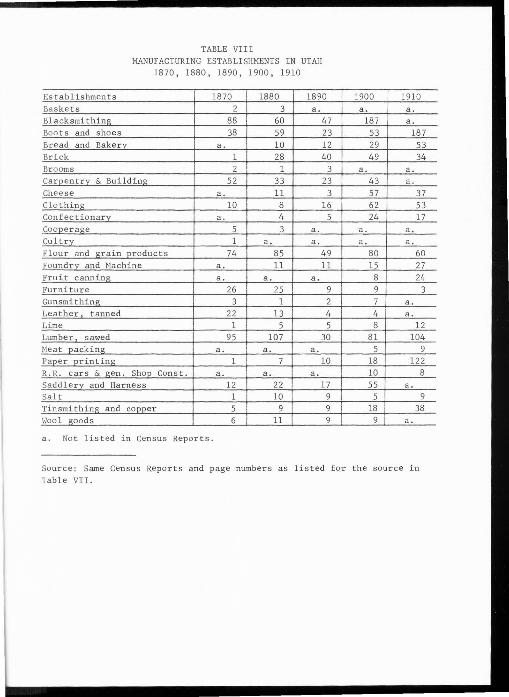
TABLE VIII MANUFACTURING ESTABLISHMENTS IN UTAH
1870, 1880, 1890, 1900, 1910
Establishments 1870 1880 1890 Baskets 2 3 a . Bl acksmithing 88 60 47 Boo ts and shoes 38 59 23 Bread and Bakery a . 10 12 Brick 1 28 40 Brooms 2 1 3 Carpentry & Build i ng 52 33 23 Cheese a. 11 3 Clothing 10 8 16 Confect i o nar v a. 4 5 Cooperage 5 3 a. Cul try 1 a. a. Flour and gr ain products 74 85 49 Foundry and Machine a. 11 11 Fruit canning a. a. a . Furniture 26 25 9 Gunsmithing_ 3 1 2 Leather tanned 22 13 4 Lime 1 5 5 Lumber sawed 95 107 30 Meat packing a. a . a. Paper printing 1 7 10 R.R. cars & _&en . Shop_ Cons t . a. a. a. Saddlery and Harness 12 22 17 Salt 1 10 9 Tinsmithing and coppe r 5 9 9 Wool good s 6 11 9
a . No t listed in Census Repor t s.
1900 1910 a. a .
187 a . 53 187 29 53 49 34
a. a. 43 a . 57 37 62 53 24 17
a. a. a. a .
80 60 15 27
8 24 9 3 7 a. 4 a. 8 12
81 104 5 9
18 122 10 8 55 a.
5 9 18 38
9 a.
Source: Same Census Repor ts and page number s as listed for the source in Tab l e VII.

TABLE IX NUMBER AND PERCENT EMPLOYED IN EACH OCCUPATION OR INDUSTRY IN UTAH
1870, 1880, 1890, 1900, 1910
CEN SUS YEAR OF REPORT 1870 1880 1890 1900
INDUSTRY OR OCCUPATI ON Number
'7o Numbe r
% Number
% Number
Employed Employed Employed Emploved %
All Occupations and 21,517 100 40,055 100 66,901 100 84,604 100
Industries 1. Agr icultural 10,428 48.5 14,550 36.3 20,031 29.9 29,247 34.6
a. General and crop Agriculture 10,221 J47.5 13,322 33.3 17,613 26.3 26,262 31.0
b. Stock raising 207 1.0 1,228 3.1 2,418 3 .6 2,985 3 .5 2. Forestry and Fishing 73 .3 212 15 347 .5 214 . 3 3. Extraction of minerals 575 2.7 2,648 6.6 3,819 5.7 7,028 8.3
a. Coal mining ------ ---- ------ ---- 529 .8 989 1.2 b. Metal mining 519 2.4 2.602 6.5 3,164 4. 7 5,951 7.0 c. Quarrying 56 .3 45 . 2 124 .2 88 .1
4. Building trades and construction 1,198 5.6 2,101 5.2 5,538 8.3 4,009 4 . 4
5. Manufacturing 2,259 10.5 4,931 12.3 7,704 11.5 9,194 10.9 a. Apparel & other
fabricated Textile 210 1.0 850 2.1 1,839 2.8 2,164 2.6 b. Clay, glass & stone
products 109 .5 286 . 7 702 1.0 314 .4
1910 Number Employed
131 ,540
37 , 241
33 ,641 3,600
176 10,019
2,463 7,250
273
15,442 15, 711
2,886
1,059 c. Food and kindred
1 1.0 ' products 182 .8 454 1.1 790 1.2 869 1,557 d . Furniture, Lumber and I Wood Produ cts 220 1.0 416 1.0 327 .5 186 . 2 294 e. I ron & Steel machinery
veh. 586 2.7 889 2.2 1,601 2.4 l, 738 2.1 4 ,8 91 f. Non-ferrous metal
I enterprises 52 . 2 323 .8 344 I .5 522 .6 2,024 g. LiQuor & beverages 18 .1 56 . l 86 I .1 78 . 1 ------
%
100
33 .5
21.2 12.3
. 7 7.5 1.9 5.5
. 3
11.7 11.9
2.2
.8
1.2
. 2
3. 7
1.5 ----

TABLE IX CONTINUED
CENSUS YEAR OF REPORT 1870 1880 1890 1900 1910
INDUSTRY OR OCCUPATION Number
% Number
% Number
% Number
% Numbe r
% Emoloved Emoloved Emoloved Emoloved Emoloved
h. Paper, printing, publishing 62 .3 162 .4 463 . 7 448 .5 720 .5
i. Shoes & leather products 493 2.3 731 1.8 783 1.2 643 .8 538 .5
j . Textile mill products 283 1.3 412 l.O 470 . 7 451 .5 520 .4
l. Miscellaneous 44 . 2 352 . 9 299 .4 l, 771 2.1 1,192 .9 6. Transportation, communi-
cations and other utilit . 1,073 5 .0 1,950 4.9 4,282 6.4 5,643 6 . 7 I 11, no 8.9 a. Steam R.R. 520 2.4 l ,001 2.5 2,094 , 'I 3,414
4 .0 I 8,199 6.2 b. Road & water
Transportation 500 2.3 830 2.1 1,958 2.9 1,927 2.3 2,449 1.7 I
c. Telegraph, telephone, I & o ther utilities
I
--~= I 53 .2 119 . 3 230 -;J -~:~;~ 939 . 7
d. Electric & gar utilit. ------ ---- ------ ---- ------ 133 .l 7. Wholesale and retail trade 601 2.8 2 ,048 5.1 4,825 5.8 ! 12,246 9.3 8. Finance & Clerical 13 . 1 123 .3 1,929 2. 91 3,613 4. 3 ! 7,141 5 .4 9. Domestic and personal
7.8 1 11,081 service 1, 312 6.1 2,886 7. 0 6,058 9.1 6,605 8.6 I
10 . Pr ofessional 308 1.4 1,089 2.7 2,608 3.9 4,427 5.2 7,971 6.1 a. Education 140 . 7 444 l.l 804 1.2 1,709 2.0 3,013 I 2.3 b. Other 168 .8 643 1.7 1,804 2. 7 1 2,718 3 .2 4,958 3 .8
11. Public Service 220 l.O 682 1.6 1,231 1.8 898 l.O 2,792 2.1 a. Military 117 .5 417 1.7 785 1.2 245 l.O I 950 2.1 b. Federal Officials
. 2\ and employees 103 . 3 265 . 7 446 . 7 165 571 .4
c. State and local gov. ------ ---- ------ ---- ------ ---- 488
--~~ 1 -=~ =~= 1 .0
12 . Labor, unspecified 3,457 16.1 6, 912 17. 3 8,529 12.8 ------ ----Source: Leonard J . Arrington, Industrial Struc ture of Mountain West, 1850-1950, Number £f Th ese Each Indust ry (Utah State Un i versity) , Tables Ill, I V, y, VI, VI II .
Aggr ega te 1870
United Stat es 49 168 Utah b.
TABLE X RAILROAD MILEAGE IN UTAH
1870, 1880, 1890 , 1900, 1910
1880 1890
87 801.42 163 562 . 12 706 . 34 l 085 .14
1900
a. a.
a. On l y wa ter transpo r tat i on repo r ted in the Cen sus Reports for these years . b. Not r eport ed fo r t he se cens us .
1910
a. a.
Source: U.S., Department of In t erior, Census Office, Tenth Census £l the Un i t ed States, 1880, (Vol . IV), Report ~ Agencie s of Trans port ation, 290 ; U. S. , Depar tment of In t erior , Census Office , El even th Censu s of t he United States, 1890 , (Vol . XVII), Repor t on Transportation Business, Pa r t I, Tr anspor t ation EY Land , 4-6 , 21 .
Aggr ega t e 1870
Farms Irriga ted (II) a. Acreag_e a. Miles of cana l s a.
TABLE XI IRRIGATION STATISTICS FOR UTAH
1870, 1880 , 1890, 1900, 1910
1880 1890
a. 9 724 a. 263 473 a. a.
a. Info rmat ion not available in the Census Repo r ts.
1900
17 924 629 203
2 838
Source: Same Census Reports and page number s as listed f or the s ource in Table I.
1910
19 709 999 410
7 709

32
MANUFACTURING IN UTAH, 1870-1910
Commercial manufacturing in Utah was relatively unimportant until the
completion of the railroad in 1869 . Utah evolved from a basically agriculture
mining economy to one depending not only upon these two extract ive indu stries
but upon manufacturing as well. Utah's economic expansion is closely related
to the continued growth of the state ' s manufacturing industries. These, in
turn, were based primarily upon the processing of the agricultural and
mineral resources of the state. Tables VII and VIII depict various features
of Utah 's manufacturing growth from 1870 to 1910. However, Table VIII lists
only a sample of the manufacturing establishments. This selection is made t o
give an idea of the many small manufacturing establishments as well as some
of the large ones in the state.
From 533 establishments in 1870 with 1,534 employees, Utah's manufactur
ing grew by 1910 to 749 establishments with 11,749 employees. The tables do
not reflect how many closed or started. This could be learned by reading
the census reports and determining which was not reported between the last
census and the next census report.
One of the best measuring sticks of manufacturing growth is the product's
value. This represents the difference between the cost of materials, supplies,
fuel, electricity, and contract work and the value of the finished product.
Value added by Utah ' s manufacturing grew from $2,343,019 in 1870 to $61,989,277
in 1910. Another measuring stick for manufacturing growth is the total wages
and salaries paid by the industries. Tota l wages paid in 1870 was $395,365
compared to $8,400,000 in 1910.
In glancing over Utah's manufacturing history from 1870 to 1910, it
would seem there are two distinct periods of manufacturing growth in the
state. The first period was from 1870 to 1900 and the second period from
1900 to 1910.
First Period of Manufacturing Growth, 1870-1 900.
While manufacturing began with the arrival of the pioneers in 1847, the
real impetus began shortly after the coming of the railroad in 1869. The

railroad provided an outlet for the manufactured goods and eastern capital
carne into the state to assist in the development of manufacturing.
A brief summary of manufacturing prior to 1870 may be helpful to an
understanding of Utah's manufacturing growth thereafter. Within a few
months after the pioneers arrival, manufacturing began. The first plants
in 1848 were a sawmill, gristmill and adobe works. The grist mill on City
Creek was a crude affair but did suffice for the small quantities of grain
brought across the plains. The following year a flour mill was built.34
33
The pioneer leaders energetically promoted home manufacturing industries
as they were necessary to the growth of the commonwealth. A wool carding
mill was built in 1849; the next year an iron smelting project was launched
i n Southern Utah; and in 1852 sugar refining machinery was brought from
France . 35
Early operations were begun in the textile and weaving industries. By
1855 Matthew Gaunt was producing $500 worth of cloth weekly in hi s Jordan
River mill south of Salt Lake City. Three yards of cotton fabric was first
manufactured in 1854 from Utah-grown cotton. Woolen mills were established
in 1858 at Provo, Ogden in 1867, and Logan in 1871. Steps were t aken t o
establish a leather industry because a critical shortage of leather goods
appeared soon after the arrival of the pioneers. The first skin was tanned
in 1850 by Samuel Mulliner. The leather industry was hampered by shortage
of suitable tanning materials; however, many plants were in operation between
1850 and 1870. Also pottery and cutlery plants were started during this
period . 36
The census of 1870 showed 26 plants making furniture, 74 producing flour
and grain products, 15 making leather goods, 9 making woolen, 88 blacksmithing
34Nelson, Utah's Economic Patterns, 198.
35Nelson, Utah's Economic Patterns, 198-99.
36Nelson, Utah's Economic Patterns, 198.
shops , and 52 carpentry and building plants . Other industries, including
baske ts, brooms, bricks, cooperage, cutlery, paper printing, and many
others not listed in Table VIII, were in the census report .
Many of these home industries were cooperative ventures. Mater ial
was bartered for the manufactured product. The settlers used their
ingenuity to manufacture many items needed in neighborhood hand building
industries rather than do without.
34
The effect of the railroad on manufacturing in Utah was to open new markets
for manufactured goods making possible profitable use of the state's mineral
deposits and the importation of eastern manufactured goods.
Prio r to the railroad the people's main contacts with the outside were
t hrough the arrival of immigrant groups, the long freight wagon trains, and
sporadic arrivals of the stage coaches. Utah was one of a very few areas
of large population centers existing nearly a thousand miles from the nearest
navigable water of a sea coast or inland water way. Freight was hauled in
wagons holding from 5,000 to 7,000 pounds pulled by yokes of oxen. It
re quired a full summer t o make a round t rip from Independence, Missouri, to
Sal t Lake City.37
Completion of the railroad in 1869 had an instantaneous effect on
manufacturing in Utah. The railroad caus ed some home industries to disappear
or decline while a few grew (see Table VIII). These home industries, many of
them unnatural to the state, had been promoted because they were needed and
fostered by necessity of pr oduc ing certain goods. Among those establishments
which disappeared were baskets, brooms, cooperage, gunsmithing, leather
tanning, saddlery and harness making, and woolen goods production.38
37Nelson, Utah's Economic Patterns, 199.
38u . s., Department of the Interior, Census Office, Nin th Censu s of the United Stat es, 1870, [Vol. III], Statistics of the~ and Industry of the United States, 392-93, 574-75 (hereafter cited as Census, 1870, III, Wealth and Industry). U.S., Department of the Interior, Censu s Office, Tenth~ of the Un it ed States, 1880, [Vol. II ] , Report££ the Manufactures, 89 (h ereafter ci ted as Census, 1880, II, Manufactures). U.S., Department of the Interior, Census Office, Eleventh Census ~1 the~ States, 1890, [Vol. XI], Report on Manufacturing Industries, Part I, Totals for State s and Industries, 8, 604-7
35
At this time a foundation was laid for the building of those industries
fo r which the state was best suited. They previously had not prospered due
to transportation to markets. These new industries, as well as the old ones
that survived were based on the resources of mining and agriculture. There-
after, not only agriculture and mining economies grew, but the processing of
raw products increased. They concentrated on industries which could be
profitably sold on national markets.
The railroads brought in new manufacturing enterprises and gave impetus
to those that could produce products from natural resources. New mining
enterprises expanded from old ones, and new ones developed. In 1870 there
were 74 f l our and grain producing establishments which increased to 85 by
1880 . This manufacturing establishment as well as others fluctuated in
numbers for the next three decades while there was steady increase in product
value from $2,343,019 in 1870 to $61,989,277 in 1910 (see Tables VII and VIII).
Further expansion of manufacturing is indicated in the census reports.
In 1880 ten salt manufacturing plants were in existence with a product valued
at $60,000. Meat packing had begun by 1890. Confectionery manufacturing was
started in 1880 and cheese making and others began to increase as indicated
by the tables.
Gradually the smaller industries gave way to larger ones or disappeared
completely. However, by 1900 the number of manufacturing establishments and
number of employees had increased. In 1870 there were 533 establishments with
1 ,534 employees as compared to 575 establishments with 5,413 employees in 1910.
(hereafter cited as Census, 1890, XI, Manufactures, I, States and Industries). U. S. , Department of the Interior, Census Office, Twelfth Census of the United States, 1900, Vol. VIII, Manufactures, Part II, States and Territories, 887-90 (hereafter cited as ~, 1900, VIII, Manufactures, II, States and Territories). U.S . , Department of Commerce, Bureau of the Census, Thirteenth Census of the United States, 1910, Vol. VIII, Manufactures, 1909, General Report and Analysis, 31 (hereafter cited as Census, 1910, VIII, Manufactures). U.S., Department of Commerce and Labor, Bur eau of Census, Thirteenth Census £i the United States, 1910, Vol . IX, Manufactures, 1909, Reports £y the States with Statis tics for Principal Cities, 1226-41 (hereafter cited as Census, 1910, IX, Manufactures, 1909, States and Cities) .
The increase in the number of establishments was small but the employee
increase was significant. I t is also significant that the value of manu
factured products greatly increased from 1870 to 1910. The value produced
in 1870 by 533 firms was $2,343 ,019 and by 1910 it had increased almost
ten-fold to $21,156,183.
Utah's manufacturing had at least left its swaddling clothes and put
itself in a position for substantial growth, now joining agricul ture and
mining as one of the basic industries of Utah.
Second Period of Manufacturing Growth, 1900-1910.
36
The second period of Utah's manufacturing witnessed rapid gr owth. This
was because Utah was making a transition from a strictly agriculture and
mining economy to one now depending on agriculture, mining, and manufacturing.
The number of manufacturing establishments increased by 30%, or 575 to
749, from 1900 to 1910, as compared to about 9%, from 1870 to 1900. The
employment increased from 1,534, or about four-fold, from 1870 to 1900. From
1900 to 1910 employment increased from 5,413 to 14,133, or almost three-fold,
for a ten year period (1900-1910) as to four-fold for a 30 year period
(1870 - 1900).
Produ ct value increased slowly from $2,343,019 to $8,911,047 for a
twenty year period, 1870-1890; two and one-half fold, $8,911,047 to $21,156,183
from 1890-1900; and almost three-fold, $21,156 ,18 3 to $61,989,299 from 1900-1910.
The category of product value shows the gr ea t significance of the growth period
from 1900-1910.
Three industries--the smelting and r efinement of copper, the smelting of
lead and zinc , and the manufacture of beet sugar--contributed significantly
to this rapid growth. Lead and zinc smelting added $1 . 73 million to the
pro duct value total in 1910 and employed 1,546 personnel. Also of importance
by number of employees were cars and general shop construction and repair s by
railroad companies.39
39census, 1910, IX, Manufactures, 1909, ~and Cities, 1226-4 1.

37
In addition to the mining smelters already mentioned, important factories
had been established to refine salt, make candy, can fruit, and process meat.
The salt industry gained prominence in 1880 when it showed a product
value of over $60,000 in 10 plants. The number of plants fluctuated; however,
the product value continued to increase to $183,843 by 1910 thus adding to
the expanding manufacturing economy.40
The first sugar plant in Utah was built at Lehi in 1891 by the Utah
Sugar Company. The plant employed 100 personnel to process 36,000 tons of
sugar beets per season and added to the income of 600 families. To acquire
money for expansion, a controlling interest was sold to American Sugar
Refining Company. lHthin a year the company doubled the capacity of the
Lehi plant and erected a million dollar plant at Garland in 1903. This
caused several companies to be established at Ogden and Logan , Utah, and
some in Idaho. Slic ing plants as auxiliaries to the plant at Lehi were
built at Provo, Springville and Spanish Fork. Much of the sugar produced
in Utah was exported. Most of these plants were united in 1907 under
Utah-Idaho Sugar Company with a $13 million capitalization.
A natural outgrowth of the sugar industry was candy manufacturing
which was started in 1870 with a product value of $441 ,044 with 168 employees.
It increased to product value of $3,300 ,895 with 586 employees by 1910.41
Commercial canning of fruit and vegetables began relatively late in
Utah because of the rural orientation of its people, who undoubtedly used
most of fruit produced for home consumption. However, the growth of the
sugar industry gave impetus to the canning of fruit. The canning industry was
first reported in 1900 with 141 employees and a product value of $300,349. It
increased by 1910 to 396 employees and a product value of $1,059,487.4 2
40census, 1880, II, Manufactures, 89. Census, 1910, IX, Manufactures, 1909, States and Cities, 1226-41.
41census, 1870, III, Wealth and Industry, 392-93, 574-75.
42census, 1900, VIII, Manufactures, II, States and Territories, 887-95.

38
Another industry that was becoming important in Utah was the meat pack-
ing industry. This industry began in 1900 with five plants, 34 employees,
and a pr9duct value of $343,444. It increased to 12 plants, 99 employees
and a product value of $1,690,447 by 1910.43
As shown by Table VII I the manufacturing or processing of cheese and
butter became more important during the period 1900-1910. This development
was related to the growth of the dairy industry.44
43census, 1870, III, Wealt~ and Industry, 392-95, 574-75. Census, 1910, IX, Manufactures, 1909, States and Cities, 1226-41.
44census, 1910, IX, Manufactures, 1909, States and Cities, 1226-41. Table VIII of this report .
INDUSTRIAL STRUCTURE OF UTAH, 1870-1910
One way to determine the economic profile of Utah is to compare the
number of persons employed in each occupation by number and by percentage
of the total in all occupations. How many persons of the total labor
39
force obtained their living through agriculture, mining, manufacturing or
some other industrial occupation? From 1870 to 1910 what were the people
in Utah doing for a living? Table IX shows the occupational and industrial
structure of Utah listing the number of persons in each occupation, and
showing the percentage for occupations listed.
The percentage of people employed by the big four of the basic
industrial structure in 1870 were agriculture 48.5% or 10,428 persons,
manufacturing at 10.5% or 2,259 persons, building trades and construction
at 5.6% or 1,198 persons, and mining at 2.7% or 575 persons. There were
other occupations that employed more persons than manufacturing, building
trades and construction, and mining; however, these have been classified
for the purpose of this report as "service in s upport" of the basic
industrial structure occupations (agriculture, manufacturing, building
trades and construction, and mining). The leading occupations in this
classification were labor unspecified at 16.1% or 3,457 persons, domestic
and personnel services at 6.1% or 1,312 persons, and transportation,
commun ications and other utilities at 5.0% or 1,075 persons.
In 1910, the basic four of the industrial structure remained the
same in the order of number of employed, but agriculture had decreased by
15% of the total. A reason for this decrease was the corresponding
i ncrease of manufacturing and mining operations. Also, improved methods
in agricultural production permitted a decrease in the number of agricultural
workers. This reason applied to immigrants to Utah in the 1880s and later
years, to seek livelihood in other industries than agriculture.
Manufacturing, representing 11.7% of the total labor or occupational
force employed in 1910, had increased about 1.4% in the forty year period
f r om 1870-1910. It had been higher in the 1880 report, but had decreased
i n the next two decades. This increase and then decline from 1870-1880 was
40
probably due t o old and new industries attempting to manufacture new pro
ducts, to compete in the eastern markets, and some of these manufacturing
establishments began to fail. This failure caused the percentages to
decrease. However the number employed, as did the total number employed,
increased in all occupations. The total occupational fo rces also increased
very rapidly.
The moderate increases in manufacturing were due to: (l) numerous small
home businesses; (2) the transition from these to larger commercial establish
ments, both old and new, attempting to compete with well-established eastern
concerns who could produce goods more cheaply; and (3) home consumption was
not sufficient to provide large lucrative markets in Utah. Consequently,
manufacturing to expand in Utah had to seek new markets in competition with
eastern goods. Manufacturing did increase by 6,500 employees from 1900 to
1910 due to development of large non-ferrous metal, machine and foundry works,
clay, glass, and stone products.
The slight increases or decreases from 1870 to 1910 in employment in the
building trades and construction was closely related to the manufacturing
growth. This area increased 7 . 3% from 1900 to 1910. A major reason for
this increase was in the mineral extraction and new manufacturing .
In the forty year period, 1870-1910, metal mining did not increase more
than 3.5% until new methods for copper smelting emerged between 1890-1900.
The increase was 5.0% in 1900 over 1870. It decreased 1.2% from 1900 to
1910 . This decrease in percentage, even though a larger number of persons
were employed in 1910 than 1900 was because the total number employed had
increased approximately 52% or 46,936 (difference between 131,540 in 1910
and 84,604 in 1900) from 1900-1910 .
Those occupations classified as "service in support" of the basic
occupations (agriculture, manufacturing, building trades and construction,
and mining) increased as d i d the basic four. The wholesale and retail trade
area of the economy made the most significant increases, from 2.8%, or 601
persons in 1870, to 9.3%, or 12,246 persons, employed in 1910. The increases
i n this area would be expected as the total number i n these occupations grew

41
from 21,517 persons in 1870 to 131,540 persons in 1910, or increased about
six-fold . As the assets and administration grew in all occupations so did
financial and clerical occupation employment grow, which increased from .1%
in 1870 to 5.4% in 1910.
The professional occupations increased from 1.4% in 1870 to 6.1% in
1910 . There was , and should have been, an increase in these occupations
to support the basic four in the industrial structure.
In keeping with the industrial growth, the number employed in government
increased from 488 in 1900 to 1,271 in 1910. This occupation had not been
reported until 1900. After 1896, when Utah became a state, the transition
from territorial government with many of its offices filled by federal
appointees to a government being organized to operate the affairs of a
state would be a major reason for the growth in number and percent of
employees in this occupation.
Industrial Structure.
Agriculture was the predominant occupation in Utah for the forty year
period, 1870-1910. It consistently led each of the other major occupations
by at least two and one-half to one. In 1910, agriculture employed 37,241
persons out of 131,540 persons employed in the total occupational force,
representing 33.5%. Manufacturing was one-third as large as agriculture
with 11.9%. Building trades and construction were almost the same as
manufacturing with 11.7%. Mining started low but increased with the rail
road network in Utah and the new open pit method of mining copper.
The other occupations classified as "service in support" of the basic
industrial structure listed in order of importance were: wholesale and
retailing at 8.9%, domestic services at 8.4%, professional service a t 6.1%,
cle r ical and financial at 5.4%, and others of less significance. Labor,
unspecified, was large in 1870 at 16.1%; however, it was not reported in
1900 and 1910.
Although metal mining, listed as one of the basic four in the industrial
structure, did not increase more than 3.5% until copper smelting emerged
be tween 1890 and 1900, then the increase was 5% over 1870 and 2.5% over 1890.

42
The industrial growth, other than agriculture, manufacturing, and metal
extraction, had large increases after 1900. The rate of increase was 7% in
building trades and construction and 2% in transportation. There was growth
in almost all the occupational fields listed. Quite significant was the
increase of 9% in livestock raising as compared to a 10% decrease in crop
and general agriculture. The development of the meat packing industry and
the railroad network within Utah was a major reason for the increase in
stock raising, and perhaps some of the persons engaged in general crop rais
ing also turned to stock rai sing.
These increases in the industrial structure were due to the development
of transportation facilities, population growth, competition in eastern
markets, investment capital for mining and manufacturing, and expansion of
western markets. Also as manufacturing developed, it increased the amount
of hard cash available; therefore, the people in Utah had more money with
"hich to buy manufactured goods.

43
RAILROADS IN UTAH, 1870-1910
The completion of the transcontinental railroad in 1869 had an
instantaneous effect upon Utah 's economy. The major impacts were: (1)
impetus to Utah's mining industry; (2) reduction in cost of eastern goods;
(3) markets for Utah's agricultural products; (4) failure of many of Utah's
home manufacturing establishments; and (5) unemployment of men who had done
freighting.
The losses through closing small home manufacturing establishments
and reduction of jobs for teamsters were offset by new developing economic
patterns. Some of the small manufacturers entered into o ther activities
such as wholesaling and retai ling. Some entered into manufacturing of
goods that had a possibility of competing in the eastern markets. Most of
the teamsters became employed in building of railroads in Utah and surround
ing areas.
The effect upon agriculture became significant as Utah's livestock could
be shipped without the long trek over mountains, plains, or desert. The
railroad created another market for agricultural products. The Union Pacific
paid more than $120 for a ton of hay and $14 for a bushel of potatoes.45
Mining now gained momentum with the introduction of machinery and eastern
capita l.
After the completion of the transcontinental railroad in 1869, Utah
enjoyed the benefits of railroad expansion as a r ailroad center between
California and the east. Table X shows railroad mileage for Utah in 1880
and 1890. This is the only information listed by the census for this period.
The census reports after 1890 list only water transportation. The railroad
miles began to increase immediately after the joining of the rails at
Promonto r y Summit, May 10, 1869. Steps were begun to build railroads within
Utah. Some of these were:46 (l) the Utah Central built from Salt Lake City
45Nelson, Utah's Economic Patterns, 245.
46Nelson, Utah's Economic Patterns, 245-47.

44
to Ogden, 1869-70; (2) the Utah Southern extended south through Utah and
J uab Counties into Milford and eventually to Los Angeles, 1871-79; (3) the
Utah Northern extended north from Brigham City towards Butte, Montana, and
was connected with the Union Pacific at Brigham City, 1870s; (4) the Denver
Rio Grande was formed as a subsidiary of the Denver Rio Grande of Colorado,
1881; (5) the Great Salt Lake and Ho t Springs (Bamberger, 1907) was built
to Beck's Hot ~prings, Ogden, Logan, and into Idaho and south to Payson,
1890s.
The railroads in Utah had the following general effects: (1) general
merchandise, coal, coke, and ores of lead, rock, limestone, iron, and fire
c l ay, were transported to California; (2) Carbon County coal fields were
opened; (3) better communciations were provided within Utah and to the
nation; (4) the mining districts of Alta, Bingham Canyon, and others were
connected with the main lines; (5) markets were opened for agricultural
and manufactured products; (6) eastern goods could be purchased in Utah at
a cheaper cost.
Summary of Railroads in Utah.
Railroads were probably the most significant factor in changing Utah's
e conomic patterns. They changed home manufacturing from home-owned to a
larger commercial type to compete with the eastern and western markets.
They made a tremendous impact on the mining development and agricultural
production. Railroads paved the way for a general surge in the entire
economic growth of Utah. They ended somewhat the isolation of the state
from within and particularly from the rest of the nation. Economically,
Utah's growth in all aspects was enhanced by the railroads during the
period of 1870-1910.
CONCLUSIONS
In supporting Utah 's economic growth in mining, manufacturing, and
agriculture, the single most important factor was the railroads, primarily
45
the completion of the transcontinental railroad in 1869 and later the rail
r oad network within the state itself. Without the railroads it is reasonable
to presume that during the period of this report, Utah would have remained a
quasi-self-suffic ient agricultural economy with little mining activity, and
only small home-owned manufacturing. Transportation costs due to long
distances, along with Utah's isolation, were prohibitive to compete in
eastern and/or western markets. Bringing in needed goods were almost
prohibitive because of high transportation costs. The larger increases in
agricultural products, mining development, and manufacturing growth is shown
after completion of the transcontinental railroad. Further, railroads pro
vided employment as well as cheaper methods of transporting Utah's products
which were the means of earning hard cash so vitally needed by its inhabitants.
Prior to the 1890s population increases were influenced by t he vigorous
missionary activities of the Mormon Church and the urging of the Church
leaders for all converts to migrate to "Zion." After the 1890s, the Church
leaders quietly encouraged converts to remain in their present location.
This was done in order to encourage the Federal government to approve Utah's
application for statehood. The advent of mining and manufacturing on a
larger scale, after 1870, was an influence for people other than Mormons to
come to Utah. The high birth rate and low death rate combined to produce a
high population growth.
Agricul ture was the dominant industry from 1870-1910. The basis of
survival for a new community during the early development of the United States
was agriculture. This was true in Utah's communities. It was developed and
vigorously pursued because of the Mormon leaders' desires for self-sufficiency
and isolation. After the 1870s, with the completion of the first transconti
nental railroad, the importance of mining and manufacturing within the
industrial structure became important; however, agriculture was still the
l eading industry. Agricultural products increased as other industries grew.

Although minerals were discovered early in Utah and limited mining
was begun, mining was unimportant to Utah's industrial growth until the
railroad came in 1869. This provided transportation of machinery into the
state for larger mining operations and the transportation of mining pro
ducts. It also attracted capital to the state for the development of the
mining industry.
Manufacturing changed from small home-owned to the larger commercial
businesses after the completion of the transcontinental railroad in 1869.
The small factories could not compete with the cheaper eastern goods, but
railroads made available many eastern and western markets which were
supplied more profitably by larger manufacturing establishments. It was
normal and expected that the number of persons employed should increase
as the manufacturing industry developed and grew.
46
Irrigation expanded as more tillable acres were needed to support
Utah's growing population. Because of the low annual rainfall, irrigation
was vital to survival. Water was also vital to the growth of manufacturing
and mining within the state. Utah's terrain limit s the amount o f acreage
that can be put into cultivation; therefore, to enhance manufacturing
growth and mining development better utilization of the available water
will have to be accomplished through storage and dams.

BIBLIOGRAPHY
Government Documents
U.S. Department of the Interior . Census Office. ~Compendium of the Ninth Census, 1870.
U.S. Department of the Interior. Census Office. Ninth Census of the United States, 1870. [Vol. I], Statistics of Population.
U. S. Department of the Interior. Census Office. Ninth Census of the United States, 1870 . [Vo l. III], Statistics of the l<ealth and Industry .<?.£ the United States.
U.S. Department of the Interior. Census Office. Compendium of the Tenth Census of the United States, 1880.
U.S . Department of the Interior. Census Office. Tenth Census of the United States, 1880. [Vol. I], Statistics of Population.
U.S. Department of the Interior. Census Office. Tenth Census of the United States, 1880. [Vol. II], Report .2.!! the Manufactures.
U.S. Department of the Interior. Census Office. Tenth Census of the Un ited ~' 1880. [Vo l. I V] , Report on the Agencies of Transportation.
U. S. Department of the Interior. Census Office. Tenth Census of the United States, 1880. [Vol. VII], Report .2.!! Valuation, Taxation, and Public Indebtedness in the United States.
U.S . Department of the Interior. Census Office. Tenth Census of the United States, 1880. [Vol . VII], History and Present Condition of the Newspaper and Periodical Press.
U.S. Department of the Interior. Census Office. Tenth Census of the Un ited States, 1880. [Vol. XV], Report .2.!! the Mining Industries of the United States.
47
U.S. Department of the Interior. Census Office. Compendium of the Eleventh Census of the United States, 1890. Part I, Popu l ation.
U.S. Department of the Interior. Census Office. Compendium of the Eleventh Census of the United States, 1890. Part II, Vital and Soc ial Statistics.
U.S. Department of the Interior . Census Office. Compendium of the Eleventh Census .<?.£ the~~' 1890. Part III, [Analysis of the Population].
U.S . Department of the Interior. Census Office. Eleventh Census of the United States, 1890. [Vol. I], Report .2.!! the Statistics of Agriculture.
U.S. Department of the In terior . Census Office. El eventh Census of the United States, 1890 . [Vol. XI], Report .2.!! Manufacturing Indust r ies. Part I, ~for States and Industries.

48
U.S. Department of the Interior. Census Of fice . Eleventh Census of the Un ited States, 1890 . (Vol. XIII], Report££ Manufacturing Industries. Part III, Selected Industries.
U.S. Department of the Interior. Census Of fice. Eleventh Census of the Unit ed States, 1890. (Vol. XIV], Report on Mineral I ndustries .
U.S. Department of the Interior. Census Office. Eleventh~ of the Un i t ed ~. 1890. (Vol. XVIII], Report ££ Transportation Business. Par t I, Transportation EY Land.
U.S . Department of the Interior. Census Office. Eleventh Census of the ~ States, 1890. (Vol. XXII], Report ££Vital and Social Statistics. Part III, Statistics of Deaths.
U.S. Department of the Interior. Censu s Office. Eleventh Census of the United States, 1890. (Vol. XXIV], Report££ Wealth, Debt, and Taxation. ~art I, ~Debt .
U.S. Department of the Interior. Census Of fi ce . Twelfth Census £i the United States , 1900. Vo l. I , Population Part l·
U.S. Department of the Interior. Census Office. Twelfth Census of the United States, 1900. Vo l. II, Population Part II.
u.s. Department of the Interior. Census Off ice . Twelfth Census of the United States, 1900. Vol. IV, Vital Statistics. Part II, Statistics £i Deaths.
U. S . Department of the Interior. Census Office. Twelfth Census of the United States, 1900 . Vol. V, Agriculture. Part I, Farms, Livestock, and An i mal Products.
u.s.
u.s.
u.s.
u.s.
Department of United States , gat ion.
Department of United States,
EY Industries.
Department of United States, Territories.
the Interior. Census Office. Twelfth Census of the 1900. Vo l. VI, Agriculture. Part II, Crops and Irri-
the Interior . Census Office. Twel f th Census of the 1900 . Vo l . VII, Manufactures . Part I, Unit ed States
the Interior. Census Office. Twel fth Census of the 1900. Vol. VIII, Manufactures. Part II, State s and
Department of the Interior. Census Office. Twelfth Census £i the United ~. 1900. Vol. IX, Manufactures . Part III, Special Reports ££Selected Indus tries.
U. S. Department o f Commerce and Labor. Census Office . Special Reports, Mines and Quarries, 1902.
U.S. Department of Commerce and Labor. Census Office. Special Reports, Telephone and Telegraph, 1902.

U.S. Department of Commerce. the~~, 1910.
U.S. Department of Commerce. the United States, 1910. Alabama-Montana.
U. S . Department of Commerce. the United States, 1910. Nebraska-Wyoming.
U.S. Department of Commerce. the United~, 1910. Report and Analysis.
49
Bureau of the Census. Thirteenth Census of Vol. I, Population. General Report and Analysis.
Bureau of the Census.
Vol. II, Population.
Bureau of the Census. Vol. III, Population.
Thirteenth ~ of Reports £y the States,
Thirteenth Census of Reports £y the States,
Bureau of the Census. Thirteenth Census of Vol. V, Agriculture, 1909 and 1910. General
U. S. Department of Commerce. Bureau of the Census. Thirteenth Census of the United States, 1910. Vol. VI, Agriculture, 1909 and 1910. Reports £y States, with Statistics for Counties. Alabama-Montana.
U. S. Department of Commerce. Bureau of the Census. Thirteenth Census of the~ States, 1910. Vol. VII, Agriculture, 1909 and 1910. Reports £y States, with Statistics for Counties. Nebraska-Wyoming.
U. S. Department of Commerce. the United States, 1910. and Analysis.
Bureau of the Census. Thirteenth Census of Vol. VIII, Manufactures, 1909. General Report
U.S . Department of Commerce and Labor. Bureau of the Census. Thirteenth ~of the United States, 1910. Vol. IX, Manufactures, 1909 . Reports £y the States with Statistics for Principal Cities.
u. s. Department of Commerce. Bureau of the Census. Thirteenth~ o f the United States, 1910 . Vol. XI, Mines and Quarries, 1909. General Report and Analysis .
U. S . Department of Commerce. Bureau of the Census. Wealth, Debt, and Taxation, 1913.
U.S. Department of Commerce. Bureau of the Census. Telephones and Telegraphs. 1912.
Books and Articles
Andrew Love Neff. History of Utah, 1847 ~ 1869 (Salt Lake City, Utah: The Deseret News Press, cl940).
Nels Anderson. Desert Saints, the Mormon Frontier in Utah (Chicago: The University of Chicago Press, cl966).
Leonard J. Arrington. Great Basin Kingdom: An Economic History£.!. the Latter-day Saints, 1830-1900 (Cambridge, Massachusetts: Harvard University Press, 1958).

50
Industrial Structure of the Mountain West 1850-1950. Number of These in Each Industry. (Logan: Utah State University, 1963).
"The Commercialization of Utah's Economy: Trends and Development of Economics from Statehood to 1910." (Utah State University, 1964).
Stan le y S. Ivins. "Notes on Mormon Polygamy," The Western Humanities~' X (Summer 1956).
Utah ,~ Guide to ~~ (New York: Hastings House Publishers, cl954).
El Roy Ne lson. Utah 's Economic Patterns (Salt Lake City, Utah: University of Utah, 1956).
1969 Statistical Abstract of Utah. Bureau of Economic and Business Research, Division of Economic Development and Research Center for Economic and Community Development. (Salt Lake City, Utah: University of Utah, Jan. 1969).
The United States Book of Facts, Statistics, and Information for 1969. (New York: Washington Square Press Inc., 1969).
NEWSPAPERS
Deseret News (Salt Lake City, Utah), December 14, 1907.

VITA
Daniel Jerome Ringle
Candidate for the Degree of
Master of Science
Two Plan B Reports: The Effec ts of Huguenot Set tlement s Upon the French Colonial Emp ire; On Human, Economic, and Natural Resources for the State of Utah from 1870-1910 from U.S. Census Reports
Major Field: History
Biographica l Information:
Personal Data: Born at Sycamore, Kansas, May 6, 1918, son of Fred F. and Edyth 0. Ringle; married Luana Harris July 8, 1943; seven children--Daniel J. II, David, Debra, Darlyn, Donald, Delane, and Douglas.
Education: Attended Larimer Elementary Schoo l, Sycamore Township, Montgomery County, Kansas; Graduated from Independence High School, Independence, Kansas, in 1935; received the Bachelor of Science Degree from Utah State University, with a double major in Education and History, in 1961; completed requirements for Master of Sc ience degree, specializing in History at Utah State University in 1971.
Professional Experiences : 1961 to present, Social Science teacher, secondary schools, Ogden City School District, Ogden, Ctah; 1959-60, Associate Professor, Air Science, Utah State University; 1960, Lt. Co lonel, retired from USAF; 1937-60 served in World War II and Korean Conf lict with the USMC and USAF; 1949 decorated for service with Berlin Airlift; 1956-59 Chairmen, Ryrukan American Communi t y Relation, Kadena, Okinawa; Ten years traveling in Europe, China, Japan, Philippine Isl ands and Pacific Islands; Five years, Air Traffic Controller: fifteen years, personnel, administration, and personnel management.