An Introduction to Computational Diffusion MRI: the Diffusion Tensor and Beyond
Upload
independentCategory
view
3download
0
Preliminary release Not for distribution
Self-Diffusion of Iron in L10 FePd films Upon He-irradiation
(alternative title: An alternative for diffusion studies in isotopic FePd
multilayers)
D. G. Merkel, F. Tanczikó, Sz. Sajti, M. Major, Cs. Fetzer and L. Bottyán
KFKI Research Institute for Particle and Nuclear Physics, P.O.B 49, H 1525,
Budapest, Hungary
A. Kovács
MTA Research Institute for Technical Physics and Materials Science (MFA), P.O.B
49, H 1525, Budapest, Hungary
R. Rüffer, S. Stankov
European Synchrotron Radiation Facility, BP 220, 38043 Grenoble CEDEX 9, France
ABSTRACT
The continuous need towards improving the capacity of magnetic storage devices requires
materials with strong perpendicular magnetic anisotropy. FePd, CoPd and their Co(Fe)Pt
counterparts very attractive candidate for such purposes. The magnetic properties of these
films are largely dependent on the orientation and local distribution of the L10 FePd phase
fraction which are mainly controlled by diffusion processes and involve diffusion paths of a
few angstroms. Highly ordered as well as disordered epitaxial isotope-periodic 57
FePd/nat
FePd
(001) thin films were prepared by molecular-beam epitaxy on MgO(001) substrate. Short
range diffusion of different phases in FePd thin film induced by room temperature 130 keV
He+ irradiation was investigated at fluences up to 30×10
15 ions/cm
2. Conversion electron
Mössbauer spectroscopy and synchrotron Mössbauer reflectivity experiments showed that the
inter-atomic diffusion across 57
FePd/nat
FePd interface occur mainly via the iron rich regions.
The ratio of the diffusion length in the L10, fcc and iron rich structure are 1:1.4:5.6
respectively. Assuming that the diffusion coefficient in the fcc phase is between the diffusion
coefficient of the L10 phase in the crystallographic c direction and perpendicular to it, the
diffusion coefficient in the c-direction of the L10 phase is found more than 1.9 times lower
than in the a-b plane.
PACS 75.70.-i, 75.30.Gw, 75.50.Ss, 61.80.-x, 74.25.Ha
I INTRODUCTION
Due to their high perpendicular magnetic anisotropy, (PMA), L10 (CuAu(I)-type) ordered
FePd as well as FePt and CoPt are candidate materials for future ultra-high density magnetic
recording [1,2,3]. PMA has been reported to originate in these materials from growth-induced
heterogeneity, compressive strain, short-range order driven segregation or magnetically
induced phase separation, but was not found to be linked to the appearance of any long range
ordered phase. At room temperature, Fe1-xPdx exhibits equilibrium L10 structure in the

Preliminary release Not for distribution
composition range 0.5 < x < 0.6, with alternating Fe and Pd planes along the [001] direction.
In the L10 FePd structure the short and long lattice parameter ratio (former along the [001]
axis) varies between 0.96 and 0.97. The anisotropy energy is in range of 107erg/cm
3 [4,5,6]
which is of primary interest for magnetic storage applications since it allows nano-size
magnetic volumes to remain ordered against thermal agitation. The ordered L10 to disordered
fcc phase transition is driven by short range diffusion.
Atomic diffusion governs the structural relaxation and associated changes in the physical and
magnetic properties in these alloys. Depth profiling techniques like radioactive tracer and
secondary ion mass spectrometry are most widely used for such studies. However, the depth
resolution of these techniques is often limited to a few houndred angströms. This is a severe
limitation, since in metastable systems such large diffusion lengths may be difficult to achieve
without fundamental structural transformations. Dynamic techniques like Mössbauer
spectroscopy or nuclear forward scattering of synchrotron radiation, on the other hand, are
limited by the data acquisition time and the time window over which they are sensitive to
atomic diffusion. For example, diffusivities accessible using 57
Fe Mössbauer spectroscopy are
in the range of 10-12
to 10-13
m2/s [7] which is not enough to follow diffusion in atomic range.
In studies of chemically modulated multilayers x-ray diffraction (XRD) and x-ray reflection
(XRR) methods are commonly used. By XRR, it is possible to study diffusion lengths below
the detection limit achievable by the sectioning and profiling techniques [8,9,10,11,12].
Despite the difficulties that arise due to the concentration dependence of the diffusion
coefficient, these techniques are widely used to study interdiffusion in compositionally
heterogeneous multilayers, it is not possible to follow self-diffusion by these techniques in
chemically homogenous materials since the solely electronic interaction with the x-ray
photons produces no contrast between the adjacent layers.
To investigate self diffusion, an isotope sensitive technique is required. Conventional x-ray
techniques don’t have this feature but neutrons may have significant difference in scattering

Preliminary release Not for distribution
cross section for the different isotopes of the same element. Neutron reflectivity is a suitable
non-destructive method to study self-diffusion in a chemically homogenous isotope multilayer
with diffusion lengths of the order of a few angstrøms [13,14]. A recently emerged similar
isotope sensitive non destructive method for studying self diffusion is Synchrotron Mössbauer
Reflectivity (SMR) [15]. Due to the nuclear (hyperfine) interaction between the atomic nuclei
and the highly monochromatized synchrotron radiation (tuned to the transition energy of the
resonant isotope, hereafter 57
Fe), Mössbauer isotopes have very large scattering amplitude as
compared to that of non-Mössbauer-isotopes of the same material providing an isotope
contrast between the adjacent layers of the sample. This results in Bragg peaks in the
reflectivity pattern, related to the period of the periodic multilayer sample. The sensitivity of
these methods are suitable for the layer thickness used in our case. From the variation of the
Bragg peak intensity, valuable information can be gathered on the change of the isotope depth
profile, and consequently on the interlayer diffusion. However, isotope sensitive neutron and
Mössbauer reflectometry has been already used by different groups [16,17] they assumed that
the sample structure remained unchanged during the heat treatment thus neglecting the effect
of phase evolution.
Low energy(~130keV) He+ implantation features low collision cross section with the
intention to avoid defect interactions and small energy transfer to minimize recoil
displacement. However, the beam energy is sufficient for the ions to pass through the layer
and stop deep (~1.5 μm) in the substrate, leaving a rather homogeneous defect distribution in
the (65 nm thick) film to relax. According to SRIM [18] simulations each incoming ion
generates ~6 displacements on average, which mainly generate vacancies and equal number
of interstitials According to these simulations, the probability of sputtering by these He+ ions
is negligible (< 10-5
). This kind of low energy ion implantation doesn’t induce collision
cascades in the layer and results similar effect as heat treatment.

Preliminary release Not for distribution
In this paper we use SMR method to study the self-diffusion of Fe in an isotope periodic
natFePd/57
FePd multilayer film following room temperature low energy He+ irradiation of
various doses. Isotope layers with originally sharp interfaces were used to avoid chemical
effects of diffusion. X-ray diffraction (XRD), conversion electron Mössbauer spectroscopy
(CEMS), high resolution transmission electron microscopy (HRTEM), completed by selected
area electron diffraction (SAED) and SMR were used to characterize the samples and to
follow the irradiation induced processes in the samples.
II THEORETICAL CONSIDERATION
SMR experiments can give information on the atomic movement below the nanometer scale,
which is indispensable to understand self-diffusion-controlled processes. The 57
Fe
concentration in one isotope layer of nat
Fe47Pd53/ 57
Fe47Pd53 system can be expressed in a
Fourier series [11,19]
)exp()( zikCzC nnn
(1)
Where kn=2n/ with being the periodicity of the multilayer and z the depth of the sample.
When atomic diffusion takes place in the sample by annealing or irradiation the magnitude of
the Fourier component Cn decays with time. If the atomic migration by annealing results
diffusion in the sample then we can use the 1D Fick equation. Substituting (1) into this
equation one obtain the following equation.
DtkCC nnn
2
0 exp (2)
Where D and t are the diffusivity at a given temperature, and the retention time, respectively.
If the atomic migration is diffusion then D depends from temperature Arrhenius like. If the
atomic migration is irradiation induced then D depends from the energy loss of the ion beam
for a given depth.
Preliminary release Not for distribution
T. Mizoguchi et al.[20
] derived a formula, which relates the intensity of the n-th order Bragg
peak in the reflectivity pattern at t = 0 (I0) to that at time t, according to the following
expression:
tTDn
I
tI)(
)(log
2
22
0
, (3)
where log stands for the natural logarithm. The corresponding diffusion length due to
thermally induced diffusion is:
tTnDLd )(2 (4)
In the following we show that low energy ion-irradiation can be treated in a very similar way.
Materials exposed to ion irradiation exhibit significant atomic rearrangement, so-called ion-
beam mixing. Several processes are responsible for the ion mixing effect, all of which are
initiated by the interaction of energetic ions with the solid. The relative significance of the
ballistic, recoil and cascade effects can be altered by changing the mass and/or energy of the
ions impinging on the sample. Increasing the mass of the ions increases the amount of energy
deposited in nuclear collisions per unit length traveled by the ion. Consequently, the amount
of mixing, Q, at the interface of two layers can be expressed as [21]:
2/1
ndx
dEQ (5)
Where (dE/dx)n is the nuclear stopping power and represents the ion dose that have passed
through the interface. Electronic interaction between the beam and the atom results only
ionization and causes no mixing hence it doesn’t play role in our case. Since the dose rate, in
ion/cm2/s, can be considered constant during an ion mixing experiment, the ion dose is
proportional to time, leading to the observed behavior that mixing is proportional to (dose)1/2
[22]. This implies that ion mixing is also proportional to the square root of ion mixing time.
One can compare this proportionality to that observed for a reaction layer formed between

Preliminary release Not for distribution
two materials by thermally activated interatomic diffusion [23]. The width of the reacted layer
W, found to behave as follows:
dLtDW ~
2 (6)
where D~
is of the form of an interdiffusion coefficient. Because of these similarities many
ion mixing models are based on diffusion and interdiffusion analogues with mixing described
in terms of an effective mixing diffusion coefficient, .~D
III EXPERIMENT
Highly ordered (majority L10) and also disordered (fcc) isotope-periodic Fe47Pd53 were
grown on 20×20×2 mm3 MgO(001) substrates by the method of molecular-beam epitaxy
(MBE). In the case of ordered sample the substrate was held at 350C and in the case of
disordered sample the substrate was at room temperature during growth. In order to obtain
epitaxial growth of Pd, a seed layer of 3 nm Cr was evaporated onto the MgO(001) surface at
a rate of 0.07 Å/s, followed by the growth of a Pd buffer layer of 15 nm thickness at a rate of
0.2 Å/s. Then the bi-layer sequence of 3 nm nat
Fe47Pd53 and 2 nm 57
Fe47Pd53 was repeated ten
times. All nat
Fe47Pd53 and 57
Fe47Pd53 layers were prepared by co-evaporation of Fe and Pd at a
rate of 0.0485 Å/s for both 57
Fe and nat
Fe and 0.0682 Å/s for Pd. To avoid oxidation of Fe a 1
nm Pd layer was grown on top of the sample. The 57
Fe was evaporated from Knudsen-cell (at
1410 oC), all other layers were deposited using electron-beam evaporation. The base pressure
was 2×10⁻¹⁰
mbar in the MBE chamber, which raised to 2.8×10⁻⁹
mbar during the growth. It is
very important to achieve identical layer composition in the nat
FePd and 57
FePd layers,
therefore the so-called MBE tooling factors were carefully calibrated using Fe and Pd as well
as FexPdy test films, the layer thickness and the composition of which were determined by x-
ray reflectometry and Rutherford Back-Scattering. The evaporation was controlled by two
independent quartz thickness monitors.

Preliminary release Not for distribution
The samples were cut into eight equal pieces of 10×5×2 mm3. Before He
+-ion irradiation,
SRIM [18] simulation were performed and the energy of the ion was chosen so that the He+
passes through the layer and stops deep in the substrate without causing collision cascades.
The ordered samples were then irradiated by 1.0×10¹⁴
to 1.49×10¹⁶
at/cm2 and the disordered
ones were irradiated by 3.7×10¹⁴
to 3×10¹⁶
at/cm2 He
+ of energy 130 keV and one sample of
each set were left unirradiated.
The CEMS experiments were performed by using a 57
Co(Rh) single line Mössbauer source
with a home made gas-flow single-wire proportional counter operating with He gas with 4.7%
CH4 extinction gas and at a bias voltage of 83010 V.
SMR measurements were performed at the ID18 and ID22 beam line of the European
Synchrotron Radiation Facility (ESRF, Grenoble, France) in 16 buntch mode. For sequential
monochromatization of the beam to the 14.4 keV Mössbauer transition ((=0.86025 Å) of
57Fe, a Si(111), then a Si(422)/Si(12.2.2) double channel cut monochromator were used.
Prompt (non-resonant) and 57
Fe delayed (time integrated) nuclear resonant reflectograms were
recorded on each sample. In this method the interacting photon scatter on both the atomic
electron and nucleus. The characteristic time of the electronic scattering is typically 10-15
s
from which the signal of nuclear scattering is well distinguishable since it is seven orders
slower (~10-8
s). This means that the delayed signal is fully originates from the nuclear
scattering and basically free from noise. Since the monochromatization of the synchrotron
beam is currently a few meV and this is orders of magnitude higher than the transition energy
of the nucleus (~100 neV) the different transitions of the nucleus are excited together and this
results interference in the time spectrum. This time spectrum can be considered as the Fourier
transformation of the conventional Mössbauer spectrum. The Synchrotron Mössbauer
Reflectometry is the integration of the time spectrum at each angle which gives a very useful
isotope sensitive method.

Preliminary release Not for distribution
X-ray diffraction was carried out using a D8 Discover type diffractometer (equipped with a
Göbel-mirror on the primary side) in Bragg-Brentano geometry using Cu K radiation
(=1.5415 Å).
IV RESULT AND DISCUSSION
The He+ irradiation not only causes interface mixing in the FePd samples, but also induces, as
we shall see, structural transformation. Detailed CEMS, XRD and TEM evaluation of the
ordered irradiated samples has been published elsewhere [24,25]. Our earlier CEMS
experiment show, three distinct micro structural units, the low hyperfine (hf) field, a large hf
field, and an intermediate hf field local environment could be identified in the ordered
samples, which were attributed to the ordered L10, one iron-rich phase and the disordered fcc
structural units, respectively (Figure 1 a.). The iron-rich environment consists of iron
nanoclusters within the L10 matrix, being magnetically coupled with it. In the ordered and
iron-rich components the hf field points out of the sample plane, while the disordered phase
has random magnetic orientation. By increasing the fluence of the He+ irradiation from zero to
14.9×10¹⁵
ions/cm2, the CEMS spectral fraction of the ordered L10 phase decreases from 81%
to 44%, while the disordered phase increases from 15% to 36%. The fraction of the partially
ordered component also increases from 3.4% to 20%, but it reaches this value already at a
fluence of 7.4×10¹⁵
ions/cm2 (Figure 2 a.)
Preliminary release Not for distribution
-10 -8 -6 -4 -2 0 2 4 6 8 10
1.00
1.05
1.10
1.15
20 24 28 32 36 40
0.00
0.02
0.04
0.06
Ordered FePd
as deposited
-10 -8 -6 -4 -2 0 2 4 6 8 10
1.00
1.02
1.04
1.06
20 24 28 32 36 40
0.00
0.01
0.02
0.03
7.4x10¹⁵
ion/cm2
-10 -8 -6 -4 -2 0 2 4 6 8 10
1.00
1.05
1.10
V (mm/s)
20 24 28 32 36 40
0.00
0.02
0.04
Hyperfine field (T)
14.9x10¹⁵
ion/cm2
-10 -8 -6 -4 -2 0 2 4 6 8 10
0.99
1.00
1.01
1.02
1.03 As deposited
20 25 30 35 40
0.000
0.002
0.004
0.006
0.008
0.010
0.012
0.014
-10 -8 -6 -4 -2 0 2 4 6 8 10
0.990
1.005
1.020
1.03515x10
15 ion/cm
2
20 25 30 35 40
0.000
0.005
0.010
0.015
0.020
0.025
-10 -8 -6 -4 -2 0 2 4 6 8 10
0.99
1.00
1.01
1.02
V (mm/s)
30x1015
ion/cm2
20 25 30 35 40
0.000
0.005
0.010
0.015
0.020
Hyperfine field (T)
Disordered FePd
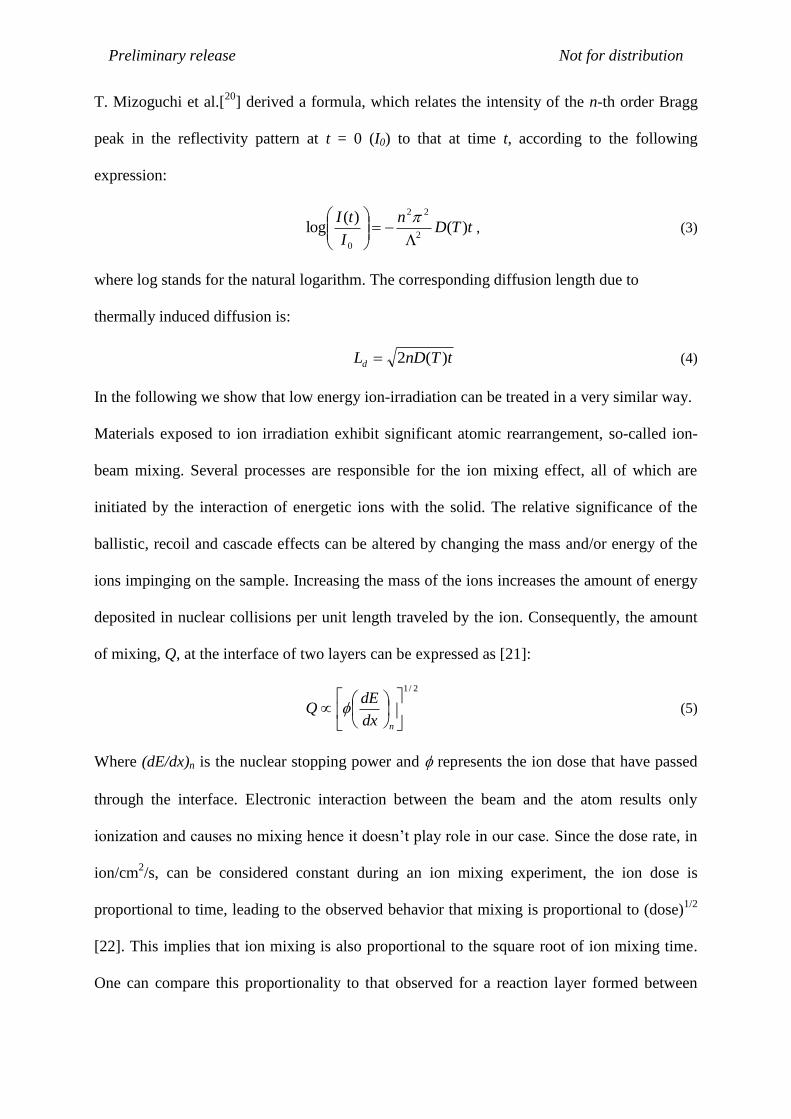
Figure 1 The change of the CEMS spectra and hyperfine field distribution taken after growth, medium and high
irradiation. A) ordered sample b) disordered sample.
The CEMS characterization of the disordered samples showed the lack of the L10 and the high
hf field component (Figure 1 b.) and only the disordered fcc component is present in these
kind of samples. The irradiation does not effent this structure (Figure 2 b.).
0 5 10 15
0
5
10
15
20
Fluence (1015
He+/cm
2)
iron rich
20
30
40
50
Co
ntr
ibu
tio
n to
th
e fu
ll sp
ectr
um
(%
)
fcc
30
40
50
60
70
80
L10
-1.0
-0.5
0.0
0.5
1.0
L10
99.0
99.5
100.0
100.5
101.0
Co
ntr
ibu
tio
n to
th
e fu
ll s
pe
ctr
um
(%
)
fcc
0 7 14 21 28
-1.0
-0.5
0.0
0.5
1.0
Fluence (1015
He+/cm
2)
iron rich
Figure 2 The change of fractions of the different phases in ( a) ordered b) disordered) FePd after various
fluences of He+ irradiation as obtained from CEMS spectral intensities of the different species. a) The ordered
L10 phase decreases from 81% to 44%, while the disordered phase increases from 15% to 36%. The fraction of
the iron ri component increases from 3.4% to 20%. b) The fraction of the disordered fcc environment increased
from 52% to 62% and the iron region decreased from 48% to 38%.

Preliminary release Not for distribution
In order to gather information about the distribution of the local environment obtained from
CEMS, additional selected area electron diffraction (SAED) measurements on the ordered
sample were performed. This method is highly suitable to distinguish separate phases since it
works in reciprocal space and so the higher index reflections of similar structures can be well
separated On Figure 3 SAED measurement taken on the full sample (fcc-Pd + L10) and nano
beam diffractin taken only on L10-FePd are compared.

Preliminary release Not for distribution
A
b
Figure 3 Selected area electron diffraction taken from MgO, Cr, Pd and FePd layers (a) and the corresponding
linescans taken on L10(204) and Pd(204) (up) and on L10(202) and Pd(202) (down). Nano-beam diffraction
taken from only FePd layers (b) (from an area of ~10nm in diameter) and the linescan of L10(204) (up) and
L10(202) down.
When distinct fcc-FePd phases separated by phase boundaries were present in the L10-FePd
structure then it could be seen on the distribution of the 204 index reflection. of the SAED
snapshot taken from the FePd layer, Since no such distribution is present we concluded that
the size of any kind of precipitate cannot exceed the size of 5 Å and the structure of the
sample can be treated as a random alloy of separate microstructural environments.
The evaluation of the reflectivity spectra in similar previous studies [16,17 ,26
] was restricted to
follow the decay of the isotopic multilayer (ML) Bragg peak height in the time integral SMR
reflectivity curve normalized to the intensity of the total reflection peak. However, since the
Bragg peak shape depends on the hyperfine fields (and their distributions) of the different
species in the layers [see also 27], it is not justified to take only the normalized Bragg peak
amplitude into account. Moreover, the normalization - in general – is only possible to the
intensity of the total reflection peak, as an “internal standard”, but its intensity is extremely
sensitive not only to small differences in the successive beam alignments prior to recording

Preliminary release Not for distribution
the SMR spectra of the different samples, but also, due to the limited penetration of the
radiation, to the absorption of the near-surface layers, which may be differently effected by
the progress of the diffusion. Consequently, normalization of the isotope Bragg peak height to
the total reflection peak height may become rather uncertain. Therefore the in a proper
evaluation the entire reflectivity curve has to be fitted to a layer model, which takes the
diffusion prehistory of the multilayer properly into account. This latter procedure was
followed here. The evaluation of the delayed SMR spectra was performed by FitSuite [28]
program (Figure 4). The implemented routine is organized as follows.
0 2 4 6 8 10 12 14
0
50
100
150
200
250
300
as deposited
0 10 20 30 40 50
0.0
0.2
0.4
0.6
0.8
1.0
0 2 4 6 8 10 12 14
-50
0
50
100
150
200
250
300
350
Inte
nsity [
au
]
3.7x10¹⁵
He+/cm
2
Ordered FePd
0 10 20 30 40 50
0.0
0.2
0.4
0.6
0.8
1.0
0 2 4 6 8 10 12 14
0
50
100
150
200
250
7.4x10¹⁵
He+/cm
2
0 10 20 30 40 50
0.0
0.2
0.4
0.6
0.8
1.0
0 2 4 6 8 10 12 14
-20
0
20
40
60
80
100
120
140
theta [mrad]
14.9x10¹⁵
He+/cm
2
0 10 20 30 40 50
-0.2
0.0
0.2
0.4
0.6
0.8
1.0
1.2
depth [A]a)
0
100
200
300
400
500
600
as deposited
0.0
0.5
1.0
B
A
-200
0
200
400
600
800
1000
1200
1400
1600
3.71015
ion/cm2
0.0
0.5
1.0
B
A
-200
0
200
400
600
800
1000
1200
1400
1600
7.4x10¹⁵
ion/cm2
-0.2
0.0
0.2
0.4
0.6
0.8
1.0
1.2
B
A
0
200
400
600
800
1000
15x1015
ion/cm2
-0.2
0.0
0.2
0.4
0.6
0.8
1.0
1.2
B
A
0
200
400
600
800
1000
20x1015
ion/cm2
-0.2
0.0
0.2
0.4
0.6
0.8
1.0
1.2
B
A
0
200
400
600
800
1000
1200
theta (mrad)
30x1015
ion/cm2
-0.2
0.0
0.2
0.4
0.6
0.8
1.0
1.2
B
depth (A)
Inte
nsity
disordered FePd
b)
Figure 4 The change of synchrotron Mössbauer refletivity spectra and the corresponding diffusion profile a)
ordered FePd b) disordered FePd upon He+ irradiation.
The squared diffusion lengths, Wi2 can be summed up for successive heat treatments or
consecutive irradiation steps. According to TEM studies the irradiated layers do not show
distinct boundary-separated phases, therefore the Mössbauer species represent various
environments in an otherwise single phase sample. Therefore, in the following we use the
approximation of a multi-component random alloy. Figure 5 a and b shows the Dt evaluated
from fitting SMR spectra for the FePd multilayers with different initial structure. On the left
side the originally ordered sample while on the right side the originally disordered sample is
present.

Preliminary release Not for distribution
0 10 20
0
5
10
Data: Diffshort_Dt
Model: user_integral
Equation: (((-39.35302*5.32726*exp(-x/5.32726)+40.91745*x)-(-39.35302*5.32726))/x)*(P1*x)+(((-25.0056*-9.34777*exp(x/-9.34777)+40.90763*x)-(-25.0056*-9.34777))/x)*(P2*x)+(((19.91139*x-(-16.48499*exp(-0.36305*x)/0.36305))+(-16.48499/0.36305))/x)*(P3*x)
Weighting:
y No weighting
Chi^2/DoF = 0.0066
R^2 = 0.99957
P1 0.00094 ±0.00008
P2 0.00174 ±0
P3 0.03 ±0
Dt (A
2)
Fluence (1015
He+/cm
2)a)
0 5 10 15 20 25 30
0
10
20
30
40
Dt
(A2)
Fluence (1015
He+/cm
2)b)
Figure 5 The change of the fitted Dt for the whole system after He+ irradiation. A) ordered b) disordered sample.
The dashed line indicates the Dt for a structurally homogenous system.
At the as deposited samples there was only negligible mixing between the adjacent isotope
layers. By the fulence of 15×1015
He+/cm
2 the Dt increased upto 9 Å
2 in the case of the
ordered sample and reached 21 Å2 for the disordered sample. This significant difference
indicates that the inner structure of FePd plays major role in the scale diffusion process. One
can also see that the two curves show different tendencies with the fluence of irradiation. It
has been shown already that the effective mixing diffusion coefficient of a structurally
homogenous material depends linearly on the irradiation dose [29]. By the ordered sample the
growing tendency of the Dt exhibits a slight increase which is not the case of disordered FePd
where it shows a constant tendency with the dose. The reason for the increasing Dt is that the
ratio of the component which blocks the diffusion are decrasing while the ones in which the
diffusion is faster increase after irradiation.
If we consider the model where the D~
piecewise constant, thus D~
takes an arbitrary positive value
iD~
in volumes of arbitrary size, the squared diffusion length of Fe in the multilayer,
2/1)~
( tDW is, like in a random alloy, a weighed sums of the individual squared diffusion
lengths of the different Fe-environments, 2/1)~
( tDKW iii , i.e. the total Dt can be written as
follows.
POPOfccfccLL tDxtDxtDxtD~~~~
00 11 (6)
Preliminary release Not for distribution
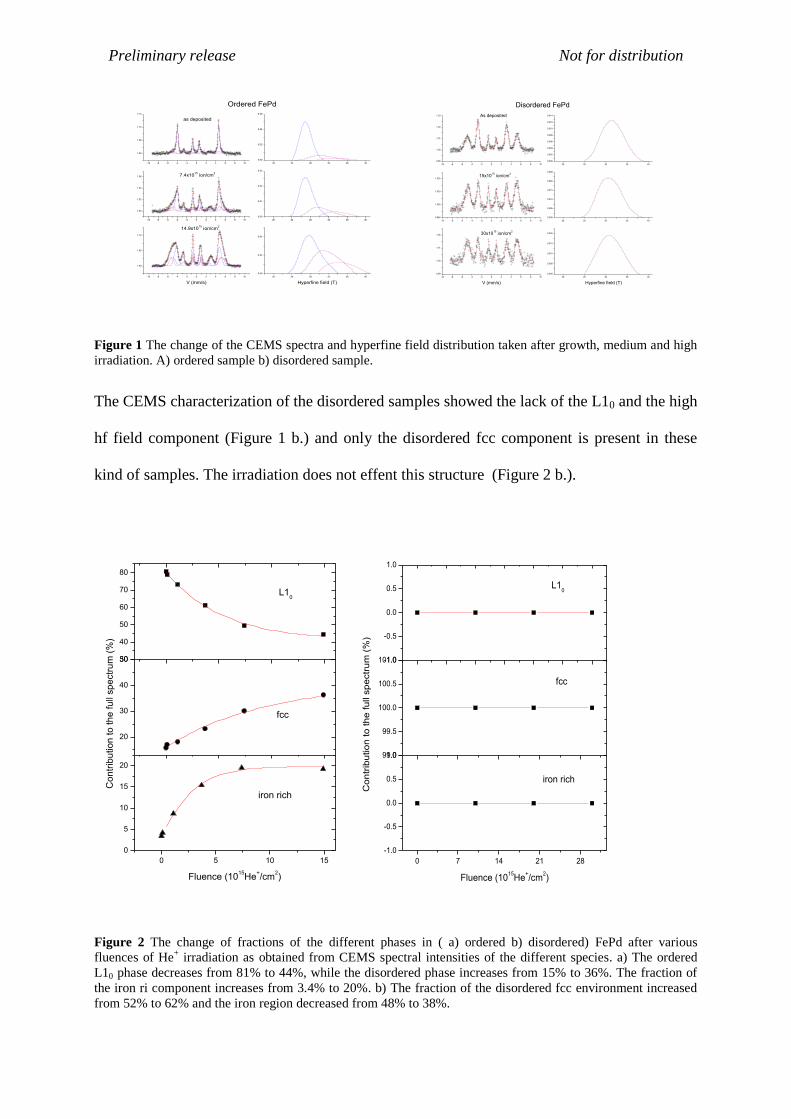
Where 01Lx , fccx , POx and
01LDt , fccDt , PODt are the ratios and the effective diffusion
parameters of the ordered L10, disordered fcc and partially ordered phases, respectively. The
ratios as well as the effective diffusion parameters depend on the dose of irradiation. The
fluence dependence of the ratios were determined by fitting (see Figure 2).
With these conditions (6) has the following form:
0
0
0
0
0
1
0 )(1
)~
()(1
)~
()(1
)~
()(~
001dxctDdxbtDdxatDtD POfccL POfccL
(7)
By simultaneously fitting the total Dt of the ordered and disordered system obtained from
evaluation of SMR spectra (Figure 4) with (7) we get the contribution of each particular
environment to the diffusion of the entire multilayer (Figure 6).
-2 0 2 4 6 8 10 12 14 16
-5
0
5
10
15
20
25
30
35
40
45
50
iron rich
fcc
Dt(
A2)
Fluence (1015
He+/cm
2)
L10
Figure 6 Contribution of the individual Fe-environments in the FePd to the total diffusion length
The ratio of the effective diffusion parameters in the L10, fcc and partially ordered structures
are 1:42:64, respectively. The effective diffusion lengths (perpendicular to the sample plane)
in the different microstructural species are significantly different. Indeed, in the ordered L10
phase the diffusion of iron is almost blocked (the direction perpendicular to the sample plane
coincides with the crystallographic c axis in these epitaxial samples). This means, that atomic

Preliminary release Not for distribution
migration across 57
FePd/nat
FePd “interface” occurs mainly via the iron rich regions.
According to (4), the diffusion lengths are related as 1:6.4:8 in the L10, the fcc and the iron
rich regions, respectively. Taking a plausible assumption, namely that the value of the
diffusion coefficient in the fcc phase is between the diffusion coefficient of the L10 phase in
the crystallographic c-direction and the diffusion coefficient of the L10 phase in the a-b plane,
the diffusion coefficient in the c-direction of the L10 phase is more than 1.9 times lower than
in the a-b plane. Indeed, vacancy diffusion in the c-direction requires exchange of a vacancy
between the Fe layer and the Pd layer, which have rather different vacancy creation energies.
V. SUMMARY
In summary, the short range diffusion of 57
Fe in highly ordered and disordered isotope-
periodic epitaxial Fe47Pd53 thin film after varying fluence of 0 to 14.9×10¹⁵
ion/cm2 in the
ordered and 0-30 ion/cm2 of 130 keV He
+ irradiation in the disordered sample was
investigated. The local structural changes were followed by Mössbauer spectroscopy. With
increasing fluence, in the case of the ordered FePd, the fraction of the disordered and of the
partially ordered components increased at the expense of the ordered L10 phase. In the case of
disordered sample the L10 structure was not present and the fcc region increased at the
expense of the iron rich region. The evaluation of the full delayed SMR intensity curves
showed considerable interdiffusion of the isotope layers. The total diffusion length of the
multiplayer is separated to individual diffusion lengths of the distinct microstructural species
of the otherwise homogeneous phase. By fitting the variation of effective diffusion parameters
using the corresponding Mössbauer spectral intensities of the individual Fe-environments as
weights, we obtained an effective diffusion length for each Fe-environment. We find the ratio
of the effective diffusion lengths in the L10, fcc and partially ordered structure to be 1:6.4:8,
respectively By assuming the diffusion coefficient of the fcc phase to be between that of the
Preliminary release Not for distribution
L10 phase in the crystallographic c-direction and perpendicular to it, the diffusion coefficient
in the c-direction of the L10 phase is more than 6.4 times lower than in the x-y plane.
ACKNOWLEDGEMENTS
This work was partially supported by the Hungarian National Fund (OTKA) and by the
National Office for Research and Technology of Hungary under contract numbers K 62272
and NAP-VENEUS’05, respectively. Beam time and ESRF
REFERENCES
1 T. Devolder, H. Bernas, D.Ravelosona, C. Chappert, S. Pizzini, J. Vogel, J. Ferré, J. P. Jamet, J. Chen and V.
Mathet, Nucl. Instr. and Meth. B 175-177, 375 (2001)
2 K. Piao, D.J. Li, D. Wei, J. Magn. Magn, Mater 303, e39 (2006)
3 T. Suzuki, K. Harada, N. Honda and K. Ouchi, J. Magn. Magn, Mater 193, 85 (1999)
4 . M. R. Visokay and R. Sinclair, Appl. Phys. Lett. 66, 1692 (1995)
5 H. Shima, K. Oikawa, A. Fujita, K. Fukamichi, K. Ishida and A. Sakuma Phys. Rev. B 70 224408 (2004)
6 O. Ersen, V. Parasote, V. Pierron-Bohnes, M. C. Cadeville and C. Ulhaq-Bouillet, J. Appl. Phys 93, 5 (2003)
7 A Heiming, K H Steinmetzt, G Vogl and Y Yoshida J. Phys. F: Met. Phys. 18 1491 (1988).
8 J. Drinklage and R. Frerichs, J. Appl. Phys. 34, 2633 (1963)
9 H. E. Cook and J. E. Hilliard, J. Appl. Phys. 40, 2191 (1969)
10 M. P. Rosenblum and D. Turnbull, Appl. Phys. Lett. 37, 184 (1980)
11 T. Mizoguchi, S. Tanabe, and M. Murata, J. Magn. Magn. Mater. 126, 96 (1993)
12 W.-H. Wang, H. Y. Bai, M. Zhang, J. H. Zhao, X. Y. Zhang, and W. K. Wang, Phys. Rev. B 59, 10 811
(1999)
13 A. L. Greer, Defect and Diffusion. Forum 143-147, 557 (1997)
14 A. L. Greer, J. Magn. Magn. Mater. 126, 89 (1993)
15 A. Gupta, M. Gupta, B. A. Dasannacharya, S. Kikuta, Y. Yoda, and M. Seto, J. Phys. Soc. Jpn. 73, 423 (2004)
16 M Gupta, A Gupta, J Stahn and T Gutberlet New J. Phys. 10, 053031 (2008)
17 M. Rennhofer, B. Sepiol, M. Sladecek, D. Kmiec, S. Stankov and G. Vogl Phys. Rev. B 74, 104301 (2006)
18 J. F. Ziegler and J. P. Biersak, http://www.srim.org/

Preliminary release Not for distribution
19
A. L. Greer and F. Spaepen, Synthetic Modulated Structures edited p. 419 (1985)
20 T. Mizoguchi, S. Tanabe, and M. Murata, J. Magn. Magn. Mater. 126, 96 (1993)
21 M. Nastasi , J.W.Mayer and J.K.Hirvonen Ion-Solid Interactions p. 297 (1996)
22 B.Y. Tsaur, S.S. Lau, Z.L.Liau and J.W. Mayer Thin Solid Films 63, 31. (1979)
23 J.W. Mayer, S.S. Lau, B.Y. Tsaur, J.M. Poate and J.K. Hirvonen, Ion Implantation Metallurgy p. 37 (1980)
24 A. Kovács,a, D.G. Merkel, F. Tanczikó, S. Stankov, Y. Hirotsua and L. Bottyán Scripta Materialia 58, 635
(2008)
25 D. G. Merkel, F. Tanczikó, Sz. Sajti, M. Major, A. Németh, L. Bottyán,Z. E. Horváth, J. Waizinger, S.
Stankov, and A. Kovács, JAP 104, 013901 (2008)
26 M. Rennhofer, B. Sepiol, M. Sladecek, D. Kmiec, S. Stankov and G. Vogl Phys. Rev. B 74, 104301 (2006)
27 M.A. Andreeva, N.G. Monina and S. Stankov MOSCOW UNIVERSITY PHYSICS BULLETIN 63, No. 2
(2008)
28 Sz. Sajti and H. Spiering, www.fs.kfki.hu
29 S. Matteson, B.M. Paine, M.G. Grimaldi, G. Mezey and M.-A. Nicolet Nucl. Instrum & Meth. 182/183, 43
(1981)
Copyright © 2022 FDOKUMEN