Selective increases of bifidobacteria in gut microflora improve high-fat-diet-induced diabetes in...
10
ARTICLE Selective increases of bifidobacteria in gut microflora improve high-fat-diet-induced diabetes in mice through a mechanism associated with endotoxaemia P. D. Cani & A. M. Neyrinck & F. Fava & C. Knauf & R. G. Burcelin & K. M. Tuohy & G. R. Gibson & N. M. Delzenne Received: 22 May 2007 / Accepted: 6 July 2007 / Published online: 6 September 2007 # Springer-Verlag 2007 Abstract Aims/hypothesis Recent evidence suggests that a particular gut microbial community may favour occurrence of the metabolic diseases. Recently, we reported that high-fat (HF) feeding was associated with higher endotoxaemia and lower Bifidobacterium species (spp.) caecal content in mice. We therefore tested whether restoration of the quantity of caecal Bifidobacterium spp. could modulate metabolic endotoxaemia, the inflammatory tone and the development of diabetes. Methods Since bifidobacteria have been reported to reduce intestinal endotoxin levels and improve mucosal barrier function, we specifically increased the gut bifidobacterial content of HF-diet-fed mice through the use of a prebiotic (oligofructose [OFS]). Results Compared with normal chow-fed control mice, HF feeding significantly reduced intestinal Gram-negative and Gram-positive bacteria including levels of bifidobacteria, a dominant member of the intestinal microbiota, which is seen as physiologically positive. As expected, HF-OFS-fed mice had totally restored quantities of bifidobacteria. HF- feeding significantly increased endotoxaemia, which was normalised to control levels in HF-OFS-treated mice. Multiple-correlation analyses showed that endotoxaemia significantly and negatively correlated with Bifidobac- terium spp., but no relationship was seen between endotoxaemia and any other bacterial group. Finally, in HF-OFS-treated-mice, Bifidobacterium spp. significantly and positively correlated with improved glucose toler- ance, glucose-induced insulin secretion and normalised inflammatory tone (decreased endotoxaemia, plasma and adipose tissue proinflammatory cytokines). Conclusions/interpretation Together, these findings suggest that the gut microbiota contribute towards the pathophysio- logical regulation of endotoxaemia and set the tone of inflammation for occurrence of diabetes and/or obesity. Thus, it would be useful to develop specific strategies for modifying gut microbiota in favour of bifidobacteria to prevent the deleterious effect of HF-diet-induced metabolic diseases. Keywords Bifidobacteria . Diabetes . Endotoxin . GLP-1 . Glucagon-like peptide-1 . Gut microflora . Inflammation . Obesity . Prebiotics Abbreviations HF high-fat HF-Cell high-fat cellulose HF-OFS high-fat oligofructose LPS lipopolysaccharide MIB mouse intestinal bacteria OFS oligofructose spp. species Diabetologia (2007) 50:2374–2383 DOI 10.1007/s00125-007-0791-0 Electronic supplementary material The online version of this article (doi:10.1007/s00125-007-0791-0) contains supplementary material, which is available to authorised users. P. D. Cani (*) : A. M. Neyrinck : N. M. Delzenne (*) Unit of Pharmacokinetics, Metabolism, Nutrition and Toxicology, Université catholique de Louvain, Av. E. Mounier, 73/69, 1200 Brussels, Belgium e-mail: [email protected] F. Fava : K. M. Tuohy : G. R. Gibson Food Microbial Sciences Unit, Department of Food Biosciences, The University of Reading, Reading, UK C. Knauf : R. G. Burcelin Rangueil Institute of Molecular Medicine, I2MR, IFR31, Toulouse, France e-mail: [email protected]
Transcript of Selective increases of bifidobacteria in gut microflora improve high-fat-diet-induced diabetes in...

ARTICLE
Selective increases of bifidobacteria in gutmicroflora improve high-fat-diet-induced diabetes in micethrough a mechanism associated with endotoxaemia
P. D. Cani & A. M. Neyrinck & F. Fava & C. Knauf &R. G. Burcelin & K. M. Tuohy & G. R. Gibson &
N. M. Delzenne
Received: 22 May 2007 /Accepted: 6 July 2007 / Published online: 6 September 2007# Springer-Verlag 2007
AbstractAims/hypothesis Recent evidence suggests that a particulargut microbial community may favour occurrence of themetabolic diseases. Recently, we reported that high-fat (HF)feeding was associated with higher endotoxaemia andlower Bifidobacterium species (spp.) caecal content inmice. We therefore tested whether restoration of thequantity of caecal Bifidobacterium spp. could modulatemetabolic endotoxaemia, the inflammatory tone and thedevelopment of diabetes.Methods Since bifidobacteria have been reported to reduceintestinal endotoxin levels and improve mucosal barrierfunction, we specifically increased the gut bifidobacterialcontent of HF-diet-fed mice through the use of a prebiotic(oligofructose [OFS]).Results Compared with normal chow-fed control mice, HFfeeding significantly reduced intestinal Gram-negative and
Gram-positive bacteria including levels of bifidobacteria, adominant member of the intestinal microbiota, which isseen as physiologically positive. As expected, HF-OFS-fedmice had totally restored quantities of bifidobacteria. HF-feeding significantly increased endotoxaemia, which wasnormalised to control levels in HF-OFS-treated mice.Multiple-correlation analyses showed that endotoxaemiasignificantly and negatively correlated with Bifidobac-terium spp., but no relationship was seen betweenendotoxaemia and any other bacterial group. Finally, inHF-OFS-treated-mice, Bifidobacterium spp. significantlyand positively correlated with improved glucose toler-ance, glucose-induced insulin secretion and normalisedinflammatory tone (decreased endotoxaemia, plasma andadipose tissue proinflammatory cytokines).Conclusions/interpretation Together, these findings suggestthat the gut microbiota contribute towards the pathophysio-logical regulation of endotoxaemia and set the tone ofinflammation for occurrence of diabetes and/or obesity. Thus,it would be useful to develop specific strategies for modifyinggut microbiota in favour of bifidobacteria to prevent thedeleterious effect of HF-diet-induced metabolic diseases.
Keywords Bifidobacteria . Diabetes . Endotoxin . GLP-1 .
Glucagon-like peptide-1 . Gut microflora . Inflammation .
Obesity . Prebiotics
AbbreviationsHF high-fatHF-Cell high-fat celluloseHF-OFS high-fat oligofructoseLPS lipopolysaccharideMIB mouse intestinal bacteriaOFS oligofructosespp. species
Diabetologia (2007) 50:2374–2383DOI 10.1007/s00125-007-0791-0
Electronic supplementary material The online version of this article(doi:10.1007/s00125-007-0791-0) contains supplementary material,which is available to authorised users.
P. D. Cani (*) :A. M. Neyrinck :N. M. Delzenne (*)Unit of Pharmacokinetics, Metabolism, Nutrition and Toxicology,Université catholique de Louvain,Av. E. Mounier, 73/69,1200 Brussels, Belgiume-mail: [email protected]
F. Fava :K. M. Tuohy :G. R. GibsonFood Microbial Sciences Unit, Department of Food Biosciences,The University of Reading,Reading, UK
C. Knauf :R. G. BurcelinRangueil Institute of Molecular Medicine, I2MR, IFR31,Toulouse, France
e-mail: [email protected]

Introduction
Evidence suggests that obesity and metabolic disorders(type 2 diabetes and insulin resistance) are tightly linked toinflammation [1, 2]. Although obesity results from inter-actions between genetic and environmental factors, eatinghabits contributing to an increase in fat intake can promotemetabolic diseases.
In models of diet-induced and genetic obesity, adiposetissue has increased production and content of pro-inflam-matory cytokines such as IL-1, IL-6 and TNF-α [3, 4].
Cytokines have been shown to cause insulin resistance[5, 6], which favours hyperinsulinaemia and excessivehepatic and adipose tissue lipid storage. However, whileextensive research has been dedicated to the effects ofinflammatory reactions on energy metabolism, the trigger-ing factor linking inflammation to a high-fat (HF)-diet-induced metabolic syndrome remains to be determined.
An innovative hypothesis was recently proposed: the gutflora could be an important factor affecting energy disposaland could be implicated in metabolic disease associatedwith obesity [7–11]. One observation reported that youngadult germ-free mice had 40% less body fat than theirconventionalised counterparts on the same diet. Similarly,lean axenic mice colonised with microbiota from ob/obmice increased body weight [7]. The authors suggested thatgut microbiota from obese mice allowed energy to besalvaged from otherwise non-digestible dietary polysac-charides producing substantial elevations in serum glucoseand insulin, both factors that trigger lipogenesis. However,this hypothesis of microbiota-induced lipogenesis did notexplain the differential effect on body weight of a HF dietvs regular chow, since axenic mice fed a HF diet did notgain weight. This suggests that a bacterially related factorwas responsible for HF-diet-induced obesity [9] and thatlipids alone were not sufficient to promote obesity andinflammation.
The relationship between HF feeding and the develop-ment of a low-grade inflammatory tone is unclear, but maybe related to the microbiota present in the digestive tract.With regard to the role of gut microbiota in the develop-ment of metabolic diseases, we recently reported [12] thatHF feeding in mice induced a low-grade inflammatory toneand that metabolic disease was associated with reducednumbers of Bifidobacterium species (spp.) in caecal contentand higher plasma endotoxin (lipopolysaccharide [LPS])concentrations (defined as metabolic endotoxaemia).Hence, LPS appears to be a molecular link between HFfeeding, microbiota and inflammation. LPS was identifiedas a novel factor triggering the onset of HF diet-inducedobesity and type 2 diabetes [12]. We have also shown thatmice lacking the major LPS co-receptor CD14 wereresistant to HF-diet-induced inflammation and metabolic
diseases [12]. Since bifidobacteria reduced intestinal endo-toxin levels and improved mucosal barrier function [13–15],we decided to specifically increase the gut bifidobacterialcontent of HF-diet-treated mice through prebiotic dietaryfibre (oligofructose [OFS]), which can reproducibly mod-ulate the gut microbiota typified by increased bifidobacteria[16].
We therefore tested the hypothesis that the pattern ofbacterial changes occurring through dietary interventionwith OFS may control the occurrence of metabolic diseasesin mice fed a HF diet for 14 weeks.
Methods
Animals Male C57bl6/J mice (12 weeks old; Charles River,Brussels, Belgium) were housed in a controlled environ-ment (12 h daylight cycle, lights off at 18:00 hours) withfree access to food and water. All mouse experiments wereapproved by the local ethics committee and housingconditions were as specified by the Belgian Law of 14November 1993 on the protection of laboratory animals(agreement number LA 1230314). Mice were killed bycervical dislocation after a 5 h period of fasting. Caecum(full and empty) and adipose tissues (epididymal, subcuta-neous and visceral) were precisely dissected, weighed,immersed in liquid nitrogen and stored at −80°C, for furtheranalysis.
Diet and experimental groups Mice (n=8 per group) werefed four different experimental diets for 14 weeks asfollows: (1) standard diet (control) (A04; UAR, Villemois-son-sur-Orge, France) [17]; (2) HF diet containing 49.5%fat (g/100 g of total dry diet) corresponding to 72% of thetotal energy content (UAR, Epinay-sur-Orge, France); (3) amix of HF diet and a fermentable dietary fibre (OFS) (HF-OFS) (kind gift from Orafti, Tienen, Belgium) [18]; and (4)a mix of HF diet and a non-fermentable dietary fibre(microcrystalline cellulose [HF-Cell]) (Vivapur microcrys-talline cellulose; J. Rettenmaier & Söhne, Weissenborn,Germany). Dietary fibre was added in a proportion of 90:10(weight of HF diet:weight of fibre). Nutritional composi-tions of the experimental diets are provided in theElectronic supplementary material (ESM Table 1).
Glucose tolerance test Oral glucose tolerance tests wereperformed after 13 weeks of treatment in mice that had beenfasted for 6 h. Glucose was orally administered (3 g/kgbody weight, 660 g/l glucose solution) and blood glucosedetermined through a glucose meter (Roche Diagnostics,Meylan, France) using 3.5 μl of blood collected from thetip of the tail vein before and at administration of glucoseload (−30 and 0 min) and after glucose load (15, 30, 60, 90,
Diabetologia (2007) 50:2374–2383 2375

120 min). To assess plasma insulin concentration, 20 μl ofblood was sampled 30 min before and 15 min following theglucose load.
Biochemical analyses Plasma LPS determinations wereperformed using a kit based on a Limulus amoebocyteextract (LAL kit; Cambrex BioScience, Walkersville, MD,USA); samples were diluted 1:50 and heated for 10 min at70°C. Plasma insulin concentration was determined in 5 μlof plasma using an ELISA kit (Mercodia, Uppsala,Sweden) according to the manufacturer’s instructions.Cytokines were determined in 12 μl of plasma using a kit(Bio-Plex Multiplex; Bio-Rad, Nazareth, Belgium) andmeasured using Luminex technology (Bio-Plex; Bio-Rad).
Microbial quantification in intestinal contents by fluores-cence in situ hybridisation (FISH) analysis Caecal contentscollected post mortem from mice were stored at −70°C.Samples were thawed on ice and diluted 1:10 in sterile icecold PBS (0.1 mol/l phosphate, pH 7.0) (0.1 mol/l phosphate,pH 7.0). The suspension was homogenised by pipetting andcentrifuging at 3,500×g for 15 min to remove particulatematter. The supernatant fraction containing bacterial cellswas fixed overnight in 4% (w/v) paraformaldehyde. Thebacterial cells were then washed and re-suspended twice insterile PBS and finally stored in 500 ml ethanol/l PBS at−20°C until hybridisation with appropriate molecularprobes targeting specific regions of 16S rRNA. The probesused were: EREC 482 [19] for Eubacterium rectale–Clostridium coccoides group, Lab158 [20] for lactobacilliand enterococci and Bif164 [21] for Bifidobacterium spp.(Gram-positive bacteria); and Bac303 [22] for Bacteroides–Prevotella spp., MIB 661 [23] for Bacteroides mouseintestinal bacteria (MIB), SRB 687 [24] for sulphate-reducing bacteria and probe D [25] for Enterobacteriaceaespp. (Gram-negative bacteria) within the murine intestinalmicroflora. The nucleic acid stain DAPI was used for totalbacterial counts. The DNA probes were tagged with the Cy3fluorescence dye so that the hybridised samples could be exam-ined using fluorescence microscopy. Results were expressed asLog10 (bacterial cells per g caecal content wet weight).
Real-time quantitative PCR Total RNAs from white viscer-al adipose tissue were prepared using a reagent (TriPure;Roche, Basel, Switzerland) as described [26]. PCRs wereperformed using a sequence detection system instrumentand software (AbiPrism 5700; Applied Biosystems, FosterCity, CA, USA) as described [26]. Primer sequences for thetargeted mouse genes are available upon request ([email protected]).
Statistical analysis Results are presented as mean ± SEM.Statistical significance of differences was analysed by one-
way ANOVA followed by post hoc (Bonferroni’s multiplecomparison test). Correlations between parameters whereassessed by Pearson’s correlation test, using GraphPadPrism version 4.00 for Windows (GraphPad Software, SanDiego, CA, USA). A value of p<0.05 was regarded asstatistically significant.
Results
Specific increase of bifidobacteria by prebiotics Themaintenance of mice on a HF diet resulted in a significantmodulation of population levels of the dominant membersof the intestinal microbiota as compared with control diet(Fig. 1). The major modifications observed were a dramaticreduction in quantities of bifidobacteria in HF-fed micecompared with control and the Gram-negative BacteroidesMIB, as previously described [12]. To determine themetabolic role of bifidobacteria following HF-diet feeding,we took advantage of the prebiotic model, known tospecifically increase gut bifidobacterial contents. For14 weeks mice were fed a HF diet enriched or not withprebiotic non-digestible carbohydrate (OFS) (HF-OFS) ornon-prebiotic non-digestible carbohydrate (HF-Cell) asnegative control. Importantly, quantities of bifidobacteriain HF-OFS fed mice were restored and even higher thanthose of control mice (Fig. 1a), confirming the role of OFSas a prebiotic. Numbers of the newly recognised Gram-negative operating taxonomic unit, MIB, which residewithin the Cytophaga–Flavobacter–Bacteroides phylum(referred to here as Bacteroides MIB), were markedlyreduced in all HF-diet-treated mice. These bacteria areclosely related to the Bacteroides–Prevotella group, but notquantified by the probe Bac303. Together with the E.rectale–C. coccoides group, they constitute the dominantmembers of the mouse intestinal microbiota [23]. Numbersof the E. rectale–C. coccoides group were also significantlylower in animals fed the HF diet compared with control andeven more so in HF-Cell mice (Fig. 1).
Prebiotics lower endotoxaemia We observed that HF andHF-Cell mice showed a significant increase of endotoxaemiawhereas HF-OFS normalised to control values (Table 1). Thissuggests that the increase in bifidobacteria by prebioticsprotected against endotoxaemia induced by a HF diet.
Gram-positive Bifidobacterium spp. negatively correlatedwith endotoxaemia To identify whether one specific groupof gut bacteria was involved in the determination ofendotoxaemia, we performed multiple correlations analysesbetween the major Gram-positive and Gram-negativebacteria present in the caecal contents of mice (Fig. 2).
2376 Diabetologia (2007) 50:2374–2383

Endotoxaemia significantly and negatively correlated withBifidobacterium spp. (Fig. 2a), but no relationship was seenbetween endotoxaemia and any other bacterial group(Fig. 2). Since we found that prebiotic fed mice onlyexhibited higher gut bifidobacteria and normalised endo-toxaemia, we studied the putative causative link betweensuch parameters and metabolic disorders in these mice.
Prebiotics improve glucose tolerance and restore glucose-induced insulin secretion HF mice showed strong glucoseintolerance, as shown by glucose excursion and AUC data(Fig. 3a,b). HF-OFS improved glucose tolerance comparedwith HF and HF-Cell mice (Fig. 3a,b). Fasted insulinaemiawas significantly increased in HF and HF-Cell micecompared with control (Fig. 3c) and insulin secretion
following glucose load was almost absent in HF and HF-Cell mice (Fig. 3c,d). In contrast, HF-OFS mice showednormal fasting plasma insulin levels and restored glucose-induced insulin secretion (Fig. 3c,d). Moreover, fastedinsulin and glycaemic response were positively correlatedwith plasma endotoxin levels (Fig. 4a,b) and negativelycorrelated with bifidobacteria (Fig. 4c,d). This set of datasuggests that the specific increase of bifidobacteria andsubsequent lower level of endotoxaemia measured in HF-OFS mice impacted on glucose homeostasis.
Prebiotic supplementation improves body weight gain andenergy intake, reduces fat mass development and increasescolonic glucagon-like peptide-1 precursor HF diet in-creased total body weight gain and fat mass by 2.5-fold
Fig. 1 Modulation of gut bac-teria by dietary treatments. Cae-cal bacterial content of aBifidobacterium spp., b Eubac-terium rectale–Clostridium coc-coides group, c lactobacilli–enterococci, d Bacteroides spp.,e Enterobacteriaceae, f Bacter-oides MIB, g sulphate-reducingbacteria and h total bacteria.Bacterial quantities areexpressed as Log10 (bacterialcells/g caecal content wetweight). Data are mean ± SE.Data with different superscriptletters are significantly differentp<0.05, according to the posthoc ANOVA statistical analysis.CT Control diet, HF high-fatdiet, HF-Cell high-fat diet andnon-fermentable dietary fibre,HF-OFS high-fat diet and fer-mentable dietary fibre
9.5
8.5
7.5
6.5
9.50
9.25
9.00
8.75
8.5
7.5
6.5
10.0
9.5
9.0
8.5
10.0
9.5
9.0
8.5
CT HF HF-OFSHF-Cell
CT HF HF-OFSHF-Cell
CT HF HF-OFSHF-Cell
CT HF HF-OFSHF-Cell
CT HF HF-OFSHF-Cell
CT HF HF-OFSHF-Cell
CT HF HF-OFSHF-Cell
CT HF HF-OFSHF-Cell
Bifid
obacte
rium
spp.
(Lo
g1
0 [bacte
rial cells/g
caecal conte
nt])
E. re
cta
le/C
. coccoid
es g
roup
Bacte
roid
es s
pp.
Bacte
roid
es M
IB
Lacto
bacilli/e
nte
rococci
Ente
robacte
riaceae
Su
lph
ate
-re
du
cin
g b
acte
ria
Tota
l bacte
ria
(Lo
g1
0 [bacte
rial cells/g
caecal conte
nt])
(Lo
g1
0 [bacte
rial cells/g
caecal conte
nt])
(Lo
g1
0 [bacte
rial cells/g
caecal conte
nt])
(Lo
g1
0 [bacte
rial cells/g
caecal conte
nt])
(Lo
g1
0 [bacte
rial cells/g
caecal conte
nt])
(Lo
g1
0 [bacte
rial cells/g
caecal conte
nt])
(Lo
g1
0 [bacte
rial cells/g
caecal conte
nt])
10
9
8
8.0
7.5
7.0
10.50
10.25
10.00
9.75
a b
c d
e f
g h
Diabetologia (2007) 50:2374–2383 2377

and 3- to 4-fold, respectively, compared with the standarddiet. HF-OFS and HF-Cell-fed mice had reduced energyintake compared with HF (Table 1). In addition, treatedmice showed significantly reduced body weight gain andfat mass development compared with HF. Nevertheless,HF-OFS fed mice had 20% lower subcutaneous adiposetissue than HF-Cell counterparts (Table 1). Here again wefound that body weight and visceral fat mass correlatedpositively with plasma endotoxin levels (Fig. 5a,b) and
negatively with bifidobacteria (Fig. 5c,d). We have previ-ously described how OFS feeding promotes endogenousglucagon-like peptide-1 (GLP-1) production (i.e. colonicproglucagon mRNA) [17, 18, 27–29]. We thereforemeasured colonic proglucagon mRNA in the present study.HF-OFS fed mice exhibited a strong increase of progluca-gon mRNA precursor (by about 4.6-, 3.7- and 2.5-fold,compared with control, HF and HF-Cell respectively)(Table 1).
Fig. 2 Gram-positive Bifidobacterium spp. negatively correlates withendotoxaemia. Correlations between groups of bacteria present in thecaecal content of mice. Main Gram-positive gut bacteria: a Bifido-bacterium spp., b lactobacilli–enterococci, c Eubacterium rectale–Clostridium coccoides group. Main Gram-negative gut bacteria:
d Bacteroides spp., e Enterobacteriaceae, f sulphate-reducing bacte-ria. Bacterial quantities and plasma endotoxin levels are expressed asindicated. Pearson’s r correlations: r=−0.41, p=0.025 (a); r=−0.06,p=0.79 (b); r=−0.03, p=0.81 (c); r=−0.18, p=0.3 (d); r=−0.12, p=0.51 (e); r=0.21, p=0.28 (f)
Table 1 Body weight, plasma, adipose tissue inflammatory markers and GLP-1 precursor mRNA
Parameters CT HF HF-Cell HF-OFS
Body weight gain (g) 4.82±0.52a 11.56±1.34b 8.03±0.52c 7.74±0.57c
Daily energy intake (kJ/mouse) 37.82±2.46a 79.04±6.22b 64.03±1.29b,* 61.02±1.21b,*
Adipose tissue weight (g/100 g body weight)Visceral 0.59±0.05a 1.16±0.11b 0.89±0.03a 0.90±0.05a
Epididymal 1.38±0.1a 4.74±0.54b 3.21±0.26c 3.16±0.22c
Subcutaneous 1.42±0.08a 5.28±0.65b 3.85±0.47c 3.18±0.14c
Plasma endotoxin (EU/ml) 5.02±0.56a 9.03±1.25b 11.28±3.52b 6.16±0.47a
Visceral adipose tissue mRNA (AU)Il-1 3.59±0.68a 5.54±2.24a 5.88±1.57a 2.33±0.69a,**
Pai-1 3.98±0.83a 17.44±3.74b 65.89±25.79c 11.58±4.92a,b
Tnf-α 2.88±0.63a 4.63±1.67a 4.40±1.21a 1.97±0.67a
Colon proglucagon mRNA (AU) 1.49±0.55a 1.87±0.43a 2.78±0.20a 6.96±0.95b
Data are mean ± SEMAU Arbitrary units* p=0.1 vs HF** p=0.06 vs HF-Cella,b,c Data with different superscript letters are significantly different p<0.05, according to the post hoc ANOVA statistical analysis.CT Control diet, HF high-fat diet, HF-Cell high-fat diet and non-fermentable dietary fibre, HF-OFS high-fat diet and fermentable dietary fibre
2378 Diabetologia (2007) 50:2374–2383

Prebiotics control high-fat-diet-induced inflammation Sincewe observed higher endotoxaemia in HF-fed and HF-Cell-fed mice, we measured plasma IL-1α, IL-1β and IL-6. Itwas seen that IL-1α, IL-1β and IL-6 were increased in HFmice compared with control (Fig. 6). HF-OFS hadsignificantly normalised IL-1α and IL-6 cytokines plasmalevels compared with HF and tended to have decreased IL-1β, with HF-Cell mice showing intermediary levels. Theadipose tissue mRNA concentrations of Il-1 (also known asIl1), TNF-α (also known as Tnf) and plasminogen activatorinhibitor type 1 (Pai-1, also known as Serpine1) wereincreased in HF and HF-Cell-fed mice, whereas thisincrease was blunted in HF-OFS fed mice (Table 1). Theselast results demonstrate that the lower fat mass and bodyweight observed in HF-Cell mice is not a prerequisite forreduction of the inflammatory tone as measured in theplasma and adipose tissue of HF-OFS fed mice.
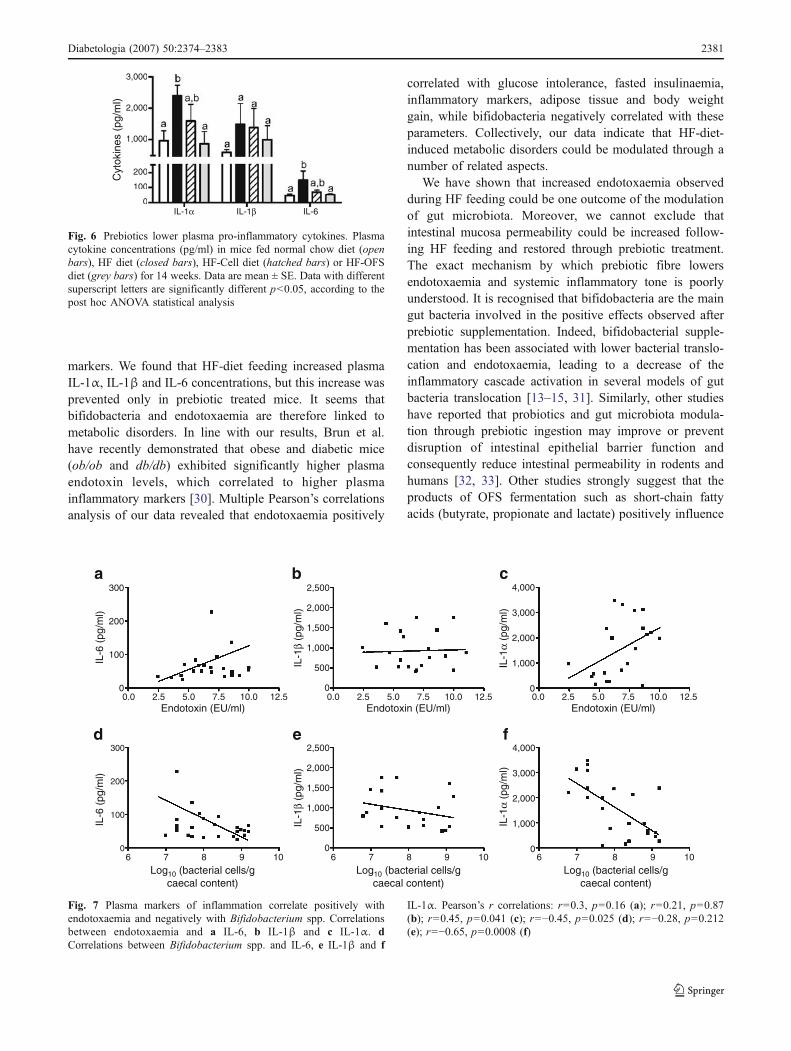
Here, too, we found that plasma cytokines were positivelycorrelated with plasma endotoxin levels (Fig. 7a–c) andnegatively correlated with bifidobacteria (Fig. 7d–f).
Discussion
Recent studies have highlighted key mammalian host–gutmicrobial relationships, suggesting that the gut microbiotaplay an important role in energy metabolism [7]. Moreover,our recent studies have demonstrated that HF diet-fed micedeveloped insulin resistance and inflammation by amechanism directly dependent on a gut bacterial Gram-negative derived compound, namely LPS [12]. Here wereport that HF feeding alters the intestinal microbiotacomposition: quantities of the dominant Gram-positivegroups Bifidobacterium spp. and E. rectale–C. coccoidesgroup were reduced, as were the numbers of the numericallydominant murine Gram-negative group, Bacteroides MIB,compared with controls fed a standard diet. Moreover, wefound that among the different gut bacteria analysed,plasma LPS concentrations correlated negatively withBifidobacterium spp. Since, bifidobacteria have been shownto reduce intestinal endotoxin levels and improve mucosalbarrier function [13–15], we decided to specifically increasethe gut bifidobacterial content of HF-diet-treated mice
25
20
15
10
5
2,500
1,500
500
250
200
150
100
50
0
400
300
200
100
0
CT HF HF-Cell HF-OFS
CT HF HF-Cell HF-OFS
−30 −15
−30 15
0 15 30 45 60 75 90 105 120
Pla
sma
gluc
ose
(mm
ol/l)
Pla
sma
insu
lin (
pmol
/l)
∆ In
sulin
(pm
ol/l)
AU
C
Time (min)
Time (min)
a b
c d
Fig. 3 Prebiotics improve glucose tolerance and glucose-inducedinsulin secretion. a Plasma glucose (mmol/l) following an oral glucoseload (3 g/kg) in control mice fed a normal chow diet (closed squares)or in mice fed an HF diet (closed circles) or an HF-OFS diet (opencircles) or an HF-Cell diet (open squares) for 14 weeks. b AUCs inthe same groups. c Plasma insulin concentrations 30 min before (−30)and 15 min after (15) an oral glucose load in control mice fed a normalchow diet (open bars) or in mice on HF diet (closed bars) or on an
HF-Cell diet (hatched bars) or an HF-OFS diet (grey bars) for14 weeks. d Δ Insulin between 30 min before and 15 min after an oralglucose load. Data are mean ± SE. Data with different superscriptletters are significantly different p<0.05, according to the post hocANOVA statistical analysis. CT Control diet, HF high-fat diet, HF-Cell high-fat diet and non-fermentable dietary fibre, HF-OFS high-fatdiet and fermentable dietary fibre
Diabetologia (2007) 50:2374–2383 2379

through supplementation with prebiotic dietary fibre (OFS).Mice fed the prebiotic dietary fibre had normal endotox-aemia. This observation strongly correlated with improvedglucose tolerance as explained by the normalisation ofglucose-induced insulin secretion. Although glucose-in-duced insulin secretion was normalised in HF-OFS mice,glucose tolerance following a glucose load was improved,but did not reach control values. This suggests that OFS-fed mice remained insulin resistant. According to these
results, we have previously shown that HF-diet-inducedhepatic insulin resistance was normalised in OFS fed mice,without significant improvement in whole-body insulinsensitivity [18]. Moreover, the improved hepatic insulinsensitivity observed in HF-OFS fed mice was stronglyassociated with a significantly lower hepatic inflammatorytone [18].
Since we observed higher endotoxaemia in HF-diet-fedmice, we measured plasma and adipose tissue inflammatory
0.0 2.5 5.0 7.5 10.0 12.5
Endotoxin (EU/ml)0.0 2.5 5.0 7.5 10.0 12.5
Endotoxin (EU/ml)
20
15
10
5
0
20
15
10
5
0
2.0
1.5
1.0
0.5
0.0
Bod
y w
eigh
t gai
n (g
)B
ody
wei
ght g
ain
(g)
Vis
cera
l adi
pose
tiss
ue(%
of b
ody
wei
ght)
Vis
cera
l adi
pose
tiss
ue(%
of b
ody
wei
ght)
2
1
06 7 8 9 10 6 7 8 9 10
Log10 (bacterial cells/gcaecal content)
Log10 (bacterial cells/gcaecal content)
a
c d
bFig. 5 Body weight and fatmass correlate positively withendotoxaemia and negativelywith Bifidobacterium spp. Cor-relations between endotoxaemiaand a body weight or b adiposefat mass. c Correlations betweenBifidobacterium spp. and bodyweight or d adipose fat mass.Pearson’s r correlations: r=0.61,p=0.005 (a); r=0.39, p=0.03(b); r=−0.61, p=0.0003 (c); r=−0.46, p=0.01 (d)
3,000
2,000
1,000
0
3,000
2,000
1,000
0.0 2.5 5.0 7.5 10.0 12.5 0.0 2.5 5.0 7.5 10.0 12.5
400
300
200
100
0
400
300
200
100
06 7 8 9 10 6 7 8 9 10
Endotoxin (EU/ml) Endotoxin (EU/ml)
Log10 (bacterial cells/gcaecal content)
Log10 (bacterial cells/gcaecal content)
Fas
ted
insu
lin (
pmol
/l)F
aste
d in
sulin
(pm
ol/l)
Glu
cose
tole
ranc
e te
st (
AU
C)
Glu
cose
tole
ranc
e te
st (
AU
C)
a b
c d
Fig. 4 Glucose tolerance andfasted plasma insulin correlatepositively with endotoxaemiaand negatively withBifidobacterium spp. Correla-tion between endotoxaemia anda glycaemic response to glucoseload (AUC) or b fasted insulin.c Correlation betweenBifidobacterium spp. andglycaemic response to glucoseload (AUC) or d fasted insulin.Pearson’s r correlations: r=0.36,p=0.05 (a); r=0.41, p=0.027(b); r=−0.51, p=0.005 (c);r=−0.46, p=0.011 (d)
2380 Diabetologia (2007) 50:2374–2383
markers. We found that HF-diet feeding increased plasmaIL-1α, IL-1β and IL-6 concentrations, but this increase wasprevented only in prebiotic treated mice. It seems thatbifidobacteria and endotoxaemia are therefore linked tometabolic disorders. In line with our results, Brun et al.have recently demonstrated that obese and diabetic mice(ob/ob and db/db) exhibited significantly higher plasmaendotoxin levels, which correlated to higher plasmainflammatory markers [30]. Multiple Pearson’s correlationsanalysis of our data revealed that endotoxaemia positively
correlated with glucose intolerance, fasted insulinaemia,inflammatory markers, adipose tissue and body weightgain, while bifidobacteria negatively correlated with theseparameters. Collectively, our data indicate that HF-diet-induced metabolic disorders could be modulated through anumber of related aspects.
We have shown that increased endotoxaemia observedduring HF feeding could be one outcome of the modulationof gut microbiota. Moreover, we cannot exclude thatintestinal mucosa permeability could be increased follow-ing HF feeding and restored through prebiotic treatment.The exact mechanism by which prebiotic fibre lowersendotoxaemia and systemic inflammatory tone is poorlyunderstood. It is recognised that bifidobacteria are the maingut bacteria involved in the positive effects observed afterprebiotic supplementation. Indeed, bifidobacterial supple-mentation has been associated with lower bacterial translo-cation and endotoxaemia, leading to a decrease of theinflammatory cascade activation in several models of gutbacteria translocation [13–15, 31]. Similarly, other studieshave reported that probiotics and gut microbiota modula-tion through prebiotic ingestion may improve or preventdisruption of intestinal epithelial barrier function andconsequently reduce intestinal permeability in rodents andhumans [32, 33]. Other studies strongly suggest that theproducts of OFS fermentation such as short-chain fattyacids (butyrate, propionate and lactate) positively influence
300
200
100
0
300
200
100
0
0.0 2.5 5.0
a b c
d e f
7.5 10.0 12.5 0.0 2.5 5.0 7.5 10.0 12.5
2,500
2,000
1,500
1,000
500
0
2,500
2,000
1,500
1,000
500
0
4,000
3,000
2,000
1,000
0
4,000
3,000
2,000
1,000
0
Endotoxin (EU/ml) Endotoxin (EU/ml)0.0 2.5 5.0 7.5 10.0 12.5
Endotoxin (EU/ml)
6 7 8 9 106 7 8 9 10 6 7 8 9 10
Log10 (bacterial cells/gcaecal content)
Log10 (bacterial cells/gcaecal content)
Log10 (bacterial cells/gcaecal content)
IL-6
(pg
/ml)
IL-6
(pg
/ml)
IL-1
β (p
g/m
l)IL
-1β
(pg/
ml)
IL-1
α (p
g/m
l)IL
-1α
(pg/
ml)
Fig. 7 Plasma markers of inflammation correlate positively withendotoxaemia and negatively with Bifidobacterium spp. Correlationsbetween endotoxaemia and a IL-6, b IL-1β and c IL-1α. dCorrelations between Bifidobacterium spp. and IL-6, e IL-1β and f
IL-1α. Pearson’s r correlations: r=0.3, p=0.16 (a); r=0.21, p=0.87(b); r=0.45, p=0.041 (c); r=−0.45, p=0.025 (d); r=−0.28, p=0.212(e); r=−0.65, p=0.0008 (f)
3,000
2,000
1,000
200
100
0IL-1α IL-1β IL-6
Cyt
okin
es (
pg/m
l)
Fig. 6 Prebiotics lower plasma pro-inflammatory cytokines. Plasmacytokine concentrations (pg/ml) in mice fed normal chow diet (openbars), HF diet (closed bars), HF-Cell diet (hatched bars) or HF-OFSdiet (grey bars) for 14 weeks. Data are mean ± SE. Data with differentsuperscript letters are significantly different p<0.05, according to thepost hoc ANOVA statistical analysis
Diabetologia (2007) 50:2374–2383 2381

the gut barrier function [34], i.e. in vitro butyrate, acetateand propionate all exert a concentration-dependent reduc-tion of paracellular permeability in the Caco-2 model ofcolonic epithelium [35]. In the present study, we observedthat HF-OFS-fed mice exhibit a significant increase in totaland empty caecum weight compared with HF and HF-Cellmice (data not shown). This supports the idea that thefermentation of dietary fibre allowing the proliferation ofspecific bacteria such as bifidobacteria influences the profileof short-chain fatty acids released in the gut. The con-sequences of the specific fermentation are lower endotox-aemia and an improvement of metabolic disturbances.
With regard to the role of gut bacteria in the develop-ment of metabolic disorders, Brugman et al. have shownthat antibiotic treatment partially protects against theoccurrence of diabetes in a diabetes-prone rat that developsinsulitis. The authors proposed that altering the gut micro-biota composition by antibiotic treatment reduces theantigenic load and hence the inflammatory reaction thathad led to pancreatic beta cell destruction [36]. Consistentwith these results, we have recently demonstrated that HF-diet-fed mice and ob/ob mice treated with antibiotics for4 weeks were partially protected against the development ofmetabolic diseases and inflammatory tone (P. D. Cani, N. M.Delzenne and R. Burcelin, unpublished data).
We cannot rule out the putative implication of anotherimportant mechanism to explain the improved glucosemetabolism in prebiotic-fed mice. Indeed, we have previ-ously reported that prebiotic dietary fibre improved diabetesand insulin sensitivity by a mechanism promoting synthesisand secretion of the incretin, GLP-1 [18, 28, 29]. Here, weconfirmed that prebiotic dietary fibre only strongly increasecolonic proglucagon mRNA content. Therefore, the presentdata suggest that there is a link between modulation of gutmicrobiota, endotoxaemia, inflammation and GLP-1 secre-tion. This merits further investigation. While the doses usedin animal studies are not directly transposable to humannutrition, several reports have demonstrated that ingestionof fructo-oligosaccharides at the dose of 5 to 20 g/day aresufficient to promote prebiotic [37–40] and physiologicaleffects [41–44].
In conclusion, dietary modulation of gut microbiota witha view to increasing bifidobacteria reduced endotoxaemiaand improved glucose tolerance and insulin secretion, aswell as reducing inflammation development in HF-diet-fedmice. Together, these findings suggest that the gut micro-biota contribute to the pathophysiological regulation ofendotoxaemia and set the tone of inflammation, glucosetolerance and insulin secretion.
Thus, specific strategies for modifying gut microbiota infavour of bifidobacteria could be useful tools for reducingthe impact of high-fat feeding on the occurrence ofmetabolic diseases.
Acknowledgements This work was supported by an FSR (FondsSpéciaux de Recherche) grant from the Université catholique de Louvainand by a grant from the Fonds National de la Recherche Scientifique(FNRS 1.5.231.06-Belgium). P. D. Cani is a postdoctoral researcher fromthe FNRS Belgium. We would like to thank C. Feyt, and E. Delmée forhelpful criticism and F. Debacker for excellent technical assistance.
Duality of interest The authors declare that there is no duality ofinterest associated with this manuscript.
References
1. Wellen KE, Hotamisligil GS (2005) Inflammation, stress, anddiabetes. J Clin Invest 115:1111–1119
2. Kahn BB, Flier JS (2000) Obesity and insulin resistance. J ClinInvest 106:473–481
3. Hotamisligil GS, Shargill NS, Spiegelman BM (1993) Adiposeexpression of tumor necrosis factor-alpha: direct role in obesity-linked insulin resistance. Science 259:87–91
4. Weisberg SP, McCann D, Desai M, Rosenbaum M, Leibel RL,Ferrante AW, Jr (2003) Obesity is associated with macrophageaccumulation in adipose tissue. J Clin Invest 112:1796–1808
5. Hotamisligil GS, Peraldi P, Budavari A, Ellis R, White MF,Spiegelman BM (1996) IRS-1-mediated inhibition of insulinreceptor tyrosine kinase activity in TNF-alpha- and obesity-induced insulin resistance. Science 271:665–668
6. Plomgaard P, Bouzakri K, Krogh-Madsen R, Mittendorfer B,Zierath JR, Pedersen BK (2005) Tumor necrosis factor-alphainduces skeletal muscle insulin resistance in healthy humansubjects via inhibition of Akt substrate 160 phosphorylation.Diabetes 54:2939–2945
7. Backhed F, Ding H, Wang T et al (2004) The gut microbiota as anenvironmental factor that regulates fat storage. Proc Natl Acad SciUSA 101:15718–15723
8. Backhed F, Ley RE, Sonnenburg JL, Peterson DA, Gordon JI(2005) Host–bacterial mutualism in the human intestine. Science307:1915–1920
9. Backhed F, Manchester JK, Semenkovich CF, Gordon JI (2007)Mechanisms underlying the resistance to diet-induced obesity ingerm-free mice. Proc Natl Acad Sci USA 104:979–984
10. Ley RE, Backhed F, Turnbaugh P, Lozupone CA, Knight RD,Gordon JI (2005) Obesity alters gut microbial ecology. Proc NatlAcad Sci USA 102:11070–11075
11. Ley RE, Turnbaugh PJ, Klein S, Gordon JI (2006) Microbial ecology:human gut microbes associated with obesity. Nature 444:1022–1023
12. Cani PD, Amar J, Iglesias MA et al (2007) Metabolic endotoxemiainitiates obesity and insulin resistance. Diabetes 56:1761–1772
13. Griffiths EA, Duffy LC, Schanbacher FL et al (2004) In vivoeffects of bifidobacteria and lactoferrin on gut endotoxinconcentration and mucosal immunity in Balb/c mice. Dig DisSci 49:579–589
14. Wang Z, Xiao G, Yao Y, Guo S, Lu K, Sheng Z (2006) The role ofbifidobacteria in gut barrier function after thermal injury in rats. JTrauma 61:650–657
15. Wang ZT, Yao YM, Xiao GX, Sheng ZY (2004) Risk factors ofdevelopment of gut-derived bacterial translocation in thermallyinjured rats. World J Gastroenterol 10:1619–1624
16. Tuohy KM, Rouzaud GC, Bruck WM, Gibson GR (2005)Modulation of the human gut microflora towards improved healthusing prebiotics—assessment of efficacy. Curr Pharm Des 11:75–90
2382 Diabetologia (2007) 50:2374–2383

17. Cani PD, Dewever C, Delzenne NM (2004) Inulin-type fructansmodulate gastrointestinal peptides involved in appetite regulation(glucagon-like peptide-1 and ghrelin) in rats. Br J Nutr 92:521–526
18. Cani PD, Knauf C, Iglesias MA, Drucker DJ, Delzenne NM,Burcelin R (2006) Improvement of glucose tolerance and hepaticinsulin sensitivity by oligofructose requires a functional glucagon-like peptide 1 receptor. Diabetes 55:1484–1490
19. Franks AH, Harmsen HJ, Raangs GC, Jansen GJ, Schut F,Welling GW (1998) Variations of bacterial populations in humanfeces measured by fluorescent in situ hybridization with group-specific 16S rRNA-targeted oligonucleotide probes. Appl EnvironMicrobiol 64:3336–3345
20. Harmsen HJ, Wildeboer-Veloo AC, Raangs GC et al (2000)Analysis of intestinal flora development in breast-fed andformula-fed infants by using molecular identification and detec-tion methods. J Pediatr Gastroenterol Nutr 30:61–67
21. Langendijk PS, Schut F, Jansen GJ et al (1995) Quantitativefluorescence in situ hybridization of Bifidobacterium spp. withgenus-specific 16S rRNA-targeted probes and its application infecal samples. Appl Environ Microbiol 61:3069–3075
22. Manz W, Amann R, Ludwig W, Vancanneyt M, Schleifer KH(1996) Application of a suite of 16S rRNA-specific oligonucle-otide probes designed to investigate bacteria of the phylumcytophaga–flavobacter–bacteroides in the natural environment.Microbiology 142:1097–1106
23. Salzman NH, de Jong H, Paterson Y, Harmsen HJ, Welling GW,Bos NA (2002) Analysis of 16S libraries of mouse gastrointestinalmicroflora reveals a large new group of mouse intestinal bacteria.Microbiology 148:3651–3660
24. Devereux R, Mundfrom GW (1994) A phylogenetic tree of 16SrRNA sequences from sulfate-reducing bacteria in a sandy marinesediment. Appl Environ Microbiol 60:3437–3439
25. Ootsubo M, Shimizu T, Tanaka R et al (2002) Oligonucleotideprobe for detecting Enterobacteriaceae by in situ hybridization. JAppl Microbiol 93:60–68
26. Knauf C, Rieusset J, Foretz M et al (2006) Peroxisomeproliferator-activated receptor-alpha-null mice have increasedwhite adipose tissue glucose utilization, GLUT4, and fat mass:role in liver and brain. Endocrinology 147:4067–4078
27. Cani PD, Neyrinck AM, Maton N, Delzenne NM (2005)Oligofructose promotes satiety in rats fed a high-fat diet:involvement of glucagon-like peptide-1. Obes Res 13:1000–1007
28. Cani PD, Daubioul CA, Reusens B, Remacle C, Catillon G,Delzenne NM (2005) Involvement of endogenous glucagon-likepeptide-1(7-36) amide on glycaemia-lowering effect of oligofruc-tose in streptozotocin-treated rats. J Endocrinol 185:457–465
29. Cani PD, Hoste S, Guiot Y, Delzenne NM (2007) Dietary non-digestible carbohydrates promote L-cell differentiation in theproximal colon of rats. Br J Nutr 98:32–37
30. Brun P, Castagliuolo I, Leo VD et al (2007) Increased intestinalpermeability in obese mice: new evidence in the pathogenesis ofnonalcoholic steatohepatitis. Am J Physiol Gastrointest LiverPhysiol 292:G518–G525
31. Caplan MS, Miller-Catchpole R, Kaup S et al (1999) Bifidobacterialsupplementation reduces the incidence of necrotizing enterocolitis ina neonatal rat model. Gastroenterology 117:577–583
32. Commane DM, Shortt CT, Silvi S, Cresci A, Hughes RM,Rowland IR (2005) Effects of fermentation products of pro- andprebiotics on trans-epithelial electrical resistance in an in vitromodel of the colon. Nutr Cancer 51:102–109
33. Spindler-Vesel A, Bengmark S, Vovk I, Cerovic O, Kompan L(2007) Synbiotics, prebiotics, glutamine, or peptide in earlyenteral nutrition: a randomized study in trauma patients. JPEN JParenter Enteral Nutr 31:119–126
34. Guarner F (2005) Inulin and oligofructose: impact on intestinaldiseases and disorders. Br J Nutr 93(Suppl 1):S61–S65
35. Mariadason JM, Barkla DH, Gibson PR (1997) Effect of short-chain fatty acids on paracellular permeability in Caco-2 intestinalepithelium model. Am J Physiol 272:G705–G712
36. Brugman S, Klatter FA, Visser JT et al (2006) Antibiotic treatmentpartially protects against type 1 diabetes in the Bio-Breedingdiabetes-prone rat. Is the gut flora involved in the development oftype 1 diabetes? Diabetologia 49:2105–2108
37. Gibson GR, Willems A, Reading S, Collins MD (1996)Fermentation of non-digestible oligosaccharides by human colon-ic bacteria. Proc Nutr Soc 55:899–912
38. Gibson GR (1998) Dietary modulation of the human gutmicroflora using prebiotics. Br J Nutr 80:S209–S212
39. Gibson GR (1999) Dietary modulation of the human gutmicroflora using the prebiotics oligofructose and inulin. J Nutr129:1438S–1441S
40. Gibson GR, Roberfroid MB (1995) Dietary modulation of thehuman colonic microbiota: introducing the concept of prebiotics. JNutr 125:1401–1412
41. Scholz-Ahrens KE, Ade P, Marten B et al (2007) Prebiotics,probiotics, and synbiotics affect mineral absorption, bone mineralcontent, and bone structure. J Nutr 137:838S–846S
42. Cani PD, Joly E, Horsmans Y, Delzenne NM (2006) Oligofructosepromotes satiety in healthy human: a pilot study. Eur J Clin Nutr60:567–572
43. Daubioul CA, Horsmans Y, Lambert P, Danse E, Delzenne NM(2005) Effects of oligofructose on glucose and lipid metabolism inpatients with nonalcoholic steatohepatitis: results of a pilot study.Eur J Clin Nutr 59:723–726
44. Letexier D, Diraison F, Beylot M (2003) Addition of inulin to amoderately high-carbohydrate diet reduces hepatic lipogenesis andplasma triacylglycerol concentrations in humans. Am J Clin Nutr77:559–564
Diabetologia (2007) 50:2374–2383 2383