Interval Type-2 Complex-Fuzzy Inferential System ― A New Approach to Modeling

DISCURSIVE PAPER
Selecting the most appropriate inferential statistical test for your
quantitative research study
Josette Bettany-Saltikov and Victoria Jane Whittaker
Aims and objectives. To discuss the issues and processes relating to the selection of the most appropriate statistical test. A
review of the basic research concepts together with a number of clinical scenarios is used to illustrate this.
Background. Quantitative nursing research generally features the use of empirical data which necessitates the selection of
both descriptive and statistical tests. Different types of research questions can be answered by different types of research
designs, which in turn need to be matched to a specific statistical test(s).
Design. Discursive paper.
Methods. This paper discusses the issues relating to the selection of the most appropriate statistical test and makes some rec-
ommendations as to how these might be dealt with.
Conclusion. When conducting empirical quantitative studies, a number of key issues need to be considered. Considerations
for selecting the most appropriate statistical tests are discussed and flow charts provided to facilitate this process.
Relevance to clinical practice. When nursing clinicians and researchers conduct quantitative research studies, it is crucial that
the most appropriate statistical test is selected to enable valid conclusions to be made.
Key words: inferential, quantitative, selecting, statistical test
Accepted for publication: 27 February 2013
Aim
The aim of this paper is to discuss the issues and pro-
cesses relating to the selection of the most appropriate
statistical test for quantitative research studies. A review
of the relevant basic research concepts is first undertaken.
This is followed by the presentation of a number of
clinical scenarios to illustrate the process of selecting the
test.
Design
A discursive paper is used to explain the key principles for
selecting the most appropriate statistical test based on the
research question and appropriate research design. This is
crucial to obtain valid and generalisable results from the
research study.
Methods
This paper discusses the issues and approaches relating to
the selection of the most appropriate statistical test(s) for
quantitative research designs. A number of recommenda-
tions as to how you can best deal with them by discussing
a number of clinical scenarios are then presented. Hicks
(2009, p. 69) states that when carrying out any research
which involves testing an idea or hypothesis the following
steps have to be undertaken:
Authors: Josette Bettany-Saltikov, MSc, MCSP, Dip Physio, PhD,
Senior Lecturer in Research Methods and Chartered Physiothera-
pist, Teesside University, Institute of Health and Social Care,
Middlesbrough; Victoria Jane Whittaker, BSc, MSc, Senior Lecturer
in Research Methods, Teesside University, Institute of Health and
Social Care, Middlesbrough, UK
Correspondence: Josette Bettany-Saltikov, Senior Lecturer in
Research Methods and Chartered Physiotherapist, Teesside Univer-
sity, Institute of Health and Social Care, Middlesbrough TS13BA,
UK. Telephone: +44 (0)1642 342981.
E-mail: [email protected]
© 2013 John Wiley & Sons Ltd
Journal of Clinical Nursing, doi: 10.1111/jocn.12343 1
1 A hypothesis (an educated guess about how things
work) must be devised and stated.
2 A research project must be designed (research design)
which tests the hypothesis.
3 Results from the research have to be analysed using
appropriate descriptive and statistical tests.
All the above points will be discussed in turn. Descriptive
statistics will not be discussed in depth as it is out of the
scope of this paper. Before you can select the most
appropriate statistical test for your research question,
however, there are a number of issues that you need to
consider.
A hypothesis must be devised and stated
Before stating your hypothesis, it is important to specify the
variables and the levels of measurement within your research
study. To enable you to do this, there are a number of ques-
tions you need to ask yourself which are detailed below.
What are the independent and dependent variables in your
research question?
There are two main types of variables, independent and
dependent. Independent variables (IVs) are also referred to as
factors, covariates and predictor variables. In an experimen-
tal study, the researcher manipulates an IV, which is the pre-
dictor, whilst measuring the changes of a dependent variable
(DV), the criterion. All other extraneous variables, also called
confounding or uncontrolled variables, are variables other
than the IVs that are measured in a study, which might have
an effect on the DV (Watson et al. 2006). Extraneous vari-
ables need to be controlled to prevent them from having a
confounding effect on the DV. The usual ways to control
them are by ‘randomising them out’, as in a true experiment,
or to statistically control them, for example, through the
analysis of covariance.
Sometimes, however, the variables the researcher is inter-
ested in may be ‘concepts’ or ‘psychological’ variables.
These cannot be manipulated or measured directly. In this
case, in order that the research can be considered empiri-
cal, the researcher must come up with operational defini-
tions for each variable, which specify how they will be
measured.
Often IVs have an umbrella term and related levels or
conditions (that are subsumed under the umbrella term;
Bowers 2008). For example, gender is an umbrella term
with two levels: male and female. However, it is important
to bear in mind that there are many nursing investigations
where the IV vs. DV distinction is irrelevant, for example,
much of survey research and all of factor analysis. (Factor
analysis is a correlation technique that is used to determine
meaningful clusters of shared variance.)
A well-framed research question will usually have three or
four elements (Fleming 1998). Once you have formulated
your question, the next step is to separate it into parts as seen
below. The question formation usually includes identifying
all the component parts, the population (P), the intervention
(I), the comparative intervention (C), if any, and the out-
comes (O) that are measured. The acronym for this is PICO
or PEO. PICO is designed mainly for questions of therapeutic
interventions (Khan et al. 2003), whilst PEO, which stands
for patient, exposure and outcome, is used most frequently
for qualitative questions (Khan et al. 2003).
The following clinical scenario will be used to help you
understand these concepts better.
Scenario 1: A specialist spinal nurse is conducting a
research study, and her research question is as follows:
In adults with chronic back pain (P), is a new exercise
programme (I) more effective than standard exercises
(C) for reducing the severity of low back pain (O)?
In the scenario above, there is one IV, which is the type
of treatment with two levels, the new exercise programme
and the standard exercise programme, and there is one DV
that is pain. There is also the possibility of an extraneous
variable that needs to be considered. This may be the ‘pain
medication’ that the patients may be taking at the same
time as doing the exercise programme. It is considered an
extraneous variable as taking medication can also have an
effect on pain.
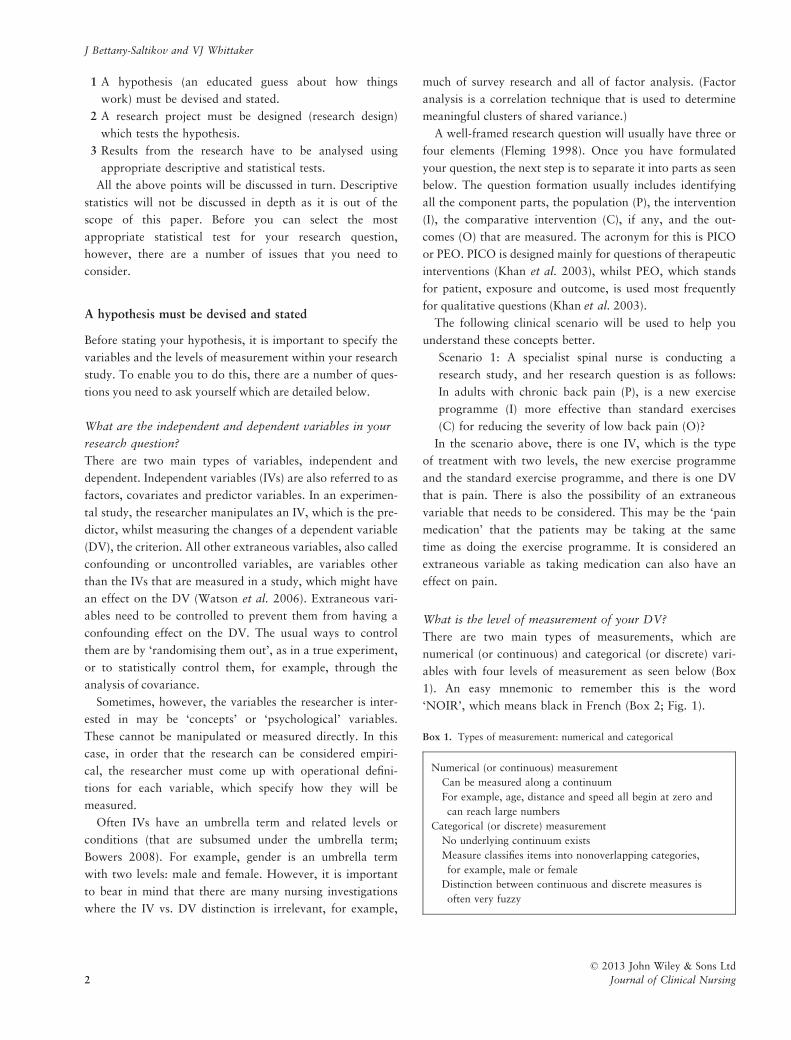
What is the level of measurement of your DV?
There are two main types of measurements, which are
numerical (or continuous) and categorical (or discrete) vari-
ables with four levels of measurement as seen below (Box
1). An easy mnemonic to remember this is the word
‘NOIR’, which means black in French (Box 2; Fig. 1).
Box 1. Types of measurement: numerical and categorical
Numerical (or continuous) measurement
Can be measured along a continuum
For example, age, distance and speed all begin at zero and
can reach large numbers
Categorical (or discrete) measurement
No underlying continuum exists
Measure classifies items into nonoverlapping categories,
for example, male or female
Distinction between continuous and discrete measures is
often very fuzzy
© 2013 John Wiley & Sons Ltd
2 Journal of Clinical Nursing
J Bettany-Saltikov and VJ Whittaker

Box 2. Levels of measurement
1. Nominal Measurement in categories, for example,
smoking status (smokers/nonsmokers)
2. Ordinal Categorical data to be rank ordered, for
example, grade of AHPs (student, newly
qualified, senior)
3. Interval Equal intervals between points on the
measurement scale, but no theoretical zero
point (e.g. temperature)
4. Ratio Equal intervals between points on the
measurement scale, meaningful ratios can be
made and theoretical zero point (e.g. weight,
height)
In the scenario above, it is important to decide how you
plan to measure the DV ‘pain’ in the study. Generally, it is
possible to measure your DV(s) in a number of ways using
different levels of measurement. So, for instance, pain could
be measured using the four different levels of measurement
mentioned above. It usually depends on how you intend to
perform the actual measurement.
If, for instance, you were to ask the patients, ‘Do you
have any pain?’ Yes or no? This would be classified as a
categorical or nominal variable as you are only assigning
names or labels to the measurement of pain. However, it
is also possible to change this level of measurement to an
ordinal level of measurement and measure it on a rating
scale containing three categories: no pain, a little pain
and a lot of pain. In some circumstances, as discussed on
page 13, ‘pain’ could also be considered to be interval/
ratio data. (Please refer to page 13 for in-depth discus-
sion.)
What are your hypotheses?
So, let us return to the issue of stating your hypotheses.
These are developed on the basis of clinical observations,
previous literature and the specific research question for
your research study. It specifies the relationship between
two or more variables (IVs and DVs) and is a statement of
what you expect to find in your primary ‘quantitative’
research study (Hicks 2009). It is often reported at the end
of the literature review (i.e. after the objectives and research
questions). It is common for published quantitative studies
to omit formal hypotheses and only report objectives and/
or research questions (Denscombe 2002). However, if you
are writing a proposal for a research study, then you may
be expected to state all your hypotheses including the null
hypothesis (see Box 3 below).
Box 3. Experimental and null hypothesis
Hypotheses
Null hypothesis (Ho) – states that there is no relationship
between the IV and DV
Experimental hypothesis (H1) – states that there is a
relationship between the IV and DV
When conducting a quantitative research study, the
researcher sets out to support (accept) the experimental
hypothesis and refute (reject) the null hypothesis (Salkind
2010). Often there is a primary hypothesis and one or more
secondary hypotheses for additional research questions. It is
important to remember that there are two formats for writ-
ing out experimental hypotheses as shown in Box 4 (Plichta
& Kelvin 2013).
Box 4. One- and two-tailed hypothesis
A one-tailed (directional) hypothesis predicts the direction of
the relationship between the IV and DV
The null hypothesis Ho
Ho – The new exercise programme will not produce
greater reductions in the severity of pain than the
standard exercise programme in adults with low back pain
OR
Ho – There is no difference in mean reduction in pain
scores between the two groups
H1 – The new exercise programme will produce greater
reductions in the severity of pain than the standard
exercise programme in adults with low back pain
OR
H1 – Mean pain will be reduced further with the new
exercise programme than with the standard programme
A two-tailed (nondirectional) hypothesis – predicts a
relationship between the IV and DV, but does not specify
the direction
Ho – There is no difference in mean reduction in pain
scores between the two groups
H1 – There is a difference in pain severity in adults with
low back pain who have received the new exercise
programme compared with those who received the
standard exercise programme
Nominal Ordinal Interval Ratio
Levels of measurement
Categorical Continuous
Data
Figure 1 Data can be divided into categorical data (which include
nominal and ordinal data) and continous data (which include inter-
val and ratio data).
© 2013 John Wiley & Sons Ltd
Journal of Clinical Nursing 3
Discursive paper Selecting the appropriate inferential statistical test

Whilst hypothesis testing is key to several research
designs, it is important to remember that there are also
many investigations for which interval estimation (confi-
dence intervals) is preferred to hypothesis testing (signifi-
cance tests; Bowling 2009).
A research project that tests the hypothesis must be
designed
Before you can choose your statistical test, it is imperative
that you know what type of research design you will be
using to conduct your study. In other words, you have to
decide on the best way ‘to find out if your predicted rela-
tionship actually exists. In other words you need to design
a suitable research project (Hicks 2009, p. 72)’.
Hicks states that ‘There are often a number of designs
that can be used to test the hypothesis and it is up to the
researcher to select the most appropriate one. As there is
usually no single correct way of testing a hypothesis, the
researcher must take into account several design consider-
ations such as the specific aims and objectives of their
specific study. It is important to reiterate that there is rarely
such a thing as a perfect research design and usually com-
promise decisions need to be made which need to be both
informed and justified (Hicks 2009, p. 73)’.
The type of research design can be thought of as the
structure of the research study. It is a whole plan of how
all the parts of the project fit together. This will include
who the subjects are, what instruments are to be used if
any, and how the study will be conducted and analysed
and finally discussed (Polgar 2008).
Hopkins (2008) states, ‘In quantitative research your
aim is to determine the relationship between one thing (an
IV) and another (a dependent or outcome variable) in a
population. Quantitative research designs are either
descriptive (subjects usually measured once) or experimen-
tal (subjects measured before and after a treatment). A
descriptive study establishes only associations between
variables. An experiment study establishes causality. How-
ever for an accurate estimate of the relationship between
variables, a descriptive study usually needs a sample of
hundreds or even thousands of subjects; an experiment,
especially a crossover, may need only tens of subjects. The
estimate of the relationship is less likely to be biased if
you have a high participation rate in a sample selected
randomly from a population. In experiments, bias is also
less likely if subjects are randomly assigned to treatments,
and if subjects and researchers are blind to the identity of
the treatments’. Please refer to Hopkins (2008)’s statistical
website for further information on research designs (http://
www.sportsci.org/2008/index.html). To summarise, there-
fore, there are essentially two basic types of designs:
experimental and correlational. Both designs start with an
experimental hypothesis that predicts a relationship
between two variables, but the aims and methods of each
approach are different.
Hicks (2009, p. 73) provides an excellent summary on
this issue; ‘Let’s take the hypothesis that the professional
rank of the nurse affects the degree of job satisfaction that
is experienced. This hypothesis can be answered either by
an experimental design or a correlational design, but in
essence the experimental design will look for differences in
job satisfaction between different ranks of nurses and the
correlational design is interested to see if there is any pat-
tern or relationship between the rank of nurses and degree
of job satisfaction’.
Selecting the most appropriate inferential test to use for
your research question and research design: parametric
or nonparametric?
There are two main types of inferential tests: parametric
and nonparametric. So what’s the difference? Parametric
tests are more powerful tests that make certain assump-
tions of your data. They are much more sensitive, and four
conditions must be fulfilled to use a parametric test (Hicks
2009).
Data must be interval/ratio (This has been discussed above)
This condition is critical and cannot be violated as para-
metric tests cannot be used on nominal or ordinal data.
The subjects should have been randomly selected (This
condition can sometimes be violated to some extent)
It is important to bear in mind, however, that researchers
do not always have a random sample from a population
and may not want to make inferences from the sample to
the population from which the sample was drawn.
Researchers often have data for an entire population or for
a nonrandom (‘convenience’) sample; in both these situa-
tions, all that are needed and justified may be descriptive
statistics only. It all depends on the research design (Salkind
2010).
Data should be normally distributed
Normal distribution (or bell-shaped curve) is a theoretical,
not an actual distribution (continuous data rarely follow
this pattern precisely). In many cases (particularly for small
samples), the frequency distribution is skewed by outliers
and will not conform to the curve of a normal distribution
© 2013 John Wiley & Sons Ltd
4 Journal of Clinical Nursing
J Bettany-Saltikov and VJ Whittaker

(Figs 2–4). Normality can be assessed in a number of differ-
ent ways (Bowers 2008).
1 Subjectively with histograms – not recommended.
2 Calculate the mode, median and mean – if they are sub-
stantially different, it is likely that the data are skewed
and not normally distributed.
3 Statistically using ‘tests of normality’ (or goodness-of-fit
tests).
Normality can be assessed using a statistical assessment
of normality such as the Kolmogorov–Smirnov test (Field
2009). This checks the frequency distribution (variables
considered need to be interval or ratio level of measure-
ment) for similarity to the normal distribution. Generally
speaking, however:
1 If the p-value is >0�05, this indicates that the data are
normally distributed. This suggests that a parametric
statistical test can be used.
2 If the p-value is <0�05, this indicates that the data are
not normally distributed, and therefore, this suggests
that a nonparametric statistical test should be used. If
a continuous variable is not normally distributed, then
the median and interquarter range should be reported
instead of the mean and standard deviation.
Whilst this information is important for the selection of
the most appropriate inferential statistical test, obtaining a
large p-value does not, however, guarantee normality; it
merely indicates that the hypothesis of normality is tenable
and that the data may be normally distributed. It is
important to bear in mind that it is an inferential statistical
test that is parametric or nonparametric; it is not the vari-
ables nor the data (Bowers 2008).
The variation in results from each condition should be
similar
The above sentence means that the variability of scores, in
each group or condition, needs to be similar. This can be
assessed using a test for the homogeneity of variance such
as Levene’s test. However, do remember that it is the first
condition that is essential. The other three can be violated
to some extent (Bowers 2008).
Example of a normal distribution curve
5
4
3
2
1
0
Teenage8·00 10·00 12·00 14·00 16·00 18·00 20·00
Freq
uenc
y
Mean = 14·00SD = 2·041n = 25
Figure 2 Example of a normal distribution curve, (1) bell-shaped
curve, (2) symmetrical, (3) mean, median and mode are the same,
(4) starts slowly, rises rapidly to centre, falls rapidly and tails off
slowly, (5) tails of the curve never reach the horizontal axis and (6)
defined by the mean (centre) and standard deviation (spread).
Example of a negatively skewed distribution curve
10
8
6
4
2
0
Teenage8·00 10·00 12·00 14·00 16·00 18·00 20·00
Freq
uenc
y
Mean = 16·80SD = 2·565n = 30
Figure 3 A negatively skewed distribution curve. A frequency dis-
tribution where there is a long tail towards the negative end of
x-axis. The mode is greater than the median, which is greater than
the mean.
Example of a positively skewed curve
6
4
2
0
Teenage8·00 10·00 12·00 14·00 16·00 18·00 20·00
Freq
uenc
y
Mean = 10·87SD = 3·203n = 30
Figure 4 A positively skewed distribution curve. The mean is
greater than the median, which in turn is greater than the mode. A
frequency distribution where there is a long tail towards the posi-
tive end of the x-axis.
© 2013 John Wiley & Sons Ltd
Journal of Clinical Nursing 5
Discursive paper Selecting the appropriate inferential statistical test

Nonparametric tests
These are less powerful tests that make fewer assumptions
of your data. Nonparametric tests do not require the condi-
tions listed above to be fulfilled and can be used with any
level of measurement (Bryan 2008).
To summarise, therefore, if your data are interval or ratio
and normally distributed, you will most likely be able to
use a parametric test. However, if your data are interval or
ratio but are not normally distributed, you would most
likely be using a nonparametric test. Bear in mind, how-
ever, that if your data are nominal or ordinal, you will not
be able to use a parametric test as this will violate condi-
tion one. You will in this case therefore need to use a
nonparametric statistical test.
Let us consider, for example, that you, a nurse
researcher, are conducting an experimental quantitative
study (a randomised control trial or RCT), and you have
just finished collecting your data. What do you do with
this data once you have collected it? The first step after
checking that you have typed your data correctly into
the statistical programme (e.g. SPSS for Windows; IBM
SPSS, Armonk, NY, USA) is to summarise and describe
your data. This is usually carried out using descriptive
statistics, and you can describe your data by calculating
the mean, median and mode and evaluate the spread of
your data (Clegg 1983). If you need more information
on calculating descriptive statistics, please refer to a basic
research textbook as this is out of the scope of this
paper.
The ‘statistical tests’ that are performed on the data
collected in quantitative studies are called ‘inferential’ sta-
tistics, and they provide an objective way of quantifying
the strength of the evidence against your null hypothesis
(Polgar & Thomas 2000). When you carry out a statisti-
cal test for an experimental, quasi-experimental or corre-
lational design, you will most likely be looking for
differences or relationships between variables.
Whilst researchers are not nowadays expected to calcu-
late these statistical tests mathematically, it is, however,
important to select the most appropriate test that matches
the research design used in your study (Hicks 2009). It is
important to clarify that when selecting a statistical test,
there may be no single right answer. There may be vari-
ous tests that can be used to answer a research question,
but it is your (the researcher’s) responsibility to select the
one that best answers your research question, your aims
and your research hypotheses that you initially proposed
for your specific research study.
Once you have determined that you need to make
inferences from your sample to the general population,
you then need to select the most appropriate statistical
test to answer your specific research question, it is impor-
tant for you to make sure that you have answers to the
following three questions.
To decide which test to use, you need to know three
things
1 Whether it is appropriate to use a parametric test or
not? In other words, what are the levels of each of your
variables, and are all the conditions for using a paramet-
ric test met?
2 Whether the IV is within participants (repeated measures
of the same subjects) or between participants (indepen-
dent different subjects in the different groups)?
3 How many levels are there within the IV?
When deciding on which statistical test to choose, you
need to first check whether the four conditions for using a
parametric test are fulfilled. So if we consider the scenario
example above, let us consider that you will be using a
visual analogue scale. This will involve presenting patients
with an unmarked line of length of exactly 10 cm long
(Hicks 2009):
0 100 mm (cm)
No pain Excruciating pain
Before going any further, it is important to mention that
sometimes ‘researchers treat point scales as though they
were interval scales rather than ordinal scales because when
they have constructed the point scale, they have assumed
equal intervals between the points. Sometimes this is
entirely legitimate (e.g. when analysing questionnaire data).
As a broad rule of thumb, if you construct a point scale
with at least 7 points on it and are assuming that the dis-
tances between the points are comparable, then you may
wish to classify this as an interval scale for the purposes of
analysis (Hicks 2009, p. 42–43)’.
The patient is then asked to place a mark on the line
that represents their pain. So, for instance, before treat-
ment, the patient may place a mark on 72 mm and after
treatment on 50 mm. Hicks (2009) states (p. 42) that
‘the problem then is how to classify the data as pain is
subjective, so should this be an ordinal scale? However
length measurement is measured in mm or cm and is an
interval/ratio scale. So how can this issue be resolved?’
Generally speaking and as a rule of thumb for data col-
lection, it is best to use the most sophisticated level of mea-
surement that you can as this will enable you to use the
© 2013 John Wiley & Sons Ltd
6 Journal of Clinical Nursing
J Bettany-Saltikov and VJ Whittaker

more sophisticated level of data analysis. So it may be best
to treat visual analogue data as interval ratio data.
As discussed previously, the first condition for a
parametric test is met, that is, data are interval/ratio
level. If the data are also normally distributed, then it
may be possible for you to use a parametric test as
two of four conditions for using a parametric test have
been met. On the other hand, if you decide to ask
patients whether or not they have pain with the only
possible answers being yes or no (i.e. a nominal level
of measurement), then the first condition for using a
parametric test is not met, and you, therefore, need to
use a nonparametric test.
Another important consideration to remember is that
each experimental design has its own statistical test,
which must be used when analysing the results (Hicks
2009, p. 121). So a key feature when planning your
research is to match up the research design with the
appropriate statistical test. Using a flow chart is the easi-
est way to decide on the appropriate statistical test as
can be seen in Hicks (2009, p. 33–36).
Matching the design to the test
To select the most appropriate test for your design, you
must ask a number of questions (Hicks 2009).
1 Is the design experimental or correlational? In other
words (for your specific research question), are you
looking for differences (experimental) or patterns and
relationships (correlational)?
2 How many conditions are there? Two or more than
two?
3 If the design is experimental, are the subjects the same,
matched or different subjects?
Examples of experimental scenarios
So, once again if we consider the low back pain scenario
above, the answers for the researcher would be as follows:
1 She is looking for differences as she is trying to evaluate
whether there are any differences in the effectiveness
between the two exercise programmes. This suggests the
study is experimental.
2 There are two conditions, the experimental and the stan-
dardised exercise programmes.
3 The design is experimental using different subjects.
(Each subject appears in only one of the intervention
groups.)
Below you can see a flow chart (Fig. 5) that you can
use to help choose the appropriate statistical test. So, to
summarise, in this scenario, there is one IV, type of exer-
cise programme, which has two levels, the new and stan-
dard exercises. The level of measurement of the DV, pain,
is in this instance being measured at an interval/ratio level
of measurement (and we will assume normality), and there
are two groups of different participants; therefore, these
will be considered independent groups. Therefore, follow-
ing the flow chart (Fig. 5), the most appropriate statistical
test to use in this instance is the independent samples
t-test.
Box 5. Clinical scenario for an experimental study with one indepen-
dent variable with two levels
Scenario: in adults with chronic back pain (P), is a new
exercise regime (I) more effective than standard exercises
(C) for reducing severity of pain (O)?
Subject gp 1 – new exercise regime
Subject gp 2 – standard exercises
Research design = randomised control trial (RCT)
H0 = there is no difference in mean pain reduction between
the two exercise programmes
H1 = the mean reduction in pain score in the new exercise
group is greater than the standard exercise group
IV = type of treatment with two levels (new and standard);
different groups of participants (i.e. independent measures)
DV = pain
Levels of measurement = interval/ratio
Is it normally distributed? Yes
So if you follow the flow chart (Fig. 5), this would mean you
would be using the independent measures t-test
Let us now consider a slightly different scenario. You
now want to evaluate whether adding another new exer-
cise programme is more effective than the other two pro-
grammes. So if we consider the low back pain scenario
with the third exercise programme, once again the
researcher is looking for differences, so this suggests that
the study is experimental, and there are now three condi-
tions, two experimental ones and the standard exercises.
This suggests that the research design is therefore
experimental and using different subjects in each group,
that is, independent groups. So if we refer to the flow
chart in Fig. 6, this time we can see that there is one IV,
type of treatment, with three levels – the three different
exercise programmes. The level of measurement of pain
(as measured using a 10-cm VAS) is ratio level (and we
will assume normally distributed), and the measures are
independent (as the subjects only take part in one exer-
cise programme). So if we follow the flow chart above,
the most appropriate test in this instance is a between-
subject one-way analysis of variance (ANOVA; Box 6 and
Fig. 6).
© 2013 John Wiley & Sons Ltd
Journal of Clinical Nursing 7
Discursive paper Selecting the appropriate inferential statistical test

Box 6. Clinical scenario for an experimental study with one IV with
three levels
Scenario: in adults with chronic back pain (P), is there a
difference between two new exercise programmes as
compared to standard exercises (I & C) for reducing the
severity of pain (O)?
Subject gp 1 – new exercise regime 1
Subject gp 2 – new exercise regime 2
Subject gp 3 – standard exercise regime
Research design = RCT
H0 = there is no difference in mean pain reduction between
the three exercise programmes
H1 = the mean reduction in pain scores is greater in the new
regimes than in the standard
IV = type of treatment with three levels and different groups
of participants (i.e. independent measures)
DV = pain
Levels of measurement = interval/ratio
Is it normally distributed?
Most appropriate statistical test – between-subjects one-way
analysis of variance (ANOVA)
In another clinical scenario, let us now consider that you
would like to know whether the decrease in pain is main-
tained in the long term. So you decide to test the patients
again after six months and one year. How would this change
the inferential test used? In this scenario, therefore, you now
have two IVs, the type of treatment (with three levels for each
of the exercise programmes), and the second IV is the effect
of time (i.e. Are there any differences in the outcomes mea-
sures immediately after treatment, at six months and at one
year?). So this means you will be repeating the measurements
at these time intervals. Use the flow chart (Fig. 7) to go
through the scenario below (Box 7).
If the two IVs measured are, however, at a nominal level,
for instance gender (male or female) and smoking status
(Do you smoke? yes/no), then the most appropriate test to
use here is the chi-squared test for independence/association
(see Fig. 7).
Examples of scenarios evaluating patterns or
relationships
Two patient scenarios evaluating patterns or relationships
between two different variables are discussed below:
Scenario 1: Is there any association between age and
recovery time following spinal surgery such that the
older the patient, the longer the recovery time (Box 8)?
Scenario 2: Is there any relationship between obesity and
the incidence of patients with type 2 diabetes? (same as
Box 8).
Box 7. Clinical scenario for an experimental study with two IVs (treat-
ment and time) with three levels each (the three different treatments
and three measurement times)
Scenario: in adults with chronic back pain (P), is there a
difference between two new exercise programmes as
compared to standard exercises (I & C) for reducing the
severity of pain (O) after one month, six months and one
year?
Subject gp 1 – new exercise regime 1
Subject gp 2 – new exercise regime 2
Subject gp 3 – standard exercise regime
Research design = RCT
H0 = there is no difference between the three exercise
programmes in mean reduction in pain at the three
time points.
H1 = the mean reduction in pain scores is greater in the new
regimes than in the standard at the three time points
IV = there are two IVs. The type of treatment has three
levels and TIME has three repeated levels. There are
different groups of participants (i.e. independent measures)
in the different treatments. However, the same
participants will be measured repeatedly, before and
immediately after treatment, at six months and one year
after treatment
DV and level of measurement = pain (ratio) and time (ratio)
– time (here the level of measurement is at least interval,
and these are treated like ratio data for the purposes of
selecting statistical tests)
Statistical test – as one IV is an independent measure (three
different treatment groups) and one IV is repeated measure
(time), the most appropriate test is a two-way mixed-
measures ANOVA
Box 8. Clinical scenario 2 for a study with a correlation design
Scenario: is there any association between age and recovery
time following spinal surgery such that the older the
patient, the longer the recovery time?
One group of patients with varying ages from
10–70 years
Research design = correlational design
H0 = there is no association between age and recovery time
following spinal surgery
H1 = there is an association between age and recovery time
following spinal surgery such that the older the patient, the
longer the recovery time Or
H1 = recovery time following spinal surgery increases with
age
Two variables: age (ratio) and recovery time (measured in
days, so this is ratio)
Statistical test – as both variables are ratio and normally
distributed, the most appropriate test would be a Pearson’s
correlation
© 2013 John Wiley & Sons Ltd
8 Journal of Clinical Nursing
J Bettany-Saltikov and VJ Whittaker

If you now look at the two scenarios above, you will
notice that both scenarios are looking for patterns or
relationships; however, the levels of measurement for both
variables for scenario 1 are interval/ratio level (time and
age), so Pearson’s correlation test can be used, but those for
scenario 2 are not so clear and are very much dependent on
how ‘obesity’ and ‘incidence of type 2 diabetes’ will be mea-
sured. The level of measurement for the ‘incidence of diabe-
tes’ is quite straightforward as they are numbers and are
therefore ratio level. However, the test used for the second
Tests of differences
One independent variable (IV) with 2 levels
Two of levels of IV
Independentmeasures
Type of IV
Level of measurement of DV
Interval/Ratio (parametric)
Mann–whitney U test
Wilcoxon signedrank test
Ordinal (nonparametric)
Independentmeasures t-test
If assumptions of normality are not met –treat as ordinal
Type of IV
Paired samplest-test
Repeatedmeasures
Independentmeasures
Repeatedmeasures
Figure 5 Flow chart to use for experimental studies with one independent variable with two levels (or groups).
Tests of differences
withOne independent variable (IV) 3 or more levels
Independent measures
Type of IV
Repeatedmeasures
Level of measurement of DV
Interval/Ratio (parametric)
Kruskal–Wallis
Ordinal (nonparametric)
Between subjects one-
way ANOVA
Within subjects one-
way ANOVA
Nominal Cochrane’s Q
If assumptions of normality are not met for interval/ratio data then treat as ordinal
Type of IV
Independentmeasures
Repeatedmeasures
Friedmantest
Figure 6 Flow chart to use for experimental studies with one independent variable with three levels (or groups).
© 2013 John Wiley & Sons Ltd
Journal of Clinical Nursing 9
Discursive paper Selecting the appropriate inferential statistical test

scenario depends on how you intend to measure the level of
obesity. If you measured obesity at a nominal level (i.e. you
categorised them into two groups, obese or not obese) as
you see from the flow chart below, the best test would now
be a point bi-serial Pearson’s correlation (Fig. 8). If, on the
other hand, you measured obesity on a scale of not obese, a
little obese and very obese, that is on an ordinal scale, then
the most appropriate test would be the Spearman’s correla-
tion (Fig. 8).
Statistical decisions
Once you have carried out the statistical analysis, what do
you do next? At this point, you can either reject or fail to
reject the null hypothesis. Rejecting the null hypothesis sug-
gests that there is a relationship between the variables as
predicted by H1. If you do not reject the null hypothesis
(i.e. you accept it), this suggests that no difference exists.
This decision is based on probability (alpha). This is the
statistical decision criterion that is usually set to small
values (0�05 or 0�01; Hicks 2009).
However, it is very important to bear in mind that there
is always a chance for error in your decision. There are two
main errors you can make during hypothesis testing: a type
1 error and type 2 error (Polgar and Thomas 2000). A type
1 error (or alpha error) is also called the false-positive or
the false alarm. In this case, the treatment may not work
and you report it did. This commonly occurs, if, for exam-
ple, you have chosen the wrong statistical test, and instead
of using one statistical test, such as a two-way analysis of
variance, with repeated measures, you used multiple t-tests
unnecessarily. In this scenario, the chance of a type 1 error
is quite high because you have used too many statistical
tests (The more tests you carry out, the more likely you are
to find a significant result by chance).
A type 2 (or beta error – remember beta is the second letter
in Greek alphabet) is also sometimes called ‘The lost Oppor-
tunity’. In this scenario, the treatment may be effective, but
you report it did not work. It is similar to winning lottery
and not collecting money. This type of error is very common
in student projects where not enough participants may have
participated in the research study. This will result in the
researcher not finding a difference between two groups not
because there really is no difference, but because not enough
participants were used. To try and eliminate the chances of
this happening, it is crucial to conduct a sample size calcula-
tion before you start a quantitative research study.
Statistical vs. clinical significance
Once you have the results of your statistical test(s), it is
important to interpret the results with caution. It is impor-
tant to consider the differences between statistical and
clinical significance. For instance, if having conducted your
test, you obtain a p-value of <0�05, this would imply that
there is a difference between your groups. However, if
you had a very large group, this may not be clinically
Both IVs areindependent
measures
Both IVs arerepeatedmeasures
One IV is repeatedmeasures and
other isindependent
measures
Two-wayindependent
measures ANOVA
Two-waymixed
measuresANOVA
Two-way repeatedmeasures ANOVA
Tests of differences
Two independent variables
Both variables nominal Chi-square testFor independence/association
Note: ideally ANOVA requirethe DV to be at least intervallevel of measurement
This flowchart above assumes normality of the dependent variable
Figure 7 Flow chart for use with two independent variables.
Tests to assess relationships between two variables depend
on the level of measurement of the two variables
If both variables areinterval/ratio
Pearson correlation Spearman correlation
If one variable isinterval/ratio and the other
is ordinal OR both variablesare ordinal
If one variable isinterval/ratio and the other
is nominal with 2 levels
Point Bi-serial (Pearson)correlation
If both variables arenominal
Cramer’s v
Figure 8 Flow chart for use with correlational designs.
© 2013 John Wiley & Sons Ltd
10 Journal of Clinical Nursing
J Bettany-Saltikov and VJ Whittaker

significant. Statistical significance means that the observed
mean differences are not likely due to sampling error. It is
possible to obtain statistical significance, even with very
small population differences, if the sample size is large
enough.
Clinical significance, on the other hand, looks at whether
the difference is large enough to be of value in a practical
clinical sense. Let us consider a simple example. As a
primary care nurse, you are conducting a research study to
assess whether a new medication to help patients lose
weight is better than the current medication being used. So
you go ahead and recruit more than 1000 patients to con-
duct an RCT, with one group of patients receiving the stan-
dard medication and the second group of patients receiving
the new medication. The results show that the new medica-
tion lowered the patients’ weight by 3 lbs more than the
standard medication over a period of six months, and this
value was statistically significant. However, a difference of
3 lbs in weight over a six-month period, in clinical terms, is
hardly of any significance at all.
Conclusions
Inferential statistics are used to establish differences or rela-
tionships between variables that can be generalised from the
sample to the target population. This paper has discussed the
issues that need to be considered for selecting the most
appropriate inferential statistical test(s) to use for a quantita-
tive research study. A number of clinical scenarios and flow
charts were provided to illustrate and aid the decision.
Relevance to clinical practice
When nursing clinicians and researchers conduct primary
quantitative research studies, it is crucial that the most
appropriate statistical test is selected to enable valid conclu-
sions to be made.
Contributions
Manuscript preparation: JB-S, VJW.
References
Bowers D (2008) Medical Statistics from
Scratch: An Introduction, 2nd edn.
Wiley and Son, East Sussex.
Bowling A (2009) Research Methods in
Health: Investigating Health and
Health Services, 3rd edn. Open Uni-
versity Press, Buckingham.
Bryan A (2008) Social ResearchMethods, 3rd
edn.Oxford University Press, Oxford.
Clegg F (1983) Simple Statistics: A Course
Book for the Social Sciences. Cam-
bridge University Press, Cambridge.
Denscombe M (2002) Ground Rules for
Good Research: A 10 Point Guide for
Social Researchers. Open University
Press, Buckingham.
Field A (2009) Discovering Statistics Using
SPSS, 3rd edn. Sage Publications,
London.
Flemming k (1998) Asking answerable
questions. Evidence-based Nursing 1,
36–37.
Hicks C (2009) Research Methods for
Clinical Therapists: Applied Project
Design and Analysis, 5th edn. Chur-
chill Livingstone, Edinburgh.
Hopkins W (2008) Sports Science.
Available at: http://www.sportsci.org/
2008/index.html (accessed 7 January
2013).
Khan KS, Kunz R, Kleijnen J & Antes G
(2003) Five steps to conducting a sys-
tematic review. Journal of the Royal
Society of Medicine 96, 118–121.
Plichta S & Kelvin E (2013) Munro’s
Statistical Methods for Health Care
Research, 6th edn. Williams and
Wilkins, Walters-Kluwer and Philadel-
phia, PA.
Polgar S (2008) Introduction to Research
in the Health Science, 5th edn.
Churchill Livingstone Elsevier, Edin-
burgh.
Polgar S & Thomas SA (2000) Introduc-
tion to Research in the Health Sci-
ences, 5th edn. Churchill Livingstone
Elsevier, Edinburgh.
Salkind N (2010) Statistics for People Who
(Think They) Hate Statistics, 4th edn.
Sage, London.
Watson R, Atkinson I & Egerton P (2006)
Successful Statistics for Nursing &
Healthcare. Palgrave Macmillan,
Houndmills.
© 2013 John Wiley & Sons Ltd
Journal of Clinical Nursing 11
Discursive paper Selecting the appropriate inferential statistical test

The Journal of Clinical Nursing (JCN) is an international, peer reviewed journal that aims to promote a high standard of
clinically related scholarship which supports the practice and discipline of nursing.
For further information and full author guidelines, please visit JCN on the Wiley Online Library website: http://
wileyonlinelibrary.com/journal/jocn
Reasons to submit your paper to JCN:High-impact forum: one of the world’s most cited nursing journals, with an impact factor of 1�316 – ranked 21/101
(Nursing (Social Science)) and 25/103 Nursing (Science) in the 2012 Journal Citation Reports� (Thomson Reuters,
2012).
One of the most read nursing journals in the world: over 1�9 million full text accesses in 2011 and accessible in over
8000 libraries worldwide (including over 3500 in developing countries with free or low cost access).
Early View: fully citable online publication ahead of inclusion in an issue.
Fast and easy online submission: online submission at http://mc.manuscriptcentral.com/jcnur.
Positive publishing experience: rapid double-blind peer review with constructive feedback.
Online Open: the option to make your article freely and openly accessible to nonsubscribers upon publication in Wiley
Online Library, as well as the option to deposit the article in your preferred archive.
© 2013 John Wiley & Sons Ltd
12 Journal of Clinical Nursing
J Bettany-Saltikov and VJ Whittaker
Copyright © 2022 FDOKUMEN