Intuition Versus Analysis- Which Process is Most Appropriate ...
Upload
khangminh22Category
view
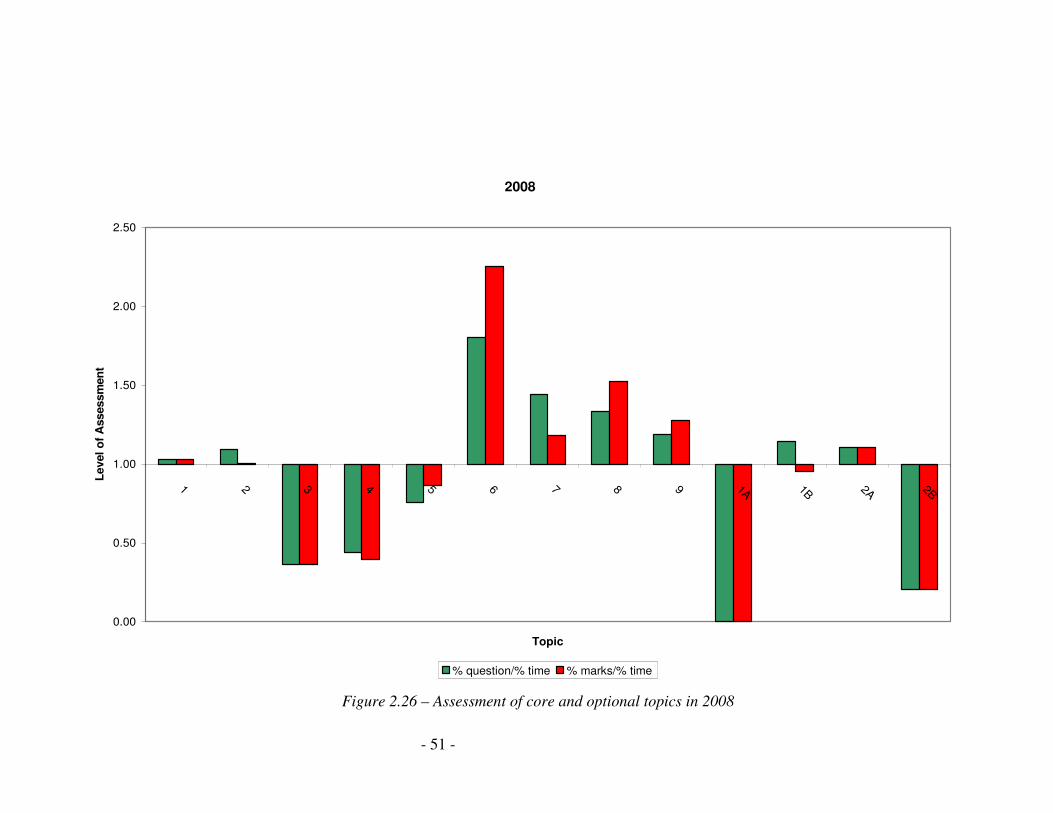
0download
0
i
QUESTIONING FOR APPROPRIATE
ASSESSMENT AND LEARNING
By
Edel Brid McCrudden BScEd. (Hons)
A thesis submitted to Dublin City University for the degree of
MASTERS OF SCIENCE
This work was carried out under the supervision of Dr Odilla E. Finlayson,
School of Chemical Sciences, Dublin City University.
September 2008
ii
Authors Declaration
I hereby certify that this material, which I now submit for assessment on the programme of
study leading to the award of Masters of Science (CHPM2) is entirely my own work, that I
have exercised reasonable care to ensure that the work is original, and does not to the best
of my knowledge breach any law of copyright, and has not been taken from the work of
others save and to the extent that such work has been cited and acknowledged within the
text of my work.
Signed: _____________________
(Candidate) ID No.: 52025795
Date: ______________________
iii
Dedication
This thesis is dedicated to my family; parents, Ben and Kathleen McCrudden, sisters,
Emma and Claire and brother, Matthew.
iv
Acknowledgements
The author wishes to express her gratitude to the following:
� My supervisor Dr Odilla E Finlayson for her direction, support and encouragement
throughout the course of this research and for offering the opportunity to conduct
this study.
� Caroline McKenna, Susanna Farrell, Erin Losty, Nadia Coburn, Ciaran Dolan,
Lorraine McCormack, James Lovatt, Thomas Wemyss and David Smith for their
encouragement, guidance and support throughout my two years of research in
Dublin City University.
� Patrick O’Malley and John McLoughlin for their advice and guidance.
� The staff and students of the School of Chemical Sciences in Dublin City University
for their cooperation throughout the course of this research.
� Martin Hynes and IRCSET/embark Initiative for providing the sponsorship
necessary to complete my research.
v
Abstract
Assessment methods/formats have come to the forefront of issues concerning
educationalists in the last few decades as they began to question established methods. These
questions were mainly concerned with the understanding that was being assessed of
students and what results were telling educators about the way in which their students were
engaging with chemistry material. All assessment formats have been grouped essentially
into two types: summative and formative assessment. Summative assessment is concerned
with an end of term/module assessment which examines students understanding of
information/concepts covered during the course of a topic. This provides teachers/lecturers
with a grade to award students based on a single examination.
This study has investigated three forms of assessment: the summative assessment
employed at Leaving Certificate level for Chemistry and the formative assessment methods
used in two chemistry modules in Dublin City University. This study is divided into four
separate chapters, dealing with the aforementioned studies conducted and a the first chapter
dealing with comprehensive literature review on assessment formats, question styles and
technology employed in this study.
For the second chapter analysis was performed on the current Leaving Certificate
Chemistry Curriculum (implemented in 2000, first examined in 2002) and the examinations
completed by students at Higher Level since 2000. One method of analysis performed
utilised Blooms Taxonomy to identify the level of questioning used at Leaving Certificate
Level. Results have shown that the majority percentage of questions employed at Higher
Level are of the lower order identified by Bloom, with little or no questions of the higher
orders, such as analysis, synthesis and evaluation questions being identified. Further
analysis performed have shown that there is a lack of assessment of students understanding
of some core/sub topics, while others are over assessed, in comparison to the number of
classes allocated to them in the Chemistry curriculum.
The third chapter has investigated the implementation of a continuous assessment
element into a physical chemistry module for second year undergraduate chemistry
students. This study employed the use of an electronic assessment tool to encourage student
engagement with lecture material. Results have shown that the continuous assessment
element has successfully identified problem areas in chemical kinetics and thermodynamics
which requires more focus and explanation on the part of the lecturer. Results have shown
vi
that students displayed a lack of engagement with lecture material and also student surveys
have supported these findings. Data has shown however that students enjoyed the use of
these electronic assessment tools and began to take a more active role in their learning
towards the end of the module as they used the CA elements in their revision for the end of
module examination.
The fourth and final chapter deals with the formative assessment introduced into a
practical laboratory session through the use of pre and post laboratory tasks for first year
undergraduate chemistry students. In this study a VLE was used to host a series of pre
laboratory quizzes and post laboratory activities which aimed to help encourage
engagement with laboratory material out of the practical session. The pre laboratory
quizzes were designed to help prepare students for their practical session. The post
laboratory questions were designed to assess students’ understanding through the
application and analysis of concepts covered within the practical session. Results have
shown that the use of pre and post laboratory sessions has engaged students outside of the
practical session and that students feel readily prepared for their practical upon completion
of the pre - laboratory quiz. However students displayed a lack of engagement with
chemical concepts in the majority of the completed chemistry laboratories and have
admitted to finding the post - laboratory questions employed particularly challenging.
Those laboratories which did show an increase in student engagement with chemical
concepts, have displayed a large degree of linkage between the elements of the concept
questioned on both pre and post laboratory tasks.
This study has highlighted that regardless of the assessment method employed at
either second or third level, the information that is provided by formative assessment can be
appropriately utilised to ensure that students engage with chemical content. The most
important conclusion which has been made in relation to all of the assessments analysed is
the importance of appropriate question use. In order to assess student understanding of a
chemical concept or completion of learning outcomes/objectives, educators must ensure
that the questions employed are challenging but doable for all students, no matter what their
chemical background and that the information provided by student attempts will help to
identify problem areas for the entire cohort of students.
vii
Table of Contents
Page
Abstract…………………………………………………………………………….. v
Table of Contents…………………………………………………………………... vii
Chapter 1 Assessment – an overview
Page
Assessment………..………………………………………..……………………… 2
References……………………………………………………………………….... 9
Chapter 2 Leaving Certificate Chemistry - Analysis of examination in relation to
the curriculum.
2.1 Introduction…...…………..………………………………………………… 11
2.1.1 Established Leaving Certificate Chemistry Examination…………………….. 12
2.1.2 Use of Blooms Taxonomy………………………………………………… 19
2.2 Methodology…………………………………………………………………... 22
2.2.1 Identification of question types and marks allocated………………………... 22
2.2.2 Questions and marks per core topics/sub topics…………………….............. 26
2.3 Results and discussion……………………………………………………… 32
2.3.1 Application of Blooms Taxonomy: questions and marks………………...... 33
2.3.2 Questions and marks allocated to topics/sub topics……………………… 44
2.3.2.1 Core topic analysis….…………………………………………………… 44
2.3.2.2 Sub topic analysis….………………………………………………… 56
2.3.3 Meeting the curriculum objectives………………………………………… 70
2.4 Conclusion…………………………………………………………………… 73
References…………………………………………………………………………. 77
viii
Chapter 3 Use of Classroom Response Systems a method of formative assessment
to encourage student engagement.
Page
3.1 Introduction………..…………………………………………………………… 79
3.1.1 Classroom Response Systems….………………………………………… 79
3.1.2 Multiple Choice Questions…………………………………………………. 83
3.2 Methodology……………………………………………………………… 86
3.3 Results and discussion…………………………………………………… 89
3.3.1 Students Mathematical Assessment……………………………………… 89
3.3.2 Overall Chemical Kinetics Assessment…………………………………… 92
3.3.3 Overall Thermodynamic Assessment……………………………………... 97
3.3.4 Student attempts on graphical interpretation questions…………………… 101
3.3.5 Student opinions…………………………………………………………… 103
3.4 Conclusion……………………………………………………………………. 107
References…………………………………………………………………… 110
Chapter 4 The use of pre and post laboratory tasks to maximise students’
laboratory experience an example of formative assessment
Page
4.1 Introduction……..………………………………………………………….... 113
4.1.1 Laboratory Work………….………………………………………………. 113
4.1.2 Pre and Post Laboratory Assignments............................................................. 116
4.1.3 Online Assessment……………………………………………………….. 120
4.2 Methodology………….………………………………………………………. 123
4.3 Results and discussion……………………………………………………...... 127
4.3.1 Students performance in pre and post laboratories……………………… 127
4.3.2 Correlation of overall pre and post laboratory results…………………... 138
4.3.3 Students pre and post laboratory task and prior chemistry experience….. 140
4.3.4 Student survey results – pre and post laboratory opinions……………… 149
4.3 Conclusion…………………………………………………………………. 154
References……………………………………………………………………… 157
ix
Appendices Page
Appendix A Leaving Certificate Chemistry Analysis……………………….. 159
Appendix B Questions employed in Module CS201………………………... 173
Appendix C Pre and Post Laboratory Tasks for semester 1 and 2………….. 184
Appendix D Conference Abstracts and Poster……………………………… 207

x
1
Chapter 1
Assessment – an overview

2
Assessment
The term assessment is often interlinked or confused with evaluation. Assessment is
understood as the collection of data about a learner’s understanding while evaluation is the
passing of judgment on the learner’s understanding based on the data collected through
assessment1. Evaluation is a necessary part of the educational process but appropriate
evaluation requires good assessment strategies and tools. It has been highlighted that
further work is required on the evaluation of the accuracy and precision of data collected
through assessment is required1. While the reliability and validity of education assessments
can be established through statistical analysis2, the purpose of assessment is to collect high
quality data about students’ competency in an area. This leads to the inevitable question
“what are the educators trying to assess?”
Assessment when appropriately used can provide information to3:
• Students, about the extent of their learning and possibilities for success in future
courses;
• Teachers, about the extent to which their teaching practices are facilitating student
learning, and how they might make modifications to those practices;
• Administrations and other stakeholders, about course design, program effectiveness
and what students are able to do as they complete a program.
While a great deal of discussion has occurred concerning what content should be taught and
how this content should be taught4, it is only in the recent decade that the area of assessing
what we are assessing has come to the forefront.
One of the recommendations made by Bodner et al.5 stated that “the methods we use for
assessing our students and our teaching must change so that it no longer focuses on the
lowest levels of learning and must provide us with the insight into our methods and our
tools that we need to drive change.”
3
Assessment has now moved to the heart of considerations of teaching and learning and is
back, centre-stage and is of widespread interest and concern6. It is impossible to ignore
assessment issues as they can aid or inhibit our endeavors in improving teaching and
learning. Learning is often concerned with elements of input and output. While inputs
include teachers, students and others involved in education along with rules, curricula,
syllabi, standards and points/grade requirements, the outputs of successful learning are
satisfied and fulfilled students, better test results and content teachers. It is also expected
that students will be more knowledgeable about the studied topic and it is through
assessment that a students’ understanding is ascertained.
Assessment generally drives learning. It is essential that the correct assessment is selected
for each individual circumstance as poorly designed or badly constructed assessment can
have a more detrimental effect on a student than the teaching employed during the
completion of a course/module7. If assessment methods are not employed effectively good
learning will not be promoted, and also a concern has been raised that some grading
methods used promote unhealthy competition within class groups rather than personal
development. During the construction and development of assessment, educators need to
ensure that they keep in mind the purpose of their assessment and what information the
assessment will provide them with.
While Black and Wiliam7 defined assessment broadly to include all activities which
educators and students undertake to obtain information that can be used diagnostically to
alter teaching and learning, it was Scriven8 who made the distinction between formative
and summative assessment methods.
Assessment is an integral part of effective learning whereby students are provided with
comments on their progress9. However, this is not a characteristic of summative
assessment. Summative assessment encompasses any assessments occurring after the
learning has taken place, such as end-of-year examinations or projects that are graded to
make a judgement about the extent and quality of learning that has been demonstrated10
.
Summative assessment has been distinctly associated with determining the extent to which
a student has achieved a curricular objective11
. Summative assessment does not allow

4
reflective practice on the part of either the educator or the student. The student cannot
assess how well their study practices have succeeded for them, while the teachers cannot
determine how well their teaching methodologies employed have engaged their students11
.
The characteristics of summative assessment 12
are that it:
• Takes place at certain intervals when achievement has to be reported;
• Relates to progression in learning against state or national curricula;
• Allows for the results of different pupils to be compared for various purposes
because they are based on the same criteria;
• Requires methods which are as reliable as possible without endangering validity;
• Involves some quality assurance procedures;
• Should be made on evidence from the full range of performance relevant to the
criteria being used.
The summative assessment format employed at both Leaving Certificate in Ireland and at
A-level in the UK provides information to potential future employers and also to third level
establishments as to the grade a candidate achieved in this summative assessment13
.
However this form of assessment, in contrast to the last point made by Harlen and James13
above, provides no distinction between students’ strengths and weaknesses in a given
subject but rather their performance or overall grade for a select amount of content.
Formative assessment, however, encompasses teacher observation, classroom discussion
and analysis of student work including assignments and tests. While summative assessment
provides information at the end of a term or year of study as to a student’s performance on
a limited section of content, assessment becomes formative when the information is used to
adapt teaching and learning to meet students’ needs when applied at a number of stages or
at the end of a topic.
5
Formative assessment is effective in virtually all educational settings, content areas,
knowledge and skill types, and levels of education14
. The research conducted by Black and
Wiliam7 indicated that grades and marks do not deliver as much formative information to a
student as do tailored comments and in some situations can be counterproductive,
particularly with learners of lower ability. This is a very interesting finding as the majority
of student assessments are graded and students may look to their grade only rather than
focussing on the comments.
Formative assessment helps to support the expectation that all students can learn to high
levels and counteracts the cycle in which students attribute poor performance to lack of
ability and therefore become discouraged and unwilling to invest in further learning15
. It is
a form of assessment that supports students in their learning. Black and Wiliam7 also
encourage educators to use questioning and classroom discussion as an opportunity to
increase their students’ knowledge and improve understanding. They caution that educators
need to make sure to ask thoughtful, reflective questions rather than simple factual ones and
then give their students adequate time to respond7. They suggest strategies such as:
• Inviting students to discuss their thinking about a question or topic in pairs or small
groups, then ask a representative to share the thinking with the larger groups;
• Presenting several possible answers to a question and ask students to vote on them;
• Asking all students to write down an answer then read a select few out loud.
Formative assessment is essentially feedback both to the educator and the student about
present understanding and skill development in order to determine the way forward.
Assessment for this purpose is part of teaching and learning: learning with understanding
depends on it.
Formative assessments are always made in relation to where students are in their learning in
terms of specific content or skills14
. The justification for this is that the individual
circumstances must be taken into account if the assessment is to help learning and to
encourage the learner.
6
The characteristics of formative assessment16
include:
• Positive in intent – it is directed towards promoting learning;
• Takes into account the progress of each individual, the effort put in and other
aspects of learning which may be unspecified in the curriculum;
• Takes into account several instances in which certain skills and ideas are used and
there will be inconsistencies as well as patterns in behaviour; with formative
assessment “errors” provide diagnostic information;
• Validity and usefulness are paramount in formative assessment and should take
priority over concerns for reliability;
• Formative assessment requires that students have a central part as they are required
to be active in their own learning.
The basis of formative assessment is that if students don’t come to understand their
strengths and weaknesses and how to deal with them, they will not make progress;
Tests and assignments can be used formatively if teachers analyse where students are in
their learning and provide specific, focused feedback regarding performance and ways to
improve it. For example, there is now a lot of literature on areas of chemistry that students
find difficult and even the misconceptions that students have of particular concepts, both at
2nd
and 3rd
level. Suitable assessments focussing on these areas of potential misconception
or difficulty could be of immense benefit to the student learner and teacher alike.
Black and Wiliam make the following recommendations7 for good use of formative
assessment:
• Frequent short tests are better than infrequent long ones;
• New learning should be tested within about a week of first exposure;
• Be mindful of the quality of test items and work with other teachers and outside
sources to collect good ones.
As stated earlier, feedback on assessment is crucial if a student is to benefit from it.
Feedback usually consists of reporting right or wrong answers to the students, where a
7
teacher tells a student if something is correct or incorrect. This form of feedback can be
automated though objective testing and a key to responses for students.
However if the feedback is set to be more informative there are various types that may be
employed such as the written form or oral statements which can be interpreted by students.
Educators sometimes take for granted that providing feedback to the learner about
performance will lead to self-assessment and improvement. Feedback must be expressed by
the teacher in language that is already known and understood by the learner15
. Students
must be informed as to how feedback should be interpreted and how to make connections
between their work and their feedback. It cannot be assumed that when students are “given
feedback” that they will know what to do with it.
As assessment is used to drive learning and also as a measure of learning, it is important to
have a good understanding of how particular assessments are constructed and conducted. In
this study, different assessments are analysed to determine the efficiency of each
assessment for its stated purpose along with relevant literature in these areas.
In Chapter 2, the Leaving Certificate examination in Chemistry is analysed in relation to
the stated aims and objectives of the curriculum. This is important as, as stated earlier,
assessment can drive learning, so if the assessment questions are related closely to the aims
and objectives, then the curriculum is successful. Detailed analysis of examination
questions that have appeared on the past nine years of Leaving Certificate examinations is
given in Chapter 2.
At 3rd
level, much of the current assessment is summative. Difficulties with the inclusion of
formative assessment methodologies are often due to large numbers of students, marking of
extensive examinations, transmission of grades from pen/paper to electronic methods etc.
In Chapter 3, the use of technology in the form of Personal Assessment Devices (PADs)
has been investigated with a focus on the development of appropriate questions for
formative assessment.
8
Within the subject area of chemistry, laboratory work is considered to be of great
importance. However, assessment of laboratory work is often reduced to marking of the
end of experiment/end of module laboratory reports. Again from the viewpoint of formative
assessment, this type of assessment has its flaws as it does not take account of a students’
prior knowledge, of their laboratory skills and it gives little scope for students to reflect on
the completion of their own work. Therefore in Chapter 4 we have included a form of
formative assessment in 1st year undergraduate chemistry laboratories in order to assess
both students’ prior and basic knowledge of chemistry before laboratory completion and
also their understanding of the concepts covered in each of the laboratory sessions in a post
laboratory task.
In both of these situations of formative assessment, it was hoped that by the use of these
formative assessment processes that it would encourage student engagement with lecture
material and help to promote independent learning.
9
References
1. Slavings, R., Cochran, N., and Bowen, C.W. (1997) The Chemical Educator, 2, 1.
2. Oosterhof, A. (1994) Classroom applications of Educational Measurement 2nd
Ed
Macmillan, New York
3. Doran, R.L, Lawrenz, F. and Helgeson, S. (1994) Handbook of Research on Science
Teaching and Learning, 388 – 442.
4. Lloya, B. A. (1994) New Directions for General Chemistry. ACS Division of
Chemical Education, Lancaster.
5. Bodner, G., Arena, S., Bhat, C., Kozlowski, A., Kozma, R., Lagowski, J., Pryde, L.,
Spencer, B., Williams, T., Zumbahl, S. (1994) Innovation and Change in the
Chemistry Curriculum, National Science Foundation, Washington DC. 10-12
6. Boud, D. (1995) Assessment for Learning in Higher Education. Knight, London, 35
– 48
7. Black, P. and Wiliam, D. (1988). Inside the black box; Raising standard through
classroom assessment. Assessment in Education, 80 (2), 139 – 148
8. Scriven, M. (1967) The methodology of evaluation. American Educational Research
Association Monograph. Rand McNally, Chicago.
9. Leung, C. F. (2000) International Journal of Technology and Design Education. 10,
149 – 161
10. Kelly, D. (2005) Do you know what your students are learning?
http://www.aishe.org/readings/2005 - 1/ [last accessed 30th July 2007]
11. Yorke, M. (2003) Higher Education 45, 477 – 501
12. Harlen, W. and James, M. (1997) Assessment in Education, 4(3), 365 – 379
13. Black, P. and Wiliam, D. (1998) Assessment in Education, 5(1), 7 – 74
14. Harlen, W. and James, M. (1997) Assessment and learning: differences and
relationships between formative and summative assessment. Assessment in
Education, 4(3), 365 – 379
15. Ames, C. (1992) Classrooms: Goals, structures and student motivation. Journal of
Educational Psychology, 84(3), 261 – 271
16. Sadler, D.R. (1998) Formative Assessment: revisiting the territory. Assessment in
Education, 5(1), 77 – 84
10
Chapter 2
Leaving Certificate Chemistry –
Analysis of examinations in relation
to the curriculum
11
2.1 Introduction
The Leaving Certificate Chemistry Examination is performed by Leaving Certificate
students of ages 17 to 18 years old, following two years of study. Students are expected to
have acquired, during the course of their studies, an understanding of core chemical topics
which will be assessed during their examination and to have fulfilled a series of stated
curriculum objectives.
In this Chapter, the Leaving Certificate examination in Chemistry is analysed in relation to
the stated aims and objectives of the curriculum. This is important as, as stated earlier,
assessment can drive learning, so if the assessment questions are related closely to the aims
and objectives, then the curriculum is successful. However, if the examination questions
are not closely aligned to the stated aims and objectives of the curriculum, then there is a
serious mismatch between the curriculum and the assessment. As the Leaving Certificate is
a summative assessment, any mismatch can have a detrimental effect on standards
achieved.
12
2.1.1 Established Leaving Certificate Chemistry Examination
In Ireland, chemistry is taught in the first three years of secondary education as part of a
science course for the Junior Certificate (ages 13-15). The curriculum consists of a core
component composed almost equally of Physics, Chemistry and Biology, and extensions,
of which Chemistry is one (other extensions are Biology, Physics and Applied Science).
The course is offered at both higher and ordinary levels.
At the senior cycle (ages 16-17), the Leaving Certificate is a two year course, and students
take seven subjects at the Leaving Certificate summative examination at the end of the two
years of study. Chemistry is one of five separate science subjects offered again at higher
and ordinary levels.
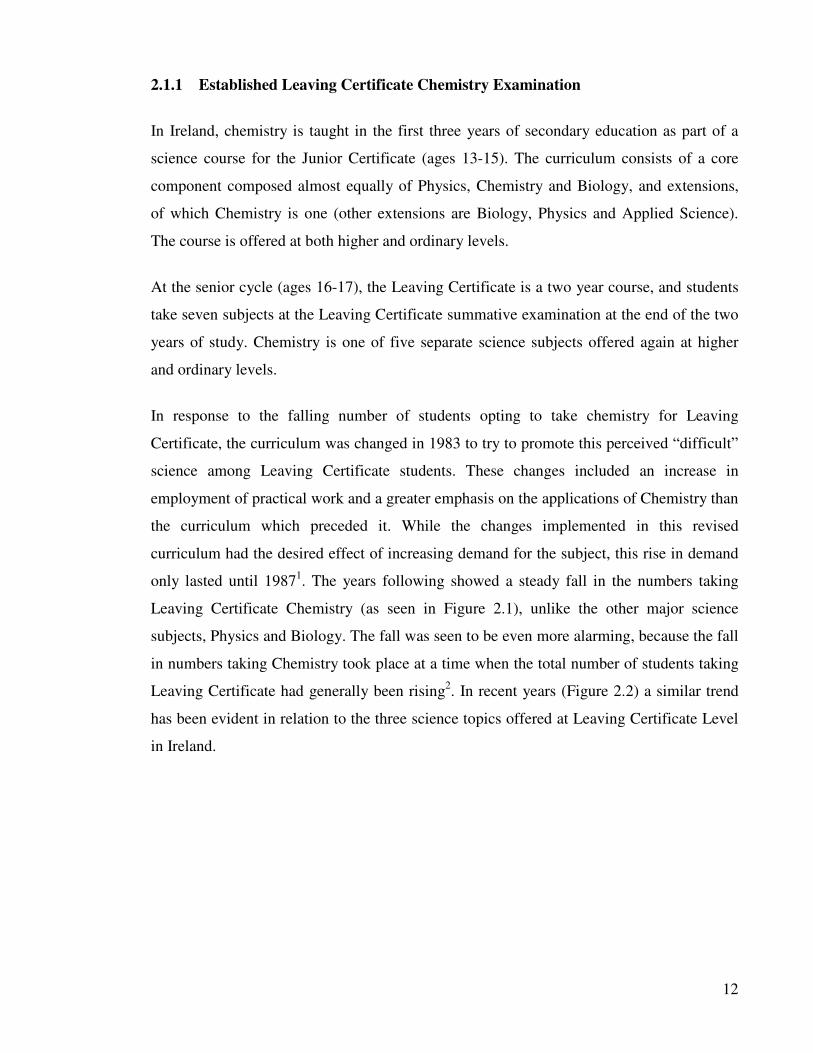
In response to the falling number of students opting to take chemistry for Leaving
Certificate, the curriculum was changed in 1983 to try to promote this perceived “difficult”
science among Leaving Certificate students. These changes included an increase in
employment of practical work and a greater emphasis on the applications of Chemistry than
the curriculum which preceded it. While the changes implemented in this revised
curriculum had the desired effect of increasing demand for the subject, this rise in demand
only lasted until 19871. The years following showed a steady fall in the numbers taking
Leaving Certificate Chemistry (as seen in Figure 2.1), unlike the other major science
subjects, Physics and Biology. The fall was seen to be even more alarming, because the fall
in numbers taking Chemistry took place at a time when the total number of students taking
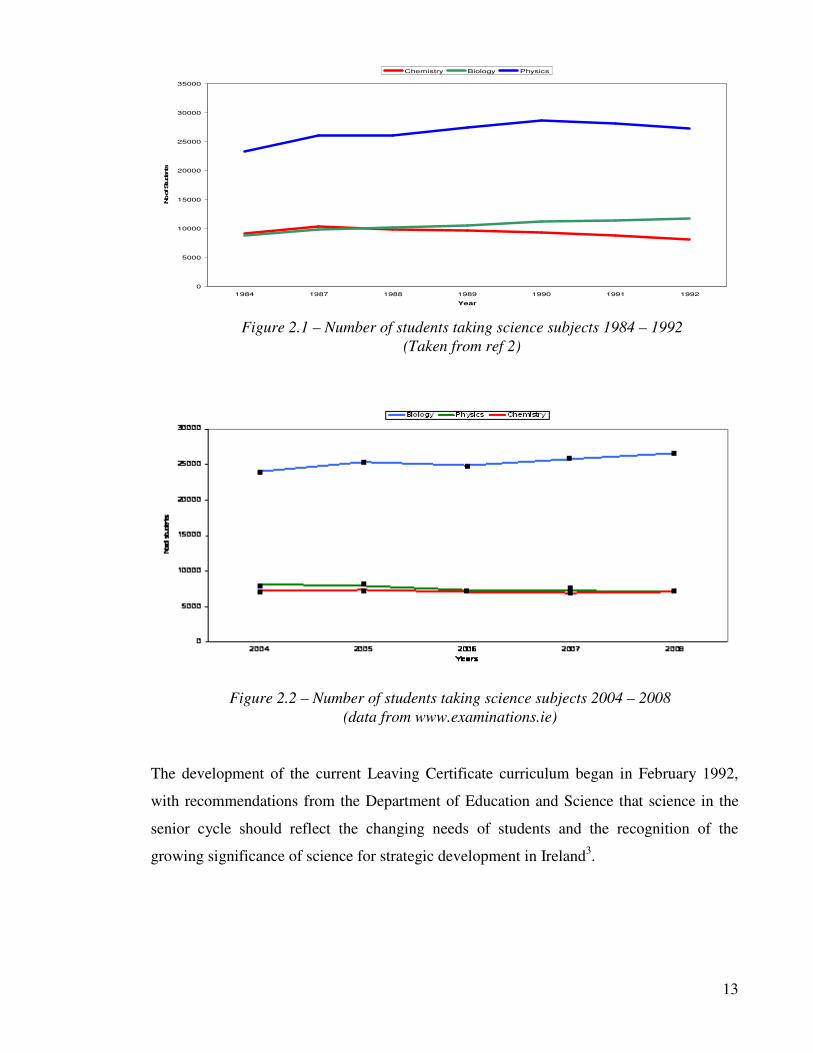
Leaving Certificate had generally been rising2. In recent years (Figure 2.2) a similar trend
has been evident in relation to the three science topics offered at Leaving Certificate Level
in Ireland.
13
0
5000
10000
15000
20000
25000
30000
35000
1984 1987 1988 1989 1990 1991 1992
Year
No o
f Stu
dents
Chemistry Biology Physics
The development of the current Leaving Certificate curriculum began in February 1992,
with recommendations from the Department of Education and Science that science in the
senior cycle should reflect the changing needs of students and the recognition of the
growing significance of science for strategic development in Ireland3.
Figure 2.1 – Number of students taking science subjects 1984 – 1992
(Taken from ref 2)
Figure 2.2 – Number of students taking science subjects 2004 – 2008
(data from www.examinations.ie)

14
The changes in comparison to the 1983 curriculum included4:
• An expanded curriculum, rather than the outline curriculum provided in 1983;
• Differently presented material with a new four column arrangement, see Figure 2.3
below;
• Division of the curriculum into two separate sections – higher level and ordinary
level (the 1983 curriculum presented both syllabi in one document);
• Alteration of several of the section headings in the 1983 curriculum with a
consequent rearrangement of the content;
• Elimination of some content of the curriculum;
• Restriction of the number of mandatory experiments to 28;
• Greater emphasis on social and applied aspects.
Figure 2.3 Example of revised curriculum lay out (those in bold are on HL only)

15
The current Leaving Certificate Chemistry Curriculum was implemented in 2000 with its
first examination in 20024 and was designed to incorporate the following components:
• Science for the enquiring mind, or pure science, to include the principles,
procedures and concepts of the subject as well as its cultural and historical aspects
(70%);
• Science for action, or the applications of science, and its interface with technology
(22.5%);
• Science which is concerned with issues – political, social and economic – of
concern to citizens (7.5%).
There is 30% of the new syllabus devoted to social and applied aspects, which is one of the
major changes to the revised curriculum combining the two areas ‘Science for Action’ and
‘Science which deals with issues of concern for students’. A study conducted in 2006
examined the inclusion of the social and applied aspects. This study5 investigated the
implementation of the Science, Technology and Society (STS) of the revised Chemistry
curriculum. This study revealed that this new inclusion in the revised 2000 curriculum was
not adequately reflected in either state examinations or textbooks. This study also revealed
that while the NCCA had stipulated that STS should have a 30% weighting in the
curriculum there was inadequate coverage in both the examination papers and textbooks in
relation to the STS inclusion.
16
Along with the aforementioned changes to the layout and content of the 1983 curriculum,
the 2000 curriculum has also revised its aims4:
• To stimulate and sustain students’ interest in, and enjoyment of, chemistry;
• To provide a relevant course for those students who will complete their study of
chemistry at this level;
• To provide a foundation course in chemistry for those students who will continue
their studies in chemistry or in related subjects;
• To encourage an appreciation of the scientific, social, economic, environmental and
technological aspects of chemistry and an understanding of the historical
development of chemistry;
• To illustrate generally how humanity has benefited from the study and practice of
chemistry;
• To develop an appreciation of scientific method and rational thought;
• To develop skills in laboratory procedures and techniques, carried out with due
regard for safety, together with the ability to assess the uses and limitations of these
procedures;
• To develop skills of observation, analysis, evaluation, communication and problem
solving.
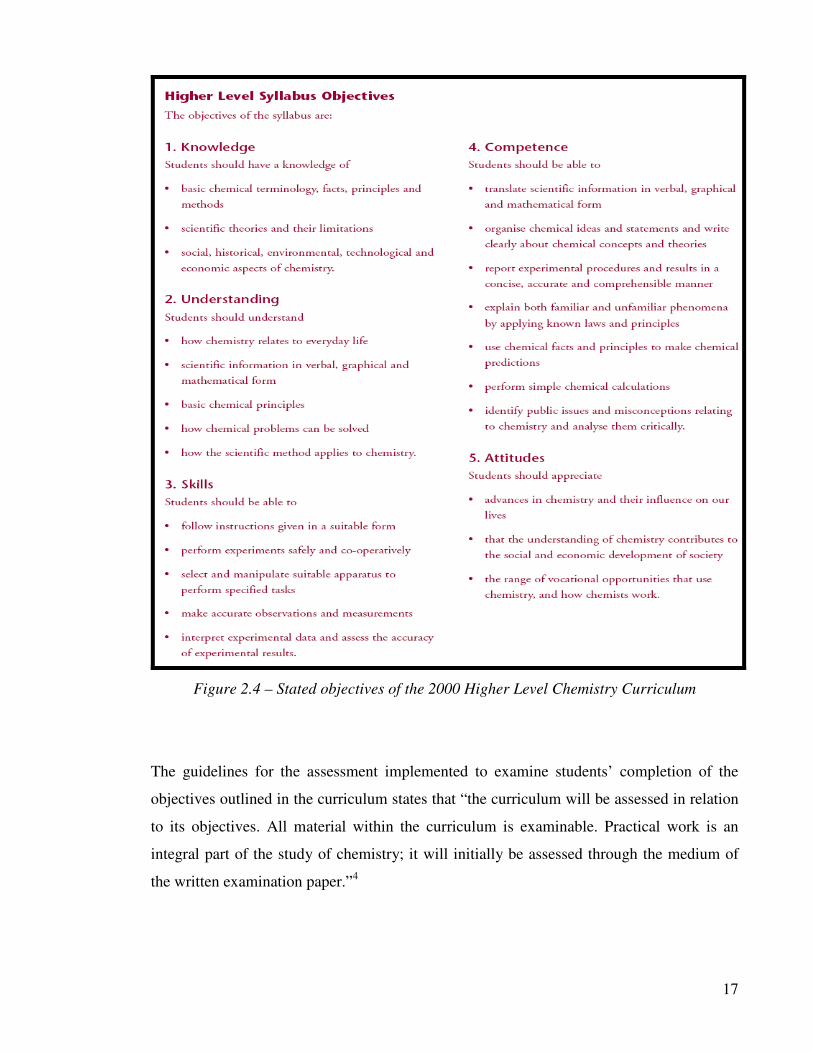
The 2000 curriculum also provided five core objectives as seen in Figure 2.4 for the Higher
Level Chemistry Course.
17
Figure 2.4 – Stated objectives of the 2000 Higher Level Chemistry Curriculum
The guidelines for the assessment implemented to examine students’ completion of the
objectives outlined in the curriculum states that “the curriculum will be assessed in relation
to its objectives. All material within the curriculum is examinable. Practical work is an
integral part of the study of chemistry; it will initially be assessed through the medium of
the written examination paper.”4
18
Still to date, eight years since the implementation of the 2000 curriculum, the only method
that has been employed by the Department of Science and Education to assess students’
skills and competence of practical laboratory work is through written examination. It must
be stated that this is currently under revision as it has been recognised that this is not the
best means of ascertaining students’ practical competence.
Written assessment may take many formats, however the type of questions asked in an
examination will guide the learning by the student. Assessment drives learning6, whether
summative or formative. Therefore in this study, we wished to determine if the questions
asked in the summative Leaving Certificate Chemistry paper are of the lower – order type
requiring mainly recall and memorisation to answer them or are of the higher – order
(synthesis and evaluation) type where students could show their level of knowledge of the
broad area of chemistry. Also, analysis has been carried out to ascertain how successfully
the stated objectives in Figure 2.4 have been assessed in the examination.
19
2.1.2 Use of Bloom’s Taxonomy
Any assessment implemented during the course of a module or school year aims to provide
feedback to teachers, students, future employers and/or colleges/universities about the
abilities that a student possess in order to fulfil a role or an employed position within
society6.
In order to ascertain the level of thinking that students have accomplished during the course
of their education, Bloom’s Taxonomy has been applied as a schematic which provides
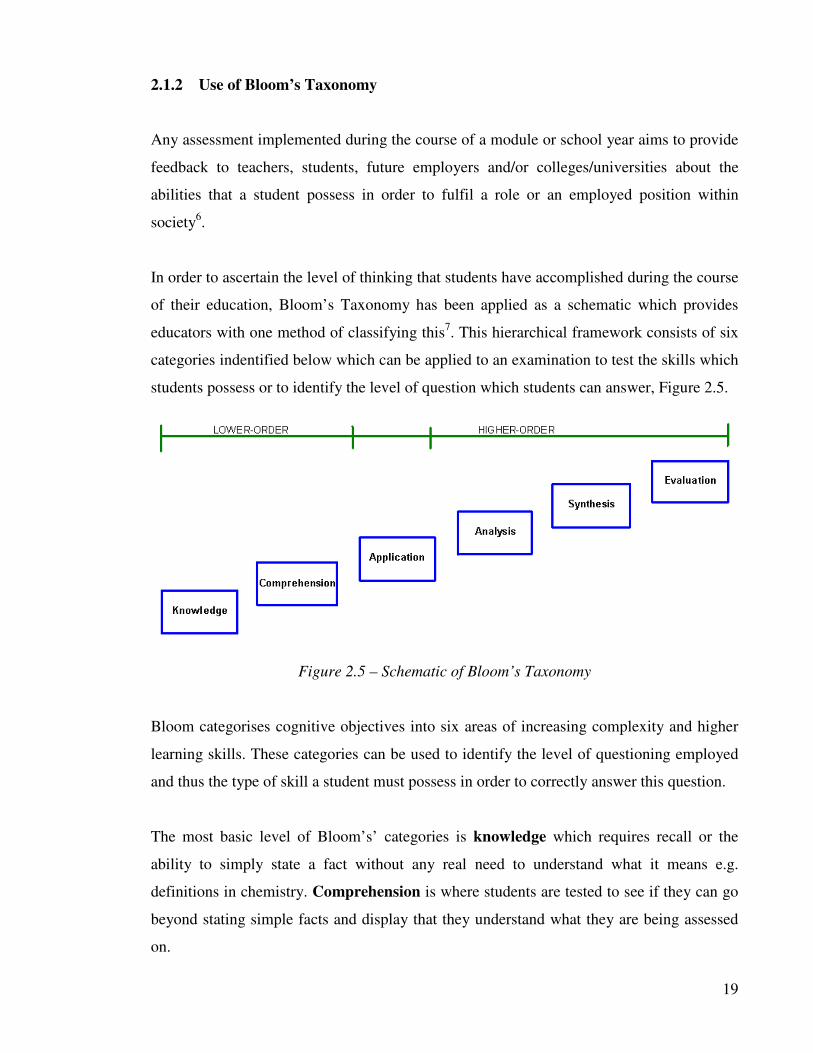
educators with one method of classifying this7. This hierarchical framework consists of six
categories indentified below which can be applied to an examination to test the skills which
students possess or to identify the level of question which students can answer, Figure 2.5.
Figure 2.5 – Schematic of Bloom’s Taxonomy
Bloom categorises cognitive objectives into six areas of increasing complexity and higher
learning skills. These categories can be used to identify the level of questioning employed
and thus the type of skill a student must possess in order to correctly answer this question.
The most basic level of Bloom’s’ categories is knowledge which requires recall or the
ability to simply state a fact without any real need to understand what it means e.g.
definitions in chemistry. Comprehension is where students are tested to see if they can go
beyond stating simple facts and display that they understand what they are being assessed
on.
20
Application is where students use their accumulated knowledge of concepts to solve
problems on an analytical basis. These three questioning types are grouped together as
lower order questions. These question types have tended to be the dominate form of
examination questions as they are easy to set, answer and grade8.
The three types of higher order questions require more critical thinking and skill by the
examination setter, student and marker. Analysis seeks to see if students break down a
complex idea into its basic components, evaluate them critically and formulate an answer.
Synthesis involves the student making predictions or seeking links between different ideas
and concepts. The final level of objective identified by Bloom is evaluation where the
students are required to make judgments about the quality of ideas or problem solutions. It
often seeks to see if students can give rational opinions or assessments on controversies that
can be justified by concrete evidence or factual information they have accumulated.
Bloom’s taxonomy has been applied in a number of educational situations including
applications represented by articles and websites describing corrosion training and medical
preparation9. In almost all circumstances when an instructor wishes to move a group of
students through a learning process utilising the organised framework Bloom’s taxonomy
has proven useful10
.
In one particular application11
, Bloom’s taxonomy was used to plan and deliver an
integrated English and history course. This taxonomy provided teachers with a new outlook
on assessment and enabled them to create assignments and projects that required students to
operate at more complex levels of thinking. Another application of Bloom’s taxonomy
allowed researchers to investigate the different types of questions emphasised in various
school curricula5 and in traditional nationally implemented curricula
12 such as that
examined in this study.
Bloom’s taxonomy has also been applied to the assessment of students’ practical skills in
the Leaving Certificate Chemistry course in Ireland. This study8 determined that the
questions employed to assess students’ practical skills showed only a very limited number
of areas were examined and at the lower level of Bloom’s Taxonomy.
21
However Bloom’s taxonomy is one of eleven classification systems which include those
proposed by Rosenshine, Dunkin and Biddle and Taba, Gallagher and Carner (as discussed
by Gall13
). It was proposed in the late sixties and also received criticism based on its
limitations13
. Gall states that “if a researcher is interested in more detailed descriptions
asked in a specific context, application of Bloom, Gallagher and Carner do not provide this
detail.”
Some of the limitations suggested by Gall include a cross over of the questioning terms that
are used to identify each of the cognitive levels. Due to this cross over some questions can
be open in interpretation to each educator which allows for some subjectivity when
categorising examination questions. It was suggested that this flaw would cause differences
in opinions as to which category certain questions belong to, which could lead to problems
when comparing results from different educators or studies.
Despite the limitations as stated by Gall above, it was decided that as a comparison /
diagnostic tool, the use of Bloom’s Taxonomy for this study was appropriate.
Bloom’s six categories of learning skills have been applied to nine years of Leaving
Certificate Higher Level Chemistry examination papers in order to identify the level of
questioning that has been employed during this summative examination and therefore the
level of thinking that is demanded of students completing these examinations.
22
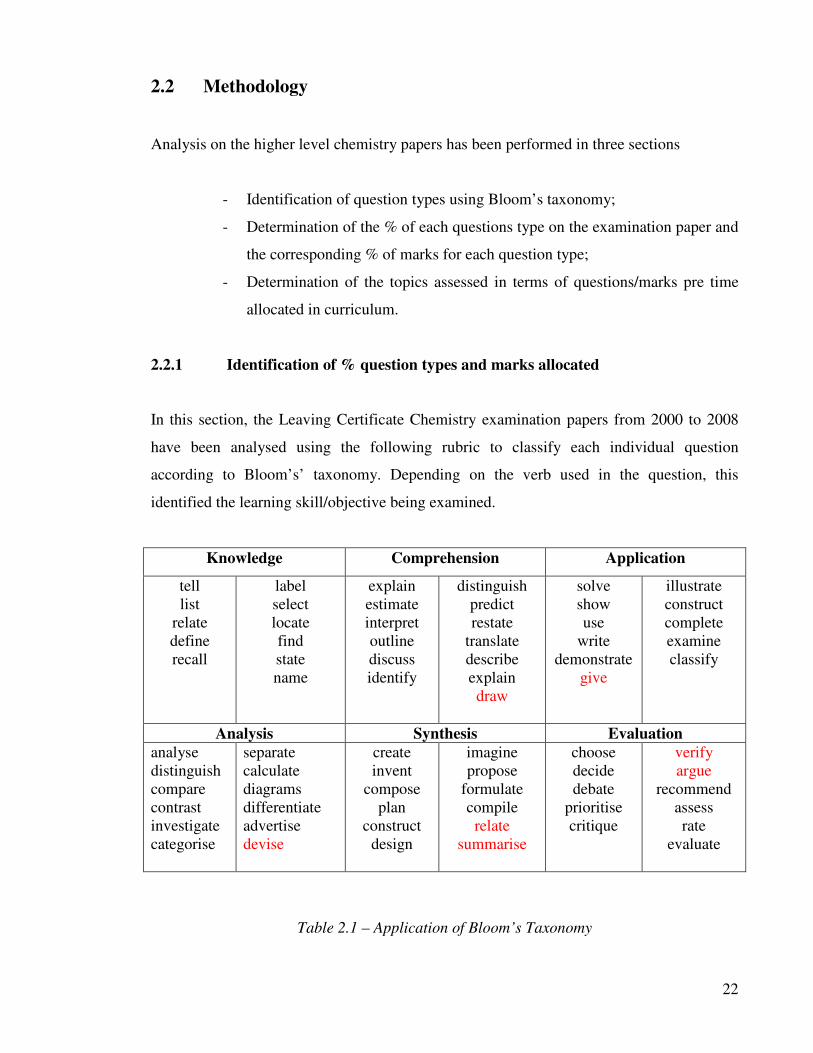
2.2 Methodology
Analysis on the higher level chemistry papers has been performed in three sections
- Identification of question types using Bloom’s taxonomy;
- Determination of the % of each questions type on the examination paper and
the corresponding % of marks for each question type;
- Determination of the topics assessed in terms of questions/marks pre time
allocated in curriculum.
2.2.1 Identification of % question types and marks allocated
In this section, the Leaving Certificate Chemistry examination papers from 2000 to 2008
have been analysed using the following rubric to classify each individual question
according to Bloom’s’ taxonomy. Depending on the verb used in the question, this
identified the learning skill/objective being examined.
Knowledge Comprehension Application
tell
list
relate
define
recall
label
select
locate
find
state
name
explain
estimate
interpret
outline
discuss
identify
distinguish
predict
restate
translate
describe
explain
draw
solve
show
use
write
demonstrate
give
illustrate
construct
complete
examine
classify
Analysis Synthesis Evaluation
analyse
distinguish
compare
contrast
investigate
categorise
separate
calculate
diagrams
differentiate
advertise
devise
create
invent
compose
plan
construct
design
imagine
propose
formulate
compile
relate
summarise
choose
decide
debate
prioritise
critique
verify
argue
recommend
assess
rate
evaluate
Table 2.1 – Application of Bloom’s Taxonomy

23
The model found in Table 2.1, has been adapted from the form presented by Dalton &
Smith14
, as this model was used to identify question types used for primary level classes.
Other more general terms have been included (in red) to incorporate similar descriptive
verbs found at Leaving Certificate Chemistry level.
In applying the rubric, each sub question was analysed using this rubric e.g. in Figure 2.6
question (iv) has been identified as a knowledge and comprehension question with each
part awarded 6 marks. This is as the marks allocated have been divided into equal parts, 6
for the naming of two compounds and 6 for the writing of an equation, according to the
marking scheme for this particular year. When the question had been identified the
percentage appearance of each question type was calculated as follows.
The number of question types were divided by the total number of questions asked on that
given paper e.g. if there were 17 knowledge style questions asked out of a total of 84
questions on a paper then the percentage of knowledge questions is 20.23%. This method of
calculation was employed for all questioning types found on the Leaving Certificate
Chemistry papers and the results of this analysis are given in section 2.4.1
K/
K K/
C
An
Figure 2.6 –Part of a questions showing example of Knowledge,
Comprehension and Analysis question types employed in Leaving
Certificate examination
K/
C
24
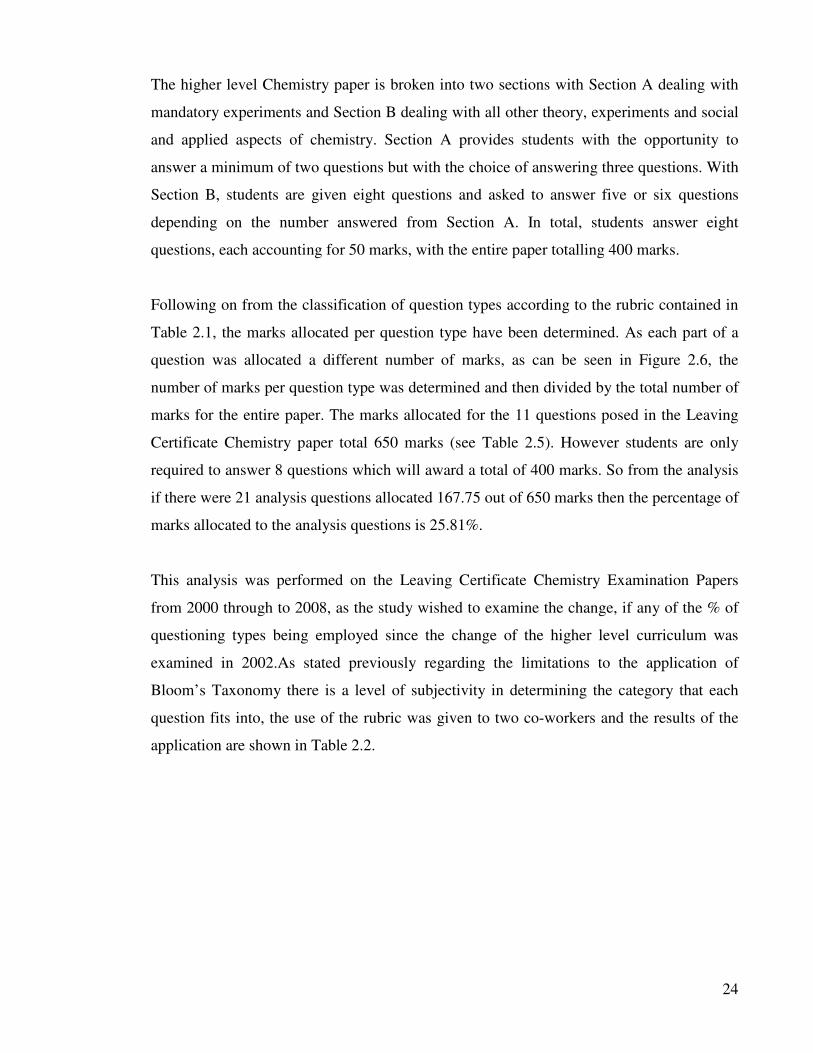
The higher level Chemistry paper is broken into two sections with Section A dealing with
mandatory experiments and Section B dealing with all other theory, experiments and social
and applied aspects of chemistry. Section A provides students with the opportunity to
answer a minimum of two questions but with the choice of answering three questions. With
Section B, students are given eight questions and asked to answer five or six questions
depending on the number answered from Section A. In total, students answer eight
questions, each accounting for 50 marks, with the entire paper totalling 400 marks.
Following on from the classification of question types according to the rubric contained in
Table 2.1, the marks allocated per question type have been determined. As each part of a
question was allocated a different number of marks, as can be seen in Figure 2.6, the
number of marks per question type was determined and then divided by the total number of
marks for the entire paper. The marks allocated for the 11 questions posed in the Leaving
Certificate Chemistry paper total 650 marks (see Table 2.5). However students are only
required to answer 8 questions which will award a total of 400 marks. So from the analysis
if there were 21 analysis questions allocated 167.75 out of 650 marks then the percentage of
marks allocated to the analysis questions is 25.81%.
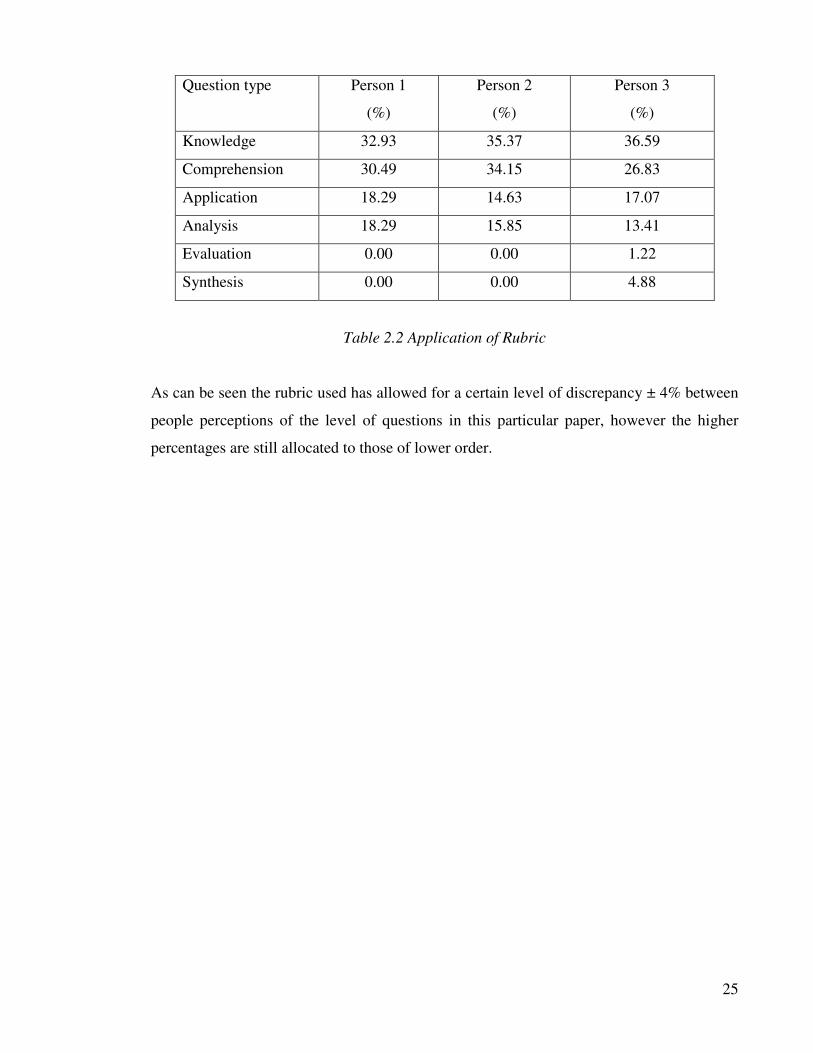
This analysis was performed on the Leaving Certificate Chemistry Examination Papers
from 2000 through to 2008, as the study wished to examine the change, if any of the % of
questioning types being employed since the change of the higher level curriculum was
examined in 2002.As stated previously regarding the limitations to the application of
Bloom’s Taxonomy there is a level of subjectivity in determining the category that each
question fits into, the use of the rubric was given to two co-workers and the results of the
application are shown in Table 2.2.
25
Question type Person 1
(%)
Person 2
(%)
Person 3
(%)
Knowledge 32.93 35.37 36.59
Comprehension 30.49 34.15 26.83
Application 18.29 14.63 17.07
Analysis 18.29 15.85 13.41
Evaluation 0.00 0.00 1.22
Synthesis 0.00 0.00 4.88
Table 2.2 Application of Rubric
As can be seen the rubric used has allowed for a certain level of discrepancy ± 4% between
people perceptions of the level of questions in this particular paper, however the higher
percentages are still allocated to those of lower order.
26
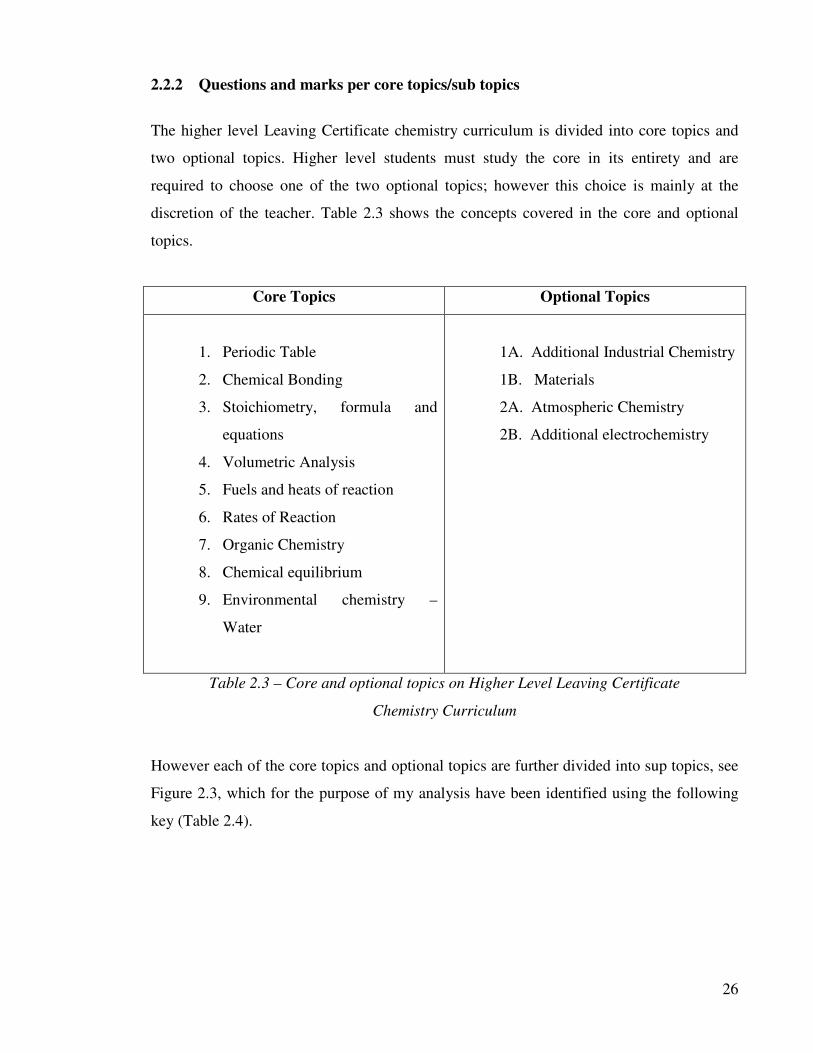
2.2.2 Questions and marks per core topics/sub topics
The higher level Leaving Certificate chemistry curriculum is divided into core topics and
two optional topics. Higher level students must study the core in its entirety and are
required to choose one of the two optional topics; however this choice is mainly at the
discretion of the teacher. Table 2.3 shows the concepts covered in the core and optional
topics.
Core Topics Optional Topics
1. Periodic Table
2. Chemical Bonding
3. Stoichiometry, formula and
equations
4. Volumetric Analysis
5. Fuels and heats of reaction
6. Rates of Reaction
7. Organic Chemistry
8. Chemical equilibrium
9. Environmental chemistry –
Water
1A. Additional Industrial Chemistry
1B. Materials
2A. Atmospheric Chemistry
2B. Additional electrochemistry
Table 2.3 – Core and optional topics on Higher Level Leaving Certificate
Chemistry Curriculum
However each of the core topics and optional topics are further divided into sup topics, see
Figure 2.3, which for the purpose of my analysis have been identified using the following
key (Table 2.4).

27
Core Topic Label Sub Topic Time allocated
(class periods)
Periodic Table 1.1 Periodic Table 3
1.2 Atomic Structure 6
1.3 Radioactivity 2
1.4 Electronic Structure of atoms 11
1.5 Oxidation and Reduction 7
Chemical
bonding
2.1 Chemical compounds 5
2.2 Ionic bonding 4
2.3 Covalent bonding 4
2.4 Electronegativity 2
2.5 Shapes of molecules and
intermolecular forces
5
2.6 Oxidation numbers 5
Stoichiometry,
formula and
equations
3.1 States of matter 1
3.2 Gas Laws 7
3.3 The mole 9
3.4 Chemical formulae 6
3.5 Chemical equations 11
Volumetric
Analysis
4.1 Concentrations of solutions 8
4.2 Acid and Bases 4
4.3 Volumetric analysis 22
Fuels and heats
of reaction
5.1 Sources of Hydrocarbons 1
5.2 Structure of Aliphatic
Hydrocarbons
5
5.3 Aromatic Hydrocarbons 1
5.4 Exothermic and endothermic
reaction
9
5.5 Oil refining and its products 4
5.6 Other Chemical Fuels 3
Rates of
reaction
6.1 Reaction rates 3
6.2 Factors affecting the rate of
reaction
8
Organic
Chemistry
7.1 Tetrahedral carbon 4
7.2 Planar carbon
11
7.3 Organic Chemical Reaction
types
21
7.4 Organic Natural Products
4
28
Core Topic Label Sub Topic Time allocated
(class periods)
7.5 Chromatography and
Instrumentation in Organic
Chemistry
3
Chemical
equilibrium
8.1 Chemical Equilibrium 8
8.2 Le Chateliers principle 5
Environmental
Chemistry
9.1 pH scale 6
9.2 Water Hardness 3
9.3 Water treatment 5
9.4 Water analysis 11
Optional
Topic
Label Sub Topic Time allocated
(class periods)
Industrial
Chemistry
1A.1 General principles of
industrial chemistry
3
1A.2 Case studies 5
Atmospheric
Chemistry
1B.1 Oxygen 1
1B.2 Nitrogen 2
1B.3 Carbon dioxide 4
1B.4 Atmospheric pollution 2
1B.5 The ozone layer 4
Materials 2A.1 Crystals 3
2A.2 Addition polymers 5 2A.3 Metals 1
Electrochemistry
and extraction of
metals
2B.1 The electrochemical series 1
2B.2 Electrolysis of molten salts 1
2B.3 Corrosion 2
2B.4 Strongly electropositive
(Na and Al)
4
2B.5 d-block Metals 4
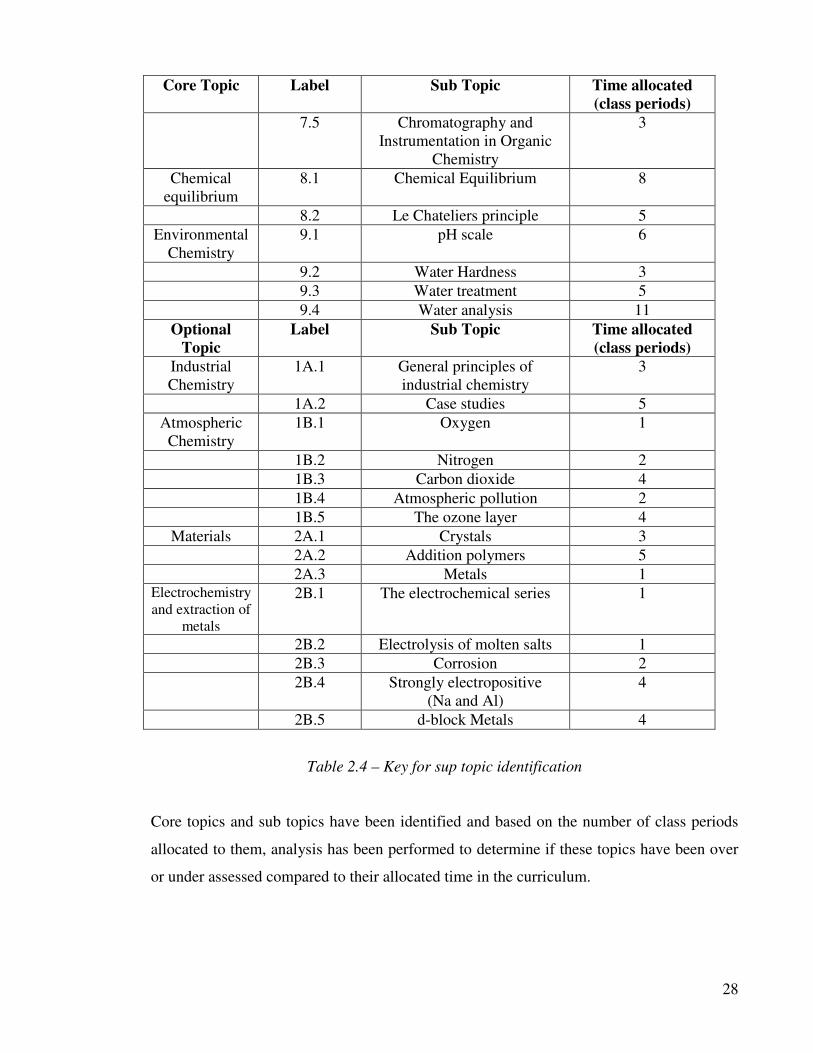
Table 2.4 – Key for sup topic identification
Core topics and sub topics have been identified and based on the number of class periods
allocated to them, analysis has been performed to determine if these topics have been over
or under assessed compared to their allocated time in the curriculum.
29
In order to determine if a topic/sub topic had been over or under assessed the % appearance
of a question on that topic was calculated per year from 2002 to 2008. 2000 and 2001
examination papers were not used in this part of the analysis as these were both examined
according to the 1983 curriculum.
Each question was classified as dealing with content pertaining to topics/sub topics. The
graphs, appearing in section 2.3.2 were calculated as follows; the % questions of
topics/subtopics was determined by dividing the number of times a topic had appeared by
the total number of questions asked, e.g. if there were 19 questions on volumetric analysis
asked in a particular year out of a total of 85 questions asked on the examination in total,
then the percentage of questions asked on the volumetric analysis is 22.35%. Then the
allocated number of class periods for that topic is divided by the total number of allocated
class periods, e.g. for volumetric analysis 34 class periods divided by 258 yields a
percentage of 13.18%.
Finally to determine if the topic has been over or under assessed relative to the time
allocated to this topic, the % questions is divided by the % time e.g. 22.35%/13.18% =
1.69. If the number is greater than 1, the topic/sub topic is deemed to be over-assessed,
while if the number is less than 1, the topic/subtopic is deemed to be under-assessed
according to the time allocated.
Along with the % questions given to a certain topic/sub topic, the % marks allocated for a
topic/subtopic was also determined. In each Leaving Certificate Chemistry Higher Level
paper there are a possible 11 questions and students are required to answer 8 of these 11.
The total marks awarded to the students for the completion of these eight questions is 400
marks. However as these papers were analysed based on all possible questions being
answered the total number of marks awarded per paper were 650.
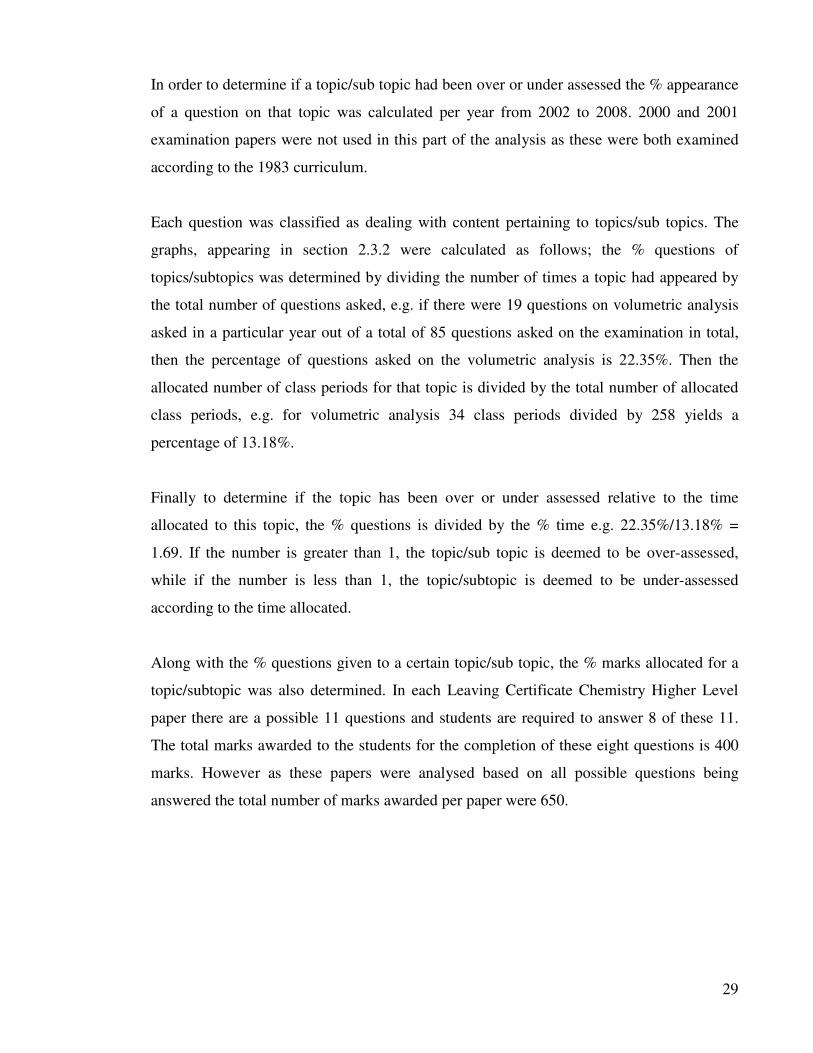
30
The break down of marks is shown in Table 2.5 below.
Question Number of choices Marks awarded per
choice
Total possible
marks for question
1 1 50 50
2 1 50 50
3 1 50 50
4 12 6.25 75
5 1 50 50
6 1 50 50
7 1 50 50
8 1 50 50
9 1 50 50
10 3 25 75
11 4 25 100
Total marks per
paper available
650
Table 2.5 Accounting for 650 possible marks in the Leaving Certificate Chemistry Paper
The number of marks allocated to topic/subtopic was calculated and again divided by the
total number of marks for a paper e.g. water analysis (sub topic 9.4) has been awarded
24.25 marks out of 650 for a particular year as explained above, therefore the % of marks
allocated to this sub section = 3.73%. Again to determine if a topic/subtopic has been over,
or under assessed, the % marks was divided by the % time allocated by the curriculum e.g.
11 classes for water analysis out of 258 classes gives 4.26%, which when divides into the
% marks allocated for this subtopic yields 0.88, which in this example shows that this is a
lower % of marks compared to the allocated class time.
31
In this sort of analysis one difficulty is the build up or scaffolding approach of chemical
understanding which is required. This analysis has shown that is can be difficult to state
precisely that one question belongs solely to a particular subtopic when in fact it also
involves one or possibly two other subtopics. This was especially the case in terms of
volumetric analysis questions which incorporated the use of students’ knowledge of
molarity, molecular weights, concentration and balancing of equations, all of which are
contained in Section 3, however were identified under the subtopic heading of volumetric
analysis Section 4.
32
2.3 Results & Discussion
This section gives the results of three types of analysis that have been performed on the
Leaving Certificate Chemistry Higher Level papers. Only Higher Level papers were
considered in this study as the majority of students to take Leaving Certificate Chemistry
do so at the higher level e.g. in 2008, 83% of students who took Chemistry at Leaving
Certificate did so at higher level. This analysis aims to answer the following questions:
• Does the current assessment employed at Leaving Certificate level incorporate all
level of questioning identified by Bloom?
• Are the % marks and % questions awarded to each topic equally represented?
• Are certain topics/ sub topics being over assessed?
• Does the Leaving Certificate assess students’ competence of the stated objectives?
As stated in section 2.1.1, the curriculum was changed in 2000 and first examined in 2002.
Analysis of question types has been carried out on all examinations from 2000 to 2008 to
determine if there was a change in questions type emphasis based on the new curriculum.
Analysis concerning the topic and subtopic determination has only been employed on years
from 2002 to 2008 as the 2000 curriculum content and suggested time allocation was not
applicable to the years examining the 1983 curriculum.
33
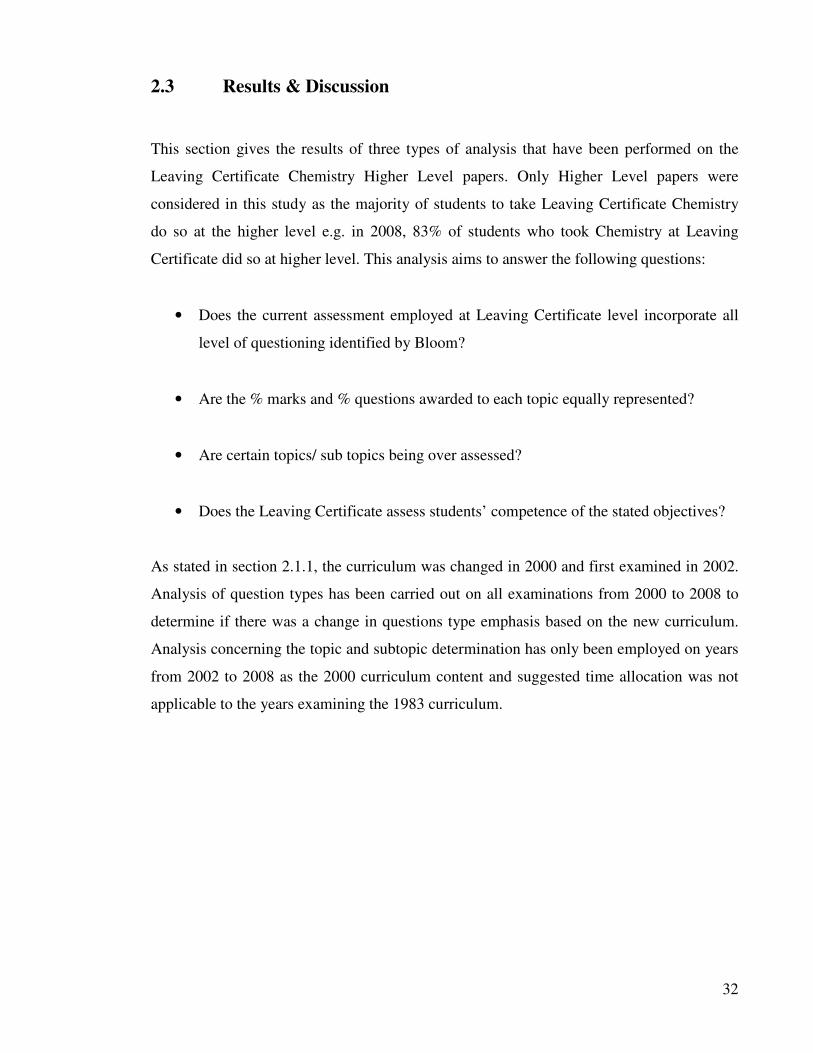
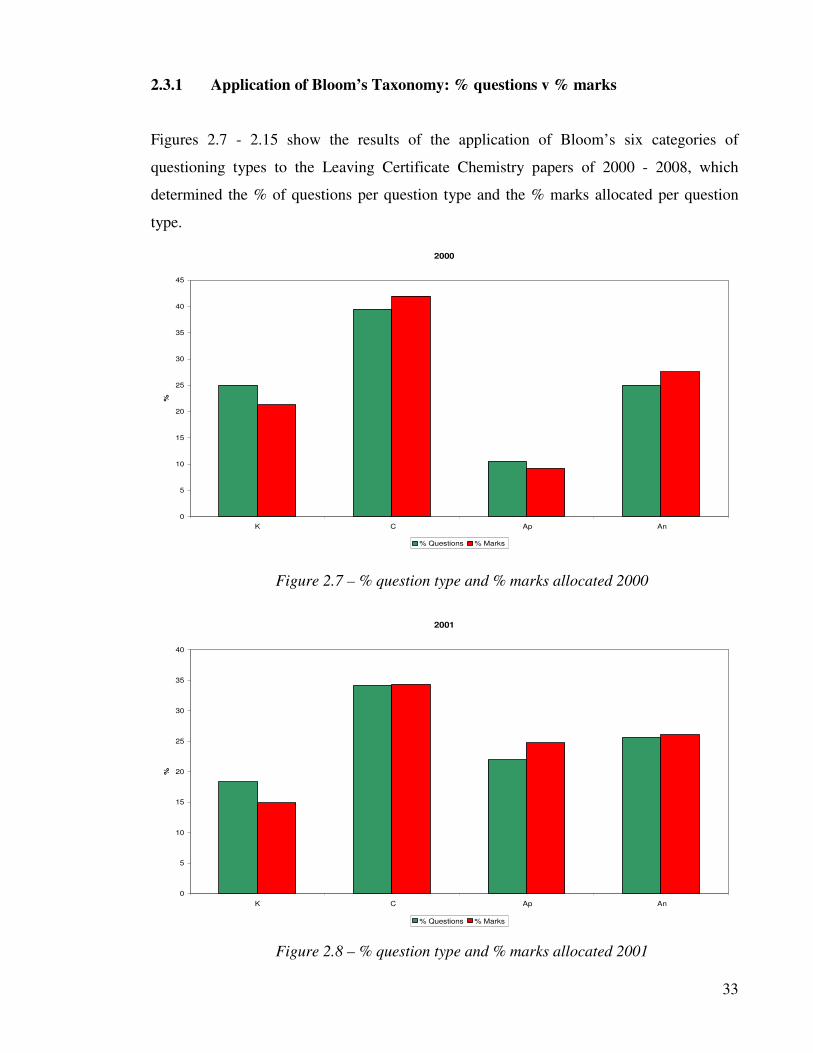
2.3.1 Application of Bloom’s Taxonomy: % questions v % marks
Figures 2.7 - 2.15 show the results of the application of Bloom’s six categories of
questioning types to the Leaving Certificate Chemistry papers of 2000 - 2008, which
determined the % of questions per question type and the % marks allocated per question
type.
2000
0
5
10
15
20
25
30
35
40
45
K C Ap An
%
% Questions % Marks
2001
0
5
10
15
20
25
30
35
40
K C Ap An
%
% Questions % Marks
Figure 2.7 – % question type and % marks allocated 2000
Figure 2.8 – % question type and % marks allocated 2001
34
2002
0
5
10
15
20
25
30
35
40
45
K C Ap An
%
% Questions % Mark
2003
0
5
10
15
20
25
30
35
40
K C Ap An
%
% Questions % Marks
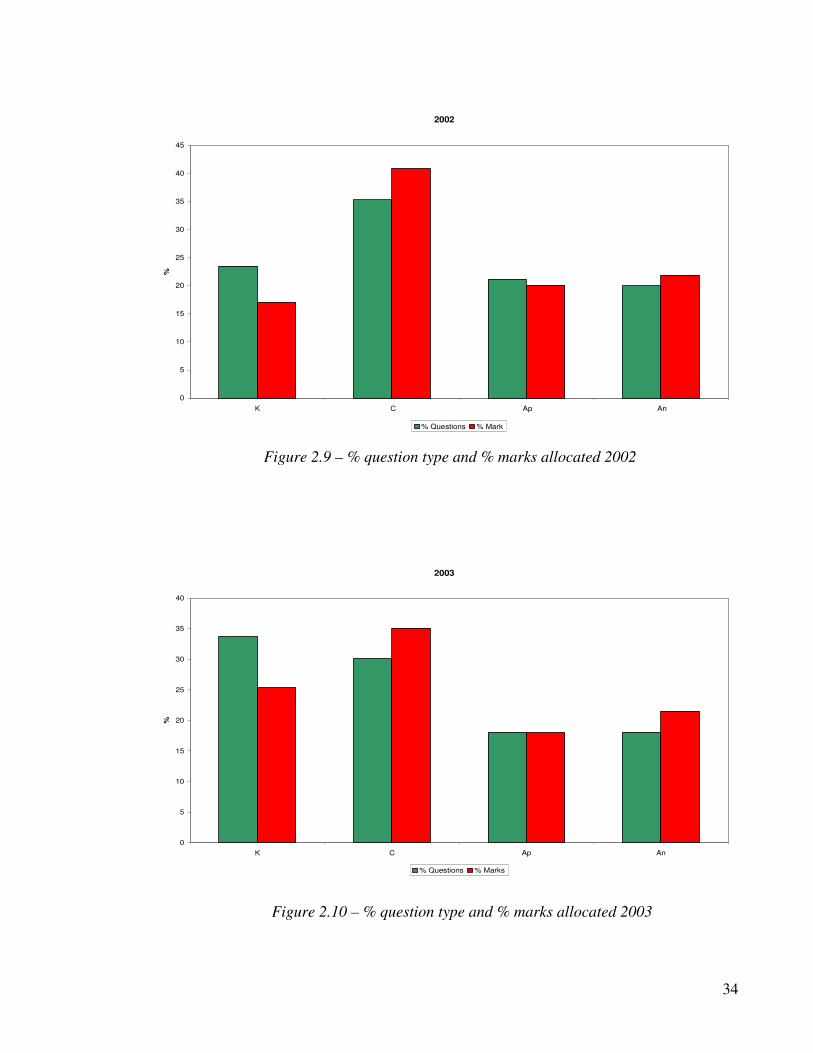
Figure 2.9 – % question type and % marks allocated 2002
Figure 2.10 – % question type and % marks allocated 2003
35
2004
0
5
10
15
20
25
30
35
K C Ap An
%
% Question % Marks
2005
0
5
10
15
20
25
30
35
40
K C Ap An
%
% Questions % Marks
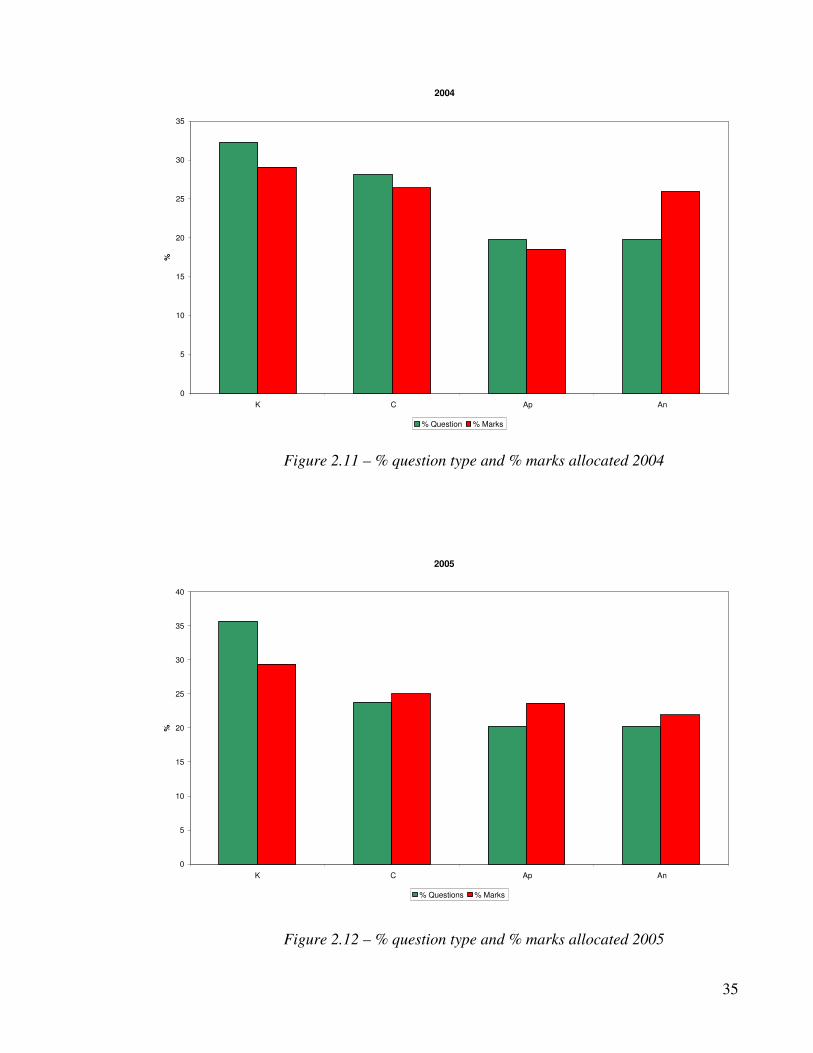
Figure 2.11 – % question type and % marks allocated 2004
Figure 2.12 – % question type and % marks allocated 2005
36
2006
0
5
10
15
20
25
30
35
40
K C Ap An
%
% Questions % Mark
2007
0
5
10
15
20
25
30
35
40
K C Ap An
%
% Questions % Marks
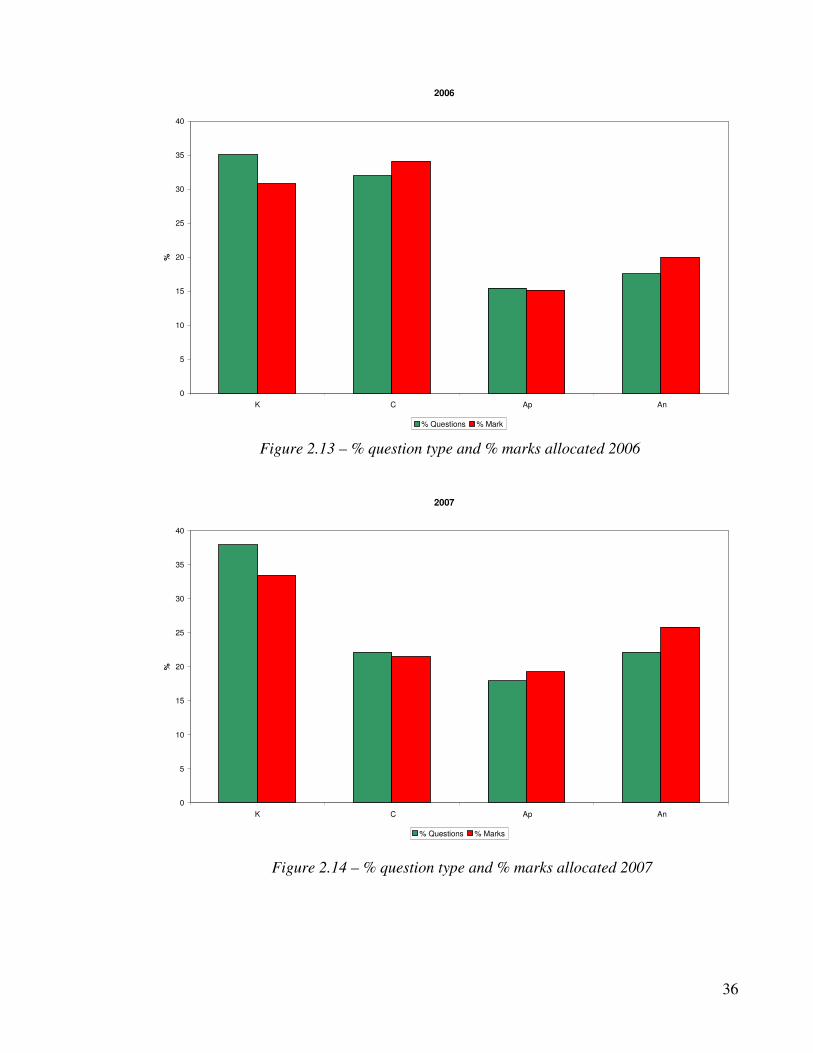
Figure 2.13 – % question type and % marks allocated 2006
Figure 2.14 – % question type and % marks allocated 2007
37
2008
0
5
10
15
20
25
30
35
40
K C Ap An
%
% Questions % Marks
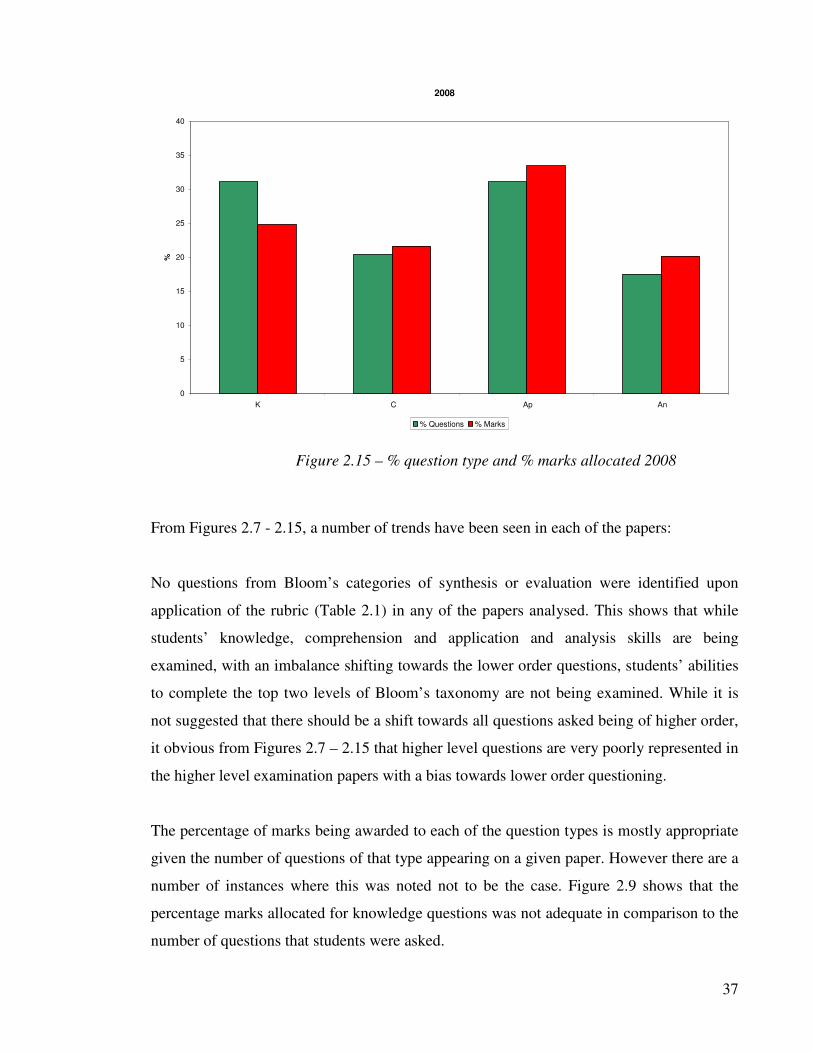
From Figures 2.7 - 2.15, a number of trends have been seen in each of the papers:
No questions from Bloom’s categories of synthesis or evaluation were identified upon
application of the rubric (Table 2.1) in any of the papers analysed. This shows that while
students’ knowledge, comprehension and application and analysis skills are being
examined, with an imbalance shifting towards the lower order questions, students’ abilities
to complete the top two levels of Bloom’s taxonomy are not being examined. While it is
not suggested that there should be a shift towards all questions asked being of higher order,
it obvious from Figures 2.7 – 2.15 that higher level questions are very poorly represented in
the higher level examination papers with a bias towards lower order questioning.
The percentage of marks being awarded to each of the question types is mostly appropriate
given the number of questions of that type appearing on a given paper. However there are a
number of instances where this was noted not to be the case. Figure 2.9 shows that the
percentage marks allocated for knowledge questions was not adequate in comparison to the
number of questions that students were asked.
Figure 2.15 – % question type and % marks allocated 2008

38
This displays that the knowledge questions were not being greatly rewarded for the
completion of these low order question types. Figure 2.10 again presents the imbalance
between the marks allocated for the number of questions asked at knowledge level.
Students were more appropriately rewarded for their attempts on comprehension,
application or analysis questions in this particular year. Figure 2.11 is the first instance
where a significant difference is noted in relation to the marks rewarded upon completion
of the analysis questions in comparison to the number of questions of this typed being used
in 2004. However in 2005 (Figure 2.12) once again the imbalance between the marks
allocated for the number of questions asked at knowledge level can be seen. This example
of a lower percentage of marks allocated for knowledge type questions is again seen in
2007 (Figure 2.14) and 2008 (Figure 2.15), once again demonstrating the lack of reward
that is associated with these questions.
From each of the figures the imbalance between the appearance in lower order and higher
order questions is extremely obvious. In the case of Figure 2.7 knowledge, comprehension
and application questions encompass 75% of the questions asked and 74% of the marks
allocated. The number of and marks allocated to higher level question (analysis only) is
very low in this particular year. In 2002, the first year of examination of the new curriculum
(Figure 2.9) the lower order question occupy 80% of the questions asked on this, with a fall
of 5.6% in the number of higher order questions employed in comparison to 2001. While
the new syllabus aimed to provide students with abilities such as those outlined in Figure
2.4, these papers reward students for demonstrating their lower order skills while failing to
assess student’s abilities to evaluate and synthesis chemical concepts. This trend of
employment of lower order questions continues through to 2006 (Figure 2.13) however in
2007 (Figure 2.14) the percentage of questions of analysis type reaches its highest since the
introduction of the current curriculum at 22%. Unfortunately this increase was short-lived
as in 2008 (Figure 2.15) the percentage of questions fell by 5% from 2007. However the %
questions requiring knowledge skills fell to their lowest level since the introduction of the
2000 curriculum to 31%.
39
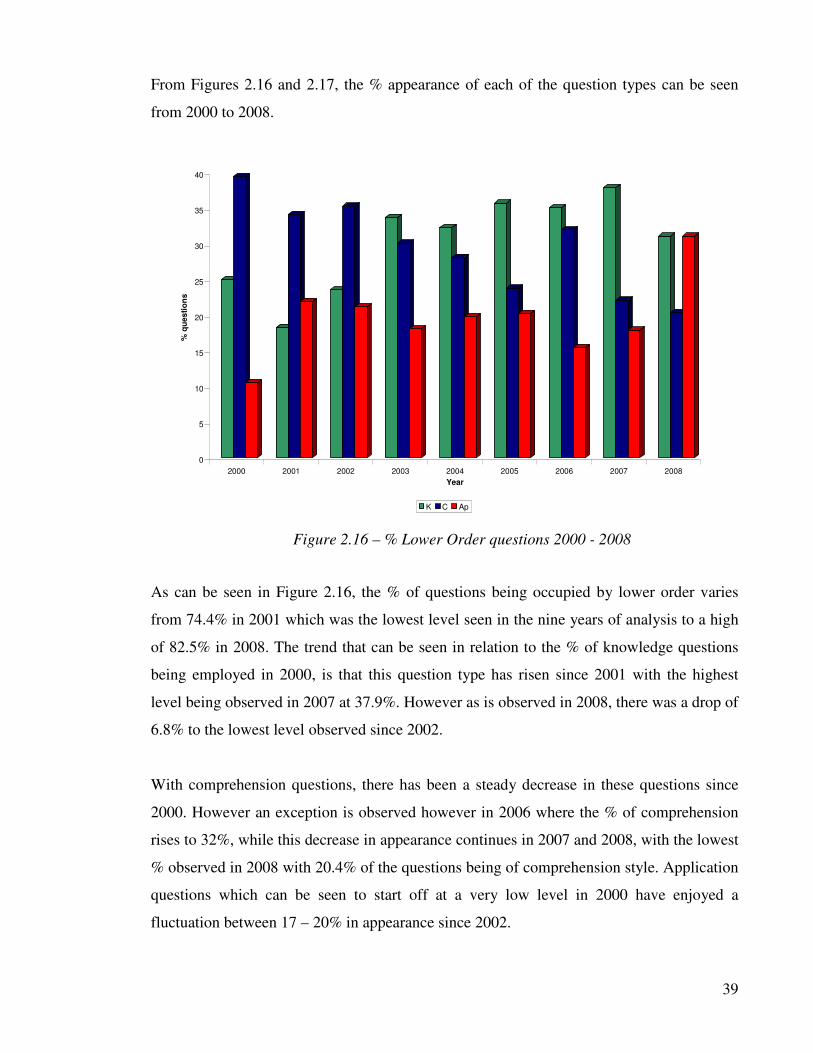
From Figures 2.16 and 2.17, the % appearance of each of the question types can be seen
from 2000 to 2008.
0
5
10
15
20
25
30
35
40%
qu
es
tio
ns
2000 2001 2002 2003 2004 2005 2006 2007 2008
Year
K C Ap
As can be seen in Figure 2.16, the % of questions being occupied by lower order varies
from 74.4% in 2001 which was the lowest level seen in the nine years of analysis to a high
of 82.5% in 2008. The trend that can be seen in relation to the % of knowledge questions
being employed in 2000, is that this question type has risen since 2001 with the highest
level being observed in 2007 at 37.9%. However as is observed in 2008, there was a drop of
6.8% to the lowest level observed since 2002.
With comprehension questions, there has been a steady decrease in these questions since
2000. However an exception is observed however in 2006 where the % of comprehension
rises to 32%, while this decrease in appearance continues in 2007 and 2008, with the lowest
% observed in 2008 with 20.4% of the questions being of comprehension style. Application
questions which can be seen to start off at a very low level in 2000 have enjoyed a
fluctuation between 17 – 20% in appearance since 2002.
Figure 2.16 – % Lower Order questions 2000 - 2008
40
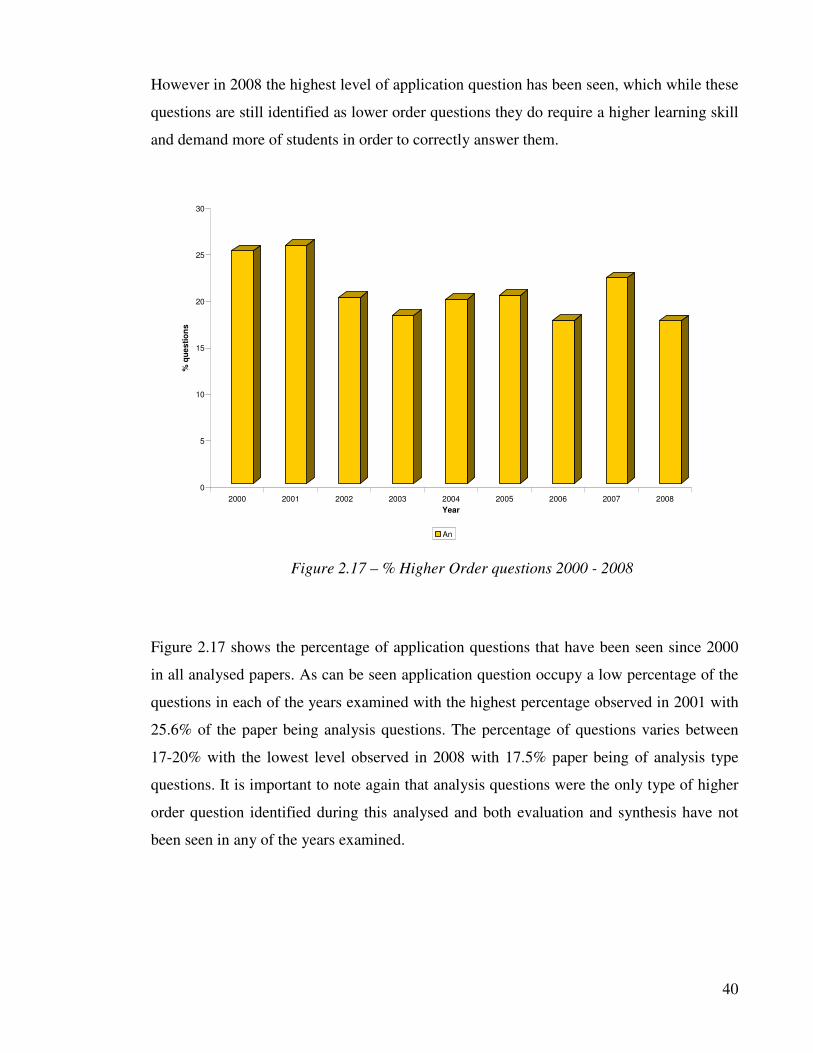
However in 2008 the highest level of application question has been seen, which while these
questions are still identified as lower order questions they do require a higher learning skill
and demand more of students in order to correctly answer them.
0
5
10
15
20
25
30
% q
ue
sti
on
s
2000 2001 2002 2003 2004 2005 2006 2007 2008
Year
An
Figure 2.17 shows the percentage of application questions that have been seen since 2000
in all analysed papers. As can be seen application question occupy a low percentage of the
questions in each of the years examined with the highest percentage observed in 2001 with
25.6% of the paper being analysis questions. The percentage of questions varies between
17-20% with the lowest level observed in 2008 with 17.5% paper being of analysis type
questions. It is important to note again that analysis questions were the only type of higher
order question identified during this analysed and both evaluation and synthesis have not
been seen in any of the years examined.
Figure 2.17 – % Higher Order questions 2000 - 2008
41
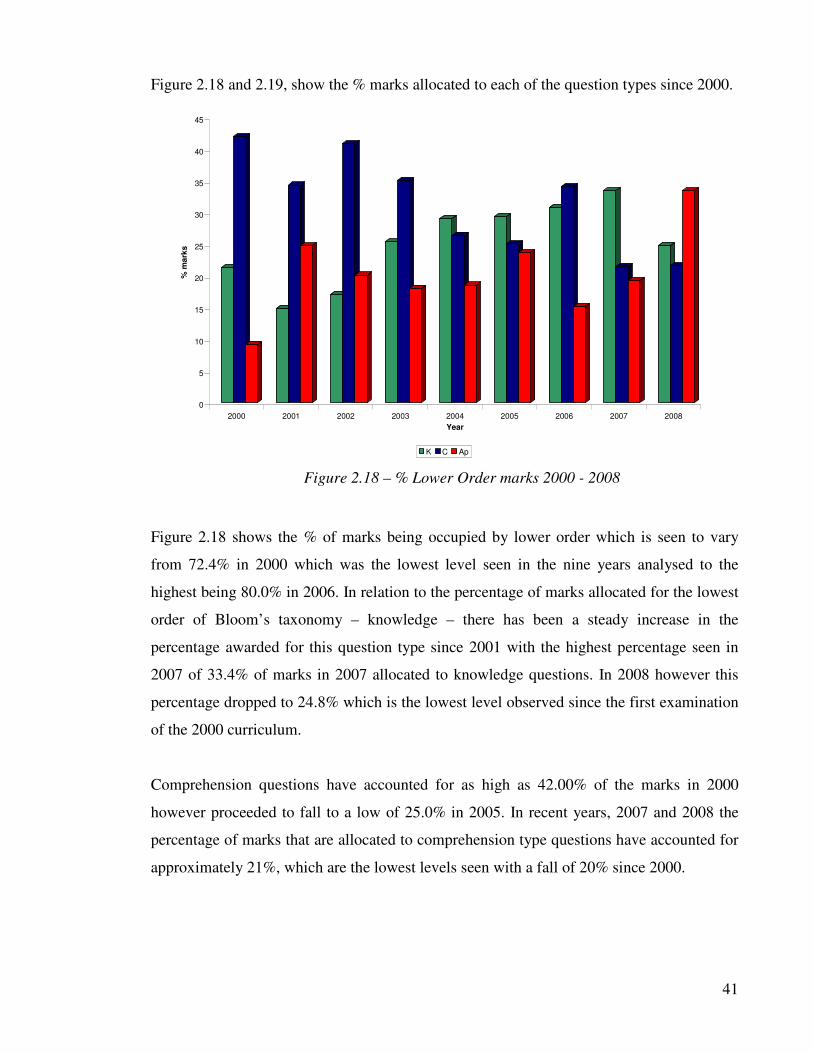
Figure 2.18 and 2.19, show the % marks allocated to each of the question types since 2000.
0
5
10
15
20
25
30
35
40
45
% m
ark
s
2000 2001 2002 2003 2004 2005 2006 2007 2008
Year
K C Ap
Figure 2.18 shows the % of marks being occupied by lower order which is seen to vary
from 72.4% in 2000 which was the lowest level seen in the nine years analysed to the
highest being 80.0% in 2006. In relation to the percentage of marks allocated for the lowest
order of Bloom’s taxonomy – knowledge – there has been a steady increase in the
percentage awarded for this question type since 2001 with the highest percentage seen in
2007 of 33.4% of marks in 2007 allocated to knowledge questions. In 2008 however this
percentage dropped to 24.8% which is the lowest level observed since the first examination
of the 2000 curriculum.
Comprehension questions have accounted for as high as 42.00% of the marks in 2000
however proceeded to fall to a low of 25.0% in 2005. In recent years, 2007 and 2008 the
percentage of marks that are allocated to comprehension type questions have accounted for
approximately 21%, which are the lowest levels seen with a fall of 20% since 2000.
Figure 2.18 – % Lower Order marks 2000 - 2008
42
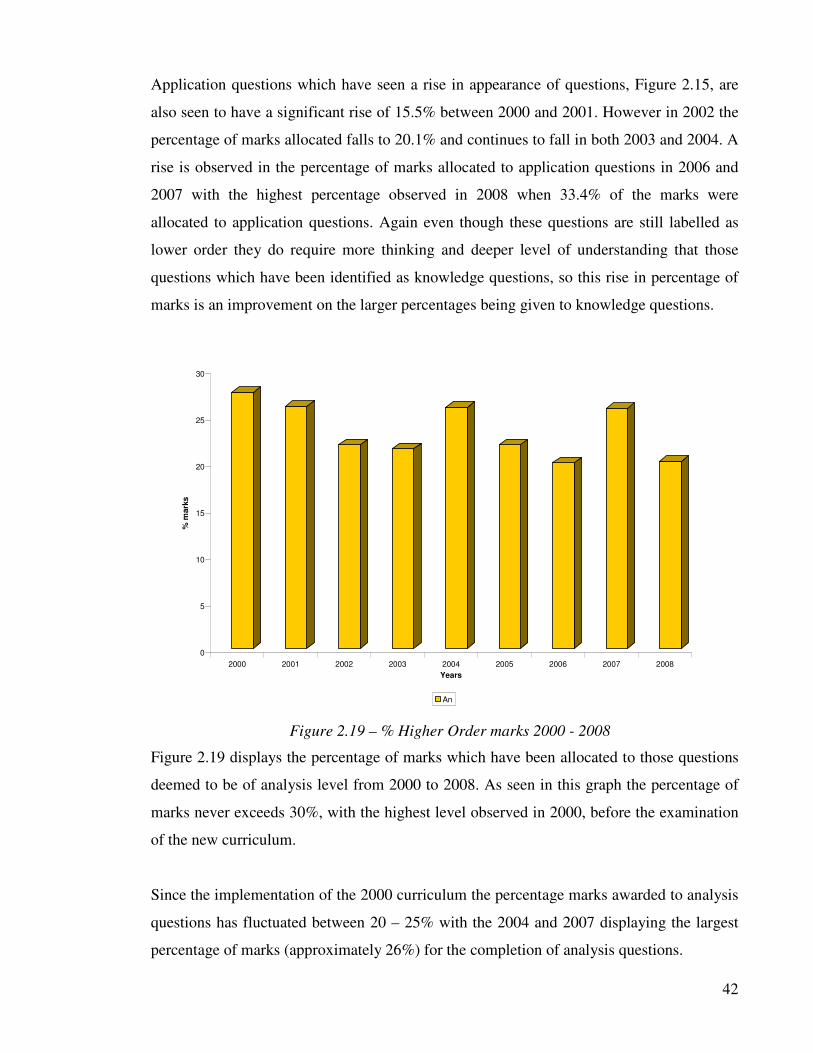
Application questions which have seen a rise in appearance of questions, Figure 2.15, are
also seen to have a significant rise of 15.5% between 2000 and 2001. However in 2002 the
percentage of marks allocated falls to 20.1% and continues to fall in both 2003 and 2004. A
rise is observed in the percentage of marks allocated to application questions in 2006 and
2007 with the highest percentage observed in 2008 when 33.4% of the marks were
allocated to application questions. Again even though these questions are still labelled as
lower order they do require more thinking and deeper level of understanding that those
questions which have been identified as knowledge questions, so this rise in percentage of
marks is an improvement on the larger percentages being given to knowledge questions.
0
5
10
15
20
25
30
% m
ark
s
2000 2001 2002 2003 2004 2005 2006 2007 2008
Years
An
Figure 2.19 displays the percentage of marks which have been allocated to those questions
deemed to be of analysis level from 2000 to 2008. As seen in this graph the percentage of
marks never exceeds 30%, with the highest level observed in 2000, before the examination
of the new curriculum.
Since the implementation of the 2000 curriculum the percentage marks awarded to analysis
questions has fluctuated between 20 – 25% with the 2004 and 2007 displaying the largest
percentage of marks (approximately 26%) for the completion of analysis questions.
Figure 2.19 – % Higher Order marks 2000 - 2008

43
In 2008 there was a significant drop in the marks awarded for analysis questions, which
mirror those results displayed in Figure 2.16. Again higher order questions are outweighed
by those for lower order in both questions asked and marks allocated.
44
2.3.2 Questions and marks allocated to topics/sub topics
This section deals with the analysis performed on papers from 2002-2008 using the key
shown in Table 2.4. For the purposes of this discussion the graphs dealing with core – topic
will be displayed and discussed followed by the sub - topic graphs. In each graph the ratio
of % questions : % classes allocated and % marks : % classes allocated have been
determined i.e. questions/time and marks/time for each core/sub topic. Along with these
graphs will be a series of tables depicting the results clearly from each year.
The assessment of core topics from 2002 through to 2008 are discussed in Section 2.3.2.1
and are shown in Figures 2.20 – 2.26. Assessment of sub topics from 2002 to 2008 are
shown in Figures 2.27 – 2.33 and are discussed in Section 2.3.2.2. Tables 2.6 and 2.7
indicate whether topics are over or under assessed for each topic while Tables 2.8 and 2.9
show the results for each sub topic.
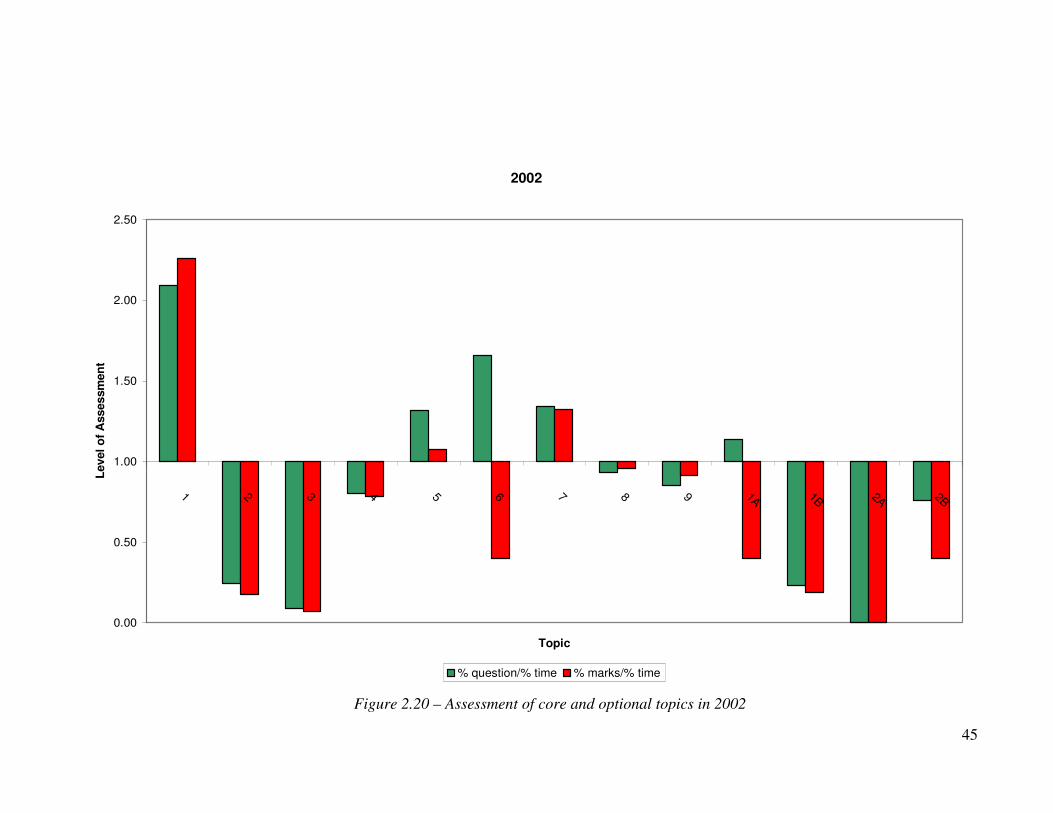
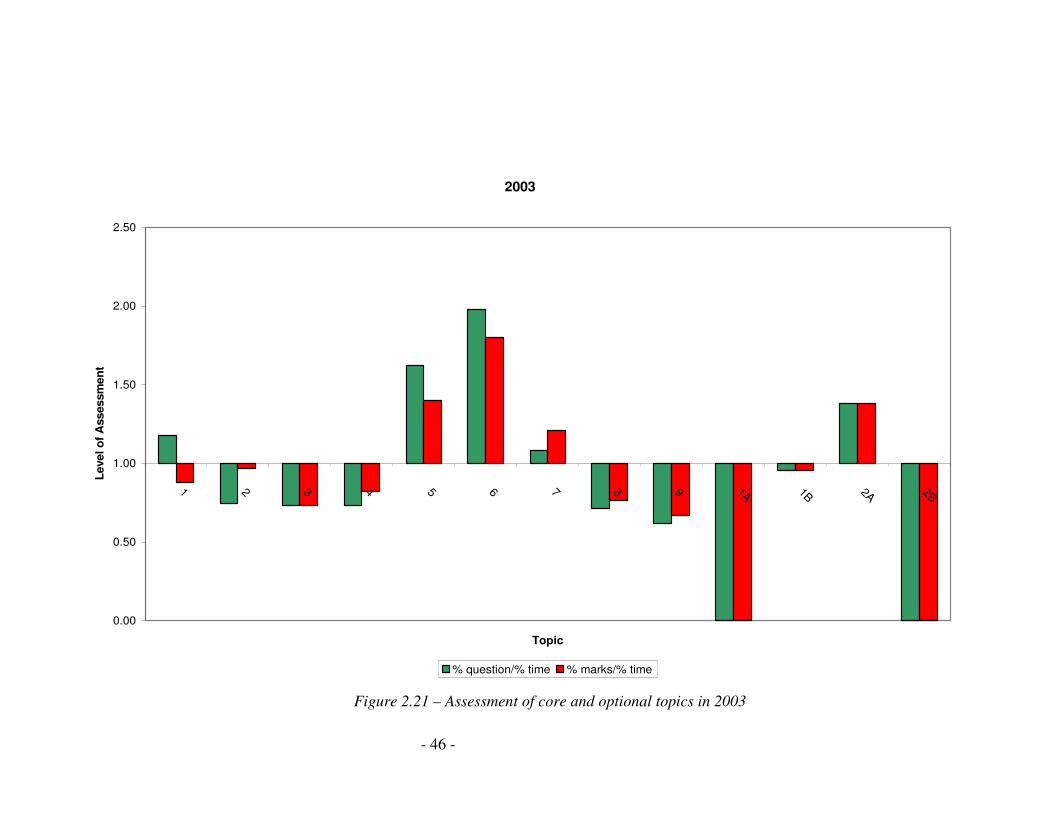
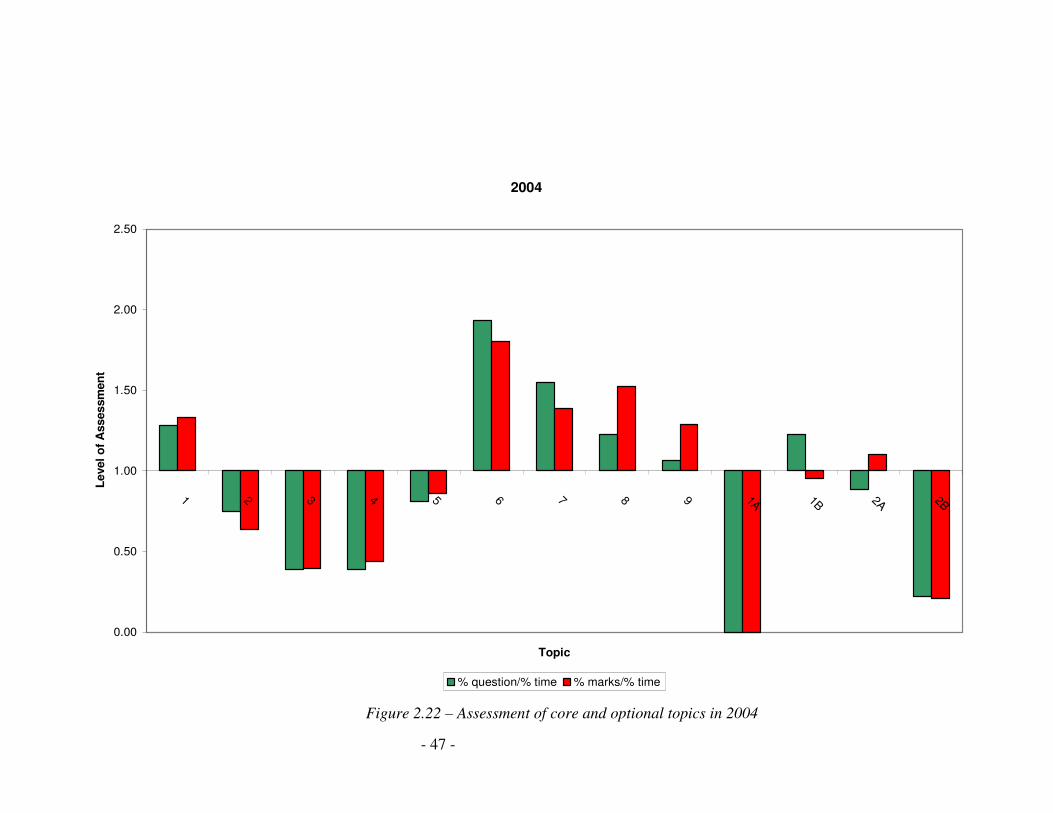
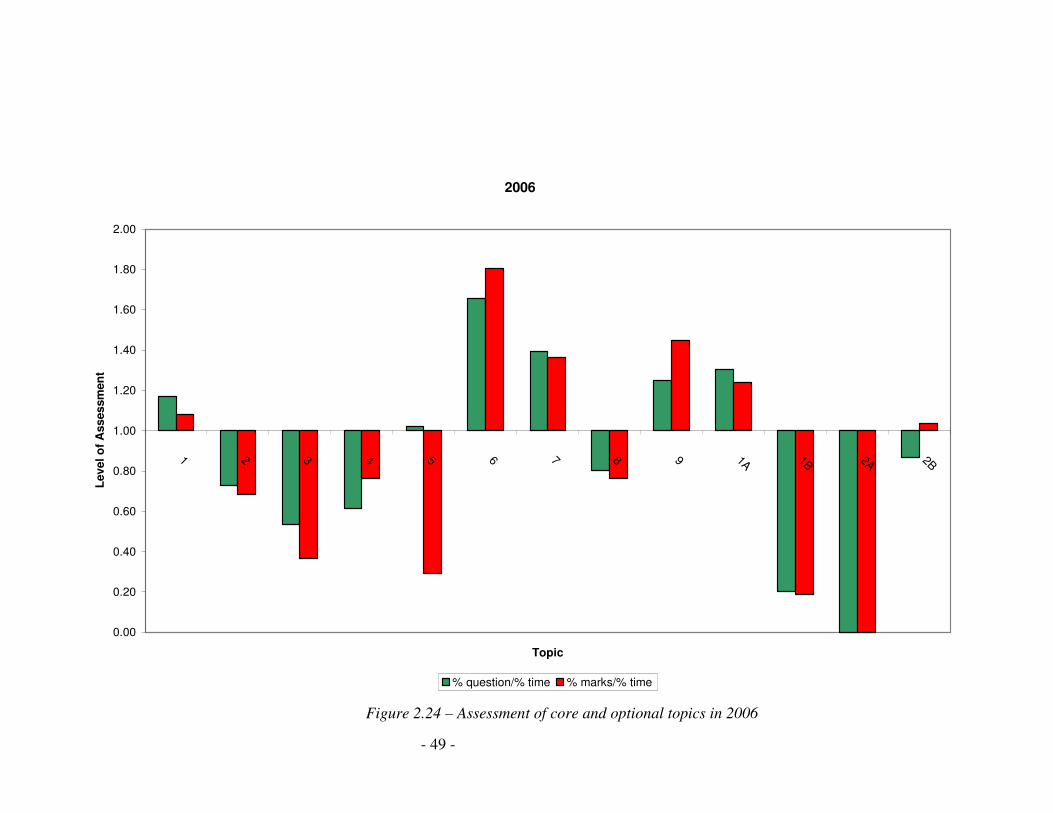
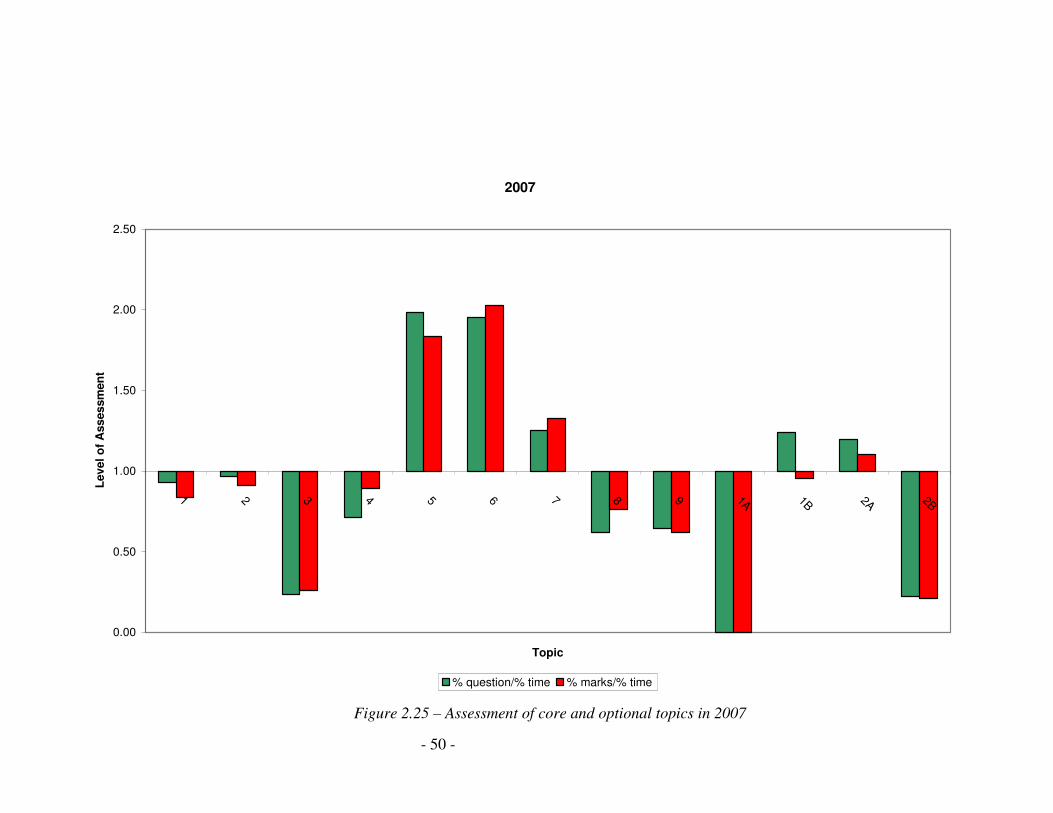
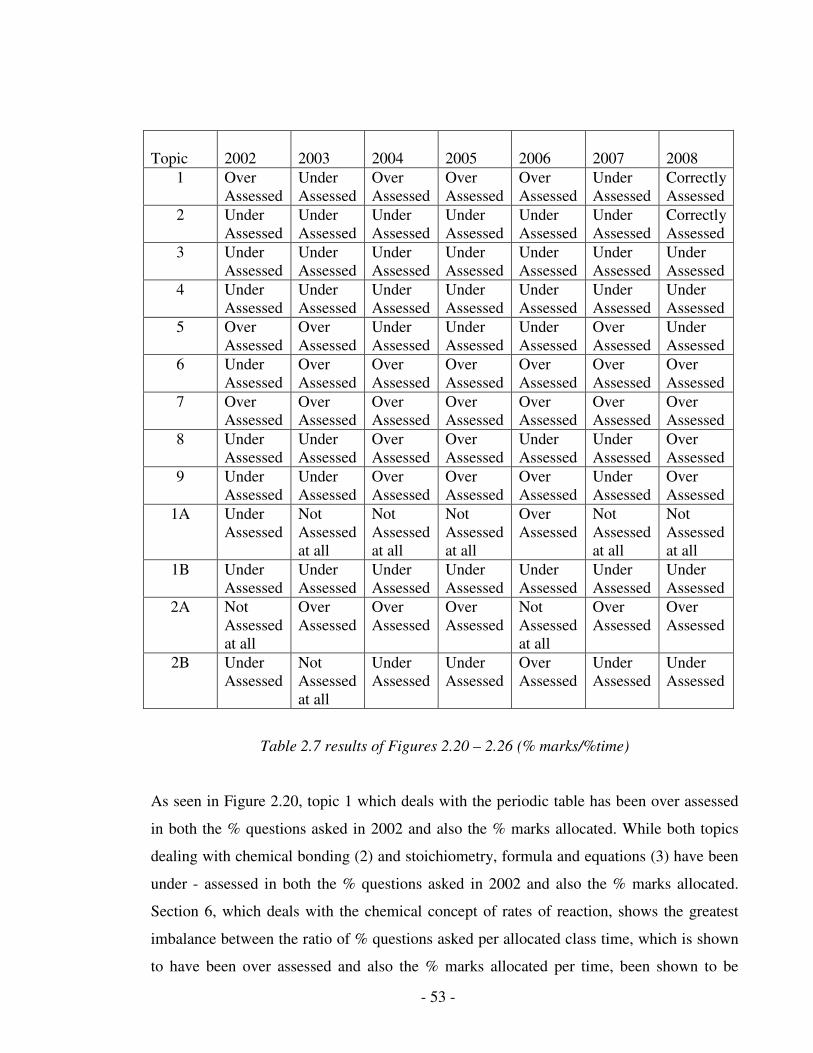
2.3.2.1 Core topics
Those topics which have been deemed to be under assessed in term of % questions and %
marks per allocated class time are found below the x axis, with those deemed to be over -
assessed in term of % questions and % marks per allocated class time are found above the x
axis.
It is important to note that those topics whose assessment is 0 such as topic 2A in Figure
2.20 have not appeared on that paper and are therefore under - assessed as while they are
still allocated a given number of hours in the curriculum have not been questioned at all in
that particular year.
45
2002
0.00
0.50
1.00
1.50
2.00
2.50
1 2 3 4 5 6 7 8 9 1A 1B 2A 2B
Topic
Level
of
Assessm
en
t
% question/% time % marks/% time
Figure 2.20 – Assessment of core and optional topics in 2002
- 46 -
2003
0.00
0.50
1.00
1.50
2.00
2.50
1 2 3 4 5 6 7 8 9 1A 1B 2A 2B
Topic
Level o
f A
ssessm
en
t
% question/% time % marks/% time
Figure 2.21 – Assessment of core and optional topics in 2003
- 47 -
2004
0.00
0.50
1.00
1.50
2.00
2.50
1 2 3 4 5 6 7 8 9 1A 1B 2A 2B
Topic
Level
of
Assessm
en
t
% question/% time % marks/% time
Figure 2.22 – Assessment of core and optional topics in 2004

- 48 -
2005
0.00
0.50
1.00
1.50
2.00
2.50
1 2 3 4 5 6 7 8 9 1A 1B 2A 2B
Topic
Level
of
Assessm
en
t
% question/% time % marks/% time
Figure 2.23 – Assessment of core and optional topics in 2005
- 49 -
2006
0.00
0.20
0.40
0.60
0.80
1.00
1.20
1.40
1.60
1.80
2.00
1 2 3 4 5 6 7 8 9 1A 1B 2A 2B
Topic
Level
of
Assessm
en
t
% question/% time % marks/% time
Figure 2.24 – Assessment of core and optional topics in 2006
- 50 -
2007
0.00
0.50
1.00
1.50
2.00
2.50
1 2 3 4 5 6 7 8 9 1A 1B 2A 2B
Topic
Level
of
Assessm
en
t
% question/% time % marks/% time
Figure 2.25 – Assessment of core and optional topics in 2007
- 51 -
2008
0.00
0.50
1.00
1.50
2.00
2.50
1 2 3 4 5 6 7 8 9 1A 1B 2A 2B
Topic
Level o
f A
ssessm
en
t
% question/% time % marks/% time
Figure 2.26 – Assessment of core and optional topics in 2008
- 52 -
Topic
2002
2003
2004
2005
2006
2007
2008
1 Over
Assessed
Over
Assessed
Over
Assessed
Over
Assessed
Over
Assessed
Under
Assessed
Correctly
Assessed
2 Under
Assessed
Under
Assessed
Under
Assessed
Under
Assessed
Under
Assessed
Under
Assessed
Over
Assessed
3 Under
Assessed
Under
Assessed
Under
Assessed
Under
Assessed
Under
Assessed
Under
Assessed
Under
Assessed
4 Under
Assessed
Under
Assessed
Under
Assessed
Under
Assessed
Under
Assessed
Under
Assessed
Under
Assessed
5 Over
Assessed
Over
Assessed
Under
Assessed
Over
Assessed
Over
Assessed
Over
Assessed
Under
Assessed
6 Over
Assessed
Over
Assessed
Over
Assessed
Under
Assessed
Over
Assessed
Over
Assessed
Over
Assessed
7 Over
Assessed
Over
Assessed
Over
Assessed
Under
Assessed
Over
Assessed
Over
Assessed
Over
Assessed
8 Under
Assessed
Under
Assessed
Over
Assessed
Under
Assessed
Under
Assessed
Under
Assessed
Over
Assessed
9 Under
Assessed
Under
Assessed
Over
Assessed
Over
Assessed
Over
Assessed
Under
Assessed
Over
Assessed
1A Over
Assessed
Not
Assessed
at all
Not
Assessed
at all
Not
Assessed
at all
Over
Assessed
Not
Assessed
at all
Not
Assessed
at all
1B Over
Assessed
Under
Assessed
Over
Assessed
Over
Assessed
Under
Assessed
Over
Assessed
Over
Assessed
2A Not
Assessed
at all
Over
Assessed
Under
Assessed
Over
Assessed
Not
Assessed
at all
Over
Assessed
Over
Assessed
2B Under
Assessed
Not
Assessed
at all
Under
Assessed
Under
Assessed
Under
Assessed
Under
Assessed
Under
Assessed
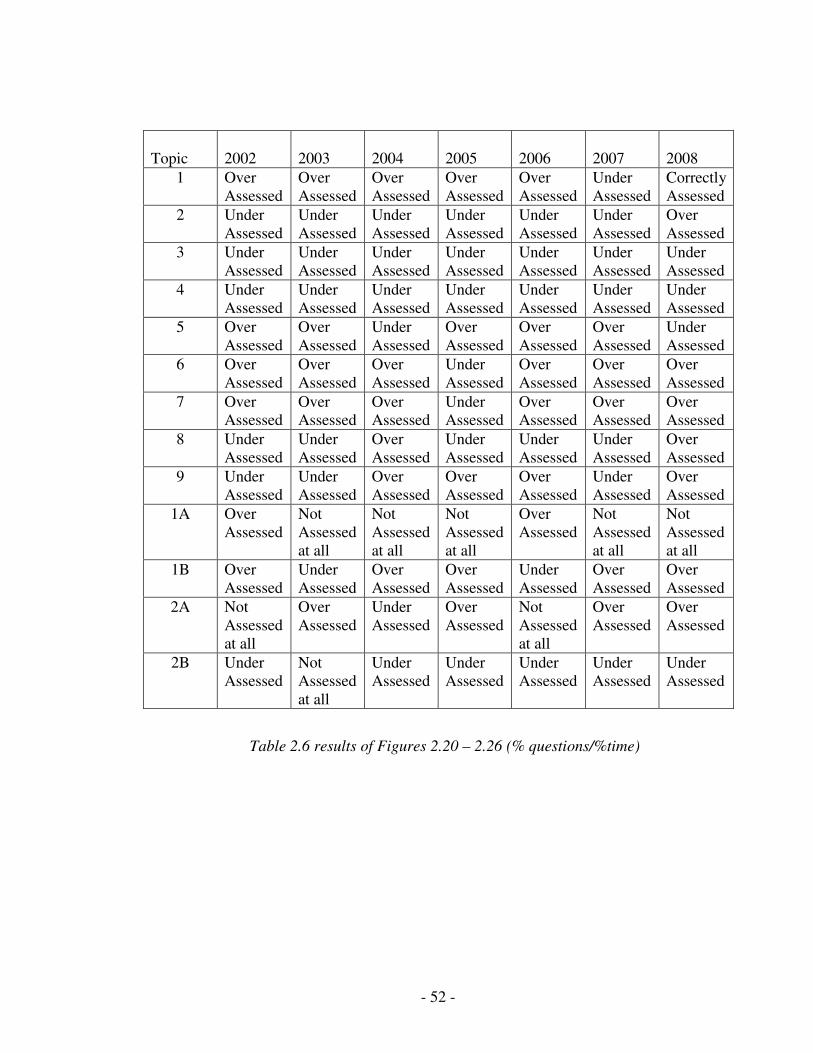
Table 2.6 results of Figures 2.20 – 2.26 (% questions/%time)
- 53 -
Topic
2002
2003
2004
2005
2006
2007
2008
1 Over
Assessed
Under
Assessed
Over
Assessed
Over
Assessed
Over
Assessed
Under
Assessed
Correctly
Assessed
2 Under
Assessed
Under
Assessed
Under
Assessed
Under
Assessed
Under
Assessed
Under
Assessed
Correctly
Assessed
3 Under
Assessed
Under
Assessed
Under
Assessed
Under
Assessed
Under
Assessed
Under
Assessed
Under
Assessed
4 Under
Assessed
Under
Assessed
Under
Assessed
Under
Assessed
Under
Assessed
Under
Assessed
Under
Assessed
5 Over
Assessed
Over
Assessed
Under
Assessed
Under
Assessed
Under
Assessed
Over
Assessed
Under
Assessed
6 Under
Assessed
Over
Assessed
Over
Assessed
Over
Assessed
Over
Assessed
Over
Assessed
Over
Assessed
7 Over
Assessed
Over
Assessed
Over
Assessed
Over
Assessed
Over
Assessed
Over
Assessed
Over
Assessed
8 Under
Assessed
Under
Assessed
Over
Assessed
Over
Assessed
Under
Assessed
Under
Assessed
Over
Assessed
9 Under
Assessed
Under
Assessed
Over
Assessed
Over
Assessed
Over
Assessed
Under
Assessed
Over
Assessed
1A Under
Assessed
Not
Assessed
at all
Not
Assessed
at all
Not
Assessed
at all
Over
Assessed
Not
Assessed
at all
Not
Assessed
at all
1B Under
Assessed
Under
Assessed
Under
Assessed
Under
Assessed
Under
Assessed
Under
Assessed
Under
Assessed
2A Not
Assessed
at all
Over
Assessed
Over
Assessed
Over
Assessed
Not
Assessed
at all
Over
Assessed
Over
Assessed
2B Under
Assessed
Not
Assessed
at all
Under
Assessed
Under
Assessed
Over
Assessed
Under
Assessed
Under
Assessed
Table 2.7 results of Figures 2.20 – 2.26 (% marks/%time)
As seen in Figure 2.20, topic 1 which deals with the periodic table has been over assessed
in both the % questions asked in 2002 and also the % marks allocated. While both topics
dealing with chemical bonding (2) and stoichiometry, formula and equations (3) have been
under - assessed in both the % questions asked in 2002 and also the % marks allocated.
Section 6, which deals with the chemical concept of rates of reaction, shows the greatest
imbalance between the ratio of % questions asked per allocated class time, which is shown
to have been over assessed and also the % marks allocated per time, been shown to be
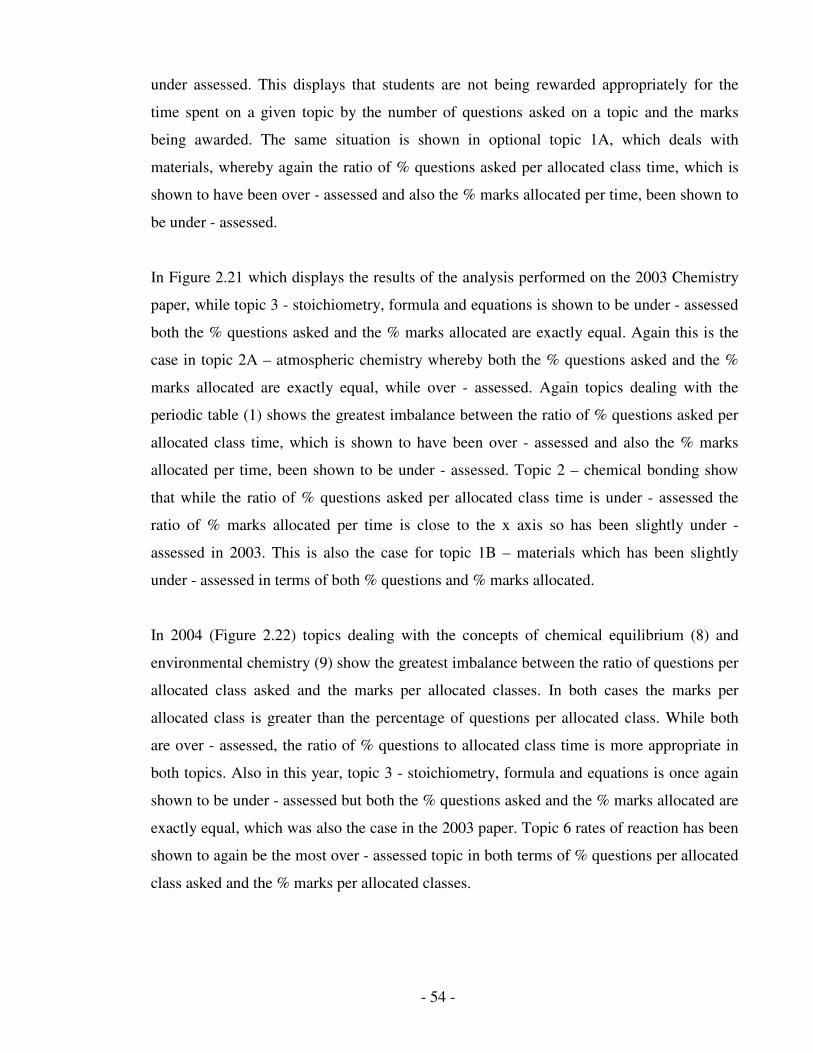
- 54 -
under assessed. This displays that students are not being rewarded appropriately for the
time spent on a given topic by the number of questions asked on a topic and the marks
being awarded. The same situation is shown in optional topic 1A, which deals with
materials, whereby again the ratio of % questions asked per allocated class time, which is
shown to have been over - assessed and also the % marks allocated per time, been shown to
be under - assessed.
In Figure 2.21 which displays the results of the analysis performed on the 2003 Chemistry
paper, while topic 3 - stoichiometry, formula and equations is shown to be under - assessed
both the % questions asked and the % marks allocated are exactly equal. Again this is the
case in topic 2A – atmospheric chemistry whereby both the % questions asked and the %
marks allocated are exactly equal, while over - assessed. Again topics dealing with the
periodic table (1) shows the greatest imbalance between the ratio of % questions asked per
allocated class time, which is shown to have been over - assessed and also the % marks
allocated per time, been shown to be under - assessed. Topic 2 – chemical bonding show
that while the ratio of % questions asked per allocated class time is under - assessed the
ratio of % marks allocated per time is close to the x axis so has been slightly under -
assessed in 2003. This is also the case for topic 1B – materials which has been slightly
under - assessed in terms of both % questions and % marks allocated.
In 2004 (Figure 2.22) topics dealing with the concepts of chemical equilibrium (8) and
environmental chemistry (9) show the greatest imbalance between the ratio of questions per
allocated class asked and the marks per allocated classes. In both cases the marks per
allocated class is greater than the percentage of questions per allocated class. While both
are over - assessed, the ratio of % questions to allocated class time is more appropriate in
both topics. Also in this year, topic 3 - stoichiometry, formula and equations is once again
shown to be under - assessed but both the % questions asked and the % marks allocated are
exactly equal, which was also the case in the 2003 paper. Topic 6 rates of reaction has been
shown to again be the most over - assessed topic in both terms of % questions per allocated
class asked and the % marks per allocated classes.

- 55 -
Figure 2.23 which shows the assessment of % questions per allocated class asked and the %
marks per allocated classes for the 2005 paper, continues to display the under - assessment
of topics 2, 3, and 4 which has been seen in all previous years in both % questions per
allocated class asked and the % marks per allocated classes. This graph also displays the
imbalance that appears in 2005 in questions per allocated class and the marks per allocated
classes for topics 5, 6, 7 and 8. In the case of rates of reaction (6), organic chemistry (7) and
chemical equilibrium (8) the ratio of % questions per allocated class asked has been
calculated to be over - assessed while the ratio of % marks per allocated classes is seen to
be under - assessed with the greatest imbalance being observed for topic 6. Fuels and heats
of reaction (5) however displays the reverse of these three topics with the ratio of %
questions per allocated class has been shown to be over - assessed while the ratio of %
marks per allocated classes has been under - assessed.
In 2006, Figure 2.24, topic 6 which deals with rates of reaction has been shown once again
to be the most over - assessed topic in both terms of questions per allocated class and the
marks per allocated classes, which is a repeat of the trend seen in 2004. Fuels and heats of
reaction obtained almost a perfect ratio between the questions per time allocated while the
ratio of marks per time allocated is seen to be dramatically under - assessed. Once again
sections 2, 3 and 4 are all under - assessed in terms of both % questions and % marks per
allocated class, which has been displayed in the previous five years.
Figure 2.25 which displays the results of analysis performed on the 2007 paper shows that
once again topic 6 which deals with rates of reaction has been shown to be the most over
assessed topic in both terms of % questions per allocated class asked and the % marks per
allocated classes, along with topic 5. While stoichiometry, formula and equations (3) and
volumetric analysis (4) are once again under assessed, topic 2, chemical bonding has
moved closer to the x axis displaying that while this topic is still slightly under - assessed
the balance between classes allocated to this topic in the curriculum has been nearly
achieved in this paper.
In 2008 (Figure 2.26), the trends which have been observed since 2002 continue in that
both stoichiometry, formula and equations (3) and volumetric analysis (4) are once again
under - assessed, while chemical bonding is seen to been allocated the appropriate marks
- 56 -
per allocated class and slightly over - assessed in terms of questions per allocated class.
However in the case of the periodic table (1) a balance has been accomplished between the
marks per allocated class and questions per allocated class. Again topic 6 has been shown
to be the most over - assessed topic in both terms of questions per allocated class asked and
the marks per allocated classes.
In each year every topic has been seen to appear whether in an over - assessed or under -
assessed capacity apart from the optional topics which would not be expected to appear
every year. Analysis has shown that topic 6, rates of reaction has been readily over –
assessed in each of the seven years as has topic 7, organic chemistry, however not to the
same extent as section 6. Analysis has also shown that some core topics are under -
assessed each year with topics 3 and 4, stoichiometry, balancing and equations and
volumetric analysis being under - assessed each year in relation to the number of allocated
classes in the curriculum.
2.3.2.2 Sub topic analysis
Figures 2.27 - 2.33 show the appearance of sub topics over the years 2002 to 2008.
Summary tables of the data are given in Tables 2.8 and 2.9.

- 57 -
2002
0.00
1.00
2.00
3.00
4.00
5.00
6.00
7.00
8.00
9.00
10.00
1.2 1.3 1.4 1.5 2.2 2.3 3.1 4.1 4.3 5.1 5.2 5.4 5.5 6.2 7.2 7.3 7.5 8.1 8.2 9.1 9.3 9.4 1A.2 1B.5 2B.4
Sub - topic
Lev
el
of
Ass
ess
me
nt
% marks/% time % question/% time
Figure 2.27 – Assessment of sub topics in 2002
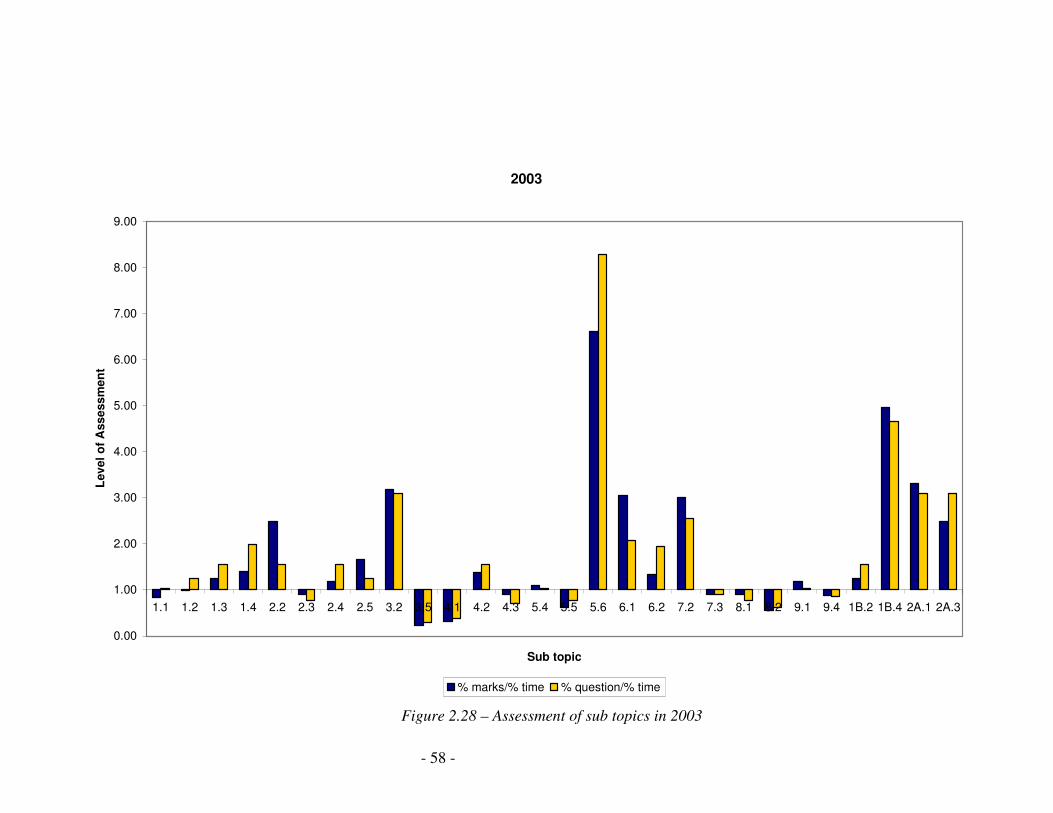
- 58 -
2003
0.00
1.00
2.00
3.00
4.00
5.00
6.00
7.00
8.00
9.00
1.1 1.2 1.3 1.4 2.2 2.3 2.4 2.5 3.2 3.5 4.1 4.2 4.3 5.4 5.5 5.6 6.1 6.2 7.2 7.3 8.1 8.2 9.1 9.4 1B.2 1B.4 2A.1 2A.3
Sub topic
Lev
el
of
Ass
ess
me
nt
% marks/% time % question/% time
Figure 2.28 – Assessment of sub topics in 2003
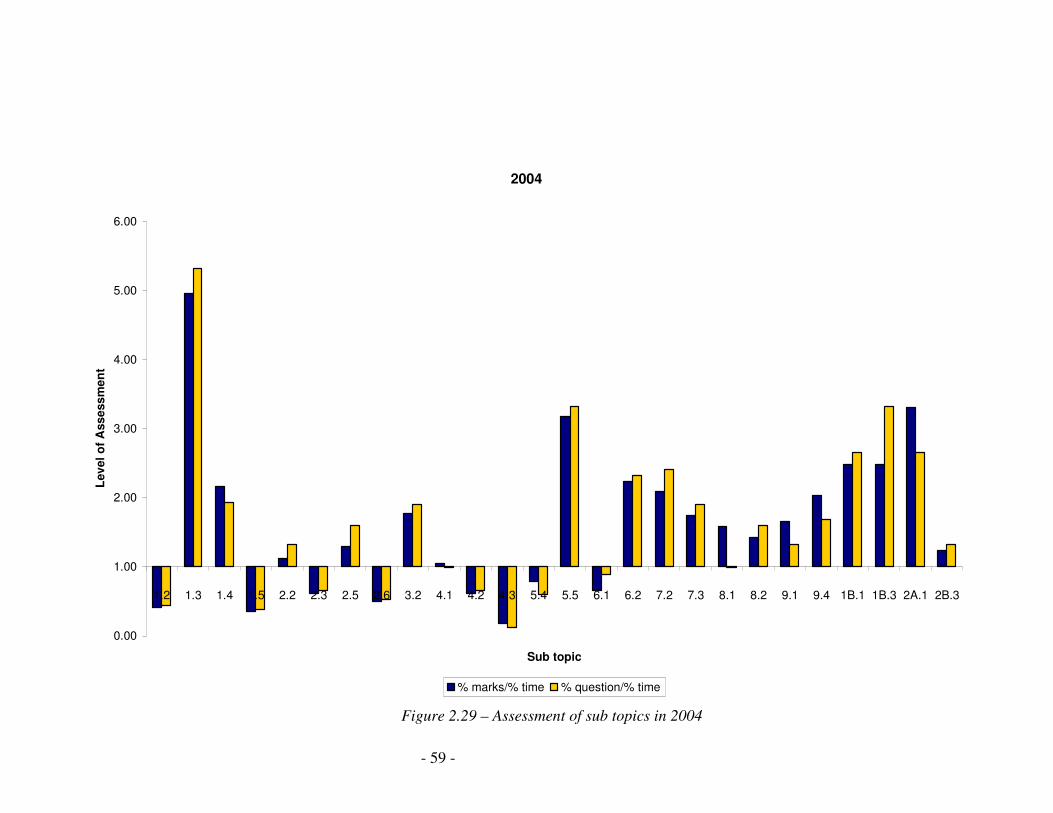
- 59 -
2004
0.00
1.00
2.00
3.00
4.00
5.00
6.00
1.2 1.3 1.4 1.5 2.2 2.3 2.5 2.6 3.2 4.1 4.2 4.3 5.4 5.5 6.1 6.2 7.2 7.3 8.1 8.2 9.1 9.4 1B.1 1B.3 2A.1 2B.3
Sub topic
Lev
el
of
Ass
ess
me
nt
% marks/% time % question/% time
Figure 2.29 – Assessment of sub topics in 2004
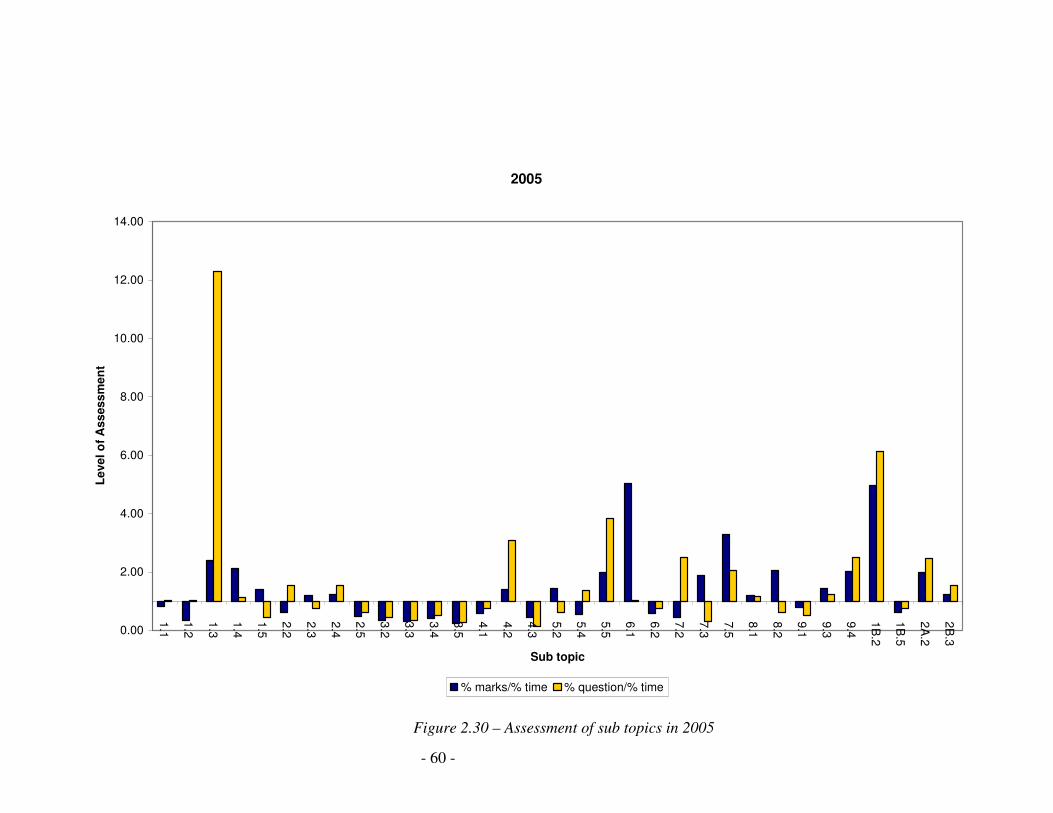
- 60 -
2005
0.00
2.00
4.00
6.00
8.00
10.00
12.00
14.00
1.1
1.2
1.3
1.4
1.5
2.2
2.3
2.4
2.5
3.2
3.3
3.4
3.5
4.1
4.2
4.3
5.2
5.4
5.5
6.1
6.2
7.2
7.3
7.5
8.1
8.2
9.1
9.3
9.4
1B
.2
1B
.5
2A
.2
2B
.3
Sub topic
Le
ve
l o
f A
ss
es
sm
en
t
% marks/% time % question/% time
Figure 2.30 – Assessment of sub topics in 2005
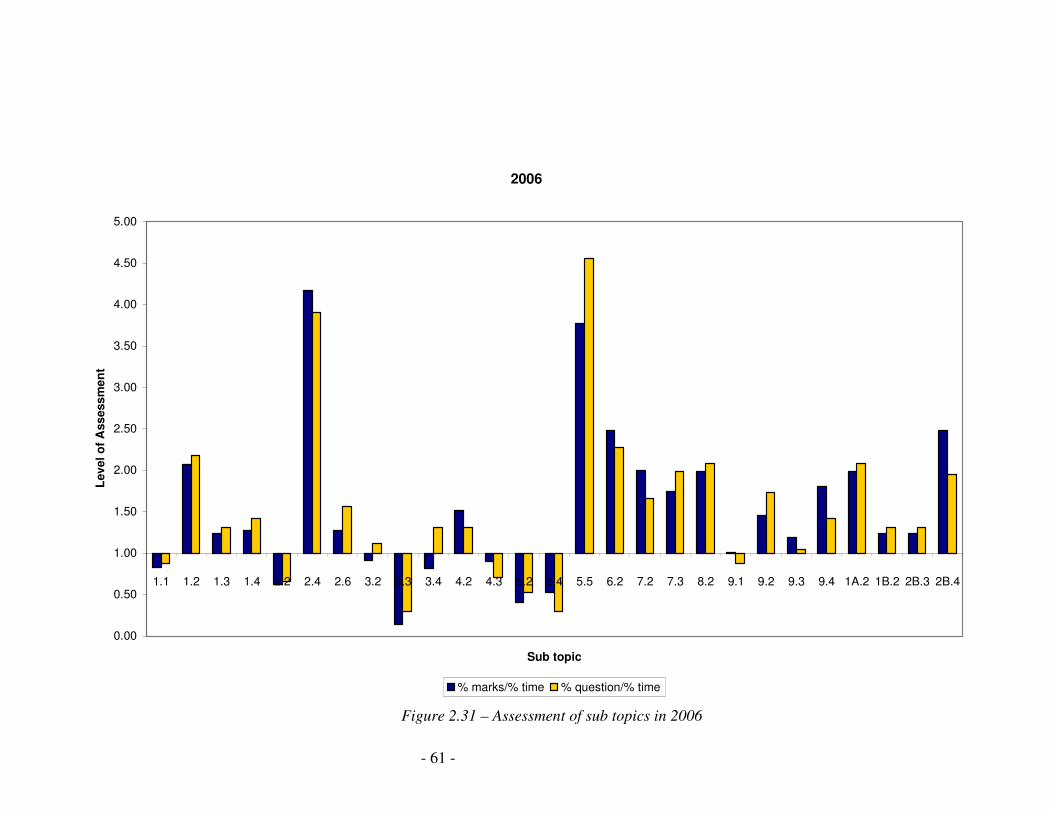
- 61 -
2006
0.00
0.50
1.00
1.50
2.00
2.50
3.00
3.50
4.00
4.50
5.00
1.1 1.2 1.3 1.4 2.2 2.4 2.6 3.2 3.3 3.4 4.2 4.3 5.2 5.4 5.5 6.2 7.2 7.3 8.2 9.1 9.2 9.3 9.4 1A.2 1B.2 2B.3 2B.4
Sub topic
Lev
el
of
Ass
ess
me
nt
% marks/% time % question/% time
Figure 2.31 – Assessment of sub topics in 2006
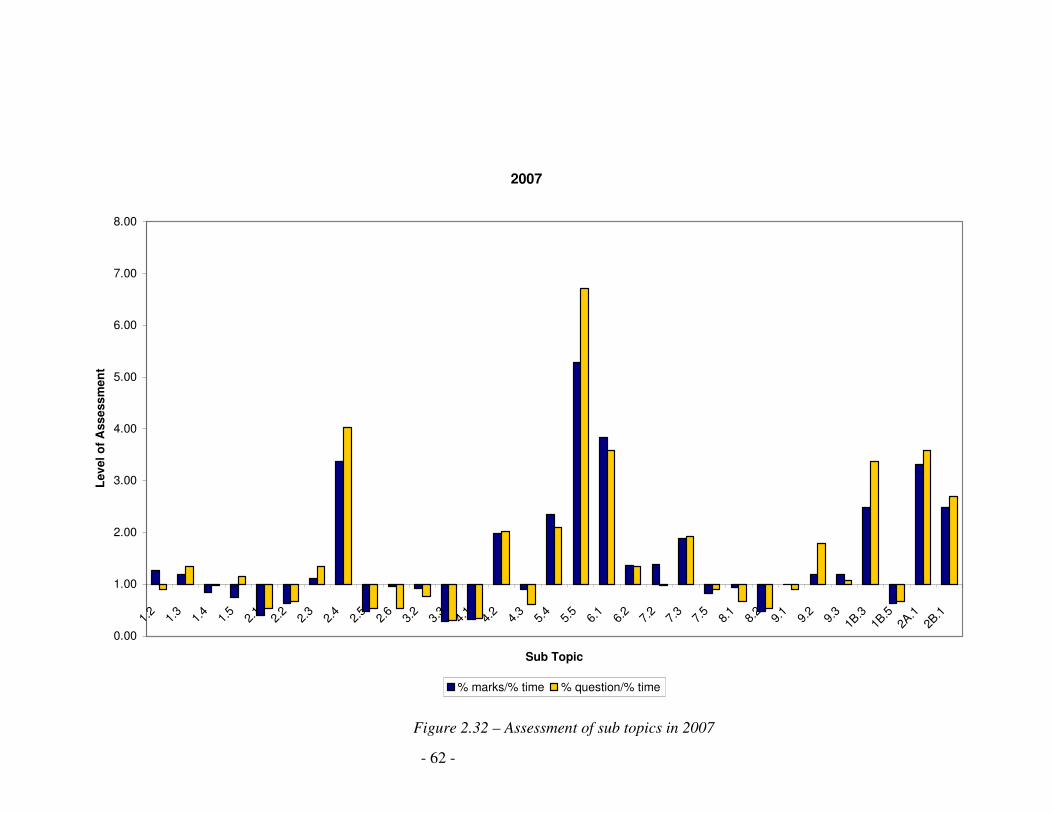
- 62 -
2007
0.00
1.00
2.00
3.00
4.00
5.00
6.00
7.00
8.00
1.2
1.3
1.4
1.5
2.1
2.2
2.3
2.4
2.5
2.6
3.2
3.3
4.1
4.2
4.3
5.4
5.5
6.1
6.2
7.2
7.3
7.5
8.1
8.2
9.1
9.2
9.3
1B.3
1B.5
2A.1
2B.1
Sub Topic
Lev
el
of
Ass
ess
me
nt
% marks/% time % question/% time
Figure 2.32 – Assessment of sub topics in 2007
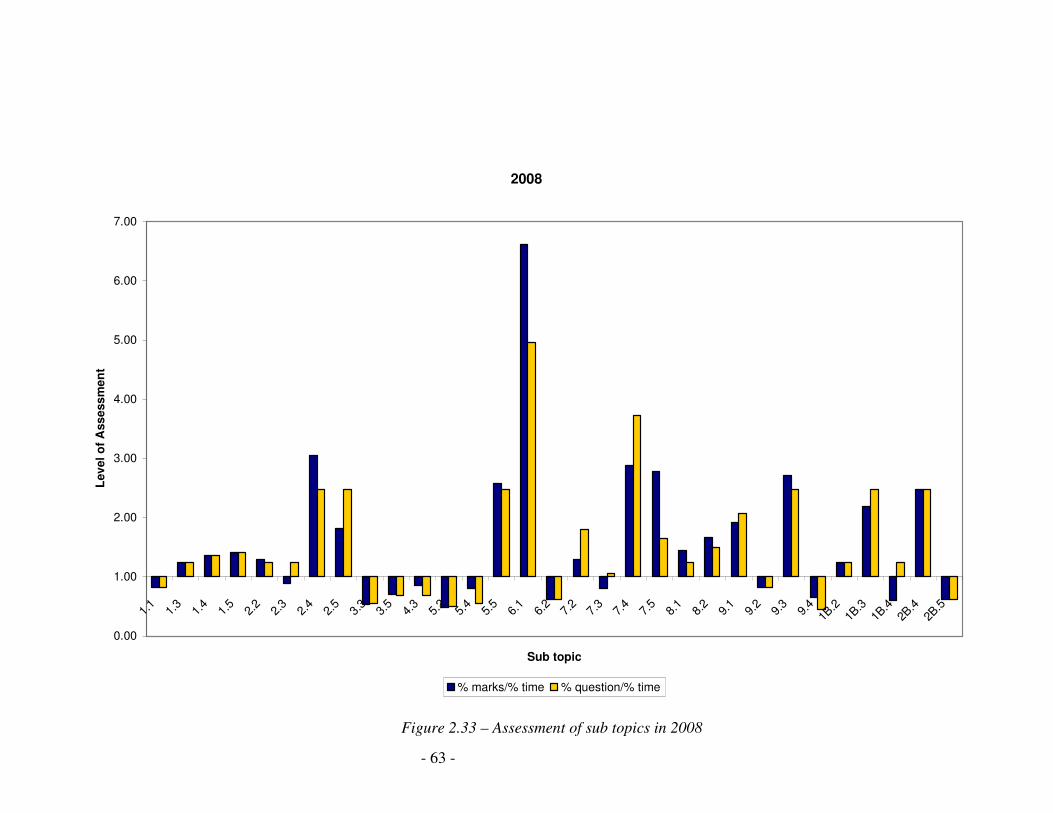
- 63 -
2008
0.00
1.00
2.00
3.00
4.00
5.00
6.00
7.00
1.1
1.3
1.4
1.5
2.2
2.3
2.4
2.5
3.3
3.5
4.3
5.2
5.4
5.5
6.1
6.2
7.2
7.3
7.4
7.5
8.1
8.2
9.1
9.2
9.3
9.4
1B.2
1B.3
1B.4
2B.4
2B.5
Sub topic
Lev
el
of
Ass
ess
me
nt
% marks/% time % question/% time
Figure 2.33 – Assessment of sub topics in 2008
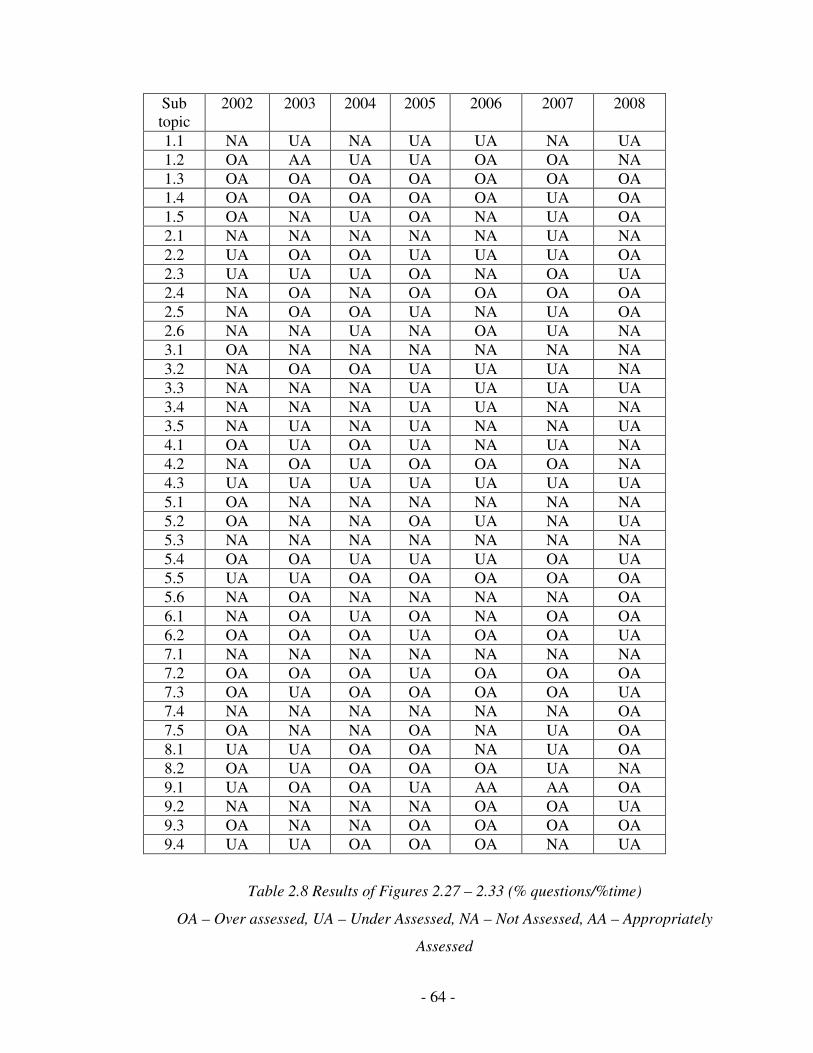
- 64 -
Sub
topic
2002 2003 2004 2005 2006 2007 2008
1.1 NA UA NA UA UA NA UA
1.2 OA AA UA UA OA OA NA
1.3 OA OA OA OA OA OA OA
1.4 OA OA OA OA OA UA OA
1.5 OA NA UA OA NA UA OA
2.1 NA NA NA NA NA UA NA
2.2 UA OA OA UA UA UA OA
2.3 UA UA UA OA NA OA UA
2.4 NA OA NA OA OA OA OA
2.5 NA OA OA UA NA UA OA
2.6 NA NA UA NA OA UA NA
3.1 OA NA NA NA NA NA NA
3.2 NA OA OA UA UA UA NA
3.3 NA NA NA UA UA UA UA
3.4 NA NA NA UA UA NA NA
3.5 NA UA NA UA NA NA UA
4.1 OA UA OA UA NA UA NA
4.2 NA OA UA OA OA OA NA
4.3 UA UA UA UA UA UA UA
5.1 OA NA NA NA NA NA NA
5.2 OA NA NA OA UA NA UA
5.3 NA NA NA NA NA NA NA
5.4 OA OA UA UA UA OA UA
5.5 UA UA OA OA OA OA OA
5.6 NA OA NA NA NA NA OA
6.1 NA OA UA OA NA OA OA
6.2 OA OA OA UA OA OA UA
7.1 NA NA NA NA NA NA NA
7.2 OA OA OA UA OA OA OA
7.3 OA UA OA OA OA OA UA
7.4 NA NA NA NA NA NA OA
7.5 OA NA NA OA NA UA OA
8.1 UA UA OA OA NA UA OA
8.2 OA UA OA OA OA UA NA
9.1 UA OA OA UA AA AA OA
9.2 NA NA NA NA OA OA UA
9.3 OA NA NA OA OA OA OA
9.4 UA UA OA OA OA NA UA
Table 2.8 Results of Figures 2.27 – 2.33 (% questions/%time)
OA – Over assessed, UA – Under Assessed, NA – Not Assessed, AA – Appropriately
Assessed
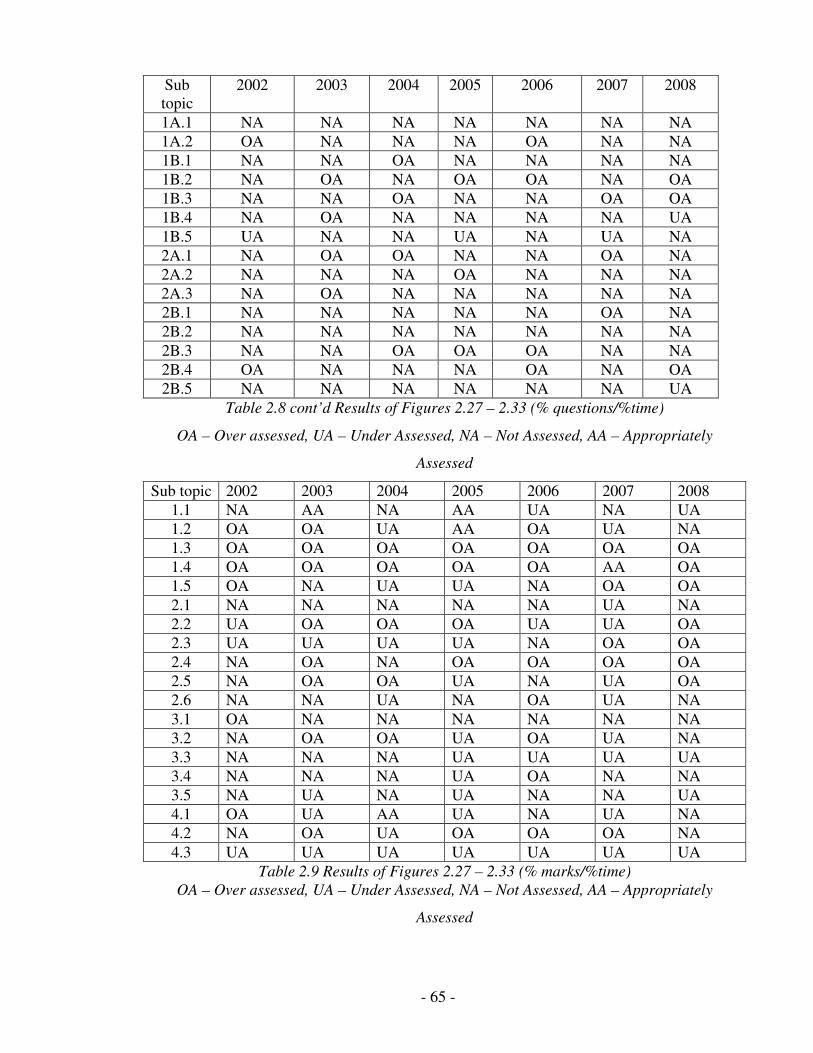
- 65 -
Sub
topic
2002 2003 2004 2005 2006 2007 2008
1A.1 NA NA NA NA NA NA NA
1A.2 OA NA NA NA OA NA NA
1B.1 NA NA OA NA NA NA NA
1B.2 NA OA NA OA OA NA OA
1B.3 NA NA OA NA NA OA OA
1B.4 NA OA NA NA NA NA UA
1B.5 UA NA NA UA NA UA NA
2A.1 NA OA OA NA NA OA NA
2A.2 NA NA NA OA NA NA NA
2A.3 NA OA NA NA NA NA NA
2B.1 NA NA NA NA NA OA NA
2B.2 NA NA NA NA NA NA NA
2B.3 NA NA OA OA OA NA NA
2B.4 OA NA NA NA OA NA OA
2B.5 NA NA NA NA NA NA UA
Table 2.8 cont’d Results of Figures 2.27 – 2.33 (% questions/%time)
OA – Over assessed, UA – Under Assessed, NA – Not Assessed, AA – Appropriately
Assessed
Sub topic 2002 2003 2004 2005 2006 2007 2008
1.1 NA AA NA AA UA NA UA
1.2 OA OA UA AA OA UA NA
1.3 OA OA OA OA OA OA OA
1.4 OA OA OA OA OA AA OA
1.5 OA NA UA UA NA OA OA
2.1 NA NA NA NA NA UA NA
2.2 UA OA OA OA UA UA OA
2.3 UA UA UA UA NA OA OA
2.4 NA OA NA OA OA OA OA
2.5 NA OA OA UA NA UA OA
2.6 NA NA UA NA OA UA NA
3.1 OA NA NA NA NA NA NA
3.2 NA OA OA UA OA UA NA
3.3 NA NA NA UA UA UA UA
3.4 NA NA NA UA OA NA NA
3.5 NA UA NA UA NA NA UA
4.1 OA UA AA UA NA UA NA
4.2 NA OA UA OA OA OA NA
4.3 UA UA UA UA UA UA UA
Table 2.9 Results of Figures 2.27 – 2.33 (% marks/%time)
OA – Over assessed, UA – Under Assessed, NA – Not Assessed, AA – Appropriately
Assessed
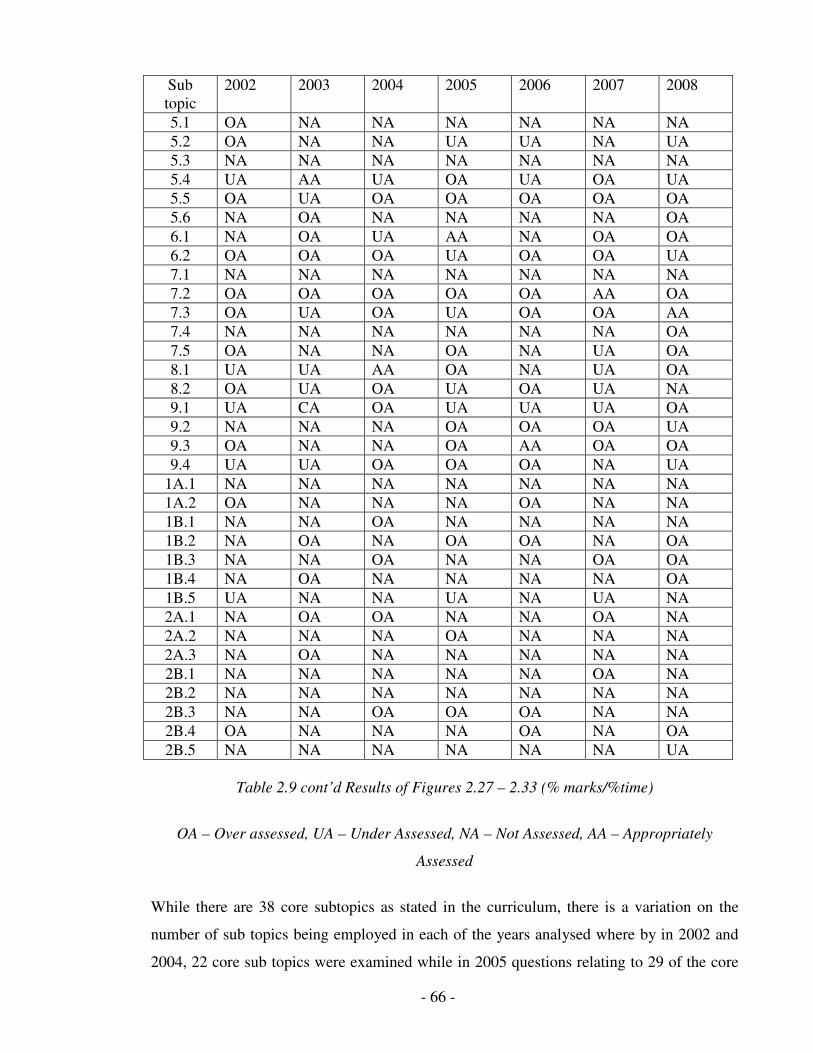
- 66 -
Sub
topic
2002 2003 2004 2005 2006 2007 2008
5.1 OA NA NA NA NA NA NA
5.2 OA NA NA UA UA NA UA
5.3 NA NA NA NA NA NA NA
5.4 UA AA UA OA UA OA UA
5.5 OA UA OA OA OA OA OA
5.6 NA OA NA NA NA NA OA
6.1 NA OA UA AA NA OA OA
6.2 OA OA OA UA OA OA UA
7.1 NA NA NA NA NA NA NA
7.2 OA OA OA OA OA AA OA
7.3 OA UA OA UA OA OA AA
7.4 NA NA NA NA NA NA OA
7.5 OA NA NA OA NA UA OA
8.1 UA UA AA OA NA UA OA
8.2 OA UA OA UA OA UA NA
9.1 UA CA OA UA UA UA OA
9.2 NA NA NA OA OA OA UA
9.3 OA NA NA OA AA OA OA
9.4 UA UA OA OA OA NA UA
1A.1 NA NA NA NA NA NA NA
1A.2 OA NA NA NA OA NA NA
1B.1 NA NA OA NA NA NA NA
1B.2 NA OA NA OA OA NA OA
1B.3 NA NA OA NA NA OA OA
1B.4 NA OA NA NA NA NA OA
1B.5 UA NA NA UA NA UA NA
2A.1 NA OA OA NA NA OA NA
2A.2 NA NA NA OA NA NA NA
2A.3 NA OA NA NA NA NA NA
2B.1 NA NA NA NA NA OA NA
2B.2 NA NA NA NA NA NA NA
2B.3 NA NA OA OA OA NA NA
2B.4 OA NA NA NA OA NA OA
2B.5 NA NA NA NA NA NA UA
Table 2.9 cont’d Results of Figures 2.27 – 2.33 (% marks/%time)
OA – Over assessed, UA – Under Assessed, NA – Not Assessed, AA – Appropriately
Assessed
While there are 38 core subtopics as stated in the curriculum, there is a variation on the
number of sub topics being employed in each of the years analysed where by in 2002 and
2004, 22 core sub topics were examined while in 2005 questions relating to 29 of the core
- 67 -
sub topics were asked. The appearance of optional sub topics remains constant at either 4 or
5 of the 14 optional sub topics appearing each year.
In 2002 there were a number of subtopics being both over - assessed, 17 sub topics, and
under assessed 9 sub topics (see Figure 2.27). However the sub topic concerning the
sources of hydrocarbons has been allocated a high percentage of both questions and marks
in relation to the number of classes allocated by the curriculum as it gives the highest peak
on this graph, with questions far surpassing the marks. According to this graph and the
values obtained, this sub topic is very much over - assessed on this paper in relation to the
number of classes allocated. In the same year, chromatography and instrumentation in
organic chemistry was the second highest peak on this graph, with the ratio of marks to
classes allocated being greater than the ratio of questions to classes allocated. One of the
sub topics however, 5.4 shows that exothermic and endothermic reactions were correctly
assigned their marks in comparison to the classes allocated however were under - assessed
in terms of the questions that should have been asked. In no instance through out the sub
topics identified in 2002, did the level of % questions equal the % marks allocated in terms
of classes allocated. The closest to this is 1.5 – oxidation and reduction, but while the %
questions is almost equal to the % marks allocated, both of these are determined to be over
- assessed in comparison to number of allocated classes.
In 2003 the highest peak reached on Figure 2.28, is by the sub section dealing with
chemical fuels with again the % of marks allocated being lower than the % questions asked
on this sub topic. Also in this year the optional sub topics are showing a larger %
appearance and % marks allocation with each of the four identified being over - assessed in
comparison to the number of classes allocated. Again sub topic 5.4 shows the closest
agreement between % marks and % questions per class allocated, with both values nearing
an ideal ratio of 1.
In 2004, sub section 1.3 - radioactivity displays the highest disproportion between % marks
and % questions per allocated class, with the optional topics all being shown as over -
assessed in both terms of % questions and % marks allocated. This particular year shows
the highest number of sub topics being over assessed with 8 subtopics calculated to be
under- assessed in both terms of % questions and % marks allocated. Sub topic 5.4, which

- 68 -
had demonstrated to be correctly assessed in terms of % questions and % marks allocated in
both previous years is seen to be under - assessed in 2004 (Figure 2.29).
The 2005 examination paper (Figure 2.30) displays the most number of sub topics being
questioned since the introduction of the 2000 curriculum, and to-date this is still the case
with 29 core sub topics and 4 optional sub topics being assessed. Here as in 2004 sub
section 1.3 - radioactivity displays the highest disproportion between % marks and %
questions per allocated class. Also in this year sub topics; 1.1 - periodic table, 1.2 – atomic
structure, 1.5 – oxidation and reduction, 2.2 – ionic bonding, 2.3 – covalent bonding, 5.2 –
structure of aliphatic hydrocarbons, 5.4 – exothermic and endothermic reaction, 7.2 –
planar carbons, 7.3 – organic chemical reactions and 8.2 – le chateliers principle, all display
under - assessment in one of the two variables, % marks per class allocated or % questions
per class allocated, while being over - assessed in the other. This shows that there is an
unequal distribution in the marks awarded for a given question on a sub topic and students
are not receiving apt marks for their work.
In 2006 (Figure 2.31) both sub topics 3.3 – the mole and 5.5 – oil refining were found to be
over - assessed in terms of the % marks allocated per class and also % questions appearing
per class. Again all of the optional sub topics were over assessed in this year while only two
sub topics displayed under - assessment in one of the two variables, % marks per class
allocated or % questions per class allocated, while being over - assessed in the other, 3.2 –
gas laws and 3.4 – chemical formulae. 2006 also displayed the smallest number of sub
topics being under - assessed in terms of % marks per allocated class and % questions per
allocated class.
2007 demonstrates the second highest number of core sub topics being employed on the
paper – 27. Of these sub topics the largest peaks are shown by sub section 5.5 – oil refining
and its products and 2.4 – electronegativity each displaying that the ratio of % marks
allocated per class was less than the % questions asked per class in this year. This year also
shows a large number of sub topics being under - assessed in terms of both % marks
allocated per class and % questions asked per class as 13 sub topics appear below the x axis
in Figure 2.32.

- 69 -
Sub topic 6.1 – reaction rates, shows the highest peak in Figure 2.33 with ratio of % marks
allocated per class surpassing the ratio of % questions asked per class in this year, 2008.
Only two sub topics have shown under - assessment in one of the two variables, % marks
per class allocated or % questions per class allocated, while being over - assessed in the
other 2.3 – covalent bonding and 7.3 – organic chemical reactions.
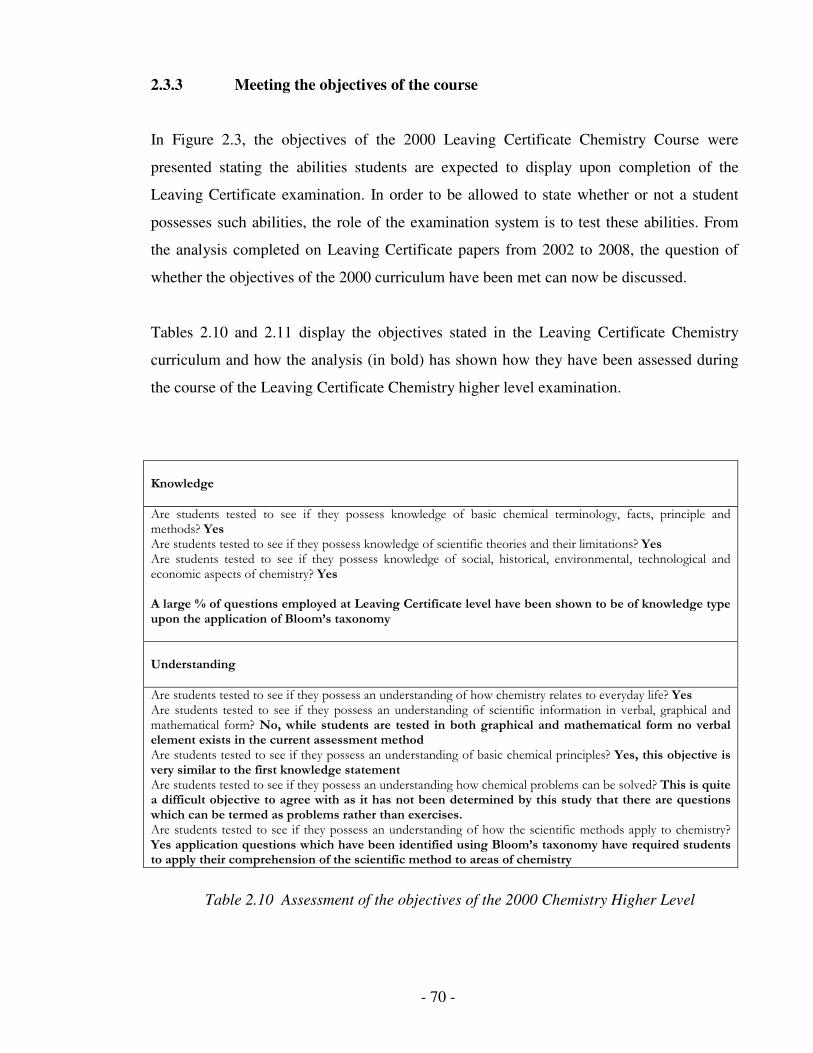
- 70 -
2.3.3 Meeting the objectives of the course
In Figure 2.3, the objectives of the 2000 Leaving Certificate Chemistry Course were
presented stating the abilities students are expected to display upon completion of the
Leaving Certificate examination. In order to be allowed to state whether or not a student
possesses such abilities, the role of the examination system is to test these abilities. From
the analysis completed on Leaving Certificate papers from 2002 to 2008, the question of
whether the objectives of the 2000 curriculum have been met can now be discussed.
Tables 2.10 and 2.11 display the objectives stated in the Leaving Certificate Chemistry
curriculum and how the analysis (in bold) has shown how they have been assessed during
the course of the Leaving Certificate Chemistry higher level examination.
Knowledge
Are students tested to see if they possess knowledge of basic chemical terminology, facts, principle and methods? Yes Are students tested to see if they possess knowledge of scientific theories and their limitations? Yes Are students tested to see if they possess knowledge of social, historical, environmental, technological and economic aspects of chemistry? Yes A large % of questions employed at Leaving Certificate level have been shown to be of knowledge type upon the application of Bloom’s taxonomy
Understanding
Are students tested to see if they possess an understanding of how chemistry relates to everyday life? Yes Are students tested to see if they possess an understanding of scientific information in verbal, graphical and mathematical form? No, while students are tested in both graphical and mathematical form no verbal element exists in the current assessment method Are students tested to see if they possess an understanding of basic chemical principles? Yes, this objective is very similar to the first knowledge statement Are students tested to see if they possess an understanding how chemical problems can be solved? This is quite a difficult objective to agree with as it has not been determined by this study that there are questions which can be termed as problems rather than exercises. Are students tested to see if they possess an understanding of how the scientific methods apply to chemistry? Yes application questions which have been identified using Bloom’s taxonomy have required students to apply their comprehension of the scientific method to areas of chemistry
Table 2.10 Assessment of the objectives of the 2000 Chemistry Higher Level
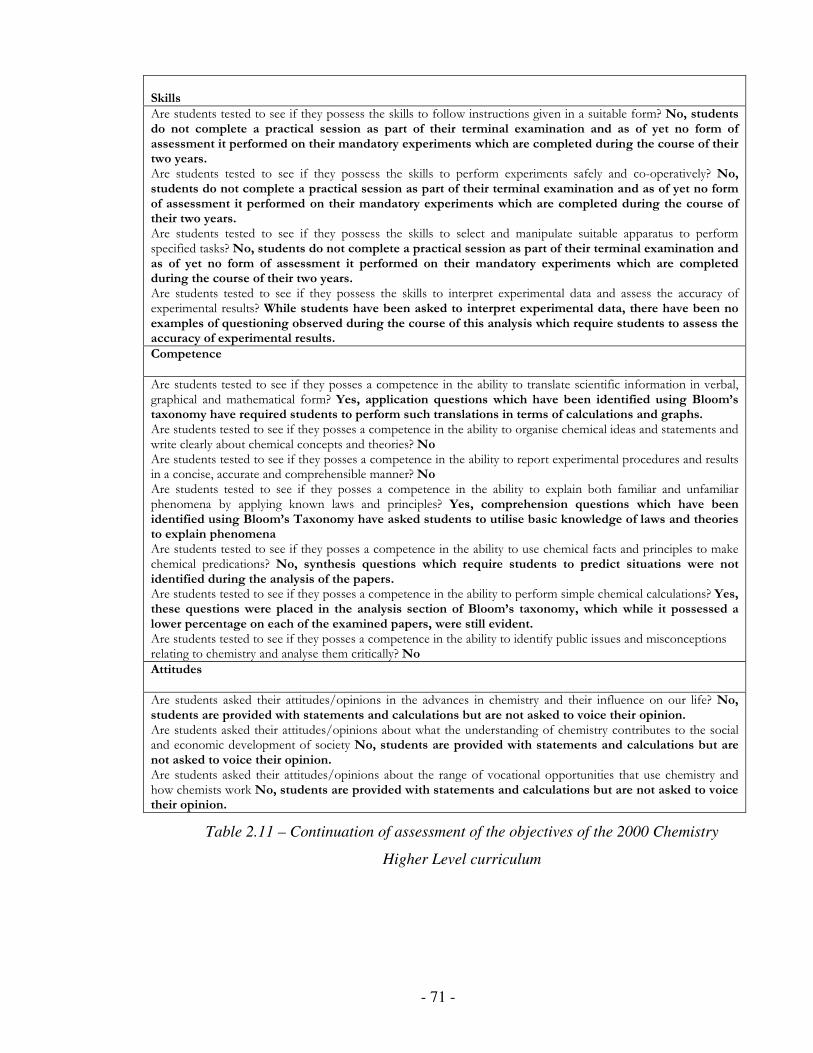
- 71 -
Skills
Are students tested to see if they possess the skills to follow instructions given in a suitable form? No, students do not complete a practical session as part of their terminal examination and as of yet no form of assessment it performed on their mandatory experiments which are completed during the course of their two years. Are students tested to see if they possess the skills to perform experiments safely and co-operatively? No, students do not complete a practical session as part of their terminal examination and as of yet no form of assessment it performed on their mandatory experiments which are completed during the course of their two years. Are students tested to see if they possess the skills to select and manipulate suitable apparatus to perform specified tasks? No, students do not complete a practical session as part of their terminal examination and as of yet no form of assessment it performed on their mandatory experiments which are completed during the course of their two years. Are students tested to see if they possess the skills to interpret experimental data and assess the accuracy of experimental results? While students have been asked to interpret experimental data, there have been no examples of questioning observed during the course of this analysis which require students to assess the accuracy of experimental results. Competence
Are students tested to see if they posses a competence in the ability to translate scientific information in verbal, graphical and mathematical form? Yes, application questions which have been identified using Bloom’s taxonomy have required students to perform such translations in terms of calculations and graphs. Are students tested to see if they posses a competence in the ability to organise chemical ideas and statements and write clearly about chemical concepts and theories? No Are students tested to see if they posses a competence in the ability to report experimental procedures and results in a concise, accurate and comprehensible manner? No Are students tested to see if they posses a competence in the ability to explain both familiar and unfamiliar phenomena by applying known laws and principles? Yes, comprehension questions which have been identified using Bloom’s Taxonomy have asked students to utilise basic knowledge of laws and theories to explain phenomena Are students tested to see if they posses a competence in the ability to use chemical facts and principles to make chemical predications? No, synthesis questions which require students to predict situations were not identified during the analysis of the papers. Are students tested to see if they posses a competence in the ability to perform simple chemical calculations? Yes, these questions were placed in the analysis section of Bloom’s taxonomy, which while it possessed a lower percentage on each of the examined papers, were still evident. Are students tested to see if they posses a competence in the ability to identify public issues and misconceptions relating to chemistry and analyse them critically? No Attitudes
Are students asked their attitudes/opinions in the advances in chemistry and their influence on our life? No, students are provided with statements and calculations but are not asked to voice their opinion. Are students asked their attitudes/opinions about what the understanding of chemistry contributes to the social and economic development of society No, students are provided with statements and calculations but are not asked to voice their opinion. Are students asked their attitudes/opinions about the range of vocational opportunities that use chemistry and how chemists work No, students are provided with statements and calculations but are not asked to voice their opinion.
Table 2.11 – Continuation of assessment of the objectives of the 2000 Chemistry
Higher Level curriculum
- 72 -
As can be seen from Tables 2.10 and 2.11, from the twenty three objectives, stated in the
curriculum, only eight objectives have been identified by this study as being achieved by
the current assessment used at Leaving Certificate level. The objectives under the heading
of skills and attitudes are met to the least extent as there is no scope under the current
terminal examination for either of these objectives to be met.
Students are not required to express personal opinions about the impact that chemistry has
on their lives or society during the course of the examination, and to date no practical
element has been incorporated into the final assessment, which would be the only possible
way of assessing students’ experimental skills which have been outlined in the stated
objectives.
- 73 -
2.4 Conclusion
From the application of Bloom’s taxonomy to the nine years of examination papers and as
was seen in Section 2.3.1, the levels of lower order questions identified in each year in
examinations, far surpasses the % of questions and marks allocated to those questions of a
higher order.
The lack of the appearance of the higher order questioning types, synthesis and evaluation,
has resulted in no marks being allocated for these questioning types. It would be expected
that had these styles been employed on the examination that they would merit a greater
percentage of the marks allocated. These questions demand a higher level of understanding
on the part of the student and this would be reflected in a greater reward for students’
attempts to defend their opinions and summations of chemical knowledge. Interestingly
with the introduction of the 2000 curriculum which was examined in 2000 and 2001,
analysis of both of these years has shown that the inclusion of higher level questions
yielded a higher percentage that those years examined under the 2000 curriculum.
While it is not suggested that examinations should on any level only employ higher order
questions, it is expected that a balance can be obtained in order to assess all levels of
student understanding. Bloom’s model of student learning15
states that students must have a
competence in the lower order questions before they can begin to be able to answer the
higher order questions. Therefore it stands that in order to give all students an opportunity
to obtain some level of completion of the exam, a certain level of the paper should be
allocated to lower order question styles. However in order to fully assess the level of
understanding that a student has engaged in during their Leaving Certificate years, there
must be a full representation of all levels of lower and higher order questioning.

- 74 -
From the analysis performed on the appearance of subtopics in terms of marks allocated
and questions asked there was a constant disagreement between these two ratios. During the
six years examined there were no cases identified where the ratio of % marks per allocated
class exactly matched by the ratio of % questions per allocated class. Some sub topics have
appeared in each of the seven years analysed, in either an under - assessed or over -
assessed capacity but have appeared each year since 2002.
Among these were: the electronic structure of atoms, oxidation and reduction and factor
affecting the rate of reaction, while on the other end of the scale some sub topics have
appeared less frequently or not at all. These included sources of hydrocarbons, chemical
compounds, tetrahedral carbons and chemical fuels.
However in the case of these subtopics, they have been identified according to the depth of
treatment section of the curriculum structure (see Figure 2.3). While some of these sections
may include balancing of equations and chemical bonding, which would be considered to
be essential components of basic chemistry, have not been identified as separate subtopics.
These have been identified as part of the volumetric analysis or organic chemistry section
e.g. if a student is asked to balance an organic chemistry equation dealing with the
combustion of a hydrocarbon, that has been considered to be part of the organic chemistry
sub-topic rather than the application of students’ ability to balance an equation which is a
different sub-topic.
From the analysis performed on the question/time and mark/time ratio which was a result of
the analysis performed in terms of sub topics, some core topics are being over - assessed,
especially in the case of rates of reaction which has been observed to be the highest ratio of
over - assessment in five out of the seven analysed years. Others topics are being constantly
under - assessed in relation to the time that they have been allocated in the new curriculum,
with examples of stoichiometry, balancing equations and volumetric analysis. It must be
stated however that this analysis shows the imbalance in questions/time to that topic in the
curriculum and mark/time allocated to that topic in the curriculum, which shows if a topic
is being over or under - assessed in comparison to the time devoted to it in the curriculum.
- 75 -
From this analysis it would be suggested that revisions be made to the employment of
questions on the terminal examination to appropriately reflect the amount of time suggested
to allocate to that topic/sub – topic. It is only right that if a chemical concept requires
twenty two classes to complete that students receive appropriate questions and marks to
reflect the effort and time spent learning this concept.
The imbalance which is displayed in Figures 2.20 to 2.33, suggests that a review of both the
curriculum and the questions asked of students relating to topics/sub topics needs to be
performed by the NCCA and Department of Science and Education to ensure a balance is
found between the level of questioning employed in the Leaving Certificate Chemistry
examination and the appearance of topics/sub topics.
As can be seen in Section 2.3 the objectives have not been met completely, from those
stated in the Chemistry curriculum, except those relating to student knowledge. The area
which has shown the greatest lack of assessment is students’ display of skills obtained
during their completion of the Leaving Certificate course and student attitudes. In no case
during the assessment are students required to complete a practical session, as the terminal
examination is purely a written examination. It is suggested that the experimentally based
questions, which are examined in Section A will draw on student experiences in the
laboratory with the completion of their mandatory experiments; however there is no
questioning in place to differentiate those students who have completed the experiment and
those who have simply memorised the procedure in the text book. Neither are students
required to, at any point, express their individual opinions or attitudes towards the impact
that chemistry has on their lives or on society but rather are provided with chemical facts.
The lack of STS related questions up to 2004 has already been highlighted in the thesis of
Jemma Lynch5 and so has not been focused on in this study.
The curriculum is currently under revision, predominantly looking at the inclusion of a
second component to address the underassessment of laboratory work. However, it is
suggested from the analysis performed during this study that the level of questioning
employed requires attention as well as the reflection of the allocated class period to the
number of questions and marks awarded for topics/sub topics in the curriculum.

- 76 -
It is hoped that a revision of the terminal examination with closer attention being paid to the
stated objectives outlined by the Leaving Certificate Chemistry curriculum would result in
students completing this examination with all of the expected abilities appropriately
assessed.
- 77 -
References
1. Childs, P. (2002) “Securing the future of chemistry: A case study of developments
in chemical education in Ireland” CERP 3 (3), 361 – 369
2. McCarthy, J. (1994) Revised Leaving Certificate Chemistry curriculum, Chemistry
in Action 40
3. Department of Education and Science. Leaving Certificate Guidelines for Teachers.
[Online] (2000)http://www.education.ie/servlet/blobservlet/lc_chemistry_guide.pdf
4. An Roinn Oideachais agus Eolaiochta, Leaving Certificate Chemistry Curriculum
(Ordinary and Higher Level); Dublin, The Stationary Office (1999)
5. Lynch, J. (2006) “An analysis of the implementation of STS in the new Leaving
Certificate curriculum” M.Sc Thesis, University of Limerick
6. Bennet, S.W (2004) “Assessment in Chemistry and the role of examinations”
University Chemistry Education 8, 52 – 57
7. Bloom, B. (1956) Taxonomy of Educational Objectives, David McHay Co Inc,
New York
8. Noble, T. (2004). Integrating the revised bloom's taxonomy with multiple
intelligences: A planning tool for curriculum differentiation, Teachers College
Record 106, 193, Blackwell Publishing Limited.
9. Ferguson, C. (2002). Using the Revised Taxonomy to Plan and Deliver Team-
Taught, Integrated, Thematic Units. Theory into Practice, 41 (4), 239-244.
10. Pfeiffer, L. and Davis, O.L. (1965) Teacher made examinations – What kind of
thinking do they demand? NASSP Bulletin 49, 1-10
11. Sloan F.A. and Pate, R.T. (1966) Teacher student interaction in two approaches to
mathematics. The Elementary School Journal 67, 161-167
12. Bennet, J. and Kennedy, D. (2001) International Journal of Science Education 23, 1.
91 - 110
13. Gall, M.D. (1972) The use of questions in teaching. Review of Educational
Research, 40, 707 – 721
14. Dalton, J. and Smith, D. (1986) “Extending Children’s Special Abilities – Strategies
for primary classrooms” Department of School Education, Victoria. Melbourne 36-
37
- 78 -
Chapter 3
Use of Classroom Response Systems
for continuous assessment to
encourage student engagement
- 79 -
3.1 Introduction
Classroom response systems have been used as a rapid and efficient means of carrying out
a method of formative assessment - continuous assessment. This chapter will detail the type
of questioning possible and the development of appropriate questions.
3.1.1 Classroom response systems (PADs)
As stated in chapter 1, formative assessment when used appropriately can actively engage
students in lecture material which is often seen as abstract and difficult to most students.
One of the problems with the introduction of continuous assessment (a form of formative
assessment) especially in cases where the cohort is large, approximately 200 students, are
the logistics involved in dealing with a large group.
Clickers, personal assessment devices (PADs) and classroom response systems are all
names describing the electronic system employed by educators to sample the knowledge of
all their students, at any time, without students having to risk embarrassing themselves in
front of their peers. A student who is hesitant to raise a hand in response to certain chemical
questions may feel no inhibition to responding when using the PADs1.
As with the introduction of any new technology as an educational tool, the pedagogical
reasoning behind their implementation must stand up to scrutiny. Draper
2 sets forward the
following arguments for the use of PADs in the classroom, in that they can provide:
• Assessment, both formative and summative;
• Formative feedback on learning;
• Formative feedback on teaching to the lecturer;
• Room for peer assessment;
• The opportunity to build community mutual awareness;
• An opening for experiments using human responses;
• Opportunity to initiate a discussion especially in small groups.
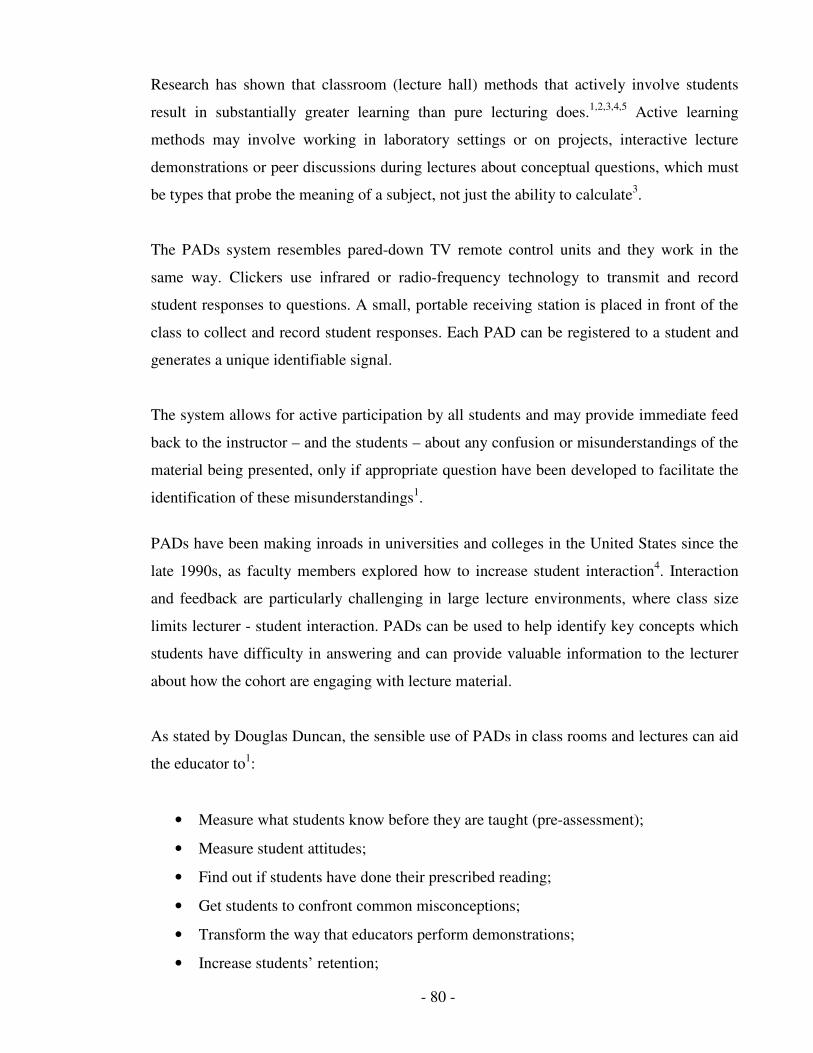
- 80 -
Research has shown that classroom (lecture hall) methods that actively involve students
result in substantially greater learning than pure lecturing does.1,2,3,4,5
Active learning
methods may involve working in laboratory settings or on projects, interactive lecture
demonstrations or peer discussions during lectures about conceptual questions, which must
be types that probe the meaning of a subject, not just the ability to calculate3.
The PADs system resembles pared-down TV remote control units and they work in the
same way. Clickers use infrared or radio-frequency technology to transmit and record
student responses to questions. A small, portable receiving station is placed in front of the
class to collect and record student responses. Each PAD can be registered to a student and
generates a unique identifiable signal.
The system allows for active participation by all students and may provide immediate feed
back to the instructor – and the students – about any confusion or misunderstandings of the
material being presented, only if appropriate question have been developed to facilitate the
identification of these misunderstandings1.
PADs have been making inroads in universities and colleges in the United States since the
late 1990s, as faculty members explored how to increase student interaction4. Interaction
and feedback are particularly challenging in large lecture environments, where class size
limits lecturer - student interaction. PADs can be used to help identify key concepts which
students have difficulty in answering and can provide valuable information to the lecturer
about how the cohort are engaging with lecture material.
As stated by Douglas Duncan, the sensible use of PADs in class rooms and lectures can aid
the educator to1:
• Measure what students know before they are taught (pre-assessment);
• Measure student attitudes;
• Find out if students have done their prescribed reading;
• Get students to confront common misconceptions;
• Transform the way that educators perform demonstrations;
• Increase students’ retention;
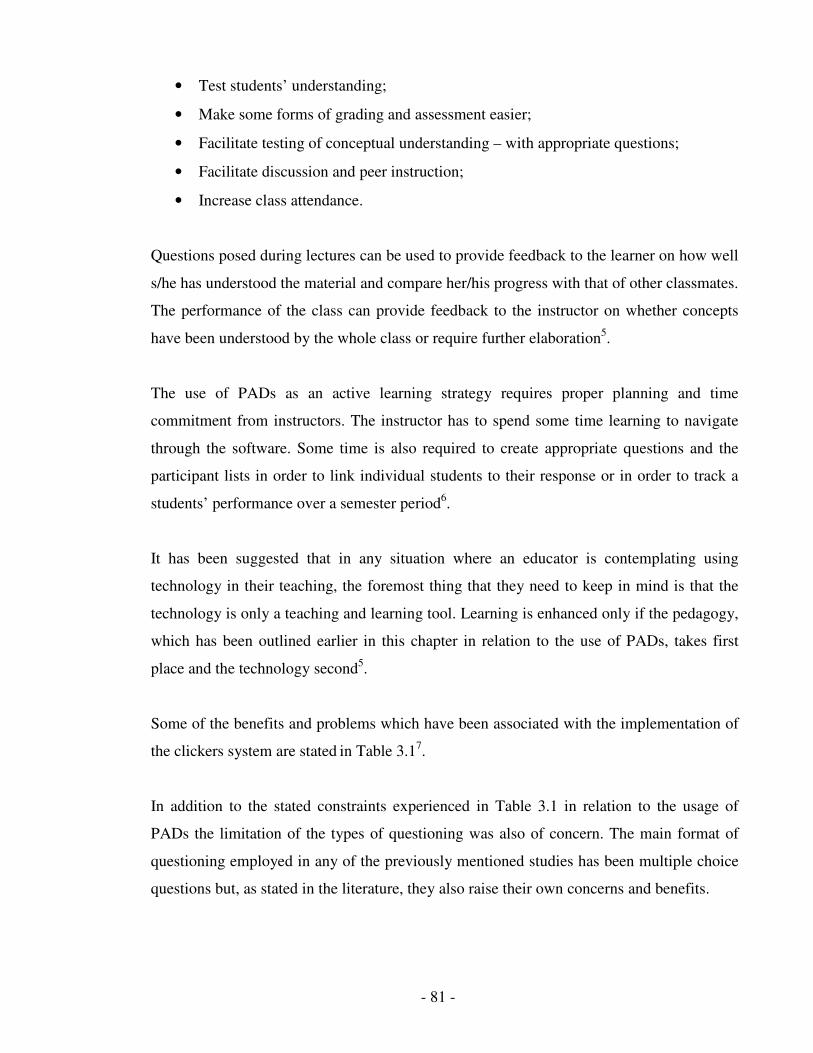
- 81 -
• Test students’ understanding;
• Make some forms of grading and assessment easier;
• Facilitate testing of conceptual understanding – with appropriate questions;
• Facilitate discussion and peer instruction;
• Increase class attendance.
Questions posed during lectures can be used to provide feedback to the learner on how well
s/he has understood the material and compare her/his progress with that of other classmates.
The performance of the class can provide feedback to the instructor on whether concepts
have been understood by the whole class or require further elaboration5.
The use of PADs as an active learning strategy requires proper planning and time
commitment from instructors. The instructor has to spend some time learning to navigate
through the software. Some time is also required to create appropriate questions and the
participant lists in order to link individual students to their response or in order to track a
students’ performance over a semester period6.
It has been suggested that in any situation where an educator is contemplating using
technology in their teaching, the foremost thing that they need to keep in mind is that the
technology is only a teaching and learning tool. Learning is enhanced only if the pedagogy,
which has been outlined earlier in this chapter in relation to the use of PADs, takes first
place and the technology second5.
Some of the benefits and problems which have been associated with the implementation of
the clickers system are stated in Table 3.1
7.
In addition to the stated constraints experienced in Table 3.1 in relation to the usage of
PADs the limitation of the types of questioning was also of concern. The main format of
questioning employed in any of the previously mentioned studies has been multiple choice
questions but, as stated in the literature, they also raise their own concerns and benefits.
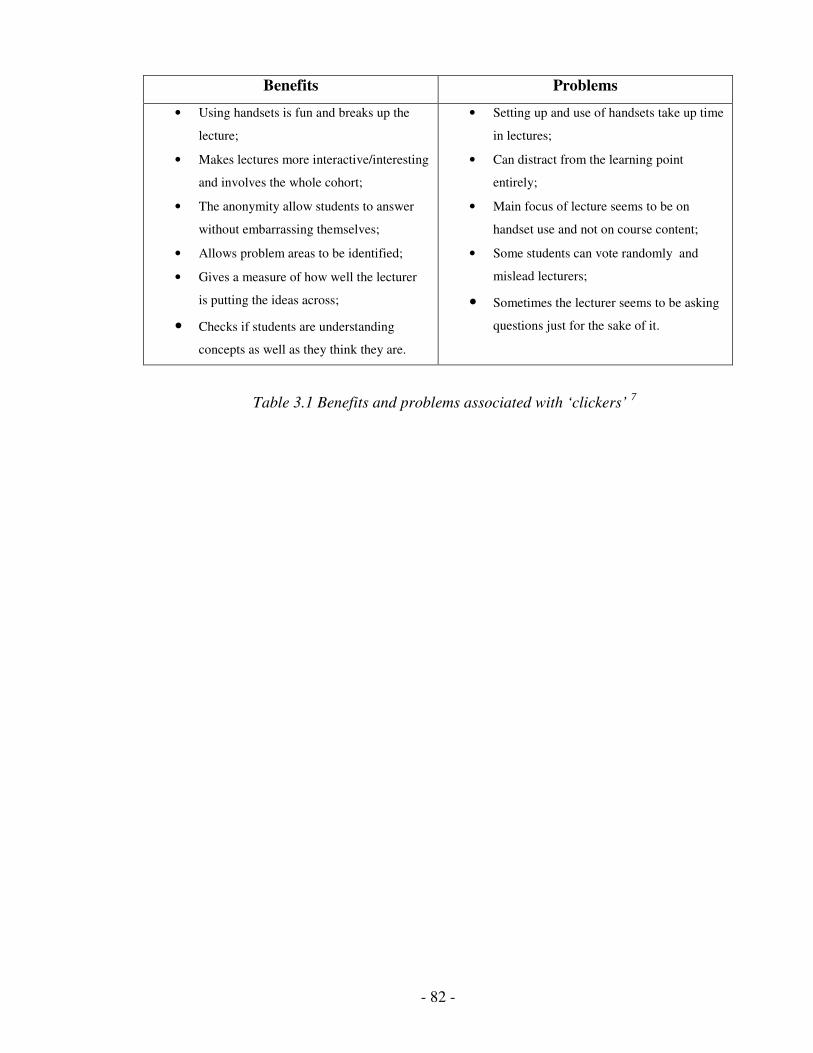
- 82 -
Benefits Problems
• Using handsets is fun and breaks up the
lecture;
• Makes lectures more interactive/interesting
and involves the whole cohort;
• The anonymity allow students to answer
without embarrassing themselves;
• Allows problem areas to be identified;
• Gives a measure of how well the lecturer
is putting the ideas across;
• Checks if students are understanding
concepts as well as they think they are.
• Setting up and use of handsets take up time
in lectures;
• Can distract from the learning point
entirely;
• Main focus of lecture seems to be on
handset use and not on course content;
• Some students can vote randomly and
mislead lecturers;
• Sometimes the lecturer seems to be asking
questions just for the sake of it.
Table 3.1 Benefits and problems associated with ‘clickers’ 7
- 83 -
3.1.2 Multiple Choice Questions
While there are a number of different methods of assessment available to educators, some
often choose to rely on simple methods for testing – such as multiple choice questioning –
or on the traditional methods of written examinations. Berk quips that the multiple choice
questioning format ‘holds the world record in categories such as most popular, most
unpopular, most used and most misused, most loved and most hated’8.
The multiple choice questioning format has been criticised almost since the time of its
inception. The most formidable challenge perhaps was during the 1990s as an increasing
number of educationalists, guided by the constructivist theories proffered by Maron &
Saljo9, Entwistle
10, Biggs
11 and Ramsden
12, argued for teaching and assessment methods
that encourage higher order thinking skills.
Multiple choice questions have a reputation of being easy to set, easy to answer and easy to
mark and it is recognised there is a danger that they may be all of the above. In their
defence however it has been argued that any form of assessment can be designed for a
particular level of difficulty8. The difficulty level depends upon the nature of the questions
asked and also how the multiple choice questions fit into the overall scheme of assessment.
Multiple choice types of assessment have some disadvantages compared to written
assessment. Educators cannot be certain if students have demonstrated knowledge levels
appropriate to their marks, as guessing and looking for patterns are obvious tactics which
can be employed to answer this form of questioning. It has been suggested that the use of
multiple choice questions may encourage learning of surface detail rather than a deeper
understanding of the under lying concepts13
.
Some students will learn by rote regardless of which assessment format is employed in
their learning. The development of appropriate multiple choice questions can be used to
distinguish the surface learner from the deeper learner by setting questions which require
analysis and application skills.
- 84 -
The element of guess work is a problem that educators also readily associate with multiple
choice questions. It has been argued that this is no worse than a student who adopts the
‘write-all-you-know’ approach to a question for which s/he can generally expect to pick up
marks for the correct points the marker has laboriously identified within the largely
irrelevant answer14
.
There are various possibilities that have been suggested to coping with the problem of
guessing including15
:
• Use of negative marking to discourage students from equating multiple choice with
multiple guesses;
• Adopting mathematical strategies to “normalise” marks achieved;
• Ensuring there are sufficient options for each question and/or raising the overall
pass mark for the test to reduce the likelihood of a student passing through chance.
There are a number of advantages associated with the multiple choice questions for their
defence as a form of valid assessment. They are objective, so variations in marking due to
subjective factors are eliminated and this also makes them easy to mark16
. They are
efficient because questions take less time to complete on the part of the student and
therefore it is possible to test a greater range of the curriculum through their
employement15
.
Multiple choice questions are versatile and it is only if they are inappropriately used or
poorly designed that there is a risk of being too easy or for them to be concentrated on
surface level learning.
Poorly designed questions may17
:
• Give away clues to the answer;
• Fail to test the skills required by the intended learning outcomes;
• Contain obvious wrong answers which can be eliminated by students with only
limited knowledge;
• Encourage rote learning;
• Confuse or frustrate students with sound understanding.

- 85 -
Multiple choice questioning is an economical and versatile assessment instrument capable
of providing the necessary precision required to measure learning outcomes. Multiple
choice questions are capable of being truly effective as long as psychometric editing is
performed; however this is essential for all of types of assessment18
.
During the course of their employment in this study, the disadvantages and advantages of
multiple choice questioning have been taken into account to ensure that they are used in an
appropriate and accessible manner.
The multiple choice format has been used as a form of continuous assessment in this study,
where a continuous assessment element was introduced into a physical chemistry lecture
and contributed 20% to the end of year examination. Students also completed a written
examination at the end of semester and it was hoped that the use of multiple choice
questioning in this format will help to encourage student engagement in lecture material
and provide feedback to lecturers as to areas of difficulty through appropriate questioning.
Taking into consideration all of the stated advantages and disadvantages of both the
‘clickers (PADs)’ and of multiple choice questions put forward by the literature, it was
decided that a continuous assessment element would be implemented into a physical
chemistry module within Dublin City University. This continuous assessment element
would utilise the multiple choice format and be implemented using the PADs system which
was easier when dealing with a large cohort instead of traditional pen and paper assessment
and results will be discussed in chapter 3.
While this form of technology has been employed in a lecture environment to introduce
formative assessment to 2nd
year students, another form of technology will be discussed
later, in chapter 4, to show how this was used to implement another formative assessment
to 1st year chemistry students.
- 86 -
3.2 Methodology
The continuous assessment (CA) element was introduced to encourage of student
engagement and these CA elements involved questions underpinning the core concepts of
the physical chemistry module – CS201 Kinetics and Thermodynamics. Results from
previous years have shown that students find this module particularly challenging and
lecturers have associated student difficulties with student lack of interaction with the course
material and their inability to deal with the required mathematical element. The CA
element accounted for 20% of the final mark for this particular module. The PADs were
used to as the means for conducting the CA element.
This module consisted of twenty-four lectures, twelve lectures based on the core concepts
of Kinetics and twelve lectures on Thermodynamics. 126 students from four different
programmes (Analytical Science, Biotechnology, Science Education and Chemical &
Pharmaceutical Sciences) registered for module CS201, which is a 2nd
year undergraduate
chemistry module, with an average of 81 students attending the 7 assessment elements.
The questions were developed in collaboration with the two lecturers involved. The core
concepts in both Kinetics and Thermodynamics were at the fore-front of the issues which
had arisen in previous years. The questions needed to assess students understanding of
basic concepts as, with the demanding nature of this subject area, it is essential that students
have a grasp of the basic elements before they can progress onto the more complex and
advanced concepts.
The PADs used in this particular instance were the Quizdom R4 remotes which are used in
conjunction with Microsoft PowerPoint 2003/2007 edition. These remotes operate by
infrared technology and receive data from each handheld remote to a parent hub connected
to the lecturers’ laptop or PC. The lecturer creates their presentation on Microsoft
PowerPoint and launches the Quizdom Interactive Quiz on demand. This software along
with 200 student hand held remotes can cost in the region of €16,000 in 2006.
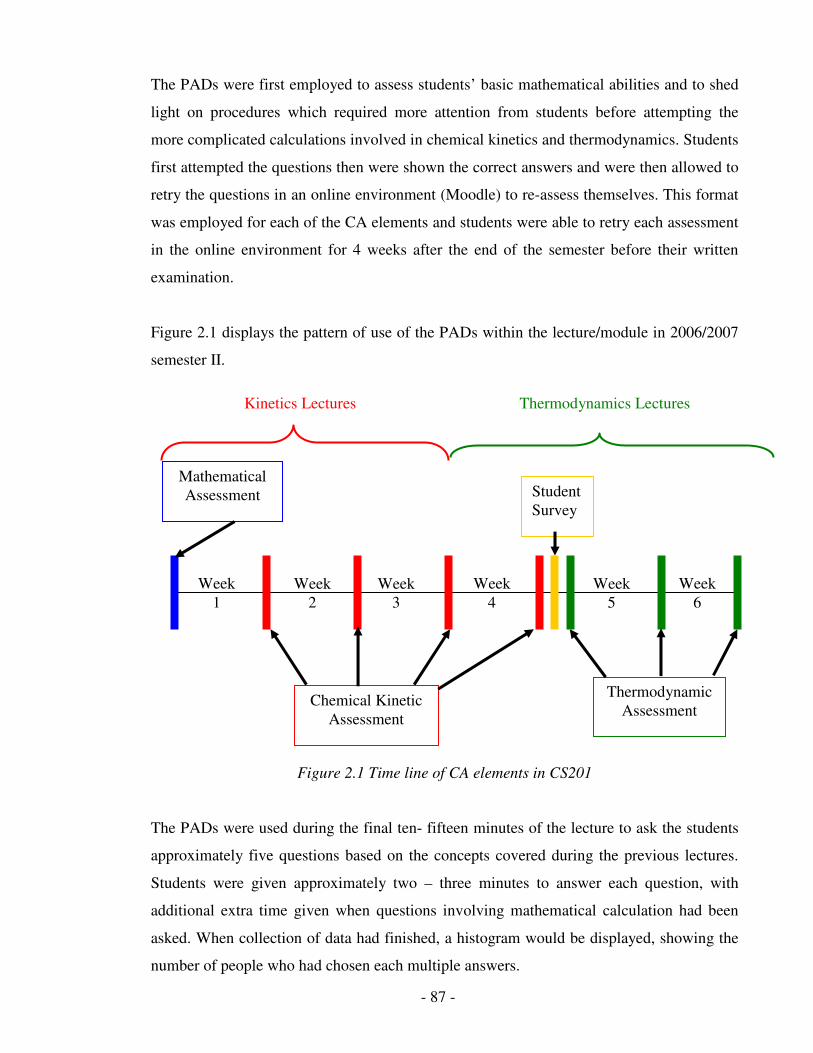
- 87 -
The PADs were first employed to assess students’ basic mathematical abilities and to shed
light on procedures which required more attention from students before attempting the
more complicated calculations involved in chemical kinetics and thermodynamics. Students
first attempted the questions then were shown the correct answers and were then allowed to
retry the questions in an online environment (Moodle) to re-assess themselves. This format
was employed for each of the CA elements and students were able to retry each assessment
in the online environment for 4 weeks after the end of the semester before their written
examination.
Figure 2.1 displays the pattern of use of the PADs within the lecture/module in 2006/2007
semester II.
Figure 2.1 Time line of CA elements in CS201
The PADs were used during the final ten- fifteen minutes of the lecture to ask the students
approximately five questions based on the concepts covered during the previous lectures.
Students were given approximately two – three minutes to answer each question, with
additional extra time given when questions involving mathematical calculation had been
asked. When collection of data had finished, a histogram would be displayed, showing the
number of people who had chosen each multiple answers.
Week
6
Week
5
Week
4
Week
3
Week
2
Week
1
Mathematical
Assessment
Chemical Kinetic
Assessment
Thermodynamic
Assessment
Student
Survey
Kinetics Lectures Thermodynamics Lectures
- 88 -
Everyone participating could see the degree of consensus, while knowing themselves their
selected answer and so how this compared to the rest of the cohort. Each person’s response
was anonymous to the rest of the audience, but for the purpose of the assessment the
lecturer could track a students’ performance based on their allocated eight digit student
number which was required to log into the PADs system.
During this module students were also asked to complete a survey in week 6 of the
semester, which contained a series of statements about the PADs and continuous
assessment element. Students were informed that opinions expressed during this survey
were for research purpose only and had no impact on or contribution to their assessment.
- 89 -
3.3 Results & Discussion
The questions which this study aims to answer are:
� Can the PADs be used to help to develop independent learning?
� Can suitable questions be employed to test student abilities in relation to physical
chemistry concepts, given the limitations of PADs?
� Can the introduction of PADs be effectively used to engage students in module
CS201?
� What are student opinions in relation to the introduction of a continuous assessment
element and the tool used to assess them?
3.3.1 Students Mathematical Assessment
At the beginning of lectures for module CS201, students were required to conduct a series
of questions involving mathematical techniques. It was hoped that the assessment of
students’ mathematical abilities would help to identify for both the lectures and students
themselves, those who had difficulty with simple calculations, derivations and graphical
interpretation.
The PADs were introduced so students would become familiar with how these assessment
tools would be incorporated into future lectures. This first introduction allowed students to
interact with the lecturer and discussion began among students as to what the correct
answers could have been. Students were given adequate time to complete this assessment
and, as it would not contribute to the CA element, students were also shown immediately
how they and their class mates had performed in this assessment element. Students were
able to compare their performance with those of their class mates and identify what
mathematical areas were posing problems for the cohort.
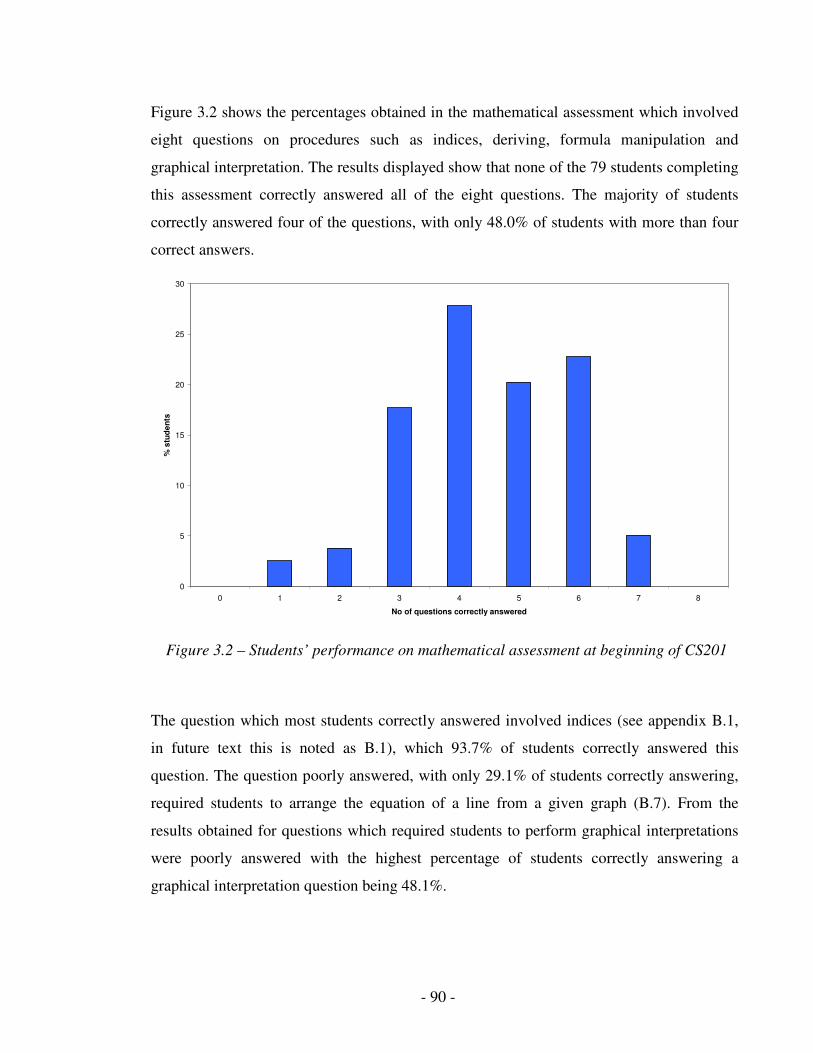
- 90 -
Figure 3.2 shows the percentages obtained in the mathematical assessment which involved
eight questions on procedures such as indices, deriving, formula manipulation and
graphical interpretation. The results displayed show that none of the 79 students completing
this assessment correctly answered all of the eight questions. The majority of students
correctly answered four of the questions, with only 48.0% of students with more than four
correct answers.
0
5
10
15
20
25
30
0 1 2 3 4 5 6 7 8
No of questions correctly answered
% s
tud
en
ts
The question which most students correctly answered involved indices (see appendix B.1,
in future text this is noted as B.1), which 93.7% of students correctly answered this
question. The question poorly answered, with only 29.1% of students correctly answering,
required students to arrange the equation of a line from a given graph (B.7). From the
results obtained for questions which required students to perform graphical interpretations
were poorly answered with the highest percentage of students correctly answering a
graphical interpretation question being 48.1%.
Figure 3.2 – Students’ performance on mathematical assessment at beginning of CS201
- 91 -
The number of questions correctly answered by student varied from 1 correct to 7 correct
however no student incorrectly answered all 8 questions which was somewhat encouraging
while on the other end of the scale no student correctly answered all 8 questions either.
Among the questions asked of students were indices (B.1), determination of rate (B.2),
derivation (B.3), graphical interpretation (B.4, B.6, B.7, and B.8) and formula manipulation
(B.5).
From these questions it was determined that while B.1, B.2, and B.3 were answered well by
the cohort with 97%, 75% and 87% respectively, there was a noted decrease especially in
those questions that required students to perform graphical interpretation. Questions B.4,
B.6 and B.7 showed the lowest percentages of this assessment with 39%, 35% and 29% of
students selecting the correct answer, with B.7 being the question which the majority of
students were unable to answer correctly.
In this question (B.7) students were given a graph with labelled x and y axis and asked to
identify the correct equation of the line for this particular graph. The majority of students
reverted back to their learned formula of y = mx + c, while if they had applied this known
formula to the graph itself they would have correctly identified the slope. This shows that
while students had learned the correct formula to calculate the equation of a line, they were
unable to apply this knowledge to the given graph.
In question 1(B.1), students were asked to identify which mathematical expression was the
same as 3 x from a choice of four possible answers. Only 2 students were unable to
correctly identify x 3/1 as the equivalent, as they chose x3 demonstrating that they didn’t
understand the significance of the cubed root. In the second most correctly answered
question, (B.3) students were asked to correctly identify the derivative of 3x4. 87% of the
cohort were able to identify correctly that the derivative was 12x3 while the majority of the
students incorrectly identified the derivative of 3x4 as 12x. Students identifying this answer
have correctly multiplied the power by the coefficient of x, however they neglected to
subtract one from the original power to leave it x3.
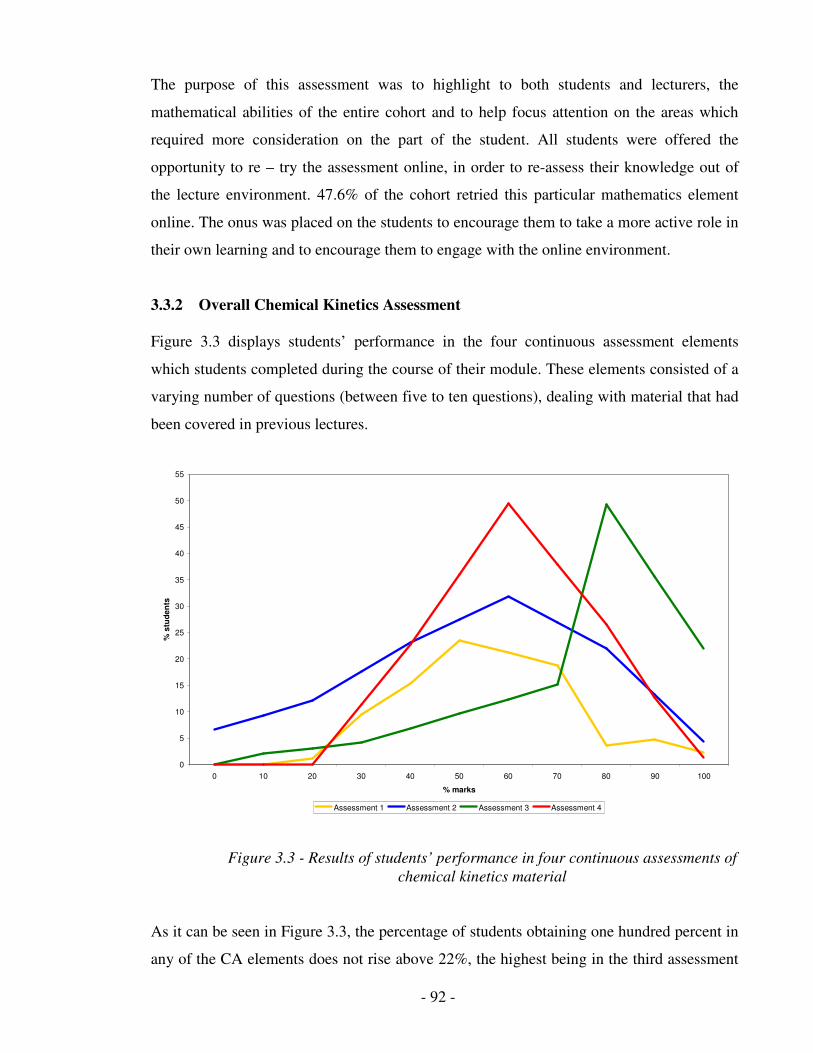
- 92 -
The purpose of this assessment was to highlight to both students and lecturers, the
mathematical abilities of the entire cohort and to help focus attention on the areas which
required more consideration on the part of the student. All students were offered the
opportunity to re – try the assessment online, in order to re-assess their knowledge out of
the lecture environment. 47.6% of the cohort retried this particular mathematics element
online. The onus was placed on the students to encourage them to take a more active role in
their own learning and to encourage them to engage with the online environment.
3.3.2 Overall Chemical Kinetics Assessment
Figure 3.3 displays students’ performance in the four continuous assessment elements
which students completed during the course of their module. These elements consisted of a
varying number of questions (between five to ten questions), dealing with material that had
been covered in previous lectures.
0
5
10
15
20
25
30
35
40
45
50
55
0 10 20 30 40 50 60 70 80 90 100
% marks
% s
tud
en
ts
Assessment 1 Assessment 2 Assessment 3 Assessment 4
As it can be seen in Figure 3.3, the percentage of students obtaining one hundred percent in
any of the CA elements does not rise above 22%, the highest being in the third assessment
Figure 3.3 - Results of students’ performance in four continuous assessments of
chemical kinetics material
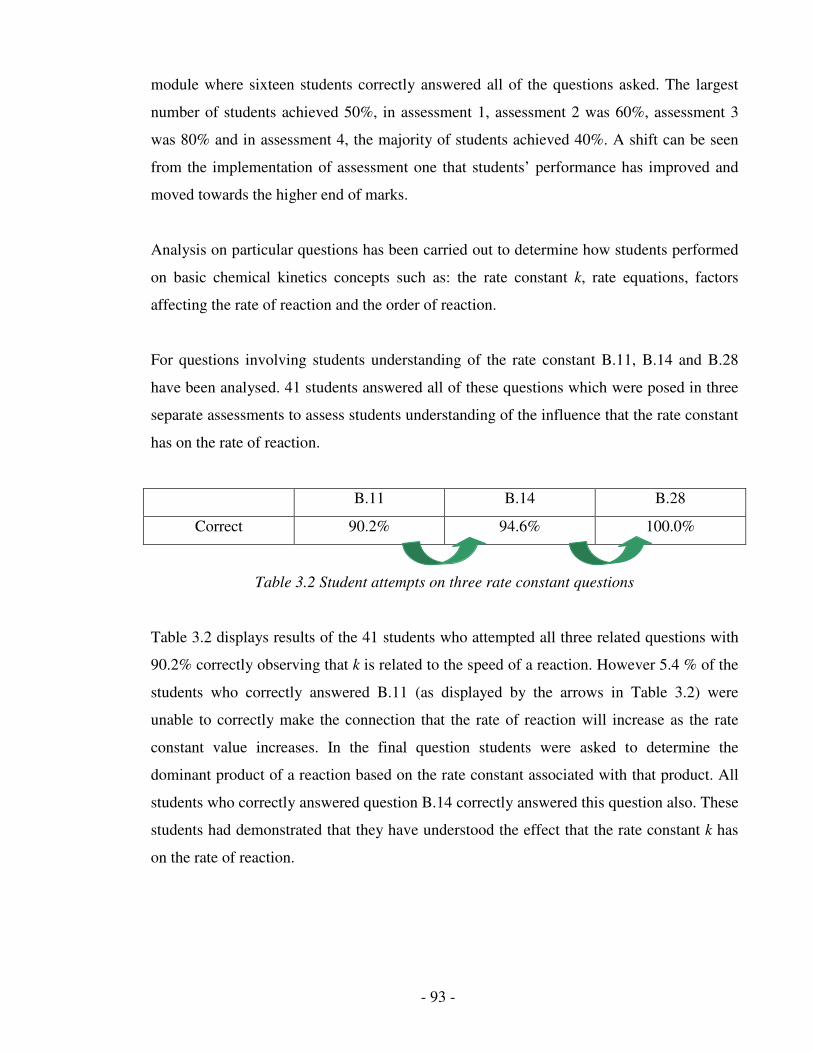
- 93 -
module where sixteen students correctly answered all of the questions asked. The largest
number of students achieved 50%, in assessment 1, assessment 2 was 60%, assessment 3
was 80% and in assessment 4, the majority of students achieved 40%. A shift can be seen
from the implementation of assessment one that students’ performance has improved and
moved towards the higher end of marks.
Analysis on particular questions has been carried out to determine how students performed
on basic chemical kinetics concepts such as: the rate constant k, rate equations, factors
affecting the rate of reaction and the order of reaction.
For questions involving students understanding of the rate constant B.11, B.14 and B.28
have been analysed. 41 students answered all of these questions which were posed in three
separate assessments to assess students understanding of the influence that the rate constant
has on the rate of reaction.
B.11 B.14 B.28
Correct 90.2% 94.6% 100.0%
Table 3.2 Student attempts on three rate constant questions
Table 3.2 displays results of the 41 students who attempted all three related questions with
90.2% correctly observing that k is related to the speed of a reaction. However 5.4 % of the
students who correctly answered B.11 (as displayed by the arrows in Table 3.2) were
unable to correctly make the connection that the rate of reaction will increase as the rate
constant value increases. In the final question students were asked to determine the
dominant product of a reaction based on the rate constant associated with that product. All
students who correctly answered question B.14 correctly answered this question also. These
students had demonstrated that they have understood the effect that the rate constant k has
on the rate of reaction.
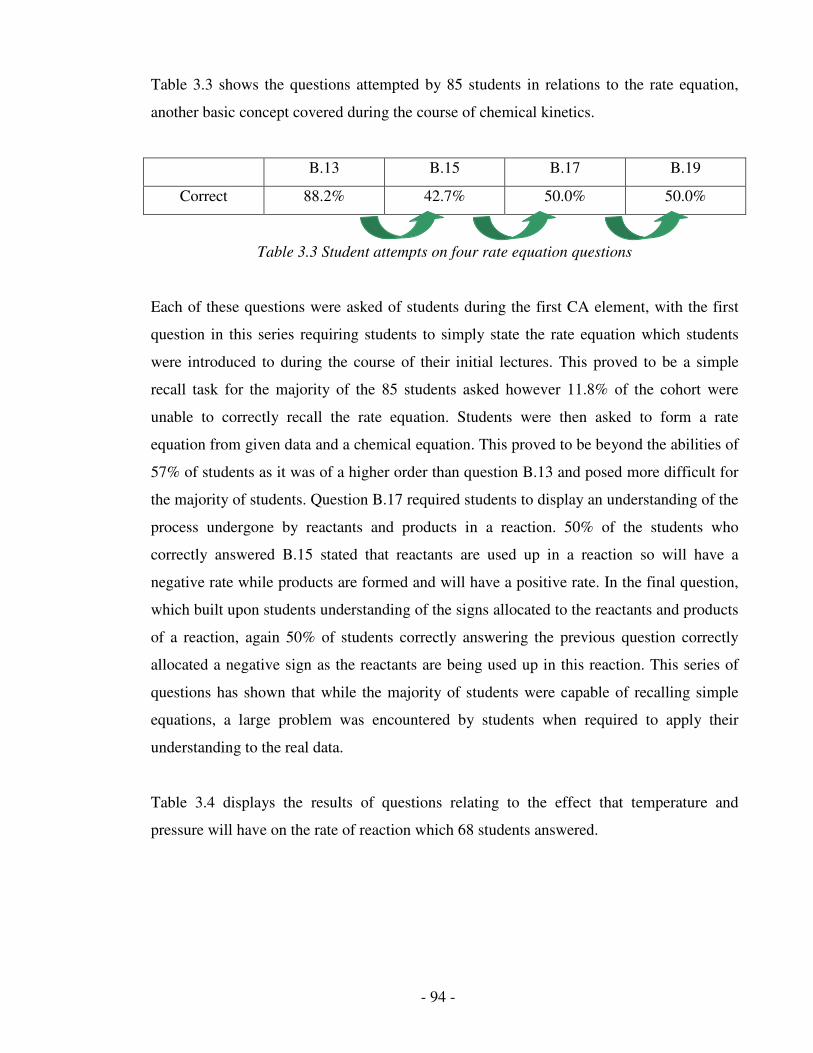
- 94 -
Table 3.3 shows the questions attempted by 85 students in relations to the rate equation,
another basic concept covered during the course of chemical kinetics.
B.13 B.15 B.17 B.19
Correct 88.2% 42.7% 50.0% 50.0%
Table 3.3 Student attempts on four rate equation questions
Each of these questions were asked of students during the first CA element, with the first
question in this series requiring students to simply state the rate equation which students
were introduced to during the course of their initial lectures. This proved to be a simple
recall task for the majority of the 85 students asked however 11.8% of the cohort were
unable to correctly recall the rate equation. Students were then asked to form a rate
equation from given data and a chemical equation. This proved to be beyond the abilities of
57% of students as it was of a higher order than question B.13 and posed more difficult for
the majority of students. Question B.17 required students to display an understanding of the
process undergone by reactants and products in a reaction. 50% of the students who
correctly answered B.15 stated that reactants are used up in a reaction so will have a
negative rate while products are formed and will have a positive rate. In the final question,
which built upon students understanding of the signs allocated to the reactants and products
of a reaction, again 50% of students correctly answering the previous question correctly
allocated a negative sign as the reactants are being used up in this reaction. This series of
questions has shown that while the majority of students were capable of recalling simple
equations, a large problem was encountered by students when required to apply their
understanding to the real data.
Table 3.4 displays the results of questions relating to the effect that temperature and
pressure will have on the rate of reaction which 68 students answered.
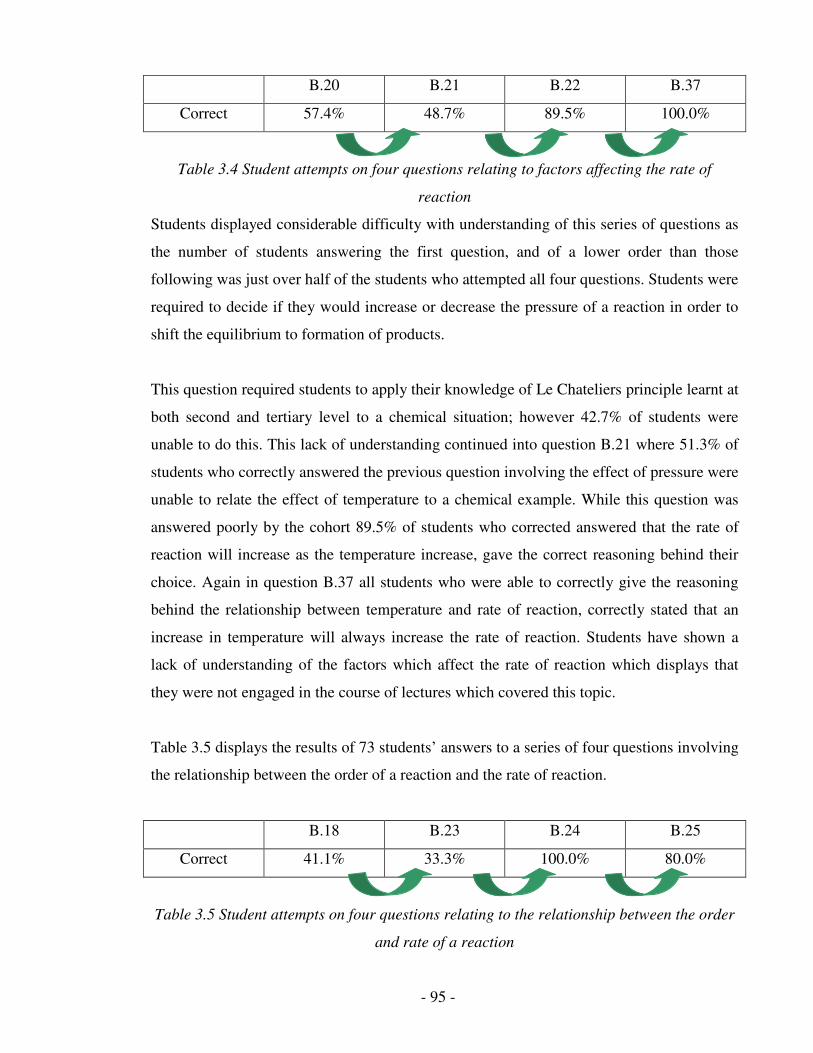
- 95 -
B.20 B.21 B.22 B.37
Correct 57.4% 48.7% 89.5% 100.0%
Table 3.4 Student attempts on four questions relating to factors affecting the rate of
reaction
Students displayed considerable difficulty with understanding of this series of questions as
the number of students answering the first question, and of a lower order than those
following was just over half of the students who attempted all four questions. Students were
required to decide if they would increase or decrease the pressure of a reaction in order to
shift the equilibrium to formation of products.
This question required students to apply their knowledge of Le Chateliers principle learnt at
both second and tertiary level to a chemical situation; however 42.7% of students were
unable to do this. This lack of understanding continued into question B.21 where 51.3% of
students who correctly answered the previous question involving the effect of pressure were
unable to relate the effect of temperature to a chemical example. While this question was
answered poorly by the cohort 89.5% of students who corrected answered that the rate of
reaction will increase as the temperature increase, gave the correct reasoning behind their
choice. Again in question B.37 all students who were able to correctly give the reasoning
behind the relationship between temperature and rate of reaction, correctly stated that an
increase in temperature will always increase the rate of reaction. Students have shown a
lack of understanding of the factors which affect the rate of reaction which displays that
they were not engaged in the course of lectures which covered this topic.
Table 3.5 displays the results of 73 students’ answers to a series of four questions involving
the relationship between the order of a reaction and the rate of reaction.
B.18 B.23 B.24 B.25
Correct 41.1% 33.3% 100.0% 80.0%
Table 3.5 Student attempts on four questions relating to the relationship between the order
and rate of a reaction
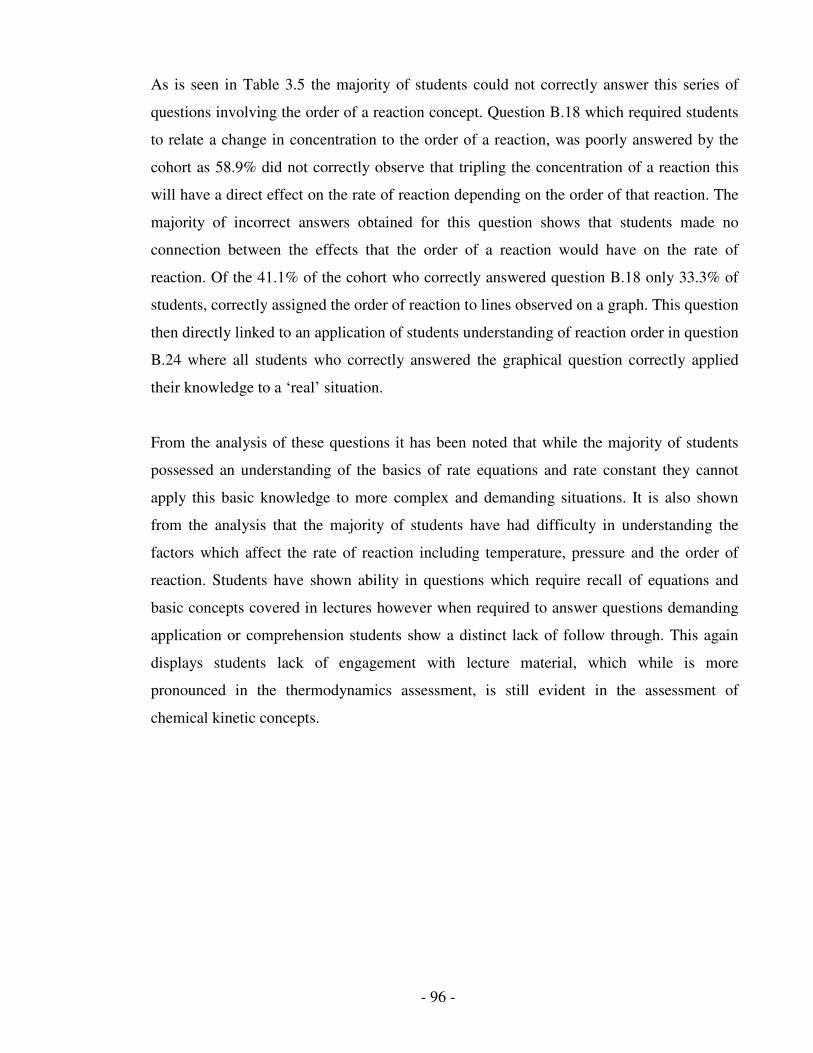
- 96 -
As is seen in Table 3.5 the majority of students could not correctly answer this series of
questions involving the order of a reaction concept. Question B.18 which required students
to relate a change in concentration to the order of a reaction, was poorly answered by the
cohort as 58.9% did not correctly observe that tripling the concentration of a reaction this
will have a direct effect on the rate of reaction depending on the order of that reaction. The
majority of incorrect answers obtained for this question shows that students made no
connection between the effects that the order of a reaction would have on the rate of
reaction. Of the 41.1% of the cohort who correctly answered question B.18 only 33.3% of
students, correctly assigned the order of reaction to lines observed on a graph. This question
then directly linked to an application of students understanding of reaction order in question
B.24 where all students who correctly answered the graphical question correctly applied
their knowledge to a ‘real’ situation.
From the analysis of these questions it has been noted that while the majority of students
possessed an understanding of the basics of rate equations and rate constant they cannot
apply this basic knowledge to more complex and demanding situations. It is also shown
from the analysis that the majority of students have had difficulty in understanding the
factors which affect the rate of reaction including temperature, pressure and the order of
reaction. Students have shown ability in questions which require recall of equations and
basic concepts covered in lectures however when required to answer questions demanding
application or comprehension students show a distinct lack of follow through. This again
displays students lack of engagement with lecture material, which while is more
pronounced in the thermodynamics assessment, is still evident in the assessment of
chemical kinetic concepts.
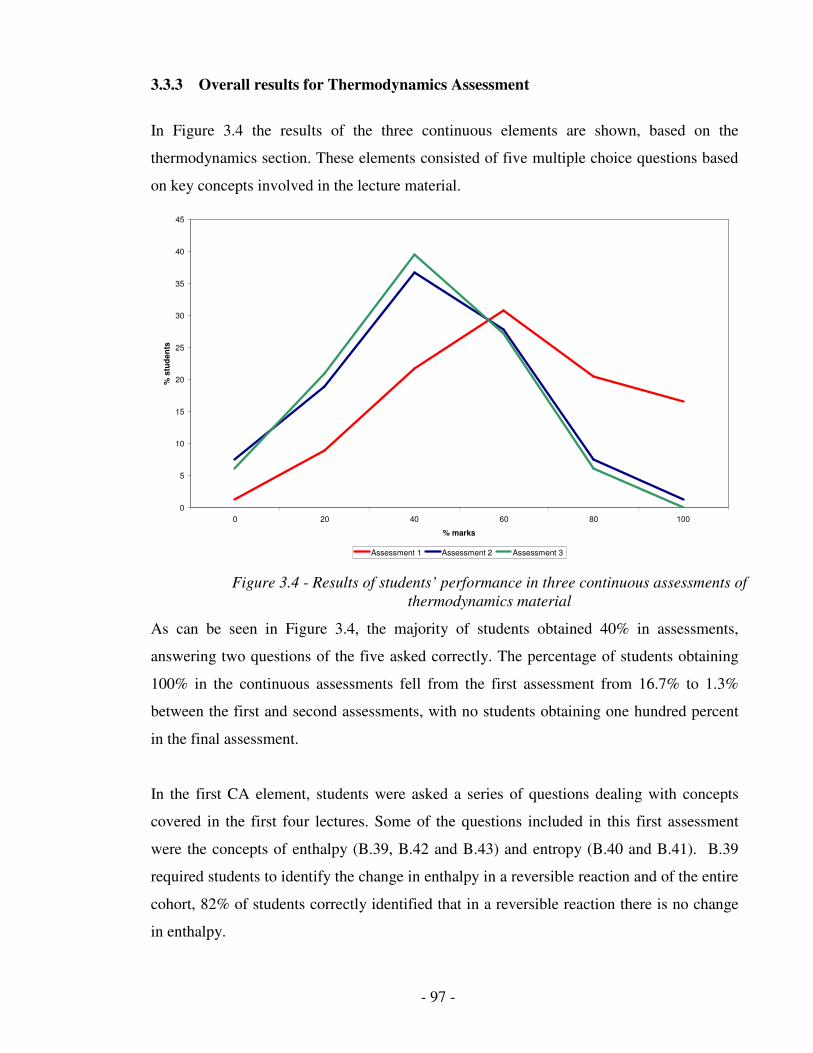
- 97 -
3.3.3 Overall results for Thermodynamics Assessment
In Figure 3.4 the results of the three continuous elements are shown, based on the
thermodynamics section. These elements consisted of five multiple choice questions based
on key concepts involved in the lecture material.
0
5
10
15
20
25
30
35
40
45
0 20 40 60 80 100
% marks
% s
tud
en
ts
Assessment 1 Assessment 2 Assessment 3
As can be seen in Figure 3.4, the majority of students obtained 40% in assessments,
answering two questions of the five asked correctly. The percentage of students obtaining
100% in the continuous assessments fell from the first assessment from 16.7% to 1.3%
between the first and second assessments, with no students obtaining one hundred percent
in the final assessment.
In the first CA element, students were asked a series of questions dealing with concepts
covered in the first four lectures. Some of the questions included in this first assessment
were the concepts of enthalpy (B.39, B.42 and B.43) and entropy (B.40 and B.41). B.39
required students to identify the change in enthalpy in a reversible reaction and of the entire
cohort, 82% of students correctly identified that in a reversible reaction there is no change
in enthalpy.
Figure 3.4 - Results of students’ performance in three continuous assessments of
thermodynamics material
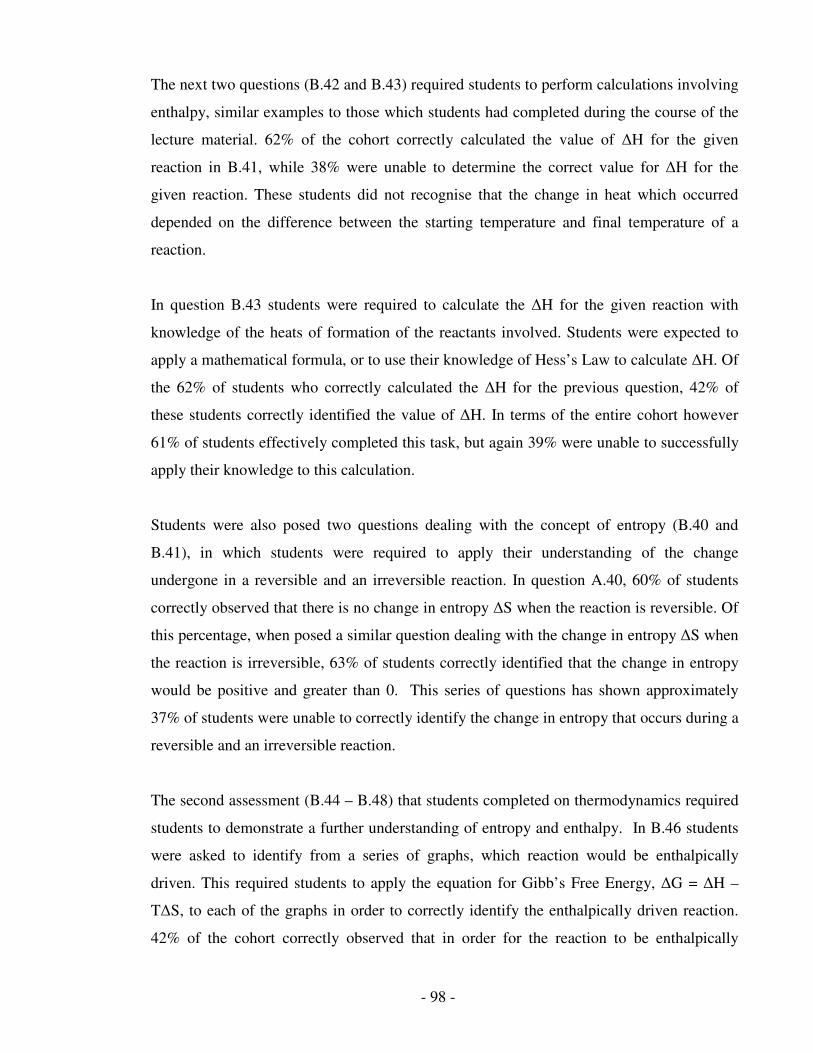
- 98 -
The next two questions (B.42 and B.43) required students to perform calculations involving
enthalpy, similar examples to those which students had completed during the course of the
lecture material. 62% of the cohort correctly calculated the value of ∆H for the given
reaction in B.41, while 38% were unable to determine the correct value for ∆H for the
given reaction. These students did not recognise that the change in heat which occurred
depended on the difference between the starting temperature and final temperature of a
reaction.
In question B.43 students were required to calculate the ∆H for the given reaction with
knowledge of the heats of formation of the reactants involved. Students were expected to
apply a mathematical formula, or to use their knowledge of Hess’s Law to calculate ∆H. Of
the 62% of students who correctly calculated the ∆H for the previous question, 42% of
these students correctly identified the value of ∆H. In terms of the entire cohort however
61% of students effectively completed this task, but again 39% were unable to successfully
apply their knowledge to this calculation.
Students were also posed two questions dealing with the concept of entropy (B.40 and
B.41), in which students were required to apply their understanding of the change
undergone in a reversible and an irreversible reaction. In question A.40, 60% of students
correctly observed that there is no change in entropy ∆S when the reaction is reversible. Of
this percentage, when posed a similar question dealing with the change in entropy ∆S when
the reaction is irreversible, 63% of students correctly identified that the change in entropy
would be positive and greater than 0. This series of questions has shown approximately
37% of students were unable to correctly identify the change in entropy that occurs during a
reversible and an irreversible reaction.
The second assessment (B.44 – B.48) that students completed on thermodynamics required
students to demonstrate a further understanding of entropy and enthalpy. In B.46 students
were asked to identify from a series of graphs, which reaction would be enthalpically
driven. This required students to apply the equation for Gibb’s Free Energy, ∆G = ∆H –
T∆S, to each of the graphs in order to correctly identify the enthalpically driven reaction.
42% of the cohort correctly observed that in order for the reaction to be enthalpically
- 99 -
driven, ∆G will remain negative until the temperature becomes positive and the reaction
becomes spontaneous when the temperature of the reaction is greater than 0.
Students also completed a calculation based on the change in entropy which occurs when
egg white is denatured (B.47). Students are provided with the require data to complete the
calculation but are not given the required formula. From the entire cohort 39% of students
correctly identified the change in entropy that occurred during this reaction, using the
formula, ∆S = )(
)( 1
KT
kJmolH −∆
. A large percentage of the cohort were unable to apply the
equation to this situation, which had been encountered during lecture material, with the
majority of students stating that the correct answer was none of the choices provided.
In the final assessment, students completed a series of questions which included those
based on the concepts of entropy of systems. In B.49 students were posed a question
involving the relationship between the entropy of a system and the volume of that system,
and how the pressure of the system will affect the value of an equation. 48% of students
were able to identify that if the pressure of the system is measured instead of the volume of
a system that it will change the sign of the coefficient n in the following equation: ∆Ssys =
nRln(Xf/Xi). 52% of students were unable to relate the change in variable to the correct
effect on the stated equation.
The second question (B.50) examined students understanding of the entropy change which
occurs to the surroundings when an exothermic reaction is involved. Students were
provided with the formula ∆S = q/T and were informed that ∆H of the system is greater
than zero. 63% of the cohort correctly identified that the entropy of the surroundings will be
less than 0 in these given circumstances. The majority of students who incorrectly answered
this question assumed that the entropy of the system would be the same as the enthalpy of
the system. Once again students were unable to put into context the material which they
have encountered during the lectures on thermodynamics.
The majority of students correctly answering three questions per assessment remained quite
consistent between assessment elements however, the percentage of students obtaining 0%
rose in both the second and third assessment element.

- 100 -
Student averages were lower in the thermodynamic assessments compared to those
obtained in the chemical kinetics assessments. In focus group discussion, see Section 3.3.5,
students expressed opinions on these results stating that the material covered in lectures did
not seem as closely connected to the assessment elements, in Thermodynamics, as those
questions asked in terms of chemical kinetics.
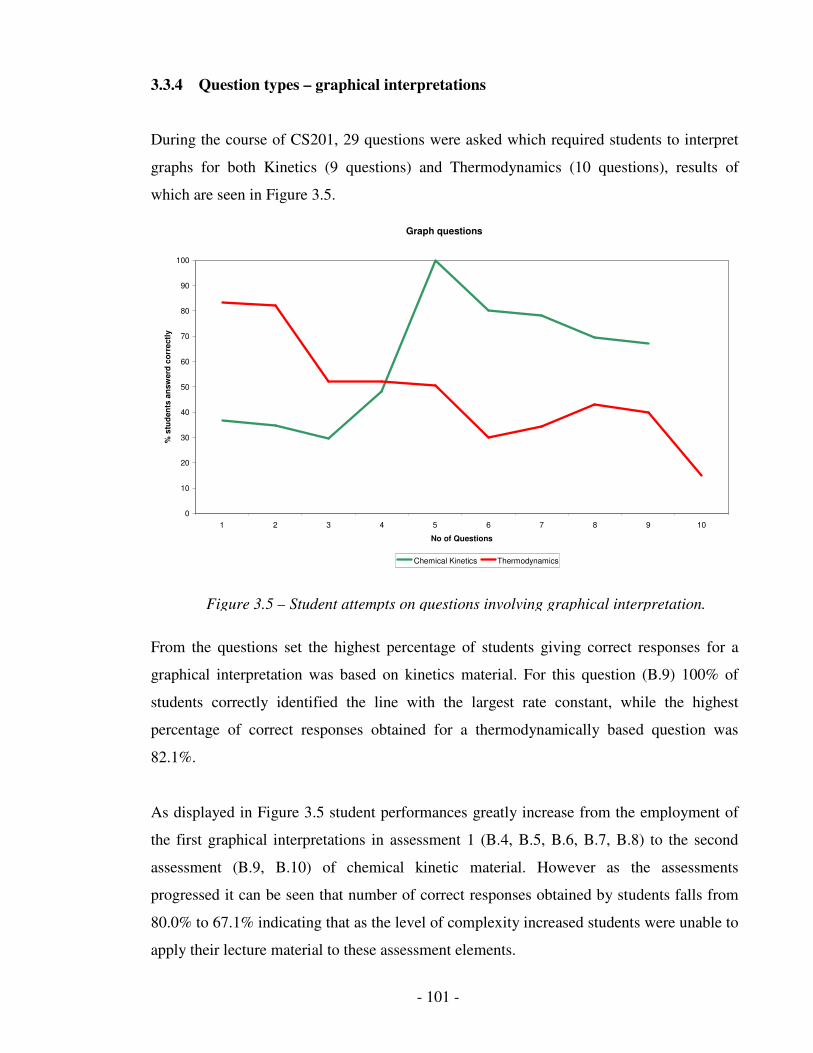
- 101 -
3.3.4 Question types – graphical interpretations
During the course of CS201, 29 questions were asked which required students to interpret
graphs for both Kinetics (9 questions) and Thermodynamics (10 questions), results of
which are seen in Figure 3.5.
Graph questions
0
10
20
30
40
50
60
70
80
90
100
1 2 3 4 5 6 7 8 9 10
No of Questions
% s
tud
en
ts a
nsw
erd
co
rre
ctl
y
Chemical Kinetics Thermodynamics
From the questions set the highest percentage of students giving correct responses for a
graphical interpretation was based on kinetics material. For this question (B.9) 100% of
students correctly identified the line with the largest rate constant, while the highest
percentage of correct responses obtained for a thermodynamically based question was
82.1%.
As displayed in Figure 3.5 student performances greatly increase from the employment of
the first graphical interpretations in assessment 1 (B.4, B.5, B.6, B.7, B.8) to the second
assessment (B.9, B.10) of chemical kinetic material. However as the assessments
progressed it can be seen that number of correct responses obtained by students falls from
80.0% to 67.1% indicating that as the level of complexity increased students were unable to
apply their lecture material to these assessment elements.
Figure 3.5 – Student attempts on questions involving graphical interpretation.
- 102 -
While one of the reasons for the incorporation of this continuous assessment is to
encourage engagement with lecture material, these particular questions display that this was
not the case.
In terms of the results obtained in thermodynamic questions which student encountered
during the 3 continuous assessment elements performed, 83.3% of students demonstrated a
competent understanding of enthalpy (B.39) however when introduced to terms such as
reversible (B.40) and irreversible(B.41) in relation to their understanding of entropy, this
percentage fell to 52.0%. This inability of 48.1% of students to correct answer questions
relating to material covered in lectures continued to be demonstrated, seen in Figure 3.5.
This was especially evident in the final assessment which included three questions on
graphical elements. It is seen that 43.2% of students correctly identified the diagram which
displays how entropy changes in water when heated (B.51) while this % continued to fall to
the lowest percentage observed on this question type of 15.00% of students correctly
identifying the enthalpy change which occurs when two ideal gases are mixed (B.53).
As was seen in terms of students’ inability to relate material covered during chemical
kinetics to graphical questions posed during their continuous assessment, similar results are
observed with thermodynamic graphs, however somewhat to a greater extent. This lack of
engagement has also been expressed by students in both the survey completed and student
interviews that were conducted in connection with the implementation of this continuous
assessment element.
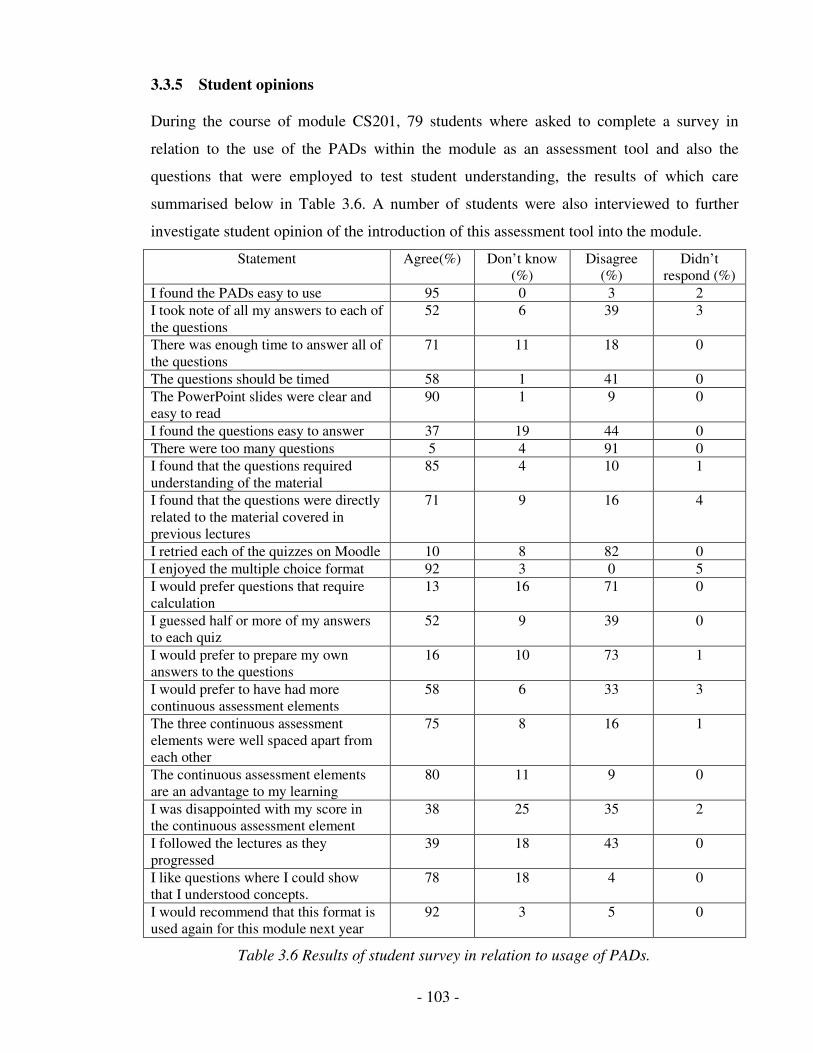
- 103 -
3.3.5 Student opinions
During the course of module CS201, 79 students where asked to complete a survey in
relation to the use of the PADs within the module as an assessment tool and also the
questions that were employed to test student understanding, the results of which care
summarised below in Table 3.6. A number of students were also interviewed to further
investigate student opinion of the introduction of this assessment tool into the module.
Statement Agree(%) Don’t know
(%)
Disagree
(%)
Didn’t
respond (%)
I found the PADs easy to use 95 0 3 2
I took note of all my answers to each of
the questions
52 6 39 3
There was enough time to answer all of
the questions
71 11 18 0
The questions should be timed 58 1 41 0
The PowerPoint slides were clear and
easy to read
90 1 9 0
I found the questions easy to answer 37 19 44 0
There were too many questions 5 4 91 0
I found that the questions required
understanding of the material
85 4 10 1
I found that the questions were directly
related to the material covered in
previous lectures
71 9 16 4
I retried each of the quizzes on Moodle 10 8 82 0
I enjoyed the multiple choice format 92 3 0 5
I would prefer questions that require
calculation
13 16 71 0
I guessed half or more of my answers
to each quiz
52 9 39 0
I would prefer to prepare my own
answers to the questions
16 10 73 1
I would prefer to have had more
continuous assessment elements
58 6 33 3
The three continuous assessment
elements were well spaced apart from
each other
75 8 16 1
The continuous assessment elements
are an advantage to my learning
80 11 9 0
I was disappointed with my score in
the continuous assessment element
38 25 35 2
I followed the lectures as they
progressed
39 18 43 0
I like questions where I could show
that I understood concepts.
78 18 4 0
I would recommend that this format is
used again for this module next year
92 3 5 0
Table 3.6 Results of student survey in relation to usage of PADs.
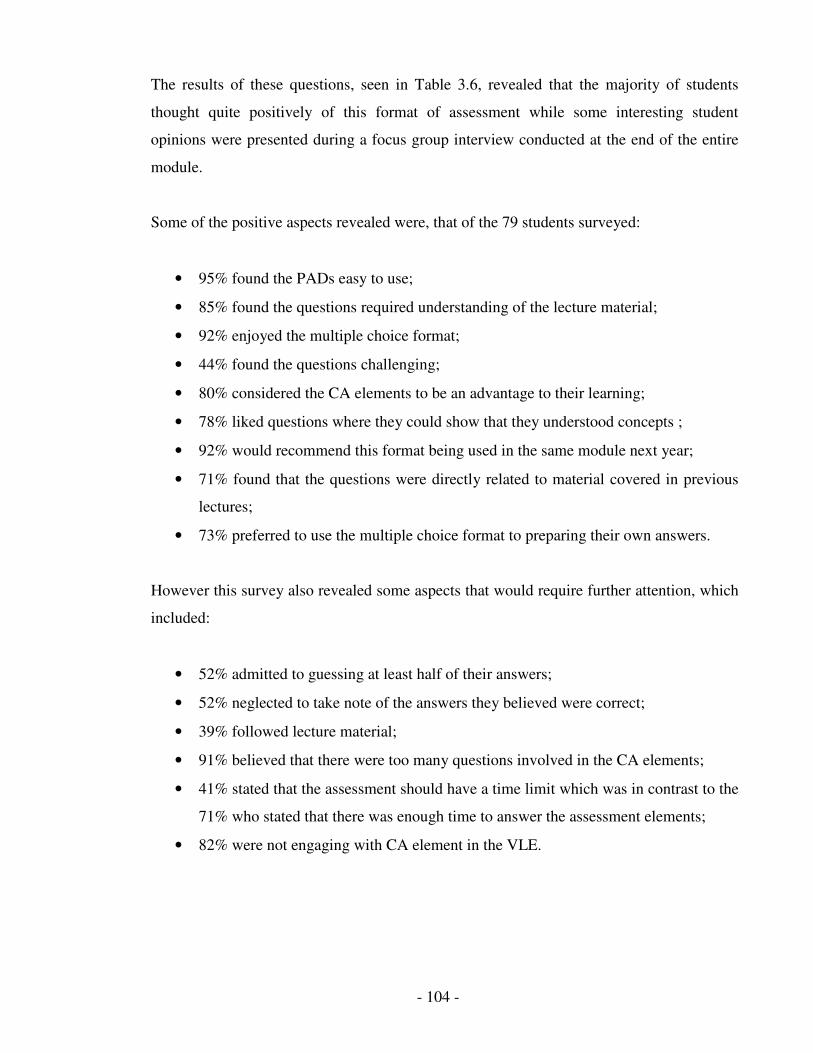
- 104 -
The results of these questions, seen in Table 3.6, revealed that the majority of students
thought quite positively of this format of assessment while some interesting student
opinions were presented during a focus group interview conducted at the end of the entire
module.
Some of the positive aspects revealed were, that of the 79 students surveyed:
• 95% found the PADs easy to use;
• 85% found the questions required understanding of the lecture material;
• 92% enjoyed the multiple choice format;
• 44% found the questions challenging;
• 80% considered the CA elements to be an advantage to their learning;
• 78% liked questions where they could show that they understood concepts ;
• 92% would recommend this format being used in the same module next year;
• 71% found that the questions were directly related to material covered in previous
lectures;
• 73% preferred to use the multiple choice format to preparing their own answers.
However this survey also revealed some aspects that would require further attention, which
included:
• 52% admitted to guessing at least half of their answers;
• 52% neglected to take note of the answers they believed were correct;
• 39% followed lecture material;
• 91% believed that there were too many questions involved in the CA elements;
• 41% stated that the assessment should have a time limit which was in contrast to the
71% who stated that there was enough time to answer the assessment elements;
• 82% were not engaging with CA element in the VLE.
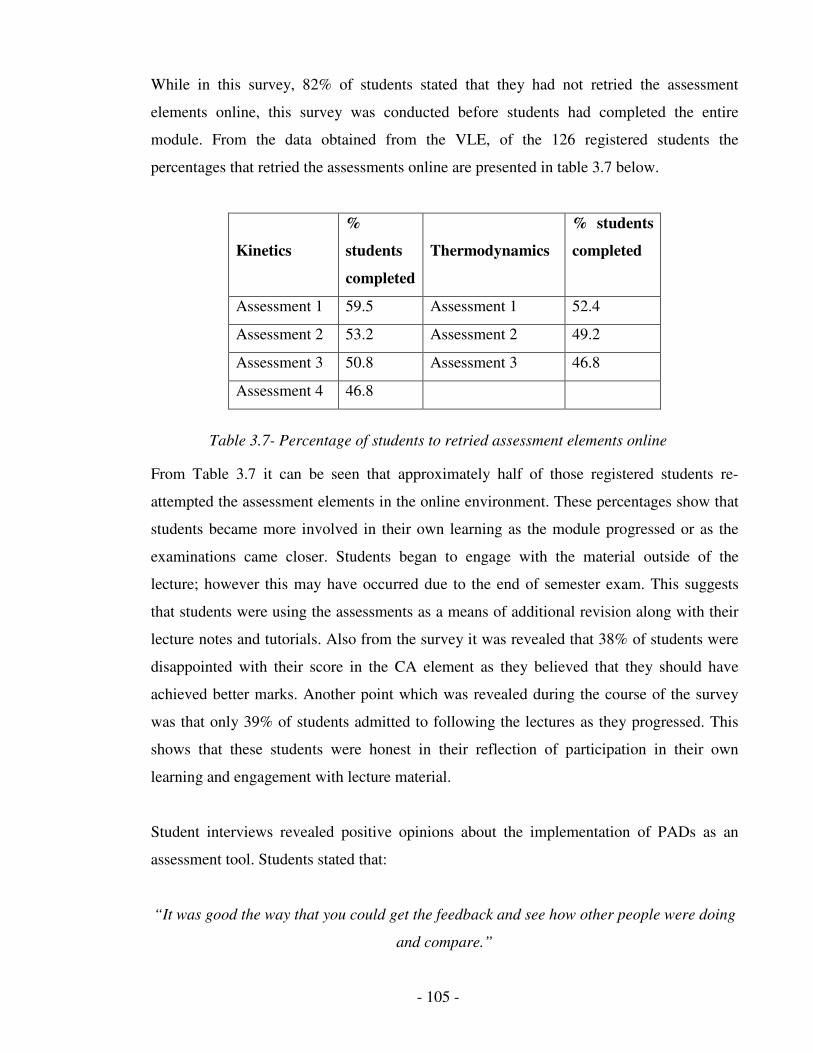
- 105 -
While in this survey, 82% of students stated that they had not retried the assessment
elements online, this survey was conducted before students had completed the entire
module. From the data obtained from the VLE, of the 126 registered students the
percentages that retried the assessments online are presented in table 3.7 below.
Kinetics
%
students
completed
Thermodynamics
% students
completed
Assessment 1 59.5 Assessment 1 52.4
Assessment 2 53.2 Assessment 2 49.2
Assessment 3 50.8 Assessment 3 46.8
Assessment 4 46.8
From Table 3.7 it can be seen that approximately half of those registered students re-
attempted the assessment elements in the online environment. These percentages show that
students became more involved in their own learning as the module progressed or as the
examinations came closer. Students began to engage with the material outside of the
lecture; however this may have occurred due to the end of semester exam. This suggests
that students were using the assessments as a means of additional revision along with their
lecture notes and tutorials. Also from the survey it was revealed that 38% of students were
disappointed with their score in the CA element as they believed that they should have
achieved better marks. Another point which was revealed during the course of the survey
was that only 39% of students admitted to following the lectures as they progressed. This
shows that these students were honest in their reflection of participation in their own
learning and engagement with lecture material.
Student interviews revealed positive opinions about the implementation of PADs as an
assessment tool. Students stated that:
“It was good the way that you could get the feedback and see how other people were doing
and compare.”
Table 3.7- Percentage of students to retried assessment elements online
- 106 -
They believed that the PADs assessment was useful in terms of the amount of time required
to complete the assessment so it was never tedious. When quizzed on the element of guess
work which is introduced with the multiple choice format, these students stated that:
“the multiple choice format provided the students with a goal to work towards and they
could work out their answer towards this goal.”
However they did admit that when they didn’t understand what was being asked in the
question this would be the situation where they would guess their answer. Students were
also asked to compare their experience of kinetics and thermodynamic questions. Students
stated that
“The thermodynamic questions were generally harder and less obvious. You had to think
an awful lot more to interpret the graphs which while it may be getting you thinking, it
could be too hard for some people and this is where the guess work could begin.”
“The connection between the kinetics material and assessment element was more obvious
than the thermodynamic material. The thermodynamic assessments seemed to be more
abstract and unrelated to the lecture material.”
Students also believed that the time restrictions became very obvious in this section as they
were trying to interpret the question, work out their answers and their time was already up
before they had made a selection. The students interviewed agreed that the CA element
helped to cement things in their minds from the week of lectures. They also stated
“The assessment helped to encourage me to read over the lecture material out of lecture
time even if it was only glancing over my lecture notes before each assessment.”
Students agreed that they saw the benefits to the introduction to the PADs system, however
as questions were generated by two different lecturers, it was obvious to students the extent
to which material was being tested, was distinctively different between both sections.
- 107 -
3.4 Conclusion
For this section, it is important to refer back to the question posed at the beginning of
Section 3.3. Have each of these questions been answered and to what degree does the
analysis support a positive answer in each case?
With the format of ‘assess – correct – reassess’ which was employed during the course of
this module students were offered that opportunity to retry each of the assessments in order
to improve their understanding of these basic concepts. 82% of students admitted to not re-
attempting the assessments online when asked 6 weeks prior to their end of semester
examination. However the results that were obtained from the online data show that the
percentage of students attempting to reassess their learning was as high as 50% of the entire
126 students enrolled for this module. Students received no additional percentage
contribution from reattempts towards end of year results, however they proceeded to retry
the assessment online up until the week before their examination, with some students
attempting the assessments more than once. This shows that students may have been using
the online material as a revision/practice tool.
From the questions that were used during the course, specific areas of basic concepts were
assessed and results revealed that the majority of students had difficulty with the
application of basic concepts while they were competent at simple recall. Particular
questions were identified in sections 3.3.2 and 3.3.3 as providing students with challenging
material while other questions simply required students to recall equations or statements
that had been presented during the course of lecture material. The length of time that was
allocated to the preparation of these questions however cannot be over stated. It was
essential that while these questions appropriately tested students understanding of chemical
concepts, they must also provide lecturers with information as to where they are losing
students in terms of increasing complexity in lecture material. Lecturers were informed of
the areas that were proving to be quite challenging to students such as those identified, e.g.
the affect that order has on the rate of reaction, calculations involving Gibb’s energy and
questions which require the application of knowledge to a graphical interpretation.
- 108 -
The PADs have proven to be an acceptable and appropriate assessment tool to measure the
understanding of a large cohort of students in this module; however, the development of
appropriate questions is an essential element to their successful incorporation in any
module.
During the course of CS201 students completed 7 CA elements – 4 involving chemical
kinetic concepts and 3 based on thermodynamic concepts. Each of these assessments tested
students’ knowledge and application of basic concepts involved in these physical chemistry
elements. As seen from the responses of students in terms of each assessment, the majority
were unable to correctly answer all questions in chemical kinetics assessments with an
average percentage of 62.3% obtained. In the thermodynamics assessment the average
percentage obtained by the cohort was 41.0%.
These results support the statements made by students, that they perceived a lack of
coherence between the lecture and assessed material in terms of the thermodynamic
material. However these results also illustrate that students were not actively engaging with
all elements of the lecture material, as all assessed material had been covered within the
lecture environment.
Student surveys and opinions have shown that they recognise the advantages of both the
PADs and the use of continuous assessment in this particular module. They admitted to
finding the questions employed challenging and more closely related to the material in
chemical kinetics lectures than that of the thermodynamic lectures. Students stated that they
found the PADs easy to use, that they enjoyed the multiple choice format that was used and
the majority of students suggested that this format be used again. As the incorporation of
multiple choice questions introduces the element of guess work, students were honest as
52% stated that they guessed more than half of their assigned answers. The focus group
revealed that students were more inclined to guess their answer if the question was
confusing or if they had insufficient time to answer the questions. So while students saw
the benefits of the PADs system, they were still critical of certain elements of them.
- 109 -
The PADs system has been successfully implemented in module CS201 as a tool for
continuous assessment and the multiple choice format has been embraced by both students
and lectures. Key concepts that require more in depth explanation have been identified for
both lecturers and students and the online engagement of students has shown that when
examinations loom, students take a more active role in their own learning 50% of this
cohort applied themselves. While certain issues have been raised from the use of these
continuous assessment tools, such as guesswork and lack of engagement with lecture
material during the course of the module, the PADs have allowed 50% of students to
become more active in their own learning and have provided valuable feedback to lecturers
about key areas that most students have difficultly with, long before the end of semester
examination.
Valid comparison of final assessment marks with performance in previous years was not
possible as the course content, along with assessment formats and the individual lecturers
involved differed to previous years. It was considered that too many variables had changed
over the years that could contribute to any differences observable and therefore no
comparison to previous cohorts has been made.
- 110 -
References
1. Duncan D. Clickers in the Classroom (2005) Addison Wesley Pearson
2.
Draper, S.W. (2001) Want to try interactive handsets in your lecture? [Available
online] www.psy.gla.ac.uk/~steve/ilig/ad.html [last accessed 31st November 2007]
3. Sokoloff, D.R. and Thornton, R.K. (1997) Using interactive lecture demonstrations
to create an active learning environment. The Physics Teacher, 35, 340 - 346
4. Crouch, C. H. and Mazur, E. (2001). Peer instruction: Ten years of experience and
results. American Journal of Physics, 69 (9), 970-209.
5. Premkumar, K. and Coupal, C.(2008) Rules of engagement – 12 tips for successful
use of clickers in the classroom. Medical teacher, 30, 146 – 149
6. Rodgers, M.L. and Starrett, D.A (2007) Calling all students….. come in students
http://www.cnc.ucr.edu/clickers/ [last accessed 23rd
July 2008]
7. Draper, S.W. and Brown M.I. (2004) Increasing interactivity in lectures using an
electronic voting system. Journal of Computer Assisted Learning, 20, 81 – 94
8. Berk, R.A. (1998) A humorous account of 10 multiple choice test item flaws that
clue test wise students. Available online at
http://celt.muohio.edu/ject/issue.php?v=9&n=2[last accessed 18th
January 2008]
9. Barton, F. and Saljo, R. (1976) On qualitative differences in learning – 1: outcome
and process British Journal of Educational Psychology, 46, 4 – 11
10. Entwistle, N. (1981) Styles of learning and teaching: an integrated outline of
educational psychology for students, teachers and lecturers, Wiley, Chicester.
11. Biggs, J. (1993) What do inventories of students learning process really measure? A
theoretical review and clarification. British Journal of Educational Psychology, 83,
6 - 19
12. Ramsden, P. (1992) Learning to teach in higher education, Rutledge, London.
13. O’Loughlin, E and Osterlind, S. (2007) A study of blended assessment techniques
in on-line testing Teaching and Learning in the Changing World Higher Education
Conference 30th
and 31st of August 2007, NUI Maynooth
http://www.aishe.org/events/2006-2007/conf2007/proceedings/ [last accessed 25th
August 2008]
14. Alldridge, P. (1997) Multiple Choice Examining in Law. Law Teacher, 31, 167
- 111 -
15. Bush, M. (1999) Alternative marking schemes for online multiple choice tests
[Online] http://www.caacentre.ac.uk/dldocs/BUSHMARK.PDF [last accessed 30th
October 2007]
16. Simes, S. (1997) Inns of Court School of Law. Test yourself in Evidence, Civil
Procedure, Criminal Procedure, Sentencing. Blackstone Press, London
17. Higgins, E. and Tatham, L. (2003) Exploring the potential of Multiple Choice
Questions in Assessment. Learning and Teaching in Action, 2 (1), 1- 12
18. Williams, J.B. (2006) Assertion – reason multiple choice testing as a tool for deep
learning: a qualitative analysis. Assessment and Evaluation in Higher Education, 31
(3), 287 – 301
- 112 -
Chapter 4
The use of pre and post laboratory tasks to
maximise students’ laboratory experience
– another example of formative
assessment.

- 113 -
4.1 Introduction
This chapter deals with the formative assessment method of pre and post laboratory tasks
which have been introduced in a virtual learning environment for first year undergraduate
chemistry students. These pre laboratory tasks aim to prepare students for their practical
session and then the post laboratory tasks present questions to help them to implement what
they have learned in the laboratory.
To ensure that the students have carried out that pre and post laboratory tasks they are given
a percentage of marks towards their final assessment.
4.1.1 Laboratory work
As stated previously one of the aspects of chemistry which has been deemed to be essential
but also one of the most difficult aspects of chemistry to perform assessment appropriately
is on students’ practical skills. However laboratory work has been identified as on of the
most essential parts of undergraduate programmes in chemistry for over the last twenty
decades1. While it has been agreed that the inclusion of practical work has proven to aid
students in their understanding and knowledge of chemistry, the purposes, methodologies
and time allocation have been the subject of much debate in recent years2.
In 1961, Kerr3 complied a list of the ten aims of practical work which have subsequently
been agreed to by the Swain4, Kempa and Ward
5, Johnstone and Wood
6 and Garnett and
Hacklin7. This list stated that practical work will:
• Encourage accurate observations and careful recordings;
• Promote simple, common sense, scientific methods of thought;
• Develop manipulate skills;
• Give training in problem solving;
• Fit the requirements of practical exam requirements;
- 114 -
• Elucidate theoretical work so as to aid comprehension;
• Verify facts and principles which have been already taught;
• Be an integral part of the process of finding facts by investigating and arriving at
principles;
• Raise and maintain interest in the subject;
• Make phenomena more real through actual experience.
However while the benefits of practical work are many, there are also difficulties associated
with the implementation of chemical laboratory work especially when dealing with large
numbers. In the case of many undergraduate chemistry courses, the number of students
involved in chemical laboratories rarely is below 150. For laboratory work, the pressure of
increasing numbers of students coupled with restrictions on people power, materials and
equipment and contact hours have been significant8.
Some of the additional issues which are associated with the integration of practical work in
undergraduate chemistry courses include safety issues, staff and demonstrator costs,
varying student chemistry experiences and the type of assessment which should be
employed in order to correctly reward students for the effort expected of them9. However
even with the various disadvantages which are related to the employment of practical work,
it is still noted that the benefits that are shown from the appropriate use far out weigh these
stated issues. The practical laboratory session offers an environment which10
:
• Allows students to build on their new learning or their prior knowledge;
• Allows learners to handle practical/skill information;
• Facilitates feedback, discussion and reassurance;
• Allows students to apply theory to a practical situation;
• Allows students to make suggestions, propose theories, explore, create and to
present their “distilled” knowledge and understanding.
As stated by Bennett2, methods employed in the practical chemistry laboratory session have
come under review in the last few decades. The most predominant form of laboratory
which has been used in third level establishments is the expository laboratory – within this
- 115 -
learning environment the instructor defines the topic, relates it to previous work and directs
students’ action. This form of instruction has been criticised for the little emphasis which
has been placed on student engagement and thinking as11
:
• Its ‘cookbook’ nature emphasises the following of specific procedures to collect
data;
• It gives no room for the planning of an experiment;
• It is an ineffective means of building scientific experiments.
Students often learn very little from the time they spend in the laboratory as they may see
or make few connections with the appropriate chemistry lecture material. As stated by
Rollnick12
, “The separate nature of laboratories and the logistics of offering them to large
numbers of students, makes it difficult to ensure that the content being offered in lectures
and tutorials relates to the practical work being carried out.” Students can feel that they are
being treated less as adults in their first year laboratory experiences with the closed, limited
nature of the expository lab. They can feel that the assessment does not match their effort or
that “the weighting of the assessment will encourage them to cut corners”13
.
Some of the common student opinions/comments which were gathered by Carnduff and
Reid about experiences of undergraduate chemistry laboratory sessions included14
:
• Too long for the marks awarded;
• Just following a recipe;
• Cannot see the point;
• Far too much information;
• Does not help learning.
One of the changes which has been widely accepted by educators is a shift in the emphasis
towards students actively engaging in laboratory material in their own time and to
encourage student preparation and reading of essential information such as safety
requirements for chemicals and equipment being used, formulae and equations required
during the course of the experiment, before they enter the laboratory15,16,17
.
- 116 -
It was obvious from this literature that any activity that maximises what students gain from
the time that they are actually in the laboratory is worth while. These activities more often
require an involvement of students in preparing for their laboratory experience by
completing a form of pre-laboratory task which would take on the form of a series of
multiple choice questions utilising the benefits as outlined in section 3.1.2.
4.1.2 Pre and Post Laboratory assignments
The use of pre-laboratory tasks/assignments before the laboratory to ‘prepare the mind of
the learner’ is not a new one. Johnstone8 described the elements of an effective pre-lab
exercise as including:
• Revision of theory;
• Re-acquaintance with skills;
• Planning the experiment to some extent;
• Discussion with peers.
When combined with elements of ownership and relevance for the students, the pre-lab can
be very effective at preparing the mind of the learner8. Also, if students have had direct
input into the laboratory experience, for example deciding the procedure or techniques to be
employed and have a natural curiosity in the experiments, due to their relation to everyday
life for example, they will have a greater motivation and personal interest for actually doing
the experiment.
Johnstone et al. 17
stated that in relation to the use of pre-labs in physics:
‘The aim of the pre-labs was to prepare students to take an intelligent interest in the
experiment by knowing where they were going, why they were going there and how
they were going to get there’.
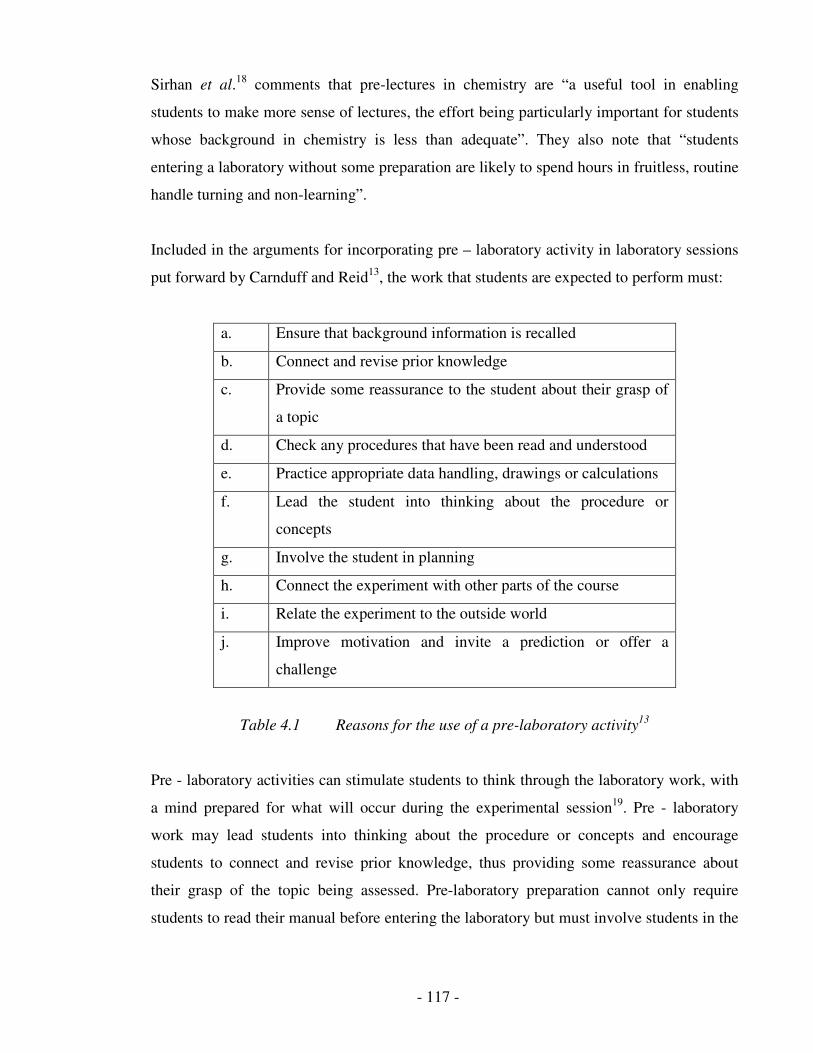
- 117 -
Sirhan et al.18
comments that pre-lectures in chemistry are “a useful tool in enabling
students to make more sense of lectures, the effort being particularly important for students
whose background in chemistry is less than adequate”. They also note that “students
entering a laboratory without some preparation are likely to spend hours in fruitless, routine
handle turning and non-learning”.
Included in the arguments for incorporating pre – laboratory activity in laboratory sessions
put forward by Carnduff and Reid13
, the work that students are expected to perform must:
a. Ensure that background information is recalled
b. Connect and revise prior knowledge
c. Provide some reassurance to the student about their grasp of
a topic
d. Check any procedures that have been read and understood
e. Practice appropriate data handling, drawings or calculations
f. Lead the student into thinking about the procedure or
concepts
g. Involve the student in planning
h. Connect the experiment with other parts of the course
i. Relate the experiment to the outside world
j. Improve motivation and invite a prediction or offer a
challenge
Table 4.1 Reasons for the use of a pre-laboratory activity13
Pre - laboratory activities can stimulate students to think through the laboratory work, with
a mind prepared for what will occur during the experimental session19
. Pre - laboratory
work may lead students into thinking about the procedure or concepts and encourage
students to connect and revise prior knowledge, thus providing some reassurance about
their grasp of the topic being assessed. Pre-laboratory preparation cannot only require
students to read their manual before entering the laboratory but must involve students in the
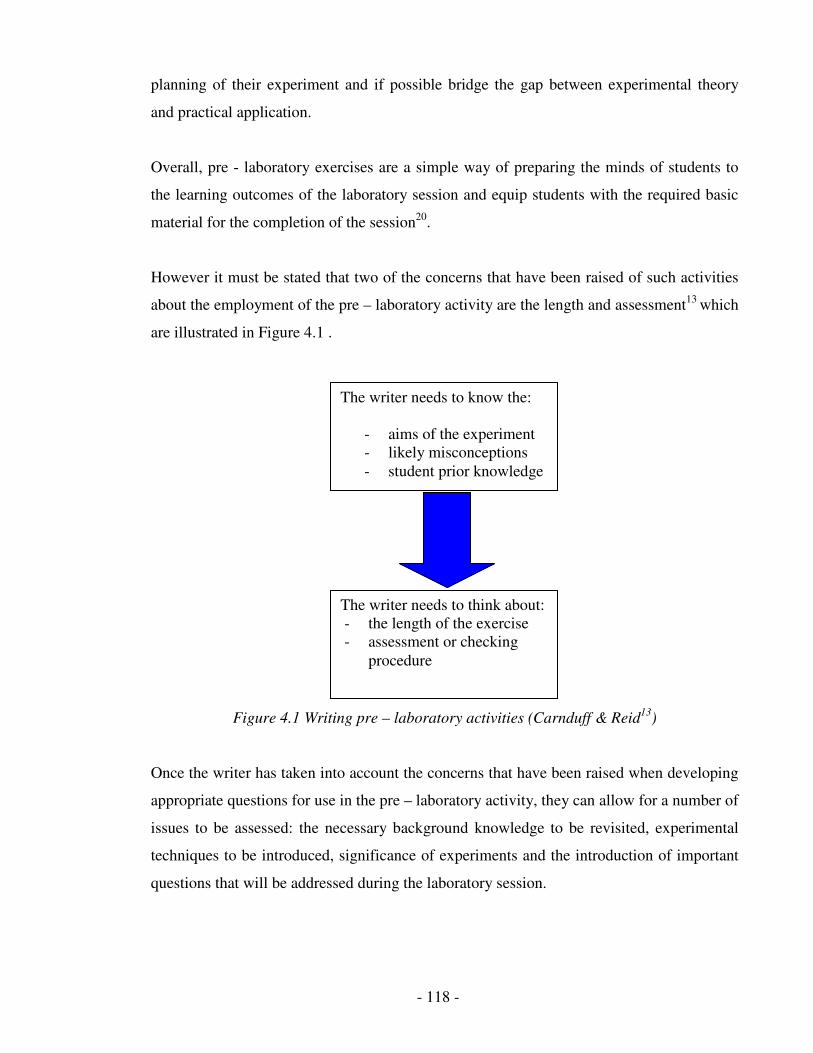
- 118 -
planning of their experiment and if possible bridge the gap between experimental theory
and practical application.
Overall, pre - laboratory exercises are a simple way of preparing the minds of students to
the learning outcomes of the laboratory session and equip students with the required basic
material for the completion of the session20
.
However it must be stated that two of the concerns that have been raised of such activities
about the employment of the pre – laboratory activity are the length and assessment13
which
are illustrated in Figure 4.1 .
Figure 4.1 Writing pre – laboratory activities (Carnduff & Reid13
)
Once the writer has taken into account the concerns that have been raised when developing
appropriate questions for use in the pre – laboratory activity, they can allow for a number of
issues to be assessed: the necessary background knowledge to be revisited, experimental
techniques to be introduced, significance of experiments and the introduction of important
questions that will be addressed during the laboratory session.
The writer needs to know the:
- aims of the experiment
- likely misconceptions
- student prior knowledge
The writer needs to think about:
- the length of the exercise
- assessment or checking
procedure
- 119 -
Studies that have employed pre – laboratory activities14,16,17
have provided clear evidence
that the learning of students has increased and that their motivation has been enhanced also.
In relation to the advantages which have been stated for pre – laboratory activities certain
chemistry textbooks have begun to include such activities. “Laboratory experiments for
chemistry and the living organism” (1992) Chichester & Wiley and “Laboratory
experiments for General Chemistry”(1998) Fort Worth & Saunders are two such examples
that have incorporated the pre – laboratory activity into their text books.
It has been stated that in order to provide students with an all encompassing experience for
the laboratory session the inclusion of post - lab activities should also be considered8. Post
laboratory activities are designed to encourage students to reflect on what they have been
performing during the laboratory session. It has been suggested that post - laboratory
questions should be linked to the pre- laboratory exercises in order to make the laboratory
experience more of a complete whole14
. Post laboratory activities, as stated by Carnduff
and Reid13
should include problems which:
• Interpret students results and observations made during the experimental session;
• Compare student results and observations to those of other classmates and the
literature;
• Explore implications and applications of the theory involved;
• Re-examine the procedure used by students and if there are any improvements that
could be made;
• Promote discussion between students and tutors.
These pre and post laboratory activities were introduced into a 1st year undergraduate
chemistry practical laboratory as a formative assessment method with the aim that the
feedback provided to the students by their completion of these tasks, would promote their
understanding of the chemical concepts covered in each session. However an appropriate
vehicle was required in order to ensure that the utilisation of these additional requirements
did not place extra burden on either students or tutors involved.
- 120 -
4.1.3 Online Assessment – Virtual Learning Environment (VLE)
As stated in chapter 3, technology can play an important role in the implementation of
formative assessment when chosen appropriately and used effectively. Educational
research21
has shown that traditional teaching methods which are based on large numbers of
students do not promote active engagement in the learning process, such that students are
passively learning at a moderately shallow level. A suggested solution for this problem, put
forward by Gibbs and Simpson22
is that assessment should be designed that engage students
with the learning outcomes of the course without generating large volumes of marking for
the lecturer/tutor. As with the implementation of the PADs’ as stated in section 3.3 it was
envisaged that a technological tool could aid in the introduction of the pre and post
laboratory activities into the 1st year undergraduate chemistry laboratory.
However another factor is said to be contributing to the lack of engagement with course
material and that is student motivation23
. Students are becoming increasingly strategic
about the length of time, they allocate to their course material with a number of competing
demands such as extra curricular activities and part time employment. Due to these
restrictions and perceived selectiveness of students, the incorporation of online assessment
has been suggested as a solution to student engagement24
.
As reported by Mercer – Chalmers et al25
, VLEs’ are a mechanism whereby students can
gather the necessary theory and background at their own pace as well as gaining familiarity
with necessary ICT and computer skills. In this model of assessment, an approach was
incorporated where students were provided with background information and then were
required to answer a series of online questions based on the information for the
experimental session. Mercer – Chalmers reported that students appreciated being able to
access the VLE in their own time and that they were given ample time to complete the
given tasks. Students also stated that one of the difficulties which they had to overcome was
their individual computer knowledge and experience, however this was gradually solved as
students gained the appropriate skills from exposure to the software used.

- 121 -
Nicholls26
advises that online computer assessment programmes can be written so that:
• Students can work at their own rate and repeat any exercise until they understand
the particular lesson involved;
• Students are active by involvement in the learning process is ensured by requiring
frequent and creative interaction with the computer;
• Student usage is logged to give the tutor a usage profile for individual students;
• Student competence with specified tasks is tested and automatically marked without
recourse to a tutor.
Barajas & Owen27
complied a list of advantages and disadvantages for both educators and
students that should be considered before the implementation of a VLE into a course or
module. These are listed in Table 4.2.
Advantages Disadvantages
Students • to experience online learning
for it’s own sake
• to access information and
assessment
• to participate in an alternative
learning environment
• lack of technological skills
• have had bad experience using
new technology and are reluctant
to engage in a new form of
assessment
Educators • to experience teaching in a
VLE
• to offer a new method of
learning to students
• to reduce their marking of
material
• to utilize animations and
graphical skills
• lack of necessary technological
skills
• prefer to stick to the method of
pen and paper assessment
Table 4.2 Advantages and Disadvantages of VLE’s (Barajas & Owen)
- 122 -
First year undergraduate chemistry laboratories have undergone a series of changes over the
last number of years within Dublin City University. Pre - laboratory activities involving a
selection of written questions and assignments were introduced for a small cohort of
students in order their preparation for the laboratory session.
Following from the successful implementation of these pre laboratory exercises, a further
study was carried out whereby these activities were performed by the entire first year
undergraduate cohort. In addition to the pre - laboratory exercises students were also
required to complete a number of questions upon finishing their laboratory session that
required information based on their experimental data or the concepts involved in the
laboratory.
However, these questions were to be completed during the laboratory session and if there
was insufficient time, students did not complete these questions and were not assessed as to
their understanding of the concepts covered in the laboratory session. The logistics element
that was also posing additional pressure for tutors, as during the laboratory session they
would correct student pre - laboratory attempts, laboratory note books and these post -
laboratory questions for each individual student.
For the purpose of this project, using the evidence supplied by the literature concerning
MCQs, online and formative assessment , it was decided that an online assessment element
would be introduced into the practical laboratory module to facilitate the pre and post
laboratory activities which would be completed outside of practical laboratory time. This
would allow tutors to give feedback to students on their post laboratory assignments outside
of laboratory time and allow tutors to concentrate on students performances during the
laboratory session. It also ensures that students were not limited by their three hour
laboratory sessions to complete these post laboratory questions.
- 123 -
4.2 Methodology
First year undergraduate chemistry students (n = 219) who registered to take chemistry
laboratories are heterogeneous in their in both their degree programmes (Analytical
Science, Biotechnology, Chemical and Pharmaceutical Science, Common Entry Science,
Environmental Science and Health, Genetics and Cell Biology, Science Education and
Science International) and in their prior chemistry experience. Some students have studied
chemistry to Leaving Certificate level, while other students will have little, Junior
Certificate Science or no chemical knowledge. In this particular cohort, 2007/2008 50.7%
of students have Leaving Certificate Chemistry while 49.3% have little or no prior
chemistry experience.
Students completed one three hour laboratory session each week dealing with a different
chemical concept which can be seen in Table 4.3. For each of these laboratory sessions
students were required to complete a pre – laboratory quiz in preparation for their practical
session. The questions involved in these online quizzes required students to have basic
knowledge of terminology, chemical techniques, simple calculations, chemical formulas,
equations and some times safety aspects related to the experiment to be completed. These
questions were designed to ensure that students were prepared on a basic level for the
concepts that would be covered in the practical session.
Students were required to log on to the VLE called Moodle to answer the pre laboratory
quiz where they could download the word document containing the pre – laboratory quiz
for the forthcoming laboratory session, if they wished to complete the quiz before
submitting their answers online. Students were given access to the pre-laboratory tasks for a
particular experiment for approximately one week before they entered the laboratory
session. They were allowed to complete their quiz at any time within that week, any
number of times, however only a students’ first attempt was awarded marks.
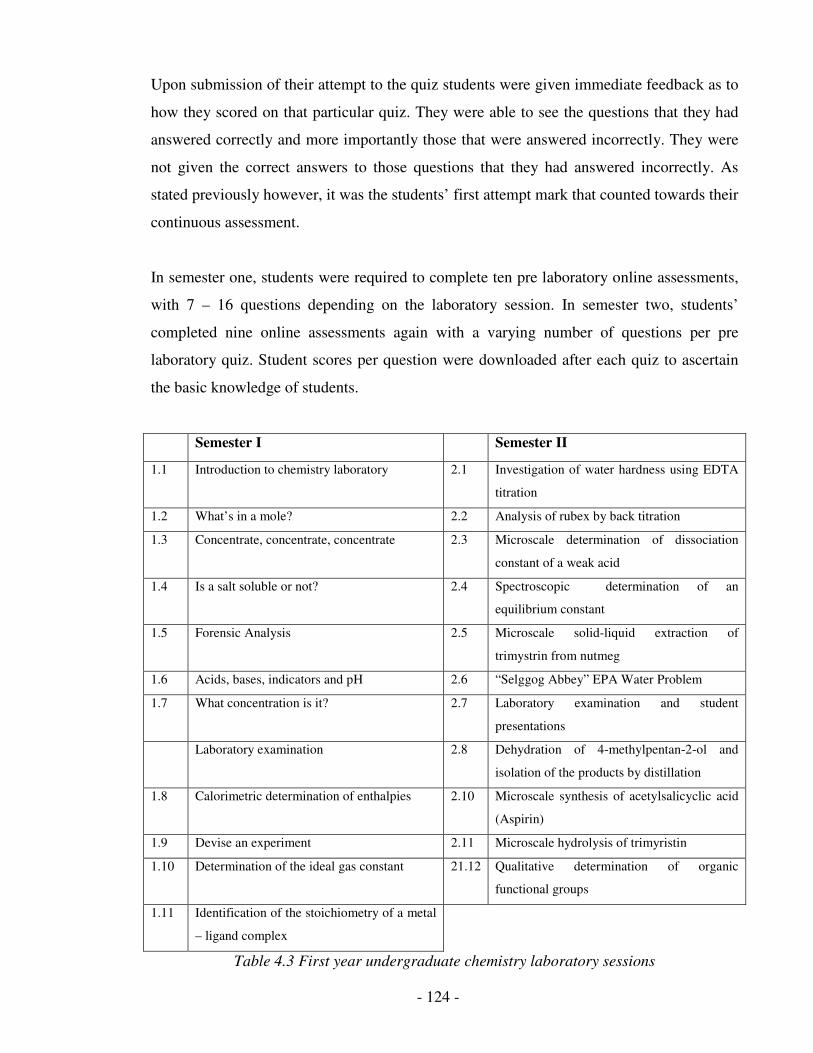
- 124 -
Upon submission of their attempt to the quiz students were given immediate feedback as to
how they scored on that particular quiz. They were able to see the questions that they had
answered correctly and more importantly those that were answered incorrectly. They were
not given the correct answers to those questions that they had answered incorrectly. As
stated previously however, it was the students’ first attempt mark that counted towards their
continuous assessment.
In semester one, students were required to complete ten pre laboratory online assessments,
with 7 – 16 questions depending on the laboratory session. In semester two, students’
completed nine online assessments again with a varying number of questions per pre
laboratory quiz. Student scores per question were downloaded after each quiz to ascertain
the basic knowledge of students.
Semester I Semester II
1.1 Introduction to chemistry laboratory 2.1 Investigation of water hardness using EDTA
titration
1.2 What’s in a mole? 2.2 Analysis of rubex by back titration
1.3 Concentrate, concentrate, concentrate 2.3 Microscale determination of dissociation
constant of a weak acid
1.4 Is a salt soluble or not? 2.4 Spectroscopic determination of an
equilibrium constant
1.5 Forensic Analysis 2.5 Microscale solid-liquid extraction of
trimystrin from nutmeg
1.6 Acids, bases, indicators and pH 2.6 “Selggog Abbey” EPA Water Problem
1.7 What concentration is it? 2.7 Laboratory examination and student
presentations
Laboratory examination 2.8 Dehydration of 4-methylpentan-2-ol and
isolation of the products by distillation
1.8 Calorimetric determination of enthalpies 2.10 Microscale synthesis of acetylsalicyclic acid
(Aspirin)
1.9 Devise an experiment 2.11 Microscale hydrolysis of trimyristin
1.10 Determination of the ideal gas constant 21.12 Qualitative determination of organic
functional groups
1.11 Identification of the stoichiometry of a metal
– ligand complex
Table 4.3 First year undergraduate chemistry laboratory sessions
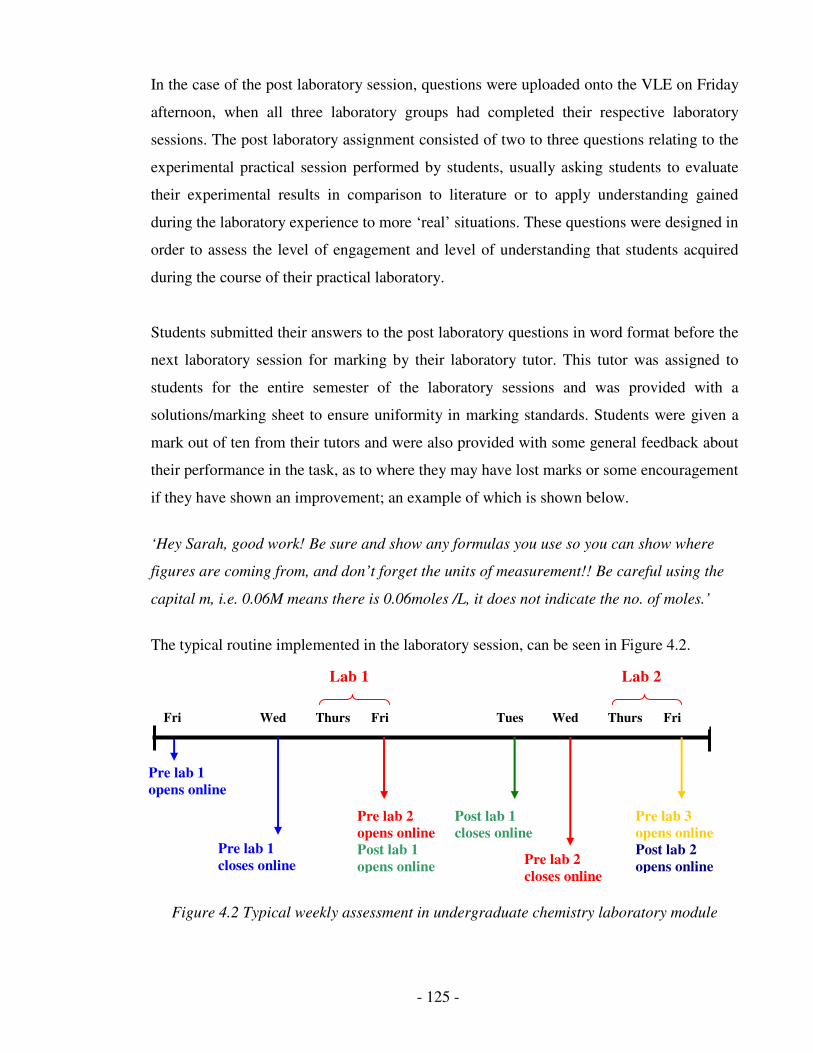
- 125 -
In the case of the post laboratory session, questions were uploaded onto the VLE on Friday
afternoon, when all three laboratory groups had completed their respective laboratory
sessions. The post laboratory assignment consisted of two to three questions relating to the
experimental practical session performed by students, usually asking students to evaluate
their experimental results in comparison to literature or to apply understanding gained
during the laboratory experience to more ‘real’ situations. These questions were designed in
order to assess the level of engagement and level of understanding that students acquired
during the course of their practical laboratory.
Students submitted their answers to the post laboratory questions in word format before the
next laboratory session for marking by their laboratory tutor. This tutor was assigned to
students for the entire semester of the laboratory sessions and was provided with a
solutions/marking sheet to ensure uniformity in marking standards. Students were given a
mark out of ten from their tutors and were also provided with some general feedback about
their performance in the task, as to where they may have lost marks or some encouragement
if they have shown an improvement; an example of which is shown below.
‘Hey Sarah, good work! Be sure and show any formulas you use so you can show where
figures are coming from, and don’t forget the units of measurement!! Be careful using the
capital m, i.e. 0.06M means there is 0.06moles /L, it does not indicate the no. of moles.’
The typical routine implemented in the laboratory session, can be seen in Figure 4.2.
Figure 4.2 Typical weekly assessment in undergraduate chemistry laboratory module
Fri Wed Thurs Fri Tues Wed Thurs Fri
Lab 1 Lab 2
Pre lab 1
opens online
Pre lab 1
closes online
Pre lab 2
opens online
Post lab 1
opens online
Post lab 1
closes online
Pre lab 2
closes online
Pre lab 3
opens online
Post lab 2
opens online

- 126 -
Students were required to ensure that both their post and pre laboratory tasks were
submitted to the online environment on the Tuesday and Wednesday respectively before
entering their next laboratory session. As the post laboratory mark was allocated by their
tutor sufficient time was given for correction so that students could receive feedback on
their attempt in the following laboratory.
- 127 -
4.3 Results & Discussion
The questions that this study has aimed to answer are:
• Does the implementation of pre and post laboratory tasks influences student
learning?
• Does a student’s prior chemistry experience determine their success in pre and post
laboratory activities?
• What are the opinions of students, who have had no experience of a VLE or pre and
post – laboratory activities prior to this of their introduction?
4.3.1 Students performance in pre and post laboratories
In this section two results will be presented
• Correlation between students’ results in pre and post laboratory activities;
• Paired t tests on students’ performances.
Pearsons correlation coefficient investigates if there is a relationship between two or more
variables showing if there is positive, negative or no association. A positive association
would mean that high values in one variable are correlated with high values in the other
variable. Values ranging from –1 to +1 are obtained indicating the strength and direction of
the association. The closer the value of the sample correlation coefficient is to +1, the
stronger the positive association, and vice versa for a negative association.
Using Statistical Program for Scientific Statistics (SPSS) the significance of the Pearsons’
coefficient has also been calculated with a value below 0.05 meaning that there is a
statistically significant difference at 95% confidence, whereas if the significance is greater
than 0.05, then the means are not significantly different.
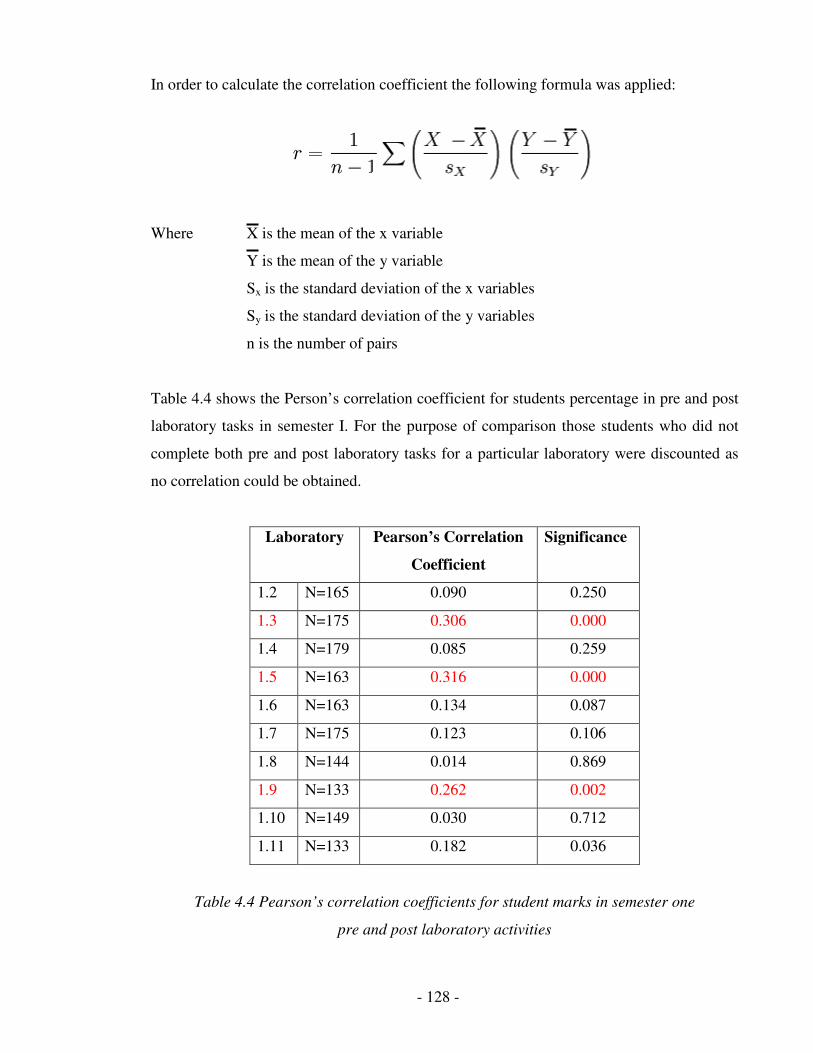
- 128 -
In order to calculate the correlation coefficient the following formula was applied:
Where X is the mean of the x variable
Y is the mean of the y variable
Sx is the standard deviation of the x variables
Sy is the standard deviation of the y variables
n is the number of pairs
Table 4.4 shows the Person’s correlation coefficient for students percentage in pre and post
laboratory tasks in semester I. For the purpose of comparison those students who did not
complete both pre and post laboratory tasks for a particular laboratory were discounted as
no correlation could be obtained.
Laboratory Pearson’s Correlation
Coefficient
Significance
1.2 N=165 0.090 0.250
1.3 N=175 0.306 0.000
1.4 N=179 0.085 0.259
1.5 N=163 0.316 0.000
1.6 N=163 0.134 0.087
1.7 N=175 0.123 0.106
1.8 N=144 0.014 0.869
1.9 N=133 0.262 0.002
1.10 N=149 0.030 0.712
1.11 N=133 0.182 0.036
Table 4.4 Pearson’s correlation coefficients for student marks in semester one
pre and post laboratory activities
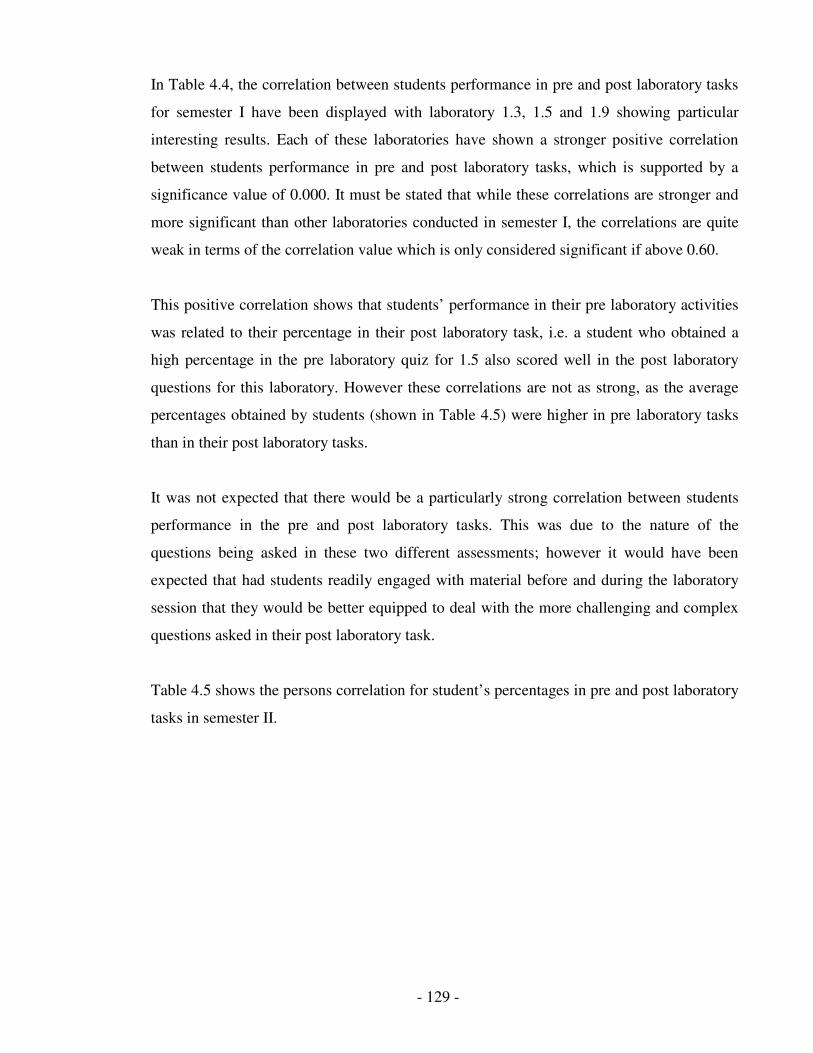
- 129 -
In Table 4.4, the correlation between students performance in pre and post laboratory tasks
for semester I have been displayed with laboratory 1.3, 1.5 and 1.9 showing particular
interesting results. Each of these laboratories have shown a stronger positive correlation
between students performance in pre and post laboratory tasks, which is supported by a
significance value of 0.000. It must be stated that while these correlations are stronger and
more significant than other laboratories conducted in semester I, the correlations are quite
weak in terms of the correlation value which is only considered significant if above 0.60.
This positive correlation shows that students’ performance in their pre laboratory activities
was related to their percentage in their post laboratory task, i.e. a student who obtained a
high percentage in the pre laboratory quiz for 1.5 also scored well in the post laboratory
questions for this laboratory. However these correlations are not as strong, as the average
percentages obtained by students (shown in Table 4.5) were higher in pre laboratory tasks
than in their post laboratory tasks.
It was not expected that there would be a particularly strong correlation between students
performance in the pre and post laboratory tasks. This was due to the nature of the
questions being asked in these two different assessments; however it would have been
expected that had students readily engaged with material before and during the laboratory
session that they would be better equipped to deal with the more challenging and complex
questions asked in their post laboratory task.
Table 4.5 shows the persons correlation for student’s percentages in pre and post laboratory
tasks in semester II.
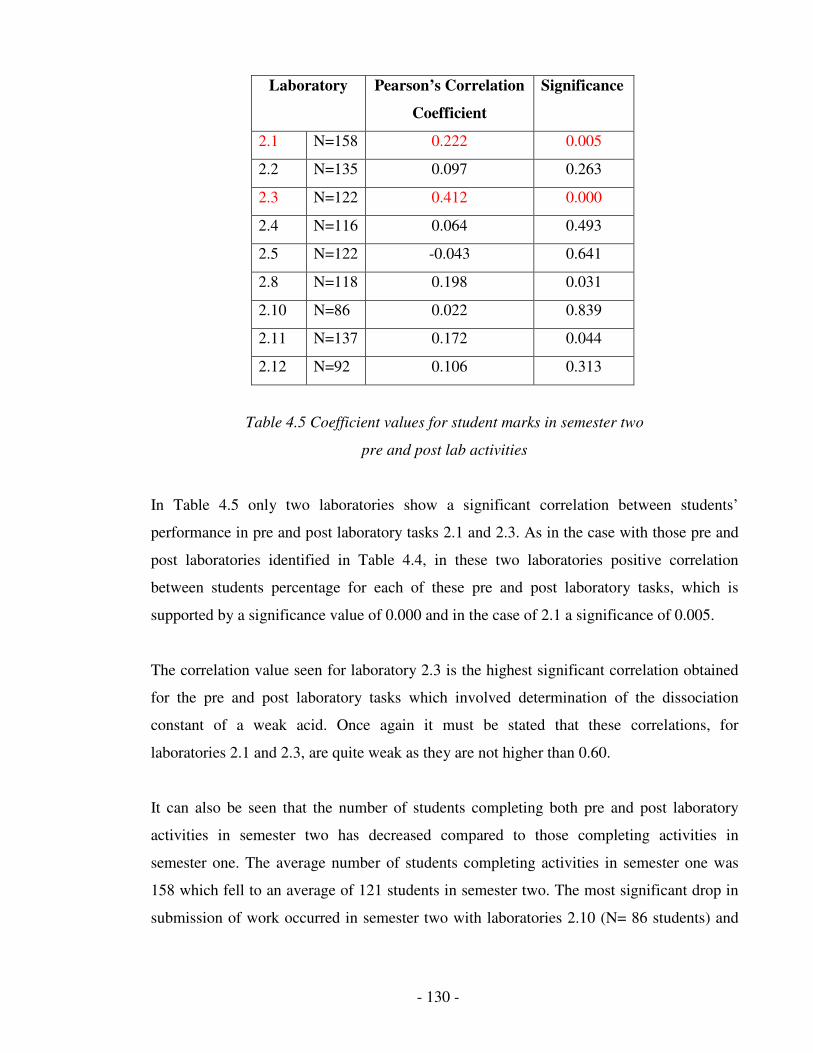
- 130 -
Laboratory Pearson’s Correlation
Coefficient
Significance
2.1 N=158 0.222 0.005
2.2 N=135 0.097 0.263
2.3 N=122 0.412 0.000
2.4 N=116 0.064 0.493
2.5 N=122 -0.043 0.641
2.8 N=118 0.198 0.031
2.10 N=86 0.022 0.839
2.11 N=137 0.172 0.044
2.12 N=92 0.106 0.313
Table 4.5 Coefficient values for student marks in semester two
pre and post lab activities
In Table 4.5 only two laboratories show a significant correlation between students’
performance in pre and post laboratory tasks 2.1 and 2.3. As in the case with those pre and
post laboratories identified in Table 4.4, in these two laboratories positive correlation
between students percentage for each of these pre and post laboratory tasks, which is
supported by a significance value of 0.000 and in the case of 2.1 a significance of 0.005.
The correlation value seen for laboratory 2.3 is the highest significant correlation obtained
for the pre and post laboratory tasks which involved determination of the dissociation
constant of a weak acid. Once again it must be stated that these correlations, for
laboratories 2.1 and 2.3, are quite weak as they are not higher than 0.60.
It can also be seen that the number of students completing both pre and post laboratory
activities in semester two has decreased compared to those completing activities in
semester one. The average number of students completing activities in semester one was
158 which fell to an average of 121 students in semester two. The most significant drop in
submission of work occurred in semester two with laboratories 2.10 (N= 86 students) and
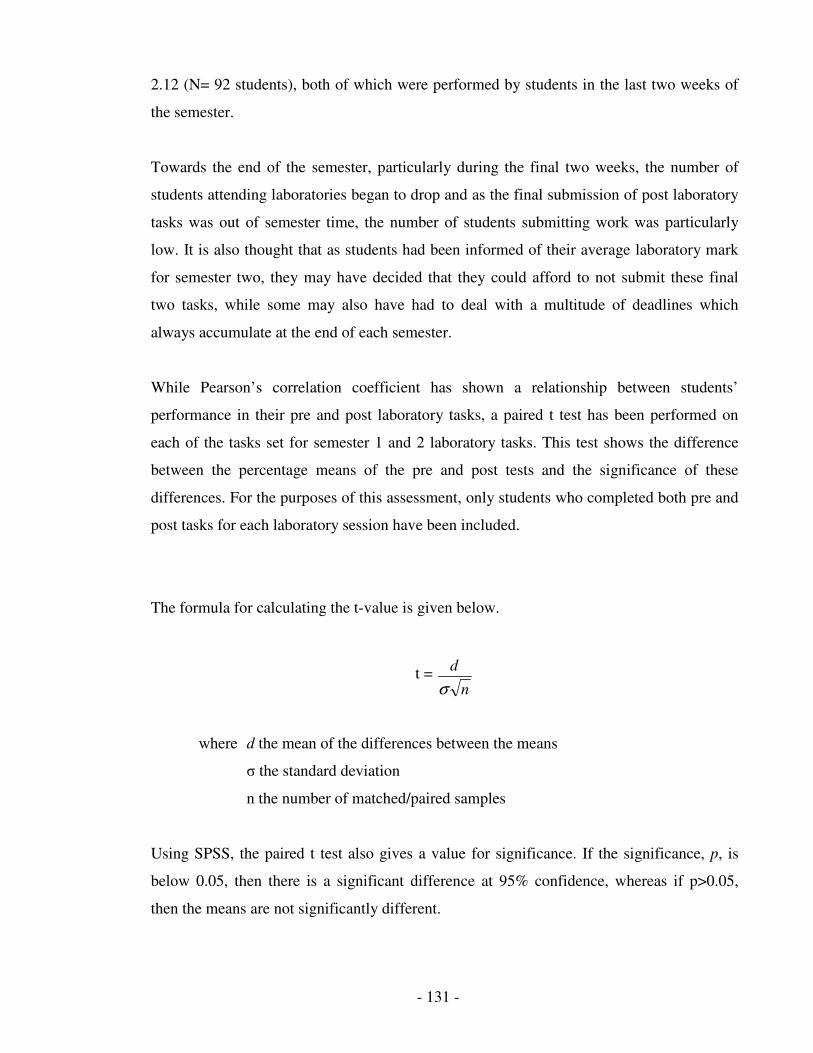
- 131 -
2.12 (N= 92 students), both of which were performed by students in the last two weeks of
the semester.
Towards the end of the semester, particularly during the final two weeks, the number of
students attending laboratories began to drop and as the final submission of post laboratory
tasks was out of semester time, the number of students submitting work was particularly
low. It is also thought that as students had been informed of their average laboratory mark
for semester two, they may have decided that they could afford to not submit these final
two tasks, while some may also have had to deal with a multitude of deadlines which
always accumulate at the end of each semester.
While Pearson’s correlation coefficient has shown a relationship between students’
performance in their pre and post laboratory tasks, a paired t test has been performed on
each of the tasks set for semester 1 and 2 laboratory tasks. This test shows the difference
between the percentage means of the pre and post tests and the significance of these
differences. For the purposes of this assessment, only students who completed both pre and
post tasks for each laboratory session have been included.
The formula for calculating the t-value is given below.
t =
n
d
σ
where d the mean of the differences between the means
σ the standard deviation
n the number of matched/paired samples
Using SPSS, the paired t test also gives a value for significance. If the significance, p, is
below 0.05, then there is a significant difference at 95% confidence, whereas if p>0.05,
then the means are not significantly different.
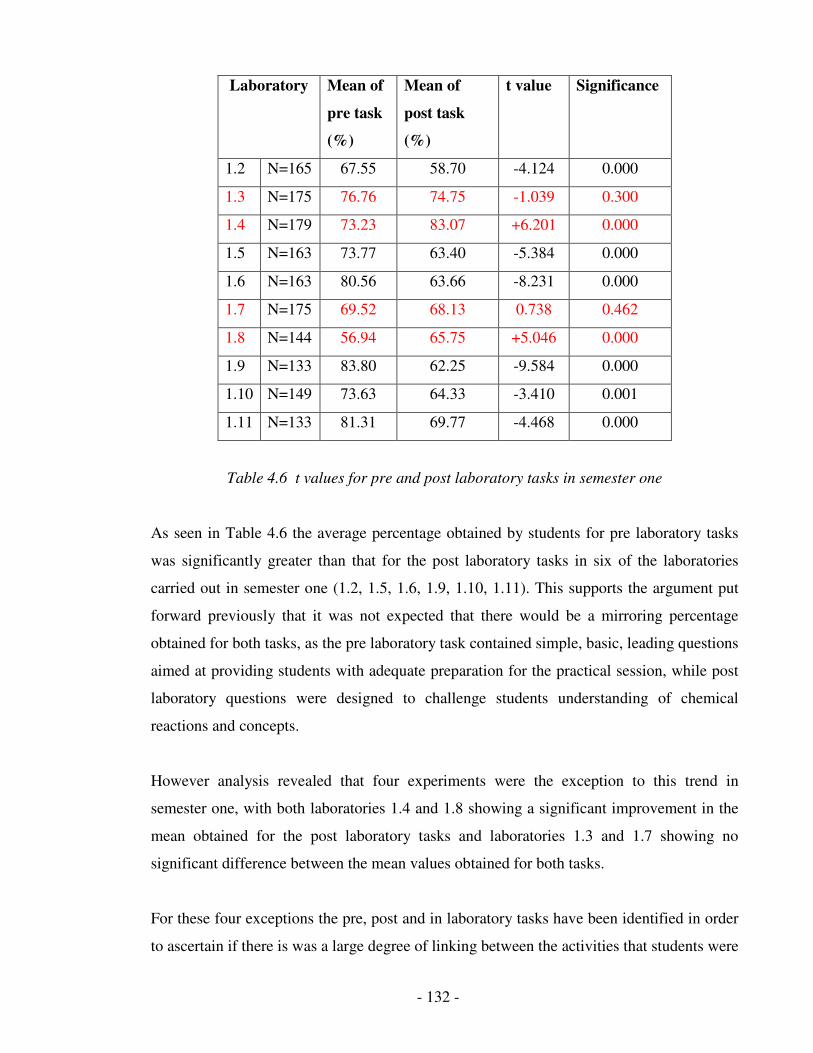
- 132 -
Laboratory Mean of
pre task
(%)
Mean of
post task
(%)
t value Significance
1.2 N=165 67.55 58.70 -4.124 0.000
1.3 N=175 76.76 74.75 -1.039 0.300
1.4 N=179 73.23 83.07 +6.201 0.000
1.5 N=163 73.77 63.40 -5.384 0.000
1.6 N=163 80.56 63.66 -8.231 0.000
1.7 N=175 69.52 68.13 0.738 0.462
1.8 N=144 56.94 65.75 +5.046 0.000
1.9 N=133 83.80 62.25 -9.584 0.000
1.10 N=149 73.63 64.33 -3.410 0.001
1.11 N=133 81.31 69.77 -4.468 0.000
Table 4.6 t values for pre and post laboratory tasks in semester one
As seen in Table 4.6 the average percentage obtained by students for pre laboratory tasks
was significantly greater than that for the post laboratory tasks in six of the laboratories
carried out in semester one (1.2, 1.5, 1.6, 1.9, 1.10, 1.11). This supports the argument put
forward previously that it was not expected that there would be a mirroring percentage
obtained for both tasks, as the pre laboratory task contained simple, basic, leading questions
aimed at providing students with adequate preparation for the practical session, while post
laboratory questions were designed to challenge students understanding of chemical
reactions and concepts.
However analysis revealed that four experiments were the exception to this trend in
semester one, with both laboratories 1.4 and 1.8 showing a significant improvement in the
mean obtained for the post laboratory tasks and laboratories 1.3 and 1.7 showing no
significant difference between the mean values obtained for both tasks.
For these four exceptions the pre, post and in laboratory tasks have been identified in order
to ascertain if there is was a large degree of linking between the activities that students were
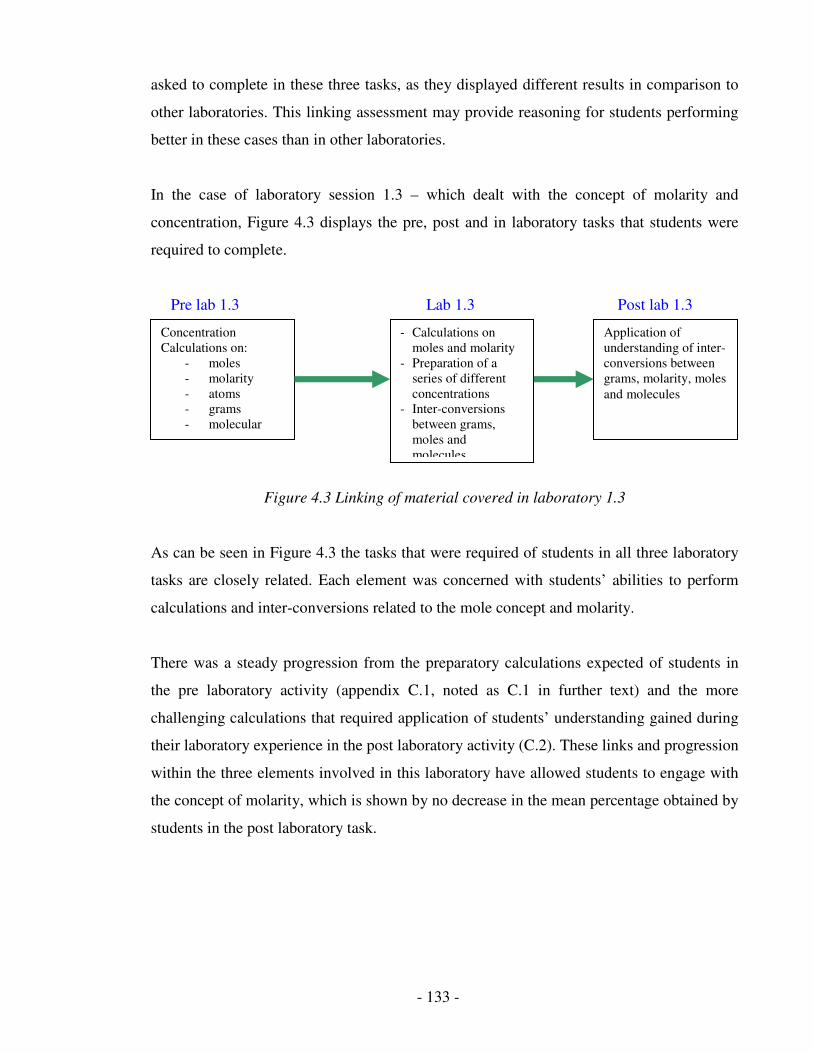
- 133 -
asked to complete in these three tasks, as they displayed different results in comparison to
other laboratories. This linking assessment may provide reasoning for students performing
better in these cases than in other laboratories.
In the case of laboratory session 1.3 – which dealt with the concept of molarity and
concentration, Figure 4.3 displays the pre, post and in laboratory tasks that students were
required to complete.
Pre lab 1.3 Lab 1.3 Post lab 1.3
Figure 4.3 Linking of material covered in laboratory 1.3
As can be seen in Figure 4.3 the tasks that were required of students in all three laboratory
tasks are closely related. Each element was concerned with students’ abilities to perform
calculations and inter-conversions related to the mole concept and molarity.
There was a steady progression from the preparatory calculations expected of students in
the pre laboratory activity (appendix C.1, noted as C.1 in further text) and the more
challenging calculations that required application of students’ understanding gained during
their laboratory experience in the post laboratory activity (C.2). These links and progression
within the three elements involved in this laboratory have allowed students to engage with
the concept of molarity, which is shown by no decrease in the mean percentage obtained by
students in the post laboratory task.
Concentration
Calculations on:
- moles
- molarity
- atoms
- grams
- molecular
mass
- Calculations on
moles and molarity
- Preparation of a
series of different
concentrations
- Inter-conversions
between grams,
moles and
molecules
Application of
understanding of inter-
conversions between
grams, molarity, moles
and molecules

- 134 -
Figure 4.4 displays the pre, post and in – laboratory tasks that students were required to
complete in laboratory 1.4 which introduced students to anions and solubility rules.
Pre lab 1.4 Lab 1.4 Post lab 1.4
Figure 4.4 Linking of material covered in laboratory 1.4
The results obtained in Table 4.6 show that there was no significant difference between the
average percentages obtained in the pre (C.3) and post laboratory activities (C.4) for
laboratory 1.4. As the post laboratory activities were designed to challenge and to test
students knowledge from their in – laboratory experience, in this example students are
showing that the clear linking of material is allowing them to apply their understanding to
these more complex problems.
Figure 4.5 displays the pre, post and in – laboratory tasks that students were required to
complete for laboratory 1.7 involved students applying their understanding of molarity to a
chemical titration.
Pre lab 1.7 Lab 1.7 Post lab 1.7
Figure 4.5 Linking of material covered in laboratory 1.7
-Identification of
anions
-Calculation of
number of sub atomic
particles in anions
-Matching of anion
symbols with correct
names
-Identification of
compounds based on
solubility rules
-Testing for anions
using “positive” tests
-Identification of a
compound based on
listed chemical
observations
- Planning of tests to
identify a series of
unlabelled chemical
compounds
-Calculation of titre
values, molarity and
moles
-Identification of the
pH of common
substances
- Identification of
primary standards and
weak/strong acids and
bases
-Preparation of
primary standards
-Preparation of
primary standards
- Carrying out
titrations involving
strong acid/weak base
- Calculations based
on results obtained
Justification of
chemical procedures
carried out by students
during the course of
the experimental
session
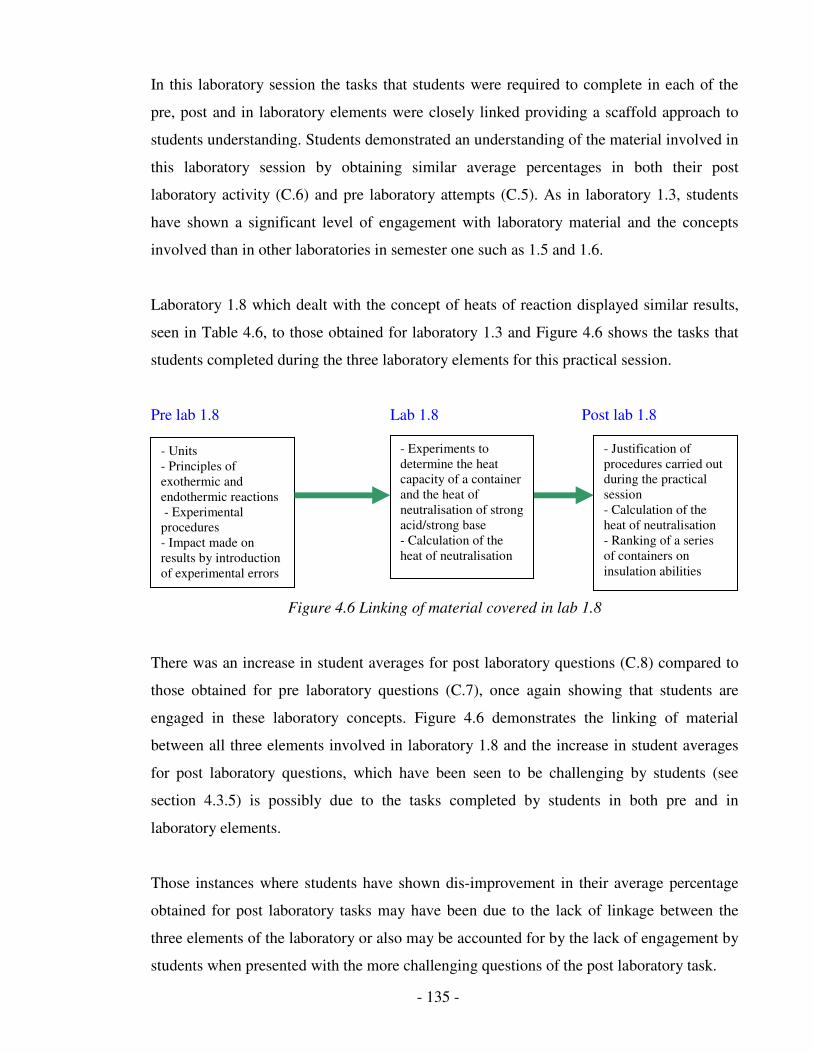
- 135 -
In this laboratory session the tasks that students were required to complete in each of the
pre, post and in laboratory elements were closely linked providing a scaffold approach to
students understanding. Students demonstrated an understanding of the material involved in
this laboratory session by obtaining similar average percentages in both their post
laboratory activity (C.6) and pre laboratory attempts (C.5). As in laboratory 1.3, students
have shown a significant level of engagement with laboratory material and the concepts
involved than in other laboratories in semester one such as 1.5 and 1.6.
Laboratory 1.8 which dealt with the concept of heats of reaction displayed similar results,
seen in Table 4.6, to those obtained for laboratory 1.3 and Figure 4.6 shows the tasks that
students completed during the three laboratory elements for this practical session.
Pre lab 1.8 Lab 1.8 Post lab 1.8
Figure 4.6 Linking of material covered in lab 1.8
There was an increase in student averages for post laboratory questions (C.8) compared to
those obtained for pre laboratory questions (C.7), once again showing that students are
engaged in these laboratory concepts. Figure 4.6 demonstrates the linking of material
between all three elements involved in laboratory 1.8 and the increase in student averages
for post laboratory questions, which have been seen to be challenging by students (see
section 4.3.5) is possibly due to the tasks completed by students in both pre and in
laboratory elements.
Those instances where students have shown dis-improvement in their average percentage
obtained for post laboratory tasks may have been due to the lack of linkage between the
three elements of the laboratory or also may be accounted for by the lack of engagement by
students when presented with the more challenging questions of the post laboratory task.
- Units
- Principles of
exothermic and
endothermic reactions
- Experimental
procedures
- Impact made on
results by introduction
of experimental errors
- Experiments to
determine the heat
capacity of a container
and the heat of
neutralisation of strong
acid/strong base
- Calculation of the
heat of neutralisation
- Justification of
procedures carried out
during the practical
session
- Calculation of the
heat of neutralisation
- Ranking of a series
of containers on
insulation abilities
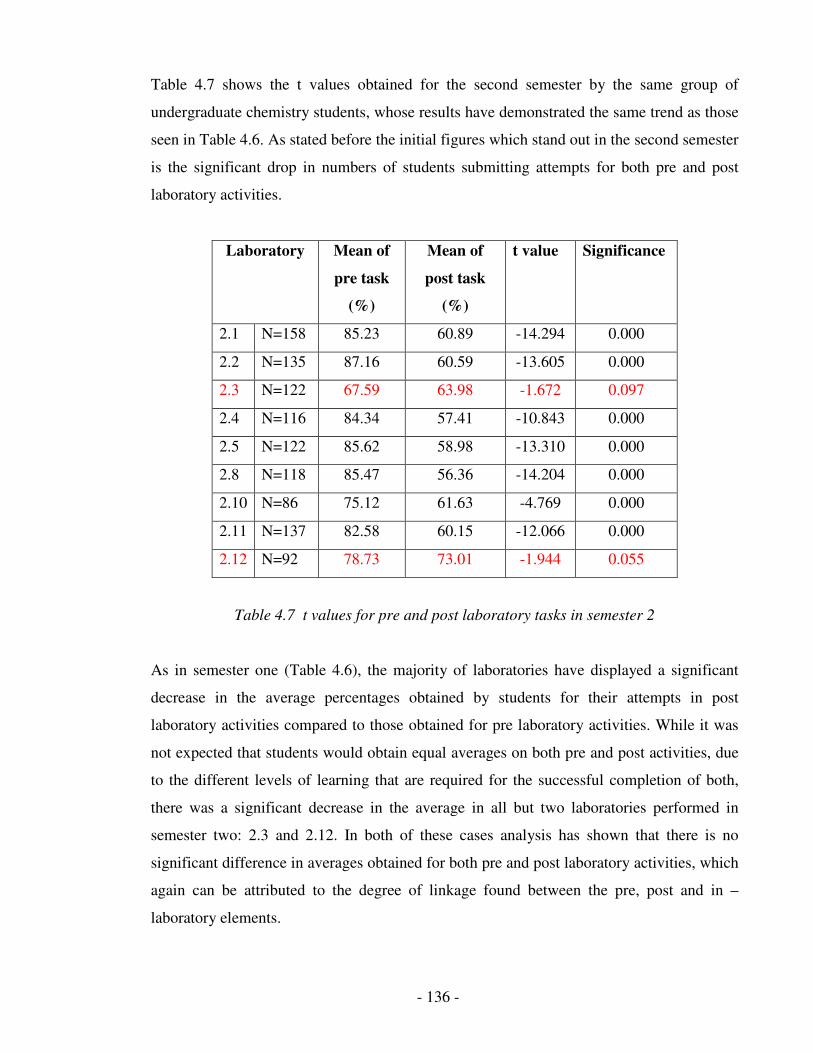
- 136 -
Table 4.7 shows the t values obtained for the second semester by the same group of
undergraduate chemistry students, whose results have demonstrated the same trend as those
seen in Table 4.6. As stated before the initial figures which stand out in the second semester
is the significant drop in numbers of students submitting attempts for both pre and post
laboratory activities.
Laboratory Mean of
pre task
(%)
Mean of
post task
(%)
t value Significance
2.1 N=158 85.23 60.89 -14.294 0.000
2.2 N=135 87.16 60.59 -13.605 0.000
2.3 N=122 67.59 63.98 -1.672 0.097
2.4 N=116 84.34 57.41 -10.843 0.000
2.5 N=122 85.62 58.98 -13.310 0.000
2.8 N=118 85.47 56.36 -14.204 0.000
2.10 N=86 75.12 61.63 -4.769 0.000
2.11 N=137 82.58 60.15 -12.066 0.000
2.12 N=92 78.73 73.01 -1.944 0.055
Table 4.7 t values for pre and post laboratory tasks in semester 2
As in semester one (Table 4.6), the majority of laboratories have displayed a significant
decrease in the average percentages obtained by students for their attempts in post
laboratory activities compared to those obtained for pre laboratory activities. While it was
not expected that students would obtain equal averages on both pre and post activities, due
to the different levels of learning that are required for the successful completion of both,
there was a significant decrease in the average in all but two laboratories performed in
semester two: 2.3 and 2.12. In both of these cases analysis has shown that there is no
significant difference in averages obtained for both pre and post laboratory activities, which
again can be attributed to the degree of linkage found between the pre, post and in –
laboratory elements.
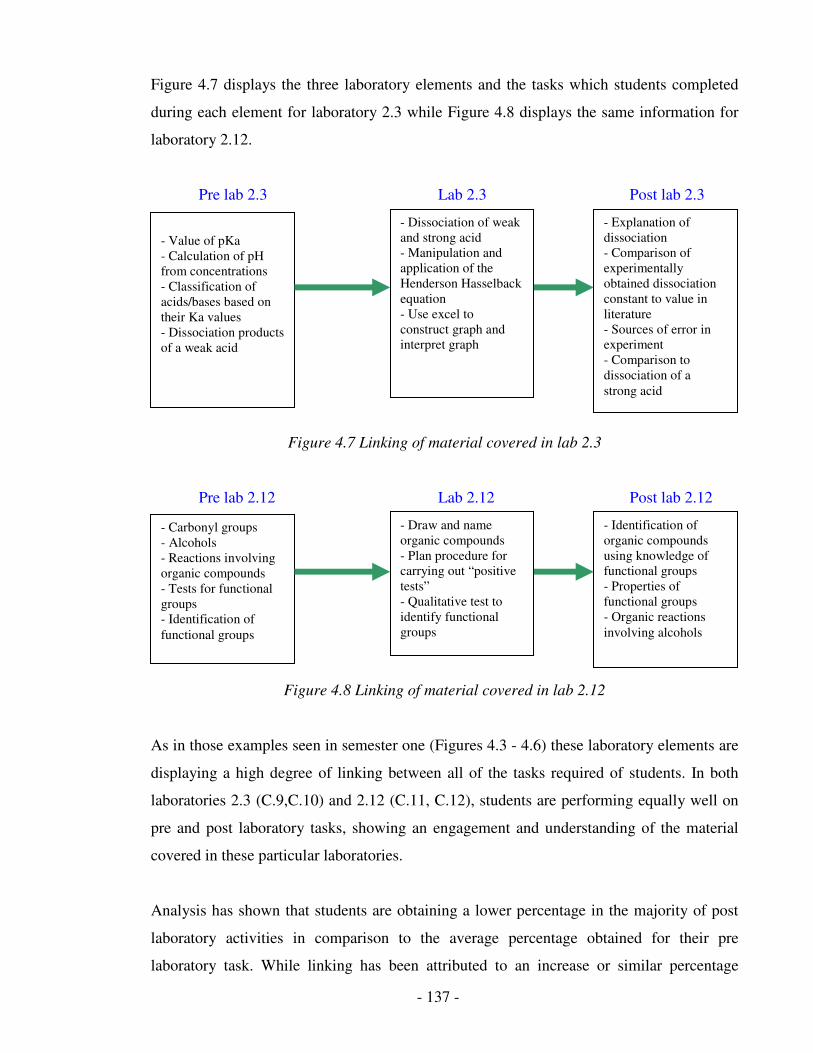
- 137 -
Figure 4.7 displays the three laboratory elements and the tasks which students completed
during each element for laboratory 2.3 while Figure 4.8 displays the same information for
laboratory 2.12.
Pre lab 2.3 Lab 2.3 Post lab 2.3
Figure 4.7 Linking of material covered in lab 2.3
Pre lab 2.12 Lab 2.12 Post lab 2.12
Figure 4.8 Linking of material covered in lab 2.12
As in those examples seen in semester one (Figures 4.3 - 4.6) these laboratory elements are
displaying a high degree of linking between all of the tasks required of students. In both
laboratories 2.3 (C.9,C.10) and 2.12 (C.11, C.12), students are performing equally well on
pre and post laboratory tasks, showing an engagement and understanding of the material
covered in these particular laboratories.
Analysis has shown that students are obtaining a lower percentage in the majority of post
laboratory activities in comparison to the average percentage obtained for their pre
laboratory task. While linking has been attributed to an increase or similar percentage
- Value of pKa
- Calculation of pH
from concentrations
- Classification of
acids/bases based on
their Ka values
- Dissociation products
of a weak acid
- Dissociation of weak
and strong acid
- Manipulation and
application of the
Henderson Hasselback
equation
- Use excel to
construct graph and
interpret graph
- Explanation of
dissociation
- Comparison of
experimentally
obtained dissociation
constant to value in
literature
- Sources of error in
experiment
- Comparison to
dissociation of a
strong acid
- Carbonyl groups
- Alcohols
- Reactions involving
organic compounds
- Tests for functional
groups
- Identification of
functional groups
- Draw and name
organic compounds
- Plan procedure for
carrying out “positive
tests”
- Qualitative test to
identify functional
groups
- Identification of
organic compounds
using knowledge of
functional groups
- Properties of
functional groups
- Organic reactions
involving alcohols
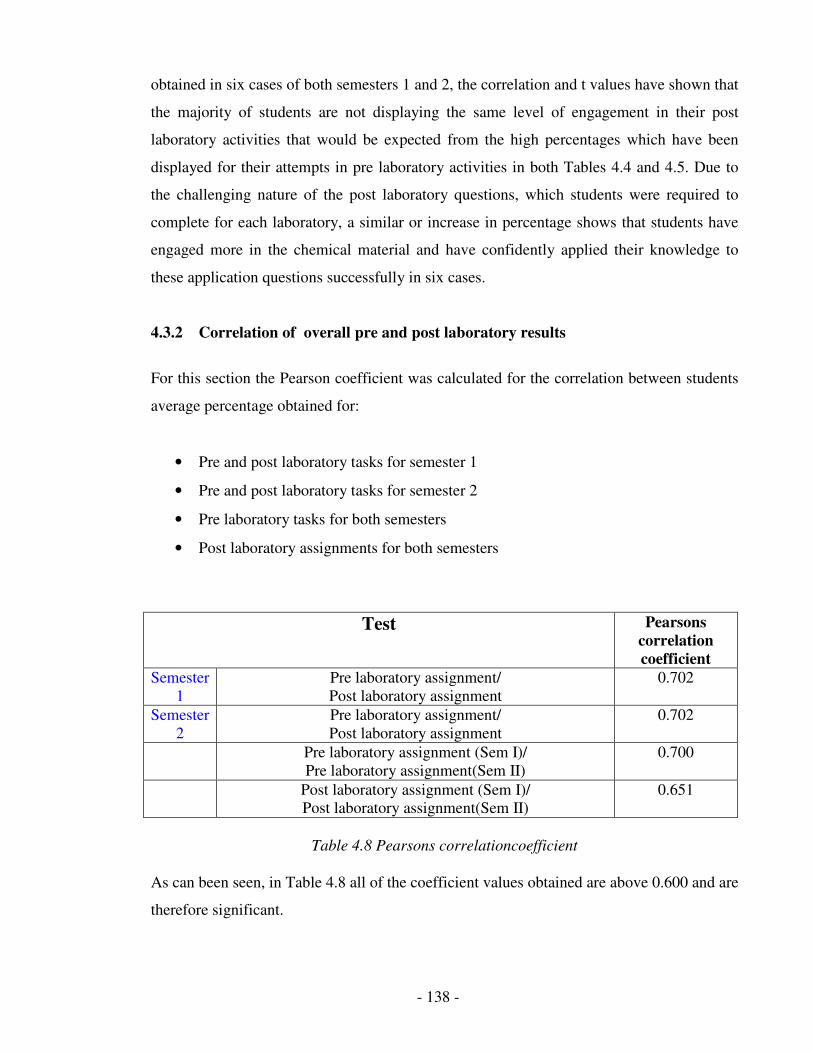
- 138 -
obtained in six cases of both semesters 1 and 2, the correlation and t values have shown that
the majority of students are not displaying the same level of engagement in their post
laboratory activities that would be expected from the high percentages which have been
displayed for their attempts in pre laboratory activities in both Tables 4.4 and 4.5. Due to
the challenging nature of the post laboratory questions, which students were required to
complete for each laboratory, a similar or increase in percentage shows that students have
engaged more in the chemical material and have confidently applied their knowledge to
these application questions successfully in six cases.
4.3.2 Correlation of overall pre and post laboratory results
For this section the Pearson coefficient was calculated for the correlation between students
average percentage obtained for:
• Pre and post laboratory tasks for semester 1
• Pre and post laboratory tasks for semester 2
• Pre laboratory tasks for both semesters
• Post laboratory assignments for both semesters
Test Pearsons
correlation
coefficient
Semester
1
Pre laboratory assignment/
Post laboratory assignment
0.702
Semester
2
Pre laboratory assignment/
Post laboratory assignment
0.702
Pre laboratory assignment (Sem I)/
Pre laboratory assignment(Sem II)
0.700
Post laboratory assignment (Sem I)/
Post laboratory assignment(Sem II)
0.651
Table 4.8 Pearsons correlationcoefficient
As can been seen, in Table 4.8 all of the coefficient values obtained are above 0.600 and are
therefore significant.
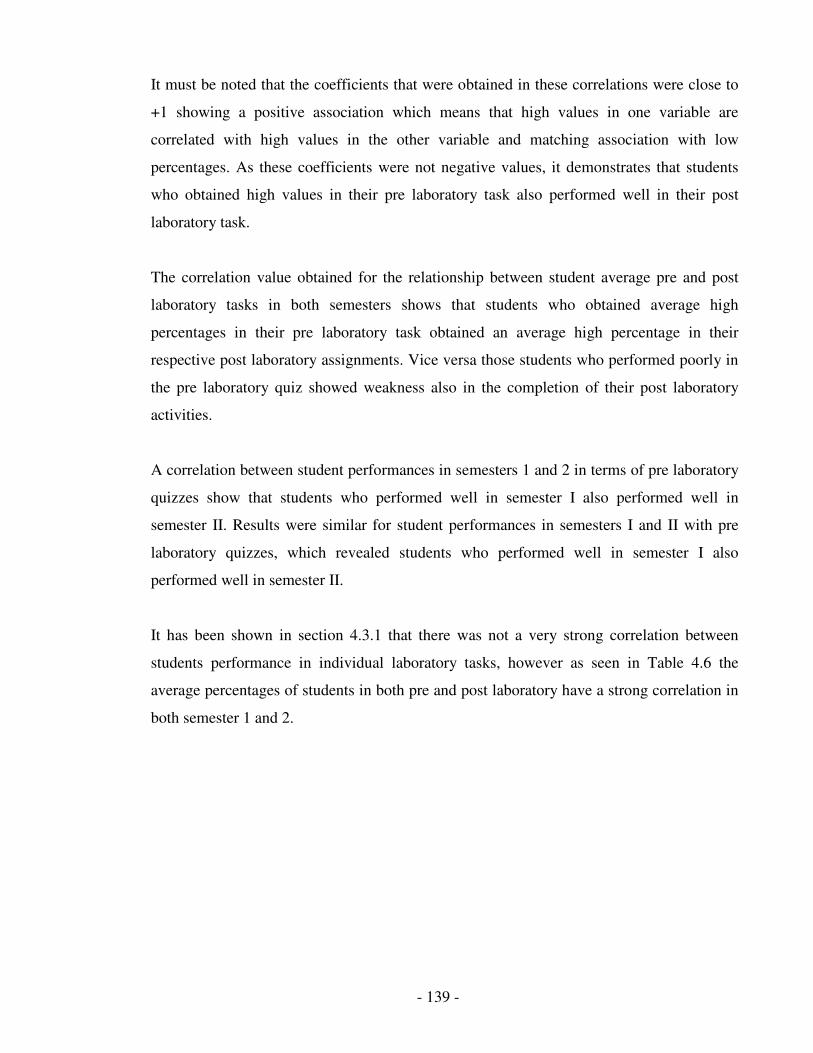
- 139 -
It must be noted that the coefficients that were obtained in these correlations were close to
+1 showing a positive association which means that high values in one variable are
correlated with high values in the other variable and matching association with low
percentages. As these coefficients were not negative values, it demonstrates that students
who obtained high values in their pre laboratory task also performed well in their post
laboratory task.
The correlation value obtained for the relationship between student average pre and post
laboratory tasks in both semesters shows that students who obtained average high
percentages in their pre laboratory task obtained an average high percentage in their
respective post laboratory assignments. Vice versa those students who performed poorly in
the pre laboratory quiz showed weakness also in the completion of their post laboratory
activities.
A correlation between student performances in semesters 1 and 2 in terms of pre laboratory
quizzes show that students who performed well in semester I also performed well in
semester II. Results were similar for student performances in semesters I and II with pre
laboratory quizzes, which revealed students who performed well in semester I also
performed well in semester II.
It has been shown in section 4.3.1 that there was not a very strong correlation between
students performance in individual laboratory tasks, however as seen in Table 4.6 the
average percentages of students in both pre and post laboratory have a strong correlation in
both semester 1 and 2.
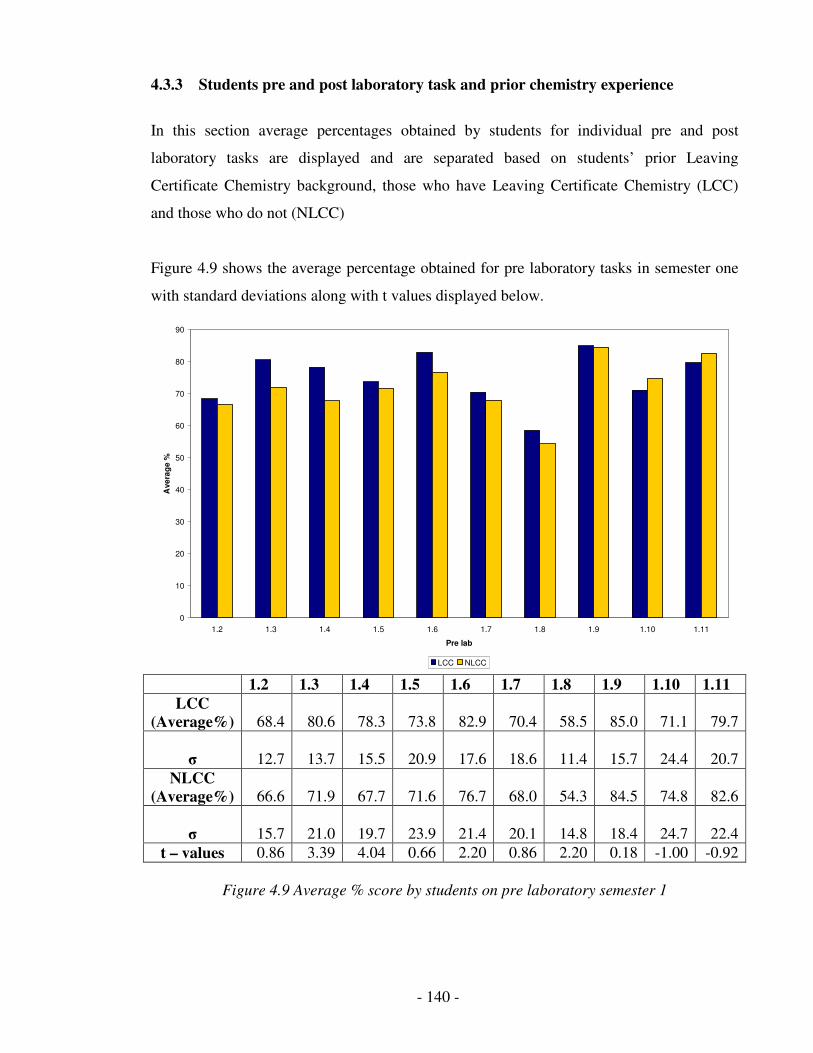
- 140 -
4.3.3 Students pre and post laboratory task and prior chemistry experience
In this section average percentages obtained by students for individual pre and post
laboratory tasks are displayed and are separated based on students’ prior Leaving
Certificate Chemistry background, those who have Leaving Certificate Chemistry (LCC)
and those who do not (NLCC)
Figure 4.9 shows the average percentage obtained for pre laboratory tasks in semester one
with standard deviations along with t values displayed below.
0
10
20
30
40
50
60
70
80
90
1.2 1.3 1.4 1.5 1.6 1.7 1.8 1.9 1.10 1.11
Pre lab
Ave
rag
e %
LCC NLCC
1.2 1.3 1.4 1.5 1.6 1.7 1.8 1.9 1.10 1.11
LCC
(Average%) 68.4 80.6 78.3 73.8 82.9 70.4 58.5 85.0 71.1 79.7
σ 12.7 13.7 15.5 20.9 17.6 18.6 11.4 15.7 24.4 20.7
NLCC
(Average%) 66.6 71.9 67.7 71.6 76.7 68.0 54.3 84.5 74.8 82.6
σ 15.7 21.0 19.7 23.9 21.4 20.1 14.8 18.4 24.7 22.4
t – values 0.86 3.39 4.04 0.66 2.20 0.86 2.20 0.18 -1.00 -0.92
Figure 4.9 Average % score by students on pre laboratory semester 1

- 141 -
Firstly from Figure 4.9 it can be seen that on average both LCC and NLCC students were
performing particularly well on all semester 1 pre laboratory tasks with average scores in
excess of 50%. This shows that students are not only attempting the preparatory tasks
before completing their practical sessions but also they have a basic knowledge of the
concepts to be covered in the laboratory.
The averages overall obtained by NLCC students were only marginally lower than those
obtained by LCC students showing that the questions being used were not over challenging
even to those who had little or no chemistry knowledge. These questions, as stated
previously in section 4.2 were designed to be basic and straightforward yet helping to
introduce students to terminology and simple chemistry that they should be aware of before
attempting the laboratory session. As can be also be seen in Figure 4.9, LCC students were
still challenged by these questions, even when they may have encountered the majority of
these concepts at Leaving Certificate level.
The standard deviation values also displayed in Figure 4.9, show that the percentages
obtained by NLCC students were considerably larger in range than those of LCC students.
As observed particularly for laboratory 1.3, the standard deviation value obtained for LCC
was 13.7 while for non NLCC students was 21.00, displaying that the percentages obtained
by NLCC students were of greater distance from the mean, both higher and lower, than
those obtained by LCC students.
The t values, which are displayed at the bottom of Figure 4.9 are only considered
significant when the t -value is above 1.96 to account for a 95% confidence interval
(Statistics for Dummies). Therefore the pre laboratory quizzes were LCC students
preformed significantly better than their NLCC counterparts were 1.3, 1.4, 1.6 and 1.8.
These pre laboratory tasks involved molarity, solubility rules, titrations and the calculation
of heats of neutralisation. As would be expected for questions dealing with mole and
molarity, LCC students performed better than those students with no chemistry
background. These LCC students would have been exposed to the concepts and
calculations involved in their prior LCC studies.
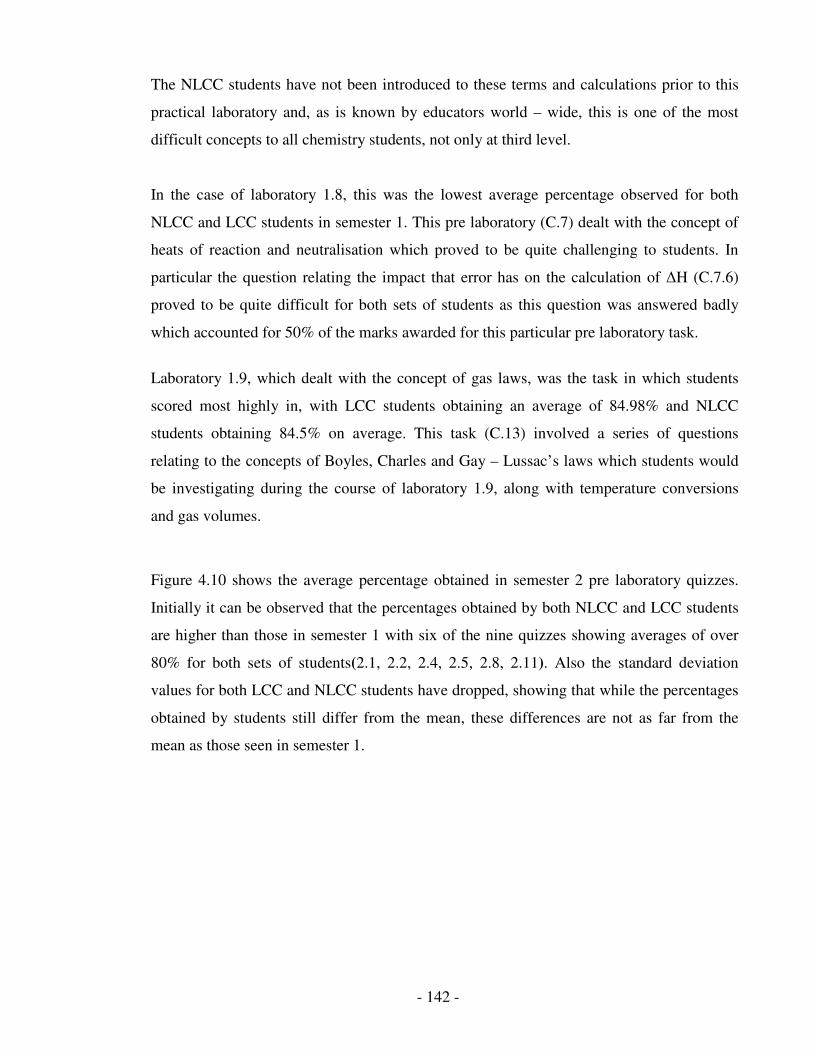
- 142 -
The NLCC students have not been introduced to these terms and calculations prior to this
practical laboratory and, as is known by educators world – wide, this is one of the most
difficult concepts to all chemistry students, not only at third level.
In the case of laboratory 1.8, this was the lowest average percentage observed for both
NLCC and LCC students in semester 1. This pre laboratory (C.7) dealt with the concept of
heats of reaction and neutralisation which proved to be quite challenging to students. In
particular the question relating the impact that error has on the calculation of ∆H (C.7.6)
proved to be quite difficult for both sets of students as this question was answered badly
which accounted for 50% of the marks awarded for this particular pre laboratory task.
Laboratory 1.9, which dealt with the concept of gas laws, was the task in which students
scored most highly in, with LCC students obtaining an average of 84.98% and NLCC
students obtaining 84.5% on average. This task (C.13) involved a series of questions
relating to the concepts of Boyles, Charles and Gay – Lussac’s laws which students would
be investigating during the course of laboratory 1.9, along with temperature conversions
and gas volumes.
Figure 4.10 shows the average percentage obtained in semester 2 pre laboratory quizzes.
Initially it can be observed that the percentages obtained by both NLCC and LCC students
are higher than those in semester 1 with six of the nine quizzes showing averages of over
80% for both sets of students(2.1, 2.2, 2.4, 2.5, 2.8, 2.11). Also the standard deviation
values for both LCC and NLCC students have dropped, showing that while the percentages
obtained by students still differ from the mean, these differences are not as far from the
mean as those seen in semester 1.
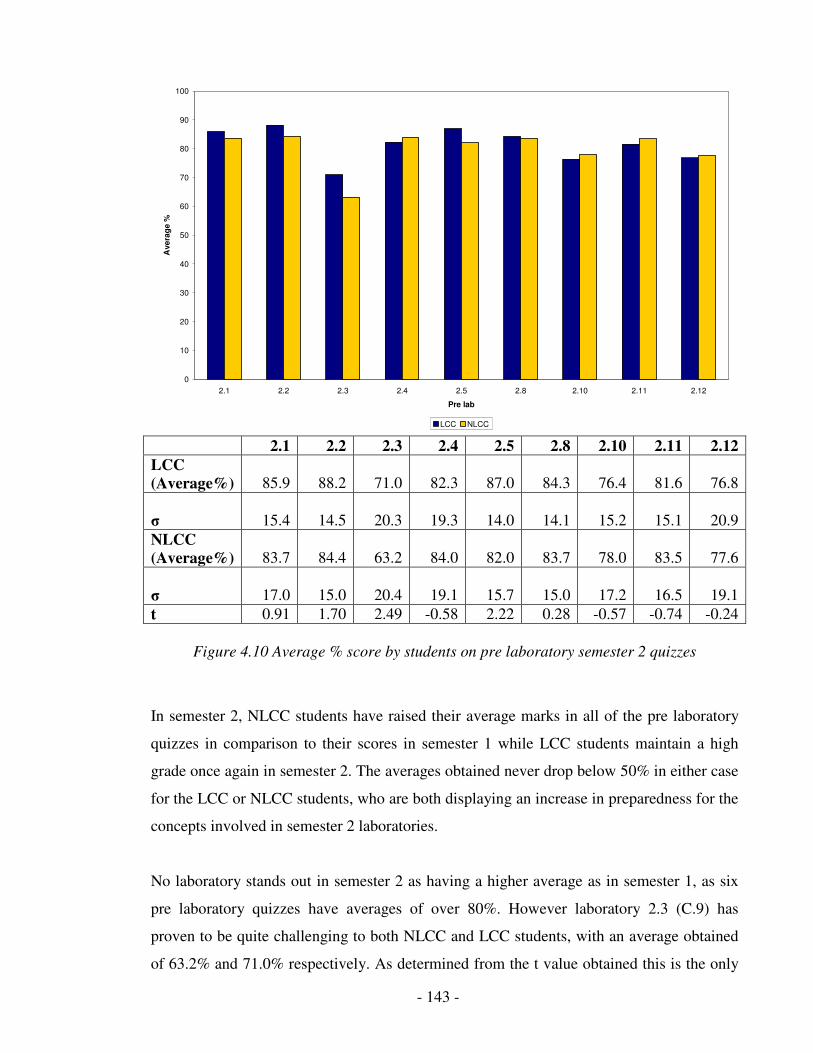
- 143 -
0
10
20
30
40
50
60
70
80
90
100
2.1 2.2 2.3 2.4 2.5 2.8 2.10 2.11 2.12
Pre lab
Ave
rag
e %
LCC NLCC
2.1 2.2 2.3 2.4 2.5 2.8 2.10 2.11 2.12
LCC
(Average%) 85.9 88.2 71.0 82.3 87.0 84.3 76.4 81.6 76.8
σ 15.4 14.5 20.3 19.3 14.0 14.1 15.2 15.1 20.9
NLCC
(Average%) 83.7 84.4 63.2 84.0 82.0 83.7 78.0 83.5 77.6
σ 17.0 15.0 20.4 19.1 15.7 15.0 17.2 16.5 19.1
t 0.91 1.70 2.49 -0.58 2.22 0.28 -0.57 -0.74 -0.24
Figure 4.10 Average % score by students on pre laboratory semester 2 quizzes
In semester 2, NLCC students have raised their average marks in all of the pre laboratory
quizzes in comparison to their scores in semester 1 while LCC students maintain a high
grade once again in semester 2. The averages obtained never drop below 50% in either case
for the LCC or NLCC students, who are both displaying an increase in preparedness for the
concepts involved in semester 2 laboratories.
No laboratory stands out in semester 2 as having a higher average as in semester 1, as six
pre laboratory quizzes have averages of over 80%. However laboratory 2.3 (C.9) has
proven to be quite challenging to both NLCC and LCC students, with an average obtained
of 63.2% and 71.0% respectively. As determined from the t value obtained this is the only
- 144 -
pre laboratory quiz which can be compare directly as the t value obtained is over 1.96. Here
LCC students have performed significantly better than their NLCC counterparts with an
average of 6% difference between the two cohorts. These questions were used in order to
prepare students for the experimental session to determine the dissociation constant of a
weak acid.
Students were required to calculate the pH of a series of acids and bases (C.9.3) from their
[H+] and also to classify an acid/base as weak or strong based on their Ka value (C.9.4) as
two of the questions in this pre laboratory task. As both questions were allocated 38.5% of
the total percentage for this task and as they proved to be quite challenging to both sets of
students, this accounts for the lower average percentages obtained by NLCC and LCC
students.
In both semesters NLCC students have shown a strong chemical ability as the average
obtained across the two semesters never dropped below 50%. This also provides evidence
that the level of chemistry which was expected from students in order to adequately prepare
for their laboratory session was appropriate for those students with little or no chemical
experience. However the pre laboratory tasks still proved to be challenging for LCC
students as while their scores also never dropped below 50% there was no one week in
either semester where the average obtained climbed over 90%. As these students have
completed chemistry to Leaving Certificate Level it would be expected that the average
marks obtained could reach 100% as the questions posed required basic chemical
knowledge.
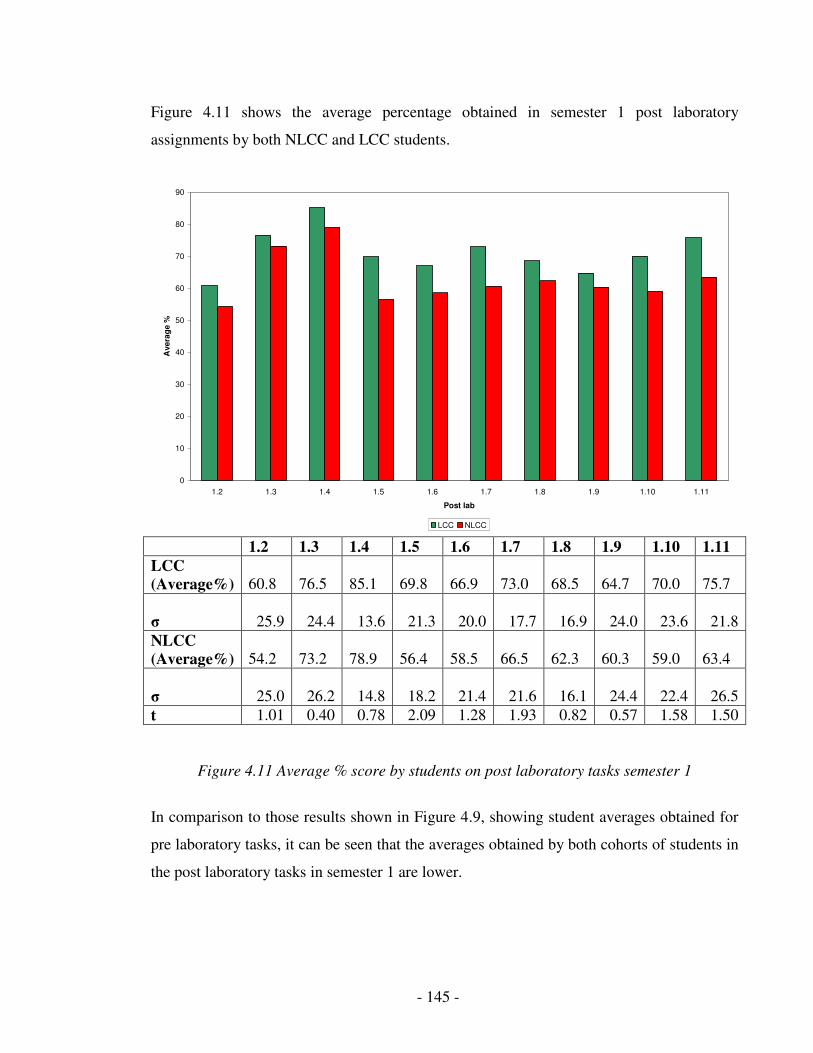
- 145 -
Figure 4.11 shows the average percentage obtained in semester 1 post laboratory
assignments by both NLCC and LCC students.
0
10
20
30
40
50
60
70
80
90
1.2 1.3 1.4 1.5 1.6 1.7 1.8 1.9 1.10 1.11
Post lab
Ave
rag
e %
LCC NLCC
1.2 1.3 1.4 1.5 1.6 1.7 1.8 1.9 1.10 1.11
LCC
(Average%) 60.8 76.5 85.1 69.8 66.9 73.0 68.5 64.7 70.0 75.7
σ 25.9 24.4 13.6 21.3 20.0 17.7 16.9 24.0 23.6 21.8
NLCC
(Average%) 54.2 73.2 78.9 56.4 58.5 66.5 62.3 60.3 59.0 63.4
σ 25.0 26.2 14.8 18.2 21.4 21.6 16.1 24.4 22.4 26.5
t 1.01 0.40 0.78 2.09 1.28 1.93 0.82 0.57 1.58 1.50
Figure 4.11 Average % score by students on post laboratory tasks semester 1
In comparison to those results shown in Figure 4.9, showing student averages obtained for
pre laboratory tasks, it can be seen that the averages obtained by both cohorts of students in
the post laboratory tasks in semester 1 are lower.

- 146 -
Once again both LCC and NLCC students are displaying some engagement with the
material assessed in the post laboratory tasks as both cohorts obtained averages greater than
50%, similar as in the pre laboratory tasks of semesters 1 and 2.
In relation to the performance of LCC students, the impact that prior chemical knowledge
has on students’ scores in post laboratory activities is more evident than in pre laboratory
tasks, as the averages obtained by both LCC and NLCC students are substantially lower
than what they obtained in their attempts in both pre laboratory tasks for semesters 1 and 2,
however the drop in percentage is greater for the NLCC students.
Post laboratories 1.5 and 1.7 are the only two post laboratory assignments were the results
obtained by NLCC and LCC students show a significant difference. While 1.7 has a t value
of less than 1.96 this is to a 90% confidence interval rather than a 95% confidence interval
as with 1.5. In post laboratory 1.5 students were required to complete a series of questions
based on the solubility rules they had investigated during their laboratory session. In post
laboratory 1.7 students were tested on their ability to perform a titration calculation which
was hoped to build on their experience of calculations during the laboratory session. LCC
students would be expected to have somewhat of an advantage on their NLCC counterparts
as they would have had some experience in the completion of these calculations, balancing
of equations and ion formation as they are an integral part of the Leaving Certificate
Chemistry course.
As seen in Figure 4.10, laboratory 1.4 (C.4) shows the highest average percentage obtained
by both LCC and NLCC students while post laboratory task 1.2 (F.13) proved to be the
most challenging of the ten tasks in semester 1. Section 4.2.1 discussed the linkage that was
seen between the in-laboratory session and the questions asked of students in their post
laboratory activity. It is thought that this high degree of linkage proved to engage students
in their post laboratory questions and accounts for the high level of achievement that has
been seen in the average percentage obtained for this laboratory.
The laboratory 1.2 dealing with the mole has been seen to be quite challenging to both LCC
and NLCC students. This concept was relatively new to NLCC students and proved to be
quite difficult which accounts for their low average percentage.
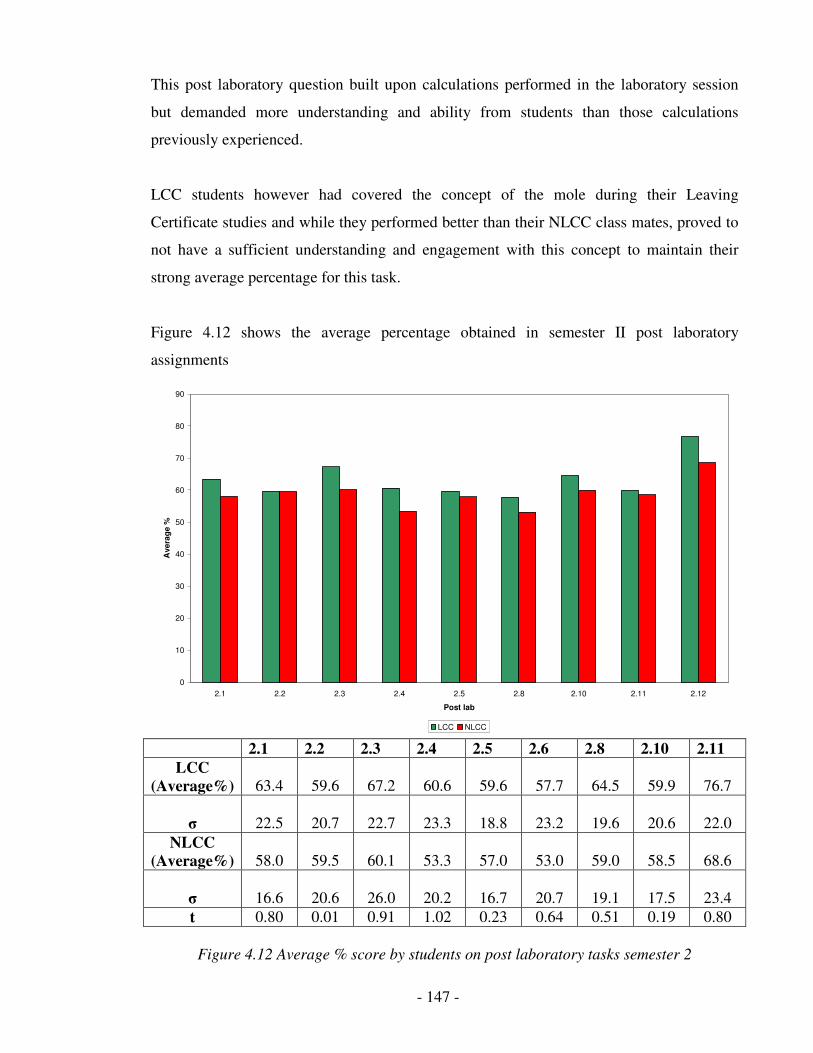
- 147 -
This post laboratory question built upon calculations performed in the laboratory session
but demanded more understanding and ability from students than those calculations
previously experienced.
LCC students however had covered the concept of the mole during their Leaving
Certificate studies and while they performed better than their NLCC class mates, proved to
not have a sufficient understanding and engagement with this concept to maintain their
strong average percentage for this task.
Figure 4.12 shows the average percentage obtained in semester II post laboratory
assignments
0
10
20
30
40
50
60
70
80
90
2.1 2.2 2.3 2.4 2.5 2.8 2.10 2.11 2.12
Post lab
Ave
rag
e %
LCC NLCC
2.1 2.2 2.3 2.4 2.5 2.6 2.8 2.10 2.11
LCC
(Average%) 63.4 59.6 67.2 60.6 59.6 57.7 64.5 59.9 76.7
σ 22.5 20.7 22.7 23.3 18.8 23.2 19.6 20.6 22.0
NLCC
(Average%) 58.0 59.5 60.1 53.3 57.0 53.0 59.0 58.5 68.6
σ 16.6 20.6 26.0 20.2 16.7 20.7 19.1 17.5 23.4
t 0.80 0.01 0.91 1.02 0.23 0.64 0.51 0.19 0.80
Figure 4.12 Average % score by students on post laboratory tasks semester 2
- 148 -
It is obvious in comparison to those average percentages observed in Figure 4.11 that
neither group of students are engaging with the material to the same extent as in semester 1
and that the post laboratory tasks are proving to be quite challenging for all. The
percentages obtained by LCC have dropped significantly in comparison to those they
achieved in semester 1, the average percentage obtained by LCC students has fallen from
71.1% in semester 1 to 63.2% in semester 2. In comparison to this the average by NLCC
students has fallen from 62.7% semester 1 to 58.7% in semester 2. This also may be
accounted for by the fall in number of students completing post laboratory tasks as seen in
Table 4.5 in section 4.2.1.
The post laboratory task in which students obtained the highest average percentage was
laboratory 2.12 (C.12), which was shown in section 4.2.1 to have a high degree of linkage
between the laboratory tasks and the post laboratory questions.
However in semester 2 there was no particular post laboratory task which has shown to
have been particularly difficult for either LCC or NLCC students as none of the nine post
laboratory percentages achieved by either cohort have shown significance over 1.96. The
associated standard deviations have shown that in post laboratory activities, standard
deviations are greater for the LCC cohort in seven of the post laboratory tasks than for the
LCC cohort.
In summary, both sets of students have performed well on pre laboratory tasks in both
semester 1 and 2 with an increase in the average percentages evident in semester 2.
However in the case of the post laboratory tasks, a sharp fall in the average percentages
obtained by both NLCC and LCC cohorts has shown that the questions involved in these
laboratories have proven more challenging to students and may indicate reduced
engagement by students. It must be noted that there was also a change in academic staff
running the laboratory session for semester 1 to semester 2 and the effect of this (if any) is
difficult to quantify.
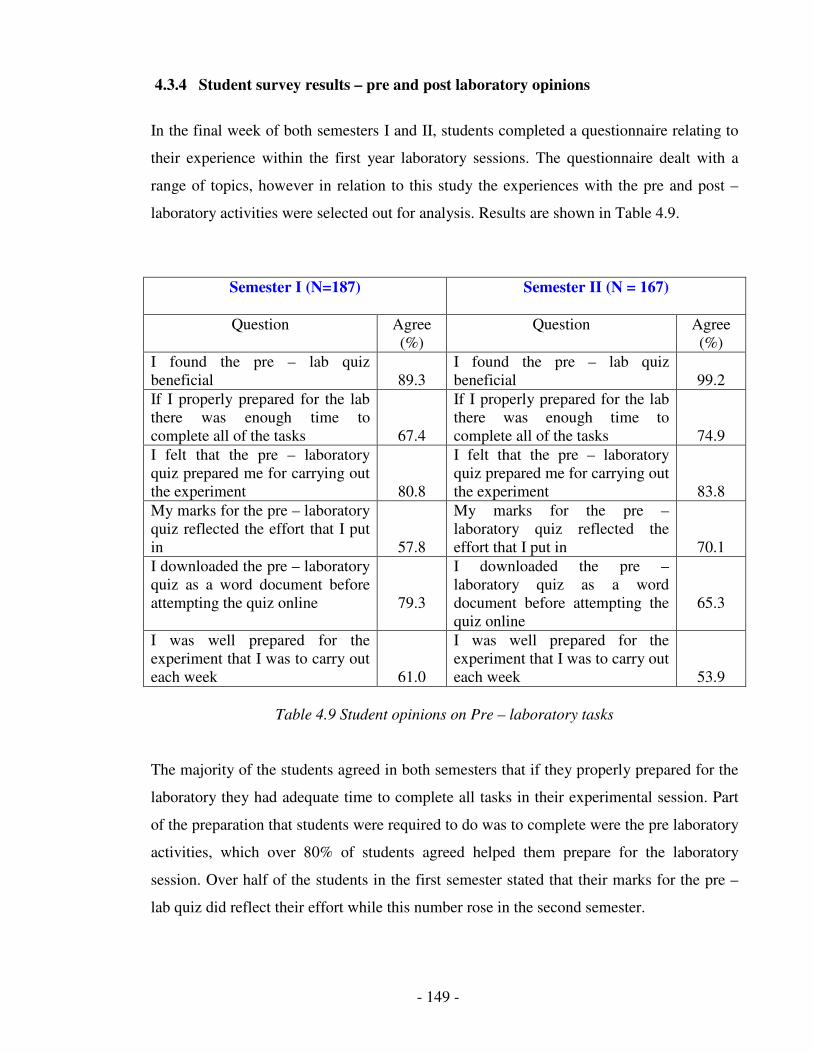
- 149 -
4.3.4 Student survey results – pre and post laboratory opinions
In the final week of both semesters I and II, students completed a questionnaire relating to
their experience within the first year laboratory sessions. The questionnaire dealt with a
range of topics, however in relation to this study the experiences with the pre and post –
laboratory activities were selected out for analysis. Results are shown in Table 4.9.
Semester I (N=187) Semester II (N = 167)
Question Agree
(%)
Question Agree
(%)
I found the pre – lab quiz
beneficial
89.3
I found the pre – lab quiz
beneficial
99.2
If I properly prepared for the lab
there was enough time to
complete all of the tasks
67.4
If I properly prepared for the lab
there was enough time to
complete all of the tasks
74.9
I felt that the pre – laboratory
quiz prepared me for carrying out
the experiment
80.8
I felt that the pre – laboratory
quiz prepared me for carrying out
the experiment
83.8
My marks for the pre – laboratory
quiz reflected the effort that I put
in
57.8
My marks for the pre –
laboratory quiz reflected the
effort that I put in
70.1
I downloaded the pre – laboratory
quiz as a word document before
attempting the quiz online
79.3
I downloaded the pre –
laboratory quiz as a word
document before attempting the
quiz online
65.3
I was well prepared for the
experiment that I was to carry out
each week
61.0
I was well prepared for the
experiment that I was to carry out
each week
53.9
Table 4.9 Student opinions on Pre – laboratory tasks
The majority of the students agreed in both semesters that if they properly prepared for the
laboratory they had adequate time to complete all tasks in their experimental session. Part
of the preparation that students were required to do was to complete were the pre laboratory
activities, which over 80% of students agreed helped them prepare for the laboratory
session. Over half of the students in the first semester stated that their marks for the pre –
lab quiz did reflect their effort while this number rose in the second semester.
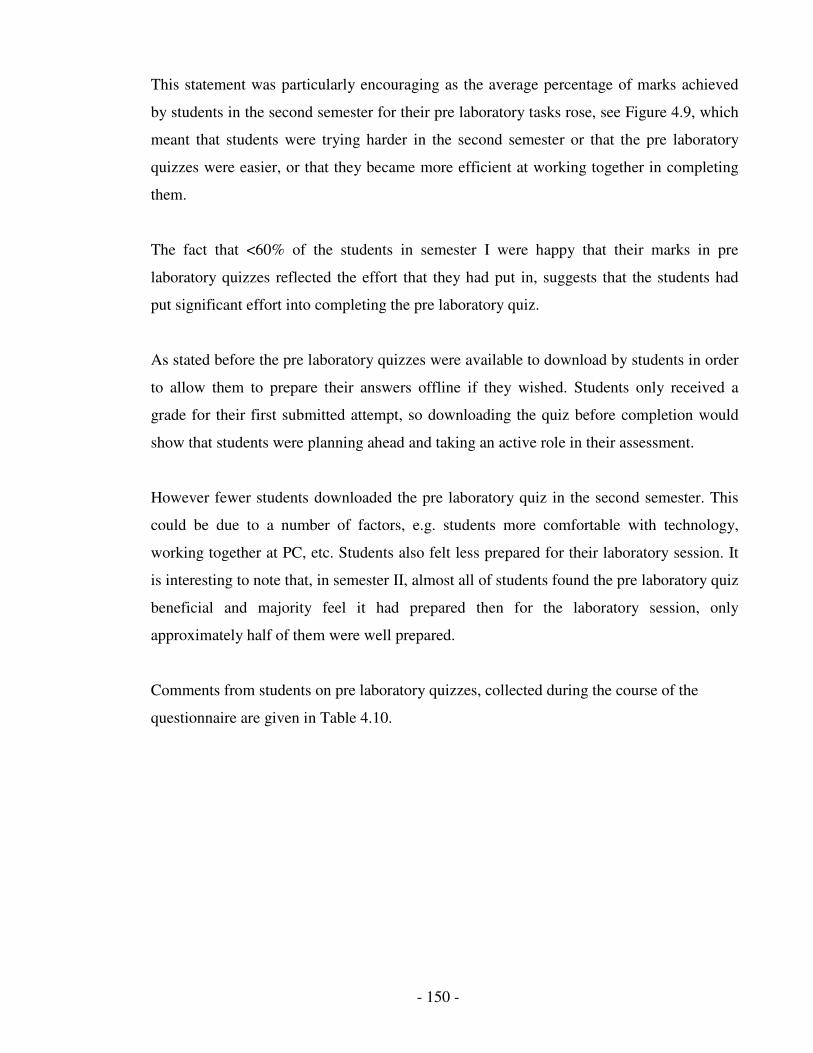
- 150 -
This statement was particularly encouraging as the average percentage of marks achieved
by students in the second semester for their pre laboratory tasks rose, see Figure 4.9, which
meant that students were trying harder in the second semester or that the pre laboratory
quizzes were easier, or that they became more efficient at working together in completing
them.
The fact that <60% of the students in semester I were happy that their marks in pre
laboratory quizzes reflected the effort that they had put in, suggests that the students had
put significant effort into completing the pre laboratory quiz.
As stated before the pre laboratory quizzes were available to download by students in order
to allow them to prepare their answers offline if they wished. Students only received a
grade for their first submitted attempt, so downloading the quiz before completion would
show that students were planning ahead and taking an active role in their assessment.
However fewer students downloaded the pre laboratory quiz in the second semester. This
could be due to a number of factors, e.g. students more comfortable with technology,
working together at PC, etc. Students also felt less prepared for their laboratory session. It
is interesting to note that, in semester II, almost all of students found the pre laboratory quiz
beneficial and majority feel it had prepared then for the laboratory session, only
approximately half of them were well prepared.
Comments from students on pre laboratory quizzes, collected during the course of the
questionnaire are given in Table 4.10.
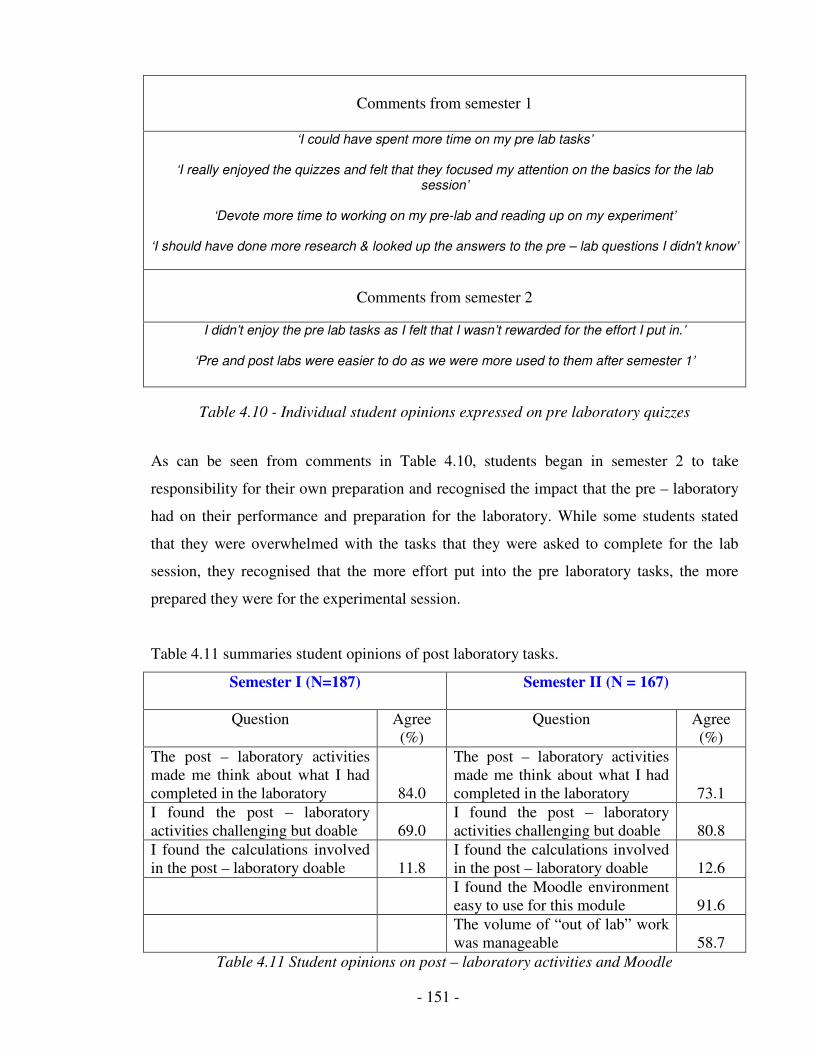
- 151 -
Comments from semester 1
‘I could have spent more time on my pre lab tasks’
‘I really enjoyed the quizzes and felt that they focused my attention on the basics for the lab
session’
‘Devote more time to working on my pre-lab and reading up on my experiment’
‘I should have done more research & looked up the answers to the pre – lab questions I didn't know’
Comments from semester 2
I didn’t enjoy the pre lab tasks as I felt that I wasn’t rewarded for the effort I put in.’
‘Pre and post labs were easier to do as we were more used to them after semester 1’
Table 4.10 - Individual student opinions expressed on pre laboratory quizzes
As can be seen from comments in Table 4.10, students began in semester 2 to take
responsibility for their own preparation and recognised the impact that the pre – laboratory
had on their performance and preparation for the laboratory. While some students stated
that they were overwhelmed with the tasks that they were asked to complete for the lab
session, they recognised that the more effort put into the pre laboratory tasks, the more
prepared they were for the experimental session.
Table 4.11 summaries student opinions of post laboratory tasks.
Semester I (N=187) Semester II (N = 167)
Question Agree
(%)
Question Agree
(%)
The post – laboratory activities
made me think about what I had
completed in the laboratory
84.0
The post – laboratory activities
made me think about what I had
completed in the laboratory
73.1
I found the post – laboratory
activities challenging but doable
69.0
I found the post – laboratory
activities challenging but doable
80.8
I found the calculations involved
in the post – laboratory doable
11.8
I found the calculations involved
in the post – laboratory doable
12.6
I found the Moodle environment
easy to use for this module
91.6
The volume of “out of lab” work
was manageable
58.7
Table 4.11 Student opinions on post – laboratory activities and Moodle
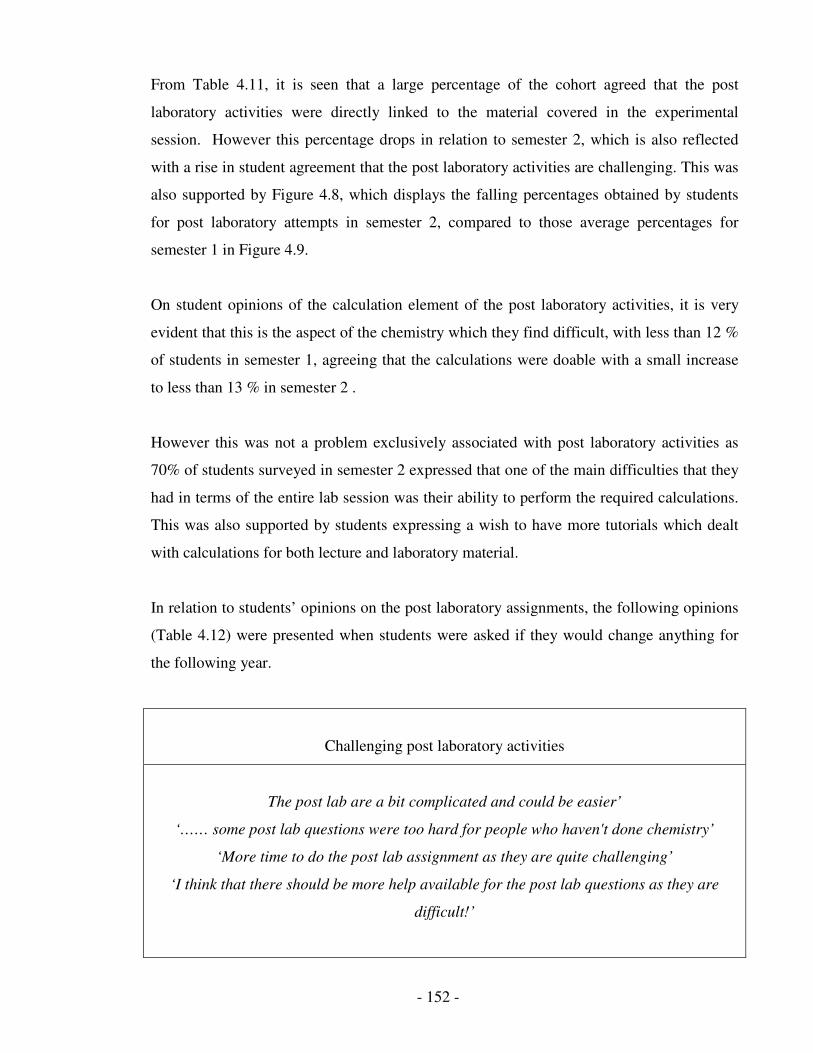
- 152 -
From Table 4.11, it is seen that a large percentage of the cohort agreed that the post
laboratory activities were directly linked to the material covered in the experimental
session. However this percentage drops in relation to semester 2, which is also reflected
with a rise in student agreement that the post laboratory activities are challenging. This was
also supported by Figure 4.8, which displays the falling percentages obtained by students
for post laboratory attempts in semester 2, compared to those average percentages for
semester 1 in Figure 4.9.
On student opinions of the calculation element of the post laboratory activities, it is very
evident that this is the aspect of the chemistry which they find difficult, with less than 12 %
of students in semester 1, agreeing that the calculations were doable with a small increase
to less than 13 % in semester 2 .
However this was not a problem exclusively associated with post laboratory activities as
70% of students surveyed in semester 2 expressed that one of the main difficulties that they
had in terms of the entire lab session was their ability to perform the required calculations.
This was also supported by students expressing a wish to have more tutorials which dealt
with calculations for both lecture and laboratory material.
In relation to students’ opinions on the post laboratory assignments, the following opinions
(Table 4.12) were presented when students were asked if they would change anything for
the following year.
Challenging post laboratory activities
The post lab are a bit complicated and could be easier’
‘…… some post lab questions were too hard for people who haven't done chemistry’
‘More time to do the post lab assignment as they are quite challenging’
‘I think that there should be more help available for the post lab questions as they are
difficult!’
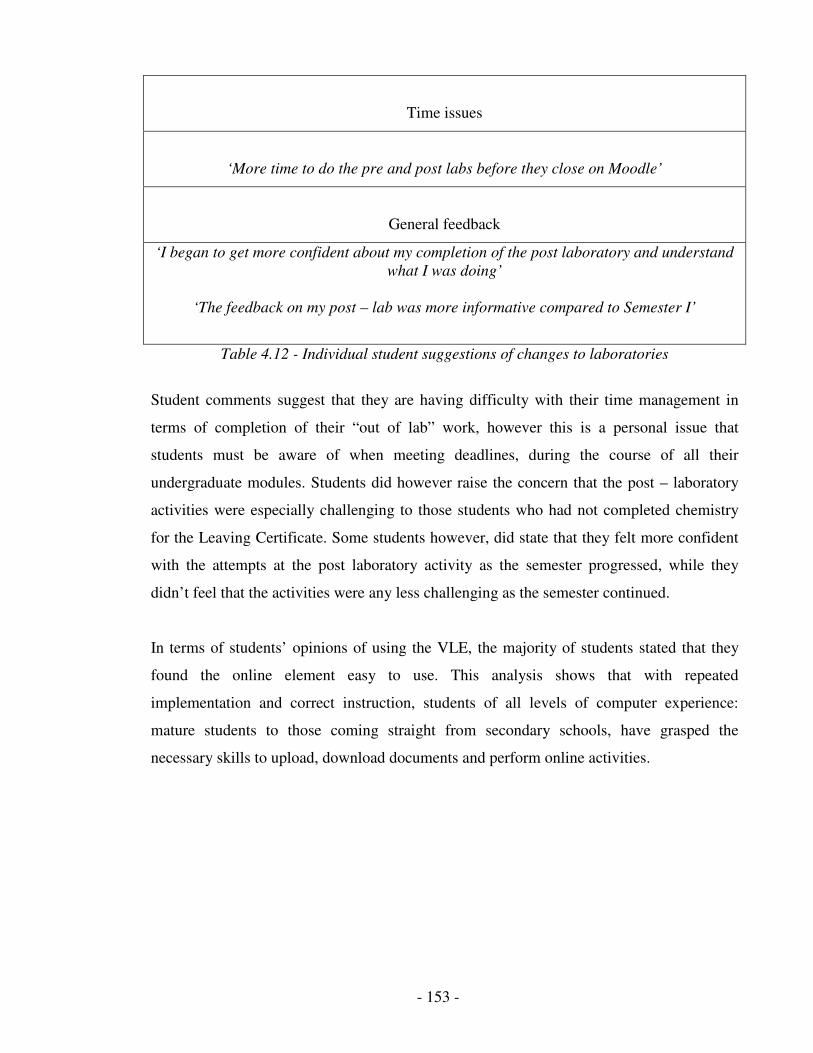
- 153 -
Time issues
‘More time to do the pre and post labs before they close on Moodle’
General feedback
‘I began to get more confident about my completion of the post laboratory and understand
what I was doing’
‘The feedback on my post – lab was more informative compared to Semester I’
Table 4.12 - Individual student suggestions of changes to laboratories
Student comments suggest that they are having difficulty with their time management in
terms of completion of their “out of lab” work, however this is a personal issue that
students must be aware of when meeting deadlines, during the course of all their
undergraduate modules. Students did however raise the concern that the post – laboratory
activities were especially challenging to those students who had not completed chemistry
for the Leaving Certificate. Some students however, did state that they felt more confident
with the attempts at the post laboratory activity as the semester progressed, while they
didn’t feel that the activities were any less challenging as the semester continued.
In terms of students’ opinions of using the VLE, the majority of students stated that they
found the online element easy to use. This analysis shows that with repeated
implementation and correct instruction, students of all levels of computer experience:
mature students to those coming straight from secondary schools, have grasped the
necessary skills to upload, download documents and perform online activities.
- 154 -
4.4 Conclusion
The implementation of pre and post laboratory activities is not a new concept and has been
shown in the literature to benefit student learning in the laboratory context.
The VLE has proven to be a useful and easy tool with which to provide students, tutors and
academic staff with feedback on students’ performance both prior to and after the
laboratory session. Students received immediate feedback on basic pre – laboratory
questions while tutors and academics were able to identify problem areas that could be
dealt with in either group tutorial or on a one to one basis within the laboratory session. The
marking of the post laboratory activities allowed tutors to provide their students with
guidance and appropriate feedback on their attempts. Students could discuss their marks
with their tutor and also could self assess their post laboratory attempt once provided with
appropriate feedback, which allowed them to see where problems had arisen.
As students were allocated a given percentage of their overall laboratory work for the
completion of their pre and post laboratory activities, their interaction with the online
material was not an issue until the last few weeks of each semester, Table 4.6, where
student number began to fall, with the lowest percentage of students observed in the final
week of semester 2 with 40.8% of the cohort completing both the pre and post laboratory
tasks.
Students have expressed their opinions in terms of the pre and post laboratories and the
effect that they have had on students in - laboratory experiences. Students have stated that
they found that the pre laboratory quiz helped to focus their learning on the principles
involved in their laboratory session, and that it also helped in their preparation for the
laboratory tasks. Students also stated that they found the majority of post laboratory
assignments challenging but doable, the averages seen in section 4.2.3 and 4.2.1 show that
the post laboratory tasks were more challenging for students in semester 2. Students did
also express some issues with the time limits that were allocated for the completion of the
post laboratory activities and that the level of post – laboratory assignments could be made
easier in future.

- 155 -
Results have shown that students saw the benefits of their pre laboratory quizzes and their
average scores reflected this enthusiasm, with an increase in student averages between
semester 1 and semester 2. The results shown in section 4.2.3 display that the level of
questioning chosen for these pre laboratory quizzes allowed even those with little or no
chemistry experience to adequately prepare for their practical element as high averages
were achieved by both LCC and NLCC students.
Students’ results in relation to their attempts on post laboratory activities showed that a
large percentage of students found the questions difficult and were not engaging with the
material covered in the majority of laboratory sessions in both semesters 1 and 2. It also
was seen in both student surveys and in average percentages that the post laboratory
questions in semester 2 proved to be more challenging to the students than those in
semester 1. It was also seen from the correlation and t values, that there was a degree of
linkage between four experiments in semester 1 and two experiments in semester 2 which
allowed students to clearly relate all material covered in the pre, post and in laboratory
tasks. This linkage, when evident to students, allowed them to build upon their knowledge
and to successfully apply their understanding to the more complex questions of the post
laboratory session. When this linkage was not obvious to students and their understanding
was not as clearly questioned, student engagement with the post laboratory questions
resulted in a fall in percentage obtained, in comparison to their obtained average for the pre
laboratory task for the same experimental session.
Students did express during the course of the laboratory evaluation surveys, that they found
the calculation aspect of the laboratory sessions, pre and post assignments quite difficult.
This is not, an aspect that is only seen in the chemical laboratory environment, it is evident
in all elements of the chemistry modules. While students have the required mathematical
ability, based on the entry requirements for each of the chemistry courses, they are unable
to apply their knowledge of mathematical procedures and techniques to chemical situations.
It has been observed from the numbers of students completing both pre and post laboratory
tasks, and from the opinions extracted from student questionnaires, that the online
assessment element is a successful method of assessing students understanding both before
and after a practical session.

- 156 -
Students have noted the positive impact that the pre laboratory quizzes have had on their
preparation for laboratory sessions, and that the post laboratory questions made them think
about the concepts covered in laboratories.
However results have shown that unless there is a strong linkage between the three
elements that students are required to complete in their practical laboratory experience, pre,
in and post laboratory tasks, they display a lack of engagement with the post laboratory
material. While the linkage of material used in pre, post and in laboratory elements may be
very obvious to academics and tutors it may not be as evident to undergraduate students. In
order to ensure that the success demonstrated in six of the nineteen analysed laboratory
sessions is promoted, further work needs to be done on those questions employed to
prepare and assess students’ chemical knowledge both prior and after the laboratory
session. Once this linkage of material is evident to students in pre, post and in – laboratory
tasks it would be hoped that a positive correlation would be seen between students’
performances in all practical sessions.
Based on the opinions and experiences of both students and tutors the pre and post
laboratory tasks have been slightly modified to suit changes in individual laboratory
sessions, but the same format is now being employed in the 1st year undergraduate
chemistry practical laboratories for the academic year 2008/2009.
- 157 -
References
1. Pickering, M. (1989) Journal of Chemistry Education, 8, 845
2. Bennett, S.W. (2000) Education in Chemistry, 37, 49
3. Kerr, J.F. (1963) Practical work in school science: an inquiry into the nature and
purpose of practical work in school science teaching in England and Wales.
Leicester University Press, Leicester
4. Swain, J. (1974) Education in Chemistry, 11, 152
5. Kempa, A.H. and Ward, J.E. (1988) International Journal of Science Education, 3,
275
6. Johnstone A.H. and Wood, C.A. (1977) Education in Chemistry, 11, 11
7. Garnett, P.J. and Hackling, M.W. (1995) Australian Science Teachers’ Journal, 41,
26
8. Johnstone, A.H. (1997) Journal of Chemistry Education, 72 , 262
9. Wellington J. (1998) ‘Practical work in school science: which way now?’ Routledge
London.
10. Ausubel, D.P. (1988) Educational Psychology: a cognitive view. Holt, London
11. Johnstone, A.H. and Wham, A.J.B (1982) Education in Chemistry, 10, 71
12. Rollnick, M. (2001) International Journal of Science Education, 23, 1053
13. Carnduff J and Reid, N. (2003) Enhancing undergraduate chemistry laboratories.
Royal Society of Chemistry.
14. Meester, M.A.M. and Maskill, R. (1994) Second Year Practical Classes in
Undergraduate Chemistry Courses in England and Wales. Royal Society of
Chemistry, London
15. Logawski, J.J. (1990) Journal of Chemistry Education, 67, 543
16. Pickering, M. (1987) Journal of Chemistry Education, 64, 52
17. Johnstone, A.H., Watt, A. and Zaman, T.U. (1998) Physics Education, 33, 22
Sirhan, G., Gray, C., Johnstone, A.H. and Reid, N. (1999) University Chemistry
Education, 3, 43
18. Johnstone, A.H, Sleet, R.J. and Vianna, J.F. (1994) Studies in Higher Education, 19,
77
- 158 -
19. Johnstone, A.H and Al-Shuaili, A. (2001) University Chemistry Education, 5, 42
20. Horgan, J. (1999) ‘Lecturing for Learning’, London UK, 83
21. Gibbs. G and Simpson, C. (2004) Conditions under which assessment supports
student learning. Learning and Higher Education E- journal
www.glos.ac.uk/adu/cit/lathe.issue1/index.cfm [last accessed 20th June 2008]
22. MacFarlane, B. (1992) Journal of Further and Higher Education, 60, 60
23. Overfield, J.A. and Bryan-Lluka.L (2003) An evaluation of factors affected
computer based learning in Homeostasis. Bioscience Education E – journal
www.bioscience.heacademy.ac.uk/journal/vol1/beej-1-9.htm
[last accessed 18th April 2008]
24. Mercer-Chalmers, J.D, Goodfellow, C.L and Price, G.J. (2004) Using a VLE to
enhance a Foundation Chemistry laboratory module. CAL laborate, Nov
25. Nicholls, B.S. (1999) University Chemistry Education, 3, 22
26. Barajas, M. & Owen, M. (2000) Journal of Educational Technology and Society,
3,(3), 39
- 159 -
APPENDIX
A
LEAVING CERTIFICATE
CHEMISTRY ANALYSIS
This appendix contains the results of analysis performed on Leaving Certificate Chemistry
Higher Level papers from 2000 to 2008. Analysis has been performed using Bloom’s
Taxonomy. For this application of Bloom’s Taxonomy the following key has been used: K
= Knowledge, C = Comprehension, Ap = Application, An = Analysis, E = Evaluation and S
= Synthesis. Also the key seen in Table 1.7 has been used on years 2002 – 2008 to identify
the sub topics on each examination paper.

- 160 -
Leaving Certificate Chemistry Paper Higher Level - 2000
Question
Number Question
type Marks Question Number
Question type Marks
Q1 iii Ap 9
A C 6.36 iv An 9
B K 6.36 v C 15
C An 6.36 vi Ap 12
D C 6.36 Q7
E K 6.36 ia K 9
F K 6.36 ib K 12
G C 6.36 ii C 6
H An 6.36 iii Ap 9
I C 6.36 iv Ap 9
J Ap 6.36 v An 12
k C 6.36 vi An 9
l K 6.36 Q8
m C 6.36 i K 6
n K 6.36 ii C 12
o An 6.36 iii C 18
Q2 iv An 18
i C 9 v C 12
ii C 15 Q9
iii K 12 ai K 9
iv C 12 aii C 9
v An 18 bi C 6
Q3 bii An 12
i C 12 c K 9
ii C 12 ci An 6
iii K 9 cii An 6
iv C 15 ciii An 9
v An 18 Q10 Q4 a K 6
K 6 ai Ap 6
i Ap 6 aii C 9
ii C 15 aiii An 12
iii An 21 bi C 15
iv An 12 bii C 12
v An 6 biii C 6
Q5 c K 12
ia K 9 ci An 15
ib K 9 cii An 6
ii C 15 di K 9
iii C 24 dii C 3
iv C 9 diii Ap 12
Q6 div C 9
i K 12
ii C 9
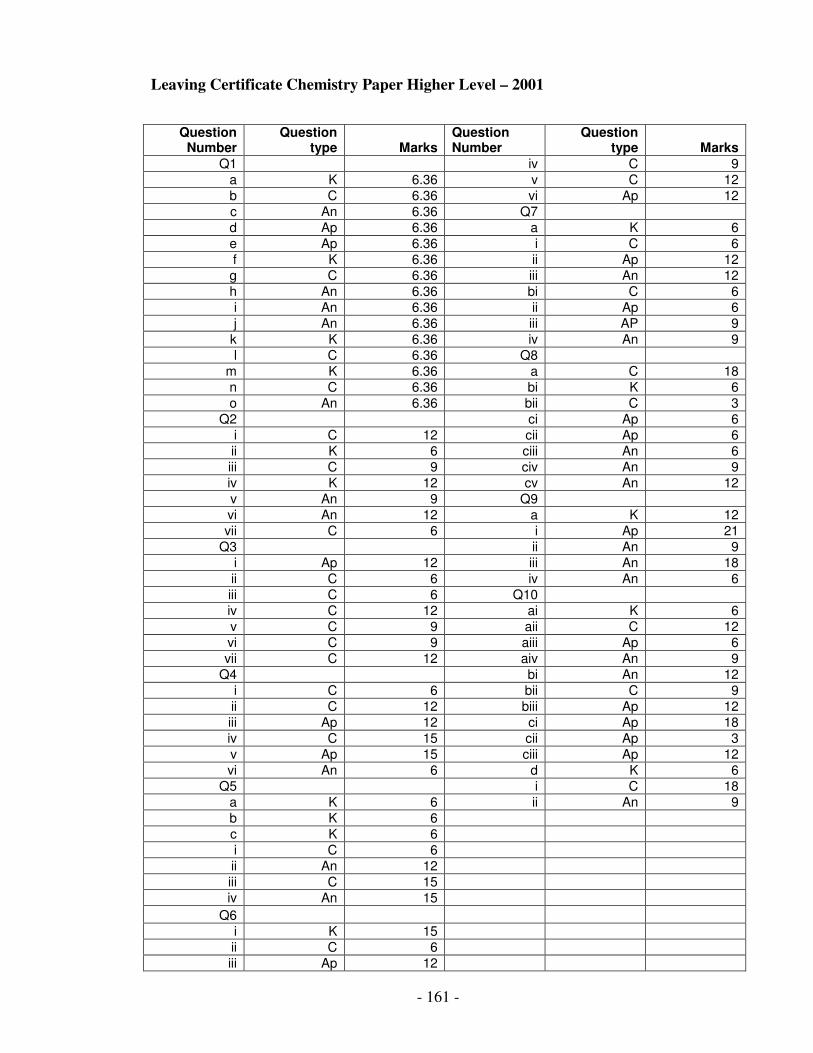
- 161 -
Leaving Certificate Chemistry Paper Higher Level – 2001
Question Number
Question type Marks
Question Number
Question type Marks
Q1 iv C 9
a K 6.36 v C 12
b C 6.36 vi Ap 12
c An 6.36 Q7
d Ap 6.36 a K 6
e Ap 6.36 i C 6
f K 6.36 ii Ap 12
g C 6.36 iii An 12
h An 6.36 bi C 6
i An 6.36 ii Ap 6
j An 6.36 iii AP 9
k K 6.36 iv An 9
l C 6.36 Q8
m K 6.36 a C 18
n C 6.36 bi K 6
o An 6.36 bii C 3
Q2 ci Ap 6
i C 12 cii Ap 6
ii K 6 ciii An 6
iii C 9 civ An 9
iv K 12 cv An 12
v An 9 Q9
vi An 12 a K 12
vii C 6 i Ap 21
Q3 ii An 9
i Ap 12 iii An 18
ii C 6 iv An 6
iii C 6 Q10
iv C 12 ai K 6
v C 9 aii C 12
vi C 9 aiii Ap 6
vii C 12 aiv An 9
Q4 bi An 12
i C 6 bii C 9
ii C 12 biii Ap 12
iii Ap 12 ci Ap 18
iv C 15 cii Ap 3
v Ap 15 ciii Ap 12
vi An 6 d K 6
Q5 i C 18
a K 6 ii An 9
b K 6
c K 6
i C 6
ii An 12
iii C 15
iv An 15
Q6
i K 15
ii C 6
iii Ap 12
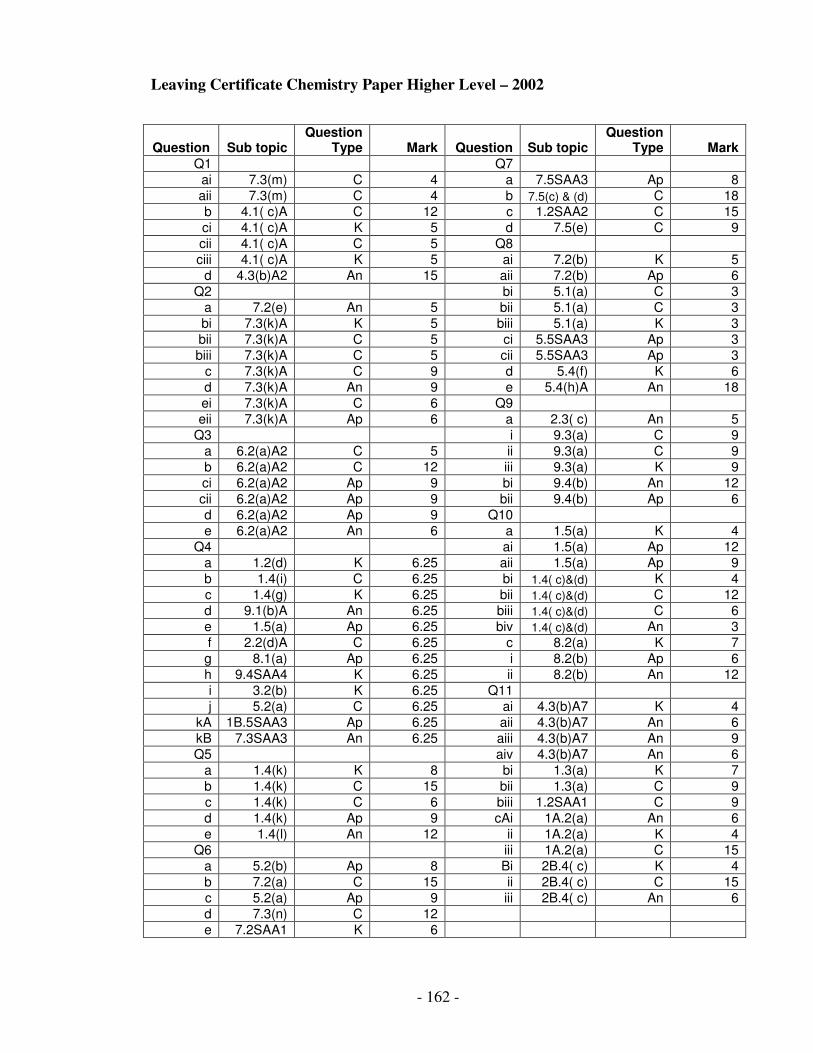
- 162 -
Leaving Certificate Chemistry Paper Higher Level – 2002
Question Sub topic Question
Type Mark Question Sub topic Question
Type Mark
Q1 Q7
ai 7.3(m) C 4 a 7.5SAA3 Ap 8
aii 7.3(m) C 4 b 7.5(c) & (d) C 18
b 4.1( c)A C 12 c 1.2SAA2 C 15
ci 4.1( c)A K 5 d 7.5(e) C 9
cii 4.1( c)A C 5 Q8
ciii 4.1( c)A K 5 ai 7.2(b) K 5
d 4.3(b)A2 An 15 aii 7.2(b) Ap 6
Q2 bi 5.1(a) C 3
a 7.2(e) An 5 bii 5.1(a) C 3
bi 7.3(k)A K 5 biii 5.1(a) K 3
bii 7.3(k)A C 5 ci 5.5SAA3 Ap 3
biii 7.3(k)A C 5 cii 5.5SAA3 Ap 3
c 7.3(k)A C 9 d 5.4(f) K 6
d 7.3(k)A An 9 e 5.4(h)A An 18
ei 7.3(k)A C 6 Q9
eii 7.3(k)A Ap 6 a 2.3( c) An 5
Q3 i 9.3(a) C 9
a 6.2(a)A2 C 5 ii 9.3(a) C 9
b 6.2(a)A2 C 12 iii 9.3(a) K 9
ci 6.2(a)A2 Ap 9 bi 9.4(b) An 12
cii 6.2(a)A2 Ap 9 bii 9.4(b) Ap 6
d 6.2(a)A2 Ap 9 Q10
e 6.2(a)A2 An 6 a 1.5(a) K 4
Q4 ai 1.5(a) Ap 12
a 1.2(d) K 6.25 aii 1.5(a) Ap 9
b 1.4(i) C 6.25 bi 1.4( c)&(d) K 4
c 1.4(g) K 6.25 bii 1.4( c)&(d) C 12
d 9.1(b)A An 6.25 biii 1.4( c)&(d) C 6
e 1.5(a) Ap 6.25 biv 1.4( c)&(d) An 3
f 2.2(d)A C 6.25 c 8.2(a) K 7
g 8.1(a) Ap 6.25 i 8.2(b) Ap 6
h 9.4SAA4 K 6.25 ii 8.2(b) An 12
i 3.2(b) K 6.25 Q11
j 5.2(a) C 6.25 ai 4.3(b)A7 K 4
kA 1B.5SAA3 Ap 6.25 aii 4.3(b)A7 An 6
kB 7.3SAA3 An 6.25 aiii 4.3(b)A7 An 9
Q5 aiv 4.3(b)A7 An 6
a 1.4(k) K 8 bi 1.3(a) K 7
b 1.4(k) C 15 bii 1.3(a) C 9
c 1.4(k) C 6 biii 1.2SAA1 C 9
d 1.4(k) Ap 9 cAi 1A.2(a) An 6
e 1.4(l) An 12 ii 1A.2(a) K 4
Q6 iii 1A.2(a) C 15
a 5.2(b) Ap 8 Bi 2B.4( c) K 4
b 7.2(a) C 15 ii 2B.4( c) C 15
c 5.2(a) Ap 9 iii 2B.4( c) An 6
d 7.3(n) C 12
e 7.2SAA1 K 6

- 163 -
Leaving Certificate Chemistry Paper Higher Level – 2003
Question Sub topic Question
Type Mark Question Sub topic Question
Type Mark
Q1 Q7
a 4.3(b)A5 C 5 a 6.1(a) K 5
b 4.3(b)A5 C 18 i 6.1(a) An 18
c 4.3(b)A5 An 6 b 6.2(a) K 6
d 4.3(b)A5 K 3 i 6.2(a) C 6
e 4.3(b)A5 An 18 ii 6.2(a) C 6
Q2 iii 6.2(a) C 5
a 5.6(a)A1 C 8 iv 6.2(a) K 4
b 5.6(a)A1 C 3 Q8
c 5.6(a)A1 Ap 6 a 4.2(a) K 8
di 5.6(a)A1 C 5 i 4.2(b) C 6
dii 5.6(a)A1 Ap 4 b 9.1(a) K 6
ei 5.6(a)A1 C 9 i 9.1(a)A An 12
eii 5.6(a)A1 Ap 9 ci 9.4(a)A C 12
f 5.6(a)A1 Ap 6 cii 9.4(a)A K 6
Q3 Q9
a 3.2(a)A2 K 5 ai 7.2( c) Ap 8
bi 3.2(a)A2 Ap 11 ii 7.2( c) Ap 12
bii 3.2(a)A2 An 10 iii 7.3(n) C 6
c 3.2(a)A2 Ap 6 bi 7.2SAA3 K 6
d 3.2(a)A2 An 12 ii 7.2SAA3 C 12
e 3.2(a)A2 An 6 iii 7.2SAA3 K 6
Q4 Q10
a 1.2( c) C 6.25 a 5.4(f) K 7
b 3.5( c) An 6.25 i 5.4(h)A An 12
c 3.2(a)A2 K 6.25 ii 5.4(h)A An 6
d 1.2SAA2 C 6.25 b 7.2SAA6 Ap 18
e 9.4(b) K 6.25 i 7.2SAA6 K 7
f 1.3(a) C 6.25 ci 2.2(d)A K 10
g 4.1(a) An 6.25 ii 2.2(d)A C 15
h 7.2(l) C 6.25 Q11
i 1.1SAA2 K 6.25 a 8.2(a) K 7
j 5.5SAA5 Ap 6.25 i 8.1(b) Ap 6
kA 1B.2( c) An 6.25 ii 8.1(b)A An 12
kB 2A.3(a) K 6.25 bi 1.4(k) Ap 7
Q5 ii 1.4(l) C 12
i 1.4(a) K 4 iii 1.4(l) An 6
ii 1.4(g) Ap 4 cA 1B.5(a) K 7
iii 1.4(i) An 3 i 1B.5SAA4 K 6
iv 1.4(h) K 3 ii 1B.5SAA6 C 12
bi 2.4(a) Ap 6 cBi 2A.1(a) K 4
bii 2.5( c) K 9 ii 2A.1(a) C 15
biii 2.5(a) C 12 iii 2A.1(a) K 6
c C 9
Q6
a 7.2(a) Ap 8
b 7.3(a) C 9
c 7.3(b) K 3
d 7.3(g) K 6
ei 7.3(d) C 18
eii 7.3(d) K 6
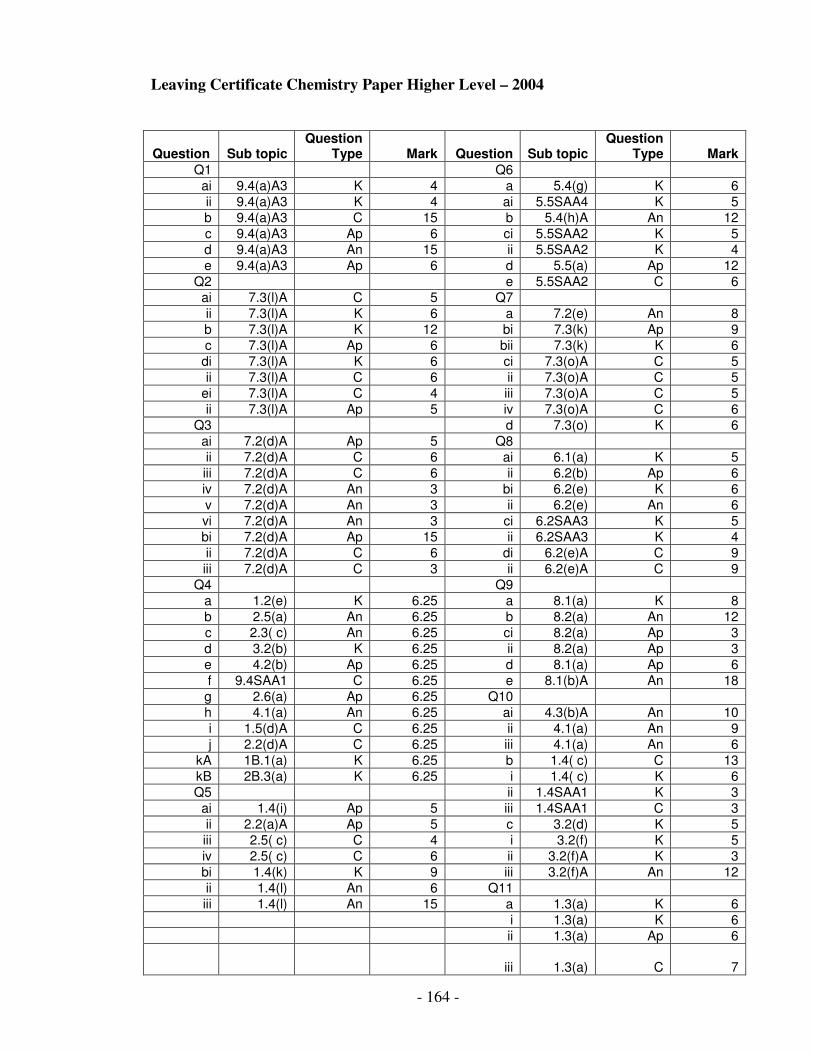
- 164 -
Leaving Certificate Chemistry Paper Higher Level – 2004
Question Sub topic Question
Type Mark Question Sub topic Question
Type Mark
Q1 Q6
ai 9.4(a)A3 K 4 a 5.4(g) K 6
ii 9.4(a)A3 K 4 ai 5.5SAA4 K 5
b 9.4(a)A3 C 15 b 5.4(h)A An 12
c 9.4(a)A3 Ap 6 ci 5.5SAA2 K 5
d 9.4(a)A3 An 15 ii 5.5SAA2 K 4
e 9.4(a)A3 Ap 6 d 5.5(a) Ap 12
Q2 e 5.5SAA2 C 6
ai 7.3(l)A C 5 Q7
ii 7.3(l)A K 6 a 7.2(e) An 8
b 7.3(l)A K 12 bi 7.3(k) Ap 9
c 7.3(l)A Ap 6 bii 7.3(k) K 6
di 7.3(l)A K 6 ci 7.3(o)A C 5
ii 7.3(l)A C 6 ii 7.3(o)A C 5
ei 7.3(l)A C 4 iii 7.3(o)A C 5
ii 7.3(l)A Ap 5 iv 7.3(o)A C 6
Q3 d 7.3(o) K 6
ai 7.2(d)A Ap 5 Q8
ii 7.2(d)A C 6 ai 6.1(a) K 5
iii 7.2(d)A C 6 ii 6.2(b) Ap 6
iv 7.2(d)A An 3 bi 6.2(e) K 6
v 7.2(d)A An 3 ii 6.2(e) An 6
vi 7.2(d)A An 3 ci 6.2SAA3 K 5
bi 7.2(d)A Ap 15 ii 6.2SAA3 K 4
ii 7.2(d)A C 6 di 6.2(e)A C 9
iii 7.2(d)A C 3 ii 6.2(e)A C 9
Q4 Q9
a 1.2(e) K 6.25 a 8.1(a) K 8
b 2.5(a) An 6.25 b 8.2(a) An 12
c 2.3( c) An 6.25 ci 8.2(a) Ap 3
d 3.2(b) K 6.25 ii 8.2(a) Ap 3
e 4.2(b) Ap 6.25 d 8.1(a) Ap 6
f 9.4SAA1 C 6.25 e 8.1(b)A An 18
g 2.6(a) Ap 6.25 Q10
h 4.1(a) An 6.25 ai 4.3(b)A An 10
i 1.5(d)A C 6.25 ii 4.1(a) An 9
j 2.2(d)A C 6.25 iii 4.1(a) An 6
kA 1B.1(a) K 6.25 b 1.4( c) C 13
kB 2B.3(a) K 6.25 i 1.4( c) K 6
Q5 ii 1.4SAA1 K 3
ai 1.4(i) Ap 5 iii 1.4SAA1 C 3
ii 2.2(a)A Ap 5 c 3.2(d) K 5
iii 2.5( c) C 4 i 3.2(f) K 5
iv 2.5( c) C 6 ii 3.2(f)A K 3
bi 1.4(k) K 9 iii 3.2(f)A An 12
ii 1.4(l) An 6 Q11
iii 1.4(l) An 15 a 1.3(a) K 6
i 1.3(a) K 6
ii 1.3(a) Ap 6
iii 1.3(a) C 7
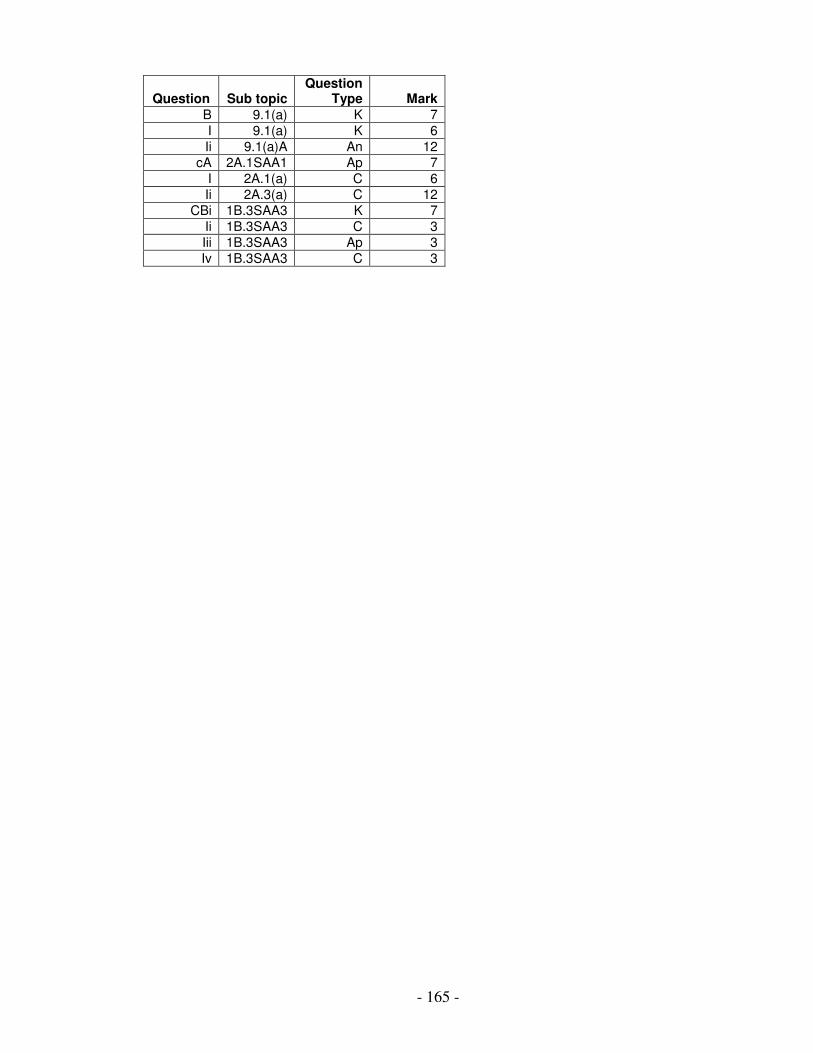
- 165 -
Question Sub topic Question
Type Mark
B 9.1(a) K 7
I 9.1(a) K 6
Ii 9.1(a)A An 12
cA 2A.1SAA1 Ap 7
I 2A.1(a) C 6
Ii 2A.3(a) C 12
CBi 1B.3SAA3 K 7
Ii 1B.3SAA3 C 3
Iii 1B.3SAA3 Ap 3
Iv 1B.3SAA3 C 3
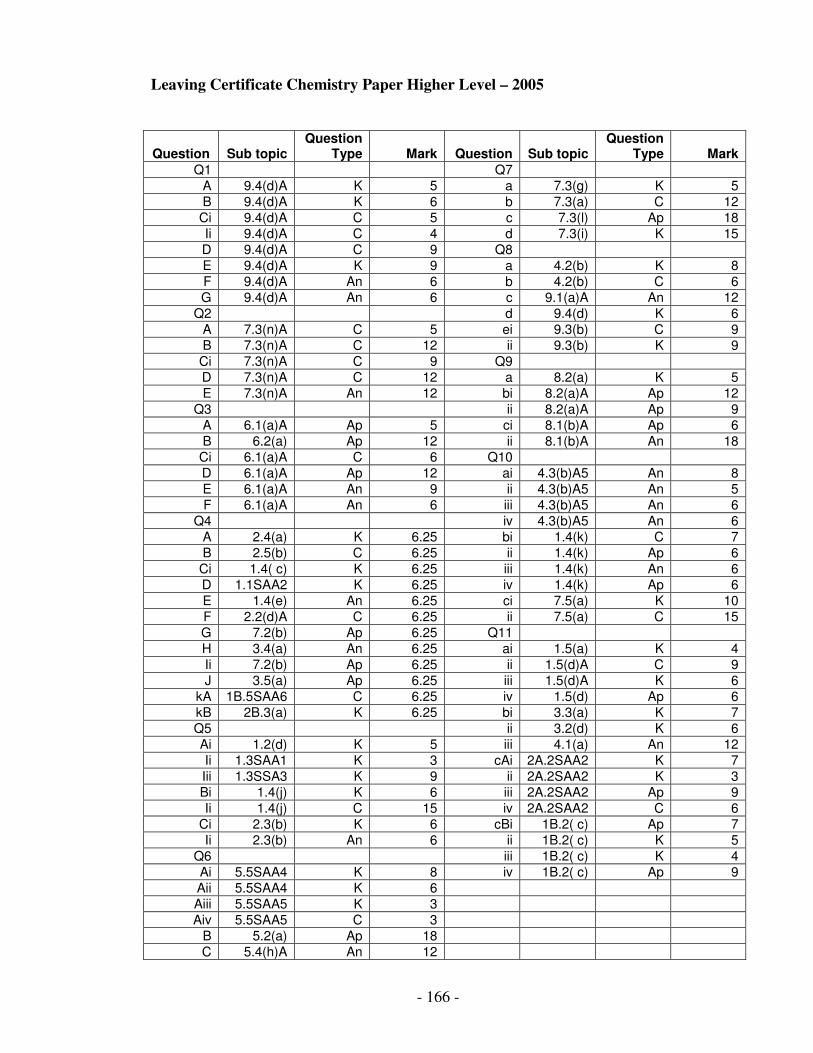
- 166 -
Leaving Certificate Chemistry Paper Higher Level – 2005
Question Sub topic Question
Type Mark Question Sub topic Question
Type Mark
Q1 Q7
A 9.4(d)A K 5 a 7.3(g) K 5
B 9.4(d)A K 6 b 7.3(a) C 12
Ci 9.4(d)A C 5 c 7.3(l) Ap 18
Ii 9.4(d)A C 4 d 7.3(i) K 15
D 9.4(d)A C 9 Q8
E 9.4(d)A K 9 a 4.2(b) K 8
F 9.4(d)A An 6 b 4.2(b) C 6
G 9.4(d)A An 6 c 9.1(a)A An 12
Q2 d 9.4(d) K 6
A 7.3(n)A C 5 ei 9.3(b) C 9
B 7.3(n)A C 12 ii 9.3(b) K 9
Ci 7.3(n)A C 9 Q9
D 7.3(n)A C 12 a 8.2(a) K 5
E 7.3(n)A An 12 bi 8.2(a)A Ap 12
Q3 ii 8.2(a)A Ap 9
A 6.1(a)A Ap 5 ci 8.1(b)A Ap 6
B 6.2(a) Ap 12 ii 8.1(b)A An 18
Ci 6.1(a)A C 6 Q10
D 6.1(a)A Ap 12 ai 4.3(b)A5 An 8
E 6.1(a)A An 9 ii 4.3(b)A5 An 5
F 6.1(a)A An 6 iii 4.3(b)A5 An 6
Q4 iv 4.3(b)A5 An 6
A 2.4(a) K 6.25 bi 1.4(k) C 7
B 2.5(b) C 6.25 ii 1.4(k) Ap 6
Ci 1.4( c) K 6.25 iii 1.4(k) An 6
D 1.1SAA2 K 6.25 iv 1.4(k) Ap 6
E 1.4(e) An 6.25 ci 7.5(a) K 10
F 2.2(d)A C 6.25 ii 7.5(a) C 15
G 7.2(b) Ap 6.25 Q11
H 3.4(a) An 6.25 ai 1.5(a) K 4
Ii 7.2(b) Ap 6.25 ii 1.5(d)A C 9
J 3.5(a) Ap 6.25 iii 1.5(d)A K 6
kA 1B.5SAA6 C 6.25 iv 1.5(d) Ap 6
kB 2B.3(a) K 6.25 bi 3.3(a) K 7
Q5 ii 3.2(d) K 6
Ai 1.2(d) K 5 iii 4.1(a) An 12
Ii 1.3SAA1 K 3 cAi 2A.2SAA2 K 7
Iii 1.3SSA3 K 9 ii 2A.2SAA2 K 3
Bi 1.4(j) K 6 iii 2A.2SAA2 Ap 9
Ii 1.4(j) C 15 iv 2A.2SAA2 C 6
Ci 2.3(b) K 6 cBi 1B.2( c) Ap 7
Ii 2.3(b) An 6 ii 1B.2( c) K 5
Q6 iii 1B.2( c) K 4
Ai 5.5SAA4 K 8 iv 1B.2( c) Ap 9
Aii 5.5SAA4 K 6
Aiii 5.5SAA5 K 3
Aiv 5.5SAA5 C 3
B 5.2(a) Ap 18
C 5.4(h)A An 12
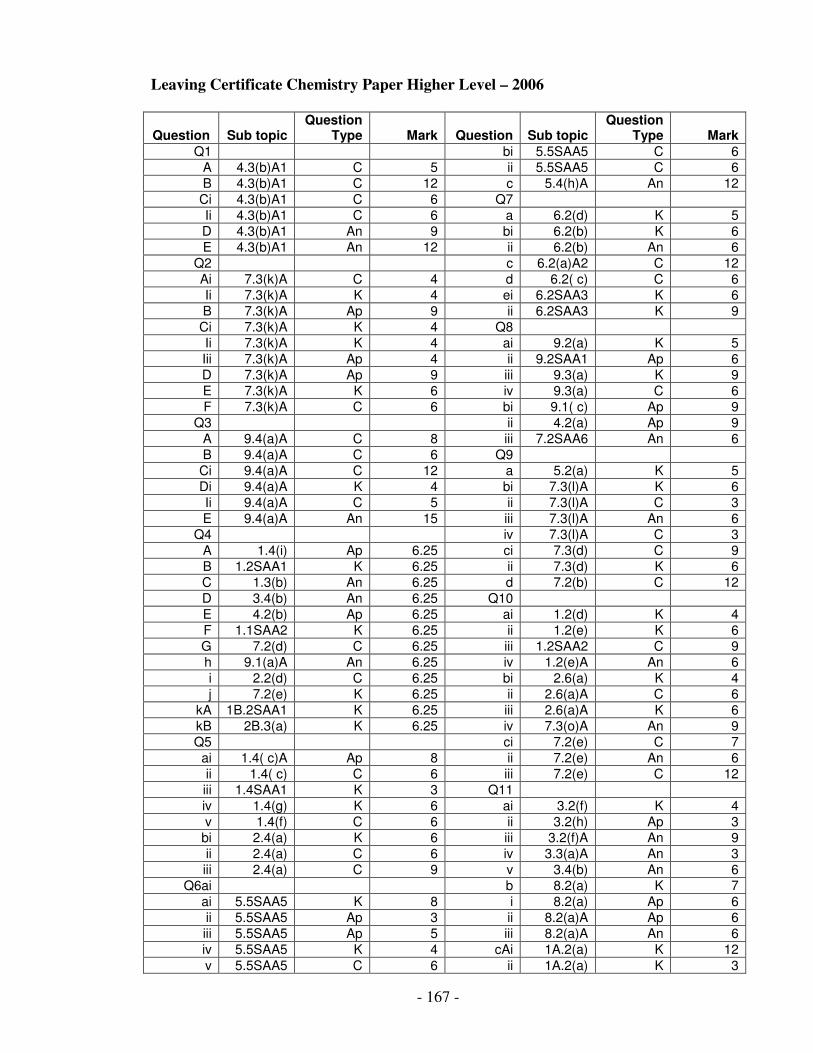
- 167 -
Leaving Certificate Chemistry Paper Higher Level – 2006
Question Sub topic Question
Type Mark Question Sub topic Question
Type Mark
Q1 bi 5.5SAA5 C 6
A 4.3(b)A1 C 5 ii 5.5SAA5 C 6
B 4.3(b)A1 C 12 c 5.4(h)A An 12
Ci 4.3(b)A1 C 6 Q7
Ii 4.3(b)A1 C 6 a 6.2(d) K 5
D 4.3(b)A1 An 9 bi 6.2(b) K 6
E 4.3(b)A1 An 12 ii 6.2(b) An 6
Q2 c 6.2(a)A2 C 12
Ai 7.3(k)A C 4 d 6.2( c) C 6
Ii 7.3(k)A K 4 ei 6.2SAA3 K 6
B 7.3(k)A Ap 9 ii 6.2SAA3 K 9
Ci 7.3(k)A K 4 Q8
Ii 7.3(k)A K 4 ai 9.2(a) K 5
Iii 7.3(k)A Ap 4 ii 9.2SAA1 Ap 6
D 7.3(k)A Ap 9 iii 9.3(a) K 9
E 7.3(k)A K 6 iv 9.3(a) C 6
F 7.3(k)A C 6 bi 9.1( c) Ap 9
Q3 ii 4.2(a) Ap 9
A 9.4(a)A C 8 iii 7.2SAA6 An 6
B 9.4(a)A C 6 Q9
Ci 9.4(a)A C 12 a 5.2(a) K 5
Di 9.4(a)A K 4 bi 7.3(l)A K 6
Ii 9.4(a)A C 5 ii 7.3(l)A C 3
E 9.4(a)A An 15 iii 7.3(l)A An 6
Q4 iv 7.3(l)A C 3
A 1.4(i) Ap 6.25 ci 7.3(d) C 9
B 1.2SAA1 K 6.25 ii 7.3(d) K 6
C 1.3(b) An 6.25 d 7.2(b) C 12
D 3.4(b) An 6.25 Q10
E 4.2(b) Ap 6.25 ai 1.2(d) K 4
F 1.1SAA2 K 6.25 ii 1.2(e) K 6
G 7.2(d) C 6.25 iii 1.2SAA2 C 9
h 9.1(a)A An 6.25 iv 1.2(e)A An 6
i 2.2(d) C 6.25 bi 2.6(a) K 4
j 7.2(e) K 6.25 ii 2.6(a)A C 6
kA 1B.2SAA1 K 6.25 iii 2.6(a)A K 6
kB 2B.3(a) K 6.25 iv 7.3(o)A An 9
Q5 ci 7.2(e) C 7
ai 1.4( c)A Ap 8 ii 7.2(e) An 6
ii 1.4( c) C 6 iii 7.2(e) C 12
iii 1.4SAA1 K 3 Q11
iv 1.4(g) K 6 ai 3.2(f) K 4
v 1.4(f) C 6 ii 3.2(h) Ap 3
bi 2.4(a) K 6 iii 3.2(f)A An 9
ii 2.4(a) C 6 iv 3.3(a)A An 3
iii 2.4(a) C 9 v 3.4(b) An 6
Q6ai b 8.2(a) K 7
ai 5.5SAA5 K 8 i 8.2(a) Ap 6
ii 5.5SAA5 Ap 3 ii 8.2(a)A Ap 6
iii 5.5SAA5 Ap 5 iii 8.2(a)A An 6
iv 5.5SAA5 K 4 cAi 1A.2(a) K 12
v 5.5SAA5 C 6 ii 1A.2(a) K 3
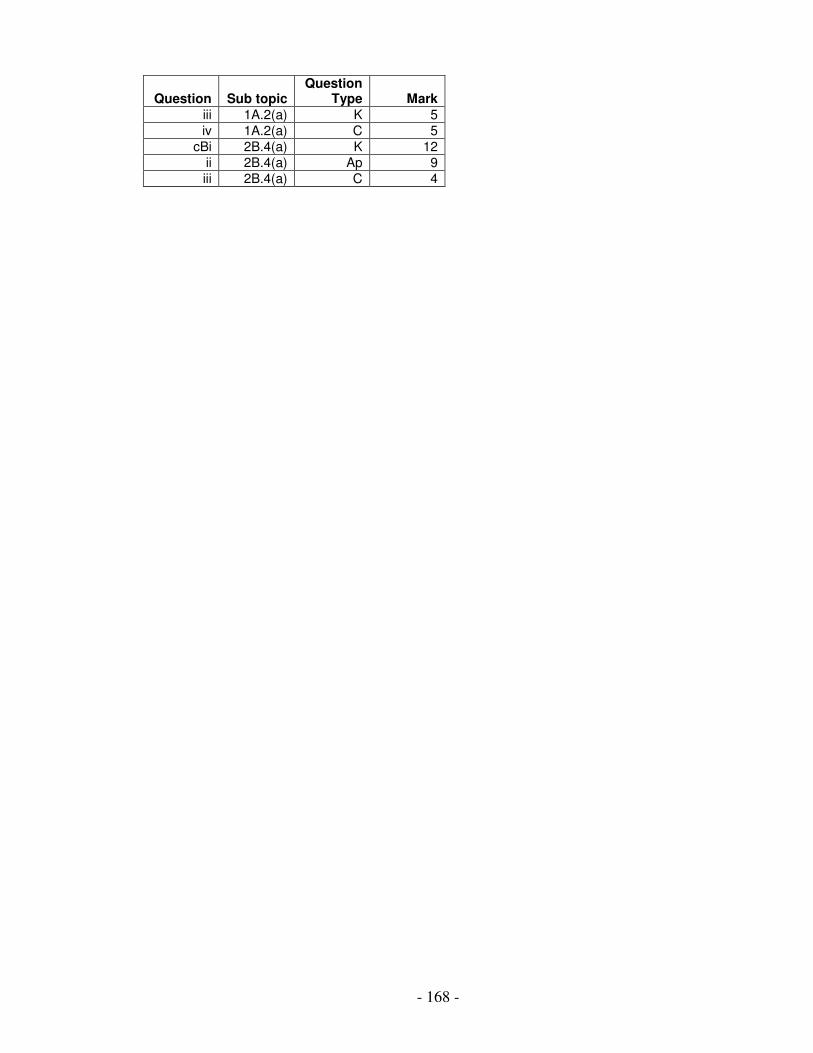
- 168 -
Question Sub topic Question
Type Mark
iii 1A.2(a) K 5
iv 1A.2(a) C 5
cBi 2B.4(a) K 12
ii 2B.4(a) Ap 9
iii 2B.4(a) C 4
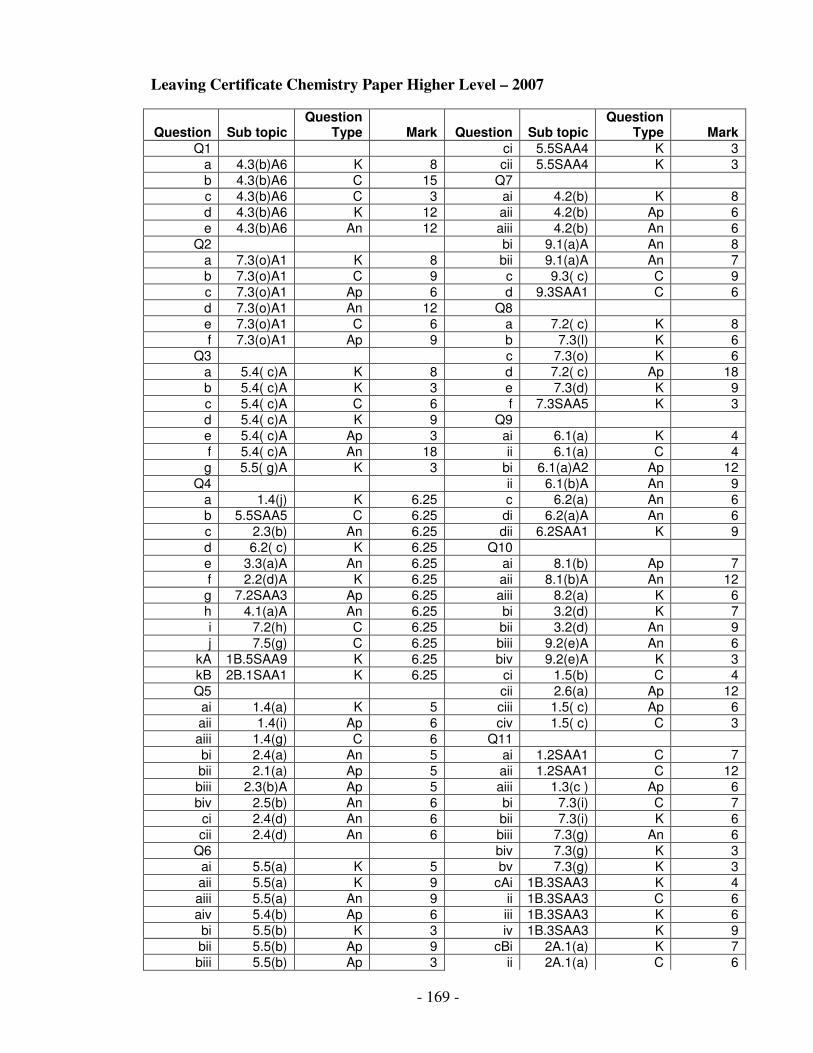
- 169 -
Leaving Certificate Chemistry Paper Higher Level – 2007
Question Sub topic Question
Type Mark Question Sub topic Question
Type Mark
Q1 ci 5.5SAA4 K 3
a 4.3(b)A6 K 8 cii 5.5SAA4 K 3
b 4.3(b)A6 C 15 Q7
c 4.3(b)A6 C 3 ai 4.2(b) K 8
d 4.3(b)A6 K 12 aii 4.2(b) Ap 6
e 4.3(b)A6 An 12 aiii 4.2(b) An 6
Q2 bi 9.1(a)A An 8
a 7.3(o)A1 K 8 bii 9.1(a)A An 7
b 7.3(o)A1 C 9 c 9.3( c) C 9
c 7.3(o)A1 Ap 6 d 9.3SAA1 C 6
d 7.3(o)A1 An 12 Q8
e 7.3(o)A1 C 6 a 7.2( c) K 8
f 7.3(o)A1 Ap 9 b 7.3(l) K 6
Q3 c 7.3(o) K 6
a 5.4( c)A K 8 d 7.2( c) Ap 18
b 5.4( c)A K 3 e 7.3(d) K 9
c 5.4( c)A C 6 f 7.3SAA5 K 3
d 5.4( c)A K 9 Q9
e 5.4( c)A Ap 3 ai 6.1(a) K 4
f 5.4( c)A An 18 ii 6.1(a) C 4
g 5.5( g)A K 3 bi 6.1(a)A2 Ap 12
Q4 ii 6.1(b)A An 9
a 1.4(j) K 6.25 c 6.2(a) An 6
b 5.5SAA5 C 6.25 di 6.2(a)A An 6
c 2.3(b) An 6.25 dii 6.2SAA1 K 9
d 6.2( c) K 6.25 Q10
e 3.3(a)A An 6.25 ai 8.1(b) Ap 7
f 2.2(d)A K 6.25 aii 8.1(b)A An 12
g 7.2SAA3 Ap 6.25 aiii 8.2(a) K 6
h 4.1(a)A An 6.25 bi 3.2(d) K 7
i 7.2(h) C 6.25 bii 3.2(d) An 9
j 7.5(g) C 6.25 biii 9.2(e)A An 6
kA 1B.5SAA9 K 6.25 biv 9.2(e)A K 3
kB 2B.1SAA1 K 6.25 ci 1.5(b) C 4
Q5 cii 2.6(a) Ap 12
ai 1.4(a) K 5 ciii 1.5( c) Ap 6
aii 1.4(i) Ap 6 civ 1.5( c) C 3
aiii 1.4(g) C 6 Q11
bi 2.4(a) An 5 ai 1.2SAA1 C 7
bii 2.1(a) Ap 5 aii 1.2SAA1 C 12
biii 2.3(b)A Ap 5 aiii 1.3(c ) Ap 6
biv 2.5(b) An 6 bi 7.3(i) C 7
ci 2.4(d) An 6 bii 7.3(i) K 6
cii 2.4(d) An 6 biii 7.3(g) An 6
Q6 biv 7.3(g) K 3
ai 5.5(a) K 5 bv 7.3(g) K 3
aii 5.5(a) K 9 cAi 1B.3SAA3 K 4
aiii 5.5(a) An 9 ii 1B.3SAA3 C 6
aiv 5.4(b) Ap 6 iii 1B.3SAA3 K 6
bi 5.5(b) K 3 iv 1B.3SAA3 K 9
bii 5.5(b) Ap 9 cBi 2A.1(a) K 7
biii 5.5(b) Ap 3 ii 2A.1(a) C 6
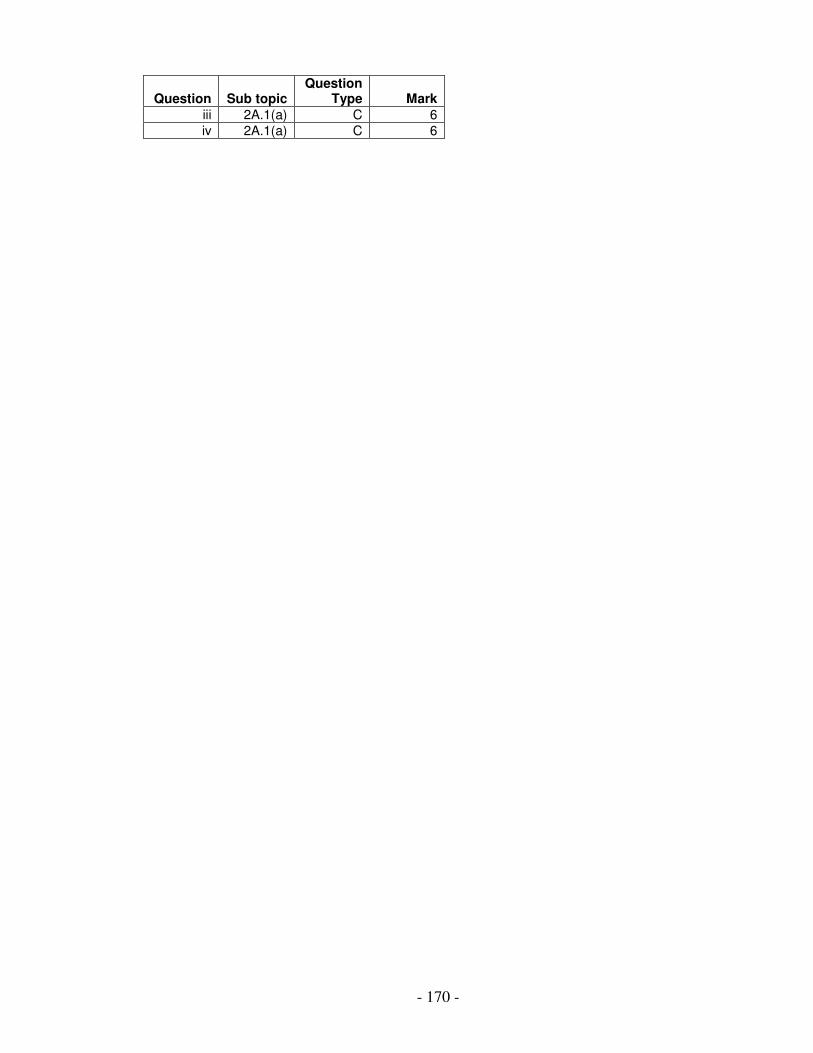
- 170 -
Question Sub topic Question
Type Mark
iii 2A.1(a) C 6
iv 2A.1(a) C 6
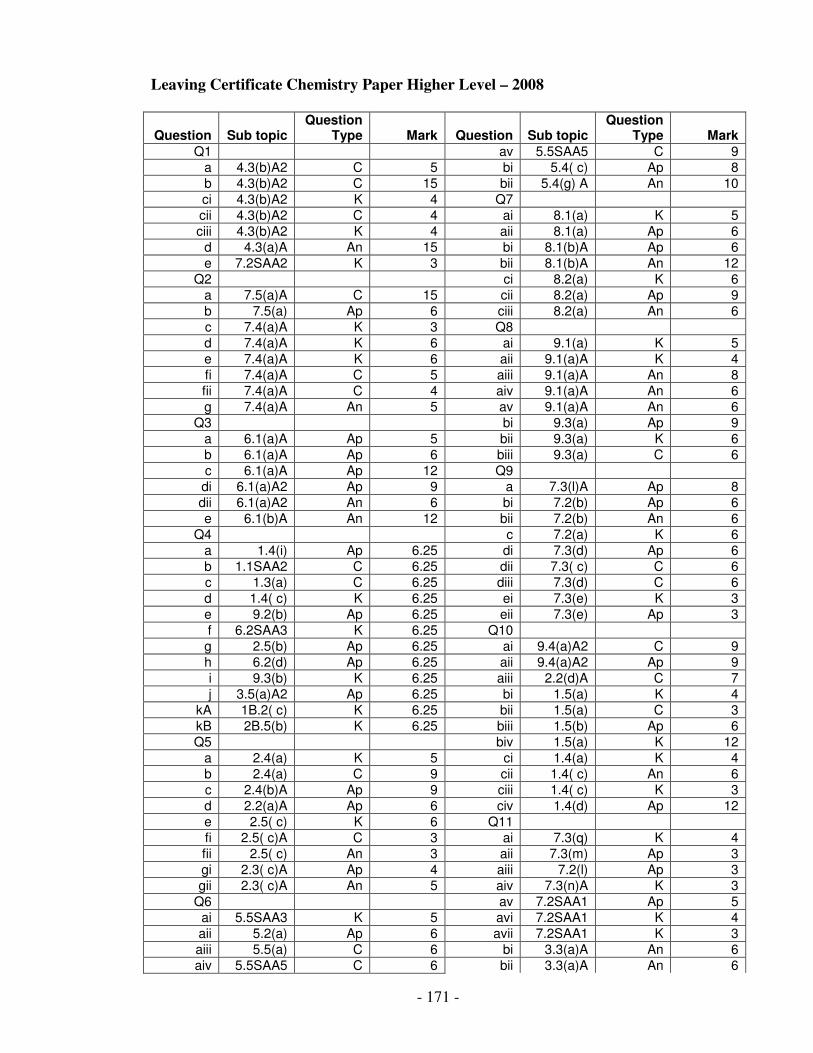
- 171 -
Leaving Certificate Chemistry Paper Higher Level – 2008
Question Sub topic Question
Type Mark Question Sub topic Question
Type Mark
Q1 av 5.5SAA5 C 9
a 4.3(b)A2 C 5 bi 5.4( c) Ap 8
b 4.3(b)A2 C 15 bii 5.4(g) A An 10
ci 4.3(b)A2 K 4 Q7
cii 4.3(b)A2 C 4 ai 8.1(a) K 5
ciii 4.3(b)A2 K 4 aii 8.1(a) Ap 6
d 4.3(a)A An 15 bi 8.1(b)A Ap 6
e 7.2SAA2 K 3 bii 8.1(b)A An 12
Q2 ci 8.2(a) K 6
a 7.5(a)A C 15 cii 8.2(a) Ap 9
b 7.5(a) Ap 6 ciii 8.2(a) An 6
c 7.4(a)A K 3 Q8
d 7.4(a)A K 6 ai 9.1(a) K 5
e 7.4(a)A K 6 aii 9.1(a)A K 4
fi 7.4(a)A C 5 aiii 9.1(a)A An 8
fii 7.4(a)A C 4 aiv 9.1(a)A An 6
g 7.4(a)A An 5 av 9.1(a)A An 6
Q3 bi 9.3(a) Ap 9
a 6.1(a)A Ap 5 bii 9.3(a) K 6
b 6.1(a)A Ap 6 biii 9.3(a) C 6
c 6.1(a)A Ap 12 Q9
di 6.1(a)A2 Ap 9 a 7.3(l)A Ap 8
dii 6.1(a)A2 An 6 bi 7.2(b) Ap 6
e 6.1(b)A An 12 bii 7.2(b) An 6
Q4 c 7.2(a) K 6
a 1.4(i) Ap 6.25 di 7.3(d) Ap 6
b 1.1SAA2 C 6.25 dii 7.3( c) C 6
c 1.3(a) C 6.25 diii 7.3(d) C 6
d 1.4( c) K 6.25 ei 7.3(e) K 3
e 9.2(b) Ap 6.25 eii 7.3(e) Ap 3
f 6.2SAA3 K 6.25 Q10
g 2.5(b) Ap 6.25 ai 9.4(a)A2 C 9
h 6.2(d) Ap 6.25 aii 9.4(a)A2 Ap 9
i 9.3(b) K 6.25 aiii 2.2(d)A C 7
j 3.5(a)A2 Ap 6.25 bi 1.5(a) K 4
kA 1B.2( c) K 6.25 bii 1.5(a) C 3
kB 2B.5(b) K 6.25 biii 1.5(b) Ap 6
Q5 biv 1.5(a) K 12
a 2.4(a) K 5 ci 1.4(a) K 4
b 2.4(a) C 9 cii 1.4( c) An 6
c 2.4(b)A Ap 9 ciii 1.4( c) K 3
d 2.2(a)A Ap 6 civ 1.4(d) Ap 12
e 2.5( c) K 6 Q11
fi 2.5( c)A C 3 ai 7.3(q) K 4
fii 2.5( c) An 3 aii 7.3(m) Ap 3
gi 2.3( c)A Ap 4 aiii 7.2(l) Ap 3
gii 2.3( c)A An 5 aiv 7.3(n)A K 3
Q6 av 7.2SAA1 Ap 5
ai 5.5SAA3 K 5 avi 7.2SAA1 K 4
aii 5.2(a) Ap 6 avii 7.2SAA1 K 3
aiii 5.5(a) C 6 bi 3.3(a)A An 6
aiv 5.5SAA5 C 6 bii 3.3(a)A An 6
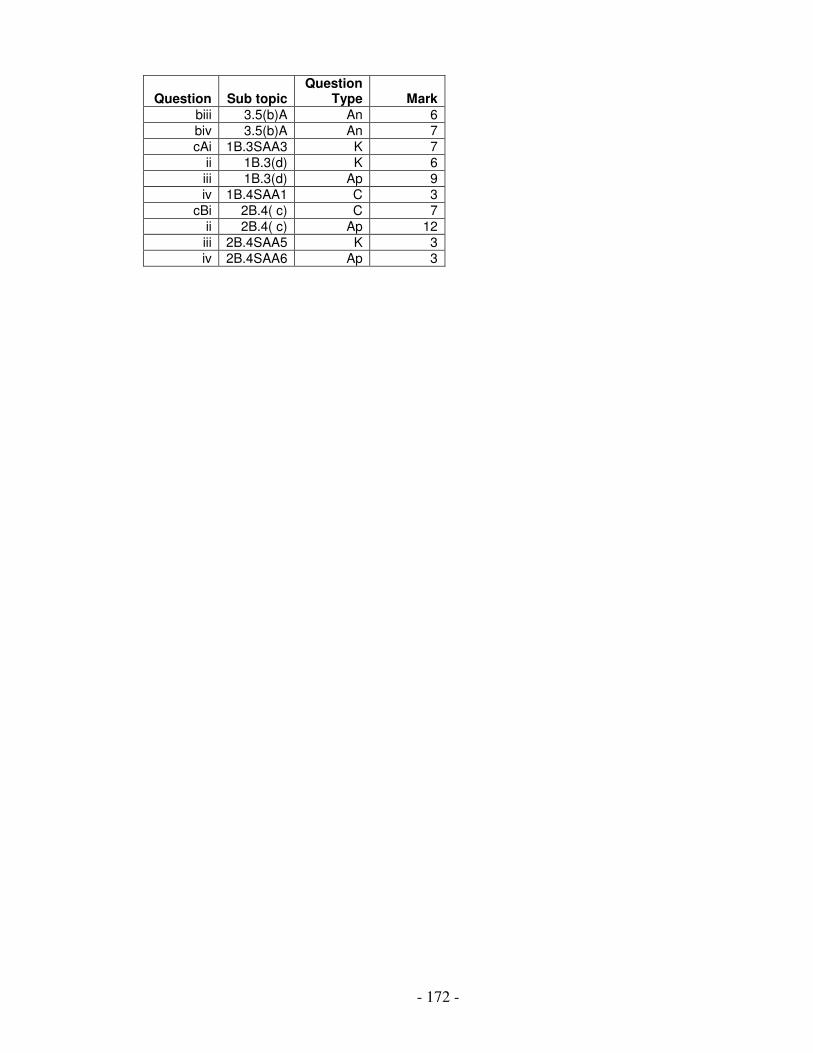
- 172 -
Question Sub topic Question
Type Mark
biii 3.5(b)A An 6
biv 3.5(b)A An 7
cAi 1B.3SAA3 K 7
ii 1B.3(d) K 6
iii 1B.3(d) Ap 9
iv 1B.4SAA1 C 3
cBi 2B.4( c) C 7
ii 2B.4( c) Ap 12
iii 2B.4SAA5 K 3
iv 2B.4SAA6 Ap 3

- 173 -
APPENDIX
B
QUESTIONS EMPLOYED IN
MODULE CS201
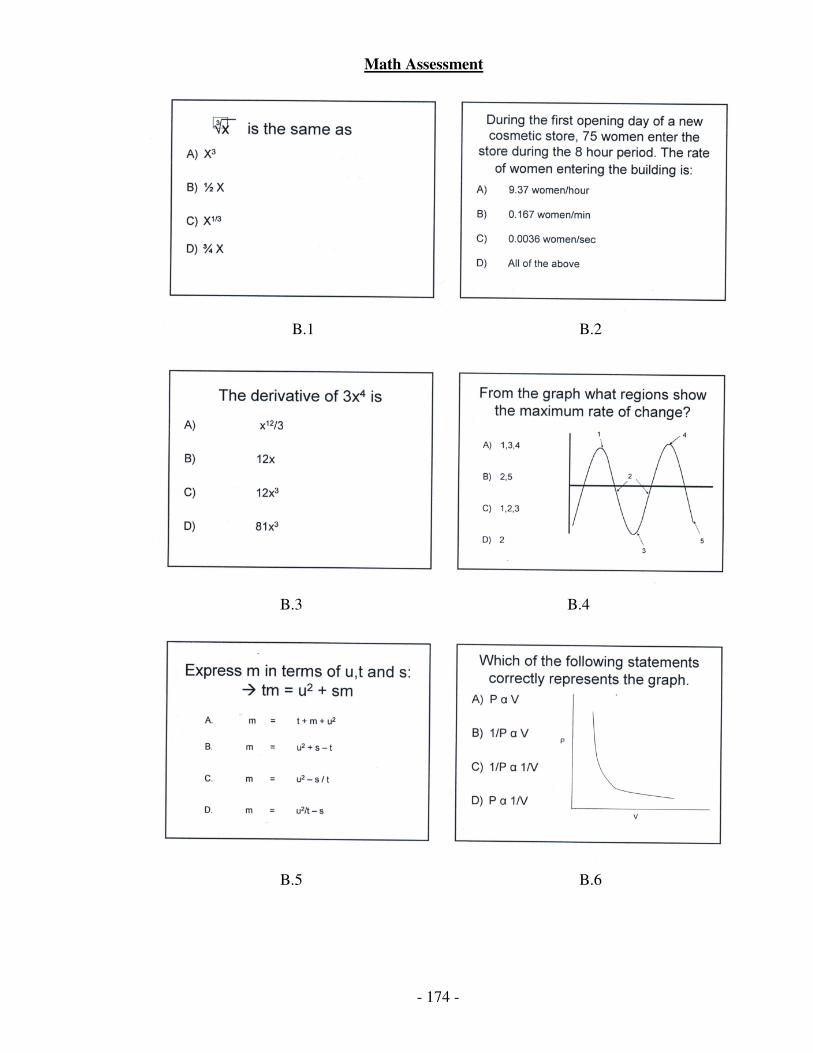
- 174 -
B.1 B.2
B.3 B.4
B.5 B.6
Math Assessment

- 175 -
In lecture assessment
B.7 B.8
B.9 B.10
B.11 B.12
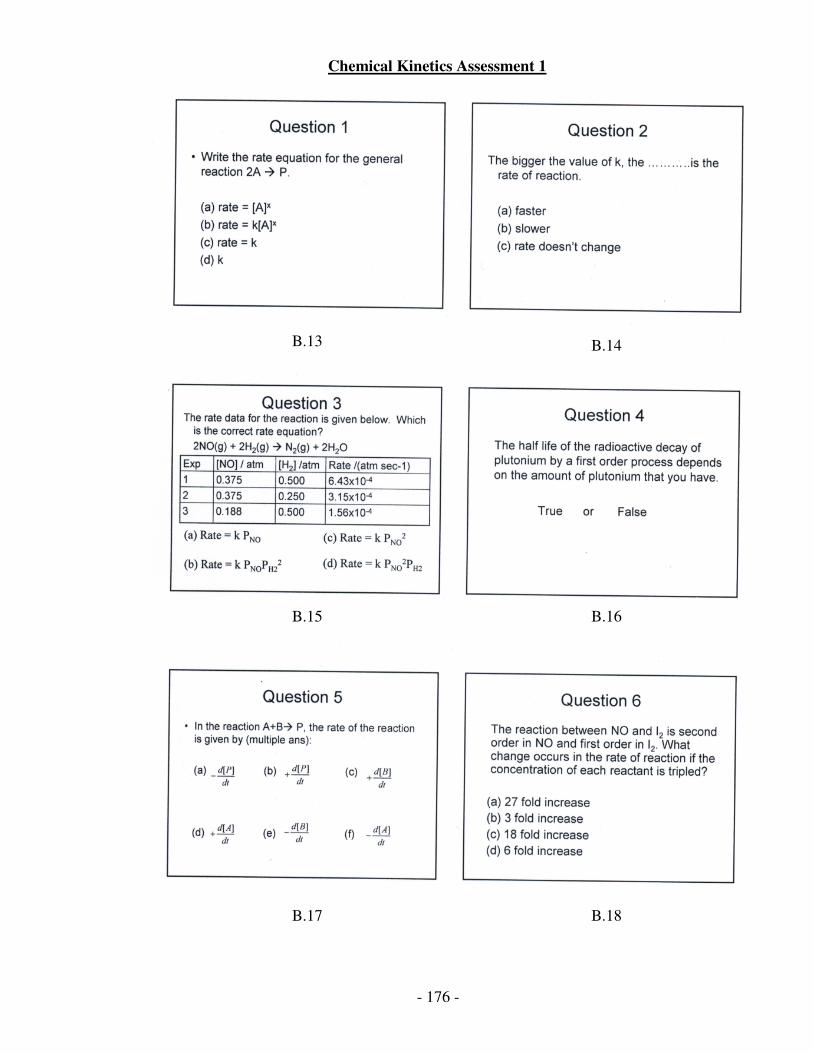
- 176 -
B.13 B.14
B.15 B.16
B.17 B.18
Chemical Kinetics Assessment 1
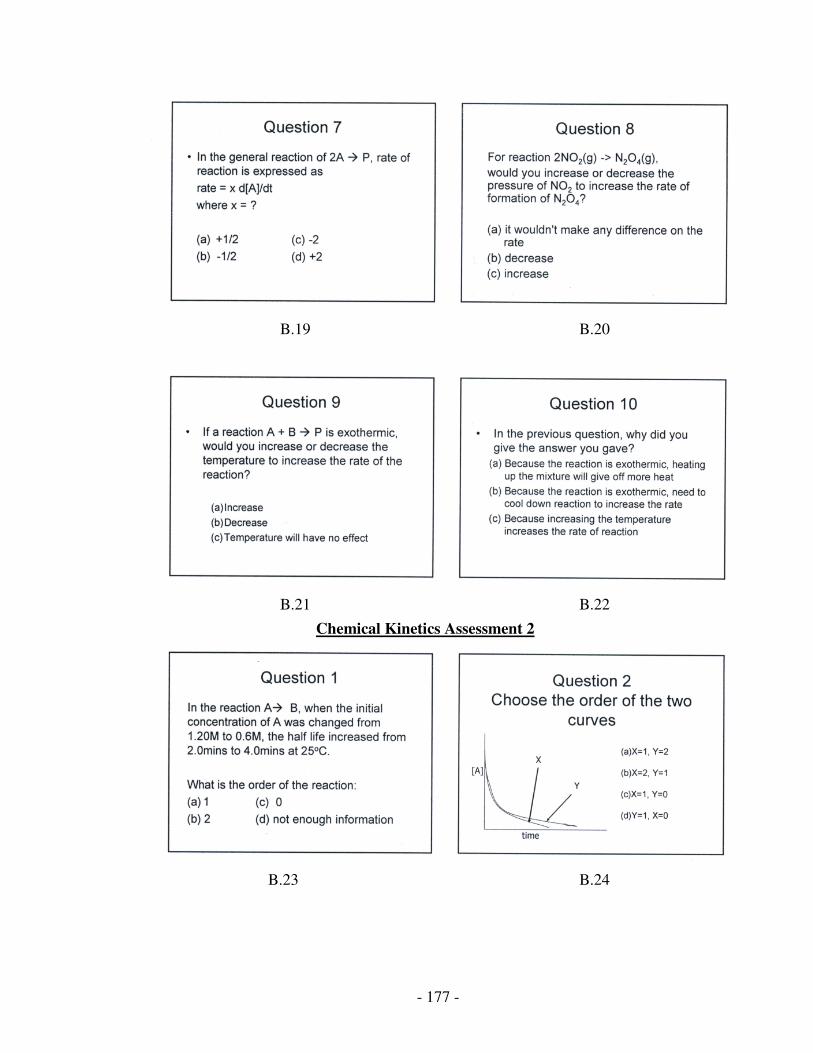
- 177 -
B.19 B.20
B.21 B.22
B.23 B.24
Chemical Kinetics Assessment 2
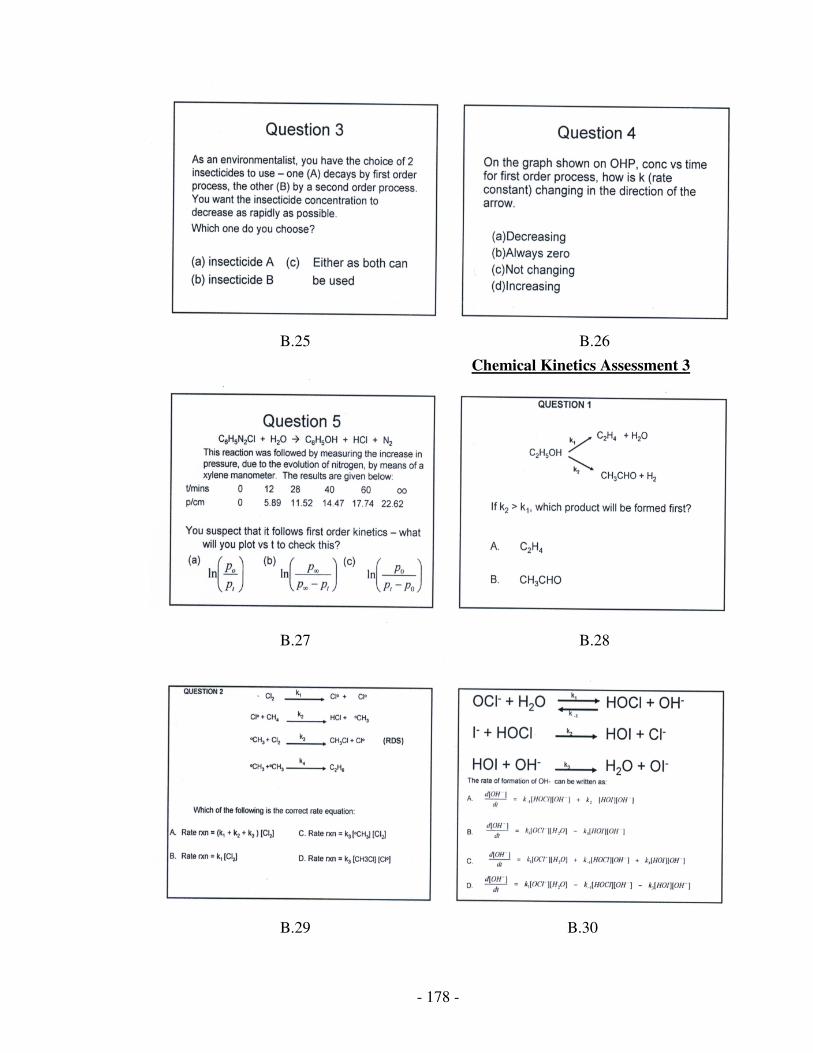
- 178 -
B.25 B.26
B.27 B.28
B.29 B.30
Chemical Kinetics Assessment 3
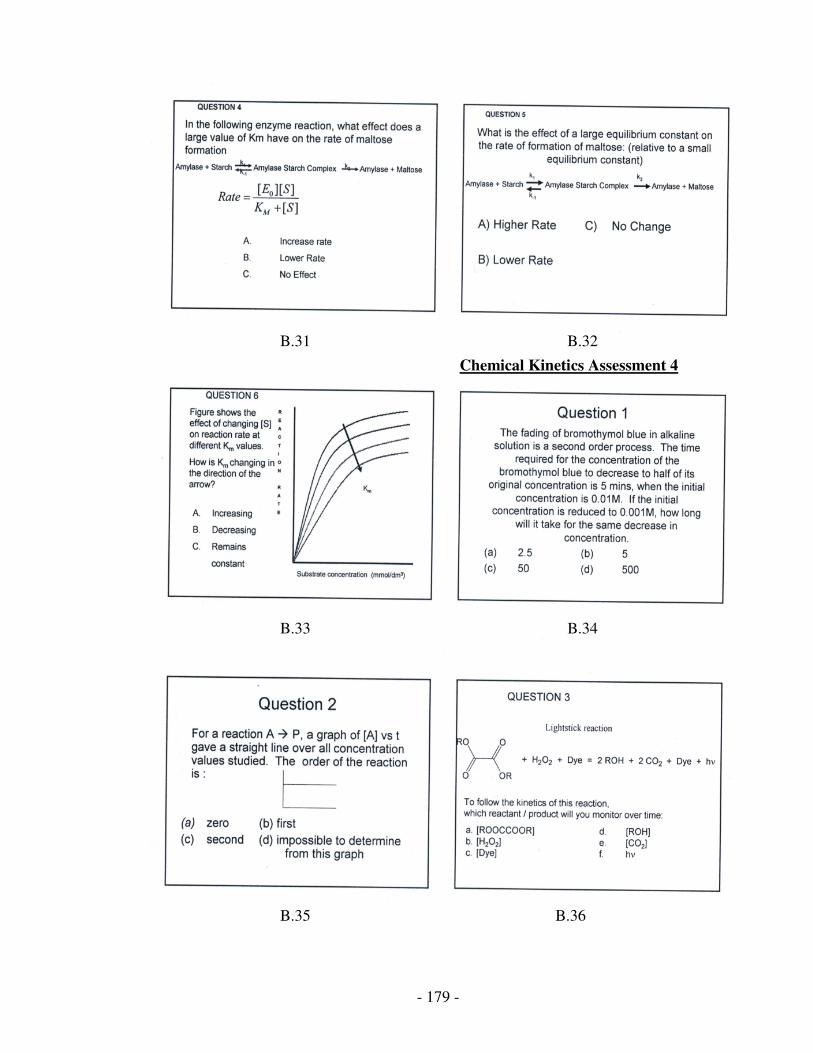
- 179 -
B.31 B.32
B.33 B.34
B.35 B.36
Chemical Kinetics Assessment 4
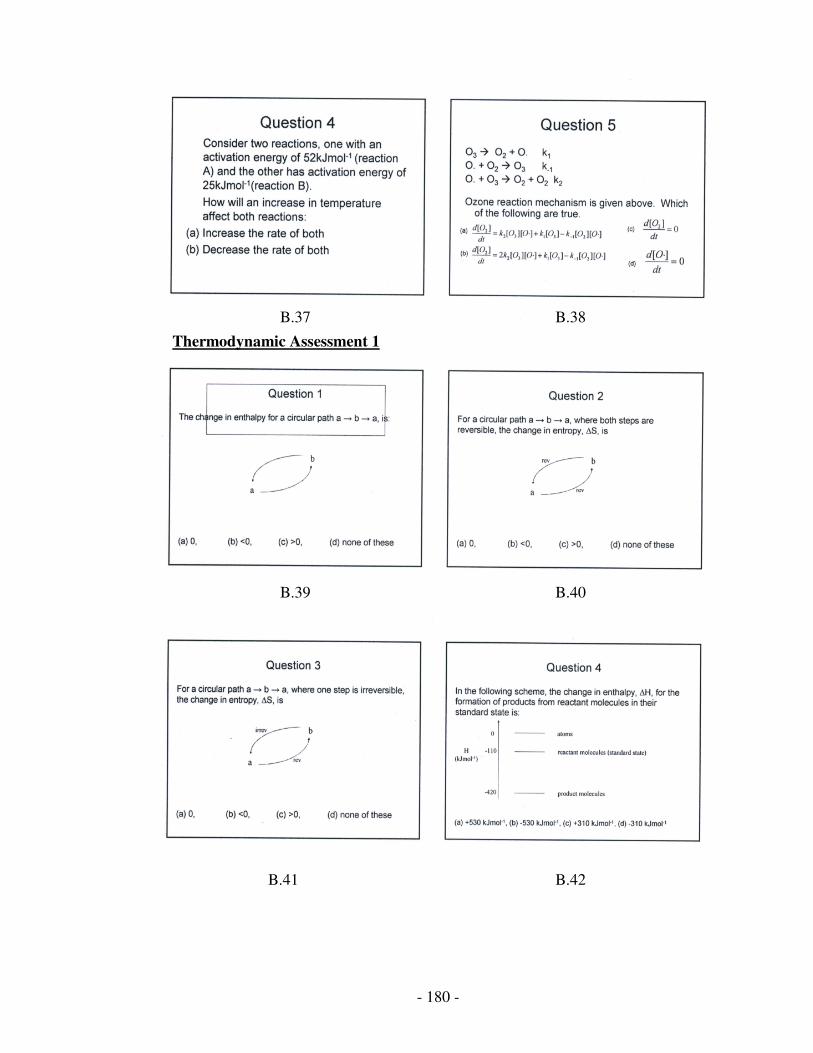
- 180 -
B.37 B.38
B.39 B.40
B.41 B.42
Thermodynamic Assessment 1
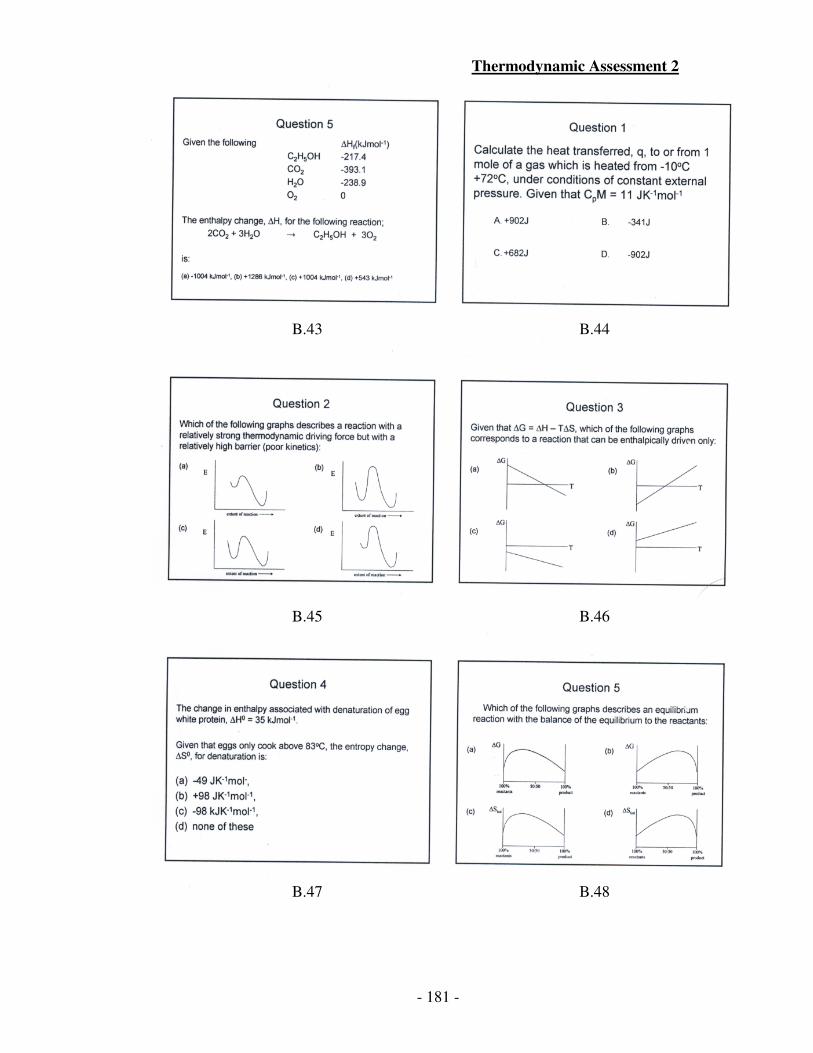
- 181 -
B.43 B.44
B.45 B.46
B.47 B.48
Thermodynamic Assessment 2
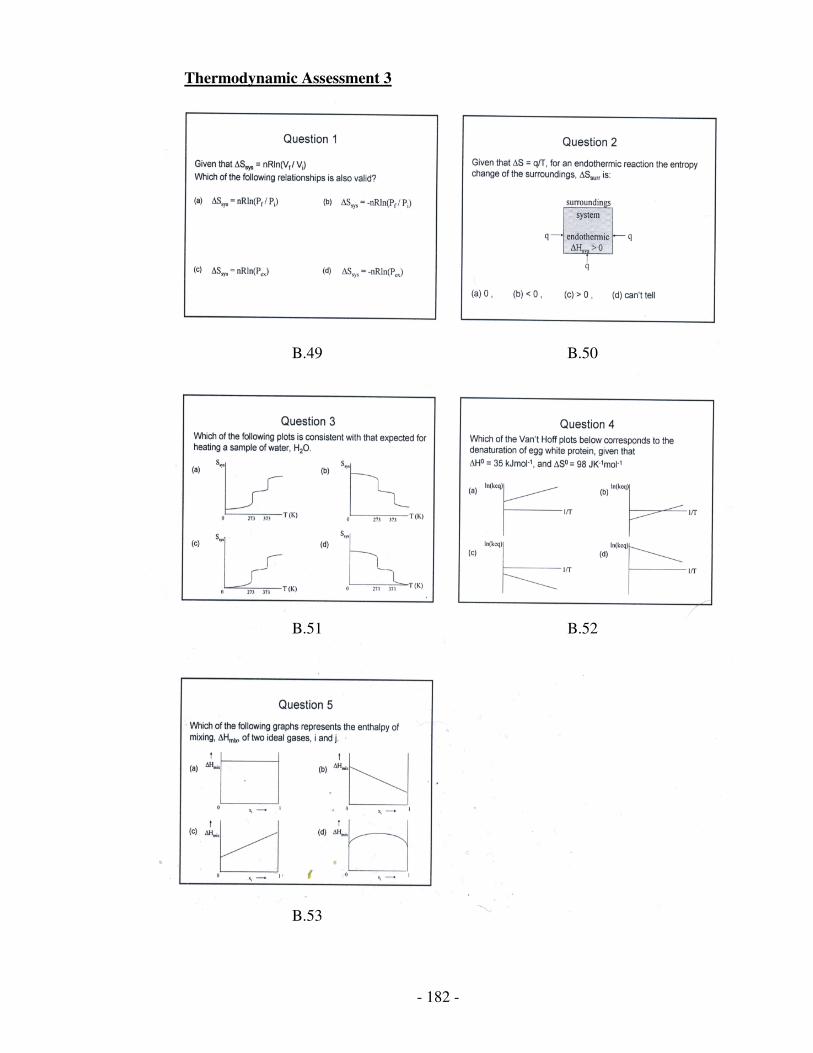
- 182 -
B.49 B.50
B.51 B.52
B.53
Thermodynamic Assessment 3
- 183 -
APPENDIX
C
PRE AND POST
LABORATORY TASKS
FOR
SEMESTER 1 AND 2
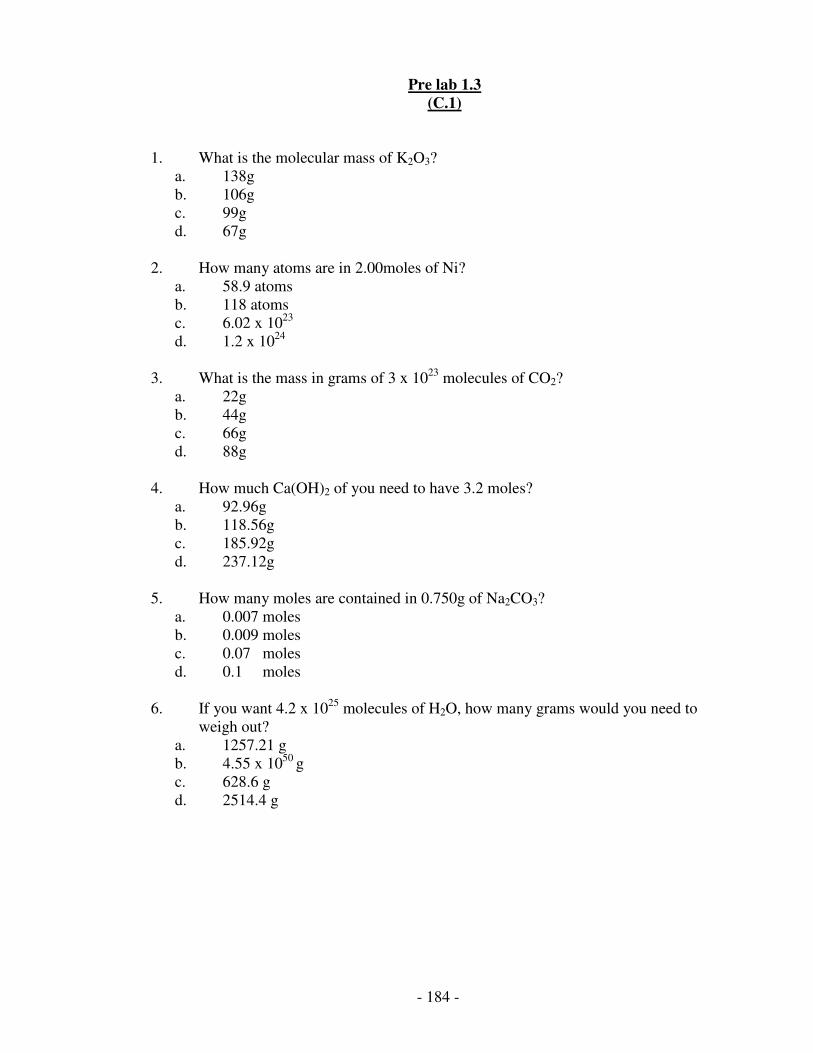
- 184 -
Pre lab 1.3
(C.1)
1. What is the molecular mass of K2O3?
a. 138g
b. 106g
c. 99g
d. 67g
2. How many atoms are in 2.00moles of Ni?
a. 58.9 atoms
b. 118 atoms
c. 6.02 x 10²³
d. 1.2 x 1024
3. What is the mass in grams of 3 x 10²³
molecules of CO2?
a. 22g
b. 44g
c. 66g
d. 88g
4. How much Ca(OH)2 of you need to have 3.2 moles?
a. 92.96g
b. 118.56g
c. 185.92g
d. 237.12g
5. How many moles are contained in 0.750g of Na2CO3?
a. 0.007 moles
b. 0.009 moles
c. 0.07 moles
d. 0.1 moles
6. If you want 4.2 x 1025
molecules of H2O, how many grams would you need to
weigh out?
a. 1257.21 g
b. 4.55 x 1050
g
c. 628.6 g
d. 2514.4 g
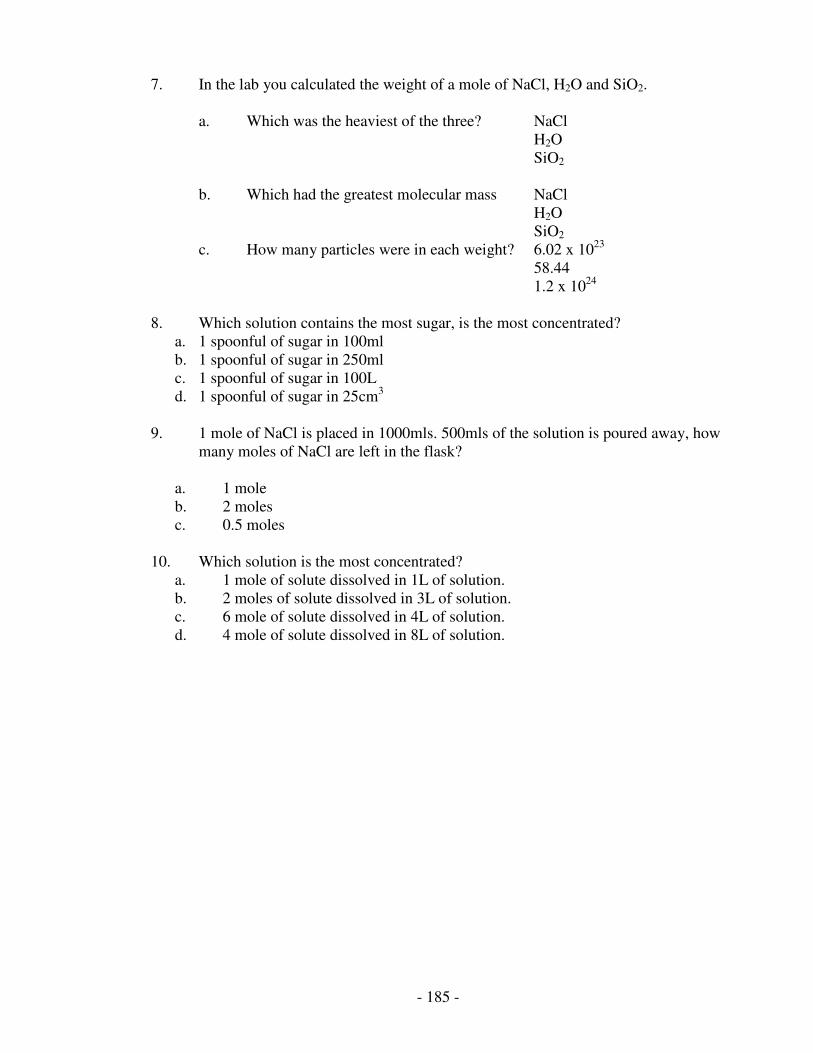
- 185 -
7. In the lab you calculated the weight of a mole of NaCl, H2O and SiO2.
a. Which was the heaviest of the three? NaCl
H2O
SiO2
b. Which had the greatest molecular mass NaCl
H2O
SiO2
c. How many particles were in each weight? 6.02 x 10²³
58.44
1.2 x 1024
8. Which solution contains the most sugar, is the most concentrated?
a. 1 spoonful of sugar in 100ml
b. 1 spoonful of sugar in 250ml
c. 1 spoonful of sugar in 100L
d. 1 spoonful of sugar in 25cm3
9. 1 mole of NaCl is placed in 1000mls. 500mls of the solution is poured away, how
many moles of NaCl are left in the flask?
a. 1 mole
b. 2 moles
c. 0.5 moles
10. Which solution is the most concentrated?
a. 1 mole of solute dissolved in 1L of solution.
b. 2 moles of solute dissolved in 3L of solution.
c. 6 mole of solute dissolved in 4L of solution.
d. 4 mole of solute dissolved in 8L of solution.
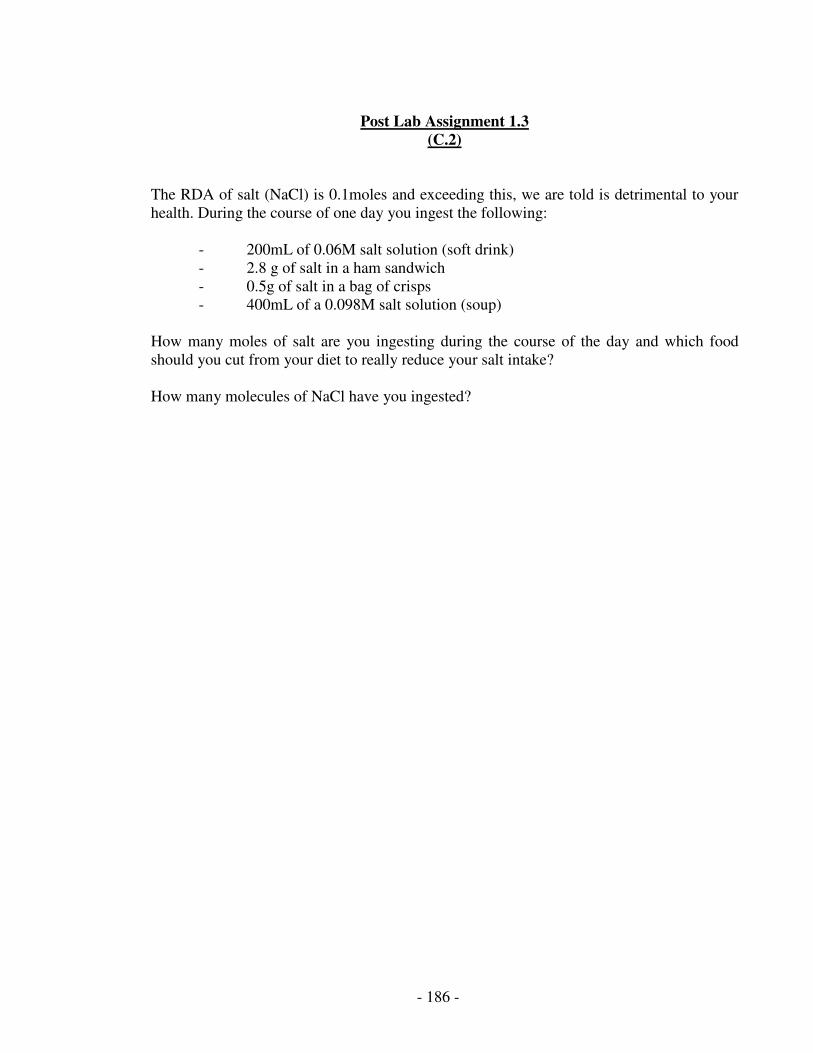
- 186 -
Post Lab Assignment 1.3
(C.2)
The RDA of salt (NaCl) is 0.1moles and exceeding this, we are told is detrimental to your
health. During the course of one day you ingest the following:
- 200mL of 0.06M salt solution (soft drink)
- 2.8 g of salt in a ham sandwich
- 0.5g of salt in a bag of crisps
- 400mL of a 0.098M salt solution (soup)
How many moles of salt are you ingesting during the course of the day and which food
should you cut from your diet to really reduce your salt intake?
How many molecules of NaCl have you ingested?
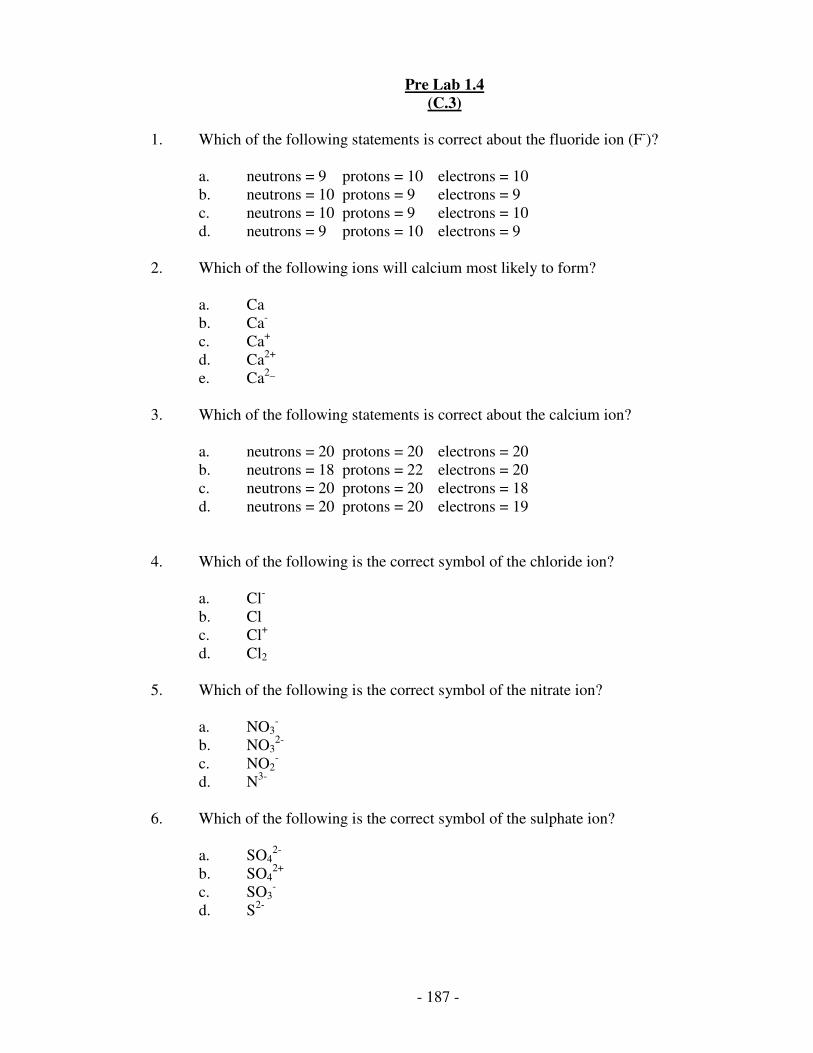
- 187 -
Pre Lab 1.4
(C.3)
1. Which of the following statements is correct about the fluoride ion (F-)?
a. neutrons = 9 protons = 10 electrons = 10
b. neutrons = 10 protons = 9 electrons = 9
c. neutrons = 10 protons = 9 electrons = 10
d. neutrons = 9 protons = 10 electrons = 9
2. Which of the following ions will calcium most likely to form?
a. Ca
b. Ca-
c. Ca+
d. Ca2+
e. Ca2_
3. Which of the following statements is correct about the calcium ion?
a. neutrons = 20 protons = 20 electrons = 20
b. neutrons = 18 protons = 22 electrons = 20
c. neutrons = 20 protons = 20 electrons = 18
d. neutrons = 20 protons = 20 electrons = 19
4. Which of the following is the correct symbol of the chloride ion?
a. Cl-
b. Cl
c. Cl+
d. Cl2
5. Which of the following is the correct symbol of the nitrate ion?
a. NO3-
b. NO32-
c. NO2-
d. N3-
6. Which of the following is the correct symbol of the sulphate ion?
a. SO42-
b. SO42+
c. SO3-
d. S2-
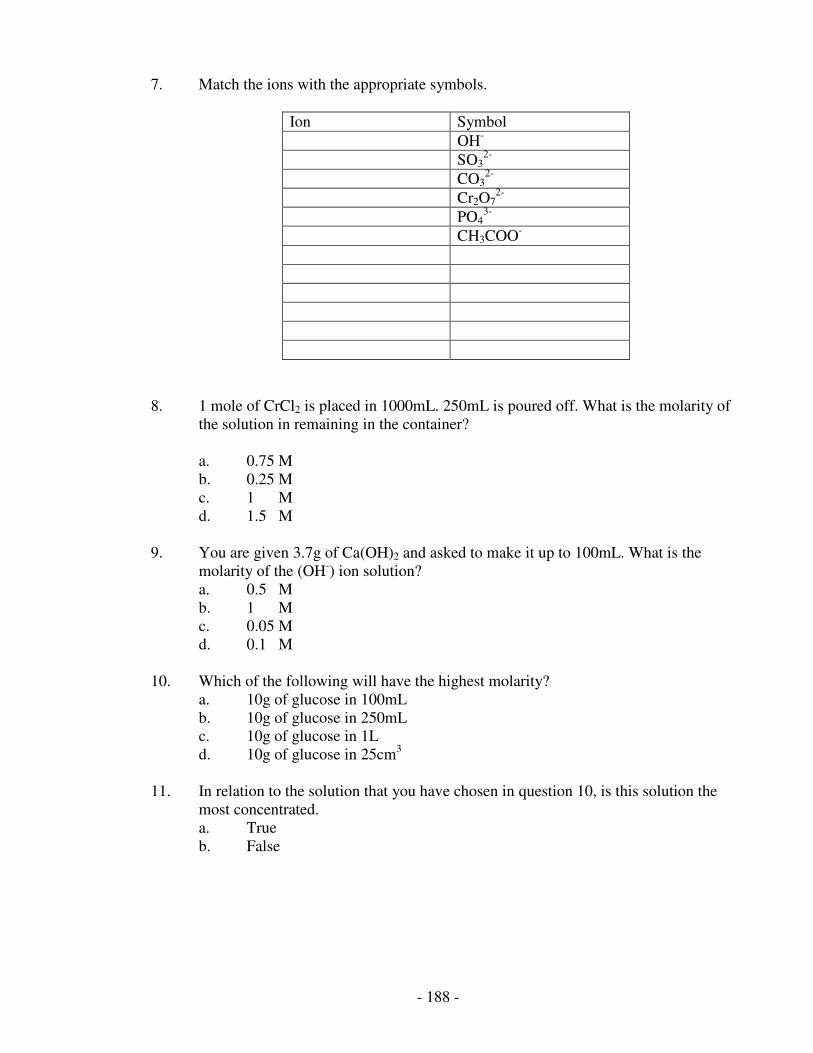
- 188 -
7. Match the ions with the appropriate symbols.
Ion Symbol
OH-
SO32-
CO32-
Cr2O72-
PO43-
CH3COO-
8. 1 mole of CrCl2 is placed in 1000mL. 250mL is poured off. What is the molarity of
the solution in remaining in the container?
a. 0.75 M
b. 0.25 M
c. 1 M
d. 1.5 M
9. You are given 3.7g of Ca(OH)2 and asked to make it up to 100mL. What is the
molarity of the (OH-) ion solution?
a. 0.5 M
b. 1 M
c. 0.05 M
d. 0.1 M
10. Which of the following will have the highest molarity?
a. 10g of glucose in 100mL
b. 10g of glucose in 250mL
c. 10g of glucose in 1L
d. 10g of glucose in 25cm3
11. In relation to the solution that you have chosen in question 10, is this solution the
most concentrated.
a. True
b. False
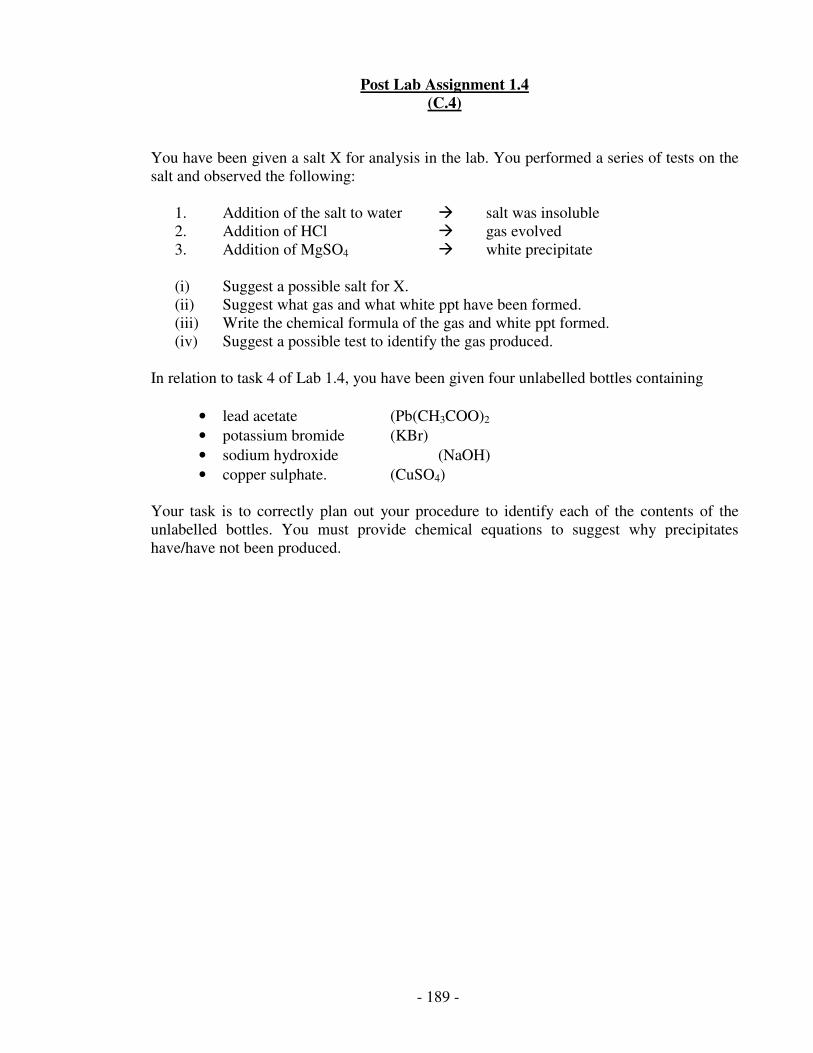
- 189 -
Post Lab Assignment 1.4
(C.4)
You have been given a salt X for analysis in the lab. You performed a series of tests on the
salt and observed the following:
1. Addition of the salt to water � salt was insoluble
2. Addition of HCl � gas evolved
3. Addition of MgSO4 � white precipitate
(i) Suggest a possible salt for X.
(ii) Suggest what gas and what white ppt have been formed.
(iii) Write the chemical formula of the gas and white ppt formed.
(iv) Suggest a possible test to identify the gas produced.
In relation to task 4 of Lab 1.4, you have been given four unlabelled bottles containing
• lead acetate (Pb(CH3COO)2
• potassium bromide (KBr)
• sodium hydroxide (NaOH)
• copper sulphate. (CuSO4)
Your task is to correctly plan out your procedure to identify each of the contents of the
unlabelled bottles. You must provide chemical equations to suggest why precipitates
have/have not been produced.
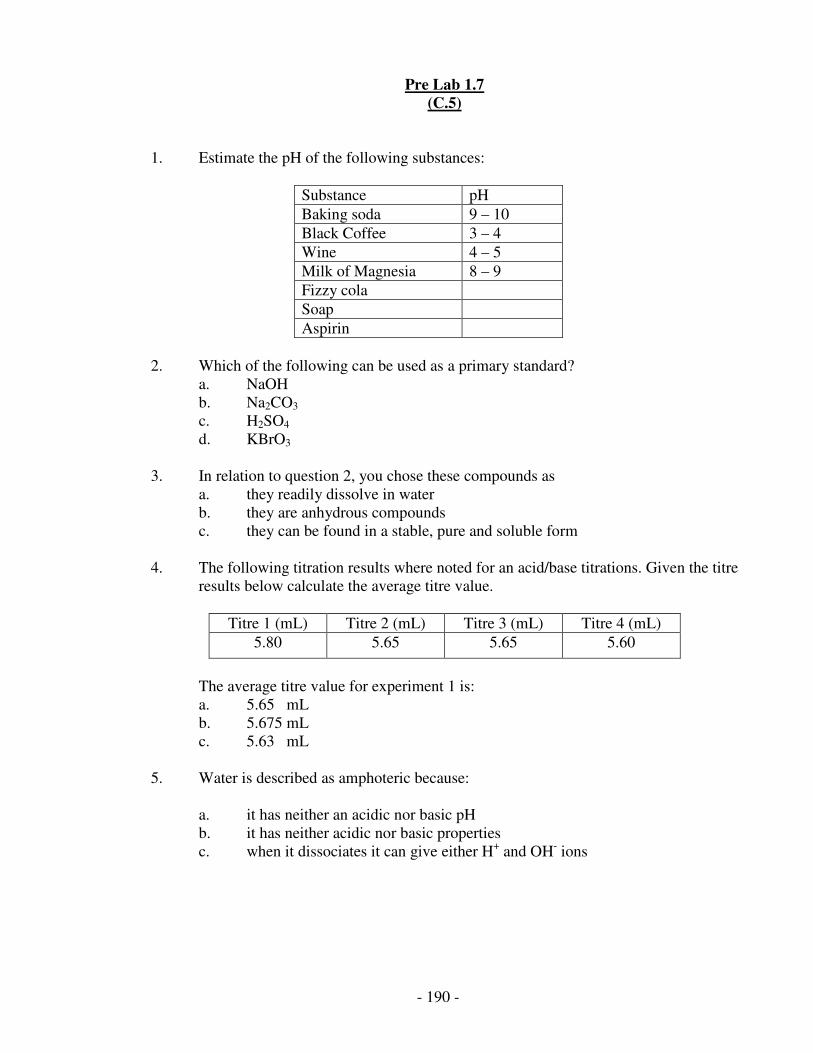
- 190 -
Pre Lab 1.7
(C.5)
1. Estimate the pH of the following substances:
Substance pH
Baking soda 9 – 10
Black Coffee 3 – 4
Wine 4 – 5
Milk of Magnesia 8 – 9
Fizzy cola
Soap
Aspirin
2. Which of the following can be used as a primary standard?
a. NaOH
b. Na2CO3
c. H2SO4
d. KBrO3
3. In relation to question 2, you chose these compounds as
a. they readily dissolve in water
b. they are anhydrous compounds
c. they can be found in a stable, pure and soluble form
4. The following titration results where noted for an acid/base titrations. Given the titre
results below calculate the average titre value.
Titre 1 (mL) Titre 2 (mL) Titre 3 (mL) Titre 4 (mL)
5.80 5.65 5.65 5.60
The average titre value for experiment 1 is:
a. 5.65 mL
b. 5.675 mL
c. 5.63 mL
5. Water is described as amphoteric because:
a. it has neither an acidic nor basic pH
b. it has neither acidic nor basic properties
c. when it dissociates it can give either H+ and OH
- ions

- 191 -
6. Identify each of the following as a strong base (SB), weak base (WB), strong acid
(SA) or weak base(WB).
Compound SB/SA/WB/WA
Acetic Acid
Hydrochloric Acid
Ammonium Hydroxide
Sodium Hydroxide
Citric Acid
Sulphuric Acid
Strontium Hydroxide
Ammonia Gas
7. 9g of calcium hydroxide are dissolved in solution and made up to 1L. How many
moles are contained in 20mL of this solution?
a. 0.1216 moles
b. 0.0024 moles
c. 0.0049 moles
d. 0.0012 moles
8. When sulphuric acid and sodium hydroxide react the balanced equation is
H2SO4 + xNaOH � NaySO4 + zH2O where x, y and z are:
a. 2, 3, 4.
b. 2, 2, 2.
c. 1, 2, 3.
d. 3, 3, 2.
9. When 0.2moles of sulphuric acid reacts completely with sodium hydroxide, how
many moles of sodium hydroxide are required?
a. 0.2 moles
b. 1 mole
c. 0.4 moles
d. 0.1 mole
10. When preparing a primary standard the volumetric flask is inverted a number of
times to:
a. remove all air bubbles
b. ensure all of the primary standard has been dissolved
c. ensure a homogenous/uniform concentration of the solution
d. ensure that the solution has touched all sides of the flask
- 192 -
11. If you have 0.02moles of NaOH in 22.5mL, what is the molarity of the solution?
a. 0.02 M
b. 0.2 M
c. 0.09 M
d. 0.89 M
12. From the molarity chosen above what is the concentration of this solution in g/L?
a. 35.5 g/L
b. 0.8 g/L
c. 8 g/L
d. 3.6 g/L

- 193 -
Post lab 1.7
(C.6)
1. In your opinion, why is a conical flask used in titrimetric analysis rather than a
beaker?
2. In part 2 of the standardisation of HCl, step 6 allowed you to rinse the inside
wall of the conical flask with distilled water during the titration. Won’t this
change the concentration of acid in the conical flask and hence change the
amount of base required to neutralise it? Is this correct?
3. Why do you take burette readings from the bottom of the meniscus?
4. In this titration, you used the indicator methyl orange. If you phenolphthalein,
would you have gotten the same answer? Explain.
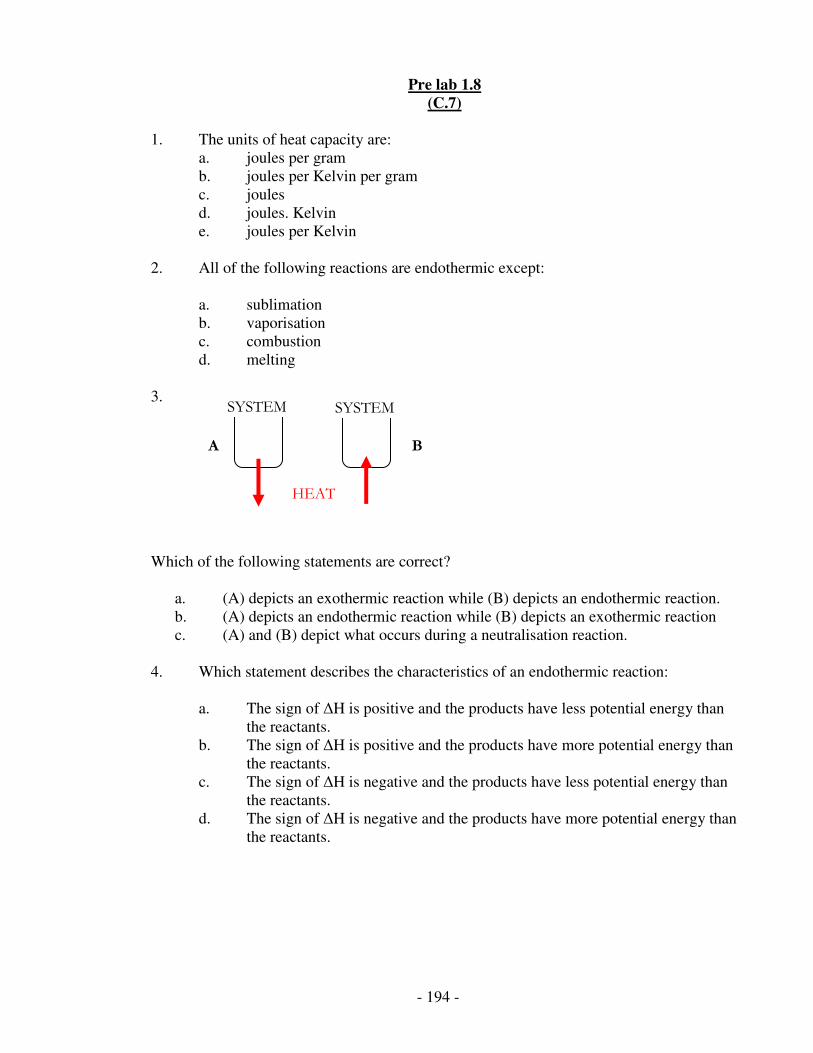
- 194 -
Pre lab 1.8
(C.7)
1. The units of heat capacity are:
a. joules per gram
b. joules per Kelvin per gram
c. joules
d. joules. Kelvin
e. joules per Kelvin
2. All of the following reactions are endothermic except:
a. sublimation
b. vaporisation
c. combustion
d. melting
3.
Which of the following statements are correct?
a. (A) depicts an exothermic reaction while (B) depicts an endothermic reaction.
b. (A) depicts an endothermic reaction while (B) depicts an exothermic reaction
c. (A) and (B) depict what occurs during a neutralisation reaction.
4. Which statement describes the characteristics of an endothermic reaction:
a. The sign of ∆H is positive and the products have less potential energy than
the reactants.
b. The sign of ∆H is positive and the products have more potential energy than
the reactants.
c. The sign of ∆H is negative and the products have less potential energy than
the reactants.
d. The sign of ∆H is negative and the products have more potential energy than
the reactants.
SYSTEM SYSTEM
HEAT
A B
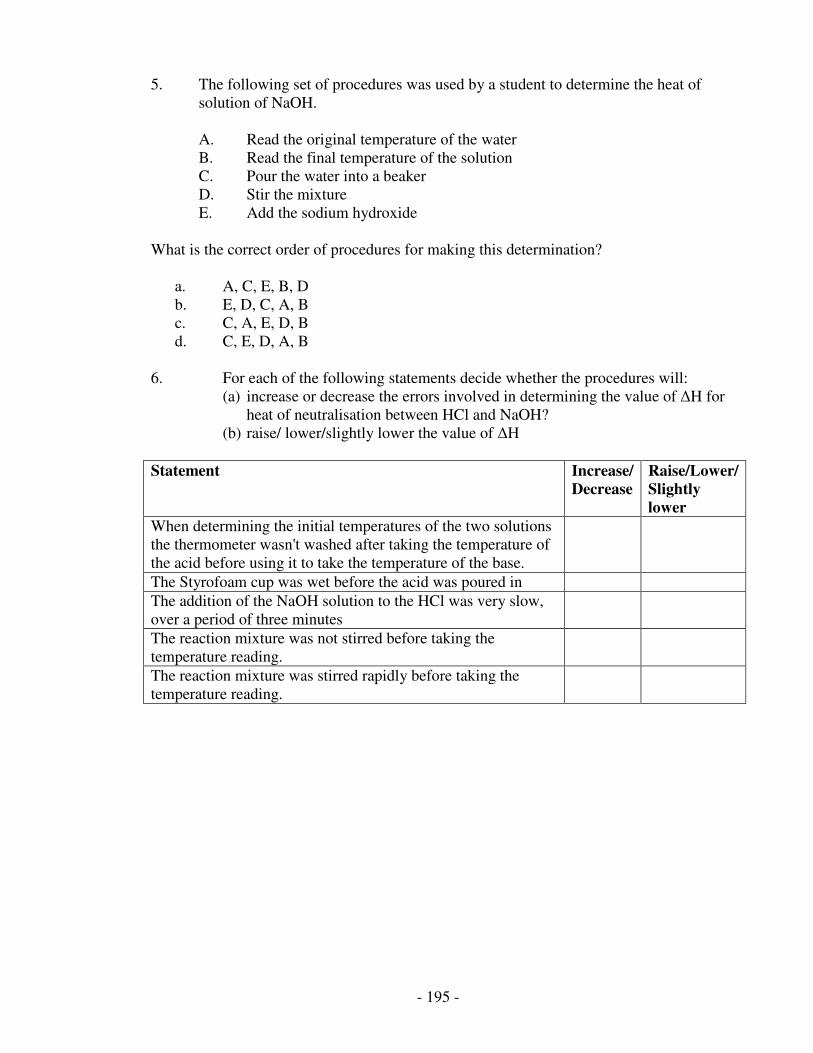
- 195 -
5. The following set of procedures was used by a student to determine the heat of
solution of NaOH.
A. Read the original temperature of the water
B. Read the final temperature of the solution
C. Pour the water into a beaker
D. Stir the mixture
E. Add the sodium hydroxide
What is the correct order of procedures for making this determination?
a. A, C, E, B, D
b. E, D, C, A, B
c. C, A, E, D, B
d. C, E, D, A, B
6. For each of the following statements decide whether the procedures will:
(a) increase or decrease the errors involved in determining the value of ∆H for
heat of neutralisation between HCl and NaOH?
(b) raise/ lower/slightly lower the value of ∆H
Statement Increase/
Decrease
Raise/Lower/
Slightly
lower
When determining the initial temperatures of the two solutions
the thermometer wasn't washed after taking the temperature of
the acid before using it to take the temperature of the base.
The Styrofoam cup was wet before the acid was poured in
The addition of the NaOH solution to the HCl was very slow,
over a period of three minutes
The reaction mixture was not stirred before taking the
temperature reading.
The reaction mixture was stirred rapidly before taking the
temperature reading.
- 196 -
Post lab Assignment 1.8
(C.8)
1. When 200cm3 of NaOH solution was added to 200cm
3 of a 0.4M solution of H2SO4 in a
plastic container the temperature of solution rose from 11oC to 16.5
oC. The heat
capacity of the solution formed was 4.2 kJ kg-1
.
(a) Why was a plastic container used?
(b) What steps would you take to ensure an accurate measurement of the
temperature rise?
(c) Calculate the heat of neutralisation?
2. You want to keep a cup of tea “hot” for as long as possible. Rank the following
containers in order of your choice and explain the order?
(a) Styrofoam cup
(b) Ceramic mug
(c) Styrofoam cup with lid
(d) Thermos flask
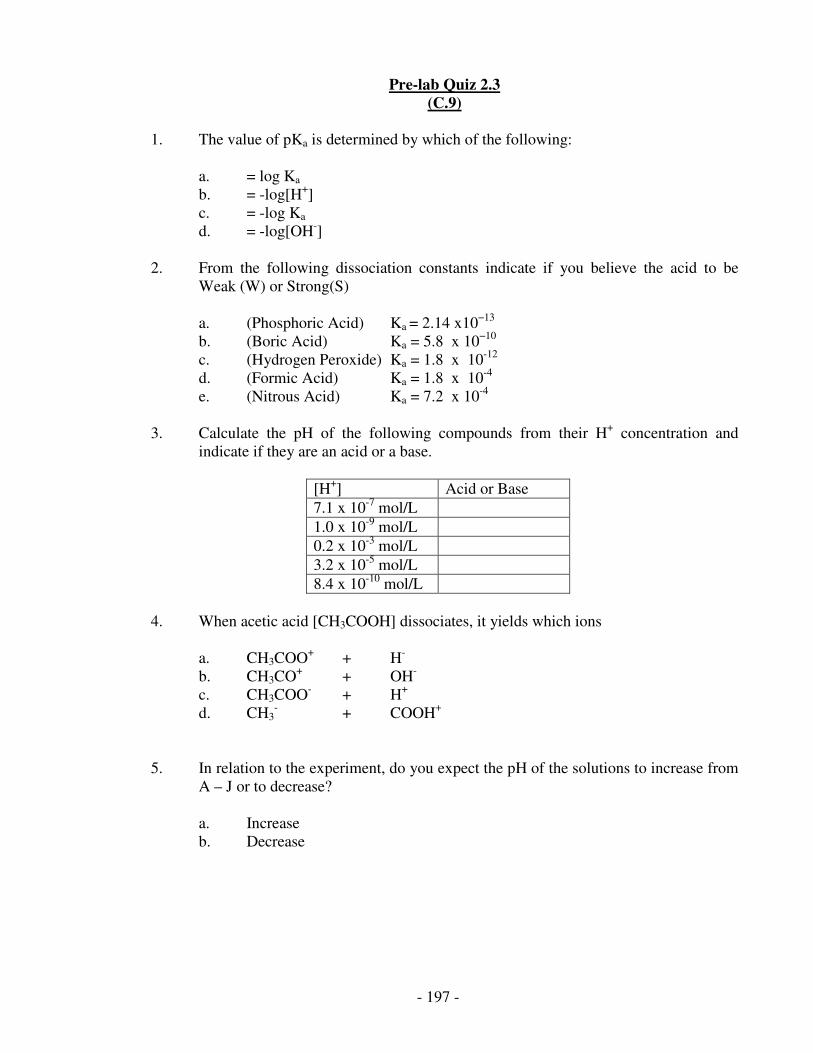
- 197 -
Pre-lab Quiz 2.3
(C.9)
1. The value of pKa is determined by which of the following:
a. = log Ka
b. = -log[H+]
c. = -log Ka
d. = -log[OH-]
2. From the following dissociation constants indicate if you believe the acid to be
Weak (W) or Strong(S)
a. (Phosphoric Acid) Ka = 2.14 x10⁻¹³
b. (Boric Acid) Ka = 5.8 x 10⁻¹⁰
c. (Hydrogen Peroxide) Ka = 1.8 x 10⁻¹²
d. (Formic Acid) Ka = 1.8 x 10
-4
e. (Nitrous Acid) Ka = 7.2 x 10⁻⁴
3. Calculate the pH of the following compounds from their H+ concentration and
indicate if they are an acid or a base.
[H+] Acid or Base
7.1 x 10⁻⁷
mol/L
1.0 x 10⁻⁹
mol/L
0.2 x 10⁻³
mol/L
3.2 x 10⁻⁵
mol/L
8.4 x 10⁻¹⁰
mol/L
4. When acetic acid [CH3COOH] dissociates, it yields which ions
a. CH3COO+ + H
-
b. CH3CO+ + OH
-
c. CH3COO- + H
+
d. CH3- + COOH
+
5. In relation to the experiment, do you expect the pH of the solutions to increase from
A – J or to decrease?
a. Increase
b. Decrease

- 198 -
Post lab Assignment 2.3
(C.10)
1. Explain, in your own words, what you understand by the dissociation of an acid and
a base. It is also sometimes referred to as their ionisation. Do you agree with this
statement? Give examples (equations) to support your answer.
2. What is the Ka value of acetic acid? Please state your source for this value (website,
book, etc). How does your experimentally obtained value for the dissociation
constant compare? Where do you believe the largest source of error may have been
introduced?
3. Write the equation for the dissociation of sulphuric acid. Would you expect the Ka
value to be higher or lower than that of acetic acid? Explain your answer.
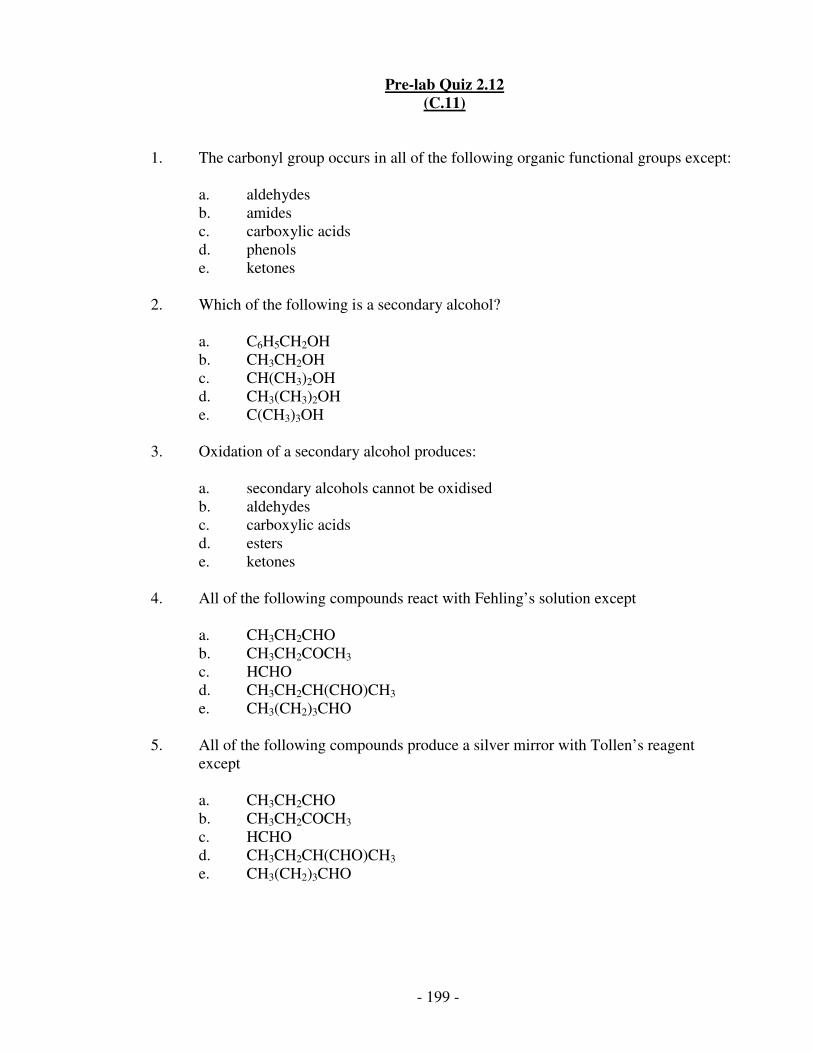
- 199 -
Pre-lab Quiz 2.12
(C.11)
1. The carbonyl group occurs in all of the following organic functional groups except:
a. aldehydes
b. amides
c. carboxylic acids
d. phenols
e. ketones
2. Which of the following is a secondary alcohol?
a. C6H5CH2OH
b. CH3CH2OH
c. CH(CH3)2OH
d. CH3(CH3)2OH
e. C(CH3)3OH
3. Oxidation of a secondary alcohol produces:
a. secondary alcohols cannot be oxidised
b. aldehydes
c. carboxylic acids
d. esters
e. ketones
4. All of the following compounds react with Fehling’s solution except
a. CH3CH2CHO
b. CH3CH2COCH3
c. HCHO
d. CH3CH2CH(CHO)CH3
e. CH3(CH2)3CHO
5. All of the following compounds produce a silver mirror with Tollen’s reagent
except
a. CH3CH2CHO
b. CH3CH2COCH3
c. HCHO
d. CH3CH2CH(CHO)CH3
e. CH3(CH2)3CHO
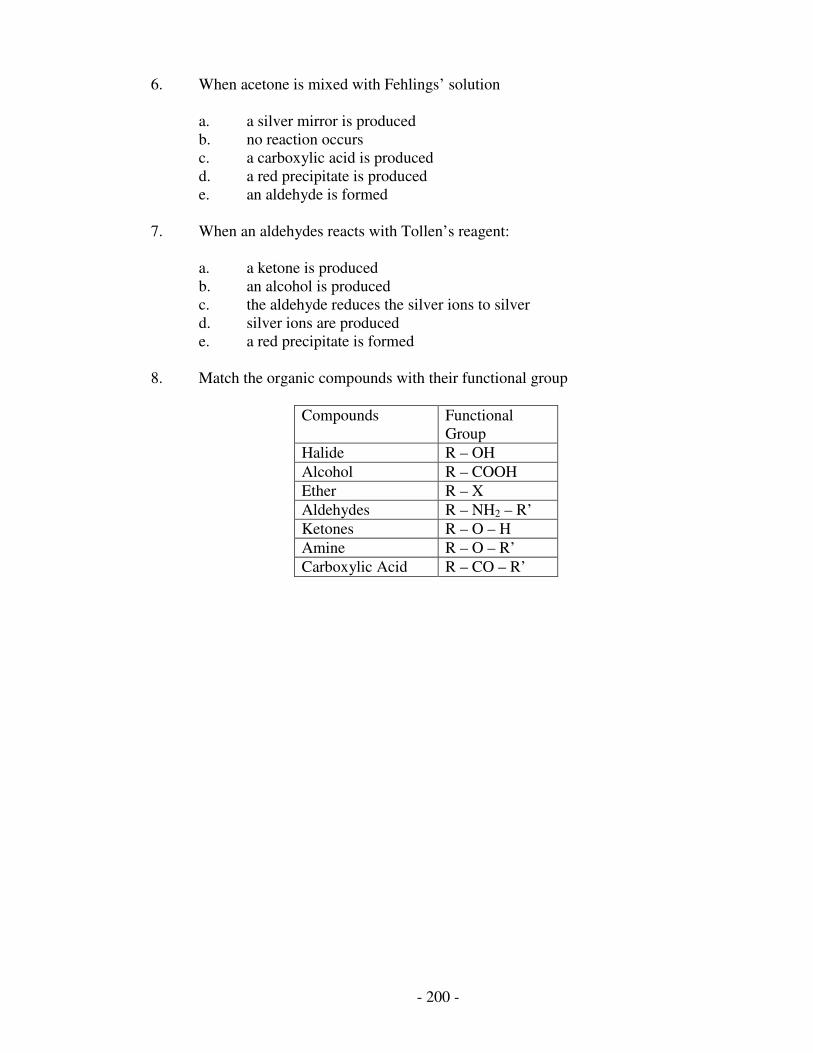
- 200 -
6. When acetone is mixed with Fehlings’ solution
a. a silver mirror is produced
b. no reaction occurs
c. a carboxylic acid is produced
d. a red precipitate is produced
e. an aldehyde is formed
7. When an aldehydes reacts with Tollen’s reagent:
a. a ketone is produced
b. an alcohol is produced
c. the aldehyde reduces the silver ions to silver
d. silver ions are produced
e. a red precipitate is formed
8. Match the organic compounds with their functional group
Compounds Functional
Group
Halide R – OH
Alcohol R – COOH
Ether R – X
Aldehydes R – NH2 – R’
Ketones R – O – H
Amine R – O – R’
Carboxylic Acid R – CO – R’
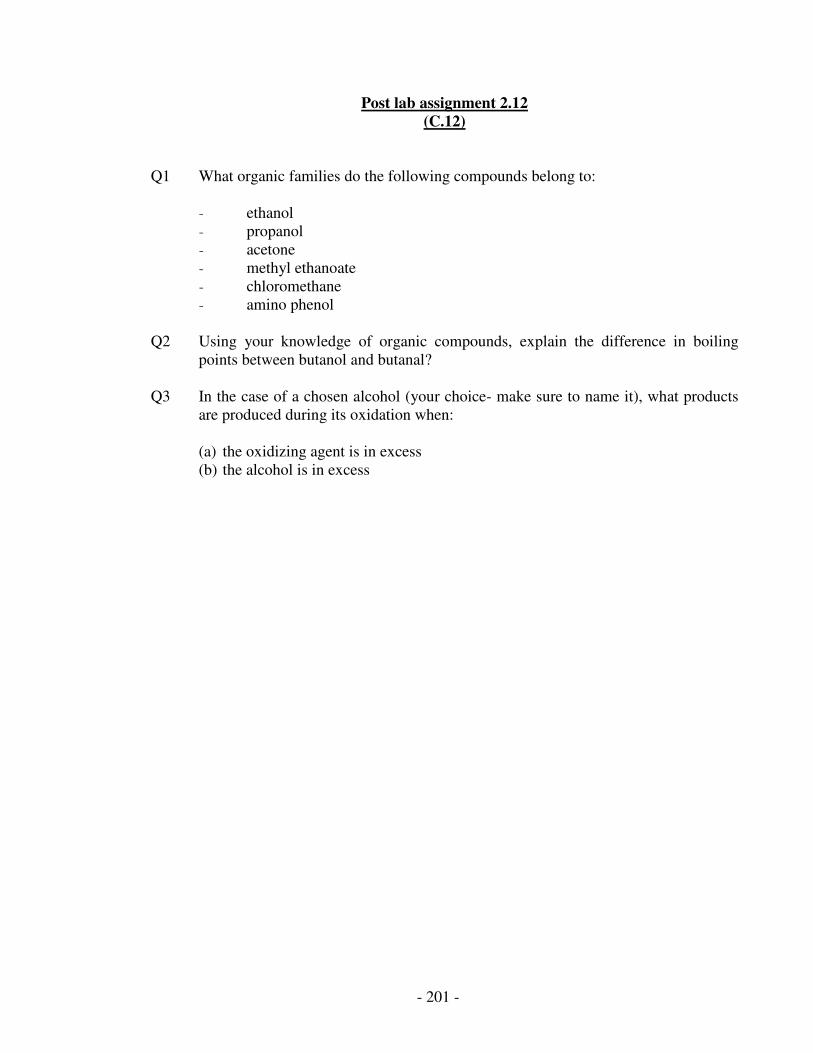
- 201 -
Post lab assignment 2.12
(C.12)
Q1 What organic families do the following compounds belong to:
- ethanol
- propanol
- acetone
- methyl ethanoate
- chloromethane
- amino phenol
Q2 Using your knowledge of organic compounds, explain the difference in boiling
points between butanol and butanal?
Q3 In the case of a chosen alcohol (your choice- make sure to name it), what products
are produced during its oxidation when:
(a) the oxidizing agent is in excess
(b) the alcohol is in excess
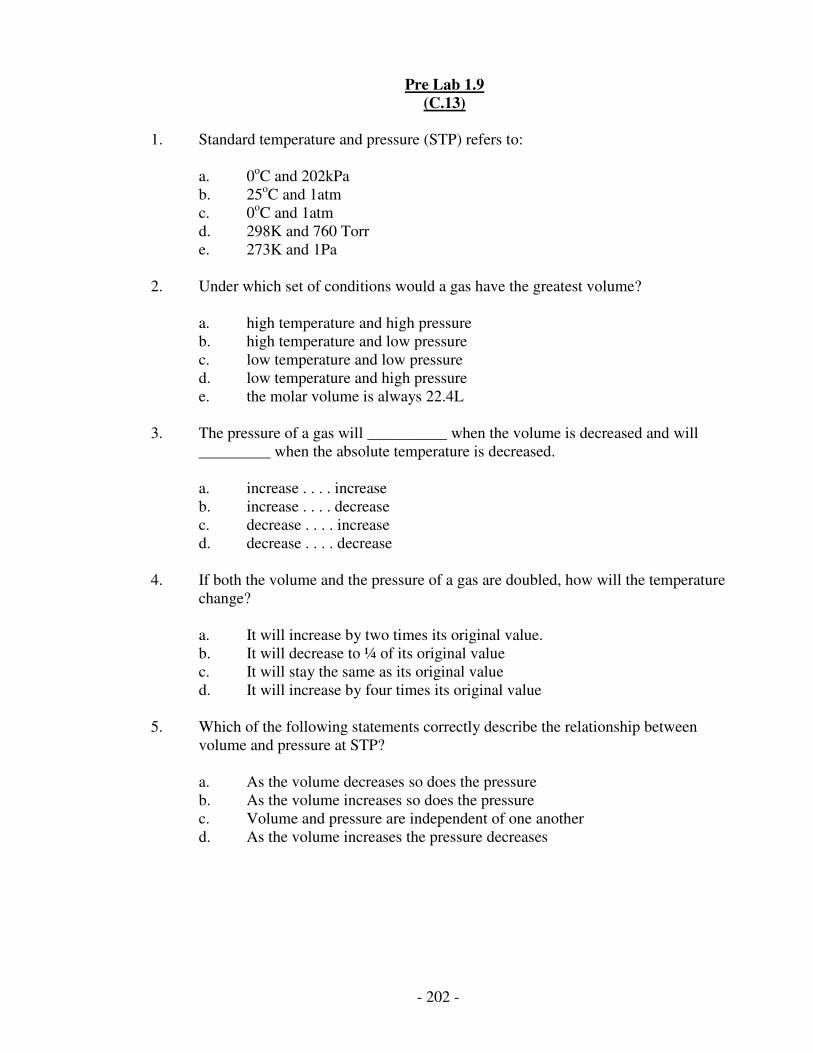
- 202 -
Pre Lab 1.9
(C.13)
1. Standard temperature and pressure (STP) refers to:
a. 0oC and 202kPa
b. 25oC and 1atm
c. 0oC and 1atm
d. 298K and 760 Torr
e. 273K and 1Pa
2. Under which set of conditions would a gas have the greatest volume?
a. high temperature and high pressure
b. high temperature and low pressure
c. low temperature and low pressure
d. low temperature and high pressure
e. the molar volume is always 22.4L
3. The pressure of a gas will __________ when the volume is decreased and will
_________ when the absolute temperature is decreased.
a. increase . . . . increase
b. increase . . . . decrease
c. decrease . . . . increase
d. decrease . . . . decrease
4. If both the volume and the pressure of a gas are doubled, how will the temperature
change?
a. It will increase by two times its original value.
b. It will decrease to ¼ of its original value
c. It will stay the same as its original value
d. It will increase by four times its original value
5. Which of the following statements correctly describe the relationship between
volume and pressure at STP?
a. As the volume decreases so does the pressure
b. As the volume increases so does the pressure
c. Volume and pressure are independent of one another
d. As the volume increases the pressure decreases

- 203 -
6. Convert the following into Kelvin units (whole numbers)
Temperature (oC) Temperature (K)
0
10
-25
-17
7. Which gas will occupy a greater volume?
(a) 2 moles of CO2 at STP
(b) H2O vapour in a balloon of volume 4.5L.
8. If you are determining the volume of gas when you know its temperature, which
two parameters do you need to keep constant?
(a) n & P
(b) V & T
(c) V & n
(d) P & n
- 204 -
Post Lab Assignment 2.2
(C.14)
You wish to make an engagement ring consisting of Ag and Au. The average weight of a
ring is approximately 2g. There are two scenarios:
(a) You start with equal weights of Ag and Au. Assuming that they mix
homogenously calculate the ratio of Ag atoms to Au atoms?
(b) You start with an equal number of particles of Ag and Au. Assuming that they
mix homogenously, calculate the weight ratio of Ag and Au?
(c) What appearance (colour) will you expect each ring to have?
- 205 -
APPENDIX
D
CONFERENCE ABSTRACTS
AND POSTERS
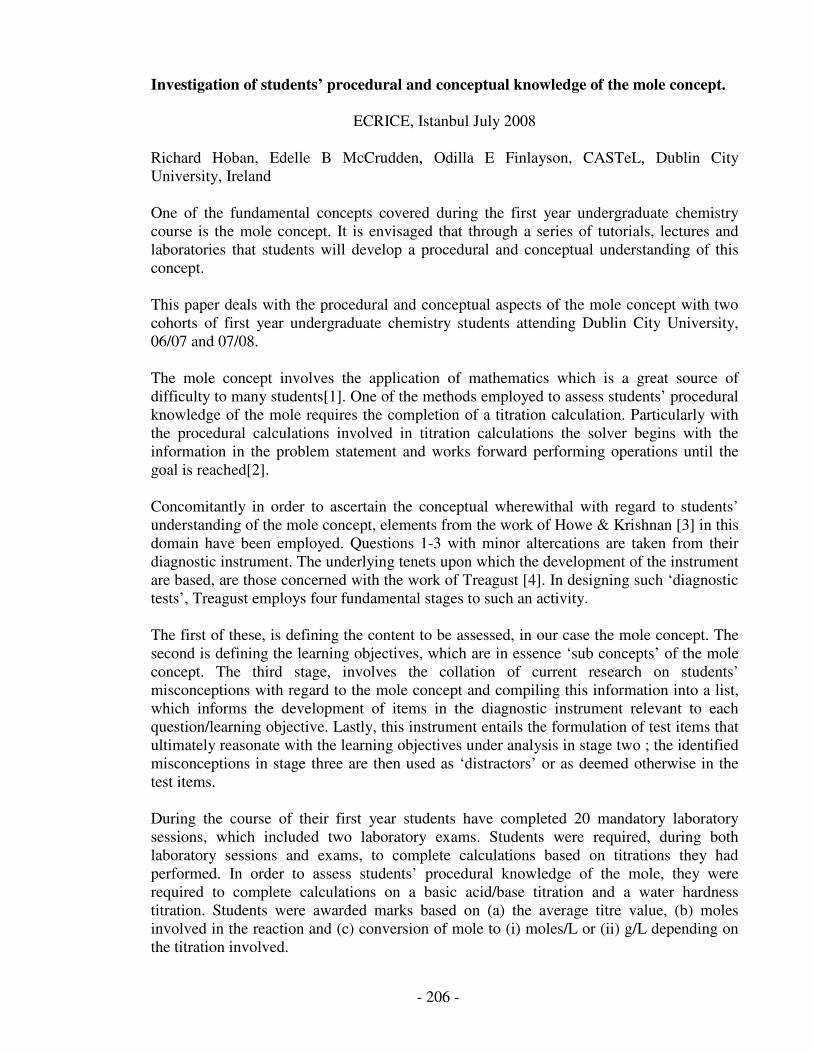
- 206 -
Investigation of students’ procedural and conceptual knowledge of the mole concept.
ECRICE, Istanbul July 2008
Richard Hoban, Edelle B McCrudden, Odilla E Finlayson, CASTeL, Dublin City
University, Ireland
One of the fundamental concepts covered during the first year undergraduate chemistry
course is the mole concept. It is envisaged that through a series of tutorials, lectures and
laboratories that students will develop a procedural and conceptual understanding of this
concept.
This paper deals with the procedural and conceptual aspects of the mole concept with two
cohorts of first year undergraduate chemistry students attending Dublin City University,
06/07 and 07/08.
The mole concept involves the application of mathematics which is a great source of
difficulty to many students[1]. One of the methods employed to assess students’ procedural
knowledge of the mole requires the completion of a titration calculation. Particularly with
the procedural calculations involved in titration calculations the solver begins with the
information in the problem statement and works forward performing operations until the
goal is reached[2].
Concomitantly in order to ascertain the conceptual wherewithal with regard to students’
understanding of the mole concept, elements from the work of Howe & Krishnan [3] in this
domain have been employed. Questions 1-3 with minor altercations are taken from their
diagnostic instrument. The underlying tenets upon which the development of the instrument
are based, are those concerned with the work of Treagust [4]. In designing such ‘diagnostic
tests’, Treagust employs four fundamental stages to such an activity.
The first of these, is defining the content to be assessed, in our case the mole concept. The
second is defining the learning objectives, which are in essence ‘sub concepts’ of the mole
concept. The third stage, involves the collation of current research on students’
misconceptions with regard to the mole concept and compiling this information into a list,
which informs the development of items in the diagnostic instrument relevant to each
question/learning objective. Lastly, this instrument entails the formulation of test items that
ultimately reasonate with the learning objectives under analysis in stage two ; the identified
misconceptions in stage three are then used as ‘distractors’ or as deemed otherwise in the
test items.
During the course of their first year students have completed 20 mandatory laboratory
sessions, which included two laboratory exams. Students were required, during both
laboratory sessions and exams, to complete calculations based on titrations they had
performed. In order to assess students’ procedural knowledge of the mole, they were
required to complete calculations on a basic acid/base titration and a water hardness
titration. Students were awarded marks based on (a) the average titre value, (b) moles
involved in the reaction and (c) conversion of mole to (i) moles/L or (ii) g/L depending on
the titration involved.
- 207 -
In the second semester, both cohorts were asked to complete a questionnaire which
assessed students’ conceptual understanding of the mole by examining three learning
objectives pertinent to the mole concept. They are:
• The mole is a counting unit and one mole of any substance contains the same number
of units as one mole of any other substance.
• The mole is defined as the amount of substance containing Avogadro’s number of
units or particles of that substance.
• The atomic ratios in the formula of a molecule is also the molar ratio of atoms in that
molecule.
Students’ results of semester one laboratory exam revealed that neither cohort performed
well on this calculation, showing particular difficulty with conversion of units and the
calculation of mole ratio. In semester two, students from both cohorts showed a general
improvement in the second lab exam, with the second cohort (07/08) performing slightly
better on the overall completion of the calculation.
Preliminary results of the conceptual questionnaire suggest that the 07/08 cohort of students
is showing an improvement in learning objective one on a percentage basis. For learning
objectives 2 & 3, there was a drop percentage wise in the correct answering of this question
for the 07/08 cohort in comparison to the 06/07 cohort.
1. Newell A and Simon HA (1972)’Human Problem solving’ (Englewood Cliffs,
NJ Prentice-Hall)
2. Owen E and Sweller J (1985) ‘What so students learn while solving
mathematics problems?’ Journal of Educational Psychology, 77, 272-284
- 208 -
Changes in the Leaving Certificate Higher Level Chemistry Syllabus, have they been
reflected in the assessment?
ECRICE, Istanbul July 2008
Edelle B. McCrudden, Odilla E. Finlayson, CASTeL, Dublin City University, Ireland
Assessment at both second and third level has come under immense scrutiny over the last
decade with particular emphasis placed on the role it can play in student learning. Good
assessment strategy should be preformed in such a way that is justifiable and allows all
students to achieve their maximum potential [1]. Assessment should also reflect the stated
objectives and leaning outcomes of a curriculum [2].
The revised Irish second level national syllabus (Leaving Certificate) in Chemistry was
implemented in 2000 and first examined in 2002. The syllabus aims to:
- Stimulate and sustain student interest in and enjoyment of chemistry
- Encourage an appreciation of the scientific, social and economic, environmental and
technological aspects of chemistry among others. [3]
This syllabus will be assessed in relation to its objectives which include:
- an ability to interpret experimental data and assess the accuracy of experimental
results.
- an ability to organise chemical ideas and statements and write clearly about
chemical concepts and theories. [3]
This new revised syllabus has received criticism due to the implementation of mandatory
experiments without the proper equipping of all Irish Secondary and Vocational Schools,
and also the failure of the terminal exam to provide adequate assessment for the shift in
emphasis to the applied aspects of chemistry. [4,5]
The new syllabus is structured into thirteen examinable topics, nine core and four optional
topics. The examination consists of two sections; section A containing three questions
dealing with mandatory experiments completed by students during the course of their two
years of study and section B containing seven questions which contain questions dealing
with theory, applied aspects and applications of chemistry.
In this study, analysis has been completed on the last seven annual exams, with focus
placed on the frequency of appearance of these particular topics in order to ascertain if
there is a high level of predictability within the chemistry paper. Topics which haven’t
appeared on the last seven years, in either section A or B, also have been identified.
While there are issues in relation to the use of Blooms Taxonomy [6] in determining
question type, in this study it is being used purely as a tool in order to compare the
examination questions over a number of years.

- 209 -
Questions have been identified as knowledge, comprehension, application, analysis,
synthesis or evaluation, and this has revealed that the predominant question type is of lower
order with only a small percentage of higher order questions appearing in each
examination.
Both the question type and frequency of appearance of keys areas and concepts of
chemistry will be presented in this talk in an effort to identify or map out the trends in the
examination.
Also as the Leaving Certificate Chemistry paper in 2008 has recently been completed in
Ireland (05/06/08), an analysis of this paper will also be included in this study.
[1] Bennet Stuart, Open University Press, Milton Keynes (2002)
[2] Doran, R. , United Book Press, Virgina (1998)
[3] Leaving Certificate Chemistry Syllabus, NCCA The Stationary Office Government
Publications Dublin (1999)
http://www.education.ie/servlet/blobservlet/lc_chemistry_sy.pdf?language=EN
[4] Matthews, P., Chemistry in Action 46, 24-35 (1995)
[5] Childs, P.E., Chemistry in Action 46, 42-44 (1995b)
[6] Bloom B, Taxonomy of Educational Objectives, David McHay Co Inc, New York
(1956)
- 210 -
Analysis of Leaving Certificate Chemistry Examination
SMEC,DCU, Dublin October 2008
Edelle B. McCrudden, Odilla E. Finlayson, CASTeL, Dublin City University, Ireland
Assessment at both second and third level has come under immense scrutiny over the last
decade with particular emphasis placed on the role it can play in student learning. Good
assessment strategy should be preformed in such a way that is justifiable and allows all
students to achieve their maximum potential [1]. Assessment should also reflect the stated
objectives and leaning outcomes of a curriculum [2].
The revised Irish second level national syllabus (Leaving Certificate) in Chemistry was
implemented in 2000 and first examined in 2002.
This syllabus will be assessed in relation to its objectives which include:
- an ability to interpret experimental data and assess the accuracy of experimental
results.
- an ability to organise chemical ideas and statements and write clearly about
chemical concepts and theories. [3]
This new revised syllabus has received criticism due to the implementation of mandatory
experiments without the proper equipping of all Irish Secondary and Vocational Schools,
and also the failure of the terminal exam to provide adequate assessment for the shift in
emphasis to the applied aspects of chemistry. [4,5] This study aims to assess the level of
questioning used in the Leaving Certificate examination and how well the final examination
assesses students competence of the stated outcomes.
While there are issues in relation to the use of Blooms Taxonomy [6] in determining
question type, in this study it is being used purely as a tool in order to compare the
examination questions from 2000 to 2008, for the higher level examination papers.
Questions have been identified as knowledge, comprehension, application, analysis,
synthesis or evaluation using a devised rubric, and this has revealed that the predominant
question type is of lower order with only a small percentage of higher order questions
appearing in each examination.
Copyright © 2022 FDOKUMEN