Finding Appropriate Learning Objects: An Empirical Evaluation

A MORE APPROPRIATE PROTEIN CLASSIFICATION USING DATA MINING
1MUHAMMAD MAHBUBUR RAHMAN, 2ARIF UL ALAM, 3ABDULLAH-AL-MAMUN,
4TAMNUN E MURSALIN
1
Lecturer, Department of CSE, American International University-Bangladesh,
2 Lecturer, Department of ETE, University of Liberal Arts Bangladesh,
4Assoc Prof., Department of CSE, University of Liberal Arts Bangladesh
ABSTRACT Research in bioinformatics is a complex phenomenon as it overlaps two knowledge domains, namely, biological and computer sciences. This paper has tried to introduce an efficient data mining approach for classifying proteins into some useful groups by representing them in hierarchy tree structure. There are several techniques used to classify proteins but most of them had few drawbacks on their grouping. Among them the most efficient grouping technique is used by PSIMAP. Even though PSIMAP (Protein Structural Interactome Map) technique was successful to incorporate most of the protein but it fails to classify the scale free property proteins. Our technique overcomes this drawback and successfully maps all the protein in different groups, including the scale free property proteins failed to group by PSIMAP. Our approach selects the six major attributes of protein: a) Structure comparison b) Sequence Comparison c) Connectivity d) Cluster Index e) Interactivity f) Taxonomic to group the protein from the databank by generating a hierarchal tree structure. The proposed approach calculates the degree (probability) of similarity of each protein newly entered in the system against of existing proteins in the system by using probability theorem on each six properties of proteins. This function generates probabilistic value for deriving its respective weight against that particular property. All probabilistic values generated by six individual functions will be added together to calculate the bond factor. Bond Factor defines how strongly one protein bonds with another protein base on their similarity on six attributes. Finally, in order to group them in hierarchy tree, the aggregated probabilistic value will be compared with the probabilistic value of the protein that resides at the root. If there is no root protein (i.e. at the initial state), the first protein will be considered as the root and depending on the probabilistic value it can change its relative position. Recursively, at each node, we have applied this technique to calculate the highest probable position for a particular protein in the tree. Keywords: Bioinformatics, Protein, Protein Grouping Techniques, PSIMAP, Scale Free Protein. 1. INTRODUCTION:
Classification of protein based on their various properties is a crucial issue in different fields of biological science. Researches in pharmacy, biochemistry, genetic engineering even in agriculture vastly rely on appropriate protein grouping techniques. Emphasizing the importance of protein classification some research groups in bioinformatics have initiated their projects with a view to deriving appropriate algorithms for protein classification. Protein can be classified based on their some properties, namely, a) Structure comparison b)Sequence Comparison c) Connectivity d) Cluster Index e) Interactivity f) Taxonomic and age diversity[1]. Individual
1
research group, so far has attempted to classify protein focusing on only one or two above stated properties. As for example, BMC bioinformatics research group has developed an in silico classification system entitled HODOCO (Homology modeling, Docking and Classification Oracle), in which protein Residue Potential Interaction Profiles (RPIPS) are used to summarize protein -protein interaction characteristics. This system applied to a dataset of 64 proteins of the death domain super family this was used to classify each member into its proper subfamily. Two classification methods were attempted, heuristic and support vector machine learning. Both methods were tested with a 5-fold cross-validation. The heuristic approach yielded a 61% average accuracy,

while the machine learning approach yielded an 89% average accuracy. Though this is a good technique but it concentrates on only protein-protein interaction property [2].
Wan K. Kim, Dan M. Bolser and Jong H. Park [1] had used PSIMAP for large-scale co-evolution analysis of protein structural interlogues. They investigated the degree of co-evolution for more than 900 family pairs in a global protein structure interactome map. They have constructed PSIMAP by systematic extraction of all protein domain contacts in the web based Protein Data Bank. Their PSIMAP contained 37387 interacting domain pairs with five or more contacts within 5 A. They have first confirmed that correlated evolution is observed extensively throughout the interacting pairs of structural families in PDB, indicating that the observation is a general property of protein evolution. The overall average correlation was 0.73 for a relatively reliable set of 454 family pairs, of which 78% showed significant correlation at 99% confidence. In total, 918 family pairs have been investigated and the correlation was 0.61 on average. But the statistical validity was weak for the family pairs with small N (the number of member domain pairs) of their research. This is the first step in protein classification technique two combine two properties of proteins, namely, structure comparison and interactivity.
Mr. Jong Park and Dan Bolser established a bioinformatics research group in UK named MRC-DUNN. They stated their research on protein network. They worked on structure of proteins. They also used PSIMAP concept. But the limitation is that they only focused on protein intractability and taxonomic diversity. As a result their concept did not help that much on protein structure analysis using PSIMAP concept.
Again in February 2003, Mr. Jong Park and Dan Bolser tried to integrate Biological network evolution hypothesis to protein structural interactome. PSI-MAP was used to identify all the structurally observed interactions at the structure family level. To assess the functional and evolutionary differences between the most interactive and the least interactive folds, they used the latest HIINFOLD and LOINFOLD comparison sets (Park and Bolser, 2001): high interaction structure families and low interaction structure families. The major problem of their system is that they said that scale free topology is robust. But in practical it’s not true.
BMC bioinformatics research group has developed a concept of Visualization and graph-
theoretic analysis of a large-scale protein structural interactome. They presented a global analysis of PSIMAP using several distinct network measures relating to centrality, interactivity, fault-tolerance, and taxonomic diversity. But to get proper structure and layout they put several proteins according to maximum similarity. As a result some proteins are placed in wrong places. And lots of scale free proteins do not get proper places. Sungsam Gong, Giseok Yoon, Insoo Jang, Dan Bolser, Panos Dafas and some other famous scientist developed PSIBase for Protein Structural Interactome map (PSIMAP). They introduced PSIbase: the PSIMAP web server and database. It contains (1) domain–domain and protein–protein interaction information from proteins whose 3D-structures are identified, (2) a protein interaction map and its viewer at protein super family and family levels, (3) protein interaction interface viewers and (4) structural domain prediction tools for possible interactions by detecting homologous matches in the Protein Data Bank (PDB) from query sequences. They developed an algorithm. According to that algorithm the basic mechanism to check interactions between any two domains or proteins is the calculation of the Euclidean distance in order to see if they are within a certain distance threshold. PSIMAP checks every possible pair of structural domains in a protein to see if there are at least five residue contacts within a 5Å distance [18].
Daeui Park, Semin Lee, Dan Bolser, Michael Schroeder some other scientists at beginning of 2005 have developed Comparative interactomics analysis of protein family interaction networks using PSIMAP (protein structural interactome map) They have confirmed that all the predicted protein family interactomes (the full set of protein family interactions within a proteome) of 146 species are scale-free networks, and they share a small core network comprising 36 protein families related to indispensable cellular functions. To construct the protein family interaction network in a particular proteome, they first assigned the known 3D structural families (on which PSIMAP is based) to the protein sequences. 146 completely sequenced species from the European Bioinformatics Institute (EBI) and their 578,625 protein sequences were used (Pruess, et al., 2003).
The above study clearly shows that yet now there is no technique has developed to classify proteins incorporating all six major properties. Though in protein grouping technique PSIMAP is one of the remarkable achievements in this context but it has some drawbacks [1, 19] especially in
2

grouping the proteins in different classes based on some essential features. To get the optimum output using PSIMAP in this context researchers have to put some proteins in comparative places [1]. As a result actual classification cannot be done using PSIMAP. This affects bad lay out for 3-d structure design of protein [1]. These proteins which cannot be placed in proper groups may be termed as scale free proteins [1, 3, 4, and 5]. We have tried to develop a smart algorithm to put right proteins in right places with an optimum output.
Analyzing the limitations of PSIMAP our proposed algorithm has incorporated all six major properties of proteins and succeeded to eliminate any scale free protein. 2. LIMITATIONS OF EXISTING ALGORITHMS IN PROTEIN GROUPING
We have studied and analyzed PSIMAP (Protein Structural Interactome Map) [1], Visualization and graph-theoretic analysis of a large-scale protein structural interactome [1, 9-16] to predict some protein functions. The predicted proteins’ functions are domain-domain interaction, scale free property, age and taxonomic diversity, connectivity, interaction matrix and cluster index [1, 17] .We gave our main attention on one of the recent functions, scale free property of proteins. According to scale free property, some proteins can not be placed any where in the whole proteins network. We have developed our algorithm based on above proteins’ functions, probability theorem and graph theory to remove scale free proteins from proteins network and finally we have grouped them.
With a view to designing a special algorithm for classification of proteins, we have examined the available searching algorithm and their effectiveness for our specific purpose. It may be mentioned that as we have planned to design a tree structure for providing a good lay out for protein groups, we have given special attention to searching algorithm in analyzing the algorithms we have considered time complexity, and their applicability in our specific context. The following searching algorithms have revealed their inefficiency to fulfill our objectives: 1. Hash Table, Selection Search and Linear Search
algorithms incorporating with sorting algorithm are used to search a particular key value. We have not considered these searching
3
algorithms for our specific purpose. Although these three algorithms work efficiently on considerably small size of data [8, 20]. But our objective is to design an algorithm which can efficiently work on a huge database like Protein Data Bank on the Web. In fact PDB contains huge data on protein and perhaps it is the largest web based protein database [1, 21].
2. Again we also have not considered A* search algorithm for our searching technique. Because A* search algorithm is used to search a shortest path from root to a given goal node [8, 20]. But in this field of work we do not have any goal node where the newly coming node will be placed. Rather we have to find the exact position of the newly coming protein out by dynamically.
3. The DFS and BSF algorithms are widely used for finding out shortest path from source to destination. However, as in grouping proteins as our attempt is to generate a tree rather than a graph we have discarded these algorithms too. Besides, in discarding these algorithms we have also considered their time complexities in order of 0(n+e) [8] which are very high for our objective.
4. Best-first search is the updated version of depth first search algorithm. So it also inherits properties from DFS. So for the similar reasons we have not considered this algorithm..
5. Finally Binary search tree algorithm can be considered for its less time complexity, effectiveness and efficiency [8]. However as in binary search tree, each node can have at most two children node which would not be adopted for our protein classification algorithm because each group of proteins have many members and all of them may have more than two children coming out from a particular node.
Considering limitations of the above stated popular search algorithms we have considered to derive a special algorithm to fulfill our specific objective. For this, we have used weighted search concept for searching and selecting the exact position of a newly coming proteins in the big protein database. We have used partially BFS concept and also DFS concept based on weighted search concept to get the desired position of the protein. 3. METHODOLOGY
We have designed the algorithm using incorporating six major properties of protein. We

have calculated probability of each protein newly entered in the system against of existing proteins in the system. In our approach we have considered six functions for calculating probabilities based on six properties of proteins. The individual function generates probabilistic value for deriving its respective weight against that particular property. All probabilistic values generated by six individual functions will be added together. The aggregated probabilistic value will be compared with the probabilistic value of the protein that resides at the root. If there is not root protein (i.e. at the initial state), the first protein will be considered as the root and depending on the probabilistic value it can change its relative position. Based on guided search algorithm we chose the node which has the highest probability of level 1. Then it will start calculation and comparison the probabilistic values of level 2 of selected node from level 1. Then we chose the node having highest probability and continued until getting the exact position of newly entered protein. In this way, a super kingdom tree for all proteins will be generated. 3.1. DETERMINING THE BOND FACTOR
We have applied the general probability function to calculate similarity factor of proteins of each function individually Let, if an event is A, then the probability formula for calculation probability of A is P (A) = Total Output / Expected Output Now if there are n events, then The total Bond Factor of all events is P (Total) = P (A1) + P (A2) + P (A3) + P (A4) + ……………. + P (An)
Using the above formulae, the similarity factor of a protein p1 against another protein p2 is of above functions are given below: P (p1.p2.Structure) = Similarity between p1 and p2 with respect to structure / expected similarity of p1 and p2 with respect to structure P (p1.p2.Sequence) = Similarity between p1 and p2 with respect to Sequence/ expected similarity of p1 and p2 with respect to Sequence P (p1.p2.Connectivity) = Similarity between p1 and p2 with respect to Connectivity/ expected similarity of p1 and p2 with respect to Connectivity
P (p1.p2.Cluster index) = Similarity between p1 and p2 with respect to Cluster index / expected
similarity of p1 and p2 with respect to Cluster index
P (p1.p2 .Interactivity) = Similarity between p1 and p2 with respect to Interactivity / expected similarity of p1 and p2 with respect to Interactivity
P (p1.p2.Taxonomic and age diversity) = Similarity between p1 and p2 with respect to Taxonomic and age diversity / expected similarity of p1 and p2 with respect to Taxonomic and age diversity
So the total probability of p1 with respect to p2 P (p1.p2) = P (p1.p2.Structure) + P (p1.p2.Sequence) + P (p1.p2.Connectivity) + P (p1.p2.Cluster index) + P (p1.p2.Interactivity) + P (p1.p2.Taxonomic and age diversity)
A Proof of our algorithm To prove the efficiency of our algorithm, we have used some dummy data containing probabilistic values for each function.
Let p1, p2, p3, p4, p5, p6, p7, p8, p9,
p10, p11, p12, p13, p14, p15 are some proteins of which structure, sequence, interactivity, cluster index [1, 17], connectivity and taxonomic and age diversity values known. Based on these dummy values we have proved our proposed algorithm.
Table 1: Probabilistic values for Structure
similarities of the above proteins
P1
P2
P3
P4
P5
P6
P7
P8
P9
P10
P11
P12
P13
P14
P15
P1 100
40 20 80 35 28 60 35 70 10 05 30 10 10 95
P2 40 100
40 20 90 10 05 10 50 20 70 45 35 25 45
P3 20 40 100
30 20 60 10 32 12 30 50 10 05 12 03
P4 80 20 30 100
10 21 35 40 50 10 60 12 60 05 50
P5 35 90 20 10 100
00 30 20 60 12 35 73 13 40 10
P6 28 10 60 21 00 100
10 00 01 60 34 21 90 07 95
P7 60 05 10 35 30 10 100
21 32 41 55 00 30 05 01
P8 35 10 32 40 20 00 21 100
00 00 01 55 11 32 50
P9 70 50 12 50 60 01 32 00 100
90 12 35 21 24 90
4
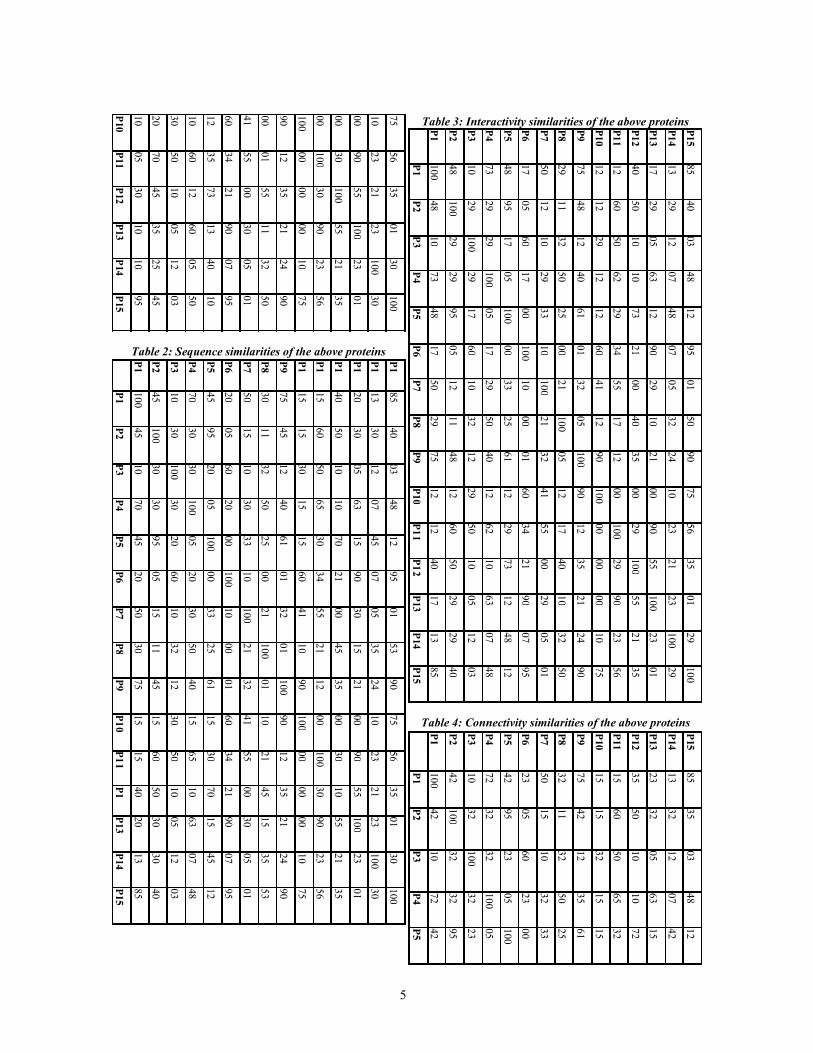
Table 2: Sequence similarities of the above proteins
5
Table 3: Interactivity similarities of the above proteins
Table 4: Connectivity similarities of the above proteins
P1 0
10
20
30
10
12
60
41
00
90
100
00
00
00
10
75
P1 1
05
70
50
60
35
34
55
01
12
00
100
30
90
23
56
P1 2
30
45
10
12
73
21
00
55
35
00
30
100
55
21
35
P1 3
10
35
05
60
13
90
30
11
21
00
90
55
100
23
01
P1 4
10
25
12
05
40
07
05
32
24
10
23
21
23
100
30
P1 5
95
45
03
50
10
95
01
50
90
75
56
35
01
30
100
P1
P2
P3
P4
P5
P6
P7
P8
P9
P1
P1
P1
P1
P1
P1
P1
100
45
10
70
45
20
50
30
75
15
15
40
20
13
85
P2
45
100
30
30
95
05
15
11
45
15
60
50
30
30
40
P3
10
30
100
30
20
60
10
32
12
30
50
10
05
12
03
P4
70
30
30
100
05
20
30
50
40
15
65
10
63
07
48
P5
45
95
20
05
100
00
33
25
61
15
30
70
15
45
12
P6
20
05
60
20
00
100
10
00
01
60
34
21
90
07
95
P7
50
15
10
30
33
10
100
21
32
41
55
00
30
05
01
P8
30
11
32
50
25
00
21
100
01
10
21
45
15
35
53
P9
75
45
12
40
61
01
32
01
100
90
12
35
21
24
90
P1 0
15
15
30
15
15
60
41
10
90
100
00
00
00
10
75
P1 1
15
60
50
65
30
34
55
21
12
00
100
30
90
23
56
P1
40
50
10
10
70
21
00
45
35
00
30
10
55
21
35
P1 3
20
30
05
63
15
90
30
15
21
00
90
55
100
23
01
P1 4
13
30
12
07
45
07
05
35
24
10
23
21
23
100
30
P1 5
85
40
03
48
12
95
01
53
90
75
56
35
01
30
100
P1
P2
P3
P4
P5
P6
P7
P8
P9
P 10
P 11
P 12
P 13
P 14
P 15
P1
100
48
10
73
48
17
50
29
75
12
12
40
17
13
85
P2
48
100
29
29
95
05
12
11
48
12
60
50
29
29
40
P3
10
29
100
29
17
60
10
32
12
29
50
10
05
12
03
P4
73
29
29
100
05
17
29
50
40
12
62
10
63
07
48
P5
48
95
17
05
100
00
33
25
61
12
29
73
12
48
12
P6
17
05
60
17
00
100
10
00
01
60
34
21
90
07
95
P7
50
12
10
29
33
10
100
21
32
41
55
00
29
05
01
P8
29
11
32
50
25
00
21
100
05
12
17
40
10
32
50
P9
75
48
12
40
61
01
32
05
100
90
12
35
21
24
90
P1 0
12
12
29
12
12
60
41
12
90
100
00
00
00
10
75
P1 1
12
60
50
62
29
34
55
17
12
00
100
29
90
23
56
P1 2
40
50
10
10
73
21
00
40
35
00
29
100
55
21
35
P1 3
17
29
05
63
12
90
29
10
21
00
90
55
100
23
01
P1 4
13
29
12
07
48
07
05
32
24
10
23
21
23
100
29
P1 5
85
40
03
48
12
95
01
50
90
75
56
35
01
29
100
P1
P2
P3
P4
P5
P6
P7
P8
P9
P1 0
P1 1
P1 2
P1 3
P1 4
P1 5
P1
100
42
10
72
42
23
50
32
75
15
15
35
23
13
85
P2
42
100
32
32
95
05
15
11
42
15
60
50
32
32
35
P3
10
32
100
32
23
60
10
32
12
32
50
10
05
12
03
P4
72
32
32
100
05
23
32
50
35
15
65
10
63
07
48
P5
42
95
23
05
100
00
33
25
61
15
32
72
15
42
12

Table 5: Cluster index similarities of the above proteins
6
Table 6: Taxonomic and age diversity similarities of the
above proteins
P6
23
05
60
23
00
100
10
00
01
60
34
21
92
07
95
P7
50
15
10
32
33
10
100
21
32
41
55
00
32
05
01
P8
32
11
32
50
25
00
21
100
01
10
21
42
15
35
53
P9
75
42
12
35
61
01
32
01
100
92
12
35
21
24
92
P1 0
15
15
32
15
15
60
41
10
92
100
00
00
00
10
75
P1 1
15
60
50
65
32
34
55
21
12
00
100
32
92
23
56
P1 2
35
50
10
10
72
21
00
42
35
00
32
100
55
21
35
P1 3
23
32
05
63
15
92
32
15
21
00
92
55
100
23
01
P1 4
13
32
12
07
42
07
05
35
24
10
23
21
23
100
32
P1 5
85
35
03
48
12
95
01
53
92
75
56
35
01
32
100
P1
P2
P3
P4
P5
P6
P7
P8
P9
P1 0
P1 1
P1 2
P1 3
P1 4
P1 5
P1
100
45
10
65
45
20
50
30
75
12
12
38
20
13
85
P2
45
100
30
30
95
05
12
11
45
12
60
50
30
30
38
P3
10
30
100
30
20
60
10
32
12
30
50
10
05
12
03
P4
65
30
30
100
05
20
30
50
38
12
65
10
63
07
48
P5
45
95
20
05
100
00
33
25
61
12
30
65
12
45
12
P6
20
05
60
20
00
100
10
00
01
60
34
21
90
07
95
P7
50
12
10
30
33
10
100
21
32
41
55
00
30
05
01
P8
30
11
32
50
25
00
21
100
01
10
21
45
12
28
53
P9
75
45
12
38
61
01
32
01
100
90
12
28
21
24
90
P1 0
12
12
30
12
12
60
41
10
90
100
00
00
00
10
75
P1 1
12
60
50
65
30
34
55
21
12
00
100
30
90
23
56
P1 2
38
50
10
10
65
21
00
45
28
00
30
100
55
21
28
P1 3
20
30
05
63
12
90
30
12
21
00
90
55
100
23
01
P1 4
13
30
12
07
45
07
05
28
24
10
23
21
23
100
30
P1 5
85
38
03
48
12
95
01
53
90
75
56
28
01
30
100
P1
P2
P3
P4
P5
P6
P7
P8
P9
P1 0
P1 1
P1 2
P1 3
P1 4
P1 5
P1
100
45
10
70
45
25
48
32
75
15
15
40
25
13
85
P2
45
100
32
32
95
05
15
11
45
15
60
48
32
32
40
P3
10
32
100
32
25
60
10
32
12
32
48
10
05
12
03
P4
70
32
32
100
05
25
32
48
40
15
65
10
63
07
48
P5
45
95
25
05
100
02
33
25
61
15
32
70
15
45
12
P6
25
05
60
25
02
100
10
02
01
60
34
21
90
07
95
P7
48
15
10
32
33
10
100
21
32
41
55
02
32
05
01
P8
32
11
32
48
25
02
21
100
01
10
21
45
15
35
53
P9
75
45
12
40
61
01
32
01
100
90
12
35
21
24
90
P1 0
15
15
32
15
15
60
41
10
90
100
02
02
02
10
75
P1 1
15
60
48
65
32
34
55
21
12
02
100
32
90
23
56
P1 2
40
48
10
10
70
21
02
45
35
02
32
100
55
21
35
P1 3
25
32
05
63
15
90
32
15
21
02
90
55
100
23
01
P1 4
13
32
12
07
45
07
05
35
24
10
23
21
23
100
32
P1 5
85
40
03
48
12
95
01
53
90
75
56
35
01
32
100

Table 7: Total probability of all proteins with respect to structure, sequence, connectivity, cluster index,
interactivity and taxonomic and age diversity P1 P2 P3 P4 P5 P6 P7 P8 P9 P10
P11 P12 P13 P14 P15
P1
6 2 0 4 2 1 3 1 4 0 0 2 1 0 5
. . . . . . . . . . . . . .
65 70 30 60 33 08 88 45 79 74 23 15 75 20
P2 6 1 1 5 0 0 0 2 0 3 2 1 1 2
. . . . . . . . . . . . .
93 73 65 35 74 65 75 89 70 93 88 78 38
P3 6 1 1 3 0 1 0 1 2 0 0 0 0
. . . . . . . . . . . .
83 25 80 60 92 72 83 98 60 30 72 18
P4 6 0 1 1 2 2 0 3 0 3 0 2
. . . . . . . . . . .
35 26 88 88 43 79 82 62 75 40 90
P5 6 0 1 1 3 0 1 4 0 2 0
. . . . . . . . . .
02 95 45 65 81 88 23 82 65 70
P6 6 0 0 0 3 2 1 5 0 5
. . . . . . . . .
60 02 06 60 04 26 42 42 70
P7 6 1 1 2 3 0 1 0 0
. . . . . . . .
26 92 46 30 02 83 30 06
P8 6 0 0 1 2 0 1 3
. . . . . . .
09 52 02 17 78 97 12
P9 6 5 0 2 1 1 5
. . . . . .
42 72 03 26 44 42
P10
6 0 0 0 0 4
. . . . .
02 02 02 60 50
P11
6 1 5 1 3
. . . .
83 42 38 36
P12
6 3 1 2
. . .
30 26 03
P13
6 1 0
. .
38 06
P14
6 1
.
83
P15
6
Now using the respective value for Bond Factor. Let the sequence of entering proteins are p1, p2, p3, p4, p5, p6, p7, p8, p9, p10, p11, p12, p13, p14, p15.
p1
Figure 1: Step1, Entry of p1
p1
p2
Figure 2: Step2, Entry of p2
p1
p2
p3
Figure 3: Step3, Entry of p3
p1
p2 p4
p3
Figure 4: Step4, Entry of p4
p1
p2 p4
p3 p5
Figure 5: Step5, Entry of p5
Now based on the total Bond Factor
stated in Table 7, the proposed algorithm has been simulated with a view to generating a tree structure using all 15 proteins leaving no scale free protein.
Let the sequence of entering proteins are p1, p2, p3, p4, p5, p6, p7, p8, p9, p10, p11, p12, p13, p14, p15.
p1
p6
p2 p4
p3 p5
Figure 6: Step6, Entry of p6 7

p1
P7
p2
p4
p3 p6
p5
Figure 7: Step7, Entry of p7
p1
p2
P7
p3 p4
p6
p5
p8
Figure 8: Step8, Entry of p8
p p
p p
p p
p
p
p
Figure 9: Step9, Entry of p9
p1 p9
p2 p7
p3 p4
p6
p10
p5
p8
Figure 10: Step10, Entry of p10
8
p1 p9
p2 p7
p3 p4
p6
p10
p5
p8 p11
Figure 11: Step11, Entry of p11
p1 p9
p2 p7
p3 p4
p6
p10
p5
p8 p11
p12
Figure 12: Step12, Entry of p12
p1 p9
p2 p7
p3 p4
p10
p6
p5
p8 p13
p11
p12
Figure 13: Step13, Entry of p13
p1 p9
p2 p7
p3 p4
p10
p6
p5
p8 p13
p11
p12
p14
Figure 14: Step14, Entry of p14

14 Do
15 {
p1
p9 16 proteinFile2 = Read a protein;
17 TreeNode = Parent [0];
18 While (Location is not fix)
p2 p7 p10 19 Do
p4 20 CurrentSelectedNode
p3 p6 = TreeNode;
For each node n of
p5
p15 21
TreeNode
p13
Do
p8 22
p11
23 Calculate
p12
TotalProbability = StructuralProbability (n,
p14
proteinFile2) + SequentialProbability (n,
proteinFile2) + InteractivityProbability (n,
Figure 15: Step15, Entry of p15 proteinFil e2) + ClusterIndexProbability
(n,proteinFile2) + ConnectivityProbability (n,
3.2. PSEUDO CODE: proteinFile2)+
TaxonomicAgeDiversityProbability (n,
The simple pseudo code of the algorithm proteinfile2);
is given below // Use different functions to calculate the total
Begin:
// probability
1 Protein proteinFile1;
// declare a
24
If
protein file variable
2 Protein proteinFile2; // declare a TotalProbability > = MaximumProbability
protein file variable 25 Then
3 proteinFile1= Read a protein; // 26
Read a protein File MaximumProbability = TotalProbability;
4 Parent [0] = proteinFile1; // 27
Initialize the parent array by file proteinFile1 as CurrentSelectedNode = n;
root 28 // End If
5 TotalProbability = 0; // 29 // End For
initialize the total probability as zero 30 If (all nodes of
6 MaximumProbability = 0; TreeNode are
7 Structural probability; // finished and
declare variable for structural probability TreeNode =
8 Sequential probability; // CurrentSelectedN
declare variable for sequential probability ode)
9 Interactivity probability; // 31
Then
declare variable for interactivity probability
10 Cluster index probability; // 32 TreeNode ->
declare variable for cluster index probability Child = proteinFile2; // put the position of the
11 Connectivity probability; // protein which was newly
declare variable for connectivity probability
Taxonomic and age diversity read
probability; // declare variable for 33 Break; //
taxonomic out from inner while loop
//and age diversity probability
34 Else
35 TreeNode =
12 TreeNode; CurrentSelectedNode; // select next parent node
// declare TreeNode as a node of tree 36 // End If
13 CurrentSelectedNode; 37 // End While
// declare CurrentSelectedNode as a 38 }
node of Tree 39 While (! End of proteins)
9

40 // End While
End; 3.3. TIME COMPLEXITY OF THE PROPOSED ALGORITHM
We considered only time complexity. The T (A) is total time of compilation and execution by the algorithm. The compile time doesn’t depend on the instance characteristics. So we just concern ourselves with the run time of the algorithm.
The time complexity of the proposed algorithm Worst case: T (A) = O (n) where n= number of protein file or node Best case: T (A) = O (l) where l = level of the tree 4. CONCLUSION
Our algorithm for protein classification has incorporated the major six properties of protein, namely, a) Structure comparison b)Sequence Comparison c) Connectivity d) Cluster Index e) Interactivity f) Taxonomic and age diversity. Integration of all properties in a single protein group technique provides a new dimension in protein grouping. Unlike PSIMAP technique this will leave any scale free protein that to be created using this algorithm. The simulation of the algorithm using dummy data has been proved our assertion. Moreover, in term of time complexity if we consider huge protein database then it will be more efficient comparing with other existing protein grouping techniques.
However, the success of this algorithm depends on the functions that are to be used to generate probabilistic value for each protein in the proposed algorithm. But our study has revealed that some of such functions based on the properties of proteins are yet to be derived in different bioinformatics research lab [7] such as cluster index [1, 17], connectivity and interactivity. If the respective functions for cluster index, connectivity and interactivity are achieved then our algorithm will be the protein grouping technique. REFERENCES [1] Dan M Bolser, Panos Dafas, Richard Harrington, Jong Park and Michael Schroeder,
10
“Visualization and Graph-theoretic Analysis of a Large-scale Protein Structural Interactome”, BMC Bioinformatics, 8 October 2003, 4, 45:1471-2105, pp. 1-11. [2] Drew Lett1, Michael Hsing2 and Frederic Pio, "Interaction profile-based protein classification of death domain", 09 June 2004, BMC Bioinformatics 2004, 5:75 doi: 10.1186/1471-2105-5-75, pp.1 [3] Lun Li, David Alderson¤, John C. Doyle¤, Walter Willingery, “Towards a Theory of Scale-Free Graphs: Definition, Properties, and Implications”, August 25, 2005, pp. 1-5 [4] Francesc Comellas, “Recursive graphs with small-world scale-free properties”, Department de Matema`tica Aplicada IV, EPSC, Universitat Polite`cnica de Catalunya, Avinguda Canal Olı´mpic s/n, 08860 Castelldefels, Barcelona, Catalonia, Spain, Received 26 November 2002; revised manuscript received 15 December 2003; published 31 March 2004 [5] Albert-László Barabási , Zoltán Dezs˝o , Erzsébet Ravasz , Soon-Hyung Yook and Zoltán Oltvai, “Scale-free and hierarchical structures in complex networks” , Department of Physics, University of Notre Dame, Notre Dame, IN 46556, USA., Department of Pathology, Northwestern University, Illinois 60611, USA [6] Dr.P.I.Haris, famous scientist and principal lecturer in Biochemistry of Leicester De Monfort University, UK [7] John E., A Bioinformatics Researcher at Bioinformatics.org, [email protected] [8] Ellis Horowitz, Sartaj Sahni, Sanguthevar Rajasekaran , Fundamentals of computer algorithm, 2000, Galgotia Publications Pvt. Ltd [9] McCraith S et al.: Genome-wide analysis of vaccinia virus protein-protein interactions. Proc Natl Acad Sci USA 2000,97(9):4879-4884. [10] Uetz P et al.: A comprehensive analysis of protein-protein interactions in: Saccharomyces cerevisiae. Nature 2000,403(6770):623-7. [11] Walhout AJ et al.: Protein Interaction Mapping in C. elegans Using Proteins Involved in Vulval Development. Science 1999,5450:116-121.

[12] Fromont-Racine M et al.: Genome-wide protein interaction screens reveal functional networks involving Sm-like proteins. Yeast 2000, 17(2):95-110. [13] Fromont-Racine M, Rain JC and Legrain P: Toward a functional analysis of the yeast genome through exhaustive two-hybrid screens. Nat Genet 1997, 16(3):277-82. [14] Ito T et al.: Toward a protein-protein interaction map of the budding yeast: A comprehensive system to examine twohybrid interactions in all possible combinations between the yeast proteins. Proc Natl Acad Sci U S A 2000, 97(3):1143-7. [15] Flajolet M et al.: A genomic approach of the hepatitis C virus generates a protein interaction map. Gene 2000, 242(1– 2):369-79. [16] Rain JC et al.: The protein-protein interaction map of Helicobacter pylori. Nature 2001, 409(6817): 211-5. [17] Watts DJ and Strogatz SH: Collective dynamics of 'small-world' networks. Nature 1998, 393(6684): 440-2. [18] Sungsam Gong1, Giseok Yoon2, Insoo Jang3, Dan Bolser4, Panos Dafas5,Michael Schroeder6, Hansol Choi1, Yoobok Cho2, Kyungsook Han7, Sunghoon Lee3,Hwanho Choi1, Michael Lappe8, Liisa Holm9, Sangsoo Kim3, Donghoon Oh2 and Jonghwa Bhak1, "PSIbase: a database of Protein Structural Interactome map (PSIMAP)", March 3, 2005. pp. 2. [19] Daeui Park1, Semin Lee2, Dan Bolser3, Michael Schroeder4, Michael Lappe5, Donghoon Oh1 and Jong Bhak2, "Comparative interactomics analysis of protein family interaction networks using PSIMAP (protein structural interactome map)" [20] Niklaus Wirth, Algorithm + Data Structure = Programs, Prentice-Hall of India Private Limited, New Delhi-110 001, 2001 [21] www.rcsb.org, A group of biochemistry, located in the Department of Chemistry and Chemical Biology at Rutgers, [email protected].
11
Copyright © 2022 FDOKUMEN