Seismic structure beneath the Tonga arc and Lau back-arc basin determined from joint Vp, Vp/Vs...
21
Seismic structure beneath the Tonga arc and Lau back-arc basin determined from joint Vp, Vp/Vs tomography James A. Conder and Douglas A. Wiens Department of Earth and Planetary Sciences, Washington University, Campus Box 1169, One Brookings Drive, St. Louis, Missouri 63130, USA ([email protected]) [1] The Tonga arc and associated Lau basin exhibit many geologically important processes that link subduction and mantle flow with plate separation and crustal production. We create seismic tomograms of the Tonga-Lau region by jointly inverting for Vp and Vp/Vs structure using data from the LABATTS ocean bottom seismograph experiment and several island deployments to better constrain dynamic processes in the mantle wedge. Jointly using P and S data can help distinguish between the various mechanisms responsible for seismic velocity anomalies such as temperature and the presence of melt and/ or volatiles. Because high attenuation in the wedge limits the S wave data set, we focus on 2-D inversions beneath the linear OBS array where resolution is best and also parameterize the solution in terms of the Vp/ Vs ratio. As expected, the subducting slab has fast Vp and Vs and a low Vp/Vs ratio, consistent with the cold downgoing plate. The Central Lau Spreading Center (CLSC) exhibits stronger anomalies in Vp/Vs than in Vp, with the anomalies larger than would be predicted purely by temperature variations. The CLSC anomaly extends >100 km to the west of the axis, suggesting a broad region of melt production driven by passive upwelling from plate separation rather than active upwelling mechanisms. The anomaly is asymmetric about the axis, suggesting that slab-induced corner flow possibly influences mantle dynamics several hundred kilometers away from the arc. There is a strong anomaly beneath the volcanic arc that gradually deepens as it trends toward the back arc, likely outlining a hydrated region of melt production that feeds the volcanic front. Hydration possibly continues throughout the wedge to at least 400 km depth. The Lau ridge exhibits a thicker lithosphere relative to the rest of the Basin, while the Fiji platform likely has a thinner lithosphere than the Lau Ridge from more recent extension. There is also a reasonable likelihood of a small degree of partial melt in the uppermost mantle beneath the platform. Components: 13,796 words, 10 figures. Keywords: back-arc basin; Fiji; island arc; Lau; subduction; tomography. Index Terms: 3001 Marine Geology and Geophysics: Back-arc basin processes; 7270 Seismology: Tomography (6982, 8180); 8170 Tectonophysics: Subduction zone processes (1031, 3060, 3613, 8413). Received 12 August 2005; Revised 15 December 2005; Accepted 27 January 2006; Published 31 March 2006. Conder, J. A., and D. A. Wiens (2006), Seismic structure beneath the Tonga arc and Lau back-arc basin determined from joint Vp, Vp/Vs tomography, Geochem. Geophys. Geosyst., 7, Q03018, doi:10.1029/2005GC001113. 1. Introduction [2] Back-arc basins and associated volcanic arcs are key geological systems in the development and recycling of the Earth’s crust with many geologi- cally significant and intertwining processes associ- ated with subduction, melting, and basin dynamics. For example, magmatism at volcanic arcs is de- rived from varying degrees of wedge hydration from the slab [Cameron et al., 2003; Roggensack et al., 1997; Walker et al., 1995], decompression melting in the corner [Conder et al., 2002a; Sisson and Bronto, 1998; Walker et al., 1995], and possi- bly slab sediment melting [Conder, 2005; Johnson and Plank, 1999]; Each of these mechanisms may produce spatially different melt regions. The Lau G 3 G 3 Geochemistry Geophysics Geosystems Published by AGU and the Geochemical Society AN ELECTRONIC JOURNAL OF THE EARTH SCIENCES Geochemistry Geophysics Geosystems Article Volume 7, Number 3 31 March 2006 Q03018, doi:10.1029/2005GC001113 ISSN: 1525-2027 Copyright 2006 by the American Geophysical Union 1 of 21
Transcript of Seismic structure beneath the Tonga arc and Lau back-arc basin determined from joint Vp, Vp/Vs...
Seismic structure beneath the Tonga arc and Lau back-arcbasin determined from joint Vp, Vp/Vs tomography
James A. Conder and Douglas A. WiensDepartment of Earth and Planetary Sciences, Washington University, Campus Box 1169, One Brookings Drive, St.Louis, Missouri 63130, USA ([email protected])
[1] The Tonga arc and associated Lau basin exhibit many geologically important processes that linksubduction and mantle flow with plate separation and crustal production. We create seismic tomograms ofthe Tonga-Lau region by jointly inverting for Vp and Vp/Vs structure using data from the LABATTSocean bottom seismograph experiment and several island deployments to better constrain dynamicprocesses in the mantle wedge. Jointly using P and S data can help distinguish between the variousmechanisms responsible for seismic velocity anomalies such as temperature and the presence of melt and/or volatiles. Because high attenuation in the wedge limits the S wave data set, we focus on 2-D inversionsbeneath the linear OBS array where resolution is best and also parameterize the solution in terms of the Vp/Vs ratio. As expected, the subducting slab has fast Vp and Vs and a low Vp/Vs ratio, consistent with thecold downgoing plate. The Central Lau Spreading Center (CLSC) exhibits stronger anomalies in Vp/Vsthan in Vp, with the anomalies larger than would be predicted purely by temperature variations. The CLSCanomaly extends >100 km to the west of the axis, suggesting a broad region of melt production driven bypassive upwelling from plate separation rather than active upwelling mechanisms. The anomaly isasymmetric about the axis, suggesting that slab-induced corner flow possibly influences mantle dynamicsseveral hundred kilometers away from the arc. There is a strong anomaly beneath the volcanic arc thatgradually deepens as it trends toward the back arc, likely outlining a hydrated region of melt productionthat feeds the volcanic front. Hydration possibly continues throughout the wedge to at least 400 km depth.The Lau ridge exhibits a thicker lithosphere relative to the rest of the Basin, while the Fiji platform likelyhas a thinner lithosphere than the Lau Ridge from more recent extension. There is also a reasonablelikelihood of a small degree of partial melt in the uppermost mantle beneath the platform.
Components: 13,796 words, 10 figures.
Keywords: back-arc basin; Fiji; island arc; Lau; subduction; tomography.
Index Terms: 3001 Marine Geology and Geophysics: Back-arc basin processes; 7270 Seismology: Tomography (6982,
8180); 8170 Tectonophysics: Subduction zone processes (1031, 3060, 3613, 8413).
Received 12 August 2005; Revised 15 December 2005; Accepted 27 January 2006; Published 31 March 2006.
Conder, J. A., and D. A. Wiens (2006), Seismic structure beneath the Tonga arc and Lau back-arc basin determined from joint
Vp, Vp/Vs tomography, Geochem. Geophys. Geosyst., 7, Q03018, doi:10.1029/2005GC001113.
1. Introduction
[2] Back-arc basins and associated volcanic arcsare key geological systems in the development andrecycling of the Earth’s crust with many geologi-cally significant and intertwining processes associ-ated with subduction, melting, and basin dynamics.For example, magmatism at volcanic arcs is de-
rived from varying degrees of wedge hydrationfrom the slab [Cameron et al., 2003; Roggensack etal., 1997; Walker et al., 1995], decompressionmelting in the corner [Conder et al., 2002a; Sissonand Bronto, 1998; Walker et al., 1995], and possi-bly slab sediment melting [Conder, 2005; Johnsonand Plank, 1999]; Each of these mechanisms mayproduce spatially different melt regions. The Lau
G3G3GeochemistryGeophysics
Geosystems
Published by AGU and the Geochemical Society
AN ELECTRONIC JOURNAL OF THE EARTH SCIENCES
GeochemistryGeophysics
Geosystems
Article
Volume 7, Number 3
31 March 2006
Q03018, doi:10.1029/2005GC001113
ISSN: 1525-2027
Copyright 2006 by the American Geophysical Union 1 of 21
Basin between Fiji and Tonga has long beenconsidered a type example of active back-arctectonics [Karig, 1971]. This consideration hasrecently been underscored by the selection of theEastern Lau Spreading Center (ELSC) as a focussite of the U.S. RIDGE 2000 program (http://www.ridge2000.org/science/info/science_plan.html).
[3] The Lau Basin has likely undergone severalepisodes of rifting and subsequent seafloor spread-ing in the back arc during its geological history[Martinez and Taylor, 2002; Parson and Hawkins,1994; Taylor et al., 1996]. The current stage ofrifting in the Lau basin began at 4–6 Ma, begin-ning in the northern section of the basin andpropagating southward [Taylor et al., 1996]. TheLau spreading system comprises a number ofrobust spreading centers roughly north-south ori-entated trends extending from 15�S to 24�S(Figure 1), with slower diffuse rifting further southin the Havre Trough [Fujiwara et al., 2001]. Ratesalong the southernmost Eastern Lau spreadingcenter increase from <3 cm/yr at the southernterminus to �9 cm/yr near 19�300S [Zellmer andTaylor, 2001]. Northward, the spreading systemmoves from the ELSC to the Central Lau Spread-ing Center (CLSC) via a �50 km overlapping
spreading center discontinuity. The CLSC is a�110 km long fast spreading segment with aspreading rate of 8.5 cm/yr [Zellmer and Taylor,2001]. To the north, the CLSC terminates at anextensional relay zone and Peggy Ridge (PR)transform fault [Eguchi et al., 1989]. The northernLau basin, where full spreading rates are greatest(�15 cm/yr [Bevis et al., 2000]), comprises severalmicroplates with sub-parallel spreading boundariesthat each account for a portion of the full rate ofextension [Pelletier et al., 2001; Zellmer andTaylor, 2001].
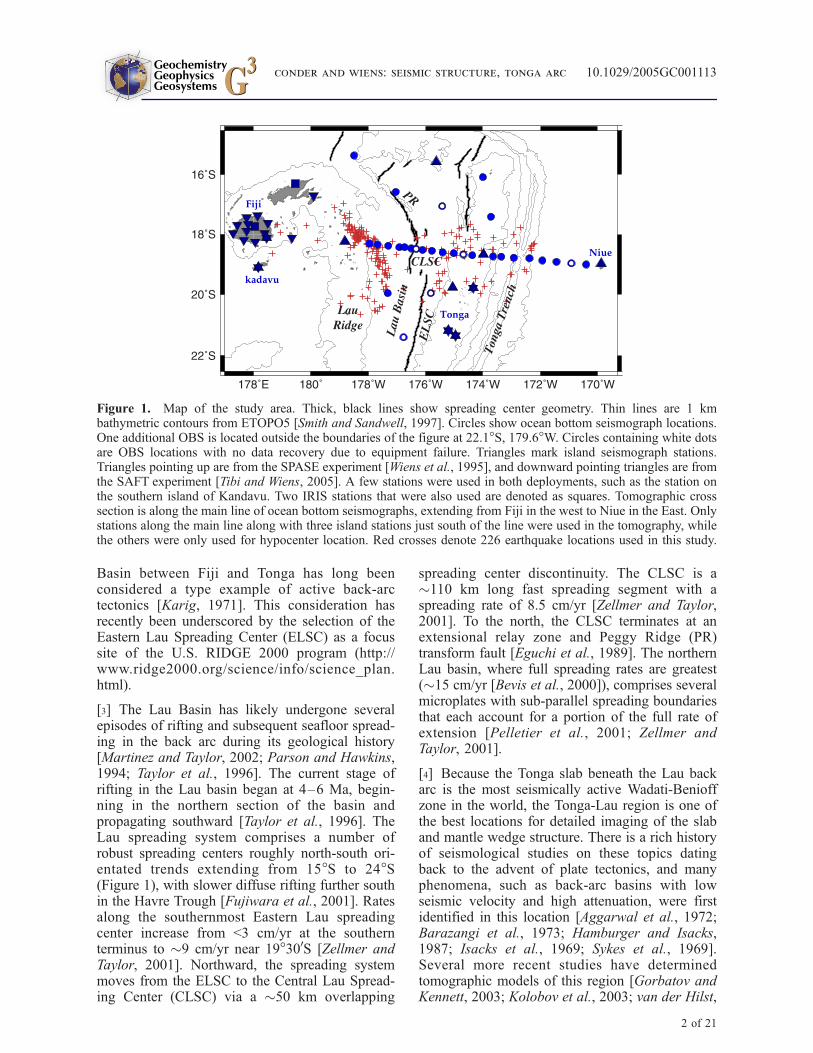
[4] Because the Tonga slab beneath the Lau backarc is the most seismically active Wadati-Benioffzone in the world, the Tonga-Lau region is one ofthe best locations for detailed imaging of the slaband mantle wedge structure. There is a rich historyof seismological studies on these topics datingback to the advent of plate tectonics, and manyphenomena, such as back-arc basins with lowseismic velocity and high attenuation, were firstidentified in this location [Aggarwal et al., 1972;Barazangi et al., 1973; Hamburger and Isacks,1987; Isacks et al., 1969; Sykes et al., 1969].Several more recent studies have determinedtomographic models of this region [Gorbatov andKennett, 2003; Kolobov et al., 2003; van der Hilst,
Figure 1. Map of the study area. Thick, black lines show spreading center geometry. Thin lines are 1 kmbathymetric contours from ETOPO5 [Smith and Sandwell, 1997]. Circles show ocean bottom seismograph locations.One additional OBS is located outside the boundaries of the figure at 22.1�S, 179.6�W. Circles containing white dotsare OBS locations with no data recovery due to equipment failure. Triangles mark island seismograph stations.Triangles pointing up are from the SPASE experiment [Wiens et al., 1995], and downward pointing triangles are fromthe SAFT experiment [Tibi and Wiens, 2005]. A few stations were used in both deployments, such as the station onthe southern island of Kandavu. Two IRIS stations that were also used are denoted as squares. Tomographic crosssection is along the main line of ocean bottom seismographs, extending from Fiji in the west to Niue in the East. Onlystations along the main line along with three island stations just south of the line were used in the tomography, whilethe others were only used for hypocenter location. Red crosses denote 226 earthquake locations used in this study.
GeochemistryGeophysicsGeosystems G3G3
conder and wiens: seismic structure, tonga arc 10.1029/2005GC001113
2 of 21
1995], delineating the Tonga Benioff Zone as ahigh-velocity slab with a low-velocity region in theLau back arc. However, these studies using tele-seismic arrival times lack the spatial resolutionnecessary for detailed studies and modeling ofarc and back-arc processes.
[5] Several of the recent seismic studies of thisregion result from a data set collected by theSPASE deployment of 12 land seismic stationsfrom 1993–1995 [Wiens et al., 1995] and thecontemporaneous 3 month LABATTS deploymentof ocean bottom seismographs (OBS). Most of the30OBSs in this experimentwere deployed in a lineararray across the CLSC and Tonga arc (Figure 1) toimage the mantle wedge structure beneath thecentral Lau basin. Zhao et al. [1997] used the Pwave data set from this experiment to determine anew, more detailed 3-D P wave tomographic modelthat showed low P velocity within the upper 400 kmof the mantle wedge. The lowest mantle P velocitieswere immediately westward of the CLSC andbeneath the Tonga volcanic arc. Attenuation tomog-raphy also showed extremely high attenuationbeneath the Lau back arc [Roth et al., 1999], andwaveform inversion showed extremely slow shearvelocities at depths of 30–90 km beneath the Laubasin [Xu and Wiens, 1997]. Koper et al. [1999]used P and S wave travel times from selectedearthquakes to investigate the fractional change inS velocity relative to P velocity (dlnVs/dlnVp, oftendenoted as n). They found that n was about 1.2–1.3throughout the entire region, inconsistent with theoccurrence of widespread melt in the upper mantleof the Lau Basin for experimentally determinedmodels of melt geometry [e.g., Hammond andHumphreys, 2000], suggesting that temperaturecontrols the broad variations in seismic velocitystructure throughout the wedge.
[6] There are two major limitations with the pre-vious work. First, the Zhao et al. [1997] study doesnot include any S wave data, and therefore there areno Vp/Vs constraints on the material properties andthe possible distribution of melt. Second, the Koperet al. [1999] study only solved for n of the bulkmantle wedge, and provides no information onhow the Vp/Vs ratio may vary within the wedge.In this paper, we expand on these and other priorstudies by using both P wave and S wave data fromthe OBS and island stations in the Lau Basin, aswell as island station data from a new study carriedout in 2001–2002 [Tibi and Wiens, 2005], tojointly invert for Vp and Vp/Vs structure through-out the wedge. Correlating the spatial distribution
and magnitudes of Vp and Vp/Vs anomalies de-rived by a joint Vp and Vp/Vs tomography willhelp shed light on the overall wedge and slabstructure, advance our understanding of such geo-logic processes as wedge hydration and melt gen-eration/interaction and delineate regions within thewedge containing partial melt and/or volatiles.
2. Data
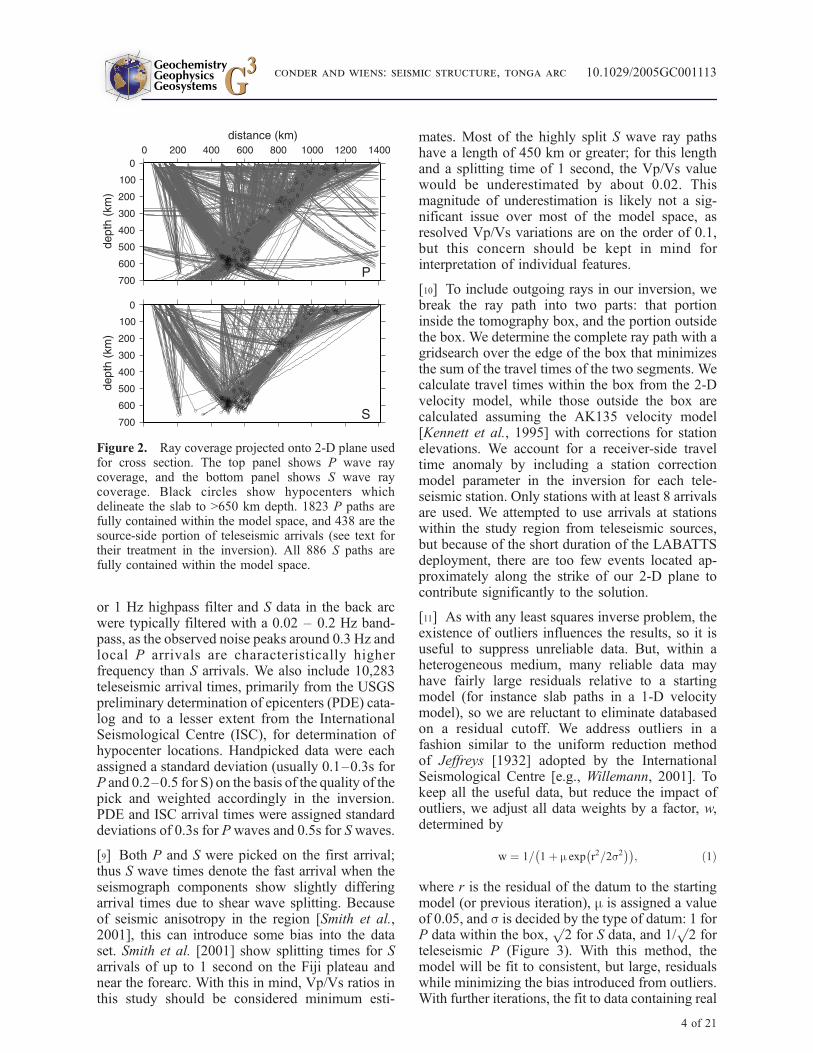
[7] Strong attenuation of S waves caused by thelow Q back arc [Roth et al., 1999] restrictsthe observations of S waves in the back arc tothe larger earthquakes, and provides only a limitedS wave data set. This S wave data set is inadequatefor good 3-D S wave tomography, and in addition,both P and S 3-D velocity models would be bestresolved along the E-W line of OBSs compared toelsewhere in the model. Therefore, in this study wefocus on using available high quality travel timesto create 2-D Vp and Vp/Vs structures. Our 2-Dtomography grid extends 700 km deep and 1400 kmacross from west of the Fiji platform, along theOBS line and ending at Niue Island on the Pacificplate. Hypocenters used in this study are within�125 km of the cross-section line (Figure 1). Weinclude a few deep events a little further to thesouth, as the slab is relatively 2-D in that direction.For our tomographic analysis, we use 2261 P wavearrivals and 886 S wave arrivals from 226 localearthquakes. All of the S observations wererecorded by the local stations and the paths arefully contained within the box defined for thistomographic study (Figure 2). 438 of the P pathsare from sources inside the box and arrive atteleseismic stations reasonably aligned with ourcross section, such as Port Moresby, Papua NewGuinea to the west and Rarotonga in the CookIslands to the east. These teleseismic rays aretypically downgoing so they provide informationabout portions of the model space that are other-wise largely devoid of local ray paths. In additionto the previously determined P wave arrival timesfrom the LABATTS OBS experiment [Koper et al.,1999; Zhao et al., 1997] and the island-basedSPASE [Wiens et al., 1995] deployments, we deter-mined additional S wave arrival times and addedadditional P and S observations from the 2001–2002 SAFT [Tibi and Wiens, 2005] experiment.
[8] The land seismic stations were equipped withSTS-2 and Guralp-3T and 40T broadband sensors;the OBSs used 1 Hz L-4 sensors. Where possible,arrivals are picked from the unfiltered waveforms.Otherwise, P data are typically filtered with a 0.6
GeochemistryGeophysicsGeosystems G3G3
conder and wiens: seismic structure, tonga arc 10.1029/2005GC001113conder and wiens: seismic structure, tonga arc 10.1029/2005GC001113
3 of 21
or 1 Hz highpass filter and S data in the back arcwere typically filtered with a 0.02 – 0.2 Hz band-pass, as the observed noise peaks around 0.3 Hz andlocal P arrivals are characteristically higherfrequency than S arrivals. We also include 10,283teleseismic arrival times, primarily from the USGSpreliminary determination of epicenters (PDE) cata-log and to a lesser extent from the InternationalSeismological Centre (ISC), for determination ofhypocenter locations. Handpicked data were eachassigned a standard deviation (usually 0.1–0.3s forP and 0.2–0.5 for S) on the basis of the quality of thepick and weighted accordingly in the inversion.PDE and ISC arrival times were assigned standarddeviations of 0.3s for P waves and 0.5s for S waves.
[9] Both P and S were picked on the first arrival;thus S wave times denote the fast arrival when theseismograph components show slightly differingarrival times due to shear wave splitting. Becauseof seismic anisotropy in the region [Smith et al.,2001], this can introduce some bias into the dataset. Smith et al. [2001] show splitting times for Sarrivals of up to 1 second on the Fiji plateau andnear the forearc. With this in mind, Vp/Vs ratios inthis study should be considered minimum esti-
mates. Most of the highly split S wave ray pathshave a length of 450 km or greater; for this lengthand a splitting time of 1 second, the Vp/Vs valuewould be underestimated by about 0.02. Thismagnitude of underestimation is likely not a sig-nificant issue over most of the model space, asresolved Vp/Vs variations are on the order of 0.1,but this concern should be kept in mind forinterpretation of individual features.
[10] To include outgoing rays in our inversion, webreak the ray path into two parts: that portioninside the tomography box, and the portion outsidethe box. We determine the complete ray path with agridsearch over the edge of the box that minimizesthe sum of the travel times of the two segments. Wecalculate travel times within the box from the 2-Dvelocity model, while those outside the box arecalculated assuming the AK135 velocity model[Kennett et al., 1995] with corrections for stationelevations. We account for a receiver-side traveltime anomaly by including a station correctionmodel parameter in the inversion for each tele-seismic station. Only stations with at least 8 arrivalsare used. We attempted to use arrivals at stationswithin the study region from teleseismic sources,but because of the short duration of the LABATTSdeployment, there are too few events located ap-proximately along the strike of our 2-D plane tocontribute significantly to the solution.
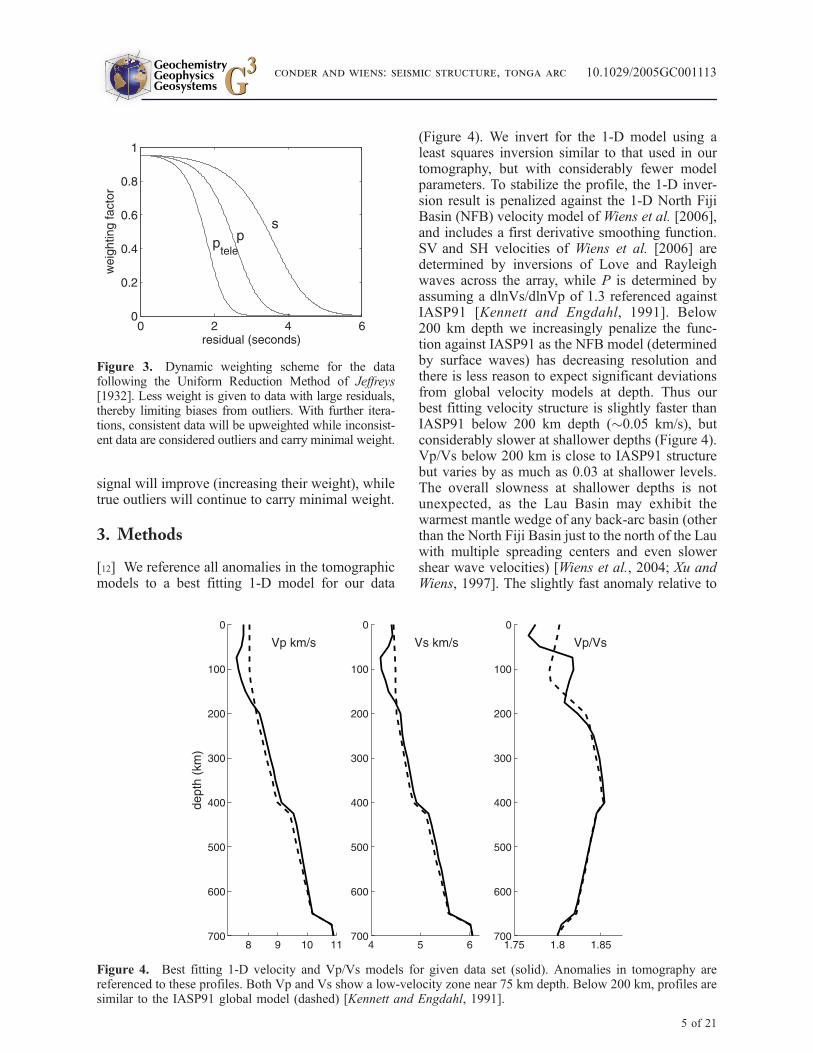
[11] As with any least squares inverse problem, theexistence of outliers influences the results, so it isuseful to suppress unreliable data. But, within aheterogeneous medium, many reliable data mayhave fairly large residuals relative to a startingmodel (for instance slab paths in a 1-D velocitymodel), so we are reluctant to eliminate databasedon a residual cutoff. We address outliers in afashion similar to the uniform reduction methodof Jeffreys [1932] adopted by the InternationalSeismological Centre [e.g., Willemann, 2001]. Tokeep all the useful data, but reduce the impact ofoutliers, we adjust all data weights by a factor, w,determined by
w ¼ 1= 1þ m exp r2=2s2� �� �
; ð1Þ
where r is the residual of the datum to the startingmodel (or previous iteration), m is assigned a valueof 0.05, and s is decided by the type of datum: 1 forP data within the box,
p2 for S data, and 1/
p2 for
teleseismic P (Figure 3). With this method, themodel will be fit to consistent, but large, residualswhile minimizing the bias introduced from outliers.With further iterations, the fit to data containing real
Figure 2. Ray coverage projected onto 2-D plane usedfor cross section. The top panel shows P wave raycoverage, and the bottom panel shows S wave raycoverage. Black circles show hypocenters whichdelineate the slab to >650 km depth. 1823 P paths arefully contained within the model space, and 438 are thesource-side portion of teleseismic arrivals (see text fortheir treatment in the inversion). All 886 S paths arefully contained within the model space.
GeochemistryGeophysicsGeosystems G3G3
conder and wiens: seismic structure, tonga arc 10.1029/2005GC001113
4 of 21
signal will improve (increasing their weight), whiletrue outliers will continue to carry minimal weight.
3. Methods
[12] We reference all anomalies in the tomographicmodels to a best fitting 1-D model for our data
(Figure 4). We invert for the 1-D model using aleast squares inversion similar to that used in ourtomography, but with considerably fewer modelparameters. To stabilize the profile, the 1-D inver-sion result is penalized against the 1-D North FijiBasin (NFB) velocity model of Wiens et al. [2006],and includes a first derivative smoothing function.SV and SH velocities of Wiens et al. [2006] aredetermined by inversions of Love and Rayleighwaves across the array, while P is determined byassuming a dlnVs/dlnVp of 1.3 referenced againstIASP91 [Kennett and Engdahl, 1991]. Below200 km depth we increasingly penalize the func-tion against IASP91 as the NFB model (determinedby surface waves) has decreasing resolution andthere is less reason to expect significant deviationsfrom global velocity models at depth. Thus ourbest fitting velocity structure is slightly faster thanIASP91 below 200 km depth (�0.05 km/s), butconsiderably slower at shallower depths (Figure 4).Vp/Vs below 200 km is close to IASP91 structurebut varies by as much as 0.03 at shallower levels.The overall slowness at shallower depths is notunexpected, as the Lau Basin may exhibit thewarmest mantle wedge of any back-arc basin (otherthan the North Fiji Basin just to the north of the Lauwith multiple spreading centers and even slowershear wave velocities) [Wiens et al., 2004; Xu andWiens, 1997]. The slightly fast anomaly relative to
Figure 3. Dynamic weighting scheme for the datafollowing the Uniform Reduction Method of Jeffreys[1932]. Less weight is given to data with large residuals,thereby limiting biases from outliers. With further itera-tions, consistent data will be upweighted while inconsist-ent data are considered outliers and carry minimal weight.
Figure 4. Best fitting 1-D velocity and Vp/Vs models for given data set (solid). Anomalies in tomography arereferenced to these profiles. Both Vp and Vs show a low-velocity zone near 75 km depth. Below 200 km, profiles aresimilar to the IASP91 global model (dashed) [Kennett and Engdahl, 1991].
GeochemistryGeophysicsGeosystems G3G3
conder and wiens: seismic structure, tonga arc 10.1029/2005GC001113
5 of 21
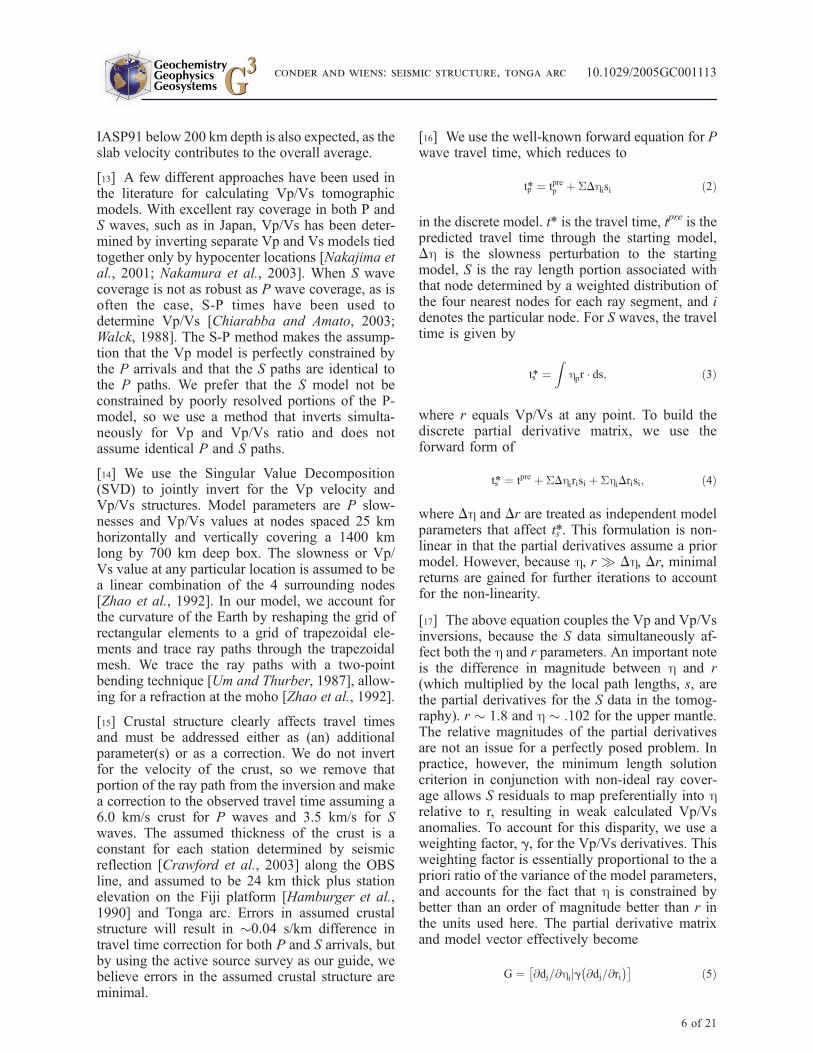
IASP91 below 200 km depth is also expected, as theslab velocity contributes to the overall average.
[13] A few different approaches have been used inthe literature for calculating Vp/Vs tomographicmodels. With excellent ray coverage in both P andS waves, such as in Japan, Vp/Vs has been deter-mined by inverting separate Vp and Vs models tiedtogether only by hypocenter locations [Nakajima etal., 2001; Nakamura et al., 2003]. When S wavecoverage is not as robust as P wave coverage, as isoften the case, S-P times have been used todetermine Vp/Vs [Chiarabba and Amato, 2003;Walck, 1988]. The S-P method makes the assump-tion that the Vp model is perfectly constrained bythe P arrivals and that the S paths are identical tothe P paths. We prefer that the S model not beconstrained by poorly resolved portions of the P-model, so we use a method that inverts simulta-neously for Vp and Vp/Vs ratio and does notassume identical P and S paths.
[14] We use the Singular Value Decomposition(SVD) to jointly invert for the Vp velocity andVp/Vs structures. Model parameters are P slow-nesses and Vp/Vs values at nodes spaced 25 kmhorizontally and vertically covering a 1400 kmlong by 700 km deep box. The slowness or Vp/Vs value at any particular location is assumed to bea linear combination of the 4 surrounding nodes[Zhao et al., 1992]. In our model, we account forthe curvature of the Earth by reshaping the grid ofrectangular elements to a grid of trapezoidal ele-ments and trace ray paths through the trapezoidalmesh. We trace the ray paths with a two-pointbending technique [Um and Thurber, 1987], allow-ing for a refraction at the moho [Zhao et al., 1992].
[15] Crustal structure clearly affects travel timesand must be addressed either as (an) additionalparameter(s) or as a correction. We do not invertfor the velocity of the crust, so we remove thatportion of the ray path from the inversion and makea correction to the observed travel time assuming a6.0 km/s crust for P waves and 3.5 km/s for Swaves. The assumed thickness of the crust is aconstant for each station determined by seismicreflection [Crawford et al., 2003] along the OBSline, and assumed to be 24 km thick plus stationelevation on the Fiji platform [Hamburger et al.,1990] and Tonga arc. Errors in assumed crustalstructure will result in �0.04 s/km difference intravel time correction for both P and S arrivals, butby using the active source survey as our guide, webelieve errors in the assumed crustal structure areminimal.
[16] We use the well-known forward equation for Pwave travel time, which reduces to
tp* ¼ tprep þ SDhisi ð2Þ
in the discrete model. t* is the travel time, tpre is thepredicted travel time through the starting model,Dh is the slowness perturbation to the startingmodel, S is the ray length portion associated withthat node determined by a weighted distribution ofthe four nearest nodes for each ray segment, and idenotes the particular node. For S waves, the traveltime is given by
ts* ¼Z
hpr � ds; ð3Þ
where r equals Vp/Vs at any point. To build thediscrete partial derivative matrix, we use theforward form of
ts* ¼ tpre þ SDhirisi þ ShiDrisi; ð4Þ
where Dh and Dr are treated as independent modelparameters that affect t*s . This formulation is non-linear in that the partial derivatives assume a priormodel. However, because h, r Dh, Dr, minimalreturns are gained for further iterations to accountfor the non-linearity.
[17] The above equation couples the Vp and Vp/Vsinversions, because the S data simultaneously af-fect both the h and r parameters. An important noteis the difference in magnitude between h and r(which multiplied by the local path lengths, s, arethe partial derivatives for the S data in the tomog-raphy). r � 1.8 and h � .102 for the upper mantle.The relative magnitudes of the partial derivativesare not an issue for a perfectly posed problem. Inpractice, however, the minimum length solutioncriterion in conjunction with non-ideal ray cover-age allows S residuals to map preferentially into hrelative to r, resulting in weak calculated Vp/Vsanomalies. To account for this disparity, we use aweighting factor, g, for the Vp/Vs derivatives. Thisweighting factor is essentially proportional to the apriori ratio of the variance of the model parameters,and accounts for the fact that h is constrained bybetter than an order of magnitude better than r inthe units used here. The partial derivative matrixand model vector effectively become
G ¼ @dj=@hijg @dj=@ri� �� �
ð5Þ
GeochemistryGeophysicsGeosystems G3G3
conder and wiens: seismic structure, tonga arc 10.1029/2005GC001113
6 of 21
and
m ¼ Dhij 1=gð ÞDri½ �T; ð6Þ
where dj refers to the jth datum and superscript Tdenotes transpose. For the tomography presentedhere, we set g equal to 24. Greater weightingproduces little change in the results, suggesting thatthis value is about the minimum weight that puts asmuch emphasis on Vp/Vs as possible given themodel setup.
[18] Hypocenters are relocated prior to each tomo-graphic iteration using a weighted least squaresscheme using both local and teleseismic arrivals.Partial derivatives for hypocenter relocation for thelocal arrivals are given by Wright and Holt [1986]using successively updated tomographic velocitymodels. Teleseismic arrival partial derivatives arefound using the AK135 velocity model [Kennett etal., 1995] with travel times corrected for stationelevation. Data weights are identical to those dis-cussed above for the tomographic inversion, in-cluding the uniform reduction for outliers.
[19] Ray paths are initially traced and eventslocated within a 2-D velocity model assuming aNorth Fiji Basin velocity structure in the back-arcregion above the slab [Wiens et al., 2006]. Belowand east of the slab, we assume a Pacific platevelocity structure [Xu and Wiens, 1997]. We in-clude an anomaly defined by a 100 km thick slabwith an 8% fast maximum anomaly (relative to theNorth Fiji Basin model) at the slab surface justbelow the overlying lithosphere that tapers to 4% at650 km depth and to zero at the base of the slab.The shape and location of the initial slab surface isfrom Chen and Brudzinski [2001]. The initialraytracing must include a seismically fast slab orthe non-linearity of the problem drives the solutionto a local minimum with the slab anomaly dis-placed well below the Wadati-Benioff zone [Zhaoet al., 1997].
[20] Multidimensional velocity gradients can leadto multipathing of rays near the slab. This effect isnoticeable for stations west of the trench for eventswith sources greater than a few 100 km. We oftenobserve two arrivals with different frequencies andray parameters at these eastern stations (arrivaltimes are similar near the trench and divergeprogressively eastward), with the higher frequencyarrival having the greater ray parameter (slowerapparent velocity). This behavior suggests that thelower frequency arrival is a direct phase and thehigher frequency arrival is from a guided phase in
the slab and Pacific plate. We were unsuccessful atcapturing both arrivals with the two-point bendingtechnique, but routinely traced the first arrival.Ideally the tomography would use both arrivals,but for this study we only included the initialarrivals in our data set.
[21] Because both the ray paths and the hypocenterlocations depend on the assumed velocity model,ray paths and source locations were iterated as thecalculated velocity model was improved. Hypo-centers were relocated prior to each of eightsuccessive velocity model inversions. Betweenhypocenter relocations, iterative tomographic mod-els were calculated by iteratively updating the raypaths twice while keeping the hypocenters fixed.Further iterations for either the ray paths or hypo-center relocations do not significantly decrease thevariance. Tests show that the final structure isrelatively insensitive to the details and magnitudeof the initial slab anomaly.
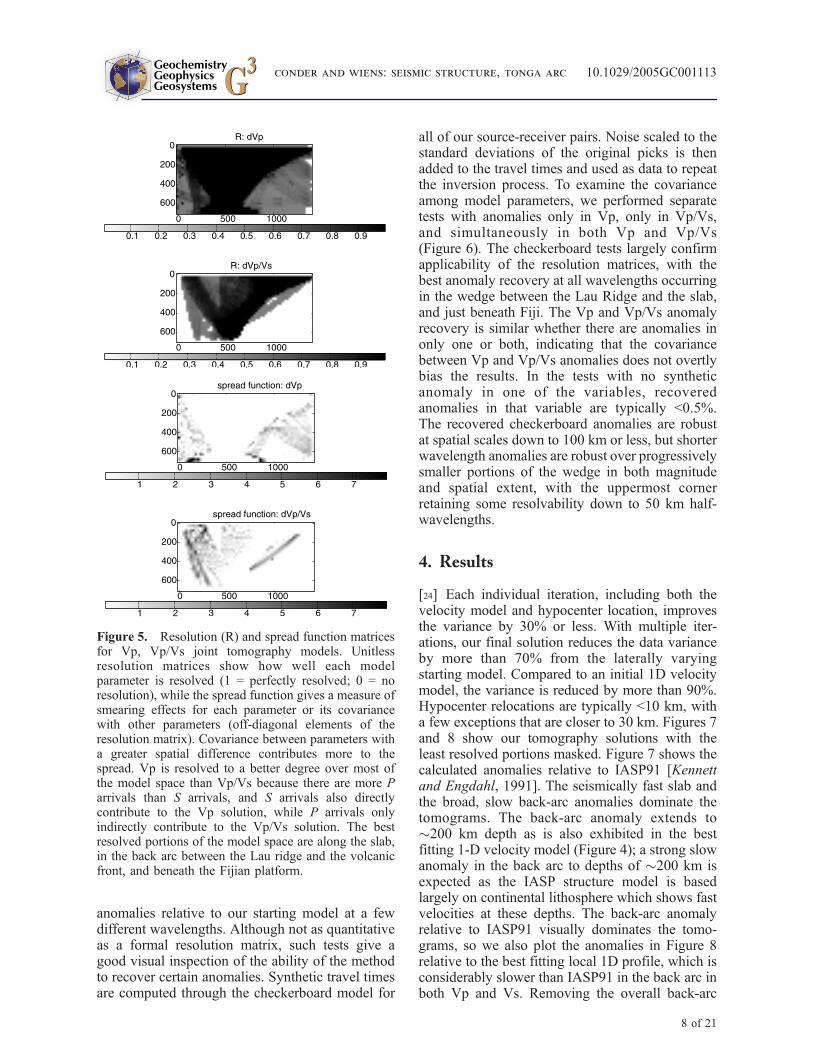
[22] We include smoothing constraints to helpstabilize the inversion. We accomplish this byputting the smoothing constraints directly into thepartial derivative matrix before inverting for thetomographic structure. We use a uniformly appliedsecond derivative constraint that depends only onthe immediately surrounding nodes [Menke, 1984].We weight the smoothing constraints to maintain asmuch structure as possible while suppressing largeanomaly variations at individual nodes. With thesmoothing constraints included directly in the Gmatrix, the problem becomes nearly overdeter-mined. Consequently, we use almost all the eigen-vectors from the SVD solution. With SVD, theresolution matrix is straightforward to calculate.Figure 5 shows the resolution and spread function[Toomey and Foulger, 1989] matrices, neglectingthe smoothing constraints. We neglect the smooth-ing constraints in the resolution and spread matri-ces, since including the constraints causes theproblem to approach the overdetermined case,where the resolution and spread matrices losemeaning. Instead, we prefer to illuminate only theportion of the model space illuminated by actualdata. We mask the portions of the tomograms whereVp/Vs resolution is limited (<0.5) (Figure 5).Although the SVD method gives a quantifiableresolution matrix, the resolution solution shouldbe viewed in relative terms rather than absolute,as the uncertainty in and covariance with thehypocenter locations are not reflected in this matrix.
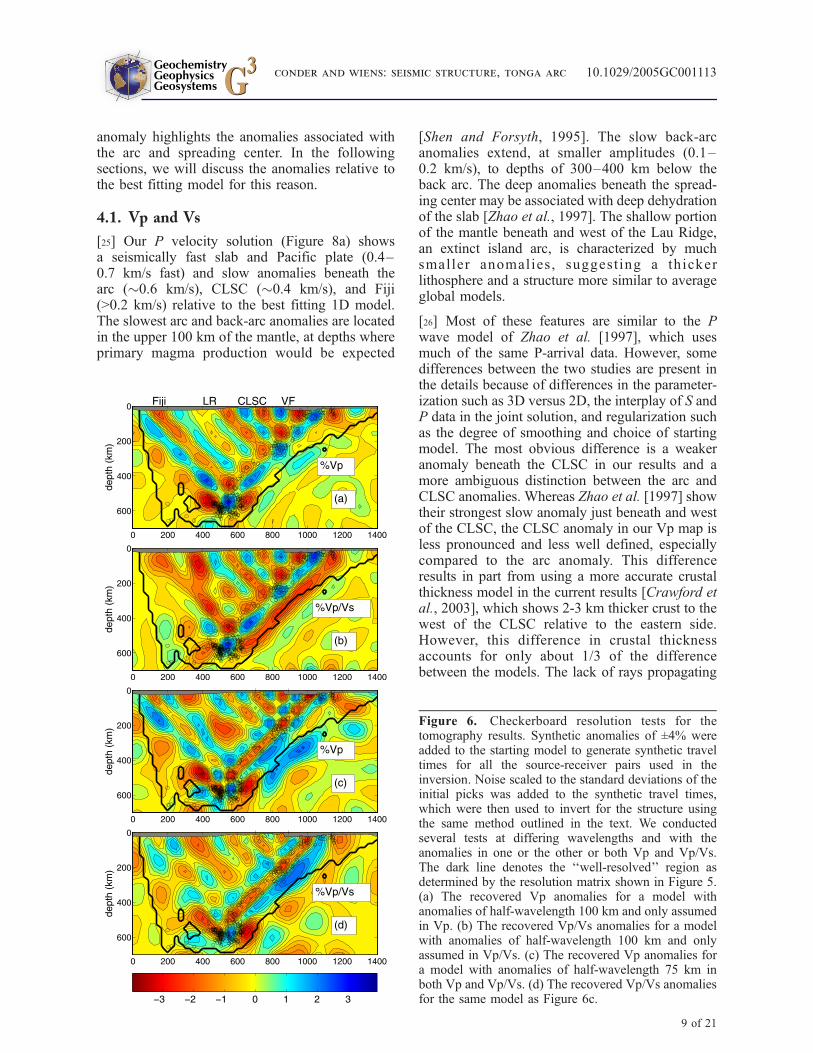
[23] As another measure of the resolution wecomputed several checkerboard tests with ±4%
GeochemistryGeophysicsGeosystems G3G3
conder and wiens: seismic structure, tonga arc 10.1029/2005GC001113
7 of 21
anomalies relative to our starting model at a fewdifferent wavelengths. Although not as quantitativeas a formal resolution matrix, such tests give agood visual inspection of the ability of the methodto recover certain anomalies. Synthetic travel timesare computed through the checkerboard model for
all of our source-receiver pairs. Noise scaled to thestandard deviations of the original picks is thenadded to the travel times and used as data to repeatthe inversion process. To examine the covarianceamong model parameters, we performed separatetests with anomalies only in Vp, only in Vp/Vs,and simultaneously in both Vp and Vp/Vs(Figure 6). The checkerboard tests largely confirmapplicability of the resolution matrices, with thebest anomaly recovery at all wavelengths occurringin the wedge between the Lau Ridge and the slab,and just beneath Fiji. The Vp and Vp/Vs anomalyrecovery is similar whether there are anomalies inonly one or both, indicating that the covariancebetween Vp and Vp/Vs anomalies does not overtlybias the results. In the tests with no syntheticanomaly in one of the variables, recoveredanomalies in that variable are typically <0.5%.The recovered checkerboard anomalies are robustat spatial scales down to 100 km or less, but shorterwavelength anomalies are robust over progressivelysmaller portions of the wedge in both magnitudeand spatial extent, with the uppermost cornerretaining some resolvability down to 50 km half-wavelengths.
4. Results
[24] Each individual iteration, including both thevelocity model and hypocenter location, improvesthe variance by 30% or less. With multiple iter-ations, our final solution reduces the data varianceby more than 70% from the laterally varyingstarting model. Compared to an initial 1D velocitymodel, the variance is reduced by more than 90%.Hypocenter relocations are typically <10 km, witha few exceptions that are closer to 30 km. Figures 7and 8 show our tomography solutions with theleast resolved portions masked. Figure 7 shows thecalculated anomalies relative to IASP91 [Kennettand Engdahl, 1991]. The seismically fast slab andthe broad, slow back-arc anomalies dominate thetomograms. The back-arc anomaly extends to�200 km depth as is also exhibited in the bestfitting 1-D velocity model (Figure 4); a strong slowanomaly in the back arc to depths of �200 km isexpected as the IASP structure model is basedlargely on continental lithosphere which shows fastvelocities at these depths. The back-arc anomalyrelative to IASP91 visually dominates the tomo-grams, so we also plot the anomalies in Figure 8relative to the best fitting local 1D profile, which isconsiderably slower than IASP91 in the back arc inboth Vp and Vs. Removing the overall back-arc
Figure 5. Resolution (R) and spread function matricesfor Vp, Vp/Vs joint tomography models. Unitlessresolution matrices show how well each modelparameter is resolved (1 = perfectly resolved; 0 = noresolution), while the spread function gives a measure ofsmearing effects for each parameter or its covariancewith other parameters (off-diagonal elements of theresolution matrix). Covariance between parameters witha greater spatial difference contributes more to thespread. Vp is resolved to a better degree over most ofthe model space than Vp/Vs because there are more Parrivals than S arrivals, and S arrivals also directlycontribute to the Vp solution, while P arrivals onlyindirectly contribute to the Vp/Vs solution. The bestresolved portions of the model space are along the slab,in the back arc between the Lau ridge and the volcanicfront, and beneath the Fijian platform.
GeochemistryGeophysicsGeosystems G3G3
conder and wiens: seismic structure, tonga arc 10.1029/2005GC001113
8 of 21
anomaly highlights the anomalies associated withthe arc and spreading center. In the followingsections, we will discuss the anomalies relative tothe best fitting model for this reason.
4.1. Vp and Vs
[25] Our P velocity solution (Figure 8a) showsa seismically fast slab and Pacific plate (0.4–0.7 km/s fast) and slow anomalies beneath thearc (�0.6 km/s), CLSC (�0.4 km/s), and Fiji(>0.2 km/s) relative to the best fitting 1D model.The slowest arc and back-arc anomalies are locatedin the upper 100 km of the mantle, at depths whereprimary magma production would be expected
[Shen and Forsyth, 1995]. The slow back-arcanomalies extend, at smaller amplitudes (0.1–0.2 km/s), to depths of 300–400 km below theback arc. The deep anomalies beneath the spread-ing center may be associated with deep dehydrationof the slab [Zhao et al., 1997]. The shallow portionof the mantle beneath and west of the Lau Ridge,an extinct island arc, is characterized by muchsmaller anomalies, suggest ing a thickerlithosphere and a structure more similar to averageglobal models.
[26] Most of these features are similar to the Pwave model of Zhao et al. [1997], which usesmuch of the same P-arrival data. However, somedifferences between the two studies are present inthe details because of differences in the parameter-ization such as 3D versus 2D, the interplay of S andP data in the joint solution, and regularization suchas the degree of smoothing and choice of startingmodel. The most obvious difference is a weakeranomaly beneath the CLSC in our results and amore ambiguous distinction between the arc andCLSC anomalies. Whereas Zhao et al. [1997] showtheir strongest slow anomaly just beneath and westof the CLSC, the CLSC anomaly in our Vp map isless pronounced and less well defined, especiallycompared to the arc anomaly. This differenceresults in part from using a more accurate crustalthickness model in the current results [Crawford etal., 2003], which shows 2-3 km thicker crust to thewest of the CLSC relative to the eastern side.However, this difference in crustal thicknessaccounts for only about 1/3 of the differencebetween the models. The lack of rays propagating
Figure 6. Checkerboard resolution tests for thetomography results. Synthetic anomalies of ±4% wereadded to the starting model to generate synthetic traveltimes for all the source-receiver pairs used in theinversion. Noise scaled to the standard deviations of theinitial picks was added to the synthetic travel times,which were then used to invert for the structure usingthe same method outlined in the text. We conductedseveral tests at differing wavelengths and with theanomalies in one or the other or both Vp and Vp/Vs.The dark line denotes the ‘‘well-resolved’’ region asdetermined by the resolution matrix shown in Figure 5.(a) The recovered Vp anomalies for a model withanomalies of half-wavelength 100 km and only assumedin Vp. (b) The recovered Vp/Vs anomalies for a modelwith anomalies of half-wavelength 100 km and onlyassumed in Vp/Vs. (c) The recovered Vp anomalies fora model with anomalies of half-wavelength 75 km inboth Vp and Vp/Vs. (d) The recovered Vp/Vs anomaliesfor the same model as Figure 6c.
GeochemistryGeophysicsGeosystems G3G3
conder and wiens: seismic structure, tonga arc 10.1029/2005GC001113
9 of 21
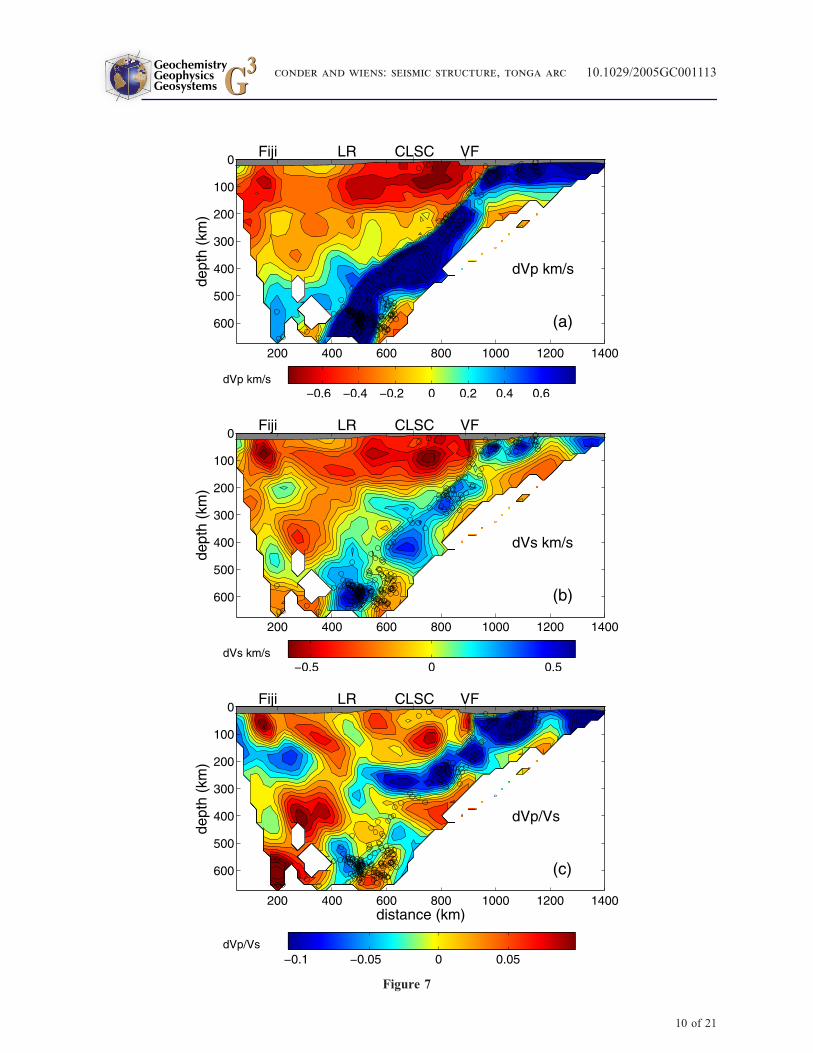
Figure 7
GeochemistryGeophysicsGeosystems G3G3
conder and wiens: seismic structure, tonga arc 10.1029/2005GC001113
10 of 21
in a north-south direction in the current study mayalso contribute to this difference.
[27] The Vs structure (Figure 8b) was not directlysolved, but determined by dividing the Vp solutionby the Vp/Vs solution. Not surprisingly, much ofthe same character is exhibited in the Vs structureas the Vp, but with overall differing magnitudes. Inparticular, the structure exhibits a fast slab (0.2–0.4 km/s) and a slow arc and spreading center(0.3–0.5 km/s) with several deeper slow anomaliesthroughout the mantle wedge. Fiji also shows aslow Vs anomaly (0.4 km/s). The CLSC anomalyis of similar dimension and location to the CLSCVp anomaly of Zhao et al. [1997], extending>100 km west of the axis, but little to the east.The arc anomaly appears to extend �150 km westof the volcanic front to �50 km from the CLSC,while possibly reaching depths >150 km. Theproximity of the separate arc and CLSC anomaliesin the tomography (and presumably regions of meltproduction) makes interpretation of the degree ofseparation between the two anomalies a bittenuous, but there does appear to be a distinctseparation between the anomalies in the Vs andVp/Vs tomograms with the CLSC anomaly almostentirely beneath the west side of the axis. Interpre-tation that the two melting regimes are distinct isconsistent with a lack of melting regime interactionat the CLSC as suggested by petrology [Taylor andMartinez, 2003].
4.2. Vp/Vs
[28] The resultant Vp/Vs structure (Figure 8c)highlights many of the features observed on theVp and Vs maps, although the anomalies appear tobe somewhat more discontinuous. The anomaliesshown are unitless, as they are deviations frominitially assumed average Vp/Vs values for theentire region. There are large positive Vp/Vsanomalies associated with the arc (�0.05–0.1)and CLSC (�0.1), with the CLSC anomaly appear-ing to be shifted nearly entirely west of the axis.The CLSC signature in our models (west of theaxis) is dominated by the S wave residuals as theanomaly appears stronger in Vp/Vs and Vs than inVp. There is also a large Vp/Vs anomaly in the
shallow mantle beneath the Fiji platform (�0.1).Large negative anomalies are associated with thecold, downgoing slab (0.04–0.1), particularlyalong the shallower section.
[29] The upper mantle portion of the slab exhibitslarge negative Vp/Vs anomalies (�0.1) while theslab anomaly in the transition zone is more sub-dued. Unexpectedly, there is a large negative Vp/Vs anomaly at depths of 250–350 km beneath theback-arc basin. We hesitate to directly interpret thisfeature as it is virtually the only anomaly in thesetomograms that is anticorrelated in Vp and Vs(slow Vp, fast Vs). There are few known mecha-nisms for such an anticorrelation, all of whichinvolve complex compositional variations that arefar more likely to occur in the lowermost mantle[Trampert et al., 2004; van der Hilst, 2004]. Thislarge negative Vp/Vs wedge anomaly at depths of250–350 km may partially arise from unaccountedanisotropy in the wedge. Shear wave splitting isstronger (�1s splitting) beneath the Lau Ridge andFiji plateau than beneath the basin itself [Smith etal., 2001]. The large number of rays to Fiji from200–300 km depth could result in the smearing offast S rays into a portion of the model with thefewest crossing rays. However, this hypothesis canaccount for only 50% of the anomaly magnitude.Another contributing factor may include a system-atic error in hypocenter location, but a series oftests with different a priori velocity models pro-ducing different initial earthquake locations showvirtually no change in the final result. The resultsmay be suggesting at minimum that a significantslow Vs anomaly does not extend to 300–400 kmdepth.
4.3. dlnVs/dlnVp
[30] dlnVs/dlnVp, often noted as n, is a measure ofthe relative percentage change of Vs relative to Vp.We obtain one measure of n by dividing the changein natural logarithm of the Vs anomalies by thechange in natural log of the Vp anomalies relativeto our best fitting 1D model (Figure 9). The largestvalues of n (>2) are located in the uppermost 50 kmof the mantle directly beneath the volcanic frontand west of and below the CLSC. Nakajima et al.
Figure 7. Final iterated solutions for (a) P wave velocity anomaly structure (Vp), (b) S wave velocity anomalystructure (Vs), and (c) Vp/Vs anomaly structure. Solutions are determined by a joint Vp and Vp/Vs Singular ValueDecomposition inversion. Vs structure is determined by combining the Vp and Vp/Vs tomograms. Anomalies arereferenced to the IASP91 global velocity model. The solutions are masked where the structures cannot be adequatelyresolved. Black circles denote hypocenter locations for final iteration. Assumed crustal thickness as determinedprimarily by seismic refraction [Crawford et al., 2003] is shown with gray band at top. Contour intervals are0.08 km/s for Vp, 0.06 km/s for Vs, and 0.012 units for Vp/Vs.
GeochemistryGeophysicsGeosystems G3G3
conder and wiens: seismic structure, tonga arc 10.1029/2005GC001113
11 of 21
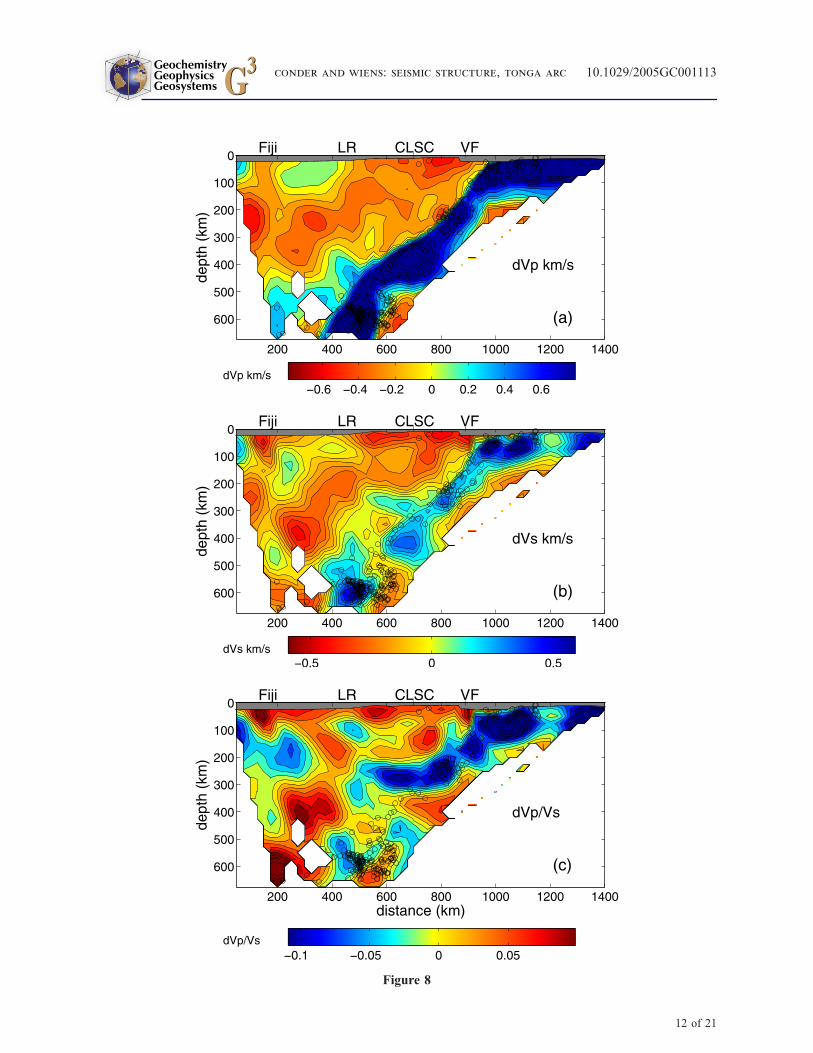
Figure 8
GeochemistryGeophysicsGeosystems G3G3
conder and wiens: seismic structure, tonga arc 10.1029/2005GC001113
12 of 21

[2005] show similar variation in n beneath north-eastern Japan with the highest values (>2) between40–65 km depth beneath the arc and close tounity elsewhere. Although the above measure ofn gives a good indication of how n variesthroughout the model, it is susceptible to errorsof small number arithmetic (where one or both ofthe anomalies are nearly zero), resulting in anumber of spurious values and also gives ameasure that is highly dependant on the referencemodel. So we also present the distribution of nfor particular regions of interest by creatinghistograms of
nij ¼ lnVsi ln Vsj� �
= ln Vpi ln Vpj� �
; ð7Þ
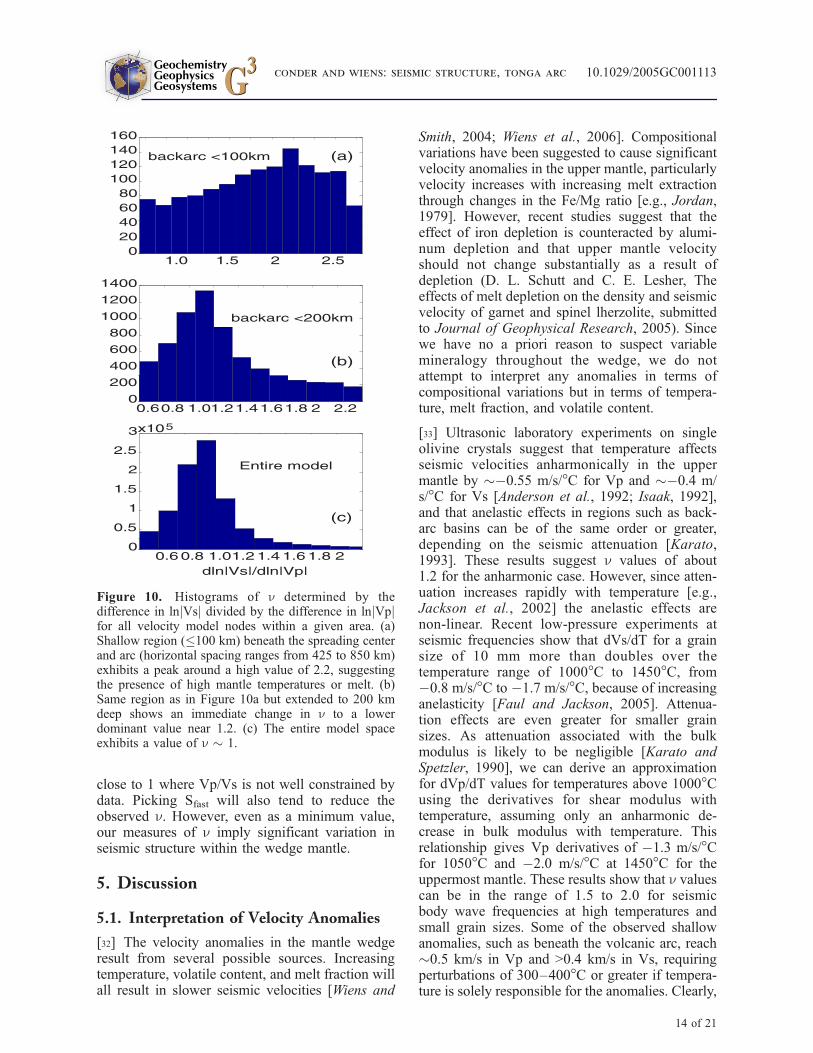
where i and j denote the nodes within the particularregion. This histogram representation allows amodel independent assessment of the dominant nsignal for a given region. n for our entire modelspace is close to 1 (Figure 10), but the wedgeshows a n dependent on depth. The shallowestportion of the wedge (�100 km) shows a wide
scatter in n values, but has a peak at n � 2.2(Figure 10). Extending the region to 200 km depthdevelops a strong peak near 1.2, but adds little tothe peak at 2.2 (Figure 10). Extending the wedge to400 km depth results in a histogram peakedstrongly near 1 and is nearly indistinguishable tothat of the entire model. These results suggest thatthe mantle wedge is characterized by n values thatshow high values of n(�2.2) for some portions ofthe shallowmost structure (depth <100 km), withvalues then rapidly decreasing to near unity withincreasing depth. These results generally agreewith Koper et al. [1999], who found an averagemantle wedge n of 1.2–1.3 for ray paths that weredominantly bottoming at depths of 100–200 kmbeneath the back arc.
[31] We note that either measure of n may beunderestimated because of its derivation; i.e., bytaking the ratio of two quantities, one of which haspreviously been determined by a division operationand not directly from the inversion. Along with theother caveats of Vs, the measure of n is highlysusceptible the damping, which tends to make n
Figure 8. Same as Figure 7, except with the anomalies referenced against the best fitting local 1-D structure(Figure 4). The locally derived 1-D model has a much slower shallow mantle than IASP91 presumably because theupper mantle in the Lau basin is exceptionally warm and IASP91 is biased toward continental structure. Referencingthe anomalies against this slower average model highlights other local phenomena, such as the anomalies associatedwith the arc and CLSC.
Figure 9. dlnVs/dlnVp (n) in the uppermost mantle of the back arc as measured by dividing the natural log of theVs anomalies by the natural log of the Vp anomalies relative to the best fitting 1D model in Figure 4. Contour intervalis 0.14 units. This measure is susceptible to large swings where Vp and/or Vs anomalies are small, as evidenced bythe two negative (blue) regions shown. For example, the blue spot below the volcanic front (VF) near 100 km depthis the transition region between the seismically fast slab and the seismically slow back arc. Still, some characteristicsof the basin are apparent, such as the large (>2) values of n from 50 km depth to the top of the mantle beneath thevolcanic front and west of and below the CLSC.
GeochemistryGeophysicsGeosystems G3G3
conder and wiens: seismic structure, tonga arc 10.1029/2005GC001113
13 of 21
close to 1 where Vp/Vs is not well constrained bydata. Picking Sfast will also tend to reduce theobserved n. However, even as a minimum value,our measures of n imply significant variation inseismic structure within the wedge mantle.
5. Discussion
5.1. Interpretation of Velocity Anomalies
[32] The velocity anomalies in the mantle wedgeresult from several possible sources. Increasingtemperature, volatile content, and melt fraction willall result in slower seismic velocities [Wiens and
Smith, 2004; Wiens et al., 2006]. Compositionalvariations have been suggested to cause significantvelocity anomalies in the upper mantle, particularlyvelocity increases with increasing melt extractionthrough changes in the Fe/Mg ratio [e.g., Jordan,1979]. However, recent studies suggest that theeffect of iron depletion is counteracted by alumi-num depletion and that upper mantle velocityshould not change substantially as a result ofdepletion (D. L. Schutt and C. E. Lesher, Theeffects of melt depletion on the density and seismicvelocity of garnet and spinel lherzolite, submittedto Journal of Geophysical Research, 2005). Sincewe have no a priori reason to suspect variablemineralogy throughout the wedge, we do notattempt to interpret any anomalies in terms ofcompositional variations but in terms of tempera-ture, melt fraction, and volatile content.
[33] Ultrasonic laboratory experiments on singleolivine crystals suggest that temperature affectsseismic velocities anharmonically in the uppermantle by � 0.55 m/s/�C for Vp and � 0.4 m/s/�C for Vs [Anderson et al., 1992; Isaak, 1992],and that anelastic effects in regions such as back-arc basins can be of the same order or greater,depending on the seismic attenuation [Karato,1993]. These results suggest n values of about1.2 for the anharmonic case. However, since atten-uation increases rapidly with temperature [e.g.,Jackson et al., 2002] the anelastic effects arenon-linear. Recent low-pressure experiments atseismic frequencies show that dVs/dT for a grainsize of 10 mm more than doubles over thetemperature range of 1000�C to 1450�C, from 0.8 m/s/�C to 1.7 m/s/�C, because of increasinganelasticity [Faul and Jackson, 2005]. Attenua-tion effects are even greater for smaller grainsizes. As attenuation associated with the bulkmodulus is likely to be negligible [Karato andSpetzler, 1990], we can derive an approximationfor dVp/dT values for temperatures above 1000�Cusing the derivatives for shear modulus withtemperature, assuming only an anharmonic de-crease in bulk modulus with temperature. Thisrelationship gives Vp derivatives of 1.3 m/s/�Cfor 1050�C and 2.0 m/s/�C at 1450�C for theuppermost mantle. These results show that n valuescan be in the range of 1.5 to 2.0 for seismicbody wave frequencies at high temperatures andsmall grain sizes. Some of the observed shallowanomalies, such as beneath the volcanic arc, reach�0.5 km/s in Vp and >0.4 km/s in Vs, requiringperturbations of 300–400�C or greater if tempera-ture is solely responsible for the anomalies. Clearly,
Figure 10. Histograms of n determined by thedifference in lnjVsj divided by the difference in lnjVpjfor all velocity model nodes within a given area. (a)Shallow region (�100 km) beneath the spreading centerand arc (horizontal spacing ranges from 425 to 850 km)exhibits a peak around a high value of 2.2, suggestingthe presence of high mantle temperatures or melt. (b)Same region as in Figure 10a but extended to 200 kmdeep shows an immediate change in n to a lowerdominant value near 1.2. (c) The entire model spaceexhibits a value of n � 1.
GeochemistryGeophysicsGeosystems G3G3
conder and wiens: seismic structure, tonga arc 10.1029/2005GC001113
14 of 21

such mechanisms as partial melt or the presence offluids could be important as well.
[34] Several studies have investigated how partialmelt affects the elastic moduli and therefore seis-mic velocities [Hammond and Humphreys, 2000;Schmeling, 1985; Takei, 2002], showing that notonly the melt fraction, but also the shape distribu-tion of the melt strongly affects the seismic wavespeeds. Poro-elastic calculations show that dlnVs/dlnVp is sensitive to the pore geometry of the meltand/or fluid phase present in the matrix, whereasthe magnitude of the velocity perturbations is anindication of the porosity of the mantle [Takei,2002]. Hammond and Humphreys [2000] suggestthat melt can be identified by values of n near 2 orgreater. However, Yoshino et al. [2005] suggests themelt geometry used in Hammond and Humphreys[2000] may not be appropriate, and values of n ofless than 1.5 can result from an equilibrium meltgeometry. It is also clear from Faul and Jackson[2005] that n values of near 2 are possible in themelt-free case for high temperatures and small grainsizes. Faul et al. [2004] also show for experimentsusing melt-containing samples at seismic frequen-cies that grain-boundary sliding produces a shearmodulus reduction that is in addition to the poro-elastic effects noted by other studies [Hammond andHumphreys, 2000; Schmeling, 1985; Takei, 2002].This shear modulus reduction would affect the Svelocity more than the P velocity and serve tofurther increase n. Thus the effect of melt is likelyto be substantial shear modulus reduction and highvalues of n, but the effects of in situ melt in the uppermantle on seismic velocities have not been ade-quately constrained for a quantitative interpretationof mantle porosity at this point.
5.2. Tonga Slab
[35] The slab is seismically fast for both Vp and Vsas expected because of the colder temperatures.Koper et al. [1999] found nslab in this regionroughly 1.1–1.2 using a set of 11 deep events(therefore no depth resolution). By dividing thenatural log of slab Vs anomalies by the natural logof slab Vp anomalies, we find n � 1 over much ofthe slab length, but somewhat higher (1.3–1.5) forthe shallowest portion (100–200 km depth), con-sistent with the average value determined by theirprevious study. The slab exhibits fairly weak Vp/Vs anomalies below 300 km depth. The slabanomaly may be particularly affected by theneglect of anisotropy in the tomography if therefast direction is down (up) dip, because the slab
structure is dominated by ray paths traveling thesame direction (up dip) through the slab, unlikemost of the back arc with a better proportion ofcrossing paths (Figure 2). An up dip fast directionwould make Vs appear artificially slow relative toVp and could overestimate Vp/Vs by as much as0.05 and a corresponding Vs would appear tooslow by as much as �0.1 km/s.
[36] Kennett and Gorbatov [2004] suggest thatmost slabs exhibit stronger anomalies in shear thanin compression, reaching a maximum differencewhen the subducting slab age is 80–110 Ma (nearmaximum thickness). While there does seem to bea good correlation for most subduction zonesaround the Pacific [Kennett and Gorbatov, 2004;Widiyantoro et al., 1999], the Tonga slab seems tobe an exception. The subducting seafloor in thisregion is poorly dated, but certainly older than 110Ma [Mueller et al., 1997]. Even after accountingfor possible anisotropy in the slab, the portion ofthe slab deeper than 300 km exhibits strongeranomalies in Vp than in Vs, particularly in thetransition zone. The studies using teleseismic P andS travel times have lower resolution, but show asimilar structure with bulk sound speed anomaliesstronger than shear anomalies for this slab [Gorbatovand Kennett, 2003; Kennett and Gorbatov, 2004],which would predict relatively high Vp/Vs values.We may speculatively attribute stronger Vp than Vsanomalies deeper than 300 km to a reduced rigidityresulting from grain-size reduction associated withphase transformations [Riedel and Karato, 1997;Widiyantoro et al., 1999].
5.3. Tonga Arc
[37] The portion of the mantle wedge beneath thevolcanic arc exhibits some of the largest slowanomalies in the velocity model, reaching >6% inVp, >10% in Vs, and a change of nearly 0.1 in Vp/Vs. Solely temperature-induced anomalies wouldrequire an anomaly of nearly 400�C relative to thealready slow back arc. However, melt and hydra-tion are integral to arc processes, and a 400�Canomaly at depths of 50–150 km should be wellabove the peridotite solidus [Hirschmann, 2000],suggesting that melt and/or volatiles are largelyresponsible for the velocity anomalies. The largeVp/Vs anomaly also points to melt and hydrationplaying a significant role beneath the arc.
[38] Given possible extremely low melt fractionsimplied by rapid extraction times for arc melts[Turner et al., 2000], the slow-velocity anomalybeneath the arc is plausibly derived from the pres-
GeochemistryGeophysicsGeosystems G3G3
conder and wiens: seismic structure, tonga arc 10.1029/2005GC001113
15 of 21
ence of fluids rather than melt. The anomaly mayreach a depth of >150 km as it extends toward theback arc, as was also shown by Zhao et al. [1997].This depth is likely determined by the breakdown ofhydrous minerals in the slab at shallow depth, suchas serpentine or amphibole [Fumagalli et al., 2001].The anomaly appears to extend�150 km toward theback arc, further than would be inferred by thedistribution of volcanoes at the surface. This sug-gests that melt migration beneath arcs requires eithera focusing mechanism, such as reactive channeldevelopment [Kelemen et al., 1995] or coalescingdiapirs [Hall and Kincaid, 2001], to extract melt at adiscrete location some distance from the volcanicfront or, that melt is retained in the mantle becausethe melt geometry is less favorable for rapid migra-tion at a given distance from the volcanic front. Overmost of the arc anomaly n is large suggesting afavorable geometry for melt extraction [Takei, 2002](Figure 9), so the arc signal may be primarily a resultof hydration. At present, we cannot resolve theporosity magnitude of in situ melt or fluids, butthe tomograms likely delineate the respective meltproduction regions. Undoubtedly, some melt orhydration is present beneath the arc. However, asthe experimental data and theoretical considerationssuggest large effects on attenuation (and subse-quently velocity) with melt and/or fluids, only asmall degree of melt (likely substantially <1%) orhydration may be necessary to produce the observedanomalies.
5.4. Central Lau Spreading Center
[39] Melt generation at spreading centers could bea passive process associated with decompressionduring plate separation [Phipps Morgan, 1987] orcould be an active process as buoyant melt drivesconvection in a narrow region beneath the axis[Buck and Su, 1989]. Whether one process domi-nates over the other may depend on spreading rateor other factors such as the viscosity of the mantle[Parmentier and Phipps Morgan, 1990]. Seismicresults from the East Pacific Rise (EPR) show abroad zone of melting, consistent with a passivemelt generation mechanism [Forsyth et al., 1998;Hung and Forsyth, 2000]. Although the CLSC is afast spreading center like the EPR, the somewhatslower spreading rate (9 cm/yr instead of 14.5 cm/yr)[Zellmer and Taylor, 2001] and the back-arc natureof the CLSC imply the possibility of more com-plex geodynamic behaviors that could result in anactive upwelling pattern beneath the axis [Jurdyand Stefanick, 1983; Ribe, 1989]. The CLSCanomaly extends over a wide region (�150 km)
to the west of the axis, and to a limited extent tothe east. Such a broad anomaly suggests a passiveplate separation melting mechanism dominates atfast spreading centers, even in the more complexback-arc environment.
[40] While the arc anomaly seems to deepen as itapproaches the back arc, the CLSC anomalyappears to remain shallower than 70 km to thewest of the axis. The CLSC shows large velocityanomalies in Vp (0.2–0.4 km/s), Vs (0.3–0.4 km/s),and Vp/Vs (0.06–0.1), with n > 2 (Figures 9and 10). These anomalies are comparable to thelargest anomalies observed on the EPR [Gu et al.,2005]. The CLSC anomaly magnitudes are too largeto easily explain solely by thermal variations, evenfor a grain size of�1mm [Faul and Jackson, 2005].In addition, it may be difficult to reach n > 2 withouta small degree of melt or fluid present or submilli-meter scale grain size [Faul and Jackson, 2005;Takei, 2002]. However, it probably retains no moremelt than inferred for the EPR (<0.5%) [Hammondand Toomey, 2003; Gu et al., 2005]. So, while theVp anomaly associated with the CLSC is somewhatambiguous, the significant Vp/Vs anomaly beneaththe CLSC is well defined and likely defines theprimary region of melt production associated withthe spreading center.
[41] The spatial distribution of the melt productionregions of the CLSC (and arc) has important impli-cations regarding mantle geodynamics of the backarc. Mantle flow driven primarily by plate separa-tion would result in a primarily symmetric upwell-ing structure beneath the axis [e.g., Phipps Morgan,1987] and shallow, symmetric anomalies. The samemay be true of upwelling driven primarily bydiapirism beneath the axis, although the depth extentis more uncertain. Given the asymmetry of theCLSC anomaly, the complex mantle dynamics inthis back-arc region likely modifies the upwellingdriven by plate separation with a component ofacross-axis mantle flow [Conder et al., 2002a,2002b].We note that although the anomaly is shiftedsignificantly westward away from the trench, it doesnot imply the absence of north-south flow as in-ferred by geochemical [Turner and Hawkesworth,1998] or shear wave splitting studies [Fischer et al.,2000; Smith et al., 2001], but rather that there mustbe a significant component of subduction relatedcorner flow 400 km away from the trench.
5.5. Mantle Wedge
[42] Between 200–400 km depth, the tomogramsexhibit moderate anomalies in Vp, Vs, and Vp/Vs.
GeochemistryGeophysicsGeosystems G3G3
conder and wiens: seismic structure, tonga arc 10.1029/2005GC001113
16 of 21
The largest arc associated anomalies appear toextend to 150–200 km depth. This may mark thedepth of primary dehydration of the slab. Theproximity of these anomalies at 150–200 kmdepth to both the volcanic front and the CLSCleaves the possibility of interaction with theCLSC. However, such interaction is probablyminimal as the petrology and other geophysicalsignatures of the CLSC show little affinity for arcmelts [Martinez and Taylor, 2002; Taylor andMartinez, 2003]. Deeper, weaker anomaliesthroughout the wedge may indicate weak, contin-uous hydration continuing below 200 km, asthose extending to 300 km beneath the spreadingcenter may result from a small amount of contin-uous hydration from the subducting slab [Poli andSchmidt, 1995; Schmidt and Poli, 1998; Zhao etal., 1997]. Conversely, these anomalies could alsobe accounted for by moderate temperature pertur-bations, which may be supported by the absenceof significant slow Vs anomalies above the slab atdepths >250 km.
[43] Most of the wedge exhibits a n� 1 (Figure 10),consistent with temperature as the primary mecha-nism for velocity perturbations below 350 km.However, the one localized anomaly at 400 kmdepth below the Lau Ridge is somewhat higher(1.5–2) when examined in isolation. Hydratedmantle could account for such a signature, as theanomaly is quite weak in Vp (<0.1 km/s), while thedVp/Vs anomaly is much stronger (�0.4) andhydration from the subducting slab could be punc-tuated in places [Tatsumi, 1989] as well as contin-uous with the breakdown at depth of phengiteor topaz-OH in the sediments [Ono, 1998], orlawsonite in the MORB crust [Ono, 1998; Poliand Schmidt, 2002]. If this anomaly is the resultof slab dehydration, it may not have come from theTonga slab as this anomaly is >100 km away fromthe Tonga slab with a fast Vs anomaly between.However, subduction was occurring beneath theLau Ridge at 5 Ma [Cole et al., 1990], and theVitiaz slab was subducting from the north asrecently as 2 Ma [Sinton et al., 1985; Pelletier etal., 1996]. With the complex subduction history inthis region, other sources may account for deephydration beneath the Lau Ridge. It is also likelythat Indian mantle influxes into the Lau Basin[Hergt and Hawkesworth, 1994; Pearce et al.,1995], so it may be that this anomaly is a hydratedregion or region with preferentially small grain sizeof influxing Indian mantle. Although, it is also notobvious why incoming Indian mantle would con-tain such a heterogeneity.
5.6. Fiji
[44] Seismic velocities are faster beneath the LauRidge compared to elsewhere in the back arc(Figure 8). These faster velocities likely indicatea thicker lithosphere, which did not undergo muchextension during rifting of the basin. The slow-velocity anomalies and large Vp/Vs anomaly asso-ciated with the Fiji plateau indicating thinnerlithosphere than beneath the Lau ridge and thepossibility of magmagenesis.
[45] Extensional faulting has occurred and is pres-ently occurring on the Fiji platform [Hamburger etal., 1988, 1990]. Volcanism in Fiji began in theupper Eocene (�40 Ma) and has continued to therecent past [Colley and Hindle, 1984; Gill et al.,1984]. Most of Viti Levu (the largest Fijian island)was emplaced prior to 6 Ma, with the more recent,but less voluminous volcanic deposits occurringaway from Viti Levu on the Lau islands, Koro,Kadavu, and Taveuni [Colley and Hindle, 1984],with the most recent documented eruption at�2000 BP in Taveuni [Cole et al., 1990]. Whilewe include the station at Kadavu, the stations onViti Levu dominate the ray coverage to Fiji, so theanomaly seems to be associated with the mainFijian island rather than the outer islands.
[46] Although unexpected, the large Vp/Vs anom-aly beneath Fiji is large enough to suggest hightemperatures and possible melt production in theshallow mantle. Explanations for melt productionbeneath Fiji remain speculative, with the variablepetrology observed in recent (<3 Myr) volcanismindicating a complexity of melting mechanisms[Gill et al., 1984]. It may be possible that upwell-ing beneath the extended lithosphere has triggereda small amount of melting beneath the platform.The true dimensions of this anomaly are poorlydefined in our tomograms, primarily because allthe arrivals come from the east or directly beneathFiji. However, its presence appears robust, as thisregion is a fairly well resolved portion of the modelwith crossing rays to Viti Levu having a reasonabledistribution of incidence angles between 0� and 90�(Figure 5).
6. Summary
[47] The Lau Basin is a geologically dynamicregion with arc volcanism, back-arc spreadingand volatile migration occurring within the mantlewedge. Using joint Vp, Vp/Vs tomography, weilluminate wedge structure linked to processes thatcontrol the dynamics and geological history of the
GeochemistryGeophysicsGeosystems G3G3
conder and wiens: seismic structure, tonga arc 10.1029/2005GC001113
17 of 21
Lau Basin. Nearly all key geophysical processesresponsible for the observed seismic anomalies inthe Basin are influenced by the subducting Pacificplate. The Pacific plate itself is old, thick, and coldwith a fast seismic signature for both P and S wavevelocities. The slab appears to release a significantamount of volatiles to a depth of 150–200 kminducing the arc volcanism observed along theTofua arc (active western edge of the Tonga arc).The arc anomaly is strong immediately beneath thearc front, and extends westward and deeper towardthe back arc. Continued wedge hydration maycontinue to 300 km depth or more at a lesser rate,with a possible surge because of the completebreakdown of one or more hydrous minerals nearthat depth.
[48] The CLSC melting region is likely distinctfrom the arc melting region at this spacing. Theslow anomaly associated with the CLSC is broad,extending �150 km to the west, suggesting thatmelting at the CLSC is passively driven by spread-ing of the lithosphere. The distribution of larger nvalues to the west of the axis relative to the east,coupled with the petrology and other geophysicalfactors [Martinez and Taylor, 2002], suggest that astrong asymmetry is likely and that the anomalyeast of the axis is probably associated with the arc.If the melt production region is asymmetric aboutthe axis, the asymmetry probably results from asignificant corner flow in the wedge induced fromthe downgoing slab [Conder et al., 2002a]. If theasymmetry is less, the degree of interaction be-tween the arc and spreading center melt regionscould be greater at this spacing than is presentlyassumed. A component of north-south flow in thewedge could also be present, but cannot be deter-mined from our east-west cross section.
[49] Although the primary signature beneath theLau ridge is consistent with thicker lithospherethan the adjacent basin, the seismic signaturebeneath Fiji suggests a thinner lithosphere andwarmer mantle temperatures. Partial melt beneathFiji may be triggered by upwelling beneath athinned lithosphere.
Acknowledgments
[50] We thank Gideon Smith, Rob Dunn, and Uli Faul for
thoughtful comments and discussions. Bill Menke suggested
the joint inverse procedure we used. We thank Leroy Dorman,
Paul Friberg, John Hildebrand, Patrick Shore, and Spahr Webb
for assistance in collecting the original data during the SPASE,
LABATTS, and SAFT projects and Keith Koper and Dapeng
Zhao for previous work with parts of this arrival time database.
Andrew Goodliffe provided the locations for the neovolcanic
zone delineated in Figure 1. Yu Jeffery Gu and an anonymous
reviewer provided useful and insightful comments that im-
proved the quality of this manuscript. This research was
supported by National Science Foundation grants OCE-
0002527, EAR-0001158, and OCE-0305292.
References
Aggarwal, Y. P., M. Barazangi, and B. Isacks (1972), P andS travel times in the Tonga-Fiji region: A zone of low-velocity in the uppermost mantle behind the Tonga IslandArc, J. Geophys. Res., 77(32), 6427–6434.
Anderson, O. L., D. Isaak, and H. Oda (1992), High-temperature elastic constant data on mineral relevant to geo-physics, Rev. Geophys., 30, 57–90.
Barazangi, M., B. L. Isacks, J. Oliver, J. Dubois, and G. Pascal(1973), Descent of lithosphere beneath New Hebrides,Tonga-Fiji and New Zealand: Evidence for detached slabs,Nature, 242(5393), 98–101.
Bevis, M., D. A. Phillips, F. W. Taylor, J. Beavan, E. Kendrick,D. Matheson, and B. Schutz (2000), Revised estimates ofcrustal velocity in the Tonga-Lau System, Eos Trans. AGU,Fall Meet. Suppl., 81(48), Abstract G11A-18.
Buck, R., and W. Su (1989), Focused mantle upwelling belowmid-ocean ridges due to feedback between viscosity andmelting, Geophys. Res. Lett., 16, 641–644.
Cameron, B. I., J. A.Walker, M. J. Carr, L. C. Patino, O. Matias,and M. D. Feigenson (2003), Flux versus decompressionmelting at stratovolcanoes in southeastern Guatemala,J. Volcanol. Geotherm. Res., 119(1–4), 21–50.
Chen, W.-P., and M. R. Brudzinski (2001), Evidence for alarge-scale remnant of subducted lithosphere beneath Fiji,Science, 292(5526), 2475–2479.
Chiarabba, C., and A. Amato (2003), Vp and Vp/Vs images inthe Mw 6.0 Colfiorito fault region (central Italy): A contribu-tion to the understanding of seismotectonic and seismogenicprocesses, J. Geophys. Res., 108(B5), 2248, doi:10.1029/2001JB001665.
Cole, J. W., I. J. Graham, and I. L. Gibson (1990), Magmaticevolution of late Cenozoic volcanic rocks of the Lau Ridge,Fiji, Contrib. Mineral. Petrol., 104(5), 540–554.
Colley, H., and W. H. Hindle (1984), Volcano-tectonic evolu-tion of Fiji and adjoining marginal basins, in Marginal BasinGeology, edited by B. P. Kokelaar and M. F. Howells, Geol.Soc. Spec. Publ., 16, 151–162.
Conder, J. A. (2005), A case for hot slab surface temperaturesin numerical viscous flow models of subduction zones withan improved fault zone parameterization, Phys. Earth Planet.Inter., 149, 155–164.
Conder, J. A., D. A. Wiens, and J. Morris (2002a), On thedecompression melting structure at volcanic arcs and back-arc spreading centers, Geophys. Res. Lett., 29(15), 1727,doi:10.1029/2002GL015390.
Conder, J. A., D. W. Forsyth, and E. M. Parmentier (2002b),Asthenospheric flow and asymmetry of the East Pacific Rise,MELT area, J. Geophys. Res., 107(B12), 2344, doi:10.1029/2001JB000807.
Crawford, W. C., J. A. Hildebrand, L. M. Dorman, S. C. Webb,and D. A. Wiens (2003), Tonga Ridge and Lau Basin crustalstructure from seismic refraction data, J. Geophys. Res.,108(B4), 2195, doi:10.1029/2001JB001435.
Eguchi, T., Y. Fujinawa, and M. Ukawa (1989), Microearth-quakes and tectonics in an active back-arc basin; the LauBasin, Phys. Earth Planet. Inter., 56(3–4), 210–229.
GeochemistryGeophysicsGeosystems G3G3
conder and wiens: seismic structure, tonga arc 10.1029/2005GC001113
18 of 21
Faul, U. H., and I. Jackson (2005), The seismological signatureof temperature and grain size variations in the Upper Mantle,Earth Planet. Sci. Lett., 234, 119–134.
Faul, U. H., J. D. Fitz Gerald, and I. Jackson (2004), Shear waveattenuation and dispersion in melt-bearing olivine polycrys-tals: 2. Microstructural interpretation and seismological im-plications, J. Geophys. Res., 109, B06202, doi:10.1029/2003JB002407.
Fischer, K. M., E. M. Parmentier, A. R. Stine, and E. R. Wolfe(2000), Modeling anisotropy and plate-driven flow in theTonga subduction zone back arc, J. Geophys. Res., 105,16,181–16,191.
Forsyth, D. W., et al. (1998), Imaging the deep seismic struc-ture beneath a mid-ocean ridge: The MELT experiment,Science, 280(5367), 1215–1218.
Fujiwara, T., T. Yamazaki, and M. Joshima (2001), Bathymetryand magnetic anomalies in the Havre Trough and southernLau Basin: From rifting to spreading in back-arc basins,Earth Planet. Sci. Lett., 185(3–4), 253–264.
Fumagalli, P., L. Stixrude, S. Poli, and D. Snyder (2001), The10A phase: A high-pressure expandable sheet silicate stableduring subduction of hydrated lithosphere, Earth Planet. Sci.Lett., 186(2), 125–141.
Gill, J. B., A. L. Stork, and P. M. Whelan (1984), Volcanismaccompanying back-arc basin development in the southwestPacific, Tectonophysics, 102, 207–224.
Gorbatov, A., and B. L. N. Kennett (2003), Joint bulk-soundand shear tomography for western Pacific subduction zones,Earth Planet. Sci. Lett., 210(3–4), 527–543.
Gu, Y. J., S. C. Webb, A. Lerner-Lam, and J. B. Gaherty(2005), Upper mantle structure beneath the eastern PacificOcean ridges, J. Geophys. Res., 110, B06305, doi:10.1029/2004JB003381.
Hall, P. S., and C. Kincaid (2001), Diapiric flow at subductionzones: A recipe for rapid transport, Science, 292(5526),2472–2475.
Hamburger, M. W., and B. L. Isacks (1987), Deep earthquakesin the Southwest Pacific: A tectonic interpretation, J. Geo-phys. Res., 92(13), 13,841–13,854.
Hamburger, M. W., I. B. Everingham, B. L. Isacks, andM. Barazangi (1988), Active tectonism with the FijiPlatform, Southwest Pacific, Geology, 16(3), 237–241.
Hamburger, M. W., I. B. Everingham, B. L. Isacks, andM. Barazangi (1990), Seismicity and crustal structure ofthe Fiji Platform, Southwest Pacific, J. Geophys. Res.,95(3), 2553–2573.
Hammond, W. C., and E. D. Humphreys (2000), Upper mantleseismic wave velocity: Effects of realistic partial melt geo-metries, J. Geophys. Res., 105, 10,975–10,986.
Hammond, W. C., and D. R. Toomey (2003), Seismic velocityanisotropy and heterogeneity beneath the Mantle Electromag-netic and Tomography Experiment (MELT) region of the EastPacific Rise from analysis of P and S body waves, J. Geophys.Res., 108(B4), 2176, doi:10.1029/2002JB001789.
Hergt, J. M., and C. J. Hawkesworth (1994), Pb-, Sr-, and Nd-isotopic evolution of the Lau Basin; implications for mantledynamics during backarc opening, Proc. Ocean Drill.Program Sci. Results, 135, 505–517.
Hirschmann, M. M. (2000), Mantle solidus: Experimental con-straints and the effects of peridotite composition, Geochem.Geophys. Geosyst., 1(10), doi:10.1029/2000GC000070.
Hung, S.-H., and D. W. Forsyth (2000), Can a narrow, melt-rich, low-velocity zone of mantle upwelling be hiddenbeneath the East Pacific Rise? Limits from waveform mod-eling and the MELT experiment, J. Geophys. Res., 105,7945–7960.
Isaak, D. G. (1992), High-temperature elasticity of iron-bearing olivines, J. Geophys. Res., 97(B2), 1871–1885.
Isacks, B., L. R. Sykes, and J. Oliver (1969), Focal mechanismsof deep and shallow earthquakes in the Tonga-Kermadecregion and the tectonics of island arcs, Geol. Soc. Am. Bull.,80(8), 1443–1469.
Jackson, I., J. D. Fitz Gerald, U. H. Faul, and B. H. Tan (2002),Grain-size-sensitive seismic wave attenuation in polycrystal-line olivine, J. Geophys. Res., 107(B12), 2360, doi:10.1029/2001JB001225.
Jeffreys, H. (1932), An alternative to the rejection of observa-tions, Proc. R. Soc. London, Ser. A, 137, 78–87.
Johnson, M. C., and T. Plank (1999), Dehydration and meltingexperiments constrain the fate of subducted sediments, Geo-chem. Geophys. Geosyst., 1(1), doi:10.1029/1999GC000014.
Jordan, T. H. (1979), Mineralogies, densities, and seismicvelocities of garnet lherzolites and their geophysical implica-tions, in The Mantle Sample: Inclusions in Kimberlitesand Other Volcanics: Proceedings of the 2nd InternationalKimberlite Conference, vol. 2, edited by F. R. Boyd et al.,pp. 1–14, AGU, Washington, D.C.
Jurdy, D. M., and M. Stefanick (1983), Flow models for back-arc spreading, Tectonophysics, 99, 191–206.
Karato, S. (1993), Importance of anelasticity in the interpreta-tion of seismic tomography, Geophys. Res. Lett., 20, 1623–1626.
Karato, S., and H. A. Spetzler (1990), Defect microdynamicsin minerals and solid-state mechanisms of seismic wave at-tenuation and velocity dispersion in the mantle, Rev. Geo-phys., 28, 399–421.
Karig, D. E. (1971), Origin and development of marginal ba-sins in the western Pacific, J. Geophys. Res., 76, 2542–2561.
Kelemen, P. B., J. A. Whitehead, E. Aharonov, and K. A.Jordahl (1995), Experiments on flow focusing in solubleporous media, with applications to melt extraction from themantle, J. Geophys. Res., 100(1), 475–496.
Kennett, B. L. N., and E. R. Engdahl (1991), Travel times forglobal earthquake location and phase identification, Geo-phys. J. Int., 105(2), 429–465.
Kennett, B. L. N., and A. Gorbatov (2004), Seismic hetero-geneity in the mantle: Strong shear wave signature of slabsfrom joint tomography, Phys. Earth Planet. Inter., 146, 87–100.
Kennett, B. L. N., E. R. Engdahl, and R. Buland (1995),Constraints on seismic velocities in the Earth from traveltimes, Geophys. J. Int., 122(1), 108–124.
Kolobov, V. Y., I. Y. Kulakov, and Y. V. Tikunov (2003), Deepstructure and geodynamic evolution of the Tonga-NewHebrides region from seismic tomography data, Geotec-tonics, 37(2), 151–160.
Koper, K. D., D. A. Wiens, L. Dorman, J. Hildebrand, andS. Webb (1999), Constraints on the origin of slab and mantlewedge anomalies in Tonga from the ratio of S to P velocities,J. Geophys. Res., 104(7), 15,089–15,104.
Martinez, F., and B. Taylor (2002), Mantle wedge control onback-arc crustal accretion, Nature, 416, 417–420.
Menke, W. (1984), Geophysical Data Analysis: DiscreteInverse Theory, 260 pp., Elsevier, New York.
Mueller, R. D., W. R. Roest, J.-Y. Royer, L. M. Gahagan, andJ. G. Sclater (1997), Digital isochrons of the world’s oceanfloor, J. Geophys. Res., 102(2), 3211–3214.
Nakajima, J., T. Matsuzawa, A. Hasegawa, and D. Zhao(2001), Three-dimensional structure of Vp, Vs, and Vp/Vs
beneath northeastern Japan: Implications for arc magmatismand fluids, J. Geophys. Res., 106(B10), 21,843–21,858.
GeochemistryGeophysicsGeosystems G3G3
conder and wiens: seismic structure, tonga arc 10.1029/2005GC001113
19 of 21
Nakajima, J., Y. Takei, and A. Hasegawa (2005), Quantitativeanalysis of the inclined low-velocity zone in the mantlewedge of northeastern Japan: A systematic change of melt-filled pore shapes with depth and its implications for meltmigration, Earth Planet. Sci. Lett., 234, 59–70.
Nakamura, M., Y. Yoshida, D. Zhao, H. Katao, andS. Nishimura (2003), Three-dimensional P- and S-wavevelocity structures beneath the Ryukyu Arc, Tectonophysics,369, 121–143.
Ono, S. (1998), Stability limits of hydrous minerals in sedi-ment and mid-ocean ridge basalt compositions; implicationsfor water transport in subduction zones, J. Geophys. Res.,103(8), 18,253–18,267.
Parmentier, E. M., and J. Phipps Morgan (1990), Spreadingrate dependence of three-dimensional structure in oceanicspreading centres, Nature, 348(6299), 325–328.
Parson, L. M., and J. W. Hawkins (1994), Two-stage ridge pro-pagation and the geological history of the Lau backarc basin,Proc. Ocean Drill. Program Sci. Results, 135, 819–828.
Pearce, J. A., M. Ernewein, S. H. Bloomer, L. M. Parson, B. J.Murton, and L. E. Johnson (1995), Geochemistry of LauBasin volcanic rocks: Influence of ridge segmentation andarc proximity, in Volcanism Associated With Extension atConsuming Plate Margins, edited by J. L. Smellie, Geol.Soc. Spec. Publ., 81, 53–75.
Pelletier, B., J.-M. Auzende, and J.-Y. Collot (1996), Geometryand structure of the Vitiaz Trench lineament (SW Pacific),Mar. Geophys. Res., 18, 305–335.
Pelletier, B., Y. Lagabrielle, M. Benoit, G. Cabioch,S. Calmant, E. Garel, and C. Guivel (2001), Newly identifiedsegments of the Pacific-Australia plate boundary along theNorth Fiji transform zone, Earth Planet. Sci. Lett., 193(3–4),347–358.
Phipps Morgan, J. (1987), Melt migration beneath mid-oceanspreading centers, Geophys. Res. Lett., 14(12), 1238–1241.
Poli, S., and M. W. Schmidt (1995), H2O transport and releasein subduction zones: Experimental constraints on basalticand andesitic systemsJ. Geophys. Res., 100(11), 22,299–22,314.
Poli, S., and M. W. Schmidt (2002), Petrology of subductedslabs, Annu. Rev. Earth Planet. Sci., 30, 207–235.
Ribe, N. M. (1989), Mantle flow induced by back arc spread-ing, Geophys. J. Int., 98, 85–91.
Riedel, M. R., and S.-i. Karato (1997), Grain-size evolution insubducted oceanic lithosphere associated with the olivine-spinel transformation and its effects on rheology, EarthPlanet. Sci. Lett., 148(1–2), 27–43.
Roggensack, K., R. L. Hervig, S. B. McKnight, and S. N.Williams (1997), Explosive basaltic volcanism from CerroNegro Volcano; influence of volatiles on eruptive style,Science, 277(5332), 1639–1642.
Roth, E. G., D. A. Wiens, L. M. Dorman, J. Hildebrand, andS. C. Webb (1999), Seismic attenuation tomography of theTonga-Fiji region using phase pair methods, J. Geophys.Res., 104, 4795–4810.
Schmeling, H. (1985), Numerical models on the influence ofpartial melt on elastic, anelastic and electric properties ofrocks: Part 1, Elasticity and anelasticity, Phys. Earth Planet.Inter., 41(1), 34–57.
Schmidt, M. W., and S. Poli (1998), Experimentally basedwater budgets for dehydrating slabs and consequences forarc magma generation, Earth Planet. Sci. Lett., 163(1–4),361–379.
Shen, Y., and D. W. Forsyth (1995), Geochemical constraintson initial and final depths of melting beneath mid-oceanridges, J. Geophys. Res., 100, 2211–2237.
Sinton, J. M., K. T. M. Johnson, R. C. Price, and T. M. Brocher(1985), Petrology and geochemistry of volcanic rocks fromthe Northern Melanesian Borderland, in Investigations of theNorthern Melanesian Borderland, Earth Sci. Ser., vol. 3,edited by T. M. Brocher, pp. 35–65, Circum-Pac. Counc. forEnergy and Miner. Resour., Houston, Tex.
Sisson, T. W., and S. Bronto (1998), Evidence for pressure-release melting beneath magmatic arcs from basalt atGalunggung, Indonesia, Nature, 391, 883–886.
Smith, G. P., D. A. Wiens, K. M. Fischer, L. M. Dorman, S. C.Webb, and J. A. Hildebrand (2001), A complex pattern ofmantle flow in the Lau backarc, Science, 292, 713–716.
Smith, W. H. F., and D. T. Sandwell (1997), Global sea floortopography from satellite altimetry and ship depth sound-ings, Science, 277(5334), 1956–1962.
Sykes, L. R., B. L. Isacks, and J. Oliver (1969), Spatial dis-tribution of deep and shallow earthquakes of small magni-tudes in the Fiji-Tonga region, Bull. Seismol. Soc. Am.,59(3), 1093–1113.
Takei, Y. (2002), Effect of pore geometry on VP/VS: Fromequilibrium geometry to crack, J. Geophys. Res., 107(B2),2043, doi:10.1029/2001JB000522.
Tatsumi, Y. (1989), Migration of fluid phases and genesis ofbasalt magmas in subduction zones, J. Geophys. Res., 94(4),4697–4707.
Taylor, B., and F. Martinez (2003), Back-arc basin basalt sys-tematics, Earth Planet. Sci. Lett., 210(3–4), 481–497.
Taylor, B., K. Zellmer, F. Martinez, and A. M. Goodliffe(1996), Sea-floor spreading in the Lau back-arc basin, EarthPlanet. Sci. Lett., 144(1–2), 35–40.
Tibi, R., and D. A. Wiens (2005), Detailed structure and sharp-ness of upper mantle discontinuities in the Tonga subductionzone from regional broadband arrays, J. Geophys. Res., 110,B06313, doi:10.1029/2004JB003433.
Toomey, D. R., and G. R. Foulger (1989), Tomographic inver-sion of local earthquake data from the Hengill-Grensdalurcentral volcano complex, Iceland, J. Geophys. Res., 94,17,497–17,510.
Trampert, J., F. Deschamps, J. Resovsky, and D. Yuen (2004),Probabilistic tomography maps chemical heterogeneitiesthroughout the lower mantle, Science, 306, 853–856.
Turner, S., B. Bourdon, C. Hawkesworth, and P. Evans (2000),226Ra-230Th evidence for multiple dehydration events, rapidmelt ascent and the time scales of differentiation beneath theTonga-Kermadec island arc, Earth Planet. Sci. Lett., 179(3–4), 581–593.
Turner, S., and C. Hawkesworth (1998), Using geochemistryto map mantle flow beneath the Lau Basin, Geology, 26(11),1019–1022.
Um, J., and C. H. Thurber (1987), A fast algorithm for two-point seismic ray tracing, Bull. Seismol. Soc. Am., 77(3),972–986.
van der Hilst, R. (1995), Complex morphology of subductedlithosphere in the mantle beneath the Tonga Trench, Nature,374(6518), 154–157.
van der Hilst, R. (2004), Changing views on Earth’s deepmantle, Science, 306, 817–818.
Walck, M. C. (1988), Three-dimensional Vp/Vs variations forthe Coso region, California, J. Geophys. Res., 93(3), 2047–2052.
Walker, J. A., M. J. Carr, L. C. Patino, C. M. Johnson, M. D.Feigenson, and R. L. Ward (1995), Abrupt change in magmageneration processes across the Central American Arc insoutheastern Guatemala: Flux-dominated melting near thebase of the wedge to decompression melting near the top ofthe wedge, Contrib. Mineral. Petrol., 120(3–4), 378–390.
GeochemistryGeophysicsGeosystems G3G3
conder and wiens: seismic structure, tonga arc 10.1029/2005GC001113
20 of 21

Widiyantoro, S., B. L. N. Kennett, and R. D. van der Hilst(1999), Seismic tomography with P and S data reveals lateralvariations in the rigidity of deep slabs, Earth Planet. Sci.Lett., 173(1–2), 91–100.
Wiens, D. A., and G. P. Smith (2004), Seismological constraintson structure and flow patterns within the mantle wedge, inInside the Subduction Factory, Geophys. Monogr. Ser., vol.138, edited by J. Eiler, pp. 57–81, AGU, Washington, D. C.
Wiens, D. A., P. J. Shore, J. J. McGuire, E. Roth, M. G. Bevis,and K. Draunidalo (1995), The Southwest Pacific SeismicExperiment, IRIS Newsl., 14(1), 1–4.
Wiens, D. A., K. Kelley, and T. Plank (2004), Mantle tempera-ture variations in active back-arc basins inferred fromseismology, petrology, and bathymetry, Eos Trans. AGU,85(47), Fall Meet. Suppl., Abstract T24B-02.
Wiens, D. A., K. Kelley, and T. Plank (2006), Mantle tempera-ture variations beneath back-arc spreading centers inferredfrom seismology, petrology, and bathymetry, Earth Planet.Sci. Lett., in press.
Willemann, R. J. (2001), Criteria for evaluating alternative hy-pocentres, analysis paper, Int. Seismol. Cent., Berkshire, UK.
Wright, S. J., and J. N. Holt (1986), A new non-linear leastsquares algorithm for the seismic inversion problem,Geophys. J. R. Astron. Soc., 87(3), 1041–1056.
Xu, Y., and D. A. Wiens (1997), Upper mantle structure of thesouthwest Pacific from regional waveform inversion, J. Geo-phys. Res., 102, 27,439–27,451.
Yoshino, T., Y. Takei, D. A. Wark, and E. B. Watson (2005),Grain boundary wetness of texturally equilibrated rocks, withimplications for seismic properties of the upper mantle,J. Geophys. Res., 110, B08205, doi:10.1029/2004JB003544.
Zellmer, K. E., and B. Taylor (2001), A three-plate kinematicmodel for Lau Basin opening, Geochem. Geophys. Geosyst.,2(5), doi:10.1029/2000GC000106.
Zhao, D., A. Hasegawa, and S. Horiuchi (1992), Tomo-graphic imaging of P and S wave velocity structure beneathnortheastern Japan, J. Geophys. Res., 97(13), 19,909–19,928.
Zhao, D., Y. Xu, D. A. Wiens, L. Dorman, J. Hildebrand, andS. Webb (1997), Depth extent of the Lau back-arc spreadingcenter and its relationship to the subduction process, Science,278, 254–257.
GeochemistryGeophysicsGeosystems G3G3
conder and wiens: seismic structure, tonga arc 10.1029/2005GC001113
21 of 21