Chemistry of hot springs along the Eastern Lau Spreading Center
63
Chemistry of hot springs along the Eastern Lau Spreading Center Michael J. Mottl, Jeffrey Seewald, C. Geoffrey Wheat, Margaret K. Tivey, Peter J. Michael, Giora Proskurowski, Thomas M. McCollom, Eoghan Reeves, Jessica Sharkey, C.-F. You, L.-H. Chan*, and Thomas Pichler *deceased Final version of ms. W6987, resubmitted to Geochimica et Cosmochimica Acta, December 8, 2010 Affiliations: Mottl: Dept. of Oceanography, University of Hawaii, 1000 Pope Road, Honolulu HI 96822 USA Seewald, Tivey, Proskurowski, and Reeves: Dept. of Marine Chemistry and Geochemistry, Woods Hole Oceanographic Institution, Woods Hole MA 02543 USA Wheat: Global Undersea Research Unit, P.O. Box 757220, University of Alaska, Fairbanks AK 99775 USA Michael: Dept. of Geosciences, The University of Tulsa, 800 S. Tucker Drive, Tulsa OK 74104 USA McCollom: Laboratory for Atmospheric and Space Physics, University of Colorado, 1234 Innovation Drive, Boulder CO 80303 Sharkey:
Transcript of Chemistry of hot springs along the Eastern Lau Spreading Center
Chemistry of hot springs along the Eastern Lau Spreading Center
Michael J. Mottl, Jeffrey Seewald, C. Geoffrey Wheat, Margaret K. Tivey, Peter J. Michael,
Giora Proskurowski, Thomas M. McCollom, Eoghan Reeves, Jessica Sharkey, C.-F. You, L.-H.
Chan*, and Thomas Pichler
*deceased
Final version of ms. W6987,
resubmitted to Geochimica et Cosmochimica Acta, December 8, 2010
Affiliations:
Mottl:
Dept. of Oceanography, University of Hawaii, 1000 Pope Road, Honolulu HI 96822 USA
Seewald, Tivey, Proskurowski, and Reeves:
Dept. of Marine Chemistry and Geochemistry, Woods Hole Oceanographic Institution,
Woods Hole MA 02543 USA
Wheat:
Global Undersea Research Unit, P.O. Box 757220, University of Alaska, Fairbanks AK 99775
USA
Michael:
Dept. of Geosciences, The University of Tulsa, 800 S. Tucker Drive, Tulsa OK 74104 USA
McCollom:
Laboratory for Atmospheric and Space Physics, University of Colorado, 1234 Innovation Drive,
Boulder CO 80303
Sharkey:

2
Global Undersea Research Unit, P.O. Box 757220, University of Alaska, Fairbanks AK 99775
USA
You:
Dept. of Earth Sciences, National Cheng Kung University, No. 1 University Road, Tainan City
701, Taiwan
*Chan:
Dept. of Geology and Geophysics, Louisiana State University, Baton Rouge LA 70803
Pichler:
Fachbereich Geowissenschaften, University of Bremen, Postfach 330 440, 28334 Bremen,
Germany

3
Abstract
The Eastern Lau Spreading Center (ELSC) is the southernmost part of the back-arc
spreading axis in the Lau Basin, west of the Tonga trench and the active Tofua volcanic arc.
Over its 397-km length it exhibits large and systematic changes in spreading rate,
magmatic/tectonic processes, and proximity to the volcanic arc. In 2005 we collected 81 samples
of vent water from six hydrothermal fields along the ELSC. The chemistry of these waters varies
both within and between vent fields, in response to changes in substrate composition,
temperature and pressure, pH, water/rock ratio, and input from magmatic gases and subducted
sediment. Hot-spring temperatures range from 229º to 363ºC at the five northernmost fields, with
a general decrease to the south that is reversed at the Mariner field. The southernmost field, Vai
Lili, emitted water at up to 334C in 1989 but had a maximum venting temperature of only
121ºC in 2005, due to waning activity and admixture of bottom seawater into the subseafloor
plumbing system. Chloride varies both within fields and from one field to another, from a low of
528 mmol/kg to a high of 656 mmol/kg, and may be enriched by phase separation and/or
leaching of Cl from the rock. Concentrations of the soluble elements K, Rb, Cs, and B likewise
increase southward as the volcanic substrate becomes more silica-rich, especially on the Valu Fa
Ridge. Iodine and 7Li increase southward, and
11B decreases as B increases, apparently in
response to increased input from subducted sediment as the arc is approached. Species that
decrease southward as temperature falls are Si, H2S, Li, Na/Cl, Fe, Mn, and 87
Sr/86
Sr, whereas
pH, alkalinity, Ca, and Sr increase. Oxygen isotopes indicate a higher water/rock ratio in the
three systems on Valu Fa Ridge, consistent with higher porosity in more felsic volcanic rocks.
Vent waters at the Mariner vent field on the Valu Fa Ridge are significantly hotter, more acid
and metal-rich, less saline, and richer in dissolved gases and other volatiles, including H2S, CO2,
and F, than the other vent fields, consistent with input of magmatic gases. The large variations in
geologic and geophysical parameters produced by back-arc spreading along the ELSC, which
exceed those along mid-ocean ridge spreading axes, produce similar large variations in the
composition of vent waters, and thus provide new insights into the processes that control the
chemistry of submarine hot springs.

4
1. INTRODUCTION
Seafloor spreading in back-arc basins contrasts significantly with that along mid-ocean
ridges in the associated mantle dynamics, structure and composition of the crust, seafloor
morphology, and related hydrothermal springs and deposits. Back-arc crust may be more closely
analogous to ophiolites, and hydrothermal sulfide deposits formed there are more closely
analogous to massive sulfide ore deposits that are exploited on land (e.g., Franklin et al., 1981;
Sawkins, 1990; Hannington et al., 2005). Back-arc spreading axes provide critical geographic
and genetic links in the global distribution of hydrothermal vent organisms, especially in the
South and Western Pacific. For these reasons a back-arc spreading site was chosen for long-term
interdisciplinary study by U.S. National Science Foundation‘s RIDGE 2000 (R2K) program as
one of its first three Integrated Studies Sites (ISS). The targeted backarc for R2K is the Eastern
Lau Spreading Center (ELSC) in the Lau Basin, west of the Tonga volcanic arc (Fig. 1). The
ELSC is a first-order ridge segment that extends 397 km from the large non-transform offset near
1920‘S to the propagating southern tip of the Valu Fa Ridge (VFR) at about 2245‘S, where the
basin narrows toward the arc. The ELSC displays large and systematic variation over this
distance in spreading rate, magma source and lava chemistry, axial depth and morphology, melt
lens characteristics, crustal structure, and proximity to arc magma sources and to the subducting
slab at depth.
The VFR, which comprises the southernmost segments of the ELSC south of the non-
transform offset near 21˚26‘S and extending to 2245‘S, is the shallowest part of the ELSC,
despite having the slowest spreading rate and the deepest melt lens (Jacobs et al., 2007). It is
shallowest because it is closest to the active Tofua arc and presumably has the highest magma
supply rate (Martinez et al., 2006). Prior to the inception of R2K, the three hydrothermal fields
known from the ELSC were all on the VFR, and none of them had been visited since 1989: the
inactive White Church field, the low-temperature Hine Hina field with abundant macrofauna,
and the high-temperature Vai Lili field with sparse organisms (Fouquet et al., 1993; Herzig et al.,
1993). The 1989 data showed these fields to be unusual compared with hot springs from normal
mid-ocean ridges: the high-temperature (334C) Vai Lili field near 2215‘S displayed the lowest
pH (2.0) and the highest concentrations of K, Mn, Zn, Cd, Pb, As, and rare-earth elements ever
5
measured in a deep-sea hot spring. In 1989 the Vai Lili springs also had higher Cu, B, Rb, and
Cs than most mid-ocean ridge hydrothermal vents.
R2K has sponsored a series of cruises to the Lau Basin since 2004. Cruise 1 located 29
hydrothermal plume signatures in the water column along the ELSC (Baker et al., 2006;
Martinez et al., 2006). Cruise 2 used the Autonomous Benthic Explorer (ABE) to locate, map,
and photograph vent fields associated with these plumes. Three vent fields (Kilo Moana,
TowCam, and ABE) were located and imaged in detail (German et al., 2008). A fourth field,
Mariner, was discovered by Japanese scientists (Ishibashi et al., 2006), in part through use of
information provided by investigators on Cruise 2. Our Cruise 3, TUIM05MV on the R/V
Melville in April-May, 2005, located a fifth new vent field, Tui Malila, and visited all five as
well as the Vai Lili field with the ROV Jason, mapping them in detail (Ferrini et al., 2008) and
sampling them for igneous substrate, vent deposits, macro- and microbiota, and spring water.
Here we report results of shipboard and shorebased analyses of 81 spring water samples
collected from 43 vents in the six vent fields. Our immediate objective is to describe the
compositions of the vent waters and place them in the context of the variable geologic settings
present along the ELSC, in order to identify factors that affect the compositions of the hot
springs. Our larger objective is to determine the linkages among the regional and fine-scale
geology, the distribution and types of hydrothermal venting and resulting deposits, and the
biological communities that have evolved in response to the unusual and contrasting gradients in
spreading rate, magma supply, lava chemistry, and crustal structure found along the ELSC. A
clear understanding of these gradients, including the full range of variables and their
interrelationships, their upper and lower limits and their patterns of variation, whether uniform in
slope, stepwise or variable in some other way, is an essential prerequisite to understanding the
interplay among magmatic, tectonic, hydrothermal, and biological processes along the Lau back-
arc spreading axis.
2. GEOLOGIC SETTING
The ELSC encompasses among the most striking and pronounced gradients in
fundamental properties of any similar length of spreading axis on the globe (Martinez and
Taylor, 2002; Martinez et al., 2006). Accretionary variables such as ridge cross-sectional area

6
and axial depth, moreover, are anti-correlated with spreading rate, in contrast with the usual
positive correlations along the mid-ocean ridge. As the full spreading rate decreases from 97 to
39 mm/yr from north to south along the ELSC, axial depth shows a pronounced decrease from
3000 to 1600 mbsl (Fig. 2) rather than the usual increase, and axial cross-sectional area increases
southward (Table 1), from an axial valley with split volcanoes, through transitional, low-
amplitude morphology, to the steeply-sided axial ridge of the VFR (Martinez et al., 2006). Here,
the master variable appears to be proximity to the active Tofua arc, which is 110 km east of the
ELSC at the northern end but only 40 km away at the southern end where the VFR is
propagating into old arc crust. Increasing subduction influence appears to enhance magma
supply and to overwhelm the ―normal‖ controls imposed by spreading rate variation. Over the
same distance north to south the dominant crustal lithology changes from depleted tholeiitic
back-arc basin basalt (BABB) with Indian-type isotopic ratios along the northern ELSC, to arc-
like basaltic andesite, andesite, and rhyodacite with Pacific-type isotopic ratios along the VFR
closer to the arc (Martinez and Taylor, 2002). The southward increase in the silica content of
magmas would be accompanied by an increase in their volatile content, porosity, and viscosity,
which is reflected in the change in volcanic morphology (Table 1; Jacobs et al., 2007).
Gradients in other parameters, however, seem to be influenced by both spreading rate and
subduction influence, as estimated by proximity to the arc. The seismically imaged magma-lens
reflector deepens southward as spreading slows and the arc is approached (Fig. 2; Jacobs et al.,
2007). North of the ELSC the Central Lau Spreading Center (CLSC), opening at 87-90 mm/yr,
displays a shallow (1.1-2.0 km deep) reflector from 1820‘ to 1907‘S, typical of magma-lens
depths along the fast-spreading East Pacific Rise. Except for an isolated melt sill north of the
Kilo Moana vent field, no melt-lens reflectors have been detected along the northernmost 70 km
of the ELSC, even though this section has the fastest opening rates of 97-77 mm/yr. There is a
continuous or nearly continuous reflector southward from 2030‘S, however, that deepens
abruptly, from 2.0-2.4 km north of the VFR, to 2.3-3.3 km on the slower-spreading but inflated
VFR. The ELSC has a correspondingly thicker and slower layer 2A than the CLSC, and this
thickness is greatest and seismic velocity slowest along the VFR (Table 1). Moreover, along the
ELSC the layer 2A thickness has already reached its maximum at the axis, and shows no further
thickening with crustal age, as occurs along the CLSC and most mid-ocean ridges. Overall
crustal thickness increases southward along axis as well, from about 5.5 km at 18º33‘S

7
(Crawford et al., 2003) to as much as 9.0 km on the VFR (Turner et al., 1999). The thinnest crust
along the ELSC is found north of 2030‘S where there is no magma-lens reflector. These
changes contrast with those in response to increasing magma supply along the near-constant (45-
56 mm/yr) intermediate spreading rate Galapagos Spreading Center (GSC) as it approaches the
Galapagos hotspot (Detrick et al., 2002). As magma supply increases along the GSC, the magma
lens becomes shallower, layer 2a becomes thinner, but overall crustal thickness increases. The
crustal structure of the ELSC lies well outside that of normal crust formed along any mid-ocean
ridge (Jacobs et al., 2007).
2.1. Geologic setting of vent fields and vents
The six vent fields we sampled for hot spring waters are separated by distances of 4 to
142 km along the ELSC. Differences in geological and geophysical parameters at each vent field
are summarized in Table 1 and Figure 2. The northernmost fields, Kilo Moana and TowCam, are
located at similar depths of 2620 m and 2700 m, respectively. Hydrothermal activity in these
fields is associated with faults and fissures that crosscut broad, low-relief volcanic domes and
pillow and lobate flows (Ferrini et al., 2008). Igneous rocks recovered from these two fields are
basaltic in composition and exhibit small-scale chemical heterogeneities (Escrig et al., 2009).
Hot water discharges locally from edifices that stand ~3 to 16 m tall and are ~2 to 5 m in
diameter and, in the southern part of the TowCam vent field, from an ~8 m diameter mound
capped with small pipe-like chimneys. Warm, diffuse flow discharges from the basaltic substrate
near the base of edifices at the Kilo Moana vent field, and both near and far from edifices at the
TowCam field (Ferrini et al., 2008). The edifices are composed of coalesced pipes, some with
cactus-like protrusions (Tivey et al., 2005). Hot water exits from both open-conduit ―black
smokers‖ and from ―diffusers‖, ―white smoker‖ spires that lack any large open conduits.
Farther south, the ABE and Tui Malila vent fields are hosted in terrain that exhibits more
variable and complex volcanic morphology. Volcanic domes within and near these vent fields
have higher aspect ratios (height to width) than those near the northern fields. Pillows, aa-type
lavas, and distinct finger-like flows are also present, likely reflecting higher lava viscosity
(Ferrini et al., 2008). Igneous rocks recovered from near the ABE vent field are basaltic
andesites, with all lavas at or above saturation with H2O. A plot of the ratio of Ba/La, both highly

8
incompatible elements, from north to south exhibits a pronounced step to higher values near the
ABE vent field, reflecting a step-like change to a more andesitic composition and greater
subduction influence (Fig. 3; Escrig et al., 2009). The silica content of lavas recovered in 1989
from near the latitude of the Tui Malila vent field indicates rocks of basaltic andesite
composition (Fouquet et al., 1993). The ABE and Tui Malila vent fields are located at
significantly different depths of 2140 m and 1880 m, respectively, on two different spreading
segments, which differ in their large scale morphology from rounded at the latitude of ABE to
peaked at that of Tui Malila (Martinez et al., 2006). Both fields, however, are hosted on a
basaltic andesite substrate, both exhibit aa-type lavas and finger-like flows, and both are crosscut
by faults that trend N-S to NE-SW, with throws of 4 to 20 m, down-dropped to the east.
Columnar jointing was also observed in both vent fields along stepped fault scarps (Ferrini et al.,
2008). Hot water exits both open conduit ―black smokers‖ and ―diffusers‖ from vents that stand
3 to 8 m tall and have multiple spires, or from small (<1 m tall) chimneys; in addition, slightly
cooler waters pool beneath flanges that protrude from either fault scarps or sulfide-rich edifices
(Ferrini et al., 2008).
Farthest south, at the Mariner and Vai Lili vent fields on the Valu Fa Ridge, south of the
overlapping spreading center at 22°12'S, the volcanic morphology is dominated by small (tens of
meters diameter) domes, identifiable flow fronts, and an absence of crosscutting faults or fissures
(except for a single identified fault within the Vai Lili vent field; Ferrini et al., 2008). Volcanic
relief is greater than that within vent fields to the north, and aa-type lava flows dominate,
consistent with more viscous lavas (Ferrini et al., 2008). The silica content of lavas recovered in
1989 from near the latitude of these vent fields indicates rocks of predominantly basaltic-
andesite and andesite composition, with some basalts and dacites also recovered (Fouquet et al.,
1993). At the Mariner vent field, hot water discharges from the base and sides of tall (<10 to
27m), narrow (3 to 4 m diameter) pinnacles, while lower temperature water emanates from
tabular, squat edifices (Ferrini et al., 2008). While temperatures as high as 334°C were measured
at the Vai Lili vent field in 1989 (Fouquet et al., 1993), no high-temperature venting was
observed there in 2005. The highest temperature (121°C) water sampled in 2005 was from a pool
beneath a marcasite-lined flange. Cooler, clear, focused fluids (70°C) were sampled from an Fe-
oxide-rich chimney. Lower temperature (40°C) diffuse waters exiting directly from the igneous
substrate, and associated with thick microbial mats, were also sampled.

9
3. METHODS
81 spring water samples were collected by the ROV Jason in two types of bottles: 13 in
conventional 750-mL Ti-syringe samplers (Edmond et al., 1992) and 68 in 90-mL isobaric gas-
tight samplers (Seewald et al., 2002). For the gas-tight samplers, temperature was measured
continuously over the 1-2 minutes during which the sampler filled. For the Ti-syringes,
temperature was measured using the Jason probe immediately prior to sampling. In both cases
we report the maximum temperature measured. Dives were variable in duration so that 5-23
hours typically passed between sampling on the seafloor and recovery of samples on deck. Once
in hand samples were processed and analyzed as quickly as possible, although for a limited
number of samples 1-2 days passed before the samples could be processed due to malfunction of
the shipboard gas chromatographs.
Samples were filtered through 0.45 μm nylon filters and analyzed onboard ship using
IAPSO seawater as a standard (with estimated 1σ precisions in parentheses), for pH (±0.05 units)
by ion-specific electrode, alkalinity (±2%) by potentiometric Gran titration with 0.1N HCl,
chlorinity (±0.3%) (= chloride + bromide) by automated electrochemical titration with 0.1M
silver nitrate, Ca (±0.5%) by automated titration with 0.01M EGTA using an Orion Model 93-20
calcium ion-specific electrode, and Mg (±0.4%) by colorimetric titration with 0.03M EDTA for
total alkaline earths (Gieskes et al., 1991). Total aqueous sulfide (ΣH2S) was quantitatively
precipitated as Ag2S onboard ship so that concentrations (±4%) could be calculated following
gravimetric measurement in a shore-based laboratory at Woods Hole. Also analyzed shipboard,
using prepared standards, were dissolved sulfide (±5%) by colorimetry using methylene blue,
fluoride (±2%) by Orion Model 94-09 ion-specific electrode on solutions buffered with TISAB II
and corrected for Mg concentration, sulfate (±2%) and bromide (±4%) by ion chromatography,
and H2, methane, and CO by gas chromatography. Analysis of aqueous Mg concentration (±2%)
was repeated onshore by inductively-coupled plasma atomic-emission spectrometry (ICP-AES).
The shorebased gravimetric analyses for dissolved sulfide are reported here, as they proved to be
more accurate and precise. The shorebased analyses for Mg are reported only for those samples
in which the concentration was <5 mmol/kg, and thus difficult to measure accurately by the more

10
precise colorimetric titration. Where analyses were performed volumetrically, we converted the
results from mmol/liter to mmol/kg using a nominal density of 1.0243.
Elements measured in shorebased laboratories include Li, Na, K, Sr, B, Si, Mn, and Fe by
ICP-AES (C.G. Wheat); and Al, P, I, Rb, and Cs by ICP-mass-spectrometry (ICP-MS) (C.G.
Wheat and C.-F. You). As, Ge, Se, Sb, and Te were measured by hydride generation followed by
ICP-AES (T. Pichler). The abundances of Mn and Fe were determined in solids precipitated from
the solutions in the samplers subsequent to sampling, as well as in the solutions themselves. The
reported concentrations of Mn and Fe include the amount precipitated in the samplers. Reported
concentrations for Na were calculated from charge balance, as these values agree approximately
with those measured by ICP-AES but are much more precise. Dissolved inorganic carbon (DIC:
nearly all CO2 at low pH) was analyzed at Woods Hole by gas chromatography (Proskurowsi et
al., 2007). Isotopes were analyzed by mass spectrometry for O and H in H2O at the SIRFER
laboratory of the University of Utah, following evaporative separation to remove dissolved salts;
Li at Louisiana State University (L.H. Chan), B at National Cheng Kung University in Taiwan
(C.-F. You), and Sr at the University of Hawaii (M.J. Mottl); and S in H2S and C in methane and
DIC at Woods Hole. Carbon and helium isotopic results have been reported by Proskurowsi et al.
(2007).
4. RESULTS
We sampled 43 different vents from the six vent fields and collected 81 spring water
samples, 55 of which contained <10 mmol/kg Mg (and 52 <6 mmol/kg). Four samples from
three vents are not plotted in Figures 4 and 6-12 because they had >49.8 mmol/kg Mg and are
estimated to consist of >94% bottom seawater. The composition of hot springs within the six
vent fields varies both within a single field and from one field to another. To illustrate the intra-
field variations we have plotted the composition of each vent against distance from north to
south along the long axis of the vent field, which runs NE-SW, subparallel to the ridge axis, for
every field except Kilo Moana, which runs NNW-SSE (Figs. 4, 6-12, and Tables 2 and 3). We
have plotted the zero-Mg end-member concentrations for each vent, as is the usual practice, by
extrapolating from the composition of bottom seawater collected at each vent field, through the
Mg concentration measured in the samples from a given vent.

11
4.1. Temperature
The five northernmost fields vented low-Mg (<9 mmol/kg) fluids ranging in temperature
from 229º to 363ºC (Fig. 2 and Table 2). The four northern vent fields show a slight decline in
temperature from north to south (Fig. 4), but this trend is reversed at Mariner, which has the
largest range in temperature for low-Mg springs. With only three exceptions, the low-
temperature waters when extrapolated to zero Mg yielded temperatures within the same range as
the high-temperature vents from the same field, demonstrating that they were cooled mainly by
mixing with bottom seawater, introduced just prior to sampling, either within the edifice prior to
venting or by entrainment of ambient seawater during sampling. At the Vai Lili field in 2005 we
found a maximum temperature of only 121ºC, compared with 334C measured in 1989 (Fouquet
et al., 1993), indicating that hydrothermal activity is waning at Vai Lili. The Vai Lili springs
showed uniformly high Mg concentrations of 14-46 mmol/kg, suggesting that extensive mixing
with unreacted seawater in the shallow subsurface was a major factor in lowering their
temperature. Correcting for subseafloor mixing by extrapolating to zero Mg (Fig. 4) raises the
70º and 121ºC springs at Vai Lili to 95 ± 1º and 189 ± 3ºC, respectively (and the 40ºC spring to
270 ± 20ºC, although substantial uncertainty is associated with this value due to the large
extrapolation, from a measured concentration of 44.8 mmol/kg Mg).
4.2. Mg and Sulfate
As is typical for high-temperature springs of seawater origin, Mg and sulfate decrease
together linearly from their concentrations in seawater to nearly zero (Fig. 5). Negative
deviations from a linear decrease could result from precipitation of anhydrite on mixing of spring
water with seawater, as occurs within high-temperature chimneys. Positive deviations could
result from dissolution by cooler solutions of anhydrite precipitated earlier in the subsurface, or
from dissolution within the samplers of chimney particles that may have been entrained during
sampling.
4.3. pH, Alkalinity, Fe, Mn, H2S, and Si
12
Alkalinity (not shown) and pH generally increase southward from Kilo Moana to Vai
Lili, except for sharply decreased values at Mariner (Fig. 6). Mariner yielded a minimum pH of
2.5, similar to the value of 2 measured in the 334°C spring at Vai Lili in 1989 but much lower
than the 5.2 at Vai Lili in 2005. The negative values for alkalinity typically measured (Table 2)
denote the presence of mineral acidity. The patterns of variation in Fe and Mn from field to field
are almost exact mirror images of that for pH (Fig. 6), such that higher concentrations of these
metals correlate with lower pH. The only discrepancies are for Fe at Vai Lili in 1989, which is
lower than it would be if Fe mirrored pH perfectly, and Mn at Vai Lili in 2005. As Vai Lili
cooled from 334º to 121ºC between 1989 and 2005, pH rose from 2.0 to 5.3 and Fe fell 10-20-
fold, whereas Mn fell only 3-5-fold. The much smaller drop in Mn is consistent with our
interpretation in section 4.1 that the major cause of cooling at Vai Lili is mixing with seawater in
the shallow subsurface, a process that would efficiently precipitate Fe as sulfide minerals, but
leave Mn largely in solution.
Si and H2S show similar patterns from one field to the next (Figs. 4 and 6), decreasing
southward from Kilo Moana to Tui Malila, increasing to Mariner, and then decreasing sharply to
Vai Lili. These chemical species closely track temperature (Fig. 4).
4.4. Chlorinity and Br
Chlorinity varies both within fields and from one field to another, from a low of 528
mmol/kg at TowCam to a high of 656 mmol/kg at Tui Malila (Fig.7). Nearly all samples are
saltier than the ambient bottom seawater, and only TowCam has an average chlorinity (536 ± 10
mmol/kg) that is similar to that of bottom seawater (538 mmol/kg). Mariner shows the largest
range in chlorinity, from 531 to 626 mmol/kg. The range at ABE is almost as large, with
chlorinity increasing systematically from north to south. Chlorinity at TowCam and Tui Malila
also increases southward, whereas at Kilo Moana it increases northward.
Ratios of measured Br/chlorinity average 1.56 ± 0.05 (1σ) for the 81 samples, vs. 1.54 ±
0.03 for seawater (accounting for ±4% analytical uncertainty for Br). The three northern fields
average 1.57 ± 0.05. The three southern fields, those on the VFR, average 1.54 ± 0.04 and thus
on average are indistinguishable from seawater.
13
4.5. Alkali and Alkaline Earth Elements
Concentrations of Li and especially Na follow those of chlorinity (Fig. 7). Plotting the
ratios of Li (not shown) and Na to chlorinity (Fig. 7) eliminates the effect of variation in the
major anion and shows that these elements decrease southward, except for a strong reversal in
this trend for Na at Vai Lili. Na thus shows a strong minimum at Mariner, which has among the
lowest Na/chlorinity ratios ever measured in a seafloor hot spring.
In contrast with Li and Na, the patterns for the heavier alkalies K, Rb, and Cs are not so
strongly affected by chlorinity (Fig. 8). Plotting these elements as ratios to chlorinity (not shown)
removes most of the intrafield variation at ABE and Mariner, showing that it results mainly from
variation in chlorinity. Concentrations of K, Rb, and Cs are similar at the two northernmost,
basalt-hosted sites Kilo Moana and TowCam and are the only elements we measured (along with
possibly B and F) for which this is the case. These elements trend in the opposite direction from
Li and Na, increasing southward to a strong maximum at Tui Malila before decreasing slightly to
Mariner and Vai Lili.
The field-to-field pattern for Ca and Sr (Fig. 9) resembles that for K, Rb, and Cs, as both
sets of elements increase southward to a maximum at Tui Malila. The chief difference is that Ca
and Sr are higher at TowCam than at ABE or Kilo Moana. This pattern changes dramatically for
Ca, however, when it is plotted as the ratio to chlorinity (not shown): TowCam has the highest
Ca/chlorinity ratios, and ABE, Tui Malila, and Mariner are nearly identical to each other. The Sr
isotopic ratio (Fig. 9) is more or less inversely related to the Sr concentration. It also shows a
nearly identical pattern to temperature, Si, and H2S, except for a sharp increase at Vai Lili rather
than a decrease. This difference at Vai Lili represents a shift toward the value in seawater for all
three species, however, to very low values for H2S and Si and a higher value for the Sr isotopic
ratio, so in this sense the three patterns are similar.
4.6. Fluoride, CO2, I, and B, and the Isotopes of Li, B, O, and H
Fluoride (Fig. 10) is depleted relative to seawater in the four northernmost vent fields,
highly enriched at Mariner, and then highly depleted at Vai Lili. The pattern for CO2 (Fig. 10) is

14
nearly identical, except that all samples are enriched in CO2 relative to the concentration of
dissolved inorganic carbon (DIC) in seawater of 2.3 mmol/kg.
Iodine (Fig. 11) increases steadily southward from Kilo Moana to Mariner and then falls
off at Vai Lili. The isotopic composition of dissolved Li (Fig. 11) likewise increases southward,
all the way to Vai Lili. The resemblance between these two species extends to intra- as well as
interfield variation. Whereas all samples are highly enriched in I relative to seawater, they are all
depleted in 7Li compared with the
7Li value of about +32‰ in bottom seawater (Tomascak,
2004).
Like I and 7Li, B (Fig. 11) increase southward from Kilo Moana to Mariner and then
decrease at Vai Lili. This contrasts with δ11
B, which decreases steadily southward (Fig. 11). All
samples are substantially enriched in B relative to seawater and there is significant variation
within each vent field. All samples have lower δ11
B than does seawater.
The end-member oxygen isotopic ratio (Fig. 12) is significantly higher in the three
northern vent fields (18
O = +0.79 ± 0.19‰, 1σ, based on individual samples) than in the three
southern fields (18
O = +0.28 ± 0.10‰). In spite of a large range at some vent fields, especially
Kilo Moana (18
O = +0.39 to +1.08‰), there is almost no overlap between the northern fields
and the southern fields. All samples are slightly enriched in 18
O compared with bottom seawater.
The end-member hydrogen isotopic ratio (Fig. 12) is largely trendless from field to field,
as the average at Tui Malila is identical with that at Kilo Moana at D = -0.95‰ (based on
individual samples). Mariner is only slightly heavier at +0.01 ± 1.2‰ (1σ). δD ranges by several
per mil within each field, with the largest range of -4.1 to +2.2 again at Kilo Moana; in fact, this
range encompasses the entire range at the five northern vent fields. Nearly all samples are
heavier than bottom seawater, and only Vai Lili has an average δD (-5.1 ± 1.8‰) that is lighter.
4.7. Other Elements
Ge and As (not shown) trend upward from Kilo Moana in the north to Tui Malila in the
south, to maximum concentrations of 0.27 and 2.1 umol/kg, respectively, and then drop at
Mariner. Our maximum As concentration is far lower than the 6 to 11 mol/kg measured
shipboard at Vai Lili in 1989 (Fouquet et al., 1993). P, Se, Sb, and Te were also measured, with
maximum concentrations of 25 mol/kg and 15, 28, and <8 nmol/kg, respectively, but the results
15
are scattered and trendless. We have not plotted these data because they were mistakenly
measured on unacidified samples, are highly scattered, and probably do not represent the real
concentrations in the springs because of precipitation subsequent to collection.
Al was measured on 18 samples from the six vent fields. The Mariner field yielded
concentrations of <1, 8, and 11 mol/kg, and the ABE field concentrations of <1, <1, 4, and 4
mol/kg. The other 11 samples were below our detection limit of 1 mol/kg. The higher
concentration at Mariner is to be expected from its lower pH.
5. DISCUSSION
The six vent fields sampled during this study are spread along 246 km of the ELSC from
Kilo Moana in the north to Vai Lili in the south (Fig. 1). Owing to the southward convergence of
the ELSC and the Tofua arc volcanic front (Fig. 1), there is a systematic increase in the influence
of the arc and subducted slab on the composition and structure of the ridge-crest from north to
south along this distance. With respect to depth, igneous substrate, and large-scale
magmatic/tectonic parameters the six vent fields fall into three groups (Table 1): 1) Kilo Moana
and TowCam located on the northern ELSC are 29 km apart and lie on depleted tholeiitic back-
arc basin basalt (BABB) at 2620-2730 m depth, where the spreading rate is fast, the crust is
relatively thin, the axis is a trough, a magma lens is absent, and faults are abundant, large, and
widely spaced; 2) the ABE field, located 50 km south of TowCam on the central ELSC, lies on
basaltic andesites at an intermediate depth of ~2150 m, where spreading rate and crustal
thickness have intermediate values, the axis is flat, there is a moderately deep magma lens
(though not directly beneath the vent field), and km-scale faulting is less abundant (although
faults and fissures proved to be abundant at a vent field scale (Ferrini et al., 2008)); and 3) the
three southern fields lie on basaltic andesite and more felsic rocks along 25 km of the VFR at
1710-1920 m depth, where the spreading rate is much slower, the crust is thick, the axis is a
peaked ridge, and the magma lens is deep (Martinez et al., 2006). In the northern part of the VFR
near Tui Malila faults are common but are small and closely spaced (Martinez et al., 2006); at
the vent-field scale, in fact, Tui Malila resembles ABE. By contrast, except for a single eruptive
fissure seen at Vai Lili, surficial faults and fissures were not obseved at the two southernmost
fields, where hydrothermal circulation is likely controlled by volcanic structures and plumbing,

16
rather than by faulting and tectonics as appears to be the case at the four northern fields (Ferrini
et al., 2008). The transition from basalt in the north to basaltic andesite in the south, with much
greater influence from subduction, is abrupt along the ELSC, occurring over only ~15 km south
of TowCam as the spreading axis shoals from ~2500 to 2200 (Fig. 2)(Lau ISS Workshop Report,
2006; Michael and Seewald, 2007; Escrig et al., 2009). There is a gap of 142 km between ABE
and the three southern fields within which several hydrothermal plumes were found (Baker et al.,
2006), but which we did not have time to investigate.
Submarine hydrothermal fluids represent the integrated effects of reaction between
seawater and the rocks of the oceanic lithosphere, phase separation, and the release of volatile
species during magmatic degassing. The direction and magnitude of chemical exchange
associated with these processes is influenced by numerous variables that include temperature,
pressure, water/rock ratio, rock composition and texture, and subsurface hydrology. Accordingly,
substantial differences in the physical and chemical conditions along the ELSC may significantly
influence the composition of high-temperature vent waters from north to south in Lau Basin.
Results of this study show systematic variations in the physical and chemical properties of vent
waters from Kilo Moana in the north to Tui Malila in the south, while farther to the south, the
Mariner and Vai Lili vent fields are distinct in both temperature and fluid composition.
Assessing the response of vent water chemistry to changes in crustal structure and
composition is complex due to large differences in the chemical behavior of a given species
during high-temperature water-rock reaction. Species typically referred to as ―mobile‖ or
―soluble‖, for example, readily partition into the aqueous phase during water-rock reaction and
are only slightly incorporated into secondary alteration minerals (Mottl et al., 1978; Seyfried et
al., 1984; Von Damm, 1995). Their abundance in high-temperature hydrothermal fluids is
controlled mainly by substrate composition and water/rock ratio rather than by temperature and
pressure. In contrast, the abundances of species regulated by reversible chemical equilibrium,
commonly referred to as solubility controlled species, respond systematically to changes in
temperature, pressure, and the composition of the chemical system. The aqueous concentration
of a solubility controlled species will not directly reflect its abundance in the substrate due to its
incorporation into secondary alteration minerals. Although each type of species can be used as a
geochemical indicator to elucidate water-rock reactions in the subsurface, the response to

17
changing physical and chemical conditions from north to south along the ELSC may be very
different.
5.1. Temperature
Measured temperature represents an excellent example of how hydrothermal activity is
influenced by changing conditions along the ridge axis. The decrease in hot spring temperatures
southward from Kilo Moana to Tui Malila (Fig. 4) is consistent with circulation deeper into the
crust at the northern sites, as suggested by Martinez et al. (2006) based on a lower magma supply
there; a lower temperature of intrusion for more silicic magma at the southern sites; and/or a
higher water/rock ratio in the more porous silicic magma that characterizes the VFR, as
suggested by the oxygen isotope composition of the fluids (see below). Temperature could also
be influenced by buoyancy, which increases dramatically with increasing temperature and
decreasing pressure in the near-critical region of seawater (407C, 298 bar; Bischoff and
Rosenbauer, 1985). The decrease in maximum measured temperature from TowCam to ABE is
consistent with shoaling of the ridge axis from ~2700 m to ~2100 m between these two vent
fields. Further shoaling from ABE to Tui Malila is accompanied by a further decrease in average
temperature, although the temperature of the hottest vent at Tui Malila is similar to that at ABE,
suggesting seafloor depth is not the only factor influencing vent fluid temperature. The high
maximum temperature at Mariner (363C) in spite of its relatively shallow water depth (1920 m)
likely reflects input of high-enthalpy magmatic volatiles (see below) and/or differences in
subsurface hydrology associated with the absence of faulting.
5.2. Role of substrate composition
In general, the chemistry of the vent fields we sampled does not readily fall into the three
groups defined above on the basis of geology and substrate. Vent fields within the same group,
including Kilo Moana and Towcam on one hand and the three VFR fields on the other, do not
strongly resemble one another, and transitions from one group to another tend to be gradual
rather than abrupt. In particular, the hot springs in the four northernmost fields, which span all
three groups, show a more gradual and continuous variation than the abrupt changes in substrate
18
lithology and depth would suggest. This observation is perhaps not surprising considering that a
high degree of compositional heterogeneity is observed in crustal rocks at all locations (Fig. 3),
and this heterogeneity would be averaged by the circulating hydrothermal fluids. It clearly
implies, however, that substrate is not the dominant factor determining vent composition. The
hot springs at Tui Malila represent in most ways a continuation of trends shown by the three
fields much farther to the north, even though they lie shallower than 1900 m depth on more felsic
rocks on the VFR, south of the 142-km gap in our sampling. This generalization holds for
temperature, H2S, Si, 87
Sr/86
Sr, alkalinity, Li, Na/Cl, K, Rb, Cs, B, 11
B, F, I, and 7Li. The
largest discontinuity in hot spring chemistry lies between Tui Malila and the Mariner field,
which also lies on the VFR and is only 25 km farther south (although Tui Malila apparently has
only basaltic andesite, whereas dacites and rhyolites lie close to the vents at Mariner). This
discontinuity can be seen in temperature, H2S, pH, alkalinity, Fe, Mn, F, CO2, Na/Cl, K, Rb, and
Cs.
Although ridge segments along the ELSC are not characterized by distinct fluid
composition, there are some chemical trends that correlate directly with variations in substrate
composition from north to south. As felsic volcanism becomes more abundant southward due to
the influence of the subducted slab, the trace element composition of the rocks also changes. The
Ba/La ratio in crustal rocks is an excellent indicator of the slab component because these
elements are not fractionated during partial melting or fractional crystallization, but retain the
relative abundance of their source. High Ba/La ratios are indicative of an elevated slab
contribution (Pearce et al., 2005). Although they display a wide range in composition at any
location, rock samples collected as part of the R2K Lau ISS initiative show that gradients in
Ba/La and other parameters do not vary smoothly with distance from the arc or along axis, but
show instead a steep gradient between TowCam and ABE (Fig. 3). The rapid increase in Ba/La
and Ba concentration between TowCam and ABE and the more gradual increase farther south
would be accompanied by increased abundances of other incompatible elements such as K, Rb,
Cs, B, and Cl (Bezos et al., 2009; Escrig et al., 2009).
A striking feature of the chemical composition of ELSC vent fluids is the strong correlation
of mobile trace element abundances and substrate composition. Boron increases steadily from north
to south as far as the Mariner field (Fig. 11), and K, Rb, and Cs increase southward as far as Tui
Malila (Fig. 8), consistent with the higher abundance of these species in more slab-influenced

19
felsic rocks. The close relationship between mobile trace elements in fluids and rocks is
emphasized by the compositional changes between TowCam and ABE. Rock Ba/La ratios that
remain constant between Kilo Moana and TowCam show a rapid increase over the 50 km that
separates TowCam from ABE (Fig. 3). This trend is duplicated by the abundances of dissolved
K, Rb, Cs, and B, which are similar at Kilo Moana and TowCam and increase substantially at
ABE, suggesting that the source regions for these high-temperature fluids do not extend for large
distances along axis.
Fluid-mobile elements such as Rb, Cs, and B can be used to estimate water/rock ratios in
hydrothermal systems if their concentrations in the rock are known (Mottl and Holland, 1978;
Von Damm et al., 1985). Because the spread in rock composition is so large at each vent field,
these calculations are highly approximate. Using data for Rb and Cs in glasses from the Lau
Basin from PetDB (Lehnert et al., 2000) and from Bezos et al. (2009), we estimate water/rock
mass ratios for the six vent fields in 2005 to be in the range 1.6 to 3.7 (Table 4). These are
maximum values because the calculation assumes 100% extraction of Rb and Cs from the rock.
They show no obvious trend along axis. The oxygen isotopic composition of ELSC vent fluids
(Fig. 12: δ18
O = 0.1 to 1.1 ‰, heavier than seawater because of input of oxygen from the rock)
indicates similarly low water/rock ratios (Shanks, 1995). Lower δ18
O values at the three southern
vent fields that are more similar to the seawater value suggest higher water/rock ratios in their
high-temperature reaction zones than at the three northern fields. Low water/rock ratios indicate
that water-rock interaction in subsurface reaction zones is occurring under rock-dominated
conditions that likely buffer the abundance of solubility controlled aqueous species in response
to fluid-mineral equilibria (Bowers et al., 1985; Berndt et al., 1989; Seyfried et al., 1991).
Aqueous Li is another mobile species that is typically used to estimate water/rock ratios.
Unlike Rb and Cs, however, aqueous Li follows Na/Cl in decreasing in vent waters from north to
south (Fig. 7), despite being enriched in more felsic rocks. This trend suggests that Li is not
behaving as a mobile trace element, but instead is being regulated in solution by a secondary
alteration phase.
5.2.1. Chloride variability
Enrichments and depletions of Cl relative to seawater in mid-ocean ridge vent fluids are
typically attributed to phase separation (Butterfield et al., 1994, Von Damm et al., 1997; Seewald

20
et al. 2003; Seyfried et al., 2003). Maximum measured temperatures at the Mariner vent field
(363C) are very close to the two-phase boundary for seawater at the seafloor depth of 1920 m
(365C; Bischoff and Rosenbauer, 1985), consistent with on-going phase separation at this
location. Fluids from the four northern vent fields, however, have measured temperatures
significantly below the two-phase boundary, indicating that if phase separation has affected these
fluids, extensive subsurface cooling has occurred prior to venting at the seafloor. Most fluids at
mid-ocean ridge hydrothermal systems are characterized by non-seawater Cl concentrations and
vent at temperatures below the two-phase boundary, suggesting that phase separation followed
by cooling is a pervasive phenomenon (German and Von Damm, 2004; Von Damm, 1995).
In addition to phase separation, vent fluid Cl concentrations may be enriched by leaching
of rock-derived Cl. Leaching of Cl from rocks has not been considered as a source of Cl
enrichment in mid-ocean ridge hydrothermal systems because mid-ocean ridge basalts contain
very low concentrations of Cl. Back-arc basin basalts, however, are substantially enriched in Cl
relative to mid-ocean ridge basalts, and thus warrant consideration as a source of Cl to high-
temperature vent fluids in the Lau Basin. Cl abundances in crustal rocks along the ELSC show a
high degree of variability at a given latitude and, except for an apparent decrease from Kilo
Moana to TowCam, show an increase from north to south (Fig. 13). In general, ELSC vent fluids
are characterized by large enrichments relative to seawater by as much as 22%, although a few
fluids at TowCam, ABE, and Mariner show minor depletions (≤2 %) (Fig. 7). Variations in vent-
fluid chlorinity along axis are remarkably similar to variations in rock Cl content: both show a
decrease from Kilo Moana to TowCam and an increase farther south (Figs. 7 and 14), suggesting
that leaching of Cl from rock during high-temperature alteration may contribute to the elevated
Cl in ELSC vent fluids. Such an interpretation is consistent with the predominance of brines and
the scarcity of conjugate Cl-depleted vapors. Rock hydration during hydrothermal alteration may
also result in small degrees of vent fluid Cl enrichment. TowCam and ABE fluids with small Cl-
depletions may be indicative of minor Cl-fixation in amphiboles as is observed in
hydrothermally altered rocks from oceanic spreading centers (Ito et al. 1983).
Observed Br/Cl ratios in the ELSC show little variation and are close to seawater values.
At first glance, this might be interpreted as evidence to suggest phase separation is responsible
for Cl variability since Cl and Br do not fractionate during phase separation at near-critical
conditions (Berndt and Seyfried, 1990; Foustoukos and Seyfried, 2007). However, Br/Cl molar
21
ratios in mid-ocean ridge basalts (1.1) and arc volcanics (1.5 to 1.8; Villemant et al., 2008) are
not substantially different from that in seawater (1.54). If it is assumed that the Br/Cl ratio of
back-arc crust lies somewhere between that of mid-ocean ridge basalts and arc volcanics, mass
balance constraints do not allow leaching of halides from back-arc volcanics to change
significantly the Br/Cl ratio of vent fluids that have relatively small Cl enrichments (≤22 %). In
this case, therefore, constant Br/Cl ratios in vent fluids of varying chlorinity do not require phase
separation.
Data for the abundance of Cl in rocks along the ELSC (Fig. 13) allow assessment of
water/rock mass ratios in a similar manner to the calculations above based on Rb and Cs, if we
attribute the entire vent-fluid Cl enrichment over seawater values to rock leaching. Water/rock
ratios so calculated vary from 0.1 to 0.9 (Table 4), with no apparent trend from north to south.
These values are somewhat lower than those calculated from Rb and Cs, suggesting either that
Rb and Cs are incompletely leached or that the entire Cl increase cannot be attributed to rock
leaching, and some must result from phase separation and/or rock hydration. None of these
processes are mutually exclusive and all may play a role in regulating vent fluid Cl abundances
at Lau Basin. Overall, the range of water/rock mass ratios is comparable to values calculated for
mid-ocean ridge hydrothermal systems based on Li, K, and Rb, (0.3 to 1.9; Von Damm et al.,
1985) and B isotopic methods (0.28-0.66; Spivack and Edmond, 1987), and all indicate water-
rock reaction under rock-dominated conditions.
Concentrations of Cl that approach 0.15 wt % in nearby rocks at Mariner, and the
presence of vent fluids at the two-phase boundary for seawater, provide an excellent example of
vent-fluid Cl abundances that may be influenced by both rock leaching and active phase
separation. If it is assumed that Mariner fluids have the same or higher Cl content as at Tui
Malila prior to phase separation, then all fluids at Mariner may represent a vapor phase formed
from a brine, despite absolute Cl concentrations in Mariner fluids that are in excess of the
seawater value.
5.2.2. Contribution from subducted sediment
The strongest evidence for increased input from subducted sediment southward as the arc
is approached is iodine (Fig. 11) (Campbell and Edmond, 1989; You et al., 1994). This element
increases steadily from Kilo Moana in the north to Mariner in the south, along with F, 7Li, and
22
B. Boron concentrations on the ELSC are exceptionally high among seafloor hot springs, and
11
B is exceptionally low, especially to the south (Fig. 11). Both are exceeded only by fluids
from sedimented ridges at the Okinawa Trough (You et al., 1994) and the Suiyo Seamount in the
Izu-Bonin island arc (Ishibashi and Urabe, 1995). Although the scatter in 11
B is large (Fig. 14),
the two northern vents Kilo Moana and TowCam could arguably represent mixtures of seawater
B with B leached from basalt. The southern vents, including ABE and the three VFR fields, have
an additional isotopic component, which is probably B desorbed from slab sediments, as
suggested for the 1989 Vai Lili samples by You et al. (1994). Desorbed B has a 11
B value of
about +15 ‰ (Spivack et al., 1987). Like I, the B data support a contribution from subducted
sediment that increases to the south as the arc is approached.
The range in 7Li in our samples is quite small, only +3 to +7‰, but the trend is quite
regular, increasing southward in parallel with I (Fig. 11) as the Li concentration decreases from
900 to 300 mol/kg, compared with only 27 mol/kg in seawater at +32‰ 7Li. The narrow
range in 7Li is not diagnostic, as it overlaps the ranges for mid-ocean ridge basalt (MORB) of
+3 to +6‰, arc lavas of +1 to +11‰, and sediments of -5 to +8‰ (Tomascak, 2004) (Fig. 15).
Nevertheless, its close tracking with I (Fig. 11) suggests that it too reflects a proportionately
larger contribution from subducted sediment that increases to the south (although the
concentration of Li decreases southward).
5.3. Fluid-mineral equilibria
Laboratory and theoretical studies have demonstrated that fluid-mineral equilibria under
hydrothermal conditions are a sensitive function of temperature and pressure. It is not surprising,
therefore, that aqueous concentrations of solubility controlled species in Lau vent waters vary
systematically from north to south. Perhaps the best example of this is the observed SiO2(aq)
concentrations that decrease from a maximum value of 21.7 mmol/kg at Kilo Moana to 7.8
mmol/kg at the low-temperature Vai Lili vents (Fig. 4). This trend is consistent with aqueous
SiO2 abundance being controlled by quartz solubility, which increases with temperature and
pressure below the critical point of seawater (Fournier, 1983; Von Damm et al., 1992;
Foustoukos and Seyfried, 2007).
23
Dissolved Na and Ca concentrations are likewise known to be buffered by fluid-rock
reactions at elevated temperature and pressure. In particular, the stability of plagioclase solid
solutions plays a critical role in regulating Na and Ca in solution (Seyfried et al, 1987; Berndt et
al., 1989; Seyfried et al., 1991; Berndt and Seyfried, 1993) according to the reaction:
CaAl2Si2O8 + 2Na+ + 4SiO2(aq) = 2NaAlSi3O8 + Ca
2+ (1)
anorthite albite
where anorthite and albite represent the calcic and sodic components of plagioclase solid
solution, respectively. The extent of Na-fixation that occurs in response to albitization decreases
with increasing temperature due to a decrease in the equilibrium constant for reaction 1 (Seyfried
et al., 1988). Because Na is the major cation in seafloor hydrothermal fluids, charge balance,
mass action, and compositional constraints require that its concentration be closely linked to
chloride in fluids with salinity near that of seawater. Accordingly, when evaluating along-axis
variations in aqueous Na abundance it is useful to normalize end-member Na concentrations to
chloride. The Na/Cl ratio decreases from north to south along the ELSC to values significantly
below that of seawater (Fig. 7). While phase separation and rock hydration have a minor effect
on aqueous Na/Cl ratios (Bernd and Seyfried, 1997), the influence of Cl leaching is unknown
due to a lack of information on the mode of Cl occurrence in rocks, the mechanisms associated
with release of Cl to solution, and the cation that is ultimately needed to balance charge.
Although the decrease in the Na/Cl ratio may be attributed to addition of rock-derived Cl if Na is
not the cation that balances charge, it is also consistent with an increase in the extent of
albitization from north to south, a trend that, except for the volatile influenced Mariner and Vai
Lili vent fluids, is generally consistent with decreasing temperatures (Fig. 4). The Na/Cl ratio at
Kilo Moana appears slightly anomalous, however, as it is slightly higher than at TowCam, the
similar temperatures and aqueous SiO2 concentrations notwithstanding. Decreased albitization
may suggest higher temperatures in deep-seated reaction zones at Kilo Moana that are masked by
subsequent cooling of fluids during upflow to the seafloor.
Additional evidence for enhanced albitization to the south is provided by along-axis
variations in Li abundance that are virtually identical to those observed for Na/Cl ratios (Fig.7).
Although Li is typically viewed as a mobile element during hydrothermal fluid-rock interaction

24
(Seyfried et al., 1984), it is also incorporated into extensively albitized mid-ocean ridge basalts
(Shaw et al., 1977). Moreover, laboratory experiments have demonstrated uptake of Li during
albitization of calcic plagioclase at greenschist-facies temperatures (Seewald, 1987).
Accordingly, both Na and Li provide evidence for plagioclase buffering of major and trace
elements in ELSC vent fluids.
Aqueous Ca and Sr represent additional species influenced by plagioclase equilibria
under hydrothermal conditions (Berndt et al., 1988, 1989). Ca concentrations are consistent with
the extent of albitization as indicated by Na/Cl ratios. Kilo Moana fluids, e.g., have the lowest Ca
concentrations, consistent with high Na/Cl ratios, while increases in Ca in the southern vent
fluids (Fig. 9) are consistent with enhanced albitization. It has been well documented that water-
rock reactions that regulate Ca concentration also regulate the abundance of Sr (Berndt et al.,
1989; Ravizza et al., 2001), and this is clearly the case in ELSC vent fluids as evidenced by the
strong covariation of Ca and Sr (Fig. 9).
Because Sr isotopes (Fig. 9) do not fractionate during dissolution and precipitation
reactions, they can be used to identify sources and sinks for Sr and Ca in subsurface
environments. The Sr isotopic composition of ELSC vent waters shows a strong linear
correlation when plotted against 1/Sr (Fig. 16). This trend is not consistent with simple mixing
between Sr from seawater (87
Sr/86
Sr = 0.70910) and Sr from crustal rocks along the VFR
(87
Sr/86
Sr = 0.7032; Vallier et al., 1991; Escrig et al., 2009), which would produce significantly
higher 87
Sr/86
Sr values for a given Sr concentration than is observed. Berndt et al. (1988) have
shown that the relationship between 87
Sr/86
Sr and Sr abundance observed in mid-ocean ridge
vent waters can be accounted for by a two-stage evolution involving 1) early precipitation of
anhydrite during recharge that results in removal of Sr and Ca from solution, followed by 2)
dissolution of primary plagioclase that releases Sr and Ca to solution in high-temperature
reaction zones. Early- stage precipitation removes seawater Sr from solution, while subsequent
dissolution of plagioclase adds rock Sr, decreasing the 87
Sr/86
Sr ratio and increasing the Sr
concentration in solution.
The precipitation/dissolution model of Berndt et al. (1988) can be applied to the ELSC
vent fluids to estimate the amount of Sr removed during recharge and the extent of plagioclase
dissolution. Figure 17 shows that the correlation of 87
Sr/86
Sr ratio with Sr concentration is
consistent with mixing between a low-Sr fluid containing approximately 23 m/kg produced by

25
precipitation of anhydrite, with varying amounts of rock Sr characterized by a 87
Sr/86
Sr ratio of
0.7032, similar to that measured in andesitic rocks from the VFR (Vallier et al., 1991). The
narrow range of Sr concentrations indicated for the fluid prior to mixing with rock Sr suggests
that the amount of anhydrite precipitated is relatively uniform along the entire length of the
ELSC. This result is somewhat surprising considering the large variations in depth and
subsurface hydrology from north to south.
Estimated water/rock ratios according to the precipitation/dissolution model vary from 10
to 20, and are higher than values estimated based on the abundance of mobile species.
Water/rock ratio estimates, however, are species-specific and provide different types of
information. Mobile elements such as K, Rb, Cs, B, and Cl tend to be rapidly and quantitatively
released from interstitial glass and unstable phases, and so provide an indicator of the total
amount of rock physically encountered by a fluid. In contrast, Sr resides mainly in the more
stable phases plagioclase and clinopyroxene. The higher water/rock ratios calculated from Sr
isotopes thus will reflect alteration of only these Sr-bearing phases. Moreover, the model utilized
above is likely an oversimplification of what is actually occurring in the subsurface, since Sr is
incorporated into secondary alteration phases such as hydrothermal plagioclase, epidote, and
amphiboles. As noted by Berndt et al. (1989), non-unique, path-dependent models that account
for incorporation of Sr into alteration phases other than anhydrite produce lower estimated
water/rock ratios.
Despite these uncertainties, the relative distribution of water/rock ratio should reflect the
extent of plagioclase recrystallization during albitization. Thus, water/rock ratios that decrease
from Kilo Moana, to similar values at TowCam and ABE, to even lower values at Tui Malila
(Fig. 16), are entirely consistent with other aspects of fluid composition that suggest increasing
albitization from north to south. Neither Mariner nor Vai Lili as sampled in 1989 fit with this
trend, probably because the extremely high H+ activity in those two fields influences the stability
of Sr-bearing phases.
The major element composition of submarine hydrothermal fluids plays a critical role in
regulating their in situ pH and their ability to transport metals, the aqueous activity of which is
controlled by the solubility of sulfide minerals. Several studies have demonstrated that in basalt-
hosted systems acidity is generated in high-temperature reaction zones by Ca-fixation in
clinozoisite (the Ca-component of epidote solid solution) or in other Ca-bearing minerals such as
26
amphiboles (Seyfried et al, 1987; Berndt et al., 1989; Seyfried et al., 1991). High Ca activity in
solution is maintained by the stability of calcic plagioclase, which buffers Na/Ca ratios at
temperatures near the critical point of seawater. The effectiveness of Ca-fixation as a mechanism
for generating acidity and mobilizing metals decreases dramatically with decreasing temperature
and anorthite activity (Seyfried and Janecky, 1985; Berndt et al., 1989; Seewald and Seyfried,
1990; Seyfried et al., 1991). Increasing pH (as measured at 25C) and decreasing concentrations
of dissolved metals from Kilo Moana to Tui Malila (Fig. 6) indicate that the ability of vent fluids
to transport metals to the seafloor is decreasing from north to south. This trend likely reflects
both a southward decrease in temperature and a change in substrate composition as the anorthite
component of plagioclase decreases in more felsic rocks to the south. The influence of
temperature and pH is also evident in the aqueous concentrations of dissolved H2S that
systematically decrease from north to south (Fig. 6).
The possibility that temperatures in deep-seated reaction zones may be significantly
higher than values measured at the seafloor at Kilo Moana, as suggested by Na/Cl ratios and Ca
concentrations, is supported by the lower pH (25°C) and higher H2S, Fe, and Mn concentrations
than at TowCam. Indeed, measured Fe concentrations at Kilo Moana are almost an order of
magnitude higher than at TowCam, consistent with a pH (25C) that is substantially lower. That
Fe concentrations are significantly higher at Kilo Moana than is typically observed in submarine
hot springs at temperatures 333C (Von Damm, 1995; German and Von Damm, 2004) suggests
that cooling and subsequent ascent of hydrothermal fluid to the seafloor at Kilo Moana is
sufficiently rapid to preclude re-equilibration as the solutions cool.
5.4. Intra-field variability
Many of the basin-wide trends observed in the composition of vent waters along the
ELSC are also apparent within the 665 m length of spreading axis sampled at the ABE vent field.
For example, end-member concentrations of mobile elements K, Rb, Cs (Fig. 8), Cl (Fig. 7), and
I (Fig. 11) increase from north to south, a trend that can be attributed to a local continuation of
the steep gradient in substrate composition observed on a larger scale between TowCam and
ABE. Alternatively, increasing abundances of mobile trace elements may reflect decreasing

27
water/rock ratios from north to south within the ABE field, as suggested by oxygen isotopes
(Fig. 12). Presently, the data do not allow us to distinguish between these two possibilities.
Systematic intra-field compositional variation at ABE is not limited to mobile elements,
but applies as well to the concentrations of solubility controlled species. Aqueous SiO2, Na/Cl,
Fe, Mn, and H2S all decrease from north to south with temperature (Figs. 4, 6, and 7), while pH
(25C), Ca, and Sr increase (Figs. 6 and 10). As is the case for the basin-wide trends, these
variations are consistent with decreasing temperature within the ABE vent field, from a
maximum of 309C at the northern vents to 295C at the southern vents. This decrease results in
greater albitization, lower aqueous SiO2 due to reduced quartz solubility, higher pH, and reduced
metal mobility.
Variations in the Sr isotopic composition and Sr concentration of the vent waters also
indicate decreased water/rock ratio to the south within the ABE field. In particular, the
southernmost waters contain the highest Sr concentration and lowest 87
Sr/86
Sr ratio (Fig. 9),
consistent with reaction at lower water/rock ratio (Fig. 16). It is not possible to determine
whether this reflects an increase in the amount of rock that has reacted with fluids or enhanced
albitization due to lower temperatures. The observation that mobile trace elements increase to the
south in conjunction with lowered measured vent temperatures, however, suggests that both
processes are important.
5.5. Role of magmatic gases
The chemistry of vent fluids at the four northern vent fields along the ELSC is very
similar to fluids from numerous basalt-hosted mid-ocean ridge hydrothermal systems sampled at
similar temperatures (Von Damm 1995; German and Von Damm, 2004). In the 2005 Lau data
set, however, an abrupt change in chemistry occurs between Tui Malila and Mariner, two fields
on the VFR that are only 25 km apart, resulting in fluid compositions at Mariner and Vai Lili that
are not observed at mid-ocean ridges. Vent waters at Mariner are significantly hotter, more acid
and metal-rich, less saline, and richer in dissolved gases and other volatiles, including H2S, CO2,
and F (Figs. 6 and 11), than those at Tui Malila and vents farther north. These characteristics are
similar to those that prevailed at Vai Lili in 1989 (Fouquet et al., 1993). Although differences in
fluid composition are expected at Mariner due to higher temperatures of water-rock reaction and
28
active phase separation at and below the seafloor, the extreme levels of acidity and associated
metal mobility are not observed in basalt-hosted mid-ocean ridge hydrothermal systems at
similar or higher temperatures that are also experiencing active phase separation (Butterfield et
al., 1994; Von Damm et al., 1997; Seyfried et al., 2003). Because the substrate at Mariner is
similar to that at Tui Malila (except for nearby dacites at Mariner), the substantial difference in
fluid composition suggests a fundamental shift in geochemical processes regulating fluid
composition.
The dramatically lower pH and higher CO2 and fluoride in Mariner vent fluids is almost
certainly due to input of magmatic volatiles from an actively degassing magma chamber. It is
possible that for the more felsic magmas of this region, SO2 represents a stable sulfur species that
is degassed (Wallace, 2001). Mixing of any magmatically derived SO2 with convecting
hydrothermal fluids would cause the SO2 to disproportionate on cooling into sulfuric acid and
either one or both of elemental sulfur and H2S, depending on temperature and the redox state of
the fluid (Gamo et al., 1997). Thus, addition of magmatic gases rich in sulfuric acid along with
HCl and HF will greatly increase the acidity of convecting seawater-derived hydrothermal fluids,
enabling them to carry exceptionally high concentrations of chalcophile metals such as Fe, Cu,
and Zn. Elevated sulfate concentrations would not be expected in fluids affected by SO2 addition
because the high concentration of Ca and the strong retrograde solubility of anhydrite (Bischoff
and Seyfried, 1978; Holland and Malinin, 1979) would cause anhydrite to precipitate, leaving
low pH as the only evidence of subsurface SO2 contributions. Evidence for subsurface
precipitation of anhydrite by this mechanism has been reported from drillcore samples recovered
from beneath the PACMANUS hydrothermal system in the eastern Manus Basin (Roberts et al.,
2003).
High concentrations of fluoride at Mariner, well above that in seawater, may be
diagnostic of a magmatic input, as ridge-crest hydrothermal fluids are generally depleted in
fluoride relative to seawater (Edmond et al., 1979; Von Damm et al., 1985), as are the four
northern vent fields of the ELSC reported here (Fig. 10). Laboratory experiments suggest that
fluoride substitutes for OH- in hydrous phases during water-rock reactions at 150 to 250C, but
that it is highly mobile at temperatures >250C (Seyfried and Ding, 1995). The sharp increase in
fluoride at Mariner does not appear to correlate with substrate composition, which shows a
continuous and gradual southward increase in F beginning in the region of Kilo Moana (Fig. 13).

29
Mass balance calculations based on the abundances shown in Fig. 13 indicate that very little of
the fluoride present in crustal rocks of the ELSC is mobilized into solution during water-rock
reaction. The elevated concentrations appear to reflect direct injection of magmatic volatiles
under temperature and pH conditions that limit the formation of fluoride-bearing phases.
The absence of evidence for magmatic degassing into the hydrothermal system at Tui
Malila is intriguing, as seismic data indicate that both Mariner and Tui Malila are underlain by
magma chambers (Jacobs et al., 2007), though the horizontal extent of the reflector beneath
Mariner is exceptionally large (Collier and Sinha, 1992). This observation suggests that if the
magma chamber at Tui Malila is degassing, then differences in subsurface hydrology, perhaps
due to the presence or absence of extensive faulting, is preventing these volatiles from
interacting with seawater-derived hydrothermal fluids. Alternatively, low abundances of
magmatic volatiles in Tui Malila vent fluids may reflect a lack of magmatic degassing due to
differences in the volatile content of magmas at these two locations. Jacobs et al. (2007) have
suggested that an increase in the thickness of crustal layer 2A and a deepening of the magma
chamber between Tui Malila and Mariner is due to increased abundance of magmatic volatiles at
Mariner. These geophysical observations are consistent with the composition of vent fluids at
Tui Malila and Mariner.
6. SUMMARY AND CONCLUSIONS
The ELSC displays large and systematic variation in spreading rate, magma source and
lava chemistry, axial depth and morphology, melt lens characteristics, crustal structure, and
proximity to the volcanic arc over its 397-km length. These variations are strongly reflected in
the chemistry of the fluids we sampled for this study from six hydrothermal vent fields that span
247 km of the ELSC. For some elements the composition of the hot springs depends directly on a
geologic parameter, as in the case of the fluid-mobile elements K, Rb, and Cs, which depend on
crustal composition. The concentrations of these elements increase southward as far as the Tui
Malila vent field as the arc is approached and the crust becomes more felsic. Vent field chloride
variations likewise seem to be related to concentrations of Cl in the substrate, in addition to
phase separation. In similar fashion B, I, and 7Li increase southward all the way to the Mariner
vent field, and 11
B decreases, indicating an increasing southward influence of subducted
30
sediment. A second direct dependency applies to those chemical species introduced by magmatic
degassing, such as F and CO2 at the Mariner vent field, and the effect of magmatic gases on pH.
For other chemical species, however, their chemistry depends indirectly on geologic and
geophysical parameters, via the effect of these parameters on changes in temperature, pressure,
and water/rock ratio, related to the hydrogeology of the hydrothermal fields. Solubility controlled
species that are largely determined by temperature include pH (which rises as temperature
decreases southward to Tui Malila), Si, H2S, Li, Na, Ca, and Sr. Fe and Mn respond to both
temperature and pH. Oxygen isotopes respond mainly to changes in water/rock ratio, which is
apparently higher in the felsic rocks of the Valu Fa Ridge. Sr isotopes respond to both
temperature and water/rock ratio.
The large variations in geologic and geophysical parameters produced by back-arc
spreading along the ELSC exceed those along mid-ocean ridge spreading axes and differ
significantly in their interrelationships, especially between spreading rate and magma supply.
These variations provide important new insights into the specific processes that control the
chemistry of submarine hydrothermal springs.
Acknowledgments. We thank the captain, crew, and technicians of the R/V Melville, and the crew
of the DSV Jason, for enabling us to discover the Tui Malila vent field and to collect such an
excellent suite of samples at all six vent fields and to map them so thoroughly. The authors thank
the scientists and crew members of R/V Kilo Moana (KM0417; Charles Langmuir, Chief
Scientist) and R/V Southern Surveyor (TELVE; Richard Arculus, Chief Scientist) for their
tremendous efforts in mounting field programs to obtain rock samples. We thank the U.S.
National Science Foundation and its RIDGE 2000 Program for funding this study via grants
OCE0241826 (to MJM), OCE0242902 (to PJM), OCE0241796 (to JSS, MKT), and
OCE0242088 (to CGW), as well as the Deep Ocean Exploration Institute at WHOI (to GP, ER).
We thank Drs. Jun-Ichiro Ishibashi and Kentaro Nakamura and two anonymous reviewers for
their helpful comments. We dedicate this work to the memory of Drs. Karen Von Damm and
Lui-Heung Chan, and especially their mentor Dr. John Edmond, who did so much to further our
understanding of hydrothermal vent chemistry over the past three decades.
31
REFERENCES
Baker E. T., Resing J. A., Walker S. L., Martinez F., Taylor B. and Nakamura K. (2006)
Abundant hydrothermal venting along melt-rich and melt-free segments in the Lau back-arc
basin. Geophys. Res. Lett. 33, L07308, doi:10.1029/2005GL025283.
Berndt M. E. and Seyfried W. E. Jr. (1993) Calcium and sodium exchange during hydrothermal
alteration of calcic plagioclase at 400°C and 400 bars. Geochim. Cosmochim. Acta 57, 4445-
4451.
Berndt M. E. and Seyfried W. E. Jr. (1990) Boron, bromide, and other trace elements as clues to
the fate of chlorine in mid-ocean ridge vent fluids. Geochim. Cosmochim. Acta 54, 2235-2245.
Berndt M. E., Seyfried W. E. Jr. and Janecky D. R. (1989) Plagioclase and epidote buffering of
cation ratios in mid-ocean ridge hydrothermal fluids: experimental results in the near
supercritical region. Geochim. Cosmochim. Acta 53, 2283-2300.
Berndt M. E., Seyfried W. E. Jr. and Beck J. W. (1988) Hydrothermal alteration processes at
midocean ridges: experimental and theoretical constraints from Ca and Sr exchange reactions
and Sr isotopic ratios. J. Geophys. Res. 93, 4573-4583.
Bézos A., Escrig S., Langmuir C. H., Michael P. J. and Asimow P. D. (2009) Origins of chemical
diversity of back-arc basin basalts: a segment scale study of the Eastern Lau Spreading Center. J.
Geophys. Res. 114, B06212, doi:10.1029/2008JB005924, 30 June 2009.
Bischoff J. L. and Rosenbauer R. B. (1985) An empirical equation of state for hydrothermal
seawater (3.2 percent NaCl). Amer. J. Sci. 285, 725-763.
Bischoff J. L. and Seyfried W. E. Jr. (1978) Hydrothermal chemistry of seawater from25° to
350°C. Amer. J. Sci. 278, 838-860.
Bowers T. S., Von Damm K. L. and Edmond J. M. (1985) Chemical evolution of mid-ocean
ridge hot springs. Geochim. Cosmochim. Acta 49, 2239-2252.
Butterfield D. A., McDuff R. E., Mottl M. J., Lilley M. D., Lupton J. E. and Massoth G. J.
(1994) Gradients in the composition of hydrothermal fluids from the Endeavour segment vent
field: phase separation and brine loss. J. Geophys. Res. 99, 9561-9583.
Campbell A. C. and Edmond J. M. (1989) Halide systematics of submarine hydrothermal vents.
Nature 342, 168-170.
Collier J.S. and Sinha M.C. (1992) Seismic mapping of a magma chamber beneath the Valu Fa
Ridge, Lau Basin. J. Geophys. Res. 97, 14,031-14,053.
32
Crawford W. C., Hildebrand J. A., Dorman L. M., Webb S. C. and Wiens D. A. (2003) Tonga
Ridge and Lau Basin crustal structure from seismic refraction data. J. Geophys. Res. 108,
doi:10.1029/2001JB001435.
Detrick R. S., Sinton J. M., Ito G., Canales J. P., Behn M., Blacic T., Cushman B., Dixon J. E.,
Graham D. W. and Mahoney J. (2002) Correlated geophysical, geochemical and volcanological
manifestations of plume-ridge interaction along the Galapagos Spreading Center. Geochem.,
Geophys., Geosyst. 3 (10), 8501, doi:10.1029/ 2002GC000350, 2002.
Edmond J. M., Massoth G. and Lilley M. D. (1992) Submersible deployed samplers for axial
vent waters. RIDGE Events 3 (1), 23–24.
Edmond J. M., Measures C., McDuff R. E., Chan L. H., Collier R., Grant B., Gordon L. I. and
Corliss J. B. (1979) Ridge crest hydrothermal activity and the balances of the major and minor
elements in the ocean: the Galapagos data. Earth Plan. Sci. Lett. 46, 1-18.
Escrig S., Bézos A., Goldstein S. L., Langmuir C. H. and Michael P. J. (2009) Mantle source
variations beneath the Eastern Lau Spreading Center and the nature of subduction components in
the Lau basin-Tonga arc system. Geochem., Geophys., Geosyst. 10, Q04014,
doi:10.1029/2008GC002281.
Ferrini V. L., Tivey M. K., Carbotte S. M., Martinez F. and Roman C. (2008) Variable
morphologic expression of volcanic, tectonic, and hydrothermal processes at six hydrothermal
vent fields in the Lau back-arc basin. Geochem. Geophys. Geosystems 9 (7),
doi:10.1029/2008GC002047.
Fouquet Y., von Stackelberg U., Charlou J. L., Erzinger J., Herzig P. M., Muhe R. and Wiedicke
M. (1993) Metallogenesis in back-arc environments: the Lau Basin example. Econ. Geol. 88,
2154-2181.
Fournier R. 0. ( l983) A method of calculating quartz solubilities in aqueous sodium chloride
solutions. Geochim. Cosmochim. Acta 47, 579-586.
Foustoukos D. I. and Seyfried W. E. Jr. (2007) Trace element partitioning between vapor, brine
and halite under extreme phase separation conditions. Geochim. Cosmochim. Acta 71, 2056-
2071.
Franklin J. M., Lydon J. W. and Sangster D. F. (1981) Volcanic–associated massive sulfide
deposits. Econ. Geol. 75, 485–627.
Gamo T., Okamura K., Charlou J.-L., Urabe T., Auzende J.-M., Ishibashi J., Shitashima K.,
Chiba H. and the Shipboard Scientific Party of the ManusFlux Cruise (1997) Geology 25, 139-
142.
German C. R. and Von Damm K. L. (2004) Hydrothermal processes. In The Treatise on
Geochemistry, edited by K. K. Turekian and H. D. Holland, chap. 6.07, pp. 181–222, Elsevier,

33
New York.
German C. R., Yoerger D. R., Jakuba M., Shank T. M., Langmuir C. H. and Nakamura K. (2008)
Hydrothermal exploration with the Autonomous Benthic Explorer. Deep Sea Res. Pt. I. 55 (2),
203-219. 10.1016/j.dsr.2007.11.004.
Gieskes J. M., Gamo T. and Brumsack H. (1991) Chemical methods for interstitial water
analysis aboard JOIDES Resolution. Ocean Drilling Program, Texas A&M University, Tech.
Note 15, College Station TX, 59 pp.
Hannington M. D., de Ronde C. E. J. and Petersen S. (2005). Sea-floor tectonics and submarine
hydrothermal systems, p. 111–141 in 100th Anniversary Volume of Economic Geology. J.
Hedenquist et al., eds., Society of Economic Geologists, Littleton, Colorado.
Herzig P., Hannington M. D., Fouquet Y., von Stackelberg U. and Petersen S. (1993) Gold-rich
polymetallic sulfides from the Lau back arc and implications for the geochemistry of gold in sea-
floor hydrothermal systems of the Southwest Pacific, Econ. Geol. 88, 2182-2209.
Holland H. D. and Malinin S. D. (1979) The solubility and occurrence of non-ore minerals. In
Geochemistry of Hydrothermal Ore Deposits (ed. H. L. Barnes), pp. 461-508. Wiley-
Interscience.
Ishibashi J.-I. and Urabe T. (1995) Hydrothermal activity related to arc-backarc magmatism in
the western Pacific. In B. Taylor (ed.), Backarc Basins;Tectonics and Magmatism, 451–495,
Plenum Press, New York.
Ishibashi, J.-I., Lupton J. E., Yamaguchi T., Querellou J., Nonoura T. and Takai K. (2006)
Expedition reveals changes in Lau Basin hydrothermal system, Eos Trans. AGU 87(2), 13,
doi:10.1029/2006EO020001.
Ito E., Harris D. M. and Anderson A.T. Jr. (1983) alteration of oceanic crust and geologic
cycling of chlorine and water. Geochim. Cosmochim Acta 47, 1613-1624.
Jacobs A. M., Harding A. J. and Kent G. M. (2007) Axial crustal structure of the Lau back-arc
basin from velocity modeling of multichannel seismic data. Earth. Planet. Sci. Lett. 259, 239-
255, 2007.
Lau Integrated Studies Site Focus Workshop (2006) RIDGE 2000 Workshop Report, 19 pp.
Lehnert K., Su Y., Langmuir C., Sarbas B. and Nohl U. (2000) A global geochemical database
structure for rocks. Geochem. Geophys. Geosyst. 1, doi:10.1029/1999GC00026.
Martinez F. and Taylor B. (2002) Mantle wedge control on back-arc crustal accretion. Nature
416, 417-420.
34
Martinez F., Taylor B., Baker E. T., Resing J. A. and Walker S. L. (2006) Opposing trends in
crustal thickness and spreading rate along the back-arc Eastern Lau Spreading Center:
implications for controls on ridge morphology, faulting, and hydrothermal activity, Earth Planet.
Sci. Lett. 245, 655-672.
Michael P. and Seewald J. (2007) Focus On: Studies at the Lau Basin. Ridge Events 2, 11-21.
Mottl M. J. and Holland H. D. (1978) Chemical exchange during hydrothermal alteration of
basalt by seawater. I. Experimental results for major and minor components of seawater.
Geochim. Cosmochim. Acta 42, 1103-1115.
Pearce J. A., Stern R. J., Bloomer S. H. and Fryer P. (2005) Geochemical mapping of the
Mariana arc-basin system: Implications for the nature and distribution of subduction
Components. Geochem. Geophys. Geosys. 6, no. 7, Q07006, doi:10.1029/2004GC000895.
Proskurowsi G., Seewald J. S., Reeves E., McCollom T. M., Lupton J., Sylva S. and Tivey M. K.
(2007) Volatile chemistry at Lau Basin hydrothermal sites: basin-wide trends of slab carbonate
influence and suggestions of abiotic methane oxidation at the Mariner vent site, Eos Trans. AGU,
88 (52), abstract V34B-04.
Ravizza G., Blusztajn, J., Von Damm, K. L., Bray A. M., Bach W. and Hart S. R. (2001) Sr
isotope variations in vent fluids from 9°46‘-9°54‘N East Pacific Rise: Evidence of a non-zero-
Mg fluid component. Geochim. Cosmochim Acta 65, 729-739.
Roberts S., Bach W., Binns R. A., Vanko D. A., Yeats C. J., Teagle D. A. H., Blacklock
K., Blusztajn J. S., Boyce A. J. and Cooper M. J. (2003) Contrasting evolution of
hydrothermal fluids in the PACMANUS system, Manus Basin: The Sr and S isotope evidence.
Geology 31 (9), 805–808.
Sawkins F. J. (1990) Metal Deposits in Relation to Plate Tectonics. Springer–Verlag.
Seewald J. S. (1987) Na and Ca metasomatism during hydrothermal basalt alteration: an
experimental and theoretical study. Unpublished M.Sc. Thesis, University of Minnesota. 75 p.
Seewald J. S. and Seyfried W. E. Jr. (1990) The effect of temperature on metal mobility in
subseafloor hydrothermal systems: constraints from basalt alteration experiments. Earth Planet.
Sci. Lett. 101, 388-403.
Seewald J. S., Cruse A. and Saccocia P. (2003) Aqueous volatiles in hydrothermal fluids from
the Main Endeavour Field, northern Juan de Fuca Ridge: temporal variability following
earthquake activity. Earth Planet. Sci. Lett. 216, 575-590.
Seewald J. S., Doherty K. W., Hammar T. R. and Liberatore S. P. (2002) A new gas-tight
isobaric sampler for hydrothermal fluids. Deep-Sea Res. Pt. 1, 49, 189-196.
35
Seyfried W. E. Jr. and Ding K. (1995) The hydrothermal chemistry of fluoride in seawater.
Geochim. Cosmochim. Acta 59, 1063-1071.
Seyfried W. E. Jr. and Janecky D. R. (1985) Heavy metal and sulfur transport during subcritical
and supercritical hydrothermal alteration of basalt: influence of fluid pressure and
basalt composition and crystallinity. Geochim. Cosmochim. Acta 49, 2545-2560.
Seyfried W. E. Jr., Seewald J. S., Berndt M. E., Ding K. and Foustoukos D. (2003) Chemistry of
hydrothermal vent fluids from the Main Endeavour Field, Northern Juan de Fuca Eidge:
Geochemical controls in the aftermath of the June 1999 seismic events. J. Geophys. Res. 108,
2429-2452.
Seyfried W. E. Jr., Ding K. and Berndt M. E. (1991) Phase equilibria constraints on the
chemistry of hot spring fluids at mid-ocean ridges. Geochim. Cosmochim. Acta 55, 3559-3580.
Seyfried W. E., Jr., Berndt M.E. and Seewald J. S. (1988). Hydrothermal alteration processes at
mid-ocean ridges: constraints from diabase alteration experiments, hot-spring fluids and
composition of the oceanic crust. Can. J. Earth Sci. 26, 787-804.
Seyfried W. E. Jr., Janecky D. R. and Mottl M. J. (1984) Alteration of the oceanic crust:
implications for geochemical cycles of lithium and boron. Geochim. Cosmochim. Acta 48, 557-
569.
Shanks W. C. III, Böhlke J.K. and Seal R.R. II (1995) Stable isotopes in mid-ocean ridge
hydrothermal systems: interactions between fluids, minerals and organisms. In S. E. Humphris,
R. A. Zierenberg, L. S. Mullineaux and R. E. Thomson (eds.), Seafloor Hydrothermal Systems:
Physical, Chemical, Biological, and Geological Interactions. Geophys. Mono. 91, Amer.
Geophys. Union, 194-221.
Shaw D. M., Vatin-Perignon N., and Muysson J. R. (1977) Lithium in spilites. Geochim.
Cosmochim. Acta 41, 1601-1607.
Spivack A. J. and Edmond J. M. (1987) Boron isotope exchange between seawater and the
oceanic crust. Geochim. Cosmochim. Acta 51, 1033-1043.
Spivack A. J., Palmer M. R. and Edmond J. M. (1987) The sedimentary cycle of the boron
isotopes. Geochim. Cosmochim. Acta 51, 1939-1949.
Takai K., Nunoura T., Ishibashi J.-I., Lupton J., Suzuki R., Hamasaki H., Ueno Y., Kawagucci
S., Gamo T., Suzuki Y., Hirayama H. and Horikoshi K. (2008) Variability in the microbial
communities and hydrothermal fluid chemistry at the newly discovered Mariner hydrothermal
field, southern Lau Basin. J. Geophys. Res. 113, G02031, doi:10.1029/2007JG000636.
Tivey M. K., Craddock P., Seewald J., Ferrini V., Kim S., Mottl M., Sterling A., Reysenbach A.-
L. and Wheat C.G. (2005) Characterization of six vent fields within the Lau Basin, Eos Trans.

36
Amer. Geophys. Union 86 (52), Fall Meet. Suppl., Abstract: T31A-0477.
Tomascak P. B. (2004) Developments in the understanding and application of lithium isotopes in
the earth and planetary sciences, Rev. Mineral. Geochem. 55, 153-195.
Turner I. M., Peirce C. and Sinha M. C. (1999) Seismic imaging of the axial region of the Valu
Fa Ridge, Lau Basin—the accretionary processes of an intermediate back-arc spreading axis.
Geophys. J. Int. 138, 495-519.
T. L. Vallier, Jenner G. A., Frey F. A., Gill J. B., Davis A. S., Volpe A. M., Hawkins J. W.,
Morris J. D., Cawood P. A., Morton J. L., Scholl D. W., Rautenschlein M., White W. M.,
Williams R. W., Stevenson A. J. and White L. D. (1991) Subalkaline andesite from Valu Fa
Ridge, a back-arc spreading center in southern Lau Basin: petrogenesis, comparative chemistry,
and tectonic implications. Earth Planet. Sci. Lett. 91, 227-256.
Villemant B., Mouatt J. and Michel A. (2008) Andesitic magma degassing investigated through
H2O vapour–melt partitioning of halogens at Soufrière Hills Volcano, Montserrat (Lesser
Antilles). Earth Planet. Sci. Lett. 269, 212-229.
Von Damm K. L. (1995) Controls on the chemistry and temporal variability of seafloor
hydrothermal fluids. In S. E. Humphris, R. A. Zierenberg, L. S. Mullineaux and R. E. Thomson
(eds.), Seafloor Hydrothermal Systems: Physical, Chemical, Biological, and Geological
Interactions. Geophys. Mono. 91, Amer. Geophys. Union, 222-247.
Von Damm K. L., Buttermore L. G., Oosting S. E., Bray A. M. Fornari D. J., Lilley M. D. and
Shanks W. C. III (1997) Direct observation of the evolution of a seafloor ‗black smoker‘ from
vapor to brine. Earth. Planet. Sci. Lett. 149, 101-111.
Von Damm K. L., Bischoff J. L. and Rosenbauer R. J. (1992) Quartz solubility in hydrothermal
seawater: an experimental study and equation describing quartz solubility for up to 0.5M NaCl
solutions. Amer. J. Sci. 291, 977-1007.
Von Damm K. L., Edmond J. M., Grant B., Measures C. I., Walden B. and Weiss R. F. (1985)
Chemistry of submarine hydrothermal solutions at 21°N, East Pacific Rise. Geochim.
Cosmochim. Acta 49, 2197-2220.
Wallace P. J. (2001) Volcanic SO2 emissions and the abundance and distribution of exsolved gas
in magma bodies. J. Volc. Geotherm. Res. 108, 85-106.
You C.-F., Butterfield D. A., Spivack A. J., Gieskes J. M., Gamo T. and Campbell A. J. (1994)
Boron and halide systematics in submarine hydrothermal systems: effects of phase separation
and sedimentary contributions, Earth Planet. Sci. Lett. 123, 227-238.
Zellmer K. E., and Taylor B. (2001) A three-plate kinematic model for Lau Basin opening.
Geochem. Geophys. Geosys. 2, 2000GC000106, 2001.

37
Figure Captions
Figure 1. Location of known active hydrothermal vent fields along the Eastern Lau Spreading
Center (ELSC). Inset: Map of the Lau Basin showing spreading centers (heavy lines) and arc
volcanoes (triangles). Areas above 2000 m are shaded gray. CLSC and ILSC = Central and
Intermediate Lau Spreading Centers, respectively.
Figure 2. Along-axis depth profile of the Eastern Lau Spreading Center showing the location of
known active vent fields and the extent of a seismically imaged melt lens.
Figure 3. Along-axis depth profile of the Eastern Lau Spreading Center showing the location of
known active vent fields, compared with ratios of the highly incompatible elements Ba/La in
volcanic rocks sampled from the same latitude (Bezos et al., 2009; Escrig et al., 2009). Note the
abrupt transition from mafic to felsic rocks at 20.6°S, just north of the ABE vent field.
Figure 4. Top: Measured temperature of vents from the six vent fields, based on 65
measurements from 40 vents sampled in this study in 2005 (circles and squares), plus
temperature at the Vai Lili vent field in 1989 (Fouquet et al., 1993) and maximum temperature at
the Mariner field in 2004 (Takai et al., 2008)(stars). Intrafield spatial variation is shown within
each vertical panel, as the 2005 temperature data are plotted against distance along the long-axis
of each vent field (see section 4.0). The width of each panel represents 1000 m (see scale bar).
The 1989 and 2004 data (solid stars) are arbitrarily positioned within each panel to facilitate
temperature comparison only. Besides the stars for Vai Lili in 1989 and Mariner in 2004,
symbols denote Mg concentration, in mmol/kg, measured in each sample from 2005: black

38
squares 0.7-9, gray squares 12-35, gray circles 45-49.5. The open squares and circles denote the
corresponding measured temperatures extrapolated to zero Mg. When the eight high-Mg fluids
are corrected to zero Mg to account for mixing, all but three (A6, TM9, MA4) of these cooler
vents (excepting Vai Lili) have temperatures similar to the high-temperature vents from the same
vent field, demonstrating that they were cooled mainly by mixing with bottom seawater,
introduced just prior to sampling, either naturally within the edifice or artificially at the orifice.
Bottom: End-member Si, based on 77 samples collected from 40 vents in 2005, plus earlier
samples from the Vai Lili vent field in 1989 and the Mariner field in 2004. Bottom seawater
contained 0.13 mmol/kg Si. Symbols are as above except that open circles have been replaced by
plusses.
Figure 5. Mg vs. sulfate in all 81 vent water samples collected for this study, from 43 vents at six
vent fields. The dotted line connects seawater with the origin. Error bars for analytical
uncertainty are smaller than the symbols.
Figure 6. pH measured at 25°C and zero-Mg end-member Fe, Mn, and H2S in 40 vents from six
vent fields, based on 77 vent water samples collected in 2005, plus earlier samples from the Vai
Lili vent field in 1989 and the Mariner field in 2004 (stars). Other symbols denote Mg
concentration, in mmol/kg, measured in each sample from 2005: black squares 0.7-9, open
squares 12-38, plusses 45-49.5. Bottom seawater at the six vent fields ranged in pH from 7.50 to
7.64.
39
Figure 7. End-member chlorinity, Na, Na/chlorinity, and Li in 40 vents from six vent fields,
based on 77 vent water samples collected in 2005, plus earlier samples from the Vai Lili vent
field in 1989 and the Mariner field in 2004 (stars). Other symbols denote Mg concentration and
are as in Figure 6. Li in bottom s
Figure 8. End-member K, Rb, and Cs in 40 vents from six vent fields, based on 77 vent water
samples collected in 2005, plus earlier samples from the Vai Lili vent field in 1989 and the
Mariner field in 2004 (stars). Other symbols denote Mg concentration and are as in Figure 6.
Figure 9. End-member Ca, Sr, and Sr isotopic ratio at six vent fields sampled in 2005, plus
earlier samples from the Vai Lili vent field in 1989 and the Mariner field in 2004 (stars). Other
symbols denote Mg concentration and are as in Figure 6. Ca and Sr are based on 77 vent water
samples collected in 2005 from 40 vents. The Sr isotopic ratio for the waters is for 18
representative samples from 18 different vents that have 1.5-4.2 mmol/kg Mg (except at Vai Lili,
which has 13.8 and 18.8 mmol/kg). The end-member Sr isotopic composition was calculated by
extrapolating the measured values against 1/Sr to the zero-Mg end-member Sr concentration.
Bottom seawater has a Sr isotopic ratio of 0.7091. The Sr isotopic ratio for the rocks (solid
circles) is shown for each vent field for which there are data, using an average weighted by
distance from the vents for all samples within 6 km. The error bars display the total range.
Figure 10. End-member CO2 and F in 40 vents from six vent fields sampled in 2005, plus earlier
samples from the Mariner field in 2004 (stars). Other symbols denote Mg concentration and are

40
as in Figure 6. CO2 is based on 50 samples collected in 2005 from 33 vents, and F on 77 samples
from 40 vents. Bottom seawater contains 2.3 mmol/kg dissolved inorganic carbon (DIC).
Figure 11. End-member I, 7 11
B at six vent fields sampled in 2005, plus earlier
samples from the Vai Lili vent field in 1989 and the Mariner field in 2004 (stars). Other symbols
denote Mg concentration and are as in Figure 6. B concentration is based on 77 vent water
samples collected in 2005 from 40 vents. Other species are based on 18 representative samples
from 18 vents that have 1.5-4.2 mmol/kg Mg (except at Vai Lili, which has 13.8 and 18.8
mmol/kg). The end-member Li and B isotopic compositions were calculated by extrapolating the
measured values against 1/Li and 1/B to the zero-Mg end-member Li and B concentrations. The
δ7Li ratio in seawater lies within the range 31.5 ± 2.2; analyses by TIMS suggests a value of
about 32.5 (Tomascak, 2004).
Figure 12. End-member O and H isotopic composition at six vent fields, based on 32 vent water
samples collected in 2005 from 31 different vents. These samples have 0.7-9 mmol/kg Mg
(except for Vai Lili, with 13.8 and 18.8 mmol/kg). Symbols denote Mg concentration and are as
in Figure 6. The dashed horizontal lines are for ambient bottom seawater, as measured. The solid
horizontal line in the δ18
O plot emphasizes the almost complete lack of overlap between the three
northern fields and the three southern fields.
Figure 13. Concentrations of Cl and F in volcanic rocks vs. latitude along the Eastern Lau
Spreading Center compared with end-member Cl and F in the vent waters. Note that the rocks
and the water are plotted on different concentration scales. Rock data are from P.J. Michael;
41
analytical uncertainty (±2σ) is ±0.0025 (smaller than symbols) for Cl and ±0.008 for F, as shown
by representative error bar.
Figure 14. End-11
B vs. the ratio of the B concentration in seawater to that in the
hydrothermal end-member solution for the six vent fields, based on 18 water samples collected
from 18 vents in 2005, plus three samples from Vai Lili collected in 1989 (Fouquet et al., 1993).
Lines connecting seawater with the values for B in mid-ocean ridge basalt (MORB) and of B
desorbed from sediment (Spivack et al., 1987) indicate that most of the data can be modeled as
mixtures of B from these three sources.
Figure 15. End-member 7Li the ratio of the Li concentration in seawater to that in the
hydrothermal end-member solution for the six vent fields sampled in 2005, based on 18 water
samples from 18 vents. These samples have 0.7-9 mmol/kg Mg (except for Vai Lili, with 13.8
and 18.8 mmol/kg). The lower figure expands the horizontal scale of the upper figure. Lines
connecting seawater with a range of values for Li in mid-ocean ridge basalt (MORB) (Tomascak,
2004) indicate that most of the data can be modeled as mixtures of B from these two sources.
Figure 16. End-member 87
Sr/86
Sr vs. the ratio of the Sr concentration in seawater to that in the
hydrothermal end-member solution for the six vent fields sampled in 2005, based on 18 water
samples from 18 vents in 2005, plus three samples from Vai Lili collected in 1989 (Fouquet et
al., 1993). The data are plotted against the two-stage dissolution-precipitation model of Berndt et
al. (1988) which shows one set of contours (thin solid lines) for Sr concentration in solution
following early precipitation of anhydrite during recharge, and a second set (dashed lines) for the
42
water/rock mass ratio prevalent during subsequent water/rock interaction in the high-temperature
reaction zone with rock having a Sr isotopic ratio of 0.7032, as on the Valu Fa Ridge (Vallier et
al, 1991; Escrig et al., 2009). Regression of the vent fluid data (thick solid line) indicates that the
majority of ELSC fluids are consistent with approximately 75% Sr removal and water/rock ratios
from 10 to 20 (Table 4).

Table 1. Vent fields sampled along the Eastern Lau Spreading Center (ELSC) in April-May 2005Distance
Vent field* Distance Distance Opening Character Axial Crustal Layer 2A Layer 2A Volcanic morphology Faulting Plume sampledalong to next rate* of axis area thick- thickness velocity Flows Domes near- in incidence onaxis field S (cm/yr) (km2) ness (m) axis, vent long axis+
(km) (km) (km) (km/s) large field (m)
N.end of ELSC 0 97 ~6 500 2.9Kilo Moana 90 29 87 no high -3.8 450 3.2 pillow and low relief many yes 0.44 151Towcam 119 50 83 no high -0.8 550 2.9 lobate low relief many yes 0.44 196ABE 169 142 75 rounded -0.3 750 2.8 pillows, aa, medium some yes 0.38 644Tui Malila 310 21 55 peaked 1.6 7.5-9 650 2.6 finger flows high relief few yes 0.24 396Mariner 332 4 52 peaked 1.8 9 950 2.5 aa and high relief none none 0.24 178Vai Lili 336 -- 51 peaked 2.4 950 2.5 finger flows high relief none one 0.24 166S.end of ELSC 397 39 1300 2.8
Ref. 1 1 2,3 2 4 5,6 7 7 8 8 3,8 2,9 1
*Latitude and longitude of vent fields are given by Ferrini et al. (2008) and in the appendix.**calculated assuming a linear change with distance along the axis+distance from northernmostmost to southernmost vent sampled, as measured along the long axis of the vent field
References: 1) This paper, 2) Martinez et al. (2006), 3) Zellmer and Taylor (2001), 4) Martinez and Taylor (2002), 5) Turner et al. (1999),6) Crawford et al. (2003), 7) Jacobs et al. (2007), 8) Ferrini et al. (2008), 9) Baker et al., (2006).

Table 2. Endmember concentrations* of aqueous species in vent fluids from the Eastern Lau SpreadingCenter.
Vent max. T min. Mg pH Alk Na K Li δ7Li Rb Cs Ca Sr87Sr/86Sr
°C mm 25° meq/kg mm mm m ‰ m nm mm m
Kilo MoanaKM1 333 1.6 3.6 -0.37 486 16.9 875 2.90 9.8 106 34.9 118 0.70446KM2 332 2.8 3.6 -0.44 477 17.7 903 9.2 99 35.0 122KM3 321 2.4 2.9 -1.78 487 15.9 817 3.38 9.2 103 33.5 110 0.70445KM4 300 2.2 3.2 -1.02 481 17.0 882 3.67 9.9 112 36.0 123 0.70453KM5 329 1.5 3.5 -0.62 491 16.3 839 9.7 104 34.0 111KM6 306 2.9 3.6 -0.57 497 16.8 860 3.78 9.8 107 36.5 121 0.70442KM8 333 1.8 4.0 -0.37 490 17.3 897 8.2 93 34.7 122TowCamTC1 328 1.5 4.1 -0.25 421 15.6 597 3.75 8.7 112 45.5 147 0.70439TC3 320 0.7 4.0 -0.29 423 14.7 576 8.8 114 45.1 142TC4 316 2.3 4.1 -0.08 422 14.8 576 8.4 107 44.8 142TC5 302 3.3 3.7 -0.49 442 16.1 620 4.19 9.1 116 43.4 146 0.70430TC7 288 2.2 4.0 -0.24 446 15.7 592 4.64 8.9 115 43.5 144 0.70434TC8 308 1.5 4.1 -0.32 425 14.8 578 8.7 112 44.2 142ABEA1 309 2.3 4.3 -0.34 430 24.6 646 4.43 20 390 39.1 115 0.70422A4 278 2.5 4.4 -0.31 467 28.7 670 5.00 23 418 44.3 143 0.70415A5 290 1.7 4.5 -0.15 439 27.7 694 4.46 22 400 40.5 129 0.70422A8 308 1.9 4.5 -0.26 446 25.9 659 23 411 39.4 120A9 295 2.8 4.6 -0.20 476 27.4 649 4.45 23 415 44.2 136 0.70418Tu'i MalilaTM1 279 5.5 4.5 -0.35 509 44.4 614 48 840 47.1 184TM2 312 1.9 4.4 -0.12 512 43.6 612 5.76 49 866 47.5 180 0.70385
TM4 178† 26.0 5.7 -0.04 500 39.3 531 38 671 46.7 168TM5 265 11.7 4.6 -0.54 507 47.7 659 50 863 47.0 178TM6 265 2.6 4.4 0.06 504 40.8 551 6.08 44 781 49.4 190 0.70382
TM7 198† 12.1 5.0 -0.03 505 38.8 530 44 787 48.2 178TM8 229 2.7 4.4 -0.09 500 43.4 582 45 798 49.2 199TM10 274 2.2 4.2 -0.11 508 42.6 590 46 820 46.2 186MarinerMA1 334 2.7 2.5 -3.06 458 35.8 375 4.94 33 745 45.4 155 0.70413MA2 311 8.9 2.6 -4.49 449 35.1 362 32 734 45.5 150MA3 363 1.9 2.7 -2.25 439 36.9 385 5.86 32 735 43.8 162 0.70419MA5 249 4.2 2.6 -3.54 383 28.8 308 6.98 28 647 40.9 141 0.70424MA6 240 3.7 2.7 -3.06 385 29.3 312 27 624 39.7 143Vai LiliVLa 40 44.8 6.5 -0.23 518 37 377 30 515 50.9 140VLb 121 18.8 5.3 -0.30 476 39 359 6.15 35 530 31.8 93 0.7054VLc 70 13.8 5.2 -0.16 477 35 318 5.86 31 442 35.1 93 0.7056Bottom SeawaterSW 2 52.8 7.6 2.45 460 10.1 27 31.00 1.4 2.3 10.2 88 0.7091*mm=mmol/kg fluid, m=mol/kg fluid, nm=nmol/kg fluid.† Low measured temperatures for these fluids likely reflects subsurface seawater mixing. Extrapolation to zero Mg yields 334 and 246°C at TM4 and TM7, respectively.

2 (continued)
Vent Chl Br F I SiO2 H2S CO2 Mn Fe B δ11B δ18Ovsmow δDvsmow
mm m m m mm mm mm m m m ‰ ‰ ‰
Kilo MoanaKM1 581 883 10.4 0.54 19.0 6.0 8.1 512 2485 535 25.7 0.82 2.2KM2 575 925 9.5 19.1 5.4 7.7 695 3202 518 0.39 -4.1KM3 582 867 9.6 0.66 20.0 6.4 7.5 733 3836 508 27.2 0.45 0.6KM4 574 893 10.4 0.66 19.0 5.4 8.2 526 2945 554 29.5 0.41 -1.1KM5 584 936 17.0 21.7 6.3 718 2916 525 0.87 -1.5KM6 593 946 13.4 0.71 19.7 5.4 676 3071 537 34.3 0.94 -1.8KM8 584 905 15.9 20.6 5.5 8.5 553 2557 575 1.08 -0.9TowCamTC1 530 781 13.7 0.73 18.5 4.8 10.5 388 305 605 30.2 0.64 -3.3TC3 530 814 12.1 18.7 4.9 10.6 398 267 551 0.93 -0.1TC4 528 867 11.9 18.9 4.9 10.7 407 282 514 -2.5TC5 549 897 8.4 0.85 18.6 4.5 11.5 332 332 584 26.5 0.92 -2.1TC7 551 884 7.7 0.88 20.1 3.7 11.1 389 368 531 17.7 0.96 -0.7TC8 530 837 19.3 5.2 375 302 542 0.96 -0.9ABEA1 535 851 13.1 1.9 17.1 3.6 6.9 468 268 698 22.6 0.86 -1.0A4 585 938 17.2 2.0 15.8 2.8 5.1 273 225 825 25.8 0.70 -0.6A5 550 854 16.7 2.0 16.0 3.1 6.4 289 174 881 24.4 0.84 1.0A8 553 869 16.9 15.5 2.9 6.3 303 374 665 0.89 -1.2A9 594 921 15.3 2.2 15.8 2.6 5.2 284 158 653 26.1 0.78 -1.5Tu'i MalilaTM1 651 1064 29.9 14.0 2.3 12.6 433 219 1036 0.28 -0.6TM2 653 1008 26.2 2.6 14.6 2.5 13.0 406 210 760 21.5 0.33 -1.8
TM4 634 1041 33.0 14.2 1.2 11.7 332 143 740TM5 654 1007 29.2 16.4 2.3 13.8 441 199 1073TM6 646 974 20.1 3.0 15.3 2.4 12.4 399 218 915 26.4 0.20 -1.5
TM7 642 968 19.8 14.9 2.1 12.3 413 199 699 - -TM8 644 1006 16.3 2.1 380 153 836 0.13 -0.9TM10 645 984 22.3 16.7 2.0 380 255 766 0.25 0.1MarinerMA1 624 983 76.8 3.6 15.8 6.2 32.3 5938 11262 1010 24.9 0.34 1.9MA2 618 917 112 16.7 4.2 50.2 6276 11265 889 0.40 -1.3MA3 605 972 71.4 3.5 15.1 9.3 39.8 5723 12991 1109 25.8 0.35 0.2MA5 533 802 113 2.9 16.1 4.5 68.2 5441 10547 831 17.4 0.17 -0.2MA6 531 813 110 16.3 6.4 71.4 4875 10684 879 0.15 -0.6Vai LiliVLa 611 972 37.5 13.6 1.0 2644 237 753VLb 590 900 <0 2.0 8.9 0.013 1363 127 807 18 0.40 -6.4VLc 587 899 <0 2.0 7.7 0.011 10.4 1403 148 612 27 0.34 -3.9Bottom SeawaterSW 538 825 67.0 0.4 0.13 0.0 2.3 0 0 407 39.6 -0.13 -3.2*mm=mmol/kg fluid, m=mol/kg fluid, nm=nmol/kg fluid.
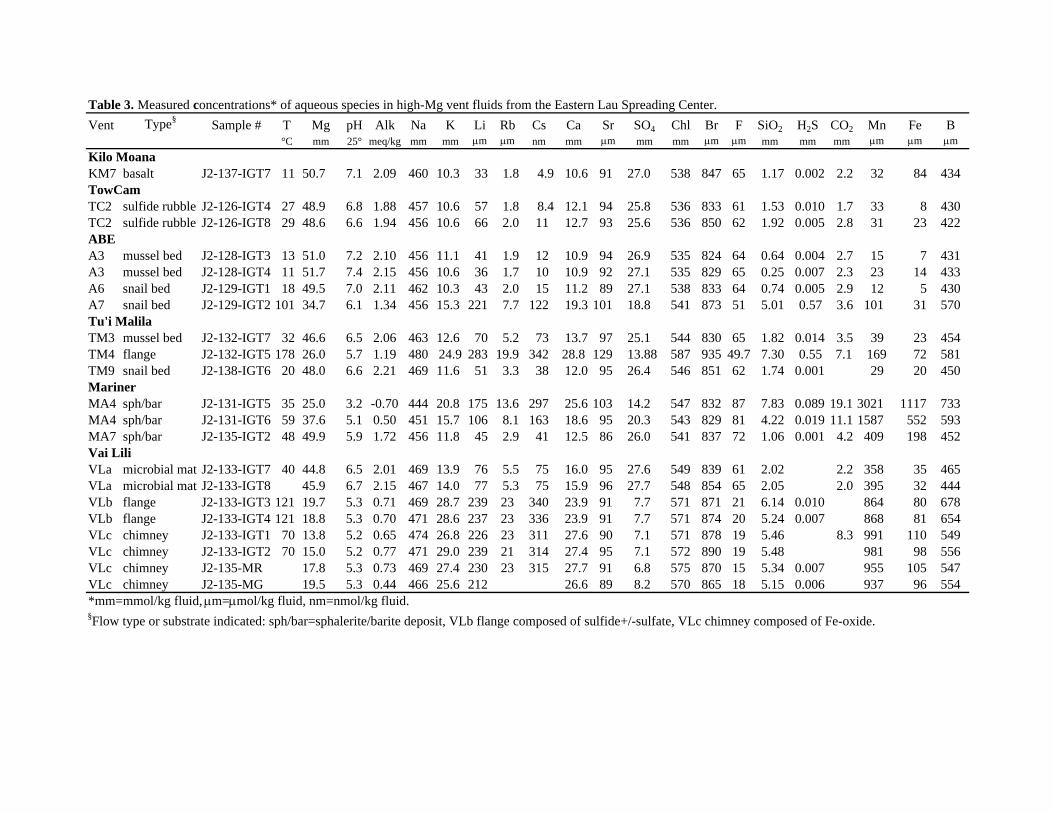
Table 3. Measured concentrations* of aqueous species in high-Mg vent fluids from the Eastern Lau Spreading Center.Vent Type§ Sample # T Mg pH Alk Na K Li Rb Cs Ca Sr SO4 Chl Br F SiO2 H2S CO2 Mn Fe B
°C mm 25° meq/kg mm mm m m nm mm m mm mm m m mm mm mm m m mKilo MoanaKM7 basalt J2-137-IGT7 11 50.7 7.1 2.09 460 10.3 33 1.8 4.9 10.6 91 27.0 538 847 65 1.17 0.002 2.2 32 84 434TowCamTC2 sulfide rubble J2-126-IGT4 27 48.9 6.8 1.88 457 10.6 57 1.8 8.4 12.1 94 25.8 536 833 61 1.53 0.010 1.7 33 8 430TC2 sulfide rubble J2-126-IGT8 29 48.6 6.6 1.94 456 10.6 66 2.0 11 12.7 93 25.6 536 850 62 1.92 0.005 2.8 31 23 422ABEA3 mussel bed J2-128-IGT3 13 51.0 7.2 2.10 456 11.1 41 1.9 12 10.9 94 26.9 535 824 64 0.64 0.004 2.7 15 7 431A3 mussel bed J2-128-IGT4 11 51.7 7.4 2.15 456 10.6 36 1.7 10 10.9 92 27.1 535 829 65 0.25 0.007 2.3 23 14 433A6 snail bed J2-129-IGT1 18 49.5 7.0 2.11 462 10.3 43 2.0 15 11.2 89 27.1 538 833 64 0.74 0.005 2.9 12 5 430A7 snail bed J2-129-IGT2 101 34.7 6.1 1.34 456 15.3 221 7.7 122 19.3 101 18.8 541 873 51 5.01 0.57 3.6 101 31 570Tu'i MalilaTM3 mussel bed J2-132-IGT7 32 46.6 6.5 2.06 463 12.6 70 5.2 73 13.7 97 25.1 544 830 65 1.82 0.014 3.5 39 23 454TM4 flange J2-132-IGT5 178 26.0 5.7 1.19 480 24.9 283 19.9 342 28.8 129 13.88 587 935 49.7 7.30 0.55 7.1 169 72 581TM9 snail bed J2-138-IGT6 20 48.0 6.6 2.21 469 11.6 51 3.3 38 12.0 95 26.4 546 851 62 1.74 0.001 29 20 450MarinerMA4 sph/bar J2-131-IGT5 35 25.0 3.2 -0.70 444 20.8 175 13.6 297 25.6 103 14.2 547 832 87 7.83 0.089 19.1 3021 1117 733MA4 sph/bar J2-131-IGT6 59 37.6 5.1 0.50 451 15.7 106 8.1 163 18.6 95 20.3 543 829 81 4.22 0.019 11.1 1587 552 593MA7 sph/bar J2-135-IGT2 48 49.9 5.9 1.72 456 11.8 45 2.9 41 12.5 86 26.0 541 837 72 1.06 0.001 4.2 409 198 452Vai LiliVLa microbial mat J2-133-IGT7 40 44.8 6.5 2.01 469 13.9 76 5.5 75 16.0 95 27.6 549 839 61 2.02 2.2 358 35 465VLa microbial mat J2-133-IGT8 45.9 6.7 2.15 467 14.0 77 5.3 75 15.9 96 27.7 548 854 65 2.05 2.0 395 32 444VLb flange J2-133-IGT3 121 19.7 5.3 0.71 469 28.7 239 23 340 23.9 91 7.7 571 871 21 6.14 0.010 864 80 678VLb flange J2-133-IGT4 121 18.8 5.3 0.70 471 28.6 237 23 336 23.9 91 7.7 571 874 20 5.24 0.007 868 81 654VLc chimney J2-133-IGT1 70 13.8 5.2 0.65 474 26.8 226 23 311 27.6 90 7.1 571 878 19 5.46 8.3 991 110 549VLc chimney J2-133-IGT2 70 15.0 5.2 0.77 471 29.0 239 21 314 27.4 95 7.1 572 890 19 5.48 981 98 556VLc chimney J2-135-MR 17.8 5.3 0.73 469 27.4 230 23 315 27.7 91 6.8 575 870 15 5.34 0.007 955 105 547VLc chimney J2-135-MG 19.5 5.3 0.44 466 25.6 212 26.6 89 8.2 570 865 18 5.15 0.006 937 96 554*mm=mmol/kg fluid, m=mol/kg fluid, nm=nmol/kg fluid.§Flow type or substrate indicated: sph/bar=sphalerite/barite deposit, VLb flange composed of sulfide+/-sulfate, VLc chimney composed of Fe-oxide.

Table 4. Water/rock mass ratios calculated from leaching of Rb, Cs, and Cl and from Sr isotopic exchange
Vent field Rb Rb Cs Cs Cl Cl 87Sr/86Sr 87Sr/86Sr w/r w/r w/r w/r fromin rock in vents in rock in vents in rock in vents in rock in vents from Rb from Cs from Cl 87Sr/86Sr(ppm) (mol/kg) (ppm) (nmol/kg) (ppm) (mmol/kg)
Kilo Moana 1.2 9.4 0.024 103 500 582 0.7032 0.7045 1.7 1.8 0.3 20TowCam 2.3 8.8 0.05 113 200 536 0.70319 0.7043 3.7 3.4 -3.4 16ABE 6.2 22.2 0.13 407 800 563 0.70326 0.7042 3.5 2.4 0.9 17Tui Malila 8.1 46.6 0.17 822 1100 648 0.70319 0.7038 2.1 1.6 0.3 12Mariner 8.1 30.4 0.17 697 1200 582 0.70330 0.7042 3.3 1.8 0.8 15Vai Lili (2005) 8.1 32.0 0.17 496 1200 596 0.70325 0.7055 3.1 2.6 0.6 34Vai Lili (1989) 8.1 64.7 0.17 1330 1200 769 0.70320 0.7044 1.5 1.0 0.1 20
Bottom seawater: Rb = 1.4 mol/kg, Cs = 2.3 nmol/kg, Cl = 538 mmol/kg, 87Sr/86Sr = 0.7091Rb and Cs in rock based on data for Lau Basin glasses from PetDB (Lehnert et al., 2000) and from Bezos et al. (2009).Data on Cl and 87Sr/86Sr in rock are from P. J. Michael.
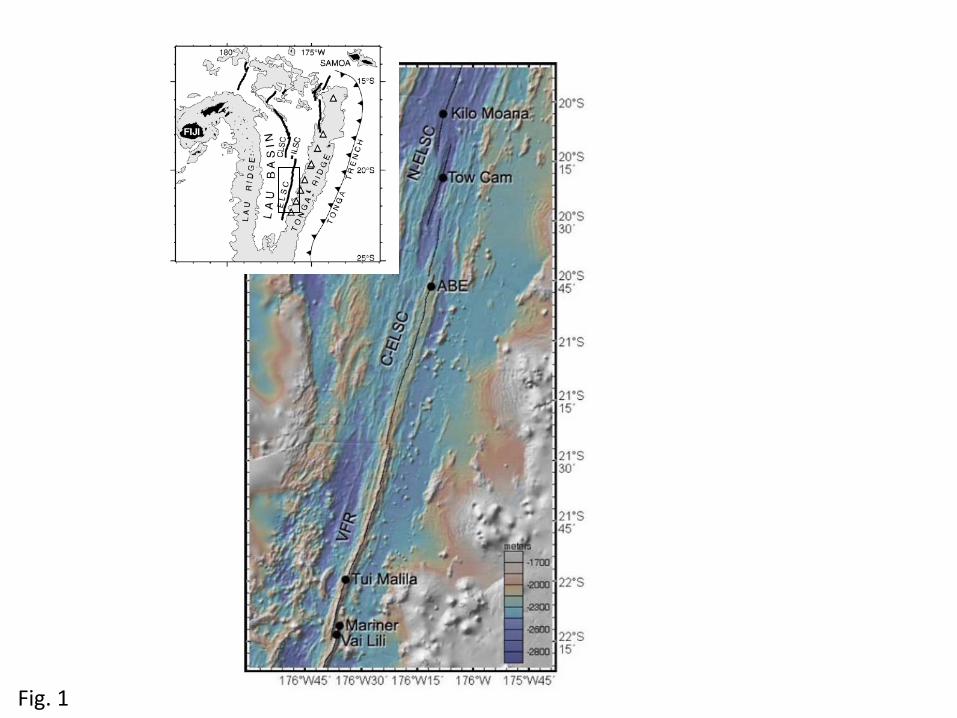
Fig. 1

Axial melt lens*
Depth (mbsf)1 2606-2640 2690-2728 2104-2163 1839-1928 1877-1951 1691-1766 Distance to arc (km)2 95 85 70 55 50 50Depth to
magma lens (km)3 no lens no lens 2.0* 2.3 2.8 2.8Substrate4,5 basalt basalt basalt-andesite basalt-andesite basalt-andesite
(some dacite) Temperature 293-333 287-328 269-309 229-312 240-363 40-121 of vent fluid (ºC)6
N-ELSC C-ELSC VFR
References: 1) Ferrini et al. (2008), 2) Martinez et al. (2002), 3) Jacobs et al. (2007), 4) Michael and Seewald (2007),5) Fouquet et al. (1993), 6) this paper.
*Ref. 3 notes that dashed line of axial melt lens is “nearly continuous” versus “continuous” to south; Lau ISS workshop report (2006) notes “Our initial analyses show that all three explored ELSC vent fields, Kilo Moana, Tow Cam, and ABE, lack areas of nearly pure melt directly beneath them. However, several areas of nearly pure melt lie beneath the southern end of the spreading segment just northwest of the ABE site.”
Fig. 2
Dep
th (
mbs
f) 1500
2000
2500
3000
TowCam
ABEKilo Moana
Tui Malila MarinerVai Lili

60
50
40
Ba/La30
20
10
0
Fig. 3
0
5
10
15
20
25
30
35
40
45
19.5 20.0 20.5 21.0 21.5 22.0 22.5
Ba/La by
mass
Lau Basin volcanic rocks
Dep
th (
mbs
f) 1500
2000
2500
3000
TowCam
ABEKilo Moana
Tui MalilaMarinerVai Lili

Fig. 4
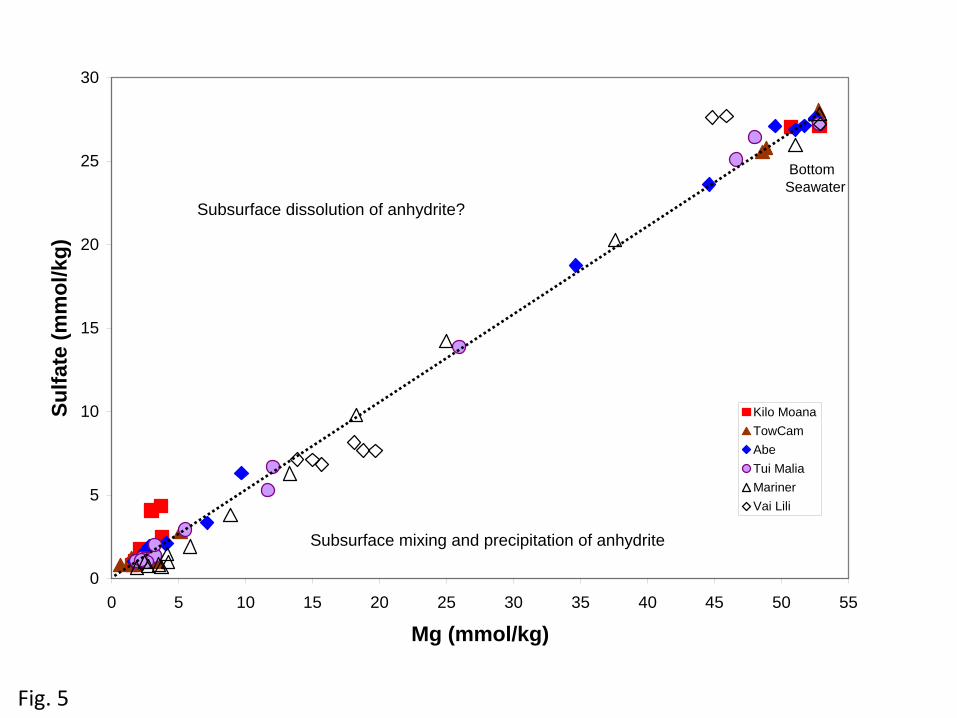
0
5
10
15
20
25
30
0 5 10 15 20 25 30 35 40 45 50 55
Mg (mmol/kg)
Su
lfat
e (m
mo
l/kg
)
Kilo Moana
TowCam
Abe
Tui Malia
Mariner
Vai Lili
Bottom Seawater
Subsurface mixing and precipitation of anhydrite
Subsurface dissolution of anhydrite?
Fig. 5
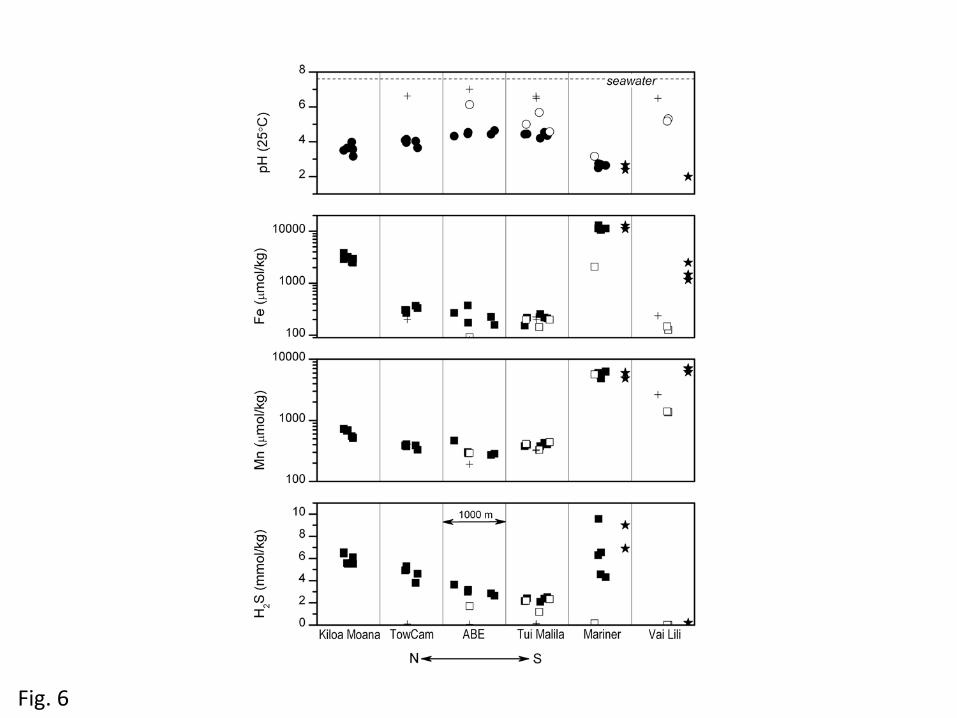
Fig. 6
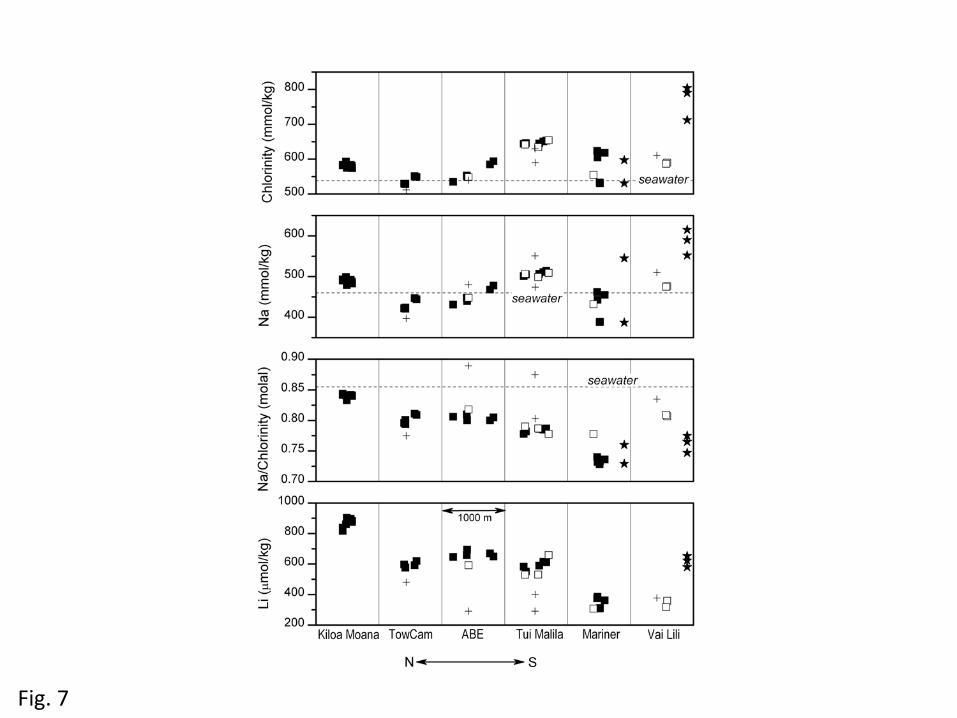
Fig. 7
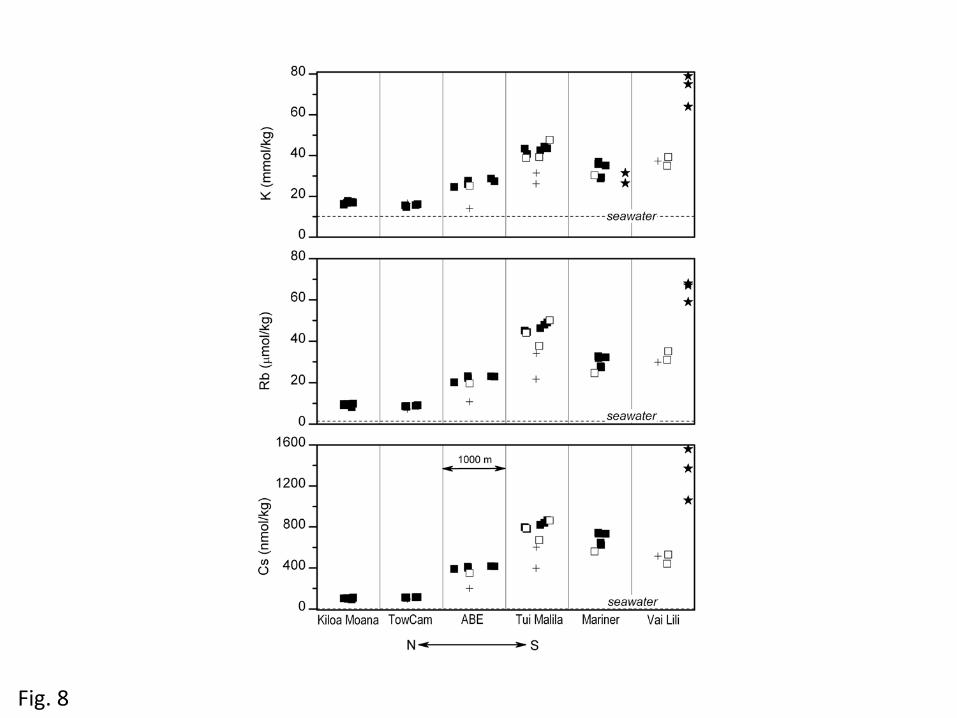
Fig. 8

Fig. 9

Fig. 10

Fig. 11
Iodi
ne (m
ol/k
g)B
(m
ol/k
g)7
Li (
‰)
11B
(‰
)

Fig. 12

Fig. 13
KMTC
ABE
TM
MA,VL
Roc
k F
Con
tent
(w
t.%)
Roc
k C
lCon
tent
(w
t.%)
Flu
id C
hlor
inity
(mm
ol/k
g)F
luid
F (m
ol/k
g)
Latitude (°S)

Fig. 14
-5
0
5
10
15
20
25
30
35
40
0.0 0.1 0.2 0.3 0.4 0.5 0.6 0.7 0.8 0.9 1.0
Bseawater/Bhydrothermal end member
11B
in e
nd
mem
ber
Kilo Moana
TowCam
ABE
Tui Malila
Mariner
Vai Lili
Seawater
1989
Seawater
MORB
B desorbed from sediment

Fig. 15
to MORB
to Seawater at 32 o/oo
Kilo MoanaTowCamABETui MalilaMarinerVai LiliSeawater
Linear, KM to VL

0.703
0.704
0.705
0.706
0.707
0.708
0.709
0.710
0.35 0.45 0.55 0.65 0.75 0.85 0.95 1.05 1.15 1.25
Srseawater/Srendmember (molal)
87 S
r/8
6 Sr
Kilo MoanaTowCamABETui MalilaMarinerVai LiliVai Lili, 1989 (Fouquet et al., 1993)Seawater
W/R=30
20
Sr=1 m/kg
10
30
20
40
50
60
70
80
88
10
Seawater
Fig. 16