Sedimentary environment and depositional evolution ... - Nature
Upload
istanbultekCategory
view
4download
0
Marine Geology 254 (2008) 1-17
Contents lists available at ScienceDirect
Marine Geology
j ourna l homepage: www.e lsev ie r.com/ locate /margeo
Seismic stratigraphy and Quaternary sedimentary history of the northeast Aegean Sea
E.B. Işler a,⁎, A.E. Aksu a, C. Yaltırak b, R.N. Hiscott a
a Department of Earth Sciences, Centre for Earth Resources Research, Memorial University of Newfoundland, St. John's, Newfoundland, Canada A1B 3X5b Istanbul Technical University, Avrasya Earth Sciences Institute, Department of Geophysical Engineering, Ayazağa, Istanbul 80626, Turkey
⁎ Corresponding author.E-mail address: [email protected] (E.B. Işler).
0025-3227/$ – see front matter © 2008 Elsevier B.V. Aldoi:10.1016/j.margeo.2008.04.003
A B S T R A C T
A R T I C L E I N F OArticle history:
Seismic profiles show that Received 5 July 2007Received in revised form 31 March 2008Accepted 10 April 2008Keywords:Seismic stratigraphyAegean SeaQuaternary sea-levelForced regressionDeltas
the upper Quaternary–Recent stratigraphic architecture of the NE Aegean Sea ischaracterized by several vertically stacked depositional sequences which are developed within three NE–SW-trending basins. The depositional sequences are separated from one another by prominent shelf-crossingunconformities, formed during periods of falling and low sea level and reworked further during thesubsequent sea-level rise by shoreface erosion. Each depositional sequence consists of a lower mainlyparallel-stratified subunit, and an upper oblique to sigmoid-oblique prograded subunit. The lower subunitrepresents hemipelagic and prodeltaic deposition of the transgressive and early highstand systems tracts.The upper subunit represents deltas of the forced regressive systems tract. The chronology of thedepositional sequences is constrained by radiocarbon and U/Th dates on cores. An average sedimentationrate of ∼30 cm/ka is calculated for basinal muds of the region. Correlations with global sea-level curves basedon oxygen-isotope stratigraphy reveal that the seaward-prograded delta sequences developed on a rapidlysubsiding shelf during successive glacio-eustatic sea-level falls associated with late Quaternary glaciations. Aset of paleogeographical maps shows changing basin configuration since ∼330 ka. Volumes of thedepositional sequences compare well with the volumes of sediment estimated to have been eroded from theincised valleys of the Tuzla, Karamenderes, and Dümbek rivers draining the Biga Peninsula.
© 2008 Elsevier B.V. All rights reserved.
1. Introduction
Rapid changes in base level over short time frames have extremeeffects onmaritime river systems. For example, during a period of sea-level fall, rivers can quickly lose their graded profiles, and either incisetheir downstream valleys if the former shelf was steep, or aggradethose valleys if the former shelf had a low inclination (Woolfe et al.,1998). How far the delta will eventually prograde (defining thepaleoshoreline position) is determined by an interplay between therates of sea-level variations, the rates of tectonic movements along themargin, and the rate of sediment influx. The rates of sea-level changeand subsidence/uplift control the rate of creation of accommodationspace, whereas the rate of sediment supply determines whether thisspace will be filled by sediments or water. In stable shelf regions, witha static sea level and significant sediment supply, progradation withlittle or no subsidence causes each delta lobe to develop progressivelyseaward of the previous lobe, allowing the shoreline to quickly reachthe shelf edge (e.g., Tesson et al., 2000). In contrast, progradationwithsubsidence results in the vertical stacking of delta successions on theinner shelf (e.g., Winn et al., 1998).
Previous studies in the eastern Mediterranean showed that deltaprogradation onto rapidly subsiding continental shelves during
l rights reserved.
Quaternary glacio-eustatic sea-level oscillations produced a series ofstacked prograded deltaic successions, separated from one another bymajor shelf-crossing unconformities (Aksu et al., 1987; Piper andPerissoratis, 1991; Aksu et al., 1992a,b; Piper and Aksu, 1992). Theseunconformities developed through a complex series of steps involvingsubaerial erosion during the glacio-eustatic falls and low stands of sealevel, and subsequent submarine erosion and reworking (i.e., ravine-ment) during post-glacial rises. Piper and Aksu (1992) have demon-strated that, in such settings, the maximum seaward extents of theshelf-crossing deltas can be reliably correlated with glacial maxima. Inthe eastern Mediterranean Sea, the shelf-crossing unconformitiesdeveloped during glacial isotopic stages 2–4, 6, 8, and 10 when theshelves were exposed to subaerial erosion, and the unconformitieswere modified or accentuated during the subsequent transgressionsat global isotopic stage boundaries 2/1, 6/5, 8/7, and 10/9, respectively(Aksu et al., 1992b). The transgressive erosion produced widespreadwave-ravinement surfaces.
This paper presents the late Quaternary stratigraphic andpaleogeographic evolution of the northeastern Aegean Sea betweenthe islands of Bozcaada and Lesbos and the Biga Peninsula (Fig. 1)using high-resolution seismic-reflection profiles and cores. A historyof deltaic deposition is recognized from ∼330 ka to the Present, underthe influence of active transtensional tectonics and high-frequencysea-level fluctuations. The study area is part of a string of transten-sional basins that developed along the western seaward extension ofthe central strand of the North Anatolian Transform Fault. Single-

Fig. 2. Index map showing the location of seismic-reflection profiles and numberedcores collected during the MAR98, MAR00, MAR02 and MAR03 cruises of the RV KocaPiri Reis. Heavy lines are the locations of seismic profiles with numbers F4, F5, etc,indicating figure numbers for each profile. For full core numbers, see Table 1 (e.g.,138=MAR02-138). Asterisks represent the locations of topset-to-foreset transitions ofDS5–7 used to calculate subsidence rates in Section 6.2. TF = Tuzla Fault; R = river
2 E.B. Işler et al. / Marine Geology 254 (2008) 1-17
channel seismic-reflection profiles across the northeastern Aegeanshelf immediately south of the Strait of Dardanelles clearly imageseveral stacked prograded delta successions. A dense grid of high-resolution reflection profiles was acquired to allow detailed mappingof these delta successions, and to delineate the stratigraphic andsedimentary architecture of the shelf sequences. In several places, thetopset-to-foreset transitions of those deltas which reached the shelfedge during glacial maxima occur beneath a thin veneer of youngersediments. The feather-edges of these deltas are sufficiently thin andshallowly buried to be fully penetrated and dated by strategicallyplaced long piston cores.
2. Data acquisition and methods
During four cruises of the RV Koca Piri Reis in 1998, 2000, 2002, and2003, ∼1600 km of seismic-reflection and side-scan sonar profiles,and eleven piston and gravity cores were collected from the north-eastern Aegean Sea (Fig. 2). Navigational fixes were determined usingan onboard GPS system. Bathymetry was recorded every 10 min usinga 12 kHz echo sounder. Huntec deep tow system (DTS) profiles werecollected in 1998 and 2000 using a 0.5 kJ source. Reflections werereceived at the tow fish using both a single high-resolutionhydrophone and a 21-element, 6 m-long Benthos streamer. Deeperpenetrating seismic profiles were collected using a 1.58 kJ multi-tipsparker (1998) and a 655 cm3 (40 in.3) sleeve gun (2000); thesereflections were received using a 7.6 m-long Benthos streamer. Side-scan sonar data were collected in conjunction with seismic profiles in2000 using a Klein 590 system set at 100 kHz. The side-scan fish wastowed close to the sea bed at approximately 1/10 of the water depthand the range was set at 125 m per channel (swath=250 m). During1998 cruise, four gravity cores were collected using a 4 m-long corerwith 10 cm internal diameter and 400-kg weight, whereas during the2002 and 2003 cruises, seven 4–10 m-long piston cores wererecovered using a Benthos piston corer (Fig. 2; Table 1). Cores werestored upright onboard ship and were transported to MemorialUniversity of Newfoundland, where they were split and described.
Fig. 1. Simplified bathymetry of the Aegean Sea (from Intergovernmental Oceano-graphic Commission, 1981) showing the location of the study area. Shaded seabed tonesshow basinal depths at 200 m intervals from 600 m to N1200 m. M-3 core location fromRoussakis et al. (2004).
Sediment colour was determined using the Rock-Colour Chart of theGeological Society of America. The chronology of the successionsobserved in the high-resolution seismic-reflection profiles is con-strained by seven radiocarbon and two U/Th dates on in situ shellsamples extracted from five cores (Table 2), and the ages of several air-fall tephra layers in the cores, which can be matched to dated onshoreeruptions. In this paper, conversions of acoustic two-way travel timeto sub-seafloor depth are based on an acoustic velocity of 1500 m s−1
in water-saturated muds, so 10 milliseconds (ms) TWT ∼7.5 msediment.
3. Bathymetry
Detailed bathymetry shows that the study area can be divided intotwo physiographic provinces: a gently southwest-sloping shelf mostlynorth of 39°30′N, and a west-deepening trough to the south. In theshelf region, the seabed has a smooth to gently undulating morphol-ogy, with a gradient ranging between 0.1° and 0.8° (Fig. 3). The shelfbreak occurs at ∼−120m. Seaward of the shelf break, steep slopes (8°–13°) lead to a ∼450 m-deep E–W-oriented trough which extendswestward from a point midway between the SW tip of the BigaPeninsula and the Island of Lesbos (Fig. 3). Across the southern fringesof the Biga Peninsula, the elevation difference between coastal hills
Table 1Coordinates, water depths and lengths of cores collected from the northeast Aegean Sea
Core numbers Latitude Longitude Water depth Core length(m) (cm)
MAR98-16 39°40.760′N 25°44.191′E 126 27MAR02-113 39°24.184′N 26°04.121′E 298 731MAR02-114 39°32.401′N 25°55.005′E 189 458MAR02-138 39°31.312′N 25°58.000′E 147 421MAR03-48 39°28.351′N 25°51.723′E 311 251MAR03-49 39°28.102′N 25°51.436′E 321 358

Fig. 3. (A) Physiographicmap of the study area. Bathymetry is compiled using soundingsobtained during cruises of the RV K Piri Reis in 1998, 2000 and 2002, and additional datafrom maps published by the Institute of Geology and Mineral Exploration (1989) andIntergovernmental Oceanographic Commission (1981). Topography is from base mapsof the Institute of Mineral Research and Exploration. Elevation contours are in metres.Land areas are shaded. Boz = Bozcaada. (B) Block diagram of the study area showingmorphological features of the sea bed. The white line crossing the block diagram is themodern shoreline.
Table 2Inventory of radiometric dates
Core and sample depth(cm)
WD(m)
Dated sample Age(yr BP)
Laboratorynumber
Cal yr BP range MedianCal yr BP
MAR98-16 23 126 Turritella spp. 9630±70 TO-7793 10422–10565 10490MAR02-113 112 298 Top S1, literature 6400±40 6819–6938 6877MAR02-113 112 298 Base S1, literature 9600±60 10403–10538 10463MAR02-113 400 298 Pecten spp. 16,930±140 TO-11151 19533–19814 19682MAR02-113 445 298 Y2 tephra 18,000±10 21300MAR02-113 672 298 Worm tubes 26,100±250 TO-11152 30500MAR02-114 283 189 Algal bioherm 42,490±1020 TO-11153 49490MAR02-114 431 189 Trisidos sp. 42,990±1160 TO-11154 49990MAR02-138 45 147 Algal bioherm 35,960±560 TO-11155 41700MAR02-138 297 147 Algal bioherm 43,810±930 TO-11156 50810MAR03-48 44 311 Ostrea sp. 118,927+6193–5852 UQAM 112113–125120 118927MAR03-49 270 321 Ostrea sp. 133,218+7318–6814 UQAM 126404–140536 133218M-3 72 800 Bulk sediment 5040±60 BA-157951 5312–5452 5394M-3 137 800 Bulk sediment 7840±40 BA-157952 8273–8366 8312M-3 165 800 Bulk sediment 9030±60 BA-157953 9611–9833 9726M-3 230 800 Bulk sediment 14100±200 BA-157954 15982–16617 16297M-3 310 800 Bulk sediment 16610±80 BA-157955 19298–19469 19372M-3 408 800 Bulk sediment 19860±80 BA-157956 22925–23398 23150
UQAM = U/Th dates from Université du Montréal. TO and BA = uncalibrated 14C dates from Isotrace Laboratories (University of Toronto), and Beta Analytic, respectively (half-life of 5568 yr;errors represent 68.3% confidence limits). S1 age, Y2 age and Cal yr BP calibration procedures explained in text. Dates from core M-3 from Roussakis et al. (2004). WD = water depth.
3E.B. Işler et al. / Marine Geology 254 (2008) 1-17
and the seafloor exceeds ∼750 m. West of 26°10′E, the trough isbounded onboth sides by steep escarpments (Fig. 3). Across thefloor ofthe trough, the seafloor appears to be highly corrugated.
4. Structural setting and sequence stratigraphy
Examination of the seismic-reflection profiles reveals the presenceof three NE–SW trending sedimentary basins (B1, B2 and B3) and twointervening ridges (R1 and R2) cored by elevated acoustic basement(Fig. 4A). The basement exhibits high amplitude, folded to inclinedreflections (Fig. 5) that become predominantly chaotic at depth. Theridges and basins constitute narrow anticlinal and broadly opensynclinal structures, respectively. The structural framework of thestudy area is characterized by a series of broadly northeast–south-west-trending and east–west-trending extensional and transtensionalfaults (Fig. 4B; Işler, 2005). Many of these faults have morphologicalexpression on the seafloor. Two major faults, A1 and β8, are identifiedas through-going master faults. Immediately south of these masterfaults, narrowly-spaced clusters of en échelon faults are recognized,consisting of 9–12 vertical to sub-vertical, northeast- and southwest-dipping, northwest-trending faults that display normal- and reverse-sense dip–slip separations. Many of the structural patterns identifiedin the study area are characteristic of strike–slip deformation. Thebasin-bounding major fault A1 represents the western extension ofthe central strand of the North Anatolian Fault, whereas the north-east–southwest-trending segment β8 forms a releasing bend, extend-ing into the North Skiros Basin (Fig. 4B; Işler, 2005).
The basin-filling sedimentary successions are thickest along theaxes of the basins and show dramatic thinning toward the ridges,revealed by the convergence of reflections toward the ridges (Fig. 6).This convergence is attributed to progressive onlap associated withvariable amounts of erosion beneath the shelf-crossing unconformi-ties (see below). In the southern portions of the study area, the ridgesare only blanketed by a thin veneer of sediments (20–25 ms thick);however, toward the north, they are largely exposed at the seafloor.
On the basis of reflection configuration and internal architecture,eight depositional sequences are delineated in the seismic-reflectionprofiles (Figs. 7 and 8). A depositional sequence is defined as a packageof relatively conformable and genetically related reflections, boundedat its top and base by unconformities or their correlative conformities(e.g. Mitchum et al., 1977). The depositional sequences in the studyarea are separated from one another by prominent shelf-crossing

Fig. 4. (A) Simplified map showing basins (B1–B3) and ridges (R1, R2) delineated by the morphology and elevation of the underlying acoustic basement. (B) Fault map of the studyarea. A1 and β8 are major basin-bounding faults discussed in the text. (C, D) Isopach maps of depositional sequences 6 and 5 showing sediment thicknesses in milliseconds two-waytravel time (100 ms ∼75 m thickness). Shaded areas offshore in C and D represent regions where depositional sequences are either eroded or were never deposited.
Fig. 5. Huntec DTS profile showing the folded and inclined basement reflectors that are exposed on the seafloor. DS1 is a thin surficial mud drape. See Fig. 2 for location.
Fig. 6. Airgun seismic-reflection profile showing the symmetric cross-sectional geometry of basin B2, narrowly-spaced normal faults and the internal architecture of several stackeddepositional sequences (DS1–DS5) and their bounding unconformities (α, α0, α1, α2). Note that bubble pulse obscures DS1. See Fig. 2 for location.
4 E.B. Işler et al. / Marine Geology 254 (2008) 1-17

Fig. 7. Airgun seismic-reflection profile showing the internal architecture of depositional sequences 5, 6, 7, and 8with clinoforms at the top of each; their bounding unconformitiesα1,
α2 α3,α4; the distal reflections of depositional sequences 1–4, and their bounding correlative conformitiesα–α0 in deeper water regions in basin B1. Bubble pulse obscures DS1. Notethat depositional sequences are offset by narrowly-spaced normal faults. See Fig. 2 for location.
5E.B. Işler et al. / Marine Geology 254 (2008) 1-17
unconformities, identified by truncation and/or downlap, onlap andtoplap reflection terminations at the lower and upper boundaries ofthe depositional sequences. The unconformities bounding thedepositional sequences define prominent surfaces extending acrossthe entire width of the shelf. Several unconformities truncate smallchannels and cut-and-fill sequences (Fig. 9), mostly in basins B2 andB3. The long axes of the channels are oriented broadly parallel to theaxes of the basins (Fig. 10). The channels exhibit large variability intheir dimensions, from 10–50 m for the axial thickness of the fill, andfrom 300 m to N900 m in width (Figs. 9 and 10).
The shelf-crossing unconformities are interpreted as compositesurfaces which initially developed by subaerial exposure and erosionculminating at the time of the maximum regression, followed byshoreface erosion during the subsequent transgression when long-
Fig. 8. Sparker seismic-reflection profile showing the internal architecture of depositional seunconformities α0, α′, and depositional sequences 1 and 2, across the shelf region in basinnormal faults. See Fig. 2 for location.
shore currents and waves cut a ravinement surface (Swift, 1968). Theinitial subaerial exposure and valley incision produced the cut-and-fillstructures and channels. Beyond the shelf edge, the unconformitiespass into parallel-bedded conformable successions, which are inter-preted as the correlative conformities of the shelf-crossing unconfor-mities. Depositional sequence 1 is the uppermost seismic unit (Figs. 7,8 and 11). Airgun records reveal the unit to be composed of relativelystrong, continuous parallel reflectors which form a thin (b20 ms)veneer blanketing all the morphological features throughout thestudy area. Depositional sequence 1 is marked at its base by the shelf-crossing unconformity α. In high-resolution Huntec DTS profiles, theunit is locally imaged as a series of wedge-shape bodies (Fig. 11). Thesedeposits have crests which are oriented essentially parallel to theisobaths. They are hundreds of metres across, several kilometres long
quences 4, 5, and 6; associated bounding unconformities α1 and α2; the nearly-mergedB2. Bubble pulse obscures DS1. Note synsedimentary growth on the hanging walls of

Fig. 9. Sparker seismic-reflection profiles showing several cut-and-filled fluvial channels beneath the shelf. The unconformity at the base of each channel was subsequently cut by awave-ravinement surface during transgression, generating the shelf-crossing unconformities α, α0. See Fig. 2 for location.
Fig. 10. Map showing the progradation directions of depositional sequences, calculatedusing apparent dips of prominent clinoforms in crossing seismic-reflection profiles. Alsoshown are the locations of cut-and-fill structures and buried fluvial channels.
6 E.B. Işler et al. / Marine Geology 254 (2008) 1-17
(parallel to their crests) and have central thicknesses ranging from 9–15 ms (∼7–11 m). Internally, these deposits show seaward progradingclinoforms. They have asymmetrical cross-sectional geometries withwider gently dipping sides and narrower more steeply dipping sides(Fig. 11); all dips are in the seaward direction except inwedge 3 wherethere are gentle landward dips. The wedge-shaped bodies occur inseveral linear, progressively landward-stepping clusters that aregently shingled on top of one another. The geometry of theselenticular deposits, oriented parallel to the isobaths, and their internalarchitecture suggest that they are drowned beaches and associatedshoreface and shoreline deposits. They are interpreted as retro-gradational bodies within a transgressive systems tract (e.g., Coe andChurch, 2003). The clustering of sets of parallel ridges at progressivelyshallower water depths points to landward migration of the shorelinein distinct steps.
Depositional sequences 2–8 define well-developed progradationallobes which are predominantly nestled within the deepest portions ofthe sedimentary basins, but which also extend across the shelf edgeinto deeperwater (Figs. 4C, D, 6–8 and 12). Each depositional sequenceis characterized by an upper subunit consisting of obliquely progradedclinoforms, and a lower subunit generally consisting of horizontal togently seaward-dipping parallel reflectors (Figs. 7, 8 and 13). The lowersubunit is everywhere much thinner than the upper subunit; it main-tains a more-or-less uniform thickness across the entire width of the
shelf, but thickens slightly in the landward direction. The boundarybetween the upper and lower subunits is not a single reflection, but isbest defined as a 5–10 ms-thick zone (Figs. 7, 8 and 13). In many

Fig.11.Huntec DTS profile showing three prominent seaward prograded clinoforms (wedges 1, 2 and 3) which progressively step landward. (B) is an expanded view of wedges 1 and 2in (A). See Fig. 2 for location.
7E.B. Işler et al. / Marine Geology 254 (2008) 1-17
profiles, the clinoforms of the upper subunit downlap onto theuppermost flat-lying reflection of the lower subunit, suggesting thepresence of a mild unconformity at that level. The clinoforms havemaximum dips in the range 6°–8°.
Each lower subunit lies immediately above the shelf-crossingravinement surface of the previous cycle, and formed during thetransgressive period and the early highstand when only fine grainedmuds reached the outer shelf (see core descriptions below). Hence, thelower subunits are inferred to contain the maximum flooding surfaceassociated with the time of maximum transgression. During trans-gression, siliciclastic sediment supply is generally much lower than atother times because flooded valleys trap sediments in proximal areas.The gentle landward thickening of the lower subunits is attributed tothis landward shift in deposition. The internal seismic architecture ofthe lower subunit is similar to Quaternary delta successions describedelsewhere in the eastern Mediterranean (e.g., Aksu et al., 1992a,b).
The prominent clinoforms of each upper subunit clearly documenta phase of progradation (Figs. 7, 8 and 13). However, the seawarddescent of the topset-to-foreset transitions in each depositionalsequence, together with distinctive downward shifts of the offlapbreak in the seaward direction, demonstrate that deposition tookplace during a progressive drop in sea level. Thus, the upper subunitsare interpreted as progradational bodies of the forced-regressivesystems tract (e.g., Posamentier et al., 1992; Helland-Hansen andGjelberg, 1994).
Isopach maps show the development of two distinct morphologi-cal types of sedimentary unit: (i) detached depositional sequences and(ii) attached depositional sequences. The detached depositionalsequences are best observed in basin B3, where depositionalsequences 5 and 6 contain prominent lobes which are restricted tothe deeper part of the basin and absent from the adjacent shelf in thevicinity of ridge R2 (Fig. 4C, D). In cross-sectional viewwithin basin B3,depositional sequences 5 and 6 consist of wedges which are tapered inthe landward direction (Fig. 14) and capped by the shelf-crossingunconformities α1 and α2, respectively. This type of detached ar-chitecture is representative of major bypass of the shelf and shelf edgeduring the development of these sequences, so that accommodationspace was insufficient over what is now the modern shelf for deltaprogradation to occur. Instead, the deltas were rapidly displacedseaward to the shelf edge, and prograded into deeper water. Theattached progradational sequences are best developed in basins B1
and B2 (e.g., Figs. 7 and 8). Here, the shelf-crossing unconformitiesthat define the upper boundaries of each sequence are clearly inclinedin the seaward direction, and the prograded clinoform packagesmaintain a relatively uniform thickness across the entire width of theshelf. The offlap break (i.e., topset-to-foreset transition) of a givenprograded package is topographically lower than the offlap break inthe previous set of clinoforms. In both the attached and detachedsequences, the most seaward and lowest-elevation topset-to-foresettransitions of the depositional sequences represent the latest phaseof progradation, immediately prior to the subsequent sea-level rise(Fig. 15).
5. Chronostratigraphy
This section has two central objectives. The first is to directly datethe younger depositional sequences. Several calibrated radiocarbonand uranium/thorium (U/Th) dates and the recognition of distincttephra and sapropel layers constrain the ages of depositionalsequences 1–4 (Fig. 16; Table 2). The second objective is to establishthe age of the older depositional sequences. This is done primarily byextrapolation of accumulation rates from shallower levels, and bycomparison with the global oxygen-isotopic curve (e.g., Lisiecki andRaymo, 2005). Age picks for isotopic stage boundaries are based, inpart, on orbital (Milankovitch) theory so are effectively calendar years.
5.1. Radiometric dates and air-borne tephra
All 14C ages have been converted to calibrated calendar years(Cal years or Cal ka) using a reservoir correction of 408 yr (Ma-rine04.14C calibration curve; Calib 5.0.2 on-line utility at http://calib.qub.ac.uk/calib/calib.html). For radiocarbon ages between 21,880 and42,000 14C yr (i.e., beyond the range of the Marine04.14C curve),calibration was achieved by correcting the 14C age for reservoir effects(R=408 yr) and then estimating the best fit to the calibration scatter-plot for GB-89-24-1 provided by Beck et al. (2001). Older 14C ages werecalibrated by adding 7000 yr to the raw 14C age (Beck et al., 2001).Where 14C ages of other authors are presented, they have been cali-brated using the same procedures. Calibrated ages are rounded to thenearest 5 yr. Dates based on other techniques (e.g., U/Th, 40Ar/39Ar,orbital theory) need no calibration and are therefore reported ascalendar ages (Cal ka).

Fig. 12. Isopach maps of depositional sequences 4, 3 and 2 showing sedimentthicknesses in milliseconds two-way travel time (100 ms ∼75 m of sediment). Shadedareas offshore represent regions where depositional sequences are either eroded orwere never deposited.
8 E.B. Işler et al. / Marine Geology 254 (2008) 1-17
A radiocarbon date of 10,490 Cal yr on an in situ Turritella spp. shellin core MAR98-16 (Table 2) constrains the age of depositionalsequence 1 to the Holocene and latest Pleistocene. This depositionalsequence also contains sapropel S1, dated by Aksu et al. (1995a,b) to∼6.9–10.5 Cal ka (6.4–9.6 14C ka). There are six radiocarbon dates indepositional sequence 2, spanning 19.7–50.4 Cal ka (Table 2). Thisdepositional sequence includes a tephra horizon identified bygeochemical fingerprinting as Y2 (Aksu et al., 2008). The Y2 tephralayer has been attributed to Santorini activity dated elsewhere at21,705±0.311 Cal ka (Eriksen et al., 1990).
Core MAR02-113P is instrumental in dating α, depositional se-quence 2, and in establishing an average accumulation rate for basinalprodelta muds of the lower subunits of the Aegean Sea depositional
sequences. This average accumulation rate provides the basis for thedating of the older depositional sequences. Chronological data forcoreMAR02-113P (2 radiocarbon dates+known ages for base and topof S1+known age of Y2) are plotted in Fig. 17. There is no seismic orlithological evidence for a hiatus at the level of α at this core site.Reflectorαwas traced from seismic profiles where it is a clear angularunconformity to core site MAR02-113P. At this core site, it occurs at adepth of ∼260 cm below the seabed. The seismic data are airgunrecords with perhaps 50 cm vertical resolution in near-surfacedeposits, so the interpreted depth to α might reasonably range from∼210–310 cm. The age–depth plot of Fig. 17 indicates an age of∼14 Cal ka for α if it indeed corresponds to a core depth of 260 cm(±∼2 Cal ka for the ±50 cm uncertainty). This is the age assignmentused in the rest of this paper.
Based on the slope of the age–depth plot for core MAR02-113P, theaccumulation rate for most of the cored succession is ∼27 cm ka−1
(Fig. 17). We also calibrated the radiocarbon ages presented byRoussakis et al. (2004) for nearby core M-3 in the North Skiros Basin(Fig. 1) and plotted these against core depth. These data support anaccumulation rate of ∼27 cm ka−1 for the distal, basinal muds of thelower subunits of the Aegean Sea depositional sequences (Fig. 17). Ofcourse this average rate can only be used in conformable successionsand not across unconformities like those that punctuate coresMAR03-48P and MAR03-49P (Fig. 16).
The recognition by Aksu et al. (2008) of the widespread Y5 tephrain cores MAR03-48P and MAR03-49P (Fig. 16) helps constrain the ageof α0, which must be older than that tephra. The Y5 tephra layer iscorrelated with the Campanian Ignimbrite, which has been datedusing 40Ar/39Ar methods to 39.28±0.11 Cal ka (De Vivo et al., 2001;Pyle et al., 2006). This agrees within error with an estimate of 38±2.5 Cal ka based on oxygen-isotope stratigraphy of cores containingY5 in the eastern Mediterranean Sea (Thunell et al., 1979).
Because of the distal setting of core site MAR02-113P, all de-positional sequences are prodeltaicmuds at that locality (Fig.18A). Thecorrelative conformities of the shelf-crossing unconformities α′, α0,α1, α2, α3 and α4 lie at sub-seafloor depths of ∼10.2, 17.7, 38.2, 75.1,101.9 and 126.4 m, respectively. Compaction is not significant at theseburial depths (Rowan et al., 2003) so an average accumulation rate canbe used without adjustment to estimate the ages of the olderstratigraphic markers. Although piston-core data support an averagerate of∼27 cmka−1 (Fig.17), this ratewas derived for only the youngestdeposits. Fortuitously, there are two U/Th dates on Ostrea shellsextracted from cores MAR03-48P and MAR03-49P, just above and justbelow the α1 level (Fig. 16). Cores MAR03-48P and MAR03-49P weretaken from the deeper portions of the eastern basin, immediatelyseaward of the topset–foreset transition of depositional sequence 5,whereα1 is situated near the seabed (Fig.18B). TheseU/Th dates can beused to provide a second and independent estimate of accumulationrate that is a longer-term average. The ages above and below α1 are118,927 yr and 133,218 yr, respectively (Fig. 16; Table 2). α1 has beentraced beneath the MAR02-113P core site where it occurs at a sub-seafloor depth of 38.2 m. If this horizon is as young as 119 Cal ka, thenthe accumulation rate could be no more than 38.2/119=32 cm ka−1,whereas if its age is as old as 133 Cal ka, then the accumulation ratecould be no less than 38.2/133=29 cm ka−1. This range, 29–32 cm ka−1,is very close to the estimate of ∼27 cm ka−1 obtained frompiston cores(Fig. 17), but is a more reliable long-term average. Using theintermediate rate of 30 cm ka−1, the ages of the distal extensions ofthe shelf-crossing unconformities α′, α0, α1, α2, α3 and α4 can beestimated as 33.8, 63.7, 127.3, 250.3, 339.5 and 421.3 Cal ka,respectively (Fig. 19).
5.2. Correlations with the oxygen isotope stages and sea-level curves
Calculated ages for the unconformities and the overall stackedstratigraphic architecture suggest that depositional sequences 2–7

Fig. 13.Huntec DTS profile showing the detailed internal architecture of depositional sequence 4, characterized by an upper subunit consisting of oblique-prograded clinoforms and alower subunit consisting of generally horizontal to gently seaward-dipping parallel reflectors. Core MAR02-138 samples depositional sequence 2 (Fig. 16). See Fig. 4B for the locationof the prominent basin-bounding, shelf-delimiting normal fault A1 and Fig. 2 for location of the seismic profile.
9E.B. Işler et al. / Marine Geology 254 (2008) 1-17
represent distinct phases of delta progradation during the last423 ka (Fig. 19). Sea-level falls and rises are imaged in seismic-reflection profiles as the oblique-prograded upper subunits of de-positional sequences and shelf-crossing ravinement unconformi-ties, respectively.
Sequence boundaries α and α1 have been securely dated usingradiocarbon and U/Th dates, and ties to dated tephra layers. Where itis a conformable surface in deep water, α has an age of ∼14 Cal ka,coinciding with the onset of rapid transgression after the lastdeglaciation (Waelbroeck et al., 2002). The age of α1 coincides closelywith the sea-level rise at the oxygen-isotopic stage 6–5 boundary. Weuse these two excellent matches to justify a chronological modelwhich assigns the deltaic upper subunits of the depositionalsequences to glacial lowstands, and the intervening sequenceboundary unconformities to times of glacio-eustatic sea-level rise ateven–odd oxygen-isotopic stage boundaries (e.g., 2–1, 4–3, 6–5 etc.).The only exception is the atypical unconformity α′, which does notoverly a depositional sequence having deltaic clinoforms. Instead,depositional sequence 3 between α′ and α0 is thin, only locallydeveloped and consists of parallel reflectors. The calculated age of33.8 Cal ka for α′ coincides with the minor sea-level rise occurred
Fig. 14. Sparker seismic-reflection profile showing the internal architecture of the detached
between 35,000 and 31,000 yr BP and favorably matches with theoxygen-isotopic stage boundary 3–2 (i.e., 32,000 yr; Waelbroeck et al.,2002; Fig. 19). The ages of all other unconformities, their correlativeconformities, and the depositional sequences closelymatch the timingof glacial and interglacial episodes, as given by the global oxygen-isotopic curve and Milankovitch theory (Fig. 19). For example, thecalculated age of unconformity α0 (63.7 Cal ka) beneath the MAR02-113P core site closely matches the transition from glacial stage 4 tointerglacial stage 3, ∼64,000 yr ago. The α1 sequence boundarycoincideswith the transition from glacial to interglacial isotopic stages6–5, ∼128,000 yr ago. Shelf-crossing unconformitiesα2,α3 andα4 areassigned, based on the chronological model, to oxygen-isotopic stageboundaries 8–7, 10–9 and 12–11, respectively. It is quite remarkablethat the calculated ages for these surfaces, based on a 30 cm ka−1
average accumulation rate, so closely match the published ages for theoxygen-isotopic stage boundaries (e.g., Lisiecki and Raymo, 2005).
5.3. Volume and mass calculations
Total volume of the sediments stored in depositional sequences 2–6 and in each basin was calculated assuming an average acoustic
stacked, prograded depositional sequences 5 and 6 in basin B3. See Fig. 2 for location.
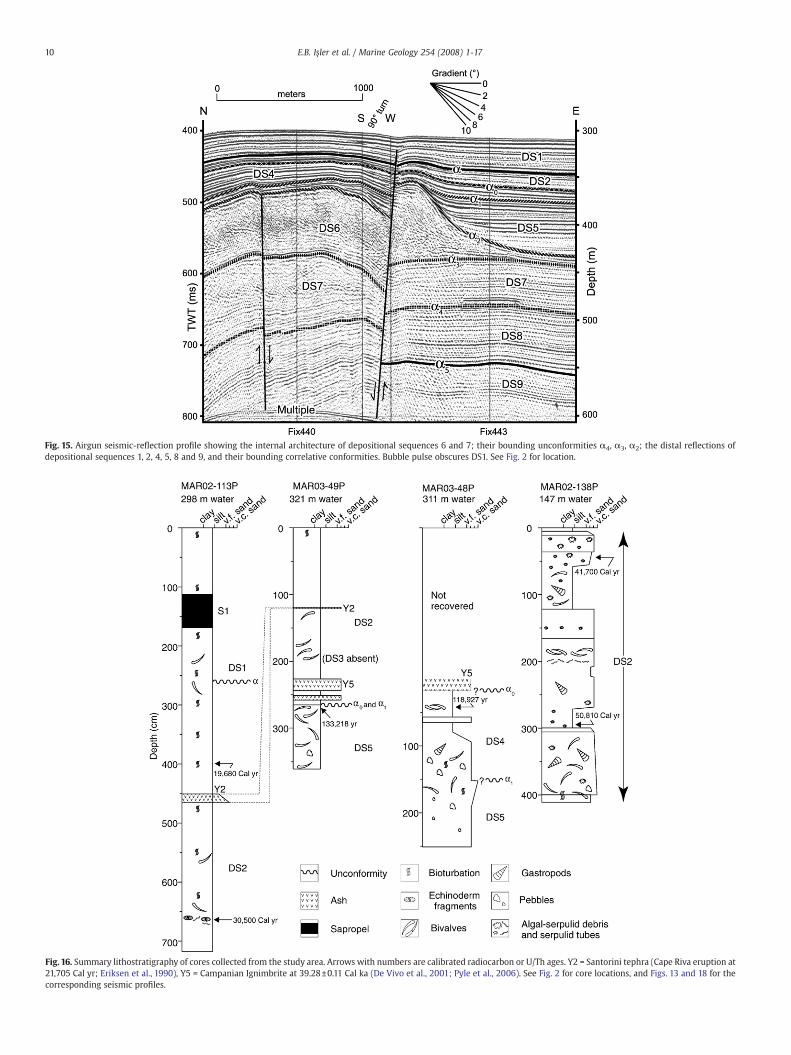
Fig. 16. Summary lithostratigraphy of cores collected from the study area. Arrows with numbers are calibrated radiocarbon or U/Th ages. Y2 = Santorini tephra (Cape Riva eruption at21,705 Cal yr; Eriksen et al., 1990), Y5 = Campanian Ignimbrite at 39.28±0.11 Cal ka (De Vivo et al., 2001; Pyle et al., 2006). See Fig. 2 for core locations, and Figs. 13 and 18 for thecorresponding seismic profiles.
Fig. 15. Airgun seismic-reflection profile showing the internal architecture of depositional sequences 6 and 7; their bounding unconformities α4, α3, α2; the distal reflections ofdepositional sequences 1, 2, 4, 5, 8 and 9, and their bounding correlative conformities. Bubble pulse obscures DS1. See Fig. 2 for location.
10 E.B. Işler et al. / Marine Geology 254 (2008) 1-17

Fig. 17. Calculated mean sedimentation rate deduced from age versus depth plots ofcalibrated radiocarbon dates (Table 2) and known ages of sapropel S1 and the Y2 tephra.Data from this study and Roussakis et al. (2004).
11E.B. Işler et al. / Marine Geology 254 (2008) 1-17
velocity of 1500 m s−1 and using the areal distribution of eachdepositional sequence obtained from detailed isopach maps (Table 3).Depositional sequences 7 and 8 are not considered because they areobscured by acoustic multiples in many parts of the study area.Throughout the study area, depositional sequences 2–6 are mostlywithin 75 m of the seafloor. The assumed acoustic velocity isapproximate because sediments, at sub-seafloor depths of about60 m, may transmit sound at velocities slightly higher than 1500 ms−1
(Aksu et al., 1999). However, the discrepancy between 1500 m s−1 andthe actual velocity is small and has no serious impact on results. Thepurpose of calculating volumes is to compare themass of sediments inthe entire study area to the anticipated yield of rivers on the adjacentlandmass over the same time period. For depositional sequences 2–6,this time period is ∼330 ka (Fig.19). If the chronology of Fig.19 is valid,then there should be a reasonablematch between the river supply andthe integrated volume of the depositional sequences. To allowcomparison, the calculated volumes were first converted to massesof solid detrital particles using a grain density of 2.65 g cm−3 and anaverage porosity of 35% (average value in mixed sands andmuds, fromHegarty et al., 1988). The calculated sediment volumes and, accord-ingly, the masses of sediment are only approximate because: (1)
Fig. 18. Airgun seismic-reflection profiles showing the positions of core MAR02-113 (A) andMAR03-49 in part B have been projected to the profile from 500 and 1100 m off track, resp
particularly in the northern portion of the central basin, most of thesequence boundaries (prominent unconformities) lie beneath the firstmultiple so thickness measurement has some uncertainty, and (2) thelimited seismic coverage does not allow tracing of the 0 m contourline of most of the depositional sequences so that isopach maps arenot complete. The yield of rivers that supplied these deltaic unitsmust have been higher than the calculated masses, because ∼40% ofthe load reaching a delta is dispersed well beyond the delta itself(Kukal,1971, p.38). For this reason, the totalmass of∼1.43×10¹¹ tonnes(Table 3) needs to be sought from rivers with a total mass yield of∼2.30×10¹¹ tonnes over a period of ∼330 ka.
6. Discussion
Several vertically stacked, broadly south/southwest-progradeddepositional sequences are observed in the NE Aegean Sea, betweenthe islands of Bozcaada and Lesbos and the Biga Peninsula. Thesuccessive development of younger depositional sequences atop olderdepositional sequences is the characteristic architecture of a rapidlysubsiding shelf environment off a river mouth.
6.1. Sediment sources
Because the depositional sequences developed within broadlynortheast–southwest-trending basins separated by major ridges, eachbasin was likely supplied by a different river. Several superimposedcut-and-fill structures are interpreted as remnants of these paleoval-leys in basins B2 and B3 (Figs. 9 and 10). The true dip-directions of thedeltaic clinoforms calculated from different depositional sequences(Fig. 10), and the trends of paleovalleys identified off the BigaPeninsula, further support the idea that the sediments weretransported by several rivers. The Tuzla, Karamenderes, and DümbekRivers (Fig. 2) are the plausible candidates.
The amount of sediment eroded from each drainage basin is thesum of the original volume of rock stripped from the drainage area,above the elevation of the present interfluves, plus the volumeremoved from the modern valleys. Field observations in the BigaPeninsula show that, at present, the Bayramiç Formation is largelyrestricted to the drainage area of the Karamenderes River and has an
cores MAR03-48 and MAR03-49 (B). Note that the locations of cores MAR03-48 andectively. Bubble pulse obscures DS1. See Fig. 2 for core locations.

Fig. 19. Proposed chronology for the stacked prograded delta successions in the Aegean Sea correlated with (a) the global oxygen isotope curve constructed from a stack of numerousbenthic δ18O records collected from different sites throughout the Pacific and Atlantic oceans (from Lisiecki and Raymo, 2005) and (b) the global sea-level curve (from Waelbroecket al., 2002). Major transgressions are correlated with shelf-crossing unconformities (α–α4).
Table 3Volumes (including porosity) and solid masses (without porosity) for depositionalsequences (DS) 2–6, and estimated river yield required to supply these masses
DS Volume(km3)
Mass(tonnes)
River yield(tonnes)
DS2 20.3 2.10×10¹⁰ 3.50×10¹⁰
DS3 11.5 1.17×10¹⁰ 1.98×10¹⁰
DS4 25.9 2.93×10¹⁰ 4.46×10¹⁰
DS5 38.2 4.05×10¹⁰ 6.58×10¹⁰
DS6 37.8 4.01×10¹⁰ 6.51×10¹⁰
Basin B1 50.5 5.42×10¹⁰ 8.69×10¹⁰
Basin B2 62.7 6.72×10¹⁰ 10.80×10¹⁰
Basin B3 19.5 2.12×10¹⁰ 3.36×10¹⁰
Total DS2–DS6 133.7 1.43×10¹¹ 2.30×10¹¹
See text for full discussion.
12 E.B. Işler et al. / Marine Geology 254 (2008) 1-17
average thickness of 50–150 m (Siyako et al., 1989). Limitedbiostratigraphic data suggest that the age of the top of the formationis earliest Pleistocene (∼1.2 Ma; Siyako et al., 1989; Genç, 1998).Assuming that the original areal distribution of the BayramiçFormation was also largely restricted to the present-day Karamen-deres drainage basin (e.g. Siyako et al., 1989; Yılmaz and Karacık,2001) and that it had a pre-erosion average thickness of ∼100 m, wecan calculate the original volume of sediment that was removed fromthis area by exhumation and erosion in the Quaternary–Recent. TheKaramenderes drainage basin covers an area of 1897 km−2 so the totalvolume is 190 km3. Assuming that the rate of erosion remainedapproximately constant for the last 1.2 Ma, the volume of sedimentremoved across this region during the last 330,000 yr is approxi-mately 52.3 km3. Because this material would have been essentiallyunconsolidated, we assume a porosity of ∼35% and calculate a solidsvolume of ∼52.3×0.65=34.0 km3. The Bayramiç Formation has itsbase near the tops of the present fluvial valleys. The valleysthemselves are almost exclusively carved into Oligo-Miocene rocks.The volume of older strata eroded during incision of the Karamen-deres River valley since 1.2 Ma was calculated to be 209 km3, usingdigitized, 1:100,000-scale, 3-D topographic maps using Digital TerrainModeling and Geographic Information System and ERDAS software.The proportion that can be ascribed to erosion during the last 330 ka is57.5 km3. These rocks have low porosity so no correction is required toarrive at the solids volume. Similar calculations reveal that theamounts of bedrock eroded from the Tuzla and Dümbek valleysystems since 330 ka are 48.0 km3 and 9.5 km3, respectively. The totalsolids volume denuded from the three drainage basins over the 330 kais therefore 34.0+57.5+48.0+9.5=149 km3. Using a grain density of2.65 g cm−3 gives an equivalent mass of 3.94×10¹¹ tonnes. The solidsvolume required to account for depositional sequences 2–6 is2.30×1011 tonnes (Table 3). These first-order calculations clearlyshow that the late Quaternary yields of the Karamenderes, Tuzla andDümbek rivers were more than adequate to deliver the requiredquantity of detrital material to the basins of the NE Aegean Sea.
6.2. Delta progradation history and paleogeography
Işler (2005) provides a thorough step-by-step explanation of thedevelopment of each depositional sequence, including the effects ofminor rises and falls of sea level superimposed on the longer-termglacial–interglacial trends. This paper provides a detailed analysis foronly one depositional sequence (DS6), in order to illustrate howsediment supply, sea-level excursions, and subsidence controlleddeposition. For the other depositional sequences, Table 4 summarizesthe range of variation for the primary controlling factors and the maindepositional events, and Fig. 20C–I illustrate the changing paleogeo-graphy. Each depositional sequence developed after the start of aninterglacial highstand, generally with five developmental stages:
1) deposition of horizontally bedded prodeltaic muds when riverdeltas were restricted to a landward position by high base levels;
2) possible minor shoreline oscillation because of cyclic sea-levelexcursions during the highstand;

Table 4Schematic overview of the chronostratigraphy of the depositional sequences, unconformities, the range of sea-level fluctuations, and inferred sedimentary-tectonic processes duringsequence development (from Işler, 2005)
13E.B. Işler et al. / Marine Geology 254 (2008) 1-17
3) progradation of a clinoform package (the delta front and delta top)as sediment supply and the rate of sea-level drop exceeded the rateat which tectonic subsidence created new accommodation space;
4) possible stillstands and minor transgressive events during overallseaward migration of the shoreline because of fluctuations inglobal sea level, sediment supply or subsidence;
5) delta abandonment and backstepping during the next interglacialsea-level rise.
The tendency of delta fronts to prograde, and the eventual distanceof progradation into the basin depend on the balance between the rateof creation of accommodation space and the rate of sediment supply.Accommodation space is created by tectonic subsidence and sea-levelrise and, if created rapidly enough, can balance or exceed the sedimentsupply so that deltas cannot advance seaward. When subsidence ratedecreases or sea level falls, deltaic wedges can advance seaward bysediment-driven progradation, or by forced regression if there is arapid fall in base level (Posamentier et al., 1992). It is not knownwhether there might have been variations in sediment supply fromthe Tuzla, Karamenderes and Dümbek rivers, nor whether subsidencerates might have fluctuated since ∼330 Cal ka. Hence, our assessmentof the depositional historymust be based, to a large degree, on averagerates.
In an effort to quantify subsidence rates, the elevations of thetopset-to-foreset transitions of depositional sequences DS5, DS6 andDS7 were measured at two separate locations in the central parts ofbasins B1 and B2 (Figs. 2 and 4A). Only the latter two depositionalsequences provide data in Basin B2. The elevations of the topset-to-foreset transitions were used as input to a decompaction andbackstripping analysis using the freeware OSXBackstrip 2.2. Thewater depth over topset-to-foreset transitions was set to ∼15 m, andthe times of themost seaward delta advances were picked from Fig.19and Table 4. Corresponding global sea levels were obtained from Fig.
19. The net subsidence rate, including components attributable totectonic movements, sediment and water loads, was 1.8 m ka−1 in thecentre of Basin B1 and 0.3 m ka−1 in the centre of Basin B2. These ratesapply to the times of accumulation of DS6 (both basinal sites) and DS5(Basin B1 only). Whenever the combined rates of sea-level fall andsediment supply exceeded these subsidence rates, deltas were able toprograde across the Aegean Sea shelves. The seismic architecture (Fig.8) indicates that there were cyclic phases of delta progradation(followed by abandonment and drowning) throughout the lateQuaternary; these must have been triggered mainly by sea-levelfluctuations. Tectonic subsidence served primarily to create sufficientspace for the preservation of each progradational unit, so that astacked set of deltaic successions accumulated. Because of ongoingsubsidence, these successions now lie in water depths of tens tohundreds of metres beneath unfilled accommodation space.
The seaward limit of prograded deltaic bodies is similar for DS7–DS5. This is interpreted to indicate a similar minimum sea level duringglacial stages 10, 8 and 6. In cases where the most seaward topset-to-foreset transition of a depositional sequence is farther basinward (e.g.,DS7), the seabed was presumably shallower because of a lower rate ofsubsidence (or greater sea-level drop), so that progradation pre-dominated over aggradation during delta development and theshoreline advanced rapidly seaward even under conditions ofessentially constant sediment supply.
6.3. Example of sequence development from highstand to lowstand: DS 6
Here we demonstrate the complex interaction of base-levelchanges, subsidence and sediment supply as controls on thedevelopment of depositional sequence DS6. During the peak ofinterglacial isotopic stage 9 at ∼330 ka, sea level reached its highestlevel of +5m (Waelbroeck et al., 2002). Tectonic subsidence and globalsea-level rise created considerable accommodation space. Isolation of

14 E.B. Işler et al. / Marine Geology 254 (2008) 1-17

Fig. 20. (Left) Maps showing the paleoshoreline, the Dümbek, Karamenderes and Tuzla rivers, and the development of depositional sequences 7 (A) through 1 (I) in the northernAegean Sea. The present-day coastline is dotted. Isobaths in metres. The maps were constructed using published topographic and bathymetric maps, corrected for subsequent upliftalong the Strait of Dardanelles (Yaltırak et al., 2002) and subsidence along the shelf south of the Island of Bozcaada (Boz). TF = Tuzla Fault; Les = Lesbos. (Right) Correspondingschematic cross sections along profile X–X′ or Y–Y′ (inset) showing the position of paleo-sea level and the development of the shelf-crossing unconformities α3, α2, α1, α0. t/f =topset-to-foreset transition. Global δ18O curve from Lisiecki and Raymo (2005), with labelled solid dots corresponding to each part of the figure.
15E.B. Işler et al. / Marine Geology 254 (2008) 1-17
the study area from the shoreline led to the deposition of a veneer ofsediments originating from distant active deltas and from reworkingof the underlying Subunit 7a (Fig. 20A). This blanket of sedimentsprobably filled the topographic lows (i.e., former incised valleys)created during the previous erosional stage. During the highstandinterval, the paleoshoreline migrated well landward and a consider-able part of the islands of Limnos, Bozcaada and Gökçeada, and thelow-lying regions of the Gelibolu and Biga peninsulas were flooded.The global sea-level curve shows that, during interglacial isotopicstage 9, sea level experienced a 27 m drop from +5 m to −22 m (330–317 ka) and a subsequent rise from −22 m to −15 m (317–311 ka) (Fig.19; Waelbroeck et al., 2002). The Karamenderes, Tuzla and DümbekRivers likely had started to prograde seaward during these stadial andinterstadial episodes of interglacial isotopic stage 9. However, none ofthe seismic-reflection profiles show a highstand delta with itsdiagnostic sigmoidal to complex oblique-sigmoidal internal seismicarchitecture, as observed elsewhere at the mouths of moderate-sizerivers along the Aegean coastline (Aksu et al., 1987). Instead, thedeposits of the lower subunit 6a of depositional sequence 6 arecharacterized by nearly flat-lying to gently seaward-dipping parallelreflectors (Fig. 20B). The absence of sigmoid prograded clinoformsimplies that either these deposits are only preserved near the present-day shoreline (or as raised deposits) or they were subjected to intensesubaerial erosion during the subsequent sea-level fall and werecompletely stripped away, being reworked into foresets of theuppermost Subunit 6a.
Across the transition from interglacial isotopic stage 9 to glacialisotopic stage 8, the Karamenderes, Tuzla and Dümbek rivers startedto prograde farther seaward during a time when global sea level fellfrom its highest level of −15 m to a low of ∼−109 m, interrupted bytwo short intervals of sea-level rise (Waelbroeck et al., 2002). Between311 and 297 ka, sea level fell continuously from −15 m to −62 m at arate of 3.3 m ka−1 (Fig. 19) and the Tuzla River swung toward thesouthwest into basin B1 (Işler, 2005). The Karamenderes and theDümbek rivers took a southwesterly course, passing southeast of theIsland of Bozcaada and between the islands of Tavan and Bozcaada,respectively. The rate of sea-level fall far exceeded the rate ofsubsidence; thus, no accommodation space was created on the formershelf during this period, and the Karamenderes, Tuzla and Dümbekdeltas prograded as sediment largely bypassed the topset area,creating oblique-prograded foreset deposits. The progressive subaer-ial exposure and erosion of the former delta tops must have providedmore sediment for progradation.
Sea level rose ∼47 m between 297 and 286 ka (Fig. 19; Waelbroecket al., 2002). The rapidly rising sea level (4.3 m ka−1; Waelbroeck et al.,2002) and persistent subsidence must have shifted the shorelinelandward and induced aggradation of delta topsets. However, theseismic-reflection profiles show no evidence of topset beds genera-ted during this short sea-level rise, suggesting that they were eithernever deposited or were stripped away and used for delta prograda-tion during the subsequent sea-level fall from −15 m to −95 mbetween 286 and 269 ka. During this regression, the high rate of sea-

16 E.B. Işler et al. / Marine Geology 254 (2008) 1-17
level fall (i.e., 5.0 m ka−1) initiated topset bypass and developmentof the prominent oblique-prograded clinoform architecture observedin Subunit 6a (Fig. 20B). During the lowstand between 269 and248 ka, the Gulf of Edremit and the region between the islands ofLimnos, Gökçeada and the Biga Peninsula were all subaerially ex-posed (Fig. 20B).
The progradation of the Karamenderes, Tuzla, and DümbekSubunit 6a deltas must have decelerated and possibly halted duringthe 10 m sea-level rise which took place between 269 and 259 ka,temporarily interrupting the overall fall from 286 to 248 ka. However,during the renewed sea-level fall which ended at ∼250 ka, the deltasapparently re-established a dynamic equilibrium with the environ-ment and started to prograde again. The youngest Subunit 6a foresetdevelopment occurred 109 m below the present sea level at ∼250 kaBP, during the transition from glacial isotopic stage 8 to interglacialisotopic stage 7. At this time of maximum lowstand, the Karamen-deres, Tuzla and Dümbek rivers reached their maximum extent andtheir deltas prograded well into basins B1, B2, and B3, respectively(Fig. 20B).
7. Conclusions
The Quaternary successions seaward of the Biga Peninsula arelargely confined to a set of transtensional basins: B1, B2 and B3. Thestratigraphic architecture of the Quaternary successions is character-ized by more than seven vertically stacked depositional sequences.Each depositional sequence consists of a lower subunit of predomi-nantly horizontal reflectors overlain conformably or across a mildunconformity by an upper subunit of oblique to complex sigmoid-oblique prograded reflectors. Except for depositional sequence 3, alldepositional sequences are separated from one another by majorshelf-crossing unconformities. The lower subunits are interpreted ashemipelagic and prodelta muds, whereas the upper subunits areinterpreted as the clinoforms of river deltas.
The ages of a few of the depositional sequences and the shelf-crossing unconformities have been established using nine radiometricdates of in situ shells extracted from five sediment cores, supplemen-ted by tephra and sapropel ages. The chronostratigraphic frameworkof the rest of the Quaternary succession observed in the seismicprofiles is established using an average accumulation rate of 30 cm ka−1
based on dates in the cores, and correlations with the global sea-levelcurve ofWaelbroeck et al. (2002). Even though the NE Aegean Sea shelfis an area of strong subsidence, the rapid rate of glacio-eustatic sea-levelchanges is the dominant factor controlling relative sea-level changes,transgressions and regressions. Rates of eustatic sea-level rise and fallare several times greater than thehighest rates of subsidence in the area.According to the age model developed in this paper, depositionalsequences and the intervening shelf-crossing unconformities developedin response to rises and falls of sea level associated with glacial/interglacial cycles of the Quaternary.
Sediment budget calculations and paleocurrent directions inferredfrom clinoform dips and channel trends suggest that terrigenoussediment supply was from the Tuzla, Karamenderes and Dümbekrivers. During maximum lowstands at glacial maxima, the riversextended as far as 65 km seaward of the Biga Peninsula. At these times,what is now Edremit Bay and the area between the Biga Peninsula andthe Island of Limnos became river flood plains.
With the initiation of global sea-level rises associated with thetransitions from glacial to interglacial isotopic stages, formerlysubaerial coastal areas were inundated as the shoreline migratedlandward. Basinal conformities which are correlative to sequenceboundaries date from this time of initial rapid sea-level rise. By theend of the transgressive phases, the position of the paleoshorelinewasmore-or-less the same as the present-day coastline. Once the high-stand was reached, and throughout the interglacial periods, deltasbecame re-established and began to prograde across the inner shelf.
However, in deeper water, only hemipelagic and prodelta muds of thelower subunits of depositional sequences accumulated.
Acknowledgments
We thank the officers and crew of the RV Koca Piri Reis for theirassistance in data acquisition, in particular the Chief Engineer ÖmerÇubuk. We acknowledge research and ship time funds from theNatural Sciences and Engineering Research Council of Canada (NSERC)to Aksu and Hiscott, travel funds from the Dean of Science, MemorialUniversity of Newfoundland, and a special grant from the VicePresident of Research, Memorial University of Newfoundland.
References
Aksu, A.E., Piper, D.J.W., Konuk, T., 1987. Late Quaternary tectonic and sedimentaryhistory of outer Izmir and Çandarlı Bays, western Turkey. Mar. Geol. 76, 89–104.
Aksu, A.E., Uluğ, A., Piper, D.J.W., Konuk, Y.T., Turgut, S., 1992a. Quaternary sedimentaryhistory of Adana, Cilicia and Iskenderun Basins; Northeast Mediterranean Sea. Mar.Geol. 104, 55–71.
Aksu, A.E., Calon, T.J., Piper, D.J.W., Turgut, S., Izdar, E., 1992b. Architecture of lateorogenic Quaternary basins in northeastern Mediterranean Sea. Tectonophysics210, 191–213.
Aksu, A.E., Yaşar, D., Mudie, P.J., Gillespie, H., 1995a. Late glacial-Holocene paleoclimaticand paleoceanographic evolution of the Aegean Sea: micropaleontological andstable isotopic evidence. Mar. Micropaleontol. 25, 1–28.
Aksu, A.E., Yaşar, D., Mudie, P.J., 1995b. Paleoclimatic and paleoceanographiccircumstances leading to the development of sapropel layer S1 in the Aegean SeaBasins. Palaeogeogr. Palaeoclimatol. Palaeoecol. 116, 71–101.
Aksu, A.E., Hiscott, R.N., Yaşar, D., 1999. Oscillating Quaternary water levels of theMarmara Sea and vigorous outflow into the Aegean Sea from the Marmara Sea–Black Sea drainage corridor. Mar. Geol. 153, 275–302.
Aksu, A.E., Jenner, G.A., Hiscott, R.N., Işler, B., 2008. Occurrence, stratigraphy andgeochemistry of Late Quaternary tephra layers in the Aegean Sea and the Marmara.Sea. Mar. Geol. 252, 174–192.
Beck, J.W., Richards, D.A., Lawrence, R., Edwards, R.L., Silverman, B.W., Smart, P.L.,Donahue, D.J., Hererra-Osterheld, S., Burr, G.S., Calsoyas, L., Jull, A.J.T., Biddulph, D.,2001. Extremely large variations of atmospheric 14C concentration during the lastglacial period. Science 292, 2453–2458. doi:10.1126/science.1056649.
Coe, A.L., Church, K.D., 2003. Sequence stratigraphy. In: A.L. Coe (Ed.), The SedimentaryRecord of Sea-Level Change. Cambridge University Press, p. 57–98, 288 pp.
De Vivo, B., Rolandi, G., Gans, P.B., Calvert, A., Bohrson,W.A., Spera, F.J., Belkin, H.E., 2001.New constraints on the pyroclastic eruptive history of the Campanian volcanic plain(Italy). Mineral. Petrol. 73, 47–65.
Eriksen, U., Friedrich, W.L., Buchardt, B., Tauber, H., Thomson, M.S., 1990. The StronghyleCaldera: geological, paleontological and stable isotope evidence from radiocarbon-dated stromatolites from Santorini. In: Hardy, D.A., Keller, J., Galanopoulos, V.P.,Flemming, N.C., Druitt, T.H. (Eds.), Thera and the Aegean World III. Santorini,Greece, pp. 139–150.
Genç, Ö.C., 1998. Evolution of Bayramiç magmatic complex, northwestern Anatolia.J. Volcanol. Geotherm. Res. 85, 233–249.
Hegarty, K.A., Weisel, J.K., Mutter, J.C., 1988. Subsidence history of the Australia'ssouthern margin: constraints on basin models. AAPG Bull. 72, 615–633.
Helland-Hansen, W., Gjelberg, J.G., 1994. Conceptual basis and variability in sequencestratigraphy: a different perspective. Sediment. Geol. 92, 31–52.
Institute of Geology and Mineral Exploration (IGME), 1989. 1:500,000 scale Seismotec-tonic Map Of Greece with Seismological Data, 4 sheets.
Intergovernmental Oceanographic Commission (IOC), 1981. International BathymetricChart of the Mediterranean. Russia under the authority of IOC, 10 sheets. HeadDepartment of Navigation and Oceanography.
Işler, E.B., 2005. Late Quaternary stratigraphy and tectonic evolution of the northeastAegean Sea. MSc Thesis, Memorial University of Newfoundland, 259 pp.
Kukal, Z., 1971. Geology of Recent Sediments. Academic Press, London. 490 pp.Lisiecki, L.E., Raymo, M.E., 2005. A Pliocene–Pleistocene stack of 57 globally distributed
benthic δ18O records. Paleoceanography 20, PA1003. doi:10.1029/2004PA001071.Mitchum, R.M., Vail, P.R., Thompson, S., 1977. Seismic stratigraphy and global changes of
sea level, Part 2: the depositional sequence as a basic unit of stratigraphic analysis.In: C.E. Payton (Ed.), Seismic stratigraphy—application to hydrocarbon exploration.American Association of Petroleum Geologists, Memoir 26: 53–62, 516 pp.
Piper, D.J.W., Aksu, A.E., 1992. Architecture of stacked Quaternary deltas correlated withglobal oxygen isotopic curve. Geology 20, 415–418.
Piper, D.J.W., Perissoratis, C., 1991. Late Quaternary sedimentation on the North Aegeancontinental margin, Greece. AAPG Bull. 75, 46–61.
Posamentier, H.W., Allen, G.P., James, D.P., Tesson, M., 1992. Forced regression in asequence stratigraphic framework: concepts, examples and exploration signifi-cance. AAPG Bull. 76, 1687–1709.
Pyle, D.M., Ricketts, G.D., Margari, V., van Andel, T., Sinitsyn, A.A., Praslov, N., Lisitsyn, S.,2006. Wide dispersal and deposition of distal tephra during the Pleistocene‘Campanian Ignimbrite/Y5’ eruption, Italy. Quat. Sci. Rev. 25, 2713–2728.
Roussakis, G., Karageorgis, A.P., Conispoliatis, N., Lykousis, V., 2004. Last glacial–Holocenesediment sequences in N. Aegean basins: structure, accumulation rates and claymineral distribution. Geo Mar. Lett. 24, 97–111. doi:10.1007/s00367-004-0167-0.

17E.B. Işler et al. / Marine Geology 254 (2008) 1-17
Rowan, E.L., Hayba, D.O., Nelson, P.H., Burns, W.M., Houseknecht, D.W., 2003. Sandstoneand shale compaction curves derived from sonic and gamma ray logs in offshorewells, North Slope, Alaska; parameters for basin modeling. Open File Report OF 03-0329, 3 sheets. U.S. Geological Survey.
Siyako, M., Bürkan, A.K., Okay, A., 1989. Tertiary geology and hydrocarbon potential ofthe Biga and Gelibolu Peninsulas. TPJD, Bull. 1/3, 183–199.
Swift, D.J.P., 1968. Coastal erosion and transgressive stratigraphy. J. Geol. 76, 444–456.Tesson, M., Posamentier, H.W., Gensous, B., 2000. Stratigraphic organization of Late
Pleistocene deposits of the western part of the Golfe du Lion shelf (LanguedocShelf), western Mediterranean Sea, using high-resolution seismic and core data.AAPG 84, 119–150.
Thunell, R., Federman, A., Sparks, S., Williams, D., 1979. The age, origin and vol-canological significance of the Y-5 ash layer in the Mediterranean. Quat. Res. 12,241–253.
Waelbroeck, C., Labeyrie, L., Michel, E., Duplessy, J.C., McManus, J.F., Lambeck, K., Balbon,E., Labracherie, M., 2002. Sea-level and deep water temperature changes derivedfrom benthic Foraminifera isotopic records. Quat. Sci. Rev. 21, 295–305.
Winn Jr., R.D., Roberts, H.H., Kohl, B., Fillon, R.H., Crux, J.A., Bouma, A.H., Spero, H.W.,1998. Upper Quaternary strata of the upper continental slope, Northeast Gulf ofMexico; sequence stratigraphic model for terrigenous shelf edge. J. Sediment. Res.68, 579–595.
Woolfe, K.J., Larcombe, P., Naish, T., Purdon, R.G., 1998. Lowstand rivers need not incisethe shelf: an example from the Great Barrier Reef, Australia, with implications forsequence stratigraphic models. Geology 26, 75–78.
Yaltırak, C., Sakınç, M., Aksu, A.E., Hiscott, R.N., Galleb, B., Ülgen, U.B., 2002. Global sea-level variations and raised coastal deposits along the southwestern Marmara Seaduring the last 224,000 years. Mar. Geol. 190, 283–305.
Yılmaz, Y., Karacık, Z., 2001. Geology of the northern side of the Gulf of Edremit and itstectonic significance for the development of the Aegean grabens. Geodin. Acta 14,31–43.
Copyright © 2022 FDOKUMEN