Seismic Response of Secondary Systems Supported by Torsionally Yielding Structures
21
Journal of Earthquake Engineering, 12:932–952, 2008 Copyright © A.S. Elnashai & N.N. Ambraseys ISSN: 1363-2469 print / 1559-808X online DOI: 10.1080/13632460701758588 932 UEQE 1363-2469 1559-808X Journal of Earthquake Engineering, Vol. 0, No. 0, Dec 2007: pp. 0–0 Journal of Earthquake Engineering Seismic Response of Secondary Systems Supported by Torsionally Yielding Structures PS-System Torsional Response H. H. Mohammed, A. Ghobarah, and T. S. Aziz H. H. MOHAMMED, 1 A. GHOBARAH, 1 and T. S. AZIZ 2 1 Department of Civil Engineering, McMaster University, Hamilton, Ontario, Canada 2 Atomic Energy of Canada Ltd, Sheridan Park, Ontario, Canada Substantial damage sustained during several recent earthquakes was non structural in nature. The economic consequence in terms of non structural component damage far exceeded the structural damage. Currently, there are several analytical studies that address the interaction between non structural components or Secondary systems (S-systems) and the main supporting structure or Pri- mary system (P-system). Only a few of these analytical approaches have been proposed to evaluate and characterize the response of the S-systems attached to torsionally coupled P-systems. In addi- tion, the experimental verification for the analytical approaches is scarce. In the current study, the results and observations of an experimental research program con- ducted to characterize the behavior of both stiffness eccentric and mass eccentric torsionally cou- pled Primary-Secondary systems (PS-systems) are presented. From this experimental investigation it was found that the torsional yielding of the primary system has significant implications on the deamplification of near tuned secondary system response. The location of the S-system mounted on the P-system affects the peak response amplification, and interaction with the coupled P-system. Keywords Shake Table; Seismic; Dynamic; Secondary System; Torsional Coupling; Experimental 1. Introduction Critical mechanical equipment in lifeline and other critical installations such as power plants, hospitals, refineries, and hazardous chemical plants, should be designed to remain functional during and after an earthquake. The equipment and non structural components or Secondary systems (S-systems) are subjected to dynamic load that depends on characteris- tics of the dynamic interaction with the main supporting structure or Primary system (P-system). Elastic and inelastic dynamic interaction between the primary and secondary systems has been the subject of extensive investigations [Aziz and Duff, 1978; Sackman and Kelly, 1979; Hernried and Sackman, 1984; Ghobarah et al., 1987]. Several researchers recognized the need for a better understanding of the response of coupled Primary- Secondary systems (PS-systems) through experimental research. Of particular interest are the effects of nonlinear P-system response on the S-system. The goal of such an experimen- tal investigation is to provide quantitative means for evaluating the relative importance of parameter uncertainties in the design of S-systems. Segal and Hall [1989] conducted an experimental investigation to evaluate the translational response of appendages mounted on yielding primary structures using small-scale shake table experiments. Adam [2001] con- ducted small-scale experiments on translational behavior of a S-system supported on a Received 19 April 2006; accepted 19 October 2007. Address correspondence to A. Ghobarah, Department of Civil Engineering, McMaster University, Hamilton, Ontario, Canada; E-mail: [email protected] Downloaded By: [Ghobarah, A.] At: 17:37 6 August 2008
-
Upload
independent -
Category
Documents
-
view
0 -
download
0
Transcript of Seismic Response of Secondary Systems Supported by Torsionally Yielding Structures
Journal of Earthquake Engineering, 12:932–952, 2008Copyright © A.S. Elnashai & N.N. AmbraseysISSN: 1363-2469 print / 1559-808X onlineDOI: 10.1080/13632460701758588
932
UEQE1363-24691559-808XJournal of Earthquake Engineering, Vol. 0, No. 0, Dec 2007: pp. 0–0Journal of Earthquake Engineering
Seismic Response of Secondary Systems Supported by Torsionally Yielding Structures
PS-System Torsional ResponseH. H. Mohammed, A. Ghobarah, and T. S. AzizH. H. MOHAMMED,1 A. GHOBARAH,1 and T. S. AZIZ2
1Department of Civil Engineering, McMaster University, Hamilton, Ontario,Canada2Atomic Energy of Canada Ltd, Sheridan Park, Ontario, Canada
Substantial damage sustained during several recent earthquakes was non structural in nature. Theeconomic consequence in terms of non structural component damage far exceeded the structuraldamage. Currently, there are several analytical studies that address the interaction between nonstructural components or Secondary systems (S-systems) and the main supporting structure or Pri-mary system (P-system). Only a few of these analytical approaches have been proposed to evaluateand characterize the response of the S-systems attached to torsionally coupled P-systems. In addi-tion, the experimental verification for the analytical approaches is scarce.
In the current study, the results and observations of an experimental research program con-ducted to characterize the behavior of both stiffness eccentric and mass eccentric torsionally cou-pled Primary-Secondary systems (PS-systems) are presented. From this experimental investigationit was found that the torsional yielding of the primary system has significant implications on thedeamplification of near tuned secondary system response. The location of the S-system mounted onthe P-system affects the peak response amplification, and interaction with the coupled P-system.
Keywords Shake Table; Seismic; Dynamic; Secondary System; Torsional Coupling; Experimental
1. Introduction
Critical mechanical equipment in lifeline and other critical installations such as powerplants, hospitals, refineries, and hazardous chemical plants, should be designed to remainfunctional during and after an earthquake. The equipment and non structural components orSecondary systems (S-systems) are subjected to dynamic load that depends on characteris-tics of the dynamic interaction with the main supporting structure or Primary system(P-system). Elastic and inelastic dynamic interaction between the primary and secondarysystems has been the subject of extensive investigations [Aziz and Duff, 1978; Sackmanand Kelly, 1979; Hernried and Sackman, 1984; Ghobarah et al., 1987]. Several researchersrecognized the need for a better understanding of the response of coupled Primary-Secondary systems (PS-systems) through experimental research. Of particular interest arethe effects of nonlinear P-system response on the S-system. The goal of such an experimen-tal investigation is to provide quantitative means for evaluating the relative importance ofparameter uncertainties in the design of S-systems. Segal and Hall [1989] conducted anexperimental investigation to evaluate the translational response of appendages mounted onyielding primary structures using small-scale shake table experiments. Adam [2001] con-ducted small-scale experiments on translational behavior of a S-system supported on a
Received 19 April 2006; accepted 19 October 2007.Address correspondence to A. Ghobarah, Department of Civil Engineering, McMaster University,
Hamilton, Ontario, Canada; E-mail: [email protected]
Downloaded By: [Ghobarah, A.] At: 17:37 6 August 2008
PS-System Torsional Response 933
yielding P-system. Villaverde [1997] recognized the importance of the influence of the tor-sional motion of a supporting structure on the response of attached S-systems.
The objective of this investigation was to experimentally characterize the response oftorsionally coupled nonlinear PS-systems. This research program represents the firstattempt to experimentally investigate the effect of the S-system eccentricity with respectto the P-system’s Centre of Mass (CM) and Centre of Rigidity (CR). This experimentalshake table study aimed at calibrating and refining analytical modeling of PS-systemresponse.
The tested PS-system was subjected to a synthetically generated record based on theKanai-Tajimi Power Spectral Density Function (PSDF) model. Both the P-system andS-system were modeled as lumped masses via rigid diaphragms. The P-system was per-mitted to translate laterally and rotate in plane in a torsional manner whereas the S-systemwas permitted to only translate laterally. Torsional coupling of the P-system was inducedby the eccentricity between the P-system’s CM and CR. The degree of torsional couplingof the modeled P-system was adjusted by varying the supporting elements’ stiffnesseccentricity or by changing the location of masses on the P-system for mass eccentricity.The eccentricity of the S-system relative to the P-system’s CM was also studied. Theexperiments were conducted for the near tuned case of the coupled Primary SecondarySystem (PS-system) where the frequencies of free vibration of the elastic uncoupledsubsystems were almost coincident. This is generally considered to be the most criticalcase of interest in assessing the response of PS-systems leading to quasi-resonance behavior.Torsional interaction and response amplification of the coupled PS-system were charac-terized and quantified.
2. Model Parameters
The behavior of the PS-system model is characterized by system parameter ratios such asthe secondary to primary mass ratio (ms/mp), frequency ratio (fs/fp), and structural yield-ing. The model parameters were selected to represent a practical range of cases. The rangeof structures housing non structural components extends from very flexible tall structuresof fundamental frequencies of approximately 0.1 Hz to very rigid reactor shells in nuclearpower plants and single story industrial structures of frequencies of 10 Hz. The practicaldamping ratio (ξ) may vary between 2–5% of critical depending on the construction mate-rial and type of construction [Newmark and Hall, 1982]. Representative mass ratios foractual coupled PS-systems range between 0.1 and 10%. A mass ratio of 3.2% was the low-est physically possible in the experimental setup and was used in the current study for boththe stiffness eccentric experiments and mass eccentric experiments. This did not representa serious limitation in the testing program because smaller mass ratios such as 0.1% wouldnot produce significant interaction effects. The selected normalized parameters representwide practical range of primary and secondary systems.
3. Test Setup
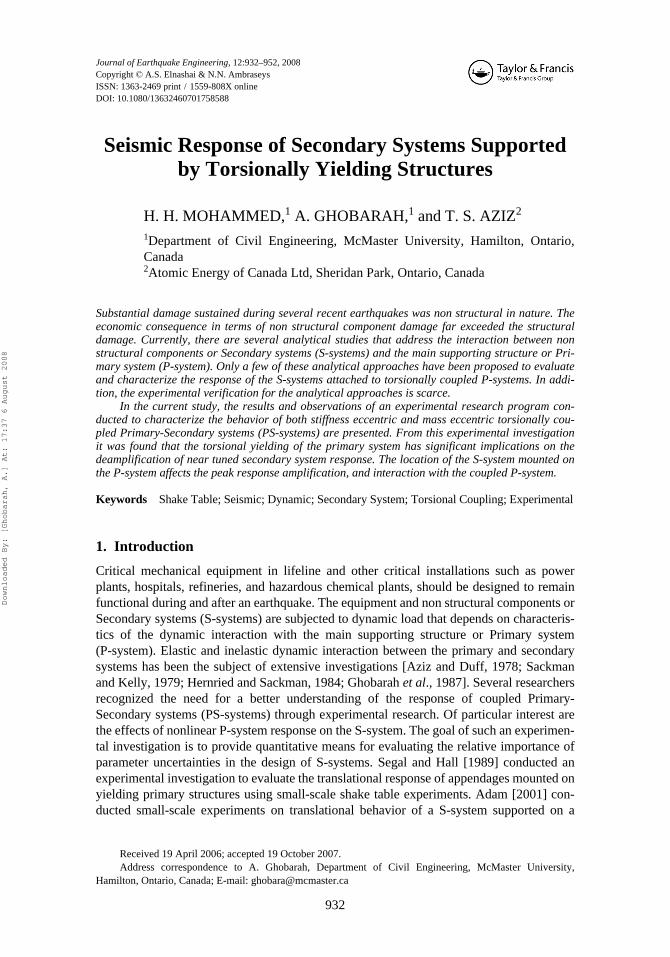
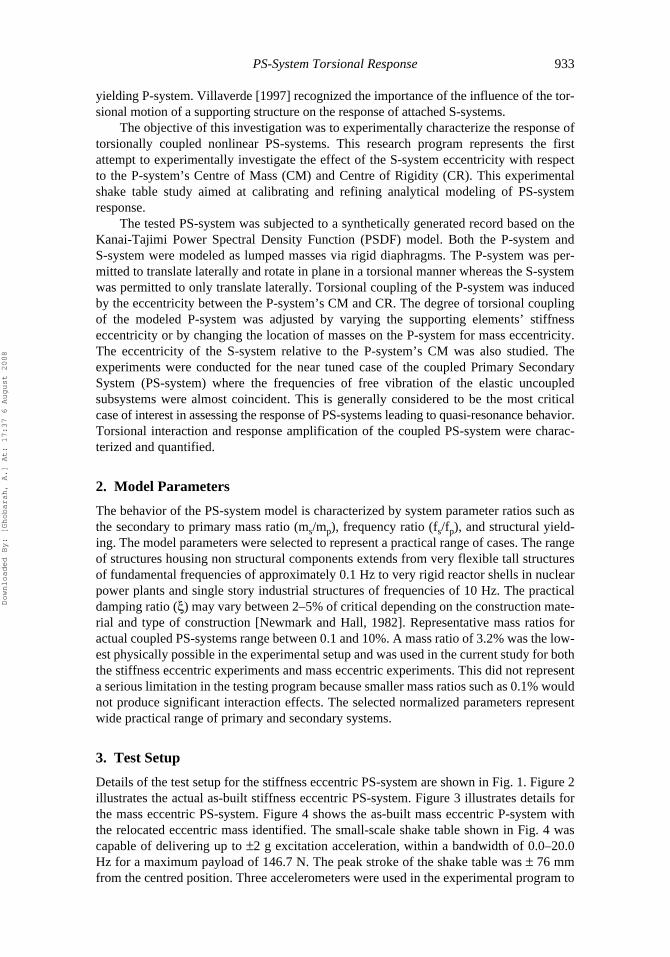
Details of the test setup for the stiffness eccentric PS-system are shown in Fig. 1. Figure 2illustrates the actual as-built stiffness eccentric PS-system. Figure 3 illustrates details forthe mass eccentric PS-system. Figure 4 shows the as-built mass eccentric P-system withthe relocated eccentric mass identified. The small-scale shake table shown in Fig. 4 wascapable of delivering up to ±2 g excitation acceleration, within a bandwidth of 0.0–20.0Hz for a maximum payload of 146.7 N. The peak stroke of the shake table was ± 76 mmfrom the centred position. Three accelerometers were used in the experimental program to
Downloaded By: [Ghobarah, A.] At: 17:37 6 August 2008
934 H. H. Mohammed, A. Ghobarah, and T. S. Aziz
record the response accelerations. An accelerometer was attached on the shake table torecord the actual base acceleration. The second accelerometer was attached on theP-system platform at the geometric center, as shown in Fig. 2. For the stiffness eccentricexperiments, the geometric centre of the P-system platform coincided with the P-systemcentre of mass (CM). A third accelerometer was attached to the S-system frame. The
FIGURE 1 Stiffness eccentric experimental model details.
FIGURE 2 Stiffness eccentric PS-system.
Downloaded By: [Ghobarah, A.] At: 17:37 6 August 2008
PS-System Torsional Response 935
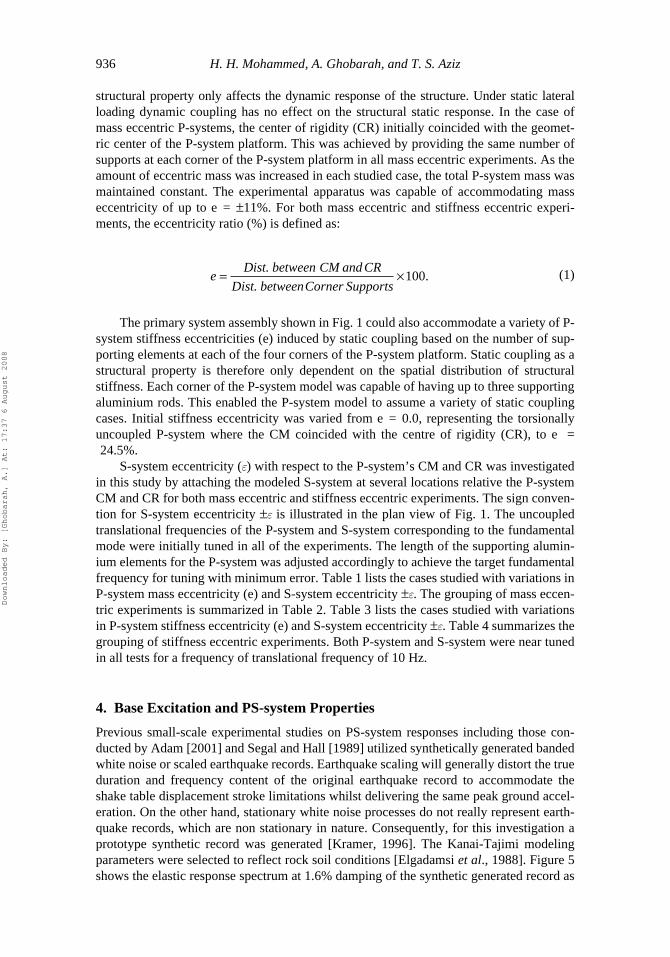
accelerometers used were capable of measuring up to ±5 g. Masses of the accelerometersattached to the two sub-systems were considered throughout the experimental program tobe part of the overall subsystem masses. The P-system consisted of a square aluminiumplatform (300 mm × 300 mm), supported by circular aluminium rods fixed at the platformlevel and base level by clamp mechanisms, as illustrated in Fig. 2. Additional P-systemmass was provided through steel strips fastened to the platform. For the mass eccentricexperiments exhibiting dynamic coupling of the P-system, a number of these steel plateswere attached eccentrically on the side, as shown in Fig. 4. Dynamic coupling as a
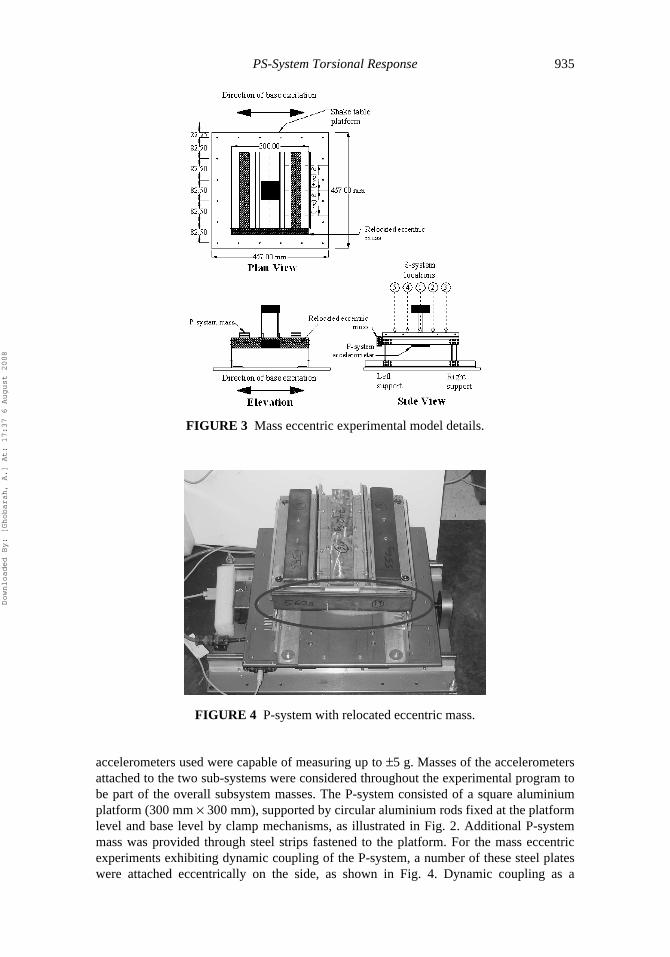
FIGURE 3 Mass eccentric experimental model details.
FIGURE 4 P-system with relocated eccentric mass.
Downloaded By: [Ghobarah, A.] At: 17:37 6 August 2008
936 H. H. Mohammed, A. Ghobarah, and T. S. Aziz
structural property only affects the dynamic response of the structure. Under static lateralloading dynamic coupling has no effect on the structural static response. In the case ofmass eccentric P-systems, the center of rigidity (CR) initially coincided with the geomet-ric center of the P-system platform. This was achieved by providing the same number ofsupports at each corner of the P-system platform in all mass eccentric experiments. As theamount of eccentric mass was increased in each studied case, the total P-system mass wasmaintained constant. The experimental apparatus was capable of accommodating masseccentricity of up to e = ±11%. For both mass eccentric and stiffness eccentric experi-ments, the eccentricity ratio (%) is defined as:
The primary system assembly shown in Fig. 1 could also accommodate a variety of P-system stiffness eccentricities (e) induced by static coupling based on the number of sup-porting elements at each of the four corners of the P-system platform. Static coupling as astructural property is therefore only dependent on the spatial distribution of structuralstiffness. Each corner of the P-system model was capable of having up to three supportingaluminium rods. This enabled the P-system model to assume a variety of static couplingcases. Initial stiffness eccentricity was varied from e = 0.0, representing the torsionallyuncoupled P-system where the CM coincided with the centre of rigidity (CR), to e =24.5%.
S-system eccentricity (e) with respect to the P-system’s CM and CR was investigatedin this study by attaching the modeled S-system at several locations relative the P-systemCM and CR for both mass eccentric and stiffness eccentric experiments. The sign conven-tion for S-system eccentricity ±e is illustrated in the plan view of Fig. 1. The uncoupledtranslational frequencies of the P-system and S-system corresponding to the fundamentalmode were initially tuned in all of the experiments. The length of the supporting alumin-ium elements for the P-system was adjusted accordingly to achieve the target fundamentalfrequency for tuning with minimum error. Table 1 lists the cases studied with variations inP-system mass eccentricity (e) and S-system eccentricity ±e. The grouping of mass eccen-tric experiments is summarized in Table 2. Table 3 lists the cases studied with variationsin P-system stiffness eccentricity (e) and S-system eccentricity ±e. Table 4 summarizes thegrouping of stiffness eccentric experiments. Both P-system and S-system were near tunedin all tests for a frequency of translational frequency of 10 Hz.
4. Base Excitation and PS-system Properties
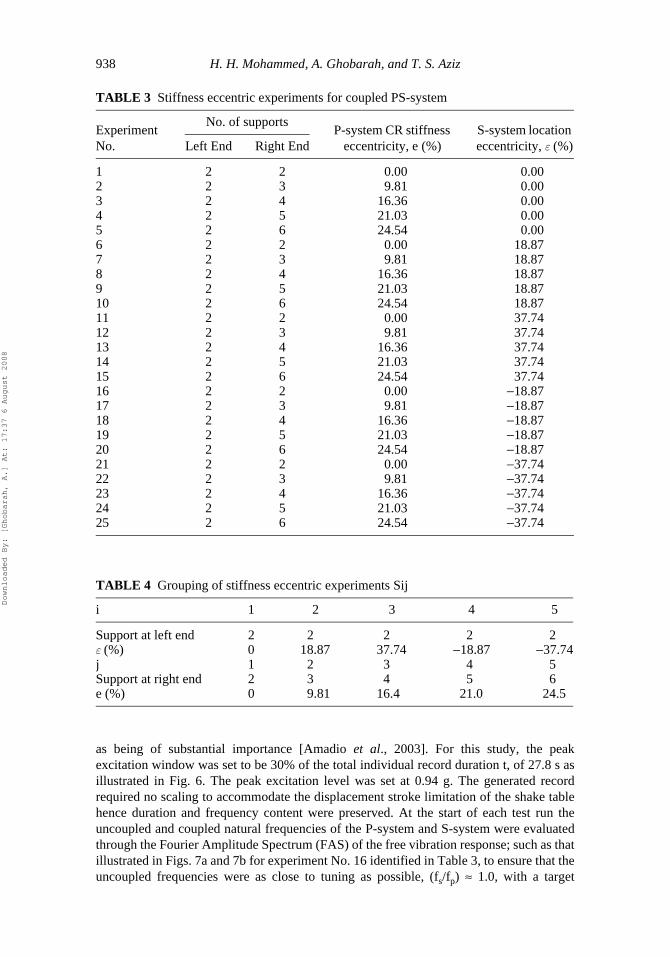
Previous small-scale experimental studies on PS-system responses including those con-ducted by Adam [2001] and Segal and Hall [1989] utilized synthetically generated bandedwhite noise or scaled earthquake records. Earthquake scaling will generally distort the trueduration and frequency content of the original earthquake record to accommodate theshake table displacement stroke limitations whilst delivering the same peak ground accel-eration. On the other hand, stationary white noise processes do not really represent earth-quake records, which are non stationary in nature. Consequently, for this investigation aprototype synthetic record was generated [Kramer, 1996]. The Kanai-Tajimi modelingparameters were selected to reflect rock soil conditions [Elgadamsi et al., 1988]. Figure 5shows the elastic response spectrum at 1.6% damping of the synthetic generated record as
e = ×Dist. between CM and CR
Dist. betweenCorner Supports100. (1)
Downloaded By: [Ghobarah, A.] At: 17:37 6 August 2008

PS-System Torsional Response 937
compared to the elastic response spectrum of the 1971 San Fernando Earthquake 90°corrected component. It is noted that within the frequency range of interest in this investi-gation (4–20 Hz), the synthetic record exhibited spectral characteristics similar to those ofthe 1971 San Fernando Earthquake, which represented a possible extreme load event.
During the experiments, the excitation was repeated in a simplified “seismicsequence” driving the P-system to failure. Although not likely to occur, this sequence wasselected to simplify the analysis procedure and to ensure that the P-system will yield aftera limited number of test runs. The effect of repeated earthquake ground motions on thenonlinear response of dynamic systems has been previously investigated and acknowledged
TABLE 1 Mass eccentric experiments for coupled PS-system
No. of supports
Experiment No.
Left End
Right End
P-system CM mass eccentricity, e (%)
S-system location Eccentricity, e (%)
1 4 4 0.00 0.002 4 4 −2.72 0.003 4 4 −5.43 0.004 4 4 −8.13 0.005 4 4 −10.87 0.006 4 4 0.00 18.877 4 4 −2.72 18.878 4 4 −5.43 18.879 4 4 −8.13 18.8710 4 4 −10.87 18.8711 4 4 0.00 37.7412 4 4 −2.72 37.7413 4 4 −5.43 37.7414 4 4 −8.13 37.7415 4 4 −10.87 37.7416 4 4 0.00 −18.8717 4 4 −2.72 −18.8718 4 4 −5.43 −18.8719 4 4 −8.13 −18.8720 4 4 −10.87 −18.8721 4 4 0.00 −37.7422 4 4 −2.72 −37.7423 4 4 −5.43 −37.7424 4 4 −8.13 −37.7425 4 4 −10.87 −37.74
TABLE 2 Grouping of mass eccentric experiments Mij
i 1 2 3 4 5
e (%) 0 18.87 37.74 −18.87 −37.74Left 4 4 4 4 4Right 4 4 4 4 4j 1 2 3 4 5Mass Eccentricity 0 −2.72 −5.43 −8.3 −10.87
Downloaded By: [Ghobarah, A.] At: 17:37 6 August 2008
938 H. H. Mohammed, A. Ghobarah, and T. S. Aziz
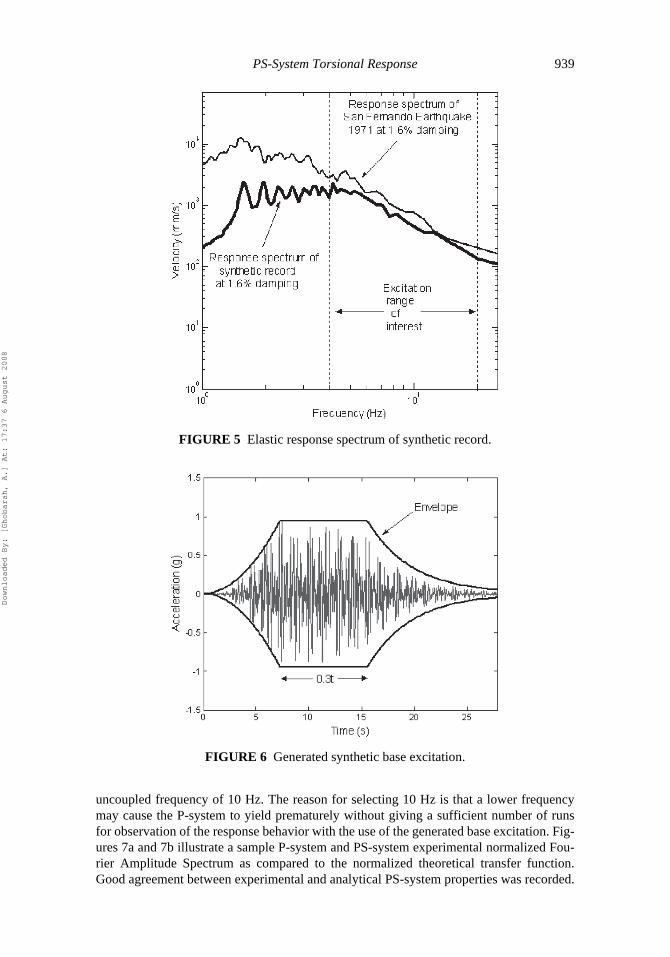
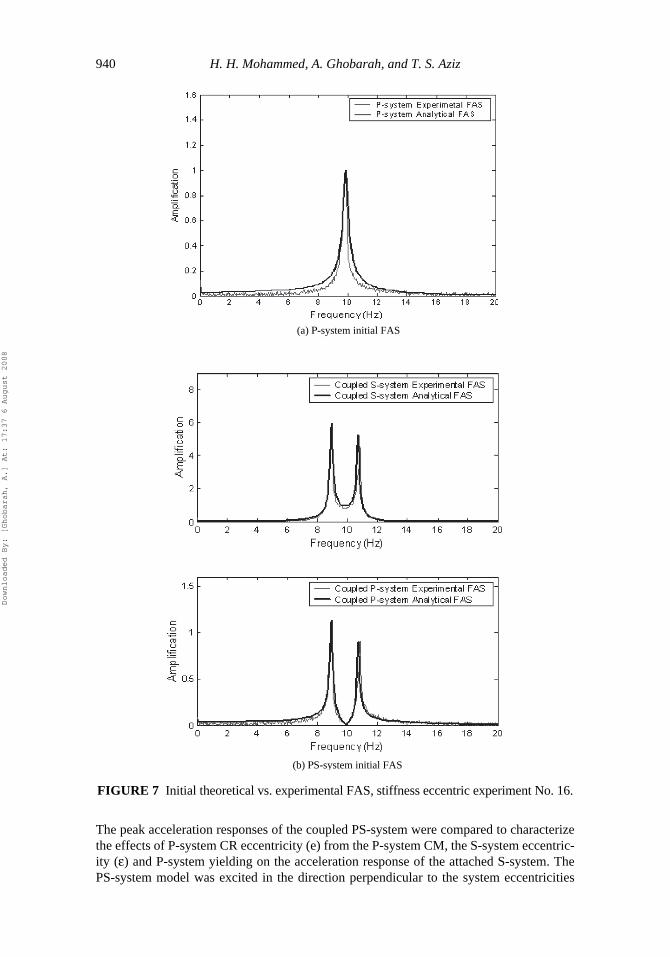
as being of substantial importance [Amadio et al., 2003]. For this study, the peakexcitation window was set to be 30% of the total individual record duration t, of 27.8 s asillustrated in Fig. 6. The peak excitation level was set at 0.94 g. The generated recordrequired no scaling to accommodate the displacement stroke limitation of the shake tablehence duration and frequency content were preserved. At the start of each test run theuncoupled and coupled natural frequencies of the P-system and S-system were evaluatedthrough the Fourier Amplitude Spectrum (FAS) of the free vibration response; such as thatillustrated in Figs. 7a and 7b for experiment No. 16 identified in Table 3, to ensure that theuncoupled frequencies were as close to tuning as possible, (fs/fp) ≈ 1.0, with a target
TABLE 3 Stiffness eccentric experiments for coupled PS-system
Experiment No.
No. of supportsP-system CR stiffness
eccentricity, e (%)S-system location eccentricity, e (%)Left End Right End
1 2 2 0.00 0.002 2 3 9.81 0.003 2 4 16.36 0.004 2 5 21.03 0.005 2 6 24.54 0.006 2 2 0.00 18.877 2 3 9.81 18.878 2 4 16.36 18.879 2 5 21.03 18.8710 2 6 24.54 18.8711 2 2 0.00 37.7412 2 3 9.81 37.7413 2 4 16.36 37.7414 2 5 21.03 37.7415 2 6 24.54 37.7416 2 2 0.00 −18.8717 2 3 9.81 −18.8718 2 4 16.36 −18.8719 2 5 21.03 −18.8720 2 6 24.54 −18.8721 2 2 0.00 −37.7422 2 3 9.81 −37.7423 2 4 16.36 −37.7424 2 5 21.03 −37.7425 2 6 24.54 −37.74
TABLE 4 Grouping of stiffness eccentric experiments Sij
i 1 2 3 4 5
Support at left end 2 2 2 2 2e (%) 0 18.87 37.74 −18.87 −37.74j 1 2 3 4 5Support at right end 2 3 4 5 6e (%) 0 9.81 16.4 21.0 24.5
Downloaded By: [Ghobarah, A.] At: 17:37 6 August 2008
PS-System Torsional Response 939
uncoupled frequency of 10 Hz. The reason for selecting 10 Hz is that a lower frequencymay cause the P-system to yield prematurely without giving a sufficient number of runsfor observation of the response behavior with the use of the generated base excitation. Fig-ures 7a and 7b illustrate a sample P-system and PS-system experimental normalized Fou-rier Amplitude Spectrum as compared to the normalized theoretical transfer function.Good agreement between experimental and analytical PS-system properties was recorded.
FIGURE 5 Elastic response spectrum of synthetic record.
FIGURE 6 Generated synthetic base excitation.
Downloaded By: [Ghobarah, A.] At: 17:37 6 August 2008
940 H. H. Mohammed, A. Ghobarah, and T. S. Aziz
The peak acceleration responses of the coupled PS-system were compared to characterizethe effects of P-system CR eccentricity (e) from the P-system CM, the S-system eccentric-ity (ε) and P-system yielding on the acceleration response of the attached S-system. ThePS-system model was excited in the direction perpendicular to the system eccentricities
FIGURE 7 Initial theoretical vs. experimental FAS, stiffness eccentric experiment No. 16.
(a) P-system initial FAS
(b) PS-system initial FAS
Downloaded By: [Ghobarah, A.] At: 17:37 6 August 2008

PS-System Torsional Response 941
(e) and (ε), as illustrated in Figs. 1 and 3. For each of the experiments the accelerationhistory (i.e., base excitation signal from the shake table) as well as the accelerationresponses of the coupled PS-system were recorded using the attached accelerometers anddata acquisition system.
5. Results
5.1. Effect of Yielding and Torsional Coupling on Peak Responses
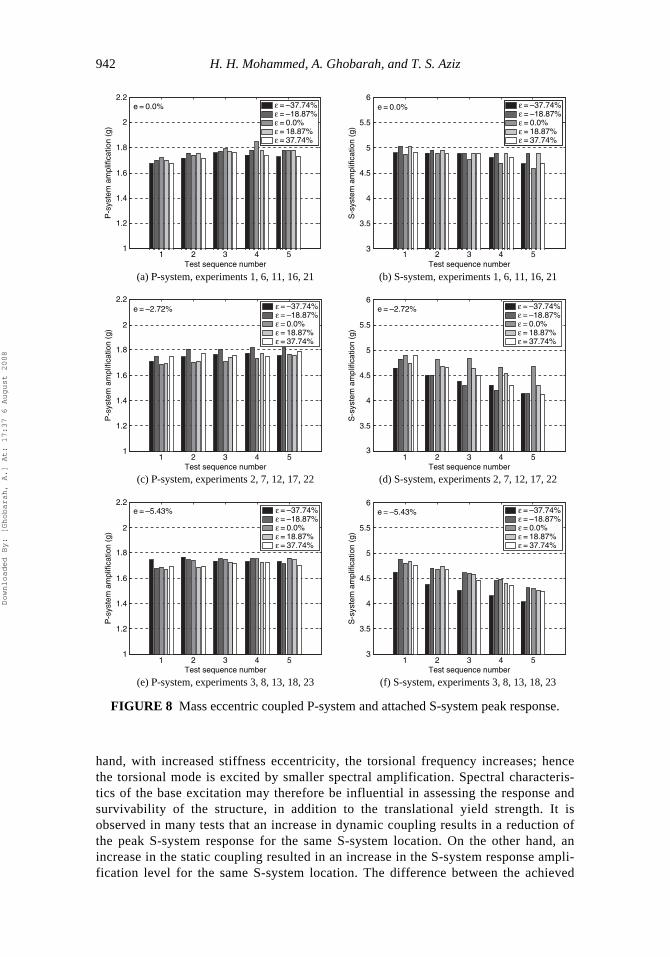
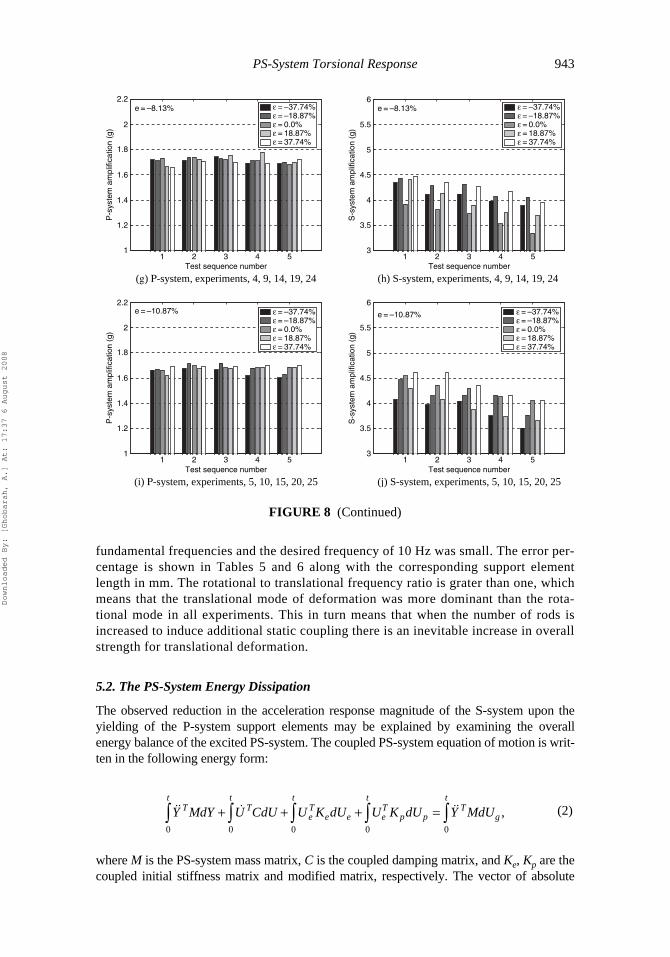
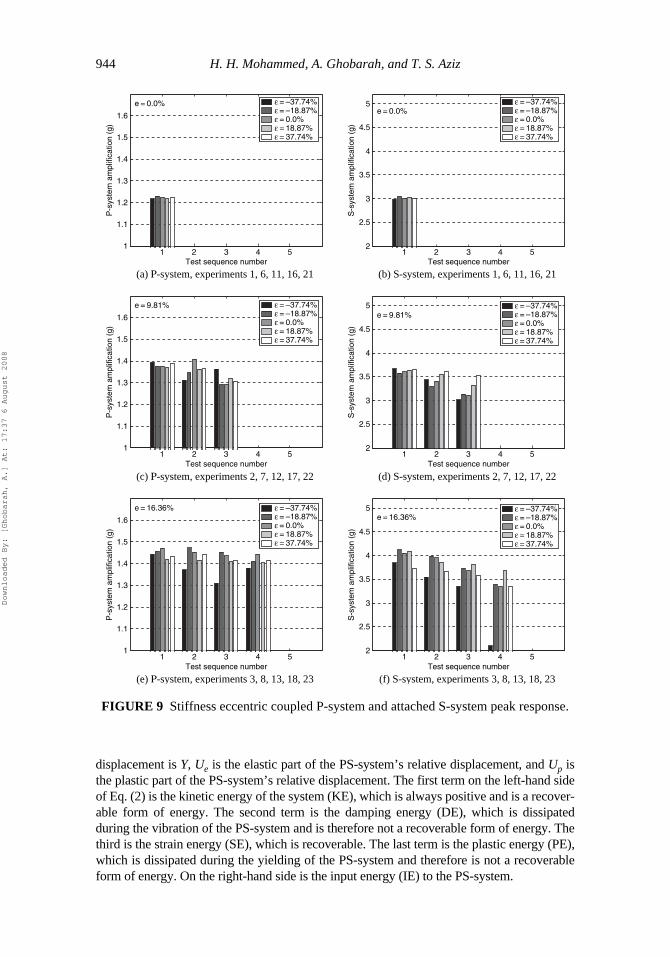
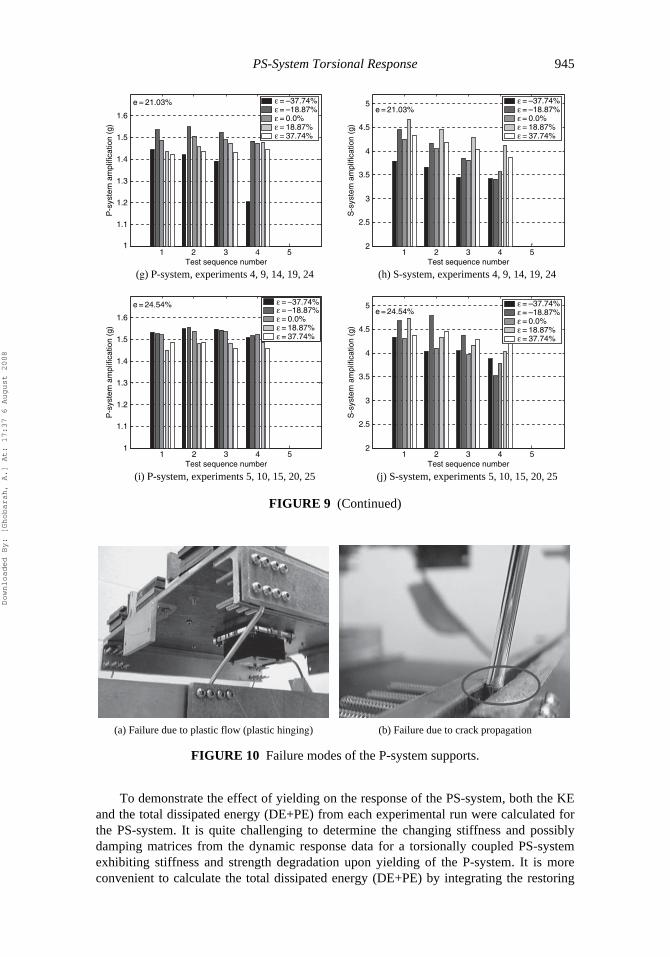
Figures 8 and 9 show recorded peak absolute acceleration responses of the coupled masseccentric and stiffness eccentric PS-system experiments identified in Tables 1 and 3,respectively. The vertical axis represents the amplified response acceleration amplitude ing’s. The horizontal axis represents the number of test runs conducted in the seismicsequence using the same synthetic accelerogram until the P-system collapsed. In the barcharts of Fig. 8 and 9 the peak responses of the P-system and attached S-system werearranged and grouped such that they can be directly correlated with the five cases ofP-system mass eccentricity and five cases of stiffness eccentricity (e), outlined in Tables 1and 3, respectively, as well as the five cases of S-system location eccentricity (ε) illus-trated in Figs. 1 and 3.
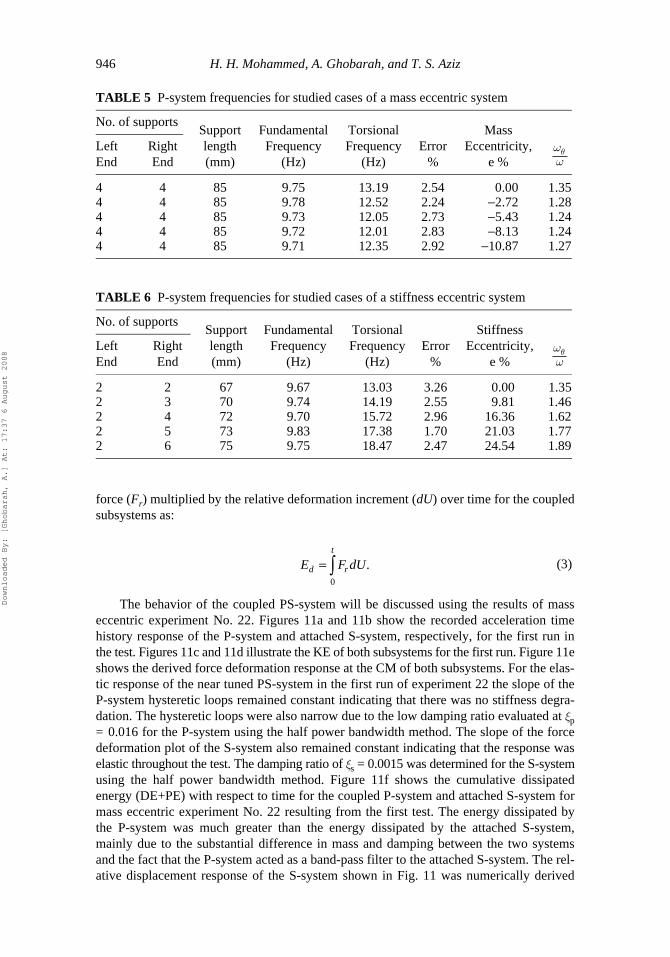
It is observed from Figs. 8 and 9 that the response of the attached, near tunedS-system was greatly amplified as compared to the P-system response for all the consid-ered cases of stiffness and mass eccentricities. With successive excitation, the peakresponse of the coupled S-system was gradually reduced as the P-system began behavingnonlinearly due to plastic flow at the plastic hinges of the supports and/or the developmentand propagation of cracks at the support ends as shown in Fig. 10.
In the studied cases, the fundamental frequency of the uncoupled P-system asso-ciated with the translation was maintained the same as much as possible for all masseccentric and stiffness eccentric experiments at approximately 10 Hz. However, formass eccentric experiments, the torsional P-system frequency decreased with theincrease in the eccentric mass, while maintaining the total P-system mass constant.This resulted in a more torsionally flexible system with the ratio approachingunity, where wq is the torsional angular frequency and w is the translational angularfrequency, as illustrated in Table 5. Hence, with increased mass eccentricity the PS-system became further dynamically coupled and was able to sustain a smaller numberof repeated excitations when responding inelastically. On the contrary, Table 6 showsthat the torsional frequency for the stiffness eccentric tests increased with increasingstiffness eccentricity while maintaining the P-system uncoupled fundamental transla-tional frequency as close to 10 Hz as possible, achieved by varying the length of thesupporting element, as shown in Table 6. Thus the ratio increased resulting in fur-ther torsional stiffness (static coupling) and greater redundancy, which explains thegreater number of excitations the coupled PS-system was able to sustain before failurein Fig. 9i as compared to Figure 9a. This experimental observation pertaining to stati-cally coupled P-systems which sustained more test runs with increased torsional cou-pling; is consistent with the findings of Kan and Chopra [1979] who noted based ontheir analytical studies that for buildings that are strong in torsion; yielding of the sys-tem is controlled primarily by the translational yield strength. Furthermore, the baseexcitation spectral characteristics must be kept in mind to understand the behavior ofthe tested mass eccentric and stiffness eccentric systems. It is observed from Fig. 5that as the torsional frequency decreases with increased mass eccentricity of theP-system, the torsional mode is excited by greater spectral amplification. On the other
wwq
wwq
Downloaded By: [Ghobarah, A.] At: 17:37 6 August 2008
942 H. H. Mohammed, A. Ghobarah, and T. S. Aziz
hand, with increased stiffness eccentricity, the torsional frequency increases; hencethe torsional mode is excited by smaller spectral amplification. Spectral characteris-tics of the base excitation may therefore be influential in assessing the response andsurvivability of the structure, in addition to the translational yield strength. It isobserved in many tests that an increase in dynamic coupling results in a reduction ofthe peak S-system response for the same S-system location. On the other hand, anincrease in the static coupling resulted in an increase in the S-system response ampli-fication level for the same S-system location. The difference between the achieved
FIGURE 8 Mass eccentric coupled P-system and attached S-system peak response.
1 2 3 4 51
1.2
1.4
1.6
1.8
2
2.2e = 0.0%
Test sequence number
P-s
yste
m a
mpl
ifica
tion
(g)
P-s
yste
m a
mpl
ifica
tion
(g)
P-s
yste
m a
mpl
ifica
tion
(g)
S-s
yste
m a
mpl
ifica
tion
(g)
S-s
yste
m a
mpl
ifica
tion
(g)
S-s
yste
m a
mpl
ifica
tion
(g)
1 2 3 4 53
3.5
4
4.5
5
5.5
6e = 0.0%
Test sequence number
1 2 3 4 51
1.2
1.4
1.6
1.8
2
2.2e = –2.72%
Test sequence number1 2 3 4 5
3
3.5
4
4.5
5
5.5
6e = –2.72%
Test sequence number
1 2 3 4 51
1.2
1.4
1.6
1.8
2
2.2
e = –5.43%
Test sequence number1 2 3 4 5
3
3.5
4
4.5
5
5.5
6e = –5.43%
Test sequence number
(a) P-system, experiments 1, 6, 11, 16, 21 (b) S-system, experiments 1, 6, 11, 16, 21
(c) P-system, experiments 2, 7, 12, 17, 22 (d) S-system, experiments 2, 7, 12, 17, 22
(e) P-system, experiments 3, 8, 13, 18, 23 (f) S-system, experiments 3, 8, 13, 18, 23
ε = –37.74%ε = –18.87%ε = 0.0%ε = 18.87%ε = 37.74%
ε = –37.74%ε = –18.87%ε = 0.0%ε = 18.87%ε = 37.74%
ε = –37.74%ε = –18.87%ε = 0.0%ε = 18.87%ε = 37.74%
ε = –37.74%ε = –18.87%ε = 0.0%ε = 18.87%ε = 37.74%
ε = –37.74%ε = –18.87%ε = 0.0%ε = 18.87%ε = 37.74%
ε = –37.74%ε = –18.87%ε = 0.0%ε = 18.87%ε = 37.74%
Downloaded By: [Ghobarah, A.] At: 17:37 6 August 2008
PS-System Torsional Response 943
fundamental frequencies and the desired frequency of 10 Hz was small. The error per-centage is shown in Tables 5 and 6 along with the corresponding support elementlength in mm. The rotational to translational frequency ratio is grater than one, whichmeans that the translational mode of deformation was more dominant than the rota-tional mode in all experiments. This in turn means that when the number of rods isincreased to induce additional static coupling there is an inevitable increase in overallstrength for translational deformation.
5.2. The PS-System Energy Dissipation
The observed reduction in the acceleration response magnitude of the S-system upon theyielding of the P-system support elements may be explained by examining the overallenergy balance of the excited PS-system. The coupled PS-system equation of motion is writ-ten in the following energy form:
where M is the PS-system mass matrix, C is the coupled damping matrix, and Ke, Kp are thecoupled initial stiffness matrix and modified matrix, respectively. The vector of absolute
FIGURE 8 (Continued)
1 2 3 4 51
1.2
1.4
1.6
1.8
2
2.2e = –8.13%
Test sequence number1 2 3 4 5
3
3.5
4
4.5
5
5.5
6e = –8.13%
Test sequence number
1 2 3 4 51
1.2
1.4
1.6
1.8
2
2.2e = –10.87%
Test sequence number1 2 3 4 5
3
3.5
4
4.5
5
5.5
6
e = –10.87%
Test sequence number
(g) P-system, experiments, 4, 9, 14, 19, 24 (h) S-system, experiments, 4, 9, 14, 19, 24
(i) P-system, experiments, 5, 10, 15, 20, 25 (j) S-system, experiments, 5, 10, 15, 20, 25
P-s
yste
m a
mpl
ifica
tion
(g)
P-s
yste
m a
mpl
ifica
tion
(g)
S-s
yste
m a
mpl
ifica
tion
(g)
S-s
yste
m a
mpl
ifica
tion
(g)
ε = –37.74%ε = –18.87%ε = 0.0%ε = 18.87%ε = 37.74%
ε = –37.74%ε = –18.87%ε = 0.0%ε = 18.87%ε = 37.74%
ε = –37.74%ε = –18.87%ε = 0.0%ε = 18.87%ε = 37.74%
ε = –37.74%ε = –18.87%ε = 0.0%ε = 18.87%ε = 37.74%
&& & &&Y MdY U CdU U K dU U K dU Y MdUT TeT
e e eT
p pT
g
ttttt
+ + + = ∫∫∫∫∫00000
, (2)
Downloaded By: [Ghobarah, A.] At: 17:37 6 August 2008
944 H. H. Mohammed, A. Ghobarah, and T. S. Aziz
displacement is Y, Ue is the elastic part of the PS-system’s relative displacement, and Up isthe plastic part of the PS-system’s relative displacement. The first term on the left-hand sideof Eq. (2) is the kinetic energy of the system (KE), which is always positive and is a recover-able form of energy. The second term is the damping energy (DE), which is dissipatedduring the vibration of the PS-system and is therefore not a recoverable form of energy. Thethird is the strain energy (SE), which is recoverable. The last term is the plastic energy (PE),which is dissipated during the yielding of the PS-system and therefore is not a recoverableform of energy. On the right-hand side is the input energy (IE) to the PS-system.
FIGURE 9 Stiffness eccentric coupled P-system and attached S-system peak response.
1 2 3 4 51
1.1
1.2
1.3
1.4
1.5
1.6
e = 0.0%
Test sequence number1 2 3 4 5
2
2.5
3
3.5
4
4.5
5e = 0.0%
Test sequence number
1 2 3 4 51
1.1
1.2
1.3
1.4
1.5
1.6
e = 9.81%
Test sequence number1 2 3 4 5
2
2.5
3
3.5
4
4.5
5e = 9.81%
Test sequence number
1 2 3 4 51
1.1
1.2
1.3
1.4
1.5
1.6
e = 16.36%
Test sequence number1 2 3 4 5
2
2.5
3
3.5
4
4.5
5e = 16.36%
Test sequence number
(a) P-system, experiments 1, 6, 11, 16, 21 (b) S-system, experiments 1, 6, 11, 16, 21
(c) P-system, experiments 2, 7, 12, 17, 22 (d) S-system, experiments 2, 7, 12, 17, 22
(e) P-system, experiments 3, 8, 13, 18, 23 (f) S-system, experiments 3, 8, 13, 18, 23
P-s
yste
m a
mpl
ifica
tion
(g)
P-s
yste
m a
mpl
ifica
tion
(g)
P-s
yste
m a
mpl
ifica
tion
(g)
S-s
yste
m a
mpl
ifica
tion
(g)
S-s
yste
m a
mpl
ifica
tion
(g)
S-s
yste
m a
mpl
ifica
tion
(g)
ε = –37.74%ε = –18.87%ε = 0.0%ε = 18.87%ε = 37.74%
ε = –37.74%ε = –18.87%ε = 0.0%ε = 18.87%ε = 37.74%
ε = –37.74%ε = –18.87%ε = 0.0%ε = 18.87%ε = 37.74%
ε = –37.74%ε = –18.87%ε = 0.0%ε = 18.87%ε = 37.74%
ε = –37.74%ε = –18.87%ε = 0.0%ε = 18.87%ε = 37.74%
ε = –37.74%ε = –18.87%ε = 0.0%ε = 18.87%ε = 37.74%
Downloaded By: [Ghobarah, A.] At: 17:37 6 August 2008
PS-System Torsional Response 945
To demonstrate the effect of yielding on the response of the PS-system, both the KEand the total dissipated energy (DE+PE) from each experimental run were calculated forthe PS-system. It is quite challenging to determine the changing stiffness and possiblydamping matrices from the dynamic response data for a torsionally coupled PS-systemexhibiting stiffness and strength degradation upon yielding of the P-system. It is moreconvenient to calculate the total dissipated energy (DE+PE) by integrating the restoring
FIGURE 9 (Continued)
1 2 3 4 51
1.1
1.2
1.3
1.4
1.5
1.6
e = 21.03%
Test sequence number1 2 3 4 5
2
2.5
3
3.5
4
4.5
5e = 21.03%
Test sequence number
1 2 3 4 51
1.1
1.2
1.3
1.4
1.5
1.6
e = 24.54%
Test sequence number1 2 3 4 5
2
2.5
3
3.5
4
4.5
5e = 24.54%
Test sequence number
(g) P-system, experiments 4, 9, 14, 19, 24 (h) S-system, experiments 4, 9, 14, 19, 24
(i) P-system, experiments 5, 10, 15, 20, 25 (j) S-system, experiments 5, 10, 15, 20, 25
P-s
yste
m a
mpl
ifica
tion
(g)
P-s
yste
m a
mpl
ifica
tion
(g)
S-s
yste
m a
mpl
ifica
tion
(g)
S-s
yste
m a
mpl
ifica
tion
(g)
ε = –37.74%ε = –18.87%ε = 0.0%ε = 18.87%ε = 37.74%
ε = –37.74%ε = –18.87%ε = 0.0%ε = 18.87%ε = 37.74%
ε = –37.74%ε = –18.87%ε = 0.0%ε = 18.87%ε = 37.74%
ε = –37.74%ε = –18.87%ε = 0.0%ε = 18.87%ε = 37.74%
FIGURE 10 Failure modes of the P-system supports.
(a) Failure due to plastic flow (plastic hinging) (b) Failure due to crack propagation
Downloaded By: [Ghobarah, A.] At: 17:37 6 August 2008
946 H. H. Mohammed, A. Ghobarah, and T. S. Aziz
force (Fr) multiplied by the relative deformation increment (dU) over time for the coupledsubsystems as:
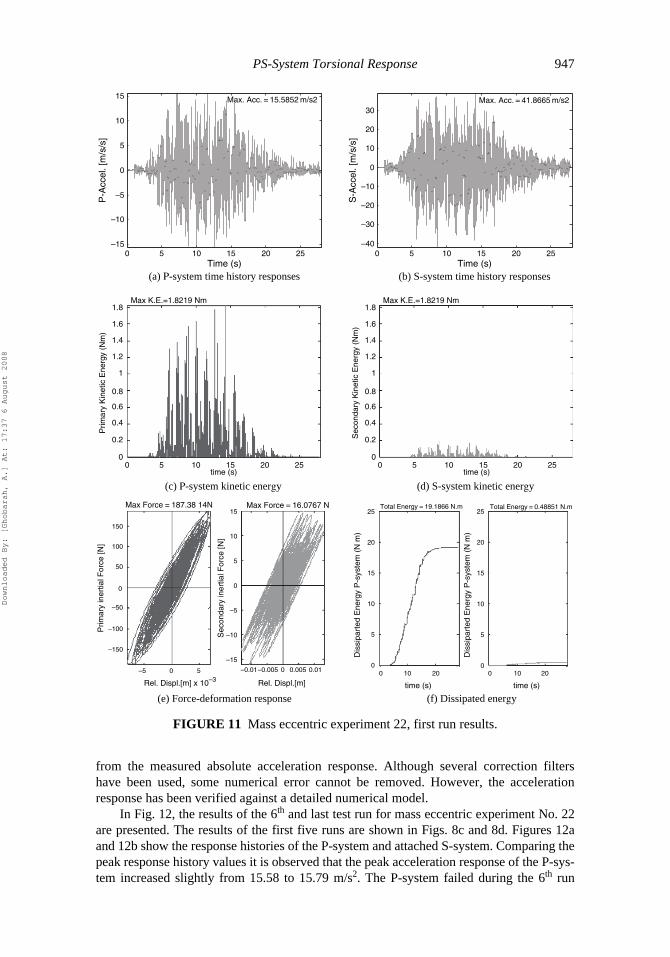
The behavior of the coupled PS-system will be discussed using the results of masseccentric experiment No. 22. Figures 11a and 11b show the recorded acceleration timehistory response of the P-system and attached S-system, respectively, for the first run inthe test. Figures 11c and 11d illustrate the KE of both subsystems for the first run. Figure 11eshows the derived force deformation response at the CM of both subsystems. For the elas-tic response of the near tuned PS-system in the first run of experiment 22 the slope of theP-system hysteretic loops remained constant indicating that there was no stiffness degra-dation. The hysteretic loops were also narrow due to the low damping ratio evaluated at xp= 0.016 for the P-system using the half power bandwidth method. The slope of the forcedeformation plot of the S-system also remained constant indicating that the response waselastic throughout the test. The damping ratio of xs = 0.0015 was determined for the S-systemusing the half power bandwidth method. Figure 11f shows the cumulative dissipatedenergy (DE+PE) with respect to time for the coupled P-system and attached S-system formass eccentric experiment No. 22 resulting from the first test. The energy dissipated bythe P-system was much greater than the energy dissipated by the attached S-system,mainly due to the substantial difference in mass and damping between the two systemsand the fact that the P-system acted as a band-pass filter to the attached S-system. The rel-ative displacement response of the S-system shown in Fig. 11 was numerically derived
TABLE 5 P-system frequencies for studied cases of a mass eccentric system
No. of supportsSupport length (mm)
Fundamental Frequency
(Hz)
Torsional Frequency
(Hz)Error
%
Mass Eccentricity,
e %Left End
Right End
4 4 85 9.75 13.19 2.54 0.00 1.354 4 85 9.78 12.52 2.24 −2.72 1.284 4 85 9.73 12.05 2.73 −5.43 1.244 4 85 9.72 12.01 2.83 −8.13 1.244 4 85 9.71 12.35 2.92 −10.87 1.27
wwq
TABLE 6 P-system frequencies for studied cases of a stiffness eccentric system
No. of supportsSupport length (mm)
Fundamental Frequency
(Hz)
Torsional Frequency
(Hz)Error
%
Stiffness Eccentricity,
e %Left End
Right End
2 2 67 9.67 13.03 3.26 0.00 1.352 3 70 9.74 14.19 2.55 9.81 1.462 4 72 9.70 15.72 2.96 16.36 1.622 5 73 9.83 17.38 1.70 21.03 1.772 6 75 9.75 18.47 2.47 24.54 1.89
wwq
E F dUd r
t
= ∫0
. (3)
Downloaded By: [Ghobarah, A.] At: 17:37 6 August 2008
PS-System Torsional Response 947
from the measured absolute acceleration response. Although several correction filtershave been used, some numerical error cannot be removed. However, the accelerationresponse has been verified against a detailed numerical model.
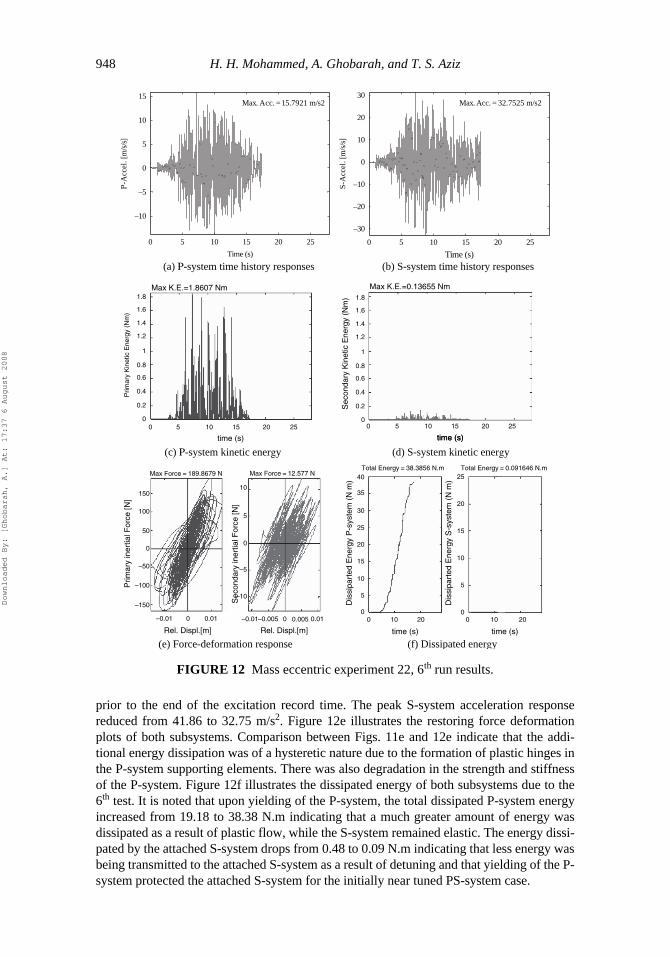
In Fig. 12, the results of the 6th and last test run for mass eccentric experiment No. 22are presented. The results of the first five runs are shown in Figs. 8c and 8d. Figures 12aand 12b show the response histories of the P-system and attached S-system. Comparing thepeak response history values it is observed that the peak acceleration response of the P-sys-tem increased slightly from 15.58 to 15.79 m/s2. The P-system failed during the 6th run
FIGURE 11 Mass eccentric experiment 22, first run results.
0 5 10 15 20 25–15
–10
–5
0
5
10
15P
-Acc
el. [
m/s
/s]
S-A
ccel
. [m
/s/s
]
Max. Acc. = 15.5852 m/s2
Time (s)0 5 10 15 20 25
–40
–30
–20
–10
0
10
20
30Max. Acc. = 41.8665 m/s2
Time (s)(a) P-system time history responses (b) S-system time history responses
(c) P-system kinetic energy (d) S-system kinetic energy
(e) Force-deformation response (f) Dissipated energy
1.8
1.6
1.4
1.2
1
0.8
0.6
0.4
0.2
00
15
150
100
10
5
–5
–10
–15
–0.01–0.005 0.0050 0.01
0
25Total Energy = 19.1866 N.m Total Energy = 0.48851 N.m
20
15
5
0
Dis
sipa
rted
Ene
rgy
P-s
yste
m (
N m
)
Dis
sipa
rted
Ene
rgy
P-s
yste
m (
N m
)
0 10
time (s)
20 0 10
time (s)
20
10
25
20
15
5
0
10
50
–50
–100
–150
Prim
ary
iner
tial F
orce
[N]
Sec
onda
ry in
ertia
l For
ce [N
]
–5
Rel. Displ.[m] x 10–3 Rel. Displ.[m]
50
0
Max K.E.=1.8219 Nm
Max Force = 187.38 14N Max Force = 16.0767 N
Max K.E.=1.8219 Nm
Prim
ary
Kin
etic
Ene
rgy
(Nm
)
1.8
1.6
1.4
1.2
1
0.8
0.6
0.4
0.2
0
Sec
onda
ry K
inet
ic E
nerg
y (N
m)
5 10 15time (s)
20 25 0 5 10 15time (s)
20 25
Downloaded By: [Ghobarah, A.] At: 17:37 6 August 2008
948 H. H. Mohammed, A. Ghobarah, and T. S. Aziz
prior to the end of the excitation record time. The peak S-system acceleration responsereduced from 41.86 to 32.75 m/s2. Figure 12e illustrates the restoring force deformationplots of both subsystems. Comparison between Figs. 11e and 12e indicate that the addi-tional energy dissipation was of a hysteretic nature due to the formation of plastic hinges inthe P-system supporting elements. There was also degradation in the strength and stiffnessof the P-system. Figure 12f illustrates the dissipated energy of both subsystems due to the6th test. It is noted that upon yielding of the P-system, the total dissipated P-system energyincreased from 19.18 to 38.38 N.m indicating that a much greater amount of energy wasdissipated as a result of plastic flow, while the S-system remained elastic. The energy dissi-pated by the attached S-system drops from 0.48 to 0.09 N.m indicating that less energy wasbeing transmitted to the attached S-system as a result of detuning and that yielding of the P-system protected the attached S-system for the initially near tuned PS-system case.
FIGURE 12 Mass eccentric experiment 22, 6th run results.
0 5 10 15 20 25
–10
–5
0
5
10
15
P-A
ccel
. [m
/s/s
]
Max. Acc. = 15.7921 m/s2
Time (s)
(a) P-system time history responses Time (s)
0 5 10 15 20 25
–30
–20
–10
0
10
20
30
S-A
ccel
. [m
/s/s
]
Max. Acc. = 32.7525 m/s2
(b) S-system time history responses
(c) P-system kinetic energy (d) S-system kinetic energy
(e) Force-deformation response (f) Dissipated energy
Prim
ary
Kin
etic
Ene
rgy
(Nm
)
0 5 10 15
time (s)time (s)
20 25
Max K.E.=1.8607 Nm
Sec
onda
ry K
inet
ic E
nerg
y (N
m)
Max K.E.=0.13655 Nm
150
100
50
0
–50
–100
–150
Prim
ary
iner
tial F
orce
[N]
–0.01
Rel. Displ.[m]
0.010
Max Force = 189.8679 N Max Force = 12.577 N
–0.01–0.005 0.0050 0.01
Rel. Displ.[m]
10
5
–5
–10
0
Sec
onda
ry in
ertia
l For
ce [N
]
25
30
35
40Total Energy = 38.3856 N.m Total Energy = 0.091646 N.m
20
15
5
00 10
time (s)
20 0 10
time (s)
20
10
Dis
sipa
rted
Ene
rgy
P-s
yste
m (
N m
)
Dis
sipa
rted
Ene
rgy
S-s
yste
m (
N m
) 25
20
15
5
0
10
0 5 10 15
time (s)
20 25
1.8
1.6
1.4
1.2
1
0.8
0.6
0.4
0.2
0
1.8
1.6
1.4
1.2
1
0.8
0.6
0.4
0.2
0
Downloaded By: [Ghobarah, A.] At: 17:37 6 August 2008
PS-System Torsional Response 949
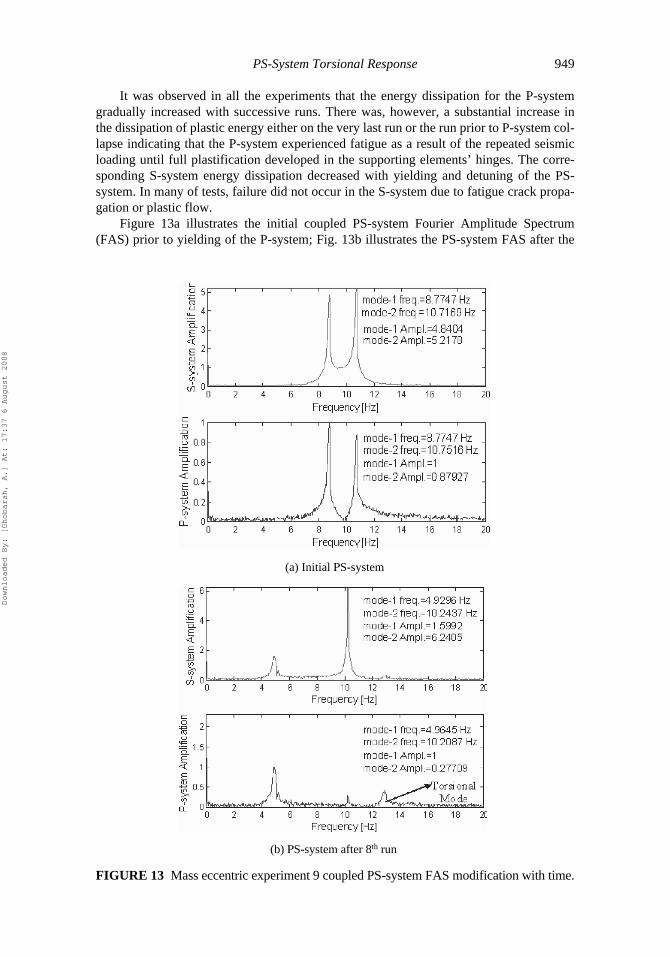
It was observed in all the experiments that the energy dissipation for the P-systemgradually increased with successive runs. There was, however, a substantial increase inthe dissipation of plastic energy either on the very last run or the run prior to P-system col-lapse indicating that the P-system experienced fatigue as a result of the repeated seismicloading until full plastification developed in the supporting elements’ hinges. The corre-sponding S-system energy dissipation decreased with yielding and detuning of the PS-system. In many of tests, failure did not occur in the S-system due to fatigue crack propa-gation or plastic flow.
Figure 13a illustrates the initial coupled PS-system Fourier Amplitude Spectrum(FAS) prior to yielding of the P-system; Fig. 13b illustrates the PS-system FAS after the
FIGURE 13 Mass eccentric experiment 9 coupled PS-system FAS modification with time.
(a) Initial PS-system
(b) PS-system after 8th run
Downloaded By: [Ghobarah, A.] At: 17:37 6 August 2008
950 H. H. Mohammed, A. Ghobarah, and T. S. Aziz
yielding of the P-system for mass eccentric experiment No. 9. The first modal coupled fre-quency decreased to 4.96 Hz from an initial 8.77 Hz due to P-system softening. The par-ticipation of the torsional mode at 12.7 Hz increased, as shown in Fig. 13b. As a result ofdetuning, the amplification effect on the S-system response due to the first modal fre-quency drops significantly.
5.3. Eccentricity of the Attached S-System
For the dynamically coupled experiments, Fig. 8b shows that when e = 0.0%, S-systemresponse at different (e) locations varied slightly. The difference increased with the yield-ing of the P-system and increased rotation, with the positions of e = ±18.87% being morecritical than e = ±37.74% and e = 0.0%. The case where the P-system CM and CR coin-cide is represented by e = 0.0%. With increased dynamic coupling Figs. 8d and 8f indicatethat the best location for the S-system is at e = −37.74% closer the left end; while the posi-tion resulting in greater amplification of the S-system response corresponding to e = −8.13% and e = −0.87% was at e = +37.74% as illustrated in Figs. 8h and 8j, respectively.The pattern pertaining to levels of amplification for each of the (e) positions appears toremain consistent with successive yielding of the P-system for each case of P-system masseccentricity, although the ratio of peak amplitudes changes.
A similar pattern of behavior is observed in the cases where the P-system was stati-cally coupled. In particular, it is observed from Fig. 9h where e = 21.03%, that the mostcritical location for the S-system was at e = +18.87%, which was closest to the CR of theP-system. The smallest S-system amplification was obtained when the S-system waslocated at e = −37.74% closer to the left end where the weaker supports are. Figure 9jshows the results for e = +24.54%. Initially, when the P-system was strong in torsion, theamplification pattern for the various attachment locations (e) on the S-system was similarto that of a symmetric P-system with the most critical S-system locations being at e =±18.87%. With successive yielding, the CR moves closer to the right end supports andamplification at e = +37.74% is observed to be more critical as the torsional response ofthe P-system developed.
6. Conclusions
An experimental program was conducted to evaluate the response and behavioral charac-teristics of initially near tuned PS-systems that exhibit yielding of the P-system as well astorsional coupling. Different cases of mass and stiffness eccentricities for the P-systemwere considered. The location eccentricity of the attached S-system was also considered.The experimental setup was successful in modeling the PS-system interaction when the P-system undergoes dynamic translation and torsion. The following conclusions are reachedfor the studied cases:
1. For a P-system and S-system initially tuned at the translational frequency of 10 Hz,
increasing mass eccentricity reduced the ratio making the P-system more
torsionally flexible which subsequently reduced the number of excitations the PS-system was able to sustain. On the other hand, increasing the stiffness eccentricity
while increasing the ratio resulted in a more torsionally stiff (redundant) sys-
tem that was able to sustain more excitations.2. In the cases where the synthetic ground excitation was used to yield the dynami-
cally and statically coupled P-system initially at 10 Hz, the further the S-system
wwq
wwq
Downloaded By: [Ghobarah, A.] At: 17:37 6 August 2008

PS-System Torsional Response 951
was located from the CR of the P-system (i.e., location 5 in Figs. 1 and 2 sideview), the greater the S-system feedback interaction with the P-system. The reasonwas that the S-system was supported closer to the weaker supports of the P-systemof the statically coupled P-system, which were the supports susceptible to earlierfailure in the dynamically coupled P-system. This interaction reduced the responseof the S-system as compared to locations 2 and 3, which were closer to the CR,especially where e = −10.87% for dynamic coupling and where e = +21.03% ande = +24.54% for static coupling. These values represent the largest P-system CMmass and CR stiffness eccentricities. The closer the S-system was positioned to theP-system’s CR (locations 2 and 3 in Figs. 1 and 2 side view), the less the effect offeedback interaction of the S-system with the supporting P-system and hence thehigher the response amplification.
3. The response amplification pattern for a particular P-system torsional eccentricityand various S-system location eccentricity combinations was found to be more orless consistent on successive excitations for many of the studied cases with theP-system yielding. However, the relative amplification ratios for the various S-system location changed with P-system yielding.
4. For mass eccentric experiments, supporting elements at the left end of the dynami-cally coupled P-system identified in Fig. 1, yielded and failed first though theP-system was initially statically uncoupled. This occurred due to the presence ofthe induced torsional moment, which increased with softening of the P-systembecause the CR moved towards the right end of the P-system increasing the P-system eccentricity “e”. For statically coupled experiments, supports farthest fromthe P-system CR location will fail first for the same reasons.
5. Results of the yielding PS-system initially near tuned at 10 Hz indicated that anoptimal location can be found in the design of critical non-structural componentsor equipment supported by torsionally coupled structures. This optimum locationdepends on the level of P-system to S-system tuning as well as degree and type ofP-system torsional coupling and the level of yielding anticipated and/or permittedin either subsystem. It is noted that in the design phase, when yielding of eithersubsystem is anticipated or permitted, nonlinearity must be considered in the anal-ysis to estimate the true response of either subsystem especially under the baseexcitation of severe earthquakes.
The conclusions of this research program are based on a limited number of tests using asingle ground motion and two fundamental frequencies of the supporting structure. Theextrapolation of the conclusions to different systems under different ground motions orwhen higher mode frequencies are tuned may require further experimental verification.
References
Adam, C. [2001] “Dynamics of elastic-plastic shear frames with secondary structures: shake tableand numerical studies,” Earthquake Engineering and Structural Dynamics 30, 257–277.
Amadio, C., Fragiacomo, M., and Rajgelj, S. [2003] “The effect of repeated earthquake groundmotions on the non-linear response of SDOF systems,” Earthquake Engineering and StructuralDynamics 32, 291–308.
Aziz, T. S. and Duff, C. G. [1978] “Mass coupling effects in the dynamic analysis of nuclear powerplant systems,” Joint ASME/CSME Pressure Vessels and Piping Conference, Montreal, Canada,pp.2–8.
Elgadamsi, F. E., Mohraz, B., Lee, C. T., and Moayyad, P. [1988] “Time-dependent power spectraldensity of earthquake ground motion,” Soil Dynamics and Earthquake Engineering 7(1), 15–21.
Downloaded By: [Ghobarah, A.] At: 17:37 6 August 2008
952 H. H. Mohammed, A. Ghobarah, and T. S. Aziz
Ghobarah, A., Aziz, T., and Nguyen, C. X. [1987] “Inelastic response of tuned systems,” FifthCanadian Conference on Earthquake Engineering, Ottawa, pp. 571–576.
Hernried, A. G. and Sackman, J. L. [1984] “Response of secondary systems in structures subjectedto transient excitation,” Earthquake Engineering and Structural Dynamics 12, 737–748.
Kan, C., and Chopra, A. [1979] “Linear and nonlinear earthquake responses of simple torsionallycoupled systems,” Report No. UCB/EERC-79/03, University of California at Berkeley,Berkeley, CA.
Kramer, S. [1996] Geotechnical Earthquake Engineering, Prentice Hall, Englewood Cliffs, NJ.Newmark, N. M. and Hall, W. J. [1982] “Earthquake spectra and design,” Earthquake Engineering
Research Institute, Berkeley, CA.Sackman, J. L. and Kelly, J. M. [1979] “Seismic analysis of internal equipment and components in
structures,” Engineering Structures 1, 179–190.Segal, D. and Hall, W. J. [1989] Experimental Seismic Investigation of Appendages in Structures,
Civil Engineering Studies, Structural Research Series No. 545, University of Illinois, Urbana, IL.Villaverde, R. [1997] “Seismic design of secondary structures: state of the art,” Journal of Struc-
tural Engineering 123(8), 1011–1019.Wong, K. and Yang, R. [2002] “Earthquake response and energy evaluation of inelastic structures,”
Journal of Engineering Mechanics 128(3), 308–317.
Downloaded By: [Ghobarah, A.] At: 17:37 6 August 2008