Ventilation measurements - NIST Technical Series Publications
Upload
khangminh22Category
view
7download
0
Segmentation and Cell Tracking of BreastCancer Cells
Adele P. Peskin1, Daniel J. Hoeppner2, and Christina H. Stuelten2
1 NIST, Boulder, CO 803052 NIH, Bethesda, MD 20892
Abstract. We describe a new technique to automatically segment andtrack the cell images of a breast cancer cell line in order to study cellmigration and metastasis. Within each image observable cell character-istics vary widely, ranging from very bright completely bounded cells tobarely visible cells with little to no apparent boundaries. A set of dif-ferent segmentation algorithms are used in series to segment each celltype. Cell segmentation and cell tracking are done simultaneously, andno user selected parameters are needed. A new method for backgroundsubtraction is described and a new method of selective dilation is used tosegment the barely visible cells. We show results for initial cell growth.
1 Introduction
The ability of cells to migrate varies widely during development and the life ofmulticellular organisms. For example, cell migration is crucial during the earlystages of development when organs are formed. During adulthood, a wide arrayof immune cells can migrate at speeds that can reach more than one cell lengthper minute. These cells travel over wide distances to sites of inflammation orinjury to precipitate the host′s immune response. On the other hand, epithelialcells, which line cavities and surfaces inside the body, are characterized by tightcontact with neighboring cells and typically do not migrate over far distances.
Cell- and organ-specific regulation of the migratory behavior of cells is crucialunder both physiological and pathological conditions. In normal epithelia, suchas breast epithelium, cell migration is restricted, but in tumor disease thesetransformed epithelial cells acquire mutations that allow them to migrate intothe surrounding connective tissue (invasive tumor) and then to distant sites toestablish metastatic disease [1]. Therefore, investigating the migratory behaviorof epithelial and tumor cells may enable us to find new ways to control migrationof tumor cells to distant sites and reduce metastasis.
Cell migration can be studied by visualizing cell responses through the cap-ture of time-lapse images for long periods of time. Quantitative analysis of theseimages is performed by tracking the position of individual cells as a function oftime, which is labor-intensive and can only be done manually for a few selected0 This contribution of NIST, an agency of the U.S. government, is not subject to
copyright.
2 Peskin, et al.
cells. Thus, current ways to analyze cell migration often generate data of lim-ited statistical value. To robustly analyze migration of cells over a time rangeof days, an image analysis program would ideally be able (a) to segment imagesand identify cells, (b) to individually name cells, (c) to assign cells in one imageto cells in the preceding and succeeding images, that is, identify the same cellin sequential images although this cell may change location, size and shape, (d)identify whether a cell dies, (e) notice whether a cell divides and identify theoffspring as new cells but related to the parental cell.
We developed a segmentation method specific for the cell line studied here,MCF10CA1a cells [2]. Many segmentation methods exist in the literature: edge-based methods, methods which minimize certain energy functions [3] [4], andmethods that combine different techniques, such as the coarse-to-fine iterativesegmentation of 3T3 cells [5]. Several methods determine cell boundaries bytracking cell movements over time, either by tracking cell trajectories [6], orby feature-specific shape change detection [7]. Ersoy et.al. propose a flux-tensorbased method that detects cell movements [8]. The images from this cell linepresent segmentation problems that are not addressed by these solutions: celledges are not clearly defined and cell shapes are not consistent from one imageto the next, so methods that depend on these features are not useful for this cellline. Other cell tracking methods fail to accurately track both the bright roundcells, and the barely visible cells. In this paper, we discuss a method that tracksthe combination of diverse, often fast-moving, cells of this breast cancer line.The parameters used in the segmentation method are based on the statistics ofimage intensities and user input is not required.
2 Tissue Culture
Breast cancer cells (MCF10CA1a cells) were cultured as described previously[9] [10]. Briefly, cells were grown in DMEM/F12 supplemented with 5 % horseserum (both Invitrogen, Carlsbad, CA) in a humidified atmosphere at 5 % CO2.For experiments, cells were trypsinized and resuspended in a 1:1 mixture ofDMEM/F12 supplemented with 5 % horse serum and DMEM, low glucose, sup-plemented with 10 % fetal bovine serum (Invitrogen). 25000 cells were platedinto each dish (total volume: 3 ml). Cells were allowed to adhere overnight andthen transferred into the incubator chamber of the microscope for monitoringcell migration. 3
3 Microscopy
Cultured cells were imaged continuously in a 5 % CO2 environment (Zeiss CO2
module S). Temperature was regulated to 37 ◦C ± 0.1 ◦C by use of an AirTherm
3 Certain trade names are identified in this report in order to specify the experimentalconditions used in obtaining the reported data. Mention of these products does notconstitute an endorsement of them.
Segmentation of Breast Cancer Cells 3
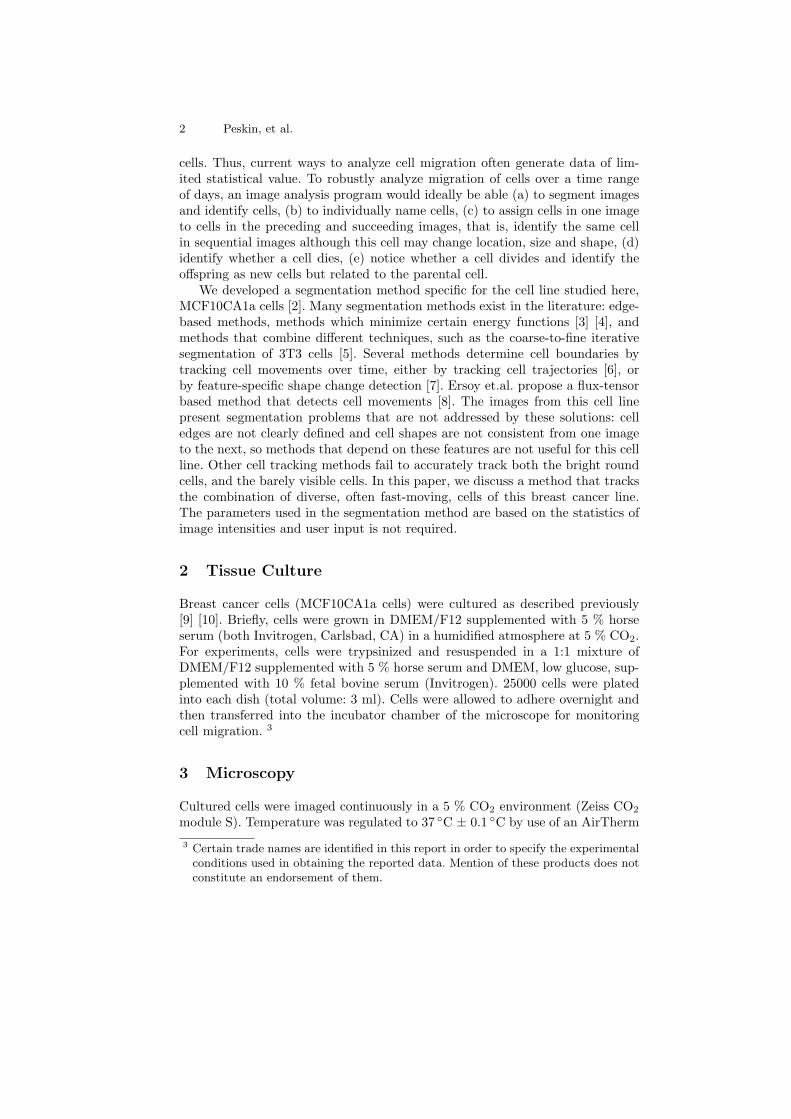
heater (WPI). Cells were imaged by use of a Zeiss AxioObserver microscopewith a 40x, 1.3 NA oil-immersion objective and Cargille 37 immersion oil. DICimages were captured with an Orca EM (Hamamatsu) CCD camera every 2min and saved as .zvi files at 512x512 pixels and 16 bit depth. Original files wereconverted to .tif series using ImageJ with no post-hoc file manipulation. Multipleareas of the coverslip were imaged simultaneously using a computer-controlledmotorized stage (Ludl Mac5000) with a linear encoder. Axiovision (Zeiss, Version4.6) software was used to control all hardware components. To minimize phototoxicity, 15 ms exposure times were achieved using a shutter (UniBlitz). Sampleimages can be found at: http://www.nist.gov/itl/math/hpcvg/cellimgvis.cfm.
Fig. 1. Early image.
4 Background Removal
Background values for live cell images have been computed in a number of dif-ferent ways, from taking the mean value or weighted mean of pixel intensitiesat each location [11] [3], to modeling pixel intensities over time at each locationwith Gaussian distributions representing cell and background [12], to top-hatfiltering [4]. The goal for this segmentation is to do simultaneous cell track-ing along with the segmentation, so we chose a method that can be performedon each image without knowledge of previous background image information.Background removal needs to be highly accurate in order to track the barelyvisible cells. To start, a mean value is found for the image as a whole, and allpixels with an intensity higher than three standard deviations above the meanare temporarily replaced by the mean value to smooth out the image. Then thebackground value for each individual pixel is determined by the average value ina small neighborhood of that pixel. We experimented with different sized neigh-borhoods, from 3 to 20 pixels in each direction. A neighborhood of ten pixelsin each direction was used, which produced a smooth background without re-moving features of the image. Figure 1 shows an image at the start of growth
4 Peskin, et al.
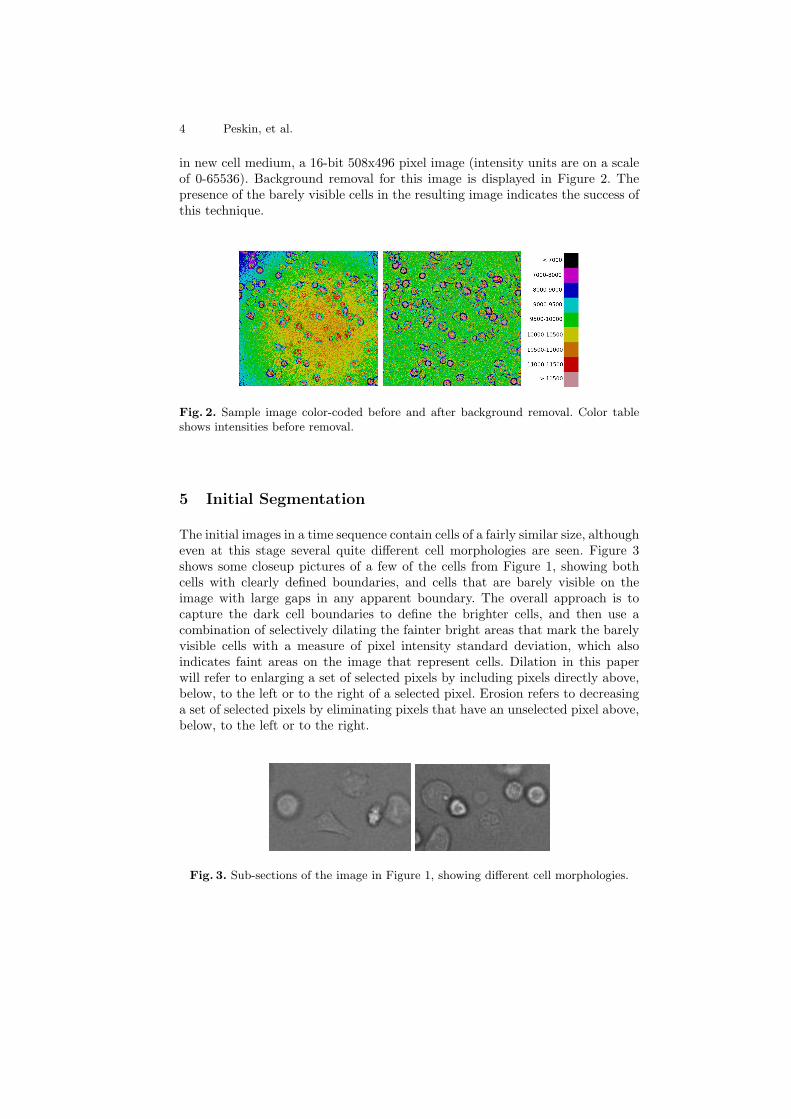
in new cell medium, a 16-bit 508x496 pixel image (intensity units are on a scaleof 0-65536). Background removal for this image is displayed in Figure 2. Thepresence of the barely visible cells in the resulting image indicates the success ofthis technique.
Fig. 2. Sample image color-coded before and after background removal. Color tableshows intensities before removal.
5 Initial Segmentation
The initial images in a time sequence contain cells of a fairly similar size, althougheven at this stage several quite different cell morphologies are seen. Figure 3shows some closeup pictures of a few of the cells from Figure 1, showing bothcells with clearly defined boundaries, and cells that are barely visible on theimage with large gaps in any apparent boundary. The overall approach is tocapture the dark cell boundaries to define the brighter cells, and then use acombination of selectively dilating the fainter bright areas that mark the barelyvisible cells with a measure of pixel intensity standard deviation, which alsoindicates faint areas on the image that represent cells. Dilation in this paperwill refer to enlarging a set of selected pixels by including pixels directly above,below, to the left or to the right of a selected pixel. Erosion refers to decreasinga set of selected pixels by eliminating pixels that have an unselected pixel above,below, to the left or to the right.
Fig. 3. Sub-sections of the image in Figure 1, showing different cell morphologies.
Segmentation of Breast Cancer Cells 5
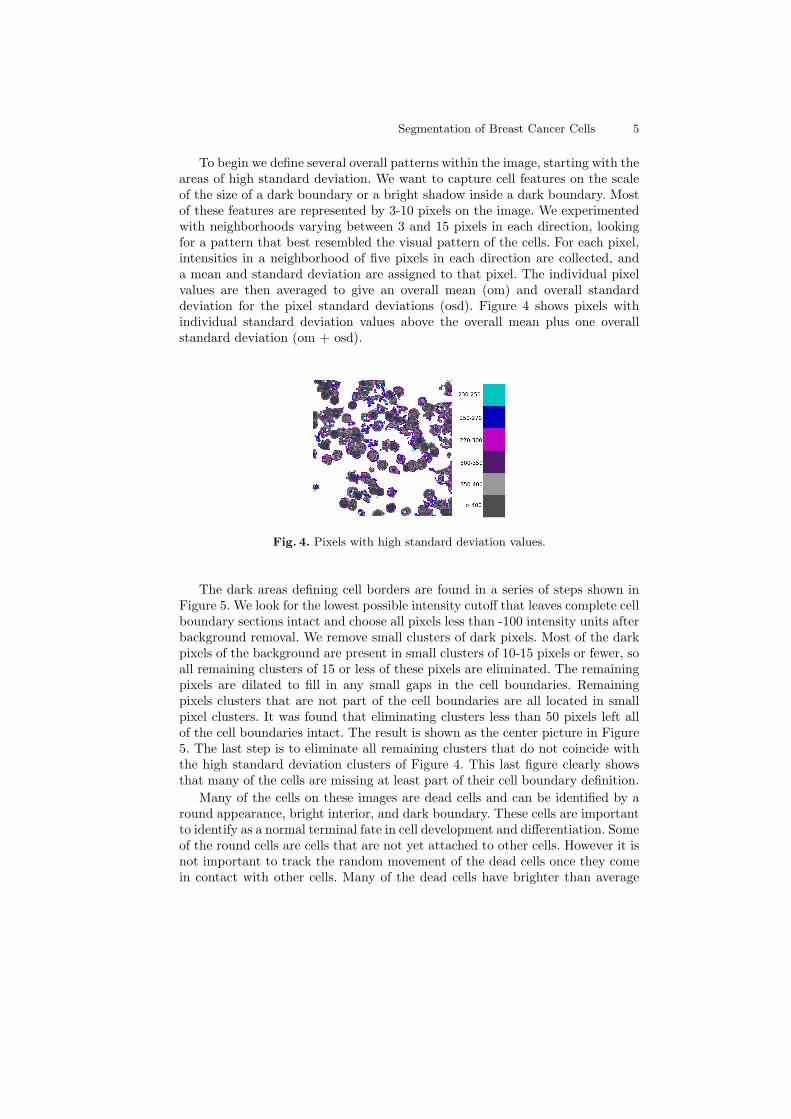
To begin we define several overall patterns within the image, starting with theareas of high standard deviation. We want to capture cell features on the scaleof the size of a dark boundary or a bright shadow inside a dark boundary. Mostof these features are represented by 3-10 pixels on the image. We experimentedwith neighborhoods varying between 3 and 15 pixels in each direction, lookingfor a pattern that best resembled the visual pattern of the cells. For each pixel,intensities in a neighborhood of five pixels in each direction are collected, anda mean and standard deviation are assigned to that pixel. The individual pixelvalues are then averaged to give an overall mean (om) and overall standarddeviation for the pixel standard deviations (osd). Figure 4 shows pixels withindividual standard deviation values above the overall mean plus one overallstandard deviation (om + osd).
Fig. 4. Pixels with high standard deviation values.
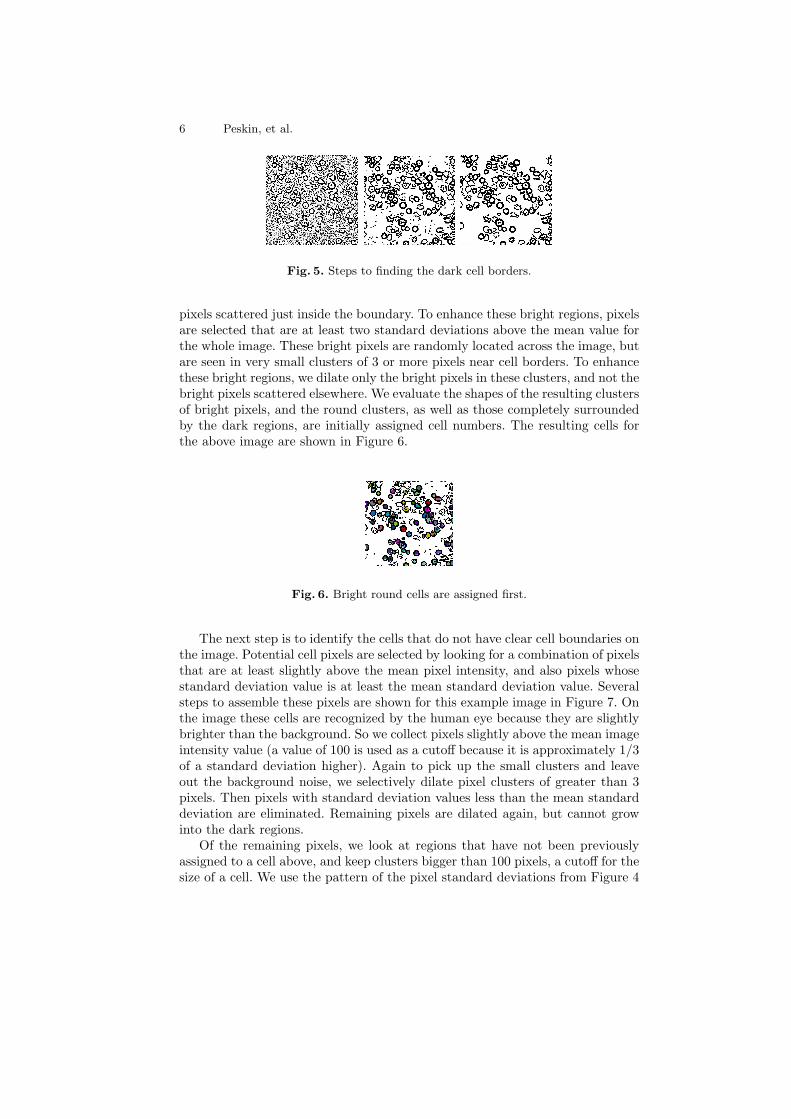
The dark areas defining cell borders are found in a series of steps shown inFigure 5. We look for the lowest possible intensity cutoff that leaves complete cellboundary sections intact and choose all pixels less than -100 intensity units afterbackground removal. We remove small clusters of dark pixels. Most of the darkpixels of the background are present in small clusters of 10-15 pixels or fewer, soall remaining clusters of 15 or less of these pixels are eliminated. The remainingpixels are dilated to fill in any small gaps in the cell boundaries. Remainingpixels clusters that are not part of the cell boundaries are all located in smallpixel clusters. It was found that eliminating clusters less than 50 pixels left allof the cell boundaries intact. The result is shown as the center picture in Figure5. The last step is to eliminate all remaining clusters that do not coincide withthe high standard deviation clusters of Figure 4. This last figure clearly showsthat many of the cells are missing at least part of their cell boundary definition.
Many of the cells on these images are dead cells and can be identified by around appearance, bright interior, and dark boundary. These cells are importantto identify as a normal terminal fate in cell development and differentiation. Someof the round cells are cells that are not yet attached to other cells. However it isnot important to track the random movement of the dead cells once they comein contact with other cells. Many of the dead cells have brighter than average
6 Peskin, et al.
Fig. 5. Steps to finding the dark cell borders.
pixels scattered just inside the boundary. To enhance these bright regions, pixelsare selected that are at least two standard deviations above the mean value forthe whole image. These bright pixels are randomly located across the image, butare seen in very small clusters of 3 or more pixels near cell borders. To enhancethese bright regions, we dilate only the bright pixels in these clusters, and not thebright pixels scattered elsewhere. We evaluate the shapes of the resulting clustersof bright pixels, and the round clusters, as well as those completely surroundedby the dark regions, are initially assigned cell numbers. The resulting cells forthe above image are shown in Figure 6.
Fig. 6. Bright round cells are assigned first.
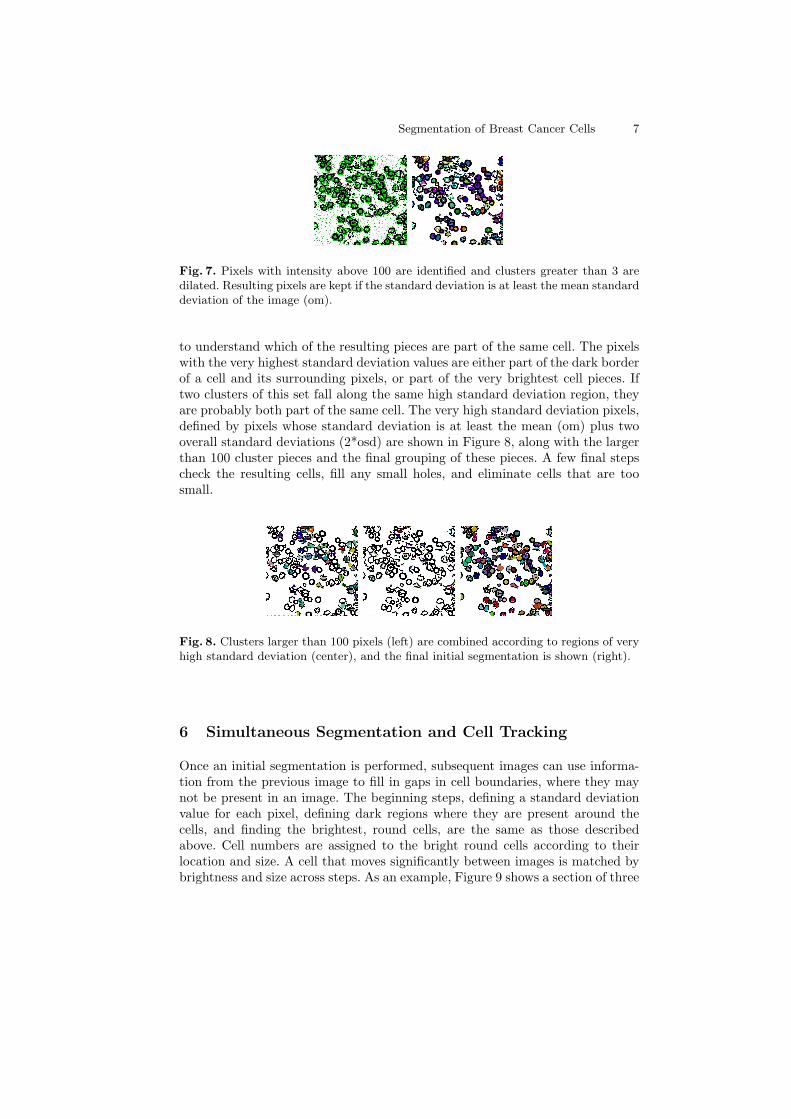
The next step is to identify the cells that do not have clear cell boundaries onthe image. Potential cell pixels are selected by looking for a combination of pixelsthat are at least slightly above the mean pixel intensity, and also pixels whosestandard deviation value is at least the mean standard deviation value. Severalsteps to assemble these pixels are shown for this example image in Figure 7. Onthe image these cells are recognized by the human eye because they are slightlybrighter than the background. So we collect pixels slightly above the mean imageintensity value (a value of 100 is used as a cutoff because it is approximately 1/3of a standard deviation higher). Again to pick up the small clusters and leaveout the background noise, we selectively dilate pixel clusters of greater than 3pixels. Then pixels with standard deviation values less than the mean standarddeviation are eliminated. Remaining pixels are dilated again, but cannot growinto the dark regions.
Of the remaining pixels, we look at regions that have not been previouslyassigned to a cell above, and keep clusters bigger than 100 pixels, a cutoff for thesize of a cell. We use the pattern of the pixel standard deviations from Figure 4
Segmentation of Breast Cancer Cells 7
Fig. 7. Pixels with intensity above 100 are identified and clusters greater than 3 aredilated. Resulting pixels are kept if the standard deviation is at least the mean standarddeviation of the image (om).
to understand which of the resulting pieces are part of the same cell. The pixelswith the very highest standard deviation values are either part of the dark borderof a cell and its surrounding pixels, or part of the very brightest cell pieces. Iftwo clusters of this set fall along the same high standard deviation region, theyare probably both part of the same cell. The very high standard deviation pixels,defined by pixels whose standard deviation is at least the mean (om) plus twooverall standard deviations (2*osd) are shown in Figure 8, along with the largerthan 100 cluster pieces and the final grouping of these pieces. A few final stepscheck the resulting cells, fill any small holes, and eliminate cells that are toosmall.
Fig. 8. Clusters larger than 100 pixels (left) are combined according to regions of veryhigh standard deviation (center), and the final initial segmentation is shown (right).
6 Simultaneous Segmentation and Cell Tracking
Once an initial segmentation is performed, subsequent images can use informa-tion from the previous image to fill in gaps in cell boundaries, where they maynot be present in an image. The beginning steps, defining a standard deviationvalue for each pixel, defining dark regions where they are present around thecells, and finding the brightest, round cells, are the same as those describedabove. Cell numbers are assigned to the bright round cells according to theirlocation and size. A cell that moves significantly between images is matched bybrightness and size across steps. As an example, Figure 9 shows a section of three
8 Peskin, et al.
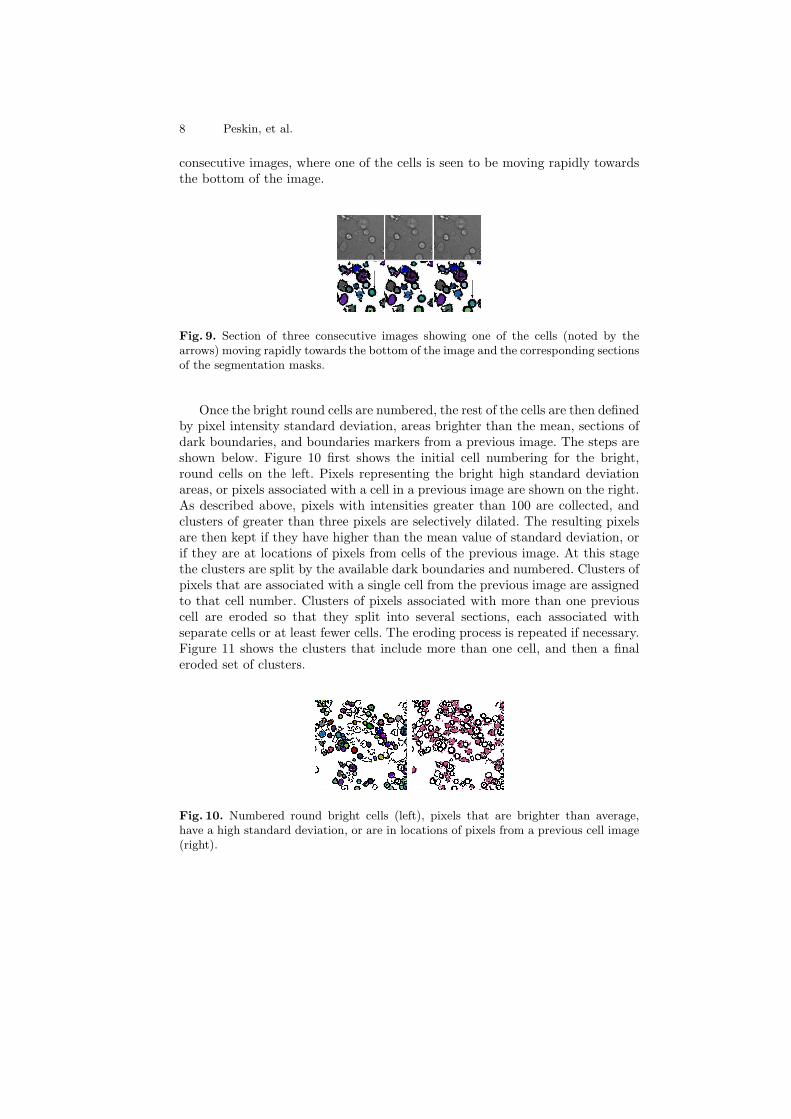
consecutive images, where one of the cells is seen to be moving rapidly towardsthe bottom of the image.
Fig. 9. Section of three consecutive images showing one of the cells (noted by thearrows) moving rapidly towards the bottom of the image and the corresponding sectionsof the segmentation masks.
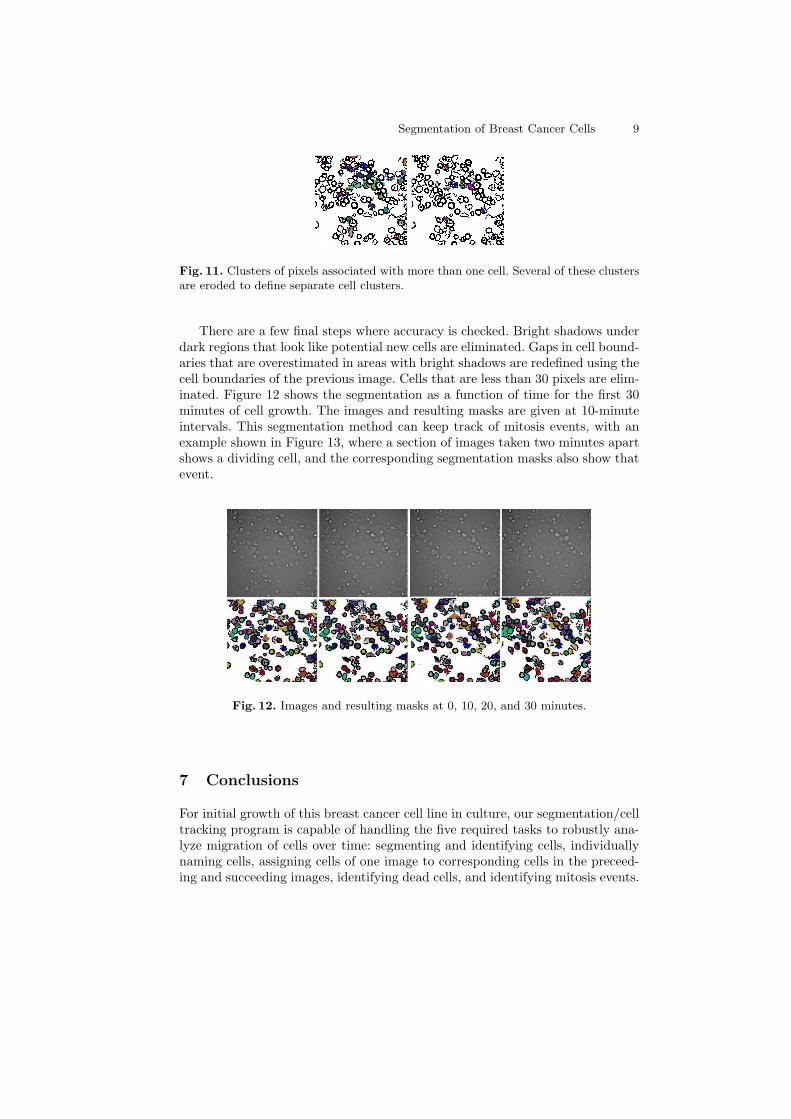
Once the bright round cells are numbered, the rest of the cells are then definedby pixel intensity standard deviation, areas brighter than the mean, sections ofdark boundaries, and boundaries markers from a previous image. The steps areshown below. Figure 10 first shows the initial cell numbering for the bright,round cells on the left. Pixels representing the bright high standard deviationareas, or pixels associated with a cell in a previous image are shown on the right.As described above, pixels with intensities greater than 100 are collected, andclusters of greater than three pixels are selectively dilated. The resulting pixelsare then kept if they have higher than the mean value of standard deviation, orif they are at locations of pixels from cells of the previous image. At this stagethe clusters are split by the available dark boundaries and numbered. Clusters ofpixels that are associated with a single cell from the previous image are assignedto that cell number. Clusters of pixels associated with more than one previouscell are eroded so that they split into several sections, each associated withseparate cells or at least fewer cells. The eroding process is repeated if necessary.Figure 11 shows the clusters that include more than one cell, and then a finaleroded set of clusters.
Fig. 10. Numbered round bright cells (left), pixels that are brighter than average,have a high standard deviation, or are in locations of pixels from a previous cell image(right).
Segmentation of Breast Cancer Cells 9
Fig. 11. Clusters of pixels associated with more than one cell. Several of these clustersare eroded to define separate cell clusters.
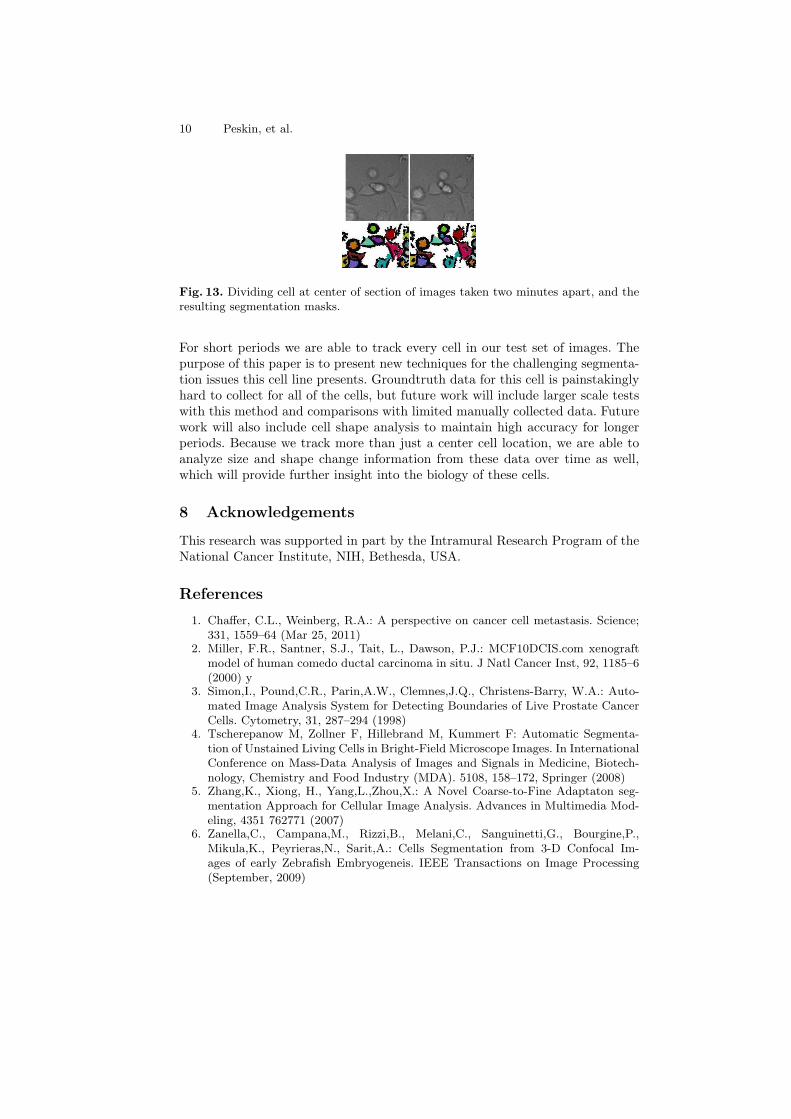
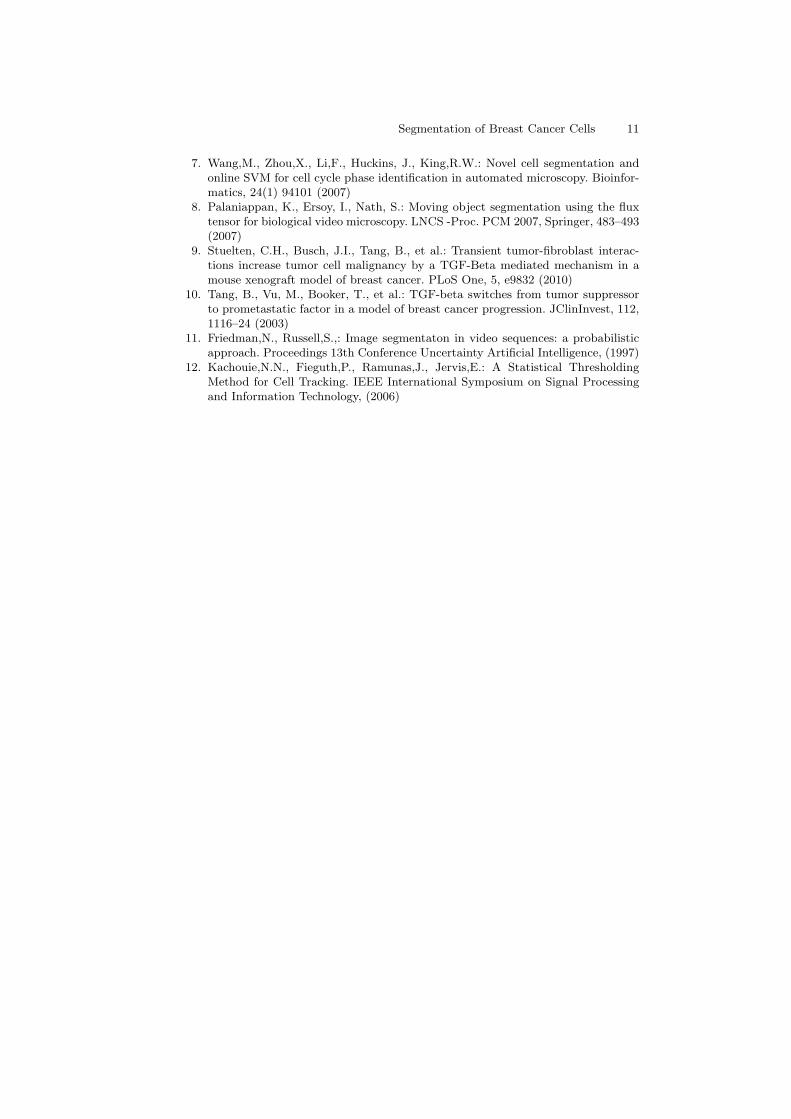
There are a few final steps where accuracy is checked. Bright shadows underdark regions that look like potential new cells are eliminated. Gaps in cell bound-aries that are overestimated in areas with bright shadows are redefined using thecell boundaries of the previous image. Cells that are less than 30 pixels are elim-inated. Figure 12 shows the segmentation as a function of time for the first 30minutes of cell growth. The images and resulting masks are given at 10-minuteintervals. This segmentation method can keep track of mitosis events, with anexample shown in Figure 13, where a section of images taken two minutes apartshows a dividing cell, and the corresponding segmentation masks also show thatevent.
Fig. 12. Images and resulting masks at 0, 10, 20, and 30 minutes.
7 Conclusions
For initial growth of this breast cancer cell line in culture, our segmentation/celltracking program is capable of handling the five required tasks to robustly ana-lyze migration of cells over time: segmenting and identifying cells, individuallynaming cells, assigning cells of one image to corresponding cells in the preceed-ing and succeeding images, identifying dead cells, and identifying mitosis events.
10 Peskin, et al.
Fig. 13. Dividing cell at center of section of images taken two minutes apart, and theresulting segmentation masks.
For short periods we are able to track every cell in our test set of images. Thepurpose of this paper is to present new techniques for the challenging segmenta-tion issues this cell line presents. Groundtruth data for this cell is painstakinglyhard to collect for all of the cells, but future work will include larger scale testswith this method and comparisons with limited manually collected data. Futurework will also include cell shape analysis to maintain high accuracy for longerperiods. Because we track more than just a center cell location, we are able toanalyze size and shape change information from these data over time as well,which will provide further insight into the biology of these cells.
8 Acknowledgements
This research was supported in part by the Intramural Research Program of theNational Cancer Institute, NIH, Bethesda, USA.
References
1. Chaffer, C.L., Weinberg, R.A.: A perspective on cancer cell metastasis. Science;331, 1559–64 (Mar 25, 2011)
2. Miller, F.R., Santner, S.J., Tait, L., Dawson, P.J.: MCF10DCIS.com xenograftmodel of human comedo ductal carcinoma in situ. J Natl Cancer Inst, 92, 1185–6(2000) y
3. Simon,I., Pound,C.R., Parin,A.W., Clemnes,J.Q., Christens-Barry, W.A.: Auto-mated Image Analysis System for Detecting Boundaries of Live Prostate CancerCells. Cytometry, 31, 287–294 (1998)
4. Tscherepanow M, Zollner F, Hillebrand M, Kummert F: Automatic Segmenta-tion of Unstained Living Cells in Bright-Field Microscope Images. In InternationalConference on Mass-Data Analysis of Images and Signals in Medicine, Biotech-nology, Chemistry and Food Industry (MDA). 5108, 158–172, Springer (2008)
5. Zhang,K., Xiong, H., Yang,L.,Zhou,X.: A Novel Coarse-to-Fine Adaptaton seg-mentation Approach for Cellular Image Analysis. Advances in Multimedia Mod-eling, 4351 762771 (2007)
6. Zanella,C., Campana,M., Rizzi,B., Melani,C., Sanguinetti,G., Bourgine,P.,Mikula,K., Peyrieras,N., Sarit,A.: Cells Segmentation from 3-D Confocal Im-ages of early Zebrafish Embryogeneis. IEEE Transactions on Image Processing(September, 2009)
Segmentation of Breast Cancer Cells 11
7. Wang,M., Zhou,X., Li,F., Huckins, J., King,R.W.: Novel cell segmentation andonline SVM for cell cycle phase identification in automated microscopy. Bioinfor-matics, 24(1) 94101 (2007)
8. Palaniappan, K., Ersoy, I., Nath, S.: Moving object segmentation using the fluxtensor for biological video microscopy. LNCS -Proc. PCM 2007, Springer, 483–493(2007)
9. Stuelten, C.H., Busch, J.I., Tang, B., et al.: Transient tumor-fibroblast interac-tions increase tumor cell malignancy by a TGF-Beta mediated mechanism in amouse xenograft model of breast cancer. PLoS One, 5, e9832 (2010)
10. Tang, B., Vu, M., Booker, T., et al.: TGF-beta switches from tumor suppressorto prometastatic factor in a model of breast cancer progression. JClinInvest, 112,1116–24 (2003)
11. Friedman,N., Russell,S.,: Image segmentaton in video sequences: a probabilisticapproach. Proceedings 13th Conference Uncertainty Artificial Intelligence, (1997)
12. Kachouie,N.N., Fieguth,P., Ramunas,J., Jervis,E.: A Statistical ThresholdingMethod for Cell Tracking. IEEE International Symposium on Signal Processingand Information Technology, (2006)
Copyright © 2022 FDOKUMEN