SEED MASS VARIATION IN SEED LOTS OF NINE CULTIVARS OF SUNFLOWER (HELIANTHUS ANNUUS L.)
11
INT. J. BIOL. BIOTECH., 8 (2): 263-273, 2011. SEED MASS VARIATION IN SEED LOTS OF NINE CULTIVARS OF SUNFLOWER (HELIANTHUS ANNUUS L.) D. Khan, Muhammad Anis and Muhammad Javed Zaki Department of Botany, University of Karachi, Karachi- 74700, Pakistan. ABSTRACT Seed mass variation in seed lots of nine sunflower cultivars viz. S-278, local, Hybrid 1, Hysun 33, Hysun 39, N K Armoni, Aussie gold 04, Aussie gold 61 and Aussie gold 62 is described. Within individual cultivars seed mass varied substantially from 1.91-folds in cultivar S-278 to 3.68-folds in Hybrid 1. The variation in terms of coefficient of variation was also the lowest in cultivar S-278 (13.91 %) followed by N K Armoni (15.99%). It was the highest (24.62 %) in cultivar ‘local’. In pooled sample, variation was 26.1% (heaviest / lightest seed ratio 3.96). Cultivars varied in mean seed mass which was 50.52 ± 1.05 mg in Hysun 39 to 81.79 ± 1.14 mg in S-278. Mean seed mass of N K Armoni was 74.82 ± 1.196 mg. In other varieties mean seed weight was between 51 and 58 mg. Mean seed mass of the pooled sample was 60.12 ± 0.523 mg. The distribution of mean seed mass around the grand mean was negatively skewed. The coefficient of variation among means was 17.74% i.e., the variation was 1.62-folds. The seed masses exhibited significantly positive skewness in four cultivars local, Hysun 39, Hybrid 1, and Aussie gold 62 and pooled sample. In cultivar NK Armoni, seed masse distribution was significantly negatively skewed. The distribution was characterized with significantly positive kurtosis (leptokurtosis) in cultivars local and Hybrid 1, insignificant leptokurtosis in Aussie gold 62 and Hysun 33 and insignificantly negative kurtosis (platykurtosis) in S-278, Hysun 39, NK Armoni, Aussie gold 61, Aussie gold 04 and the pooled sample of seeds. The normality of distribution was tested with Shapiro-Wilks test. The distribution of individual seed mass was found to be normal in six cultivars viz. S-278, local, Hysun 39, Hysun 33, Aussie gold 61 and Aussie gold 04 and Non-normal in NK Armoni, Hybrid 1, Aussie gold 61 and the pooled sample of all cultivars. Hierarchical clustering, on the basis of seed mass, discretely classified varieties into two groups. Cultivars S-278 and N K Armoni were heavier seed cultivars and cultivars local, Hybrid 1, Hysun 33, Hysun 39, Aussie gold 04, Aussie gold 61 and Aussie gold 62 were substantially lighter seed varieties. Key Words: Sunflower (Helianthus annuus L.) cultivars, Seed mass variation and distribution. INTRODUCTION Literature survey of the subject indicates that there exists considerable variation in seed weight within and among species, cultivars of a species, within individual plant and even within and between the fruits of a plant (Black, 1959; Harper, 1977; Janzen, 1977; Sachaal, 1980; Thompson, 1984; Stanton, 1984; Mazer, 1987; Thomson and Pellmyr, 1989; Hendrix, 1984; Hendrix and Sun, 1989; Zhang and Maun, 1990; Kang et al., 1992; Zhang, 1998; Shaukat et al., 1999; Shaukat and Burhan, 2000; Susko and Lovett-Doust, 2000; Cardazzo, 2002; Halpern, 2005; Busso and Perryman, 2005; Cahill and Ehdaie, (2005); Fasoula and Boerma, 2007; Aziz and Shaukat, 2010; Guo et al., 2010; Tíscar Oliver and Borja (2010); Ghosh and Singh, 2011; Anis et al., 2011). The plasticity in seed weight appears to be regulated by the internal and external environments of the mother plants (see Krannitz, 1997) and the genetic reasons (Alonso-Blanco et al., 1999; Doganlar et al., 2000). Alexander et al. (2001) have reported the seed weight of sunflower crop, hybrid F1 and wild genotype. Anis et al. (2011) have reported seed weight variation in sunflower cultivar Aussie gold 61. In this paper we record mean seed weight and seed weight variation in nine sunflower cultivars available in Pakistan in view of their importance in agriculture and the oil economy. MATERIALS AND METHODS Seed Mass variation: One hundred seeds randomly drawn from each of the lots of nine sunflower cultivars supplied by Federal Seed Certification Department, Malir Halt, Karachi, were weighed individually on an electronic balance with an accuracy of 0.1 mg. The box plot distribution of seed masses was constructed and location and dispersion statistics were calculated. The symmetry, skewness and kurtosis were calculated (Sokal and Rohlf, 1995). Normal distribution of seed mass data was tested by Shapiro-Wilks W test. This test assesses whether the observations could reasonably have come from the normal distribution. The varieties were compared on the basis of seed size and they were linked by hierarchical cluster analysis with respect to their compositional similarity on the basis of seed masses. The statistical analyses were performed with softwares viz. ‘SPSS version ‘10’ and ‘Statistica’ (edition 99).
-
Upload
independent -
Category
Documents
-
view
0 -
download
0
Transcript of SEED MASS VARIATION IN SEED LOTS OF NINE CULTIVARS OF SUNFLOWER (HELIANTHUS ANNUUS L.)
INT. J. BIOL. BIOTECH., 8 (2): 263-273, 2011.
SEED MASS VARIATION IN SEED LOTS OF NINE CULTIVARS OF SUNFLOWER
(HELIANTHUS ANNUUS L.)
D. Khan, Muhammad Anis and Muhammad Javed Zaki
Department of Botany, University of Karachi, Karachi- 74700, Pakistan.
ABSTRACT
Seed mass variation in seed lots of nine sunflower cultivars viz. S-278, local, Hybrid 1, Hysun 33, Hysun 39, N K
Armoni, Aussie gold 04, Aussie gold 61 and Aussie gold 62 is described. Within individual cultivars seed mass varied
substantially from 1.91-folds in cultivar S-278 to 3.68-folds in Hybrid 1. The variation in terms of coefficient of
variation was also the lowest in cultivar S-278 (13.91 %) followed by N K Armoni (15.99%). It was the highest (24.62
%) in cultivar ‘local’. In pooled sample, variation was 26.1% (heaviest / lightest seed ratio 3.96). Cultivars varied in
mean seed mass which was 50.52 ± 1.05 mg in Hysun 39 to 81.79 ± 1.14 mg in S-278. Mean seed mass of N K Armoni
was 74.82 ± 1.196 mg. In other varieties mean seed weight was between 51 and 58 mg. Mean seed mass of the pooled
sample was 60.12 ± 0.523 mg. The distribution of mean seed mass around the grand mean was negatively skewed. The
coefficient of variation among means was 17.74% i.e., the variation was 1.62-folds. The seed masses exhibited
significantly positive skewness in four cultivars local, Hysun 39, Hybrid 1, and Aussie gold 62 and pooled sample. In
cultivar NK Armoni, seed masse distribution was significantly negatively skewed. The distribution was characterized
with significantly positive kurtosis (leptokurtosis) in cultivars local and Hybrid 1, insignificant leptokurtosis in Aussie
gold 62 and Hysun 33 and insignificantly negative kurtosis (platykurtosis) in S-278, Hysun 39, NK Armoni, Aussie
gold 61, Aussie gold 04 and the pooled sample of seeds. The normality of distribution was tested with Shapiro-Wilks
test. The distribution of individual seed mass was found to be normal in six cultivars viz. S-278, local, Hysun 39,
Hysun 33, Aussie gold 61 and Aussie gold 04 and Non-normal in NK Armoni, Hybrid 1, Aussie gold 61 and the pooled
sample of all cultivars. Hierarchical clustering, on the basis of seed mass, discretely classified varieties into two groups.
Cultivars S-278 and N K Armoni were heavier seed cultivars and cultivars local, Hybrid 1, Hysun 33, Hysun 39,
Aussie gold 04, Aussie gold 61 and Aussie gold 62 were substantially lighter seed varieties.
Key Words: Sunflower (Helianthus annuus L.) cultivars, Seed mass variation and distribution.
INTRODUCTION
Literature survey of the subject indicates that there exists considerable variation in seed weight within and among
species, cultivars of a species, within individual plant and even within and between the fruits of a plant (Black, 1959;
Harper, 1977; Janzen, 1977; Sachaal, 1980; Thompson, 1984; Stanton, 1984; Mazer, 1987; Thomson and Pellmyr,
1989; Hendrix, 1984; Hendrix and Sun, 1989; Zhang and Maun, 1990; Kang et al., 1992; Zhang, 1998; Shaukat et al.,
1999; Shaukat and Burhan, 2000; Susko and Lovett-Doust, 2000; Cardazzo, 2002; Halpern, 2005; Busso and
Perryman, 2005; Cahill and Ehdaie, (2005); Fasoula and Boerma, 2007; Aziz and Shaukat, 2010; Guo et al., 2010;
Tíscar Oliver and Borja (2010); Ghosh and Singh, 2011; Anis et al., 2011). The plasticity in seed weight appears to be
regulated by the internal and external environments of the mother plants (see Krannitz, 1997) and the genetic reasons
(Alonso-Blanco et al., 1999; Doganlar et al., 2000).
Alexander et al. (2001) have reported the seed weight of sunflower crop, hybrid F1 and wild genotype. Anis et al.
(2011) have reported seed weight variation in sunflower cultivar Aussie gold 61. In this paper we record mean seed
weight and seed weight variation in nine sunflower cultivars available in Pakistan in view of their importance in
agriculture and the oil economy.
MATERIALS AND METHODS
Seed Mass variation: One hundred seeds randomly drawn from each of the lots of nine sunflower cultivars supplied
by Federal Seed Certification Department, Malir Halt, Karachi, were weighed individually on an electronic balance
with an accuracy of 0.1 mg. The box plot distribution of seed masses was constructed and location and dispersion
statistics were calculated. The symmetry, skewness and kurtosis were calculated (Sokal and Rohlf, 1995). Normal
distribution of seed mass data was tested by Shapiro-Wilks W test. This test assesses whether the observations could
reasonably have come from the normal distribution. The varieties were compared on the basis of seed size and they
were linked by hierarchical cluster analysis with respect to their compositional similarity on the basis of seed masses.
The statistical analyses were performed with softwares viz. ‘SPSS version ‘10’ and ‘Statistica’ (edition 99).

D. KHAN ET AL.,
INTERNATIONAL JOURNAL OF BIOLOGY ANF BIOTECHNOLOGY 8 (2): 263-273, 2011.
264
RESULTS
Seed mass variation in seed lots of nine sunflower cultivars viz. S-278, local, Hybrid 1, Hysun 33, Hysun 39, N
K Armoni, Aussie gold 04, Aussie gold 61 and Aussie gold 62 is presented in Fig.1 and Table 1.
100100100100100100100100100N =
CV9CV8CV7CV6CV5CV4CV3CV2CV1
120
100
80
60
40
20
0
87
31
81
4252
42
3599
Fig. 1.Box plot distribution of seed weight (mg) of sunflower cultivars. Cv1, S-278; cv2, Local; cv3, Hysun 39; cv4,
NK Armoni; cv5, Hybrid 1; cv6, Hysun 33; cv7, Aussie gold 61; cv8, Aussie gold 62; cv9, Aussie gold 4. The box plot shows median and inter-quartile range. The solid line within a box represents Q2 (median) and
box vertical lower and upper limits represent Q1 and Q3, respectively. The capping line represents 10 and
90 percentiles. Circles represent the data points outside the 10-90 percentiles.
Table 1. Location and dispersion parameters of seed mass (mg) in nine sunflower cultivars.
Parameters
SUNFLOWER CULTIVARS
S-278
Local
Hysun
39
NK
Armoni
Hybrid
1
Hysun
33
Aussie
gold 61
Aussie
gold 62
Aussie
gold 04
Cultivars
Pooled
N 100 100 100 100 100 100 100 100 100 900
Mean 81.794 57.729 50.519 74.823 54.648 51.402 57.164 56.659 55.95 60.119
SE 1.1374 1.4212 1.0549 1.1963 1.2492 1.145 1.298 1.1480 1.134 0.5233
CV(%) 13.90 24.62 20.75 15.99 22.86 22.27 22.70 21.22 20.27 26.11
Median 81.60 55.50 50.40 76.10 53.00 50.40 54.95 55.20 54.55 57.50
g1 0.157 0.532 0.870 -0.384 0.556 0.462 0.252 0.759 0.023 0.458
g2 -0.390 0.397 -0.252 -0.693 1.267 0.243 -0.490 1.710 -0.685 -0.251
Min. 57.7 30.4 30.2 46.7 27.80 28.0 30.0 30.5 30.40 27.80
Max. 110.0 105.3 72.4 93.9 102.2 84.6 91.7 101.3 85.0 110.0
Max / Min 1.91 3.46 2.40 2.01 3.68 3.02 3.06 3.32 2.80 3.96
Sh-W 0.9802 0.9764 0.9818 0.9608 0.9737 0.9782 0.9790 0.9677 0.9796 0.9793
p < 0.1373 0.0692 0.1826 0.0046 0.0428 0.0964 0.0911 0.0148 0.1244 0.00001
G1, skewness; g2, kurtosis; St. error of skewness (Sg1) = 0.241; St. error of kurtosis (Sg2) = 0.478; Sh-W, Shapiro-
Wilks test.

SEED MASS VARIATION IN NINE CULTIVARS OF SUNFLOWER
INTERNATIONAL JOURNAL OF BIOLOGY ANF BIOTECHNOLOGY 8 (2): 263-273, 2011.
265
Within individual cultivars seed mass varied substantially from 1.91 fold in cultivar S-278 and 3.68 fold in Hybrid
1. The variation in terms of coefficient of variation was also the lowest in cultivar S-278 (13.90 %) followed by N K
Armoni (15.99%). It was the highest (24.62 %) in cultivar ‘local’. In pooled sample seed mass variation was 26.1%
and the heaviest / lightest seed mass ratio was 3.96. The seed weight varied among and within cultivars significantly.
The seed mass varied among cultivars by 41% and within cultivar by 59% (Table 2).
Table 2. One Way ANOVA for seed masses of nine sunflower cultivars.
Source SS df MS F p % variance
accounted for
Between 91108.807 8 11388.601
77.56
< 0.0001
41.05
Within 130831.513 891 146.837 58.95
Total 221940.32 899 - 100
In most of the cultivars mean seed mass was larger than median by only a little fraction of mass ranging from
0.194 to 2.30 mg (mean: 1.29 mg)In cv NK Armoni, however median was larger than the mean by 1.28 mg. There
were a few outliers only – one in cv. Local and two outliers each in Hybrid 1 and Hysun 33 and three outliers in
Aussie gold 62 (Fig. 1).
The skewness appearing from unequal whiskers in box plot representation was ascertained by calculating g1 and
standard error of g1 (Sg1). Kurtosis was ascertained by calculating g2 and standard error of kurtosis (Sg2). The seed
masses exhibited significantly positive skewness in four cultivars local, Hysun 39, Hybrid 1, and Aussie gold 62 and
pooled sample. In cultivar NK Armoni, seed masse distribution was significantly negatively skewed. The distribution
was characterized with significantly positive kurtosis (leptokurtosis) in cultivars local and Hybrid 1, insignificant
leptokurtosis in Aussie gold 62 and Hysun 33 and insignificantly negative kurtosis (platykurtosis) in S-278, Hysun 39,
NK Armoni, Aussie gold 61, Aussie gold 04 and the pooled sample of seeds. The normality of distribution was tested
with Shapiro-Wilks test. The distribution of individual seed mass was found to be normal in six cultivars viz. S-278,
local, Hysun 39, Hysun 33, Aussie gold 61 and Aussie gold 04 and Non-normal in NK Armoni, Hybrid 1, Aussie gold
61 and the pooled sample of all cultivars (Table 1 and Fig.2).
Mean seed mass was the lowest (50.52 ± 1.05 mg) in cultivar Hysun 39 and the highest (81.79 ± 1.14 mg) in
cultivar S-278. Mean seed mass of N K Armoni was 74.82 ± 1.196 mg. In other varieties mean seed mass was between
51 and 58 mg. The average seed mass in the pooled sample for all cultivars (N = 900) was 60.12 ± 0.523 mg (Table 1).
Thus, S-278 appeared to be the heaviest seeded cultivar and Hysun-39 the lightest seeded cultivar – difference in mean
seed mass being 31.27 mg.
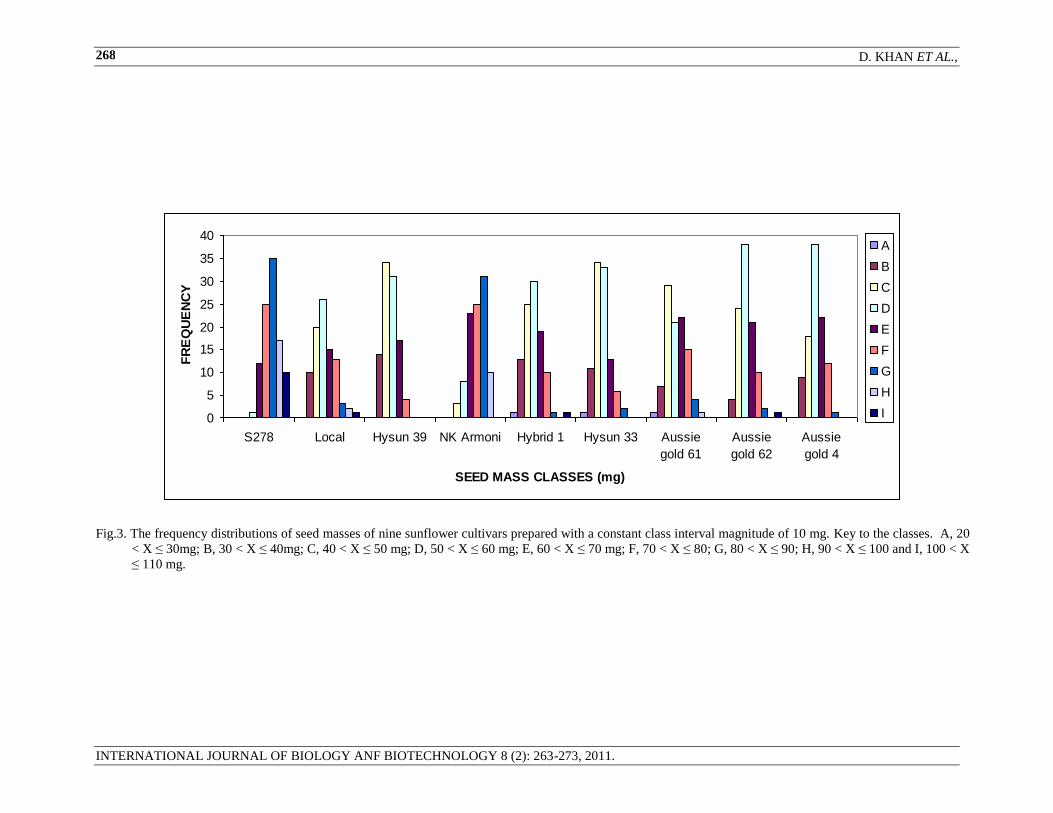
Figure 3 portrays the distribution of seed masses of the cultivars amongst the nine size classes as standard
(ranging from 20 to 110 mg with an interlude of 10 mg) so that the cultivars may be compared with respect to their
seed size spectra. The seed weight distribution was substantially among the cultivars. Following text compares the
cultivars.
1. cv. S-278 – The modal class extended from 81-90 mg occupying 35% of the seeds. Some 89% of the seeds
fall in size of 61-70 mg. Some 17% of the seeds were in the size category of 71-80 mg and 10% of the
seeds had mass > 100mg. There was no seed below 50 mg of mass.
2. cv. NK Armoni – Modal class extending from 71-80 mg occupying c 25% of the seeds. Some 89% 0f the
seeds fall in the category of seed mass between 71 to 100 mg. Some 10% of the seeds were in 91-100 mg
category. There was no seed below 40 mg of mass.
3. cv. Local – Modal class extended from 51-60 mg with 26% of the seeds. Around 46% of the seeds fall
under the category of 41 to 60 mg. Some 10% of the seeds occupied the lower category of 31-40 mg and
only 1% of the seeds had mass greater than 110 mg.
4. cv. Hysun – 39 - Some 34% of the seeds fall in the Modal class, 41-50 mg. There was no seed weighing
above 80 mg. Ninety per cent of the seeds had weight between 41 to 70 mg. Some 14% of the seeds
weighed below 40 mg.
5. cv. Hysun - 33 – Modal class was the same as in Hysun – 39 occupying 34% of the seeds. No seed weighed
above 90 mg and 12% of the seeds had weight below 40 mg.

D. KHAN ET AL.,
INTERNATIONAL JOURNAL OF BIOLOGY ANF BIOTECHNOLOGY 8 (2): 263-273, 2011.
266
6. cv. Hybrid-1 – Modal class was 51-60 mg with c 30% of the seeds. One per cent of the seeds weighed
below 30 mg and 1% above 100 mg. Some 74% of the seeds belonged to the category of 41-70 mg
categories.
CV1
107.5
102.5
97.5
92.5
87.5
82.5
77.5
72.5
67.5
62.5
57.5
Fre
quency
16
14
12
10
8
6
4
2
0
CV2
105.0
100.0
95.0
90.0
85.0
80.0
75.0
70.0
65.0
60.0
55.0
50.0
45.0
40.0
35.0
30.0
Fre
quency
30
20
10
0
CV3
77.5
75.0
72.5
70.0
67.5
65.0
62.5
60.0
57.5
55.0
52.5
50.0
47.5
45.0
42.5
40.0
37.5
35.0
32.5
30.0
Fre
quency
20
10
0
CV4
95.0
92.5
90.0
87.5
85.0
82.5
80.0
77.5
75.0
72.5
70.0
67.5
65.0
62.5
60.0
57.5
55.0
52.5
50.0
47.5
Fre
quency
12
10
8
6
4
2
0
CV5
100.0
95.0
90.0
85.0
80.0
75.0
70.0
65.0
60.0
55.0
50.0
45.0
40.0
35.0
30.0
Fre
quency
30
20
10
0
CV6
82.5
77.5
72.5
67.5
62.5
57.5
52.5
47.5
42.5
37.5
32.5
27.5
Fre
quency
16
14
12
10
8
6
4
2
0
Fig. 2. Seed weight distribution in 9 sunflower varieties and their pooled data. (Continues on the next page)
SEED WEIGHT CLASSES (mg)
HYSUN 33
SEED WEIGHT CLASSES (mg)
SEED WEIGHT CLASSES (mg)
HYBRID 1
N K ARMONI HYSUN 39
LOCAL S-278

SEED MASS VARIATION IN NINE CULTIVARS OF SUNFLOWER
INTERNATIONAL JOURNAL OF BIOLOGY ANF BIOTECHNOLOGY 8 (2): 263-273, 2011.
267
CV7
90.085.080.075.070.065.060.055.050.045.040.035.030.0
Fre
quency
30
20
10
0
CV8
100.0
95.0
90.0
85.0
80.0
75.0
70.0
65.0
60.0
55.0
50.0
45.0
40.0
35.0
30.0
25.0
Fre
quency
30
20
10
0
CV9
85.0
80.0
75.0
70.0
65.0
60.0
55.0
50.0
45.0
40.0
35.0
30.0
Fre
quency
12
10
8
6
4
2
0
CVPOOL
104.9
96.4
87.9
79.4
70.9
62.4
53.9
45.4
36.9
28.4
Fre
qu
en
cy
140
120
100
80
60
40
20
0
Fig. 2 (continued). Seed weight distribution in nine sunflower varieties and their pooled data.
7. cv. Aussie gold 61 – The modal class (41-50 mg) contained c 295 of the seeds. A great proportion of
seeds (72%) had weight between 51-70 mg. One seed had mass below 30 mg and one above 90 mg.
8. cv. Aussie gold 62 – Thirty eight per cent of the seeds belonged to the modal class (51-60 mg). A
sizeable proportion of seeds (62%) weighed between 41 and 60mg and 31% between 61-80 mg. Eighty
three per cent of seeds had mass between 41 and 70 mg.
9. cv. Aussie gold 04 - Thirty eight per cent of the seeds belonged to the modal class (51-60 mg) and 33%
of seeds weighed between 61-80 mg. There was no seed above 90 mg of weight and there were no seeds
below 40 mg.
10. Pooled Sample – Around 25 % of the seeds fall within the modal class of 51-60 mg. There were 1.44 %
seeds above 100 mg in mass and around 0.33% of the seeds had masses below 30 mg and 7.56% between
312 and 40 mg. Some 32.7% of the seeds weighed between 61-80 mg (Fig. 4).
The distribution of mean seed mass around the grand mean was negatively skewed. The coefficient of variation
among means was 17.74% i.e., the variation was 1.62-folds (Fig. 5).
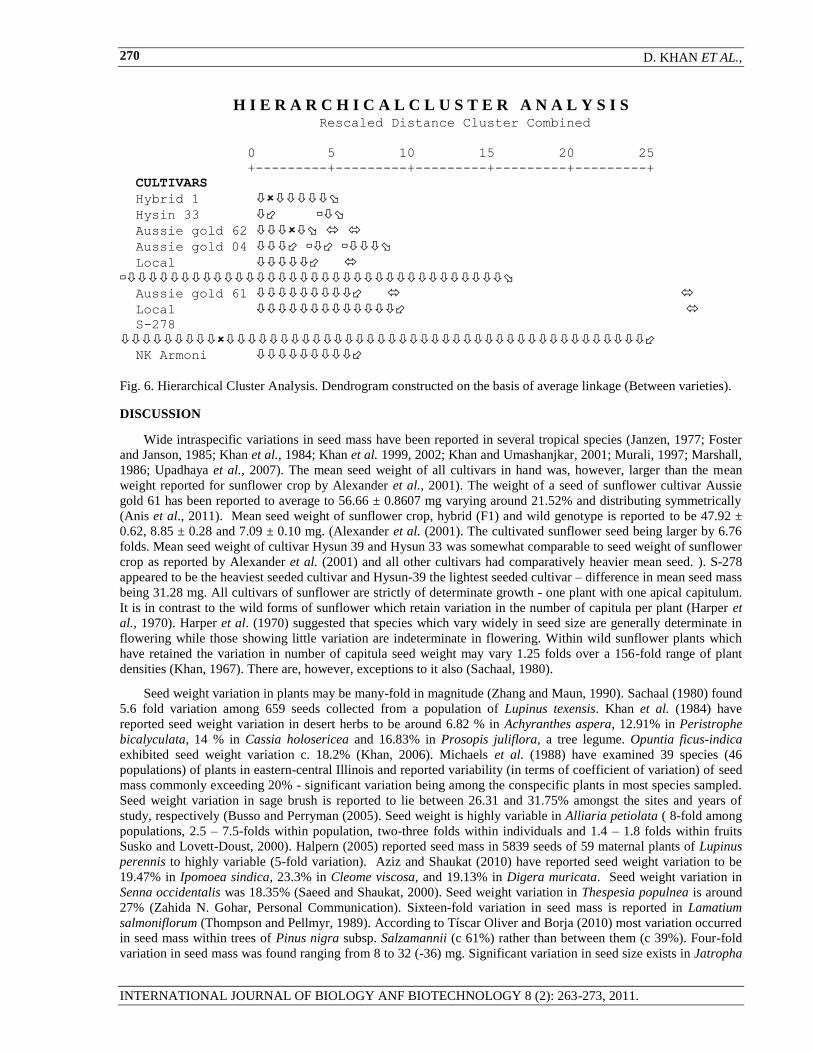
Hierarchical clustering, on the basis of seed mass, discretely classified varieties into two groups. Cultivars S-
278 and N K Arconi were heavier seed cultivars and cultivars local, Hybrid 1, Hysun 33, Hysun 39, Aussie gold 04,
Aussie gold 61 and Aussie gold 62 were substantially lighter seed varieties (Fig.6).
SEED WEIGHT CLASSES (mg)
SEED WEIGHT CLASSES (mg)
AUSSIE GOLD 61 AUSSIE GOLD 62
AUSSIE GOLD 4 CULTIVARS
POOLED
D. KHAN ET AL.,
INTERNATIONAL JOURNAL OF BIOLOGY ANF BIOTECHNOLOGY 8 (2): 263-273, 2011.
268
0
5
10
15
20
25
30
35
40
S278 Local Hysun 39 NK Armoni Hybrid 1 Hysun 33 Aussie
gold 61
Aussie
gold 62
Aussie
gold 4
SEED MASS CLASSES (mg)
FR
EQ
UE
NC
Y
A
B
C
D
E
F
G
H
I
Fig.3. The frequency distributions of seed masses of nine sunflower cultivars prepared with a constant class interval magnitude of 10 mg. Key to the classes. A, 20
< X ≤ 30mg; B, 30 < X ≤ 40mg; C, 40 < X ≤ 50 mg; D, 50 < X ≤ 60 mg; E, 60 < X ≤ 70 mg; F, 70 < X ≤ 80; G, 80 < X ≤ 90; H, 90 < X ≤ 100 and I, 100 < X
≤ 110 mg.

SEED MASS VARIATION IN NINE CULTIVARS OF SUNFLOWER
INTERNATIONAL JOURNAL OF BIOLOGY ANF BIOTECHNOLOGY 8 (2): 263-273, 2011.
269
0
5
10
15
20
25
30
Cultivar Pooled
SEED MASS CLASSES (mg)
% F
RE
QU
EN
CY
Fig. 4. The frequency distribution pooled seed mass data of all cultivars studied. Key to the classes: A0, 10 < X ≤ 20
mg, A, 20 < X ≤ 30mg; B, 30 < X ≤ 40mg; C, 40 < X ≤ 50 mg; D, 50 < X ≤ 60 mg; E, 60 < X ≤ 70 mg; F, 70 <
X ≤ 80; G, 80 < X ≤ 90; H, 90 < X ≤ 100 and I, 100 < X ≤ 110 mg.
0
10
20
30
40
50
60
70
80
90
1 2 3 4 5 6 7 8 9
CULTIVARS - Ordered by mean seed Mass
ME
AN
SE
ED
MA
SS
(m
g)
Fig.5. Variation of mean seed masses of nine sunflower cultivars ordered in ascending mean seed mass. The SEs
shown are two-times magnified. Key to the cultivars: 1, Hysun 39; 2, Hysun 33; 3, Hybrid 1; 4, Aussie gold
4; 5, Aussie gold 62; 6, Aussie gold 61; 7, Local; 8, NK Armoni; 9, S-278. Grand mean mass is drawn as
broken line.
Grand mean = 60.12 ± 0.52
Ao A B C D E F G H I
SEED MASS CLASSES (mg)
D. KHAN ET AL.,
INTERNATIONAL JOURNAL OF BIOLOGY ANF BIOTECHNOLOGY 8 (2): 263-273, 2011.
270
H I E R A R C H I C A L C L U S T E R A N A L Y S I S
Rescaled Distance Cluster Combined
0 5 10 15 20 25
+---------+---------+---------+---------+---------+
CULTIVARS
Hybrid 1
Hysin 33
Aussie gold 62
Aussie gold 04
Local
Aussie gold 61
Local
S-278
NK Armoni
Fig. 6. Hierarchical Cluster Analysis. Dendrogram constructed on the basis of average linkage (Between varieties).
DISCUSSION
Wide intraspecific variations in seed mass have been reported in several tropical species (Janzen, 1977; Foster
and Janson, 1985; Khan et al., 1984; Khan et al. 1999, 2002; Khan and Umashanjkar, 2001; Murali, 1997; Marshall,
1986; Upadhaya et al., 2007). The mean seed weight of all cultivars in hand was, however, larger than the mean
weight reported for sunflower crop by Alexander et al., 2001). The weight of a seed of sunflower cultivar Aussie
gold 61 has been reported to average to 56.66 ± 0.8607 mg varying around 21.52% and distributing symmetrically
(Anis et al., 2011). Mean seed weight of sunflower crop, hybrid (F1) and wild genotype is reported to be 47.92 ±
0.62, 8.85 ± 0.28 and 7.09 ± 0.10 mg. (Alexander et al. (2001). The cultivated sunflower seed being larger by 6.76
folds. Mean seed weight of cultivar Hysun 39 and Hysun 33 was somewhat comparable to seed weight of sunflower
crop as reported by Alexander et al. (2001) and all other cultivars had comparatively heavier mean seed. ). S-278
appeared to be the heaviest seeded cultivar and Hysun-39 the lightest seeded cultivar – difference in mean seed mass
being 31.28 mg. All cultivars of sunflower are strictly of determinate growth - one plant with one apical capitulum.
It is in contrast to the wild forms of sunflower which retain variation in the number of capitula per plant (Harper et
al., 1970). Harper et al. (1970) suggested that species which vary widely in seed size are generally determinate in
flowering while those showing little variation are indeterminate in flowering. Within wild sunflower plants which
have retained the variation in number of capitula seed weight may vary 1.25 folds over a 156-fold range of plant
densities (Khan, 1967). There are, however, exceptions to it also (Sachaal, 1980).
Seed weight variation in plants may be many-fold in magnitude (Zhang and Maun, 1990). Sachaal (1980) found
5.6 fold variation among 659 seeds collected from a population of Lupinus texensis. Khan et al. (1984) have
reported seed weight variation in desert herbs to be around 6.82 % in Achyranthes aspera, 12.91% in Peristrophe
bicalyculata, 14 % in Cassia holosericea and 16.83% in Prosopis juliflora, a tree legume. Opuntia ficus-indica
exhibited seed weight variation c. 18.2% (Khan, 2006). Michaels et al. (1988) have examined 39 species (46
populations) of plants in eastern-central Illinois and reported variability (in terms of coefficient of variation) of seed
mass commonly exceeding 20% - significant variation being among the conspecific plants in most species sampled.
Seed weight variation in sage brush is reported to lie between 26.31 and 31.75% amongst the sites and years of
study, respectively (Busso and Perryman (2005). Seed weight is highly variable in Alliaria petiolata ( 8-fold among
populations, 2.5 – 7.5-folds within population, two-three folds within individuals and 1.4 – 1.8 folds within fruits
Susko and Lovett-Doust, 2000). Halpern (2005) reported seed mass in 5839 seeds of 59 maternal plants of Lupinus
perennis to highly variable (5-fold variation). Aziz and Shaukat (2010) have reported seed weight variation to be
19.47% in Ipomoea sindica, 23.3% in Cleome viscosa, and 19.13% in Digera muricata. Seed weight variation in
Senna occidentalis was 18.35% (Saeed and Shaukat, 2000). Seed weight variation in Thespesia populnea is around
27% (Zahida N. Gohar, Personal Communication). Sixteen-fold variation in seed mass is reported in Lamatium
salmoniflorum (Thompson and Pellmyr, 1989). According to Tíscar Oliver and Borja (2010) most variation occurred
in seed mass within trees of Pinus nigra subsp. Salzamannii (c 61%) rather than between them (c 39%). Four-fold
variation in seed mass was found ranging from 8 to 32 (-36) mg. Significant variation in seed size exists in Jatropha
SEED MASS VARIATION IN NINE CULTIVARS OF SUNFLOWER
INTERNATIONAL JOURNAL OF BIOLOGY ANF BIOTECHNOLOGY 8 (2): 263-273, 2011.
271
curcas in various agro-ecological zones of India (Ghosh and Singh, 2011). Variation among sunflower cultivars in
mean seed mass indicates that both environmental and genetic components are involved.
Seed weight distribution was found to be normal in six sunflower cultivars in hand viz. S-278, local, Hysun 39,
Hysun 33, Aussie gold 61 and Aussie gold 04 and Non-normal in NK Armoni, Hybrid 1, Aussie gold 61 and the
pooled sample of all cultivars. Seed mass in a seed lot of sunflower cultivar Aussie gold 61 is reported to normal
distribution by Anis et al. (2011). Seed mass was found to be normally distributed in Blutapason portulacoides and
Panicum recemosum but not in case of Spartina ciliata (Cardazzo, 2002). Halpern (2005) reported normal
distribution of seed mass in Lupinus perennis. Zhang (1998) has reported seed mass variation in Aeschynomene
americana by weighing 150 seeds from each of its 72 populations to be normally distributed in 9, positively skewed
significantly (p < 0.05) in 14 and negatively skewed in 49 populations. The mass of mature seeds had a normal
distribution in two natural populations of Arum italicum (Mendez (1997). Seed weight is reported to vary within a
species with site quality and year of study – varying from symmetry to skewness, from leptokurtic to platykurtic
(Busso and Perryman, 2005). Seed weight distribution was reported to be skewed in Phlox drummondii (Leverich
and Levin, 1979). Such a high degree of variation in seed mass may be thought to have important ecological
implications forming basis of qualitative and quantitative female reproductive fitness so crucial in life history
diversification (Braza et al. (2010).
The variation in seed size may be the result of myriad of factors (Fenner, 1985; Wulff, 1986). Earlier
impression of seed weight constancy in earlier ecological literature seems to be arising primarily from observations
of the relative constancy of mean seed mass in some plant species rather than an analysis of the variability among
individual seed masses which have demonstrated considerable variability (Obeid et al., 1967). The analysis of
means alone may, therefore, not realistically uncover the variability of seed masses in natural plant populations
(Obeid et al., 1967; Thompson, 1984). Winn (1991) has suggested that plants may not have the capability of
producing a completely uniform seed weight simply as a result of variations in resource availability (e. g., soil
moisture during seed development). Seed size is significantly reduced under moisture stress in mature trees of
walnut (Martin et al., 1980). Seed weight is said to be the direct function of precipitation (moisture availability) and
monthly precipitation is reported to explain around 85% of the total variation in seed weight in Wyoming sage
brush, Artemisia tridentata (Busso and Perryman, 2005). Seed weight is also reported to decline with age in walnut
(Juglans major) in terrace habitat of central Arizona (Stromberg and Patten (1990). Seed weight has also been
reported to be the function of plant height in a population of Ranunculus acris (Totland and Birks, 1996). The large
variation of seed mass among plants suggests a potential for but not necessarily the presence of genetic control of
seed size. This is because maternal parents may influence seed size via both maternal genetics and the maternal
environment effect (Roach and Wulff, 1987; Busso and Perryman, 2005). Obviously the seeds collected from the
plants might be a mixture of half sibs and full sibs instead of strict half sibs. Seed weight variation in plants thus
appears universal which may be due to trade-off of resource allocation between seed size and number (Venable,
1992) or environmental heterogeneity (Janzen, 1977) or the genetic reasons. Alonso-Balnco et al., (1999) have
indeed identified several gene loci responsible for natural genetic variation in seed size in Arabidopsis thaliana.
Doganlar et al., (2000) have presented seed weight variation model in tomato. It may be asserted that within a
species, seed mass variation should have both genetic and environmental components. Contrary to it the variation
within a plant can only reflect environmental variance due to either development stability or genetically based
adaptive variability –very difficult to distinguish (Hickman, 1979).
Seed weight in elite cultivars is generally considered to be highly homogenous as the other traits. Sunflower
cultivars, however, exhibited considerable variation in seed weight among and within cultivars. In all cases, the seed
mass variation was substantially high as compared to those for a variety of biological traits which Simpson et al.
(1960) have suggested to usually have a value ≈ 5%. Intra-cultivar variation in seed mass has also been reported by
Fasoula and Boerma (2007) in three elite soybean cultivars. They found the magnitude of intra-cultivar variation in
seed weight across years between the largest- and the smallest-seeded lines averaged to 36 mg / seed for cultivar
Benning, 22mg / seed for cultivar Cook and 45 mg / seed for cultivar Haskell in Soybean. One should agree with
their contention that cultivars may not be permanent records with non-existent variation but genetic material that can
be upgraded to maintain uniformity in the long-term and further improve desirable agronomic or seed trait
characteristics.
REFERENCES
Alexander, H.M., C.L. Cummings, L. Kahn and A.A. Snow (2001). Seed size variation and predation of seeds
produced by wild and crop-wild sunflowers. Am. J. Bot. 88(4): 623-627.
D. KHAN ET AL.,
INTERNATIONAL JOURNAL OF BIOLOGY ANF BIOTECHNOLOGY 8 (2): 263-273, 2011.
272
Alonso-Blanco. C., H.B. Vries, C.J. Hauhart and M. Koornneef (1999). Natural allelic variation at seed size loci in
relation to other life history traits of Arabidopsis thaliana. Proc. Natl. Acad. Sci. USA 96: 4710-4717.
Anis, M, D. Khan, M.J. Zaki and MQ. Khan. (2011). Seed mass variation and its effects on germination, seedling
growth and root infectivity with Macrophomina phaseolina in sunflower (Helianthus annuus L.). Int. J. Boil. &
Biotech. 8(1):155-165.
Aziz, S. and S.S. Shaukat (2010). Effect of seed mass variations on the germination and survival of three desert
annuals. Pak. J. Bot. 42(4): 2813-2825.
Black, J.N. (1959). Seed size in herbage legumes. Herb. Abst. 29: 235-241.
Braza, R., J. Arroyo and M.B. García (2010). Natural variation of fecundity components in a widespread plant with
dimorphic seeds. Acta Oecologia 36: 471-476.
Busso, C.A. and B.L. Perryman. (2005). Seed weight variation of Wyoming sagebrush in Northern Nevada. Biocell
29 (3): 279 – 285).
Cahill, J.P. and B. Ehdaie (2005). Variation and heritability of seed mass in Chia (Salvia hispanica L.) Genetic
Resources & crop Evolution 52 (2): 201-207.
Cardazzo, C.V. (2002). Effect of seed mass on germination and growth in three dominant species in southern
Brazilian coastal dunes. Braz. J. Biol., 62 (3): (doi:10.1590/S1519-69842002000300005)
Doganlar, S., A. Frary and S.D. Tanksley (2000). The genetic basis of seed weight variation: tomato as a model
system. Theor. Appl. Genet. 100: 4267 – 1273.
Fasoula, V.A,. and H.R. Roger (2007). Intra-cultivar variation for seed weight and other agronomic traits within
three elite soybean cultivars. Crop Sci. 47(1): 367-373.
Fenner, M. (1985). Seed Ecology. Chapman and Hall., NY. 151 pp.
Foster, S.A. and S.A. Janson (1985). The relationship between seed size and establishment conditions in tropical
woody plants. Ecology, 66: 773 – 780.
Ghosh, L. and L. Singh (2010). Variation in seed mass and seedling characters of Jatropha curcas L. with varying
zones and provenances. Tropical Ecology 52(1): 113- 122.
Guo, H., S.J. Mazer and G. Du (2010). Geographic variation in seed mass within and among nine species of
Pedicularis (Orobanchaceae); effects of elevation, plant size and seed number per fruit. J. Ecol. 98: 1232-1242.
Halpern, S.L. (2005). Sources and consequences of seed size variation in Lupinus perennis (Fabaceae): adaptive and
non-adaptive hypotheses. Am. J. Bot. 92(2): 205-213.
Harper, J.L. (1977). Population Biology of Plants. Academic Press, N.Y.
Harper, J.L., P.H. Lovell and K.G. Moore (1970). The shape and sizes of seeds. Ann. Rev. Ecol. & Syst. 1: 327 –
356.
Hendrix, S.D. (1984). Variation in seed weight and its effects on germination in Pastinaca sativa L. (Umbelliferae).
Am. J. Bot., 71: 795 – 802.
Hendrix, S.D. and I-Fang Sun (1989). Inter- and intraspecific variation in seed mass in seven species of Umbellifer.
New Phytol. 112: 445-451.
Hickman, J.C. (1979). The Basic Biology of Plant Numbers. In: O.T. Solbrig, S. Jain, G.B. Johnson and R.H. Raven
(Eds.). Topics in Plant Populations Biology. Columbia Univ. Press, N.Y.
Janzen, D.H. (1977). Variation in seed weight in Costa Rican Cassia grandis (Leguminosae). Tropical Ecology 18:
177 – 186.
Kang, H., G. Jaschek and K.S. Bawa (1992). Variation in seed and seedling traits in Pithecellobium pedicellare, a
tropical rain forest tree. Oecologia 91: 239-244.
Khan, D. S.S. Shaukat and M. Faheemuddin (1984). Germination studies of certain desert plants. Pak. J. Bot. 16:
231 – 254.
Khan, D. (2006). Some seed and seedling characteristics (tricotyledony) of Opuntia ficus-indica (L.) Mill.
(Cactaceae). Intern. J. Biol. & Biotech., 3(4): 795 - 800.
Khan, M.I. (1967). The genetic control of canalization of seed size in plants. Ph.D. thesis. Uni. Whales, UK. (seen in
Harper et al., 1970).
Khan, M L., P. Bhuyan, N.D. Singh and N.P. Todaria (2002). Fruit set, seed germination, and seedling growth of
Mesua ferra Linn. (Clusiaceae) in relation to light intensity. J. Trop. Forest. Sci. 14: 35 – 48.
Khan, M. L, P. Bhuyan, U. Shankar, N.D. Singh and N.P. Todaria (1999). Seed germination and seedling fitness in
Mesua ferra L. in relation to fruit size and number of seed per fruit. Acta Oecol. 20: 599 – 606.
Khan, M. L. and Uma Shankar (2001). Effect of seed weight, light regime, and substratum microsite on germination
and seedling growth of Quercus semiserrata Roxb. Trop. Ecol. 42: 117 – 125.
Krannitz, P.G. (1997). Seed weight variability of antelope Bitterbrush (Purshia tridentate: Rosaceae). Am. Midl.
Nat. 138: 306 -321.

SEED MASS VARIATION IN NINE CULTIVARS OF SUNFLOWER
INTERNATIONAL JOURNAL OF BIOLOGY ANF BIOTECHNOLOGY 8 (2): 263-273, 2011.
273
Leverich, W.J. and D.A. Levin (1979). Age-specific survivorship and fecundity in Phlox drummondii Hook. Am.
Nat. 113: 881-903.
Marshall, D.L. (1986). Effect of seed size on seedling success in three species of Sesbania (Fabaceae). Am. J. Bot.
73: 457 – 464.
Martin, G.C., K. Uriu and C. N. Nishijuma (1980). The effect of drastic reduction of water input on mature walnut
tree. Hortic. Sci., 15: 157 – 158.
Mazer, S.J. (1987). The quantitative genetics of life history and fitness components in Raphanus raphanistrum L.
(Brassicaceae): ecological and evolutionary consequences of seed size variation. Am. Nat. 130: 891-914.
Méndez, M. (1997). Sources of variation in seed mass in Arum italicum. Int. J. Plant Sci. 158(3): 298-305.
Michaels, H.J., B. Benner, A.P. Hartgerink, T.D. lee, S. Rice, M. F. Wilson and R.I. Bertin (1988). Seed size
variation: magnitude, distribution and ecological correlates. Evol. Ecol. 2 (2): 157 – 166.
Murali, K.S. (1997). Pattern of seed size, germination and seed viability of tropical tree species in southern India.
Biotropica, 29: 271 – 279.
Obeid, M., D. Machin, and J. L. Harper (1967). Influence of density on plant to plant variations in fiber flax, Linum
usitatissimum. Crop Science, 7: 471 – 473.
Roach, D.A. and R.D. Wulff. 1987. Maternal effects in plants. Ann. Rev. Ecol. Syst. 18; 209 – 235. Sachaal, B.A. (1980). Reproduction capacity and seed size in Lupinus texensis. Am. J. Bot. 67: 703 – 709.
Shaukat, S.S. and N. Burhan (2000). Fecundity, seed characteristics, and factors regulating germination of
Rhynchosia minima (L.) Dc. Pak. J. Bot. 32: 211-226.
Shaukat, S.S., Z.S. Siddiqui and S. Aziz (1999). Seed size variation and its effects on germination, growth and
seedling survival in Acacia nilotica sub. sp. indica (Benth.) Brenan. Pak. J. Bot. 31 (2): 253 – 263.
Simpson, G.G., A. Roe and R.C. Lewontin (1960). Quantitative Zoology. Harcourt, Brace & Co. New York, N.Y.,
USA.
Sokal, R.R. and E.J. Rholf (1995). Biometry. III edition. Freeman, San Francisco, CA, USA.
Stanton, M.L. (1984). Seed variation in wild radish: effect of seed size on components of seedling and adult fitness.
Ecology, 65: 1105- 1112.
Stromberg, J.C. and D.T. Patten (1990). Variation in seed size of a southwestern riparian tree, Arizona walnut
(Juglans major). Am. Midland Nat., 124(2): 269 – 276.
Susko, D.J. and L. Lovett-Doust (2000). Patterns of seed mass variation and their effects on seedling trait in Alliaria
petiolata (Brassicaceae). Am. J. Bot. 87: 56 – 66.
Thompson, J.N. 1984. Variation among individual seed masses in Lamatium grayi (Umbelliferae) under controlled
conditions: magnitude and partitioning of the variance. Ecology, 65: 626 -631.
Thompson, J.N. and O. Pellmyr (1989). Origins of variation in seed number and mass: interaction of sex expression
and herbivory in Lamatium salmoniflorum. Oecologia 79: 395-402.
Tíscar Oliver, P.A. and M.E. Lucas Borja (2010). Seed mass variation, germination time and seedling performance
in a population of Pinus niger subsp. Salzamannii. Forest Systems 19(3): 344 – 353.
Totland, Q. and H.J.B. Birks (1996). Factors influencing inter-population variation in Ranunculus acris seed
production in an alpine area of south-western Norway. Ecography 19 (3): 269 – 278. (doi: 10.1111/j.1600-
0587.1996.tb00236.x)
Upadhaya, K. H.N. Pandey and P.S. Law (2007). The effect of seed mass on germination, seedling survival and
growth in Prunus jenkinsii Hook. f. & Thoms. Turk. J. Bot. 31: 31 – 36.
Venable, D.L. (1992). Size-number trade off and the variation in seed size with plant resource status. The Am.
Naturalist, 140: 287-304.
Winn, A.A. (1991). Proximate and ultimate sources of within-individual variation in seed mass in Prunella vulgaris
(Lamiaceae). Am. J. Bot. 78: 838-844.
Wullf, R.D. (1986). Seed size variation in Desmodium paniculatum I. factors affecting seed size. J. Ecol. 74: 87 –
Zhang, J. (1998). Variation and allometry of seed weight in Aeschynomene americana. Annals of Botany 82: 843 –
847.
Zhang, J. and M.A. Maun (1983). Fruit size variation and its effect on germination and seedling growth in Xanthium
strumarium. Can. J. Bot. 61: 2309-2315.
(Accepted for publication November 2010)