SECTION 2.11 Reference Method for the Determination of ...
172
SECTION 2.11 Reference Method for the Determination of Particulate Matter as PMlO in the Atmos- phere (High-Volume PMlO Sampler Method) Outline Sub- Fu 11 Section No. of section Title Number pages 0 Introduction 2.ll.O 6 0 Method Highlights 2.11.0 2 1 Procurement of Equipment and Supplies 2.11.1 5 2 Calibration Procedures 2.11.2 30 3 Field Operations 2.11.3 31 4 Filter Preparation and Analysis 2.11.4 10 5 Calculations, Validations, and Reporting of PMlO Data 2.11.5 10 6 Maintenance 2.11.6 5 7 Auditing Procedures 2.11.7 19 8 Assessment of Monitoring Data for Precision and Accuracy 2.11.8 3 9 Recommended Standards for Establishing Traceability 2.11.9 1 10 Reference Method 2.11.10 5 11 References 2.11.11 1 12 Data Forms 2.11.12 16 @ Printed on Recycled Paper
-
Upload
khangminh22 -
Category
Documents
-
view
4 -
download
0
Transcript of SECTION 2.11 Reference Method for the Determination of ...

SECTION 2.11
Reference Method for the Determination of Particulate Matter as PMlO in the Atmosphere (High-Volume PMlO Sampler Method)
Outline
Sub- Fu 11 Section No. of section Title Number pages
0 Introduction 2.ll.O 6 0 Method Highlights 2.11.0 2
1 Procurement of Equipment and Supplies 2.11.1 5
2 Calibration Procedures 2.11.2 30 3 Field Operations 2.11.3 31 4 Filter Preparation and Analysis 2.11.4 10 5 Calculations, Validations, and
Reporting of PMlO Data 2.11.5 10 6 Maintenance 2.11.6 5 7 Auditing Procedures 2.11.7 19 8 Assessment of Monitoring Data
for Precision and Accuracy 2.11.8 3 9 Recommended Standards for
Establishing Traceability 2.11.9 1 10 Reference Method 2.11.10 5 11 References 2.11.11 1 12 Data Forms 2.11.12 16
@ Printed on Recycled Paper

2.11.0 INTRODUCTION
Section No.: 2.11.0 Date: January 1990 Page: 1
PMlO is the designation for particulate matter in the atmosphere that has an aerodynamic diameter of 10 micrometers (µm) or less. A high-volume (HV) PMlO sampler draws a known volume of ambient air at a constant flow rate through a sizeselective inlet and through one or more filters. Particles in the PMlO size range are then collected on the filter(s) during the specified 24-hour sampling period. Each sample filter is weighed before and after sampling to determine the net weight (mass) gain of the collected PMlO sample. The reference method for PMlO sampling is given in the Code of Federal Regulations (40 CFR 50, Appendix J), which is reproduced in Subsection 11.12(1).
The total volume of air sampled is determined from the measured volumetric flow rate and the sampling time. The concentration of PMlO in the ambient air is compu ted as the total mass of collected particles in the PMlO size range divided by the volume of air sampled. This sampled volume must be corrected to EPA standard conditions (25°C, 760 mm Hg or 101 kPa), and the PMlO measurement is expressed as micrograms per standard cubic meter (µg/std. m3) .
The performance parameters of PMlO samplers are tested in accordance with explicit test procedures t hat are prescribed in 40 CFR 53(2). One such performance parameter is the particle size discrimination characteristic (i.e., sampler effectiveness) of the sampler inlet over the PMlO size range. Of particular importance is the particle size at which the sampler effectiveness is 50 percent (i.e., the particle size cutpoint). Methods for PMlO that meet all requirements in both Parts 50 and 53 are designated as PMlO reference methods for use in State and Local Air Monitoring System (SLAMS} and Prevention of Significant Deterioration (PSD) monitoring. These designated methods are usually identified by the name of the manufacturer and the model of the sampler.
Two common types of PMlO samplers that meet these designation requirements are high-volume PMlO samplers (HV PMlO} and dichotomous samplers. Only HV PMlO samplers are discussed in this section; dichotomous samplers are discussed in Section 2.10.
An HV PMlO sampler consists of two basic components: a specially designed inlet that transmits only thos e particles less than 10 µm in diameter and a flow control system capable of maintaining a constant flow rate within the design speci fications of the inlet. Currently, two types of HV PMlO inlets are available . They are distinguishable by their method of particle discrimination (impaction or cyclonic). Although these two types of inlets differ in their physical size and and their principles of operation, they hav e similar flow-rate requirements . Two common types of flow-control systems (base units) are also available. One is equipped with a mass-flow-control (M FC} system; the other is equipped with a volumetric-flow-control {VFC) system. Because t he calibration and standard operating procedures differ considerably between these two types of flow-control systems, this document presents procedures that are contro l -system-specific. Either type of i nlet can be used with either the MFC or VFC systems.
Impaction Inlet
Section No.: 2.11.0 o"ate: January 1990 Page: 2
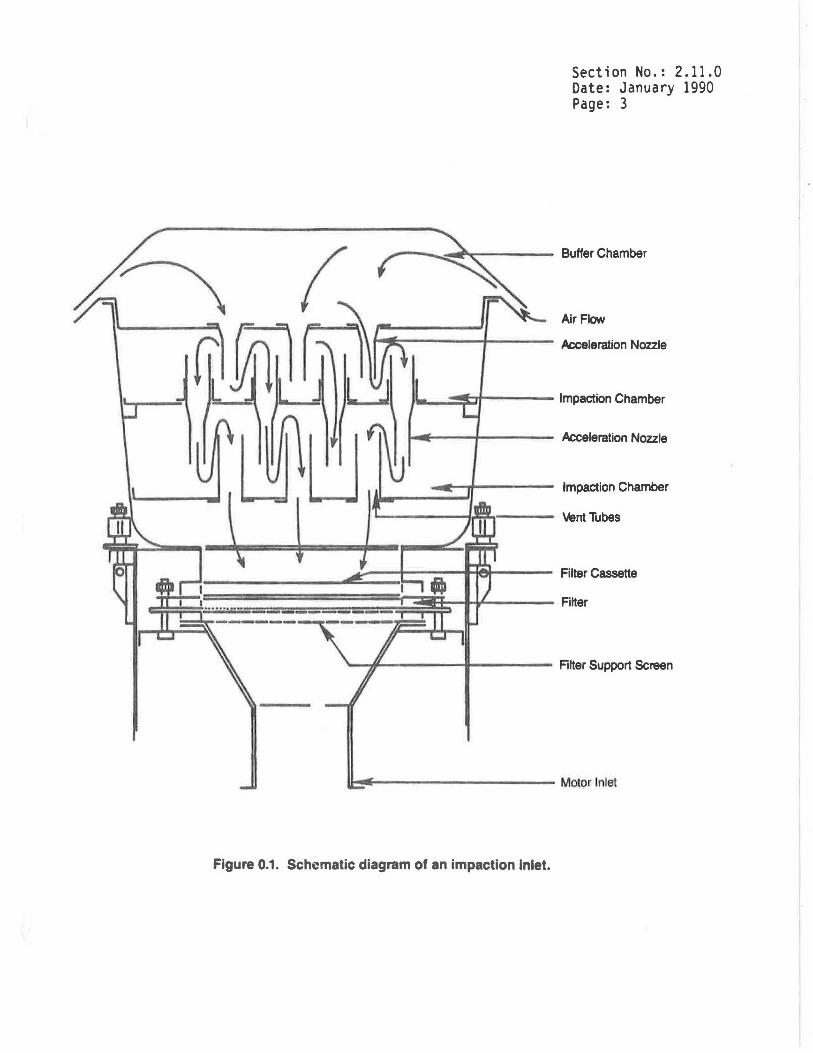
Figure 0.1 is a schematic drawing showing the basic elements of an impaction HV PMlO inlet. The symmetrical design of the inlet insures wind-direction insensitivity. Ambient air that is drawn into the inlet is evacuated from the buffer chamber through nine acceleration nozzles into the first impaction chamber, where ·1nitial particle separation occurs. The air is then accelerated through an addi,tional 16 jets into a second impaction chamber. The acceleration jets have critical diameters calculated by the manufacturer to provide the necessary changes in velocity to effect correct particle size fractionation within the impaction chambers. The air flow finally exits the inlet through nine vent tubes onto a sample filter. Because air velocities are critical to maintain the correct particle size cutpoint within the inlet, maintaining the correct design flow rate through the inlet is important. This design flow rate is specified by the manufacturer in the instruction manual. For example, the design flow rate for one popular impaction inlet is 1.13 m3/min.
Cyclonic Inlet
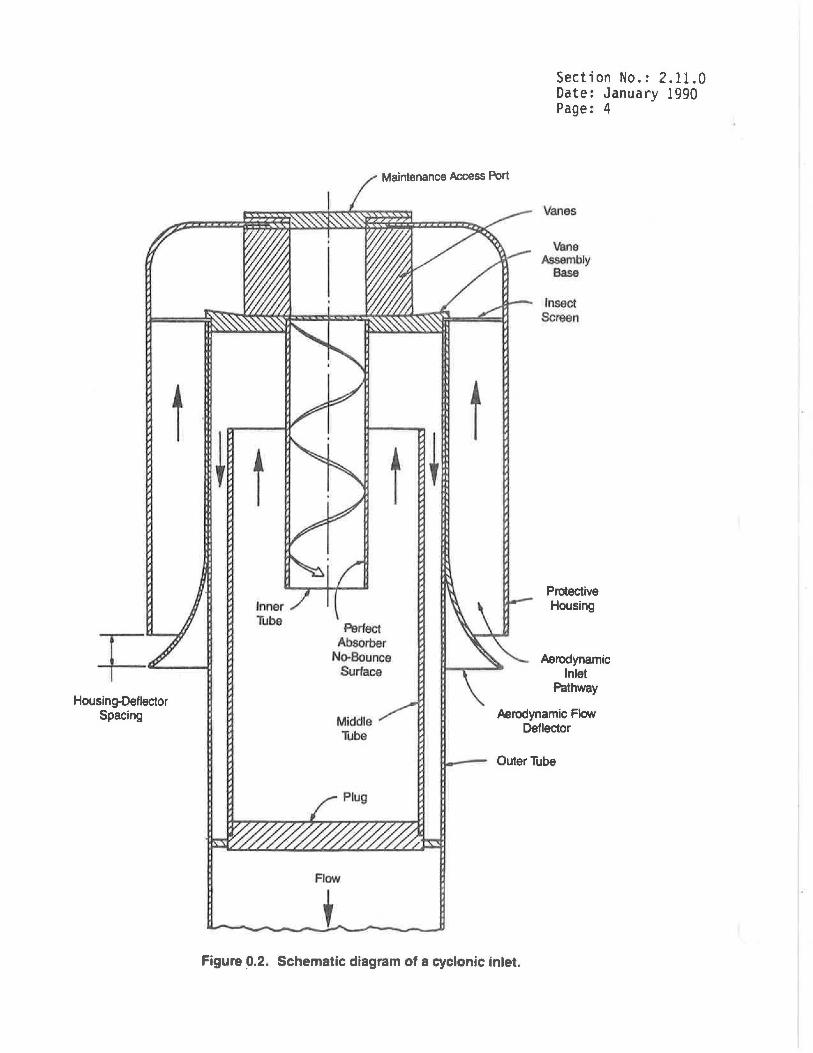
Figure 0.2 is a schematic drawing of a cyclonic HV PMlO inlet. The omnidirectional cyclone used for fractionation in this inlet allows particles to enter from all angles of approach. An angular velocity component is imparted to the sample air stream and the particles contained in it by a series of evenly spaced vanes. Larger particle removal occurs in an inner collection tube. This tube incorporates a "perfect absorber"--an oil-coated surface to eliminate particle bounce and reentrainment. The sample flow (with the unremoved smaller particles) then enters an intermediate tube, where the trajectory is altered to an upward direction. An additional turn is then made to alter the flow to a downward trajectory to allow fhe remaining particles (i.e., PMlO fraction) ultimately to deposit on a filter for subsequent analysis. As with the impaction inlet, control of air velocities in the cyclonic inlet is critical to maintain the correct particle size cutpoint. Maintaining the correct design volumetric flow rate through the inlet is important. This design flow rate is specified by the manufacturer in the instruction manual. For example, as in the case of the impaction inlet, a popular cyclonic inlet also has a design flow rate of 1.13 m3/min.
Mass-Flow-Control· (MFC) System
The flow rate in a MFC system is actively sensed and controlled at some predetermined set point. Air is pulled through the filter into the intake of a blower and subsequently exits the sampler through an exit orifice, which facilitates measurement of the flow with a manometer or pressure recorder. The flow rate is control led by an electronic mass-flow controller, which uses a flow sensor installed below the filter holder to monitor the mass flow rate and to control the speed of the motor accordingly. The controlled flow rate can be changed by an adjustment knob on the flow controller.
Volumetric-Flow-Control (VFC) System
A VFC system maintains a constant volumetric flow rate (given a fixed temperature) through the inlet, rather than a constant mass flow rate as in the MFC
Section No.: 2.11.0 Date: January 1990 Page: 3
Air Flow
J!...-.:::=lbt---- Impaction Chamber
...,..IE-_ _,.. ____ Acceleration Nozzle
Impaction Chamber
,._ ..... __________ Motor Inlet
Figure 0.1. Schematic diagram of an impaction Inlet.
Housin~Deflector Spacing
t
Section No.: 2.11.0 Date: January 1990 Page: 4
Maintenance Access Port
Perfect Absorber
No-Bounce Surface
Middle Tube
Flow
Vanes
Vane Assembly
Base
Insect Screen
Protective Housing
Aerodynamic Inlet
Pathway
Aerodynamic Flow Deflector
Outer Tube
Figure ~.2. Schematic diagram of a cyclonic inlet.
Section No.: 2.11.0 Date: January 1990 Page: 5
system. In a popular commercial VFC system, a choked-flow venturi is operated such that the air attains sonic velocity in the throat of the device. In this ~choked'' mode, the flow rate is unaffected by downstream conditions such as motor speed or exit pressure, and is a predictable function of upstream conditions, such as the stagnation pressure ratio and temperature. Thus, the volumetric flow is controlled without any moving parts or electronic components. In this type of flow control system, no means is provided for adjusting the controlled flow rate.
Section No.: 2.11.0 Date: January 1990 Page: 6
METHOD HIGHLIGHTS
The procedures set forth in this document are designed to serve as guidelines for the development of quality assurance (QA) programs associated with the operation of an HV PMlO sampler. Because recordkeeping is a critical part of QA activi~ies, several data forms are included to aid in the documentation of data. The blank data forms (see Subsection 12) may be used as they are, or they may serve as guidelines for preparing forms more specific to the needs of the individual monitoring agency. Partially filled-in forms are included at appropriate places in the discussion of the procedures to illustrate their uses.
Tables at the end of some subsections summarize the material covered in those subsections. The material covered in the various subsections of this section is summarized here:
1. Subsection l, Procurement of Equipment and Supplies, includes recommended procurement procedures, equipment selection criteria, and minimum accuracy requirements. It also provides an example of a permanent procurement record.
2. Subsection 2, Calibration Procedures, provides detailed calibration procedures for the HV PMIO sampler. A table at the end of this subsection summarizes acceptance limits and gives references for the calibration procedures of associated monitoring equipment used in a PMlO sampling program.
3. Subsection 3, Field Operations, provides detailed procedures for filter installation and recovery, sample handling, and data documentation. It also includes procedures for the field flow-rate calibration check. Complete documentation of background information during sampling is one of several QA activities important to future data validation; particularly important information are any unusual conditions that existed during sample collection. Such conditions should be noted.
4. Subsection 4, Filter Preparation and Analysis, presents important considerations for the handling, integrity, identification, equilibration, and weighing of filters. A high-quality microquartz filter is recommended. Subsection 4 also briefly describes minimum laboratory quality control (QC) procedures. The analytical balance must be calibrated annually, and the filters must be equilibrated in a controlled environment.
5. Subsection 5, Calculations, Validations, and Reporting of PMlO Data, presents calculations for determining PMIO mass concentrations and minimum data validation requirements. The final data review and validation, including standardized reporting procedures, are all important parts of a QA program. Independent checks of the data and calculations are required to ensure that the reported data are both accurate and precise.
6. Subsection 6, Maintenance, recommends periodic maintenance schedules to ensure that the equipment is capable of performing as specified. The objective of a routine maintenance program is to increase measurement system reliability.

Section No.: 2.11.0 Date: January 1990 Page: 7
7. Subsection 7, Auditing Procedures, presents independent audit activities that provide performance checks of flow-rate measurements and data processing. An analytical process evaluation and a system audit checklist are also provided. Independent audits evaluate data validity.
8. Subsection 8, Assessment of Monitoring Data for Precision and Accuracy, describes the assessment procedures for determi ning the accuracy and precision of the data. The precision check is performed by using collocated samplers.
9. Subsection 9, Recommended Standards for Establishing Traceability, discusses the traceability of calibration equipment to established standards of higher accuracy. Such traceability is a prerequisite for obtaining accurate data.
10. Subsections 10 and 11 contain the PMlO Reference Method and pertinent references used to prepare this document. Subsection 12 provides blank data forms for the convenience of the user.


2.11.1 PROCUREMENT OF EQUIPMENT AND SUPPLIES
Section No.: 2.11.1 Date: January 1990 Page~ 1
The establishment of an ambient PMlO air monitoring network requires the procurement of specialized equipment and supplies for field operations and subsequent filter analysis. Information in this section has been provided to assist the agency in selecting the proper equipment. Subsection 1.1 presents minimum sampling equipment necessary to conduct field operations. Recommended laboratory instrumentation is presented in Subsection 1.2.
In addition to field operations and laboratory equipment, a data-handling system (including forms, logs, files, and reporting procedures) must be developed and implemented. Sample blank data sheets are presented in Subsection 12.
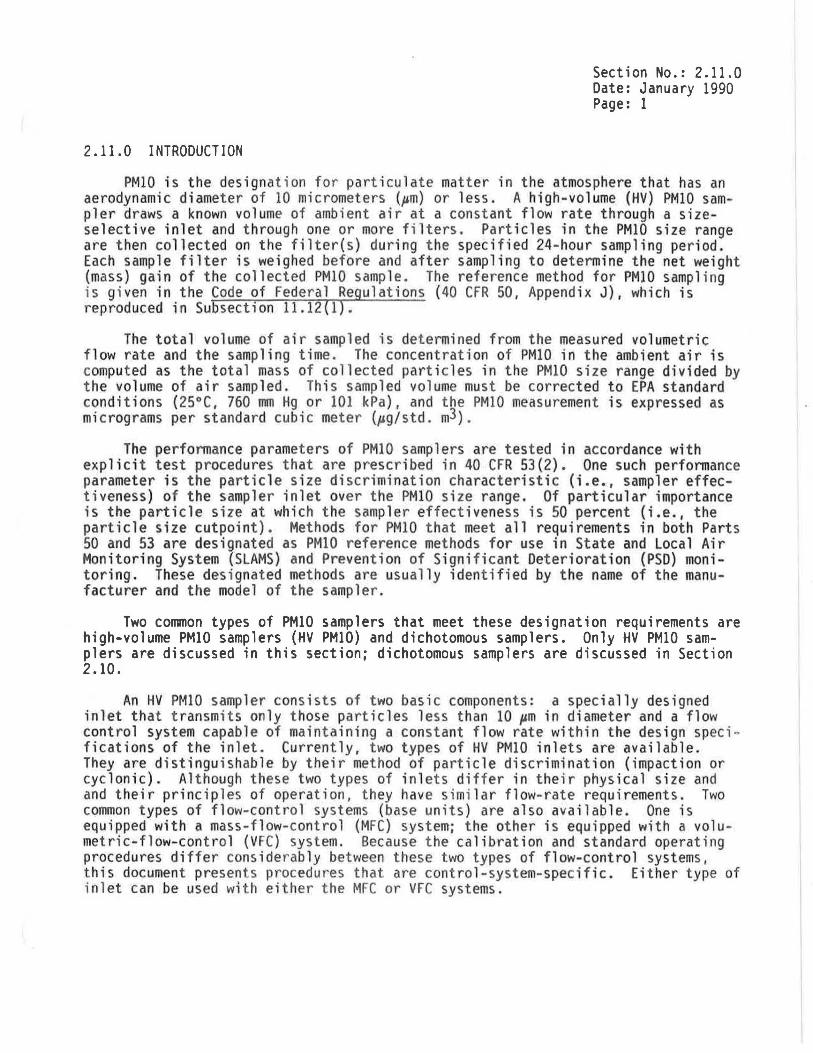
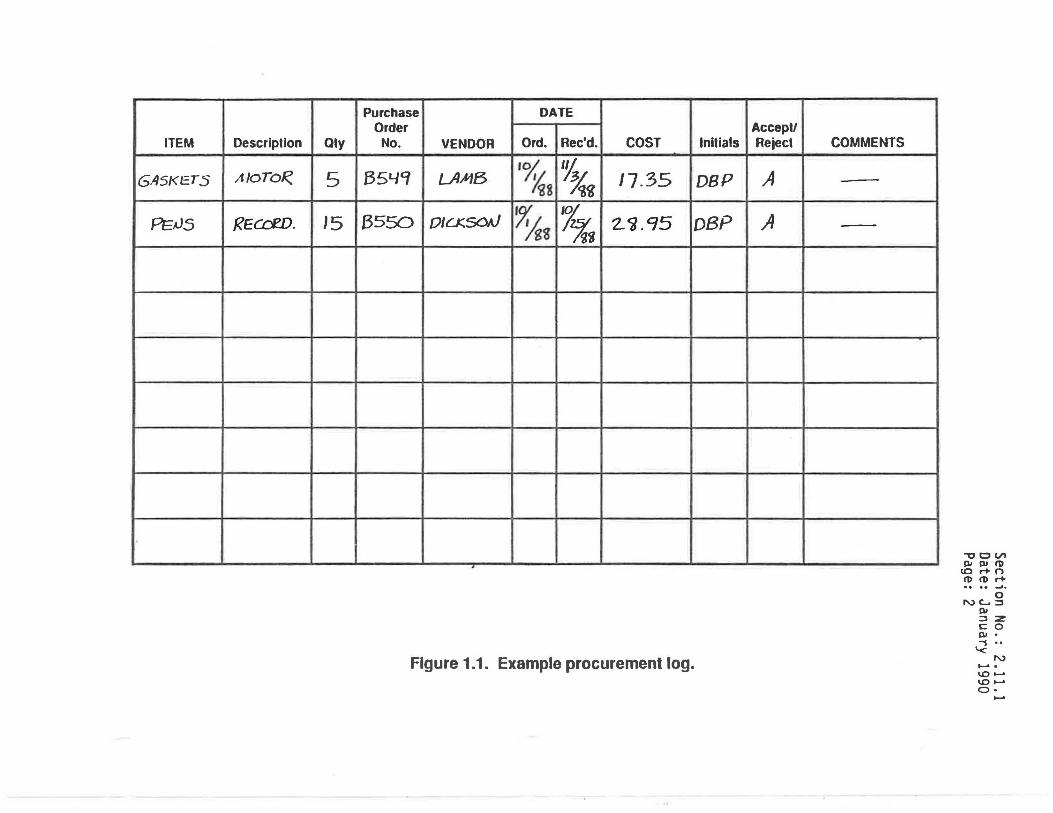
It is recommended that each agency establish minimum monitoring equipment requirements and budgetary limits before the procurement procedures are initiated. Upon receipt of the sampling equipment and supplies, appropriate procurement checks should be conducted to determine their acceptability, and whether they are accepted or rejected should be recorded in a procurement log. Figure 1.1, which is an example of such a log, will serve as a permanent record for procurements and provide fiscal projections for future programs . It will also help to provide a continuity of equipment and supplies. Table 1.1, at the end of the subsection, lists the major equipment needed, how it should be tested, suggested acceptance limits, and actions to be taken if acceptance limits are not met.
1.1 Procurement Prereguisites--Field Operations
1.1.1 HV PMlO Samplers - An individual sampler must meet U.S. EPA operational standards and be a model designated as a reference or equivalent method. A complete lis t ing of minimum sampler requirements (i.e., 40 CFR 50, Appendix J) is reproduced in Subsection 10. Those HV PMlO samplers not designated as reference or equivalent methods may not be used for reporting data to determine attainment of the National Ambient Air Quality Standards (NAAQS) for particulate matter. The cost of HV PMlO ·samplers will vary by manufacturer and the options chosen (i.e., continuous flow recorder, timer).
An in-house inventory of general maintenance supplies and replacement parts is recommended. These include various handtools; faceplate, motor, and filter cassette gaskets; general all-purpose cleaner; penetrating oil; distilled water; Kimwipes (or equivalent); soft brush; and cotton swabs. Spare parts for the sampler may be supplied by the manufacturer, or many of them may be purchased locally.
1.1.2 Calibration Equi~ment - Calibration activities require specialized equipment that will not necessari y be used in routine monitoring. At a minimum, the following equipment is required.
• A thermometer capable of accurately measuring ambient temperatures to the nearest 1l°C and referenced to a National Institute of Standards and Technology (NIST) or an American Society for Testing Materials (ASTM) thermometer within 12°C (NIST is the former National Bureau of Standards [NBS]).
Purchase DATE Order
ITEM Descripllon Qly No. VENDOR Ord. Rec'd. COST
GASKETS AloToR. 5 B54Cf L4"1B '°/,, ~g '~ %i 17.35
PE.V5 REcoW. 15 85!50 010:.scW rYs gg % ~s z_ ~. 95
Figure 1.1. Example procurement log.
Acee pl/ lnllials Reiecl COMMENTS
DBP A -DBP A -
""CCtn Ill Ill 111 ~ r+ n
111 111 r+ •• •• ...J ..
0 N~:::::I
Ill :::I :z: r:: 0 Ill • , .. '<
N ...... . l.O ...... l.O ...... O• ......

Section No.: 2.11.1 Date: January 1990 Page: 3
• A barometer capable of accurately measuring barometric pressure over a range of 500 to 800 mm Hg (66 to 106 kPa) to the nearest millimeter of Hg and referenced at least annually to a standard of known accuracy within iS mm Hg. For laboratory measurements, a Fortin-type, mercury-column barometer is appropriate. For field measurements, a portable, aneroid barometer (e.g., a climber's or engineer's altimeter) is appropriate.
• An orifice transfer standard (e.g., top-hat orifice, variable orifice, or ReF device) capable of accurately measuring the operational flow rate of an HV PMlO sampler at actual conditions. The transfer standard calibration relationship must be referenced annually and be within t2 percent of the NIST-traceable .primary standard.
• Water or oil manometer(s) with a 0- to 400-mm H20 (0- to 16-in.) range and a minimum scale division of 2 mm (0.1 in.). The VFC sampler calibration procedure requires a second oil or water manometer with a 0- to 1000-mm H20 (0- to 36-in. H20) range and with a minimum scale division of 2 mm (O.l in.).
• Spare recorder charts (if the sampler is equipped with a continuous-flow recorder), miscellaneous handtools, and 51-mm (2-in.) duct tape.
1.1.3 QC Flow-Check Device - A QC flow-check device is required for routine operation of the HV PMlO sampler; a calibrated orifice transfer standard is recommended.
The orifice transfer standard must have an NIST-traceable calibration relationship and be capable of accurately measuring volumetric flows between 1.02 and 1.24 m3/min. The calibration relationship must be referenced annually and be within i2 percent of the NIST-traceable primary standard. This orifice transfer standard may be the same one that is used for calibration.
1.1.4 Audit Equipment - The equipment needed for auditing is similar to the calibration equipment; however, the audit orifice transfer standard MUST be a different device from the one that is used for routine calibration and flow checks.
1.2 Procurement Prereguisites--Laboratory Operations
1.2.1 Filter Media - The microquartz fiber filter is currently the only co1T11nercial ly available HV PMlO filter that satisfies all criteria specified in 40 CFR 50, Appendix J. These filters may be brittle, which makes them more difficult to handle, and they may be more expensive than glass - fiber filters. The operating agency should determine the relative importance of cert ain filter evaluation criteria (e.g., physical and chemical characteristics, ease of handling, cost). Subsection 4, Table 4.1, presents basic criteria that must be met regardless of the filter type selected.
Gloves should be worn -during the handling of all filter~. and touching should be limited to the edges. Gloves will help to eliminate interference from body oils, hygroscopic particles, and static electricity during weighing operations.
Section No.: 2.11.1 Date: January 1990 Page: 4
1.2.2 Filter Protection - Post-sampling particle loss and filter damage will occur if proper handling procedures are not followed. Filter cassettes are reconnnended for sampling with most HV PMlO samplers. These may be purchased through the HV PMlO sampler's manufacturer. A sufficient number of cassettes must be purchased to allow insertion and removal of the filters in the laboratory. For storage of exposed filters, however, cassettes may prove to be expensive and unwieldy.
For assurance of the integrity of the exposed filter during handling and storage, some type of protective covering is required; a manila folder in a protective envelope is reconmended. The folder and envelope should be of comparable size (large enough to allow easy removal of the filter, yet small enough to prevent excess movement within the envelope) and be sealed to preclude damage or loss of particles during transportation to the analytical laboratory. The folder can be printed to serve as a data sheet for proP.er documentation during sampling. A sufficient number of protective envelopes must be available to provide protection for the filters during transportation to and from the monitoring location and for storage of the exposed filters for subsequent gravimetric or chemical analysis.
1.2.3 Laboratory Equipment - The analytical balance must be suitable for weighing the type and size of HV PMlO filters used. The range and sensitivity depend on routine tare weights and expected loadings. The balance must be calibrated at installation and recalibrated at least once a year, as specified by the manufacturer.
Prior to their weighing, filters must be conditioned in an environment where the mean relative humidity (RH) is between 20 and 45 percent and controlled within tS percent, and mean temperature is between 15° and 30°C and controlled within t3°C. Temperature and RH readings must be recorded daily, either manually or by hygrothermograph. Among the options available to ensure compliance with the reference method specifications are a sling psychrometer and a calibrated precision thennometer (capable of measuring temperatures over a range of 10° to 30°C (283 to 303 K] to the nearest tl°C) that has been checked against an NIST or ASTM thermometer to within t2°C.
It is impossible to present a complete procurement package that would provide for unexpected contingencies in any monitoring network. Ea~h agency must detennine the extent of its in-house inventory and the items that should be ordered before sampling can begin. The agency must also be prepared to order any additional equipment required over and above that outlined ;n th;s subsection.
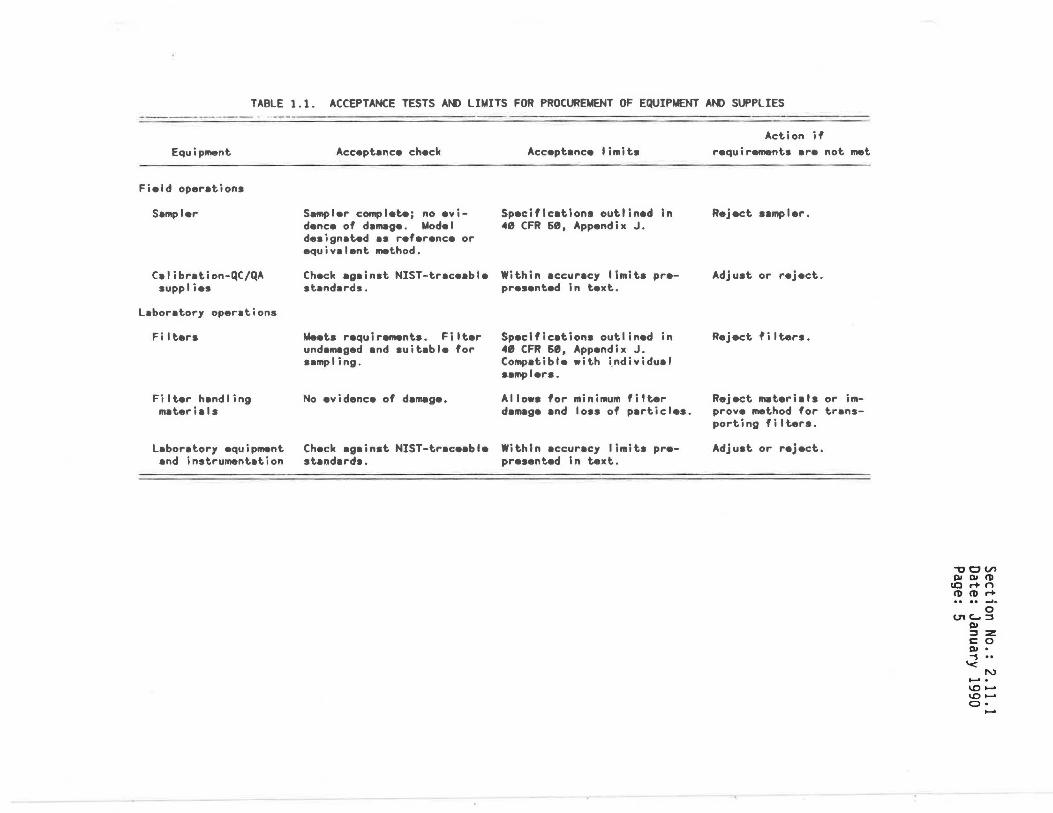
TABLE 1.1. ACCEPTANCE TESTS AN> LIMITS FOR PROCUREMENT OF EQUIPMENT AN> SUPPLIES
Equipment
Field operetions
Sampler
Calibration-QC/QA supplies
Leboretory operetions
Filters
Fi I ter hand I i ng materials
Leboratory equipment end instrumentation
Accept.enc• check
Sampler complete; no evidence of damage. Model designat.ed es reference or equivelent method.
Check against NIST-traceable stenderds.
Meets requirements. Filter undemaged and suiteble for Hmpl ing.
No evidence of damage.
Check egainst NIST-traceable standards.
Accept.enc• limits
Specifications outlined ln 40 CFR 69, Appendix J.
Within accuracy limits prepresented In t.ext.
Specifications outlined in 49 CFR 69, Appendix J. Competible with i.ndividual semplers.
Allows for minimum filter damage end loss of particles.
Within accuracy limits prepresented In t.ext.
Action if requirements ere not met
Reject sampler.
Adjust or reject.
Reject filters.
Reject materials or improve method for transporting filters.
Adjust or reject.
-0 c (/) QI QI t1) ~ r+ n t1) t1) r+ . . .. --'•
0 lTI c.... :::s
QI :::s :z co QI • ..., .. '<
N ...... l.O ..... l.O ..... C> • .....


2.11.2 CALIBRATION PROCEDURES
Section No.! 2.11.2 Date: January 1990 Page: 1
Before a PMlO monitoring program commence~, it is essential to properly calibrate all sampling and laboratory equipment. Calibration is defined as the relationship between an instrumental output and the input of a known reference standard. Data that are traceable to common reference standards are more uniform in character and more readily comparable than data that are not traceable. Because PMlO concentration standards are not available for determining calibration relationships, individual components of the sampling method must be calibrated to ensure the integrity of reported data.
Like a TSP sampler, an HV PMlO sampler is essentially a device that pulls a sample of ambient air through a filter during a measured time period and collects particulate mass on the filter. Thus, to establish ambient PMlO concentrations, three independent determinations are made: air volume flow rate, sampling time, and particulate mass. The objective of this subsection is to provide technically sound flow-rate calibration procedures for both the MFC and VFC HV PMlO samplers.
Note: Calibration procedures for samplers that have been designated as reference methods will also be provided by the manufacturer in the operation or instruction manual. These manufacturer-provided calibration procedures are likely to be more specific and detailed than the more generic procedures presented herein. Also, minimum calibration requirements for the determination of particulate mass and sample time are presented in a table at the end of this subsection (Table 2.1).
Although it concerns TSP samplers rather than HV PMIO samplers, Reference 3 provides useful information concerning flow-rate-calibration procedures that is applicable to PMIO samplers. Reference 4 provides useful information concerning positive-displacement, standard volume meters (e.g., RootsR Meters).
The following aspects of PMlO monitoring are discussed in this subsection:
2.1 A discussion of volumetric and mass flow measurements and their applic-ability in a PMlO monitoring program.
2.2 A certification procedure for an orifice flow-rate transfer standard.
2.3 Basic calibration procedure specific to an MFC HV PMlO sampler.
2.4 Basic calibration procedure specific to a VFC HV PMlO sampler.
2.5 Calibration frequency requirements.
Table 2.1, at the end of this subsection, presents minimum accuracy requirements for equipment that is used in PMlO sampling. It also references appropriate subsections in Section 2.2 of this volume.
Note: Consistency of temperature and barometric pressure units is required. It is recommended that all temperatures be expressed in kelvin (K = °C + 273). It is also recommended that all barometric pressures be expressed in either mm Hg or kPa
Section No.: 2.11.2 Date: January 1990 Page: 2
(but do not mix the two units). Take care to avoid calibrating a PMlO sampler using one set of units and then performing sample calculations using another set of units.
2.1 Discussion of Flow-Rate Measurement and General Aspects of PMlO Sampler Calibration
An HV PMlO sampler consists of two basic components: a specially designed inlet and a flow-rate controlling system. The particle size discrimination characteristics of both the impaction and cyclonic type inlets depend critically on maintaining certain air velocities within the inlet; a change in velocity will result in a change in the nominal particle size collected. For this reason, it is imperative that the flow rate through the inlet be maintained at a constant value that is as close as possible to the inlet's design flow rate. The design flow rate for a given sampler is specified in the sampler's instruction manual. The manual may also provide tolerance limits (or upper and lower limits) within which the sampler flow must be maintained. If the tolerance is not specified by the manufacturer, it should be assumed to be tlO percent. For example, if the design flow rate is specified as 1.13 m3/min with no tolerance given, the acceptable flow-rate range would be 1.02 to 1.24 m3/min.
As indicated above, the true or actual flow rate through the sampler inlet must be known and controlled to ensure that only those particles nominally less than 10 µmare being collected. A common source of error in a PMlO monitoring program is confusion of various air volume flow-rate measurement units. Although the sampler's operational flow rate must be monitored in terms of actual volume flow rate units (Qa), sampler flow rates must be corrected to standard volume flow rate units (Qstd) at EPA standard conditions of temperature and pressure to calculate PMlO concentrations as required by EPA. Thus, both Qa and Qstd flow rates are used for PMlO measurements. Before calibration procedures are initiated, the operating agency personnel should review the following flow-rate measurement designations:
•
•
!@_: Actual volumetric air flow rates, measured and expressed at existing conditions of temperature and pressure and denoted by Qa (Qactual). Typical units are L/min and m3/min. Inlet design flow rates are always given in actual volumetric flow rate units.
Qstd: Air flow rates that have been corrected to equivalent standard VOTUme flow rates at EPA standard conditions of temperature and pressure (25 °C or 298 K and 760 nm Hg or 101 kPa) and denoted by Qstd (Qstandard). Typical units are std. L/min and std. m3/min. Standard volume flow-rate units are often used by engineers and scientists because they are equivalent to mass flow units. Standard volumes (derived from standard volume flow rates) are required for the calculation of PMlO mass concentration (µg/std. m3) in reporting PMlO measurements.
These Qa and Qstd measurement units must not be confused or interchanged. The flow rate units can be converted as follows, provided the existing temperature and pressure (or in some cases the average temperature and pressure over a sampling period) are known:
where: Qstd
Qa Pa
Pstd Tstd
Ta Qstd
Qa Pav
Tav
= = = = ::
= = = =
=
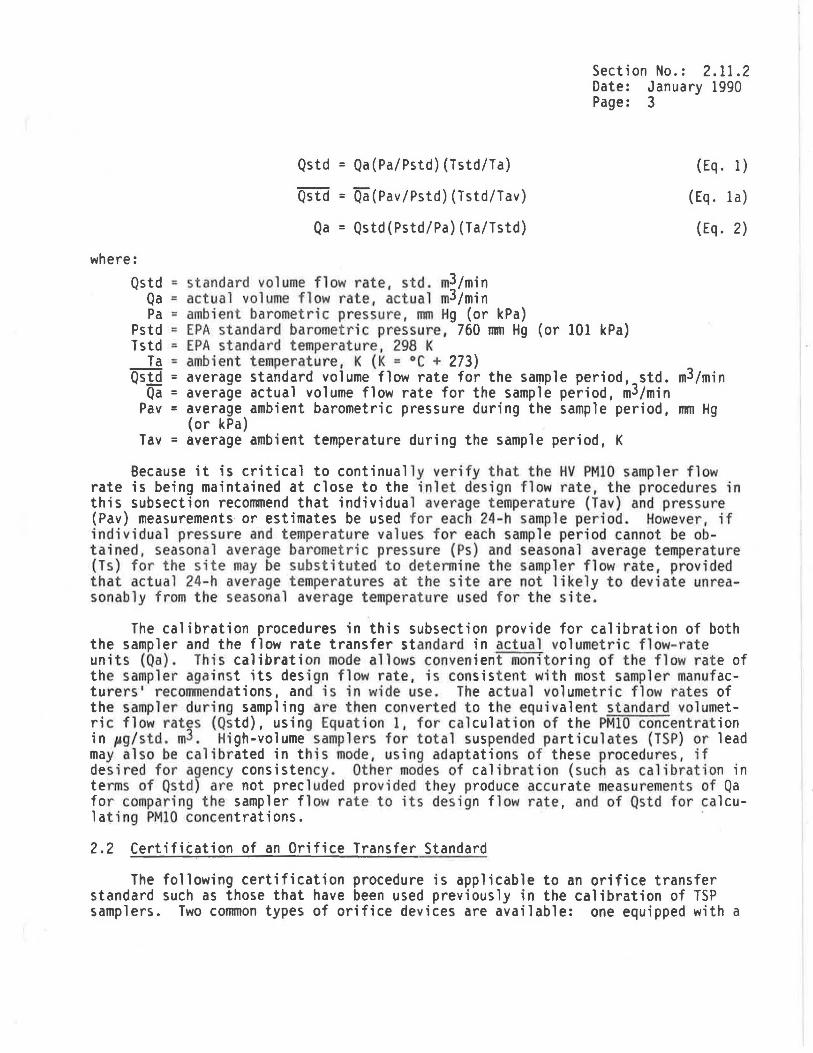
Qstd = Qa(Pa/Pstd)(Tstd/Ta)
Qstd = Qa(Pav/Pstd)(Tstd/Tav)
Qa = Qstd(Pstd/Pa)(Ta/Tstd)
standard volume flow rate, std. m3/min actual volume flow rate, actual m3/min ambient barometric pressure, mm Hg (or kPa)
Section No.: 2.11.2 Date: January 1990 Page: 3
( Eq. 1)
(Eq. la)
(Eq. 2)
EPA standard barometric pressure, 760 mm Hg (or 101 kPa) EPA standard temperature, 298 K ambient temperature, K (K = °C + 273) average standard volume flow rate for the sample period, std. m3/min average actual volume flow rate for the sample period, m3/min average ambient barometric pressure during the sample period, mm Hg (or kPa) average ambient temperature during the sample period, K
Because it is critical to continually verify that the HV PMlO sampler flow rate is being maintained at close to the inlet design flow rate, the procedures in this subsection recommend that individual average temperature (Tav) and pressure (Pav) measurements or estimates be used for each 24-h sample period. However, if individual pressure and temperature values for each sample period cannot be obtained, seasonal average barometric pressure (Ps) and seasonal average temperature (Ts) for the site may be substituted to detennine the sampler flow rate, provided that actual 24-h average temperatures at the site are not likely to deviate unreasonably from the seasonal average temperature used for the site.
The calibration procedures in this subsection provide for calibration of both the sampler and the flow rate transfer standard in actual volumetric flow-rate units (Qa). This calibration mode allows convenient monitoring of the flow rate of the sampler against its design flow rate, is consistent with most sampler manufacturers' recommendations, and is in wide use. The actual volumetric flow rates of the sampler during sampling are then converted to the equivalent standard volumetric flow rates (Qstd), using Eq uation 1, for calculation of the PMlO concentration in µg/std. m3. High-volume samplers for total suspended particulates (TSP) or lead may also be calibrated in this mode, using adaptations of these procedures, if desired for agency consistency. Other modes of calibration (such as calibration in terms of Qstd) are not precluded provided they produce accurate measurements of Qa for comparing the sampler flow rate to its design flow rate, and of Qstd for calculating PMlO concentrations.
2.2 Certification of an Orifice Transfer Standard
The following certification procedure is applicable to an orifice transfer standard such as those that have been used previously in the calibration of TSP samplers. Two common types of orifice devices are available: one equipped with a
Section No.: 2.11.2 Date: January 1990 Page: 4
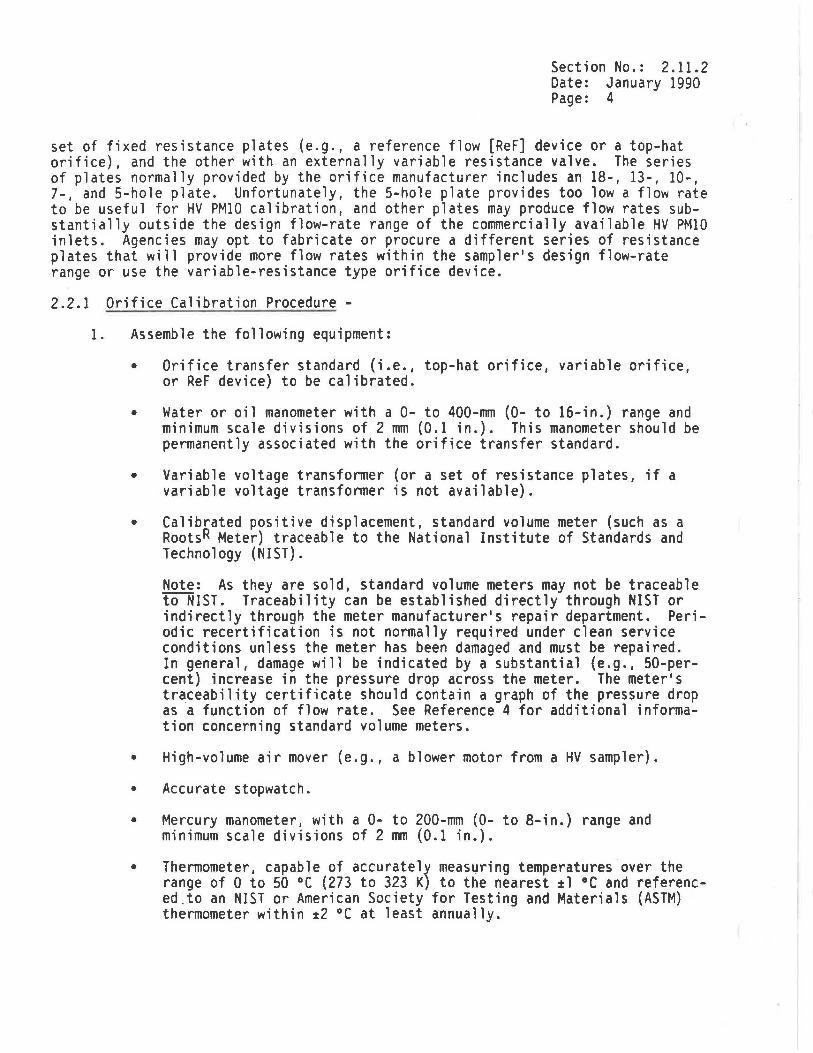
set of fixed resistance plates (e.g., a reference flow [ReF] device or a top-hat orifice}, and the other with an externally variable resistance valve. The series of plates normally provided by the orifice manufacturer includes an 18-, 13-, 10-, 7-, and 5-hole plate. Unfortunately, the 5-hole plate provides too low a flow rate to be useful for HV PMlO calibration, and other plates may produce flow rates substantially outside the design flow-rate range of the commercially available HV PMlO inlets. Agencies may opt to fabricate or procure a different series of resistance plates that will provide more flow rates within the sampler's design flow-rate range or use the variable-resistance type orifice device.
2.2.1 Orifice Calibration Procedure -
1. Assemble the following equipment:
• Orifice transfer standard (i.e., top-hat orifice, variable orifice, or ReF device) to be calibrated.
• Water or oil manometer with a 0- to 400-mm (0- to 16-in.) range and minimum scale divisions of 2 mm (0.1 in.). This manometer should be permanently associated with the orifice transfer standard.
• Variable voltage transformer (or a set of resistance plates, if a variable voltage transformer is not available).
• Calibrated positive displacement, standard volume meter (such as a RootsR Meter) traceable to the National Institute of Standards and Technology (NIST).
Note: As they are sold, standard volume meters may not be traceable to NIST. Traceability can be established directly through NIST or indirectly through the meter manufacturer's repair department. Periodic recertification is not normally required under clean service conditions unless the meter has been damaged and must be repaired. In general, damage will be indicated by a substantial (e.g., SO-percent) increase in the pressure drop across the meter. The meter's traceability certificate should contain a graph of the pressure drop as a function of flow rate. See Reference 4 for additional information concerning standard volume meters.
• High-volume air mover (e.g., a blower motor from a HV sampler).
• Accurate stopwatch.
• Mercury manometer, with a 0- to 200-mm (0- to 8-in.) range and minimum scale divisions of 2 mm (0.1 in.).
• Thermometer, capable of accurately measuring temperatures over the range of 0 to 50 °C (273 to 323 K) to the nearest tl °C and referenced .to an NIST or American Society for Testing and Materials (ASTM) thermometer within t2 °C at least annually.
Section No.: 2.11.2 Date: January 1990 Page: 5
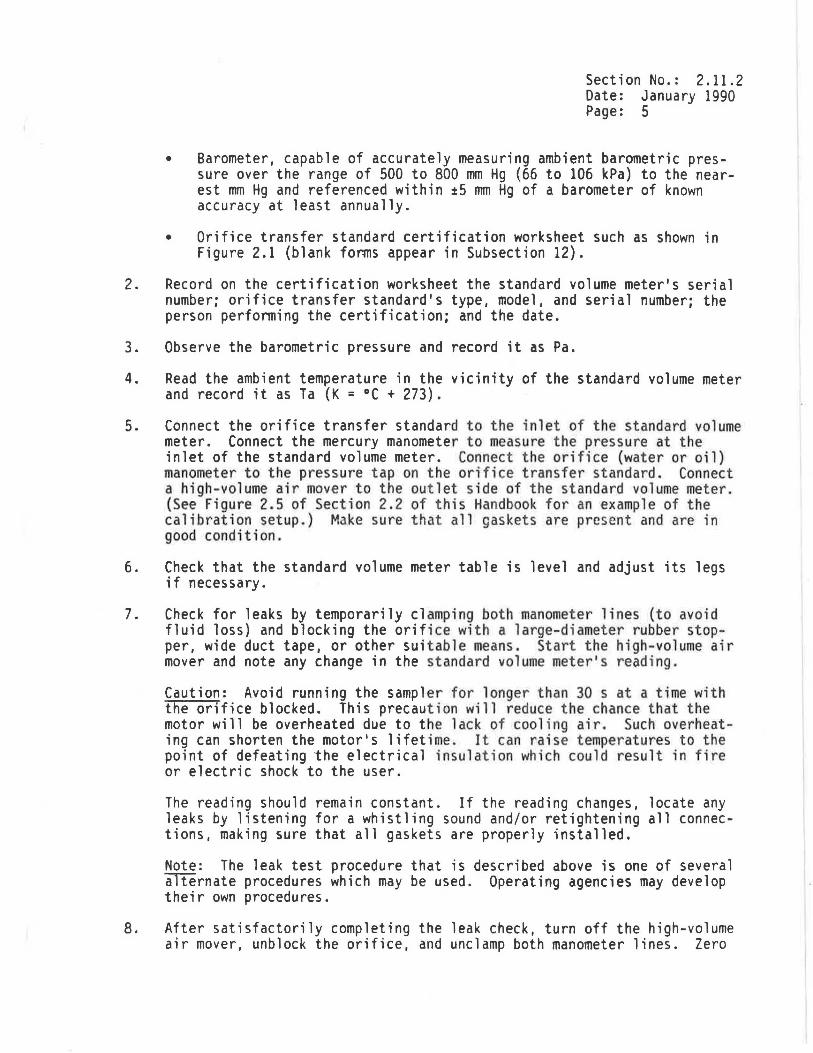
• Barometer, capable of accurately measuring ambient barometric pressure over the range of 500 to 800 mm Hg (66 to 106 kPa) to the nearest mm Hg and referenced within ~s mm Hg of a barometer of known accuracy at least annually.
• Orifice transfer standard certification worksheet such as shown in Figure 2.1 (blank forms appear in Subsection 12).
2. Record on the certification worksheet the standard volume meter's serial number; orifice transfer standard's type, model, and serial number; the person performing the certification; and the date.
3. Observe the barometric pressure and record it as Pa.
4. Read the ambient temperature in the vicinity of the standard volume meter and record it as Ta (K = °C + 273).
5. Connect the orifice transfer standard to the inlet of the standard volume meter. Connect the mercury manometer to measure the pressure at the inlet of the standard volume meter. Connect the orifice (water or oil) manometer to the pressure tap on the orifice transfer standard. Connect a high-volume air mover to the outlet side of the standard volume meter. (See Figure 2.5 of Section 2.2 of this Handbook for an example of the calibration setup.) Make sure that all gaskets are present and are in good condition.
6. Check that the standard volume meter table is level and adjust its legs if necessary.
7. Check for leaks by temporarily clamping both manometer lines (to avoid fluid loss) and blocking the orifice with a large-diameter rubber stopper, wide duct tape, or other suitable means. Start the high-volume air mover and note any change in the standard volume meter's reading.
Caution: Avoid running the sampler for longer than 30 s at a time with the orifice blocked. This precaution will reduce the chance that the motor will be overheated due to the lack of cooling air. Such overheating can shorten the motor's lifetime. It can raise temperatures to the point of defeating the electrical insulation which could result in fire or electric shock to the user.
The reading should remain constant. If the reading changes, locate any leaks by listening for a whistling sound and/or retightening all connections, making sure that all gaskets are properly installed.
Note: The leak test procedure that is described above is one of several alternate procedures which may be used. Operating agencies may develop their own procedures.
8. After satisfactorily completing the leak check, turn off the high-volume air mover, unblock the orifice, and unclamp both manometer lines. Zero

Section No.: 2.11.2 Date: January 1990 Page: 6
ORIFICE TRANSFER STANDARD CERTIFICATION WORKSHEET
DClte: 7 /i:z .. / <i '8 Roots meter SIN: 7'-f 6'-/'31 8 Ta: 2.2.G K Z95. b Operator: 6. Pl?.ATT Orifice SIN: 2 Pa: 756. 2. mm Hg
Plate or Initial Volts AC Volume Final Volume ~Vol. ~Time (min) .:lHg (mm) .lH20 (in.)
I 5~'12.. 5GCf5 3.0 3. L./ I I '8 3.0 2. 56~8 570/ 3.0 z.75 2..5 l.f .s 3 5705 5708 3.0 Z.3'-f 32. 6.0 '-f 5 71 z.. 5?15 3.0 z..oo '-t z. «g.Q 5 5719 572.2. 3.0 I.~ cg l.f 'B Cf.a
DATA TABULATION
(x-axis) (y-axis) (x-axis) (y-axis) Vstd Qstd [~H20 (Pa/Ta}) Y2 • Va Ca [.lH20 (TalPa)]YZ
2. . CJZ. '1 o. 859 /.OZ3 2.. CfO I I. 055 /. 3Z. 7 2.~73 J. 22.'8 }. 532 z. g33 /. '-117 J. 76'1 z.~10 J.'-1'15 I. 'B76
m= m= /. Z.3~0 . -b :: b = o. 0172.. - . r = r = o. '1Cf '7~
CALCULATIONS
Vstd = .l Vol !(Pa - ~g)l760) (298fTa)· Va = .lVol ((Pa - ~g)/Pal Ostd = Vstd/.lTime· Oa .. Va/.lTime y = mx + b y = mx + b
For subsequent flow rate calculations:
Ostd = a.iH20 (Pa/Ta)J'12 - b I P Im I ' Oa = : (.iH20 (Ta/Pa))'': - bl I 1/m l
·NOTE: For PM10 monitoring, a calibration curve corrected to standard conditions is op1ional
Figure 2.1. Example Orifice Transfer Standard Certification Worksheet.

Section No.: 2.11.2 Date: January 1990 Page: 7
the water and mercury manometers by sliding their scales so that their zero lines are even with the bottom of the meniscuses.
9. Turn on the high-volume air mover. Adjust the variable voltage transformer to achieve an appropriate flow rate (i.e ., within the approximate range of 0.9 to 1.3 m3/min (32 to 46 ft3/min)). If necessary, use fixed resistance plates or the variable resistance valve to achieve the appropriate flow rate. The use of fixed resistance plates is discouraged (but not prohibited) because the leak check must be repeated each time that a plate is installed.
10. After setting a flow rate, allow the system to run for at least 1 min to attain a constant motor speed. Observe the standard volume meter dial reading and simultaneously start the stopwatch. Error in reading the meter dial can be minimized by starting and stopping the stopwatch on whole number dial readings (e.g., 4091.00).
11. Record the initial volume that the meter dial was indicating when the stopwatch was started. Maintain this constant.flow rate until at least 3 m3 of air have passed through the standard volume meter. Record the standard volume meter•s inlet pressure manometer reading as AHg, and the orifice manometer reading as AH20. Be sure to indicate the correct units of measurement. If AH20 changes significantly during the run, abort the run and start again.
12. When at least 3 m3 of air have passed through the system, note the standard volume meter reading and simultaneously stop the stopwatch. Record the final volume that the meter dial was indicating when the stopwatch was stopped. Record the elapsed time (ATime) indicated on the stopwatch.
13. Calculate the volume measured by the standard volume meter (AVol.) using Equation 3 and record.
AVol. =Final Volume - Initial Volume (Eq. 3)
14. Correct. this volume to ambient atmospheric pressure.
Va= 6Vol.(Pa - AHg)/Pa (Eq. 4)
where: Va = actual volume at ambient barometric pressure, m3
~Vol. =actual volume measured by the standard volume meter, m3 Pa = ambient barometric pressure during calibration, mm Hg (or
kPa) AHg = .differential pressure at inlet to volume meter, mm Hg (or
kPa).

Section No.: 2.11.2 Oate: January 1990 Page: 8
15. Calculate the actual volumetric flow rate (m3/min).
16.
17.
18.
19.
where:
Qa = Va/ATime (Eq. 5)
Qa = actual volumetric flow rate through the orifice~ m3/min Va = actual volume at ambient barometric pressure, mJ
ATime = elapsed time, min.
Repeat Steps 9 through 15 for at least four additional flow rates within the approximate range of 0.9 to 1.3 m3/min (32 to 46 ft3/min). At least five evenly distributed different flow rates are required, and at least three flow rates must be in the specified inlet flow-rate interval [1.02 to 1.24 m3/min (36 to 44 ft3/min)J. Better calibration precision may be obtained by running additional flow rates or repeating the flow rates.
For each flow, compute [(AH20)(Ta/Pa)]l/2, and plot these values against the corresponding values of Qa. Draw the orifice trqnsfer standard's certification curve. For the model [(AH20)(Ta/Pa)]l/2 = m(Qa) + b, calculate the linear least squares regression's slope (m), intercept (b), and correlation coefficient (r) of the certification relationship. Plot the regression line on the same graph as the calibration data. A certification graph should be readable to 0.02 m3/min.
If any calibration point does not fall within %2 percent of the line, rerun that point, recalculate, and replot.
For subsequent use of the orifice transfer standard, calculate Qa from the calibration·relationship as:
Qa(orifice) = {[(AH20)(Ta/Pa)]l/2 - b} {l/m} (Eq. 6)
where: Qa(orifice) =
AH20 = Ta = Pa = b = m =
actual volumetric flow rate as indicated by the orifice transfer standard, m3/min pressure drop across the orifice, mm (or in.) H20 ambient temperature during use, K (K = °C + 273) ambient barometric pressure during use, mm Hg (or kPa) intercept of the orifice calibration relationship slope of the orifice calibration relationship.
2.2.2 Orifice Transfer Standard Calibration Frequency -
UpoQ receipt and at 1-yr intervals, the calibration of the orifice transfer standard should be certified with a standard volume meter (such as a RootsR Meter) traceable to NIST. An orifice transfer standard should be visually inspected for signs of damage before each use, and should be recalibrated if the inspection reveals any nicks or dents.

2.3 Basic Calibration Procedure for a Mass-Flow-Controlled (MFC) Sampler Using an Orifice Transfer Standard
Section ~o.: 2.11.2 Date: January 1990 Page: 9
The MFC sampler calibration procedure presented in this subsection relates known flow rates to the pressure in the exit orifice plenum. The known flow rates are determined by an orifice transfer standard that has been certified according to the procedure presented in Section 2.2.1. The exit orifice plenum is the area within the motor housing (below the motor unit) that contains the air flow just before it is exhausted to the atmosphere through the exit orifice. It is recommended that this exit orifice plenum pressure be measured with a 25-cm (10- in.) water or oil manometer. It is further recommended that each sampler should have its own dedicated manometer, which can be conveniently mounted to the side of the sampler housing. Other types of pressure measurement devices may be used provided they have comparable accuracy. However, the 4-in. continuous pressure (flow} recorders of the type often supplied with HV PMlO samplers are generally not sufficiently accurate and are not recommended for quantitative sampler pressure or flow measurements. These flow recorders should be used only for nonquantitative determination that the flow was approximately constant and uninterrupted over the sample period. The flow recorder may be connected in parallel with the manometer or other pressure measuring device, using a tee or "Y" tubing connection.
Note: Because flow recorders are still in wide use for quantitative flow measurements, the calibration procedure includes specific instructions for quantitatively calibrating a flow recorder. These flow recorder instructions are enclosed in brackets [ ] and should be used only when a manometer or other pressure measurement device cannot be used.
For this MFC calibration procedure, the following conditions are assumed:
• The HV PMlO sampler is equipped with a mass flow controller to control its sample flow rate.
• The sampler flow rate is measured by measuring the exit orifice plenum pressure, using a water or oil manometer [or, if necessary, a continuousflow recording device using square-root-scale chart paperj.
• The sampler inlet is designed to operate at an actual volumetric flow rate of 1.13 m3/min, and the acceptable flow-rate range is %10 percent of this value.
• The transfer standard for the flow-rate calibration is an orifice device equipped with either a series of resistance plates or an integral variable-resistance valve. The pressure drop across the orifice is measured by an associated water or oil manometer.
• The sampler will be calibrated in actual volumetric flow-rate units (Qa), and the orifice transfer standard is also calibrated in Qa, as specified in Subsection 2.2.

Section No.: 2.11.2 Date: January 1990 Page: 10
2.3.1 Calibration Equipment -
1. Orifice transfer standard with calibration traceable to NIST (see Subsection 2.2).
Note: The predrilled resistance plates that are supplied with the orifice transfer standard may have to be modified for the calibration of PMlO samplers. The holes in the plates may have to be enlarged or additional holes may have to be drilled to obtain flow rates within the acceptable range. Alternately, new resistance plates could be purchased if they are available.
2. An associated water or oil manometer, with a 0- to 400-mm (O- to 16-in.) range and a minimum scale division of 2 mm (0.1 in.).
3. A water or oil manometer, with minimum scale division of 2 mm exit orifice plenum pressure. the sampler.
a 0- to 200-mm (0- to 8-in.) range and a (0.1 in.) for measurement of the sampler This manometer should be associated with
Note: Manometers used for field calibration may be subject to damage or malfunction and should thus be checked frequently.
4. Thermometer, capable of accurately measuring temperature over the range of 0 to 50 °C (273 to 323 K) to the nearest ±1 °C and referenced to an NIST or ASTM thermometer within ±2 °C at least annually.
5. A portable aneroid barometer (e.g., a climber's or engineer's altimeter) capable of accurately measuring ambient barometric pressure over the range of 500 to 800 mm Hg (66 to 106 kPa) to the nearest mm Hg and referenced within ±5 ITITI Hg of a barometer of known accuracy at least annually.
6. Miscellaneous handtools, calibration data sheets or station log book, and 51-mm ·(2-in.) duct tape.
2.3.2 Multipoint Flow-Rate Calibration Procedure - MFC Sampler -
The procedure presented here is basic and generic, given the assumptions listed in Subsection 2.3. There may be more detailed calibration procedures, variations, or alternative calibration procedures presented in the manufacturer's instruction manual. It is recommended that the manual be reviewed carefully and that the various calibration variations or alternative procedures be evaluated. Inhouse equipment and personnel, procedural simplicity and uniformity, and subsequent data applications should be considered in establishing the specific, detailed calibration procedure to be implemented.
Caution: Do not ~ttempt to calibrate Short-term wind velocity fluctuations will the orifice transfer standard's manometer. because of the pressure variations.
the MFC sampler under windy conditions. produce variable pressure readings by
The calibration will be less precise
...

Section No.: 2.11.2 Date: January 1990. Page: 11
1. Set up the calibration system as recommended by the manufacturer. Figure 2.2 illustrates the calibration configuration of a typical MFC sampler. MFC samplers are calibrated without a filter or filter cassette installed.
2. Disconnect the motor from the flow controller and plug it directly into a stable line voltage source (i.e., the sampler's on-off timer, if so equipped, or other source of the line voltage).
3. Install the orifice transfer standard and its adapter faceplate on the sampler. Check all gaskets and replace any questionable ones.
Caution: Tighten the faceplate nuts evenly on alternate corners to properly align and seat the gaskets. The nuts should be only hand-tightened because ~oo muc~ compression can damage the sealing gasket.
4. Select the first calibration flow rate and install the appropriate resistance plate or adjust the variable orifice valve. At least four flow rates are required to define the calibration relationship.
At least three flow rates should be within (or nearly within) the acceptable flow-rate range (i.e., 1.02 to 1.24 m3/min) for the sampler inlet. For resistance plate orifices, make sure that the orifice and resistance plate ~askets are in place and the orifice is not cross-threaded on the faceplate.
· 5. Leak Test: Block the orifice with a large-diameter rubber stopper, wide duct tape, or other suitable means. Seal the pressure port with a rubber cap or similar device. Turn on the sampler.
Caution: Avoid running the sampler for longer than 30 s at a time with the orifice blocked. This precaution will reduce the chance that the motor will be overheated due to the lack of cooling air. Such overheating can shorten the motor's lifetime. It can raise t emperatures to the point of defeating the electrical insulation, which could result in fire or electric shock to the user.
Gently rock the orifice transfer standard and listen for a whistling sound that would indicate a leak in the system. A leak-free system will not produce an upscale response in the sampler's exit orifice manometer or flow recorder. Leaks are usually caused either by a damaged or missing gasket between the orifice transfer standard and the faceplate or by cross-threading of the orifice transfer standard on the faceplate. All leaks must be eliminated before proceeding with the calibration. When the system is determined to be leak-free, turn off the sampler and unblock the orifice.
Note: The leak test procedure that is described above is one of several alternate procedures which may be used. Operating agencies may develop their own procedures.
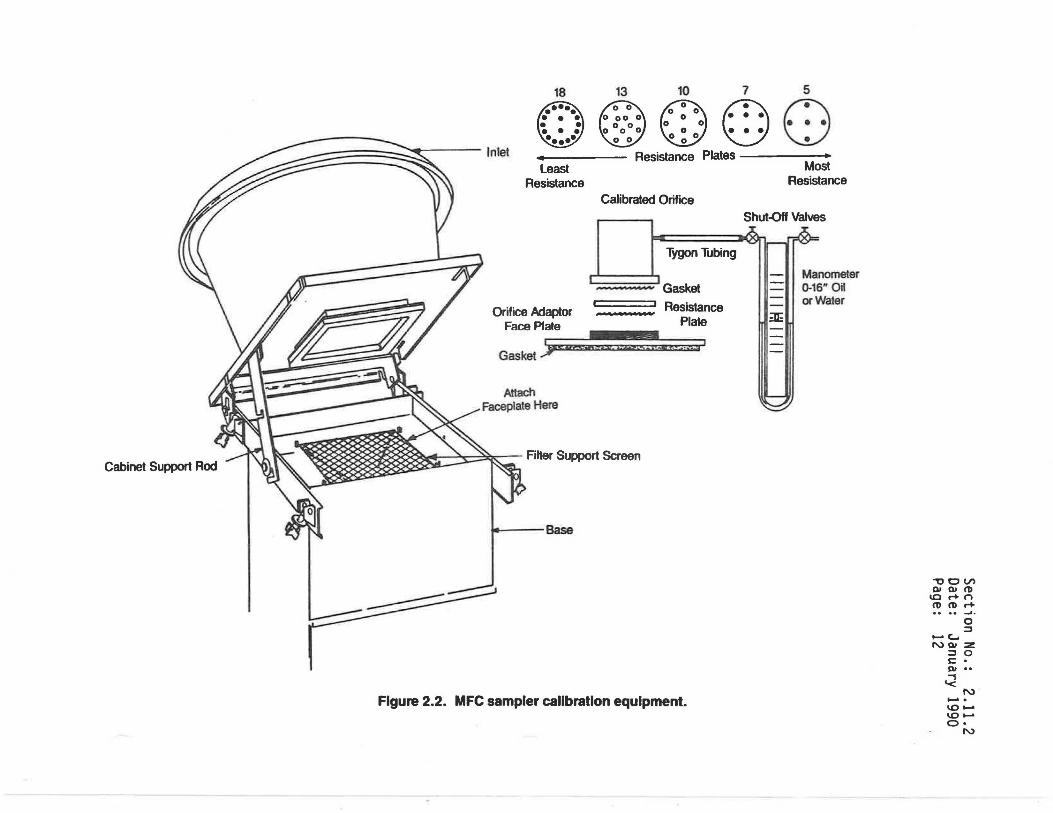
18 13 10 7 5
00 • • • • • ~ Inlet Resistance Plates ------
Most Resistance
Least Resistance
Calibrated Orifice
Tygon Tubing
Gasket
Resistance Plate
Orifice Adaptor Face Plate
Gasket )~-~s;ii. v:?:iesi .... ~;::~u~•· .. ~iw~i5~-a~ •• r;;,,;:.i; ... ;;j:l3 1
Attach Faceplate Here
:~~~~mm~~~~lF~ Filter support Screen
.. Base
Figure 2.2. MFC sampler callbratlon equipment.
Shut-Off Valves
:IE
Manometer 0-16" Oil or Water
"1:1 CJ VI QI QI t1) '° r+ n t1) t1) r+
0 ~
-c... N QI :z ~o c . QI ••
~ N -. '°'°O• N
Section No.: 2.11.2 Date: January 1990 Page: 13
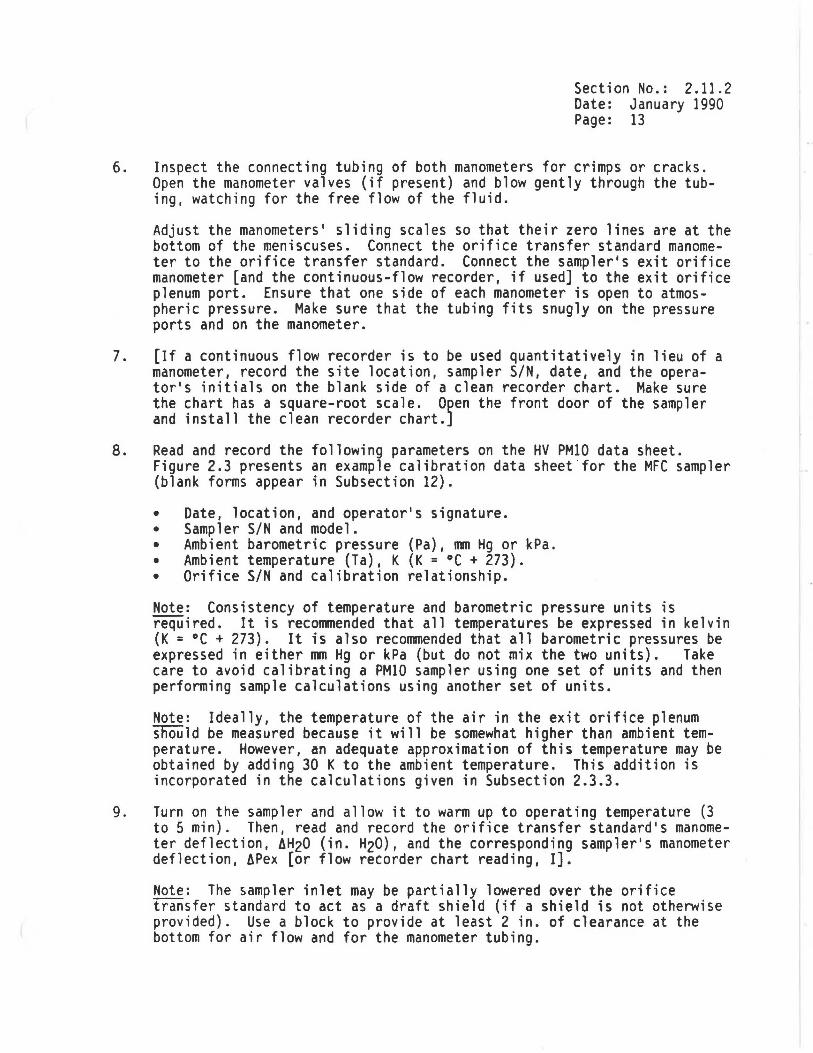
6. Inspect the connecting tubing of both manometers for crimps or cracks. Open the manometer valves (if present) and blow gently through the tubing, watching for the free flow of the fluid.
Adjust the manometers' sliding scales so that their zero lines are at the bottom of the meniscuses. Connect the orifice transfer standard manometer to the orifice transfer standard. Connect the sampler's exit orifice manometer [and the continuous-flow recorder, if used] to the exit orifice plenum port. Ensure that one side of each manometer is open to atmospheric pressure. Make sure that the tubing fits snugly on the pressure ports and on the manometer.
7. [If a continuous flow recorder is to be used quantitatively in lieu of a manometer, record the site location, sampler S/N, date, and the operator's initials on the blank side of a clean recorder chart. Make sure the chart has a square-root scale. O~en the front door of the sampler and install the clean recorder chart.J
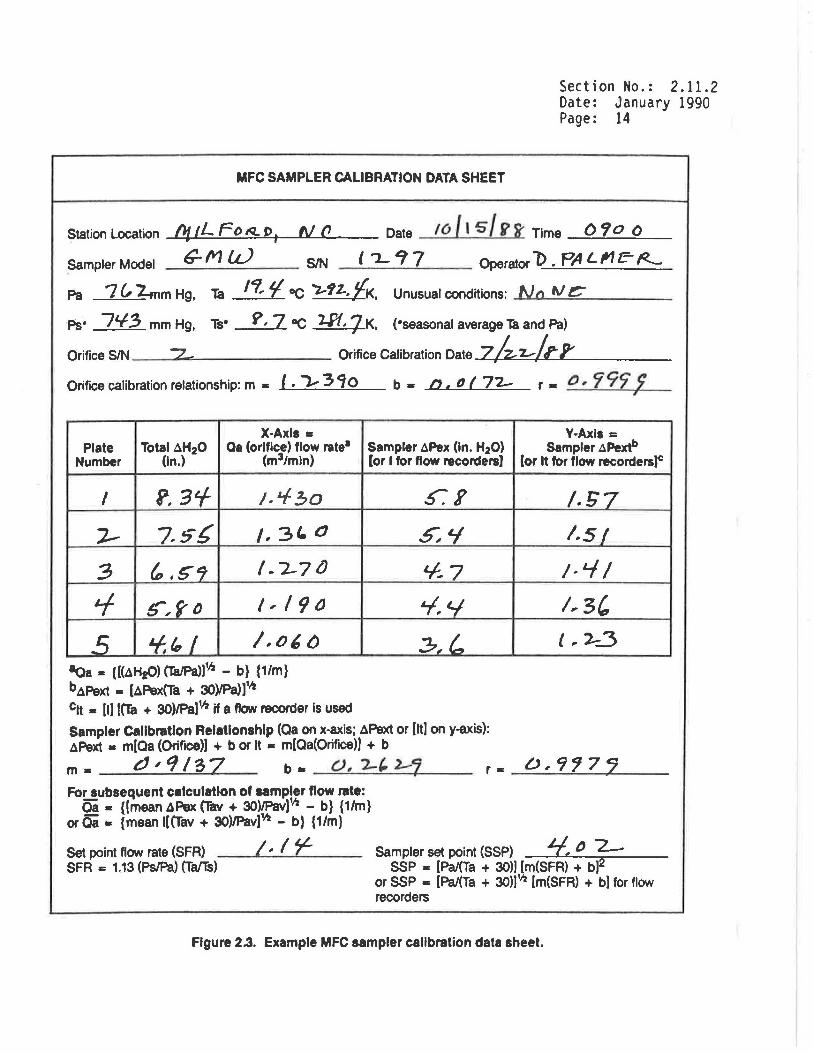
8. Read and record the following parameters on the HV PMlO data sheet. Figure 2.3 presents an example calibration data sheet.for the MFC sampler (blank forms appear in Subsection 12).
• Date, location, and operator's signature. • Sampler S/N and model. • Ambient barometric pressure (Pa), 11111 Hg or kPa. • Ambient temperature (Ta), K (K = °C + 273). • Orifice S/N and calibration relationship.
Note: Consistency of temperature and barometric pressure units is required. It is reconrnended that all temperatures be expressed in kelvin (K = °C + 273). It is also recormnended that all barometric pressures be expressed in either mm Hg or kPa (but do not mix the two units). Take care to avoid calibrating a PMIO sampler using one set of units and then performing sample calculations using another set of units.
Note: Ideally, the temperature of the air in the exit orifice plenum should be measured because it will be somewhat higher than ambient temperature. However, an adequate approximation of this temperature may be obtained by adding 30 K to the ambient temperature. This addition is incorporated in the calculations given in Subsection 2.3.3.
9. Turn on the sampler and allow it to warm up to operating temperature (3 to 5 min). Then, read and record the orifice transfer standard's manometer deflection, AH20 (in. H20), and the corresponding sampler's manometer deflection, 6Pex [or flow recorder chart reading, I].
Note: The sampler inlet may be partially lowered over the orifice transfer standard to act as a draft shield (if a shield is not otherwise provided). Use a block to provide at least 2 in. of clearance at the bottom for air flow and for the manometer tubing.
Section No.: 2.11.2 Date: January 1990 Page: 14
MFC SAMPLER CALIBRATION DATA SHEET
Station Location _.Oz.._......i'-L---"-F_o_R.-"'-=-1>+1 ~tJ~l'_...___ Date t 6 f t s / V i' Time 0 "IO 0
Sampler Model _ G-_ M_u.J ___ SIN _l_L-_~--'-7 __ Operator 1> . PA L ~ E- p..__
Pa 7 (, bmm Hg, Ta /'1, f oC '1.-fZ.. fK, Unusual conditions: _,,N.-..uo.....;;W.;;....:e;-:;__ ___ _
·Ps• 7'-1.3 mm Hg, Ts• V. 7 oC 2¥f. 7 K, (•seasonal average Ta and Pa)
Orifice SIN __ ?. .... ~ ... ------- Orifice Calibration Date 7 /z.. -z-/r I' v .
Orifice calibration relationship: m • t. ,._. 3<io b• ,, '" l 72- r. O, 797 i_ 1'
X·Axls = Plate Total AH20 Qa (orifice) flow rate•
Number (In.) (m3/mln)
I f, 3'f 1.'f-30
i- 7.s£ /., 3l. 0
.3 t, . 5"' 1-2-7lJ
'f tr, yo ,, /9()
_t; 'f, to I /.,o(, tJ 8aa • {[(AHz(>) (Ta/Pa)]1
h - b} f1/m} bAPext • [APex(Ta + 30)/Pa))'h
C1t • [I] ((Ta + 30)/Pa]YI if a flow recorder is used
Y-Axls = Sampler APex (In. H20) Sampler APextb [or I for flow recorders] [or It for flow recorders]c
.s-: I' /. !;7
5, Lf l.s I
Lf-7 l·'-11
'-1 .. t../ /,3,
:7~ L {" 2-_3
Sampler Calibration Relatlonshlp (Qa on x-axis; APext or (It] on y-axis): APext • m(Qa (Orifice)] + b or It • m[Qa(Orifice)] + b
m. d' '113 7 b • 0, '- &. l-1 r • _b_,;_,9~'!_7....,J.L---For subsequent calculatlon of sampler flow rate:
Qa - {[mean APex (Tav + 30)/Pav]YI - b} {1/m} or Qa • {mean l[(Tav + 30)/Pav]~ - b} {1/m}
Set point flow rate (SFR) /.. I ~ SFR = 1.13 (Ps/Pa) (Ta!Ts)
Sampler set point (SSP) ~ 0 2--SSP -= [Pa/(Ta + 30)) [m(SFR) + b]2
or SSP • [Pa/(Ta + 30)]'"2 [m(SFR) + b] for flow recorders
Figure 2.3. Example MFC sampler calibration data sheet.
Section No.: 2 .11. 2 Date: January 1990 Page: 15
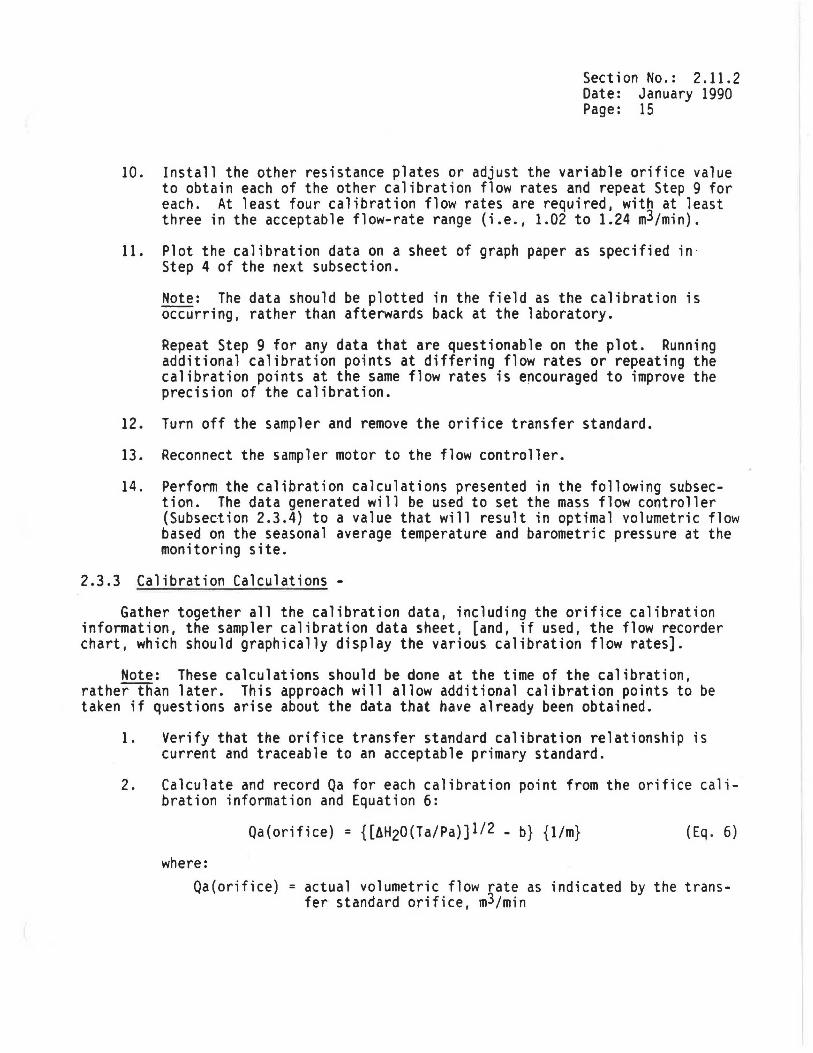
10. Install the other resistance plates or adjust the variable orifice value to obtain each of the other calibration flow rates and repeat Step 9 for each. At least four calibration flow rates are required, with at least three in the acceptable flow-rate range (i.e., 1.02 to 1.24 m3/min).
11. Plot the calibration data on a sheet of graph paper as specified in· Step 4 of the next subsection.
Note: The data should be plotted in the field as the calibration is occurring, rather than afterwards back at the laboratory.
Repeat Step 9 for any data that are questionable on the plot. Running additional calibration points at differing flow rates or repeating the calibration points at the same flow rates is encouraged to improve the precision of the calibration.
12. Turn off the sampler and remove the orifice transfer standard.
13. Reconnect the sampler motor to the flow controller.
14. Perform the calibration calculations presented in the following subsection. The data generated will be used to set the mass flow controller (Subsection 2.3.4) to a value that will result in optimal volumetric flow based on the seasonal average temperature and barometric pressure at the monitoring site.
2.3.3 Calibration Calculations -
Gather together all the calibration data, including the orifice calibration information, the sampler calibration data sheet, [and, if used, the flow recorder chart, which should graphically display the various calibration flow rates].
Note: These calculations should be done at the time of the calibration, rather-ffian later. This approach will allow additional calibration points to be taken if questions arise about the data that have already been obtained.
1. Verify that the orifice transfer standard calibration relationship is current and traceable to an acceptable primary standard.
2. Calculate and record Qa for each calibration point from the orifice calibration information and Equation 6:
Qa(orifice) = {[6H20(Ta/Pa)]l/2 - b} {1/m} ( Eq . 6)
where: Qa(orifice) = actual volumetric flow rate as indicated by the trans
fer standard orifice, m3/min
AH20 Ta Pa b m
= = = = =
Section No.: 2.11.2 Date: January 1990 Page: 16
pressure drop across the orifice, mm (or in.) H20 ambient temperature during use, K (K s °C + 273) ambient barometric pressure during use, mm Hg (or kPa) intercept of the orifice calibration relationship slope of the orifice calibration relationship.
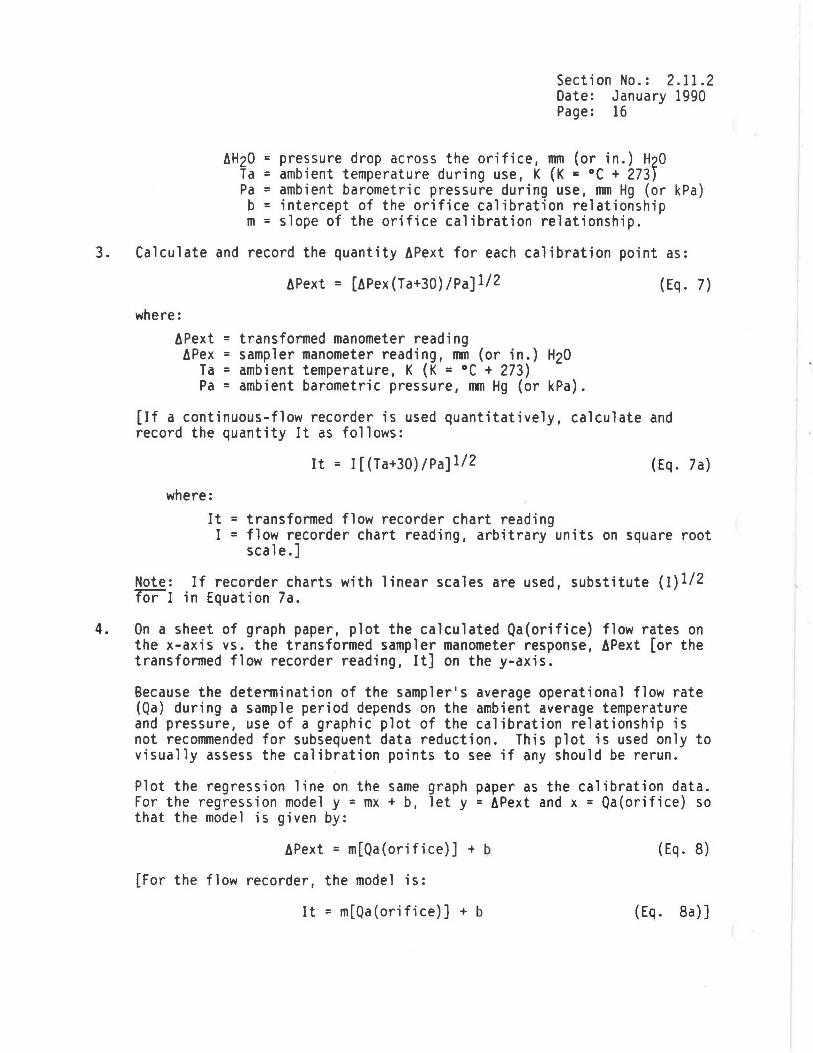
3. Calculate and record the quantity APext for each calibration point as:
APext = [APex(Ta+30)/Pa]l/2
where: APext = transformed manometer reading
APex = sampler manometer reading, mm (or in.) H20 Ta = ambient temperature, K (K = °C + 273) Pa= ambient barometric pressure, mm Hg (or kPa).
(Eq. 7)
[If a continuous-flow recorder is used quantitatively, calculate and record the quantity It as follows:
It = l[(Ta+30)/Pa]l/2 (Eq. 7a)
where: It = transformed flow recorder chart reading I = flow recorder chart reading, arbitrary units on square root
scale.]
Note: If recorder charts with linear scales are used, substitute (I)l/2 lOr""I in Equation 7a.
4. On a sheet of graph paper, plot the calculated Qa(orifice) flow rates on the x-axis vs. the transformed sampler manometer response, APext [or the transformed flow recorder reading, It] on the y-axis.
Because the determination of the sampler's average operational flow rate (Qa) during a sample period depends on the ambient average temperature and pressure, use of a graphic plot of the calibration relationship is not recommended for subsequent data reduction. This plot is used only to visually assess the calibration points to see if any should be rerun.
Plot the regression line on the same graph paper as the calibration data. For the regression model y = mx + b, let y = APext and x = Qa(orifice) so that the model is given by:
APext = m[Qa(orifice)] + b ( Eq. 8)
[For the flow recorder, the model is:
It = m[Qa(orifice)] + b (Eq. 8a)]
Section No.: 2.11.2 Date: January 1990 Page: 17
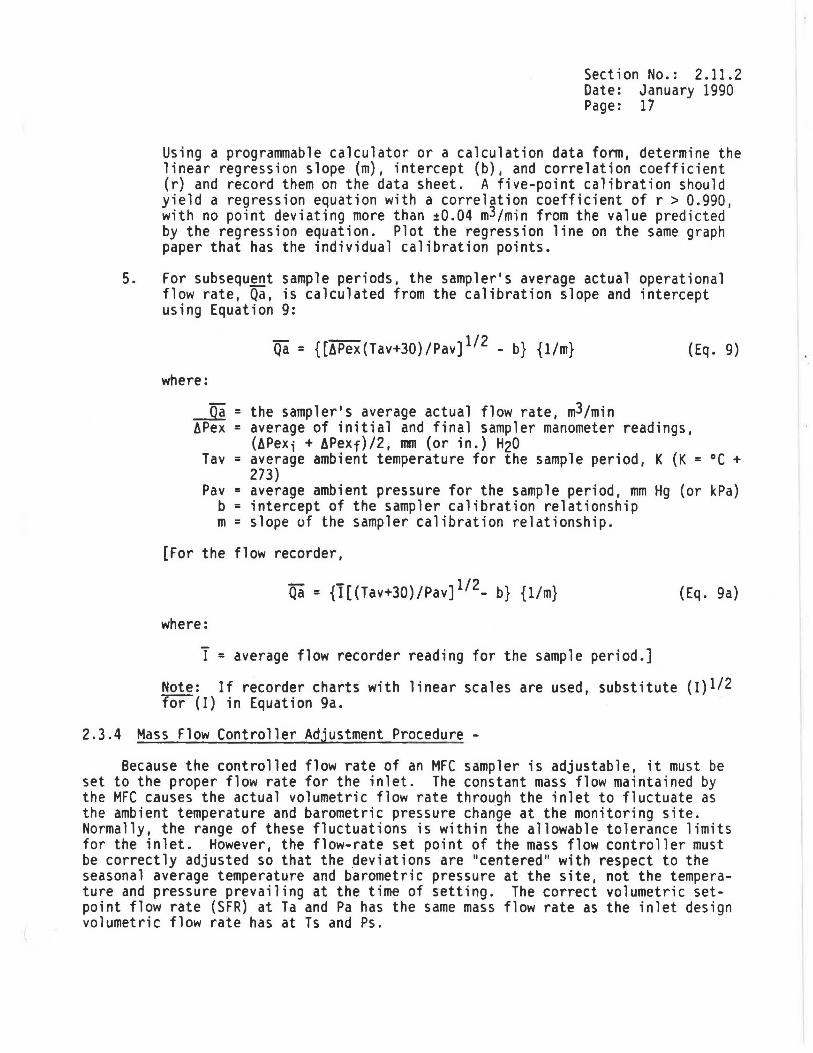
Using a programmable calculator or a calculation data fonn, determine the linear regression slope (m), intercept (b}, and correlation coefficient (r) and record them on the data sheet. A five-point calibration should yield a regression equation with a correlation coefficient of r > 0.990, with no point deviating more than t0.04 m3/min from the value predicted by the regression equation. Plot the regression line on the same graph paper that has the individual calibration points.
5. For subsequ~t sample periods, the sampler's average actual operational flow rate, Qa 1 is calculated from the calibration slope and intercept using Equation 9:
Qa = {[APex(Tav+30)/Pav] 112 - b} {1/m} (Eq. 9)
where:
Qa = the sampler's average actual flow rate, m3/min APex = average of initial and final sampler manometer readings,
(APexi + APexf)/2, Rill (or in.) H20 Tav = average ambient temperature for the sample period, K (K = °C +
273) Pav = average ambient pressure for the sample period, mm Hg (or kPa)
b = intercept of the sampler calibration relationship m = slope of the sampler calibration relationship.
[For the flow recorder,
Qa = {I[(Tav+30}/Pav] 112- b} {1/m} (Eq. 9a)
where:
T = average flow recorder reading for the sample period.]
Note: If recorder charts with linear scales are used, substitute (I)l/2 ~(I) in Equation 9a.
2.3.4 Mass Flow Controller Adjustment Procedure -
Because the controlled flow rate of an MFC sampler is adjustable, it must be set to the proper flow rate for the inlet. The constant mass flow maintained by the MFC causes the actual volumetric flow rate through the inlet to fluctuate as the ambient temperature and barometric pressure change at the monitoring site. Normally, the range of these fluctuations is within the allowable tolerance limits for the inlet. However, the flow-rate set point of the mass flow controller must be correctly adjusted so that the deviations are "centered" with respect to the seasonal average temperature and barometric pressure at the site, not the temperature and pressure prevailing at the time of setting. The correct volumetric setpoint flow rate (SFR) at Ta and Pa has the same mass flow rate as the inlet design volumetric flow rate has at Ts and Ps.
Section No.: 2.11.2 Date: January 1990 Page: 18
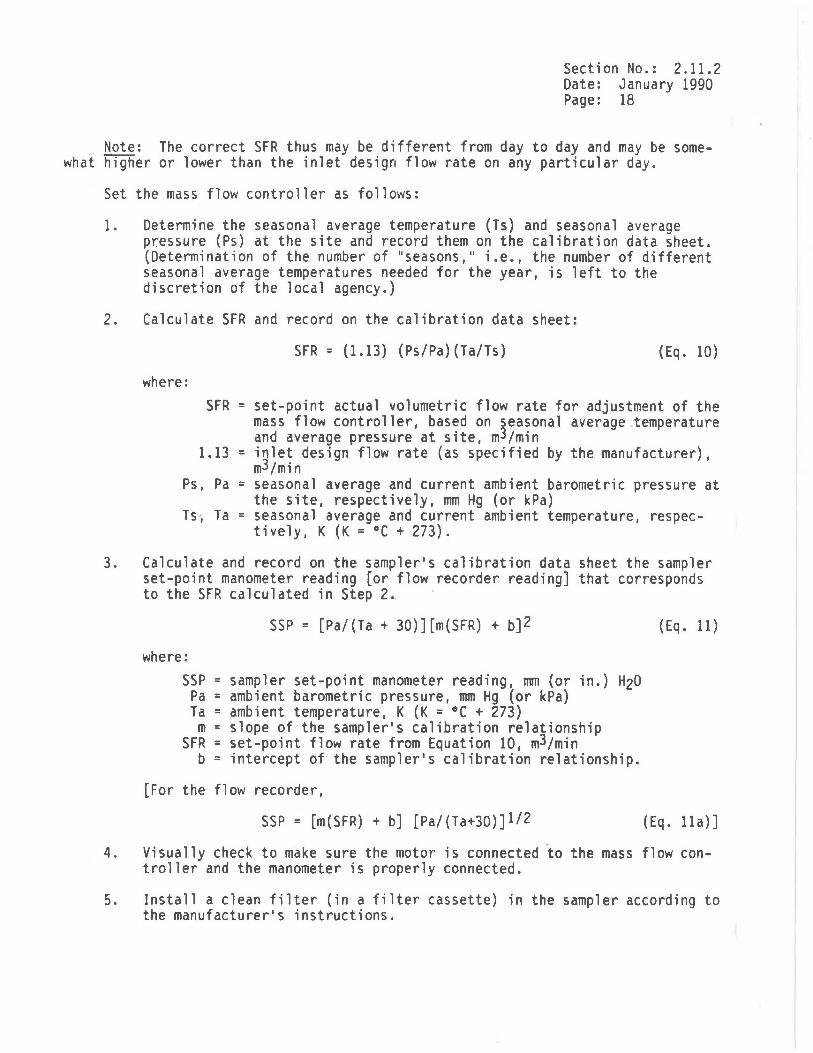
Note: The correct SFR thus may be different from day to day and may be somewhat higher or lower than the inlet design flow rate on any particular day.
Set the mass flow controller as follows:
1. Determine the seasonal average temperature (Ts) and seasonal average pressure (Ps) at the site and record them on the calibration data sheet. (Determination of the number of 11 seasons, 11 i.e., the number of different seasonal average temperatures needed for the year, is left to the discretion of the local agency.)
2. Calculate SFR and record on the calibration data sheet:
where: SFR
1.13
Ps, Pa
Ts; Ta
=
=
=
=
SFR = (1.13) (Ps/Pa) (Ta/Ts) (Eq. 10)
set-point actual volumetric flow rate for adjustment of the mass flow controller, based on seasonal average temperature and average pressure at site, m3/min inlet design flow rate (as specified by the manufacturer), m3/min seasonal average and current ambient barometric pressure at the site, respectively, mm Hg (or kPa) seasonal average and current ambient temperature, respectively, K (K = °C + 273).
3. Calculate and record on the sampler's calibration data sheet the sampler set-point manometer reading [or flow recorder reading] that corresponds to the SFR calculated in Step 2. ·
SSP = [Pa/(Ta + 30)][m(SFR) + b]2
where: SSP = sampler set-point manometer reading, mm (or in.) H20
Pa = ambient barometric pressure, mm Hg (or kPa) Ta = ambient temperature, K (K = °C + 273) m = slope of the sampler's calibration relationship
SFR = set-point flow rate from Equation 10, m3/min b = intercept of the sampler's calibration relationship.
[For the flow recorder,
SSP = [m(SFR) + b] [Pa/(Ta+30)]1/2
( Eq. 11)
(Eq. lla)]
4. Visually check to make sure the motor is connected to the mass flow controller and the manometer is properly connected.
5. Install a clean filter (in a filter cassette} in the sampler according to the manufacturer's instructions.
Section No.: 2.11.2 Date: January 1990 Page: 19
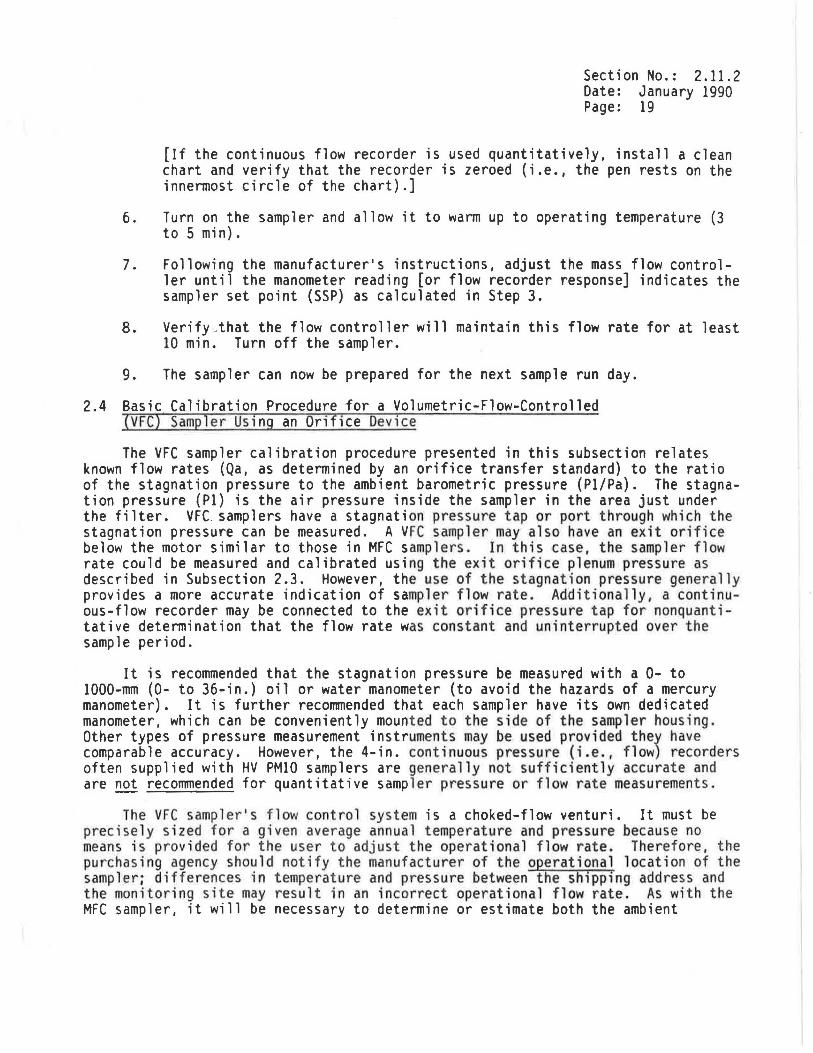
[If the continuous flow recorder is used quantitatively, install a clean chart and verify that the recorder is zeroed (i.e., the pen rests on the innermost circle of the chart).]
6. Turn on the sampler and allow it to warm up to operating temperature (3 to 5 min).
7. Following the manufacturer's instructions, adjust the mass flow controller until the manometer reading [or flow recorder response] indicates the sampler set point (SSP) as calculated in Step 3.
8. Verify~that the flow controller will maintain this flow rate for at least 10 min. Turn off the sampler.
9. The sampler can now be prepared for the next sample run day.
2.4 Basic Calibration Procedure for a Volumetric-Flow-Controlled (VFC) Sampler Using an Orifice Device
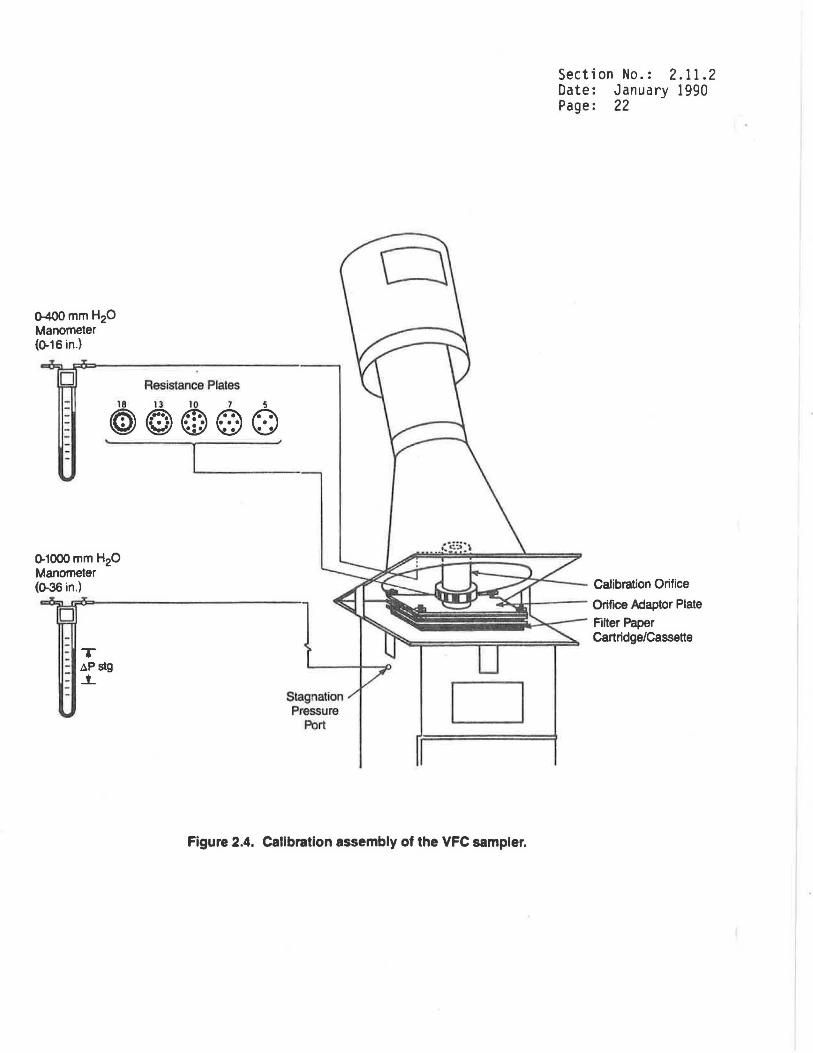
The VFC sampler calibration procedure presented in this subsection relates known flow rates (Qa, as determined by an orifice transfer standard) to the ratio of the stagnation pressure to the ambient barometric pressure (Pl/Pa). The stagnation pressure (Pl) is the air pressure inside the sampler in the area just under the filter. VFC. samplers have a stagnation pressure tap or port through which the stagnation pressure can be measured. A VFC sampler may also have an exit orifice below the motor similar to those in MFC samplers. In this case, the sampler flow rate could be measured and calibrated using the exit orifice plenum pressure as described in Subsection 2.3. However, the use of the stagnation pressure generally provides a more accurate indication of sampler flow rate. Additionally, a continuous-flow recorder may be connected to the exit orifice pressure tap for nonquantitative determination that the flow rate was constant and uninterrupted over the sample period.
It is recommended that the stagnation pressure be measured with a 0- to 1000-mm (0- to 36-in.) oil or water manometer (to avoid the hazards of a mercury manometer). It is further recommended that each sampler have its own dedicated manometer, which can be conveniently mounted to the side of the sampler housing. Other types of pressure measurement instruments may be used provided they have comparable accuracy. However, the 4-in. continuous pressure (i.e., flow) recorders often supplied with HV PMIO samplers are generally not sufficiently accurate and are not recommended for quantitative sampler pressure or flow rate measurements.
The VFC sampler's fl ow control system is a choked-flow venturi. It must be precisely sized for a given average annual temperature and pressure because no means is provided for the user to adjust the operational flow rate. Therefore, the purchasing agency should notify t he manufacturer of the operational location of the sampler; differences in temperature and pressure between the shipping address and the monitoring si t e may result in an incorrect operational flow rate. As with the MFC sampler, it will be necessary to determine or estimate both the ambient
Section No.: 2.11.2 Date: January 1990 Page: 20
temperature and barometric pressure readings during the sample period for the subsequent calculation of total sample volume in standard volume units.
For this VFC calibration procedure, the following conditions are assumed:
• The VFC sampler uses a choked-flow venturi to control the actual volumetric flow rate.
• The sampler flow rate is measured by measuring the stagnation pressure ratio, and the sampler is not equipped with a continuous flow recorder.
• The sampler inlet is designed to operate at a constant actual volumetric flow rate of 1.13 m3/min, and the acceptable flow-rate range is ±10 percent of this value.
• The transfer standard for the flow-rate calibration is an orifice device equipped with either a series of resistance plates or an integral variable-resistance valve. The pressure drop across the orifice is measured by an associated water or oil manometer.
• The sampler will be calibrated in actual volumetric flow-rate units (Qa), and the orifice transfer standard is also calibrated in Qa, as specified in Subsection 2.2.
2.4.1 Calibration Equipment -
1. Orifice transfer standard with proper calibration traceable to NIST (see Subsection 2.2).
Note: The predrilled resistance plates that are supplied with the orifice transfer standard may have to be modified for the calibration of PMlO samplers. The holes in the plates may have to be enlarged or additional holes may have to be drilled to obtain flow rates within the acceptable range. Alternatively, new resistance plates could be purchased if they are available.
2. An associated water or oil manometer, with a 0- to 400-mm (O- to 16-in.) range and minimum scale divisions of 2 mm (0.1 in.) for measurement of transfer standard pressure.
3. An oil or water manometer, with a 0- to 1000-nnn (0- to 36-in.) range and minimum scale divisions of 2 mm (0.1 in.) or other pressure measurement device for measurement of the sampler stagnation pressure. Ideally, this manometer (or other pressure instrument) should be associated with the sampler.
Note: Manometers used for field calibration may be subject to damage or malfunction and should thus be checked frequently.
4. Thermometer, capable of accurately measuring temperature over the range of 0 to 50 °C (273 to 323 K) to the nearest ±1 °C and referenced to an NIST or ASTM thermometer within ±2 °C at least annually.

Section No.: 2.11.2 Date: January 1990 Page: 21
5. A portable, aneroid barometer (e.g ., a climber's or engineer's altimeter), capable of accurately measuring ambient barometric pressure over the range of 500 to 800 mm Hg (66 to 106 kPa) to the nearest mm Hg and referenced within iS mm Hg to a barometer of known accuracy at least annually.
6. Calibration data sheets or the station log book and 51-nrn (2-in.)-wide duct tape.
7. A clean filter.
2.4.2 Multipoint Flow-Rate Calibration Procedure - VFC Sampler -
The procedure presented here is basic and intended to be. generic, given the assumptions listed in Subsection 2.4. There may be more detailed calibration procedures, variations, or alternative calibration procedures presented ·;n the manufacturer's instruction manual. It is recommended that the manual be reviewed carefully and that the various calibration variations or alternative procedures be evaluated. In-house equipment and personnel, procedura l simplicity and uniformity, and subsequent data applications should be considered in estab li shing t he specific, detailed calibration procedure to be implemented.
Note: The calibration of some VFC samplers may be affected by changes in line voltage, particularly if the line voltage is below normal (normal is about 115 VAC). For this reason, VFC samplers should always be calibrated at the monitoring site. Further, if the line voltage at the site is low and likely to fluctuate significantly, a line voltage booster or regulator may be advisable. Also, be sure that replacement blower motors are of the correct type. Avoid the use of loweramperage blower motors that are intended for use in HV TSP samplers.
Caution: Do not attempt to calibrate the VFC sampler under windy conditions. Short-term velocity fluctuations will produce variable pressure readings by the orifice transfer standard's manometer. The calibration will be less precise because of the pressure variations.
1. Set up the calibration system as recommended by the manufacturer. Figure 2.4 illustrates the calibration configuration of a typical VFC sampler. The VFC sampler manufacturer may specify that the sampler be calibrated with a filter installed, which generally precludes calibration flow rates higher than normal operating flow rate. Additional calibration flow rates obtained withou~ a filter may be appropriate, as discussed in Step 8.
2. Install the orifice transfer standard and its adapter faceplate on the sampler: First inspect all gaskets and seals, and replace any doubtful ones.
Caution: Tighten the faceplate nuts evenly on alternate corners to properly align and uniformly seat the gaskets. The nuts should be handtightened only; too much compression can damage the sealing gasket.
0-400mm H20 Manometer (0-16 in.)
0
0-1000 mm H20 Manometer (0-36 in.)
D
- T - ~p stg -i
Resistance Plates
Stagnation Pressure
Port
Figure 2.4. Calibration assembly of the VFC sampler.
Section No.: 2.11.2 Date: January 1990 Page: 22
Section No.: 2.11.2 Date: January 1990 Page: 23
3. Select a calibration flow rate and install the appropriate resistance plate (or no plate) or adjust the variable resistance valve. At least four flow rates are required to define the calibration relationship. At least three flow rates should be within the acceptable flow-rate range (i.e., 1.02 to 1.24 m3/min) for the sampler inlet. For resistance plate orifices, make sure the orifice and resistance plate gaskets are in place and the orifice is not cross-threaded on the faceplate.
4. Leak Test: Block the orifice with a large-diameter rubber stopper, wide duct tape, or other suitable means. Seal both orifice and stagnation pressure ports with rubber caps or similar devices. Turn on the sampler.
Caution: Avoid running the sampler for longer than 30 s at a time with the orifice blocked. This precaution will reduce the chance that the motor will be overheated due to the lack of cooling air. Such overheating can shorten the motor's lifetime. It can raise temperatures to the point of defeating the electrical insulation, which could result in fire or electric shock to the user.
Gently rock the orifice transfer standard and listen for a whistling sound that would indicate a leak in the system. Leaks are usually caused either by a damaged or missing gasket between the orifice transfer standard and the faceplate or by crossthreading of the orifice transfer standard on the faceplate. All leaks must be eliminated before proceeding with the calibration. When the system is determined to be leak-free, turn off the sampler and unblock the orifice.
Note: The leak test procedure that is described above is one of many alternate procedures which may be used. Operating agencies may develop· their own procedures.
5. Inspect the connecting tubing of the manometers for crimps or cracks. Open the manometer valves (if present) and blow gently through the tubing, watching for the free flow of the fluid.
Adjust the manometers' sliding scales so that their zero lines are at the bottom of the meniscuses. Connect the transfer standard manometer to the transfer standard and the sampler stagnation pressure manometer (or other pressure instrument) to the stagnation pressure port. Ensure that one side of each manometer is open to atmqspheric pressure. Make sure the tubing fits snugly on the pressure ports and on the manometers.
6. Read and record the following parameters on the VFC Sampler Data Sheet. Figure 2.5 presents an example calibration data sheet for the VFC sampler (blank forms appear in Subsection 12).
• Date, location, and operator's signature. • Sampler S/N and model.

Section No.: 2.11 .2 Date: January 1990 Page: 24
VFC SAMPLER CALIBRATION DATA SHEET
Station Location C '- £ tJ:P" RR , ~ A Date 5 {, / Y1 Time )_; 3o A'l:J Sampler Model Wc,pp1N~ SIN 4..3lf1Jl7<'.)17 2.P Operator T: W1.sBSrtl
Pa 7£ 5 mm Hg, Ta "'2..--J... -z.......- °C XS. '"2..-K, Unusual Conditions /11'4 IVE-Orifice S/N "l- Orifice Calibration Date 7 I i..:2-ir r
I
Orifice Calibration Relationship: m • I. "2-.69c b • ~ .0/ 7v r • 0.9'i97
Plate No.
aPstg (mm Hg)•
Operational Flow Rate U . l-L)
8mm Hg • 25.4 (in. H20/13.6)
baa (orifice) = 1/m {( (aH20) (TaJPa)J1h - b}
c% Difference • r Oa (sampler) - Qa (orifice) l [100) [ Qa (orifice) J
Sampler Calibration Relationship "}!!!( Lookup Table Validated (i.e. , O/o difference < 4) D New calibration relationship:
(X = Qa (orifice), y .. (P1 /Pa)
(Taf12
m= ___ b• --- r•
For subsequent calculation of sampler flow rate:
Oa = {[P1/Pa - b)[Taf"'} {1/m}
Operational Flow Rate / . l 'i I m3/min
o. s.:J
Qa (Orifice)
/. 17 /,/_ ~
Qa (orifice) flow rateb (m3/mln)
-Qa (sampler)
(Lookup Table)
/,. 1~'7 /.115
Figure 2.5. Example VFC sampler calibration data sheet.
Qa (orifice)
[Ta)'h
% Dlfferencec
-1- 'f--/ . .3
Section No.: 2.11.2 Date: January 1990 Page: 25
• Ambient barometric pressure (Pa), mm Hg (or kPa). • Ambient temperature (Ta), °C and K (K = °C + 273). • Orifice S/N and calibration relationship.
Note: Consistency of temperature and barometric pressure units is required. It is recommended that all temperatures be expressed in kelvin (K = °C + 273). It is also recommended that all barometric pressures be expressed in either mm Hg or kPa (but do not mix the two units). Take care to avoid calibrating a PMlO sampler using one set of units and then performing sample calculations using another set of units.
7. Turn on the sampler and allow it to warm up to operating temperature (3 to 5 min).
Note: The sampler inlet may be partially lowered over the orifice transfer standard to act as a draft shield (if a shield is not otherwise provided). Use a block to provide at least 2 in. of clearance at the bottom for air flow and for the manometer tubing).
Then, read and record the orifice transfer standard's manometer reading, AH20, and the corresponding sampler relative stagnation pressure manometer reading, APstg, on the data sheet. (Relative stagnation pressure is a negative pressure [i.e., a vacuum] relative to atmospheric pressure as measured by a manometer with one leg open to the atmosphere.)
Note: Be sure to convert APstg to mm Hg using Equation 12 before recordTn'Q""the reading on the calibration data sheet:
lll1l Hg = 25.4(in. H20/13.6) (Eq. 12)
8. Install the other resistance plates or adjust the variable orifice value to obtain each of the other calibration flow rates and repeat Step 7 for each. At least four calibration flow rates are required, with at least three in the acceptable flow-rate range (i.e., 1.02 to 1.24 m3/min).
Difficulties may be encountered in obtaining flow rates in the acceptable range. Even with modified resistance plates (or with no plates) installed, it may be impossible to obtain three acceptable flow rates with a filter mounted on the sampler. In this case, either lower flowrate calibration points must be used and the calibration must be extrapolated into the acceptable range, or additional calibration points must be run without a filter installed in the sampler. If additional calibration points are obtained without a filter, they should be examined carefully to make sure they are consistent with the calibration points obtained with a filter (i.e., they fall on a smooth curve through all the calibration points).
9. Plot the calibration data on a sheet of graph paper as specified in Step 5 of the next subsection.

Section No.: 2.11.2 Date: January 1990 Page: 26
Note: The data should be plotted in the field as the calibration is occurring, rather than afterwards back at the laboratory.
Repeat Step 7 for any data that are questionable on the plot. Running additional calibration points at differing flow rates or repeating the calibration points at the same flow rates is encouraged to improve the precision of the calibration.
10. Turn off the sampler and remove the orifice transfer standard.
11. Install a clean filter on the sampler in the normal sampling mode (use a filter cassette if one is normally used). Turn on the sampler and allow it to warm up to operating temperature.
12. Read the relative stagnation pressure as in Step 7 and record it on the data sheet in the row for the operational flow rate.
13. Perform the calibration calculations presented in the following subsection.
2.4.3 Calibration Calculations -
Gather together all the calibration data, including the orifice transfer standard's calibration information and the sampler calibration data sheet.
Note: These calculations should be done at the time of the calibration, rather than later. This approach will allow additional calibration points to be taken if questions arise about the data that have already been obtained.
1. Verify that the orifice transfer standard calibration relationship is current and traceable to an acceptable primary standard.
2. Calculate and record Qa(orifice) for each calibration point from the orifiCe calibration informatio·n and Equation 6:
Qa(orifice) = {[6H20(Ta/Pa)]l/2 - b} {l/m} ( Eq. 6)
where: Qa(orifice) = actual volumetric flow rate as indicated by the trans
fer standard orifice, m3/min =pressure drop across the orifice, mm (or in.) H20 = ambient temperature during use, K (K = °C + 273) = ambient barometric pressure during use, mm Hg (or kP~) = intercept of the orifice transfer standard's calibra
m = tion relationship slope of the orifice transfer standard's calibration relationship.
3. Calculate and record the value of the absolute stagnation pressure, Pl, for each calibration point:

Pl = Pa - bPstg
where:
Pl = absolute stagnation pressure, mm Hg Pa = ambient barometric pressure, mm Hg
bPstg = relative stagnation pressure, mm Hg.
4. Calculate and record the stagnation pressure ratio:
Stagnation pressure ratio = Pl/Pa
Section No.: 2.11.2 Date: January 1990 Page: 27
(Eq. 13)
(Eq. 14)
5. On a sheet of graph paper, plot the calculated orifice transfer standard's flow rates, Qa(orifice), on the x-axis vs. the corresponding stagnation pressure ratios, Pl/Pa, on the y-axis. Draw a smooth curve through the plotted data. If necessary, extrapolate the curve to include the acceptable flow-rate range.
6. If the sampler manufacturer has provided a factory calibration table (i.e., the lookup table) for the sampler, compare Qa(orifice) for several points on the calibration plot with Qa(sampler) determined from the factory calibration at Ta. Calculate the percentage difference between Qa(orifice) and Qa(sampler) using Equation 17:
• Difference = [Oa(sampler) ; ga(orifice)] [ioo] 0 Qa(or1f1ce) (Eq. 17)
\
If the agreement is within a few (i.e., 3 or 4) percent, the factory calibration is validated and may be used for subsequent sample periods. Proceed to Subsection 2.4.5.
7. If the agreement is not within a few percent, recheck the accuracy of the orifice transfer standard and recheck the calibration procedure. Look for leaks, manometer reading errors, incorrect temperature or pressure data, or miscalculations. Also check for abnormally low line voltage at the site (it should be at least 110 VAC), for the correct blower motor, and for the presence of a gasket between the motor and the choked-flow venturi. A factory calibration is not likely to be substantially incorrect, and any discrepancy of more than a few percent is probably due to some problem with the sampler or with the calibration procedure. However, if no errors or problems with the sampler or with the calibration can be found, or if no factory calibration is provided by the manufacturer, proceed as described in Subsection 2.4.4.
2.4.4 Generation of Calibration Relationship - VFC Sampler -
1. For each calibration point, calculate and record the quantity,
Qa(orifice)/[Ta]l/2

2.
where:
Section No.: 2.11.2 Date: January 1990 Page: 28
Qa(orifice) = actual volumetric flow rate as indicated by the transfer standard orifice, m3/min
Ta = ambient temperature during sampler calibration, K (K = °C + 273)
For the general linear regression model, y =· mx + b, let y =Pl/Pa and let x = Qa(orifice)/[Ta]l72, such that the model is given by:
Pl/Pa = m[Qa(orifice)]/[Ta]l/2 + b (Eq. 15}
Calculate the linear regression slope (m), intercept (b), and correlation coefficient (r).
Note: Inspect the plotted calibration curve to determine whether any of the calibration points that are substantially outside of the acceptable flow-rate range need to be eliminated so that they do not cause an inappropriate linear regression line.
3. For subsequ_fillt sample periods, the sampler's average actual operating flow rate, Qa, is calculated from the calibration slope and intercept using Equation 16:
Qa(sampler) = {[(Pi/Pav)-b][Tav]l/2}{1/m} (Eq. 16)
where:
Qa(sa!!!Qler) = the sampler's average actual flow rate, m3/min Pl/Pav= average stagnation pressure ratio for the sampling
period Tav = average ambient temperature for the sampling period, K
(K = °C + 273) b = intercept of the sampler calibration relationship m = slope of the sampler calibration relationship.
Note: 'The average value for Pl should be calculated from stagnation pressure measurements taken before and after the sampling period. Pav should be estimated from barometric pressure for the sampling period. See also Subsection 3.3 for additional information.
4. If a calibration (lookup) table is desired, evaluate Equation 16 for various appropriate values of Pl/Pa and Ta and list the corresponding values of Qa(sampler) in tabular form.
Note: A calibration table based on Equation 16 may not match the manufacturer's lookup table exactly because the manufacturer may use a different or more sophisticated model than Equation 15.
...
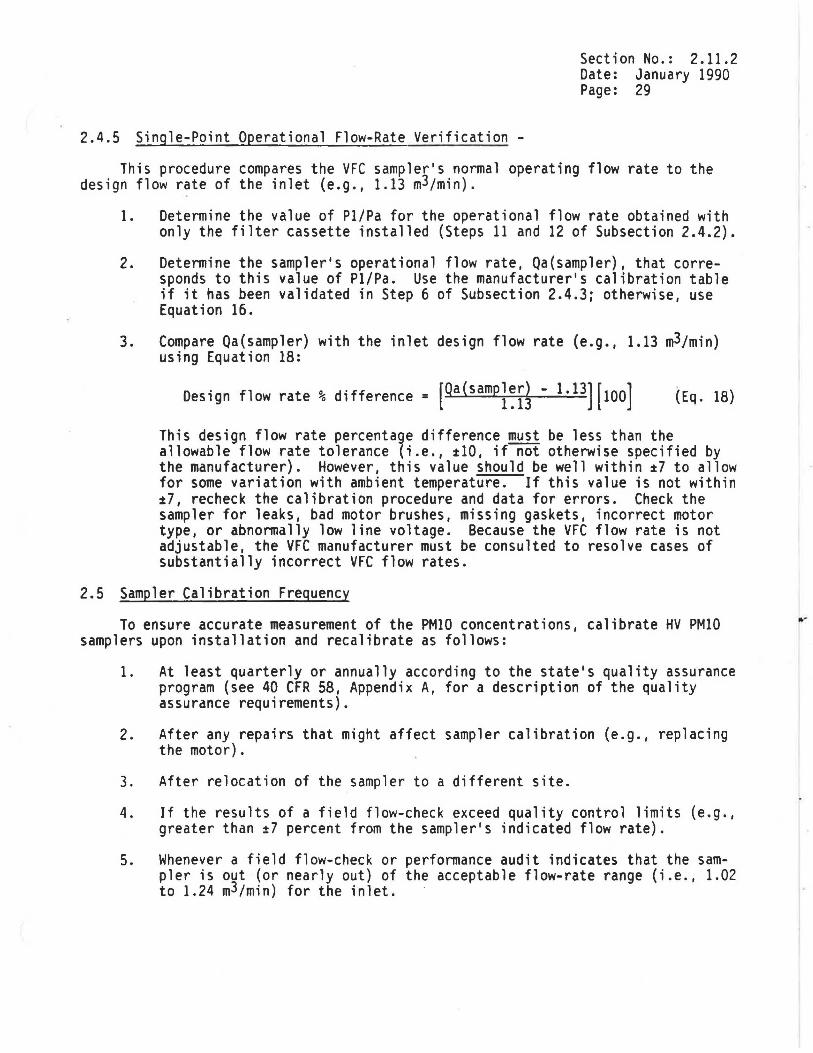
2.4.5 Single-Point Operational Flow-Rate Verification -
Section No.: 2.11.2 Date: January 1990 Page: 29
This procedure compares the VFC sampler's normal operating flow rate to the design flow rate of the inlet (e.g., 1.13 m3/min).
1. Determine the value of Pl/Pa for the operational flow rate obtained with only the filter cassette installed (Steps 11 and 12 of Subsection 2.4.2).
2. Determine the sampler's operational flow rate, Qa(sampler), that corresponds to this value of Pl/Pa. Use the manufacturer's calibration table if it has been validated in Step 6 of Subsection 2.4.3; otherwise, use Equation 16.
3. Compare Qa(sampler) with the inlet design flow rate (e.g., 1.13 m3/min) using Equation 18:
Design flow rate% difference= [Qa(sampl~r~ - 1•13)[100) (Eq. 18)
This design flow rate percentage difference must be less than the allowable flow rate tolerance (i.e., tlO, if not otherwise specified by the manufacturer). However, this value should be well within ±7 to allow for some variation with ambient temperature. If this value is not within ±7, recheck the calibration procedure and data for errors. Check the sampler for leaks, bad motor brushes, missing gaskets, incorrect motor type, or abnormally low line voltage. Because the VFC flow rate is not adjustable, the VFC manufacturer must be consulted to resolve cases of substantially incorrect VFC flow rates.
2.5 Sampler Calibration Frequency
To ensure accurate measurement of the PMIO concentrations, calibrate HV PMIO samplers upon installation and recalibrate as follows:
1. At least quarterly or annually according to the state's quality assurance program (see 40 CFR 58, Appendix A, for a description of the quality assurance requirements).
2. After any repairs that might affect sampler calibration (e.g., replacing the motor).
3. After relocation of the sampler to a different site.
4. If the results of a field flow-check exceed quality control limits (e.g., greater than ±7 percent from the sampler's indicated flow rate).
5. Whenever a field flow-check or performance audit indicates that the sampler is out (or nearly out) of the acceptable flow-rate range (i.e., 1.02 to 1.24 m3/min) for the inlet.
Section No.: 2.11.2 Date: January 1990 Page: 30
Note: Multipoint flow-rate calibrations should be distinguished from single-point, quality control flow checks (see Subsection 3.5). The latter are done more frequently than calibrations and are intended to check if the sampler flow rate, Qa(sampler), or the calibration relationship have changed significantly since the last calibration.
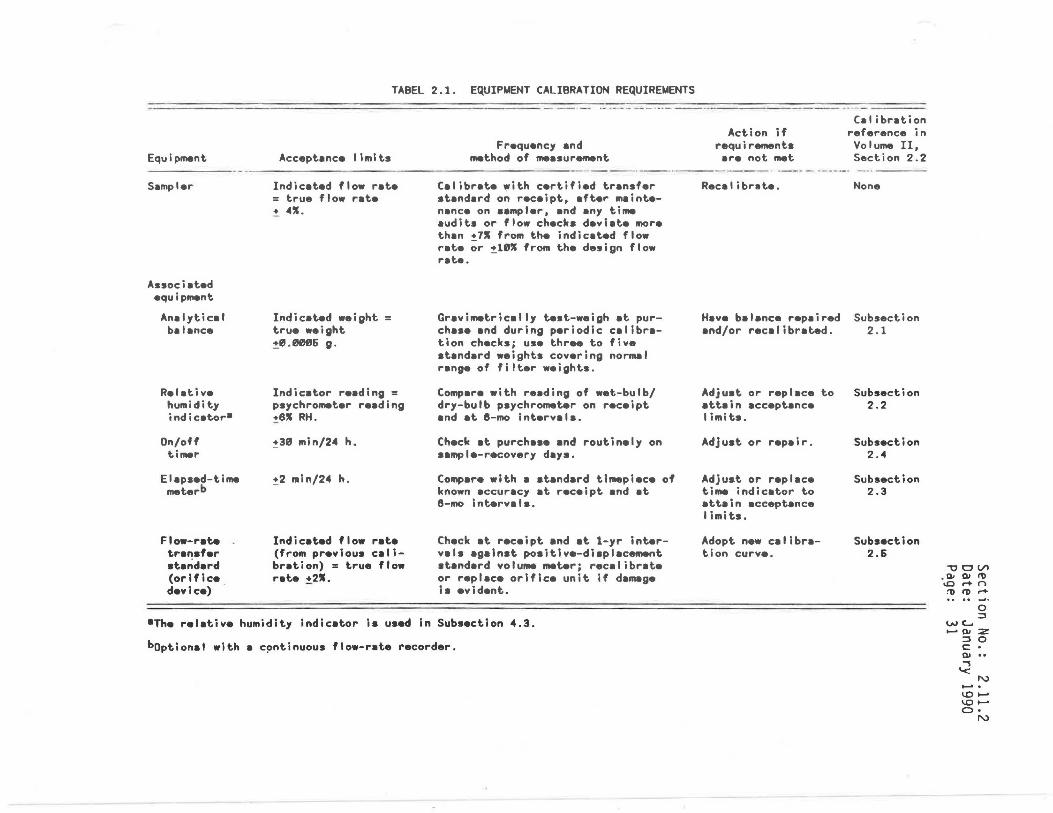
Equipment
S•mpler
Associ•t•d equipment
An•lytic•I b•l•nce
Rel•ti v• humidity indic•tor•
On/off timer
El•psed-time meterb
Flow-rate tr•nsfer st.nd•rd (or-If ice device) ·
TABEL 2.1. EQUIPMENT CALIBRATION REQUIREMENTS
Accept•nc• limits
Indic•ted flow r•t• = true flow r•t• ~ 41.
Indic•t•d weight = true weight ~8.llH!JfJ6 g.
Indic•tor r••dlng = psychrometer r••dlng !61 RH.
!38 min/24 h.
!2 min/24 h.
Indic•ted flow r•t• (from previous c•libr•tion) = true flow r•t• ~21.
Frequency •nd method of me•surement
C•libr•t• ~ith certified tr•nsfer st•nd•rd on receipt, •fter m•inten•nce on sampler, •nd •ny time •udits or flow checks devi•t• more th•n +71 from the indic•ted flow r•t• ~r !18" from the design flow r•te.
Gr•vimetrically test-weigh •t purch•s• •nd during periodic c•libr•tion checks; use three to five st•nd•rd weights covering normal r•nge of filter weights.
Comp•r• with re•ding of wet-bulb/ dry-bulb psychrometer on receipt •nd •t 8-mo interv•ls.
Check at purch•s• and routinely on s•mple-recovery d•ys.
Comp•r• with a st•ndard timepiece of known accuracy at receipt and at 8-mo interv•ls.
Check at receipt and •t 1-yr interv• ls •g•lnst positive-displacement st•nd•rd volume meter; recalibr•t• or repl•c• orifice unit if d•rnage is evident.
•The relative humidity indicator is used in Subsection 4.3.
boptional with a c~ntinuous flow-rate recorder.
Action if requir-nts •re not met
Recalibrate.
Have b•lance rep•ired •nd/or rec•libr•ted.
Adjust or repl•ce to attain accept•nce I imits.
Adjust or repair.
Adjust or replace time indic•tor to •ttaln acceptance limits.
Adopt new calibr•tion curve.
c.1 ibntion reference in Volume II, Section 2.2
None
Subsection 2.1
Subsection 2.2
Subsection 2.4
Subsection 2.3
Subsection 2.6
-,, C VI
. °' °' 11> '° r+ n :1) t1) .....
0 :::::I
we... ...... °' :z ::I 0 c: • °' .. ..., '<
N ........ '° ...... '° ...... O•
N


2.11.3 FIELD OPERATIONS
Section No.: 2.11.3 Date: January 1990 Page: 1
This section presents information pertinent to the routine operation of a PMlO monitoring site using an HV PMlO sampler. It covers an array of topics, ranging from initial site selection to final data documentation. The procedures herein are intended to serve as guidelines for the development of a monitoring program that will accurately reflect trends in local or regional air quality. The effectiveness of the monitoring program depends on responsible day-to-day operation of the monitoring site. The operators who conduct sampling activities offer a unique perspective on the sampler 1 s performance, and their awareness and attention to detail will salvage data that may otherwise be lost. It must be stressed, however, that 11 routine'' does not mean ~unimportant.'' The site operator provides cohesiveness in a sampling program.
3.1 Siting Requirements
As with any type of air monitoring study in which sample data are used to draw conclusions about a general population, the validity of the conclusfons depends on the repre~entativeness of the sample data. Therefore, the primary goal of a PMlO monitoring project is to select a site or sites where the collected particulate mass is representative of the monitored area.
Table 3.1 presents basic siting criteria for the placement of the HV PMlO sampler. This is not a complete listing of siting requirements; instead, it should be used as an outline by the operating agency to determine a sampler's optimum location. Complete siting criteria are presented in 40 CFR 58, Appendix E. Additional information on optimum network design and site exposure criteria is given in Reference 5.
Additional factors not specified in the CFR must be considered in determining where the sampler will be deployed. These include accessibility under all weather conditions, availability of adequate electricity, and security of the monitoring personnel and equipment.
The sampler must be situated where the operator can reach it safely despite adverse weather conditions. If the sampler is located on a rooftop, care should be taken that the operator's personal safety is not jeopardized by a slippery roof surface during inclement weather. Consideration also should be given to the fact that routine operation (i.e., calibrations, filter installation and recovery, flow checks, and audits) involves transporting supplies and equipment to and from the monitoring site.
To ensure that adequate power is available, one should consult the manufacturer's instruction manual for the sampler's minimum voltage and power requirements. Lack of a stable power source can result in the loss of many samples because of power interruptions.
The security of the sampler itself depends mostly on its location. Rooftop sites with locked access and ground-level sites with fences are common. In all cases, the security of the operating personnel as well as the sampler should be considered.

Scale
Micro
Middle, neighborhood, urban, and regional scale
Section No.: 2.11 .3 Date: January 1990 Page: 2
TABLE 3.1. MINIMUM HV PMIO SAMPLER SITING CRITERIA
Height above ground, meters
2 to 7
2 to 15
Distance from supporting structure, meters Vertical Horizontala Other spacing criteria
>2 1. Should be >20 meters from trees.
>2 2. Distance from sampler to obstacle, such as buildings, must be twice the height that the obstacle protrudes above the sampler.
3. Must have unrestricted air flow 270 degrees around the sampler inlet.
4. No furnace or incineration flues should be nearby.b
5. Spacing from roads varies with traffic (see 40 CFR 58, Appendix E).
6. Sampler inlet is at least 2 m but not greater than 4 m from any collocated PMlO sampler. (See 40 CFR 58, Appendix A.)
awhen inlet is located on rooftop, this separation distance is in reference to walls, parapets, or penthouses located on the roof.
bDistance depends on the height of furnace or incineration flues, type of fuel or waste burned, and quality of fuel (sulfur, ash, or lead c9ntent). This is to avoid undue influences from minor pollutant sources.
3.2 Sampler Installation Procedures
Section No.: 2.11.3 Date: January 1990 Page: 3
1. On receipt of an HV PMlO sampler from the manufacturer, visually inspect it to ensure that all components are accounted for. Compare the equipment delivered with the enclosed packing slip. Notify the manufacturer immediately of any missing or damaged equipment.
2. Perform a laboratory check to determine if the sampler is operational. Turn on the sampler and observe the vacuum motor performance and shift the recorder response (if so equipped).
3. Carefully transport the sampler to the field site. The manufacturers generally ship a HV PMlO inlet in a separate container from the base. To avoid damage, transport the inlet to the site in its shipping carton. If possible, install the HV PMlO sampler in the center of a site platform. This practice will ensure easy access to the sampler's inlet during maintenance procedures and will reduce inlet damage if the sampler should topple over.
4. Following manufacturer's instructions, carefully assemble the base of the HV PMlO sampler. The sampler must be bolted down to a secure mounting surface.
5. Assemble the sampler inlet according to the manufacturer's instructions and carefully install it on the base unit.
6. Chee~ all tubing and power cords for crimps, cracks, or breaks.
7. Plug the power cord into a line voltage outlet. If possible, this outlet should be protected by a ground fault interrupter (GFI) for the operator's safety. The use of waterproof interlocking electrical connectors is also reconmended to ensure operator safety and to avoid shorts or power interruptions. Do not allow any electrical connections to be submerged during periods of inclement weather.
8. Turn on the sampler and make sure that it is still working properly. Investigate and correct any malfunctions before proceeding. Operate the sampler for approximately 30 min to ensure that the motor brushes are properly seated and that the motor is operating at full performance.
9. Perform a multipoint flow-rate calibration, as described in Section 2.11.2.
3.3 Sampling Operations
Operational procedures will vary according to the sampler model and options (e.g., the types of flow-rate controller and timer) selected for use in the monitoring program. Consult the instrument manual before putting the sampler into operation. Significant differences exist in the field operation of the two types of flow-controlling systems, and hence, in the determination of operational flow rates. The following assumptions are made in this subsection:

Section No.: 2.11.3 Date: January 1990 Page: 4
• The flow rate through a PMlO sampler that is equipped with a mass-flow controller is indicated by the exit orifice plenum pressure. This pressure is measured with a manometer [or a flow recorder].
• The flow rate through a PMlO sampler that is equipped with a volumetricflow controlle~ is indicated by the stagnation pressure. This pressure is measured with a manometer.
• The sampler has been calibrated according to procedures presented in Subsection 2.
Sampling procedure checks are summarized in Table 3.2 at the end of this section.
The average actual flow rate for MFC samplers is calculated by determining (a) the average of the initial and final manometer readings of the exit orifice plenum pressure [or the average flow recorder reading], (b) the average ambient temperature (Tav), and (c) the average ambient barometric pressure (Pav) during the sampling period. These values are then applied to the sampler's calibration relationship. The 4-in. pressure (flow} recorders of the type often supplied with HV PMlO samplers are generally not sufficiently accurate and are not recommended for quantitative sampler pressure or flow rate measurements. These flow recorders should be used only for nonquantitative determination that the flow was approximately constant and uninterrupted over the sampling period. The flow recorder may be connected in parallel with the manometer or other pressure measuring device, using a tee or "Y" tubing connector.
Note: Because flow recorders are still in wide use for quantitative flow rate measurements, the procedures in this section include specific instructions for the use of a flow recorder. These flow recorder instructions are enclosed in brackets [] .
The average actual flow rate for VFC samplers is calculated by determining (a) the average of the initial and final relative stagnation pressures (APstg), (b) the average ambient temperature (Tav), and (c) the average barometric pressure (Pav) d~ring the sampling period and then by applying these values to the calibration relationship.
Note: Consistency of temperature and barometric pressure units is required. It is recommended that a.11 temperatures be expressed in kelvin (K = °C + 273). It is also recommended that all barometric pressures be expressed in either mm Hg or kPa (but do not mix the two units). Take care to avoid calibrating a PMlO sampler using one set of units and then performing sample calculations using another set of units.
3.3.1 Presampling Filter Preparation Procedures - Most HV PMlO samplers have been designed to accept filter cassettes. Loading these cassettes in the laboratory will minimize damage; however, if extreme care is exercised, they can be loaded at the site when ambient conditions permit. Workers should wear protective gloves when handling filters to avoid contaminating the filters with body oils and moisture. The filters should be kept in protective folders or boxes. Unexposed

Section No.: 2.11.3 Date: January 1990 Page: 5
filters must never be bent or folded. The analytical laboratory (and/or filter manufacturer) will give each filter an ID number. Because it is extremely difficult to see the ''up" side of a quartz filter (i.e., the side with the slightly rougher texture}, it is recommended that filters consistently be labeled on one side. When a filter that has been labeled on its ''down" side is folded for transport to the laboratory, its sample number will be readily accessible for documentation on laboratory log sheets upon arrival at the laboratory.
Following the manufacturer's instructions, caref~lly load the filter in the filter cassette. The filter should be centered on the wire screen so that the gasket will form an airtight seal on the outer edge of the filter when the faceplate is in place. Poorly aligned filters show uneven white borders after exposure. Care should be taken to ensure that the filter cassette is not excessively tightened, as the filter may stick or the gasket may be permanently damaged. Check that the gasket is in good condition and has not deteriorated.
The site operator who is responsible for readying the HV PMlO sampler for the next run day can now transport the filter cassette to the monitoring site.
3.3.2 Sampling Procedures--MFC Sampler -
Filter Installation Procedure - Upon arriving at the monitoring site, the site operator will follow these procedures:
1. Following the manufacturer's instructions, loosen the nuts that secure the inlet to the base and gently tilt back the inlet to allow access to the filter support screen.
2. Examine the filter support screen. If the screen appears dirty, wipe it clean. If the filter cassette is equipped with a protective cover, remove it and place the loaded cassette in position on the sampler support screen. Tighten the thumb nuts sufficiently to hold the filter cassette securely. Check that the gasket is in good condition and has not deteriorated.
Caution: Tighten the thumb nuts evenly on alternate corners to properly align and seat the gasket. The nuts should be only hand-tightened because too much compression can damage the sealing gasket.
3. Lower the sample inlet. Inspect the sample inlet to make sure that it is resting on the filter cassette and not on the PMlO sampler's frame. Secure the sample inlet to the sampler base.
4. [Open the front door of the sampler and examine the flow recorder. Remove any moisture inside by wiping it with a clean cloth. Record the sampler S/N, filter ID number, site location, and sampling date on the back of a clean chart and install the chart in the flow recorder.]
[Note: Charts used for PMlO samplers normally have square-root-function scales; however, linear-function scales may be used. If charts with linear-function scales are used, Equations 7a and 9a will have to be modified from their current form by replacing I with (I)l/2.]

Section No.: 2.11.3 Date: January 1990 Page: 6
[While installing the chart, do not bend the pen arm beyond its limits of travel. Raise the pen head by pushing on the very top of the pen arm (or by using the pen lift). Be sure that the chart tab is centered on the slotted drive to ensure full 360-degree rotation in 24 h. Make sure that the chart edges are properly located beneath the retainers. Lower the pen arm and tap the recorder face lightly to make certain that the pen is free.]
[Note: During periods of inclement weather, the chart tends to stick to the recorder face. Two charts can be installed simultaneously to enable the sample (top, annotated) chart to rotate freely.]
5. [Using a coin or slotted screwdriver, advance the chart and check to see that the pen rests on zero--the smallest circle diameter. If necessary, adjust the zero set screw while gently tapping on the side of the flow recorder. If a chart with a linear-function scale is used, some positive zero offset may be desirable to allow for normal variations in the zero readings.]
6. Turn on the sampler and allow it to equilibrate to operating temperature (3 to 5 min).
7. While the sampler is equilibrating, record the following parameters on the MFC Sampler Field Data Sheet (Figure 3.1):
• Site location. • Sample date. • Filter ID number. • Sampler model and S/N. • Operator's initials.
8. Inspect the manometer for crimps or cracks in its connecting tubing. Open the valves and blow gently through the tubing of the manometer while watching for the free flow of the fluid. Adjust the manometer's sliding scale so that its zero line is at the bottom of the meniscuses.
9. Measure the initial exit orifice plenum pressure (APex) using an oil or water manometer, with a 0- to 200-mm (0- to 8-in.) range and a minimum scale division of 2 mm (0.1 in.). Record the initial APex on the MFC Sampler Field Data Sheet. If APex is substantially different than for previous samples or otherwise appears abnormal, carry out a QC flow check as described in Subsection 3.5.1.
10. [Verify that the flow recorder (if used) is operational and that the pen is inking. Note the flow recorder reading. If it is substantially different than for previous samples or otherwise appears abnormal, carry out a QC flow-check as described in Subsection 3.5.1.]
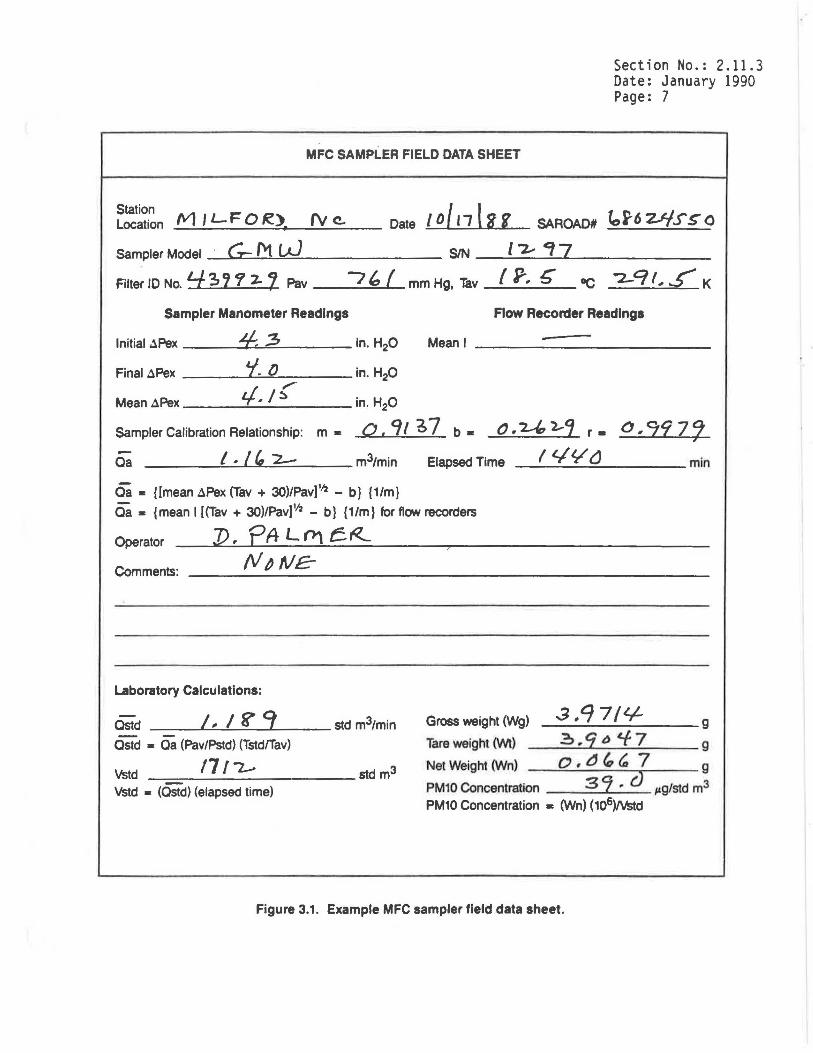
Section No.: 2.11.3 Date: January 1990 Page: 7
MFC SAMPLER FIELD DATA SHEET
Station Location _/\11_..;.__I L._F_O_R....:::)....___rv:......:...._c..__ Date
SIN l "2-- CJ 7 Sampler Model · C._ f'1 W Filter ID No. 4 ~? 1 2- 1 Pav 7' f mm Hg, Tav f P... 6' °C "'2-q I., ~ K
Sampler Manometer Readings Flow Recorder Readings
Initial .lPex ___ 4,.+-L...c:.3:;..._ ___ in. H20 Mean I ------------
Final APex ___ .....1'/.c...::·.....::O~--- in. H20 ,,-
Mean APex ----'-if_,_/_!) ____ in. H20
Sampler Calibration Relationship: m• 0 , CJ I ?, 7 b • 0 • ~ '2...1 r • 0 .. 99 7 2 Qa ----='"--' ...._/_,,,,:......=2--;;;,.,_ ___ m3/min Elapsed Time I '-/ ¥' d min
Oa • {[mean APex (Tav + 30)/Pavfh - b} {1/m}
Oa • {mean I ((Tav + 30)/Pavfh - b} {1/m} for flow recorders
Operator J>. PAL ni e,;z_
Laboratory Calculations:
0std /, I ~ '=t std m3/min Gross weight (Wg) .3 /171'-I- g
Tare weight (Wt} ?J,t:j6<.f7 g - -Ostd • Oa (Pav/Pstd) (Tstd/Tav)
std m3 Net Weight (Wn) o."'1' 7 g
PM10 Concentration 39,cJ µg/std m3 PM10 Concentration • (Wn) (106)/Vstd
11 /-i,_.. Vstd Vstd • (Ostd) (elapsed time)
Figure 3.1. Example MFC sampler field data sheet.

11. Turn the sampler off.
Section No.: 2.11.3 Date: January 1990 Page: 8
12. [Check the time indicated by the time-set pointer on the flow recorder. If it is in error, rotate the chart clockwise by inserting a screwdriver or coin in the slotted drive in the center of the chart face until the correct time is indicated.]
13. Reset the elapsed time meter to 0000 min and the sampler timer for the next run day. Close the sampler door, taking care not to crimp the vacuum tubing or any power cords. The sampler is now ready to sample ambient air.
Filter Recovery Procedure - As soon as possible after sampling, the operator should return to the monitoring site to retrieve the exposed filter. Particle loss or filter damage will result if the filter is left in the sampler for extended periods.
1. Turn on the sampler and allow it to equilibrate to operating temperature (3 to 5 min).
2. Measure the final APex and record it on the MFC Sampler Field Data Sheet.
3. Turn off the sampler.
4. [Open the door of the sampler, remove the flow recorder chart, and examine the recorder trace. If the trace indicates extensive flow fluctuations, investigate and correct before the next sampling day.]
5. Record the following parameters on the MFC Sampler Field Data Sheet:
• Elapsed time of the sampling period, min. • Average recorder response, arbitrary units. • Average ambient temperature for the run day (Tav), K (K = °C + 273). • Average ambient barometric pressure for the run day (Pav), mm Hg or
kPa.
Note: The calculations presented in this subsection assume that the sampler has been calibrated in terms of actual temperature and barometric pressure. Average sampler flow rate for a samp~eriod is determined from the average exit orifice plenum pressure (APex) and the average ambient temperature (Tav) and average ambient pressure (Pav) for the sample period. Tav and Pav readings may be recorded or estimated on-site or may be obtained from a nearby U.S. National Weather Service Forecast Office or airport weather station. Barometric pressure readings obtained from remote sources must be at station pressure (not corrected to sea level), and they may have to be corrected for differences between the elevation of the monitoring site and that of the airport.
Section No.: 2.11.3 Date: January 1990 Page: 9
Note: If specific Tav or Pav values for the sample period cannot be obtained, seasonal average temperature for the site (Ts} may be substituted for Tav, and average barometric pressure for the site (Ps) may be substituted for Pav. Care must be taken, however, that the actual conditions at the site during the sample period can be reasonably represented by such averages. It is therefore recommended that seasonal values be used to represent actual values only within 20°C and 40 11111 Hg.
6. Calculate and record the average actual flow rate (as determined by the sampler's calibration relationship) on the MFC Sampler Field Data Sheet and on the back of the chart. Attach the chart to the data sheet.
{[APex (Tav + 30)/Pa] 112 - b} {1/m}
or for the flow recorder,
Qa = {T [(Tav + 30)/Pa] 112 - b} {1/m}
where
~ = average sampler flow rate, actual m3/min APe! = average exit orifice plenum pressure, 11111 Hg or kPa
[I = average flow recorder response, arbitrary units] Tav = average ambient temperature for the run day, K Pav = average ambient pressure for the run day, 11111 Hg or kPa
b = intercept of the MFC sampler calibration relationship m = slope of the MFC sampler calibration relationship.
Note: If charts with linear-function scales are used, substitute (T) l/l for T.
(Eq. 9)
(Eq. 9a)
4. Observe conditions around the monitoring site; note any activities that may affect filter particle loading (e.g., paving, mowing, fire) and record this information on the MFC Sampler Field Data Sheet.
5. Raise the sampler inlet and remove the filter cassette. Replace the cassette protective cover (if so equipped). To avoid particle loss, be careful to keep the cassette as level as possible.
6. The sampler may now be readied for the next run day.
7. Keeping the filter cassette level, carefully transport it, the data sheet, and the flow recorder chart to the laboratory sample custodian.
3.3.3 Sampling Procedures--VFC Sampler -
Filter Installation Procedure - Upon arriving at the monitoring site, the operator will follow the procedure presented below:

Section No.: 2.11.3 Date: January 1990 Page: 10
1. Following the manufacturer's instructions, loosen the nuts that secure the inlet to the base and gently tilt back the inlet to allow access to the filter support screen.
2. Examine the filter support screen. If the screen appears dirty, wipe it clean. If the filter cassette is equipped with a protective cover, remove it and place the loaded cassette in position on the sampler support screen. Tighten the thumb nuts sufficiently to hold the filter cassette securely. Check that the gasket is in good condition and has not deteriorated.
Caution: Tighten the thumb nuts evenly on alternate corners to properly align and seat the gasket. The nuts should be only hand-tightened because too much compression can damage the sealing gasket.
3. Lower the sample inlet and secure it to the sampler base. For impaction inlets, inspect the sample inlet to make sure that it is resting on the filter cassette and not on the PMlO sampler's frame. Secure the sampler inlet to the sampler base.
4. Turn on the sampler and allow it to reach a stable operating temperature (3 to 5 min).
5. While the sampler is warming up, record the following parameters on the VFC Sampler Field Data Sheet (Figure 3.2):
• Site location. • Sample date. • Filter ID number. • Sampler model and S/N. • Operator's initials.
6. Bring an oil or water manometer to the side of the sampler. This manometer should have a range of 0 to 1000 mm (O to 36 in.) and a minimum scale division of 2 mm (0.1 in.).
Inspect the manometer for crimps or cracks in its connecting tubing. Open the valves and blow gently through the tubing of the manometer, while watching for the free flow of the fluid.
Adjust the manometer's sliding scale so that its zero line is at the bottom of the meniscuses.
7. Remove the vacuum cap from the stagnation pressure port located on the side of the sampler base. Using the connecting tubing, attach one side
·of the manometer to the port. Leave the other side of the manometer open to atmospheric pressure. Make sure the tubing snugly fits the port and the manometer.

Section No.: 2.11.3 Date: January 1990 Page: 11
VFC SAMPLER FIELD DATA SHEET
Station Location ....;:b~LE::.;.).J~OC~RA~, ..... C:..;.:A-'---- Date 5 /7 /gj SAROAD# O'i/C/ 1'7'-1'"!
Sampler Model --=W'--e_-=D..;:D;......:..;.J AJ __ G..;;;;_ _____ _ SIN 03'-10 ~7 017 z.p Filter ID No. b 7 7 J L-f Pav 7 50
Relative Stagnation Pressure Readings
Initial .lPstg _____ 2_'7_._5 ____ mm Hg
Final .lPstg ___ Z_'7_._9.._ _ __ mm Hg
Average .lPstg • _Z_ 't_. 7 _ __ mm Hg
Average Stagnation Pressure Ratio (P1 /Pav)
Average Flowrate (Oa)• /. / 7 ca m3/min •Obtained from manufacturer's lookup table (or from alternate calibration relationship)
Operator T. lU I 513£:T H
Comments: )JoJJE
Laboratory Calculations:
Ostd I · I '-1 '1 Std m3/min
OStd • Oa (Pav/Pstd) (Tstdffav)
Vstd /660 std m3
Vstd -= (Ostd) (Elapsed Time)
mm Hg, Tav 2 ~ · 6 °C 30 I · b K
Absolute Stagnation Pressure
P1 = --..:7_Z_..;;.CJ_.~3~ _________ mmHg
P1 • Pav - Average ~Pstg
o.960
Elapsed Time __ /'--L/...._'-1-=5:...-____ min
Gross Weight (Wg) '-/. '-17 2.1 g
Tare Weight (Wt) '-/. 3 ~o 2... g
Net Weight (Wn) o. 09/9 g
PM10 Concentration 55. '-/ ~19/std m3
PM10 Concentration • (Wn) (106)Nstd
Figure 3.2. Example VFC sampler field data sheet.
Section No.: 2.11.3 Date: January 1990 Page: 12
8. Measure the initial relative stagnation pressure (~Pstg) and record this reading on the VFC Sampler Field Data Sheet.
Note: Be sure to convert the manometer reading to mm Hg using Equation 12 before recording the reading on the VFC Sampler Field Data Sheet.
mm Hg = (25.4) (in. H20/13.6) (Eq. 12)
9. Turn off the sampler, disconnect the manometer, and replace the vacuum cap on the stagnation pressure port.
10. Reset the elapsed-time meter to 0000 min and the sampler timer for the next run day.
11. The sampler is now ready to sample ambient air.
Filter Recovery Procedure - As soon as possible after sampling, the operator should return to the monitoring site to retrieve the exposed filter. Particle loss or filter damage will result if the filter is left in the sampler for extended periods.
1. Turn on the sampler and allow it to warm up to operating temperature (3 to 5 min).
2. While the sampler is equilibrating, record the following parameters on the VFC Sampler Field Data Sheet:
• Elapsed time of the sampling period, min. • Average ambient temperature for the run day (Tav), °C and K. • Average ambient barometric pressure for the run day (Pav), mm Hg or
kPa.
Note: Tav and Pav readings may be recorded or estimated on site or may be obtained from a nearby U.S. National Weather Service Forecast Office or airport weather station. Barometric pressure readings obtained from remote sources must be at station pressure (not corrected to sea level), and they may have to be corrected for differences between the elevation of the monitoring site and that of the airport. If Tav and Pav readings are not available, seasonal average temperature {Ts) and barometric pressure (Ps) can be substituted. Care must be taken, however, that the actual conditions at the site can be reasonably represented by such averages. It is therefore recommended that seasonal values represent actual values within 20°C and 40 mm Hg.
3. Inspect the manometer for crimps or cracks in its connecting tubing. Open the valves and blow gently through the tubing of the manometer, while watching for the free flow of the fluid. Adjust the manometer sliding scale so that its zero line is at the bottom of the meniscuses.

Section No.: 2.11.3 Date: January 1990 Page: 13
4. Remove the vacuum cap from the stagnation pressure port located on the side of the sampler base. Using the connecting tubing, attach one side of the manometer to the port. Make sure that the tubing snugly fits the port and the manometer. Leave the other side open to atmospheric pressure.
5. Record the final APstg on the VFC Sampler Field Data Sheet. Turn off the sampler and replace the vacuum cap.
Note: Be sure to convert the manometer reading to mm Hg using Equation 12 before recording the reading on the data sheet.
mm Hg = 25.4 (in. H20/13.6) (Eq. 12)
6. Calculate the average relative stagnat~on pressure (APstg) and record it on the data sheet.
7. Calculate the average absolute stagnation pressure (Pl) for the sample run day and record it on the data sheet.
where
Pl = Pav - APstg (Eq. 13)
PI = average absolute stagnation pressure, nm Hg or kPa. Pav = average ambient barometric pressure for the run day (not the
retrieval day), mm Hg or kPa. APstg = average stagnation pressure drop, mm Hg or kPa.
8. Calculate and record the average stagnation pressure ratio:
where
Average stagnation = Pl/Pav pressure ratio
PI = average absolute stagnation pressure, nnn Hg or kPa
(Eq. 14a)
Pav = average ambient barometric pressure on the sample run day, mm Hg or kPa.
9. Using the manufacturer's lookup table (or an alternate calibration relationship as described in Subsection 2.4.4), locate the column and row corresponding to Pl/Pav an.Q._the Tav value for the sample run day. Read and record the indicated Qa value.

Section No.: 2.11.3 Date: January 1990 Page: 14
10. Observe conditions around the monitoring site; note any activities that may affect filter particle loading (paving, mowing, fire) and record this information on the VFC Sampler Field Data Sheet.
11. Raise the sampler inlet and remove the filter cassette. Replace the cassette protective cover (if so equipped). To avoid particle loss, be careful to keep the cassette as level as possible.
12. The sampler may now be readied for the next sampling period.
13. Keeping the filter cassette level, carefully transport it and the data sheet to the laboratory sample custodian.
3.3.4 Post-Sampling Filter Handlin~ Procedures - If a sample will not be analyzed immediately, the sample custodian s ould store the filter within a protective covering to minimize the loss of volatile particles. Because filter cassettes often prove too expensive and unwieldy for storage purposes, the use of a manila folder and a protective envelope of comparable size to that of the filter is recommended. Laboratory personnel should adhere to the following procedure:
1. Following the manufacturer's instructions, remove the top frame of the filter cassette.
2. Conduct a secondary check of a sample's validity as presented in "Laboratory Validation Criteria" (Subsection 3.4).
3. Carefully slip a manila The filter may stick in filter cassette gasket. brittle quartz filter.
folder underneath the edge of the exposed filter. the cassette because of overcompression of the
Be extremely careful to avoid damage to the
4. Center the filter on the folder. If the filter must be touched, do not touch or jar the deposit. Fold the manila folder lengthwise at the middle with the exposed side of the filter in. If the collected sample is not centered on the filter (i.e., the unexposed border is not uniform around the filter), fold it so that only deposit touches deposit. Do not crease the folder--the sample filter may tear. If the filter shears or breaks, ensure that all pieces of the filter are included within the folder.
5. Insert the folder into the protective envelope.
6. Deliver the filter in its protective folder and envelope, accompanied by the completed data sheet, to the analytical laboratory.
3.3.5 Filter Analysis and Calculation of PMlO Concentrations - Post-sampling filter analysis is discussed in Subsections 4.6 and 4.7. The calculation of PMlO concentrations is discussed in Subsection 5.1.2.
3.4 Sample Validation and Documentation -
Section No.: 2.11.3 Date: January l990 Page: 15
3.4.1 Field Validation Criteria - The following criteria have been established to assist the operator in initially determining whether a sample is valid. If a sample fails to meet these criteria, do not discard the filter. Document any factors observed that may result in a sample's invalidation on the sample data sheet, and forward the data sheet and the filter to the laboratory supervisor, who will make the final decision regarding the sample's validity.
1. Timing:
• •
All samplers must be turned ON and OFF within 1/2 h of midnight • All samplers must operate for at least 23 but no more than 25 h (1,380 to 1,500 min).
2. Flow Rates:
After each sampling period, calculate the percentage difference between Qa and the design flow rate (1.13 m3/min) using the following formula:
% Difference = 100 [ ga - 1.13 ] 1.13 (Eq. 18)
Record this value on a control chart for the field validation of the sampler's actual volumetric flow rate as is shown in Figure 3.3.
Qa must be within flow-rate limits specified by the inlet manufacturer. The most common impaction and cyclonic inlets have an acceptable flowrate range of 90 to 110 percent of 1.13 m3/min (i.e., 1.02 to 1.24 m3/min) expressed in actual volumetric units. If these limits are exceeded, investigate potential error sources irrmediately. The following criteria should be used as the basis for determining a sample's validity:
• Decreases in flow rate during sampling (due to mechanical problems) of more than 10 percent from the initial set point result in sample invalidation. Recalibrate the sampler. A sample flow rate may also fluctuate due to heavy filter loading. If a high PMlO concentration is suspected, the operator should indicate this on the field data sheet. The laboratory supervisor will make the final decision regarding the sample's validity.
• Changes in flow-rate calibration of more than 10 percent, as determined by a field QC flow-rate check (Subsection 3.5), will invalidate all samples collected back to the last calibration or valid flow check. Recalibrate the sampler.

+15
Q) +10 -co a: :t 0 u:: c +5 Cl ·u; Cl> 0
E e - 0 Cl> 0 c ~ ~ i:5 Cl> -5 Cl !!? c Cl> 0 ... Cl> a. -10
-15
;a
I ""'
I \, I 1/ r-1 \ I v N v -v
~ KECAL
Day 10 20 30 10 20 30 10 20
Month AuGVST Month SEPTE.MBEe_ Month O:mag
Vear /78 ~ Site Location /ff1LFOl2.Q, Jlbt<TH CAeou,tJA
Figure 3.3. Example QC control chart for field valldatlon of flow rates.
--
30 "'O C VI Ill Ill '1>
u:> ~ n .,, .,, r+
0 .... c....~ °'QI ~ .:z c: 0 QI • .., .. '<
N ...... \0 ..... \0 ..... C>.
w

Section No.: 2.11.3 Date: January 1990 Page: 17
3.4.2 Laboratory Validation Criteria - The sample custodian at the analytical laboratory is responsible for conducting a secondary check of a sample's validity. Do not discard a sample that fails to meet these criteria; instead, forward it to the laboratory supervisor, who will make the final decision of a sample's validity .
1. Check the filter for signs of air leakage. Leakage may result from a worn or improperly installed faceplate gasket. A gasket generally deteriorates slowly. The custodian should be able to decide well in advance (by the increased fuzziness of the sample outline) when to change the gasket before total gasket failure results. If signs of leakage are observed, void the sample, determine the cause, and instruct the operator to take.corrective actions before starting another sampling period.
2. Check the exposed filter for physical damage that may have occurred during or after sampling. Physical damage after sampling would not invalidate the sample if all pieces o·f the filter were put in the folder; however, complete losses of loose particulate after sampling (e.g., loss when folding the filter) would void the sample. Mark such samples as "void" on the HV PMlO data sheet.
3. Check the appearance of the particles. Any changes from normal color may indicate new emission sources or construction activity in the area. Note any change on the data sheet.
3.4.3 Data Documentation - Recordkeeping is a critical part of the QA program. · careful documentation of sampling data will salvage samples that may otherwise be lost. The sheer repetition of recording data may result in errors; however, this cross-referencing between data sheets, log books, and (for those samplers so equipped) the continuous-flow-recor-der charts will allow the operator to pinpoint discrepancies that may result in a sample's invalidation.
Note: The use of log books at PMlO monitoring sites is highly encouraged, but is not required.
The following information should be recorded on the field data sheet (OS), sampler recorder chart (RC)., in the site log book (LB), and on the flow-rate control chart (CC).
0 erator Who Starts the Sam le - (The designation in parentheses indicates where the data must be inscribed :
1. Site designation and location (OS)(RC)(LB). This information should be recorded in the log book only once at the initi~tion of a monitoring program.
2. Sampler model and S/N (DS)(RC)(LB). This information needs to be recorded in the log book only at the commencement of monitoring, unless there is more than one sampler or a new sampler has been deployed.
3. Filter ID number (OS) (RC) (LB). 4. Sample date (OS) (RC) (LB).
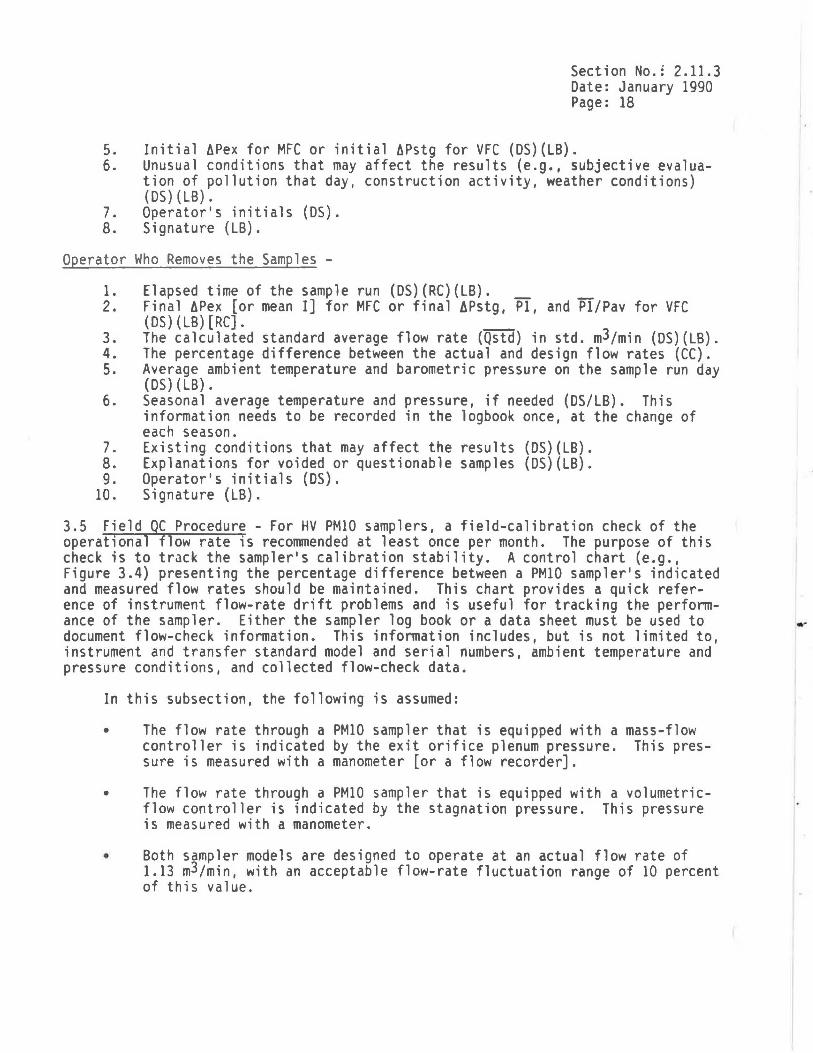
Section No.: 2.11.3 Date: January 1990 Page: 18
5. Initial APex for MFC or initial APstg for VFC (DS)(LB). 6. Unusual conditions that may affect the results (e.g., subjective evalua
tion of pollution that day, construction activity, weather conditions) (OS) (LB).
7. Operator's initials (OS). 8. Signature (LB).
Operator Who Removes the Samples -
1. Elapsed time of the sample run (OS)(RC)(LB). 2. Final APex [or mean I] for MFC or final APstg, Pl, and Pl/Pav for VFC
(DS)(LB)[RC]. _ 3. The calculated standard average flow rate (Qstd) in std. m3/min (DS)(LB). 4. The percentage difference between the actual and design flow rates (CC). 5. Average ambient temperature and barom:etric pressure on the sample run day
(DS)(LB). 6. Seasonal average temperature and pressure, if needed (OS/LB). This
information needs to be recorded in the logbook once, at the change of each season.
7. Existing conditions that may affect the results (DS)(LB). 8. Explanations for voided or questionable samples (DS)(LB). 9. Operator's initials (OS).
10. Signature (LB).
3.5 Field QC Procedure - For HV PMlO samplers, a field-calibration check of the operational flow rate is recommended at least once per month. The purpose of this check is to track the sampler's calibration stability. A control chart (e.g., Figure 3.4) presenting the percentage difference between a PMlO sampler's indicated and measured flow rates should be maintained. This chart provides a quick reference of instrument flow-rate drift problems and is useful for tracking the performance of the sampler. Either the sampler log book or a data sheet must be used to document flow-check information. This information includes, but is not limited to, instrument and transfer standard model and serial numbers, ambient temperature and pressure conditions, and collected flow-check data.
In this subsection, the following is assumed:
• The flow rate through a PMlO sampler that is equipped with a mass-flow controller is indicated by the exit orifice plenum pressure. This pressure is measured with a manometer [or a flow recorder].
• The flow rate through a PMlO sampler that is equipped with a volumetricflow controller is indicated by the stagnation pressure. This pressure is measured with a manometer.
• Both sampler models are designed to operate at an actual flow rate of 1.13 m3/min, with an acceptable flow-rate fluctuation range of 10 percent of this value.
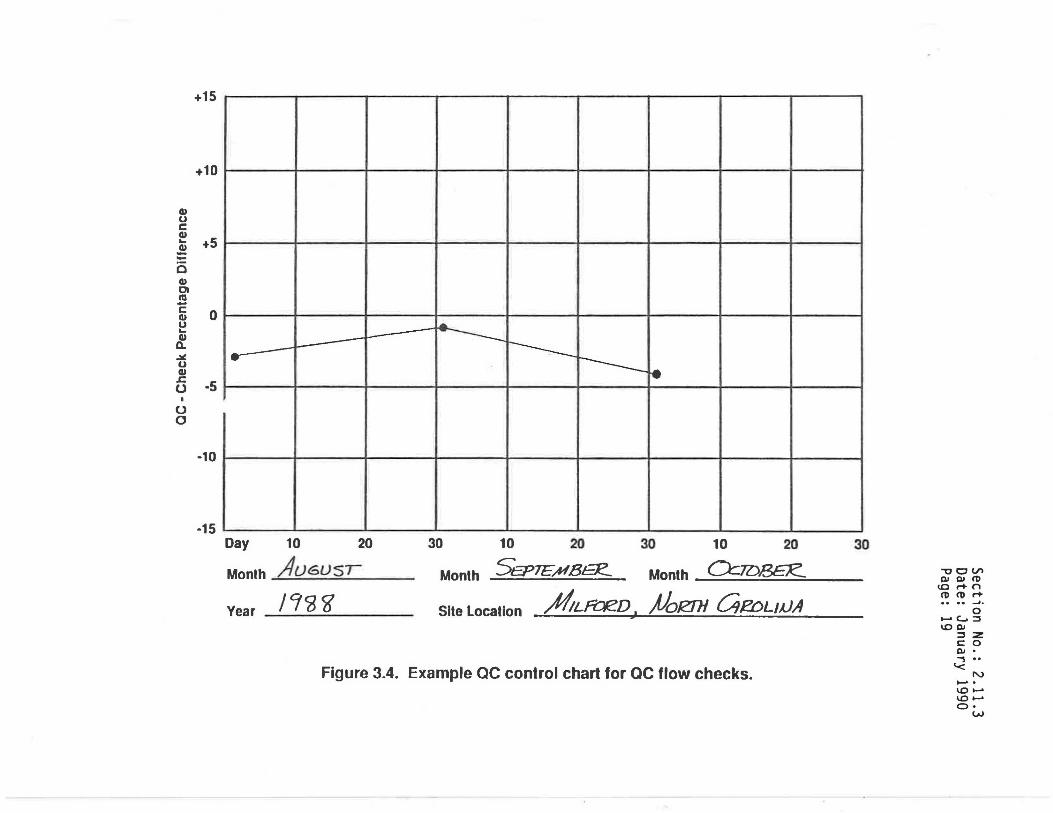
+15
+10
Cl) 0 c Cl) ... +5 .! = 0 Cl) Cl cu E Cl) 0 0 ... Cl) a. .:ii. 0 Cl) .c u ·5
I
u 0
·10
·15
.... L----- - ------- ----.-- ---- fe
Day 10 20 30 10 20 30 10 20
Month AuGVSI Month 5EP"JE;H BEi:?_ Month Cl::mBE'R..
Year / '1~ <;I Site Location ~LFt::JIZD, )}oJZTH (}JJ!DLJVA >
Figure 3.4. Example QC control chart for QC flow checks.
30
""Cc V'\ D> D> Cb
IC r+ n Cb Cb r+ •• •• ~a
0 ...... c.... ::::s \0 D>
::::s :z c: 0 °' . , .. '<
N ....... \0 ......
'° ..... C>. w

Section No.: 2.11.3 Date: January 1990 Page: 20
• The transfer standard will be an orifice device equipped with a water or oil manometer.
• The orifice transfer standard's calibration relationship is in terms of the actual volumetric flow rate (Qa).
3.5.1 QC Flow-Check Procedure--MFC Sampler -
The indicated flow rate (Qa (sampler)) for MFC samplers is calculated by determining (a) the manometer reading of the exit orifice plenum pressure [or the flow recorder reading], {b) the ambient temperature (Ta), and (c) the barometric pressure (Pa) during the flow check. These values are then applied to the sam·pler's calibration relationship. The 4-in. pressure {flow) recorders of the type often supplied with HV PMlO samplers are generally not sufficiently accurate and are not recommended for quantitative sampler pressure or flow measurements. The flow recorder may be connected in parallel with the manometer or other pressure measuring device, using a tee or "Y" tubing connector.
Note: Do not attempt to conduct a flow check of PMlO samplers under windy conditions. Short-term wind velocity fluctuations will produce variable pressure readings by the orifice transfer standard's manometer. The flow check will be less precise because of the pressure variations.
An alternate QC flow-check procedure may be presented in the manufacturer's instruction manual. It is recommended that the manual be reviewed and the various methods be evaluated. In-house equipment and procedural simplicity should be considered in determining which method to use.
1. Collect the following equipment and transport it to the monitoring station. This equipment may be the same equipment as used for calibrations.
• A water or oil manometer with a 0- to 200-nwn (O- to 8-in.) range and a minimum scale division of 2 mm (0.1 in.) for measurement of the sampler's exit orifice plenum pressure. This manometer should be the same as is used routinely for sampler flow rate measurements.
• An orifice transfer standard and its calibration relationship.
• An associated water or oil manometer with a 0- to 400-mm (0- to 16-in.) range and a minimum scale division of 2 mm (0.1 in.) for measurement of the orifice transfer standard.
• A thermometer capable of accurately measuring temperature over the range of 0° to 50°C (273 to 323 K) to the nearest ±1°C and referenced to an NIST or ASTM thermometer within ±2°C at least annually.
• A portable aneroid barometer (e.g., a climber's or engineer's altimeter) capable of accurately measuring ambient pressure over the range of 500 to 800 mm Hg (66 to 106 kPa) to the nearest millimeter Hg and referenced within ±5 mm Hg of a barometer of known accuracy at least annually.
• The sampler's calibration information.
Section No.: 2.11.3 Date: January 1990 Page: 21
• Spare recorder charts and a clean flow-check filter.
• MFC Sampler Flow-Check Data Sheet (Figure 3.5) or site log book.
2. [Record the site location, sampler S/N, and date on the back of a clean chart and install it in the flow recorder. While installing the chart, do not bend the pen arm beyond its limits of travel. Raise the pen head by pushing on the very top of the pen arm (or by using the pen lift) and simultaneously insert the chart.]
3. [Lower the pen arm and tap the recorder face lightly to make certain that the pen can move freely.]
4. [Using a coin or slotted screwdriver, advance the chart and check to see that the pen head rests on zero (i.e., the smallest diameter circle). If necessary, adjust the zero-set screw while gently tapping on the side of the recorder. A quarter turn of the set screw usually results in large offsets: adjust the set screw carefully.]
5. Set up the flow-check system as previously illustrated in Figure 2.2. MFC samplers are normally flow-checked with a filter in line (i.e., between the orifice transfer standard and the motor). Install a clean filter in the sampler. Place the filter directly upon the sampler's filter screen. Do not use a filter cassette. A flow-check filter should never be used for subsequent sampling because particles larger than 10 µm can be collected on the filter while the inlet is raised. The sample mass will be biased as a result of using a filter for both a flow check and subsequent sampling.
6. Install the orifice transfer standard and its faceplate on the sampler. Do not - restrict the flow rate through the orifice (i.e., by using fixedresistance plates or closing the variable-resistance valve).
Caution: Tighten the faceplate nuts on alternate corners first to eliminate leaks and to ensure even tightening. The nuts should be handtightened; too much compression can damage the sealing gasket. Make sure the orifice transfer standard gasket is in place and the orifice transfer standard is not cross-threaded on the faceplate.
7. Connect the orifice manometer to the pressure port of the orifice transfer standard and the sampler manometer to the sampler's exit orifice plenum. Inspect the manometers' connecting tubing for crimps and cracks. Open the manometer valves and blow gently through the tubing. Watch for the free flow of fluid. Adjust the manometers' scale so that their zero lines are at the bottom of the meniscuses. Section 2.2 of this volume, Figure 2.6, illustrates the correct method for reading oil or water manometers. Make sure that the connecting tubing snugly fits the manometer and the pressure port.

Section No.: 2.11.3 Date: January 1990 Page: 22
MFC SAMPLER FLOW CHECK DATA SHEET
~~~~n A11LF02.D, NC Date I/ /1 /gg Time /O: 30 A#/
Sampler Model GM tJ SIN / 2 CJ 7 Operator D · R4 LA1ER.
Pa 763 mm Hg, Ta 27. 0
Orifice SIN I 0 3 ~ 7 °C 30 Cl• 0 K, Unusual Conditions AJo..<JE"
Orifice Calibration Date 7 / Z Z / ~ ~ Orifice Calibration Relationship: m •
Sampler Calibration Relationship: m •
Orifice Pressure Drop (..iH20) ':/ . ~
/. 2.L/30
a.t:t137
b. -0.0062. r .. O . 9999
b. O . 2.62.CJ r.., O. 9979
Oa (Orifice)a _ _...;_/.--=-I _J _0 ____ m3tmin
Sampler Pressure Drop (ti.Pex)
Oa (sampler)b
QC-Check Percentage Differencec
With Orifice Installed
___ L-f_. 0 ___ in. H20
__ /_._/ 5_ 2 __ m3/min
.3. ct __ _;;,._ _ _ ___ %
Oa (corrected sampler)d I . o e:!;r .,. ________ o<_,___ __ m31min
-3 c Design Flow Rate Percentage Differencee ____ • ------ %
aFor calculation of orifice flow rates:
Oa (orifice) • {(.l(H20) (Ta/Pa)) 112 - bl {1/m}
bFor calculation of sampler flow rates:
Oa (sampler) • {((.lPex/Pa)(Ta + 30)]'12 - bl {11m}
Without Orifice Installed
___ 3_ . ..:..'1 ___ in. H20
__ /_._/_3_...;.'-/ __ m31min
cQC 0 D'ff [ Oa (sampler) - Oa (orifice) J [ ] Vo 1 erence = 100 where Oa (sampler) is measured with the
Oa (orifice) orifice installed
d [ 100 - QC O/o difference J Oa (corrected sampler) = Oa (sampler) where Oa (sampler) is measured 100 without the orifice installed.
e . [ Oa (corr. sampler) - 1.13 J [ J Design Flow Rate% Difference = 1.13
100
Figure 3.5. Example MFC sampler flow check data sheet.

Section No.: 2.11.3 Date: January 1990 Page: 23
8. Turn on the sampler and allow it to warm up to operating temperature (3 to 5 min).
Note: The sampler inlet may be partially lowered over the orifice transfer standard to act as a draft shield (if a shield is not otherwise provided). Use a block to provide at least 2 in. of clearance at the bottom for air flow and for the manometer tubing.
9. Read and record the following parameters on the MFC Sampler Flow-Check Data Sheet:
• Sampler location and date. • Sampler model and S/N • Ambient temperature (Ta), °C and K. • Ambient barometric pressure (Pa), 11111 Hg or kPa. • Unusual weather conditions. • Orifice transfer standard S/N and calibration relationship. • Operator's signature.
10. Observe the AH20 across the orifice by reading the manometer deflection. Section 2.2 of this volume, Figure 2.6, illustrates the correct way to read a water or oil manometer. Record the manometer deflection on the MFC Sampler Flow-Check Data Sheet.
11. Measure the exit orifice plenum pressure (APex) by reading the manometer deflection. Record the manometer deflection on the MFC Sampler FlowCheck Data Sheet.
12. [Using a coin or small screwdriver, advance the recorder chart to read the sampler's corresponding response (I) and record on the data sheet. A gentle tap on the recorder face is often necessary to ensure that the pen is not sticking to the chart.]
13. Turn off the sampler and remove the orifice transfer standard, but not the filter. Turn on the sampler and repeat Step 11 [or 12] to check the flow rate under normal operating conditions. Turn off the sampler and remove the filter.
14. Calculate and record Qa(orifice) at actual conditions using the following equation:
where
Qa(orifice) = {[(AH20)(Ta/Pa)]l/2 - b} {1/m} (Eq. 6)
Qa(orifice) = actual volumetric flow rate as indicated by the orifice transfer standard, m3/min
= pressure drop across the orifice, mm (or in.) H20 = ambient temperature, K = ambient barometric pressure, mm Hg or kPa = intercept of the orifice calibration relationship
m = slope of the orifice calibration relationship.

Section No.: 2.11.3 Date: January 1990 Page: 24
15. Calculate and record the corresponding sampler flow rate at actual conditions and record.
Qa(sampler) = {[dPex (Ta+ 30)/Pa]l/2 - b} {1/m} ( Eq. 9)
or if a flow recorder is being used to measure the exit orifice plenum pressure,
where
Qa(sampler) = {I[(Ta + 30)/Pa]l/2 - b} {l/m}
Qa(sampler) = sampler flow rate, actual m3/min dPex = exit orifice plenum pressure, mm (or in.) H20
I = recorder response, arbitrary units
(Eq. 9a)
Ta = ambient temperature during the flow check, K (K = °C + 273)
Pa = ambient barometric pressure during the flow check, mm Hg or kPa
b =.intercept of the MFC sampler calibration relationship m = slope of the MFC sampler calibration relationship.
Note: If charts with linear-function scales are used, substitute (I)l/2 for I.
16. Using this information and the formulas provided on the MFC Sampler FlowCheck Data Sheet, calculate the QC check percentage differences.
QC-check% d'fference = [Qa(sampler) ~ qa(orifice)] (100] 1 Qa(or1f1ce} (Eq. 17)
where Qa(sampler) is measured with the orifice transfer standard being installed.
Record this value on the MFC Sampler Flow-Check Data Sheet and plot on the QC control chart. If the sampler flow rate is within 93 to 107 percent (t7 percent difference) of the calculated Qa(orifice) flow rate (in actual volumetric units), the sampler calibration is acceptable. If these limits are exceeded, investigate and correct any malfunction. Recalibrate the sampler before sampling is resumed. Differences exceeding tlO percent may result in the invalidation of all data collected subsequent to the last calibration or valid flow check. Before invalidating any data, double-check the orifice transfer standard's calibration and all calculations.
17. Calculate the corrected sampler flow rate, Qa(corr. sampler) using Equation 23:
Qa(corr. sampler) = [oa(sampler)] [(lOO - % 1~6fference)] (Eq. 23)
Section No.: 2.11.3 Date: January 1990 Page: 25
where Qa(sampler) is measured without the orifice transfer standard being installed and where the QC-check percentage difference was obtained from Equation 17 above.
Note: Take care to use the correct sign (i.e., positive or negative) for the-% difference when it is used in Equation 23.
18. Calculate and record on the MFC Sampler Flow-Check Data Sheet the percentage difference between the inlet's design flow rate (e.g., 1.13 m3/min) and the corrected sampler flow rate as:
Design fl ow rate % difference = [Oa (corr· s~~yj er) - l. l3] [ 100] ( Eq. 18)
It is assumed in this subsection that the inlet is designed to operate at a flow rate of 1.13 actual m3/min. If the design flow rate percentage difference is less than or equal to ±7 percent, the sampler calibration is acceptable. If the difference is greater than ±7 percent, investigate potential error sources and correct any malfunction. Recalibrate the sampler before sampling is resumed. Differences exceeding ±10 percent may result in the invalidation of all data collected subsequent to the last calibration or valid flow check. Before invalidating any data, double-check the sampler's calibration, the orifice transfer standard's certification, and all calculations.
Note: Deviations from the design flow rate may be caused in part by deviations in the site temperature and pressure from the seasonal average conditions. Recalculate the optimum set-point flow rate (SFR) according to Equation 10 in Subsection 2.3 to determine if the flow controller should be adjusted.
19. Set up the sampler for the next sampling period according to the operating procedure in Subsection 3.3.
3.5.2 QC Flow-Check Procedure--VFC Sampler -
The indicated flow rate (Qa (sampler)) for VFC samplers is calculated by determining (a) the relative stagnation pressure (APstg), (b) the ambient temperature (Ta), and (c) the barometric pressure (Pa) during the flow check. These values are then applied to the sampler's calibration relationship.
Note: Do not attempt fo conduct a flow check of PMlO samplers under windy conditions. Short-term wind velocity fluctuations will provide variable pressure readings by the orifice transfer standard's manometer. The flow check will be less precise because of the pressure variations.
Note: An alternative QC flow-check procedure may be presented in the manufacturer'S""lnstruction manual. It is recommended that the manual be reviewed and the various methods be evaluated. In-house equipment and procedural simplicity should be considered in determining which method to use.
1. Collect the following equipment and transport it to the monitoring station:

Section No.: 2.11.3 Date: January 1990 Page: 26
• A orifice transfer standard and its calibration relationship in actual volumetric flow units (Qa).
• An associated oil or water manometer, with a 0- to 400-mm (0- to 16-in.) range and minimum scale divisions of 2 mm (0.1 in.).
• An oil or water manometer, with a 0- to 1000-mm (0- to 36-in.) range and minimum scale divisions of 2 mm (0.1 in.) or other pressure measurement device for measurement of the sampler stagnation pressure. Ideally, this manometer (or other pressure measurement device) should be associated with the sampler.
Note: Manometers used for QC flow-checks may be subject to damage or malfunction and thus should be checked frequently.
• A thermometer capable of accurately measuring temperature over the range of 0° to 50°C (273 to 323 K) to the nearest t1°C and referenced to an NIST or ASTM thermometer within 2°C at least annually. To calculate the orifice flow rates, it will be necessary to convert °C to K.
• A portable aneroid barometer (e.g., a climber's or engineer's altimeter) capable of accurately measuring ambient barometric pressure over the range of 500 to 800 mm Hg (66 to 106 kPa) to the nearest millimeter Hg and referenced within 5 mm Hg of a barometer of known accuracy at least annually.
• The sampler's calibration relationship (i.e., lookup table or alternative calibration relationship).
• A clean flow-check filter loaded into a filter cassette.
• A VFC Sampler Flow-Check Data Sheet (Figure 3.6) or a site log book.
2. Set up the flow-check system as previously illustrated in Figure 2.4. VFC samplers are normally flow-checked with a loaded filter cassette in line (i.e., between the orifice transfer standard and the motor). The orifice transfer standard should be installed without fixed resistance plates or with the adjustable resistance value fully open.
A flow-check filter should never be used for subsequent sampling because particles larger than 10 µm can be collected on the filter while the inlet is raised. The sample mass will be biased as a result of using a filter for both a flow check and subsequent sampling.
Caution: Tighten the faceplate nuts on alternate corners first to eliminate leaks and to ensure even tightening. The fittings should be handtightened; too much compression can damage the sealing gasket. Make sure the orifice gasket is in place and the orifice transfer standard is not cross-threaded on the faceplate.
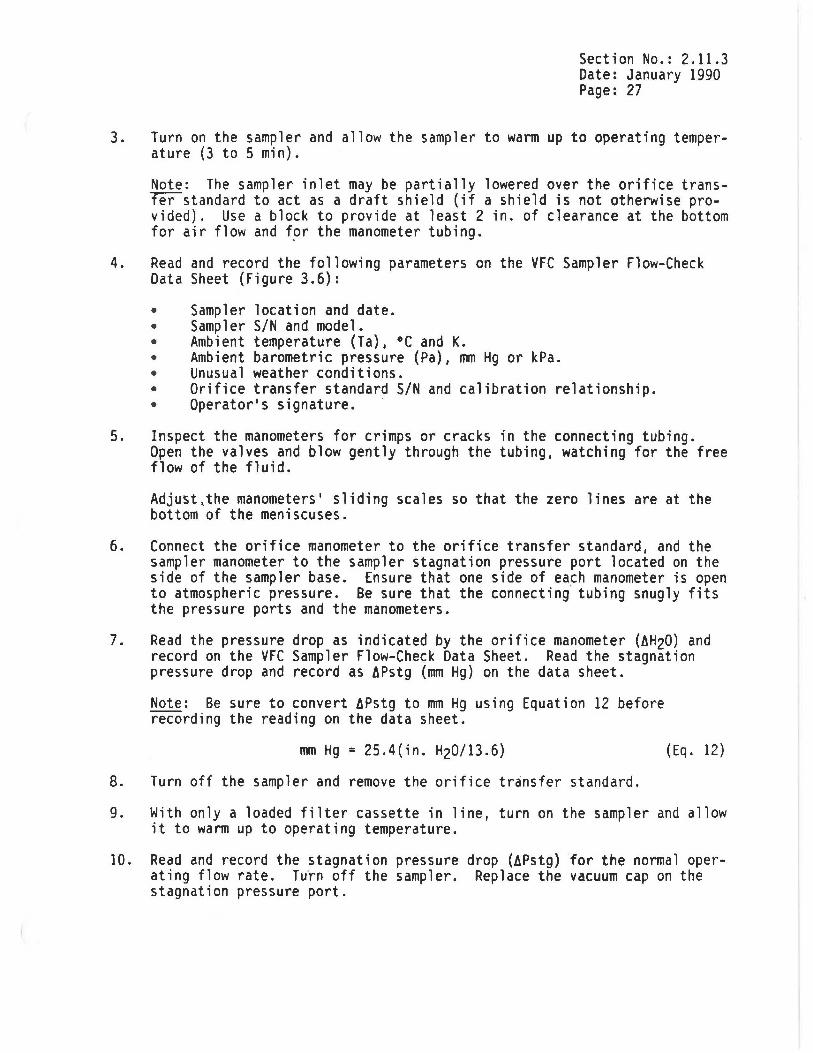
Section No.: 2.11.3 Date: January 1990 Page: 27
3. Turn on the sampler and allow the sampler to warm up to operating temperature (3 to 5 min).
Note: The sampler inlet may be partially lowered over the orifice transfer standard to act as a draft shield (if a shield is not otherwise provided). Use a block to provide at least 2 in. of clearance at the bottom for air flow and f~r the manometer tubing.
4. Read and record the following parameters on the VFC Sampler Flow-Check Data Sheet (Figure 3.6):
• Sampler location and date. • Sampler S/N and model. • Ambient temperature (Ta), °C and K. • Ambient barometric pressure (Pa), nun Hg or kPa. • Unusual weather conditions. • Orifice transfer standard S/N and calibration relationship. • Operator's signature.
5. Inspect the manometers for crimps or cracks in the connecting tubing. Open the valves and blow gently through the tubing, watching for the free flow of the fluid.
Adjust\the manometers' sliding scales so that the zero lines are at the bottom of the meniscuses.
6. Connect the orifice manometer to the orifice transfer standard, and the sampler manometer to the sampler stagnation pressure port located on the side of the sampler base. Ensure that one side of ea~h manometer is open to atmospheric pressure. Be sure that the connecting tubing snugly fits the pressure ports and the manometers.
7. Read the pressure drop as indicated by the orifice manometer (AH20) and record on the VFC Sampler Flow-Check Data Sheet. Read the stagnation pressure drop and record as APstg (mm Hg) on the data sheet.
Note: Be sure to convert APstg to mm Hg using Equation 12 before recording the reading on the data sheet.
mm Hg = 25.4(in. H20/13.6)
8. Turn off the sampler and remove the orifice transfer standard.
(Eq. 12)
9. With only a loaded filter cassette in line, turn on the sampler and allow it to warm up to operating temperature.
10. Read and record the stagnation pressure drop (APstg) for the normal operating flow rate. Turn off the sampler. Replace the vacuum cap on the stagnation pressure port.
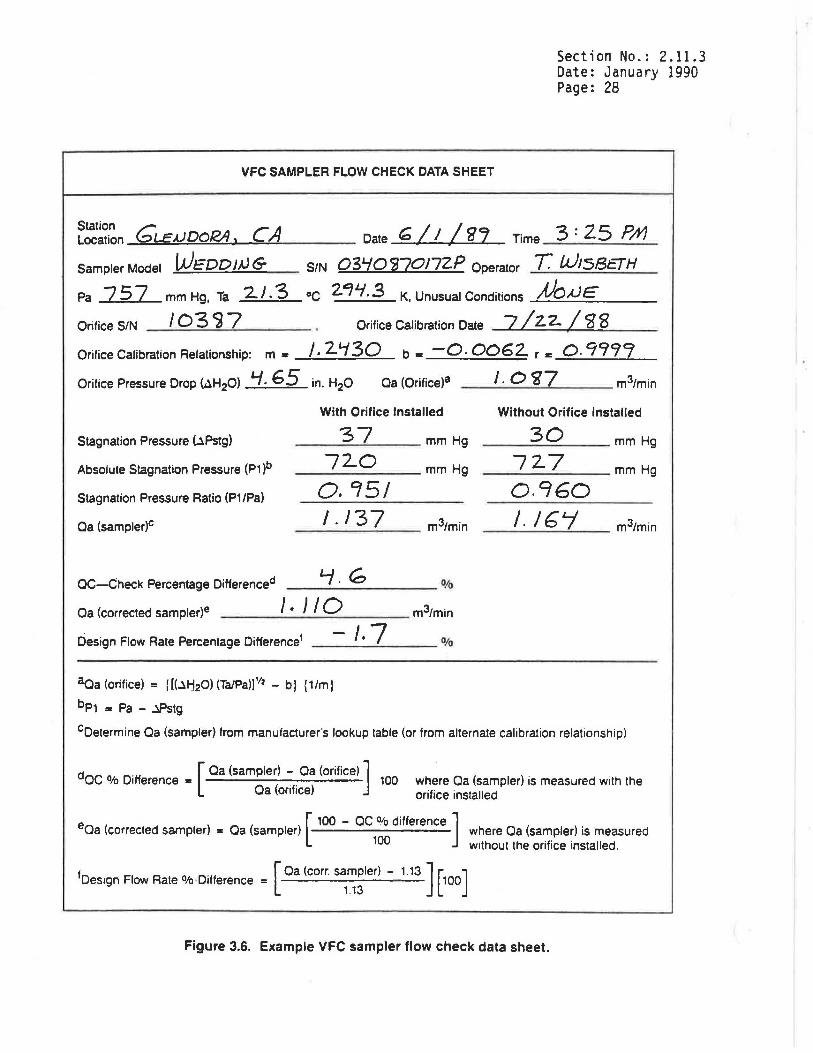
Section No.: 2.11.3 Date: January 1990 Page: 28
VFC SAMPLER FLOW CHECK DATA SHEET
~:~~i~n bLE).)D012A , CA Date t;; /I / g7 nme 3 : ZS P/11 I
Sampler Model lJEDDJ~ G SIN 03'-/0 'a]OJ7ZP Operator T /).)1s8ETH
Pa 757 mm Hg, Ta 21.3 °C 2~'1.3 K, Unusual Conditions AJo..UE Orifice SIN __ / _0_3 ............ ~_7....__ __ _ Orifice Calibration Date 7 / 2- Z. / ~ 8
Orifice Calibration Relationship: m • /. 2. '-/ 30 b • -0. 0062. r ., O. 9999
Orifice Pressure Drop (.!l.H20) '7. 65 in. H20 Oa (Orifice)a I· 0 'J 7 m3/min
Stagnation Pressure (.lPstg)
Absolute Stagnation Pressure (P1 )b
Stagnation Pressure Ratio (P1 /Pa)
Oa (sampler)c
QC-Check Percentage Differenced
With Orifice Installed
___ 3_7-'---- mm Hg
_ _ 7_ 2-_0 ___ mm Hg
o. '151 __ f_._1_3_7 __ m3/min
__ '-t_._<0 ____ %
Oa (corrected sampler)e ___ J_. _J_/_Q ____ m3/min
Design Flow Rate Percentage Difference' __ /_. --"'7 ___ 010
aaa (orifice) = :l(.l!-120) (Ta/Pa)J 112 - b} {1/m}
bpi = Pa - .lPstg
Without Orifice Installed
__ _...;:.,3_0.;;._ _ _ mm Hg
__ 7_ 2._7 ___ mm Hg
o.960 __ /_. _/_6_'-/_,___ m3/min
cDetermine Qa (sampler) from manufacturer's lookup table (or from alternate calibration relationship)
doc 0 D'H [ Oa (sampler) - Oa (orifice) J Vo 1 erence = 100 where Qa (sampler) is measured with the
Oa (orifice) orifice installed
e [ 100 - QC % difference ] Oa (corrected sampler) = Qa (sampler) where Oa (sampler) is measured
100 without the orifice installed.
f [ Oa (corr. sampler) - 1. 13 ] [ J Design Flow Rate % -Difference = l.13
100
Figure 3.6. Example VFC sampler flow check data sheet.
Section No.: 2.11.3 Date: January 1990 Page: 29
11. Calculate and record Qa(orifice) flow rate for the flow-check point, as in Equation (6), reproduced below:
where
Qa(orifice) = {[(dH20)(Ta/Pa)]l/2 - b} {l/m} (Eq. 6)
Qa(orifice) =
dH20 = Ta = Pa = b = m =
actual volumetric flow rate as indicated by the transfer standard orifice, m3/min pressure drop across the orifice, mm (or in.) H20 ambient temperature, K (K = °C + 273) ambient barometric pressure, mm Hg or kPa intercept of the orifice calibration relationship slope of the orifice calibration relationship.
12. Calculate and record the value of Pl (mm Hg) for the measurements with and without the orifice installed.
where
Pl = Pa - dPstg
Pl = stagnation pressure, mm Hg or kPa Pa = ambient barometric pressure, mm Hg or kPa
dPstg = stagnation pressure drop, nun Hg or kPa.
(Eq. 13)
13. Calculate and record the stagnation pressure ratio for the measurements with and without the orifice installed.
Stagnation pressure ratio = Pl/Pa (Eq. 14)
where
Pl = stagnation pressure, mm Hg or kPa. Pa = ambient barometric pressure, mm Hg or kPa.
14. Refer to the instrument manufacturer's lookup table (or alternative calibration relationship as described in Subsection 2.4.4) and determine the Qa(sampler) flow rates (m3/min) for the measurements with and without the orifice installed as indicated for the ratio of Pl/Pa and ambient temperature in °C. Record these values on the VFC sampler flow check data sheet.
15. Using Qa(orifice) and Qa(sampler) for the measurements with the orifice installed, calculate the QC-check percentage difference as:
QC-check ~ difference = (Qa(sampler) ~ ga(orifice)] [100] 0 Qa(or1f1ce} (Eq. 17)
Record this value on the VFC Sampler Flow-Check Data Sheet and plot it on the control chart for QC flow checks. If the QC-check percentage differ-

Section No.: 2.11.3 Date: January 1990 Page: 30
ence is less than or equal to ±7 percent, the sampler calibration is acceptable. Those differences exceeding ±7 percent will require recalibration. Differences exceeding ±10 percent may result in the invalidation of all data collected subsequent to the last calibration or valid flow check. Before invalidating any data, double-check the sampler's calibration, the orifice transfer standard's certification, and all calibrations.
16. Using this percentage difference and Qa (sampler) from the measurements without the orifice installed (i.e., for the normal operating flow rate), calculate the corrected sampler flow rate as:
17.
Qa (corr. sampler) = [oa (sampler)] [100 - % 1 ~6fference] (Eq. 23)
Record Qa (corr. sampler) on the VFC Sampler Flow-Check Data Sheet.
Determine the design flow rate percentage difference between the inlet design flow rate (e.g., 1.13 m3/min) and Qa (corr. sampler) as:
Design flow rate% difference= (Oa (corr.l~~~pler) - 1.13] (Eq. 18)
Record this design flow rate percentage difference on the VFC Sampler Flow-Check Data Sheet and plot it on the control chart for the field validation of flow rates. When plotting this value, use a different symbol than is normally used for plotting values that are obtained during sampling periods. If the design flow rate percentage difference is less than or equal to ±7 percent, the sampler calibration is acceptable. Those differences exceeding ±7 percent will require recalibration. Differences exceeding ±10 percent may result in the invalidation of all data obtained subsequent to the last calibration or valid flow check. Before invalidating any data, double-check the sampler's calibration, the orifice transfer standard's certification, and all calculations.

Procedure
Filter inst•l l•tion
S•mple v•lid•tion •nd document•t ion
Post-s•mple inspection
Flow checks
TABLE 3.2. SAMPLING PROCEDURE CHECKS
Frequency •nd method
Visu•lly check each filter. Inspect g•skets •f ter ••ch s•mple.
Visu•lly check ••ch s•mple •nd the s•mple d•t• sheet for completeness.
Check operation•! flow rate for conform•nce with inlet design flow r•te for ••ch ••mple.
Vlsu•lly check each ••mple for missing pieces or le•kage.
Check flow-r•t• calibration at le•st once per month.
Requir-nts --Filters must be und•m•ged •nd provided with ID numbers; c•ssette must be centered on ••mpler; filter must be centered on cassette screen with edges p•r•llel to edges of screen and to faceplate g•sket; gasket must be tightened to prevent leak•ge.
Record on d•t• sheet must show the ••mpling d•te, filter ID, ••mpler S/N, st•tion loc•tion, flow r•te, sample time, and •ny unusual conditions.
S•mpler oper•tional flow r•t• must be within 99 to 110~ of the inlet design flow r•te.
There must be no evidence of filter d•m•g• or ••mpler m•lfunction.
The QC-check •nd design condition percent•g• differences should be less th•n or equ•I to !7 percent.
Action if requirements •re not met
Void the filter; inst•ll substitute f i I ter. ·
Complete or correct the document•tion; if un•vailable, void the sample.
Re•djust oper•tion•I flowr•t• set point or consult manufacturer. Invalidate all ••mples back to the l•st •ccept•ble flow check.
Void the s•mple; correct the c•use of malfunction.
If the percentage differences exceed !7 percent, rec•librate the s•mpler. If they exceed !10 percent, invalid•t• •II dat• collected subsequent to the last c•libr•tion or valid flow check. Investig•t• potenti•I error sources in the sampler, the c•libr•tion d•t•, •nd the c•lculations. "'tJ c V'I
°' °' 11) IC r+ n 11) 11) r+
0 w c... ::I
...... °' ::I z c: 0
°' ~ N .......
\0 ...... \0 ..... 0·
w

2.11.4 FILTER PREPARATION AND ANALYSIS
Section No.: 2.11.4 Date: January 1990 Page: 1
The accuracy of a PMlO sampling program depends on several factors. A primary factor is the analytical laboratory staff's attention to detail and balance technique. This section offers guidelines to enhance the accuracy of the laboratory operation and, hence, the determination of PMlO mass concentrations.
The agency must be aware of two primary sources of error in the handling of HV PMlO filters:
1. Loss of particles during shipment or handling. Subsection 4.1 presents guidelines to help prevent post-sampling particle loss.
2. Artifact formation errors are caused by the retention of sulfur dioxide in the form of sulfate particulate on alkaline filters. The results of experiments involving a variety of filters indicated that sulfate loading errors of the order of 0.3 to 3.0 µg/m3 can be expected with the use of common glass fiber filters under normal Hi-Vol sampling conditions and that larger sulfate errors are possible under extreme sampling conditions (see Reference 6.) A neutral or low-alkalinity filter medium will elim-inate excessive artifact formation. ·
Accuracy, precision, and calibration procedures for the laboratory apparatus are referenced in Subsection 2, Table 2.1. The recommended filter media and acceptance criteria of 40 CFR 50, Appendix J, are summarized in Table 4.1. The specifications given in this table are minimum requirements to ensure acceptability of the data for determining the PMlO mass concentration in the atmosphere.
The microquartz fiber filter is currently the only commercially available HV PMlO filter that satisfies all criteria specified in 40 CFR 50, Appendix J. These filters may be brittle, which makes them more difficult to handle. They may be more expensive than glass-fiber filters. The operating agency must evaluate new filter media (as they become available) to ensure that they comply with Federal guidelines. Laboratory activities are summarized in Table 4.2 at the end of this subsection.
4.1 Filter Handling
Quartz filter material may be brittle and subject to shearing and breakage. Laboratory and field personnel must be aware of these characteristics and handle sample filters with care.
For convenience, tare-weighed filters should be packed in groups of 50 or less in their original container or in a box of comparable size. The filters should be separated by a sheet of 8-1/2 x 11-in. tracing paper. Filter inventory can be controlled by stacking the filters in numerical order so that the operator will use the proper filter first. One side of the shipping box can be cut away to allow the operator to remove the filter easily without damaging the corners.
A filter identification number must be assigned to each filter. Because it is extremely difficult to see the "up" side (i.e., the side with the slightly rougher
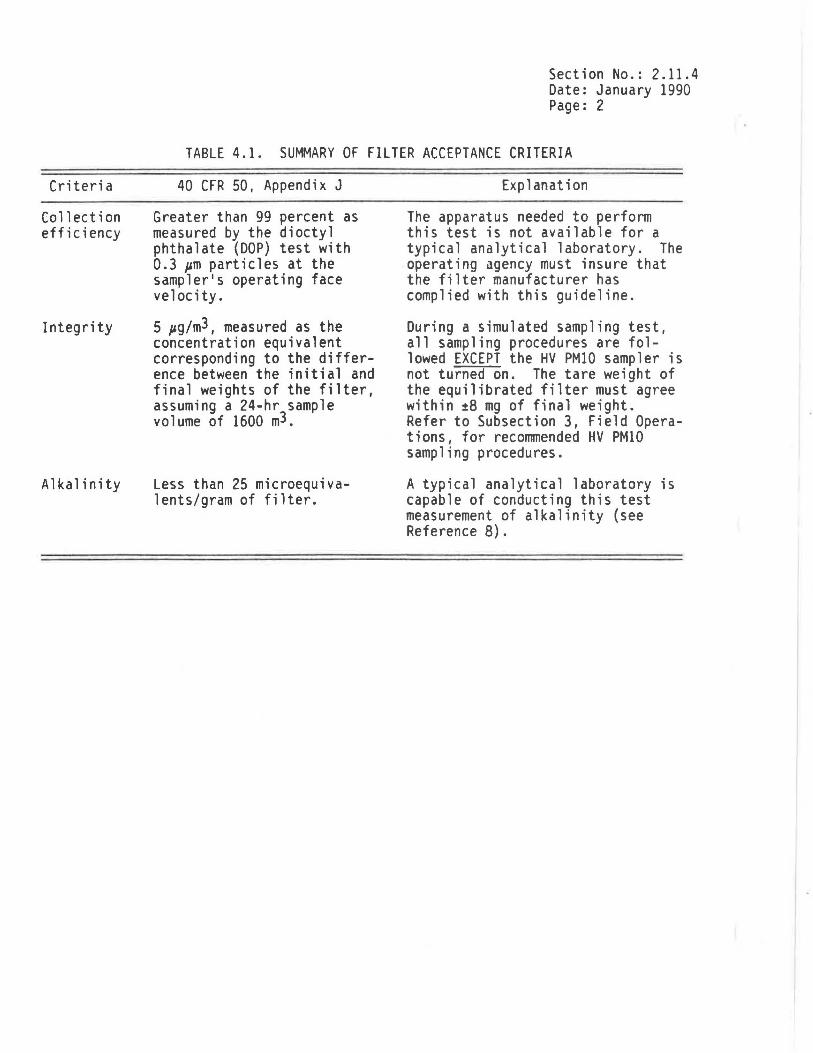
Criteria
Collection efficiency
Integrity
Alkalinity
Section No.: 2.11.4 Date: January 1990 Page: 2
TABLE 4.1. SUMMARY OF FILTER ACCEPTANCE CRITERIA
40 CFR 50, Appendix J
Greater than 99 percent as measured by the dioctyl phthalate (DOP) test with 0.3 µm particles at the sampler's operating face velocity.
5 µg/m3, measured as the concentration equivalent corresponding to the difference between the initial and final weights of the filter, assuming a 24-hr sample volume of 1600 m3.
Less than 25 microequivalents/gram of filter.
Explanation
The apparatus needed to perform this test is not available for a typical analytical laboratory. The operating agency must insure that the filter manufacturer has complied with this guideline.
During a simulated sampling test, all sampling procedures are followed EXCEPT the HV PMlO sampler is not turned on. The tare weight of the equilibrated filter must agree within ~a mg of final weight. Refer to Subsection 3, Field Operations 1 for recommended HV PMlO sampling procedures.
A typical analytical laboratory is capable of conducting this test measurement of alkalinity (see Reference 8).

Section No.: 2.11.4 Date: January 1990 Page: 3
texture) of the quartz filter, consistency in labeling these filters will allow the balance operator easy access to the filter ID number for documentation and crossreferencing of laboratory data forms. This will also eliminate confusion in loading the filter cassettes for subsequent sampling. If the filter ID number is to be embossed by the operating agency, gentle pressure must be used to avoid filter damage, and extreme care must be taken to avoid duplication or missed numbers.
If samples are to be mailed, the field operator should be supplied with reinforced envelopes and manila folders for protection of the exposed filters during their return to the analytical laboratory. These manila folders may be printed to serve as sample data sheets.
4.2 Visual Filter Inspection
All filters must be visually inspected for defects before their initial weighing, and defective filters must be rejected if any are found. Batches of filters containing numerous defects should be returned to the supplier.
The following are specific defects to look for:
1. Pinhole--A small hole appearing as a distinct and obvious bright point of light when examined over a light table or screen, or as a dark spot when viewed over a black surface.
2. Loose material--Any- extra loose material or dirt particles on the filter that must be brushed off before the filter is weighed.
3. Discoloration--Any obvious visible discoloration that might be evidence of a contaminant.
4. Filter nonuniformity--Any obvious visible nonuniformity in the appearance of the filter when ·viewed over a light table or black surface that might indicate gradations in porosity across the face of the filter.
5. Other--A filter with any imperfection not described above, such as irreg~surfaces or other results of poor workmanship.
4.3 Filter Equilibration
Filters must be equilibrated in a conditioning environment for at least 24 h before being weighed. This can be done in an equilibration chamber or in an environmentally controlled weighing room. Relative humidity (RH) should be held constant at a mean value between 20 and 45 percent, with a variability of not more than i5 percent. Temperature should be held constant with a mean value between 15 and 30°C, with a variability of ·not more than t3°C. An air-conditioned room may be used for equilibration if it can be maintained in this RH and temperature range while the filters are equilibrating. RH and temperature must be checked and recorded on equilibration days (either manually or by a hygrothermograph) to assure compliance with these guidelines. Equilibration chamber malfunctions, discrepancies, and maintenance activities also should be recorded in the equilibration chamber or laboratory log book.
4.4 Initial Weighing Procedures (Tare Weight)
Section No.: 2.11.4 Date: January 1990 Page: 4
Enough filters to last for at least a 3-mo sampling period should be numbered and weighed at one time.
Filters must be weighed on an analytical balance with a minimum resolution of 0.1 mg and a precision of 0.5 mg. Each balance used in the weighing procedures must be identified by a balance number. Each balance should be assigned a block of filter numbers to be used sequentially. Procedures are as follows:
1. Make sure that the balance has been calibrated (at least annually) and maintained according to manufacturer's recommendations. If the balance is out of calibration, have it calibrated according to manufacturer's directions.
2. Zero the balance according to manufacturer's directions.
3. Perform a QC "Standard Weight" check on the analytical balance. (Procedures are outlined in the next subsection.)
4. If filters must be weighed outside the conditioning chamber, take care to avoid interference with ambient hygroscopic particles, and begin the weighing procedure within 30 s. Weigh the filter according to manufacturer's instructions, making sure that a stable reading is obtained. At routine intervals, check the zero and calibration of the balance as out-1 ined in the next subsection.
Note: Be careful when loading and unloading the balance with quartz fTTters. The corners and edges of the filter should not bump the balance door because the filter may break or filter material may be lost.
5. Place the tared filter, with the filter ID number facing upwards, in its original container or a comparably sized box. Place a sheet of 8-1/2 x 11-in. tracing paper between each filter.
6. Record the balance number, the filter ID number, and the tare weight on the Laboratory Data/Coding Form (see Figure 4.1) or alternative data recording medium. When bound, these forms serve as a laboratory notebook. Any filter weight outside of the normal range of 3.7 to 4.7 g should be investigated immediately. Sequentially number each form in the upper right-hand corner.
7. Perform the tare and gross weight QC checks as detailed in the following subsection and submit all data to the QC supervisor for review. (Minimum QC supervisor activities are also presented in Subsection 4.5.)
4.5 Internal QC
During the filter weighing process, the following QC checks are recommended. All QC data, including the actual and measured weights, the date, and the operator's initials, should be recorded on an Internal Quality Control Log Sheet (see Figure 4.2).

Balance ID Number 5LJ320J Balance I<. WR. JGHT Operator
Balance Date Filter No. Tare
10/11 /ca~ . 67/L/3 0.0000 671'1'-/ 0 .0000 671'15 0.0001
I0/17/ii 67/'73 0.0000 67 J'-/Lf O.Oc'.'.)OQ
67/'75 o.occo
- ---
----· ·- - · -·- --- ·- - - -·- · -- ... -- ---- -··- ... ·-
Quality Control Supervisor
Tare Wt.
3. 91'77 3. Cj0'6C/ 3.'7100
--
Section No.: 2.11.4 Date: January 1990 Page: 5
R.SHOR.ES Add'I
Gross Wt. analysis
- -- -- -
3.°J7/L/ -3. '1550 -3. CfCJ73 -
Figure 4.1. Example laboratory data/coding form.
..

-..
Balance ID Number 5L.J320J
Balance R. W121GHT Quality Control
R.SHoRES Operator Supervisor
Standard Zero Check Calibration Check Tare and Gross Weight Checks
Weight Checks (:t:O.S mg) (:t:0.5 mg)
Original Observed Original Observed Original Observed Original Observed Dale Value Value Value Value Value Value Filler ID Value Value
10;11 /9'?, L../.0170 '1.0173 o.cx::oo o.o:>o/ 5D007 5.CXll/ f, 71'-13 3. 9/'17 3.'11'1'1
671'15 3.?/00 3.'10j<J
--·
- . ' . ··----- --·
--- --·-- ·---- .
··-·- · - ----- ···~--
---··-- --·---
aTare or Gross Measurement
Figure 4.2. Example internal Quality Control Log Sheet.
T/G8
T T
-,,cc.n Cl> Cl> l't>
l.O r+ n rt> rt> r+ .... ~-
0 O\C.... ~
Cl> ~ :z co °' . , .. '<
l'\J ...... . l.D ......
'° ...... C>. ~
Section No.: 2.11.4 Date: January 1990 Page: 7
4.5.1 "Standard Weight" Check - Before the first filter is weighed, the balance should be checked by weighing a set of "standard weights 11 between 3 and 5 g. If the actual and measured values differ by more than ±0.5 mg, the values should be reported to the supervisor before proceeding. If the actual and measured values agree within t0.5 mg, each filter should be weighed to the nearest milligram. "Standard filter" checks are not a recommended QC check for HV PMlO filters. With repeated handling, the quartz filter will degrade rapidly and not allow for reproducible data.
4.5.2 Zero and Calibration Checks - After every 5 to 10 weighings, the operator should recheck the balance zero and record these check values on the Internal Quality Control Log Sheet. Zero QC checks within t0.5 mg of true zero are acceptable.
The calibration of the balance must be checked at least daily and possibly after every 15 filters unless laboratory records indicate that the balance is stable over longer periods of time. A set of standard Class-S Weights (these weights may be the same set used for the initial "standard weight" check) should be used at the 1-, 2-, and 5-g levels. These weights must also agree within ±0.5 mg. Larger discrepancies should be corrected immediately. When zero and calibration checks exceed acceptable limits, all previously weighed filters must be rechecked.
4.5.3 Tare and Gross Weight Checks - On each day of operation, the operator should reweigh five to seven exposed and unexposed filters per balance. Weights of clean filters should be within t2.8 mg of original values; if not, troubleshooting and reweighing are in order. Because of the loss of volatile components, no definitive limits are set for exposed filters; however, if the difference exceeds t5.0 mg, the laboratory QC supervisor should investigate immediately.
4.5.4 QC Supervisor Duties - The supervisor should keep a bound QC notebook. These notebooks should contain all QC data, including balance calibration and maintenance information, internal routine QC checks, and independent audits. For cross-checking, the supervisor should reference all QC data on the Internal Quality Control Log Sheet to the laboratory QC log book. Control charts should be maintained on each balance and also included in the log book. These charts will indicate any excess drift caused by an instrument malfunction.
The QC supervisor must daily certify the acceptability of all filter weights and recorded QC data.
4.6 Post-Sampling Documentation and Inspection
Upon receipt of exposed filters from the field, the sample custodian should adhere to the following procedure:
1. Examine the field data sheet. Determine whether all data needed to verify sample validity and to calculate mass concentration are provided (e.g., average flow rate, ambient temperature and barometric pressure and elapsed time). Void the sample if data are missing or unobtainable from a field operator or if a sampler malfunction is evident.

2.
3.
4.
5.
Section No.: 2.11.4 Date: January 1990 Page: 8
If the exposed filter was packaged for shipment, remove the filter from its protective envelope and examine the shipping envelope. If sample material has been dislodged from a filter, recover as much as possible by brushing it from the envelope onto the deposit on the filter with a soft camel's-hair brush.
Match the filter ID number with the correct laboratory data/coding form on which the original balance ID number, filter ID number, filter tare weight, and other information are inscribed. The sample custodian should group filters according to their recorded balance ID numbers. Initial separation of filters by balance ID number will decrease the probability of a balance error that could result from the use of different balances for tare and gross weights.
Remove the filter from the protective manila folder. Should the filter be retained in its filter cassette, loosen the .nuts on the top and remove the filter. Overtightening of the nuts may cause the filter to adhere to the cassette gasket. Gently remove it by the extreme corners to avoid damage. Inspect the filters for any damage that may have occurred during sampling. Conduct a secondary check of a sample's validity (as presented in Subsection 3.3). If insects are •~mbedded in the sample deposit, remove them with Teflon-tipped tweezers and disturb as little of the sample deposit as possible. If more than 10 insects are observed, refer the sample to the supervisor for a decision on acceptance or rejection of the filter for analysis.
Place defect-free filters in protective envelopes and forward them to the laboratory for weighing and analysis. File the data sheets for subsequent mass concentration calculations.
6. Place defective filters, with the type of defect(s) listed, in separate clean envelopes, label the envelopes, and submit them to the laboratory supervisor for final approval of filter validity.
4.7 Final Weighing Procedure (Gross Weight)
1. Place the defect-free filter(s) in a conditioning environment and allow them to equilibrate according to procedures outlined in Subsection 4.3.
2. Repeat Steps 1 through 6 of the HV PMlO filter tare-weighing procedure (Subsection 4.4). Record the indicated gross weight on the Laboratory Data/Coding Form.
3. Perform the internal QC checks described in Subsection 4.5 to ensure the validity of reweighing.
4. If the HV PMlO filter is not to receive additional analysis, place it into a protective envelope or folder. Deliver weighed filters to the sample custodian for archiving.
..

Section No.: 2.11.4 Date: January 1990 Page: 9
5. If the filter is to receive further analysis, place it in a protective covering and note on the envelope or folder what additional analyses are required. Place an asterisk after the gross weight column on the Laboratory Data/Coding Form to indicate that the filter requires additional analysis. Carefully transport each packaged filter to the sample custodian, who will forward it to the laboratory responsible for the additional analyses.
4.8 Calculation of PMlO Net Filter Loading
The gross weight minus the tare weight of an HV PMlO filter is the net weight of PMlO for that filter. Each calculation of this process must be independently validated. Subsection 5 presents information regarding the calculation of PMlO mass concentration.
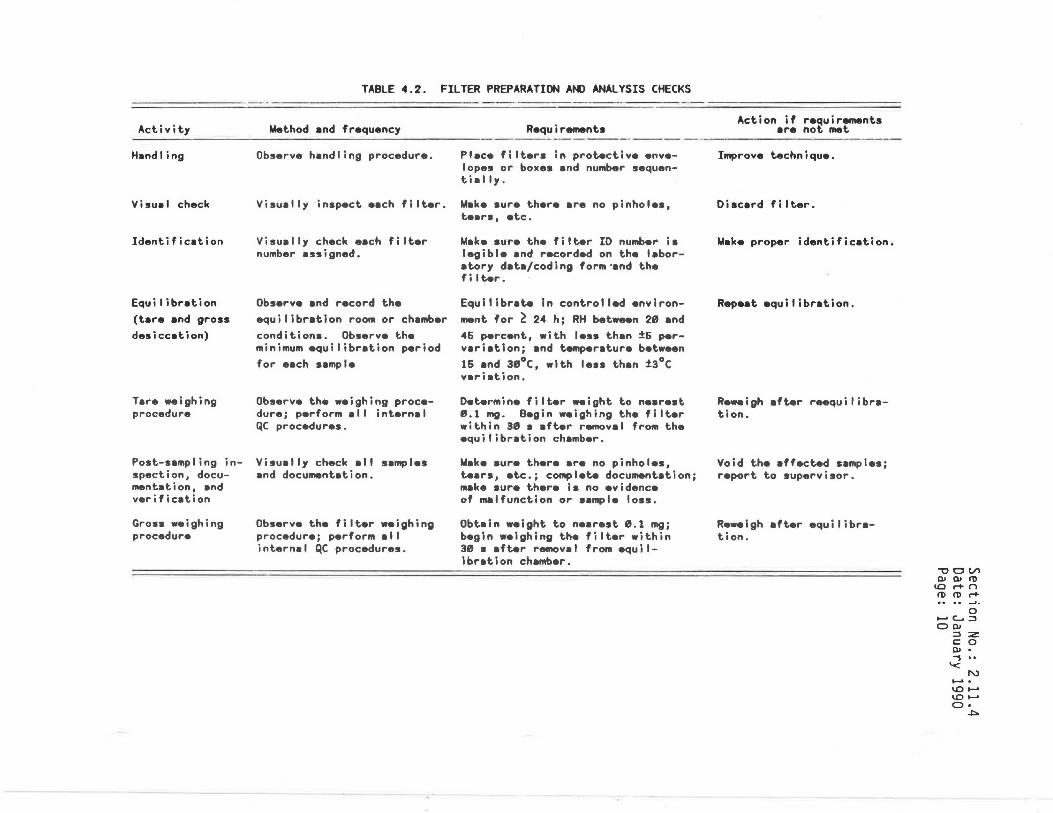
Activity
Hand I ing
Visuel check
Identification
Equi I ibration (tare end gross desiccation)
Tare weighing procedure
Post-sampling inspection, documentation, and verification
Gross weighing procedure
TABLE 4.2. FILTER PREPARATION AN> ANALYSIS CHECKS
Method end frequency Requirements - ----· -----
Observe hendling procedure. Place filters in protective envelopes or boxes and number sequentie I ly.
Visually inspect each filter. Make sure there are no pinholes, tears, etc.
Visually check each filter number assigned.
Observe and record the equilibration room or chamber conditions. Observe the minimum equilibration period for eech sample
Observe the weighing procedure; perform all internal QC procedures.
Visually check all samples and documentation.
Observe the filter weighing procedure; perform ell internal QC procedures.
Make sure the filter IO number is legible and recorded on the laboratory data/coding form·and the filter.
Equlllbrate In controlled environment for ~ 24 h; RH betw .. n 28 and 46 percent, with less than ±6 per-variation; and temperature between 16 and 38°C, with less than f3°C variation.
Determine filter weight to nearest 8.1 mg. Begin weighing the filter within 38 s after removal from the equilibration chamber.
Make aur• there are no pinholes, tears, etc.; complete documentation; make sure there is no evidence of malfunction or sample loss.
Obtain weight to nearest 8.1 mg; begin weighing the filter within 38 s after removal from equilibration chamber.
Action if requirements ere not met
Improve technique.
Discard fi It.er.
Make proper identification.
Repeat equilibration.
Reweigh after reequilibration.
Void the affected samples; report to supervisor.
Reweigh efter equilibration.
""O c Vl QI QI I'!)
u:::i r+ n 11> 11> r+
0 ..... c... ::I 0 QI
::I :z c: 0 QI ., '<
N ...... '° ..... '° ..... O• ~
2.11.5 CALCULATIONS, VALIDATIONS, AND REPORTING OF PMlO DATA
Section No.: 2.11.5 Date: January 1990 Page: 1
Measurements of PMlO mass concentration in the atmosphere that are used to determine attainment of the National Ambient Air Quality Standards for particulate matter must be expressed in units of micrograms per standard cubic meter (µg/std. m3) of air. for these measurements, "standard" means EPA-standard conditions of temperature and pressure, which are 25 °C (298 K) and 760 mm Hg (101 kPa), respectively. This section presents the calculations required to compute and report ambient PMIO concentrations. A summary of all calculation formulas and associated symbols presented in Section 2.11 is given in Table 5.1.
Particle size discrimination by inertial separation requires that specific air velocities be maintained in the sampler's air inlet system. These design velocities are obtained when a specified "design flow rate'' is maintained. The design flow rate is specified as an actual volumetric flow ra'te (Qa), measured at existing conditions of temperature (Ta) and pressure (Pa).
The sampler's operational flow rate (i.e., the actual flow rate when the sampler is operating normally to collect a PMlO sample) should, of course, be very close to the design flow rate. All PMlO samplers have some means for measuring the operational flow rate, and that flow rate measurement system must be calibrated periodically with a certified flow rate transfer standard. Usually, measurements (or estimates) of ambient temperature and barometric pressure are required to get an accurate indication of the operational flow rate. For determining the average sampler flow rate over a sample period, use of average temperature (Tav) and average barometric pressure (Pav) over the samiple period are recommended. However, if average temperature and pressure values (or reasonable estimates) cannot be obtained for each sample period, seasonal average temperature (Ts) and barometric pressure (Ps) for the site may be substituted.
Tav and Pav readings may be recorded on site or estimated from data obtained from a nearby U.S. National Weather Service Forecast Office or airport weather station. Barometric pressure readings obtained from airports or other sources must be at station pressure (i.e., not corrected to sea level), and they may have to be corrected for differences between the elevation of the monitoring site and that of the airport. If individual Tav and Pav readings cannot be obtained for each sample period and seasonal averages for the site are routinely substituted, care must be taken that the actual temperature and barometric pressure at the site can be reasonably represented by such averages. It is therefore recommended that seasonal average temperature and pressure values (Ts and Ps) for the site be used only when these values are within 20 K and 40 mm Hg (5 kPa) of the actual average temperature and barometric pressure (Tav and Pav) for the sample period.
The calculations presented in this subsection assume that the sampler has been calibrated in actual volumetric flow rate units (Qa) and that individual average temperature and barometric pressure values are used for each sample period. If seasonal average temperature and pressure values for the site are to be used, Ts may be substituted for Tav, and Ps may be substituted for Pav in Equations la, 9, 9a, 14a, and 16.
Section No.: 2.11.5 Date: January 1990 Page: 2
5.1 Calculations
5.1.1. Flow Rate Calculations - Because flow control methods (and hence, calibration procedures) vary among different sampler models, the calculations necessary to determine the average actual flow rate during a sample run will also differ. The following general procedures are recommended for calculating the average ambient flow rate of the HV PMlO sampler. In this subsection, it is assumed that the samplers have been calibrated according to procedures outlined in Subsection 2.
Note: Consistency in units is required. Adoption of uniform designations of K.for temperature and mm Hg (or kPa) for pressure is recommended in all calculations.
MFC Sampler - The average actual flow rate for the sample period is calculated by determining (a) the average of the initial and final manometer readings (APex) [or the average flow reco~der trace], (b) the average ambient temperature (Tav), and (c) the average ambient barometric pressure (Pav) during the sampling period and applying these values to the calibration relationship.
Each sampler's flow measurement system should be calibrated periodically, and the calibration should be described by a mathematical expre5sion (e.g., a leastsquares linear regression equation) that indicates the slope and intercept of the calibration relationship. Following the procedure in Subsection 2, this expression is in the fonn of:
where:
Qa = {[APex(Tav+30)/PavJ 112 - b} {1/m} (Eq. 9)
Qa = the sampler's average actual flow rate for the sample period, m3/min
APex = average of initial and final sampler manometer readings, (APexi + APexf)/2, mm (or in.) H20
Tav = average ambient temperature for the sample period, K (K = °C + 273)
Pav = average barometric pressure for the sample period, mm Hg (or kPa) b = intercept of the sampler calibration relationship m = slope of the sampler calibration relationship. ·
[For the flow recorder,
Qa = {T[(Tav+30)/Pav]l/2 - b} {l/m} (Eq. 9a)
where:
1 = average flow recorder reading for the sample period.]
The average actual flow rate is then corrected to EPA-standard conditions, calculated as:
where:
Qstd = Qa =
Pstd = Tstd =
Qstd = Qa(Pav/Pstd)(Tstd/Tav)
Section No.: 2.11.5 Date: January 1990 Page: 3
(Eq. la)
average sampler flow rate corrected to EPA-standard volume flow rate units, std. m3/min average actual sampler flow rate for the sample period, m3/min standard barometric pressure, 760 mm Hg (or 101 kPa) standard temperature, 288 K
VFC Sampler - The average actual flow rate for the sample period is calculated by determining the ratio of the average absolute stagnation pressure to the average ambient barometric pressure (Pl/Pav) and the ambient average temperature (Tav) for the sampler period.
1. Calculate the value of Pl in lllJl Hg (or kPa):
where:
PI = Pav - APstg (Eq. 13)
PI = average absolute stagnation pressure for the sample period, mm Hg (or kPa)
Pav = average barometric pressure for the sample period, mm Hg (or kPa) APstg = average of initial and final relative stagnation pressure read
ings, 11111 Hg (or kPa)
Note: Be sure to convert a water manometer reading to nwn Hg using Equation 12 before recording the reading on the data sheet:
mm Hg = 25.4 (in. H20/13.6) (Eq. 12)
2. Calculate and record the value of the average stagnation pressure ratio:
Average stagnation pressure ratio = (Pl/Pav) (Eq. 14a)
3. Use the manufacturer's lookup table J.Qr alternate calibration relationship; see Subsec1i,on 2) to det~rmine Qa from the average stagnation ___ pressure ratio (Pl/Pav) and Tav for the sample period. This value of Qa is the average volumetric flow rate for the sampler period.
4. The average actua 1 fl ow rate is then corrected to EPA standard conditions:
where:
Qstd = Qa(Pav/Pstd)(Tstd/Tav) (Eq. la)
average sampler flow rate corrected to EPA-standard volume flow rate units, std- m3/min

Section No.: 2.11.5 Date: January 1990 Page: 4
Qa = average actual sampler flow rate for the sample period, m3/min
Pstd Tstd
= standard barometric pressure, 760 mm Hg (or 101 kP~) = standard temperature, 298 K
5.1.2 Calculation of PMlO Concentrations - Accurate reporting of total PMlO mass concentration data requires the calculation of the total standard volume of air sampled (Equation 21) and the final computation of total PMlO mass concentration (~quation 22).
I. Calculate the total standard volume of air sampled:
Vstd = (Qstd)(t) (Eq. 21) where:
Vstd = total volume of air sampled in standard volume units, std. m3 Qstd = average sampler flow rate corrected to EPA-standard condi
tions, std. m3/min t = total elapsed sampling time, min.
2. Calculate total PMIO mass concentration in pg/std~ -m3:
PMIO = (I06)(Wg - Wt)/Vstd
where:
PMIO = PMlO mass concentration, pg/std. m3 106 = conversion factor, pg/g
(Eq. 22)
Wg, Wt = gross and tare weights of the HV PMlO filter, respectively, g Vstd = total sample volume in standard volume units, std. m3
5.2 Calculation Validation
Data that are needed to compute the mass concentration of PMlO originate from two main sources: field operations and laboratory operations. These data must be validated to ensure that all reported PMlO measurements are accurate relative to the overall scope of the quality assurance program. When the final mass concentration of PMlO in a sample has been computed, the validation procedure not only will check on these computations, but also will aid in the flagging of questionable mass concentrations (i.e., extremely high or low values). Therefore, should a mass concentration approach the primary or secondary ambient air quality standard, this validation procedure will provide checks for all preliminary field and laboratory operations. The steps of the calculation validation procedure are as follows:
1. Gather the following data for each sample:
• Total sampling time (min) • Average actual volumetric flow rate, Qa (m3/min) • Tare and gross weights, Wt and Wg, of the HV PMlO filter (g)
Section No.: 2.11.5 Date: January 1990 Page: 5
2. Recalculate the total mass concentration of PMlO for 7 samples per 100 (minimum of 4 per lot) as specified in Subsections 5.1.1 or 5.1.2. These suggested frequencies may be idjusted subsequently, based on accumulated experience and level of data quality. Decrease the frequency if experience indicates that data are of good quality, or increase it if data are of marginal or poor quality. It is more important to be sure that the validation check is representative of the various conditions that may influence data quality than to adhere to a fixed frequency.
3. Compare each validated PMlO concentration with the originally reported value. Correct any errors that are found, initial them, and indicate the date of correction. If a high percentage of errors is found, check additional calculated values. If consistent errors are found, check all values in the block of data and investigate and correct the cause.
4. Scan all total mass concentration values; note those that appear excessively high or low and investigate. Repeat Steps 2 and 3 for these samples.
5. If all mass concentration computations appear correct and questionably high or low values still exist, review all raw data (i.e., sample time, average actual volumetric flow rate, and its subsequent correction to standard conditions) for completeness and correctness.
5.3 Data Reporting
Attainment of the standards for particulate matter in the ambient air is based on the measured mass concentration of PMlO. Information on reporting and interpretation of PMlO data with respect to the attainment of these standards is covered in 40 CFR 50, Appendix K.
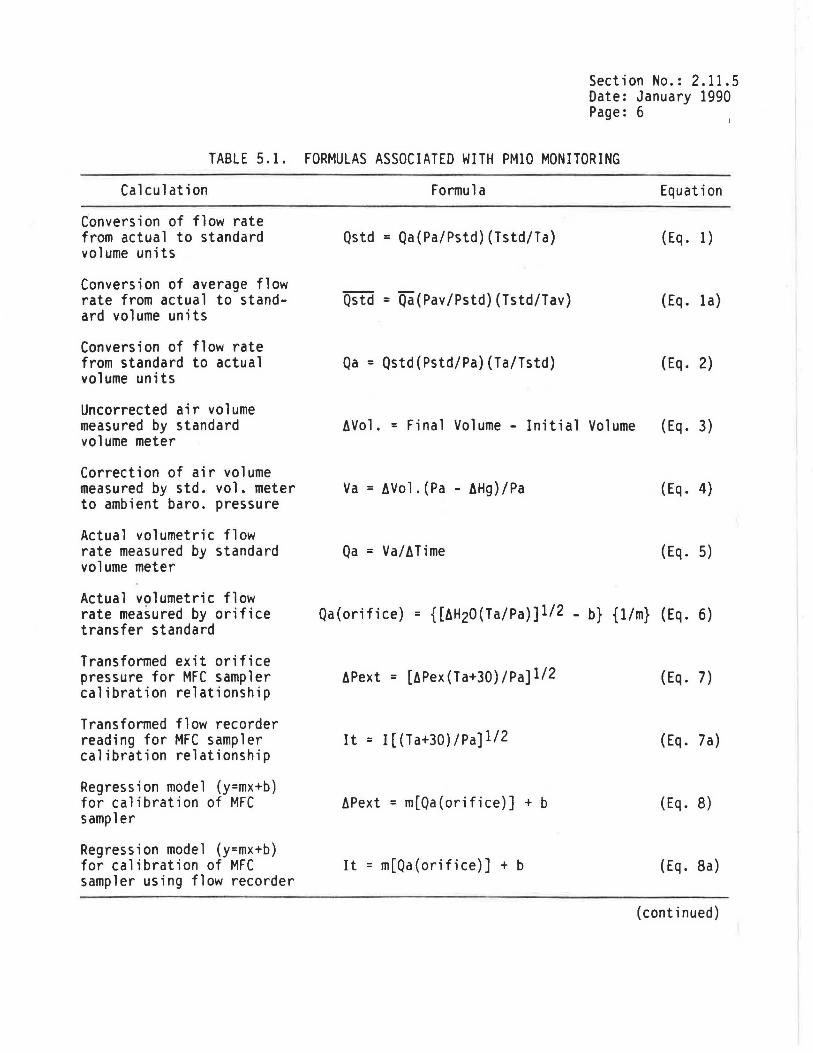
Section No.: 2.11.5 Date: January 1990 Page: 6
TABLE 5.1. FORMULAS ASSOCIATED WITH PMlO MONITORING
Calculation
Conversion of flow rate from actual to standard volume units
Conversion of average flow rate from actual to standard volume units
Conversion of flow rate from standard to actual volume units
Uncorrected air volume measured by standard volume meter
Correction of air volume measured by std. vol. meter to ambient baro. pressure
Actual volumetric flow rate measured by standard volume meter
Actual volumetric flow rate measured by orifice transfer standard
Transformed exit orifice pressure for MFC sampler calibration relationship
Transformed flow recorder reading for MFC sampler calibration relationship
Regression model (y=mx+b) for calibration of MFC sampler
Regression model (y=mx+b) for calibration of MFC sampler using flow recorder
Formula Equation
Qstd = Qa(Pa/Pstd)(Tstd/Ta) ( Eq. 1)
Qstd = Qa(Pav/Pstd)(Tstd/Tav) (Eq. la)
Qa = Qstd(Pstd/Pa)(Ta/Tstd) (Eq. 2)
AVol. =Final Volume - Initial Volume (Eq. 3)
Va= AVol.(Pa - AHg)/Pa ( Eq. 4)
Qa = Va/ATime ( Eq. 5)
Qa(orifice) = {[AH20(Ta/Pa)]l/2 - b} {1/m} (Eq. 6)
APext = [APex(Ta+30)/Pa]l/2 (Eq. 7)
It = I[(Ta+30)/Pa]l/2 (Eq. 7a)
APext = m[Qa(orifice)] + b (Eq. 8)
It = m[Qa(orifice)] + b (Eq. Ba)
(continued)

Section No.: 2.11.5 Date: January 1990 Page: 7
TABLE 5.1. FORMULAS ASSOCIATED WITH PMlO MONITORING (Cont 1 d)
Calculation
Calibration relationship for MFC samp l.er
Calibration relationship for MFC sampler using fl ow recorder
Set-point flow rate for MFC sampler
Set-point manometer reading for MFC sampler
Set-point reading for MFC sampler using flow recorder
Conversion of manometer reading in inches of H20 to mm Hg
Absolute stagnation pressure
Stagnation press. ratio
Avg. stagnation press. ratio
Regression model (y=mx+b) for calibration of VFC sampler
Calibration relationship for VFC sampler
Audit or QC flow check of sampler calibration
Audit or QC flow check of sampler operational flow rate Regression model (y=mx+b) for provisional calibration of VFC sampler for audit
Formula Equation
Qa = {[APex(Tav+30)/Pav)]l/2 - b} {1/m} (Eq. 9)
Qa = {1[(Tav+30)/Pav]l/2 - b} {l/m}
SFR = (1.13)(Ps/Pa)(Ta/Ts)
SSP = [Pa/(Ta + 30)][m(SFR) + b]2
SSP = [m(SFR) + b][Pa/(Ta+30)]1/2
mm Hg = 25.4(in. H20/13.6)
Pl = Pa - APstg, Pl = Pa - APstg
Stagnation press. ratio = Pl/Pa
Avg. stag. press. ratio =PT/Pav
Pl/Pa = m[Qa(orifice)]/[Ta]l/2 + b
(Eq. 9a)
(Eq. 10)
(Eq. 11)
(Eq. lla)
(Eq. 12)
(Eq. 13)
(Eq. 14)
(Eq. 14a)
(Eq. 15)
Qa(sampler) = {[(Pl/Pav) - b][Tav]l/2}{1/m} (Eq. 16)
'.f. d"ff = [Qa(sampler~ - gafaudit)J [10o] 1 • Qa audit ( Eq. 17)
,, difference= [Qa(audii~ 1 3 1.l3] [100] ( Eq. 18)
(Pl/Pa) = m• [Qa(audit)] + b' (Eq. 19)
(continued)
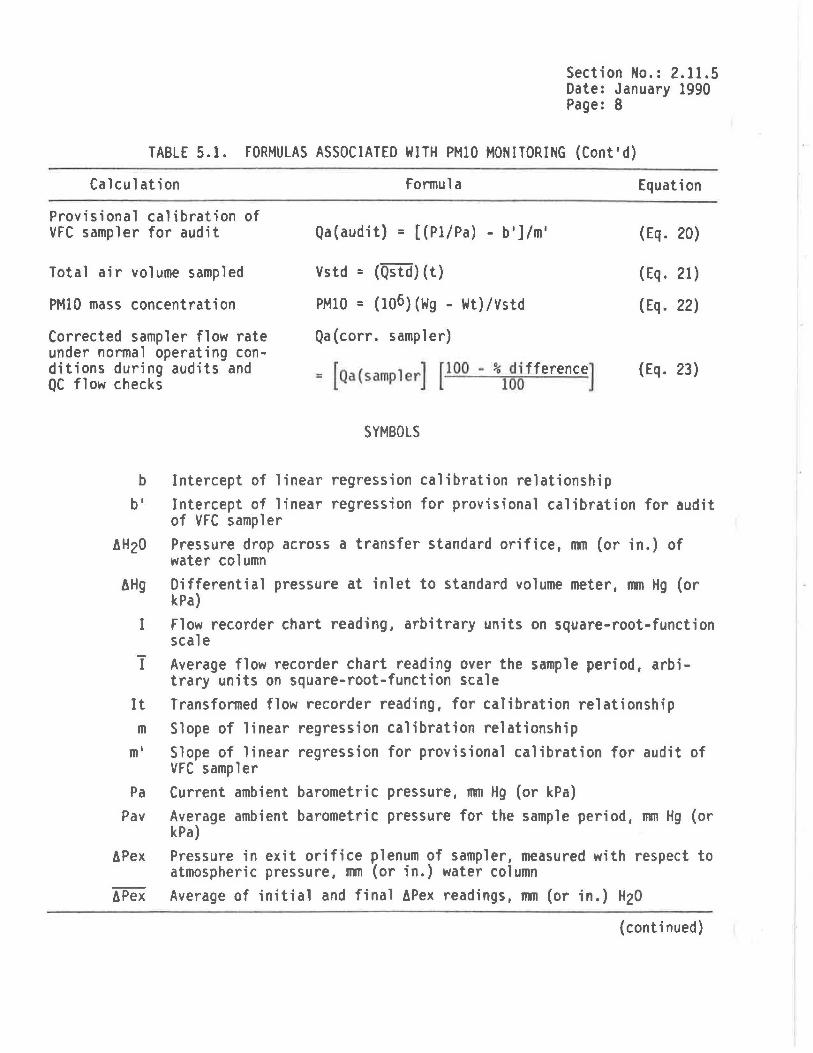
Section No.: 2.11.5 Date: January 1990 Page: 8
TABLE 5.1. FORMULAS ASSOCIATED WITH PMlO MONITORING (Cont'd)
Ca lcu lat ion
Provisional calibration of VFC sampler for audit
Total air volume sampled
PMlO mass concentration
Corrected sampler flow rate under normal operating conditions during audits and QC fl ow checks
Fonnul a
Qa(audit) = [(Pl/Pa) - b']/m'
Vstd = (Qstd)(t)
PMlO = (1Q6)(Wg - Wt}/Vstd
Qa(corr. sampler)
= (oa(sampler] (100 - \~~fference]
SYMBOLS
b Intercept of linear regression calibration relationship
Equation
(Eq. 20)
(Eq. 21)
(Eq. 22)
(Eq. 23)
b' Intercept of linear regression for provisional calibration for audit of VFC sampler
AH20 Pressure drop across a transfer standard orifice, Riii (or in.) of water column
AHg Differential pressure at inlet to standard volume meter, Riii Hg (or kPa)
I Flow recorder chart reading, arbitrary units on square-root-function scale
T Average flow recorder chart reading over the sample period, arbitrary units on square-root-function scale
It Transfonned flow recorder reading, for calibration relationship m Slope of linear regression calibration relationship
m' Slope of linear regression for provisional calibration for audit of VFC sampler
Pa Current ambient barometric pressure, mm Hg (or kPa) Pav Average ambient barometric pressure for the sample period, nun Hg (or
kPa) APex Pressure in exit orifice plenum of sampler, measured with respect to
atmospheric pressure, mn (or in.) water column APex Average of initial and final APex readings, nin (or in.) H20
(continued)
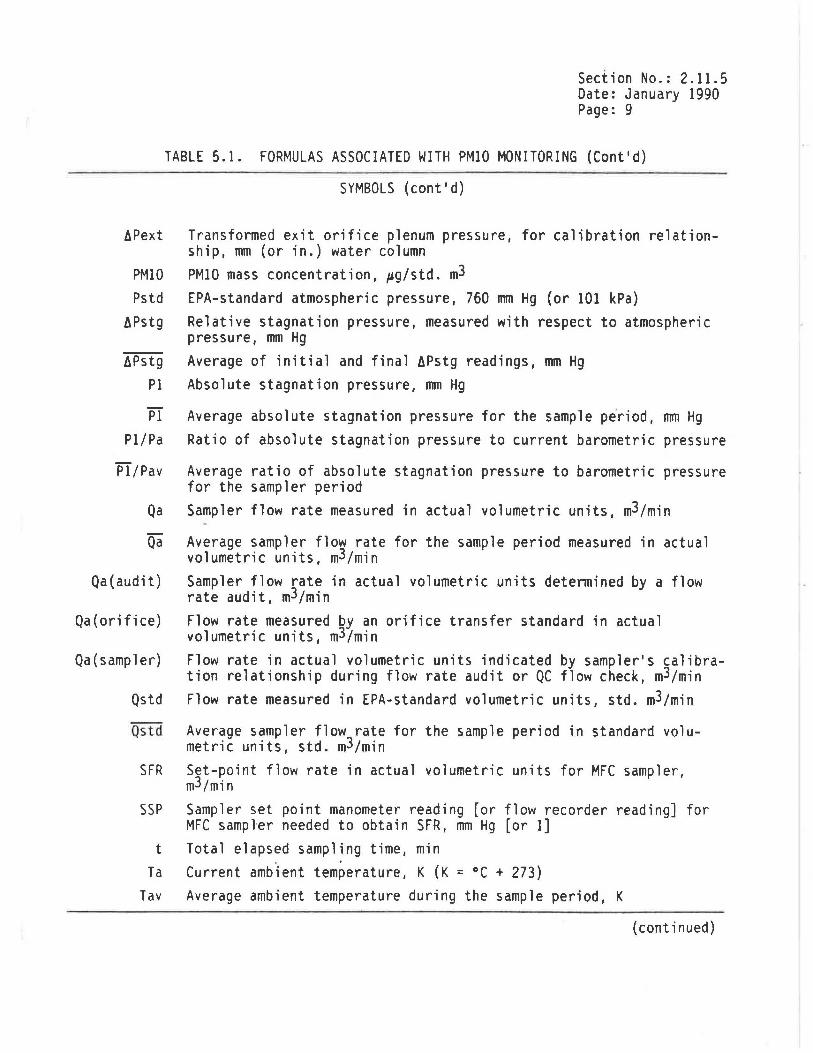
tiPext
PMlO Pstd
tiPstg
tiPstg Pl
Pf Pl/Pa
Pl/Pav
Qa
Qa
Qa(audit)
Qa(orifice)
Qa(sampler)
Qstd
Qstd
SFR
Section No.: 2.11.5 Date: January 1990 Page: 9
TABLE 5.1. FORMULAS ASSOCIATED WITH PMlO MONITORING (Cont'd)
SYMBOLS (cont'd)
Transformed exit orifice plenum pressure, for calibration relationship, mm (or in.) water column PMlO mass concentration, µg/std. m3 EPA-standard atmospheric pressure, 760 mm Hg (or 101 kPa) Relative stagnation pressure, measured with respect to atmospheric pressure, mm Hg Average of initial and final tiPstg readings, mm Hg Absolute stagnation pressure, mm Hg
Average absolute stagnation pressure for the sample pe.riod, mm Hg Ratio of absolute stagnation pressure to current barometric pressure
Average ratio of absolute stagnation pressure to barometric pressure for the sampler period Sampler flow rate measured in actual volumetric units, m3/min
Average sampler flow rate for the sample period measured in actual volumetric units, m3/min Sampler flow rate in actual volumetric units detennined by a flow rate audit, m3/min Flow rate measured by an orifice transfer standard in actual volumetric units, m3/min Flow rate in actual volumetric units indicated by sampler's calibration relationship during flow rate audit or QC flow check, m3/min Flow rate measured in EPA-standard volumetric units, std. m3/min
Average sampler flow rate for the sample period in standard volumetric units, std. m3/min Set-point flow rate in actual volumetric units for MFC sampler, m3/min
SSP Sampler set point manometer reading [or flow recorder reading] for MFC sampler needed to obtain SFR, mm Hg [or I]
t Total elapsed sampling time, min Ta Current ambient temperature, K (K = °C + 273)
Tav Average ambient temperature during the sample period, K
(continued)

ATime
Tstd Va
AVol Vstd
Wg, Wt
Section No.: 2.11.5 Date: January 1990 Page: 10
TABLE 5.1. FORMULAS ASSOCIATED WITH PMlO MONITORING (Cont'd)
SYMBOLS (cont'd)
Elapsed time during which a flow rate is measured by a standard volume meter, min EPA-standard temperature, 298 K Actual air volume measured by standard volume meter at ambient temperature and barometric pressure, m3 Uncorrected air volume measured by standard volume meter, m3 Total sample volume measured in standard volume units, m3 Gross and tare weights of the HV PMlO filter, respectively, g

2.11.6 MAINTENANCE
Section No.: 2.11.6 Date: January 1990 Page: 1
Maintenance is defined as a program of positive actions aimed toward preventing failure of monitoring and analytical systems. The overall objective of a routine preventive maintenance program is to increase measurement system reliability and to provide for more complete data acquisition.
This section outlines general maintenance procedures for HV PMlO samplers. For more complete information on a particular sampler or on laboratory equipment maintenance, refer to the manufacturer's instruction manual for the individual instrument. Table 6.1 at the end of this section summarizes maintenance activities for the HV PMlO sampler.
Records should be maintained for the maintenance schedule of each HV PMlO sampler. Files should reflect the history of maintenance, including all replacement parts, suppliers, costs, expenditures, and an inventory of on-hand spare equipment for each sampler. Check sheets should be used to record preventive and/or corrective maintenance activities and the subsequent sampler calibration curve.
6.1 Maintenance Procedures
The HV PMlO sampler is comprised of two basic components: the inlet and the flow control system. Because of the differences between sampler models, it will be necessary to refer to the manufacturer's instruction manual for specific, step-bystep maintenance guidelines and necessary supplies.
6.2 Recommended Maintenance Schedules
Although no maintenance schedule is explicitly prescribed in the Reference Method (40 CFR 50, Appendix J), field testing of the most common HV PMlO samplers determined the following maintenance frequencies.
6.2.1 Impaction Inlet - The impaction inlet should be dismantled and cleaned at intervals specified by the manufacturer to preclude problems with particle bounce. It is recommended that scribe marks be etched on the inlet to ensure proper alignment during reassembly.
Note: Bees often use this inlet as a hive, so be very careful during disassembly. A screen can be installed around the "lip" of the sampler inlet to prohibit larger insects from entering.
6.2.2 Cyclonic Inlet - The cyclonic inlet should be cleaned at intervals specified by the manufacturer. The inlet is constructed to allow easy access to the fractionating element through a maintenance access port.
Caution: Prolonged positioning of the cyclonic inlet at angles exceeding 90 degrees from vertical (during maintenance activities) may result in residual leakage of oil from the middle tube onto the inside surfaces of the outer tube. If this occurs, the outer tube will require wiping with a Kimwipe to prevent the oil from contaminating the filter substrate.
Section No.: 2.11.6 Date: January 1990 Page: 2
6.2.3 MFC Base - The MFC base is equipped with the following items:
1. Connecting tubing and power lines, which must be checked for crimps, cracks, or obstructions on sample recovery days. Fittings should be inspected periodically for cross-threading and tightness.
2. A filter screen, which should be inspected on sample recovery days for any impacted deposits.
3. Filter cassette gaskets, which need to be inspected each time a cassette is loaded. A worn cassette gasket is characterized on exposed filters by a gradual blending of the boundary between the collected particulates and the filter border.
4. Motor and housing gaskets, which should be thecked at 3-mo intervals and replaced as necessary.
5. Blower motor brushes, which should be replaced before they become worn to the point that damage may occur. Although motor brushes usually require replacement after 600 to 1,000 h of operation, the optimum replacement interval must be determined by experience. A pumice stone can be used against the motor's contacts to ensure high conductivity. Change the brushes according to manufacturer's instructions, and perform the operator's field-calibration check as presented in Subsection 3.5. If the sampler's indicated flow rate exceeds the manufacturer-specified designflow-rate range, adjust the sampler before the next run day.
6.
To achieve the best performance, new brushes should be properly seated on the motor's conunutator before full voltage is applied to them. After the brushes have been changed, operate the sampler at 50 to 75 percent of normal line voltage for approximately 30 min. The motor should return to full performance after an additional 30 to 45 min at norma.1 line voltage.
Caution: The motors that are used for HV PMlO samplers are higher-current versions of the motors that have been used for HV total suspended particulate samplers. The brushes for the two types of motor are different. Make sure that the correct replacement brushes are used for the maintenance of HV PMlO samplers.
If a motor needs to be replaced, be sure to sions that are needed for HV PMlO sampling. are installed in HV PMlO samplers, the flow with changes in the line voltage.
use the higher-current verWhen lower-current motors
rate has been found to vary
7. A flow controller, which should be replaced if the flow recorder indicates no flow, low flow, excessive flow, or erratic flow. Minor adjustments can be made to alter sampling flow rates; however, the controller generally cannot be repaired in the field.
8. A flow recorder, which requires very little maintenance, but does deteriorate with age. Difficulty in zeroing the recorder and/or significant
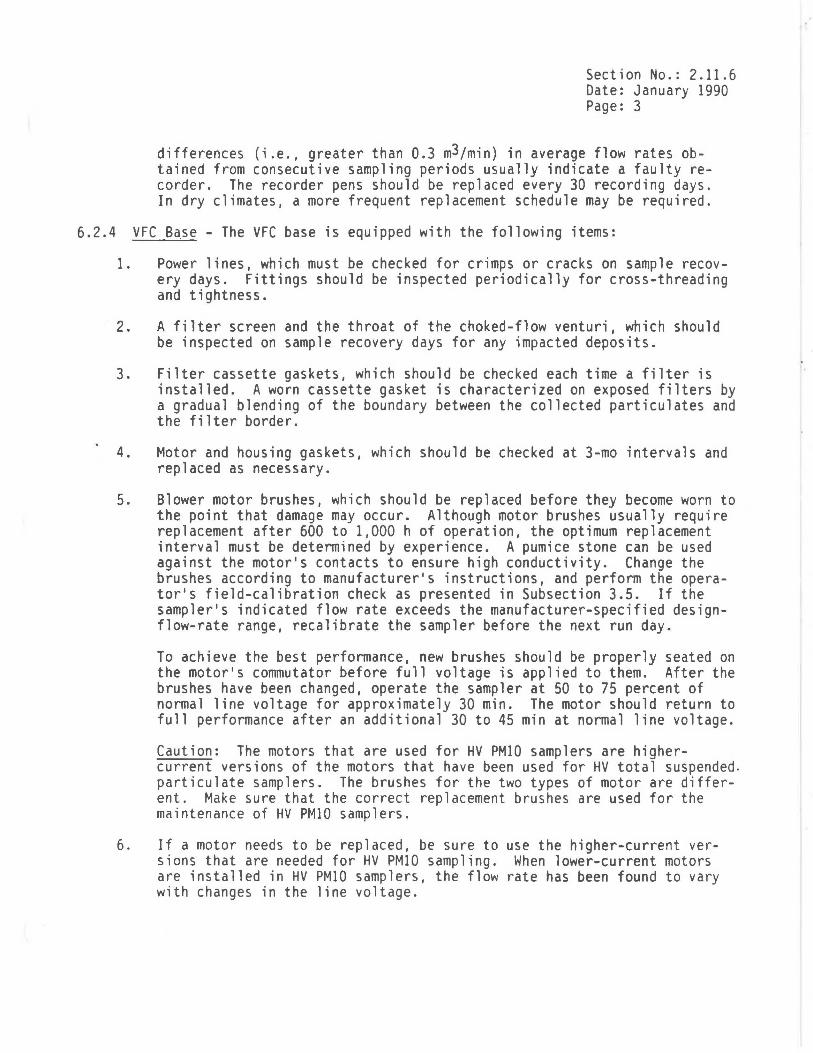
Section No.: 2.11.6 Date: January 1990 Page: 3
differences (i.e., greater than 0.3 m3/min) in average flow rates obtained from consecutive sampling periods usually indicate a faulty recorder. The recorder pens should be replaced every 30 recording days. In dry climates, a more frequent replacement schedule may be required.
6.2.4 VFC Base - The VFC base is equipped with the following items:
1. Power lines, which must be checked for crimps or cracks on sample recovery days. Fittings should be inspected periodically for cross-threading and tightness.
2. A filter screen and the throat of the choked-flow venturi, which should be inspected on sample recovery days for any impacted deposits.
3. Filter cassette gaskets, which should be checked each time a filter is installed. A worn cassette gasket is characterized on exposed filters by a gradual blending of the boundary between the collected particulates and the filter border.
4. Motor and housing gaskets, which should be checked at 3-mo intervals and replaced as necessary.
5. Blower motor brushes, which should be replaced before they become worn to the point that damage may occur. Although motor brushes usually require replacement after 600 to 1,000 h of operation, the optimum replacement interval must be determined by experience. A pumice stone can be used against the motor's contacts to ensure high conductivity. Change the brushes according to manufacturer's instructions, and perform the operator's field-calibration check as presented in Subsection 3.5. If the sampler's indicated flow rate exceeds the manufacturer-specified designflow-rate range, recalibrate the sampler before the next run day.
6.
To achieve the best performance, new brushes should be properly seated on the motor's commutator before full voltage is applied to them. After the brushes have been changed, operate the sampler at 50 to 75 percent of normal line voltage for approximately 30 min. The motor should return to full performance after an additional 30 to 45 min at normal line voltage.
Caution: The motors that are used for HV PMlO samplers are highercurrent versions of the motors that have been used for HV total suspended. particulate samplers. The brushes for the two types of motor are different. Make sure that the correct replacement brushes are used for the maintenance of HV PMlO samplers.
If a motor needs to be replaced, be sure to sions that are needed for HV PMlO sampling. are installed in HV PMlO samplers, the flow with changes in the line voltage.
use the higher-current verWhen lower-current motors
rate has been found to vary
6.3 Refurbishment of HV PMlO Samplers
Section No.: 2.11.6 Date: January 1990 Page: 4
If operated in the field for extended periods, HV PMlO samplers may require major repairs or complete refurbishment. If so, refer to the manufacturer's instrument manual before work is undertaken. A sampler that has undergone major repairs or refurbishment must be leak-checked and calibrated prior to sample collection.
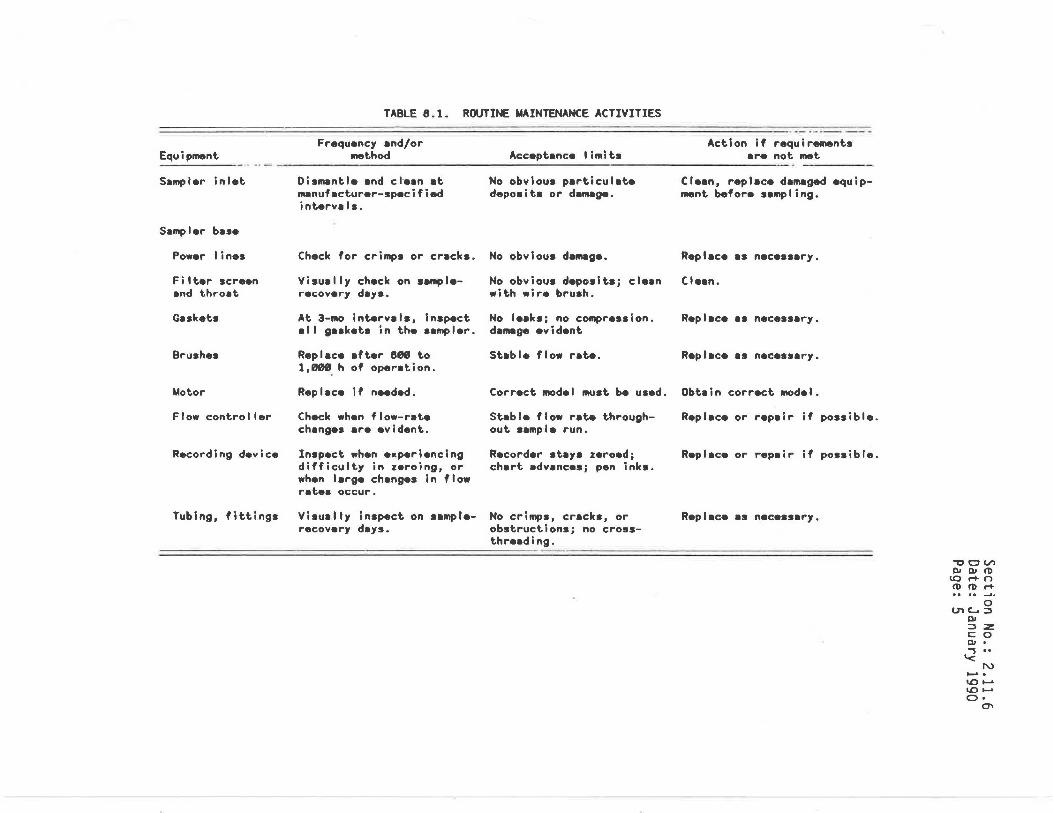
Equipment
S•mpler inlet
S•mpler b•se
Power I ines
Filter screen •nd thro•t
G•skets
Brushes
Motor
Flow controller
Recording device
Tubing, fittings
TABLE 8.1. ROUTINE MAINTENANCE ACTIVITIES
Frequency •nd/or method
Oism•ntle •nd c~e•n •t m.nuf•cturer-specif ied interv•ls.
Check for crimps or cr•cks.
Visu•lly check on s•mplerecovery d•ys.
At 3-mo lnterv•ls, inspect •II g•skets in the s•mpler.
Repl•ce •fter 8"8 to 1,""8_ h of oper•tion.
Repl•ce if needed.
Check when flow-r•te ch•nges •re evident.
Inspect when eKperiencing difficulty in zeroing, or when l•rge ch•nges in flow r•tes occur.
Visu•lly inspect on s•mplerecovery d•ys.
Accept•nce limits
No obvious p•rticul•te deposits or d•m.ge.
No obvious d•m.ge.
No obvious deposits; cle•n with wire brush.
No leaks; no compression. dam.ge evident
Stable flow rate.
Correct model must be used.
St•ble flow rate throughout sample run.
Recorder stays zeroed; chart advances; pen inks.
No crimps, cr•cks, or obstructions; no crossthreading.
Action if requirements •r• not met
Cle•n, replace dam.ged equipment before sampling.
Repl•ce •s necess•ry.
Cle•n.
Repl•ce •s necess•ry.
Repl•ce •s necess•ry.
Obt•in correct model.
Repl•ce or rep•ir if possible.
Repl•c• or rep•ir if possible.
Repl•ce •s necess•ry.
.,, 0 V'I QI QI Cl>
IO r+ n Cl> Cl> r+
0 01 c....::;,
QI ::;, :z c: 0 QI -s '<
N ........ o.o ..... \0 ....... 0.
°'

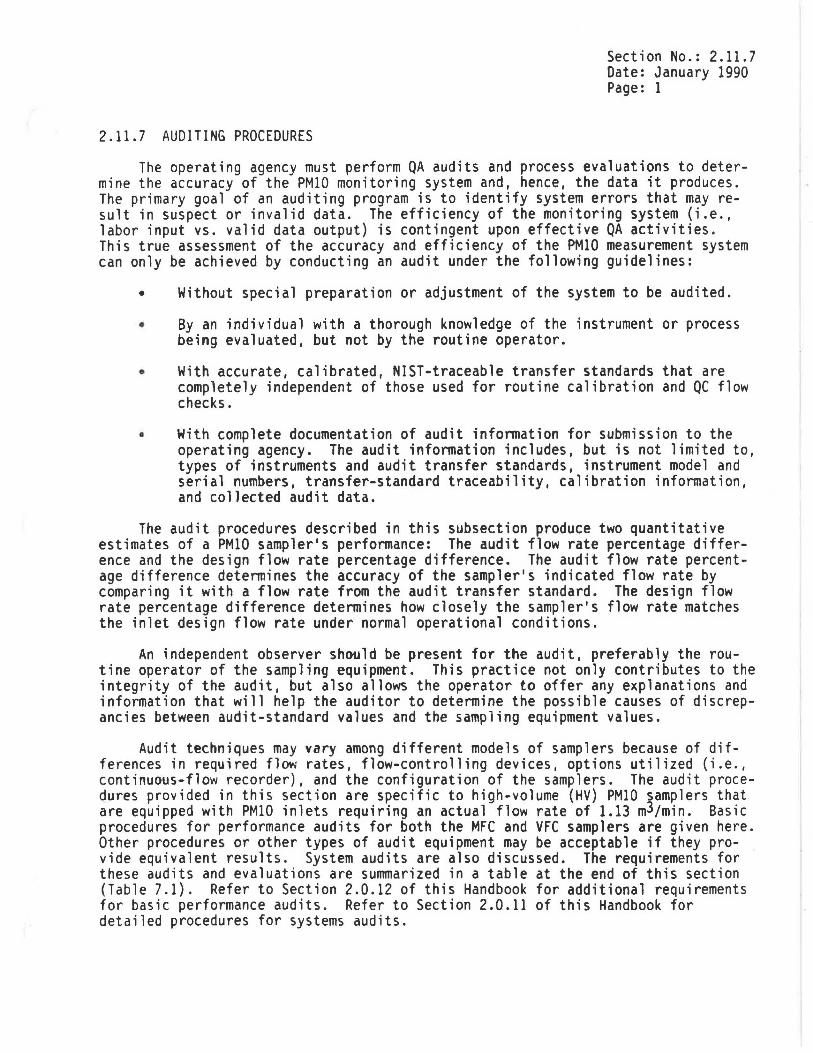
2.11.7 AUDITING PROCEDURES
Section No.: 2.11.7 Date: January 1990 Page: 1
The operating agency must perform QA audits and process evaluations to determine the accuracy of the PMlO monitoring system and, hence, the data it produces. The primary goal of an auditing program is to identify system errors that may result in suspect or invalid data. The efficiency of the monitoring system (i.e., labor input vs. valid data output) is contingent upon effective QA activities. This true assessment of the accuracy and efficiency of the PMlO measurement system can only be achieved by conducting an audit under the following guidelines:
• Without special preparation or adjustment of the system to be audited.
• By an individual with a thorough knowledge of the instrument or process being evaluated, but not by the routine operator.
• With accurate, calibrated, NIST-traceable transfer standards that are comp,etely independent of those used for routine calibration and QC flow checks.
• With complete documentation of audit infonnation for submission to the operating agency. The audit infonnation includes, but is not limited to, types of instruments and audit transfer standards, instrument model and serial numbers, transfer-standard traceability, calibration infonnation, and collected audit data.
The audit procedures described in this subsection produce two quantitative estimates of a PMlO sampler's performance: The audit flow rate percentage difference and the design flow rate percentage difference. The audit flow rate percentage difference detennines the accuracy of the sampler's indicated flow rate by comparing it with a flow rate from the audit transfer standard. The design flow rate percentage difference detennines how closely the sampler's flow rate matches the inlet design flow rate under normal operational conditions.
An independent observer should be present for the audit, preferably the routine operator of the sampling equipment. This practice not only contributes to the integrity of the audit, but also allows the operator to offer any explanations and information that will help the auditor to determine the possible causes of discrepancies between audit-standard values and the sampling equipment values.
Audit techniques may vary among different models of samplers because of differences in required flow rates, flow-controlling devices, options utilized (i.e., continuous-flow recorder), and the configuration of the samplers. The audit procedures provided in this section are specific to high-volume (HV) PMlO samplers that are equipped with PMlO inlets requiring an actual flow rate of 1.13 m3/min. Basic procedures for performance audits for both the MFC and VFC samplers are given here. Other procedures or other types of audit equipment may be acceptable if they provide equivalent results. System audits are also discussed. The requirements for these audits and evaluations are summarized in a table at the end of this section (Table 7.1). Refer to Section 2.0.12 of this Handbook for additional requirements for basic performance audits. Refer to Section 2.0.11 of this Handbook for detailed procedures for systems audits.

Section No.: 2.11.7 Date: January 1990 Page: 2
7.1 Flow-Rate Performance Audit Procedure for Mass-Flow-Controlled (MFC) HV PMlO Samplers
For this MFC procedure, the following conditions are assumed:
• The MFC sampler utilizes an electronic mass-flow controller for flow-rate control.
• The sampler's flow rate is measured by a water or oil manometer connected to the exit orifice plenum pressure port [or, if necessary, by a continuous flow recorder connected to the exit orifice port and equipped with square-root-scale chart paper].
• The sampler inlet is designed to operate at a flow rate of 1.13 m3/min at actual conditions; the acceptable flow-rate fluctuation range is tlO percent of this value (i.~ •• 1.02 to 1.24 rn3/min).
• The calibrated, NIST-traceable audit transfer standard is an orifice device with an associated water or oil manometer.
• The audit orifice transfer standard's calibration relationship is expressed in actual volumetric flow-rate units (Qa) as described in Subsection 2.2.
Note: Do not attempt to audit HV PMlO samplers under windy conditions. Short-term wind velocity fluctuations will produce variable pressure readings by the audit orifice transfer standard's manometer. The audit will be less precise because of the pressure variations.
The auditor should adhere to the following procedures during an audit of the MFC sampler:
1. Transport the following equipment to the monitoring site:
• Audit orifice transfer standard with calibration relationship in actual volumetric flow-rate (i.e., Qa) units and traceable to NIST (see Subsection 2.2). This orifice transfer standard should not be the same one that is used for routine calibrations and QC flow checks.
• An associated water or oil manometer, with a 0- to 400-mm (0- to 16-in.) range and minimum scale divisions of 2 mm (0.1 in.).
• A thermometer, capable of accurately measuring temperature over an appropriate range to the nearest tl °C and referenced to an NIST or ASTM thermometer within t2 °C at least annually.
. '
Section No.: 2.11.7 Date: January 1990 Page: 3
• A portable aneroid barometer (e.g., a climber's or engineer's altimeter), capable of accurately measuring ambient barometric pressure over the range of approximately 500 to 800 mm Hg (66 to 106 kPa) to the nearest mm Hg and referenced within i5 mm Hg to a barometer of known accuracy at least annually.
• MFC Sampler Audit Data Sheet such as shown in Figure 7.1 (blank forms appear in Subsection 12).
• Clean filter [and clean recorder chart, if a flow recorder is used to quantitatively measure the flow rate].
Note: The site operator is responsible for providing the manometer (or other device) that is normally used for measuring the sampler's flow rate, the sampler calibration relationship that is currently in effect for determining the flow rate for sample periods, and any other information or equipment that is normally used to determine the sampler's indicated fl ow rate.
2. [If a continuous flow recorder is being used quantitatively in lieu of a manometer to measure sampler flow rate, record the site location, sampler S/N, date, and the auditor's initials on the blank side of a clean recorder chart. Open the front door of the sampler and install the clean recorder chart. If the MFC sampler was calibrated by using square-rootscale chart paper, the audit must be conducted with the same type of chart paper. Observe the recorder zero setting. If necessary, instruct the operator to adjust the pen to indicate true zero.]
3. Instruct the operator to install a clean filter in the HV PMlO. DO NOT use a filter cassette; place the filter directly on the sampler filter screen. An audit filter should never be used for subsequent sampling because particles larger than 10 µm can be collected on the filter while the inlet is raised. The sampler mass will be biased as a result of using a filter for both an audit and subsequent sampljng.
4. Install the audit orifice transfer standard's faceplate on the sampler. Check that the gaskets are in good condition and have not deteriorated.
Caution: Tighten the faceplate nuts evenly on alternate corners to properly align and uniformly seat the gaskets. The nuts should be handtightened only; too much compression can damage the sealing gaskets.
5. Install the audit orifice transfer standard with no resistance plate, or open the valve of a variable-resistance orifice wide open. For resistance plate orifices, make sure the orifice gasket is present and the audit orifice transfer standard is not cross-threaded on the faceplate. Seal the audit orifice transfer standard's pressure port with a rubber cap or similar device.
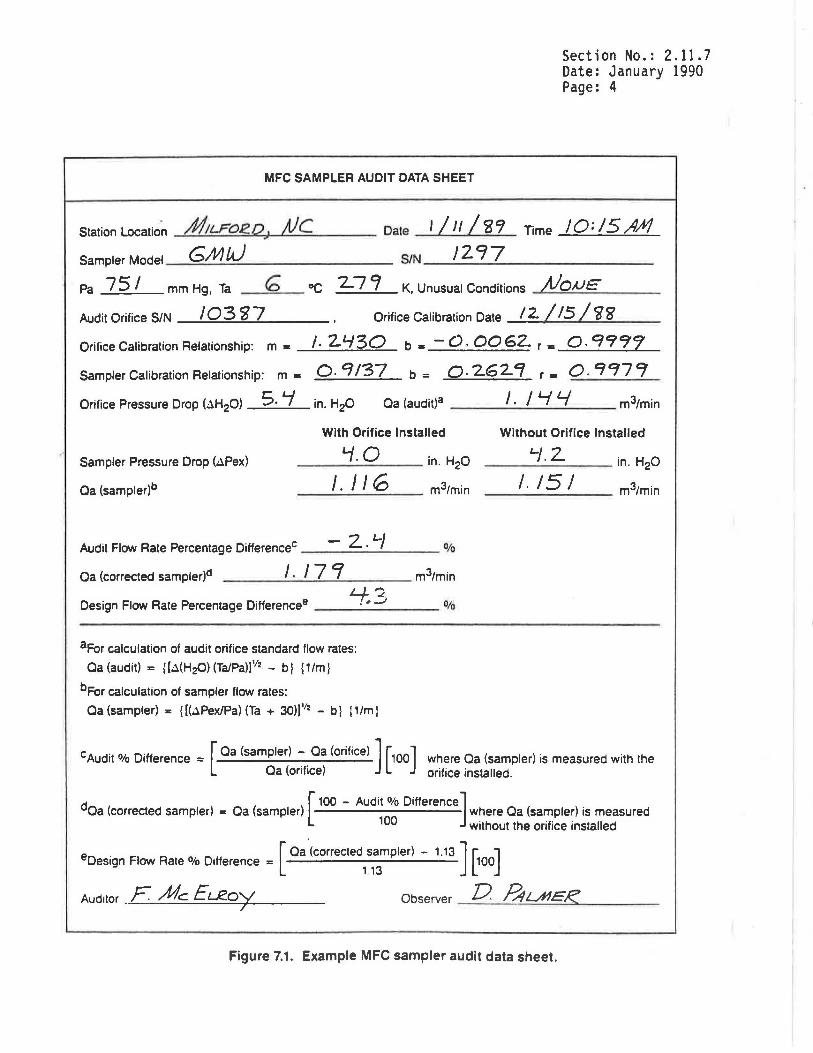
MFC SAMPLER AUDIT DATA SHEET
Sect ion No. : 2. 11 . 7 Date: January 1990 Page: 4
Station Location /1111-FOl?.D. ).)C Date I /J/ /gCJ Time /O: 15 A/11 >
Sampler Model GMlJ SIN __ / 2_ 9_:..7 _____ _
Pa 75/ mm Hg, Ta fO °C 2.79 K, Unusual Conditions ;t/o.uE Audit Orifice SIN _...:../-=0~3;....;~:.......:.7 ___ _ Orifice Calibration Date 12. / 15 J ~ '8
J.2430 b.-0.0062.r. o.q997 Orifice Calibration Relationship: m ..
Sampler Calibration Relationship: m "" 0.9/37 b= Q.262C/ r• O.Cf'77Cf
Orifice Pressure Drop (-lH20) 5. '-/ in. H20 Ca (audit)a I· / Lf Lf m3/min
With Orifice Installed
Sampler Pressure Drop (.il.Pex)
Ca (sampler)b
___ '-f_. Q ___ in. H20
I. I I G m3/min -------
Audit Flow Rate Percentage Differencec - 2. · L-j %
Ca (corrected sampler)d I . I 7 '1 4-. ':!
Design Flow Rate Percentage Differencee ___ . ,_._/ ____ %
aFor calculation of audit orifice standard flow rates:
Ca (audit) = { [~(H~) (Ta/Pa)J'12 - bl { 1 /ml
bFor calculation of sampler flow rates:
Ca (sampler) = {[(.lPex/Pa) (Ta + 30))'12 - bl ptml
Without Orifice Installed
'-/. 2. ------- in. H20
__ J_. _1_5_/ __ m3/min
cAudit % Difference = [Ca (sampler) - Ca (orifice) J [100] where Ca (sampler) is measured with the Ca (orifice) orifice installed.
d [ 100 - Audit % Difference] Ca (corrected sampler) = Ca (sampler) where Ca (sampler) is measured
100 without the orifice installed
[Ca (corrected sampler) - 1.13 J [ J
eDesign Flow Rate% Difference = 1.13
100
Auditor _ F ,41c. E l..J?.O'j Observer D f31L...A?ER
Figure 7.1. Example MFC sampler audit data sheet.

Section No.: 2.11.7 Date: January 1990 Page: 5
6. Leak test the audit system (refer to Subsection 2.3.2, Step 5). Identify and correct any leaks before continuing.
7. Inspect the audit orifice manometer connecting tubing for crimps or cracks. Open the manometer valves fully and blow gently through the tubing, watching for the free flow of the fluid. Adjust the manometer sliding scale so that the zero line is at the bottom of the meniscuses. Connect the audit manometer to the pressure port on the orifice. Make sure the unconnected side of the manometer is open to the atmosphere. Make sure that the tubing fits snugly on the pressure port and on the manometer.
8. Turn on the sampler and allow it to warm up to operating temperature (3 to 5 min).
Note: The sampler inlet may be partially lowered over the audit orifice transfer standard to act as a draft s,hield (if a shield is not otherwise provided). Use a block to provide at least 2 in. of clearance at the bottom for air flow and for the manometer tubing.
9. Observe and record the following parameters on the MFC Sampler Audit Data Sheet:
• Sampler location, date, time. • Sampler model and S/N, and calibration relationship. • Ambient temperature (Ta), K (K = °C + 273). • Ambient barometric pressure (Pa), mm Hg or kPa. • Unusual weather conditions. • Audit orifice transfer standard S/N and calibration information.
10. When the sampler has wanned up to operating temperature, observe the pressure drop across the orifice by reading the total manometer deflection, and record as AH20 on the audit data sheet.
11. Instruct the operator to read the sampler exit orifice manometer reading, APex [or the continuous flow recorder response, I], and record it on the data sheet.
12. Turn off the sampler and remove the audit orifice transfer standard, but do not remove the filter. Turn the sampler on again and repeat Step 11 for the normal operating flow rate.
13. Gather together all audit data, including the audit orifice transfer standard's calibration information, the MFC sampler's calibration data, [and the recorder chart that graphically displays the sampler response].
14. Verify that the correct readings have been inscribed on the data sheet.
15. Determine the flow rate through the audit orifice transfer standard, as presented in Equation 6:

Qa(audit) = {[AH20(Ta/Pa)]l/2 - b} {l/m}
where:
Section No.: 2.11.7 Date: January 1990 Page: 6
( Eq. 6)
Qa(audit) = actual volumetric flow rate as indicated by the audit orifice transfer standard, m3/min
AH20 = pressure drop across the orifice, mm (or in.) HzO Ta = ambient temperature, K (K = •c + 273) Pa = ambient barometric pressure, mm Hg (or kPa) b = intercept of the audit orifice transfer standard's cali
bration relationship. m = slope of the audit orifice transfer standard's calibra
tion relationship
16. Instruct the operator to calculate the sampler's indicated flow rate, Qa(sampler) with and without the orifice installed, as it is normally done, using the sampler's calibration relationship (Equation 9 [or 9a], Subsection 2.3.3) and record both Qa(sampler) values on the data sheet.
17. Calculate the percentage difference between the sampler's indicated flow rate, Qa(sampler) with the orifice installed, and the corresponding audit flow rate, Qa(audit), determined from the audit orifice transfer standard as:
Audit flow rate~ difference= [Qa(sampler) -.Qa(audit)] [100] • Qa(aud1t) (Eq. 17)
18. Record the audit flow rate percentage difference on the data sheet. If the audit flow rate percentage difference is less than or equal to ±7 percent, the sampler calibration is acceptable. Differences exceeding ±7 percent require sampler recalibration. Differences exceeding ±10 percent may result in invalidation of all data subsequent to the last calibration or valid flow check. Before invalidating any data, doublecheck the sampler's calibration, the audit orifice transfer standard's certification, and all calculations.
19. Calculate the corrected sampler flow rate, Qa(corrected sampler), using Equation 23:
Qa(corr. sampler) = [oa(sampler)] (100 - audi~O~ difference] (Eq. 23)
where Qa(sampler) is for the measurement without the audit orifice transfer standard installed. Be sure to carry over the sign of the audit % difference from Step 17.
Calculate the design flow rate percentage difference between the corrected sampler flow rate, Qa(corr. sampler), and the inlet design flow rate of 1.13 m3/min as:

Desig~ flow rate= [Oa(corr. sampler) - 1.13] [loo] % difference 1.13
Section No.: 2.11.7 Datf; January 1990 PagE:: 7
(Eq. 18)
20. Record the design flow rate percentage difference. If the design flow rate percentage difference is less than or equal to t7 percent, the sampler calibration is acceptable. Differences exceeding t7 percent should be investigated, and deviations exceeding tlO percent (or the acceptable design flow-rate range specified by the inlet manufacturer) may result in invalidation of all data obtained subsequent to the last calibration or valid flow check. Before invalidating any data, double-check the audit orifice transfer standard's certification and all calculations.
Note: Deviations from the inlet design flow rate may be caused in part by deviations in the ambient temperature and pressure from the seasonal average conditions. Calculate the optimum set-point flow rate (SFR) according to Equation 10 in Subsection 2.3.4 to determine if the sample set point should be adjusted.
7 .2 Flow-Rate Performance Audit Procedure for Volumetric-FlowControl led (VFC) HV PMlO Sampler
For this VFC procedure, the following conditions are assumed:
• The VFC sampler utilizes a choked-flow venturi for flow-rate control.
• The sampler's flow rate is measured by a manometer (or other pressure measuring instrument) connected to measure the stagnation pressure via a stagnation pressure port. (This procedure does not provide an audit of a continuous flow recorder that may be connected to the exit orifice port.)
• The sampler inlet is designed to operate at a flow rate of 1.13 m3/min at actual conditions; the acceptable flow-rate fluctuation range is tlO percent of this value (i.e., 1.02 to 1.24 m3/min).
• The calibrated, NIST-traceable transfer standard is an orifice type with an associated water or oil manometer.
• The audit orifice transfer standard's calibration relationship is expressed in actual volumetric flow-rate (Qa) units as described in Subsection 2.2.
Note: Do not attempt to audit HV PMlO samplers under windy conditions. Short-term wind velocity fluctuations wi 11 produce va.ri ab le pressure readings by the audit orifice transfer standard's manometer. The audit will be less precise because of the pressure variations.
The auditor should adhere to the following procedures during an audit of the VFC sampler. A flowchart of the audit procedures is given in Figure 7.2.

Install filler and orifice on sampler and leak check
(Steps 1-8)
~ Measure audit flow rate,
Oa (audit) (Steps 9, 12}
~ Sampler operator measures
P1/Pa not on stagnation pressure ratio and determines indicated lookup table flow rate, Qa (sampler) from sampler calibration
(Steps 10,11, 13)
+ Calculate tentative % diff. not within ~6% % difference for
sampler calibration (Steps 14, 15, 16)
+ %diff. wilhin.:t::6%
Audit flow rate % difference is firm
+ Remove orifice; operator measures
stagnation pressure at normal operating flow rate, with filler
(Steps 16, 17, 18)
• Operator determines indicated flow rate, Oa (sampler), at normal operating flow
rate. (Step 19)
+ Calculated Oa (corrected sampler) using audit flow rate % difference
(Step 20)
+ Calculate design flow rate 0.4
difference using Qa (corrected sampler) (Steps 21, 22)
' One-Point Audit is Complete
''
Section No.: 2.11.7 Date: January 1990 Page: 8
Measure stagnation pressure and Qa (orifice) at 2 or more additional flow rates and compute provisional
calibration slope and intercept (Steps 23. 24)
Remove orifice; operator measures stagnation pressure at normal operating flow rate, with filter
(Steps 25, 26, 27)
' Calculate Oa (sampler) and Oa (audit) at normal operating flow rate
(Step 28)
Compute audit flow rate % difference of Oa (sampler) with resped to
Oa (audit) (Steps 29,30)
Compute design flow rate % difference of Oa (audit) with respect to design flow
rate. (Steps 31, 32)
+ Three-Point Audit is Complete
Figure 7.2. Flow chart of performance audit procedures for . volumetric-flow-controlled PM10 samplers.
Section No.: 2.11.7 Date: January 1990 Page: 9
1. Transport the following equipment to the monitoring site:
• Audit orifice transfer standard with calibration relationship in actual volumetric flow-rate (Qa) units and traceable to NIST. The audit orifice transfer standard's faceplate or filter cassette may require modification to ensure a good seal during the performance audit. The audit orifice transfer standard should not be the same one that is used for routine calibrations and QC flow checks.
• An associated water or oil manometer, with a 0- to 400-mm (0- to 16-in.) range and minim~m scale division of 2 mm (O.l in.).
• A thermometer, capable of accurately measuring temperature over an appropriate range to the nearest il °C and referenced to an NIST or ASTM thermometer within t2 °C at least annually.
• A portable aneroid barometer (e.g., a climber's or engineer's altimeter), capable of accurately measuring ambient barometric pressure over the range of approximately 500 to 800 mm Hg (66 to 106 kPa) to the nearest mm Hg and referenced within tS mm Hg of a barometer of known accuracy at least annually.
• VFC Sampler Audit Data Sheet such as shown in Figure 7.3 (blank forms appear in Subsection 12).
• A clean filter.
Note: The site operator is responsible .for providing the manometer (or other pressure measuring device) that is normally used for measuring the sampler's stagnation pressure, the sampler lookup table or alternative calibration relationship that is currently in effect for determining the flow rate for sampling periods, and any other information or equipment that is normally used to determine the sampler's indicated flow rate.
2. Instruct the operator to install a clean filter in the VFC sampler. A filter cassette may be used if the audit orifice transfer standard can be properly mounted on top of the cassette. Otherwise, install the filter without the cassette. An audit filter should never be used for subsequent sampling because particles larger than 10 µm can be collected on the filter while the inlet is raised. The sample mass will be biased as a result of using a filter for both an audit and subsequent sampling.
3. Install the audit orifice transfer standard's faceplate on the sampler. Check that the gaskets are in good condition and have not deteriorated.
Caution: Tighten the faceplate nuts evenly on alternate corners to properly align and uniformly seat the gaskets. The nuts should be handtightened only; too much compression can damage the sealing gaskets.
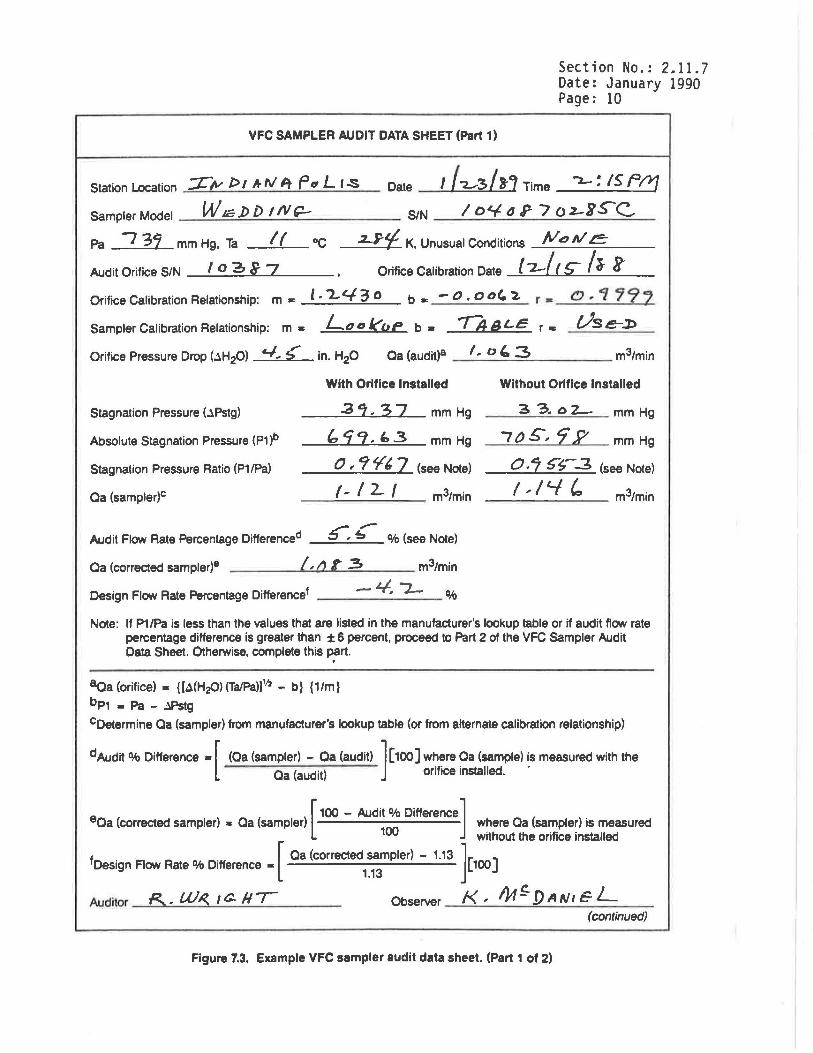
VFC SAMPLER AUDIT DATA SHEET (Part 1)
Section No.: 2.11.7 Date: January 1990 Page: 10
Station Location ::Z: IV l> I It' IV ~ f' t1 L I -S
Sampler Model W IE]) D IN~ Pa I 3'? mm Hg, Ta If
Date I f..2.,3/tj Time "'2-: IS F/YJ Io<{." F 7 o:z-iS-C, SIN _ _.:__......:...._:_;:__....:...__.=-___::.....__=--
i.r'f K, Unusual Conditions /ti~ ft/ e Audit Orifice SIN I 0 ~ i 7 Orifice Calibration Date ( 7-/t £ / ~ f Orifice Calibration Relationship: m • b • - o. o oC.. '2 r •
Sampler Calibration Relationship: m • L" 0 l(oe b - 771 Bl-e r -
Orifice Pressure Drop (.1H20) '-I, S in. H20 Oa (audit)8 /
- 0 ' 3 m31min
Stagnation Pressure (.1Pstg)
Absolute Stagnation Pressure (P1 '1'
Stagnation Pressure Ratio (P1 /Pa)
Oa (sampler)c
With Orifice Installed
35'. 37 mm Hg
b 'i 9. " .3 mm Hg
0 , Cf¥' 7 (see Note)
f - I 2. I m31min
Without Orifice Installed
3 3. o 2.- mm Hg
7()5", 7£ mm Hg
0 · '7 5"~ -3 (see Note)
__ f_,_l_'-f_ C:, __ m31min
Audit Flow Rate Percentage Differenced 5, C % (see Note)
Qa (corrected sampler)8 /,a r .3 m31min
Design Flow Rate Percentage Difference1 - 'I_ "2- %
Note: If P11Pa is less than the values that are listed in the manufacturer's lookup table or if audit flow rate percentage difference is greater than ± 6 percent, proceed to Part 2 of the VFC Sampler Audit Data Sheet. Otherwise, complete this part . .
8aa (orifice)• {[~(H~)(Ta/Pa)) 112 - bl {11m}
bp1 - Pa - .lPstg
C0etermine Oa (sampler) from manufacturer's lookup table (or from alternate calibration relationship)
dAudit % Difference • [ (Oa (sampler) - Qa (audit) ] [ 100] w~~re ~a (sample) ~s measured with the Oa (audit) orifice installed.
[ 100 - Audit % Difference]
eaa (corrected sampler) • Oa (sampler) where Oa (sampler) is measured 100 without the orifice installed
f [ Oa (corrected sampler) - 1.13 ] Design Flow Rate% Difference • [100]
1.13
Auditor IS. WI{ IC- II I Observer I< , l}1 ~..DAN I E- L (continued)
Figure 7.3. Example VFC sampler audit data sheet. (Part 1 of 2)

Section No.: 2.11.7 Date: January 1990 Page: 11
VFC SAMPLER AUDIT DATA SHEET (Part 2)
(continued from Part 1 of this form)
Station Location Uau AN~ F c LI .S Date I /z. 2 / N Time '2-.: 15 P /\'] Sampler Model Wi5 P D I N t? SIN I 0 Lf. 0 i 7 0 c:l r ~ C.. Pa 7 31 mm Hg, Ta I I °C 2- P- ;: K, Unusual Conditions N" ti f#:
Audit Orifice SIN / O .3,.. 7 , Orifice Calibration Date 12-/r-s= /? ? Orifice Calibration Relationship: m • ,/ • 2- '-130 b • - t.J • co~ 2- r • 0 . f 9 9 'J
Plate AH20 "1Pstg P1• P1/Pa Qa (Oriflce)b No. (In.) (mm Hg) (mm Hg) (mm Hg) (m3/mln)
I 'f.5 3,, 37 fD 'l 1, " 3 tJ. 9'1,7 /,06 .3
2- Lf-. 35 '-/ '-f. l/-5 le, ~ '-f. 5 .s 0. 9.3<f9 /, ol/-5
....3 L/-. I s2.01 ~Pb.'? 3 0,'92..1£° I, 0 t.S-
Provisional Sampler Calibration Relationship: X • Qa (Orifice), Y • (P11Pa)
m' '"' 0 · ~S' 7 I b' • {), ~ '1" 9 r' .. _ e;_. _9__,9'--~-7 __
Measurements with filter installed and Audit Orifice Transfer Standard removed:
~Pstg .3.3. t:J '2- mm Hg P1 1 7o £. q? mmHg
P1/Pa 0 , 2S-.S-..:3 Qa (audit)c I ' 0 Y 5 m3/min Qa (samplerf /, I '-/ 6
c; / Audit Flow Rate Percentage Difference8 ------'._).....;''--~------------ %
Design Flow Rate Percentage Difference' -Lf. l:> O/o
8 P1 •Pa - ~g baa (orifice) • {[("1H20)(TaJPa)]Y2 - b} { 1 /m}
caa (audit) • ((P1 /Pa) - b')/m'
daa (sampler) is determined from the lookup table or alternative calibration relationship
[(Qa (sampler) - Qa (audit)]
eAudit Flow Rate% Difference = Q ( . ) [100] a audit
f [ Qa (audit) - 1.13] Design Flow Rate% Difference • [ 100] 1.13
Auditor Observer---'~~·_(Vl,.......:...._f~])""'--U.d-.J.,.;~c...:./...:::/5_L __
Figure 7.3. Example VFC sampler audit data sheet. (Part 2 of 2)

Section No.: 2.11.7 Date: January 1990 Page: 12
4. Install the audit orifice transfer standard with no resistance plate, or open the valve of a variable-resistance orifice wide open. For resistance plate-type orifices, make sure the orifice gasket is present and that the audit orifice transfer standard is not cross-threaded on the faceplate. Seal the audit orifice transfer standard's pressure port and the stagnation pressure port with rubber caps or similar devices.
S. Leak test the audit system (refer to Subsection 2.4.2, Step 4). Identify and correct any leaks before proceeding.
6. Inspect the audit manometer connecting tubing for crimps or cracks. Fully open the valves and blow gently through the tubing, watching for the free flow of the fluid. Adjust the manometer sliding scale so that the zero line is at the bottom of the meniscuses. Connect the audit manometer to the pressure port on the audit orifice transfer standard. Make sure the unconnected side of the manometer is open to the atmosphere. Make sure that the tubing fits snugly on the pressure port and on the manometer.
7. Read and record the following parameters on the VFC Sampler Audit Data Sheet:
• Sampler location, date, time. • Sampler model and S/N. • Ambient temperature (Ta), °C and K (K = °C + 273). • Ambient barometric pressure (Pa), nun Hg (or kPa). • Unusual weather conditions. • Audit orifice transfer standard's S/N and calibration relationship. • Sampler lookup table number or other calibration relationship cur
rently in effect.
8. Turn on the sampler and allow it to warm up to operating temperature (3 to 5 min).
Note: The sampler inlet may be partially lowered over the audit orifice transfer standard to act as a draft s.hield (if a shield is not otherwise provided). Use a block to provide at least 2 in. of clearance at the bottom for air flow and for the manometer tubing.
9. When the sampler has warmed up to operating temperature, observe the pressure drop across the orifice by reading the total manometer deflection and record as AH20 on the audit data sheet.
10. Instruct the operator to measure the sampler's relative stagnation pressure (i.e. relative to atmospheric pressure) with the manometer (or other pressure measurement instrument) normally used to measure stagnation pressure. Record the relative stagnation pressure as APstg on the data sheet. If APstg is measured in inches of water, convert the reading to mm Hg using Equation 12:

mm Hg = 25.4 (in. H20)/13.6
Section No.: 2.11.7 Date: January 1990 Page: 13
(Eq. 12)
11. Compute the absolute stagnation pressure, Pl, as:
Pl = Pa - APstg
and the absolute stagnation pressure ratio as:
Stagnation pressure ratio = Pl/Pa
Record the Pl/Pa ratio on the audit data sheet.
(Eq. 13)
(Eq. 14)
12. Determine the flow rate through the audit orifice transfer standard, Qa(audit), using Equation 6:
Qa(audit) = {[AH20(Ta/Pa)]l/2 - b} {l/m} (Eq. 6)
where:
Qa(audit) = actual volumetric flow rate as indicated by the audit orifice transfer standard, m3/min
AH20 = pressure drop across the orifice, mm (or in.) H20 Ta = ambient temperature, K (K = °C + 273) Pa = ambient barometric pressure, nun Hg (or kPa) b = intercept of the audit orifice transfer standard's cali
bration relationship m = slope of the audit orifice transfer standard's calibra
tion relationship.
13. Instruct the operator to detennine the sampler's indicated flow rate, l Qa(sampler), using the Pl/Pa value obtained in Step 11 and the sampler's · lookup table or alternative calibration relationship. Record this flow rate on the audit data sheet. If Pl/Pa is below the range covered by the lookup . table or alternative calibration relationship, proceed to Step 23.
14. Calculate the audit flow rate percentage difference between the sampler's indicated flow rate, Qa(sampler), and the corresponding audit flow rate, Qa(audit), determined from the audit orifice transfer standard as:
Audit flow rate = [Oa(sampler) -.Qa(audit)] [loo] % difference Qa(aud1t)
For the moment, this value should be considered as tentative. this value on the audit data sheet.
(Eq. 17)
Record
15. If the audit flow rate percentage difference is within %6, the value may be considered as firm and may be recorded on Part 1 of the audit data sheet. Proceed to Step 16. If the value is not within %6, or if a more comprehensive three-point audit is desired, s'i<TP to Step 23.
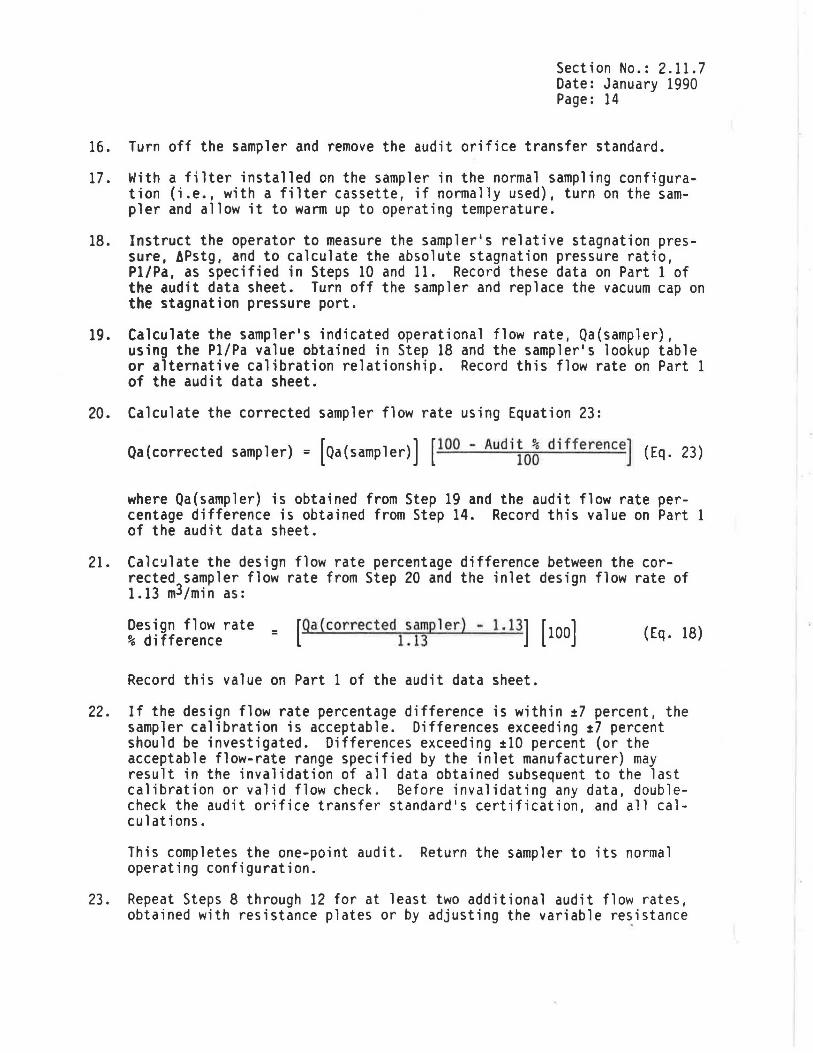
Section No.: 2.11.7 Date: January 1990 Page: 14
16. Turn off the sampler and remove the audit orifice transfer standard.
17. With a filter installed on the sampler in the normal sampling configuration (i.e., with a filter cassette, if normally used), turn on the sampler and allow it to warm up to operating temperature.
18. Instruct the operator to measure the sampler's relative stagnation pressure, !Pstg, and to calculate the absolute stagnation pressure ratio, Pl/Pa, as specified in Steps 10 and 11. Record these data on Part 1 of the audit data sheet. Turn off the sampler and replace the vacuum cap on the stagnation pressure port.
19. Calculate the sampler's indicated operational flow rate, Qa(sampler), using the Pl/Pa value obtained in Step 18 and the sampler's lookup table or alternative calibration relationship. Record this flow rate on Part 1 of the audit data sheet.
20. Calculate the corrected sampler flow rate using Equation 23:
Qa(corrected sampler)= [oa(sampler)] [100 - Audij03 difference] (Eq. 23)
where Qa(sampler) is obtained from Step 19 and the audit flow rate percentage difference is obtained from Step 14. Record this value on Part 1 of the audit data sheet.
21. Calc~late the design flow rate percentage difference between the corrected sampler flow rate from Step 20 and the inlet design flow rate of 1. 13 m3 Im i n as :
Design flow rate = [Oa(corrected 1 !f~pler) - 1.13) [loo] % difference
Record this value on Part 1 of the audit data sheet.
(Eq. 18)
22. If the design flow rate percentage difference is within :7 percent, the sampler calibration is acceptable. Differences exceeding :7 percent should be investigated. Differences exceeding :10 percent (or the acceptable flow-rate range specified by the inlet manufacturer) may result in the invalidation of all data obtained subsequent to the last calibration or valid flow check. Before invalidating any data, doublecheck the audit orifice transfer standard's certification, and all calculations.
This completes the one-point audit. Return the sampler to its normal operating configuration.
23. Repeat Steps 8 through 12 for at least two additional audit flow rates, obtained with resistance plates or by adjusting the variable re~istance

Section No.: 2.11.7 Date: January 1990 Page: 15
valve. These additional flow rates should be within or only slightly below the acceptable flow-rate range (i.e., 1.02 to 1.24 rn3/rnin) of the sampler inlet, if possible. Record the data from all three points on Part 2 of the audit data sheet.
Note: Resistance plates supplied by the manufacturer of the audit ori~ fice transfer standard may have to be modified (i.e., holes enlarged or additional holes drilled) to obtain appropriate flow rates.
24. For each calibration point, calculate and record the quantities (Pl/Pa) and Qa(orifice). For the linear regression model,
(Pl/Pa) = m'[Qa(orifice)] + b' (Eq. 19)
Calculate the linear regression slope (m'), intercept (b') and correlation coefficient (r'). Be sure to include the data obtained for the first flow rate in Steps 11 and 12 in the calculation of the linear regression. The regression calculations require a total of at least three points. Record these values on Part 2 of the audit data sheet.
Note: This is a temporary, provisional calibration relationship that is varfd only during the audit because no temperature tenn is included in the calculations.
25. Turn off the sampler and remove the audit orifice transfer standard.
26. With a filter installed on the sampler in the nonnal sampling configuration (i.e., with a filter cassette, if nonnally used), turn on the sampler and allow it to wann up to operating temperature.
27. Instruct the operator to measure the sampler's relative stagnation pressure, APstg, and to calculate the absolute stagnation pressure ratio, Pl/Pa as specified in Steps 10 and 11. Record these data on Part 2 of the audit data sheet. Turn off the sampler and replace the vacuum cap on the stagnation pressure port.
28. Calculate the sampler's indicated operational flow rate, Qa(sampler), using the Pl/Pa value obtained in Step 27 and the sampler's lookup table or alternative calibration relationship. Calculate the audit value for the sampler's operational flow rate, Qa(audit), using the (Pl/Pa) value obtained in Step 27 and the slope (m') and intercept (b') of the provisional sampler calibration relationship obtained in Step 24. Record these two flow rates on Part 2 of the audit data sheet.
29. Calculate the audit flow rate percentage difference between Qa(sampler) and Qa(audit) obtained in Step 28 as:
Audit flow rate % difference = [
Qa(sampler) -_Qa(audit)] [ioo] Qa(aud1t) (Eq. 17)

Record this value on Part 2 of the audit data sheet.
Section No.: 2.11.7 Date: January 1990 Page: 16
30. If the audit flow rate percentage difference is within t7 percent, the sampler calibration is acceptable. Differences exceeding t7 percent will require recalibration. Differences exceeding tlO percent may result in the . invalidation of all data subsequent to the last calibration or valid flow check. Before invalidating any data, double check the sampler's calibration, the audit orifice transfer standard's certification, and all calculations.
31. Calculate the design flow rate percentage difference between the Qa(audit) obtained from Step 28 and the inlet design flow rate of 1.13 m3/min as:
Design flow rate = [Qa(audii~l3 1.13) [loo) % difference
Record this value on Part 2 of the audit data sheet.
(Eq. 18)
32. If the design flow rate percentage difference is within t7 percent, the sampler calibration is acceptable. Differences exceeding t7 percent should be investigated. Differences exceeding tlO percent (or the acceptable flow-rate range specified by the inlet manufacturer) may result in the invalidation of all data obtained subsequent to the last calibration or valid flow check. Before invalidating any data, double check the audit orifice transfer standard's certification, and all calculations.
This completes the three-point audit. Return the sampler to its normal operating configuration.
7.3 Audit Data Reporting -
The operating agency should be given a copy of the audit preliminary results at the completion of the audit. The audit data sheet should be signed by both the auditor and the observer, and the results should be discussed. These preliminary data should never be used to make monitoring system adjustments. Auditors may make mistakes, and calibration curves may shift. A post-audit verification of audit equipment and data is essential before inferences can be drawn regarding the sampler's performance. An auditor should be able to support audit data with complete pre- or post-audit equipment verification documentation.
Final verified audit data should be submitted to the operating agency as soon as possible. Delays may result in data loss; a sampler out of audit limits is also out of calibration limits, and the data colle~ted may. be invalid. If a sampler exhibits unsatisfactory agreement with the verified audit results (i.e., audit flow rate percentage differences exceeding ±7 percent), a calibration should be performed immediately, certainly before the next run day.
..
7.4 flow-Rate Performance Audit Frequency -
Section No.: 2.11.7 Date: January 1990 Page: 17
The frequency of flow-rate audits depends on the use of the data (e.g., for PSD air monitoring or for SLAMS). for PSD monitoring, the flow rate of each sampler must be audited at least once per sampling quarter. for SLAMS, flow rate audits should be conducted on at least 25 percent of the operational samplers in the monitoring network each quarter such that each sampler is audited at least once a year. If a reporting organization has fewer than four PMlO samplers, one or more randomly selected samplers should be reaudited so that at least one sampler is audited each calendar quarter.
7.5 System Audit -
A system audit is an onsite inspection and review of the quality of the total measurement system (i.e., sample collection, sample analysis, data processing, etc.). This audit is normally conducted at the startup of a new monitoring system and as appropriate thereafter. Sections 7.5.1 and 7.5.2 present system audit procedures to evaluate data processing and laboratory operations.
Section 2.0.11 of this Handbook provides additional detailed procedures and forms for system audits.
7.5.1 System Audit of Data Processing - Data processing should be audited soon after the original calculations have been performed to allow corrections to be made immediately and to allow for possible retrieval of additional explanatory data from field personnel. A minimum frequency of 7 samples per 100 (or a minimum of 4 samples per lot) is reconunended. The following procedure is suggested:
1. Use the operational flow rates as reported on the sample data sheets.
2. Beginning with the raw data on the HV PMlO sample data sheet and the filter net and tare weights, independently compute the PMlO concentration (micrograms per standard cubic meter) and compare it with the corresponding concentration originally reported. If the mass concentration computed by the audit check does not agree with the original value within roundoff error, recheck the calculations for all samples in the lot.
3. Record the audit values on a data sheet, and report them, along with the original values, to the supervisor for review. The audit value is always given as the correct value, based on the assumption that a discrepancy between the two values is always double-checked by the auditor.
7.5.2 Analytical Process System Evaluation - This subsection presents an analytical evaluation of the filter weighing process. In addition to observing the balance operator's technique, the auditor should conduct an independent audit of exposed filter reweighing as discussed in Section 2.2.8 of this volume. The performance evaluation of the HV PMlO filter weighing process should be conducted in the following manner:
Section No.: 2.11.7 Date: January 1990 Page: 18
1. Instruct the operator to weigh a set of three to five Class S standard weights covering the range normally encountered during gravimetric analysis. The weighed value should agree within ±0.5 mg of the stated values.
2. Observe the balance operator's technique, and review the laboratory weighing procedure for determining both the tare and gross weights of the sampling filters.
3. Review the maintenance and calibration log for each balance. Routine balance maintenance and calibrations must be performed by the manufacturer's service representative at manufacturer-specified scheduled intervals. In no case should the interval between calibrations exceed 1 year.
4. Review QC data records for the filter-weighing process. Ensure that the following QC activities have been performed and documented:
• Standard weight check every day of balance operation.
• Zero checks after every 5 to 10 filter weighings, calibration checks after every 15, unless longer term stability of the balance has been established by records (at least 1 calibration check per day).
• At least five filters reweighed each day.
If any of these QC checks are out of limits, note what action was taken.
I ,

Pr-ocedure
Flow-r-ate audit
Systems audit
Data pr-ocessing
Filter -ighing
Balance
TABLE 7.1. All>ITING REqtJIREMENTS
Fr-equency and/or- method
Once each quar-ter- for- PSD monltor-ing, once per- 1••r- for- SLAMS.
At beginning of • new monltor-ing •1•tem and per-iodlcally •• appr-opr-iate, obaer-ve pr-ocedur-es end use checkli•t.
Independently repeat calculation of PM19 concentr-ation fr-om data recor-d for- 7 samples per 198 (minimum of 4 per- lot).
Per-foMll 7 audita/198 filter-•, or- 4 audits/~69 filter-a; use •n•lytical bal•nce; condition filters for- at least 24 h before -ighing .
Observe weighing technique; r-eview bal•nce mainten•nce •nd calibr-•tion log.
Acceptance limits
1. Per-centage difference betw .. n the sampler--indicated flow r-ates and the auditmeasur-ed flow r-ate is within 71.
2. !181 of inlet design flow rate.
Method described in this subsection and Section 2.8.11 of this Handbook.
Audit concentr•tion •gr .. • with original report concentr-ation within r-ound-off er-r-or.
Audit -lght = or-iglnal weight !6 mg for unexposed fi lter-s.
Balance is maintained and calibr-ated at least annually.
Action if r-equir-ements ar-e not met
Recalibr-•t• befor-e r-esuming sampling; if difference exceeds !lei, double-check calculations. If difference still exceeds !181, inv•lidate data since last calibration or valid flow check.
Readjust flow contr-oller- if necessary (MFC sampler-) or contact manufactur-er (VFC sampler-). Recalibrate.
Initiate improved methods and/or training pr-ogr-ams.
Recheck all calculations.
R.-igh all filter-sin the lot.
Re-igh all filter-s; calibrate balance.
-0 c V'I DI DI 11> co r+ n
11> 11> r+
0 .... c....:::J 0.0 DI
::I :z c: 0 DI • , .. '<
N ..... 0.0...-0.0-O• __,

I I I

2.11.8 ASSESSMENT OF MONITORING DATA FOR PRECISION AND ACCURACY
8.1 Precision
Section No.: 2.11.8 Date: January 1990 Page: 1
One or more monitoring sites within the reporting organization are selected for duplicate, collocated sampling as follows: for a network of 1 to 5 sites, 1 site is selected; for a network of 6 to 20 sites, 2 sites are selected; and for a network of more than 20 sites, 3 sites are selected. Where possible, additional collocated sampling is encouraged. Annual mean particulate matter concentrations of the selected sites should be among the highest 25 percent of the annual mean PMlO concentrations for all the sites in the network. If such sites are impractical, however, alternate sites approved by the Regional Administrator may be selected.
Collocated PMlO samplers being used for assessment of precision should generally be of the same type. That is, they should have similar flow rates (e.g., high, medium, or low), similar inlet types (e.g., impaction or cyclonic), and similar flow controller types (e.g., MFC or VFC). Where a PMlO network contains more than one type of sampler, each type should be represented by at least one collocated sampler pair, if possible.
The two collocated samplers must be within 4 m of each other, but at least 2 m apart to preclude air flow interference. Calibration, sampling, and analysis must be the same for both collocated samplers and all other samplers in the network. One of each pair of collocated samplers is designated as the primary sampler from which samples will be used to report air quality for the site; the other is designated as the duplicate sampler. Each duplicate sampler must be operated concurrently with its associated routine sampler at least once a week. The operation schedule should be selected so that the sampling days are distributed evenly over the year and over the 7 days of the week. The every-6-day schedule used by many monitoring agencies is reco11111ended. The measurements from both samplers at each collocated sampling site are reported. An example precision data reporting form is presented in Figure 8.1. The percentage differences in measured concentrations (micrograms/standard cubic meter) between the two collocated samplers are used to calculate precision as described in 40 CFR 58, Appendix A.
8.2 Accuracy
The accuracy of the HV PMlO sampler method in the measurement of PMlO is assessed by auditing the performance of the sampler (at its specified flow rate) as described in Subsection 7. Both the audit flow rate and the corresponding sampler flow rate are reported. An example accuracy data reporting form is presented in Figure 8.2. The percentage differences between these flow rates are used to calculate accuracy as described in 40 CFR 58, Appendix A.
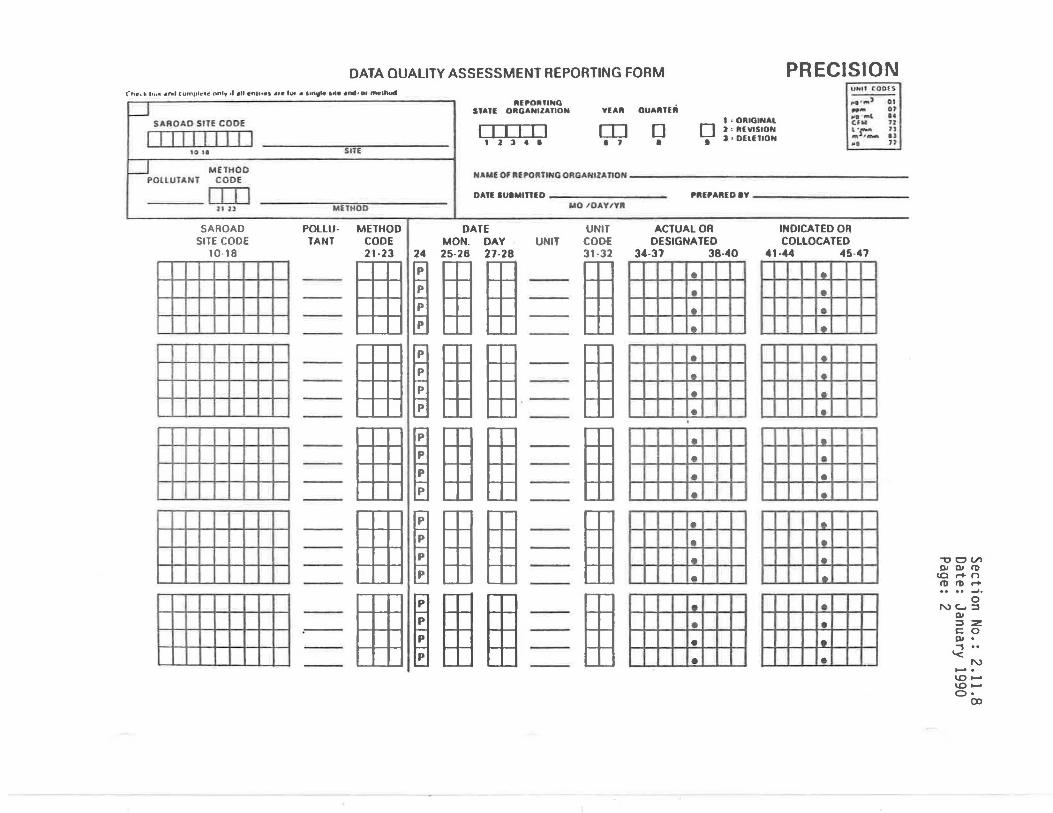
DATA QUALITY ASSESSMENT REPORTING FORM PRECISION fhiro.." 1111• .. ,.., (un111lrl~ only 11 •11 enll••• 41•e IUf • ''""'• 1t1e •nd•o• lft~lhod
uH1t coots
1-J SAAOAD SITE CODE
I I I I II I I I J lO t•
LJPOllUTANT METHOD
CODE __ rm JI 1l
SA ROAD SITE CODE
10-18
Sl1E
ll(POllllNQ SlA11 OllGANIZATION YIAll OUAll1Ui
I I I I I I CD D 1 z > e I I 1 I
1 ' OlllOINAL D J ' ft( VISION I J • OElETION
'4 ' 1111'> QI ..... .... . llll CUI
~·~n-••
01 .. ,, ,, al J)
NAME OF llEPOllTINOORGANllATION ------------------------
DATl IUIMITIID ---------- PlllPAlll08Y~-------------
METHOD UO /OAYIYll
POLLUTANT
METHOD CODE 21·23 24
DATE MON. DAY 25-26 27-28
UNIT UNIT
CODE 31-32
1~mm m 1~mm m 1~mm m 1~mm m 1~mm m
ACTUAL OR DESIGNATED
34.37 38-40
• •
I•
I•
• I•
• • I•
• • • • • I•
• :.
• • •
INDICATED OR COLLOCATED
41-44 45-47
• • • • •
!•
I•
I•
la
• • I•
le
le
I•
•
• •
le
•
.,, c V'I QI QI 11> '° .-+ n 11> 11> ......
0 NC... :l
QI :l :z c: 0 QI • , .. '<
N -· l.0-1.0-C>.
CX>

DATA QUALITY ASSESSMENT REPORTING FORM ACCURACY (he· ... • lo••• •nd, ..,.n11lc1.: uni, •I .•II 1.•1111n!'~ .ue lul J ~10lj~ "''~ •n.I &H 1111•llMatl
LJ SAROAD Sill CODE
I I II I I I I I I to 11 SIU
_J METHOD POLLUTANT CODE
I I I I nn MUHOO
S.alfllOAO OAll POllU Ml 1HOD
'""' COOi ,•,a MON 0.U' 1111 CODI UN If
Ulflf COOi
Ufflf COOfS
, .• ,.1 01 lllPOIUING OUAlllfll - 01 5fAll ORGANllAflON YlAR , .. , .... ..
1 'OlllGINAl CIM 11
I I I I I I rn D D Z. RIVISION :.:.rr .. n ., l •Dlll110N
~· n I J l .. • I 1 I I
NAME Of lllPOll11NG OllGANllAllON
DAit SUIMIOID PllfPAlllD IY MO 'DAYIYll
ACIUAl LEVEL I -AHD ACfUAl INDICAflD
11111111 I I _OIJl0 1111100 [I] lQ1 1-1 ........ 1 'T'"""ll 1 ........ 1 ....... 1 .,....,, I Ir-Pl ...,....I T"""lll .......... 1 ....... 1 ........ 1 I LEVEL;;:.....Z ------.-r-.....-r--.
-11-1 -1 l~., ......... 1 ........ 11 11 11 I.I I I I 10 18 Z1·2l }4 U -78 29 JO ll · lZ ll 0·41 l• )J ll 40 41 -44 - 0 f>I f>Hi4 f>f> U f>9 61
LEVEL 3 LEVEL 4 GJ r--PI 1.....,...1.......,1 1 ......... 1.....,...1.,....,.11 ,....,.1 1 ........ 1 ....... , I .......... , ....... I ........ , I ...... 1 I -.-1 .,....,I I ......... I ...... I ....-.Ill r-r 1-.-1 ........ , I ......... ,-I ....... I I ll 34-lJ 11·40 " ... . 0 •41 O ·il 12·1<1 &5 ·U H ·61
• LEVEL I LEVEL 2
I I I I I 11 I I I _ [[J] 10 11 l I I 0 0 _ [O (Q] I I I I I.I II I lr-T'l ...... I ......... , , ........ ,I ........ , -1 I ,....,..., 1---1 ........ 11-.1 ........ , "W-.11 1 ........ 1-.-1 ........ , , ......... , I ....... I ......... , I LEVHl LEVEL 4
fil 1-1 ......... 1 ..-.I 1 ...... 1--1 ...... I I 1-1--1 ---1 1-.1 ....... 1 1-1 ,-,-.-, -11-., ........ 1 ......... 111 -1-1-11-.1-1 ......... , , LEVEL I LEVEL Z
11111111 11 _0JJI ~ 1111100 _OJ (Q] -11-1 'T'"""l11 ...... 1--1 ....... 11 -11.....,...1 ....... 11 ......... 1 ........ 1-1 I -11-1 ........ , 1-.l ....-I .,...,I I ,.....,.11-1 ........ , I..-. I .....-I ......... , I
[!] I I I LEVEL 3 I 1.1 I 11 I 11 I I I • 11 I LEVEL 4
...... , ,-I ........ , , ....... , ..... I .,....,, I ,.....,., I .,....I ........ , I....,..· I -I T'""'lll I LEVEL I
111 I 11 I I I I _(Il] 10 11 I I I 0 D _ [O ~ -11-1._....11-.1-1...;.;;.l I r-'Tll.....,...1 ....... 11 .......... 1 ....... l l"""'tl I LEVEL Z
...... , ,-, ........ 11-.1--1 ........ 11 ,-,--1-11-.1--1 ...... , I
l!1 I I I I 1.1 I riY 111 1.1 I I I LEVEL 4
llr-r ....... , -1 1 ....... 1--1 ..;.;;.I I ~11--1 -1 1-.1 ....... 1 ..-.I I
I I I I I I I I I I _[ill I ~ I I II ID D - [O ~ I I I I I.I I riY I 11 1.1 I I I 11 I I 1.1 I riY I I I 1·1 I I I
' .!_re ol •ud" 1 AurM tllnduct•d by ••i1Uft1ng oru•n.t•ttOR. •udtt ll•ncb•d ce1ht.ed by repu11.n1 or1•ne1Mt0n 2 Aud11 conducled liy reporlmg o•G••11•••1on. •1.dl111•nct.1d certJ1ed br •no11.., 0•1•n11•tt1t11 l Aud11 curnSuu9d br 4Jlhe1 thin tepotltng CHU•,.••l1DI\
LEVEL4 [!] I I I I I I I LEVEL 3 ' II II I II.II I I 1-1-1 -, ,-.1-1-111r-r1--1-11-.1-1 -11 ._ .................. . '6i ,......... flO. , ........ . -........... -.... c c:.-•• r.-. ......-....-.-.. I----#---...................
........ -.. --',_._.._.. . ..................... .,. ................. ,,., • c..w...~ ......... . _.._ __ _ I ......... .............. w-·----
.. .... , ....... ................. ........~ .....
I-·-----
SINO COMPlUID fORM TG RIGIONAl OfFICE
-00~ QI QI I» '° .-+ n Cl> Cl> .-+ .... ~.
0 w c.... ::s
QI ::s ::z co QI •
~ "' -. \0-
\0-O•
CX>


2.11.9 RECOMMENDED STANDARDS FOR ESTABLISHING TRACEABILITY
Section No.: 2.11.9 Date: January 1990 Page: 1
Two factors are essential for attaining accurate data: (1) the measurement process must be under statistical control at the time of the measurement, and (2) the combination of systematic errors and random variation (i.e., measurement errors) must yield a suitably small uncertainty. The attainment ·of accurate data requires the performance of QC checks, independent audits of the flow measurement process, careful documentation of monitoring data, and the use of equipment and standards that can be traced to appropriate primary standards.
9.1 Recommended Standards for Establishing Traceability
1. Class-S weights of NIST specifications are recommended for the laboratory balance calibration. See Subsection 4.5 for details on balance calibration checks.
2. Use of a positive-displacement standard volume meter (e.g., a RootsR Meter) is recommended for calibrating the flow-rate transfer standards that are used to calibrate and audit the HV PMlO sampler.
Note: As they are sold, standard volume meters may not be traceable to NIST. Traceability can be established through NIST or through the meter manufacturer's repair department. Periodic recertification is not normally required under clean service conditions unless the meter has been damaged and must be repaired. Subsection 2 presents details on HV PMlO sampler calibration, and Subsection 7 presents details on the flow-rate performance audits.
3. The elapsed-time meter should be checked upon initial receipt and referenced at least annually against an accurate timepiece to within 15 min/day.
4. The accuracy of associated monitoring equipment (i.e., thermometers, barome.ters, stop watches, etc.) should be checked at routine intervals, but no less than once per year, against standards of known accuracy and traceable to NIST.


Environmental Protedion Agency
.APPENDIX J-REFERENCE METHOD FOR THE 0E'l'EIUUNATION OF PARTICULATE MA'lTER AS PM11 IN THE ATMOSPHERE
1.0 Appliccibilit11. 1.1 Thia method provides for the meas
urement of the mass concentration of particulate matter with an aerodynamic diameter less than or equal to a nominal 10 ml· crometers <PM10> In ambient air over a 24-hour period for purposes of determJnJnr attainment and maintenance of the primary and secondary national ambient &Ir quality standards for particulate matter specified In I 50.6 of thla chapter. The measurement process la nondestructive, and the PM11 sample can be subjected to subsequent physical or chemical analyses. Quality assurance procedures and irulda.nce are provided In Part 58, Appendices A and B, of thla chapter and In References 1 and 2.
2.0 Principle. 2.1 An air sampler draws ambient air at a
constant now rate Into a specially shaped Inlet where the suspended particulate matter la Inertially separated Into one or more size !?:1Ct!or.:: within the PM11 size ranre. Each size fraction In the PM,0 size range Ls then collected on a separate filter over the specified sampling period. The par· tlcle size discrimination characteristics <sampling effectiveness and 50 percent cutpoint> of the sampler Inlet are prescribed as performance specifications In Part 53 of this chapter.
2.2 Each filter la weighed (after moisture equilibration> before and after use to determine the net weight <mass> gain due to collected PM,.. The total volume of &Ir sampled, corrected to EPA reference conditions <25" c. 101.3 kPa>, is determined from the measured now rate and the sampling time. The mass concentration of PM,. In the ambient air l.s computed as the total mass of collected particles In the PM,. size range di· vtded by the volume of air sampled, and is expressed In micrograms per standard cubic meter (fl.I/std mJ). For PM,. samples collected at temperatures and pressures sicnifl· cantly different from EPA reference conditions, these corrected concentrations sometimes differ substantially from actual concentrations <In micrograms per actual cubic meter>. particularly at high elevations. Al· though not ~ulred, the actual PM,. concentration can be calculated from the corrected concentration, using the average ambient temperature and barometric pressure durln1 the sampling period.
2.3 A method based on .this principle will be considered a reference method only if <a>
Section No.: 2.11.10 Date: January 1990 Pace: 1
Part 50, App. J
the usoclated sampler meets the requirements specified In this appendix and the requirements In Part 53 of thla chapter. and <b> the method has been deslcnated as a reference method In accordance with Part 53 of thla chapter .
3.0 Range. 3.1 The lower limit of the mass concen
tration range Is determined by the repeatability of filter tare weights, assumJnc the nominal air sample volume for the sampler. For samplers having an automatic fllterchancinl mechanism, there may be no upper limit. For samplers that do not have an automatic filter-chanrtn1 mechanism, the upper llm!t is determined by the ·filter mass loading beyond which the sampler no loncer maintains the operating now rate within specified limits due to increased preSsure drop across the loaded filter. This upper limit cannot be specified precisely be· cause It la a complex function of the ambi· ent particle size distribution and type, humidity, filter type, and perhaps other factors. Nevertheless, all samplers should be capable of measuring 24-hour PM,. mass concentrations of at lea.st 300 fl.I/Std ma while main~ the operating now rate within the specified limits.
4.0 Preci8ion. 4.1 The precision of ·PM,. samplers must
be 5 J&r/m1 for PM,. concentrations below 80 p.g/mJ and '1 percent for PM .. concentrations above 80 f'(/m1 , as required by Part 53 of thla chapter, which prescribes a test pro· cedure that determines the variation In the PM,. concentration measurements of Identical samplers under typical sampling condl· tlons. Continual asses<1ment of precision via collocated samplers la required by Part 58 of thl.s chapter for PM11 samplers used In cer· taln monJtorinl networks.
5.0 Accuracy. 5.1 Because the 1lze of the particles
making up ambient particulate matter varies over a wide range and the concentration of particles varies with particle alze, it Is difficult to define the absolute accuracy of PM.. samplers. Part 53 of thla chapter provides a specification for the sampling effectiveness of PM,. samplers. This specification requires that the expected mass concentration calculated for a candidate PM10 sampler, when sampling a specified particle size distribution. be within ::t:lO percent of that calculated for an Ideal sampler whose sampling effectiveness Is explicitly specified. Also, the particle size for 50 percent sampling effectivensss Is required to be lO::t:0.5 micrometers. Other specifications related to accuracy apply to now measurement and calibration. filter media, analytical <weighing> procedures, and artifact. The now rate accuracy of PM,. samplers used In certain monitoring networks is required by Part 58
703
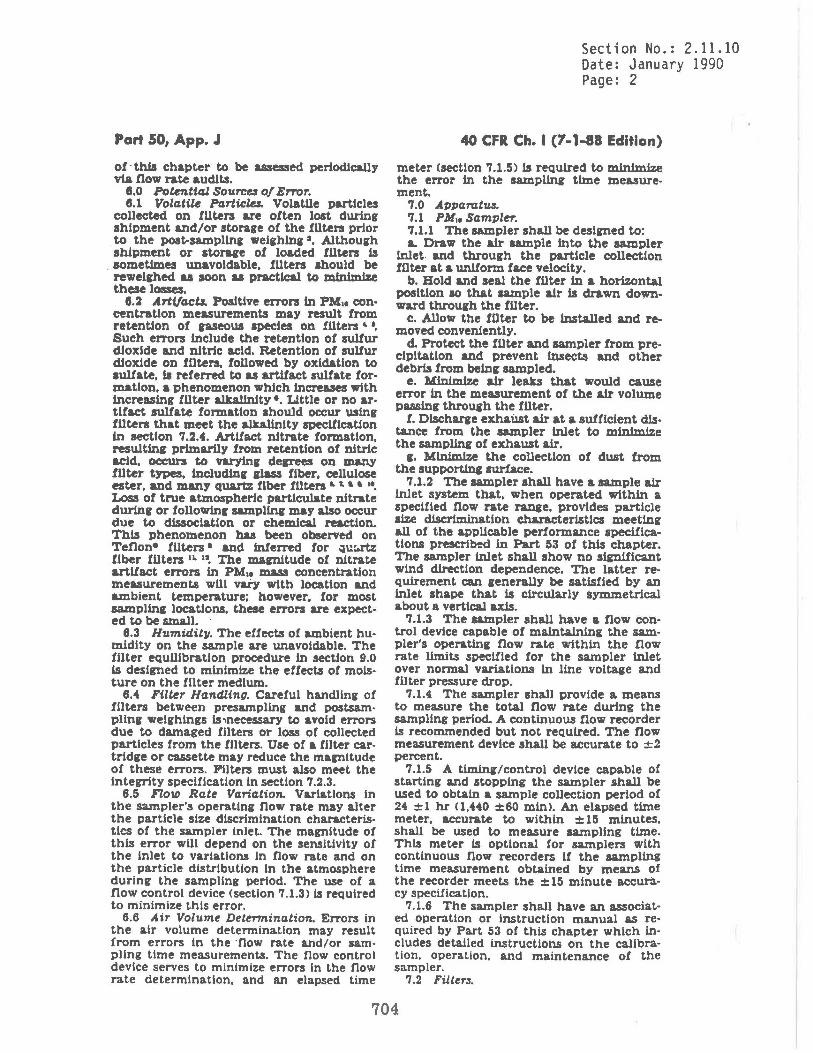
Part 50, App. J
of· this chapter to be assessed periodically via now rate audit.a.
8.0 Potentta.l Sourcu of Error. 8.1 Volatile Particla. Volatile particles
collected on fllters are often lost durtnr shipment and/or storare of the filters prior to the post-sampllnr wel1hln1 1. Although shipment or storaee of loaded fllters Is
. sometimes unavoidable, filters should be reweighed as soon as practical to mln1mJze these losses.
8.2 Ar«ta.cU. Poaltlve errors In PM11 concentration measurement.a may i'eslllt from retention of gaseous species on filters t. •.
Such errors Include the retention of aulfur dioxide and nitric actd. Retention of sulfur dioxide on filters. followed by oxidation to sulfate, la referred to as artifact sulfate formation, a 1>henomenon which Increases with Increasing filter alltallnlty •. Little or no &r· tlfact aulfate formation should occur using filters that meet the alkalinity specification 1n section 'I .2.4. Artifact nitrate formation, resultlnc prl.ma.rlly from retention of nitric acid, occurs to V&rYinr degrees on many filter tJ'l)eS, lncludlnr glass fiber, cellulose ester, and many quartz fiber filters""""••. Loss of true atmospheric particulate nitrate durlnr or followlnr sampllnc may also occur due to dlsaociatlon or chemical reaction. This phenomenon has been obsened on Tenon• fllters • and Inferred for >iu:.rtz fiber filters •L 11. The marnltude of nitrate artifact errors in PM11 ma.ss concentration measurements wlll vary with location and ambient temperature; however, for most aampllnc locations. these errors are expected to be small. ·
8.3 Humid.it11. The effect.a of ambient humidity on the sample are unavoidable. The filter equlltbration procedure in section 9.0 Is designed to minimize the effects of mols· ture on the filter medium.
8.4 Filter Handling. Careful handllnr of filters between presampllng and postsam· pllng weighlnrs lsmecessary to avoid errors due to damaged filters or loss or collected particles from the filters. Use of a filter car· tridge or cassette may reduce the marnltude of these errors. Filters must also meet the integrity specification In section 'l.2.3.
8.5 Flow Rate Variation. Variations in the sampler's operatlnr flow rate may alter the particle size discrimination characteris· tics or the sampler Inlet. The marnitude of this error wlll depend on the sensitivity or the inlet to variations In flow rate and on the particle distribution In the atmosphere during the sampling period. The use or a flow control device <section 'l.1.3> is required to minimize this error.
6.6 Air Volume Detennination. Errors in the air volume determination may result from errors in the 'flow rate and/or sam· piing time measurements. The now control device serves to minimize errors In the flow rate determination, and an elapsed time
Section No.: 2.11.10 Date: January 1990 Page: 2
40 CFR Ch. I (7-1-88 Edition)
meter <section 7.1.5> ls required to m1n1m1ze the error In the sampllnr ti.me measurement.
'1.0 Apparatw. '1.1 PM11 Sampler. 'l.1.1 The sampler shall be desirned to: L Draw the air sample into the sampler
Inlet. and through the particle collection filter at a uniform face velocity.
b. Hold and seal the filter In a horizontal position so that sample air ls drawn downward throurh the filter.
c. Allow the filter to be Installed and removed conveniently.
d Protect the filter and sampler from precipitation and prevent Insects and other debris from belnr sampled
e. Minimize air leaks that would cause error in the measurement of the air volume passing throurh the filter.
f. Discharge exhauat air at a sufficient dis· tance from the sampler inlet to minimize the sampl.lng of exhaust air.
r. Mlnimlze the collection of dust from the supporting surface.
'l.1.2 The sampler shall have a sample air inlet system that, when operated within a specified now rate ranse. provides particle size dlscrlmination characteristics meetlnr all of the applicable performance specifications prescribed In Part 53 of this chapter. The sampler inlet shall show no silnlficant wind direction dependence. The latter requirement can 1enerally be satisfied by an inlet shape that ls circularly symmetrical about a vertical axis.
'l.1.3 The sampler shall have a now control device capable of maintaining the sampler's operatlnr now ra.te within the now rate limits specified for the sampler inlet over normal variations in line voltage and fllter pressure drop.
'l.1.4 The sampler shall provide a. means to measure the total flow rate during the sampling period. A continuous now recorder is recommended but not required. The flow measurement device shall be accurate to ±2 .percent.
'l.1.5 A timlnr/control device capable of starting a.nd stoppinr the sampler shall be used to obtain a sample collection period of 24 :I: l hr <l,440 ±80 min>. An elapsed time meter, accurate to within :I: 15 minutes. shall be used to measure sampling time. This meter is optional for samplers with continuous flow recorders If the sampling time measurement obtained by means of the recorder meets the ::!:: 15 minute accuracy specUicatlon.
'l.1.6 The sampler shall have an associated operation or Instruction manual as re· quired by Part 53 of this chapter which in· eludes detailed Instructions on the calibration, operation. and maintenance of the sampler.
'1.2 Filten.
704

Environmental Protedion Agency
'1.2.1 Filter Medium. No commercially available filter medium Is Ideal In all re· spect.s for all samplers. The user's iroals In sampling determine the relative Importance of various filter characteristics <e.ir .• cost, ease of handlln&'. physical and chemical characteristics, etc.> and, consequently, determine the choice amonir acceptable filters. Furthermore, certain types of filters may not be sultable for use with some samplers, particularly under heavy loadlns conditions <hish mass concentrations>. because of high or rapid Increase In the filter now resistance that would exceed the capability of the sampler's now control device. However, aamplers equipped with automatic fllter-changlnl mechanisms may allow use of these types of filters. The specifications liven below are mlnlmum requirements to ensure acceptablllty of the filter medium for measurement of PM,. mass concentrations. Other filter evaluation criteria should be considered to meet Individual sampling and analysis objectives.
7.2.2 Collection E/ficien.C'll. :>99 percent. as measured by the DOP test <ASTM-2986> with 0.3 ,...m particles at the sampler's operating face velocity.
7.2.3 lntegritJl~.±5 ,...g/m' <assumlnir sampler's nominal 24-hour air sample volume>. Intep1ty la measured as the PM,. concentration equivalent correspondlnir to the averaee difference between the initial and the final weishts of a random sample of test filters that are weighed and handled under actual or simulated sampling conditions. but have no air sample passed through them <le., filter blanks>. As a minimum. the test procedure must Include Initial equlllbration and weighing, installation on an inoperative sampler, removal from the sampler, and final equlllbratlon and weighing.
7.2.4 .AlkalinitJI. <25 microequlvalents/ sram of filter, as measured by the proce· dure liven in Reference 1:: following at least two months storage in a clean environment <free from contamination by acid.le irases> at room temperature and humidity.
7.3 Fl.ow Ra.le Tran.3/er Sta.nda.rd. The now rate transfer standard must be suitable for the sampler's operating now rate and must be calibrated against a primary now or volume standard that ls traceable to the National Bureau of Standards <NBS>. The flow rate transfer standard must be capable of measuring the sampler's operating flow rate With an accuracy of ±2· percent.
7.4 Filter Conditioning Environment. 7.4.1 Temperature range: 15" to 30" C. 7.4.2 Temperature control: :t:3" C. 7.4.3 Humidity range: 203 to 453 RH. 7.4.4 Humidity control: ±53 RH. 7.5 Ana.lytica.l Ba.la.nee. The analytical
balance must be suitable for weighing the type and size of filters required by the sam· Pier. The range and sensitivity required will depend on the filter tare weights and mass
Sec t ; on No. : 2. 11 . I 0 Date: January 1990 'Page: 3
Part 50, App. J
loadlnirs. Typically, an analytical balance with a sensitivity of 0.1 ms Is required for hlirh volume samplers :now rates >0.5 m~/ min>. Lower volume samplers <now rates <0.5 m1 /mln> wlll require a more sensitive balance.
8.0 Calibnltion. 8.1 ~ &111dnments. 8.1.l Calibration of the sampler's now
measurement device Is required to establish traceability of subsequent now measurements to a primary standard A now rate transfer standard calibrated apinst a primary flow or volume standard shall be used to calibrate or verify the accuracy of the sampler's flow measurement device.
8.1.2 Particle size dlscrimination by inertial separation requires that sped.fie air velocities be maintained in the sampler's air inlet system. Therefore. the now rate through the sampler's Inlet must be maintained throughout the sampllnir period within the design flow rate ranire specified by the manufacturer. Deslln flow rates a.re specified as actual volumetric now rates, measured at existing conditions of temperature and pressure <Q.>. In contrast, mass concentrations of PM,. are computed using flow rates corrected to EPA reference condl· tions of temperature and pressure <Q.w>·
8.2 Flow Rate Calibration Procedure. 8.2.1 PM,. samplers employ various types
of flow control and now measurement devices. The specl1lc procedure used for now rate calibration or verification will vary dependlnir on the type of flow controller and flow Indicator employed. Calibration In terms of actual volumetric now rates <Q.> is irenerally recommended. but other measures of now rate <e.ir .• Q...> may be used provided the requirements of section 8.1 are met. The seneral procedure liven here is based on actual volumetric flow units CQ.> and serves to Illustrate the steps involved In the calibration of a PM11 sampler. Consult the sampler manufacturer's instruction manual and Reference 2 for specific iruidance on callbra· tion. Reference 14 provides additional information on the use of the commonly used measures of now rate and their interrela· tlonships.
8.2.2 Calibrate the now rate transfer standard airalnst a primary flow or volume standard traceable to NBS. Establish a calibration relationship <e.g., an equation or family of curves> such that traceability to the primary standard ls accurate to within 2 percent over the expected range of ambient conditions <I.e., temperatures and pressures> under which the transfer standard will be used. Recalibrate the transfer standard peri· odlcally.
8.2.3 Following the sampler manufactur· er's Instruction manual, remove the sampler Inlet and connect the flow rate transfer standard to the sampler such that the trans·
705

Part 50, App. J
fer standard accurately measures the s&m· pier's now rate. Make sure there are no leaks between the transfer stand&rd and the ampler.
8.2.4 Choose a minimum of three now rates <actual m•/min>. spaced over the ac· ceptable now rate range specified for the Inlet <see 7.1.2> that can be obtained by suit· able adjustment of the sampler now rate. In a.c:cordance with the sampler manufactur· er'1 Instruction manual, obtain or verify the calibration relationship between the now rate <actual m• /min> aa indicated by the transfer standard and the sampler's now in· dicator response. Record the ambient tem· perature and barometric pressure. Tempera· ture and pressure corrections to subsequent now indicator readlnp may be required for cert&ln types of now measurement devices. When such corrections are necessary, cor· rectlon on an individual or daily basis Is preferable. However, seasonal average tem· perature and average barometric pressure for the sampling site may be incorporated into the sampler calibration to avoid dally corrections. Consult the sampler manufac· turer's instruction manual and Reference 2 for additional guidance.
8.2.5 Followtnc calibration, verify that the sampler II operatinc at Its design now rate <actual m•/min> with a clean filter In pJ:i.ce.
8.2.6 Replace the sampler inlet. 9.0 Procedure. 9.1 The sampler shall be operated In ac·
cord&nce with the specific guidance provid· ed In the sampler manufacturer's instruc· tlon manual and In Reference 2. The general procedure given here assumes that the sampler's now rate calibration ls based on now rate:: at ambient C\lndiwor.is <Q.> and serves to lliustrate the steps involved In the operation of a PM,. sampler.
9.2 Inspect each filter for pinholes, partl· cles, and other imperfections. Establlsh a filter Information record and asslcn an Iden· tiflcatlon number to each filter.
9.3 Equilibrate each filter in the condl· tioninc environment <see 7.4> for at least 24 hours.
9.4 Followtnc equilibration. weigh each filter and record the presampling weight with the filter Identification number.
9.5 Install a preweighed filter in the sam· pier following the instructions provided In the sampler manu!acturer·s instruction manual.
9.6 Tum on the sampler and allow It to establish run-temperature conditions. Record the now Indicator reading and, if needed, the ambient temperature and baro· metric pressure. Determine the sampler now rate <actual ms /min> In accordance with the instructions provided in the sarn· pler manufacturer's instruction manual. NOTE.-No onsite temperature or pressure measurements a.re necessary if the sampler's
Section No.: 2.11.10 Date: January 1990 Page: 4
40 CFR Ch. I (7-1-88 Edition)
now indicator does not require temperature or pressure corrections or If seasonal average temperature and averaee barometric pressure for the sampllnr site are Incorporated into the sampler calibration <see step 1.2.4>. U Individual or daily temperature and pressure corrections are required, ambient temperature and barometric pressure can be obtained by on-site measurements or from a nearby weather st&Uon. Barometric pres•ure readincs obtained from airports must be station pressure, not corrected to sea level, and may need to be corrected for differences In elevation between the sampling .site and the airport.
9.7 If the now rate Is outside the acceptable ranee specified by the manufacturer, check for leaks, and 1f necessary, adjust the now rate to the specified setpoint. Stop the ampler.
9.8 Set the timer to start and stop the ampler at appropriate times. Set the elapsed time meter to zero or record the lni· t1al meter reading. ·
9.9 Record the sample Information <site location or Identification number, sample date, filter identlflcatlon number, and sampler model and serial number>.
9.10 Sample for 24± 1 hours. 9.11 Determine and record the average
now rate <Q.> In actual m•/mln for the sampllnc period In accordance with the instructions provided In the sampler manufacturer's Instruction manual. Record the elapsed time meter final reading and, 1f needed. the averaee ambient temperature and barometric pressure for the sampling period <see note followtnr step 9.6>.
9.12 Carefully remove the filter from the sampler, following the sampler manufacturer's Instruction manual. Touch only the outer edces of the f'llter.
9.13 Place the filter In a proteetlve holder or container <e.c .• petri dish, 1la.ssine envelope, or manila folder>.
9.14 Record any facton such u meteorolocical conditions, construction activity, fires or dust stonns, etc., that mtrht be pertinent to the measurement on the filter In· formation record.
9.15 Transport the expased sample filter to the fllter conditioning environment as soon as possible for equlltbration and subse· quent welrhinr.
9.16 Equilibrate the exposed fllter in the conditioning environment for at least 24 hours under the same temperature and hu· midity conditions used for presampllng filter equilibration <see 9.3>.
9.17 Immediately after equilibration, re· weigh the filter and record the postsam· pling weight with the filter identification number.
10.0 Sampler Maintenance. 10.1 The PM,. sampler shall be main·
tained In strict accordance with the mainte·
706
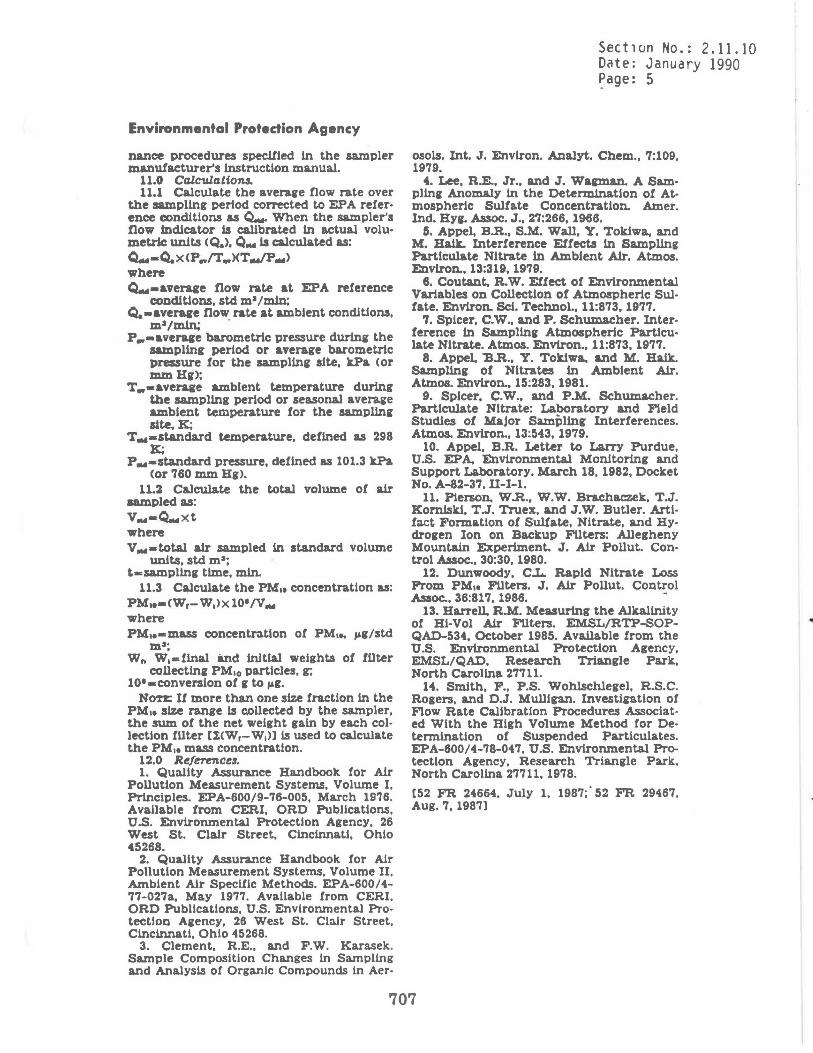
Environmental Protedion Agency
nance procedures specltled in the sampler manufacturer's instruction manual.
11.0 Calculatiom. 11.1 Calculate the averare flow rate over
the sampling period corrected t.o EPA refer· ence conditions as ~ When the sampler's flow Indicator ls callbrated in actual volu· metric units < Q.>. Q ... ls calculated as: Q...-Q.x<P .. IT .. XT ... IP..,.> where Q...-averaae flow rate at EPA reference
conditions, std m 1 /min; Q.-averaae flow rate at ambient conditions,
m'/m.in; " P .. -averaae barometric pressure during the
sampling period or averaae barometric pressure for the sampling alte, ltPa <or mm Hr>:
T .. -averaae ambient temperature during the sampling period or seasonal average ambient temperature for the sampling site, K;
T .. -sta.ndard temperature, defined as 298 It;
P .. -standard pressure, defined as 101.3 t.Pa <or 760 mm Hg>.
11.2 Calculate the total volume of air sampled a.s: v .. -Q..xt where v ... -total air sampled in standard volume
units, std m 1 ;
t-sampllng time, min. 11.3 C-.Iculate the PM11 concentration as:
PM,.-<W,-W,>x 10• IV.,. where PM,.-mass concentr.itlon of PM,., J'g/std
m•; w,, w,.flnal and initial weights of filter
collectinr PM10 particles, r. 10•-conversion of r t.o JAi·
Non: If more .than one size fraction In the PM,. size range Is aollected by the sampler, the sum of the net weight ga.ln by each col· lectlon tuter C%<W1-W1>l ls used to calculate the PM,. mass concentration.
12.0 Rtt/ern&Ce3. 1. Quality Assurance Handbook for Air
Pollution Measurement Systems, Volume I. Principles. EPA-600/9-76-005, March 1976. Available from CERI, ORD Publications, U.S. Environmental Protection Agency, 26 West St. Clair Street, Cincinnati, Ohio 45268.
2. Quality Assurance Handbook for Air Pollution Measurement Systems, Volume II, Ambient Air Speclflc Methods. EPA-600/4-77-027&, May 1977. Available from CERI, ORD Publications, U.S. Environmental Pro· tection Agency, 26 West St. Clair Street, Cincinnati, Ohio 45268.
3. Clement, R.E., and F.W. Karasek. Sample Composition Changes In Sampling and Analysis of Organic Compounds In Aer·
Section No.: 2.11.10 Date: January 1990 ~age: 5
osols. Int. J. Environ. Analyt. Chem., 7:109, 1979.
4. Lee, R.E., Jr., and J. Wagman. A Sam· pllng Anomaly in the DetermJnatlon of Atmospheric Sulfate Concentration. A.mer. Ind. HY1. Assoc. J., 27:266, 1966.
5. Appel, B.R., S.M. Wall, Y. Toklwa, and M. Haik. Interference Effect.a In Sampling Particulate Nitrate in Ambient Air. Atmos. Environ.. 13:319, 1979.
6. Coutant. R.W. Effect of Environmental Variables on Collection of Atmospheric Sul· fate. Environ. Sci. Technol., 11:873, 1977.
7. Spicer, C.W., and P. Schumacher. Inter· ference in Sampling Atmospheric Partlcu· late Nitrate. Atmos. Environ., 11:873, 1977.
8. Appel, "B.R., Y. Toldwa, and M. Halk. Sampling of Nitrates in Ambient Air. Atmos. Environ., 15:283, 1981.
9. Spicer, C.W., and P.M. Schumacher. Particulate Nitrate: Laboratory and Field Studies of Major Samplinr Interferences. Atmos. Environ., 13:543, 1979.
10. Appel, B.R. Letter to Larry Purdue, U.S. EPA. Environmental Monitoring and Support Laboratory. March 18, 1982, Docket No. A-82-37, II-1-1.
11. Pierson. W.R., W.W. Brachac:zek, T.J. Komiskl, T.J. Truex, and J.W. Butler. Artf· fact Formation of Sulfate, Nitrate, and Hydroren Ion on Backup Filters: Allegheny Mountain Experiment. J. Air Pollut. Con· trol Assoc., 30:30, 1980.
12. Dunwoody, C.L. Rapid Nitrate Loss Prom PM,. Filters. J. Air Pollut. Control Assoc., 36:817, 1986. -
13. Harrell. R.M. Mea.surlng the Alkalinity of Hl-Vol Air Filters. EMSL/RTP-SOPQAD-534, October 1985. Av&ilable from the U.S. Environmental Protection Agency, EMSL/QAD, Research Triangle Pa.rk, North Carolina 2'Ml1.
14. Smith, F., P.S. Wohlschlegel, R.S.C. Rogers, and D.J. Mulllga.n. lnvestlption of Flow Rate Calibration Procedures Assoclat· ed With the High Volume Method for De· termination of Suspended Particulates. EPA-600/4-78-047, U.S. Environmental Protection Agency, Research Triangle Park, North Carolina 27711, 1978.
C52 FR 24664, July 1, 1987;. 52 FR 29467, Aug. 7, 1987]
707
..

2.11.11 REFERENCES
Section No.: 2.11.11 Date: January 1990 Page: 1
1. U.S. Environmental Protection Agency. Code of Federal Regulations. Title 40, Chapter I, Subchapter C, Part 50, Appendix J. Washington, D.C. Office of the Federal Register. 1988.
2. U.S. Environmental Protection Agency. Code of Federal Regulations. Title 40, Chapter I, Subchapter C, Part 53, Subpart D. Washington, D.C. Office of the Federal Register. 1988.
3. Smith, F., P. S. Wohlschlegel, R.S.C. Rogers and D. J. Mulligan. Investigation of Flow Rate Calibration Procedures Associated with the High Volume Method for Determination of Suspended Particulates. EPA-600/4-78-047, U.S. Environmental Protection Agency, Research Triangle Park, North Carolina, 1978.
4. American Gas Association. American National Standard for Rotary-Type Gas Displacement Meters. ANSI Standard No. 8109.3, AGA Catalog No. X68606, Arlington, Virginia, 1986.
· 5. Koch, R. C. and H. E. Rector. Optimum Network Design and Site Exposure Criteria for Particulate Matter. EPA-450/4-87-009, U.S. Environmental Protection Agency, Research Triangle Park, North Carolina, 1987.
6. Coutant, R. W. "Effect of Environmental Variables on Collection of Atmospheric Sulfate," Environmental Science and Technology, 1!(9):873-878, September 1977.
7. American Society for Testing and Materials. Standard Method for Evaluation of Air Assay Media by the Monodisperse DOP (Dioctyl Phthalate) Smoke Test, ASTM Standard No. D2986-71(78) in Annual Book of ASTM Standards, Volume 11.03-Atmospheric Analysis; Occupational Health and Safety, Philadelphia, Pennsylvania, 1988.
8. Harrell, R. M. Measuring the Alkalinity of Hi-Vol Air Filters. EMSL/RTP-SOPQAD-534. October 1985. Available from the U.S. Environmental Protection Agency, Atmospheric Research and Exposure Assessment Laboratory, Quality Assurance Division, Research Triangle Park, North Carolina 27711.

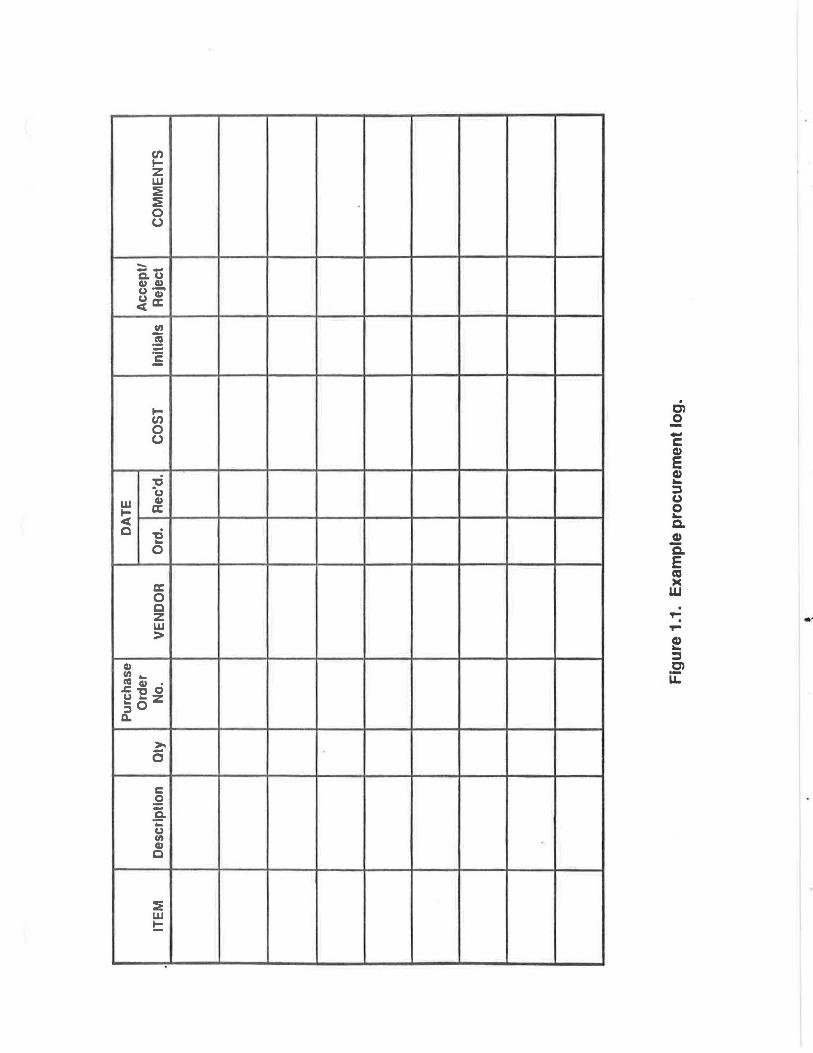
en I-z w == == 0 u
---'2. u G> G> u a; ~ a:
~ ~ c:
I-en 0 u
:C u
w G>
I- a: < c i:i ...
0
a: 0 c z w >
IU en ._ ~ IU • u "C 0 ...... z ::sO ~
>. s c: .2 Q. ... (,) en G> c
== w !::
I I I
ch £ -c Q)
E ! :::s (,)
E c. Q)
'a. E «J )(
w . 'f"" .

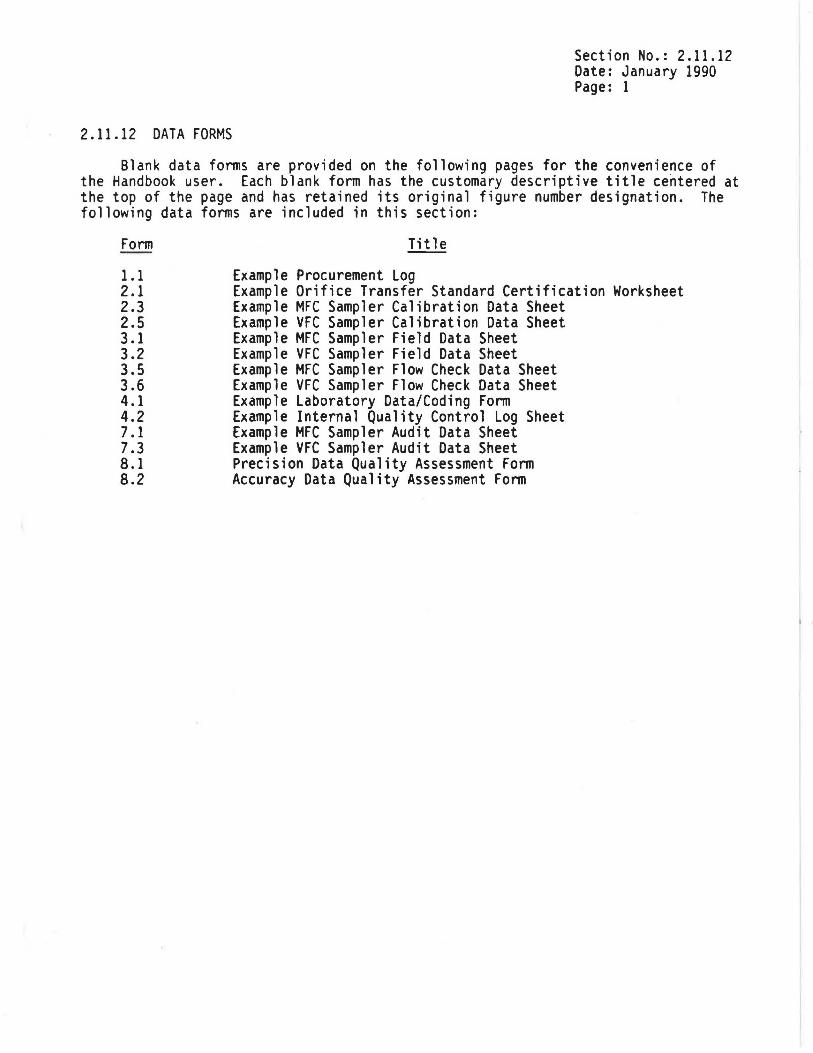
2.11.12 DATA FORMS
Section No.: 2.11.12 Date: January 1990 Page: 1
Blank data forms are provided on the following pages for the convenience of the Handbook user. Each blank form has the customary descriptive title centered at the top of the page and has retained its original figure number designation. The following data forms are included in this section:
Form
1.1 2 .1 2.3 2.5 3 .1 3.2 3.5 3.6 4 .1 4.2 7.1 7.3 8.1 8.2
Title
Example Procurement Log Example Orifice Transfer Standard Certification Worksheet Example MFC Sampler Calibration Data Sheet Example VFC Sampler Calibration Data Sheet Example MFC Sampler Field Data Sheet Example VFC Sampler Field Data Sheet Example HFC Sampler Flow Check Data Sheet Example VFC Sampler Flow Check Data Sheet Example Laboratory Data/Coding Form Example Internal Quality Control Log Sheet Example MFC Sampler Audit Data Sheet Example VFC Sampler Audit Data Sheet Precision Data Quality Assessment Form Accuracy Data Quality Assessment Form


ORIFICE TRANSFER STANDARD CERTIFICATION WORKSHEET
Date: Roots meter SIN: Ta: K
Operator: Orifice S/N: Pa: mm Hg
Plate or Initial Volts AC Volume Final Volume .i Vol. ~Time (min) .1Hg (mm) .1H20 (in.)
DATA TABULATION
(x-axis) (y-axis) (x-axis) (y-axis) Vstd Qstd [.iH20 (Pa/Ta)] 112 • Va Qa [.iH20 (Ta/Pa)f12
m= m=
b= b=
r = r =
CALCULATIONS
Vstd = ~Vol [(Pa - ~g)/7601 (298/Ta)' Va = ~Vol [(Pa - ~g)/Pal Ostd = Vstd/~ Time· Qa ... Va/ ~Time y = mx + b y = mx + b
For subsequent flow rate calculations:
Ostd = l[~H20 (Pa/Ta)f12 - b: :1/ml Oa = l [~H20 (Ta/Pa)J 112
- b: :11m:
·NOTE: For PM10 monitoring, a calibration curve corrected to standard conditions is optional.
Figure 2.1. Example Orifice Transfer Standard Certification Worksheet.

I I I

MFC SAMPLER CALIBRATION DATA SHEET
Station Location ----------- Date ---- -- Time _____ _
Sampler Model _______ SIN - - ----- Operator
Pa ___ mm Hg, Ta ___ °C ___ K, Unusual conditions: ---------
Ps• ___ mm Hg, Ts• °C ___ ,K, (•seasonal average Ta and Pa)
Orifice SIN----------- Orifice Calibration Date _ _ ________ _
Orifice calibration relationship: m • ______ b• ______ r •
Plate Number
X-Axis = Qa (orifice) flow rate•
(m3/min)
8aa • {[(AH~) (Ta1Pa)J1h - b} {1/m} b '1Pext • ['1Pex(Ta + 30)/Pa) J'h cit • [I] ((Ta + 30)/Pa]'h if a flow recorder is used
Y·Axls = Sampler '1Pex (In. H20) Sampler ~Pextb [or I for flow recorders) [or H for flow recorders)c
Sampler Callbratlon Relationship (Qa on x-axis; APext or (It] on y-axis): APext • m[Qa (Orifice)] + b or It • m[Qa(Orifice)] + b
m • --------- b - --------- r • ---------For subsequent celculatlon of sampler flow rate:
Qa - {(mean APex (Tav + 30)!Pav]'h - b} {1/m} or Oa • {mean l((Tav + 30)/Pav]lo'J - b} {1/m}
Set point flow rate (SFR) SFR • 1.13 (Ps/Pa) (TafTs)
Sampler set point (SSP) SSP • [Pal(Ta + 30)) ~m(SFR) + bJ2
or SSP • [Pal(Ta + 30)]1 [m(SFR) + bJ for flow recorders
Figure 2.3. Example MFC sampler calibration data sheet.

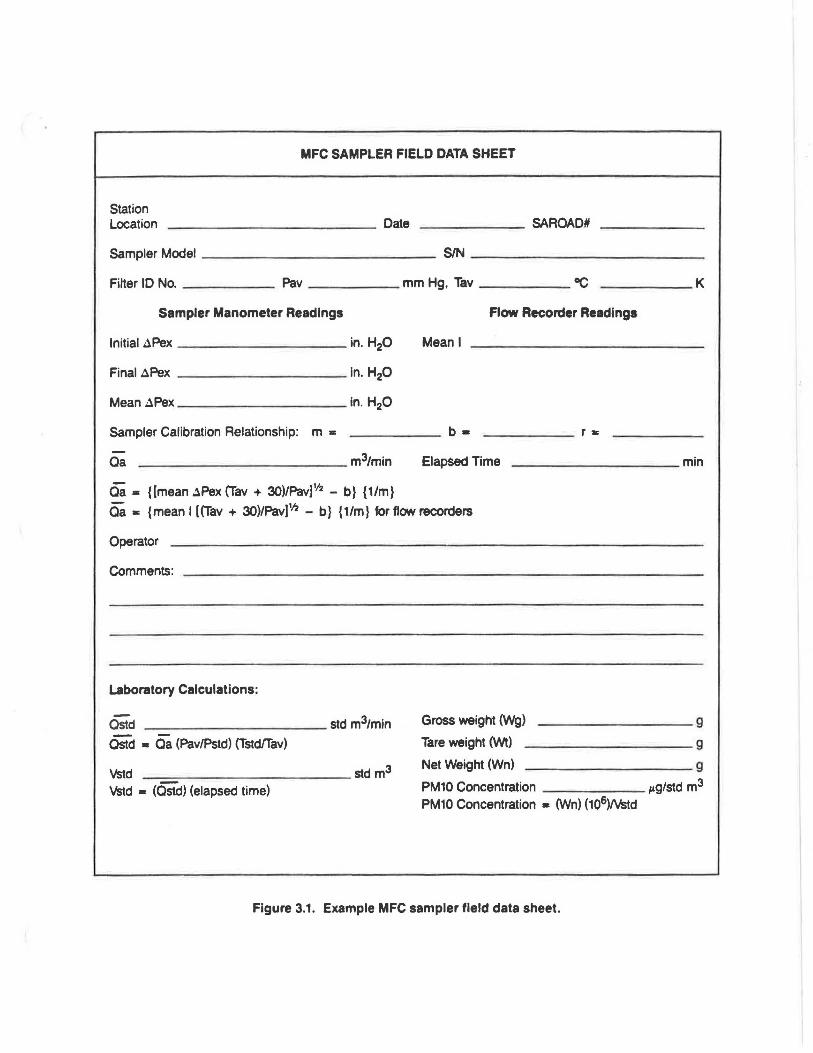
Station Location
MFC SAMPLER FIELD DATA SHEET
------------ Date ------ SAROAD#
Sampler Model ------------- SIN ------------
Filter ID No. ----- Pav -----mm Hg. Tav ----- oC _____ K
Sampler Manometer Readings Flow Recorder Readings
Initial APex ---------- in. H20
Final APex -------- -- in. H20
Mean .:1Pex ---------- in. H20
Meanl --------------
Sampler Calibration Relationship: m • _____ b• - ----- r•
Oa m3/min Elapsed Time __________ min
Oa = {[mean APex (Tav + 30)/PavJ112 - b} {1/m}
Oa • {mean I ((Tav + 30)/Pav]Yz - b} {1/m} for flow recorders
Operator
Comments:
Laboratory Calculations:
Qstd __________ _
OStd • Oa (Pav/Pstd) (Tstd/Tav)
Vstd Vstd = (Ostd) (elapsed time)
std m3/min
std m3
Gross weight (Wg)
Tare weight (Wt)
Net Weight (Wn)
PM10 Concentration PM10 Concentration • (Wn) (106)/Vstd
Figure 3.1. Example MFC sampler field data sheet.
g
g
g
µg/std m3

,,

VFC SAMPLER CALIBRATION DATA SHEET
Station Location ------------ Date ------ Time _____ _
Sampler Model _______ SIN ------- Operator
Pa mm Hg, Ta ____ oe ____ K, Unusual Conditions -------
Orifice SIN ---------- Orifice Calibration Date ----------
Orifice Calibration Relationship: m = ------ b .. _ _ ____ r = _____ _
Plate No.
Operational Flow Rate
~Pstg (mm Hg)•
8mm Hg • 25.4 (in. H20/13.6)
P1=Pa-~tg (mm Hg)
baa (orifice) • 1/m {[(~H20) (Ta/Pa)]1h - b}
c% Difference • r Ca. (sampler) - Ca (orifice)] [100] [ Ca (orifice}
Sampler Calibration Relationship D Lookup Table Validated (i.e.,% difference lit 4) D New calibration relationship:
(X = Ca (orifice), y • (P1 /Pa)
[Tafh
m= b• --- r=
For subsequent calculation of sampler flow rate:
Ca • {[P1/Pa - b][Ta]l/2 } {1/m}
Operational Flow Rate ______ m3/min
P1/Pa (mm Hg)
Qa (Orifice)
Qa (orifice) flow rateb (m3/mln)
Qa (sampler) (Lookup Table)
Figure 2.5. Example VFC sampler calibration data sheet.
Qa (orifice)
[Ta]Y2
% Dlfferencec

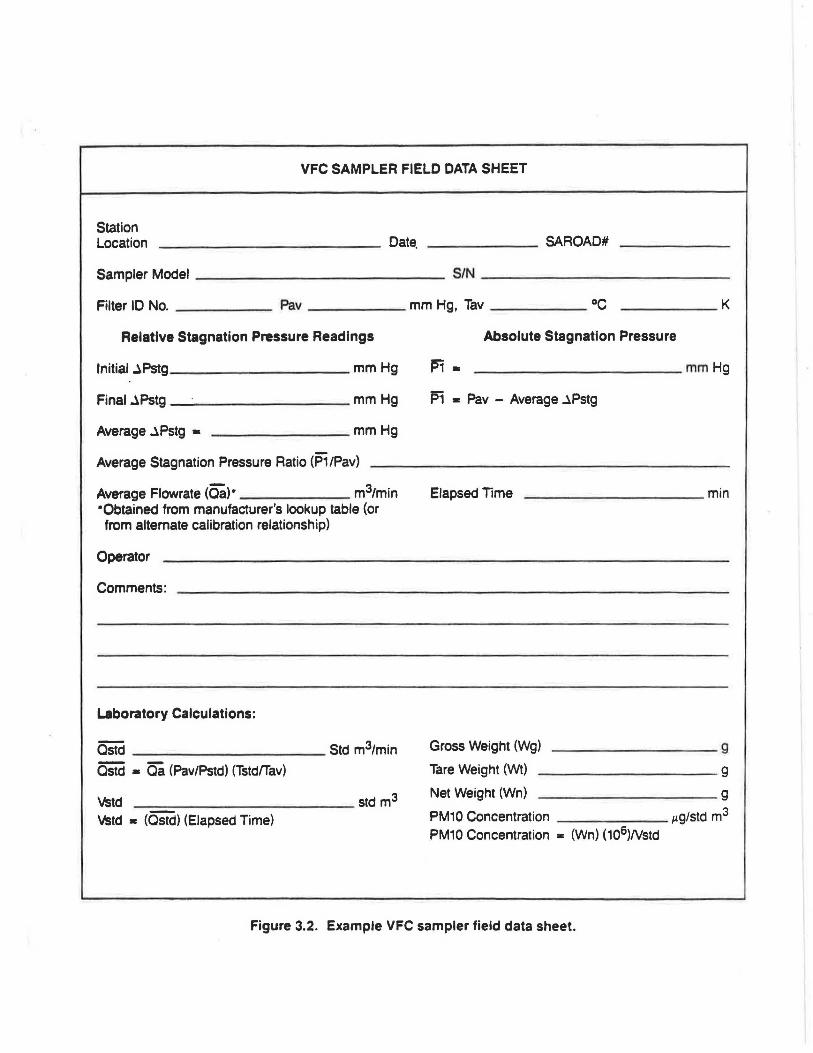
VFC SAMPLER FIELD DATA SHEET
Station Location ------------ Date. ------ SAROAD#
Sampler Model -------------- SIN -------------
Filter ID No. ----- Pav ----- mm Hg, Tav ----- °C _____ K
Relative Stagnation Pressure Readings
Initial ~Pstg __________ mm Hg
Final ~Pstg _ _________ mm Hg
Average ~Pstg • -------- mm Hg
Average Stagnation Pressure Ratio (P1/Pav)
Average Flowrate (Ca)• m3/min •Obtained from manufacturer's lookup table {or from alternate calibration relationship)
Operator
Comments:
Laboratory Calculations:
Osid ----------Std m3/min Ostd • aa (Pav/Pstd) (Tstdffav)
Vstd ------------ std m3
Vstd • (Ostd) (Elapsed Time)
Absolute Stagnation Pressure
___________ mm Hg
P1 • Pav - Average ~Pstg
Elapsed Time __________ min
---------9 Gross Weight (Wg)
Tare Weight (Wt)
Net Weight (Wn) ----------9 ---------- g
PM10 Concentration µg/std m3
PM10 Concentration .. (Wn) (106)Nstd
Figure 3.2. Example VFC sampler field data sheet.


MFC SAMPLER FLOW CHECK DATA SHEET
Station Location ---- ----------- Date ------- Time ______ _
Sampler Model -------- SIN - - ------ Operator
Pa _ _ __ mm Hg, Ta ____ oc ____ K, Unusual Conditions ------- -
Orifice SIN Orifice Calibration Date
Orifice Calibration Relationship: m = ------· b • --- --- r • - -----
Sampler Calibration Relationship: m • _____ _ b• ______ r.
Orifice Pressure Drop (AH20) in. H20 Qa (Orifice)8 _ _____ ____ m3/min
Sampler Pressure Drop (.o.Pex)
Qa (samp.ler)b
QC-Check Percentage Oitterencec
With Orifice Installed
___ ___ __ in. H20
m3/min ------------------ o~
Qa (corrected sampler)d ------------ m3tmin
Design Flow Rate Percentage Ditterencee -------- %
aFor calculation of orifice flow rates:
Qa (orifice) • {(.;i(H20) (Ta/Pa))'12 - bl ( 11m l
bFor calculation of sampler flow rates:
Qa (sampler) • {((.:lPex/Pa) (Ta + 30))'12 - bl (11ml
Without Orifice Installed
- - --- --- in. H20
-------- m3/min
c c o · [ Qa (sampler) - Qa (orifice) J [ J 0 % 1fference = 100 where Qa (sampler) is measured with the Oa (orifice) orifice installed
d [ 100 - QC % difference ] Oa (corrected sampler) = Oa (sampler) where Qa (sampler) is measured
100 without the orifice installed.
[ Qa (corr. sampler) - 1.13 J [ J eoesign Flow Rate % Difference =
1.13
100
Figure 3.5. Example MFC sampler flow check data sheet.

1. I
VFC SAMPLER FLOW CHECK DATA SHEET
Station J Location ______________ Date _______ Time ______ _
Sampler Model -------- SIN -------- Operator
Pa ____ mm Hg, Ta ____ oc ---- K, Unusual Conditions _______ _,,, -;;
Orifice SIN Orifice Calibration Date
Orifice Calibration Relationship: m '"' ------ b • ------ r • ------
Orifice Pressure Drop (AH20) in. H20 Qa (Orifice )8 ----------m
3/min
Stagnation Pressure (APstg)
Absolute Stagnation Pressure (P1 )b
Stagnation Pressure Ratio (P1 /Pa)
Qa (sampler)c
QC-Check Percentage Differenced
With Orifice Installed
--------mm Hg
--------mm Hg
-------- m3/min
----------o~ Qa (corrected sampler)e ------------m3/min
Design Flow Rate Percentage Difference' --------~o
a.ca (orifice) • {l(AH20) (TatPa)J'h - b I { 1/m}
bp1 • Pa - APstg
Without Orifice Installed
--------mm Hg
--------mm Hg
-------- m3/min
coetermine Qa (sampler) from manufacturer's lookup table (or from alternate calibration relationship)
d [ Qa (sampler) - Qa (orifice) J QC O/o Difference = ( ) 100
Qa orifice where Qa (sampler) is measured with the orifice installed
[ 100 - QC % difference J
eaa (corrected sampler) = Qa (sampler) where Oa (sampler) is measured 100 without the orifice installed.
t [ Qa (corr. sampler) - 1.13 ] [ ] Design Flow Rate% Difference ""
1_13
100
Figure 3.6. Example VFC sampler flow check data sheet.

I •
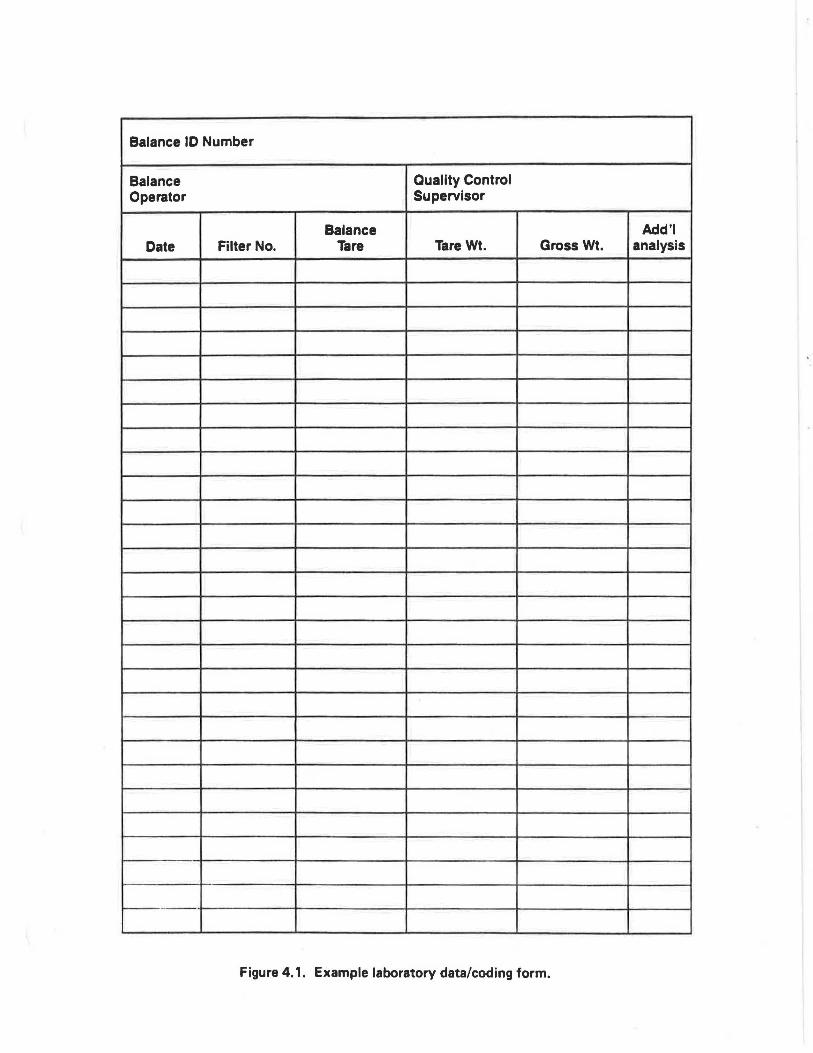
Balance ID Number
Balance Quality Control Operator Supervisor
Balance Add'I Date Filter No. Tare Tare Wt. Gross Wt. analysis
,____
Figure 4.1. Example laboratory data/coding form.


Balance ID Number
Balance Quality Control Operator Supervisor
Standard Zero·Check Callbratlon Check Tare and Gross Weight Checks
Weight Checks (±0.5 mg) (±0.5 mg)
Original Observed Orlglnal Observed Origlnal Observed Original Observed Date Value ·Value Value Value Value Value Fiiter ID Value Value T/G8
--- ..
-
- --
..
-
---·-->---·
. - -
--- -., _____ - ---
·--- - -·--
· ---- --- ·---··· . . ·---· -
aTare or Gross Measurement
Figure 4.2. Example internal Quality Control Log Sh~t.


DATA QUALITY ASSESSMENT REPORTING FORM ACCURACY (hi·•• It•••"''"''...,,._, ... , .... '"''' 11 .111 &'11111&.'") .Ji•~ lu• ti ~·n~k 11th! o1n.I UI llM'llMKI n•ot ruu•~
_J RIPOR11NG ,.g · .,_..) 01
SJAH ORGANllAllON VIAR OUARUR ·- 01
SAROAD SITE CODE ..,g l ML ..
I I I I I I ITJ D D 1 - ORIGINAL CIM »
I I I I I I I I I I :II - REVISION !:~~
))
l'DElUION ll
• :II l .. 6 ' 1 I 9 ~· 11
10 .. SIU
LJ METHOD POLLUJANT CODE
NAME Of REPORJING ORGANIZA JION
I I I I DAJE 5UIMITIED PREPARED IY
IAllO&D
"II CODI
lt lJ
POUU UUHOO IANI COOi
METHOD
DAii llDN DAY t 1 IJ
1111111111 _ (]]]10 1111100 UNll
UNll
CODI ACIUAl
MO IDAYIYR
INOICAUD
10111 21·21 I 24 U -211 29 JO ll·l2 ll l4l1 11140 41·44 4641 LEVEL J
[J 1-1-1-11-.1-1-11 -11--1-11 ........ 1-1-1 I Jl J4 J1 l8 40 4. ..... 4fi 41
LEVEL 1
11111111 I I _(]]]I[~) 1111100 _DJ IQ] 1~1-1 ~, ,~,1--1 ~I I 1~1--1 ......... 1 1 ......... 1....-1 ........ 1 I Q LEVEL l
l!.J 1 I I I I.I I I I I I I I 1.1 I I I LEVEL 1
1111111111 _(]]]10 1111100 _ ITJ ~ -11--1 ..... 11--.1--1 ....... 11 1--1-1-11 ....... 1-1-11 [!] I I I I I I I LEVEL l • II I I I I I.I 11 I
LEVEL 1
I I I I I I I I I I _ (]]] I ~ I I I I I 0 D _ DJ IQ] ........ , 1-1.........,1 1--.1---1,.....,.11 -1 1--1 ......... , I ........ , ........ I _..I I
[!] I I I I I I I LEVEL l ' II I I 11 1.1 11 I LEVEL 1
11111111 11 _ (]]]I0 1111100 _DJ IQ] ,-,-1-11-.1-1-11 , ...... 1--1 _,, 1 ......... 1--1 __,,, , [!] I I I LEVEL J I I.I I I I I I I I 1.1 I I I
J~_.~ ........ ..., .......
ACIUAl LEVEL 2 INDICAllD
-11 -1 -, ,~.,-1 ~, , 1-1-1 -1 ,-,1-1 -11 411 Iii li2 !i4 !iii-fill &9 61
LEVEL 4 ...... , ,.....-, ......... , , ........ 1 ........ , ........ , I ........ 11....-1 ........ , 1 ......... ,-1 ....... , , 48 Iii !i2 S4 SS &8 !i9 61
LEVEL 2
........ 11-1 ........ , l ....... 1--1 ........ I I .......... , 1---1 -1 I ........ I -.-I --1 I LEVEL4
-11-1 ........ , 1-.1--1 -11 ........ II ....-I ........ , J"""""'",1--1 ....... , I LEVEL 2
,.._. ,-, ........ , , ....... 1--1-111 .......... 1---1..-.1 1 ....... 1-1 --11 LEVEL 4
1-1-1 -11 ....... ,--, ........ 111 -1-1-11-.1-1-11 LEVEL 2
1-1-1 ........ 1 , ....... 1--1 -1 II ....... 1--1 ........ , 1 ....... 1 ........ I ....... , I LE\lfl 4
1 ....... 1-1 ........ , I....,..., ........ I ....-.1111 ....... ---1 ........ , I ....... I ....-I ....... , I
LEVEL 2
r-T"l I .....-1 ......... , ll"""'T".1 ....... 1 ...;.:.,I I ....... 11--1 ........,I 1 ....... 1-1 ........ , I LEVEL4
1 ........ 1-.-1 ....... I l .......... 1--1 ........ II --11---1 ......... , l ....... 1--1 ....... I I I .!.le! ol <1ud11
t Audu conduc1.,d by r•potU11g otu•ne1•11on. aud.1 51•00.•d c••hf1ed br reporung 0111•ne1••aon 2 Aaut,1 conducltJd br •~1Mntu~ 0tg•n11il1.on. •uOI •l•ndard cenll••d by ••iioth•• 01UiiHUl~h11n l Aud11 cund,._t•lf IJr U1ht11 lh•n ••JIU'hng ocy41w1ii11100
LU '........S It-S~ . -- l • __ ... ......
• 11151 , .... _ ... Ill .._._.__, ...... 4 ...
CM..cllll.l........_ ................... ..,.... ... ....,. SEND COMPLETED fORM TO REGIONAL Off ICE
£ ,_. .. c... . .....--.. ........... I ..._ ------, ,_ __ _.. ..
• ...-- ... s..
• .... _.... . ... , .. Cl p ,c.,..... .. ~ ..... .............. . ...,_ ....... , ................ u ------
I------

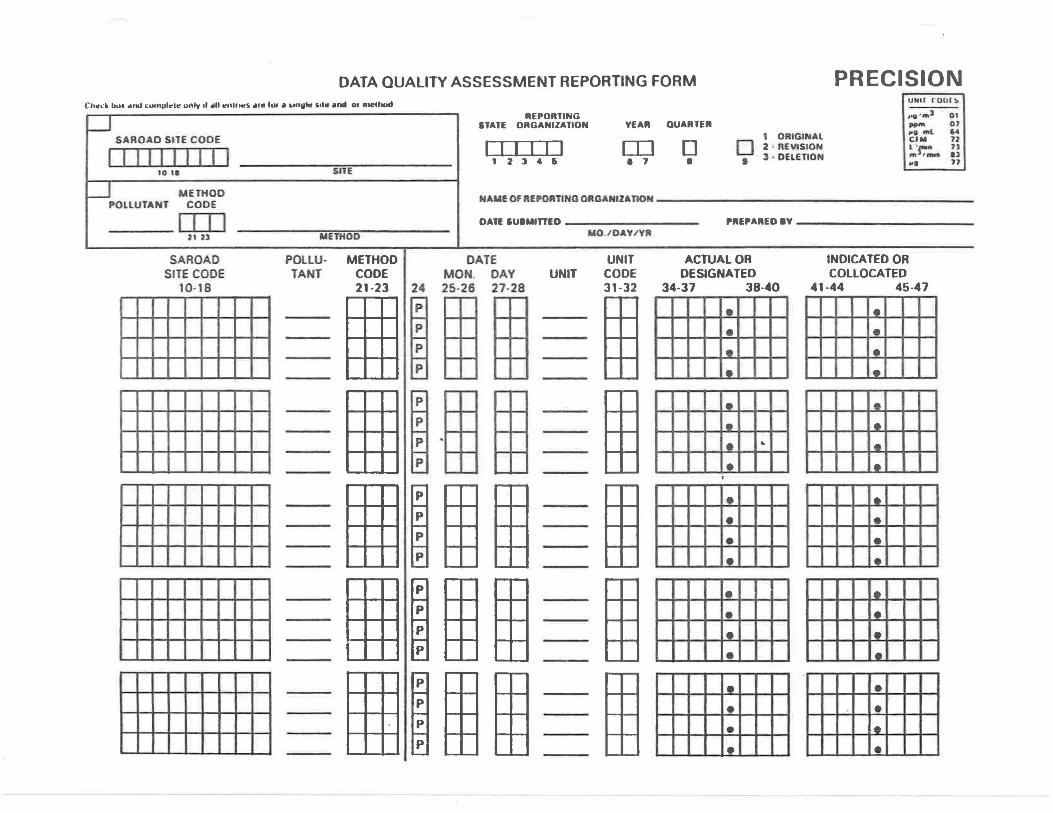
DATA QUALITY ASSESSMENT REPORTING FORM PRECISION Ch~t:• bu• •ntJ .:umpl~•~ onlv 11 •II ~nlf 11ts ••• llM' • ~muht 511• i1nd or meUM>d
SAROAD SITE COO£
I I I I I I I I I I 10 II
METHOD POLLUTANT CODE
rm --- 212>
SA ROAD SITE CODE
10-18
SllE
METHOD
POLLUTANT
METHOD CODE
2:-2.3 I I~ p
p
p
p
p
p
p
p
p
p
p
p
p
p
p
p
p
p
p
p
REPORTING STATE ORGANIZATION
r11111 ' 2 l .. Ii
YEAR
LO • 1
QUARTER
D •
0 I
1 ORIGINAL 2 · REVI SION 3 ·DELETION
UNU ( ' 011£~
''" '"'J. 01 PP"' O) ,,9 ml 14 CfM 11
~r,:.... ~~ ... )J
NAME OF REPORTING ORGANIZATION------------------------
OATE IUBMITIEO ---------- PREPARED •Y --------- ----
DATE MON. DAY 25-26 27-28
UNIT
MO.IOAY/YA
UNIT CODE 31-32
ACTUAL OR DESIGNATED
34-37 38-40
• • • • • • • .. • • • • • • • • • • • • •
INDICATED OR COLLOCATED
41-44 45-47
• • • • • • • • • • • • • • • • • • • •


MFC SAMPLER AUDIT DATA SHEET
Station Location ------- ------ Date ------ Time ------
Sampler Model _____________ _ SIN _________ _ ___ _
Pa ____ mm Hg, Ta ____ °C ____ K, Unusual Conditions ---- ----
Audit Orifice SIN ---------- Orifice Calibration Date ----------
Orifice Calibration Relationship: m • - ----- b : ------- r ""------
Sampler Calibration Relationship: m = ______ b = ------ r'"'
Orifice Pressure Drop (~H20) in. H20 Oa (audit)a ----------m3/min
With Orifice Installed
Sampler Pressure Drop (APex)
Qa (sampler)b - ------- m3tmin
Audit Flow Rate Percentage Differencec --------- O/o
Oa (corrected sampler)d ------------ m3/min
Design Flow Rate Percentage Differencee -------- O/o
aFor calculation of audit orifice standard flow rates:
Qa (audit) = {[A(H20) (Ta/Pa)J'12 - bl { 1/m l
bFor calculation of sampler flow rates:
Oa (sampler} = {[(APex/Pa} (Ta + 30)]'12 - bl {1/m)
Without Orifice Installed
________ in. H20
m3/min --------
cAudit % Difference = [ Oa (sampler} - Oa (orifice) J [ioo] where Qa (sampler) is measured with the · Qa (orifice) orifice installed.
d [ 100 - Audit % Difference] Oa (corrected sampler) = Qa (sampler} where Qa (sampler) is measured
100 without the orifice installed
[ Qa (corrected sampler) - 1.13 J [ 1
eoes1gn Flow Rate% Dilference = 1_13
tOOJ
Auditor ---------- --- Observer ----- --------
Figure 7.1. Example MFC sampJer audit data sheet.

• I
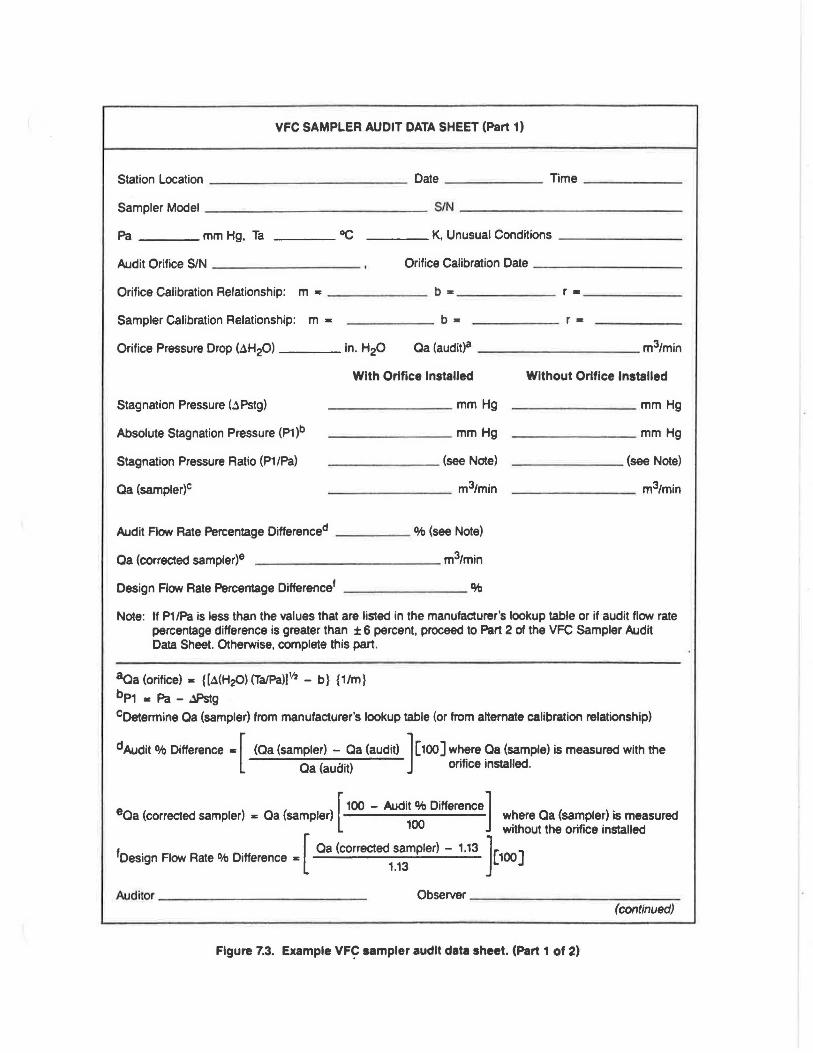
VFC SAMPLER AUDIT DATA SHEET (Part 1)
Station Location --- --------- Date ------ Time ------
Sampler Model ------------- SIN -------------
Pa ____ mm Hg, Ta ____ oe ____ K, Unusual Conditions - ---- ---
Audit Orifice SIN --------- Orifice Calibration Date ---------
Orifice Calibration Relationship: m • ______ b • --- --- r • _____ _
Sampler Calibration Relationship: m • _____ b------ r•
Orifice Pressure Drop (~H20) in. H20 Qa (audit)8 _______ ___ m3tmin
Stagnation Pressure (~Pstg)
Absolute Stagnation Pressure (P1 )b
Stagnation Pressure Ratio (P1 /Pa)
Qa (sampler)c
With Orifice Installed
----- -- mm Hg
------- mm Hg
_______ (see Note)
- ------- m3/min
Audit Flow Rate Percentage Differenced _____ O/o (see Note)
Qa (corrected sampler)9 -----------m
3/min
Design Flow Rate Percentage Difference' ------- O/o
Without Orifice Installed
-------- mm Hg
-------- mm Hg
_____ _ _ (see Note)
-------- m3/min
Note: If P1/Pa is less than the values that are listed in the manufacturer's lookup table or if audit flow rate percentage difference is greater than ± 6 percent, proceed to Part 2 of the VFC Sampler Audit Data Sheet. Otherwise, complete this part.
8aa (orifice) • {[~(H~) (TatPa)J112 - b} { 1 /m}
bP1 - Pa - ~g CDetermine Qa (sampler) from manufacturer's lookup table (or from alternate calibration relationship)
dAudit O/o Difference ., [ (Oa (sampler) - Qa (audit) ] [ 100] where Qa (sample) is measured with the Qa (auait) orifice installed.
[ 100 - Audit% Difference]
eaa (corrected sampler) s Qa (sampler) where Qa (sampler) is measured 100 without the orifice installed
t [ Oa (corrected sampler) - 1.13 J Design Flow Rate% Difference • (100)
1.13
Auditor -------------Observer ___ ____ _____ _
(continued)
Figure 7.3. Example VF~ sampler audit data sheet. (Part 1 of 2)

I
, ..
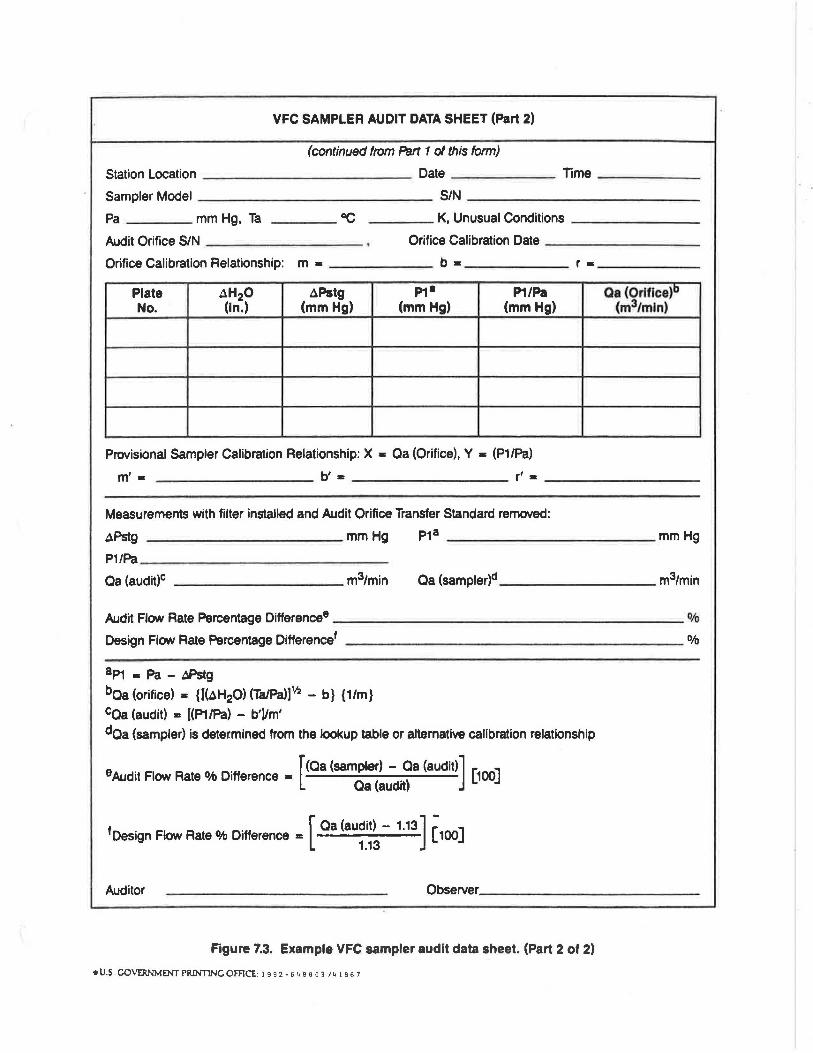
VFC SAMPLER AUDIT DATA SHEET (Part 2)
(continued from Pa.rt 1 of this form)
Station Location ------------ Date ------ Time _____ _
Sampler Model SIN -------------Pa ____ mm Hg, Ta ____ oe ____ K, Unusual Conditions ______ _
Audit Orifice SIN -------- Orifice Calibration Date ---------
Orifice Calibration Relationship: m • ------ b • ------ r • ------
Plate No.
~Pstg (mm Hg)
P1. (mm Hg)
P1/Pa (mm Hg)
Provisional Sampler Calibration Relationship: X • Qa (Orifice), Y • (P1/Pa)
Qa (Orlflce)b (m3/mln)
m' • --------- b' • --------- r' • ---------
Measurements with filter installed and Audit Orifice Transfer Standard removed:
~Pstg mm Hg P1 8 _ ___________ mm Hg
P1/Pa _____________ _
Qa (audit)c ----------m3/min Oa (sampler)d _________ m3/min
Audit Flow Rate Percentage Difference9 --------------------%
Design Flow Rate Percentage Difference' O/o
ap1 •Pa - ~g
baa (orifice) • {[~H20) (Ta1Pa)J1fz - b} {1/m}
caa (audit) - [(P1/Pa) - b')/m'
daa (sampler) is determined from the lookup table or alternative calibration relationship
. [(Qa (sampler) - Qa (audit)] eAudit Flow Rate% Difference • ( . ) [100]
Qa audit
t . [ Oa (audit) - 1.13] [ Design Flow Rate% Difference • 100]
1.13
Auditor Observer ____________ ~
Figure 7.3. Example VFC sampler audit data sheet. (Part 2 of 2)
•U.S COVt:RNMENT PRINTING OFFICE: 19 9 2 • 6 4 e ~ o 3 /41e61