Reference Data
25
Securities Code: 4523 February 2, 2018 Eisai Co., Ltd. http://www.eisai.com/ For Inquiries: Investor Relations: TEL +81-(0)3-3817-3016 Public Relations: TEL +81-(0)3-3817-5120 FY 2017 (Ending March 31, 2018) Third Quarter Financial Results Reference Data Forward-Looking Statements and Risk Factors Materials and information provided in this financial disclosure may contain “forward-looking statements” based on current expectations, forecasts, estimates, business goals and assumptions that are subject to risks and uncertainties, which could cause actual outcomes and results to differ materially from these statements. Risks and uncertainties include general industry and market conditions, and general domestic and international economic conditions such as interest rate and currency exchange fluctuations. Risks that may cause significant fluctuations in the consolidated results of the Eisai Group or have a material effect on investment decisions are described below. These are risk factors that have been identified and assessed as of the disclosure date of the Financial Report. Risk factors associated with our business include, but are not limited to, risks related to product safety and quality, possible occurrence of side effects, lawsuits, changes in laws and regulations, intellectual property, uncertainties in new drug development, impact of medical cost containment measures, generic products, challenges arising in overseas operations, alliances with other companies, acquisitions of companies and product lines, outsourcing, IT security and information management, internal control systems for financial reporting, financial market conditions and currency movement, plant closure or shutdown, environmental issues, and disasters. This English presentation was translated from the original Japanese version. In the event of any inconsistency between the statements in the two versions, the statements in the Japanese version shall prevail.
-
Upload
khangminh22 -
Category
Documents
-
view
2 -
download
0
Transcript of Reference Data
Securities Code: 4523
February 2, 2018
Eisai Co., Ltd.
http://www.eisai.com/
For Inquiries:
Investor Relations: TEL +81-(0)3-3817-3016Public Relations: TEL +81-(0)3-3817-5120
FY 2017 (Ending March 31, 2018)Third Quarter Financial Results
Reference Data
Forward-Looking Statements and Risk FactorsMaterials and information provided in this financial disclosure may contain “forward-looking statements” basedon current expectations, forecasts, estimates, business goals and assumptions that are subject to risks anduncertainties, which could cause actual outcomes and results to differ materially from these statements. Risksand uncertainties include general industry and market conditions, and general domestic and internationaleconomic conditions such as interest rate and currency exchange fluctuations.
Risks that may cause significant fluctuations in the consolidated results of the Eisai Group or have a materialeffect on investment decisions are described below. These are risk factors that have been identified andassessed as of the disclosure date of the Financial Report.
Risk factors associated with our business include, but are not limited to, risks related to product safety andquality, possible occurrence of side effects, lawsuits, changes in laws and regulations, intellectual property,uncertainties in new drug development, impact of medical cost containment measures, generic products,challenges arising in overseas operations, alliances with other companies, acquisitions of companies andproduct lines, outsourcing, IT security and information management, internal control systems for financialreporting, financial market conditions and currency movement, plant closure or shutdown, environmental issues,and disasters.
This English presentation was translated from the original Japanese version. In the event of any inconsistencybetween the statements in the two versions, the statements in the Japanese version shall prevail.
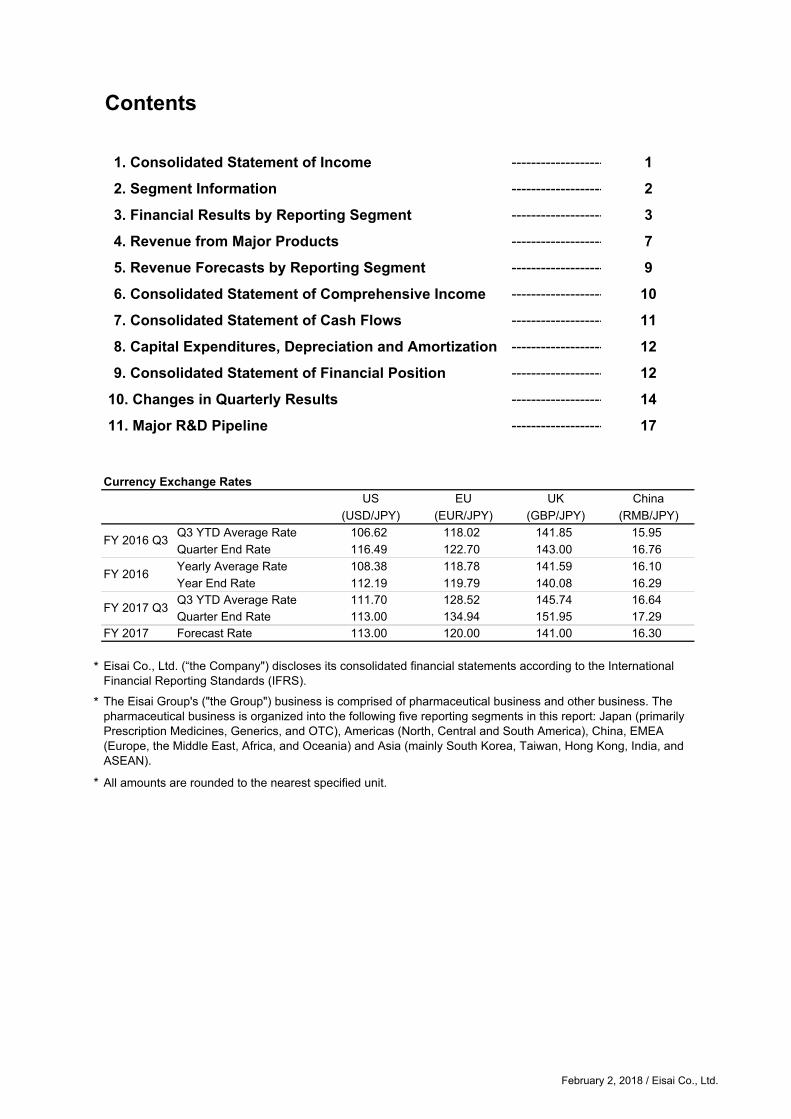
Contents
1. Consolidated Statement of Income ------------------- 1
2. Segment Information ------------------- 2
3. Financial Results by Reporting Segment ------------------- 3
4. Revenue from Major Products ------------------- 7
5. Revenue Forecasts by Reporting Segment ------------------- 9
6. Consolidated Statement of Comprehensive Income ------------------- 10
7. Consolidated Statement of Cash Flows ------------------- 11
8. Capital Expenditures, Depreciation and Amortization ------------------- 12
9. Consolidated Statement of Financial Position ------------------- 12
10. Changes in Quarterly Results ------------------- 14
11. Major R&D Pipeline ------------------- 17
Currency Exchange Rates
US EU UK China
(USD/JPY) (EUR/JPY) (GBP/JPY) (RMB/JPY)
Q3 YTD Average Rate 106.62 118.02 141.85 15.95
Quarter End Rate 116.49 122.70 143.00 16.76
Yearly Average Rate 108.38 118.78 141.59 16.10
Year End Rate 112.19 119.79 140.08 16.29Q3 YTD Average Rate 111.70 128.52 145.74 16.64
Quarter End Rate 113.00 134.94 151.95 17.29FY 2017 Forecast Rate 113.00 120.00 141.00 16.30
*
*
* All amounts are rounded to the nearest specified unit.
FY 2017 Q3
Eisai Co., Ltd. (“the Company") discloses its consolidated financial statements according to the InternationalFinancial Reporting Standards (IFRS).
The Eisai Group's ("the Group") business is comprised of pharmaceutical business and other business. Thepharmaceutical business is organized into the following five reporting segments in this report: Japan (primarilyPrescription Medicines, Generics, and OTC), Americas (North, Central and South America), China, EMEA(Europe, the Middle East, Africa, and Oceania) and Asia (mainly South Korea, Taiwan, Hong Kong, India, andASEAN).
FY 2016 Q3
FY 2016
February 2, 2018 / Eisai Co., Ltd.
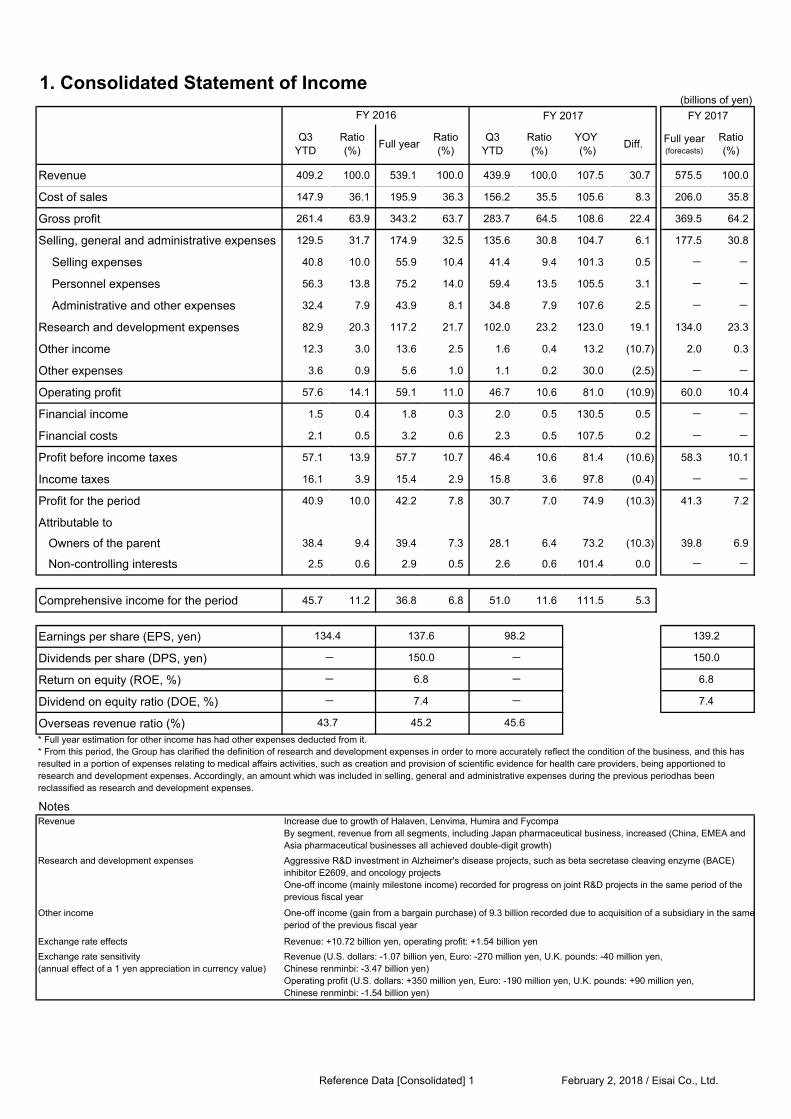
1. Consolidated Statement of Income(billions of yen)
FY 2017 FY 2017
Revenue 409.2 100.0 539.1 100.0 439.9 100.0 107.5 30.7 575.5 100.0
Cost of sales 147.9 36.1 195.9 36.3 156.2 35.5 105.6 8.3 206.0 35.8
Gross profit 261.4 63.9 343.2 63.7 283.7 64.5 108.6 22.4 369.5 64.2
Selling, general and administrative expenses 129.5 31.7 174.9 32.5 135.6 30.8 104.7 6.1 177.5 30.8
Selling expenses 40.8 10.0 55.9 10.4 41.4 9.4 101.3 0.5 - -
Personnel expenses 56.3 13.8 75.2 14.0 59.4 13.5 105.5 3.1 - -
Administrative and other expenses 32.4 7.9 43.9 8.1 34.8 7.9 107.6 2.5 - -
Research and development expenses 82.9 20.3 117.2 21.7 102.0 23.2 123.0 19.1 134.0 23.3
Other income 12.3 3.0 13.6 2.5 1.6 0.4 13.2 (10.7) 2.0 0.3
Other expenses 3.6 0.9 5.6 1.0 1.1 0.2 30.0 (2.5) - -
Operating profit 57.6 14.1 59.1 11.0 46.7 10.6 81.0 (10.9) 60.0 10.4
Financial income 1.5 0.4 1.8 0.3 2.0 0.5 130.5 0.5 - -
Financial costs 2.1 0.5 3.2 0.6 2.3 0.5 107.5 0.2 - -
Profit before income taxes 57.1 13.9 57.7 10.7 46.4 10.6 81.4 (10.6) 58.3 10.1
Income taxes 16.1 3.9 15.4 2.9 15.8 3.6 97.8 (0.4) - -
Profit for the period 40.9 10.0 42.2 7.8 30.7 7.0 74.9 (10.3) 41.3 7.2
Attributable to
Owners of the parent 38.4 9.4 39.4 7.3 28.1 6.4 73.2 (10.3) 39.8 6.9
Non-controlling interests 2.5 0.6 2.9 0.5 2.6 0.6 101.4 0.0 - -
Comprehensive income for the period 45.7 11.2 36.8 6.8 51.0 11.6 111.5 5.3
Earnings per share (EPS, yen)
Dividends per share (DPS, yen)
Return on equity (ROE, %)
Dividend on equity ratio (DOE, %)
Overseas revenue ratio (%)
Notes Revenue
Research and development expenses
Other income
Exchange rate effects
Exchange rate sensitivity(annual effect of a 1 yen appreciation in currency value)
139.2
150.0
Full year(forecasts)
Ratio(%)
YOY (%)
Diff.
FY 2016
137.6
150.0
6.8
7.4
Q3YTD
Ratio(%)
-
134.4
Full yearRatio(%)
Q3YTD
-
98.2
Ratio(%)
45.243.7
-
-
6.8
7.4
-
45.6
-
Revenue (U.S. dollars: -1.07 billion yen, Euro: -270 million yen, U.K. pounds: -40 million yen,Chinese renminbi: -3.47 billion yen)Operating profit (U.S. dollars: +350 million yen, Euro: -190 million yen, U.K. pounds: +90 million yen,Chinese renminbi: -1.54 billion yen)
Increase due to growth of Halaven, Lenvima, Humira and FycompaBy segment, revenue from all segments, including Japan pharmaceutical business, increased (China, EMEA andAsia pharmaceutical businesses all achieved double-digit growth)
One-off income (gain from a bargain purchase) of 9.3 billion recorded due to acquisition of a subsidiary in the sameperiod of the previous fiscal year
Revenue: +10.72 billion yen, operating profit: +1.54 billion yen
Aggressive R&D investment in Alzheimer's disease projects, such as beta secretase cleaving enzyme (BACE)inhibitor E2609, and oncology projectsOne-off income (mainly milestone income) recorded for progress on joint R&D projects in the same period of theprevious fiscal year
* Full year estimation for other income has had other expenses deducted from it.* From this period, the Group has clarified the definition of research and development expenses in order to more accurately reflect the condition of the business, and this hasresulted in a portion of expenses relating to medical affairs activities, such as creation and provision of scientific evidence for health care providers, being apportioned toresearch and development expenses. Accordingly, an amount which was included in selling, general and administrative expenses during the previous period has beenreclassified as research and development expenses.
Reference Data [Consolidated] 1 February 2, 2018 / Eisai Co., Ltd.
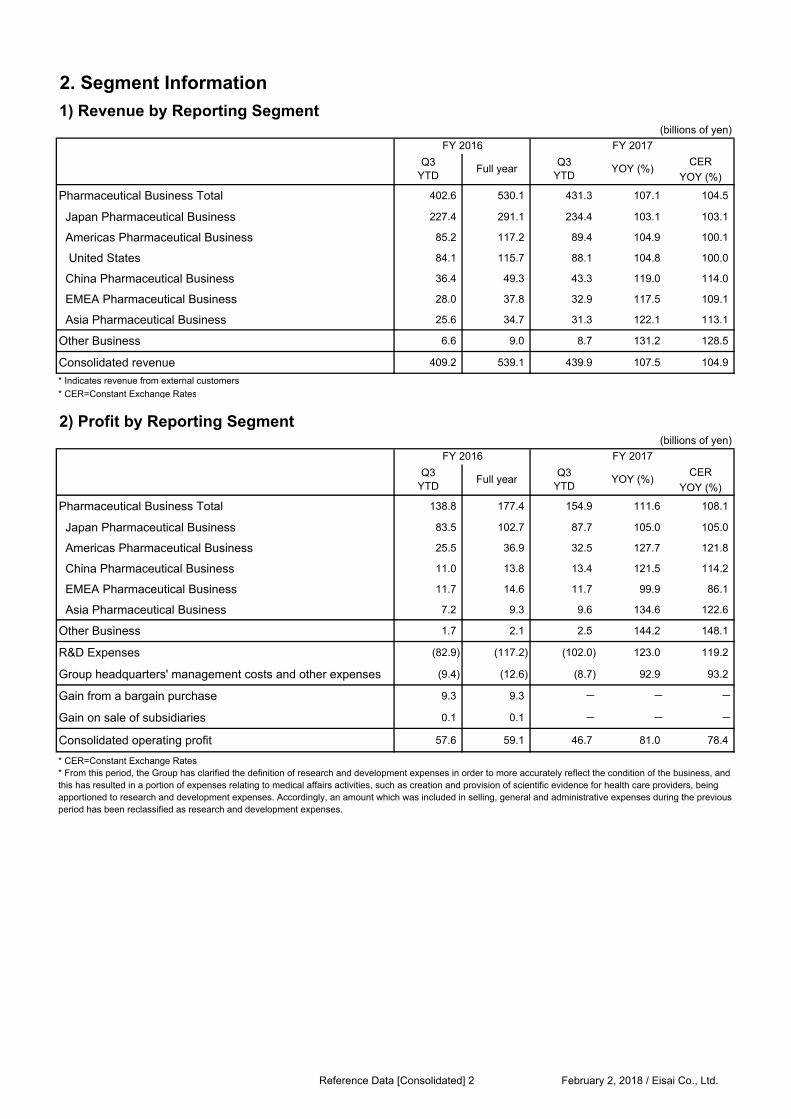
2. Segment Information
1) Revenue by Reporting Segment(billions of yen)
CER
YOY (%)
Pharmaceutical Business Total 402.6 530.1 431.3 107.1 104.5
Japan Pharmaceutical Business 227.4 291.1 234.4 103.1 103.1
Americas Pharmaceutical Business 85.2 117.2 89.4 104.9 100.1
United States 84.1 115.7 88.1 104.8 100.0
China Pharmaceutical Business 36.4 49.3 43.3 119.0 114.0
EMEA Pharmaceutical Business 28.0 37.8 32.9 117.5 109.1
Asia Pharmaceutical Business 25.6 34.7 31.3 122.1 113.1
Other Business 6.6 9.0 8.7 131.2 128.5
Consolidated revenue 409.2 539.1 439.9 107.5 104.9
* Indicates revenue from external customers
* CER=Constant Exchange Rates
2) Profit by Reporting Segment(billions of yen)
CER
YOY (%)
Pharmaceutical Business Total 138.8 177.4 154.9 111.6 108.1
Japan Pharmaceutical Business 83.5 102.7 87.7 105.0 105.0
Americas Pharmaceutical Business 25.5 36.9 32.5 127.7 121.8
China Pharmaceutical Business 11.0 13.8 13.4 121.5 114.2
EMEA Pharmaceutical Business 11.7 14.6 11.7 99.9 86.1
Asia Pharmaceutical Business 7.2 9.3 9.6 134.6 122.6
Other Business 1.7 2.1 2.5 144.2 148.1
R&D Expenses (82.9) (117.2) (102.0) 123.0 119.2
Group headquarters' management costs and other expenses (9.4) (12.6) (8.7) 92.9 93.2
Gain from a bargain purchase 9.3 9.3 - - -
Gain on sale of subsidiaries 0.1 0.1 - - -
Consolidated operating profit 57.6 59.1 46.7 81.0 78.4
* CER=Constant Exchange Rates* From this period, the Group has clarified the definition of research and development expenses in order to more accurately reflect the condition of the business, andthis has resulted in a portion of expenses relating to medical affairs activities, such as creation and provision of scientific evidence for health care providers, beingapportioned to research and development expenses. Accordingly, an amount which was included in selling, general and administrative expenses during the previousperiod has been reclassified as research and development expenses.
Q3YTD
Q3YTD
YOY (%)
FY 2017
Full year
FY 2016
Full year
FY 2016
Q3YTD
YOY (%)Q3
YTD
FY 2017
Reference Data [Consolidated] 2 February 2, 2018 / Eisai Co., Ltd.

3. Financial Results by Reporting Segment
1) Japan Pharmaceutical Business(billions of yen)
FY 2016
Q3YTD
Full yearQ3
YTDYOY (%)
Revenue 227.4 291.1 234.4 103.1
Prescription Medicines 191.4 244.0 195.6 102.2
Generics 20.8 28.0 21.3 102.5
Consumer Healthcare Business 15.2 19.0 17.5 115.1
Segment profit 83.5 102.7 87.7 105.0
Japan prescription medicines - revenue from major products
Fully human anti-TNF-α monoclonal antibodyHumira
29.3 37.7 34.3 117.0
Pain treatment (neuropathic pain, fibromyalgia)Lyrica
18.4 24.3 20.5 111.3
Alzheimer's disease / Dementia with Lewy bodies treatmentAricept
24.1 29.5 20.2 84.0
Proton-pump inhibitorPariet**
17.0 21.2 13.9 81.8
Peripheral neuropathy treatmentMethycobal
14.4 18.2 13.8 95.7
Insomnia treatmentLunesta
6.1 8.0 8.0 131.6
Anticancer agentHalaven
6.0 7.8 7.4 123.4
Anticancer agentTreakisym
3.1 4.2 5.4 176.3
Elemental dietElental**
5.1 6.6 5.1 100.2
Oral anticoagulantWarfarin
5.4 6.8 4.8 89.0
Branched-chain amino acid preparationLivact**
5.1 6.7 4.6 90.5
Anticancer agentLenvima
2.1 2.7 2.4 113.5
Antiepileptic agentFycompa
0.3 0.5 1.3 389.4
Consumer Healthcare Business―Japan - revenue from major products
Vitamin B2 preparation, "Chocola BB Plus," etc.Chocola BB Group
9.9 12.4 11.2 112.5
* The revenue for Pariet includes the revenue for triple formulation packs for Helicobacter pylori eradication, Rabecure Pack 400/800 and Rabefine Pack.
* Co-promotion income has been booked as revenue for Lyrica.
** EA Pharma product
FY 2017
Reference Data [Consolidated] 3 February 2, 2018 / Eisai Co., Ltd.
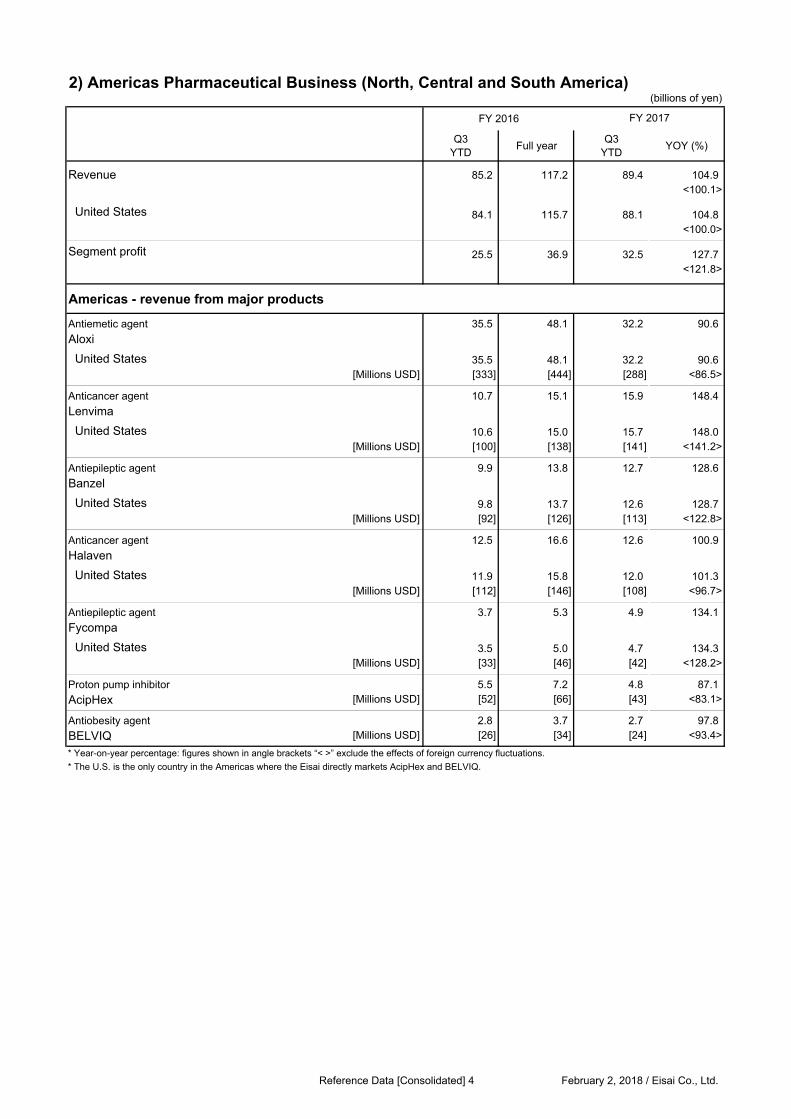
2) Americas Pharmaceutical Business (North, Central and South America)
FY 2016
Q3YTD
Full yearQ3
YTDYOY (%)
Revenue 85.2 117.2 89.4 104.9<100.1>
United States 84.1 115.7 88.1 104.8<100.0>
Segment profit 25.5 36.9 32.5 127.7<121.8>
Americas - revenue from major products
Antiemetic agent 35.5 48.1 32.2 90.6
Aloxi
United States 35.5 48.1 32.2 90.6
[Millions USD] [333] [444] [288] <86.5>
Anticancer agent 10.7 15.1 15.9 148.4
Lenvima
United States 10.6 15.0 15.7 148.0
[Millions USD] [100] [138] [141] <141.2>
Antiepileptic agent 9.9 13.8 12.7 128.6
Banzel
United States 9.8 13.7 12.6 128.7[Millions USD] [92] [126] [113] <122.8>
Anticancer agent 12.5 16.6 12.6 100.9
Halaven
United States 11.9 15.8 12.0 101.3
[Millions USD] [112] [146] [108] <96.7>
Antiepileptic agent 3.7 5.3 4.9 134.1
Fycompa
United States 3.5 5.0 4.7 134.3[Millions USD] [33] [46] [42] <128.2>
Proton pump inhibitor 5.5 7.2 4.8 87.1
AcipHex [Millions USD] [52] [66] [43] <83.1>
Antiobesity agent 2.8 3.7 2.7 97.8
BELVIQ [Millions USD] [26] [34] [24] <93.4>
* Year-on-year percentage: figures shown in angle brackets “< >” exclude the effects of foreign currency fluctuations.
* The U.S. is the only country in the Americas where the Eisai directly markets AcipHex and BELVIQ.
(billions of yen)
FY 2017
Reference Data [Consolidated] 4 February 2, 2018 / Eisai Co., Ltd.
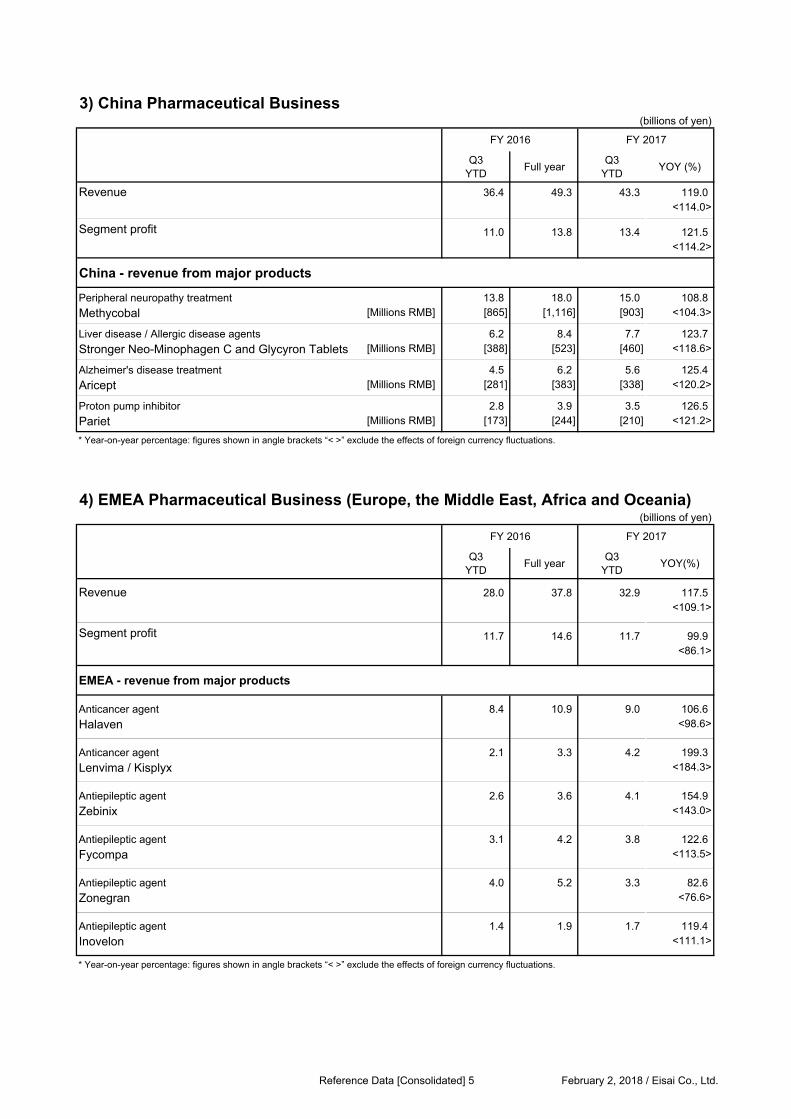
3) China Pharmaceutical Business(billions of yen)
FY 2016 FY 2017
Q3YTD
Full yearQ3
YTDYOY (%)
Revenue 36.4 49.3 43.3 119.0<114.0>
Segment profit 11.0 13.8 13.4 121.5<114.2>
China - revenue from major products
Peripheral neuropathy treatment 13.8 18.0 15.0 108.8
Methycobal [Millions RMB] [865] [1,116] [903] <104.3>
Liver disease / Allergic disease agents 6.2 8.4 7.7 123.7
Stronger Neo-Minophagen C and Glycyron Tablets [Millions RMB] [388] [523] [460] <118.6>
Alzheimer's disease treatment 4.5 6.2 5.6 125.4
Aricept [Millions RMB] [281] [383] [338] <120.2>
Proton pump inhibitor 2.8 3.9 3.5 126.5
Pariet [Millions RMB] [173] [244] [210] <121.2>
4) EMEA Pharmaceutical Business (Europe, the Middle East, Africa and Oceania)(billions of yen)
FY 2016 FY 2017
Q3YTD
Full yearQ3
YTDYOY(%)
Revenue 28.0 37.8 32.9 117.5<109.1>
Segment profit 11.7 14.6 11.7 99.9<86.1>
EMEA - revenue from major products
Anticancer agent 8.4 10.9 9.0 106.6
Halaven <98.6>
Anticancer agent 2.1 3.3 4.2 199.3
Lenvima / Kisplyx <184.3>
Antiepileptic agent 2.6 3.6 4.1 154.9
Zebinix <143.0>
Antiepileptic agent 3.1 4.2 3.8 122.6
Fycompa <113.5>
Antiepileptic agent 4.0 5.2 3.3 82.6
Zonegran <76.6>
Antiepileptic agent 1.4 1.9 1.7 119.4
Inovelon <111.1>
* Year-on-year percentage: figures shown in angle brackets “< >” exclude the effects of foreign currency fluctuations.
* Year-on-year percentage: figures shown in angle brackets “< >” exclude the effects of foreign currency fluctuations.
Reference Data [Consolidated] 5 February 2, 2018 / Eisai Co., Ltd.
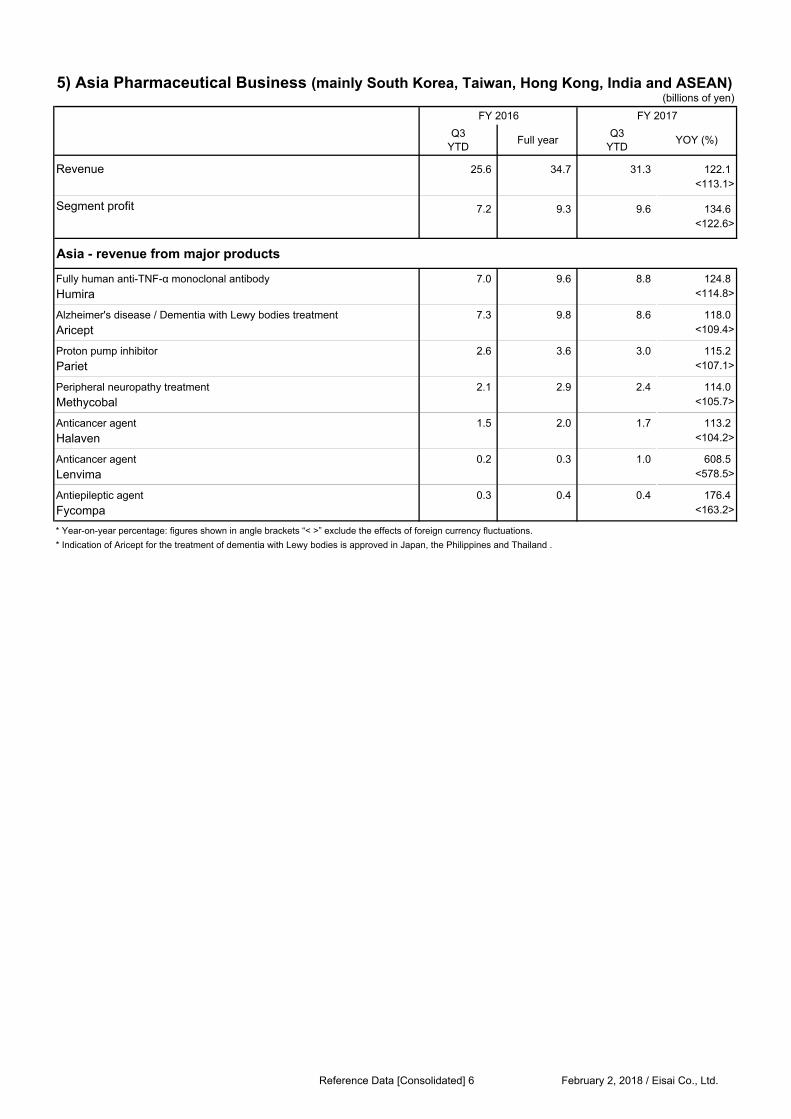
5) Asia Pharmaceutical Business (mainly South Korea, Taiwan, Hong Kong, India and ASEAN)
FY 2016 FY 2017
Q3YTD
Full yearQ3
YTDYOY (%)
Revenue 25.6 34.7 31.3 122.1<113.1>
Segment profit 7.2 9.3 9.6 134.6<122.6>
Asia - revenue from major products
Fully human anti-TNF-α monoclonal antibody 7.0 9.6 8.8 124.8
Humira <114.8>
Alzheimer's disease / Dementia with Lewy bodies treatment 7.3 9.8 8.6 118.0
Aricept <109.4>
Proton pump inhibitor 2.6 3.6 3.0 115.2
Pariet <107.1>
Peripheral neuropathy treatment 2.1 2.9 2.4 114.0
Methycobal <105.7>
Anticancer agent 1.5 2.0 1.7 113.2
Halaven <104.2>
Anticancer agent 0.2 0.3 1.0 608.5
Lenvima <578.5>
Antiepileptic agent 0.3 0.4 0.4 176.4
Fycompa <163.2>
* Indication of Aricept for the treatment of dementia with Lewy bodies is approved in Japan, the Philippines and Thailand .
* Year-on-year percentage: figures shown in angle brackets “< >” exclude the effects of foreign currency fluctuations.
(billions of yen)
Reference Data [Consolidated] 6 February 2, 2018 / Eisai Co., Ltd.
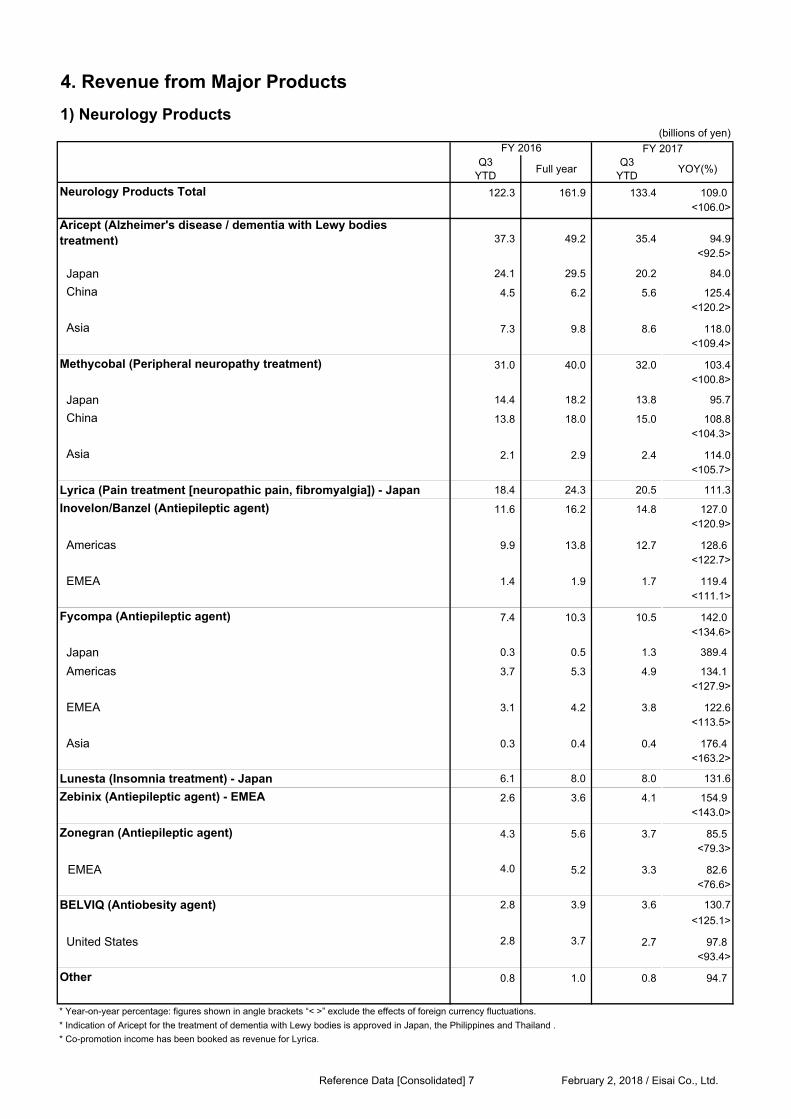
4. Revenue from Major Products
1) Neurology Products
FY 2017Q3
YTDFull year
Q3YTD
YOY(%)
Neurology Products Total 122.3 161.9 133.4 109.0<106.0>
Aricept (Alzheimer's disease / dementia with Lewy bodiestreatment) 37.3 49.2 35.4 94.9
<92.5>
Japan 24.1 29.5 20.2 84.0
China 4.5 6.2 5.6 125.4<120.2>
Asia 7.3 9.8 8.6 118.0<109.4>
Methycobal (Peripheral neuropathy treatment) 31.0 40.0 32.0 103.4<100.8>
Japan 14.4 18.2 13.8 95.7
China 13.8 18.0 15.0 108.8<104.3>
Asia 2.1 2.9 2.4 114.0<105.7>
Lyrica (Pain treatment [neuropathic pain, fibromyalgia]) - Japan 18.4 24.3 20.5 111.3
Inovelon/Banzel (Antiepileptic agent) 11.6 16.2 14.8 127.0<120.9>
Americas 9.9 13.8 12.7 128.6<122.7>
EMEA 1.4 1.9 1.7 119.4<111.1>
Fycompa (Antiepileptic agent) 7.4 10.3 10.5 142.0<134.6>
Japan 0.3 0.5 1.3 389.4
Americas 3.7 5.3 4.9 134.1<127.9>
EMEA 3.1 4.2 3.8 122.6<113.5>
Asia 0.3 0.4 0.4 176.4<163.2>
Lunesta (Insomnia treatment) - Japan 6.1 8.0 8.0 131.6
Zebinix (Antiepileptic agent) - EMEA 2.6 3.6 4.1 154.9<143.0>
Zonegran (Antiepileptic agent) 4.3 5.6 3.7 85.5<79.3>
EMEA 4.0 5.2 3.3 82.6<76.6>
BELVIQ (Antiobesity agent) 2.8 3.9 3.6 130.7
<125.1>
United States 2.8 3.7 2.7 97.8<93.4>
Other 0.8 1.0 0.8 94.7
* Year-on-year percentage: figures shown in angle brackets “< >” exclude the effects of foreign currency fluctuations.
* Indication of Aricept for the treatment of dementia with Lewy bodies is approved in Japan, the Philippines and Thailand .
* Co-promotion income has been booked as revenue for Lyrica.
(billions of yen)
FY 2016
Reference Data [Consolidated] 7 February 2, 2018 / Eisai Co., Ltd.

2) Oncology Products
FY 2017Q3
YTDFull year
Q3YTD
YOY(%)
Oncology Products Total 87.4 118.3 97.6 111.7<106.8>
Aloxi (Antiemetic agent) - Americas 35.5 48.1 32.2 90.6<86.5>
Halaven (Anticancer agent) 28.4 37.3 30.6 107.9<103.1>
Japan 6.0 7.8 7.4 123.4
Americas 12.5 16.6 12.6 100.9<96.2>
EMEA 8.4 10.9 9.0 106.6<98.6>
Asia 1.5 2.0 1.7 113.2<104.2>
Lenvima / Kisplyx (Anticancer agent) 15.1 21.5 23.5 155.8<148.5>
Japan 2.1 2.7 2.4 113.5
Americas 10.7 15.1 15.9 148.4<141.6>
EMEA 2.1 3.3 4.2 199.3<184.3>
Asia 0.2 0.3 1.0 608.5<578.5>
Treakisym/Symbenda (Anticancer agent) 3.3 4.5 5.6 170.8<170.4>
Other 5.2 7.0 5.7 110.3<104.9>
(billions of yen)
* Year-on-year percentage: figures shown in angle brackets “< >” exclude the effects of foreign currency fluctuations.
FY 2016
Reference Data [Consolidated] 8 February 2, 2018 / Eisai Co., Ltd.
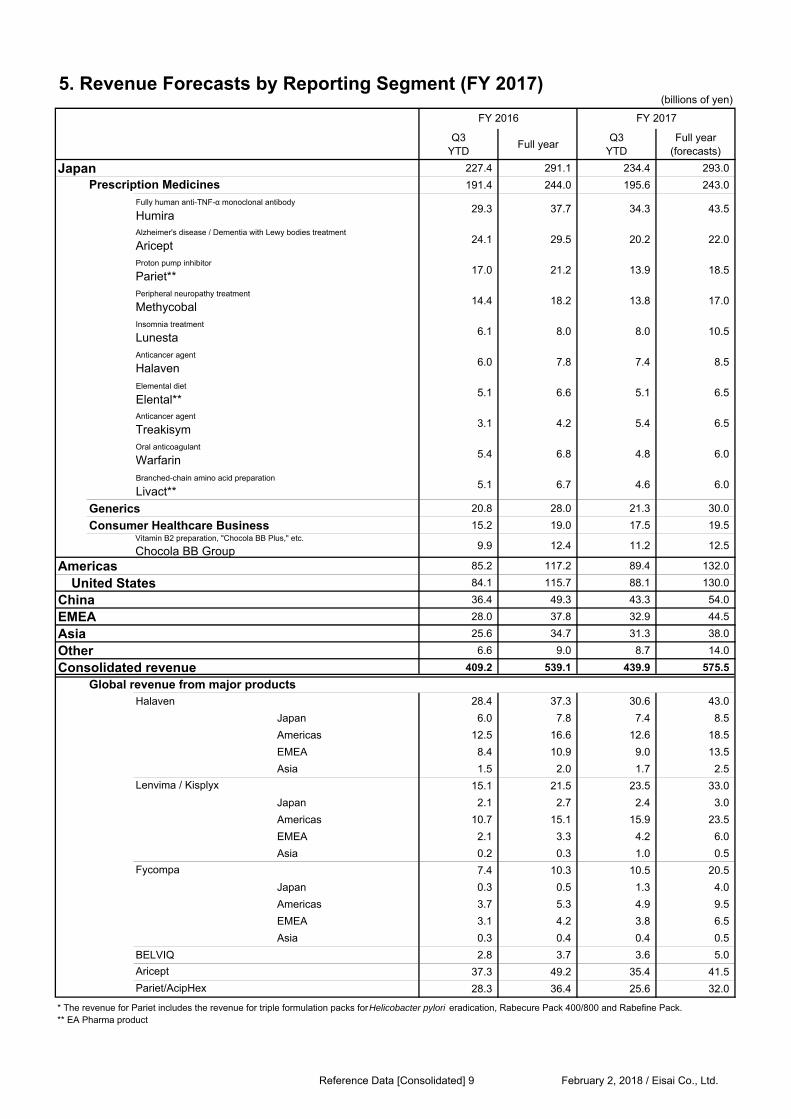
5. Revenue Forecasts by Reporting Segment (FY 2017)(billions of yen)
Q3YTD
Full yearQ3
YTDFull year
(forecasts)
Japan 227.4 291.1 234.4 293.0
191.4 244.0 195.6 243.0
29.3 37.7 34.3 43.5
24.1 29.5 20.2 22.0
17.0 21.2 13.9 18.5
14.4 18.2 13.8 17.0
6.1 8.0 8.0 10.5
6.0 7.8 7.4 8.5
5.1 6.6 5.1 6.5
3.1 4.2 5.4 6.5
5.4 6.8 4.8 6.0
5.1 6.7 4.6 6.0
Generics 20.8 28.0 21.3 30.0
Consumer Healthcare Business 15.2 19.0 17.5 19.5
9.9 12.4 11.2 12.5
Americas 85.2 117.2 89.4 132.0
United States 84.1 115.7 88.1 130.0
China 36.4 49.3 43.3 54.0
EMEA 28.0 37.8 32.9 44.5
Asia 25.6 34.7 31.3 38.0
Other 6.6 9.0 8.7 14.0
Consolidated revenue 409.2 539.1 439.9 575.5
Global revenue from major productsHalaven 28.4 37.3 30.6 43.0
Japan 6.0 7.8 7.4 8.5
Americas 12.5 16.6 12.6 18.5
EMEA 8.4 10.9 9.0 13.5
Asia 1.5 2.0 1.7 2.5
15.1 21.5 23.5 33.0
Japan 2.1 2.7 2.4 3.0
Americas 10.7 15.1 15.9 23.5
EMEA 2.1 3.3 4.2 6.0
Asia 0.2 0.3 1.0 0.5
7.4 10.3 10.5 20.5
Japan 0.3 0.5 1.3 4.0
Americas 3.7 5.3 4.9 9.5
EMEA 3.1 4.2 3.8 6.5
Asia 0.3 0.4 0.4 0.5
BELVIQ 2.8 3.7 3.6 5.0
37.3 49.2 35.4 41.5
28.3 36.4 25.6 32.0
Aricept
* The revenue for Pariet includes the revenue for triple formulation packs for Helicobacter pylori eradication, Rabecure Pack 400/800 and Rabefine Pack.** EA Pharma product
Vitamin B2 preparation, "Chocola BB Plus," etc.
Chocola BB Group
Lenvima / Kisplyx
Fycompa
Pariet/AcipHex
FY 2017
Prescription Medicines
Alzheimer's disease / Dementia with Lewy bodies treatment
AriceptProton pump inhibitor
Pariet**
Fully human anti-TNF-α monoclonal antibody
Humira
FY 2016
Peripheral neuropathy treatment
Methycobal
Oral anticoagulant
Warfarin
Insomnia treatment
Lunesta
Branched-chain amino acid preparation
Livact**
Elemental diet
Elental**Anticancer agent
Treakisym
Anticancer agent
Halaven
Reference Data [Consolidated] 9 February 2, 2018 / Eisai Co., Ltd.
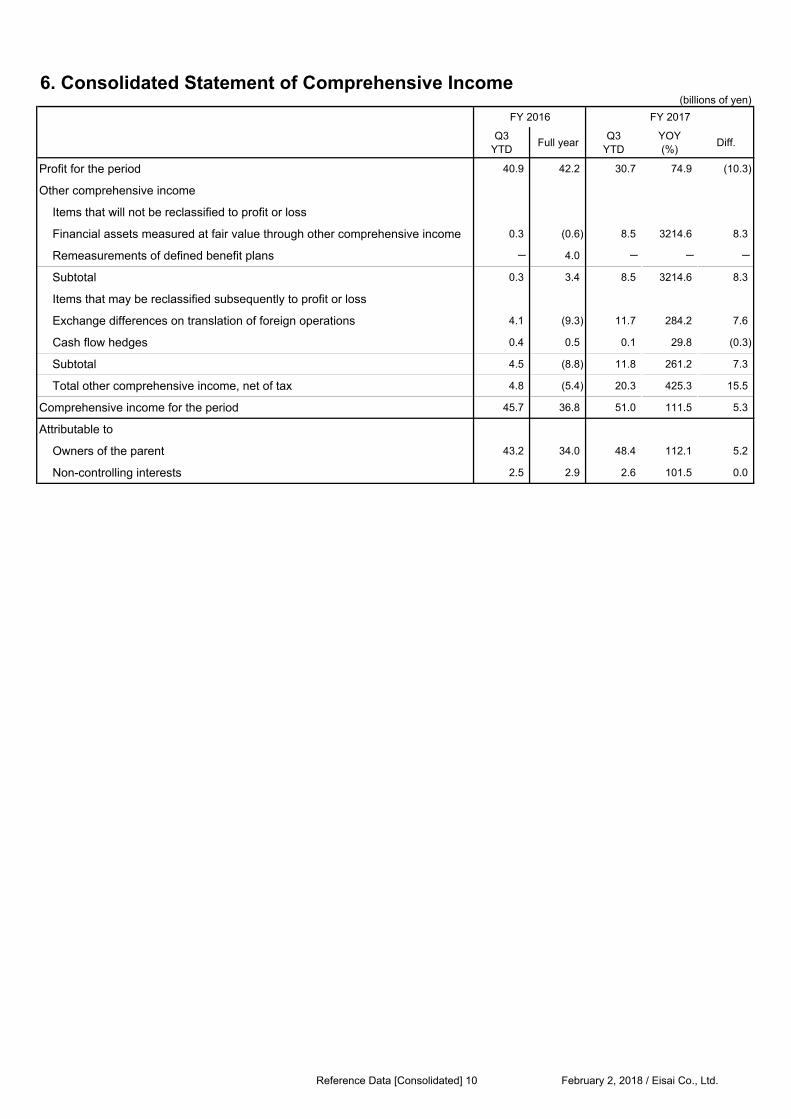
6. Consolidated Statement of Comprehensive Income(billions of yen)
FY 2016 FY 2017
Q3YTD
Full yearQ3
YTDYOY(%)
Diff.
Profit for the period 40.9 42.2 30.7 74.9 (10.3)
Other comprehensive income
Items that will not be reclassified to profit or loss
Financial assets measured at fair value through other comprehensive income 0.3 (0.6) 8.5 3214.6 8.3
Remeasurements of defined benefit plans - 4.0 - - -
Subtotal 0.3 3.4 8.5 3214.6 8.3
Items that may be reclassified subsequently to profit or loss
Exchange differences on translation of foreign operations 4.1 (9.3) 11.7 284.2 7.6
Cash flow hedges 0.4 0.5 0.1 29.8 (0.3)
Subtotal 4.5 (8.8) 11.8 261.2 7.3
Total other comprehensive income, net of tax 4.8 (5.4) 20.3 425.3 15.5
Comprehensive income for the period 45.7 36.8 51.0 111.5 5.3
Attributable to
Owners of the parent 43.2 34.0 48.4 112.1 5.2
Non-controlling interests 2.5 2.9 2.6 101.5 0.0
Reference Data [Consolidated] 10 February 2, 2018 / Eisai Co., Ltd.
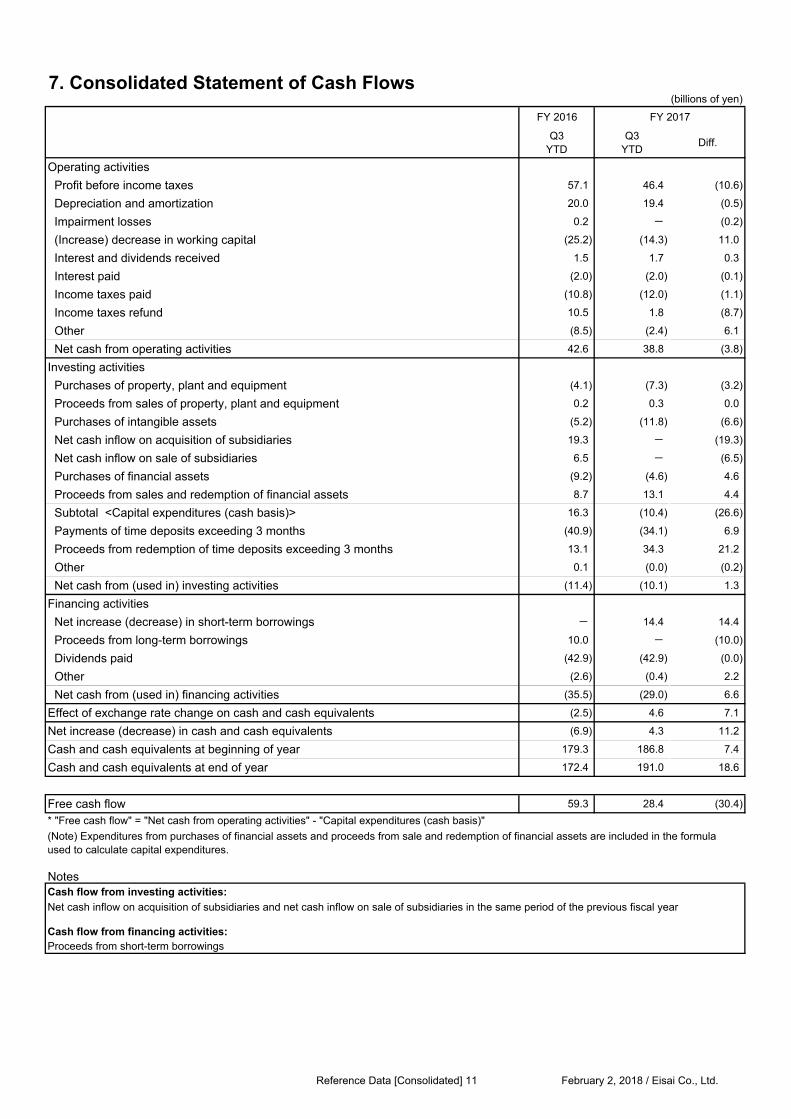
7. Consolidated Statement of Cash Flows(billions of yen)
FY 2016 FY 2017
Q3YTD
Q3YTD
Diff.
Operating activities
Profit before income taxes 57.1 46.4 (10.6)
Depreciation and amortization 20.0 19.4 (0.5)
Impairment losses 0.2 - (0.2)
(Increase) decrease in working capital (25.2) (14.3) 11.0
Interest and dividends received 1.5 1.7 0.3
Interest paid (2.0) (2.0) (0.1)
Income taxes paid (10.8) (12.0) (1.1)
Income taxes refund 10.5 1.8 (8.7)
Other (8.5) (2.4) 6.1
Net cash from operating activities 42.6 38.8 (3.8)
Investing activities
Purchases of property, plant and equipment (4.1) (7.3) (3.2)
Proceeds from sales of property, plant and equipment 0.2 0.3 0.0
Purchases of intangible assets (5.2) (11.8) (6.6)
Net cash inflow on acquisition of subsidiaries 19.3 - (19.3)
Net cash inflow on sale of subsidiaries 6.5 - (6.5)
Purchases of financial assets (9.2) (4.6) 4.6
Proceeds from sales and redemption of financial assets 8.7 13.1 4.4
Subtotal <Capital expenditures (cash basis)> 16.3 (10.4) (26.6)
Payments of time deposits exceeding 3 months (40.9) (34.1) 6.9
Proceeds from redemption of time deposits exceeding 3 months 13.1 34.3 21.2
Other 0.1 (0.0) (0.2)
Net cash from (used in) investing activities (11.4) (10.1) 1.3
Financing activities
Net increase (decrease) in short-term borrowings - 14.4 14.4
Proceeds from long-term borrowings 10.0 - (10.0)
Dividends paid (42.9) (42.9) (0.0)
Other (2.6) (0.4) 2.2
Net cash from (used in) financing activities (35.5) (29.0) 6.6
Effect of exchange rate change on cash and cash equivalents (2.5) 4.6 7.1
Net increase (decrease) in cash and cash equivalents (6.9) 4.3 11.2
Cash and cash equivalents at beginning of year 179.3 186.8 7.4
Cash and cash equivalents at end of year 172.4 191.0 18.6
Free cash flow 59.3 28.4 (30.4)
* "Free cash flow" = "Net cash from operating activities" - "Capital expenditures (cash basis)"
NotesCash flow from investing activities:
Cash flow from financing activities:Proceeds from short-term borrowings
Net cash inflow on acquisition of subsidiaries and net cash inflow on sale of subsidiaries in the same period of the previous fiscal year
(Note) Expenditures from purchases of financial assets and proceeds from sale and redemption of financial assets are included in the formulaused to calculate capital expenditures.
Reference Data [Consolidated] 11 February 2, 2018 / Eisai Co., Ltd.
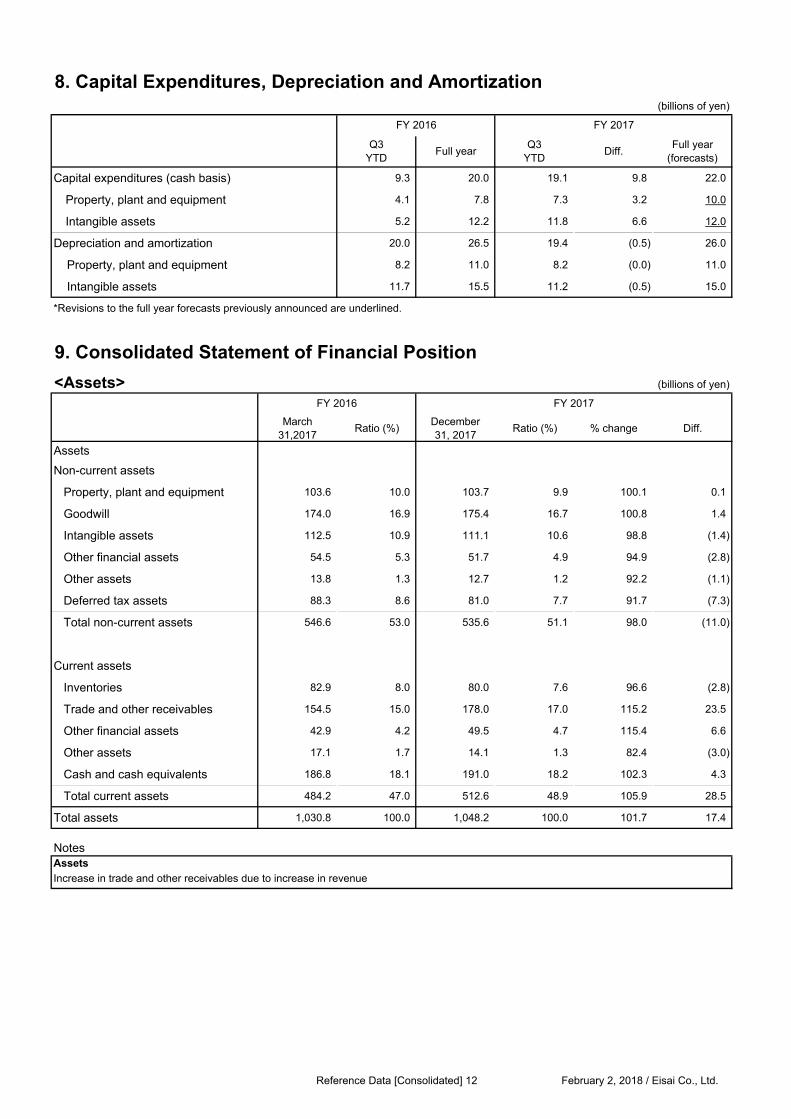
8. Capital Expenditures, Depreciation and Amortization(billions of yen)
Capital expenditures (cash basis) 9.3 20.0 19.1 9.8 22.0
Property, plant and equipment 4.1 7.8 7.3 3.2 10.0
Intangible assets 5.2 12.2 11.8 6.6 12.0
Depreciation and amortization 20.0 26.5 19.4 (0.5) 26.0
Property, plant and equipment 8.2 11.0 8.2 (0.0) 11.0
Intangible assets 11.7 15.5 11.2 (0.5) 15.0
*Revisions to the full year forecasts previously announced are underlined.
9. Consolidated Statement of Financial Position
<Assets> (billions of yen)
March31,2017
Ratio (%)December31, 2017
Ratio (%) % change Diff.
Assets
Non-current assets
Property, plant and equipment 103.6 10.0 103.7 9.9 100.1 0.1
Goodwill 174.0 16.9 175.4 16.7 100.8 1.4
Intangible assets 112.5 10.9 111.1 10.6 98.8 (1.4)
Other financial assets 54.5 5.3 51.7 4.9 94.9 (2.8)
Other assets 13.8 1.3 12.7 1.2 92.2 (1.1)
Deferred tax assets 88.3 8.6 81.0 7.7 91.7 (7.3)
Total non-current assets 546.6 53.0 535.6 51.1 98.0 (11.0)
Current assets
Inventories 82.9 8.0 80.0 7.6 96.6 (2.8)
Trade and other receivables 154.5 15.0 178.0 17.0 115.2 23.5
Other financial assets 42.9 4.2 49.5 4.7 115.4 6.6
Other assets 17.1 1.7 14.1 1.3 82.4 (3.0)
Cash and cash equivalents 186.8 18.1 191.0 18.2 102.3 4.3
Total current assets 484.2 47.0 512.6 48.9 105.9 28.5
Total assets 1,030.8 100.0 1,048.2 100.0 101.7 17.4
NotesAssets
Increase in trade and other receivables due to increase in revenue
Full yearQ3
YTDQ3
YTD
FY 2016 FY 2017
Diff.Full year
(forecasts)
FY 2017FY 2016
Reference Data [Consolidated] 12 February 2, 2018 / Eisai Co., Ltd.
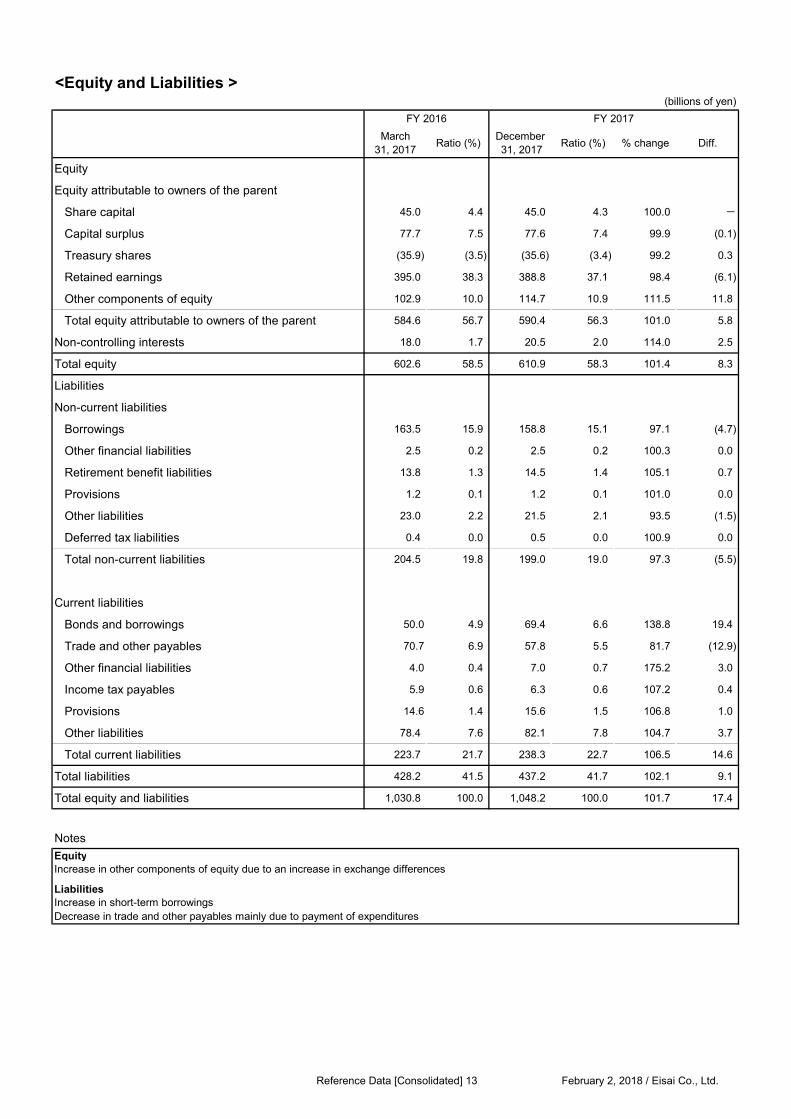
<Equity and Liabilities >(billions of yen)
March31, 2017
Ratio (%)December 31, 2017
Ratio (%) % change Diff.
Equity
Equity attributable to owners of the parent
Share capital 45.0 4.4 45.0 4.3 100.0 -
Capital surplus 77.7 7.5 77.6 7.4 99.9 (0.1)
Treasury shares (35.9) (3.5) (35.6) (3.4) 99.2 0.3
Retained earnings 395.0 38.3 388.8 37.1 98.4 (6.1)
Other components of equity 102.9 10.0 114.7 10.9 111.5 11.8
Total equity attributable to owners of the parent 584.6 56.7 590.4 56.3 101.0 5.8
Non-controlling interests 18.0 1.7 20.5 2.0 114.0 2.5
Total equity 602.6 58.5 610.9 58.3 101.4 8.3
Liabilities
Non-current liabilities
Borrowings 163.5 15.9 158.8 15.1 97.1 (4.7)
Other financial liabilities 2.5 0.2 2.5 0.2 100.3 0.0
Retirement benefit liabilities 13.8 1.3 14.5 1.4 105.1 0.7
Provisions 1.2 0.1 1.2 0.1 101.0 0.0
Other liabilities 23.0 2.2 21.5 2.1 93.5 (1.5)
Deferred tax liabilities 0.4 0.0 0.5 0.0 100.9 0.0
Total non-current liabilities 204.5 19.8 199.0 19.0 97.3 (5.5)
Current liabilities
Bonds and borrowings 50.0 4.9 69.4 6.6 138.8 19.4
Trade and other payables 70.7 6.9 57.8 5.5 81.7 (12.9)
Other financial liabilities 4.0 0.4 7.0 0.7 175.2 3.0
Income tax payables 5.9 0.6 6.3 0.6 107.2 0.4
Provisions 14.6 1.4 15.6 1.5 106.8 1.0
Other liabilities 78.4 7.6 82.1 7.8 104.7 3.7
Total current liabilities 223.7 21.7 238.3 22.7 106.5 14.6
Total liabilities 428.2 41.5 437.2 41.7 102.1 9.1
Total equity and liabilities 1,030.8 100.0 1,048.2 100.0 101.7 17.4
Notes
Equity
LiabilitiesIncrease in short-term borrowingsDecrease in trade and other payables mainly due to payment of expenditures
FY 2017FY 2016
Increase in other components of equity due to an increase in exchange differences
Reference Data [Consolidated] 13 February 2, 2018 / Eisai Co., Ltd.
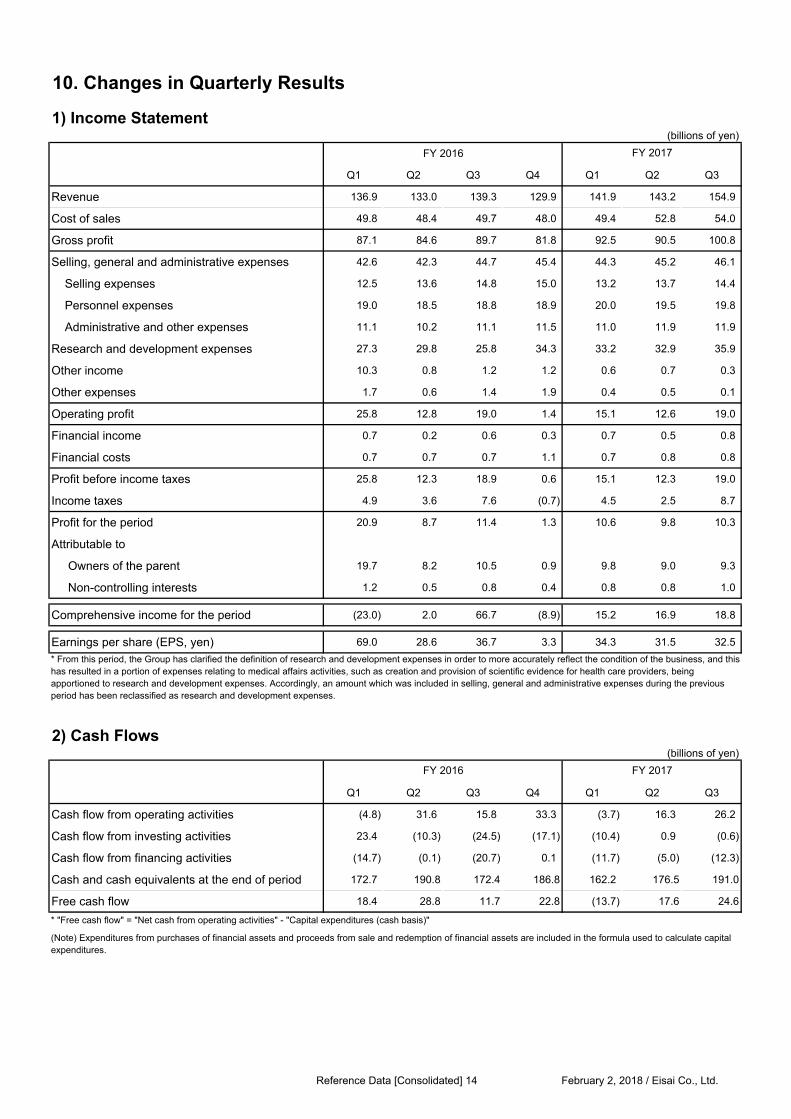
10. Changes in Quarterly Results
1) Income Statement (billions of yen)
FY 2016
Q1 Q2 Q3 Q4 Q1 Q2 Q3
Revenue 136.9 133.0 139.3 129.9 141.9 143.2 154.9
Cost of sales 49.8 48.4 49.7 48.0 49.4 52.8 54.0
Gross profit 87.1 84.6 89.7 81.8 92.5 90.5 100.8
Selling, general and administrative expenses 42.6 42.3 44.7 45.4 44.3 45.2 46.1
Selling expenses 12.5 13.6 14.8 15.0 13.2 13.7 14.4
Personnel expenses 19.0 18.5 18.8 18.9 20.0 19.5 19.8
Administrative and other expenses 11.1 10.2 11.1 11.5 11.0 11.9 11.9
Research and development expenses 27.3 29.8 25.8 34.3 33.2 32.9 35.9
Other income 10.3 0.8 1.2 1.2 0.6 0.7 0.3
Other expenses 1.7 0.6 1.4 1.9 0.4 0.5 0.1
Operating profit 25.8 12.8 19.0 1.4 15.1 12.6 19.0
Financial income 0.7 0.2 0.6 0.3 0.7 0.5 0.8
Financial costs 0.7 0.7 0.7 1.1 0.7 0.8 0.8
Profit before income taxes 25.8 12.3 18.9 0.6 15.1 12.3 19.0
Income taxes 4.9 3.6 7.6 (0.7) 4.5 2.5 8.7
Profit for the period 20.9 8.7 11.4 1.3 10.6 9.8 10.3
Attributable to
Owners of the parent 19.7 8.2 10.5 0.9 9.8 9.0 9.3
Non-controlling interests 1.2 0.5 0.8 0.4 0.8 0.8 1.0
Comprehensive income for the period (23.0) 2.0 66.7 (8.9) 15.2 16.9 18.8
Earnings per share (EPS, yen) 69.0 28.6 36.7 3.3 34.3 31.5 32.5
2) Cash Flows(billions of yen)
Q1 Q2 Q3 Q4 Q1 Q2 Q3
Cash flow from operating activities (4.8) 31.6 15.8 33.3 (3.7) 16.3 26.2
Cash flow from investing activities 23.4 (10.3) (24.5) (17.1) (10.4) 0.9 (0.6)
Cash flow from financing activities (14.7) (0.1) (20.7) 0.1 (11.7) (5.0) (12.3)
Cash and cash equivalents at the end of period 172.7 190.8 172.4 186.8 162.2 176.5 191.0
Free cash flow 18.4 28.8 11.7 22.8 (13.7) 17.6 24.6
(Note) Expenditures from purchases of financial assets and proceeds from sale and redemption of financial assets are included in the formula used to calculate capitalexpenditures.
FY 2016
* "Free cash flow" = "Net cash from operating activities" - "Capital expenditures (cash basis)"
FY 2017
FY 2017
* From this period, the Group has clarified the definition of research and development expenses in order to more accurately reflect the condition of the business, and thishas resulted in a portion of expenses relating to medical affairs activities, such as creation and provision of scientific evidence for health care providers, beingapportioned to research and development expenses. Accordingly, an amount which was included in selling, general and administrative expenses during the previousperiod has been reclassified as research and development expenses.
Reference Data [Consolidated] 14 February 2, 2018 / Eisai Co., Ltd.
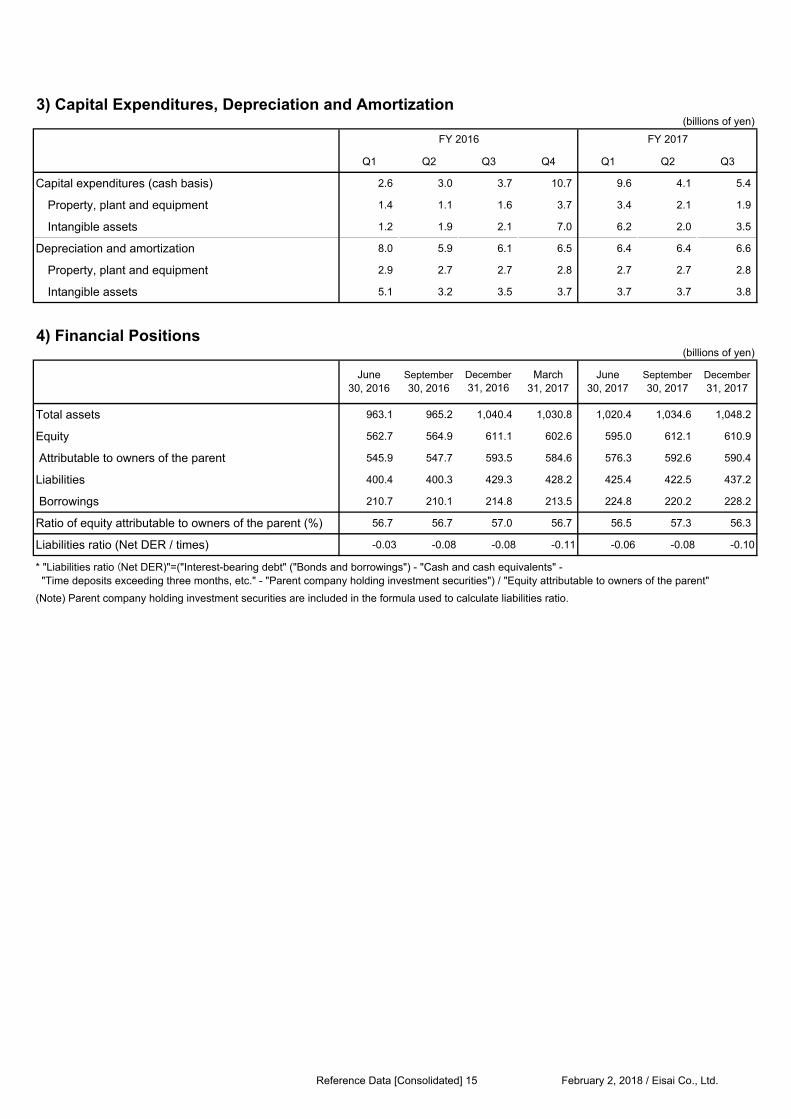
3) Capital Expenditures, Depreciation and Amortization(billions of yen)
Q1 Q2 Q3 Q4 Q1 Q2 Q3
Capital expenditures (cash basis) 2.6 3.0 3.7 10.7 9.6 4.1 5.4
Property, plant and equipment 1.4 1.1 1.6 3.7 3.4 2.1 1.9
Intangible assets 1.2 1.9 2.1 7.0 6.2 2.0 3.5
Depreciation and amortization 8.0 5.9 6.1 6.5 6.4 6.4 6.6
Property, plant and equipment 2.9 2.7 2.7 2.8 2.7 2.7 2.8
Intangible assets 5.1 3.2 3.5 3.7 3.7 3.7 3.8
4) Financial Positions (billions of yen)
Total assets 963.1 965.2 1,040.4 1,030.8 1,020.4 1,034.6 1,048.2
Equity 562.7 564.9 611.1 602.6 595.0 612.1 610.9
Attributable to owners of the parent 545.9 547.7 593.5 584.6 576.3 592.6 590.4
Liabilities 400.4 400.3 429.3 428.2 425.4 422.5 437.2
Borrowings 210.7 210.1 214.8 213.5 224.8 220.2 228.2
Ratio of equity attributable to owners of the parent (%) 56.7 56.7 57.0 56.7 56.5 57.3 56.3
Liabilities ratio (Net DER / times) -0.03 -0.08 -0.08 -0.11 -0.06 -0.08 -0.10
(Note) Parent company holding investment securities are included in the formula used to calculate liabilities ratio.
* "Liabilities ratio (Net DER)"=("Interest-bearing debt" ("Bonds and borrowings") - "Cash and cash equivalents" - "Time deposits exceeding three months, etc." - "Parent company holding investment securities") / "Equity attributable to owners of the parent"
FY 2016
June30, 2016
March31, 2017
September30, 2016
December31, 2016
June30, 2017
September30, 2017
December31, 2017
FY 2017
Reference Data [Consolidated] 15 February 2, 2018 / Eisai Co., Ltd.
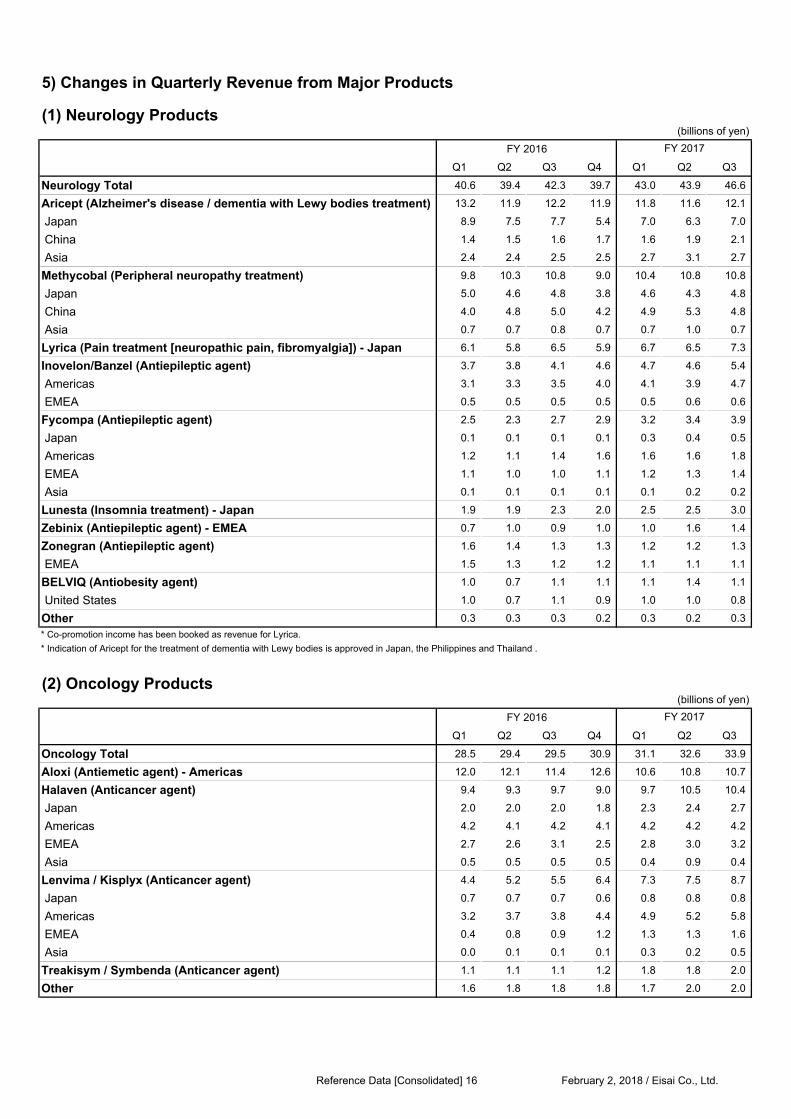
5) Changes in Quarterly Revenue from Major Products
(1) Neurology Products(billions of yen)
FY 2016
Q1 Q2 Q3 Q4 Q1 Q2 Q3
Neurology Total 40.6 39.4 42.3 39.7 43.0 43.9 46.6
Aricept (Alzheimer's disease / dementia with Lewy bodies treatment) 13.2 11.9 12.2 11.9 11.8 11.6 12.1
Japan 8.9 7.5 7.7 5.4 7.0 6.3 7.0
China 1.4 1.5 1.6 1.7 1.6 1.9 2.1
Asia 2.4 2.4 2.5 2.5 2.7 3.1 2.7
Methycobal (Peripheral neuropathy treatment) 9.8 10.3 10.8 9.0 10.4 10.8 10.8
Japan 5.0 4.6 4.8 3.8 4.6 4.3 4.8
China 4.0 4.8 5.0 4.2 4.9 5.3 4.8
Asia 0.7 0.7 0.8 0.7 0.7 1.0 0.7
Lyrica (Pain treatment [neuropathic pain, fibromyalgia]) - Japan 6.1 5.8 6.5 5.9 6.7 6.5 7.3
Inovelon/Banzel (Antiepileptic agent) 3.7 3.8 4.1 4.6 4.7 4.6 5.4
Americas 3.1 3.3 3.5 4.0 4.1 3.9 4.7
EMEA 0.5 0.5 0.5 0.5 0.5 0.6 0.6
Fycompa (Antiepileptic agent) 2.5 2.3 2.7 2.9 3.2 3.4 3.9
Japan 0.1 0.1 0.1 0.1 0.3 0.4 0.5
Americas 1.2 1.1 1.4 1.6 1.6 1.6 1.8
EMEA 1.1 1.0 1.0 1.1 1.2 1.3 1.4
Asia 0.1 0.1 0.1 0.1 0.1 0.2 0.2
Lunesta (Insomnia treatment) - Japan 1.9 1.9 2.3 2.0 2.5 2.5 3.0
Zebinix (Antiepileptic agent) - EMEA 0.7 1.0 0.9 1.0 1.0 1.6 1.4
Zonegran (Antiepileptic agent) 1.6 1.4 1.3 1.3 1.2 1.2 1.3
EMEA 1.5 1.3 1.2 1.2 1.1 1.1 1.1
BELVIQ (Antiobesity agent) 1.0 0.7 1.1 1.1 1.1 1.4 1.1
United States 1.0 0.7 1.1 0.9 1.0 1.0 0.8
Other 0.3 0.3 0.3 0.2 0.3 0.2 0.3
* Co-promotion income has been booked as revenue for Lyrica.
* Indication of Aricept for the treatment of dementia with Lewy bodies is approved in Japan, the Philippines and Thailand .
(2) Oncology Products(billions of yen)
FY 2016
Q1 Q2 Q3 Q4 Q1 Q2 Q3
Oncology Total 28.5 29.4 29.5 30.9 31.1 32.6 33.9
Aloxi (Antiemetic agent) - Americas 12.0 12.1 11.4 12.6 10.6 10.8 10.7
Halaven (Anticancer agent) 9.4 9.3 9.7 9.0 9.7 10.5 10.4
Japan 2.0 2.0 2.0 1.8 2.3 2.4 2.7
Americas 4.2 4.1 4.2 4.1 4.2 4.2 4.2
EMEA 2.7 2.6 3.1 2.5 2.8 3.0 3.2
Asia 0.5 0.5 0.5 0.5 0.4 0.9 0.4
Lenvima / Kisplyx (Anticancer agent) 4.4 5.2 5.5 6.4 7.3 7.5 8.7
Japan 0.7 0.7 0.7 0.6 0.8 0.8 0.8
Americas 3.2 3.7 3.8 4.4 4.9 5.2 5.8
EMEA 0.4 0.8 0.9 1.2 1.3 1.3 1.6
Asia 0.0 0.1 0.1 0.1 0.3 0.2 0.5
Treakisym / Symbenda (Anticancer agent) 1.1 1.1 1.1 1.2 1.8 1.8 2.0
Other 1.6 1.8 1.8 1.8 1.7 2.0 2.0
FY 2017
FY 2017
Reference Data [Consolidated] 16 February 2, 2018 / Eisai Co., Ltd.
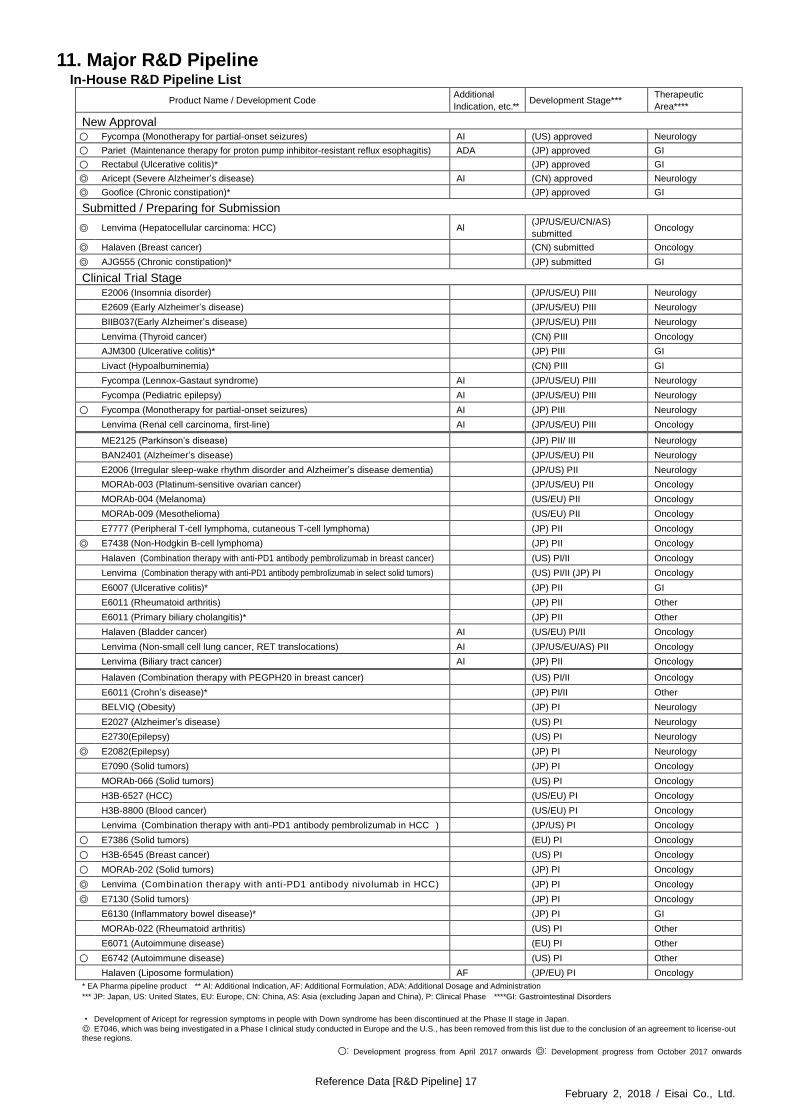
Reference Data [R&D Pipeline] 17 February 2, 2018 / Eisai Co., Ltd.
11. Major R&D Pipeline In-House R&D Pipeline List
Product Name / Development Code Additional
Indication, etc.** Development Stage***
Therapeutic
Area****
New Approval
○ Fycompa (Monotherapy for partial-onset seizures) AI (US) approved Neurology
○ Pariet (Maintenance therapy for proton pump inhibitor-resistant reflux esophagitis) ADA (JP) approved GI
○ Rectabul (Ulcerative colitis)* (JP) approved GI
◎ Aricept (Severe Alzheimer’s disease) AI (CN) approved Neurology
◎ Goofice (Chronic constipation)* (JP) approved GI
Submitted / Preparing for Submission
◎ Lenvima (Hepatocellular carcinoma: HCC) Al (JP/US/EU/CN/AS)
submitted Oncology
◎ Halaven (Breast cancer) (CN) submitted Oncology
◎ AJG555 (Chronic constipation)* (JP) submitted GI
Clinical Trial Stage
E2006 (Insomnia disorder) (JP/US/EU) PIII Neurology
E2609 (Early Alzheimer’s disease) (JP/US/EU) PIII Neurology
BIIB037(Early Alzheimer’s disease) (JP/US/EU) PIII Neurology
Lenvima (Thyroid cancer) (CN) PIII Oncology
AJM300 (Ulcerative colitis)* (JP) PIII GI
Livact (Hypoalbuminemia) (CN) PIII GI
Fycompa (Lennox-Gastaut syndrome) AI (JP/US/EU) PIII Neurology
Fycompa (Pediatric epilepsy) AI (JP/US/EU) PIII Neurology
○ Fycompa (Monotherapy for partial-onset seizures) AI (JP) PIII Neurology
Lenvima (Renal cell carcinoma, first-line) AI (JP/US/EU) PIII Oncology
ME2125 (Parkinson’s disease) (JP) PII/ III Neurology
BAN2401 (Alzheimer’s disease) (JP/US/EU) PII Neurology
E2006 (Irregular sleep-wake rhythm disorder and Alzheimer’s disease dementia) (JP/US) PII Neurology
MORAb-003 (Platinum-sensitive ovarian cancer) (JP/US/EU) PII Oncology
MORAb-004 (Melanoma) (US/EU) PII Oncology
MORAb-009 (Mesothelioma) (US/EU) PII Oncology
E7777 (Peripheral T-cell lymphoma, cutaneous T-cell lymphoma) (JP) PII Oncology
◎ E7438 (Non-Hodgkin B-cell lymphoma) (JP) PII Oncology
Halaven (Combination therapy with anti-PD1 antibody pembrolizumab in breast cancer) (US) PI/II Oncology
Lenvima (Combination therapy with anti-PD1 antibody pembrolizumab in select solid tumors) (US) PI/II (JP) PI Oncology
E6007 (Ulcerative colitis)* (JP) PII GI
E6011 (Rheumatoid arthritis) (JP) PII Other
E6011 (Primary biliary cholangitis)* (JP) PII Other
Halaven (Bladder cancer) AI (US/EU) PI/II Oncology
Lenvima (Non-small cell lung cancer, RET translocations) AI (JP/US/EU/AS) PII Oncology
Lenvima (Biliary tract cancer) AI (JP) PII Oncology
Halaven (Combination therapy with PEGPH20 in breast cancer) (US) PI/II Oncology
E6011 (Crohn’s disease)* (JP) PI/II Other
BELVIQ (Obesity) (JP) PI Neurology
E2027 (Alzheimer’s disease) (US) PI Neurology
E2730(Epilepsy) (US) PI Neurology
◎ E2082(Epilepsy) (JP) PI Neurology
E7090 (Solid tumors) (JP) PI Oncology
MORAb-066 (Solid tumors) (US) PI Oncology
H3B-6527 (HCC) (US/EU) PI Oncology
H3B-8800 (Blood cancer) (US/EU) PI Oncology
Lenvima (Combination therapy with anti-PD1 antibody pembrolizumab in HCC ) (JP/US) PI Oncology
○ E7386 (Solid tumors) (EU) PI Oncology
○ H3B-6545 (Breast cancer) (US) PI Oncology
○ MORAb-202 (Solid tumors) (JP) PI Oncology
◎ Lenvima (Combination therapy with anti -PD1 antibody nivolumab in HCC) (JP) PI Oncology
◎ E7130 (Solid tumors) (JP) PI Oncology
E6130 (Inflammatory bowel disease)* (JP) PI GI
MORAb-022 (Rheumatoid arthritis) (US) PI Other
E6071 (Autoimmune disease) (EU) PI Other
○ E6742 (Autoimmune disease) (US) PI Other
Halaven (Liposome formulation) AF (JP/EU) PI Oncology
* EA Pharma pipeline product ** AI: Additional Indication, AF: Additional Formulation, ADA: Additional Dosage and Administration
*** JP: Japan, US: United States, EU: Europe, CN: China, AS: Asia (excluding Japan and China), P: Clinical Phase ****GI: Gastrointestinal Disorders
・ Development of Aricept for regression symptoms in people with Down syndrome has been discontinued at the Phase II stage in Japan.
◎ E7046, which was being investigated in a Phase I clinical study conducted in Europe and the U.S., has been removed from this list due to the conclusion of an agreement to license-out these regions.
○: Development progress from April 2017 onwards ◎: Development progress from October 2017 onwards
○ Development progress from April 2017 onwards ◎ Development progress from October 2017 onwards
Reference Data [R&D Pipeline] 18 February 2, 2018 / Eisai Co., Ltd.
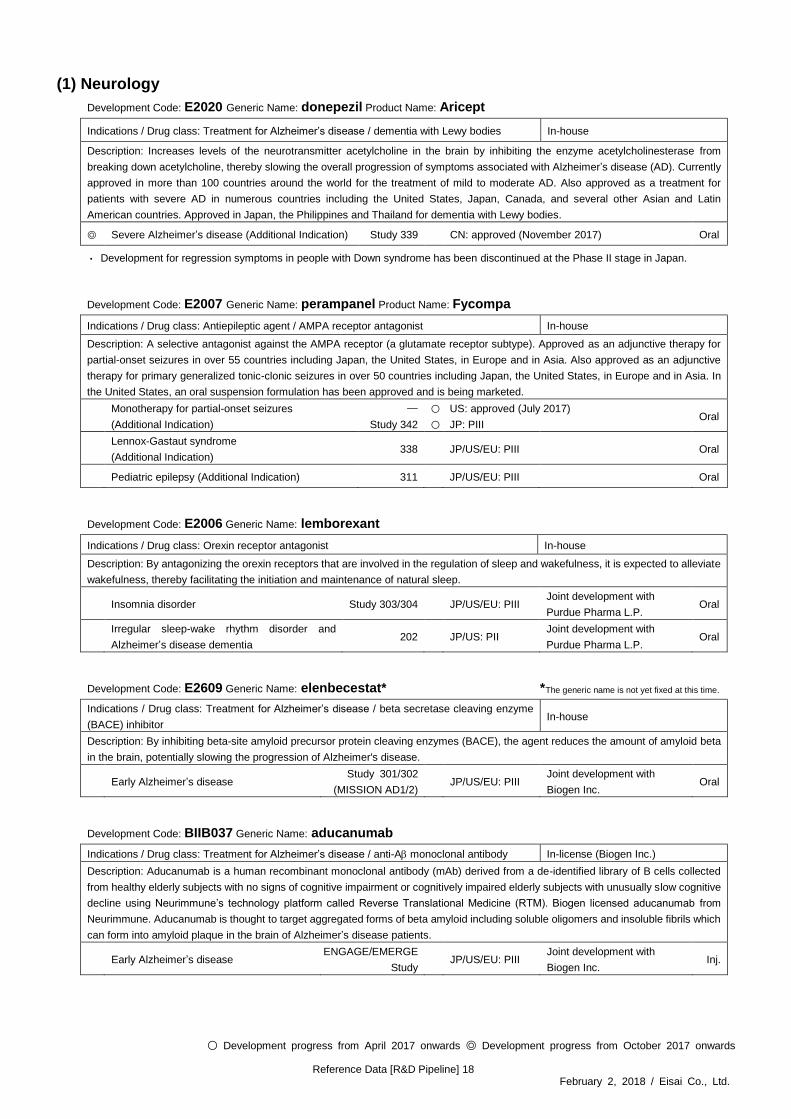
(1) Neurology
Development Code: E2020 Generic Name: donepezil Product Name: Aricept
Indications / Drug class: Treatment for Alzheimer’s disease / dementia with Lewy bodies In-house
Description: Increases levels of the neurotransmitter acetylcholine in the brain by inhibiting the enzyme acetylcholinesterase from
breaking down acetylcholine, thereby slowing the overall progression of symptoms associated with Alzheimer’s disease (AD). Currently
approved in more than 100 countries around the world for the treatment of mild to moderate AD. Also approved as a treatment for
patients with severe AD in numerous countries including the United States, Japan, Canada, and several other Asian and Latin
American countries. Approved in Japan, the Philippines and Thailand for dementia with Lewy bodies.
◎ Severe Alzheimer’s disease (Additional Indication) Study 339 CN: approved (November 2017) Oral
・ Development for regression symptoms in people with Down syndrome has been discontinued at the Phase II stage in Japan.
Development Code: E2006 Generic Name: lemborexant
Indications / Drug class: Orexin receptor antagonist In-house
Description: By antagonizing the orexin receptors that are involved in the regulation of sleep and wakefulness, it is expected to alleviate
wakefulness, thereby facilitating the initiation and maintenance of natural sleep.
Insomnia disorder Study 303/304 JP/US/EU: PIII Joint development with
Purdue Pharma L.P. Oral
Irregular sleep-wake rhythm disorder and
Alzheimer’s disease dementia 202 JP/US: PII
Joint development with
Purdue Pharma L.P. Oral
Development Code: E2609 Generic Name: elenbecestat* *The generic name is not yet fixed at this time.
Indications / Drug class: Treatment for Alzheimer’s disease / beta secretase cleaving enzyme
(BACE) inhibitor In-house
Description: By inhibiting beta-site amyloid precursor protein cleaving enzymes (BACE), the agent reduces the amount of amyloid beta
in the brain, potentially slowing the progression of Alzheimer's disease.
Early Alzheimer’s disease Study 301/302
(MISSION AD1/2) JP/US/EU: PIII
Joint development with
Biogen Inc. Oral
Development Code: BIIB037 Generic Name: aducanumab
Indications / Drug class: Treatment for Alzheimer’s disease / anti-A monoclonal antibody In-license (Biogen Inc.)
Description: Aducanumab is a human recombinant monoclonal antibody (mAb) derived from a de-identified library of B cells collected
from healthy elderly subjects with no signs of cognitive impairment or cognitively impaired elderly subjects with unusually slow cognitive
decline using Neurimmune’s technology platform called Reverse Translational Medicine (RTM). Biogen licensed aducanumab from
Neurimmune. Aducanumab is thought to target aggregated forms of beta amyloid including soluble oligomers and insoluble fibrils which
can form into amyloid plaque in the brain of Alzheimer’s disease patients.
Early Alzheimer’s disease ENGAGE/EMERGE
Study JP/US/EU: PIII
Joint development with
Biogen Inc. Inj.
Development Code: E2007 Generic Name: perampanel Product Name: Fycompa
Indications / Drug class: Antiepileptic agent / AMPA receptor antagonist In-house
Description: A selective antagonist against the AMPA receptor (a glutamate receptor subtype). Approved as an adjunctive therapy for
partial-onset seizures in over 55 countries including Japan, the United States, in Europe and in Asia. Also approved as an adjunctive
therapy for primary generalized tonic-clonic seizures in over 50 countries including Japan, the United States, in Europe and in Asia. In
the United States, an oral suspension formulation has been approved and is being marketed.
Monotherapy for partial-onset seizures
(Additional Indication)
―
Study 342
○
○
US: approved (July 2017)
JP: PIII Oral
Lennox-Gastaut syndrome
(Additional Indication) 338 JP/US/EU: PIII Oral
Pediatric epilepsy (Additional Indication) 311 JP/US/EU: PIII Oral
○ Development progress from April 2017 onwards ◎ Development progress from October 2017 onwards
Reference Data [R&D Pipeline] 19 February 2, 2018 / Eisai Co., Ltd.
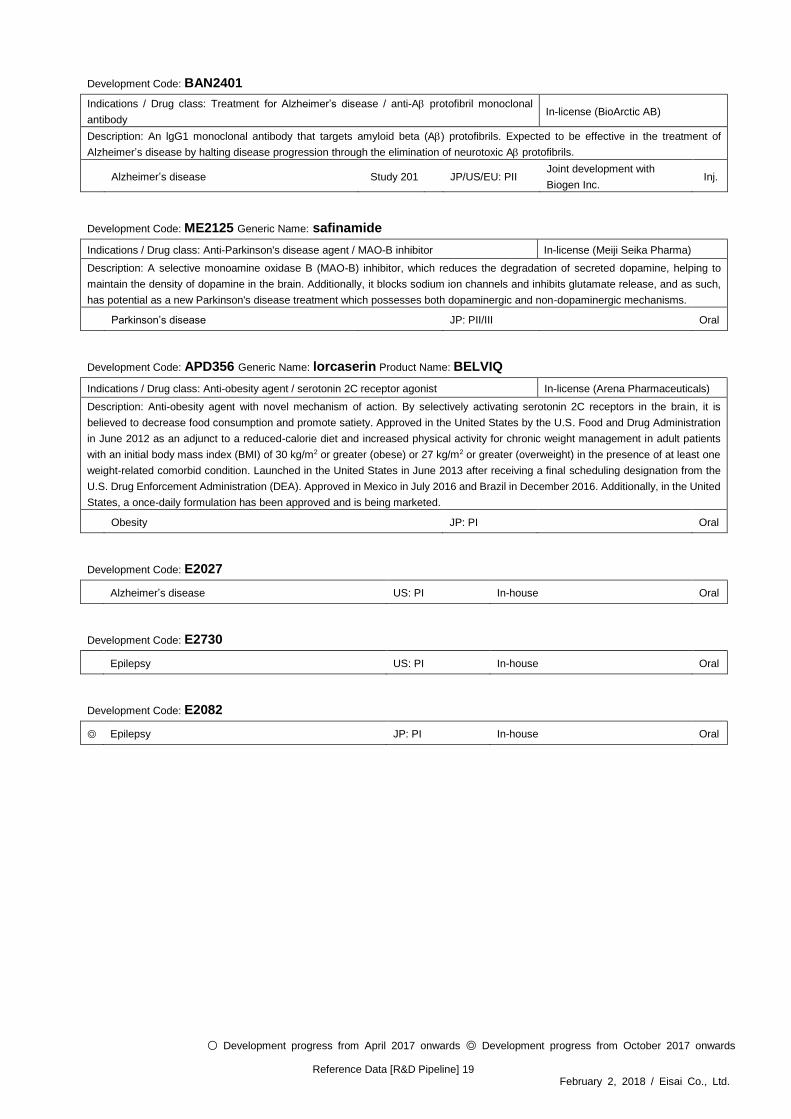
Development Code: BAN2401
Indications / Drug class: Treatment for Alzheimer’s disease / anti-A protofibril monoclonal
antibody In-license (BioArctic AB)
Description: An lgG1 monoclonal antibody that targets amyloid beta (A) protofibrils. Expected to be effective in the treatment of
Alzheimer’s disease by halting disease progression through the elimination of neurotoxic A protofibrils.
Alzheimer’s disease Study 201 JP/US/EU: PII Joint development with
Biogen Inc. Inj.
Development Code: ME2125 Generic Name: safinamide
Indications / Drug class: Anti-Parkinson's disease agent / MAO-B inhibitor In-license (Meiji Seika Pharma)
Description: A selective monoamine oxidase B (MAO-B) inhibitor, which reduces the degradation of secreted dopamine, helping to
maintain the density of dopamine in the brain. Additionally, it blocks sodium ion channels and inhibits glutamate release, and as such,
has potential as a new Parkinson's disease treatment which possesses both dopaminergic and non-dopaminergic mechanisms.
Parkinson’s disease JP: PII/III Oral
Development Code: APD356 Generic Name: lorcaserin Product Name: BELVIQ
Indications / Drug class: Anti-obesity agent / serotonin 2C receptor agonist In-license (Arena Pharmaceuticals)
Description: Anti-obesity agent with novel mechanism of action. By selectively activating serotonin 2C receptors in the brain, it is
believed to decrease food consumption and promote satiety. Approved in the United States by the U.S. Food and Drug Administration
in June 2012 as an adjunct to a reduced-calorie diet and increased physical activity for chronic weight management in adult patients
with an initial body mass index (BMI) of 30 kg/m2 or greater (obese) or 27 kg/m2 or greater (overweight) in the presence of at least one
weight-related comorbid condition. Launched in the United States in June 2013 after receiving a final scheduling designation from the
U.S. Drug Enforcement Administration (DEA). Approved in Mexico in July 2016 and Brazil in December 2016. Additionally, in the United
States, a once-daily formulation has been approved and is being marketed.
Obesity JP: PI Oral
Development Code: E2027
Alzheimer’s disease US: PI In-house Oral
Development Code: E2730
Epilepsy US: PI In-house Oral
Development Code: E2082
◎ Epilepsy JP: PI In-house Oral
○ Development progress from April 2017 onwards ◎ Development progress from October 2017 onwards
Reference Data [R&D Pipeline] 20 February 2, 2018 / Eisai Co., Ltd.
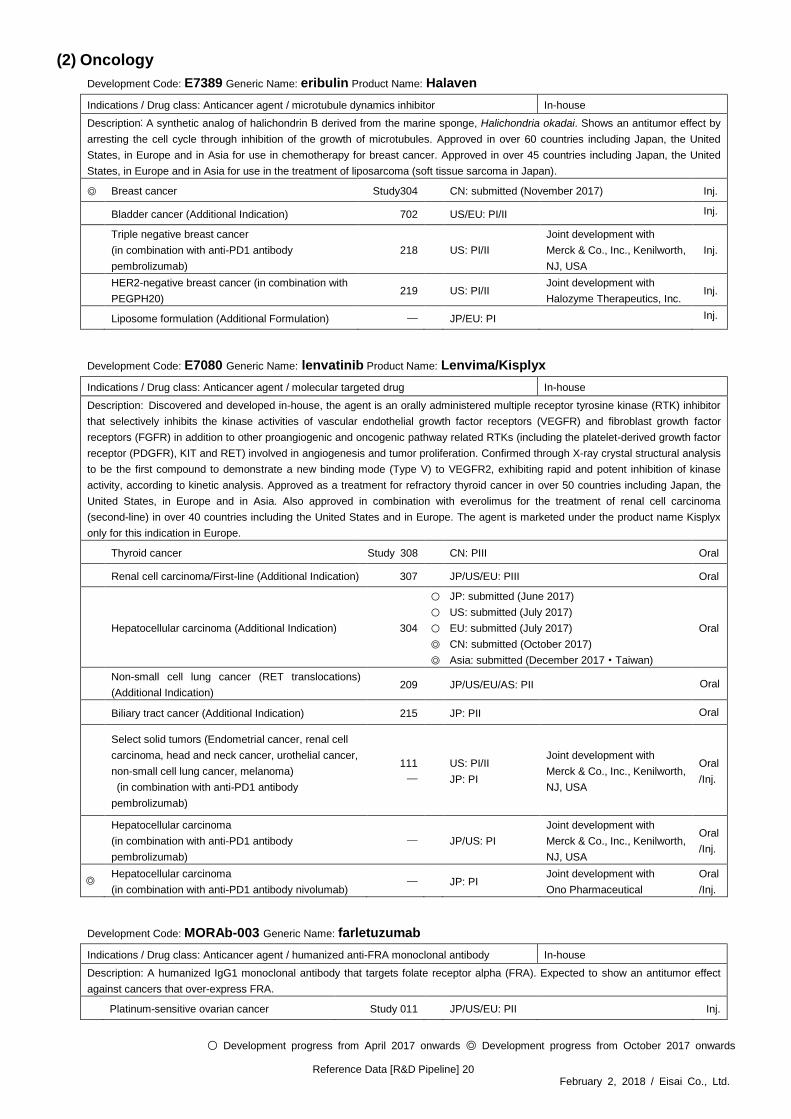
(2) Oncology
Development Code: E7389 Generic Name: eribulin Product Name: Halaven
Indications / Drug class: Anticancer agent / microtubule dynamics inhibitor In-house
Description: A synthetic analog of halichondrin B derived from the marine sponge, Halichondria okadai. Shows an antitumor effect by
arresting the cell cycle through inhibition of the growth of microtubules. Approved in over 60 countries including Japan, the United
States, in Europe and in Asia for use in chemotherapy for breast cancer. Approved in over 45 countries including Japan, the United
States, in Europe and in Asia for use in the treatment of liposarcoma (soft tissue sarcoma in Japan).
◎ Breast cancer Study304 CN: submitted (November 2017) Inj.
Bladder cancer (Additional Indication) 702 US/EU: PI/II Inj.
Triple negative breast cancer
(in combination with anti-PD1 antibody
pembrolizumab)
218 US: PI/II
Joint development with
Merck & Co., Inc., Kenilworth,
NJ, USA
Inj.
HER2-negative breast cancer (in combination with
PEGPH20) 219 US: PI/II
Joint development with
Halozyme Therapeutics, Inc. Inj.
Liposome formulation (Additional Formulation) ― JP/EU: PI Inj.
Development Code: E7080 Generic Name: lenvatinib Product Name: Lenvima/Kisplyx
Indications / Drug class: Anticancer agent / molecular targeted drug In-house
Description: Discovered and developed in-house, the agent is an orally administered multiple receptor tyrosine kinase (RTK) inhibitor
that selectively inhibits the kinase activities of vascular endothelial growth factor receptors (VEGFR) and fibroblast growth factor
receptors (FGFR) in addition to other proangiogenic and oncogenic pathway related RTKs (including the platelet-derived growth factor
receptor (PDGFR), KIT and RET) involved in angiogenesis and tumor proliferation. Confirmed through X-ray crystal structural analysis
to be the first compound to demonstrate a new binding mode (Type V) to VEGFR2, exhibiting rapid and potent inhibition of kinase
activity, according to kinetic analysis. Approved as a treatment for refractory thyroid cancer in over 50 countries including Japan, the
United States, in Europe and in Asia. Also approved in combination with everolimus for the treatment of renal cell carcinoma
(second-line) in over 40 countries including the United States and in Europe. The agent is marketed under the product name Kisplyx
only for this indication in Europe.
Thyroid cancer Study 308 CN: PIII Oral
Renal cell carcinoma/First-line (Additional Indication) 307 JP/US/EU: PIII Oral
Hepatocellular carcinoma (Additional Indication) 304
○
○
○
◎
◎
JP: submitted (June 2017)
US: submitted (July 2017)
EU: submitted (July 2017)
CN: submitted (October 2017)
Asia: submitted (December 2017・Taiwan)
Oral
Non-small cell lung cancer (RET translocations)
(Additional Indication) 209 JP/US/EU/AS: PII Oral
Biliary tract cancer (Additional Indication) 215 JP: PII Oral
Select solid tumors (Endometrial cancer, renal cell
carcinoma, head and neck cancer, urothelial cancer,
non-small cell lung cancer, melanoma)
(in combination with anti-PD1 antibody
pembrolizumab)
111
―
US: PI/II
JP: PI
Joint development with
Merck & Co., Inc., Kenilworth,
NJ, USA
Oral
/Inj.
Hepatocellular carcinoma
(in combination with anti-PD1 antibody
pembrolizumab)
― JP/US: PI
Joint development with
Merck & Co., Inc., Kenilworth,
NJ, USA
Oral
/Inj.
◎ Hepatocellular carcinoma
(in combination with anti-PD1 antibody nivolumab) ― JP: PI
Joint development with
Ono Pharmaceutical
Oral
/Inj.
Development Code: MORAb-003 Generic Name: farletuzumab
Indications / Drug class: Anticancer agent / humanized anti-FRA monoclonal antibody In-house
Description: A humanized IgG1 monoclonal antibody that targets folate receptor alpha (FRA). Expected to show an antitumor effect
against cancers that over-express FRA.
Platinum-sensitive ovarian cancer Study 011 JP/US/EU: PII Inj.

○ Development progress from April 2017 onwards ◎ Development progress from October 2017 onwards
Reference Data [R&D Pipeline] 21 February 2, 2018 / Eisai Co., Ltd.
Development Code: MORAb-004
Indications / Drug class: Anticancer agent / humanized anti-endosialin monoclonal antibody In-house
Description: A humanized lgG1 monoclonal antibody that targets Tumor Endothelial Marker 1 (TEM-1) / endosialin. Expected to show
an antitumor effect against cancers that express endosialin.
Melanoma Study 201 US/EU: PII Inj.
Development Code: MORAb-009 Generic Name: amatuximab
Indications / Drug class: Anticancer agent / chimeric anti-mesothelin monoclonal antibody In-house
Description: A chimeric IgG1 monoclonal antibody that targets mesothelin. Expected to show an antitumor effect against cancers that
express mesothelin.
Mesothelioma Study 003/201 US/EU: PII Inj.
Development Code: E7777
Indications / Drug class: Anticancer agent / interleukin-2 diphtheria toxin fusion protein In-house
Description: A fusion protein that combines the interleukin-2 (IL-2) receptor binding domain with diphtheria toxins. Specifically binds to
IL-2 receptors on the cell surface, causing diphtheria toxins that have entered cells to inhibit protein synthesis.
Peripheral T-cell lymphoma and cutaneous T-cell
lymphoma Study 205 JP: PII Inj.
Development Code: E7438 Generic Name: tazemetostat
Indications / Drug class: Anticancer agent / EZH2 inhibitor In-license (Epizyme, Inc.)
Description: Believed to have an important role in carcinogenesis, the epigenetic enzyme EZH2 is one of the proteins that constitute the
histone methyltransferases. Discovered by Epizyme through its proprietary product platform, E7438 is a first-in-class, orally
administered small molecule inhibitor, and is expected to exhibit antitumor effects via inhibition of the epigenetic enzyme EZH2. Eisai is
responsible for development and commercialization within Japan and has the right of first negotiation for licensing rights in Asia.
◎ Non-Hodgkin B-cell lymphoma Study 206 JP: PII Oral
Development Code: E7090
Solid tumors JP: PI In-house Oral
Development Code: MORAb-066
Solid tumors US: PI In-license (Janssen Biotech) Inj.
Development Code: H3B-6527
Hepatocellular carcinoma US/EU: PI In-house Oral
Development Code: H3B-8800
Blood cancer US/EU: PI In-house Oral
Development Code: E7386
○ Solid tumors EU: PI Collaboration (PRISM Pharma) Oral
Development Code: H3B-6545
○ Breast cancer US: PI In-house Oral
○ Development progress from April 2017 onwards ◎ Development progress from October 2017 onwards
Reference Data [R&D Pipeline] 22 February 2, 2018 / Eisai Co., Ltd.
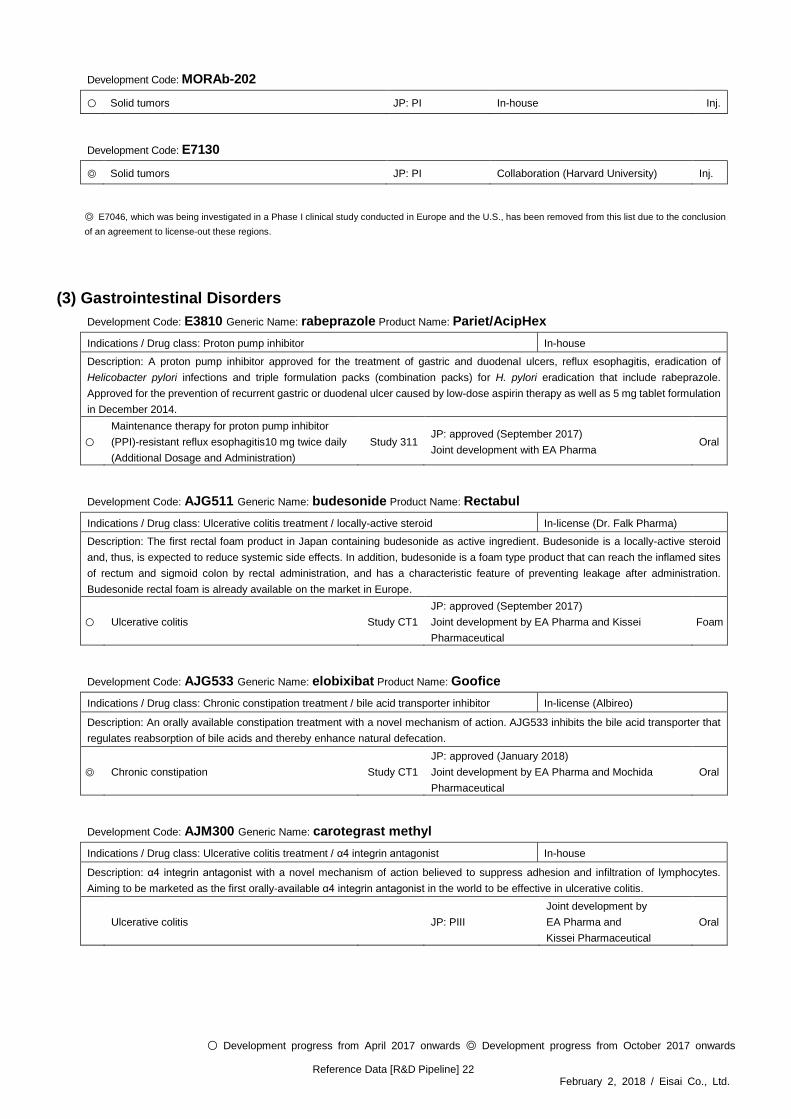
Development Code: MORAb-202
○ Solid tumors JP: PI In-house Inj.
Development Code: E7130
◎ Solid tumors JP: PI Collaboration (Harvard University) Inj.
◎ E7046, which was being investigated in a Phase I clinical study conducted in Europe and the U.S., has been removed from this list due to the conclusion
of an agreement to license-out these regions.
(3) Gastrointestinal Disorders
Development Code: E3810 Generic Name: rabeprazole Product Name: Pariet/AcipHex
Indications / Drug class: Proton pump inhibitor In-house
Description: A proton pump inhibitor approved for the treatment of gastric and duodenal ulcers, reflux esophagitis, eradication of
Helicobacter pylori infections and triple formulation packs (combination packs) for H. pylori eradication that include rabeprazole.
Approved for the prevention of recurrent gastric or duodenal ulcer caused by low-dose aspirin therapy as well as 5 mg tablet formulation
in December 2014.
○
Maintenance therapy for proton pump inhibitor
(PPI)-resistant reflux esophagitis10 mg twice daily
(Additional Dosage and Administration)
Study 311 JP: approved (September 2017)
Joint development with EA Pharma Oral
Development Code: AJG511 Generic Name: budesonide Product Name: Rectabul
Indications / Drug class: Ulcerative colitis treatment / locally-active steroid In-license (Dr. Falk Pharma)
Description: The first rectal foam product in Japan containing budesonide as active ingredient. Budesonide is a locally-active steroid
and, thus, is expected to reduce systemic side effects. In addition, budesonide is a foam type product that can reach the inflamed sites
of rectum and sigmoid colon by rectal administration, and has a characteristic feature of preventing leakage after administration.
Budesonide rectal foam is already available on the market in Europe.
○ Ulcerative colitis Study CT1
JP: approved (September 2017)
Joint development by EA Pharma and Kissei
Pharmaceutical
Foam
Development Code: AJG533 Generic Name: elobixibat Product Name: Goofice
Indications / Drug class: Chronic constipation treatment / bile acid transporter inhibitor In-license (Albireo)
Description: An orally available constipation treatment with a novel mechanism of action. AJG533 inhibits the bile acid transporter that
regulates reabsorption of bile acids and thereby enhance natural defecation.
◎ Chronic constipation Study CT1
JP: approved (January 2018)
Joint development by EA Pharma and Mochida
Pharmaceutical
Oral
Development Code: AJM300 Generic Name: carotegrast methyl
Indications / Drug class: Ulcerative colitis treatment / α4 integrin antagonist In-house
Description: α4 integrin antagonist with a novel mechanism of action believed to suppress adhesion and infiltration of lymphocytes.
Aiming to be marketed as the first orally-available α4 integrin antagonist in the world to be effective in ulcerative colitis.
Ulcerative colitis JP: PIII
Joint development by
EA Pharma and
Kissei Pharmaceutical
Oral
○ Development progress from April 2017 onwards ◎ Development progress from October 2017 onwards
Reference Data [R&D Pipeline] 23 February 2, 2018 / Eisai Co., Ltd.
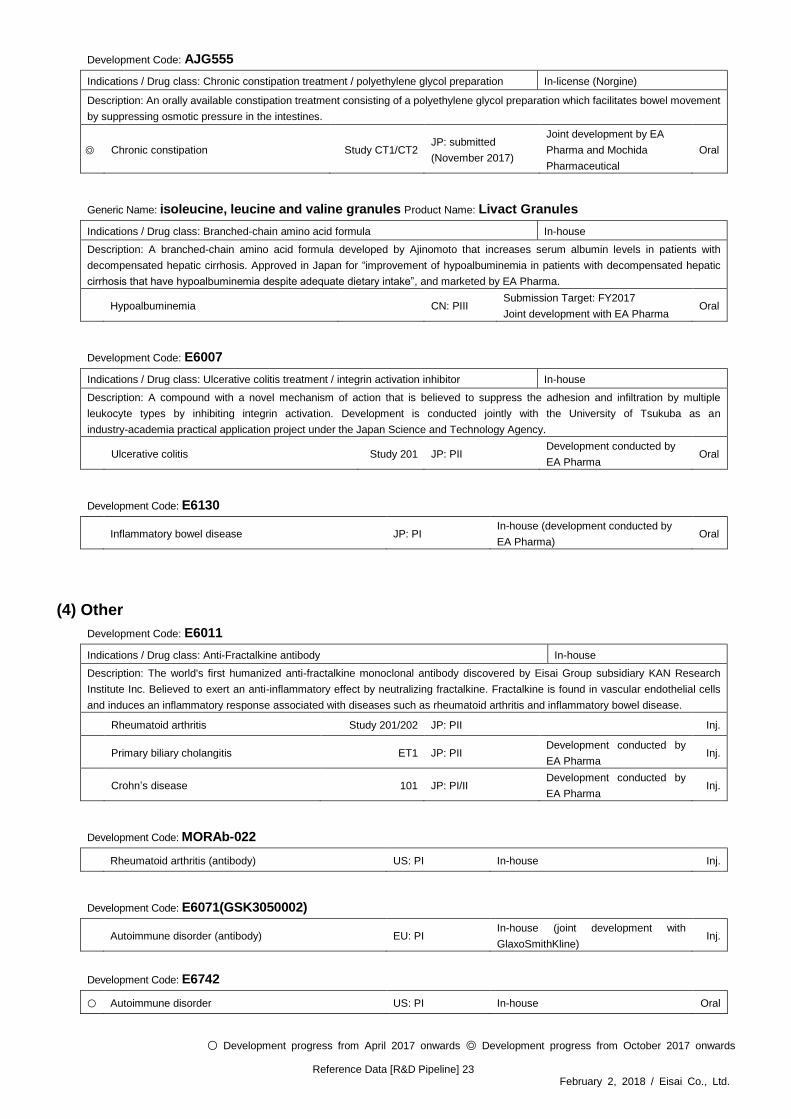
Development Code: AJG555
Indications / Drug class: Chronic constipation treatment / polyethylene glycol preparation In-license (Norgine)
Description: An orally available constipation treatment consisting of a polyethylene glycol preparation which facilitates bowel movement
by suppressing osmotic pressure in the intestines.
◎ Chronic constipation Study CT1/CT2 JP: submitted
(November 2017)
Joint development by EA
Pharma and Mochida
Pharmaceutical
Oral
Generic Name: isoleucine, leucine and valine granules Product Name: Livact Granules
Indications / Drug class: Branched-chain amino acid formula In-house
Description: A branched-chain amino acid formula developed by Ajinomoto that increases serum albumin levels in patients with
decompensated hepatic cirrhosis. Approved in Japan for “improvement of hypoalbuminemia in patients with decompensated hepatic
cirrhosis that have hypoalbuminemia despite adequate dietary intake”, and marketed by EA Pharma.
Hypoalbuminemia CN: PIII Submission Target: FY2017
Joint development with EA Pharma Oral
Development Code: E6007
Indications / Drug class: Ulcerative colitis treatment / integrin activation inhibitor In-house
Description: A compound with a novel mechanism of action that is believed to suppress the adhesion and infiltration by multiple
leukocyte types by inhibiting integrin activation. Development is conducted jointly with the University of Tsukuba as an
industry-academia practical application project under the Japan Science and Technology Agency.
Ulcerative colitis Study 201 JP: PII Development conducted by
EA Pharma Oral
Development Code: E6130
Inflammatory bowel disease JP: PI In-house (development conducted by
EA Pharma) Oral
(4) Other
Development Code: E6011
Indications / Drug class: Anti-Fractalkine antibody In-house
Description: The world's first humanized anti-fractalkine monoclonal antibody discovered by Eisai Group subsidiary KAN Research
Institute Inc. Believed to exert an anti-inflammatory effect by neutralizing fractalkine. Fractalkine is found in vascular endothelial cells
and induces an inflammatory response associated with diseases such as rheumatoid arthritis and inflammatory bowel disease.
Rheumatoid arthritis Study 201/202 JP: PII Inj.
Primary biliary cholangitis ET1 JP: PII Development conducted by
EA Pharma Inj.
Crohn’s disease 101 JP: PI/II Development conducted by
EA Pharma Inj.
Development Code: MORAb-022
Rheumatoid arthritis (antibody) US: PI In-house Inj.
Development Code: E6071(GSK3050002)
Autoimmune disorder (antibody) EU: PI In-house (joint development with
GlaxoSmithKline) Inj.
Development Code: E6742
○ Autoimmune disorder US: PI In-house Oral