Section 19. Energy and Utilities - Census.gov
22
Section 19 Energy and Utilities This section presents statistics on fuel resources, energy production and con- sumption, electric energy, hydroelectric power, nuclear power, solar energy, wood energy, and the electric and gas utility industries. The principal sources are the U.S. Department of Energy’s Energy Infor- mation Administration (EIA), the Edison Electric Institute, Washington, DC, and the American Gas Association, Arlington, VA. The Department of Energy was created in October 1977 and assumed and central- ized the responsibilities of all or part of several agencies including the Federal Power Commission (FPC), the U.S. Bureau of Mines, the Federal Energy Administra- tion, and the U.S. Energy Research and Development Administration. For addi- tional data on transportation, see Section 23; on fuels, see Section 18; and on energy-related housing characteristics, see Section 20. The EIA, in its Annual Energy Review, pro- vides statistics and trend data on energy supply, demand, and prices. Information is included on petroleum and natural gas, coal, electricity, hydroelectric power, nuclear power, solar, wood, and geother- mal energy. Among its annual reports are Annual Energy Review, Electric Power Annual, Natural Gas Annual, Petroleum Supply Annual, State Energy Data Report, State Energy Price and Expenditure Report, Financial Statistics of Selected Electric Utilities, Performance Profiles of Major Energy Producers, Annual Energy Outlook, and International Energy Annual. These various publications contain state, national, and international data on pro- duction of electricity, net summer capabil- ity of generating plants, fuels used in energy production, energy sales and con- sumption, and hydroelectric power. The EIA also issues the Monthly Energy Review, which presents current supply, disposition, and price data and monthly publications on petroleum, coal, natural gas, and electric power. Data on residen- tial energy consumption, expenditures, and conservation activities are available from EIA’s Residential Energy Consump- tion Survey and are published every 4 years. The Edison Electric Institute’s monthly bul- letin and annual Statistical Year Book of the Electric Utility Industry for the Year contain data on the distribution of electric energy by public utilities; information on the electric power supply, expansion of electric generating facilities, and the manufacture of heavy electric power equipment is presented in the annual Year-End Summary of the Electric Power Situation in the United States. The Ameri- can Gas Association, in its monthly and quarterly bulletins and its yearbook, Gas Facts, presents data on gas utilities and financial and operating statistics. Btu conversion factors—Various energy sources are converted from original units to the thermal equivalent using British thermal units (Btu). A Btu is the amount of energy required to raise the temperature of 1 pound of water 1 degree Fahrenheit (F) at or near 39.2 degrees F. Factors are calculated annually from the latest final annual data available; some are revised as a result. The following list provides con- version factors used in 2001 for produc- tion and consumption, in that order, for various fuels: Petroleum, 5.800 and 5.345 mil. Btu per barrel; total coal, 20.443 and 20.655 mil. Btu per short ton; and natural gas (dry), 1,028 Btu per cubic foot for both. The factors for the production of nuclear power and geothermal power were 10,442 and 21,017 Btu per kilowatt- hour, respectively. The fossil fuel steam- electric power plant generation factor of 10,127 Btu per kilowatt-hour was used for hydroelectric power generation and for wood and waste, wind, photovoltaic, and solar thermal energy consumed at electric utilities. Energy and Utilities 579 U.S. Census Bureau, Statistical Abstract of the United States: 2003
-
Upload
khangminh22 -
Category
Documents
-
view
3 -
download
0
Transcript of Section 19. Energy and Utilities - Census.gov

Section 19
Energy and Utilities
This section presents statistics on fuelresources, energy production and con-sumption, electric energy, hydroelectricpower, nuclear power, solar energy, woodenergy, and the electric and gas utilityindustries. The principal sources are theU.S. Department of Energy’s Energy Infor-mation Administration (EIA), the EdisonElectric Institute, Washington, DC, and theAmerican Gas Association, Arlington, VA.The Department of Energy was created inOctober 1977 and assumed and central-ized the responsibilities of all or part ofseveral agencies including the FederalPower Commission (FPC), the U.S. Bureauof Mines, the Federal Energy Administra-tion, and the U.S. Energy Research andDevelopment Administration. For addi-tional data on transportation, see Section23; on fuels, see Section 18; and onenergy-related housing characteristics,see Section 20.
The EIA, in its Annual Energy Review, pro-vides statistics and trend data on energysupply, demand, and prices. Informationis included on petroleum and natural gas,coal, electricity, hydroelectric power,nuclear power, solar, wood, and geother-mal energy. Among its annual reports areAnnual Energy Review, Electric PowerAnnual, Natural Gas Annual, PetroleumSupply Annual, State Energy Data Report,State Energy Price and ExpenditureReport, Financial Statistics of SelectedElectric Utilities, Performance Profiles ofMajor Energy Producers, Annual EnergyOutlook, and International Energy Annual.These various publications contain state,national, and international data on pro-duction of electricity, net summer capabil-ity of generating plants, fuels used inenergy production, energy sales and con-sumption, and hydroelectric power. TheEIA also issues the Monthly EnergyReview, which presents current supply,disposition, and price data and monthlypublications on petroleum, coal, natural
gas, and electric power. Data on residen-tial energy consumption, expenditures,and conservation activities are availablefrom EIA’s Residential Energy Consump-tion Survey and are published every 4years.
The Edison Electric Institute’s monthly bul-letin and annual Statistical Year Book ofthe Electric Utility Industry for the Yearcontain data on the distribution of electricenergy by public utilities; information onthe electric power supply, expansion ofelectric generating facilities, and themanufacture of heavy electric powerequipment is presented in the annualYear-End Summary of the Electric PowerSituation in the United States. The Ameri-can Gas Association, in its monthly andquarterly bulletins and its yearbook, GasFacts, presents data on gas utilities andfinancial and operating statistics.
Btu conversion factors—Various energysources are converted from original unitsto the thermal equivalent using Britishthermal units (Btu). A Btu is the amount ofenergy required to raise the temperatureof 1 pound of water 1 degree Fahrenheit(F) at or near 39.2 degrees F. Factors arecalculated annually from the latest finalannual data available; some are revised asa result. The following list provides con-version factors used in 2001 for produc-tion and consumption, in that order, forvarious fuels: Petroleum, 5.800 and 5.345mil. Btu per barrel; total coal, 20.443 and20.655 mil. Btu per short ton; and naturalgas (dry), 1,028 Btu per cubic foot forboth. The factors for the production ofnuclear power and geothermal powerwere 10,442 and 21,017 Btu per kilowatt-hour, respectively. The fossil fuel steam-electric power plant generation factor of10,127 Btu per kilowatt-hour was usedfor hydroelectric power generation andfor wood and waste, wind, photovoltaic,and solar thermal energy consumed atelectric utilities.
Energy and Utilities 579
U.S. Census Bureau, Statistical Abstract of the United States: 2003

No. 893. Utilities—Establishments, Revenue, Payroll, andEmployees by Kind of Business (NAICS Basis): 1997
[411,713 represents $411,713,000,000. See Appendix III]
Kind of business NAICScode 1 Estab-
lish-ments
(number)
Revenue Annual payroll Paidemployee
for payperiod
includingMarch 12(number)
Total(mil. dol.)
Perpaid
employee(dol.)
Total(mil. dol.)
Perpaid
employee(dol.)
Utilities . . . . . . . . . . . . . . . . . . . . 22 15,513 411,713 585,899 36,595 52,077 702,703
Electric power generation,transmission, & distribution . . . . . . . . . . . . 2211 7,935 269,095 476,676 30,440 53,921 564,525Electric power generation . . . . . . . . . . . . 22111 1,745 73,375 493,492 8,369 56,289 148,686
Fossil fuel electric power generation . . . 221112 1,009 48,324 515,374 5,049 53,843 93,765Nuclear electric power generation . . . . . 221113 67 13,967 406,231 2,202 64,045 34,381Other electric power generation . . . . . . 221119 316 8,011 608,723 725 55,069 13,160
Electric power transmission, control &distribution . . . . . . . . . . . . . . . . . . . . . 22112 6,190 195,720 470,663 22,070 53,074 415,839Electric bulk power transmission &control . . . . . . . . . . . . . . . . . . . . . . 221121 120 956 395,361 116 47,852 2,418
Electric power distribution . . . . . . . . . . 221122 6,070 194,764 471,103 21,955 53,105 413,421Other combination utilities . . . . . . . . 2211223 30 428 630,811 52 76,771 678
Natural gas distribution . . . . . . . . . . . . . . . 2212 2,747 136,995 1,331,629 5,110 49,666 102,878Natural gas transmission & distribution. . 2212101 713 18,267 629,034 1,534 52,838 29,039Natural gas distribution . . . . . . . . . . . . 2212102 1,682 87,105 1,387,135 2,955 47,059 62,795Mixed, manu., or LP gas pro &/or dist. . . 2212103 86 (D) (NA) (D) (NA) (2)Electric & other serv. combined (naturalgas distribution) . . . . . . . . . . . . . . . . 2212104 145 28,110 4,193,063 413 61,565 6,704
Gas & other serv. combined (naturalgas distribution) . . . . . . . . . . . . . . . . 2212105 119 2,853 915,151 149 47,705 3,117
Water, sewage, & other systems . . . . . . . . . 2213 4,831 5,623 159,284 1,045 29,614 35,300Water supply & irrigation systems. . . . . . . 22131 4,052 4,454 159,447 825 29,550 27,933Sewage treatment facilities . . . . . . . . . . . 22132 696 596 106,399 139 24,816 5,600Steam & air-conditioning supply . . . . . . . . 22133 83 573 324,314 81 45,838 1,767
D Withheld to avoid disclosing data of individual companies; data are included in higher level totals. NA Not available.1 North American Industry Classification System, 1997; see text, Section 15. 2 1,000 to 2,499 employees.
Source: U.S. Census Bureau, 1997 Economic Census, Utilities, Series EC97T22A-US, issued December 1999.
No. 894. Private Utilities—Employees, Annual Payroll, and Establishmentsby Industry: 2001
[41,942 represents $41,942,000,000. Excludes government employees, railroad employees, self-employed persons, etc. See‘‘General Explanation’’ in source for definitions and statement on reliability of data. An establishment is a single physical locationwhere business is conducted or where services or industrial operations are performed. See Appendix III]
Year and industry NAICScode 1
Num-ber of
employ-ees 2
Annualpayroll
(mil.dol.)
Aver-age
payrollper em-ployee
(dol.)
Establishment by employment size-class
Total
Under20 em-
ployees
20 to99 em-
ployees
100 to499em-
ployees
500 andoverem-
ployees
Utilities, total . . . . . . . . . . . . . . . 22 654,484 41,942 64,085 17,702 12,505 3,837 1,168 192
Electric power generation,transmission and distribution . . . . . . . . 2211 515,988 34,338 66,548 9,207 5,202 2,902 933 170
Electric power generation . . . . . . . . . . . 22111 139,254 10,188 73,162 2,208 1,305 582 263 58Hydroelectric power generation . . . . 221111 11,650 793 68,028 462 363 71 25 3Fossil fuel electric power generation. 221112 80,674 5,683 70,445 1,301 664 412 211 14Nuclear electric power generation . . 221113 33,064 2,791 84,424 72 18 9 11 34Other electric power generation. . . . 221119 13,866 921 66,426 373 260 90 16 7
Electric pwr transmsn, control &distribution . . . . . . . . . . . . . . . . . . 22112 376,734 24,150 64,103 6,999 3,897 2,320 670 112Electric bulk power transmission &control . . . . . . . . . . . . . . . . . . . 221121 6,233 366 58,683 161 103 45 12 1
Electric power distribution. . . . . . . . 221122 370,501 23,784 64,194 6,838 3,794 2,275 658 111
Natural gas distribution. . . . . . . . . . . . . 2212 95,348 6,001 62,939 2,831 2,001 616 194 20
Water, sewage & other systems . . . . . . . 2213 43,148 1,603 37,162 5,664 5,302 319 41 2Water supply & irrigation systems . . . . 22131 35,206 1,325 37,634 4,832 4,562 234 34 2Sewage treatment facilities . . . . . . . . 22132 6,312 198 31,340 748 688 54 6 -Steam & air-conditioning supply . . . . . 22133 1,630 81 49,506 84 52 31 1 -
- Represents zero. 1 North American Industry Classification System, 1997. 2 Covers full- and part-time employees whoare on the payroll in the pay period including March 12.
Source: U.S. Census Bureau, County Business Patterns, annual. See also <http://www.census.gov/epcd/cbp/view/us01.txt>(issued April 2003).
580 Energy and Utilities
U.S. Census Bureau, Statistical Abstract of the United States: 2003
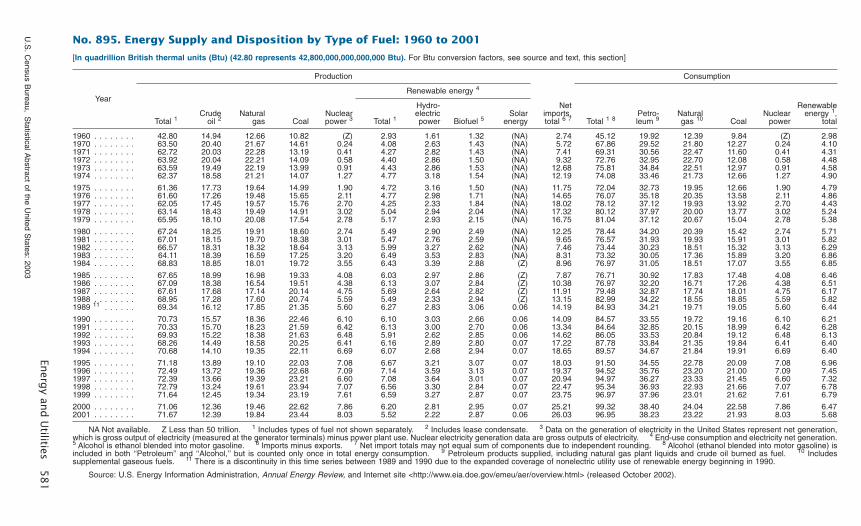
No. 895. Energy Supply and Disposition by Type of Fuel: 1960 to 2001
[In quadrillion British thermal units (Btu) (42.80 represents 42,800,000,000,000,000 Btu). For Btu conversion factors, see source and text, this section]
Year
Production
Netimports,total 6 7
Consumption
Total 1Crude
oil 2Natural
gas CoalNuclearpower 3
Renewable energy 4
Total 1 8Petro-leum 9
Naturalgas 10 Coal
Nuclearpower
Renewableenergy 1,
totalTotal 1
Hydro-electricpower Biofuel 5
Solarenergy
1960 . . . . . . . . 42.80 14.94 12.66 10.82 (Z) 2.93 1.61 1.32 (NA) 2.74 45.12 19.92 12.39 9.84 (Z) 2.981970 . . . . . . . . 63.50 20.40 21.67 14.61 0.24 4.08 2.63 1.43 (NA) 5.72 67.86 29.52 21.80 12.27 0.24 4.101971 . . . . . . . . 62.72 20.03 22.28 13.19 0.41 4.27 2.82 1.43 (NA) 7.41 69.31 30.56 22.47 11.60 0.41 4.311972 . . . . . . . . 63.92 20.04 22.21 14.09 0.58 4.40 2.86 1.50 (NA) 9.32 72.76 32.95 22.70 12.08 0.58 4.481973 . . . . . . . . 63.59 19.49 22.19 13.99 0.91 4.43 2.86 1.53 (NA) 12.68 75.81 34.84 22.51 12.97 0.91 4.581974 . . . . . . . . 62.37 18.58 21.21 14.07 1.27 4.77 3.18 1.54 (NA) 12.19 74.08 33.46 21.73 12.66 1.27 4.90
1975 . . . . . . . . 61.36 17.73 19.64 14.99 1.90 4.72 3.16 1.50 (NA) 11.75 72.04 32.73 19.95 12.66 1.90 4.791976 . . . . . . . . 61.60 17.26 19.48 15.65 2.11 4.77 2.98 1.71 (NA) 14.65 76.07 35.18 20.35 13.58 2.11 4.861977 . . . . . . . . 62.05 17.45 19.57 15.76 2.70 4.25 2.33 1.84 (NA) 18.02 78.12 37.12 19.93 13.92 2.70 4.431978 . . . . . . . . 63.14 18.43 19.49 14.91 3.02 5.04 2.94 2.04 (NA) 17.32 80.12 37.97 20.00 13.77 3.02 5.241979 . . . . . . . . 65.95 18.10 20.08 17.54 2.78 5.17 2.93 2.15 (NA) 16.75 81.04 37.12 20.67 15.04 2.78 5.38
1980 . . . . . . . . 67.24 18.25 19.91 18.60 2.74 5.49 2.90 2.49 (NA) 12.25 78.44 34.20 20.39 15.42 2.74 5.711981 . . . . . . . . 67.01 18.15 19.70 18.38 3.01 5.47 2.76 2.59 (NA) 9.65 76.57 31.93 19.93 15.91 3.01 5.821982 . . . . . . . . 66.57 18.31 18.32 18.64 3.13 5.99 3.27 2.62 (NA) 7.46 73.44 30.23 18.51 15.32 3.13 6.291983 . . . . . . . . 64.11 18.39 16.59 17.25 3.20 6.49 3.53 2.83 (NA) 8.31 73.32 30.05 17.36 15.89 3.20 6.861984 . . . . . . . . 68.83 18.85 18.01 19.72 3.55 6.43 3.39 2.88 (Z) 8.96 76.97 31.05 18.51 17.07 3.55 6.85
1985 . . . . . . . . 67.65 18.99 16.98 19.33 4.08 6.03 2.97 2.86 (Z) 7.87 76.71 30.92 17.83 17.48 4.08 6.461986 . . . . . . . . 67.09 18.38 16.54 19.51 4.38 6.13 3.07 2.84 (Z) 10.38 76.97 32.20 16.71 17.26 4.38 6.511987 . . . . . . . . 67.61 17.68 17.14 20.14 4.75 5.69 2.64 2.82 (Z) 11.91 79.48 32.87 17.74 18.01 4.75 6.171988 . . . . . . . . 68.95 17.28 17.60 20.74 5.59 5.49 2.33 2.94 (Z) 13.15 82.99 34.22 18.55 18.85 5.59 5.821989 11 . . . . . . 69.34 16.12 17.85 21.35 5.60 6.27 2.83 3.06 0.06 14.19 84.93 34.21 19.71 19.05 5.60 6.44
1990 . . . . . . . . 70.73 15.57 18.36 22.46 6.10 6.10 3.03 2.66 0.06 14.09 84.57 33.55 19.72 19.16 6.10 6.211991 . . . . . . . . 70.33 15.70 18.23 21.59 6.42 6.13 3.00 2.70 0.06 13.34 84.64 32.85 20.15 18.99 6.42 6.281992 . . . . . . . . 69.93 15.22 18.38 21.63 6.48 5.91 2.62 2.85 0.06 14.62 86.05 33.53 20.84 19.12 6.48 6.131993 . . . . . . . . 68.26 14.49 18.58 20.25 6.41 6.16 2.89 2.80 0.07 17.22 87.78 33.84 21.35 19.84 6.41 6.401994 . . . . . . . . 70.68 14.10 19.35 22.11 6.69 6.07 2.68 2.94 0.07 18.65 89.57 34.67 21.84 19.91 6.69 6.40
1995 . . . . . . . . 71.18 13.89 19.10 22.03 7.08 6.67 3.21 3.07 0.07 18.03 91.50 34.55 22.78 20.09 7.08 6.961996 . . . . . . . . 72.49 13.72 19.36 22.68 7.09 7.14 3.59 3.13 0.07 19.37 94.52 35.76 23.20 21.00 7.09 7.451997 . . . . . . . . 72.39 13.66 19.39 23.21 6.60 7.08 3.64 3.01 0.07 20.94 94.97 36.27 23.33 21.45 6.60 7.321998 . . . . . . . . 72.79 13.24 19.61 23.94 7.07 6.56 3.30 2.84 0.07 22.47 95.34 36.93 22.93 21.66 7.07 6.781999 . . . . . . . . 71.64 12.45 19.34 23.19 7.61 6.59 3.27 2.87 0.07 23.75 96.97 37.96 23.01 21.62 7.61 6.79
2000 . . . . . . . . 71.06 12.36 19.46 22.62 7.86 6.20 2.81 2.95 0.07 25.21 99.32 38.40 24.04 22.58 7.86 6.472001 . . . . . . . . 71.67 12.39 19.84 23.44 8.03 5.52 2.22 2.87 0.06 26.03 96.95 38.23 23.22 21.93 8.03 5.68
NA Not available. Z Less than 50 trillion. 1 Includes types of fuel not shown separately. 2 Includes lease condensate. 3 Data on the generation of electricity in the United States represent net generation,which is gross output of electricity (measured at the generator terminals) minus power plant use. Nuclear electricity generation data are gross outputs of electricity. 4 End-use consumption and electricity net generation.5 Alcohol is ethanol blended into motor gasoline. 6 Imports minus exports. 7 Net import totals may not equal sum of components due to independent rounding. 8 Alcohol (ethanol blended into motor gasoline) isincluded in both ‘‘Petroleum’’ and ‘‘Alcohol,’’ but is counted only once in total energy consumption. 9 Petroleum products supplied, including natural gas plant liquids and crude oil burned as fuel. 10 Includessupplemental gaseous fuels. 11 There is a discontinuity in this time series between 1989 and 1990 due to the expanded coverage of nonelectric utility use of renewable energy beginning in 1990.
Source: U.S. Energy Information Administration, Annual Energy Review, and Internet site <http://www.eia.doe.gov/emeu/aer/overview.html> (released October 2002).
Energ
yan
dU
tilities5
81
U.S
.C
ensusB
ureau,S
tatisticalAbstract
ofthe
United
States:
2003

Figure 19.1Energy Production, Trade, and Consumption: 1980 to 2001
1Imports minus exports.Source: Chart prepared by U.S. Census Bureau. For data, see Table 895.
Quadrillion Btu
Production
Net imports1
Consumption
0
20
40
60
80
100
120
200120001998199619941992199019881986198419821980
Figure 19.2Top Suppliers of U.S. Crude Oil Imports: 2002 (In millions of barrels)
Angola117
Iraq168
Venezuela438
Colombia 86
Mexico548
Total imports = 3,336
Nigeria215
Saudi Arabia1
554
1Imports from the neutral zone between Kuwait and Saudi Arabia are included in Saudi Arabia.
Source: Chart prepared by U.S. Census Bureau. For data, see Table 910.
Norway127
Canada527
United Kingdom148
OPEC CountriesNon-OPEC Countries
Other, Non-OPEC293
Other, OPEC115
582 Energy and Utilities
U.S. Census Bureau, Statistical Abstract of the United States: 2003

No. 896. Energy Supply and Disposition by Type of Fuel—Estimates,2000 and 2001, and Projections, 2005 to 2020
[Quadrillion Btu (72.15 represents 72,150,000,000,000,000) per year. Btu=British thermal unit. Totals may not equal sum of com-ponents due to rounding. Projections are ‘‘reference’’ or mid-level forecasts. See report for methodology and assumptions used ingenerating projections]
Type of fuel2000 2001
Projections
2005 2010 2015 2020
Production, total . . . . . . . . . . . . . . . . . . . . . . 72.15 72.81 74.60 79.27 82.25 86.10Crude oil and lease condensate . . . . . . . . . . . 12.44 12.29 11.82 11.91 11.11 11.56Natural gas plant liquids . . . . . . . . . . . . . . . . 2.71 2.65 2.95 3.16 3.42 3.59Natural gas, dry . . . . . . . . . . . . . . . . . . . . . 19.50 19.97 20.68 22.47 24.47 25.75Coal . . . . . . . . . . . . . . . . . . . . . . . . . . . . . 22.58 23.97 23.33 25.30 26.37 27.69Nuclear power . . . . . . . . . . . . . . . . . . . . . . 7.87 8.03 8.28 8.36 8.41 8.43Renewable energy 1 . . . . . . . . . . . . . . . . . . 5.96 5.33 6.71 7.23 7.75 8.28Other 2 . . . . . . . . . . . . . . . . . . . . . . . . . . . 1.09 0.57 0.83 0.84 0.74 0.80
Imports, total . . . . . . . . . . . . . . . . . . . . . . . . 28.98 30.13 31.94 37.96 43.43 47.76Crude oil 3 . . . . . . . . . . . . . . . . . . . . . . . . . 19.69 20.26 22.34 25.13 26.93 27.61Petroleum products 4 . . . . . . . . . . . . . . . . . . 4.73 5.04 4.25 6.41 9.59 11.97Natural gas . . . . . . . . . . . . . . . . . . . . . . . . 3.86 4.10 4.54 5.52 5.94 7.22Other imports 5 . . . . . . . . . . . . . . . . . . . . . . 0.69 0.73 0.81 0.90 0.98 0.96
Exports, total . . . . . . . . . . . . . . . . . . . . . . . . 3.92 3.64 3.64 3.76 3.55 3.49Petroleum 6 . . . . . . . . . . . . . . . . . . . . . . . . 2.15 2.01 2.05 2.24 2.26 2.34Natural gas . . . . . . . . . . . . . . . . . . . . . . . . 0.25 0.37 0.59 0.62 0.55 0.41Coal . . . . . . . . . . . . . . . . . . . . . . . . . . . . . 1.53 1.27 1.00 0.91 0.74 0.74
Consumption, total . . . . . . . . . . . . . . . . . . . . 99.38 97.30 103.16 113.26 121.91 130.12Petroleum products 7 . . . . . . . . . . . . . . . . . . 38.53 38.46 39.79 44.65 48.93 52.60Natural gas . . . . . . . . . . . . . . . . . . . . . . . . 24.07 23.26 25.24 27.75 30.25 32.96Coal . . . . . . . . . . . . . . . . . . . . . . . . . . . . . 22.64 22.02 22.82 24.98 26.30 27.68Nuclear power . . . . . . . . . . . . . . . . . . . . . . 7.87 8.03 8.28 8.36 8.41 8.43Renewable energy 1 other 8 . . . . . . . . . . . . . 6.27 5.54 7.03 7.52 8.02 8.45
Net imports of petroleum. . . . . . . . . . . . . . . . 22.28 23.29 24.54 29.31 34.26 37.24
Prices (1999 dollars per unit):World oil price (dol. per bbl.) 9 . . . . . . . . . . . . 28.35 22.01 23.27 23.99 24.72 25.48Gas wellhead price (dol. per mcf.) 10. . . . . . . . 3.83 4.12 2.88 3.29 3.55 3.69Coal minemouth price (dol. per ton) . . . . . . . . 17.18 17.59 16.50 14.99 14.67 14.38Average electric price (cents per kWh) . . . . . . 6.9 7.3 6.5 6.4 6.5 6.6
1 Includes grid-connected electricity from conventional hydroelectric; wood and wood waste; landfill gas; municipal solid waste;other biomass; wind; photovoltaic and solar thermal sources; nonelectric energy from renewable sources, such as active andpassive solar systems, and wood; and both the ethanol and gasoline components of E85, but not the ethanol components of blendsless than 85 percent. Excludes electricity imports using renewable sources and nonmarketed renewable energy. See Table A18for selected nonmarketed residential and commercial renewable energy. 2 Includes liquid hydrogen, methanol, supplementalnatural gas, and some domestic inputs to refineries. 3 Includes imports of crude oil for the Strategic Petroleum Reserve.4 Includes imports of finished petroleum products, imports of unfinished oils, alcohols, ethers, and blending components.5 Includes coal, coal coke (net), and electricity (net). 6 Includes crude oil and petroleum products. 7 Includes natural gas plantliquids, crude oil consumed as a fuel, and nonpetroleum based liquids for blending, such as ethanol. 8 Includes net electricityimports, methanol, and liquid hydrogen. 9 Average refiner acquisition cost for imported crude oil. 10 Represents lower 48onshore and offshore supplies.
Source: U.S. Energy Information Administration, Annual Energy Outlook, 2003, DOE/EIA-0383(2003). See also<http://www.eia.doe.gov/oiaf/aeo/pdf/appa.pdf> (released 9 January 2003).
No. 897. Energy Consumption by End-Use Sector: 1970 to 2001
[67.86 represents 67,860,000,000,000,000 Btu) Btu=British thermal units. For Btu conversion factors, see source and text, thissection. See Appendix III]
Year Total con-sumption
(quad. Btu)
Residentialand
commercial 1
(quad. Btu)Industrial 2
(quad. Btu)
Transpor-tation
(quad. Btu)
Percent of total
Residentialand com-mercial 1 Industrial 2
Transpor-tation
1970 . . . . . . . . 67.86 22.11 29.65 16.10 32.6 43.7 23.71975 . . . . . . . . 72.04 24.33 29.46 18.24 33.8 40.9 25.31980 . . . . . . . . 78.44 26.53 32.21 19.70 33.8 41.1 25.11985 . . . . . . . . 76.70 27.58 29.06 20.07 36.0 37.9 26.2
1990 . . . . . . . . 84.57 30.15 31.90 22.53 35.6 37.7 26.61992 . . . . . . . . 86.05 30.85 32.74 22.46 35.9 38.0 26.11993 . . . . . . . . 87.78 32.17 32.74 22.88 36.6 37.3 26.11994 . . . . . . . . 89.57 32.41 33.67 23.50 36.2 37.6 26.2
1995 . . . . . . . . 91.50 33.50 34.04 23.96 36.6 37.2 26.21996 . . . . . . . . 94.52 34.99 35.01 24.51 37.0 37.0 25.91997 . . . . . . . . 94.97 34.90 35.25 24.81 36.7 37.1 26.11998 . . . . . . . . 95.34 35.14 34.85 25.35 36.9 36.6 26.61999 . . . . . . . . 96.97 36.13 34.74 26.09 37.3 35.8 26.9
2000 . . . . . . . . 99.32 37.75 34.86 26.70 38.0 35.1 26.92001 3 . . . . . . . 96.95 37.60 32.60 26.75 38.8 33.6 27.6
1 Commercial sector fuel use, including that at commercial combined-heat-and-power (CHP) and industrial electricity-onlyplants. 2 Industrial sector fuel use, including that at industrial combined-heat-and-power (CHP) and industrial electricity-onlyplants. 3 Preliminary.
Source: U.S. Energy Information Administration, Annual Energy Review 2000, DOE/EIA-0384(2001). See also<http://www.eia.doe.gov/emeu/aer/pdf/pages/sec24.pdf> (released October 2002).
Energy and Utilities 583
U.S. Census Bureau, Statistical Abstract of the United States: 2003

No. 898. Energy Consumption—End-Use Sector and Selected Sourceby State: 2000
[In trillions of Btu (98,216 represents 98,216,000,000,000,000), except as indicated]
State
Total 1
Percapita 2
(mil.Btu)
End-use sector 3 Source
Resi-dential
Com-mercial
Indus-trial 1
Trans-portation
Petro-leum
Naturalgas
(dry) 4 Coal
Hydroelectric
power 5
Nuclearelectricpower
United States . . 98,216 349 18,178 14,931 38,217 26,889 38,402 23,003 22,580 3,020 7,862
Alabama . . . . . . . 1,977 445 339 219 936 483 581 351 900 59 327Alaska. . . . . . . . . 627 1,001 42 63 310 212 260 334 22 10 -Arizona . . . . . . . . 1,216 237 283 263 206 463 506 207 433 89 317Arkansas . . . . . . . 1,084 405 194 126 466 298 394 259 268 24 122California . . . . . . . 8,519 252 1,318 1,189 2,950 3,063 3,558 2,273 70 436 367
Colorado . . . . . . . 1,200 279 267 247 316 370 455 349 388 15 -Connecticut . . . . . 863 253 243 191 200 230 376 130 36 16 171Delaware . . . . . . . 303 386 54 48 128 73 139 54 50 - -District ofColumbia . . . . . . 166 291 33 102 3 27 34 34 (Z) - -
Florida. . . . . . . . . 3,944 247 989 795 736 1,425 1,971 561 761 1 337
Georgia . . . . . . . . 2,770 338 589 429 883 869 1,040 408 820 24 339Hawaii. . . . . . . . . 265 219 24 26 89 127 222 3 18 1 -Idaho . . . . . . . . . 511 395 95 88 201 127 175 73 14 113 -Illinois . . . . . . . . . 4,418 356 885 719 1,839 975 1,327 1,043 1,027 2 933Indiana . . . . . . . . 2,778 457 463 306 1,342 667 910 591 1,595 6 -
Iowa . . . . . . . . . . 1,099 376 213 154 458 274 417 234 446 9 46Kansas . . . . . . . . 1,036 385 201 168 384 282 407 324 363 (Z) 95Kentucky . . . . . . . 1,868 462 306 214 903 446 713 234 1,002 24 -Louisiana. . . . . . . 3,965 887 322 238 2,505 900 1,681 1,605 253 5 165Maine . . . . . . . . . 561 440 92 61 287 122 251 9 10 78 -
Maryland . . . . . . . 1,520 287 353 325 436 407 553 217 312 18 144Massachusetts . . . 1,723 271 418 329 521 455 677 349 115 15 58Michigan . . . . . . . 3,122 314 734 553 1,013 822 1,062 950 779 13 197Minnesota . . . . . . 1,688 343 346 221 604 517 680 360 374 64 135Mississippi . . . . . . 1,144 402 206 141 432 365 469 294 148 - 112
Missouri. . . . . . . . 1,659 297 425 330 343 561 693 290 689 4 104Montana . . . . . . . 595 659 63 54 369 108 168 68 177 98 -Nebraska. . . . . . . 584 341 129 114 166 175 226 125 207 15 90Nevada . . . . . . . . 633 317 125 96 207 206 230 188 199 25 -New Hampshire . . 329 266 79 59 90 102 181 22 44 25 83
New Jersey . . . . . 2,707 322 530 506 744 927 1,262 614 115 6-1 298New Mexico . . . . . 621 341 92 108 192 229 251 227 306 2 -New York. . . . . . . 4,620 244 1,132 1,253 1,252 984 1,699 1,292 331 315 329North Carolina . . . 2,502 311 567 434 792 709 976 236 786 33 408North Dakota . . . . 365 569 54 43 187 81 120 59 425 23 -
Ohio . . . . . . . . . . 4,002 353 844 622 1,541 994 1,331 917 1,438 6 175Oklahoma . . . . . . 1,401 406 262 195 514 429 522 539 381 22 -Oregon . . . . . . . . 1,080 316 225 182 354 319 378 231 39 390 -Pennsylvania . . . . 4,780 389 854 609 2,305 1,012 1,416 728 1,507 19 769Rhode Island . . . . 250 239 66 51 68 66 97 81 (Z) 10 -
South Carolina . . . 1,477 368 285 201 608 383 481 160 432 5 531South Dakota . . . . 246 326 54 40 67 86 119 40 51 59 -Tennessee . . . . . . 2,026 356 434 316 687 589 720 276 705 58 269Texas . . . . . . . . . 11,589 556 1,333 1,161 6,483 2,611 5,501 4,253 1,548 12 392Utah . . . . . . . . . . 718 322 125 119 251 223 275 173 403 8 -
Vermont . . . . . . . 165 270 44 29 40 52 88 11 (Z) 38 47Virginia . . . . . . . . 2,304 325 497 455 658 694 904 282 505 6-6 295Washington . . . . . 2,174 369 410 321 815 627 868 297 106 795 90West Virginia . . . . 744 411 136 100 321 187 218 154 980 12 -Wisconsin . . . . . . 1,800 336 369 277 731 423 666 396 499 23 120Wyoming . . . . . . . 417 845 36 44 223 114 158 102 506 10 -
- Represents zero. Z Less than 0.5 trillion Btu. 1 U.S. total energy and U.S. industrial sector include 65.4 trillion Btu ofnet imports of coal coke that is not allocated to the states. State and U.S. totals include 81.8 trillion Btu of net imports of electricitygenerated from nonrenewable energy sources. 2 Based on estimated resident population as of July 1. 3 End-use sector datainclude electricity sales and associated electrical system energy losses. 4 Includes supplemental gaseous fuels. 5 Includes netimports of hydroelectricity. A negative number in this column results from pumped storage for which, overall, more electricity isexpended than created to provide electricity during peak demand periods. 6 Minus sign (-) indicates when amount of energyexpended exceeds amount of energy consumed.
Source: U.S. Energy Information Administration, State Energy Data Report, 2000, annual. See also <http://www.eia.doe.gov/emeu/states/sepsum/html/pdf/sumuseall.pdf> (released May 2003).
584 Energy and Utilities
U.S. Census Bureau, Statistical Abstract of the United States: 2003

No. 899. Renewable Energy Consumption Estimates by Type: 1995 to 2001[In quadrillion Btu (7.31 represents 7,310,000,000,000,000. Renewable energy is obtained from sources that are essentially inex-haustible unlike fossil fuels of which there is a finite supply]
Source and sector 1995 1996 1997 1998 1999 2000 2001 1
Consumption, total . . . . . . . . . . . . . (NA) (NA) 7.31 6.77 6.78 6.45 5.67Conventional hydroelectric power 2 . . . . . . . (NA) (NA) 3.88 3.52 3.47 3.08 2.38Geothermal energy 3. . . . . . . . . . . . . . . . . (NA) (NA) 0.33 0.33 0.33 0.32 0.32Biomass 4 . . . . . . . . . . . . . . . . . . . . . . . . (NA) (NA) 3.00 2.82 2.86 2.93 2.85Solar energy 5 . . . . . . . . . . . . . . . . . . . . . (NA) (NA) 0.07 0.07 0.07 0.07 0.06Wind energy 6 . . . . . . . . . . . . . . . . . . . . . (NA) (NA) 0.03 0.03 0.05 0.06 0.06Residential 7 . . . . . . . . . . . . . . . . . . . . . . 0.67 0.67 0.51 0.46 0.49 0.50 0.48
Biomass 4 . . . . . . . . . . . . . . . . . . . . . . 0.60 0.60 0.43 0.39 0.41 0.43 0.41Geothermal 3 . . . . . . . . . . . . . . . . . . . . 0.01 0.01 0.01 0.01 0.01 0.01 0.01Solar 5 8 . . . . . . . . . . . . . . . . . . . . . . . 0.07 0.07 0.07 0.07 0.06 0.06 0.06
Commercial 9. . . . . . . . . . . . . . . . . . . . . . 0.09 0.11 0.11 0.11 0.11 0.11 0.10Biomass 4 . . . . . . . . . . . . . . . . . . . . . . 0.09 0.10 0.11 0.10 0.11 0.10 0.09Geothermal 3 . . . . . . . . . . . . . . . . . . . . 0.01 0.01 0.01 0.01 0.01 0.01 0.01Hydroelectric 2 . . . . . . . . . . . . . . . . . . . (Z) (Z) (Z) (Z) (Z) (Z) (Z)
Industrial 10 . . . . . . . . . . . . . . . . . . . . . . . 1.91 1.97 1.98 1.84 1.83 1.87 1.82Biomass 4 . . . . . . . . . . . . . . . . . . . . . . 1.85 1.91 1.92 1.78 1.78 1.82 1.77Geothermal 3 . . . . . . . . . . . . . . . . . . . . (Z) (Z) (Z) (Z) (Z) (Z) 0.01Hydroelectric 2 . . . . . . . . . . . . . . . . . . . 0.06 0.06 0.06 0.06 0.05 0.04 0.04
Transportation:Alcohol fuels 11 . . . . . . . . . . . . . . . . . . . 0.11 0.08 0.10 0.11 0.11 0.13 0.13
Electric power 12 . . . . . . . . . . . . . . . . . . . 3.89 4.31 4.38 4.03 4.03 3.58 2.99Electric utilities 13 . . . . . . . . . . . . . . . . . 3.17 3.55 3.62 3.28 3.12 2.61 2.04Biomass 4 . . . . . . . . . . . . . . . . . . . . . . 0.02 0.02 0.02 0.02 0.02 0.02 0.02Geothermal 3 . . . . . . . . . . . . . . . . . . . . 0.10 0.11 0.12 0.11 0.04 (Z) (Z)Hydroelectric 2 . . . . . . . . . . . . . . . . . . . 3.06 3.42 3.49 3.15 3.07 2.58 2.02Solar 5 . . . . . . . . . . . . . . . . . . . . . . . . (Z) (Z) (Z) (Z) (Z) (Z) (Z)Wind 6 . . . . . . . . . . . . . . . . . . . . . . . . (Z) (Z) (Z) (Z) (Z) (Z) (Z)
NA Not available. Z Less than 5 trillion Btu. 1 Preliminary 2 Power produced from natural streamflow as regulated byavailable storage. 3 As used at electric power plants, hot water or steam extracted from geothermal reservoirs in the Earth’s crustthat is supplied to steam turbines at electric power plants that drive generators to produce electricity. 4 Organic nonfossil materialof biological origin constituting a renewable energy source. 5 The radiant energy of the sun, which can be converted into otherforms of energy, such as heat or electricity. 6 Energy present in wind motion that can be converted to mechanical energy fordriving pumps, mills, and electric power generators. Wind pushes against sails, vanes, or blades radiating from a central rotatingshaft. 7 Consists of living quarters for private households, but excludes institutional living quarters. 8 Includes small amountsof distributed solar thermal and photovoltaic energy used in the commercial, industrial, and electric power sectors. other private andpublic organizations. Includes institutional living quarter and sewage treatment facilities. 9 Consists of service-providing facilitiesand equipment of businesses, governments, and other private and public organizations. Includes institutional living quarters andsewage treatment facilities. 10 Consists of all facilities and equipment used for producing, processing, or assembling goods.11 Ethanol primarily derived from corn. 12 Consists of electricity only and combined heat and power plants who sell electricity andheat to the public. 13 A corporation or other legal entity aligned with distribution facilities for delivery of electric energy, primarilyfor public use.
Source: U.S. Energy Information Administration, Renewable Energy Annual 2001, Series DOE/EIA-0603(2001). See also<http://tonto.eia.doe.gov/FTPROOT/renewables/060301.pdf> (issued November 2002).
No. 900. Energy Expenditures and Average Fuel Prices by Source and Sector:1970 to 2000
[82,898 represents $82,898,000,000. For definition of Btu, see text, this section. End-use sector and electric utilities excludeexpenditures and prices on energy sources such as hydropower, solar, wind, and geothermal. Also excludes expenditures forreported amounts of energy consumed by the energy industry for production, transportation, and processing operations]
Source and sector 1970 1975 1980 1985 1990 1995 1996 1997 1998 1999 2000
EXPENDITURES(mil. dol.)
Total 1. . . . . . . . . . 82,898 171,802 374,319 437,271 472,214 516,207 562,600 569,011 527,028 560,161 703,188Natural gas . . . . . . . . . . 10,891 20,061 51,061 72,938 64,102 74,150 85,634 91,736 81,628 83,559 115,910Petroleum products . . . . 47,942 103,372 237,628 223,597 235,328 237,110 268,447 267,621 232,367 262,912 362,026
Motor gasoline . . . . . . 31,596 59,446 124,408 118,048 126,558 136,647 148,344 149,668 132,730 149,260 193,999Coal. . . . . . . . . . . . . . . 4,630 13,021 22,607 29,673 28,637 27,632 28,168 28,276 28,139 27,621 28,728Electricity sales . . . . . . . 23,345 50,680 98,095 149,233 176,737 205,932 211,011 213,645 216,928 216,737 231,653
Residential sector 2 . . . . 20,213 36,932 69,438 98,899 109,954 128,330 137,931 138,848 134,977 137,300 155,625Commercial sector 2 . . . . 10,628 22,869 46,932 70,349 78,942 91,644 95,959 100,362 98,298 98,089 113,030Industrial sector 1 . . . . . . 16,678 41,068 94,268 106,835 102,650 108,484 120,549 120,852 109,104 115,755 152,582Transportation sector . . . 35,379 70,933 163,680 161,188 180,668 187,749 208,161 208,950 184,649 209,017 (NA)
Motor gasoline . . . . . . 30,525 57,992 121,809 115,205 123,845 134,641 146,106 147,164 130,709 147,592 (NA)Electric utilities 1 3 . . . . . 4,316 16,396 37,435 42,507 38,287 34,765 36,635 37,765 37,527 36,490 41,375
AVERAGE FUEL PRICES(dol. per mil. Btu)
All sectors 1 . . . . . 1.65 3.33 6.89 8.36 8.25 8.24 8.72 8.78 8.15 8.34 9.85
Residential sector 2 . . . . 2.10 3.81 7.46 10.96 11.94 12.60 12.71 13.28 13.46 13.17 14.28Commercial sector 2 . . . . 1.98 4.08 7.85 11.65 11.95 12.69 12.82 13.09 13.08 12.78 13.93Industrial sector 1 . . . . . . 0.98 2.12 5.15 6.27 5.18 4.32 5.11 4.83 4.24 4.38 5.18Transportation sector . . . 2.31 4.02 8.61 8.26 8.28 8.09 8.76 8.70 7.48 8.19Electric utilities 1 3 . . . . . 0.32 0.96 1.75 1.85 1.46 1.23 1.28 1.30 1.24 1.22 1.43
NA Not available. 1 There are no direct fuel costs for hydroelectric, geothermal, wind, photovoltaic, or solar thermal energy.2 There are no direct fuel costs for geothermal, photovoltaic, or solar thermal energy. 3 Net imports of electricity generated fromnonrenewable energy sources are included in this total but not in any other columns.
Source: U.S. Energy Information Administration, State Energy Price and Expenditure Report, annual. See also<http://www.eia.doe.gov/emeu/states/sepprices/total/pdf/prus.pdf> (accessed May 2003).
Energy and Utilities 585
U.S. Census Bureau, Statistical Abstract of the United States: 2003

No. 901. Energy Expenditures—End-Use Sector and Selected Sourceby State: 2000
[In millions of dollars (703,188 represents $703,188,000,000). End-use sector and electric utilities exclude expenditures on energysources such as hydroelectric, photovoltaic, solar thermal, wind, and geothermal. Also excludes expenditures for reported amountsof energy consumed by the energy industry for production, transportation, and processing operations]
StateTotal 1
End-use sector Source
Resi-dential
Com-mercial Industrial
Transpor-tation
Petroleumproducts
Naturalgas Coal
Electricitysales
U.S. . . . . . 703,188 155,625 113,030 152,582 281,952 362,026 115,910 28,728 231,653
AL . . . . . . . . . . 12,094 2,739 1,574 2,863 4,919 5,787 1,550 1,291 4,592AK. . . . . . . . . . 2,722 354 368 239 1,759 1,992 247 47 532AZ. . . . . . . . . . 10,562 2,520 1,961 1,094 4,987 5,439 1,100 546 4,431AR. . . . . . . . . . 7,326 1,571 784 1,939 3,032 3,809 1,254 383 2,349CA. . . . . . . . . . 71,058 13,305 11,886 13,084 32,784 35,101 13,512 115 22,915
CO . . . . . . . . . 8,690 1,894 1,472 1,189 4,135 4,820 1,458 361 2,508CT. . . . . . . . . . 8,275 2,631 1,699 1,012 2,933 4,314 997 83 2,852DE. . . . . . . . . . 2,072 494 311 454 811 1,121 294 74 682DC . . . . . . . . . 1,530 312 853 18 347 400 338 (Z) 798FL . . . . . . . . . . 31,178 8,220 5,448 3,098 14,412 17,476 2,803 1,240 13,526
GA . . . . . . . . . 19,782 4,876 3,047 3,412 8,447 9,827 2,479 1,269 7,368HI . . . . . . . . . . 2,634 512 500 525 1,097 1,614 47 31 1,341ID . . . . . . . . . . 3,158 599 427 674 1,457 1,838 324 16 953IL . . . . . . . . . . 30,122 7,248 5,257 6,671 10,947 13,259 6,682 1,226 9,293IN . . . . . . . . . . 17,033 3,321 1,898 4,830 6,984 8,426 3,067 1,889 5,022
IA . . . . . . . . . . 8,314 1,807 1,052 2,438 3,017 4,457 1,454 408 2,319KS. . . . . . . . . . 7,392 1,607 1,149 1,983 2,653 3,941 1,359 359 2,242KY. . . . . . . . . . 11,356 1,961 1,201 3,466 4,729 6,495 1,220 1,242 3,248LA . . . . . . . . . . 20,726 2,680 1,856 8,999 7,191 11,753 4,986 327 5,117ME . . . . . . . . . 3,772 1,029 579 732 1,433 2,426 43 22 1,179
MD . . . . . . . . . 11,796 3,134 2,356 1,437 4,869 5,940 1,731 405 4,089MA . . . . . . . . . 15,459 4,242 3,032 2,677 5,508 7,439 2,829 244 4,914MI . . . . . . . . . . 22,704 5,194 3,988 4,462 9,061 11,283 3,975 1,049 7,400MN . . . . . . . . . 12,224 2,684 1,447 2,543 5,549 6,723 1,954 434 3,477MS . . . . . . . . . 7,462 1,628 990 1,545 3,299 4,091 1,148 225 2,606
MO . . . . . . . . . 13,277 3,271 2,121 1,850 6,035 7,142 1,870 644 4,370MT . . . . . . . . . 2,852 429 310 901 1,213 1,481 366 279 717NE. . . . . . . . . . 4,323 886 679 861 1,897 2,376 668 123 1,292NV. . . . . . . . . . 4,834 932 631 907 2,364 2,567 951 253 1,692NH . . . . . . . . . 3,227 919 594 459 1,255 1,906 174 66 1,143
NJ . . . . . . . . . . 21,639 4,902 4,247 3,307 9,183 11,403 3,565 161 6,599NM . . . . . . . . . 4,109 741 731 587 2,050 2,460 571 421 1,219NY. . . . . . . . . . 42,563 12,818 12,854 5,321 11,571 17,030 9,695 487 16,167NC . . . . . . . . . 19,351 5,009 3,023 3,608 7,712 9,884 1,539 1,142 7,767ND . . . . . . . . . 2,077 388 263 615 810 1,187 189 430 509
OH . . . . . . . . . 29,645 7,173 4,754 6,675 11,043 13,359 5,544 2,110 10,499OK . . . . . . . . . 9,337 1,990 1,272 1,916 4,159 4,788 2,344 384 2,897OR . . . . . . . . . 7,644 1,488 1,033 1,422 3,701 4,129 1,135 41 2,460PA. . . . . . . . . . 30,484 8,076 4,796 6,579 11,033 14,115 4,545 2,001 10,175RI . . . . . . . . . . 2,381 690 480 413 798 1,088 544 (Z) 743
SC. . . . . . . . . . 10,176 2,387 1,398 2,318 4,074 4,810 934 613 4,332SD. . . . . . . . . . 1,952 429 264 336 923 1,233 198 54 524TN. . . . . . . . . . 13,792 3,059 2,156 2,618 5,959 6,858 1,505 798 5,313TX. . . . . . . . . . 74,045 11,356 8,257 29,809 24,623 43,536 15,373 1,902 20,328UT. . . . . . . . . . 4,561 799 630 690 2,442 2,725 679 429 1,111
VT. . . . . . . . . . 1,629 501 287 186 655 996 57 (Z) 579VA. . . . . . . . . . 16,791 4,237 2,813 2,305 7,437 9,041 1,867 715 5,722WA . . . . . . . . . 13,180 2,439 1,688 2,378 6,675 7,548 1,476 235 4,131WV . . . . . . . . . 4,434 947 584 1,063 1,841 2,305 595 1,207 1,395WI . . . . . . . . . . 13,059 2,962 1,795 3,269 5,032 6,878 2,415 537 3,691WY . . . . . . . . . 2,242 237 235 663 1,107 1,413 260 413 526
Z Less than $500,000. 1 Includes sources not shown separately. Total expenditures are the sum of purchases for eachsource (including electricity sales) less electric utility purchases of fuel.
Source: U.S. Energy Information Administration, State Energy Price and Expenditure Report, 2000, Series DOE/EIA-0376(00). See also <http://www.eia.doe.gov/emeu/states/sepfuel/html/pdf/fuelte.pdf>.
586 Energy and Utilities
U.S. Census Bureau, Statistical Abstract of the United States: 2003

No. 902. Residential Energy Consumption, Expenditures, and Average Price:1980 to 1997
[9.32 represents 9,320,000,000,000,000 Btu. For period April to March for 1980-1984; January to December for 1987 to 1997.Excludes Alaska and Hawaii in 1980. Covers occupied units only. Excludes household usage of gasoline for transportation and theuse of wood or coal. Based on Residential Energy Consumption Survey; see source. For composition of regions, see inside frontcover. Btu=British thermal unit; see text, this section]
Type of fuel Unit 1980 1984 1987 1990 1993 1997
CONSUMPTION
Total . . . . . . . . . . . . . . . Quad. Btu . . 9.32 9.04 9.13 9.22 10.00 10.25Avg. per household . . . . Mil. Btu . . . . 114 105 101 98 104 102
Natural gas . . . . . . . . . . . . . . Quad. Btu . . 4.97 4.98 4.83 4.86 5.27 5.28Electricity . . . . . . . . . . . . . . . Quad. Btu . . 2.48 2.48 2.76 3.03 3.28 3.54Fuel oil, kerosene . . . . . . . . . . Quad. Btu . . 1.52 1.26 1.22 1.04 1.07 1.07Liquid petroleum gas . . . . . . . . Quad. Btu . . 0.35 0.31 0.32 0.28 0.38 0.36
EXPENDITURES
Total . . . . . . . . . . . . . . . Bil. dol. . . . . 74.80 97.00 97.70 110.20 123.91 135.79Avg. per household . . . . Dollars . . . . . (NA) (NA) 1,080 1,172 1,282 1,338
Natural gas . . . . . . . . . . . . . . Bil. dol. . . . . 19.77 29.78 26.10 27.30 32.04 35.81Electricity . . . . . . . . . . . . . . . Bil. dol. . . . . 40.81 54.48 61.60 71.50 81.08 88.33Fuel oil, kerosene . . . . . . . . . . Bil. dol. . . . . 12.24 9.60 7.20 8.30 6.98 7.61Liquid petroleum gas . . . . . . . . Bil. dol. . . . . 2.80 3.12 2.81 3.14 3.81 4.04
AVERAGE PRICE
Total . . . . . . . . . . . . . . . Dol./mil. Btu. 8.03 10.73 10.70 11.95 12.39 13.25Natural gas . . . . . . . . . . . . . . Dol./mil. Btu . 3.98 5.98 5.40 5.62 6.08 6.78Electricity . . . . . . . . . . . . . . . Dol./mil. Btu . 16.46 21.97 22.32 23.60 24.72 24.97Fuel oil, kerosene . . . . . . . . . . Dol./mil. Btu . 8.05 7.62 5.90 7.98 6.52 15.56Liquid petroleum gas . . . . . . . . Dol./mil. Btu . 8.00 10.06 8.78 11.21 10.03 11.23
NA Not available.
Source: U.S. Energy Information Administration, Residential Energy Consumption Survey: Consumption and Expenditures,annual through 1983 beginning 1985, triennial. For 1987 to 1997, Household Energy Consumption and Expenditures, 1997. Alsosee <http://www.eia.doe.gov/residential.html>.
No. 903. Residential Energy Consumption and Expenditures by Type of Fueland Selected Household Characteristic: 1997
[For period January through December. Quad.=quadrillion (10.25 represents 10,250,000,000,000,000 Btu). See headnote,Table 902]
Characteristic
Consumption (Btu) Expenditures
Total 1
(quad.)
Avg. perhouse-
hold1
(mil.)
Naturalgas
(quad.)
Elec-tricity
(quad.)Fuel oil2(quad.)
Total1(bil.
dol.)
Avg. perhouse-
hold1
(dol.)
Naturalgas (bil.
dol.)
Electric-ity (bil.
dol.)Fuel oil2(bil. dol.)
Total households . . 10.25 101 5.28 3.54 1.01 135.8 1,338 35.81 88.33 7.11
Single family . . . . . . . . . 8.46 115 4.46 2.84 0.83 110.0 1,492 29.97 70.33 6.13Two-to-four unit building . 0.51 92 0.34 0.12 0.05 6.2 1,108 2.36 3.47 0.35Five-or-more unitbuilding. . . . . . . . . . . . 0.77 49 0.32 0.32 0.12 11.9 755 2.46 8.84 0.59
Mobile home . . . . . . . . . 0.50 80 0.16 0.25 (B) 7.6 1,206 1.02 5.68 (B)
Year house built:1949 or earlier . . . . . . 3.48 125 2.05 0.74 0.54 39.6 1,420 14.15 20.03 3.771950 to 1959 . . . . . . . 1.33 106 0.77 0.39 0.15 16.8 1,340 5.30 10.14 1.081960 to 1969 . . . . . . . 1.39 96 0.73 0.47 0.14 18.3 1,264 4.88 11.85 0.971970 to 1979 . . . . . . . 1.71 87 0.74 0.80 0.09 25.3 1,291 4.75 19.03 0.631980 to 1989 . . . . . . . 1.41 82 0.56 0.74 0.06 22.5 1,302 3.83 17.62 0.441990 to 1997 . . . . . . . 0.92 95 0.43 0.41 0.03 13.3 1,369 2.91 9.66 0.22
1997 family income:Less than $10,000 . . . 1.02 76 0.53 0.33 0.11 13.3 2,013 (NA) (NA) (NA)$10,000 to $24,999 . . . 2.54 87 1.30 0.89 0.22 33.7 3,478 (NA) (NA) (NA)$25,000 to $49,999 . . . 3.19 103 1.65 1.08 0.31 41.6 2,670 (NA) (NA) (NA)$50,000 or more . . . . . 3.49 125 1.80 1.24 0.37 47.3 3,434 (NA) (NA) (NA)
B Base figure too small to meet statistical standards for reliability of a derived figure. NA Not available. 1 Includes liquidpetroleum gas, not shown separately. 2 Includes kerosene.
Source: U.S. Energy Information Administration, Household Energy Consumption and Expenditures, 1987, 1990, 1993, and1997. Also see <http://www.eia.doe.gov/emeu/recs/contents.html>.
Energy and Utilities 587
U.S. Census Bureau, Statistical Abstract of the United States: 2003
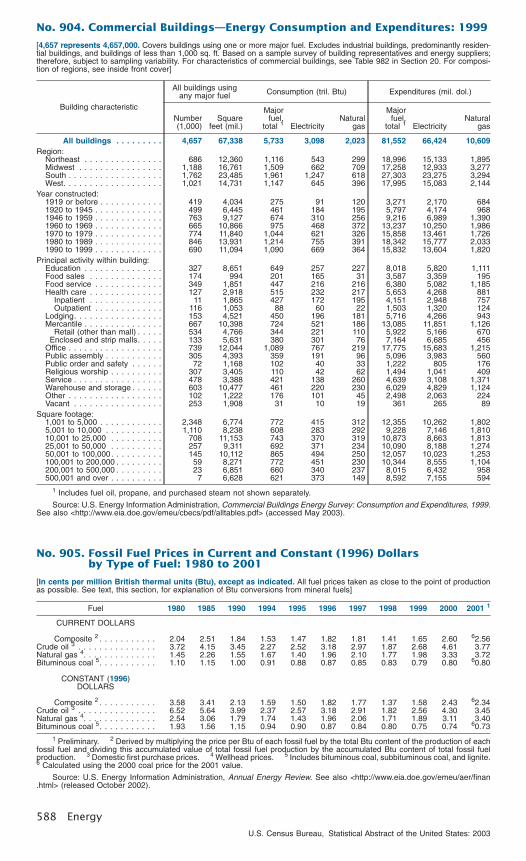
No. 904. Commercial Buildings—Energy Consumption and Expenditures: 1999
[4,657 represents 4,657,000. Covers buildings using one or more major fuel. Excludes industrial buildings, predominantly residen-tial buildings, and buildings of less than 1,000 sq. ft. Based on a sample survey of building representatives and energy suppliers;therefore, subject to sampling variability. For characteristics of commercial buildings, see Table 982 in Section 20. For composi-tion of regions, see inside front cover]
Building characteristic
All buildings usingany major fuel Consumption (tril. Btu) Expenditures (mil. dol.)
Number(1,000)
Squarefeet (mil.)
Majorfuel,
total 1 ElectricityNatural
gas
Majorfuel,
total 1 ElectricityNatural
gas
All buildings . . . . . . . . . 4,657 67,338 5,733 3,098 2,023 81,552 66,424 10,609Region:
Northeast . . . . . . . . . . . . . . . 686 12,360 1,116 543 299 18,996 15,133 1,895Midwest . . . . . . . . . . . . . . . . 1,188 16,761 1,509 662 709 17,258 12,933 3,277South . . . . . . . . . . . . . . . . . . 1,762 23,485 1,961 1,247 618 27,303 23,275 3,294West. . . . . . . . . . . . . . . . . . . 1,021 14,731 1,147 645 396 17,995 15,083 2,144
Year constructed:1919 or before . . . . . . . . . . . . 419 4,034 275 91 120 3,271 2,170 6841920 to 1945 . . . . . . . . . . . . . 499 6,445 461 184 195 5,797 4,174 9681946 to 1959 . . . . . . . . . . . . . 763 9,127 674 310 256 9,216 6,989 1,3901960 to 1969 . . . . . . . . . . . . . 665 10,866 975 468 372 13,237 10,250 1,9861970 to 1979 . . . . . . . . . . . . . 774 11,840 1,044 621 326 15,858 13,461 1,7261980 to 1989 . . . . . . . . . . . . . 846 13,931 1,214 755 391 18,342 15,777 2,0331990 to 1999 . . . . . . . . . . . . . 690 11,094 1,090 669 364 15,832 13,604 1,820
Principal activity within building:Education . . . . . . . . . . . . . . . 327 8,651 649 257 227 8,018 5,820 1,111Food sales . . . . . . . . . . . . . . 174 994 201 165 31 3,587 3,359 195Food service . . . . . . . . . . . . . 349 1,851 447 216 216 6,380 5,082 1,185Health care . . . . . . . . . . . . . . 127 2,918 515 232 217 5,653 4,268 881
Inpatient . . . . . . . . . . . . . . 11 1,865 427 172 195 4,151 2,948 757Outpatient . . . . . . . . . . . . . 116 1,053 88 60 22 1,503 1,320 124
Lodging. . . . . . . . . . . . . . . . . 153 4,521 450 196 181 5,716 4,266 943Mercantile . . . . . . . . . . . . . . . 667 10,398 724 521 186 13,085 11,851 1,126
Retail (other than mall) . . . . . 534 4,766 344 221 110 5,922 5,166 670Enclosed and strip malls. . . . . 133 5,631 380 301 76 7,164 6,685 456
Office . . . . . . . . . . . . . . . . . . 739 12,044 1,089 767 219 17,775 15,683 1,215Public assembly . . . . . . . . . . . 305 4,393 359 191 96 5,096 3,983 560Public order and safety . . . . . . 72 1,168 102 40 33 1,222 805 176Religious worship . . . . . . . . . . 307 3,405 110 42 62 1,494 1,041 409Service . . . . . . . . . . . . . . . . . 478 3,388 421 138 260 4,639 3,108 1,371Warehouse and storage . . . . . . 603 10,477 461 220 230 6,029 4,829 1,124Other . . . . . . . . . . . . . . . . . . 102 1,222 176 101 45 2,498 2,063 224Vacant . . . . . . . . . . . . . . . . . 253 1,908 31 10 19 361 265 89
Square footage:1,001 to 5,000 . . . . . . . . . . . . 2,348 6,774 772 415 312 12,355 10,262 1,8025,001 to 10,000 . . . . . . . . . . . 1,110 8,238 608 283 292 9,228 7,146 1,81010,001 to 25,000 . . . . . . . . . . 708 11,153 743 370 319 10,873 8,663 1,81325,001 to 50,000 . . . . . . . . . . 257 9,311 692 371 234 10,090 8,188 1,27450,001 to 100,000. . . . . . . . . . 145 10,112 865 494 250 12,057 10,023 1,253100,001 to 200,000 . . . . . . . . . 59 8,271 772 451 230 10,344 8,555 1,104200,001 to 500,000 . . . . . . . . . 23 6,851 660 340 237 8,015 6,432 958500,001 and over . . . . . . . . . . 7 6,628 621 373 149 8,592 7,155 594
1 Includes fuel oil, propane, and purchased steam not shown separately.
Source: U.S. Energy Information Administration, Commercial Buildings Energy Survey: Consumption and Expenditures, 1999.See also <http://www.eia.doe.gov/emeu/cbecs/pdf/alltables.pdf> (accessed May 2003).
No. 905. Fossil Fuel Prices in Current and Constant (1996) Dollarsby Type of Fuel: 1980 to 2001
[In cents per million British thermal units (Btu), except as indicated. All fuel prices taken as close to the point of productionas possible. See text, this section, for explanation of Btu conversions from mineral fuels]
Fuel 1980 1985 1990 1994 1995 1996 1997 1998 1999 2000 2001 1
CURRENT DOLLARS
Composite 2 . . . . . . . . . . . 2.04 2.51 1.84 1.53 1.47 1.82 1.81 1.41 1.65 2.60 62.56Crude oil 3 . . . . . . . . . . . . . . . 3.72 4.15 3.45 2.27 2.52 3.18 2.97 1.87 2.68 4.61 3.77Natural gas 4. . . . . . . . . . . . . . 1.45 2.26 1.55 1.67 1.40 1.96 2.10 1.77 1.98 3.33 3.72Bituminous coal 5. . . . . . . . . . . 1.10 1.15 1.00 0.91 0.88 0.87 0.85 0.83 0.79 0.80 60.80
CONSTANT (1996)DOLLARS
Composite 2 . . . . . . . . . . . 3.58 3.41 2.13 1.59 1.50 1.82 1.77 1.37 1.58 2.43 62.34Crude oil 3 . . . . . . . . . . . . . . . 6.52 5.64 3.99 2.37 2.57 3.18 2.91 1.82 2.56 4.30 3.45Natural gas 4. . . . . . . . . . . . . . 2.54 3.06 1.79 1.74 1.43 1.96 2.06 1.71 1.89 3.11 3.40Bituminous coal 5. . . . . . . . . . . 1.93 1.56 1.15 0.94 0.90 0.87 0.84 0.80 0.75 0.74 60.73
1 Preliminary. 2 Derived by multiplying the price per Btu of each fossil fuel by the total Btu content of the production of eachfossil fuel and dividing this accumulated value of total fossil fuel production by the accumulated Btu content of total fossil fuelproduction. 3 Domestic first purchase prices. 4 Wellhead prices. 5 Includes bituminous coal, subbituminous coal, and lignite.6 Calculated using the 2000 coal price for the 2001 value.
Source: U.S. Energy Information Administration, Annual Energy Review. See also <http://www.eia.doe.gov/emeu/aer/finan.html> (released October 2002).
588 Energy
U.S. Census Bureau, Statistical Abstract of the United States: 2003

No. 906. Manufacturing Energy Consumption for all Purposes by Type of Fueland Major Industry Group: 1998
[In trillions of Btu (23,783 represents 23,783,000,000,000). Estimates represented consumption of energy for all purposes (FirstUse) represents unduplicated demand for energy by manufacturers. ‘‘First Use’’ is all energy produced offsite, all energy producedonsite, either directly from captive mines and wells or as byproducts from nonenergy materials (such as sawdust from furniture pro-duction, hydrogen from electrolysis of brine, nut shells from peanut processing). Based on the Manufacturing Energy Consump-tion Survey and subject to sampling variability]
Industry NAICS 1
codeTotal
Netelec-
tricity 2
Residualfuel
oil
Distil-latefueloil 3
Naturalgas 4
LPGand
NGL 5 Coal
Cokeand
breeze Other 6
All industries, total . . . . . . (X) 23,783 3,035 406 142 7,426 1,882 1,814 461 8,967
Food and kindred products . . . . . 311 1,044 213 14 16 568 5 129 2 97Beverage and tobacco products . . 312 108 24 2 2 45 1 29 - 4Textile mills. . . . . . . . . . . . . . . . 313 256 102 12 4 103 2 20 - 14Textile product mills . . . . . . . . . . 314 50 18 3 (S) 25 (Z) 3 - (Z)Apparel . . . . . . . . . . . . . . . . . . 315 48 18 2 1 23 1 1 - 4Leather and allied products . . . . . 316 8 3 (Z) (Z) 4 (Z) - - (Z)Wood products . . . . . . . . . . . . . 321 509 72 1 13 73 4 2 - 343Paper . . . . . . . . . . . . . . . . . . . 322 2,733 240 151 9 586 5 277 - 1,465Printing and related support . . . . . 323 98 51 (Z) (Z) 44 1 (Z) - 2Petroleum and coal products . . . . 324 7,320 126 72 28 1,007 39 12 - 6,082
Petroleum refineries . . . . . . . . 324110 7,130 118 70 4 948 33 (Z) - 5,957Chemicals 7 . . . . . . . . . . . . . . . 325 6,064 577 98 10 2,709 1,796 300 7 677
Petrochemicals . . . . . . . . . . . 325110 723 8 - (Z) (D) 222 (D) - (D)Other basic organic chemicals . 325199 1,740 73 3 (D) 782 639 (D) - 201Plastics materials and resins . . 325211 1,067 66 2 1 259 675 17 (Z) 60Nitrogenous fertilizers . . . . . . . 325311 592 13 - (Z) 572 (Z) - - 6
Plastics and rubber products . . . . 326 328 183 5 1 126 5 3 - 5Nonmetallic mineral products . . . . 327 979 134 4 17 444 3 284 11 82Primary metals 7 . . . . . . . . . . . . 331 2,560 545 30 9 933 3 715 437 82
Iron and steel mills . . . . . . . . . 331111 1,584 158 29 5 494 (Z) 680 388 22Alumina and aluminum . . . . . . 3313 490 246 (Z) 1 189 1 2 2 49Primary aluminum. . . . . . . . . . 331312 254 196 (Z) (Z) (D) (Z) (D) - 41
Fabricated metal products . . . . . . 332 445 176 2 6 241 5 3 3 10Machinery . . . . . . . . . . . . . . . . 333 217 96 1 3 99 3 6 - 7Computer and electronic products. 334 205 137 1 1 64 (Z) (Z) - 1Electrical equipment, appliances,and component . . . . . . . . . . . . 335 143 55 1 1 53 2 1 (Z) 30
Transportation equipment . . . . . . 336 492 195 5 15 212 4 29 1 31Furniture and related products . . . 337 88 30 (Z) 1 27 1 2 - 28Miscellaneous . . . . . . . . . . . . . . 339 89 40 1 2 40 1 (Z) - 4
- Represents or rounds to zero. D Withheld to avoid disclosing data for individual establishments. S Withheld becauseRelative Standard Error is greater than 50 percent. X Not applicable. Z Less than 0.5 trillion Btu. 1 North American IndustryClassification System, 1997; see text, Section 15. 2 Net electricity is obtained by aggregating purchases, transfers in, andgeneration from noncombustible renewable resources minus quantities sold and transferred out. Excludes electricity inputs fromonsite cogeneration or generation from combustible fuels because that energy has already been included as generating fuel (forexample, coal). 3 Includes Nos. 1, 2, and 4 fuel oils and Nos. 1, 2, and 4 diesel fuels. 4 Includes natural gas obtained fromutilities, transmission pipelines, and any other supplier such as brokers and producers. 5 Liquid petroleum gas and natural gasliquids. 6 Includes net steam, and other energy that respondents indicated was used to produce heat and power or asfeedstock/raw material inputs. 7 Includes types not shown separately.
Source: U.S. Energy Information Administration, <http://www.eia.doe.gov/emeu/mecs/mecs98/datatables/contents.html>(accessed 22 January 2001).
No. 907. Energy Prices: 1980 to 2001
Product Unit 1980 1990 1995 1996 1997 1998 1999 2000 2001
Crude oil domestic first purchaseprice:Nominal . . . . . . . . . . . . . . . . Dol./bbl . . . . . . . 21.6 20.0 14.6 18.5 17.2 10.9 15.6 26.7 21.9Real 1 . . . . . . . . . . . . . . . . . . Dol./bbl . . . . . . . 37.9 23.2 14.9 18.5 16.9 10.5 14.9 25.0 20.0
Motor gasoline. . . . . . . . . . . . . . Cents/gal. . . . . . 122.0 122.0 121.0 129.0 129.0 112.0 122.0 156.0 153.0Leaded regular . . . . . . . . . . . . Cents/gal. . . . . . 119.0 115.0 (NA) (NA) (NA) (NA) (NA) (NA) (NA)Unleaded regular . . . . . . . . . . Cents/gal. . . . . . 125.0 116.0 115.0 123.0 123.0 106.0 117.0 151.0 146.0Premium . . . . . . . . . . . . . . . . Cents/gal. . . . . . (NA) 135.0 134.0 141.0 142.0 125.0 136.0 169.0 166.0
Natural gas, residential . . . . . . . . Dol/1,000 cu. ft. . 3.7 5.8 6.1 6.3 6.9 6.8 6.7 7.8 10.0Heating oil, residential . . . . . . . . . Cents/gal. . . . . . 97.4 106.3 86.7 98.9 98.4 85.2 87.6 131.1 124.9Coal, all . . . . . . . . . . . . . . . . . . Dol/short tons. . . 24.7 21.8 18.8 18.5 18.1 17.7 16.6 16.8 (NA)Electricity, total. . . . . . . . . . . . . . Cents/kWh. . . . . 4.7 6.6 6.9 6.9 6.9 6.7 6.7 6.8 7.3Uranium, domestic purchases. . . . Dol/lb . . . . . . . . (NA) 15.7 11.1 13.8 12.9 12.3 11.9 11.5 10.5
NA Not available. 1 In chained (1996) dollars, calculated by using gross domestic product implicit price deflators.
Source: U.S. Energy Information Administration, Annual Energy Review, 2001. Also see <http://www.eia.doe.gov/emeu/aer/contents.html> (released October 2002).
Energy and Utilities 589
U.S. Census Bureau, Statistical Abstract of the United States: 2003

No. 908. Energy Imports and Exports by Type of Fuel: 1980 to 2001[In quadrillion of Btu (12.25 represents 12,250,000,000,000,000 Btu). For definition of Btu, see text, this section]
Type of fuel 1980 1985 1990 1994 1995 1996 1997 1998 1999 2000 2001 1
Net imports, total 2 . . . . 12.25 7.87 14.09 18.65 18.03 19.37 20.94 22.47 23.75 25.21 26.03Coal . . . . . . . . . . . . . -2.39 -2.39 -2.70 -1.66 -2.08 -2.17 -2.01 -1.87 -1.30 -1.21 -0.77Natural gas (dry). . . . . 0.96 0.90 1.46 2.52 2.74 2.85 2.90 3.06 3.50 3.62 3.72Petroleum 3 . . . . . . . . 13.50 8.95 15.29 17.26 16.89 18.23 19.64 20.94 21.18 22.38 22.82Other 4 . . . . . . . . . . . 0.18 0.41 0.03 0.53 0.47 0.46 0.41 0.35 0.37 0.42 0.25
Imports, total . . . . . . . . . 15.97 12.10 18.95 22.73 22.57 24.01 25.51 26.85 27.54 29.31 29.95Coal . . . . . . . . . . . . . 0.03 0.05 0.07 0.22 0.24 0.20 0.19 0.22 0.23 0.31 0.49Natural gas (dry). . . . . 1.01 0.95 1.55 2.68 2.90 3.00 3.06 3.22 3.66 3.87 4.12Petroleum 3 . . . . . . . . 14.66 10.61 17.12 19.24 18.88 20.29 21.74 22.91 23.13 24.53 24.88Other 4 . . . . . . . . . . . 0.28 0.49 0.22 0.58 0.55 0.52 0.52 0.50 0.52 0.59 0.45
Exports, total . . . . . . . . . 3.72 4.23 4.87 4.08 4.54 4.64 4.56 4.37 3.80 4.09 3.92Coal . . . . . . . . . . . . . 2.42 2.44 2.77 1.88 2.32 2.37 2.19 2.09 1.53 1.53 1.27Natural gas (dry). . . . . 0.05 0.06 0.09 0.16 0.16 0.16 0.16 0.16 0.16 0.25 0.40Petroleum 3 . . . . . . . . 1.16 1.66 1.82 1.99 1.99 2.06 2.10 1.97 1.95 2.15 2.06Other 4 . . . . . . . . . . . 0.09 0.08 0.18 0.05 0.07 0.06 0.11 0.15 0.15 0.17 0.20
1 Preliminary. 2 Net imports equals imports minus exports. Minus sign (-) denotes an excess of exports over imports.3 Includes imports into the Strategic Petroleum Reserve, which began in 1977. 4 Coal coke and small amounts of electricitytransmitted across U.S. borders with Canada and Mexico.
Source: U.S. Energy Information Administration, Annual Energy Review. See also <http://www.eia.doe.gov/emeu/aer/pdf/pages/sec1-45.pdf> (released November 2002).
No. 909. U.S. Foreign Trade in Selected Mineral Fuels: 1980 to 2001[985 represents 985,000,000,000 cu. ft. Minus sign (-) indicates an excess of imports over exports]
Mineral fuel Unit 1980 1985 1990 1995 1997 1998 1999 2000 2001 1
Natural gas:Imports 2 . . . . . . . . Bil. cu. ft.. . . . 985 950 1,532 2,841 2,994 3,152 3,586 3,782 4,029Exports . . . . . . . . . Bil. cu. ft.. . . . 49 55 86 154 157 159 163 244 394Net trade . . . . . . . . Bil. cu. ft.. . . . -936 -894 -1,447 -2,687 -2,837 -2,993 -3,422 -3,538 -3,635
Crude oil:Imports 3 . . . . . . . . Mil. bbl.. . . . . 1,921 1,168 2,151 2,639 3,002 3,178 3,187 3,311 3,338Exports . . . . . . . . . Mil. bbl.. . . . . 105 74 40 35 39 40 43 18 8Net trade . . . . . . . . Mil. bbl.. . . . . -1,816 -1,094 -2,112 -2,604 -2,963 -3,138 -3,144 -3,293 -3,330
Petroleum products:Imports . . . . . . . . . Mil. bbl.. . . . . 601 681 775 586 707 731 775 872 903Exports . . . . . . . . . Mil. bbl.. . . . . 94 211 273 312 327 305 300 361 350Net trade . . . . . . . . Mil. bbl.. . . . . -507 -470 -502 -274 -380 -426 -475 -511 -553
Coal:Imports . . . . . . . . . Mil. sh. tons. . 1.2 2.0 2.7 9.5 7.5 8.7 9.1 12.5 19.8Exports . . . . . . . . . Mil. sh. tons. . 91.7 92.7 105.8 88.5 83.5 78.0 58.5 58.5 48.7Net trade . . . . . . . . Mil. sh. tons. . 90.5 90.7 103.1 79.0 76.0 69.3 49.4 46.0 28.9
1 Preliminary. 2 Included in the total, but not shown separately, are liquified natural gas imports from Indonesia in 2000,Malaysia in 1999, and Oman in 2000 and 2001. 3 Beginning 1980, includes strategic petroleum reserve imports.
Source: U.S. Energy InformationAdministration, Annual Energy Review. See also <http://www.eia.doe.gov/eneu/aer/contents.html>(accessed August 4, 2003).
No. 910. Crude Oil Imports Into the U.S. by Country of Origin: 1980 to 2002[In millions of barrels (1,921 represents 1,921,000,000). Barrels contain 42 gallons]
Country of origin 1980 1985 1990 1995 1996 1997 1998 1999 2000 2001 2002
Total imports . . . 1,921 1,168 2,151 2,639 2,740 3,002 3,178 3,187 3,311 3,405 3,336OPEC,1 2 3 4 total. . . . . . 1,410 479 1,283 1,219 1,255 1,378 1,522 1,543 1,659 1,770 1,490
Algeria . . . . . . . . . . . 166 31 23 10 3 2 4 9 (Z) 4 11Iraq . . . . . . . . . . . . . 10 17 188 - (Z) 32 123 265 226 290 168Kuwait 5 . . . . . . . . . . 10 1 29 78 86 92 110 90 96 87 79Saudi Arabia 5 . . . . . . 456 48 436 460 456 472 512 506 556 588 554United Arab Emirates. . 63 13 3 2 1 - 1 - 1 8 4Indonesia . . . . . . . . . 115 107 36 23 16 19 18 26 13 15 18Nigeria . . . . . . . . . . . 307 102 286 227 217 251 251 227 319 307 215Venezuela . . . . . . . . . 57 112 243 420 476 509 503 420 446 471 438
Non-OPEC6, total . . . . . . 511 689 869 1,419 1,486 1,624 1,656 1,643 1,652 1,635 1,846Angola . . . . . . . . . . . (NA) (NA) 86 131 126 155 170 130 108 117 117Canada. . . . . . . . . . . 73 171 235 380 392 437 462 430 492 495 527Colombia. . . . . . . . . . (NA) (NA) 51 76 82 99 127 165 116 95 86Ecuador 2 . . . . . . . . . 6 20 (2) 35 35 42 36 42 46 41 37Gabon 3 . . . . . . . . . . 9 19 (3) 84 67 84 76 61 52 51 52Mexico . . . . . . . . . . . 185 261 251 375 441 496 482 458 479 509 548Norway . . . . . . . . . . . 53 11 35 94 107 105 81 96 110 103 127Trinidad and Tobago . . 42 36 28 23 21 20 19 15 20 19 25United Kingdom . . . . . 63 101 57 124 79 62 59 104 106 89 148
- Represents zero. NA Not available. Z Represents less than half the unit of measure. 1 OPEC (Organization ofPetroleum Exporting Countries)includes the Persian Gulf nations shown below, except Bahrain, which is not a member of OPEC,and also includes nations shown under ‘‘Other OPEC.’’ 2 Ecuador withdrew from OPEC on Dec. 31, 1992; therefore, it is includedunder OPEC for the period 1973 to 1992. 3 Gabon withdrew from OPEC on Dec. 31, 1994; therefore, it is included under OPECfor the period 1973 to 1994. 4 Excludes petroleum imported into the United States indirectly from members of the Organizationof Petroleum Exporting Countries (OPEC), primarily from Caribbean and West European areas, as petroleum products that wererefined from crude oil produced by OPEC. 5 Imports from the Neutral Zone between Kuwait and Saudi Arabia are included inSaudi Arabia. 6 Includes petroleum imported into the United States indirectly from member of OPEC, primarily from Caribbeanand West European areas, as petroleum products that were refined from crude oil produced by OPEC.
Source: U.S. Energy Information Administration, Petroleum Supply Annual, Vol. I. See also <http://www.eia.doe.gov/pub/oilgas/petroleum/datapublications/petroleumsupplyannual/psavolume1/current/pdf/tables03>.
590 Energy and Utilities
U.S. Census Bureau, Statistical Abstract of the United States: 2003

No. 911. Crude Oil and Refined Products—Summary: 1980 to 2002
[13,481 represents 13,481,000 bbl. Barrels of 42 gallons. Data are averages]
Year
Crude oil(1,000 bbl. per day)
Refined oil products(1,000 bbl. per day)
Total oilimports 2
(1,000bbl. per
day)
Crude oil stocks3
(mil. bbl.)
Input torefiner-
ies
Domesticproduc-
tion
Imports
ExportsDomesticdemand Imports Exports Total
StrategicreserveTotal 1
Strategicreserve
1980 . . . . 13,481 8,597 5,263 44 287 17,056 1,646 258 6,909 4466 1081985 . . . . 12,002 8,971 3,201 118 204 15,726 1,866 577 5,067 814 493
1990 . . . . 13,409 7,355 5,894 27 109 16,988 2,123 748 8,018 908 5861992 . . . . 13,411 7,171 6,083 10 89 17,033 1,805 861 7,888 893 5751993 . . . . 13,613 6,847 6,787 15 98 17,237 1,833 904 8,620 922 5871994 . . . . 13,866 6,662 7,063 12 99 17,718 1,933 843 8,996 929 592
1995 . . . . 13,973 6,560 7,230 - 95 17,725 1,605 855 8,835 895 5921996 . . . . 14,195 6,465 7,508 - 110 18,309 1,971 871 9,478 850 5661997 . . . . 14,662 6,452 8,225 - 108 18,620 1,936 896 10,162 868 5631998 . . . . 14,889 6,252 8,706 - 110 18,917 2,002 835 10,708 895 5711999 . . . . 14,804 5,881 8,731 8 118 19,519 2,122 822 10,852 852 5672000 . . . . 15,067 5,822 9,071 8 50 19,701 2,389 990 11,459 826 5412001 . . . . 15,128 5,801 9,328 11 20 19,649 2,543 951 11,871 862 5502002 . . . . 14,947 5,746 9,140 16 9 19,761 2,390 975 11,530 877 599
- Represents zero. 1 Includes Strategic Petroleum Reserve. 2 Crude oil (including Strategic Petroleum Reserve imports)plus refined products. 3 End of year. 4 Stocks of Alaskan crude oil in transit are included from January 1985 forward.
Source: U.S. Energy Information Administration, Monthly Energy Review, July 2003 issue.
No. 912. Petroleum and Coal Products Corporations—Sales, Net Profit, andProfit Per Dollar of Sales: 1990 to 2002
[318.5 represents $318,500,000,000. Represents SIC group 29 (NAICS group 324). Through 2000 based on Standard IndustrialClassification code; beginning 2001 based on North American Industry Classification System, 1997. Profit rates are averages ofquarterly figures at annual rates. Beginning 1990, excludes estimates for corporations with less than $250,000 in assets]
Item Unit 1990 1993 1994 1995 1996 1997 1998 1999 2000 2001 2002
Sales . . . . . . . . . . . . . . . . . Bil. dol . . 318.5 266.1 268.2 283.1 323.5 320.0 250.4 277.0 455.2 472.5 484.9Net profit:
Before income taxes . . . . . Bil. dol . . 23.1 14.9 17.2 16.5 32.6 36.8 9.7 20.3 55.5 47.2 24.6After income taxes . . . . . . Bil. dol . . 17.8 13.0 14.9 13.9 26.6 29.4 8.3 17.2 42.6 35.8 20.8
Depreciation1. . . . . . . . . . . . Bil. dol . . 18.7 17.4 17.1 16.7 15.9 15.6 14.7 13.5 15.5 17.2 17.7Profits per dollar of sales:
Before income taxes . . . . . Cents . . 7.3 5.6 6.3 5.8 10.1 11.5 3.5 7.1 12.2 9.7 5.2After income taxes . . . . . . Cents . . 5.6 4.9 5.5 4.9 8.2 9.2 3.1 6.0 9.4 7.4 4.3
Profits on stockholders’equity:Before income taxes . . . . . Percent . 16.4 11.8 13.2 12.6 23.2 23.5 6.0 13.0 29.4 21.8 1.5After income taxes . . . . . . Percent . 12.7 10.2 11.4 10.6 18.9 18.9 5.2 11.0 22.6 16.5 8.9
1 Includes depletion and accelerated amortization of emergency facilities.Source: U.S. Census Bureau, Quarterly Financial Report for Manufacturing, Mining and Trade Corporations.
No. 913. Major Petroleum Companies—Financial Summary: 1980 to 2002
[32.9 represents $32,900,000,000. Data represent a composite of approximately 42 major worldwide petroleum companiesaggregated on a consolidated total company basis]
Item 1980 1985 1990 1995 1997 1998 1999 2000 2001 2002
FINANCIAL DATA (bil. dol.)
Net income . . . . . . . . . . . . . . . . . . . . . . 32.9 19.4 26.8 24.3 40.0 14.5 35.3 76.4 62.0 44.3Depreciation, depletion, etc . . . . . . . . . . . 32.5 53.0 38.7 43.1 46.0 61.0 45.0 53.3 63.4 61.2Cash flow 1 . . . . . . . . . . . . . . . . . . . . . . 65.4 72.4 65.5 67.4 86.0 75.5 75.3 129.7 140.0 118.0Dividends paid. . . . . . . . . . . . . . . . . . . . 9.3 12.0 15.9 17.6 20.1 20.9 21.7 23.0 29.7 27.3Net internal funds available for investmentor debt repayment 2 . . . . . . . . . . . . . . . 56.1 60.4 49.6 49.8 65.9 54.6 54.1 106.7 110.4 90.7
Capital and exploratory expenditures . . . . . 62.1 58.3 59.6 59.8 75.3 83.9 67.7 72.8 99.9 88.7Long-term capitalization. . . . . . . . . . . . . . 211.4 272.1 300.0 304.3 372.5 382.0 456.2 516.9 543.8 548.1
Long-term debt . . . . . . . . . . . . . . . . . . 49.8 93.5 90.4 85.4 86.1 103.9 105.4 112.8 143.2 153.5Preferred stock. . . . . . . . . . . . . . . . . . 2.0 3.3 5.2 5.7 5.1 3.9 4.8 5.4 6.7 2.5Common stock and retained earnings 3. . 159.6 175.3 204.4 213.2 281.3 274.2 346.0 398.7 393.9 392.1
Excess of expenditures over cashincome 4 . . . . . . . . . . . . . . . . . . . . . . . 6.0 -2.1 10.0 10.0 9.4 29.3 13.6 -33.9 -10.5 -2.0
RATIOS 5 (percent)
Long-term debt to long-term capitalization. . 23.6 34.4 30.1 28.1 23.1 27.2 23.1 21.8 26.7 28.3Net income to total average capital . . . . . . 17.0 7.0 9.1 8.1 11.3 3.8 8.9 15.7 12.3 8.7Net income to average common equity. . . . 22.5 10.8 13.5 11.6 15.1 5.2 12.4 20.5 16.3 11.5
1 Generally represents internally-generated funds from operations. Sum of net income and noncash charges such asdepreciation, depletion, and amortization. 2 Cash flow minus dividends paid. 3 Includes common stock, capital surplus, andearned surplus accounts after adjustments. 4 Capital and exploratory expenditures plus dividends paid minus cash flow.5 Represents approximate year-to-year comparisons because of changes in the makeup of the group due to mergers and othercorporate changes.
Source: Carl H. Pforzheimer & Co., New York, NY, Comparative Oil Company Statements, annual.
Energy and Utilities 591
U.S. Census Bureau, Statistical Abstract of the United States: 2003
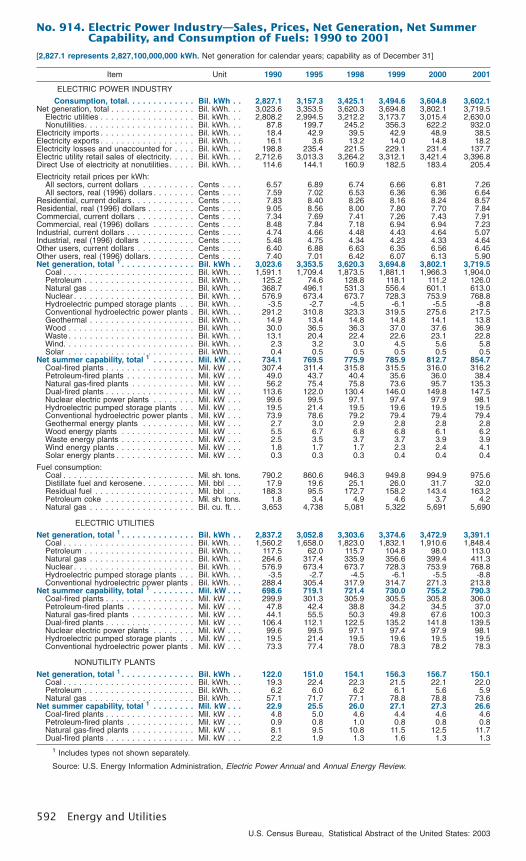
No. 914. Electric Power Industry—Sales, Prices, Net Generation, Net SummerCapability, and Consumption of Fuels: 1990 to 2001
[2,827.1 represents 2,827,100,000,000 kWh. Net generation for calendar years; capability as of December 31]
Item Unit 1990 1995 1998 1999 2000 2001
ELECTRIC POWER INDUSTRY
Consumption, total. . . . . . . . . . . . . Bil. kWh . . 2,827.1 3,157.3 3,425.1 3,494.6 3,604.8 3,602.1Net generation, total . . . . . . . . . . . . . . . . Bil. kWh. . . 3,023.6 3,353.5 3,620.3 3,694.8 3,802.1 3,719.5
Electric utilities . . . . . . . . . . . . . . . . . . Bil. kWh. . . 2,808.2 2,994.5 3,212.2 3,173.7 3,015.4 2,630.0Nonutilities. . . . . . . . . . . . . . . . . . . . . Bil. kWh. . . 87.8 199.7 245.2 356.3 622.2 932.0
Electricity imports . . . . . . . . . . . . . . . . . . Bil. kWh. . . 18.4 42.9 39.5 42.9 48.9 38.5Electricity exports . . . . . . . . . . . . . . . . . . Bil. kWh. . . 16.1 3.6 13.2 14.0 14.8 18.2Electricity losses and unaccounted for . . . . Bil. kWh. . . 198.8 235.4 221.5 229.1 231.4 137.7Electric utility retail sales of electricity. . . . . Bil. kWh. . . 2,712.6 3,013.3 3,264.2 3,312.1 3,421.4 3,396.8Direct Use of electricity at nonutilities . . . . . Bil. kWh. . . 114.6 144.1 160.9 182.5 183.4 205.4
Electricity retail prices per kWh:All sectors, current dollars . . . . . . . . . . Cents . . . . 6.57 6.89 6.74 6.66 6.81 7.26All sectors, real (1996) dollars . . . . . . . . Cents . . . . 7.59 7.02 6.53 6.36 6.36 6.64
Residential, current dollars . . . . . . . . . . . . Cents . . . . 7.83 8.40 8.26 8.16 8.24 8.57Residential, real (1996) dollars . . . . . . . . . Cents . . . . 9.05 8.56 8.00 7.80 7.70 7.84Commercial, current dollars . . . . . . . . . . . Cents . . . . 7.34 7.69 7.41 7.26 7.43 7.91Commercial, real (1996) dollars . . . . . . . . Cents . . . . 8.48 7.84 7.18 6.94 6.94 7.23Industrial, current dollars . . . . . . . . . . . . . Cents . . . . 4.74 4.66 4.48 4.43 4.64 5.07Industrial, real (1996) dollars . . . . . . . . . . Cents . . . . 5.48 4.75 4.34 4.23 4.33 4.64Other users, current dollars . . . . . . . . . . . Cents . . . . 6.40 6.88 6.63 6.35 6.56 6.45Other users, real (1996) dollars. . . . . . . . . Cents . . . . 7.40 7.01 6.42 6.07 6.13 5.90Net generation, total 1 . . . . . . . . . . . . . . Bil. kWh . . 3,023.6 3,353.5 3,620.3 3,694.8 3,802.1 3,719.5
Coal . . . . . . . . . . . . . . . . . . . . . . . . . Bil. kWh. . . 1,591.1 1,709.4 1,873.5 1,881.1 1,966.3 1,904.0Petroleum . . . . . . . . . . . . . . . . . . . . . Bil. kWh. . . 125.2 74.6 128.8 118.1 111.2 126.0Natural gas . . . . . . . . . . . . . . . . . . . . Bil. kWh. . . 368.7 496.1 531.3 556.4 601.1 613.0Nuclear . . . . . . . . . . . . . . . . . . . . . . . Bil. kWh. . . 576.9 673.4 673.7 728.3 753.9 768.8Hydroelectric pumped storage plants . . . Bil. kWh. . . -3.5 -2.7 -4.5 -6.1 -5.5 -8.8Conventional hydroelectric power plants . Bil. kWh. . . 291.2 310.8 323.3 319.5 275.6 217.5Geothermal . . . . . . . . . . . . . . . . . . . . Bil. kWh. . . 14.9 13.4 14.8 14.8 14.1 13.8Wood . . . . . . . . . . . . . . . . . . . . . . . . Bil. kWh. . . 30.0 36.5 36.3 37.0 37.6 36.9Waste . . . . . . . . . . . . . . . . . . . . . . . . Bil. kWh. . . 13.1 20.4 22.4 22.6 23.1 22.8Wind. . . . . . . . . . . . . . . . . . . . . . . . . Bil. kWh. . . 2.3 3.2 3.0 4.5 5.6 5.8Solar . . . . . . . . . . . . . . . . . . . . . . . . Bil. kWh. . . 0.4 0.5 0.5 0.5 0.5 0.5
Net summer capability, total 1 . . . . . . . . Mil. kW . . . 734.1 769.5 775.9 785.9 812.7 854.7Coal-fired plants . . . . . . . . . . . . . . . . . Mil. kW . . . 307.4 311.4 315.8 315.5 316.0 316.2Petroleum-fired plants . . . . . . . . . . . . . Mil. kW . . . 49.0 43.7 40.4 35.6 36.0 38.4Natural gas-fired plants . . . . . . . . . . . . Mil. kW . . . 56.2 75.4 75.8 73.6 95.7 135.3Dual-fired plants . . . . . . . . . . . . . . . . . Mil. kW . . . 113.6 122.0 130.4 146.0 149.8 147.5Nuclear electric power plants . . . . . . . . Mil. kW . . . 99.6 99.5 97.1 97.4 97.9 98.1Hydroelectric pumped storage plants . . . Mil. kW . . . 19.5 21.4 19.5 19.6 19.5 19.5Conventional hydroelectric power plants . Mil. kW . . . 73.9 78.6 79.2 79.4 79.4 79.4Geothermal energy plants . . . . . . . . . . Mil. kW . . . 2.7 3.0 2.9 2.8 2.8 2.8Wood energy plants . . . . . . . . . . . . . . Mil. kW . . . 5.5 6.7 6.8 6.8 6.1 6.2Waste energy plants . . . . . . . . . . . . . . Mil. kW . . . 2.5 3.5 3.7 3.7 3.9 3.9Wind energy plants . . . . . . . . . . . . . . . Mil. kW . . . 1.8 1.7 1.7 2.3 2.4 4.1Solar energy plants . . . . . . . . . . . . . . . Mil. kW . . . 0.3 0.3 0.3 0.4 0.4 0.4
Fuel consumption:Coal . . . . . . . . . . . . . . . . . . . . . . . . . Mil. sh. tons. 790.2 860.6 946.3 949.8 994.9 975.6Distillate fuel and kerosene. . . . . . . . . . Mil. bbl . . . 17.9 19.6 25.1 26.0 31.7 32.0Residual fuel . . . . . . . . . . . . . . . . . . . Mil. bbl . . . 188.3 95.5 172.7 158.2 143.4 163.2Petroleum coke . . . . . . . . . . . . . . . . . Mil. sh. tons. 1.8 3.4 4.9 4.6 3.7 4.2Natural gas . . . . . . . . . . . . . . . . . . . . Bil. cu. ft. . . 3,653 4,738 5,081 5,322 5,691 5,690
ELECTRIC UTILITIES
Net generation, total 1 . . . . . . . . . . . . . . Bil. kWh . . 2,837.2 3,052.8 3,303.6 3,374.6 3,472.9 3,391.1Coal . . . . . . . . . . . . . . . . . . . . . . . . . Bil. kWh. . . 1,560.2 1,658.0 1,823.0 1,832.1 1,910.6 1,848.4Petroleum . . . . . . . . . . . . . . . . . . . . . Bil. kWh. . . 117.5 62.0 115.7 104.8 98.0 113.0Natural gas . . . . . . . . . . . . . . . . . . . . Bil. kWh. . . 264.6 317.4 335.9 356.6 399.4 411.3Nuclear . . . . . . . . . . . . . . . . . . . . . . . Bil. kWh. . . 576.9 673.4 673.7 728.3 753.9 768.8Hydroelectric pumped storage plants . . . Bil. kWh. . . -3.5 -2.7 -4.5 -6.1 -5.5 -8.8Conventional hydroelectric power plants . Bil. kWh. . . 288.4 305.4 317.9 314.7 271.3 213.8
Net summer capability, total 1 . . . . . . . . Mil. kW . . . 698.6 719.1 721.4 730.0 755.2 790.3Coal-fired plants . . . . . . . . . . . . . . . . . Mil. kW . . . 299.9 301.3 305.9 305.5 305.8 306.0Petroleum-fired plants . . . . . . . . . . . . . Mil. kW . . . 47.8 42.4 38.8 34.2 34.5 37.0Natural gas-fired plants . . . . . . . . . . . . Mil. kW . . . 44.1 55.5 50.3 49.8 67.6 100.3Dual-fired plants . . . . . . . . . . . . . . . . . Mil. kW . . . 106.4 112.1 122.5 135.2 141.8 139.5Nuclear electric power plants . . . . . . . . Mil. kW . . . 99.6 99.5 97.1 97.4 97.9 98.1Hydroelectric pumped storage plants . . . Mil. kW . . . 19.5 21.4 19.5 19.6 19.5 19.5Conventional hydroelectric power plants . Mil. kW . . . 73.3 77.4 78.0 78.3 78.2 78.3
NONUTILITY PLANTS
Net generation, total 1 . . . . . . . . . . . . . . Bil. kWh . . 122.0 151.0 154.1 156.3 156.7 150.1Coal . . . . . . . . . . . . . . . . . . . . . . . . . Bil. kWh. . . 19.3 22.4 22.3 21.5 22.1 22.0Petroleum . . . . . . . . . . . . . . . . . . . . . Bil. kWh. . . 6.2 6.0 6.2 6.1 5.6 5.9Natural gas . . . . . . . . . . . . . . . . . . . . Bil. kWh. . . 57.1 71.7 77.1 78.8 78.8 73.6
Net summer capability, total 1 . . . . . . . . Mil. kW . . . 22.9 25.5 26.0 27.1 27.3 26.6Coal-fired plants . . . . . . . . . . . . . . . . . Mil. kW . . . 4.8 5.0 4.6 4.4 4.6 4.6Petroleum-fired plants . . . . . . . . . . . . . Mil. kW . . . 0.9 0.8 1.0 0.8 0.8 0.8Natural gas-fired plants . . . . . . . . . . . . Mil. kW . . . 8.1 9.5 10.8 11.5 12.5 11.7Dual-fired plants . . . . . . . . . . . . . . . . . Mil. kW . . . 2.2 1.9 1.3 1.6 1.3 1.3
1 Includes types not shown separately.
Source: U.S. Energy Information Administration, Electric Power Annual and Annual Energy Review.
592 Energy and Utilities
U.S. Census Bureau, Statistical Abstract of the United States: 2003

No. 915. Electric Utility Industry—Capability, Peak Load, and Capacity Margin:1980 to 2001
[558,237 represents 558,237,000kW. Excludes Alaska and Hawaii. Capability represents the maximum kilowatt output with all powersources available and with hydraulic equipment under actual water conditions, allowing for maintenance, emergency outages, andsystem operating requirements. Capacity margin is the difference between capability and peak load]
Year
Capability at the time of— Noncoincidentpeak load Capacity margin
Summer peak load(1,000 kW)
Winter peak load(1,000 kW)
Summer Winter
Summer Winter
Amount
Changefromprioryear Amount
Changefromprioryear
Amount(1,000
kW)
Percentof
capa-bility
Amount(1,000
kW)
Percentof
capa-bility
1980 . . . . . . . . 558,237 13,731 572,195 17,670 427,058 384,567 131,179 23.5 187,628 32.81982 . . . . . . . . 586,142 13,923 598,066 11,497 415,618 373,985 170,524 29.1 224,081 37.51983 . . . . . . . . 596,449 10,307 612,453 14,387 447,526 410,779 148,923 25.0 201,674 32.91984 . . . . . . . . 604,240 7,791 622,125 9,672 451,150 436,374 153,090 25.3 185,751 29.91985 . . . . . . . . 621,597 17,357 636,475 14,350 460,503 423,660 161,094 25.9 212,815 33.41986 . . . . . . . . 633,291 11,694 646,721 10,246 476,320 422,857 156,971 24.8 223,864 34.61987 . . . . . . . . 648,118 14,827 662,977 16,256 496,185 448,277 151,933 23.4 214,700 32.41988 . . . . . . . . 661,580 13,462 676,940 13,963 529,460 466,533 132,120 20.0 210,407 31.11989 . . . . . . . . 673,316 11,736 685,249 8,309 523,432 496,378 149,884 22.3 188,871 27.61990 . . . . . . . . 685,091 11,775 696,757 11,508 545,537 484,014 139,554 20.4 212,743 30.51991 . . . . . . . . 690,915 5,824 703,212 6,455 551,320 485,435 139,595 20.2 217,777 31.01992 . . . . . . . . 695,436 4,521 707,752 4,540 548,707 492,983 146,729 21.1 214,769 30.31993 . . . . . . . . 694,250 -1,186 711,957 4,205 575,356 521,733 118,894 17.1 190,224 26.71994 . . . . . . . . 702,985 8,735 715,090 3,133 585,320 518,253 117,665 16.7 196,837 27.51995 . . . . . . . . 714,222 11,237 727,679 12,589 620,249 544,684 93,973 13.2 182,995 25.11996 . . . . . . . . 723,571 9,349 740,526 12,847 615,529 545,061 108,042 14.9 195,465 26.41997 . . . . . . . . 729,079 5,508 743,774 3,248 631,355 560,228 97,724 13.4 183,546 24.71998 . . . . . . . . 724,193 -4,886 735,090 -8,684 660,293 567,558 63,900 8.8 167,532 22.81999 . . . . . . . . 733,481 9,288 748,036 12,946 681,449 570,915 52,032 7.1 177,121 23.72000 . . . . . . . . 750,771 17,290 767,505 19,469 678,413 588,426 72,358 9.6 179,079 23.32001 . . . . . . . . 783,737 32,966 806,598 39,093 687,812 576,312 95,925 12.2 230,286 28.6
Source: Edison Electric Institute, Washington, DC, Statistical Yearbook of the Electric Utility Industry, annual.
No. 916. Electric Energy Sales by Class of Service and State: 2001
[In billions of kilowatt-hours (3,369.8 represents 3,369,800,000,000)]
State Total 1Resi-
dentialCom-
mercialIndus-
trial
United States . . . . 3,369.8 1,202.6 1,089.2 964.2
Alabama . . . . . . . . . . . 79.2 27.8 18.9 31.8Alaska . . . . . . . . . . . . 5.4 1.9 2.3 1.1Arizona . . . . . . . . . . . . 62.3 26.2 22.1 11.4Arkansas. . . . . . . . . . . 41.7 15.1 9.2 16.7California. . . . . . . . . . . 235.4 77.3 100.2 46.5
Colorado . . . . . . . . . . . 44.2 14.5 17.9 10.9Connecticut . . . . . . . . . 30.5 12.0 12.4 5.6Delaware. . . . . . . . . . . 10.7 3.7 3.6 3.2District of Columbia. . . . 9.4 1.7 7.3 0.3Florida . . . . . . . . . . . . 199.7 101.4 74.0 18.8
Georgia . . . . . . . . . . . 117.8 44.4 37.8 33.9Hawaii . . . . . . . . . . . . 9.8 2.8 3.1 3.8Idaho . . . . . . . . . . . . . 21.1 6.9 6.5 7.3Illinois . . . . . . . . . . . . . 135.7 41.8 43.8 37.9Indiana . . . . . . . . . . . . 97.7 29.4 25.6 42.1
Iowa. . . . . . . . . . . . . . 39.2 12.4 8.5 16.2Kansas . . . . . . . . . . . . 35.8 12.1 12.8 10.6Kentucky. . . . . . . . . . . 80.0 23.7 14.3 38.7Louisiana . . . . . . . . . . 74.7 25.8 17.7 28.6Maine . . . . . . . . . . . . . 11.8 4.7 4.5 2.6
Maryland. . . . . . . . . . . 59.8 24.0 25.4 9.7Massachusetts . . . . . . . 52.7 18.0 25.0 9.0Michigan . . . . . . . . . . . 102.0 32.3 34.9 33.9Minnesota . . . . . . . . . . 60.3 19.4 19.8 20.4Mississippi. . . . . . . . . . 44.3 16.9 11.4 15.3
State Total 1Resi-
dentialCom-
mercialIndus-
trial
Missouri . . . . . . . . . . . 73.2 30.2 26.0 15.8Montana . . . . . . . . . . . 11.2 3.9 3.6 3.3Nebraska . . . . . . . . . . 24.7 8.6 7.2 7.3Nevada. . . . . . . . . . . . 28.2 9.6 6.7 11.2New Hampshire . . . . . . 10.3 3.8 3.9 2.5
New Jersey . . . . . . . . . 72.3 25.4 34.0 12.4New Mexico. . . . . . . . . 18.7 5.0 6.8 5.3New York . . . . . . . . . . 141.4 44.0 59.4 24.7North Carolina . . . . . . . 117.6 46.2 37.7 31.5North Dakota . . . . . . . . 9.8 3.5 3.1 2.8
Ohio. . . . . . . . . . . . . . 154.5 47.3 39.5 63.8Oklahoma . . . . . . . . . . 49.7 19.8 13.6 13.4Oregon . . . . . . . . . . . . 45.9 17.5 14.8 13.1Pennsylvania . . . . . . . . 137.9 46.3 44.0 46.4Rhode Island . . . . . . . . 7.8 2.7 3.7 1.3
South Carolina . . . . . . . 74.8 24.9 17.5 31.5South Dakota. . . . . . . . 8.6 3.6 2.9 1.7Tennessee. . . . . . . . . . 95.3 36.9 26.0 31.3Texas . . . . . . . . . . . . . 316.1 117.3 88.2 95.8Utah. . . . . . . . . . . . . . 23.2 6.7 8.3 7.4
Vermont . . . . . . . . . . . 5.6 2.0 2.0 1.6Virginia . . . . . . . . . . . . 96.1 37.3 29.0 19.5Washington . . . . . . . . . 79.7 31.6 23.8 20.5West Virginia . . . . . . . . 27.7 9.8 6.8 11.0Wisconsin . . . . . . . . . . 65.2 20.4 18.7 25.3Wyoming. . . . . . . . . . . 13.0 2.1 2.9 7.7
1 Includes ‘‘other service’’ not shown separately.
Source: U.S. Energy Information Administration, Electric Sales and Revenue 2001. Also see <http://www.eia.doe.gov/cneaf/electricity/esr/table1abcd.xls#A105> (issued January 2003).
Energy and Utilities 593
U.S. Census Bureau, Statistical Abstract of the United States: 2003

No. 917. Electric Utilities—Net Generation and Net Summer Capability byState: 1995 to 2001
[Capability as of Dec. 31. (2,994.5 represents 2,994,500,000,000). Covers utilities for public use]
State
Net generation(bil. kWh) Net summer capability
(mil. kW)
1995 1999 2000
2001
Total
Percentfromcoal 1995 1999 2000 2001
United States. . . . . . . . 2,994.5 3,173.7 3,015.4 2,630.0 59.3 706.1 639.3 604.3 549.9
Alabama. . . . . . . . . . . . . . . 99.6 113.9 118.0 118.7 60.2 20.5 21.5 22.4 22.5Alaska . . . . . . . . . . . . . . . . 4.8 4.6 4.9 5.4 3.6 1.7 1.7 1.8 1.8Arizona. . . . . . . . . . . . . . . . 69.0 83.1 88.2 85.8 46.3 15.2 15.1 15.1 15.3Arkansas . . . . . . . . . . . . . . 39.5 44.1 41.5 44.7 55.2 9.6 9.3 9.3 9.6California . . . . . . . . . . . . . . 121.9 87.9 85.9 70.1 - 43.3 24.3 24.3 24.4
Colorado. . . . . . . . . . . . . . . 32.7 36.2 40.1 42.0 85.0 6.6 7.3 7.3 7.5Connecticut . . . . . . . . . . . . . 26.9 20.5 17.0 2.8 - 6.7 2.9 2.2 0.2Delaware . . . . . . . . . . . . . . 8.3 6.2 4.1 1.9 86.9 2.2 2.3 1.0 0.2District of Columbia . . . . . . . 0.2 0.2 0.1 (NA) (NA) 0.8 0.8 (NA) (NA)Florida . . . . . . . . . . . . . . . . 147.2 166.9 169.9 171.0 36.9 35.9 36.5 37.3 38.2
Georgia . . . . . . . . . . . . . . . 102.0 110.5 116.2 110.6 66.4 22.3 23.3 24.9 24.1Hawaii . . . . . . . . . . . . . . . . 6.2 6.5 6.5 6.4 - 1.6 1.6 1.6 1.6Idaho . . . . . . . . . . . . . . . . . 10.1 12.5 10.1 6.7 - 2.6 2.6 2.6 2.7Illinois . . . . . . . . . . . . . . . . 145.2 149.8 113.6 29.8 97.6 33.1 17.0 17.5 4.4Indiana. . . . . . . . . . . . . . . . 105.2 114.2 119.7 114.7 98.7 20.7 20.4 20.6 20.6
Iowa . . . . . . . . . . . . . . . . . 33.5 37.0 39.6 38.8 86.4 8.2 8.4 8.5 8.4Kansas. . . . . . . . . . . . . . . . 38.2 42.0 44.8 44.6 71.2 9.7 10.0 10.1 10.2Kentucky . . . . . . . . . . . . . . 86.2 81.7 81.4 83.7 94.9 15.4 14.7 14.8 15.2Louisiana . . . . . . . . . . . . . . 65.6 64.8 57.6 50.4 21.7 17.0 16.3 14.3 14.2Maine. . . . . . . . . . . . . . . . . 2.7 1.2 (Z) (Z) - 2.4 0.1 (Z) (Z)
Maryland . . . . . . . . . . . . . . 44.7 49.3 31.8 0.1 - 11.0 11.0 0.8 0.1Massachusetts. . . . . . . . . . . 27.0 4.4 1.7 1.6 70.0 9.3 2.2 1.0 1.0Michigan. . . . . . . . . . . . . . . 92.5 87.9 89.6 97.1 69.0 22.0 22.4 22.8 22.8Minnesota. . . . . . . . . . . . . . 42.5 44.2 46.6 44.8 69.3 8.9 9.0 9.1 10.1Mississippi . . . . . . . . . . . . . 26.4 32.2 33.9 47.6 40.4 7.2 6.8 7.1 8.0
Missouri . . . . . . . . . . . . . . . 65.4 73.5 76.3 79.0 82.9 15.7 16.8 17.2 17.7Montana . . . . . . . . . . . . . . . 25.4 27.6 6.6 4.4 7.0 4.9 3.0 3.0 2.2Nebraska . . . . . . . . . . . . . . 25.3 30.0 29.0 30.4 66.4 5.5 5.8 5.9 6.0Nevada . . . . . . . . . . . . . . . 20.0 26.5 29.3 27.9 63.6 5.6 5.4 5.4 5.4New Hampshire . . . . . . . . . . 13.9 13.9 12.7 13.1 28.3 2.5 2.3 2.3 1.1
New Jersey. . . . . . . . . . . . . 27.1 38.9 25.3 1.6 88.3 13.8 12.1 1.2 1.2New Mexico . . . . . . . . . . . . 29.4 31.7 32.9 32.2 88.2 5.1 5.3 5.3 5.3New York . . . . . . . . . . . . . . 101.2 97.0 73.2 58.6 3.6 32.1 17.7 15.8 11.6North Carolina . . . . . . . . . . . 96.1 109.9 114.4 109.8 62.6 20.6 21.2 22.0 23.5North Dakota. . . . . . . . . . . . 28.8 31.3 31.1 30.1 95.5 4.5 4.7 4.7 4.7
Ohio . . . . . . . . . . . . . . . . . 137.9 140.9 144.4 135.5 87.7 27.4 27.1 26.3 27.1Oklahoma . . . . . . . . . . . . . . 48.0 50.3 51.4 50.4 63.8 12.9 12.9 13.4 13.4Oregon. . . . . . . . . . . . . . . . 44.0 51.7 46.1 38.1 11.6 10.4 10.3 10.4 10.4Pennsylvania. . . . . . . . . . . . 168.9 161.6 97.1 27.6 50.2 33.7 25.3 13.4 5.0Rhode Island. . . . . . . . . . . . 0.7 (Z) (Z) (Z) - 0.4 (Z) (Z) (Z)
South Carolina. . . . . . . . . . . 78.4 87.3 90.4 86.7 41.9 16.7 17.7 17.7 18.2South Dakota . . . . . . . . . . . 8.8 10.6 9.7 7.4 48.8 3.0 2.9 2.8 2.8Tennessee . . . . . . . . . . . . . 82.3 89.7 92.3 92.9 62.6 16.1 17.3 17.9 18.6Texas. . . . . . . . . . . . . . . . . 261.7 292.5 297.3 265.0 49.9 64.4 65.3 65.4 38.9Utah . . . . . . . . . . . . . . . . . 32.1 36.1 35.8 35.1 94.5 4.8 5.1 5.1 5.1
Vermont . . . . . . . . . . . . . . . 4.8 4.7 5.3 4.7 - 1.1 0.8 0.8 0.3Virginia. . . . . . . . . . . . . . . . 52.7 65.1 65.8 62.1 49.3 14.3 15.3 15.6 15.8Washington . . . . . . . . . . . . . 95.7 112.1 96.2 67.7 - 24.3 25.2 23.8 24.1West Virginia . . . . . . . . . . . . 77.3 91.7 89.7 51.6 99.0 14.5 14.5 14.5 10.2Wisconsin . . . . . . . . . . . . . . 51.0 54.7 55.7 55.0 73.1 11.5 12.1 12.2 12.2Wyoming . . . . . . . . . . . . . . 39.7 43.0 44.6 43.8 97.3 6.0 6.0 6.0 6.1
- Represents zero. NA Not available. Z Represents less than 50 million kWh or 50,000 kW.
Source: U.S. Energy Information Administration, Electric Power Annual 2001 and Inventory of Electric Utility Power Plants inthe United States 2000. Also see <http://www.eia.doe.gov/fuelelectric.html> (accessed August 4, 2003).
594 Energy and Utilities
U.S. Census Bureau, Statistical Abstract of the United States: 2003
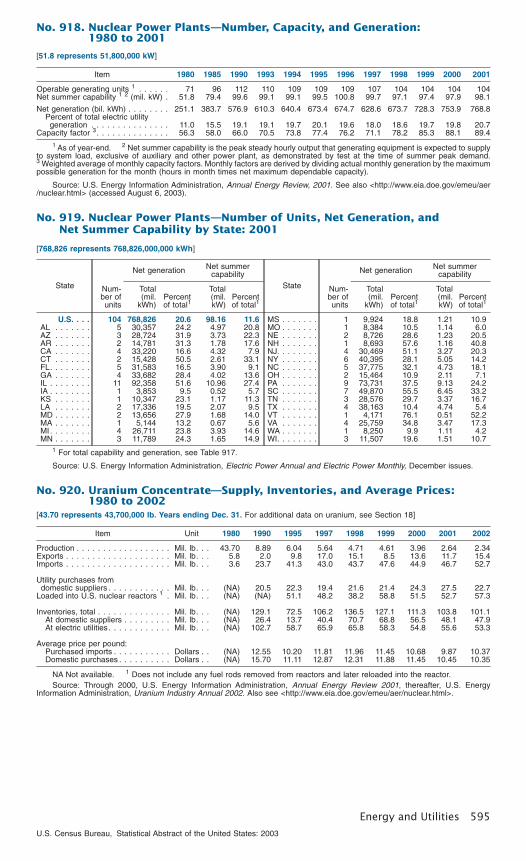
No. 918. Nuclear Power Plants—Number, Capacity, and Generation:1980 to 2001
[51.8 represents 51,800,000 kW]
Item 1980 1985 1990 1993 1994 1995 1996 1997 1998 1999 2000 2001
Operable generating units 1 . . . . . . 71 96 112 110 109 109 109 107 104 104 104 104Net summer capability 1 2 (mil. kW) . 51.8 79.4 99.6 99.1 99.1 99.5 100.8 99.7 97.1 97.4 97.9 98.1
Net generation (bil. kWh) . . . . . . . . 251.1 383.7 576.9 610.3 640.4 673.4 674.7 628.6 673.7 728.3 753.9 768.8Percent of total electric utilitygeneration . . . . . . . . . . . . . . . 11.0 15.5 19.1 19.1 19.7 20.1 19.6 18.0 18.6 19.7 19.8 20.7
Capacity factor 3. . . . . . . . . . . . . . 56.3 58.0 66.0 70.5 73.8 77.4 76.2 71.1 78.2 85.3 88.1 89.4
1 As of year-end. 2 Net summer capability is the peak steady hourly output that generating equipment is expected to supplyto system load, exclusive of auxiliary and other power plant, as demonstrated by test at the time of summer peak demand.3 Weighted average of monthly capacity factors. Monthly factors are derived by dividing actual monthly generation by the maximumpossible generation for the month (hours in month times net maximum dependable capacity).
Source: U.S. Energy Information Administration, Annual Energy Review, 2001. See also <http://www.eia.doe.gov/emeu/aer/nuclear.html> (accessed August 6, 2003).
No. 919. Nuclear Power Plants—Number of Units, Net Generation, andNet Summer Capability by State: 2001
[768,826 represents 768,826,000,000 kWh]
State Num-ber ofunits
Net generation Net summercapability
Total(mil.
kWh)Percentof total1
Total(mil.kW)
Percentof total1
U.S. . . . 104 768,826 20.6 98.16 11.6AL . . . . . . . 5 30,357 24.2 4.97 20.8AZ . . . . . . . 3 28,724 31.9 3.73 22.3AR . . . . . . . 2 14,781 31.3 1.78 17.6CA . . . . . . . 4 33,220 16.6 4.32 7.9CT . . . . . . . 2 15,428 50.5 2.61 33.1FL. . . . . . . . 5 31,583 16.5 3.90 9.1GA . . . . . . . 4 33,682 28.4 4.02 13.6IL . . . . . . . . 11 92,358 51.6 10.96 27.4IA . . . . . . . . 1 3,853 9.5 0.52 5.7KS . . . . . . . 1 10,347 23.1 1.17 11.3LA . . . . . . . 2 17,336 19.5 2.07 9.5MD . . . . . . . 2 13,656 27.9 1.68 14.0MA . . . . . . . 1 5,144 13.2 0.67 5.6MI. . . . . . . . 4 26,711 23.8 3.93 14.6MN . . . . . . . 3 11,789 24.3 1.65 14.9
State Num-ber ofunits
Net generation Net summercapability
Total(mil.
kWh)Percentof total1
Total(mil.kW)
Percentof total1
MS . . . . . . . 1 9,924 18.8 1.21 10.9MO . . . . . . . 1 8,384 10.5 1.14 6.0NE . . . . . . . 2 8,726 28.6 1.23 20.5NH . . . . . . . 1 8,693 57.6 1.16 40.8NJ. . . . . . . . 4 30,469 51.1 3.27 20.3NY . . . . . . . 6 40,395 28.1 5.05 14.2NC . . . . . . . 5 37,775 32.1 4.73 18.1OH . . . . . . . 2 15,464 10.9 2.11 7.1PA . . . . . . . 9 73,731 37.5 9.13 24.2SC . . . . . . . 7 49,870 55.5 6.45 33.2TN . . . . . . . 3 28,576 29.7 3.37 16.7TX . . . . . . . 4 38,163 10.4 4.74 5.4VT . . . . . . . 1 4,171 76.1 0.51 52.2VA . . . . . . . 4 25,759 34.8 3.47 17.3WA . . . . . . . 1 8,250 9.9 1.11 4.2WI. . . . . . . . 3 11,507 19.6 1.51 10.7
1 For total capability and generation, see Table 917.
Source: U.S. Energy Information Administration, Electric Power Annual and Electric Power Monthly, December issues.
No. 920. Uranium Concentrate—Supply, Inventories, and Average Prices:1980 to 2002
[43.70 represents 43,700,000 lb. Years ending Dec. 31. For additional data on uranium, see Section 18]
Item Unit 1980 1990 1995 1997 1998 1999 2000 2001 2002
Production . . . . . . . . . . . . . . . . . . Mil. lb. . . 43.70 8.89 6.04 5.64 4.71 4.61 3.96 2.64 2.34Exports . . . . . . . . . . . . . . . . . . . . Mil. lb. . . 5.8 2.0 9.8 17.0 15.1 8.5 13.6 11.7 15.4Imports . . . . . . . . . . . . . . . . . . . . Mil. lb. . . 3.6 23.7 41.3 43.0 43.7 47.6 44.9 46.7 52.7
Utility purchases fromdomestic suppliers . . . . . . . . . . . . Mil. lb. . . (NA) 20.5 22.3 19.4 21.6 21.4 24.3 27.5 22.7
Loaded into U.S. nuclear reactors 1 . Mil. lb. . . (NA) (NA) 51.1 48.2 38.2 58.8 51.5 52.7 57.3
Inventories, total . . . . . . . . . . . . . . Mil. lb. . . (NA) 129.1 72.5 106.2 136.5 127.1 111.3 103.8 101.1At domestic suppliers . . . . . . . . . Mil. lb. . . (NA) 26.4 13.7 40.4 70.7 68.8 56.5 48.1 47.9At electric utilities . . . . . . . . . . . . Mil. lb. . . (NA) 102.7 58.7 65.9 65.8 58.3 54.8 55.6 53.3
Average price per pound:Purchased imports . . . . . . . . . . . Dollars . . (NA) 12.55 10.20 11.81 11.96 11.45 10.68 9.87 10.37Domestic purchases . . . . . . . . . . Dollars . . (NA) 15.70 11.11 12.87 12.31 11.88 11.45 10.45 10.35
NA Not available. 1 Does not include any fuel rods removed from reactors and later reloaded into the reactor.Source: Through 2000, U.S. Energy Information Administration, Annual Energy Review 2001, thereafter, U.S. Energy
Information Administration, Uranium Industry Annual 2002. Also see <http://www.eia.doe.gov/emeu/aer/nuclear.html>.
Energy and Utilities 595
U.S. Census Bureau, Statistical Abstract of the United States: 2003

No. 921. Nonutility Electric Power Producers—Summary by Type of Fuel:1998 to 2000
[98,213 represents 98,213,000 kWh. All data is for 1 megawatt and greater. A nonutility power producer may be a corporation,person, agency, authority, or other legal entity or instrumentality that owns electric generating capacity and is not an electric util-ity. Nonutility power producers include qualifying cogenerators, qualifying small power producers, and other nonutility generators(including independent power producers) without a designated franchised service area, and which do not file forms listed in the Codeof Federal Regulations, Title 18, Part 141]
Type of fuelInstalled capacity 1 2
(1,000 kWh)Gross generation 3
(Mil. kWh)
1998 1999 2000 1998 1999 2000
All types, total. . . . . . . . . . . . 98,213 160,525 228,594 422,985 544,561 828,325Coal 4 . . . . . . . . . . . . . . . . . . . 17,217 40,580 59,196 70,014 121,072 287,141Petroleum . . . . . . . . . . . . . . . . . 2,472 4,161 11,015 19,519 33,087 41,249Natural gas 5 . . . . . . . . . . . . . . . 39,795 47,516 73,186 227,719 268,237 323,143Other gas 6 . . . . . . . . . . . . . . . . 1,560 1,813 1,723 13,893 14,632 14,620Dual fired 3 . . . . . . . . . . . . . . . . 18,171 41,190 47,534 (X) (X) (X)Hydroelectric pumped storage . . . - 600 1,453 - - 1,655Hydroelectric (conventional) . . . . . 4,340 5,403 5,761 14,713 20,147 22,644Geothermal . . . . . . . . . . . . . . . . 1,424 2,719 2,683 9,932 13,638 14,461Solar . . . . . . . . . . . . . . . . . . . . 864 963 410 529 518 526Wind . . . . . . . . . . . . . . . . . . . . 1,711 2,222 2,323 3,053 4,510 5,621Biomass 7 . . . . . . . . . . . . . . . . . 10,545 10,510 10,144 59,894 61,211 62,288Nuclear . . . . . . . . . . . . . . . . . . - 2,527 12,622 - 3,318 49,959Other 8 . . . . . . . . . . . . . . . . . . . 114 322 545 3,718 4,191 5,017
- Represents or rounds to zero. X Not applicable. 1 There is a discontinuity in capacity estimates between 1999 andearlier years due to a change in reporting practices. In 1999 for the first time respondents self identified the facility’s primary energysource resulting in a reclassification compared to earlier years in some cases. 1998 and 1999 data in this table have been adjustedaccordingly, but data corresponding to this table in previous editions are not comparable. 2 Petroleum figures are for petroleumonly. 3 Petroleum figures include petroleum, petroleum coke, diesel, kerosene, light oil, liquid butane, liquid propane, oil waste,sludge oil, and tar oil. 4 Includes coal, anthracite culm, bituminous gob, coke breeze, fine coal, liqnite waste, tar coal, and wastecoal. 5 Includes natural gas and waste heat. 6 Includes butane, propane, and other gas. 7 Includes black liquor, peat,railroad ties, red liquor, sludge wood, spent sulfite liquor, utility poles, and wood/waste, agricultural byproducts, digester gas, fishoil, liquid acetonitrile waste, landfill gas, medical waste, methane, municipal solid waste, paper pellets, sludge waste, solidbyproducts, straw, tires, tall oil, and waste alcohol. 8 Includes batteries, chemicals, hydrogen, pitch, purchased steam, and sulfer.
Source: Energy Information Administration, Electric Power Annual, Vol. II. Also see <http://tonto.eia.doe.gov/FTPROOT/electricity/0348002.pdf>; and Inventory of Nonutility Electric Power Plants in the United States, annual. Also see <http://www.ei.doe.gov/cneaf/electricity/ipp/ippsum2.html>.
No. 922. Electric Utilities—Generation, Sales, Revenue, and Customers:1980 to 2002
[2,290 represents 2,290,000,000,000 kWh. Sales and revenue are to and from ultimate customers]
Class Unit . . . . 1980 1990 1995 1997 1998 1999 2000 2001 2002
Generation 1 2 . . . . . . . . . . . . Bil. kWh . 2,290 3,038 3,353 3,492 3,620 3,695 3,802 3,737 3,839
Sales 3 . . . . . . . . . . . . . . . . . Bil. kWh. 2,126 2,684 3,007 3,139 3,240 3,236 3,379 3,396 3,471Residential or domestic . . . . . Bil. kWh . 734 916 1,042 1,079 1,128 1,141 1,194 1,206 1,267
Percent of total . . . . . . . . Percent . 34.5 34.1 34.7 34.4 34.8 35.3 35.3 35.5 36.5Commercial 4 . . . . . . . . . . . Bil. kWh . 524 739 864 929 969 971 1,037 1,110 1,122Industrial 5 . . . . . . . . . . . . . Bil. kWh . 794 932 1,006 1,028 1,040 1,018 1,041 970 973
Revenue 3 . . . . . . . . . . . . . . . Bil. dol . 95.5 176.5 207.6 215.1 218.4 215.5 226.3 238.7 250.1Residential or domestic . . . . . Bil. dol . . 37.6 71.7 87.6 90.9 93.2 93.1 97.8 102.1 106.8
Percent of total . . . . . . . . Percent . 39.4 40.6 42.2 42.2 42.7 43.2 43.2 42.7 42.7Commercial 4 . . . . . . . . . . . Bil. dol . . 27.4 54.2 66.5 70.5 71.8 70.5 74.6 82.0 89.0Industrial 5 . . . . . . . . . . . . . Bil. dol . . 27.3 44.9 46.9 46.7 46.6 45.1 46.9 47.1 47.1
Ultimate customers, Dec. 31 3 . Million. . 92.7 110.1 118.3 122.2 124.0 125.2 128.5 130.7 (NA)Residential or domestic . . . . . Million . . 82.2 97.0 103.9 107.1 108.7 109.8 112.6 114.3 (NA)Commercial 4 . . . . . . . . . . . Million . . 9.7 12.1 12.9 13.5 13.8 14.0 14.4 14.8 (NA)Industrial 5 . . . . . . . . . . . . . Million . . 0.5 0.5 0.6 0.6 0.5 0.5 0.5 0.6 (NA)
Avg. kWh used percustomer. . . . . . . . . . . . . . . 1,000. . . 22.9 24.4 25.4 25.7 26.1 25.8 26.3 26.0 (NA)Residential . . . . . . . . . . . . . 1,000. . . 8.9 9.4 10.0 10.1 10.4 10.4 10.6 10.5 (NA)Commercial 4 . . . . . . . . . . . 1,000. . . 54.0 61.0 66.7 68.7 70.0 69.5 72.0 75.1 (NA)
Avg. annual bill per customer . Dollar . . 1,030 1,603 1,755 1,761 1,760 1,720 1,761 1,826 (NA)Residential . . . . . . . . . . . . . Dollar . . 457 739 843 849 857 848 868 892 (NA)Commercial 4 . . . . . . . . . . . Dollar . . 4,059 3,356 3,259 3,123 3,084 3,096 3,001 2,894 (NA)
Avg. revenue per kWh sold. . . Cents . . 13.00 19.27 19.91 19.95 19.36 18.89 18.95 19.79 19.74Residential . . . . . . . . . . . . . Cents . . 5.12 7.83 8.40 8.43 8.26 8.16 8.19 8.46 8.43Commercial 4 . . . . . . . . . . . Cents . . 5.22 7.33 7.70 7.58 7.41 7.26 7.20 7.39 7.93Industrial 5 . . . . . . . . . . . . . Cents . . 3.44 4.82 4.66 4.54 4.48 4.43 4.51 4.85 4.84
NA Not available. 1 Source: U.S. Energy Information Administration, Monthly Energy Review, monthly. Also see <http://www.eia.doe.gov /emeu/mer/pdf/pages/sec75.pdf>. 2 ‘‘Generation’’ includes batteries, chemicals, hydrogen, pitch, sulfur, andpurchased steam. 3 Includes other types not shown separately. 4 Small light and power. 5 Large light and power.
Source: Except as noted, Edison Electric Institute, Washington, DC, Statistical Yearbook of the Electric Utility Industry, annual.
596 Energy and Utilities
U.S. Census Bureau, Statistical Abstract of the United States: 2003

No. 923. Major Investor-Owned Electric Utilities—Balance Sheet and IncomeAccount of Privately Owned Companies: 1995 to 2000
[In millions of dollars (199,967 represents $199,967,000,000). As of Dec. 31. Covers approximately 180 investor-owned elec-tric utilities that during each of the last 3 years met any one or more of the following conditions—1 mil. megawatt-hrs. of total sales;100 megawatt-hrs. of sales for resale, 500 megawatt-hrs. of gross interchange out, and 500 megawatt-hrs. of wheeling for other]
Item 1995 1996 1997 1998 1999 2000
COMPOSITE INCOME ACCOUNTSOperating revenue . . . . . . . . . . . . . . . . . . . . . 199,967 207,459 215,083 218,175 214,160 235,336
Electric . . . . . . . . . . . . . . . . . . . . . . . . . . . 183,655 188,901 195,898 201,970 197,578 214,707Gas . . . . . . . . . . . . . . . . . . . . . . . . . . . . . 15,580 17,869 18,663 15,735 16,033 19,948Other utility . . . . . . . . . . . . . . . . . . . . . . . . 731 689 522 470 550 682
Operating expenses 1 . . . . . . . . . . . . . . . . . . . 165,321 173,920 182,796 186,498 182,258 210,324Electric 1 . . . . . . . . . . . . . . . . . . . . . . . . . . 150,599 156,938 165,443 171,689 167,266 191,329
Operation . . . . . . . . . . . . . . . . . . . . . . . . 91,881 97,207 104,337 110,759 108,461 132,662Maintenance . . . . . . . . . . . . . . . . . . . . . . 11,767 12,050 12,368 12,486 12,276 12,185Depreciation 2 . . . . . . . . . . . . . . . . . . . . . 19,885 21,194 23,072 24,122 23,968 23,670Taxes other than income taxes . . . . . . . . . . 13,519 13,569 13,612 12,867 12,336 11,883Income taxes . . . . . . . . . . . . . . . . . . . . . 11,480 11,195 11,862 13,037 14,843 7,641Deferred income tax . . . . . . . . . . . . . . . . . 1,474 1,617 25 -476 -2,216 -945Investment tax credit (net) . . . . . . . . . . . . . -550 -577 -448 -651 -1,695 -561
Gas . . . . . . . . . . . . . . . . . . . . . . . . . . . . . 14,073 16,258 16,925 14,396 14,493 18,341Other utility . . . . . . . . . . . . . . . . . . . . . . . . 649 725 427 413 499 654
Operating income . . . . . . . . . . . . . . . . . . . . . . 34,646 33,539 32,286 31,677 31,902 25,012Electric . . . . . . . . . . . . . . . . . . . . . . . . . . . 33,057 31,963 30,454 30,281 30,311 23,377Gas . . . . . . . . . . . . . . . . . . . . . . . . . . . . . 1,507 1,612 1,737 1,339 1,540 1,607Other utility . . . . . . . . . . . . . . . . . . . . . . . . 82 -36 95 57 51 29
Total income before interest charges . . . . . . . . . 36,457 35,153 34,100 32,788 33,567 28,621Less: Net interest charges . . . . . . . . . . . . . . . . 14,421 13,990 14,086 14,057 13,691 13,781
Interest expense . . . . . . . . . . . . . . . . . . . . . 14,170 13,646 13,768 13,670 13,376 13,666Less allow. for borrowed funds used duringconstuction . . . . . . . . . . . . . . . . . . . . . . . . 435 326 331 328 331 397
Other charges, net. . . . . . . . . . . . . . . . . . . . 687 671 649 715 646 512Net income before extraordinary charges . . . . . . 22,036 21,162 20,014 18,732 19,876 14,840Less extraordinary items after taxes . . . . . . . . . . -25 -66 3,151 1,344 2,793 1,567Equals: Net income. . . . . . . . . . . . . . . . . . . . 22,061 21,228 16,863 17,388 17,083 13,274Dividends declared - preferred stock . . . . . . . . . 1,519 1,248 1,005 750 687 568Earnings available for common stocks . . . . . . . . 20,542 19,980 15,857 16,638 16,396 12,706Dividends declared - common stock . . . . . . . . . . 16,250 16,810 17,756 17,414 18,687 16,677Additions total earnings . . . . . . . . . . . . . . . . . . 4,282 2,193 -1,960 -199 -2,785 -3,971
COMPOSITE BALANCE SHEETTotal assets and other debits . . . . . . . . . 578,934 581,991 586,241 598,856 585,827 606,372
Utility plant, net . . . . . . . . . . . . . . . . . . . . . . . 397,383 396,438 385,258 362,388 344,112 340,897Electric utility plant, net. . . . . . . . . . . . . . . . . 366,116 363,854 351,427 327,646 310,317 307,284
Electric utility plant . . . . . . . . . . . . . . . . . . 553,858 569,969 579,042 575,651 567,825 570,320Construction work in progress . . . . . . . . . . 13,523 11,396 11,164 11,886 12,306 14,766Less accumulated depreciation. . . . . . . . . . 201,265 217,510 238,779 259,892 269,813 277,802
Nuclear fuel, net . . . . . . . . . . . . . . . . . . . . . 5,286 5,444 5,219 4,731 4,265 3,974Other utility plant, net . . . . . . . . . . . . . . . . . . 25,981 27,140 28,613 30,011 29,529 29,639
Other property and investments. . . . . . . . . . . . . 27,988 33,120 43,248 48,853 54,546 56,992Current and accrued assets . . . . . . . . . . . . . . . 44,140 43,515 47,639 54,901 57,324 79,169Deferred debits . . . . . . . . . . . . . . . . . . . . . . . 109,423 108,918 110,096 132,714 129,845 129,312
CAPITALIZATION AND LIABILITIESLiabilities and other credits . . . . . . . . . . . 578,934 581,991 586,241 598,856 585,827 606,372
Capitalization . . . . . . . . . . . . . . . . . . . . . . . . . 365,775 365,783 369,079 367,052 345,786 341,163Common stock equity (end of year) . . . . . . . . 170,497 174,325 174,467 172,239 165,341 160,380Preferred stock . . . . . . . . . . . . . . . . . . . . . . 21,569 18,830 16,080 14,447 12,061 9,893Long-term debt . . . . . . . . . . . . . . . . . . . . . . 173,708 172,627 178,532 180,366 168,384 170,891
Current liabilities and deferred credits. . . . . . . . . 213,159 216,208 217,162 231,803 240,041 265,208
1 Includes items not shown separately. 2 Includes amortization and depletion.Source: U.S. Energy Information Administration, Electric Power Annual, Vol. II, 2000. Also see <http://www.eia.doe
.gov/cneaf/electricity/epav2/backissues.html>.
No. 924. Solar Collector Shipments by Type, End Use, and Market Sector:1980 to 2001
[Shipments in thousands of square feet (19,398 represents 19,398,000). Solar collector is a device for intercepting sunlight,converting the light to heat, and carrying the heat to where it will be either used or stored. 1985 data are not available]
Year Number ofmanufac-
turers
Totalship-
ments 1 2 3
Collector type End use Market sector
Low tem-perature
Mediumtempera-ture, spe-
cial, other 2Pool
heatingHot
waterSpace
heatingResi-
dentialCom-
mercial Industrial
1980 . . . . . 233 19,398 12,233 7,165 12,029 4,790 1,688 16,077 2,417 4881986 4 . . . . 98 9,360 3,751 1,111 3,494 1,181 127 4,131 703 131990 4 . . . . 51 11,409 3,645 2,527 5,016 1,091 2 5,835 294 221995 . . . . . 36 7,666 6,813 840 6,763 755 132 6,966 604 821999 . . . . . 29 8,583 8,152 427 8,141 373 42 7,774 785 182000 . . . . . 26 8,354 7,948 400 7,863 367 99 7,473 810 572001 . . . . . 26 11,189 10,919 268 10,797 274 70 10,125 1,012 17
1 Includes shipments of high temperature collectors to the government, including some military, but excluding spaceapplications. Also includes end uses such as process heating, utility, and other market sectors not shown separately. 2 Includesimputation of shipment data to account for nonrespondents. 3 Total shipments include all domestic and export shipments andmay include imported collectors that subsequently were shipped to domestic or foreign customers. 4 Declines between 1986 and1990 are primarily due to the expiration of the federal energy tax credit and industry consolidation.
Source: U.S. Energy Information Administration, 1974-1993, Solar Collector Manufacturing Activity, annual reports; thereafter,Renewable Energy Annual. See also <http://www.eia.doe.gov/cneaf/solar.renewables/page/readata/rea.pdf> (released November2002).
Energy and Utilities 597
U.S. Census Bureau, Statistical Abstract of the United States: 2003

No. 925. Total Renewable Net Generation by Source and State: 2000
[In millions of kilowatthours (275,573 represents 275,573,000,000). MSW=municipal solid waste]
StateTotal 1
Hydro-electric
MSW/landfill
gas
Otherbio-
mass 2
Wood/woodwaste
U.S. . . 356,480 275,573 20,305 2,828 37,595AL . . . . 9,894 5,818 4 25 4,047AK . . . . 1,002 1,002 (X) (X) (X)AZ . . . . 8,359 8,354 (X) 5 (X)AR . . . . 3,965 2,370 (X) 7 1,587CA . . . . 60,837 38,334 1,938 673 3,574CO . . . . 1,474 1,454 (X) 19 (X)CT . . . . 2,679 526 1,957 196 (X)DE . . . . 19 (X) 19 (X) (X)DC . . . . (X) (X) (X) (X) (X)FL. . . . . 5,777 87 3,037 594 2,059GA . . . . 5,586 2,481 17 72 3,015HI . . . . . 921 103 350 188 (X)ID . . . . . 11,450 10,967 (X) (X) 483IL . . . . . 1,052 144 611 297 (X)IN . . . . . 718 588 130 (X) (X)IA . . . . . 1,486 904 71 18 (X)KS . . . . 15 15 (X) (X) (X)KY . . . . 2,337 2,325 (X) (X) 12LA . . . . 3,325 532 (X) 95 2,698ME . . . . 7,413 3,591 421 160 3,241MD . . . . 2,551 1,733 639 (Z) 180MA . . . . 3,262 1,065 2,050 25 122MI. . . . . 4,317 1,428 1,031 68 1,791MN . . . . 2,975 931 790 8 522MS . . . . 1,680 (X) (X) (Z) 1,680
StateTotal 1
Hydro-electric
MSW/landfill
gas
Otherbio-
mass 2
Wood/woodwaste
MO . . . . 683 600 73 10 (X)MT . . . . 9,670 9,623 (X) (X) 47NE . . . . 1,517 1,501 (X) 17 (X)NV . . . . 3,800 2,429 (X) (X) (X)NH . . . . 2,534 1,427 244 (X) 862NJ. . . . . 1,378 14 1,350 14 (X)NM . . . . 230 221 (X) 8 (X)NY . . . . 27,792 24,910 2,227 4 640NC . . . . 4,911 3,138 98 11 1,664ND . . . . 2,131 2,123 (X) 8 (X)OH . . . . 1,230 583 27 (X) 621OK . . . . 2,425 2,277 2 (X) 146OR . . . . 38,819 38,116 95 (X) 541PA . . . . 5,021 2,290 1,954 74 692RI . . . . . 120 5 115 (X) (X)SC . . . . 2,953 1,533 63 6 1,351SD . . . . 5,716 5,716 (X) (X) (X)TN . . . . 7,196 6,396 37 2 761TX . . . . 2,600 829 60 66 1,152UT . . . . 907 746 9 (X) (X)VT . . . . 1,581 1,221 (X) (X) 348VA . . . . 2,856 712 461 6 1,677WA . . . . 81,754 80,263 205 45 1,241WV . . . . 1,165 1,151 - 14 (X)WI. . . . . 3,139 1,986 220 90 841WY . . . . 1,257 1,011 (X) (X) (X)
- Represents zero. X Not applicable. Z Less than 500,000 thousand kilowatthours. 1 Includes types not shownseparately. 2 Agriculture byproducts/crops, sludge waste, tires and other biomass solids, liquids, and gases.
Source: Energy Information Administration, Renewable Energy Annual 2001. Also see <http://www.eia.doe.gov/cneaf/solar.renewables/page/readata/rea.pdf>.
No. 926. Privately Owned Gas Utility Industry—Balance Sheet andIncome Account: 1980 to 2001
[In millions of dollars (75,851 represents $75,851,000,000). The gas utility industry consists of pipeline and distribution com-panies. Excludes operations of companies distributing gas in bottles or tanks]
Item 1980 1990 1995 1996 1997 1998 1999 2000 2001
COMPOSITE BALANCE SHEET
Assets, total . . . . . . . . . . . 75,851 121,686 141,965 121,328 134,715 119,715 155,413 165,709 170,898Total utility plant . . . . . . . . . . . . . 67,071 112,863 143,636 135,179 140,268 135,092 166,134 162,206 175,280Depreciation and amortization. . . . 26,162 49,483 62,723 58,815 62,554 61,226 73,823 69,366 74,167
Utility plant (net). . . . . . . . . . . . . 40,909 63,380 80,912 76,364 77,714 73,866 92,311 92,839 101,113Investment and fund accounts . . . 15,530 23,872 26,489 13,207 22,812 12,337 17,344 10,846 10,674Current and accrued assets . . . . . 17,243 23,268 18,564 17,393 19,084 17,348 22,443 35,691 29,053Deferred debits 1 . . . . . . . . . . . . 2,169 9,576 13,923 11,983 12,844 13,721 20,922 24,279 28,206
Liabilities, total . . . . . . . . . 75,851 121,686 141,965 121,328 134,775 119,715 155,413 165,709 170,898Capitalization, total . . . . . . . . . . . 51,382 74,958 90,581 77,440 78,887 71,718 95,244 96,079 106,635
Capital stock . . . . . . . . . . . . . 29,315 43,810 54,402 43,555 42,530 37,977 859 760 734Long-term debts . . . . . . . . . . . 22,067 31,148 35,548 33,644 35,971 33,386 46,906 48,267 49,145
Current and accrued liabilities. . . . 18,119 29,550 28,272 22,098 33,507 26,953 32,683 42,312 35,214Deferred income taxes 2 . . . . . . . 4,149 11,360 14,393 13,326 13,636 13,239 17,120 17,157 20,180Other liabilities and credits . . . . . . 2,201 5,818 8,715 8,464 8,745 7,806 10,365 10,161 8,869
COMPOSITE INCOME ACCOUNT
Operating revenues, total . . 85,918 66,027 58,390 63,600 62,617 57,117 59,142 72,042 78,489Minus: Operating expenses 3 . . . . 81,789 60,137 50,760 56,695 59,375 50,896 38,752 64,988 70,443
Operation and maintenance . . . 74,508 51,627 37,966 43,742 46,070 41,026 41,415 54,602 58,506Federal, state, and local taxes. . 4,847 4,957 6,182 6,362 7,182 5,429 5,605 6,163 7,055
Equals: Operating income . . . . . . 4,129 5,890 7,630 6,905 3,242 6,220 20,390 7,053 8,046
Utility operating income . . . . . . . . 4,471 6,077 7,848 7,013 3,337 6,361 16,614 7,166 8,174Income before interest charges. . . 6,929 8,081 9,484 8,030 4,193 7,779 17,531 7,589 8,261Net income . . . . . . . . . . . . . . . . 4,194 4,410 5,139 4,797 48 4,379 10,420 4,245 4,003Dividends . . . . . . . . . . . . . . . . . 2,564 3,191 4,037 4,138 6,258 2,263 5,595 3,239 3,757
1 Includes capital stock discount and expense and reacquired securities. 2 Includes reserves for deferred income taxes.3 Includes expenses not shown separately.
Source: American Gas Association, Arlington, VA, Gas Facts, annual (copyright).
598 Energy and Utilities
U.S. Census Bureau, Statistical Abstract of the United States: 2003

No. 927. Gas Utility Industry—Summary: 1980 to 2001
[47,223 represents 47,223,000. Covers natural, manufactured, mixed, and liquid petroleum gas. Based on a questionnaire mailedto all privately and municipally owned gas utilities in United States, except those with annual revenues less than $25,000]
Item Unit 1980 1990 1995 1997 1998 1999 2000 2001
End users 1. . . . . . . . . . . . . . 1,000 . . . . 47,223 54,261 58,728 59,790 62,421 64,071 64,194 64,792Residential . . . . . . . . . . . . . 1,000 . . . . 43,489 49,802 53,955 54,993 57,465 58,939 59,129 59,729Commercial . . . . . . . . . . . . 1,000 . . . . 3,498 4,246 4,530 4,589 4,755 4,920 4,820 4,869Industrial and other . . . . . . . 1,000 . . . . 187 166 181 170 164 174 163 172
Sales 2 . . . . . . . . . . . . . . . . . Tril. Btu 3 . 15,413 9,842 9,221 8,880 8,630 8,889 9,025 8,565Residential . . . . . . . . . . . . . Tril. Btu . . . 4,826 4,468 4,803 5,013 4,828 4,865 4,948 4,739
Percent of total . . . . . . . . Percent . . . 31.3 45.4 52.0 56.3 56.3 54.7 54.8 55.3Commercial . . . . . . . . . . . . Tril. Btu . . . 2,453 2,192 2,281 2,234 2,157 2,087 2,118 2,142Industrial . . . . . . . . . . . . . . Tril. Btu . . . 7,957 3,010 1,919 1,511 1,528 1,868 1,361 1,225Other . . . . . . . . . . . . . . . . . Tril. Btu . . . 177 171 218 123 117 69 599 458
Revenues 2 . . . . . . . . . . . . . . Mil. dol . . . 48,303 45,153 46,436 51,531 47,930 48,423 59,705 71,730Residential . . . . . . . . . . . . . Mil. dol . . . 17,432 25,000 28,742 33,175 31,333 31,472 37,522 44,789
Percent of total . . . . . . . . Percent . . . 36.1 55.4 61.9 64.2 65.4 65.0 62.8 62.4Commercial . . . . . . . . . . . . Mil. dol . . . 8,183 10,604 11,573 12,632 11,523 11,133 13,662 17,831Industrial . . . . . . . . . . . . . . Mil. dol . . . 22,215 8,996 5,571 5,236 4,684 5,547 6,000 6,820Other . . . . . . . . . . . . . . . . . Mil. dol . . . 473 553 549 488 391 272 2,521 2,290
Prices per mil. Btu 3. . . . . . . . Dollars . . . 3.13 4.59 5.05 5.80 5.55 5.45 6.62 8.38Residential . . . . . . . . . . . . . Dollars . . . 3.61 5.60 6.00 6.62 6.49 6.47 7.58 9.45Commercial . . . . . . . . . . . . Dollars . . . 3.34 4.84 5.07 5.65 5.34 5.34 6.45 8.32Industrial . . . . . . . . . . . . . . Dollars . . . 2.79 2.99 2.98 3.53 3.18 3.19 4.41 5.57
Gas mains mileage . . . . . . . . 1,000 . . . . 1,052 1,207 1,261 1,251 1,295 1,389 1,380 1,433Field and gathering . . . . . . . 1,000 . . . . 84 90 60 43 40 40 36 35Transmission. . . . . . . . . . . . 1,000 . . . . 266 280 264 251 256 254 246 259Distribution . . . . . . . . . . . . . 1,000 . . . . 702 837 937 957 999 1,095 1,098 1,139
Construction expenditures 4 . . Mil. dol . . . 5,350 7,899 10,760 6,830 10,978 8,320 8,624 9,511Transmission. . . . . . . . . . . . Mil. dol . . . 1,583 2,886 3,380 1,319 3,656 1,785 1,590 3,234Distribution . . . . . . . . . . . . . Mil. dol . . . 1,869 3,714 5,394 4,188 5,035 4,180 5,437 4,520Production and storage . . . . . Mil. dol . . . 1,150 309 367 276 598 161 138 113General . . . . . . . . . . . . . . . Mil. dol . . . 352 770 1,441 891 1,389 1,974 1,273 1456Underground Storage . . . . . . Mil. dol . . . 396 219 177 156 299 220 185 188
1 Annual average. 2 Excludes sales for resale. 3 For definition of Btu, see text, this section. 4 Includes general.
Source: American Gas Association, Arlington, VA, Gas Facts, annual (copyright).
No. 928. Gas Utility Industry—Customers, Sales, and Revenuesby State: 2001
[64,792 represents 64,792,000. See headnote, Table 927. For definition of Btu, see text, this section]
State
Customers 1
(1,000)Sales 2
(tril. Btu)Revenues 2
(mil. dol.)
TotalResi-
dential TotalResi-
dential TotalResi-
dential
U.S. . . 64,792 59,729 8,565 4,739 71,730 44,789AL . . . . 920 846 117 54 1,090 618AK . . . . 107 94 59 17 146 71AZ . . . . 930 875 94 36 747 377AR . . . . 625 553 77 38 631 369CA . . . . 10,037 9,596 718 518 7,095 5,324
CO . . . . 1,551 1,411 204 130 1,626 1,084CT . . . . 511 464 91 42 874 515DE . . . . 134 123 19 9 162 83DC . . . . 128 119 17 10 219 138FL. . . . . 758 706 69 19 693 288
GA . . . . 415 378 66 23 520 238HI . . . . . 101 93 9 2 167 41ID . . . . . 337 299 39 23 308 193IL . . . . . 3,847 3,602 532 409 4,658 3,678IN . . . . . 1,746 1,595 230 146 2,042 1,364
IA . . . . . 916 819 122 74 1,110 728KS . . . . 1,708 1,557 189 131 1,690 1,240KY . . . . 1,097 987 139 77 1,217 712LA . . . . 974 912 192 46 1,178 446ME . . . . 49 35 10 2 94 21
MD . . . . 833 778 87 62 956 709MA . . . . 1,663 1,524 216 130 2,350 1,604MI. . . . . 3,230 2,998 474 337 2,591 1,885MN . . . . 1,402 1,276 264 128 2,015 1,112MS . . . . 487 435 80 31 644 300
State
Customers 1
(1,000)Sales 2
(tril. Btu)Revenues 2
(mil. dol.)
TotalResi-
dential TotalResi-
dential TotalResi-
dential
MO . . . . 1,078 986 143 89 1,360 901MT . . . . 255 226 30 20 217 142NE . . . . 537 479 77 44 609 380NV . . . . 584 551 55 33 455 292NH . . . . 123 103 19 9 205 101NJ. . . . . 2,814 2,566 515 234 3,622 1,807
NM . . . . 530 486 58 35 421 267NY . . . . 4,328 3,996 512 326 5,465 3,765NC . . . . 1,004 889 140 62 1,339 732ND . . . . 123 107 22 11 156 81OH . . . . 2,724 2,511 342 246 3,065 2,287
OK . . . . 1,016 928 124 70 1,024 648OR . . . . 685 607 91 45 760 416PA . . . . 2,566 2,358 340 222 3,579 2,489RI . . . . . 250 224 29 9 325 226SC . . . . 555 496 92 29 786 337
SD . . . . 163 143 23 12 185 111TN . . . . 1,231 1,094 183 78 1,597 768TX . . . . 4,026 3,710 873 214 5,286 1,951UT . . . . 1,381 1,284 179 115 1,249 863VT . . . . 36 31 8 3 60 29
VA . . . . 987 899 134 70 1,358 815WA . . . . 1,043 942 149 84 1,358 764WV . . . . 402 366 59 33 413 256WI. . . . . 1,686 1,530 230 130 1,847 1,124WY . . . . 159 142 24 14 167 100
1 Averages for the year. 2 Excludes sales for resale.
Source: American Gas Association, Arlington, VA, Gas Facts, annual (copyright).
Energy and Utilities 599
U.S. Census Bureau, Statistical Abstract of the United States: 2003

No. 929. Public Drinking Water Systems by Size of Community Served andSource of Water: 2002
[As of September. Covers systems that provide water for human consumption through pipes and other constructed conveyancesto a least 15 service connection or serve an average of at least 25 persons for at least 60 days a year. Based on reported datain the Safe Drinking Water Information System maintained by the Environmental Protection Agency]
Type of system
Total
Size of community served Water source
500 orfewer
persons
501 to3,300
persons
3,301 to10,000
persons
10,001to
100,000
100,000personsor more
Groundwater
Surfacewater
Total systems . . . . . . . . . . . . . . . . . . 161,316 132,974 19,706 4,799 3,467 370 146,752 14,564
COMMUNITY WATER SYSTEMS 1
Number of systems . . . . . . . . . . . . . . . 53,437 30,703 14,331 4,606 3,436 361 41,691 11,746Percent of systems . . . . . . . . . . . . . 100 57 27 9 6 1 78 22
Population served (1,000) . . . . . . . . . . . 267,723 5,045 20,180 26,717 96,258 119,523 84,025 183,698Percent of systems . . . . . . . . . . . . . 100 2 8 10 36 45 31 69
NONTRANSIENT, NONCOMMUNITYWATER SYSTEM 2
Number of systems . . . . . . . . . . . . . . . 18,687 15,887 2,690 93 14 3 17,931 756Percent of systems . . . . . . . . . . . . . 100 85 14 - - - 96 4
Population served (1,000) . . . . . . . . . . . 6,033 2,218 2,643 467 325 380 5,298 735Percent of systems . . . . . . . . . . . . . 100 37 44 8 5 6 88 12
TRANSIENT NONCOMMUNITYWATER SYSTEM 3
Number of systems . . . . . . . . . . . . . . . 89,192 86,384 2,685 100 17 6 87,130 2,062Percent of systems . . . . . . . . . . . . . 100 97 3 - - - 98 2
Population served (1,000) . . . . . . . . . . . 22,850 7,338 2,645 538 370 11,958 12,107 10,742Percent of systems . . . . . . . . . . . . . 100 32 12 2 2 52 53 47
- Represents zero. 1 A public water system that suplies water to the same population year-round. 2 A public water systemthat regularly supplies water to at least 25 of the same people at least 6 months per year, but not year-round. Some examples areschools, factories, and office buildings which have their own water systems. 3 A public water system that provides water in aplace such as a gas station or campground where people do not remain for long periods of time.
Source: U.S. Environmental Protection Agency, Factoids: Drinking Water and <http://www.epa.gov/safewater/data/pdfs/02factoids.pdf> (accessed May 2003).
No. 930. Water and Sewage Treatment Facilities: 1997
[Based on the North American Industry Classification System, 1997; see Appendix III]
State
Water supply(NAICS 2213101)
Sewage treatmentfacilities
(NAICS 22132)
Number ofestablish-
ments
Paidemploy-
ees
Number ofestablish-
ments
Paidemploy-
ees
U.S. . . 3,721 26,597 696 5,600AL . . . . . . 96 (1) 13 (2)AK . . . . . . 6 (3) (NA) (NA)AZ . . . . . . 129 1,131 8 40AR . . . . . . 140 (4) 9 (5)CA . . . . . . 374 2,848 27 116CO. . . . . . 71 314 14 51CT . . . . . . 32 (6) 9 (5)DE . . . . . . 9 (1) (NA) (NA)DC. . . . . . (NA) (NA) (NA) (NA)FL . . . . . . 129 1,393 88 (4)GA. . . . . . 34 130 10 (5)HI . . . . . . 9 24 13 (2)ID . . . . . . 35 (2) 6 20IL. . . . . . . 82 (4) 27 (2)IN . . . . . . 114 (6) 30 (2)IA . . . . . . 25 (2) 7 (5)KS . . . . . . 38 (2) (NA) (NA)KY . . . . . . 42 (1) 13 116LA . . . . . . 192 (4) 21 (2)ME. . . . . . 22 (2) (NA) (NA)MD. . . . . . 8 (5) 9 107MA. . . . . . 18 (2) 21 (1)MI . . . . . . 12 66 10 24MN. . . . . . 6 (5) 13 (5)MS. . . . . . 332 1,001 14 (5)
State
Water supply(NAICS 2213101)
Sewage treatmentfacilities
(NAICS 22132)
Number ofestablish-
ments
Paidemploy-
ees
Number ofestablish-
ments
Paidemploy-
ees
MO . . . . . 57 (4) 15 (5)MT. . . . . . 35 113 6 (3)NE . . . . . . (NA) (NA) (NA) (NA)NV . . . . . . 23 (5) (NA) (NA)NH. . . . . . 10 (2) (NA) (NA)NJ . . . . . . 49 (6) 24 (4)NM. . . . . . 90 323 (NA) (NA)NY . . . . . . 41 (4) 28 (2)NC. . . . . . 81 577 18 (5)ND. . . . . . 24 (5) (NA) (NA)OH. . . . . . 60 686 19 (2)OK. . . . . . 105 (1) 9 (2)OR. . . . . . 63 (2) 7 (5)PA . . . . . . 125 2,568 59 (1)RI . . . . . . (NA) (NA) (NA) (NA)SC . . . . . . 48 (1) 12 (5)SD . . . . . . 29 (2) (NA) (NA)TN . . . . . . 30 (1) 11 (2)TX . . . . . . 601 2,514 38 (4)UT . . . . . . 23 71 (NA) (NA)VT . . . . . . 7 (5) (NA) (NA)VA . . . . . . 48 (1) 12 (5)WA . . . . . 148 (1) 8 (5)WV . . . . . 40 523 20 94WI . . . . . . (NA) (NA) 13 47WY . . . . . 16 (5) (NA) (NA)
NA Not available. 1 250-499 employees. 2 100-249. 3 1-19. 4 500-999. 5 20-99. 6 1000-2499.
Source: U.S. Census Bureau, 1997 Economic Census, Utilities. See also <http://www.census.gov/epcd/www/97EC22.htm>(accessed May 2002).
600 Energy and Utilities
U.S. Census Bureau, Statistical Abstract of the United States: 2003