Second report on chicken genes and chromosomes 2005
65
Fax +41 61 306 12 34 E-Mail [email protected] www.karger.com Cytogenet Genome Res 109:415–479 (2005) DOI: 10.1159/000084205 Second Report on Chicken Genes and Chromosomes 2005 © 2005 S. Karger AG, Basel 1424–8581/05/1094–0415$22.00/0 Accessible online at: www.karger.com/cgr Organized by Michael Schmid Indrajit Nanda David W. Burt Painting on a dinner plate. French, possibly Lunéville, early 1800’s. Royal Ontario Museum, Toronto.
Transcript of Second report on chicken genes and chromosomes 2005

Fax +41 61 306 12 34E-Mail [email protected]
Cytogenet Genome Res 109:415–479 (2005)DOI: 10.1159/000084205
Second Report on Chicken Genes and Chromosomes 2005
© 2005 S. Karger AG, Basel1424–8581/05/1094–0415$22.00/0
Accessible online at:www.karger.com/cgr
Organized byMichael SchmidIndrajit NandaDavid W. Burt
Painting on a dinner plate. French, possibly Lunéville, early 1800’s. Royal Ontario Museum, Toronto.

Chromosome Workshop
Second report on chicken genes andchromosomes 2005
Prepared by
M. Schmid,a I. Nanda,a H. Hoehn,a M. Schartl,b T. Haaf,c J.-M. Buerstedde,d H. Arakawa,d
R.B. Caldwell,d S. Weigend,e D.W. Burt,f J. Smith,f D.K. Griffin,g J.S. Masabanda,g
M.A.M. Groenen,h R.P.M.A. Crooijmans,h A. Vignal,i V. Fillon,i M. Morisson,i F. Pitel,i
M. Vignoles,i A. Garrigues,i J. Gellin,i A.V. Rodionov,j S.A. Galkina,k N.A. Lukina,k G. Ben-Ari,l
S. Blum,l J. Hillel,l T. Twito,m U. Lavi,m L. David,n M.W. Feldman,n M.E. Delany,o
C.A. Conley,p V.M. Fowler,q S.B. Hedges,r R. Godbout,s S. Katyal,s C. Smith,t Q. Hudson,t
A. Sinclairt and S. Mizunou
a Department of Human Genetics, University of Würzburg, Würzburg (Germany);b Department of Physiological Chemistry I, University of Würzburg, Würzburg (Germany);c Department of Human Genetics, University of Mainz, Mainz (Germany);d Department of Molecular Radiobiology, GSF, Neuherberg (Germany);e Department of Animal Science and Animal Behavior, Mariensee, Federal Agricultural Research Center (Germany);f Department of Genetics and Genomics, Roslin Institute, Roslin (Edinburgh), Midlothian (UK);g Department of Biological Sciences, University of Brunel, Uxbridge (UK);h Animal Breeding and Genetics Group, Wageningen University, Wageningen (The Netherlands);i Institut National de la Recherche Agronomique, Centre INRA de Toulouse (France);j Komarov Botanical Institute, St. Petersburg (Russia);k Biological Institute, St. Petersburg State University, St. Petersburg (Russia);l The Hebrew University, Rehovot (Israel); m ARO, Volcani Center (Israel); n Stanford University, Stanford (USA);o Department of Animal Science, University of California, Davis (USA);p NASA Ames Research Center, Space Life Sciences Research Branch, Moffet Field (USA);q Department of Cell Biology, The Scripps Research Institute, La Jolla (USA);r Department of Biology, Pennsylvania State University, University Park (USA);s Department of Oncology, University of Alberta, Cross Cancer Institute, Edmonton (Canada);t Department of Pediatrics and Murdoch Childrens Research Institute, University of Melbourne, Melbourne (Australia);u Department of Agricultural and Biological Chemistry, College of Bioresource Sciences, Nihon University, Fujisawa (Japan)
Contributions received from 7 March 2003 to 17 November 2004; accepted for publication by M. Schmid 25 November 2004.
Supported by the UK Biotechnology and Biological Research Council, by grantRFBR 03-04-49477 and grant MK-4046.2004.04 from the President of the Rus-sian Federation, by the Deutsche Forschungsgemeinschaft, grant SCHM484/21-1 and SCHM 484/21-2, by Grants-in-Aid for Scientific Research on PriorityAreas (2) 14014248 and 15011252 from the Ministry of Education, Culture,Sports, Science and Technology and Grant-in-Aid for Scientific Research (B)12460036 from Japan Society for the Promotion of Science, by the United StatesDepartment of Agriculture 02-35205-11568, by a research grant from theNational Cancer Institute of Canada with funds from the Canadian Cancer Soci-ety, by the EU Framework VI program “Geninteg”, and by grants from theNational Science Foundation and NASA.
This report is dedicated to the memory of Shigeki Mizuno (Nihon University,Fujisawa).
Request reprints from:Dr. Michael SchmidDepartment of Human Genetics, University of WürzburgBiozentrum, Am Hubland, D–97074 Würzburg (Germany)telephone: 0049-931-888-4077; fax: 0049-931-888-4058e-mail: [email protected]
Dr. Indrajit Nanda, Department of Human Genetics, University of WürzburgBiozentrum, Am Hubland, DE–97074 Würzburg (Germany)telephone: 0049-931-888-4078; fax: 0049-931-888-4058e-mail: [email protected]
Dr. David W. Burt, Department of Genomics and BioinformaticsRoslin Institute (Edinburgh), Roslin, Midlothian EH25 9PS (UK)telephone: 0044-131-527-4200; fax: 0044-131-440-0434e-mail: [email protected]
ABC Fax + 41 61 306 12 34E-mail [email protected]
© 2005 S. Karger AG, Basel1424–8581/05/1094–0415$22.00/0
Accessible online at:www.karger.com/cgr

Cytogenet Genome Res 109:415–479 (2005) 417
The chicken: a powerful model organism comes of age(Prepared by D.W. Burt)
The First Report on Chicken Genes and Chromosomes(Schmid et al., 2000) marked a significant point in the historyof chicken genomics. It was a time when practical, high-resolu-tion genetic and physical maps were first made available. Evenat that time it was possible to reveal significant similarities inthe genome organization of species as diverse as chicken andman. This, the Second Report on Chicken Genes and Chromo-somes marks another landmark with the release of the chickengenome sequence (Burt, 2004a, b; International Chicken Ge-nome Sequencing Consortium, 2004). The assembly of thechicken genome sequence was based on a combination of shot-gun sequencing and integration with available genetic andphysical mapping resources. In this report, we have summarieson these cytogenetic, genetic, BAC and radiation hybrid physi-cal mapping resources. The future of genetic studies will bebased on dense maps of single nucleotide polymorphisms. Thepotential of these SNP maps is described (see Chicken Varia-tion Database web site http://chicken.genomics.org.cn/index.jsp for a summary of the 2.8 million SNPs now available in thechicken). Besides being critical for the assembly of the chickengenome sequence itself these resources will now serve as thebasis for comparative genome mapping studies in other birds,as illustrated in this issue. Furthermore, this report contains avariety of topics relevant for avian genetics and genome evolu-tion. The chicken has now an impressive array of tools (seeARK-genomics web site http://www.ark-genomics.org/) and ge-nome resources (see the AvianNET web site http://www.chick-en-genome.org/ for a list of genome browsers and other re-sources) and certainly represents a powerful model organism –for other birds and vertebrates.
The genetic map(Prepared by M. Groenen and R. Crooijmans)
In chicken the consensus linkage map first published in2000 (Groenen et al., 2000) plays a central role in the alignmentof the different types of maps developed for chicken. The con-sensus linkage map combines the data from the original geneticmaps based on the three different mapping populations set upin East Lansing (Crittenden et al., 1993), Compton (Bumsteadand Palyga, 1992) and Wageningen (Groenen et al., 1998).Since that time the map has seen a modest increase in the num-ber of markers from 1,889 loci on 51 linkage groups spanning3,800 cM, to its current size of 4,200 cM with 2,261 loci on 53linkage groups. Currently the East Lansing and the Wageningenreference populations are the two mapping populations stillactively used for linkage mapping. Although, marker informa-tion from QTL mapping studies can be used to add additionalmarkers to the consensus map, the exact marker order betweenmarkers typed on the different populations is more difficult toestimate. Mapping information from QTL mapping studiesnevertheless allowed the further localization of 45 microsatel-lites on the consensus map (Jacobsson et al., 2004; Rabie, 2004)resulting in a total number of 2,306 markers.
The two major types of marker on the consensus linkagemap are microsatellites and AFLPs. However, in the past twoyears a sharp increase is seen in the number of SNP markersand it is to be expected that this trend will further increase withthe SNP marker soon being the dominant type of marker on theconsensus map. The main reason for this is the ongoing effort tomap markers from unassigned BAC contigs to the consensuslinkage map as well as the finemapping of quantitative trait loci(QTL). Because of the lack of detailed RH maps for many of thechicken chromosomes, the consensus linkage map has played acentral role in the assembly of the draft sequence of the chickengenome (International Chicken Genome Sequencing Consor-tium, 2004). Furthermore, the linkage map remains the essen-tial tool for the mapping of QTL. The most up to date versionof the chicken consensus linkage map is available through theChickAce database at https://acedb.asg.wur.nl/ or through thechicken comparative mapping database ChickCmap at http://www.animalsciences.nl/cmap. ChickCmap also allows thealignment of the chicken maps with the human and mousesequence maps. An example of the aligned linkage, RH andsequence maps for chicken chromosome 5 (GGA5) is shown inFig. 1.
So far, 31 of the linkage groups have been assigned to a par-ticular chromosome (Masabanda et al., 2004). The remaining22 linkage groups have an ExxCxxWxx number with referenceto the linkage groups of the original three linkage maps. Ongo-ing experiments are aimed at the development of genetic mark-ers from unassigned FPC contigs and sequence contigs (see Thephysical map, below) and the mapping of these (SNP) markerson the consensus linkage map. A large proportion of these SNPmarkers are being mapped both on the East Lansing and theWageningen reference populations, which should result in afurther reduction of the number of linkage groups. Currently,sequence maps are only available for 30 chromosomes and theultimate aim is to construct linkage and sequence maps for allthe 39 individual chromosomes in the chicken genome.
The physical map(Prepared by R. Crooijmans and M. Groenen)
A considerable number of different BAC libraries have beenconstructed in chicken (Zoorob et al., 1996; Zimmer et al.,1997; Crooijmans et al., 2000; Ren et al., 2003) but only five ofthese are predominantly used for the building of BAC contigmaps in chicken. Four of these BAC libraries (Ren et al., 2003;Pieter de Jong, unpublished results) are derived from the oneinbred Red Jungle fowl bird used in whole genome sequencingand the fifth library was derived from a White Leghorn bird(Crooijmans et al., 2000), a breed phenotype selected for eggproduction. Using chromosome walking, partial BAC contigmaps have been constructed for a number of different chromo-somes (Crooijmans et al., 2001; Buitenhuis et al., 2002; Jennenet al., 2002, 2003) but these maps only covered between 10–50% of these chromosomes. The construction of a physicalBAC map of a complete vertebrate genome the size of that ofthe chicken is not feasible using chromosome walking. Finger-print clone (FPC) maps, based upon complete restriction

418 Cytogenet Genome Res 109:415–479 (2005)
Fig. 1. Alignment of different maps for GGA5 in ChickCmap. Left: theconsensus linkage map (Groenen et al., 2000); middle: radiation hybrid map(Pitel et al., 2004); right: sequence map (International Chicken GenomeSequencing Consortium, 2004). The purple bars to the left of the linkage mapshow the location of QTL that have been mapped on this chromosome.Detailed information of the QTL and the genetic markers are provided
through a direct link to the ChickAce database. More detailed information ofthe chicken genes on the sequence map is provided through a direct link tothe Ensemble database at www.ensembl.org/Gallus_gallus/. Microsatelliteand STS markers that form the links between the different maps are shown inred. ChickCmap has been built using the open source software packageCmap available at www.gmod.org.

Cytogenet Genome Res 109:415–479 (2005) 419
Fig. 2. ChickFPC showing a detail of the central region of FPC BACcontig ctg64007. This BAC contig consists of 1,239 clones and spans theregion from 56 to 120 cM of the consensus linkage map of chromosome 10.Color codes of the BACs are as follows: Green, BAC clones from the Wage-ningen white leghorn library; blue, BAC clones from the Chori-261 library of
Pieter de Jong; ochre, BAC clones from the EcoRI Texas A&M library; yel-low, BAC clones from the HindIII Texas A&M library; red, BAC clones fromthe BamHI Texas A&M library. The dots in the upper panel indicate theapproximate location of STS markers from chromosome 10.
enzyme digests of clones and the subsequent determination ofclone overlap by comparing fragment sizes are the method ofchoice towards this goal. A physical clone map is a valuableresource to be linked to a sequence to identify local mis-assem-blies, supply long-range linking of assembly supercontigs toanchor sequence contigs to the genetic map, and to providetemplates for closing gaps in draft sequence assemblies. Thefirst published preliminary chicken BAC based maps of 7.5×and 3.6× genome coverage (Ren et al., 2003; Aerts et al., 2003)lacked the required coverage to obtain a whole genome physicalmap. Both efforts, however, represented considerable progressin the alignment of the physical and linkage maps by providinga large number of links between BACs and markers that arelocated on the chicken consensus linkage map. All these fiveBAC libraries were eventually used in a combined effort to gen-erate a comprehensive BAC contig map covering 95% of thechicken genome (Wallis et al., 2004). This map consists of over
180,000 BAC clones representing 20-fold coverage of the chick-en genome. These BACs could eventually be assembled into 260contigs of which 226 could be assigned to a particular chromo-some (Fig. 2). However, 10% of these contigs still have ambi-guous links to different chromosomes which currently are beingfurther addressed by the development and mapping of SNPmarkers on the chicken consensus linkage map. Many of theBACs from the FPC map have been end sequenced also enablingthe alignment of the FPC contigs with the chicken sequencemap. In total over 140,000 BAC end sequences have been depos-ited in GenBank. The alignment of the FPC BAC contigs as wellas the chromosome walking contigs with the chicken linkage andsequence maps is available at the ChickCmap website. An exam-ple showing the available BAC contig maps for chicken chromo-some 10 is shown in Fig. 3. Details of the chicken FPC BACcontigs are also available at http://www.animalsciences.nl/ChickFPC/ or http://www.genome.wustl.edu.

420 Cytogenet Genome Res 109:415–479 (2005)
Fig. 3. ChickCmap alignment of the walking (wCTG) and FPC (ctg) BAC contigs on chromosome 10. Markers that are locatedon the linkage and on the BAC contigs are highlighted in red.

Cytogenet Genome Res 109:415–479 (2005) 421
Integration of the genetic and physical maps of thechicken: update(Prepared by J. Smith and D. Burt)
Here we present an update on the mapping status of loci thathave been both physically and genetically mapped in the chick-
en. Most linkage groups have now been assigned a chromosomenumber and have a marker available which can be used to iden-tify one microchromosome from another (Masabanda et al.,2004). The clones that have been both genetically and physi-cally mapped for each chromosome (including microchromo-somes) are shown in Table 1.
Table 1. Loci that have been both physicallyand genetically mapped in the chicken Locus References Chr Linkage group RBGa FLpter Consensus
(cM)
Error
(cM)
MCW0248 Schmid et al., 2000 1 1 p26 0.01 0
ALVE6A Schmid et al., 2000 1 1 p26 0.02 0
GCT0006 Schmid et al., 2000 1 1 p24-p22 0.13 66
IFNG Schmid et al., 2000 1 1 p23-p21 0.16 105 06
LYZ Schmid et al., 2000 1 1 p22-p15 0.20 112 12
HMGIC Schmid et al., 2000 1 1 p21-p13 0.23 116 20.5
DCN Schmid et al., 2000 1 1 p21-p13 0.23 116 20.5
GCT0015 Schmid et al., 2000 1 1 p22-p21 0.21 118
CRADD Schmid et al., 2000 1 1 p21-p15 0.22 132 07
H1F1 Schmid et al., 2000 1 1 p22-p21 0.25 143 01
ADSL Schmid et al., 2000 1 1 p21-p13 0.22 151 10
H1F0 Schmid et al., 2000 1 1 p14-p13 0.25 155 10
ASCL1 Schmid et al., 2000 1 1 p15-p11 0.29 160 29.5
IGF1 Schmid et al., 2000 1 1 p12-p11 0.31 172 17
LDHB Schmid et al., 2000 1 1 p13-p11 0.34 204 03
ALVE1 Schmid et al., 2000 1 1 p12-p11 0.36 204
CCND2 Schmid et al., 2000 1 1 p11-q11 0.39 230 35
GAPD Schmid et al., 2000 1 1 q11-q12 0.47 241 13
SCYC1 Morroll et al., 2001 1 1 q11-q13 0.46 266 44
CRYAA Schmid et al., 2000 1 1 q14-q21 0.57 341 01
OTC Schmid et al., 2000 1 1 q13-q14 0.57 356
GCT0013 Schmid et al., 2000 1 1 q14 0.57 362
EWSR1 Groenen et al., unpublished 1 1 q31 0.75 433 17
GCT0007 Schmid et al., 2000 1 1 q31-q35 0.79 441
PGR Schmid et al., 2000 1 1 q42-q44 0.94 520 26
TYR Schmid et al., 2000 1 1 q42-q44 0.95 556 14.5
LEI0331 Schmid et al., 2000 1 1 qter 0.97 561
MCW0107 Schmid et al., 2000 1 1 q45 0.99 565
LEI0332 Schmid et al., 2000 1 1 qter 1 566
VIM Schmid et al., 2000 2 2 p24-p21 0.14 76 12
TGFBR1 Schmid et al., 2000 2 2 p12-p11 0.27 179 12
PRL Schmid et al., 2000 2 2 p11 0.32 186 19
OVY Schmid et al., 2000 2 2 q11-q12 0.49 226
GCT0023 Schmid et al., 2000 2 2 q11-q12 0.53 241
ROS0150 Schmid et al., 2000 2 2 q26-q32 0.75 336
LYN Schmid et al., 2000 2 2 q26 0.77 355 06.5
CALB1 Schmid et al., 2000 2 2 q26 0.79 358 01
SDC2 Chen et al., 2002 2 2 q31 0.84 372 07.5
ROS0120 Schmid et al., 2000 2 2 q32-q35 0.89 395
ADL0146 Schmid et al., 2000 2 2 q36-37 0.98 403
MCW0261 Schmid et al., 2000 3 3 p12 0 0
BMP2 Schmid et al., 2000 3 3 q11-q21 0.22 52 14
TGFB2 Schmid et al., 2000 3 3 q22-q23 0.23 77 12
MYB Schmid et al., 2000 3 3 q24-q26 0.53 170 10
CCNC Schmid et al., 2000 3 3 q26-q29 0.60 210 10
ROS0119 Schmid et al., 2000 3 3 q27-q29 0.63 210
ROS0108 Schmid et al., 2000 3 3 q29-q33 0.63 210
GCT0019 Schmid et al., 2000 3 3 q28-q2.10 0.68 210
MCW0037 Schmid et al., 2000 3 3 q35 0.98 317
HPRT1 Schmid et al., 2000 4 4 p14 0.02 –9 17
ADL0143 Schmid et al., 2000 4 4 p14 0.03 0
ROS0107 Schmid et al., 2000 4 4 p14-p13 0.04 1
PGK1 Schmid et al., 2000 4 4 p14-p11 0.11 48 24
TLR2 Boyd et al., 2001 4 4 q11 0.30 90 06.5
FGB Schmid et al., 2000 4 4 q11 0.31 90 06.5
IL8 Schmid et al., 2000 4 4 q12-q13 0.44 118 16
CLOCK Noakes et al., 2000;
Yoshimura et al., 2000
4 4 q13 0.45 131
ALB Schmid et al., 2000 4 4 q13-q24 0.61 158 16

422 Cytogenet Genome Res 109:415–479 (2005)
Table 1 (continued)Locus References Chr Linkage group RBGa FLpter Consensus
(cM)
Error
(cM)
GC Schmid et al., 2000 04 4 q13-q24 0.61 158 16
MCW0240 Schmid et al., 2000 04 4 q21 0.76 201
LEI0073 Schmid et al., 2000 04 4 q25 0.97 243
LEI0340 Schmid et al., 2000 04 4 qter 1.00 269
LEI0341 Schmid et al., 2000 04 4 qter 1.00 270
CD5 Koskinen et al., 2001 05 5 p11-q11 0.14 19 19
MCW0263 Schmid et al., 2000 05 5 q11 0.17 28
MYOD1 Schmid et al., 2000 05 5 q11-q12 0.27 44 19
IGF2 Schmid et al., 2000 05 5 q11-q12 0.31 57 12
INS Schmid et al., 2000 05 5 q12 0.34 57 12
TH Schmid et al., 2000 05 5 q12 0.34 57 12
CCND1 Schmid et al., 2000 05 5 q11-q12 0.31 61 22.5
RYR3 Schmid et al., 2000 05 5 q13 0.47 106 01
FUT8 Coullin et al., 2002 05 5 q13 0.46 108 02
HTR1D Schmid et al., 2000 05 5 q21-q22 0.69 110 10
PTAFR Schmid et al., 2000 05 5 q21-q22 0.69 110 10
UNK unpublished 05 5 q21-q22 0.69 110 10
AF111167.2 unpublished 05 5 q21-q22 0.69 110 10
TGFB3 Schmid et al., 2000 05 5 q21-q22 0.69 110 10
ADL0298 Schmid et al., 2000 05 5 q25 0.98 198
LEI0192 Schmid et al., 2000 06 6 q11 0.22 31
SUPV3L1 Schmid et al., 2000 06 6 q12 0.37 59 06
SCD Schmid et al., 2000 06 6 q14 0.58 63 05
MCW0326 Schmid et al., 2000 06 6 q14-15 0.72 63
THRSP Carre et al., 2001 06 6 q12-q14 0.60 64 04
LEI0064 Schmid et al., 2000 07 7 p12 0.00 0
ROS00331 Schmid et al., 2000 07 7 p11 0.17 40
MCW0201 Schmid et al., 2000 07 7 q13-q14 0.66 79
ROS0128 Schmid et al., 2000 07 7 q13 0.59 80
RPL37A Schmid et al., 2000 07 7 q12-q14 0.60 80
ADL0169 Schmid et al., 2000 07 7 q16 0.94 165
MCW0275 Schmid et al., 2000 08 8 p12 0.11 6
AT3 Schmid et al., 2000 08 8 p11 0.33 50 13
RPL5 Schmid et al., 2000 08 8 p11-q11 0.35 56 40
ROS0149 Schmid et al., 2000 08 8 8cen 0.5 66
LEI0044 Schmid et al., 2000 08 8 q14 0.99 96
B2M Schmid et al., 2000 10 E29C09W09 m N/A 1 01
CSK Crooijmans et al., 2001 10 E29C09W09 m N/A 1 01
CYP11A Crooijmans et al., 2001 10 E29C09W09 m N/A 1 01
MLSN1 Crooijmans et al., 2001 10 E29C09W09 m N/A 48 01
NTRK3 Crooijmans et al. 2001 10 E29C09W09 m N/A 71 01
AGC1 Schmid et al., 2000 10 E29C09W09 m N/A 71 01
IGF1R Schmid et al., 2000 10 E29C09W09 m N/A 88 01
MEF2A Crooijmans et al., 2001 10 E29C09W09 m N/A 101 01
UQCRFS1 Smith J. et al., 2002 11 E30C14W10 m N/A 32
CCNE Smith J. et al., 2002 11 E30C14W10 m N/A 38 01
KIAA0355 Smith J. et al., 2002 11 E30C14W10 m N/A 44 01
GPI Smith J. et al., 2002 11 E30C14W10 m N/A 44 01
GABRA6 Buitenhuis et al., 2002 13 E48C28W13 m N/A 32–39
GABRA1 Buitenhuis et al., 2002 13 E48C28W13 m N/A 32–39
GABRG2 Buitenhuis et al., 2002 13 E48C28W13 m N/A 32–39
KIAA1673 Buitenhuis et al., 2002 13 E48C28W13 m N/A 39
MSX2 Buitenhuis et al., 2002 13 E48C28W13 m N/A 39–47
FLJ12686 Buitenhuis et al., 2002 13 E48C28W13 m N/A 47
KIAA0731 Buitenhuis et al., 2002 13 E48C28W13 m N/A 47
C5ORF4 Buitenhuis et al., 2002 13 E48C28W13 m N/A 51
CNOT8 Buitenhuis et al., 2002 13 E48C28W13 m N/A 51
SPARC Buitenhuis et al., 2002 13 E48C28W13 m N/A 51–55
CDX1 Buitenhuis et al., 2002 13 E48C28W13 m N/A 55
FLJ10290 Buitenhuis et al., 2002 13 E48C28W13 m N/A 55
MADH5 Buitenhuis et al., 2002 13 E48C28W13 m N/A 55–67
CAMLG Schmid et al., 2000 13 E48C28W13 m N/A 70 07
UBE2B Buitenhuis et al., 2002 13 E48C28W13 m N/A 67
DTR Buitenhuis et al., 2002 13 E48C28W13 m N/A 67–74
POU4F3 Buitenhuis et al., 2002 13 E48C28W13 m N/A 67–74
KIAA0837 Buitenhuis et al., 2002 13 E48C28W13 m N/A 67–74
IRF1 Buitenhuis et al., 2002 13 E48C28W13 m N/A 67–74
NR3C1 Buitenhuis et al., 2002 13 E48C28W13 m N/A 67–74
HBA1 Schmid et al., 2000 14 E35C18W14 m N/A 26 30
CRYBB1 Schmid et al., 2000 15 E18W15 m N/A 31 03

Cytogenet Genome Res 109:415–479 (2005) 423
Table 1 (continued)Locus References Chr Linkage group RBGa FLpter Consensus
(cM)
Error
(cM)
IGL@ Schmid et al., 2000 15 E18W15 m N/A 35 01
HLA Schmid et al., 2000 16 16 m N/A 0 20
SURF5 Colombo et al., 1992 17 E41W17 m N/A 11 01
RPL7A Schmid et al., 2000 17 E41W17 m N/A 11 01
SURF1 Colombo et al., 1992 17 E41W17 m N/A 11 01
SURF2 Colombo et al., 1992 17 E41W17 m N/A 11 01
SURF4 Colombo et al., 1992 17 E41W17 m N/A 11 01
ABL1 Schmid et al., 2000 17 E41W17 m N/A 22 01
AK1 Schmid et al., 2000 17 E41W17 m N/A 29 01
MYH1 Schmid et al., 2000 18 E31E21C25W12 m N/A 0 01
H3F3B Schmid et al., 2000 18 E31E21C25W12 m N/A 35 05
FASN Schmid et al., 2000 18 E31E21C25W12 m N/A 40 12
ACACA Schmid et al., 2000 19 E52W19 m N/A –1 45
HCK Schmid et al., 2000 20 E32W24 m N/A 15 06
BMP7 Schmid et al., 2000 20 E32W24 m N/A 16 6
CDC2L1 Schmid et al., 2000 21 E54 m N/A 0 01
AGRN Schmid et al., 2000 21 E54 m N/A 25 01
ETS1 Jennen et al., 2002 24 E49C20W21 m N/A 0 01
SEMA3C Jennen et al., 2002 24 E49C20W21 m N/A 20 01
HNT Jennen et al., 2002 24 E49C20W21 m N/A 20 01
OPCML Jennen et al., 2002 24 E49C20W21 m N/A 20 01
CD3E Jennen et al., 2002 24 E49C20W21 m N/A 40 20
ZW10 Jennen et al., 2002 24 E49C20W21 m N/A 40 20
NCAM1 Jennen et al., 2002 24 E49C20W21 m N/A 40 20
APOA1 Jennen et al., 2002 24 E49C20W21 m N/A 59 10
KIAA1532 Smith J. et al., 2002 28 E53C34W16 m N/A 2 05
hnRNP-M4 Smith J. et al., 2002 28 E53C34W16 m N/A 2
SF3A2 Smith J. et al., 2002 28 E53C34W16 m N/A 21
AMH Smith J. et al., 2002 28 E53C34W16 m N/A 21 01
PTB Smith J. et al., 2002 28 E53C34W16 m N/A 30
TRAP95 Smith J. et al., 2002 28 E53C34W16 m N/A 30
ROD1 Smith J. et al., 2002 28 E53C34W16 m N/A 30
ABCA7 Smith J. et al., 2002 28 E53C34W16 m N/A 46
JUND Smith J. et al., 2002 28 E53C34W16 m N/A 48
GDF1 Smith J. et al., 2002 28 E53C34W16 m N/A 48
RENT1 Smith J. et al., 2002 28 E53C34W16 m N/A 48
COMP Smith J. et al., 2002 28 E53C34W16 m N/A 48
INSR Smith J. et al., 2002 28 E53C34W16 m N/A 58
PTPRS Smith J. et al., 2002 28 E53C34W16 m N/A 60
CALR Smith J. et al., 2002 30 E65 m N/A 0
GCDH Smith J. et al., 2002 30 E65 m N/A 0
RAD23A Smith J. et al., 2002 30 E65 m N/A 0
FARSL Smith J. et al., 2002 30 E65 m N/A 0
LIG1 Smith J. et al., 2002 31 E64 m N/A 0
EZFIT Smith J. et al., 2002 31 E64 m N/A 0
SNRPD2 Smith J. et al., 2002 32 E25C31 m N/A –2
TGFB1 Smith J. et al., 2002 32 E25C31 m N/A –1
RYR1 Smith J. et al., 2002 32 E25C31 m N/A 0
CAPN4 Smith J. et al., 2002 32 E25C31 m N/A 16
CKM Smith J. et al., 2002 32 E25C31 m N/A 20
ATP5A1 Schmid et al., 2000 Z Z p24-p23 0.06 –1 15
ADL0022 Schmid et al., 2000 Z Z p24-p23 0.03 0
PRLR Schmid et al., 2000 Z Z p23-p22 0.13 24 04
GHR Schmid et al., 2000 Z Z p23-p22 0.13 28 01
DMRT1 Schmid et al., 2000 Z Z p21-p13 0.24 37 08
VLDLR Schmid et al., 2000 Z Z p13-p12 0.28 73 05
NTRK2 Schmid et al., 2000 Z Z p12-p11 0.36 125 05
CHD1 Schmid et al., 2000 Z Z q21-q22 0.57 131 06
CHRNB3 Schmid et al., 2000 Z Z q12-q13 0.68 139 04
ALDOB Schmid et al., 2000 Z Z q13-q22 0.78 160 10
LEI0075 Schmid et al., 2000 Z Z q14-q21 0.75 165
ACO1 Schmid et al., 2000 Z Z q13-q22 0.80 187 06
B4GALT1 Schmid et al., 2000 Z Z q13-q22 0.80 187 05
a RBG positions were estimated in cases where GTG positions were published and FLpters estimated from given
band positions; m = microchromosome

424 Cytogenet Genome Res 109:415–479 (2005)
Genetic Distance (cM) Genetic Distance (cM)
Genetic Distance (cM) Genetic Distance (cM)
Genetic Distance (cM) Genetic Distance (cM)
Genetic Distance (cM) Genetic Distance (cM)
Genetic Distance (cM)

Cytogenet Genome Res 109:415–479 (2005) 425
Table 2. Summary of chromosome probesidentifying each chromosome. Markers andlinkage groups are indicated where known(Masabanda et al., 2004; adapted and expandedupon from Fillon et al., 1998).
Group Chromosome
number
Chromosome
paint isolated?
BAC (or cosmid)
isolated?
Linkage groupa Markerb
A 1 + + N/A
2 + + N/A
3 + + N/A
4 + + N/A
5 + + N/A
6 + + N/A
7 + + N/A
8 + + N/A
9 + + E36C06W08 MCW0134
10 + + E29C09W09 ADL0112
B 11 + + E30C14W10 LEI0143
12 + + E16C17W22 MCW332
13 + + E48C28W13W27 GCT907
14 – + E35C18W14 + C37 GCT903
15 – + E18C15W15 + C37 GCT14
16 – + NOR chromosome MCW371
C 17 – + E41W17 + C24 ADL0293
18 + + E31E21C25W12 FASN
19 + + E52W19 ACACA
20 – + E47W24 + E32 ADL324
21 – + E54 PLOD
22 – + E38 TVSB3
23 + + E27C36W25W26 MCW249
24 + + E49C20W21 GCT905
25 + – – *
26 + + E60E04W23 GCT906
27 + + E59C35W20 GCT22
28 + + E53C34W16 GCT904
29 + + (cosmid) E62 ROS0257
30 + + (cosmid) E65 ROS0263
31 + + (cosmid) E64 ROS0264
32 – + (cosmid) E25C31 –
D 33 + – – –
34 + – – –
35 + – – –
36 + – – –
37 + – – –
38 + – – –
A Z + – N/A
A W + – N/A
a N/A: not applicable.b *: Chromosome 25 paint was isolated 11 times following microdissection and flow sorting experiments. Each
time the paint was bright and specific leading us to conclude that this chromosome mostly consists of highly
repetitive sequences.
We have correlated genetic (cM) to physical distance (FL-pter) for the macrochromosomes as shown in Fig. 4, whichallows estimation of genetic position from physical data and viceversa. Where no direct FLpter data was available, we estimatedfractions from the given cytogenetic band positions. The in-crease in mapping information since the First Report was pub-lished in 2000 (Schmid et al., 2000), means that we can drawmore detailed conclusions about how physical distance relates togenetic position for each of the nine largest chromosomes. Cur-rent physical and genetic mapping data on the chicken is avail-able at http://www.thearkdb.org/browser?species=chicken.
Fig. 4. Correlation of genetic distance with physical distance for each ofthe chicken macrochromosomes. Centromere positions are marked by astar.
Note: When presenting cytogenetic data, standardization isimportant. FLpter measurements must be given so that resultscan be assigned to the correct band on either the GTG or RBGideograms.
The last major karyotype?(Prepared by D.K. Griffin and J.S. Masabanda)
A karyotype of any organism can be thought of as a low-resolution map of the genome of that species. Each gene repro-ducibly resides in the same place on the same chromosome inevery cell and physical evidence of genetic linkage can be pro-vided by the co-localization of two or more loci on the samechromosome. Thus both physical and genetic maps are drawnwith respect to a chromosomal assignment. Indeed, in humansand many other species, “chromosomology” was the first stepin the mapping of the genome and allowed genes to be given

426 Cytogenet Genome Res 109:415–479 (2005)
Fig. 5. Eleven-color painting of chromosomes1–10 and Z.
Fig. 6. Single color painting of chromo-some 35.
proper assignments in terms of a convention agreed by thescientific community. In the case of humans, the Paris Confer-ence (1971) finally agreed on a standard nomenclature forhuman chromosomes following the work of Sumner et al.(1971) that permitted reproducible identification of each hu-man chromosome. This preceded the announcement of thecompletion of the human genome map and sequence by over 30years. In the case of chickens however the completion of thekaryotype and of the genome sequence has occurred almostsimultaneously. This is largely due to the fact that chicken chro-mosomes belie assignment by conventional means a) becausethere are so many of them (2n = 78) and b) because the majorityof them are tiny microchromosomes. Nevertheless, in issue 166of the Journal “Genetics” we reported the accurate assignmentof each individual chromosome by molecular cytogeneticmeans (Masabanda et al., 2004). A collaboration of the skills ofa large number of groups made this possible and the work hastaken approximately seven years to complete. Table 2 gives theassignment of each chromosome and indicates the meansthrough which each chromosome was identified. In essence,two approaches permitted chromosomal assignment namely
a) chromosome painting and b) mapping of known clones anduse of them as landmarks for the chromosomes. Of course, formany chromosomes, both individual landmark clones andchromosome paints were generated (Masabanda et al., 2004).
Strategies for probe generationIn the case of chromosome paints, essentially four ap-
proaches were used; all involved isolation of individual chro-mosomes and subsequent amplification and labeling by degen-erate oligonucleotide primed (DOP) PCR. Two approachesinvolved flow-cytometry and two involved chromosome mi-crodissection (Griffin et al., 1999). In the case of the former, thelarger chromosomes tractable in a flow-karyotype were sortedin multiple copies (Fig. 5). For chromosomes that were not easi-ly resolved however (including some of the larger microchro-mosomes) it was necessary to isolate single microchromosomesand perform amplification and labeling from this single chro-mosomal template (Griffin et al., 1999; Masabanda et al.,2004). While this was not as reliable in generating paints asperforming it from multiple copies (nor were the paints asbright or specific), this proved a successful strategy in some

Cytogenet Genome Res 109:415–479 (2005) 427
cases and we are indebted to the Ferguson-Smith lab (particu-larly Patricia O’Brien) for performing the flow-cytometry. Forthe microdissection-based approaches, the amplification of sin-gle templates met with some success (Fig. 6), however, for thevery smallest of the microchromosomes we adopted an ap-proach of pre-hybridization of DOP-PCR amplified DNA tothe chromosomes prior to microdissection, amplification andlabeling (Masabanda et al., 2004).
For individual clones, BACs or cosmids (once isolated andmapped to a microchromosome by FISH) were used as land-marks for that chromosome. In the use of these clones, we fol-lowed the convention set down by Fillon, Vignal and colleagues(Schmid et al., 2000) for assignment of chromosomes 9–30 (Ta-ble 2). Given that many of these clones had been previouslyassigned to known linkage groups, co-hybridization experi-ments permitted integration of genetic and physical maps.
Classification of chromosomesIn the past, avian chromosomes have been classified as eith-
er macro- or microchromosomes. The definition of the border-line between the two has, however, varied in the literature withbetween 6 and 10 pairs of macrochromosomes including the Zand W in the heterogametic female reported (e.g. Kaelbling andFechheimer, 1983; Fritschi and Stranzinger, 1985; Auer et al.,1987; Schmid et al., 1989; Ponce de Leon et al., 1992). We how-ever propose a system that does not make that distinction sincethere is no clear size-based separation between macro- andmicrochromosomes. Instead, we propose that chromosomes 1–10 (plus the sex chromosomes) should be called group A andinclude all those that are tractable in a flow-karyotype. Conve-niently, this includes chromosome 10 which, although slightlysmaller than 11 and 12 had already been assigned to linkagegroup E29C09W09 and also can be isolated individually in aflow karyotype whereas 11 and 12 sort together in the samepeak. Group D (chromosomes 33–38) are the smallest of thechromosomes and were classified as such as they had yet to beassigned to a known linkage group. At time of writing we are inthe process of sequencing DNA from these paints to try andestablish matches with recently established data. We took thedecision to split the remaining chromosomes either side of theNOR chromosome. A change of assignment of this chromo-some was suggested as size measurements clearly indicate thatit is much smaller than the designation 16 would suggest (withthe current 22 being called 19 and the current 19 taking up the16 assignment). This was met with some support but was, over-all, rejected by the wider chicken genome mapping communityand thus the designation 16 will be retained for the NOR chro-mosome. Therefore group B includes chromosomes 11–16,leaving the remainder (17–32) designated as group C. Interest-ingly, our studies uncovered a chromosome (chromosome 25)that produced a paint that was bright, specific and was gener-ated 11 times despite there being no means of prior selection ofwhich chromosome was being isolated. In other words therewas no means of knowing which chromosome was being iso-lated until the paint was made and co-hybridized with a pre-existing one. We feel that the most likely explanation for this isthat the chromosome contains a large number of repeats. Fillonet al. (1998) reported that one BAC painted the whole of one
microchromosome and half of another suggesting a highlyrepeated sequence shared across two chromosomes; in ourstudies we have found no evidence for this but have not yetbeen able to use this BAC in our own laboratory to confirmthese results.
Utility of the resourceThe ability to identify each chicken chromosome opens up a
range of possibilities for scientific research. The first is compar-ative genomics. The ability to distinguish each chicken chro-mosome is key to the development of genome maps in otherbirds as cross species FISH is an efficient means of generatinglow-resolution physical gene maps (Wienberg and Stanyon,1995; O’Brien et al., 1997). This commonly makes use ofhuman chromosome paints on the metaphases of other mam-mals but to date has been applied relatively rarely to non-mam-malian vertebrates (Suzuki et al., 1999; Nanda et al., 2000;Suchyta et al., 2001). Priority avian species for comparativegene mapping are turkey, goose, duck and quail. Less commonspecies however are under investigation and chromosomepainting strategies have established that, in contrast to mam-mals, bird chromosomes are remarkably conserved throughoutevolution (Shetty et al., 1999). Similar experiments with mi-crochromosomes will now ensue.
It is becoming increasingly apparent that three- and four-dimensional genome organization in the interphase nucleus iscentral to development and disease. Assaying for the positionof chromosome territories is a well-established assay for estab-lishing genome organization and our chromosome probes havemade it possible to begin to study structure and arrangementsof chromosome territories in chicken cells (Habermann et al.,2001). It seems likely that these investigations will be extendedto a range of developmental processes and tissue types.
Chicken chromosome probes are essential for the character-ization of aberrant avian karyotypes such as chromosomallyrearranged (e.g. infertile) individuals or aberrant cell lines.They have been used in the characterization of functionaldomains in the BRCA2 gene (Warren et al., 2002) and forDT40 karyotyping (Fukagawa et al., 1999). Detecting chromo-some aberrations in DT40 can be a fundamental step inaddressing questions of genome stability, DNA repair, geneexpression, cell death, cell division and non-disjunction.
In conclusion, we have provided an essential step for thecompletion of genetic and physical maps of birds and devel-oped a resource that is applicable in a wide range of investiga-tions. Researchers are encouraged to contact us if they wish tomake use of this resource.
Comparative mapping – fluorescent in situ hybridizationof BAC clones reveals strong homologies betweenGalliformes and Anseriformes(Prepared by V. Fillon, M. Vignoles, A. Garrigues,R. Crooijmans, M. Groenen, J. Gellin and A. Vignal)
During the last few years, international collaborative effortsled to a consensus molecular linkage map of the chickengenome (Groenen et al., 2000; Schmid et al., 2000) of high

428 Cytogenet Genome Res 109:415–479 (2005)
Fig. 7. The typical organization of avian ka-ryotypes comprising a few macrochromosomepairs and a lot of tiny microchromosomes. Chick-en (Gallus gallus domesticus) 2n = 78, quail (Co-turnix coturnix japonica) 2n = 78, turkey (Melea-gris gallopavo) 2n = 80, duck (Anas platyrhyn-chos) 2n = 80.
interest for the mapping of quantitative trait loci (QTL). Thisknowledge on the chicken genome could be of direct benefit forother poultry species and therefore comparative mapping stud-ies were developed.
Most of the avian karyotypes share the same typical organi-zation comprising a few macrochromosome pairs and manymicrochromosomes, too small to be identified unambiguouslyand usually classified approximately by size (Stock and Bunch,
1982) (Fig. 7). In chicken, a standard for the eight macrochro-mosome pairs, plus the Z and W gonosomes has been described(Ladjali-Mohammedi et al., 1999) and 22 of the thirty micro-chromosome pairs have been identified by FISH markers, theothers still remaining indistinguishable (Fillon et al., 1998;Schmid et al., 2000).
This presence of microchromosomes complicated greatlyclassical cytogenetics, as compared to mammals. The order

Cytogenet Genome Res 109:415–479 (2005) 429
Fig. 8. Localization of different chicken BAC clones along chromosomes 1 of chicken, quail, turkey and duck. The order ineach chromosome is quite similar to that of chicken, demonstrating the high degree of homology.
Galliformes is one of the best studied, and many homologieshave been shown between poultry species (Stock and Bunch,1982). Therefore, despite of this lack of banding studies, theconservation of avian macrochromosomes was supposed to behigh. Using Zoo-FISH, Shetty et al. (1999) demonstrated theremarkable homology between the chromosomes of chickenand emu (Dromaius novaehollandiae) over 80 million years ofbird evolution. The occurrence of homologous chromosomesegments in the genome of several bird species was also evi-denced by Guttenbach et al., using chromosome painting (seeSchmid et al., 2000). Moreover, a fine comparative cytogeneticstudy by FISH of chicken cosmid clones has shown that themacrochromosome locations of DNA clones and the gene orderwere quite similar in Japanese quail (Coturnix japonica) andchicken (Suzuki et al., 1999; Shibusawa et al., 2001), with avery low number of internal rearrangements.
Considering the chicken standard karyotype as a reference(Ladjali-Mohammedi et al., 1999) idiograms based on bandingpatterns previously described have been established for theduck (Anas platyrhynchos, 2n = 80; Denjean et al., 1997), thequail (Coturnix coturnix, 2n = 78; Stock and Bunch, 1982;Suzuki et al., 1999) and the turkey (Meleagris gallopavo, 2n =80; Stock and Bunch, 1982) (summary in Schmid et al., 2000).
In order to establish precise chromosome correspondencesbetween the poultry species, with an insight on internal rearran-gements, we hybridized BAC (Bacterial Artificial Chromo-some) clones (Zoorob et al., 1996; Crooijmans et al., 2000) inheterologous conditions on quail, turkey and duck metaphases.All the BACs used had been previously mapped on chickenchromosomes (Fillon et al., 1998; Morisson et al., 1998;Schmid et al., 2000). Although most results showed similarlocalizations in all four species, several intrachromosomal rear-rangements were detected on macrochromosomes (Table 3,Fig. 8).
Table 3. Correspondences between macrochromosomes in chicken (Gal-lus gallus domesticus, GGA), quail (Coturnix coturnix, CCO), turkey (Melea-gris gallopavo, MGA) and duck (Anas platyrhynchos, APL). Only intrachro-mosomal rearrangements, fusions or fissions were detected.
GGA CCOa MGAa APLa
1 1 (inv) 1 (rea) 1
2 2 (inv) 3 + 6 2
3 3 2 3
4 4 (inv) 4 + micro 4 (rea) + micro
5 5 5 (with p-arm) 5 (rea)
6 6 8 6 (rea)
7 7 (rea) 7 7 (rea)
8 8 (inv) 9 8 (rea)
Z Z Z (inv) Z (rea)
No. of probesb 28/29 43/48 25/26
a inv: inversion, rotation around the centromere; rea: rearrangement, the order of
the markers is not the same between species because of an intrachromosomal
rearrangement. b Number of markers hybridized in heterologous conditions. Only a few of them
gave no hybridization signal.
Most BAC clones from chicken microchromosomes gavehybridization signals on microchromosomes in duck (29 out of34 probes gave a result), turkey (23 out of 28) and quail (20 outof 20), demonstrating a very low rate of rearrangements. Sur-prisingly, rearrangements between macro- and microchromo-somes were almost never detected, except for the chicken chro-mosome 4 that separated into chromosome 4 plus a pair ofmicrochromosomes in duck and turkey.
From the evolutionary point of view, it appears that birdkaryotypes have evolved slower in time than those of mammalsfor which more drastic rearrangements have been described.

430 Cytogenet Genome Res 109:415–479 (2005)
Table 4. Sequence tagged sites (STSs): Primer sequences, PCR product length and BAC clone name
STS Oligo1 Oligo2 Size BAC-end Contig
T10BE004 CAGCCGTAGTTCTGTTTGGG CACCACATCTGAAGTGCCGG 145 bW092I14Q ADL0231
T10BE007 TGATACGGTACTGAAGAAAC CTCTGAATAACACAGGACAG 163 bW071J05R ADL0209/COM0101
T10BE008 GCACTAGAAAGCAGTTTGAG CACTGCAGGTTATCGTTGTC 141 bW098C14Q ADL0112
T10BE009 AGGGTGTGGGGAGAAAGAGG GCTCGACTTCATGAGAAGGG 270 bW098C14R ADL0112
T10BE014 ACAGTGTAGACACCATGTTC CTTCAGCTTCAACATTACGG 199 bW046J07Q MCW0194
T10BE016 GACTGAAAGCACTGACTGTC TCAGCAGGTGTAAGTAGCTG 137 bW033O18Q MCW0357
T10BE030 CCCCCTCAAATACCACAAAG TTAGAAGAGTGGCCCGGAAC 156 bW071I20R LEI0112
T10BE035 GCTTACATGATGCTGTTTGG TAAGGGGTTACCAGTACAAG 194 bW045D14Q LEI0112
T10BE071 CAGAATTCTCATACCCTGGG CATGTGTTAGGGAGCTCATG 239 bW038M03R AGC1
T10BE075 CCAGAGCATCTTGCATCATG ATCAGGACTGCAAAGACAGC 217 bW033L04R CRABP1
T10BE078 GCTTGTTGTCCCTTTACAAG ATCACGCTTTGCTCTTTCAG 197 bW009F14Q ANXA2
T10BE085 GTGTTCCAGACTTGCGTGACC TGCTGAGTGTCCTTCTCACC 218 bW025K19Q NEO1
T10BE086 AATCGTAAGGGGTGGAAGAG GGGCATATCTCCTTATCTGG 132 bW025K10R NEO1
T10BE104 AATGGAGCGAGGACAAAAGC CCCTTCTCTTCTCCAACATG 140 bW014H05Q LEI0112
T10BE108 CAAGCAATTGTACATCTGAG AGGAATGAAAGAGTAGCTTG 240 bW028E16Q ADL0038
T10BE111 CACAAAGTAAGATCCTTGGC GTATCAGCTTTATCCGTTGG 115 bW030D08Q ADL0038
T10BE116 TCTGCTGCTCTGCTCATGAC TTAGGTCCCACAGTTGGAGC 155 bW033G17Q ADL0272
T10BE119 CAATGGCAACTGACATACTC TAGCTGTAAACATGTGTCCC 180 bW041G13R ADL0209/COM0101
T10BE122 AAGCTTGGCAGCTCGCAGAC CACAGTCTGCAGCCAAACTC 138 bW072B05Q ADL0209/COM0101
T10BE140 CAACATCCAGTTCTTCTCAG CTAACTCAGCAGTGCTCTAC 182 bW011O02R MCW0067
T10BE141 CCACTGGCTAGTGACAAATC TAAGGAATGGCTGGAACTGC 262 bW037E07R MCW0357
T10BE143 ATTAGGTCAAACCATGTGCC AGATTACCAGAATTGAGACC 166 bW021F07Q ADL0106
T10BE145 CTTGTCCTTCGTAGCGTTGG GGAATCTGGTGCCTGTTTGG 242 bW028F24Q CRABP1
T10BE148 CTGGAGACAACAGCAGAGTC TTTGCTATGCAGAACCGGTC 130 bW014A09Q AGC1
T10BE150 TTCATCTCGGTCCAATCTGC AACTTGGAGGAGCACGATTC 239 bW017L04Q ADL0272
T10BE153 CCACAACTAAGTAGCACGAC ATTCCATGCCTTTTCTTCCC 223 bW081N11Q MCW0035
T10BE156 AAGGATCTGCTGCCTCTAAC ATGGGACTGAGTGATGCTTG 249 bW011D17R IGF1R
T10BE157 ACATCATCCAGTAACAGTGC AAACCCTACGATGAGTTGCC 179 bW008G10Q MCW0132
T10BE158 AAGCTTGATGAGAGAGACCC TTGGGCCAGTTTCAGTTCAC 263 bW030I03Q CYP11A
T10BE159 TCATTTGCATGCTTGCCATG TTCTACCTAACCTATTCAGG 157 bW066K13Q CHRNA7
T10BE160 CAACCATAGAGATGGCATGG AGTAGCTGCAGAATAAGGCG 282 bW066K13R CHRNA7
T10BE167 ATCAGTGGCAGTAGGAAGTC TGTGGTTCAGTCCTCTAATG 199 bW043H13R ADL0158
T10BE169 CCCAAGAAAGCAAACTCAAC CCCCAATGGACAACGATAAG 200 bW038A10R MCW0035
T10BE170 TATCTTGAGAGCCCTCACTG ACCTCGAAGAATACAAGTGG 278 bW038K03R MCW0132
T10BE171 GCAGAACACTTCTGAAGATC AAATGGGTGACTCAACACAG 330 bW012C22R MCW0356
T10BE172 CTAAAGCCAGCATATCCTGC AGCCATCCATCCACAGATAC 256 bW006E19R LEI0112
T10BE177 GGAGGAAACCTGAAATGCTG GAAGCTCTAGATGGCAATTC 241 bW026J07R LEI0112
T10BE178 ACAATCCAGGCAGTCTGACC CATCCTGGTATCTAACACAG 235 bW003G13R ADL0158
T10BE185 AAGAGGCTTTCTGCACACAG CAAGAAGCCTACCTACCAAG 195 bW112M15R B2M
T10BE187 TCATTGTGGAGGCTGTTAGG AACGCATCTGAGTGCACAAG 194 bW116J21R B2M
T10BE188 TCAGTAGTCCTTGTTTTCGG GAGGAAGAGAGGGCATAATC 219 bW044O14R MCW0194
T10BE189 ACTCAACCTGCCTCAATTTC GCTTGTTTCATCCAAAAGCC 219 bW029L15R ADL0272
T10BE196 ACTGGAAGCTCAGAACTCAG CCTGCCTCAGTTTGACGTTG 261 bW006H24R IGF1R
T10BE199 AATCGGATAGGACAGCTCTG GTGACAGATTCCTTCCATAC 213 bW086J14R N2RF2
T10BE201 CCTGTCTGTCTCCTGCATTG ACTCCGAGATACCAGCATGC 248 bW010O09R ANXA2
T10BE207 GCAACTGTTGAAGCAGAAGG ATGACCTTGGTAAGCTCCAG 230 bW085M07Q ADL0102
T10BE208 CTTTGCCACTAACAGCACAG CCTCATTCATCTTCAACCCG 165 bW039P22Q ADL0038
T10BE231 GACCTGCCAACAAGCTGTTG GGGAAAGCGAATTATGCTTC 190 bW023K12Q LEI0112
T10BE234 GAGTCCAGGGAGAGTCAAGG GAGCCGTGGGGATGTGATAC 250 bW096N16Q NTRK3
T10BE241 AGGTCTGGATGTGCTGACTC ACAGAGCTCTCAGGGCTTTC 142 bW020P08Q MYO5A
T10BE242 CAAAGGATAATTGAGGGCAC AATGAAGGTGAAATCCAGCC 155 bW005N24Q ADL0158
T10BE245 TGATCTGGCTTAGGGGCAGG TGCTTTGTGCTCCCACTGGG 300 bW086J14Q N2RF2
These data also suggest that the evolution of bird karyotypescould be the result of many fusion/fission processes and/orinversions instead of reciprocal translocations. Thus, micro-chromosomes could represent the conservation of ancestralsyntenies (Burt, 2002).
This high conservation of poultry genomes will facilitate tobuild comparative maps and will be of great help for the studyof genes with zootechnical interest in other poultry speciesusing the chicken genetic map as reference.
A radiation hybrid map of GGA10 as a test case for theresolution power of ChickRH6(Prepared by M. Morisson, R.P.M.A. Crooijmans, F. Pitel,M.A.M. Groenen and A. Vignal)
As a first step towards the development of radiation hybridmaps, we produced chicken whole genome radiation hybrids byfusing female chicken fibroblasts irradiated at 6,000 rad to aHPRT-deficient hamster cell line (Morisson et al., 2002). Toconfirm that the achieved resolution is higher than recombi-nant mapping, we selected 72 of the hybrids for their high

Cytogenet Genome Res 109:415–479 (2005) 431
microchromosome retention rate and genotyped 65 markerschosen on microchromosome GGA10.
Selection of a panel of 72 microchromosome-rich hybridsThe whole genome retention rate of each of the 452 hybrids
was assessed by genotyping markers chosen across the genome.Due to the particularities of the chicken genome structure, carewas taken in the choice of markers to represent the two chromo-some types. Among the 45 markers used, 22 were located onmacrochromosomes, 16 were on identified microchromo-somes, two were on small linkage groups and five were geneti-cally unlinked. These seven markers were assumed to belocated on microchromosomes and we analyzed the results con-sidering two classes of markers: 22 localized on macrochromos-omes and 23 localized on microchromosomes.
We selected 72 hybrids for their high microchromosomeretention rate. The average retention rates of this panel were21.2% for the whole genome, 15.9% for the macrochromo-somes and 25.7% for the microchromosomes.
Development of sequence tagged sites (STSs)Fifty-two STS markers were generated for physical mapping
of GGA10 using two different approaches.The first consists of chromosome walking from BAC clones
isolated with microsatellite markers that were previously map-ped to GGA10. BAC clones were end-sequenced with either theforward (Q) or reverse (R) M13 universal sequence primers.STS markers were made in the BAC-end sequences, generatingPCR products in the size range of 120 to 400 bp. These weresubsequently used for screening the chicken BAC library(Crooijmans et al., 2000).
The other approach consists of designing specific PCRprimers in chicken gene sequences homologous to genes fromregions of conserved syntenies on human chromosome 15(Crooijmans et al., 2001). The primers were also used to screenthe chicken BAC library. The BAC clones and therefore also thegenes, were mapped by FISH or mapped in the RH panel (thispaper) and used as starting points for chromosome walking ifthey were mapped to GGA10 (as described above).
The list of 52 STS markers derived from the different BAC-end sequences, including primer sequences, PCR productlength and BAC clone names is shown in Table 4.
Construction of the GGA10 RH mapThe 52 contig-end STS markers, 12 microsatellite markers
(ADL0158, LEI0112, MCW0132, MCW0035, ADL0106,MCW0067, ADL0272, MCW0194, LEI0103, LEI0333,ADL0231 and MCW0003) as well as one gene tag (FBNI) weregenotyped in duplicate and scored as present, absent or ambi-guous when positive in only one of the PCR typings. The esti-mated retention frequency for the data set was 20.7%.
Pairwise and multipoint data analyses were completed us-ing RH2PT and RHMAXLIK programs in the RHMAP3.0software package (Boehnke et al., 1991; Lunetta and Boehnke,1994). We assumed random breakage along the chromosomesand equiprobable retention of fragments.
We used a lod score threshold of 6 to define linkage groupsand that resulted in a large group including 47 markers, a small-
er one including seven markers, and three very small onesincluding only two markers. The five following markers wereunlinked: LEI0112, T10BE086, T10BE035, T10BE078,T10BE201, of which T10BE078 and T10BE201 belong to thesame contig as well as T10BE035 and LEI0112. Among them,LEI0112 showed a very low overall retention (0.070) andshould be genotyped again.
Multipoint analyses were performed using the RHMAXLIKprogram. For each of the two larger linkage groups, a frame-work map was built with a threshold likelihood ratio 11:1,000(minimum log10 likelihood difference of 3). Eleven markersmapped on the framework in the large linkage group and fivemarkers mapped on the framework in the small one. A globalframework of 16 markers (Fig. 9) was assembled by testing thefour possible orientations of the two previous frameworks usingthe RHMAXLIK program. The global framework was checkedagain by removing one marker at a time and analyzing the like-lihood of all its possible locations on the map compared to theother markers, and T10BE111 was added to the global frame-work. This framework was validated when log10 likelihood dif-ference for one order compared to the other orders was superiorto 3. A comprehensive map was established by adding theremaining markers at their most likely locations to the right ofthe framework map (Fig. 9). The map design was created byusing MapChart, a software for the graphical presentation oflinkage maps and QTL developed by Voorrips (2002).
Microsatellite markers localized on the RH map are indi-cated in bold in Fig. 9. They facilitate integration of the geneticand RH maps. The radiation map is 562.6 cR6000 long and thegenetic map is 120 cM long, which resulted in a distance (genet-ic vs RH) ratio for GGA10 of 1 cM = 4.7 cR6000. The order ofthe shared markers is the same for the two maps except forADL0272 which is mapped below marker ADL0231 on the RHmap which is in agreement with BAC contig data (R.P.M.A.Crooijmans, personal communication).
The nine STS markers linked to genes (on the same BACcontig), T10BE156 to IGF1R; T10BE071 to AGCI; T10BE160to CHRNA7; T10BE145 to CRABP1; T10BE085 to NEO1;T10BE199 to NR2F2; T10BE158 to CYP11A; T10BE241 toMYO5A and T10BE185 to B2M appear underlined in Fig. 9.Together with the gene FBNI, which is localized on the compre-hensive map, we could map ten genes on GGA10.
The primary goal of this work was to test the validity of theradiation dose applied to the chicken fibroblasts used to buildthe ChickRH6 panel. It was therefore performed before com-pletion of the definitive panel.
The results show that the radiation dose chosen is lowenough to allow the construction of linkage groups and highenough to refine the genetic map. In this preliminary work wecould map ten genes on microchromosome GGA10. Thus thedefinitive panel, ChickRH6 composed of 90 clones, which isnow available to the academic community, provides a valuablecomplementary approach to the other chicken genome map-ping techniques. Data thus obtained can be of great help forbuilding the more detailed maps based on large insert BACclone contigs (Lee et al., 2001; Jennen et al., 2004). The map-ping of genes is also greatly facilitated, as compared to geneticmapping, an important point to be taken into consideration

432 Cytogenet Genome Res 109:415–479 (2005)
Fig.
9. G
enet
ic a
nd ra
diat
ion
map
s of m
icro
chro
mos
ome
GG
A10
.

Cytogenet Genome Res 109:415–479 (2005) 433
with the large amount of EST data now available (Abdrakhma-nov et al., 2000; Tirunagaru et al., 2000; Carre et al., 2001;Boardman et al., 2002; Buerstedde et al., 2002).
Moreover, although human/chicken comparative mappinghas been well studied so far (Schmid et al., 2000; Crooijmans etal., 2001; Ladjali-Mohammedi et al., 2001; Buitenhuis et al.,2002; Jennen et al., 2002, 2003; Nanda et al., 2002a; Smith J. etal., 2002), RH-mapping data will increase the resolution of thegene maps within the conserved syntenies. It will thus help inrefining the synteny breakpoints as well as detecting internalrearrangements, as it has been done in other species (Barbazuk etal., 2000; Goureau et al., 2001; Smith S.F. et al., 2002; Sun et al.,2002; Lahbib-Mansais et al., 2003; Martins-Wess et al., 2003).
Using the ChickRH6 definitive panel, composed of 90clones, will enhance the precision of comparative mapping andwill extend the number of positional candidates in QTL map-ping approaches.
Single nucleotide polymorphism (SNPs) in chicken:resources and possible applications
(Prepared by G. Ben-Ari, L. David, S. Blum, T. Twito,A. Vignal, S. Weigend, M.W. Feldman, U. Lavi and J. Hillel)
PrefaceThis review was invited on February 2003 and submitted on
August 2003. Its publication at the present date should notdiminish from its significance. Meanwhile, the chicken genomedraft has been released on March 2004. On December 2004,three important articles on the chicken genome have been pub-lished in Nature: (1) Sequence and comparative analysis of thechicken genome (International Chicken Genome SequencingConsortium, 2004), (2) 2.8 million SNPs in the chicken genome(International Chicken Polymorphism Map Consortium,2004), and (3) physical map of the chicken genome (Wallis etal., 2004). These revolutionary events point out the necessity tofurther study the chicken genetic variation at the level of singlenucleotide polymorphism and face serious scientific challengefor the chicken geneticists.
SNPs – the latest type of DNA markersSingle nucleotide polymorphisms (SNPs) are the latest gen-
eration of DNA markers (Jin et al., 1995; Collins et al., 1997;McKenzie et al., 1998; Wang et al., 1998). SNPs are singlenucleotide differences between individuals that are found infunctional regions (e.g. promoters and exons) and in non-func-tional regions of the genome. Almost all SNPs constitute biallel-ic polymorphisms. They are the most common polymorphismsin all genomes that have been examined, and probably accountfor most of the genotypic contributions to phenotypic variation(Botstein and Risch, 2003). Other types of sequence variationsuch as chromosome aberrations and variation in number oftandem repeats are less common throughout the genome, andtheir distribution does not seem to be as random as SNPs (Car-gill et al., 1999; Hacia et al., 1999).
A major effort is currently being devoted to researchand utilization of SNPs in the human genome. NCBI’s
dbSNP (http://www.ncbi.nlm.nih.gov/SNP/) currently con-tains 4,540,241 validated human entries, out of which 45,896are non-synonymous coding SNPs (Reumers et al., 2005). Animportant goal of the human genome project is to generate anearly complete catalog of the common genetic variants (Kri-glysh and Nikerse, 2001).
So far, only a few studies have focused on the characteriza-tion and application of SNPs in chicken but, similarly tohumans, this type of polymorphism has the potential for futureinteresting discoveries. The current status of SNP discoveryand utilization in chickens is presented below.
Sources of informationChicken databases. Several research centers have facilitated
SNP research in chickens by maintaining public databases ofchicken ESTs and SNPs. The University of Delaware – UD(http://www.chickest.udel.edu/) provides data on SNPs inchicken genes using a diverse collection of chicken EST librar-ies. The database is based on 18 cDNA libraries generated fromvarious tissues including liver, oviduct, fat, pituitary, reproduc-tive tract, muscle, and lymphoid cells. Over 40,000 ESTsequences were generated from these libraries. The informationincludes the construction of each library and protocols for deal-ing with the inserts. Approximately 3,000 contigs were assem-bled from more than 23,000 chicken ESTs from various indi-viduals, populations and tissues. A total of 12,019 SNPs arecurrently available in this EST data set, discovered by align-ment of homologous ESTs. The average SNP within transcrip-tional regions of this data set occurs every 2,119 bp, which israther low relative to other reports on the chicken genome. TheUD chicken SNPs homepage (http://chicksnps.afs.udel.edu/)contains a searchable database of the chicken cSNPs (Emaraand Kim, 2003).
In the UK, a collaborative effort of UMIST (University ofManchester Institute of Science and Technology), NottinghamUniversity, the University of Dundee, and BBSRC (Biotechno-logy and Biological Sciences Research Council) has yielded340,000 ESTs (http://chick.umist.ac.uk). These were se-quenced from 21 different fetal and adult chicken tissues. Alltissues originated from the White Leghorn breed (Boardman etal., 2002).
The chicken gene index at the Institute for Genome Re-search (TIGR), combines research data from all internationalGallus gallus EST sequences and genetic research projects. Thegoal is to generate a non-redundant database of all chickengenes, their expression patterns, functions and evolutionaryrelationships. The current “release 5” (5 January 2003) shows71,395 singleton ESTs out of a total of almost 108,000 ESTs. Atotal of 35,790 “tentative consensus” genes (EST clusters) and684 “mature transcripts” (ETs) were identified. The databasecan be searched for sequences and genes of interest (http://www.tigr.org/tdb/tgi/gggi).
SNP characterization. SNP studies have typically involvedtwo main phases: SNP discovery and SNP genotyping. Themain approach for SNP discovery is sequence comparison ofspecific regions between various individuals (Fig. 10). Thisapproach is costly and time consuming. In addition, when twoalleles are present at a locus of an individual, it is hard to distin-

434 Cytogenet Genome Res 109:415–479 (2005)
guish between sequencing artifacts and an actual heterozygotefor the genotyped site. SNPs identified on the basis of EST dataare of special interest since they have a greater chance of result-ing in amino acid change. However, it has been claimed thatthe number of SNPs of this kind is limited due to selection pres-sure that coding sequences have undergone (Vignal et al.,2002). Bacterial artificial chromosome (BAC) libraries can beused for SNP discovery. However, the distribution of theseSNPs is uneven across the genome and depends on the numberof overlapping BAC clones along the genome (Sachidanandamet al., 2001). In addition, in silico comparison of DNAsequences (ESTs and genes) can reveal SNPs. Identification ofSNPs has been improved by the development of computer pro-
grams with better quality of base-calling such as PHRED (Ew-ing and Green, 1998; Ewing et al., 1998), and polymorphismdetection using POLYPHRED (Nickerson et al., 1997) andPOLYBAYES (Marth et al., 1999).
SNP genotyping can be done using several methodologiesand instruments. The genotyping methods are based on the dis-crimination between different alleles and signal-detection tech-nologies. The different methodologies are chosen according totheir accuracy, throughput and price. The major techniques ofSNP genotyping are: (a) Oligonucleotide chips, in which fluo-rescently labeled PCR products are hybridized to sets of oligo-nucleotides complementary to the allelic sequences placed on amicroarray. The fluorescence pattern is analyzed to determinewhich allelic set of probes gives a positive hybridization signal(Wang et al., 1998). (b) MALDI-TOF Mass Spectrometry isbased on differential extension of a short primer through thepolymorphic region. The specific amplification products areimmobilized on a magnetic solid phase and subsequently dena-tured. A specific primer is annealed close to the SNP site and alimited primer extension reaction is performed in the presenceof at least one dideoxynucleotide triphosphate. Specific termi-nation products are generated and then analyzed by MALDI-TOF mass spectrometry (O’Donnell et al., 1997). (c) Pyrose-quencing is based on the detection of pyrophosphate (PPi) dur-ing the incorporation of dNTP into a newly synthesized DNA.The released pyrophosphate allows the synthesis of ATP, whichserves to release light in the presence of luciferase (Ronaghi etal., 1998). Several other methods have been developed for SNPgenotyping (Twyman and Primrose, 2003).
SNP frequencies and their association with phenotypesFrequency and distribution. The private sequencing endea-
vor of the human genome has so far reported 2.4 million SNPsand the public SNP consortium 1.8 million SNPs; the totalnumber of SNPs was estimated by Botstein and Risch (2003) tobe at least 15 million. In the avian genome however, we are justat the very first steps; at the time of writing, there have beenonly a few reports regarding frequencies and distribution ofSNPs (Table 5). Sequencing of 21 fragments from a cDNA
Fig. 10. SNP discovery by sequence align-ment of three individuals. The SNP position ismarked with arrows. 1a: homozygous AA; 1b: het-erozygous AG; 1c: homozygous GG.
Table 5. Literature summary of frequenciesand distribution of SNPs in fowls Population SNP
frequency
Source of
DNA
% Transi-
tion SNPs
Number of
individuals
% of non-syno-
nymous SNPs
Reference
Chicken 1:277 bp 10
Guinea fowl 1:1029 bp 10
Pigeon 1:159 bp 10
Quail 1:1632 bp 10
Smith E.J. et al.,
2000a
White leghorn 1:470 bp 64 1 Smith E.J. et al.,
2001b
Between layers 1:138 bp 40 10
Between broilers 1:180 bp
EST
40 10
Smith E.J. et al.,
2002c
1:640 bp EST 85 35Between layers
and broilers 1:144 bp Introns and
promoters
53
1 from each Twito et al., 2002
a SNPs within species. b SNPs within white leghorn. Heterozygotes were identified as SNPs. c SNPs between broilers and between layers. Six layer lines and three broiler lines were used. Heterozygotes
were identified as SNPs.

Cytogenet Genome Res 109:415–479 (2005) 435
library of turkey in five species resulted in SNP rates rangingfrom 1:159 bp in pigeon to 1:1,632 bp in quail (Smith et al.,2000). Heterozygosity estimation based on sequencing of 50ESTs from one embryo of a White Leghorn chicken suggested aSNP frequency of 1:470 bp (Smith et al., 2001). Comparing 12ESTs among six lines of layers resulted in SNP every 138 bp.The same sequences yielded a SNP every 180 bp among threebroiler lines. Only 33% of these SNPs were common betweenlayers and broilers (Smith E.J. et al., 2002). The common SNPswere C}T and A}G transitions.
In a follow up study conducted in our labs in Israel aimed atthe identification of type-specific SNPs (broilers and layers),primers were synthesized on the basis of EST data. Liver cDNAfragments of one broiler and one layer were compared for SNPdiscovery. Each detected SNP was validated by reverse-primersequencing. A total of 16,630 bp (from 37 coding regions)revealed 26 cDNA SNPs (cSNPs), ranging from 0 to 5 persequence. The average was 1 SNP in 640 bp (Table 5).
Thirty-five percent of the cSNPs were found to be non-syn-onymous (causing a change of amino acid). In addition, wesearched for chicken genes in the NCBI database (http://www.ncbi.nlm.nih.gov/) and designed primers for non-coding re-gions. A total of 7,930 bp (from 18 genes) revealed 55 SNPs,ranging from 0 to 9 per sequence, an average of one SNP atevery 144 bp. In both, coding and non-coding regions, most ofthe SNPs were transitions. In the coding sequences the percent-age of transitions was 85% compared to 53% in the non-codingregions (P[t] = 0.0012).
In a collaborative project – AVIANDIV (EC project: Devel-opment of Strategy and Application of Molecular Tools toAssess Biodiversity in Chicken Genetic Resources; EC Con-tract No. BIO4-CT98-0342: Weigend S. [Coordinator], Groen-en M.A.M., Tixier-Boichard M., Vignal A., Hillel J., WimmersK., Burke T. and Mäki-Tanila A.), ten individuals from each often chicken populations of various origins were genotyped atSNP loci. Sequencing of 6,952 bp from 15 genomic DNA frag-ments yielded 145 genomic DNA SNPs (gSNPs), giving anaverage of 1 per 50 bp, which is much higher than the reportedfrequencies in chickens, and in other species, particularly inhuman (F1 per 1,000 bp; Marth et al., 2001). This high fre-quency presumably reflects the wide genetic spectrum amongthe tested populations, including the wild Red Jungle Fowl.The average frequency of the rare allele was 0.13, which is simi-lar to humans where no SNP with rare allele frequency below4% was observed (Hillel et al., 2002; Vignal et al., 2002).
In a study performed in our laboratories in Israel, ten indi-viduals from each of twenty populations of the AVIANDIVpopulations (the ten populations mentioned above are in-cluded) were genotyped at 25 cSNP loci of 25 genes (one SNPper gene). Genotyping was carried out by the MassArray (massspectrometry) technology. All SNPs were found to be biallelic.Frequencies of the rare alleles were 0.29, 0.29 and 0.095 in theuntranslated regions, synonymous and non-synonymous SNPs,respectively (Fig. 11).
The rare allele frequency at the non-synonymous SNPs issignificantly lower than in the untranslated regions (P ! 0.0001)and in the synonymous SNPs (P ! 0.0001). Similar results havebeen reported in humans (Cargill et al., 1999). In the chicken
Fig. 11. Frequencies of the rare and the fre-quent alleles of various SNPs used in the biodiv-ersity analysis.
cSNPs mentioned above, the average frequency of the rarestallele was 0.28 and the average observed frequency of the het-erozygotes, 0.23, was significantly different from the expectedfrequency – 0.4, assuming Hardy-Weinberg equilibrium (P[t] =0.0009).
Association between SNPs and phenotypes. More than 1,200human disease genes have been identified over the past twodecades (Botstein and Risch, 2003). As of March 2003, theHuman Gene Mutation Database (HGMD) has reported on39,145 mutations in 1,516 genes, which are associated withhuman diseases and traits (Stenson et al., 2003). The relativefrequencies of the various types of these mutations are as fol-lows: the majority originated from in-frame amino acid substi-tutions, including missense and nonsense mutations (57.5%),deletions (22.2%), insertions/duplications (7.4%), splice-sitemutations (9.6%), indels (1%), and less than 1% are in regula-tory regions. At this stage, the rate at which annual increaseentries in this database accumulate is more than 5,000.
In order to narrow the genomic interval containing genes ofinterest, one needs a saturated map of markers and a largeresource population. In chickens, there is a need to increase themarker density of the genetic map, especially in the microchro-mosomes. Currently, genome scans for linkage between mark-ers and genes of interest are within the range of about 10–20 cMor more (Groenen et al., 2000). Efforts should be made to bene-fit from the abundance of SNPs in the chicken genome andmap them in intervals of less than 5 cM apart, which will facili-tate “fine-mapping” of chromosome fragments.
Both synonymous and non-synonymous SNPs are valuablegenetic markers to map QTL. Indeed, high-resolution geneticmaps based on SNPs are under development for many humanchromosomes to facilitate fine-mapping studies (Mullikin etal., 2000; Roberts, 2000; Taillon-Miller and Kwok, 2000; Shas-try, 2002; Akey et al., 2003). Although many SNPs are random-ly distributed along the genome, some are clustered within cer-tain genes (Feder et al., 1996). These clusters can actually be

436 Cytogenet Genome Res 109:415–479 (2005)
Fig. 12. Hierarchical clustering of 100 indi-viduals. Labels designate the ten populations.
used to generate a molecular haplotype across a gene (Judsonand Stephens, 2001).
Many SNPs were found to be fully informative in crossesbetween inbred lines of mouse (Lindblad-Toh et al., 2000).This is relevant to chickens, where several inbred lines areavailable and some of the resource populations for mappingcomplex traits are derived from crosses between these inbredlines (Vallejo et al., 1997; Yonash et al., 1999, 2001; Deeb andLamont, 2003).
Interest in the discovery and analysis of SNPs grows withthe increase in genome projects resulting in full sequence ofmore and more species. Associations between SNPs and com-plex phenotypes have already been characterized in a few casessuch as schizophrenia (Chumakov et al., 2002; Stefansson et al.,2003) and cancer in humans (Bonnen et al., 2002), and the abil-ity of Saccharomyces cerevisiae to grow at high temperature(Steinmetz et al., 2002). A few studies in chicken have identi-fied association between SNPs and phenotypes. Liu et al.(2003) found SNP polymorphism in a highly conserved regionof Natural Resistance-Associated Macrophage Protein 1 gene(NRAMP1) associated with S. enteritidis vaccine and pathogenchallenge response in young chicks. An SNP within NRAMP1was found to be associated with the control of resistance to Sal-monella carrier state in hens by Beaumont et al. (2003). Zhouand Lamont (2003) detected associations of single nucleotidepolymorphisms in MHC class I and II genes with antibodyresponse parameters (Liu et al., 2002, 2003). A non-synony-mous SNP resulting in a specific amino acid substitution (Serto Asn) in the chicken Mx gene was considered to determine theantivirally positive or negative Mx gene for responses toinfluenza virus and vesicular stomatitis virus (Ko et al., 2002).
Biodiversity and phylogenetic analysesThe species gene pool of chickens consists of many breeds
and strains. The pattern of polymorphism in each of these pop-ulations results from mutation, genetic drift and selection (Hil-lel et al., 2002).
Assessments of genetic diversity between and within chick-en populations have been carried out using various DNA mark-ers (Dunnington et al., 1994; Zhou and Lamont, 1999; Roma-nov and Weigend, 2001; Rosenberg et al., 2001; Hillel et al.,2002, 2003). These studies contribute to the assessment ofgenetic relationship between these populations. SNPs are avery promising class of markers for use in biodiversity studiesbecause of their abundance and their amenability to highthroughput analysis. SNPs are applicable to biodiversity stud-ies using both coding and non-coding regions. These markerscan be used as single loci as well as haplotypes which are quitestable on an evolutionary time scale. On the other hand, SNPsare slower evolving markers than microsatellites. Thus, it ispredicted that more recent changes in the history of popula-tions would be hard to detect using SNPs.
Nuclear SNPs. Eight European laboratories collaborated ina research project (AVIANDIV) to study biodiversity among52 chicken populations, ten of which were genotyped at SNPloci (ten individuals per population). Sequencing of 6,952 bpfrom genomic DNA fragments yielded 145 gSNPs. Based onthese 145 gSNP data, clustering analysis assigned most of theindividuals to their original population (Fig. 12).
When genotype frequencies of these 145 SNPs were used toconstruct hierarchical clusters of the ten populations, bootstrapvalues of the resulting SNP tree were high (data not shown).Thus, in this case, the high value of the bootstraps for the un-rooted SNPs tree is in good agreement with the high proportionof correct assignments of the individual birds to their originalpopulations. Rosenberg et al. (2001) used data on 22 micro-

Cytogenet Genome Res 109:415–479 (2005) 437
satellite markers to cluster 600 birds, 30 individuals from each of20 populations (the ten populations mentioned above constitutea subset of these 20 populations, which in turn is a subset of the52 AVIANDIV samples). About 98% of the 600 individualswere correctly assigned to their populations from just their geno-types. However, when hierarchical clustering of these 20 popula-tions was done, bootstrap values were low. From these particularsets of data one may conclude that when SNP data are used, highbootstrap values for trees correlate well with correct affiliation ofindividuals to their original populations. Microsatellite data, onthe other hand, provide very good affiliation of the individualsbut produce a poor population tree. It is not clear whether thisresult was obtained by chance or whether it is a rule, due to thedifferent mutation rate of the two marker types and the relative-ly few generations (at most, hundreds) of separation betweenmost of the analyzed populations.
This dilemma could also be relevant to the following experi-ment. In biodiversity studies where populations are representedby a given sample size of individuals and our resources are lim-ited, we often struggle with the question: what is the best trade-off between number of individuals per population, and numberof loci for genotyping. It is obvious that there is no definite singlerule, since it depends on the genetic variability within theassessed populations, on the genetic distances between popula-tion pairs and on the polymorphism level of the marker locibeing used. To partially address this question on a given genepool described above, we first analyzed the data on the 145 SNPloci for two sample sizes of the ten populations: (1) three individ-uals per population and (2) ten individuals per population. Thetwo resulting trees were similar with quite high bootstrap values.A similar examination was performed for the number of loci tobe used; we compared the ten individuals from each of the tenpopulations, once with 145 loci located on 14 fragments, andagain with 50 loci (3–4 SNP loci at each of the fragments). Thesmaller sample of loci provided different tree patterns withmuch lower bootstrap values. Improved bootstrap values for thesample size of ten individuals per population were achievedwhen the number of loci was about 100. This examination indi-cates that when SNP data are used for phylogenetic studies, sam-pling variation among markers is higher than among individu-als. Similar results were obtained for microsatellite data (datanot shown). At this point and for this particular set of samplesand markers it was evident that sample size can be quite small(! 10) while the number of loci should be large (1 50). An inter-esting and probably unexpected result was obtained with regardto the effect of number of loci within DNA fragments (about460 bp each). From the above detailed examination and fromother particular tests it was detected that increasing the numberof SNP loci within fragments significantly improved the reliabil-ity (bootstrap values) of the tree in spite of the expected linkagedisequilibrium between loci. Interestingly, similar results wereobtained when data were analyzed as 145 non-linked markers oras haplotypes from 14 fragments.
SNPs in the mitochondria. The chicken mitochondrial DNAis a circular molecule, containing 16,775 base pairs. This mito-chondrial sequence was fully described by Desjardins andMorais (1990), and has the genetic code common to all verte-brates.
SNPs in the mitochondrial DNA (mtDNA) are widely usedin molecular evolutionary studies. These sequences have prov-en helpful for estimating times of species and population diver-gence, and for comparison of evolutionary rates and phyloge-netic relationships (Nei, 1987). The mutation rate of the mito-chondrial DNA is 10–20 times higher than that of the nuclearsites (Merriwether et al., 1991).
The displacement loop (D-loop) region of the mtDNA con-tains the elements that control the replication of the molecule.This region is characterized by a high mutation rate. Therefore,this region has frequently been used to study matriarchal evolu-tionary and phylogenetic aspects of species and populations.Ancestry of the domesticated fowls has been described usingsequence variation and restriction patterns from the controlregion (Fumihito et al., 1994, 1996). In these SNP studies,mtDNA of wild species and subspecies of Gallus were com-pared with mtDNA of domesticated populations. The authorssuggest that the origin of the domestic fowls is monophyletic.Most of the variation found in the domesticated specimens wascommon to Gallus gallus gallus and Gallus gallus spadiceus,both of which are subspecies of the Red Jungle fowl. Some vari-ation patterns, however, were common also to Gallus gallusbankiva. The wild chicken samples were obtained mainly fromThailand and therefore, this region was suggested as the geo-graphic origin of domestication. It would be interesting to testthe ancestry of domesticated fowls based on nuclear SNPs andwith broader geographical sampling, in order to see if thesefindings are true for the patriarchal ancestry and for other pos-sible origins of domestication as well. SNP analysis of the D-loop region in some native Chinese breeds suggests that theyoriginated in Thailand as well (Niu et al., 2002).
Chicken SNPs in mitochondrial regions other than the D-loop have also been used in phylogenetic studies. For instance,the sequence of the Cyt-b gene has proven useful in distinguish-ing between meat-type chickens (chunky broiler from Japan)and egg-type chickens (White Leghorn, Fayoumi, and BlackMinorca breeds). The chunky broiler was much more polymor-phic than the egg-type breeds (Shen et al., 2002).
Concluding remarksIn summary, SNPs can be considered as a good tool for the
identification of genes controlling important traits as well as forthe assessment and analysis of biodiversity and phylogeneticrelationships. Either associations between SNP alleles and phe-notypes or the allelic variants themselves are expected to beused to improve chicken breeding programs. Detection of allel-ic variants in agriculturally important genes will improve ourunderstanding of the connection between sequence variationand phenotypes. In addition, SNPs can be used to study thegenetic structure of wild and domesticated populations in orderto both preserve and utilize the existing genetic resources. Forthat, we need to develop SNP-specific strategies for accurateand reliable estimation of genetic diversity and to use optimalapproaches for its conservation. Recently, the sequence draft ofthe chicken genome was released in March 2004, and a relevantarticle in December 2004 (International Chicken GenomeSequencing Consortium, 2004). At the same time the Inter-national Chicken Polymorphism Map Consortium (2004) re-

438 Cytogenet Genome Res 109:415–479 (2005)
Fig. 13. Chicken lampbrush chromosome 1.(a) Coomassie blue R250 staining. The landmarksof chromosome regions A–L and some markerloops are shown. DBL, distal border loops of loop-less regions; PBL, loops on the proximal border ofloopless regions; TBL, telomeric bow-like loop onqter; L1D11, L1J21, marker loops; cen, centrom-eric region. (b) Cytological map. The map showsthe landmarks of chromosome regions. (c) Chro-momere map. Blue axial dots symbolize DAPI-positive chromomeres. (d) DAPI staining. Thelandmarks of chromosome regions A–L and somemarker chromomeres are shown. C1B1–C1I21,marker chromomeres. a b c d
ported on the chicken variation database (http://chicken.ge-nomics.org.cn/index.jsp) containing 2.8 million SNPs. Theseimportant milestones will significantly improve the two mainareas of chicken SNP research: (1) detecting genes involved inthe genetic variation of important traits and understandingtheir role and function, and (2) better assessment of chickenbiodiversity, including phylogenetic issues related to the timeof locations and species that were involved in the process of thechicken domestication.
Maps of the lampbrush macrochromosomes of thechicken and Japanese quail(Prepared by A.V. Rodionov, S.A. Galkina andN.A. Lukina)
Lampbrush chromosomes (LBCs) in oocyte nuclei of thechicken were first observed by Holl in 1890. Later they weredescribed by Loyez (1906), who also studied the lampbrush stageof oogenesis in some other birds. Then Koltzoff (1938)
studying LBCs of the chicken, pigeon, and tritons arrived at theconclusion that an LBC is a giant chain molecule, a so-calledgenonema. In his opinion it consists of elementary chromo-meres, which reproduce by a template copying mechanism and,by a similar mechanism, induce the formation of gene productsin the form of either granular strands or lampbrush loops. Kropo-tova and Gaginskaya (1984) and Hutchison (1987) introducedthe bird LBCs as a new model in current cytogenetics. Theybelieved, and we hold this viewpoint, that bird LBCs can be afruitful tool for poultry cytogenetics and genome research. Inparticular, the use of these extended, looped chromosomes canfacilitate high-resolution gene mapping and preparation of locus-specific DNA sequence libraries by microdissection. Becauseeach lampbrush bivalent possesses one or few chiasmata, whichare a reliable indicator of reciprocal recombination events, theycan also be used in the study of the chromosome control of cross-ing over in the chicken and other poultry species.
Chromosomes in the form of lampbrushes appear in thechicken growing oocytes at 2–3 weeks of posthatching develop-ment (Gaginskaya and Chin, 1980). In practice, well-developed

Cytogenet Genome Res 109:415–479 (2005) 439
Fig. 14. Chicken lampbrush chromosome 2. All indications as for Fig. 13. SM, spaghetti marker.
a b c d
LBCs are prepared by manual isolation from the oocyte nucleiof previtellogenic white follicules with diameters of 0.5–1.5 mm from sexually mature hens. Isolation of oocyte nucleiand chromosomes from smaller oocytes is more difficult. Inmore advanced vitellogenic yellow oocytes chromosomes aremuch shorter and condensed, their lateral loops are alreadycontracted (Chelysheva et al., 1990). The technique for workingwith bird LBCs was described by Solovei et al. (1992) and Rod-ionov and Chechik (2002).
Figures 13a–23a show chicken and Japanese quail LBCsstained with Coomassie blue R250. In each LBC the homolo-gous chromosomes are held together by few or single chiasma-ta. Each homologue consists of a linear array of numerous com-pact chromatin granules or chromomeres from which laterallyprojecting loops arise. According to their length the macrobi-valents are numbered from 1 to 5. ZW describes the sex bival-ent. A characteristic serpentine form of the sex bivalent is dueto a single terminal chiasma.
Electron microscope studies showed that each chromomereof the avian LBCs is composed of both numerous miniatureand few extended lateral loops with a contour length of about
10–15 Ìm or more (Kropotova and Gaginskaya, 1984; Hutchi-son, 1987; Tsvetkov, 1987; Solovei et al., 1992). Thus theextended loops contain about 30–40 kb. The longest everobserved loop, the telomeric loop of turkey chromosome 4,measures 215 Ìm corresponding to 688 kb of fully extendedDNA (Myakoshina and Rodionov, 1994). In light microscopepreparations the chromomeres without extended loops looklike loop-less.
Each lateral loop contains a single DNP axis with almostfully extended DNA, which carries numerous RNA polymer-ases and their associated RNP transcripts. There are lateralloops consisting of a single transcription unit or few transcrip-tion units of different lengths and polarities (Kropotova andGaginskaya, 1984; Hutchison, 1987; Tsvetkov, 1987). The factthat each extended lateral loop carries a bulk of RNA trans-cripts provides a way to study the genetic content and tran-scription pattern of individual loops by in situ hybridization(Pukkila, 1975; Tarantul et al., 1989; Solovei et al., 1993). Notealso, that numerous RNA transcripts on the lateral loops shouldconsiderably amplify the hybridization signal (Weber et al.,1984).

440 Cytogenet Genome Res 109:415–479 (2005)
a b c dFig. 15. Chicken lampbrush chromosome 3.
All indications as for Fig. 13.
Fig. 16. Chicken lampbrush chromosome 4.All indications as for Fig. 13. DB, double bridge. a b c d

Cytogenet Genome Res 109:415–479 (2005) 441
Fig. 17. Chicken lampbrush chromosome 5.All indications as for Fig. 13. a b c d
Fig. 18. Chicken lampbrush ZW-bivalent. All indications as for Fig. 13.
a b c d
Fig. 19. Japanese quail lampbrush chromosome 1. All indications as forFig. 13.
a b c d

442 Cytogenet Genome Res 109:415–479 (2005)
Fig. 20. Japanese quail lampbrush chromo-some 2. All indications as for Fig. 13. a b c d
Fig. 21. Japanese quail lampbrush chromo-some 3. All indications as for Fig. 13. a b c d
The staining of the chicken LBCs with the dA-dT-specificdye DAPI and the dG-dC-specific dye chromomycin A3
(CMA3) shows a distinction between two types of chromo-meres. In contrast to amphibian LBCs (see Sims et al., 1984),the axis of bird macro-LBCs consists of single chromomeres ar-
ranged in linear arrays, and the clusters of chromomeres stucktogether. Some of them fluoresce very strongly with DAPI, oth-er ones fluoresce dull after DAPI-staining but they are brightafter CMA-staining (Fig. 24). Each macro-LBC is composed ofa chromosome-specific number of chromomeres (Table 6).

Cytogenet Genome Res 109:415–479 (2005) 443
Fig. 22. Japanese quail lampbrush chromosome 4. All indications as forFig. 13.
a b c d
Fig. 23. Japanese quail lampbrush ZW-bivalent. All indications as forFig. 13.
a b c d
Fig. 24. CMA3 (green fluorescence) and DAPI(blue fluorescence) positive chromomeres onchicken lampbrush chromosome 1.
LBCs of the chicken and Japanese quail may be identified bytheir length and by morphological characteristics such as markerloops and DAPI-positive chromomeres. Table 6 gives the meanvalue of the chicken LBC lengths. Different types of markerloops used for chromosome identification in the chicken andJapanese quail are presented in Figs. 13–23. In the chicken,there are the specific telomeric bow-like loops (TBLs) and inter-
stitial lumpy loops (LLs). The ZW-bivalent carries characteristicgiant lumpy loops (GLLs) (Chelysheva et al., 1990). A nucleolus-like protein structure, the spaghetti-marker (SM), is located inthe subtelomeric region of the 2p-arm of the chicken (Solovei etal., 1992). In spite of the varying size of the lateral loops duringthe different phases of oocyte development, the marker loopscan usually be identified in each chromosome set.

444 Cytogenet Genome Res 109:415–479 (2005)
Table 6. Average chromomere number andDNA content in chicken macrochromosomes 1–5, Z and W
LBC LBC length
(µm)
DNA content per
chromosomea
(Mb)
Chromomere
number per
LBCb
DNA content
per chromomere
(Mb)
G- and R-
bands
numberc
Chromomere
number per
band
1 185.2 ± 6.3 250 115 ± 6 2.1 ± 0.11 34 3.5
2 150.6 ± 1.3 181 103 ± 4 1.8 ± 0.07 28 3.6
3 128.0 ± 3.1 138 83 ± 6 1.7 ± 0.13 24 3.3
4 107.2 ± 3.4 109 50 ± 1 2.3 ± 0.05 20 2.4
5 71.3 ± 3.2 64 28 ± 1 2.3 ± 0.08 12 2.3
Z 62.3 ± 1.1 101 53 ± 3 1.9 ± 0.11 18 2.9
W 5.0 ± 0.2 34 7d 4.8 08 0.9
a Smith and Burt, 1998. b Our data. c Ladjali-Mohammedi et al., 1999. d Solovei et al., 1993.
Fig. 25. The position of TTAGGG-positive sites on the chicken mitoticand lampbrush chromosome 1.
Working maps exhibiting the positions of landmark loopsand other features have been published earlier by Chelysheva etal. (1990) and Rodionov and Chechik (2002). Figures 13–23present a new version of these maps that are adapted to FISH.The chromosome axes are represented as a line correspondingto the mean length of the bivalent. Blue axial dots symbolizeDAPI-positive chromomeres. On the map, the letters L and Cdesignate marker loops and chromomeres, respectively. Thenext character of the marker symbols shows the chromosomenumber, then a letter referring to the chromosome region name,and then a number of subregions. A final character in each LBCmarker symbol is an individual number of either the loop orchromomere within the chromosome subregion. For example,L1K21 is the first loop of subregion 2 of region K of the chickenLBC1. For a few marker loops that were identified and desig-nated earlier (Chelysheva et al., 1990) we used traditionalnames: e.g. PBLs and DBLs for the proximal and distal borderloops of the loop-less regions, respectively. DB (double bridge)marks the positions of weak sites of the chromosome axis thatlook usually as a pair of long interchromomere fibrils, the so-called double-loop bridges (Callan, 1986). Lateral loops aredrawn on one side of the axis only according to their respectivemean length. Note that the relative modal length of lateral loopsis a characteristic feature of individual chromosome regions.
In the chicken we established a correlation between LBCsand mitotic chromosomes by comparative mapping ofTTAGGG repeats. An alignment of the mitotic and LBC 1 ofthe chicken are presented in Fig. 25.
The bird LBCs are diplotene bivalents with easily identifia-ble chiasmata (Rodionov et al., 1992, 2002). Since chiasmata indiplotene chromosomes correspond in position to the sites ofcrossovers (Tease and Jones, 1995), estimation of the crossov-er-determined distances between chromosome markers andconstruction of a chiasma-based map of chromosome markerlinkages is possible (Fig. 26, Table 7). Note that the lengths ofchiasma-based linkages in all cases are lower than the distancesestimated in molecular genetic experiments (Rodionov et al.,2002).
As the chicken and Japanese quail are useful genetic andlaboratory animals, an investigation of theirs LBCs is a worth-while approach for poultry cytogenetics and genomics.

Cytogenet Genome Res 109:415–479 (2005) 445
Table 7. Chiasma frequency and linkage length in chicken and quailfemale
Chiasma frequency
± SE
Chiasma-based genetic
length (cM), ± SE
Chromosome of
the standard
galliform
karyotypea Japanese quail Chicken Japanese quail Chicken
Chromosome 1 6.3 ± 0.94 7.7 ± 0.11 313 ± 47.2 386 ± 5.3
Chromosome 2 4.8 ± 0.7 6.1 ± 0.09 238 ± 34.9 304 ± 4.3
Chromosome 3 3.1 ± 0.67 4.5 ± 0.09 154 ± 33.4 227 ± 4.7
Chromosome 4 2.8 ± 0.38 3.9 ± 0.13 143 ± 18.9 195 ± 6.5
Chromosome 5 about 2 2.9 ± 0.11 about 100 144 ± 5.5
Bivalent ZW 1.0 ± 0.0 1.0 ± 0.0 50 50
Macro 1–5 19 25.1 948 1256
Micro 6–10 about 10 8.5 about 500 625
Total per oocyte
genome 55.34 ± 2.69 61.6 2650–2900 2950–3200
a Ladjali-Mohammedi et al., 1999; Schmid et al., 2000.
x__
x__
Fig. 26. Integration of the physical maps of the chicken lampbrush andmitotic chromosome 1 and chiasma-based genetic distances between chro-mosomes markers. (a) Chiasma distribution on the chicken lampbrush chro-mosome 1. Percent bivalents with chiasmata. (b) Chiasma-based genetic dis-tance. (c) Ideogram of the banded mitotic chromosome 1 (Ladjali-Moham-medi et al., 1999).
1p1.1
1p2.9
1p2.6
1p2.4
1p2.8
1p2.2
1p1.6
1p1.4
46cM
a b c
43.5cM
53cM
14cM
125cM
40.5cM
64cM
1p1.2
1q1.1
1q1.2
1q1.4
1q2.2
1q2.4
1q3.2
1q3.4
1q3.6
1q4.21q4.41q4.5
1q3.1
1q2.3
1q2.1
1p2.1
100% 50%
Sex chromosomes and sex determination in birds(Prepared by I. Nanda, T. Haaf, M. Schartl, H. Hoehnand M. Schmid)
Although in both birds and mammals sex is determined dur-ing fertilization by the inheritance of specific sex chromo-somes, there are striking differences between the avian ZZ/ZWand the mammalian XX/XY sex chromosome systems. Unlikemammals, male birds are the homogametic (ZZ) and femalesthe heterogametic (ZW) sex. The function(s) of avian sex chro-mosomes during sex determination and sex differentiation islikely to be different from that of the mammalian X and Ychromosomes. In addition, the Z and W chromosomes harbordifferent sex-determining genes than the X and Y.
In mammals, heterogametic (XY) individuals develop intomales because they express the SRY gene from the Y chromo-some (Koopman et al., 1991). Since no avian SRY homolog wasfound, it has been speculated that a W-linked gene functions asa dominant ovary-determining factor in female birds. How-ever, none of the few known W-linked genes seems to perform agenuine female-specific role. Alternatively, it is possible thatthe two copies of the Z chromosome in male birds, comparedwith only one copy in females determine sex by a dosage-depen-dent mechanism. A somewhat contradictory report by Arit etal. (2004) calls the role of Z chromosome dosage in sex determi-nation in question. Genes on the Z chromosome may have aselective advantage because of extreme forms of sexual selec-tion in many birds. In contrast to the situation in mammals inwhich males do not receive a paternal X chromosome, in birdsZ-linked loci involved in sexual selection could be beneficial tohomogametic ZZ males (antagonistic alleles).
In the light of excellent and comprehensive reviews on aviansex chromosomes and sex determination (e.g., Graves, 2003;Handley et al., 2004; Schartl, 2004; Smith and Sinclair, 2004),here we will provide only a brief overview over some recentresearch advances.
Structural organization and evolution of avian Z and W sexchromosomes from an ancestral chromosome pairIn modern birds (Neognathae) both Z and W sex chromo-
somes are easily recognized by conventional cytogenetic meth-ods. The Z is usually a medium-sized macrochromosome,representing 7–10% of the entire genome. The highly variablemorphology of the Z chromosome in different bird karyotypessuggests that the Z has undergone extensive structural changesduring avian evolution. Therefore, the gene order can beexpected to differ significantly between the Z chromosomes ofdifferent bird species. The average W chromosome is muchsmaller than the Z and sometimes only slightly larger than themicrochromosomes. It is gene-poor and largely heterochromat-ic. However, because of the accumulation of constitutive hete-rochromatin in some species the W chromosome became evenlarger than most macrochromosomes (Fig. 27). In extant pal-eognathous birds (Ratitae) the W chromosome resembles the Zin size and morphology and most likely also in gene content

446 Cytogenet Genome Res 109:415–479 (2005)
Fig. 27. Female metaphases of chicken (a) andbarn owl (b), displaying C-band positive hete-rochromatin in the sex chromosomes. Note thelarge amounts of constitutive heterochromatin inboth small (a) and extremely large W chromo-somes (b).
Fig. 28. G-banded ideogram of chicken sex chromosomes showing cyto-logical location of sex determining candidate genes (bold) as well as the genesshared between Z and W. (* Unpublished observation of Handley et al.,2004).
24
23
22
21
13
12
11
11
12
13
14
15
16
21
22
24
23
22
21
13
12
11
11
12
13
14
15
16
21
22
GGA Z
p14p13p12
p11
q11
q12q13q14
GGA W
ATP5A1Z
UBAP2Z *
SPINZHINTZ
CHD1Z
ATP5A1WFET1
HINTWCHD1WSPINW
*UBAP2W
Zp
Zq
DMRT1
(Fridolfsson et al., 1998; Ogawa et al., 1998). During meiosis inmost birds the Z and W are paired to some extent and at leastone recombination nodule is formed in the synapsed region(s).Meiotic and chromosome painting studies suggest that the Zand W sex chromosomes have a common ancestry. Chicken Z
painting probes labeled both the Z and W chromosomes of rep-resentative carinate and ratite birds (Shetty et al., 1999; Raud-sepp et al., 2002). Differentiation of the Z and W chromosomesin carinates and other modern birds is thought to result fromcessation of meiotic recombination.
Data published by the research groups of S. Mizuno inJapan and H. Ellegren in Sweden have provided new insightsinto the gene content and evolution of the W chromosome. Fiveof the six known W-linked genes have homologs on the Z(Fig. 28; Hori et al., 2000; Itoh et al., 2001; Handley et al.,2004), reflecting their common origin from an ancestral homol-ogous chromosome pair. Phylogenetic analysis of intron se-quences from five gametologous genes (CHD1, HINT, SPIN,UBAP2, ATP5A1) in different avian lineages suggests that avi-an sex chromosomes evolved in two steps. The initial step prob-ably involved suppression of Z-W recombination around 102–170 million years ago (Mya) through at least one mutationalevent, i.e. an inversion on the W (Handley et al., 2004). Molec-ular analysis of four gametologous gene loci in a paleognathousbird, Tinamous, revealed only a single gene, SPIN, that had dif-ferentiated into Z and W forms. This is consistent with the viewthat suppression of recombination did not occur simultaneous-ly for all gametologous loci but in different steps, maybe involv-ing different genes in different species (de Kloet and de Kloet,2003). Female ostriches possess a single copy of the Z-linkedmarker IREBP, whereas in emus IREBP is present on both theZ and W chromosomes. This promotes the idea that a smalldeletion involving the IREBP locus has generated an active Zcopy and a degenerated W copy in primitive sex chromosomes(Ogawa et al., 1998). Following the initial differentiationevent(s), which may be “frozen” in the primitive ratite sexchromosomes, subsequent rounds of heterochromatinizationand deletions of genetically inert material on the W, as well asextensive intrachromosomal rearrangements of the Z, mayhave formed the highly differentiated sex chromosomes inextant birds.

Cytogenet Genome Res 109:415–479 (2005) 447
In many respects the avian ZW sex chromosomes exhibitremarkable parallels to the mammalian XY pair. Therefore ithas been assumed for a long time that both types of sex chromo-some pairs originated from a common ancestral chromosomepair (Ohno, 1967). However, our previous comparative map-ping data of Z-linked genes in the human genome (Nanda et al.,2000, 2002a) as well as the current assembly of the chickengenome draft sequence failed to detect orthologous loci on theavian Z and mammalian X chromosome. On the contrary,most Z-linked genes have signatures on human chromosome 9and chromosome 5, implying that the Z chromosome is largelyhomologous to HSA9 and HSA5. Three additional humanchromosomes, HSA2, HSA4, and HSA8 share smaller seg-ments of conserved synteny with the chicken Z. These segmentswere most likely inserted into a Z chromosome ancestor afterthe split of the avian and mammalian lineages. Evidently, mostof the avian Z chromosome and human chromosomes 9 and 5evolved from the same ancestral chromosome. This impliesthat avian and mammalian sex chromosome systems evolvedindependently from each other.
Candidate sex-determining genes on the Z andW chromosomesSince avian sex is thought to be controlled by either Z chro-
mosome dosage or by a W-linked dominant gene, severalresearch groups have searched for candidate sex-determininggenes on both Z and W chromosomes. Five of the six knownW-linked genes have Z chromosome homologs and lack afemale sex-specific expression profile consistent with an ovary-determining function. The most interesting candidate for anovary-determining gene is FET1 (female expressed transcript1), which was isolated through differential screening of genesthat are expressed in chicken gonads. It lies in the euchromaticregion of the W short arm and lacks a Z homolog (Fig. 28). Itsexpression is restricted to females and up-regulated in the cor-tex of the left gonad during the critical sex-determining period(Reed and Sinclair, 2002). The encoded protein, which con-tains a signal peptide and a transmembrane domain, has noorthologs in mammals. Although FET1 displays some featuresof a dominant sex-determining gene in birds, its female sex-specific expression and localization on the W but not the Zneeds to be confirmed in paleognathous birds. In addition, theprecise role of FET1 and the characterization of its down-stream target genes remain to be elucidated.
The homology between the chicken Z chromosome andHSA9 is of particular interest, because deletion of a criticalregion on the short arm of HSA9 leads to gonadal dysgenesisand XY sex reversal in humans. Several DMRT (Doublesexand Mab3-related transcription factor) genes, which share sig-nificant structural homology with male sex-regulatory genes ofnematode and fly, are localized in the critical region HSA9p24and expressed in adult testis (Raymond et al., 1998; Ottolenghiet al., 2002). Based on this information, an ortholog of mamma-lian DMRT1 was isolated from the short arm of the chicken Z(Nanda et al., 1999). During early embryonic development,chicken DMRT1 is expressed in the genital ridge of both sexeswith a higher expression in male chicken embryos; however,after the onset of sexual differentiation DMRT1 expression
becomes confined to the testes (Raymond et al., 1999; Shan etal., 2000). As expected from a dosage-sensitive sex-determininggene, DMRT1 has no homolog on the W and is conserved onthe Z chromosomes of both neognathous and paleognathousbirds (Nanda et al., 2000; Shetty et al., 2002). Its exclusive Z-chromosomal location, its expression during gonadal develop-ment, and its conserved testis-specific expression pattern in dif-ferent vertebrate orders all support a role for DMRT1 in aviansex determination. In this model, avian sex is determined by agene dosage effect: two DMRT1 dosages are required for testisformation in ZZ males, whereas a single dosage in ZW femalesleads to differentiation of an ovary.
Both experimental sex reversal and natural sex chromosomeaneuploidy can provide important clues as to the importance ofZ chromosome dosage in avian sex determination. Induction offemale-to-male sex reversal in chicken embryos treated with anaromatase inhibitor leads to elevated DMRT1 expression levelsin the sex-reversed male embryos (Smith et al., 2003). Thisargues in favor of the notion that up-regulation of DMRT1rather than Z chromosome dosage is the key event in male sexdetermination. Nevertheless, in the normal situation an in-creased expression of DMRT1 may require the presence of twoZ chromosomes, which then lead to male sexual differentiation.Very recently, an unusual case of female 2A:ZZW aneuploidywas reported in a natural population of great reed warblers(Arit et al., 2004). This aneuploid female bird reproduced regu-larly, although it had two Z chromosomes, as revealed by hete-rozygosity for two Z-linked microsatellite loci. The female phe-notype of this ZZW bird is not consistent with the view that twoZ chromosome dosages trigger male sexual differentiation. Sur-prisingly, all male offspring from this ZZW female inheritedonly the alleles from one particular Z chromosome. This unusu-al inheritance could be explained by the fact that the other Zwas truncated. In this situation it might be implied that thetruncated Z did not possess a functional DMRT1 copy. Unfor-tunately, the presence of two Z chromosomes in the aneuploidZZW female was not confirmed by cytogenetic analysis.
The mechanism by which DMRT1 is down-regulated on thesingle Z chromosome of female embryos remains to be eluci-dated. There seems to be a complete cessation of DMRT1expression in the developing ovaries. Teranishi et al. (2001)hypothesized that this downregulation of DMRT1 in the femalegonad depends on an interaction between Z and W chromo-somes. In females a non-coding RNA is expressed from a regionon the single Z in close proximity to DMRT1. This locus(MHM) remains perpetually hypermethylated in males and canonly be transcribed in the presence of a W chromosome. Inter-estingly, the MHM region is transcribed in ZZW triploid birds,but it remains inactive in ZZZ males (Teranishi et al., 2001). Asimilar phenomenon can also explain the female phenotype ofthe reported ZZW aneuploid great reed warbler. Thus, the Wchromosome may exert an effect on a Z-linked region that isdirectly or indirectly involved in the regulation of the putativesex-determining gene, DMRT1. Graves (2003) proposed theexistence of an as yet unknown locus (ZUF) on the W chromo-some that activates the MHM region on the Z chromosome(s)in females.

448 Cytogenet Genome Res 109:415–479 (2005)
Table 8. Putative germ cells associated functions of Z linked orthologs inmammals. Orthologs with ubiquitous expression are not included. Many ofthe cited orthologs may have somatic functions.
Genes Chickena Mammals (mouse, human)
DMRT1 (HSA9) Testis Testis
VASA (HSA5) Testis, Ovary Testis, ovary
FGF10 (HSA5) Limb development Accessory sex organs/prostrate
SCOT (HSA5) n.s. Sperm, Leydig & Sertoli cells
CDK7 (HSA5) n.s. Testis (meiotic function)
MADH2 (HSA5) Ovarian granulosa Meiotic germ cells
PDE4D (HSA5) n..s Spermatid
HEXB (HSA5) n.s. Testis (epididymis)
HMGCR (HSA5) n.s. Gonadal function (via cholesterol)
POLK (HSA5) n.s. Testis (spermatogenesis)
ALDH1 (HSA9) n.s. Testis (Leydig cells)
ALDH5 (HSA9) n.s. Testis (cytosolic)
TRKB (HSA9) Ovarian follicle Germ cells and peritubular cells
DAZAP1 (HSA19) n.s. Spermatogenesis
PCSK4 (HSA19) n.s. Spermatocytes, round spermatids
GAK (HSA4) n.s. Ubiquitous (testis high)
PRLR (HSA5) Testis Testis (spermatogenesis)
SPTRX3 (HSA9) n.s. Testis (spermatocytes, acrosome)
CAMK4 (HSA5) n.s. Chromatin remodeling during
nuclear condensation of spermatids
FST (HSA5) Ovary Germ cell survival in ovary
GP130 (HSA5) n.s. Ovary
RAD17 (HSA5) DNA damage Testis (high expression)
MSH3 (HSA5) n.s. Testis (pachytene spermatocytes)
VLDLR (HSA9) Ovary Ovary, testis
RAD23B (HSA9) n.s. Testis
PAM (HSA5) n.s. Testis
SPIN (HSA9) Ovary (high expression) Gametogenesis
PCSK5 (HSA9) n.s. Testis (activates MIS)
a n.s.: not studied.
The Z chromosome was shaped to execute male specificfunctionsSecondary sexual characters are very conspicuous in birds.
Considering the degenerate nature of the W chromosome inmodern birds, it is plausible that sex-specific traits involved inthe mating system are encoded on the Z chromosome. Forexample, Z-linked genes seem to control male plumage charac-ters (Saetre et al., 2003). Similarly, zebrafinch males, but notfemales, sing a courtship song. Recent studies revealed that sexchromosomal genes are expressed differently in brain cells ofmales versus females. These genes act in a cell-autonomousfashion and are responsible for sex-specific differences in thedevelopment of the song system (Agate et al., 2003). The Zchromosome may not only be important for sex determinationbut also plays a role in several other aspects of reproduction. Inthis context, it is interesting to note that the mammalian Xchromosome is enriched with genes related to sexuality andreproduction (Saifi and Chandra, 1999; Zechner et al., 2001). Asystematic study of the functions of Z-linked genes which areavailable in the public database (http://www.ensembl.org/Gal-lus_gallus) may reveal a similar enrichment of reproductivegenes on the Z. Indeed we already identified a number of Z-linked genes with mammalian orthologs that are expressed intestis and/or exert a specific function(s) during spermatogene-sis. Although it is not known whether these genes are alsoexpressed in the avian testis or ovary, their evolutionary con-
servation may be considered a good indicator for comparablefunctions in mammals and birds. One important example is thelocation of VASA on the Z chromosome. This gene is requiredfor both germ line and oocyte differentiation in various animalgroups including mammals (Noce et al., 2001). However, aknock-out study in mice suggests that Vasa is required for sper-matogenesis and may be dispensable in germ line formation(Tanaka et al., 2000). Another interesting Z-linked gene isPCSK5 (proprotein convertase), which is required for bioacti-vation of Mullerian inhibiting substance (MIS). On the otherhand, there are a number of Z-linked genes (VLDLR, AVIDIN,FST and ZOV3) that are important for ovarian functions and,therefore, may be down-regulated in ZZ males. It is possiblethat the very early expression of DMRT1 and other male-spe-cific genes (e.g. MIS) interferes with the expression of female-specific Z-linked genes in males. As seen in Table 8, there aremany HSA5 and HSA9 orthologs with testis-related functionson the chicken Z chromosome. This supports the simplisticview that the Z chromosome was shaped during evolution tocarry out male-specific functions in birds. However, a morecomprehensive analysis of the gene content of the avian Z andW chromosomes is necessary to prove this hypothesis.
ConclusionsSex chromosomes and sex determination will undoubtedly
continue to excite biologists. Recently, it was reported that thesex chromosomes of the platypus form multivalent meioticchains which share homology with the human X and bird Zchromosomes. Because monotremes represent the earliestmammalian lineage, an evolutionary link between mammalianand avian sex chromosomes has been suggested (Grützner etal., 2004). However our growing information on the gene con-tent of the chicken Z chromosome is not consistent with thisview and strongly supports an independent evolution of theavian and mammalian sex determination systems. We may beable to learn more about the specific functions of candidategenes for avian sex determination such as FET1 and DMRT1by over-expression and knock-down experiments. Although thedifferentiation of the heteromorphic avian Z and W sex chro-mosomes from an ancestral autosome pair resembles the evolu-tion of the mammalian X and Y, the master control genes inavian and mammalian sex determination are clearly different(i.e., DMRT1 vs. SRY). If a control gene confers sexual differ-entiation as a dominant factor it may evolve as one allele of agene on opposite sex chromosomes as illustrated by the Y-borne SRY and X-linked SOX3 in mammals. However, in thisrespect avian sex determination may differ from the mammali-an situation.
Sex chromosome-linked genes and DNA sequences ofchickens and their relevance to the process of sexdetermination or gonadal sex differentiation(Prepared by S. Mizuno)
The aim of this article is to review briefly newly describedgenes and DNA sequences and to further characterize previous-ly identified genes on the chicken sex chromosomes, which may

Cytogenet Genome Res 109:415–479 (2005) 449
Fig. 29. Approximate positions of genes andDNA sequences pertinent to this article on the Wand Z chromosomes of chicken.
be relevant to the process of sex determination or gonadal sexdifferentiation, since the publication of the First Report in2000 (Schmid et al., 2000). Approximate map positions ofthese genes and sequences are illustrated in Fig. 29.
Genes on the W and Z chromosomesspindlin gene. The experimental approach which led to the
identification of spindlin genes on the W chromosome (SPIN-W) and the Z chromosome (SPIN-Z) was described in the FirstReport in 2000. It is unlikely that these genes are directlyinvolved in sex determination because their cDNA sequencesare nearly identical except for slight differences in their se-quences of 3)-untranslated regions (UTRs). One region in the 3)UTR showing sequence difference of about 20% was utilized asa probe to distinguish mRNA molecules transcribed from theW- or Z-linked gene under stringent hybridization conditions.The results suggest that SPIN-W is expressed in embryonicgonads and in the somatic tissues of the ovary of adult chickens,whereas SPIN-Z seems to be expressed ubiquitously. Thus, theW- and Z-linked spindlin genes seem to be controlled underdifferent transcriptional regulatory mechanisms. When FLAG-tagged SPIN-W was expressed in chicken embryonic fibro-blasts, it was largely accumulated in ND10 (nuclear dots) withSUMO-1 during interphase, while it became associated withentire chromosomes during mitosis. It is notable that the poten-tial sites of PKC phosphorylation and tyrosine phosphorylationand the RNA-binding motif, RNP-1, are well conserved amongspindlins of chicken, human and mouse, human DXF34 andmouse Ssty (Itoh et al., 2001). The active SPIN-W on the Wchromosome may have a role in ovarian differentiation infemales.
MHM region and DMRT1 gene. The presence of MHM(male hypermethylated) region adjacent to the DMRT1 gene onthe short arm of the chicken Z chromosome was mentioned inthe First Report 2000. The detailed description of this interest-ing region was published subsequently (Teranishi et al., 2001).The MHM region consists of about 210 tandem repeats of aBamHI 2.2-kb sequence (the genomic and cDNA sequencesare deposited with DDBJ/EMBL/GenBank nucleotide se-
quence databases under accession numbers AB046698 andAB046699). This region was first noticed as a female-specificcDNA clone from the cDNA library of the lampbrush-stagechicken oocytes. Fluorescence in situ hybridization (FISH) tothe lampbrush ZW bivalent revealed that RNA transcripts fromthe MHM region accumulated on a pair of loops and that theDMRT1 gene was located at the base of each of these particularloops on the Z chromosome. The high level methylation of cyto-sines in CpG sequences of MHM regions on the two Z chromo-somes in male cells is established after fertilization and beforethe one-day embryonic stage. Similarly, hypomethylation of theMHM region on a sperm-derived Z chromosome in female cellsis established after fertilization and before the one-day em-bryonic stage. These situations are different from those ofgenomic imprinting in mammals, because the allele-specific dif-ferential CpG methylation patterns related to genomic imprint-ing are established during the later stage of gametogenesis (Con-stancia et al., 1998). In ZZW triploid intersex chickens, MHMregions are hypomethylated and transcribed on both Z chromo-somes, whereas MHM regions are hypermethylated and nottranscribed on the three Z chromosomes in ZZZ triploid males.It thus suggests that the state of methylation of the MHM regionis affected by the presence or absence of the W chromosome.
In female cells, the MHM region is transcribed into non-coding RNA (MHM-RNA) molecules of approximately 10 kbbut heterogeneous in size, which are accumulated in thenucleus at or in close vicinity of the site of transcription on theZ chromosome. When female chicken embryonic fibroblastswere subjected simultaneously to RNA-FISH, to MHM-RNAand to DNA-FISH to either MHM region or DMRT1 gene, theaccumulation of MHM-RNA was observed very closely to theMHM region and also to the DMRT1 gene locus. These obser-vations imply the possibility that the accumulation of MHM-RNA in the female cell nucleus may be a factor contributing tothe inactivation of DMRT1 gene expression. However, thisnotion has not been proved at a biochemical or a molecularlevel. Chromatin structures of the MHM region and the adja-cent DMRT1 locus in male and female chicken cells are nowbeing investigated in our laboratory.

450 Cytogenet Genome Res 109:415–479 (2005)
Fig. 30. Locations of three repetitive familiesand two genes on the W lampbrush chromosomeof chicken. Results of high-resolution FISH map-ping (Solovei et al., 1998; Itoh and Mizuno, 2002)are illustrated. Chromomeres are numbered (1 to7) as indicated. DNA sequences constituting chro-momeres 2, 4, and 7 are unknown.
FET1 gene. A new W-linked gene, FET1 (female expressedtranscript 1), was discovered recently by a differential expres-sion screening of male and female chicken embryonic gonadsduring F4.5–6.5 days of incubation (Reed and Sinclair, 2002).This gene was located by FISH in close vicinity of the ASW/PKCI-W gene locus in the terminal region of the W short arm.The nucleotide sequence of FET1 cDNA (accession numberAY113681 in DDBJ/EMBL/GenBank nucleotide sequence da-tabases) revealed that it was a novel gene. The deducedsequence of FET1 contains a putative signal sequence and atrans-membrane domain. The mRNA-level expression ofFET1 was low but similar in the left and right embryonicgonads between day 3 (Hamburger-Hamilton stage 20) and day4 (stage 24). The expression became conspicuous in the cortexof the left developing gonad at day 4.5 (stage 25) and continuedthrough day 6 (stage 29) in female embryos but the expressiondeclined sharply at day 6.5 (stage 30). The mRNA-level expres-sion of FET1 was also observed in the caudal portions of devel-oping somites and the neural tube and in the waste collectionducts in early female embryos. These results suggest that FET1may play a role in the early process of the ovarian develop-ment.
Although the counter-part gene of FET1 on the Z chromo-some has not been identified, the four published W-linkedgenes, CHD1-W, ATP5A1-W, ASW/PKCI-W and SPIN-W,have their respective counterpart genes on the Z chromosome(Fig. 29). The latter facts are in accordance with the suggestionthat the present day W and Z chromosomes of birds haveevolved from a pair of homologous chromosomes that existedbefore the divergence of Carinatae and Ratitae birds (Ogawa etal., 1998; Nishida-Umehara et al., 1999).
SspI-family: an additional repetitive sequence family on theW chromosomeAbout 60% of DNA of the chicken W chromosome consists
of XhoI- and EcoRI-family repetitive sequences. The XhoI-family exists in the pericentric region and the major fraction ofthe EcoRI-family occupies a large area of the long arm and theminor fraction of the EcoRI-family is present at a middleregion of the short arm (Fig. 29). Recently, SspI-family, inwhich a 0.5-kb SspI fragment is tandemly repeated about11,300 times, was found on the chicken W chromosome andthe family was located in the terminal region of the short arm ofthe mitotic W chromosome by FISH (Fig. 29) (Itoh and Mizu-no, 2002). A unique feature of the SspI-family is that its 0.5-kbrepeating unit contains a 120-bp stretch of polypurine/polypy-rimidine sequence (GGAGA repeats) at its 3) end region. Thetotal amount of SspI-family DNA is about 6 Mb. Together with11 Mb of EcoRI-family DNA, 21 Mb of XhoI-family DNA and6 Mb of uncharacterized repetitive DNA, the sum of repetitiveDNA in the W chromosome is about 44 Mb, leaving only about10 Mb as non-repetitive DNA (Itoh and Mizuno, 2002). About20 active genes are estimated to be present in the 10-Mb non-repetitive region (Mizuno et al., 2002).
The SspI-family itself does not seem to be directly related tothe process of sex determination or sex differentiation. How-ever, this family does have some relevance to the study and thestate of active genes on the W chromosome in two differentaspects. First, this family is a useful positional marker in FISHmapping of active genes on the W chromosome, because theSspI-family is located at the heterochromatin/euchromatinboundary in the terminal region of the short arm. High resolu-tion FISH mapping on the lampbrush ZW bivalent preparedfrom a germinal vesicle of a diplotene-stage oocyte (Mizunoand Macgregor, 1998; Solovei et al., 1998) with the digoxige-nin-labeled 0.5-kb SspI-family repeating unit and the biotiny-lated BAC clone containing a genomic sequence of SPIN-W orPKCI-W indicated a precise location of each gene relative tothe position of the SspI-family as illustrated in Fig. 30. The sec-ond aspect may have some biological significance; that is, theSspI-family sequence forms a much more diffused chromatinstructure in nuclei than XhoI- and EcoRI-family sequences(Itoh and Mizuno, 2002). This is probably caused by the pres-ence of a polypurine/polypyrimidine stretch in each of the SspI-family repeating units. It has been shown by non-denaturingFISH to RNase-pretreated nuclei that polypurine/polypyrimid-ine sequences form triple-stranded DNA clusters in nuclei(Ohno et al., 2002), where nucleosome-based chromatin struc-ture should be interrupted. The presence of SspI-family se-quences at the heterochromatin/euchromatin boundary on theW short arm may be effective in preventing long-range spread-ing of heterochromatin into the terminal euchromatic region(Suka et al., 1993), where most W-linked active genes areexpected to be located.
Dosage compensation of Z-linked genes may be achieved inthe absence of Z chromosome inactivation in malesA randomly chosen X chromosome (Xi) in female cells of
mammals forms facultative heterochromatin in which tran-scription of the majority of genes is virtually silenced with con-

Cytogenet Genome Res 109:415–479 (2005) 451
comitant epigenetic modifications of its DNA and chromatin:high-level methylation of cytosines in CpG sequences, chromo-some-wide spreading of Xist RNA, methylation of lysine 9 ofhistone H3, accumulation of macrohistone H2A1 and BRCA1,and Xi shows the typical late replication pattern (Heard et al.,2001; Ganesan et al., 2002). This mechanism, i.e. X inactiva-tion, is the basis of dosage compensation of X-linked genesbetween male and female mammals.
It has been suggested that a Z inactivation mechanism isunlikely to operate in male birds with different experimentalapproaches. A late replicating Z chromosome was not observedin male cells of the chicken, the Japanese quail and the griffonvulture by the technique of DNA replication banding after suc-cessive incorporation of 5-bromo-deoxyuridine and deoxythy-midine (Schmid et al., 1989). The enzymatic activity of the Z-linked cytoplasmic aconitase (ACO1 or iron-responsive ele-ment-binding protein, IREBP) in liver was 1.4 to 2.4 timeshigher in males than in females of the house sparrow, the chick-en and the spotted turtle-dove (Baverstock et al., 1982). ThemRNA-level expression of the Z-linked DMRT1 gene in thegenital ridge of chicken embryos at stages 25 to 31 detected bywhole mount RNA-FISH was about twofold higher in malesthan in females (Raymond et al., 1999).
The above results are suggestive but not conclusive for theabsence of Z inactivation at the level of transcription of alleleson the two Z chromosomes. More direct evidences wereobtained recently with two different approaches. The firstapproach utilized RNA-FISH on nascent transcripts in a nu-cleus (Kuroda et al., 2001). Antisense riboprobes for an intronregion of each of the five Z-linked chicken genes, growth hor-mone receptor (GHR), nicotinic acetylcholine receptor ß3(CHRNB3), aldolase B (ALDOB), ß1,4-galactosyltransferase 1(B4GALT-1), iron responsive element-binding protein (IREBPor ACO1), all hybridized to two spots of nascent RNA in anucleus of male cells but to a single spot in a nucleus of femalecells. These cells were derived from a tissue in which the respec-tive gene was expressed in both males and females. The twospots detected in the nucleus of male cells coincided with thecorresponding gene loci which were detected by DNA-FISH.These results suggest strongly that both alleles of the five Z-linked genes are transcribed in male cells.
The other approach made use of a single nucleotide poly-morphism (SNP) found in an exon region between alleles onthe two Z chromosomes in male cells (Kuroiwa et al., 2002).Transcripts from each allele could be distinguished by theprimer extension with a single radioactive NTP (for CHD1-Z)or by differential digestion with RsaI (for B4GALT-1). It wasdemonstrated with this approach that the two Z-linked genes,B4GALT-1 and CHD1-Z, were transcribed from both alleles ina single cell of the male chicken. These results show unequivo-cally that a Z inactivation mechanism does not operate on thetwo Z-linked genes examined. Considering the recent and pre-vious results mentioned above, it is very likely that a Z inacti-vation mechanism which leads to a virtual shut-off of transcrip-tion of genes on one of the two Z chromosomes in males isabsent in birds.
On the other hand, studies with the real-time quantitativePCR demonstrated that relative numbers of transcripts in male
and female chicken embryos were near equivalent for six (FS,VLDLR, BRM, CHRNB3, ALDOB, IREBP) out of nine Z-linked genes examined (McQueen et al., 2001). The six genesincluded CNRNB3, ALDOB and ACO1/IREBP which wereshown not to be subjected to Z inactivation as mentionedabove. The same procedure applied to male and female chickenembryos also demonstrated that the dosage compensation waslikely attained for transcripts of CHD1-Z but not for those ofB4GALT1 in spite of the biallelic expression of both genes (Ku-roiwa et al., 2002). It is thus conceivable that a dosage compen-sation mechanism to yield near equivalent levels of steady-statemRNA concentrations between males and females may bepresent in chickens for certain Z-linked genes but in theabsence of Z inactivation. If dosage compensation is attainedby a single mechanism or by combination of events such asallelic difference in the efficiency of transcription, efficiency ofpre-mRNA splicing and mRNA export to the cytoplasm, andstability of mRNA remains to be elucidated.
PerspectivesSex-determining gene. The chicken DMRT1 gene, a candi-
date for the male-determining gene on the Z chromosome,shows characteristic biphasic expression patterns: approxi-mately male 2:female 1 mRNA levels in undifferentiated ordeveloping gonads in embryos of stages 25 to 31 and testis-specific expression after hatching (Raymond et al., 1999; Shanet al., 2000). The twofold higher level of DMRT1 mRNA inearly male embryos has been implicated to cause the maledetermination in chickens (Raymond et al., 1999; Shan et al.,2000), because in humans, XY sex reversal takes place whenthe distal region containing DMRT1 and DMRT2 genes on theshort arm of one of the chromosomes 9 is deleted (Guioli et al.,1998; Ottolenghi et al., 2000). On the other hand, the testis-specific expression of DMRT1 in post-hatched male chickensimplies its role in the differentiation or functions of the testis. Ifthe half dosage of DMRT1 mRNA in early embryos initiatesthe cascade of gene expression toward female development,then the key event in female development that is expression ofthe aromatase gene (CYP19) by the time of stage 30 to 31 (Mi-zuno et al., 2002) must be explained as its consequence. Clear-ly, we need to know the dosage-dependent protein function ofDMRT1 and its molecular target.
Among the four W-linked genes listed above, ASW/PKCI-W is unique in that protein-coding sequences of W- and Z-linked genes are substantially different; i.e., overall identity ofthe deduced amino acid sequences is about 60% (Hori et al.,2000). Both PKCI-W and PKCI-Z are transcribed actively infemale embryos of stages 20 to 29 in several tissues includingthe left and right genital ridges. The Z-linked PKCI-Z is thechicken ortholog of mammalian PKCI/HINT. HINT (histidinetriad nucleotide-binding protein) forms a branch in the HIT(histidine triad) superfamily of nucleotide hydrolases andtransferases and shows adenosine 5)-monophosphoramidaseactivity (Brenner, 2002). The deduced sequence of ASW/PKCI-W does not contain the HIT motif, that is essential forthe enzymatic function of HINT, but it contains a unique Leu,Arg-rich region, implying that proteins produced from the W-and Z-linked genes exhibit different functions (Hori et al.,

452 Cytogenet Genome Res 109:415–479 (2005)
2000). This is a situation resembling the functional differentia-tion of an original pair of homologous genes on the present-dayX and Y chromosomes in mammals; i.e., SOX3 on the X chro-mosome mainly functioning in the brain development andSRY on the Y chromosome functioning in triggering the testisdifferentiation (Collignon et al., 1996; Katoh and Miyata,1999; Graves, 2002).
It has been shown that the mammalian PKCI/HINT existsas a homodimer and that the ·-helix region and the C-terminalregion encompassing the HIT domain are involved in dimeri-zation (Lima et al., 1996; Brenner et al., 1997). As the latter tworegions are well conserved between PKCI-W and PKCI-Z, ithas been proposed that PKCI-W would form a heterodimerwith PKCI-Z and thereby inhibits function(s) of PKCI/HINTin females, which may be a key step in the sex determination inchickens (Hori et al., 2000; O’Neill et al., 2000). Recently, weprepared fusion and tagged forms of PKCI-W and PKCI-Z anddemonstrated that PKCI-W formed a heterodimer with PKCI-Z and inhibited the adenosine 5)-monophosphoramidase activ-ity of PKCI-Z in a dominant-negative manner in vitro (Moriya-ma et al., in preparation).
The immediate question is how the adenosine 5)-mono-phosphoramidase activity of PKCI-Z and its inhibition byPKCI-W are related to their putative sex-determining func-tions. However, it has also been demonstrated that PKCI/HINT interacts with microphthalmia (mi) and inhibits itsactivity as a transcription factor (Razin et al., 1999) and thatPKCI/HINT interacts with human Cdk7, a catalytic subunit ofthe Cdc2 activating kinase, or its yeast homologue Kin28 (Kor-sisaari and Mäkelä, 2000). The loss of HINT1 enzyme activityin yeast caused hypersensitivity to mutations in Ccl1, Tfb3 andKin28, whose products constitute the TFIIK kinase subcom-plex in TFIIH (Bieganowski et al., 2002). These results mayimply in vivo protein-protein interacting functions of PKCI/HINT. It has been speculated that PKCI/HINT may exhibit aprotein adenylation activity under such circumstances (Bren-ner, 2002). It is essential to examine and demonstrate in vivofunction and target of PKCI-Z and in vivo functional interac-tion of PKCI-W with PKCI-Z in early chicken embryos.
Search for more genes on the W chromosome. Based on thegene density around SPIN-W we estimated about 20 activegenes on the chicken W chromosome (Mizuno et al., 2002).However, this number could be about 50 if the average genedensity of the human Y chromosome, whose size is about thesame as that of the chicken W chromosome, is applied (Graves,2002). More accurate estimation will be obtained from theresults of the chicken whole genome sequencing project. In anycase, a substantial number of hitherto unknown genes areexpected to be found on the W chromosome and we may find anew gene involved in the process of female sex determinationamong them. Recently, this subject has been approached byscreening cDNA macroarrays in the author’s laboratory. cDNAmacroarrays carrying about 20,000 clones which were random-ly picked up from female-minus-male subtraction cDNA librar-ies from 2- to 5-day chicken embryos were hybridized succes-sively with male-minus-female cDNA, female-minus-malecDNA, total male cDNA, total female cDNA preparationsfrom each developmental stage as probes. About 1,300 clones
exhibiting female-specific or substantially female-dominant ex-pression patterns were selected. Southern blot hybridization tofemale and male genomic DNAs digested with appropriaterestriction enzymes with each of these clones as a probe select-ed a few candidates of clones derived from W-linked genes,interestingly mostly from the two-day (stages 12 to 13) embryos(Yamada et al., in preparation).
Molecular genetics of gonadal sex differentiation andanalysis of candidate sex-determining genes(Prepared by C. Smith, Q. Hudson and A. Sinclair)
As in other vertebrates, the gonads of birds develop frommesodermal tissue on the ventral surface of the mesonephrickidneys during embryogenesis. In the chicken embryo, thegonadal primordia become apparent between days 2 and 3 ofincubation (Hamilton and Hamburger 16–18). At this stage,the gonads are morphologically identical in both sexes. Histo-logical differentiation into testes or ovaries commences at day6.5 (stage 29–30; Fig. 31), when Sertoli cells differentiate andbegin organizing into seminiferous cords in males, while theouter cortical layer of the gonad begins to thicken in females(Smith and Sinclair, 2004). It has been reported that some sex-ual dimorphisms exist prior to gonadal sex differentiation.Germ cell numbers, for example, are apparently more numer-ous and asymmetrically distributed at an earlier stage infemales (Zaccanti et al., 1990). In the chicken embryo, only theleft gonad differentiates into a functional ovary, the right gonadregresses.
Genes thought to be involved in gonad formation and sex-ual differentiation in the chicken embryo are shown semi-sche-matically in Fig. 31. In mammals, some key genes have beenidentified that are required for the formation of the undifferen-tiated (or “bipotential”) gonads. These genes are conserved inchicken and their embryonic expression profiles imply thatthey play the same role in birds. Genes encoding the transcrip-tion factors steroidogenic factor-1 (SF1) and Wilms tumor 1(WT1), for example, are both expressed in early forminggonads (Fig. 31). Meanwhile, the onset of testicular differentia-tion is characterized by the male-specific expression of the tran-scription factor SOX9 (Kent et al., 1996) and Anti-Müllerianhormone (AMH), as in mammals. Unlike mammals, ovariandifferentiation is marked by the expression of rate-limitingenzymes required for estrogen synthesis, namely, aromataseand 17-ß hydroxysteroid dehydrogenase (17ß-HSD). Severallines of evidence indicate that estradiol is required for ovariandifferentiation in birds (as in lower vertebrates but in contrastto eutherian mammals) (Smith and Sinclair, 2004). The wingedhelix transcription factor, FOXL2, has a female-specific expres-sion pattern that is coincident with that of aromatase, suggest-ing potential interaction.
In birds, as in mammals, sexual differentiation of thegonads must be controlled by genes on the sex chromosomes.Chickens and other birds have a ZZ male/ZW female sex chro-mosome system, but the sex determining gene(s) remain un-known. Under the Z dosage hypothesis, males inherit twocopies of a gene required for testis development, and females

Cytogenet Genome Res 109:415–479 (2005) 453
Fig. 31. Profile of genes expressed during go-nadal development and sexual differentiation inthe chicken embryo. Genes shown in open circlesare expressed at similar levels in both sexes.Genes shown in dark gray are more highly ex-pressed in males, genes shown in light gray aremore highly expressed in females. The onset ofmorphological differentiation of the gonads ishighlighted (day 6.5/stage 29–30). Small black cir-cles represent germ cells. Modified from Smithand Sinclair (2004).
inherit one, resulting in ovary differentiation. The Z-linkedDMRT1 gene is conserved, and more highly expressed in maleembryonic gonads prior to and during sexual differentiation(Smith et al., 1999). This gene is the strongest candidate sexdeterminant under the Z dosage hypothesis. The W chromo-some is analogous to the mammalian Y because it is largelyheterochromatic and carries few bona fide genes. Evidencefrom ZZW triploid chickens (Thorne and Sheldon, 1993) andfrom a female warbler with an apparent ZZW phenotype (Aritet al., 2004) support the view that the W chromosome carriesan ovary-determining gene in birds. (The triploid chicken data,however, suggest that the effect of the W can be overridden bytwo Z chromosomes, as the birds are initially feminized butlater become masculinized.) The W-linked gene, ASW (alsocalled WPCKI or HINTW) is a strong candidate ovary determi-nant. It is present in multiple copies on the W, is widelyexpressed only in female embryos, and is conserved in non-ratite birds (Hori et al., 2000; O’Neill et al., 2000). It encodes adivergent form of the histidine triad nucleotide hydrolaseenzyme, HINT, while the bona fide HINT gene is present onthe Z. It has been suggested that the derived W protein, ASW/WPKC, may interfere with the Z copy to elicit ovary develop-ment (Hori et al., 2000). There may be other interactionsbetween Z and W, involving methylation of the Z, with a W-linked factor transcribed in females repressing male genes car-ried on the Z (Teranishi et al., 2001). These observations sug-gest that both the W and Z sex chromosomes are involved inavian sex determination. Another candidate female-determin-ing gene is FET1 (female-expressed transcript #1), which is alsoW-linked and expressed in female urogenital systems (Reedand Sinclair, 2002). FET1 encodes an avian retroviral
element. If it plays a role in gonadal sex differentiation, itwould represent an intriguing case of viral co-option by theembryo for a developmental process.
Definitive proof that any of these genes are involved in avi-an sex determination will require transgenic over-expression ordeletion. There are a number of features of avian reproductivebiology that make the production of transgenic birds more dif-ficult than in laboratory mammals, although progress has beenmade (Mozdziak et al., 2003; Sang, 2004). More rapid alterna-tive approaches include gene transfer using avian-specific re-troviral vectors and/or electroporation in the developing em-bryo, and direct assessment of the embryos (See the specialissues devoted to chicken embryology in Developmental Dy-namics, vol 229, 2004, and Mechanisms of Development, vol121, 2004). Using this approach, embryos could then be exam-ined for phenotypic effects of over-expression (such as gonadalsex reversal). Electroporation has proven very useful for deliv-ering plasmid-based expression constructs into tissues such asthe neural tube or limb (Krull, 2004; Nakamura et al., 2004).However, gene expression is transient and the method is notwell suited to targeting mesenchymal tissue or tissues contain-ing extensive basement membrane, such as the gonads. Avianretroviral vectors do provide longer lasting expression of trans-genes (Ishii et al., 2004). Vectors such as RCAS are replicationcompetent and can spread from cell to cell following initialtransfection into early embryos. Attempts are currently beingmade to over-express candidate male (DMRT1) or female(ASW) genes cloned into RCAS vectors and injected into chick-en embryos prior to gonadal sex differentiation. The aim ofthese experiments is to induce complete or partial sex reversal(Smith and Sinclair, 2004).

454 Cytogenet Genome Res 109:415–479 (2005)
Alternatively, candidate gene expression could theoreticallybe down-regulated, using RNA antisense technology in ovo(Kos et al., 2003) or in isolated gonads grown in vitro. RNAinterference is now being widely used for specific gene knock-down in vertebrate cells and tissues, and in whole embryos (Pe-karik et al., 2003). In the chicken embryo, however, thisapproach has focused primarily upon accessible tissues such asthe brain, neural tube or limb. Recently, researchers have com-bined the superior delivery provided by replication-competentavian retroviruses with antisense RNA to development vectorscapable of down-regulating target genes, at least in vitro (Brom-berg-White et al., 2004). For all of these approaches, the chal-lenge will be to ensure sufficient delivery of over-expression orknockdown constructs such that an effect on gonadal differenti-ation is observed.
The ribosomal DNAs of the chicken genome(Prepared by M.E. Delany)
The translation of mRNA into protein in eukaryotes occurswithin the cytoplasmic ribosomes which number in the tens ofmillions per cell. An appropriate capacity for ribosome biogen-esis is intimately associated with cell growth, differentiationand homeostasis. The mature 80S ribosome consists of twosubunits, large (60S) and small (40S), and contains over 80ribosomal (r) proteins and four different species of rRNA. The28S, 5.8S and 5S rRNAs are incorporated into the large subunitalong with F50 r-proteins (L1–L50); the 18S rRNA is incorpo-rated into the small subunit along with F33 r-proteins (S1–S33). Pre-ribosome subunit assembly occurs within the nucleo-lus. The nucleolus, first described in 1781, is located within thenucleus and is a prominent cytological feature of interphasecells, disappearing during mitosis and re-forming in daughtercells (Hadjiolov, 1985). Decades ago McClintock developedthe cytogenetic concept for the “nucleolus organizer region”(NOR), i.e., the chromosomal region which controls the forma-tion of the nucleolus (McClintock, 1934); years later it was dis-covered that the NOR encodes the high copy number, tandem-ly repeated 18S-5.8S-28S rRNA genes (Brown and Gurdon,1964; Ritossa and Spiegelman, 1965). Within the nucleolus thepre-ribosomal subunits are assembled utilizing the processedlocal transcripts (18S, 5.8S, 28S), imported 5S rRNA synthe-sized at an unlinked locus (in most eukaryotes, excepting yeast),and the r-proteins imported following their message translationin the cytoplasm (most r-protein genes are single-copy andunlinked, found scattered around the genome). The 18S-5.8S-28S genes are transcribed by Pol I, the r-protein genes by Pol II,and the 5S rRNA by Pol III. The coordination of the transcrip-tion of numerous genes, protein translation and molecularshuttling necessary to accomplish ribosome manufacture isremarkable. In addition to the components necessary for rDNAprocessing and ribosome biogenesis, other important cellularmolecules, e.g., the telomerase components TR and TERT,localize to the nucleolus (Etheridge et al., 2002). Interestingly,abnormal NOR and nucleolar architecture is a hallmark featureof both metastatic and aging cells (see Hadjiolov, 1985 and ref-erences therein; Delany et al., 1998).
18S-5.8S-28S rDNA (NOR)In higher vertebrates, the 18S, 5.8S and 28S rRNA genes are
arranged as a single transcription unit (18S-5.8S-28S) which istandemly repeated at one or more loci (e.g., five NOR loci inhuman and mouse); the repeat units are present in high copynumber (100’s to 1000’s of genes/haploid genome). The singleNOR locus in chicken was initially mapped to microchromo-some 16 (q arm) and linked to the MHC by trisomy mappingutilizing the aneuploid “Trisomic” line which segregates indi-viduals with extra copies of the NOR chromosome (Bloom andBacon, 1985). The map location was further confirmed by bothcytogenetic analysis (Fillon et al., 1998) and sequencing of cos-mid clusters (Guillemot et al., 1988). Gene copy number wasestablished by studies utilizing the NOR-aneuploid “Trisomic”line (Muscarella et al., 1985), and other research and commer-cial stocks (Su and Delany, 1998; Delany and Krupkin, 1999;Delany, 2000) with diploid values ranging from F300 toF500 copies (F150 to F250 repeats/chromosome). NOR-deficient chromosomes from genetic populations selected onthe basis of reduced nucleolar size were found to have 65 genes(“PNU” line) and as few as 40 genes (“mPNU” line) (Delany etal., 1994a, b, 1995). The NOR-deficient lines were used toestablish the minimum number of 18S-5.8S-28S genes neces-sary for embryonic viability (F160/diploid) and the stage atwhich embryonic failure occurs in severely rDNA-deficientindividuals (gastrulation) (Delany et al., 1991, 1994a, b, 1995).Studies of gene expression in NOR-aneuploid and NOR-defi-cient genetic lines indicate regulated expression of the 18S-5.8S-28S genes accommodating variations in gene copy num-ber and developmental stage (Muscarella et al., 1985; Delany etal., 1994b, 1995). Regulation appears to be mediated throughchromatin architecture (Muscarella et al., 1987). The degree ofcopy number variation and the incidence of nucleolar size poly-morphisms within diploid populations (Delany et al., 1994a, b;Su and Delany, 1998) suggest that alteration in gene copy num-ber is a frequent event. The underlying genetic mechanism forshifts in gene copy number may be unequal recombination pro-moted by out-of-register pairing (see Delany et al., 1991 for dis-cussion); it has been proposed that the NOR is located betweenthe MHC and the “MHC-like” Rfp-Y locus, and that a highrecombination rate within the NOR is the genetic mechanismresponsible for the lack of genetic linkage between the MHCand Rfp-Y (Miller et al., 1996).
Molecular features of the 18S-5.8S-28S rRNA genesEach gene repeat unit consists of an intergenic spacer (IGS)
5) of the gene, the 18S-coding region, an internal transcribedspacer (ITS1), the 5.8S gene, an ITS2, and the 28S-codingregion. The primary rRNA transcript (F10 kb) includes both5) and 3) external transcribed spacer sequences (ETS) plus the18S, ITS1, 5.8S, ITS2 and 28S sequences; the primary trans-cript is processed via a series of cleavage reactions into the indi-vidual 18S, 5.8S and 28S rRNAs assuring production of equi-molar amounts of these rRNAs (Hadjiolov, 1985). The order ofthe genes within the repeat unit, their sequences, and someaspects of the processing steps are highly conserved amongeukaryotes and even prokaryotes. In contrast, the adjacent IGSregions vary significantly for size and sequence and this genetic

Cytogenet Genome Res 109:415–479 (2005) 455
variation has been studied in a number of organisms (see Dela-ny and Krupkin, 1999 and references therein). In chicken, thesize of the repeat unit varies according to the size of the adja-cent IGS, and enormous heterogeneity exists with repeat sizesfrom 11 to 50 kb. IGS region variation is important because ofthe cis-control regions 5) and 3) of the repeat unit (promoter,enhancer and termination sites) among other important se-quences, e.g., replication origins, recombination hotspot mo-tifs, matrix attachment regions (MARs), etc. (see Gonzalez andSylvester, 1995). Repeat size variation exists at several levelsincluding both within the NOR locus, between NOR chromo-somes within a population and between populations (Delanyand Krupkin, 1999; Delany, 2000). The average size of therepeat in UCD 001 (Red Jungle Fowl, RJF) was 7 kb smallerthan that of UCD 003 (Single Comb White Leghorn, SCWL).UCD 001 exhibited two predominant repeat size classes (29.5and 30.5 kb, with minor repeats ranging from 15 to 50 kb)whereas UCD 003 exhibited one main repeat class (37 kb, withminor repeats ranging from 19 kb to over 50 kb). The averagesize of the entire rDNA array (based on copy number andrepeat size) was 5 Mb in UCD 001 and 7 Mb in UCD 003(Delany and Krupkin, 1999). NOR variation was also exam-ined in broiler and layer chickens (Delany, 2000). The averagegene repeat size in commercial white-egg populations was 36 kbwhereas in brown egg layers and broilers the average generepeat sizes were 32.5 and 33.9 kb, respectively. NOR arraysize was similar among the three types of chicken populations,6 Mb; populations with larger repeat unit size generally pos-sessed a lower number of gene repeats. The diversity patterns ofNOR-gene repeat variation within and between populationssuggested that breed origin as well as selection scheme mayhave influenced the degree of variation seen within and be-tween NORs; repeat unit size variation was greatest in thebroiler populations.
Molecular and cytogenetic features of 5S rDNAThe 5S rRNA genes in higher eukaryotes are arranged in
arrays of tandem repeats. The repeat unit contains a non-tran-scribed IGS region (spacer) adjacent to the highly conserved,small coding region (F120 bp). Most vertebrate genomes con-tain only one or two loci, Xenopus being an unusual exceptionwith repeats located at the telomeres of most chromosomes(Pardue et al., 1973). The function of the 5S rRNA is unknown.Studies of prokaryote ribosomes indicate that it crowns thelarge ribosomal subunit having extensive interactions with pro-teins and may serve to stabilize the r-proteins (Ban et al., 2000).Unlike the 18S-5.8S-28S genes, transcript levels appear unaf-fected by changes in growth conditions (de la Serna et al.,2000).
The molecular characteristics of the chicken 5S rRNA geneswere recently described (see Daniels, 2001; Daniels and Dela-ny, 2003). A predominant 2.2-kb gene (·) repeat (coding plusIGS) was found in both research and commercial chickenstocks and a minor 0.6-kb (ß) repeat (having a significantlysmaller IGS) was found in a subset of the populations. FISHmapping indicated a single locus and placed the chicken 5SrRNA gene array on chromosome 9 near the centromere on theq arm. Positioning of the 5S array orients the markers of the
linkage group (E36, GGA9) and suggests there are no markersyet for the p arm. Linkage analysis conducted using AluI PCR-RFLP and the E. Lansing reference population indicated a highdouble recombination rate (25%) involving 5S, ROS0152 andMSU0346 suggesting that the 5S array might be a recombina-tion hotspot. The arrangement of the · and ß genes (inter-spersed or separate clusters) within the array is unknown; inhuman separate clusters of 5S genes map to chromosome 1(Kost et al., 1995). The size of the 5S rDNA array in UCD 001(RJF) (possessing only the · gene repeat) was found to be 83 kband can be used to provide an estimated gene copy number of76 genes per diploid genome; the human genome estimatesbeing more than double, F180 genes/diploid genome (Littleand Braaten, 1989). Sequence analysis was conducted on both5S· (UCD 001 and UCD 003) and 5Sß (UCD 003) genes(AF419700, AF419701) and features characteristic of Pol IIIpromoter systems were identified in both gene classes (A-, C-and D-box, termination sequences) along with homopolymericG/C stretches, and a matrix attachment region (MAR) (Danielsand Delany, 2003).
Chicken telomere biology: telomeres and telomerase(Prepared by M.E. Delany)
The telomere is the specialized nucleoprotein structurewhich “caps” the ends of linear chromosomes and telomerase isthe specialized enzyme responsible for maintaining the lengthof the telomere (Greider and Blackburn, 1985, 1989). Telomer-ase catalyzes the addition of the telomere repeat (TTAGGG) tothe 3) end of parental DNA strand(s) thus preventing diminu-tion of the telomere resulting from the 5) end replication prob-lem (Olovnikov, 1973). In human somatic cells, the develop-mental regulation of telomerase activity plays an importantrole in genome stability and cellular lifespan. Lack of telomer-ase activity in aging somatic cells (in vitro or in vivo) correlateswith telomere shortening and once telomeres reach a criticalthreshold size, ensuing cytogenetic abnormalities involving thechromosome ends eventually trigger apoptosis and/or cellularsenescence (Counter et al., 1992; Karlseder et al., 1999). Thistelomere-initiated genetic mechanism provides an importantlimitation to cellular lifespan and thus prevents uncontrolledcell proliferation of aging and abnormal cell populations (i.e., ifother control mechanisms fail to remove aged cells from the cellcycle, eventually the telomere mechanism will be invoked).Subversion of this mechanism occurs in human cancers withthe resumption of telomerase activity and stabilization of telo-mere length (Shay and Bacchetti, 1997). Notably, the telomerebiology of the laboratory mouse model differs from that ofhuman, i.e., telomerase activity is constitutive in somatic cellsand telomere shortening is not normally a feature of aging cellsor a primary genetic mechanism involved in murine cell cyclecontrol (reviewed in Forsyth et al., 2002). Recent experimentshave focused on the molecular details of telomere array organi-zation and telomerase activity in chicken to establish the keyfeatures of telomere biology in this important food animal andmodel system (Delany et al., 2000, 2003; Taylor and Delany,2000; Delany and Daniels, 2003; Swanberg and Delany, 2003).

456 Cytogenet Genome Res 109:415–479 (2005)
Array organizationChicken telomere arrays can be divided into three main cate-
gories based on size, chromosomal location, and stability. Class Iarrays are interstitial, range from 0.5 to 10 kb in size, and showno evidence of telomere shortening (Delany et al., 2000). Class IIarrays are terminal, range from 10 to 40 kb, and show evidenceof age-related telomere shortening in vivo and in vitro (Delany etal., 2000; Taylor and Delany, 2000; Swanberg and Delany,2003). Class III arrays are terminal, range from 40 kb to 1–2 Mb,and do not exhibit telomere shortening (possibly a resolutionissue given their large size) although the telomeres in this catego-ry show evidence of hypervariability (Delany et al., 2003; Rodri-gue and Delany, in preparation). Nanda et al. (2002b) studiedthe distribution of the (TTAGGG)n repeat sequences by FISHanalysis of chromosomes from 16 bird species and report theenrichment of telomeric DNA on the microchromosomes ascompared to the macrochromosomes and the variability amonggenomes of interstitial telomere sequence content; similarly, notall bird species possess the extremely large telomere tracts (Dela-ny et al., 2000; Nanda et al., 2002b).
Telomerase activity and telomere shorteningTelomerase activity is high during the early differentiation
stages of chicken embryogenesis (pre-blastula Stage X to neuru-la Stage 8) and organogenesis (E5 to E10). In the late stageembryo and post-natally, down-regulation of activity occurs ina tissue-specific manner (Taylor and Delany, 2000) except ingermline and highly proliferative tissues (e.g., intestine) wherehigh telomerase activity is found even in older adults. Esti-mates for telomere shortening in vivo are 160 bp/cell divisionbased on germline vs erythrocyte comparisons of adults from 2to 9 years of age (Delany et al., 2000) and F600 bp/year basedon adult organ vs germline (gonad) comparisons of 5-year-oldadult males (Taylor and Delany, 2000).
Telomerase activity is not routinely detected in primary cul-tures of chicken embryo fibroblasts (CEFs), although activitycan be detected occasionally (and transiently) in flasks at differ-ent passages. Telomere profiles of CEF cultures studied overtime suggest a dynamic shift in cell populations over the courseof a culture lifespan, although ultimately a significant loss oftelomeric DNA occurs concomitant with senescence (Swanbergand Delany, 2003). Overall, losses in Class II arrays rangedfrom 40 to 85% (of original levels) and mean array lengths werereduced by 621 to 2,191 bp (data from five different culturesestablished from single E11 embryos, UCD 003 line). Telomereshortening values from the cultures exhibiting reductions in tel-omere length ranged from –28 to –88 bp per population dou-bling (average value of –61 bp).
In contrast, transformed avian (chicken, turkey, quail) cellsin vitro (and in vivo tumor samples) exhibited telomeraseactivity (cell lines examined: RP-19, DT40, RP-9, MSB-1, MQ-NCSU, QT6, QT35, LMH, LMH/2A) (Swanberg and Delany,2003). Interestingly, the telomeric DNA profiles of the trans-formed cells were similar to those of the senescent CEFs, exhib-iting very little DNA in the Class II array category, perhapsindicating stabilization of telomere-deficient genomes (al-though this remains to be tested experimentally). In other stud-ies of cells in vitro, telomerase activity was detected in short-
term turkey muscle satellite (stem) cells but did not correlatewith proliferation potential of large and small-cell colonies(Mozdziak et al., 2000). Quail embryo myoblasts and chickenneuroretina cells in culture were telomerase negative but be-came telomerase positive upon v-myc transformation (Falchet-ti et al., 1999).
The telomerase RNA geneTelomerase consists of two components, a small RNA (TR)
having template binding and copying functions and a special-ized reverse transcriptase (TERT) responsible for nucleotideaddition. Chicken TR (chTR) is a single copy gene which mapsto chromosome 9 (GGA9q terminal). Thus, of seven codingloci on GGA9, four map to human chromosome 3 (TRFC,EIF4A2, SKIL, TR), two map to HSA2 (NCL, PAX3) and onemaps to HSA1 (5S rDNA) (Delany and Daniels, 2003).
The TR-coding region is 465 bp and both the primarysequence and proposed secondary structure share many fea-tures in common with other vertebrate TRs (Chen et al., 2000).A unique feature of chTR is an expanded GC-rich region(termed the “co-axial stacking” region) between two conserveddomains. The coding region along with 600 bp 5) and 2,700 bp3) was sequenced in UCD 001 (3.7 kb total, AY312571) foranalysis of local and distal characteristics (Delany and Daniels,2003) including regulatory element/transcription factor bind-ing motifs, GC content and identification of regions homolo-gous to the TR sequences identified in oncogenic strains ofMarek’s disease virus (see also Fragnet et al., 2003).
The GC content of the chTR gene and associated sequencesis high, the 5) sequence (–604 to –1) is 67.1% GC, the codingregion (+1 to +465) is 77% GC, and the 3) region (+466 to+3159) is 52.2% GC. A CpG island is indicated for positions–556 to +1436. Five blocks of sequences (from 5), coding, and3) regions) have homology with MDV (GA, Md5, RB1B)sequences (sequence identities ranging from 82 to 95%, seeFig. 1 in Delany and Daniels, 2003). Interestingly, the GC-richcoaxial stacking region is the only region of the coding sequencemissing from the MDV chicken TR sequence. Chen et al.(2000) hypothesize that that region imparts binding stability.The biological significance of the presence of TR sequences inthe MDV genome in regard to transformation remains to beelucidated; Fragnet et al. (2003) report expression of the MDVTR in peripheral blood of infected birds. In human cancer cells,there exists evidence for upregulation (“dysregulation”) of TRvia aneuploid and amplification mechanisms (Avilion et al.,1996; Soder et al., 1997, 1998).
More than 30 regulatory element motifs exist 5) of the chTRcoding sequence, including many Sp1 sites, oncogene transcrip-tion factor motifs (c-Myb), steroid receptor binding sites. Manyof these motifs are also found 5) of the human TR gene, e.g.,Sp1, GR, c-Myb, ER, CCAAT and in positions of the same rela-tive proximity to the coding region. Additionally, numerousmotifs are found 3) of the gene and many of these (more than50) correspond to elements also known to be involved in TERTregulation as defined by studies in model organisms (see Dela-ny and Daniels, 2003). In human cells, TR is constitutivelyexpressed whereas TERT exhibits regulated expression (Merg-ny et al., 2002).

Cytogenet Genome Res 109:415–479 (2005) 457
In summary, key aspects of telomere biology established forthe chicken are similar to that described for human and include(1) age-associated telomere shortening in somatic cells both invivo and in vitro, (2) down-regulation of telomerase activity innon-transformed non stem-cell types in vivo and in vitro, (3) tel-omerase activity in transformed cell types (tumors and cell lines),(4) TR gene organization including a single locus (GGA9) with anumber of important regulatory element motifs (e.g., oncogenetranscription factor binding sites) both 5) and 3) of the gene.
Tropomodulin genes in Gallus domesticus and inmammals: gene structure, protein homologies and tissuedistribution(Prepared by C.A. Conley and V.M. Fowler)
The tropomodulins (Tmods) are a relatively small family ofactin-binding proteins that are present in both vertebrates andinvertebrates as an essential component of the actin cytoskele-ton. Biochemically, Tmods bind to tropomyosin and bind orcap the slow-growing (pointed) ends of actin filaments (Fowler,1996, 1997; Fowler and Conley, 1999). In vivo, Tmod proteinsare localized to the pointed ends of a variety of actin filaments,including the short filaments that form the vertices of the spec-trin-actin membrane skeleton (Ursitti and Fowler, 1994), thecontractile actin filaments of striated muscle sarcomeres (Fowl-er et al., 1993; Gregorio and Fowler, 1995; Almenar-Queralt etal., 1999), and the dynamic actin filaments in the dendritic net-work in lamellipodia of migrating endothelial cells (Fischer etal., 2003). In cultured chick cardiomyocytes, disruption ofTmod function using microinjected antibodies leads to elonga-tion of sarcomeric thin filaments from their pointed ends andinhibition of cell beating (Gregorio et al., 1995). Transgenicmice overexpressing the Tmod1 isoform under the control of acardiac promoter develop dilated cardiomyopathy (Sussman etal., 1998), and the human gene for Tmod1 maps very close to ahuman familial cardiomyopathy (Krajinovic et al., 1995).Tmod3 is a negative regulator of cell migration in endothelialcells (Fischer et al., 2003) and Tmod2 may play a role in synap-tic plasticity in neurons, based on behavioral deficits andenhanced long term potentiation in a Tmod2 knockout mouse(Cox et al., 2003). Understanding the comparative biology ofthe Tmods should lead to improvements in our understandingof basic biological processes, as well as provide the potential fornovel therapeutic procedures.
Tmod gene familyAlthough Tmod function was first studied in the chicken,
the Tmod gene family is best understood in mammals. Twosubclasses of Tmods are known, an F40-kDa subclass alsocalled Tmods and a larger F65-kDa subclass that is referred toas leiomodins (Lmods). The entire Tmod family is character-ized by two conserved regions present in all isoforms, with vari-able sequences present elsewhere that distinguish particularisoforms (Fig. 32A). The first conserved region is located at theamino-terminus of all family members, and has been demon-strated to bind tropomyosin (Babcock and Fowler, 1994; Kos-tyukova et al., 2000; Greenfield and Fowler, 2002). The second
conserved region is located in the carboxy-terminal half of theF40-kDa Tmods and in the middle of the F65-kDa Lmods,and has been shown to contain the actin-capping region (Fowl-er et al., 2003). In the Lmods, the sequences interveningbetween the conserved regions are of variable length, and theLmods also carry a carboxy-terminal extension following thesecond conserved region (Conley et al., 2001 and manuscript inpreparation).
In the nearly complete genomes of mice, rats, and humans,there are four F40-kDa Tmod genes and three F65-kDa Lmodgenes (Cox and Zoghbi, 2000; Conley et al., 2001, and manu-script in preparation). Each of the mammalian genes displaysdistinct but overlapping patterns of expression, with some iso-forms being found widely while others are restricted to a smallsubset of tissue types. In chickens, two Tmod genes have beenreported previously, that are most similar to the mammalianTMOD1 and TMOD4. Chicken TMOD1, otherwise known aserythrocyte Tmod or E-Tmod, was the first chicken Tmod iso-form cloned (Babcock and Fowler, 1994), and has been the sub-ject of considerable study. In chickens, TMOD1 is associatedwith the pointed ends of the thin filaments in the sarcomeres ofcardiac and slow skeletal muscle and with the costameres onthe sarcolemma of fast skeletal muscle (Almenar-Queralt et al.,1999; Greenfield and Fowler, 2002). A crystal structure for thecarboxy-terminal half of chicken TMOD1 has recently becomeavailable, and shows that this portion of the molecule is com-posed of a series of five leucine-rich repeats (Krieger et al.,2002). TMOD4, also known as skeletal-muscle Tmod or Sk-Tmod, was also originally studied in chickens and is found atthe pointed ends of thin filaments in chicken fast skeletal mus-cle fibers (Almenar-Queralt et al., 1999) and in mammalianskeletal muscle (Conley et al., 2001). Curiously, TMOD4 isexpressed in the fiber cells of the eye lens and in mature eryth-rocytes in chickens, whereas in mammals TMOD1 is expressedin these cell types (Almenar-Queralt et al., 1999; Cox and Zogh-bi, 2000; Fischer et al., 2000). This suggests that some Tmodisoforms have exchanged tissue-specific functions during evo-lution.
Considerably less is known concerning Lmod function andexpression. In humans, the two published Lmods have beenshown to display distinct patterns of expression (Conley et al.,2001). LMOD1 is expressed widely and predominantly in tis-sues containing smooth muscle, and LMOD1 is localized tosmooth muscle cells in tissues containing multiple cell types(Conley, 2001). LMOD2 is expressed in adult skeletal muscle aswell as fetal and adult cardiac muscle, a pattern resemblingTMOD1 expression in muscle tissue (Conley et al., 2001). Theexpression of Lmod3 has not yet been reported in the literature(Conley et al., manuscript in preparation), however based onthe abundance of EST sequences from fetal tissues LMOD3 islikely to be highly expressed in embryos, both in mammals andin chickens (Table 9).
Avian-mammalian conservationFor this review, we have performed searches of the chicken
EST database and have identified chicken sequences encodingthe two remaining Tmod isoforms (TMOD2 and TMOD3) aswell as the three Lmod isoforms (Table 9). All Tmod sequences
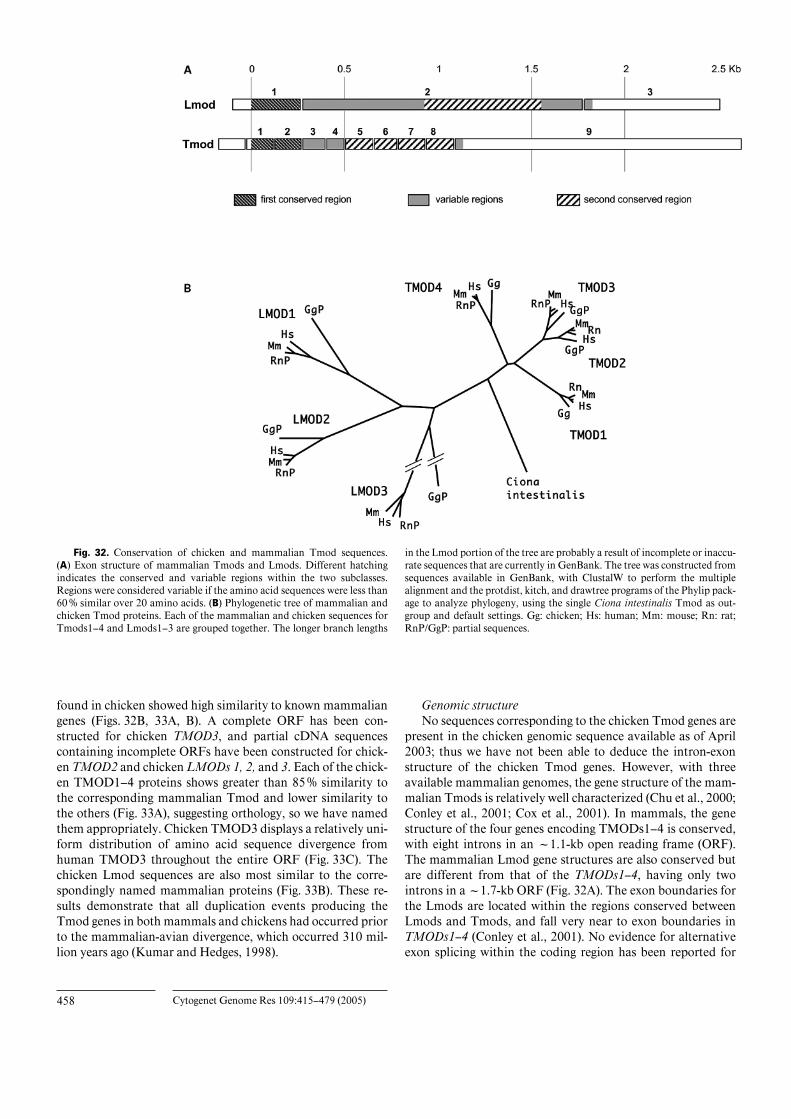
458 Cytogenet Genome Res 109:415–479 (2005)
Fig. 32. Conservation of chicken and mammalian Tmod sequences.(A) Exon structure of mammalian Tmods and Lmods. Different hatchingindicates the conserved and variable regions within the two subclasses.Regions were considered variable if the amino acid sequences were less than60 % similar over 20 amino acids. (B) Phylogenetic tree of mammalian andchicken Tmod proteins. Each of the mammalian and chicken sequences forTmods1–4 and Lmods1–3 are grouped together. The longer branch lengths
in the Lmod portion of the tree are probably a result of incomplete or inaccu-rate sequences that are currently in GenBank. The tree was constructed fromsequences available in GenBank, with ClustalW to perform the multiplealignment and the protdist, kitch, and drawtree programs of the Phylip pack-age to analyze phylogeny, using the single Ciona intestinalis Tmod as out-group and default settings. Gg: chicken; Hs: human; Mm: mouse; Rn: rat;RnP/GgP: partial sequences.
found in chicken showed high similarity to known mammaliangenes (Figs. 32B, 33A, B). A complete ORF has been con-structed for chicken TMOD3, and partial cDNA sequencescontaining incomplete ORFs have been constructed for chick-en TMOD2 and chicken LMODs 1, 2, and 3. Each of the chick-en TMOD1–4 proteins shows greater than 85% similarity tothe corresponding mammalian Tmod and lower similarity tothe others (Fig. 33A), suggesting orthology, so we have namedthem appropriately. Chicken TMOD3 displays a relatively uni-form distribution of amino acid sequence divergence fromhuman TMOD3 throughout the entire ORF (Fig. 33C). Thechicken Lmod sequences are also most similar to the corre-spondingly named mammalian proteins (Fig. 33B). These re-sults demonstrate that all duplication events producing theTmod genes in both mammals and chickens had occurred priorto the mammalian-avian divergence, which occurred 310 mil-lion years ago (Kumar and Hedges, 1998).
Genomic structureNo sequences corresponding to the chicken Tmod genes are
present in the chicken genomic sequence available as of April2003; thus we have not been able to deduce the intron-exonstructure of the chicken Tmod genes. However, with threeavailable mammalian genomes, the gene structure of the mam-malian Tmods is relatively well characterized (Chu et al., 2000;Conley et al., 2001; Cox et al., 2001). In mammals, the genestructure of the four genes encoding TMODs1–4 is conserved,with eight introns in an F1.1-kb open reading frame (ORF).The mammalian Lmod gene structures are also conserved butare different from that of the TMODs1–4, having only twointrons in a F1.7-kb ORF (Fig. 32A). The exon boundaries forthe Lmods are located within the regions conserved betweenLmods and Tmods, and fall very near to exon boundaries inTMODs1–4 (Conley et al., 2001). No evidence for alternativeexon splicing within the coding region has been reported for

Cytogenet Genome Res 109:415–479 (2005) 459
mammalian TMODs1–4, although an additional gene has beenreported that is interspersed within the introns of the tandemlyrepeated TMODs 2 and 3 (Cox et al., 2001). No evidence foralternative splicing was found during our examination of chick-en Tmod ESTs.
The conservation of Tmod vs. Lmod gene structure suggeststhat an ancient gene duplication event created the genes encod-ing the F65-kDa Lmods and genes encoding the F40-kDaTmods, and that subsequent duplication events created multi-ple isoforms in the different subclasses that retained the ances-tral gene structure. Thus it is reasonable to predict that thechicken gene structure for both TMODs1–4 and the Lmods willbe similar to that of mammals.
Using the reported synteny between chicken and mammali-an chromosomes (Schmid et al., 2000), we can also predict thelocation of unmapped chicken Tmod genes. The genetic loca-tion of the two previously reported chicken Tmod genes,TMOD1 and TMOD4, has been determined on the physicalmap of the chicken genome. Chicken TMOD1 maps to one tipof the Z chromosome at Zq21 (Nanda et al., 2000), which issyntenic to the portion of the human chromosome 9 and mousechromosome 4 that carry the respective human TMOD1(9q22.3) and mouse Tmod1 (4 at 21.5 cM) genes (White et al.,1995; Sung et al., 1996). TMOD4 maps to 1q12 in humans andto chromosome 3 at 52.0 cM in mice (Cox and Zoghbi, 2000).One named microchromosome, E26C13, shares synteny withboth human chromosome 1 and mouse chromosome 3, andmay be the location of chicken TMOD4. Based on synteny, wecan also predict that chicken TMOD2 and TMOD3 will belocated in tandem on chicken chromosome 10 betweenCRABP1 and TPM1, since in human they are located in tan-dem on chromosome 15q21.1-2 and in mouse on chromosome9 at 38.0–52.0 cM (http://www.ncbi.nlm.nih.gov/LocusLink/).
The Lmods are somewhat less well characterized in mam-mals, with LMOD1 located on human chromosome 1q32/mouse chromosome 1 at cytoband F and LMOD2 located onhuman chromosome 7q31/mouse chromosome 6 at cytobandA3 (LocusLink). The locations of chicken LMOD1 andLMOD2 can be predicted to be chromosome 8 and chromo-some 1 respectively. Human LMOD3 is mapped to 3p14.1,which does not show synteny to any chicken chromosomes inthe 2000 map (Schmid et al., 2000), thus this gene may belocated on one of the smaller microchromosomes. These pre-dicted locations could be useful for directing the screening ofchicken BAC libraries for genomic Tmod sequences, as well asperhaps focusing efforts in mapping the unmapped chickenTmod genes.
DEAD box genes in chicken(Prepared by R. Godbout and S. Katyal)
DEAD box proteins are members of an extensive family ofputative RNA helicases that share nine conserved motifs (Q, I,Ia, Ib, II–VI) (Linder et al., 1989; Tanner et al., 2003). Motif IIconsists of D(asp)-E(glu)-A(ala)-D(asp), part of the more ex-tended sequence V/I-L-D-E-A-D-X-(M/L)-L-X-X-G that repre-sents the signature motif of this protein family. The conserved
Table 9. Chicken ESTs encoding novel Tmod sequences. ESTs encodingTmod protein sequences were collected as of April 2003. The correspondingmammalian protein and the mammalian tissue-level localization are given asheadings, and the GenBank accession number and source tissue for that par-ticular cDNA are listed below. The tissue sources for the chicken ESTs corre-spond quite well with the reported mammalian expression patterns. Themammalian expression for F-Lmod is only predicted from available ESTs.
Accession # Tissue source
Tmod1 (erythrocytes, striated muscle) BU131801 stage 36 trunks
BU250803 stage 36 trunks
BU261195 stage 36 limbs
BU320389 stage 22 heads
BU411792 adult muscle
BU411879 adult muscle
Tmod2 (brain) BU353735 adult cerebellum
BU353797 adult cerebellum
Tmod3 (ubiquitous) AJ395122 bursal lymphocyte
AJ445489 bursal lymphocyte
AJ447852 bursal lymphocyte
AJ449020 bursal lymphocyte
AJ449021 bursal lymphocyte
AJ450032 bursal lymphocyte
AJ451371 bursal lymphocyte
AJ453003 bursal lymphocyte
AJ453905 bursal lymphocyte
AJ454353 bursal lymphocyte
AJ455036 bursal lymphocyte
AJ456003 bursal lymphocyte
AJ456819 bursal lymphocyte
AL588234 brain
BU142366 stage 20 – 21 embryo
BU203073 stage 20 – 21 embryo
BU104108 stage 20 – 21 embryo
BU245532 adult liver
BU286851 adult kidney + adrenal
BU291377 adult kidney + adrenal
BU309324 adult heart
BU317272 stage 36 heads
BU382716 stage 36 trunks
BU403773 stage 36 limbs
Tmod4 (skeletal muscle) BM486166 breast muscle
BM486873 breast muscle
BM488992 breast muscle
BU407410 stage 36 limbs
BX267380 multiple tissues
BX267381 multiple tissues
Lmod1 (smooth muscle) BI066925 fat
BU295945 adult small intestine
BU29755 adult small intestine
BU455951 adult ovary
Lmod2 (striated muscle) BU214157 stage 20-21 embryo
BU402089 stage 36 limbs
BU411942 adult muscle
Lmod3 (predicted embryos and muscle) BU127797 stage 36 limbs
BU236847 stage 22 heads
BU411890 adult muscle
BU475151 adult chondrocytes
motifs in DEAD box proteins are required for ATP binding/hydrolysis and RNA binding (reviewed in Caruthers andMcKay, 2002). In addition to RNA-dependent ATPase activi-ty, some DEAD box proteins have been shown to have RNAunwinding or RNA destabilizing activity (Hirling et al., 1989;Rozen et al., 1990; Gururajan et al., 1994). DEAD box proteins

460 Cytogenet Genome Res 109:415–479 (2005)
Fig. 33. Sequence similarity of chicken and mammalian Tmod genes.(A) Matrix of identity (below diagonal) and similarity (above diagonal)between chicken and mammalian Tmod1–4 proteins. (B) Matrix of identity(below diagonal) and similarity (above diagonal) between chicken and mam-malian Lmod1–3 proteins. The shaded boxes indicate sequences that are tak-en to be orthologous, as they show much higher similarity within the box than
to other sequences. Among the Lmods, many of these sequences are incom-plete, thus the degree of similarity is reduced. The matrices were producedfrom the same ClustalW alignment used to generate the tree displayed inFig. 32. (C) Alignment of chicken and human Tmod3 protein sequences, gen-erated using ClustalW. The shading indicates identical amino acids. Gg:chicken; Hs: human; Mm: mouse; Rn: rat.
have been implicated in virtually every aspect of RNA metabo-lism, including transcription, splicing, stability, ribosome bio-genesis and translation initiation (reviewed in Abdelhaleem etal., 2003). With few exceptions (e.g. translation initiation factoreIF-4A), the function of most DEAD box proteins expressed inhigher eukaryotes is either not known or only partially under-stood.
At least twenty-nine mammalian DEAD box proteins havebeen reported, in either the literature or in databases (Ta-ble 10). With the exception of the conserved domains which
tend to be similarly spaced, members of the DEAD box proteinfamily show little sequence similarity to each other. However, asignificant level of similarity has been observed for the sameDEAD box protein in different species. For example, Drosophi-la melanogaster DDX1 is 58.9% identical (424 identities over720 amino acids) to human DDX1 (Rafti et al., 1996). It istherefore possible to distinguish one DEAD box protein fromanother in widely divergent species, even though all DEAD boxproteins share a core of conserved sequences.

Cytogenet Genome Res 109:415–479 (2005) 461
Table 10. Percent identity and similaritybetween human and chicken DEAD box proteins DEAD Box Size of human and
chicken proteins (aa)
Identity
(%)
Similarity
(%)
Commentsa
DDX1 740/740 93 097 Godbout et al. (2002)
DDX2B 407/407 98 099.5 Accession number AF515726
DDX4 691/663 54 067 Tsunekawa et al. (2000)
DDX5 614/595 90 094 Jost et al. (1999)
DDX2A 406/402 96.2 099 Missing first 4 aa*
DDX3 662/402 92 093.5 Missing first 258 aa, contains a 9 aa duplication
DDX6 472/472 99 099 Full-length sequence
DDX10 875/526 57.4 071.9 Missing first 349 aa
DDX17 651/526 92.4 094.7 Missing first 17 aa and last 105 aa
DDX18 670/311 91.6 095.8 Missing first 163 aa and last 196 aa
DDX19 479/267 95.5 098.9 Missing first 212 aa
DDX20 No ESTs
DDX23 820/420 99.5 100 Missing first 241 aa and last 159 aa
DDX24 859/538 50.7 061.3 Missing last 340 aa
DDX25 483/236 68.4 085 Missing first 104 aa
DDX27 769/717 80.9 089.3 Missing first 53 aa
DDX28 540/260 56.9 073.5 Missing first 281 aa
DDX31 851/458 67.7 080.6 Missing first 351 aa, area of similarity ends
abruptly at position 805 in human DDX31
DDX41 623/369 98.1 099.7 Missing first 252 aa
DDX42 No ESTs
DDX43 No ESTs
DDX46 1032/543 93.4 096.1 Missing first 496 aa
DDX47 455/440 91.4 095.5 No similarity in first 15 aa
DDX48 411/411 97.6 099.3 Full-length sequence
DDX49 483/392 77.8 085.7 Missing first 91 aa
DDX51 666/488 65.6 080.5 Missing first 181 aa
DDX54 865/247 63.6 078.5 Missing first 620 aa
DDX55 600/497 85.3 093.8 Missing first 77 aa, gap in open reading frame
DDX56 No ESTs
a *: Compiled chicken ESTs lack sequences corresponding to the first 4 amino acids of the human protein.
To date, full-length cDNA sequences corresponding to fourchicken DEAD box proteins have been reported, includingDDX1, DDX2B (eIF-4AII), DDX4 (Vasa) and DDX5 (p68).Both the chicken and human DDX1 have a predicted size of740 amino acids, with 93% (689/740) identical residues and97% similar residues (Godbout et al., 2002) (Table 10, top sec-tion). Chicken DDX2B (Accession No. AF515726) is 98%identical (398/407) and 99.5% similar to human DDX2B. Thelevel of identity between chicken and human DDX4 is consid-erably lower, with 54% identical residues (363/663) and 67%similar residues over the entire sequence (Tsunekawa et al.,2000). The predicted sizes of chicken and human DDX5 are595 and 614 amino acids, respectively, with most of the extraresidues in human DDX5 located at the N-terminus (Jost et al.,1999). Chicken DDX5 is 90% identical (535/595) and 94%similar to human DDX5.
With the increasing number of chicken ESTs availablethrough DNA databases, we reasoned that it should be possibleto identify the majority of DEAD box transcripts expressed inchicken, based on similarity to their mammalian counterparts.To carry out this analysis, we used the TBLASTN program toidentify chicken ESTs corresponding to each of the 25 mamma-lian DEAD box genes listed in Table 10 (bottom section).Chicken ESTs representing the same transcript were linked
together using the BBSRC EST assembly program (www.chick.umist.ac.uk) (Boardman et al., 2002). Each compiled cDNAsequence was then used to carry out BLASTX searches of NCBIprotein databases. With this approach, we were able to conclu-sively identify the chicken counterparts for 21 of the 25 DEADbox transcripts. No ESTs were identified for DDX20, DDX42,DDX43 and DDX56. Inability to identify the chicken ortholo-gues of these four genes may indicate that: (i) these transcriptsare expressed only at low levels in chicken tissues and/or ESTshave not yet been identified, (ii) these genes are absent in thechicken genome, or (iii) the level of similarity between thechicken and human transcripts is too low to allow identifica-tion of the chicken orthologue.
As shown in Table 10, full-length (or close to full-length)sequences were obtained for five chicken DEAD box proteins:DDX2A (also called eIF-4AI), DDX6 (p54, RCK), DDX48(eIF-4A-like), DDX27 and DDX47. The first three showedexceptional identity (196%) to their human counterparts,while DDX27 and DDX47 were 80.9 and 91.4% identical,respectively. In the remaining 16 cases, the compiled cDNAsrepresented only partial protein sequences, usually lacking partof the N-terminal region. The number of amino acids missingfrom the compiled chicken sequence in relation to the humanprotein sequence is indicated in Table 10. By combining all

462 Cytogenet Genome Res 109:415–479 (2005)
data (published, full-length sequences and partial sequences),14 out of 25 DEAD box proteins were found to be highly con-served (190% identity) between human and chicken. Substan-tially lower levels of sequence conservation were observed forfour DEAD box proteins: DDX4 (54% identical; 67% similar),DDX10 (57.4% identical; 71.9% similar over 526 aa), DDX24(50.7% identical; 61.3% similar over 538 aa) and DDX28(56.9% identical; 73.5% similar over 260 aa).
In summary, there are at least 25 DEAD box genes in thechicken genome, in comparison to at least 29 in the humangenome. Failure to identify four DEAD box genes in chickenmay reflect low transcript and/or EST abundance in the librar-ies that have been screened to date, rather than their absence inthe chicken genome. The high level of sequence similarityobserved for the majority of DEAD box proteins expressed inhuman and chicken suggest that the functions of these proteinsin birds and mammals are strictly conserved. The less evolu-tionarily conserved DEAD box proteins may have functionsthat allow more sequence flexibility or, alternatively, may haveadapted to fulfill roles specific to the individual species.
Tissue distribution of DEAD box transcripts in chicken(Prepared by R. Godbout and S. Katyal)
D(Asp)-E(glu)-A(ala)-D(Asp) box genes encode putativeRNA helicases that have been implicated in a wide variety ofRNA metabolic processes. There are at least 29 DEAD boxgenes in the human genome. Using chicken expressed sequencetag (EST) databases, we have identified cDNAs correspondingto 25 of the 29 human DEAD box genes. Here, we carry out insilico analysis of ESTs in order to study the tissue expressionpatterns of these 25 chicken DEAD box genes.
DEAD box proteins are putative RNA helicases character-ized by eight to nine conserved motifs including the D(asp)-E(glu)-A(ala)-D(asp) box motif (Linder et al., 1989; Tanner etal., 2003). These motifs have been shown to be involved in ATPbinding/hydrolysis, RNA binding and RNA unwinding (Pauseand Sonenberg, 1992; Pause et al., 1993; Caruthers andMcKay, 2002). Related to the DEAD box proteins are theDEAH and the DExD/H family of proteins, all three of whichare members of the superfamily 2 (SF2) of helicases (Silvermanet al., 2003). DEAD box proteins have been found in a widevariety of organisms, from complex multicellular organisms tobacteria and viruses. DEAD box proteins have been implicatedin virtually every aspect of RNA metabolism, including transla-tion initiation, RNA splicing, RNA stability, RNA export andribosome biogenesis (Abdelhaleem et al., 2003). While someDEAD box proteins are well characterized (e.g. translation ini-tiation factor eIF-4A), the role of the majority of DEAD boxproteins expressed in higher eukaryotes remains poorly de-fined.
Only a few chicken DEAD box proteins have been describedin the literature, including DDX1, DDX4 (Vasa), DDX5 (p68)and DDX17 (p72) (Table 11). DDX1 is an 82-kDa protein pri-marily found in the nucleus which has been shown to be associ-ated with the RNA processing factor CstF-64 (Bléoo et al.,2001). DDX1 is widely expressed in the developing chick, with
highest levels in tissues of neural origin such as retina and brain(Godbout et al., 2002). DDX4, first shown to be expressed inDrosophila germ cells, plays a role in germline determination(Hay et al., 1988; Lasko and Ashburner, 1990). In chicken,DDX4 (CVH) is found in granulofilamentous structures in thecytoplasm of germ cells and is detected as early as the firstcleavage of fertilized eggs (Tsunekawa et al., 2000). The expres-sion pattern of DDX5 in chicken suggests a role in neural, andto a lesser extent, mesodermal, development (Seufert et al.,2000). Chicken DDX5 has been shown to be tightly associatedwith 5-methylcytosine (5MeC)-DNA glycosylase, involved inDNA demethylation (Jost et al., 1999). DDX17 is widelyexpressed in the developing chick embryo, with highest levelsin brain and testis. Brain, muscle and liver maturation isaccompanied by down-regulation of DDX17, suggesting a rolein early development (Ip et al., 2000).
The last few years have seen a great expansion in the num-ber of chicken ESTs available through various databases mak-ing it possible to carry out in silico analysis of tissue expression.We have used these EST databases to provide a more compre-hensive view of the expression patterns of DEAD box genes inchicken. For the purpose of this study, DEAD box genes aredefined as those encoding proteins that have the D-E-A-Dmotif as well as the additional seven or eight motifs (dependingon how the motifs are defined) characteristic of this proteinfamily. At the time of analysis, 150 human DDX (DEAD Box)genes (DDX1 to DDX56) had been reported either in the litera-ture or in databases, of which 31 had DEAD box motifs (Ta-ble 11). Two of these 31 genes have been excluded from thisanalysis: DDX26 (DICE1), which has a DEAD box motif but ismissing some of the other motifs characteristic of DEAD boxproteins, and DDX7, originally classified as a human DEADbox gene but subsequently found to be of bacterial origin. Theremaining DDX genes either have DEAH or DExD/H motifs orcould not be linked to any database entry.
Chicken ESTs corresponding to the majority of the 29DEAD box genes (25/29) were identified using the TBLASTNprogram, based on sequence similarity to the previously char-acterized human DEAD box proteins. The chicken ESTs wereassembled into contiguous cDNA sequences using the BBSRCEST assembly program (www.chick.umist.ac.uk) (Boardman etal., 2002). The resulting cDNA sequences were then used tocarry out BLASTN searches of the BBSRC ChickEST database(www.chick.umist.ac.uk) which contains 339,314 ESTs from21 embryonic and adult tissues. Additional ESTs from normaltissue cDNA libraries were identified by BLASTN searches ofthe NCBI chicken EST database (www.ncbi.nlm.nih.gov). Asresults obtained from these searches are not quantitative, thisapproach was used to identify trends in the relative abundanceand tissue-specific distribution of the various DDX trans-cripts.
Results for 25 of the 29 DEAD box genes are shown inFig. 34. No ESTs were identified for DDX20, DDX42, DDX43and DDX56, perhaps due to the absence of the correspondinggenes in the chicken genome or because of a relatively low levelof similarity between the human and chicken proteins. Alterna-tively, the corresponding transcripts may be in low abundancein chicken tissues and/or corresponding ESTs have not yet been

Cytogenet Genome Res 109:415–479 (2005) 463
Table 11. List of DEAD, DEAH, DexD/Hgenes with DDX designation. DEAD boxproteins are highlighted in gray.
Name Other Names Motif cDNAs published ESTs Notes
DDX1 HuDBP-RB DEAD AY057383 yes Godbout et al. (2002)
DDX2A eIF-4AI DEAD no yes
DDX2B eIF-4AII DEAD AF515726 yes also called DDX14
DDX3 PL10, An3, DBX, DBY DEAD no yes
DDX4 VASA DEAD AB004836 yes Tsunekawa et al. (2000)
DDX5 p68, HLR1 DEAD AF158370 yes Jost et al. (1999)
DDX6 p54, HLR2, RCK DEAD no yes
DDX7 NP-52 DEAD bacterial DEAD box
DDX8 HRH1, PRP22 DEAH
DDX9 RNA Helicase A, NDHII DEIH
DDX10 DEAD no yes
DDX11 CLHR1, KRG2 DEAH
DDX12 CHLR2 DEAH
DDX13 SKI2W, HLH DEVH
DDX15 DBP1, PRP43, HRH2 DEAH
DDX16 DBP2, PRP8 DEAH
DDX17 p72 DEAD no yes
DDX18 MrDb DEAD no yes
DDX19 DBP5 DEAD no yes
DDX20 DP103, Gemin3 DEAD no no
DDX21 RNA Helicase II/Gu DEVD
DDX22 - - - not identified
DDX23 PRP28 DEAD no yes
DDX24 DEAD no yes
DDX25 GRTH DEAD no yes
DDX26 DICE1 DEAD other motifs highly divergent
DDX27 DEAD no yes
DDX28 MDDX28 DEAD no yes mitochondrial (m) DDX28
DDX29 DEVH
DDX30 DEVH
DDX31 DEAD no yes
DDX32 DCVD
DDX33 DEAH
DDX34 DEVH
DDX35 DEAH
DDX36 DEIH
DDX37 DEAH
DDX38 PRP16 DEAH
DDX39 DECD
DDX40 DEAH
DDX41 abstrakt DEAD yes
DDX42 SF3b125 DEAD no
DDX43 DEAD no
DDX44 - - - not identified
DDX45 - - - not identified
DDX46 PRP5, U5-200 kDa, HEL117 DEAD no yes
DDX47 DEAD no yes
DDX48 eIF-4A-like NUK-34 DEAD no yes
DDX49 DEAD no yes
DDX50 RH-II/Gubeta (GU2) DEVD
DDX51 DEAD no yes
DDX52 ROK1 DESD
DDX53 - - - not identified
DDX54 APR-5, DP97 DEAD no yes only described in mouse
DDX55 DEAD no yes
DDX56 NOH61 DEAD no no
isolated. Based on the number of hits obtained from theBLAST searches, the most abundant DEAD box transcripts areDDX2B (eIF-4AII) and DDX5 (summarized in Table 12). Bothtranscripts appear to be widely expressed in embryonic andadult tissues. In contrast to DDX2B, DDX2A (eIF-4AI) ESTswere primarily found in the embryonic libraries. Interestingly,this pattern appears to be reversed in mouse, with eIF-4AIbeing ubiquitously expressed and eIF-4AII showing a morevariable tissue distribution (Nielsen and Trachsel, 1988).
DDX4 and DDX18 generated the least number of hits, witha total of three ESTs and eight ESTs, respectively. Two of the
three DDX4 ESTs were found in the ovary and in the testis/ovary/oviduct libraries. Other DDXs demonstrating significantdevelopmental stage- or tissue-specific patterns include DDX10(6/20 ESTs from stage 22 limb), DDX23 (7/18 ESTs from stage20–21 embryo), DDX24 (3/12 ESTs from stage 22 limb),DDX31 (5/20 ESTs from brain, parts other than cerebrum andcerebellum), DDX46 (5/24 ESTs from ovary), DDX49 (8/36ESTs from ovary) and DDX54 (3/11 ESTs from ovary) (Ta-ble 12). Some DDXs appeared especially abundant in 2–3 weekbursal lymphocytes, including DDX3 (8/48 ESTs), DDX5 (33/261), DDX17 (15/94), DDX25 (18/64) and DDX48 (9/37).

464 Cytogenet Genome Res 109:415–479 (2005)
34

Cytogenet Genome Res 109:415–479 (2005) 465
(For Fig. 34 continued on page 466.)
34

466 Cytogenet Genome Res 109:415–479 (2005)
Fig. 34. Graphs of the number of DDX ESTs obtained for each of thetissues listed. Data for embryonic and adult tissues were obtained by BLASTsearches of the BBSRC ChickEST database. Data for other tissues wereobtained by BLAST searches of the NCBI chicken EST database. The nineBBSRC embryo/embryonic tissues are (with total number of ESTs obtainedfrom the cDNA libraries): stage 10 whole embryo (F12,000 ESTs); stage20–21 whole embryo (F26,000); stage 22 head (F18,000); stage 22 limb(F15,000); stage 36 head (F15,000); stage 36 heart (F8000); stage 36 limb(F19,000); stage 36 trunk (F13,000); embryonic day 16 brain (F16,000).The twelve BBSRC adult tissues are: adipose (F2,500); brain–cerebrum(F14,000); brain–cerebellum (F14,000); brain–other parts (F15,000);chondrocytes (F32,000); heart (F9,000); small intestine (F17,000); kidneyand adrenal (F19,000); liver (F13,000); muscle (F9,000); ovary(F29,000); pancreas (F8,000). The thirteen NCBI libraries included in thisanalysis are: 50 hour somites associated with neural tube; embryonic day 3.5to 6 limb bud; embryonic day 5 embryo; multiple tissues from embryonic toadult stages; brain–unknown stage; 2–3 weeks old bursal lymphocytes; fat;intestine-lymphocytes; liver; muscle–breast, leg, epiphyseal growth plate;pituitary/hypothalamus/pineal gland; testis/ovary/oviduct; thymus/bursa/spleen/peripheral blood lymphocytes/bone marrow (lymphoid). Abbrevia-tions used are underlined.
Although this preponderance of DDX ESTs in bursal lympho-cytes may reflect to some extent the large number of ESTs iso-lated from this library (Abdrakhmanov et al., 2000), not allDDXs are well-represented in this library, suggesting enrich-ment of some DDXs in bursal lymphocytes compared to oth-ers.
Most tissues expressed many DEAD box genes (Fig. 34).For example, ESTs representing 13 different DDX genes wereobserved in embryonic day 16 brain. This number increased to19 DDX genes in adult brain. In stage 36 heart, ESTs corre-sponding to 10/25 DDX transcripts were observed, with thenumber increasing to 12 in adult heart. There was concordancefor 17/25 DDX genes in embryonic and adult heart, with sevengenes represented in both tissues and ten genes represented inneither. The adult chondrocyte library had ESTs from 16 of theDDX genes, while the ovarian library had 18 different DDXESTs. Even though only F3,000 ESTs have been sequencedfrom the adult adipocyte library, ESTs representing six DDXgenes were identified in this tissue: DDX2B, DDX5, DDX18,DDX19, DDX27, DDX55. Of note, the only DDX18 EST foundin the 13 BBSRC adult libraries was derived from adipocytetissue.
From this analysis, one can conclude that: (i) very fewDEAD box transcripts are tissue specific; in fact, with the pos-
Table 12. Number of ESTs in BBSRC embryonic libraries, BBSRC adulttissue libraries and other (NCBI) libraries
DEAD Box # ESTs
embryonic
# ESTs
adult
# ESTs
other
Comments
DDX1 21 17 06
DDX2A 22 2 10 mainly embryonic
DDX2B 87 113 58 abundant, widely expressed
DDX3 10 21 17
DDX4 0 1 02 reproductive organs - 2/3
DDX5 76 87 73 abundant, widely expressed
DDX6 6 9 01
DDX10 8 12 00 st. 22 limb - 6/20
DDX17 38 34 22 bursal lymphocytes - 15/94
DDX18 2 1 05 bursal lymphocytes - 3/8
DDX19 39 38 10
DDX23 10 4 04 st. 20-21 embryo - 7/18
DDX24 6 4 02 st. 22 limb - 3/12
DDX25 23 21 21 bursal lymphocytes - 18/64
DDX27 9 19 11
DDX28 10 16 04
DDX31 7 10 03 brain - 5/20
DDX41 9 9 06
DDX46 6 13 05 ovary - 5/24
DDX47 11 10 04
DDX48 14 10 13 bursal lymphocytes - 9/37
DDX49 10 19 07 ovary - 8/36
DDX51 12 13 03
DDX54 3 4 04 ovary - 3/11
DDX55 11 10 09
sible exception of DDX4, it is not clear that any DEAD boxtranscripts are tissue specific, (ii) a number of DEAD box trans-cripts are enriched in specific tissues, (iii) the majority ofDEAD box transcripts appear equally abundant in embryonicand adult tissues, (iv) most tissues express a variety of DEADbox transcripts. These observations are consistent with themultiple roles in RNA metabolism proposed for DEAD boxproteins and would suggest that the need for an extendedDEAD box protein family is not based so much on tissue-spe-cific functions as on a requirement for these proteins to carryout a variety of functions in the cell. Except for their conservedmotifs, most DEAD box proteins show little similarity to eachother. Specificity of function for the different DEAD box pro-teins may be governed through specific protein-protein and/orprotein-RNA interactions.
DT40 in the genomic age(Prepared by J.-M. Buerstedde, H. Arakawa andR.B. Caldwell)
The chicken B cell line DT40 has been extensively used tostudy the function of genes by disruption due to its high homol-ogous recombination activity. Topics of fruitful research in-clude among others B cell-specific receptor signaling and im-munoglobulin repertoire development as well as ubiquitous cel-lular processes like DNA repair and mRNA processing.
The entire chicken genome has recently been released withprofound implications for researchers using the DT40 genetic

Cytogenet Genome Res 109:415–479 (2005) 467
Fig. 35. Conditional gene knockouts usingCre-mediated exon deletion.
exonB
exonBexonA exonC
marker
Induction of MerCreMerrecombinase Marker cassette excised
Targeted integration
loxP
Exon excised
loxP loxP
exonA exonC
exonA
exonA
exonC
exonC
exonB marker
exonB
model. Here, we shall review how the genome sequence willenable better identification of genes and sequence motives,facilitate technical aspects of gene targeting and lead to ad-vances in mutant phenotype analysis.
Identification of evolutionarily conserved genes andsequence motivesStudies in DT40 are generally undertaken to discover
aspects of gene function which are conserved during vertebrateevolution and relevant for our understanding of mammalianbiology (Kurosaki, 2002; Arakawa and Buerstedde, 2004;Hochegger et al., 2004; Shin et al., 2004). Due to the lack offorward mutant screens, almost all genes disrupted in DT40have counterparts previously described for other organisms. Inthe early days, the chicken homologs had to be cloned by cross-hybridization or reverse PCR using degenerate PCR primerscorresponding to conserved sequences. Later, with the releaseof EST databases from bursal B cells (Abdrakhmanov et al.,2000) and other chicken tissue (Boardman et al., 2002), partialcDNA sequences of knock-out candidate genes could often beretrieved by BLAST searches using mammalian cDNAs as que-ry sequences. This approach suffered however from the disad-vantage that the available ESTs did not cover the conservedcoding regions of all genes. In the absence of a reliable chickengene catalog, it was also difficult to ascertain that the discov-ered cDNA represented indeed the homolog of the mammaliangene and not a related paralog. The release of the chickengenome sequence (International Chicken Genome SequencingConsortium, 2004) solves most of these problems, since it isnow possible to search for the most closely related gene bygenome BLAST (http://genome.ucsc.edu/cgi-bin/hgBlat). How-ever, one needs to keep in mind that the current genome assem-bly contains gaps which by various estimates encompass about5–10% of all transcripts, so that a homolog missed by genomicBLAST searches might still exist.
The chicken genome can now also be searched for conservednon-coding sequences with roles in gene expression, mRNAprocessing or translation. These sequences might be worthwhiletargets for disruption and substitution analysis in DT40, if theassociated gene is active in DT40 and its altered expression canbe measured in mutant clones. Other intergenic sequences,which are often strongly conserved between the human, murineand chicken genomes, represent more challenging mutation tar-gets, as it is difficult to predict the mutant phenotypes.
Design of targeting constructsThe genome sequence greatly facilitates the design and the
construction of the targeting vectors. Conventional DT40knock-out vectors require genomic fragments upstream anddownstream of the dominant drug resistance marker for align-ment and crossing-over at the target locus (Arakawa et al.,2001). In addition, at least partial knowledge of the exon-intronstructure of the target gene locus is needed to predict the effectof gene targeting. These prerequisites often led to the unattrac-tive task to clone and characterize an unknown chicken locus.One of the possible shortcuts was to amplify genomic DNA bylong-range PCR using primers from the cDNA sequence (Bez-zubova et al., 1997). In most cases a partial exon-intron struc-ture and a crude restriction map of the locus could be deducedfrom the amplified fragments. Suitable parts were then ampli-fied by appropriately modified primers and cloned into the tar-get vector. To the delight of DT40 veterans, this somehowunpredictable procedure is now obsolete, because a BLASTsearch of a cDNA sequence against the genome reveals the pre-cise exon-intron structure and a complete restriction map of thelocus. Since isogenic vector target arms are expected to increasethe targeting efficiency, one would simply amplify suitable frag-ments by PCR from genomic DNA of DT40 after confirmingthat the restriction sites relevant for the cloning do not differbetween the wild-jungle fowl genome sequence and DT40.

468 Cytogenet Genome Res 109:415–479 (2005)
The availability of sequences from entire loci not only easesconventional targeting vector design, but also encourages moreprecise and subtle mutagenesis. Whereas most DT40 knock-outs in the past have combined truncations and deletions ofconserved coding regions, entire gene deletions are now possi-ble, if the target locus is not larger than 10–20 kb. In addition,single amino acid substitutions or added in-frame codingregions can be incorporated into the vector target arms andthen recombined into the locus. As the co-inserted drug resis-tance marker might interfere with gene expression, mutantloxP flanked marker should be used which can be removed bytransient Cre recombinase expression (Arakawa et al., 2001).Such strategies should be considered, if physiological geneexpression control is needed and the complementation of agene knock-out by the expression of the cDNA is challenging.
The function of genes essential for cell survival has been tra-ditionally studied in DT40 by gene disruption under the pro-tection of conditional cDNA expression (Wang et al., 1996).With the precise exon-intron structure of the target genes athand, an alternative approach is the conditional gene inactiva-tion by Cre-mediated deletion of loxP-flanked exons (Kwan,2002). After targeted integration of vectors designed for thispurpose (Fig. 35), transfectants with crossover distal for anintragenic loxP site are identified. In the next step, the loxPresistance marker would be removed by brief Cre recombinaseleaving a single loxP site which can recombine with the distalintragenic loxP site. Vectors are currently developed for use inDT40 with convenient restriction sites to insert genomic frag-ments at the right position with regard to the loxP site and thedrug resistance marker (Arakawa et al., unpublished). Againthis strategy is most advantageous, if physiologic transcriptioncontrol of the knock-out target gene is required.
Gene expression profilingChanges in the transcription of multiple genes accompany
many of the processes studied in DT40, for example, B cell sig-naling or DNA damage responses. In addition, various groupshave started to disrupt transcription factor genes involved in Bcell differentiation and immunoglobulin gene diversification.To the resulting phenotypes, the transcription profiles of wild-type and mutant cells need to be analyzed. Micro-array analysisis able to measure the transcription levels of thousands of genesand first results using filter- or chip-based micro-arrays havebeen reported (Neiman et al., 2001; Koskela et al., 2003). Nev-ertheless, the cDNA inserts used for the micro-arrays were notcompletely sequenced thus complicating the assignment of sig-nals to defined transcripts. Another problem is that the resultsof different laboratories are difficult to compare due to differ-ences in micro-array production and hybridization conditions.Efforts are now underway to use the chicken gene catalog basedon automatic gene predictions and the genomic mapping ofESTs and cDNAs to generate a normalized chicken unigenechip (Affymetrix Inc, Santa Clara, USA, personal communica-tion) which should improve and standardize the analysis oftranscription profiles of DT40 mutants.
Another way to investigate the transcription profile of a giv-en cell sample is Serial Analysis of Gene Expression (SAGE)based on large scale sequencing of short cDNA tags derived
from the bulk mRNA (Velculescu et al., 1995). Whereas tagmapping to cDNA and genome sequences indicates the type ofexpressed genes, the prevalence of individual tags within thelibrary reflects their relative expression levels. SAGE analysis ismost profitable, if a large percentage of tags can be mappedunambiguously to transcripts. This represented a problem forthe first chicken SAGE analysis performed recently on bursalcells and DT40 (Wahl et al., 2004) as only one third of all tagswith matches could be mapped to annotated transcripts. Nev-ertheless, another third of the tags mapped into the neighbor-hood of transcripts and these can now be used to improve thetranscript annotations. Accumulation of additional data willfurther facilitate the interpretation of results and thus establishthe technique as a useful tool for the analysis of DT40mutants.
Full-length cDNA databasesAlthough gene finder programs can define evolutionarily
conserved exons with reasonable accuracy, they often fail tocorrectly predict 5) and 3) transcript boundaries and poorlyconserved exons. This was confirmed when the cDNA se-quences of more than 2,000 new bursal genes were sequencedand compared with the chicken transcript build of the Ensemblteam (Caldwell et al., 2005). If the bursal full-length cDNAs arecombined with previously known chicken transcript sequencesand cDNA recently sequenced from other tissues (Hubbard etal., 2005), this collection will encompass a large fraction of alltranscripts expressed in DT40. The full-length cDNAs not onlyhelp to define the transcript borders, but also facilitate the com-plementation of mutant DT40 phenotypes by genetic comple-mentation. It is a convenience that many of the cDNAs areavailable as fully sequenced plasmid inserts ready to be clonedinto cDNA expression vectors.
Studies of protein interactionsRecent advances in protein tagging and the improved accu-
racy and sensitivity of partial peptide sequencing assist theanalysis of protein complexes. Although some techniques stillneed to be optimized for DT40, there are clear benefits to com-bine the study of protein interactions with gene targeting. Forexample, it is possible to express a tagged protein either as amodified cDNA in a deletion background or by adding the tagto the genomic open reading frame. In addition, all modifiedproteins can be easily checked for their functionality by trans-fecting a disruption mutant and looking for complementation.The assignment of peptide sequences to proteins is helped bythe bursal cDNA collection (http://pheasant.gsf.de/DEPART-MENT/DT40/dt40Transcript.html) and the Ensembl chickengene catalog (International Chicken Genome Sequencing Con-sortium, 2004).
Turning RNAi into an advantageRNAi now allows studying the function of many genes in
mammalian cell culture models by gene knock-down and thushas created alternatives to knock-out experiments in DT40.However, the possibility to easily modify the genome of DT40remains a distinct advantage enabling clean knock-outs ofgenes and regulatory sequences, genetic complementation by

Cytogenet Genome Res 109:415–479 (2005) 469
mutants and multiple gene disruptions. Still, RNAi has thepotential to significantly enhance the DT40 genetic model.Libraries of RNAi vectors corresponding to all genes expressedin DT40 should allow genome-wide screening for recessivemutants similar to what was recently reported for mammaliancell lines (Berns et al., 2004; Paddison et al., 2004). As transfec-tion by electroporation is difficult to scale up and to adapt tomicrotiter plate format, replication-incompetent derivatives ofRCAS vectors (http://home.ncifcrf.gov/hivdrp/RCAS/plasmid.html) appear like a reasonable choice to express the RNAisequences. Any results obtained by RNAi could subsequentlybe confirmed by gene disruption. In addition, by using amutant DT40 clone as a recipient of the RNAi library it may bepossible that suppressor (van Haaften et al., 2004) or syntheticlethal mutants could be identified.
We would like to thank all members of the lab for helpful discussions.
An overview of avian evolution(Prepared by S.B. Hedges)
Present and past diversityThe living birds form a large and diverse group of verte-
brates, with nearly 10,000 species in approximately 2,000 gen-era, 200 families and 29 orders (Sibley and Monroe, 1990;IUCN, 2004). New species are discovered each year, but at a lowrate indicating that our knowledge of avian diversity is quitegood. The major uncertainty in the total number of species con-cerns disagreement over the definition of particular species, suchas the recognition of subspecies as full species, rather than dis-covery of new species. In contrast, other groups of tetrapods(e.g., mammals, lizards, snakes, amphibians) have fewer speciesand a higher rate of species discovery (Uetz, 2004).
The fossil record of birds is relatively poor, probablybecause the avian skeleton is fragile (hollow bones), and mostspecies are small and occur in environments (humid forests)where decomposition is rapid. However, the early history ofbirds has become much better known in the last decade withthe discovery of exceptionally preserved fossils of birds anddinosaurs from the Cretaceous (142–65 million years ago,Mya), especially in China (Chiappe and Dyke, 2002). The ear-liest bird is Archaeopteryx from the late Jurassic (F150 Mya)of Germany, and the consensus view is that birds evolved fromcarnivorous (theropod) dinosaurs called coelurosaurs (e.g., Ty-rannosaurus rex), and specifically from a group of relativelysmall and agile species called dromaeosaurids (e.g., Velocirap-tor). This was suggested in the 19th century when Archaeopteryxwas first classified as a small dinosaur, before the impressionsof feathers were noted, and has since been supported bydetailed comparisons of anatomy and (recently) egg morpholo-gy (Varricchio et al., 1997). To recognize this derivation fromdinosaurs, paleontologists sometimes refer to birds as “livingdinosaurs” and refer to classical dinosaurs (e.g., Stegosaurus) as“non-avian dinosaurs”. The carnivorous (theropod) ancestry ofbirds is also illustrated by the fact that Archaeopteryx and manyof the other Mesozoic (251–65 Mya) species possessed sharpteeth and raptorial claws.
Discoveries of feathered dinosaurs in the last decade havealso bolstered the link between birds and dinosaurs. In the ear-liest-branching species of coelurosaurs, the feathers were fila-mentous and probably functioned more like the down of someliving birds, providing insulation (Chiappe and Dyke, 2002).However, the maniraptoran coelurosaurs (including dromaeo-saurids), which were the closest relatives of birds, possessedvaned feathers that more closely resembled avian flight feath-ers. There is no evidence that these dinosaurs could undergothe sustained flapping flight of modern birds, but extensivedevelopment of feathers and their configuration indicate that atleast some of these dinosaurs were gliders (Xu et al., 2003).These fossils have helped to blur the distinction between dino-saurs and birds. Nonetheless, the full suite of adaptations forsustained, flapping flight, such as asymmetric feathers, alulas(wing structures for improving the airfoil function), and otheraerodynamic structures, are found only in birds. Even Ar-chaeopteryx probably was able to initiate flight directly fromthe ground (Chiappe and Dyke, 2002).
Debate continues as to how the Cretaceous birds are classi-fied. One arrangement divides them into two large groups (Sau-riurae and Ornithurae) whereas another places them in a lad-der-like tree of lineages leading to modern birds (Chiappe andDyke, 2002). In either case, the closest relative of modern birdsis believed to be Ichthyornis, a small, toothed, tern-like marinebird of the late Cretaceous. Some Cretaceous fossils have beenpostulated to be representatives of modern orders such as Galli-formes (e.g., fowl), Anseriformes (e.g., ducks), Psittaciformes(e.g., parrots), Charadriiformes (e.g., plovers), Procellariformes(e.g., petrels, albatrosses), Gaviiformes (e.g., loons), Grui-formes (e.g., cranes), and Pelecaniformes (e.g., pelicans). How-ever, all of these fossils are considered to be problematic insome way (Chiappe and Dyke, 2002). With those aside, the fos-sil record of birds shows a major dichotomy at the Cretaceous-Tertiary boundary (65 Mya), when a large asteroid collidedwith Earth causing the extinction of the dinosaurs and otherlife. Almost no unambiguous fossils of modern (neornithine)birds are known before that event and no fossils of non-neorni-thine birds are known after that event. One important excep-tion is Presbyornis, an aquatic neornithine bird apparentlyrelated to ducks (Anseriformes) which is known from the lateCretaceous and the early Tertiary (Kurochkin et al., 2002). Fos-sils of most orders of modern birds appear in the early part ofthe Cenozoic (65–0 Mya).
Phylogenetic relationshipsIn general, the phylogeny of modern birds is poorly known
despite decades of attention from morphologists and molecularphylogeneticists. Although molecular studies (Sibley and Ahl-quist, 1990) have identified some obvious cases of convergencein previous morphological classifications and have helped tobetter organize the higher-level classification of birds, it isunclear why those studies and the numerous DNA sequencestudies collected in recent years have yet to resolve the aviantree, even at the ordinal level (Cracraft et al., 2004). Probablythe best explanation is that the large number of taxa (e.g., spe-cies, genera, and families) requires even more characters thanhave been applied thus far (i.e., it is data limited). An addition-

470 Cytogenet Genome Res 109:415–479 (2005)
Fig. 36. Relationships and divergence times of birds and other amniote vertebrates (see text). Shaded area in Neoaves repre-sents a time when most ordinal and superordinal lineages diverged based on molecular clocks. The lineages of Mesozoic birds andArchaeopteryx are shown ending arbitrarily at the Cretaceous/Tertiary boundary, although fossil data are sparse and somelineages may have disappeared earlier.
Neoaves (orders)
Galliformes (e.g., fowl)
Anseriformes (e.g., ducks)
Tinamous
Ratites (e.g., emu)
Mesozoic birds
Archaeopteryx (earliest bird)
Coelurosaurs (dinosaurs)
Crocodilians
Turtles
Squamates (lizards, snakes)
Mammals
CretaceousMESOZOIC CENOZOICPALEOZOIC
TertiaryJurassicTriassicPermianCarb.
300 250 200 150 100 50 0
Million years ago
Asteroid impact
al compounding problem is that the tree of avian orders hasunusually short internodes, suggesting that there was a relative-ly rapid radiation which will require even more characters toresolve (Cracraft et al., 2004).
While a detailed tree of birds remains a future task, some ofthe higher level clades are now firmly established (Fig. 36). Forexample, there is wide agreement that modern birds (Neor-nithes) form three major clades: Paleognathae (tinamous andratites), Galloanserae (e.g., ducks, fowl), and Neoaves (all otherbirds). In addition, DNA sequence analyses, primarily of nu-clear genes, indicate that Galloanserae and Neoaves are closestrelatives (Groth and Barrowclough, 1999; van Tuinen et al.,2000). Although earlier DNA hybridization studies had cor-rectly identified the three groups (Sibley and Ahlquist, 1990),those data were ambiguous regarding their relationships.Initially, even data from complete mitochondrial genomes(F16 kb) provided a conflicting signal, indicating that Passeri-
formes was the most basal clade of modern birds and that thepaleognaths and galloanserines were close relatives (Harlid andArnason, 1999; Mindell et al., 1999). Later mitochondrial anal-yses with additional taxa found support for the paleognath-bas-al tree (Paton et al., 2002; Garcia-Moreno et al., 2003).
The living ratites (flightless paleognaths) include the ostrichof Africa, rheas of South America, the emu of Australia, thecassowaries of Australia and New Guinea, and the kiwis ofNew Zealand. Extinct species occurred on Madagascar (ele-phant bird), New Zealand (moas), and elsewhere. The phyloge-ny of these birds has garnered considerable interest, in partbecause of their primarily southern distribution and the expec-tation that the breakup of Gondwana influenced their biogeo-graphic history. Although the moas are now extinct, completemitochondrial genome sequences have been obtained from fos-sil remains, and phylogenetic trees have been constructed withlarge data sets of DNA sequences. Nonetheless, the relation-

Cytogenet Genome Res 109:415–479 (2005) 471
ships have proven to be difficult to resolve. Three of the Aus-tralasian species (kiwi, emu, and cassowary) form a group inmost analyses, but the moa usually branches basally whenpresent in the tree (Lee et al., 1997; van Tuinen et al., 1998;Cooper et al., 2001; Haddrath and Baker, 2001; Paton et al.,2002). In contrast morphological trees place the kiwi as a basallineage, separate from the other Australasian species (Lee et al.,1997). Firm biogeographic conclusions must await additionaldata and analyses.
The Galloanserae includes two orders of primarily robust-bodied birds. The Galliformes consists of mostly non-aquatic,ground-dwelling birds such as game fowl, megapodes, guans,and chachalacas. The chicken (Gallus gallus; common name,Domestic Fowl) belongs to this order. Its wild counterpart (alsoGallus gallus) goes by the common name Red Jungle Fowl andis native to the lowlands (! 2,000 m) of southern Asia and theMalay archipelago (Sibley and Monroe, 1990). It is placed inthe family Phasianidae along with other widely domesticatedspecies such as the common quail (Coturnix coturnix), turkey(Meleagris gallopavo), and pheasant (Phasianus colchicus).Other members of the order Galliformes include the NewWorld quails (Odontophoridae) and guinea fowl (Numididae).The other order within Galloanserae, the Anseriformes (ducks,geese, swans, screamers), is primarily aquatic and comprisesabout 450 species in F125 genera (Sibley and Monroe, 1990).
Neoaves is the third major clade of living birds and accountsfor 95% of the species. Although some of the 20 or so neoavianorders are well defined, others are not (Cracraft et al., 2004).For example, the diving birds, wading birds, and marine birdsare placed by most morphologists into about 8–9 differentorders, including Charadriiformes (e.g., gulls, plovers), Ciconii-formes (e.g., storks), Gaviiformes (loons), Gruiformes (e.g.,cranes), Pelecaniformes (e.g., pelicans, boobies, tropicbirds),Phoenicopteriformes (flamingos), Podicipediformes (e.g.,grebes), Procellariiformes (albatrosses, shearwaters), and Sphe-nisciformes (penguins). Most of these orders are recognizedtoday in avian field guides and other reference sources. How-ever, DNA hybridization data (Sibley and Ahlquist, 1990) andDNA sequences (Hedges and Sibley, 1994; van Tuinen et al.,2001; Cracraft et al., 2004) have revealed relationships thatplace into question the recognition of those orders. For exam-ple, the pelicans are most closely related to the shoebill storkand hammerkop, and not to the boobies or tropicbird, and thegrebes are most closely related to the flamingos, not to the loons(Hedges and Sibley, 1994; van Tuinen et al., 2001; Cracraft etal., 2004). Those surprising findings have been obtained withmultiple genes, in different laboratories, and they have strongstatistical support. Other controversial findings among thewater birds, such as a clustering of New World vultures withstorks (Sibley and Ahlquist, 1990), have not yet been corrobo-rated.
Besides the water birds, progress has been made with DNAsequence analyses in understanding relationships within otherneoavian groups, including the Passeriformes (Johansson et al.,2001, 2002; Barker et al., 2002; Yuri and Mindell, 2002; Cra-craft et al., 2004). One particularly problematic bird has beenthe hoatzin (Opisthocomus hoazin) of South America, some-times placed in its own order (Opisthocomiformes). It is the
only bird that uses microbial foregut fermentation to convertcellulose into simple sugars, as in some mammals (e.g., rumi-nants). It feeds on young leaves and twigs of marsh plants andhas a large muscular crop for fermentation. Most phylogeneticanalyses have placed the hoatzin in the Galloanserae, but DNAhybridization studies and DNA sequence studies have agreedthat it is a neoavian species (Sibley and Ahlquist, 1990; Hedgeset al., 1995; Hughes and Baker, 1999; Sorenson et al., 2003).However, its particular relationship within Neoaves has not yetbeen resolved. In fact, the relationships of nearly all neoavianorders remain essentially unresolved and are best viewed atpresent as a “comb” (Cracraft et al., 2004) (Fig. 36).
Molecular clocks and biogeographyA literal reading of the fossil record of birds is that the mod-
ern orders evolved and radiated in the early Cenozoic, after theCretaceous-Tertiary extinctions (Feduccia, 1995, 2003). Eventhe problematic Cretaceous fossils of Neornithine birds notedabove are mostly from the final stage of the Cretaceous (Maas-trichian; 71–65 Mya). However, molecular clocks have insteadindicated that the orders of modern birds branched relativelydeeply in the Cretaceous (120–75 Mya) (Hedges et al., 1996;Cooper and Penny, 1997; Kumar and Hedges, 1998; Haddrathand Baker, 2001; van Tuinen and Hedges, 2001; Paton et al.,2002). If these molecular clocks are correct, why is there such alarge gap in the avian fossil record? It is possible that some errorin time estimates can be explained by rate variation on lineagesand calibrations made with problematic avian fossils. How-ever, local clock methods (e.g., Bayesian) have been used inaddition to global clocks, and some studies (Hedges et al., 1996;Kumar and Hedges, 1998; van Tuinen and Hedges, 2001) havecalibrated from outside of the avian fossil record to avoidpotential calibration biases. Despite the use of these differentmethods, the resulting time estimates have been fairly consis-tent in supporting relatively deep divergences among modernbirds (Fig. 36).
The divergence of the chicken (Galliformes) and duck (An-seriformes) has proven to be an important anchor point for avi-an molecular clocks. Anseriformes is about the only order ofmodern birds that can be confidently placed in the Cretaceous,with the earliest fossils from the Campanian (84–71 Mya)(Chiappe and Dyke, 2002). Calibrating outside of birds andusing 12 constant-rate nuclear genes, this divergence was esti-mated to be 90 B 7 Mya (van Tuinen and Hedges, 2001). Asimilar date of 85 B 17 Mya was obtained with different data(mitochondrial DNA), calibrations (internal avian calibra-tions), and clock methods (“rate smoothing” local clock) (Had-drath and Baker, 2001). The advantage of establishing ananchor point within birds is to provide a robust calibration forobtaining other time estimates among birds (van Tuinen andHedges, 2004). Using that chicken-duck calibration point, sev-eral data sets were analyzed (mitochondrial DNA, DNA-DNAhybridization, and transferrin immunological data), resultingin the following mean divergence times for major nodes: 119 B5 Mya (paleognath-neognath), 104 B 3 (Galloanserae-Neoaves), and 89 B 9.6 Mya (base of neoavian radiation).Dates among paleognaths ranged from 50 Mya (kiwi-emu) to83 (tinamous-ratites), between orders 76–80 Mya, and within

472 Cytogenet Genome Res 109:415–479 (2005)
orders 39 Mya (chicken-quail) to 80 Mya (kingfisher-hornbill).However, sequence data were limited and most neoavianorders were not represented.
In another study (Paton et al., 2002), divergence time esti-mates were obtained using mitochondrial sequence data, localclock methods, and calibrations of 85 Mya (chicken-duck) and35 Mya (emu-cassowary). The resulting times were similar tothe previous study in finding deep splits (Cretaceous) amongneoavian orders and a deep divergence between paleognathsand neognaths (123 Mya; 156–108 Mya). However, theirdates for divergences among paleognaths were slightly older:105 Mya (tinamous versus ratites), 89 Mya (rhea versus os-trich), and 81 Mya (kiwi versus emu). As more sequences areobtained, especially from nuclear genes, time estimates frommolecular clocks should become more stable until the pointwhere most or all error is from the fossil record and calibrationpoints (Hedges and Kumar, 2003, 2004).
With this current timescale and phylogeny of avian evolu-tion (Fig. 36), and recognizing its limitations, it is possible todraw some general inferences concerning the niche and mor-phology (habitus) of birds during their early history. For exam-ple, the heavy-bodied habitus and primarily ground dwelling,non-marine habits of the Galloanserae and Paleognathae, andtheir dinosaurian ancestors, suggest that these features werecommon among the stem neornithine birds of the Cretaceous(van Tuinen et al., 2000). Also, considering that shallow, mar-ine environments are favorable for fossilization, this (the pre-dominance of non-marine species) may in part explain thesparseness of the early fossil record of modern birds. Nonethe-less, fossils indicate that Cretaceous birds also occupied otherniches (e.g., perching, diving, etc.).
The early (Cretaceous) branching of ordinal lineages ofmodern birds found with molecular clocks “is compatible withthe extensive speciation that occurred within orders followingthe sudden availability of niches in the early Tertiary period”(Hedges et al., 1996). Those niches were vacated by dinosaurs,pterosaurs, and other vertebrate groups that became extinct fol-
lowing the Cretaceous-Tertiary asteroid impact. The near si-multaneous appearance of so many major lineages of neoavianbirds, adapted to different environments, in the early Tertiarysupports the niche-filling hypothesis.
One explanation for the early branching of ordinal andsuperordinal lineages of birds is that they reflect the splitting oflandmasses in the Cretaceous, the Continental Breakup hy-pothesis (Hedges et al., 1996). The same hypothesis was pro-posed for the orders of placental mammals (Hedges et al.,1996), based on molecular clock evidence, and subsequent phy-logenetic analyses have provided support (Springer et al., 1997;Stanhope et al., 1998). In birds, it has proven more difficult toassociate particular orders with geographic regions (e.g., conti-nents) because of their wider distributions and ease of disper-sal. As noted above, ratites have been singled out as having anevolutionary history associated with continental breakup (Cra-craft, 1973, 2001; van Tuinen et al., 1998), but biogeographicdetails will remain sketchy until their relationships are betterresolved. A good case has been made that modern (neornithine)birds in general are Gondwana in origin, based on a review offossils, phylogeny, and molecular divergence times (Cracraft,2001). However, the extent that plate tectonics and the diver-gence of continents have had on avian evolution remains unan-swered.
Completion of the chicken genome will be a major benefitfor evolutionary studies. For example, orthology determina-tion, which is necessary for assembling phylogenetic data sets ofnuclear genes, will be greatly facilitated by having an aviangenome for comparison. At a higher level, genome comparisonswill now be able to include a representative bird (reptile) andtherefore help fill the current genomic gap between mammalsand fishes. Finally, detailed studies within birds, involvingmolecular clocks and phylogenies, will have the benefit of anavian genome for primer design, clock calibration, and bettergenetic comparisons in general.
I thank Jennifer Hines for drawings of animals.
References
Abdelhaleem M, Maltais L, Wain H: The human DDXand DHX gene families of putative RNA helicases.Genomics 81:618–622 (2003).
Abdrakhmanov I, Lodygin D, Geroth P, Arakawa H,Law A, Plachy J, Korn B, Buerstedde JM: A largedatabase of chicken bursal ESTs as a resource forthe analysis of vertebrate gene function. GenomeRes 10:2062–2069 (2000).
Aerts J, Crooijmans RPMA, Cornelissen S, Hemma-tian K, Veenendaal T, Jaadar A, et al: Integrationof chicken genomic resources to enable whole-genome sequencing. Cytogenet Genome Res 102:297–303 (2003).
Agate RJ, Grisham W, Wade J, Mann S, Wingfield J,Schanen C, Palotie A, Arnold AP: Neural, notgonadal, origin of brain sex differences in a gynan-dromorphic finch. Proc Natl Acad Sci USA 100:4873–4878 (2003).
Akey JM, Zhang K, Xiong M, Jin L: The effect of singlenucleotide polymorphism identification strategieson estimates of linkage disequilibrium. Mol BiolEvol 20:232–342 (2003).
Almenar-Queralt A, Lee A, Conley CC, Ribas de Pou-plana Ll, Fowler VM: Identification of a novel tro-pomodulin isoform, Skeletal-tropomodulin, thatcaps actin filament pointed ends in fast skeletalmuscle. J Biol Chem 274:28466–28475 (1999).
Arakawa H, Buerstedde JM: Immunoglobulin geneconversion: insights from bursal B cells and theDT40 cell line. Dev Dyn 229:458–464 (2004).
Arakawa H, Lodygin D, Buerstedde JM: Mutant loxPvectors for selectable marker recycle and condi-tional knock-outs. BMC Biotechnol 1:7 (2001).
Arit D, Bensch S, Hansson B, Hasselquist D, Wester-dahl H: Observation of a ZZW female in a naturalpopulation: implications for avian sex determina-tion. Proc R Soc Lond B Biol Sci 271:S249–251(2004).
Auer H, Mayr B, Lambrou M, Schleger W: An extendedchicken karyotype, including the NOR chromo-some. Cytogenet Cell Genet 45:218–221 (1987).
Avilion AA, Piatyszek MA, Gupta J, Shay JW, Bacchet-ti S, Greider CW: Human telomerase RNA andtelomerase activity in immortal cell lines and tu-mor tissues. Cancer Res 56:645–650 (1996).
Babcock GG, Fowler VM: Isoform specific interactionof tropomodulin with skeletal muscle and erythro-cyte tropomyosins. J Biol Chem 269:27510–27518(1994).
Ban N, Nissen P, Hansen J, Moore P, Steitz T: Thecomplete atomic structure of the large ribosomalsubunit at 2.4 Å resolution. Science 289:905–919(2000).
Barbazuk WB, Korf I, Kadavi C, Heyen J, Tate S, WunE, et al: The syntenic relationship of the zebrafishand human genomes. Genome Res 10:1351–1358(2000).
Barker FK, Barrowclough GF, Groth JG: A phylogenet-ic hypothesis for passerine birds: taxonomic andbiogeographic implications of an analysis of nu-clear DNA sequence data. Proc R Soc Lond B Bio269:295–308 (2002).
Baverstock PR, Adams M, Polkinghorne RW, GelderM: A sex-linked enzyme in birds – Z-chromosomeconservation but no dosage compensation. Nature296:763–766 (1982).

Cytogenet Genome Res 109:415–479 (2005) 473
Beaumont C, Protais J, Pitel F, Leveque G, Malo D,Lantier F, et al: Effect of two candidate genes onthe Salmonella carrier state in fowl. Poult Sci82:721–726 (2003).
Berns K, Hijmans EM, Mullenders J, BrummelkampTR, Velds A, Heimerikx M, et al: A large-scaleRNAi screen in human cells identifies new compo-nents of the p53 pathway. Nature 428:431–437(2004).
Bezzubova O, Silbergleit A, Yamaguchi-Iwai Y, Take-da S, Buerstedde JM: Reduced X-ray resistanceand homologous recombination frequencies in aRAD54 –/– mutant of the chicken DT40 cell line.Cell 89:185–193 (1997).
Bieganowski P, Garrison PN, Hodawadekar SC, FayeG, Barnes LD, Brenner C: Adenosine monophos-phoramidase activity of Hint and Hnt1 supportsfunction of Kin28, Ccl1, and Tfb3. J Biol Chem277:10852–10860 (2002).
Bléoo S, Sun X, Hendzel MJ, Rowe JM, Packer M,Godbout R: Association of human DDX1 with acleavage stimulation factor involved in 3)-end pro-cessing of pre-mRNA. Mol Biol Cell 12:2046–3059(2001).
Bloom SE, Bacon LD: Linkage of the major histocom-patibility (B) complex and the nucleolar organizerin the chicken: assignment to a microchromosome.J Hered 76:146–154 (1985).
Boardman PE, Sanz-Ezquerro J, Overton IM, BurtDW, Bosch E, Fong WT, et al: A comprehensivecollection of chicken cDNAs. Curr Biol 12:1965–1969 (2002).
Boehnke MK, Lange K, Cox DR: Statistical methodsfor multipoint radiation hybrid mapping. Am JHum Genet 49:1174–1188 (1991).
Bonnen PE, Wang PJ, Kimmel M, Chakraborty R, Nel-son DL: Haplotype and linkage disequilibrium ar-chitecture for human cancer-associated genes. Ge-nome Res 12:1846–1853 (2002).
Botstein D, Risch N: Discovering genotypes underlyinghuman phenotypes: past successes for Mendeliandisease, future approaches for complex disease.Nat Genet 33:228–237 (2003).
Boyd Y, Goodchild M, Morroll S, Bumstead N: Map-ping of the chicken and mouse genes for toll-likereceptor 2 (TLR2) to an evolutionarily conservedchromosomal segment. Immunogenetics 52:294–298 (2001).
Brenner C: Hint, Fhit, and GalT: function, structure,evolution, and mechanism of three branches of thehistidine triad superfamily of nucleotide hydro-lases and transferases. Biochemistry 41:9003–9014(2002).
Brenner C, Garrison P, Gilmour J, Peisach D, Ringe D,Petsko GA, Lowenstein JM: Crystal structures ofHINT demonstrate that histidine triad proteins areGalT-related nucleotide-binding proteins. NatStruct Biol 4:231–238 (1997).
Bromberg-White JL, Webb CP, Patacsil VS, MirantiCK, Williams BO, Holmen SL: Delivery of shorthairpin RNA sequences by using a replication-competent avian retroviral vector. J Virol 78:4914–4916 (2004).
Brown DD, Gurdon JB: Absence of ribosomal RNAsynthesis in the anucleolate mutant of Xenopus lae-vis. Proc Natl Acad Sci USA 51:139–146 (1964).
Buerstedde JM, Arakawa H, Watahiki A, Carninci PP,Hayashizaki YY, Korn B, Plachy J: The DT40 website: sampling and connecting the genes of a B cellline. Nucleic Acids Res 30:230–231 (2002).
Buitenhuis AJ, Crooijmans RPMA, Bruijnesteijn vanCoppenraet ES, Veenendaal A, Groenen MAM,van der Poel JJ: Improvement of the comparativemap of chicken chromosome 13. Anim Genet33:249–254 (2002).
Bumstead N, Palyga J: A preliminary linkage mapof the chicken genome. Genomics 13:690–697(1992).
Burt D: Origin and evolution of avian microchromo-somes. Cytogenet Genome Res 96:97–112 (2002).
Burt DW: The chicken genome and the developmentalbiologist. Mech Dev 121:1129–1135 (2004a).
Burt DW: Chicken genomics charts a path to thegenome sequence. Brief Funct Genomic Proteomic3:60–67 (2004b).
Caldwell R, Kierzek A, Arakawa H, Bezzubov Y, ZaimJ, Fiedler P, et al: Full-length cDNAs from chickenbursal lymphocytes to facilitate gene function anal-ysis. Genome Biol 6:R6 (2005).
Callan HG: Lampbrush Chromosomes (Springer-Ver-lag, Berlin 1986).
Cargill M, Altshuler D, Ireland J, Sklar P, Ardlie K,Patil N, et al: Characterization of single-nucleotidepolymorphisms in coding regions of human genes.Nat Genet 22:231–238 (1999).
Carre W, Diot C, Fillon V, Crooijmans RP, LagarrigueS, Morisson M, et al: Development of 112 uniqueexpressed sequence tags from chicken liver usingan arbitrarily primed reverse transcriptase-poly-merase chain reaction and single strand conforma-tion gel purification method. Anim Genet 32:289–297 (2001).
Caruthers JM, McKay DB: Helicase structure andmechanism. Curr Opin Struct Biol 12:123–133(2002).
Chelysheva LA, Solovei IV, Rodionov AV, YakovlevAF, Gaginskaya ER: Lampbrush chromosomes ofthe chicken: the cytological map of the macrobival-ents. Cytology (Russ.) 32:303–316 (1990).
Chen J-L, Blasco MA, Greider CW: Secondary struc-ture of vertebrate telomerase RNA. Cell 100:503–514 (2000).
Chen L, Couchman JR, Smith J, Woods A: Molecularcharacterization of chicken syndecan-2 proteogly-can. Biochem J 366:481–490 (2002).
Chiappe LM, Dyke GJ: The Mesozoic radiation ofbirds. Annu Rev Ecol Syst 33:91–124 (2002).
Chu X, Thompson D, Yee LJ, Sung LA: Genomic orga-nization of mouse and human erythrocyte tropo-modulin genes encoding the pointed end cappingprotein for the actin filaments. Gene 256:271–281(2000).
Chumakov I, Blumenfeld M, Guerassimenko O, Cava-rec L, Palicio M, Abderrahim H, et al: Genetic andphysiological data implicating the new human geneG72 and the gene for D-amino acid oxidase inschizophrenia. Proc Natl Acad Sci USA 99:13675–13680 (2002).
Collignon J, Sockanathan S, Hacker A, Cohen-Tan-noudji M, Norris D, Rastan S, et al: A comparisonof the properties of Sox-3 with Sry and two relatedgenes, Sox-1 and Sox-2. Development 122:509–520 (1996).
Collins FS, Guyer MS, Chakravarti A: Variations on atheme: cataloging human DNA sequence varia-tion. Science 278:1580–1581 (1997).
Colombo P, Yon J, Garson K, Fried M: Conservationof the organization of five tightly clustered genesover 600 million years of divergent evolution. ProcNatl Acad Sci USA 89:6358–6362 (1992).
Conley CA: Leiomodin and tropomodulin in smoothmuscle. Am J Physiol Cell Physiol 280: C1645–C1656 (2001).
Conley CA, Fritz-Six KL, Almenar-Queralt A, FowlerVM: Leiomodins: Larger members of the tropomo-dulin (Tmod) gene family. Genomics 73:127–139(2001).
Constancia M, Pickard B, Kelsey G, Reik W: Imprint-ing mechanisms. Genome Res 8:881–900 (1998).
Cooper A, Penny D: Mass survival of birds across theCretaceous-Tertiary boundary: molecular evi-dence. Science 275:1109–1113 (1997).
Cooper A, Lalueza-Fox C, Anderson S, Rambaut A,Austin J, Ward R: Complete mitochondrial ge-nome sequences of two extinct moas clarify ratiteevolution. Nature 409:704–707 (2001).
Coullin P, Crooijmans RP, Groenen MA, Heilig R,Mollicone R, Oriol R, Candelier JJ: Assignment ofFUT8 to chicken chromosome band 5q1.4 and tohuman chromosome 14q23.2→q24.1 by in situ hy-bridization. Conserved and compared synteny be-tween human and chicken. Cytogenet Genome Res97:234–238 (2002).
Counter CM, Avilion AA, LeFeuvre CE, Stewart NG,Greider CW, Harley CB, Bacchetti S: Telomereshortening associated with chromosome stability isarrested in immortal cells which express telomer-ase activity. EMBO J 11:1921–1929 (1992).
Cox PR, Zoghbi HY: Sequencing, expression analysis,and mapping of three unique human tropomodulingenes and their mouse orthologs. Genomics 63:97–107 (2000).
Cox PR, Siddique T, Zoghbi HY: Genomic organiza-tion of Tropomodulins 1 and 4 and unusual inter-genic and intraexonic splicing of YL-1 and Tropo-modulin 4. BMC Genomics 2:7–16 (2001).
Cox PR, Fowler VM, Xu B, Sweatt JD, Paylor R, Zogh-bi HY: Mice lacking tropomodulin-2 (Tmod2)show enhanced long-term potentiation, hyperac-tivity and deficits in learning and memory. MolCell Neurosci 23:1–12 (2003).
Cracraft J: Continental drift, paleoclimatology, and theevolution and biogeography of birds. J Zool 169:455–545 (1973).
Cracraft J: Avian evolution, Gondwana biogeographyand the Cretaceous-Tertiary mass extinction event.Proc R Soc Lond B Bio 268:459–469 (2001).
Cracraft JC, Barker FK, Braun M, Harshman J, DykeGJ, Feinstein J, et al: Phylogenetic relationshipsamong modern birds (Neornithes), in Cracraft JC,Donoghue MJ (eds): Assembling the Tree of Life(Oxford University Press, Oxford 2004).
Crittenden LB, Provencher L, Santangelo L, Levin I,Abplanalp H, Briles RW, Briles WE, Dodgson JB:Characterisation of a Red Jungle Fowl by WhiteLeghorn backcross reference population for molec-ular mapping of the chicken genome. Poultry Sci72:334–348 (1993).
Crooijmans RPMA, Vrebalov J, Dijkhof RJ, van derPoel JJ, Groenen MA: Two-dimensional screeningof the Wageningen chicken BAC library. MammGenome 11:360–363 (2000).
Crooijmans RPMA, Dijkhof RJ, Veenendaal T, vander Poel JJ, Nicholls RD, Bovenhuis H, GroenenMA: The gene orders on human chromosome 15and chicken chromosome 10 reveal multiple inter-and intrachromosomal rearrangements. Mol BiolEvol 18:2102–2109 (2001).
Daniels LM: Molecular analysis of the 5S rDNA arrayin chicken (Gallus gallus domesticus). M.S. Thesis,University of California, Davis (2001).
Daniels LM, Delany ME: Molecular and cytogeneticorganization of the 5S ribosomal DNA in chicken(Gallus gallus). Chromosome Res 11:305–317(2003).
de Kloet RS, de Kloet SR: Evolution of the spindlingene in birds: independent cessation of the recom-bination of sex chromosomes at the spindlin locusin neognathous birds and tinamous, a palaeogna-thous avian family. Genetica 119:333–342 (2003).
de la Serna I, Cujec T, Shi Y, Tyler B: Non-coordinateregulation of 5S rRNA genes and the gene encodingthe 5S rRNA-binding ribosomal protein homologin Neurospora crassa. Mol Gen Genet 263:987–994 (2000).
Deeb N, Lamont SJ: Use of a novel outbred by inbredF1 cross to detect genetic markers for growth.Anim Genet 34:205–212 (2003).
Delany ME: Patterns of ribosomal gene variation inelite commercial chicken pure line populations.Anim Genet 31:110–116 (2000).

474 Cytogenet Genome Res 109:415–479 (2005)
Delany ME, Daniels LM: The chicken telomerase RNAgene: Conservation of sequence, regulatory ele-ments and synteny among viral, avian and mam-malian genomes. Cytogenet Genome Res 102:309–317 (2003).
Delany ME, Krupkin AB: Molecular characterizationof ribosomal gene variation within and amongNORs segregating in specialized populations ofchicken. Genome 42:60–71 (1999).
Delany ME, Muscarella DE, Bloom SE: Formation ofnucleolar polymorphisms in trisomic chickens andsubsequent microevolution of rRNA gene clustersin diploids. J Hered 82:213–220 (1991).
Delany ME, Emsley A, Smiley M, Putnam JR, BloomSE: Nucleolar size polymorphisms in commerciallayer chickens: determination of incidence, inheri-tance, and nucleolar sizes. Poultry Sci 73:1211–1217 (1994a).
Delany ME, Muscarella DM, Bloom SE: Effects ofrRNA gene copy number and nucleolar variationon early development: inhibition of gastrulation inrDNA-deficient chick embryos. J Hered 85:211–217 (1994b).
Delany ME, Taylor RL Jr, Bloom SE: Teratogenicdevelopment in chicken embryos associated with amajor deletion in the rRNA gene cluster. DevGrowth Differ 37:403–412 (1995).
Delany ME, Gurel V, Taylor RL Jr: Ribosomal DNAgenotypes and nucleolar phenotypes of v-src ini-tiated tumors in 6.B congenic chickens. Poultry Sci77(s1):5 (1998).
Delany ME, Krupkin AB, Miller MM: Organization oftelomere sequences in birds: evidence for arrays ofextreme length and for in vivo shortening. Cyto-genet Cell Genet 90:139–145 (2000).
Delany ME, Daniels LM, Swanberg SE, Taylor HA:Telomeres in the chicken: Chromosome ends andgenome stability. Poultry Sci 82:917–926 (2003).
Denjean B, Ducos A, Darré A, Pinton A, Séguéla A,Berland H, et al: Caryotypes des canards commun(Anas platyrhynchos), Barbarie (Cairina moscha-ta) et de leur hybride. Revue Méd Vét 148:695–704 (1997).
Desjardins P, Morais R: Sequence and gene organiza-tion of the chicken mitochondrial genome. A novelgene order in higher vertebrates. J Mol Biol 212:599–663 (1990).
Dunnington EA, Stallard LC, Hillel J, Siegel PB: Genet-ic diversity among commercial chicken popula-tions estimated from DNA fingerprints. PoultrySci 73:1218–1225 (1994).
Emara MG, Kim H: Genetic markers and their applica-tion in poultry breeding. Poultry Sci 82:952–957(2003).
Etheridge KT, Banik SSR, Ambruster BN, Zhu Y,Terns RM, Terns MP, Counter CM: The nucleolarlocalization domain of the catalytic subunit of hu-man telomerase. J Biol Chem 277:24764–24770(2002).
Ewing B, Green P: Base-calling of automated sequencertraces using phred. II. Error probabilities. GenomeRes 8:186–194 (1998).
Ewing B, Hillier L, Wendl MC, Green P: Base-calling ofautomated sequencer traces using phred. I. Accura-cy assessment. Genome Res 8:175–185 (1998).
Falchetti ML, Falcone G, D’Ambrosio E, Verna R, Ale-ma S, Levi A: Induction of telomerase activity inv-myc-transformed avian cells. Oncogene 18:1515–1519 (1999).
Feder JN, Gnirke A, Thomas W, Tsuchihashi Z, RuddyDA, Basava A: A novel MHC class I-like gene ismutated in patients with hereditary haemochro-matosis. Nat Genet 13:399–408 (1996).
Feduccia A: Explosive evolution in tertiary birds andmammals. Science 267:637–638 (1995).
Feduccia A: “Big bang” for tertiary birds? Trends EcolEvol 18:172–176 (2003).
Fillon V, Morisson M, Zoorob R, Auffray C, DouaireM, Gellin J, Vignal A: Identification of 16 chickenmicrochromosomes by molecular markers usingtwo-colour fluorescence in situ hybridization(FISH). Chromosome Res 6:307–313 (1998).
Fischer RS, Lee A, Fowler VM: Tropomodulin and tro-pomyosin mediate lens cell actin cytoskeleton reor-ganization in vitro. Invest Ophthalmol Vis Sci41:166–174 (2000).
Fischer RS, Fritz-Six KL, Fowler VM: Actin pointedend capping by tropomodulin 3 negatively regu-lates cell motility in endothelial cells. J Cell Biol161:1–12 (2003).
Forsyth NR, Wright WE, Shay JW: Telomerase and dif-ferentiation in multicellular organisms: Turn it off,turn it on, and turn it off again. Differentiation69:188–197 (2002).
Fowler VM: Regulation of actin filament length inerythrocytes and striated muscle. Curr Opin CellBiol 8:86–96 (1996).
Fowler VM: Capping actin filament growth: Tropomo-dulin in muscle and nonmuscle cells, in Cytoskele-tal Regulation of Membrane Function, 50th An-nual Meeting and Symposium of the Society ofGeneral Physiologists, Vol. 52, pp 79–89 (1997).
Fowler VM, Conley CC: Tropomodulin, in Kreis TE,Vale RD (eds): Guidebook to the Cytoskeletal andMotor Proteins, 2nd edition, pp 154–159 (OxfordUniversity Press, Oxford 1999).
Fowler VM, Sussman MA, Miller PG, Flucher BE,Daniels MP: Tropomodulin is associated with thefree (pointed) ends of the thin filaments in rat skel-etal muscle. J Cell Biol 120:411–420 (1993).
Fowler VM, Greenfield NJ, Moyer J: Tropomodulincontains two actin filament pointed end-cappingdomains. J Biol Chem 278:40000–40009 (2003).
Fragnet L, Blasco MA, Klapper W, Rasschaert D: TheRNA subunit of telomerase is encoded by Marek’sDisease Virus. J Virol 77:5985–5996 (2003).
Fridolfsson AK, Cheng H, Copeland NG, Jenkins NA,Liu HC, Raudsepp T, et al: Evolution of the aviansex chromosomes from an ancestral pair of autos-omes. Proc Natl Acad Sci USA 95:8147–8152(1998).
Fritschi S, Stranzinger G: Fluorescent chromosomebanding in inbred chicken: quinacrin bands, se-quential chromomycin and DAPI bands. TheorAppl Genet 71:408–412 (1985).
Fukagawa T, Hayward N, Yang J, Azzalin C, Griffin D,Stewart AF, Brown W: The chicken HPRT gene: acounter selectable marker for the DT40 cell line.Nucleic Acids Res 27:1966–1969 (1999).
Fumihito A, Miyake T, Sumi S, Takada M, Ohno S,Kondo N: One subspecies of the red jungle fowl(Gallus gallus gallus) suffices as the matriarchicancestor of all domestic breeds. Proc Natl Acad SciUSA 91:12505–12509 (1994).
Fumihito A, Miyake T, Takada M, Shingu R, Endo T,Gojobori T, Kondo N, Ohno S: Monophyletic ori-gin and unique dispersal patterns of domesticfowls. Proc Natl Acad Sci USA 93:6792–6795(1996).
Gaginskaya ER, Chin SH: Peculiarities of oogenesis inthe chick II. Follicular period in the developmentof oocytes. Ontogenez (Russ.) 11:213–221 (1980).
Ganesan S, Silver DP, Greenberg RA, Avni D, DrapkinR, Miron A, et al: BRCA1 supports XIST RNAconcentration on the inactive X chromosome. Cell111:393–405 (2002).
Garcia-Moreno J, Sorenson MD, Mindell DP: Con-gruent avian phylogenies inferred from mitochon-drial and nuclear DNA sequences. J Mol Evol57:27–37 (2003).
Godbout R, Packer M, Katyal S, Bléoo S: Cloning andexpression analysis of the chicken DEAD boxgene DDX1. Biochim Biophys Acta 1574:63–71(2002).
Gonzalez IL, Sylvester JE: Complete sequence of the43-kb human ribosomal DNA repeat: Analysisof the intergenic spacer. Genomics 27:320–328(1995).
Goureau A, Garrigues A, Tosser-Klopp G, Lahbib-Mansais Y, Chardon P, Yerle M: Conserved synte-ny and gene order difference between human chro-mosome 12 and pig chromosome 5. Cytogenet CellGenet 94:49–54 (2001).
Graves JAM: The rise and fall of SRY. Trends Genet18:259–264 (2002).
Graves JAM: Sex and death in birds: a model of dosagecompensation that predicts lethality of sex chro-mosome aneuploids. Cytogenet Genome Res 101:278–282 (2003).
Greenfield NJ, Fowler VM: Tropomyosin requires anintact N-terminal coiled-coil to interact with tropo-modulin. Biophys J 82:2580–2591 (2002).
Gregorio CC, Fowler VM: Mechanisms of thin filamentassembly in embryonic chick cardiac myocytes:Tropomodulin requires tropomyosin for assembly.J Cell Biol 129:683–695 (1995).
Gregorio CC, Weber A, Bondad M, Pennise CR, Fowl-er VM: Requirement of pointed end capping bytropomodulin to maintain actin filament length inembryonic chick cardiac myocytes. Nature 377:83–86 (1995).
Greider CW, Blackburn EH: Identification of a specifictelomere terminal transferase activity in Tetrahy-mena cell extracts. Cell 43:405–413 (1985).
Greider CW, Blackburn EH: A telomeric sequence inthe RNA of Tetrahymena telomerase is requiredfor telomere repeat synthesis. Nature 337:331–337(1989).
Griffin DK, Habermann F, O’Brien PCM, Bagga M,Smith J, Burt D, Ferguson-Smith MA: Macro- andmicro-chromosome paints generated by flow cy-tometry and chromosome microdissection: Toolsfor mapping the chicken genome. Cytogenet CellGenet 87:278–281 (1999).
Groenen MAM, Crooijmans RPMA, Veenendaal A,Cheng HH, Siwek M, van der Poel JJ: A compre-hensive microsatellite linkage map of the chickengenome. Genomics 49:265–274 (1998).
Groenen MAM, Cheng HH, Bumstead N, Benkel BF,Briles WE, Burke T, et al: A consensus linkage mapof the chicken genome. Genome Res 10:137–147(2000).
Groth JG, Barrowclough GF: Basal divergences inbirds and the phylogenetic utility of the nuclearRAG-1 gene. Mol Phyl Evol 12:115–123 (1999).
Grützner F, Rens W, Tsend-Ayush E, El-Mogharbel N,O’Brien PC, Jones RC, Ferguson-Smith MA,Graves JAM: In the platypus a meiotic chain of tensex chromosomes shares genes with the bird Z andmammal X chromosomes. Nature 432:913–917(2004).
Guillemot F, Billault A, Pourquie O, Behar G, ChausseAM, Zoorob R, Kreibick GC, Auffray C: A molec-ular map of the chicken major histocompatibilitycomplex: the class II B genes are closely linked tothe class I genes and the nucleolar organizer.EMBO J 7:2775–2785 (1988).
Guioli S, Schmitt K, Critcher R, Bouzyk M, Spurr NK,Ogata T, et al: Molecular analysis of 9p deletionsassociated with XY sex reversal: Refining the local-ization of a sex-determining gene to the tip of thechromosome. Am J Hum Genet 63:905–908(1998).
Gururajan R, Mathews L, Longo FJ, Weeks DL: An3mRNA encodes an RNA helicase that colocalizeswith nucleoli in Xenopus oocytes in a stage-specificmanner. Proc Natl Acad Sci USA 91:2056–2060(1994).
Habermann FA, Cremer M, Walter J, Kreth G, vonHase J, Bauer K, et al: Arrangements of macro- andmicrochromosomes in chicken cells. ChromosomeRes 9:569–584 (2001).

Cytogenet Genome Res 109:415–479 (2005) 475
Hacia JG, Fan JB, Ryder O, Jin L, Edgemon K, Ghan-dour G, et al: Determination of ancestral alleles forhuman SNPs using high-density oligonucleotidearrays. Nat Genet 22:164–167 (1999).
Haddrath O, Baker AJ: Complete mitochondrial DNAgenome sequences of extinct birds: ratite phyloge-netics and the vicariance biogeography hypothesis.Proc R Soc Lond B Biol Sci 268:939–945 (2001).
Hadjiolov AA: The nucleolus and ribosome biogenesis.Cell Biology Monographs, Vol. 12 (Springer-Ver-lag, New York 1985).
Handley LJ, Ceplitis H, Ellegren H: Evolutionary strataon the chicken Z chromosome: implications for sexchromosome evolution. Genetics 167:367–376(2004).
Harlid A, Arnason U: Analyses of mitochondrial DNAnest ratite birds within the Neognathae: supportinga neotenous origin of ratite morphological charac-ters. Proc R Soc Lond B Biol 266:305–309 (1999).
Hay B, Jan LY, Jan YN: A protein component of Dro-sophila polar granules is encoded by vasa and hasextensive sequence similarity to ATP-dependenthelicases. Cell 55:577–587 (1988).
Heard E, Rougeulle C, Arnaud D, Avner P, Allis CD,Spector DL: Methylation of histone H3 at Lys-9 isan early mark on the X chromosome during Xinactivation. Cell 107:727–738 (2001).
Hedges SB, Kumar S: Genomic clocks and evolutiona-ry timescales. Trends Genet 19:200–206 (2003).
Hedges SB, Kumar S: Precision of molecular time esti-mates. Trends Genet 20:242–247 (2004).
Hedges SB, Sibley CG: Molecules vs. morphology inavian evolution: the case of the “pelecaniform”birds. Proc Natl Acad Sci USA 91:9861–9865(1994).
Hedges SB, Simmons MD, VanDikj MA, Caspers G,DeJong WW, Sibley CG: Phylogenetic relation-ships of the Hoatzin, an enigmatic South Americanbird. Proc Natl Acad Sci USA 92:11662–11665(1995).
Hedges SB, Parker PH, Sibley CG, Kumar S: Continen-tal breakup and the ordinal diversification of birdsand mammals. Nature 381:226–229 (1996).
Hillel J, Groenen MAM, Tixier-Boichard M, Korol A,David L, Ben-Ari G, et al: Genetic diversity ofchickens, in 11th European Poultry Conference,August 6–10, Bremen, Germany (2002).
Hillel J, Groenen MAM, Tixier-Boichard M, Korol AB,David L, Kirzhner VM, et al: Biodiversity of 52chicken populations assessed by microsatellite typ-ing of DNA pools. Genet Sel Evol 35:533–557(2003).
Hirling H, Scheffner M, Restle T, Stahl H: RNA heli-case activity associated with the human p68 pro-tein. Nature 339:562–564 (1989).
Hochegger H, Sonoda E, Takeda S: Post-replicationrepair in DT40 cells: translesion polymerases ver-sus recombinases. Bioessays 26:151–158 (2004).
Holl M: Über die Reifung der Eizelle des Huhnes. Sit-zungsber Akad Wiss Wien 99:311–370 (1890).
Hori T, Asakawa S, Itoh Y, Shimizu N, Mizuno S:Wpkci, encoding an altered from of PKCI, is con-served widely on the avian W chromosome andexpressed in early female embryos: Implication ofits role in female sex determination. Mol Biol Cell11:3645–3660 (2000).
Hubbard SJ, Grafham DV, Beattie KJ, Overton IM,McLaren SR, Croning MDR, et al: Transcriptomeanalysis for the chicken based on 19,626 finishedcDNA sequences and 485,337 expressed sequencetags. Genome Res 15:174–183 (2005).
Hughes JM, Baker AJ: Phylogenetic relationships of theenigmatic hoatzin (Opisthocomus hoazin) resolvedusing mitochondrial and nuclear gene sequences.Mol Biol Evol 16:1300–1307 (1999).
Hutchison N: Lampbrush chromosomes of the chicken,Gallus domesticus. J Cell Biol 105:1493–1500(1987).
International Chicken Genome Sequencing Consor-tium: Sequence and comparative analysis of thechicken genome provide unique perspectives onvertebrate evolution. Nature 432:695–716 (2004).
International Chicken Polymorphism Map Consor-tium: A genetic variation map for chicken with 2.8million single-nucleotide polymorphisms. Nature432:717–722 (2004).
Ip FCF, Chung SSK, Fu W-Y, Ip NY: Developmentaland tissue-specific expression of the DEAD boxprotein p72. Mol Neurosci 11:457–462 (2000).
Ishii Y, Reece D, Mikawa T: Somatic transgenesisusing retroviral vectors in the chicken embryo. DevDyn 229:630–642 (2004).
Itoh Y, Mizuno S: Molecular and cytological character-ization of SspI-family repetitive sequence on thechicken W chromosome. Chromosome Res 10:499–511 (2002).
Itoh Y, Hori T, Saitoh H, Mizuno S: Chicken spindlingenes on W and Z chromosomes: transcriptionalexpression of both genes and dynamic behavior ofspindlin in interphase and mitotic cells. Chromo-some Res 9:283–299 (2001).
IUCN: IUCN Redlist of Threatened Species. Interna-tional Union for the Conservation of Nature, Cam-bridge, UK (2004).
Jacobsson L, Park H-B, Wahlberg P, Jiang S, Siegel PB,Andersson L: Assignment of fourteen microsatel-lite markers to the chicken linkage map. PoultrySci 83:1825–1831 (2004).
Jennen DG, Crooijmans RP, Kamps B, Acar R, Veen-endaal A, van der Poel JJ, Groenen MA: A compar-ative map of chicken chromosome 24 and humanchromosome 11. Anim Genet 33:205–210 (2002).
Jennen DG, Crooijmans RP, Kamps B, Acar R, Veen-endaal A, van der Poel JJ, Groenen MA: Compara-tive map between chicken chromosome 15 andhuman chromosomal region 12q24 and 22q11→q12. Mamm Genome 14:629–639 (2003).
Jennen DG, Crooijmans RP, Morisson M, GrootemaatAE, van der Poel JJ, Vignal A, Groenen MA: Aradiation hybrid map of chicken chromosome 15.Anim Genet 35:63–65 (2004).
Jin L, Underhill PA, Oefner PJ, Cavalli-Sforza LL: Sys-tematic search for polymorphisms in the humangenome using denaturing high-performance liquidchromatography (DHPLC). Am J Hum Genet 57,Suppl:26 (1995).
Johansson US, Parsons TJ, Irestedt M, Ericson PGP:Clades within the “higher land birds”, evaluated bynuclear DNA sequences. J Zool Syst Evol Res39:37–51 (2001).
Johansson US, Irestedt M, Parsons TJ, Ericson PGP:Basal phylogeny of the tyrannoidea based on com-parisons of cytochrome b and exons of nuclear c-myc and RAG-1 genes. Auk 119:984–995 (2002).
Jost J-P, Schwarz S, Hess D, Angliker H, Fuller-PaceFV, Stahl H, Thiry S, Siegmann M: A chickenembryo protein related to the mammalian DEADbox protein p68 is tightly associated with the highlypurified protein-RNA complex of 5-MeC-DNAglycosylase. Nucleic Acids Res 27:3245–3252(1999).
Judson R, Stephens JC: Notes from the SNP vs. haplo-type front. Pharmacogenomics 2:7–10 (2001).
Kaelbling M, Fechheimer NS: Synaptonemal com-plexes and the chromosomes of the domestic fowl,Gallus domesticus. Cytogenet Cell Genet 35:87–92(1983).
Karlseder JD, Broccoli Y, Dai Hardy S, de Lange T:p53 and ATM-dependent apoptosis induced bytelomeres lacking TRF2. Science 283:1321–1325(1999).
Katoh K, Miyata T: A heuristic approach of maximumlikelihood method for inferring phylogenetic treeand an application to the mammalian SOX-3 ori-gin of the testis-determining gene SRY. FEBS Lett463:129–132 (1999).
Kent J, Wheatley SC, Andrews JE, Sinclair AH, Koop-man P: A male-specific role for SOX9 in vertebratesex determination. Development 122:2813–2822(1996).
Ko JH, Jin HK, Asano A, Takada A, Ninomiya A, KidaH, et al: Polymorphisms and the differential antivi-ral activity of the chicken Mx gene. Genome Res12:595–601 (2002).
Koltzoff NK: The structure of the chromosomes andtheir participation in cell-metabolism. Biol Zh(Russ.) 7:44–46 (1938).
Koopman P, Gubbay J, Vivian N, Goodfellow P, Lov-ell-Badge R: Male development of chromosomallyfemale mice transgenic for Sry. Nature 351:117–121 (1991).
Korsisaari N, Mäkelä TP: Interactions of Cdk7 andKin28 with Hint/PKCI-1 and Hnt1 histidine triadproteins. J Biol Chem 275:34837–34840 (2000).
Kos R, Tucker RP, Hall R, Duong TD, Erickson CA:Methods for introducing morpholinos into thechicken embryo. Dev Dyn 226:470–477 (2003).
Koskela K, Kohonen P, Nieminen P, Buerstedde JM,Lassila O: Insight into lymphoid development bygene expression profiling of avian B cells. Immuno-genetics 55:412–422 (2003).
Koskinen R, Salomonsen J, Goodchild M, BumsteadN, Boyd Y, Vainio O: Structure and chromosomallocalization of chicken CD5. Scand J Immunol54:141–145 (2001).
Kost M, Alimov A, Sarafanov A, Tikchomirova T,Bumeniuk R, Timofeeva M, Zelenin A: 5S rRNAgene hybridizes to human chromosome 1 at twosites (1q42.11→q42.13 and 1q43). Cytogenet CellGenet 68:82–83 (1995).
Kostyukova A, Maeda K, Yamauchi E, Krieger I, Mae-da Y: Domain structure of tropomodulin. Distinctproperties of the N-terminal and C-terminalhalves. Eur J Biochem 267:6470–6475 (2000).
Krajinovic M, Pinamonti B, Sinagra G, Vatta M, Sev-erini GM, Milasin J, et al: Linkage of familialdilated cardiomyopathy to chromosome 9. Am JHum Genet 57:846–852 (1995).
Krieger I, Kostyukova A, Yamashita A, Nitanai Y,Maeda Y: Crystal structure of the C-terminal halfof tropomodulin and structural basis of actin fila-ment pointed-end capping. Biophys J 83:2716–2725 (2002).
Kriglysh L, Nikerse DA: Variation is the spice of life.Nat Genet 27:234–236 (2001).
Kropotova EV, Gaginskaya ER: Lampbrush chromo-somes from Japanese quail oocytes. Tsitologia26:1008–1014 (1984).
Krull CE: A primer on using in ovo electroporation toanalyse gene function. Dev Dyn 229:433–439(2004).
Kumar S, Hedges SB: A molecular timescale for verte-brate evolution. Nature 392:917–920 (1998).
Kurochkin EN, Dyke GJ, Karhu AA: A new presbyor-nithid bird (Aves, Anseriformes) from the late cre-taceous of Southern Mongolia. Am Museum Novi-tates 1–11 (2002).
Kuroda Y, Arai N, Arita M, Teranishi M, Hori T,Harata M, Mizuno S: Absence of Z-chromosomeinactivation for five genes in male chickens. Chro-mosome Res 9:457–468 (2001).
Kuroiwa A, Yokomine T, Sasaki H, Tsudzuki M, Tana-ka K, Namikawa T, Matsuda Y: Biallelic expres-sion of Z-linked genes in male chickens. CytogenetGenome Res 99:310–314 (2002).
Kurosaki T: Regulation of B-cell signal transduction byadaptor proteins. Nat Rev Immunol 2:354–363(2002).
Kwan KM: Conditional alleles in mice: practical con-siderations for tissue-specific knockouts. Genesis32:49–62 (2002).

476 Cytogenet Genome Res 109:415–479 (2005)
Ladjali-Mohammedi K, Bitgood JJ, Tixier-BoichardM, Ponce de Leon FA: International system forstandardized avian karyotypes (ISSAK): standard-ized banded karyotypes of the domestic fowl (Gal-lus domesticus). Cytogenet Cell Genet 86:271–276(1999).
Ladjali-Mohammedi K, Grapin-Botton A, Bonnin MA,Le Douarin NM: Distribution of HOX genes in thechicken genome reveals a new segment of conser-vation between human and chicken. CytogenetCell Genet 92:157–161 (2001).
Lahbib-Mansais Y, Tosser-Klopp G, Leroux S, CabauC, Karsenty E, Milan D, et al: Contribution tohigh-resolution mapping in pigs with 101 type Imarkers and progress in comparative map betweenhumans and pigs. Mamm Genome 14:275–288(2003).
Lasko PF, Ashburner M: Posterior localization of vasaprotein correlates with, but is not sufficient for,pole cell development. Genes Dev 4:905–921(1990).
Lee K, Feinstein J, Cracraft JC: The phylogeny of ratitebirds: resolving conflicts between molecular andmorphological data sets, in Mindell DP (ed): AvianMolecular Evolution and Systematics, pp 173–211(Academic Press, San Diego 1997).
Lee MK, Ren C, Ling P, Cox B, Dodgson JB, ZhangHB: Development of a BAC-based physical map ofchicken genome for high-throughput gene mappingand cloning. Plant & Animal Genome IX Confer-ence, January 13–17, Town & Country Hotel, SanDiego, CA (2001).
Lima CD, Klein MG, Weinstein IB, Hendrickson WA:Three-dimensional structure of human protein ki-nase C interacting protein I, a member of the HITfamily of proteins. Proc Natl Acad Sci USA 93:5357–5362 (1996).
Lindblad-Toh K, Winchester E, Daly MJ, Wang DG,Hirschhorn JN, Laviolette JP, et al: Large scale dis-covery and genotyping of single nucleotide poly-morphisms in the mouse. Nat Genet 24:381–386(2000).
Linder P, Lasko PF, Ashburner M, Leroy P, Nielsen PJ,Nishi K, Schnier J, Slonimski PP: Birth of the D-E-A-D box. Nature 337:121–122 (1989).
Little R, Braaten D: Genomic organization of human5S rDNA and sequence of one tandem repeat.Genomics 4:376–383 (1989).
Liu W, Miller MM, Lamont SJ: Association of MHCclass I and class II gene polymorphisms with vac-cine or challenge response to Salmonella enteritidisin young chicks. Immunogenetics 54:582–590(2002).
Liu W, Kaiser MG, Lamont SJ: Natural resistance-associated macrophage protein 1 gene polymor-phisms and response to vaccine against or chal-lenge with Salmonella enteritidis in young chicks.Poultry Sci 82:259–266 (2003).
Loyez M: Recherches sur le developpement ovarien desoeufs meroblastiques à vitellus nutritif abondant.Arch Anat Microsc Morphol Exp 8:69–397(1906).
Lunetta KL, Boehnke M: Multipoint radiation hybridmapping: comparison of methods, sample size re-quirements, and optimal study characteristics. Ge-nomics 21:92–103 (1994).
Marth GT, Korf I, Yandell MD, Yeh RT, Gu Z, ZakeriH, et al: A general approach to single-nucleotidepolymorphism discovery. Nat Genet 23:452–456(1999).
Marth GT, Yeh RT, Minton M, Donaldson R, Li Q,Duan S, et al: Single-nucleotide polymorphisms inthe public domain: how useful are they? Nat Genet27:371–372 (2001).
Martins-Wess F, Milan D, Drögemüller C, Vobeta-Nemitz R, Brenig B, Robic A, Yerle M, Leeb T: Ahigh resolution physical and RH map of pig chro-mosome 6q1.2 and comparative analysis with hu-man chromosome 19q13.1. BMC Genomics 4:20(2003).
Masabanda JS, Burt DW, O’Brien PC, Vignal A, FillonV, Walsh PS, et al: Molecular cytogenetic defini-tion of the chicken genome: the first complete avi-an karyotype. Genetics 166:1367–1373 (2004).
McClintock B: The relation of a particular chromosom-al element to the development of the nucleoli inZea mays. Z Zellforsch Mikr Anat 21:294–328(1934).
McKenzie SE, Mansfield E, Rappaport E, Surrey S,Fortina P: Parallel molecular genetic analysis. EurJ Hum Genet 6:417–429 (1998).
McQueen HA, McBride D, Miele G, Bird AP, ClintonM: Dosage compensation in birds. Curr Biol 11:253–257 (2001).
Mergny JL, Riou JF, Mailliet P, Teulade-Fichous MP,Gilson E: Natural and pharmacological regulationof telomerase. Nucleic Acids Res 30:839–865(2002).
Merriwether DA, Clark AG, Ballinger SW, Schurr TG,Soodyall H, Jenkins T, Sherry ST, Wallace DC:The structure of human mitochondrial DNA varia-tion. J Mol Evol 33:543–555 (1991).
Miller MM, Goto RM, Taylor RL Jr., Zoorob R, Auf-fray C, Briles RW, Briles WE, Bloom SE: Assign-ment of Rfp-Y to the chicken major histocompati-bility complex/NOR microchromosome and evi-dence for high-frequency recombination associatedwith the nucleolar organizer region. Proc NatlAcad Sci USA 93:3958–3962 (1996).
Mindell DP, Sorenson MD, Dimcheff DE, HasegawaM, Ast JC, Yuri T: Interordinal relationships ofbirds and other reptiles based on whole mitochon-drial genomes. Syst Biol 48:138–152 (1999).
Mizuno S, Macgregor H: The ZW lampbrush chromo-somes of birds: a unique opportunity to look at themolecular cytogenetics of sex chromosomes. Cyto-genet Cell Genet 80:149–157 (1998).
Mizuno S, Kunita R, Nakabayashi O, Kuroda Y, AraiN, Harata M, et al: Z and W chromosomes ofchickens: studies on their gene functions in sexdetermination and sex differentiation. CytogenetGenome Res 99:236–244 (2002).
Morisson M, Pitel F, Fillon V, Pouzadoux A, Berge R,Vit JP, et al: Integration of chicken cytogenetic andgenetic maps: 18 new polymorphic markers iso-lated from BAC and PAC clones. Anim Genet 29:348–355 (1998).
Morisson M, Lemiere A, Bosc S, Galan M, Plisson-Petit F, Pinton P, et al: ChickRH6: a chickenwhole-genome radiation hybrid panel. Genet SelEvol 34:521–533 (2002).
Morroll S, Goodchild M, Salmon N, Copeland NG,Gilbert DJ, Jenkins NA, Bumstead N, Boyd Y: Thegenes encoding E-selectin (SELE) and lymphotac-tin (SCYC1) lie on separate chicken chromosomesalthough they are closely linked in human andmouse. Immunogenetics 53:477–482 (2001).
Mozdziak PE, McFarland DC, Schultz E: Telomericprofiles and telomerase activity in turkey satellitecell clones with different in vitro growth character-istics. Biochim Biophys Acta 1492:362–368(2000).
Mozdziak PE, Borwornpinyo S, McCoy DW, PetitteJN: Development of transgenic chickens express-ing bacterial ß-galactosidase. Dev Dyn 226:439–445 (2003).
Mullikin JC, Hunt SE, Cole CG, Mortimore BJ, RiceCM, Burton J, et al: An SNP map of human chro-mosome 22. Nature 407:516–520 (2000).
Muscarella DE, Vogt VM, Bloom SE: The ribosomalRNA gene cluster in aneuploid chickens: evidencefor increased gene dosage and regulation of geneexpression. J Cell Biol 101:749–756 (1985).
Muscarella DE, Vogt VM, Bloom SE: Characterizationof ribosomal RNA synthesis in a gene dosage mu-tant: the relationship of topoisomerase I and chro-matin structure to transcriptional activity. J CellBiol 105:1501–1513 (1987).
Myakoshina YA, Rodionov AV: Meiotic lampbrushchromosomes in turkey, Meleagris gallopavo (Gal-liformes: Meleagrididae). Genetika (Russ.) 30:577–583 (1994).
Nakamura H, Katahira T, Sato T, Watanabe Y, Funa-hashi J: Gain- and loss-of-function in chick em-bryos by electroporation. Mech Dev 121:1137–1143 (2004).
Nanda I, Shan Z, Schartl M, Burt DW, Koehler M,Nothwang H, et al: 300 million years of conservedsynteny between chicken Z and human chromo-some 9. Nat Genet 21:258–259 (1999).
Nanda I, Zend-Ajusch E, Shan Z, Grutzner F, SchartlM, Burt DW, et al: Conserved synteny between thechicken Z sex chromosome and human chromo-some 9 includes the male regulatory gene DMRT1:a comparative (re)view on avian sex determina-tion. Cytogenet Cell Genet 89:67–78 (2000).
Nanda I, Haaf T, Schartl M, Schmid M, Burt DW:Comparative mapping of Z-orthologous genes invertebrates: implications for the evolution of aviansex chromosomes. Cytogenet Genome Res 99:178–184 (2002a).
Nanda I, Schrama D, Feichtinger W, Haaf T, SchartlM, Schmid M: Distribution of telomeric(TTAGGG)n sequences in avian chromosomes.Chromosoma 111:215–227 (2002b).
Nei M: Molecular Evolutionary Genetics (ColumbiaUniversity Press, New York 1987).
Neiman PE, Ruddell A, Jasoni C, Loring G, ThomasSJ, Brandvold KA, et al: Analysis of gene expres-sion during myc oncogene-induced lymphomagen-esis in the bursa of Fabricius. Proc Natl Acad SciUSA 98:6378–6383 (2001).
Nickerson DA, Tobe VO, Taylor SL: PolyPhred: auto-mating the detection and genotyping of single nu-cleotide substitutions using fluorescence-based re-sequencing. Nucleic Acids Res 25:2745–2751(1997).
Nielsen PJ, Trachsel H: The mouse protein synthesisinitiation factor 4A gene family includes two relat-ed functional genes which are differentially ex-pressed. EMBO J 7:2097–2105 (1988).
Nishida-Umehara C, Fujiwara A, Ogawa A, Mizuno S,Abe S, Yoshida MC: Differentiation of Z and Wchromosomes revealed by replication banding andFISH mapping of sex-chromosome-linked DNAmarkers in the cassowary (Aves, Ratitae). Chromo-some Res 7:635–640 (1999).
Niu D, Fu Y, Luo J, Ruan H, Yu XP, Chen G, ZhangYP: The origin and genetic diversity of Chinesenative chicken breeds. Biochem Genet 40:163–174(2002).
Noakes MA, Campbell MT, Van Hest BJ: The chickenCLOCK gene maps to chromosome 4. Anim Genet31:333–334 (2000).
Noce T, Okamoto-Ito S, Tsunekawa N: Vasa homologgenes in mammalian germ cell development. CellStruct Funct 26:131–136 (2001).
O’Brien SJ, Wienberg J, Lyons LA: Comparative ge-nomics: lessons from cats. Trends Genet 13:393–399 (1997).
O’Donnell MJ, Little DP, Braun A: MassArray as anenabling technology for the industrial scale analysisof DNA. Genet Eng News 21:1–3 (1997).
Ogawa A, Murata K, Mizuno S: The location of Z- andW-linked marker genes and sequence on the homo-morphic sex chromosomes of the ostrich and theemu. Proc Natl Acad Sci USA 95:4415–4418(1998).

Cytogenet Genome Res 109:415–479 (2005) 477
Ohno M, Fukagawa T, Lee JS, Ikemura T: Triplex-forming DNAs in the human interphase nucleusvisualized in situ by polypurine/polypyrimidineDNA probes and antitriplex antibodies. Chromo-soma 111:201–213 (2002).
Ohno S: Sex Chromosomes and Sex Linked Genes(Springer Verlag, Berlin 1967).
Olovnikov A: A theory of marginotomy: the incompletecopying of template margin in enzymatic synthesisof polynucleotides and biological significance ofthe phenomenon. J Theor Biol 41:181–190(1973).
O’Neill M, Binder M, Smith C, Andrews J, Reed K,Smith M, et al: ASW: a gene with conserved avianW-linkage and female specific expression in chickembryonic gonad. Dev Genes Evol 210:243–249(2000).
Ottolenghi C, Veitia R, Quintana-Murci L, TorchardD, Scapoli L, Souleyreau-Therville N, et al: Theregion on 9p associated with 46,XY sex reversalcontains several transcripts expressed in the uroge-nital system and a novel doublesex-related domain.Genomics 64:170–178 (2000).
Ottolenghi C, Fellous M, Barbieri M, McElreavey K:Novel paralogy relations among human chromo-somes support a link between the phylogeny ofdoublesex-related genes and the evolution of sexdetermination. Genomics 79:333–343 (2002).
Paddison PJ, Silva JM, Conklin DS, Schlabach M, LiM, Aruleba S, et al: A resource for large-scale RNA-interference-based screens in mammals. Nature428:427–431 (2004).
Pardue M, Brown D, Birnstiel M: Location of the genesfor 5S ribosomal RNA in Xenopus laevis. Chro-mosoma 42:191–203 (1973).
Paris Conference: Standardization in Human Cytogen-etics: Birth Defects. Original Article Series 8:1–46(1971).
Paton T, Haddrath O, Baker AJ: Complete mitochon-drial DNA genome sequences show that modernbirds are not descended from transitional shore-birds. Proc Roy Soc Lond B Bio 269:839–846(2002).
Pause A, Sonenberg N: Mutational analysis of a DEADbox RNA helicase: the mammalian translation ini-tiation factor eIF-4A. EMBO J 11:2643–2654(1992).
Pause A, Méthot N, Sonenberg N: The HRIGRXXRregion of the DEAD box RNA helicase eukaryotictranslation initiation factor 4A is required for RNAbinding and ATP hydrolysis. Mol Cell Biol 13:6789–6798 (1993).
Pekarik V, Bourikas D, Miglino N, Joset P, PreiswerkS, Stoeckli ET: Screening for gene function inchicken embryo using RNAi and electroporation.Nat Biotech 21:93–96 (2003).
Pitel F, Abasht B, Morisson M, Crooijmans RP, Vig-noles F, Leroux S, et al: A high-resolution radiationhybrid map of chicken chromosome 5 and compar-ison with human chromosomes. BMC Genomics5:66 (2004).
Ponce de Leon FA, Li Y, Weng Z: Early and late repli-cative chromosomal banding patterns of Gallusdomesticus. J Hered 83:36–42 (1992).
Pukkila PJ: Identification of lampbrush chromosomeloops which transcribe 5S ribosomal RNA bymolecular hybridization. Dev Biol 63:197–212(1975).
Rabie TKSM: Pulmonary hypertension syndrome inchicken: Peeking under QTL peaks. Chapter 4,Validation and fine-scale mapping of quantitativetrait loci affecting pulmonary hypertension syn-drome (PHS) in broilers using advanced intercrossline. Thesis, pp 65–83 (ISBN: 90-8504-132-5)(2004).
Rafti F, Scarvelis D, Lasko PF: A Drosophila melano-gaster homologue of the human DEAD-box geneDDX1. Gene 171:225–229 (1996).
Raudsepp T, Houck ML, O’Brien PC, Ferguson-SmithMA, Ryder OA, Chowdhary BP: Cytogenetic anal-ysis of California condor (Gymnogyps californian-us) chromosomes: comparison with chicken (Gal-lus gallus) macrochromosomes. Cytogenet Ge-nome Res 98:54–60 (2002).
Raymond CS, Shamu CE, Shen MM, Seifert KJ, HirschB, Hodgkin J, Zarkower D: Evidence for evolution-ary conservation of sex-determining genes. Nature391:691–695 (1998).
Raymond CS, Kettlewell JR, Hirsch B, Bardwell VJ,Zarkower D: Expression of Dmrt1 in the genitalridge of mouse and chicken embryos suggests a rolein vertebrate sexual development. Dev Biol 215:208–220 (1999).
Razin E, Zhang ZC, Nechushtan H, Frenkel S, Lee Y-N, Arudchandran R, Rivera J: Suppression of mi-crophthalmia transcriptional activity by its asso-ciation with protein kinase C-interacting protein 1in mast cells. J Biol Chem 274:34272–34276(1999).
Reed KJ, Sinclair AH: FET-1: a novel W-linked, femalespecific gene up-regulated in the embryonic chick-en ovary. Mech Dev 119, Suppl 1:S87–90 (2002).
Ren C, Lee MK, Yan B, Ding K, Cox B, Romanov MN,et al: A BAC-based physical map of the chickengenome. Genome Res 3:2754–2758 (2003).
Reumers J, Schymkowitz J, Ferkinghoff-Borg J, Strich-er F, Serrano L, Rousseau F: SNPeffect: a databasemapping molecular phenotypic effects of humannon-synonymous coding SNPs. Nucleic Acids Res33 (Database Issue):D527–D532 (2005).
Ritossa F, Spiegelman S: Localization of DNA comple-mentary to rRNA in the nucleolus organizer regionof Drosophila melanogaster. Proc Natl Acad SciUSA 53:737–745 (1965).
Roberts L: Human genome research. SNP mappersconfront reality and find it daunting. Science287:1898–1899 (2000).
Rodionov AV, Chechik MS: Cytogenetic map of theJapanese quail lampbrush chromosomes. Genetika(Russ.) 38:1246–1251 (2002).
Rodionov AV, Myakoshina YA, Chelysheva LA, Solo-vei IV, Gaginskaya ER: Chiasmata in the lamp-brush chromosomes of Gallus gallus domesticus:The cytogenetic study of recombination frequencyand linkage map lengths. Genetika (Russ.) 28:53–63 (1992).
Rodionov AV, Galkina SA, Lukina NA, Solovei I, Sac-cone S: Crossing over in chicken oogenesis: cyto-logical and chiasma-based genetic maps of thechicken lampbrush chromosome 1. J Hered 93:125–129 (2002).
Romanov MN, Weigend S: Using RAPD markers forassessment of genetic diversity in chickens. ArchGeflügelk 65:1–4 (2001).
Ronaghi M, Uhlen M, Nyren P: A sequencing methodbased on real-time pyrophosphate. Science 281:363–365 (1998).
Rosenberg NA, Burke T, Elo K, Feldman MW, FreidlinPJ, Groenen MA, et al: Empirical evaluation ofgenetic clustering methods using multilocus geno-types from 20 chicken breeds. Genetics 159:699–713 (2001).
Rozen F, Edery I, Meerovitch K, Dever TE, MerrickWC, Sonenberg N: Bidirectional RNA helicase ac-tivity of eucaryotic translation initiation factors 4Aand 4F. Mol Cell Biol 10:1134–1144 (1990).
Sachidanandam R, Weissman D, Schmidt SC, KakolJM, Stein LD, Marth G, et al.: A map of humangenome sequence variation containing 1.42 millionsingle nucleotide polymorphisms. Nature 409:928–933 (2001).
Saetre GP, Borge T, Lindroos K, Haavie J, Sheldon BC,Primmer C, Syvanen AC: Sex chromosome evolu-tion and speciation in Ficedula flycatchers. Proc RSoc Lond B Biol Sci 270:53–59 (2003).
Saifi GM, Chandra HS: An apparent excess of sex- andreproduction-related genes on the human X chro-mosome. Proc R Soc Lond B Biol Sci 266:203–209(1999).
Sang H: Prospects for transgenesis in the chick. DevDyn 121:1179–1186 (2004).
Schartl M: Sex chromosome evolution in non-mamma-lian vertebrates. Curr Opin Genet Dev 14:634–641(2004).
Schmid M, Enderle E, Schindler D, Schempp W: Chro-mosome banding and DNA replication patterns inbird karyotypes. Cytogenet Cell Genet 52:139–146(1989).
Schmid M, Nanda I, Guttenbach M, Steinlein C,Hoehn H, Schartl M, et al: First report on chickengenes and chromosomes 2000. Cytogenet CellGenet 90:169–218 (2000).
Seufert DW, Kos R, Erickson CA, Swalla BJ: p68, aDEAD-box RNA helicase, is expressed in chordateembryo neural and mesodermal tissues. J Exp Zool28:193–204 (2000).
Shan Z, Nanda I, Wang Y, Schmid M, Vortkamp A,Haaf T: Sex-specific expression of an evolutionari-ly conserved male regulatory gene, DMRT1, inbirds. Cytogenet Cell Genet 89:252–257 (2000).
Shastry BS: SNP alleles in human disease and evolu-tion. J Hum Genet 47:561–566 (2002).
Shay JW, Bacchetti S: A survey of telomerase activity inhuman cancer. Eur J Cancer 33:787–191 (1997).
Shen XJ, Ito S, Mizutani M, Yamamoto Y: Phylogenet-ic analysis in chicken breeds inferred from com-plete cytochrome b gene information. BiochemGenet 40:129–141 (2002).
Shetty S, Griffin DK, Graves JA: Comparative paintingreveals strong chromosome homology over 80 mil-lion years of bird evolution. Chromosome Res7:289–295 (1999).
Shetty S, Kirby P, Zarkower D, Graves JA: DMRT1 ina ratite bird: evidence for a role in sex determina-tion and discovery of a putative regulatory ele-ment. Cytogenet Genome Res 99:245–251 (2002).
Shibusawa M, Minai S, Nishida-Umehara C, Suzuki T,Mano T, Yamada K, Namikawa T, Matsuda Y: Acomparative cytogenetic study of chromosome ho-mology between chicken and Japanese quail. Cyto-genet Cell Genet 95:103–109 (2001).
Shin C, Feng Y, Manley JL: Dephosphorylated SRp38acts as a splicing repressor in response to heatshock. Nature 427:553–558 (2004).
Sibley CG, Ahlquist JE: Phylogeny and Classificationof Birds (Yale University Press, New Haven1990).
Sibley CG, Monroe BL Jr: Distribution and Taxonomyof Birds of the World (Yale University Press, NewHaven 1990).
Silverman E, Edwalds-Gilbert G, Lin R-J: DExD/H-box proteins and their partners: helping RNA heli-cases unwind. Gene 312:1–16 (2003).
Sims SH, Macgregor HC, Pellatt PS, Horner HA: Chro-mosome 1 in crested and marbled newts (Triturus):An extraordinary case of heteromorphism and in-dependent chromosome evolution. Chromosoma89:169–185 (1984).
Smith CA, Sinclair AH: Sex determination: Insightsfrom the chicken. Bioessays 26:120–132 (2004).
Smith CA, McClive PJ, Western PS, Reed KJ, SinclairAH: Conservation of a sex-determining gene. Na-ture 402:601–602 (1999).
Smith CA, Katz M, Sinclair AH: DMRT1 is upregu-lated in the gonads during female-to-male sex re-versal in ZW chicken embryos. Biol Reprod 68:560–570 (2003).
Smith EJ, Shi L, Drummond P, Rodriguez L, HamiltonR, Powell E, et al: Development and characteriza-tion of expressed sequence tags for the turkey(Meleagris gallopavo) genome and comparative se-quence analysis with other birds. Anim Genet31:62–67 (2000).

478 Cytogenet Genome Res 109:415–479 (2005)
Smith EJ, Shi L, Drummond P, Rodriguez L, HamiltonR, Ramlal S, et al: Expressed sequence tags for thechicken genome from a normalized 10-day-oldWhite Leghorn whole embryo cDNA library: 1.DNA sequence characterization and linkage analy-sis. J Hered 92:1–8 (2001).
Smith EJ, Shi L, Smith G: Expressed sequence tags forthe chicken genome from a normalized 10-day-oldwhite leghorn whole-embryo cDNA library. 3.DNA sequence analysis of genetic variation incommercial chicken populations. Genome 45:261–267 (2002).
Smith J, Burt DW: Parameters of the chicken genome(Gallus gallus). Anim Genet 29:290–294 (1998).
Smith J, Paton IR, Murray F, Crooijmans RPMA,Groenen MAM, Burt DW: Comparative mappingof human chromosome 19 with the chicken showsconserved synteny and gives an insight into evolu-tion. Mamm Genome 13:310–315 (2002).
Smith SF, Snell P, Gruetzner F, Bench AJ, Haaf T,Metcalfe JA, Green AR, Elgar G: Analyses of theextent of shared synteny and conserved gene ordersbetween the genome of Fugu rubripes and human20q. Genome Res 12:776–784 (2002).
Soder AI, Hoare SF, Muir S, Going JJ, Parksinson EK,Keith WN: Amplification, increased dosage and insitu expression of the telomerase RNA gene inhuman cancer. Oncogene 14:1013–1021 (1997).
Soder AI, Going JJ, Kaye SB, Keith WN: Tumor spe-cific regulation of telomerase RNA gene expressionvisualized by in situ hybridization. Oncogene 16:979–983 (1998).
Solovei I, Gaginskaya E, Allen T, Macgregor H: A novelstructure associated with a lampbrush chromo-some in the chicken, Gallus domesticus. J Cell Sci101:759–772 (1992).
Solovei IV, Gaginskaya ER, Hutchison N, MacgregorH: Avian sex chromosomes in the lampbrush form:the ZW lampbrush bivalents from six species ofbird. Chromosome Res 1:153–166 (1993).
Solovei IV, Ogawa A, Naito M, Mizuno S, MacgregorH: Specific chromomeres on the chicken W lamp-brush chromosome contain specific repetitiveDNA sequence families. Chromosome Res 6:323–327 (1998).
Sorenson MD, Oneal E, Garcia-Moreno J, Mindell DP:More taxa, more characters: the hoatzin problem isstill unresolved. Mol Biol Evol 20:1484–1498(2003).
Springer MS, Cleven GC, Madsen O, Jong WW, Wad-dell VG, Amrine HM, Stanhope MJ: EndemicAfrican mammals shake the phylogenetic tree. Na-ture 388:61–63 (1997).
Stanhope MJ, Waddell VG, Madsen O, Jong W,Hedges SB, Cleven G, Kao D, Springer MS: Molec-ular evidence for multiple origins of Insectivoraand for a new order of endemic African insectivoremammals. Proc Natl Acad Sci USA 95:9967–9972(1998).
Stefansson H, Sarginson J, Kong A, Yates P, Stein-thorsdottir V, Gudfinnsson E, et al: Association ofneuregulin 1 with schizophrenia confirmed in aScottish population. Am J Hum Genet 72:83–87(2003).
Steinmetz LM, Sinha H, Richards DR, Spiegelman JI,Oefner PJ, McCusker JH, Davis RW: Dissectingthe architecture of a quantitative trait locus inyeast. Nature 416:326–330 (2002).
Stenson PD, Ball EV, Mort M, Phillips AD, Shiel JA,Thomas NST, Abeysinghe S, Krawczak M, CooperDN: Human Gene Mutation Database (HGMD):2003 Update. Hum Mutat 21:577–581 (2003).
Stock AD, Bunch TD: The evolutionary implications ofchromosome banding pattern homologies in thebird order Galliformes. Cytogenet Cell Genet 34:136–148 (1982).
Su M, Delany ME: Ribosomal RNA gene copy num-ber variation in directionally selected enhanced-growth lines of chicken. Poultry Sci 77:1748–1754(1998).
Suchyta SP, Cheng HH, Burnside J, Dodgson JB: Com-parative mapping of chicken anchor loci ortholo-gous to genes on human chromosomes 1, 4 and 9.Anim Genet 32:12–18 (2001).
Suka N, Shinohara Y, Saitoh Y, Saitoh H, Ohtomo K,Harata M, Shpigelman E, Mizuno S: W-hetero-chromatin of chicken; its unusual DNA compo-nents, late replication, and chromatin structure.Genetica 88:93–105 (1993).
Sumner AT, Evans HJ, Buchland RA: A new techniquefor distinguishing between human chromosomes.Nat New Biol 232:31–32 (1971).
Sun HS, Tuggle CK, Goureau A, Fitzsimmons CJ, Pin-ton P, Chardon P, Yerle M: Precise mapping ofbreakpoints in conserved synteny between humanchromosome 1 and pig chromosomes 4, 6 and 9.Anim Genet 33:91–96 (2002).
Sung LA, Fan Y-S, Lin CC: Gene assignment, expres-sion and homology of human tropomodulin. Ge-nomics 34:92–96 (1996).
Sussman MA, Welch S, Cambon N, Klevitsky R, He-wett TE, Price RL, Witt SA, Kimball TR: Myofi-bril degeneration caused by tropomodulin overex-pression leads to dilated cardiomyopathy in juve-nile mice. J Clin Invest 101:51–61 (1998).
Suzuki T, Kansaku N, Kurosaki T, Shimada K, Zad-worny D, Koide M, et al: Comparative FISH map-ping on Z chromosomes of chicken and Japanesequail. Cytogenet Cell Genet 87:22–26 (1999).
Swanberg SE, Delany ME: Dynamics of telomere ero-sion in transformed and non-transformed aviancells in vitro. Cytogenet Genome Res 102:318–325(2003).
Taillon-Miller P, Kwok PY: A high-density single-nucleotide polymorphism map of Xq25→q28. Ge-nomics 65:195–202 (2000).
Tanaka SS, Toyooka Y, Akasu R, Katoh-Fukui Y,Nakahara Y, Suzuki R, Yokoyama M, Noce T: Themouse homolog of Drosophila Vasa is required forthe development of male germ cells. Genes Dev14:841–853 (2000).
Tanner NK, Cordin O, Banroques J, Doère M, LinderP: The Q motif: a newly identified motif in DEADbox helicases may regulate ATP binding and hy-drolysis. Mol Cell 11:127–138 (2003).
Tarantul VZ, Rodionov AV, Makarova IV, Gol’tsovVA, Chelysheva LA, Khutinaeva MA, GaginskayaER, Gazaryan KG: Transcription of moderatelyrepeated conservative sequences of the vertebrategenome: molecular and cytological analysis. Tsito-logia 31:619–625 (1989).
Taylor HA, Delany ME: Ontogeny of telomerase inchicken: Impact of down-regulation on pre- andpostnatal telomere length in vivo. Dev Growth Dif-fer 42:613–621 (2000).
Tease C, Jones GH: Do chiasmata disappear? Anexamination of whether closely spaced chiasmataare liable to reduction or loss. Chromosome Res3:162–168 (1995).
Teranishi M, Shimada Y, Hori T, Nakabayashi O,Kikuchi T, Macleod T, et al: Transcripts of theMHM region on the chicken Z chromosome accu-mulate as non-coding RNA in the nucleus offemale cells adjacent to the DMRT1 locus. Chro-mosome Res 9:147–165 (2001).
Thorne M, Sheldon B: Triploid intersex and chimericchickens: useful models for studies of avian sexdetermination, in Reed KC, Graves JAM (eds):Sex Chromosomes and Sex Determining Genes, pp201–208 (Harwood Academic, Chur 1993).
Tirunagaru VG, Sofer L, Cui J, Burnside J: An ex-pressed sequence tag database of T-cell-enrichedactivated chicken splenocytes: sequence analysis of5251 clones. Genomics 66:144–151 (2000).
Tsunekawa N, Naito M, Sakai Y, Nishida T, Noce T:Isolation of chicken vasa homolog gene and tracingthe origin of primordial germ cells. Development127:2741–2750 (2000).
Tsvetkov AG: Electronic microscope study of thespreaded lampbrush chromosomes from the chick-en oocytes. PhD thesis, Leningrad (1987).
Twito T, Ben-Ari G, Blum S, David L, Fleischer H, Lin-ial N, et al: Discovery and genotyping of SNPs inchicken for gene hunting and the study of bio-diversity, in 11th European Poultry Conference,August 6–10 Bremen, Germany (2002).
Twyman RM, Primrose SB: Techniques patents forSNP genotyping. Pharmacogenomics 4:67–79(2003).
Uetz P: The EMBL Reptile Database. Peter Uetz andthe European Molecular Biology Laboratory, Hei-delberg (2004).
Ursitti JA, Fowler VM: Immunolocalization of tropo-modulin, tropomyosin and actin in spread humanerythrocyte skeletons. J Cell Sci 107:1633–1639(1994).
Vallejo RL, Bacon LD, Liu HC, Witter RL, GroenenMAM, Hillel J, Cheng HH: Genetic mapping ofquantitative trait loci affecting susceptibility toMarek’s disease virus induced tumors in F2 inter-cross chickens. Genetics 148:349–360 (1997).
van Haaften G, Vastenhouw NL, Nollen EA, PlasterkRH, Tijsterman M: Gene interactions in the DNAdamage-response pathway identified by genome-wide RNA-interference analysis of synthetic lethal-ity. Proc Natl Acad Sci USA 101:12992–12996(2004).
van Tuinen M, Hedges SB: Calibration of avian molec-ular clocks. Mol Biol Evol 18:206–213 (2001).
van Tuinen M, Hedges SB: The effect of external andinternal fossil calibrations on the avian evolutiona-ry timescale. J Paleontol 78:45–50 (2004).
van Tuinen M, Sibley CG, Hedges SB: Phylogeny andbiogeography of ratite birds inferred from DNAsequences of the mitochondrial ribosomal genes.Mol Biol Evol 15:370–376 (1998).
van Tuinen M, Sibley CG, Hedges SB: The early histo-ry of modern birds inferred from DNA sequencesof nuclear and mitochondrial ribosomal genes. MolBiol Evol 17:451–457 (2000).
van Tuinen M, Butvill DB, Kirsch JA, Hedges SB: Con-vergence and divergence in the evolution of aquat-ic birds. Proc R Soc Lond B Biol Sci 268:1345–1350 (2001).
Varricchio DJ, Jackson F, Borkowski JJ, Horner JR:Nest and egg clutches of the dinosaur Troodon for-mosus and the evolution of avian reproductivetraits. Nature 385:247–250 (1997).
Velculescu VE, Zhang L, Vogelstein B, Kinzler KW:Serial analysis of gene expression. Science 270:484–487 (1995).
Vignal A, Milan D, SanCristobal M, Eggen A: A reviewon SNP and other types of molecular markers andtheir use in animal genetics. Genet Sel Evol 34:275–305 (2002).
Voorrips RE: MapChart: software for the graphical pre-sentation of linkage maps and QTLs. J Hered 93:77–78 (2002).
Wahl MB, Caldwell RB, Kierzek AM, Arakawa H,Eyras E, Hubner N, et al: Evaluation of the chickentranscriptome by SAGE of B cells and the DT40cell line. BMC Genomics 5:98 (2004).
Wallis JW, Aerts J, Groenen MA, Crooijmans RP, Lay-man D, Graves TA, et al: A physical map of thechicken genome. Nature 432:761–764 (2004).
Wang DG, Fan JB, Siao C, Berno A, Young P, SapolskyR, et al: Large-scale identification, mapping, andgenotyping of single-nucleotide polymorphismsin the human genome. Science 280:1077–1082(1998).

Cytogenet Genome Res 109:415–479 (2005) 479
Wang J, Takagaki Y, Manley JL: Targeted disruption ofan essential vertebrate gene: ASF/SF2 is requiredfor cell viability. Genes Dev 10:2588–2599(1996).
Warren M, Smith A, Partridge N, Masabanda J, GriffinD, Ashworth A: Structural analysis of the chickenBRCA2 gene facilitates identification of functionaldomains and disease causing mutations. Hum MolGenet 11:841–851 (2002).
Weber T, Schmidt E, Scheer U: Mapping of transcrip-tion units of Xenopus laevis lampbrush chromo-somes by in situ hybridization with biotin-labeledcDNA probes. Eur J Cell Biol 50:144–153 (1984).
White RA, Dowler LL, Woo M, Adkison LR, Pal S,Gershon D, Fowler VM: The tropomodulin(Tmod) gene maps to chromosome 4, closely linkedto Mup1. Mamm Genome 6:332–333 (1995).
Wienberg J, Stanyon R: Chromosome painting inmammals as an approach to comparative genom-ics. Curr Opin Genet Dev 5:792–797 (1995).
Xu X, Zhou ZH, Wang XL, Kuang XW, Zhang FC, DuXK: Four-winged dinosaurs from China. Nature421:335–340 (2003).
Yonash N, Bacon LD, Witter RL, Cheng HH: Highresolution mapping and identification of newquantitative trait loci (QTL) affecting susceptibili-ty to Marek’s disease. Anim Genetics 30:126–135(1999).
Yonash N, Cheng HH, Hillel J, Heller DE, Cahaner A:DNA microsatellites linked to quantitative traitloci affecting antibody response and survival ratein meat-type chickens. Poultry Sci 80:22–28(2001).
Yoshimura T, Suzuki Y, Makino E, Suzuki T, KuroiwaA, Matsuda Y, Namikawa T, Ebihara S: Molecularanalysis of avian circadian clock genes. Brain ResMol Brain Res 78:207–215 (2000).
Yuri T, Mindell DP: Molecular phylogenetic analysis ofFringillidae, “New World nine-primaried oscines”(Aves: Passeriformes). Mol Phylogenet Evol 23:229–243 (2002).
Zaccanti F, Vallisneri M, Quaglia A: Early aspects ofsex differentiation in the gonads of chick embryos.Differentiation 43:71–80 (1990).
Zechner U, Wilda M, Kehrer-Sawatzki H, Vogel W,Fundele R, Hameister H: A high density of X-linked genes for general cognitive ability: a run-away process shaping human evolution? TrendsGenet 17:697–701 (2001).
Zhou H, Lamont SJ: Genetic characterization of bio-diversity in highly inbred chicken lines by microsa-tellite markers. Anim Genet 30:256–264 (1999).
Zhou H, Lamont SJ: Chicken MHC class I and II geneeffects on antibody response kinetics in adultchickens. Immunogenetics 55:133–140 (2003).
Zimmer R, King WA, Verrinder Gibbins AM: Genera-tion of chicken Z-chromosome painting probes bymicrodissection for screening large-insert genomiclibraries. Cytogenet Cell Genet 78:124–130(1997).
Zoorob R, Billault A, Severac V, Fillon V, Vignal A,Auffray C: Two chicken genomic libraries in thePAC and BAC cloning systems: Organization andcharacterization. Anim Genet 27, Suppl 2:69(1996).