SEC 17-A (2020).pdf - Robinsons Land Corporation
269
*SGVFSM006221* C O V E R S H E E T for AUDITED FINANCIAL STATEMENTS SEC Registration Number 9 3 2 6 9 - A C O M P A N Y N A M E R O B I N S O N S L A N D C O R P O R A T I O N A N D S U B S I D I A R I E S PRINCIPAL OFFICE ( No. / Street / Barangay / City / Town / Province ) L e v e l 2 , G a l l e r i a C o r p o r a t e C e n t e r , E D S A c o r n e r O r t i g a s A v e n u e , Q u e z o n C i t y , M e t r o M a n i l a Form Type Department requiring the report Secondary License Type, If Applicable A A F S S E C N / A C O M P A N Y I N F O R M A T I O N Company’s Email Address Company’s Telephone Number Mobile Number [email protected] 8397-1888 N/A No. of Stockholders Annual Meeting (Month / Day) Fiscal Year (Month / Day) 1,052 Last Wednesday of May 12/31 CONTACT PERSON INFORMATION The designated contact person MUST be an Officer of the Corporation Name of Contact Person Email Address Telephone Number/s Mobile Number Mr. Kerwin Max S. Tan [email protected] 8397-1888 N/A CONTACT PERSON’s ADDRESS 14 Floor Robinsons Cyberscape Alpha cor. Sapphire & Garnet Road Ortigas Center, Pasig City NOTE 1 : In case of death, resignation or cessation of office of the officer designated as contact person, such incident shall be reported to the Commission within thirty (30) calendar days from the occurrence thereof with information and complete contact details of the new contact person designated. 2 : All Boxes must be properly and completely filled-up. Failure to do so shall cause the delay in updating the corporation’s records with the Commission and/or non-receipt of Notice of Deficiencies. Further, non-receipt of Notice of Deficiencies shall not excuse the corporation from liability for its deficiencies.
-
Upload
khangminh22 -
Category
Documents
-
view
0 -
download
0
Transcript of SEC 17-A (2020).pdf - Robinsons Land Corporation

*SGVFSM006221*
C O V E R S H E E Tfor
AUDITED FINANCIAL STATEMENTS
SEC Registration Number
9 3 2 6 9 - A
C O M P A N Y N A M E
R O B I N S O N S L A N D C O R P O R A T I O N A N D
S U B S I D I A R I E S
PRINCIPAL OFFICE ( No. / Street / Barangay / City / Town / Province )
L e v e l 2 , G a l l e r i a C o r p o r a t e C e
n t e r , E D S A c o r n e r O r t i g a s A v e n
u e , Q u e z o n C i t y , M e t r o M a n i l a
Form Type Department requiring the reportSecondary License Type, If
Applicable
A A F S S E C N / A
C O M P A N Y I N F O R M A T I O N
Company’s Email Address Company’s Telephone Number Mobile Number
[email protected] 8397-1888 N/A
No. of Stockholders Annual Meeting (Month / Day) Fiscal Year (Month / Day)
1,052 Last Wednesday of May 12/31
CONTACT PERSON INFORMATION
The designated contact person MUST be an Officer of the Corporation
Name of Contact Person Email Address Telephone Number/s Mobile Number
Mr. Kerwin Max S. Tan [email protected] 8397-1888 N/A
CONTACT PERSON’s ADDRESS
14 Floor Robinsons Cyberscape Alpha cor. Sapphire & Garnet Road Ortigas Center, Pasig City
NOTE 1 : In case of death, resignation or cessation of office of the officer designated as contact person, such incident shall be reported to theCommission within thirty (30) calendar days from the occurrence thereof with information and complete contact details of the new contact persondesignated.
2 : All Boxes must be properly and completely filled-up. Failure to do so shall cause the delay in updating the corporation’s records withthe Commission and/or non-receipt of Notice of Deficiencies. Further, non-receipt of Notice of Deficiencies shall not excuse the corporation fromliability for its deficiencies.

SEC Number 93269-A File Number
________________________________________________
ROBINSONS LAND CORPORATION AND SUBSIDIARIES
________________________________________________ (Company’s Full Name)
Level 2, Galleria Corporate Center, EDSA corner Ortigas Avenue,
Quezon City, Metro Manila _________________________________________________
(Company’s Address)
8397-1888 ______________________________________
(Telephone Number)
DECEMBER 31 ______________________________________
(Calendar Year Ending) (month & day)
FORM 17-A (ANNUAL REPORT) ______________________________________
Form Type
______________________________________ Amendment Designation (if applicable)
December 31, 2020 ______________________________________
Period Ended Date
CN 000452-R-Listed __________________________________________________
(Secondary License Type and File Number)
1

SECURITIES AND EXCHANGE COMMISSION
SEC FORM 17-A
ANNUAL REPORT PURSUANT TO SECTION 17 OF THE SECURITIES REGULATION CODE AND SECTION 141
OF THE CORPORATION CODE OF THE PHILIPPINES 1. For the calendar year ended : December 31, 2020 2. SEC Identification Number : 93269-A 3. BIR Tax Identification No. 000-361-376-000 4. Exact name of issuer as specified in its charter
ROBINSONS LAND CORPORATION
5. Manila, Philippines 6. (SEC Use Only) Province, Country or other
jurisdiction of incorporation or organization
Industry Classification Code:
7. Level 2, Galleria Corporate Center, EDSA corner Ortigas Avenue, Quezon
City, Metro Manila, 1605 Address of principal office Postal Code 8. 8397-1888 Issuer's telephone number, including area code 9. N.A ………………............................................................................... Former name, former address, and former fiscal year, if changed since last report. 10. Securities registered pursuant to Sections 8 and 12 of the SRC, or Sec. 4 and 8
of the RSA2
Title of Each Class Number of Shares of Common Stock
Outstanding and Amount of Debt Outstanding
Common Stock 5,193,830,685 shares Registered bonds payable P=25,190,280,000.00
11. Are any or all of these securities listed on a Stock Exchange. Yes [] No [ ]
2

If yes, state the name of such stock exchange and the classes of securities listed therein: Philippine Stock Exchange Common Shares 12. Check whether the issuer: (a) has filed all reports required to be filed by Section 17 of the SRC and SRC Rule 17 thereunder or Section 11 of the RSA and RSA Rule 11(a)-1 thereunder, and Sections 26 and 141 of The Corporation Code of the Philippines during the preceding twelve (12) months (or for such shorter period that the registrant was required to file such reports); Yes [] No [ ] (b) has been subject to such filing requirements for the past ninety (90) days. Yes [] No [ ] 13. Aggregate market value of the voting stock held by non-affiliates: P=42,722,633,853.60
3

TABLE OF CONTENTS TABLE OF CONTENTS…………………………………………………………………………………………4
PART I – BUSINESS AND GENERAL INFORMATION…………………………………………………….6
ITEM 1. BUSINESS…………………………………………………………………………………………..6
a) Overview……………………………………………………………………………………………….6 b) Business………………………………………………………………………………………………...9
i. Commercial Centers Division……………………………………………………………………………...9 ii. Residential Division……………………………………………………………………………................11
1) Robinsons Luxuria………………………………………………………………………………..12 2) Robinsons Residences…………………………………………………………………………….13 3) Robinsons Communities………………………………………………………………………….16 4) Robinsons Homes………………………………………………………………………………...20 5) Chengdu Ban Bian Jie …………………………………………………………………………...26
iii. Office Buildings Division…………………………………………………………………………………26 iv. Hotels and Resorts Division………………………………………………………………………………31 v. Industrial and Integrated Developments Division……………...…………………………………………33
c) Significant Subsidiaries………………………………………………………………………………34 d) Competition…………………………………………………………………………………………...37
i. Commercial Centers Division…………………………………………………………………………….37 ii. Residential Division………………………………………………………………………………………38 iii. Office Buildings Division…………………………………………………………………………………39 iv. Hotels and Resorts Division………………………………………………………………………………40 v. Industrial and Integrated Developments Division………….…………………..…………………………40
e) Sources and Availability of Raw Materials and Names of Principal Suppliers...................................41 f) Customers……………………………………………………………………………………………...41 g) Employees and Labor………………………………………………………………………………...42 h) Industry Risk………………………………………………………………………………………….42
ITEM 2. PROPERTIES……………………………………………………………………………………..46 ITEM 3. LEGAL PROCEEDINGS…………………………………………………………………………48 ITEM 4. SUBMISSION OF MATTERS TO A VOTE OF SECURITY HOLDERS…………………….48 ITEM 5. REGULATORY AND ENVIRONMENTAL MATTERS………………………………………...49
a) Shopping Malls……………………………………………………………………………………….49 b) Residential Condominium and Housing and Land Projects………………………………………….49 c) Hotels…………………………………………………………………………………………………51 d) Zoning and Land Use…………………………………………………………………………………52 e) Special Economic Zone……………………………………………………………………………….52 f) Effect of Existing or Probable Governmental Regulations on the Business…………….……………53 g) Effect of COVID-19 on the Business…………………………………………………….……………53
PART II – OPERATIONAL AND FINANCIAL INFORMATION…………………………………………...54
ITEM 6. MARKET INFORMATION………………………………………………………………………..54 ITEM 7. DIVIDENDS………………………………………………………………………………………..54 ITEM 8. PRINCIPAL SHAREHOLDERS…………………………………………………………………55
ITEM 9. MANAGEMENT DISCUSSION AND ANALYSIS OF FINANCIAL CONDITION AND RESULTS OF OPERATION………………………………………….…………………………..56
a) Results of Operations and Financial Condition……………………………………………………...56 i. Year ended December 31, 2020 versus same period in 2019……………………………………………..56 ii. Year ended December 31, 2019 versus same period in 2018….………………………………………….59 iii. Year ended December 31, 2018 versus same period in 2017……………………………………………..62
ITEM 10. TRENDS, EVENTS OR UNCERTAINTIES THAT HAVE HAD OR THAT ARE REASONABLY EXPECTED TO AFFECT REVENUES AND INCOME…………………..66
ITEM 11. FINANCIAL STATEMENTS……...…………………………………………………………….66 ITEM 12. INFORMATION ON INDEPENDENT ACCOUNTANT AND OTHER RELATED MATTERS…………………………...……………..……………………………………………67
a) External Audit Fees and Services…………………………………………………………………….67 b) Changes in and Disagreements with Accountants on Accounting and Financial Disclosure………..67
ITEM 13. SECURITY OWNERSHIP OF CERTAIN RECORD AND BENEFICIAL OWNERS AND
4

MANAGEMENT………………………...………..……………………………………………...68 a) Security Ownership of Certain Record and Beneficial Owners……………………………………...68 b) Security Ownership of Management as of December 31, 2020………………………………………69 c) Voting Trust Holder of 5% or more - as of December 31, 2020……………………………………..70 d) Changes in Control…………………………………………………………………………………...70
PART III – CONTROL AND COMPENSATION INFORMATION…………………………………………71
ITEM 14. DIRECTORS AND EXECUTIVE OFFICERS OF THE REGISTRANT…………………….71
a) Directors’ and Key Officers’ Experience……………………………………………………………..72 b) Involvement in Certain Legal Proceedings of Directors and Executive Officers…………………….79 c) Family Relationships…………………………………………………………………………………79
ITEM 15. EXECUTIVE COMPENSATION…………………………....................................................80 a) Summary Compensation Table………………………………………………………………….........80 b) Standard Arrangement………………………………………………………………………………..81 c) Other Arrangement…………………………………………………………………………………...81 d) Any employment contract between the company and named executive officer………………………81 e) Warrants and Options Outstanding…………………………………………………………………..81
ITEM 16. CERTAIN RELATIONSHIPS AND RELATED PARTY TRANSACTIONS………………...82
PART IV – CORPORATE GOVERNANCE………………………………………………………………….83
PART V – SUSTAINABILITY REPORT………………….………………………………………………….84
PART VI – EXHIBITS AND SCHEDULES…………………………………………...…………………….124
ITEM 17. EXHIBITS AND REPORTS ON SEC FORM 17-C……………………………………….124 (A) Exhibits-See Accompanying Index to Exhibits (Page 267)………………..………………………..124
(B) Reports on SEC Form 17-C (Current Report)…………………………………………………..124
5

PART I - BUSINESS AND GENERAL INFORMATION
Item 1. Business
a) Overview Robinsons Land Corporation (RLC, the Parent Company or the Company) is a stock corporation organized under the laws of the Philippines and has eleven (11) subsidiaries. The Parent Company’s principal executive office is located at Level 2, Galleria Corporate Center, EDSA corner Ortigas Avenue, Quezon City, Metro Manila. The Group has 2,623 and 2,823 employees as of December 31, 2020 and 2019, respectively. RLC is one of the Philippines’ leading real estate developers in terms of revenues, number of projects and total project size. It is engaged in the construction and operation of lifestyle commerical centers, offices, hotels and industrual facilities; and the development of mixed-use properties, residential buildings, as well as land and residential housing developments, including socialized housing projects located in key cities and other urban areas nationwide. RLC adopts a diversified business model, with both an ‘investment’ component, in which the Company develops, owns and operates commercial real estate projects (principally lifestyle commercial centers, office buildings, hotels and industrial facilities); and a ‘development’ component, in which RLC develops real estate projects for sale (principally residential condominiums, serviced lots, house and lot packages and commercial lots). RLC’s operations are divided into its five business divisions:
The Commercial Centers Division develops, leases and manages lifestyle commercial centers or shopping malls throughout the Philippines. As of December 31, 2020, RLC operates fifty-two (52) shopping malls, comprising of nine (9) malls in Metro Manila and forty-three (43) malls in other urban areas throughout the Philippines, and has another two (2) new malls, two (2) expansions and one mall to reopen in the planning and development stage for completion in the next two (2) years.
The Residential Division develops and sells residential developments for
sale/pre-sale. As of December 31, 2020, RLC’s Residential Division has eighty (80) residential condominium buildings/towers/housing projects and thirty-nine (39) housing subdivisions, of which ninety-three (90) have been completed and twenty-eight (28) are still ongoing. It currently has several projects in various stages for future development that are scheduled for completion in the next one (1) to five (5) years.
On the other hand, the Company has one (1) residential project located in Chengdu, China called ‘Chengdu Ban Bian Jie’. Chengdu Ban Bien Jie is
6

RLC’s first international foray spanning across 8.5 hectares of land acquired in 2016 through a public auction.
The Office Buildings Division develops office buildings for lease. As of
December 31, 2020, this division has completed twenty-five (25) office developments. These are located in Quezon City, Mandaluyong City, Cebu City, Ilocos Norte, Tarlac City, Naga City and Davao City. We also have office projects in the Central Business Districts of Pasig City, Makati City and Taguig City. Furthermore, a robust pipeline of new offices has been prepared and these offices are set for completion in the next two (2) years.
The Hotels and Resorts Division has a diverse portfolio covering the
following brand segments: upscale international deluxe hotels, mid-market boutique city hotels, essential service value hotels, and most recently, the luxury resort category. As of December 31, 2020, RLC operated twenty (20) hotels and resort for a total of 3,188 rooms in strategic metropolitan and urbanized locations consisting of eleven (11) Go Hotels, six (6) Summit Hotels and three (3) international deluxe brands. In 2020, RLC opened the remaning rooms in Dusit Thani Mactan Cebu Resort. The resort is being managed by Dusit Thani Company Limited (“Dusit Thani International”). RLC currently has a lineup of developments for the expansion of its portfolio of hotels and resorts.
The Industrial and Integrated Developments Division (IIDD) focuses on
mixed-used developments and masterplanned communities. These developments incorporate different property formats such as residences, work places, commercial centers, logistics facilities and other institutional developments into a single setting. IIDD continues to make substantial progress in its landmark Destination Estates—the 30-hectare Bridgetowne in Pasig and Quezon City, the 18-hectare Sierra Valley in Cainta, and the 200-hectare Montclair in Pampanga. The division shall continue to embark on strategic land bank acquisitions to add to its growing number of township developments. Another key role of this division is the development of industrial facilities. As of December 31, 2020, RLC has four (4) operational industrial facilities with plans to expand in terms of net leasable area and geographic location in the next two (2) years.
RLC was incorporated on June 4, 1980 as the real estate investment arm of JG Summit Holdings Inc. (‘JG Summit’), and its shares were offered to the public in an initial public offering and were subsequently listed in the Manila Stock Exchange and Makati Stock Exchange (predecessors of the Philippine Stock Exchange) on October 16, 1989. The Company had succesful follow-on offering of primary and secondary shares in October 2006 where a total of 932.8 million shares were offered to domestic and international investors, generating USD 223 million or P=10.87 billion in proceeds. Of this amount, approximately P=5.30 billion was raised from the primary portion, intended to be used to fund its capital expenditure programs for fiscal year 2007. The additional shares were listed on October 4, 2006. JG Summit, RLC’s controlling shareholder, owned approximately 60.97% of RLC’s outstanding
7
shares as of calendar year 2019. On November 19, 2010, the Board of Directors approved the increase in the authorized capital stock of RLC from 3,000,000,000 common shares into 8,200,000,000 commons shares, with a par value of one peso (P=1) per share. In line with the foregoing, the Board of Directors also approved on February 16, 2011 a 1:2 stock rights offering to stockholders of record as of March 30, 2011 (ex - date March 25, 2011). Accordingly, the Company received subscriptions for 1,364,610,228 shares at an offer price of P=10 per share on April 11-15, 2011. The subscription receivables were fully collected in October 2011. The SEC approved the increase in capital stock on May 17, 2011. On November 13, 2017, the BOD of the Company approved in principle the stock rights offering (SRO) of up to P=20.00 billion composed of 1.1 billion common shares, with a par value of P=1.00 per share, to all stockholders as of record date January 31, 2018. The Company intends to use the proceeds from the SRO to finance the acquisition of land located in various parts of the country for all its business segments. The Company has obtained the approval of the BOD of the Philippine Stock Exchange, Inc. (PSE) for the listing and trading of the rights shares on January 10, 2018, while the PSE’s confirmation of exempt transaction covering the offer was obtained on December 14, 2017. The following are the key dates of the SRO: • Pricing date – January 24, 2018 • Ex-date – January 26, 2018 • Record date – January 31, 2018 • Offer period – February 2 to 8, 2018 • Listing date – February 15, 2018
The Company has successfully completed its P=20.00 billion SRO of common shares following the close of the offer period on February 8, 2018. A total of 1.1 billion common shares from the SRO were issued at a price of P=18.20 each. The listing of the shares occurred on February 15, 2018.
On July 31, 2019, the BOD of the Parent Company approved the declaration of property dividend, of up to One Hundred Million (100,000,000) common shares of Altus Property Ventures, Inc. (APVI) (formerly Altus San Nicolas Corp.) in favor of the registered shareholders (the Receiving Shareholders) of the Parent Company as of August 15, 2019. The SEC approved the property dividend declaration on November 15, 2019 and the Certificate Authorizing Registration was issued by the Bureau of Internal Revenue on December 6, 2019.
The Receiving Shareholders received a ratio of one (1) share of APVI for every fifty-one and 9384/10000 (51.9384) shares of the Parent Company, net of applicable final withholding tax on December 20, 2019. No fractional shares were issued and no shareholder was entitled to any fractional shares. RLC’s
8

remaining interest in APVI after the dividend distribution is 6.11%.
b) Business
RLC has five business divisions – Commercial Centers, Residential, Office Buildings, Hotels and Resorts, and Industrial and Integrated Developments.
i. Commercial Centers Division
RLC’s Commercial Centers Division develops, leases and manages lifestyle centers throughout the Philippines. The Commercial Centers Division accounted for P=5.96 billion or 23% of RLC’s revenues and P=4.11 billion or 30% of RLC’s EBITDA in calendar year 2020 and P=13.25 billion or 43% of RLC’s revenues and P=8.82 billion or 51% of RLC’s EBITDA in calendar year 2019. As of December 31, 2020 and 2019, the Company’s Commercial Centers Division had assets valued on a historical cost less depreciation basis at P=77.61 billion and P=73.47 billion, respectively. The Company’s Commercial Centers Division has felt the most impact of the pandemic on its operations especially on the first half of 2020. Rental concessions were provided to support the recovery of partner tenants affected by temporary mall closures and quarantine restrictions. In the second half of 2020, mall revenues started to rebound on the back of sustained improvements in operational gross leasable area, number of operational tenants and foot traffic. These performance indicators are expected to gradually rise over time as the government continues to ease quarantine restrictions. During calendar year 2020, the Commercial Centers Division started expanding the front portion of its Dumaguete mall. The total mall count remains at 52, with nine (9) of the malls in Metro Manila and the rest in other urban areas throughout the Philippines. System-wide leased percentage posted at 93%. In addition, GFA slightly declined to approximately 3.0 million square meters due to the deconsolidation of APVI’s assets from RLC following the property dividend distribution. Aside from expanding mall footprint, several innovative services were rolled out in 2020 to facilitate worry-free shopping experiences. Robinsons Malls’ ‘Pickup Station’, ‘RDelivery’, and ‘RPersonal Shopper’ offer safe and easy ways for customers to shop, while enabling partner tenants to expand consumer reach.
9

The table below sets out certain key details of RLC's mall portfolio as of December 31, 2020:
Name Location Calendar Year
Opened
Approximate Gross Floor Area
(in ‘000 sq.m.)
Metro Manila
Robinsons Galleria ................................EDSA corner Ortigas Avenue, Quezon City 1990 221
Robinsons Place Manila ................................M. Adriatico Street, Ermita, Manila 1997 241
Robinsons Novaliches ................................Quirino Highway, Novaliches, Quezon City 2001 70
Robinsons Metro East ................................Marcos Highway, Brgy. Dela Paz, Pasig City 2001 119
Forum Robinsons ................................EDSA Corner Pioneer Road, Mandaluyong City 2004 55
Robinsons Otis .....................................................P.M. Guanzon St., Paco, Manila 2007 32
Robinsons Magnolia ......................... Aurora Blvd. corner Doña Hemady St., Quezon City 2012 162
Robinsons Town Mall Malabon......... Gov. Pascual Ave. cor. Crispin St., Tinajeros, Malabon 2013 17
Robinsons Place Las Piñas………… Alabang-Zapote Road, Brgy. Talon, Las Piñas City 2014 59
Outside Metro Manila
Robinsons Place Bacolod ................................Lacson Street, Mandalagan, Bacolod City 1997 61
Robinsons Place Imus ................................Aguinaldo Highway, Tanzang Luma V, Imus, Cavite 1998 65
Robinsons Fuente Cebu ................................Fuente Osmena, Bo. Capitol, Cebu City 2000 17
Robinsons Town Mall Los Baños ..........................Lopez Avenue, Batong Malaki, Los Baños, Laguna 2000 10
Robinsons Place Iloilo ................................Quezon-Ledesma Street, Rojas Village, Iloilo City 2001 75
Robinsons Star Mills Pampanga ............................San Jose, San Fernando, Pampanga 2002 69
Robinsons Santa Rosa ................................Old Nat’l Hi-way, Brgy Tagapo, Sta Rosa, Laguna 2002 37
Robinsons Place Dasmariñas ...............................Pala-Pala, Dasmarinas, Cavite 2003 96
Robinsons Cagayan de Oro ................................Limketkai Complex, Lapasan, Cagayan De Oro City 2002 18
Robinsons Place Lipa ................................Mataas Na Lupa, Lipa City, Batangas 2003 59
Robinsons Cainta ................................Ortigas Avenue Extension, Junction, Cainta, Rizal 2004 31
Robinsons Place Angeles ................................McArthur Highway, Balibago, Angeles City, Pampanga 2004 31
Robinsons Cybergate Bacolod .............................Barrio Tangub, National Road, Bacolod City 2004 18
Robinsons Luisita ................................McArthur Highway, Brgy. San Miguel, Tarlac City 2007 17
Robinsons Cabanatuan ................................Km. 3, Maharlika Highway, Cabanatuan City 2008 18
Robinsons Pulilan ................................Trinidad Highway, Brgy. Cutcot, Pulilan, Bulacan 2008 12
Summit Ridge Tagaytay ................................Km. 58, Tagaytay-Nasugbu Road, Tagaytay City 2008 14
Robinsons Cybergate Davao ................................J. P. Laurel Avenue, Davao City 2009 14
Robinsons Place Tacloban ................................National Highway, Marasbaras, Tacloban City 2009 63
Robinsons Place General Santos .........................Jose Catolico Sr. Ave., Lagao, General Santos City 2009 33
Robinsons Place Dumaguete............ Calindagan Business Park, Dumaguete City 2009 38
Robinsons Ilocos Norte Expansion.... Brgy. 1 San Francisco, San Nicolas, Ilocos Norte 2009 45
Robinsons Cybergate Cebu.............. Don Gil Garcia St., Capitol, Cebu City 2009 20
Robinsons Place Pangasinan............ McArthur Highway, Brgy. San Miguel, Calasiao Pangasinan 2012 33
Robinsons Place Palawan................. National Highway, Brgy. San Miguel, Puerto Princesa City 2012 45
Robinsons Place Butuan................... J.C. Aquino Avenue, Brgy Libertad, Butuan City 2013 59
10

Robinsons Place Malolos.................. MacArthur Highway, Brgy. Sumapang Matanda, Malolos City, Bulacan 2013 68
Robinsons Place Roxas.................... Immaculate Heart of Mary Avenue, Pueblo de Panay, Brgy. Lawa-an, Roxas City, Capiz 2014 37
Robinsons Place Santiago................ Maharlika Highway, Brgy Mabini, Santiago City, Isabela 2014 40
Robinsons Place Antipolo.................. Sumulong Highway, cor. Circumferential Road, Antipolo City 2014 43
Robinsons Place Antique…………… Brgy. Maybato, San Jose, Antique 2015 28
Robinsons Galleria Cebu…………… Gen. Maxilom Ave. Ext, Cebu City, Cebu 2015 139
Robinsons Place Tagum…………… Tagum City, Davao del Norte 2016 65
Robinsons Place General Trias…… Governor’s Drive, General Trias, Cavite 2016 56
Robinsons Place Jaro………………. E Lopez St. Jaro, Iloilo City, Iloilo 2016 52
Robinsons Place Iligan……………… Macapagal Ave., Brgy. Tubod, Iligan City, Lanao del Norte 2017 51
Robinsons Place Naga……………… Roxas Ave., cor. Almeda Highway, Brgy. Triangulo, Naga City, Camarines Sur 2017 77
Robinsons North Tacloban…………. Brgy. Abucay, Tacloban City, Leyte 2017 56
Robinsons Place Ormoc…………… Brgy. Cogon, Ormoc City, Leyte 2018 35
Robinsons Place Pavia……………… Brgy. Ungka 2, Pavia, Iloilo 2018 41
Robinsons Place Tuguegarao……… Brgy. Tanza, Tuguegarao City, Cagayan 2018 60
Robinsons Place Valencia…………. Sayre Highway, Brgy. Hagkol, Bagontaas Valencia, Bukidnon 2018 47
Robinsons Galleria South…………… Km. 31, National Highway, Brgy. Nueva, San Pedro, Laguna 2019 118
Total 2,990
The Commercial Centers Division’s main revenue stream is derived from the lease of commercial spaces. Revenues from the Commercial Centers Division, which represent recurring lease rentals, comprise significant part of RLC’s revenues. Historically, revenues from lease rentals have been a steady source of operating cash flows for the Company. RLC expects that the revenues and operating cash flows generated by the commercial centers business shall continue to be a major driver for the Company’s growth in the future. As of calendar year 2020, the Company has two (2) new malls, two (2) expansions and one mall to reopen in the planning and development stage for completion in the next two (2) years. The Company’s business plan for the Commercial Centers Division over the next five years, subject to market conditions, is to sustain its growth momentum via development of new shopping malls and expansion of existing ones. The Group also leases commercial properties to affiliated companies. Rental income arising from the lease of commercial properties to affiliated companies amounted to about P=2.10 billion and P=3.00 billion for the calendar years ended December 31, 2020 and 2019, respectively.
ii. Residential Division
The Residential Division focuses on the construction and sale of residential condominium, subdivision projects and other real estate properties. The Division accounted for P=12.13 billion or 48% of RLC’s revenues and P=4.16 billion or 31% of RLC’s EBITDA in calendar year 2020, and P=9.13 billion or
11

30% of RLC’s revenues and P=2.97 billion or 17% of RLC’s EBITDA in calendar year 2019. As of December 31, 2020 and 2019, the Company’s Residential Division had assets valued on a historical cost less depreciation basis at P=77.60 billion and P=59.96 billion, respectively. Percentage of realized revenues from foreign sales to total consolidated revenues for calendar years 2020, 2019 and 2018 are 8.58%, 5.19% and 1.75%, respectively while percentage of realized revenues from foreign sales to consolidated net income for calendar years 2020, 2019 and 2018 are 41.43%, 18.24% and 6.28%, respectively. The Residential Division is categorized into four brands. The different brands differ in terms of target market, location, type of development and price ranges to allow clear differentiation among markets. These four brands are:
Robinsons Luxuria Robinsons Residences Robinsons Communities Robinsons Homes
1)
1) ROBINSONS LUXURIA
Robinsons Luxuria builds its brand on providing a seamless pampered experience via its generous living spaces, distinctive style infrastructure, iconic locations and attention to service and detail. It provides uniquely luxurious living spaces through its projects located in iconic locations such as Cebu, Ortigas Center and Makati. Currently, there are nine (9) residential condominium buildings/towers under the Robinsons Luxuria portfolio, of which eight (8) have been completed and one (1) project is under construction. Key details of the Company’s Robinsons Luxuria residential projects are set forth in the table below:
Name Storeys Number of Units
Current project
The Residences at The Westin Manila Sonata Place (1)……….. 50 344
Completed projects
Galleria Regency (1)12(2) ................................................................ 13 108
Amisa Private Residences Tower A (1) ...........................................14 131
Amisa Private Residences Tower B (1) ...........................................18 155
Amisa Private Residences Tower C (1) ............................................18 189
Signa Designer Residences Tower 1 ..............................................29 306
Signa Designer Residences Tower 2 ..............................................28 351
1 Part of a mixed-used development 2 Located in a 33-storey building, 20 floors of which are occupied by the Crowne Plaza Hotel
12

Sonata Private Residences – Building 1 (1) ................................ 29 270
Sonata Private Residences – Building 2 (1) ................................ 30 269
The Robinsons Luxuria projects are detailed as follows:
1. The Residences at The Westin Manila Sonata Place (legal name Sonata Premier) the first Westin-branded Residences in Southeast Asia and the final residential tower in the Sonata Place mixed-use community. Recognized as the 2018-2019 Best Residential High-Rise Development Philippines by the Asia Pacific Property Awards.
2. Galleria Regency is part of the Galleria mixed-use development which
includes the Robinsons Galleria mall, two office buildings (Galleria Corporate Center and Robinsons - Equitable Tower) and two hotels (the Crowne Plaza Manila Galleria and the Holiday Inn Manila Galleria).
3. Signa Designer Residences Towers 1 and 2 is a joint venture project
between Robinsons Land Corporation and Security Land Corporation in Makati CBD. Recognized in 2013 by the International Property Awards for Asia Pacific as the Best Residential Condominium in the Philippines.
4. Amisa Private Residences Towers A, B and C are the first 3 of 6 mid-
rise residential condominiums within a mixed-use resort development in Mactan, Cebu.
5. Sonata Private Residences – Buildings 1 and 2 are part of a Sonata
Place mixed-use community in Ortigas Center that has been masterplanned to consist of three residential condominiums, and one hotel. RLC was recognized by FIABCI as the Outstanding Developer in the Philippines for this Residential-Vertical project in 2016.
The Company’s business plan for its Robinsons Luxuria brand is to continue to acquire and launch properties in key central and strategic locations within Metro Manila ideal for low density vertical or horizontal developments. It sees potential to differentiate by combining prestigious addresses with distinctive features and amenities.
2) ROBINSONS RESIDENCES
Robinsons Residences offers the perfect urban home for professionals and urbanites, combining prime locations with contemporary designs, efficiently designed living spaces, stress-busting amenities and lifestyle perks and privileges. As of December 31, 2020, Robinsons Residences segment had a portfolio of thirty four (34) residential condominium buildings/towers, of which twenty-six (26) had been completed and eight (8) are under various stages of development. Key details of Company’s residential projects under the Robinsons
13

Residences brand are as follows:
Name Storeys Number of Units
Current projects
Galleria Residences Cebu Tower 1 ………………………….. 21 270
Galleria Residences Cebu Tower 2 ………………………….. 22 352
Galleria Residences Cebu Tower 3 ………………………….. 22 299
The Trion Towers – Building 3 ……………………….……….. 50 636
The Radiance Manila Bay South Tower ……………………… 41 597
The Magnolia Residences Tower D …….……………………. 30 420
The Sapphire Bloc East Tower ……..…………………………. 44 665
The Sapphire Bloc South Tower ……..……………………….. 44 665
Completed projects
Robinsons Place Residences 1 .......................................................38 388
Robinsons Place Residences 2 .......................................................38 388
One Gateway Place ................................................................ 28 413
Gateway Garden Heights ................................................................32 549
One Adriatico Place ................................................................ 38 572
Two Adriatico Place ................................................................ 38 546
Three Adriatico Place ................................................................ 38 537
Fifth Avenue Place ..........................................................................38 611
Otis 888 Residences ................................................................ 3 195
McKinley Park Residences ..............................................................44 391
East of Galleria ................................................................................44 693
The Fort Residences ................................................................ 31 242
Vimana Verde Residences Tower A ................................................ 6 20
Vimana Verde Residences Tower B ................................................ 6 20
Vimana Verde Residences Tower C ................................................ 7 45
Azalea Place Cebu ..........................................................................25 408
The Trion Towers - Building 1 .........................................................49 694
The Trion Towers - Building 2 …………………………………. 50 725
Gateway Regency ...........................................................................31 463
The Magnolia Residences Tower A ................................................36 378
The Magnolia Residences Tower B ................................................38 419
The Magnolia Residences Tower C ................................................38 433
The Radiance Manila Bay North Tower ..........................................36 538
The Sapphire Bloc North Tower .....................................................38 412
The Sapphire Bloc West Tower .....................................................38 416
Woodsville Residences ................................................................ 2 185
The Robinsons Residences projects are detailed as follows:
1. One Gateway Place, Gateway Garden Heights and Gateway Regency are part of the Pioneer mixed-use development located on the corner of EDSA and Pioneer Street, which includes Gateway Garden Ridge, Gateway Regency Studios, the Robinsons Forum mall,
14

four office buildings (Robinsons Cybergate Center Tower 1, Robinsons Cybergate Center Tower 2, Robinsons Cybergate Center Tower 3 and Robinsons Cybergate Plaza) and Go Hotels Mandaluyong.
2. One Adriatico Place, Two Adriatico Place, Three Adriatico Place and Robinsons Place Residences 1 and 2 are part of the Ermita mixed-use development, which includes the Robinsons Place Manila mall.
3. Otis 888 Residences is part of the mixed-use development in Paco, Manila, which includes Robinsons Otis mall and Go Hotels Otis.
4. The Magnolia Residences Towers A, B, C and D are part of the
mixed-use development on what was the former Magnolia Ice Cream Plant in New Manila, Quezon City. It has been masterplanned to include Robinsons Magnolia mall, Summit Hotel and four (4) residential buildings. Recognized in 2013 by the International Property Awards for Asia Pacific as the Best Mixed-Use Development in the Philippines. Adjudged by International Property Awards as the Best Residential High-Rise Development – 2019-2020 and Property Guru Philippine Property Awards for 2019 Best Interior Design Award for Mid-End Condo Category.
5. Fifth Avenue Place is a 38-storey development in Bonifacio Global City. Composed of 611 units, it is the first completed project of RLC in the area.
6. McKinley Park Residences is a 44-storey development in Fort Bonifacio Global City. It is composed of 391 units.
7. The Fort Residences is a 31-storey development in Fort Bonifacio
Global City. It is composed of 242 units—flat and loft type.
8. The Trion Towers 1, 2 and 3 compose the three-tower development in Bonifacio Global City. In 2015, RLC was recognized by FIABCI as the Outstanding Developer in the Philippines for this Residential-Vertical project.
9. East of Galleria is a one-tower development located along Topaz Street, Ortigas Center. It is conveniently located near RLC’s Robinsons Galleria mixed-use complex.
10. Woodsville Residences is the townhouse development under the Robinsons Residences portfolio. It is strategically located in Merville, Paranaque.
11. The Sapphire Bloc is a four-tower development that features a lifestyle retail podium. It is located on a property bounded by Sapphire, Onyx and Garnet Streets, at the Ortigas Center, conveniently near RLC’s Robinsons Galleria mixed-use complex. This project was recognized in the 2015 Philippine Property Awards and 2016 Asia Pacific Awards, as
15

the Best Mid-Range Condo Development and Best Residential High-Rise Development in the country, respectively. The project was recognized as the Best Residential Interior Design during 2017 Philippine Property Awards and 2017 Asian Property Award (Philippines).
12. Vimana Verde Residences Buildings A, B and C is a three mid-rise building development located in St. Martin Street, Valle Verde, Pasig City.
13. Azalea Place Cebu is a 25-storey development located along Gorordo
Avenue, Cebu City.
14. The Radiance Manila Bay North and South Towers are the main components of the two-tower residential development that features a lifestyle retail wing. It is located along Roxas Boulevard in Pasay City. Recognized in 2016 Asia Pacific Awards as the Best High-Rise Development in the Philippines.
15. Galleria Residences Cebu Towers 1, 2 and 3 is the three-tower
residential component of the Robinsons Galleria Cebu Complex which consists of a full-service mall, hotel and office building. It is located along Maxilom Avenue, Cebu City. Highly commended by Property Guru Philippine Property Awards as the Best High Rise Condo Development in Cebu for 2019.
The Company’s business plan for its Robinsons Residences brand is to cater to urban professionals with projects geared towards a live-work-play lifestyle that this market values. It capitalizes on the company’s expertise in delivering mixed-use mid- to high-rise developments located within business districts and emerging cities.
3) ROBINSONS COMMUNITIES
Robinsons Communities is the residential brand of RLC which caters to the needs of early nesters, young mobile achievers and families coming from the B to BB segment who wish to live independently and comfortably close to their workplace, schools and leisure centers. Robinsons Communities provides convenient community living through its affordable quality condominiums that offer open spaces, fun and functional amenities and complementing commercial spaces. Most of Robinsons Communities’ projects are strategically located near major gateways, highly developed cities and central business districts to provide easy access to schools, work places and vital institutions. As of December 31, 2020, Robinsons Communities had completed twenty-eight (28) residential condominium buildings/towers including two (2) subdivision projects. It has nine (9) on-going projects in different stages that are scheduled for completion over the next five years.
16

Robinsons Communities is currently focusing on the development of both mid-rise and high-rise residential condominium projects that primarily offer compact units. Its condominium projects are located in Metro Manila and Tagaytay City while the subdivisions are in Quezon City. Key details of Company’s residential projects under Robinsons Communities are set forth in the table below:
Name Residential
Floors Number of
Residential Units
Current Projects
Axis Residences - Building B …………….. 37 792
Acacia Escalades - Building B …………… 13 414
Chimes Greenhills..................................... 24 378
Aurora Escalades Tower........................... 21 800
Gateway Regency Studios........................ 28 378
Cirrus………………………………………… 34 1,371
SYNC S Tower……………………………... 21 598
Sierra Valley Gardens – Building 1………. 16 383
Sierra Valley Gardens – Building 2………. 16 383
Completed Projects
Acacia Escalades - Building A …………… 11 383
Axis Residences - Tower A ………………. 37 873
Escalades East Tower ……………………. 11 269
Escalades at 20th Avenue - Tower 1 ................................10 120
Escalades at 20th Avenue - Tower 2 ................................10 120
Escalades at 20th Avenue - Tower 3 ................................10 120
Escalades at 20th Avenue - Tower 4 ................................10 120
Escalades at 20th Avenue - Tower 5 ................................10 120
Escalades at 20th Avenue - Tower 6 ................................10 120
Escalades South Metro - Tower A ................................ 9 176
Escalades South Metro - Tower B ................................ 9 176
The Pearl Place - Tower A ................................ 33 653
The Pearl Place - Tower B ................................ 34 640
Wellington Courtyard - Bldg A ................................ 5 34
Wellington Courtyard - Bldg B ................................ 5 34
Wellington Courtyard - Bldg C ................................ 5 45
Wellington Courtyard - Bldg D ................................ 5 41
Wellington Courtyard - Bldg E ................................ 5 38
Gateway Garden Ridge ................................ 15 373
Woodsville Viverde Mansions - Bldg 1 ................................8 72
Woodsville Viverde Mansions - Bldg 2 ................................8 96
Woodsville Viverde Mansions - Bldg 3 ................................10 89
Woodsville Viverde Mansions - Bldg 4 ................................12 108
Woodsville Viverde Mansions - Bldg 5 ................................8 72
Woodsville Viverde Mansions - Bldg 6 ................................8 64
Woodsville Viverde Mansions - Bldg 8 ................................8 72
17

Bloomfields Novaliches* ................................ - 461
Centennial Place* ................................................................- 50 *horizontal
The Robinsons Communities projects are detailed as follows:
1. Woodsville Viverde Mansions Buildings 1 to 6 and 8 is within a
mixed-use development located in Paranaque. It includes a village mall and a cluster of residential mid-rise buildings.
2. Escalades at 20th Avenue Towers 1 to 6 - A mid-rise residential building complex featuring a tropical-inspired central garden, strategically located along 20th Avenue and nearby Aurora Boulevard. A total of 720 units, 120 per building; Building 1 consists of twelve (12) storeys composed of ten (10) residential floors, ground amenity floor and basement parking. While Building 2 to 6 are composed of ten (10) residential floors and a ground parking area.
3. The Wellington Courtyard Buildings A to E - Country-style in design, this is another vacation condominium in Tagaytay City within the one-hectare property of OMICO Corporation. This project of residential Low-Rise Buildings (LRBs) covers two Phases, Phase I (2 LRBs) and Phase II (3 LRBs), with 192 units.
4. Gateway Garden Ridge is part of the Pioneer mixed-use development
in Mandaluyong which includes Robinsons Forum mall, four office buildings, Go Hotels Mandaluyong and several other residential buildings.
5. Escalades South Metro is composed of two (2) mid-rise residential buildings located in Sucat, Muntinlupa with generous open spaces allocated to amenities and facilities. Project amenities include a central clubhouse, swimming pool, and adequate play spaces for the kids.
6. The Pearl Place is a two-tower high-rise residential development located at the heart of Ortigas Center, Pasig City. Primarily intended for start-up families, investors, retirees and young/urban professionals, The Pearl Place boasts of affordable compact residential units in a modern setting. The development contains amenities at the 6th floor (Towers A and B) and 40th floor (Tower A), and retail spaces at the ground floor.
7. Axis Residences is a high-rise residential development located in Pioneer St., Mandaluyong City. The project is a joint venture project between Federal Land Inc. and Robinsons Land Corporation. It boasts of compact units that primarily caters to the housing needs of young urban professionals, investors and start up families.
8. Acacia Escalades is a mid-rise residential development located at the
corner of Calle Industria and Amang Rodriguez, Brgy. Manggahan,
18

Pasig City. The project comprise two mid-rise buildings with commercial component.
9. Chimes Greenhills is a 40-storey development that incorporates a hotel component and 24 floors of residential units, located at Annapolis St., Greenhills, San Juan. Recipient of the FIABCI Philippines Property and Real Estate Awards Silver Award for Outstanding Developer in the Residential High Rise Category for 2019.
10. Escalades East Tower is a 14-storey residential development with 11
residential floors located along 20th Ave., Cubao, QC and is part of the Escalades-Cubao complex.
11. Aurora Escalades Tower is a 21-storey residential development
located along Aurora Blvd., Cubao, QC and is the last building of the Escalades-Cubao complex.
12. Gateway Regency Studios is the last residential tower at the EDSA-
Pioneer mixed-use development offering studio units to urban professionals.
13. Bloomfields Novaliches is a horizontal residential development
situated behind the Robinsons Place Novaliches mall.
14. Centennial Place - This is a half-hectare townhouse development located in Bgy. Horseshoe, C. Benitez Street, Quezon City. It consists of fifty (50) townhouses, with lots ranging from 65 to 70 square meters.
15. Cirrus - First residential development in the premier township
development, Bridgetowne East, located at Rosario, Pasig City. Recognized by DOT Property Awards as the Best High Rise Development for 2019.
16. SYNC - S Tower is part of a four (4) tower residential development that
features a lifestyle retail wing and is located along C5 Bagong Ilog, Pasig. It is recognized by DOT Property Awards as the Best Value for Money Development in 2019.
17. Sierra Valley Garden - Buildings 1 & 2 is the first phase of residential
development in the mixed used development located at the boundary of Cainta & Taytay, Rizal.
The Company has decided to consolidate its three (3) vertical development brands into a singular brand. In 2021, Robinsons Communities projects were incorporated into the new RLC Residences brand. The Company will continue to be a key player in the affordable to middle-cost condominium market.
As the Company keeps abreast of market conditions, it is also preparing to officially launch in 2021 the results of its rebranding strategy aimed at creating
19

a cohesive brand identity that better resonates with its target customers. From the previous vertical residential groupings of Luxuria, Residences, and Communities, the Residential Division will now banner its products under a single, integrated brand – ‘RLC Residences’. It is expected to optimize resources and increase brand mindshare as a result of the simplified structure.
4) ROBINSONS HOMES
Robinsons Homes is one of the residential brands of RLC. It offers choice lots in master planned, gated subdivisions with option for house construction to satisfy every Filipino’s dream of owning his own home. As of December 31, 2020, Robinsons Homes has thirty nine (39) projects in its portfolio. Ten (10) of these projects are on-going construction. Among the thirty-nine (39) projects, twenty nine (29) have been substantially completed and sold. Key details of RLC’s projects in Robinsons Homes as of calendar year 2020 are set forth in the table below:
Name Location Started (1) Approximate Gross
Land Area (2) Number of Lots/Units
Robinsons Homes East ................................Antipolo City August 1995 41.0 3,735
Robinsons Vineyard ................................Cavite May 1996 71.8 2,899
South Square Village ................................Cavite August 1998 26.7 3,896
San Lorenzo Homes ................................Antipolo City September 1999 2.8 372
Robinsons Highlands ................................Davao City May 1999 46.0 811
Grosvenor Place ................................Cavite July 2000 13.9 999
Robinsons Hillsborough Pointe´ ................................Cagayan De Oro City November 2002 20.0 318
Forest Parkhomes ................................Angeles City August 2004 8.9 319
San Jose Estates ................................Antipolo City May 2005 1.8 80
Robinsons Residenza Milano ................................Batangas City August 2005 7.3 357
Fernwood Parkhomes ................................Pampanga November 2005 14.5 654
Rosewood Parkhomes ................................Angeles City November 2005 3.0 117
Bloomfields Tagaytay ..................... Tagaytay City November 2005 4.2 104
Richmond Hills ................................Cagayan De Oro City May 2005 8.3 282
Bloomfields Davao ......................... Davao City June 2006 10.5 316
Mirada Dos ................................................................Pampanga September 2006 4.5 181
Brighton Parkplace ................................Laoag City December 2006 5.0 172
Brighton Parkplace North ................................Laoag City April 2007 3.8 90
Montclair Highlands ................................Davao City July 2007 15.3 365
Aspen Heights ................................Consolacion, Cebu July 2007 25.0 583
Blue Coast Residences.................. Cebu N November 2007 3.2 79
Fresno Parkview ................................Cagayan de Oro City February 2008 15.0 501
St. Bernice Estates ................................Antipolo City March 2008 3.4 212
Hanalei Heights ................................Laoag City March 2011 22.2 558
Forest Parkhomes North ................................Angeles City March 2011 7.0 276
1 The Company considers a project “started” when it has obtained permits necessary that allow it to pre-sell lots. 2 “Gross Land Area” means the total area of land in hectares acquired by the Company
20

Name Location Started (1) Approximate Gross
Land Area (2) Number of Lots/Units
Grand Tierra ................................................................Tarlac May 2011 18.3 572
St. Judith Hills ................................................................Antipolo City June 2012 9.6 390
Bloomfields Heights Lipa ................................Lipa, Batangas July 2012 12.4 340
Nizanta at Ciudades ................................Davao City March 2013 12.9 477
Bloomfields Cagayan De Oro.......... Cagayan De Oro City March 2013 6.5 144
Brighton Baliwag............................. Baliwag, Bulacan April 2014 15.7 524
Bloomfields General Santos………. General Santos City May 2014 33.0 755
Brighton Bacolod…………………… Negros Island February 2016 22.4 735
Brighton Puerto Princesa………….. Palawan August 2016 13.1 377
Springdale I at Pueblo Angono…… Angono, Rizal November 2016 3.8 197
Brighton at Pueblo Angono…….… Angono, Rizal August 2017 4.6 140
Terrazo at Robinsons Vineyard… Dasmarinas, Cavite July 2017 13.4 328
Springdale II at Pueblo Angono… Angono, Rizal June 2018 4.9 271
Forbes Estates Lipa……………….. Lipa, Batangas December 2020 21.0 221
The Robinsons Homes portfolio of projects are described as follows: 1. Robinsons Homes East. A 41-hectare community development located in
Brgy. San Jose, Antipolo City, Rizal. The development consists of three enclaves: a.) Robinsons Homes East, a project with about 3,000 mixed houseand-lot packages; b.) San Jose Heights, a subdivision of more than 200 townhouse units and option for lot-only purchase; and finally, c.) Robinsons Commercial Arcade, featuring fourteen (14) shop house units at 190sqm/unit and eight commercial lots with a minimum size of 216 sqm/unit.
2. Robinsons Vineyard. A 71.8-hectare joint-venture project with Vine Development Corporation located in Dasmariñas, Cavite. It consists of about 2,900 residential lots with an average lot size of approximately 120 square meters each. In addition to the mid-cost residential lots offered in Robinsons Vineyard, Robinsons Homes also offers house and lot packages to prospective clients.
3. Southsquare Village. This is a 26.7-hectare socialized housing project located in General Trias, Cavite. On the average, each housing unit has a floor area of 20 square meters lying on a minimum 32 square meter lot. The project has almost 4,000 residential units. Southsquare Plaza, a commercial development within the subdivision, offers lots only, with minimum lot area of 100 square meters.
4. San Lorenzo Homes. This is a 2.8-hectare expansion project of
Robinsons Home East. It is a 372-unit neighborhood of 2-storey houses, each with a floor area of 48 square meters, built on lots with a minimum size of 40 square meters. This project has been fully completed.
5. Robinsons Highlands. This is a 46.0-hectare, middle-cost residential development located in Buhangin, Davao City, and a joint venture with
21

Lopzcom Realty Corporation. This project consists of three enclaves, namely Robinsons Highlands, Highland Crest, and Highlands Peak. This subdivision features over 800 residential lots with an average lot size of 180 square meters.
6. Grosvenor Place. This is a 13.9-hectare residential/commercial
development project located in Tanza, Cavite. This development offers 999 lots with an average lot cut of 120 square meters.
7. Robinsons Hillsborough Pointé. This subdivision is a 20-hectare joint
venture with Pueblo de Oro Development Corporation. The project is situated within the 360-hectare Pueblo de Oro Township project in Cagayan de Oro City. RLC’s share in the joint venture is 318 lots in four phases, which have been fully completed. The lots have an average size of 150 square meters.
8. Forest Parkhomes. An 8.9 hectare mid-cost residential subdivision in Bgy.
Pampang, Angeles City, Pampanga, Forest Parkhomes is RLC’s first housing development in the North. The project is a joint venture with Don Pepe Henson Enterprises, Inc. It offers 319 units with a minimum lot size of 150 square meters.
9. San Jose Estates. This is a 2-hectare residential enclave in front of
Robinsons Homes East in Antipolo City; the project consists of 80 units. Minimum cuts for residential lots is 120 square meters per unit.
10. Robinsons Residenza Milano. Set in the rustic village of San Isidro,
Batangas City, this 7.3-hectare Italian-inspired residential subdivision primarily caters to OFWs in Italy. Robinsons Homes’ first venture in Batangas offers 357 households with a minimum lot cut of 100 square meters per unit.
11. Fernwood Parkhomes. This 14.5-hectare residential subdivision in the
town of Mabalacat, Pampanga is strategically located right next to Sta. Ines exit of the NLEX. It is developed in partnership with Mayen Development Corp. and Mayen Paper Inc., this Mediterranean-inspired residential community features 654 households, each with a minimum lot cut of 120 square meters. A commercial development located along its frontage is also offered.
12. Rosewood Parkhomes. Located along Fil-Am Friendship Highway in
Brgy. Cutcut, Angeles City, this 3-hectare contemporary American-inspired joint venture project with Ms. Rosalie Henson-Naguiat offers exclusivity to 116 choice residential lots. The subdivision primarily offers lots-only, with option for housing, with an average-per-unit lot cut of 150 square meters for residential and 195 square meters for commercial.
13. Bloomfields Tagaytay. Located in the heart of Tagaytay City, this serene
contemporary American-inspired enclave features 104 prime residential lots with minimum lot cuts of 240 square meters. This 4.2-hectare haven
22

has ready access to the adjacent commercial center, hotel and sports facilities in addition to its own leisure amenities.
14. Richmond Hills. Located within an 8.3-hectare property of Dongallo
Family, this mid-cost subdivision in Brgy. Camaman-an, Cagayan De Oro City, offers both a scenic view of the city skyline and a serene living experience complemented by a picturesque view. Offering a total of 282 lots with option for housing and with an average lot cut of 150 square meters.
15. Bloomfields Davao. This exclusive 10.5-hectare residential subdivision in
Lanang, Davao City fronts the prestigious Lanang Golf Course and Country Club and is just 15 minutes away from downtown and Davao International Airport. Charmed with the American contemporary theme, this upscale residential development has 316 residential lots that is enveloped with fresh breeze from the mountains and sea.
16. Mirada Dos. This Spanish-themed clustered parkhomes in Northern Luzon
is situated within the 4.5-hectare property of the Miranda Family. Nestled along MacArthur Highway, Brgy. Sindalan, San Fernando, Pampanga, this mid-cost residential/commercial subdivision offers 181 lots with sizes ranging from 150 to 230 square meters.
17. Forest Parkhomes North. This is an exclusive 7-hectare residential
community located at Brgy. Pampang, Angeles City, Pampanga. This is a mid-cost residential subdivision with approximately 276 lots at an average lot cut of 150 square meters.
18. Hanalei Heights. A 22.2-hectare prime residential enclave located just a
few kilometers away from the Laoag International Airport and the famous Fort Ilocandia Hotel Complex, Hanalei Heights offers 558 lots at an average lot cut of 120 square meters. This project is located at Brgy. Balacad, Laoag City, Ilocos Norte.
19. Brighton Parkplace. A 5.0-hectare mid-cost residential development is
located at Brgy. Araniw, Laoag City, Ilocos Norte. Offering over 170 residential lots with predominant lot cuts ranging from 150 to 200 square meters, Brighton Parkplace also offers easy access to the Laoag International Airport and Robinsons Place Ilocos.
20. Brighton Parkplace North. This development is a 3.8-hectare residential
development located at Brgy. Cavit, Laoag City, Ilocos Norte. This subdivision offers 90 residential lots with lot sizes that range from 195 to 445 square meters.
21. Montclair Highlands. A 15.3-hectare residential development offers 365-
unit mid-cost residential cum commercial development is located along the Diversion Road in Buhangin, Davao City. Lot cuts range from 192 to 440 square meters.
23

22. Aspen Heights. A 25.0-hectare mid-cost residential development, located in Brgy. Tolo-tolo and Brgy. Danglag, Consolacion, Cebu, offers 583 units with predominant lot cut of 120 square meters.
23. Blue Coast Residences. This 3.2-hectare nature-endowed residential
resort community is located in the Mactan Island of Cebu. With 79 units at lot cuts ranging from 96 to 400 square meters, the project is also conveninetly located less than 5 minutes away from the Mactan International Airport and offers a picturesque sea view right from your own home.
24. Fresno Parkview. A 15.0-hectare mid-cost development is located in
Brgy. Lumbia, Cagayan de Oro. It offers 501 residential units with predominant lot cut of 150 square meters amidst its rolling terrain and impressive view.
25. St. Bernice Estates. This is an expansion of San Jose Estates, this
3.4-hectare residential project along the Antipolo-Teresa Highway in Bgy. San Jose, Antipolo City, offers 212 residential units with options for lot-only and house-and-lot packages.
26. Nizanta at Ciudades. This 12.9-hectare property is a tropical Asian-
inspired development located in Brgy. Mandug, Davao City. Prospective buyers may choose from 477 residential lots with lot cuts that range from 150 to 220 square meters.
27. Grand Tierra. This 18.3-hectare residential development is a Western-
inspired community located in Capas, Tarlac. This offers 572 lots with predominant lot cut of 140 square meters.
28. Bloomfields Heights Lipa. A 12.4-hectare premium residential
development located in Brgy. Tibig, Lipa City, Batangas. This masterplanned community showcases a modern tropical theme and offers 340 residential units. With a typical lot area of 192 square meters, this subdivision is also complemented by wide-open spaces and exclusive lifestyle amenities.
29. St. Judith Hills. A 9.6-hectare mid-cost development located in Brgy. San
Jose, Antipolo City. It is mediterranean-inspired with 279 residential lots with predominant lot cuts of 150 square meters for lots only and 111 townhouse units with a lot size of 75 square meters.
30. Bloomfields General Santos. A 33-hectare residential development
located in Brgy. Labangal, General Santos City. This tropical oasis in the heart of the city offers 755 residential and commercial lots with lot cuts ranging from approximately 200 to 600 square meters.
31. Bloomfields Cagayan De Oro. Enjoy relaxed tropical living at this
6.5-hectare haven where lush greenery over rolling terrain. Overlooking the majestic Cagayan De Oro skyline, this prime residential development
24

features 144 lots with lot cuts averaging 250 square meters in size.
32. Brighton Baliwag. A 15.7 hectare residential development located in Brgy. Sta. Barbara, Baliwag, Bulacan. This Mediterranean themed subdivision offers 524 residential lots with a predominant lot cut of 180 square meters.
33. Brighton Bacolod. This 22.4 hectare subdivision in Brgy. Estefania
Bacolod City is the first foray of Robinsons Homes in Negros Islands. The mediterranean-themed development has 735 residential lots with a predominant lot cut of 180 square meters.
34. Brighton Puerto Princesa. This mediterranean-themed subdivision offers
377 residential lots in a 13.1-hectare development catered to locals and tourists. Average lot area is 180 square meters which is complemented by amenities such as clubhouse, multi-purpose court and swimming pool.
35. Springdale I at Pueblo Angono. An affordable modern-contemporary
residential development spanning 3.8 hectares of land. This subdivision offers 197 units with a predominant area of 100 square meters.
36. Springdale II at Pueblo Angono. An affordable modern-contemporary
residential development spanning 4.9 hectares of land. This subdivision offers 271 units with a predominant area of 100 square meters.
37. Brighton at Pueblo Angono. An Asian-Tropical themed subdivision of
140 residential lots ideal for clients with a growing family. This development has a predominant lot cut of 180 square meters and is completed by amenities fit for families looking for a brighter future ahead.
38. Terrazo at Robinsons Vineyard. This 13.4-hectare contemporary-
themed expansion of Robinsons Vineyard offers 477 residential lots catered to middle-class families who want to reside in Dasmariñas, Cavite.
39. Forbes Estates Lipa. The flagship development under the premier Forbes
Estates brand. This 21-hectare luxury residential development of 221 lots is complimented by a 1-hectare Forbes Club amenity, a Forbes Park, and a community lifestyle center.
Some of these developments include lots zoned for commercial use. For projects undertaken through joint venture arrangements, these commercial lots are allocated equitably between RLC and its joint venture partners. The Company’s business plan for Robinsons Homes, subject to market conditions, is to launch at least two new projects per year. To this end, the Company is expanding the geographic region in which it seeks land by pursuing opportunities in select regional areas. As of December 31, 2020, it was in various stages of negotiations for the acquisition of vast tracks of land in key regional cities throughout the Philippines.
25

5) CHENGDU BAN BIAN JIE
It is 8.5 hectares in size with a plot ratio of 2.6 times resulting to approximately 220,000 square meters of buildable GFA. The project is spread over two phases consisting of residential condominium units, townhouses, car parks and shophouses/clubhouses.
As of December 31, 2020, Chengdu Ban Bien Jie project continued to perform remarkably well with recorded sell-out for both its residential and townhouse components. 92% of the project had been sold, while construction for Phase 2 continues to be on track. Revenues shall be recognized after completely satisfying regulatory requirements for the turnover of the units to the individual buyers.
iii. Office Buildings Division
RLC’s Office Buildings Division develops office buildings for lease. The Office Buildings Division accounted for P=5.85 billion or 23% of RLC’s revenues and P=5.08 billion or 37% of RLC’s EBITDA in calendar year 2020, and P=5.32 billion or 17% of RLC’s revenues and P=4.56 billion or 27% of RLC’s EBITDA in calendar year 2019. As of December 31, 2020 and 2019, the Company’s Office Buildings Division had assets valued on a historical cost less depreciation basis at P=28.49 billion and P=24.31 billion, respectively. RLC engages outside architects and engineers for the design of its office developments. Due to the sustained growth from the IT Business Process Management (IT-BPM) sector and increasing office space demand from multinational and logistic companies, the Company has secured a number of major customers as long-term tenants in its office buildings. It also has continuously improved its developments including building features, office layouts and amenities. The Company is one of the leading providers of office spaces in the Philippines. In its effort to be environmentally responsive, Robinsons Offices has built sustainable, green office buildings over the years. The projects are Leadership in Energy and Environmental Design (LEED) certified. The US Green Building Council registered LEED buildings are: Tera Tower (LEED Gold), Exxa Tower (LEED Silver), Zeta Tower (LEED Silver) and Giga Tower (LEED Gold). In addition, Robinsons Offices has placed high emphasis on the health and well-being of its tenants. In this regard, it embarked on deploying technological innovations for its buildings such as metal detectors with thermal scanners and destination control elevators with turnstiles. These provide safe and easy access to premises within the building. Also, the Company installed microbial film on frequently touched surfaces to help prevent the spread of viruses. In 2020, the Office Buildings Division completed two new offices namely Robinsons Luisita Office 3 (located within the Company’s Robinsons Luisita
26

Complex in Tarlac City) and Cybergate Delta 2 (located within the Robinsons Cyberpark Davao). The two new offices increased net leasable area by 4% to 613,000 square meters and brought the total count of office developments located in central business districts and in key cities across the country to twenty-five (25). System-wide leased rate rate as of December 31, 2020 is 91%. Meanwhile, the Company continues to strengthen its portfolio of flexible workspace business, ‘work.able’. work.able offers plug and play workspaces to clients who are looking for flexible office options such as private offices, venues for meetings and events and co-working spaces. In November 2020, the Company successfully completed its first two (2) build-to-suit work.able projects at Giga Tower and Cyber Sigma with sign-ups from two multinational companies, capping the number of operational work.able sites to five (5) as of December 31, 2020. Also in 2020, the Office Buildings Division partially completed Cyber Omega which is located in Ortigas Center, Pasig City. Together with one (1) Metro Manila and three (3) provincial office structures, the Company is expected to complete Cyber Omega in 2021 which will boost the total leasable area by approximately 18%. The table below sets out certain key details of RLC's office portfolio as of December 31, 2020:
Name Location Size &
Designation
Galleria Corporate Center ................................Along EDSA corner Ortigas Avenue, Quezon City 30 storeys
Robinsons Equitable Tower ................................Corner of ADB and Poveda Streets, Pasig City 45 storeys
Robinsons Summit Center ................................Ayala Avenue, Makati City 37 storeys
Robinsons Cybergate Center Tower 1 ..................Pioneer Street, Mandaluyong City 18 storeys
Robinsons Cybergate Center Tower 2 ..................Pioneer Street, Mandaluyong City 27 storeys
Robinsons Cybergate Center Tower 3 ..................Pioneer Street, Mandaluyong City 27 storeys
Robinsons Cybergate Plaza ................................EDSA, Mandaluyong City 12 storeys
Robinsons Cybergate Cebu ...............................Fuente Osmena, Bo. Capitol, Cebu City 3 storeys
Cyberscape Alpha…................................... Sapphire and Garnet Roads, Pasig City 26 storeys
Cyberscape Beta........................................ Ruby and Topaz Roads, Pasig City 37 storeys
Tera Tower…………………………………… Bridgetowne, C5 Road, Quezon City 20 storeys
Robinsons Galleria Cebu Office…………… Gen. Maxilom Avenue, Cebu City 4 storeys
Robinsons Place Ilocos Office……………... San Nicolas, Ilocos Norte 4 storeys
Cyber Sigma………………….……………... Fort Bonifacio, Taguig City 21 storeys
Robinsons Luisita Office………………….... Luisita, Tarlac City 3 storeys
Cybergate Delta.…………….…………….... JP. Laurel Ave., Davao City 5 storeys
Cybergate Naga.…………………………..... Roxas Ave., Naga City 4 storeys
Cyberscape Gamma………………………... Ruby and Topaz Roads, Pasig City 37 storeys
Exxa Tower…………………………………...
Zeta Tower……………………………………
Bridgetowne, C5 Road, Quezon City
Bridgetowne, C5 Road, Quezon City
20 storeys
20 storeys
Cybergate Magnolia………………………… Robinsons Magnolia Town Center, Quezon City 6 storeys
Robinsons Luisita Office 2…………………. Luisita, Tarlac City 2 storeys
27

Name Location Size &
Designation
Giga Tower…………………………………... Bridgetowne, C5 Road, Quezon City 28 storeys
Robinsons Luisita Office 3…………………. Luisita, Tarlac City 28 storeys
Cybergate Delta 2…………………………... JP Laurel Ave., Davao City 28 storeys
The Company’s completed office buildings are described as follows: 1. Galleria Corporate Center. This is a 30-storey office tower located along
EDSA corner Ortigas Avenue in Quezon City which is directly connected to the Robinsons Galleria shopping mall. The office tower has an approximate net floor area (comprising only leasable space) of 25,000 square meters. As of December 31, 2020, approximately 85% of the Galleria Corporate Center had been sold while the remaining areas, which are owned by RLC, had a 57% occupancy rate.
2. Robinsons-Equitable Tower. This is a 45-storey office tower located at
the corner of ADB Avenue and Poveda Street in Pasig City. The office tower has an approximate net floor area (comprising only leasable space) of 52,000 square meters. As of December 31, 2020, RLC had sold approximately 70% of the net floor area within Robinsons-Equitable Tower and retains the rest for lease. RLC-owned units within Robinsons-Equitable Tower had a 93% occupancy rate as of December 31, 2020.
3. Robinsons Summit Center. This is a 37-storey office tower located along Ayala Avenue in the Makati central business district. The office tower has an approximate net floor area (comprising only leasable space) of 31,000 square meters. RLC owns and is currently leasing out substantially all of the net floor area of this building. RLC-owned units within Robinsons Summit Center had a 84% occupancy rate as of December 31, 2020.
4. Robinsons Cybergate Center Tower 1. This is an 18-storey office building complex located at Pioneer St., Mandaluyong. The office building has an an approximate gross leasable area of 27,000 square meters. RLC owns 100% of the net floor area. Robinsons Cybergate Center Tower 1 had a 78% occupancy rate as of December 31, 2020.
5. Robinsons Cybergate Center Tower 2. This is a 27-storey office building, located in the Pioneer mixed-use complex next to Robinsons Cybergate Center Tower 1. The office building has an approximate gross leasable area of 44,000 square meters. RLC owns 100% of the net floor area. Robinsons Cybergate Center Tower 2 had a 100% occupancy rate as of December 31, 2020.
6. Robinsons Cybergate Center Tower 3. This is a 27-storey office buildings, located in the Pioneer mixed-use complex. The office building has an approximate gross leasable area of 44,000 square meters. RLC owns 100% of the net floor area. Robinsons Cybergate Center Tower 3 had a 90% occupancy rate as of December 31, 2020.
28

7. Robinsons Cybergate Plaza. This is a 12-storey building, located within the Pioneer mixed-use complex, along EDSA. The building has 2 hotel floors with an approximate area of 7,000 square meters and small-cut retail spaces at the ground floor. The office floors are located at the 2nd, 7th to 12th floors with an approximate gross leasable area of 25,000 square meters. RLC owns 100% of the net floor area. Robinsons Cybergate Plaza had a 86% occupancy rate as of December 31, 2020.
8. Robinsons Cybergate Cebu. This is a mixed-use building with a mall and
office space located in Fuente Osmena Circle, Cebu City. The office space comprise three floors located on top of the mall with an approximate gross leasable area of 7,000 sqm. As of December 31, 2020, the office floors had an occupancy rate of 100%.
9. Cyberscape Alpha. This is a 26-storey building, located along Sapphire
and Garnet Roads within the Ortigas CBD, only a stone’s throw away from Robinsons Galleria. The building has 3 hotel floors with an approximate area of 6,000 square meters and small-cut retail spaces at the ground floor. The office floors are located from the 5th to the 26th levels. The building has a gross leasable area of approximately 38,500 square meters. RLC owns 100% of the gross floor area. Cyberscape Alpha had a 100% occupancy rate as of December 31, 2020.
10. Cyberscape Beta. This is a 37-storey building, located along Topaz and
Ruby Roads within the Ortigas CBD. Retail spaces are located at the Ground and Mezzanine levels. The office floors are located from the 9th to the 37th levels. The building has a gross leasable area of approximately 42,000 square meters. RLC owns 100% of the gross floor area. Cyberscape Beta had a 91% occupancy rate as of December 31, 2020.
11. Tera Tower. This is a 20-storey building, located within the Bridgetowne
Complex in C-5 Road, Ugong Norte in Quezon City. The building has retail support at the ground floor. The office spaces are located at the 6th to 20th floors. The building has a gross leasable area of approximately 35,000 square meters. RLC owns 100% of the gross floor area. Tera Tower had a 100% occupancy rate as of December 31, 2020.
12. Robinsons Galleria Cebu Office. The office development is integrated
with the mall. It is located at General Maxilom Avenue, corner Sergio Osmena Boulevard in Cebu City. It has a total gross leasable area of approximately 8,500 square meters. The office has its own lobby and RLC owns 100% of the gross floor area. Robinsons Galleria Cebu had a 100% occupancy rate as of December 31, 2020.
13. Robinsons Place Ilocos Office. This office development is integrated
with the mall expansion. The office development has a gross leasable area of 7,500 square meters and it is 100% owned by RLC.
14. Cyber Sigma. This is a 21-storey office development located in Fort
Bonifacio, Taguig City. The office project has access to both Lawton
29

Avenue and Le Grand in Mckinley West. It has a leasable area of approximately 50,000 sqm and was completed last December 2017. It had an occupany rate of 98% as of December 31, 2020.
15. Robinsons Luisita Office. This build to suit development consists of a 3-
storey of dedicated office space to a BPO client. The space was commited ahead and was custom built based on the requirement of our client. It has a leasable area of 5,700 sqm and was completed last October 31, 2017. As of December 31, 2020, it had a 100% occupancy rate.
16. Cybergate Delta. This is a 5-storey office project located within the PEZA
registered IT Park, Robinsons Cyberpark located in JP. Laurel Avenue in Davao City. The development sits on more than a hectare property and has it’s own commercial spaces at the ground floor to support its office tenants’ food and dining requirements. It has a leasable area of approximately 11,900 sqm and was completed last December 2017. As of December 31, 2020, it had an occupancy rate of 100%.
17. Cybergate Naga. This office development is located within the Robinsons
Place Naga complex in Roxas Ave, Naga City. It is a 4-storey office development with a leasable area of approximately 5,700 sqm. As of December 31, 2020 occupancy rate is at 100%.
18. Cyberscape Gamma. This is a 37-storey building, located along Topaz
and Ruby Roads within the Ortigas CBD. This is interconnected with Cyberscape Beta via its Ground, Mezzanine and parking floors. The building has a gross leasable area of approximately 43,500 square meters. This was completed in December 2019 and it had a 99% occupancy rate as of December 31,2020.
19. Exxa Tower. This 20-storey office building, located within the Bridgetowne Complex in C-5 Road, Ugong Norte in Quezon City, is a twin tower of Zeta Tower. They share common retail and parking podium floors. The building including the 2 floors of retail spaces has a gross leasable area of approximately 39,800 square meters. RLC owns 100% of the gross floor area. As of December 31, 2020, it had an occupancy rate of 96%.
20. Zeta Tower. This is a 20-storey office building, located within the Bridgetowne Complex in C-5 Road, Ugong Norte in Quezon City. The building has a gross leasable area of approximately 34,500 square meters. RLC owns 100% of the gross floor area. The building was completed in December 31, 2020 and as of the same period, it had an occupancy rate of 86%.
21. Cybergate Magnolia. This is a 6-storey office development located on top
of the Robinsons Magnolia expansion in Quezon City. The building has a gross leasable area of 10,500 sqm. RLC owns 100%. The building was completed in October 2019.
30

22. Robinsons Luisita Office 2. This build to suit development consists of a 2-storey of dedicated office space to a BPO client. The space was commited ahead and was custom built based on the requirement of the client. It has a leasable area of 5,000 sqm and was completed last December 2019. As of December 31, 2020, it had a 100% occupancy rate.
23. Giga Tower. This is a 28-storey office building, located within the
Bridgetowne Complex in C-5 Road, Ugong Norte in Quezon City. The building has a gross leasable area of approximately 53,200 square meters. RLC owns 100% of the building. The building was completed in December 2019 and it had an occupancy rate of 97%.
24. Robinsons Luisita Office 3. This build to suit development consists of 3-
storeys and is solely occupied by a BPO client. The space was pre-commited and was custom-built based on the requirement of the client. It has a leasable area of 5,600 sqm and was completed last October 2020. As of December 31, 2020, the building has an occupancy rate of 100%.
25. Cybergate Delta 2. This is a 7-storey office project located within Robinsons Cyberpark along JP. Laurel Avenue in Davao City. This is a PEZA registered IT Park. Furthermore, the development sits on a property that is a little more than a hectare. The development has its own commercial spaces to support its office tenants’ food and dining requirements. It has a leasable area of approximately 15,400 sqm and was completed last December 2020. As of December 31, 2020, it had an occupancy rate of 40%.
As of calendar year 2020, the Company has six (6) office projects in the planning and development stage and for completion in the next two (2) years.
iv. Hotels and Resorts Division
RLC’s Hotels and Resorts Division owns, develops, and operates hotels and resorts within Metro Manila, and urbanized and targeted tourist destinations in the Philippines. The Hotels and Resorts Division’s revenue and EBITDA contribution to RLC in calendar year 2020 was P=1.08 billion or 4% and P=0.15 billion or approximately 1%, respectively. For the previous calendar year 2019, revenue and EBITDA contribution to RLC was P=2.43 billion or 8% and P=0.70 billion or 4%, respectively. As of December 31, 2020 and 2019, the Company’s Hotels and Resorts Division had assets valued on a historical cost less depreciation basis at P=10.03 billion and P=10.19 billion, respectively. The Hotels and Resorts Division carries the following brand segments: 1. Upscale international deluxe hotels – RLC owns Crowne Plaza Manila
Galleria (“Crowne Plaza”) and Holiday Inn Manila Galleria (“Holiday Inn”). Crowne Plaza and Holiday Inn are managed by Holday Inn (Philippines), Inc., a subsidiary of the InterContinental Hotels Group (“InterContinental”), pursuant to a long-term hotel management agreement. Crowne Plaza and
31

Holiday Inn offer MICE (meetings, incentives, conferences, events) facilities, guest activities and services, and dining services.
2. Mid-market boutique city and resort hotels – RLC owns and manages the Summit Hotels and Resorts brand, RLC’s own contemporary hotel and resort brand that caters to the middle market. Summit Hotels and Resorts are located in Metro Manila and in other urbanized areas in the Philippines, with some equipped with MICE facilities, sports and pool amenities, and full service restaurants.
3. Essential service value hotels – RLC owns and manages the Go Hotel
brand, which caters to smart and busy travellers. Go Hotels offer comfortable yet affordable accomodations and an option to add on services and amenities as they need them. Go Hotels are present in Metro Manila and in emerging urban locations around the Philippines.
4. 4. Luxury resorts – In 2019, RLC opened its first luxury resort with Dusit
Thani Mactan Cebu Resort. This resort is managed by Dusit Thani International. RLC has engaged in a long-term hotel management agreement with Dusit Thani International. The 272-room hotel and resort sits at the northern tip of Punta Engano Peninsula and boasts of complete MICE facilities, guest activities and services, dining services, and luxury room and bath amenities.
RLC has entered into an agreement with its franchisee, Roxaco-Asia Hospitality Corporation, for four (4) Go Hotels present in Manila Airport Road, Ermita Manila, Timog-Quezon City, and North EDSA-Quezon City. Combined, the five Go Hotels account for 804 rooms.
The table below sets out certain key details of RLC's company-owned portfolio of hotels and resorts as of December 31, 2020:
Name Location Number of Operational
Rooms
Crowne Plaza Manila Galleria …. Ortigas Avenue, Cor ADB Avenue, Quezon City
263
Holiday Inn Manila Galleria…………………………....
One ADB Avenue, Ortigas Center, Pasig City
285
Dusit Thani Mactan Cebu Resort.. Punta Engaño, Mactan Island, Cebu City
272
Summit Circle Cebu (formerly Cebu Midtown Hotel) …………… Fuente Osmena, Bo. Capitol, Cebu City 211
Summit Ridge Tagaytay ………... Aguinaldo Highway, Tagaytay City 108
Summit Hotel Magnolia…………. Dona Hemady cor. Aurora Boulevard, Quezon City
82
Summit Galleria Cebu..…………. Benedicto St. Cor. Gen. Maxilom Ave. Ext., Cebu City
220
Summit Hotel Tacloban…………. National Highway, Marasbaras, Tacloban City
138
Summit Hotel Greenhills…………. Annapolis St., Brgy. Greenhills, San Juan City
100
32

Go Hotel ………………………….. Pioneer Street, Mandaluyong City 223
Go Hotel ………………………….. Puerto Princesa City, Palawan 108
Go Hotel ………………………….. Dumaguete City, Negros Oriental 102
Go Hotel ………………………….. Tacloban City, Leyte 98
Go Hotel ………………………….. Bacolod City, Negros Occidental 108
Go Hotel ………………………….. Paco, Manila 118
Go Hotel ………………………….. Iloilo City, Iloilo 167
Go Hotel ………………………….. Ortigas Center, Pasig City 198
Go Hotel…………………………... Butuan City, Agusan Del Norte 104
Go Hotel…………………………... Lanang, Davao City 183
Go Hotel…………………………... Iligan City, Lanao Del Norte 100
Total 3,188
In 2020, RLC operated a maximum of 13 of its 20 hotel properties in the midst of a global pandemic that crippled the hospitality and tourism industries. Occupancy rates in these operational hotels ranged from 20% to 96% as of December 31, 2020. Meanwhile, the completion of remaining rooms in Dusit Thani Mactan Cebu increased total room keys to approximately 3,188.
In response to the challenges brought about by quarantine measures, RLC repurposed its accommodation facilities and offered relevant solutions to customes. Summit Hotels and Resorts and Go Hotels launched ‘Working-On-the-Go Private Offices’ to offer affordable private office packages for the growing work-at-home population. Go Hotels also rolled out long-stay services under the ‘Just-Got-Home’ program, which primarily attracted urban professionals looking for a budget-friendly place that is in close proximity to their workplaces and other key establishments.
In preparation for the anticipated recovery of domestic tourism in the near-term, the Hotels and Resorts Division plans to increase hotel room count by 10% to over 3,400 operational rooms with the opening of Summit Naga, Summit GenSan, Go Hotels Naga and Go Hotels Tuguegarao. In 2022, RLC intends to launch Fili Urban Resort, the Philippines’ first ever five-star homegrown hotel, and Westin Sonata, our fourth international hotel. These new properties will push total hotel room count up by 19% to over 4,100 rooms by the end of 2022.
v. Industrial and Integrated Developments (IID)
IID is focused on strategic land bank acquisition and management, exploration of real estate-related infrastructure projects, strategic partnerships, and development of warehouse and logistics facilities. Despite the COVID-19 pandemic, IID carried on with the development of its destination estates namely Bridgetowne--the 30.6-hectare property that connects the cities of Pasig and Quezon, Sierra Valley--the 18-hectare
33

property in Cainta and Taytay, Rizal, and Montclair—the 204-hectare property in Porac, Pampanga. For Bridgetowne, sufficient progess for the completion of its Phase 1 was accomplished in 2020 and it is expected to be completed by 2021. Sierra Valley’s interim retail component was completed in 2020 and 50% of which has been leased out by the end of the year. For Montclair, the early development of its new interchange connecting to SCTEX started in 2020. The Company expects to receive all necessary permits and approvals for the new interchange in 2021. Under its investment arm, IID expanded its industrial leasing business which registered a net leasable area by the end of 2020 at 99,000 square meters, a 29% increase versus the previous year, with the completion of its third and fourth industrial facilities located in Calamba, Laguna and in Sierra Valley in Cainta. IID’s investment portfolio accounted for P=0.26 billion or 1% of RLC’s revenues and P=0.14 billion or 1% of RLC’s EBITDA in calendar year 2020, and P=0.14 billion or 1% of RLC’s revenues and P=0.04 billion or 0.2% of RLC’s EBITDA in calendar year 2019. On the other hand, developmental revenues from the partial recognition of gains on the sale of prime lots to Robinsons-DMC, Inc. (RDMCI) and Shang Robinsons Properties, Inc. (SRPI) reached P=0.13 billion or 1% of RLC’s revenues and P=0.10 billion or 1% of RLC’s EBITDA in calendar year 2020, and P=0.32 billion or 1% of RLC’s revenues and P=0.20 billion or 1% of RLC’s EBITDA in calendar year 2019. As of December 31, 2020 and 2019, the Company’s IID Division had assets valued on a historical cost less depreciation basis at P=21.47 billion and P=21.71 billion, respectively. RLC will continue to make substantial progress in its landmark desitnation estates. To strengthen earnings, the division will likewise explore innovative real estate formats, new business ventures, and strategic partnerships for its mixed-use developments
c) Significant Subsidiaries
As of December 31, 2020, RLC has eleven (11) subsidiaries, all of which are consolidated with the Company’s financial statements.
On March 4, 2009, the Securities and Exchange Commission (SEC) approved the plan of merger of the Parent Company with wholly-owned subsidiaries, Robinsons Homes, Inc. (RHI), Trion Homes Development Corporation (THDC) and Manila Midtown Hotels and Land Corporation (MMHLC). The merger resulted to enhanced operating efficiencies and economies, increased financial strength through pooling of resources and more favorable financing and credit facilities. No Parent Company shares were issued in exchange for the net assets of RHI, THDC and MMHLC.
34

The merger was accounted for similar to a pooling of interest method because the combined entities were under common control, therefore, has no effect on the consolidated financial statements. The subsidiaries after the merger are RII, RRMC, RPMMC, RCL, AAI, AMVI, GHDI, RLCRL, BPVI, BRFLC and RLGBLC.
Key details of each of RLC’s subsidiaries are set forth below.
1. Robinson's Inn, Inc. Robinson’s Inn, Inc. (RII) was incorporated on October 19, 1988, has a registered share capital of 25,000,000 and is 100%-owned by RLC. RII’s principal business is to engage in the development and operation of apartelles, inns, motels, condominiums, apartments and other allied business, and to acquire, purchase, sell, assign or lease land, buildings and other improvements. RII is part of the Company’s hotels and resorts division, and runs the Robinsons Apartelle which closed operations effective August 31, 2007.
2. Robinsons Realty and Management Corporation. Robinsons Realty and Management Corporation (RRMC) was registered with the Philippine Securities and Exchange Commission on May 16, 1988 primarily to acquire by purchase, lease, donation or otherwise, and to own, use , improve, develop, subdivide, sell, mortgage, exchange, lease and hold for investment or otherwise, real estate of all kinds.
3. Robinsons Properties Marketing & Management Corporation. Robinsons Properties Marketing & Management Corporation (RPMMC) was incorporated on November 25,1998, has a registered share capital of 1,000,000 and is 100%-owned by the Parent Company. RPMMC is part of the Company’s Residential Division. RPMMC manages the marketing of the portfolio of residential units that are available for sale through the Residential Division's Robinsons Communities, Robinsons Residences, and Robinsons Luxuria brands. RPMMC’s primary purpose is to acquire, own, use, sell, exchange, lease and develop real property of all kinds, and to market, manage or otherwise sell and convey buildings, houses, apartments and other structures of whatever kind together with their appurtenances.
4. Robinsons (Cayman) Ltd. Robinsons (Cayman) Ltd (RCL) was incorporated in Cayman Islands, British West Indies on March 25, 1997 with a registered authorized capital stock of US$50,000.00 at $1.00 per share, 1,000 shares of which is subscribed and paid up by the Parent Company. RCL acts as a real estate agent on the international market, among others, for the Residential Division.
5. Altus Angeles, Inc. Altus Angeles, Inc. (AAI) was incorporated on October 30, 2002, has a registered share capital of 400,000 and is 51%-owned by the Parent Company. AAI is a joint venture within the Company’s Commercial Centers Division. AAI’s principal business is to establish, manage and maintain commercial complexes, offer such services and merchandise of all kinds and to do and perform such acts as necessary or incidental to the accomplishment of the foregoing corporate business objects insofar as may be allowed by applicable rules and regulations.
35

6. Altus Mall Ventures, Inc. Altus Mall Ventures, Inc. (AMVI) was incorporated on August 19, 2002, has a registered share capital of 4,000,000 and is 100%-owned by the Parent Company. AMV’s primary purpose is to acquire by purchase, lease, donation or otherwise, and to own, use, improve, develop, subdivide, sell, mortgage, exchange, lease and hold for investment or otherwise, real estate of all kinds.
7. GoHotels Davao, Inc. GoHotels Davao, Inc. (GHDI) was incorporated on March 13, 2013, has a registered share capital of 100,000,000 and is 51%-owned by the Parent Company. GHDI is a joint venture between RLC within the Hotels and Resorts Division and Udenna Development Corporation (UDEVCO). GHDI's principal business is to establish, acquire, own, develop, operate and manage hotels and/or transient guest lodging services under the "gohotels.ph" mark and other similar and ancillary facilities and services related to the hospitality and allied industries, offer such services and merchandise to the public in connection with the operation of hotels and/or transient guest lodging services, and to make and enter into all kinds of contracts, agreements and obligations with any person, partnership, corporation or association for the leasing of commercial space or the disposition, sale, acquisition of goods, wares, merchandise, and services of all kinds and to do and perform such acts and things necessary or incidental to the accomplishment of the foregoing corporate business and objects as may be allowed by applicable laws, rules and regulations.
8. RLC Resources, Ltd. RLC Resources, Ltd. (RLCRL) was incorporated on September 10, 2001 in the British Virgin Islands as an International Business Company, has an initial registered share capital of 50,000, which was increased to 500,000 in fiscal year 2016 and is 100%-owned by the Parent Company. RLC Resources, Ltd.’s principal business is to purchase or otherwise acquire and undertake the whole or any part of the business, goodwill, assets and liabilities of any person, firm or company; to acquire an interest in, amalgamate with or enter into arrangements with any person, firm or company; to promote, sponsor, establish, constitute, form, participate in, organize, manage, supervise and control any corporation, company, fund, trust, business or institution; to purchase or otherwise acquire and hold, in any manner and upon any terms, and to underwrite, invest and deal in shares, stocks, debentures, debenture stock, annuities and foreign exchange, foreign currency deposits and commodities and enter into any interest rate exchange contracts, forward contracts, futures contracts and enforce all rights and powers incidental to RLCRL’s interest therein.
9. Bonifacio Property Ventures, Inc. Bonifacio Property Ventures, Inc. (BPVI) was incorporated on December 21, 2018, has a registered share capital of 1,000,000,000 with a par value of Php 1.00 per share, 500,000,000 shares of which is subscribed and paid up by the Parent Company. BPVI’s principal business is to acquire by purchase, lease, donation or otherwise, and to own, use, improve, develop, subdivide, sell, mortgage, exchange, lease, develop and hold for investment or otherwise, real estate of all kinds, whether improve, manage or otherwise dispose of buildings, houses, apartments and other real estate and/or structures of whatever kind, together with their oppurtenances.
36

10. Bacoor R and F Land Corporation. Bacoor R&F Land Corporation (BRFLC) was incorporated on October 15, 2018, has a registed share capital of 10,000,000 with a par value of Php 100.00 per share, 4,000,000 shares of which is subscribed and paid up by Parent Company. BRFLC’s principal business is to acquire, own, and hold real estate properties situated in Bacoor City, Province of Cavite or any other properties approved by the Board of Directors or stockholders of the corporation, and to sell, lease, mortgage, alienate or develop the parcels of land acquired by the corporation.
11. RLGB Land Corporation. RLGB Land Corporation (RLGBLC) was incorporated on June 7, 2019, has a registed share capital of 5,000,000,000 and is 51%-owned by the Parent Company. RLGBLC’s principal business is to acquire by purchase, lease, donation or otherwise, and to own, use, improve, develop, subdivide, sell, mortgage, exchange, lease, develop and hold for investment or otherwise, real estate of all kinds, whether to improve, manage or otherwise dispose of buildings, houses, apartments and other real estate and/or structures of whatever kind, together with their appurtenances.
On July 31, 2019, the BOD of the Parent Company approved the declaration of property dividend, of up to One Hundred Million (100,000,000) common shares of APVI in favor of the registered shareholders (the Receiving Shareholders) of the Parent Company as of August 15, 2019. The SEC approved the property dividend declaration on November 15, 2019 and the Certificate Authorizing Registration was issued by the Bureau of Internal Revenue on December 6, 2019.
The Receiving Shareholders received a ratio of one (1) share of APVI for every fifty-one and 9384/10000 (51.9384) shares of the Parent Company, net of applicable final withholding tax on December 20, 2019. No fractional shares were issued and no shareholder was entitled to any fractional shares.
RLC’s remaining interest in APVI after the dividend distribution is 6.11%.
d) Competition
i. Commercial Centers Division
RLC has two major competitors in its Commercial Centers Division—SM Prime Holdings, Inc. (SMPHI) and Ayala Land, Inc. (ALI). Each of these companies has certain distinct advantages over RLC, including SMPHI's considerably larger mall portfolio and ALI's access to prime real estate in the heart of Metro Manila. In terms of total assets and equity accounts as of September 30, 2020, the mall segment of SMPHI has P=378.2 billion and P=138.2 billion while the mall segment of ALI has P=205.9 billion and P=70.8 billion, respectively. There are a number of other players in the shopping mall business in the Philippines, but they are significantly smaller and, because of the high barriers to entry into the business (which include cost, branding, reputation, scale and access to prime real estate), RLC expects that it will continue to compete principally with these two major companies in this market sector for the foreseeable future. RLC has,
37

however, recently seen an increase in the development of specialty malls by companies that are not traditional players in the industry, and it is unclear whether or how this trend might affect the competitive landscape. Shopping mall operators also face competition from specialty stores, general merchandise stores, discount stores, warehouse outlets, street markets and online stores. RLC believes its strength is in its mixed-use, retail, commercial and residential developments. RLC operates on the basis of its flexibility in developing malls with different sizes depending on the retail appetite of the market per location. It is focused on balancing its core tenant mix and providing a more distinctive shopping mall experience to its loyal customers, as well as its ability to leverage the brand equity and drawing power of its affiliated companies in the retail trade business.
ii. Residential Division
1. Robinsons Luxuria
The Robinsons Luxuria brand continues to develop projects that caters to the high-end market. It strives to compete with developers who have already established their names in tapping this slice of the market. RLC aims to increase its share of this elite market segment and steer buyers of competitors such as Ayala Land Premier, Rockwell Land Corporation (ROCK), Century Properties Group, Inc. (CPGI) and Megaworld Corporation (MEG) to its developments. ROCK’s total assets and equity accounts as of September 30, 2020 amounted to P=62.4 billion and P=24.8 billion, respectively; CPGI’s total assets and equity accounts as of September 30, 2020 amounted to P=53.9 billion and P=21.3 billion, respectively, while MEG’s total assets and equity accounts as of September 30, 2020 amounted to P=374.7 billion and P=211.5 billion, respectively.
2. Robinsons Residences
RLC’s competitors (Alveo Land, MEG, Filinvest Land, Inc. (FLI), and Ortigas & Co.) under this segment targets the same market and offers similar products. There are also a number of players who try to compete in this segment of the market with one or two projects. Projects under Robinsons Residences remain among the top of mind developments as a result of growing experienced sales and distribution network and convenient locations. Projects are located within Central Business Districts or RLC’s mixed-use development.
3. Robinsons Communities
Robinsons Communities has numerous competitors in the middle income segment. This is in part a function of the fact that as compared to other business areas, RLC does not enjoy the same "early mover" advantage. Currently, Robinsons Communities' competitors include
38

companies like Avida Land (AL), FLI, SMPHI and DMCI Homes. As of September 30, 2020, total assets and equity accounts amounted to P=178.7 billion and P=73.2 billion, respectively, for FLI while total assets and equity accounts of SMPHI’s property development segment as of September 30, 2020 amounted to P=692.8 billion and P=303.8 billion, respectively. Based on public records and independent industry reports and its own market knowledge, the Company believes that it is among the top five middle-ranged condominium developers in the Philippines in terms of revenues from sales. The Company believes that it can successfully compete in this market segment on the basis of its brand name, technical expertise, financial standing and track record of successfully completed, quality projects.
4. Robinsons Homes
Recognizing the growing housing market in the Philippines, RLC continues to embark on building subdivisions through its Robinsons Homes brand. For families aspiring to own their first home or upgrade to a better abode and neighborhood, Robinsons Homes provides them themed, master-planned, secure and gated horizontal subdivisions in key urbanized cities nationwide ideal to start the good life. In order to cater to varying market profiles, Robinsons Homes launched its five sub-brands namely: Forbes Estates for Premier development, Bloomfields for the high-end market, Brighton for mid-cost development, Springdale for the affordable market segment and Happy Homes for socialized housing. It stands in close competition with ALI, FLI and Vista Land & Lifescapes, Inc. (VLL). Total assets and equity accounts of VLL as of September 30, 2020 amounted to P=286.9 billion and P=104.9 billion, respectively. Robinsons Homes competes on the basis of location. It is a nationwide residential subdivision developer with projects in Laoag, Tarlac, Pampanga, Antipolo, Angono, Cavite, Batangas, Puerto Princesa, Bacolod, Cebu, Cagayan de Oro, Davao and General Santos. Robinsons Homes is committed to provide green communities with lifestyle amenities in response to changing needs of the market. The Company believes that its market specific branding, reliability to deliver and consistent quality products at an affordable price has contributed to its ability to generate sales and its overall success.
iii. Office Buildings Division
The Company believes that competition for office space is principally on the basis of location, quality and reliability of the project’s design and equipment, reputation of the developer, availability of space, and PEZA registration. The biggest competitors of the Company under this segment are ALI, Megaworld and SM.
39

The Company competes in this market on the basis of the strategic locations of its buildings, including their proximity to the malls and residences as part of its mixed-use developments and its accessibility to public transportation, building features as the office projects can accommodate all types of tenants including companies in the IT Business Process Management (IT-BPM) sector, corporate headquarters and traditional offices. The Company also believes that its established reputation of good quality, ease of doing business, and completing projects on time makes it one of the most preferred choices of the IT-BPM industry as well as local and multinational companies. The Company is committed in providing an excellent customer experience and satisfaction by developing office projects of high quality and reliability, meeting the evolving needs of its customers.
iv. Hotels and Resorts Division
RLC competes in different markets for its hotels and resorts segments. Across all of its hotel formats, its main competitors in terms of number of rooms are: Ayala Land, Alliance Global Group Inc., SM Hotels and Conventions Corporation, and Filinvest Land Inc. Aside from these large hotel owners and developers, there is a growing number of small independent players and foreign entrants that increases the competitive landscape of hospitality in the country. The influx of foreign arrival and regional travellers in the Philippines stimulates growth and opportunities for many in the hospitality and tourism industry, and is likewise strongly supported by government incentive programs.
RLC believes in its market strength rooted from a deep understanding of the mass Filipino consumer. RLC continues to solidify its position and ability to serve travellers in multiple points of the Philippines through growing its hotel and resorts portfolio while enhancing its overall brand. With its longstanding expertise in developing and managing hotels and resorts, RLC is focused on scaling its business with improving standards leading up to world-class quality.
v. Industrial and Integrated Developments Division
Though Industrial and Integrated Developments is a new Division under RLC, RLC is not a newcomer in integrated developments. RLC has developed four major mixed used developments in Metro Manila alone, namely, Robinsons Galleria, Robinsons Forum, Robinsons Manila, and Robinsons Magnolia. These projects are anchored by Robinsons Mall with components of Office and/or Residential and/or Hotel/Leisure. With the formation of the Industrial and Integrated Development Division, RLC can now focus on this new fast growing development format. Despite the Covid-19 pandemic, major developers are still into integrated developments. Developers have been acquiring big parcels of land and incorporating different real estate components to attract investors and customers. The biggest competitors of RLC in integrated developments are
40

Ayala Land, Inc., Megaworld Corp, Filinvest, Inc., Double Dragon Properties Corp., and SM Prime Holdings. Even before the Covid-19 pandemic, demand for logistics facilities has been on the rise in the country and this demand further increased during the pandemic. Under its RLX Logistics Facilities brand, the Industrial and Integrated Developments Division develops excellent quality logistics facilities in industrial centers of growth around the Philippines. The biggest competitors of RLC in the development of logistics facilities are Ayalaland Logistics Holdings Corp. and Double Dragon Properties Corp. IID will harness opportunities for synergies with RLC’s other business units: Commercial, Residential, Hotel, and Office Division. RLC, having years of experience in these real estate components, will thus have a competitive advantage. With efficient master planning, innovative designs, and quality construction, RLC is committed to sustainable and future-proof communities.
e) Sources and Availability of Raw Materials and Suppliers
Construction and development of malls, high-rise office and condominium units as well as land and housing construction are awarded to various reputable construction firms subject to a bidding process and management’s evaluation of the price and qualifications of and its relationship with the relevant contractor. Most of the materials used for construction are provided by the contractors themselves in accordance with the underlying agreements, although sometimes the Company will undertake to procure the construction materials when it believes that it has an advantage in doing so. The Company typically will require the contractor to bid for a project on an itemized basis, including separating the costs for project materials that it intends to charge the Company. If the Company believes that it is able to acquire any of these materials (such as cement or steel) at a more competitive cost than is being quoted to it, it may remove these materials from the project bid and enter into a separate purchase order for the materials itself, to reduce project costs.
f) Customers RLC has a broad base of customers, comprised of both local and foreign individuals, and institutional clients. The Company is not dependent on a single or a few customers, the loss or any of which would have a material adverse effect on the business taken as a whole.
41
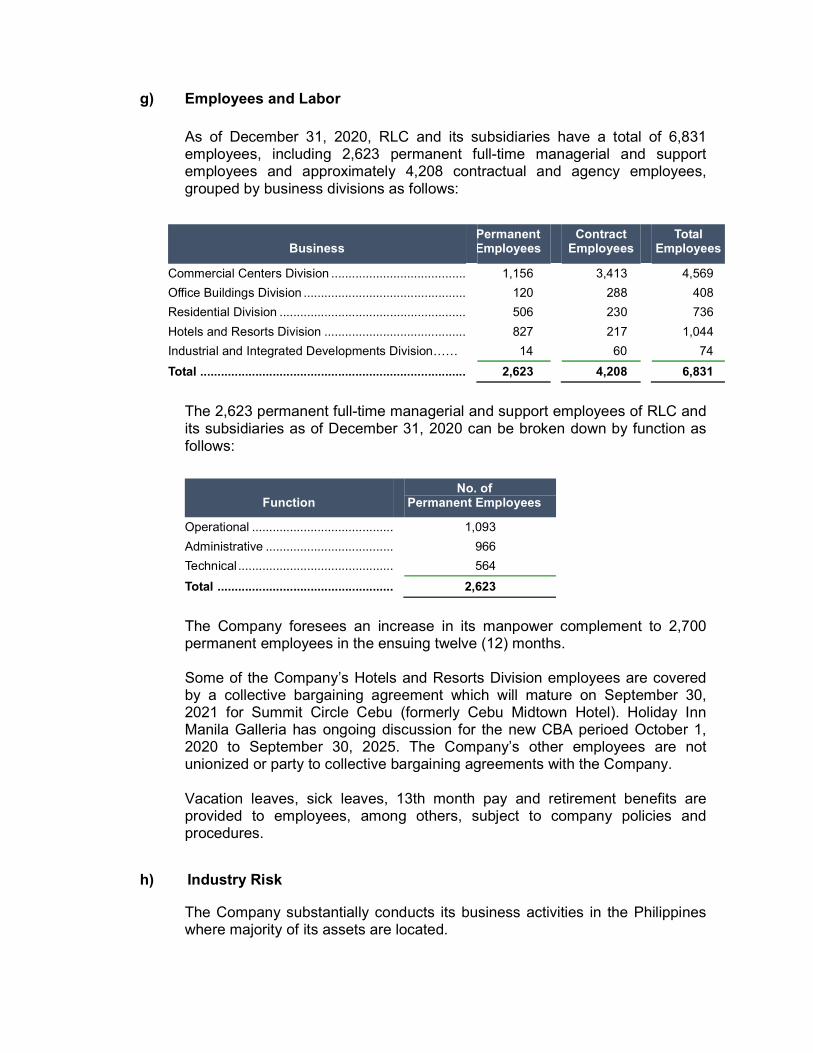
g) Employees and Labor
As of December 31, 2020, RLC and its subsidiaries have a total of 6,831 employees, including 2,623 permanent full-time managerial and support employees and approximately 4,208 contractual and agency employees, grouped by business divisions as follows:
Business Permanent Employees
Contract Employees
Total Employees
Commercial Centers Division .......................................................1,156 3,413 4,569
Office Buildings Division ...............................................................120 288 408
Residential Division ................................................................ 506 230 736
Hotels and Resorts Division .........................................................827 217 1,044
Industrial and Integrated Developments Division…… 14 60 74
Total .............................................................................................2,623 4,208 6,831
The 2,623 permanent full-time managerial and support employees of RLC and its subsidiaries as of December 31, 2020 can be broken down by function as follows:
Function No. of
Permanent Employees
Operational ................................................................1,093
Administrative ................................................................966
Technical ................................................................ 564
Total ................................................................ 2,623
The Company foresees an increase in its manpower complement to 2,700 permanent employees in the ensuing twelve (12) months. Some of the Company’s Hotels and Resorts Division employees are covered by a collective bargaining agreement which will mature on September 30, 2021 for Summit Circle Cebu (formerly Cebu Midtown Hotel). Holiday Inn Manila Galleria has ongoing discussion for the new CBA perioed October 1, 2020 to September 30, 2025. The Company’s other employees are not unionized or party to collective bargaining agreements with the Company. Vacation leaves, sick leaves, 13th month pay and retirement benefits are provided to employees, among others, subject to company policies and procedures.
h) Industry Risk
The Company substantially conducts its business activities in the Philippines where majority of its assets are located.
42

Demand for and prevailing prices of shopping mall, office and warehouse leases, as well as the development of the Philippine hospitality sector are directly related to the strength of the Philippine domestic economy and the overall levels of business activity in the Philippines. RLC’s Commercial Centers Division is directly affected by level of consumption, demographic structure, social trends, changing spending patterns and consumer sentiments in the Philippines, which are in turn heavily influenced by economic, political and security conditions in the Philippines. The level of consumption is largely determined by the income levels of consumers which is supplemented by a large number of Overseas Filipino Workers (OFWs) and expatriate Filipinos employed in countries around the world. This exposes RLC to changes in the specific economies of the countries where OFWs are deployed.
As the fastest growing sector in the Philippine real estate industry, the Information Technology-Business Process Management (IT-BPM) outsourcing sector drives office space demand which fuels the performance and profitability of RLC’s Office Buildings Division. The growth of the IT-BPM sector is heavily dependent on the availability of Information and Communications Technology (ITC) hubs across the country which provide sufficient labor supply and upgraded talent ecosystem, good ITC infrastructure and service capabilities, efficient cost and overall business environment as a product of sound macroeconomic fundamentals and geopolitical climate in the country. RLC’s Hotels and Resorts Division, on the other hand, is anchored on the development of Philippine tourism which is contingent on the rate of response of the Philippine government to address infrastructure challenges across the country. On the development side of the Company’s business, RLC is engaged in both domestic and international residential development. The property market has been cyclical where property values have been affected by confidence in the economy as well the interest rate environment.
Global pandemics (such as the COVID-19 outbreak) and economic/political uncertainties in the Philippines may have adverse effects on consumer spending habits, construction costs, availability of labor and materials and other factors affecting the Company and its businesses. Notably, global health outbreaks can also have a potential material impact on tourism and hospitality sector as well as the demand for shopping mall spaces given the travel restrictions and social-distancing protocols. Significant expenditures associated with investment in real estate, such as real estate taxes, maintenance costs and debt payments, generally cannot be correspondingly reduced if changes in the Philippine property market or the Philippine economy cause a decrease in revenues from the Company’s properties. Because majority of RLC’s businesses are in the Philippines, reduced levels of economic growth, adverse changes in the country’s political or security situation, or weaker performance of the country’s property development
43

market generally may materially adversely affect RLC’s financial performance, position and profitability. RLC operates in a highly competitive industry. The Company’s future growth and development is dependent, in large part, on the availability and affordability of large tracts of land suitable for development. As the Company and its competitors attempt to locate sites for development, it may become more difficult to locate parcels of suitable size in locations and at prices acceptable to the Company, particularly in Metro Manila and other urban areas. To the extent that the Company is unable to acquire suitable land at acceptable prices, its growth prospects could be limited and its business and results of operations could be adversely affected. A number of other commercial center and residential developers and real estate services companies, some with greater financial and other resources and more attractive land banks than the Company, compete with RLC in various aspects of its business. Competition from other real estate developers and real estate services companies may adversely affect RLC’s ability to develop and sell its properties or attract and retain tenants, and continued development by these and other market participants could result in saturation of the market for commercial and residential real estate.
44

ADDITIONAL REQUIREMENTS AS TO CERTAIN ISSUES OR ISSUER Not Applicable
45

Item 2. Properties Over the years, the Company has invested in a number of properties located across the Philippines for existing and future development projects. All of these properties are fully owned by the Company and none of which are subject to any mortgage, lien or any form of encumbrance. The Company also enters into joint venture arrangements with land owners in order to optimize their capital resources. Not only does this encourage raw land development for future projects but it also provides them exclusive development and marketing rights. As of December 31, 2020, the following are locations of the Company’s properties: Location Use Status LAND Metro Manila
Manila Mixed-use (mall/residential/hotel) No encumbrances
Quezon City Residential/Office Building/Mixed-use (mall/residential/hotel/office) No encumbrances
Pasay City Residential No encumbrances Mandaluyong City Mixed-use (mall/hotel/residential) No encumbrances Makati City Office Building/Residential No encumbrances
Pasig City Residential/Mall/Office Building/ Mixed-use (mall/hotel/residential) No encumbrances
Paranaque City Residential No encumbrances Muntinlupa City Residential No encumbrances Las Pinas City Mall No encumbrances Taguig City Residential No encumbrances Malabon City Mall No encumbrances San Juan City Residential/Hotel No encumbrances Metro Manila area Land bank No encumbrances
Luzon La Union Residential No encumbrances Pangasinan Mall No encumbrances Bulacan Mall No encumbrances Nueva Ecija Mall No encumbrances Pampanga Mall No encumbrances Tarlac Mall/Office Building No encumbrances Batangas Mall/Residential No encumbrances Cavite Mall/Residential/Mixed-use (mall/hotel/residential) No encumbrances Laguna Mall No encumbrances Palawan Mixed-use (mall/hotel/residential) No encumbrances Rizal Residential/Mall No encumbrances Isabela Mall No encumbrances Ilocos Norte Mixed use (mall/office) No encumbrances Camarines Sur Mall/Office Building No encumbrances Cagayan Mall No encumbrances Laguna Mall No encumbrances Luzon area Land bank No encumbrances
Visayas Iloilo Mall No encumbrances Negros Occidental Mall/Hotel No encumbrances Cebu Hotel/ Residential/Mixed-use (mall/hotel/residential/office) No encumbrances Negros Oriental Mixed-use (mall/hotel) No encumbrances Leyte Mall/Mixed-use(mall/hotel) No encumbrances Capiz Mall No encumbrances
46

Antique Mall No encumbrances Visayas area Land bank No encumbrances
Mindanao Agusan Del Norte Mixed-use (mall/hotel) No encumbrances Misamis Oriental Residential No encumbrances Davao Del Sur Mall/Hotel/Office Building No encumbrances South Cotabato Mall/ Residential No encumbrances Lanao Del Norte Mixed-use (mall/hotel) No encumbrances Davao Del Norte Mall No encumbrances Bukidnon Mall No encumbrances Mindanao Area Land bank No encumbrances
BUILDING AND IMPROVEMENTS Metro Manila
Manila Mixed-use (mall/residential/hotel) No encumbrances
Quezon City Residential/Office Building/Mixed-use (mall/residential/hotel/office) No encumbrances
Pasay City Residential No encumbrances Mandaluyong City Mixed-use (mall/hotel/residential/office) No encumbrances Makati City Office Building/Residential No encumbrances
Pasig City Residential/Mall/Office Building/ Mixed-use (mall/hotel/residential) No encumbrances
Paranaque City Residential No encumbrances Muntinlupa City Residential/Warehousing facility No encumbrances Las Pinas City Mall No encumbrances Taguig City Residential/Office Building No encumbrances Malabon City Mall No encumbrances San Juan City Residential/Hotel No encumbrances
Luzon La Union Residential No encumbrances Pangasinan Mall No encumbrances Bulacan Mall No encumbrances Nueva Ecija Mall No encumbrances Pampanga Mall No encumbrances Tarlac Mall/Office Building No encumbrances Batangas Mall/Residential No encumbrances Cavite Mall/Residential/Mixed-use (mall/hotel/residential) No encumbrances Laguna Mall No encumbrances Palawan Mixed-use (mall/hotel/residential) No encumbrances Rizal Mall/Residential No encumbrances Isabela Mall No encumbrances Ilocos Norte Mixed-use (mall/office) No encumbrances Camarines Sur Mall/Office Building No encumbrances Cagayan Mall No encumbrances Laguna Mall No encumbrances
Visayas Iloilo Mall/Mixed-use (mall/hotel) No encumbrances Negros Occidental Mall/Hotel No encumbrances Cebu Hotel/Mixed-use (mall/hotel/residential/office) No encumbrances Negros Oriental Mixed-use (mall/hotel) No encumbrances Leyte Mall/Mixed-use (mall/hotel) No encumbrances Capiz Mall No encumbrances Antique Mall No encumbrances
Mindanao Misamis Oriental Mall/Residential No encumbrances Davao Del Sur Mall/Hotel/Office Building No encumbrances South Cotabato Mall/Residential No encumbrances Agusan Del Norte Mixed-use (mall/hotel) No encumbrances
47

Davao Del Norte Mall No encumbrances Lanao Del Norte Mixed-use (mall/hotel) No encumbrances Bukidnon Mall No encumbrances
China Chengdu Residential No encumbrances
The Company owns all the land properties upon which all of its existing commercial centers and offices are located, except for the following: (i) Robinsons Place Iloilo, (ii) Robinsons Cagayan de Oro, (iii) Robinsons Cainta, (iv) Robinsons Pulilan, (v) Robinsons Place Jaro, (vi) Cyber Sigma, and (vii) Robinsons Place Tuguegarao. These seven land properties are leased at prevailing market rates. The leases for the Iloilo and Cagayan de Oro properties are for 50 years each and commenced in October 2001 and December 2002, respectively. The leases for the Cainta, Pulilan, Cyber Sigma, and Tuguegarao properties are for 25 years each and commenced in December 2003, January 2008, August 2014, and January 2018, respectively. Renewal options for Cainta, Pulilan, Cyber Sigma and Tuguegarao are available to the Company, with an Option to Purchase the property and its improvements for Cyber Sigma. The lease for the Jaro, Iloilo property is for 30 years and commenced in March 2015. Operating leases of these land properties were accounted for under PFRS 16 in 2020 and 2019 and under PAS 17 in 2018. Total amortization of ROU assets and total interest expense on lease liabilities amounted to P=59.80 million and P=147.01 million, respectively, or a total P=206.81 million expense in 2020 and P=56.26 million and P=145.56 million, respectively, or a total P=201.82 million expense in 2019 while total rent expense amounted to P=245.42 million in calendar year 2018. For calendar year 2021, the Company has appropriated approximately P=26.00 billion of its retained earnings for domestic capital expenditures which will be funded through internally generated cash from operations and borrowings. The earmarked amount is for the continuing capital expenditures of the Company for subdivision land, condominium, residential units and other real estate properties for sale, development and expansion of investment properties and property and equipment.
Item 3. Legal Proceedings
The Company and its subsidiaries and affiliates are not parties to, and their respective properties are not the subject of, any material pending legal proceeding that could be expected to have a material adverse effect on their financial results or operations. Item 4. Submission of Matters to A Vote of Security Holders There were no matters submitted to a vote of security holders during the fourth quarter of the calendar year covered by this report.
48
Item 5. Regulatory and Environmental Matters
a) Shopping Malls
Shopping mall centers are regulated by the local government unit of the city or municipality where the establishment is located. In line with this, mall operators must secure the required mayor’s permit or municipal license before operating. In addition, no mall shall be made operational without complying first with the provisions of the fire code and other applicable local ordinances. Furthermore, shopping malls with food establishments must obtain a sanitary permit from the Department of Health. It is also compulsory for shopping malls discharging commercial waste water to apply for a waste water discharge permit from the DENR and to pay the fee incidental to the permit.
As a tourism-related establishment, shopping malls may obtain accreditation from the Department of Tourism. A shopping mall can only be accredited upon conformity with the minimum physical, staff and service requirements promulgated by the Department of Tourism.
For the shopping malls owned by the Company, RLC has ensured that it is compliant with all of the above regulations.
b) Residential Condominium and Housing and Land Projects
Presidential Decree No. 957 (The Subdivision and Condominium Buyers’ Protective Decree) as amended, is the principal statute which regulates the development and sale of real property as part of a condominium project or subdivision. The law covers subdivision projects and all areas included therein for residential, commercial, industrial and recreational purposes as well as condominium projects for residential or commercial purposes. It also sets out standards for lower density developments. Republic Act No. 4726 (The Condominium Act), on the other hand, is the primary law governing condominiums. The law covers the legal definition of a condominium, the rights of a unit owner, and the rules governing transfers, conveyances and partitions in condominiums.
The Housing and Land Use Regulatory Board (HLURB) is the administrative agency of the Government which, together with local government units, enforces these laws and has jurisdiction to regulate the real estate trade and business. Subdivision or condominium units may be sold or offered for sale only after a license to sell (LTS) has been issued by the HLURB. The LTS may be issued only against a performance bond posted to guarantee the completion of the construction of the subdivision or condominium project and compliance with applicable laws and regulations. All subdivision and condominium plans are subject to approval by the relevant Local Government Unit (LGU) in which the project is situated and by the HLURB. The development of subdivision and condominium projects can
49

commence only after the HLURB has issued a development permit. Approval of such plans is conditional on, among other things, the developer’s financial, technical and administrative capabilities. Alterations of approved plans which affect significant areas of the project, such as infrastructure and public facilities, also require the prior approval of the LGU and HLURB.
Owners of or dealers in real estate projects are required to obtain licenses to sell before making sales or other dispositions of lots or real estate projects. Republic Act No. 9646 (The Real Estate Service Act of the Philippines) provides that real estate consultants, appraisers, assessors and brokers must pass the requisite exams and be duly registered and licensed by the Professional Regulation Commission (PRC), while real estate salespersons, or those who act of a real estate broker to facilitate a real estate transaction, only need to be accredited by the PRC. Project permits and the LTS may be suspended, cancelled or revoked by the HLURB by itself or upon a verified complaint from an interested party for reasons such as non-delivery of title to fully-paid buyers or deviation from approved plans. A license or permit to sell may only be suspended, cancelled or revoked after notice to the developer has been served and all parties have been given an opportunity to be heard in compliance with the HLURB’s rules of procedure and other applicable laws. Residential subdivision developments must comply with applicable laws and standards regarding the suitability of the site, road access, necessary community facilities, open spaces, water supply, the sewage disposal system, electrical supply, lot sizes, the length of the housing blocks and house construction. Under current regulations, a developer of a residential subdivision is required to reserve at least 30% of the gross land area of such subdivision for open space for common uses, which include roads and recreational facilities. A developer of a commercial subdivision is required to reserve at least 3.5% of the gross project area for parking and pedestrian malls, but the minimum parking area requirement may be further increased by ordinances promulgated by LGUs. Republic Act No. 7279 (Urban Development and Housing Act of 1992), as amended by Republic Act No. 10884, requires developers of proposed subdivision projects to develop an area for socialized housing equivalent to at least 15% of the total subdivision area or total subdivision project cost and at least 5% of condominium area or project cost, at the option of the developer, in accordance with the standards set by the HLURB. Alternatively, the developer may opt to buy socialized housing bonds issued by various accredited government agencies or enter into joint venture arrangements with other developers engaged in socialized housing development. The Company has benefited from providing low-income housing or projects of such types which are financially assisted by the government. These policies and programs may be modified or discontinued in the future.
The Government may also adopt regulations which may have the effect of increasing the cost of doing business for real estate developers. Under R.A.
50

No. 10884, income derived by domestic corporations from the development and sale of socialized housing is exempt from project related income taxes, capital gains tax on raw lands used for the project, value-added tax for the project contractor concerned, transfer tax for both raw completed projects, and donor’s tax for lands certified by the LGUs to have been donated for socialized housing purposes. Under the current Investment Priorities Plan issued by the Board of Investments, mass housing projects including development and fabrication of housing components, are eligible for government incentives subject to certain policies and guidelines. In the future, since the sale of socialized housing units comprise a portion of homes sold by the Company, any changes in the tax treatment of income derived from the sale of socialized housing units may affect the effective rate of taxation of the Company.
c) Hotels
The Philippine Department of Tourism promulgated the Hotel Code of 1987 (the “Hotel Code”) in order to govern the business and operation of all hotels in the Philippines. Investors that wish to operate a hotel must first register and apply for a license with the local government of the city or municipality where the hotel is located. For purposes of registration and licensing, hotels are classified into four groups: De Luxe Class, First Class, Standard Class and Economy Class. The Hotel Code provides minimum standards for the establishment, operation and maintenance of hotels depending on the hotel’s classification. The Philippine Department of Tourism is in the process of revising the current classification from Hotel Class System to Hotel Star Rating System. A certificate of registration and license as a hotel will not be granted unless the relevant establishment has passed all the conditions of the Hotel Code, the Fire and Building Codes, Zoning Regulations and other municipal ordinances. Furthermore, hotels can only be opened for public patronage upon securing of a sanitary permit from the city or municipal health office having jurisdiction over the establishment. The Department of Tourism is the government agency which is tasked with the accreditation of hotels. The Department promulgates the minimum standards and procedures for hotel accreditation. While accreditation is non-compulsory, accredited hotels are given incentives by the Department of Tourism. All hotels operated by the Company are compliant with the Hotel Code. Since the onset of the COVID-19 pandemic in 2020, the Philippine hospitality industry has been subjected to various implementing rules and regulations set by the government’s Inter-Agency Task Force (IATF) and Department of Tourism. These guidelines are regularly updated according to the requirements of community quarantine classifications intended to manage and curb the pandemic.
51

d) Zoning and Land Use
Under the agrarian reform law currently in effect in the Philippines and the regulations issued thereunder by the DAR, land classified for agricultural purposes as of or after 15 June 1988, cannot be converted to non-agricultural use without the prior approval of DAR. Land use may be also limited by zoning ordinances enacted by local government units. Once enacted, land use may be restricted in accordance with a comprehensive land use plan approved by the relevant local government unit. Lands may be classified under zoning ordinances as commercial, industrial, residential or agricultural. While a procedure for change of allowed land use is available, this process may be lengthy and cumbersome.
e) Special Economic Zone
The Philippine Economic Zone Authority (“PEZA”) is a government corporation that operates, administers and manages designated special economic zones (“Ecozones”) around the country. Ecozones, which are generally created by proclamation of the President of the Philippines, are areas earmarked by the government for development into balanced agricultural, industrial, commercial, and tourist/recreational regions. An Ecozone may contain any or all of the following: industrial estates, export processing zones, free trade zones, and tourist/recreational centers. PEZA registered enterprises locating in an Ecozone are entitled to fiscal and non-fiscal incentives such as income tax holidays and duty-free importation of equipment, machinery and raw materials. Information technology (“IT”) enterprises offering IT services (such as call centers, and business process outsourcing using electronic commerce) are entitled to fiscal and non-fiscal incentives if they are PEZA-registered locators in a PEZA-registered IT Park, IT Building, or Ecozone. An IT Park is an area which has been developed into a complex capable of providing infrastructures and other support facilities required by IT enterprises, as well as amenities required by professionals and workers involved in IT enterprises, or easy access to such amenities. An IT Building is an edifice, a portion or the whole of which, provides such infrastructure, facilities and amenities. PEZA requirements for the registration of an IT Park or IT Building differ depending on whether it is located in or outside Metro Manila. These PEZA requirements include clearances or certifications issued by the city or municipal legislative council, the DAR, the National Water Resources Board, and the DENR. The Company actively seeks PEZA registration of its buildings, as this provides significant benefits to the Company’s tenants. PEZA registration provides significant tax incentives to those of the Company’s customers that
52

are PEZA-registered (they can, for example, avail themselves of income tax incentives such as income tax holidays or 5% gross income taxation), thereby making tenancy in the Company’s PEZA-registered buildings potentially more attractive to them. As of calendar year 2019, a number of RLC malls and office buildings are PEZA-registered.
f) Effect of Existing or Probable Governmental Regulations on the Business
The existing regulatory and environmental/governmental regulations mentioned under "items 5a-e" as well as possible governmental regulations on the various business segments may affect the Company's profitability through possible reduction in revenues. The aggregate cost of compliance with environmental laws covering all business segments including waste management, among others, amounted to P=45.34 million, P=44.83 million and P=30.05 million in calendar years 2020, 2019 and 2018, respectively.
g) Effect of COVID-19 on the Business
RLC is cognizant of COVID-19’s potential material impact on its financial performance, the execution of its plans and strategies, and its customers and employees should the situation persist in the longer-term. Nonetheless, its broad business footprint and diversified revenue stream helped cushion the blow of this unprecedented event on the Company.
53

PART II - OPERATIONAL AND FINANCIAL INFORMATION
Item 6. Market Information The Company's common stock is traded in the PSE under the stock symbol “RLC”. Data on the quarterly price movement of its shares for the past three calendar years are set forth below. 2020 2019 2018 Quarter High Low Close High Low Close High Low Close
1 15.68 14.42 14.84 24.80 24.25 24.50 20.45 19.50 20.20 2 17.48 16.82 17.48 26.45 25.65 26.35 19.42 18.50 18.50 3 14.40 14.20 14.20 24.90 24.05 24.50 20.30 19.28 20.30 4 21.40 20.45 21.20 28.15 27.20 27.55 20.55 20.40 20.55
Additional information as of March 31, 2021 are as follows:
Market Price: Period High Low
Jan. to Mar. 2021 P=17.96 P=17.70
Item 7. Dividends Effective 2019, the Company adopted a new dividend policy upon the approval of the Board. Under the dividend policy, the Company shall implement an annual cash dividend pay-out ratio of at least twenty (20%) of its recurring net income for the preceding year. The payment of the Company’s dividends depends upon the earnings, cash flow and financial condition of the Company, legal, regulatory and contractual restrictions, loan obligations, and other factors that the Board of Directors may deem relevant. RLC declared cash dividends for each of the calendar years 2020, 2019 and 2018. For calendar year 2020, the Company declared a cash dividend of P=0.50 per share from unrestricted Retained Earnings as of December 31, 2019 to all stockholders on record as of June 10, 2020 and October 1, 2020, which were paid out in two tranches on July 7, 2020 and October 27, 2020, respectively. For calendar year 2019, the Company declared a cash dividend of P=0.50 per share from unrestricted retained earnings as of December 31, 2018 to all stockholders on record as of June 18, 2019. The cash dividends were paid out on July 12, 2019. On July 31, 2019, the Board of Directors of the Company approved the declaration of property dividend, of up to one hundred million (100,000,000) common shares of APVI in favor of the registered shareholders (the “Receiving Shareholders”) of the Company as of August 15, 2019. The SEC approved the property dividend
54

declaration on November 15, 2019 and the Certificate Authorizing Registration was issued by the Bureau of Internal Revenue on December 6, 2019. The Receiving Shareholders received a ratio of one (1) share of APVI for every 51.9384 shares of the Company, net of applicable final withholding tax. No fractional shares were issued and no shareholder was entitled to any fractional shares. For calendar year 2018, the Company declared a cash dividend of P=0.36 per share from unrestricted Retained Earnings as of December 31, 2017 to all stockholders on record as of April 26, 2018. The cash dividends were paid out on May 23, 2018. For calendar year 2017, the Company declared a cash dividend of P=0.36 per share from unrestricted Retained Earnings as of September 30, 2016 to all stockholders on record as of April 3, 2017. The cash dividends were paid out on May 2, 2017. RLC’s unappropriated retained earnings include accumulated equity in undistributed net earnings of subsidiaries amounting to P=3.25 billion and P=2.22 billion as of December 31, 2019 and 2018, respectively. These amounts are not available for dividend declaration until received in the form of dividends. Furthermore, retained earnings are restricted for payment of dividends to the extent of the amount appropriated for expansion totaling P=27.00 billion as of December 31, 2019. Furthermore, retained earnings are restricted for payment of dividends to the extent of the amount appropriated for expansion totaling P=26.00 billion as of December 31, 2020.
Item 8. Principal Shareholders
JG Summit, RLC’s controlling shareholder, owns approximately 60.97% of RLC’s outstanding shares as at December 31, 2020. The following table sets forth the Company’s top twenty (20) shareholders and their corresponding number of shares held as of December 31, 2020:
Name of Stockholders
Number of Shares
Subscribed
% of Total Outstanding
Shares 1 JG Summit Holdings, Inc. 3,166,806,886 60.97% 2 PCD Nominee Corporation (Non-Filipino) 1,041,882,997 20.06% 3 PCD Nominee Corporation (Filipino) 958,770,233 18.46% 4 John Gokongwei, Jr. 8,124,721 0.16% 5 Cebu Liberty Lumber 2,203,200 0.04% 6 James L. Go 2,139,011 0.04% 7 Frederick D. Go 1,642,527 0.03% 8 Elizabeth Y. Gokongwei &/or John Gokongwei, Jr. 988,000 0.02% 9 Quality Investments & Sec Corp. 903,000 0.02%
10 Alberto Mendoza &/or Jeanie Mendoza 532,800 0.01% 11 Elizabeth Yu Gokongwei 499,500 0.01% 12 Robina Y. Gokongwei-Pe 360,000 0.01% 13 Samuel C. Uy 324,000 0.01%
55

14 John L. Gokongwei, Jr. 300,000 0.01% 15 Ong Tiong 204,996 0.01% 16 Lisa Yu Gokongwei 180,000 0.00% 17 FEBTC #103-00507 156,240 0.00% 18 Francisco L. Benedicto 150,000 0.00% 19 Ching Tiong Keng and/or Cynthia D. Ching 150,000 0.00% 20 Arthur C. Uy 144,000 0.00%
OTHERS 7,368,574 0.14%
Total 5,193,830,685 100.00%
Item 9. Management Discussion and Analysis of Financial Condition and Results of Operation
a) Results of Operations and Financial Condition
RLC derives its revenues from real estate operations and hotel operations. Revenues from real estate operations account for approximately 96% of the Company’s total revenues in 2020 and are derived from the lease of commercial spaces in the various malls, the lease of space in office buildings and industrial facilities, the sale of residential units from the Company’s various housing projects and the sale of parcels of land. Approximately 4% of total revenues are derived from hotel operations.
i. Year ended December 31, 2020 versus same period in 2019
RLC generated total gross revenues of P=25.40 billion for calendar year 2020, a decrease of 16.9% from P=30.58 billion the previous year. EBIT and EBITDA declined by 30.9% to P=8.49 billion and 20.7% to P=13.68 billion, respectively. Meanwhile, net income ended at P=5.26 billion, 39.5% lower compared to calendary year 2019. The Commercial Centers Division accounted for 23% of total company revenues to close at P=5.96 billion in 2020, 55.0% lower versus previous year. Rental concessions were provided to support the recovery of partner tenants affected by temporary mall closures and quarantine restrictions. To compensate, immediate actions were taken to rationalize operating expenses which helped EBITDA to decline at a slower pace than revenues by 53.4% to P=4.11 billion. Meanwhile, additional depreciation from new malls that opened in 2019 dragged EBIT by 92.2% to P=0.40 billion. Office Buildings Division finished the year strong and contributed 23% to total company revenues. The success of leasing activities for new developments and rental escalations in existing office buildings grew revenues by 10.0% to P=5.85 billion versus the same period last year. EBITDA accelerated 11.5% to P=5.08 billion, while EBIT surged 12.2% to P=4.18 billion. In 2020, the Company adopted a new accounting treatment on revenue recognition for its Residential Division. Realized revenues were booked at 10% equity versus the previous threshold of 15% equity to be consistent with
56

the practice of most property companies in the Philippines. As a result, realized revenues rose 32.8% to P=12.13 billion, while EBITDA and EBIT surged 40.1% and 41.3% to P=4.16 billion and P=4.07 billion, respectively. The Hotels and Resorts Division managed to post revenues of P=1.08 billion or 4% of total company revenues as against last year’s P=2.43 billion. The 55.5% decrease in hotel revenues was due to the massive contraction in demand and limited operations as a result of the COVID-19 pandemic. EBITDA fell 78.2% to P=0.15 billion on the back of fixed overhead cost; while additional depreciation from hotels opened in calendar year 2019 resulted to a negative EBIT of P=0.26 billion. The IID Division posted P=0.39 billion of revenues, down by 14.0% from last year’s P=0.46 billion. Its industrial leasing business generated P=0.26 billion revenues, up by 89.9% mainly from the additional revenues from its first Calamba warehouse. Meanwhile, developmental revenues dropped 58.7% drop to P=0.13 billion in 2020 from P=0.32 billion last year due to the high-base effect of the partial recognition in 2019 of the gain on sale of land to JV Company that was formed with DMCI. EBITDA and EBIT for calendar year 2020 ended at P=0.24 billion and P=0.19 billion, respectively. Interest income was lower at P=0.24 billion from P=0.29 billion last year due to lower average balance of cash and cash equivalents during the calendar year 2020. Cost of rental services was flat at P=5.34 billion in calendar year 2020. On the other hand, real estate sales went up by 45.5% to P=6.16 billion from P=4.24 billion last year due to increase in realized sales brought about by the change in full equity threshold from 15% to 10%. Cost of amusement services declined by 90.3% to P=0.9 billion following the temporary suspension of cinema operations as a result of lockdown measures implemented starting March 2020 due to COVID-19 pandemic. Other expenses under Real Estate Operations decreased by 75.6% due to lower level of activities in 2020 as a result of the implementation of community quarantine. Hotel expenses dropped 35.5% to P=1.35 billion attributable to limited operations as a result of the movement and travel restrictions implemented. General and administrative expenses declined by 12.4% to P=3.59 billion owing to the Company’s cost rationalization initiatives to temper the impact on the Company’s bottom line of the significant drop in revenues. Gain or loss from foreign exchange mainly pertains to foreign currency denominated transactions of the Company’s foreign subsidiary. Gain on sale of property and equipment mainly pertains to sale of retired transportation equipment. In 2020, the Company paid off all of its short-term loans. However, on July 17, 2020, the Company issued bonds with an aggregate principal amount of
57

P=13.19 billion which obtained the highest credit rating of “PRS Aaa with a stable outlook” and was well-received by the debt capital markets. Together with the availment of long-term bank loans, the bond issuance caused interest expense to surge by 49.8% to P=1.58 billion from P=1.05 billion last year. As of December 31, 2020, total assets of the Group stood at P=215.20 billion, a growth of 13.5% from P=189.65 billion the previous year. Cash and cash equivalents increased by 98.3% to P=14.00 billion mainly from net cash flows provided by operations and net cash flows from financing activities on the back of the proceeds from the bond issuance and long-term loan availment; offset by capital expenditures. Receivables (current and noncurrent-net) increased by 26.1% to P=22.29 billion mainly due to increase in trade receivables by P=5.05 billion or 32.5% as a result of additional revenues recognized from the change in the accounting treatment of residential sales. Subdivision land, condominium and residential units for sale grew by 14.4% to P=41.25 billion due to higher level of capital expenditures. Other current assets increased by 23.5% to P=9.27 billion from P=7.50 billion last year mainly due to increase in cash under escrow which will mainly be used for the construction of real estate inventories and land acquisitions, increase in net input VAT and prepaid expenses. Investment properties - net grew by 5.4% to P=109.42 billion due to land acquisitions, ongoing construction and development of real estate properties, net of depreciation during the year. Right-of-use (ROU) assets totaling P=1.11 billion as of December 31, 2020 declined by 5.1% mainly due to amortization. ROU assets was initially recognized in 2019 following the Company’s adoption of PFRS 16 as a lessee. ROU assets represent the right to use the underlying asset during the lease term. Other noncurrent assets jumped by 35.9% to P=6.98 billion from P=5.13 billion last year mainly due to higher level of advances to lot owners. Loans payable (current and noncurrent) posted a net increase of 24.1% to P=53.60 billion mainly due to the bonds issued and long-term bank loans availed during the calendar year as aforementioned in the previous paragraphs; offset by the payment of all short-term debts. Deposits (current and noncurrent) and Other liabilities increased by 47.0% to P=39.10 billion primarily due to additional deposits from real estate buyers and lessees for new malls and offices.
58

The increase in deferred tax liabilities - net of 9.7% to P=4.79 billion is mainly attributed to the tax effect of the excess of real estate revenue based on percentage-of-completion over real estate revenue based on tax rules. Equity attributable to equity of the Parent Company as of December 31, 2020 stood at P=101.84 billion. It grew slightly by 2.3% from P=99.51 billion last year due to earnings in 2020 amounting to P=5.26 billion, tempered by the payment of cash dividends of P=2.60 billion. A summary of RLC’s key performance indicators for the calendar year follows: 2020 2019 Gross revenues P=25.40 billion P=30.58 billion EBIT 8.49 billion 12.28 billion EBITDA 13.68 billion 17.25 billion Net income 5.26 billion 8.69 billion Earnings per share 1.01 1.67 Net book value per share 19.61 19.16 Current ratio 1.49:1 1.37:1 Debt-to-equity ratio 0.53:1 0.43:1 Interest coverage ratio 3.70:1 6.98:1 Asset to equity ratio 2.10:1 1.90:1 Operating margin ratio 0.33:1 0.40:1
Capital additions and additions to subdivision land, condominium and residential units for sale for the calendar year ended December 31, 2020 amounted to P=20.33 billion, funding of which was sourced from proceeds from borrowings and internally-generated funds.
ii. Year ended December 31, 2019 versus same period in 2018
RLC generated total gross revenues of P=30.58 billion for calendar year 2019, an increase of 3.5% from P=29.56 billion total gross revenues for calendar year 2018. EBIT grew 3.3% to P=12.28 billion while EBITDA posted a 5.5% growth to P=17.25 billion. Net income stood at P=8.69 billion, up by 5.7% compared to last year. The Commercial Centers Division accounted for P=13.25 billion of the real estate revenues for the year versus P=11.94 billion last year or an 11.0% increase. The increase in revenues was brought about by stable same mall rental revenue growth of existing malls, the full-year impact of new malls that opened in 2018, namely Robinsons Place Ormoc, Robinsons Place Pavia, Robinsons Place Tuguegarao and Robinsons Place Valencia, as well as the opening of Robinsons Galleria South and the expansion of Robinsons Magnolia in 2019. Cinema revenues also improved with the opening of new branches. The Division’s EBIT and EBITDA grew by 21.8% and 15.1%, respectively.
59

Revenues of Office Buildings Division grew by 23.8% to P=5.32 billion from P=4.29 billion over the same period last year. Revenue growth was mainly attributable from a combination of rental escalation and higher renewal rates in existing offices, as well as contribution from the newly completed offices, namely Robinsons Cybergate Magnolia, Luisita 2, and Giga Tower in 2019. The Division’s EBIT and EBITDA showed positive variances of 21.5% and 21.2%, respectively. The Residential Division’s realized revenues is at P=9.13 billion this year versus P=8.66 billion last year, an increase of 5.4%, due to higher level of buyers meeting the equity requirement in recognizing sales based on percentage of construction completion. EBIT and EBITDA increased by 32.8% and 32.3%, respectively. The Hotels and Resorts Division registered gross revenues of P=2.43 billion as against last year’s P=1.98 billion. The 22.7% increase in hotel revenues was due to higher occupancy rates of company-owned brands—Go Hotels and Summit Hotels, and increased system-wide average room rate. Hotels and Resorts Division’s EBIT declined by 19.3% due to additional depreciation from the new hotels that were opened in 2019 namely Dusit Thani Mactan Cebu Resort and Summit Greenhills; while the decline in last year’s EBITDA recovered with a 4.3% increase this year at P=0.70 billion. The IID Division accounted for P=0.46 billion revenues, generated from lease of warehouse facilities and sale of commercial lots. Developmental revenues of IID registered an 87.4% drop to P=0.32 billion in 2019 from P=2.55 billion in 2018 following the partial recognition last year of the gain on sale of land to Shang Robinsons Properties, Inc. Revenues in 2019 mainly came from the gain on sale of land located in Las Pinas to Robinsons DMCI Properties Ventures, Inc., which yielded additional EBIT and EBITDA of P=0.20 billion. Further gains will be realized from the selling of lots with joint ventures. EBIT and EBITDA for calendar year 2019 stood at P=0.21 billion and P=0.24 billion, respectively. Interest income increased to P=287.42 million from P=156.97 million last year due to higher average balance of cash and cash equivalents during the calendar year 2019. Cost of real estate sales went down by 14.1% to P=4.24 billion from P=4.93 billion last year due to recognition of sales from high-margin projects. Cost of rental services increased by 5.7% to P=5.36 billion from P=5.07 billion last year. The opening of new malls raised the level of depreciation expense of Commercial Centers Division by P=196.62 million or 5.7%; while completion of new office buildings increased depreciation expense of the Office Buildings Division by P=118.89 million or 17.1%. Furthermore, cinema expense rose by 5.6% or P=50.46 million in line with the increase in cinema revenues. Hotel expenses rose by 34.2% to P=2.09 billion attributable to the increase in depreciation, salaries and wages, and contracted services, that were incurred prior the start of commercial operations of new and upcoming hotels.
60

Gain or loss from foreign exchange mainly pertains to foreign currency denominated transactions of the Company’s foreign subsidiary. Gain on sale of property and equipment mainly pertains to sale of retired transportation equipment. As a result of property dividend distribution, the Group lost control over APVI. Loss on deconsolidation amounting to P=12.28 million resulted from the derecognition of related assets and liabilities of APVI. Interest expense increased by 25.9% to P=1.05 billion from P=0.84 billion last year due to the availment of additional short-term loans and recognition of interest on lease liabilities as a result of the Company’s adoption of PFRS 16 in 2019. As of December 31, 2019, total assets of the Group stood at P=189.65 billion, a growth of 8.9% from P=174.16 billion last year. Cash and cash equivalents increased by 177.6% or P=4.52 billion due to the proceeds from availment of additional short-term loans, and cash generated from operations; offset by payments of income tax, dividends, loans, and capital expenditures for new and ongoing projects. Receivables (current and noncurrent-net) increased by 57.7% or P=2.50 billion to P=6.82 billion mainly due to increase in receivable from affiliated companies by P=1.15 billion or 452.7% and recognition of receivable for insurance recoveries arising from a fire incident in Robinsons Place Tacloban in the second half of the calendar year 2019. Subdivision land, condominium and residential units for sale grew by 14.6% to P=36.06 billion due to higher level of capital expenditures for new and ongoing projects under the Residential division. Other current assets decreased by 36.1% to P=7.50 billion from P=11.74 billion last year mainly due to decrease in cash under escrow which will mainly be used for the construction of real estate inventories. Property and equipment increased by 13.4% to P=8.90 billion due to expansion projects from International Branded Hotels and Summit Hotels & Resorts. Investments in joint venture consist of investments in stocks of joint venture companies intended to acquire, develop, sell and lease real estate properties. Right-of-use (ROU) assets totaling P=1.17 billion was initially recognized in 2019 following the Company’s adoption of PFRS 16 as a lessee. The ROU assets represents the right to use the underlying asset during the lease term. Other noncurrent assets increased by 7.5% to P=5.13 billion from P=4.78 billion last year mainly due to higher level of advances to lot owners, suppliers and contractors.
61

Contract liabilities (current and noncurrent), deposits and other liabilities (current and noncurrent) totaling P=26.61 billion increased by 11.3% from P=23.91 billion last year mainly due to increase in reservation sales during the year and additional deposits from lessees for new malls and offices and the recognition of lease liabilities under PFRS 16 partially offset by the reversal of accrued rent expense under PAS 17 as a result of the adoption of PFRS 16. Contract liabilities consist of collections from real estate customers which have not reached the equity threshold to qualify for revenue recognition and excess of collections over the goods and services transferred by the Group based on percentage of completion. Loans payable (current and noncurrent) increased by 15.6% to P=43.21 billion due to availment of additional long term loans to fund the Group’s property constructions and developments. The increase in deferred tax liabilities - net of 22.0% to P=4.37 billion is mainly attributed to the tax effect of the prepayment of rent for a 25-year operating lease agreement between the Province of Bulacan and the Parent Company. Equity attributable to equity of the Parent Company as of December 31, 2019 stood at P=99.51 billion. It grew by 6.4% from P=93.51 billion last year due to earnings in 2019 amounting to P=8.69 billion plus the transition adjustments on the initial adoption of PFRS 16, tempered by the payment of cash and property dividends of P=2.60 billion and P=0.64 billion, respectively. A summary of RLC’s key performance indicators for the calendar year follows: 2019 2018 Gross revenues P=30.58 billion P=29.56 billion EBIT 12.28 billion 11.89 billion EBITDA 17.25 billion 16.35 billion Net income 8.69 billion 8.22 billion Earnings per share 1.67 1.62 Net book value per share 19.16 18.00 Current ratio 1.37:1 1.65:1 Debt-to-equity ratio 0.43:1 0.40:1 Interest coverage ratio 6.98:1 6.72:1 Asset to equity ratio 1.90:1 1.85:1 Operating margin ratio 0.40:1 0.40:1
Capital additions and additions to subdivision land, condominium and residential units for sale for the calendar year ended December 31, 2019 amounted to P=20.19 billion, funding of which was sourced from proceeds from borrowings and internally-generated funds.
iii. Year ended December 31, 2018 versus same period in 2017 RLC generated total gross revenues of P=29.56 billion for calendar year 2018, an increase of 31.3% from P=22.52 billion total gross revenues for calendar
62

year 2017. EBIT grew 38.9% to P=11.89 billion while EBITDA posted a 31.0% growth to P=16.35 billion. Net income stood at P=8.22 billion, up by 39.8% compared to last year. The Commercial Centers Division accounted for P=11.94 billion of the real estate revenues for the year versus P=10.79 billion last year or a 10.7% increase. The increase in rental revenues was brought about by the full year impact of new malls that opened during the second half of 2017, as well as the opening of four new malls in Ormoc, Iloilo, Tuguegarao and Bukidnon. Robinsons Galleria in Ortigas also contributed to the rental growth as tenants’ occupancy and sales had started to pick up since the completion of its redevelopment. Cinema revenues also improved with the opening of new branches. The Division’s EBIT and EBITDA grew by 6.2% and 8.9%, respectively. Revenues of Office Buildings Division grew by 31.4% to P=4.29 billion from P=3.27 billion over the same period last year. Revenue growth was mainly attributable to rental escalations and high renewal rates, as well as contribution from the offices completed in 2017 namely Cyber Sigma, Cybergate Delta, Cybergate Naga and Robinsons Luisita office and offices completed in 2018 namely Exxa Tower, Zeta Tower and Cyberscape Gamma. The Division’s EBIT and EBITDA showed positive variances of 33.3% and 28.3%, respectively. The Residential Division realized revenues is at P=8.66 billion this year versus P=6.55 billion last year, an increase of 32.2%, due to higher level of buyers meeting the equity requirement in recognizing sales based on percentage of construction completion and sale of parcels of land. EBIT and EBITDA increased by 21.8% and 22.1%, respectively. The Hotels and Resorts Division registered gross revenues of P=1.98 billion as against last year’s P=1.89 billion. The 4.7% increase in hotel revenues principally came from the new hotels namely Summit Galleria Cebu, Summit Hotel Tacloban and Go Hotels Iligan. Hotels and Resorts Division EBIT and EBITDA declined by 21.6% and 6.9%, respectively, as the division continues to redevelop some of the existing hotels and incurrence of a much accelerated pre-operating expenses on hotels to be opened in 2019 as well as higher overhead expense in the Head Office. The IID Division accounted for P=2.68 billion revenues, with 95% attributed to the sale of the commercial lots and the remainder 5% is the revenue generated from lease of warehouse facilities. Further gains will be realized from the selling of lots with joint ventures. EBIT and EBITDA for calendar year 2018 stood at P=2.05 billion and P=2.07 billion, respectively. Interest income increased to P=157.0 million from P=36.8 million last year due to higher average balance of cash and cash equivalents during the calendar year 2018.
63
Real estate costs went up by 30.6% to P=12.11 billion from P=9.28 billion last year. The higher level of realized sales of residential units and sale of parcels of land brought cost of real estate sales to increase by P=1.79 billion or 56.9%. The opening of new malls raised the level of depreciation expense of Commercial Centers Division by P=380.2 million or 12.5%; while completion of new office buildings increased depreciation expense of the Office Buildings Division by P=64.2 million or 10.2%. Furthermore, cinema expense rose by 10.4% or P=85.2 million in line with the increase in cinema revenues. Hotel expenses rose by 15.3% to P=1.56 billion due substantially to higher level of property and maintenance cost, depreciation, salaries and wages, contracted services, which were all due to higher level of operations brought about by higher room revenues and pre-operating expenses on hotels to be opened in 2019. General and administrative expenses went up by 20.1% to P=4.00 billion due to higher commission, rent, advertising and promotions and salaries, among others. Gain or loss from foreign exchange mainly pertains to foreign currency denominated transactions of the Company’s foreign subsidiary. As of December 31, 2018, total assets of the Group stood at P=174.16 billion, a growth of 17.6% from P=148.13 billion last year. Cash and cash equivalents increased by 22.6% or P=0.47 billion due to the proceeds from the SRO, cash generated from operations; offset by payments of dividends, loans, and capital expenditures for new and ongoing projects. Receivables (current and noncurrent-net) decreased by 53.7% or P=5.01 billion to P=4.33 billion due to reclassification to ‘Contract assets’ account amounting to P=10.76 billion in 2018. Subdivision land, condominium and residential units for sale grew by 9.0% to P=31.46 billion due to higher level of capital expenditures for new and ongoing projects under the Residential division. Contract assets (current and noncurrent) totaling P=10.76 billion refer to the right to consideration in exchange for goods or services transferred to the customers. If the Company performs by transferring goods or services to a customer before the customer pays consideration or before payment is due, a contract asset is recognized for the earned consideration that is conditional. This is reclassified as installment contract receivables when the monthly amortization is already due for collection. The movement in contract asset is mainly due to new real estate sales contract recognized during the period, increase in percentage of completion, less reclassification of installment contract receivable.
64

Other current assets went up by 176.3% to P=11.74 billion from P=4.25 billion last year mainly due to increase in cash under escrow which will mainly be used for the construction of real estate inventories. Investment properties and Property and equipment increased by 7.8% to P=99.32 billion and 17.2% to P=7.84 billion, respectively. Increase in Investment properties is due to reclassification of land from ‘Subdivision land, Condominium and Residential units for Sale’ account and costs incurred for the construction of new malls and office developments. On the other hand, the increase in Property and equipment is due to expansion projects from all three hotel segments namely Go Hotels, Summit Hotels, and International. Investments in joint venture consist of investments in stocks of joint venture companies intended to acquire, develop, sell and lease real estate properties. Contract liabilities (current and noncurrent) totaling P=15.31 billion consist of collections from real estate customers which have not reached the equity threshold to qualify for revenue recognition and excess of collections over the goods and services transferred by the Group based on percentage of completion. The movement in the ‘Contract liability’ account is mainly due to reservation sales and advance payment of buyers less real estate sales recognized upon reaching the equity threshold from increase in percentage of completion. Loans payable (current and noncurrent) decreased by 27.2% to P=37.39 billion due to settlement of a significant portion of short-term borrowings. The increase in deferred tax liabilities - net of 25.0% to P=3.58 billion is mainly attributed to excess of real estate revenues based on percentage-of-completion over real estate revenues based on collections. Deposits (current and noncurrent) and Other liabilities went down by 29.0% to P=8.60 billion primarily due to reclassification of deposits from real estate buyers to contract liabilities beginning 2018. Equity attributable to equity of the Parent Company as of December 31, 2018 stood at P=93.51 billion, up by 39.4% from P=67.09 billion last year due to successful SRO during the year, current earnings of P=8.22 billion, net of payment of dividends of P=1.87 billion. A summary of RLC’s key performance indicators for the calendar year follows: 2018 2017 Gross revenues P=29.56 billion P=22.52 billion EBIT 11.89 billion 8.56 billion EBITDA 16.35 billion 12.48 billion Net income 8.22 billion 5.88 billion Earnings per share 1.62 1.44 Net book value per share 18.00 16.39 Current ratio 1.65:1 1.20:1 Debt-to-equity ratio 0.40:1 0.77:1
65

Interest coverage ratio 6.72:1 4.72:1 Asset to equity ratio 1.85:1 2.20:1 Operating margin ratio 0.40:1 0.38:1
Capital additions and additions to subdivision land, condominium and residential units for sale for the calendar year ended December 31, 2018 amounted to P=19.31 billion, funding of which was sourced from proceeds from borrowings and internally-generated funds.
Item 10. Trends, Events or Uncertainties that have had or that are reasonably expected to affect revenues and income
There are no known trends, events or uncertainties that have had or that are
reasonably expected to have a material effect on revenues or income from continuing operations.
The Company currently derives substantially all of its revenues and income from
its property investment and development businesses in the Philippines. Their performance and profitability are anchored on the strength of the Philippine economy that is largely driven by private consumption, remittances from OFWs, growth of the IT-BPM sector, flourishing tourism industry, and a low interest rate environment.
There are (i) no significant elements of income or loss that did not arise from the registrant's continuing operations, (ii) no material off-balance sheet transactions, arrangements, obligations (including contingent obligations), and other relationships of the Company with unconsolidated entries or other persons created during the reporting period, or (iii) no event that may trigger direct or contingent financial obligation that is material to the company, including any default or acceleration of an obligation. Except for income generated from retail leasing, there are no seasonal aspects that have a material effect on RLC’s financial conditions or results of operations, there are no seasonal aspects that had a material effect on the financial condition or results of operations.
Item 11. Financial Statements
The consolidated financial statements and schedules listed in the accompanying
Index to Financial Statements and Supplementary Schedules (page 126) are filed as part of this Form 17-A (pages 127 to 266).
66

Item 12. Information on Independent Accountant and Other Related Matters
a) External Audit Fees and Services
Audit and Audit-Related Fees
The table below sets forth the aggregate fees billed to the Company for each of the last two years for professional services rendered by Sycip, Gorres Velayo & Co. and Punongbayan & Araullo :
Particulars 2020 2019
Audit and Audit-Related Fees
Fees for services that are normally provided by
the external auditor in connection with statutory
and regulatory filings or engagements ................................P=5,549,800
P=7,291,240
All other fees .....................................................................................99,415 1,705,000
TOTAL .............................................................................................P=5,649,215 P=8,996,240
There were no other significant professional services rendered by the external auditors during the period.
b) Changes in and Disagreements with Accountants on Accounting and Financial Disclosure
There were no disagreements with the external auditors of the Company on accounting and financial disclosures.
67

Item 13. Security Ownership of Certain Record and Beneficial Owners and Management
a) Security Ownership of Certain Record and Beneficial Owners
As of December 31, 2020, the following are the owners of the Company’s common stock in excess of 5% of total outstanding shares:
Title of Class
Name and addresses of record owners and
relationship with the Company
Names of beneficial owner and relationship
with record owner
Citizenship
No. of shares held
% to Total Outstanding
Common JG Summit Holdings, Inc. 1 43/F Robinsons Equitable Tower, ADB Avenue corner Poveda Street, Ortigas Center, Pasig City (stockholder)
Same as record owner
(see note 1)
Filipino
3,166,806,886 60.97%
Common PCD Nominee Corporation 2 (Non-Filipino) 37/F Tower I, The Enterprise Center 6766 Ayala Ave. corner Paseo de Roxas, Makati City (stockholder)
PCD Participants and their clients
(see note 2)
Non-Filipino 1,041,882,997
20.06%
Common PCD Nominee Corporation (Filipino) 37/F Tower I, The Enterprise Center 6766 Ayala Ave. corner Paseo de Roxas, Makati City (stockholder)
PCD Participants and their clients
(see note 2)
Filipino 958,770,233 18.46%
Notes: 1 The Chairman and the President of JG Summit Holdings Inc. (JGSHI) are both empowered under its by-laws to
vote any and all shares owned by JGSHI, except as otherwise directed by its board of directors. The incumbent Chairman and Chief Executive Officer and President and Chief Operating Officer of JGSHI are Mr. James L. Go and Mr. Lance Y. Gokongwei, respectively.
2 PCD Nominee Corporation is the registered owner of the shares in the books of the Corporation’s transfer agent.
PCD Nominee Corporation is a corporation wholly owned by the Philippine Depository and Trust Corporation, Inc. (formerly the Philippine Central Depository) (“PDTC”), whose sole purpose is to act as nominee and legal title holder of all shares of stock lodged in the PDTC. PDTC is a private corporation organized to establish a central depository in the Philippines and introduce scripless or book-entry trading in the Philippines. Under the current PDTC system, only participants (brokers and custodians) will be recognized by PDTC as the beneficial owners of the lodged shares. Each beneficial owner of shares through his participants will be the beneficial owner to the extent of the number of shares held by such participant in the records of the PCD Nominee.
Out of the PCD Nominee Corporation account, “Deutsche Bank Manila-Clients”, “The HongKong and Shanghai
Banking Corp. Ltd.- Clients Account” and “Citibank N.A.” hold for various trust accounts the following shares of the Corporation as of December 31, 2020:
No. of shares held % to total outstanding
Deutsche Bank Manila-Clients 558,298,653 10.75% Citibank N.A. 512,709,911 9.87% The Hongkong and Shanghai Banking 280,329,624 5.40% Corp. Ltd. - Clients Acct. Voting instructions may be provided by the beneficial owners of the shares.
68
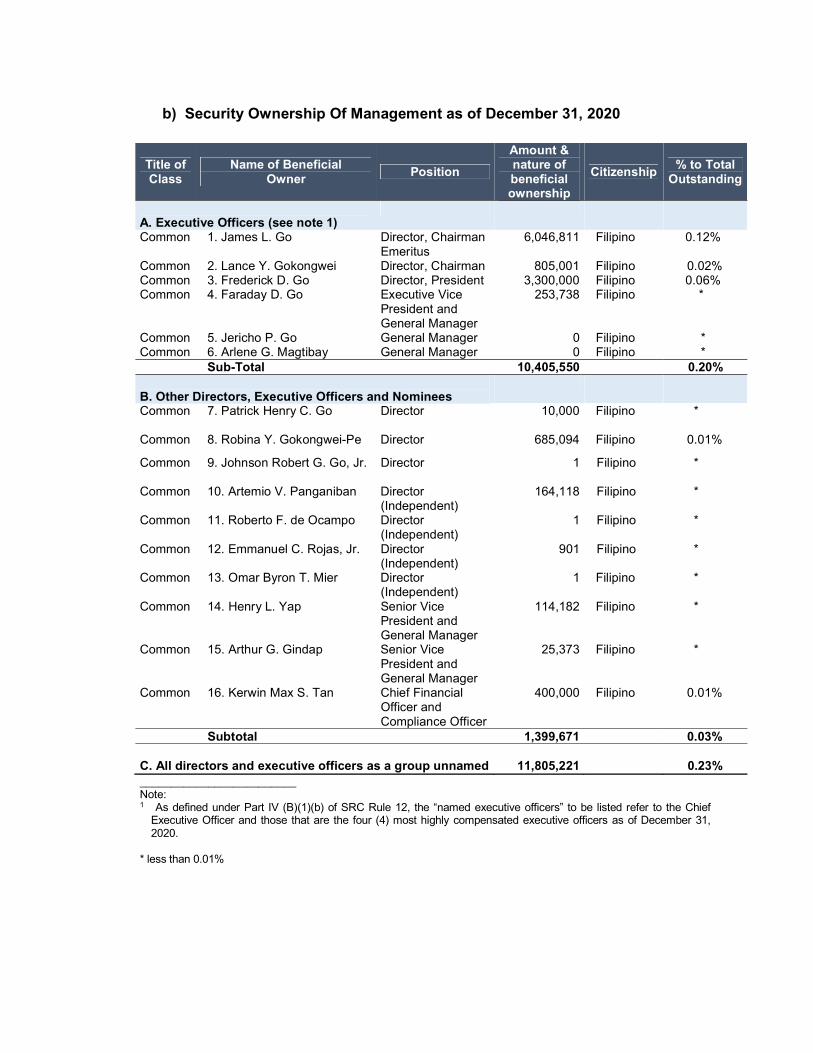
b) Security Ownership Of Management as of December 31, 2020
Title of Class
Name of Beneficial Owner
Position
Amount & nature of beneficial ownership
Citizenship % to Total
Outstanding
A. Executive Officers (see note 1)
Common 1. James L. Go Director, Chairman Emeritus
6,046,811 Filipino 0.12%
Common 2. Lance Y. Gokongwei Director, Chairman 805,001 Filipino 0.02% Common 3. Frederick D. Go Director, President 3,300,000 Filipino 0.06% Common 4. Faraday D. Go Executive Vice
President and General Manager
253,738 Filipino *
Common 5. Jericho P. Go General Manager 0 Filipino * Common 6. Arlene G. Magtibay General Manager 0 Filipino * Sub-Total 10,405,550 0.20% B. Other Directors, Executive Officers and Nominees
Common
7. Patrick Henry C. Go Director 10,000 Filipino *
Common 8. Robina Y. Gokongwei-Pe Director 685,094 Filipino 0.01%
Common 9. Johnson Robert G. Go, Jr.
Director 1 Filipino *
Common 10. Artemio V. Panganiban Director (Independent)
164,118 Filipino *
Common 11. Roberto F. de Ocampo Director (Independent)
1 Filipino *
Common 12. Emmanuel C. Rojas, Jr. Director (Independent)
901 Filipino *
Common 13. Omar Byron T. Mier Director (Independent)
1 Filipino *
Common 14. Henry L. Yap Senior Vice President and General Manager
114,182 Filipino *
Common 15. Arthur G. Gindap Senior Vice President and General Manager
25,373 Filipino *
Common 16. Kerwin Max S. Tan Chief Financial Officer and Compliance Officer
400,000 Filipino 0.01%
Subtotal 1,399,671 0.03% C. All directors and executive officers as a group unnamed
11,805,221
0.23%
_________________________ Note: 1 As defined under Part IV (B)(1)(b) of SRC Rule 12, the “named executive officers” to be listed refer to the Chief
Executive Officer and those that are the four (4) most highly compensated executive officers as of December 31, 2020.
* less than 0.01%
69

c) Voting Trust Holder of 5% or more - as of December 31, 2020 There are no persons holding more than 5% of a class under a voting trust or similar agreement.
d) Changes in Control There has been no change in control of the Company since December 31, 2020.
70

PART III- CONTROL AND COMPENSATION INFORMATION
Item 14. Directors and Executive Officers of the Registrant
The overall management and supervision of the Company is undertaken by the Board of Directors. The Company’s executive officers and management team cooperate with the Board of Directors by preparing appropriate information and documents concerning business operations, financial condition and results of operations of the Company for its review. Currently, the Board of Directors of the Company consists of eleven members, of which four are independent directors. The table below sets forth Board of Directors and Executive Officers of the Company as of December 31, 2020:
Name Age Position Citizenship
James L. Go ................................ 81 Director, Chairman Emeritus Filipino
Lance Y. Gokongwei ................................ 54 Director, Chairman Filipino
Frederick D. Go ................................ 51 Director, President & Chief Executive Officer Filipino
Patrick Henry C. Go ................................ 50 Director Filipino
Johnson Robert G. Go, Jr. ................................ 55 Director Filipino
Robina Y. Gokongwei-Pe ................................ 59 Director Filipino
Artemio V. Panganiban ................................ 84 Director (Independent) Filipino
Roberto F. de Ocampo................................. 75 Director (Independent) Filipino
Emmanuel C. Rojas, Jr. ................................ 85 Director (Independent) Filipino
Omar Byron T. Mier…………… 75 Director (Independent) Filipino
Faraday D. Go…………………. 45 Executive Vice President and Business Unit General Manager
Filipino
Kerwin Max S. Tan ................................ 50 Chief Financial Officer Filipino
Henry L. Yap………………….. 57 Senior Vice President and Business Unit
General Manager
Filipino
Arlene G. Magtibay ................................ 58 Senior Vice President and Business Unit General Manager
Filipino
Arthur Gerrard D. Gindap....….. 59 Senior Vice President and Business Unit General Manager
Filipino
Ma. Socorro Isabelle V. Aragon-Gobio…………………..
47 Senior Vice President and Business Unit General Manager
Filipino
Jericho P. Go.......................….. 49 Senior Vice President and Business Unit General Manager
Filipino
Corazon L. Ang Ley…………… 53 Business Unit General Manager Filipino
Anna Katrina C. De Leon …….. 35 Vice President - Group Controller Filipino
71

Name Age Position Citizenship
Joanna N. Laiz.………………… 50 Vice President Filipino
Ernesto B. Aquino………...…… 52 Vice President Filipino
Emmanuel G. Arce…………….. 63 Vice President Filipino
Constantino C. Felipe…………. 58 Vice President Filipino
Catalina M. Sanchez………….. 41 Vice President Filipino
Jonathan P. Balboa..………….. 46 Vice President Filipino
Sylvia B. Hernandez…………... 56 Vice President - Treasurer Filipino
Ronald de Guzman Paulo.…... 55 Senior Vice President and Head - Corporate Construction Management
Filipino
Elaine G. Miranda-Araneta ................................ 56 Corporate Secretary Filipino
The above directors and officers have served their respective offices since May 14, 2020. The independent directors of the Company are Roberto F. de Ocampo, Emmanuel C. Rojas Jr., Retired Chief Justice Artemio V. Panganiban, and Omar Byron T. Mier. Atty. Elaine G. Miranda-Araneta was appointed as Corporate Secretary effective October 1, 2020. A brief description of the directors and executive officers’ business experience and other directorships held in other reporting companies are provided as follows:
a) Directors’ and Key Officers’ Experience James L. Go, 81, is the Chairman Emeritus and member of the Board of Directors of RLC. He is the Chairman of JG Summit Holdings, Inc. and Cebu Air, Inc. He is also the Chairman and Chief Executive Officer of Oriental Petroleum and Minerals Corporation. He is the Chairman Emeritus of Universal Robina Corporation, JG Summit Petrochemical Corporation, and JG Summit Olefins Corporation. He is the Vice Chairman of Robinsons Retail Holdings, Inc. and a director of Marina Center Holdings Private Limited, United Industrial Corporation Limited and Hotel Marina City Private Limited. He is also the President and Trustee of the Gokongwei Brothers Foundation, Inc. He has been a director of the Philippine Long Distance Telephone Company (PLDT) since November 3, 2011. He is a member of the Technology Strategy Committee and Advisor of the Audit Committee of the Board of Directors of PLDT. He was elected a director of Manila Electric Company on December 16, 2013. Mr. Go received his Bachelor of Science Degree and Master of Science Degree in Chemical Engineering from Massachusetts Institute of Technology, USA. Lance Y. Gokongwei, 54, is the Chairman of RLC. He is the President and Chief Executive Officer of JG Summit Holdings, Inc. and Cebu Air, Inc. He is the Chairman of Universal Robina Corporation, Robinsons Retail Holdings, Inc., JG Summit Petrochemical Corporation, JG Summit Olefins Corporation and Robinsons Bank Corporation. He is a director and Vice Chairman of Manila Electric Company and a director Oriental Petroleum and Minerals Corporation, and United Industrial Corporation Limited. He is a member of the Board of Global Reporting Initiative. He
72

is also a trustee and Chairman of the Gokongwei Brothers Foundation, Inc. He received a Bachelor of Science degree in Finance and a Bachelor of Science degree in Applied Science from the University of Pennsylvania. Frederick D. Go, 51, is the President and Chief Executive Officer of RLC. He is the Chairman and President of Altus Property Ventures, Inc. and the President of Robinsons Recreation Corporation. He is the Group General Manager of Shanghai Ding Feng Real Estate Development Company Limited, Xiamen Pacific Estate Investment Company Limited, Chengdu Ding Feng Real Estate Development Company Limited, Taicang Ding Feng Real Estate Development Company Limited, Taicang Ding Sheng Real Estate Development Company Limited, Chongqing Robinsons Land Real Estate Company Limited, and Chongqing Ding Hong Real Estate Development Company Limited. He is the Chairman of Luzon International Premier Airport Development Corporation. He is the Vice Chairman of the Board of Directors of Robinsons Bank Corporation and also serves as the Vice Chairman of the Executive Committee of the said bank. He also serves as a director of Cebu Air, Inc., Manila Electric Company, JG Summit Petrochemical Corporation, JG Summit Olefins Corporation, and Cebu Light Industrial Park. He is the Vice Chairman of the Philippine Retailers Association. He received a Bachelor of Science degree in Management Engineering from the Ateneo de Manila University. Patrick Henry C. Go, 50, was elected as a director of RLC on January 17, 2000. He is also Executive Vice President of URC. He is the President and Chief Executive Officer of JG Summit Petrochemical Corporation, JG Summit Olefins Corporation. He is also a director of JG Summit Holdings, Inc., Robinsons Land Corporation, Robinsons Bank Corporation, Global Power Business Corporation and Meralco Powergen Corporation. He is a trustee and treasurer of the Gokongwei Brothers Foundation, Inc. He received a Bachelor of Science degree in Management from the Ateneo de Manila University and attended the General Manager Program at Harvard Business School. Mr. Patrick Henry C. Go is a nephew of Mr. John L. Gokongwei, Jr. Johnson Robert G. Go, Jr., 55, was elected as a director of RLC on May 29, 2005. He is currently a director of JG Summit Holdings, Inc., Universal Robina Corporation, Robinsons Bank Corporation and A. Soriano Corporation. He is also a trustee of the Gokongwei Brothers Foundation, Inc. He received a Bachelor of Arts degree in Interdisciplinary Studies (Liberal Arts) from the Ateneo de Manila University. He is a nephew of Mr. John L. Gokongwei, Jr. Robina Gokongwei-Pe, 59, was elected as a director of RLC on May 5, 2005. She is the President and Chief Executive Officer of Robinsons Retail Holdings, Inc. She is also a director of JG Summit Holdings, Inc., Robinsons Land Corporation, Robinsons Bank Corporation and Cebu Air, Inc. She is a trustee and the secretary of the Gokongwei Brothers Foundation, Inc. and a trustee of the Immaculate Concepcion Academy Scholarship Fund. She is also a member of the Xavier School Board of Trustees. She was also a member of the University of the Philippines Centennial Commission and was a former Trustee of the Ramon Magsaysay Awards Foundation. She attended the University of the Philippines-Diliman from 1978 to 1981 and obtained a Bachelor of Arts degree (Journalism) from New York University in 1984.
73

Artemio V. Panganiban, 84, was elected as an independent director of RLC on May 14, 2008. He is concurrently an adviser, consultant and/or independent director of several business, civic, non-government and religious groups. He also writes a regular column in the Philippine Daily Inquirer. He is a retired Chief Justice of the Philippines and was concurrently Chairperson of the Presidential Electoral Tribunal, the Judicial and Bar Council and the Philippine Judicial Academy. Prior to becoming Chief Justice, he was Justice of the Supreme Court of the Philippines (1995-2005), Chairperson of the Third Division of the Supreme Court (2004-2005), Chairperson of the House of Representatives Electoral Tribunal (2004-2005), Consultant of the Judicial and Bar Council (2004-2005) and Chairperson of eight Supreme Court Committees (1998-2005). He authored thirteen (13) books. Retired Chief Justice Panganiban obtained his Bachelor of Laws degree, cum laude, from the Far Eastern University and placed 6th in the 1960 bar examination. He was conferred the title Doctor of Laws (Honoris Causa) by the University of Iloilo in 1997, the Far Eastern University in 2002, the University of Cebu in 2006, the Angeles University in 2006, and the Bulacan State University in 2006. Roberto F. de Ocampo, 75, was elected as an independent director of RLC on May 28, 2003. He is the former Secretary of Finance and former President of the Asian Institute of Management (AIM), one of Asia’s leading international business management graduate schools based in the Philippines. He is among others, currently the Chairman of the Philippine Veterans Bank, and is Chairman of the Board of Advisors of the RFO Center for Public Finance and Regional Economic Cooperation (an ADB Regional Knowledge Hub), Vice Chairman of the Makati Business Club, Chairman of the Foundation for Economic Freedom (FEF) and past President of MAP. As Secretary of Finance of the Republic of the Philippines from 1994-1998 during the presidency of Fidel V. Ramos he was named Global Finance Minister of the year in 1995, 1996, and 1997. He was previously Chairman and Chief Executive Officer of the Development Bank of the Philippines during the presidency of Cory Aquino and Chairman of the Land Bank during the Ramos Administration. Dr. de Ocampo graduated from De La Salle College and Ateneo de Manila University, received an MBA from the University of Michigan, holds a post-graduate diploma in Development Administration from the London School of Economics, and has four doctorate degrees (Honoris Causa) conferred by the De La Salle University in Business Administration, by the University of Angeles City in Public Administration, by the Philippine Women’s University in Laws, and by the San Beda College in Humane Letters. Dr. de Ocampo was a member of the Board Governors of the World Bank, IMF, and ADB and was Chairman of the APEC and ASEAN Finance Ministers in 1997-98.He was awarded by Queen Elizabeth the Most Excellent Order of the British Empire (OBE), by France as a Chevalier (Knight) of the Legion d'Honneur, and by the Vatican as Knight of the Holy Sepulchre of Jerusalem. He is the recipient of many other awards including Philippine Legion of Honor, ADFIAP Man of the Year, Ten Outstanding Young Men Award, CEO Excel Award, several Who’s Who Awards and the 2006 Asian HRD Award for Outstanding Contribution to Society. He is also a member /Advisory Board Member of a number of important global institutions including The Conference Board, the Trilateral Commission, the BOAO Forum for Asia and the Emerging Markets Forum, and The Global Reporting Initiative (GRI). Emmanuel C. Rojas, Jr., 85, was elected as a director of RLC on September 28, 2005 and is presently an independent director of the Company. He had been a
74

Consultant and Corporate Secretary of RLC until May 27, 2003. Mr. Rojas is presently an independent director of Unicon Insurance Brokers Corporation. Mr. Rojas previously served as Independent Director of Robinsons Bank and Legaspi Savings Bank for about one year in 2013. He was also a Consultant and Corporate Secretary of JG Summit Holdings, Inc., Universal Robina Corporation, and CFC Corporation. Mr. Rojas retired from his position as First Vice President for Tax Administration under the compulsory retirement policy of the Company upon reaching the age of 60. He also served in various other head positions in administration, audit, controllership and treasurership for the various companies in the Group. A Certified Public Accountant, Mr. Rojas practiced with Fleming and Williamson and SGV & Co. before joining the Group in 1962. He was with IBM Philippines prior to becoming a CPA. Omar Byron T. Mier, 75, was appointed as an Independent Director of RLC on August 13, 2015. He is also a Director of Robinsons Bank Corporation and Legaspi Savings Bank. He is also a director of Paymaya since 2016 and Chairman of the Board and Audit Committee and a director of RCBC Leading Corp. and a member of the Audit Compliance Committees since 2018. Prior to joining RLC, he was the President and CEO of Philippine National Bank from 2005-2010 then from 2012 to 2014. He also worked at Deutsche Bank Manila as Deputy General Manager and Head of the Corporate Banking Group. He also worked for Citibank Manila in various positions such as Head of the Multinational Corporations Group, Head of the Local Corporate Group, Head of the Risk Management Group, Headed the Remedial Management Group, and Senior Credit Officer. He was also a Senior Credit Officer at Citibank Malaysia (for both Kuala Lumpur and Penang branch). He is a lecturer for credit and corporate finance at the Citibank Training Center in Singapore, and Guest Risk Asset and Credit Reviewer for various branches in Malaysia, South Korea, Indonesia, Thailand, and Hongkong. He obtained his degrees in Bachelor of Science in Business Administration, Major in Accounting, Bachelor of Arts in Economics. He is a Certified Public Accountant. Faraday D. Go, 45, was appointed as Executive Vice President of Robinsons Land Corporation effective June 1, 2018. Prior to joining RLC, he was Vice President of the Retail Management and Corporate Sales Division of Digitel Mobile Philippines, Inc. He has over fifteen years’ experience in the following businesses: Apo Cement, JG Summit Petrochemical Corporation and Digitel Mobile Philippines, Inc. He received a Bachelor of Science degree in Management (Minor in Finance) from the Ateneo de Manila University in 1998. Mr. Faraday D. Go is a nephew of Mr. John L. Gokongwei, Jr. Kerwin Max S. Tan, 50, is the Chief Financial Officer of RLC effective March 1, 2016. Previously, he was appointed as the Vice President - Treasurer of RLC on October 2014 and Vice President and Deputy Treasurer of RLC on January 2014. Before this assignment, he was the Vice President for Operations of Robinsons Luxuria, Robinsons Residences and Robinsons Communities effective March 1, 2007. Prior to working in RLC, he worked in various divisions of Citibank N.A. for nine years. His last position at Citibank N.A. was Assistant Vice President and Head of Cash Management Operations. He received a degree in Bachelor of Science in Industrial Engineering from the University of the Philippines, Diliman.
75

Henry L. Yap, 57, is the Senior Vice President and Business Unit General Manager of RLC Residences (RLC Residential Division). Prior to assuming this post, he served the group/company as the Country Business Unit General Manager of Ding Feng Real Estate Companies (China), Business Unit General Manager of the Office Buildings Division, Vice President of RLC’s Property Planning and Design Department and member of the Investors Relations Team. Before joining RLC, he headed the Property Planning and Design Group of Fort Bonifacio Development Corporation and sat on the Boards of seven subsidiaries, affiliates and foundation of FBDC. He worked as Manager for Metro Manila Camps of the Bases Conversion and Development Authority where he was involved in the planning, design, privatization and implementation of the Bonifacio Global City, among others. He also lent his expertise to Government by serving as the head of the National Committee on Architecture and the Allied Arts and member of the Sub-Commission on the Arts of the National Commission for Culture and the Art. He also taught at the University of the Philippines where he was Senior Lecturer at the School of Urban and Regional Planning and at the College of Architecture. He holds a Master's of Science in Urban Planning in Developing Countries from the University of Wales College of Cardiff (UK), Bachelor of Science in Architecture, cum laude, and earned units for his Ph.D. in Urban and Regional Planning, both from UP. Henry Yap is Philippine-licensed Architect and Environmental Planner. Arlene G. Magtibay, 58, is the Senior Vice President and Business Unit General Manager of the Commercial Centers Division of Robinsons Land Corporation. She has 31 years experience in the planning, development and management of shopping centers. Prior to joining the Company, she was a Director and Senior Vice President at Landco Pacific Corporation where she held the position of SBU Head for Shopping Centers and CBDs. She earned her Bachelor of Science degree in Business Economics, cum laude, from the University of the Philippines, and obtained her Master’s in Business Management, with distinction, from the Asian Institute of Management. Arthur Gerrard D. Gindap, 59, is Senior Vice President and Business Unit General Manager of Robinsons Hotels & Resorts. Prior to joining RLC in 2018, he was Regional Vice President, Philippines & Thailand, and Vice President, Global Operations & Customer Service for The Ascott Ltd. For the period 1989 to 2004, he held various senior and general management positions with Mandarin Oriental Hotels, Shangri-La Hotels, Swiss-Belhotel International and The Mulia Group. He received a Hotel & Restaurant Diploma from Sheridan College in Brampton, Ontario, Canada in 1980. Ma. Soccorro Isabelle V. Aragon-Gobio, 47, was appointed as Senior Vice President and Business Unit General Manager of Industrial and Integrated Developments Division effective October 1, 2016. She has been with RLC for 25 years and is concurrently director of Manhattan Building Management Corporation, Manchego Food Corporation, and various condominium corporations of the Company’s projects. She received a degree in Bachelor of Science in Management Engineering with a minor in International Business from the Ateneo de Manila University and is a PRC licensed Real Estate Broker.
76

Jericho P. Go, 49, is Senior Vice President and Business Unit General Manager of Robinsons Offices. He is concurrently the President of Robinsons DoubleDragon Corp. and member of the Board of Directors of Robinsons Equitable Tower Condominium Corporation, Robinsons Summit Center Condominium Corporation and Galleria Corporate Center Condominium Corporation. He has over 28 years of experience in the field of real estate and was responsible for filing and registering the Philippines' very first IT park with the Philippine Economic Zone Authority (PEZA) way back in 1997. This ushered in the establishment of IT parks and buildings all over the country and aided the growth of IT & BPO in the Philippines. Prior to joining RLC in 2019, he was Senior Vice President of Megaworld Corporation for business development & office leasing, investor relations and public relations from 1997 to 2019. He also held various positions in Greenfield Development Corporation and Ayala Land, Inc. He received a Bachelor of Arts degree in Development Studies from the University of the Philippines and graduated Magna Cum Laude and Class Salutatorian in 1993. Corazon L. Ang Ley, 53, is the Business Unit General Manager for Robinsons Homes concurrent to her role as Corporate Land Acquisition Head for RLC. She’s held various positions and functions within RLC during her 27 years of service including her 3 year stint in China. She is also a Board Member of several companies namely Altus Mall Ventures, Inc., Robinsons Realty and Management Corp, Robinsons Recreation Corp, Robinsons Land Foundation Inc, and RL Logistix and Industrials, Inc. She graduated from the University of the Philippines - Asian Institute of Tourism in 1987. Anna Katrina C. De Leon, 35, was appointed as Vice President - Group Controller of RLC. Concurrently, she handles RLC’s subsidiaries and is an active member of RLC’s Investor Relations Team since 2013. She was also appointed as Vice President - Group Controller of Altus Property Ventures, Inc. A Certified Public Accountant, she had a three-year stint in SGV & Co. (a member firm of Ernst & Young) as an external auditor with a broad audit client base including publicly-listed and privately-held real estate entities prior joining RLC in 2011. A consistent Dean’s Lister, she received a Bachelor’s Degree in Accountancy from the University of the East in 2008. Joanna N. Laiz, 50, is currently taking the position of Vice President, Lease of RLC. She had over 25 years of experience in Real Estate covering the areas of Leasing, Tenant Relations and Networking, Business Development, Advertising and Promotions, Mall Operations, Asset Management and Site Development. Her most recent job before RLC was in Vista Malls between 2013 and 2018. Followed by Filinvest Land in 2012. She also worked for Viscal Development Corp (Metro Gaisano) briefly between 2010 and 2011. Additionally, she worked for Landco Pacific Corp and Golden Arches Development Corp between 1992 and 2009. She received a Bachelor of Science in Computer Science degree from AMA Computer College in 1991. Ernesto “Boyong” Aquino, Jr., 52, is Vice President of Corporate Property Planning Dept Project Office of RLC Commercial Center Division. He joined RLC in 2000 as the head of Store Planning, Visuals and Engineering department of Big R Stores Inc and was moved in 2004 to Hotels Division as Senior Project Director. Prior
77

to joining RLC, he was a Creative Manager of Store Planning Department in Robinsons Retail Group for 8 years. He graduated in Mapua Institute of Technology in 1990 with a degree of BS Architecture. Emmanuel G. Arce, 63, is the Vice President for Project Management Department effective June 2007. He started in RLC on August 2004 as Project Director then Assistant Vice President. Prior to joining RLC in 2004, he was the Estate Manager of the Bonifacio Estate Service Corporation, General Manager of Capstone Builders Corporation, Assistant Vice President of Cebu Light Industrial Park and Investment Capital Corporation of the Philippines (ICCP land Management Inc.) and Vice President of Gateway Property Holdings Inc. He received a Bachelor of Science in Civil Engineering from the Far Eastern University. Constantino Felipe, 58, is the Vice President for Human Resources. Prior to joining RLC, he handled various HR roles within the Philippines and Asia Pacific. He is experienced in team and change management process, employee counseling and training program development. He received a bachelor degree in Psychology from the University of the Philippines and was trained in competency based assessments by Egon Zehnder and action learning by the World Institute of Action Learning. Catalina Mallari-Sanchez, 41, was appointed as Vice President for Business Development and Marketing for Office Buildings Division. She is also a member of the Investor Relations team of RLC and is handling the company’s flexible workspace business, work.able. She has over 20 years of experience in the real estate industry particularly in the residential, office and flexible workspace segments. She holds a degree in Bachelor of Science in Economics minor in Communication Research from University of the Philippines, Diliman. Jonathan P. Balboa, 46, is Vice President of Leasing from the Office Buildings Division of Robinsons Land Corporation. Before joining RLC, he was Vice President for Business Development and Leasing of Megaworld Corporation. From 2001 to 2011 he held corporate sales and account management positions with Digital Telecommunications Inc., and Helius Technologies. He received a Bachelor of Arts degree majoring in Organizational Communication from the University of the Philippines Manila in 1999. Sylvia B. Hernandez, 56, was appointed as Vice President - Treasurer of RLC on February 1, 2016. She currently holds the position as Assistant Treasurer of other affiliate companies (Altus Angeles Inc, Altus San Nicolas Corp., Robinsons Recreation Corp., and Manhattan Building Management Corp.); Various Condominium Corporation, such as Rob. Equitable Tower Condo Corp., Rob. Summit Center Condo Corp.) Prior to joining RLC in 1996 as Assistant Treasurer, she was the Special Assistant to the VP - Treasurer of Robinsons Inn Inc. and Manila Midtown Hotel. She was also the Chief Accountant of Robinsons Inc. and Shrine Galleria Corporation. Sylvia has been with JGSHI since November 16, 1983. She graduated from Polytechnic University of the Philippines with a degree of Bachelor in Accountancy. She is a Certified Public Accountant. Engr. Ronald de Guzman Paulo, 55, is currently Senior Vice President and Head - Corporate Construction Management of Robinsons Land Corporation. The Corporate
78

Construction Management Group was created under the office of the President/CEO. Its objective is to improve the overall project and construction management performance of all projects, from design management, procurement management, construction and post construction. Prior to rejoining RLC in 2019, Ronald's first stint with the Company was in 1997 as a project manager for one of RLC's mall project. He was involved in the development and completion of at least 20 commercial centers . He rose through the ranks and in 2007 was appointed as Corporate Project Director for Robinsons Land China, overseeing the project implementation of various mixed-use projects of the Company in several key cities in China. Ronald moved to Megawide Construction Corp. as its Vice President for Operations in 2012. In 2016, he was promoted as Executive Vice President and Head of Construction. He was instrumental in the successful completion of multiple residential, office and hotel projects. He was also involved in the implementation of several PPP projects of Megawide. Ronald is a licensed Civil Engineer and has a Masters Degree in Business Administration from the De La Salle University Graduate School of Business and Economics. He is a father to two daughters, Patricia and Isabelle, and is happily married to his wife Catherine. Elaine G. Miranda-Araneta, 56, is the Corporate Secretary of Robinsons Land Corporation. Concurrent with her appointment, she is also the head of the Corporate Legal Affairs of Office Buildings Division of Robinsons Land Corporation. Atty. Miranda-Araneta has had extensive experience as a corporate lawyer having been the corporate legal counsel of the JG Summit Group of Companies since 1992. She attended the Ateneo de Manila University School of Law in 1989 and University of the Philippines in 1985, where she earned her Bachelor of Laws degree (Consistent Dean’s Lister and graduated Second Honors) and BA Economics, minor in Philosophy (Cum Laude), respectively. She was admitted to the Philippine Bar in 1990. She previously worked as a confidential attorney of Justice Gloria C. Paras of the Court of Appeals, and was an associate lawyer in Carag, Caballes, Jamora & Somera Law Offices.
b) Involvement In Certain Legal Proceedings of Directors and Executive Officers
None of the members of RLC’s Board nor its executive officers are involved in any criminal, bankruptcy or insolvency investigations or proceedings for the past five (5) years.
c) Family Relationships
James L. Go is the brother of John Gokongwei, Jr. Lance Y. Gokongwei is the nephew of James L. Go Frederick D. Go is the nephew of James L. Go Patrick Henry C. Go is the nephew of James L. Go Johnson Robert G. Go, Jr. is the nephew of James L. Go Robina Y. Gokongwei-Pe is the niece of James L. Go Faraday D. Go, Jr. is the nephew of James L. Go
79

Item 15. Executive Compensation
a) Summary Compensation Table
The following table identifies RLC’s Chief Executive Officer and the five (5) most highly compensated executive officers and summarizes their aggregate compensation as of calendar year ended December 31, 2020.
The following table identifies RLC’s Chief Executive Officer and the four (4) most highly compensated executive officers and summarizes their aggregate compensation as of calendar year ended December 31, 2019.
* Per diem
Position Salary Bonus *Others Total
P 55,856,422 P 1,500,000 P 725,000 P 58,081,422Position
1. James L. Go2. Frederick D. Go
3. Faraday D. Go
4. Jericho P. Go 5.
6.Arlene G. Magtibay Lance Y. Gokongwei
P 97,943,499 P 3,500,000 P 1,625,000
P 103,068,499
Name
Executive Vice President and BU General Manager Senior Vice President and BU General Manager Senior Vice President and BU General Manager Director, Chairman
B. All other officers and directors as a group unnamed
Calendar Year 2020 Name
Director, President and Chief Executive Officer Director, Chairman Emeritus
A. CEO and five most highly compensated executive officers
Position Salary Bonus *Others Total
P 43,501,997 P 2,000,000 P 1,025,000 P 46,526,997Position
1. James L. Go2. Frederick D. Go
3. John L. Gokongwei, Jr.
4. Arlene G. Magtibay 5.
Lance Y. Gokongwei
P 105,865,198 P 3,500,000 P 1,575,000
P 110,940,198
Name
Director, Chairman Emeritus and Founder Senior Vice President and BU General Manager Director, Chairman
B. All other officers and directors as a group unnamed
Calendar Year 2019 Name
Director, President and Chief Executive Officer Director, Chairman Emeritus
A. CEO and four most highly compensated executive officers
80

The following table lists the name of the Company’s Chief Executive Officer and the five most highly compensated executive officers and summarized their aggregate compensation for the ensuing year:
* Per diem ** Estimated
b) Standard Arrangement
Other than payment of reasonable per diem, there are no standard arrangements pursuant to which directors of the Company are compensated, or are to be compensated, directly or indirectly, for any services provided as director for the last completed calendar year and the ensuing year.
c) Other Arrangement
There are no other arrangements pursuant to which any director of the Company was compensated, or is to be compensated, directly or indirectly, during the Company’s last completed calendar year, and the ensuing year, for any service provided as a director.
d) Any employment contract between the company and named executive officer
There are no special employment contracts between the registrant and the named executive officers.
e) Warrants and Options Outstanding There are no outstanding warrants or options held by the Company’s CEO, the named executive officers, and all officers and directors as a Group.
Position Salary Bonus *Others Total
P 58,983,953 P 1,500,000 P 725,000 P 61,208,953Position
1. James L. Go2. Frederick D. Go
3. Faraday D. Go
4. Jericho P. Go 5.
6.Arlene G. Magtibay Lance Y. Gokongwei
P 103,850,686 P 3,500,000 P 1,625,000
P 108,975,686
Name
Executive Vice President and BU General Manager Senior Vice President and BU General Manager Senior Vice President and BU General Manager Director, Chairman
B. All other officers and directors as a group unnamed
Calendar Year 2021** Name
Director, President and Chief Executive Officer Director, Chairman Emeritus
A. CEO and five most highly compensated executive officers
81

Item 16. Certain Relationships And Related Party Transactions
RLC is the real estate arm and a member of the JG Summit group. The JG Summit group is comprised of JG Summit and its subsidiaries. As of March 31, 2020, JG Summit held 60.97% of the outstanding shares of the Company. It was incorporated in November 1990 as the holding company for a group of companies with diverse interests in branded consumer foods, agro-industrial and commodity food products, textile, telecommunications, petrochemicals, air transportation and financial services. RLC and its subsidiaries, in their ordinary course of business, engage in transactions with companies in the JG Summit group and other companies controlled by the Gokongwei Family. RLC’s policy with respect to related party transactions is to ensure that these transactions are entered into on terms comparable to those available from unrelated third parties. The Company’s major related party transactions include leases of significant portions of its commercial centers and office buildings to companies controlled by the Gokongwei Family, including Robinsons Department Store, Robinsons Supermarket and Handyman Do-It-Best. Other affiliates from whom RLC earns rental income include Robinsons Bank and Cebu Pacific Air, Inc. Rental income paid to RLC by affiliates amounted to P=2.10 billion and P=3.00 billion for the years ended December 31, 2020 and 2019, respectively.
RLC and its subsidiaries also maintain savings and current accounts and time deposits with Robinsons Bank, an affiliated local commercial bank. These balances amounted to P=1.56 billion and P=1.92 billion as of December 31, 2020 and 2019, respectively. In 2019, the Company has entered into contracts to sell parcels of land to the joint venture companies it had formed with Shang Properties, Inc., Hong Kong Land Group and DMCI Project Developers, Inc. Furthermore, JG Summit also provides RLC with certain corporate services including corporate finance, corporate planning, procurement, human resources, legal and corporate communications. For further information on the Company’s related party transactions, including detailed breakdowns of amounts receivable from and amounts payable to affiliated companies as well as details on the sale of land to joint venture companies, see Note 20 to the Company’s financial statements as of and for the calendar years ended December 31, 2020 and 2019.
82

PART IV. CORPORATE GOVERNANCE Robinsons Land acknowledges that good corporate governance is essential to build an environment of trust, transparency and accountability necessary for fostering long-term performance, financial stability, business integrity and sustainability of the company for the protection of the interests of shareholders and other stakeholders. Corporate governance is the framework of rules, systems and processes of the corporation that governs the performance by the Board of Directors and Management of their respective duties and responsibilities to the stakeholders. In late 2003, the Board of Directors approved its Corporate Governance Compliance Evaluation System (“System”) in order to monitor and assess the level of compliance of the Company with leading practices on good corporate governance as specified in its Corporate Governance Manual and pertinent SEC Circulars. The System likewise highlights areas for compliance improvement and actions to be taken. One of the System’s output is the Annual Corporate Governance Compliance Evaluation Form (“ACGCEF”) submitted to the SEC and PSE on or before January 30 of every year. RLC began making such submission of the ACGEF covering the previous calendar year to the SEC and PSE in 2004. The Company continuously strives to strengthen and improve its corporate governance practices by adopting best practices that includes building a competent board, aligning strategies with goals, managing risk effectively, adhering to high standards of ethics and integrity, and promoting accountability by defining roles and responsibilities. In view of this, a Revised Corporate Governance Manual (“Revised Manual”) was adopted to institutionalize corporate governance principles as a guide for the daily conduct of business. Consistent with the Revised Manual and pursuant to the recommendations provided in the Code of Corporate Governance for Publicly Listed Companies (“PLCs”), the Company strengthened its policies on Board Diversity, Board Nomination and Election, Succession Planning and Remuneration, Material Related Party Transactions and Whistleblowing to reinforce the governance framework of the Company. There has been no deviation from the Company’s Revised Manual since it was adopted. Furthermore, the Company ensures compliance with the reportorial requirements for PLCs such as the submission of the Integrated Corporate Governance Report (“I-ACGR”) to the SEC and the PSE. The I-ACGR is a reportorial requirement under SEC Memorandum Circular No. 15 series of 2017 to all PLCs to disclose the Company’s compliance/non-compliance with the recommendations provided under the Corporate Governance Code for PLCs. With the “comply or explain” approach, voluntary compliance to recommended corporate governance best practices is combined with mandatory disclosure. The Company submitted its I-ACGR for calendar year 2019 on May 30, 2019. The Company also submitted the Material Related Party Transactions Policy to the SEC on October 28, 2019 as required under SEC Memorandum Circular No. 10 series of 2019.
83

Part V: Robinsons Land Corp. (RLC)
Sustainability Report
Contextual Information
Company Details Name of Organization
Robinsons Land Corporation
Location of Headquarters
Level 2, Galleria Corporate Center, EDSA corner Ortigas Avenue, Quezon City, Metro Manila
Location of Operations
We have 52 commercial centers, 119 residential buildings and subdivisions, 25 office buildings, 5 flexible spaces, 20 hotels and resorts, 4 industrial facilities and 3 integrated developments – distributed in 49 cities and 11 municipalities in 29 provinces across the Philippines. Attached in Annex A is the list of properties and respective locations.
Report Boundary: Legal entities (e.g. subsidiaries) included in this report
Robinsons Land Corporation, covering the following divisions: 1. Robinsons Malls 2. Robinsons Hotels and Resorts 3. Robinsons Offices 4. Robinsons Residential 5. Robinsons Industrial and Integrated Developments
Business Model, including Primary Activities, Brands, Products, and Services
Robinsons Land Corporation (RLC) is a leading real estate developer in the Philippines with a well-diversified portfolio. We are mainly engaged in the development and operation of shopping malls, office buildings, hotels, and logistics facilities. We are also strongly involved in residential developments both in vertical and horizontal projects located in key cities and urban areas nationwide. Key brands for malls include Robinsons Galleria, Robinsons Place, Robinsons Metro. For residential, we have now RLC’s Residences as our brand for vertical projects and Robinsons Homes for our horizontal developments. For Hotels and Resorts: Go Hotels and Summit Hotels. For Industrial and Integrated Developments: Robinsons Land Logistics and Facilities (RLX). Details of each key brand are provided in Annex 1.
Reporting Period
January 1, 2020 – December 31, 2020
Highest Ranking Person responsible for this report
Mr. Rommel L. Rodrigo, Head of Investor Relations
84

Materiality Process
We conducted a series of workshops and discussions with key persons in our company and a cross-section of our stakeholders to help us identify what truly matters to us and to our stakeholders. This process helped widen our business perspective and enabled us to set approaches to improve our performance in both financial and non-financial aspects. The following specific steps were undertaken:
1. Understanding the Sustainability Context. Understanding societal needs was the first step we took to determine the contributions of our core business to sustainable development. This also allowed us to identify which impacts are most material from the societal point of view. 2. Engaging our Stakeholders. Our stakeholders’ inputs helped us validate and enhance our list of material topics. The process also helped us put emphasis on topics that are most important to them. We captured our stakeholders’ perspectives through regular meetings, surveys, interviews and focus group discussions. 3. Identifying Material Topics. We looked at the entire value chain of our different property types, both in construction and operations, identifying key sustainability topics that matter to us and to our stakeholders. We determined the economic, environmental, and social topics that we should monitor and continually improve on moving forward. We considered the key impacts of each of our activities, relevant risks and opportunities including the key capitals we rely on to sustain and grow our business. We identify focus by looking into aspects that we are best positioned to effect positive change. 4. Measuring Performance and Defining Management Approaches. In 2019, we obtained baseline data (2018) as basis for measuring our performance on each of the material topics identified. Following the GRI reporting standards and consolidation guidance, we ensured that the metrics used were right, and the data collected were accurate and comparable. This year, we did an analysis of gaps in data in each performance areas. We began setting up a procedure to systematically collect more data to better measure our sustainability performance. We have also defined management approaches that will help us improve our performance on these areas. We also referred to the UN Sustainable Development Goals to see how our impacts to environment, economy, and society is linked to delivering on specific SDG targets. Materiality is an iterative process for us. We will continue to review how we impact the environment and society, how we measure our performance on these impact areas, and how we can better communicate these to our stakeholders. Important Note: The discussion of impacts, risks, and opportunities are made per topic, instead per metric,
since the risks and opportunities apply to the topic rather than the individual metrics under one topic. For
example, for topic on Anti-corruption, only one discussion on Impacts, Risks, and Opportunities is made
that covers both metrics: a) Training on Anti-corruption Policies and b) Procedures and Incidents of
Corruption. This makes the disclosure on management approach more focused and not repetitive.
85

ECONOMIC
Economic Performance
Direct Economic Value Generated and Distributed (in Billions)
Disclosure Amount (2019)
Amount (2020)
Units
Direct economic value generated (revenue) 30.58 25.40 PhP
Direct economic value distributed: a. Employee wages and benefits 1.19 1.33 PhP
b. Payments to suppliers, other operating costs 16.24 14.92 Php
c. Dividends given to stockholders and interest payments to loan providers
4.92 4.89 PhP
d. Taxes given to government 3.18 1.91 PhP
e. Investments to community (e.g., donations, CSR) 0 0 PhP
Procurement Practices
Proportion of spending on local suppliers
Disclosure Quantity Units
Percentage of procurement budget used for significant locations of operations that is spent on local suppliers
Not available yet1 %
1We do not currently tag our payments to suppliers according to our definition of what is local. We are still developing the system and will be able to report in 2022.
Economic Performance and Procurement Practices
Impacts and Risks: Where it occurs, RLC’s involvement, stakeholders affected
Impacts. In 2020, about 91% of our revenue flows back to society, through our key stakeholder, our suppliers, employees, and government. Our impact to the economy is in terms of how we increase or decrease and distribute economic activity in the areas where we operate and in the locations of our suppliers. How we flow value to our different stakeholders determines whether we are equitable and inclusive and if we contribute to economic growth or diminish economic value. How we distribute economic opportunities to both urban and rural areas in the country also shapes our economic performance. 2020 revenues declined versus in 2019 as our malls and hotels have limited operations brought by the pandemic (COVID-19) which have adverse effects to our stakeholders’ businesses.
In 2020, eight percent of our revenue went to government in the form of taxes. Our employees got five percent, while investors and lenders got 19%. Our biggest value distribution went to suppliers (59%) and their suppliers who are supporting a significant number of jobs. The value we retained and reinvested for business growth was at 9%.
Our key properties i.e. malls, office buildings, and hotels and resorts also host more than 9,000 businesses who also create and support around 140,390 decent jobs.
Risks. Since 59% of our revenue flows to our suppliers, the biggest risk of inequitable flow of economic value lies in our supply chain. Any unfair practice from our suppliers in the way they deal with their suppliers or employees could pose a risk to our ability to flow value to society in an equitable way. In addition, our inability to serve local businesses in our malls and offices may also severely affect their ability to compete and succeed in the market.
86

Management Approach for Impacts and Risks
Ensuring Equitable Flow of value. We ensure that we maintain highest standards of corporate governance, i.e., anti-corruption in all our transactions to safeguard that economic value flows to the right stakeholders. We make sure that we pay a fair price to all our stakeholders to ensure equitable distribution of economic value. Year-on-year, we monitor the total economic value distribution as percentage of our revenue. In the last five years, an average of 84% of our revenues has flowed back to the economy. The value that we retained is reinvested to drive future growth.
Fostering equitable distribution of economic opportunities. In our properties we also hire locally. This provides locals access to economic opportunities wherever we locate. We prioritize sourcing goods and services locally if suppliers who meet our minimum standards are available in the locality. We only source in Metro Manila when qualified suppliers do not exist in local provincial areas. We also take an effort to source from MSMEs whenever possible. Currently, we are still challenged to find the right suppliers that will meet our supplier accreditation criteria, particularly in our Visayas and Mindanao locations. We are currently implementing initiatives to build our supplier base in areas outside the greater Metro Manila.
Ensuring equitable access to our products. Our malls and offices enable businesses to grow and flourish by providing the right locations that affords them and their clients a space to transact their businesses. We ensure that we cater to the needs of local merchants and organizations and grow local businesses as well as foreign brands.
Ensuring fair compensation to our employees. We benchmark our compensation packages against industry standards in the Philippines to ensure our compensation package remains competitive in the market, while ensuring our employees are paid at least a minimum wage and afford them social safety nets in cases of emergencies.
Opportunities & Management Approach
During the height of the pandemic, we have strengthened our on-line and e-commerce platforms (RShoppers and RDelivery) in support of our tenants’ operations and have also partnered with the Department of Agriculture to promote locally sourced produce and gardening fair. For Hotels, we have developed innovative products (Just-Got-Home and Working-On-The-Go) designed for the evolving needs of consumers in the time of the pandemic.
We see opportunities to improve our performance particularly on how we assess the economic performance of our suppliers on their policy and practice on anti-corruption, compensation and benefits. As a management approach, we will undergo a review of our accreditation and supplier assessment processes to incorporate criteria that measure the economic performance of our suppliers. We are also working on a strategy to ensure that all employees are paid, at least, a living wage.
87

Climate-related risks and opportunities
Being a real estate company, we recognize that climate related risks and opportunities are material to our organization. In 2020, we continue to assess and are still in the process of scoping and understanding the risks and opportunities related to climate impacts. At the same time, we are working on embedding this framework into our risk management processes to sufficiently and systematically produce a good basis for management to design effective approaches to manage them. When we get a strong understanding of the topic, we will elevate the same to the board and create a function in one of our board committees to look after this concern. We target to accomplish all this in the next 3-5 years, which is an ideal timeline recommended by TCFD1 experts we consulted.
1The Task Force on Climate-Related Financial Disclosures
Anti-corruption
Training on Anti-corruption Policies and Procedures
Disclosure Quantity (2020) Units
Number of employees to whom the organization’s anti- corruption policies and procedures have been communicated to
2,044 #
Number of business partners to whom the organization’s anti-corruption policies and procedures have been communicated to
No available data #
Number of directors and management that have received anti-corruption training1
32 #
Number of employees that have received anti-corruption training
2,022 #
1Upon boarding, the board of directors receives orientation on RLC’s Code of Conduct which includes anti-graft corruption policy. The Company is committed to promoting transparency and fairness to all stakeholders. The Board sets the tone and make a stand against corrupt practices by adopting an anti-corruption policy and program. Some of the Company’s Anti-Corruption programs are embodied in the Code of Business Conduct and Ethics, Conflict of Interest, Offenses Subject to Disciplinary Action (OSDA), among others. Note: The Company initiated and organized an in-house Corporate Governance Seminar for its Directors and Key Officers on December 28, 2020. This was applied to SEC as Corporate Governance Training Program for the Company.
Incidents of Corruption
Disclosure Quantity (2020) Units
Number of incidents in which directors were removed or disciplined for corruption
0 #
Number of incidents in which employees were dismissed or disciplined for corruption
0 #
Number of incidents when contracts with business partners were terminated due to incidents of corruption
0 #
Anti-Corruption
Impacts and Risks: Where it occurs, RLC’s involvement, stakeholders affected
Corruption undermines our ability to equitably flow value to our key stakeholders, i.e., suppliers, employees, government, and providers of capital. Risks can exist in key areas such as in procurement, and those functions that directly interfaces with government.
Management Approach for Impacts and Risks
The Company is committed to promoting transparency and fairness to all stakeholders. The Board sets the tone and makes a stand against corrupt practices by adopting an anti-corruption policy and program. Some
88

of the Company’s Anti-Corruption programs are embodied in the Code of Business Conduct and Ethics, Conflict of Interest, Offenses Subject to Disciplinary Action (OSDA), among others. The same are disseminated to all employees across the Company through trainings to embed them in the Company’s culture. New employees are oriented regarding policies and procedures related to Business Conduct and Ethics and similar policies. All employees are given periodic reminders. Further, all concerned employees are required to comply with the Annual Self-Disclosure Activity on an annual basis.
The following Business Conduct & Ethics Policies are in place:
• Conflict of Interest - The Company’s Code of Business Conduct and Conflict of Interest Policy require employees to make a conscious effort to avoid conflict of interest situations that his judgment and discretion are not influenced by considerations of personal gain or benefit. A conflict of interest may also occur because of the actions, employment, or investments of an immediate family member of an employee.
• Conduct of Business and Fair Dealings – The Company’s employees that recommend, endorse, or approve the procurement or sale of goods and services should make a conscious effort to avoid any conflict-of-interest situation in transactions that they are involved in.
• Receipt of Gifts from Third Parties – The Company discourages the acceptance of gifts. However, gifts like advertising novelties maybe given or accepted during the Christmas season. There is no restriction in the value of the gift accepted. However, accepted gift with an estimated value of over 2,000.00 PhP must be disclosed to the Conflicts of interest Committee.
• Compliance with Laws and Regulations - The Company ensures that all transactions comply with relevant laws and regulations. Any deficiencies are immediately rectified.
• Respect for Trade Secrets/Use of Non-public Information - The Company has policies that ensure proper and authorized disclosure of confidential information. Disclosures of material information to the public can only be done after the disclosure to SEC and PSE by the Company’s authorized officers.
• Use of Company Funds, Assets and Information - Employees are required to safeguard the Company resources and assets with honesty and integrity. Employees must ensure that these assets are efficiently, effectively, and responsibly utilized.
• Employment and Labor Laws and Policies - The Company ensures the observance, strict implementation and compliance with Philippine employment, labor laws and policies with regards to recruitment, employment, retention and benefits of the employees. Minimum notice period regarding operational changes ranges from three to six months, dependent on the proponent of change.
• Whistleblowing – The stakeholders may discuss or disclose in writing any concern on potential violation of the Code of Business Conduct with the Conflicts of Interest Committee. Reports or disclosures can be made in writing or by email. All information received in connection with the reports or disclosures shall be strictly confidential and shall not be disclosed to any person without prior consent of CICOM. The Company commits to protect those who report in good faith from retaliation, harassment and even informal pressures. It will take the necessary and appropriate action to do so in enforcing the policy.
Violation of any provision of the Code of Business Conduct as determined through a due process may result
89

in disciplinary action, including dismissal and reimbursement for any loss to the Company that result from the employee’s action. If appropriate, a violation may result in legal action against the employee or referral to the appropriate government authorities. The following shows the process of termination upon findings of Anti-Corruption:
1. In case an Offense is committed or supposed to have been committed by an employee or business
partner, his immediate superior or transacting department must properly investigate the matter.
2. Establish and check facts that will serve as basis for decision, examining evidence physical or
otherwise. Twin notices are to be sent. The concerned employee or business partner is asked to
air side, while there will also be an employee conference.
3. Analysis and evaluation of the findings
4. Preserving the integrity and reliability of evidence
5. Recommendation of Penalty. If the recommended penalty is dismissal, the department head shall
endorse the matter to HRD for further evaluation and will in turn endorse the matter to Corporate
Legal for the conduct of Administration Investigation/hearing to determine whether or not the
matter merit the imposition of dismissal
6. Imposing the penalty/dismissal will be documented using the appropriate forms
7. The concerned party will be informed verbally by explaining the findings and the penalty. All
concerned parties/department must be notified of the disciplinary penalty.
8. Upon recommendation of Corporate Legal of dismissal, the Notice of Dismissal is subject to
approval by the President or Company Officer authorized to do so. Upon approval of the Notice of
Dismissal, the department head will serve the notice to the employee. If the employee refuses to
acknowledge receipt copy of notice as such fact(s) will be annotated on all copies of the notice.
The said Notice of Dismissal has to be sent via a registered mail or other accredited courier to the
last known address of the employee. Proof of delivery must be kept as evidence to show that the
notice was served. All concerned Departments must be noticed of the dismissal.
Opportunities and Management Approach
We are taking steps to evaluate the effectiveness of implementation of our anti-corruption policy. We are
looking at opportunities to engage our employees more on this topic through conducting more regular formal
trainings on anti-corruption and how to best ensure that incidences are better tracked and avoided in the
company.
90

ENVIRONMENT
Resource Management
Energy consumption within the organization:
Disclosure Quantity (2020) Units Energy consumption (renewable sources)1 83,300.96 GJ Energy consumption (gasoline) 602.72 GJ Energy consumption (LPG) None GJ Energy consumption (diesel)2 31,741.06 GJ Energy consumption (electricity)3 1,274,046.85 GJ 1These are generated from the rooftop solar facility of our malls. 2The boundary includes office buildings, commercial centers (stand-by generators) and residential construction activities. 3This covers all our properties
Reduction of energy consumption
We have conducted several energy-efficiency projects for our malls and office building including changing of light bulbs to LED and retrofit/replacement of electronic equipment and other measures to meet the green building standards. We have set-up the data management system to effectively track the savings and energy reduction from these initiatives.
Energy and Reduction of Energy Consumption
Impacts and Risks: Where it occurs, RLC’s involvement, stakeholders affected
Energy generation in the Philippines is still primarily reliant on thermal technologies. These technologies impact the environment and people through GHG emissions, air pollution, water consumption, among others. Communities surrounding thermal power plants would have higher exposure to air pollutants (i.e., NOx, SOx, and Particulate matter). GHG emissions from these plants contribute to Climate Change that impacts vulnerable countries like the Philippines.
Management Approach for Impacts and Risks
To reduce our indirect impacts to the environment and people from our consumption of electricity, we have invested in rooftop solar power generation since 2015. In 2020, we have invested PhP290.7 million, to install a total of 18,554 panels, adding 7.1 MW power generation capacity that is used in our malls. To date, we have invested a total of PhP1.44 billion to build and operate a combined 26 MW capacity, which generated about 83,222 GJ of renewable power in 2020. Using the Philippine grid emission factor, we avoided a total of 16,345 Tonnes of CO2, in 2020 from our renewable power generation. We continue to improve the design of our properties. In our malls for example, we have skylights and glass curtain walls that allow for natural lighting during daytime and LED lights which translate to considerable energy savings. For our office buildings, we have built LEED-certified buildings which are designed and constructed with energy efficient features such as double-glazed glass façade which reduce the need for cooling, as well as LED lights that reduce power consumption.
Opportunities and Management Approach
As prices of solar panels go down, we see more opportunities in scaling our rooftop solar generation. We also see opportunities of purchasing renewable power directly from renewable energy generators through retail electricity supply agreements, to bring down our emissions relevant to our consumption of electricity (scope 2). Solar panels in the commercial centers located in Santiago, Iligan and Butuan will be made fully-operational in 2021.
91

Water consumption within the organization
Disclosure Quantity Units Water withdrawal 3,831,997.06 Cubic meters
Water consumption1 3,194,276.37 Cubic meters
Water recycled and reused2 14,835.40 Cubic meters
1This covers Office Buildings, Residential, and Commercial Centers. To calculate our water consumption, we need to gather our total water discharge volume in all of our properties. While water withdrawal data is already being consolidated centrally because of its cost implications, water discharge volume is only being tracked at the property level. We will put together the data management system to consolidate discharge data from our 220 properties across the country, and be able to report by 2022. 2This covers only Commercial Centers. To calculate our recycled and reused, we need to gather our total water recycled and reused in all of our properties. We will put together the data management system to consolidate discharge data from our 220 properties across the country, and be able to report by 2022.
Water Consumption
Impacts and Risks: Where it occurs, RLC’s involvement, stakeholders affected
Water is a vital element of our malls’ operations. We work to ensure availability of water to provide our customers clean and well-maintained premises. Because of our constant need for water, we also recognize our responsibility to use this resource as efficiently as possible. We understand that for every litter of water that we consume, we could potentially deprive communities or agriculture the water that they need, given the limited freshwater availability in many cities in the Philippines where we locate.
Management Approach for Impacts and Risks
To the extent that we can, we tap with the local water utility to take advantage of surface water sources. In some areas however, it is currently inevitable that we source from ground water. The water that we use in our operations are treated well before they are discharged. We put in place measures to reduce water consumption in our facilities, such as water saving fixtures in restrooms. We also educate our customers and employees on the importance of water conservation. Thirty-one (31) of our fifty-two (52) Robinsons’ malls are designed with either/and (i) rainwater collection system, and (ii) wastewater treatment and recycling facility to reuse water for non-potable uses. Even as we continue to expand our malls, our water consumption has gone down, showing that our efforts on water management are effective. Today, our malls use recycled wastewater for toilets and for garden use. Our wastewater recovery program has reduced our wastewater discharge to public sewers. In our construction activities particularly in residential properties, we conserve water by water rationing for masonry and testing activities onsite. For our Hotels and Resorts Division, water is an essential part of our operations and maintenance. Long and frequent hotel showers and use of pool amenities are a few of the many ways our guests enjoy in their stay in our hotels. Hotel guests expect clean bedsheets, well-maintained amenities, and facilities such as the garden and pool area. Our options for water efficiency are limited to periodic checking of leaks and investment in water-efficient fixtures and water-conserving reminders to our guests. In 2021, we will be
installing water softeners for our provincial properties that experience hardness of water supply. This will
improve efficiency and reduce high consumption of water. For our properties under development, we
92

are installing indirect heat exchangers. By doing this, we will save in our maintenance costs by protecting
pipes from scaling and also preventing high consumption of water and energy.
Opportunities and Management Approach
We see an opportunity to conserve more water by increasing our wastewater recycling capacity and rainwater harvesting in our different properties. Water catchments and water impounding areas are also good measures we are exploring to help recharge the aquifer and reduce impact of ground water extraction.
Materials used by the organization
Disclosure Quantity (2020) Units
Materials used by weight or volume
• renewable 0
• non-renewable1
• Cement 73,990,385 Kg
• Glass 148,777 Kg
• Rebars 23,327,703 Kg
Percentage of recycled input materials used to manufacture the organization’s primary products and services
0 %
1This covers office buildings, residential properties and the malls/commercial centers.
Materials
Management Approach for Impacts and Risks
Our business entails the use of a considerable number of materials to construct buildings, malls, houses, and paved roads in our subdivisions, mixed-use developments, and townships. We recognize that materials such as cement, rebars, and glass are non-renewable, and it requires high amounts of energy and emissions to produce them. We also recognize that the mining of minerals needed for glass, steel, and cement production could impact biodiversity. Our limestone deposits in the Philippines are also finite, hence conserving the use of minerals will help extend the life of these finite resources for future generations. Materials use impacts all stakeholders in general. Scarcity of materials also impacts pricing which indirectly affects our own competitiveness.
Management Approach for Impacts and Risks
To ensure it remains within a manageable level, we regularly monitor our materials consumption and intensity. We work with our contractors who build our properties to continually improve on designs and construction practices to ensure our buildings are designed and constructed with most optimized use of materials, without compromising quality and durability.
Opportunities and Management Approach
A large part of the cost of constructing a property is the materials. Reducing material use has equivalent
financial benefits. We continue to analyze materials efficiency and will use this information to look into better
designs and construction systems to increase our efficiency in the use of materials, use more renewable
materials and opt to use materials with recycled content.
93

Ecosystems and biodiversity (whether in upland/watershed or coastal/marine)
This is considered not material for our company since we do not have operations within or adjacent to biodiversity-rich areas.
Environmental impact management
Air Emissions
GHG
Disclosure Quantity Units Direct (Scope 1) GHG Emissions1 2,183.31 Tonnes CO2e Energy indirect (Scope 2) GHG Emissions2 252,048.94 Tonnes CO2e (only required if 80% emission) Indirect Emissions (Scope 3) 3 N/A Tonnes CO2e Emissions of ozone-depleting substances (ODS) R-22 (has ODP of 0.05)4
N/A Kg
1Scope 1 includes diesel consumption in operations of office buildings. This excludes direct emissions from other properties such as malls, and Hotels and Resorts. 2Boundary covers Hotels and Resorts, Office Buildings, Commercial Centers, and Residential Properties. This excludes industrial facilities – warehouses. 3,4We have yet to set-up the system to collect data from the properties.
Greenhouse Gas (GHG) Emissions
Impacts and Risks: Where it occurs, RLC’s involvement, stakeholders affected
Most of our emissions come from electricity consumption. The impacts of this activity occur at the power generation facilities. See discussion on impacts for energy, above. For scope 3, while these emissions are owned by our suppliers, they occur in our owned and controlled facilities. Since GHG emissions has global warming and climate change impacts, all stakeholders are generally affected, primarily those that are most vulnerable to climate impacts.
Management Approach for Impacts and Risks
Since our biggest emissions is generated at the power generation, our options for emission reduction are limited to choosing where to buy power while ensuring our efficiency is continually improved. The section on Energy above describes our investments in solar rooftop that has measured impacts in reducing our scope 2 emissions. Most of the emissions that occur in our facilities are contributed by our suppliers. We continue to collect consumption data from our suppliers. We aim to use the data to map the strategies that we will implement in partnership with our suppliers to reduce our overall emissions at the construction.
Opportunities and Management Approach
We see opportunities for reducing carbon emissions through purchase of renewable energy for our malls and office buildings from Retail Electricity Suppliers that can provide RE at a competitive price. This has a potential to significantly reduce our Scope 2 emissions. Moving forward, we will explore this option and find financially viable models for this mitigation strategy.
94

Air pollutants
Disclosure Quantity Units
NOx 3.33 kg
SOx 1.16 kg
COx 4.28 kg Particulate matter (PM) 6.19 kg
1 Data covers only Commercial Centers Division In 2021, we will set-up the right data management system and will report our consolidated results.
Air Pollutants
Impacts and Risks: Where it occurs, RLC’s involvement, stakeholders affected
During operations, the major source of air pollutants is from our properties that have stand-by generators. Since they’re stand-by power only, its use is limited only in times of power interruption, which has become very rare in recent years. Unlike bunker C fuel, the generating sets are fueled by diesel oil, which could easily be burnt without the release of soot. Importantly, the air to fuel ratio is optimized during the operation of the generating power units. The impact of operating the generating sets on air quality is expected to be tolerable and will not cause a significant adverse impact to environment or people.
Management Approach for Impacts and Risks
We ensure that we comply with clean air standards of the Department of Environment and Natural Resources (DENR). Our gensets are being tested twice a year by third-party consultants to ensure that it remains within DENR standards.
Opportunities and Management Approach
We see opportunities for reducing our Air Pollutants. We make sure that mitigating measures are properly implemented in all the APCS (Air Pollution Control Systems), installing and properly regular monitoring and maintenance of the generator sets and the air pollution control facilities, such as, mufflers exhausts, and air conditioning systems filters.
Solid and Hazardous Wastes
Solid Waste1
Disclosure Quantity Units
Total solid waste generated 9,774,971.79 kg
Reusable 131,922.30 kg
Recyclable 3,181.00 kg
Composted 6,306,283.49 kg
Incinerated none kg
Residuals/Landfilled 3,333,585.00 kg 1Covers only the waste generated at Commercial Centers/Malls, Hotels and Resorts and Office Buildings upon operations.
Hazardous Waste1
Disclosure Quantity Units
Total weight of hazardous waste generated 48,411.84 Kg
Total weight of hazardous waste transported 16,858.26 Kg
1Covers only the hazardous waste generated at our Office Buildings and Commercial Centers/Malls. We have yet to collect data from other properties and will disclose in 2022.
95

Solid and Hazardous Wastes
Impacts and Risks: Where it occurs, RLC’s involvement, stakeholders affected
Waste generated from our facilities are collected by our accredited waste haulers and disposed properly in the landfills closest to our locations. We recognize gaps in this system because we are unable to fully monitor how much of the wastes are being collected from our facilities and are being recycled versus how much end up in landfills. Landfills may not be ineffective in storing wastes; hence it could potentially contribute to marine litter. This could affect us and our stakeholders, including government, communities, waste pickers, and the environment. Biodegradable wastes in landfills are also a major source of GHG emissions.
Management Approach for Impacts and Risks
We assess the capability of our waste haulers to manage our wastes, including making sure that they dispose of our wastes in a legally operated landfill that meets the standards of DENR. In our properties, we allocate a space for our materials recovery facility. We designate key people to effectively manage and operate the MRFs according to DENR standards. We provide training to our housekeeping staff who handles the wastes to ensure wastes are properly managed, and hauling is done regularly. For hazardous wastes, we engage with DENR accredited transporter and treater. We allocate a separate space to store these wastes in our facilities before they are collected.
Opportunities and Management Approach
With increasing awareness on the issue on marine litter we see an opportunity to be part of the solution and position our properties to have the best waste management system in the country. We are currently improving our waste management system by working with our merchants to replace non-recyclables with recyclables to reduce total residual wastes that are more difficult to manage. We are also working with recyclers to link them with our waste collectors to ensure the recyclable waste we generate are recycled. We are also exploring ways to process our biodegradable waste into compost or energy to reduce the total waste sent to landfills. We are piloting the system in our two malls and if proven to be successful it will be scaled-up to all our commercial centers. Moving forward, this will give us an opportunity to collaborate with our stakeholders. We will innovate on waste flows by providing training and learning opportunities to both our employees and customers.
Effluents
Effluents is relevant in all our properties. By design all our commercial, office, and hotels have been fitted with wastewater treatment facilities to meet with the regulatory requirements of DENR.
Environmental compliance
Environmental Compliance
Impacts and Risks: Where it occurs, RLC’s involvement, stakeholders affected
The activities that we do in our value chain such as in construction involves movement of soil, materials, and potential disruption of the environment. Operating large properties like office buildings and malls also consume significant quantities of resources and produce large volumes of wastes. Hence, risk to non-compliance to environmental laws exist across our value chain.
96

Impacts of non-compliance to environmental laws and regulations could grossly impact our operations and costs, including reputation. Non-compliance could affect a lot of stakeholders from our own employees, to those in the surrounding communities, including the environment itself.
Management Approach for Impacts and Risks
Compliance to environmental laws is fundamental to our operations. We have a designated unit that ensures all aspects of our operations are compliant with relevant laws. We ensure our gensets are maintained well to meet air quality standards and that our sewage treatment facilities are fully operational to ensure our effluents meet the Clean Water Act.
Opportunities and Management Approach
We plan to step-up our internal capability building and improve our systems so that all activities that we will
do will remain compliant to regulations. We will invest in training and monitoring activities to correct any
non-compliance issues in our operations internally to reduce findings from audits of government and third -
party consultants.
97

SOCIAL
Employee Management
Employee Hiring and Benefits
Employee data
Disclosure Quantity (2020) Units
Total number of employees 2,132 #
a. Number of female employees 1,240 #
b. Number of male employees 892 # Attrition rate1 13% rate Ratio of lowest paid employee against minimum wage 1:1 ratio
1New Hires in 2020 = 217; Turn-over = 508; 2019-2020 average employee count: 2,270 Attrition computation: Total New Hires – Turn-over / Average Total # of Employees last year & current year (217-508) / (2,408+2,132 / 2)
Employee benefits
List of Benefits Y/N
% of female employees who availed for the
Year (2020)
% of male employees who availed for the
Year (2020)
SSS1 Y 13% 13%
PhilHealth1 Y 6% 4%
Pag-ibig1 Y 9% 3%
Parental leaves2 Y 5% 5%
Vacation leaves2 6 Y 73% 67%
Sick leaves2 Y 82% 75%
Medical benefits (aside from PhilHealth)3 Y
No data provided by HMO
No data provided by HMO
Housing assistance (aside from Pag- ibig) 4
N none none
Retirement fund (aside from SSS) N 2% 2%
Further education support N 5 3
Company stock options Y - -
Telecommuting Y No data available No data available
Flexible-working Hours Y No data available No data available
Rice Subsidy 5 Y 100% 100% 1Based on total number of employees – 2132. Note that 100% of our regular employees are covered by mandatory benefits. 2Based on total number of regular employees who are entitled to leaves and the actual number of employees who availed the leaves. 3100% of regular employees are covered with at least PhP 60k/month for entry level but availment of HMO benefits is not yet being logged. 4 We only provide discount privileges to employees 5 Based on permanent employees only 6 Unclaimed Vacation and Sick Leaves for non-executive positions are convertible to cash 100% and 50% of daily rate respectively. Unclaimed Sick leaves for executives are convertible at 50% of daily rate.
98

Diversity and Equal Opportunity Disclosure Quantity (2020) Units
% of female workers in the workforce 58 % % of male workers in the workforce 42 % Number of employees from indigenous communities and/or vulnerable sector* Solo Parents only 1
75 #
*Vulnerable sector includes, elderly, persons with disabilities, vulnerable women, refugees, migrants, internally displaced
persons, people living with HIV and other diseases, solo parents, and the poor or the base of the pyramid (BOP; Class D and
E). 1 Based on solo parents entitled to solo parent leaves only
Employee Hiring and Benefits, Diversity and Equal Opportunity
Impacts and Risks: Where it occurs, RLC’s involvement, stakeholders affected
Our policy and practice in hiring determines our ability to foster equal distribution of opportunities across diverse set of peoples. For example, setting a policy on gender equality or hiring people coming from vulnerable groups will determine how much opportunity we are able to distribute to the male and female population or vulnerable groups given their nuanced needs and circumstances. Hence, we take our hiring policy seriously to provide everyone a level plane field to access the employment opportunities that we create through our business. The benefits we provide our employees deliver a lasting effect to our employee’s quality of life. For example, providing health care coverage to our employees determines their resilience to medical emergencies, which is key to maintaining quality of life. Employees who enjoy good quality of life will tend to be more engaged and productive in the workplace, which impacts our business positively.
Management Approach for Impacts and Risks
Hiring, Benefits, Diversity and Equal Opportunity. We hire based on capability and alignment with the requirements of the job. In our hiring process, we do not discriminate against any person in terms of gender, ethnicity, age, and other circumstances. We apply anticipatory hiring strategy looking at our needs in the next 3-5 years based on our long-term business strategy. We have an intake program to hire early on and better prepare our new hires even before the actual needs arises. In terms of gender diversity, we currently have about 58% female and 42% male. We are working towards striking a better balance in terms of gender. RLC was included in the 2020 Bloomberg Gender Equality Index for scoring at or above global threshold established by Bloomberg to reflect high level of disclosure and over-all performance across the frameworks’ five pillars: Female Leadership and Talent Pipeline; Equal pay and Gender Pay Parity; Inclusive Culture; Sexual Harassment Polices; and Pro-Women Brand. In particular, RLC scored high in Female Leadership and Talent Pipeline or equal representation and opportunities in the workplace. RLC’s employees are 58% women. It can also be noted that 56% of promoted employees are Female. Benefits. We benchmark our benefit structure with the industry standards and adjust accordingly to stay within the industry average. On top of government-mandated benefits, we provide other benefits as part of our engagement initiatives such as healthcare coverage (HMOs), life insurance, medical allowance, rice subsidy, bereavement assistance, discounts to our products, and access to affordable emergency loans. We also take advantage of our business ecosystem in the JG Summit Group by linking our employees to
99

Robinsons Bank for access to affordable loans tailor fitted for our employees.
Attrition Rate. Our attrition rate is currently at 13%. In exit interviews, we see offers for better employment opportunities remain the biggest reasons for attrition.
Opportunities and Management Approach
Attrition. The COVID Pandemic has made 2020 an exceptional year for RLC due to the reduction of work operations as compliance to the strict health protocols imposed by the government. RLC aims to reduce its attrition rate by 5 percentage points in the next 5 years. The management aims to improve the following, (i). training/ workshops, (ii). increase mentorship and guidance from supervisors, (iii). more discussion with employees and managers on employee’s career growth, (iv). as well as review of our benefits and total rewards policy. Benefits. To improve our talent retention and employee engagement, we see an opportunity to assess the benefit availment rates of our employees across our different benefit types to determine overall effectiveness of our benefit structure. We will continue to innovate on structures that better responds to the real needs of our employees.
Employee Training and Development
Disclosure Quantity
2020 Units
Total training hours provided to employees
a. Female employees 1,746 hours
b. Male employees 4,656 hours
Average training hours provided to employees1
a. Female employees 2.61 hours/employee
b. Male employees 3.09 hours/employee 1Training hours indicated here are the Instructor-led classroom internal trainings and online one-on-one/group trainer-led trainings. Not reflected are trainings attended by employees outside the organization, hands-on/on-the job trainings and coaching and mentoring. 2 There are 668 female employees and 1,509 male employees who underwent training in 2020.
Employee Training and Development
Impacts and Risks: Where it occurs, RLC’s involvement, stakeholders affected
The level of training hours is an important driver to employee growth and development. Our ability to meet our employees training needs impacts their overall growth as a professional. Highly trained and highly engaged employees tend to be more productive, which also benefits the company. This year about 1,746 and 4,656 training hours were provided to female and male employees, respectively. Training hours significantly decreased in number last year compared from 2019 due to the limitations on face-to-face training set-up brought about by the pandemic. For example, the typical whole day on-boarding training that includes classroom workshops and lectures was reduced to 1.5hrs of online training instead. With this regards, virtual programs and linked-in trainings for self-enrichment and adapting to the new normal situation were made available to employees during the pandemic.
100

Management Approach for Impacts and Risks
We adopt a centralized learning framework that is anchored on the Core Values of the organization. RLC follows curriculum consistent with the standards of JG Summit group of companies, which are categorized into internal learning courses as follows:
1. Core Development Programs - enhances the soft skills of employees. This includes programs on customer service, communication, and professional image. Management Development Programs aim to provide a strong leadership and coaching culture in the organization, hence programs aimed to develop these competencies fall under this. Executive Development Programs target high potential and high performing leaders. This covers programs on problem solving, negotiation, finance, and strategic communication.
2. Functional Training Programs. There are Functional Training Programs that are customized per department that address the gaps of different functions. These programs include development plans for Engineering, Leasing, Marketing, Construction Management, and Operations. There is a continuous development of in-house SMEs (subject matter experts) who continue to impart learning on the job to their colleagues via share and learn sessions that allows for sharing of best practices while learning new technology and trends at the same time.
RLC promotes the development of employees by continuously providing relevant and timely training programs anchored on the training needs of the company and the employees.
Opportunities and Management Approach
We continue to anticipate new skills and capability needed by our employees to help us prepare for the future in terms of new technologies and industry practices in real estate. For example, we are continually on the look-out for new and better technologies and practice in managing malls and hotels or in the design and construction of different property formats. Being continually informed on new industry developments enable us to take leadership in the market.
Labor-Management Relations
Disclosure Quantity
2020 Units
% of employees covered with Collective Bargaining Agreements1
1 %
Number of consultations conducted with employees concerning employee-related policies2
No data available #
1The 1% is comprised of the covered rank and file employees of 2 properties, specifically, Holiday Inn Manila Galleria and Summit Circle Cebu. 2In general, we consult our employees on any new policy that affects our them. Based on our corporate governance we afford ample time for employees to provide their inputs and feedback before we put policies in effect.
101

Labor – Management Relations
Impacts and Risks: Where it occurs, RLC’s involvement, stakeholders affected
Good labor-management relations create a healthy workplace for us. It enables our employees to raise their concerns to the management. It helps the management find ways to refine its policies and systems that improve our workplace conditions in both construction and in operations particularly in our malls and hotels and resorts. Good workplace conditions help reduce health and safety risks and provide social safety nets for our employees in times of crisis. Poor Labor-Management relations grossly affect performance and inherently has high reputational risk especially when labor unions resort to actions beyond close-door dialogues.
Management Approach for Impacts and Risks
We are committed to providing decent workplace for our employees and provide their needs to be effective in their work. We practice an open-door policy. Employees may directly communicate to their immediate superior or to HR department. We also listen to our employees through employee engagement surveys and other ad Hoc surveys that are conducted by our HR. We also provide informal avenues for employees to raise their concerns to the management, such as lunch meetings and get together activities.
Digital tools such as video meetings and group chats were utilized to frequently update our employees of changes at work. This included work protocols in line with the pandemic which provided opportunities for our employees to communicate their concerns to management. However, open lines were established due to limited face-to-face interaction during the pandemic The safety and welfare of our employees are important, protocols were placed to meet the needs of the employees during the pandemic such as the provision of healthcare monitoring system of employees, work from home arrangements, provision of shuttle service for employees, shifting schedules, postponement of construction works, essential health kit etc.
The Company ensures the observance of strict implementation and compliance with employment, labor laws and policies with regards to recruitment, employment, retention and benefits of employees. Minimum notice period regarding operational changes ranges from three to six months, dependent on the proponent of change.
Opportunities and Management Approach
We continually look for better ways to solicit feedback from our employees through formal and informal
feedback sessions. In November 2020, we received an average score of 76% when we conducted a pulse
survey to assess the impression of the employees towards management. This is in terms of employee
engagement, collaboration, communication, company leadership, customer focus, personal career growth &
development potential, job enablement, pay & benefits, performance & accountability, strategic alignment
and work process.
In 2021, we aim to create a deliberate approach to account and assess the employees' feedback in a more
systematic way.
102

Workplace Conditions, Labor Standards, and Human Rights
Occupational Health and Safety1
Disclosure Quantity
2020 Units
Safe Man-Hours 4,580,215.80 Man-hours
No. of work-related injuries 10 #
No. of work-related fatalities 0 #
No. of work-related ill-health 8 #
No. of safety drills 60 # 1This disclosure includes the Robinsons Construction Management unit.
Labor Laws and Human Rights
Disclosure Quantity
2020 Units
No. of legal actions or employee grievances involving forced or child labor
0 #
Do you have policies that explicitly disallows violations of labor laws and human rights (e.g.
harassment, bullying) in the workplace?
Topic Y/N If Yes, cite reference in the company policy
Forced labor Y Indicated in the Employee Discipline Policies and Guidelines; “Notwithstanding the express enumeration of acts, omission or incidents in the Offenses Subject to Disciplinary Action (OSDA), the pertinent provisions of the Labor Law and allied laws, rules, and regulations are deemed incorporated in the OSDA. For acts or omission not specifically treated in the OSDA, the pertinent provision of law shall apply”
Child labor Y
Human Rights Y
Indicated in OSDA; (1) Sections 3- Acts or Omissions Concerning Relationships with Superior, Attendance to and Performance of Assigned Duties, (2) Section 4- Acts or Omissions Concerning Harmony and Good Order, Safety and Decency at Work
• Policy on Sexual Harassment
• Policy on Health, Safety and Welfare
• Corporate Environment, Health and Safety Policy
• Drug Free Workplace Policy
• Workplace Policy on Prevention Control of HIV and AIDS, Hepatitis B and Tuberculosis
• Special Benefits for Women/Magna Carta for Women
• Leave Benefits Policy (includes Expanded Maternity Leave, Solo Parent Leave, Vacation Leave, Sick Leave, Service Incentive Leave, Nuptial Leave, Emergency Leave, Bereavement Leave)
103

• Whistleblowing Policy
• Data Privacy Policy • Flexible Work Arrangement Policy • Work from Home Program • Mental Health and Wellness Policy • Environment Health and Safety Policy • Retirement and Separation Benefits Policy
1We do not have explicit written corporate policies relating to these topics since these are expressly defined in our Philippine labor laws, which we ensure compliance in all our operations.
Workplace Conditions, Labor Standards, and Human Rights
Impacts and Risks: Where it occurs, RLC’s involvement, stakeholders affected
Compliance to labor laws and human rights standards, as well as safe operation and accident prevention are
fundamentals to running a good business.
Threats to the rights, health, and safety of our employees impacts our productivity, employee retention, and
employee engagement. More importantly, it impacts the wellbeing and quality of life of our employees. Risks
to health and safety are greater in construction sites than in operations.
Management Approach for Impacts and Risks
OSH management system is primarily designed to protect the health and safety of individual workers or
members of the company. OSH Trainings are regularly conducted for the Lead Persons – Engineers, Security,
Operations personnel.
Health and safety risks are regularly assessed to identify ways to eliminate or minimize incidence. We set
standards for safe working practices and ensure they are practiced by all our employees, especially those
involved in construction and operations. In-house auditing and inspections are being conducted by
facility's/property engineers and operation's personnel. Documentations is done by engineering and security
and validated by the JG Summit Engineering group.
Protocols were put in place to ensure protection of the employees from exposure of COVID-19 virus. These
included mandatory submission of health declaration, physical distancing in the workplace, work-from-home
arrangements, shifting schedules, restrictions on physical meetings & gatherings and strict implementation
of sanitation protocols. We established a healthcare team to check and assess conditions of our employees
when they have been exposed or display symptoms of the virus.
We regularly submit our safety records to the Department of Labor and Employment (DOLE) to comply with
their safety, health, and welfare standards and policies. In addition, all properties/facilities of RLC's have
clinics to cater to employees and workers.
Beyond safety, we ensure all our operations comply with labor laws, including those relevant to forced labor,
child labor, and human rights. We conduct periodic internal audits to monitor these risks in all our operations.
The findings are discussed in the top management.
104

Opportunities and Management Approach
We continue to work with our contractors to build a culture of safety in all our construction and operations. More frequent and deliberate activities will be done to educate and remind our employees on safety standards and protocols to strengthen our safety culture and make safety a second nature to our employees not just in the workplace but even in their homes.
Supply Chain Management
Do you have a supplier accreditation policy? If yes, please attach the policy or link to the policy: Yes. Pertinent portion is re-stated in column no# 3 below.
Do you consider the following sustainability topics when accrediting suppliers?
Topic Y/N 2020
If Yes, cite reference in the supplier policy
Environmental performance N1
Forced labor N1
Child labor N1
Human rights N1
Bribery and corruption Y
4. As stipulated in Supplier Accreditation Policy, “…Without the written consent of the company, directly or indirectly offers or gives any benefit or compensation in cash or otherwise, to a company employee because of the employee’s association, engagement or duties with the company.
1We do not have explicit written corporate policies relating to these topics since these are expressly defined in our Philippine labor laws, which we ensure compliance in all our operations.
Supply Chain Management
Impacts and Risks: Where it occurs, RLC’s involvement, stakeholders affected
About 59% of our revenue flows to our suppliers. Most of the activities we do in the value chain is carried out by suppliers from construction to property management. Hence the impact of our suppliers to environment, society, and economy (ESE) is a significant portion of our impact. Our supplier’s success in delivering their output determines our own success. Their impacts to ESE affect essentially all our stakeholders.
Management Approach for Impacts and Risks
Our current supplier accreditation policy ensures that all our suppliers meet the minimum standards to deliver quality output for us. Through our accreditation process, we assess their capability and compliance to all relevant laws and regulations. Our supplier accreditation process are as follows:
1. Application - All suppliers intending to do business with any BU must apply for accreditation through the submission of an accomplished Supplier Accreditation Application (SAA) together with the required documents. SAA contains the basic information about the supplier’s company, organization, products or services offered and other relevant information necessary to evaluate the supplier’s overall competencies.
105

2. Appraisal - RLC shall appraise all suppliers applying for accreditation using a rating system for both the company and the product or service. The Rating System for each accreditation criteria may vary by commodity group. The supplier must meet at least 75% to be recommended for accreditation approval.
3. Accreditation Approval – Approval will be done by the corporate supplier accreditation team of the JG Summit group.
On top of accreditation process, the following processes are being done to assess the performance of suppliers.
1. Maintenance – All accredited suppliers shall be included and maintained in the supplier information database.
2. Review and Evaluation – on a periodic basis, a complete reassessment of the supplier performance like the initial accreditation process will be conducted based on key performance metrics.
Any supplier that fails to comply with minimum standards go through the following recourse: 1) Suspension, 2) Debarment, 3) Appeal Process, and 4) Reinstatement if the supplier is able comply with our minimum standards.
Opportunities and Management Approach
We are reviewing our supplier accreditation policy to include relevant to environment, social, and economic criteria to ensure that our sustainability standards and practices is also applied to the supplier.
Relationship with Community
Significant Impacts on Local Communities
1. Operations with Significant impacts on local communities: Lingkod Pinoy Centers
The Lingkod Pinoy Centers emerged from the RLC’s desire to ease the delivery of essential government services to every Filipino. It is a one stop shop where people can access a variety of public services. Started in 2011, the Lingkod Pinoy Center is now present nationwide to provide convenience and comfortable venues to make transactions. The centers average daily transaction in 2020 is at 31,883. It hosts 19 Government Agencies and offices. By hosting select government satellite offices RLC reduces the need for people to take multiple trips and in process reduce carbon emissions from vehicle use. Location: Available in 45 malls across the country Vulnerable groups: Everyone including vulnerable groups are served. Impact on Indigenous peoples: No particular negative impacts to indigenous groups. Community rights and concerns of communities: It allows the citizens to exercise their rights to access government services. Mitigating Measures: The operations have no significant negative impact, hence it requires no mitigating measures.
106

2. Operations with Significant impacts on local communities: Transport Hubs
RLC presence in several communities makes it a strategic hub for transport connectivity. By providing terminal spaces for public utility vehicles, the malls improve accessibility to several destinations for commuters. Robinsons Malls host a variety of transport services: from P2P buss, UV Express Services and vans, electric and regular jeepneys and tricycles. Some of the Malls also provide loading bays to ensure a safe and systematic way for commuters to board and alight from public transport vehicles. In total, 63,003 sqm of space in Robinsons Malls were allotted for public transport terminals Location: Available in 24 malls across the country Vulnerable groups: Everyone including vulnerable groups are served. Impact on Indigenous peoples: No particular negative impacts to indigenous groups. Community rights and concerns of communities: It allows the citizens to exercise their rights to access government services. Mitigating Measures: The operations have no significant negative impact, hence it requires no mitigating measures.
3. Operations with Significant impacts on local communities: Go Hotels Operations & Children’s Rights
Location: All Go Hotels in the country Our hotels are exposed to risks of child abuse that may be committed by some of our customers. Vulnerable groups: Yes. Children and Youth Impact on Indigenous peoples: No particular negative impacts unique to indigenous groups. Community rights and concerns of communities: Children’s Rights. Mitigating Measures: To manage the risks, we have set-up a Child Safeguarding and Protection policy and practice in our hotels. Go hotels is committed to implement child protection through establishing framework for staff development and capacity-building of tourism professionals and front liners.
4. Operations with Significant impacts on local communities: Typhoon Ulysses Relief Operations
In times of crisis that impact jobs and livelihoods, immediate aid and support make a huge difference in helping alleviate the struggles of disadvantages populations. In 2020, RLC took part in extending emergency assistance to address the most urgent humanitarian needs after the Typhoon Ulysses.
RLC distributed food relief packs to the affected communities. Location: Bulacan
Vulnerable groups: Communities affected by the typhoon
107

Impact on Indigenous peoples: No particular negative impacts to indigenous groups. Community rights and concerns of communities: It provided immediate assistance to the vulnerable group
Mitigating Measures: The operations have no significant negative impact, hence it requires no mitigating measures.
5. Operations with Significant impacts on local communities: “Working On-The-Go” and “Just-Got-Home”: Go Hotels and Summit Hotels’ Flexible Workspaces during COVID
In the time of pandemic, Go Hotels & Summit Hotels opened its doors to accommodate guests who are looking for discounted flexible and convenient work and home spaces strategically located inside Go Hotels. Spaces provided Wi-Fi, cleaning service and a common pantry area with microwave oven, toaster, refrigerator and water dispenser. This provided options to the working community to go about with the transportation challenges and limitations during the community quarantine period.
Location: Ortigas, Mandaluyong, Quezon City (Magnolia), Cebu
Vulnerable groups: Communities affected by the community quarantine
Impact on Indigenous peoples: No particular negative impacts to indigenous groups. Community rights and concerns of communities: It provided options for a convenient and work & home arrangements to workers & travelers during the COVID pandemic. Mitigating Measures: The operations have no significant negative impact, hence it requires no mitigating measures.
6. Operations with Significant impacts on local communities: “Locally Sourced”
RLC hosted Locally Sourced exhibits in 32 malls nationwide to promote local sustainable businesses offering agriculture products. Executed in partnership with the Department of Agriculture and other various agencies, the series of exhibits helped local entrepreneurs showcase and promote their products thereby promoting the local economy and sustainability.
Location: North Tacloban, Cebu, Iloilo, Jaro, Pavia, Bacolod, Dumaguete, Antique, Roxas, Gensan, Tagum, Butuan, CDO, Iligan, Valencia, Quezon City, Pasig, Magnolia, Malabon, Malolos, Mandaluyong, Antipolo, San Fernando, Angeles, Tuguegarao, Santiago, Imus, Dasmarinas, Manila, Laguna, Imus
Vulnerable groups: Local communities
Impact on Indigenous peoples: No particular negative impacts to indigenous groups. Community rights and concerns of communities: It allows the local entrepreneurs to exercise their rights to conduct business
Mitigating Measures: The operations have no significant negative impact, hence it requires no mitigating measures.
108

7. Operations with Significant impacts on local communities: “Oplan Kalinga”
In the time of the pandemic, Go Hotels & Summit Hotels in cooperation with the Department of Health, converted its rooms into quarantine facilities for COVID positive patients. This provided isolation facilities to COVID-positive patients who are incapable of following the latest home quarantine rules. This allowed COVID-positive patients to recuperate in isolated and safe accommodation spaces that practices strict health protocols for theirs and other hotel guests’ safety.
Location: Greenhills, Mandaluyong, Davao, Tagaytay
Vulnerable groups: COVID positive patients
Impact on Indigenous peoples: No particular negative impacts to indigenous groups. Community rights and concerns of communities: It allows COVID positive patients to exercise their right to a standard living adequate for health & well-being of himself and of his family. Mitigating Measures: The operations have no significant negative impact, hence it requires no mitigating measures.
Disclosure on Free and Prior Informed Consent (FPIC) is not material given that there are no operations that is within or adjacent to ancestral domains of indigenous peoples.
Relationship with Communities
Impacts and Risks: Where it occurs, RLC’s involvement, stakeholders affected
Community could get impacted positively or negatively ranging from physical risks to social and economic risks. For example, displacement can be both physical displacement or economic displacement due to our presence. Negative impacts in the community could have significant impact to our reputation and social license to operate. Conversely, delivering positive benefits to community enable us to build stronger partnerships such as in local sourcing of goods and talents.
Management Approach for Impacts and Risks
Our social/community impact assessment and risk management process is a mandatory process that guides sustainability-related risk management and integrates a risk register into operating plans. As part of that process, exploration, production and major projects are examined against the physical, social and political settings of our operations. Local concerns may influence the potential importance of these stakeholder and environmental matters including long-term risks and cumulative impacts. Risks are identified and described by a diverse group of subject matter experts in each business unit (BU) and project. To help Business Units in Community Assessment and affairs a System Management Approach is developed:
1. Impact and Risk Assessment- Assessment is basically the identification of potential and likely risks within a particular community, and the process of prioritizing those risks. The community risk assessment process can be as complex and detailed as local resources permit. Or, using basic skills and resources available to most organizations, can be a more simplified process that will produce basic information that can be used effectively for intervention/enhancement projects.
109

2. Mapping Stakeholders and Prioritizing Risks- Identifying the people related to the project, those who will be affected by the development and those than can influence, and to help develop strategies to engage these people in the right way. In most contexts community development projects will have a wide-variety of actors. Also, during this process, a risk register is developed looking at the long term and short term, and also looking at the probability and severity.
3. Addressing the Risk- A structured and coherent approach to managing the identified and ranked risk. 4. Engage Stakeholders- Communicate and collaborate on strategies and action plans in addressing
risks and impacts. 5. Measure and Monitor- Tracking and assess actions to ensure ongoing adequacy and effectiveness of
the management system. Over-all, incorporating community affairs strategy into business brings transformative power through business excellence. Our philosophy is based on the idea that corporate success and social welfare are interdependent. A business needs a healthy, educated workforce, sustainable resources and adept government, to prosper and compete effectively. Also, for society to thrive, profitable and competitive business must be developed and supported to create income, wealth, tax revenues and opportunities for engaged social development.
Opportunities and Management Approach
RLC is currently cascading the Community Assessment tool to be used during the different phases of development; from Business development, construction and operations of projects and properties. Done properly, commercial development can improve a local community in more ways than one, by adjusting, innovating and continuously improving systems, services and products being put-out by the company. Accordingly, since engagement and transparent reporting and disclosure of how we minimize and mitigate risks associated with construction and operations is a top business priority and key concern of our stakeholders; periodic communication and reporting is to be enhanced.
Customer Management
Customer Satisfaction
Disclosure Score Did a third-party conduct
the customer satisfaction study (Y/N)?
Customer satisfaction 1 63% N 1This is based on survey conducted in 2 business units only: Robinsons Residences and Robinson Hotels & Resorts. The other business units are still developing their customer satisfaction surveying system.
Health and Safety
Disclosure Quantity Units
No. of substantiated complaints on product or service health and safety 2
263 #
No. of complaints addressed 3 270 # 2 Residential Division: 263 + Hotels & Resorts Division: 0 3 Residential Division: 254 + Hotels & Resorts Division: 16
Marketing and labelling
This topic is not material to our company, since we do not sell fast-moving consumer products.
110

Customer Privacy
Disclosure Quantity Units
No. of substantiated complaints on customer privacy 1 0 #
No. of complaints addressed 0 #
No. of customers, users and account holders whose information is used for secondary purposes
0 #
1 Substantiated complaint include complaints from customers that went through the organization’s formal
communication channels and grievance mechanisms as well as complaints that were lodged to and acted upon by
government agencies.
Data Security
Disclosure Quantity Units
No. of data breaches, including leaks, thefts and losses of data
0 #
Customer Management - Health and Safety, Customer Privacy and Data Security
Impacts and Risks: Where it occurs, RLC’s involvement, stakeholders affected
Customer management is fundamental to corporate success and sustainability. Our ability to keep our customers satisfied is at the core of our performance as a corporation. Ensuring their health and safety in the use of our products, and protecting their information are ways to deliver customer satisfaction. Our inability to meet their expectation poses a significant risk to our viability in both the short-and-long term horizons.
Management Approach for Impacts and Risks
Customer Satisfaction. We conduct periodic market research to gauge customer expectations and build the right products and services to meet their expectations, needs, and capabilities. Our customer satisfaction surveys tell us whether the products and services as designed has indeed met their requirements. We continually iterate and improve our performance through these processes. Health and Safety. We ensure that our properties do not pose any risk to health and safety of our employees. This is assured from the design process to construction as well as operations that it meets the highest building standards that ensures it is resilient to any structural threats. In our properties, we continue to assess risks to our customers such as slippage and fall and periodically audit to ensure compliance to our standards. Protocols were put in place to ensure protection of the employees from exposure of COVID-19 virus. These
included mandatory submission of health declaration (i.e. Fit To Work Certification), physical distancing in
the workplace, work-from-home arrangements, shifting schedules, restrictions on physical meetings &
gatherings and strict implementation of sanitation protocols. We established a healthcare team to check
and assess conditions of our employees when they have been exposed or display symptoms of the virus.
Customer Privacy and Data Security. All customer personal information of our transactions is collected and handled in accordance with the Data Privacy Act of 2012. The contact details of our Data Protection Office are visible on our company website and various privacy notices to receive data privacy inquiries and complaints. To protect customer data as well as all our other confidential information, we have implemented a strong security policy, put in place advanced network security protection and monitoring process in the following
111

aspects of our data management system: o Secured Email System. RLC is using advanced security protection thru Microsoft Office 365 as
employee’s corporate email. It provides URL filtering, screening of attachments and links to be protected from spam and phishing.
o End-point Security Protection. RLC installed Symantec Endpoint Protection as last defense layer to protect end-user from malware, spam and phishing.
o Protection of RLC’s edge network. RLC used a strong network firewall rules that serve as a network gateway to only allow authorized and specific ports to pass through. It also includes URL filtering and secured VPN connections among its remote sites.
o Disallowed the use of external storage by employees. o We have corporate information security team that performs Security Vulnerability Assessment and
Penetration Testing (SVAPT) on regular and on-demand basis specially before we launch a new website o 24x7 IT Service Desk that also monitors all our network, systems and applications thru our monitoring
system which could detect performance degradation, capacity threshold breach and availability faults. The team is alerted and performs remediation actions following incident management process and service level targets.
Opportunities and Management Approach
Customer management is a continual improvement process. We continually assess our customer experience journey and find ways to better meet their expectations. Moving forward, we aim to define more precise metrics for measuring our performance on these areas. Beyond customer satisfaction, we intend to measure the real economic and social value we contribute to our customers and their stakeholders, such as how our malls are able to increase their access to market through increased foot traffic to our malls to better understand how our product enable them to grow as they locate with us. A more systematized measurement of economic and social value will enable us to better optimize our products for increased value to the customers we serve and to society in general.
112

UN SUSTAINABLE DEVELOPMENT GOALS
Product or Service Contribution to UN SDGs
Key products and services and its contribution to sustainable development.
Key Products
and Services
Societal Value / Contribution to UN SDGs
Potential Negative Impact of
Contribution
Management Approach
to Negative Impact
Office Space
We provide a suitable location where businesses can operate and grow contributing to job creation and increased economic activity in the areas where we locate. To date we have 666,448 square meters of gross floor area.
Apart from the environmental, social, and economic impacts identified above, we see no further material negative impacts of this product to SDGs.
Nothing material that we could identify
Mall Space
We provide a space where our customers (merchants) benefit from the foot traffic to the malls. It allows foreign and local enterprises to access key markets and scale their businesses. People around our locations can access quality products that meets their needs from food, medicine, clothing, and other needs that improve their quality of life. To date, we have a total of 2,989,931 square meters of gross floor area. In addition, 21 of our malls offer low-carbon malls spaces, as they’re fitted with solar panels that meets a significant part of their power requirement.
Current businesses could be negatively affected through reduced customers. Increased consumerism could reduce savings of citizens. May cause traffic congestion that reduces productivity of population.
When we enter a location, we map which local enterprises could be negatively affected by our entry. We assess the impact and provide opportunities for the affected parties to locate in our mall, or their household members to given employment opportunities.
Hotel Rooms
We provide affordable, quality accommodation options for tourists who contribute economic value to the local areas where we operate. People who travel to offsite locations on business are also able to access quality rooms that meets their budget. Currently, we have 2,368 rooms in our Go Hotels and Summit Hotels Brands.
Apart from the environmental, social, and economic impacts identified above, we see no further material impacts of this product to SDGs.
Nothing material that we could identify
Vertical and Residential Products
We help families achieve their dreams of owning a home. We have a deep understanding of the needs of
Apart from the environmental, social, and economic impacts
Nothing material that we could identify
113

our customers and build for them a house that meets their needs wherever they are in their journey towards financial freedom. In 2020, we have a total of 50,166 residential units.
identified above, we see no further material impacts of this product to SDGs.
Logistics (Storage)
We provide storage space that help product-based businesses make their distribution system more efficient, ensuring that their goods are well secured. To date we have 93,000 square meters of warehouse space.
Apart from the environmental, social, and economic impacts identified above, we see no further material impacts of this product to SDGs.
Nothing material that we could identify
Master planned mixed-use developments and townships
Our master planned properties are designed to foster resilience, mobility, security, connectivity, and comfort. With well-designed combination of office space, commercial and residential areas, we create an urban environment that supports economic growth in a manner that protects the environment and puts people’s needs at the heart of it. With efficient master-planning, innovative designs, and quality construction, our townships will raise the standards of mixed-use developments in the country. Overall, the locations and design will attract foreign investments that will increase our country’s overall economic pool. The compact communities that we built also helps reduce the need to travel by car, fosters walkability, that has long term benefits to air quality, health, and climate mitigation. Currently, we have a total of 256 hectares of township developments.
Apart from the environmental, social, and economic impacts identified above, we see no further material impacts of this product to SDGs.
Nothing material that we could identify
114

Annex A. Location of Operations
115

Robinsons Malls (Total of 52)
Robinsons Malls Address Year Opened
Metro Manila (9)
Robinsons Galleria EDSA corner Ortigas Avenue, Quezon City 1990
Robinsons Place Manila M. Adriatico Street, Ermita, Manila 1997
Robinsons Novaliches Quirino Highway, Novaliches, Quezon City 2001
Robinsons Metro East Marcos Highway, Brgy. Dela Paz, Pasig City 2001
Forum Robinsons EDSA Corner Pioneer Road, Mandaluyong City 2004
Robinsons Otis P.M. Guanzon St., Paco, Manila 2007
Robinsons Magnolia Aurora Blvd. corner Doña Hemady St., Quezon City 2012
Magnolia Expansion Aurora Blvd. corner Doña Hemady St., Quezon City 2019
Robinsons Town Mall Malabon
Gov. Pascual Ave. cor. Crispin St., Tinajeros, Malabon
2013
Robinsons Place Las Piñas Alabang-Zapote Road, Brgy. Talon, Las Piñas City 2014
Outside Metro Manila Address
Year
Robinsons Malls Opened
Luzon ex-Metro Manila (22)
Robinsons Place Imus Aguinaldo Highway, Tanzang Luma V, Imus, Cavite 1998
Robinsons Town Mall Los Baños
Lopez Avenue, Batong Malaki, Los Baños, Laguna 2000
Robinsons Star Mills Pampanga
San Jose, San Fernando, Pampanga 2002
Robinsons Santa Rosa Old Nat’l Hi-way, Brgy Tagapo, Sta Rosa, Laguna 2002
Robinsons Place Dasmariñas Pala-Pala, Dasmarinas, Cavite 2003
Robinsons Place Lipa Mataas Na Lupa, Lipa City, Batangas 2003
Robinsons Cainta Ortigas Avenue Extension, Junction, Cainta, Rizal 2004
Robinsons Place Angeles McArthur Highway, Balibago, Angeles City, Pampanga
2004
Robinsons Luisita McArthur Highway, Brgy. San Miguel, Tarlac City 2007
Robinsons Cabanatuan Km. 3, Maharlika Highway, Cabanatuan City 2008
Robinsons Pulilan Trinidad Highway, Brgy. Cutcot, Pulilan, Bulacan 2008
Summit Ridge Tagaytay Km. 58, Tagaytay-Nasugbu Road, Tagaytay City 2008
Robinsons Ilocos Norte Brgy. 1 San Francisco, San Nicolas, Ilocos Norte 2009
Robinsons Place Pangasinan McArthur Highway, Brgy. San Miguel, Calasiao Pangasinan
2012
Robinsons Place Palawan National Highway, Brgy. San Miguel, Puerto Princesa City
2012
Robinsons Place Malolos MacArthur Highway, Brgy. Sumapang Matanda, Malolos City, Bulacan
2013
Robinsons Place Santiago Maharlika Highway, Brgy Mabini, Santiago City, Isabela
2014
116

Robinsons Place Antipolo Sumulong Highway, cor. Circumferential Road, Antipolo City
2014
Robinsons Place General Trias Governor’s Drive, General Trias, Cavite 2016
Robinsons Place Naga Roxas Ave., cor. Almeda Highway, Brgy. Triangulo, Naga City, Camarines Sur
2017
Robinsons Place Tuguegarao Brgy. Tanza, Tuguegarao City, Cagayan 2018
Galleria South San Pedro, Laguna 2019
Year Robinsons Malls Address Opened
Visayas (14)
Robinsons Place Bacolod Lacson Street, Mandalagan, Bacolod City 1997
Robinsons Fuente Cebu Fuente Osmena, Bo. Capitol, Cebu City 2000
Robinsons Place Iloilo Quezon-Ledesma Street, Rojas Village, Iloilo City 2001
Robinsons Cybergate Bacolod Barrio Tangub, National Road, Bacolod City 2004
Robinsons Place Tacloban National Highway, Marasbaras, Tacloban City 2009
Robinsons Place Dumaguete Calindagan Business Park, Dumaguete City 2009
Robinsons Cybergate Cebu Don Gil Garcia St., Capitol, Cebu City 2009
Robinsons Place Roxas Immaculate Heart of Mary Avenue, Pueblo de Panay, Brgy. Lawa-an, Roxas City, Capiz
2014
Robinsons Place Antique Brgy. Maybato, San Jose, Antique 2015
Robinsons Galleria Cebu Gen. Maxilom Ave. Ext, Cebu City, Cebu 2015
Robinsons Place Jaro E Lopez St. Jaro, Iloilo City, Iloilo 2016
Robinsons North Tacloban Brgy. Abucay, Tacloban City, Leyte 2017
Robinsons Place Ormoc Brgy. Cogon, Ormoc City, Leyte 2018
Robinsons Place Pavia Brgy. Ungka 2, Pavia, Iloilo 2018
Year Robinsons Malls Address Opened
Mindanao (7)
Robinsons Cagayan de Oro Limketkai Complex, Lapasan, Cagayan De Oro City 2002
Robinsons Cybergate Davao
J. P. Laurel Avenue, Davao City 2009
Robinson Place General Santos
Jose Catolico Sr. Ave., Lagao, General Santos City 2009
Robinsons Place Butuan J.C. Aquino Avenue, Brgy Libertad, Butuan City 2013
Robinsons Place Tagum Tagum City, Davao del Norte 2016
Robinsons Place Iligan Macapagal Ave., Brgy. Tubod, Iligan City, Lanao del Norte
2017
Robinsons Place Valencia Sayre Highway, Brgy. Hagkol, Bagontaas Valencia, Bukidnon
2018
117

Office Buildings (Total of 25) Office Building
Name Location Address Size & designation
Metro Manila (16)
Galleria Corporate Center Quezon City Along EDSA corner Ortigas Ave, Quezon City
30-storey
Robinsons-Equitable Tower
Ortigas Center, Pasig City
Corner of ADB Ave and Poveda St., Ortigas Center, Pasig City
45-stroey
Robinsons Summit Center Makati City Ayala Avenue, Makati City 37-storey
Robinsons Cybergate Center Tower 1
Mandaluyong City Pioneer St., Mandaluyong City 18-storey
Robinsons Cybergate Center Tower 2
Mandaluyong City Pioneer St., Mandaluyong City 27-storey
Robinsons Cybergate Center Tower 3
Mandaluyong City Pioneer St., Mandaluyong City 27-storey
Robinsons Cybergate Plaza Mandaluyong City EDSA, Mandaluyong City 12-storey
Robinsons Cyberscape Alpha
Ortigas Center, Pasig City
Sapphire and Garnet Roads, Ortigas Center, Pasig City
26-storey
Robinsons Cyberscape Beta
Ortigas Center, Pasig City
Ruby and Topaz Roads, Pasig City
37-storey
Tera Tower Bridgetowne West, Quezon City
Bridgetowne, E. Rodriguez (C5) Avenue, Quezon City
20-storey
Cyber Sigma Fort Bonifacio, Taguig City
Lawton Avenue, McKinley West, Fort Bonifacio, Taguig City
21-storey
Robinsons Cyberscape Gamma
Ortigas Center, Pasig City
Ruby and Topaz Roads, Pasig City
37-storey
Exxa Tower Bridgetowne West, Quezon City
Bridgetowne, E. Rodriguez (C5) Avenue, Quezon City
20-storey
Zeta Tower Bridgetowne West, Quezon City
Bridgetowne, E. Rodriguez (C5) Avenue, Quezon City
20-storey
Cybergate Magnolia Cubao, Quezon City Aurora Blvd. corner Doña Hemady St., Quezon City
10-storey
Giga Tower
Bridgetowne West, Quezon City
Bridgetowne, E. Rodriguez (C5) Avenue, Quezon City
20-storey
Provincial (9)
Name Location Address Size & designation
Robinsons Cybergate Cebu Cebu City Fuente Osmena, Bo. Capitol, Cebu City
3-storey
Robinsons Galleria Cebu Office
Cebu City Gen. Maxilom Avenue, Cebu City
4-storey
Robinsons Place Ilocos Office
Ilocos Norte San Nicolas, Ilocos Norte 4-storey
118

Robinsons Luisita Office Luisita Tarlac McArthur Highway Bo. Tarlac City, Tarlac
3-storey
Robinsons Luisita 2 (BPS) Luisita Tarlac McArthur Highway Bo. Tarlac City, Tarlac
3-storey
Cybergate Delta Tower 1 Davao City JP. Laurel Ave., Davao City 5-storey
Cybergate Naga Naga City Almeda Highway, cor Roxas Avenue, Naga, Camarines Sur
4-storey
Cybergate Delta Tower 2 Davao City JP. Laurel Ave., Davao City 5-storey
Robinsons Luisita 3 (BPS) Luisita Tarlac McArthur Highway Bo. Tarlac City, Tarlac
3-storey
work.able Centers Location Size in sqm
work.able Cyberscape Gamma 1 & 2
Cyberscape Gamma Topaz & Ruby Roads, Ortigas Center Pasig City
1,846
work.able Exxa-Zeta Exxa & Zeta Towers, Bridgetowne E. Rodriguez Jr. Ave., C5 Road Ugong Norte Quezon City
1,347
work.able Sigma (BTS)
Cyber Sigma, Lawton Avenue, Bonifacio, Taguig City 309
work.able Giga (BTS) Giga Tower, Bridgetowne E. Rodriguez Jr. Ave., C5 Road, Ugong Norte Quezon City
618
Total 4,120
Hotels and Resorts (Total of 20 owned hotels and resort)
# Locations Address No. of Rooms
Metro Manila
1 Go Hotels Mandaluyong
UG/F, Robinsons Cybergate Plaza, EDSA cor. Pioneer Street, Mandaluyong City, 1550
223
2 Go Hotels Otis 5F Robinsons Otis 1536 Paz Guazon St. 831 Zone 90 Paco Manila, 1007
118
3 Go Hotels Ortigas Center
Robinsons Cyberscape Alpha, Garnet Road, Ortigas Center, Pasig City, 1605
198
VISAYAS
1 Go Hotels Puerto Princesa
North Road, Brgy. San Manuel, Puerto Princesa City, Palawan, 5300
108
2 Go Hotels Dumaguete Calindagan corner South Road, Dumaguete Central Business District, Dumaguete City, 6200 Negros Oriental, 6200
102
3 Go Hotels Tacloban Tabuan National Highway, Marasbaras, Tacloban City, Leyte, 6500
98
4 Go Hotels Bacolod Lacson Street, Mandalagan, Bacolod City 6100, Negros Occidental
108
5 Go Hotels Iloilo Ledesma Street Corner Queson Street, Iloilo City, Iloilo 5000
167
119

MINDANAO
1 Go Hotels BUTUAN JC Aquino Ave., Brgy. Bayanihan, Butuan City, Agusan Del Norte, 8600
104
2 Go Hotels Lanang Davao (JV)
Phoenix Mega Service Station, J.P Laurel Ave., cor. Arroyo St., Lanang, Davao City, 8000
183
3 Go Hotels Iligan Robinsons Place Iligan, Brgy. Tubod, Iligan City, Lanao Del Norte
100
Roxaco-Asia-Hospitality Group (Franchisee)
1 Go Hotels Parañaque 608 Quirino Avenue, Brgy. Tambo, Parañaque City 199
2 Go Hotels North Edsa 1107 EDSA, Veterans Village, Bago Bantay, Quezon City 167
3 Go Hotels Ermita 1412 A. Mabini St. Ermita Manila City 219
4 Go Hotels Timog 63 Timog ave South Triangle Quezon City 219
Total 804
LUZON
1 Summit Ridge Km. 58 Gen. Aguinaldo Highway, Maharlika West, Tagaytay City, Philippines
108
2 Summit Magnolia Robinsons Magnolia, Dona M. Hemady Avenue corner Aurora Boulevard, New Manila, Quezon City 111
82
3 Summit Greenhills 13 Annapolis, San Juan, 1504 Metro Manila 100
VISAYAS
1 SCC Fuente Fuente Osmeña Corner F. Ramos St. Cebu City 211
2 SGC Maxilom Gen. Maxilom Ave cor. Benedicto St. Cebu City 220
3 SHT Tacloban Brgy. Marasbaras, Tacloban City, Leyte 138
Total 859
# Locations Address No. of rooms
Metro Manila
1 Holiday Inn ADB Avenue, Ortigas Center, Pasig 285
2 Dusit Thani Mactan, Cebu 271
3 Crowne Plaza Ortigas Ave., corner ADB Ave., Ortigas Center, Quezon City 263
Total 819
Residential Buildings
Project Name Address
COMMUNITIES
Acacia Escalades Condominium Corporation
Amang Rodriguez Ave corner Calle Industria, Brgy. Manggahan, Pasig City
Axis Residences Condominium Corporation
Pioneer St., Brgy. Barangka Ilaya, Mandaluyong City
Escalades at 20th Avenue Condominium Corporation
Corner 20th Avenue and Aurora Boulevard, Cubao, Quezon City
Escalades East Tower Condominium Corporation
20th Avenue, San Roque, Cubao, Quezon City
120

Escalades South Metro Condominium Corporation
Meralco Rd. corner Dr. A. Santos, Brgy. Sucat, Muntinlupa City
Gateway Garden Ridge Condominium Corporation
Epifanio Delos Santos Ave., Brgy. Barranca, Mandaluyong City
The Pearl Place Condominium Corporation
Gold Loop corner Pearl Drive, Brgy. San Antonio, Pasig City
The Wellington Courtyard Condominium Corporation
J.P. Rizal Avenue cor. Mayor’s Drive, Tagaytay City
Woodsville Viverde Mansions Condominium Corporation
Edison Ave. corner West Service Rd., Brgy. Merville, Parañaque City
Project Name Address
RESIDENCES AND LUXURIA
Robinsons Adriatico Residences Condominium Corporation
Adriatico St. corner Pedro Gil, Ermita, Manila
Amisa Private Residences Condominium Corporation
Brgy. Punta Engaño, Lapu-Lapu City, Cebu
Azalea Place Cebu Condominium Corporation
Gorordo Ave., Brgy. Lahug, Cebu City
East of Galleria Condominium Corporation
Topaz Road corner Ruby Road, Ortigas Center, Pasig City
Fifth Avenue Place Condominium Corporation
5th Ave. corner 21st Drive, Bonifacio Global City, Taguig
Galleria Regency Condominium Corporation
Ortigas Ave. corner ADB Ave., Quezon City
Mckinley Park Residences Condominium Corporation
3rd Avenue corner 31st Street, Crescent Park West, Fort Bonifacio, Taguig City
Robinsons Gateway Residences Condominium Corporation
Pioneer Street, Mandaluyong City
Robinsons Place Residences Condominium Corporation
Padre Faura St., Ermita, Manila
Sonata Private Residences Condominium Corporation
San Miguel Avenue corner Lourdes St., Mandaluyong City
Signa Designer Residences Condominium Corporation
Valero Street corner Rufino Street, Salcedo Village, Makati City
The Sapphire Bloc Condominium Corporation
Sapphire, Garnet, and Onyx Roads, Ortigas Center, Pasig City
The Fort Trion Towers Condominium Corporation
8th Avenue corner McKinley Parkway, Fort Bonifacio, Taguig City
Robinsons Fort Residences Condominium Corporation
8th Avenue corner McKinley Parkway, Fort Bonifacio, Taguig City
TMR New Manila Condominium Corporation
The Magnolia Residences, Aurora Blvd. corner Doña Hemady and N. Domingo Streets, New Manila Quezon City
Vimana Verde Residences Condominium Corporation
St. Martin, Brgy. Oranbo, Pasig City
121

Woodsville Residences Condominium Corporation
West Service Road, Brgy. Merville, Parañaque City
The Radiance North-South Manila Bay Condominium Corporation
Roxas Boulevard corner Maytubig Street, Pasay City
Robinsons Homes
Property Name Address
Brighton Parkplace Brgy. Araniw, Laoag, Ilocos Norte
Brighton Parkplace North Brgy. Araniw, Laoag, Ilocos Norte
Hanalei Heights Brgy. Balatong, Laoag City, Ilocos Norte
Fernwood Parkhomes Brgy. Magalang, Mabalacat Road, Pampanga
Forest Parkhomes Brgy. Sto. Niño, Angeles City
Forest Parkhomes North Brgy. Sto. Niño, Angeles City
Grand Tierra Brgy. Sto. Domingo I Capas, Tarlac
Brighton Baliwag J.P. Rizal St. Brgy. Sta. Barbara, Baliuag Bulacan
Mirada Dos Brgy. Sindalan, San Fernando Pampanga
Rosewood Parkhomes Brgy. Cutcut, Angeles City
Robinsons Homes East Brgy. San Jose, Antipolo City
San Lorenzo Homes Brgy. San Jose, Antipolo City
San Jose Estates Brgy. San Jose, Antipolo City
St. Bernice Estates Brgy. San Jose, Antipolo City
St. Judith Hills Brgy. San Jose, Antipolo City
Springdale Phase 1 at Pueblo Angono Brgy. Mahabang Parang, Angono Rizal
Springdale Phase 2 at Pueblo Angono Brgy. Mahabang Parang, Angono Rizal
Brighton at Pueblo Angono Brgy. Mahabang Parang, Angono Rizal
Robinsons Residenza Milano Brgy. San Isidro, Batangas City
Robinsons Vineyard Brgy. Sampaloc IV, Dasmariñas, Cavite
Southsquare Village Brgy. Pasong Kawayan II, General Trias, Cavite
Bloomfields Heights Lipa Brgy. Tibig, Lipa City, Batangas
Bloomfields Tagaytay Brgy. Maharlika, Tagaytay City
Brighton Puerto Princesa Brgy. Santa Lourdes, Puerto Princesa, Palawan
Aspen Heights Brgy. Danglag, Consolacion, Cebu
Blue Coast Residences Brgy. Punta Engaño, Mactan, Cebu
Brighton Bacolod Brgy. Estefania, Bacolod, Negros Occidental
Fresno Parkview Brgy. Lumbia, Cagayan De Oro City
Hillsborough Pointe Upper Carmen, Cagayan De Oro City
Richmond Hills Brgy. Camaman-an, Cagayan De Oro City
Bloomfields Cagayan De Oro Brgy. Lumbia, Cagayan De Oro City
Robinsons Davao Highlands Brgy. Buhangin, Davao City
Montclair Highlands Diversion Road, Buhangin, Davao City
Nizanta at Ciudades Brgy. Tigatto & Waan, Davao City
Bloomfields Davao Brgy. Angliongto Sr., Buhangin District Lanang, Davao City
Bloomfields General Santos Nat’l Highway, Brgy. Labangal, General Santos City
122

Robinsons Land Logistics (RLX)
Property Name Location
RLX Sucat 1 East Service Road, Brgy. Sucat, Muntinlupa City, Metro Manila
RLX Calamba 1 Brgy. Maunong, Calamba City
RLX Calamba 1B Brgy. Maunong, Calamba City
RLX Sierra Valley Ortigas Extension Ave, Cainta, Rizal
RLC Integrated Developments
Property Name Location
Bridgetowne West Brgy. Ugong Norte, Quezon City, Metro Manila
Bridgetowne East Brgy. Rosario, Pasig City
Sierra Valley Ortigas Extension Ave, Cainta, Rizal
Montclair Brgy. Manuali, Porac, Pampanga
123

PART VI - EXHIBITS AND SCHEDULES
Item 17. Exhibits And Reports On SEC Form 17-C
(A) Exhibits-See Accompanying Index To Exhibits (Page 267) The following exhibit is filed as a separate section of this report: (Exhibit 18) Subsidiaries Of The Registrant (page 268) The other exhibits, as indicated in the Index to exhibits are either not applicable
to the Company or does not require an answer.
(B) Reports on SEC Form 17-C (Current Report)
Following is a list of corporate disclosures of RLC filed under SEC Form 17-C for the period from July 1, 2020 to December 31, 2020:
Date of Disclosure Subject Matter
August 14, 2020 PSE Disclosure Form 4-30 – Appointment of the Chairman and members of the Board Committees
September 30, 2020 PSE Disclosure Form 4-8 – Appointment of New Corporate Secretary
October 22, 2020 PSE Disclosure Form 4-2 – Appointment of New Compliance Officer
124

03.30.2021
03.30.2021
03.30.2021
03.30.2021
03.30.2021
125

ROBINSONS LAND CORPORATION AND SUBSIDIARIESINDEX TO CONSOLIDATED FINANCIAL STATEMENTS
AND SUPPLEMENTARY SCHEDULESSEC FORM 17-A
CONSOLIDATED FINANCIAL STATEMENTS
Statement of Management’s Responsibility for Financial Statements
Independent Auditor’s Report on Consolidated Financial Statements
Consolidated Statements of Financial Position as at December 31, 2020 and 2019
Consolidated Statements of Comprehensive Income for the years ended December 31, 2020, 2019 and 2018
Consolidated Statements of Changes in Equity for the years ended December 31, 2020, 2019 and 2018
Consolidated Statements of Cash Flows for the years ended December 31, 2020, 2019 and 2018
Notes to Consolidated Financial Statements
SUPPLEMENTARY SCHEDULES
Independent Auditor’s Report on Supplementary Schedules
A. Financial Assets in Equity Securities
B. Amounts Receivable from Directors, Officers, Employees, Related Parties and Principal Stockholders(other than related parties)
C. Amounts Receivable from Related Parties which are Eliminated During theConsolidation of Financial Statements
D. Intangible Assets
E. Long-term debt
F. Indebtedness to Related Parties (Long term Loans from Related Companies)
G. Guarantees of Securities of Other Issuers
H. Capital Stock
Annex 68-D. Reconciliation of Unappropriated Retained Earnings Available For Dividend Declaration
Annex 68-E. Financial Soundness Indicator
Map of the Relationships of the Company within the Group
126

127

*SGVFSM006221*
INDEPENDENT AUDITOR’S REPORT
The Stockholders and the Board of DirectorsRobinsons Land CorporationLevel 2, Galleria Corporate CenterEDSA corner Ortigas Avenue, Quezon City, Metro Manila
Report on the Audit of the Consolidated Financial Statements
Opinion
We have audited the accompanying consolidated financial statements of Robinsons Land Corporation(the Parent Company) and its subsidiaries (collectively referred to as “the Group”), which comprise theconsolidated statements of financial position as at December 31, 2020 and 2019, and the consolidatedstatements of comprehensive income, consolidated statements of changes in equity and consolidatedstatements of cash flows for each of the three years in the period ended December 31, 2020, and notes tothe consolidated financial statements, including a summary of significant accounting policies.
In our opinion, the accompanying consolidated financial statements present fairly, in all material respects,the financial position of the Group as at December 31, 2020 and 2019, and its financial performance andits cash flows for the three years in the period ended December 31, 2020 in accordance with PhilippineFinancial Reporting Standards (PFRSs).
Basis for Opinion
We conducted our audits in accordance with Philippine Standards on Auditing (PSAs). Ourresponsibilities under those standards are further described in the Auditor’s Responsibilities for the Auditof the Consolidated Financial Statements section of our report. We are independent of the Group inaccordance with the Code of Ethics for Professional Accountants in the Philippines (Code of Ethics)together with the ethical requirements that are relevant to our audit of the consolidated financialstatements in the Philippines, and we have fulfilled our other ethical responsibilities in accordance withthese requirements and the Code of Ethics. We believe that the audit evidence we have obtained issufficient and appropriate to provide a basis for our opinion.
Key Audit Matters
Key audit matters are those matters that, in our professional judgment, were of most significance in ouraudit of the consolidated financial statements of the current period. These matters were addressed in thecontext of our audit of the consolidated financial statements as a whole, and in forming our opinionthereon, and we do not provide a separate opinion on these matters. For each matter below, ourdescription of how our audit addressed the matter is provided in that context.
SyCip Gorres Velayo & Co.6760 Ayala Avenue1226 Makati CityPhilippines
Tel: (632) 8891 0307Fax: (632) 8819 0872ey.com/ph
BOA/PRC Reg. No. 0001, October 4, 2018, valid until August 24, 2021SEC Accreditation No. 0012-FR-5 (Group A),
November 6, 2018, valid until November 5, 2021
A member firm of Ernst & Young Global Limited 128

*SGVFSM006221*
We have fulfilled the responsibilities described in the Auditor’s Responsibilities for the Audit of theConsolidated Financial Statements section of our report, including in relation to these matters.Accordingly, our audit included the performance of procedures designed to respond to our assessment ofthe risks of material misstatement of the consolidated financial statements. The results of our auditprocedures, including the procedures performed to address the matters below, provide the basis for ouraudit opinion on the accompanying consolidated financial statements.
Real Estate Revenue Recognition
The Group’s revenue recognition process, policies and procedures are significant to our audit becausethese involve the application of significant judgment and estimation in the following areas: (1) assessmentof the probability that the Group will be able to collect the consideration from the buyer; (2) applicationof the input method as the measure of progress of project completion in determining the revenue to berecognized; (3) determination of the actual costs incurred as cost of sales; and (4) recognition of costs toobtain a contract.
In evaluating whether collectability of the amount of consideration is probable, the Group considers thesignificance of the buyer’s initial payments (or buyer’s equity) in relation to the total contract price.Collectability is also assessed by considering factors such as past collection history with the buyer, ageand pricing of the property. Management regularly evaluates the historical sales cancellations and back-outs, after considering the impact of the coronavirus pandemic, if such would continue to support theGroup’s current threshold of buyers’ equity before commencing revenue recognition.
In determining the transaction price, the Group considers the selling price of the real estate property andother fees and charges collected from the buyers that are not held on behalf of other parties.
In measuring the progress of its performance obligation over time, the Group uses the input method.Under this method, progress is measured based on actual costs incurred on materials, labor, and actualoverhead relative to the total estimated development costs of the real estate project. The Group uses thecost accumulated by the accounting department to determine the actual costs incurred. The estimation ofthe total costs of the real estate project requires technical inputs by project engineers.
In determining the actual costs incurred to be recognized as cost of sales, the Group estimates costsincurred on materials, labor and overhead which have not yet been billed by the contractor.
The Group identifies sales commission after contract inception as the cost of obtaining the contract. Forcontracts which qualified for revenue recognition, the Group capitalizes the total sales commission due tosales agent as cost to obtain contract and recognizes the related commission payable. The Group uses thepercentage-of-completion (POC) method in amortizing sales commission consistent with the Group’srevenue recognition policy.
The disclosures related to the real estate revenue are included in Note 23 to the consolidated financialstatements.
A member firm of Ernst & Young Global Limited 129

*SGVFSM006221*
Audit Response
We obtained an understanding of the Group’s revenue recognition process, policies and procedures.
For the buyers’ equity, we evaluated management’s basis of the buyer’s equity by comparing this to thehistorical analysis of sales cancellations and back-outs of buyers with accumulated payments above thecollection threshold. We also considered the impact of the coronavirus pandemic to the level ofcancellations during the year. We traced the analysis to supporting documents such as deed ofcancellation.
For the determination of the transaction price, we obtained an understanding of the nature of other feescharged to the buyers. For selected contracts, we agreed the amounts excluded from the transaction priceagainst the expected amounts required to be remitted to the government based on existing tax rules andregulations (e.g., documentary stamp taxes, transfer taxes and real property taxes).
For the application of the input method in determining real estate revenue and for determining cost ofsales, we obtained an understanding of the Group’s processes for determining the POC, including the costaccumulation process, and for determining and updating total estimated costs, and performed tests of therelevant controls on these processes. We assessed the competence and objectivity of the project engineersby reference to their qualifications, experience and reporting responsibilities. For selected projects, wetraced costs accumulated, including those incurred but not yet billed costs, to the supporting documentssuch as purchase order, billings and invoices of contractors and other documents evidencing receipt ofmaterials and services from suppliers and contractors. We visited selected project sites and made relevantinquiries, including inquiries on how the coronavirus pandemic affected the POC during the period, withproject engineers. We performed test computation of the percentage of completion calculation ofmanagement. For selected projects, we obtained the approved total estimated costs and any revisionsthereto and the supporting details such as capital fulfillment plan, capital expenditure requests and relatedexecutive committee approvals. We likewise performed inquiries with the project engineers for therevisions.
For the recognition of cost to obtain a contract, we obtained an understanding of the sales commissionprocess. For selected contracts, we agreed the basis for calculating the sales commission capitalized andportion recognized in profit or loss, particularly (a) the percentage of commission due against contractswith sales agents, (b) the total commissionable amount (i.e., net contract price) against the related contractto sell, and, (c) the POC used in calculating the sales commission against the POC used in recognizing therelated revenue from real estate sales.
A member firm of Ernst & Young Global Limited 130

*SGVFSM006221*
Accounting for Lease Concessions
In line with the rental relief framework implemented by the government to support businesses and thebroader economy due to the impact of Covid-19, the Group waived its right to collect rent and othercharges as part of various lease concessions it granted to lessees such as lease payment holidays or leasepayment reductions. The Group assessed that the lease concessions it granted to lessees do not qualify aslease modifications since the terms and conditions under the corresponding lease contracts have not beenmodified by the waiver. The Group accounted for the lease concessions in the form of negative variablerent which the Group recorded when the concession is granted regardless of the period to which theconcession pertains. The Group’s accounting for lease concession under PFRS 16 is significant to ouraudit because there were numerous lease concessions granted to lessees during the period; the recordedamounts are material to the consolidated financial statements; and accounting for lease concessioninvolves the application of significant judgment in determining whether or not the lease concession is alease modification.
The disclosures related to the lease concession granted by the Group are included in Notes 5 and 36 to theconsolidated financial statements.
Audit Response
We determined the population of lease contracts and obtained an understanding of the type, extent andperiods covered under the various lease concessions granted by the Group to the lessees during the year.On a sample basis, we tested the population of lease agreements covered by the lease concessions bycomparing the approved contract adjustments against the lease contract database, which include contractnumber, contract name, contract type and rental rate, among others.
On a test basis, we obtained and inspected the communications of the Group to the lessees and traced therelevant information to the schedule of calculation of the amounts of lease concession. We test computedthe amounts of lease concessions.
We obtained management’s assessment supporting the conclusion that the lease concessions granted bythe Group to the lessees do not qualify as lease modifications. We reviewed the legal opinion issued bythe Group’s external legal counsel to support the Group’s assessment and conclusion about the waiver ofits right to collect rent and other charges from lessees. We involved our internal specialist in evaluatingthe legal basis supporting management’s assessment and the legal position. We also reviewed thedisclosures relating to the lease concessions.
A member firm of Ernst & Young Global Limited 131

*SGVFSM006221*
Impairment Testing of Property and Equipment and Right-of-Use Assets of Hotels and ResortsSegment
In view of the continuing community quarantines and restricted travel, the Group’s hotels divisioncontinues to be adversely affected by the lower number of guests and reduced room rates, both of whichhave significantly impacted the revenues reported for this segment. Also, many restaurants remainedclosed or allowed limited operations which impacted the food and beverage revenues of this segment.These events and conditions are impairment indicators requiring the assessment of the recoverableamount of the hotel division’s property and equipment and right-of-use assets, which involves significantjudgment, estimation and assumptions about occupancy rates, average room rates, gross margin, as wellas external inputs such as discount rate. In addition, because of the coronavirus pandemic, there is theheightened level of uncertainty on the future economic outlook and market forecast. Accordingly, suchimpairment assessment and testing is a key audit matter in our audit.
The disclosures in relation to property and equipment and right-of-use assets are included in Note 5 to theconsolidated financial statements.
Audit Response
We involved our internal specialist in evaluating the methodology and the assumptions used in estimatingthe recoverable amount. These assumptions include occupancy rates, average room rates, gross margin aswell as external inputs such as discount rate. We compared the key assumptions used such as occupancyrates, average room rates and gross margin against industry forecasts and with historical information,adjusted to take into consideration the impact associated with the coronavirus pandemic. We tested thediscount rate by comparing against market data. We also reviewed the Group’s disclosures about thoseassumptions to which the outcome of the impairment test is most sensitive; specifically, those that havethe most significant effect on the determination of the recoverable amount of property and equipment andright-of-use assets.
A member firm of Ernst & Young Global Limited 132

*SGVFSM006221*
Other Information
Management is responsible for Other Information. Other Information comprises the information includedin SEC Form 20 IS (Definitive Information Statement), SEC Form 17-A and Annual Report for the yearended December 31, 2019 but does not include the consolidated financial statements and our auditor’sreport thereon. SEC Form 20 IS (Definitive Information Statement), SEC Form 17-A and Annual Reportfor the year ended December 31, 2020 are expected to be made available to us after the date of thisauditor’s report.
Our opinion on the consolidated financial statements does not cover Other Information and we will notexpress any form of assurance conclusion thereon.
In connection with our audits of the consolidated financial statements, our responsibility is to read theOther Information identified above when it becomes available and, in doing so, consider whether suchinformation is materially inconsistent with the consolidated financial statements or our knowledgeobtained in the audits, or otherwise appears to be materially misstated.
Responsibilities of Management and Those Charged with Governance for the ConsolidatedFinancial Statements
Management is responsible for the preparation and fair presentation of the consolidated financialstatements in accordance with PFRSs, and for such internal control as management determines isnecessary to enable the preparation of consolidated financial statements that are free from materialmisstatement, whether due to fraud or error.
In preparing the consolidated financial statements, management is responsible for assessing the Group’sability to continue as a going concern, disclosing, as applicable, matters related to going concern andusing the going concern basis of accounting, unless management either intends to liquidate the Group orto cease operations, or has no realistic alternative but to do so.
Those charged with governance are responsible for overseeing the Group’s financial reporting process.
Auditor’s Responsibilities for the Audit of the Consolidated Financial Statements
Our objectives are to obtain reasonable assurance about whether the consolidated financial statements as awhole are free from material misstatement, whether due to fraud or error, and to issue an auditor’s reportthat includes our opinion. Reasonable assurance is a high level of assurance, but is not a guarantee that anaudit conducted in accordance with PSAs will always detect a material misstatement when it exists.Misstatements can arise from fraud or error and are considered material if, individually or in theaggregate, they could reasonably be expected to influence the economic decisions of users taken on thebasis of these consolidated financial statements.
A member firm of Ernst & Young Global Limited 133

*SGVFSM006221*
As part of an audit in accordance with PSAs, we exercise professional judgment and maintainprofessional skepticism throughout the audit. We also:
Identify and assess the risks of material misstatement of the consolidated financial statements,whether due to fraud or error, design and perform audit procedures responsive to those risks, andobtain audit evidence that is sufficient and appropriate to provide a basis for our opinion. The risk ofnot detecting a material misstatement resulting from fraud is higher than for one resulting from error,as fraud may involve collusion, forgery, intentional omissions, misrepresentations, or the override ofinternal control.
Obtain an understanding of internal control relevant to the audit in order to design audit proceduresthat are appropriate in the circumstances, but not for the purpose of expressing an opinion on theeffectiveness of the Group’s internal control.
Evaluate the appropriateness of accounting policies used and the reasonableness of accountingestimates and related disclosures made by management.
Conclude on the appropriateness of management’s use of the going concern basis of accounting and,based on the audit evidence obtained, whether a material uncertainty exists related to events orconditions that may cast significant doubt on the Group’s ability to continue as a going concern. Ifwe conclude that a material uncertainty exists, we are required to draw attention in our auditor’sreport to the related disclosures in the consolidated financial statements or, if such disclosures areinadequate, to modify our opinion. Our conclusions are based on the audit evidence obtained up tothe date of our auditor’s report. However, future events or conditions may cause the Group to ceaseto continue as a going concern.
Evaluate the overall presentation, structure and content of the consolidated financial statements,including the disclosures, and whether the consolidated financial statements represent the underlyingtransactions and events in a manner that achieves fair presentation.
Obtain sufficient appropriate audit evidence regarding the financial information of the entities orbusiness activities within the Group to express an opinion on the consolidated financial statements.We are responsible for the direction, supervision and performance of the audit. We remain solelyresponsible for our audit opinion.
We communicate with those charged with governance regarding, among other matters, the planned scopeand timing of the audit and significant audit findings, including any significant deficiencies in internalcontrol that we identify during our audit.
We also provide those charged with governance with a statement that we have complied with relevantethical requirements regarding independence, and to communicate with them all relationships and othermatters that may reasonably be thought to bear on our independence, and where applicable, relatedsafeguards.
A member firm of Ernst & Young Global Limited 134

*SGVFSM006221*
From the matters communicated with those charged with governance, we determine those matters thatwere of most significance in the audit of the consolidated financial statements of the current period andare therefore the key audit matters. We describe these matters in our auditor’s report, unless law orregulation precludes public disclosure about the matter or when, in extremely rare circumstances, wedetermine that a matter should not be communicated in our report because the adverse consequences ofdoing so would reasonably be expected to outweigh the public interest benefits of such communication.
The engagement partner on the audit resulting in this independent auditor’s report is Michael C. Sabado.
SYCIP GORRES VELAYO & CO.
Michael C. SabadoPartnerCPA Certificate No. 89336SEC Accreditation No. 0664-AR-4 (Group A), November 11, 2019, valid until November 10, 2022Tax Identification No. 160-302-865BIR Accreditation No. 08-001998-073-2020, December 3, 2020, valid until December 2, 2023PTR No. 8534357, January 4, 2021, Makati City
March 30, 2021
A member firm of Ernst & Young Global Limited 135
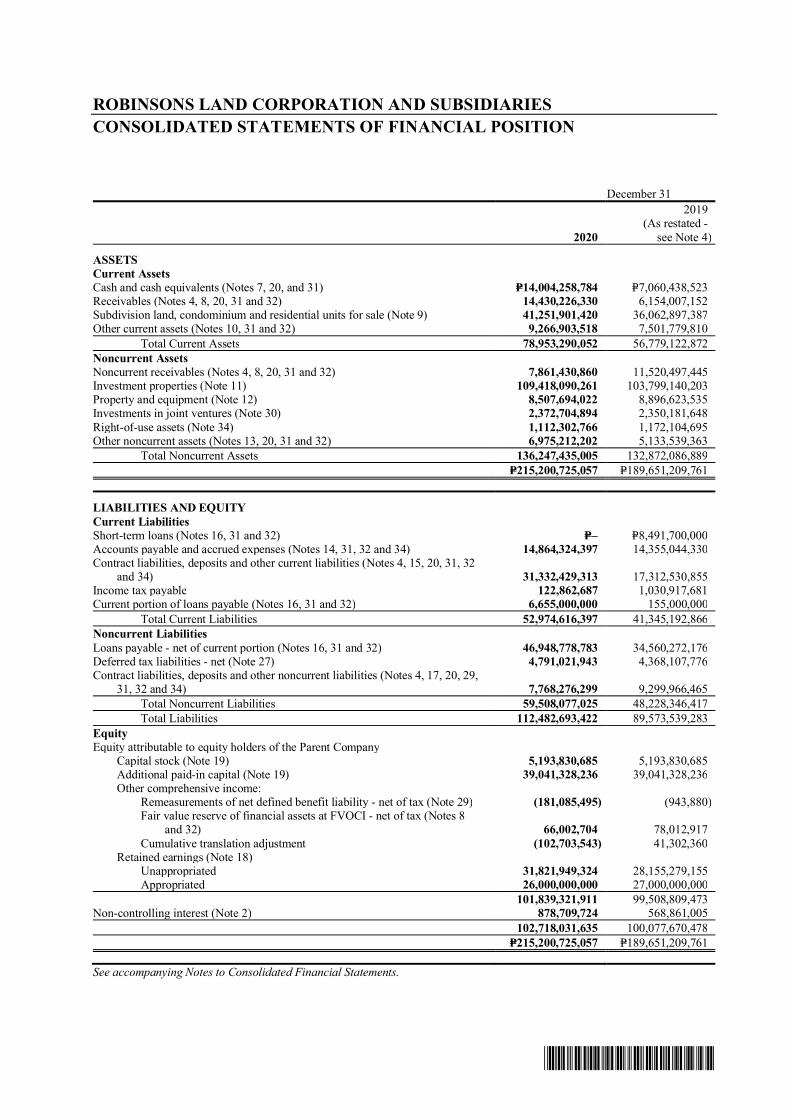
*SGVFSM006221*
ROBINSONS LAND CORPORATION AND SUBSIDIARIESCONSOLIDATED STATEMENTS OF FINANCIAL POSITION
December 31
2020
2019(As restated -
see Note 4)
ASSETSCurrent AssetsCash and cash equivalents (Notes 7, 20, and 31) P=14,004,258,784 P=7,060,438,523Receivables (Notes 4, 8, 20, 31 and 32) 14,430,226,330 6,154,007,152Subdivision land, condominium and residential units for sale (Note 9) 41,251,901,420 36,062,897,387Other current assets (Notes 10, 31 and 32) 9,266,903,518 7,501,779,810
Total Current Assets 78,953,290,052 56,779,122,872Noncurrent AssetsNoncurrent receivables (Notes 4, 8, 20, 31 and 32) 7,861,430,860 11,520,497,445Investment properties (Note 11) 109,418,090,261 103,799,140,203Property and equipment (Note 12) 8,507,694,022 8,896,623,535Investments in joint ventures (Note 30) 2,372,704,894 2,350,181,648Right-of-use assets (Note 34) 1,112,302,766 1,172,104,695Other noncurrent assets (Notes 13, 20, 31 and 32) 6,975,212,202 5,133,539,363
Total Noncurrent Assets 136,247,435,005 132,872,086,889P=215,200,725,057 P=189,651,209,761
LIABILITIES AND EQUITYCurrent LiabilitiesShort-term loans (Notes 16, 31 and 32) P=‒ P=8,491,700,000Accounts payable and accrued expenses (Notes 14, 31, 32 and 34) 14,864,324,397 14,355,044,330Contract liabilities, deposits and other current liabilities (Notes 4, 15, 20, 31, 32
and 34) 31,332,429,313 17,312,530,855Income tax payable 122,862,687 1,030,917,681Current portion of loans payable (Notes 16, 31 and 32) 6,655,000,000 155,000,000
Total Current Liabilities 52,974,616,397 41,345,192,866Noncurrent LiabilitiesLoans payable - net of current portion (Notes 16, 31 and 32) 46,948,778,783 34,560,272,176Deferred tax liabilities - net (Note 27) 4,791,021,943 4,368,107,776Contract liabilities, deposits and other noncurrent liabilities (Notes 4, 17, 20, 29,
31, 32 and 34) 7,768,276,299 9,299,966,465Total Noncurrent Liabilities 59,508,077,025 48,228,346,417
Total Liabilities 112,482,693,422 89,573,539,283EquityEquity attributable to equity holders of the Parent Company
Capital stock (Note 19) 5,193,830,685 5,193,830,685Additional paid-in capital (Note 19) 39,041,328,236 39,041,328,236Other comprehensive income:
Remeasurements of net defined benefit liability - net of tax (Note 29) (181,085,495) (943,880)Fair value reserve of financial assets at FVOCI - net of tax (Notes 8
and 32) 66,002,704 78,012,917Cumulative translation adjustment (102,703,543) 41,302,360
Retained earnings (Note 18)Unappropriated 31,821,949,324 28,155,279,155Appropriated 26,000,000,000 27,000,000,000
101,839,321,911 99,508,809,473Non-controlling interest (Note 2) 878,709,724 568,861,005
102,718,031,635 100,077,670,478P=215,200,725,057 P=189,651,209,761
See accompanying Notes to Consolidated Financial Statements.
136

*SGVFSM006221*
ROBINSONS LAND CORPORATION AND SUBSIDIARIESCONSOLIDATED STATEMENTS OF COMPREHENSIVE INCOME
Years Ended December 312020 2019 2018
REVENUE (Notes 6 and 21)Real Estate OperationsRental income (Notes 11, 15, 21 and 34) P=10,617,088,269 P=15,420,499,255 P=13,548,204,208Real estate sales (Notes 5 and 21) 11,850,184,276 9,028,944,073 10,892,384,961Amusement income (Note 21) 218,910,438 2,151,785,393 1,972,527,785Others (Notes 21 and 30) 1,635,326,439 1,549,966,856 1,163,227,782
24,321,509,422 28,151,195,577 27,576,344,736Hotel Operations (Note 21) 1,083,317,112 2,432,639,988 1,982,137,914
25,404,826,534 30,583,835,565 29,558,482,650
COSTS (Notes 6 and 22)Real Estate OperationsCost of rental services 5,340,635,930 5,363,923,175 5,072,692,446Cost of real estate sales (Note 9) 6,161,235,541 4,235,325,163 4,931,427,825Cost of amusement services 92,678,800 956,468,868 906,006,116Others 380,233,380 1,558,840,833 1,201,585,102
11,974,783,651 12,114,558,039 12,111,711,489Hotel Operations (Note 22) 1,347,774,077 2,089,588,261 1,556,880,775
13,322,557,728 14,204,146,300 13,668,592,264
12,082,268,806 16,379,689,265 15,889,890,386
GENERAL AND ADMINISTRATIVE EXPENSES(Notes 6 and 23) 3,588,403,755 4,096,793,400 3,996,352,869
INCOME BEFORE OTHER INCOME (LOSSES) 8,493,865,051 12,282,895,865 11,893,537,517
OTHER INCOME (LOSSES)Interest income (Notes 7 and 26) 239,358,482 287,417,657 156,969,192Gain (loss) on foreign exchange (Note 31) (151,057,904) 1,017,983 2,290,232Interest expense (Notes 16, 26 and 34) (1,576,998,829) (1,052,823,418) (836,112,262)Others - net (Notes 2 and 12) 1,097,316 (11,724,324) 26,346,917
(1,487,600,935) (776,112,102) (650,505,921)
INCOME BEFORE INCOME TAX 7,006,264,116 11,506,783,763 11,243,031,596
PROVISION FOR INCOME TAX (Note 27) 1,746,899,885 2,814,174,005 3,019,067,011
NET INCOME 5,259,364,231 8,692,609,758 8,223,964,585
OTHER COMPREHENSIVE INCOME (LOSS)Other comprehensive loss to be reclassified to
profit or loss in subsequent periodsCumulative translation adjustment (144,005,903) (33,541,621) (565,483)
Other comprehensive income (loss) not to be reclassified toprofit or loss in subsequent periodsRemeasurements of net defined benefit liability (Note 29) (257,345,164) 50,628,481 39,319,717Fair value reserve of financial assets at FVOCI (Notes 8 and 13) (17,157,447) 98,843,664 (9,064,944)Income tax effect (Note 27) 82,350,783 (44,841,643) (9,076,432)
(192,151,828) 104,630,502 21,178,341Total Other Comprehensive Income (Loss) (336,157,731) 71,088,881 20,612,858
TOTAL COMPREHENSIVE INCOME P=4,923,206,500 P=8,763,698,639 P=8,244,577,443
(Forward)
137

*SGVFSM006221*
- 2 -
Years Ended December 312020 2019 2018
Net Income Attributable to:Equity holders of Parent Company P=5,263,683,512 P=8,686,233,159 P=8,216,002,328Non-controlling interests (4,319,281) 6,376,599 7,962,257
P=5,259,364,231 P=8,692,609,758 P=8,223,964,585
Total Comprehensive Income Attributable to:Equity holders of Parent Company P=4,927,525,781 P=8,757,322,040 P=8,236,615,186Non-controlling interests (4,319,281) 6,376,599 7,962,257
P=4,923,206,500 P=8,763,698,639 P=8,244,577,443
Basic/Diluted Earnings Per Share (Note 28) P=1.01 P=1.67 P=1.62
See accompanying Notes to Consolidated Financial Statements.
138

ROBINSONS LAND CORPORATION AND SUBSIDIARIESCONSOLIDATED STATEMENTS OF CHANGES IN EQUITY
For the Year Ended December 31, 2020Attributable to Equity Holders of the Parent Company
Capital Stock(Note 19)
AdditionalPaid-in Capital
(Note 19)
Other EquityReserve(Note 19)
Remeasurementsof Net Defined
Benefit Liability(Note 29)
CumulativeTranslationAdjustment
Fair valuereserve of
financial assetsat FVOCI
(Notes 8 and 13)
UnappropriatedRetainedEarnings(Note 18)
AppropriatedRetainedEarnings(Note 18) Total
Non-controllingInterest Total Equity
Balances at January 1, 2020 P=5,193,830,685 P=39,041,328,236 P=− (P=943,880) P=41,302,360 P=78,012,917 P=28,155,279,155 P=27,000,000,000 P=99,508,809,473 P=568,861,005 P=100,077,670,478Comprehensive income (loss)
Net income − − − − − − 5,263,683,512 − 5,263,683,512 (4,319,281) 5,259,364,231Other comprehensive income (loss), net of tax − − − (180,141,615) (144,005,903) (12,010,213) − − (336,157,731) − (336,157,731)
Total comprehensive income (loss) − − − (180,141,615) (144,005,903) (12,010,213) 5,263,683,512 − 4,927,525,781 (4,319,281) 4,923,206,500Reversal of appropriation (Note 18) − − − − − − 27,000,000,000 (27,000,000,000) − − –Appropriation (Note 18) − − − − − − (26,000,000,000) 26,000,000,000 − − –Cash dividends (Note 18) − − − − − − (2,596,915,343) − (2,596,915,343) (10,290,000) (2,607,205,343)Stock issue costs (Note 19) − − − − − − (98,000) − (98,000) (42,000) (140,000)Additional investment in a subsidiary (Note 2) − − − − − − − − − 324,500,000 324,500,000Balances at December 31, 2020 P=5,193,830,685 P=39,041,328,236 P=− (P=181,085,495) (P=102,703,543) P=66,002,704 P=31,821,949,324 P=26,000,000,000 P=101,839,321,911 P=878,709,724 P=102,718,031,635
For the Year Ended December 31, 2019Attributable to Equity Holders of the Parent Company
Capital Stock(Note 19)
AdditionalPaid-in Capital
(Note 19)
Other EquityReserve
(Note 19)
Remeasurementsof Net Defined
Benefit Liability(Note 29)
CumulativeTranslationAdjustment
Fair valuereserve of
financial assetsat FVOCI
(Note 8)
UnappropriatedRetainedEarnings(Note 18)
AppropriatedRetainedEarnings(Note 18) Total
Non-controllingInterest Total Equity
Balances at January 1, 2019, as previously reported P=5,193,830,685 P=39,041,328,236 (P=87,597,873) (P=36,195,795) P=74,843,981 P=8,822,352 P=22,315,570,513 P=27,000,000,000 P=93,510,602,099 P=409,114,406 P=93,919,716,505Effect of adoption of PFRS 16, Leases − − − − − − 387,988,699 − 387,988,699 − 387,988,699Balances at January 1, 2019, as restated 5,193,830,685 39,041,328,236 (87,597,873) (36,195,795) 74,843,981 8,822,352 22,703,559,212 27,000,000,000 93,898,590,798 409,114,406 94,307,705,204Comprehensive income (loss)
Net income − − − − − 8,686,233,159 − 8,686,233,159 6,376,599 8,692,609,758Other comprehensive income (loss), net of tax − − − 35,439,937 (33,541,621) 69,190,565 − − 71,088,881 − 71,088,881
Total comprehensive income (loss) − − − 35,439,937 (33,541,621) 69,190,565 8,686,233,159 − 8,757,322,040 6,376,599 8,763,698,639Reversal of appropriation (Note 18) − − − − − − 27,000,000,000 (27,000,000,000) − − –Appropriation (Note 18) − − − − − − (27,000,000,000) 27,000,000,000 − − –Cash dividends (Note 18) − − − − − − (2,596,915,343) − (2,596,915,343) (5,880,000) (2,602,795,343)Property dividend (Notes 2, 18 and 19) − − 87,597,873 (188,022) − − (637,597,873) (550,188,022) − (550,188,022)Incorporation of a subsidiary (Note 2) − − − − − − − − − 159,250,000 159,250,000Balances at December 31, 2019 P=5,193,830,685 P=39,041,328,236 P=− (P=943,880) P=41,302,360 P=78,012,917 P=28,155,279,155 P=27,000,000,000 P=99,508,809,473 P=568,861,005 P=100,077,670,478
139

- 2 -
*SGVFSM006221*
For the Year Ended December 31, 2018Attributable to Equity Holders of the Parent Company
Capital Stock(Note 19)
AdditionalPaid-in Capital
(Note 19)Treasury Stock
(Note 19)
Other EquityReserve
(Note 19)
Remeasurementsof Net Defined
Benefit Liability(Note 29)
CumulativeTranslationAdjustment
Fair valuereserve of
financial assetsat FVOCI
(Note 8)
UnappropriatedRetainedEarnings(Note 18)
AppropriatedRetainedEarnings(Note 18) Total
Non-controllingInterest Total Equity
Balances at January 1, 2018 P=4,111,528,685 P=20,392,532,781 (P=221,834,657) (P=87,597,873) (P=63,719,597) P=75,409,464 P=15,167,813 P=18,469,347,232 P=24,500,000,000 P=67,190,833,848 P=281,277,149 P=67,472,110,997Comprehensive income (loss)
Net income − − − − − − 8,216,002,328 − 8,216,002,328 7,962,257 8,223,964,585Other comprehensive income (loss), netof tax − − − − 27,523,802 (565,483) (6,345,461) − − 20,612,858 − 20,612,858
Total comprehensive income (loss) − − − − 27,523,802 (565,483) (6,345,461) 8,216,002,328 − 8,236,615,186 7,962,257 8,244,577,443Reversal of appropriation (Note 18) − − − − − − − 24,500,000,000 (24,500,000,000) − − –Appropriation (Note 18) − − − − − − − (27,000,000,000) 27,000,000,000 − − –Cash dividends (Note 18) − − − − − − − (1,869,779,047) − (1,869,779,047) − (1,869,779,047)Issuance of capital stock (Note 19) 1,082,302,000 18,648,795,455 221,834,657 − − − − − − 19,952,932,112 − 19,952,932,112Incorporation of a subsidiary (Note 2) − − − − − − − − − − 120,000,000 120,000,000Sale of investment in subsidiary − − − − − − − − − − (125,000) (125,000)Balances at December 31, 2018 P=5,193,830,685 P=39,041,328,236 P=− (P=87,597,873) (P=36,195,795) P=74,843,981 8,822,352 P=22,315,570,513 P=27,000,000,000 P=93,510,602,099 P=409,114,406 P=93,919,716,505
See accompanying Notes to Consolidated Financial Statements.
140

*SGVFSM006221*
ROBINSONS LAND CORPORATION AND SUBSIDIARIESCONSOLIDATED STATEMENTS OF CASH FLOWS
Years Ended December 312020 2019 2018
CASH FLOWS FROM OPERATING ACTIVITIESIncome before income tax P=7,006,264,116 P=11,506,783,763 P=11,243,031,596Adjustments for:
Depreciation (Notes 11, 12, 22 and 24) 5,124,896,951 4,910,281,126 4,456,732,645Interest expense (Notes 16 and 26) 1,429,987,739 907,257,726 836,112,262Provision for impairment losses (Note 23) 180,022,673 − −Interest expense on lease liabilities (Note 32) 147,011,090 145,565,692 −
Accretion expense on security deposits (Notes 15 and 22) 81,719,528 76,293,508 72,906,097Net movement in pension liabilities (Note 29) 47,697,799 62,844,354 27,988,636Amortization of ROU assets (Note 34) 59,801,929 56,264,289 −Gain on sale of property and equipment (Note 12) (995,352) (560,459) (3,361,606)Equity in net earnings (loss) of joint ventures (Note 30) (155,019,617) (68,305,994) 26,148,678Loss on deconsolidation (Note 2) ‒ 12,284,783 −Interest income (Notes 7 and 26) (1,018,455,764) (610,196,621) (1,138,588,624)
Operating income before working capital changes 12,902,931,092 16,998,512,167 15,520,969,684Decrease (increase) in:
Receivables - trade (5,143,795,248) (1,015,408,456) (5,585,120,862) Subdivision land, condominium and residential units for
sale (inclusive of capitalized borrowing cost) (3,010,696,866) (4,487,851,099) (936,663,342)Other current assets (3,391,299,366) 5,696,776,754 (7,413,440,340)
Increase (decrease) in: Accounts payable and accrued expenses and other
noncurrent liabilities 630,835,247 (40,801,337) (1,255,001,726)Customers’ deposits 12,068,023,008 2,887,232,775 13,822,253,016
Cash generated from operations 14,055,997,867 20,038,460,804 14,152,996,430Interest received from installment contract receivables (Note 21) 779,097,282 322,778,964 942,301,995Income tax paid (2,156,571,138) (2,231,008,815) (1,805,290,477)Net cash flows provided by operating activities 12,678,524,011 18,130,230,953 13,290,007,948
CASH FLOWS FROM INVESTING ACTIVITIESInterest received from cash and short-term investments 229,308,899 283,605,870 77,230,423Decrease (increase) in:
Receivables from affiliated companies (Notes 8 and 20) 325,467,476 (1,148,150,529) (184,215,751)Advances to suppliers and contractors (Notes 10 and 13) (68,087,976) (583,995,374) 57,145,969Other noncurrent assets (86,296,063) 30,353,916 86,550,417Advances to lot owners (Notes 10 and 13) (1,795,473,472) (1,808,458,201) (1,603,678,636)
Additions to: Investment properties (inclusive of capitalized
borrowing cost) (Note 11) (10,173,539,392) (9,679,041,704) (11,479,665,291)Property and equipment (Note 12) (980,913,004) (1,788,359,350) (1,965,253,586)Investments in joint ventures (Note 30) (65,720,000) (1,124,368,855) (2,400,000,000)
Proceeds from:Controlling interest in a newly incorporated subsidiary ‒ 159,250,000 120,000,000Additional subscription on a subsidiary 324,500,000 − −Disposal of property and equipment (Note 12) 995,352 560,459 3,361,606Disposal of investment in subsidiary ‒ – 56,079,593
Net cash flows used in investing activities (12,289,758,180) (15,658,603,768) (17,232,445,256)
(Forward)
141

*SGVFSM006221*
- 2 -
Years Ended December 312020 2019 2018
CASH FLOWS FROM FINANCING ACTIVITIES (Note 37)Proceeds from availment of:
Loans payable (Note 168) P=19,190,280,000 P=– P=1,192,801,668 Short-term loans (Note 16) – 8,491,700,000 896,700,000
Stock rights offering (Note 19) – – 20,020,000,000Sale of lease-to-own receivables (Note 8) – – 1,135,920,631
Payments of:Cash dividends (Notes 14 and 18) (2,605,432,058) (2,602,812,061) (1,867,464,936)Loans payable (Note 16) (155,000,000) (1,806,127,328) (396,938,050)Interest on loans (1,175,776,834) (908,519,293) (853,111,456)Interest on lease liabilities (13,381,947) (38,218,003) –
Short-term loans (Note 16) (8,491,700,000) (896,700,000) (15,693,400,000)Principal portion of lease liabilities (Note 34) (105,447,215) (98,488,847) –Stock issuance cost (Note 19) (140,000) – (67,067,888)Debt issue cost (Note 16) (209,317,145) – –
Increase (decrease) in payable to affiliated companies and othernoncurrent liabilities (Notes 15 and 17) 120,969,629 (95,863,957) 43,383,643
Net cash flows provided by financing activities 6,555,054,430 2,044,970,511 4,410,823,612
NET INCREASE IN CASH AND CASH EQUIVALENTS 6,943,820,261 4,516,597,696 468,386,304
CASH AND CASH EQUIVALENTS ATBEGINNING OF YEAR 7,060,438,523 2,543,840,827 2,075,454,523
CASH AND CASH EQUIVALENTS ATEND OF YEAR (Note 7) P=14,004,258,784 P=7,060,438,523 P=2,543,840,827
See accompanying Notes to Consolidated Financial Statements.
142

*SGVFSM006221*
ROBINSONS LAND CORPORATION AND SUBSIDIARIESNOTES TO CONSOLIDATED FINANCIAL STATEMENTS
1. Corporate Information
Robinsons Land Corporation (the Parent Company) is a stock corporation organized and incorporatedon June 4, 1980 under the laws of the Philippines. The Parent Company and its subsidiaries arecollectively referred herein as “the Group”.
The Group is engaged in the business of selling, acquiring, developing, operating, leasing anddisposing of real properties such as land, buildings, lifestyle commercial centers, officedevelopments, industrial facilities, housing projects, hotels and other variants and mixed-usedproperty projects. The Group is 60.97% owned by JG Summit Holdings, Inc. (JGSHI or the UltimateParent Company) and the balance is owned by the public, directors and officers as ofDecember 31, 2020. JGSHI is one of the country’s largest conglomerates, with diverse interests inbranded consumer foods, agro-industrial and commodity food products, petrochemicals, airtransportation and financial services.
The Parent Company’s shares of stock are listed and currently traded at the Philippine StockExchange (PSE).
The Parent Company’s principal executive office is located at Level 2, Galleria Corporate Center,EDSA corner Ortigas Avenue, Quezon City, Metro Manila.
The consolidated financial statements as of December 31, 2020 and 2019 and for the years endedDecember 31, 2020, 2019 and 2018 were authorized for issue by the Parent Company’s Board ofDirectors (BOD) on March 30, 2021.
2. Basis of Preparation
The consolidated financial statements of the Group have been prepared under the historical cost basisexcept for financial assets at fair value through Other Comprehensive Income (FVOCI) that havebeen measured at fair value. The consolidated financial statements are presented in Philippine Peso(P=), the Parent Company’s functional currency. All amounts are rounded to the nearest Peso unlessotherwise indicated.
The consolidated financial statements provide comparative information in respect of the previousperiod and have been prepared under the going concern assumption. The Group is cognizant ofCOVID-19’s potential material impact on its financial performance, the execution of its plans andstrategies, and its customers and employees should the situation persist in the longer-term.Nevertheless, the Group expects to regain its significant foothold in the market it operates in asmovement restrictions ease and as consumer sentiment recovers. Furthermore, despite unprecedentedheadwinds, the Group’s financial position remains stable and strong on the back of its well-balancedand diversified business portfolio.
Statement of ComplianceThe consolidated financial statements have been prepared in accordance with Philippine FinancialReporting Standards (PFRSs) which include the availment of the relief granted by the SEC underMemorandum Circular No. 4-2020 and Memorandum Circular Nos. 14-2018 and 3-2019 for thefollowing implementation issues of PFRS 15 affecting the real estate industry:
143

*SGVFSM006221*
Deferral of the following provisions of Philippine Interpretations Committee (PIC) Q&A 2018-12,PFRS 15 Implementation Issues Affecting the Real Estate Industry
a. Exclusion of land in the determination of percentage of completion (POC) discussed in PIC Q&ANo. 2018-12-E
b. Accounting for significant financing component discussed in PIC Q&A No. 2018-12-Dc. Accounting to Common Usage Service Area (CUSA) Charges discussed in PIC Q&A
No. 2018-12-Hd. Implementation of International Financial Reporting Standards (IFRS) Interpretations Committee
(IFRIC) Agenda Decision on Over Time Transfer of Constructed Goods (Philippine AccountingStandards 23, Borrowing Cost) for Real Estate industry
Deferral of the adoption of PIC Q&A 2018-14: Accounting for Cancellation of Real Estate Sales (asamended by PIC Q&A 2020-05)
In December 2020, the SEC issued MC No. 34-2020, allowing the further deferral of the adoption ofprovisions (a) and (b) above of PIC Q&A 2018-12 and the IFRIC Agenda Decision on BorrowingCost, for another other (three) 3 years or until December 31, 2023.
The details and the impact of the adoption of the above financial reporting reliefs are discussed in theAdoption of New and Amended Accounting Standards and Interpretations section of Note 3.
PFRSs include Philippine Financial Reporting Standards, Philippine Accounting Standards andInterpretations issued by the Philippine Interpretations Committee (PIC).
Basis of ConsolidationThe consolidated financial statements comprise the financial statements of the Group as ofDecember 31, 2020 and 2019 and for each of three years in the period ended December 31, 2020,2019 and 2018.
The consolidated financial statements are prepared for the same reporting period as the ParentCompany, using uniform accounting policies for like transactions and other events in similarcircumstances.
An investee is included in the consolidation at the point when control is achieved. Control isachieved when the Group is exposed, or has rights, to variable returns from its involvement with theinvestee and has the ability to affect those returns through its power over the investee. Specifically,the Group controls an investee if and only if the Group has:
Power over the investee (i.e. existing rights that give it the current ability to direct the relevantactivities of the investee)
Exposure, or rights, to variable returns from its involvement with the investee, and The ability to use its power over the investee to affect its returns
Generally, there is a presumption that a majority of voting rights results in control. To support thispresumption and when the Group has less than a majority of the voting or similar rights of aninvestee, the Group considers all relevant facts and circumstances in assessing whether it has powerover an investee, including:
The contractual arrangement with the other vote holders of the investee Rights arising from other contractual arrangements
144

*SGVFSM006221*
The Group’s voting rights and potential voting rights
The Group re-assesses whether or not it controls an investee if facts and circumstances indicate thatthere are changes to one or more of the three elements of control. Consolidation of a subsidiarybegins when the Group obtains control over the subsidiary and ceases when the Group loses controlof the subsidiary. Assets, liabilities, income and expenses of a subsidiary acquired or disposed ofduring the year are included in the consolidated financial statements from the date the Group gainscontrol until the date the Group ceases to control the subsidiary.
The financial statements of the subsidiaries are prepared for the same reporting period as the ParentCompany, using consistent accounting policies. All intra-group balances, transactions, unrealizedgains and losses resulting from intra-group transactions and dividends are eliminated in full.
Profit or loss and each component of other comprehensive income (OCI) are attributed to the equityholders of the parent of the Group and to the non-controlling interests, even if this results in the non-controlling interests having a deficit balance. When necessary, adjustments are made to the financialstatements of subsidiaries to bring their accounting policies into line with the Group’s accountingpolicies. All intra-group assets and liabilities, equity, income, expenses and cash flows relating totransactions between members of the Group are eliminated in full on consolidation.
Non-controlling interests (NCI) pertain to the equity in a subsidiary not attributable, directly orindirectly to the Parent Company. NCI represent the portion of profit or loss and net assets insubsidiaries not owned by the Group and are presented separately in consolidated statement ofcomprehensive income and consolidated statement of changes in equity and within equity in theconsolidated statement of financial position, separately from equity holders’ of the Parent Company.
Any equity instruments issued by a subsidiary that are not owned by the Parent Company are non-controlling interests, including preferred shares and options under share-based transactions, if any.
A change in the ownership interest of a subsidiary, without a loss of control, is accounted for as anequity transaction.
If the Group loses control over a subsidiary, it:
Derecognizes the assets (including goodwill) and liabilities of the subsidiary, the carrying amountof any non-controlling interest and the cumulative translation differences recorded in equity.
Recognizes the fair value of the consideration received, the fair value of any investment retainedand any surplus or deficit in profit or loss.
Reclassifies the parent’s share of components previously recognized in other comprehensiveincome to profit or loss or retained earnings, as appropriate.
145

*SGVFSM006221*
The consolidated financial statements include the financial statements of the Parent Company and thefollowing subsidiaries as of December 31, 2020, 2019 and 2018:
Country ofIncorporation Effective Percentage of Ownership
2020 2019 2018Robinson’s Inn, Inc. Philippines 100% 100% 100%Robinsons Realty and Management Corporation Philippines 100% 100% 100%Robinsons Properties Marketing &
Management Corp. Philippines 100% 100% 100%Manhattan Buildings and Management
CorporationPhilippines 100% 100% 100%
Robinson’s Land (Cayman), Ltd. Cayman Islands 100% 100% 100%Altus Mall Ventures, Inc. Philippines 100% 100% 100%Bonifacio Property Ventures, Inc. (BPVI) Philippines 100% 100% 100%Bacoor R and F Land Corporation (BRFLC) Philippines 70% 70% 70%Altus Angeles, Inc. (AAI) Philippines 51% 51% 51%GoHotels Davao, Inc. (GDI) Philippines 51% 51% 51%RLC Resources Ltd. (RLCRL) British Virgin Island 100% 100% 100%
Land Century Holdings Ltd. (LCHL) Hong Kong 100% 100% 100%World Century Enterprise Ltd. (WCEL) Hong Kong 100% 100% 100%First Capital Development Ltd. (First Capital) Hong Kong 100% 100% 100%
Chengdu Xin Yao Real EstateDevelopment, Co. Ltd. (Chengdu Xin Yao) China 100% 100% 100%
RLGB Land Corporation (RLGB) Philippines 51% 51% −Altus Property Ventures, Inc. (formerly Altus San
Nicolas Corp.) (APVI)Philippines – – 100%
The functional currency of Robinson’s Land (Cayman), Ltd. and RLCRL is the US Dollar (US$);LCHL, WCEL and First Capital is the Hong Kong Dollar (HKD); and Chengdu Xin Yao is theRenminbi (RMB).
The voting rights held by the Parent Company in the above subsidiaries is equivalent to its ownershipinterest.
On April 20, 2018, the BOD approved the sale of the Parent Company’s 80% share in LingkodPinoy Bus Liner, Inc. (LPBLI) for P=56 million to Gran Cruiser Bus Corp. As a result of the sale,LPBLI ceased as a subsidiary of the Group and deconsolidated as of and for the year endedDecember 31, 2018.
On October 15, 2018, Bacoor R and F Land Corporation (BRFLC) was incorporated, where theParent Company owns 70% of the subscribed capital stock. The primary purpose is to acquire, own,and hold real estate properties situated in Bacoor City, Province of Cavite or any other propertiesapproved by the Board of Directors or stockholders of BRFLC, and to sell, lease, mortgage, alienate,or develop the parcels of land acquired by BRFLC.
On December 21, 2018, Bonifacio Property Ventures, Inc. (BPVI) was incorporated for the primarypurpose to acquire by purchase, lease, donation or otherwise, and to own, use, improve, develop,subdivide, sell, mortgage, exchange, lease, develop and hold for investment or otherwise, real estateof all kinds, whether improve, manage or otherwise dispose of buildings, houses, apartments andother real estate and/or structures of whatever kind, together with their appurtenances. The ParentCompany owns 100% of the subscribed capital stock of BPVI.
146

*SGVFSM006221*
On June 7, 2019, RLGB Land Corporation (RLGB ) was incorporated for the primary purpose toacquire by purchase, lease, donation or otherwise, and to own, use, improve, develop, subdivide, sell,mortgage, exchange, lease, develop and hold for investment or otherwise, real estate of all kinds,whether improve, manage or otherwise dispose of buildings, houses, apartments and other real estateand/or structures of whatever kind, together with their appurtenances. The Parent Company owns51% of the subscribed capital stock of RLGB.
On July 31, 2019, the BOD of the Parent Company approved the declaration, by way of propertydividend of up to One Hundred Million (100,000,000) common shares of Altus Property Ventures,Inc. (APVI) in favor of the registered shareholders (the Receiving Shareholders) of the ParentCompany as of August 15, 2019. The SEC approved the property dividend declaration onNovember 15, 2019 and the Certificate Authorizing Registration was issued by the Bureau of InternalRevenue on December 6, 2019.
The Receiving Shareholders received a ratio of one (1) share of APVI for every fifty-one and9384/10000 (51.9384) shares of the Parent Company, net of applicable final withholding tax. Nofractional shares were issued and no shareholder was entitled to any fractional shares. The fair valueof the APVI shares is P=10.10 per share, based on the Valuation and Fairness Opinion rendered by anindependent advisor.
As a result of the dividend distribution, the Group lost control over APVI. Accordingly, the Groupderecognized the related assets and liabilities of APVI and the remaining interest of 6,106,366 shares,representing 6.11% of total common shares of APVI, with an equivalent fair value of P=61,674,297.This was recognized as financial assets at FVOCI under “Other noncurrent assets” in the consolidatedstatement of financial position. The resultant loss of P=12 million was recognized under “Loss ondeconsolidation” in the 2019 consolidated statement of comprehensive income.
Voting rights held by non-controlling interests on AAI, GDI, BRFLC and RLGB are equivalent to49%, 49%, 30% and 49%, respectively. As of December 31, 2020 and 2019, the Group does notconsider these subsidiaries as having material non-controlling interest that would require additionaldisclosures.
3. Changes in Accounting Policies
The accounting policies adopted are consistent with those of the previous financial year except for theadoption of following new and amended PFRSs which became effective January 1, 2020. The Grouphas not early adopted any standard, interpretation or amendment that has been issued but is not yeteffective.
The nature and impact of each new standard and amendment are described below:
Amendments to PFRS 3, Definition of a Business
The amendments to PFRS 3 clarify the minimum requirements to be a business, remove theassessment of a market participant’s ability to replace missing elements, and narrow thedefinition of outputs. The amendments also add guidance to assess whether an acquired processis substantive and add illustrative examples. An optional fair value concentration test isintroduced which permits a simplified assessment of whether an acquired set of activities andassets is not a business.
147

*SGVFSM006221*
An entity applies those amendments prospectively for annual reporting periods beginning on orafter January 1, 2020, with earlier application permitted.
These amendments may impact future periods should the Group enter into any businesscombinations.
Amendments to PFRS 7, Financial Instruments: Disclosures and PFRS 9, FinancialInstruments, Interest Rate Benchmark Reform
The amendments to PFRS 9 provide a number of reliefs, which apply to all hedging relationshipsthat are directly affected by the interest rate benchmark reform. A hedging relationship isaffected if the reform gives rise to uncertainties about the timing and or amount of benchmark-based cash flows of the hedged item or the hedging instrument.
These amendments do not have a significant impact on the Group.
Amendments to PAS 1, Presentation of Financial Statements, and PAS 8, Accounting Policies,Changes in Accounting Estimates and Errors, Definition of Material
The amendments provide a new definition of material that states “information is material ifomitting, misstating or obscuring it could reasonably be expected to influence decisions that theprimary users of general purpose financial statements make on the basis of those financialstatements, which provide financial information about a specific reporting entity.”
The amendments clarify that materiality will depend on the nature or magnitude of information,either individually or in combination with other information, in the context of the financialstatements. A misstatement of information is material if it could reasonably be expected toinfluence decisions made by the primary users.
These amendments do not have a significant impact on the Group.
Amendments to PFRS 16, COVID 19-related Rent Concessions
The amendments provide relief to lessees from applying the PFRS 16 requirement on leasemodifications to rent concessions arising as a direct consequence of the COVID-19 pandemic. Alessee may elect not to assess whether a rent concession from a lessor is a lease modification if itmeets all of the following criteria:
• The rent concession is a direct consequence of COVID-19;• The change in lease payments results in a revised lease consideration that is substantially the
same as, or less than, the lease consideration immediately preceding the change;• Any reduction in lease payments affects only payments originally due on or before
June 30, 2021; and• There is no substantive change to other terms and conditions of the lease.
A lessee that applies this practical expedient will account for any change in lease paymentsresulting from the COVID-19 related rent concession in the same way it would account for achange that is not a lease modification, i.e., as a variable lease payment.
The amendments are effective for annual reporting periods beginning on or after June 1, 2020.Early adoption is permitted.
148

*SGVFSM006221*
The Group adopted the amendments beginning January 1, 2020. As there are no rent concessionsgranted to the Group as a lessee, these amendments had no impact on the consolidated financialstatements.
The Conceptual Framework for Financial Reporting
The Conceptual Framework is not a standard, and none of the concepts contained therein overridethe concepts or requirements in any standard. The purpose of the Conceptual Framework is toassist the International Accounting Standards Board in developing standards, to help preparersdevelop consistent accounting policies where there is no applicable standard in place and to assistall parties to understand and interpret the standards.
The revised Conceptual Framework includes new concepts, provides updated definitions andrecognition criteria for assets and liabilities and clarifies some important concepts.
This conceptual framework was issued on March 29, 2018 and had no impact on the consolidatedfinancial statements of the Group.
Standards Issued but not yet EffectivePronouncements issued but not yet effective are listed below. Unless otherwise indicated, the Groupdoes not expect that the future adoption of the said pronouncements will have a significant impact onits consolidated financial statements. The Group intends to adopt the following pronouncementswhen they become effective.
Effective beginning on or after January 1, 2021
Amendments to PFRS 9, PFRS 7, PFRS 4 and PFRS 16, Interest Rate Benchmark Reform –Phase 2
The amendments provide the following temporary reliefs which address the financial reportingeffects when an interbank offered rate (IBOR) is replaced with an alternative nearly risk-freeinterest rate (RFR):
• Practical expedient for changes in the basis for determining the contractual cash flows as aresult of IBOR reform
• Relief from discontinuing hedging relationships; and• Relief from the separately identifiable requirement when an RFR instrument is designated as
a hedge of a risk component
The Group shall also disclose information about:
• The nature and extent of risks to which the entity is exposed arising from financialinstruments subject to IBOR reform, and how the entity manages those risks; and
• Their progress in completing the transition to alternative benchmark rates, and how the entityis managing that transition
The amendments are effective for annual reporting periods beginning on or after January 1, 2021and must be applied retrospectively.
149

*SGVFSM006221*
Effective beginning on or after January 1, 2022
Amendments to PFRS 3, Reference to the Conceptual FrameworkThe amendments are intended to replace a reference to the Framework for the Preparation andPresentation of Financial Statements, issued in 1989, with a reference to the ConceptualFramework for Financial Reporting issued in March 2018 without significantly changing itsrequirements. The amendments added an exception to the recognition principle of PFRS 3,Business Combinations to avoid the issue of potential ‘day 2’ gains or losses arising for liabilitiesand contingent liabilities that would be within the scope of PAS 37, Provisions, ContingentLiabilities and Contingent Assets or Philippine-IFRIC 21, Levies, if incurred separately.
At the same time, the amendments add a new paragraph to PFRS 3 to clarify that contingentassets do not qualify for recognition at the acquisition date.
The amendments are effective for annual reporting periods beginning on or after January 1, 2022and must be applied prospectively.
Amendments to PAS 16, Plant and Equipment: Proceeds before Intended Use
The amendments prohibit entities deducting from the cost of an item of property, plant andequipment, any proceeds from selling items produced while bringing that asset to the location andcondition necessary for it to be capable of operating in the manner intended by management.Instead, an entity recognizes the proceeds from selling such items, and the costs of producingthose items, in profit or loss.
The amendment is effective for annual reporting periods beginning on or after January 1, 2022and must be applied retrospectively to items of property, plant and equipment made available foruse on or after the beginning of the earliest period presented when the entity first applies theamendment.
Amendments to PAS 37, Onerous Contracts – Costs of Fulfilling a Contract
The amendments specify which costs an entity needs to include when assessing whether acontract is onerous or loss-making. The amendments apply a “directly related cost approach”.The costs that relate directly to a contract to provide goods or services include both incrementalcosts and an allocation of costs directly related to contract activities. General and administrativecosts do not relate directly to a contract and are excluded unless they are explicitly chargeable tothe counterparty under the contract.
The amendments are effective for annual reporting periods beginning on or after January 1, 2022.The Group will apply these amendments to contracts for which it has not yet fulfilled all itsobligations at the beginning of the annual reporting period in which it first applies theamendments.
Annual Improvements to PFRSs 2018-2020 Cycle
o Amendments to PFRS 1, First-time Adoption of Philippines Financial Reporting Standards,Subsidiary as a first-time adopter
The amendment permits a subsidiary that elects to apply paragraph D16(a) of PFRS 1 tomeasure cumulative translation differences using the amounts reported by the parent, based
150

*SGVFSM006221*
on the parent’s date of transition to PFRS. This amendment is also applied to an associate orjoint venture that elects to apply paragraph D16(a) of PFRS 1.
The amendment is effective for annual reporting periods beginning on or after January 1,2022 with earlier adoption permitted.
o Amendments to PFRS 9, Financial Instruments, Fees in the ’10 per cent’ test forderecognition of financial liabilities
The amendment clarifies the fees that an entity includes when assessing whether the terms ofa new or modified financial liability are substantially different from the terms of the originalfinancial liability. These fees include only those paid or received between the borrower andthe lender, including fees paid or received by either the borrower or lender on the other’sbehalf. An entity applies the amendment to financial liabilities that are modified orexchanged on or after the beginning of the annual reporting period in which the entity firstapplies the amendment.
The amendment is effective for annual reporting periods beginning on or after January 1,2022 with earlier adoption permitted. The Group will apply the amendments to financialliabilities that are modified or exchanged on or after the beginning of the annual reportingperiod in which the entity first applies the amendment.
o Amendments to PAS 41, Agriculture, Taxation in fair value measurements
The amendment removes the requirement in paragraph 22 of PAS 41 that entities excludecash flows for taxation when measuring the fair value of assets within the scope of PAS 41.
An entity applies the amendment prospectively to fair value measurements on or after thebeginning of the first annual reporting period beginning on or after January 1, 2022 withearlier adoption permitted.
Effective beginning on or after January 1, 2023
Amendments to PAS 1, Classification of Liabilities as Current or Non-currentThe amendments clarify paragraphs 69 to 76 of PAS 1, Presentation of Financial Statements, tospecify the requirements for classifying liabilities as current or non-current. The amendmentsclarify:
• What is meant by a right to defer settlement• That a right to defer must exist at the end of the reporting period• That classification is unaffected by the likelihood that an entity will exercise its deferral right;
and• That only if an embedded derivative in a convertible liability is itself an equity instrument
would the terms of a liability not impact its classification
The amendments are effective for annual reporting periods beginning on or after January 1, 2023and must be applied retrospectively.
151

*SGVFSM006221*
PFRS 17, Insurance Contracts
PFRS 17 is a comprehensive new accounting standard for insurance contracts coveringrecognition and measurement, presentation and disclosure. Once effective, PFRS 17 will replacePFRS 4, Insurance Contracts. This new standard on insurance contracts applies to all types ofinsurance contracts (i.e., life, non-life, direct insurance and re-insurance), regardless of the type ofentities that issue them, as well as to certain guarantees and financial instruments withdiscretionary participation features. A few scope exceptions will apply.
The overall objective of PFRS 17 is to provide an accounting model for insurance contracts thatis more useful and consistent for insurers. In contrast to the requirements in PFRS 4, which arelargely based on grandfathering previous local accounting policies, PFRS 17 provides acomprehensive model for insurance contracts, covering all relevant accounting aspects. The coreof PFRS 17 is the general model, supplemented by:
• A specific adaptation for contracts with direct participation features (the variable feeapproach)
• A simplified approach (the premium allocation approach) mainly for short-duration contracts.
PFRS 17 is effective for reporting periods beginning on or after January 1, 2021, withcomparative figures required. Early application is permitted.
The new standard is not applicable to the Group since none of the entities within the Group haveactivities that are predominantly connected with insurance or issue insurance contracts.
Deferred effectivity
Amendments to PFRS 10, Consolidated Financial Statements, and PAS 28, Sale or Contributionof Assets between an Investor and its Associate or Joint Venture
The amendments address the conflict between PFRS 10 and PAS 28 in dealing with the loss ofcontrol of a subsidiary that is sold or contributed to an associate or joint venture. Theamendments clarify that a full gain or loss is recognized when a transfer to an associate or jointventure involves a business as defined in PFRS 3. Any gain or loss resulting from the sale orcontribution of assets that does not constitute a business, however, is recognized only to theextent of unrelated investors’ interests in the associate or joint venture.
On January 13, 2016, the Financial Reporting Standards Council deferred the original effectivedate of January 1, 2016 of the said amendments until the International Accounting StandardsBoard (IASB) completes its broader review of the research project on equity accounting that mayresult in the simplification of accounting for such transactions and of other aspects of accountingfor associates and joint ventures.
Deferment of Implementation of IFRIC Agenda Decision on Over Time Transfer of ConstructedGoods (IAS 23, Borrowing Cost) for the Real Estate Industry
In March 2019, IFRIC published an Agenda Decision on whether borrowing costs can becapitalized on real estate inventories that are under construction and for which the related revenueis/will be recognized over time under par. 35(c) of IFRS 15. IFRIC concluded that borrowingcosts cannot be capitalized for such real estate inventories as they do not meet the definition of a
152

*SGVFSM006221*
qualifying asset under IAS 23 considering that these inventories are ready for their intended salein their current condition.
The IFRIC agenda decision would change the Group’s current practice of capitalizing borrowingcosts on real estate projects with pre-selling activities.
On February 11, 2020, the Philippine SEC issued Memorandum Circular No. 4, Series of 2020,providing relief to the Real Estate Industry by deferring the mandatory implementation of theabove IFRIC Agenda Decision until December 31, 2020. Effective January 1, 2021, the RealEstate Industry will adopt the IFRIC agenda decision and any subsequent amendments theretoretrospectively or as the SEC will later prescribe. A real estate company may opt not to avail ofthe deferral and instead comply in full with the requirements of the IFRIC agenda decision.
For real estate companies that avail of the deferral, the SEC requires disclosure in the Notes to theFinancial Statements of the accounting policies applied, a discussion of the deferral of the subjectimplementation issues, and a qualitative discussion of the impact in the financial statements hadthe IFRIC agenda decision been adopted.
The Group opted to avail of the relief as provided by the SEC. Had the Group adopted the IFRICagenda decision, borrowing costs capitalized to real estate inventories related to projects with pre-selling activities should have been expensed out in the period incurred.
This adjustment should have been applied retrospectively and would have resulted to restatementof prior year financial statements. A restatement would have impacted interest expense, cost ofreal estate sales, provision for deferred income tax, subdivision land, condominium andresidential units for sale, deferred tax liability and opening balance of retained earnings.
Deferral of Certain Provisions of PIC Q&A 2018-12, PFRS 15 Implementation Issues Affectingthe Real Estate Industry (as amended by PIC Q&As 2020-02 and 2020-04)
On February 14, 2018, the PIC issued PIC Q&A 2018-12 which provides guidance on somePFRS 15 implementation issues affecting the real estate industry. On October 25, 2018 andFebruary 08, 2019, the Philippine Securities and Exchange Commission (SEC) issued SEC MCNo. 14-2018 and SEC MC No. 3-2019, respectively, providing relief to the real estate industry bydeferring the application of certain provisions of this PIC Q&A for a period of three years untilDecember 31, 2020. On December 15, 2020, the Philippine SEC issued SEC MC No. 34-2020which further extended the deferral of certain provisions of this PIC Q&A until December 31,2023. A summary of the PIC Q&A provisions covered by the SEC deferral and the relateddeferral period follows:
Deferral Perioda. Assessing if the transaction price includes a significant financing
component as discussed in PIC Q&A 2018-12-D (as amended by PICQ&A 2020-04)
Until December 31, 2023
b. Treatment of land in the determination of the POC discussed in PIC Q&A2018-12-E
Until December 31, 2023
c. Treatment of uninstalled materials in the determination of the POCdiscussed in PIC Q&A 2018-12-E (as amended by PIC Q&A 2020-02)
Until December 31, 2020
d. Accounting for CUSA Charges discussed in PIC Q&A No. 2018-12-H Until December 31, 2020
153

*SGVFSM006221*
The SEC Memorandum Circulars also provided the mandatory disclosure requirements should anentity decide to avail of any relief. Disclosures should include:
a. The accounting policies applied.b. Discussion of the deferral of the subject implementation issues in the PIC Q&A.c. Qualitative discussion of the impact on the financial statements had the concerned application
guidelines in the PIC Q&A been adopted.d. Should any of the deferral options result into a change in accounting policy (e.g., when an
entity excludes land and/or uninstalled materials in the POC calculation under the previousstandard but opted to include such components under the relief provided by the circular),such accounting change will have to be accounted for under PAS 8, i.e., retrospectively,together with the corresponding required quantitative disclosures.
In November 2020, the PIC issued the following Q&As which provide additional guidance on thereal estate industry issues covered by the above SEC deferrals:
• PIC Q&A 2020-04, which provides additional guidance on determining whether thetransaction price includes a significant financing component
• PIC Q&A 2020-02, which provides additional guidance on determining which uninstalledmaterials should not be included in calculating the POC
After the deferral period, real estate companies would have to adopt PIC Q&A No. 2018-12 andany subsequent amendments thereto retrospectively or as the SEC will later prescribe.
The Group is already compliant with PIC Q&A 2018-12-E as it normally excludes land in thedetermination of the POC.
On the other hand, the Group has adopted PIC Q&A 2020-02 and has included the uninstalledcustomized materials in the measurement of progress. This is consistent with the Group’s policy.
The Group availed of the SEC reliefs to defer certain specific provisions of PIC Q&ANo. 2018-12. Had these provisions been adopted, the Group assessed that the impact would havebeen as follows:
a. The mismatch between the POC of the real estate projects and right to an amount ofconsideration based on the schedule of payments provided for in the contract to sell mightconstitute a significant financing component. In case of the presence of significant financingcomponent, the guidance should have been applied retrospectively and would have resulted inrestatement of prior year financial statements. Adoption of this guidance would haveimpacted interest income, interest expense, revenue from real estate sales, installmentcontract receivables, provision for deferred income tax, deferred tax asset or liability for allyears presented, and the opening balance of retained earnings. The Group has yet to assess ifthe mismatch constitutes a significant financing component for its contracts to sell.
b. Had the Group accounted for the revenue from air-conditioning services, CUSA and handlingservices as principal, this would have resulted in the gross presentation of the related revenue,costs and expenses. The Group opts to use alternative presentation of CUSA as other incomeas the gross amount of revenue and related costs and expenses are not individually material.There is no impact on opening retained earnings, income and expense and the related balancesheet accounts.
154

*SGVFSM006221*
The above would have impacted the cash flows from operating activities for all years presented.
As prescribed by SEC MC No. 34-2020, for financial reporting periods beginning on or afterJanuary 1, 2021, the availment of the above deferral will impact the Group’s financial reportingduring the period of deferral as follows:
a. The consolidated financial statements are not considered to be in accordance with PFRSs andshould specify in the “Basis of Preparation of the Consolidated Financial Statements”section of the consolidated financial statements that the accounting framework is:
PFRSs, as modified by the application of the following financial reporting reliefs issued andapproved by the Securities and Exchange Commission in response to the COVID-19pandemic:
1) Assessing if the transaction price includes a significant financing component (asamended by PIC Q&A 2020-04)
b. The Auditor’s report will:
i. reflect in the Opinion paragraph that the consolidated financial statements are prepared inaccordance with the compliance framework described in the notes to the consolidatedfinancial statements; and
ii. include an Emphasis of Matter paragraph to draw attention to the basis of accounting thathas been used in the preparation of the consolidated financial statements.
Upon full adoption of the above deferred guidance, the accounting policies will have to beapplied using full retrospective approach following the guidance under PAS 8, AccountingPolicies, Changes in Accounting Estimates and Errors.
Deferral of PIC Q&A 2018-14, Accounting for Cancellation of Real Estate Sales (as amended byPIC Q&A 2020-05)
On June 27, 2018, PIC Q&A 2018-14 was issued providing guidance on accounting forcancellation of real estate sales. Under SEC MC No. 3-2019, the adoption of PIC Q&ANo. 2018-14 was deferred until December 31, 2020. After the deferral period, real estatecompanies will adopt PIC Q&A No. 2018-14 and any subsequent amendments theretoretrospectively or as the SEC will later prescribe.
On November 11, 2020, PIC Q&A 2020-05 was issued which supersedes PIC Q&A 2018-14.This PIC Q&A adds a new approach where the cancellation is accounted for as a modification ofthe contract (i.e., from non-cancellable to being cancellable). Under this approach, revenues andrelated costs previously recognized shall be reversed in the period of cancellation and theinventory shall be reinstated at cost. PIC Q&A 2020-05 will have to be applied prospectivelyfrom approval date of the Financial Reporting Standards Council which was November 11, 2020.
The Group availed of the SEC relief to defer of adoption of this PIC Q&A until December 31,2020. Currently, the Group records the repossessed inventory at cost. The Group is stillevaluating the approach to be availed among the existing options. Had the relief not beenadopted and the current practice would be different from the approach to be implemented, thiscould have impacted the recording of revenue from real estate sales, cost of real estate sales,valuation of repossessed inventory and gain or loss from repossession in 2020.
155

*SGVFSM006221*
4. Summary of Significant Accounting Policies
Revenue and Cost RecognitionRevenue Recognition
Revenue from Contract with CustomersThe Group primarily derives its real estate revenue from the sale of vertical and horizontal real estateprojects. Revenue from contracts with customers is recognized when control of the goods or servicesare transferred to the customer at an amount that reflects the consideration to which the Groupexpects to be entitled in exchange for those goods or services. Except for the provisioning of water,electricity, and common use service area in its leasing portfolio wherein it is acting as agent, theGroup has generally concluded that it is the principal in its revenue arrangements.
The disclosures of significant accounting judgments, estimates and assumptions relating to revenuefrom contracts with customers are provided in Note 21.
The following specific recognition criteria must also be met before revenue is recognized:
Real estate sales – Philippines Operations – Performance obligation is satisfied over timeThe Group derives its real estate revenue from sale of lots, house and lot and condominium units.Revenue from the sale of these real estate projects under pre-completion stage are recognized overtime during the construction period (or percentage of completion) since based on the terms andconditions of its contract with the buyers, the Group’s performance does not create an asset with analternative use and the Group has an enforceable right to payment for performance completed to date.
In measuring the progress of its performance obligation over time, the Group uses input method.Input methods recognize revenue on the basis of the entity’s efforts or inputs to the satisfaction of aperformance obligation. Progress is measured based on actual resources consumed such as materials,labor hours expended and actual overhead incurred relative to the total expected inputs to thesatisfaction of that performance obligation, or the total estimated development costs of the real estateproject. The Group uses the cost accumulated by the accounting department to determine the actualresources used. Input method exclude the effects of any inputs that do not depict the entity’sperformance in transferring control of goods or services to the customer.
Estimated development costs of the real estate project include costs of land, land development,building costs, professional fees, depreciation of equipment directly used in the construction,payments for permits and licenses. Revisions in estimated development costs brought about byincreases in projected costs in excess of the original budgeted amounts, form part of total projectcosts on a prospective basis.
Any excess of collections over the total of recognized trade receivables and installment contractreceivables is included in the “contract liabilities” account in the liabilities section of the consolidatedstatement of financial position.
The impact of the significant financing component on the transaction price has not been consideredsince the Group availed the relief granted by the SEC under Memorandum Circular Nos. 14-2018 asof 2018 for the implementation issues of PFRS 15 affecting the real estate industry. Under the SECMemorandum Circular No. 34, the relief has been extended until December 31, 2023.
156

*SGVFSM006221*
Real estate sales – Philippines Operations – Performance obligation is satisfied at a point in timeThe Group also derives real estate revenue from sale of parcels of raw land and developed land.Revenue from the sale of these parcels of raw land are recognized at a point in time (i.e., upontransfer of control to the buyer) since based on the terms and conditions of its contract with thebuyers, the Group’s performance does not create an asset with an alternative use but the Group doesnot have an enforceable right to payment for performance completed to date. The Group is onlyentitled to payment upon delivery of the land to the buyer and if the contract is terminated, the Grouphas to return all payments made by the buyer.
Real estate sales – China OperationsTaking into account the contract terms per house purchase and sales contract, Chengdu Xin Yao’sbusiness practice and, the legal and regulatory environment in China, most of the property salescontracts in China do not meet the criteria for recognizing revenue over time and therefore, revenuefrom property sales continues to be recognized at a point in time. For some properties where there isno alternative use to the Group due to contractual reasons and the Group has an enforceable right topayment from customer for performance completed to date, the revenue is recognized over time underthe percentage-of-completions Under PFRS 15, revenue from property sales is generally recognizedwhen the property is accepted by the customer, or deemed as accepted according to the contract,whichever is earlier, which is the point in time when the customer has the ability to direct the use ofthe property and obtain substantially all of the remaining benefits of the property.
Rental incomeThe Group leases its commercial real estate properties to others through operating leases. Rentalincome on leased properties is recognized on a straight-line basis over the lease term and may includecontingent rents based on a certain percentage of the gross revenue of the tenants, as provided underthe terms of the lease contract. Contingent rents are recognized as revenue in the period in whichthey are earned.
Rental income is not recognized when the Group waives its right to collect rent and other chargesunder a lease concession. This is recognized as a rent concession and reported as a variable paymentin the consolidated statement of comprehensive income (see Note 21).
Marketing fees and management feesMarketing fees and management fees from administration and property management are recognizedas revenue when the related services are rendered.
Amusement incomeRevenue is recognized upon rendering of services or at a point in time.
Revenue from hotel operationsRevenue from hotel operations is recognized as services are rendered or over time, and when foodand beverage are served. Revenue from banquets and other special events are recognized as theevents take place or over time. Rental income on leased areas of the hotel is recognized on a straight-line basis over the lease term. Revenue from food and beverage are recognized when these areserved. Other income from transport, laundry, valet and other related hotel services are recognizedwhen services are rendered.
Interest incomeInterest income is recognized as the interest accrues using the effective interest rate (EIR) method.
157

*SGVFSM006221*
Dividend incomeDividend income is recognized when the Group’s right to receive the payment is established.
Other incomeOther income is recognized when earned.
Costs RecognitionCost Recognition
Cost of Real Estate SalesThe Group recognizes costs relating to satisfied performance obligations as these are incurred takinginto consideration the contract fulfillment assets such as land and connection fees. These includecosts of land, land development costs, building costs, professional fees, depreciation, permits andlicenses and capitalized borrowing costs.
These costs are allocated to the saleable area, with the portion allocable to the sold area beingrecognized as costs of sales while the portion allocable to the unsold area being recognized as part ofreal estate inventories.
Contract costs include all direct materials and labor costs and those indirect costs related to contractperformance. Expected losses on contracts are recognized immediately when it is probable that thetotal contract costs will exceed total contract revenue. Changes in contract performance, contractconditions and estimated profitability, including those arising from contract penalty provisions, andfinal contract settlements which may result in revisions to estimated costs and gross margins arerecognized in the year in which the changes are determined.
Contract liabilitiesA contract liability is the obligation to transfer goods or services to a customer for which the Grouphas received consideration (or an amount of consideration is due) from the customer. If a customerpays consideration before the Group transfers goods or services to the customer, a contract liability isrecognized when the payment is made or the payment is due (whichever is earlier). Contractliabilities are recognized as revenue when the Group performs under the contract.
The contract liabilities also include payments received by the Group from the customers for whichrevenue recognition has not yet commenced.
Marketing fees and management feesMarketing fees and management fees from administration and property management are recognizedas expense when services are incurred.
Costs to obtain contractThe incremental costs of obtaining a contract with a customer are recognized as an asset if the Groupexpects to recover them. The Group has determined that commissions paid to brokers and marketingagents on the sale of pre-completed real estate units are deferred when recovery is reasonablyexpected and are charged to expense in the period in which the related revenue is recognized asearned. Commission expense is included in the “Cost of real estate sales” account in the consolidatedstatement of income.
Costs incurred prior to obtaining contract with customer are not capitalized but are expensed asincurred.
158

*SGVFSM006221*
Cost of hotel operations (part of cost of real estate sales in the consolidated statement of income)Cost of hotel operations pertains to expenses incurred in relation to sale of goods and rendering ofservices. These are recognized when a decrease in future economic benefits related to a decrease inan asset or an increase of a liability has arisen than can be measured reliably. These are recognizedwhen incurred and measured at the amount paid or payable.
Contract fulfillment assetsContract fulfillment costs are divided into: (i) costs that give rise to an asset; and (ii) costs that areexpensed as incurred. When determining the appropriate accounting treatment for such costs, theGroup firstly considers any other applicable standards. If those standards preclude capitalization of aparticular cost, then an asset is not recognized under PFRS 15.
If other standards are not applicable to contract fulfillment costs, the Group applies the followingcriteria which, if met, result in capitalization: (i) the costs directly relate to a contract or to aspecifically identifiable anticipated contract; (ii) the costs generate or enhance resources of the entitythat will be used in satisfying (or in continuing to satisfy) performance obligations in the future; and(iii) the costs are expected to be recovered. The assessment of this criteria requires the application ofjudgment, in particular when considering if costs generate or enhance resources to be used to satisfyfuture performance obligations and whether costs are expected to be recoverable.
The Group’s contract fulfillment assets pertain to connection fees and land acquisition costs.
Amortization, de-recognition and impairment of capitalized costs to obtain a contractFollowing the pattern of real estate revenue recognition, the Group amortizes capitalized costs toobtain a contract to cost of sales over the expected construction period using percentage ofcompletion. The amortization is included within general and administrative expenses.
A capitalized cost to obtain a contract is derecognized either when it is disposed of or when no furthereconomic benefits are expected to flow from its use or disposal.
At each reporting date, the Group determines whether there is an indication that cost to obtain acontract maybe impaired. If such indication exists, the Group makes an estimate by comparing thecarrying amount of the assets to the remaining amount of consideration that the Group expects toreceive less the costs that relate to providing services under the relevant contract. In determining theestimated amount of consideration, the Group uses the same principles as it does to determine thecontract transaction price, except that any constraints used to reduce the transaction price will beremoved for the impairment test.
Where the relevant costs or specific performance obligations are demonstrating marginal profitabilityor other indicators of impairment, judgment is required in ascertaining whether or not the futureeconomic benefits from these contracts are sufficient to recover these assets. In performing thisimpairment assessment, management is required to make an assessment of the costs to complete thecontract. The ability to accurately forecast such costs involves estimates around cost savings to beachieved over time, anticipated profitability of the contract, as well as future performance against anycontract-specific performance indicators that could trigger variable consideration, or service credits.Where a contract is anticipated to make a loss, these judgments are also relevant in determiningwhether or not an onerous contract provision is required and how this is to be measured.
159

*SGVFSM006221*
Costs and General and Administrative ExpenseCosts and expenses are recognized in the consolidated statement of comprehensive income whendecrease in future economic benefit related to a decrease in an asset or an increase in a liability hasarisen that can be measured reliably.
Costs and expenses are recognized in the consolidated statement of comprehensive income:
On the basis of a direct association between the costs incurred and the earning of specific items ofincome;
On the basis of systematic and rational allocation procedures when economic benefits areexpected to arise over several accounting periods and the association can only be broadly orindirectly determined; or
Immediately when expenditure produces no future economic benefits or when, and to the extentthat, future economic benefits do not qualify or cease to qualify, for recognition in theconsolidated statement of financial position as an asset.
Direct operating expenses and general and administrative expenses are recognized as they areincurred.
Borrowing CostsBorrowing costs directly attributable to the acquisition, construction, or production of an asset thatnecessarily takes a substantial period of time to get ready for its intended use or sale, are capitalizedas part of the cost of the asset. All other borrowing costs are expensed in the period in which theyoccur. Borrowing costs consist of interest and other costs that an entity incurs in connection with theborrowing of funds.
Interest and other financing costs incurred during the construction period on borrowings used tofinance property development are capitalized as part of development costs (included in “Subdivisionland, condominium and residential units for sale”, “Property and equipment” and “Investmentproperties” accounts in the Group’s consolidated statement of financial position). Capitalization ofborrowing costs commences when the activities to prepare the asset are in progress and expendituresand borrowing costs are being incurred. Capitalization of borrowing costs ceases when substantiallyall the activities necessary to prepare the asset for its intended use or sale are complete. If thecarrying amount of the asset exceeds its recoverable amount, an impairment loss is recorded.
Capitalized borrowing cost is based on applicable weighted average borrowing rate for those comingfrom general borrowings.
All other borrowing costs are expensed in the period they occur and is recorded under “Interestexpense.”
Debt Issue CostsTransaction costs incurred in connection with the availment of long-term debt are deferred andamortized using effective interest method over the term of the related loans.
ReclassificationsIn September 2019, the Philippine Interpretations Committee (PIC) issued a letter to the variousorganizations in the real estate industry to clarify certain issues in relation to the PFRS 15Implementation Issues and other accounting issues affecting real estate industry. The letter includesthe clarification on the conclusion of PIC Q&A 2018-12D Step 3 on the recording of contract assetfor the difference between the consideration received from the customer and the transferred goods or
160

*SGVFSM006221*
services to a customer. In the letter, the PIC allows for the meantime, the recording of the differencebetween the consideration received from the customer and the transferred goods or services to acustomer as either a contract asset or unbilled receivable. If presented as contract asset, thedisclosures required under PFRS 15 should be complied with. Otherwise, the disclosures requiredunder PFRS 9 should be followed.
As a result, the Group elected to record in 2020 the difference between the consideration receivedfrom the customer and the transferred goods or services to a customer as installment contractreceivables which differs from the 2019 presentation where the difference was recognized as acontract asset.
Accordingly, the affected assets and liabilities accounts as of December 31, 2019 have beenreclassified to conform with the 2019 presentation of accounts. Details follow:
December 31,2019,
as previouslyreported Reclassification
December 31,2019,
as adjustedCurrent assets
Receivables (Note 8) P=3,146,968,482 P=3,007,038,670 P=6,154,007,152Contract assets 3,007,038,670 (3,007,038,670) ‒
Noncurrent assetsNoncurrent receivables (Note 8) 3,677,362,062 7,843,135,383 11,520,497,445Noncurrent contract assets 7,843,135,383 (7,843,135,383) ‒
P=17,674,504,597 P=‒ P=17,674,504,597
The reclassification did not impact the consolidated statement of cash flows for the year endedDecember 31, 2019.
LeasesThe Group assesses whether a contract is, or contains a lease, at the inception of a contract. Thisassessment involves the exercise of judgment about whether it depends on a specified asset, whetherthe Group obtains substantially all the economic benefits from the use of the asset, whether the Grouphas the right to direct the use of the asset.
Group as LesseeExcept for short-term leases and leases of low-value assets, the Group recognizes a right-of-use(ROU) asset and a corresponding lease liability with respect to all lease agreements in which it is thelessee.
Right-of-use assetsThe Group recognizes ROU assets at the commencement date of the lease (i.e., the date theunderlying asset is available for use). ROU assets are measured at cost, less any accumulateddepreciation and impairment losses, and adjusted for any remeasurement of lease liabilities. The costof ROU assets includes the amount of lease liabilities recognized, initial direct costs incurred, leasepayments made at or before the commencement date less any lease incentives received, and anyestimated costs to be incurred in dismantling and removing the underlying asset, restoring the site onwhich it is located or restoring the underlying asset to the condition required by the terms andconditions of the lease, unless those costs are incurred to produce inventories. Unless the Group isreasonably certain to obtain ownership of the leased asset at the end of the lease term, the recognizedROU assets are depreciated on a straight-line basis over the shorter of its estimated useful life and theremaining lease term of up to approximately 34 years.
161

*SGVFSM006221*
ROU assets are subject to impairment. Refer to the accounting policies in Impairment of nonfinancialassets section.
Lease liabilitiesAt the commencement date of the lease, the Group recognizes lease liabilities measured at the presentvalue of lease payments to be made over the lease term. The lease payments include fixed payments(including in-substance fixed payments) less any lease incentives receivable, variable lease paymentsthat depend on an index or a rate, and amounts expected to be paid under residual value guarantees.The lease payments also include the exercise price of a purchase option reasonably certain to beexercised by the Group and payments of penalties for terminating a lease, if the lease term reflectedthe Group exercising the option to terminate. The variable lease payments that do not depend on anindex or a rate are recognized as expense in the period on which the event or condition that triggersthe payment occurs.
In calculating the present value of lease payments, the Group uses the incremental borrowing rate atthe commencement date if the interest rate implicit to the lease is not readily determinable. After thecommencement date, the amount of lease liabilities is increased to reflect the accretion of interest andreduced for the lease payments made. In addition, the carrying amount of lease liabilities isremeasured if there is a modification, a change in the lease term, a change in the in-substance fixedlease payments or a change in the assessment to purchase the underlying asset.
Short-term leasesThe Group applies the short-term lease recognition exemption to its short-term leases of office space(i.e., those leases that have a lease term of 12 months or less from the commencement date and do notcontain a purchase option). Lease payments on short-term leases are recognized as expense on astraight-line basis over the lease term.
Group as LessorLeases where the Group does not transfer substantially all the risks and benefits of ownership of theassets are classified as operating leases. Lease payments received are recognized as income in theconsolidated statement of comprehensive income on a straight-line basis over the lease term. Initialdirect costs incurred in negotiating operating leases are added to the carrying amount of the leasedasset and recognized over the lease term on the same basis as the rental income. Contingent rents arerecognized as revenue in the period in which they are earned.
Leases where the Group transfers substantially all the risk and benefits of ownership of the assets areclassified as finance leases. The Group recognizes assets held under a finance lease in itsconsolidated statement of financial position as a receivable at an amount equal to the net investmentin the lease. The lease payments received from the lessee are treated as repayments of principal andfinance income. Initial direct costs may include commissions, legal fees and internal costs that areincremental and directly attributable to negotiating and arranging the lease. They are included in themeasurement of the net investment in the lease at inception and reflected in the calculation of theimplicit interest rate. The recognition of finance income should be based on a pattern reflecting aconstant periodic rate of return on the lessor's net investment outstanding in respect of the financelease.
Fair Value MeasurementFair value is the price that would be received to sell an asset or paid to transfer a liability in an orderlytransaction between market participants at the measurement date.
162

*SGVFSM006221*
The fair value measurement is based on the presumption that the transaction to sell the asset ortransfer the liability takes place either:
In the principal market for the asset or liability, or In the absence of a principal market, in the most advantageous market for the asset or liability.
The principal or the most advantageous market must be accessible to the Group.
The fair value of an asset or a liability is measured using the assumptions that market participantswould use when pricing the asset or liability, assuming that market participants act in their economicbest interest.
A fair value measurement of a non-financial asset takes into account a market participant's ability togenerate economic benefits by using the asset in its highest and best use or by selling it to anothermarket participant that would use the asset in its highest and best use.
The Group uses valuation techniques that are appropriate in the circumstances and for whichsufficient data are available to measure fair value, maximizing the use of relevant observable inputsand minimizing the use of unobservable inputs.
All assets and liabilities for which fair value is measured or disclosed in the consolidated financialstatements are categorized within the fair value hierarchy, described as follows, based on the lowestlevel input that is significant to the fair value measurement as a whole:
Level 1 - Quoted (unadjusted) market prices in active markets for identical assets or liabilities Level 2 - Valuation techniques for which the lowest level input that is significant to the fair value
measurement is directly or indirectly observable Level 3 - Valuation techniques for which the lowest level input that is significant to the fair value
measurement is unobservable
For assets and liabilities that are recognized in the consolidated financial statements at fair value on arecurring basis, the Group determines whether transfers have occurred between levels in the hierarchyby re-assessing categorization (based on the lowest level input that is significant to the fair valuemeasurement as a whole) at the end of each reporting period.
External valuers are involved for valuation of significant assets, such as investment properties.Involvement of external valuers is decided upon annually by the Group. Selection criteria includemarket knowledge, reputation, independence and whether professional standards are maintained.
The Group, in conjunction with the external valuers, also compares each of the changes in the fairvalue of each asset with relevant external sources to determine whether the change is reasonable.
For the purpose of fair value disclosures, the Group has determined classes of assets on the basis ofthe nature, characteristics and risks of the asset and the level of the fair value hierarchy as explainedabove.
163

*SGVFSM006221*
Current and Noncurrent ClassificationThe Group presents assets and liabilities in consolidated statement of financial position based oncurrent/noncurrent classification. An asset is current when:
Expected to be realized or intended to be sold or consumed in normal operating cycle; Held primarily for the purpose of trading; Expected to be realized within 12 months after reporting date; or Cash or cash equivalent unless restricted from being exchanged or used to settle a liability for at
least 12 months after reporting date.
All other assets are classified as noncurrent.
A liability is current when:
It is expected to be settled in the normal operating cycle; It is held primarily for the purpose of trading; It is due to be settled within 12 months after reporting date; or There is no unconditional right to defer the settlement of the liability for at least 12 months after
reporting date.
The Group classifies all other liabilities as noncurrent.
Deferred tax assets and liabilities are classified as noncurrent assets and liabilities, respectively.
Financial Instruments - Initial Recognition and Subsequent RecognitionInitial recognition and measurementFinancial assets are classified, at initial recognition, as subsequently measured at amortized cost, fairvalue through other comprehensive income (OCI), and fair value through profit or loss.
The classification of financial assets at initial recognition depends on the financial asset’s contractualcash flow characteristics and the Group’s business model for managing them. With the exception oftrade receivables that do not contain a significant financing component or for which the Group hasapplied the practical expedient, the Group initially measures a financial asset at its fair value plus, inthe case of a financial asset not at fair value through profit or loss, transaction costs. Tradereceivables that do not contain a significant financing component or for which the Group has appliedthe practical expedient are measured at the transaction price determined under PFRS 15. Refer to theaccounting policies in section “Revenue from contracts with customers”.
In order for a financial asset to be classified and measured at amortized cost or fair value throughOCI, it needs to give rise to cash flows that are “solely payments of principal and interest (SPPI)” onthe principal amount outstanding. This assessment is referred to as the SPPI test and is performed atan instrument level.
The Group’s business model for managing financial assets refers to how it manages its financialassets in order to generate cash flows. The business model determines whether cash flows will resultfrom collecting contractual cash flows, selling the financial assets, or both.
Purchases or sales of financial assets that require delivery of assets within a time frame established byregulation or convention in the market-place (regular way trades) are recognized on the trade date,i.e., the date that the Group commits to purchase or sell the asset.
164

*SGVFSM006221*
Subsequent measurementFor purposes of subsequent measurement, financial assets are classified in four categories:
Financial assets at amortized cost (debt instruments) Financial assets at fair value through OCI with recycling of cumulative gains and losses (debt
instruments) Financial assets designated at fair value through OCI with no recycling of cumulative gains and
losses upon derecognition (equity instruments) Financial assets at fair value through profit or loss
Financial assets at amortized cost (debt instruments)This category is the most relevant to the Group. The Group measures financial assets at amortizedcost if both of the following conditions are met:
The financial asset is held within a business model with the objective to hold financial assets inorder to collect contractual cash flows and
The contractual terms of the financial asset give rise on specified dates to cash flows that aresolely payments of principal and interest on the principal amount outstanding
Financial assets at amortized cost are subsequently measured using the effective interest (EIR)method and are subject to impairment. Interest income and impairment losses on reversals arerecognized in the consolidated statement of income. Gains and losses are recognized in profit or losswhen the asset is derecognized, modified or impaired.
As of December 31, 2020 and 2019, the Group’s financial assets at amortized cost include cash andcash equivalents, receivables (except for receivables from lease-to-own arrangements), restricted cashunder “Other current assets” and refundable utility deposits under “Other current and noncurrentassets”.
Financial assets at fair value through OCI (debt instruments)The Group measures debt instruments at fair value through OCI if both of the following conditionsare met:
The financial asset is held within a business model with the objective of both holding to collectcontractual cash flows and selling; and
The contractual terms of the financial asset give rise on specified dates to cash flows that aresolely payments of principal and interest on the principal amount outstanding
For debt instruments at fair value through OCI, interest income, foreign exchange revaluation andimpairment losses or reversals are recognized in the consolidated statement of comprehensive incomeand computed in the same manner as for financial assets measured at amortized cost. The remainingfair value changes are recognized in OCI. Upon derecognition, the cumulative fair value changerecognized in OCI is recycled to profit or loss.
As of December 31, 2020 and 2019, the Group’s debt instruments at fair value through OCI includereceivables from lease-to-own arrangements under “Receivables”.
165

*SGVFSM006221*
Financial assets designated at fair value through OCI (equity instruments)Upon initial recognition, the Group can elect to classify irrevocably its equity investments as equityinstruments designated at fair value through OCI when they meet the definition of equity underPAS 32 Financial Instruments: Presentation and are not held for trading. The classification isdetermined on an instrument-by-instrument basis.
Gains and losses on these financial assets are never recycled to profit or loss. Dividends arerecognized as other income in the consolidated statement of comprehensive income when the right ofpayment has been established, except when the Group benefits from such proceeds as a recovery ofpart of the cost of the financial asset, in which case, such gains are recorded in OCI. Equityinstruments designated at fair value through OCI are not subject to impairment assessment.
As of December 31, 2020 and 2019, the Group’s equity instruments at fair value through OCIpresented under “Other noncurrent assets” include investment in equity instruments of affiliates underthe common control of the ultimate parent company.
Financial assets at fair value through profit or lossFinancial assets at fair value through profit or loss include financial assets held for trading, financialassets designated upon initial recognition at fair value through profit or loss, or financial assetsmandatorily required to be measured at fair value. Financial assets are classified as held for trading ifthey are acquired for the purpose of selling or repurchasing in the near term. Derivatives, includingseparated embedded derivatives, are also classified as held for trading unless they are designated aseffective hedging instruments. Financial assets with cash flows that are not solely payments ofprincipal and interest are classified and measured at fair value through profit or loss, irrespective ofthe business model. Notwithstanding the criteria for debt instruments to be classified at amortizedcost or at fair value through OCI, as described above, debt instruments may be designated at fairvalue through profit or loss on initial recognition if doing so eliminates, or significantly reduces, anaccounting mismatch.
Financial assets at fair value through profit or loss are carried in the consolidated statement offinancial position at fair value with net changes in fair value recognized in the consolidated statementof comprehensive income.
As of December 31, 2020 and 2019, the Group does not have financial assets at fair value throughprofit or loss.
DerecognitionA financial asset (or, where applicable, a part of a financial asset or part of a group of similarfinancial assets) is primarily derecognized (i.e., removed from the consolidated statement of financialposition) when:
The rights to receive cash flows from the asset have expired, or The Group has transferred its rights to receive cash flows from the asset or has assumed an
obligation to pay the received cash flows in full without material delay to a third party under a‘pass-through’ arrangement; and either (a) the Group has transferred substantially all the risks andrewards of the asset, or (b) the Group has neither transferred nor retained substantially all therisks and rewards of the asset, but has transferred control of the asset
When the Group has transferred its rights to receive cash flows from an asset or has entered into a‘pass-through’ arrangement, it evaluates if, and to what extent, it has retained the risks and rewards ofownership. When it has neither transferred nor retained substantially all of the risks and rewards of
166

*SGVFSM006221*
the asset, nor transferred control of the asset, the Group continues to recognize the transferred asset tothe extent of its continuing involvement. In that case, the Group also recognizes an associatedliability. The transferred asset and the associated liability are measured on a basis that reflects therights and obligations that the Group has retained.
Continuing involvement that takes the form of a guarantee over the transferred asset is measured atthe lower of the original carrying amount of the asset and the maximum amount of consideration thatthe Group could be required to repay.
Modification of Financial AssetsThe Group derecognizes a financial asset when the terms and conditions have been renegotiated tothe extent that, substantially, it becomes a new asset, with the difference between its carrying amountand the fair value of the new asset recognized as a derecognition gain or loss in profit or loss, to theextent that an impairment loss has not already been recorded.
When the contractual cash flows of a financial asset are renegotiated or otherwise modified and therenegotiation or modification does not result in the derecognition of that financial asset, the Grouprecalculates the gross carrying amount of the financial asset as the present value of the renegotiated ormodified contractual cash flows discounted at the original EIR (or credit-adjusted EIR for purchasedor originated credit-impaired financial assets) and recognizes a modification gain or loss in theconsolidated statement of comprehensive income.
Impairment of Financial AssetsThe Group recognizes an allowance for expected credit losses (ECLs) for all debt instruments notheld at fair value through profit or loss. ECLs are based on the difference between the contractualcash flows due in accordance with the contract and all the cash flows that the Group expects toreceive, discounted at an approximation of the original effective interest rate. The expected cashflows will include cash flows from the sale of collateral held or other credit enhancements that areintegral to the contractual terms.
ECLs are recognized in two stages. For credit exposures for which there has not been a significantincrease in credit risk since initial recognition, ECLs are provided for credit losses that result fromdefault events that are possible within the next 12-months (a 12-month ECL). For those creditexposures for which there has been a significant increase in credit risk since initial recognition, a lossallowance is required for credit losses expected over the remaining life of the exposure, irrespectiveof the timing of the default (a lifetime ECL).
For trade receivables, the Group applies a simplified approach in calculating ECLs. Therefore, theGroup does not track changes in credit risk, but instead recognizes a loss allowance based on lifetimeECLs at each reporting date. The Group has established a provision matrix for rental and accruedrent receivables and receivables from hotel operations and a vintage analysis for installment contractreceivables that is based on its historical credit loss experience, adjusted for forward-looking factorsspecific to the debtors and the economic environment.
For cash and cash equivalents, the Group applies the low credit risk simplification. The investmentsare considered to be low credit risk investments as the counterparties have investment grade ratings.It is the Group’s policy to measure ECLs on such instruments on a 12-month basis based on availableprobabilities of defaults and loss given defaults. The Group uses the ratings published by a reputablerating agency to determine if the counterparty has investment grade rating. If there are no availableratings, the Group determines the ratings by reference to a comparable bank.
167

*SGVFSM006221*
For other financial assets such as receivables from affiliated companies and utility deposits, ECLs arerecognized in two stages. For credit exposures for which there has not been a significant increase incredit risk since initial recognition, ECLs are provided for credit losses that result from default eventsthat are possible within the next 12-months (a 12-month ECL). For those credit exposures for whichthere has been a significant increase in credit risk since initial recognition a loss allowance is requiredfor credit losses expected over the remaining life of the exposure, irrespective of the timing of thedefault (a lifetime ECL).
The Group considers a debt investment security to have low credit risk when its credit risk rating isequivalent to the globally understood definition of ‘investment grade’.
The key inputs in the model include the Group’s definition of default and historical data of threeyears for the origination, maturity date and default date.
Determining the stage for impairmentAt each reporting date, the Group assesses whether there has been a significant increase in credit riskfor financial assets since initial recognition by comparing the risk of default occurring over theexpected life between the reporting date and the date of initial recognition. The Group considersreasonable and supportable information that is relevant and available without undue cost or effort forthis purpose. This includes quantitative and qualitative information and forward-looking analysis.
The Group considers a financial asset in default when contractual payments are 90 days past due.However, in certain cases, the Group may also consider a financial asset to be in default wheninternal or external information indicates that the Group is unlikely to receive the outstandingcontractual amounts in full before taking into account any credit enhancements held by the Group.
An exposure will migrate through the ECL stages as asset quality deteriorates. If, in a subsequentperiod, asset quality improves and also reverses any previously assessed significant increase in creditrisk since origination, then the loss allowance measurement reverts from lifetime ECL to 12-monthsECL.
Write-off of financial assetsA financial asset is written off when there is no reasonable expectation of recovering the contractualcash flows (e.g., when the debtor has been placed under liquidation or has entered into bankruptcyproceedings, or when the Group has effectively exhausted all collection efforts).
Financial LiabilitiesInitial recognition and measurementFinancial liabilities are classified, at initial recognition, as financial liabilities at fair value throughprofit or loss, loans and borrowings, payables, or as derivatives designated as hedging instruments inan effective hedge, as appropriate.
All financial liabilities are recognized initially at fair value and, in the case of loans and borrowingsand payables, net of directly attributable transaction costs.
Directly attributable transaction costs are documentary stamp tax, underwriting and selling fees,regulatory filing fee and other fees.
168

*SGVFSM006221*
Subsequent measurementThe measurement of financial liabilities depends on their classification, as described below:
Financial liabilities at fair value through profit or lossFinancial liabilities at fair value through profit or loss include financial liabilities held for trading andfinancial liabilities designated upon initial recognition as at fair value through profit or loss.
Financial liabilities are classified as held for trading if they are incurred for the purpose ofrepurchasing in the near term. This category also includes derivative financial instruments enteredinto by the Group that are not designated as hedging instruments in hedge relationships as defined byPFRS 9. Separated embedded derivatives are also classified as held for trading unless they aredesignated as effective hedging instruments.
Gains or losses on liabilities held for trading are recognized in the consolidated statement ofcomprehensive income.
Only if the criteria in PFRS 9 are satisfied, the designation of financial liabilities at fair value throughprofit or loss at the initial date of recognition is allowed.
The Group has not designated any financial liability as at fair value through profit or loss.
Loans and borrowingsThis is the category most relevant to the Group. After initial recognition, interest-bearing loans andborrowings are subsequently measured at amortized cost using the EIR method. Gains and losses arerecognized in profit or loss when the liabilities are derecognized as well as through the EIRamortization process.
Amortized cost is calculated by taking into account any discount or premium on acquisition and feesor costs that are an integral part of the EIR. The EIR amortization is included as finance costs in theconsolidated statement of comprehensive income.
As of December 31, 2020 and 2019, the Group’s financial liabilities under this category includeaccounts payable and accrued expenses (except statutory liabilities), short-term loans, loans payable,and payable to affiliated companies and deposits from lessees which are both included under “Depositand other current liabilities” and “Deposit and other noncurrent liabilities”.
DerecognitionA financial liability is derecognized when the obligation under the liability is discharged or cancelledor expires. When an existing financial liability is replaced by another from the same lender onsubstantially different terms, or the terms of an existing liability are substantially modified, such anexchange or modification is treated as the derecognition of the original liability and the recognition ofa new liability. The difference in the respective carrying amounts is recognized in the consolidatedstatement of comprehensive income.
Offsetting of Financial InstrumentsFinancial assets and financial liabilities are offset and the net amount is reported in the consolidatedstatement of financial position if there is a currently enforceable legal right to offset the recognizedamounts and there is an intention to settle on a net basis, or to realize the assets and settle theliabilities simultaneously. The Group assesses that it has currently enforceable right to offset if theright is not contingent on a future event and is legally enforceable in the event of insolvency orbankruptcy of the Group and all of the counterparties.
169

*SGVFSM006221*
Cash and Cash EquivalentsCash includes cash on hand and in banks. Cash equivalents are short-term, highly liquid investmentsthat are readily convertible to known amounts of cash with original maturities ofthree months or less and that are subject to an insignificant risk of changes in value.
Subdivision Land, Condominium and Residential Units for SaleSubdivision land, condominium and residential units for sale in the ordinary course of business arecarried at the lower of cost and net realizable value (NRV).
Cost includes land costs, costs incurred for development and improvement of the properties (i.e.,planning and design costs, costs of site preparation, contractor’s fees and other professional fees,property transfer taxes, construction overheads and other related costs) and borrowing costs on loansdirectly attributable to the projects which were capitalized during construction. It also includes thecost of land use right (see Note 9).
Inventories that are leased out at market rates to earn revenues to partly cover for expenses on thecondition that the intent to sell in the ordinary course of business has not changed are accounted andpresented as inventory. The rent income from inventories that are leased out is included in otherincome in the consolidated statement of comprehensive income.
NRV is the estimated selling price in the ordinary course of business less cost of completion andestimated costs necessary to make the sale.
The cost of inventory recognized in the consolidated statement of comprehensive income isdetermined with reference to the specific costs incurred on the property sold and an allocation of anynon-specific costs based on the relative size of the property sold.
Materials, Parts and SuppliesMaterials, parts and supplies are valued at the lower of cost or NRV. Cost is determined using theweighted average method. NRV is the replacement cost.
An allowance for inventory losses is provided for slow-moving, obsolete and defective materials,parts and supplies based on management’s physical inspection and evaluation. When inventories aresold, the cost and related allowance is removed from the account and the difference is charged againstoperations.
Advances to Other Companies and Advances to Contractors and SuppliersAdvances to other companies and advances to contractors and suppliers are carried at cost lessimpairment losses, if any.
Prepaid ExpensesPrepaid expenses pertain to resources controlled by the Group as a result of past events and fromwhich future economic benefits are expected to flow to the Group.
With the exception of commission from residential sales, which is amortized using the percentage ofcompletion, other prepaid expenses are amortized as incurred.
Advances to Contractors and Suppliers, Advances to Lot OwnersAdvances to contractors and suppliers and advances to lot owners are carried at cost less impairmentlosses, if any.
170

*SGVFSM006221*
DepositsDeposits from lesseesDeposits from lessees are measured initially at fair value. After initial recognition, customers’deposits are subsequently measured at amortized cost using EIR method.
The difference between the cash received and its fair value is deferred (included in the “Deposits andother liabilities” in the consolidated statement of financial position) and amortized on a straight-linebasis over the lease term.
Non-refundable deposits that are applicable against costs of services incurred or goods delivered aremeasured at fair value.
Value-added Tax (VAT)Revenues, expenses, and assets are recognized net of the amount of VAT, if applicable.
When VAT from sales of goods and/or services (output VAT) exceeds VAT passed on frompurchases of goods or services (input VAT), the excess is recognized as payable in the consolidatedstatement of financial position. When VAT passed on from purchases of goods or services (inputVAT) exceeds VAT from sales of goods and/or services (output VAT), the excess is recognized as anasset in the consolidated statement of financial position to the extent of the recoverable amount.
The net amount of VAT recoverable from the taxation authority is included as part of “Other currentassets” in the consolidated statement of financial position.
Investments in Joint VenturesInvestments in joint ventures (investee companies) are accounted for under the equity method ofaccounting. An associate an entity in which the Group has significant influence, and which is neithera subsidiary nor a joint venture. A joint arrangement is a contractual arrangement whereby two ormore parties undertake an economic activity that is subject to joint control, and a joint venture is ajoint arrangement that involves the establishment of a separate entity in which each venturer has aninterest.
An investment is accounted for using the equity method from the day it becomes a joint venture. Onacquisition of investment, the excess of the cost of investment over the investor’s share in the net fairvalue of the investee’s identifiable assets, liabilities and contingent liabilities is accounted for asgoodwill and included in the carrying amount of the investment and not amortized. Any excess of theinvestor’s share of the net fair value of the investee’s identifiable assets, liabilities and contingentliabilities over the cost of the investment is excluded from the carrying amount of the investment, andinstead included in the determination of the share in the earnings of the investees.
Under the equity method, the investments in the investee companies are carried in the consolidatedstatement of financial position at cost plus post-acquisition changes in the Group’s share in the netassets of the investee companies, less any impairment in values. The consolidated statement ofcomprehensive income reflects the share of the results of the operations of the investee companies.The Group’s share of post-acquisition movements in the investee’s equity reserves is recognizeddirectly in equity. Profits and losses resulting from transactions between the Group and the investeecompanies are eliminated to the extent of the interest in the investee companies and for unrealizedlosses to the extent that there is no evidence of impairment of the asset transferred. Dividendsreceived are treated as a reduction of the carrying value of the investment.
171

*SGVFSM006221*
The Group discontinues applying the equity method when their investments in investee companiesare reduced to zero. Unless otherwise, additional losses are not recognized when the Group hasguaranteed certain obligations of the investee companies. When the investee companies subsequentlyreport net income, the Group will resume applying the equity method but only after its share of thatnet income equals the share of net losses not recognized during the period the equity method wassuspended.
The reporting dates of the investee companies and the Group are identical and the investeecompanies’ accounting policies conform to those used by the Group for like transactions and eventsin similar circumstances.
Upon loss of significant influence over the investee companies, the Group measures and recognizesany retaining investment at its fair value. Any difference between the carrying amount of theassociate upon loss of significant influence and the fair value of the retaining investment andproceeds from disposal is recognized in the consolidated statement of comprehensive income.
Joint OperationA joint operation is a joint arrangement whereby the parties that have joint control of the arrangementhave rights to the assets, and obligations for the liabilities, relating to the arrangement. The Grouprecognize in relation to its interest in a joint operation its assets, including its share of any assets heldjointly; liabilities, including its share of any liabilities incurred jointly; revenue from the sale of itsshare of the output arising from the joint operation; share of the revenue from the sale of the outputby the joint operation; and expenses, including its share of any expenses incurred jointly.
The financial statements of the joint operation are prepared for the same reporting period as theGroup. Where necessary, adjustments are made to bring the accounting policies in line with those ofthe Group.
Investment PropertiesInvestment properties – Land, Land Improvements, Buildings and Improvements and Construction inProgress
Investment properties consist of properties that are held to earn rentals or for capital appreciation orboth, and that are not occupied by the companies consolidated into the Group. Investment properties,except for land, are carried at cost less accumulated depreciation and any impairment in value. Landis carried at cost less any impairment in value. The carrying amount includes the cost of replacingpart of an existing investment property at the time that cost is incurred if the recognition criteria aremet and excludes the cost of day-to-day servicing of an investment property. Investment propertiesare depreciated and amortized using the straight-line method over their estimated useful lives (EUL)as follows:
YearsBuildings 20 - 30Building improvements 10Land improvements 10
The useful life and depreciation method are reviewed periodically to ensure that the period andmethod of depreciation are consistent with the expected pattern of economic benefits from items ofinvestment properties.
172

*SGVFSM006221*
Construction-in-progress (CIP) is stated at cost. This includes cost of construction and other directcosts. Borrowing costs that are directly attributable to the construction of investment properties arecapitalized during the construction period. CIP is not depreciated until such time as the relevantassets are in the location and condition necessary for it to be capable of operating in the mannerintended by management.
Expenditures incurred after the investment property has been put in operation, such as repairs andmaintenance costs, are normally charged against income in the period in which the costs are incurred.
Investment properties are derecognized when either they have been disposed of or when theinvestment property is permanently withdrawn from use and no future economic benefit is expectedfrom its disposal. Any gain or loss on the retirement or disposal of an investment property isrecognized in the profit and loss in the period of retirement or disposal.
Transfers are made to investment property when, and only when, there is a change in use, evidencedby the end of owner occupation, commencement of an operating lease to another party. Transfers aremade from investment property when, and only when, there is a change in use, evidenced bycommencement of owner occupation or commencement of development with a view to sell.Transfers between investment properties, owner-occupied property and inventories do not change thecarrying amount of the property transferred and they do not change the cost of the property formeasurement or disclosure purposes.
The Group discloses the fair values of its investment properties in accordance with PAS 40,Investment Property. The Group engages independent valuation specialist to assess the fair values asat December 31, 2020 and 2019. The Group’s investment properties consist of land and buildingpertaining to land properties, retail (malls), office properties and industrial facilities. These werevalued by reference to market-based evidence using comparable prices adjusted for specific marketfactors such as nature, location and condition of the property.
Investment Properties – Land held for future developmentLand held for future development consist of raw land held by the Group which will be developed intoinvestment properties in the future. Land held for future development is carried at cost less anyimpairment in value. Transfers are made to investment properties when there is commencement ofconstruction of commercial centers or office building on the land property. Transfers are made fromland held for future development to either property and equipment or subdivision land, condominiumand residential units for sale when, and only when, there is change in use, as evidenced by owneroccupation or upon commencement of real estate development with a view to sell.
Land held for future development are derecognized when either they have been disposed of or whenthe land is permanently withdrawn from use and no future economic benefit is expected from itsdisposal. Any gain or loss on the retirement or disposal of land held for future development isrecognized in the profit and loss in the period of retirement or disposal.
Fair Value DisclosureThe Group discloses the fair values of its investment properties in accordance with PAS 40. TheGroup engages independent valuation specialist to assess the fair values as at December 31, 2020 and2019. The Group’s investment properties consist of land and building pertaining to land properties,retail (malls), office properties and industrial facilities. These are valued by reference to market-based evidence using comparable prices adjusted for specific market factors such as nature, locationand condition of the property and income approach by reference to the value of income, cash flow orcost saving generated by the asset.
173

*SGVFSM006221*
Property and EquipmentProperty and equipment are stated at cost less accumulated depreciation and any impairment in value.The cost of an item of property and equipment includes its purchase price and any cost attributable inbringing the asset to the intended location and working condition. Cost also includes interest andother charges on borrowed funds used to finance the construction of property and equipment to theextent incurred during the period of construction and installation.
Expenditures incurred after the fixed assets have been put into operation, such as repairs andmaintenance, are normally charged to expenses in the period in which the costs are incurred.
In situations where it can be clearly demonstrated that the expenditures have resulted in an increase inthe future economic benefits expected to be obtained from the use of an item of property andequipment beyond its originally assessed standard of performance, the expenditures are capitalized asan additional cost of property and equipment.
Depreciation commences once the assets are available for use and is calculated on a straight-line basisover the estimated useful life of over the EUL as follow:
YearsBuildings 20-30Building improvements 10Land improvements 5Theater furniture and equipment 5Other equipment 2.5
Assets under construction are transferred to a specific category of property and equipment when theconstruction and other related activities necessary to prepare the property and equipment for theirintended use are completed and the property and equipment are available for service.
Other equipment includes china, glassware, silver and linen on stock used in hotel operations.
The useful life and depreciation method are reviewed and adjusted, if appropriate, at each financialyear-end to ensure that the period and method of depreciation are consistent with the expected patternof economic benefits from items of property and equipment.
An item of property and equipment is derecognized upon disposal or when no future economicbenefits are expected from its use or disposal. Any gain or loss arising on derecognition of the asset(calculated as the difference between the net disposal proceeds and the carrying amount of the asset)is included in profit and loss in the period the asset is derecognized.
Impairment of Nonfinancial AssetsThe Group assesses at each reporting date whether there is an indication that the Group’s land heldfor future development, investment properties, right-of-use assets, property and equipment,investment in joint ventures and other noncurrent assets may be impaired. If any such indicationexists, the Group makes an estimate of the asset’s recoverable amount. An asset’s recoverableamount is calculated as the higher of an asset’s or cash-generating unit’s fair value less cost to selland its value in use and is determined for an individual asset, unless the asset does not generate cashinflows that are largely independent of those from other assets or group of assets.
174

*SGVFSM006221*
Where the carrying amount of an asset exceeds the recoverable amount, the asset is consideredimpaired and is written down to its recoverable amount. In assessing value in use, the estimatedfuture cash flows are discounted to their present value using a pre-tax discount rate that reflectscurrent market assessment of the time value of money and the risks specific to the asset.
Impairment losses of continuing operations are recognized in the consolidated statement ofcomprehensive income in those expense categories consistent with the function of the impaired asset.
An assessment is made at each reporting date as to whether there is any indication that previouslyrecognized impairment losses may no longer exist or may have decreased. If any such indicationexists, the Group makes an estimate of recoverable amount. A previously recognized impairment lossis reversed only if there has been a change in the estimates used to determine the asset’s recoverableamount since the last impairment loss was recognized. If that is the case, the carrying amount of theasset is increased to the recoverable amount. That increased amount cannot exceed the carryingamount that would have been determined, net of depreciation, had no impairment loss beenrecognized for the assets in prior periods, such reversal is recognized in the consolidated statement ofcomprehensive income.
The following criteria are also applied in assessing the impairment of specific assets:
Investments in Joint VenturesAfter application of the equity method, the Group determines whether it is necessary to recognize anyadditional impairment loss with respect to the Group’s net investment in the investee companies. TheGroup determines at each reporting date whether there is any objective evidence that the investmentin joint ventures is impaired. If this is the case, the Group calculates the amount of impairment asbeing the difference between the recoverable amount and the carrying value of the investee companyand recognizes the difference in the consolidated statement of comprehensive income.
EquityCapital stock is measured at par value for all shares issued. When the Group issues more than onecapital stock, a separate account is maintained for each class of stock and the number of sharesissued.
When the shares are sold at premium, the difference between the proceeds at the par value is creditedto “Additional paid-in capital” account. Direct costs incurred related to equity issuance arechargeable to “Additional paid-in capital” account. If additional paid-in capital is not sufficient, theexcess is charged against retained earnings.
Retained earnings represent accumulated earnings of the Group less dividends declared. Theindividual accumulated retained earnings of the subsidiaries are available for dividend distributionwhen they are declared by the subsidiaries as approved by their respective BOD.
Treasury StockOwn equity instruments which are acquired (treasury stock) are recognized at cost and deducted fromequity. No gain or loss is recognized in the profit and loss on the purchase, sale, issue or cancellationof the Parent Company’s own equity instruments. Any difference between the carrying amount andthe consideration, if reissued, is recognized in additional paid-in capital. Voting rights related totreasury shares are nullified for the Group and no dividends are allocated to them respectively. Whenthe shares are retired, the capital stock account is reduced by its par value and the excess of cost overpar value upon retirement is debited to additional paid-in capital when the shares were issued and toretained earnings for the remaining balance.
175

*SGVFSM006221*
Other Equity ReserveOther equity reserve pertains to the difference between the consideration paid and the carrying valueof the non-controlling interest acquired. Upon disposal of the related investment, the other equityreserve is transferred to retained earnings.
Income TaxesCurrent income taxCurrent income tax assets and liabilities for the current and prior periods are measured at the amountexpected to be recovered from or paid to the taxation authorities. The tax rates and tax laws used tocompute the amounts are those that are enacted or substantively enacted at the reporting date in thecountries where the Group operates and generates taxable income.
Deferred income taxDeferred income tax is provided using the liability method on temporary differences between the taxbases of assets and liabilities and their carrying amounts for financial reporting purposes at thereporting date. Deferred income tax liabilities are recognized for all taxable temporary differences,except:
When the deferred income tax liability arises from the initial recognition of goodwill or an assetor liability in a transaction that is not a business combination and, at the time of the transaction,affects neither the accounting profit nor taxable profit or loss
In respect of taxable temporary differences associated with investments in subsidiaries, associatesand interests in joint arrangements, when the timing of the reversal of the temporary differencescan be controlled and it is probable that the temporary differences will not reverse in theforeseeable future
Deferred income tax assets are recognized for all deductible temporary differences, the carry forwardof unused tax credits and any unused tax losses. Deferred income tax assets are recognized to theextent that it is probable that taxable profit will be available against which the deductible temporarydifferences, and the carry forward of unused tax credits and unused tax losses can be utilized, except:
When the deferred tax asset relating to the deductible temporary difference arises from the initialrecognition of an asset or liability in a transaction that is not a business combination and, at thetime of the transaction, affects neither the accounting profit nor taxable profit or loss
In respect of deductible temporary differences associated with investments in subsidiaries,associates and interests in joint arrangements, deferred tax assets are recognized only to the extentthat it is probable that the temporary differences will reverse in the foreseeable future and taxableprofit will be available against which the temporary differences can be utilized
The carrying amount of deferred income tax assets is reviewed at each reporting date and reduced tothe extent that it is no longer probable that sufficient taxable income will be available to allow all orpart of the deferred tax asset to be utilized. Unrecognized deferred income tax assets are reassessed ateach reporting date and are recognized to the extent that it has become probable that future taxableincome will allow all as part of the deferred tax and to be recovered. The Group does not recognizedeferred income tax assets that will reverse during the income tax holiday (ITH).
Deferred income tax assets and liabilities are measured at the tax rates that are expected to apply inthe year when the asset is realized or the liability is settled, based on tax rates (and tax laws) that havebeen enacted or substantively enacted at the reporting date.
176

*SGVFSM006221*
Deferred income tax relating to items recognized outside profit or loss is recognized outside profit orloss. Deferred income tax items are recognized in correlation to the underlying transaction either inOCI or directly in equity.
Deferred income tax assets and deferred income tax liabilities are offset if a legally enforceable rightexists to set off current tax assets against current tax liabilities and the deferred taxes relate to thesame taxable entity and the same taxation authority.
Pension ExpenseThe Group has a noncontributory defined benefit plan. The net defined benefit liability or asset is theaggregate of the present value of the defined benefit liability at the end of the reporting periodreduced by the fair value of plan assets (if any), adjusted for any effect of limiting a net definedbenefit asset to the asset ceiling. The asset ceiling is the present value of any economic benefitsavailable in the form of refunds from the plan or reductions in future contributions to the plan.
The cost of providing benefits under the defined benefit plan is actuarially determined using theprojected unit credit method.
Defined benefit costs comprise the following: Service costs Net interest on the net defined benefit liability or asset Remeasurements of net defined benefit liability or asset
Service costs which include current service costs, past service costs and gains or losses on non-routine settlements are recognized as expense in profit or loss. Past service costs are recognizedwhen plan amendment or curtailment occurs. These amounts are calculated periodically byindependent qualified actuary.
Net interest on the net defined benefit liability or asset is the change during the period in the netdefined benefit liability or asset that arises from the passage of time which is determined by applyingthe discount rate based on government bonds to the net defined benefit liability or asset. Net intereston the net defined benefit liability or asset is recognized as expense or income in profit or loss.
Remeasurements comprising actuarial gains and losses, return on plan assets and any change in theeffect of the asset ceiling (excluding net interest on defined benefit liability) are recognizedimmediately in OCI in the period in which they arise. Remeasurements are not reclassified to profitor loss in subsequent periods.
Plan assets are assets that are held by a long-term employee benefit fund or qualifying insurancepolicies. Plan assets are not available to the creditors of the Group, nor can they be paid directly tothe Group. Fair value of plan assets is based on market price information. When no market price isavailable, the fair value of plan assets is estimated by discounting expected future cash flows using adiscount rate that reflects both the risk associated with the plan assets and the maturity or expecteddisposal date of those assets (or, if they have no maturity, the expected period until the settlement ofthe related liabilities). If the fair value of the plan assets is higher than the present value of thedefined benefit liability, the measurement of the resulting defined benefit asset is limited to thepresent value of economic benefits available in the form of refunds from the plan or reductions infuture contributions to the plan.
177

*SGVFSM006221*
The Group’s right to be reimbursed of some or all of the expenditure required to settle a definedbenefit liability is recognized as a separate asset at fair value when and only when reimbursement isvirtually certain.
Termination benefitTermination benefits are employee benefits provided in exchange for the termination of anemployee’s employment as a result of either an entity’s decision to terminate an employee’semployment before the normal retirement date or an employee’s decision to accept an offer ofbenefits in exchange for the termination of employment.
A liability and expense for a termination benefit is recognized at the earlier of when the entity can nolonger withdraw the offer of those benefits and when the entity recognizes related restructuring costs.Initial recognition and subsequent changes to termination benefits are measured in accordance withthe nature of the employee benefit, as either post-employment benefits, short-term employee benefits,or other long-term employee benefits.
Employee leave entitlementEmployee entitlements to annual leave are recognized as a liability when they are accrued to theemployees. The undiscounted liability for leave expected to be settled wholly within twelve monthsafter the end of the annual reporting period is recognized for services rendered by employees up tothe end of the reporting period.
Foreign CurrenciesEach entity in the Group determines its own functional currency and items included in theconsolidated financial statements of each entity are measured using that functional currency.
As of the reporting date, the assets and liabilities of these subsidiaries are translated into thepresentation currency of the Parent Company (the Philippine Peso) at the closing rate as at thereporting date and their statement of comprehensive income accounts are translated at the weightedaverage exchange rates for the year. The exchange differences arising on the translation arerecognized in the consolidated statement of comprehensive income and reported as a separatecomponent of equity as “Cumulative Translation Adjustment”. On disposal of a foreign entity, thedeferred cumulative amount recognized in the consolidated statement of comprehensive incomerelating to that particular foreign operation shall be recognized in the consolidated statement ofcomprehensive income.
When previously invested capital is returned to Group and there is no loss of control, the exchangedifference arising from the original rate and new rate is recognized in the consolidated statement ofincome.
Transactions and balancesTransactions in foreign currencies are initially recorded by the Group’s entities at their respectivefunctional currency spot rates at the date the transaction first qualifies for recognition. Monetaryassets and liabilities denominated in foreign currencies are translated at the functional currency spotrates of exchange at the reporting date. Non-monetary items that are measured in terms of historicalcost in a foreign currency are translated using the exchange rates at the dates of the initialtransactions.
178

*SGVFSM006221*
Translation for consolidationOn consolidation, the assets and liabilities of foreign operations are translated into Philippine Peso atthe rate of exchange prevailing at the reporting date and their statements of profit or loss aretranslated at exchange rates prevailing at the dates of the transactions. The exchange differencesarising on translation for consolidation are recognized in the cumulative translation adjustment (CTA)in the consolidated statement of comprehensive income. On disposal of a foreign operation, thecomponent of OCI relating to that particular foreign operation is reclassified to profit or loss when thestandard permits.
Earnings Per Share (EPS)Basic EPS is calculated by dividing net income attributable to equity holders of the Parent Companyby the weighted average number of common shares outstanding during the year. Diluted EPS iscomputed by dividing net income attributable to equity holders of the Parent Company by theweighted average number of common shares issued and outstanding during the period after givingeffect to assumed conversion of potential common shares. Calculation of dilutive EPS considers thepotential ordinary shares of subsidiaries, associates and joint ventures that have dilutive effect on thebasic EPS of the Parent Company. The calculation of diluted earnings per share does not assumeconversion, exercise, or other issue of potential common shares that would have an antidilutive effecton earnings per share.
Operating SegmentThe Group’s operating businesses are organized and managed separately according to the nature ofthe products and services provided, with each segment representing a strategic business unit thatoffers different products and services and serves different markets. Financial information on businesssegments is presented in Note 6 to the consolidated financial statements.
ProvisionsProvisions are recognized when the Group has a present obligation (legal or constructive) as a resultof a past event, it is probable that an outflow of resources embodying economic benefits will berequired to settle the obligation and a reliable estimate can be made of the amount of the obligation.Where the Group expects a provision to be reimbursed, the reimbursement is recognized as a separateasset but only when the reimbursement is virtually certain. If the effect of the time value of money ismaterial, provisions are determined by discounting the expected future cash flows at a pre-tax ratethat reflects current market assessments of the time value of money and, where appropriate, the risksspecific to the liability. Where discounting is used, the increase in the provision due to the passage oftime is recognized as an interest expense. Provisions are reviewed at each reporting date and adjustedto reflect the current best estimate.
ContingenciesContingent liabilities are not recognized in the consolidated financial statements but are disclosedunless the possibility of an outflow of resources embodying economic benefits is remote. Contingentassets are not recognized in the consolidated financial statements but are disclosed when an inflow ofeconomic benefits is probable. However, when the realization of income is virtually certain, therelated asset is not a contingent asset and will be recognized.
Events After the Reporting DatePost year-end events that provide additional information about the Group’s position at the reportingdate (adjusting events) are reflected in the consolidated financial statements. Post year-end eventsthat are not adjusting events are disclosed in the consolidated financial statements when material.
179

*SGVFSM006221*
5. Significant Accounting Judgments and Estimates
The preparation of the consolidated financial statements in compliance with PFRSs requires theGroup to make judgment and estimates that affect the reported amounts of assets, liabilities, incomeand expenses and disclosure of contingent assets and contingent liabilities. Future events may occurwhich will cause the assumptions used in arriving at the estimates to change.
The effects of any change in judgments and estimates are reflected in the consolidated financialstatements, as they become reasonably determinable. Actual results could differ from such estimates.
Judgments and estimates are continuously evaluated and are based on historical experience and otherfactors, including expectations of future events that are believed to be reasonable under thecircumstances.
JudgmentsIn the process of applying the Group’s accounting policies, management has made the followingjudgments, apart from those involving estimations, which has the most significant effect on theamounts recognized in the consolidated financial statements.
Real estate revenue recognition upon adoption of PFRS 15
Existence of a contractThe Group’s primary document for a contract with a customer is a signed contract to sell. It hasdetermined, however, that in cases wherein contract to sell are not signed by both parties, thecombination of its other duly executed and signed documentation such as reservation agreement,official receipts, buyers’ computation sheets and invoices, would contain all the criteria to qualify ascontract with the customer under PFRS 15.
In addition, part of the assessment process of the Group before revenue recognition is to assess theprobability that the Group will collect the consideration to which it will be entitled in exchange forthe real estate property that will be transferred to the customer. In evaluating whether collectabilityof an amount of consideration is probable, an entity considers the significance of the customer’sinitial payments in relation to the total contract price. Collectability is also assessed by consideringfactors such as past history with the customer, age and pricing of the property. Management regularlyevaluates the historical cancellations and back-outs if it would still support its current threshold ofcustomers’ equity before commencing revenue recognition.
Identifying performance obligationIn 2018, the Parent Company entered into a contract to sell covering a land upon which, sitepreparation will be performed prior to turnover to the buyer. The Group concluded that the revenueand cost of real estate sales should be recorded upon completion of the site preparation activities asspecifically stated in the contract to sell, which is at a point in time, since there is only oneperformance obligation (i.e., developed land) and the Parent Company does not have a right todemand payment for work performed to date from the buyer (see Notes 21 and 30). For the yearsended December 31, 2020, 2019 and 2018, no revenue has been recognized as the performanceobligations under the contract to sell are ongoing.
180

*SGVFSM006221*
In 2018, the Parent Company entered into contracts to sell covering parcels of raw land. The Groupconcluded that there is one performance obligation in these contracts, the raw land. Revenue and costof real estate sales should be recorded upon delivery of the raw land to the respective buyers which isat a point in time (see Notes 21 and 30). Revenue and related cost of sale arising from these contracthave been recorded in 2019 and 2018, respectively.
Revenue recognition method and measure of progressFor the revenue from real estate sales in the Philippines, the Group concluded that revenue is to berecognized over time because: (a) the Group’s performance does not create an asset with analternative use and; (b) the Group has an enforceable right for performance completed to date. Thepromised property is specifically identified in the contract and the contractual restriction on theGroup’s ability to direct the promised property for another use is substantive. This is because theproperty promised to the customer is not interchangeable with other properties without breaching thecontract and without incurring significant costs that otherwise would not have been incurred inrelation to that contract. In addition, under the current legal framework, the customer is contractuallyobliged to make payments to the developer up to the performance completed to date. In addition, theGroup requires a certain percentage of buyer's payments of total selling price (buyer's equity), to becollected as one of the criteria in order to initiate revenue recognition. Reaching this level ofcollection is an indication of buyer’s continuing commitment and the probability that economicbenefits will flow to the Group. The Group considers that the initial and continuing investments bythe buyer of about 10% on projects that are under development and construction demonstrate thebuyer’s commitment to pay. For certain inventories that have been fully completed and ready foroccupancy, outright investment of the buyer of about 5% demonstrates the buyer’s commitment topay.
The Group has determined that input method used in measuring the progress of the performanceobligation faithfully depicts the Group’s performance in transferring control of real estatedevelopment to the customers.
Principal versus agent considerationsThe contract for the mall retail spaces and office spaces leased out by the Group to its tenantsincludes the right to charge for the electricity usage, water usage, air conditioning charges andcommon usage service area (CUSA) like maintenance, janitorial and security services.
For the electricity and water usage and CUSA, the Group determined that it is acting as an agentbecause the promise of the Group to the tenants is to arrange for the electricity and water supply to beprovided by a utility company and to provide services such as maintenance, janitorial and securityservices. The utility and service companies, and not the real estate developer, are primary responsiblefor the provisioning of the utilities while the Group, administers the leased spaces and coordinateswith the utility and service companies to ensure that tenants have access to these utilities. The Groupdoes not have the discretion on the pricing of the services provided since the price is based on theactual rate charged by the utility providers.
For the provision of air conditioning, the Group acts as a principal because it retains the right to directthe service provider of air conditioning to the leased premises. The right to the services mentionednever transfers to the tenant and the Group has the discretion on how to price the air conditioningcharges. However, since the Group has availed of the relief to the real estate industry by deferring theapplication of accounting to CUSA charges discussed in PIC Q&A No. 2018-12-H, the Groupretained its current assessment and accounting for air conditioning charges.
181

*SGVFSM006221*
Revenue and cost recognitionThe Group’s real estate sales is recognized overtime and the percentage-of-completion is determinedusing input method measured principally based on total actual cost of resources consumed such asmaterials, labor hours and actual overhead incurred over the total expected project development cost.Actual costs also include incurred costs but not yet billed which are estimated by the projectengineers. Expected project development costs include costs of land, land development, buildingcosts, professional fees, depreciation of equipment directly used in the construction, payments forpermits and licenses. Revisions in estimated development costs brought about by increases inprojected costs in excess of the original budgeted amounts, form part of total project costs on aprospective basis and is allocated between costs of sales and real estate inventories.
Real estate revenue and cost recognition from pre-selling in Chengdu ProjectIn July 2018, Chengdu Xin Yao secured the license to sell the condominium units in Phase 1 of itsresidential development in Chengdu Xin Yao Ban Bian Jie. As of December 31, 2020 and 2019, norevenue has been recognized, and while the deposits received from buyers amounted toP=22,664 million and P=9,119 million, respectively.
Revenue from the sale of real estate units of Chengdu Xin Yao will be accounted for under a fullaccrual method (i.e., at a point in time) in the Group’s consolidated financial statements. Underparagraph 35(c) of PFRS 15, “An entity shall consider the terms of the contract, as well as any lawsthat apply to the contract, when evaluating whether it has an enforceable right to payment forperformance completed to date in accordance with paragraph 35 (c). The right to payment forperformance completed to date does not need to be for a fixed amount. However, at all timesthroughout the duration of the contract, the entity must be entitled to an amount that at leastcompensates the entity for performance completed to date if the contract is terminated by thecustomer or another party for reasons other than the entity’s failure to perform as promised.” Basedon management’s assessment, throughout the duration of the contract term, Chengdu Xin Yao isentitled to an amount that does not compensate it for performance completed to date if the contract isterminated by the buyer or another party for reasons other than Chengdu Xin Yao’s failure to performas promised.
Definition of default and credit-impaired financial assetsThe Group defines a financial instrument as in default, which is fully aligned with the definition ofcredit-impaired, when it meets one or more of the following criteria:
Quantitative criteria - for installment contract receivables, the customer receives a notice ofcancellation and does not continue the payments.
Qualitative criteriaThe customer meets ‘unlikeliness to pay’ criteria, which indicates the customer is in significantfinancial difficulty. These are instances where:
a. The customer is experiencing financial difficulty or is insolventb. The customer is in breach of financial covenant(s)c. An active market for that financial assets has disappeared because of financial difficultiesd. Concessions have been granted by the Group, for economic or contractual reasons relating to the
customer’s financial difficultye. It is becoming probable that the customer will enter bankruptcy or other financial reorganization
182

*SGVFSM006221*
The criteria above have been applied to the financial instruments held by the Group and are consistentwith the definition of default used for internal credit risk management purposes. The defaultdefinition has been applied consistently to model the Probability of Default (PD), Loss Given Default(LGD) and Exposure at Default (EAD) throughout the Group’s expected loss calculation.
Incorporation of forward-looking informationThe Group incorporates forward-looking information into both its assessment of whether the creditrisk of an instrument has increased significantly since its initial recognition and its measurement ofECL.
To do this, the Group considers a range of relevant forward-looking macro-economic assumptions forthe determination of unbiased general industry adjustments and any related specific industryadjustments that support the calculation of ECLs. Based on the Group’s evaluation and assessmentand after taking into consideration external actual and forecast information, the Group formulates a‘base case’ view of the future direction of relevant economic variables as well as a representativerange of other possible forecast scenarios. This process involves developing two or more additionaleconomic scenarios and considering the relative probabilities of each outcome. External informationincludes economic data and forecasts published by governmental bodies, monetary authorities andselected private-sector and academic institutions.
The base case represents a most-likely outcome and is aligned with information used by the Group forother purposes such as strategic planning and budgeting. The other scenarios represent moreoptimistic and more pessimistic outcomes. Periodically, the Group carries out stress testing of moreextreme shocks to calibrate its determination of these other representative scenarios.
The Group has identified and documented key drivers of credit risk and credit losses of each portfolioof financial instruments and, using an analysis of historical data, has estimated relationships betweenmacro-economic variables and credit risk and credit losses.
The Group has considered the impact of COVID-19 pandemic and to the extent applicable revised itsassumptions in determining macroeconomic variables and loss rates in the ECL computation. Thechanges in the gross carrying amounts of receivables from the sale of real estate during the year andimpact of COVID-19 did not materially affect the allowance for ECLs.
Joint ControlThe Parent Company entered into various joint ventures with Shang Properties, Inc., Hong KongLand Group, DMCI Project Developers, Inc. and DoubleDragon Properties Corp. The ParentCompany considers that it has joint control over these arrangements since decisions about the relevantactivities of the joint ventures require unanimous consent of the parties as provided for in the jointventure agreements and shareholders’ agreements.
Determining whether it is reasonably certain that a renewal and termination option will be exercised– Group as a lessee (effective January 1, 2019)The Group has several lease contracts that include renewal and termination options. The Groupapplies judgment in evaluating whether it is reasonably certain to exercise the option to renew orterminate the lease. That is, it considers all relevant factors that create an economic incentive for it toexercise the renewal or termination. After the commencement date, the Group reassesses the leaseterm if there is a significant event or change in circumstances that is within its control and affects itsability to exercise (or not to exercise) the option to renew or terminate (e.g., a change in businessstrategy).
183

*SGVFSM006221*
The Group determines the lease term as the non-cancellable term of the lease, together with anyperiods covered by an option to renew the lease if it is reasonably certain to be exercised, or anyperiods covered by an option to terminate the lease, if it is reasonably certain not to be exercised.
The Group did not include the option to renew nor the option to terminate the lease in the lease termas the Group assessed that it is not reasonably certain that these options will be exercised.
Operating leases commitments - Group as lessee (prior to January 1, 2019)The Group has entered into lease contracts to develop commercial or office properties on the leasedland premises. Based on an evaluation of the terms and conditions of the arrangements, all the risksand benefits incidental to ownership of the leased land are not transferred to the Group. Indetermining significant risks and benefits of ownership, the Group considered, among others, thatthere is no transfer of ownership of the asset to the lessee by the end of the lease term (see Note 34).
Operating lease commitments - Group as lessorThe Group has entered into commercial and office property leases on its investment propertiesportfolio. Based on an evaluation of the terms and conditions of the arrangements, the Group hasdetermined that it retains all the significant risks and rewards of ownership of these properties andaccounts for them as operating leases. In determining significant risks and benefits of ownership, theGroup considered, among others, the significance of the lease term as compared with the EUL of therelated asset.
A number of the Group’s operating lease contracts are accounted for as noncancellable operatingleases and the rest are cancellable. In determining whether a lease contract is cancellable or not, theGroup considers, among others, the significance of the penalty, including the economic consequenceto the lessee (see Note 34).
Finance lease commitments - Group as lessorThe Group has entered into property leases on some of its real estate condominium unit propertyportfolio. The Group has determined, based on an evaluation of the terms and conditions of thearrangements, particularly the bargain purchase option and minimum lease payments that the Grouphas transferred all the significant risks and rewards of ownership of these properties to the lessee andaccounts for them as finance leases (see Note 34).
Assessment on whether lease concessions granted constitute a lease modificationIn line with the rental relief framework implemented by the government to support businesses and thebroader economy due to the impact of COVID-19, the Group waived its right to collect rent and othercharges as part of various lease concessions it granted to lessees such as lease payment holidays orlease payment reductions.
The Group applies judgment when assessing whether the rent concessions granted is considered alease modification under PFRS 16.
In making this judgment, the Group determines whether the rent concessions granted has changed thescope of the lease, or the consideration thereof, that was not part of the original terms and conditionsof the lease. The Group assessed that the lease concessions it granted to lessees do not qualify aslease modifications since the terms and conditions under the corresponding lease contracts have notbeen modified by the waiver and therefore, is not a lease modification under PFRS 16.
The rent concessions granted by the Group for the year ended December 31, 2020 amounted toP=3,475 million.
184

*SGVFSM006221*
Distinction among real estate inventories, land held for future development and investment propertiesThe Group determines whether a property will be classified as Real estate inventories, Land held forfuture development and Investment properties. In making this judgment, the Group considerswhether the property will be sold in the normal operating cycle (Real estate inventories), whether itwill be retained as part of the Group’s strategic land banking activities for development or sale in themedium or long-term (Land held for future development) or whether it will be held to earn rentals orfor capital appreciation (Investment properties). For land properties, the Group considers the purposefor which the land was acquired.
Recognition of deferred tax assetsDeferred tax assets are recognized for all deductible temporary differences to the extent that it isprobable that sufficient taxable income will be available against which the deductible temporarydifferences can be utilized. Significant management estimate is required to determine the amount ofdeferred tax asset that can be recognized, based upon the likely timing and level of future taxableincome together with future tax planning. Deferred tax assets recognized as of December 31, 2020and 2019 amounted to P=1,128 million and P=873 million, respectively (see Note 27).
The Group has deductible temporary difference that is available for offset against taxable income ortax payable which deferred tax asset has not been recognized. This pertains to NOLCO ofsubsidiaries amounting to P=9 million as of December 31, 2020 and 2019, respectively. The relateddeferred tax assets amounted to P=3 million as of December 31, 2020 and 2019 (see Note 27).
ContingenciesThe Group is currently involved in various legal proceedings in the ordinary course of business. Theestimate of the probable costs for the resolution of these claims has been developed in consultationwith the internal and external counsel handling the defense on these matters and is based upon ananalysis and judgment of potential results by the management. The Group currently does not believethese proceedings will have a material effect on the Group’s financial position. It is possible, thatfuture results of operations could be materially affected by changes in the judgment or in theeffectiveness of the strategies relating to these proceedings (see Note 34).
Judgments made in determining taxable profit (tax loss), tax bases, unused tax losses, unused taxcredits and tax rates applying paragraph 122 of PAS 1, Presentation of Financial StatementsUpon adoption of the Interpretation, the Group has assessed whether it has any uncertain tax position.The Group applies significant judgment in identifying uncertainties over its income tax treatments.The Group determined, based on its assessment, in consultation with its tax counsel, that it isprobable that its uncertain income tax treatments (including those for the subsidiaries) will beaccepted by the taxation authorities.
Estimates and AssumptionsThe key estimates and assumptions concerning the future and other key sources of estimationuncertainty at the reporting date that has a significant risk of causing a material adjustment to thecarrying amounts of assets and liabilities are discussed below.
Revenue and cost recognitionThe Group’s revenue recognition policies require management to make use of estimates andassumptions that may affect the reported amounts of revenue and costs. The Group’s revenue andcost from real estate where performance obligation is satisfied over time and recognized based on thepercentage of completion is measured principally on the basis of the estimated completion byreference to the actual costs incurred to date over the estimated total costs of the project. For theyears ended December 31, 2020, 2019 and 2018, the real estate sales recognized over time amounted
185

*SGVFSM006221*
to P=11,718 million, P=8,708 million and P=8,345 million, respectively, while the related cost of realestate sales amounted to P=6,149 million, P=4,150 million and P=4,533 million, respectively.
The Group also recognized revenue when control is passed on a certain point in time. The Group’srevenue and cost of real estate sales were recognized upon transfer of control to the buyer. Realestate sales pertaining to this transaction amounted to P=132 million, P=321 million and P=2,547 millionfor the years ended December 31, 2020, 2019 and 2018, respectively. The related cost of salesamounted to P=12 million, P=85 million and P=398 million for the years ended December 31, 2020, 2019and 2018, respectively.
Fair value of financial instrumentsWhen the fair values of financial assets and financial liabilities recorded or disclosed in theconsolidated statement of financial position cannot be derived from active markets, they aredetermined using internal valuation techniques using generally accepted market valuation models.The inputs to these models are taken from observable markets where possible, but where this is notfeasible, estimates are used in establishing fair values. These estimates may include considerations ofliquidity, volatility and correlation. Certain financial assets and liabilities were initially recorded attheir fair values by using the discounted cash flow methodology.
Provision for expected credit losses of trade receivablesThe Group uses a provision matrix to calculate ECLs for trade receivables other than installmentcontract receivables. The provision rates are based on days past due for groupings of variouscustomer segments that have similar loss patterns.
The provision matrix is initially based on the Group’s historical observed default rates. The Groupwill calibrate the matrix to adjust the historical credit loss experience with forward-lookinginformation such as inflation and dollar index rates. At every reporting date, the historical observeddefault rates are updated and changes in the forward-looking estimates are analyzed.
The Group uses vintage analysis approach to calculate ECLs for installment contract receivables.The vintage analysis accounts for expected losses by calculating the cumulative loss rates of a givenloan pool. It derives the probability of default from the historical data of a homogenous portfolio thatshare the same origination period. The information on the number of defaults during fixed timeintervals of the accounts is utilized to create the PD model. It allows the evaluation of the loanactivity from its origination period until the end of the contract period.
The assessment of the correlation between historical observed default rates, forecast economicconditions (inflation and interest rates) and ECLs is a significant estimate. The amount of ECLs issensitive to changes in circumstances and of forecast economic conditions. The Group’s historicalcredit loss experience and forecast of economic conditions may also not be representative ofcustomer’s actual default in the future.
The changes in the gross carrying amounts of receivables from the sale of real estate during theperiod and impact of COVID-19 did not materially affect the allowance for ECLs.
The carrying value of trade receivables as of December 31, 2020 and 2019 amounted toP=20,620 million and P=15,567 million, respectively (see Note 8). The carrying value of installmentcontract receivables as of December 31, 2020 and 2019 amounted to P=15,891 million andP=12,163 million, respectively (see Note 8).
186

*SGVFSM006221*
Evaluation of net realizable value of real estate inventoriesThe Group adjusts the cost of its real estate inventories to net realizable value based on its assessmentof the recoverability of the inventories. NRV for completed real estate inventories is assessed withreference to market conditions and prices existing at the reporting date and is determined by theGroup in light of recent market transactions. NRV in respect of real estate inventories underconstruction is assessed with reference to market prices at the reporting date for similar completedproperty, less estimated costs to complete construction and less estimated costs to sell. The amountand timing of recorded expenses for any period would differ if different judgments were made ordifferent estimates were utilized.
In line with the impact of COVID-19, the Group experienced limited selling activities that resulted tolower sales in 2020. In evaluating NRV, recent market conditions and current market prices havebeen considered (see Note 9).
As of December 31, 2020 and 2019, the Group’s subdivision land, condominium and residential unitsfor sale amounted to P=41,252 million and P=36,063 million, respectively (see Note 9).
Estimation of useful lives of property and equipment and investment propertiesThe Group estimates the useful lives of its depreciable property and equipment and investmentproperties based on the period over which the assets are expected to be available for use. The EUL ofthe said depreciable assets are reviewed at least annually and are updated, if expectations differ fromprevious estimates due to physical wear and tear and technical or commercial obsolescence on the useof these assets. It is possible that future results of operations could be materially affected by changesin these estimates brought about by changes in the factors mentioned above. A reduction in the EULof the depreciable property and equipment and investment properties would increase depreciationexpense and decrease noncurrent assets.
The carrying value of depreciable property and equipment as of December 31, 2020 and 2019amounted to P=8,508 million and P=8,897 million, respectively (see Note 12). The carrying value ofdepreciable investment properties as of December 31, 2020 and 2019 amounted to P=57,850 millionand P=58,717 million, respectively (see Note 11).
Impairment of nonfinancial assetsThe Group assesses impairment on its nonfinancial assets (i.e., investment properties, property andequipment, right-of-use assets, other noncurrent assets and investment in joint ventures) and considersthe following important indicators:
Significant changes in asset usage; Significant decline in assets’ market value; Obsolescence or physical damage of an asset; Significant underperformance relative to expected historical or projected future operating results;
and Significant negative industry or economic trends
If such indications are present and where the carrying amount of the asset exceeds its recoverableamount, the asset is considered impaired and is written down to its recoverable amount. Therecoverable amount is the higher of an asset’s fair value less costs of disposal and its value in use.The fair value less costs of disposal is the amount obtainable from the sale of an asset in an arm’slength transaction while value in use is the present value of estimated future cash flows expected toarise from the nonfinancial assets. Recoverable amounts are estimated for individual assets or, if it isnot possible, for the cash-generating unit to which the asset belongs. In determining the present value
187

*SGVFSM006221*
of estimated future cash flows expected to be generated from the continued use of the assets, theGroup is required to make estimates and assumptions that may affect the carrying amount of theassets.
In view of the continuing community quarantines and restricted travel, the Group’s hotels and resortssegment continues to be adversely affected by the lower number of guests and reduced room rates,both of which have significantly impacted the revenues reported for this segment. Also, manyrestaurants remain closed or allowed limited operations which impacted the food and beveragerevenues of the segment. In addition, because of the coronavirus pandemic, there is the heightenedlevel of uncertainty on the future economic outlook and market forecast. These events and conditionsare impairment indicators requiring the assessment of the recoverable amount of the property andequipment and right-of-use assets.
The Group estimates the recoverable amount through value in use. In determining the present valueof estimated future cash flows expected to be generated from the continued use of these assets of thehotels and resorts segment, the Group is required to make estimates and assumptions that may affectthe nonfinancial assets. The significant assumptions used in the valuation are discount rates of8.847% with an average growth rate of 3.000%. The Group also considered in its assumptions theimpact of the COVID-19 pandemic on the occupancy rate and room rates which are not expected tonormalize soon.
The carrying values of the Group’s nonfinancial assets as of December 31, 2020 and 2019 aredisclosed below. No impairment was recognized for the Group’s nonfinancial assets.
2020 2019Investment properties (Note 11) P=109,418,090,261 P=103,799,140,203Property and equipment (Note 12) 8,507,694,022 8,896,623,535Investments in joint venture (Note 30) 2,372,704,894 2,350,181,648Right-of-use assets (Note 34) 1,112,302,766 1,171,733,998Other noncurrent assets* (Note 13) 6,184,587,808 4,297,855,641
P=127,595,379,751 P=120,515,535,025*Excluding utility deposits and financial assets at fair value through OCI
Pension costThe determination of the obligation and cost of pension benefits is dependent on the selection ofcertain assumptions used in calculating such amounts. Those assumptions include, among others,discount rates and salary increase rates (see Note 29).
The cost of defined benefit pension plan and the present value of the pension liabilities aredetermined using actuarial valuations. Due to the complexity of the valuation, the underlyingassumptions and its long-term nature, defined benefit liabilities are highly sensitive to changes inthese assumptions. All assumptions are reviewed at each reporting date.
In determining the appropriate discount rate, management considers the interest rates of governmentbonds that are denominated in the currency in which the benefits will be paid, with extrapolatedmaturities corresponding to the expected duration of the defined benefit liability. Future salaryincreases are based on expected future inflation rates and other relevant factors.
The present value of the defined benefit obligation is determined by discounting the estimated futurecash outflows using interest rates of Philippine government bonds with terms consistent with theexpected employee benefit payout as of reporting date.
188

*SGVFSM006221*
As of December 31, 2020 and 2019, the Group’s net pension liabilities amounted to P=666 million andP=361 million, respectively (see Note 29).
Leases - Estimating the incremental borrowing rateThe Group cannot readily determine the interest rate implicit in the lease, therefore, it uses itsincremental borrowing rate (IBR) to measure lease liabilities. The IBR is the rate of interest that theGroup would have to pay to borrow over a similar term, and with a similar security, the fundsnecessary to obtain an asset of a similar value to the right-of-use asset in a similar economicenvironment. The IBR therefore reflects what the Group ‘would have to pay’, which requiresestimation when no observable rates are available (such as for subsidiaries that do not enter intofinancing transactions) or when they need to be adjusted to reflect the terms and conditions of thelease (for example, when leases are not in the subsidiary’s functional currency). The Group estimatesthe IBR using observable inputs (such as market interest rates) when available and is required tomake certain entity-specific estimates (such as the subsidiary’s stand-alone credit rating).
The Group’s lease liabilities amounted to P=1,977 million and P=1,936 million as of December 31, 2020and 2019, respectively (see Note 34).
6. Operating Segments
Business SegmentsThe business segment is determined as the primary segment reporting format as the Group’s risks andrates of return are affected predominantly by each operating segment.
Management monitors the operating results of its operating segments separately for the purpose ofmaking decision about resource allocation and performance assessment. Group financing (includinginterest income and interest expense) and income taxes are managed on a group basis and are notallocated to operating segments. The Group evaluates performance based on earnings before interest,income tax, depreciation and other income (losses) (EBITDA).
The Group does not report its results based on geographical segments because the Group currentlyonly has revenue generating activities in the Philippines as revenue recognition from the real estatedevelopment in China will commence upon completion of development activities and when theproperty is accepted by the customer or deemed as accepted according to the contract.
The financial information on the operations of these business segments as shown below are based onthe measurement principles that are similar with those used in measuring the assets, liabilities, incomeand expenses in the consolidated financial statements which is in accordance with PFRSs except forEBITDA.
Cost and expenses exclude interest, taxes and depreciation.
The Group derives its revenue from the following reportable units:
Commercial Centers Division - develops, leases and manages shopping malls/commercial centers allover the Philippines.
Residential Division - develops and sells residential condominium units, as well as horizontalresidential projects.
Office Buildings Division - develops and leases out office spaces.
189

*SGVFSM006221*
Hotels and Resorts Division - owns and operates a chain of hotels in various locations in thePhilippines.
Industrial and Integrated Developments Division - focuses on strategic land bank acquisition andmanagement, exploration of real estate-related infrastructure projects, development of and leasing ofwarehouse and logistics facilities.
The financial information about the operations of these business segments is summarized as follows:
2020
CommercialCenters Division
ResidentialDivision
OfficeBuildings
DivisionHotels and
Resorts Division
Industrial andIntegrated
Developments
IntersegmentEliminatingAdjustments Consolidated
Revenue Segment revenue:
Revenues from contracts P=218,910,438 P=11,717,577,404 P=– P=1,083,317,112 P=132,606,872 P=– P=13,152,411,826 with customersRental income 5,588,494,038 76,771,895 4,690,014,553 – 261,807,783 – 10,617,088,269Other income 149,196,397 330,853,099 1,154,994,555 – 282,388 – 1,635,326,439
Intersegment revenue 31,121,619 – 1,014,200 848,743 – (32,984,562) – Total Revenue 5,987,722,492 12,125,202,398 5,846,023,308 1,084,165,855 394,697,043 (32,984,562) 25,404,826,534Costs and expenses Segment costs and expenses 1,842,822,901 8,040,085,187 761,809,340 930,013,801 151,531,374 – 11,726,262,603 Intersegment costs and
expenses 8,895,013 37,542,232 (27,710,193) 11,828,241 2,429,269 (32,984,562) – Total Costs and expenses 1,851,717,914 8,077,627,419 734,099,147 941,842,042 153,960,643 (32,984,562) 11,726,262,603Earnings before interest, taxes and
depreciation 4,136,004,578 4,047,574,979 5,111,924,161 142,323,813 240,736,400 – 13,678,563,931Depreciation and amortization
(Notes 22 and 24) 3,711,870,206 97,763,190 903,746,743 417,760,276 53,558,465 – 5,184,698,880Operating income P=424,134,372 P=3,949,811,789 P=4,208,177,418 (P=275,436,463) P=187,177,935 P=– P=8,493,865,051Assets and LiabilitiesSegment assets P=77,606,552,979 P=77,599,188,022 P=28,489,598,894 P=10,031,375,412 P=21,474,009,750 P=– P=215,200,725,057Investment in subsidiaries - at cost 7,306,629,643 – 497,250,000 25,500,000 794,000,000 (8,623,379,643) –Total segment assets P=84,913,182,622 P=77,599,188,022 P=28,986,848,894 P=10,056,875,412 P=22,268,009,750 (P=8,623,379,643) P=215,200,725,057Total segment liabilities P=67,661,325,893 P=35,155,742,510 P=4,582,052,082 P=1,052,439,463 P=4,031,133,474 P=– P=112,482,693,422Other segment information:
Capital additions (Notes 11 and 12) P=11,154,452,396Additions to subdivision land, condominium and residential units for sale (Note 9) P=9,171,932,407
Cash flows from: Operating activities (P=640,961,680) P=6,766,322,760 P=4,717,498,517 P=689,167,678 P=1,146,496,736 P=– P=12,678,524,011 Investing activities (5,713,330,980) 153,478,760 (4,723,605,979) (872,124,893) (1,134,175,088) – (12,289,758,180) Financing activities 6,422,194,762 112,113,970 10,452,547 2,037,073 8,256,078 – 6,555,054,430
2019
CommercialCenters Division
ResidentialDivision
OfficeBuildingsDivision
Hotels and ResortsDivision
Industrial andIntegrated
Developments
IntersegmentEliminatingAdjustments Consolidated
RevenueSegment revenue:Revenues from contracts P=2,151,785,393 P=8,708,003,578 P=– P=2,432,639,988 P=320,940,495 P=– P=13,613,369,454
with customersRental income 10,812,598,105 100,976,731 4,369,279,039 – 137,645,380 – 15,420,499,255Other income 284,687,409 318,779,532 946,142,007 – 357,908 – 1,549,966,856Intersegment revenue 43,217,951 – 496,000 2,537,052 – (46,251,003) –Total Revenue 13,292,288,858 9,127,759,841 5,315,917,046 2,435,177,040 458,943,783 (46,251,003) 30,583,835,565
Costs and expensesSegment costs and expenses 4,427,161,923 6,199,429,618 756,306,859 1,730,215,872 221,280,013 – 13,334,394,285
Intersegment costs andexpenses 496,000 43,217,951 (7,555,220) 10,092,272 – (46,251,003) –
Total Costs and expenses 4,427,657,923 6,242,647,569 748,751,639 1,740,308,144 221,280,013 (46,251,003) 13,334,394,285Earnings before interest, taxes and
depreciation 8,864,630,935 2,885,112,272 4,567,165,407 694,868,896 237,663,770 – 17,249,441,280Depreciation and amortization (Notes
22 and 24) 3,652,030,906 95,074,282 833,893,624 359,372,389 26,174,214 – 4,966,545,415Operating income P=5,212,600,029 P=2,790,037,990 P=3,733,271,783 P=335,496,507 P=211,489,556 P=– P=12,282,895,865Assets and LiabilitiesSegment assets P=73,472,525,100 P=59,962,694,934 P=24,309,288,716 P=10,194,629,208 P=21,712,071,803 P=– P=189,651,209,761Investment in subsidiaries - at cost 10,910,909,370 – 165,750,000 25,500,000 780,000,000 (11,882,159,370) –Total segment assets P=84,383,434,470 P=59,962,694,934 P=24,475,038,716 P=10,220,129,208 P=22,492,071,803 (P=11,882,159,370)P=189,651,209,761Total segment liabilities P=58,335,790,786 P=20,717,183,095 P=4,534,903,265 P=1,325,361,503 P=4,660,300,634 P=– P=89,573,539,283Other segment information:
Capital additions (Notes 11 and 12) P=11,444,282,141Additions to subdivision land, condominium and residential units for sale (Note 9) P=8,746,295,175
Cash flows from:Operating activities P=9,326,112,683 P=5,506,243,970 P=3,690,293,288 P=264,036,093 (P=656,455,081) P=– P=18,130,230,953
Investing activities (4,841,728,095) (3,186,979,630) (4,043,094,712) (1,920,539,197) (1,666,262,134) – (15,658,603,768)Financing activities (4,545,991,517) 1,832,092,728 680,285,494 1,833,618,329 2,244,965,477 – 2,044,970,511
190

*SGVFSM006221*
2018
CommercialCenters Division
ResidentialDivision
OfficeBuildingsDivision
Hotels and ResortsDivision
Industrial andIntegrated
Developments
IntersegmentEliminatingAdjustments Consolidated
RevenueSegment revenue:Revenues from contracts P=1,972,527,785 P=8,345,617,524 P=– P=1,982,137,914 P=2,546,767,437 P=– P=14,847,050,660
with customersRental income 9,764,937,175 113,115,164 3,535,276,772 – 134,875,097 – 13,548,204,208Other income 202,813,085 202,711,808 757,721,885 – (18,996) – 1,163,227,782Intersegment revenue 42,846,948 – – 2,471,781 – (45,318,729) –Total Revenue 11,983,124,993 8,661,444,496 4,292,998,657 1,984,609,695 2,681,623,538 (45,318,729) 29,558,482,650
Costs and expensesSegment costs and expenses 4,274,831,274 6,478,178,974 532,882,081 1,308,642,999 613,677,160 – 13,208,212,488
Intersegment costs andexpenses – 42,846,948 (5,438,907) 7,910,688 – (45,318,729) –
Total Costs and expenses 4,274,831,274 6,521,025,922 527,443,174 1,316,553,687 613,677,160 (45,318,729) 13,208,212,488Earnings before interest, taxes and
depreciation 7,708,293,719 2,140,418,574 3,765,555,483 668,056,008 2,067,946,378 – 16,350,270,162Depreciation (Notes 24 and 26) 3,420,651,538 81,030,767 693,501,790 248,237,776 13,310,774 – 4,456,732,645Operating income P=4,287,642,181 P=2,059,387,807 P=3,072,053,693 P=419,818,232 P=2,054,635,604 P=– P=11,893,537,517Assets and LiabilitiesSegment assets P=73,959,589,978 P=53,680,024,065 P=19,462,199,172 P=7,881,486,731 P=19,174,860,339 P=– P=174,158,160,285Investment in subsidiaries - at cost 11,486,832,946 – – 25,500,000 780,000,000 (12,292,332,946) –Total segment assets P=85,446,422,924 P=53,680,024,065 P=19,462,199,172 P=7,906,986,731 P=19,954,860,339 (P=12,292,332,946) P=174,158,160,285Total segment liabilities P=49,605,728,995 P=20,608,010,769 P=3,655,455,825 P=1,166,561,653 P=5,202,686,538 P=– P=80,238,443,780Other segment information:
Capital additions (Notes 11 and 12) P=13,444,918,877Additions to subdivision land, condominium and residential units for sale (Note 9) P=5,868,091,167
Cash flows from: Operating activities P=9,325,467,987 (P=91,578,957) P=3,550,353,853 P=720,903,816 (P=215,138,751) P=– P=13,290,007,948
Investing activities (9,838,247,513) (2,710,192,203) (2,493,308,706) (2,217,625,037) 26,928,203 – (17,232,445,256)Financing activities 946,746,362 2,720,437,095 (1,046,865,599) 1,507,780,576 282,725,178 – 4,410,823,612
The revenue of the Group consists of sales to domestic customers. Inter-segment revenue accountedfor under PFRSs arising from lease arrangements amounting P=33 million, P=46 million andP=45 million for the years ended December 31, 2020, 2019 and 2018, respectively, are eliminated inconsolidation. The Group generally account for inter-segment sales and transfers on an arm’s lengthprices or at current market prices.
The carrying amount of assets located outside the Philippines amounted to P=32,444 million andP=21,715 million as of December 31, 2020 and 2019, respectively.
No operating segments have been aggregated to form the above reportable segments. Capitaladditions consist of additions to “Investment properties” and “Property and equipment”.
Significant customers in lease arrangements include the affiliated entities (see Note 20). Rentalincome arising from the lease of commercial properties to affiliated companies which are not part ofthe Group and therefore not eliminated amounted to P=2,103 million, P=2,997 million andP=2,787 million for the years ended December 31, 2020, 2019 and 2018, respectively.
For the years ended December 31, 2020, 2019 and 2018, there are no revenue transactions with asingle external customer which accounted 10% or more of the consolidated revenue from externalcustomers. The main revenues of the Group are substantially earned from the Philippines.
The following table shows a reconciliation of the total EBITDA to total income before income tax:
December 312020 2019 2018
EBITDA P=13,678,563,931 P=17,249,441,280 P=16,350,270,162Depreciation and amortization
(Notes 22 and 24) (5,184,698,880) (4,966,545,415) (4,456,732,645)Other losses – net (1,487,600,935) (776,112,102) (650,505,921)Income before income tax P=7,006,264,116 P=11,506,783,763 P=11,243,031,596
191

*SGVFSM006221*
Except for the impact of COVID-19 pandemic to the operating results of the Group starting March2020, there are no other trends or events or uncertainties that have had or that are reasonably expectedto have a material impact on revenues or income from continuing operations.
7. Cash and Cash Equivalents
This account consists of:
2020 2019Cash on hand and in banks P=1,108,520,005 P=6,338,788,195Short-term investments (Notes 16 and 20) 12,895,738,779 721,650,328
P=14,004,258,784 P=7,060,438,523
Cash in banks earn annual interest at the prevailing bank deposit rates. Short-term investments areinvested for varying periods of up to three (3) months and earn interest at the prevailing short-terminvestment rates ranging from 1.13% to 3.75%, 1.00% to 3.50% and 0.20% to 3.90% for the yearsended December 31, 2020, 2019 and 2018, respectively.
Interest earned from cash in banks and short-term investments for the years endedDecember 31, 2020, 2019 and 2018 amounted to P=239 million, P=287 million, and P=157 million,respectively (see Note 26).
The cash and cash equivalents as of December 31, 2020 and 2019 are free to meet the immediatecash requirements of the Group (see Note 10).
8. Receivables
This account consists of:
2020
2019(As restated -
see Note 4)Trade
Installment contract receivables - at amortized cost P=14,960,310,062 P=11,173,387,274Installment contract receivables - at FVOCI 931,573,340 990,081,179Rental receivables (Note 20) 2,625,743,652 1,022,641,161Accrued rent receivables 1,834,791,308 1,672,789,954Hotel operations 267,686,252 708,232,304
20,620,104,614 15,567,131,872Affiliated companies (Note 20) 1,029,848,891 1,355,316,367Others
Receivable from insurance 516,821,913 549,764,921Receivable from condominium corporations 232,470,481 163,242,405Advances to officers and employees 66,734,411 58,583,438Others 38,604,580 28,142,195
22,504,584,890 17,722,181,198Less allowance for impairment losses 212,927,700 47,676,601
22,291,657,190 17,674,504,597Less noncurrent portion 7,861,430,860 11,520,497,445
P=14,430,226,330 P=6,154,007,152
192

*SGVFSM006221*
Installment contract receivables consist of accounts collectible in monthly installments over a periodof one (1) to ten (10) years. These are carried at amortized cost, except for receivables from lease-to-own arrangements which are carried at fair value through OCI. The title of the real estate property,which is the subject of the installment contract receivable due beyond 12 months, passes to the buyeronce the receivable is fully paid.
Rental receivables from affiliated companies included under ‘Rental receivables’ amounted toP=262 million and P=124 million as of December 31, 2020 and 2019, respectively (see Note 20).
Accrued rent receivables represent the portion of the lease as a consequence of recognizing income ona straight-line basis. As of December 31, 2020 and 2019, the noncurrent portion of accrued rentreceivable amounted to P=1,821 million and P=1,659 million, respectively.
Receivables from hotel operations pertain to unpaid customer billings for charges from roomaccommodations, sale of food and beverage and other ancillary services. These are normallycollectible within 30 to 90 days.
Receivable from affiliates represent advances made by the Parent Company in accordance with jointventure agreements (see Note 20).
Receivable from insurance consist of claims made by the Group for losses incurred related to itsinvestment properties.
Receivable from condominium corporations pertain mostly to reimbursements for utilities paid by theParent Company.
The receivables from officers and employees are advances related to conduct of business activitiessubject to liquidation and for personal loans which are collected through salary deduction.
Other receivables consist primarily of advances to brokers, interest receivable and advances to SSS.
Movements in the allowance for impairment losses on trade receivables in 2020 follow:
RentalReceivables
HotelsOperations
InstallmentContract
Receivables TotalBalances at January 1, 2020 P=13,905,027 P=14,771,574 P=19,000,000 P=47,676,601Provision (Notes 23, 31 and 36) 176,243,695 3,778,978 – 180,022,673Write-off – (14,771,574) – (14,771,574)Balances at December 31, 2020 P=190,148,722 P=3,778,978 P=19,000,000 P=212,927,700
There is no movement in the allowance for impairment losses on trade receivables in 2019.
193

*SGVFSM006221*
Aging AnalysisThe aging analysis of the Group’s receivables follows:
December 31, 2020Neither Past Due But Not Impaired Past
TotalPast Due
nor ImpairedLess than
30 days 30 to 60 days 61 to 90 days Over 90 daysDue and
ImpairedTrade receivables
Installment contractreceivables - atamortized cost P=14,960,310,062 P=12,806,030,730 P=302,529,645 P=205,833,712 P=116,588,117 P=1,510,327,858 P=19,000,000
Installment contractreceivables - atFVOCI 931,573,340 787,496,740 17,377,240 13,013,885 8,523,429 105,162,046 –
Rental receivables(Note 20) 2,625,743,652 567,028,167 259,712,766 254,074,368 201,826,180 1,152,953,449 190,148,722
Accrued rentreceivables 1,834,791,308 1,834,791,308 – – – – –
Hotel operations 267,686,252 64,245,015 86,314,912 9,849,385 3,274,604 100,223,358 3,778,978Affiliated companies
(Note 20) 1,029,848,891 1,029,848,891 – – – – –Others 854,631,385 854,631,385 – – – – –
P=22,504,584,890 P=17,944,072,236 P=665,934,563 P=482,771,350 P=330,212,330 P=2,868,666,711 P=212,927,700
December 31, 2019Neither Past Due But Not Impaired Past
TotalPast Due
nor ImpairedLess than
30 days 30 to 60 days 61 to 90 days Over 90 daysDue and
ImpairedTrade receivables
Installment contractreceivables - atamortized cost P=11,173,387,274 P=10,850,174,053 P=57,422,900 P=21,562,826 P=47,341,381 P=177,886,114 P=19,000,000
Installment contractreceivables - atFVOCI 990,081,179 963,112,977 4,443,941 2,472,133 3,720,782 16,331,346 –
Rental receivables(Note 20) 1,022,641,161 269,344,986 160,109,276 60,412,107 26,936,664 491,933,101 13,905,027
Accrued rentreceivables 1,672,789,954 1,672,789,954 – – – – –
Hotel operations 708,232,304 506,461,162 69,831,288 31,010,457 19,885,001 66,272,822 14,771,574Affiliated companies
(Note 20) 1,355,316,367 1,355,316,367 – – – – –Others 799,732,959 799,732,959 – – – – –
P=17,722,181,198 P=16,416,932,458 P=291,807,405 P=115,457,523 P=97,883,828 P=752,423,383 P=47,676,601
A summary of the movements in the installment contract receivables - at FVOCI of the Group is asfollows:
2020 2019Beginning balance P=990,081,179 P=785,221,675Additions ‒ 106,015,840Collections (27,305,750) ‒Fair value adjustment - other comprehensive income (31,202,089) 98,843,664Ending balance P=931,573,340 P=990,081,179
The changes in the fair value of the installment contract receivables at FVOCI (net of tax) in 2020,2019 and 2018 amounted to P=22 million, P=69 million and P=9 million, respectively.
On March 25, 2020, Republic Act No. 11469, otherwise known as the Bayanihan to Heal as One Act(“Bayanihan 1 Act”) was enacted. Bayanihan 1 Act provides that all covered institutions shallimplement a 30-day grace period for all loans with principal and/or interest and lease amortizationfalling due within the ECQ Period without incurring interest on interest, penalties, fees and othercharges. Subsequently, on September 11, 2020, Republic Act No. 11494, otherwise known as the
194

*SGVFSM006221*
Bayanihan to Recover as One Act (“Bayanihan 2 Act”), was enacted. Under Bayanihan 2 Act, a one-time 60-day grace period is granted for the payment of all existing, current and outstanding loansfalling due, or any part thereof, on or before December 31, 2020, without incurring interest oninterests, penalties, fees, or other charges and thereby extending the maturity of the said loans.Furthermore, a minimum 30-day grace period shall also be granted by covered institutions to allpayments due within the period of community quarantine on rent and utility-related expenditureswithout incurring penalties, interest and other charges.
In 2020, the Group, provided reliefs under Bayanihan 1 Act and Bayanihan 2 Act, which offeredfinancial reliefs to its borrowers/counterparties as a response to the effect of the COVID-19 pandemic.These relief measures included the restructuring of existing receivables including extension of paymentterms.
Based on the Group’s assessment, the modifications in the contractual cash flows as a result of theabove reliefs are not substantial and therefore do not result in the derecognition of the affectedfinancial assets.
As of December 31, 2020 and 2019, nominal amounts of trade receivables from residential,commercial and office development totaling P=14,960 million and P=11,173 million, respectively, wererecorded initially at fair value. The fair values of the receivables were obtained by discounting futurecash flows using the applicable rates of similar types of instruments.
Movements in the unamortized discount of the Group’s receivables as of December 31, 2020 and2019 follow:
2020 2019Balance at beginning of year P=11,173,387,274 P=10,225,600,569Additions during the year 3,919,965,199 1,044,452,555Accretion for the year (Note 21) (133,042,411) (96,665,850)Balance at end of year P=14,960,310,062 P=11,173,387,274
9. Subdivision Land, Condominium and Residential Units for Sale
This account consists of:
2020 2019Land use right and development cost P=18,662,662,664 P=15,888,472,944Land and condominium units 11,614,894,462 14,087,963,035Residential units and subdivision land 3,403,756,340 3,793,355,987Land held for development 7,570,587,954 2,293,105,421
P=41,251,901,420 P=36,062,897,387
The subdivision land, condominium and residential units for sale are carried at cost.
195

*SGVFSM006221*
A summary of the movement in inventory is set out below:
2020 2019Beginning balance P=36,062,897,387 P=31,464,454,298Construction and development costs incurred 9,171,932,407 8,723,176,262Land acquisition (Note 10) 1,341,648,000 −Transfers (to) / from
Investment properties (Note 11) 824,173,445 317,625,677Property and equipment (Note 12) – (131,903,733)Unrealized land cost (sale to SRPI) (Note 20) 12,485,722 (75,129,954)
Cost of real estate sales (Note 22) (6,161,235,541) (4,235,325,163)P=41,251,901,420 P=36,062,897,387
Borrowing cost capitalized amounted to P=304 million, P=486 million and P=548 million for the yearsended December 31, 2020, 2019 and 2018, respectively. The capitalization rate used to determine theamount of borrowing costs eligible for capitalization in 2020, 2019 and 2018 is 4.54%, 4.59% and4.50%, respectively. These amounts were included in the construction and development costsincurred (see Note 16).
The amount of subdivision land, condominium and residential units for sale recognized as cost of realestate sales in the consolidated statements of comprehensive income amounted to P=6,161 million,P=4,235 million and P=4,931 million for the years ended December 31, 2020, 2019 and 2018,respectively (see Note 22).
On October 20, 2015, the Chinese government awarded the Contract for Assignment of the Rights tothe Use of State-Owned Land (the Contract) to the Group. In May 2016, the Masterplan had beencompleted and was submitted for approval to the Chinese government in the same month. TheChinese government approved the Masterplan in the first quarter of 2017 and construction activitieshave commenced (recognized as land use right and development cost).
Under the Contract, the Group is entitled to transfer, lease, mortgage all or part of the state-ownedconstruction land use right to a third party. Upon receipt of the Certificate of State-owned Land UseRight Assignment, the land title will be subdivided into Individual Property Titles which will beissued to unit owners one year after completion of the development and turn-over of the units to thebuyers. When all or part of the state-owned construction land use right is transferred, through sale ofcommercial units and high-rise condominium units to buyers, the rights and obligations specified inthe Contract and in the land registration documents shall be transferred accordingly to the buyer. Theuse term will be the remaining years as of the date of transfer based on the original use term specifiedin the Contract.
When the use term under the Contract expires (residential: 70 years and commercial: 40 years) andthe land user continues using the assigned land under the Contract, an application for renewal shall besubmitted to the Chinese government not less than one (1) year prior to the expiration of the use term.
The land use right amounting to P=10,221 million as at December 31, 2018 is pledged as security tothe Renminbi (RMB) 216 million (P=1,651 million) loan from Agricultural Bank of China (Note 18).The said loan was fully paid in December 2019. No subdivision land, condominium and residentialunits for sale were pledged as security to liabilities as of December 31, 2020.
196

*SGVFSM006221*
10. Other Current Assets
This account consists of:
2020 2019Restricted cash P=4,006,791,007 P=2,533,017,832Prepaid expenses (Note 23) 1,926,648,491 1,023,727,774Input VAT - net 1,623,017,384 578,174,256Advances to suppliers and contractors 1,327,955,054 1,140,769,746Advances to lot owners 331,941,593 2,142,570,836Supplies 38,404,355 69,613,798Utility deposits (Notes 31 and 32) 8,719,131 8,417,364Others 3,426,503 5,488,204
P=9,266,903,518 P=7,501,779,810
Restricted cash includes the deposits in local banks for the purchase of land and deposits of buyers ofChengdu Xin Yao which will mainly be used for construction of real estate inventories (see Note 9).
Prepaid expenses consist mainly of prepayments for taxes and insurance and cost to obtain contract inrelation to the Group’s real estate sales. The cost to obtain contracts which include prepaidcommissions and advances to brokers/agents amounted to P=115 million and P=106 million as ofDecember 31, 2020 and 2019, respectively.
Input VAT - net of output VAT can be applied against future output VAT.
Advances to suppliers and contractors consist of advance payment for the construction of residentialprojects. These are recouped from billings which are expected to occur in a short period of time.
Advances to lot owners consist of advance payments to landowners which shall be applied against theacquisition cost of the real estate properties.
Supplies consist mainly of office and maintenance materials.
Utility deposits consist primarily of bid bonds and meter deposits.
Others consists of advances and reserve funds.
197

*SGVFSM006221*
11. Investment Properties
A summary of the movement in the investment properties is set out below:
December 31, 2020Land Held for
FutureDevelopment Land
LandImprovements
Buildings andImprovements
ConstructionIn Progress Total
CostBalances at January 1, 2020 P=21,178,572,184 P=16,931,290,519 P=362,672,459 P=94,031,313,016 P=6,972,679,469 P=139,476,527,647Additions 1,558,318,656 5,634,309 10,958,455 1,453,440,806 7,145,187,166 10,173,539,392Reclassification and transfers - net
(Notes 9 and 12) (744,301,751) (232,527,571) 86,482,575 2,032,469,976 (1,247,062,454) (104,939,225)Balances at December 31, 2020 21,992,589,089 16,704,397,257 460,113,489 97,517,223,798 12,870,804,181 149,545,127,814Accumulated DepreciationBalances at January 1, 2020 – – 178,910,574 35,498,476,870 – 35,677,387,444Depreciation (Notes 22 and 24) – – 28,039,744 4,267,814,819 – 4,295,854,563Reclassification and transfers – – – 153,795,546 – 153,795,546Balances at December 31, 2020 – – 206,950,318 39,920,087,235 40,127,037,553Net Book Value P=21,992,589,089 P=16,704,397,257 P=253,163,171 P=57,597,136,563 P=12,870,804,181 P=109,418,090,261
December 31, 2019Land Held for
FutureDevelopment Land
LandImprovements
Buildings andImprovements
ConstructionIn Progress Total
CostBalances at January 1, 2019 P=21,644,110,051 P=16,401,461,680 P=371,698,367 P=86,699,272,436 P=6,314,587,588 P=131,431,130,122Additions 69,276,337 498,975,069 33,384,747 2,754,948,866 6,355,317,188 9,711,902,207Retirement/disposal – (100,000,000) (1,370,033) (1,106,358,267) (39,590,100) (1,247,318,400)Reclassification and transfers - net
(Notes 9 and 12) (534,814,204) 130,853,770 (41,040,622) 5,683,449,981 (5,657,635,207) (419,186,282)Balances at December 31, 2019 21,178,572,184 16,931,290,519 362,672,459 94,031,313,016 6,972,679,469 139,476,527,647Accumulated DepreciationBalances at January 1, 2019 – – 153,490,503 31,960,543,792 – 32,114,034,295Effect of adoption of PFRS 16 – – – 29,922,064 – 29,922,064Balances at January 1, 2019,
as restated – – 153,490,503 31,990,465,856 – 32,143,956,359Depreciation (Notes 22 and 24) – – 26,209,217 3,997,156,833 – 4,023,366,050Retirement/disposal – – (789,146) (414,556,318) – (415,345,464)Reclassification and transfers – – – (74,589,501) – (74,589,501)Balances at December 31, 2019 – – 178,910,574 35,498,476,870 – 35,677,387,444Net Book Value P=21,178,572,184 P=16,931,290,519 P=183,761,885 P=58,532,836,146 P=6,972,679,469 P=103,799,140,203
Investment properties consist mainly of shopping malls/commercial centers, office buildings andindustrial facilities that are held to earn rentals. Land held for future development pertains to landheld for capital appreciation and land banking activities for development.
In 2019, retirement of investment properties includes the derecognition of investment properties ofAPVI resulting from deconsolidation (see Note 2).
The construction in progress items reclassified to their respective asset accounts in 2020 and 2019amounted to P=1,247 million and P=5,658 million, respectively. The reclassifications in 2020 representoffice buildings in Davao and Luisita. The reclassifications in 2019 represent mall and warehouse inLaguna, expansions of provincial malls, office buildings in Quezon City and Luisita. These werereclassified to buildings and improvements and land improvements. The remaining construction inprogress represents new and expansion projects in various cities in Metro Manila and other parts ofLuzon and Visayas regions. These normally take three (3) to five (5) years to construct untilcompletion.
198

*SGVFSM006221*
For the years ended December 31, 2020 and 2019, the Group reclassified investment properties tosubdivision land, condominium and residential units for sale amounting to P=824 million andP=318 million, respectively (see Note 9). The Group also reclassified investment properties toproperty and equipment amounting to P=29 million and P=102 million in 2020 and 2019, respectively(see Note 12).
Depreciation expense charged to operations amounted to P=4,296 million, P=4,023 million andP=3,699 million for the years ended December 31, 2020, 2019 and 2018, respectively (see Note 24).
Borrowing costs capitalized amounted to P=425 million, P=318 million and P=323 million for the yearsended December 31, 2020, 2019 and 2018, respectively. These amounts were included in theconsolidated statements of cash flows under additions to investment properties. The capitalizationrate used to determine the amount of borrowing costs eligible for capitalization for the years endedDecember 31, 2020, 2019 and 2018 is 4.54%, 4.59% and 4.50%, respectively (see Note 16).
The aggregate fair value of the Group’s investment properties as of December 31, 2020 and 2019amounted to P=300,904 million and P=220,514 million, respectively. The fair values of the investmentproperties were determined by independent professionally qualified appraisers and exceed its carryingcost.
The following table provides the fair value hierarchy of the Group’s investment properties as ofDecember 31, 2020 and 2019:
2020
Date of Valuation
Fair value measurement using
Total
Quotedprices
in activemarkets(Level 1)
Significantobservable
inputs(Level 2)
Significantunobservable
inputs(Level 3)
Investment properties Various P=300,904,223,207 P=– P=– P=300,904,223,207
2019
Date of Valuation
Fair value measurement using
Total
Quotedprices
in activemarkets
(Level 1)
Significantobservable
inputs(Level 2)
Significantunobservable
inputs(Level 3)
Investment properties Various P=220,514,455,352 P=– P=– P=220,514,455,352
The fair values of the land held for future development were measured through market data approachwhich provides an indication of value by comparing the subject asset with an identical or similarassets for which price information is available. This approach was used for the land as it iscommonly used in the property market since inputs and data for this approach are available.
The fair values of the buildings (retail, office and warehouses) were measured through incomeapproach using the discounted cash flow analysis. This approach converts anticipated future gains topresent worth by projecting reasonable income and expenses for the subject property.
The construction-in-progress were measured at cost until such time the fair value becomes reliablymeasurable or construction is completed (whichever comes earlier).
199

*SGVFSM006221*
The significant assumptions used in the valuation are discount rates of 8% and capitalization rates of4.50% to 6.25%. The significant unobservable inputs to valuation of investment properties rangesfrom P=750 to P=364,000 per sqm.
Acquisition costs of investment properties that are recent and for land banking purposes approximatefair values. There are little or nil developments on these properties.
Rental income derived from investment properties amounted to P=10,617 million, P=15,420 million andP=13,548 million for the years ended December 31, 2020, 2019 and 2018, respectively (see Note 21).
Property operations and maintenance costs arising from investment properties amounted toP=492 million, P=680 million and P=791 million for the years ended December 31, 2020, 2019 and 2018,respectively (see Note 22).
There are no investment properties as of December 31, 2020 and 2019 that are pledged as security toliabilities. The Group has no restrictions on the realizability of its investment properties. Except forcontracts awarded, there no contractual obligations to purchase, construct or develop investmentproperties or for repairs, maintenance and enhancements.
The total contractual commitments arising from awarded contracts for the acquisition, developmentand construction of investment properties amounted to P=15,155 million and P=10,388 million, as ofDecember 31, 2020 and 2019, respectively.
12. Property and Equipment
This account consists of:
December 31, 2020
LandImprovements
Buildings andImprovements
Constructionin Progress
TheaterFurniture and
Equipment Other Equipment TotalCostBalances at January 1, 2020 P=37,280,715 P=7,858,478,190 P=2,163,578,261 P=1,236,263,555 P=5,180,638,619 P=16,476,239,340Additions 12,663,489 149,711,362 682,531,613 – 136,006,540 980,913,004Retirement/disposal – (3,122,174) – – (3,723,884) (6,846,058)Reclassifications (Note 11) – (739,385,296) 16,113,960 – 28,675,661 (694,595,675)Balances at December 31, 2020 49,944,204 7,265,682,082 2,862,223,834 1,236,263,555 5,341,596,936 16,755,710,611Accumulated DepreciationBalances at January 1, 2020 8,202,360 2,747,805,698 – 928,562,675 3,895,045,072 7,579,615,805Depreciation (Notes 22 and 24) 12,353,115 228,381,485 – 27,908,924 560,398,864 829,042,388Retirement/disposal – (3,122,174) – – (3,723,884) (6,846,058)Reclassifications (Note 11) – (153,795,546) – – – (153,795,546)Balances at December 31, 2020 20,555,475 2,819,269,463 – 956,471,599 4,451,720,052 8,248,016,589Net Book Value P=29,388,729 P=4,446,412,619 P=2,862,223,834 P=279,791,956 P=889,876,884 P=8,507,694,022
December 31, 2019
LandImprovements
Buildings andImprovements
Constructionin Progress
TheaterFurniture and
Equipment Other Equipment TotalCostBalances at January 1, 2019 P=9,701,004 P=5,857,110,497 P=2,987,546,446 P=1,063,841,909 P=4,660,858,499 P=14,579,058,355Additions 28,330,621 232,532,519 868,169,624 172,421,646 486,904,940 1,788,359,350Retirement/disposal (52,669) (1,914,060) – − (122,675,974) (124,642,703)Reclassifications (Notes 9 and 11) (698,241) 1,770,749,234 (1,692,137,809) − 155,551,154 233,464,338Balances at December 31, 2019 37,280,715 7,858,478,190 2,163,578,261 1,236,263,555 5,180,638,619 16,476,239,340
(Forward)
200

*SGVFSM006221*
December 31, 2019
LandImprovements
Buildings andImprovements
Constructionin Progress
TheaterFurniture and
Equipment Other Equipment TotalAccumulated DepreciationBalances at January 1, 2019 P=6,242,132 P=2,514,458,631 P=– P=835,707,509 P=3,378,506,011 P=6,734,914,283Depreciation (Notes 22 and 24) 2,711,138 282,754,871 – 92,855,166 508,593,901 886,915,076Retirement/disposal (52,669) (1,914,060) – − (114,836,326) (116,803,055)Reclassifications (Notes 9 and 11) (698,241) (47,493,744) – − 122,781,486 74,589,501Balances at December 31, 2019 8,202,360 2,747,805,698 – 928,562,675 3,895,045,072 7,579,615,805Net Book Value P=29,078,355 P=5,110,672,492 P=2,163,578,261 P=307,700,880 P=1,285,593,547 P=8,896,623,535
The construction in progress items reclassified to their respective asset accounts in 2020 and 2019amounted to nil and P=1,692 million, respectively. The reclassifications in 2019 represent a hotel inCebu. The remaining construction in progress represents new and expansion projects in various citiesin Metro Manila and other parts of Visayas and Mindanao regions. These normally take three (3) tofive (5) years to construct until completion.
As of December 31, 2020, the Group reclassified property and equipment to investment propertiesamounting to P=723 million including accumulated depreciation amounting to P=154 million(see Note 11).
Depreciation expense charged to operations amounted to P=829 million, P=887 million andP=757 million for the years ended December 31, 2020, 2019 and 2018, respectively (see Notes 22and 24).
Borrowing costs capitalized amounted to P=139 million, P=48 million and P=63 million for the yearsended December 31, 2020, 2019, 2018, respectively (see Note 16).
There are no property and equipment items as of December 31, 2020 and 2019 that are pledged assecurity to liabilities. The Group has no restrictions on the realizability of its property and equipment.Except for contracts awarded, there no contractual obligations to purchase, construct or developproperty and equipment or for repairs, maintenance and enhancements.
The total contractual commitments arising from awarded contracts for the acquisition, developmentand construction of property and equipment amounted to P=2,736 million and P=870 million as ofDecember 31, 2020 and 2019, respectively.
The Group performed impairment testing on its hotel property and equipment assets with a carryingvalue of P5,209 million as of December 31, 2020, by assessing the recoverable amount of cash-generating units based on a value in use (VIU) calculation using cash flow projections from financialbudgets approved by senior management covering a five-year period. The projected cash flows havebeen updated to reflect the demand for products and services, taking into consideration the impact ofthe coronavirus pandemic.
The significant assumptions used in the valuation are pre-tax discount rate of 8.791% and averagegrowth rate of 3.00% for cash flows beyond five years. Based on the impairment testing, there is noimpairment loss on the Group’s hotel property and equipment assets (see Note 5).
The calculation of value in use of the CGUs is most sensitive to the following assumptions: EBITDA margins Discount rate Growth rates used to extrapolate cash flows beyond the forecast period
201

*SGVFSM006221*
EBITDA MarginsEBITDA margins are based on average values achieved in one (1) to five (5) years preceding thebeginning of the budget period. These are increased over the budget period for anticipated efficiencyimprovements. A 28.0% to 50.0% EBITDA margin per annum was applied. A decreased demandcan lead to a decline in gross margin.
Discount RatesDiscount rates represent the current market assessment of the risks specific to each CGU, taking intoconsideration the time value of money and individual risks of the underlying assets that have not beenincorporated in the cash flow estimates. The discount rate calculation is based on the specificcircumstances of the Group and its operating segments and is derived from its weighted average costof capital (WACC). The WACC takes into account both debt and equity. The cost of equity isderived from the expected return on investment by the Group’s investors. The cost of debt is basedon the interest-bearing borrowings the Group is obliged to service. Segment-specific risk isincorporated by applying individual beta factors. The beta factors are evaluated annually based onpublicly available market data. Adjustments to the discount rate are made to factor in the specificamount and timing of the future tax flows in order to reflect a pre-tax discount rate.
Growth Rate EstimatesRates are based on published industry research. A reduction in the long-term growth rate wouldresult in impairment.
13. Other Noncurrent Assets
This account consists of:
2020 2019Advances to suppliers and contractors P=2,137,959,389 P=2,257,056,721Advances to land owners (Note 20) 3,745,307,951 1,886,052,753Utility deposits (Notes 31 and 32) 660,905,455 744,380,122Financial assets at fair value through OCI 129,718,939 91,674,297Others 301,320,468 154,375,470
P=6,975,212,202 P=5,133,539,363
Advances to suppliers and contractors represents prepayments for the construction of investmentproperties and property and equipment.
Advances to land owners consist of advance payments to land owners which shall be applied againstthe acquisition cost of the real estate properties.
Utility deposits that are refundable consist primarily of bill and meter deposits.
Financial assets at fair value through OCI represents equity shares of APVI that were retained by theGroup and equity shares of Data Analytics Ventures, Inc., both entities under the common control ofthe ultimate parent company.
202

*SGVFSM006221*
A summary of the movements follows:
2020 2019Beginning balance P=91,674,297 P=–Additions 24,000,000 91,674,297Fair value adjustment - other comprehensive income 14,044,642 –Ending balance P=129,718,939 P=91,674,297
The changes in the fair value (net of tax) in 2020, 2019 and 2018 amounted to P=14 million, nil andnil, respectively.
“Others” include refundable due diligence deposits. This also includes an upfront fee paid to theprovince of Malolos, Bulacan amounting P=100 million as of December 31, 2020 and 2019, in relationto the lease agreement executed in October 2018 for the lease of contiguous land situated at Brgy.Bulihan, City of Malolos, owned by the Province of Bulacan, pursuant to Proclamation No. 832 datedJuly 17, 2014. The project shall involve the lease of the project site and utilization thereof by theGroup for a mixed-use development.
The lease period of the project site shall be for 25 years commencing on the 3rd project year countedfrom the commencement of the Construction Date and terminating on the date 25 years thereafter.The lease shall be automatically renewed for another 25 years upon mutual agreement by the parties.The upfront fee will be offset against the rent due starting on the 1st year of operation of the ParentCompany in the said property. To date, the lease has not commenced.
14. Accounts Payable and Accrued Expenses
This account consists of:
2020 2019Accounts payable P=8,307,594,890 P=8,974,009,895Taxes and licenses payable 2,938,323,973 2,151,574,064Accrued rent expense 839,198,621 927,182,324Accrued interest payable 575,272,217 321,061,312Commissions payable 536,398,989 405,805,820Accrued contracted services 489,509,112 517,098,147Accrued salaries and wages 412,497,367 333,919,117Dividends payable 45,060,888 43,287,603Other accrued payable 720,468,340 681,106,048
P=14,864,324,397 P=14,355,044,330
Accounts payable mainly includes unpaid billings from suppliers and contractors related toconstruction activities which are non-interest bearing and are normally settled within 30-90 daysterm.
Taxes and licenses payable, accrued salaries and wages, accrued interest payable and accruedcontracted services are normally settled within one (1) year.
Accrued rent expense represents primarily accrual for film rentals.
203

*SGVFSM006221*
Commissions payable arises from obligations from contracts that qualified for revenue recognition.Consistent with the pattern of revenue recognition, the Group amortizes commission using thepercentage of completion method.
Other accrued payable includes accrued utilities and advertising expenses.
15. Contract Liabilities, Deposits and Other Current Liabilities
This account consists of:
2020 2019Contract liabilities (Notes 17 and 20) P=28,053,511,701 P=14,184,663,585Deposits from lessees (Note 17) 2,984,978,548 2,928,599,269Payable to affiliated companies (Note 20) 256,642,319 163,251,787Current portion of lease liabilities (Note 34) 37,296,745 36,016,214
P=31,332,429,313 P=17,312,530,855
Contract liabilities (including noncurrent portion shown in Note 17) consist of collections from realestate customers which have not reached the equity threshold to qualify for revenue recognition andexcess of collections over the goods and services transferred based on percentage of completion. Themovement in the contract liability is mainly due to reservation of sales and advance payment ofbuyers less real estate sales recognized upon reaching the equity threshold from increase inpercentage of completion.
The amount of revenue recognized from amounts included in contract liabilities at the beginning ofthe year amounted to P=10,459 million, P=4,045 million and P=1,663 million in 2020, 2019 and 2018,respectively.
Deposits from lessees (including noncurrent portion shown in Note 17) represent cash received inadvance equivalent to three (3) to six (6) month rent which shall be refunded to lessees at the end oflease term. These are initially recorded at fair value, which was obtained by discounting its futurecash flows using the applicable rates of similar types of instruments. The accretion expense on thesedeposits, recognized in “Accretion of security deposits” under “Cost of rental services”, amounted toP=82 million, P=76 million and P=73 million for the years ended December 31, 2020, 2019 and 2018,respectively (see Note 22).
Included in the “Deposits from lessees” are unearned rental income amounting to P=579 million andP=756 million as of December 31, 2020 and 2019, respectively. Amortization of unearned rentalincome included in “Rental income” amounted to P=80 million, P=83 million and P=97 million for theyears ended December 31, 2020, 2019 and 2018, respectively.
204

*SGVFSM006221*
16. Loans Payable
Short-term loans
As of December 31, 2020 and 2019, short-term loans amounted to nil and P=8,492 million. Details asfollows:
2019Short-term loan obtained from local banks that will mature in
January 2020. Interest rate is at 4.05% per annum. P=5,000,000,000Short-term loan obtained from local banks that will mature in
January 2020. Interest rate is at 4.10% per annum. 2,591,700,000Short-term loan obtained from a local bank that will mature in
January 2020. Interest rate is at 4.25% per annum. 900,000,000P=8,491,700,000
Peso-denominated short - term loans had a weighted average cost of 5.00% and 4.45% per annum in2020 and 2019, respectively.
Long-term loansDetails of the principal amount of the long-term loans follow:
2020 2019Seven-year bonds from BDO, HSBC, SB Capital, Standard
Chartered, DBP and East West maturing on February 23,2022. Principal payable upon maturity, with fixed rate at4.8000%, interest payable semi-annually in arrears P=10,635,500,000 P=10,635,500,000
Seven-year term loan from MBTC maturing on March 15, 2024.Principal payable in annual installment amounting to twopercent (2%) of the total drawn principal amount and thebalance upon maturity, with fixed rate at 4.7500%, interestpayable quarterly in arrears 6,720,000,000 6,860,000,000
Five-year term loan from BDO Unibank, Inc. maturing on July 8, 2021. Principal payable upon maturity, with fixed
rate at 3.8327%, interest payable quarterly in arrears. 6,500,000,000 6,500,000,000Seven-year term loan from BPI maturing on August 10, 2023.
Principal payable in annual installment amounting toP=10 million for six years and the balance upon maturity,with fixed rate at 3.8900%, interest payable quarterly inarrears. 4,960,000,000 4,970,000,000
Ten-year term loan from BPI maturing on February 13, 2027.Principal payable in annual installment amounting toP=5 million for nine years and the balance upon maturity,with fixed rate at 4.9500%, interest payable quarterly inarrears 4,485,000,000 4,490,000,000
Ten-year bonds from BDO and Standard Chartered maturing onFebruary 23, 2025. Principal payable upon maturity, withfixed rate at 4.9344%, interest payable semi-annually inarrears. 1,364,500,000 1,364,500,000
Five-year term loan from BDO Unibank, Inc. maturing on June30, 2025. Principal payable upon maturity, with fixed rateat 4.7500%, interest payable quarterly in arrears. 6,000,000,000 –
(Forward)
205

*SGVFSM006221*
2020 2019Three-year bonds maturing on July 17, 2023. Principal payable
upon maturity, with fixed rate at 3.6830%, interest payablesemi-annually in arrears. P=12,763,070,000 P=–
Five-year bonds maturing on July 17, 2025. Principal payableupon maturity, with fixed rate at 3.8000%, interest payablesemi-annually in arrears. 427,210,000 –
53,855,280,000 34,820,000,000Less debt issue costs 251,501,217 104,727,824Long-term loans net of debt issue costs 53,603,778,783 34,715,272,176Less current portion 6,655,000,000 155,000,000Noncurrent portion of long-term loans P=46,948,778,783 P=34,560,272,176
Debt issue costs are deferred and amortized using effective interest method over the term of therelated loans. Details are as follows:
Debt issue cost
2020 2019Beginning balance P=104,727,824 P=137,588,327Additions 209,317,145 –Amortizations (62,543,752) (32,860,503)Ending balance P=251,501,217 P=104,727,824
Total interest cost from short-term and long-term loans amounted to P=1,430 million, P=907 million andP=836 million for the years ended December 31, 2020, 2019 and 2018, respectively (see Note 26).
Capitalized borrowing costs amounted to P=868 million, P=852 million and P=934 million for the yearsended December 31, 2020, 2019 and 2018, respectively (see Notes 9, 11 and 12).
Seven-year bonds from BDO, HSBC, SB Capital, Standard Chartered, DBP, and East West maturingon February 23, 2022On February 23, 2015, the Group issued P=10,636 million bonds constituting direct, unconditional,unsubordinated, and unsecured obligations of the Parent Company and shall at all times rank paripassu and without preference among themselves and among any present and future unsubordinatedand unsecured obligations of the Parent Company, except for any statutory preference or priorityestablished under Philippine law. The net proceeds of the issue shall be used by the Parent Companyto refinance existing debt obligations and to partially fund investment capital expenditures.
Interest on the bonds shall be calculated on a 30/360-day count basis and shall be paid semi-annuallyin arrears on February 23 and August 23 of each year at which the bonds are outstanding.
Debt CovenantsThe Group is required to maintain a debt-to-equity ratio not exceeding 2:1 as referenced from itsconsolidated financial statements as of its fiscal year end September 30 and consolidated interimfinancial statements as at March 31. The Group has complied with the debt covenant as ofDecember 31, 2020 and 2019.
Seven-year term loan from Metropolitan Bank and Trust Company maturing on March 15, 2024On March 15, 2017, the Group borrowed unsecured P=7,000 million under Term Loan FacilityAgreements with Metropolitan Bank and Trust Company.
206

*SGVFSM006221*
The loan amounting to P=7,000 million was released on March 15, 2017 which bears interest rate at4.7500% per annum and shall be payable quarterly, computed on the basis of a year of 365 calendardays for the actual number of days elapsed. Annual principal payment is two percent (2%) of thetotal loan amount or P=140 million.
Debt CovenantsThe Group is required to maintain a ratio of consolidated total borrowings to consolidatedshareholders' equity not exceeding 2:1 as referenced from its consolidated audited financialstatements as of its calendar year end December 31 and the consolidated interim financial statementsas of March 31, June 30, and September 30. The Group has complied with the debt covenant as ofDecember 31, 2020 and 2019.
Five-year term loan from BDO Unibank, Inc. maturing on July 8, 2021On July 8, 2016, the Group borrowed unsecured P=6,500 million under Term Loan FacilityAgreements with BDO Unibank, Inc.
The loan was released on July 8, 2016 amounting to P=3,000 million and on September 27, 2016amounting to P=3,500 million with interest rate at 3.8327% per annum and shall be payable quarterly,computed on the basis of a year of 365 calendar days for the actual number of days elapsed.
Debt CovenantsThe Group is required to maintain a debt to equity ratio not exceeding 2:1. The Group has compliedwith the debt covenant as of December 31, 2020 and 2019.
Seven-year term loan from Bank of the Philippine Islands maturing on August 10, 2023On August 10, 2016, the Group borrowed unsecured P=5,000 million under Term Loan FacilityAgreements with Bank of the Philippine Islands.
Interest on the bonds shall be calculated on a 30/360-day count basis and shall be paid semi-annuallyin arrears on February 23 and August 23 of each year at which the bonds are outstanding.
Debt CovenantsThe Group is required to maintain a debt-to-equity not exceeding 2:1 as referenced from itsconsolidated audited financial statements as of its fiscal year end September 30 and consolidatedinterim financial statements as at March 31. The Group has complied with the debt covenant as ofDecember 31, 2020 and 2019.
Ten-year term loan from BPI maturing on February 13, 2027On February 10, 2017, the Group borrowed unsecured P=4,500 million under Term Loan FacilityAgreements with Bank of the Philippine Islands.
The loan was released on February 10, 2017 amounting to P=4,500 million with interest rate at4.9500% per annum and shall be payable quarterly, computed on the basis of a year of 365 calendardays for the actual number of days elapsed.
Partial payment for this loan amounting to P=5 million were made on February 13, 2019 and 2018.
Debt CovenantsThe Group is required to maintain a ratio of net debt-to-equity not exceeding 2:1 as measured at eachfiscal year-end date based on the audited consolidated financial statements. The Group has compliedwith the debt covenant as of December 31, 2020 and 2019.
207

*SGVFSM006221*
Ten-year bonds from BDO and Standard Chartered maturing on February 23, 2025On February 23, 2015, the Group issued P=1,365 million bonds constituting direct, unconditional,unsubordinated, and unsecured obligations of the Parent Company and shall at all times rank paripassu and without preference among themselves and among any present and future unsubordinatedand unsecured obligations of the Parent Company, except for any statutory preference or priorityestablished under Philippine law. The net proceeds of the issue shall be used by the Parent Companyto refinance existing debt obligations and to partially fund investment capital expenditures.
Interest on the bonds shall be calculated on a 30/360-day count basis and shall be paid semi-annuallyin arrears on February 23 and August 23 of each year at which the bonds are outstanding.
Debt CovenantsThe Group is required to maintain a debt-to-equity not exceeding 2:1 as referenced from itsconsolidated audited financial statements as of its fiscal year end September 30 and consolidatedinterim financial statements as at March 31. The Group has complied with the debt covenant as ofDecember 31, 2020 and 2019.
Five-year term loan from BDO Unibank, Inc. maturing on June 30, 2025On June 30, 2020, the Group borrowed P=6,000 million under Term Loan Facility Agreements withBDO Unibank, Inc.
The loan was released on June 30, 2020 which bears interest rate at 4.7500% computed per annumand shall be payable quarterly, computed on the basis of a year of 365 calendar days for the actualnumber of days elapsed.
Debt CovenantsThe Group is required to maintain a debt to equity ratio not exceeding 2:1. The Group has compliedwith the debt covenant as of December 31, 2020.
Three-year “Series C Bonds” maturing on July 17, 2023 and Five-Year “Series D Bonds” maturingon July 17, 2025.On July 17, 2020, the Group issued its “Series C Bonds” amounting to P=12,763 million and “Series DBonds” amounting to P=427 million constituting direct, unconditional, unsecured and unsubordinatedpeso-denominated obligations of the Parent Company and shall at all times rank pari passu andratably without any preference or priority amongst themselves and at least pari passu with all otherpresent and future unsubordinated and unsecured obligations of the Parent Company, other thanobligations preferred by law. The net proceeds of the issue shall be used by the Parent Company to:(i) partially fund the capital expenditure budget of the Company for calendar years 2020 and 2021;(ii) repay short-term loans maturing in the second half of calendar year; and (iii) fund generalcorporate purposes including, but not limited to, working capital. The bonds have been rated PRSAaa by Philippine Rating Services Corporation (PhilRatings) (Note 7).
Interest on the bonds shall be calculated on a 30/360-day count basis and shall be paid semi-annuallyin arrears on January 17 and July 17 of each year at which the bonds are outstanding.
Debt CovenantsThe Group is required to maintain a debt-to-equity ratio not exceeding 2:1 as referenced from itsconsolidated financial statements as of its calendar year end December 31 and consolidated interimfinancial statements as at June 30. The Group has complied with the debt covenant as ofDecember 31, 2020.
208

*SGVFSM006221*
Details of the Group’s loans payable by maturity follow:
Long-term loans
Within1 year >1 to 2 years >2 to 3 years >3 to 4 years >4 to 10 years Total
December 31, 2020 P=6,655,000,000 P=10,790,500,000 P=24,148,070,000 P=5,000,000 P=12,256,710,000 P=53,855,280,000December 31, 2019 P=155,000,000 P=6,655,000,000 P=10,790,500,000 P=5,085,000,000 P=12,134,500,000 P=34,820,000,000
17. Contract Liabilities, Deposits and Other Noncurrent Liabilities
This account consists of:
2020 2019Deposits from lessees (Note 15) P=3,263,657,716 P=3,171,544,926Lease liabilities - net of current portion (Note 34) 1,940,151,368 1,899,868,024Contract liabilities - net of current portion (Notes 15
and 20) 905,153,868 2,958,482,166Retentions payable 510,887,699 454,267,761Pension liabilities (Note 29) 666,282,219 361,239,256Advances for marketing and promotional fund 271,538,207 243,566,063Others 210,605,222 210,998,269
P=7,768,276,299 P=9,299,966,465
Retention payable are amounts withheld from payments to contractors which represents as guarantyfor any claims for defects in projects requiring rework. These are released after the guarantee period.These are noninterest-bearing and will be remitted to contractors at the end of the contracted work.
Advances for marketing and promotional fund represents advances from tenants for sales promotionsand marketing programs. These are tenant’s share in the costs of advertising and promotionalactivities which the Group considers appropriate to promote the business in the mall complex.
Others include payable to the non-controlling interests of the Parent Company’s subsidiaries.
18. Retained Earnings
After reconciling items, the declarable dividend of the Parent Company amounted toP=31,479 million and P=27,670 million as of December 31, 2020 and 2019, respectively.
RestrictionA portion of the unappropriated retained earnings representing the undistributed net earnings ofsubsidiaries amounting to P=3,625 million and P=3,252 million as of December 31, 2020 and 2019,respectively, are not available for dividend declaration by the Parent Company until received in theform of dividends.
Also, retained earnings amounting to P=26,000 million and P=27,000 million as of December 31, 2020and 2019 were appropriated for future and ongoing expansions and are not available for dividendsdeclaration.
209

*SGVFSM006221*
Dividends declared
Cash dividendsThe BOD declared cash dividends in favor of all its stockholders for the years endedDecember 31, 2020, 2019 and 2018 as follows:
December 31, 2020 December 31, 2019 December 31, 2018Date of declaration May 13, 2020 May 29, 2019 April 6, 2018
Date of paymentJuly 13, 2020,
October 27, 2020 July 12, 2019 May 23, 2018
Ex-dividend dateJune 10, 2020,
October 1, 2020 June 18, 2019 April 26, 2018
Dividend per shareP=0.25,P=0.25 P=0.50 P=0.36
Total dividends P=2,596,915,343 P=2,596,915,343 P=1,869,779,047
Property dividendOn July 31, 2019, the BOD of the Parent Company approved the declaration of property dividend inthe form of its shares in APVI (see Note 2).
AppropriationOn December 10, 2020, the BOD approved the reversal of the retained earnings it appropriated in2019 amounting to P=27,000 million as the related projects to which the retained earnings wereearmarked were completed already. The amount was originally earmarked for the continuing capitalexpenditures of the Group for subdivision land, condominium and residential units for sale,investment properties and property and equipment.
On the same date, the BOD also approved the appropriation of P=26,000 million, out of theunappropriated retained earnings, to support the capital expenditure requirements of the Group forvarious projects. These projects and acquisitions are expected to be completed on various dates from2021 to 2026.
On December 9, 2019, the BOD approved the reversal of the retained earnings it appropriated in 2018amounting to P=27,000 million as the related projects to which the retained earnings were earmarkedwere completed already. The amount was originally earmarked for the continuing capitalexpenditures of the Group for subdivision land, condominium and residential units for sale,investment properties and property and equipment.
On the same date, the BOD also approved the appropriation of P=27,000 million, out of theunappropriated retained earnings, to support the capital expenditure requirements of the Group forvarious projects. These projects and acquisitions are expected to be completed on various dates from2020 to 2024.
On December 14, 2018, the BOD approved the reversal of the retained earnings it appropriated in2017 amounting to P=24,500 million as the related projects to which the retained earnings wereearmarked were completed already. The amount was originally earmarked for the continuing capitalexpenditures of the Group for subdivision land, condominium and residential units for sale,investment properties and property and equipment.
210

*SGVFSM006221*
On the same date, the BOD also approved the appropriation of P=27,000 million, out of theunappropriated retained earnings, to support the capital expenditure requirements of the Group forvarious projects approved by the Executive Committee during meetings held in September 2016.These projects and acquisitions are expected to be completed on various dates from 2019 to 2023.
19. Capital Stock and Other Equity Reserve
The details of the number of common shares as of December 31, 2020 and 2019 follow:
December 31, 2020 December 31, 2019Shares Amount Shares Amount
Authorized - at P=1 par value 8,200,000,000 P=8,200,000,000 8,200,000,000 P=8,200,000,000Issued and outstanding
common shares 5,193,830,685 P=5,193,830,685 5,193,830,685 P=5,193,830,685
Below is the summary of the Parent Company’s track record of registration of securities with theSEC as of December 31, 2020:
Number of sharesregistered
Issue/offer price Date of SEC approval
Number of holders of
securities as ofyear end
Balance before Initial public offering 300,000,000Initial public offering 200,000,000 P=1.00/share February 10, 1989Increase in offer price P=5.81/share June 3, 1989Add:
1:1 stock rights offering 500,000,000 P=2.50/share March 15, 199120% stock dividend 200,000,000 P=1.00/share June 16, 19931:2 stock rights offering 600,000,000 P=2.50/share March 21, 1995
Exchange for shares of JGSHI(1)
in MMHLC(2) and in RII(3) 496,918,457 April 3, 19971:2 new share offering 450,000,000 P=12.00/share September 25, 2006
1:2 stock rights offering 1,364,610,228 P=10.00/share May 17, 2011December 31, 2017 4,111,528,685 1,066Add: Stock rights offering 1,082,302,000 P=18.20/share February 8, 2018 (5)December 31, 2018 5,193,830,685 1,061Add (deduct) movement – (13)December 31, 2019 5,193,830,685 1,048Add (deduct) movement – 4December 31, 2020 5,193,830,685 1,052
(1) JGSHI - JG Summit Holdings, Inc.(2) MMHLC - Manila Midtown Hotels and Land Corporation(3) RII - Robinson’s Inn Inc.
Stock rights offeringOn November 13, 2017, the BOD of the Parent Company approved in principle the stock rightsoffering (SRO) of up to P=20 billion composed of 1.1 billion common shares, with a par value ofP=1.00 per share, to all stockholders as of record date January 31, 2018. The Parent Company intendsto use the proceeds from the SRO to finance the acquisition of land located in various parts of thecountry for all its business segments.
211

*SGVFSM006221*
The Parent Company obtained the approval of the BOD of the Philippine Stock Exchange, Inc. (PSE)for the listing and trading of the rights shares on January 10, 2018, while the PSE’s confirmation ofexempt transaction covering the SRO was obtained on December 14, 2017. The following are thekey dates of the SRO: Pricing date - January 24, 2018 Ex-date - January 26, 2018 Record date - January 31, 2018 Offer period - February 2 to 8, 2018 Listing date - February 15, 2018
The Parent Company successfully completed its P=20 billion SRO of common shares following theclose of the offer period on February 8, 2018. A total of 1.1 billion common shares from the SROwere issued at a price of P=18.20 each. The listing of the shares occurred on February 15, 2018.
Capital ManagementThe primary objective of the Group’s capital management is to ensure that it maintains healthy capitalratios in order to support its business and maximize shareholder value. The Group manages itscapital structure and make adjustments to these ratios in light of changes in economic conditions andthe risk characteristics of its activities. In order to maintain or adjust the capital structure, the Groupmay adjust the amount of dividend payment to shareholders, return capital structure or issue capitalsecurities. No changes have been made in the objective, policies and processes as they have beenapplied in previous years.
The Group monitors its use of capital structure using a debt-to-capital ratio which is gross debtdivided by total equity. The Group includes within gross debt all interest-bearing loans andborrowings, while capital represents total equity attributable to the equity holders of the ParentCompany. Following is a computation of the Group’s debt-to-capital ratio as of December 31, 2020and 2019.
2020 2019(a) Loans payable (Note 16) P=53,603,778,783 P= 43,206,972,176(b) Capital 101,839,321,911 P=99,508,809,473(c) Debt-to-capital ratio (a/b) 0.53:1 0.43:1
As of December 31, 2020 and 2019, the Group is compliant with its debt covenants with lenders.
Other Equity ReserveOn March 6, 2013, the Parent Company acquired the remaining 20% non-controlling interest inAPVI, increasing its ownership interest from 80% to 100%. Cash consideration of P=198 million waspaid to the non-controlling shareholders. The total carrying value of the net assets of APVI at thedate of acquisition was P=578 million, and the 20% equivalent of the carrying value of the remainingnon-controlling interest acquired was P=111 million. The difference of P=88 million between theconsideration and the carrying value of the interest acquired was booked in “Other equity reserve”account within equity.
On July 31, 2019, the Board of Directors of the Parent Company approved the declaration of aproperty dividend consisting of up to 100 million common shares of APVI with a par value of OnePeso (Php1.00) per share to all eligible stockholders as of record date of August 15, 2019. Upondeconsolidation of APVI, the “Other equity reserve” was transferred to retained earnings in 2019(see Note 2).
212

*SGVFSM006221*
Stock issuance costIn 2020, BRFLC issued 200,000 additional common shares from its registered share capital of10,000,000 common shares at a par of P=100 per share, 70% of which or 140,000 common shares wassubscribed and paid up by the Parent Company.
20. Related Party Transactions
Related party transactions are made under the normal course of business. Parties are considered to berelated if one party has the ability, directly or indirectly, to control the other party or exercisesignificant influence over the other party in making financial and operating decisions; and the partiesare subject to common control or common significant influence. Affiliates are entities that are ownedand controlled by the ultimate parent company and neither a subsidiary or associate of the Group.These affiliates are effectively sister companies of the Group by virtue of ownership of the ultimateparent company. Related parties may be individuals or corporate entities. Transactions are generallysettled in cash, unless otherwise stated.
The amounts and balances arising from significant related party transactions are as follows:
December 31, 2020Amount/Volume
Receivable(Payable) Terms Conditions
Ultimate Parent CompanyRental income/receivable (a) P=79,100,497 P=73,384,001 Three to five-year lease terms at
prevailing market lease rates; renewable at the end of lease
term
Unsecured; noimpairment
Payable to affiliated companies (g) 28,392,644 (130,244,412) Non-interest bearing;due and demandable
Unsecured
Under common control of Ultimate Parent Company
Cash and cash equivalents (c)Cash in banks (739,506,924) 455,186,315 Interest bearing at prevailing
market rate; at 0.20% to0.25% per annum; due and
demandable
Unsecured;no impairment
Short-term investments 1,093,000,267 1,093,000,267 Interest bearing at prevailingmarket rate; at 0.375% to
1.25% per annum; due anddemandable
Unsecured; noimpairment
Interest income 8,225,042 1,588,149Rental income/receivable (a) 2,024,233,627 188,601,404 Three to 20-year lease terms at
prevailing market lease rates; renewable at the end of lease term
Unsecured; noimpairment
Advances to (b) 4,532,524 29,848,891 Non-interest bearing;due and demandable
Unsecured; noimpairment
Payable to affiliated companies (g) 64,997,888 (126,397,907) Non-interest bearing;due and demandable
Unsecured
Joint ventures in which the Parent Company is a venturer
Advances to (b) (330,000,000) 1,000,000,000 Interest-bearing at PDST R2 ofapplicable interest period
Unsecured;no impairment
Sale of land - contract liabilities(d)
− (2,705,550,000) Non-interest bearing;due in one year
Unsecured;no impairment
Sale of land - installment contractreceivables (e)
− 2,005,960,000 Interest bearing at 4%interest rate; with remaining
2 annual installments
Unsecured;no impairment
Elimination of excess of gainon sale against investmentin joint venture - contractliabilities (e)
− (895,520,498)
(Forward)
213

*SGVFSM006221*
December 31, 2020Amount/Volume
Receivable(Payable) Terms Conditions
Interest income from sale of land - installment contractreceivables (e)
P=101,099,160 P=101,099,160
Elimination of excess ofinterest income againstinvestment in joint venture- contract liabilities (e)
50,549,580 (50,549,580)
Other related partiesAdvances to lot owners (f) 100,977 375,376,524 Non-interest bearing; due and
demandableUnsecured;
no impairmentP=1,415,782,314
December 31, 2019Amount/Volume
Receivable (Payable) Terms Conditions
Ultimate Parent CompanyRental income/receivable (a) P=115,670,106 P=4,495,516 Three to five-year lease terms at
prevailing market lease rates; renewable at the end of lease term
Unsecured;no impairment
Payable to affiliated companies (g) (99,461,639) (101,851,768) Non-interest bearing;due and demandable
Unsecured
Under common control of Ultimate Parent Company
Cash and cash equivalents (c)Cash in banks 382,884570 1,194,693,239 Interest bearing at prevailing
market rate; at 1.00% to 1.13%per annum due and demandable
Unsecured;no impairment
Short-term investments 721,650,328 721,650,328 Interest bearing at prevailingmarket rate; at 1.13% to 3.50%per annum due and demandable
Unsecured;no impairment
Interest income 15,666,957 229,557Rental income/receivable (a) 2,881,473,517 119,716,903 Three to twenty year lease terms at
prevailing market lease rate;renewable at the end of lease term
Unsecured;no impairment
Advances to (b) 7,680,843 25,316,367 Non-interest bearing;due and demandable
Unsecured;no impairment
Payables to affiliated companies(g)
30,912,648 (61,400,019) Non-interest bearing;due and demandable
Unsecured
Joint ventures in which the Parent Company is a venturer
Advances to (b) 1,140,000,000 1,330,000,000 Interest-bearing at PDST R2 ofapplicable interest period
Unsecured;no impairment
Sale of land (d)
Cost of land sold
217,380,000
(80,087,427)
−
−
Non-interest bearing Unsecured;no impairment
Sale of land - contract liabilities(d)
− (2,705,550,000) Non-interest bearing;due in one year
Unsecured;no impairment
Sale of land - installment contractreceivables (e)
− 3,008,940,000 Interest bearing at 4% interest rate;with remaining
3 annual installments
Unsecured;no impairment
Elimination of excess of gainon sale against investmentin joint venture - contractliabilities (e)
− (1,003,834,662)
Interest income from sale ofland - installment contractreceivables (e)
141,959,070 141,959,070
Elimination of excess ofinterest income againstinvestment in joint venture- contract liabilities (e)
70,979,535 (70,979,535)
Other related partiesAdvances to lot owners (f) 77,439,650 375,275,547 Non-interest bearing; due and
demandableUnsecured;
no impairmentP=2,978,660,543
214

*SGVFSM006221*
Outstanding balances consist of the following:
2020 2019Cash and cash equivalents (Note 7) P=1,548,186,582 P=1,916,343,567Advances to affiliated companies (Note 8) 1,029,848,891 1,355,316,367Advances to lot owners (Note 13) 375,376,524 375,275,547Rental receivables (Note 8) 261,985,405 124,212,419Others (Note 8) 1,588,149 229,557Installment contract receivables (Note 8) 2,107,059,160 3,150,899,070Contract liabilities (Note 17) (3,651,620,078) (3,780,364,197)Payable to affiliated companies (Note 15) (256,642,319) (163,251,787)
P=1,415,782,314 P=2,978,660,543
Significant transactions with related parties are as follows:
(a) Rental incomeThe Group leases commercial properties to affiliated companies with a lease term of three (3) to20 years based on prevailing market lease rates.
(b) Advances to affiliated companiesThe Group, in the normal course of business, has transactions with its major stockholders,ultimate parent company and its affiliated companies consisting principally of lease arrangementsand advances principally for working capital requirement, financing for real estate development,and purchase of investment properties.
On June 13, 2019, the Parent Company has made advances to SRPI amounting to P=1,000 millionin accordance with the joint venture agreement. The advances remain outstanding as ofDecember 31, 2020.
In October 2018, the Parent Company entered a Loan Agreement with RHK Land Corporation, ajoint venture with Hong Kong Land Group, to make available a loan facility amounting toP=1,400 million. As of December 31, 2019, total drawdown from this credit facility amounting toP=330 million has been fully paid in 2020.
In 2020 and 2019, the Parent Company has also made advances to other affiliates amounting toP=30 million and P=25 million, respectively.
The total interest in 2020 and 2019 amounted to P=13 million and P=19 million, respectively.
(c) Cash and cash equivalentsThe Group maintains savings and current accounts and time deposits with an entity undercommon control which is a local commercial bank. Cash and cash equivalents earn interest at theprevailing bank deposit rates.
(d) Sale of Land – RHK Land CorporationIn 2018, the Parent Company also entered into a contract to sell a parcel of land located withinthe Bridgetowne Complex in Pasig City with RHK Land Corporation. Total selling price of theland is P=2,706 million (net of value added tax) which was fully paid as of December 31, 2018 andpresented as contract liabilities, deposits and other current liabilities in consolidated statement offinancial position.
215

*SGVFSM006221*
(e) Sale of Land – Shang Robinsons Properties, Inc.In June 2018, the Parent Company entered into a contract to sell two (2) adjoining parcels of landlocated at Bonifacio, Global City Taguig, with Shang Robinsons Properties Inc. (SRPI), a jointventure with Shang Properties, Inc. (SPI). Total selling price is P=5,015 million (net of valueadded tax) and shall be payable in five (5) annual installments, with interest at a rate of 4% perannum on the unpaid amount of the purchase price. Out of the amount of selling price and cost ofland, P=2,507 million and P=398 million were recognized in real estate sales and cost of real estatesales, respectively. These amounts represent the portion sold to SPI by virtue of its 50%ownership in SRPI. The remaining 50% will be recognized as the SRPI starts to sell to itscustomers. In 2020 and 2019, the Parent Company realized P=66 million and P=26 million fromthis deferred gain, respectively. As of December 31, 2020 and 2019, deferred gain on sale of landof P=1,277 million and P=1,079 million was presented against the carrying value of the investmentin SRPI for financial statement presentation purposes. In addition, P=896 million andP=1,113 million is currently presented under “Contract liabilities, deposits and other noncurrentliabilities” as of December 31, 2020 and 2019, respectively (see Note 30). Outstanding balancefor the purchase price amounted to P=2,006 million presented under installment contractreceivables while interest from the said receivable amounted to P=51 million and P=71 million as ofDecember 31, 2020 and 2019, respectively.
(f) Advances to lot ownersIn 2020 and 2019, the Parent Company made advances to BRFLC’s stockholder amounting toP=0.10 million and P=77 million, respectively, for the purchase of parcels of land. The totalremaining outstanding balances as of December 31, 2020 and 2019 amounted to P=375 million.
(g) Payable to affiliated companiesThe Group, in the normal course of business, has transactions with Ultimate Parent Company andits affiliated companies consisting primarily of administrative and support services.
Terms and conditions of transactions with related partiesThere have been no guarantees provided or received for any related party receivables or payables.The Group has not recognized any impairment losses on amounts receivables from related parties forthe years ended December 31, 2020, 2019 and 2018. This assessment is undertaken each financialyear through a review of the financial position of the related party and the market in which the relatedparty operates.
Compensation of key management personnel by benefit type follows:
2020 2019 2018Short-term employee benefits P=1,255,883,031 P=1,236,991,433 P=971,417,842Post-employment benefits 74,512,772 86,267,912 61,807,906
P=1,330,395,803 P=1,323,259,345 P=1,033,225,748
There are no other arrangements between the Group and any of its directors and key officersproviding for benefits upon termination of employment, except for such benefits to which they maybe entitled under the Group’s pension plan.
Approval requirements and limits on the amount and extent of related party transactionsMaterial related party transactions (MRPT) refers to any related party transactions, eitherindividually, or in aggregate over a twelve (12)–month period with the same related party, amountingto ten percent (10%) or higher of the Group’s total consolidated assets based on its latest auditedfinancial statements.
216

*SGVFSM006221*
All individual MRPTs shall be approved by at least two-thirds (2/3) vote of the BOD, with at least amajority of the Independent Directors voting to approve the MRPT. In case that a majority of theIndependent Directors’ vote is not secured, the MRPT may be ratified by the vote of the stockholdersrepresenting at least two thirds (2/3) of the outstanding capital stock.
Aggregate RPT transactions within a 12-month period that meets or breaches the materialitythreshold shall require the same Board approval in letter (d) above.
21. Revenue
The Group derives revenue from the transfer of goods and services over time and at a point in time,respectively, in different product types. The Group’s disaggregation of each sources of revenue fromcontracts with customers are presented below:
2020 2019 2018Revenue from contracts with
customersRecognized over time
Residential development P=11,717,577,404 P=8,708,003,578 P=8,345,617,524Recognized at a point in time
Industrial and integrateddevelopments 132,606,872 320,940,495 2,546,767,437
Hotels and resorts 1,083,317,112 2,432,639,988 1,982,137,914Amusement income 218,910,438 2,151,785,393 1,972,527,785
1,434,834,422 4,905,365,876 6,501,433,136Total revenue from contracts with
customers P=13,152,411,826 P=13,613,369,454 P=14,847,050,660Rental income 10,617,088,269 15,420,499,255 13,548,204,208Other income 1,635,326,439 1,549,966,856 1,163,227,782
P=25,404,826,534 P=30,583,835,565 P=29,558,482,650
Performance obligationsInformation about the Group’s performance obligations are summarized below:
Real estate salesThe Group entered into contracts to sell with one identified performance obligation which is the saleof the real estate unit together with the services to transfer the title to the buyer upon full payment ofcontract price. The amount of consideration indicated in the contract to sell is fixed and has novariable consideration.
The sale of real estate unit may cover either the (i) commercial lot; (ii) serviced lot; (iii) serviced lotand house; and (iv) condominium unit. The Group concluded that there is one performanceobligation in each of these contracts. The Group recognizes revenue from the sale of these real estateprojects under pre-completed contract over time during the course of the construction.
Payment commences upon signing of the contract to sell and the consideration is payable in cash orunder various financing schemes entered with the customer. The amount due for collection under theamortization schedule for each of the customer does not necessarily coincide with the progress ofconstruction, which results to either a receivable or contract liability.
217

*SGVFSM006221*
After the delivery of the completed real estate unit, the Group provides one-year warranty to repairminor defects on the delivered serviced lot and house and condominium unit. This is assessed by theGroup as a quality assurance warranty and not treated as a separate performance obligation.
The transaction price allocated to the remaining performance obligations (unsatisfied or partiallysatisfied) as at December 31 are as follows:
2020 2019Within one year P=27,843,679,129 P=14,184,663,585More than one year 905,153,868 2,958,482,166
P=28,748,832,997 P=17,143,145,751
The remaining performance obligations expected to be recognized within one year and in more thanone year relate to the continuous development of the Group’s real estate projects. The Group’scondominium units are completed within three years and five years from start of construction whileserviced lots and serviced lots and house are expected to be completed within two to three years fromstart of development.
Residential development
Type of Product 2020 2019 2018Residences P=10,684,921,537 P=7,693,160,488 P=7,460,955,561Homes 1,032,655,867 1,014,843,090 884,661,963
P=11,717,577,404 P=8,708,003,578 P=8,345,617,524
All of the Group’s real estate sales from residential development are revenue from contracts withcustomers recognized over time.
Real estate sales include interest income from installment contract receivables amounting toP=779 million, P=323 million and P=942 million for the years ended December 31, 2020, 2019 and 2018.These are also recognized over time.
Industrial and integrated developments
The real estate revenues amounting to P=132 million and P=321 million in 2020 and 2019, respectively,pertain to the sale of parcels of land which were recognized at a point in time.
Hotels and resorts
Type of Product 2020 2019 2018Rooms P=769,884,612 P=1,604,880,400 P=1,312,576,731Food and beverage 234,081,453 724,881,634 593,105,042Franchise revenue 16,855,546 27,137,473 16,819,902Others 62,495,501 75,740,481 59,636,239
P=1,083,317,112 P=2,432,639,988 P=1,982,137,914
The Group’s revenue from hotels and resorts is attributed to the operations from the development andmanagement of hotels and resorts. In view of the continuing community quarantines and restrictedtravel, the Group’s hotels and resorts segment continues to be adversely affected by the lower numberof guests and reduced room rates, both of which have significantly impacted the revenues reported
218

*SGVFSM006221*
under this segment. Also, many restaurants remain closed or allowed limited operations whichimpacted the food and beverage revenues of the segment.
Rental IncomeIn line with the rental relief framework implemented by the government to support businesses and thebroader economy due to the impact of COVID-19, the Group waived its right to collect rent and othercharges as part of various lease concessions it granted to lessees such as lease payment holidays orlease payment reductions. Rent discounts and concessions given vary for merchants that are (1)forced to close and (2) those that are still operational. Rental fees and common charges of merchantswho were forced to close during the quarantine period were waived.
Costs to obtain contractThe balances below pertain to the costs to obtain contract presented in the consolidated financialstatements.
2020 2019Balance at beginning of year P=230,171,138 P=283,276,408Additions 654,107,757 609,096,655Amortization (Note 23) (769,766,175) (662,201,925)Balance at end of year P=114,512,720 P=230,171,138
22. Costs
This account consists of:
2020 2019 2018Real Estate Operations Cost of Rental Services Depreciation (Note 24) P=4,766,938,604 P=4,607,173,026 P=4,208,494,869 Property operations and
maintenance costs (Note 11) 491,977,798 680,456,641 791,291,480 Accretion of security deposits
(Notes 15 and 26) 81,719,528 76,293,508 72,906,0975,340,635,930 5,363,923,175 5,072,692,446
Cost of Real Estate Sales(Note 9) 6,161,235,541 4,235,325,163 4,931,427,825
Cost of Amusement Services Film rentals expense 92,678,800 956,468,868 906,006,116 Others Contracted services 300,103,610 448,170,471 363,415,700 Others 80,129,770 1,110,670,362 838,169,402
380,233,380 1,558,840,833 1,201,585,10211,974,783,651 12,114,558,039 12,111,711,489
Hotel Operations Cost of Room Services Property operations and maintenance
costs 279,461,422 454,239,278 425,605,463 Depreciation (Note 24) 417,760,276 359,372,389 248,237,776
697,221,698 813,611,667 673,843,239 Cost of Food and Beverage 116,701,743 380,535,302 320,069,980 Others Salaries and wages (Note 25) 186,866,971 227,866,865 97,141,168 Contracted services 76,155,650 162,308,423 85,818,160 Management fees 7,475,302 27,473,180 73,189,792
(Forward)
219

*SGVFSM006221*
2020 2019 2018 Supplies P=29,247,821 P=60,043,442 P=37,493,390 Commission 15,343,086 54,021,163 15,255,321 Others 218,761,806 363,728,219 254,069,725
533,850,636 895,441,292 562,967,5561,347,774,077 2,089,588,261 1,556,880,775
P=13,322,557,728 P=14,204,146,300 P=13,668,592,264
Others under costs of real estate operations and hotel operations include expenses for utilities andother overhead expenses.
23. General and Administrative Expenses
2020 2019 2018Salaries and wages (Notes 20, 25 and 29) P=1,143,528,832 P=1,095,392,480 P=936,084,580Commission 790,062,423 807,360,809 800,153,709Taxes and licenses 660,794,393 871,343,597 732,215,601Advertising and promotions 311,495,096 610,213,348 655,239,141Association dues 148,662,981 235,682,979 117,117,754Insurance 135,467,549 152,723,079 132,096,341Light, water and communication 91,169,163 89,871,012 97,834,528Supplies 39,668,479 97,689,379 104,142,986Travel and transportation 21,746,328 53,522,483 77,071,904Rent (Note 34) 14,022,060 16,184,587 245,990,220Entertainment, amusement and recreation 8,578,646 16,030,117 18,231,929Others 223,207,805 50,779,530 80,174,176
P=3,588,403,755 P=4,096,793,400 P=3,996,352,869
Others include provision for impairment losses amounting P=180 million (Note 8). Others also includelegal fees, audit fees, consultant fees, bank charges and other professional fees.
24. Depreciation
2020 2019 2018Real estate (Notes 11, 12, 22 and 34)
Depreciation P=4,707,136,675 P=4,550,908,737 P=4,208,494,869Amortization of ROU asset (Note 34) 59,801,929 56,264,289 −
Hotel operations (Notes 12 and 22)Depreciation 417,760,276 359,372,389 248,237,776
P=5,184,698,880 P=4,966,545,415 P=4,456,732,645
25. Personnel Expenses
Personnel expenses consist of:
2020 2019 2018Salaries, wages and other staff costs P=1,182,405,179 P=1,162,639,446 P=917,284,253Pension expense (Note 29) 74,512,772 86,267,912 61,807,906SSS contributions, PAG-IBIG contributions,
premiums and others 73,477,852 74,351,987 54,133,589P=1,330,395,803 P=1,323,259,345 P=1,033,225,748
220

*SGVFSM006221*
The above amounts are distributed as follows:
2020 2019 2018General and administrative (Note 23) P=1,143,528,832 P=1,095,392,480 P=936,084,580Hotel operations (Note 22) 186,866,971 227,866,865 97,141,168
P=1,330,395,803 P=1,323,259,345 P=1,033,225,748
26. Other Income, Interest Income, Interest Expense and Finance Charges
Interest income consists of:
2020 2019 2018Interest income: Cash and cash equivalents
(Note 7) P=239,358,482 P=287,417,657 P=156,969,192Interest income from installment
contract receivable - recognizedunder real estate sales (Note 21) 779,097,282 322,778,964 981,619,432
P=1,018,455,764 P=610,196,621 P=1,138,588,624
Interest expense consists of (Notes 16, 17 and 34):
2020 2019 2018Loans payable (Note 16) P=1,429,987,739 P=907,257,726 P=836,112,262Lease liabilities (Note 34) 147,011,090 145,565,692 −Accretion on deposits – recognized
under cost of rental services(Notes 15 and 22) 81,719,528 76,293,508 72,906,097
P=1,658,718,357 P=1,129,116,926 P=909,018,359
Capitalized borrowing costs for the years ended December 31, 2020, 2019 and 2018 are discussed inNotes 9, 11, 12 and 16.
27. Income Tax
The Group’s provision for income tax includes the regular corporate income tax (RCIT), minimumcorporate income tax (MCIT) and final tax paid at the rate of 20% for peso deposits and 7.50% forforeign currency deposits which are final withholding tax on gross interest income. Details follow:
2020 2019 2018Current
RCIT P=1,224,090,815 P=2,249,459,433 P=2,305,197,006Final tax 22,422,405 22,710,178 14,307,463MCIT 2,002,924 4,699,110 403,217
1,248,516,144 2,276,868,721 2,319,907,686Deferred 498,383,741 537,305,284 699,159,325
P=1,746,899,885 P=2,814,174,005 P=3,019,067,011
221

*SGVFSM006221*
The reconciliation of statutory income tax rate to the effective income tax rate follows:
2020 2019 2018Statutory income tax rate 30.00% 30.00% 30.00%Reductions in income tax resulting from: Interest income subjected to
final tax (0.08) (0.33) (0.41)Tax exempt real estate sales (0.16) (0.19) (0.22)Income subjected to BOI, PEZA and
lower tax (4.83) (5.03) (2.52)Effective income tax rate 24.93% 24.45% 26.85%
Deferred taxes as of December 31, 2020 and 2019 relate to the tax effects of the following:
2020 2019Deferred tax assets:
Lease liabilities P=593,234,434 P=580,765,271Pension liabilities 207,932,398 126,926,589Accrued interest expense 151,140,202 126,624,344Allowance for impairment loss 68,309,782 14,302,980Accrued commissions 81,530,380 13,103,724Unrealized foreign exchange 14,541,400 –MCIT 10,993,747 10,782,821
1,127,682,343 872,505,729Deferred tax liabilities: Excess of real estate revenue based on
percentage-of-completion over real estaterevenue based on tax rules (2,830,010,602) (2,324,264,799)
Unamortized capitalized interest expense (1,963,663,525) (1,913,922,879)Accrued rent income (690,795,632) (579,446,575)Right-of-use assets (333,690,830) (351,520,199)Unamortized debt issuance cost (78,275,956) (34,243,938)Fair value reserve of financial assets at FVOCI (22,267,741) (37,215,115)
(5,918,704,286) (5,240,613,505)Net deferred tax liabilities (P=4,791,021,943) (P=4,368,107,776)
Benefit for deferred tax relating to remeasurements of defined benefit liability recognized directly inequity amounted to P=61 million for the year ended December 31, 2020. Provision for deferred taxrelating to remeasurements of defined benefit liability recognized directly in equity amounted toP=15 million and P=12 million for the years ended December 31, 2019 and 2018, respectively.
The Group has deductible temporary difference that is available for offset against taxable income ortax payable for which deferred tax asset has not been recognized. This deductible temporarydifference with no deferred tax assets recognized in the consolidated financial statements pertains toNOLCO of subsidiaries amounting to P=9 million as of December 31, 2020 and 2019. The deferredtax assets of the above deductible temporary differences for which no deferred tax assets have beenrecognized amounted to P=3 million as of December 31, 2020 and 2019.
Bayanihan to Recover as One ActRepublic Act No. 11494 or the Bayanihan to Recover as One Act was signed into law onSeptember 11, 2020. Pursuant to Revenue Regulations No. 25-2020 implementing relevantprovisions of the Bayanihan to Recover as One Act relative to Net Operating Loss Carry-Over
222

*SGVFSM006221*
(NOLCO), unless otherwise disqualified from claiming the deduction, the business or enterprisewhich incurred net operating loss for taxable years 2020 and 2021 shall be allowed to carry over thesame as a deduction from its gross income for the next five (5) consecutive taxable years immediatelyfollowing the year of such loss. The net operating loss for said taxable years may be carried over as adeduction even after the expiration of the Bayanihan to Recover as One Act, provided the same areclaimed within the next five (5) consecutive taxable years immediately following the year of suchloss.
Details of NOLCO incurred for taxable year 2020 which are available for offset against future taxableincome over a period of five (5) years are as follows:
Year incurred Amount Expired/Applied Balance Expiry Date2020 P=150,926 P=– P=150,926 December 31, 2025
As of December 31, 2020, the details of NOLCO incurred for taxable years prior to 2020 which areavailable for offset against future taxable income over a period of three (3) years are as follows:
Year incurred Amount Expired/Applied Balance Expiry Date2019 P=8,613,865 P=– P=8,613,865 December 31, 20222017 517,845 517,845 – December 31, 2020
P=9,131,710 P=517,845 P=8,613,865
MCIT that can be used as deductions against income tax liabilities are as follows:
Year incurred Amount Expired/Applied Balance Expiry Date2020 P=2,002,924 P=– P=2,002,924 December 31, 20232019 4,699,110 – 4,699,110 December 31, 20222018 403,217 – 403,217 December 31, 20212017 315,448 315,448 – December 31, 2020
P=7,420,699 P=315,448 P=7,105,251
Movement in NOLCO and MCIT follows:
NOLCO 2020 2019Beginning balances P=9,131,710 P=2,854,754Additions 150,926 8,613,865Expirations (517,845) (2,336,909)Ending balances P=8,764,791 P=9,131,710
MCIT 2020 2019Beginning balances P=5,417,775 P=1,009,765Additions 2,002,924 4,699,110Expirations (315,448) (291,100)Ending balances P=7,105,251 P=5,417,775
President Rodrigo Duterte signed into law on March 26, 2021 the Corporate Recovery and TaxIncentives for Enterprises (CREATE) Act to attract more investments and maintain fiscal prudenceand stability in the Philippines. Republic Act (RA) 11534 or the CREATE Act introduces reforms tothe corporate income tax and incentives systems. It takes effect 15 days after its completepublication in the Official Gazette or in a newspaper of general circulation or April 11, 2021.
223

*SGVFSM006221*
The following are the key changes to the Philippine tax law pursuant to the CREATE Act whichhave an impact on the Company:
Effective July 1, 2020, regular corporate income tax (RCIT) rate is reduced from 30% to 25% fordomestic and resident foreign corporations. For domestic corporations with net taxable incomenot exceeding P=5 million and with total assets not exceeding P=100 million (excluding land onwhich the business entity’s office, plant and equipment are situated) during the taxable year, theRCIT rate is reduced to 20%.
Minimum corporate income tax (MCIT) rate reduced from 2% to 1% of gross income effectiveJuly 1, 2020 to June 30, 2023.
Effective January 1, 2021, income tax rate for nonresident foreign corporation is reduced from30% to 25%.
Imposition of improperly accumulated earnings tax (IAET) is repealed. Foreign-sourced dividends received by domestic corporations are exempt from income tax
subject to the following conditions:
i. The funds from such dividends actually received or remitted into the Philippines arereinvested in the business operations of the domestic corporation in the Philippines within thenext taxable year from the time the foreign-sourced dividends were received;
ii. Shall be limited to funding the working capital requirements, capital expenditures, dividendpayments, investment in domestic subsidiaries, and infrastructure project; and
iii. The domestic corporation holds directly at least 20% of the outstanding shares of the foreigncorporation and has held the shareholdings for a minimum of 2 years at the time of thedividend distribution.
Qualified domestic market enterprises shall be entitled to 4 to 7 years ITH to be followed by5 years ED.
For investments prior to effectivity of CREATE:
i. Registered business enterprises (RBEs) granted only an ITH – can continue with theavailment of the ITH for the remaining period of the ITH.
ii. RBEs granted an ITH followed 5% GIT or are currently enjoying 5% GIT – allowed to availof the 5% GIT for 10 years.
As clarified by the Philippine Financial Reporting Standards Council in its Philippine InterpretationsCommittee Q&A No. 2020-07, the CREATE Act was not considered substantively enacted as ofDecember 31, 2020 even though some of the provisions have retroactive effect to July 1, 2020. Thepassage of the CREATE Act into law on March 26, 2011 is considered as a non-adjustingsubsequent event. Accordingly, current and deferred taxes as of and for the year endedDecember 31, 2020 continued to be computed and measured using the applicable income tax rates asof December 31, 2020 (i.e., 30% RCIT / 2% MCIT) for financial reporting purposes.
Applying the provisions of the CREATE Act, the Company would have been subjected to lowerregular corporate income tax rate of 21% to 25% effective July 1, 2020.
This will result in lower provision for current income tax for the year ended December 31, 2020and lower income tax payable as of December 31, 2020, which will be reflected in theCompany’s 2020 annual income tax return but will only be recognized for financial reportingpurposes in its 2021 financial statements. Pending clarification from the tax authorities on howthe taxable income for the period beginning July 1, 2020 will be computed, the Company has notquantified the impact of the lower corporate income tax rate on the 2020 current income tax.
224

*SGVFSM006221*
Once applied, the CREATE Act will reduce the Group’s deferred tax assets, deferred taxliabilities, and other comprehensive income recognized as of December 31, 2020 by an estimatedamount of P=153 million, P=982 million and P=31 million, respectively. These reductions will berecognized in the 2021 financial statements.
28. Basic/Diluted Earnings Per Share
Earnings per share amounts were computed as follows:
2020 2019 2018a. Net income attributable to equity
holders of Parent Company P=5,263,683,512 P=8,686,233,159 P=8,216,002,328b. Weighted average number of
common shares outstandingadjusted (Note 19) 5,193,830,685 5,193,830,685 5,056,330,685
c. Earnings per share (a/b) P=1.01 P=1.67 P=1.62
There were no potential dilutive shares for the years ended December 31, 2020, 2019 and 2018.
29. Employee Benefits
Pension PlansThe Group has funded, noncontributory, defined benefit pension plans covering all of its regularemployees.
It provides benefits based on a number of month’s salary for every year of service. Under the existingregulatory framework, Republic Act 7641, The Retirement Pay Law, requires a provision forretirement pay to qualified private sector employees in the absence of any retirement plan in theentity, provided however that the employee’s retirement benefits under any collective bargaining andother agreements shall not be less than those provided under the law. The law does not requireminimum funding of the plan.
The pension funds are being administered and managed through JG Summit Multi-EmployerRetirement Plan (the “Plan”), with Robinsons Bank Corporation (RBC) as Trustee. The plansprovide for retirement, separation, disability and death benefits to their members. The Group,however, reserves the right to discontinue, suspend or change the rates and amounts of theircontributions at any time on account of business necessity or adverse economic conditions.
The retirement plan has an Executive Retirement Committee, which is mandated to approve the plan,trust agreement, investment plan, including any amendments or modifications thereto, and otheractivities of the Plan. Certain members of the BOD of the Parent Company are represented in theExecutive Retirement Committee. RBC manages the plan assets based on the mandate as defined inthe trust agreement.
225

*SGVFSM006221*
The components of pension expense (included in “Personnel expenses” under “Costs and General andadministrative expenses” in the consolidated statements of comprehensive income) follow:
2020 2019 2018Service cost P=56,527,009 P=66,580,614 P=43,783,555Net interest cost 17,985,763 19,687,298 18,024,351Pension expense P=74,512,772 P=86,267,912 P=61,807,906
The Plan was amended effective April 1, 2019. The effect of the change in retirement plan isreflected as Past Service Cost and recognized immediately in the 2019 pension expense.
There are no plan amendments, curtailments or settlements for the years endedDecember 31, 2020, 2019 and 2018.
The amounts recognized as pension liabilities included under “Deposit and other noncurrentliabilities” in the consolidated statements of financial position follow:
2020 2019Present value of defined benefit obligation P=765,271,635 P=481,501,376Fair value of plan assets (98,989,416) (120,262,120)Pension liabilities P=666,282,219 P=361,239,256
Changes in net defined benefit liability of funded funds follow:
2020Present value ofdefined benefit
obligationFair value of
plan assets
Net definedbenefit
liability/(asset)Balance at January 1, 2020 P=481,501,376 P=120,262,120 P=361,239,256Net benefit cost in consolidated statement ofcomprehensive income:
Current service cost 56,527,009 – 56,527,009Net interest cost 23,599,028 5,613,265 17,985,763
Subtotal 80,126,037 5,613,265 74,512,772Benefits paid – (21,813,578) 21,813,578Remeasurements in other comprehensive income: Actuarial changes arising from experience
adjustments 167,174,536 – 167,174,536 Actuarial changes arising from changes in
financial/demographic assumptions 74,325,128 – 74,325,128Return on plan assets – (15,845,500) 15,845,500
Subtotal 241,499,664 (15,845,500) 257,345,164Contributions paid (37,855,442) 10,773,109 (48,628,551)Balance at December 31, 2020 P=765,271,635 P=98,989,416 P=666,282,219
226

*SGVFSM006221*
2019Present value ofdefined benefit
obligationFair value of
plan assets
Net definedbenefit
liability/(asset)Balance at January 1, 2019 P=464,993,377 P=139,980,890 P=325,012,487Net benefit cost in consolidated statement ofcomprehensive income:
Current service cost 44,277,528 – 44,277,528Past service cost 22,303,086 – 22,303,086Net interest cost 26,505,290 6,817,992 19,687,298
Subtotal 93,085,904 6,817,992 86,267,912Benefits paid (14,991,030) (15,578,368) 587,338Remeasurements in other comprehensive income: Actuarial changes arising from experience
Adjustments (144,771,038) – (144,771,038) Actuarial changes arising from changes in
financial/demographic assumptions 83,184,163 – 83,184,163Return on plan assets − (10,958,394) 10,958,394
Subtotal (61,586,875) (10,958,394) (50,628,481)Balance at December 31, 2019 P=481,501,376 P=120,262,120 P=361,239,256
2018Present value ofdefined benefit
obligationFair value of
plan assets
Net definedbenefit
liability/(asset)Balance at January 1, 2018 P=470,681,322 P=146,133,669 P=324,547,653Net benefit cost in consolidated statement ofcomprehensive income:
Current service cost 43,783,555 – 43,783,555Net interest cost 25,565,458 7,541,107 18,024,351
Subtotal 69,349,013 7,541,107 61,807,906Benefits paid (32,771,253) (10,747,898) (22,023,355)Remeasurements in other comprehensive income: Actuarial changes arising from experience
Adjustments 8,541,377 – 8,541,377 Actuarial changes arising from changes in
financial/demographic assumptions (50,807,082) – (50,807,082) Return on plan assets − (2,945,988) 2,945,988Subtotal (42,265,705) (2,945,988) (39,319,717)Balance at December 31, 2018 P=464,993,377 P=139,980,890 P=325,012,487
The major categories and corresponding fair values of plan assets by class of the Group’s Plan as atthe end of each reporting period are as follow:
2020 2019Cash and cash equivalents:
Savings deposit account P=126,295 P=1,729,968Other securities 4,925,863 5,857,464
5,052,158 7,587,432Investment in debt instruments:
Fixed rate bonds 30,062,548 32,429,238 Other debt instruments 38,918 6,098,772
30,101,466 38,528,010Accrued interest receivable 303,336 371,611Other assets 64,508,544 73,779,070Accrued trust and management fee payable (976,088) (4,003)
P=98,989,416 P=120,262,120
227

*SGVFSM006221*
The composition of the fair value of the Fund includes:
Cash and cash equivalents - include savings and time deposit with various banks and specialdeposit account with Bangko Sentral ng Pilipinas.
Investment in debt instruments - include investment in long-term debt notes and retail bondsissued by locally listed entities.
Accrued interest receivable and other receivable - include interest earned from investments andreceivable from affiliated companies.
Accrued trust and management fee payable - pertains mainly to charges of trust or in themanagement of the plan.
The fund has no investment in the Parent Company as of December 31, 2020 and 2019.
The plan assets have diverse investments and do not have any concentration risk.
The management performs an asset-liability matching strategy annually. The overall investmentpolicy and strategy of the Group’s defined benefit plans is guided by the objective of achieving aninvestment return which, together with contributions, ensures that there will be sufficient assets to paypension benefits as they fall due while also mitigating the various risk of the plans.
The overall expected rates of return on assets are based on the market expectations prevailing as at thereporting date, applicable to the period over which the obligation is settled.
The Group expects to contribute P=142 million to the defined benefit pension plans in 2021.
The average duration of the defined benefit obligation of the Group as of December 31, 2020 and2019 is 13 and 17 years, respectively.
The principal assumptions used to determine the pension benefits of the Group follow:
2020 2019Discount rate 3.17% to 4.13% 4.52% to 5.16%Rate of salary increase 4.70% to 5.70% 5.70%
There are no unusual or significant risks to which the Plan exposes the Group. However, in the eventa benefit claim arises under the Retirement Plan and the Retirement Fund is not sufficient to pay thebenefit, the unfunded portion of the claim shall immediately be due and payable from the Group tothe Retirement Fund.
The sensitivity analysis below has been determined based on reasonably possible changes of eachsignificant assumption on the retirement benefit obligation as of December 31, 2020 and 2019,assuming all other assumptions were held constant.
It should be noted that the changes assumed to be reasonably possible at the valuation date are opento subjectivity, and do not consider more complex scenarios in which changes other than thoseassumed may be deemed to be more reasonable.
228

*SGVFSM006221*
The balances below show the addition/reduction in pension obligation assuming assumptions arechanged:
Increase (decrease) on pension liabilities2020 2019
Discount rates +1.00% (P=64,775,773) (P=35,560,743)-1.00% 74,940,988 52,024,195
Salary increase rates +1.00% P=72,748,884 P=53,425,615-1.00% (64,255,469) (37,518,849)
Shown below is the maturity analysis of the undiscounted benefit payments of the Group:
2020 2019Less than 1 year P=35,064,852 P=24,120,310More than 1 years to 5 years 286,070,659 195,980,519More than 5 years to 10 years 536,142,337 327,981,150More than 10 years to 15 years 514,871,618 461,128,355More than 15 years to 20 years 525,224,875 466,560,161More than 20 years 1,111,415,273 968,316,035
30. Interest in Joint Ventures and Joint Operations
A. Interest in Joint Ventures
This account consists of the following:
Percentage ofownership 2020 2019
RHK Land Corporation 60.00 P=1,341,554,976 P=1,375,530,317Robinsons DoubleDragon Corp. 65.72 673,652,470 613,308,121RLC DMCI Property Ventures, Inc. 50.00 357,497,448 361,343,210Shang Robinsons Properties, Inc.* 50.00 − −Balance at end of year P=2,372,704,894 P=2,350,181,648*Net of deferred gain from sale of land offset against the carrying amount of investment
Details and movements of interests in joint ventures are as follows:
2020 2019Investment in stocks - cost:
Balance at beginning of year P=2,308,024,332 P=1,409,502,348Additions 65,720,000 1,124,368,855Elimination of interest income on the sale of land (47,092,151) (69,606,759)Elimination of gain on sale of land to joint venture (151,124,219) (156,240,112)Balance at end of year 2,175,527,962 2,308,024,332
Accumulated equity in net earnings:Balance at beginning of year 42,157,316 (26,148,678)Equity in net earnings during the year 155,019,616 68,305,994Balance at end of year 197,176,932 42,157,316
P=2,372,704,894 P=2,350,181,648
229

*SGVFSM006221*
Joint Venture with Hong Kong Land GroupOn February 5, 2018, the Parent Company’s BOD approved the agreement with Hong Kong LandGroup (HKLG) represented by Hong Kong Land International Holdings, Ltd. and its subsidiary IdealRealm Limited to form a joint venture corporation (JVC).
On June 14, 2018, RHK Land Corporation (RHK Land), the JVC, was incorporated. RLC and HKLGowns 60% and 40%, respectively, of the outstanding shares in RHK Land. The principal office of theJVC is at 12F Robinsons Cyberscape Alpha, Sapphire and Garnet Roads, Ortigas Center, Pasig City.
RLC and HKLG, through RHK Land, shall engage in the acquisition, development, sale and leasingof real property. RHK Land shall initially undertake the purchase of a property situated in Block 4 ofBridgetowne East, Pasig City, develop the property into a residential enclave and likewise carry outthe marketing and sales of the residential units. RHK Land also plans to pursue other developmentprojects.
In October 2018, the Parent Company entered into a Shareholder Loan Agreement with RHK Land(see Note 20). Repayment date falls on the fifth anniversary of the effective date (see Note 8).
The investment in RHK Land is accounted as an investment in joint venture using equity method ofaccounting because the contractual arrangement between the parties establishes joint control.
Summarized financial information of RHK Land, presented in Philippine Peso, which is its functionaland presentation currency and prepared in accordance with PFRSs as at and for the years endedDecember 31, 2020 and 2019 are as follows:
Summarized statements of financial position:
2020 2019Current assets P=3,275,771,788 P=3,041,593,517Noncurrent assets 428,068,906 414,407,411Current liabilities (208,968,700) (23,155,433)Noncurrent liabilities (812,701,457) (681,784,862)Equity 2,682,170,537 2,751,060,633Proportion of Group’s ownership 60.00% 60.00%Group’s share in identifiable net assets 1,609,302,322 1,650,636,380Carrying amount of investment P=1,341,554,976 P=1,375,530,317
Summarized statements of comprehensive income:
2020 2019Interest income P=380,887 P=234,930Interest expense (38,025,086) (1,363,546)Depreciation (10,347,672) (6,567,627)Other expenses (49,134,945) (25,331,213)Loss before income tax (97,126,816) (33,027,456)Income tax benefit 29,176,135 9,931,730Net loss (67,950,681) (23,095,726)Other comprehensive income − −Total comprehensive loss (P=67,950,681) (P=23,095,726)
230

*SGVFSM006221*
Additional information:
2020 2019Cash and cash equivalents P=90,508,162 P=110,354,539Noncurrent financial liabilities* 814,542,365 681,784,862*Excluding trade and other payables and provision.
Reconciliation of the carrying amount of investment in RHK Land as of December 31, 2020 and 2019is as follows:
2020 2019Beginning Balance P=1,375,530,317 P=1,383,353,670Equity in net loss (33,975,341) (7,823,353)Carrying amount of investment P=1,341,554,976 P=1,375,530,317
Joint Venture with DoubleDragon Properties Corp.On December 26, 2019, Robinsons DoubleDragon Corp. (RDDC) was incorporated as the jointventure company (JVC) between RLC and DoubleDragon Corp. The primary purpose is to engage inrealty development.
The investment in RDDC is accounted as an investment in joint venture using equity method ofaccounting because the contractual arrangement between the parties establishes joint control.
Summarized financial information of RDDC, presented in Philippine Peso, which is its functional andpresentation currency and prepared in accordance with PFRS as at December 31, 2020 and 2019 andfor the year ended December 31, 2020 and for the period December 26, 2019 to December 31, 2019are as follows:
Summarized statements of financial position:
2020 2019Current assets P=238,069,943 P= 207,092,261Noncurrent assets 797,818,128 805,030,515Current liabilities (10,896,620) (78,952,079)Equity 1,024,991,451 933,170,697Proportion of Group’s ownership 65.72% 65.72%Group’s share in identifiable net assets 673,624,382 613,279,782Carrying amount of investment P=673,624,382 P=613,279,782
Summarized statements of comprehensive income:
2020 2019Other expenses (P=966,859) (P=24,041,690)Income tax benefit − 7,212,387Net loss (966,859) (16,829,303)Other comprehensive income − −Total comprehensive loss (P=966,859) (P=16,829,303)
231

*SGVFSM006221*
Additional information:
2020 2019Cash and cash equivalents P=143,745,997 P=112,768,935
Reconciliation of the carrying amount of investment in RDDC as of December 31, 2020 is as follows:
2020 2019Beginning balance P=613,308,121 P=−Additional/initial investment 65,720,000 624,368,855Equity in net loss (5,375,651) (11,060,734)Carrying amount of investment P=673,652,470 P=613,308,121
Joint Venture with DMCI Project Developers, Inc.In October 2018, the Parent Company entered into a Joint Venture Agreement with DMCI ProjectDevelopers, Inc. (DMCI PDI) to develop, construct, manage, and sell a residential condominiumsituated in Las Pinas City. Both parties agreed to incorporate a joint venture corporation where eachparty will hold a 50% ownership.
On March 18, 2019, RLC DMCI Property Ventures, Inc. (RLC DMCI) was incorporated as the jointventure company (JVC) between RLC and DMCI PDI. The proposed project is intended to be amulti-tower residential condominium and may include commercial spaces.
The investment in RLC DMCI is accounted as an investment in joint venture using equity method ofaccounting because the contractual arrangement between the parties establishes joint control.
Summarized financial information of RLC DMCI, presented in Philippine Peso, which is itsfunctional and presentation currency and prepared in accordance with PFRS as at December 31, 2020and 2019 and for the year ended December 31, 2020 and for the period March 18, 2019 toDecember 31, 2019 are as follows:
Summarized statement of financial position:
2020 2019Current assets P=2,264,265,548 P=1,990,136,107Noncurrent assets 100,883,589 42,978,919Current liabilities (317,250,653) (53,162,175)Noncurrent liabilities (1,068,318,443) (992,681,286)Equity 979,580,041 987,271,565Proportion of Group’s ownership 50.00% 50.00%Group’s share in identifiable net assets 489,790,021 493,635,783Carrying amount of investment P=357,497,448 P=361,343,210
232

*SGVFSM006221*
Summarized statement of comprehensive income:
2020 2019Revenue P=6,211,645 P=−Cost of sales (4,221,509) −Interest income 10,853,485 5,768,638Interest expense (11,785,666) (9,882,647)Other expenses (12,061,350) (4,077,708)Loss before income tax (11,003,395) (8,191,717)Income tax benefit 3,311,871 5,463,284Net loss (7,691,524) (2,728,433)Other comprehensive income − −Total comprehensive loss (P=7,691,524) (P=2,728,433)
Additional information:
2020 2019Cash and cash equivalents P=473,607,885 P=967,056,774Noncurrent financial liabilities* (993,643,274) (992,681,286)*Excluding trade and other payables and provision.
Reconciliation of the carrying amount of investment in RLC DMCI as of December 31, 2020 is asfollows:
2020 2019Beginning balance P=361,343,210 P=−Initial investment − 500,000,000Equity in net loss (3,845,762) (1,364,217)Elimination of gain on sale of land (Note 22) − (137,292,573)Carrying amount of investment, December 31, 2020 P=357,497,448 P=361,343,210
Joint Venture with Shang Properties, Inc.On November 13, 2017, the Parent Company’s BOD approved the agreement with Shang Properties,Inc. (SPI) to form a joint venture corporation (JVC).
On May 23, 2018, Shang Robinsons Properties, Inc. (SRPI), the JVC, was incorporated. Both RLCand SPI each own 50% of the outstanding shares in SRPI. The office address of SRPI is at LowerGround Floor, Cyber Sigma Building, Lawton Avenue, Fort Bonifacio Taguig.
RLC and SPI, through SRPI, shall build and develop a property situated at McKinley Parkway corner5th Avenue and 21st Drive at Bonifacio Global City, Taguig, Metro Manila. The project is intendedto be a mixed-use development and may include residential condominium units, serviced apartmentsand commercial retail outlets. SRPI also plans to pursue other development projects.
The investment in the SRPI is accounted as an investment in joint venture using equity method ofaccounting because the contractual arrangement between the parties establishes joint control.
In accordance with the joint venture agreement with SPI, the Parent Company agrees to extend loanto SRPI, at fair and commercial rates comparable to loans extended by third party banks and financialinstitutions, an amount of P=1,000 million annually starting April 1, 2019 up to April 1, 2022. As of
233

*SGVFSM006221*
December 31, 2020, the Parent Company has already extended a loan to SRPI amounting toP=1,000 million (see Notes 8 and 20).
Summarized financial information of SRPI, presented in Philippine Peso, which is its functional andpresentation currency and prepared in accordance with PFRSs as at and for the years endedDecember 31, 2020 and 2019 are as follows:
Summarized statements of financial position:
2020 2019Current assets P=9,188,271,545 P=9,146,232,494Noncurrent assets 384,133,286 9,654,289Current liabilities (3,850,530,594) (1,944,842,884)Noncurrent liabilities (3,167,337,600) (5,052,940,000)Equity 2,554,536,637 2,158,103,899Proportion of Group’s ownership 50.00% 50.00%Group’s share in identifiable net assets 1,277,268,319 1,079,051,949Carrying amount of investment P=− P=−
Summarized statements of comprehensive income:
2020 2019Revenue P=929,357,646 P=461,237,320Cost of sales (364,980,368) 172,582,512Gross profit 564,377,278 288,654,808Interest income 30,782,143 9,735,751Depreciation (441,529) (118,599)Other expenses (77,814,376) (46,650,505)Income before income tax 516,903,516 251,621,455Income tax expense (145,836,412) (74,512,861)Net income 371,067,104 177,108,594Other comprehensive income − −Total comprehensive income P=371,067,104 P=177,108,594
Additional information:
2020 2019Cash and cash equivalents P=2,986,436,833 P=3,379,326,909Noncurrent financial liabilities* 2,000,000,000 2,000,000,000*Excluding trade and other payables and provision.
Reconciliation of the carrying amount of investment in SRPI as of December 31, 2020 and 2019 is asfollows:
2020 2019Beginning balance P=1,079,051,949 P=990,497,652Equity in net earnings 198,216,371 88,554,297
1,277,268,320 1,079,051,949Elimination of gain on sale of land (Note 20) (1,277,268,320) (1,079,051,949)Carrying amount of investment P=− P=−
234

*SGVFSM006221*
Deferred gain on sale of land to SRPI attributable to the Parent Company was offset against theremaining carrying amount of investment in SRPI. The excess of the gain on sale of land amountingto P=896 million and P=1,004 million were presented as contract liabilities - net of current portion as ofDecember 31, 2020 and 2019, respectively.
B. Joint Operations
The Group has entered into joint venture agreements with various landowners and other companieswith various percentage interests in these joint operations depending on the value of the land orinvestment against the estimated development costs. These joint venture agreements entered into bythe Group relate to the development and sale of subdivision land, condominium and residential units,with certain level of allocation of condominium unites/lots to be sold to buyers with provisions forsharing in the cash collection on the sale of allocated developed units.
The Group’s joint venture agreements typically require the joint venture partner to contribute the landfree from any lien, encumbrance and tenants or informal settlers to the project, with the Groupbearing all the cost related to the land development and the construction of subdivision land,condominium and residential units, including the facilities.
Sales and marketing costs are allocated to both the Group and the joint operations partner. Theprojects covering the joint venture agreement are expected to be completed within two to three years.Each joint operations party has committed to contribute capital based on the terms of the joint ventureagreement.
The total development costs on these joint ventures amounted to P=5,505 million and P=5,340 millionas of December 31, 2020 and 2019, respectively. Total revenues from these joint ventures amountedto P=975 million, P=961 million and P=573 million in 2020, 2019 and 2018, respectively.
Interest in joint projects with Horizon Land Property & Development Corporation, formerly HarbourLand Realty and Development Corp and Federal Land, Inc. (Jointly Controlled Operations)
On February 7, 2011, the Parent Company entered into a joint venture agreement with Horizon LandProperty & Development Corporation (HLPDC), formerly Harbour Land Realty and DevelopmentCorp and Federal Land, Inc. (FLI) to develop Axis Residences (the Project) located along PioneerStreet in Mandaluyong City. The construction of the planned 2-phase residential condominium hascommenced in March 2012. One tower of first phase was completed on September 2015.
The agreed contributions of the parties follow:
a. The Parent Company: Road lot valued at P=89 million and development costs amountingP=1,390 million
b. FLI: Development costs amounting P=739 millionc. HLPDC, an affiliate of FLI: Four (4) adjoining parcels of land valued at P=739 million located
along Pioneer St., Mandaluyong City, 21,109 sqm
Further, the sharing of saleable units (inventories) of real estate revenue, cost of real estate sales andany common expenses incurred, are as follows: the Parent Company-50% and FLI-50%. Based onthe foregoing, the Parent Company accounted for the joint arrangement as a jointly controlledoperations and accordingly, recognized its share in the installment contract receivables, subdivisionland, condominium and residential units for sale, deposits to joint venture partners, accounts payable,real estate sales and cost of real estate sales of the joint operations.
235

*SGVFSM006221*
On December 6, 2017, the Parent Company executed an addendum agreement with HLPDC and FLIto discontinue the development of Phase II.
The following were the agreements included in the addendum:
a. The development of the Project shall be limited to Phase 1;b. The discontinuance shall be without fault on either of the Parties. Accordingly, HLPDC and FLI
shall reimburse RLC the amount of P=193 million representing the non-development of four (4)towers of Phase II;
c. Ownership and right of possession of the parcels of land corresponding to Phase II shall remain tobe with HLPDC and shall be excluded from the provisions of the JVA.
d. The perpetual right to use RLC’s land contribution is limited to Phase I and to the adjacentproperties owned by HLPDC, FLI or its affiliates.
The share of the Parent Company in the net assets and liabilities of the jointly controlled operations atDecember 31, 2020 and 2019 which are included in the consolidated financial statements follow:
Assets 2020 2019Cash and cash equivalents P=1,053,151,322 P=961,787,721Receivables 889,403,010 507,047,094Inventory 75,436,830 352,942,190Other Assets 26,406,015 24,684,586Total assets P=2,044,397,177 P=1,865,003,978Total liabilities P=1,829,127,423 P=1,753,666,726
The following is the share of the Parent Company on the net income of the jointly controlledoperations for the years ended December 31, 2020 and 2019:
2020 2019Realized sales P=604,868,579 P=389,132,912Interest and other income 42,922,612 25,890,660
647,791,191 415,023,572Cost of sales 366,728,271 314,067,343General and administrative expenses 25,555,554 16,308,595Income before income tax 255,507,366 84,647,633Provision for income tax 40,237,612 21,079,580Net income P=215,269,754 P=63,568,053
Reconciliation of the carrying amount of investment in jointly controlled operations as ofDecember 31, 2020 and 2019 is as follows:
2020 2019Beginning balance P=92,794,865 P=61,010,838Equity in net earnings 122,474,889 31,784,027Carrying amount of investment P=215,269,754 P=92,794,865
There were no dividends declared in 2020, 2019 and 2018.
236

*SGVFSM006221*
31. Financial Risk Management Objectives and Policies
The Group’s principal financial instruments comprise of short-term loans, loans payable, leaseliabilities, deposit from lessees, receivables from affiliated companies, payables to affiliatedcompanies, utility deposits, receivables and cash and cash equivalents. The main purpose of thesefinancial instruments is to raise fund for the Group’s operations. The Group has various otherfinancial assets and liabilities such as trade and other receivables and trade and other payables, whicharise directly from its operations.
The main risks currently arising from the Group’s financial instruments are foreign currency marketrisk, liquidity risk, interest rate risk and credit risk. The BOD reviews and approves policies formanaging each of these risks and they are summarized below, together with the related riskmanagement structure.
Risk Management StructureThe Group’s risk management structure is closely aligned with that of the Parent Company.The BOD of the Parent Company and the respective BODs of each subsidiary are ultimatelyresponsible for the oversight of the Group’s risk management processes that involve identifying,measuring, analyzing, monitoring and controlling risks.
The risk management framework encompasses environmental scanning, the identification andassessment of business risks, development of risk management strategies, design and implementationof risk management capabilities and appropriate responses, monitoring risks and risk managementperformance, and identification of areas and opportunities for improvement in the risk managementprocess.
Each BOD has created the board-level Audit Committee (AC) to spearhead the managing andmonitoring of risks.
Audit CommitteeThe AC shall assist the Group’s BOD in its fiduciary responsibility for the over-all effectiveness ofrisk management systems, and both the internal and external audit functions of the Group.
Furthermore, it is also the AC’s purpose to lead in the general evaluation and to provide assistance inthe continuous improvements of risk management, control and governance processes.
The AC also aims to ensure that:
a. financial reports comply with established internal policies and procedures, pertinent accountingand audit standards and other regulatory requirements;
b. risks are properly identified, evaluated and managed, specifically in the areas of managing credit,market, liquidity, operational, legal and other risks, and crisis management;
c. audit activities of internal and external auditors are done based on plan, and deviations areexplained through the performance of direct interface functions with the internal and externalauditors; and
d. the Group’s BOD is properly assisted in the development of policies that would enhance the riskmanagement and control systems.
237

*SGVFSM006221*
Enterprise Risk Management Group (ERMG)To systematize the risk management within the Group, the ERMG was created to be primarilyresponsible for the execution of the enterprise risk management framework. The ERMG’s mainconcerns include:
a. recommending risk policies, strategies, principles, framework and limits;b. managing fundamental risk issues and monitoring of relevant risk decisions;c. providing support to management in implementing the risk policies and strategies; andd. developing a risk awareness program.
Support groups have likewise been created to explicitly manage on a day-to-day basis specific typesof risks like trade receivables, supplier management, etc.
Compliance with the principles of good corporate governance is also one of the objectives of theBOD. To assist the BOD in achieving this purpose, the BOD has designated a Compliance Officerwho shall be responsible for monitoring the actual compliance with the provisions and requirementsof the Corporate Governance Manual and other requirements on good corporate governance,identifying and monitoring control compliance risks, determining violations, and recommendingpenalties on such infringements for further review and approval of the BOD, among others.
Risk Management PoliciesThe main risks arising from the use of financial instruments are foreign currency risk, liquidity risk,interest rate risk and credit risk. The Group’s policies for managing the aforementioned risks aresummarized below.
Market riskForeign Currency RiskForeign currency risk is the risk that the future cash flows of a financial instrument will fluctuatebecause of changes in foreign exchange rates. Foreign currency risk arises from financial instrumentsthat are denominated in United States Dollar (USD) which result primarily from movement of thePhilippine Peso (PHP) against the USD.
The Group does not have any foreign currency hedging arrangements.
The table below summarizes the Group’s exposure to foreign currency risk:
December 31, 2020 December 31, 2019AssetsCash and cash equivalents $3,003,011 P=144,213,560 $900,147 P=45,578,947LiabilitiesAccounts payable and accrued expenses 315,028 15,128,573 483,259 24,469,776Net foreign currency-denominated assets $2,687,983 P=129,084,987 $416,888 P=21,109,171
December 31, 2020 December 31, 2019AssetsCash and cash equivalents RMB 1,579,549,449 P=11,621,323,409 RMB659,901,092 P=4,798,668,758LiabilitiesAccounts payable and accrued expenses 139,307,269 1,024,934,565 101,213,015 736,000,799Net foreign currency-denominated assets RMB 1,440,242,180 P=10,596,388,844 RMB558,688,077 P=4,062,667,959
238

*SGVFSM006221*
December 31, 2020 December 31, 2019AssetsCash and cash equivalents SGD 4,670 P=169,637 SGD1,632 P=61,401
December 31, 2020 December 31, 2019AssetsCash and cash equivalents CAD 4,604 P=172,172 CAD2,470 P=95,608
The exchange rates used to translate the Group’s USD-denominated assets and liabilities as ofDecember 31, 2020 and 2019 follow:
December 31, 2020 December 31, 2019US Dollar - Philippine Peso
exchange rate P=48.02 to US$1.00 P=50.64 to US$1.00
December 31, 2020 December 31, 2019Chinese Yuan - Philippine Peso
exchange rate P=7.36 to RMB1.00 P=7.27 to RMB1.00Singapore Dollar - Philippine Peso
exchange rate P=36.32 to SGD1.00 P=36.32 to SGD1.00Canadian Dollar - Philippine Peso
exchange rate P=37.40 to CAD1.00 P=38.72 to CAD1.00
The following table sets forth the impact of the range of reasonably possible changes in theUSD-PHP exchange rate on the Group’s income before income tax for the year endedDecember 31, 2020 and 2019.
Reasonably Possible Changes in USD-PHP Exchange RatesChange in Income
Before Income TaxDecember 31, 2020
2.0% PHP appreciation (P=2,581,700)2.0% PHP depreciation 2,581,700
December 31, 20192.0% PHP appreciation (P=422,182)2.0% PHP depreciation 422,182
Reasonably Possible Changes in RMB-PHP Exchange Rates Change in OCIDecember 31, 2020
2.0% PHP appreciation (P=211,927,777)2.0% PHP depreciation 211,927,777
December 31, 20192.0% PHP appreciation (P=81,253,359)2.0% PHP depreciation 81,253,359
Reasonably Possible Changes in SGD-PHP Exchange RatesChange in Income
Before Income TaxDecember 31, 2020
2.0% PHP appreciation (P=3,393)2.0% PHP depreciation 3,393
December 31, 20192.0% PHP appreciation (P=1,228)2.0% PHP depreciation 1,228
239

*SGVFSM006221*
Reasonably Possible Changes in CAD-PHP Exchange RatesChange in Income
Before Income TaxDecember 31, 2020
2.0% PHP appreciation (P=3,443)2.0% PHP depreciation 3,443
December 31, 20192.0% PHP appreciation (P=1,912)2.0% PHP depreciation 1,912
Sensitivity to foreign exchange rates is calculated on the Group’s foreign currency denominatedassets and liabilities, assuming a more likely scenario of foreign exchange rate of USD-PHP that canhappen within 12 months after reporting date using the same balances of financial assets andliabilities as of reporting date.
The Group does not expect the impact of the volatility on other currencies to be material.
Liquidity riskLiquidity risk is the risk arising from the shortage of funds due to unexpected events or transactions.The Group manages its liquidity profile to be able to finance the capital expenditures and service thematuring debts. To cover the financing requirements, the Group intends to use internally generatedfunds and proceeds from debt and equity offerings.
The following table summarizes the maturity profile of the Group’s financial assets and financialliabilities as of December 31, 2020 and 2019, based on contractual undiscounted cash flows. Thetable also analyses the maturity profile of the Group’s financial assets in order to provide a completeview of the Group’s contractual commitments. The analysis into relevant maturity groupings is basedon the remaining period at the end of the reporting period to the contractual maturity dates. Balancesdue within six (6) months equal their carrying amounts, as the impact of discounting is insignificant.
December 31, 2020
On Demand 1 to 3 months 3 to 12 months
More than1 year but less
than 5 years 5 years or more TotalFinancial assets at amortized costCash and cash equivalents P=1,108,520,005 P=12,895,738,779 P=– P=– P=– P=14,004,258,784Receivables
Trade 4,343,805,976 2,761,423,117 6,440,516,961 5,675,489,844 1,185,941,016 20,407,176,914Affiliated companies 1,029,848,891 – – – – 1,029,848,891Others 61,895,813 740,186,931 52,548,641 – – 854,631,385
Other assetsRestricted cash 4,006,791,007 – – – – 4,006,791,007Utility deposits 8,719,131 – – 514,748,450 146,157,005 669,624,586
Total financial assets P=10,559,580,823 P=16,397,348,827 P=6,493,065,602 P=6,190,238,294 P=1,332,098,021 P=40,972,331,567
Accounts payable and accruedexpenses P=2,796,338,396 P=6,318,533,122 P=2,848,425,651 P=664,437,426 P=2,236,589,802 P=14,864,324,397
Payables to affiliated companies andothers (included under Depositsand other current liabilities) 256,642,319 – – – – 256,642,319
Deposits from lessees – 1,428,487,668 1,556,490,880 1,716,701,000 1,546,956,716 6,248,636,264Lease liabilities – 34,153,724 104,842,182 630,780,039 5,736,218,935 6,505,994,880Loans payable and future interest
payment – 990,253,166 7,784,983,750 43,839,906,815 3,924,629,754 56,539,773,485Other financial liabilities P=3,052,980,715 P=8,771,427,680 P=12,294,742,463 P=46,851,825,280 P=13,444,395,207 P=84,415,371,345
240

*SGVFSM006221*
December 31, 2019
On Demand 1 to 3 months 3 to 12 months
More than1 year but less
than 5 years 5 years or more TotalFinancial assets at amortized costCash and cash equivalents P=6,338,788,195 P=721,650,328 P=– P=– P=– P=7,060,438,523Receivables
Trade 1,257,572,139 1,915,952,447 2,155,433,240 4,206,495,562 5,984,001,883 15,519,455,271Affiliated companies 1,355,316,367 – – – – 1,355,316,367Others 35,316,134 697,396,765 67,020,060 – – 799,732,959
Other assetsRestricted cash 2,533,017,832 – – – – 2,533,017,832Utility deposits 8,417,364 – – 510,878,279 233,501,843 752,797,486
Total financial assets P=11,528,428,031 P=3,334,999,540 P=2,222,453,300 P=4,717,373,841 P=6,217,503,726 P=28,020,758,438
Accounts payable and accruedexpenses P=3,414,792,863 P=6,000,221,826 P=2,824,471,791 P=601,897,208 P=1,513,660,642 P=14,355,044,330
Payables to affiliated companies andothers (included under Depositsand other current liabilities) 163,251,787 – – – – 163,251,787
Deposits from lessees – 1,432,862,955 1,495,736,314 1,764,874,057 1,406,670,869 6,100,144,195Lease liabilities – 31,534,814 96,802,877 589,327,721 5,953,173,907 6,670,839,319Loans payable and future interest
payment – 9,168,537,285 1,010,879,696 28,726,359,279 4,697,440,697 43,603,216,957Other financial liabilities P=3,578,044,650 P=16,621,905,244 P=5,403,126,100 P=31,080,561,057 P=13,570,946,115 P=70,892,496,588
The Group seeks to manage its liquidity profile to be able to service its maturing debts and to financecapital requirements. The Group maintains a level of cash and cash equivalents deemed sufficient tofinance operations. As part of its liquidity risk management, the Group regularly evaluates itsprojected and actual cash flows. It also continuously assesses conditions in the financial markets foropportunities to pursue fund-raising activities. Fund-raising activities may include bank loans andcapital market issues both onshore and offshore.
Interest rate riskInterest rate risk is the risk that the future cash flows of a financial instrument will fluctuate becauseof changes in market interest rates. The Group’s exposure to the risk for changes in market interestrates relates primarily to the Group’s long-term debt obligation with a floating interest rate.The Group’s policy is to manage its interest cost using a mix of fixed and variable rate debts,whenever it’s advantageous to the Group.
The Group has no financial instruments with variable interest rates exposed to interest rate risk as ofDecember 31, 2020 and 2019.
Credit riskCredit risk is the risk that counterparty will not meet its obligations under a financial instrument orcustomer contract, leading to a financial loss. The Group is exposed to credit risk from its operatingactivities (primarily from cash and cash equivalents and receivables).
The Group trades only with recognized, creditworthy third parties. It is the Group’s policy that allcustomers who wish to trade on credit terms are subject to credit verification procedures.
In addition, receivable balances are monitored on an ongoing basis. Customers credit risk is managedby each business unit subject to the Group’s established policy, procedures and controls. Creditquality of a customer is assessed and individual credit limits are defined in accordance with thisassessment. These measures result in the Group’s exposure to impairment loss as not significant. Forinstallment contract receivables, exposure to bad debt is not significant as title to real estate propertiesare not transferred to the buyers until full payment has been made and the requirement for remedialprocedure is minimal given the profile of buyers.
241

*SGVFSM006221*
Credit risk arising from rental income from leasing properties is primarily managed through a tenantselection process. Prospective tenants are evaluated on the basis of payment track record and othercredit information. In accordance with the provisions of the lease contracts, the lessees are requiredto deposit with the Group security deposits and advance rentals which helps reduce the Group’s creditrisk exposure in case of defaults by the tenants. For existing tenants, the Group has put in place amonitoring and follow-up system. Receivables are aged and analyzed on a continuous basis tominimize credit risk associated with these receivables. Regular meetings with tenants are alsoundertaken to assess paying capacity.
With respect to credit risk arising from the Group’s financial assets, which comprise of cash and cashequivalents and receivables, the Group’s exposure to credit risk arises from default of thecounterparty, with a maximum exposure equal to the carrying amount of these instruments. Creditrisk from balances with banks and financial institution is managed by the Group’s treasurydepartment. Investments are only made with approved and credit worthy counterparties and withinthe credit limits assigned to each counterparty.
The changes in the gross carrying amounts of receivables from real estate sales and impact ofCOVID-19 pandemic did not materially affect the allowance for ECLs.
a. Credit risk exposure
The table below shows the gross maximum exposure to credit risk of the Group as ofDecember 31, 2020 and 2019 without considering the effects of collaterals and other credit riskmitigation techniques:
2020 2019Cash and cash equivalents (net of cash on hand) P=13,994,251,961 P=7,031,435,021Receivables - net
Trade receivables Installment contract receivable - at
amortized cost 14,941,310,062 11,154,387,274Installment contract receivable - at FVOCI 931,573,340 990,081,179Rental receivables 2,435,594,930 1,008,736,134Accrued rent receivable 1,834,791,308 1,672,789,954Hotel operations 263,907,274 693,460,730
Affiliated companies 1,029,848,891 1,355,316,367Other receivables 854,631,385 799,732,959
Other assetsRestricted cash - escrow 4,006,791,007 2,533,017,832Utility deposits 669,624,586 752,797,486Financial assets at fair value through OCI 129,718,939 91,674,297
P=41,092,043,683 P=28,083,429,233
The credit risk on installment contract receivables is mitigated because the corresponding title tothe subdivision units sold under this arrangement is transferred to the buyers only upon fullpayment of the contract price.
Applying the expected credit risk model did not result in the recognition of an impairment lossfor all financial assets at amortized cost in 2020 and 2019.
242

*SGVFSM006221*
b. Risk concentrations of the maximum exposure to credit risk
Concentrations arise when a number of counterparties are engaged in similar business activitiesor activities in the same geographic region or have similar economic features that would causetheir ability to meet contractual obligations to be similarly affected by changes in economic,political or other conditions. Concentrations indicate the relative sensitivity of the Group’sperformance to developments affecting a particular industry or geographical location. Such creditrisk concentrations, if not properly managed, may cause significant losses that could threaten theGroup’s financial strength and undermine public confidence.
Given the Group’s diverse base of counterparties, it is not exposed to large concentrations ofcredit risks.
c. Credit quality per class of financial assets
The table below shows the credit quality by class of financial assets as of December 31, 2020 and2019, gross of allowance for credit and impairment losses:
December 31, 2020Neither Past Due Nor Impaired
HighGrade
StandardGrade
SubstandardGrade
Past Duebut not Impaired
Past Due andImpaired Total
Cash and cash equivalents(net of cash on hand) P=13,994,251,961 P=– P=– P=– P=– P=13,994,251,961
Receivables:Trade receivables
Installment contract receivables - atamortized cost 12,806,030,730 – – 2,135,279,332 19,000,000 14,960,310,062
Installment contract receivables - atFVOCI 787,496,740
– –144,076,600 – 931,573,340
Rental receivables 567,028,167 – – 1,868,566,763 190,148,722 2,625,743,652 Accrued rent receivables 1,834,791,308 – – – – 1,834,791,308
Hotel operations 64,245,015 – – 199,662,259 3,778,978 267,686,252Affiliated companies 1,029,848,891 – – – – 1,029,848,891Other receivables 854,631,385 – – – – 854,631,385
Other assetsRestricted cash 4,006,791,007 – – – – 4,006,791,007Utility Deposits 669,624,586 – – – – 669,624,586
Financial Assets at fair value throughOCI 129,718,939
– – – –129,718,939
P=36,744,458,729 P=– P=– P=4,347,584,954 P=212,927,700 P=41,304,971,383
December 31, 2019Neither Past Due Nor Impaired
HighGrade
StandardGrade
SubstandardGrade
Past Duebut not Impaired
Past Due andImpaired Total
Cash and cash equivalents(net of cash on hand) P=7,031,435,021 P=– P=– P=– P=– P=7,031,435,021
Receivables:Trade receivables
Installment contract receivables - atamortized cost 10,850,174,053 – – 304,213,221 19,000,000 11,173,387,274
Installment contract receivables - atFVOCI 963,112,977 – – 26,968,202 – 990,081,179
Rental receivables 269,344,986 – – 739,391,148 13,905,027 1,022,641,161Accrued rent receivables 1,672,789,954 – – − – 1,672,789,954Hotel operations 506,461,162 – – 186,999,568 14,771,574 708,232,304
Affiliated companies 1,355,316,367 – – − − 1,355,316,367Other receivables 799,732,959 – – − – 799,732,959
Other assets Restricted cash 2,533,017,832 – – – – 2,533,017,832
Utility deposits 752,797,486 – – − – 752,797,486 Financial assets at fair value through
OCI 91,674,297 – – – – 91,674,297P=26,825,857,094 P=– P=– P=1,257,572,139 P=47,676,601 P=28,131,105,834
High grade cash and cash equivalents are short-term placements and working cash fund placed,invested, or deposited in foreign and local banks belonging to the top ten (10) banks, including anaffiliate bank, in the Philippines in terms of resources, profitability and credit standing.
243

*SGVFSM006221*
High grade accounts, other than cash and cash equivalents, are accounts considered to be of highvalue. The counterparties have a very remote likelihood of default and have consistentlyexhibited good paying habits. Receivable from installment contract receivables are consideredhigh grade as title of the real estate property of the subject receivable passes to the buyer oncefully paid. Standard grade accounts are active accounts with propensity of deteriorating to mid-range age buckets. These accounts are typically not impaired as the counterparties generallyrespond to credit actions and update their payments accordingly.
Substandard grade accounts are accounts which have probability of impairment based onhistorical trend. These accounts show propensity to default in payment despite regular follow-upactions and extended payment terms.
32. Financial Instruments
The carrying amount of cash and cash equivalents, trade receivables (except installment contractreceivables), other receivables, utility deposits, receivable and payable to affiliated companies andaccounts payable and accrued expenses are approximately equal to their fair values due to the short-term nature of the transaction.
Set out below is a comparison of carrying amounts and fair values of installment contract receivables,deposits from lessees and loans payable that are carried in the consolidated financial statements.
December 31, 2020 December 31, 2019Carrying Amount Fair Value Carrying Amount Fair Value
Installment contract receivableMeasured at amortized cost P=14,941,310,062 P=14,435,223,345 P=11,154,387,274 P=10,929,014,937Measured at FVOCI 931,573,340 931,573,340 990,081,179 990,081,179
Equity investment at FVOCI 129,718,939 129,718,939 91,674,297 91,674,297Utility deposits 669,624,586 617,242,771 752,797,486 651,367,441Retentions payable 510,887,699 477,279,098 454,267,761 424,383,886Deposits from lessees 6,248,025,012 5,884,371,416 6,100,144,195 5,535,394,216Lease liabilities 1,977,448,113 1,742,281,832 1,935,884,238 1,586,920,563Loans payable 53,603,778,783 56,539,773,485 34,715,272,176 43,603,216,957
The fair values of installment contract receivables, customers’ deposits, retentions payable, leaseliabilities and loans payable are based on the discounted value of future cash flows using theapplicable rates for similar types of loans and receivables as of reporting date. The discount ratesused range from 1.9% to 2.7% as of December 31, 2020 and 3.6% to 4.3% as of December 31, 2019.
The fair value of equity investments at FVOCI are based on discounted value of future cash flowsusing the applicable rate of 11.8% to 12.5% as of December 31, 2020.
Fair Value HierarchyThe Group uses the following hierarchy for determining the fair value of financial instruments:
Level 1: - quoted (unadjusted) prices in active markets for identical assets or liabilities;
Level 2: - other techniques for which all inputs which have a significant effect on the recorded fairvalue are observable, either directly or indirectly;
Level 3: - techniques which use inputs which have a significant effect on the recorded fair value thatare not based on observable market data.
244

*SGVFSM006221*
The fair value of installment contract receivables, deposits from lessees and loans payable disclosedin the consolidated financial statements is categorized within level 3 of the fair value hierarchy.There has been no reclassification from Level 1 to Level 2 or 3 category.
33. Registration with the Board of Investments (BOI) and the Philippine Economic Zone Authority(PEZA)
Certain operations of the Group are registered with the BOI and PEZA as preferred pioneer and non-pioneer activities. As registered enterprises, these consolidated subsidiaries are subject to somerequirements and are entitled to certain tax and non-tax incentives which are considered in thecomputation of the provision for income tax.
Dusit Thani Mactan CebuThe Group is duly registered with the BOI under Book 1 of the Omnibus Investments Code of 1987,otherwise known as E.O. 226 “New Operator of Tourist Accommodation Facility (Dusit ThaniMactan Cebu)” on a Non-Pioneer status at a capacity of two hundred seventy two (272) rooms, underCertificate of Registration No. 2019-061 dated March 28, 2019. Under the terms of its registration,the Group is entitled to income tax holiday for a period of four (4) years from March 29, 2019 toMarch 28, 2023.
Summit Hotel GreenhillsThe Group is duly registered with the BOI under Book 1 of the Omnibus Investments Code of 1987,otherwise known as E.O. 226 “New Operator of Tourist Accommodation Facility (Summit HotelGreenhills)” on a Non-Pioneer status at a capacity of one hundred (100) rooms, under Certificate ofRegistration No. 2019-093 dated May 15, 2019. Under the terms of its registration, the Group isentitled to income tax holiday for a period of four (4) years from July 2019 to June 2023.
Summit Hotel NagaThe Group is duly registered with the BOI under Book 1 of the Omnibus Investments Code of 1987,otherwise known as E.O. 226 “New Operator of Tourist Accommodation Facility (Summit HotelNaga)” on a Non-Pioneer status at a capacity of sixty (60) rooms, under Certificate of RegistrationNo. 2020-210 dated October 28, 2020. Under the terms of its registration, the Group is entitled toincome tax holiday for a period of four (4) years from March 2021 to February 2025.
Go Hotel NagaThe Group is duly registered with the BOI under Book 1 of the Omnibus Investments Code of 1987,otherwise known as E.O. 226 “New Operator of Tourist Accommodation Facility (Go Hotel Naga)”on a Non-Pioneer status at a capacity of sixty eight (68) rooms, under Certificate of Registration No.2020-211 dated October 28, 2020. Under the terms of its registration, the Group is entitled to incometax holiday for a period of four (4) years from March 2021 to February 2025.
Westin Manila Sonata PlaceThe Group is duly registered with the BOI under Book 1 of the Omnibus Investments Code of 1987,otherwise known as E.O. 226 “New Operator of Tourist Accommodation Facility (Westin ManilaSonata Place Hotel)” on a Non-Pioneer status at a capacity of three hundred three rooms (303) rooms,under Certificate of Registration No. 2020-231 dated December 16, 2020. Under the terms of itsregistration, the Group is entitled to income tax holiday for a period of four (4) years from March2022 to February 2026.
245

*SGVFSM006221*
Go Hotel, ButuanThe Group is duly registered with the BOI under Book 1 of the Omnibus Investments Code of 1987,otherwise known as E.O. 226 “New Operator of Tourist Accommodation Establishment (Hotel - GoHotel, Butuan)” on a Non-Pioneer status at a capacity of one hundred four (104) rooms, underCertificate of Registration No. 2014-214 dated December 5, 2014. Under the terms of its registration,the Group is entitled to income tax holiday for a period of four (4) years from January 2015 toDecember 2019.
Axis Residences (Phase 1)-Tower AThe Group is duly registered with the BOI under Book 1 of the Omnibus Investments Code of 1987,otherwise known as E.O. 226 “Mass Housing” on a Non-Pioneer status at a capacity of four hundredfifty six (456) units, under Certificate of Registration No. 2015-048 dated February 26, 2015. Underthe terms of its registration, the Group is entitled to income tax holiday for a period of three (3) yearsfrom February 27, 2015 to February 26, 2018.
The Pearl Place - Tower BThe Parent Company is duly registered with the BOI under Book 1 of the Omnibus Investments Codeof 1987, otherwise known as E.O. 226 “Mass Housing” on a Non-Pioneer status at a capacity of fourhundred forty six (446) units, under Certificate of Registration No. 2016-159 dated August 3, 2016.Under the terms of its registration, the Group is entitled to income tax holiday for a period of three (3)years from October 2016 to October 2019.
Acacia Escalades-(Phase 2)-Building BThe Parent Company is duly registered with the BOI under Book 1 of the Omnibus Investments Codeof 1987, otherwise known as E.O. 226 “Mass Housing” on a Non-Pioneer status at a capacity of twohundred eighty-six (286) units, under Certificate of Registration No. 2016-264 dated December 22,2016. Under the terms of its registration, the Group is entitled to income tax holiday for a period ofthree (3) years from January 2018 to January 2021.
Axis Residences (Phase 1)-Tower BThe Parent Company is duly registered with the BOI under Book 1 of the Omnibus Investments Codeof 1987, otherwise known as E.O. 226 “Mass Housing” on a Non-Pioneer status at a capacity of fourhundred fifty-six (456) units, under Certificate of Registration No. 2016-263 dated December 22,2016. Under the terms of its registration, the Group is entitled to income tax holiday for a period ofthree (3) years from August 2018 to August 2021.
Go Hotels Davao, Inc.The Group is duly registered with the BOI under Book 1 of the Omnibus Investments Code of 1987,otherwise known as E.O. 226 “New Operator of Tourist Accommodation Facility (Go Hotels Lanang- Davao City)” on a Non-Pioneer status at a capacity of one hundred eighty three (183) rooms, underCertificate of Registration No. 2015-266 dated December 3, 2015. Under the terms of its registration,the Group is entitled to income tax holiday for a period of four (4) years from January 2016 toDecember 2019.
Summit Hotel TaclobanThe Group is duly registered with the BOI under Book 1 of the Omnibus Investments Code of 1987,otherwise known as E.O. 226 “New Operator of Tourist Accommodation Facility (Summit HotelTacloban)” on a Non-Pioneer status at a capacity of one hundred thirty eight (138) rooms, underCertificate of Registration No. 2017-236 dated August 16, 2017. Under the terms of its registration,the Group is entitled to income tax holiday for a period of four (4) years from April 2018 toMarch 2022.
246

*SGVFSM006221*
Go Hotel, IliganThe Group is duly registered with the BOI under Book 1 of the Omnibus Investments Code of 1987,otherwise known as E.O. 226 “New Operator of Tourist Accommodation Establishment (Hotel - GoHotel, Iligan)” on a Non-Pioneer status at a capacity of one hundred (100) rooms, under Certificate ofRegistration No. 2017-235 dated August 16, 2017. Under the terms of its registration, the Group isentitled to income tax holiday for a period of four (4) years from April 2018 to March 2022.
Robinsons CyberparkThe Group is also registered with PEZA (beginning October 1, 2004) as a pioneer enterprise underthe Section 6 of Republic Act No. 7916, otherwise known as “The Special Economic Zone Act of1995, as amended, its Implementing Rules and Regulations” and PEZA Board ResolutionNo. 00-262 dated August 17, 2003, for creating and designating 68,596 square meters of land locatedat EDSA corner Pioneer Street, Mandaluyong City as an IT Park to be known as The RobinsonsCyberpark. Under the terms of its registration, the Group is entitled to certain tax and nontaxincentives which include, among others, 5% special tax regime.
Robinsons Cybergate CenterThe Group is also registered with PEZA (beginning February 8, 2006) as a pioneer enterprise underthe Section 6 of Republic Act No. 7916, otherwise known as “The Special Economic Zone Act of1995, as amended, its Implementing Rules and Regulations” and PEZA Board Resolution No. 00-262dated August 17, 2003, for creating and designating 11,125 square meters of land located at AranetaSingcang St., Barrio Tangub, National Road, Bacolod City, Negros Occidental as an IT Park to beknown as The Robinsons Cybergate Center. Under the terms of its registration, the Group is entitledto certain tax and nontax incentives which include, among others, 5% special tax regime.
Robinsons Place LipaThe Group is also registered with PEZA (beginning November 3, 2006) as a pioneer enterprise underthe Section 6 of Republic Act No. 7916, otherwise known as “The Special Economic Zone Act of1995, as amended, its Implementing Rules and Regulations” and PEZA Board ResolutionNo. 00-262 dated August 17, 2003, for creating and designating 65,399 square meters of land locatedat JP Laurel Highway, Mataas na Lupa, Lipa City, Batangas as an IT Park to be known as TheRobinsons Place Lipa. Under the terms of its registration, the Group is entitled to certain tax andnontax incentives which include, among others, 5% special tax regime.
Robinsons Big Supercenter Cainta JunctionThe Group is also registered with PEZA (beginning October 28, 2005) as a pioneer enterprise underthe Section 6 of Republic Act No. 7916, otherwise known as “The Special Economic Zone Act of1995, as amended, its Implementing Rules and Regulations” and PEZA Board ResolutionNo. 00-262 dated August 17, 2003, for creating and designating 19,522 square meters of land locatedat Ortigas Avenue Extension, Cainta Junction, Cainta, Rizal as an IT Park to be known asThe Robinsons Cyberpark. Under the terms of its registration, the Group is entitled to certain tax andnontax incentives which include, among others, 5% special tax regime.
Robinsons LuisitaThe Group is also registered with PEZA (beginning December 10, 2008) as a pioneer enterprise underthe Section 6 of Republic Act No. 7916, otherwise known as “The Special Economic Zone Act of1995, as amended, its Implementing Rules and Regulations” and PEZA Board Resolution No. 08-183dated March 31, 2008, designating a building with a gross floor area of 9,025 square meters, whichstands on a 12,703 square meter lot located at McArthur Highway, San Miguel, Tarlac as InformationTechnology (IT) Center, henceforth to be known as Robinsons Luisita. On January 5, 2017, theexpansion of the existing Robinsons Luisita, specifically the construction of additional 3-storey office
247

*SGVFSM006221*
building which shall increase the gross floor area of the IT Center from 9,025 square meters to15,330.82 square meters, has also been registered with PEZA. Under the terms of its registration, theGroup’s expansion is entitled to certain tax and nontax incentives which include, among others, 5%special tax regime.
Robinsons Cybergate NagaThe Group is also registered with PEZA (beginning May 12, 2017) as a pioneer enterprise under theSection 6 of Republic Act No. 7916, otherwise known as “The Special Economic Zone Act of 1995,as amended, its Implementing Rules and Regulations” and PEZA Board Resolution No. 15-715 datedDecember 17, 2015, for creating and designating a building, which stands on a 24,807-square meter,more or less, lot located at Naga Diversion Road corner Almeda Highway, Brangay Triangulo, NagaCity as an IT Center, to be known as Robinsons Cybergate Naga. Under the terms of its registration,the Group is entitled to certain tax and nontax incentives which include, among others, 5% special taxregime.
Robinsons Cyberpark DavaoThe Group is also registered with PEZA (beginning October 3, 2017) as a pioneer enterprise underthe Section 6 of Republic Act No. 7916, otherwise known as “The Special Economic Zone Act of1995, as amended, its Implementing Rules and Regulations” and PEZA Board Resolution No. 16-377dated June 28, 2016, for creating and designating 12,022 square meters, more or less, of land locatedalong J.P. Laurel Avenue, Davao City as an IT Park, to be known as Robinsons Cyberpark Davao.Under the terms of its registration, the Group is entitled to certain tax and nontax incentives whichinclude, among others, 5% special tax regime.
Robinsons Galleria CebuThe Group is also registered with PEZA (beginning July 12, 2013) as a pioneer enterprise under theSection 6 of Republic Act No. 7916, otherwise known as “The Special Economic Zone Act of 1995,as amended, its Implementing Rules and Regulations” and PEZA Board Resolution Nos. 00-411dated December 29, 2000 and 12-001 dated January 17, 2012, for creating and designating a buildingwith an area of 46,345 square meters, more or less, located at General Maxilom Avenue, Cebu City asInformation Technology (IT) Center, to be known as Robinsons Galleria Cebu. Under the terms of itsregistration, the Group, as the Developer/Operator of the IT Center, shall not be entitled to PEZAincentives under RA 7916, as amended.
Robinsons Place Ilocos Norte ExpansionThe Group is also registered with PEZA (beginning May 13, 2016) as a pioneer enterprise under theSection 6 of Republic Act No. 7916, otherwise known as “The Special Economic Zone Act of 1995,as amended, its Implementing Rules and Regulations” and PEZA Board Resolution Nos. 00-411dated December 29, 2000 and 15-271 dated May 28, 2015, for creating and designating a buildinglocated at Barangay 1 San Francisco, San Nicolas, Ilocos Norte, with an aggregate land area of26,537 square meters, more or less, as Information Technology (IT) Center, to be known asRobinsons Place Ilocos Norte Expansion. Under the terms of its registration, the Group is entitled tocertain tax and nontax incentives which include, among others, 5% special tax regime.
Cyberscape GammaThe Group is also registered with PEZA (beginning July 16, 2015) as a pioneer enterprise under theSection 6 of Republic Act No. 7916, otherwise known as “The Special Economic Zone Act of 1995,as amended, its Implementing Rules and Regulations” and PEZA Board Resolution Nos. 00-411dated December 29, 2000 and 15-377 dated January 16, 2015, for creating and designating a buildingwhich stands on a 1,954.50 square meters, more or less, lot located at Topaz and Ruby Roads, OrtigasCenter, Pasig City as Information Technology (IT) Center, to be known as Cyberscape Gamma.
248

*SGVFSM006221*
Under the terms of its registration, the Group, as the Developer/Operator of the IT Center, shall not beentitled to PEZA incentives.
Robinsons Starmills PampangaThe Group is also registered with PEZA (beginning September 11, 2007) as a pioneer enterpriseunder the Section 6 of Republic Act No. 7916, otherwise known as “The Special Economic ZoneAct of 1995, as amended, its Implementing Rules and Regulations” and PEZA Board ResolutionNo. 06-544 dated November 28, 2006, for creating and designating a building established on parcelsof land containing an aggregate area of 238,324 square meters, more or less, located at Gapan-Olongapo Road, Brgy. San Jose, San Fernando, Pampanga as an Information Technology (IT) Center,to be known as Robinsons Starmills Pampanga. Under the terms of its registration, the Group, as theDeveloper/Operator of the IT Center, shall not be entitled to PEZA incentives.
On May 23, 2017, the Group also registered for the construction, operation, and management of a 6-level building with a gross floor area of 12,503.25 square meters to be annexed into its existingRobinsons Starmills Pampanga IT Center under resolution No. 17-276. Under the terms of itsregistration, the Group is entitled to certain tax and nontax incentives which include, among others,5% special tax regime
Robinsons Summit CenterThe Group is also registered with PEZA (beginning September 1, 2006) as a pioneer enterprise underthe Section 6 of Republic Act No. 7916, otherwise known as “The Special Economic Zone Act of1995, as amended, its Implementing Rules and Regulations” and PEZA Board ResolutionNos. 00-411 dated December 29, 2000 and 04-387 dated November 22, 2004, for creating anddesignating a building which stands on two parcels of land with an aggregate area of 2,430 squaremeters, more or less, lot located at 6783 Ayala Avenue, Salcedo Village, Barangay Bel-Air, MakatiCity, as Information Technology (IT) Building, to be known as JG Summit Center. Under the termsof its registration, the Group, as the Developer/Operator of the IT Center, shall not be entitled toPEZA incentives.
Robinsons Equitable TowerThe Group is also registered with PEZA (beginning July 21, 2003) as a pioneer enterprise under theSection 6 of Republic Act No. 7916, otherwise known as “The Special Economic Zone Act of 1995,as amended, its Implementing Rules and Regulations” and PEZA Board Resolution Nos. 00-411dated December 29, 2000 and 03-129 dated May 28, 2003, for creating and designating a 2,832square meters parcel of land with an existing 43 storey condominium office building, located at ADBAvenue corner Poveda Street, Pasig city, as an Information Technology (IT) Zone to be known asRobinsons Equitable Tower. Under the terms of its registration, the Group, as theDeveloper/Operator of the IT Zone, shall not be entitled to PEZA incentives.
Cyberscape AlphaThe Group is also registered with PEZA (beginning January 4, 2013) as a pioneer enterprise under theSection 6 of Republic Act No. 7916, otherwise known as “The Special Economic Zone Act of 1995,as amended, its Implementing Rules and Regulations” and PEZA Board Resolution Nos. 00-411dated December 29, 2000 and 11-665 dated November 25, 2011, for creating and designating abuilding located at Sapphire and Garnet Roads, Ortigas Center, Pasig City, as InformationTechnology (IT) Center, to be known as Cyberscape Alpha. Under the terms of its registration, theGroup, as the Developer/Operator of the IT Center, shall not be entitled to PEZA incentives.
249

*SGVFSM006221*
Cyberscape BetaThe Group is also registered with PEZA (beginning November 22, 2012) as a pioneer enterpriseunder the Section 6 of Republic Act No. 7916, otherwise known as “The Special Economic Zone Actof 1995, as amended, its Implementing Rules and Regulations” and PEZA Board Resolution No. 11-624 dated November 8, 2011, for creating and designating a building located at Topaz and RubyRoads, Ortigas Center, Pasig City, containing an area of 1,955 square meter, more or less (a portionof Lot 2-C) as an Information Technology (IT) Center, henceforth to be known as Cyberscape Beta.Under the terms of its registration, the Group, as the Developer/Operator of the IT Center, shall not beentitled to PEZA incentives.
Robinsons Cybergate CebuThe Group is also registered with PEZA (beginning October 28, 2009) as a pioneer enterprise underthe Section 6 of Republic Act No. 7916, otherwise known as “The Special Economic Zone Act of1995, as amended, its Implementing Rules and Regulations” and PEZA Board ResolutionNos. 00-411 dated December 29, 2000 and 08-312 dated June 26, 2008, for creating and designating4,772 square meter, more or less, of land located at Don Gil Street, Barangay Capitol Site, Cebu City,as an Information Technology Center, to be known as Robinsons Cybergate Cebu. Under the termsof its registration, the Group, as the Developer/Operator of the IT Center, shall not be entitled toPEZA incentives.
BridgetowneThe Group is also registered with PEZA (beginning June 26, 2015) as a pioneer enterprise under theSection 6 of Republic Act No. 7916, otherwise known as “The Special Economic Zone Act of 1995,as amended, its Implementing Rules and Regulations” and PEZA Board Resolution Nos. 00-411dated December 29, 2000 and 13-182 dated March 22, 2013, for creating and designating severalparcels of land located along C-5 Road, Ugong Norte, Quezon City, with an aggregate area of 79,222square meters as Information Technology (IT) Park, to be known as Bridgetowne. Under the terms ofits registration, the Group, as the Developer/Operator of the IT Center, shall not be entitled to PEZAincentives.
Cyber SigmaThe Group is also registered with PEZA (beginning December 16, 2016) as a pioneer enterprise underthe Section 6 of Republic Act No. 7916, otherwise known as “The Special Economic Zone Act of1995, as amended, its Implementing Rules and Regulations” and PEZA Board Resolution No. 15-027dated January 30, 2015, for creating and designating a building with a gross floor area of 79,124.33square meters as an Information Technology Center to be known as the Cyber Sigma which stands ona parcel of land located along Lawton Avenue, Bonifacio South, Taguig City containing an aggregatearea of 5,000 square meters more or less. Under the terms of its registration, the Group, as theDeveloper/Operator of the IT Center, shall not be entitled to PEZA incentives.
Robinsons Luisita 2The Group is also registered with PEZA (beginning June 25, 2020) as a pioneer enterprise under theSection 6 of Republic Act No. 7916, otherwise known as “The Special Economic Zone Act of 1995,as amended, its Implementing Rules and Regulations” and PEZA Board Resolution No. 19-004 datedJanuary 16, 2019, for the declaration of a 2-storey building (with roofdeck) with gross floor area of5,033.35 square meters, more or less, located at McArthur Highway, San Miguel, Tarlac City, asSpecial Economic Zone (Information Technology (IT) Center) to be known as Robinsons Luisita 2.Under the terms of its registration, the Group is entitled to certain tax and nontax incentives whichinclude, among others, 5% special tax regime.
250

*SGVFSM006221*
Robinsons Luisita 3The Group is also registered with PEZA (beginning March 4, 2021) as a pioneer enterprise under theSection 6 of Republic Act No. 7916, otherwise known as “The Special Economic Zone Act of 1995,as amended, its Implementing Rules and Regulations” and PEZA Board Resolution No. 19-429 datedAugust 29, 2019, for creating and designating a building with a gross floor area of 6,737.45 squaremeters, more or less, and the parcel of land upon which the building stands with an area of 3,254.73square meters, located along McArthur Highway, San Miguel, Tarlac City as an InformationTechnology (IT) Center - Special Economic Zone to be known as Robinsons Luisita 3. Under theterms of its registration, the Group is entitled to certain tax and nontax incentives which include,among others, 5% special tax regime.
Robinsons Cybergate MagnoliaThe Group is also registered with PEZA (beginning April 12, 2019) as a pioneer enterprise under theSection 6 of Republic Act No. 7916, otherwise known as “The Special Economic Zone Act of 1995,as amended, its Implementing Rules and Regulations” and PEZA Board Resolution No. 17-101 datedFebruary 21, 2017 as amended by Board Resolution No. 18-244 dated May 22, 2018, for thedeclaration of a proposed building, which shall stand on a 2,076.43 square meters, more or less, lotlocated at Aurora Boulevard corner Dona Hemady Street, Quezon City, as Information Technology(IT) Center, to be known as Robinsons Cybergate Magnolia. Under the terms of its registration, theGroup, as the Developer/Operator of the IT Center, shall not be entitled to PEZA incentives.
Robinsons Place DasmarinasThe Group is also registered with PEZA (beginning November 28, 2008) as a pioneer enterpriseunder the Section 6 of Republic Act No. 7916, otherwise known as “The Special Economic Zone Actof 1995, as amended, its Implementing Rules and Regulations” and PEZA Board Resolution Nos. 00-411 dated December 29, 2000 and 08-081 dated February 15, 2008, for creating and designating abuilding with an area of 45,581 square meters, more or less, located at Aguinaldo Highway cor.Governor's Drive, Sitio Pala-pala, Brgy. Sampaloc, Dasmarinas, Cavite as Information Technology(IT) Center, to be known as Robinsons Place Dasmarinas. Under the terms of its registration, theGroup, as the Developer/Operator of the IT Center, shall not be entitled to PEZA incentives under RA7916, as amended.
Robinsons OtisThe Group is also registered with PEZA (beginning June 05, 2008) as a pioneer enterprise under theSection 6 of Republic Act No. 7916, otherwise known as “The Special Economic Zone Act of 1995,as amended, its Implementing Rules and Regulations” and PEZA Board Resolution Nos. 00-411dated December 29, 2000 and 07-141 dated April 18, 2007, for creating and designating a buildingwith an area of 32,976 square meters, more or less, located at Paz Mendiola Guanzon Street, Paco,Manila as Information Technology (IT) Center, to be known as Robinsons Otis. Under the terms ofits registration, the Group, as the Developer/Operator of the IT Center, shall not be entitled to PEZAincentives under RA 7916, as amended.
Robinsons Cagayan De OroThe Group is also registered with PEZA (beginning May 09, 2008) as a pioneer enterprise under theSection 6 of Republic Act No. 7916, otherwise known as “The Special Economic Zone Act of 1995,as amended, its Implementing Rules and Regulations” and PEZA Board Resolution Nos. 00-411dated December 29, 2000 and 07-465 dated October 10, 2007, for creating and designating a buildingwith an area of 18,450 square meters, more or less, located at Rosario Crescent corner FlorentinoStreet, Limketkai Center, Cagayan de Oro City as Information Technology (IT) Center, to be knownas Robinsons Cagayan De Oro. Under the terms of its registration, the Group, as the
251

*SGVFSM006221*
Developer/Operator of the IT Center, shall not be entitled to PEZA incentives under RA 7916, asamended.
Robinsons Place Sta. RosaThe Group is also registered with PEZA (beginning February 07, 2008) as a pioneer enterprise underthe Section 6 of Republic Act No. 7916, otherwise known as “The Special Economic Zone Act of1995, as amended, its Implementing Rules and Regulations” and PEZA Board Resolution Nos. 00-411 dated December 29, 2000 and 06-545 dated November 28, 2006, for creating and designating abuilding with an area of 37,382 square meters, more or less, located at Brgy. Tagapo, Sta. Rosa,Laguna as Information Technology (IT) Center, to be known as Robinsons Place Sta. Rosa. Underthe terms of its registration, the Group, as the Developer/Operator of the IT Center, shall not beentitled to PEZA incentives under RA 7916, as amended.
Robinsons Place IloiloThe Group is also registered with PEZA (beginning June 12, 2007) as a pioneer enterprise under theSection 6 of Republic Act No. 7916, otherwise known as “The Special Economic Zone Act of 1995,as amended, its Implementing Rules and Regulations” and PEZA Board Resolution Nos. 00-411dated December 29, 2000 and 07-057 dated February 13, 2007, for creating and designating abuilding with an area of 78,158 square meters, more or less, located at Ledesma St., Iloilo City asInformation Technology (IT) Center, to be known as Robinsons Place Iloilo. Under the terms of itsregistration, the Group, as the Developer/Operator of the IT Center, shall not be entitled to PEZAincentives under RA 7916, as amended.
Robinsons Place NovalichesThe Group is also registered with PEZA (beginning December 07, 2004) as a pioneer enterprise underthe Section 6 of Republic Act No. 7916, otherwise known as “The Special Economic Zone Act of1995, as amended, its Implementing Rules and Regulations” and PEZA Board Resolution Nos. 00-411 dated December 29, 2000 and 04-211 dated June 25, 2004, for creating and designating abuilding with an area of 55,765 square meters, more or less, located at 1199 Quirino Highway cornerMaligaya Road, Barangay Pasong Putik, Novaliches, Quezon City as Information Technology (IT)Center, to be known as Robinsons Place Novaliches. Under the terms of its registration, the Group,as the Developer/Operator of the IT Center, shall not be entitled to PEZA incentives under RA 7916,as amended.
34. Commitments and Contingencies
Operating Lease Commitments - Group as LessorThe Group has entered into commercial property leases on its investment property portfolio. Thesenoncancellable leases have remaining noncancellable lease terms of between one (1) and ten (10)years. All leases include a clause to enable upward revision of the rental charge on an annual basisbased on prevailing market conditions. The lease contracts also provide for the percentage rent,which is a certain percentage of actual monthly sales or minimum monthly gross sales, whichever ishigher. Total rent income amounted to P=10,617 million, P=15,420 million and P=13,548 million for theyears ended December 31, 2020, 2019 and 2018, respectively. Total percentage rent recognized asincome for the years ended December 31, 2020, 2019 and 2018 amounted to P=2,302 million,P=3,867 million and P=3,515 million, respectively.
252

*SGVFSM006221*
Future minimum rentals receivable under noncancellable operating leases follows:
December 312020 2019
Within one (1) year P=14,080,096,258 P=14,346,692,713After one (1) year but not more than five (5) years 15,320,496,749 17,739,106,757After more than five (5) years 1,443,106,385 5,146,915,176
P=30,843,699,392 P=37,232,714,646
In 2020, the Group granted rent concessions to its tenants which were affected by the communityquarantine imposed by the government amounting to P=3,475 million. These rent concessions did notqualify as a lease modification, thus, were accounted for as a variable lease payments and reported asreduction of lease income in 2020 (see Note 4).
Finance Lease Commitments - Group as LessorThe Group has significantly entered into residential property leases on its residential condominiumunit’s portfolio. These leases have lease period of five (5) to ten (10) years and the lessee is given theright to purchase the property anytime within the lease period provided that the lessee any arrears inrental payment, condominium dues and other charges.
Future minimum lease payments under finance lease with the present value of future minimum leasepayment as of December 31, 2020 and 2019 follow:
December 31, 2020Minimum Lease
PaymentsPresent Value of Minimum
Lease PaymentsWithin one (1) year P=656,523,582 P=644,097,650After one (1) year but not more than five (5) years 275,049,758 256,955,689After more than five (5) years − −Total minimum lease payments P=931,573,340 P=901,053,339
December 31, 2019Minimum Lease
PaymentsPresent Value of Minimum
Lease PaymentsWithin one (1) year P=527,064,357 P=508,606,027After one (1) year but not more than five (5) years 288,662,164 256,322,263After more than five (5) years 78,023,547 63,354,682Total minimum lease payments P=893,750,068 P=828,282,972
Group as a LesseeThe Group has lease contracts for various parcels of land used in its operations. Leases of landgenerally have lease terms between 25 and 50 years. The Group’s obligations under its leases aresecured by the lessor’s title to the leased assets. Generally, the Group is restricted from assigning andsubleasing the leased assets and some contracts require the Group to maintain certain financial ratios.There are several lease contracts that include extension and termination options and variable leasepayments, which are further discussed below.
253
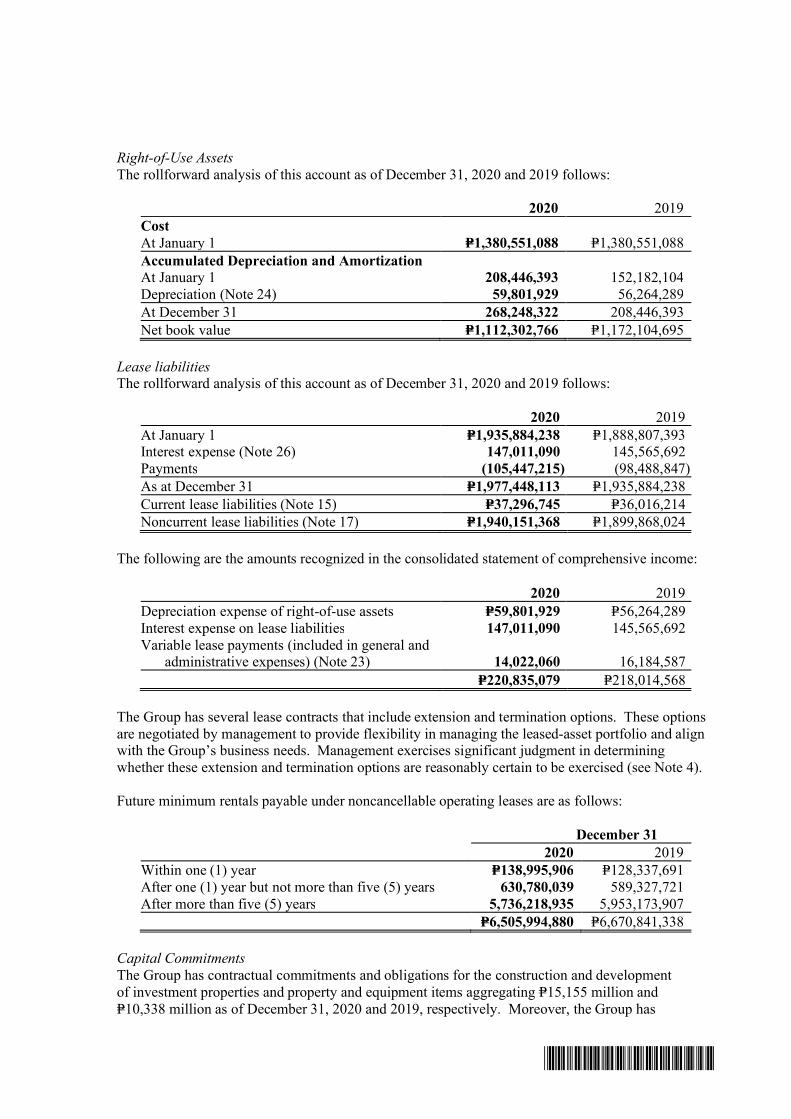
*SGVFSM006221*
Right-of-Use AssetsThe rollforward analysis of this account as of December 31, 2020 and 2019 follows:
2020 2019CostAt January 1 P=1,380,551,088 P=1,380,551,088Accumulated Depreciation and AmortizationAt January 1 208,446,393 152,182,104Depreciation (Note 24) 59,801,929 56,264,289At December 31 268,248,322 208,446,393Net book value P=1,112,302,766 P=1,172,104,695
Lease liabilitiesThe rollforward analysis of this account as of December 31, 2020 and 2019 follows:
2020 2019At January 1 P=1,935,884,238 P=1,888,807,393Interest expense (Note 26) 147,011,090 145,565,692Payments (105,447,215) (98,488,847)As at December 31 P=1,977,448,113 P=1,935,884,238Current lease liabilities (Note 15) P=37,296,745 P=36,016,214Noncurrent lease liabilities (Note 17) P=1,940,151,368 P=1,899,868,024
The following are the amounts recognized in the consolidated statement of comprehensive income:
2020 2019Depreciation expense of right-of-use assets P=59,801,929 P=56,264,289Interest expense on lease liabilities 147,011,090 145,565,692Variable lease payments (included in general and
administrative expenses) (Note 23) 14,022,060 16,184,587P=220,835,079 P=218,014,568
The Group has several lease contracts that include extension and termination options. These optionsare negotiated by management to provide flexibility in managing the leased-asset portfolio and alignwith the Group’s business needs. Management exercises significant judgment in determiningwhether these extension and termination options are reasonably certain to be exercised (see Note 4).
Future minimum rentals payable under noncancellable operating leases are as follows:
December 312020 2019
Within one (1) year P=138,995,906 P=128,337,691After one (1) year but not more than five (5) years 630,780,039 589,327,721After more than five (5) years 5,736,218,935 5,953,173,907
P=6,505,994,880 P=6,670,841,338
Capital CommitmentsThe Group has contractual commitments and obligations for the construction and developmentof investment properties and property and equipment items aggregating P=15,155 million andP=10,338 million as of December 31, 2020 and 2019, respectively. Moreover, the Group has
254

*SGVFSM006221*
contractual obligations amounting to P=7,386 million and P=5,622 million as of December 31, 2020 and2019, respectively, for the completion and delivery of real estate units that have been presold.
ContingenciesThe Group has various collection cases or claims against or from its customers and certain taxassessments, arising in the ordinary conduct of business which are either pending decision by thecourts or being contested, the outcome of which are not presently determinable. In the opinion ofmanagement and its legal counsel, the eventual liability under these lawsuits or claims, if any, willnot have a material or adverse effect on the Group’s financial position and results of operations. TheGroup does not believe that such assessments will have a material effect on its operating results andfinancial condition. The information usually required by PAS 37, Provisions, Contingent Liabilitiesand Contingent Assets, is not disclosed on the grounds that it can be expected to prejudice theoutcome of pending assessments.
35. Notes to the Consolidated Statements of Cash Flows
The Group’s noncash activities pertain to the following:
2020 Transfers from investment properties to subdivision land, condominium and residential units for
sale amounted to P=824 million (see Notes 9 and 11). Transfers from property and equipment to investment properties amounted to P=693 million
(see Notes 11 and 12). Transfers from other current assets to investment properties amounting to P=25 million
(see Notes 10 and 11). The Group has remaining unpaid cash dividend amounting to P=45 million as of
December 31, 2020 (see Note 14). Total accretion of interest in 2020 for loans, lease liabilities and security deposits amounted to
P=1,430 million, P=147 million and P=82 million, respectively (see Notes 16, 26 and 34).
2019 Transfers from investment properties to subdivision land, condominium and residential units for
sale amounted to P=318 million (see Notes 9 and 11). Transfers from investment properties to property and equipment amounted to P=102 million (see
Notes 11 and 12). Transfers from subdivision land, condominium and residential units for sale to property and
equipment amounted to P=132 million (see Notes 9 and 12). Transfers from other current assets to investment properties amounting to P=33 million
(see Notes 10 and 11). Total accretion of interest in 2019 for loans and security deposits amounted to P=836 million and
P=76 million, respectively (see Notes 16, 26 and 34).
2018 Transfers from investment properties to subdivision land, condominium and residential units for
sale amounted to P=2,072 million (see Notes 9 and 11). Transfers from investment properties to other current assets amounted to P=3 million
(see Notes 10 and 11). Transfers from other current assets to investment properties amounting to P=1,458 million
(see Notes 10 and 11).
255

*SGVFSM006221*
Total accretion of interest in 2019 for loans, lease liabilities and security deposits amounted toP=1,907 million and P=73 million, respectively (see Notes 16, 26 and 34).
Details of the movement in cash flows from financing activities follow:
For the Year Ended December 31, 2020Non-cash Changes
January 1, 2020 Cash flows
Foreignexchange
movement
Changeson fairvalues Other December 31, 2020
Loans payable P=34,715,272,176 P=19,035,280,000 P=– P=– (P=146,773,393) P=53,603,778,783Lease liabilities 1,935,884,238 (105,447,215) – – 147,011,090 1,977,448,113Short term loans 8,491,700,000 (8,491,700,000) – – – –Advances for marketing and
promotional fund and others 454,564,332 27,579,097 – – – 482,143,429Accrued interest payable 321,061,312 (1,175,776,834) – – 1,429,987,739 575,272,217Payables to affiliated companies and
others 163,251,787 93,390,532 – – – 256,642,319Dividends payable 43,287,603 (2,605,432,058) – – 2,607,205,343 45,060,888Total liabilities from financing
activities P=46,125,021,448 P=6,793,636,495 P=– P=– P=4,021,687,806 P=56,940,345,749
For the Year Ended December 31, 2019Non-cash Changes
January 1, 2019 Cash flows
Foreignexchange
movement
Changeson fairvalues Other December 31, 2019
Loans payable P=36,488,539,001 (P=1,806,127,328) P=– P=– P=32,860,503 P=34,715,272,176Lease liabilities 1,888,807,393 (98,488,847) – – 145,565,692 1,935,884,238Short term loans 896,700,000 7,595,000,000 – – – 8,491,700,000Advances for marketing and
promotional fund and others 466,576,140 (12,011,808) – – – 454,564,332Accrued interest payable 322,322,878 (908,519,292) – – 907,257,726 321,061,312Payables to affiliated companies and
others 245,560,778 (83,852,149) – – 1,543,158 163,251,787Dividends payable 43,304,321 (2,602,812,061) – – 2,602,795,343 43,287,603Total liabilities from financing
activities P=40,351,810,511 P=2,083,188,515 P=– P=– P=3,690,022,422 P=46,125,021,448
Other includes amortization of debt issue cost, declaration of dividends and accrual of interestexpense on loans.
36. Other Matters
COVID-19 PandemicFollowing the outbreak of the coronavirus disease that started in Wuhan, Hubei, China, onJanuary 30, 2020, the World Health Organization declared the 2019 coronavirus disease(“COVID-19”) outbreak a Public Health Emergency of International Concern, and subsequently, withthe continued increase in the number of confirmed cases throughout the world, a pandemic onMarch 11, 2020.
In response to the pandemic, the Philippine government took actions and implemented quarantinemeasures at varying degrees starting March 16, 2020 which mandated the temporary closure and/orreduction in operating capacity of non-essential shops and businesses, prohibited mass gatherings andall means of public transportation, and restricted traveling through air, sea and land in and out ofcountry, except by diplomats and uniformed workers (carrying medical supplies), among others.These measures have disrupted supply chains, business operations, and workplace structures, forcinga shift in priorities and short-term strategies.
256

*SGVFSM006221*
With public health and safety in mind and in full cooperation with the government, the Group’s mallsand offices remained open to support establishments offering essential services, such as groceries,pharmacies, banks, and IT-Business Process Management (IT-BPM) firms; while the Group’sresidential teams worked relentlessly to ensure safety and security across condominium properties.Likewise, the Group’s hotels served as temporary homes for returning Overseas Filipino Workers(OFWs) and guests under quarantine; while industrial facilities continued to operate under business-as-usual conditions.
The Group also institutionalized heightened cleanliness standards and invested in contactlesstechnologies to minimize health and safety risks. While the ensuring business continuity, employeewelfare and protection remained of utmost priority with the adoption of remote work arrangementsand a digital workplace.
Furthermore, the Group has rolled out innovative solutions in response to the changed businesslandscape. For the Commercial Centers Division, together with its e-commerce platform, RobinsonsMalls’ ‘Pickup Station’, ‘RDelivery’, and ‘RPersonal Shopper’ were launched to facilitate worry-freeshopping experiences while enabling partner tenants to expand consumer reach. The OfficeBuildings Division continued to expand its ‘work.able’ brand to capitalize on the growing demand forflexible workspaces. The Hotels and Resorts Division launched ‘Working-On-the-Go PrivateOffices’ to offer affordable private office packages for the growing work-at-home population and‘Just-Got-Home’ program which primarily attracted urban professionals looking for a budget-friendlyplace that is in close proximity to their workplaces and other key establishments.
The Group is cognizant of COVID-19’s potential material impact on its financial performance, theexecution of its plans and strategies, and its customers and employees should the situation persist inthe longer-term. Nevertheless, the Group expects to regain its significant foothold in the market itoperates in as movement restrictions ease and as consumer sentiment recovers. Furthermore, despiteunprecedented headwinds, the Group’s financial position remains stable and strong on the back of itswell-balanced and diversified business portfolio.
Property-for-share swap transaction with a subsidiaryIn March 2021, the Board of Directors approved in principle the transfer of some of the ParentCompany’s assets to Robinsons Realty Management Corporation, a subsidiary, in exchange for thelatter’s shares in property-for-share swap transaction through the execution of a Deed of Assignment.Final terms of the property-for-share swap will still be determined and will be subject for furtherapproval by the Board and regulatory bodies.
Corporate Recovery and Tax Incentives for Enterprises (CREATE) ActOn March 26, 2021, Pres. Rodrigo Duterte signed into law the CREATE Act which eyes to attractmore investments and maintain fiscal prudence and stability in the Philippines. Republic Act (RA)11534 or the CREATE Act introduces reforms to the corporate income tax and incentives systemswhich will take effect 15 days after its complete publication in the Official Gazette or in a newspaperof general circulation, which will be on April 11, 2021. For the detailed discussion of the CREATEAct, refer to Note 27.
Joint Venture Agreement for the Establishment of a Joint Venture CompanyOn February 16, 2021, the BOD of the Parent Company approved the execution of a joint ventureagreement for the establishment of a joint venture company (JVC) in the Philippines and theinvestment of up to 20% of the share capital and voting rights of the JVC which will operate a digitalbank in the country, subject to approval of the Bangko Sentral ng Pilipinas.
Joint Venture agreement has not yet been executed as of March 30, 2021.
257

*SGVFSM006221*
INDEPENDENT AUDITOR’S REPORTON SUPPLEMENTARY SCHEDULES
The Stockholders and the Board of DirectorsRobinsons Land CorporationLevel 2, Galleria Corporate CenterEDSA corner Ortigas Avenue, Quezon City, Metro Manila
We have audited in accordance with Philippine Standards on Auditing, the consolidated financialstatements of Robinsons Land Corporation and its subsidiaries (the Group) as at December 31, 2020 and2019, and for each of the three years in the period ended December 31, 2020, and have issued our reportthereon dated March 30, 2021. Our audits were made for the purpose of forming an opinion on the basicfinancial statements taken as a whole. The schedules listed in the Index to the Financial Statements andSupplementary Schedules are the responsibility of the Group’s management. These schedules arepresented for purposes of complying with the Revised Securities Regulation Code Rule 68 and are notpart of the basic financial statements. These schedules have been subjected to the auditing proceduresapplied in the audit of the basic financial statements and, in our opinion, fairly state, in all materialrespects, the financial information required to be set forth therein in relation to the basic financialstatements taken as a whole.
SYCIP GORRES VELAYO & CO.
Michael C. SabadoPartnerCPA Certificate No. 89336SEC Accreditation No. 0664-AR-4 (Group A), November 11, 2019, valid until November 10, 2022Tax Identification No. 160-302-865BIR Accreditation No. 08-001998-073-2020, December 3, 2020, valid until December 2, 2023PTR No. 8534357, January 4, 2021, Makati City
March 30, 2021
SyCip Gorres Velayo & Co.6760 Ayala Avenue1226 Makati CityPhilippines
Tel: (632) 8891 0307Fax: (632) 8819 0872ey.com/ph
BOA/PRC Reg. No. 0001, October 4, 2018, valid until August 24, 2021SEC Accreditation No. 0012-FR-5 (Group A),
November 6, 2018, valid until November 5, 2021
A member firm of Ernst & Young Global Limited 258

*SGVFSM006221*
INDEPENDENT AUDITOR’S REPORT ONCOMPONENTS OF FINANCIAL SOUNDNESS INDICATORS
The Stockholders and the Board of DirectorsRobinsons Land CorporationLevel 2, Galleria Corporate CenterEDSA corner Ortigas Avenue, Quezon City, Metro Manila
We have audited in accordance with Philippine Standards on Auditing, the consolidated financialstatements of Robinsons Land Corporation and its subsidiaries (the Group) at December 31, 2020 and2019, and for each of the three years in the period ended December 31, 2020, and have issued our reportthereon dated March 30, 2021. Our audits were made for the purpose of forming an opinion on the basicfinancial statements taken as a whole. The Supplementary Schedule of Financial Soundness Indicators,including their definitions, formulas, calculation, and their appropriateness or usefulness to the intendedusers, are the responsibility of the Group’s management. These financial soundness indicators are notmeasures of operating performance defined by Philippine Financial Reporting Standards (PFRSs) andmay not be comparable to similarly titled measures presented by other companies. This schedule ispresented for the purpose of complying with the Revised Securities Regulation Code Rule 68 issued bythe Securities and Exchange Commission and is not a required part of the basic financial statementsprepared in accordance with PFRSs. The components of these financial soundness indicators have beentraced to the Group’s financial statements as at December 31, 2020 and 2019, and for each of the threeyears in the period ended December 31, 2020 and no material exceptions were noted.
SYCIP GORRES VELAYO & CO.
Michael C. SabadoPartnerCPA Certificate No. 89336SEC Accreditation No. 0664-AR-4 (Group A), November 11, 2019, valid until November 10, 2022Tax Identification No. 160-302-865BIR Accreditation No. 08-001998-073-2020, December 3, 2020, valid until December 2, 2023PTR No. 8534357, January 4, 2021, Makati City
March 30, 2021
SyCip Gorres Velayo & Co.6760 Ayala Avenue1226 Makati CityPhilippines
Tel: (632) 8891 0307Fax: (632) 8819 0872ey.com/ph
BOA/PRC Reg. No. 0001, October 4, 2018, valid until August 24, 2021SEC Accreditation No. 0012-FR-5 (Group A),
November 6, 2018, valid until November 5, 2021
A member firm of Ernst & Young Global Limited 259

ROBINSONS LAND CORPORATION AND SUBSIDIARIESSUPPLEMENTARY INFORMATION AND DISCLOSURES REQUIRED ONREVISED SRC RULE 68DECEMBER 31, 2020
Schedule A. Financial AssetsThe Group does not have financial assets classified under available-for-sale, fair value through profit orloss and held to maturity as of December 31, 2020.
Schedule B. Amounts Receivable from Directors, Officers, Employees, Related Parties and PrincipalStockholders (other than related parties)The Group does not have amounts receivable from directors, officers, employees, related parties andprincipal stockholders (other than related parties) above P=1 million or 1% of total consolidated assets asof December 31, 2020.
Schedule C. Amounts Receivable from Related Parties which are Eliminated During the Consolidation ofFinancial StatementsBelow is the schedule of receivables (payables) with related parties which are eliminated in theconsolidated financial statements as of December 31, 2020:
Volume of Transactions Receivable TermsRobinsons Properties Marketing &
Management Corp. (RPMMC)Share in expenses P=3,590,974 P=46,008,281 Non-interest bearing
and to be settledwithin one year
Altus Angeles, Inc. (AAI) Advances (2,980,214) 10,333,892 Non-interest bearingand to be settledwithin one year
Altus Property Ventures, Inc.(APVI)
Advances 4,846,956 14,392,552 Non-interest bearingand to be settledwithin one year
RLGB Land Corporation (RGLB) Advances 26,528,088 26,528,088 Non-interest bearingand to be settledwithin one year
GoHotels Davao, Inc. (GHDI) Share in expenses 886,047 3,713,934 Non-interest bearingand to be settledwithin one year
Robinsons Realty and ManagementCorporation (RRMC)
Share in expenses − − Non-interest bearingand to be settledwithin one year
Bonifacio Property Ventures, Inc.(BPVI)
Advances 1,500,023,301 4,634,354,668 Non-interest bearingand to be settledwithin one year
RLC Resources Limited (RLCRL) Advances − 1,126,731 Non-interest bearingand to be settledwithin one year
P=1,532,895,152 P=4,736,458,146
Balance atend of period Current Noncurrent
BPVI P=4,634,354,668 P=4,634,354,668 P=−RPMMC 46,008,281 46,008,281 −RLGB 26,528,088 26,528,088 −ASNC 14,392,552 14,392,552 −AAI 10,333,892 10,333,892 −GHDI 3,713,934 3,713,934 −RLCRL 1,126,731 1,126,731 −
P=4,736,458,146 P=4,736,458,146 P=−
260

The intercompany transactions between the Parent Company and the subsidiaries pertain to share inexpenses, marketing fees and advances. There were no amounts written-off during the year and allamounts are expected to be settled within the year.
Related Party TransactionsDue from related partiesBelow is the list of outstanding receivables from related parties of the Group presented in theconsolidated statements of financial position as of December 31, 2020:
Nature
Balance atend ofperiod
Under common control of Ultimate Parent CompanyRobinsons Recreation Corporation B P=11,334,271Altus Property Ventures Inc. A 14,387,198JG Summit Capital Markets Corporation A 1,520,227Express Holdings, Inc. A 973,513Oriental Petroleum & Mining Corp. A 754,095Robinsons Pharmacies, Inc. A 586,618Others A, B 292,969
Joint ventures in which the Parent Company is a venturerShang Robinsons Properties, Inc. C 1,000,000,000
P=1,029,848,891
Other receivables from affiliates account consist primarily of receivables from Robinsons Handyman,Inc., Robinsons Specialty Stores, Inc. and other affiliates.
Nature of intercompany transactionsThe nature of the intercompany transactions with the related parties is described below:
(a) Expenses - these pertain to the share of the Group’s related parties in various common selling andmarketing and general and administrative expenses.
(b) Advances - these pertain to temporary advances to/from related parties for working capitalrequirements.
(c) Shareholders’ loan - this pertains to the loan extended to the joint venture in accordance with the jointventure agreement.
The outstanding balances of intercompany transactions are due and demandable as ofDecember 31, 2020.
261

Schedule D. Intangible AssetsThe Group does not have intangible assets as of December 31, 2020.
Schedule E. Long-term debtBelow is the schedule of long-term debt of the Group as of December 31, 2020:
Amount Current NoncurrentThree-year bonds maturing on July 17, 2023. Principal payable upon
maturity, with fixed rate at 3.6830%, interest payable semi-annually in arrears. P=12,763,070,000 P=− P=12,763,070,000
Seven-year bonds from Banco de Oro (BDO), Hongkong ShanghaiBanking Corporation (HSBC), SB Capital InvestmentCorporation (SB Capital), Standard Chartered Bank (StandardChartered), Development Bank of the Philippines (DBP) andEast West Banking Corporation (East West) maturing onFebruary 23, 2022. Principal payable upon maturity, with fixedrate at 4.8000%, interest payable semi-annually in arrears. 10,635,500,000 − 10,635,500,000
Seven-year term loan from MBTC maturing on March 15, 2024.Principal payable in annual installment amounting to two percent(2%) of the total drawn principal amount and the balance uponmaturity, with fixed rate at 4.7500%, interest payable quarterly inarrears 6,720,000,000 140,000,000 6,580,000,000
Five-year term loan from BDO maturing on July 8, 2021. Principalpayable upon maturity, with fixed rate at 3.8327%, interestpayable quarterly in arrears. 6,500,000,000 6,500,000,000 −
Five-year term loan from BDO Unibank, Inc. maturing on June 30,2025. Principal payable upon maturity, with fixed rate at4.7500%, interest payable quarterly in arrears. 6,000,000,000 − 6,000,000,000
Seven-year term loan from BPI maturing on August 10, 2023.Principal payable in annual installment amounting to P=10 millionfor six years and the balance upon maturity, with fixed rate at3.8900%, interest payable quarterly in arrears. 4,960,000,000 10,000,000 4,950,000,000
Ten-year term loan from BPI maturing on February 13, 2027.Principal payable in annual installment amounting to P=5 millionfor nine years and the balance upon maturity, with fixed rate at4.9500%, interest payable quarterly in arrears 4,485,000,000 5,000,000 4,480,000,000
Ten-year bonds from BDO and Standard Chartered maturing onFebruary 23, 2025. Principal payable upon maturity, with fixedrate at 4.9344%, interest payable semi-annually in arrears. 1,364,500,000 − 1,364,500,000
Five-year bonds maturing on July 17, 2025. Principal payable uponmaturity, with fixed rate at 3.8000%, interest payable semi-annually in arrears. 427,210,000 − 427,210,000
P=53,855,280,000 P=6,655,000,000 P=47,200,280,000
Schedule F. Indebtedness to Related Parties (Long term Loans from Related Companies)Below is the list of outstanding payables to related parties of the Group presented in the consolidatedstatements of financial position as of December 31, 2020:
Relationship Nature
Balance atbeginningof period
Balance atend ofperiod
JG Summit Holdings, Inc. Ultimate Parent Company A, C P=124,605753 P=152,998,397
Others
Under common control ofthe Ultimate Parent
Company A, B 38,646,034 103,643,922P=163,251,787 P=256,642,319
Others consist of payables to Robinsons Department Store, Robinsons Supermarket and Universal RobinaCorporation, among others
Due to JG Summit Holdings, Inc. mainly due to share in IT and corporate expenses.
262

Nature of intercompany transactionsThe nature of the intercompany transactions with the related parties is described below:
(a) Expenses - these pertain to the share of the Group’s related parties in various common selling andmarketing and general and administrative expenses.
(b) Advances - these pertain to temporary advances to/from related parties for working capitalrequirements.
(c) Management and marketing fee
The outstanding balances of intercompany transactions are due and demandable as ofDecember 31, 2020.
Schedule G. Guarantees of Securities of Other IssuersThe Group does not have guarantees of securities of other issuers as of December 31, 2020.
Schedule H. Capital Stock
Title of issue
Number ofshares
authorized
Number ofshares issued
andoutstanding as
shown underrelated
balance sheetcaption
Number ofshares
reserved foroptions,
warrants,conversion
and otherrights
Number ofshares held byrelated parties
Directors,Officers and
Employees OthersCommon Shares 8,200,000,000 5,193,830,685 – 3,166,806,886 11,805,421 2,015,218,378
263

ROBINSONS LAND CORPORATION AND SUBSIDIARIESANNEX 68-D. RECONCILIATION OF UNAPPROPRIATED RETAINEDEARNINGS AVAILABLE FOR DIVIDEND DECLARATIONDECEMBER 31, 2020
Unappropriated Retained Earnings, beginning, as previously reported P=26,501,747,857Adjustments 1,168,719,060Unappropriated Retained Earnings as adjusted, beginning 27,670,466,917Net income actually earned/realized during the yearNet income during the year closed to Retained Earnings 4,996,618,191Less: Non-actual/unrealized income, net of tax
Other unrealized expense or adjustments to the retainedearnings as a result of certain transactions accounted for under the PFRS:
Discounting effect on installment contract receivable (PAS 39) (78,175,990)Straight line adjustment rental income (PFRS 16) 2,731,723Straight line adjustment rental expense (PFRS 16) (162,118,027)Discounting effect on security deposits (PAS 39) 1,845,477Finance lease as a lessee (PFRS 16) 206,813,019Amortization of commission expense (PFRS 16) 538,836,323Capitalized borrowing costs (607,488,563)Gain or loss on Fair Value through Other Comprehensive Income (FVOCI) 8,407,149Provision for deferred tax 498,383,741
Net income actually earned during the period 5,405,853,043Less: Cash dividend declaration during the year (2,596,915,343)
Reversal of appropriation 27,000,000,000Additional appropriation during the year (26,000,000,000)
Total Unappropriated Retained Earnings Available For Dividend Distribution,December 31, 2020 P=31,479,404,617
264

ROBINSONS LAND CORPORATION AND SUBSIDIARIESANNEX 68-E. SCHEDULE OF FINANCIAL SOUNDNESS INDICATORSAS OF DECEMBER 31, 2020
Ratio Formula CurrentYear
PriorYear
Current ratio Current assetsCurrent liabilities 1.49 1.37
Acid test ratio(Quick ratio)
(Cash and cash equivalents + Current receivables+ Other current assets)
Current liabilities0.71 0.50
Solvency ratios Earnings before interest, taxes, depreciation and amortization(Short-term loans + Long-term loans) 0.26 0.40
Debt-to-equityratio
(Short-term loans + Long-term loans)Equity attributable to equity holders of the Parent Company 0.53 0.43
Asset-to-equityratio
Total assetsTotal equity 2.10 1.90
Interestcoverage ratio
Earnings before interest and taxesInterest expense + Capitalized interest expense 3.70 6.98
Return onequity
Net income attributable to equity holders of Parent CompanyEquity attributable to equity holders of the Parent Company 0.05 0.09
Return onassets
Net income attributable to equity holders of Parent CompanyTotal assets 0.02 0.05
Net profitmargin
Earnings before interest and taxesTotal revenues 0.33 0.40
265

LEGEND:SubsidiaryAssociateJoint Venture
JG SUMMITHOLDINGS, INC
(Parent)
100% 100% 100% 100%
Robinsons LandCorporation
(Parent)
Robinsons Realty andManagement Corporation
Robinsons Properties Marketing& Management Corp.
(Group)
Robinsons Inn,Inc
Robinsons LandCorporation &Subsidiaries
60.97%
RLGB Land Corporation Robinsons(Cayman) Ltd
100% 100% 100% 100%100%
Robinsons PropertiesMarketing & Management Corp.
(Parent)
RLC Resources Ltd.(Parent)
Land CenturyHoldings Ltd.
World CenturyEnterprises Ltd.
Manhattan BuildingManagement Corp.
100% 100%
Shang RobinsonsProperties, Inc. RHK Land Corporation
50% 60%
RLC DMCI PropertyVentures, Inc.
50%
First Capital Development LimitedRobinsons
DoubleDragon Corp.100%
65.72%
First Capital Development Limited(Parent)
Chengdu Xin Yao Real EstateDevelopment, Co. Ltd.
Bonifacio PropertyVentures, Inc.
51% 100% 100% 51% 51% 100% 70% 100%
RLC Resources Limited(Group)
Altus Angeles, Inc. Go HotelsDavao, Inc.
Altus Mall Ventures,Inc.
Bacoor R and FLand Corporation
Map of the Relationships of the Company within the Group
Below is a map showing the relationship between and among the Group and its ultimate parent company, subsidiaries, and joint ventures as ofDecember 31, 2020:
266

INDEX TO EXHIBITS
Form 17-A Page No. (3) Plan Of Acquisition, Reorganization, Arrangement, Liquidation, Or Succession * (5) Instruments Defining the Rights of Security Holders, Including Indentures * (8) Voting Trust Agreement * (9) Material Contracts * (10) Annual Report To Security Holders. Form 11-Q Or Quarterly Report To Security Holders * (13) Letter Re: Change In Certifying Accountant * (16) Report Furnished To Security Holders * (18) Subsidiaries of the Registrant 268 (19) Published Report Regarding Matters Submitted To Vote Of Security Holders * (20) Consent Of Experts And Independent Counsel * (21) Power of Attorney * ________________
These exhibits are either not applicable to the Company or require no answer.
267

EXHIBIT 18: SUBSIDIARIES OF THE REGISTRANT Robinsons Land Corporation has eleven (11) subsidiaries as of December 31, 2020:
SUBSIDIARY BUSINESS % OWNERSHIP COUNTRY OF
DIRECT EFFECTIVE INC OR RESIDENCE Robinson’s Inn, Inc. 17 Apartelle Operation 100 100 Philippines Robinsons Realty and
Management Corporation Property development 100 100
Philippines
Robinsons Properties Marketing & Management Corporation
Marketing of real properties
100
100
Philippines
Robinsons (Cayman) Ltd Property development 100 100 Cayman Islands Altus Angeles, Inc. Property management 51 51 Philippines
Altus Mall Ventures, Inc. Property management 100 100 Philippines
GoHotels Davao, Inc. Hotel Operation 51 51 Philippines RLC Resources Ltd. Property management 100 100 British Virgin Islands
Bonfacio Property Ventures, Inc. Property management 100 100 Philippines
Bacoor R and F Land Corporation Property management 70 70 Philippines
RLGB Land Corporation Property management 51 100 Philippines
1 Closed operations effective August 31, 2007
268