COVER SHEET for SEC FORM 20-IS SEC Registration Number 3 4 ...
Upload
khangminh22Category
view
1download
0
1
1 2 9 9 8SEC Registration Number
R F M C O R P O R A T I O N A N D S U B S I D I A R I E S
(Company’s Full Name)
R F M C o r p o r a t e C e n t r E , C o r n e r
P i o n e e r a n d S h e r i d a N S t r e e t s
M a n d a l u y o n g C i t y
(Business Address: No. Street City/Town/Province)
Ramon Lopez 631-8101(Contact Person) (Company Telephone Number)
1 2 3 1 1 7 - AMonth Day (Form Type) Month Day
(Calendar Year) (Annual Meeting)
Not Applicable(Secondary License Type, If Applicable)
Not ApplicableDept. Requiring this Doc. Amended Articles Number/Section
Total Amount of Borrowings
Total No. of Stockholders Domestic Foreign
To be accomplished by SEC Personnel concerned
File Number LCU
Document ID Cashier
S T A M P S
Remarks: Please use BLACK ink for scanning purposes.
COVER SHEET
1
SECURITIES AND EXCHANGE COMMISSION
SEC FORM 17-A
ANNUAL REPORT PURSUANT TO SECTION 11 OF THE REVISED SECURITIES ACTAND SECTION 141 OF CORPORATION CODE OF THE PHILIPPINES
1. For the fiscal year ended December 31, 2012
2. SEC Identification Number 12998 3. BIR Tax Identification Number 000-064-134-000
4. Exact name of registrant as specified in its charter: RFM CORPORATION
5. Philippines 6. (SEC Use Only)Province, Country or other jurisdiction of Industry Classification Code:
incorporation or organization
7. RFM Corporate Center, Corner Pioneer and Sheridan Sts.,Mandaluyong City 1550
Address of principal office Postal Code
8. (632) 631-81-01Issuer’s telephone number, including area code
9. Not applicableFormer name, former address, and former fiscal year, if changed since last report
10. Securities registered pursuant to Sections 8 and 12 of the SRC, or SEC 4 and 8 of the RSA
Title of Each ClassNumber of Shares of Common Stock Outstanding
and Amount of Debt OutstandingCommon Stock, P1.00 par value 3,160,403,866 shares
11. Are any or all of these securities listed in the Philippine Stock ExchangeYes [ ] No [ ]
All of RFM Corporation’s common shares are listed at the Philippine Stock Exchange.
12. The registrant:a. has filed all reports required to be filed by Section 17 of the SRC and SRC Rule 17
thereunder or Section 11 of the RSA and RSA Rule 11(a)-1 thereunder and Sections 26and 141 of the Corporation Code of the Philippines during the preceding 12 months (orfor such shorter period that the registrant was required to file such reports):
Yes [ ] No [ ]
b. has been subject to such filing requirements for the past 90 days.Yes [ ] No [ ]
13. Aggregate value of the voting stock held by non-affiliates: P 284 Million
14. Documents incorporated by reference. None
1
PART I – BUSINESS AND GENERAL INFORMATION
Item 1 - Business
The RFM Group
RFM Corporation (the “Company”) is a major player in the food and beverage industry in the Philippines,specifically in the processing and manufacture of flour, flour-based products like pasta, sauces and cakemixes, milk and juice drinks, canned and processed meats, and ice cream.
The Company also operates non-food businesses, which include barging services (Rizal LighterageCorporation) and insurance brokerage (RFM Insurance Brokers, Inc.), and leasing of commercial/officespaces (Invest Asia Corporation) that mainly serves the internal requirement of the various operatingdivisions.
History and Business Development
RFM Corporation was incorporated on August 16, 1957 as Republic Flour Mills, Inc. to manufacture flourin the Philippines, a country which does not grow wheat, in order to contribute to the country’s greater self-reliance in basic food. From its original business of flour milling, the Company diversified into poultry andlivestock production and areas of food manufacturing that includes flour-based products, margarine, milk &juices, canned and processed meat, ice cream, and bottled mineral water.
After RFM established itself in the flour milling business, the Company, in 1963, commissioned new plantfacilities to produce cooking oil and margarine. This was then followed by the establishment of a feed millin 1965 to manufacture poultry and hog feeds, of which key raw materials - bran and pollard - were by-products of the flour operations.
In the early 1971, RFM integrated forward into hog and poultry breeding. It entered into a licensingagreement with Peterson Industries and H & N Layers to breed day-old chicks. The Company, though,divested from the hog operation in 1994, and in the poultry business in 2003 by way of property dividendsto its shareholders.
In 1973, the Company signed an exclusive licensing agreement with Swift and Company of Illinois (nowArmour Swift & Echrich of the ConAgra Group). This move initiated the entry of RFM into the businessof chilled and canned meat processing using the “Swift” brand name. A continuous meat processing plant,the first in the country, was constructed in 1975. The “Swift” brand name was eventually purchased byRFM in 1987, allowing the Company the rights to its exclusive use in the Philippines. The “Swift” brandname is being shared by RFM and Swift Foods, Inc. in their production and sale of processed meat andchicken products, respectively.
From the 1970s to 1980s, RFM concentrated primarily on growing its established core businesses. It alsointroduced grocery items, such as cake mixes, hotcake mixes, and ingredient mixes during this period.
As RFM began to enter the 1990s, it envisioned itself to become a truly diversified Food Company cateringto the Filipino taste. This goal was and continues to be implemented through two approaches: strategicacquisition of Filipino companies with strong local brands, and partnerships with internationally-renownedfood institutions.
This vision was first manifested in the purchase of Cosmos Bottling Corporation (Cosmos), a Filipinosoftdrinks company, in 1989, from the Wong Family. Then in 1990, RFM acquired the “Selecta”trademark from the Arce Family. RFM invested in new machinery under a new company, Selecta DairyProducts, Inc. (Selecta), to mass produce the locally famous ice cream flavors within international healthstandards. And in 1993, the Company ventured into the production of ready-to-drink ultra-heat treated
2
(UHT) milk and juices in tetra-packaged format using the brand names Selecta Moo and Sunkist,respectively.
In 1994, Swift, Selecta, and Cosmos conducted an initial public offering of its shares of stock through thePhilippine Stock Exchange.
A year later, in 1995, the Company incorporated RFM Properties and Holdings, Inc. to consolidate its realestate assets as well as to break into the land and housing development business. The company was laterrenamed Philippine Townships, Inc. In 2008, the company was again renamed to Philtown Properties, Inc.
RFM continued to expand its businesses as it ventured into noodle manufacturing, tuna processing,bakeshop business with the acquisition of the Rolling Pin trademark, food franchising with the use of LittleCeasar’s Pizza brand of the USA, and thrift banking under Consumer Bank.
The Asian Financial Crisis of 1997, however, put a halt to the business expansion of RFM. The ensuingeconomic slowdown, more cutthroat market competition, and the dearth of capital financing weighedheavily on the financial operations of the Company. Furthermore, the US$83.7M bond, which it obtainedin 1996, became due in 2001, and its payment forced RFM to sell many of its operating subsidiaries,including Consumer Bank which was sold to Philippine Bank of Communications, and Cosmos which wassold to Coca-Cola Inc. and San Miguel Corporation.
In 2003, the company’s common shares from Swift Foods, Inc. were declared as property dividends to itsstockholders. Likewise, the company’s common shares from Philtown Properties, Inc. (formerly PhilippineTownships, Inc.), the property company, were declared as property dividends in tranches in 2008, 2009 and2012. However, the company remains committed in liquidating its landholdings through the developmentof middle income housing enclaves. It also builds condominium projects in saleable areas in FortBonifacio, Rockwell, and Taft.
The remaining business, nevertheless, gives RFM the foundation to build on. Within the Parent Company,the original business of flour making continues; as well as branded food products such as Swift processedchilled and canned meats like hotdogs, vienna sausage, and corned beef, Sunkist Juices, Selecta Milk,Fiesta Pasta Noodles, White King Hot Cake, Butterfresh Margarine, among others. The ice cream businessremains profitable and is presently co-owned with Unilever Philippines, under a new corporate name,Unilever-RFM Ice Cream Inc.
In late 2012, RFM entered into a Trademark and Asset Purchase Agreement with The Pacific MeatCompany, Inc. (PMCI). The terms of this agreement includes RFM’s sale of the “Swift” brand, togetherwith finished goods and raw material inventories, the goodwill of the business connected with thetrademarks used for its canned, pouch flexible heat sterilized, refrigerated, chilled and frozen meatproducts, and certain machinery and equipment, as well as all product formulations, processes, know-howand other technical information relating to the production of meat products.

3
The Group and the Products
Food Businesses
RFM Corporation (Parent Company)
RFM Corporation (the parent company) operates two major business segments:- Institutional segment, which primarily manufactures and sells flour, pasta, bakery and other bakery
products to institutional customers; and- Consumer segment, that manufactures and sells ice cream, meat, milk and juices, pasta products,
and flour and rice based mixes.See table on sales.
Unilever-RFM Ice Cream Inc. (formerly Selecta Wall’s Inc.)
Unilever-RFM Ice Cream Corporation is a joint venture enterprise owned 50%-50% by RFM Corporationand Unilever Philippines Inc. It is engaged in the business of manufacturing, marketing, distributing andselling, importing and exporting of ice cream, ice cream desserts and ice cream novelties, and similar foodproducts.
Interbake Commissary Corporation
Interbake Commissary Corporation was established in 1998, and operates a high-speed Bun ProductionLine. It’s first, and continues to be the biggest customer, is McDonald’s. Interbake supplies the bunrequirements to McDonald’s over 260 stores in Luzon. Through the years, Interbake has gained anoutstanding reputation for delivering world-class quality buns, enabling it to further expand its customerbase which now includes other quick service restaurants such as Wendy’s and KFC. Since 2007,Interbake’s bread sales volume had an average annual increase of 10%.
RFM Foods Philippines Corporation
Established in 1991 as RFM-Indofood Philippines Corporation, then a joint venture company betweenRFM Corporation and Indofood of the Salim Group of Indonesia, the company’s main product lines wereinstant noodles of various flavors and packaging. The Company, however, ceased operations in October2000 due to operating losses. The company has been renamed RFM Foods Philippines Corporation, andremains dormant.
Southstar Bottled Water Company, Inc.
Southstar Bottled Water Company, Inc. (Southstar) was incorporated in 1992 to manufacture and distributeall kinds and classes of bottle water, carbonated water, drinking water, fluoridated water, mineral water,natural water, purified water, spring water, well water, flavored water, as well as bottling equipment,purification equipment, coolers, dispensers, water treatment plants, water bottling plants, bottles, crates,including their accessories, attachments, spare parts and any merchandise of similar nature. Southstar,however, suspended its operations due to sustained operating losses.
4
FWBC Holdings, Inc.
FWBC Holdings, Inc. is 83.38% owned by RFM Corporation, and organized in 2001 to hold and manageFilipinas Water Bottling Corporation (FWBC). FWBC is involved in the processing and distribution ofbottled mountain spring water. FWBC, however, ceased operations in June 2012 due to operating losses.
Non-Food Businesses
RFM Equities, Inc.
RFM Equities Inc. is a holding company that is 100% owned by RFM. It was organized in 1996 to holdand manage RFM Corporation’s holdings in two small financial services subsidiaries – ConglomerateSecurities and Financing Corporation (CSFC) and RFM Insurance Brokers, Inc. (RIBI). CSFC providesconsumer-financing services mainly to the managers and employees of the RFM Group. RIBI meanwhileservices the insurance needs mainly of the RFM Group, affiliates and business partners.
Rizal Lighterage Corporation
Rizal Lighterage Corporation (RLC) is a barging company that is 94% owned by RFM Corporation. It isprimarily engaged in providing lighterage and cargo handling services.
WS Holdings, Inc.
WS Holdings, Inc. is 60% owned by RFM Corporation and 40% owned by Unilever Philippines, Inc. Itwas incorporated and registered with the Securities and Exchange Commission in 1999 to invest in,purchase and own shares of stocks, bonds and other securities of obligations including real estate andpersonal property of any foreign or domestic corporation, or partnership, or association.
Selecta Wall’s Land Corporation
Selecta Wall’s Land Corporation was incorporated in 1999 to acquire, own, use, develop and hold forinvestment all kinds of real estate. RFM Corporation owns 35% of this company.
Cabuyao Meat Processing Corporation
Formerly Bringmenow, Inc., the company was renamed into Cabuyao Meat Processing Corporation(CMPC) in 2005 upon the transfer into it of the meat manufacturing assets. This is 100% owned by RFMCorporation, and its primary possession is the processing plant in Cabuyao, Laguna, which produceshotdogs, corned beef, hams, and other meat products under the Swift brand. In October 2012, the Companysold its trademark “Swift”, finished goods and raw material inventories, as well as specific processed meatequipment.
Invest Asia Corporation
Invest Asia Corporation, which owns the RFM head office building and land where the building is locatedleases commercial and office spaces to its affiliates and third party tenants. RFM Corporation acquired96% equity interest of Invest Asia and became a subsidiary of the Parent Company on August 2, 2010.

5
Contribution to Sales
The Group is primarily engaged in manufacturing, milling, and marketing of food and beverage products.The Group operates its business through the business units identified below. Information as to the relativecontribution of the divisions and business to total sales are as follows:
BusinessUnit Products Brands
Contributionto Sales
InstitutionalGroup
Flour Products
Hamburger buns, Englishmuffins
Republic Special, Cinderella, Hi-ProMajestic, Pioneer, Señorita, AltarBread, Milenyo
34.7%
ConsumerGroup
Ready to Drink Juice, Readyto Drink Tea, Powdered Juice,Ready to Drink Milk,Flavored Water
Processed Meat and CannedMeat
Flour-based and rice-basedproducts
Tomato-based sauces
Ice Cream products
Sunkist Orange Pulp, Sunkist HealthyHeart, Sunkist Iced Tea, Alo GreenTea, Selecta Moo, Selecta FilledMilk, Selecta Fortified Milk, Vitwater
Swift Premium, Swift Mighty Meaty,Swift Sweet and Juicy, Swift All Meat(SAM), Swift Chicken Franks, SwiftDelicious, Swift Rica, Swift Bacon,Swift Square Ham, Swift ChristmasHam, Swift Corned Beef, Swift JuicyCorned Beef, Swift Juicy CarneNorte, Swift Meaty Corned Beef,Swift Meaty Carne Norte, Swift BlackLabel, Swift Chicken Vienna, SwiftVienna Sausage, Swift LuncheonMeat and Swift Meat Loaf
Fiesta Spaghetti, Whiteking All–Purpose flour, White King Hotcakemixes, White King Native Mixes,White King Brownie Mixes, WhiteKing Champorado Mix
Fiesta Meaty Filipino BlendsSpaghetti Sauce, Fiesta Sweet BlendSpaghetti Sauce, Fiesta Italian BlendSpaghetti Sauce
Selecta Gold Series, Selecta Overload,Selecta Double Overload, SelectaSuper Thick Classic, Selecta Birthday3-in-1, Selecta Birthday 3-in-1 +1Supreme, Selecta Magnum, SelectaCornetto, Selecta Cornetto Disc,Selecta Ice Cream Sticks, SelectaPaddle Pop
65.1%
Others 0.1%
6
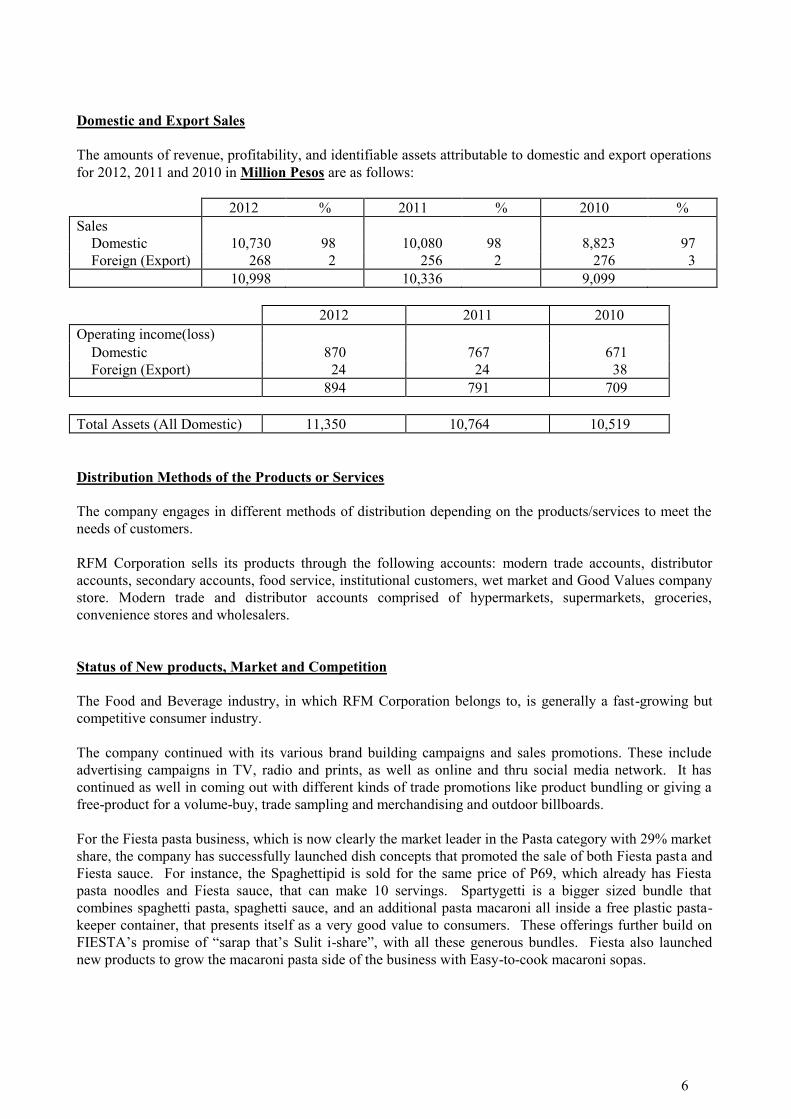
Domestic and Export Sales
The amounts of revenue, profitability, and identifiable assets attributable to domestic and export operationsfor 2012, 2011 and 2010 in Million Pesos are as follows:
2012 % 2011 % 2010 %Sales Domestic 10,730 98 10,080 98 8,823 97 Foreign (Export) 268 2 256 2 276 3
10,998 10,336 9,099
2012 2011 2010Operating income(loss) Domestic 870 767 671 Foreign (Export) 24 24 38
894 791 709
Total Assets (All Domestic) 11,350 10,764 10,519
Distribution Methods of the Products or Services
The company engages in different methods of distribution depending on the products/services to meet theneeds of customers.
RFM Corporation sells its products through the following accounts: modern trade accounts, distributoraccounts, secondary accounts, food service, institutional customers, wet market and Good Values companystore. Modern trade and distributor accounts comprised of hypermarkets, supermarkets, groceries,convenience stores and wholesalers.
Status of New products, Market and Competition
The Food and Beverage industry, in which RFM Corporation belongs to, is generally a fast-growing butcompetitive consumer industry.
The company continued with its various brand building campaigns and sales promotions. These includeadvertising campaigns in TV, radio and prints, as well as online and thru social media network. It hascontinued as well in coming out with different kinds of trade promotions like product bundling or giving afree-product for a volume-buy, trade sampling and merchandising and outdoor billboards.
For the Fiesta pasta business, which is now clearly the market leader in the Pasta category with 29% marketshare, the company has successfully launched dish concepts that promoted the sale of both Fiesta pasta andFiesta sauce. For instance, the Spaghettipid is sold for the same price of P69, which already has Fiestapasta noodles and Fiesta sauce, that can make 10 servings. Spartygetti is a bigger sized bundle thatcombines spaghetti pasta, spaghetti sauce, and an additional pasta macaroni all inside a free plastic pasta-keeper container, that presents itself as a very good value to consumers. These offerings further build onFIESTA’s promise of “sarap that’s Sulit i-share”, with all these generous bundles. Fiesta also launchednew products to grow the macaroni pasta side of the business with Easy-to-cook macaroni sopas.
7
More impressively, Fiesta has taken the lead on both volume and value in Super Value, Inc. (SVI),registering shares of 35% and 32%, respectively, and widening the gap to 12 percentage points ahead of itsclosest competition during the peak month of December. These feats were accomplished through focus andconsistency especially in delivering quality and value for money to consumers.
From the non-pasta side of the White King business came new packaging for its rice-based mixes likeArroz Caldo and Champ-O-rado that promoted the value-for money offering for these items that sell forP30, which can make 5 servings. The company still has the White King All Purpose Flour, the first of itskind in a resealable stand-up pouch, which was launched the previous year. Other products that comprisethe category include Hotcake Mixes, Native Mixes (Puto and Bibingka), and Brownie Mixes.
For the Milk products, it continued to highlight the Mas Moo-rami campaign for the new Selecta MooSuper Chocolate. It is the same Selecta Moo kids love but now made with more chocolate with a deliciouscreamy taste complemented with a playful new packaging design that catches the eye of every kid at heart.There were also promos that promote volume-buys, such as the 9+1 offering all in one box of Selecta Moochoco.
For the Beverage Business, it focused on its main brand – Sunkist. The Sunkist brand has defined two (2)major target markets – Families and Kids. Sunkist Pulp that used to be available in 320ml single serve and1L size launched a new SKU entry, Sunkist Big 1.5L, the only RTD Orange Juice in the market with pulpthat is in the 1.5L size – a size ideal for sharing with the family or friends. In addition, Sunkist Pulp Big1.5L is priced at the same price as other RTD Juice in 1L in the market but with 500ml more. The launchwas done via announcement in “Eat Bulaga”, one of the country’s favorite shows as well as in electronicbillboards in Metro Manila.
Capturing the other target market segment of Sunkist, the kids, is the Sunkist Tetra packs. The sameSunkist tetra packs that consumers have grown up with has solidified its foothold in the RTD Juice segmentfor kids via partnership with Rovio’s well loved digital app character, Angry Birds. All the packs and labeldesigns featured the four (4) most popular birds of the Angry Birds game app. The tetra packs alsocontained collectible standees at the back of every 235ml pack and once all the 8 birds are collected, onemay get a limited edition Sunkist Angry Birds school bag. The excitement on the labels were brought tolife with a TV Commercial that seemed to make Sunkist as part of the game app. The combined efforts ofSunkist targeted for families and targeted for kids propelled the beverage business to significant growth in2012.
The re-launch of Vitamin-enhanced water Vitwater is expected to promote this product as the healthier andtastier alternative to all the functional drinks in the market. Vitpower still comes in 350ml bottles and ispriced at P15.00 per bottle SRP. It has higher contents of Taurine, Inositol, Vitamin B and Ginseng thataids in the breakdown of fats and absorption of vitamins.
The Selecta ice cream business, under the joint venture with Unilever Philippines, continued to dominatethe ice cream category with 76% market share. It has launched various ice cream innovations both in thebulk ice cream category (in containers) and the impulse (single-served) category. For the bulk ice cream, itlaunched several best-selling flavors under the Supreme Overload, Super-thick and New co-brandedproduct variants. It also offered Pinoy Sorbetes Birthday pack and 3-in-1 + 1 (4 flavors in one pack). Theyear also saw the launch of numerous Selecta Cornetto variants, as well as the successful grand launch ofthe new Magnum (Belgian chocolate enrobed ice cream on stick) which performed beyond expectationduring the year.
For the flour business, the company continues to provide commodity flour to several institutional accountsand flour-based product manufacturers and retailers like biscuits, noodles cakes and breadmakers. Thereare eleven flour millers in the country, under two trade associations – Philippine Association of FlourMillers (PAFMIL) and Chamber of Philippine Flour Millers Inc (Champflour). RFM Corporation is amember PAFMIL. The Company has about 8% to 9% of total industry volume sales.

8
Purchases of Raw Materials and Supplies
RFM Corporation sources raw materials and packaging materials both overseas and domestically.
The company imports from the US and Australia (wheat,), New Zealand (anhydrous milk fat), India andAustralia (skimmed milk powder), Switzerland, Spain and other countries.
The payment forms vary for each supplier. It ranges from Letter of Credit, drawn against payment, downpayment, and various credit terms offered by supplier
Customers
RFM Corporation has a wide range of products that cater to all socio-economic class and all age groups.
Its products are sold through hypermarkets, supermarkets, groceries, convenience stores, drug stores,wholesalers, distributors, institutional customers, food establishments, wet market and the company store.
RFM Corporation is not dependent on any single or few customers that might have any material adverseeffect on its business, except for the processing and exclusive sale of hamburger buns by InterbakeCommissary Corporation to Golden Arches (Mc Donalds). These hamburger buns account for about 85%of the total sales of Interbake Commissary Corporation in 2012 and 48% in 2011.
Related Party Transactions
The Group, in the regular course of business, transact with related parties, which may consist but notlimited to the following:
Purchase of goods and services. Cash advances for working capital purposes. Lease of the Company’s main office from a subsidiary company. The Parent Company provides management services to RFM Insurance Brokerage, Inc. and
Interbake Commissary Corporation Distribution, sale and merchandising of RFM Group products.
Trademark, Royalty and Patents
A Trademark License Agreement was entered into with Unilever-RFM Ice Cream, Inc. for the exclusiveright to use the “Selecta” trademarks in its ice cream products and to manufacture, market, and sell Selectatrademarked products. The agreement shall be co-terminus with the Joint Venture Agreement betweenRFM Corporation and Unilever-RFM Ice Cream, Inc. The license is free from royalty fee and any similarkind of payment. On December 3, 2008, the Trademark License Agreement was extended for another ten(10) years, or from March 30, 2009 to March 29, 2019.
On 01 January 1995, RFM entered into a Trademark License Agreement with Sunkist Growers, Inc.(Sunkist). Under the said agreement, Sunkist grants RFM (a) exclusive right, without the right tosublicense, to use the Sunkist Trademark(s) and related Trade dress approved by Sunkist, in connectionwith the marketing, distribution and sale of licensed products in the Philippines; (b) exclusive right, withoutthe right to sublicense, to use the Know-How within the Philippines for the production and sale of LicensedProducts; (c) the right and privilege to receive technical assistance regarding the implementation of Know-How; and (d) to make available Base Ingredients directly or through authorized Base Ingredients Suppliers
9
to enable RFM to manufacture Licensed Products. For and in consideration of the rights granted above,RFM pays an annual royalty to Sunkist. The Amendment to the TLA was extended for another five (5)years or from 01 January 2005 to 31 December 2009. Another Amendment extending the TLA for anotherfive years was signed by the Parties on 27 January 2010.
On 13 March 2009, Swift Foods, Inc. (SFI) re-assigned and returned to RFM all its rights and interests inthe well-known Swift trademark. IPO registration of the mark has been transferred under RFM and a newCertificate of Registration has accordingly been issued to RFM.
In late 2012, RFM entered into a Trademark and Asset Purchase Agreement with The Pacific MeatCompany, Inc. (PMCI). The terms of this agreement includes RFM’s sale of the “Swift” brand, togetherwith finished goods and raw material inventories, the goodwill of the business connected with thetrademarks used for its canned, pouch flexible heat sterilized, refrigerated, chilled and frozen meatproducts, and certain machinery and equipment, as well as all product formulations, processes, know-howand other technical information relating to the production of meat products.
Need for Any Government Approval of Principal Products and Compliance with EnvironmentalLaws
The Group complies with environmental laws and secures government approval for all its products. TheCompany has existing permits from various government agencies that include the Bureau of Food and Drug(BFAD) and the City Environment and Natural Resources Office. The Company also complies with therequirements of Laguna Lake Development Authority (LLDA) for environmental sanitation purposes.
The Company believes that it has complied with all applicable environmental laws and regulations, andincurred about P382,000 and P360,000 during the years 2012 and 2011, respectively, for payment of annualpermits and fees.
The Group has no knowledge of recent or impending legislation, the implementation of which can result ina material adverse effect on the business or financial condition.
Research and Development Activities
The Company conducts research and development activities to improve existing products and to create newproduct lines, as well as to improve production processes, quality control measures, and packaging to meetthe continuing and changing demands of the consumers at the least possible cost. The Company spentabout P14.5 million and P15 million in 2012 and 2011 respectively, for research and development.
Employees
As of December 31, 2012, the Company and its subsidiaries had approximately 570 employees, of which 16are executives, 45 managers and 133 supervisory staff and 376 were non-supervisory staff. The Companydoes not anticipate any significant increase in the number of its employees in year 2012.
About 24% of the total employees of the Company and its subsidiaries are members of various laborunions. The Company and its subsidiaries have collective bargaining agreements with these unions.
The Company believes that its relationship with its employees is generally good. The Company has notrecently experienced any material interruption of operations due to labor disagreements. Labor-Management Councils (LCMs) regularly meet to discuss and resolve work-place issues and productionmatters.

10
The employees are covered by retirement plans per division. The plans are trusteed, noncontributorydefined benefit pension plan covering substantially all permanent employees of the Company. TheCompany has no stock option plan.
With the sale of its “Swift” brand and related machineries during the last quarter of 2012, the Company andits meat subsidiary, CMPC, had no choice but to retrench affected employees.
Effective May 2013, the Tetra operations in Manggahan, Pasig City will be moved to CMPC LightIndustrial Plant, Cabuyao, Laguna resulting to the transfer of the remaining MJ employees. However, theCompany offered a voluntary retirement program to qualified MJ rank and file employees who opted not tojoin the transfer.
Except for the affected employees in MJ and some remaining employees in Meat, the Company and itssubsidiaries do not expect any significant change in its existing workforce level within the ensuing twelve(12) months.
Working Capital
The Company funds its working capital requirements through internally-generated funds and from bankborrowings. The working capital finances the purchase of raw materials, inventory, salaries, administrativeexpenses, tax payments, and sales receivables until such sales receivables are converted into cash.
Major Business Risks
Like any other business, risks are always considered in the ability or inability to achieve the businessobjectives and execute strategy effectively. RFM Corporation and its subsidiaries perceive the followingbusiness risks:
Financial Risk Management Objectives and Policies
The Group’s principal financial instruments include non-derivative instruments such as cash and cashequivalents, AFS financial assets, accounts receivable, bank loans, accounts payable and accrued liabilities,long-term debts and obligations and advances to and from related parties. The main purpose of thesefinancial instruments includes raising funds for the Group’s operations and managing identified financialrisks. The Group has various other financial assets and financial liabilities such as other currentreceivables, other current assets, trust receipts payable and customers’ deposits which arise directly from itsoperations. The main risk arising from the use of financial instruments is credit risk, liquidity risk, interestrate risk, foreign exchange risk and equity price risk.
Credit riskCredit risk arises from the risk of counterparties defaulting. Management is tasked to minimize credit riskthrough strict implementation of credit, treasury and financial policies. The Group deals only withreputable counterparties, financial institutions and customers. To the extent possible, the Group obtainscollateral to secure sales of its products to customers. In addition, the Group transacts with financialinstitutions belonging to the top 25% of the industry, and/or those which provide the Group with long-termloans and/or short-term credit facilities.
The Group does not have significant concentrations of credit risk and does not enter into financialinstruments to manage credit risk. With respect to credit risk arising from financial assets other thaninstalment contracts and accounts receivable (such as cash and cash equivalents and AFS financial assets),the Group's exposure to credit risk arises from default of the counterparties, with a maximum exposureequal to the carrying amount of these instruments.

11
Credit quality of cash in banks and cash equivalents and AFS financial assets are based on the nature of thecounterparty and the Group’s internal rating system.
Financial assets that are neither past due nor impaired are classified as “Excellent” account when these areexpected to be collected or liquidated on or before their due dates, or upon call by the Group if there are nopredetermined defined due dates. All other financial assets that are neither past due or impaired areclassified as “Good” accounts.
Liquidity riskLiquidity risk arises from the possibility that the Group may encounter difficulties in raising fund to meetcommitments from financial instruments.
Management is tasked to minimize liquidity risk through prudent financial planning and execution to meetthe funding requirements of the various operating divisions within the Group; through long-term and short-term debts obtained from financial institutions; through strict implementation of credit and collectionpolicies, particularly in containing trade receivables; and through capital raising, including equity, as maybe necessary. Presently, the Group has existing long-term debts that fund capital expenditures. Workingcapital requirements, on the other hand, are adequately addressed through short-term credit facilities fromfinancial institutions. Trade receivables are kept within manageable levels.
Interest rate riskThe Group’s exposure to changes in interest rates relates primarily to the Group’s short-term and long-termdebt obligations.
Management is tasked to minimize interest rate risk through interest rate swaps and options, and having amix of variable and fixed interest rates on its loans. Presently, the Group’s short-term and long-term debtsand obligations are market-determined, with the long-term debts and obligations interest rates based onPDST-F-1 plus a certain spread.
There is no other impact on the Group’s equity other than those affecting the profit or loss.
Foreign exchange riskThe Group’s exposure to foreign exchange risk results from the Parent Company and URICI’s businesstransactions and financing agreements denominated in foreign currencies.
Management is tasked to minimize foreign exchange risk through the natural hedges arising from its exportbusiness and through external currency hedges. Presently, trade importations are immediately paid orconverted into Peso obligations as soon as these are negotiated with suppliers. The Group has not done anyexternal currency hedges in 2012 and 2011.
Equity price riskEquity price risk is such risk where the fair values of investments in quoted equity securities could decreaseas a result of changes in the levels of equity indices and the value of individual stock. Management strictlymonitors the movement of the share prices pertaining to its investments. The Group is exposed to equitysecurities price risk because of quoted common and golf club shares, which are classified as AFS financialassets (see Note 12).
Market risks
Market risks stems from new and/or existing re-launched products and/or new packaging at low pricesbeing introduced in the market place by competitors. To address these competitive pressures, the Companycontinues to develop new products in innovative packaging formats to keep a hold on its consumers andincrease market share. The strategy requires significant resources for market research, productdevelopment, and marketing and promotions. Attendant risks are inventory overstocks, spoilage, and
12
warehousing cost if the new product launched in the market fails to take off. To manage these risks theCompany has established a system where success indicators in the target market are closely beingmonitored and supported by effective supply chain management.
Technological changes
RFM Corporation has been in the flour manufacturing for several decades, and its operating mills are olderthan many of its competitors which have more modern equipment and, thus, better rated operating yields.To meet these challenges, the Company continues to provide sufficient repairs and maintenance on itsequipment and continually upgrades sections of its facilities to remain at par with the modern machineries.Recent installations are a Buhler blending system which allowed for more efficiency in product mixing andcustomization; and a Buhler carousel packing and weighing system provides very accurate weighing offlour in bags. In addition, the Company spends in research and development, particularly in the areas ofprocess engineering and wheat mixtures to produce higher flour yields.
In 2008, the Company invested in a new Buhler C-line Pasta Machine to service its growing market in thespaghetti noodles, under the Fiesta brand. The machine incorporates the patented Polymatik ExtrusionTechnology, which is presently one of the most advanced in raw material mixing processes, and producespasta that is firmer, brighter, and with excellent heat tolerance.
Improvements, upgrades, and regular maintenance and repairs of its Aseptic Production Line allow theMilk and Juice Division to produce good quality ready-to-drink milk and chocolate-flavored milk as well asfruit juices under the Selecta and Sunkist brands. In 2008 and 2009, investments were made in automatedPET bottle injection, blowing, filling, and packing facilities to cater to a newly developing packagingformat for juice and tea drinks.
Technological advances in manufacturing sector contributed to hectic product competition in the market,RFM recognizes the need to update its technology for a more reliable quality and higher productivity. In2011 and 2012, the Milk and Juice Division invested in improving and replacing its line instrumentationsystem which resulted to a fast and more accurate product quality monitoring which ensures that everypackage conforms to the quality standards.
Collaboration with technical experts in the field of food science and technology as well as manufacturinghas been extended to foreign and local business partners to be updated in the latest food trends, equipmentand raw materials sourcing. It has its sources of technology information via attendance to seminars,conferences, conventions, journal subscription and internet access to further enhance its research anddevelopment skills and manufacturing processes.
Labor Unrest
Like other firms in the food and beverage industry, RFM also partakes of the usual risk of labor unrest, andstrikes.
The pending cases are those which are related to the retrenchment of 116 trade merchandisers in 2006.Eventually, three (3) separate groups of employees and three (3) individuals filed separate complaints forillegal dismissal. Two cases were settled in 2012, but a small group of complainants who receivedfinancial settlement questioned the settlement in the one case. This was dismissed by the NLRC and thecase is now pending with the Court of Appeals. One case was dismissed due to prescription.
As of December 31, 2012, there were two pending cases in the Supreme Court and another case pending inthe National Labor Relations Commission. All the said cases are currently being handled by externalcounsel specializing on labor matters on behalf of the Company..
13
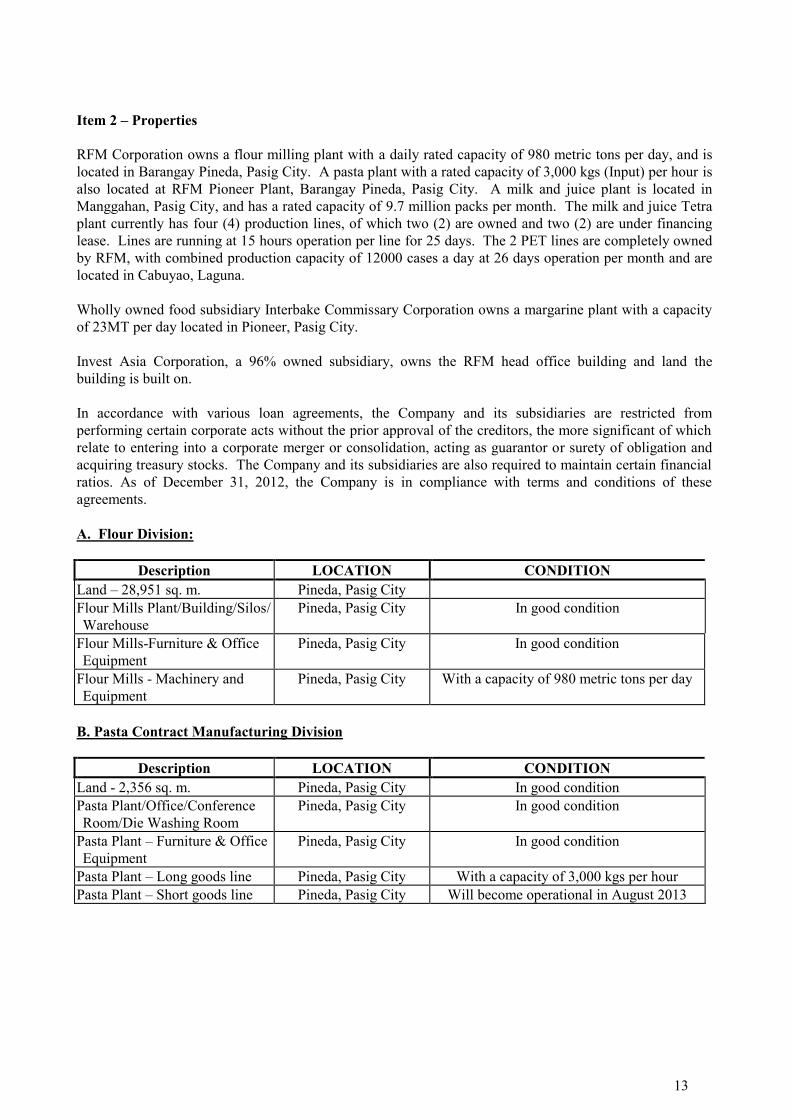
Item 2 – Properties
RFM Corporation owns a flour milling plant with a daily rated capacity of 980 metric tons per day, and islocated in Barangay Pineda, Pasig City. A pasta plant with a rated capacity of 3,000 kgs (Input) per hour isalso located at RFM Pioneer Plant, Barangay Pineda, Pasig City. A milk and juice plant is located inManggahan, Pasig City, and has a rated capacity of 9.7 million packs per month. The milk and juice Tetraplant currently has four (4) production lines, of which two (2) are owned and two (2) are under financinglease. Lines are running at 15 hours operation per line for 25 days. The 2 PET lines are completely ownedby RFM, with combined production capacity of 12000 cases a day at 26 days operation per month and arelocated in Cabuyao, Laguna.
Wholly owned food subsidiary Interbake Commissary Corporation owns a margarine plant with a capacityof 23MT per day located in Pioneer, Pasig City.
Invest Asia Corporation, a 96% owned subsidiary, owns the RFM head office building and land thebuilding is built on.
In accordance with various loan agreements, the Company and its subsidiaries are restricted fromperforming certain corporate acts without the prior approval of the creditors, the more significant of whichrelate to entering into a corporate merger or consolidation, acting as guarantor or surety of obligation andacquiring treasury stocks. The Company and its subsidiaries are also required to maintain certain financialratios. As of December 31, 2012, the Company is in compliance with terms and conditions of theseagreements.
A. Flour Division:
Description LOCATION CONDITIONLand – 28,951 sq. m. Pineda, Pasig CityFlour Mills Plant/Building/Silos/Warehouse
Pineda, Pasig City In good condition
Flour Mills-Furniture & OfficeEquipment
Pineda, Pasig City In good condition
Flour Mills - Machinery andEquipment
Pineda, Pasig City With a capacity of 980 metric tons per day
B. Pasta Contract Manufacturing Division
Description LOCATION CONDITIONLand - 2,356 sq. m. Pineda, Pasig City In good conditionPasta Plant/Office/ConferenceRoom/Die Washing Room
Pineda, Pasig City In good condition
Pasta Plant – Furniture & OfficeEquipment
Pineda, Pasig City In good condition
Pasta Plant – Long goods line Pineda, Pasig City With a capacity of 3,000 kgs per hourPasta Plant – Short goods line Pineda, Pasig City Will become operational in August 2013
14
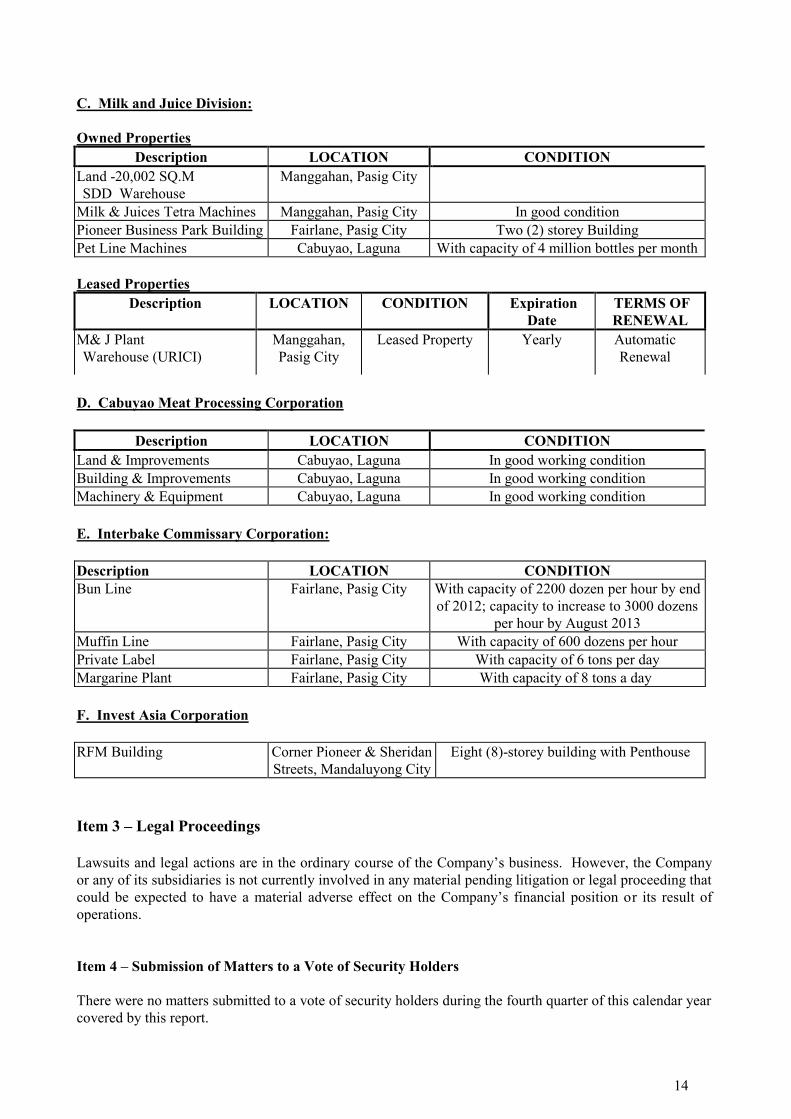
C. Milk and Juice Division:
Owned PropertiesDescription LOCATION CONDITION
Land -20,002 SQ.MSDD Warehouse
Manggahan, Pasig City
Milk & Juices Tetra Machines Manggahan, Pasig City In good conditionPioneer Business Park Building Fairlane, Pasig City Two (2) storey BuildingPet Line Machines Cabuyao, Laguna With capacity of 4 million bottles per month
Leased PropertiesDescription LOCATION CONDITION Expiration
Date TERMS OFRENEWAL
M& J PlantWarehouse (URICI)
Manggahan,Pasig City
Leased Property Yearly AutomaticRenewal
D. Cabuyao Meat Processing Corporation
Description LOCATION CONDITIONLand & Improvements Cabuyao, Laguna In good working conditionBuilding & Improvements Cabuyao, Laguna In good working conditionMachinery & Equipment Cabuyao, Laguna In good working condition
E. Interbake Commissary Corporation:
Description LOCATION CONDITIONBun Line Fairlane, Pasig City With capacity of 2200 dozen per hour by end
of 2012; capacity to increase to 3000 dozensper hour by August 2013
Muffin Line Fairlane, Pasig City With capacity of 600 dozens per hourPrivate Label Fairlane, Pasig City With capacity of 6 tons per dayMargarine Plant Fairlane, Pasig City With capacity of 8 tons a day
F. Invest Asia Corporation
RFM Building Corner Pioneer & SheridanStreets, Mandaluyong City
Eight (8)-storey building with Penthouse
Item 3 – Legal Proceedings
Lawsuits and legal actions are in the ordinary course of the Company’s business. However, the Companyor any of its subsidiaries is not currently involved in any material pending litigation or legal proceeding thatcould be expected to have a material adverse effect on the Company’s financial position or its result ofoperations.
Item 4 – Submission of Matters to a Vote of Security Holders
There were no matters submitted to a vote of security holders during the fourth quarter of this calendar yearcovered by this report.
15
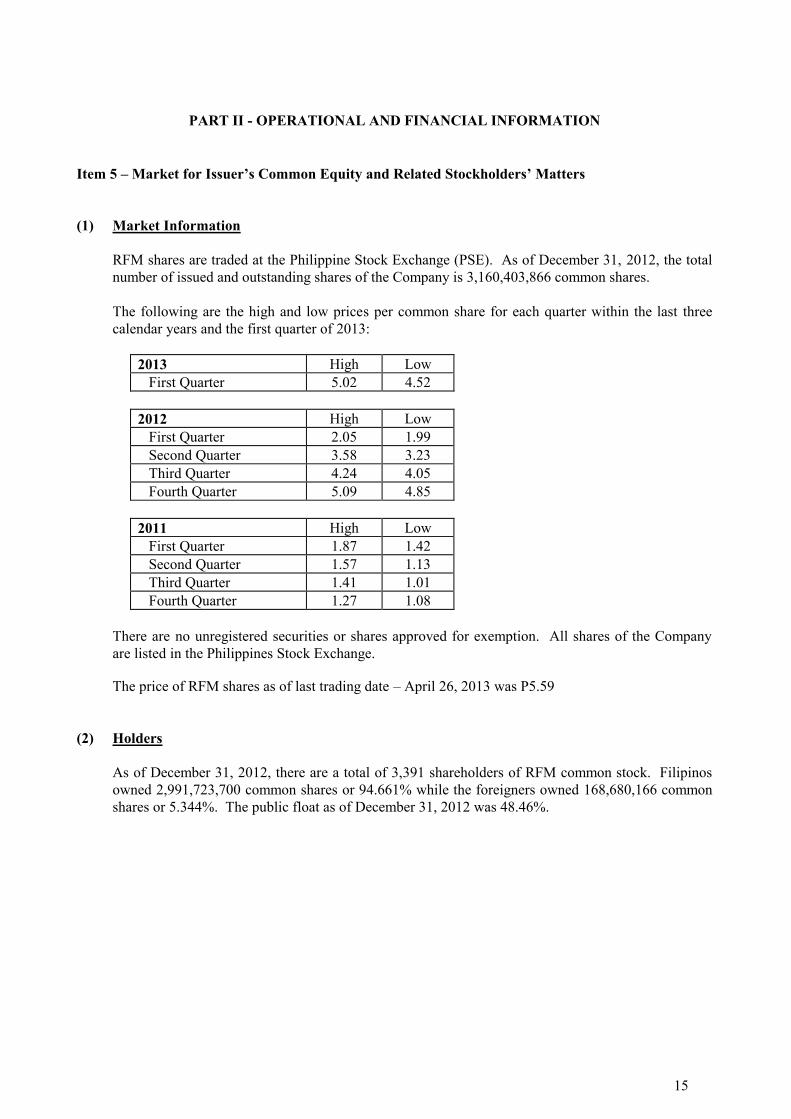
PART II - OPERATIONAL AND FINANCIAL INFORMATION
Item 5 – Market for Issuer’s Common Equity and Related Stockholders’ Matters
(1) Market Information
RFM shares are traded at the Philippine Stock Exchange (PSE). As of December 31, 2012, the totalnumber of issued and outstanding shares of the Company is 3,160,403,866 common shares.
The following are the high and low prices per common share for each quarter within the last threecalendar years and the first quarter of 2013:
2013 High Low First Quarter 5.02 4.52
2012 High Low First Quarter 2.05 1.99 Second Quarter 3.58 3.23 Third Quarter 4.24 4.05 Fourth Quarter 5.09 4.85
2011 High Low First Quarter 1.87 1.42 Second Quarter 1.57 1.13 Third Quarter 1.41 1.01 Fourth Quarter 1.27 1.08
There are no unregistered securities or shares approved for exemption. All shares of the Companyare listed in the Philippines Stock Exchange.
The price of RFM shares as of last trading date – April 26, 2013 was P5.59
(2) Holders
As of December 31, 2012, there are a total of 3,391 shareholders of RFM common stock. Filipinosowned 2,991,723,700 common shares or 94.661% while the foreigners owned 168,680,166 commonshares or 5.344%. The public float as of December 31, 2012 was 48.46%.

16
Below are the top 20 stockholders of common shares as of December 31, 2012:
Name No. of shares held % to Total1. Triple Eight Holdings, Inc.. 658,561,450 20.842. Horizons Realty, Inc.. 639,330,804 20.233. PCD Nominee Corporation (Filipino) 515,256,702 16.304. BJS Development Corporation 311,210,184 9.855. Renaissance Property Management Corp. 201,982,966 6.406. PCD Nominee Corporation (Foreign) 168,423,854 5.337. FEATI University 112,011,350 3.548. Chilco Holdings Inc. 72,748,950 2.309. Concepcion Industries, Inc. 71,384,424 2.2610. S&A Industrial Corporation 59,474,114 1.8811. Sahara Management & Development Corp. 57,539,818 1.8212. Select Two Incorporated 49,499,612 1.5713. Republic Commodities Corporation 33,115,616 1.0514. Macric Incorporated 23,302,412 0.7415. Lace Express Inc. 23,278,716 0.7416. Monaco Express Corporation 23,278,552 0.7417. Foresight Realty & Dev’t Corp 19,215,194 0.6118. Silang Forest Park, Inc. 14,915,694 0.4719. Hyland Realty Corporation 11,919,518 0.3820. Arcon Group Holdings 11,919,518 0.38
There are no securities to be issued in connection with an acquisition, business combination or otherreorganization.
(3) Dividends
(a) Dividend per Share
On April 28, 2010, the Board of Directors (BOD) approved the declaration of P=0.01582 cashdividend per share, or a total of P=50.00 million, payable to its stockholders of record as of May14, 2010. The dividends were paid on June 9, 2010.
On January 26, 2011, the BOD approved the declaration of property dividends consisting of itsconvertible preferred shares of stock in Swift up to 69,622,985 shares to stockholders owning46 shares or more as of March 16, 2011. On April 15, 2011, the SEC approved the distributionof 68,702,325 shares and was issued to the stockholders on April 29, 2011 at P=6.01 per share,for a total cost amounting to P=412.90 million.
On July 27, 2011, the BOD approved the declaration of property dividends consisting of itsconvertible preferred shares of stock in Swift up to 70,543,644 shares to stockholders owning46 shares or more as of August 11, 2011. On September 15, 2011, the SEC approved thedistribution of 70,229,846 shares and was issued to the stockholders on September 21, 2011 atP=6.01 per share, for a total cost amounting to P=422.08 million.
On March 2, 2011, the BOD approved the declaration of P=0.02968 cash dividend per share or atotal of P=93.80 million to its stockholders as of May 14, 2010.
On July 27, 2011, the BOD approved the declaration of P=0.02965 cash dividend per share or atotal of P=93.71 million representing the full declaration of 30% of recurring net income for2010 to its stockholders as of August 11, 2011.

17
On February 29, 2012, the BOD approved the declaration of P=0.02391 cash dividend per share,or a total of P=74.07 million representing the first tranche of the 30% of recurring net income for2011 to its stockholders of record as of March 14, 2012. The dividends were paid on April 12,2012.
On June 27, 2012, the BOD approved the declaration of property dividends consisting of theParent Company’s 41,431,346 common shares in Philtown Properties, Inc. to stockholdersowning 77 shares or more as of July 11, 2012. On August 13, 2012, the SEC approved thedistribution of 41,042,080 shares and was issued to the stockholders on September 7, 2012 at P=3.49 per share, for a total of P=144.75 million.
On November 14, 2012, the BOD approved the declaration of P=0.02434 cash dividend pershare, or a total of P=76.92 million representing the full declaration of the 30% recurring netincome for 2011 to its stockholders of record as of November 28, 2012. The dividends werepaid on December 26, 2012.
(b) Dividends Restriction
The Parent Company’s retained earnings as of December 31, 2012 is restricted to the extent ofthe amount of the undistributed equity in net earnings of associates included in its retainedearnings amounting to P=105.05 million. These will only be available for declaration asdividends when these are actually received.
The long-term loan agreements entered into by RFM Corporation with its creditors allows theCompany to declare and pay cash dividends upon compliance with the required current ratioand debt-to-equity ratio
Item 6 – Management Discussion and Analysis of Financial Conditions and Results of Operations forYear 2012
Introduction
This discussion summarizes the significant factors affecting the consolidated operating results and financialcondition of RFM Corporation and its Subsidiaries for the period December 31, 2012. The followingdiscussion should be read in conjunction with the attached audited consolidated financial statements of theCompany as of December 31, 2012 and 2011, and the related consolidated statements of income, changesin stockholders’ equity, and cash flows for each of the two years in the period ended December 31, 2012.All necessary adjustments to present the Company’s consolidated financial position as ofDecember 31, 2012 and 2011 and the results of operations and cash flow for the years then ended havebeen made.
Year ended December 31, 2012 vs. 2011
Management Report on Operations
Food and beverage company RFM Corporation finished the year 2012 with P682 Million net income, or a34% income growth over the previous year’s P508 Million net income. This was on the back of an 11%sales growth to P11.0 billion for the period.
The accelerated income growth was credited to stronger sales of its higher margin businesses. Bettermargins were achieved due to the lower commodity input costs this year, such as for milk, wheat and sugar,as well as better yields due to scale economies as we reach higher volumes in our key brands, such asSelecta ice cream, and Fiesta spaghetti.

18
The positive economic climate have further boosted consumer confidence and spending, which led tocontinued growth practically in all the company’s brands, led by Selecta ice cream, Fiesta pasta, WhiteKing cake and sauce mixes, Selecta milk and Sunkist juice.
Financial Position
Analysis of Balance Sheet Accounts
As of December 31, 2012, the Group’s total assets increased to P11.35 billion from P10.76 billion last year.
Total current assets of the Group increased by P1.26 billion to P6.13 billion, mainly due to its receivableswhich grew 26.5% to P2.68 billion from last year’s P2.12 billion, contributed by the growth in revenuesduring the period.
The total non-current assets rose to P5.22 billion due mainly to the increase in plant, property andequipment by P84.15 million to P4.30 billion. The increase in group plant, property and equipment wasdue to new investments to boost plant capacity and to improve manufacturing efficiencies.
The total liabilities increased by P196.57 million to P5.80 billion. Total current liabilities increased byP646.65 million mainly due to the increase in Accounts payable and accruals which primarily funded theincrease in inventory position as of year end. Meanwhile, the combined long-term debt and long-termobligations have declined by P345.10 million to P1.82 billion due to payment of loan amortizations.
Year ended December 31, 2011 vs. 2010
Management Report on Operations
Food and beverage company RFM Corporation’s full year net income of P508.3 million in 2011 surpassedmarket analysts’ year-end estimate of P420-430 million.
Higher revenues and easing of commodity cost inputs such as milk and sugar in the second half, coupledwith internal production improvements pushed-up profitability to P295 million in the second half, up 38.8%from first half income.
Topline sales registered a faster growth of 27.2% for the second semester, versus 7% growth in the firsthalf of the year, ending the year with P10.3 Billion sales revenue, 13.6% higher compared to P9.1 Billion in2010. The focus on core food and beverage business has built stronger brand equity and productinnovations have influenced the shift in buying pattern and frequency in a number of categories.
Selecta Ice Cream, a joint venture with world giant Unilever, is increasing its leadership of the industrywith market share going beyond 71%, coming from around 66% at the start of 2011. Remarkable growthwas seen in Selecta-Hersheys, Supreme, Classic and Cornetto lines, with innovations backed by strongmarketing campaigns. Flour-based businesses led by White King Fiesta spaghetti likewise continued to hitrecord sales levels, with growth close to 50%, hitting rated capacity starting September, and pushing up itsrecent market share in its biggest key account to 35% by year-end, from 28% in January last year. WhiteKing Champorado and Arroz-Caldo mixes, Sunkist litro pack and Swift Mighty Meaty and Corned BeefSwak also performed very well as the company rationalized and focused its brand portfolio, supported bymore exciting product repackaging, aggressive merchandising and trade-related programs.
Financial Position
19
Analysis of Balance Sheet Accounts
As of December 31, 2011, the Group’s total assets reached P10.8 billion from P10.6 billion last year.
Total current assets of the Group decreased by P546.4 million to P4.88 billion, mainly due to thedistribution to RFM shareholders of its investment in Swift preferred shares, which were classified as AFSinvestments in the Balance Sheet.
The total non-current assets rose to P6.0 billion due mainly to the increase in plant, property and equipmentby P742.7 million to P4.2 billion. The increase in group plant, property and equipment was due to newinvestments to boost plant capacity and to improve manufacturing efficiencies.
The total liabilities increased by P814.7 million to P5.7 billion. Total current liabilities increased byP622.1 million mainly due to maturing long-term debt and other obligations for the succeeding year 2012.Total non-current liabilities increased by P192.6 million to P2.0 billion mainly due to availment ofadditional long-term debts of P650 million. These loans are used to fund the Company’s capitalexpenditures and additional working capital.
Year ended December 31, 2010 vs. 2009
Management Report on Operations
Diversified food and beverage firm RFM Corporation registered P625.7 million in net income, an increaseby 71% from 2009.
The Company’s revenues attained P9.1 billion. The improvement in the Philippine economy as it recoversfrom the effect of global economic slump provided a favorable environment for the revenue growth. TheCompany’s ability to fulfill the increasing Filipino consumer demands for affordable quality food enabledit to grow its revenues by 9.7%.
The Company earned gross profit margins of P3.1 billion. This grew by 35% compared to previous year.The gross profit rate margin increased by 5.9% points compared to previous year. This is a reflection of theCompany’s overall improvements in its cost structure. It has inherent strengths in supply chain function asit sourced it commodity materials at opportune timing. The Company also reaped the benefits from itscapital expenditure investments for plant efficiency improvements and manufacturing capacity increase.
The operating expenses increased by 31% to P2.4 billion as the Company invested in marketing and sellingprograms in order to communicate better with its target markets and for its products to be placed inlocations which are convenient for its targeted consumers.
The Company’s operating income increased by 34.7% to P708.9 million.
With record-breaking Fiesta volumes in the last quarter this year, Fiesta spaghetti sustained its marketleadership in spaghetti category for the entire year. This was attained through value-for-money propositionof Tipid Pack, storefront billboards, merchandising and TV advertisement using an endorser.
The Fiesta brand is the company’s second market leader. It follows the Selecta brand that has continued todominate the Philippine ice cream market with over 50 percent market share.

20
Financial Position
Analysis of Balance Sheet Accounts
As of December 31, 2010, the Group’s total assets reached P10.58 billion an increase by P1.66 billion or18.6% from last year’s P8.9 billion.
Total current assets of the Group increased by P555 million to P4.58 billion, mainly due to its inventoryposition which increased by P434 million. The increase in inventory position was in anticipation to theincrease in prices of key commodity materials. Cash and cash equivalents increased by P153 million or31% from previous year. Net receivables decreased by P135 million mainly due to additional provisions inallowance for doubtful accounts.
The total non-current assets rose to P1.1 billion due mainly to the increase in plant, property and equipmentby P985 million to P3.52 billion. The increase in group plant, property and equipment was due to newinvestments to boost plant capacity and to improve manufacturing efficiencies. The Group also acquiredinvestment properties.
The total liabilities increased by P1.03 billion to P4.86 billion. Total current liabilities increased byP92.5 million while total non-current liabilities increased by P938 million to P1.82 billion. Accountspayable and accruals increased by P429.5 million to P2 billion, which primarily funded the increase ininventory position as of year end. The combined current and non-current portion of long term debtincreased by P488 million. Current portion of long term debts declined by P376 million to zero balance.This was in line with the retirement of the various bank loans with a total value of P1.31 billion (currentand non-current portion) on October 27, 2010. Several banking institutions granted the Parent Company apeso-denominated floating rate note facility with an aggregate amount of P1.5 billion on October 25, 2010.
Key Performance Indicators
For the full fiscal years 2012, 2011 & 2010 the Company’s and majority-owned subsidiaries’ top five (5)key performance indicators are as follows:
In Millions December 2012 December 2011 December 2010Revenues 10,998 10,336 9,098Operating Margin 889 791 709Net Income (Loss) 682 508 625EBITDA 1,204 1,042 890Current Ratio 1.42 1.33 1.78
(a) Revenue Growth
These indicate external performance of the Company and its subsidiaries in relation to the movement ofconsumer demand and the competitors’ action to the market behavior. These also express marketacceptability and room for development and innovations. These are being monitored and compared as abasis for further study and development.
(b) Operating Margin
This shows the result after operating expenses have been deducted. Operating expenses are examined,checked and traced for major expenses. These are being analyzed and compared to budget, and previousyears, to ensure prudence and discipline in spending behind marketing and selling activities.
21
(c) Net Income
This represents the outcome or results of operations. This measures the over-all performance of the team,the consequence of all the contributory factors affecting supply, demand, utilization and decisions.
(d) EBITDA
This measures the Company’s ability to generate cash from operation by adding back non-cash expenses(i.e. depreciation and amortization expense) to earnings before interest and tax.
(e) Current Ratio
This determines the company’s ability to meet its maturing obligations using its current resources. Itindicates the possible tolerable shrinkage in current resources without threat to the claims of currentcreditors.
Causes for Any Material Changes from Period to Period of FS, which shall include vertical andhorizontal analyses of any material item
Please refer to the discussions under Results of Operations and Financial Position for the year endedDecember 31, 2012 vs. 2011, year ended December 31, 2011 vs. 2010 and year ended December 31, 2010vs. 2009.
The Company is not aware of the following:
(i) Any events that will trigger direct or contingent financial obligation that is material to the company,including any default or acceleration of an obligation.
(ii) All material off-balance sheet transaction, arrangements, obligations (including contingentobligations), and other relationships of the company with unconsolidated entities or other personscreated during the reporting period.
Seasonal Aspects that has Material Effect on the FS
There is no material effect with the seasonal aspect of certain raw materials specifically wheat on thefinancial statements.
Audit and Audit Related Fees
For the years 2012, 2011 and 2010, the Company engaged the professional services of SGV. The Groupincurred an aggregate audit fee of P2.7 million for 2012, excluding out of pocket expenses. Theengagement involves the examination of the Company’s financial statements in accordance with generallyaccepted auditing standards. It includes on a test basis review and evaluation of system, documentation andprocedures to ascertain that adequate internal controls are in placed. Also, they provide updates on latestregulatory or compliance requirement with government agencies such as Securities and ExchangeCommission and other government agencies.
22
The audit committee’s approval policies and procedure for external auditors are:
1. Statutory audit of company's annual F/S
a. The Audit Committee ensures that the services of the external auditor conform with theprovision of the company's manual of corporate governance specifically articles 2.3.4.1; 2.3.4.3and 2.3.4.4
b. The Audit Committee makes an assessment of the quality of prior year audit work services,scope, and deliverables and makes a determination of the reasonableness of the audit fee basedon the proposed audit plan for the current year.
c. The Audit Committee approved the final audit plan and scope of audit presented by theexternal auditor before the conduct of audit. The final audit plan was already the output afterthe conclusion of the series of pre-audit planning with Management.
d. The Audit Committee reports to the Board the approved audit plan.
2. For other services other than annual F/S audit:
a. The Audit Committee evaluates the necessity of the proposed services presented byManagement taking into consideration the following:
i. The effectiveness of company's internal control and risk management arrangement,systems and procedures, and management degree of compliance.
ii. The effect and impact of new tax and accounting regulations and standards.
iii. Availability of in-house technical expertise.iv. Cost benefit of the proposed undertaking.
b. The Audit Committee approves and ensures that other services provided by the external auditorshall not be in conflict with the functions of the external auditor for the annual audit of itsfinancial statements.
Item 7 – Financial Statements
The consolidated financial statements and schedules listed are filed as part of previously submitted form17-A.
Item 8 – Changes in and Disagreements with Accountants on Accounting and Financial Disclosure
There is no event in the past five (5) years wherein the Company had any disagreement with regard to anymatter relating to accounting principles or practices, financial statement disclosure or auditing scope orprocedure.
The Company regularly adopts New Statement of Financial Accounting Standards (SFAS)/ InternationalAccounting Standards (IAS) where applicable.

23
PART III - CONTROL ON COMPENSATION AND INFORMATION
Item 9 – Directors and Executive Officers of the Issuer
(1) List of Directors, Including Independent Directors, and Executive Officers(as of 31 December 2012)
Name of Director/Executive Officer Position Age
Term asDirector
Jose S. Concepcion Jr. Chairman of the Board 81 28Ernest Fritz Server Vice Chairman 69 22Jose Ma. A. Concepcion III Director/President & CEO 54 24Joseph D. Server Director 72 31Felicisimo M. Nacino Jr. Director/EVP & COO 60 15John Marie A. Concepcion Director/Managing Director, Ice Cream 49 22Ma.Victoria Herminia C. Young Director/VP & GM, White King Division &
ICC53 4
Francisco A. Segovia Director 59 24Raissa H. Posadas Director 52 14Romeo L. Bernardo Independent Director 58 8Lilia R. Bautista Independent Director 77 5Raymond B. Azcarate SVP & CFO 49 NARowel S. Barba Corporate Secretary/VP & Head, Corporate
Legal & HR Division48 NA
Norman P. Uy SVP & GM, Flour Based Group 54 NARamon M. Lopez VP & Exec. Assistant to the President & CEO
and concurrent Head, Corporate Planning52 NA
Minerva C. Laforteza VP & Head, Management Accounting 47 NAAriel A. de Guzman VP, Internal Audit 48 NAPhilip V. Prieto VP, Corporate Purchasing & General Services 53 NAEduardo M. Policarpio VP & Head of Sales 51 NAMelchor B. Bacsa VP & Head of Operations 52 NACharmaine C. Bautista VP & Marketing Manager, BFG 38 NASusan A. Atienza AVP, Research & Development, Flour Based
Group55 NA
Alma A. Ocampo AVP, Research & Development 54 NAFaye B. Matriano AVP, Marketing Manager, WK 38 NA
As provided in the Company’s amended Articles of Incorporation, eleven (11) directors were elected to itsBoard of Directors during the last Annual Stockholders meeting. The officers, on the other hand, wereelected during the Organizational Meeting following the Annual Stockholders’ meeting, each to hold officeuntil the corresponding meeting of the Board of Directors in the next year or until a successor shall havebeen qualified and elected or appointed.
The Company’s Board of Directors has committees for Audit, Compensation, Nomination, and Investment.There are two (2) independent directors, one of whom is the Chairman of the Audit Committee and theother heads the Compensation Committee.
24
The following sets forth certain information as to the directors and executive officers of the Company as ofDecember 31, 2012:
Directors
Jose S. Concepcion, Jr.81 years oldFilipino
Born on 29 December 1931, has an Associate’s degree in Business Administration from De LaSalle University and a Bachelor’s degree in Agriculture from Araneta University. He is the Chairman ofthe Board of Directors of RFM Corporation and of Swift Foods, Inc. He also holds the Chairman positionin the Asean-Business Advisory Council – Philippines, and East-Asia Business Council - Philippines. He isthe Founding Chairman of the National Citizens Movement for Free Elections (NAMFREL), SpecialResource Person of UCPB CIIF Finance Development. He is a member of the Board of Directors ofPhiltown Properties, Inc. (formerly Philippine Townships, Inc.), and Member of the Board of Trustees ofCARITAS and RFM Foundation, Inc. He was previously the Secretary of the Department of Trade andIndustry, Chairman of the Board of Investments, member of the Central Bank Monetary Board from 1986-1991, Co-Chairman of Bishops-Businessmen Conference from 1991-1998, and a delegate to the 1971Constitutional Convention. He served as director of the Corporation from years 1970 to 1985 and was firstelected on 3 April 1997 as Chairman of the Board. He is also the Chairman of the Nomination Committeeof RFM Corporation.
Ernest Fritz Server69 years oldFilipino
Born on 08 July 1943, has a Bachelor of Arts degree in Economics from the Ateneo de ManilaUniversity and a Master’s degree in Business Administration from the Wharton School of the University ofPennsylvania. He is Vice Chairman of the Board of Directors of RFM Corporation. He is also a ViceChairman of Philtown Properties, Inc., and a Director of RFM Equities, Inc. and RFM Foundation, Inc. Heis the President of Superior Las Pinas, Inc., Westview Properties, Inc., Capital Mediaworks, Inc.Multimedia Telephony, Inc. (Broadband Philippines) and Seacage Industries, Inc. He is a member of theBoard of Directors of BJS Development Corporation, Phil Stratbase Consultancy, Inc. and Chairman ofArrakis Holding, Inc. He was the President of Philam Fund, Philippine Home Cable Holdings, Inc., Trans-Pacific Properties, Inc. and United Housing Corporation. He became the Chairman of Intercity Properties,Inc. and Vice Chairman of Commercial Bank of Manila, Consumer Bank, Cosmos Bottling, Co. He alsoserved as a Director of Farmingtown, Rizal Lighterage Corporation, RFM Insurance Brokers, Inc. and PsiTechnologies. He first became a director of the Corporation on 27 October 1988. He is also the Chairmanof the Investment Committee and a member of the Compensation Committee of RFM Corporation.
Jose Ma. A. Concepcion III54 years oldFilipino
Born on 23 June 1958, has a Bachelor's degree in Business Management from Dela Salle University. Heis the President and Chief Executive Officer of the Corporation. In 2005, he was appointed by thePresident of the Philippines as the Presidential Consultant for Entrepreneurship which he held until 2010.He is the Chairman of the Board of Directors of Cabuyao Meat Processing Corporation, InterbakeCommissary Corporation, RFM Equities, Inc., RFM Insurance Brokers, Inc., FWBC Holdings, Inc.,Filipinas Water Bottling Company, Inc., Unilever RFM Ice Cream, Inc.(formerly Selecta Walls, Inc.), He isa director of Concepcion Industries Inc., the largest air-conditioner and refrigerator manufacturer in thecountry. He was an awardee of the Ten Outstanding Young Men of the Philippines (TOYM) in 1995 andTime Global 100 List of Young Leaders for the New Millennium in 1994. He is associated with majorbusiness and industry and various socio-civic associations. He is the founding Trustee of the Philippine
25
Center for Entrepreneurship – Go Negosyo. He first became a director of the Corporation on 30 October1986 and was elected President and Chief Executive Officer in 1989.
Joseph D. Server Jr.72 years oldFilipino
Born on 08 October 1940, has a Bachelor of Arts degree in Economics from the Ateneo de ManilaUniversity and a Master’s degree in Business Administration from the Wharton School of the University ofPennsylvania in the United States. He is Chairman of the Board of BJS Development Corporation. He firstbecame a director of the Corporation on 30 August 1979. He is presently a member of the Audit andInvestment Committees of RFM Corporation.
Felicisimo M. Nacino, Jr.60 years oldFilipino
Born on 09 May 1952, has a Bachelor of Arts degree in Economics and a Master’s degree in BusinessAdministration, both from the University of the Philippines. He is the Executive Vice-President & ChiefOperating Officer of the Corporation and serves as Director of RFM Corporation, Unilever RFM Ice CreamInc., RFM Insurance Brokers, Inc., Conglomerate Securities & Financing Corporation, and other companiesin the RFM Group. He first became a director of RFM Corporation on 30 March 1995. He is also amember of the Audit Committee of the Corporation.
John Marie A. Concepcion51 years oldFilipino
Born on 13 January 1962, has a degree in Business Administration from Seattle University,Washington, U.S.A. He is the Chief Executive Officer & Managing Director of Unilever RFM - Ice CreamInc. He is also a director and treasurer of Selecta Walls Land Corporation (SWLC).He became a directorof the RFM Corporation on 29 October 1987.
Ma. Victoria Herminia C. Young53 years oldFilipino
Born on 4 August 1959, has a Bachelor of Science Degree in Management and Marketing fromAssumption College. She is currently the General Manager of Interbake Commissary Corporation and VicePresident of White King Division, a division in the Branded Food Group of the Corporation. She is aTrustee and President of RFM Foundation, Inc., Trustee of Soul Mission Org., Ronald McDonald House ofCharities and a Director of Interbake Commissary Commission.
Francisco A. Segovia59 years oldFilipino
Born on 17 January 1954, has a Bachelor of Science degree in Business Management from theAteneo De Manila University. He is President of Segovia & Corporation, Inc., Fritz InternationalPhilippines, Inc., Horseworld, Inc., Big A. Aviation Corporation, Intellicon, Inc., Regina Realty/ChilcoHoldings, Araneta Institute of Agriculture, Republic Dynamics Corporation and Republic ConsolidatedCorporation. He is a director of, RFM Insurance Brokers, Inc., RFM Equities, Inc., and PhiltownProperties, Inc. He first became a director of the RFM Corporation on 30 October 1986. He is also amember of the Investment Committee of the Corporation.
26
Raissa Hechanova Posadas52 years oldFilipino
Born on 16 April 1960, has a Master's degree in Business Administration from Imede (now IMD)Lausanne, Switzerland and a degree in Bachelor of Arts major in Applied Economics from De La SalleUniversity. She joined the Corporation as director in April 1997, replacing her father, Mr. Rafael G.Hechanova, former Chairman of the Board of Directors of RFM Corporation. She is a member of theCompensation and Nomination Committees of the Corporation.
Romeo L. Bernardo58 years oldFilipino
Born on 5 September 1954, Mr. Bernardo received his Bachelor of Science degree in BusinessEconomics from the University of the Philippines (Magna Cum Laude) and a Masters Degree inDevelopment Economics from Williams College, Mass. USA. He has had a varied career in publicinstitutions before he co-founded LBT (with former Energy Secretary Del Lazaro and corporate lawyerHelen Tiu) in 1997. His public sector work spans teaching finance at the state university, a career in theDepartment of Finance rising to the Undersecretary post , and working in multilateral institutions such asthe IMF and the World Bank, based in Washington DC, as well as the ADB in Manila. Presently, heprovides business advice as board director in leading listed Philippine companies such as ALFM family offunds (Chairman), Bank of the Philippine Islands, Globe Telecom, Aboitiz Power, National ReinsuranceCorporation of the Philippines, Philippine Investment Management (PHINMA) Inc., and Institute ofDevelopment and Econometric Analysis, Inc. He also does/has done policy advisory for multilateral andbilateral institutions and he Philippine government in public finance, capital markets, public-privatepartnership, pension reform, economic governance. He is the lead Philippine partner/advisor to GlobalSource Partners, a global network of independent analysts. He first became an independent director ofRFM Corporation on 25 September 2002. He is presently the Chairman of the Compensation Committeeand member of the Audit, Investment and Nomination Committees of RFM Corporation.
Lilia R Bautista77 years oldFilipino
Born on 16 August 1935, is an Independent Director of the Company since September 2006. She is alsoan independent director of Transnational Diversified Group and a professional lecturer at the PhilippineJudicial Academy. Recently, she was appointed as Dean of the College of Law of Jose Rizal University.She previously held several positions including as a Member of the Appellate Body of the World TradeOrganization, Chairman, Securities and Exchange Commission, Ex-Officio Member, Anti-MoneyLaundering Council, Senior DTI Undersecretary & Special Trade Negotiator and subsequently acting DTISecretary. Ex-officio member of the Monetary Board, Chairman of the Board of Investments, NationalDevelopment Company and other DTI agencies. She was appointed Ambassador to the United Nations andother international agencies in Geneva, Switzerland. She holds an L.L.B., University of the Philippines,LLM, University of Michigan (Dewitt Fellow), M.B.A., University of the Philippines, and attended specialcourses in corporate finance and reorganization, New York University and Investment negotiation course,Georgetown University. She is presently the Chairman of the Audit Committee and a member of theInvestment Committee of RFM Corporation.

27
Executive Officers
Management is comprised of owner-managers and professional managers. Mr. Jose Maria A. ConcepcionIII is the President and Chief Executive officer of RFM Corporation, and is also a major shareholder. Hejoined the Company in 1980 as a route salesman, and occupied positions in sales and marketing before hebecame President and Chief Executive Officer in 1989.
Raymond B. Azcarate49 years oldFilipino
Born on 02 October 1963, has a Bachelor of Science degree in Business Administration (cumlaude) from the University of the Philippines. He is presently the Treasurer and Senior Vice-President andChief Finance Officer of the Corporation, and Treasurer of Rizal Lighterage Corporation, InterbakeCommissary Corporation, RFM Insurance Brokers, Inc., and other subsidiaries. He joined the Corporationin 1994. He retired in March 2013.
Norman P. Uy54 years oldFilipino
Born on 23 December 1958, has a Bachelor of Arts Degree in Philosophy from the University of thePhilippines and was awarded “Athlete of the Year” in 1980. Prior to joining RFM Corporation, he wasAssistant to the Vice President of Marketing at CFC-URC, Operations Manager for Robinsons CommercialComplex, and Project Coordinator for ADMACOR based in Indonesia. He is currently Senior VicePresident & General Manager, Flour Based Group. He joined RFM in 1989 as General Services DivisionManager.
Ramon M. Lopez52 years oldFilipino
Born on 26 October 1960, has a Bachelor of Arts degree major in Economics from the U.P Schoolof Economics and a Masters Degree in Economics at Williams College, Massachusetts, U.S.A. He is amember of the Board of Directors of Phil. Chamber of Food Manufacturers. He is currently Vice President& Executive Assistant to the President and CEO, and concurrent Head, Corporate Planning and ExecutiveDirector of the Philippine Center for Entrepreneurship. He joined the Corporate Planning Department ofRFM Corporation in 1994.
Rowel S. Barba48 years oldFilipino
Born on 13 May 1964, has a Bachelor of Arts degree major in Political Science and Bachelor ofLaws degree, both from the University of the Philippines (Diliman). Prior to joining the Corporation, hewas the Corporate Secretary, Director, Member of the Management Committee and Chief Legal Counseland Head of the Legal Division of Jaka Investments Corporation. While with Jaka, he also served as theCorporate Secretary and director in various subsidiaries and affiliates, and the Operating Unit Head of theTransport Division. He was the former Governor for Southern Luzon of the Integrated Bar of thePhilippines and Legal Counsel of the Philippine Practical Shooting Association. He is currently theCorporate Secretary and Vice President and Head of Corporate Legal and Human Resources Divisions ofthe Corporation. He joined RFM Corporation in April 2007.
28
Minerva C. Laforteza48 years oldFilipino
Born on 9 March 1965, has a Bachelor of Science degree in Business Administration andAccountancy and a Masters degree in Business Administration, both from the University of thePhilippines. She joined RFM Corporation in 1989 as Accounting Supervisor. She is currently the Vice-President & Head, Management Accounting
Ariel A. de Guzman49 years oldFilipino
Born on 5 March 1964, a CPA and a graduate of Bachelor of Science in Commerce major inAccounting from Imus Institute. He joined RFM Corporation in 1988 as a financial analyst and rose fromthe ranks to become the Corporate Accounting Manager of the RFM. He later joined Philtown PropertiesInc, then a subsidiary of RFM Corporation, as AVP Controller from 2006 to 2010. He rejoined RFMCorporation as Vice President of the Internal Audit department in August 2010. He is also currently adirector of Conglomerate Securities & Financing Company and RDC Holdings Inc.
Philip V. Prieto54 years oldFilipino
Born on 20 August 1958, has a Bachelors of Arts degree from the University of San Francisco. Heis the Vice President, Corporate Procurement and Materials Management. He joined the corporation in1995 as the Purchasing Manager of Cosmos Bottling Corporation when this was still owned by RFMCorporation. .
Susan A. Atienza55 years oldFilipino
Born on 2 May 1957, has a Bachelor of Science Degree in Food Technology from the PhilippineWomen’s University. She was the former Plant Manager at Leslie Corporation from 1979 to 1987 andR&D Manager for Branded Snacks of San Miguel Mills, Inc. from 2003 to 2009. She initially joined RFMCorporation in 1987 until 2001 as R&D Manager of the Bakery Group and re-joined the company inDecember 2009 as Assistant Vice President - Research & Development of the Flour Based Group.
Eduardo M. Policarpio51 years oldFilipino
Born on 25 September 1961, has a Bachelor of Science Degree in Medical Technology from theUniversity of Santo Tomas. He became the District Manager of Merck Pharmaceuticals after passing theboard in 1983. Prior to joining RFM Corporation, he was with Universal Robina Corporation from 1995 to2010 as National Sales Director – Beverage Group for 2.5 years. He joined RFM in December 2010 as VicePresident and Head of Sales.

29
Melchor B. Bacsa52 years oldFilipino
Born on 6 January 1961, a Licensed Chemical Engineer, has a Bachelor of Science Degree inChemical Engineering from the Adamson University. Prior to joining RFM Corporation, he was theDirector for Operations, Branded Consumer Foods Division from 2008 to 2010 at Universal RobinaCorporation, where he started his career in 1983. He also held top positions in professional organizationsnamely Production Management Association of the Philippines (PROMAP) and First Cavite IndustrialEstate Association (FCIEA). He joined the company in January 2011 as Vice President and Head ofOperations.
Alma M. Ocampo54 years oldFilipino
Born on 10 September 1958, has a Bachelor of Science Degree in Food Technology from theUniversity of the Philippines, Los Baños. She was the Assistant Vice President – Corporate Research &Development at CDO-Foodsphere, Inc. from 2009 to 2011. She started her own business, Flavor DynamicsEnterprise in 2007 up to 2009 after holding the position of President at Asia Pacific Food Technologies,Inc. from 2004 to 2007. She initially joined RFM Corporation in 1979 until 1994 where she held variouspositions in R&D and Sales. She rejoined the company in February 2011 as Assistant Vice President -Research & Development.
Charmaine C. Bautista38 years oldFilipino
Born on 28 November 1974, has a Bachelor of Arts Degree in Mass Communication from theUniversity of the Philippines. She was the Assistant Vice President – Group Brand Manager at San MiguelCorporation – Beer Division from 2008 to 2011and International Franchise Manager for Non-AlcoholicBeverages in the same company from 2005 to 2007. She was the Brand Manager at Ginebra San MiguelInc. from 1995 to 2005. She joined RFM in March 2011 as Assistant Vice President – Marketing Managerand became Vice President in the same year.
Faye Christine B. Matriano38 years oldFilipino
Born on 21 December 1974, has a Bachelor’s degree in Psychology from Ateneo De ManilaUniversity and completed a Certificate Course in Marketing Management at New York University. Prior tojoining RFM Corporation, she was the Senior Brand Manager at General Mills International from 2002 to2007. She started her career in marketing at Universal Robina Corporation in 1999 to 2002 where sheinitially held the position of Brand Assistant and later on becoming the Assistant Brand Manager. Shejoined the company in March 2009 as Group Product Manager of White King Division and promoted toAssistant Vice President and Marketing Manager in May 2012.
(2) Significant Employees
There is no person other than the executive officers, who are expected by the Corporation to makesignificant contribution to the business.

30
(3) Family Relationships
Jose S. Concepcion Jr. and is the father of Jose Ma. A. Concepcion III, John Marie A. Concepcion, and Ma.Victoria Herminia C. Young. and Francisco A. Segovia is his nephew. Ernest Fritz Server and JosephServer are brothers.
(4) Involvement in Certain Legal Proceedings
To the best knowledge and information of the Corporation, the nominee for Director, its present Board ofDirectors and its Executive Officers are not, presently or during the last five years, involved or have beeninvolved in any legal proceeding involving themselves and/or their properties before any court of law oradministrative body in and out of the country that are material to their ability and/or integrity. Likewise,the said persons have not been convicted by final judgment of any offense punishable by the laws of theRepublic of the Philippines or the laws of any other country.
Item 10 – Executive Compensation
Information as to the aggregate compensation paid or accrued during the last two fiscal years, and theestimated amount to be paid in the ensuing fiscal year to the Company’s Chief Executive Officer and fourother most highly compensated executive officers follows:
(In Million Pesos)Name Position Year Total
CompensationCompensation Bonus & Others
Jose Ma. A. Concepcion IIIFelicisimo M. Nacino Jr.John Marie Concepcion
Norman P. UyRaymond B.Azcarate
President & CEOEVP & COO
Managing Director –Ice Cream
SVP & GMSVP & CFO
2013 P 38.2 P 35.3 P 2.9
All officers and directors as agroup unnamed
2013 P 22.6 P 20.9 P 1.7
(In Million Pesos)Name Position Year Total
CompensationCompensation Bonus & Others
Jose Ma. A. Concepcion IIIFelicisimo M. Nacino Jr.John Marie Concepcion
Norman P. UyRaymond B.Azcarate
President & CEOEVP & COO
Managing Director –Ice Cream
SVP & GMSVP & CFO
2012 P 37.1 P 34.2 P 2.9
All officers and directors as agroup unnamed
2012 P 22.4 P 20.7 P 1.7
Name Position Year TotalCompensation
Compensation Bonus & Others
Jose Ma. A. Concepcion IIIFelicisimo M. Nacino Jr.John Marie Concepcion
Gregory H. BanzonRaymond B.Azcarate
President & CEOEVP & COO
Managing Director –Ice Cream
SVP & Sales DirectorSVP & CFO
2011 P 35.8 P 33 P 2.8
All officers and directors as agroup unnamed
2011 P 22.1 P 20.4 P 1.7
31
Compensation of Directors and Officers
(a) Standard Arrangement.
The Board of Directors and members of the Compensation, Nomination and Audit Committees are entitledto a per diem of P10,000 for every meeting, except that of the per diem of the Chairman of theCompensation Committee amounting to P20,000. Additionally, the Chairman of the Audit Committee isentitled to a remuneration of P50,000 a month.
(b) Other Arrangement
There is no director providing any service or other arrangements for a fee, to the Company, other than thosedisclosed herein.
Employment Contracts
The registrant’s executive officers are entitled to transportation and other benefits, bonus scheme, andretirement plan.
1. Transportation Benefitsa. An executive officer is assigned a vehicle which he may purchase, at market value, after six (6)
years, or return the same to the Corporation in exchange for a replacement vehicle.b. All expenses related to the registration, comprehensive insurance, repairs and maintenance of
the assigned vehicle are paid by the Corporation.c. Reimbursement of gasoline expenses up to a certain amount of liters per month.
2. Bonus SchemeBased on individual performance and attainment of the specific objectives of the Company’s businessplan, bonus is given in accordance with company policy.
3. Retirement PlanAvailment of the retirement benefit is provided after the individual has rendered at least five (5)years of service with the Company at 25% of basic pay per year of service. The value increases by5% per additional year of service up to a maximum of 125%.
4. Other Benefitsa. Hospitalization Plan: A hospitalization plan is provided for the executive officers and his
immediate dependents in accordance with company policy.b. Vacation Leave: 15 days per year, accumulated up to 30 days but not encashable.c. Sick Leave: 15 days per year, accumulated up to 45 days but not encashable.d. Executive Check-up: Once every four (4) years; SPEC 24 KSAT blood test every two (2)
years.
Warrants and Options Outstanding: Repricing
There are no outstanding warrants or stock options held by the directors or executive officers. As such,there are no price or stock warrants or options that are adjusted or amended. There were no materialtransactions during the past three (3) years between the Corporation and its executive officers other than theregular employment agreements.

32
Item 11 – Security Ownership of Certain Beneficial Owners and Management
(a) Security Ownership of Certain Record and Beneficial Owners
As of December 31, 2012, the direct and indirect beneficial owners in excess of 5% of the common sharesof RFM Corporation are set forth in the table below.
Title of Class Name and addressrecord/beneficial owner
Name of BeneficialOwner and
relationship withRecord Owner
CitizenshipAmount and nature of
record/beneficialownership (Shares)
Percent ofClass
CommonTriple Eight Holdings, Inc.# 18 Gen. Capinpin St.,San Antonio Village, PasigCity
Triple Eight Holdings,Inc.
Filipino 658,561,450“r”
20.84
CommonHorizons Realty Inc.,11 Kawayan Road, NorthForbes Park, Makati City
Horizons Realty Filipino 639,330,804“r”
20.23
Common PCD Nominee CorporationGF MKSE Bldg., Ayala Ave.,Makati City (Filipino)
Filipino 539,552,330 17.07
CommonBJS Development Corporation1869 P. Domingo StreetMakati City
BJS DevelopmentCorp.
Filipino 311,210,184“r”
9.85
CommonRenaissance PropertyManagement CorpFEATI University Bldg.,Carlos Palanca, Sta. CruzManila
Renaissance PropertyManagement Corp.
Filipino 201,982,966“r”
6.39
List of person or persons acting together to direct the voting or disposition of the shares held by:
I. Horizons Realty, Inc.1. Jose Ma. A. Concepcion III2. Ma. Victoria Herminia C. Young3. Luis Bernardo A. Concepcion4. John Marie A. Concepcion5. Ma. Lourdes Celine C. Lebron6. Ma. Victoria Ana C. Monasterio7. Mary Elizabeth C.Santos8. Michelle C. Reyes
II. Triple Eight Holdings Inc.1. Jose Ma. A. Concepcion III2. Ma. Victoria Ana A. Concepcion3. Ma. Luisa O. Concepcion4. Margarita O. Concepcion5. Monica O. Concepcion6. Martha O. Uy
III. PCD Nominee Corporation (Filipino) – The PCD is the depository of RFM common shares which aretraded in the Philippine Stock Exchange. Where shareholders are called upon to vote on similarmatter, the PCD Nominee Corporation only informs its participant brokers of such event. In turn,participant brokers get in touch with their clients who are the beneficial owners of shares lodged withthe PCD. It is the beneficial owners who have the voting power.
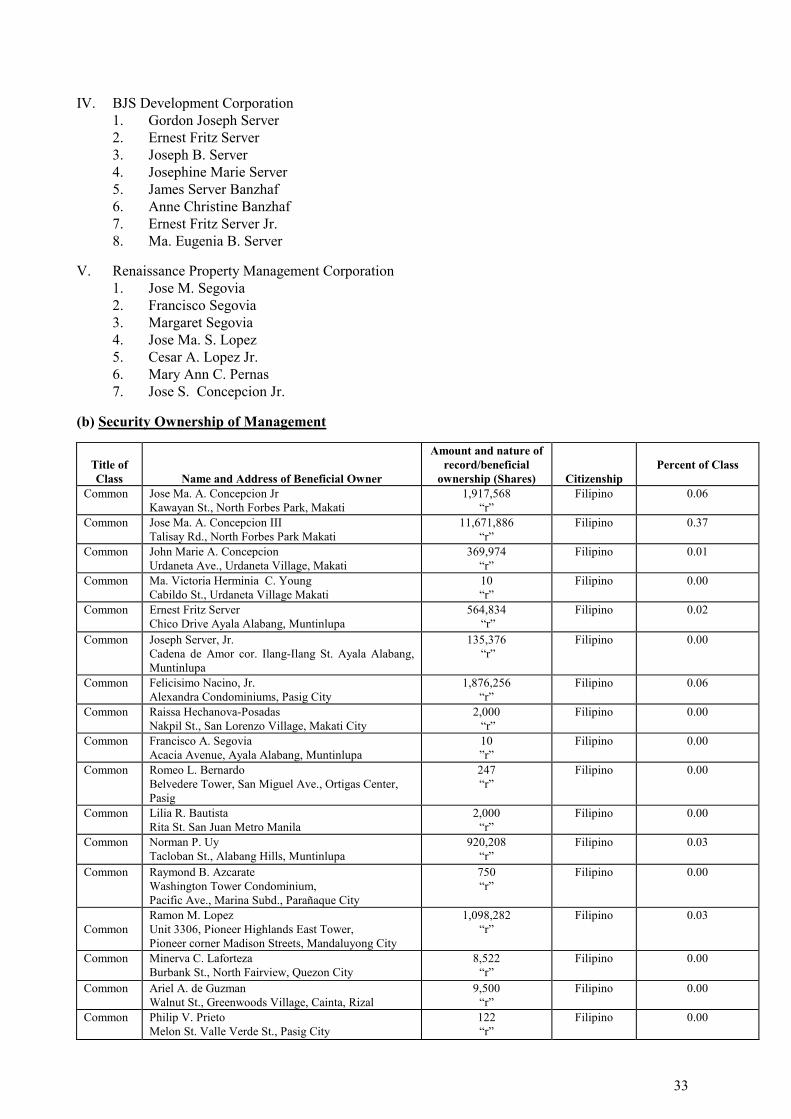
33
IV. BJS Development Corporation1. Gordon Joseph Server2. Ernest Fritz Server3. Joseph B. Server4. Josephine Marie Server5. James Server Banzhaf6. Anne Christine Banzhaf7. Ernest Fritz Server Jr.8. Ma. Eugenia B. Server
V. Renaissance Property Management Corporation1. Jose M. Segovia2. Francisco Segovia3. Margaret Segovia4. Jose Ma. S. Lopez5. Cesar A. Lopez Jr.6. Mary Ann C. Pernas7. Jose S. Concepcion Jr.
(b) Security Ownership of Management
Title ofClass Name and Address of Beneficial Owner
Amount and nature ofrecord/beneficial
ownership (Shares) CitizenshipPercent of Class
Common Jose Ma. A. Concepcion JrKawayan St., North Forbes Park, Makati
1,917,568“r”
Filipino 0.06
Common Jose Ma. A. Concepcion IIITalisay Rd., North Forbes Park Makati
11,671,886“r”
Filipino 0.37
Common John Marie A. ConcepcionUrdaneta Ave., Urdaneta Village, Makati
369,974“r”
Filipino 0.01
Common Ma. Victoria Herminia C. YoungCabildo St., Urdaneta Village Makati
10“r”
Filipino 0.00
Common Ernest Fritz ServerChico Drive Ayala Alabang, Muntinlupa
564,834 “r”
Filipino 0.02
Common Joseph Server, Jr.Cadena de Amor cor. Ilang-Ilang St. Ayala Alabang,Muntinlupa
135,376 “r”
Filipino 0.00
Common Felicisimo Nacino, Jr.Alexandra Condominiums, Pasig City
1,876,256“r”
Filipino 0.06
Common Raissa Hechanova-PosadasNakpil St., San Lorenzo Village, Makati City
2,000 “r”
Filipino 0.00
Common Francisco A. SegoviaAcacia Avenue, Ayala Alabang, Muntinlupa
10”r”
Filipino 0.00
Common Romeo L. BernardoBelvedere Tower, San Miguel Ave., Ortigas Center,Pasig
247“r”
Filipino 0.00
Common Lilia R. BautistaRita St. San Juan Metro Manila
2,000“r”
Filipino 0.00
Common Norman P. UyTacloban St., Alabang Hills, Muntinlupa
920,208“r”
Filipino 0.03
Common Raymond B. AzcarateWashington Tower Condominium,Pacific Ave., Marina Subd., Parañaque City
750“r”
Filipino 0.00
CommonRamon M. LopezUnit 3306, Pioneer Highlands East Tower,Pioneer corner Madison Streets, Mandaluyong City
1,098,282“r”
Filipino 0.03
Common Minerva C. LafortezaBurbank St., North Fairview, Quezon City
8,522“r”
Filipino 0.00
Common Ariel A. de GuzmanWalnut St., Greenwoods Village, Cainta, Rizal
9,500“r”
Filipino 0.00
Common Philip V. PrietoMelon St. Valle Verde St., Pasig City
122“r”
Filipino 0.00

34
The indirect shareholdings of directors/officers and principal stockholders as of December 31, 2012 are asfollows:
% to total Number Total Direct Total IndirectOutstanding Shares of Shares Shares Shares
Directors:Jose Concepcion, Jr. Direct 0.0606748% 1,917,568 1,917,568 Indirect ( thru Horizons Realty, Inc. ) 0.0000015% (48) Indirect ( thru Concepcion Industries Inc) 0.0000474% 1,499 Indirect (thru Renaissance Prop. Mgt.) 0.0000154% 487
Indirect (thru Republic Commodities) 0.0000000% 1Ernest Fritz Server Direct 0.0178722% 564,834 564,834 Indirect ( thru BJS Development Corp ) 0.0000537% (1,697)Jose Ma. Concepcion III Direct 0.3693163% 11,671,886 11,671,886 Indirect ( thru Horizons Realty, Inc. ) 0.0158229% (500,069) Indirect ( thru Triple Eight Holdings, Inc. ) 8.8651644% (280,175,000) Indirect ( thru Concepcion Industries Inc) 0.0000006% 19Ma. Herminia C. Young
Direct 0.0000003% 10 10Indirect (thru Horizons RealtyInc.) 0.0158229% (500,069)Indirect (thru Young Concept, Inc.) 0.0007594% 24,000Indirect (thru RepublicCmmodities) 0.0001487% 4,699Indirect (thru Silang Forest Park, Inc.) 0.0000127% 400
Felicisimo Nacino, Jr. Direct 0.0593676% 1,876,256 1,876,256
Indirect (thru USSR) 0.0079103% 249,996John Marie A. Concepcion Direct 0.0117065% 369,974 369,974 Indirect ( thru Horizons Realty, Inc. ) 0.0158214% (500,021)
Indirect ( thru Select Two Corp. ) 0.0102834% 324,996 Indirect ( thru Concepcion Industries Inc) 0.0000000% 1
InIndirect (thru Republic Commodities) 0.0001487% 4,699Indirect(thruVictoria L. AranetaProp.) 0.0000891% 2,817
Lilia R. BautistaDirect 0.0000633% 2,000 2,000
Joseph Server, Jr. Direct 0.0042835% 135,376 135,376 Indirect ( thru BJS Development Corp ) 0.0000000% (1,681)Francisco A. Segovia Direct 0.0000003% 10 10 Indirect ( thru Renaissance Prop. Mgt. ) 0.0000076% 239
Indirect ( thru Feati University ) 0.0013792% 43,589 Indirect ( thru Chilco Holdings, Inc. ) 0.0148810% 470,301 Indirect ( thru S & A Industrial Corp. ) 0.0000003% 10 Indirect ( thru Segovia & Co., Inc. ) 0.0001893% 5,984 Indirect ( thru Victoria L. Araneta Prop. ) 0.0000004% 12Raissa H. Posadas Direct 0.0000633% 2,000 2,000 Indirect ( thru Hyland Realty Corp. ) 0.0045387% 143,442 Indirect ( thru Concepcion Industries Inc) 0.0000006% 19Romeo L. Bernardo Direct 0.0000078% 247 247
Officers:Norman P. Uy Direct 0.0291168% 920,208 920,208Minerva C. Laforteza Direct 0.0002696% 8,522 8,522Raymond B. Azcarate Direct 0.0000237% 750 750Ariel A. De Guzman Direct 0.0003006% 9,500 9,500Philip V. Prieto Direct 0.0000039% 122 122Ramon M. Lopez Direct 0.0347513% 1,098,282 1,098,282
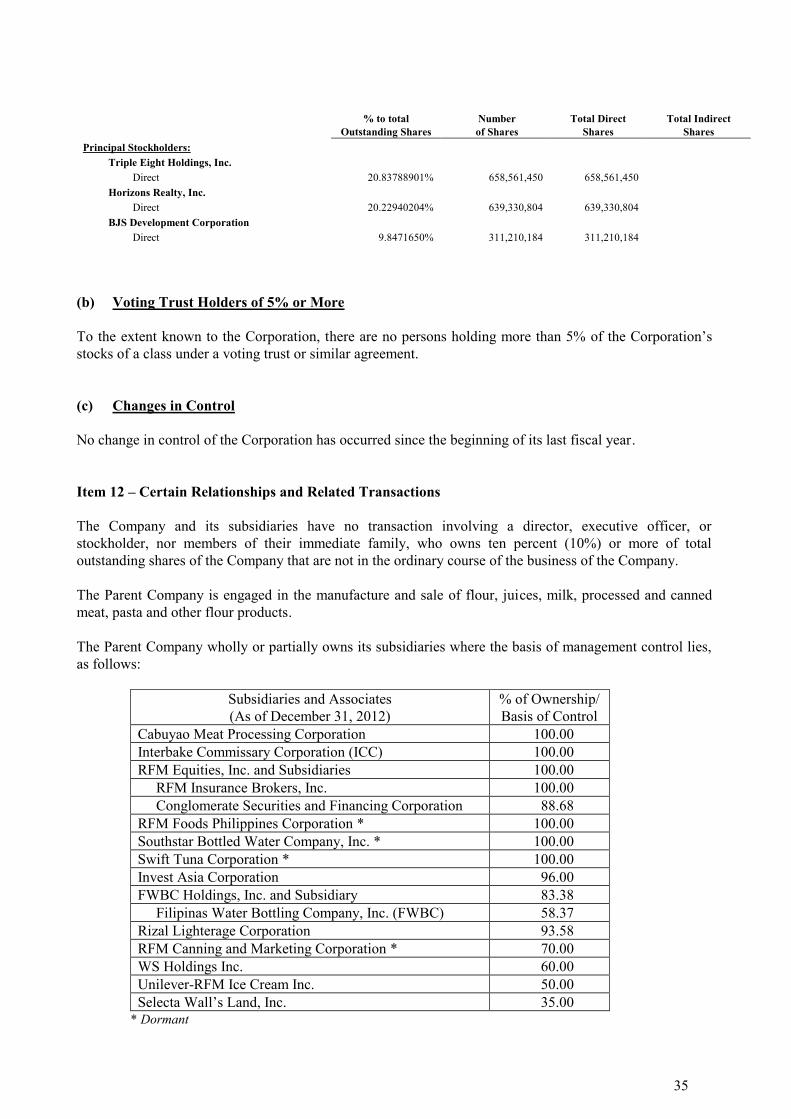
35
% to total Number Total Direct Total IndirectOutstanding Shares of Shares Shares Shares
Principal Stockholders:Triple Eight Holdings, Inc. Direct 20.83788901% 658,561,450 658,561,450Horizons Realty, Inc. Direct 20.22940204% 639,330,804 639,330,804BJS Development Corporation Direct 9.8471650% 311,210,184 311,210,184
(b) Voting Trust Holders of 5% or More
To the extent known to the Corporation, there are no persons holding more than 5% of the Corporation’sstocks of a class under a voting trust or similar agreement.
(c) Changes in Control
No change in control of the Corporation has occurred since the beginning of its last fiscal year.
Item 12 – Certain Relationships and Related Transactions
The Company and its subsidiaries have no transaction involving a director, executive officer, orstockholder, nor members of their immediate family, who owns ten percent (10%) or more of totaloutstanding shares of the Company that are not in the ordinary course of the business of the Company.
The Parent Company is engaged in the manufacture and sale of flour, juices, milk, processed and cannedmeat, pasta and other flour products.
The Parent Company wholly or partially owns its subsidiaries where the basis of management control lies,as follows:
Subsidiaries and Associates(As of December 31, 2012)
% of Ownership/Basis of Control
Cabuyao Meat Processing Corporation 100.00Interbake Commissary Corporation (ICC) 100.00RFM Equities, Inc. and Subsidiaries 100.00 RFM Insurance Brokers, Inc. 100.00
Conglomerate Securities and Financing Corporation 88.68RFM Foods Philippines Corporation * 100.00Southstar Bottled Water Company, Inc. * 100.00Swift Tuna Corporation * 100.00Invest Asia Corporation 96.00FWBC Holdings, Inc. and Subsidiary 83.38 Filipinas Water Bottling Company, Inc. (FWBC) 58.37Rizal Lighterage Corporation 93.58RFM Canning and Marketing Corporation * 70.00WS Holdings Inc. 60.00Unilever-RFM Ice Cream Inc. 50.00Selecta Wall’s Land, Inc. 35.00
* Dormant

36
Significant related party transactions are as follows:
Business Purposeof Arrangements
Related PartiesTransaction Business
Determined TransactionPrices
Description ofEvaluation, if
ApplicableOn Going Commitments
Due to ArrangementsSales
Purchases ofproduct andservices
Parent CompanyInterbakeRizal Lighterage
Parent CompanyInterbakeRizal Lighterage
2012 2011P199M P163MP414M P321MP 40M P 32M
P454M P353MP199M P163MP - P -- based on prevailing
prices available for allcustomers
for workingcapital purposesand investmentactivities from/tosubsidiaries andother relatedparties
Availment / extensions ofboth interest-bearing andnon-interest bearing cashadvances
No fixed repayment terms;certain part of the balance ofadvances from parentcompany is subject to interestbased on latest lending rateson the monthly balance.
Indefinite
Distributorshipservices
Provided by ParentCompany to URICI forexport of frozen dairydessert/ mellorine.
Inconsideration of serviceprovided, the ParentCompany bills service feesequivalent to 7% of the totalExport sales.
Automatic renewal
ManagementServices
Parent Company to RIBI Under management contracts,a yearly management fee ofP500,000
Renewable by mutualagreement of partiesconcerned
Lease of officespaces
The Company has a leaseagreement for office spacewith Invest AsiaCorporation
Lease expense amounted toP2.88M in 2012 and 2011.
Automatic renewal unlessterminated by the lessee.
Managementagreement
Parent Company to ICC Monthly fee of P2.5M in2012 and 2011
Automatic renewal
Rental ofproduction andwarehouse space
ICC leases theproductionarea andwarehouse space fromParent Company
Rental income amounted toP28.4M and P27.9M in 2012and 2011, respectively
Automatic renewal
The Company has no material transactions (that may not be available from others) with other parties fallingoutside the definition of “related parties”.
Transactions with Promoters.
None.

37
PART IV – CORPORATE GOVERNANCE
Item 13 – Corporate Governance
(a) Evaluation System to Measure Compliance with Manual of Corporate Governance
There is no particular system presently being applied to measure the Corporation’s compliance withthe provisions of its Manual on Good Corporate Governance. Compliance with the Manual on goodCorporate Governance is validated by the Corporation using the Corporate Governance Scorecardand PSE Corporate Governance Disclosure Survey.
(b) Measure being Undertaken to Fully Comply with the Adopted Leading Practices on GoodCorporate Governance
The following are some of the measures undertaken by the Corporation to ensure that full compliancewith the leading practices on good governance are observed:
1. During the scheduled meetings of the Board of Directors, the attendance of each director ismonitored and recorded;
2. The Compliance Officer has been designated to monitor compliance with the provisions andrequirements of the Corporation’s Manual on Corporate Governance;
3. The Corporation has designated an audit committee, compensation committee, nominationcommittee, and investment committee;
4. The Board has elected independent directors of at least two or 20% of the member of suchBoard, whichever is lesser;
5. The nomination committee pre-screens and shortlists all candidates nominated to becomedirectors in accordance with the qualification and disqualification set up and established;
6. The directors and officers were given copies of the Manual of the Corporate Governance of theCorporation for their information, guidance and compliance.
(c) Deviation from the Corporation’s Manual of Corporate Governance
Per records, no director failed to meet the fifty percent (50%) attendance requirement in all boardmeetings, whether regular or special, during his incumbency, or the immediately preceding twelve(12) months prior to the next election in accordance with the Manual on Corporate Governance of theCorporation.
(d) Any plan to improve corporate governance of the company
The Company will continue monitoring compliance with its Manual on Corporate Governance toensure full compliance thereto. The Company will improve its Corporate Governance Manual asneeded and proper in its best judgment.

38
PART V - EXHIBITS AND SCHEDULES
Item 14 - Exhibits and Reports on SEC Form 17-C
(a) Exhibits on SEC Form 17-C
See accompanying Index to exhibits on pages [ ].
The following exhibit is filed as a separate section of this report:
Subsidiaries of the Registrant are contained in the information on the Notes to Consolidated financialstatements on pages 1 and 2 of filed Audited Financial Statement that is filed as part of this form 11-A.
(b) Reports on SEC Form 17-C
Date ReportedItemno. Meeting/ Date Subject
26 January 2012 09 26 January 2012 Certificate of Attendance of Directors in the Board Meetingsof the Corporation for January 2011 to December 2011
15 May 2012 09 15 May 2012 Notice and Agenda of RFM’s 2012 Annual Stockholders’Meeting.
28 June 2012 09 27 June 2012 Board approval of declaration of property dividend consistingof 41,431,346 shares of Philtown Properties, Inc. (PTI)
28 June 2012 04
09
27 June 2012 1. Election by the stockholders of the following directors for2012:
Jose S. Concepcion Jr. Jose Ma. A. Concepcion III John Marie A. Concepcion Ma. Victoria Herminia C. Young Ernest Fritz Server Francisco A. Segovia Felicisimo M. Nacino Jr. Raissa Hechanova Posadas Joseph Server Jr. Lilia R. Bautista as Independent Director Romeo L. Bernardo as Independent Director
2. Approval by the stockholders of the following:
· Appointment of External Auditor
· The 2011 Audited Financial Statements and the Auditor’sReport of the Corporation as prepared by Sycip GorresVelayo & Company.

39
04 3. Election by the Board of Directors of the followingofficers of the Corporation:
Jose S. Concepcion Jr. – Chairman of the BoardErnest Fritz Server – Vice PresidentJose Ma. A. Concepcion III – President & CEOFelicisimo M. Nacino, Jr.-EVP & COOJohn Marie A. Concepcion – Managing Director, Ice CreamRaymond B. Azcarate- SVP, & Chief Financial OfficerNorman P. Uy – SVP & Gen. Manager Flour Based GroupRamon M. Lopez-VP & Exec. Asst. to Pres./CEO &
Concurrent Head, Corporate PlanningMa. Victoria Herminia C. Young- VP & Gen. Manager,White King DivisionMinerva C. Laforteza-VP, Head, Management AccountingRowel S. Barba- VP & Head, Corporate Legal & HRDivisions & Corporate SecretaryMelchor B. Bacsa – VP & Head of OperationsEduardo M.Policarpio – VP & Head of SalesPhilip V. Prieto- VP, Corporate Procurement & GeneralServicesAriel A. De Guzman – VP & Head, Internal AuditCharmaine C. Bautista – VP, Head of MarketingSusan A. Atienza – AVP & Head, Research & Development,Flour Based GroupAlma M. Ocampo – AVP & Head, Research & Development,Beverage, Milk & Meat Group
01 October 2012 03 01 October 2012 Re-appointment of Sycip Gorres Velayo & Co. as ExternalAuditor of the Corporation for the year 2012
05 October 2012 09 05 October 2012 Assessment of the Performance of the Audit Committee
The Corporation has an existing Audit Committee Charter andit is in the process of adopting a plan to comply with theGuidance for the Assessment of the Performance of AuditCommittees of Companies Listed on the Exchange under SECMemorandum Circular 4.
16 November 2012 09 14 November 2012 Board approval of cash dividend amounting toPhp76,926,220.94
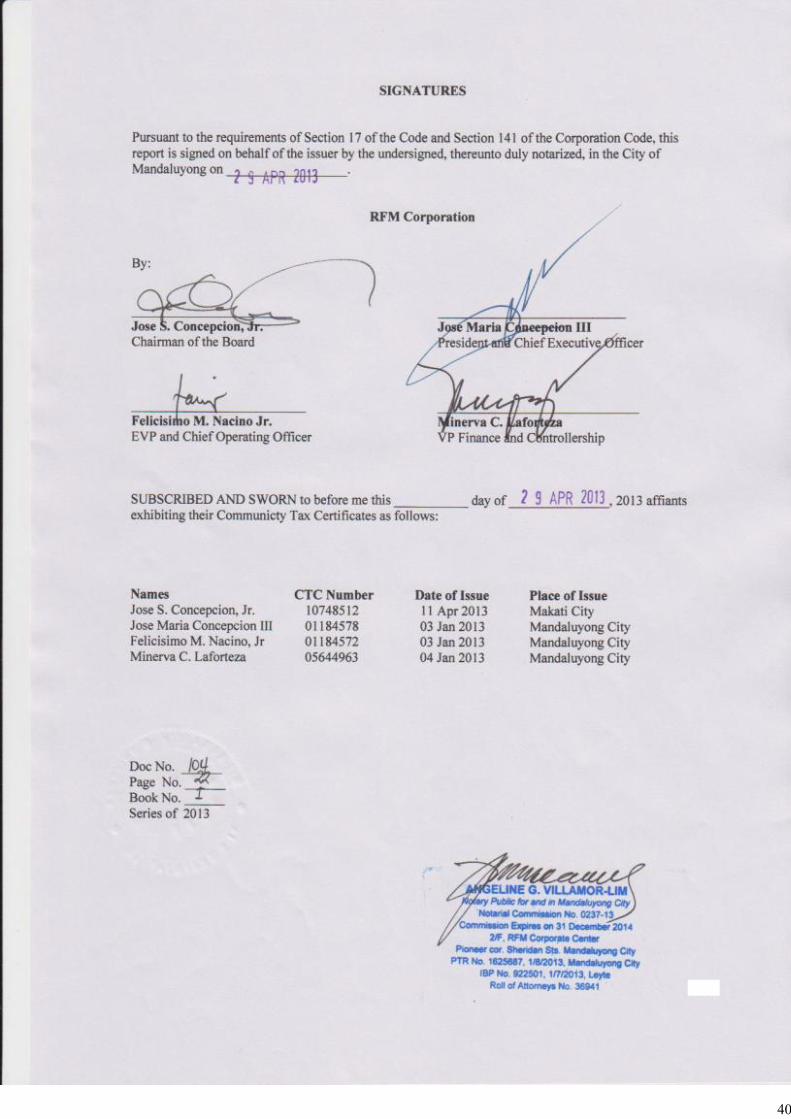
40

0
RFM CORPORATION AND SUBSIDIARIES
INDEX TO FINANCIAL STATEMENTS AND SUPPLEMENTARY SCHEDULES
FORM 17-A, Item 7
For the year ended December 31, 2012 Page No.
Statement of Management’s Responsibility
Consolidated Financial Statements
Consolidated Statement of Management’s Responsibility for Financial StatementsReport of Independent Public AccountantsConsolidated Balance Sheets as of December 31, 2012 and 2011Consolidated Statements of Income for the years ended December 31, 2012 and 2011Consolidated Statements of Comprehensive Income for the years ended
December 31, 2012 and 2011Consolidated Statements of Changes in Equity as of December 31, 2012 and 2011Consolidated Statements of Cash Flows for the years ended December 31, 2012 and 2011Notes to Consolidated Financial Statements
Supplementary Schedules
A. Financial AssetsB. Amounts Receivable from Directors, Officers, Employees, Related Parties and Principal
Stockholders (Other than Related Parties)C. Amounts Receivable from Related Parties which are eliminated during Consolidation of
Financial StatementsD. Intangible Assets – Other AssetsE. Long-term DebtF. Indebtedness to Related Parties (Long-Term Loans from Related Companies)G. Guarantees of Securities of Other IssuersH. Capital StockI. List of Philippine Financial Reporting Standards (PFRSs) [which consist of PFRSs,
Philippine Accounting Standards (PASs) and Philippine Interpretations] effective as ofDecember 31, 2012
J. Reconciliation of Retained Earnings Available for Dividend DeclarationK. Conglomerate MappingL. Financial Soundness Indicators
1
2
3456*7
8131415
* These schedules, which are required by SRC Rule68, have been omitted because they either are notapplicable or does not exceed 5% of the total assets shown in the related Consolidated Balance Sheet.


RFM Corporation and Subsidiaries
Consolidated Financial StatementsDecember 31, 2012 and 2011and Years Ended December 31, 2012, 2011 and 2010
and
Independent Auditors’ Report
SyCip Gorres Velayo & Co.

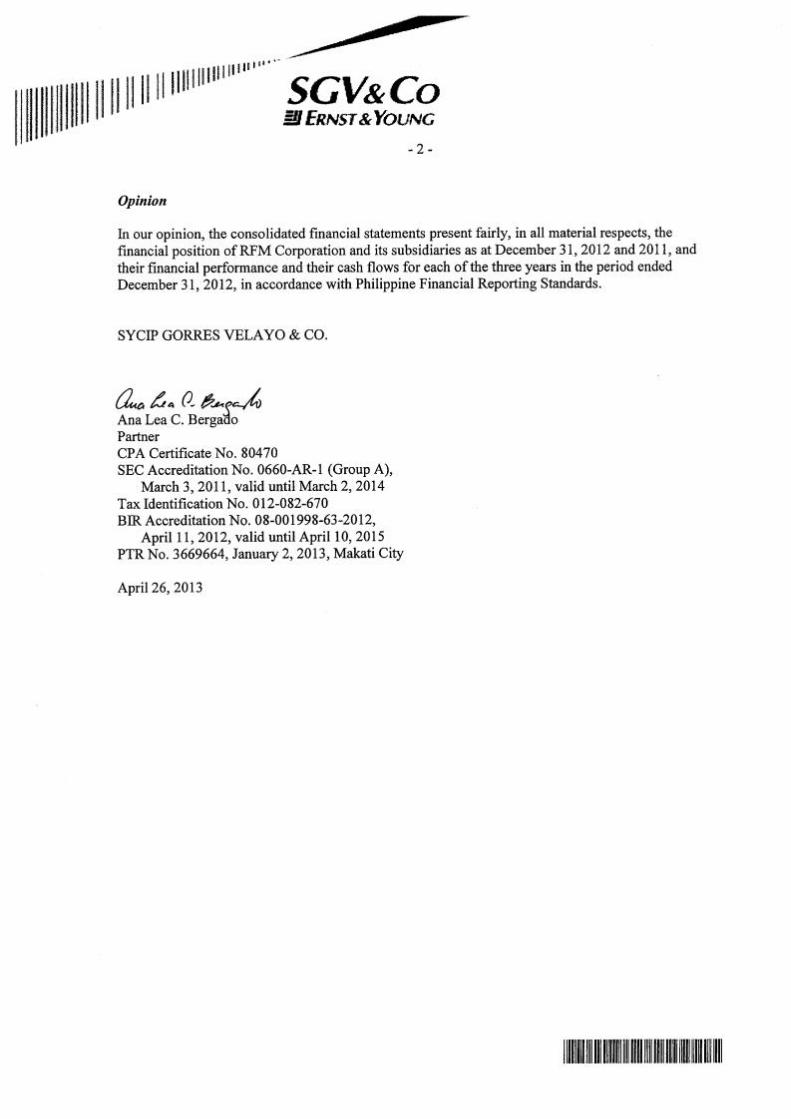

RFM CORPORATION AND SUBSIDIARIESCONSOLIDATED BALANCE SHEETS(Amounts in Thousands)
December 312012 2011
ASSETS
Current AssetsCash and cash equivalents (Note 6) P=1,474,713 P=812,997Accounts receivable (Note 7) 2,587,683 1,904,873Advances to related parties (Note 26) 89,252 211,969Inventories (Note 8) 1,789,046 1,605,219Other current assets (Note 9) 192,278 340,269Total Current Assets 6,132,972 4,875,327
Noncurrent AssetsProperty, plant and equipment (Note 10):
At cost 2,758,376 2,674,221At appraised value 1,539,359 1,539,359
Investment properties (Note 11) 56,927 78,019AFS financial assets (Note 12) 329,705 946,622Investment in an associate (Note 12) 138,852 233,410Deferred income tax assets - net (Note 29) 88,378 65,512Other noncurrent assets (Note 14) 305,338 351,295Total Noncurrent Assets 5,216,935 5,888,438
TOTAL ASSETS P=11,349,907 P=10,763,765
LIABILITIES AND EQUITY
Current LiabilitiesBank loans (Note 15) P=888,500 P=879,995Accounts payable and accrued liabilities (Note 16) 2,613,354 2,067,661Income tax payable 36,389 62,202Advances from related parties (Note 26) 69,777 74,707Customers’ deposits (Note 17) 79,208 18,341Current portion of:
Long-term obligations (Note 18) 7,261 6,574Long-term debts (Note 20) 546,078 498,529
Provisions (Note 19) 67,982 52,157Derivative liability (Note 34) – 1,732Total Current Liabilities 4,308,549 3,661,898
Noncurrent LiabilitiesLong-term obligations - net of current portion (Note 18) 1,931 9,192Long-term debts - net of current portion (Note 20) 1,265,393 1,651,471Deferred income tax liabilities - net (Note 29) 192,154 171,940Net pension obligation (Note 27) 28,148 103,836Security deposits 1,183 2,453Total Noncurrent Liabilities 1,488,809 1,938,892
Total Liabilities 5,797,358 5,600,790
(Forward)
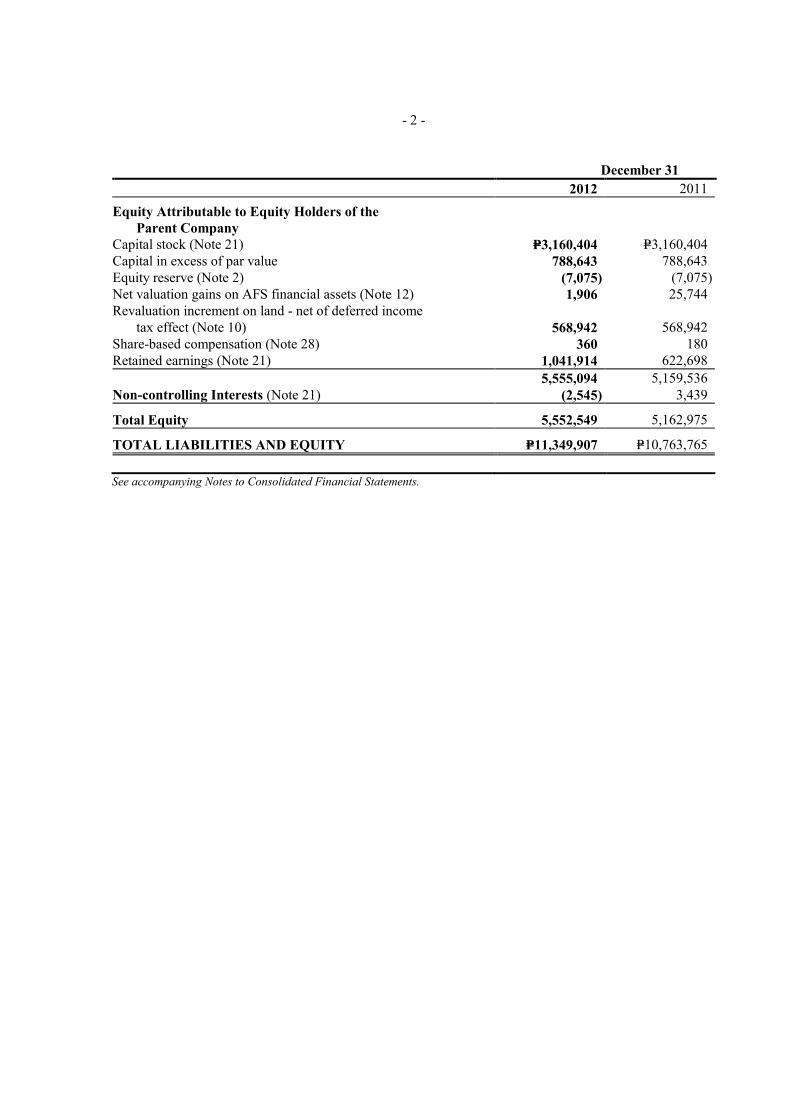
- 2 -
December 312012 2011
Equity Attributable to Equity Holders of theParent Company
Capital stock (Note 21) P=3,160,404 P=3,160,404Capital in excess of par value 788,643 788,643Equity reserve (Note 2) (7,075) (7,075)Net valuation gains on AFS financial assets (Note 12) 1,906 25,744Revaluation increment on land - net of deferred income
tax effect (Note 10) 568,942 568,942Share-based compensation (Note 28) 360 180Retained earnings (Note 21) 1,041,914 622,698
5,555,094 5,159,536Non-controlling Interests (Note 21) (2,545) 3,439
Total Equity 5,552,549 5,162,975
TOTAL LIABILITIES AND EQUITY P=11,349,907 P=10,763,765
See accompanying Notes to Consolidated Financial Statements.

RFM CORPORATION AND SUBSIDIARIESCONSOLIDATED STATEMENTS OF INCOME(Amounts in Thousands, Except Per Share Data)
Years Ended December 312012 2011 2010
REVENUEManufacturing P=10,965,933 P=10,310,477 P=9,068,799Services and others 32,116 25,845 30,104
10,998,049 10,336,322 9,098,903COST OF SALES AND SERVICES (Note 22)Manufacturing (7,220,544) (7,018,624) (5,937,773)Services and others (47,908) (38,293) (32,244)
(7,268,452) (7,056,917) (5,970,017)GROSS PROFIT 3,729,597 3,279,405 3,128,886OPERATING EXPENSESSelling and marketing (Note 23) (1,780,605) (1,601,678) (1,533,998)General and administrative (Note 24) (1,060,195) (887,074) (885,968)OTHER INCOME (CHARGES)Gain on sale of trademark (Note 30) 600,000 – –Impairment loss on AFS financial assets (Note 12) (545,861) – –Interest expense (Notes 15, 18, 20 and 25) (117,368) (128,772) (95,895)Gain on sale of investments in shares of stock (Note 12) 35,819 19,717 –Reversal of allowance for:
Doubtful accounts (Note 33) 37,143 12,843 510Inventory obsolescence (Note 8) 26,255 791 –
Interest and financing income (Note 25) 22,076 17,681 16,390Other income - net (Note 25) (3,399) 1,941 136,403INCOME BEFORE INCOME TAX 943,462 714,854 766,328PROVISION FOR INCOME TAX (Note 29)Current 276,419 187,374 189,727Deferred (15,228) 19,175 (48,493)
261,191 206,549 141,234NET INCOME P=682,271 P=508,305 P=625,094
Net income (loss) attributable to:Equity holders of the Parent Company P=685,750 P=509,580 P=624,710Non-controlling interests (3,479) (1,275) 384
P=682,271 P=508,305 P=625,094
Basic/Diluted Earnings Per Share (Note 32) P=0.217 P=0.161 P=0.198
See accompanying Notes to Consolidated Financial Statements.
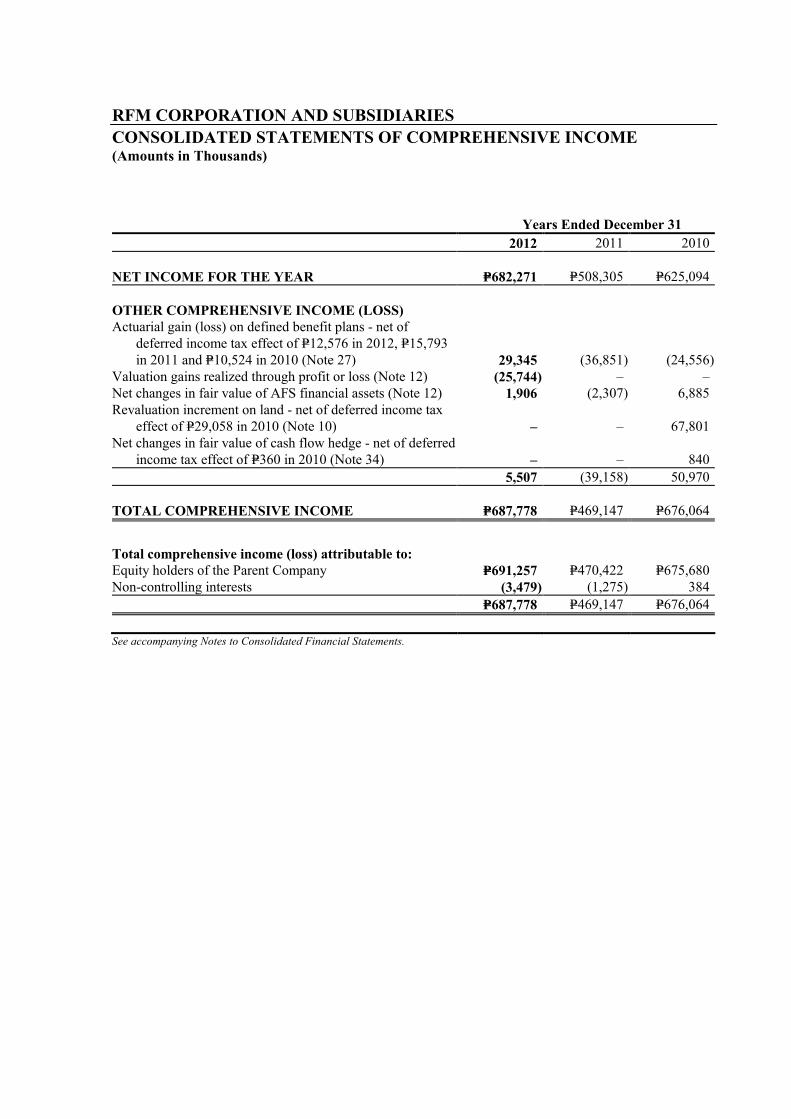
RFM CORPORATION AND SUBSIDIARIESCONSOLIDATED STATEMENTS OF COMPREHENSIVE INCOME(Amounts in Thousands)
Years Ended December 312012 2011 2010
NET INCOME FOR THE YEAR P=682,271 P=508,305 P=625,094
OTHER COMPREHENSIVE INCOME (LOSS)Actuarial gain (loss) on defined benefit plans - net of
deferred income tax effect of P=12,576 in 2012, P=15,793in 2011 and P=10,524 in 2010 (Note 27) 29,345 (36,851) (24,556)
Valuation gains realized through profit or loss (Note 12) (25,744) – –Net changes in fair value of AFS financial assets (Note 12) 1,906 (2,307) 6,885Revaluation increment on land - net of deferred income tax
effect of P=29,058 in 2010 (Note 10) – – 67,801Net changes in fair value of cash flow hedge - net of deferred
income tax effect of P=360 in 2010 (Note 34) – – 8405,507 (39,158) 50,970
TOTAL COMPREHENSIVE INCOME P=687,778 P=469,147 P=676,064
Total comprehensive income (loss) attributable to:Equity holders of the Parent Company P=691,257 P=470,422 P=675,680Non-controlling interests (3,479) (1,275) 384
P=687,778 P=469,147 P=676,064
See accompanying Notes to Consolidated Financial Statements.

RFM CORPORATION AND SUBSIDIARIESCONSOLIDATED STATEMENTS OF CHANGES IN EQUITYFOR THE YEARS ENDED DECEMBER 31, 2012, 2011 AND 2010(Amounts in Thousands)
Equity Attributable to Equity Holders of the Parent CompanyNet Valuation
Capital Gains on AFS Revaluation Non-Capital in Excess Equity Financial Increment Cash Flow Share-based Retained controlling Total
Stock of Par Value Reserve Assets on Land Hedge Compensation Earnings Subtotal Interests EquityBALANCES AT DECEMBER 31, 2009 P=3,160,404 P=788,643 P=– P=21,166 P=501,141 (P=840) P=1,624 P=622,228 P=5,094,366 P=4,330 P=5,098,696Net income for the year – – – – – – – 624,710 624,710 384 625,094Other comprehensive income (loss):
Actuarial losses on defined benefit plans - net of deferredincome tax effect (Note 27) – – – – – – – (24,556) (24,556) – (24,556)
Net changes in fair value of AFS financial assets (Note 12) – – – 6,885 – – – – 6,885 – 6,885Net changes in fair value of cash flow hedge - net of
deferred income tax effect (Notes 29 and 34) – – – – – 840 – – 840 – 840Revaluation increment on land - net of deferred
income tax effect (Notes 10 and 29) – – – – 67,801 – – – 67,801 – 67,801Total comprehensive income for the year – – – 6,885 67,801 840 – 600,154 675,680 384 676,064Cash dividends (Note 21) – – – – – – – (49,997) (49,997) – (49,997)Share-based compensation plan – – – – – – (1,347) – (1,347) – (1,347)BALANCES AT DECEMBER 31, 2010 3,160,404 788,643 – 28,051 568,942 – 277 1,172,385 5,718,702 4,714 5,723,416Net income (loss) for the year – – – – – – – 509,580 509,580 (1,275) 508,305Other comprehensive income (loss):
Actuarial losses on defined benefit plans - net of deferredincome tax effect (Note 27) – – – – – – – (36,851) (36,851) – (36,851)
Net changes in fair value of AFS financial assets (Note 12) – – – (2,307) – – – – (2,307) – (2,307)Total comprehensive income (loss) for the year – – – (2,307) – – – 472,729 470,422 (1,275) 469,147Property dividends (Note 21) – – – – – – – (834,913) (834,913) – (834,913)Cash dividends (Note 21) – – – – – – – (187,503) (187,503) – (187,503)Effect of acquisition of additional shares of stock
of a subsidiary (Note 2) – – (7,075) – – – – – (7,075) – (7,075)Share-based compensation plan – – – – – – (97) – (97) – (97)BALANCES AT DECEMBER 31, 2011 3,160,404 788,643 (7,075) 25,744 568,942 – 180 622,698 5,159,536 3,439 5,162,975Net income (loss) for the year – – – – – – – 685,750 685,750 (3,479) 682,271Other comprehensive income (loss):
Actuarial gain on defined benefit plans - net of deferredincome tax effect (Note 27) – – – – – – – 29,345 29,345 – 29,345
Valuation gains realized through profit or loss (Note 12) – – – (25,744) – – – – (25,744) – (25,744)Net changes in fair value of AFS financial assets (Note 12) – – – 1,906 – – – – 1,906 – 1,906
Total comprehensive income (loss) for the year – – – (23,838) – – – 715,095 691,257 (3,479) 687,778Property dividends (Note 21) – – – – – – – (143,388) (143,388) – (143,388)Cash dividends (Note 21) – – – – – – – (152,491) (152,491) (2,505) (154,996)Share-based compensation plan – – – – – – 180 – 180 – 180BALANCES AT DECEMBER 31, 2012 P=3,160,404 P=788,643 (P=7,075) P=1,906 P=568,942 P=– P=360 P=1,041,914 P=5,555,094 (P=2,545) P=5,552,549
See accompanying Notes to Consolidated Financial Statements.

RFM CORPORATION AND SUBSIDIARIESCONSOLIDATED STATEMENTS OF CASH FLOWS(Amounts in Thousands)
Years Ended December 312012 2011 2010
CASH FLOWS FROM OPERATING ACTIVITIESIncome before income tax P=943,462 P=714,854 P=766,328Adjustments for:
Gain on sale of trademark (Note 30) (600,000) – –Impairment loss on AFS financial assets (Note 12) 545,861 – –Depreciation and amortization (Notes 10, 11 and 25) 315,595 251,614 181,984Interest expense and financing charges
(Notes 15, 18, 20 and 25) 117,368 128,772 95,895Gain on sale of investment in shares of stocks (Note 12) (35,819) (19,717) –Movement on pension benefits liability (Note 27) (33,768) (6,711) 9,239Interest and financing income (Note 25) (22,076) (17,681) (16,390)Equity in net earnings of an associate (Note 25) (11,172) (12,451) (11,904)Impairment loss on property, plant
and equipment (Note 10) 5,243 – –Mark-to-market loss (gain) on derivative liability
(Notes 25 and 34) (1,732) (10,895) 10,614Dividend income (Note 12) (825) (552) (11,494)Gain on sale of property and equipment (Notes 10 and 25) 708 (1,649) (965)Share-based compensation (Note 28) 180 (97) (1,347)Loss on retirement of property and equipment – 866 –Unrealized foreign exchange loss (gain) - net – (1,982) 507Reversal of allowance for impairment loss on property,
plant and equipment (Note 10) – – (46,178)Excess of acquirer’s interest in the fair value of
identifiable net assets acquired over the cost ofbusiness combination (Note 5) – – (13,577)
Operating income before working capital changes 1,223,025 1,024,371 962,712Decrease (increase) in:
Accounts receivable (682,660) (169,977) 141,365Inventories (183,826) 105,463 (436,753)Other current assets 147,993 (54,503) (98,734)
Increase (decrease) in:Accounts payable and accrued liabilities 528,468 84,843 53,354Customers’ deposits 60,868 (7,559) (26,664)Provisions 15,825 50,066 (13,886)Security deposits (1,271) 820 –
Cash generated from operations 1,108,422 1,033,524 581,394Income tax paid (302,232) (170,546) (188,544)Interest paid (119,681) (152,791) (87,708)Interest received 21,926 21,023 13,568Net cash from operating activities 708,435 731,210 318,710
(Forward)
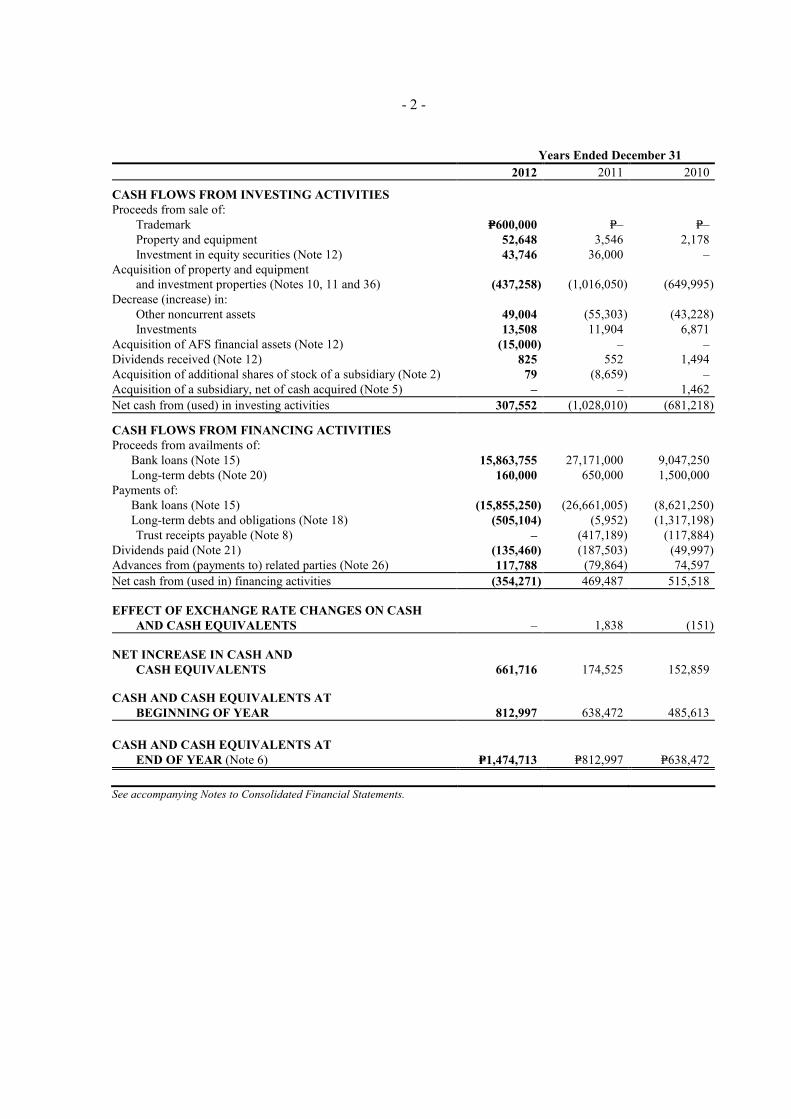
- 2 -
Years Ended December 312012 2011 2010
CASH FLOWS FROM INVESTING ACTIVITIESProceeds from sale of:
Trademark P=600,000 P=– P=–Property and equipment 52,648 3,546 2,178Investment in equity securities (Note 12) 43,746 36,000 –
Acquisition of property and equipmentand investment properties (Notes 10, 11 and 36) (437,258) (1,016,050) (649,995)
Decrease (increase) in:Other noncurrent assets 49,004 (55,303) (43,228)Investments 13,508 11,904 6,871
Acquisition of AFS financial assets (Note 12) (15,000) – –Dividends received (Note 12) 825 552 1,494Acquisition of additional shares of stock of a subsidiary (Note 2) 79 (8,659) –Acquisition of a subsidiary, net of cash acquired (Note 5) – – 1,462Net cash from (used) in investing activities 307,552 (1,028,010) (681,218)
CASH FLOWS FROM FINANCING ACTIVITIESProceeds from availments of:
Bank loans (Note 15) 15,863,755 27,171,000 9,047,250Long-term debts (Note 20) 160,000 650,000 1,500,000
Payments of:Bank loans (Note 15) (15,855,250) (26,661,005) (8,621,250)Long-term debts and obligations (Note 18) (505,104) (5,952) (1,317,198)Trust receipts payable (Note 8) – (417,189) (117,884)
Dividends paid (Note 21) (135,460) (187,503) (49,997)Advances from (payments to) related parties (Note 26) 117,788 (79,864) 74,597Net cash from (used in) financing activities (354,271) 469,487 515,518
EFFECT OF EXCHANGE RATE CHANGES ON CASHAND CASH EQUIVALENTS – 1,838 (151)
NET INCREASE IN CASH ANDCASH EQUIVALENTS 661,716 174,525 152,859
CASH AND CASH EQUIVALENTS ATBEGINNING OF YEAR 812,997 638,472 485,613
CASH AND CASH EQUIVALENTS ATEND OF YEAR (Note 6) P=1,474,713 P=812,997 P=638,472
See accompanying Notes to Consolidated Financial Statements.
RFM CORPORATION AND SUBSIDIARIESNOTES TO CONSOLIDATED FINANCIAL STATEMENTS(Amounts in Thousands, Except Number of Shares or When Otherwise Indicated)
1. Corporate Information and Authorization for the Issuance of theConsolidated Financial Statements
Corporate InformationRFM Corporation (the Parent Company) was incorporated and registered with the PhilippineSecurities and Exchange Commission (SEC) on August 16, 1957. On July 9, 2007, the SECapproved the extension of the Company’s corporate life from August 22, 2007 toOctober 13, 2056. The Parent Company is a public company under Section 17.2 of the SecuritiesRegulation Code and its shares are listed in the Philippine Stock Exchange (PSE) starting in 1966.The Parent Company is mainly involved in the manufacturing, processing and selling of wheat,flour and flour products, pasta, meat, milk, juices, margarine, and other food and beverageproducts. The Parent Company and its subsidiaries are collectively referred to as the Group.
The registered business address of the Parent Company is RFM Corporate Center, corner Pioneerand Sheridan Streets, Mandaluyong City.
Authorization for the Issuance of the Consolidated Financial StatementsThe consolidated financial statements were authorized for issuance by the Board of Directors(BOD) on April 26, 2013.
2. Summary of Significant Accounting Policies and Financial Reporting Practices
Basis of PreparationThe consolidated financial statements of the Group have been prepared using the historical costbasis, except for the Group’s land, which are stated at appraised values, and available-for-sale(AFS) financial assets and derivative liability that are measured at fair value. The consolidatedfinancial statements are presented in Philippine peso (Peso), which is the Parent Company’sfunctional currency. All values are rounded off to the nearest thousand pesos (P=000), except forthe number of shares or when otherwise indicated.
Statement of ComplianceThe consolidated financial statements of the Group have been prepared in compliance withPhilippine Financial Reporting Standards (PFRS).
Changes in Accounting Policies and Disclosures
The accounting policies adopted are consistent with those of the previous financial year, exceptfor the following amended PFRS and Philippine Accounting Standards (PAS) which wereadopted as of January 1, 2012. Except as otherwise indicated, the adoption of these changes inPFRS did not have any significant impact on the Group’s financial statements:
PFRS 7, Financial Instruments: Disclosures - Transfers of Financial Assets (Amendments),requires additional disclosures about financial assets that have been transferred but notderecognized to enhance the understanding of the relationship between those assets that havenot been derecognized and their associated liabilities. In addition, the amendments requiredisclosures about continuing involvement in derecognized assets to enable users of financial

statements to evaluate the nature of, and risks associated with, the entity’s continuinginvolvement in those derecognized assets. The amendments affect disclosures only and haveno impact on the Group’s financial position or performance.
PAS 12, Income Taxes - Deferred Tax: Recovery of Underlying Assets (Amendments), clarifiesthe determination of deferred tax on investment property measured at fair value. Theamendment introduces a rebuttable presumption that the carrying amount of investmentproperty measured using the fair value model in PAS 40, Investment Property, will berecovered through sale and, accordingly, requires that any related deferred tax should bemeasured on a “sale” basis. The presumption is rebutted if the investment property isdepreciable and it is held within a business model whose objective is to consume substantiallyall of the economic benefits in the investment property over time (“use” basis), rather thanthrough sale. Furthermore, the amendment introduces the requirement that deferred tax onnon-depreciable assets measured using the revaluation model in PAS 16, Property, Plant andEquipment, always be measured on a sale basis of the asset. The Group’s parcels of land usedin its operations are stated at appraised values which approximates the selling price of theseassets. Deferred income tax recorded in the books is already based on these appraised values.
Summary of Significant Accounting Policies
Basis of ConsolidationThe consolidated financial statements comprise the financial statements of the Group prepared forthe same reporting year as the Parent Company, using consistent accounting policies.
The consolidated subsidiaries, which are all incorporated in the Philippines and the effectivepercentages of ownership as of December 31 is as follows:
Percentage of Ownership2012 2011
Cabuyao Meat Processing Corporation (CMPC) 100.00 100.00Interbake Commissary Corporation (ICC) 100.00 100.00RFM Equities, Inc. (REI) 100.00 100.00
RFM Insurance Brokers, Inc. (RIBI) 100.00 100.00Conglomerate Securities and Financing
Corporation (CSFC) 88.68 88.68RFM Foods Philippines Corporation* 100.00 100.00Southstar Bottled Water Company, Inc. (Southstar)* 100.00 100.00Swift Tuna Corporation* 100.00 100.00Invest Asia Corporation (Invest Asia) 96.00 96.00Rizal Lighterage Corporation (RLC) 93.60 93.51FWBC Holdings, Inc. 83.38 83.38
Filipinas Water Bottling Company, Inc. (FWBC) 58.37 58.37RFM Canning and Marketing, Inc. (RFM Canning)* 70.00 70.00WS Holdings, Inc. (WHI) 60.00 60.00* Dormant
In 2012, the Parent Company acquired additional shares in RLC, a subsidiary, at a total cashconsideration of P=0.08 million and accordingly executed corresponding deeds of absolute sale ofshares of stock with the former shareholders.

In 2011, the Parent Company acquired additional 10.53% ownership interest in RLC, a subsidiary,at a total cost of P=8.66 million, and accordingly executed corresponding deeds of absolute sale ofshares of stock with the former shareholders.
SubsidiariesSubsidiaries are entities over which the Parent Company has the power to govern the financialand operating policies of the entities, or generally have an interest of more than one half of thevoting rights of the entities. The existence and effect of potential voting rights that are currentlyexercisable or convertible are considered when assessing whether the Parent Company controlsanother entity. Subsidiaries are fully consolidated from the date of acquisition, being the date onwhich the Parent Company or the Group obtains control, directly or through the holdingcompanies, and continue to be consolidated until the date that such control ceases. The financialstatements of the subsidiaries are prepared for the same accounting period as the Parent Companyusing consistent accounting policies. Control is achieved when the Parent Company has thepower to govern the financial and operating policies of an entity so as to obtain benefits from itsactivities. They are deconsolidated from the date on which control ceases.
All intra-group balances, transactions, income and expenses, and profits and losses resulting fromintra-group transactions are eliminated in full. However, intra-group losses are also eliminatedbut are considered an impairment indicator of the assets transferred.
A change in the ownership interest in a subsidiary, without a loss of control, is accounted for asan equity transaction.
If the Group loses control over a subsidiary, it derecognizes the carrying amounts of the assets(including goodwill) and liabilities of the subsidiary, carrying amount of any non-controllinginterest (including any attributable components of other comprehensive income recorded inequity), and recognizes the fair value of the consideration received, fair value of any investmentretained, and any surplus or deficit recognized in the consolidated statement of income. TheGroup also reclassifies the Parent Company’s share of components previously recognized in othercomprehensive income to profit or loss or retained earnings, as appropriate.
Non-controlling interestNon-controlling interest represents the portion of profit or loss and the net assets not held by theGroup. Profit or loss and each component of other comprehensive income (loss) are attributed tothe equity holders of the Parent Company and to the non-controlling interest. Totalcomprehensive income (loss) is attributed to the equity holders of the Parent Company and to thenon-controlling interest even if this results in the non-controlling interest having a deficit balance.
Transactions with non-controlling interest are accounted for as an equity transaction.
Business Combination and GoodwillBusiness combinations are accounted for using the acquisition method. The cost of an acquisitionis measured as the aggregate of the consideration transferred, measured at acquisition date fairvalue and the amount of any non-controlling interest in the acquiree. For each businesscombination, the acquirer measures the non-controlling interest in the acquiree either at fair valueor at the proportionate share of the acquiree’s identifiable net assets. Acquisition-related costsincurred are expensed and included in general and administrative expenses.

When the Group acquires a business, it assesses the financial assets and financial liabilitiesassumed for appropriate classification and designation in accordance with the contractual terms,economic circumstances and pertinent conditions as at the acquisition date. This includes theseparation of embedded derivatives in host contracts by the acquiree.
If the business combination is achieved in stages, the acquisition date fair value of the acquirer’spreviously held equity interest in the acquiree is remeasured to fair value at the acquisition dateand any gain or loss on remeasurement is recognized in the consolidated statement of income.
Any contingent consideration to be transferred by the acquirer will be recognized at fair value atthe acquisition date. Subsequent changes to the fair value of the contingent consideration whichis deemed to be an asset or liability, will be recognized in accordance with PAS 39 either in theconsolidated statement of income or as a change to other comprehensive income. If thecontingent consideration is classified as equity, it should not be remeasured until it is finallysettled within equity.
Goodwill is initially measured at cost being the excess of the aggregate of the considerationtransferred and the amount recognized for non-controlling interest over the net identifiable assetsacquired and liabilities assumed. If this consideration is lower than the fair value of the net assetsof the subsidiary acquired, the difference is recognized in the consolidated statement of income.
After initial recognition, goodwill is measured at cost less any accumulated impairment losses.For the purpose of impairment testing, goodwill acquired in a business combination is, from theacquisition date, allocated to each of the Group’s cash-generating units (CGU) that are expectedto benefit from the combination, irrespective of whether other assets or liabilities of the acquireeare assigned to those units.
Where goodwill forms part of a CGU and part of the operation within that unit is disposed of, thegoodwill associated with the operation disposed of is included in the carrying amount of theoperation when determining the gain or loss on disposal of the operation. Goodwill disposed of inthis circumstance is measured based on the relative values of the operation disposed of and theportion of the CGU retained.
Goodwill is reviewed for impairment, annually or more frequently if events or changes incircumstances indicate that the carrying value may be impaired.
Impairment is determined for goodwill by assessing the recoverable amount of the CGU or groupof CGUs to which the goodwill relates. Where the recoverable amount of the CGU or group ofCGUs is less than the carrying amount of the CGU or group of CGUs to which goodwill has beenallocated, an impairment loss is recognized. Impairment losses relating to goodwill cannot bereversed in future periods. The Group performs its impairment test of goodwill annually everyDecember 31.
Cash and Cash EquivalentsCash includes cash on hand and in banks. Cash equivalents are short-term, highly liquidinvestments that are readily convertible to known amounts of cash with original maturities ofthree months or less from dates of acquisition and that are subject to an insignificant risk ofchange in value.
Financial InstrumentsDate of recognitionThe Group recognizes a financial asset or a financial liability in the consolidated balance sheetwhen it becomes a party to the contractual provisions of the instrument. Purchases and sales offinancial assets that require delivery of assets within the time frame by regulation or convention inthe marketplace are recognized on the settlement date.
Initial recognition and classification of financial instrumentsAll financial assets and financial liabilities are recognized initially at fair value. Except forsecurities at fair value through profit or loss (FVPL), the initial measurement of financial assetsincludes transactions costs. The Group’s financial assets are further classified into the followingcategories: financial assets at FVPL (as derivatives designated as hedging instruments in aneffective hedge, as appropriate), loans and receivables, held-to-maturity (HTM) investments andAFS financial assets. The Group also classifies its financial liabilities as financial liabilities atFVPL (as derivatives designated as hedging instruments in an effective hedge, as appropriate) andother financial liabilities. The classification depends on the purpose for which the investmentswere acquired or whether they are quoted in an active market. The Group determines theclassification of its financial instruments at initial recognition and, where allowed andappropriate, re-evaluates such designation at each balance sheet date.
Financial instruments are classified as liability or equity in accordance with the substance of thecontractual arrangement. Interest, dividends, gains and losses relating to a financial instrument ora component that is a financial liability, are reported as expense or income. Distributions toholders of financial instruments classified as equity are charged directly to equity, net of anyrelated income tax benefits.
As of December 31, 2012 and 2011, the Group has no financial assets at FVPL and HTMinvestments. Financial liabilities at FVPL of the Group include derivative liability as ofDecember 31, 2011 and nil as of December 31, 2012.
Determination of fair valueThe fair value of financial instruments traded in active markets at the balance sheet date is basedon the quoted market price or dealer price quotations (bid price for long positions and ask priceforshort positions), without any deduction for transaction costs. When current bid and asking pricesare not available, the price of the most recent transaction provides evidence of current fair valueas long as there has not been a significant change in economic circumstances since the time oftransaction.
For all other financial instruments not listed in an active market, the fair value is determined byusing appropriate valuation methodologies. Valuation methodologies include net present valuetechniques, comparison to similar instruments for which market observable prices exist, optionspricing models and other relevant valuation models.
Fair value measurements are disclosed by source of inputs using a three-level hierarchy for eachclass of financial instrument. Fair value measurement under Level 1 is based on quoted prices inactive markets for identical financial assets or financial liabilities; Level 2 is based on inputs otherthan quoted prices included within Level 1 that are observable for the financial asset or financialliability, either directly or indirectly; and Level 3 is based on inputs for the financial asset orfinancial liability that are not based on observable market data.
Day 1 differenceWhere the transaction price in a non-active market is different from the fair value from otherobservable current market transactions in the same instrument or based on a valuation techniquewhose variables include only data from observable market, the Group recognizes the differencebetween the transaction price and fair value (a Day 1 difference) in the consolidated statement ofincome unless it qualifies for the recognition as some other type of asset. In cases where use ismade of data which is not observable, the difference between the transaction price and modelvalue is only recognized in the consolidated statement of income when the inputs becomeobservable or when the instrument is derecognized. For each transaction, the Group determinesthe appropriate method of recognizing the Day 1 difference amount.
Loans and receivablesLoans and receivables are nonderivative financial assets with fixed or determinable payments thatare not quoted in an active market. They arise when the Group provides money, goods or servicesdirectly to a debtor with no intention of trading the receivables. After initial measurement, loansand receivables are subsequently carried at cost or amortized cost using the effective interestmethod less any allowance for impairment. Gains and losses are recognized in the consolidatedstatement of income when the loans and receivables are derecognized or impaired, as well asthrough the amortization process. Loans and receivables are classified as current assets ifmaturity is within 12 months from the balance sheet date or the normal operating cycle,whichever is longer. Otherwise, these are classified as noncurrent assets.
As of December 31, 2012 and 2011, the Group’s loans and receivables include cash in banks andcash equivalents, accounts receivable, advances to related parties and other current assets.
AFS financial assetsAFS financial assets are non-derivative financial assets that are designated as AFS or are notclassified in any of the three other categories. The Group designates financial instruments as AFSfinancial assets if they are purchased and held indefinitely and may be sold in response toliquidity requirements or changes in market conditions. After initial recognition, AFS financialassets are measured at fair value with unrealized gains or losses being recognized in theconsolidated statement of comprehensive income as “Net changes in fair value of AFS financialassets”. When the financial asset is disposed of, the cumulative gain or loss previously recordedin the consolidated statement of comprehensive income is recognized in the consolidatedstatement of income. Interest earned on the investments is reported as interest income using theeffective interest method. Dividends earned on financial assets are recognized in the consolidatedstatement of income as “Dividend income” when the right of payment has been established. TheGroup considers several factors in making a decision on the eventual disposal of the investments.The major factor of this decision is whether or not the Group will experience inevitable furtherlosses on investments. These financial assets are classified as noncurrent unless there is intentionto dispose of such assets within 12 months of the balance sheet date.
AFS financial assets in unquoted equity securities are carried at historical cost, net of impairment.
As of December 31, 2012 and 2011, the Group’s AFS financial assets include investments inunquoted redeemable preferred and common shares, and quoted common and golf club shares.
Other financial liabilitiesThis category pertains to financial liabilities that are not held for trading or not designated as atFVPL upon the inception of the liability. These include liabilities arising from operations orborrowings (e.g., payables, accruals).

The financial liabilities are initially recognized at fair value and are subsequently carried atamortized cost, taking into account the impact of applying the effective interest method ofamortization (or accretion) for any related premium, discount and any directly attributabletransaction costs.
Financial liabilities are classified as current, except for maturities greater than twelve monthsafter the balance sheet date. These are classified as noncurrent liabilities.
As of December 31, 2012 and 2011, the Group’s other financial liabilities include bank loans,accounts payable and accrued liabilities, customers’ deposits, long-term debts and obligations,including current maturities, and advances from related parties.
DerivativesDerivative financial instruments (swaps and option contracts to economically hedge exposure tofluctuations in interest rates) are initially recognized at fair value on the date on which aderivative contract is entered into and are subsequently remeasured at fair value. Derivatives arecarried as assets when the fair value is positive and as liabilities when the fair value is negative.
Derivatives are accounted for as at FVPL, where any gains or losses arising from changes in fairvalue on derivatives are taken directly to consolidated statement of income for the year, unless thetransaction is a designated and effective hedging instrument.
Impairment of Financial AssetsThe Group assesses at each balance sheet date whether a financial asset or group of financialassets is impaired.
Loans and receivablesThe Group first assesses whether objective evidence of impairment exists individually forfinancial assets that are individually significant or collectively for financial assets that are notindividually significant. Objective evidence includes observable data that comes to the attentionof the Group about loss events such as but not limited to significant financial difficulty of thecounterparty, a breach of contract, such as a default or delinquency in interest or principalpayments, probability that the borrower will enter bankruptcy or other financial reorganization.
If there is objective evidence that an impairment loss on loans and receivables carried atamortized cost has been incurred, the amount of loss is measured as a difference between theasset’s carrying amount and the present value of estimated future cash flows (excluding futurecredit losses that have not been incurred) discounted at the financial asset’s original effectiveinterest rate(i.e., the effective interest rate computed at initial recognition). The carrying amount of the assetshall be reduced through the use of an allowance account. The amount of impairment loss isrecognized in the consolidated statement of income. Interest income continues to be accrued onthe reduced carrying amount based on the original effective interest rate of the asset.
If it is determined that no objective evidence of impairment exists for an individually assessedfinancial asset, whether significant or not, the asset is included in the group of financial assetswith similar credit risk and characteristics and that group of financial assets is collectivelyassessed for impairment. Assets that are individually assessed for impairment and for which animpairment loss is or continues to be recognized are not included in a collective assessment ofimpairment.
Loans and receivables, together with the related allowance, are written off when there is no realisticprospect of future recovery and all collateral has been realized. If, in subsequent period, the
amount of the impairment loss decreases and the decrease can be related objectively to an eventoccurring after the impairment was recognized, the previously recognized impairment loss isreversed. Any subsequent reversal of an impairment loss is recognized in the consolidatedstatement of income, to the extent that the carrying value of the asset does not exceed itsamortized cost at the reversal date.
In relation to receivables, a provision for impairment is made when there is objective evidence(such as the probability of insolvency or significant financial difficulties of the debtor) that theGroup will not be able to collect all of the amounts due under the original terms of the invoice.The carrying amount of the receivable is reduced either directly or through the use of anallowance account. Impaired financial assets carried at amortized cost are derecognized whenthey are assessed as uncollectible either at a direct reduction of the carrying amount or throughuse of an allowance account when impairment has been previously recognized in the said amount.
AFS financial assetsFor AFS financial assets, the Group assesses at each balance sheet date whether there is objectiveevidence that a financial asset or group of financial assets is impaired. In case of equityinvestments classified as AFS financial assets, this would include a significant or prolongeddecline in the fair value of the investments below its cost. The determination of what is“significant” or “prolonged” requires judgment. The Group treats “significant” generally as 30%or more and “prolonged” as greater than 12 months for quoted equity securities. Where there isevidence of impairment, the cumulative loss measured as the difference between the acquisitioncost and the current fair value, less any impairment loss on that financial asset previouslyrecognized in the consolidated statement of income is removed from the consolidated statement ofcomprehensive income and recognized in the consolidated statement of income.
Impairment losses on equity investments are recognized in the consolidated statement of income.Increases in fair value after impairment are recognized directly in the consolidated statement ofcomprehensive income.
In the case of debt instruments classified as AFS financial assets, impairment is assessed based onthe same criteria as financial assets carried at amortized cost. Future interest income is based onthe reduced carrying amount and is accrued based on the rate of interest used to discount futurecash flows for the purpose of measuring impairment loss. Such accrual is recorded as part of“Interest income” account in the consolidated statement of income. If, in a subsequent year, thefair value of a debt instrument increases and that increase can be objectively related to an eventoccurring after the impairment loss was recognized in consolidated statement of income, theimpairment loss is reversed through the consolidated statement of income.
Derecognition of Financial Assets and Financial LiabilitiesFinancial assetA financial asset (or, where applicable, a part of a financial asset or part of a group of similarfinancial assets) is derecognized when:
the right to receive cash flows from the asset has expired; the Group retains the right to receive cash flows from the asset, but has assumed an obligation
to pay them in full without material delay to a third party under a “pass-through”arrangement; or
the Group has transferred its right to receive cash flows from the asset and either (a) hastransferred substantially all the risks and rewards of the asset, or (b) has neither transferred

nor retained substantially all the risks and rewards of the asset, but has transferred control ofthe asset.
Where the Group has transferred its right to receive cash flows from an asset or has entered into a“pass-through” arrangement, and has neither transferred nor retained substantially all the risks andrewards of the asset nor transferred control of the asset, the asset is recognized to the extent of theGroup’s continuing involvement in the asset. Continuing involvement that takes the form of aguarantee over the transferred asset is measured at the lower of the original carrying amount ofthe asset and the maximum amount of consideration that the Group could be required to repay.
Financial liabilityA financial liability is derecognized when the obligation under the liability is discharged,cancelled or has expired.
Where an existing financial liability is replaced by another from the same lender on substantiallydifferent terms, or the terms of an existing liability are substantially modified, such an exchangeor modification is treated as a derecognition of the original liability and the recognition of a newliability, and the difference in the respective carrying amounts is recognized in the consolidatedstatement of income.
Offsetting Financial InstrumentsFinancial assets and financial liabilities are offset and the net amount reported in the consolidatedbalance sheet if, and only if, there is a currently enforceable legal right to offset the recognizedamounts and there is an intention to settle on a net basis, or to realize the asset and settle theliability simultaneously. This is not generally the case with master netting agreements, and therelated assets and liabilities are presented gross in the consolidated balance sheet.
InventoriesInventories are valued at the lower of cost and net realizable value (NRV). Costs incurred inbringing the product to its present location and condition are accounted for as follows:
Finished goods and goods in process - determined using the weighted averagemethod; cost includes direct materials, directlabor and a proportion of manufacturingoverhead costs based on normal operatingcapacity
Raw materials, spare parts and supplies - purchase cost using the weighted averagemethod
NRV of finished goods and goods in process is the estimated selling price in the ordinary courseof business, less the estimated costs of completion and the estimated costs necessary to make thesale.
For goods in process, cost includes the applicable allocation of fixed and variable overhead costs.
For raw materials, NRV is the current replacement cost. In case of spare parts and supplies, NRVis the estimated realizable value of the inventories when disposed of at their condition at thebalance sheet date.
An allowance for inventory obsolescence is provided for slow-moving, obsolete, defective anddamaged inventories based on physical inspection and management evaluation.
Investment PropertiesInvestment properties consist of land and building and improvement that are not occupiedsubstantially for use by, or in the operations of the Company, nor for sale in the ordinary courseof business, but are held primarily to earn rental income and for capital appreciation.
Investment properties are measured initially at cost, including transaction costs. The carryingamount includes the cost of replacing part of an existing investment property at the time that costis incurred if the recognition criteria are met; and excludes the costs of day to day servicing of aninvestment property. Subsequent to initial recognition, investment properties, except for land, arecarried at cost less accumulated depreciation and any impairment losses.
Depreciation of investment properties is computed using the straight-line method over theestimated useful lives of the assets.
Depreciation ceases at the earlier of the date the item is classified as held for sale (or included in adisposal group that is classified as held for sale) in accordance with PFRS 5, Noncurrent AssetsHeld for Sale and Discontinued Operations, and the date the investment property is derecognized.
The estimated useful lives and depreciation method are reviewed periodically to ensure that theperiods and method of depreciation are consistent with the expected pattern of economic benefitsfrom items of investment properties.
Investment properties are derecognized from the accounts when they have been either disposed ofor when the investment properties are permanently withdrawn from use and no future economicbenefits are expected from its disposal. Any gains or losses on the retirement or disposal ofinvestment properties are recognized in the statement of income in the year of retirement ordisposal.
Transfers are made to or from investment property only when there is a change in use. For atransfer from investment property to owner occupied property, the deemed cost for subsequentaccounting is the fair value at the date of change in use. If owner occupied property becomes aninvestment property, the Group accounts for such property in accordance with the policy statedunder property and equipment up to the date of change in use.
Property, Plant and EquipmentProperty, plant and equipment, except land, are stated at cost less accumulated depreciation andamortization, and any impairment in value.
Land is stated at appraised value based on a valuation performed by an independent firm ofappraisers. The increase in the valuation of land is credited to “Revaluation increment on land”account, net of deferred income tax effect, and presented under the equity section of theconsolidated balance sheet.
Revaluation of land is made so that the carrying amount does not differ materially from thatwhich would be determined using the fair value at the balance sheet date. For subsequentrevaluations, any resulting increase in the assets’ carrying amount as a result of the revaluation iscredited to “Revaluation increment on land” account, net of deferred income tax effect, in theconsolidated statement of comprehensive income. Any resulting decrease is directly chargedagainst any related revaluation increment to the extent that the decrease does not exceed theamount of the revaluation increment in respect of the same assets.
The initial cost of items of property, plant and equipment consists of its purchase price, includingimport duties and any directly attributable costs of bringing the asset to its working condition andlocation for its intended use. Expenditures incurred after the fixed assets have been put intooperation, such as repairs and maintenance and overhaul costs, are normally charged to theconsolidated statement of income in the period the costs are incurred. In situations where it canbe clearly demonstrated that the expenditures have resulted in an increase in the future economicbenefits expected to be obtained from the use of an item of property, plant and equipment beyondits originally assessed standard of performance, the expenditures are capitalized as an additionalcost of the item of property, plant and equipment.
Depreciation or amortization are computed on a straight-line basis over the estimated useful livesof the assets as follows:
Number of YearsLand improvements 5 to 20Silos, buildings and improvements 5 to 30Machinery and equipment 5 to 25Office furniture and fixtures 2 to 10Transportation and delivery equipment 5
Leasehold improvements are amortized over the life of the assets or the lease term, whichever isshorter.
Construction in progress are properties in the course of construction for production, rental oradministrative purposes, or for purposes not yet determined, which are carried at cost less anyrecognized impairment loss. These assets are not depreciated until such time that the relevantassets are completed and available for use.
Depreciation or amortization of an item of property, plant and equipment begins when it becomesavailable for use, i.e., when it is in the location and condition necessary for it to be capable ofoperating in the manner intended by management. Depreciation or amortization ceases at theearlier of the date that the item is classified as held for sale (or included in a disposal group that isclassified as held for sale) in accordance with PFRS 5, Noncurrent Assets Held for Sale andDiscontinued Operations, and the date the asset is derecognized.
The estimated useful lives and depreciation and amortization method are reviewed periodically toensure that the periods and method of depreciation and amortization are consistent with theexpected pattern of economic benefits from items of property, plant and equipment.
Fully depreciated assets are retained in the accounts until they are no longer in use and no furtherdepreciation is recognized in the consolidated statement of income. When assets are retired orotherwise disposed of, the cost and the related accumulated depreciation and amortization and anyimpairment in value are removed from the accounts and any resulting gain or loss is recognized inthe consolidated statement of income.
Borrowing CostsBorrowing costs are capitalized if they are directly attributable to the acquisition, construction orproduction of a qualifying asset. Capitalization of borrowing costs commences when the activitiesto prepare the asset are in progress and expenditures and borrowing costs are being incurred.Borrowing costs are capitalized until the assets are substantially ready for their intended use. If

the resulting carrying amount of the asset exceeds its recoverable amount, an impairment loss isrecorded. Borrowing costs include interest charges and other costs incurred in connection withthe borrowing of funds.
Other borrowing costs are recognized as expense in the period in which they are incurred.
Investment in an AssociateInvestment in an associate is accounted for under the equity method of accounting. An associateis an entity in which the Group has significant influence and which is neither a subsidiary nor ajoint venture of the Group. As of December 31, 2012 and 2011, the Group has a 35% interest inSelecta Walls Land Corporation (SWLC) accounted for under the equity method.
In 2011, the Parent Company sold its 30% interest in Philstar Global Corporation (Philstar) with acarrying value of P=16.28 million. Total cash consideration for the sale amounted to P=36.00million resulting to a gain of P=19.72 million (see Note 12).
Under the equity method, such investment in an associate is carried in the consolidated balancesheet at cost plus post-acquisition changes in the Group’s share in the net assets of the associate.Goodwill relating to an associate is included in the carrying amount of the investment and is notamortized. The consolidated statement of income reflects the Group’s share of the results ofoperations of the associate. Where there has been a change recognized directly in the equity ofthe associate, the Group recognizes its share of any changes, and discloses this when applicable,in the details of the changes in equity. After application of the equity method, the Groupdetermines whether it is necessary to recognize any additional impairment loss with respect to theGroup’s investment in the associate. Unrealized gains and losses resulting from transactionsbetween the Group and the associate are eliminated to the extent of the interest in the associate.
Interest in a Joint VentureThe interest in a 50%-owned joint venture, Unilever RFM Ice Cream, Inc. (URICI), is accountedfor using the proportionate consolidation method, which involves consolidating a proportionateshare of the joint venture’s assets, liabilities, income and expenses with similar items in theconsolidated financial statements on a line-by-line basis. The financial statements of the jointventure are prepared for the same reporting period as the Parent Company.
Adjustments are made in the Group’s consolidated financial statements to eliminate the Group’sshare of intragroup balances, income and expenses and unrealized gains and losses ontransactions between the Group and its jointly controlled entity to the extent of its share in interestin joint venture. Losses on transactions are recognized immediately if the loss provides evidenceof a reduction in the net realizable value of the current assets or an impairment loss. The jointventure is proportionately consolidated until the date on which the Group ceases to have jointcontrol over the joint venture.
Impairment of Noncurrent Non-financial AssetsThe carrying values of property, plant and equipment, and investment in an associate are reviewedfor impairment when events or changes in circumstances indicate that the carrying values may notbe recoverable. If any such indication exists and where the carrying value exceeds the estimatedrecoverable amount, the asset or CGU is written down to their recoverable amount. Therecoverable amount of the noncurrent non-financial assets is the greater of fair value less cost tosell and value-in-use. The fair value less cost to sell is the amount obtainable from the sale of anasset in an arm’s length transaction. In assessing value-in-use, the estimated future cash flows arediscounted to their present value using a pre-tax discount rate that reflects current market

assessments of the time value of money and the risks specific to the asset. For an asset that doesnot generate largely independent cash inflows, the recoverable amount is determined for the CGUto which the asset belongs. Impairment losses, if any, are recognized in the consolidatedstatement of income in those expense categories consistent with the function of the impairedasset.
Previously recognized impairment loss is reversed only if there has been a change in theassumptions used to determine the recoverable amount of an asset, but not, however, to an amounthigher than the carrying amount that would have been determined (net of any depreciation andamortization) had there been no impairment loss recognized for the asset in prior years. Areversal of an impairment loss is recognized in the consolidated statement of income.
Capital StockCapital stock is stated at par value for all shares issued and outstanding. When the ParentCompany issues more than one class of stock, a separate account is maintained for each class ofstock and the number of shares issued.
When the shares are sold at a premium, the difference between the proceeds and the par value iscredited to the “Capital in excess of par value” account. When shares are issued for aconsideration other than cash, the proceeds are measured by the fair value of the considerationreceived. In case shares are issued to extinguish or to settle the liability of the Parent Company,the share shall be measured at either the fair value of the shares issued or fair value of the liabilitysettled, whichever is more reliably determinable.
Direct costs incurred related to equity issuance, such as underwriting, accounting and legal fees,printing costs and taxes are charged to the “Capital in excess of par value” account.
Equity ReserveEquity reserve is the difference between the acquisition cost of an entity under common controland the Parent Company’s proportionate share in the net assets of the entity acquired as a result ofa business combination accounted for using the pooling-of-interests method. Equity reserve isderecognized when the subsidiary is deconsolidated, which is the date on which control ceases.
Share-based Compensation PlanURICI, through Unilever Philippines, Inc., operates equity-settled, share-based compensationplans. The fair value of the employee services received in exchange for the grant of the options isrecognized as an expense. The total amount to be expensed over the vesting period is determinedby reference to the fair value of the options granted and including any market performanceconditions, excluding the impact of any service and non-market performance vesting conditions(e.g. profitability, sales growth targets, employee of the entity remaining over a specified timeperiod, etc.) and impact of any non-vesting conditions (e.g. the requirement for employees toserve).
Non-market vesting conditions are included in the assumptions on the number of options that areexpected to vest. The total expense is recognized over the vesting period, which is the period overwhich all of the specified vesting conditions are to be satisfied. At the end of each reportingperiod, the entity revises its estimates of the number of options that are expected to vest based onthe non-market vesting conditions. It recognizes the impact of the revision to original estimates, ifany, in profit or loss, with a corresponding adjustment to equity.
When the options are exercised, URICI issues new shares. The proceeds received, net of anydirectly attributable transaction costs, are credited to share capital (nominal value) and sharepremium when the options are exercised.The grant of options over its equity instruments to the employees of URICI is treated as a capitalcontribution.
Retained EarningsRetained earnings represent the cumulative balance of periodic net income or loss, dividendcontributions, correction of prior year errors, effect of changes in accounting policy and othercapital adjustments. When the retained earnings account has a debit balance, it is called “deficit.”A deficit is not an asset but a deduction from equity.
Unappropriated retained earnings represent that portion which is free and can be declared asdividends to stockholders. Appropriated retained earnings represent that portion which has beenrestricted and, therefore, not available for dividend declaration.
Dividends on Common SharesCash and property dividends on common shares are recognized as liability and deducted fromequity when approved by the BOD of the Company. Stock dividends are treated as transfers fromretained earnings to common shares.
Dividends for the year that are approved after the balance sheet date are dealt with as an eventafter the balance sheet date.
Revenue RecognitionRevenue from sale of goods and services from manufacturing and service operations is recognizedto the extent that it is probable that the economic benefits will flow to the Group and the amountof revenue can be reliably measured. Revenue is measured at the fair value of the considerationreceived or receivable excluding value-added tax (VAT), returns and discounts. The Groupassesses its revenue arrangements against specific criteria in order to determine if it is acting asprincipal or an agent. The Group has concluded that it is acting as a principal in all of its revenuearrangements, except for RIBI, an insurance broker, which acts as an agent. The followingspecific recognition criteria must also be met before revenue is recognized.
Sale of goods (Manufacturing)Revenue is recognized, net of applicable discounts, when the significant risks and rewards ofownership of the goods have passed to the buyer and there is actual delivery made and the same isaccepted by the buyer.
Sale of services (Service)Revenue is recognized upon performance of services in accordance with the substance of therelevant agreements.
RentRent income is recognized on a straight-line basis over the terms of the lease.
Interest and financing incomeInterest income is recognized as the interest accrues using the effective interest method.
Dividend incomeDividend income on investments in shares of stock is recognized when the Group’s right toreceive the payment is established, which is the date when the dividend declaration is approved bythe investee’s BOD and/or the stockholders.

Cost and Expense RecognitionCost of sales and servicesCost of sales is recognized when goods are delivered to and accepted by the buyer. Cost ofservices is recognized when the related services are performed.
Selling and marketing, and general and administrative expensesSelling and marketing expenses are costs incurred to sell or distribute the goods. It includesexport and documentation processing and delivery, among others. General and administrativeexpenses constitute costs of administering the business. Selling and marketing, and general andadministrative expenses are expensed as incurred.
Other Comprehensive Income (Loss)Other comprehensive income (loss) comprises items of income and expense (including itemspreviously presented under the consolidated statement of changes in equity) that are notrecognized in the consolidated statement of income for the year in accordance with PFRS.
Pension BenefitsThe Group has defined benefit pension plans covering all permanent, regular, full-time employeesadministered by trustee banks. The cost of providing benefits under the defined benefit plans isdetermined using the projected unit credit actuarial valuation method. Actuarial gains and lossesarising from experience adjustment and change in actuarial assumptions are reported in retainedearnings in the period they are recognized as other comprehensive income.
The past service cost is recognized as an expense on a straight-line basis over the average perioduntil the benefits become vested. If the benefits are already vested, immediately following theintroduction of, or changes to, a pension plan, past service cost is recognized immediately. Gainsor losses on the curtailment or settlement of pension benefits are recognized when the curtailmentor settlement occurs.
The net pension obligation is the aggregate of the present value of the defined benefit obligationless past service cost not yet recognized and the fair value of plan assets out of which theobligation is to be settled directly.
LeasesFinance leases, which transfer to the Group substantially all the risks and rewards incidental toownership of the leased item, are capitalized at the inception of the lease at the fair value of theleased property or, if lower, at the present value of the minimum lease payments. Lease paymentsare apportioned between the finance charges and reduction of the lease liability so as to achieve aconstant rate of interest on the remaining balance of the liability. Finance charges are recognizedin the consolidated statement of income.
Capitalized leased assets are depreciated over the shorter of the estimated useful lives of theassets or the respective lease terms.
Leases where lessors retain substantially all the risks and benefits of ownership of the asset areclassified as operating leases. Operating leases are recognized as expense in the consolidatedstatement of income on a straight-line basis over the lease term.
Income TaxesCurrent income taxCurrent income tax assets and liabilities for the current and prior periods are measured at theamount expected to be recovered from or paid to the taxation authorities. The tax rates and taxlaws used as basis to compute the amount are those that have been enacted or substantivelyenacted at the balance sheet date.
Deferred income taxDeferred income tax is provided, using the balance sheet liability method, on all temporarydifferences at the balance sheet date between the tax bases of assets and liabilities and theircarrying amounts for financial reporting purposes.
Deferred income tax liabilities are recognized for all taxable temporary differences. Deferredincome tax assets are recognized for all deductible temporary differences and carryforwardbenefits of unused tax credit from excess of minimum corporate income tax (MCIT) over regularcorporate income tax (RCIT) [excess MCIT], and unused net operating loss carryover (NOLCO),to the extent that it is probable that sufficient future taxable profits will be available against whichthe deductible temporary differences and carryforward benefits of unused excess MCIT andNOLCO can be utilized.
The carrying amount of deferred income tax assets is reviewed at each balance sheet date andreduced to the extent that it is no longer probable that sufficient future taxable profits will beavailable to allow all or part of the deferred income tax assets to be utilized. Unrecognizeddeferred income tax assets are reassessed at each balance sheet date and are recognized to theextent that it has become probable that sufficient future taxable profits will allow the deferredincome tax asset to be recovered.
Deferred income tax assets and deferred income tax liabilities are measured at the tax rates thatare expected to apply to the year when the asset is realized or the liability is settled, based on taxrates and tax laws that have been enacted or substantively enacted at the balance sheet date.
Deferred income tax assets and deferred income tax liabilities are offset, if a legally enforceableright exists to offset current income tax assets against current income tax liabilities and thedeferred income taxes relate to the same taxable entity and the same taxation authority.
Deferred income tax relating to items recognized directly in equity is recognized in the statementof comprehensive income. Deferred tax items are recognized in correlation to the underlyingtransaction either in other comprehensive income or directly in equity.
Earnings Per ShareBasic earnings per share is computed by dividing the net income for the year by the weightedaverage number of common shares outstanding during the year after giving retroactive effect toany stock split or stock dividends declared and stock rights exercised during the year, if any.
The Group does not have potentially dilutive common shares.
Segment ReportingThe Group’s operating businesses are organized and managed separately according to the natureof the products provided, with each segment representing a strategic business unit that offersdifferent products and serves different markets.

Foreign Currency-Denominated Transactions and TranslationsTransactions in foreign currencies are recorded using the functional currency exchange rate at thedate of the transaction. Outstanding monetary assets and liabilities denominated in foreigncurrencies are translated using the closing exchange rate at the balance sheet date. All differencesare taken to the consolidated statement of income. Non-monetary items that are measured interms of historical cost in a foreign currency are translated using the exchange rates as at the datesof the initial transactions.
When a gain or loss on a non-monetary item is recognized in other comprehensive income, anyforeign exchange component of that gain or loss shall be recognized in the Parent Companystatement of comprehensive income. Conversely, when a gain or loss on a non-monetary item isrecognized in the profit or loss, any exchange component of that gain or loss shall be recognizedin the Parent Company statement of income.
Provisions and ContingenciesProvisions are recognized when the Group has a present obligation (legal or constructive) as aresult of a past event, it is probable (i.e., more likely than not) that an outflow of resourcesembodying economic benefits will be required to settle the obligation, and a reliable estimate canbe made of the amount of the obligation. Where the Group expects some or all of the provision tobe reimbursed, the reimbursement is recognized as a separate asset, but only when thereimbursement is virtually certain. The expense relating to any provision is presented in theconsolidated statement of income, net of reimbursement. If the effect of the time value of moneyis material, provisions are discounted using the current pre-tax rate that reflects, whereappropriate, the risks specific to the liability. Where discounting is used, the increase in theprovision due to the passage of time is recognized as interest expense.
Contingent liabilities are not recognized in the consolidated financial statements but are disclosedin the notes to consolidated financial statements unless the outflow of resources embodyingeconomic benefits is remote. Contingent assets are not recognized in the consolidated financialstatements but disclosed in the notes to consolidated financial statements when an inflow ofeconomic benefits is probable.
Events After the Balance Sheet DateEvents after the balance sheet date that provide additional information about the Group’s positionat the balance sheet date (adjusting events) are reflected in the consolidated financial statements.Events after the balance sheet date that are not adjusting events are disclosed in the notes to theconsolidated financial statements when material.
Future Changes in Accounting Policies
The Group will adopt the following standards and interpretations when these become effective.Except as otherwise indicated, the Group does not expect the adoption of these new and amendedPFRS, PAS and Philippine Interpretations based on International Financial ReportingInterpretations Committee (IFRIC) interpretations to have significant impact on its financialstatements:
Effective in 2013
PFRS 7, Financial Instruments: Disclosures - Offsetting Financial Assets and FinancialLiabilities, requires an entity to disclose information about rights of set-off and relatedarrangements (such as collateral agreements). The new disclosures are required for allrecognized financial instruments that are set off in accordance with PAS 32. These

disclosures also apply to recognized financial instruments that are subject to an enforceablemaster netting arrangement or “similar agreement”, irrespective of whether they are set-off inaccordance with PAS 32. The amendments require entities to disclose, in a tabular formatunless another format is more appropriate, the following minimum quantitative information.This is presented separately for financial assets and financial liabilities recognized at the endof the reporting period:
a. The gross amounts of those recognized financial assets and recognized financialliabilities;
b. The amounts that are set off in accordance with the criteria in PAS 32 when determiningthe net amounts presented in the balance sheet;
c. The net amounts presented in the balance sheet;d. The amounts subject to an enforceable master netting arrangement or similar agreement
that are not otherwise included in (b) above, including:i. Amounts related to recognized financial instruments that do not meet some or all of
the offsetting criteria in PAS 32; and,ii. Amounts related to financial collateral (including cash collateral); and,
e. The net amount after deducting the amounts in (d) from the amounts in (c) above.
The amendments to PFRS 7 are to be retrospectively applied for annual periods beginning onor after January 1, 2013. The amendments affect disclosures only and have no impact on theGroup’s financial position or performance.
PFRS 10, Consolidated Financial Statements, replaces the portion of PAS 27, Consolidatedand Separate Financial Statements, that addresses the accounting for consolidated financialstatements. It also includes the issues raised in Standards Interpretations Committee (SIC) 12,Consolidation - Special Purpose Entities. PFRS 10 establishes a single control model thatapplies to all entities including special purpose entities. The changes introduced by PFRS 10will require management to exercise significant judgment to determine which entities arecontrolled, and therefore, are required to be consolidated by a parent, compared with therequirements that were in PAS 27.
A reassessment of control was performed by the Parent Company on all its subsidiaries inaccordance with the provisions of PFRS 10. Following the reassessment, the Parent Companydetermined that it has control on all of its subsidiaries currently being consolidated to itsconsolidated financial statements. Such, the Parent Company will continue to include thosesubsidiaries in its consolidated financial statements.
PFRS 11, Joint Arrangements, replaces PAS 31, Interests in Joint Ventures, and SIC 13,Jointly Controlled Entities - Non-Monetary Contributions by Venturers. PFRS 11 removesthe option to account for jointly controlled entities using proportionate consolidation.Instead, jointly controlled entities that meet the definition of a joint venture must beaccounted for using the equity method.
The Parent Company has an existing joint venture arrangement with a domestic entity thatfalls within the scope of this standard. Currently, proportionate consolidation is applied forthis joint venture.
On November 22, 2012, the Parent Company was granted by the Philippine SEC anexemptive relief on the adoption of this standard given the peculiarities of its arrangementwith the other joint venturer. Such, the Parent Company will continue to consolidateproportionately the said joint venture in 2013 when this PFRS becomes effective.

PFRS 12, Disclosure of Interests in Other Entities, includes all of the disclosures related toconsolidated financial statements that were previously in PAS 27, as well as all thedisclosures that were previously included in PAS 31 and PAS 28, Investments in Associates.These disclosures relate to an entity’s interests in subsidiaries, joint arrangements, associatesand structured entities. A number of new disclosures are also required. The adoption ofPFRS 12 will affect disclosures only and have no impact on the Group’s financial position orperformance.
PFRS 13, Fair Value Measurement, establishes a single source of guidance under PFRS forall fair value measurements. PFRS 13 does not change when an entity is required to use fairvalue, but rather provides guidance on how to measure fair value under PFRS when fair valueis required or permitted. This standard should be applied prospectively as of the beginning ofthe annual period in which it is initially applied. Its disclosure requirements need not beapplied in comparative information provided for periods before initial application of PFRS13. The Group does not anticipate that the adoption of this standard will have a significantimpact on its financial position and performance.
PAS 1, Presentation of Financial Statements - Presentation of Items of Other ComprehensiveIncome or OCI (Amendments), changes the grouping of items presented in OCI. Items thatcan be reclassified (or “recycled”) to profit or loss at a future point in time (for example, uponderecognition or settlement) will be presented separately from items that will never berecycled. The amendments will be applied retrospectively and will result to the modificationof the presentation of items of OCI.
PAS 19, Employee Benefits (Revised), ranges from fundamental changes such as removing thecorridor mechanism and the concept of expected returns on plan assets to simple clarificationsand rewording. The revised standard also requires new disclosures such as, among others, asensitivity analysis for each significant actuarial assumption, information on asset-liabilitymatching strategies, duration of the defined benefit obligation, and disaggregation of planassets by nature and risk. Once effective, the Group has to apply the amendmentsretroactively to the earliest period presented.
The Parent Company reviewed its existing employee benefits and determined that theamended standard has significant impact on its accounting for retirement benefits. The ParentCompany obtained the services of an external actuary to compute the impact to the financialstatements upon adoption of the standard. The effects are detailed below:
Increase (decrease) in:Statement of Comprehensive Income 2012 2011Net pension benefit cost P=9,645 P=4,541Net income for the year (9,645) (4,541)Other comprehensive income 9,645 4,541

PAS 27, Separate Financial Statements (as revised in 2011), limits its contents to accountingfor subsidiaries, jointly controlled entities, and associates in separate financial statements as aconsequence of the new PFRS 10 and PFRS 12. This amendment has no impact on theGroup’s financial position or performance.
PAS 28, Investments in Associates and Joint Ventures (as revised in 2011), renames PAS 28as PAS 28, Investments in Associates and Joint Ventures, as a consequence of the newPFRS 11 and PFRS 12. It describes the application of the equity method to investments injoint ventures in addition to associates. The Group is already applying the equity method inaccounting its investment in an associate.
Philippine Interpretation IFRIC 20, Stripping Costs in the Production Phase of a SurfaceMine, applies to waste removal (stripping) costs incurred in surface mining activity, duringthe production phase of the mine. The interpretation addresses the accounting for the benefitfrom the stripping activity. This new interpretation is not relevant to the Group.
Effective in 2014
PAS 32, Financial Instruments: Presentation - Offsetting Financial Assets and FinancialLiabilities (Amendments), clarify the meaning of “currently has a legally enforceable right toset-off” and also clarify the application of the PAS 32 offsetting criteria to settlement systems(such as central clearing house systems) which apply gross settlement mechanisms that arenot simultaneous. The amendments affect presentation only and have no impact on theGroup’s financial position or performance. The amendments to PAS 32 are to beretrospectively applied for annual periods beginning on or after January 1, 2014.
Effective in 2015
PFRS 9, Financial Instruments: Classification and Measurement, as issued, reflects the firstphase on the replacement of PAS 39, Financial Instruments: Recognition and Measurement,and applies to the classification and measurement of financial assets and liabilities as definedin PAS 39. Work on impairment of financial instruments and hedge accounting is stillongoing, with a view to replacing PAS 39 in its entirety. PFRS 9 requires all financial assetsto be measured at fair value at initial recognition. A debt financial asset may, if the fair valueoption (FVO) is not invoked, be subsequently measured at amortized cost if it is held within abusiness model that has the objective to hold the assets to collect the contractual cash flowsand its contractual terms give rise, on specified dates, to cash flows that are solely paymentsof principal and interest on the principal outstanding. All other debt instruments aresubsequently measured at fair value through profit or loss. All equity financial assets aremeasured at fair value either through other comprehensive income (OCI) or profit or loss.Equity financial assets held for trading must be measured at fair value through profit or loss.For FVO liabilities, the amount of change in the fair value of a liability that is attributable tochanges in credit risk must be presented in OCI. The remainder of the change in fair value ispresented in profit or loss, unless presentation of the fair value change in respect of theliability’s credit risk in OCI would create or enlarge an accounting mismatch in profit or loss.All other PAS 39 classification and measurement requirements for financial liabilities havebeen carried forward into PFRS 9, including the embedded derivative separation rules and thecriteria for using the FVO. The adoption of the first phase of PFRS 9 will have an effect onthe classification and measurement of the Group’s financial assets, but will potentially haveno impact on the classification and measurement of financial liabilities. The Group is in theprocess of determining the impact of this standard on its financial position or performance.

Deferred by SEC
Philippine Interpretation IFRIC 15, Agreements for the Construction of Real Estate, coversaccounting for revenue and associated expenses by entities that undertake the construction ofreal estate directly or through subcontractors. The interpretation requires that revenue onconstruction of real estate be recognized only upon completion, except when such contractqualifies as construction contract to be accounted for under PAS 11 or involves rendering ofservices in which case revenue is recognized based on stage of completion. Contractsinvolving provision of services with the construction materials and where the risks and rewardof ownership are transferred to the buyer on a continuous basis will also be accounted forbased on stage of completion. The SEC and the Financial Reporting Standards Council(FRSC) have deferred the effectivity of this interpretation until the final Revenue standard isissued by the International Accounting Standards Board (IASB) and an evaluation of therequirements of the final Revenue standard against the practices of the Philippine real estateindustry is completed. This interpretation is not relevant to the Group.
Annual Improvements to PFRS (2009-2011 cycle)The Annual Improvements to PFRS (2009-2011 cycle) contain non-urgent but necessaryamendments to PFRS. The amendments are effective for annual periods beginning on or afterJanuary 1, 2013 and are applied retrospectively. Earlier application is permitted.
PFRS 1, First-time Adoption of PFRS - Borrowing Costs, clarifies that, upon adoption ofPFRS, an entity that capitalized borrowing costs in accordance with its previous generallyaccepted accounting principles, may carry forward, without any adjustment, the amountpreviously capitalized in its opening statement of financial position at the date of transition.Subsequent to the adoption of PFRS, borrowing costs are recognized in accordance withPAS 23, Borrowing Costs.
PAS 1, Presentation of Financial Statements - Clarification of the Requirements forComparative Information, clarifies the requirements for comparative information that aredisclosed voluntarily and those that are mandatory due to retrospective application of anaccounting policy, or retrospective restatement or reclassification of items in the financialstatements. An entity must include comparative information in the related notes to thefinancial statements when it voluntarily provides comparative information beyond theminimum required comparative period. The additional comparative period does not need tocontain a complete set of financial statements. On the other hand, supporting notes for thethird balance sheet (mandatory when there is a retrospective application of an accountingpolicy, or retrospective restatement or reclassification of items in the financial statements) arenot required.
PAS 16, Property, Plant and Equipment - Classification of Servicing Equipment, clarifies thatspare parts, stand-by equipment and servicing equipment should be recognized as property,plant and equipment when they meet the definition of property, plant and equipment andshould be recognized as inventory, if otherwise.
PAS 32, Financial Instruments: Presentation - Tax Effect of Distribution to Holders ofEquity Instruments, clarifies that income taxes relating to distributions to equity holders andto transaction costs of an equity transaction are accounted for in accordance with PAS 12,Income Taxes.
PAS 34, Interim Financial Reporting - Interim Financial Reporting and Segment Informationfor Total Assets and Liabilities, clarifies that the total assets and liabilities for a particularreportable segment need to be disclosed only when the amounts are regularly provided to thechief operating decision maker and there has been a material change from the amountdisclosed in the entity’s previous annual financial statements for that reportable segment.
The Group continues to assess the impact of the above new and amended accounting standardsand interpretations effective subsequent to the December 31, 2012 financial statements.Additional disclosures required by these amendments will be included in the financial statementswhen these amendments are adopted.
3. Management’s Use of Significant Judgments, Accounting Estimates and Assumptions
The preparation of the Group’s consolidated financial statements requires management to exercisejudgments, make accounting estimates and use assumptions that affect the amounts reported andthe disclosures made. The estimates and assumptions used in the consolidated financialstatements are based upon management’s evaluation of relevant facts and circumstances as of thedate of the financial statements. Actual results could differ from these estimates, and suchestimates will be adjusted accordingly, when the effects become determinable.
Accounting judgments, estimates and assumptions are continually evaluated and are based onhistorical experience and other factors, including expectations of future events that are believed tobe reasonable under the circumstances.
JudgmentsIn the process of applying the Group’s accounting policies, management has made the followingjudgments apart from those involving estimations, which have the most significant effect in theamounts recognized in the consolidated financial statements.
Classification of financial instrumentsThe Group exercises judgment in classifying financial instruments in accordance with PAS 39.The Group classifies a financial instrument, or its component parts, on initial recognition as afinancial asset, a financial liability or an equity instrument in accordance with the substance of thecontractual arrangement and the definitions of a financial asset, a financial liability or an equityinstrument. The substance of a financial instrument, rather than its legal form, governs itsclassification in the consolidated balance sheet. Classification of financial instruments isreviewed at each balance sheet date.
The classifications of financial assets and liabilities are presented in Note 33.
Impairment of AFS financial assetsThe Group determines that AFS financial assets are impaired when there has been a significant orprolonged decline in the fair value below their cost. This determination of what is “significant”or “prolonged” requires judgment. The Group treats “significant” generally as 20% or more and“prolonged” as greater than 12 months for the quoted equity securities. Impairment may beappropriate when there is evidence of deterioration in the financial health of the investee, industryand sector performance, changes in technology, and operational and financing cash flows. As ofDecember 31, 2012 and 2011, AFS financial assets in equity securities amounted toP=329.71 million and P=946.62 million, respectively (see Note 12a).In 2012, in light of the changing business model of Philtown, the Group performed an impairmenttesting of its AFS financial assets in Philtown using the “Adjusted Net Asset Method”. In using
this method, the fair values of the assets and liabilities of Philtown were determined as ofimpairment testing date, December 31, 2012. The computed fair values of the total assets ofPhiltown were applied against the computed fair values of its total liabilities according to priorityand the residual assets were applied against the amount of the preferred and common shares heldby the Group. The Group determined that its AFS financial assets are impaired.
Impairment loss was recognized on its AFS financial assets amounting to P=545.86 million in2012. No impairment loss was recognized in 2011 and 2010 (see Note 12a).
Provisions and contingenciesThe estimate of the probable costs for the resolution of possible third party claims has beendeveloped in consultation with outside consultant/legal counsel handling the Group’s defense onthese matters and is based upon an analysis of potential results. When management and itsoutside consultant/legal counsel believe that the eventual liabilities under these and any otherclaims, if any, will not have a material effect on the consolidated financial statements, noprovision for probable losses is recognized in the Group’s consolidated financial statements. Theamount of provision is being reassessed at least on an annual basis to consider new relevantinformation.
Total provisions amounted to P=67.98 million and P=52.16 million as of December 31, 2012 and2011, respectively (see Notes 19 and 31d).
Determination of the classification of leasesThe Group has entered into various lease agreements as a lessee. The Group accounts for leasearrangements as finance lease when the lease term is for the major part of the life of the asset andthe Group has the option to purchase the asset at a price that is expected to be sufficiently lowerthan the fair value at the date the option is exercisable. Otherwise, the leases are accounted for asoperating leases.
Obligations under finance lease and aggregate minimum lease payments are disclosed underNote 18.
Accounting Estimates and AssumptionsThe key estimates and assumptions concerning the future and other key sources of estimation atthe balance sheet date that have a significant risk of causing a material adjustment to the carryingamount of assets and liabilities within the next financial year are discussed below.
Determination of fair value of financial instrumentsFinancial assets and financial liabilities, on initial recognition, are accounted for at fair value.The fair values of financial assets and financial liabilities, on initial recognition are normally thetransaction price. In the case of those financial assets that have no active markets, fair values aredetermined using an appropriate valuation technique. Valuation techniques are used particularlyfor financial assets and financial liabilities (including derivatives) that are not quoted in an activemarket. Where valuation techniques are used to determine fair values (discounted cash flow,option models), they are periodically reviewed by qualified personnel who are independent of thetrading function. All models are calibrated to ensure that outputs reflect actual data andcomparative market prices. To the extent practicable, models use only observable data asvaluation inputs. However, other inputs such as credit risk (whether that of the Group or thecounterparties), forward prices, volatilities and correlations, require management to developestimates or make adjustments to observable data of comparable instruments. The amount of

changes in fair values would differ if the Group uses different valuation assumptions or otheracceptable methodologies. Any change in fair value of these financial instruments (includingderivatives) would affect either the consolidated statement of income or comprehensive income.
The carrying values and the fair values of financial assets and financial liabilities as ofDecember 31, 2012 and 2011 are disclosed in Note 34.
Estimation of allowance for doubtful accountsThe Group maintains allowance for doubtful accounts based on the results of the individual andcollective assessments. Under the individual assessment, the Group is required to obtain thepresent value of estimated cash flows using the receivable’s original effective interest rate.Impairment loss is determined as the difference between the receivable’s carrying balance and thecomputed present value. If no future cash flows is expected, impairment loss is equal to thecarrying balance of the receivables. Factors considered in individual assessment are paymenthistory, inactive accounts, past due status and term. The collective assessment would require theGroup to classify its receivables based on the credit risk characteristics (customer type, paymenthistory, past due status and term) of the customers. Impairment loss is then determined based onhistorical loss experience of the receivables grouped per credit risk profile. Historical lossexperience is adjusted on the basis of current observable data to reflect the effects of currentconditions that did not affect the period on which the historical loss experience is based and toremove the effects of conditions in the historical period that do not exist currently. Themethodology and assumptions used for the individual and collective assessments are based onmanagement’s judgment and estimate. Therefore, the amount and timing of recorded expense forany period would differ depending on the judgments and estimates made during the year.
As of December 31, 2012 and 2011, the carrying value of accounts receivable amounted toP=2,587.68 million and P=1,904.87 million, respectively (see Note 7). As of December 31, 2012and 2011, advances to related parties amounted to P=89.25 million and P=211.97 million,respectively(see Note 26). The related allowance for doubtful accounts for both accounts amounted toP=894.03 million and P=1,590.37 million as of December 31, 2012 and 2011, respectively(see Notes 7, 26 and 33).
In 2012 and 2011, the Group wrote off P=736.43 million and P=62.15 million from its accountsreceivable and advances to related parties (Note 33).
Estimation of inventory obsolescenceThe Group estimates the allowance for inventory obsolescence related to inventories based on acertain percentage of non-moving inventories. The level of allowance is evaluated bymanagement based on past experiences and other factors affecting the salability of goods such aspresent demand in the market and emergence of new products, among others.
The Group’s allowance for inventory obsolescence amounted to P=151.37 million andP=159.35 million as of December 31, 2012 and 2011, respectively (see Note 8). As ofDecember 31, 2012 and 2011, the carrying values of inventories at cost amounted toP=1,557.82 million and P=1,425.51 million, respectively (see Note 8).
Determination of NRV of inventoriesThe Group’s estimates of the NRV of inventories are based on the most reliable evidence availableat the time the estimates are made, of the amount that the inventories are expected to be realized.These estimates consider the fluctuations of price or cost directly relating to events occurring afterthe end of the period to the extent that such events confirm conditions existing at the end of the
period. A new assessment is made at NRV in each subsequent period. When the circumstances thatpreviously caused inventories to be written down below cost no longer exist or when there is a clearevidence of an increase in NRV because of change in economic circumstances, the amount of thewrite-down is reversed so that the new carrying amount is the lower of the cost and the revisedNRV. The Group’s inventories stated at NRV amounted to P=231.23 million andP=179.71 million as of December 31, 2012 and 2011, respectively (see Note 8).
The Group’s inventories amounting to P=127.69 million and P=153.95 million as ofDecember 31, 2012 and 2011, respectively, were fully provided with allowance (see Note 8).
Estimation of allowance for probable lossesAllowance for probable losses of prepaid expenses is based on the ability of the Group to recoverthe carrying value of the assets. Accounts estimated to be potentially unrecoverable are providedwith adequate allowance through charges to the consolidated statement of income in the form ofallowance for probable loss.
The allowance for probable losses pertaining to prepaid expenses amounted to P=33.65 million asof December 31, 2012 and 2011 (see Note 9). Other current assets amounted to P=192.23 millionand P=340.27 million as of December 31, 2012 and 2011, respectively.
Estimation of useful lives of property, plant and equipment and investment propertiesThe Group estimates the useful lives of depreciable property, plant and equipment and investmentproperties based on a collective assessment of similar businesses, internal technical evaluationand experience with similar assets. Estimated useful lives are based on the periods over which theassets are expected to be available for use. The estimated useful lives are reviewed periodicallyand are updated if expectations differ from previous estimates due to physical wear and tear,technical and commercial obsolescence and legal or other limits on the use of the assets. It ispossible, however, that future results of operations could be materially affected by changes in theamounts and timing of recorded expenses brought about by changes in the factors mentionedabove. A reduction in the estimated useful life of any item of property, plant and equipment andinvestment properties would increase the recorded operating expenses and decrease the carryingvalue of the assets and vice versa. The estimated useful lives of property, plant and equipmentand investment properties are discussed in Note 2 to the consolidated financial statements. Therehad been no changes in the estimated useful lives of property, plant and equipment andinvestment properties in 2012 and 2011.
The carrying values of these property, plant and equipment valued at cost amounted toP=2,758.38 million and P=2,674.22 million as of December 31, 2012 and 2011, respectively(see Note 10). The carrying values of investment properties amounted to P=56.93 million andP=78.02 million as of December 31, 2012 and 2011, respectively (see Note 11).
Valuation of land under revaluation basisThe Group’s parcels of land are carried at revalued amounts, which approximate their fair valuesat the date of the revaluation, less any subsequent accumulated depreciation and accumulatedimpairment losses. The revaluation is performed by professionally qualified appraisers.Revaluations are made every three to five years to ensure that the carrying amounts do not differmaterially from those which would be determined using fair values at the balance sheet date.
The appraisal increase on the valuation of land based on the appraisal report amounting toP=568.94 million as of December 31, 2012 and 2011 is presented as “Revaluation increment onland” account, net of deferred income tax effect of P=243.83 million, in the equity section of theconsolidated balance sheets (see Notes 10 and 29).

Impairment of property, plant and equipment, investment propertiesand investment in an associateThe Group assesses whether there are indications of impairment on its property, plant andequipment, investment properties and investment in an associate, at least on an annual basis. Ifthere are, impairment testing is performed. This requires an estimation of the value-in-use of theCGUs to which the assets belong. Estimating the value-in-use requires the Group to make anestimate of the expected future cash flows from the CGU and also to choose a suitable discountrate in order to calculate the present value of those cash flows.
Impairment loss recognized on property, plant and equipment amounted to P=5.24 million in 2012and nil in 2011 and 2010. The carrying value of property, plant and equipment valued at costamounted to P=2,758.38 million and P=2,674.22 million as of December 31, 2012 and 2011,respectively (see Note 10). Accumulated impairment loss on property, plant and equipmentamounted to P=26.54 million and P=21.30 million as of December 31, 2012 and 2011. The carryingvalue of investment properties amounted to P=56.93 million as of December 31, 2012 andP=78.02 million as of December 31, 2011 (see Note 11).
As of December 31, 2012 and 2011, the carrying value of investment in an associate amounted toP=138.85 million and P=233.41 million, respectively (see Note 12b). No impairment loss wasrecognized for investment properties and investment in an associate in 2012, 2011 and 2010.
Impairment of goodwillThe Group reviews the carrying value of goodwill for impairment annually or more frequently ifevents or changes in circumstances indicate that the carrying value may be impaired. The Groupperforms impairment test of goodwill annually every December 31. Impairment is determined forgoodwill by assessing the recoverable amount of the CGU or group of CGUs to which thegoodwill relates. Assessments require the use of estimates and assumptions such as discountrates, future capital requirements and operating performance. If the recoverable amount of theunit exceeds the carrying amount of the CGU, the CGU and the goodwill allocated to that CGUshall be regarded as not impaired. Where the recoverable amount of the CGU or group of CGUsis less than the carrying amount of the CGU or group of CGUs to which goodwill has beenallocated, an impairment loss is recognized. In 2012, the Parent Company performed animpairment test with respect to its goodwill resulting from its acquisition of URICI amounting toP=190.56 million as of December 31, 2012 and 2011 (see Note 14). The Parent Company used adiscount rate of 4.11% and a growth rate on sales of URICI by 15% to 17% for the succeedingfive years. No impairment losses were recognized for the years ended December 31, 2012 and2011.
Recognition of deferred income tax assetsThe Group reviews the carrying amounts of deferred income tax assets at each balance sheet dateand adjusts the balance of deferred income tax assets to the extent that it is no longer probablethat sufficient future taxable profits will be available to allow all or part of the deferred incometax assets to be utilized.
Deferred income tax assets recognized amounted to P=141.35 million and P=137.40 million as ofDecember 31, 2012 and 2011, respectively (see Note 29).
Deferred income tax assets on certain deductible temporary differences, carryforward benefits ofNOLCO and excess MCIT amounting to P=1,156.65 million and P=1,818.42 million as ofDecember 31, 2012 and 2011, respectively, were not recognized because the Group believes thatit is not probable that it will have sufficient future taxable profits against which these items can beutilized (see Note 29).

Estimation of pension benefits obligations and costsThe determination of the Group’s obligation and costs of pension benefits depends on theselection by management of certain assumptions used by the actuary in calculating such amounts.Those assumptions are described in Note 27 and include, among others the discount rate,expected rate of return and rate of salary increase. The Group recognizes all actuarial gains andlosses in the consolidated statement of comprehensive income, and therefore generally affects therecordedobligation. While management believes that the Group’s assumptions are reasonable andappropriate, significant differences in actual experience or significant changes in assumptionsmay materially affect the Group’s pension obligation.
Net pension obligation amounted to P=28.15 million and P=103.84 million as of December 31, 2012and 2011, respectively. Pension benefits costs amounted to P=19.41 million in 2012,P=18.04 million in 2011 and P=24.23 million in 2010 (see Note 27).
Use of effective interest rateThe Group made reference to the prevailing market interest rates for instruments of the sametenor in choosing the discount rates used to determine the net present value of long-term non-interest-bearing receivable from Manila Electric Company (Meralco), advances to and fromrelated parties and other long-term financial assets and obligations.
Receivable from Meralco, included under “Other current assets” account in the 2012 and 2011consolidated balance sheets, amounted to nil and P=3.04 million, respectively (see Note 9).
4. Segment Information
The Group’s management reports its operating business segments into the following:(a) institutional business, (b) consumer business, and (c) other operations. The institutionalbusiness segment primarily manufactures and sells flour, pasta, bakery and other bakery productsto institutional customers. The consumer business segment manufactures and sells ice cream,meat, milk and juices, pasta products, and flour and rice-based mixes. Other segments consist ofinsurance, financing, lighterage, moving, cargo handling, office space leasing and other servicesshown in aggregate as “Other operations”.
The operating businesses are organized and managed separately according to the nature of theproducts and services provided, with each segment representing a strategic business unit thatoffers different products and serves different markets. All operating business segments used bythe Group meet the definition of reportable segment under PFRS 8.
Management monitors the operating results of its business units separately for the purpose ofmaking decisions about resource allocation and performance assessment. Segment performance isevaluated based on operating profit or loss and is measured consistently with operating profit orloss in the consolidated financial statements.
Segment assets include all operating assets used by a segment and consist principally of operatingcash, receivables, inventories and property, plant and equipment, net of allowances andprovisions. Segment liabilities include all operating liabilities and consist principally of trade,wages and taxes currently payable and accrued liabilities.

Intersegment transactions, i.e., segment revenues, segment expenses and segment results, includetransfers between business segments. Those transfers are eliminated in consolidation andreflected in the “eliminations” column.
The Group does not have a single external customer from which revenue generated amounted to10% or more of the total revenue of the Group.
Information with regard to the Group’s significant business segments follows:
2012
ConsumerBusiness
InstitutionalBusiness
OtherOperations
UnallocatedCorporate
Balances Total Eliminations ConsolidatedNet SalesExternal sales P=7,159,702 P=3,816,614 P=6,669 P=15,064 P=10,998,049 P=– P=10,998,049Intersegment sales 3,340 626,232 92,430 – 722,002 (722,002) –
P=7,163,042 P=4,442,846 P=99,099 P=15,064 P=11,720,051 (P=722,002) P=10,998,049
ResultsInterest and other financial charges - net (P=18,866) (P=4,308) (P=5,165) (P=66,954) (P=95,293) P=– (P=95,292)Equity in net earnings of an associate P=– P=– P=11,172 P=– P=11,172 P=– P=11,172Income (loss) before provision for income
tax and non-controlling interest P=362,585 P=867,225 (P=50,075) P=225,228 P=1,404,963 (P=461,501) P=943,462Provision for income tax (172,608) (32,654) (1,505) (54,424) (261,191) – (261,191)Net income (loss) P=189,977 P=834,571 (P=51,580) P=170,804 P=1,143,772 (P=461,501) P=682,271
Other informationSegment assets P=7,767,427 P=7,618,668 P=1,202,663 P=2,773,421 P=19,362,179 (P=8,569,207) P=10,792,972Investments 463,323 – 107,362 1,134,380 1,705,065 (1,236,508) 468,557Deferred income tax assets 82,859 3,239 2,280 – 88,378 – 88,378Consolidated Total Assets P=8,313,609 P=7,621,907 P=1,312,305 P=3,907,801 P=21,155,622 (P=9,805,715) P=11,349,907
Consolidated Total Liabilities P=8,360,641 P=2,575,207 P=1,127,751 P=2,890,214 P=14,953,813 (P=9,156,455) P=5,797,358
Capital expenditures P=477,973 P=93,300 P=25,629 P=7,396 P=604,298 P=– P=604,298Depreciation and amortization 172,241 80,428 57,742 5,184 315,595 – 315,595Noncash expenses other than depreciation
and amortization 23,361 76,392 5,494 110,256 215,503 – 215,503
2011
ConsumerBusiness
InstitutionalBusiness
OtherOperations
UnallocatedCorporate
Balances Total Eliminations ConsolidatedNet SalesExternal sales P=6,233,238 P=4,076,155 P=26,929 P=– P=10,336,322 P=– P=10,336,322Intersegment sales 62,177 484,677 47,092 – 593,946 (593,946) –
P=6,295,415 P=4,560,832 P=74,021 P=– P=10,930,268 (P=593,946) P=10,336,322
ResultsInterest and other financial charges - net (P=65,863) (P=1,251) P=9,341 (P=53,318) (P=111,091) P=– (P=111,091)
Equity in net earnings of an associate P=– P=– P=12,451 P=– P=12,451 P=– P=12,451
Income (loss) before provision for incometax and non-controlling interest P=77,130 P=836,404 (P=1,374) P=2,034,382 P=2,946,542 (P=2,231,688) P=714,854
Provision for income tax (138,203) (23,524) (2,533) (42,289) (206,549) – (206,549)Net income (loss) (P=61,073) P=812,880 (P=3,907) P=1,992,093 P=2,739,993 (P=2,231,688) P=508,305
Other InformationSegment assets P=7,700,232 P=5,597,088 P=615,250 P=2,298,500 P=16,211,070 (P=6,692,849) P=9,518,221Investments 313,996 - 61,838 2,108,267 2,484,101 (1,304,069) 1,180,032Deferred income tax assets 59,392 4,214 1,906 – 65,512 – 65,512Consolidated Total Assets P=8,073,620 P=5,601,302 P=678,994 P=4,406,767 P=18,760,683 (P=7,996,918) P=10,763,765
Consolidated Total Liabilities P=7,731,275 P=1,514,658 P=635,829 P=3,031,887 P=12,913,649 (P=7,312,859) P=5,600,790
Capital expenditures P=578,069 P=394,638 P=47,473 P=1,581 P=1,021,761 P=– P=1,021,761Depreciation and amortization 161,877 58,426 25,591 5,720 251,614 – 251,614Noncash expenses other than depreciation
and amortization 36,588 10,857 17,139 3,948 68,532 – 68,532
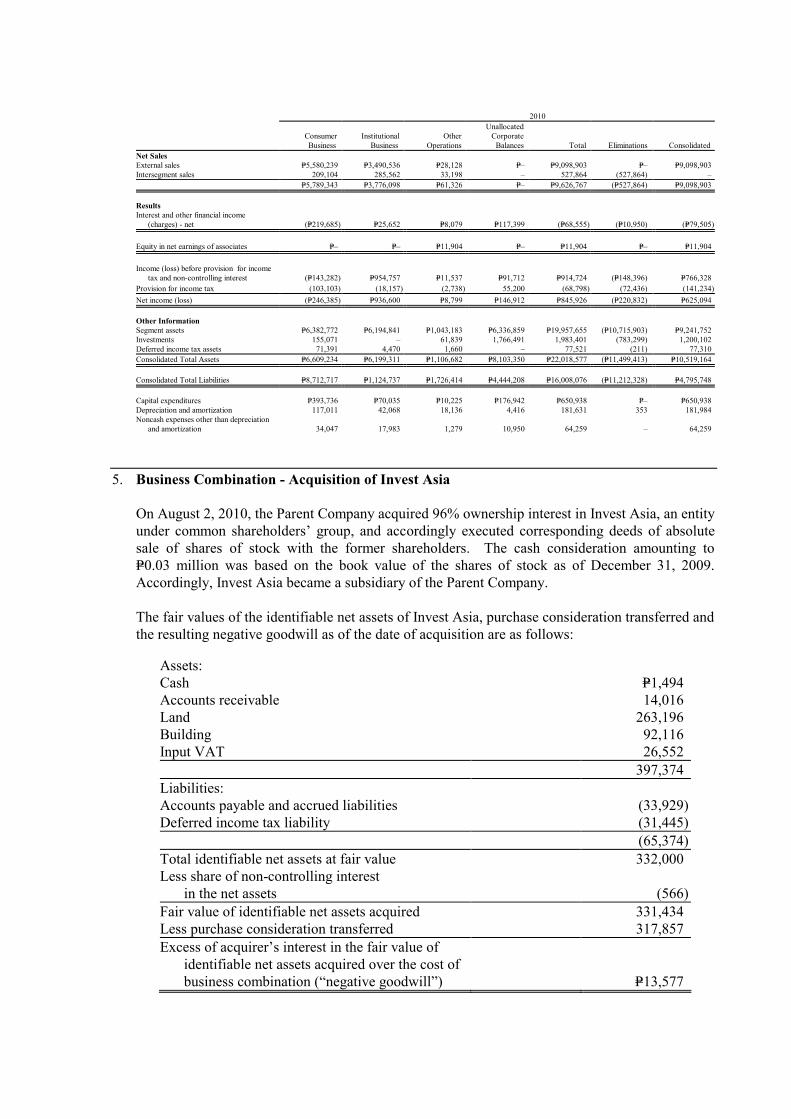
2010
ConsumerBusiness
InstitutionalBusiness
OtherOperations
UnallocatedCorporate
Balances Total Eliminations ConsolidatedNet SalesExternal sales P=5,580,239 P=3,490,536 P=28,128 P=– P=9,098,903 P=– P=9,098,903Intersegment sales 209,104 285,562 33,198 – 527,864 (527,864) –
P=5,789,343 P=3,776,098 P=61,326 P=– P=9,626,767 (P=527,864) P=9,098,903
ResultsInterest and other financial income
(charges) - net (P=219,685) P=25,652 P=8,079 P=117,399 (P=68,555) (P=10,950) (P=79,505)
Equity in net earnings of associates P=– P=– P=11,904 P=– P=11,904 P=– P=11,904
Income (loss) before provision for incometax and non-controlling interest (P=143,282) P=954,757 P=11,537 P=91,712 P=914,724 (P=148,396) P=766,328
Provision for income tax (103,103) (18,157) (2,738) 55,200 (68,798) (72,436) (141,234)Net income (loss) (P=246,385) P=936,600 P=8,799 P=146,912 P=845,926 (P=220,832) P=625,094
Other InformationSegment assets P=6,382,772 P=6,194,841 P=1,043,183 P=6,336,859 P=19,957,655 (P=10,715,903) P=9,241,752Investments 155,071 – 61,839 1,766,491 1,983,401 (783,299) 1,200,102Deferred income tax assets 71,391 4,470 1,660 – 77,521 (211) 77,310Consolidated Total Assets P=6,609,234 P=6,199,311 P=1,106,682 P=8,103,350 P=22,018,577 (P=11,499,413) P=10,519,164
Consolidated Total Liabilities P=8,712,717 P=1,124,737 P=1,726,414 P=4,444,208 P=16,008,076 (P=11,212,328) P=4,795,748
Capital expenditures P=393,736 P=70,035 P=10,225 P=176,942 P=650,938 P=– P=650,938Depreciation and amortization 117,011 42,068 18,136 4,416 181,631 353 181,984Noncash expenses other than depreciation
and amortization 34,047 17,983 1,279 10,950 64,259 – 64,259
5. Business Combination - Acquisition of Invest Asia
On August 2, 2010, the Parent Company acquired 96% ownership interest in Invest Asia, an entityunder common shareholders’ group, and accordingly executed corresponding deeds of absolutesale of shares of stock with the former shareholders. The cash consideration amounting toP=0.03 million was based on the book value of the shares of stock as of December 31, 2009.Accordingly, Invest Asia became a subsidiary of the Parent Company.
The fair values of the identifiable net assets of Invest Asia, purchase consideration transferred andthe resulting negative goodwill as of the date of acquisition are as follows:
Assets:Cash P=1,494Accounts receivable 14,016Land 263,196Building 92,116Input VAT 26,552
397,374Liabilities:Accounts payable and accrued liabilities (33,929)Deferred income tax liability (31,445)
(65,374)Total identifiable net assets at fair value 332,000Less share of non-controlling interest
in the net assets (566)Fair value of identifiable net assets acquired 331,434Less purchase consideration transferred 317,857Excess of acquirer’s interest in the fair value of
identifiable net assets acquired over the cost ofbusiness combination (“negative goodwill”) P=13,577

The purchase consideration transferred amounting to P=317.86 million consists of the cashconsideration of P=0.03 million and RFM’s advances to Invest Asia of P=317.83 million, which wasconsidered extinguished under PFRS 3.
6. Cash and Cash Equivalents
2012 2011Cash on hand and in banks P=251,544 P=404,399Short-term investments 1,223,169 408,598
P=1,474,713 P=812,997
Cash in banks earns interest at the respective bank deposit rates. Short-term investments are madefor varying periods of up to three months depending on the immediate cash requirements of theGroup, and earn interest at the respective short-term investment rates.
Interest income earned from cash in banks and short-term investments amounted toP=15.41 million in 2012, P=8.23 million in 2011 and P=9.03 million in 2010 (see Note 25).
7. Accounts Receivable
2012 2011Trade receivables:
Third parties P=2,550,078 P=2,085,771Related parties (Note 26) 388,593 386,859
Current portion of loan receivable 17,689 5,569Nontrade receivables 148,928 149,759Advances to officers and employees 48,674 47,261Other receivables 140,231 108,769
3,294,193 2,783,988Less allowance for doubtful accounts (Note 33) 706,510 879,115
P=2,587,683 P=1,904,873
Trade receivables are non-interest-bearing and are generally on 30 to 60 days term.
Nontrade receivables are amounts collectible from third parties other than the Group’s normalcustomers for transactions and events not directly related to sales of inventories.
Advances to officers and employees include car loans and cash advances which are deductibleagainst the employees’ monthly salary.
Other receivables include receivables from insurance companies, dividend receivables andinterest receivables.
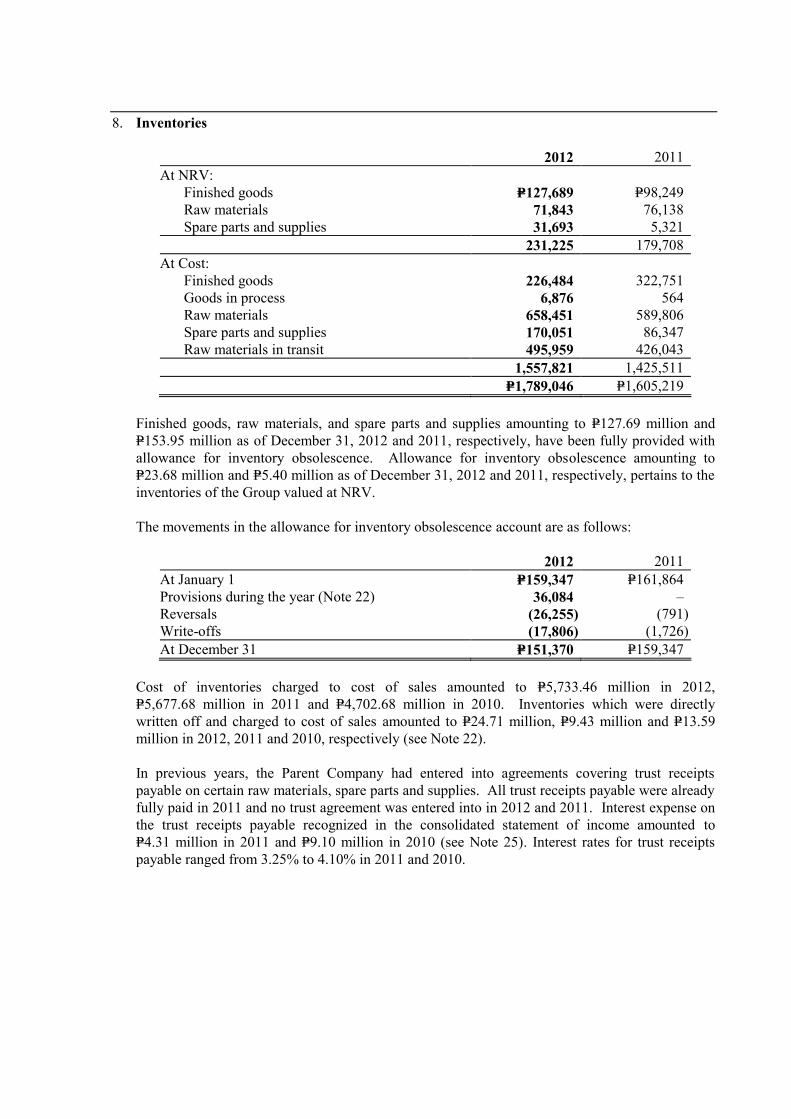
8. Inventories
2012 2011At NRV:
Finished goods P=127,689 P=98,249Raw materials 71,843 76,138Spare parts and supplies 31,693 5,321
231,225 179,708At Cost:
Finished goods 226,484 322,751Goods in process 6,876 564Raw materials 658,451 589,806Spare parts and supplies 170,051 86,347Raw materials in transit 495,959 426,043
1,557,821 1,425,511P=1,789,046 P=1,605,219
Finished goods, raw materials, and spare parts and supplies amounting to P=127.69 million andP=153.95 million as of December 31, 2012 and 2011, respectively, have been fully provided withallowance for inventory obsolescence. Allowance for inventory obsolescence amounting toP=23.68 million and P=5.40 million as of December 31, 2012 and 2011, respectively, pertains to theinventories of the Group valued at NRV.
The movements in the allowance for inventory obsolescence account are as follows:
2012 2011At January 1 P=159,347 P=161,864Provisions during the year (Note 22) 36,084 –Reversals (26,255) (791)Write-offs (17,806) (1,726)At December 31 P=151,370 P=159,347
Cost of inventories charged to cost of sales amounted to P=5,733.46 million in 2012,P=5,677.68 million in 2011 and P=4,702.68 million in 2010. Inventories which were directlywritten off and charged to cost of sales amounted to P=24.71 million, P=9.43 million and P=13.59million in 2012, 2011 and 2010, respectively (see Note 22).
In previous years, the Parent Company had entered into agreements covering trust receiptspayable on certain raw materials, spare parts and supplies. All trust receipts payable were alreadyfully paid in 2011 and no trust agreement was entered into in 2012 and 2011. Interest expense onthe trust receipts payable recognized in the consolidated statement of income amounted toP=4.31 million in 2011 and P=9.10 million in 2010 (see Note 25). Interest rates for trust receiptspayable ranged from 3.25% to 4.10% in 2011 and 2010.

9. Other Current Assets
2012 2011Creditable withholding taxes P=60,425 P=73,737Input VAT 50,638 47,697Prepaid expenses - net of allowance for probable
losses of P=33,649 in both years 42,805 157,679Deposits on purchases 33,825 53,568Receivable from Meralco – 3,037Others 4,585 4,551
P=192,278 P=340,269
Interest income earned from the receivable from Meralco amounted to nil in 2012 and 2011 andP=0.65 million in 2010 (see Note 25).
10. Property, Plant and Equipment
As of December 31, 2012:
Silos, Machinery Transportation OfficeLand Buildings and and and Delivery Furniture Construction
Improvements Improvements Equipment Equipment and Fixtures in Progress TotalAt Cost
Cost:At January 1 P=31,413 P=788,795 P=3,461,034 P=197,431 P=125,225 P=171,555 P=4,775,453Additions 598 35,306 75,398 40,625 4,398 278,189 434,514Write-off/disposal (936) – (119,204) (17,605) – – (137,745)Reclassification 398 59,889 320,152 1,410 (1,402) (356,450) 23,997At December 31 31,473 883,990 3,737,380 221,861 128,221 93,294 5,096,219
Accumulated depreciation andamortization:At January 1 10,826 278,154 1,528,813 158,898 103,245 – 2,079,936Depreciation and amortization
(Note 25) 575 40,903 239,014 23,842 9,565 – 313,899Write-off/disposal (936) – (68,728) (14,724) – – (84,388)Reclassification – 1,857 466 – (466) – 1,857At December 31 10,465 320,914 1,699,565 168,016 112,344 – 2,311,304
Accumulated impairment loss:At January 1 – – 21,296 – – – 21,296Impairment loss (Note 25) – – 5,243 – – – 5,243December 31 – – 26,539 – – – 26,539
Net Book Values at December 31 P=21,008 P=563,076 P=2,011,276 P=53,845 P=15,877 P=93,294 P=2,758,376
At Appraised Value - Land P=1,539,359
As of December 31, 2011:
Silos, Machinery Transportation OfficeLand Buildings and and and Delivery Furniture Construction
Improvements Improvements Equipment Equipment and Fixtures in Progress TotalAt Cost
Cost:At January 1 P=31,137 P=639,123 P=2,685,744 P=189,027 P=119,817 P=179,837 P=3,844,685Additions 144 83,065 379,035 17,503 7,154 506,975 993,876Write-off/disposal – (724) (39,125) (17,458) (5,801) – (63,108)Reclassification 132 67,331 435,380 8,359 4,055 (515,257) –At December 31 31,413 788,795 3,461,034 197,431 125,225 171,555 4,775,453
Accumulated depreciation andamortization:At January 1 10,295 249,681 1,373,629 157,825 100,243 – 1,891,673Depreciation and amortization
(Note 25) 531 29,160 192,639 17,470 8,807 – 248,607Write-off/disposal – (724) (37,436) (16,410) (5,774) – (60,344)Reclassification – 37 (19) 13 (31) – –At December 31 10,826 278,154 1,528,813 158,898 103,245 – 2,079,936
Accumulated impairment loss:At January 1 and December 31 – – 21,296 – – – 21,296
Net Book Values at December 31 P=20,587 P=510,641 P=1,910,925 P=38,533 P=21,980 P=171,555 P=2,674,221

At Appraised Value - LandAt January 1, 2011 P=1,539,194Additions 165At December 31, 2011 P=1,539,359
In 2008, the Group’s parcels of land were stated at their revalued amounts based on independentappraisal reports of Cuervo Appraisers, Inc. as of December 4, 2008. The appraisal increase inthe valuation of these assets amounting to P=501.14 million is presented under the “Revaluationincrement on land” account, net of deferred income tax effect of P=214.78 million, in theconsolidated statements of changes in equity. The cost of these parcels of land amounted toP=326.21 million as of December 31, 2012 and 2011.
In March 2010, the Group acquired a parcel of land and the Pioneer Business Park buildinglocated thereon. On December 31, 2010, the parcel of land was revalued based on an independentappraisal report. The appraisal increase of the land amounting to P=67.80 million is presentedunder “Revaluation increment on land” account, net of deferred income tax effect ofP=29.05 million, in the equity section of the 2012 and 2011 consolidated balance sheets. The costof this land amounted to P=142.03 million as of December 31, 2012 and 2011.
Property, plant and equipment include machinery and equipment under finance lease with netcarrying amount of P=20.44 million and P=23.75 million as of December 31, 2012 and 2011,respectively (see Note 18).
In October 2010, property, plant and equipment of the Parent Company’s Flour Division with acarrying value of P=46.18 million (net of accumulated depreciation had there been no impairmentloss recognized) have been restored, with the corresponding reversal of the allowance forimpairment loss reflected in the 2010 consolidated statement of income, in view of the increasingproduction volume requirements of the Pasta Division (see Note 25).
11. Investment Properties
As of December 31, 2012:
Buildings andLand Improvements Total
CostAt January 1 P=27,780 P=54,454 P=82,234Additions 1,127 1,617 2,744Reclassification – (23,997) (23,997)At December 31 28,907 32,074 60,981Accumulated Depreciation and AmortizationAt January 1 P=– P=4,215 P=4,215Depreciation and amortization (Note 25) – 1,696 1,696Reclassification – (1,857) (1,857)At December 31 – 4,054 4,054Net Book Values at December 31 P=28,907 P=28,020 P=56,927
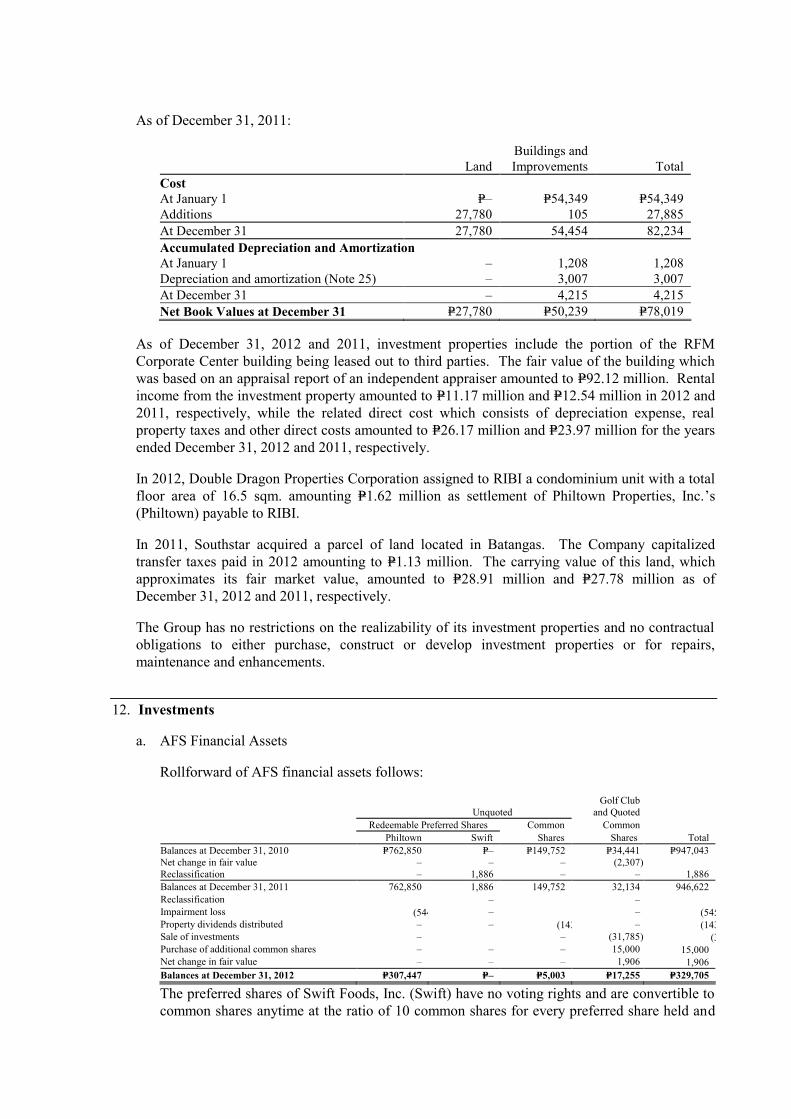
As of December 31, 2011:
Buildings andLand Improvements Total
CostAt January 1 P=– P=54,349 P=54,349Additions 27,780 105 27,885At December 31 27,780 54,454 82,234Accumulated Depreciation and AmortizationAt January 1 – 1,208 1,208Depreciation and amortization (Note 25) – 3,007 3,007At December 31 – 4,215 4,215Net Book Values at December 31 P=27,780 P=50,239 P=78,019
As of December 31, 2012 and 2011, investment properties include the portion of the RFMCorporate Center building being leased out to third parties. The fair value of the building whichwas based on an appraisal report of an independent appraiser amounted to P=92.12 million. Rentalincome from the investment property amounted to P=11.17 million and P=12.54 million in 2012 and2011, respectively, while the related direct cost which consists of depreciation expense, realproperty taxes and other direct costs amounted to P=26.17 million and P=23.97 million for the yearsended December 31, 2012 and 2011, respectively.
In 2012, Double Dragon Properties Corporation assigned to RIBI a condominium unit with a totalfloor area of 16.5 sqm. amounting P=1.62 million as settlement of Philtown Properties, Inc.’s(Philtown) payable to RIBI.
In 2011, Southstar acquired a parcel of land located in Batangas. The Company capitalizedtransfer taxes paid in 2012 amounting to P=1.13 million. The carrying value of this land, whichapproximates its fair market value, amounted to P=28.91 million and P=27.78 million as ofDecember 31, 2012 and 2011, respectively.
The Group has no restrictions on the realizability of its investment properties and no contractualobligations to either purchase, construct or develop investment properties or for repairs,maintenance and enhancements.
12. Investments
a. AFS Financial Assets
Rollforward of AFS financial assets follows:
Golf ClubUnquoted and Quoted
Redeemable Preferred Shares Common CommonPhiltown Swift Shares Shares Total
Balances at December 31, 2010 P=762,850 P=– P=149,752 P=34,441 P=947,043Net change in fair value – – – (2,307) (2,307)Reclassification – 1,886 – – 1,886Balances at December 31, 2011 762,850 1,886 149,752 32,134 946,622Reclassification 89,097 – – – 89,097Impairment loss (544,500) – (1,361) – (545,861)Property dividends distributed – – (143,388) – (143,388)Sale of investments – (1,886) – (31,785) (33,671)Purchase of additional common shares – – – 15,000 15,000Net change in fair value – – – 1,906 1,906Balances at December 31, 2012 P=307,447 P=– P=5,003 P=17,255 P=329,705
The preferred shares of Swift Foods, Inc. (Swift) have no voting rights and are convertible tocommon shares anytime at the ratio of 10 common shares for every preferred share held and
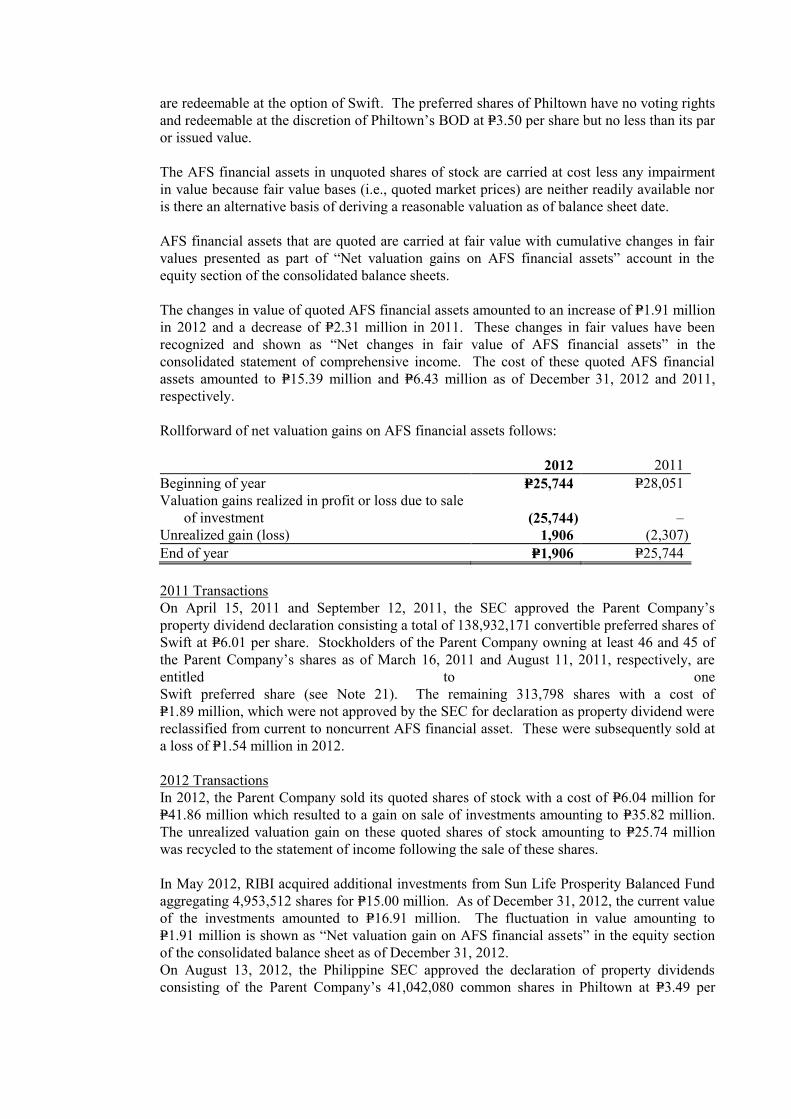
are redeemable at the option of Swift. The preferred shares of Philtown have no voting rightsand redeemable at the discretion of Philtown’s BOD at P=3.50 per share but no less than its paror issued value.
The AFS financial assets in unquoted shares of stock are carried at cost less any impairmentin value because fair value bases (i.e., quoted market prices) are neither readily available noris there an alternative basis of deriving a reasonable valuation as of balance sheet date.
AFS financial assets that are quoted are carried at fair value with cumulative changes in fairvalues presented as part of “Net valuation gains on AFS financial assets” account in theequity section of the consolidated balance sheets.
The changes in value of quoted AFS financial assets amounted to an increase of P=1.91 millionin 2012 and a decrease of P=2.31 million in 2011. These changes in fair values have beenrecognized and shown as “Net changes in fair value of AFS financial assets” in theconsolidated statement of comprehensive income. The cost of these quoted AFS financialassets amounted to P=15.39 million and P=6.43 million as of December 31, 2012 and 2011,respectively.
Rollforward of net valuation gains on AFS financial assets follows:
2012 2011Beginning of year P=25,744 P=28,051Valuation gains realized in profit or loss due to sale
of investment (25,744) –Unrealized gain (loss) 1,906 (2,307)End of year P=1,906 P=25,744
2011 TransactionsOn April 15, 2011 and September 12, 2011, the SEC approved the Parent Company’sproperty dividend declaration consisting a total of 138,932,171 convertible preferred shares ofSwift at P=6.01 per share. Stockholders of the Parent Company owning at least 46 and 45 ofthe Parent Company’s shares as of March 16, 2011 and August 11, 2011, respectively, areentitled to oneSwift preferred share (see Note 21). The remaining 313,798 shares with a cost ofP=1.89 million, which were not approved by the SEC for declaration as property dividend werereclassified from current to noncurrent AFS financial asset. These were subsequently sold ata loss of P=1.54 million in 2012.
2012 TransactionsIn 2012, the Parent Company sold its quoted shares of stock with a cost of P=6.04 million forP=41.86 million which resulted to a gain on sale of investments amounting to P=35.82 million.The unrealized valuation gain on these quoted shares of stock amounting to P=25.74 millionwas recycled to the statement of income following the sale of these shares.
In May 2012, RIBI acquired additional investments from Sun Life Prosperity Balanced Fundaggregating 4,953,512 shares for P=15.00 million. As of December 31, 2012, the current valueof the investments amounted to P=16.91 million. The fluctuation in value amounting toP=1.91 million is shown as “Net valuation gain on AFS financial assets” in the equity sectionof the consolidated balance sheet as of December 31, 2012.On August 13, 2012, the Philippine SEC approved the declaration of property dividendsconsisting of the Parent Company’s 41,042,080 common shares in Philtown at P=3.49 per

share. Stockholders of the Parent Company owning at least 77 of the Parent Company’sshares as of July 11, 2012 are entitled to one Philtown common shares (see Note 21).
In light of the changing business model of Philtown by the end of 2012, the Parent Companyperformed an impairment test of its AFS financial assets in Philtown by estimating their valueusing the “Adjusted Net Asset Method” in which the outstanding assets and liabilities ofPhiltown were valued at fair market values as of December 31, 2012 and the net amount iscompared with the carrying value of the Parent Company’s investment in Philtown. Theimpairment test resulted to an impairment loss amounting to P=545.86 million on the ParentCompany’s AFS financial assets with Philtown.
Dividend income earned from AFS financial assets amounted to P=0.83 million, P=0.55 millionand P=11.49 million in 2012, 2011 and 2010, respectively.
b. Investment in an Associate - at equity
2012 2011CostBeginning of year P=126,023 P=185,514Reclassification/Disposal (92,222) (59,491)End of year 33,801 126,023Accumulated Impairment LossBeginning of year – 43,208Disposal – (43,208)End of year – –
33,801 126,023Accumulated Equity in Net EarningsBeginning of year 107,387 110,753Equity in net earnings for the year (Note 25) 11,172 12,451Dividends received (13,508) (15,817)End of year 105,051 107,387
P=138,852 P=233,410
Summarized financial information on SWLC, an associate, as of December 31, 2012 and2011 follow:
2012 2011SWLC:
Current assets P=31,624 P=29,723Noncurrent assets 224,416 224,416Current liabilities 11,234 1,712Total equity 244,806 252,427Revenue 26,930 27,149Cost and expenses 8,309 1,660Net income 18,621 20,751
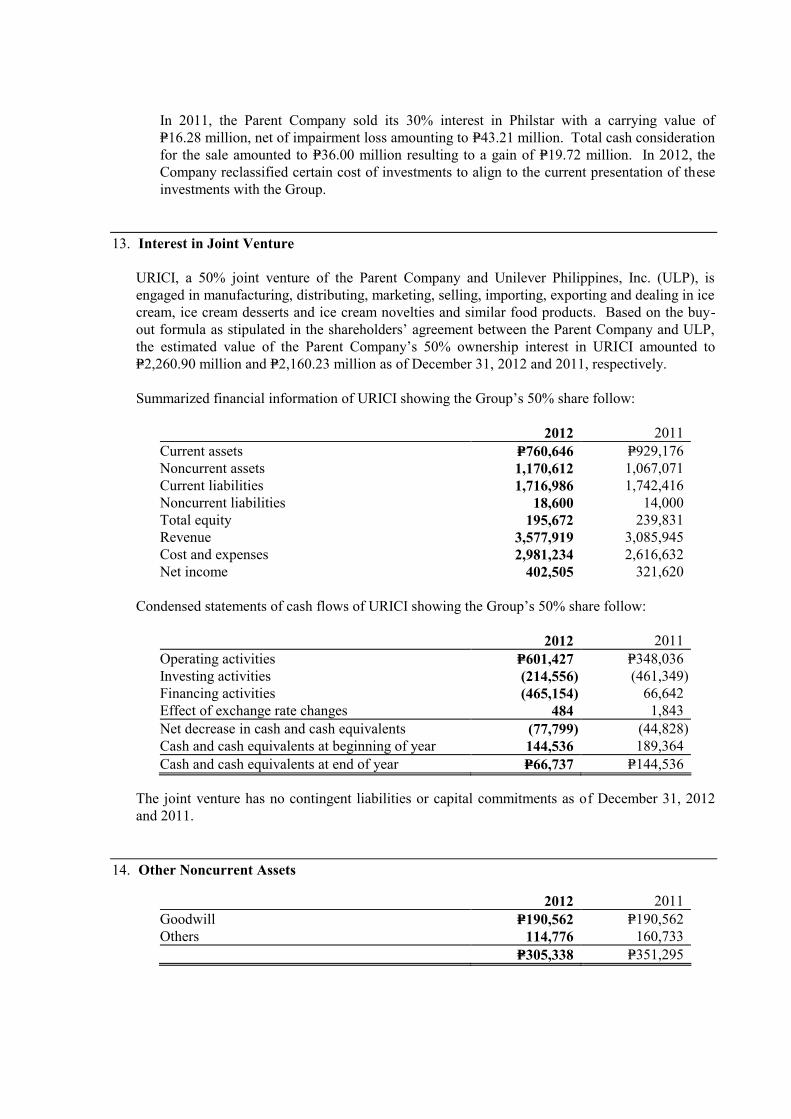
In 2011, the Parent Company sold its 30% interest in Philstar with a carrying value ofP=16.28 million, net of impairment loss amounting to P=43.21 million. Total cash considerationfor the sale amounted to P=36.00 million resulting to a gain of P=19.72 million. In 2012, theCompany reclassified certain cost of investments to align to the current presentation of theseinvestments with the Group.
13. Interest in Joint Venture
URICI, a 50% joint venture of the Parent Company and Unilever Philippines, Inc. (ULP), isengaged in manufacturing, distributing, marketing, selling, importing, exporting and dealing in icecream, ice cream desserts and ice cream novelties and similar food products. Based on the buy-out formula as stipulated in the shareholders’ agreement between the Parent Company and ULP,the estimated value of the Parent Company’s 50% ownership interest in URICI amounted toP=2,260.90 million and P=2,160.23 million as of December 31, 2012 and 2011, respectively.
Summarized financial information of URICI showing the Group’s 50% share follow:
2012 2011Current assets P=760,646 P=929,176Noncurrent assets 1,170,612 1,067,071Current liabilities 1,716,986 1,742,416Noncurrent liabilities 18,600 14,000Total equity 195,672 239,831Revenue 3,577,919 3,085,945Cost and expenses 2,981,234 2,616,632Net income 402,505 321,620
Condensed statements of cash flows of URICI showing the Group’s 50% share follow:
2012 2011Operating activities P=601,427 P=348,036Investing activities (214,556) (461,349)Financing activities (465,154) 66,642Effect of exchange rate changes 484 1,843Net decrease in cash and cash equivalents (77,799) (44,828)Cash and cash equivalents at beginning of year 144,536 189,364Cash and cash equivalents at end of year P=66,737 P=144,536
The joint venture has no contingent liabilities or capital commitments as of December 31, 2012and 2011.
14. Other Noncurrent Assets
2012 2011Goodwill P=190,562 P=190,562Others 114,776 160,733
P=305,338 P=351,295

Other noncurrent assets include car loans, multi-purpose loans to employees of the ParentCompany and its subsidiaries, and to OFW’s referred by the agencies accredited by the Group.Loans receivables of CSFC, included in “Others”, earn interest at a rate raging from 15% to 30%in 2012 and 2011. Payment for principal and interest are received in six (6) to sixty (60) equalmonthly installments.
Interest income from loans receivables amounted to P=6.66 million in 2012, P=9.46 million in 2011and P=6.72 million in 2010 (see Note 25).
15. Bank Loans
This account represents the Group’s proportionate share in the unsecured short-term loans ofURICI from local banks and lending investors bearing effective annual interest rates within therange of 3.40% to 5.18% in 2012, 3.38% to 5.18% in 2011 and 2.75% to 4.70% in 2010. Bankloans amounted to P=888.50 million and P=880.00 million as of December 31, 2012 and 2011,respectively.
Interest expense amounted to P=31.34 million in 2012, P=26.75 million in 2011 and P=8.68 million in2010 (see Note 25). Interest payable as of December 31, 2012 and 2011 amounted toP=0.28 million and P=0.78 million, respectively (see Note 16).
16. Accounts Payable and Accrued Liabilities
2012 2011Trade payables:
Third parties P=1,115,305 P=889,411Related parties (Note 26) 1,041 1,672
Accrued liabilities:Advertisements and promotions 406,829 309,388Importation 295,029 29,129Manpower services 76,487 17,370Profit bonus 73,288 61,308Freight and handling 58,617 85,813Merchandising charges 56,470 7,666Payroll 42,957 22,095Taxes 24,328 48,525Others 237,151 319,765
Dividends payable 25,714 6,178Cash bond - distributors 20,741 41,530Interest payable (Notes 15, 18 and 20) 14,171 16,483Subscriptions payable 2,758 2,258Other payables 162,468 209,070
P=2,613,354 P=2,067,661
Other accrued liabilities consist of accruals made for utilities, rentals and others.
Cash bond pertains to cash received from the distributors as security to retain their credit line.
Other payables include advances from officers and employees, withholding taxes and otherliabilities to third parties.
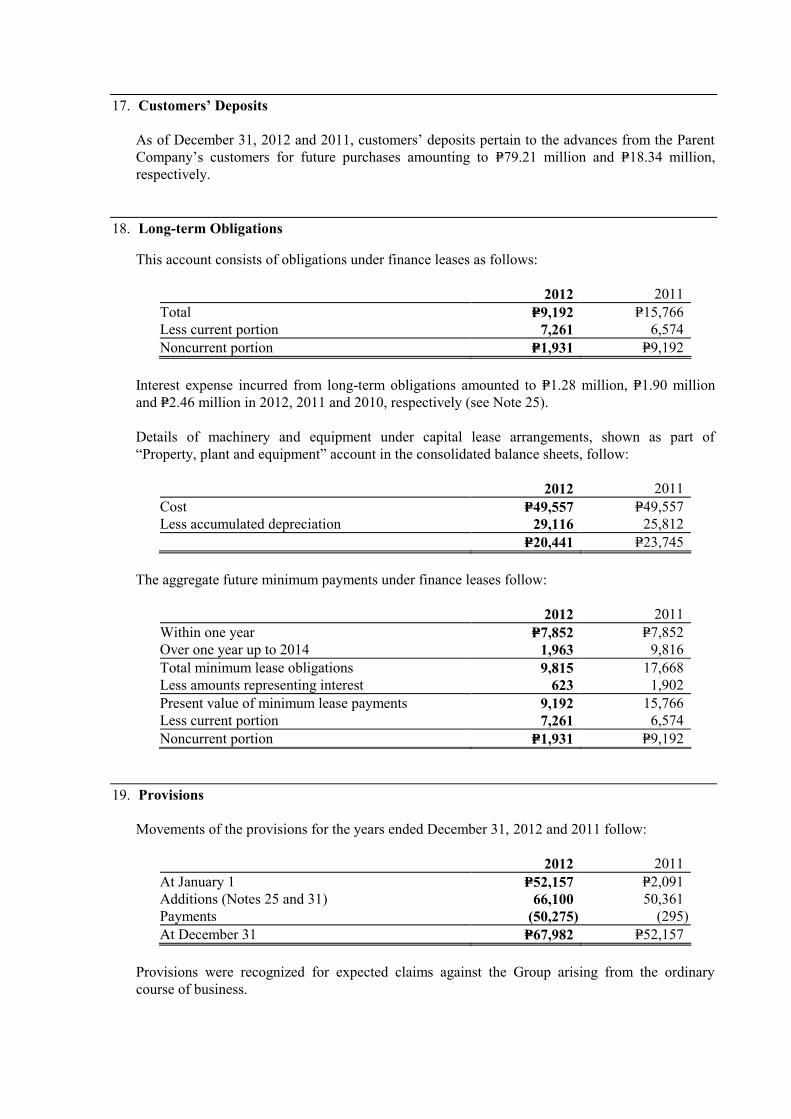
17. Customers’ Deposits
As of December 31, 2012 and 2011, customers’ deposits pertain to the advances from the ParentCompany’s customers for future purchases amounting to P=79.21 million and P=18.34 million,respectively.
18. Long-term Obligations
This account consists of obligations under finance leases as follows:
2012 2011Total P=9,192 P=15,766Less current portion 7,261 6,574Noncurrent portion P=1,931 P=9,192
Interest expense incurred from long-term obligations amounted to P=1.28 million, P=1.90 millionand P=2.46 million in 2012, 2011 and 2010, respectively (see Note 25).
Details of machinery and equipment under capital lease arrangements, shown as part of“Property, plant and equipment” account in the consolidated balance sheets, follow:
2012 2011Cost P=49,557 P=49,557Less accumulated depreciation 29,116 25,812
P=20,441 P=23,745
The aggregate future minimum payments under finance leases follow:
2012 2011Within one year P=7,852 P=7,852Over one year up to 2014 1,963 9,816Total minimum lease obligations 9,815 17,668Less amounts representing interest 623 1,902Present value of minimum lease payments 9,192 15,766Less current portion 7,261 6,574Noncurrent portion P=1,931 P=9,192
19. Provisions
Movements of the provisions for the years ended December 31, 2012 and 2011 follow:
2012 2011At January 1 P=52,157 P=2,091Additions (Notes 25 and 31) 66,100 50,361Payments (50,275) (295)At December 31 P=67,982 P=52,157
Provisions were recognized for expected claims against the Group arising from the ordinarycourse of business.

In 2012 and 2011, the Parent Company and CMPC recognized provisions for certain legal,contractual and regulatory matters and restructuring costs amounting to P=66.10 million andP=50.00 million, respectively (see Notes 25 and 31d). For the years ended December 31, 2012 and2011, URICI has recognized restructuring provisions amounting to nil and P=0.36 million,respectively (see Note 31d). Restructuring costs are mainly provisions for employee redundancyalready offered or communicated to affected employees of the Group at balance sheet date.
In 2010, the Group reversed certain outstanding provisions amounting to P=14.61 million as aresult of the issuance of resolution by the Court of Appeals (CA) in favor of the Group denyingthe plaintiff’s motion for reconsideration (see Note 31d).
20. Long-term Debts
The details of the long-term debts of the Parent Company and ICC, which consist of peso-denominated promissory notes obtained from local banks, follow:
2012 2011Parent Company:Floating rate note facility from local banks, with
interest rate of 6.12%, and principal paymentspayable in sixteen equal quarterly installments ofP=93,750 each starting January 27, 2012 P=1,125,000 P=1,500,000
Loan from a local bank with interest ratebased on 3-month PDST-F plus spread of 1.65%;payable in seventeen equal quarterly installmentsof P=29,412 each starting May 12, 2012 411,765 500,000
ICC:Loan from a local bank with interest rate
based on 3-month PDST-F plus spread of 1.75%;payable in seventeen equal quarterly installmentsof P=10,882 each starting October 31, 2013 160,000 –
Loan from a local bank with interest ratebased on 3-month PDST-F plus spread of 1.75%;payable in seventeen equal quarterly installmentsof P=8,824 each starting March 15, 2012 114,706 150,000
Total 1,811,471 2,150,000Less current portion 546,078 498,529Noncurrent portion P=1,265,393 P=1,651,471
In accordance with the loan agreements, the Parent Company is restricted from performing certaincorporate acts without the prior consent or approval of the creditors, the more significant of whichrelate to entering into merger or consolidation, entering into guaranty or surety of obligation andacquiring treasury stock. The Parent Company is also required to maintain certain financial ratiosbased on the consolidated financial statements. As of December 31, 2012 and 2011, the ParentCompany is in compliance with the terms and conditions of the loan agreements with the banks.
On October 26, 2010, several bank institutions granted the Parent Company a Peso-denominatedfloating rate notes facility in the aggregate principal amount of P=1.50 billion, which has been fullydrawn on the same date. The principal amount of the note facility shall be paid within five yearsand one day from and after the issue date with interest rate of 6.12%. The payments are to bemade in sixteen (16) equal quarterly installments of P=93.75 million each to commence at the endof the fifteenth month from the issue date.
On October 27, 2010, the Parent Company settled all its outstanding long-term debts with thelocal banks amounting to P=1.31 billion.
On May 13, 2011, the Parent Company availed of an additional loan from a local bank amountingto P=500.00 million. The principal amount of the loan shall be paid within five years from initialdrawdown date with interest rate of 3.68%. The payments are to be made in seventeen (17) equalquarterly installments of P=29.41 million each to commence at the end of the fourth quarterfollowing the date of borrowing.
On March 15, 2011, ICC obtained a P=150.00 million unsecured and interest-bearing long-termdebt from a local bank payable in seventeen (17) equal quarterly installments of P=8.82 millioneach starting March 15, 2012. The interest rate will be based on 3-month PDST-F + 1.75% perannum subject to repricing every quarter. The proceeds of the debt were used by ICC to financethe acquisitions of new machinery and equipment, and construction of a warehousebuilding extension to house the newly acquired assets. The loan agreement provides certainfinancial ratios that ICC is required to maintain. As of December 31, 2012 and 2011, ICC is incompliance with the terms and conditions of the loan agreement with the bank.
On October 19, 2012, ICC obtained another unsecured and interest-bearing long-term debt fromthe same local bank amounting to P=185.00 million payable in seventeen (17) equal quarterlyinstallments of P=10.88 million starting October 31, 2013. The interest rate will be based on 3-month PDST-F + 1.75% per annum subject to repricing per quarter. Interest rates for the periodOctober 15 to December 31, 2012 range from 2.69% to 4.51%. The proceeds of the loan wereused to finance the acquisitions of machinery and equipment. The loan agreement providescertain financial ratios that ICC is required to maintain. ICC is in compliance with the terms andconditions of the loan agreement as of December 31, 2012. The proceeds of the loan are to bedrawn by ICC based on a committed drawdown date. As of December 31, 2012, a total ofP=160.00 million have already been drawn by ICC.
Interest expense incurred from the long-term debts amounted to P=82.29 million, P=92.19 millionand P=74.64 million in 2012, 2011 and 2010, respectively (see Note 25). Actual interest rates forthe long-term debts ranged from 2.97% to 4.82% in 2012, 3.20% to 6.43% in 2011 and 6.48% to7.89% in 2010.
21. Equity
Capital stockAs of December 31, 2012 and 2011, the Parent Company has 3,978,265,025 authorized commonstock with P=1 par value. Issued and outstanding common shares of 3,160,403,866 are held by3,391 and 3,482 stockholders as of December 31, 2012 and 2011, respectively.
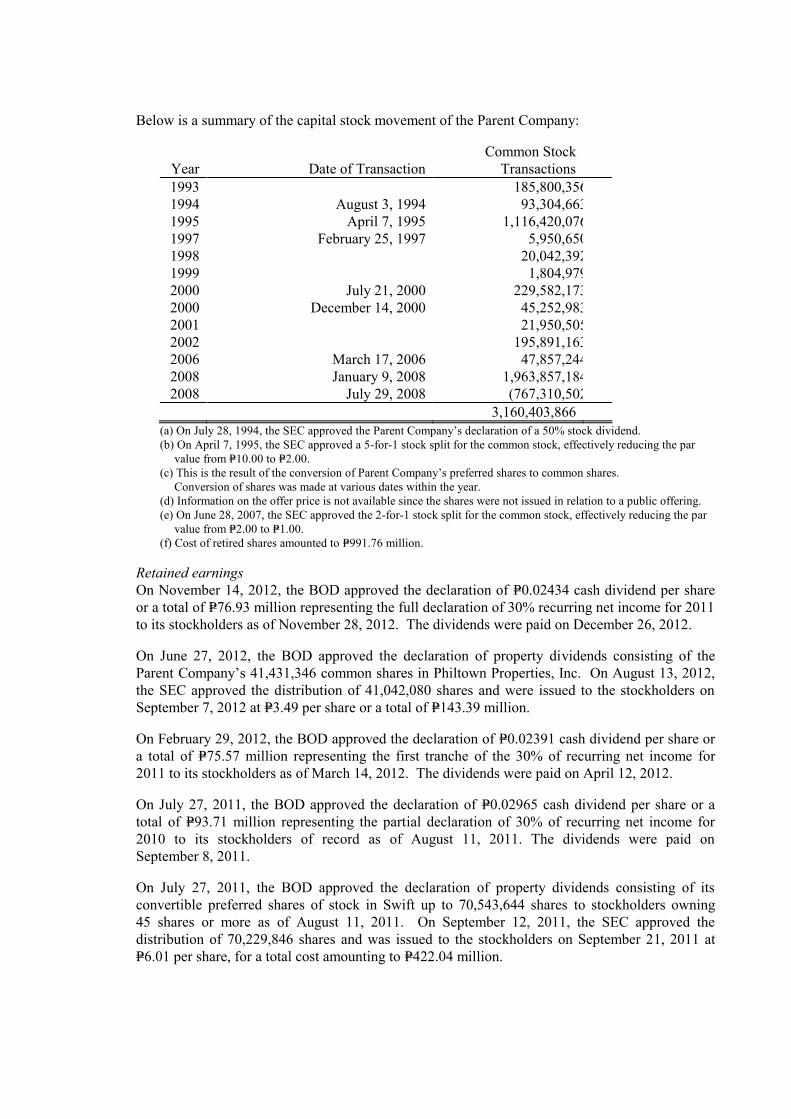
Below is a summary of the capital stock movement of the Parent Company:
Year Date of TransactionCommon Stock
Transactions1993 185,800,3561994 August 3, 1994 93,304,663 (a)
1995 April 7, 1995 1,116,420,076 (b)
1997 February 25, 1997 5,950,650 (c)
1998 20,042,392 (c)
1999 1,804,979 (c)
2000 July 21, 2000 229,582,173 (d)
2000 December 14, 2000 45,252,983 (d)
2001 21,950,505 (c)
2002 195,891,163 (c)
2006 March 17, 2006 47,857,244 (d)
2008 January 9, 2008 1,963,857,184 (e)
2008 July 29, 2008 (767,310,502) (f)
3,160,403,866(a) On July 28, 1994, the SEC approved the Parent Company’s declaration of a 50% stock dividend.(b) On April 7, 1995, the SEC approved a 5-for-1 stock split for the common stock, effectively reducing the par
value from P=10.00 to P=2.00.(c) This is the result of the conversion of Parent Company’s preferred shares to common shares.
Conversion of shares was made at various dates within the year.(d) Information on the offer price is not available since the shares were not issued in relation to a public offering.(e) On June 28, 2007, the SEC approved the 2-for-1 stock split for the common stock, effectively reducing the par
value from P=2.00 to P=1.00.(f) Cost of retired shares amounted to P=991.76 million.
Retained earningsOn November 14, 2012, the BOD approved the declaration of P=0.02434 cash dividend per shareor a total of P=76.93 million representing the full declaration of 30% recurring net income for 2011to its stockholders as of November 28, 2012. The dividends were paid on December 26, 2012.
On June 27, 2012, the BOD approved the declaration of property dividends consisting of theParent Company’s 41,431,346 common shares in Philtown Properties, Inc. On August 13, 2012,the SEC approved the distribution of 41,042,080 shares and were issued to the stockholders onSeptember 7, 2012 at P=3.49 per share or a total of P=143.39 million.
On February 29, 2012, the BOD approved the declaration of P=0.02391 cash dividend per share ora total of P=75.57 million representing the first tranche of the 30% of recurring net income for2011 to its stockholders as of March 14, 2012. The dividends were paid on April 12, 2012.
On July 27, 2011, the BOD approved the declaration of P=0.02965 cash dividend per share or atotal of P=93.71 million representing the partial declaration of 30% of recurring net income for2010 to its stockholders of record as of August 11, 2011. The dividends were paid onSeptember 8, 2011.
On July 27, 2011, the BOD approved the declaration of property dividends consisting of itsconvertible preferred shares of stock in Swift up to 70,543,644 shares to stockholders owning45 shares or more as of August 11, 2011. On September 12, 2011, the SEC approved thedistribution of 70,229,846 shares and was issued to the stockholders on September 21, 2011 atP=6.01 per share, for a total cost amounting to P=422.04 million.
On March 2, 2011, the BOD approved the declaration of P=0.02968 cash dividend per share, or atotal of P=93.80 million, payable to its stockholders of record as of March 16, 2011. The dividendswere paid on April 11, 2011.
On January 26, 2011, the BOD approved the declaration of property dividends consisting of itsconvertible preferred shares of stock in Swift up to 69,622,985 shares to stockholders owning46 shares or more as of March 16, 2011. On April 15, 2011, the SEC approved the distribution of68,702,325 shares and was issued to the stockholders on April 29, 2011 at P=6.01 per share, for atotal cost amounting to P=412.87 million.
On April 28, 2010, the BOD approved the declaration of P=0.01582 cash dividend per share, or atotal of P=50.00 million, payable to its stockholders of record as of May 14, 2010. The dividendswere paid on June 9, 2010.
The Parent Company’s retained earnings as of December 31, 2012 is restricted to the extent of theamount of the undistributed equity in net earnings of an associate included in its retained earningsamounting to P=105.05 million. These will only be available for declaration as dividends whenthese are actually received.
Retained earnings include cumulative actuarial gains on defined benefits plan of P=3.02 million asof December 31, 2012 which are not available for dividend declaration.
Non-controlling interestOn December 17, 2012, the Board of Directors of WSHI declared cash dividends amounting toP=4.96 million out of the WSHI’s retained earnings. Cash dividends attributable to non-controllinginterest amounted to P=2.51 million in 2012.
22. Cost of Sales and Services
2012 2011 2010Manufacturing:
Raw materials used and changes ininventories (Note 8) P=5,733,456 P=5,677,678 P=4,702,680
Utilities 359,048 308,751 283,256Outside services 295,105 247,510 234,744Depreciation and amortization (Note 25) 218,633 177,111 98,603Personnel costs (Notes 25, 27 and 28) 176,164 167,945 160,037Repairs and maintenance 124,297 101,039 98,594Rental 44,402 27,524 46,507Direct labor (Note 25) 40,223 67,532 75,710Provision for inventory obsolescence
(Note 8) 36,084 – 3,389Other expenses (Note 8) 193,132 243,534 234,253
7,220,544 7,018,624 5,937,773Services and others:
Outside services 24,199 21,584 18,394Depreciation and amortization (Note 25) 4,542 7,035 7,297Other expenses 19,167 9,674 6,553
47,908 38,293 32,244P=7,268,452 P=7,056,917 P=5,970,017
Other manufacturing expenses include repairs and maintenance, fuel and oil, office supplies andother miscellaneous expenses.
23. Selling and Marketing Expenses
2012 2011 2010Advertisements P=999,684 P=800,930 P=893,206Freight and handling 413,108 399,725 331,352Outside services 141,428 130,739 98,042Personnel costs (Notes 25, 27 and 28) 95,619 106,848 97,290Depreciation and amortization (Note 25) 22,079 7,692 5,955Rental 11,214 13,895 13,941Provision for doubtful accounts (Note 33) 11,071 49,069 33,741Transportation and travel 9,238 8,565 13,917Other expenses (Note 31) 77,164 84,215 46,554
P=1,780,605 P=1,601,678 P=1,533,998
Other expenses include utilities, royalty, repairs and maintenance and other miscellaneousexpenses.
24. General and Administrative Expenses
2012 2011 2010Personnel costs (Notes 25, 27 and 28) P=342,154 P=302,058 P=273,849Outside services 252,233 233,386 199,569Royalty and service fees 104,928 80,943 68,030Depreciation and amortization (Note 25) 70,341 59,776 70,129Provision for doubtful accounts
(Note 33) 66,158 3,215 31,346Taxes and licenses 47,195 36,954 25,190Utilities 27,749 24,450 25,332Transportation and travel 22,319 17,819 15,723Director’s fees 19,423 15,536 46,526Repairs and maintenance 17,081 15,558 21,618Other expenses (Note 31) 90,614 97,379 108,656
P=1,060,195 P=887,074 P=885,968
Other expenses include utilities, rental, repairs and maintenance, royalty and service fees, officesupplies, provision for restructuring costs and other miscellaneous expenses.
25. Additional Information on Income and Expense Accounts
Personnel Costs
2012 2011 2010Salaries and wages P=552,751 P=520,599 P=551,182Pension benefits costs (Note 27) 19,406 18,036 24,226Other employee benefits (Note 28) 82,003 105,748 31,478
P=654,160 P=644,383 P=606,886

The distribution of the above amounts follows:
2012 2011 2010Cost of sales and services (Note 22) P=216,387 P=235,477 P=235,747Selling and marketing expenses (Note 23) 95,619 106,848 97,290General and administrative expenses
(Note 24) 342,154 302,058 273,849P=654,160 P=644,383 P=606,886
Depreciation and Amortization of Property, Plant and Equipment and Investment Properties
2012 2011 2010Cost of sales and services (Note 22) P=223,175 P=184,146 P=105,900Selling and marketing expenses (Note 23) 22,079 7,692 5,955General and administrative expenses
(Note 24) 70,341 59,776 70,129P=315,595 P=251,614 P=181,984
Interest and Financing Income
2012 2011 2010Interest income on loan receivables
(Note 14) P=6,662 P=9,455 P=6,719Interest income on cash and cash
equivalents (Note 6) 15,414 8,226 9,026Interest income on Meralco refund
(Note 9) – – 645P=22,076 P=17,681 P=16,390
Interest Expense
2012 2011 2010Interest expense on long-term debts
(Note 20) P=82,290 P=92,194 P=74,643Interest expense on bank loans (Note 15) 31,339 26,748 8,683Interest expense on long-term obligations
(Note 18) 1,278 1,900 2,463Interest expense on trust receipts payable
(Note 8) – 4,310 9,099Others 2,461 3,620 1,007
P=117,368 P=128,772 P=95,895

Other Income (Charges)
2012 2011 2010Other income:
Equity in net earnings of an associate(Note 12b) P=11,172 P=12,451 P=11,904
Foreign exchange gain - net 9,141 – –Realized mark-to-market gain 1,732 5,952 3,227Dividend income (Note 12a) 825 552 11,494
Gain on sale of property andequipment 708 1,649 965
Income from toll processing 672 451 14,449Unrealized mark-to-market gain
(Note 34) – 4,943 7,387Reversal of allowance for
impairment loss on property,plant and equipment (Note 10) – – 46,178
Reversal of provision for lawsuitaccrual (Note 19) – – 14,608
Excess of acquirer’s interest in thefair value of identifiable netassets acquired over the cost ofbusiness combination (Note 5) – – 13,577
Others - net 43,694 26,071 15,52867,944 52,069 139,317
Other charges:Provisions for probable losses
(Notes 19 and 31) (66,100) (50,000) –Impairment loss on property and
equipment (Note 10) (5,243) – –Foreign exchange loss - net – (128) (2,914)
(71,343) (50,128) (2,914)(P=3,399) P=1,941 P=136,403
26. Related Party Transactions
Related party relationship exists when the party has the ability to control, directly or indirectly,through one or more intermediaries, or exercise significant influence over the other party inmaking financial and operating decisions. Such relationships also exist between and/or amongentities which are under common control with the reporting entity and its key managementpersonnel, directors or stockholders. In considering each possible related party relationship,attention is directed to the substance of the relationships, and not merely to the legal form.
The transactions from related parties are made under normal commercial terms and conditions.Outstanding balances as at December 31, 2012 and 2011 are unsecured and settlement occurs incash, unless otherwise indicated. There have been no guarantees provided or received for anyrelated party receivables or payables. Advances to/from related parties are non-interest-bearingand collectible/payable on demand.

Significant related party transactions with nonconsolidated entities are as follows:
a. The following are the outstanding trade receivables from related parties:
Related Parties Nature Year
Transactionsduring the Year
EndedDecember 31
OutstandingBalance as of
Year-end Terms and ConditionsEntities undercommon majorshareholder group
Swift Foods, Inc.Sale ofpollard 2012 P=612 P=7,157
Non-interest-bearing,collectible in 60 days.
2011 – 6,298 unsecured, unimpaired
Food Cart Concepts,Inc. / Kettle FoodsCorporation
Sale offlour 2012 168 4,322
Interest-bearing,collectible in 60 days.Unsecured, partially
2011 – 4,483 impaired.Philtown Properties,Inc.
Interestincome 2012 2,288 1,165 Unsecured and impaired
2011 – –
Bevco Philippines, Inc.Sale ofgoods 2012 166 166
Non-interest-bearing,collectible in 60 days.
2011 – – unsecured, unimpaired
Republic ConsolidatedCorporation - do - 2012 – –
Interest bearing,collectible in 60 days.
2011 – 1,518 Unsecured, unimpaired
Others - do - 2012 – 1,883Non-interest bearing,collectible in 60 days.
2011 – 660 Unsecured, unimpairedSubtotal 2012 3,234 14,693
2011 – 12,959Less: Allowance for 2012 6,721
doubtful accounts 2011 61Total 2012 P=3,234 P=7,972Total 2011 P=– P=12,898
b. The following are the outstanding advances to related parties:
Related Parties Nature Year
Transactionsduring the Year
EndedDecember 31
OutstandingBalance as of
Year-end Terms and Conditions
Joint VenturerUnilever Philippines,Inc. (Parent) Advances 2012 P=– P=3,092
Non-interest-bearing,collectible in 60 days.
to URICI 2011 – 5,529 Unsecured, unimpaired
Unilever Group - do - 2012 – 2,101 - do -2011 – 8,092
Unilever NV(Netherlands) - do - 2012 – 120 - do -
2011 – 308
(Forward)

Related Parties Nature Year
Transactionsduring the Year
EndedDecember 31
OutstandingBalance as of
Year-end Terms and ConditionsEntities under commonshareholder groupPhiltown Properties,Inc. Advances 2012 P=– P=153,006
Non-interest-bearing,Secured, partially
2011 – 192,503 Impaired
Asia Foods FranchisingCorporation - do - 2012 – 109,890 Non-interest bearing,
2011 – 501,961 Unsecured, impaired
RFM Foundation - do - 2012 7,903 7,903Non-interest-bearing,Unsecured, partially
2011 – – Impaired
Swift Foods, Inc. - do - 2012 36 36Non-interest-bearing,Unsecured, partially
2011 – – Impaired
Rolling Pin Corporation - do - 2012 – – Non-interest-bearing,2011 – 135,724 Impaired
Roman PizzaPhilippines, Inc. - do - 2012 – – - do -
2011 – 31,403RFM Development, Inc. - do - 2012 – – - do -
2011 – 9,674
Others - do - 2012 – 620Non-interest-bearing,Unsecured, partially
2011 – 38,025 ImpairedSubtotal 2012 7,939 276,768
2011 – 923,219Less: Allowance for 2012 187,516
doubtful accounts 2011 711,250Total 2012 P=7,939 P=89,252Total 2011 P=– P=211,969
c. The following are the advances from related parties as follows:
Related Parties Nature Year
Transactionsduring the Year
EndedDecember 31
OutstandingBalance as of
Year-end Terms and Conditions
Joint Venturer
Unilever GroupAdvances
from URICI 2012 P=26,165 P=26,485Non-interest bearing,collectible in 60 days.
2011 – 320 Unsecured, unimpairedUnilever Philippines,Inc. (Parent) - do - 2012 360 3,994 - do -
2011 – 3,634Unilever NV(Netherlands) - do - 2012 – 350 - do -
2011 – 7,886
(Forward)

Related Parties Nature Year
Transactionsduring the Year
EndedDecember 31
OutstandingBalance as of
Year-end Terms and ConditionsEntities undercommonshareholder groupPhiltown Properties,Inc/ Advances 2012 P=– P=23,993 Unsecured, unimpaired
2011 – 26,404Swift Foods, Inc. - do - 2012 – 50 - do -
2011 602 1,039PT Aqua - do - 2012 – – - do -
2011 – 16,410Selecta Wall's LandCorporation - do - 2012 – – - do -
2011 – 1,257Others - do - 2012 – 14,905 - do -
2011 – 17,757Total 2012 P=26,525 P=69,777Total 2011 P=602 P=74,707
d. The following are the outstanding trade payables from related parties:
Related Parties Nature Year
Transactionsduring the Year
EndedDecember 31
OutstandingBalance as of
Year-end Terms and ConditionsEntities undercommonshareholder groupRepublicConsolidatedCorporation
Purchase ofgoods 2012 P=1,041 P=1,041
Interest-bearing,collectible in 60 days
2011 – – Unsecured, unimpaired
Bevco Philippines,Inc.
Tollingcharges 2012 – –
Non-interest-bearing,collectible in 60 days
2011 – 1,669 Unsecured, unimpaired
Philtown Properties,Inc.
Rentexpense 2012 – –
Non-interest-bearing,collectible in 60 days
2011 – 3 Unsecured, unimpairedTotal 2012 P=1,041 P=1,041Total 2011 P=– P=1,672
e. The Group has long outstanding receivables from the shareholders of Invest Asia amountingto P=373,900 as of December 31, 2012 and 2011 which are fully provided.
Significant transactions with subsidiaries and joint venture which have been eliminated in theconsolidation:
a. Sales and purchases of products and services to/from the Parent Company and its subsidiaries:
Sales and Services Purchases2012 2011 2010 2012 2011 2010
Parent Company P=199,503 P=163,334 P=136,449 P=454,372 P=353,410 P=313,877ICC 414,236 321,343 285,561 199,503 163,334 136,449RLC 40,136 32,067 28,316 – – –
b. The Parent Company entered into a management agreement with ICC under which the ParentCompany shall receive from ICC a monthly fee of P=1.00 million. On January 1, 2011, themonthly fee was increased to P=2.50 million. Total service income amounted toP=30.00 million, P=30.00 million and P=12.00 million in 2012, 2011, and 2010, respectively.
In addition, ICC leases its production facility and warehouse from the Parent Company for itsmanufacturing operations and warehousing of its raw materials and finished goods. Rentalincome amounted to P=28.41 million, P=28.00 million and P=12.44 million in 2012, 2011 and2010, respectively. Net payable to ICC amounted to P=29.72 million as of December 31, 2012.Net receivable from ICC amounted to P=26.04 million as of December 31, 2011.
c. The Parent Company utilizes RLC for its lighterage requirements. Service fee to RLCamounted to P=40.14 million in 2012, P=32.07 million in 2011 and P=28.32 million in 2010.Deposits on purchases amounted to P=15.96 as of December 31 2012 and accounts payableamounted to P=1.23 million as of December 31, 2011.
d. The Parent Company has availments/extensions of both interest-bearing and non-interest-bearing cash advances mainly for working capital purposes and investment activities from/tosubsidiaries and other related parties with no fixed repayment terms. Advances to asubsidiary are subject to annual interest of 9% on the monthly outstanding balance. Totalinterest earned by the Parent Company amounted to P=25.75 million in 2012, P=82.12 million in2011 andP=57.10 million in 2010.
e. Distribution services provided by the Parent Company to URICI for the export of frozen dairydessert/mellorine whereby URICI pays service fees equivalent to 7% of the total net salesvalue of goods distributed. Service fees amounted to P=25.87 million, P=5.63 million andP=10.29 million for the years ended December 31, 2012, 2011 and 2010, respectively.
f. Management services of the Parent Company to RIBI wherein RIBI pays the Parent Company ayearly management fee equivalent to 5% of income before income tax or a fixed amountbased on the level of net sales, whichever is higher. Management fee for the years endedDecember 31, 2012, 2011 and 2010 amounted to P=0.50 million each year.
g. The Parent Company has a lease agreement for office space with Invest Asia, a subsidiary. Thelease covers a one-year period, renewable every two years at the option of the ParentCompany. Lease expense amounted to nil and P=2.88 million in 2012 and 2011.
Compensation of key management personnel of the Group by benefit type follows:
2012 2011 2010Salaries and other short-term benefits P=79,652 P=72,020 P=71,707Proportionate share in share-based
compensation of URICI 562 883 481Pension benefits costs 11,123 5,813 4,531
P=91,337 P=78,716 P=76,719

27. Pension Benefits
The Parent Company, joint venture and certain subsidiaries have funded, noncontributory definedbenefits pension plans (the Plans) covering substantially all their permanent employees.
a. Pension Benefits Costs
The components of pension benefits costs recognized in the consolidated statements ofincome for the years ended December 31 follow:
2012 2011 2010Current service cost P=24,098 P=18,542 P=14,842Interest cost on benefits obligation 24,467 24,972 22,906Expected return on plan assets (29,159) (25,478) (13,522)Pension benefits costs P=19,406 P=18,036 P=24,226
Actual return on plan assets P=69,451 P=10,931 P=27,848
b. Net Pension Obligation
The details of the net pension obligation and the amounts recognized in the consolidatedbalance sheets as of December 31, 2012 and 2011 follow:
2012 2011Defined benefits obligation P=406,609 P=395,269Fair value of plan assets (397,187) (291,433)
9,422 103,836Unrecognized asset due to asset ceiling limit 18,726 –Net pension obligation P=28,148 P=103,836
Changes in the present value of the defined benefits obligation follow:
2012 2011Defined benefits obligation, January 1 P=395,269 P=316,783Interest cost on benefit obligation 24,467 24,972Current service cost 24,098 18,542Actuarial loss (20,356) 38,100Benefits paid (16,869) (965)Transfers – (2,163)Defined benefits obligation, December 31 P=406,609 P=395,269
Changes in the fair value of plan assets follow:
2012 2011Fair value of plan assets, January 1 P=291,433 P=259,848Expected return on plan assets 29,159 25,478Contributions 39,108 23,782Benefits paid (2,805) (965)Actuarial gain (loss) 40,292 (14,547)Transfers – (2,163)Fair value of plan assets, December 31 P=397,187 P=291,433
Transfers pertain to the plan asset share of certain employees of URICI transferred toUnilever Philippines, Inc.
Categories of plan assets as a percentage of the fair value of total plan assets follow:
2012 2011Investments in:
Bonds 36.44% 42.43%Financial instruments 31.02% 32.66%Real estate 2.95% 7.55%
Cash and cash equivalents 28.69% 15.63%Loans and other receivables 1.15% 1.91%Payable to trustee (0.25%) (0.18%)
100.00% 100.00%
The overall expected return on the plan assets is determined based on the market prices prevailingon that date applicable to the period over which the obligation is to be settled. As ofDecember 31, 2012, 2011 and 2010, the principal assumptions used in determining pensionbenefits costs and liability for the Group’s plan follow:
December 312012 2011 2010
Discount rate per annum 5% to 6% 6% to 8% 7% to 8%Expected annual rate of return on plan assets 6% to 10% 6% to 10% 8% to 10%Future annual increase in salary rate 5% to 6% 6% to 7% 7% to 8%
The latest actuarial valuation of the Group is as of December 31, 2012. Annual contribution tothe retirement plan consists of a payment to cover the current service cost for the year pluspayment toward funding the actuarial accrued liability. The Group’s expected contribution to thefund assets in 2013 amounted to P=5.34 million.
The amounts for the current and previous periods of the fair value of the plan assets, the presentvalue of the defined benefits obligations and the experience adjustments, follow:
2012 2011 2010 2009 2008Fair value of plan assets P=397,187 P=291,433 P=259,848 P=230,439 P=172,882Defined benefits obligation (406,609) (395,269) (316,783) (238,287) (71,129)Surplus (deficit) (9,422) (103,836) (56,935) (7,848) 101,753Experience adjustments on the defined
benefit obligation 20,356 (38,100) (54,174) (153,017) (203,413)Experience adjustments on plan assets 40,292 (14,547) 14,326 37,609 (28,857)
Actuarial gains in 2012 and actuarial losses in 2011 and 2010 on defined benefit plan, net ofdeferred income tax, recognized in other comprehensive income amounted to P=29.35 million andP=36.85 million and P=24.56 million, respectively. Cumulative actuarial gain and cumulativeactuarial loss on defined benefits plan, net of deferred income tax, recognized in retained earningsamounted to P=3.02 million and P=26.32 million as of December 31, 2012 and 2011, respectively.
28. Share-based Compensation Plan
URICI has the following share-based compensation plans, wherein key management of URICI areparticipating in the following share options and purchase plans of Unilever N.V. (NV) andUnilever PLC (PLC).

Executive Option Plan (EOP)The plan was introduced in 2005 to reward key employees of URICI of NV shares for theircontribution to the enhancement of URICI’s longer term future and their commitment to URICIover a sustained period. Under this plan, options are granted to employees of the group on adiscretionary basis. The grant is dependent on the performance of URICI and the individualemployee. The share options under this plan become exercisable after a three-year period fromthe date of grant and have a maximum term of ten (10) years.
The economic fair value of the share options awarded is calculated using an option pricing model(adjusted Black-Scholes model) and the resulting cost is recognized as employee benefit cost overthe vesting period of the grant. The exercise price is the market price at the date of grant.
Global Share Incentive Plan (GSIP)Under the GSIP, annual awards of shares in NV and PLC are granted to executive directors alongwith other senior employees. The actual number of shares received at vesting after three yearsdepends on the satisfaction of performance conditions linked to improvements in URICI’sperformance.
The vesting share will be conditional on the achievement of three distinct performance conditionsover the performance period. The performance period is a 3-year calendar period. These are:(a) vesting of 40% of the shares in the award is based on a condition measuring URICI’s relativetotal shareholder return; (b) vesting of a further 30% of the shares in the award is conditional onaverage underlying sales growth performance over the three-year period; and (c) the vesting of thefinal 30% of the shares in the award is conditional on cumulative ungeared free cash flowperformance which is the basic driver of returns URICI is able to generate to its stockholders.
Management Co-Investment Plan (MCIP)The Management Co-Investment Plan further enhances alignment with shareholder’s interest.Under the MCIP, key executives can elect to invest up to 60% of their annual bonus in UnileverNV and PLC shares (Investment Shares). These are then matched with an equivalent number ofshares.
The matching shares will vest in 3 years at 0% to 200% depending on Unilever’s achievement ofthe vesting conditions. The vesting conditions are: (1) Underlying Sales Growth, (2) AverageUnderlying Operating Margin and (3) Cumulative Operating Cash Flow.
During the vesting period, the match shares can earn dividend equivalents. These dividend sharesare re-invested as additional MCIP target shares.
Share-based compensation plan recognized in equity consist of MCIP amounting to P=0.36 millionand P=0.18 million as of December 31, 2012 and 2011, respectively.
Share-based compensation expense relating to key executives that transferred employment withinthe Unilever Group entities (including URICI) are recognized in the entity where the serviceshave been rendered. Share-based compensation expense in relation to these key executives arerecognized by URICI within personnel costs in the consolidated statement of income.
In 2012 and 2011, NV and PLC charged URICI an amount equal to the fair value at grant date ofthe share options provided by URICI under GPSP, GSIP and SMP share-based plans. As a result,the related amounts of share options under share-based compensation reserve in the consolidatedstatement of changes in equity were transferred to due to related parties in the consolidatedbalance sheet.
For the year ended December 31, 2012, total recharge from NV and PLC based on the foregoingdiscussions amounted to P=0.55 million. Out of this amount, P=0.20 million was credited to
share-based compensation reserve in the statement of changes in equity and P=0.35 million wascredited to due to related parties.
For the year ended December 31, 2011, total recharge from NV and PLC based on the foregoingdiscussions amounted to P=1.40 million. Out of this amount, P=0.10 million was charged to share-based compensation reserve in the statement of changes in equity and P=1.50 million was creditedto due to related parties.
As at December 31, 2012 and 2011, the exercise price is generally equal to the market price at thedate of grant.
The summary of the status and changes on the EOP, GSIP and MCIP as of and for the years endedDecember 31 is as follows:
EOP2012 2011
Unilever NV Shares Unilever PLC Shares Unilever NV Shares Unilever PLC SharesWeighted Weighted Weighted Weighted
Average Average Average AverageNumber Exercise Number Exercise Number Exercise Number Exercise
of Options Price of Options Price of Options Price of Options PriceOutstanding at January 1 – – – – 825 €18.03 810 £11.54Exercised – – – – (825) (18.03) (810) (11.54)Lapsed – – – – – – – –Outstanding at December 31 – – – – – – – –
Exercisable at December 31 – – – – – – – –
GSIP
2012 2011Unilever NV Shares Unilever NV Shares
Number ofShares
WeightedAverage
Exercise PriceNumberof Shares
WeightedAverage
Exercise PriceOutstanding at January 1 1,978 P=18.34 1,936 P=17.31Grant 654 20.00 522 22.84Lapsed – – (14) (19.11)Released (1,452) (16.71) (466) (19.11)Outstanding at December 31 1,180 P=24.05 1,978 P=18.34
Fair value per share award during the year inEuro/Pound (a) (b) £25.02 – £22.91
Fair value per share award during the year in Peso P=1,408 – P=1,409(a) Weighted average of share awards granted during the year.(b) Estimated based on par achievement target.
MCIP
2012 2011Unilever NV Shares Unilever NV Shares
Number ofShares
WeightedAverage
Exercise PriceNumber of
Shares
WeightedAverage
Exercise PriceOutstanding at January 1 765 £22.91 – £–Grant – – 765 22.91Outstanding at December 31 765 £22.91 765 £22.91
Fair value per share award during the year inEuro/Pound (a) – – £22.91 –
Fair value per share award during the year in Peso – – P=1,409 –(a) Weighted average of share awards granted during the year.
29. Income Taxes
a. The details of the Group’s net deferred income taxes per company follows:
December 31, 2012 December 31, 2011Net deferred
income taxassets
Net deferredincome tax
liabilities
Net deferredincome tax
assets
Net deferredincome tax
liabilitiesParent Company P=– (P=172,968) P=– (P=152,754)CMPC – (19,186) – (19,186)URICI 82,859 – 59,393 –ICC 3,239 – 4,214 –Others 2,280 – 1,905 –
P=88,378 (P=192,154) P=65,512 (P=171,940)
b. The components of the Group’s net deferred income tax liabilities follow:
2012 2011Deferred income tax assets on:
Accrual of advertising and promotions P=57,728 P=36,400Doubtful accounts and probable losses 29,033 41,617Accrual of employee benefits 23,427 21,230Provision for probable losses 18,030 15,000Inventory losses and obsolescence 9,099 9,108Net pension obligation 1,931 2,398Cumulative actuarial loss on defined
benefit plan – 11,282Others 2,102 369
Total deferred income tax assets 141,350 137,404
Deferred income tax liabilities on:Revaluation increment on land (Note 10) (243,832) (243,832)Cumulative actuarial gain on defined
benefit plan (1,294) –Total deferred income tax liabilities (245,126) (243,832)Net deferred income tax liabilities (P=103,776) (P=106,428)
c. Deferred income tax assets have not been recognized by the individual subsidiaries in theGroup to which these deductible temporary differences, carryforward benefits of NOLCO andexcess of MCIT over RCIT relate because they do not expect availability of taxable income torealize the benefits:
2012 2011Allowances for:
Doubtful accounts P=797,249 P=1,451,640Inventory obsolescence 121,040 128,986Losses on prepayments 33,649 33,649Impairment losses on property, plant and
equipment 21,296 21,296
(Forward)

2012 2011Unamortized past service cost P=55,444 P=55,970Accrual and advertising promotions 52,000 –NOLCO 53,593 30,408Net pension obligation 21,711 95,843Excess MCIT 335 224Unrealized foreign exchange loss 337 399
NOLCO:
Inception Year Amount Applied/Expired Balance Expiry Year2010 P=16,752 P=– P=16,752 20132011 13,656 – 13,656 20142012 23,185 – 23,185 2015
P=53,593 P=– P=53,593
Excess MCIT:
Inception Year Amount Applied/Expired Balance Expiry Year2010 P=97 P=– P=97 20132011 127 – 127 20142012 111 – 111 2015
P=335 P=– P=335
d. A reconciliation of income tax computed at the statutory income tax rate to the provision forincome tax follows:
2012 2011 2010Provision for income tax at the statutory
income tax rate P=283,039 P=214,456 P=229,898Additions to (reductions in)
income tax resulting from:Deductible temporary differences, NOLCO
and excess MCIT for which no deferredincome tax assets were recognized inthe previous years but applied andutilized in the current year (221,864) (15,674) (85,042)
Nondeductible impairment of AFS financialassets 163,758 – –
Interest income subjected to final tax (4,624) (2,468) (2,708)Equity in net earnings of an associate (3,352) (3,735) (3,571)Nondeductible portion of interest expense 1,393 748 894Nontaxable excess of acquirer’s interest in
fair value of identifiable net assetsacquired over the cost of businesscombination - – (4,243)
Others 42,841 13,222 6,006Provision for income tax P=261,191 P=206,549 P=141,234
30. Sale of “Swift” Trademark
On October 16, 2012, the Parent Company entered into a Trademark and Asset PurchaseAgreement with Pacific Meat Company, Inc. (PMCI), the meat subsidiary of the Century CanningGroup, on the sale of the Swift trademark and certain machinery and equipment. The agreementcovers the sale of the Swift brand at P=600 million, specific processed meat equipment at P=50million, and certain raw materials and finished product inventories at P=170 million. Thetransaction was effected on November 16, 2012.
Raw materials and finished goods inventories were purchased by PMCI on a per purchase orderbasis from November 16, 2012 and in the first quarter of 2013.
31. Commitments and Contingencies
a. As discussed in Note 18, the Group entered into finance leases covering various machineryand equipment with a third party supplier.
b. The Parent Company entered into a Trademark License Agreement with Sunkist Growers,Inc. (Sunkist) whereby the latter granted the Parent Company exclusive right to use certain ofSunkist’s trademark and trade dress in connection with the manufacture, marketing,distribution and sale of non-carbonated beverages. The Parent Company agreed to pay a fixedamount of royalty, as stipulated in the Agreement, every year. The Agreement will ceaseupon mutual consent of the Parent Company and Sunkist. Unpaid royalty recorded under“Other accrued liabilities” account amounted to P=1.91 million and P=2.45 million as ofDecember 31, 2012 and 2011, respectively (see Note 16). Royalty expense under “Otherexpenses” account in selling and marketing expenses amounted to P=10.64 million,P=7.06 million and P=7.33 million in 2012, 2011 and 2010, respectively (see Note 23).
c. The Parent Company entered into a Distribution Agreement with DOLE Philippines Inc.whereby the latter appointed the Parent Company as its exclusive distributor for certainProducts to Non-Key and General Trade Customers in both Retail and Food Service. TheAgreement commenced on April 1, 2012 and shall expire on March 31, 2013. The renewaland extension is at the option of both parties, provided that in no case shall such renewal orextension be for a term more than six (6) months. Outstanding payable to DOLE, includedunder “Trade Accounts Payable” account, amounted to P=14.79 million as ofDecember 31, 2012 (see Note 16). Purchased inventories, included under “Finished GoodsInventory” account, amounted to P=50.06 million as of December 31, 2012 (see Note 8).
d. The Group is currently involved in certain legal, contractual and regulatory matters thatrequire the recognition of provisions for related probable claims against the Group.Management and its legal counsel believe the said cases and claims will be resolved in favorof the Group and in the event that any of those cases and claims will have an adverse rulingagainst the Group, it will not have a material effect on its consolidated financial statements.Certain outstanding provision as of December 31, 2009 was reversed in 2010 as a result of thefavorable resolution by the CA. The CA denied the motion for reconsideration for thelitigation claims against the Group. The Group reversed the provision made in prior years andcredited the reversal amounting to P=14.61 million to the 2010 consolidated statement ofincome (see Note 19).

Provisions for restructuring costs are recognized by URICI for employee redundancy whohave accepted the redundancy programs and financial package offered by URICI to itsemployees. The restructuring programs are generally completed a year from date ofimplementation and settled within 12 months from balance sheet date.
The Group’s provision for restructuring costs amounted to P=50.00 million and P=1.64 millionas of December 31, 2012 and 2011, respectively (see Note 19). Further, in 2012 and 2011,the Group recognized provision for certain legal and regulatory matters amounting to P=16.10million and P=50.00 million, respectively.
The disclosure of additional details beyond the present disclosures may seriously prejudicethe Group’s position and negotiation strategies with respect to these matters. Thus, asallowed by PAS 37, Provisions, Contingent Liabilities and Contingent Assets, only a generaldescription is provided.
32. Basic/Diluted Earnings Per Share
2012 2011 2010a. Net income attributable to equity
holders of the Parent Company P=685,750 P=509,580 P=624,710b. Weighted average number of
common shares outstanding 3,160,403,866 3,160,403,866 3,160,403,866c. Basic/diluted earnings per share P=0.217 P=0.161 P=0.198
The Group does not have potentially dilutive common shares as of December 31, 2012, 2011 and2010. Therefore, the basic/dilutive earnings per share are the same as of those dates.
33. Financial Risk Management Objectives and Policies
The Group’s principal financial instruments include non-derivative instruments such as cash andcash equivalents, AFS financial assets, accounts receivable, bank loans, accounts payable andaccrued liabilities, long-term debts and obligations and advances to and from related parties. Themain purpose of these financial instruments includes raising funds for the Group’s operations andmanaging identified financial risks. The Group has various other financial assets and financialliabilities such as other current receivables, other current assets and customers’ deposits whicharise directly from its operations. The main risk arising from the use of financial instruments iscredit risk, liquidity risk, interest rate risk, foreign exchange risk and equity price risk.
Credit riskCredit risk arises from the risk of counterparties defaulting. Management is tasked to minimizecredit risk through strict implementation of credit, treasury and financial policies. The Groupdeals only with reputable counterparties, financial institutions and customers. To the extentpossible, the Group obtains collateral to secure sales of its products to customers. In addition, theGroup transacts with financial institutions belonging to the top 25% of the industry, and/or thosewhich provide the Group with long-term loans and/or short-term credit facilities.
The Group does not have significant concentrations of credit risk and does not enter into financialinstruments to manage credit risk. With respect to credit risk arising from financial assets otherthan accounts receivable (such as cash and cash equivalents and AFS financial assets), theGroup’s exposure to credit risk arises from default of the counterparties, with a maximumexposure equal to the carrying amount of these instruments.
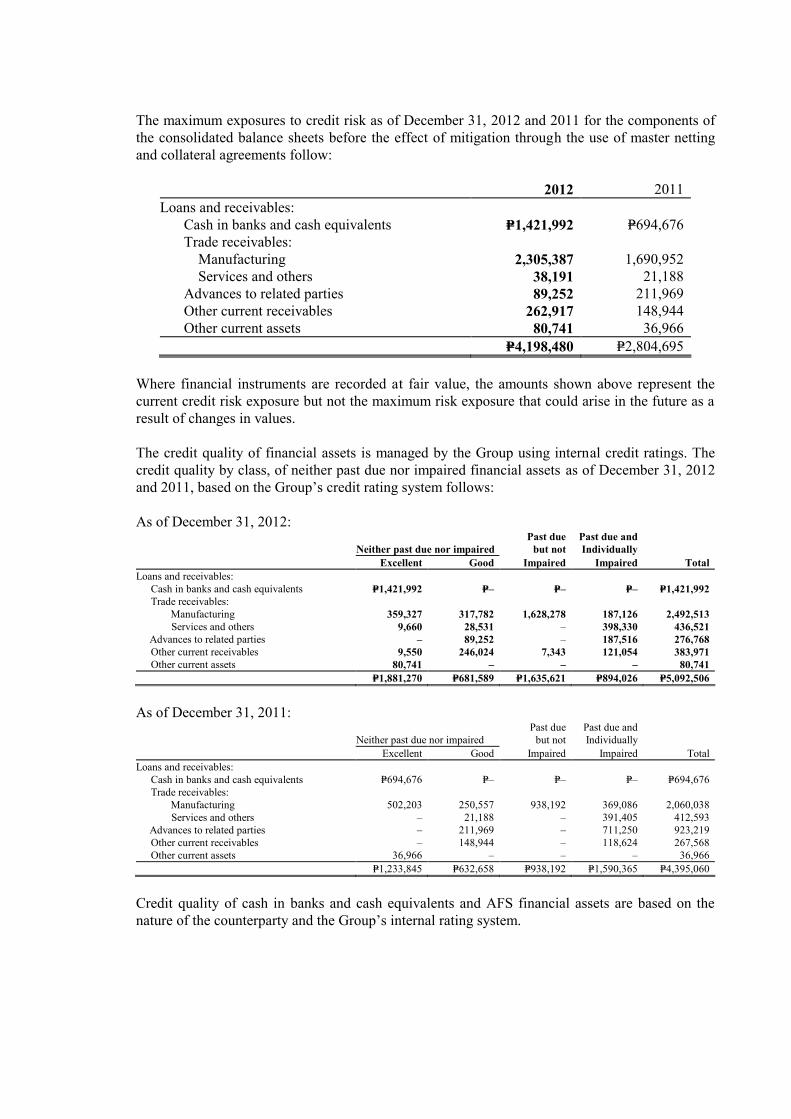
The maximum exposures to credit risk as of December 31, 2012 and 2011 for the components ofthe consolidated balance sheets before the effect of mitigation through the use of master nettingand collateral agreements follow:
2012 2011Loans and receivables:
Cash in banks and cash equivalents P=1,421,992 P=694,676Trade receivables:
Manufacturing 2,305,387 1,690,952Services and others 38,191 21,188
Advances to related parties 89,252 211,969Other current receivables 262,917 148,944Other current assets 80,741 36,966
P=4,198,480 P=2,804,695
Where financial instruments are recorded at fair value, the amounts shown above represent thecurrent credit risk exposure but not the maximum risk exposure that could arise in the future as aresult of changes in values.
The credit quality of financial assets is managed by the Group using internal credit ratings. Thecredit quality by class, of neither past due nor impaired financial assets as of December 31, 2012and 2011, based on the Group’s credit rating system follows:
As of December 31, 2012:Past due Past due and
Neither past due nor impaired but not IndividuallyExcellent Good Impaired Impaired Total
Loans and receivables:Cash in banks and cash equivalents P=1,421,992 P=– P=– P=– P=1,421,992Trade receivables:
Manufacturing 359,327 317,782 1,628,278 187,126 2,492,513 Services and others 9,660 28,531 – 398,330 436,521
Advances to related parties – 89,252 – 187,516 276,768Other current receivables 9,550 246,024 7,343 121,054 383,971Other current assets 80,741 – – – 80,741
P=1,881,270 P=681,589 P=1,635,621 P=894,026 P=5,092,506
As of December 31, 2011:Past due Past due and
Neither past due nor impaired but not IndividuallyExcellent Good Impaired Impaired Total
Loans and receivables:Cash in banks and cash equivalents P=694,676 P=– P=– P=– P=694,676Trade receivables:
Manufacturing 502,203 250,557 938,192 369,086 2,060,038 Services and others – 21,188 – 391,405 412,593
Advances to related parties – 211,969 – 711,250 923,219Other current receivables – 148,944 – 118,624 267,568Other current assets 36,966 – – – 36,966
P=1,233,845 P=632,658 P=938,192 P=1,590,365 P=4,395,060
Credit quality of cash in banks and cash equivalents and AFS financial assets are based on thenature of the counterparty and the Group’s internal rating system.
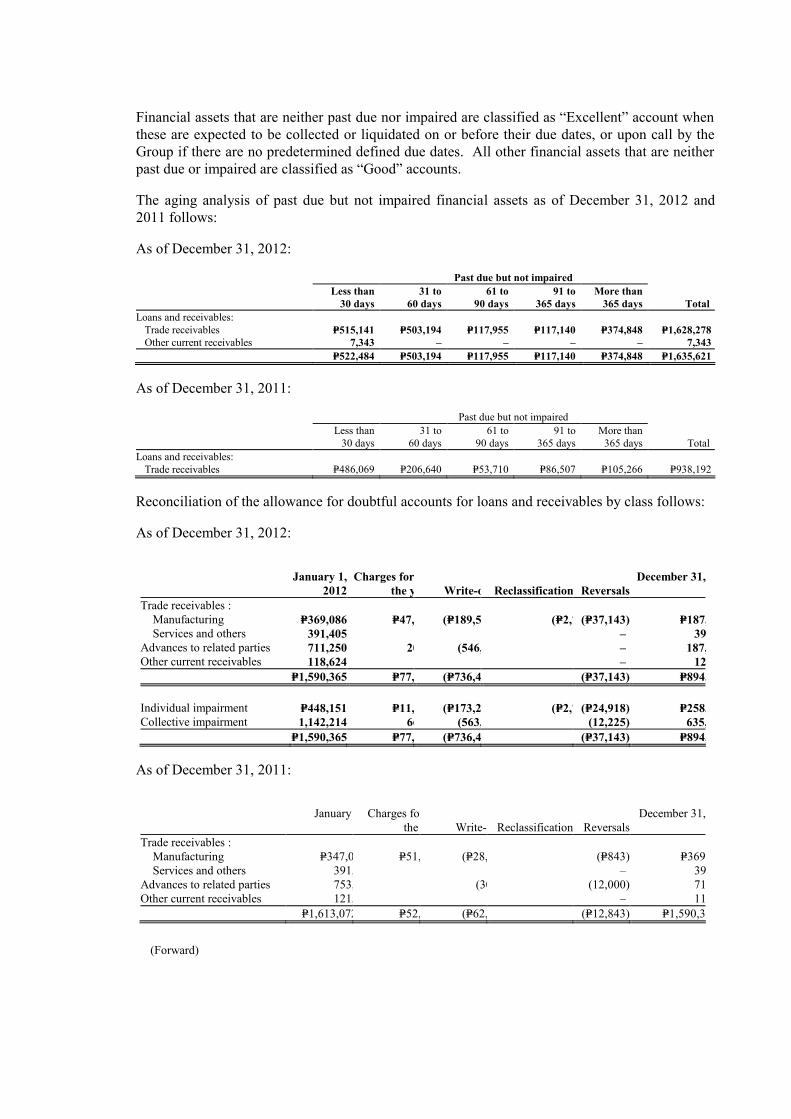
Financial assets that are neither past due nor impaired are classified as “Excellent” account whenthese are expected to be collected or liquidated on or before their due dates, or upon call by theGroup if there are no predetermined defined due dates. All other financial assets that are neitherpast due or impaired are classified as “Good” accounts.
The aging analysis of past due but not impaired financial assets as of December 31, 2012 and2011 follows:
As of December 31, 2012:
Past due but not impairedLess than 31 to 61 to 91 to More than
30 days 60 days 90 days 365 days 365 days TotalLoans and receivables:
Trade receivables P=515,141 P=503,194 P=117,955 P=117,140 P=374,848 P=1,628,278Other current receivables 7,343 – – – – 7,343
P=522,484 P=503,194 P=117,955 P=117,140 P=374,848 P=1,635,621
As of December 31, 2011:
Past due but not impairedLess than 31 to 61 to 91 to More than
30 days 60 days 90 days 365 days 365 days TotalLoans and receivables:
Trade receivables P=486,069 P=206,640 P=53,710 P=86,507 P=105,266 P=938,192
Reconciliation of the allowance for doubtful accounts for loans and receivables by class follows:
As of December 31, 2012:
January 1,2012
Charges forthe year Write-offsReclassification Reversals
December 31,2012
Trade receivables :Manufacturing P=369,086 P=47,474 (P=189,510) (P=2,781)(P=37,143) P=187,126Services and others 391,405 6,925 – –– 398,330
Advances to related parties 711,250 20,400 (546,915) 2,781 – 187,516Other current receivables 118,624 2,430 – –– 121,054
P=1,590,365 P=77,229 (P=736,425) P=–(P=37,143) P=894,026
Individual impairment P=448,151 P=11,071 (P=173,227) (P=2,781)(P=24,918) P=258,296Collective impairment 1,142,214 66,158 (563,198) 2,781(12,225) 635,730
P=1,590,365 P=77,229 (P=736,425) P=–(P=37,143) P=894,026
As of December 31, 2011:
January 1,2011Charges for
the year Write-offsReclassification ReversalsDecember 31,
2011Trade receivables :
Manufacturing P=347,078 P=51,821 (P=28,970) P=–(P=843) P=369,086Services and others 391,159 246 – –– 391,405
Advances to related parties 753,209 41 (30,000) –(12,000) 711,250Other current receivables 121,626 176 (3,178) –– 118,624
P=1,613,072 P=52,284 (P=62,148) P=–(P=12,843) P=1,590,365
(Forward)
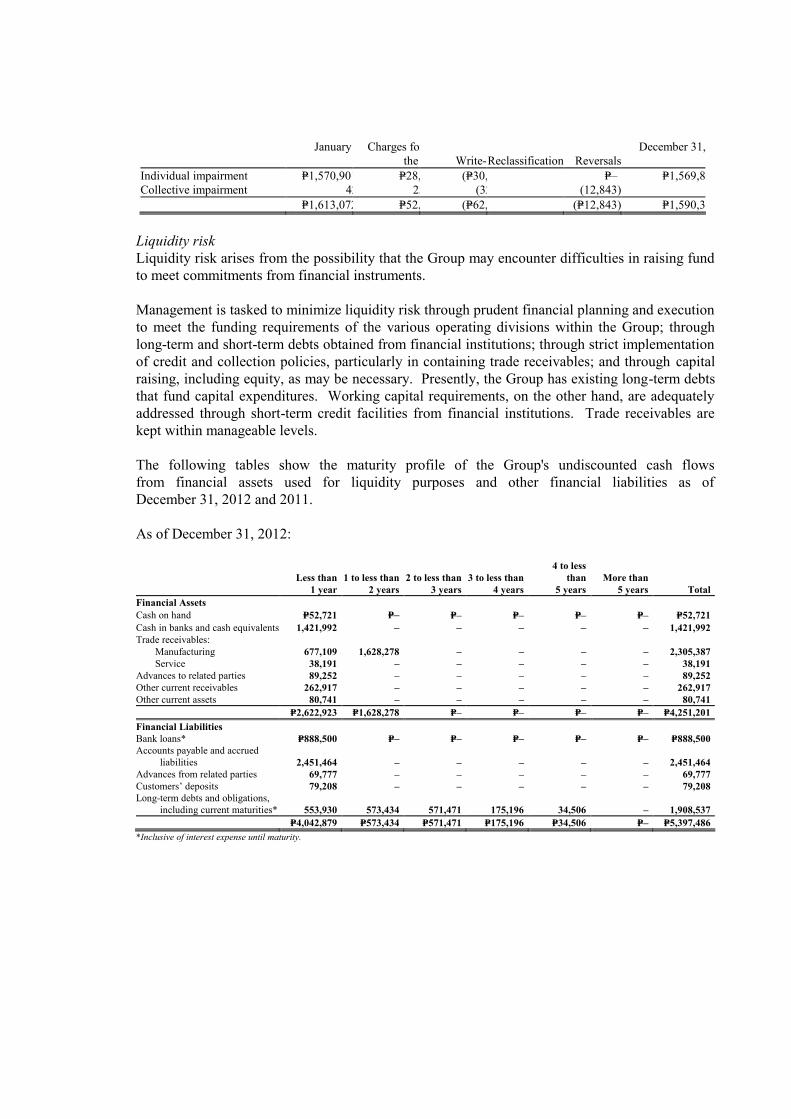
January 1,2011Charges for
the year Write-offsReclassification ReversalsDecember 31,
2011Individual impairment P=1,570,901 P=28,979 (P=30,000) P=–P=– P=1,569,880Collective impairment 42,171 23,305 (32,148) –(12,843) 20,485
P=1,613,072 P=52,284 (P=62,148) P=–(P=12,843) P=1,590,365
Liquidity riskLiquidity risk arises from the possibility that the Group may encounter difficulties in raising fundto meet commitments from financial instruments.
Management is tasked to minimize liquidity risk through prudent financial planning and executionto meet the funding requirements of the various operating divisions within the Group; throughlong-term and short-term debts obtained from financial institutions; through strict implementationof credit and collection policies, particularly in containing trade receivables; and through capitalraising, including equity, as may be necessary. Presently, the Group has existing long-term debtsthat fund capital expenditures. Working capital requirements, on the other hand, are adequatelyaddressed through short-term credit facilities from financial institutions. Trade receivables arekept within manageable levels.
The following tables show the maturity profile of the Group's undiscounted cash flowsfrom financial assets used for liquidity purposes and other financial liabilities as ofDecember 31, 2012 and 2011.
As of December 31, 2012:
Less than 1 year
1 to less than2 years
2 to less than3 years
3 to less than4 years
4 to lessthan
5 yearsMore than
5 years TotalFinancial AssetsCash on hand P=52,721 P=– P=– P=– P=– P=– P=52,721Cash in banks and cash equivalents 1,421,992 – – – – – 1,421,992Trade receivables:
Manufacturing 677,109 1,628,278 – – – – 2,305,387Service 38,191 – – – – – 38,191
Advances to related parties 89,252 – – – – – 89,252Other current receivables 262,917 – – – – – 262,917Other current assets 80,741 – – – – – 80,741
P=2,622,923 P=1,628,278 P=– P=– P=– P=– P=4,251,201Financial LiabilitiesBank loans* P=888,500 P=– P=– P=– P=– P=– P=888,500Accounts payable and accrued
liabilities 2,451,464 – – – – – 2,451,464Advances from related parties 69,777 – – – – – 69,777Customers’ deposits 79,208 – – – – – 79,208Long-term debts and obligations,
including current maturities* 553,930 573,434 571,471 175,196 34,506 – 1,908,537P=4,042,879 P=573,434 P=571,471 P=175,196 P=34,506 P=– P=5,397,486
*Inclusive of interest expense until maturity.
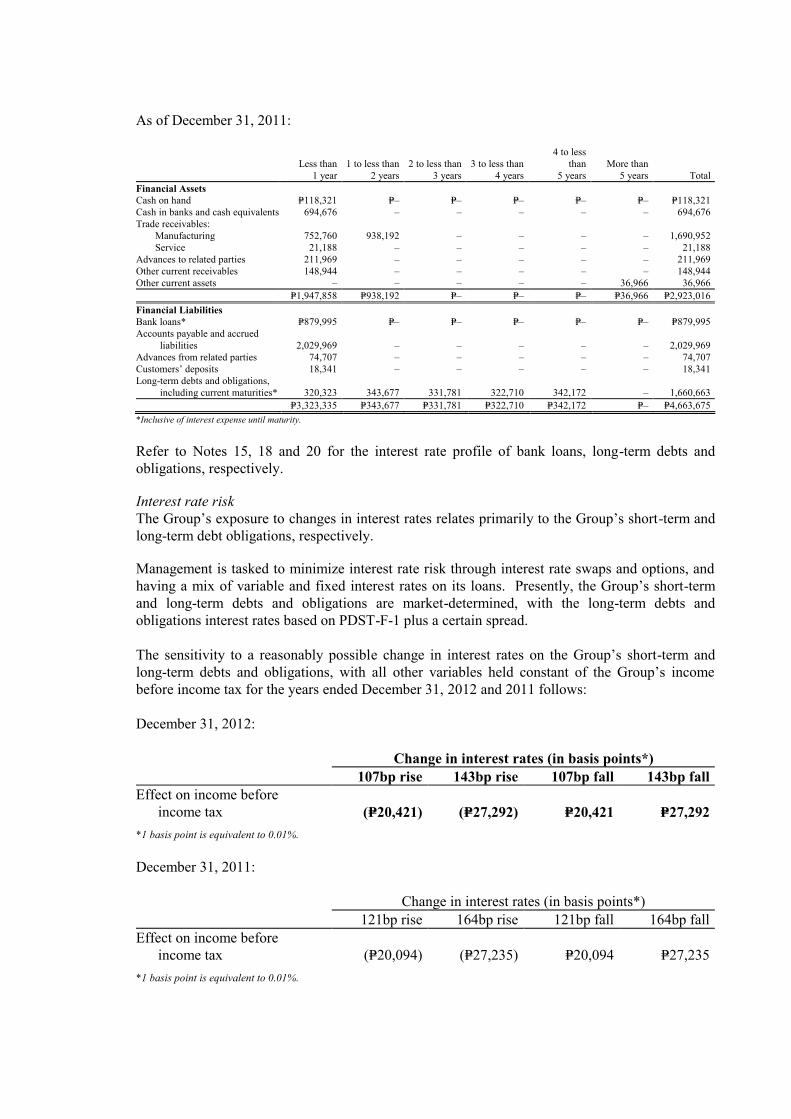
As of December 31, 2011:
Less than 1 year
1 to less than2 years
2 to less than3 years
3 to less than4 years
4 to lessthan
5 yearsMore than
5 years TotalFinancial AssetsCash on hand P=118,321 P=– P=– P=– P=– P=– P=118,321Cash in banks and cash equivalents 694,676 – – – – – 694,676Trade receivables:
Manufacturing 752,760 938,192 – – – – 1,690,952Service 21,188 – – – – – 21,188
Advances to related parties 211,969 – – – – – 211,969Other current receivables 148,944 – – – – – 148,944Other current assets – – – – – 36,966 36,966
P=1,947,858 P=938,192 P=– P=– P=– P=36,966 P=2,923,016Financial LiabilitiesBank loans* P=879,995 P=– P=– P=– P=– P=– P=879,995Accounts payable and accrued
liabilities 2,029,969 – – – – – 2,029,969Advances from related parties 74,707 – – – – – 74,707Customers’ deposits 18,341 – – – – – 18,341Long-term debts and obligations,
including current maturities* 320,323 343,677 331,781 322,710 342,172 – 1,660,663P=3,323,335 P=343,677 P=331,781 P=322,710 P=342,172 P=– P=4,663,675
*Inclusive of interest expense until maturity.
Refer to Notes 15, 18 and 20 for the interest rate profile of bank loans, long-term debts andobligations, respectively.
Interest rate riskThe Group’s exposure to changes in interest rates relates primarily to the Group’s short-term andlong-term debt obligations, respectively.
Management is tasked to minimize interest rate risk through interest rate swaps and options, andhaving a mix of variable and fixed interest rates on its loans. Presently, the Group’s short-termand long-term debts and obligations are market-determined, with the long-term debts andobligations interest rates based on PDST-F-1 plus a certain spread.
The sensitivity to a reasonably possible change in interest rates on the Group’s short-term andlong-term debts and obligations, with all other variables held constant of the Group’s incomebefore income tax for the years ended December 31, 2012 and 2011 follows:
December 31, 2012:
Change in interest rates (in basis points*)107bp rise 143bp rise 107bp fall 143bp fall
Effect on income beforeincome tax (P=20,421) (P=27,292) P=20,421 P=27,292
*1 basis point is equivalent to 0.01%.
December 31, 2011:
Change in interest rates (in basis points*)121bp rise 164bp rise 121bp fall 164bp fall
Effect on income beforeincome tax (P=20,094) (P=27,235) P=20,094 P=27,235
*1 basis point is equivalent to 0.01%.
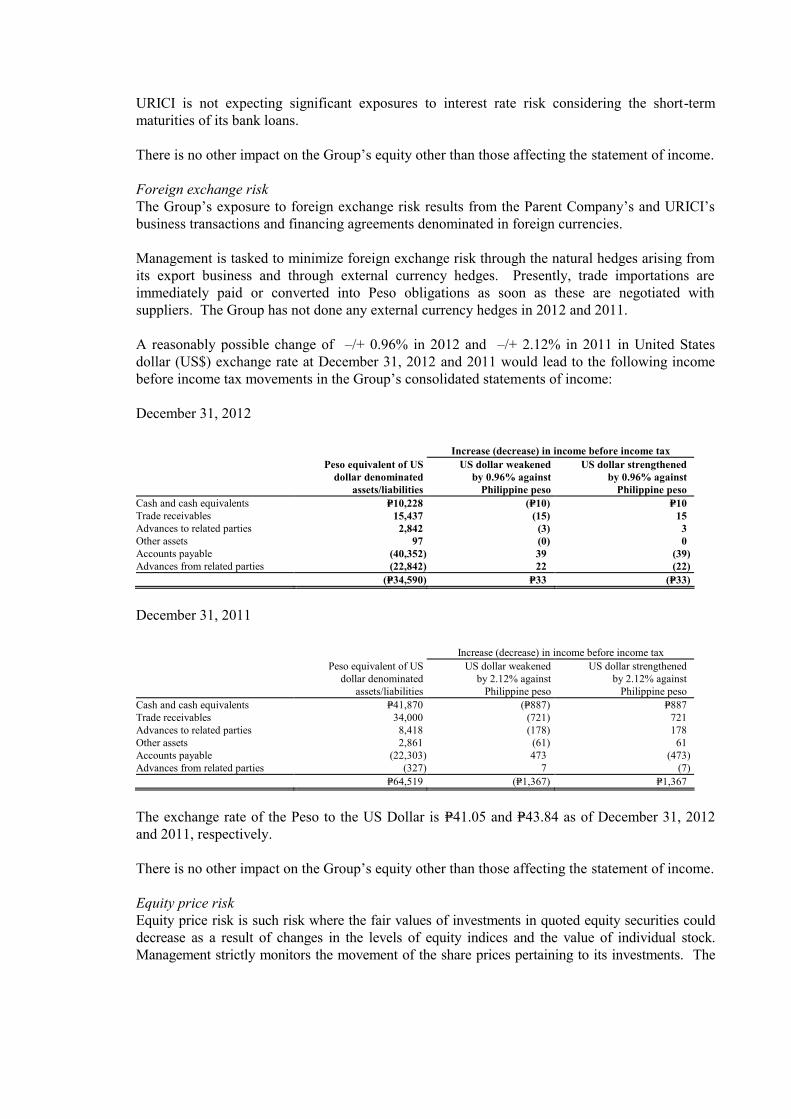
URICI is not expecting significant exposures to interest rate risk considering the short-termmaturities of its bank loans.
There is no other impact on the Group’s equity other than those affecting the statement of income.
Foreign exchange riskThe Group’s exposure to foreign exchange risk results from the Parent Company’s and URICI’sbusiness transactions and financing agreements denominated in foreign currencies.
Management is tasked to minimize foreign exchange risk through the natural hedges arising fromits export business and through external currency hedges. Presently, trade importations areimmediately paid or converted into Peso obligations as soon as these are negotiated withsuppliers. The Group has not done any external currency hedges in 2012 and 2011.
A reasonably possible change of –/+ 0.96% in 2012 and –/+ 2.12% in 2011 in United Statesdollar (US$) exchange rate at December 31, 2012 and 2011 would lead to the following incomebefore income tax movements in the Group’s consolidated statements of income:
December 31, 2012
Increase (decrease) in income before income taxPeso equivalent of US
dollar denominatedUS dollar weakened
by 0.96% againstUS dollar strengthened
by 0.96% againstassets/liabilities Philippine peso Philippine peso
Cash and cash equivalents P=10,228 (P=10) P=10Trade receivables 15,437 (15) 15Advances to related parties 2,842 (3) 3Other assets 97 (0) 0Accounts payable (40,352) 39 (39)Advances from related parties (22,842) 22 (22)
(P=34,590) P=33 (P=33)
December 31, 2011
Increase (decrease) in income before income taxPeso equivalent of US
dollar denominatedUS dollar weakened
by 2.12% againstUS dollar strengthened
by 2.12% againstassets/liabilities Philippine peso Philippine peso
Cash and cash equivalents P=41,870 (P=887) P=887Trade receivables 34,000 (721) 721Advances to related parties 8,418 (178) 178Other assets 2,861 (61) 61Accounts payable (22,303) 473 (473)Advances from related parties (327) 7 (7)
P=64,519 (P=1,367) P=1,367
The exchange rate of the Peso to the US Dollar is P=41.05 and P=43.84 as of December 31, 2012and 2011, respectively.
There is no other impact on the Group’s equity other than those affecting the statement of income.
Equity price riskEquity price risk is such risk where the fair values of investments in quoted equity securities coulddecrease as a result of changes in the levels of equity indices and the value of individual stock.Management strictly monitors the movement of the share prices pertaining to its investments. The

Group is exposed to equity securities price risk because of quoted common and golf club shares,which are classified as AFS financial assets (see Note 12). These investments, totalingP=17.26 million and P=32.13 million as of December 31, 2012 and 2011, respectively, represent0.30% and 0.33% of the total assets of the Group.
The effects on equity, as a result of a reasonably possible change in the fair value of the Group’sequity instruments held as AFS financial assets as of December 31, 2012 and 2011, which couldbe brought by changes in quoted prices with all other variables held constant, follow:
Change in quoted prices of investments carriedat fair value 2012 2011
Increase by 10% P=1,726 P=3,213Increase by 5% 863 1,607Decrease by 10% (1,726) (3,213)Decrease by 5% (863) (1,607)
There is no other impact on the Group’s equity other than those affecting the statement of income.
34. Financial Assets and Financial Liabilities
The following summarizes the carrying values and fair values of the Group’s financial assets andfinancial liabilities as of December 31:
December 31, 2012 December 31, 2011Carrying
ValueFair
ValueCarrying
ValueFair
ValueFinancial AssetsCash on hand P=52,721 P=52,721 P=118,321 P=118,321Loans and receivables:
Cash in bank and cash equivalent 1,421,992 1,421,992 694,676 694,676Trade receivables:
Manufacturing 2,305,387 2,305,387 1,690,952 1,690,952Services and others 38,191 38,191 21,188 21,188
Advances to related parties 89,252 89,252 211,969 211,969Other current receivables 262,917 262,917 148,944 148,944Other current assets 80,741 80,741 36,966 36,966
4,198,480 4,198,480 2,804,695 2,804,695AFS financial assets:
Unquoted:Redeemable preferred shares 218,350 218,350 764,736 764,736Common shares 5,003 5,003 149,752 149,752
Quoted common and golf shares 17,255 17,255 32,134 32,134240,608 240,608 946,622 946,622
P=4,491,809 P=4,491,809 P=3,869,638 P=3,869,638
(Forward)

December 31, 2012 December 31, 2011Carrying
ValueFair
ValueCarrying
ValueFair
Value
Financial LiabilitiesFinancial liabilities at FVPL P=– P=– P=1,732 P=1,732Other financial liabilities:
Bank loans 888,500 888,500 879,995 879,995Accounts payable and accrued
liabilities 2,451,464 2,451,464 2,029,969 2,029,969Advances from related parties 69,777 69,777 74,707 74,707Long-term debts and obligations,
including current maturities 1,820,663 1,820,663 2,165,766 2,165,7665,230,404 5,230,404 5,150,437 5,150,437
P=5,230,404 P=5,230,404 P=5,152,169 P=5,152,169
Fair Value of Financial InstrumentsThe following methods and assumptions were used to estimate the fair value of each class offinancial instrument for which it is practicable to estimate such value.
Due to the short-term nature of the transactions, the carrying amounts of cash and cashequivalents, accounts receivable, bank loans, accounts payable and accrued liabilities, andcustomers’ deposits approximate their fair values.
The fair value of quoted AFS financial assets has been determined by reference to quoted marketprices at the close of business as of December 31, 2012 and 2011. Investments in unquoted equitysecurities are carried at historical cost, net of impairment, as their fair value cannot be reliablymeasured.
The fair value of advances to/from related parties and long-term debts and obligations are basedon the discounted value of future cash flows using the applicable rates for similar types ofinstruments.
The Group’s investments in quoted AFS financial assets comprised of shares of stocks and golfclub shares amounted to P=17.26 million in 2012 and P=32.13 million in 2011. Fair valuemeasurements of these financial assets were determined directly by reference to published pricesquoted in an active market (Level 1 of the fair value hierarchy).
There had been no transfers between Level 1, Level 2, and Level 3 of the fair value hierarchy in2012 and 2011.
Derivative InstrumentsThe related fair values of the Group’s outstanding derivative liability arising from the interest rateswap amounted to nil and P=1.73 million as of December 31, 2012 and 2011, respectively.

Derivatives Accounted for Under Cash Flow Hedge AccountingOn August 27, 2009, the Parent Company entered into an interest rate swap transaction withHongkong and Shanghai Banking Corporation (HSBC) to hedge the cash flow variability on theBDO loan due to movements in interest rates. Details of the interest rate swap follow:
Trade Date Maturity Date Notional Amount* Receive Floating Pay FixedAugust 27, 2009 October 3, 2012 P=380.00 million PDST-F + 250 basis points 7.92% per annum
*Amortizing based on a given schedule.
Under the interest rate swap, the Parent Company will receive quarterly interest at a rate of3-months PDST-F plus 2.50% per annum spread on the outstanding peso balance startingOctober 5, 2009 until October 3, 2012, and pay quarterly interest at fixed rate of 7.92% perannum on the outstanding peso balance starting October 5, 2009 until October 3, 2012. Theoutstanding notional amount of the swap amounted to nil as of December 31, 2012 and 2011.
On October 2010, the Parent Company terminated its local bank loan, which is the underlying ofthe interest rate swap agreement. In line with the termination of the loan, the interest rate swap isaccounted for as freestanding derivative from the day the loan was terminated. Hence, unrealizedloss in equity amounting to P=0.84 million was recognized in full in the 2010 Parent Companystatement of income. As of December 31, 2012 and 2011, the fair value of the derivative liabilityamounted to nil and P=1.73 million, respectively. The Parent Company recognized in thestatements of income mark-to-market gain amounting to P=4.94 million in 2011 and mark-to-market loss of P=5.48 million in 2010. The interest rate swap agreement ended in October 2012.
Fair Value Changes on DerivativesThe net changes in the fair values of all derivative instruments for the year endedDecember 31, 2012 follow:
Balance at December 31, 2011 P=1,732Fair value changes of derivative taken to profit or loss (1,732)Derivative liability at December 31, 2012 P=-
Forward ContractsFor the year ended December 31, 2012 and 2011, URICI, through its Central TreasuryDepartment, entered into forward foreign exchange contracts as a hedge against foreign currencydenominated liabilities and commitments. These forward foreign exchange contracts are expectedto be settled within one month from the balance sheet date.
URICI’s forward foreign exchange contracts outstanding as of December 31, 2012 and 2011follow:
2012 2011Receivable leg P=29,492 P=67,482Payable leg (29,235) (56,350)Fair value P=257 P=11,132Notional principal amount in USD $712 $1,285

As at and for the years ended December 31, 2012 and 2011, the difference between the fairmarket values and aggregate notional amount of the forward contract, at net settled amount, is notconsidered significant.
The fair value of forward foreign exchange contracts is determined using forward exchangemarket rates at balance sheet date and any difference between the fair market values andaggregate notional amounts of these forward foreign exchange contracts is recognizedimmediately in the consolidated statement of income.
35. Capital Management
It is the objective of the Group to maintain a capital base that adequately services the needs of itspresent and future operations while keeping within the capital level required by creditors. Thecapital base is also sufficient to address present and future uncertainties and risks inherent in thebusiness and changes in the economic conditions. Payment of dividends, return of capital, orissuance of shares to increase capital shall be made accordingly and as may be necessary. Nochanges were made in the objectives, policies and processes as of December 31, 2012 and 2011.
The table below summarizes the total capital considered by the Group:
2012 2011Capital stock P=3,160,404 P=3,160,404Capital in excess of par value 788,643 788,643Retained earnings 1,041,914 622,698
P=4,990,961 P=4,571,745
36. Notes to Consolidated Statements of Cash Flows
Noncash Investing Activities
a. In 2012, Double Dragon Properties Corporation assigned to RIBI a condominium unit with atotal floor area of 16.5 sqm. amounting to P=1.62 million as settlement of Philtown’s payableto RIBI.
b. The Group’s noncash investing activity in 2011 pertains to acquisitions of property andequipment amounting to P=5.71 million which were not paid as of December 31, 2011. Theseamounts are included as part of the “Accounts payable and accrued liabilities” account in the2011 consolidated balance sheet.
c. The Group’s noncash investing activity in 2010 pertains to the reversal of allowance forimpairment loss on property, plant and equipment amounting to P=46.18 million, dividendreceivable from Philtown amounting to P=10.00 million, and acquisitions of property andequipment amounting to P=0.94 million which were not paid as of December 31, 2010. Therelated receivables and payables are included as part of “Other receivables” and “Accountspayable and accrued liabilities” accounts in the 2010 consolidated balance sheet.
Noncash Financing Activities
a. The Group’s noncash financing activity in 2010 pertains to the interest rate swap that wasused as hedge amounting to P=6.68 million for the exposure to change in the fair value of theGroup’s P=380.00 million fixed-rate loan.
37. Event After the Balance Sheet Date
a. On January 28, 2013, through the concurrence of the lenders, the Parent Company made apartial prepayment of its floating rate notes facility amounting toP=900.00 million and interest due thereon amounting to P=10.78 million including theamortization due amounting to P=93.75 million. After the said transaction, the outstandingbalance of the floating rate note facility amounted to P=0.54 million which is payable insubsequent quarterly installments from April 2013 to April 2014.
b. In the first quarter of 2013, the Parent Company initiated the transfer of the operatingfacilities of the Milk and Juice Division from its Manggahan plant to Cabuyao at CMPC’splant facilities.
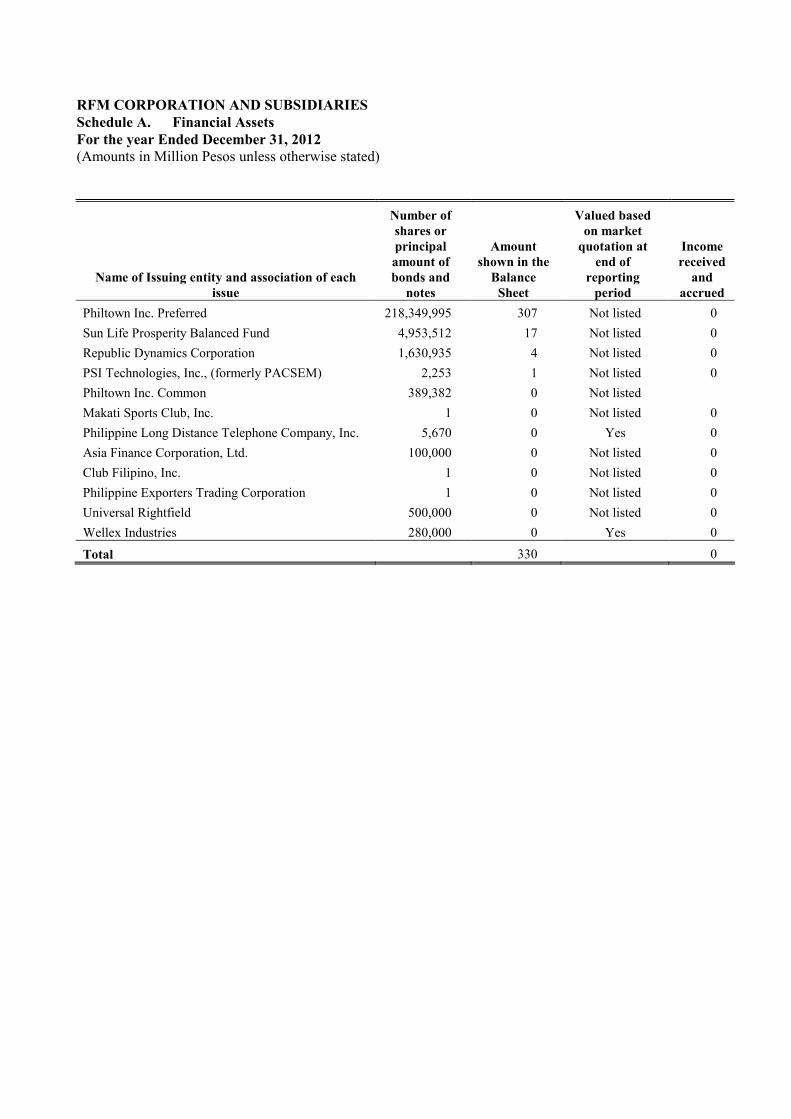
RFM CORPORATION AND SUBSIDIARIESSchedule A. Financial AssetsFor the year Ended December 31, 2012(Amounts in Million Pesos unless otherwise stated)
Name of Issuing entity and association of eachissue
Number ofshares orprincipalamount ofbonds and
notes
Amountshown in the
BalanceSheet
Valued basedon market
quotation atend of
reportingperiod
Incomereceived
andaccrued
Philtown Inc. Preferred 218,349,995 307 Not listed 0Sun Life Prosperity Balanced Fund 4,953,512 17 Not listed 0Republic Dynamics Corporation 1,630,935 4 Not listed 0PSI Technologies, Inc., (formerly PACSEM) 2,253 1 Not listed 0Philtown Inc. Common 389,382 0 Not listedMakati Sports Club, Inc. 1 0 Not listed 0Philippine Long Distance Telephone Company, Inc. 5,670 0 Yes 0Asia Finance Corporation, Ltd. 100,000 0 Not listed 0Club Filipino, Inc. 1 0 Not listed 0Philippine Exporters Trading Corporation 1 0 Not listed 0Universal Rightfield 500,000 0 Not listed 0Wellex Industries 280,000 0 Yes 0
Total 330 0

RFM CORPORATION AND SUBSIDIARIESSchedule B. Amounts Receivable from Directors, Officers, Employees, Related Parties and Principal Stockholders (Other than Affiliates)For the year Ended December 31, 2012(Amounts in Million Pesos unless otherwise stated)
Name and Designation ofDebtor
Balance atthe
beginningof period Additions
AmountsCollected
Amountswritten
off CurrentNot
Current
Balance atend ofperiod
Ifcollectionswas other
than incash,
explain
If for writeoff, givereasons
Concepcion, Jose Jr. 0 0 0Concepcion, John Marie 0 0 0Concepcion, Jose Maria III 13 13 13Nacino, Felicisimo Jr. 1 1 1Monasterio, Vina 1 1 1Others 1 1 1
17 17 - 17
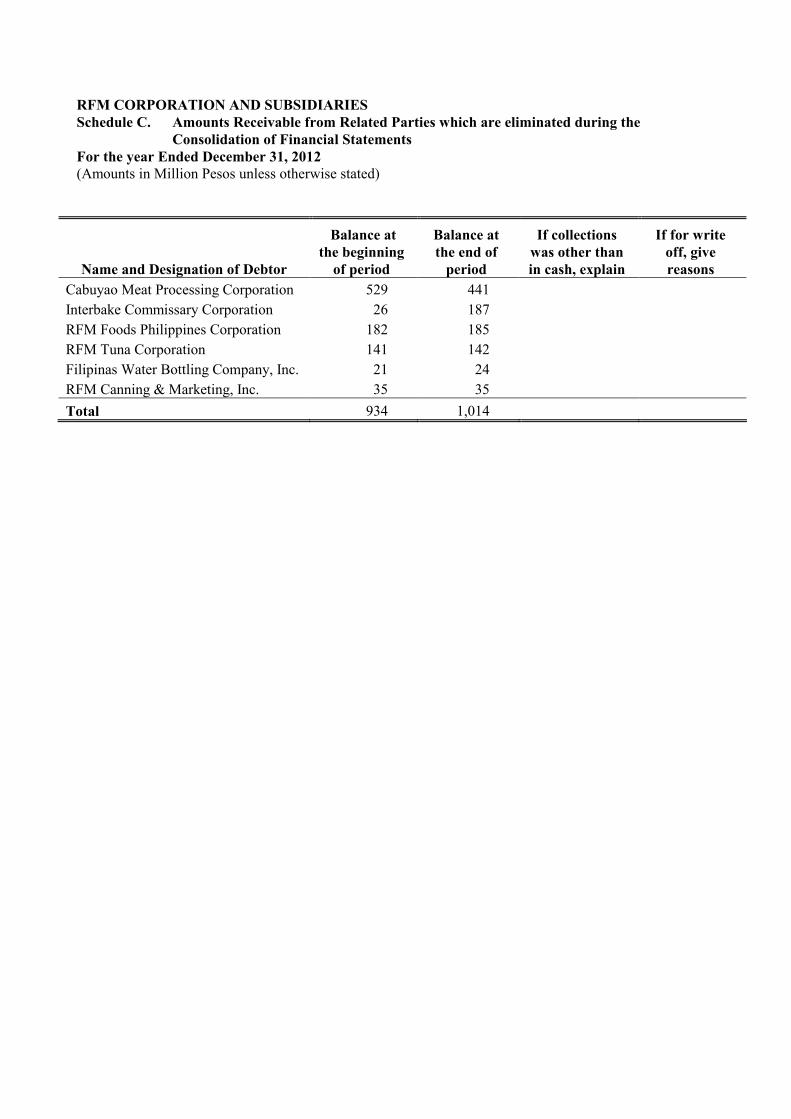
RFM CORPORATION AND SUBSIDIARIESSchedule C. Amounts Receivable from Related Parties which are eliminated during the
Consolidation of Financial StatementsFor the year Ended December 31, 2012(Amounts in Million Pesos unless otherwise stated)
Name and Designation of Debtor
Balance atthe beginning
of period
Balance atthe end of
period
If collectionswas other thanin cash, explain
If for writeoff, givereasons
Cabuyao Meat Processing Corporation 529 441Interbake Commissary Corporation 26 187RFM Foods Philippines Corporation 182 185RFM Tuna Corporation 141 142Filipinas Water Bottling Company, Inc. 21 24RFM Canning & Marketing, Inc. 35 35Total 934 1,014

4
RFM CORPORATION AND SUBSIDIARIESSchedule D. Intangible Assets - Other AssetsFor the year Ended December 31, 2012(Amounts in Million Pesos unless otherwise stated)
Name andDesignationof Debtor
Balance atthe
beginningof period Additions
AmountsCollected
Amountswritten
off CurrentNot
Current
Balance atend ofperiod
If collectionswas other
than in cash,explain
If forwrite off,
givereasons
Goodwill 191 191 191

5
RFM CORPORATION AND SUBSIDIARIESSchedule E. LONG TERM DEBTFor the year Ended December 31, 2012(Amounts in Million Pesos unless otherwise stated)
Title of Issue and type of obligation Amount
authorizedby
Indenture
Amount shown undercaption "Current
portion of long-termdebt" in related
balance sheet
Amount shownunder caption"Long-term
debt" in relatedbalance sheet
Floating rate note facility from local banks,with interest rate of 6.12% 1,500.00 375.00 750.00
Loan from local bank with interest rate basedon 3-month PDST-F plus spread of 1.65% 500.00 117.65 294.12
Loan from local bank with interest rate basedon 3-month PDST-F plus spread of 1.75% 160.00 - 160.00
Loan from local bank with interest rate basedon 3-month PDST-F plus spread of 1.75% 150.00 53.43 61.27
Total 2,310.00 546.08 1,265.39

6
RFM CORPORATION AND SUBSIDIARIESSchedule F. INDEBTEDNESS TO RELATED PARTIESFor the year Ended December 31, 2012(Amounts in Million Pesos unless otherwise stated)
Name and Designation of Debtor Balance at the
beginning of periodBalance at the end of
periodUnilever Group (0) (26)Unilever Philippines Inc. (Parent) (4) (4)Unilever NV (Netherlands) (8) (0)Philtown Propeties, Inc. (26) (24)Swift Foods Inc. (1) (0)PT Aqua (16) -Selecta Wall's Land Corporation (1) -Others (18) (15)Total (75) (70)
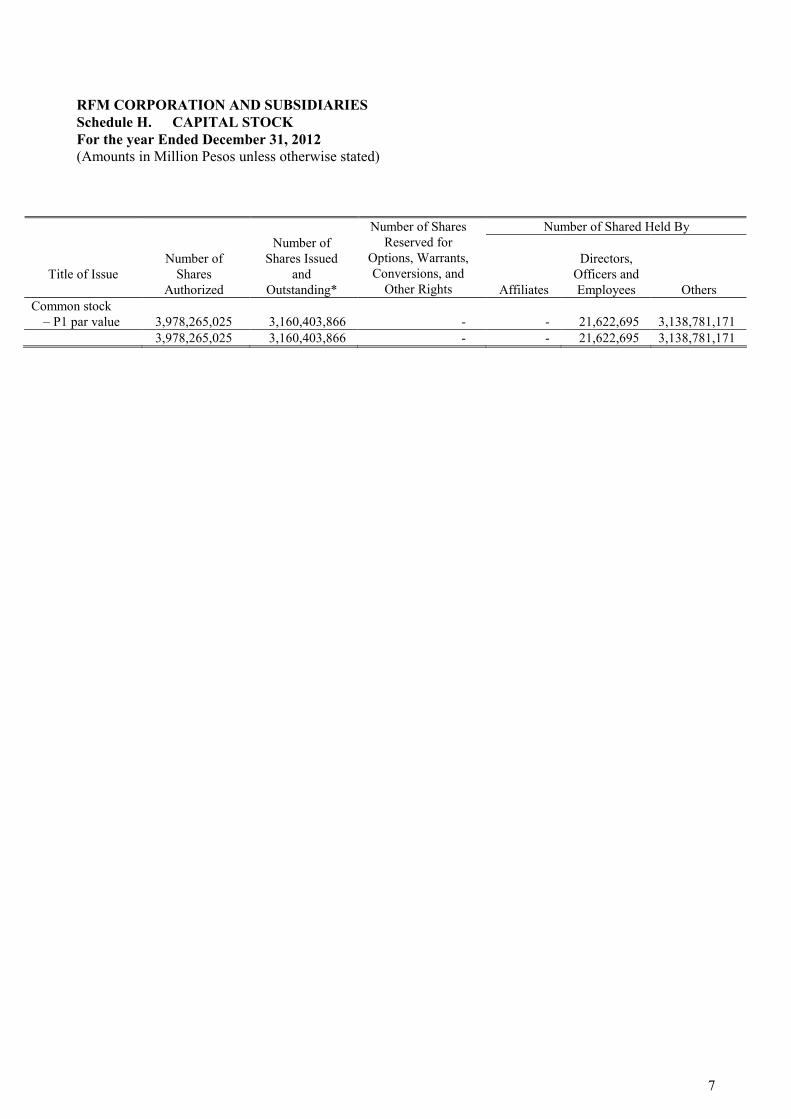
7
RFM CORPORATION AND SUBSIDIARIESSchedule H. CAPITAL STOCKFor the year Ended December 31, 2012(Amounts in Million Pesos unless otherwise stated)
Number of Shared Held By
Title of IssueNumber of
SharesAuthorized
Number ofShares Issued
andOutstanding*
Number of SharesReserved for
Options, Warrants,Conversions, and
Other Rights Affiliates
Directors,Officers andEmployees Others
Common stock– P1 par value 3,978,265,025 3,160,403,866 - - 21,622,695 3,138,781,171
3,978,265,025 3,160,403,866 - - 21,622,695 3,138,781,171

8
RFM CORPORATION AND SUBSIDIARIESSchedule I. List of Philippine Financial Reporting Standards (PFRSs) [which consist of
PFRSs, Philippine Accounting Standards (PASs) and Philippine Interpretations]effective as of December 31, 2012
PHILIPPINE FINANCIAL REPORTING STANDARDS ANDINTERPRETATIONSEffective as of December 31, 2012
Adopted Not EarlyAdopted Not Applicable
Framework for the Preparation and Presentation of FinancialStatementsConceptual Framework Phase A: Objectives and qualitativecharacteristics •PFRSs Practice Statement Management Commentary •Philippine Financial Reporting Standards
First-time Adoption of Philippine Financial ReportingStandards •Amendments to PFRS 1 and PAS 27: Cost of anInvestment in a Subsidiary, Jointly Controlled Entityor Associate •Amendments to PFRS 1: Additional Exemptions forFirst-time Adopters •Amendment to PFRS 1: Limited Exemption fromComparative PFRS 7 Disclosures for First-timeAdopters •Amendments to PFRS 1: Severe Hyperinflation andRemoval of Fixed Date for First-time Adopters •
PFRS 1(Revised)
Amendments to PFRS 1: Government Loans •Share-based Payment •Amendments to PFRS 2: Vesting Conditions andCancellations •
PFRS 2
Amendments to PFRS 2: Group Cash-settled Share-based Payment Transactions •
PFRS 3(Revised)
Business Combinations•
Insurance Contracts •PFRS 4
Amendments to PAS 39 and PFRS 4: FinancialGuarantee Contracts •
PFRS 5 Non-current Assets Held for Sale and DiscontinuedOperations •
PFRS 6 Exploration for and Evaluation of Mineral Resources •Financial Instruments: Disclosures •PFRS 7
Amendments to PFRS 7: Transition •

9
PHILIPPINE FINANCIAL REPORTING STANDARDS ANDINTERPRETATIONSEffective as of December 31, 2012
Adopted Not EarlyAdopted Not Applicable
Amendments to PAS 39 and PFRS 7: Reclassificationof Financial Assets •Amendments to PAS 39 and PFRS 7: Reclassificationof Financial Assets - Effective Date and Transition •Amendments to PFRS 7: Improving Disclosuresabout Financial Instruments •Amendments to PFRS 7: Disclosures - Transfers ofFinancial Assets •Amendments to PFRS 7: Disclosures - OffsettingFinancial Assets and Financial Liabilities •
PFRS 7
Amendments to PFRS 7: Mandatory Effective Dateof PFRS 9 and Transition Disclosures •
PFRS 8 Operating Segments •Financial Instruments •PFRS 9
Amendments to PFRS 9: Mandatory Effective Dateof PFRS 9 and Transition Disclosures •
PFRS 10 Consolidated Financial Statements •PFRS 11 Joint Arrangements* •PFRS 12 Disclosure of Interests in Other Entities •PFRS 13 Fair Value Measurement •Philippine Accounting Standards
Presentation of Financial Statements •Amendment to PAS 1: Capital Disclosures •Amendments to PAS 32 and PAS 1: PuttableFinancial Instruments and Obligations Arising onLiquidation •
PAS 1(Revised)
Amendments to PAS 1: Presentation of Items ofOther Comprehensive Income •
PAS 2 Inventories •PAS 7 Statement of Cash Flows •PAS 8 Accounting Policies, Changes in Accounting
Estimates and Errors •PAS 10 Events after the Balance Sheet Date •
* On 12 November 2012, the Parent Company was allowed by the Philippine SEC an exemptive relief on the adoption ofPFRS 11 given the peculiarities of its arrangement with the other joint venturer.

10
PHILIPPINE FINANCIAL REPORTING STANDARDS ANDINTERPRETATIONSEffective as of December 31, 2012
Adopted Not EarlyAdopted Not Applicable
PAS 11 Construction Contracts •Income Taxes •PAS 12
Amendment to PAS 12 - Deferred Tax: Recovery ofUnderlying Assets •
PAS 16 Property, Plant and Equipment •PAS 17 Leases •PAS 18 Revenue •PAS 19 Employee Benefits •
Amendments to PAS 19: Actuarial Gains and Losses,Group Plans and Disclosures •
PAS 19(Amended)
Employee Benefits•
PAS 20 Accounting for Government Grants and Disclosure ofGovernment Assistance •The Effects of Changes in Foreign Exchange Rates •PAS 21
Amendment: Net Investment in a Foreign Operation •PAS 23(Revised)
Borrowing Costs•
PAS 24(Revised)
Related Party Disclosures•
PAS 26 Accounting and Reporting by Retirement BenefitPlans •
PAS 27(Amended)
Separate Financial Statements•
PAS 28(Amended)
Investments in Associates and Joint Ventures•
PAS 29 Financial Reporting in Hyperinflationary Economies •PAS 31 Interests in Joint Ventures •
Financial Instruments: Disclosure and Presentation •Amendments to PAS 32 and PAS 1: PuttableFinancial Instruments and Obligations Arising onLiquidation •Amendment to PAS 32: Classification of RightsIssues •
PAS 32
Amendments to PAS 32: Offsetting Financial Assetsand Financial Liabilities •
PAS 33 Earnings per Share •

11
PHILIPPINE FINANCIAL REPORTING STANDARDS ANDINTERPRETATIONSEffective as of December 31, 2012
Adopted Not EarlyAdopted Not Applicable
PAS 34 Interim Financial Reporting •PAS 36 Impairment of Assets •PAS 37 Provisions, Contingent Liabilities and Contingent
Assets •PAS 38 Intangible Assets •
Financial Instruments: Recognition and Measurement •Amendments to PAS 39: Transition and InitialRecognition of Financial Assets and FinancialLiabilities •Amendments to PAS 39: Cash Flow HedgeAccounting of Forecast Intragroup Transactions •Amendments to PAS 39: The Fair Value Option •Amendments to PAS 39 and PFRS 4: FinancialGuarantee Contracts •Amendments to PAS 39 and PFRS 7: Reclassificationof Financial Assets •Amendments to PAS 39 and PFRS 7: Reclassificationof Financial Assets - Effective Date and Transition •
Amendments to Philippine Interpretation IFRIC-9and PAS 39: Embedded Derivatives •
PAS 39
Amendment to PAS 39: Eligible Hedged Items •PAS 40 Investment Property •PAS 41 Agriculture •Philippine Interpretations
IFRIC 1 Changes in Existing Decommissioning, Restorationand Similar Liabilities •
IFRIC 2 Members’ Share in Co-operative Entities and SimilarInstruments •
IFRIC 4 Determining Whether an Arrangement Contains aLease •
IFRIC 5 Rights to Interests arising from Decommissioning,Restoration and Environmental Rehabilitation Funds •
IFRIC 6 Liabilities arising from Participating in a SpecificMarket - Waste Electrical and Electronic Equipment •
IFRIC 7 Applying the Restatement Approach under PAS 29Financial Reporting in Hyperinflationary Economies •
IFRIC 8 Scope of PFRS 2 •IFRIC 9 Reassessment of Embedded Derivatives •

12
PHILIPPINE FINANCIAL REPORTING STANDARDS ANDINTERPRETATIONSEffective as of December 31, 2012
Adopted Not EarlyAdopted Not Applicable
IFRIC 9 Amendments to Philippine InterpretationIFRIC - 9 and PAS 39: Embedded Derivatives •
IFRIC 10 Interim Financial Reporting and Impairment •IFRIC 11 PFRS 2- Group and Treasury Share Transactions •IFRIC 12 Service Concession Arrangements •IFRIC 13 Customer Loyalty Programmes •
The Limit on a Defined Benefit Asset, MinimumFunding Requirements and their Interaction •
IFRIC 14
Amendments to Philippine InterpretationsIFRIC- 14, Prepayments of a Minimum FundingRequirement •
IFRIC 16 Hedges of a Net Investment in a Foreign Operation •IFRIC 17 Distributions of Non-cash Assets to Owners •IFRIC 18 Transfers of Assets from Customers •IFRIC 19 Extinguishing Financial Liabilities with Equity
Instruments •IFRIC 20 Stripping Costs in the Production Phase of a Surface
Mine* •SIC-7 Introduction of the Euro •SIC-10 Government Assistance - No Specific Relation to
Operating Activities •Consolidation - Special Purpose Entities •SIC-12
Amendment to SIC - 12: Scope of SIC 12 •SIC-13 Jointly Controlled Entities - Non-Monetary
Contributions by Venturers •SIC-15 Operating Leases - Incentives •SIC-21 Income Taxes - Recovery of Revalued Non-
Depreciable Assets •SIC-25 Income Taxes - Changes in the Tax Status of an
Entity or its Shareholders •SIC-27 Evaluating the Substance of Transactions Involving
the Legal Form of a Lease •SIC-29 Service Concession Arrangements: Disclosures •SIC-31 Revenue - Barter Transactions Involving Advertising
Services •SIC-32 Intangible Assets - Web Site Costs •

13
RFM CORPORATIONSchedule J. Reconciliation of Retained Earnings Available for Dividend DeclarationFor the year Ended December 31, 2012(Amounts in Thousand Pesos unless otherwise stated)
Retained Earnings, 1 January 2012 726,032
Add (Deduct) Reconciling Items:Unrealized actuarial loss (gain)Unrealized mark-to-market gain on derivative liabilityProvision for deferred income tax 71,892
71,892
Retained Earnings Available for Dividends, 1 January 2012 797,924
Add: Net Income actually earned/realized during the periodNet income during the period closed to Retained Earnings 715,956
Less: Non-actual/unrealized income net of taxUnrealized actuarial loss (gain) 34,200Fair value adjustment (M2M gains) 1,732Fair value adjustment of Investment Property resulting to gainAdjustment due to deviation from PFRS/GAAP-gainOther unrealized gains or adjustments to the retained earnings as a result of
certain transactions accounted for under the PFRSUnrealized mark-to-market gain on derivative liabilityProvision for income tax deferred
Sub-total 35,932
Net income actually earned during the period
Add (Less):Dividend declarations during the year 295,879
295,879
TOTAL RETAINED EARNINGS AS OF 31 DECEMBER 2012AVAILABLE FOR DIVIDEND 1,182,069
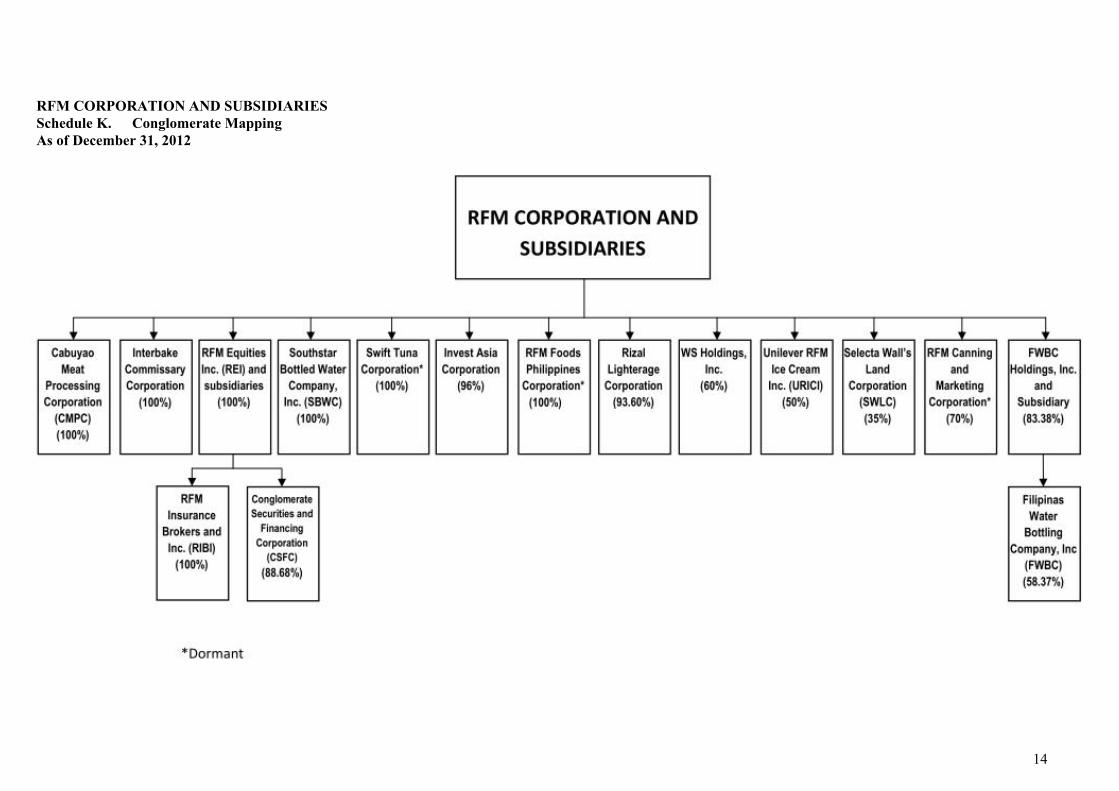
14
RFM CORPORATION AND SUBSIDIARIESSchedule K. Conglomerate MappingAs of December 31, 2012
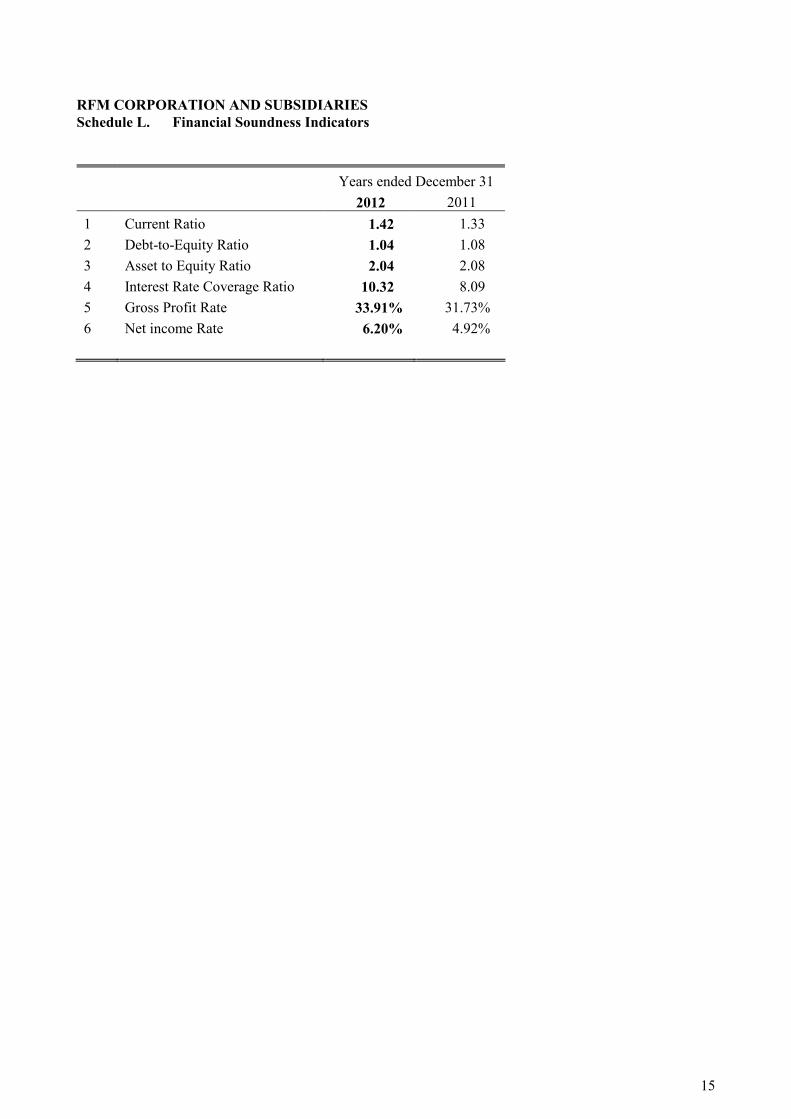
15
RFM CORPORATION AND SUBSIDIARIESSchedule L. Financial Soundness Indicators
Years ended December 31 2012 2011
1 Current Ratio 1.42 1.332 Debt-to-Equity Ratio 1.04 1.083 Asset to Equity Ratio 2.04 2.084 Interest Rate Coverage Ratio 10.32 8.095 Gross Profit Rate 33.91% 31.73%6 Net income Rate 6.20% 4.92%
Copyright © 2022 FDOKUMEN