Seasonal variability of sea surface chlorophyll-a of waters around Sri Lanka
6
Seasonal variability of sea surface chlorophyll-a of waters around Sri Lanka K ANTHI KASY APA Department of Physics, University of Ruhuna, Matara, Sri Lanka. Remotely sensed data on ocean colour of waters surrounding Sri Lanka received from the Coastal Zone Colour Scanner (CZCS) are processed and analyzed. Raw data of 1 km resolution on relatively cloud free days during 1978--1986 are processed to produce sea surface chlorophyll maps within latitudes 4.5N--11N and longitudes 78E--85E, a region in the Indian Ocean surrounding Sri Lanka. The processed data include about 110 single day maps and composite averages for each month and season. The months of July, August and September are omitted in the calculation of averages due to insufficient data. The waters in the Gulf of Mannar and Palk Bay areas show high chlorophyll-a concentrations throughout the year. However, these high values may represent other suspended particles and dissolved organic matter besides chlorophyll-a as this region is shallow (< 100 m). Regions with high chlorophyll concentrations (> 0:5 mg m 3 ) along the coast and western ocean region can be seen in the months of October and November, after the southwest monsoon period. As high surface chlorophyll concentrations may indicate high productivity, these regions need extensive measurements of primary production and also continuous monitoring of fish catches, during and after the southwest monsoon. Studies of particle composition in shallow water areas, in particular waters in Palk Bay and Gulf of Mannar, should be carried out in order to elucidate the effect of non-phytogenic. 1. Introduction Ocean colour is affected by marine plants, suspended sediments and dissolved organic matter, particularly near the coast. The pigment chlorophyll-a, found in microscopic plant phytoplankton, is known to produce systematic variations in the colour of the ocean. In open ocean waters, ocean colour is used as an indicator of chlorophyll-a concentration. Coastal Zone Colour Scanner (CZCS), designed to monitor ocean colour, was operational from 1978 until 1986 and an impressive archive of data is available for analysis and oceano- graphic interpretation. Data from CZCS have been used in studies of many regions of world oceans, extensively in North Atlantic and in the Arabian Sea. However, waters around Sri Lanka have not been given much attention, mainly due to the fact that oceano- graphy is not a well-established field of research in Sri Lanka. Here, the variability of surface phytoplankton pigments in Indian Ocean waters around Sri Lanka has been studied using CZCS raw data. The knowledge of surface pigment concentrations can be used in the location upwelling areas off the coast. When upwelling brings nutrients to sunlit waters primary production increases, thus attracting fishes to graze the new production. Fishes belong to the family of clupeidae such as sprats, herrings and sardines have commercial importance in Sri Lanka. Also, exploitation of large pelagic fishes such as tunas, tuna-like fishes, king mackerels, etc. around Sri Lanka is presently linked to the area within and up to a little beyond the edge of the continental shelf. Therefore, this knowledge will be highly beneficial in identifying possible fishing grounds off the coast of Sri Lanka for the development of the fisheries industry in the country. 2. Materials and Methods An ocean colour sensor records upward radiance from the sea surface after modification by the intervening Keywords. Chlorophyll-a; CZCS; Sri Lanka; seasonal variability; fishery industry. Proc. Indian Acad. Sci. (Earth Planet. Sci.), 109, No. 4, December 2000, pp. 427--432 # Printed in India 427
Transcript of Seasonal variability of sea surface chlorophyll-a of waters around Sri Lanka
Seasonal variability of sea surface chlorophyll-a of watersaround Sri Lanka
KANTHI K A S YAPA
Department of Physics, University of Ruhuna, Matara, Sri Lanka.
Remotely sensed data on ocean colour of waters surrounding Sri Lanka received from the Coastal ZoneColour Scanner (CZCS) are processed and analyzed. Raw data of 1 km resolution on relatively cloud freedays during 1978--1986 are processed to produce sea surface chlorophyll maps within latitudes 4.5N--11Nand longitudes 78E--85E, a region in the Indian Ocean surrounding Sri Lanka. The processed data includeabout 110 single day maps and composite averages for each month and season. The months of July,August and September are omitted in the calculation of averages due to insufficient data. The waters inthe Gulf of Mannar and Palk Bay areas show high chlorophyll-a concentrations throughout the year.However, these high values may represent other suspended particles and dissolved organic matter besideschlorophyll-a as this region is shallow (< 100 m). Regions with high chlorophyll concentrations (> 0:5 mgmÿ3) along the coast and western ocean region can be seen in the months of October and November, afterthe southwest monsoon period. As high surface chlorophyll concentrations may indicate highproductivity, these regions need extensive measurements of primary production and also continuousmonitoring of fish catches, during and after the southwest monsoon. Studies of particle composition inshallow water areas, in particular waters in Palk Bay and Gulf of Mannar, should be carried out in orderto elucidate the effect of non-phytogenic.
1. Introduction
Ocean colour is affected by marine plants, suspendedsediments and dissolved organic matter, particularlynear the coast. The pigment chlorophyll-a, found inmicroscopic plant phytoplankton, is known to producesystematic variations in the colour of the ocean. Inopen ocean waters, ocean colour is used as an indicatorof chlorophyll-a concentration. Coastal Zone ColourScanner (CZCS), designed to monitor ocean colour,was operational from 1978 until 1986 and an impressivearchive of data is available for analysis and oceano-graphic interpretation. Data from CZCS have beenused in studies of many regions of world oceans,extensively in North Atlantic and in the Arabian Sea.However, waters around Sri Lanka have not been givenmuch attention, mainly due to the fact that oceano-graphy is not a well-established field of research in SriLanka. Here, the variability of surface phytoplanktonpigments in Indian Ocean waters around Sri Lanka has
been studied using CZCS raw data. The knowledge ofsurface pigment concentrations can be used in thelocation upwelling areas off the coast. When upwellingbrings nutrients to sunlit waters primary productionincreases, thus attracting fishes to graze the newproduction. Fishes belong to the family of clupeidaesuch as sprats, herrings and sardines have commercialimportance in Sri Lanka. Also, exploitation of largepelagic fishes such as tunas, tuna-like fishes, kingmackerels, etc. around Sri Lanka is presently linked tothe area within and up to a little beyond the edge ofthe continental shelf. Therefore, this knowledge will behighly beneficial in identifying possible fishing groundsoff the coast of Sri Lanka for the development of thefisheries industry in the country.
2. Materials and Methods
An ocean colour sensor records upward radiance fromthe sea surface after modification by the intervening
Keywords. Chlorophyll-a; CZCS; Sri Lanka; seasonal variability; fishery industry.
Proc. Indian Acad. Sci. (Earth Planet. Sci.), 109, No. 4, December 2000, pp. 427--432# Printed in India 427
atmospheric path. The significance of the emergentflux from the sea is that it contains information aboutthe optical properties of the ocean and thus about theconcentrations of the optically significant constituentsin the water. Empirical relationships have been esta-blished (Sathyendranath and Morel 1983; Gordon et al1975; Morel and Prieur 1977) to link changes inradiance (corrected for atmospheric effects) withchanges in concentration of chlorophyll-a. An algo-rithm, which has the form C ¼ A½Lð�1Þ=Lð�2Þ�B, ismost commonly used to estimate chlorophyll-a con-centration (C in mg mÿ3) of surface waters. Here, L isthe radiance (watts mÿ2 steradianÿ1), �1 and �2 arewavelengths and, A (mg mÿ3) and B (dimensionless)are empirically determined coefficients. In the case ofCZCS, the wavelengths used are 443 and 550 nm forlow pigment concentrations and 520 and 550 nm forhigh pigment concentrations. Here, we have used analgorithm (SEAPAK) developed at NASA which usescoefficients A ¼ 1:13 and B ¼ ÿ1:71 (after Gordonand Morel 1983) for retrieval at low chlorophyll-a con-centrations ðC � 1:5Þ and coefficients A ¼ 3:326 andB ¼ ÿ2:439 for retrieval at high chlorophyll-aconcentrations ðC > 1:5Þ. The algorithm has beenfound to be most effective in open ocean or case 1waters (Sathyendranath and Morel 1983; Gordon andMorel 1983) where phytoplankton and their deriva-
tive products play the dominant role in determiningthe optical properties of the ocean. In coastal andshallow waters (classified as case 2 waters whereinorganic and/or organic sediments make an impor-tant or dominant contribution to the optical proper-ties) retrieval of pigment concentration is morecomplex and less reliable due to inherent limitationsin the CZCS channels and in the algorithm. Therefore,the derived values will be discussed only qualitativelyin such areas.
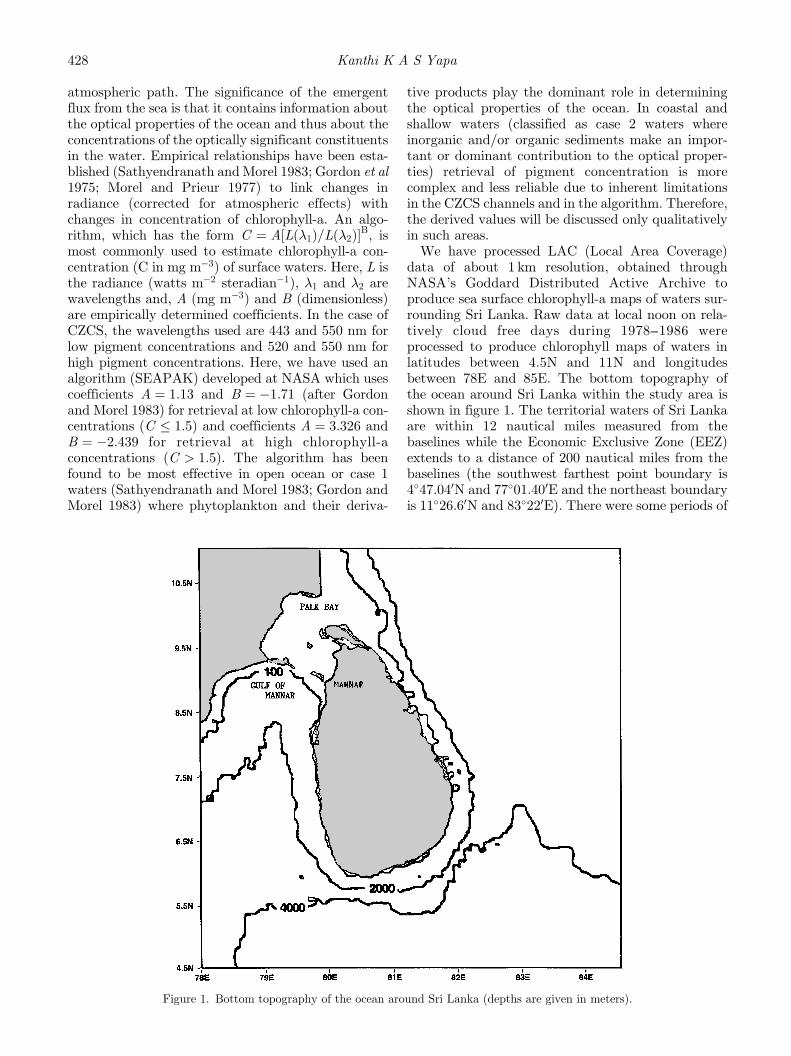
We have processed LAC (Local Area Coverage)data of about 1 km resolution, obtained throughNASA’s Goddard Distributed Active Archive toproduce sea surface chlorophyll-a maps of waters sur-rounding Sri Lanka. Raw data at local noon on rela-tively cloud free days during 1978--1986 wereprocessed to produce chlorophyll maps of waters inlatitudes between 4.5N and 11N and longitudesbetween 78E and 85E. The bottom topography ofthe ocean around Sri Lanka within the study area isshown in figure 1. The territorial waters of Sri Lankaare within 12 nautical miles measured from thebaselines while the Economic Exclusive Zone (EEZ)extends to a distance of 200 nautical miles from thebaselines (the southwest farthest point boundary is4�47:040N and 77�01:400E and the northeast boundaryis 11�26:60N and 83�220E). There were some periods of
Figure 1. Bottom topography of the ocean around Sri Lanka (depths are given in meters).
428 Kanthi K A S Yapa
missing data due to shutting off of the sensor due totechnical and other reasons (lack of continuousarchiving of LAC data may have also been due tovery little or no interest shown by ocean scientistsfrom this part of the world when CZCS was in opera-tion). Days with heavy cloud cover were leftunprocessed, as they did not provide any chlorophyllinformation after atmospheric corrections. The pro-cessed data set for the period 1978 and 1986 includesabout 110, single day chlorophyll-a maps. These singleday images were then used to make monthly andseasonal composites. As there were not enough data tomake monthly composites for each year (for example,a monthly composite is available only for October inthe year 1984), all data were pooled together andmonthly and seasonal composites were made for thewhole period. The seasons are defined approximatelyas follows: first inter-monsoon (March--May), south-west monsoon (June--September), second inter-mon-soon (October--November) and northeast monsoon(December--February). Sufficient data were not avail-
able to make monthly composites for the periodduring the southwest monsoon (SW) in part due toheavy cloud cover in the area during this period.
The southwest monsoon produces heavy rains in thesouthwestern part of the country while the northeastmonsoon, which is weaker and shorter-lived than thesouthwest monsoon, brings rain to the northern andeastern parts of the country. The general pattern oflarge-scale oceanic currents related to regional oceaniccirculation which dominate waters beyond the con-tinental shelf changes seasonally. During the NEmonsoon water movements are from east to west andthe currents are strongest off the east coast. The NEmonsoon drift is rather shallow and exerts littleinfluence on the waters below the thermocline(Wyrtiki 1973). During the southwest monsoon thecirculation changes drastically. The currents off southand southwest coast are strongest during the SWmonsoon and exhibit a westerly trend. These currentsoriginate from the Arabian Sea and flow from west toeast south of Sri Lanka (Wyrtiki 1973; De Bruin et al
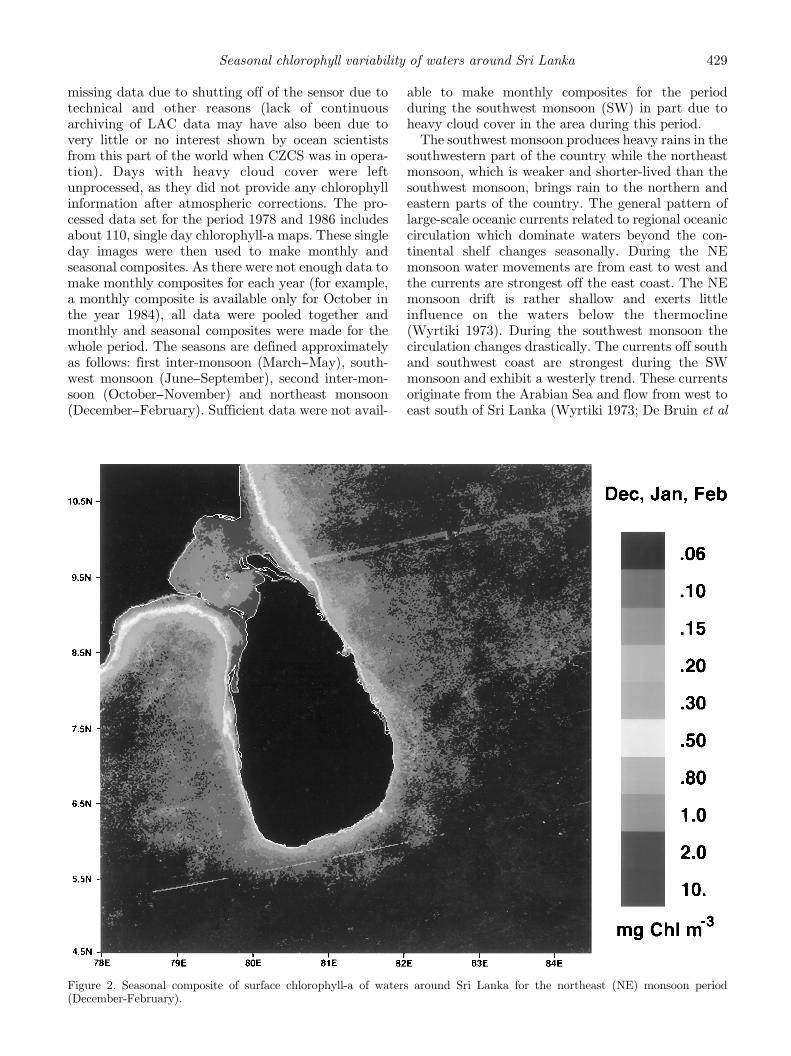
Figure 2. Seasonal composite of surface chlorophyll-a of waters around Sri Lanka for the northeast (NE) monsoon period(December-February).
Seasonal chlorophyll variability of waters around Sri Lanka 429
1994). The circulation penetrates deeper, affecting themovements of water masses below the thermocline(Wyrtiki 1973).
3. Results
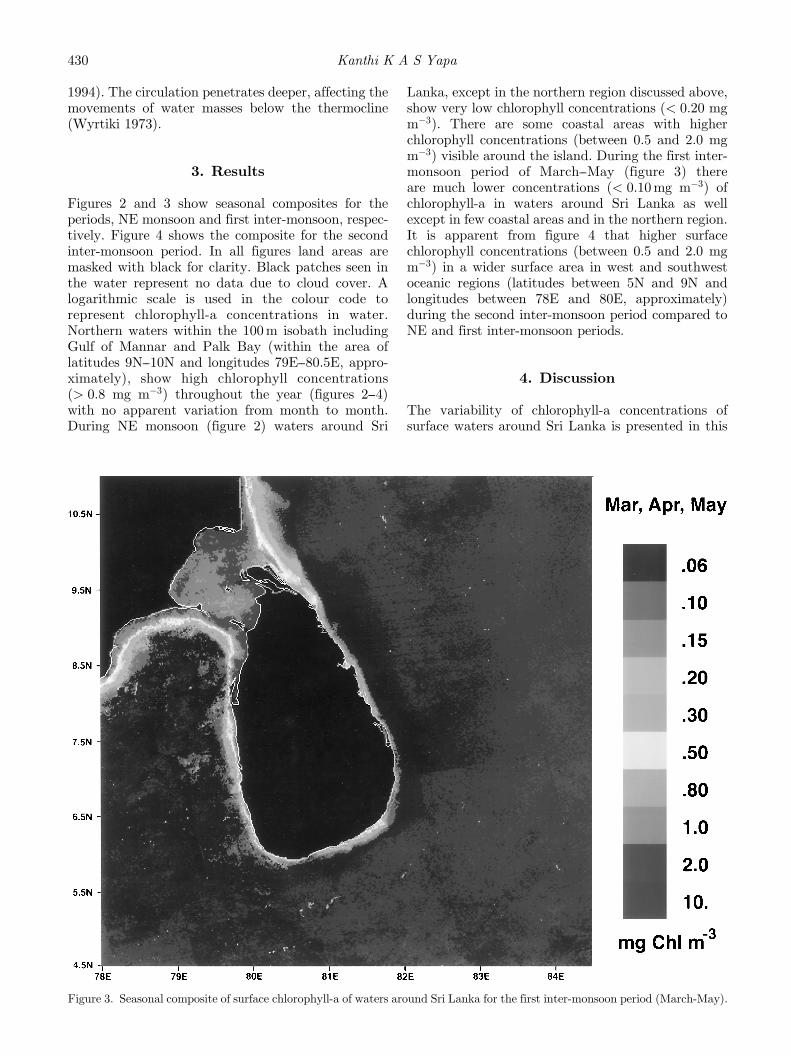
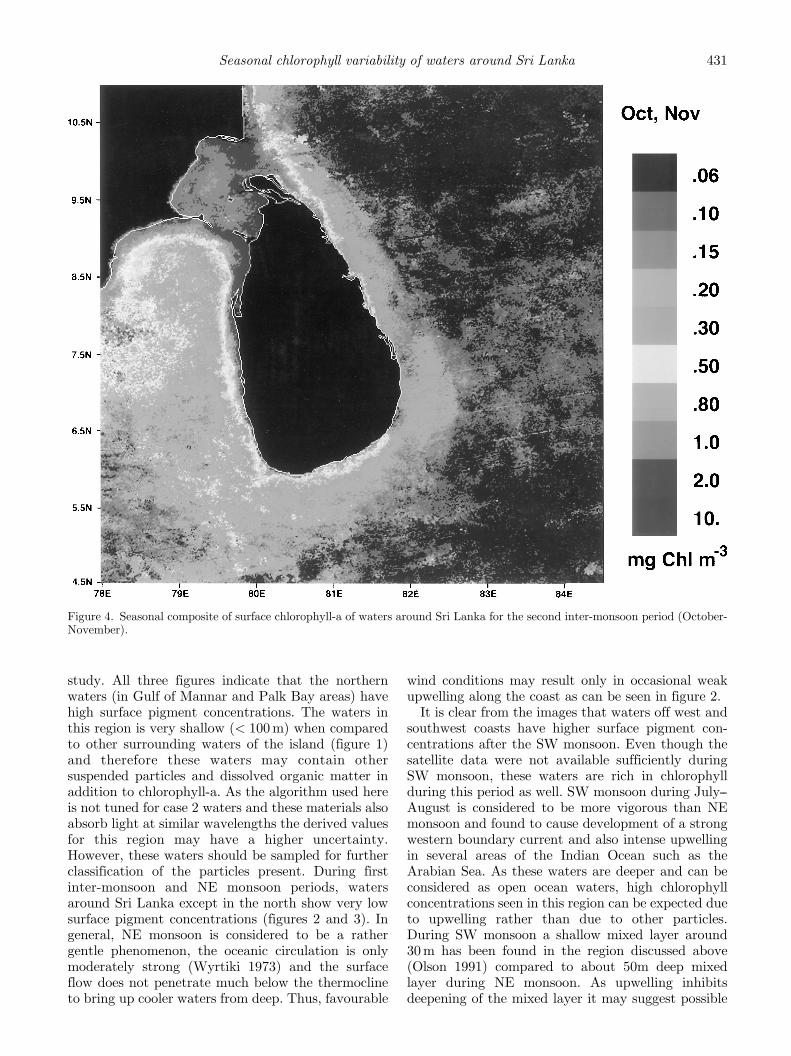
Figures 2 and 3 show seasonal composites for theperiods, NE monsoon and first inter-monsoon, respec-tively. Figure 4 shows the composite for the secondinter-monsoon period. In all figures land areas aremasked with black for clarity. Black patches seen inthe water represent no data due to cloud cover. Alogarithmic scale is used in the colour code torepresent chlorophyll-a concentrations in water.Northern waters within the 100 m isobath includingGulf of Mannar and Palk Bay (within the area oflatitudes 9N--10N and longitudes 79E--80.5E, appro-ximately), show high chlorophyll concentrations(> 0:8 mg mÿ3) throughout the year (figures 2--4)with no apparent variation from month to month.During NE monsoon (figure 2) waters around Sri
Lanka, except in the northern region discussed above,show very low chlorophyll concentrations (< 0:20 mgmÿ3). There are some coastal areas with higherchlorophyll concentrations (between 0.5 and 2.0 mgmÿ3) visible around the island. During the first inter-monsoon period of March--May (figure 3) thereare much lower concentrations (< 0:10 mg mÿ3) ofchlorophyll-a in waters around Sri Lanka as wellexcept in few coastal areas and in the northern region.It is apparent from figure 4 that higher surfacechlorophyll concentrations (between 0.5 and 2.0 mgmÿ3) in a wider surface area in west and southwestoceanic regions (latitudes between 5N and 9N andlongitudes between 78E and 80E, approximately)during the second inter-monsoon period compared toNE and first inter-monsoon periods.
4. Discussion
The variability of chlorophyll-a concentrations ofsurface waters around Sri Lanka is presented in this
Figure 3. Seasonal composite of surface chlorophyll-a of waters around Sri Lanka for the first inter-monsoon period (March-May).
430 Kanthi K A S Yapa
study. All three figures indicate that the northernwaters (in Gulf of Mannar and Palk Bay areas) havehigh surface pigment concentrations. The waters inthis region is very shallow ð< 100 mÞ when comparedto other surrounding waters of the island (figure 1)and therefore these waters may contain othersuspended particles and dissolved organic matter inaddition to chlorophyll-a. As the algorithm used hereis not tuned for case 2 waters and these materials alsoabsorb light at similar wavelengths the derived valuesfor this region may have a higher uncertainty.However, these waters should be sampled for furtherclassification of the particles present. During firstinter-monsoon and NE monsoon periods, watersaround Sri Lanka except in the north show very lowsurface pigment concentrations (figures 2 and 3). Ingeneral, NE monsoon is considered to be a rathergentle phenomenon, the oceanic circulation is onlymoderately strong (Wyrtiki 1973) and the surfaceflow does not penetrate much below the thermoclineto bring up cooler waters from deep. Thus, favourable
wind conditions may result only in occasional weakupwelling along the coast as can be seen in figure 2.
It is clear from the images that waters off west andsouthwest coasts have higher surface pigment con-centrations after the SW monsoon. Even though thesatellite data were not available sufficiently duringSW monsoon, these waters are rich in chlorophyllduring this period as well. SW monsoon during July--August is considered to be more vigorous than NEmonsoon and found to cause development of a strongwestern boundary current and also intense upwellingin several areas of the Indian Ocean such as theArabian Sea. As these waters are deeper and can beconsidered as open ocean waters, high chlorophyllconcentrations seen in this region can be expected dueto upwelling rather than due to other particles.During SW monsoon a shallow mixed layer around30 m has been found in the region discussed above(Olson 1991) compared to about 50m deep mixedlayer during NE monsoon. As upwelling inhibitsdeepening of the mixed layer it may suggest possible
Figure 4. Seasonal composite of surface chlorophyll-a of waters around Sri Lanka for the second inter-monsoon period (October-November).
Seasonal chlorophyll variability of waters around Sri Lanka 431
upwelling in the area. The high concentrations ofchlorophyll we observe in the western region may bedue to after effects of SW monsoon. Persistentupwelling along the West Coast of India has alsobeen observed (Narain et al 1992) in the months ofSeptember and October. The surface circulation of theIndian Ocean is from west to east during SW monsoonand probably these currents bring nutrient richupwelled waters from Arabian Sea and from westernIndian Ocean towards west of Sri Lanka, as well.These waters should be further investigated forchlorophyll, temperature, primary productivity andphotosynthesis parameters. Waters around Sri Lankahave not been studied extensively for oceanographi-cally important such parameters and we believe thatthis is a drawback in utilizing available remote sensingdata. As high productive areas may indicate possiblefishing grounds, these regions need extensive surveysof fish catches during and after SW monsoon. Studiesof sea surface temperature data of the waters aroundSri Lanka from NOAA satellites are being carried outat present. We expect to analyze LAC data of watersaround Sri Lanka from SeaWiFS as well.
Acknowledgement
Author thanks START secretariat, USA for grantinga visiting scientist award for the visit to BedfordInstitute of Oceanography (BIO), Canada where
processing of images had been carried out. Sincerethanks are due to Dr. Trevor Platt for initiating thevisit and providing facilities for the work, and toLinda Payzent and Heidi Bishop for the help given inprocessing. The author thanks two anonymousreferees, especially referee 2, for constructive com-ments on the manuscript.
References
Sathyendranath S and Morel A Y 1983 Light Emerging fromthe Sea -- Interpretation and Uses in Remote Sensing, inRemote sensing application in marine science and technol-ogy, (ed) A.P. Cracknell pp 323--357
Gordon H R, Brown O B and Jacobs M M 1975 Computedrelationship between the inherent and optical properties of aflat homogeneous ocean; Appl. Opt. 14 417
Morel A Y and Prieur L 1977 Analysis of variations in oceancolor; Limnol. Oceanogr, 22, 709
Gordon H R and Morel A Y 1983 Remote assessment of oceancolor for interpretation of satellite visible imagery (NewYork: Springer-Verlag) pp 114
Wyrtiki K 1973 Physical Oceanography of the Indian Ocean, inThe Biology of the Indian Ocean, (Springer-Verlag) pp 18
De Bruin G H P, Russell B C and Bogusch A 1994 Field guideto the marine fishery resources of Sri Lanka, (FAO) pp 1--8
Olson D B 1991 Mixed layer dynamics in the Arabian Sea, inUS JGOFS Planning Group, Report Number 13, pp 49
Narain A, Beena K and Raman M 1992 in Remote sensingapplications and geographic information systems: Recent-trends, (ed) I V Muralikrishna (New Delhi: Tata McGrawHill Publications) pp 332
432 Kanthi K A S Yapa