Seasonal, Topographic and Burn Frequency Effects on Biophysical/Spectral Reflectance Relationships...
17
Seasonal, topographic and burn frequency effects on biophysical/ spectral reflectance relationships in tallgrass prairie D. G. GOODIN*, J. GAO and J. M. S. HUTCHINSON Department of Geography, Kansas State University, Manhattan, Kansas 66506, USA (Received 21 November 2003; in final form 17 May 2004 ) Abstract. Application of remote sensing relies on understanding how the physical properties of surfaces (especially vegetated surfaces) control spectral reflectance. Empirical investigation of links between canopy properties/processes and spectral response have generally consisted of univariate modelling of one spectral response variable in terms of one canopy property, or less frequently, in terms of two or more canopy variables. While this approach has been fruitful, it cannot account for multivariate interactions of spectral and surface properties in determining canopy response across the spectrum. In this study, two closely related multivariate analysis techniques, canonical correlation and redundancy analysis, are used to investigate the relationship between a series of tallgrass prairie canopy biophysical properties and spectral reflectance measured in situ using a portable radiometer. To capture a variety of different conditions within the tallgrass canopy, data were collected at two times during the 2002 growing season (28 May and 18 August), from two different slope/aspect situations, located on one frequently burned and one infrequently burned watershed. Results suggest that canopy structure (canopy height, greenness fraction) is the most consistent influence on spectral reflectance during both data collection periods. Canopy optical properties also emerge as an important control in August. Neither soil moisture nor plant physiology/biochemistry systematically influenced spectral reflectance. The relative importance of the various canopy variables shows some dependence on burn frequency and topographic setting. 1. Introduction Applications of remote sensing can generally be divided into two domains: (1) retrieval of biophysical information, and (2) classification of land use/land cover (Jensen 1983). Although these two application domains are often considered independently of one another, they have many elements in common. Each is based on interpretation of spectral reflectance, but in each domain it is not spectral reflectance per se that is of interest, but physical or thematic information embedded within (and retrievable from) the spectral data. Also, in each application domain, some sort of model or algorithm is used to convert spectral reflectance data into International Journal of Remote Sensing ISSN 0143-1161 print/ISSN 1366-5901 online # 2004 Taylor & Francis Ltd http://www.tandf.co.uk/journals DOI: 10.1080/01431160412331270821 *Corresponding author. Address: Department of Geography, 118 Seaton Hall, Kansas State University, Manhattan, KS 66506, USA; tel: (785) 532-3411; fax: (785) 532-7310; e-mail: [email protected] INT. J. REMOTE SENSING, 10 DECEMBER, 2004, VOL. 25, NO. 23, 5429–5445
Transcript of Seasonal, Topographic and Burn Frequency Effects on Biophysical/Spectral Reflectance Relationships...

Seasonal, topographic and burn frequency effects on biophysical/spectral reflectance relationships in tallgrass prairie
D. G. GOODIN*, J. GAO and J. M. S. HUTCHINSON
Department of Geography, Kansas State University, Manhattan, Kansas66506, USA
(Received 21 November 2003; in final form 17 May 2004 )
Abstract. Application of remote sensing relies on understanding how thephysical properties of surfaces (especially vegetated surfaces) control spectralreflectance. Empirical investigation of links between canopy properties/processesand spectral response have generally consisted of univariate modelling of onespectral response variable in terms of one canopy property, or less frequently, interms of two or more canopy variables. While this approach has been fruitful, itcannot account for multivariate interactions of spectral and surface properties indetermining canopy response across the spectrum. In this study, two closelyrelated multivariate analysis techniques, canonical correlation and redundancyanalysis, are used to investigate the relationship between a series of tallgrassprairie canopy biophysical properties and spectral reflectance measured in situusing a portable radiometer. To capture a variety of different conditions withinthe tallgrass canopy, data were collected at two times during the 2002 growingseason (28 May and 18 August), from two different slope/aspect situations,located on one frequently burned and one infrequently burned watershed.Results suggest that canopy structure (canopy height, greenness fraction) is themost consistent influence on spectral reflectance during both data collectionperiods. Canopy optical properties also emerge as an important control inAugust. Neither soil moisture nor plant physiology/biochemistry systematicallyinfluenced spectral reflectance. The relative importance of the various canopyvariables shows some dependence on burn frequency and topographic setting.
1. Introduction
Applications of remote sensing can generally be divided into two domains: (1)
retrieval of biophysical information, and (2) classification of land use/land cover
(Jensen 1983). Although these two application domains are often considered
independently of one another, they have many elements in common. Each is based
on interpretation of spectral reflectance, but in each domain it is not spectral
reflectance per se that is of interest, but physical or thematic information embedded
within (and retrievable from) the spectral data. Also, in each application domain,
some sort of model or algorithm is used to convert spectral reflectance data into
International Journal of Remote SensingISSN 0143-1161 print/ISSN 1366-5901 online # 2004 Taylor & Francis Ltd
http://www.tandf.co.uk/journalsDOI: 10.1080/01431160412331270821
*Corresponding author. Address: Department of Geography, 118 Seaton Hall, KansasState University, Manhattan, KS 66506, USA; tel: (785) 532-3411; fax: (785) 532-7310;e-mail: [email protected]
INT. J. REMOTE SENSING, 10 DECEMBER, 2004,VOL. 25, NO. 23, 5429–5445

some form of biophysical or thematic information. Thus, spectral reflectance data
are proxies for useful information about various aspects of the Earth’s surface.
Understanding how such information (whether thematic or biophysical) is extracted
from spectral data is the foundation of remote sensing science.Retrieval of biophysical information from remote sensor data is generally done
using correlative or model-derived relationships between biophysical variables and
spectral data in the form of in-band spectral reflectance (Ahlriches and Bauer 1983,
Curran 1983, Maas 1998) or a vegetation index derived from spectral reflectance
(Shibayama and Akiyama 1989, Christensen and Goudriaan 1993, Price and
Bausch 1995, Gilbert et al. 1996, Carlson and Ripley 1997, White et al. 2000).
Generally, these empirical or modelled relationships between spectral and
biophysical information are univariate. A single dependent biophysical variableis predicted from a single independent spectral variable. Studies of the multivariate
relationships between canopy properties and spectral response are rare compared to
those detailing univariate relationships. Wiegand et al. (1992) examined the effect of
various canopy properties on the spectral reflectance of wheat. Jakubauskas (1996)
examined the relationships between Landsat Thematic Mapper (TM) bands and
canopy structural/biotic variables for coniferous forest cover in Yellowstone
National Park, USA, using canonical correlation analysis. Sampson et al. (2001)
used canonical redundancy analysis, a multivariate approach based on canonicalcorrelation, to examine the relationship between spatial structure and spectral
response in hardwood forest. Cohen et al. (2003) described an improved strategy
for extracting biophysical information from Enhanced Thematic Mapper (ETM)z
images of coniferous forest using multivariate techniques. These studies have shown
that multivariate relationships between canopy properties and spectral response are
complex and scale dependent; characterized by multidimensional, intercorrelated
relationships among both the spectral and biophysical variables (Korobov and
Railyan 1993). Multivariate analysis of the relationship between canopy biophysical
properties and spectral response can contribute to both application domains inremote sensing, by revealing the composite effects of canopy properties on
reflectance and by informing the physical interpretation of thematic classes defined
by multispectral classification.
In this study, multivariate analysis techniques are used to examine the
relationships between canopy and spectral variables in tallgrass prairie. Under-
standing these relationships is important in tallgrass prairie because the canopy is
spectrally dynamic in space and time (Davidson and Csillag 2003) and shows
spatial–spectral structure at very fine scales (Goodin and Henebry 1998). Tallgrassprairie is noteworthy for the importance of fire and fine-scale topographic
variability as agents of ecological variability (Collins and Wallace 1990, Knapp
et al. 1998). This study was designed to capture the effect of seasonality,
topographic position and fire frequency on the multivariate relationship between
canopy biophysics and spectral response.
2. Methods
2.1. The study area
Data were collected at the Konza Prairie Biological Station (KPBS; 39‡ 08’N,
97‡ 58’W) located 12 km south of Manhattan, Kansas, USA (see figure 1). The
study site is located within the Flint Hills, a narrow band of conical, stream-
dissected hills characterized by local relief varying from 50–100 m, extending
latitudinally across eastern Kansas from near the Nebraska border into Oklahoma.
5430 D. G. Goodin

The Flint Hills are the largest contiguous remnant of the North American tallgrass
prairie (Risser et al. 1981). Research at KPBS focuses on the long-term effects of
fire, grazing and climate on tallgrass prairie structure, function and dynamics
(Knapp and Seastedt 1998). Konza occupies 3487 ha, divided into 60 experimental
Figure 1. Location of KPBS, showing the watersheds where data were collected. Rectangleswithin the shaded watershed indicate location of sampling grid. Layout of thesampling grid is shown in the inset.
Biophysical/spectral reflectance relationships 5431

watersheds, each permanently assigned to a grazing treatment (grazed by cattle,
grazed by bison, or ungrazed) and a prescribed burn frequency (1, 2, 4, 10 or 20 year
fire return interval). Graminoid plant species dominate, with the majority of
phytomass composed of Andropogon gerardii (Big Bluestem), Schizochyrium
scoparius (Little Bluestem), Sorghastrum nutans (Indiangrass) and Panicum virgatum
(Switchgrass), with Bouteloua gracilis (Blue Grama), B. curtipendula (Sideoats
Grama) and Buchloe dactyloides (Buffalograss) occurring in drier areas. Forbs and
woody species are subdominant, although present in greater variety and thus
accounting for more species richness (Collins and Glenn 1991, Hartnett and Fay
1998). Common forbs include members of the Solidago, Aster, Artemesia and
Ambrosia genera. Woody vegetation of the genera Rhus, Amorpha and Cornus occur
where fire frequency is low (Freeman 1998).
2.2. Field data collection
Data were collected during two field campaigns; one conducted on 28 May
2002, the other on 18 August 2002. These dates were selected to capture contrasting
stages in the development of the tallgrass prairie canopy. In spring (represented by
the May dataset) soil moisture is generally sufficient due to accumulation of
moisture during the prior dormant period. Solar radiation is the key limiting
resource. By mid summer (represented by the August data), the canopy has reached
peak greenness and begun to yellow. Evapotranspiration has depleted much of the
stored soil moisture, thus canopy water stress is generally greater than in the early
growing season. During each field campaign, data were collected from two
watersheds with contrasting burn frequencies. One of these watersheds (002C) is
burned on a two-year cycle and was last burned in April 2000. The other watershed
(020B) is a long-term unburned unit, last burned in 1986. These two treatment types
were chosen to represent extremes within the range of naturally occurring tallgrass
prairie communities (Knapp and Seastedt 1998). More frequent burning homo-
genizes the prairie canopy by removing accumulated litter, suppressing invasion of
woody species, and favouring the growth of a variety of C3 forbs within a matrix of
C4 graminoids (Collins and Wallace 1990). As burn frequency decreases, the prairie
canopy becomes more heterogeneous as a larger variety of forbs, graminoids and
woody species become established. Thus, watershed 020B was characterized by
substantial growth of woody trees and shrubs, whereas vegetated cover in 002C
consisted mainly of dominant graminoids with subdominant forbs. Differences in
the two watersheds are illustrated by contrasts in summary descriptive statistics (see
table 1).
To capture topographic variability, two sampling grids were established on each
watershed. On watershed 002C, grids were established on adjacent east- (slope 24‡,aspect 84‡) and south-facing (slope 20‡, aspect 177‡) slopes. On 020B, the grids
faced east (slope 26‡, aspect 96‡) and west (slope 28‡, aspect 267‡). Selection of
measurement sites with multiple fire treatment and topographic conditions,
combined with sampling from two distinct stages of canopy phenology, allowed
us to compare the effect of canopy variables on spectral reflectance under a variety
of representative conditions.
Data were collected from 40 m650 m grids with 60 sampling points arranged in
a nested pattern (see figure 1). Spectral reflectance was measured using a Cropscan
MSR-5 field-portable spectroradiometer. Spectral sensitivity of the MSR-5 emulates
bands 1–5 of the Landsat TM. The MSR-5 instrument consists of two sets of
5432 D. G. Goodin

Table 1. Statistical summary of the data. Format is: mean (SD). All dates are 2002.
Variable
Watershed 020B Watershed 002C
29 May 16 August 29 May 16 August
East West East West East South East South
Rgrn 11.6 (1.4) 10.2 (1.4) 10.2 (1.6) 8.64 (1.8) 10.7 (1.4) 10.6 (0.8) 11.1 (1.1) 10.6 (1.0)Rred 10.8 (2.2) 7.9 (2.3) 9.8 (2.0) 7.34 (2.2) 9.6 (1.9) 9.8 (1.8) 9.6 (1.2) 10.4 (1.2)Rnir 46.1 (4.0) 49.8 (8.6) 49.3 (6.1) 47.3 (9.2) 43.9 (3.5) 41.4 (5.4) 49.7 (6.6) 44.4 (4.1)Rmir 63.9 (8.7) 53.3 (8.1) 58.1 (9.4) 50.7 (8.6) 54.3 (5.4) 53.0 (4.4) 56.7 (5.8) 58.9 (3.7)NDVI 0.62 (0.1) 0.72 (0.1) 0.67 (0.1) 0.73 (0.1) 0.64 (0.1) 0.61 (0.1) 0.67 (0.0) 0.62 (0.0)Chl 32.0 (4.0) 32.4 (4.7) 32.4 (5.3) 35.0 (4.7) 30.0 (2.3) 29.4 (2.7) 27.0 (2.9) 24.6 (3.2)HT 34.8 (38.4) 46.8 (44.1) 51.2 (43.8) 61.1 (41.6) 28.8 (7.6) 28.8 (7.6) 31.5 (9.6) 40.1 (8.2)PWC 0.77 (0.1) 0.73 (0.1) 0.58 (0.1) 0.55 (0.1) 0.69 (0.1) 0.68 (0.1) 0.52 (0.1) 0.53 (0.1)Fpar 0.35 (0.2) 0.34 (0.2) 0.25 (0.1) 0.20 (0.1) 0.15 (0.2) 0.24 (0.2) 0.10 (0.0) 0.21 (0.1)VWC 36.4 (17.3) 30.0 (11.9) 27.9 (14.3) 25.7 (10.6) 56.7 (21.5) 76.3 (29.8) 60.6 (17.4) 53.1 (15.9)Fgrn 0.70 (0.2) 0.63 (0.3) 0.66 (0.1) 0.49 (0.1) 0.71 (0.1) 0.63 (0.1) 0.67 (0.1) 0.68 (0.1)%N 2.62 (5.3) 2.53 (5.3) 1.37 (0.2) 1.32 (0.2) 1.30 (0.3) 1.25 (0.3) 1.06 (0.2) 1.05 (0.1)%C 42.2 (2.4) 42.9 (3.6) 45.1 (1.0) 45.8 (1.4) 43.2 (1.2) 43.1 (0.7) 44.9 (0.9) 44.9 (0.8)C : N 23.0 (5.0) 24.2 (5.1) 33.8 (5.1) 35.4 (4.8) 34.9 (7.2) 36.7 (9.1) 43.1 (6.0) 43.6 (5.5)
Bio
ph
ysica
l/spectra
lrefl
ectan
cerela
tion
ship
s5
43
3

matched sensors, one set pointed upward and covered with an opal glass diffuser to
collect irradiance, the other pointed downward toward the target with a 28‡instantaneous field of view (IFOV). The MSR-5 simultaneously collects data
from each set of sensors, computes the ratio between them in real time and applies
solar zenith angle corrections to determine reflectance. Due to a persistent
malfunction, band 1 (0.45–0.52 mm) was not used in this analysis. The radiometer
was suspended over each measurement site on a hand-held aluminium mast <1.5 m
above the soil surface (the minimum height possible with this apparatus). At this
height, the sensor’s 28‡ field of view yields a circular target with an IFOV of
< 0.4 m2. Spectral data were collected between 1000 and 1400 LST (time zone
GMT–6) to minimize the effect of varying solar illumination angle (Milton 1987).
Normalized Difference Vegetation Index (NDVI)—derived from spectral reflec-
tance data—is used extensively for estimating canopy biophysical properties
(Malingreau 1989, Baret and Guyot 1991), and was therefore calculated from red
reflectance (Rred) and near-infrared reflectance (Rnir) and used in this analysis.
Concurrently with the spectral data, a canopy biophysical dataset was collected
consisting of nine variables: leaf chlorophyll content (Chl), canopy height (HT), leaf
percentage water content (PWC), fraction of absorbed photosynthetically active
radiation (Fpar), volumetric soil water content (VWC), fraction of green vegetation
cover (Fgrn), foliar nitrogen content (%N), foliar carbon content (%C) and carbon–
nitrogen ratio (C : N). Each of these variables was measured from the area within
the IFOV of the multispectral radiometer and within 2 h of spectral data collection.
Leaf chlorophyll content (Chl) was measured using a Minolta SPAD-502 meter
(Loh et al. 2000). Five samples were taken within the spectrometer IFOV and
averaged to yield Chl values. Soil moisture was measured using a portable time
domain reflectometer (TDR) probe (Spectrum Technologies, TDR-300). A line
Photosynthetically Active Radiation (PAR) ceptometer with a 1 m probe (Delta-T
devices, Sunscan) was used to measure Fpar. Vegetation cover fraction (Fgrn) was
calculated from colour digital photographs taken vertically at 1.5 m above the
canopy (Rundquist 2001). Vegetation canopy height (HT) was measured using the
visual obstruction method (Robel et al. 1970). Canopy PWC, %C, %N and C : N
ratio were calculated from 10 g grass samples collected along with the other canopy
data and temporarily stored in sealed airtight polyethylene (‘zip-lock’) bags for
subsequent analysis. These samples were weighed, oven dried for 24 h at 80‡C, then
reweighed to determine PWC (fresh sample weights were determined within 2 h of
initial collection, samples were kept on ice until weighed). Nitrogen and carbon
percentage were determined from the oven-dried samples by combustion
chromatography (Carlo-Erba NA-1500 element analyser). Carbon–nitrogen ratio
was calculated from %C and %N.
The biophysical variables selected for the study represent a number of biotic and
abiotic characteristics known to affect canopy spectral response. Among the biotic
characteristics, HT and Fgrn are bulk structural properties, representing the density
and growth form of the canopy. Other biotic variables are more related to
individual plant physiology (PWC, Chl) and biochemistry (%C, %N and C:N)
(Asner 1998). Fraction of absorbed photosynthetically active radiation (Fpar) is a
biotic variable that quantifies both optical and structural properties of the
vegetation canopy. Soil volumetric water content, the sole abiotic variable used in
the analysis, was included because it affects turgidity/vigour and is an important
limiting factor for plant growth.
5434 D. G. Goodin

2.3. Data analysis
Multivariate relationships between spectral and biophysical canopy variables
were evaluated using canonical correlation (CCA) and redundancy analysis (RDA).
These two techniques are computationally similar; both are members of the class ofgeneral linear multivariate analysis techniques that also includes principal
components analysis, canonical variate analysis, and multivariate regression (ter
Braak 1995). In both CCA and RDA, groups of two or more variables are related
to one another by simultaneous extraction of linear components from both sets of
variables so that the correlations between the linear components are maximized
(van den Wollenberg 1977). In canonical correlation, the two sets of variables,
called canonical variates (CVs) are allowed to enter the calculation symmetrically,
thus no predictive relationships emerge from the analysis (ter Braak 1990).Canonical correlation is useful for exploring the multivariate correlation structure
of a dataset, and is capable of revealing latent correlation structures not apparent
from standard univariate linear correlation analysis (Thompson 1984).
Redundancy analysis also finds correlated linear combinations of groups of
input variables, but differs from CCA in that the relationship between the variable
groups is assumed to be asymmetric. That is, one set of variables are considered
dependent response variables, the other set are assumed to be predictors of the first
set. The linear combinations of predictor variables are called redundancy factors,and each redundancy factor accounts for a known proportion of the variance in the
response variables. The redundancy of each variable is the mean squared loading of
one set of variables on the canonical variates of the other set (van den Wollenberg
1977), thus the link between CCA and RDA. Redundancy values correspond to the
principal components of the variables computed from the covariance matrix of the
linear regression of the dependent variables on the independent variables, thus
RDA can also be considered a canonical form of PCA (Goovaerts 1994, ter Braak
1995). All multivariate analyses were done using the SAS/STAT software, version 8
(SAS Institute 1999).
3. Results and discussion
3.1. Results from canonical correlation
Following the suggestion of ter Braak (1990), results of CCA are presented as
bivariate plots with canonical variates as axes (figures 2 and 3). In this format, the
correlation structure of the data is revealed graphically. Only the first two CVs were
significant (see tables 2 and 3), thus only bivariate plots of CV1 and CV2 are
presented. The distance between the variable and the CVs in canonical space showsthe strength of correlation of variables with the two CVs. Similarly, correlated
canopy and spectral variables plot near one another in canonical space. Negatively
correlated variables plot in opposite quadrants of the bivariate plot, with the
distance between them proportional to the strength of the negative relationships.
Weakly correlated variables plot in adjoining quadrants. To clarify the
interrelationships between canopy and spectral variables, the spectral variables in
the bivariate plots are shown as arrows emanating from the origin, while the
canopy biophysical variables appear as points.Examination of the biplots for each combination of observation date, burn
treatment type, and slope/aspect combination shows some persistent relationships
between the various spectral variables (figures 2 and 3). For all eight combinations
of slope/aspect, date and fire treatment, the arrows representing Rgrn, Rred and Rmir
point in roughly the opposite direction from that of NDVI, indicating a strong
Biophysical/spectral reflectance relationships 5435

negative correlation between these variables in canonical variate space. The
negative correlation between Rred and NDVI is consistently strong across all
treatment combinations. For these vegetated surfaces, biophysical interpretation of
this pattern of negative correlation makes sense, since denser vegetation (hence
higher NDVI) is associated with increased chlorophyll absorption in the red region
of the spectrum (Knipling 1970, Gausman 1977).
In contrast, the Rnir arrow points in the same general direction as NDVI,
indicating a positive correlation on all four canonical bivariate plots. In watershed
002C, the correlation between Rnir and NDVI tends to be strongest (i.e. both have
high negative values on CV1) on the east-facing slopes, especially in the May data.
The NDVI and Rnir are less correlated on the south-facing slopes, with the
relationship weakest in the August data (figure 2(b)). On watershed 020B, Rnir is
also most strongly related to NDVI on the west-facing slope in the May data
(figure 2(c)). In the August data (figure 3(c) and 3(d )), Rnir was weakly correlated
with each canonical variate, indicating that it has little influence on NDVI values.
The persistent strong negative correlation between Rred and NDVI, coupled with
the positive but weak relationship between NDVI and Rnir, suggests that much of
the variation of NDVI in these data can be attributed to variation in red
reflectance. Red reflectance in 020B in August was higher than it was in 002C
because of the greater exposure of litter, bare soil, and rock in the unburned
watershed. The lesser influence of Rnir in determining variability of NDVI was
unexpected, in light of the well-documented prominence of the near-infrared region
Figure 2. Canonical bivariate plots for 28 May 2002 dataset. Plotted values are correlationsbetween the spectral and canopy variables and the first two (significant) canonicalvariates. Spectral variables are indicated by arrows, canopy variables by square symbols.Parenthetical numbers on axis labels indicate the percentage of total variance accountedfor by that canonical variate.
5436 D. G. Goodin

Figure 3. Canonical bivariate plots for 18 August 2002 dataset. See caption of figure 2 fordetailed explanation of plot.
Table 2. RDA results for watershed 020B and 002C on 28 May 2002. Independent spectralvariables are shown in normal typeface. Dependent canopy variables are shown initalics. Table entries are the squared multiple correlations between each variable andthe first three canonical variates. The redundancy value represents the normalizedpercentage or variance explained by each canonical variate.
Variable
Watershed 020B Watershed 002C
East aspect West aspect South aspect East aspect
CV1 CV2 CV1 CV2 CV1 CV2 CV1 CV2
Rgrn 0.48 0.48 0.53 0.61 0.40 0.04 0.14 0.15Rred 0.53 0.57 0.77 0.80 0.38 0.15 0.53 0.54Rnir 0.00 0.19 0.32 0.41 0.10 0.10 0.40 0.40Rmir 0.61 0.63 0.62 0.63 0.21 0.15 0.47 0.48NDVI 0.44 0.52 0.71 0.76 0.47 0.27 0.56 0.56Chl 0.02 0.10 0.02 0.27 0.10 0.10 0.01 0.01HT 0.61 0.61 0.61 0.72 0.35 0.07 0.01 0.02PWC 0.05 0.05 0.02 0.18 0.07 0.06 0.13 0.15Fpar 0.14 0.14 0.41 0.41 0.17 0.15 0.00 0.04VWC 0.01 0.01 0.05 0.07 0.24 0.05 0.36 0.37Fgrn 0.08 0.08 0.09 0.09 0.41 0.36 0.32 0.41%N 0.01 0.01 0.01 0.02 0.05 0.05 0.21 0.23%C 0.00 0.02 0.01 0.04 0.08 0.05 0.06 0.06C : N 0.08 0.08 0.12 0.15 0.07 0.07 0.25 0.28
p-value v0.01 0.02 v0.01 v0.01 v0.01 0.05 v0.01 0.03Canonical R2 0.69 0.44 0.85 0.60 0.58 0.45 0.63 0.29Redundancy 0.41 0.07 0.58 0.05 0.33 0.25 0.67 0.06
Biophysical/spectral reflectance relationships 5437
in the spectral reflectance curve of green vegetation (Knipling 1970, Gausman
1977). Previous studies similar to ours (e.g. Wiegand et al. 1992, Korobov and
Railyan 1993, Jakubauskas 1996) noted a much greater influence of Rnir on NDVI.
Since the biophysical canopy variables are the independent variables explaining
the observed pattern of spectral reflectance, ideally there should be little or no
intercorrelation among them. The distribution of biophysical variables in canonical
variate space does indicate the presence of some correlation, but unlike the spectral
variables, there is no indication of groups of variables persistently correlated across
burn treatment type, data collection period or slope/aspect. There are some notable
patterns of correlation within watersheds, however. In the May data, C : N, VWC,
Fpar and %C appear to be weakly correlated with one another on both the east- and
south-facing grids of watershed 002C, based on their proximity in bivariate
canonical space (figure 3(a) and 3(b)). Plant water content and %N also lie in close
proximity to each other on both 002C grids. The observed relationship of these
variables on both grids suggests that they may be linked biophysically. Clearly, C : N
is related to %C, but the ratio is also determined by %N, which is not correlated to
either variable. The potential explanatory link between canopy %N and PWC is
also not readily apparent. Abundant N and available water contribute to canopy
greenness, but the correlation between these two variables is not consistent across
all treatments and grids in these data. On watershed 020B, Fgrn, VWC and %N are
correlated on both east- and west-facing grids, as are C : N and Fpar. Again, the
underlying biophysical linkages between these variables are not readily apparent.
None of the other canopy variables are consistently correlated in the May dataset.
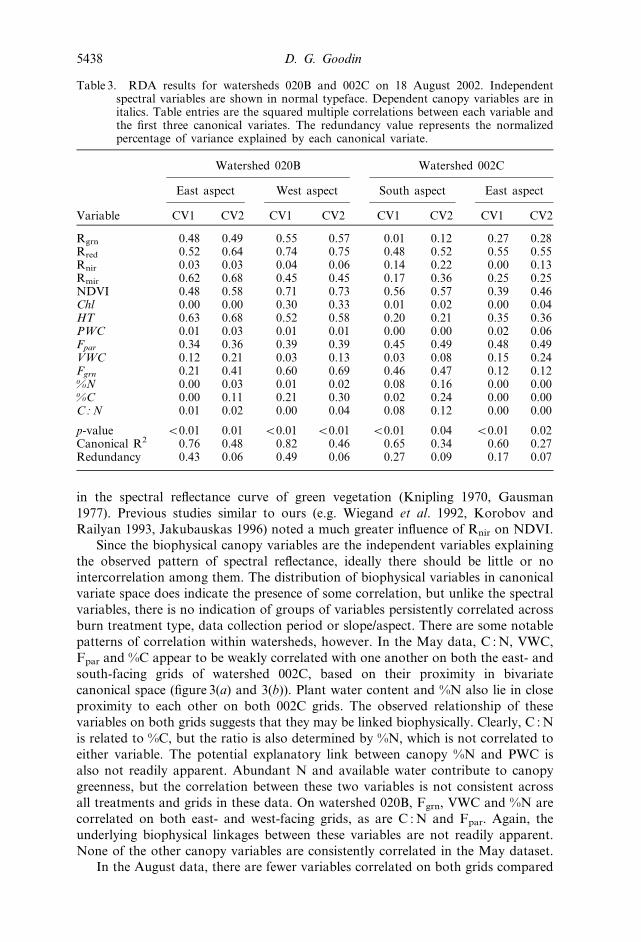
In the August data, there are fewer variables correlated on both grids compared
Table 3. RDA results for watersheds 020B and 002C on 18 August 2002. Independentspectral variables are shown in normal typeface. Dependent canopy variables are initalics. Table entries are the squared multiple correlations between each variable andthe first three canonical variates. The redundancy value represents the normalizedpercentage of variance explained by each canonical variate.
Variable
Watershed 020B Watershed 002C
East aspect West aspect South aspect East aspect
CV1 CV2 CV1 CV2 CV1 CV2 CV1 CV2
Rgrn 0.48 0.49 0.55 0.57 0.01 0.12 0.27 0.28Rred 0.52 0.64 0.74 0.75 0.48 0.52 0.55 0.55Rnir 0.03 0.03 0.04 0.06 0.14 0.22 0.00 0.13Rmir 0.62 0.68 0.45 0.45 0.17 0.36 0.25 0.25NDVI 0.48 0.58 0.71 0.73 0.56 0.57 0.39 0.46Chl 0.00 0.00 0.30 0.33 0.01 0.02 0.00 0.04HT 0.63 0.68 0.52 0.58 0.20 0.21 0.35 0.36PWC 0.01 0.03 0.01 0.01 0.00 0.00 0.02 0.06Fpar 0.34 0.36 0.39 0.39 0.45 0.49 0.48 0.49VWC 0.12 0.21 0.03 0.13 0.03 0.08 0.15 0.24Fgrn 0.21 0.41 0.60 0.69 0.46 0.47 0.12 0.12%N 0.00 0.03 0.01 0.02 0.08 0.16 0.00 0.00%C 0.00 0.11 0.21 0.30 0.02 0.24 0.00 0.00C : N 0.01 0.02 0.00 0.04 0.08 0.12 0.00 0.00
p-value v0.01 0.01 v0.01 v0.01 v0.01 0.04 v0.01 0.02Canonical R2 0.76 0.48 0.82 0.46 0.65 0.34 0.60 0.27Redundancy 0.43 0.06 0.49 0.06 0.27 0.09 0.17 0.07
5438 D. G. Goodin
to the May data. On watershed 002C, only the two tissue nutrient content variables
(%C and %N) occur together in canonical space on both grids. These variables are
interrelated, in that both are indicative of canopy biochemistry. Note that the C : N
ratio is correlated with %C and %N on the south-facing grid, but not on the east-
facing one. No other variables are correlated on both grids. On watershed 020B,
PWC and %N are correlated—the relationship is nearly perfect on the east-facing
grid. These same two variables were correlated on both grids in the May 002C data;
however, the reoccurrence of this relationship later in the season and on the
contrasting burn treatment does little to clarify the relationship between them. The
lack of consistent correlations between canopy biophysical variables across fire
treatment, topographic setting or data collection period argues against any
persistent underlying biophysical linkages between any of the canopy variables. The
occasional correlations noted here should not necessarily be interpreted as thematic
biophysical links.
3.2. Redundancy analysis
While CCA elucidates the multivariate correlation structure of the data,
redundancy analysis provides a more rigorous analysis of the influence of the
canopy variables on the spectral data. The results of RDA (tables 2 and 3) are
interpreted using the squared multiple correlations between the various canonical
variates and the spectral and canopy variables. These squared multiple correlations
are similar to factor loadings in principal components analysis (ter Braak 1995).
The redundancy values associated with each canonical variate quantify the
normalized amount of data variance accounted for by that variate—an indicator of
the ‘importance’ of each canonical variate and of the canopy and spectral variables
correlated with that variate.
Redundancy analysis of the dataset reveals that, in every case, two significant
canonical variates were extracted from the dataset. With the exception of the south
grid in watershed 002C from the May data, the redundancy value for the first
canonical variate accounted for an overwhelming proportion of the variance,
indicating that CV2 had little power to predict the spectral variables. Because of the
disparity in predictive power between the two canonical variates, in most instances
it was only necessary to analyse the first canonical variate. The RDA results show
some common relationships between canopy biophysical and spectral variables on
all grids and across both dates; however, they also show some variations that
appear to be due to topographic setting, fire treatment and canopy phenological
state.
3.2.1. Redundancy analysis of May data
In the May dataset, redundancy values are similar for the first two canonical
variates on the south-facing grid of 002C. This was the only grid where the
redundancy of the first canonical variate was not substantially higher than the
second (table 2). Although the redundancy for CV1 and CV2 are similar in value,
the squared multiple correlations (hereafter referred to as ‘loadings’) are higher on
canonical variate 1 (CV1), than on canonical variate 2 (CV2). High loading on CV1
by all spectral variables but Rnir suggests spectral reflectance across the spectrum is
influenced by similar canopy properties. The low loadings for Rnir, coupled with the
stronger loading of Rred and NDVI, supports the conclusion made in §3.1 that Rred
is the reflectance component most responsible for variability in NDVI in these data.
Biophysical/spectral reflectance relationships 5439
Among the canopy biophysical variables, Fgrn and HT appear to be the most
important determinants of spectral reflectance. Both of these variables represent
aspects of the physical structure of the canopy. Of the remaining canopy variables,
only soil moisture (VWC) and Fpar produced loading values exceeding single digits.
VWC is probably linked to canopy height and density because greater root zone
soil moisture facilitates soluble nutrient uptake, enabling vigorous canopy growth.
Fpar is influenced by the optical properties of the canopy (i.e. leaf transmissivity),
but is also linked to canopy structure because a tall or denser canopy will absorb
more PAR. The remaining canopy variables did not produce sufficiently high
loading values to warrant further analysis.
On the east-facing slope of watershed 002C, CV1 accounts for 67% of the
redundancy, far more than accounted for by CV2. As on the south-facing slopes,
nearly all of the spectral variables are strongly correlated with CV1, the exception
in this case being Rgrn. Note that Rnir is well correlated with CV1 here, whereas it
did not load strongly on either canonical variate on the south-facing slope. Among
the canopy biophysical variables, Fgrn and VWC most strongly influence the
spectral variables (0.32 and 0.36 loadings on CV1, respectively). Unlike the south-
facing slope, HT had almost no influence. The results from the east-facing grid also
differ from those of the south-facing in that leaf biochemical variables (i.e. %N and
the C:N ratio) load strongly.
Redundancy values for the May data from watershed 020B also indicate that
the first canonical variate explains the majority of the variance in the data (table 2).
On the east-facing slope, all of the spectral variables load relatively strongly on CV1
except for Rnir, which has a loading value of 0.0. On the west-facing slope, the
loading for Rnir is higher, yet still considerably less than the other spectral variables.
Once again, high loadings by Rred and NDVI, coupled with the lack of correlation
with Rnir, suggest that red reflectance determines most of the variability in NDVI
values. Middle infrared reflectance loads more strongly on CV1 in watershed 020B
compared to CV1 in 002C. Since reflectance in the middle infrared is inversely
correlated with water-bearing plant tissues, it is an important component of the
overall spectral response from ‘non-green’ components of the canopy such as stems
and litter (Gausman 1977). Because fire suppresses woody vegetation and removes
litter from previous years’ growth (Collins and Steinauer 1998), the importance of
Rmir on watershed 020B (compared to 002C) is likely attributable to the absence of
fire. Among the explanatory canopy biophysical variables, HT emerges as the most
important on both grids. Fpar loads strongly on CV1 on the west-facing grid, but
less so on the east-facing grid.
3.2.2. Results and discussion of August redundancy analysis
As in the May data, the first canonical variate accounts for the majority of the
redundancy in the August data (table 3), so that only CV1 need be analysed. On
watershed 002C, 27% and 17% of the variance on the east- and south-facing slopes,
respectively, is accounted for by CV1. Among the spectral variables, Rred and
NDVI load strongest on CV1 on both the south and east aspects of 002C, whereas
Rnir does not correlate strongly to any canonical variate. This supports the finding
evident throughout this analysis that Rred is a more important determinant of
variability in NDVI than Rnir. The rest of the spectral variables actually load more
strongly on CV2, but since the second canonical variate accounts for only 9% of the
variance on both the east- and south-facing slopes, it is unlikely that these loadings
5440 D. G. Goodin

indicate significant explanatory power. In fact, the overall low redundancy in the
August data from watershed 002C suggests that much of the spectral variability on
this watershed might be related to factors other than those measured in this study.
The pattern of loadings among the canopy biophysical variables on watershed002C shows some similarity with the May data, but also some notable differences.
In the May data, canopy structural variables (Fgrn, HT) were the dominant controls
on spectral variables. In the August data, Fpar is now the strongest determinant of
reflectance. As noted earlier, Fpar is a canopy biophysical variable related to both
the optical and structural properties of the canopy. It is also highly correlated to
leaf area index in tallgrass prairie (Walter-Shea et al. 1992). The emergence of Fpar
as an important correlate with spectral response later in the season reflects the fact
that the canopy is no longer actively growing and that its height is much moreuniform than it was earlier in the season, especially compared to 020B (see SD
values in table 1). Thus, the density and optical properties of the canopy are now
more important, and their effect is manifest in the importance of Fpar. Although
less important than Fpar, canopy structural variables are still important. Canopy
height is less important than it was earlier in the growing season (due to the more
uniform canopy height), but Fgrn continues to load strongly on CV1, indicating that
canopy density is now the more important structural determinant of reflectance.
On watershed 020B, CV1 accounts for 43% of the variance on the east-facingslope and 49% on the west-facing slope (table 3). All of the spectral variables for
both aspects load strongly on CV1, except Rnir. By now, the pattern and
implications of weak loadings associated with Rnir is familiar. Among the
explanatory variables, canopy structure continues to be important. Canopy
height exerts the strongest influence on spectral reflectance, just as it did in the
May data. However, other canopy variables also load strongly on CV1. Fgrn
emerges as a strong explanatory variable on the west-facing slope, but a less
important one on the east aspect. As in the May data, Fpar continues to exert some
influence on the canopy variables on the west-facing slope. However, its importanceon the east-facing slope increased compared to the May data. We also note that %C
shows modest importance on the west-facing slope.
4. Conclusions
In this study, we considered the relationships between spectral reflectance and
canopy properties for one land cover type (tallgrass prairie), under a variety of
treatment conditions, topographic settings and canopy phenological states. The
significance of our findings lies in the conclusions drawn about the spatial andtemporal relationships between canopy properties and spectral reflectance. In nearly
every case, RDA showed that most of the spectral variables including NDVI loaded
heavily onto the first canonical variate, which was the CV that accounted for the
majority of variance in the data. This was more apparent in the May data than in
the August data. Correlation of most spectral variables with the same CV indicates
that the same biophysical properties (i.e. those canopy variables which also load
strongly on CV1) are controlling reflectance across the spectrum. The single spectral
variable that failed to correlate frequently with CV1 was Rnir, which, except for oneinstance, did not load heavily on any of the canonical variates. Given the
prominence of Rnir in the reflectance spectrum of green vegetation (Knipling 1970,
Gausman 1977) and its observed importance in previous multivariate studies of
reflectance in forest (Jakubauskas 1996) and cropland (Wiegand et al. 1992,
Sampson et al. 2001), its lack of importance here is noteworthy. The similarity of
Biophysical/spectral reflectance relationships 5441
correlative response among the other four spectral variables and the lack of
importance of Rnir is surprising in light of the standard model for spectral
reflectance from green vegetation. According to this standard model, visible
reflectance should be controlled by leaf physiology (i.e. pigment content), near-infrared response by cell structure, and middle infrared response by tissue water
content (Hoffer 1978). The standard model for vegetation reflectance was derived
from laboratory measurements that concentrated only on leaf materials. However,
our results suggest that spectral reflectance in situ responds to a much larger range
of controlling factors, perhaps due to the wider variety of biotic and abiotic
materials (e.g. soil, litter, stems) present in the IFOV of the instrument under field
observation conditions. These findings might also mean that overactively growing
grassland canopies, the high reflectance values and lack of dynamic range in Rnir
contribute to the saturation effect frequently observed in NDVI values (Gitelson
2004). Further research incorporating modified, saturation-resistant forms of NDVI
(Gitelson 2004, Vina et al. 2004) into multivariate analysis of canopy biophysical
controls could yield insight into this problem. In addition, spectral data were
obtained with a relatively coarse spectral resolution instrument—repeating this
experiment with hyperspectral radiometry could reveal canopy reflectance responses
that are correlated to other biophysical properties but too spectrally fine to be
identified here.Among the canopy biophysical variables, the two structural variables (HT and
Fgrn) were the most consistently correlated with CV1. In all of the eight
measurement sets, one of these two variables was among the two strongest
correlates with CV1, and in six of eight sets one of the two is the strongest correlate.
Since the spectral variables (with the exception of Rnir) all loaded onto CV1, it can
be concluded that throughout the growing season, canopy structure is the most
consistent control over spectral reflectance. Structural factors are especially
important earlier in the May dataset, when the canopy is still greening anddeveloping.
By the time of the August data collection, the canopy has finished growing and
was experiencing water stress. Canopy structure continues to be a dominant control
on spectral reflectance–structural variables are the strongest correlates on both
020B grids and the south-facing grid on 002C. However, Fpar (a variable
encompassing both structural and optical canopy properties, see §2.2) also emerges
as a consistent, strong influence on spectral response. This is especially apparent on
watershed 002C, where the correlation of Fpar with CV1 is strongest among all thecanopy biophysical variables on the east-facing grid and nearly identical with Fgrn
on the south-facing grid. This suggests that canopy optical properties are more
important in determining spectral response in the mature tallgrass canopy, relative
to a canopy that is still growing and developing. Variables representing leaf
physiology and soil moisture (%C, %N, C : N, Chl, PWC, VWC) appear as
significant correlates occasionally, but their importance does not appear to be
consistently or systematically linked to canopy phenology, fire treatment or
topographic setting. At this relatively coarse level of spectral resolution, canopystructure and optics are the dominant physical controls on reflectance.
These findings shed light on biophysical interpretation of reflectance from
tallgrass prairie (and perhaps grasslands in general) and contribute to both of the
application domains of remote sensing discussed in §1. The lack of any consistent
correlation between spectral reflectance and specific biophysical variables (e.g. Fpar,
HT, Chl, C : N, etc.) suggests that spectral reflectance and NDVI cannot be
5442 D. G. Goodin

univariately linked to any single biophysical property. Rather, our results indicate
that canopy reflectance and NDVI are controlled by complex, multivariate
interactions of canopy structure and optics. These results certainly do not
contradict the use of spectral reflectance indices as univariate predictors for
tallgrass canopy properties, especially canopy structural properties. However, this
analysis suggests that researchers should be cautious about assuming that the
biophysical relationships between canopy properties and spectral response in
tallgrass prairie are spatially and temporally invariable, especially at fine spatial
scales and over small spatial extent. These results show that canopy treatment
history, topographic setting and phenological development state all affect the
relationship between biophysical canopy properties and spectral response. Cohen
et al. (2003) showed that multivariate analysis could be used to develop better
regression models for predicting biophysical properties from spectral reflectance
data. The results presented here support their conclusions by showing how the
correlation between biophysical properties and spectral reflectance vary in response
to time, treatment and topographical situation, and how CCA/RDA can be used to
determine an optimal selection of spectral variables for predicting canopy
properties.
These analyses can also help inform multispectral interpretation of tallgrass
canopy spectral data, particularly with respect to classification into functional or
ecological categories (Lobo 1997). Often, the goal of such classification is to
segment an image into ecologically meaningful categories for further analysis or
monitoring (Treitz et al. 1992, Lobo et al. 1998). Our results help interpret the
biophysical meaning of these spatially segmented data.
References
AHLRICHES, J. S., and BAUER, M. E., 1983, Relation of agronomic and multispectralreflectance characteristics of spring wheat. Agronomy Journal, 75, 987–993.
ASNER, G. P., 1998, Biophysical and biochemical sources of variability in canopy reflectance.Remote Sensing of Environment, 64, 234–253.
BARET, F., and GUYOT, G., 1991, Potentials and limits of vegetation indices for LAI andAPAR assessments. Remote Sensing of Environment, 35, 161–173.
CARLSON, T. N., and RIPLEY, D. A., 1997, On the relation between NDVI, fractionalvegetation cover, and leaf area index. Remote Sensing of Environment, 62, 241–252.
CHRISTENSEN, S., and GOUDRIAAN, J., 1993, Deriving light interception and biomass fromspectral reflectance ratio. Remote Sensing of Environment, 43, 87–96.
COHEN, W. B., MAIERSPENSER, T. K., GOWER, S. T., and TURNER, D. P., 2003, Animproved strategy for regression of biophysical variables and Landsat ETMz data.Remote Sensing of Environment, 84, 561–571.
COLLINS, S. L., and GLENN, S. M., 1991, Importance of spatial and temporal dynamics inspecies regional abundance and distribution. Ecology, 72, 654–664.
COLLINS, S. L., and STEINAUER, E. M., 1998, Disturbance, diversity, and species interactionsin tallgrass prairie. In Grassland Dynamics, edited by A. K. Knapp, J. M. Briggs,D. C. Hartnett and S. L. Collins (New York: Oxford University Press).
COLLINS, S. L., and WALLACE, L. L., 1990, Fire in North American Tallgrass Prairie(Norman, OK: University of Oklahoma Press).
CURRAN, P. J., 1983, Multispectral remote sensing for the estimation of green leaf index.Philosophical Transactions of the Royal Society of London, A309, 257–270.
DAVIDSON, A., and CSILLAG, F., 2003, A comparison of nested ANOVA and geostatisticsfor characterizing the spatial structure of patchy grassland under a limited samplingbudget: a study using simulated landscapes. Canadian Journal of Remote Sensing, 29,43–56.
FREEMAN, C. C., 1998, The flora of Konza Prairie: a historical review and contemporary
Biophysical/spectral reflectance relationships 5443
patterns. In Grassland Dynamics, edited by A. K. Knapp, J. M. Briggs, D. C. Hartnett andS. L. Collins (New York: Oxford University Press).
GAUSMAN, H. W., 1977, Reflectance of leaf components. Remote Sensing of Environment, 6,1–9.
GILBERT, M. A., GANDIA, S., and MELIA, J., 1996, Analysis of spectral–biophysicalrelationships for a corn canopy. Remote Sensing of Environment, 55, 11–20.
GITELSON, A. A., 2004, Wide dynamic range vegetation index for remote quantification ofbiophysical characteristics of vegetation. Journal of Plant Physiology, 161, 165–173.
GOODIN, D. G., and HENEBRY, G. M., 1998, Seasonality of finely-resolved spatial structureof NDVI and its component reflectances in tallgrass prairie. International Journal ofRemote Sensing, 16, 1481–1494.
GOOVAERTS, P., 1994, Study of spatial relationships between two sets of variables usingmultivariate geostatistics. Geoderma, 62, 93–107.
HARTNETT, D. C., and FAY, P. A., 1998, Plant populations: patterns and processes. InGrassland Dynamics, edited by A. K. Knapp, J. M. Briggs, D. C. Hartnett andS. L. Collins (New York: Oxford University Press).
HOFFER, R. M., 1978, Biological and physical considerations in applying computer-aidedanalysis techniques to remote sensor data. In Remote Sensing: The QuantitativeApproach, edited by P. H. Swain and S. M. Davis (New York: McGraw-Hill).
JAKUBAUSKAS, M. E., 1996, Canonical correlation analysis of coniferous forest spectral andbiotic relationships. International Journal of Remote Sensing, 12, 2323–2332.
JENSEN, J., 1983, Biophysical remote sensing. Annals of the Association of AmericanGeographers, 73, 111–132.
KNAPP, A. K., and SEASTEDT, T. R., 1998, Grasslands, Konza Prairie, and long-termecological research. In Grassland Dynamics, edited by A. K. Knapp, J. M. Briggs,D. C. Hartnett and S. L. Collins (New York: Oxford University Press).
KNAPP, A. K., BRIGGS, J. M., BLAIR, J. M., and TURNER, C. L., 1998, Patterns and controlsof aboveground net primary productivity in tallgrass prairie. In Grassland Dynamics,edited by A. K. Knapp, J. M. Briggs, D. C. Hartnett and S. L. Collins (New York:Oxford University Press).
KNIPLING, E. B., 1970, Physical and physiological basis for the reflectance of visible andnear-infrared radiation from vegetation. Remote Sensing of Environment, 1, 155–159.
KOROBOV, R. M., and RAILYAN, V. YA., 1993, Canonical correlation relationships amongspectral and phytometric variables for twenty winter wheat fields. Remote Sensing ofEnvironment, 43, 1–10.
LOBO, A., 1997, Image segmentation and discriminant analysis for the identification oflandscape units in ecology. IEEE Transactions on Geosciences and Remote Sensing,35, 1136–1145.
LOBO, A., MOLONEY, K., CHIC, O., and CHIARIELLO, N., 1998, Analysis of fine-scale spatialpattern of a grassland from remotely-sensed imagery and field collected data.Landscape Ecology, 13, 111–131.
LOH, F., GRABOSKY, J., and BASSUK, N., 2000, Use of Minolta SPAD-502 to determinechlorophyll concentration in Ficus benjamina and Populous deltoides leaf tissue.Horticultural Science, 35, abstract no. 191.
MALINGREAU, J. P., 1989, The vegetation index and the study of vegetation dynamics. InApplications of Remote Sensing to Agrometeorology, edited by F. Tosselli (Brussels:ECSC).
MAAS, S. J., 1998, Estimating cotton canopy ground cover from remotely sensed scenereflectance. Agronomy Journal, 90, 384–388.
MILTON, E. J., 1987, Principles of field spectroscopy. International Journal of RemoteSensing, 8, 1807–1827.
PRICE, J. C., and BAUSCH, W. C., 1995, Leaf area index estimation from visible and near-infrared reflectance. Remote Sensing of Environment, 52, 55–65.
RISSER, P. G., BIRNEY, E. C., BLOCKER, H. D., MAY, S. W., PARTON, W. J., andWIENS, J. A., 1981, The True Prairie Ecosystem (Stroudburg, PA: Hutchinson Ross).
ROBEL, R. J., BRIGGS, J. N., DAYTON, A. D., and HULBERT, L. C., 1970, Relationshipsbetween visual obstruction measurements and weight of grassland vegetation. Journalof Range Management, 23, 295–297.
RUNDQUIST, B. C., 2002, The influence of canopy vegetation fraction on spectral
5444 D. G. Goodin

measurements over native tallgrass prairie. Remote Sensing of Environment, 81,125–139.
SAMPSON, P. H., TREITZ, P. M., and MOHAMMED, G. R., 2001, Remote sensing of forestcondition in tolerant hardwoods: an examination of spatial scale, structure, andfunction. Canadian Journal of Remote Sensing, 27, 232–245.
SAS INSTITUTE 1990, SAS/STAT User’s Guide, version 8, 2nd edn X (Cary, NC: SASInstitute, Inc.).
SHIBAYAMA, M., and AKIYAMA, T., 1989, Seasonal visible, near-infrared, and mid-infraredspectra of rice canopies in relation to NDVI and above-ground phytomass. RemoteSensing of Environment, 27, 119–127.
TER BRAAK, C. J. F., 1990, Interpreting canonical correlation analysis through biplots ofstructure correlations and weights. Psychometrika, 55, 519–531.
TER BRAAK, C. J. F., 1995, Ordination. In Data Analysis in Community and LandscapeEcology, edited by R. H. G. Jongman, C. J. F. ter Braak and O. F. R. van Tongeren(Cambridge: Cambridge University Press).
THOMPSON, B., 1984, Canonical Correlation Analysis: Uses and Interpretation, QuantitativeApplications in the Social Sciences Series, No. 47 (Thousand Oaks, CA: Sage).
TREITZ, P. M., HOWARTH, P. J., SUFFLING, R. G., and SMITH, P., 1992, Application ofdetailed ground information to vegetation mapping with high spatial resolutiondigital imagery. Remote Sensing of Environment, 42, 65–82.
vAN DEN WOLLENBERG, A., 1977, Redundancy analysis: an alternative for canonicalcorrelation. Psychometrika, 42, 207–219.
VINA, A., HENEBRY, G. M., and GITELSON, A. A., 2004, Satellite monitoring of vegetationdynamics: sensitivity enhancement by the wide dynamic range vegetation index.Geophysical Research Letters, 31, 1–4.
WALTER-SHEA, E. A., BLAD, B. L., HAYS, C. J., MESARCH, M. A., DEERING, D. W., andMIDDLETON, E. M., 1992, Biophysical properties affecting vegetative canopyreflectance and absorbed photosynthetically active radiation at the FIFE site.Journal of Geophysical Research, 97, 18 925–18 934.
WHITE, M. A., ASNER, G. P., NEMANI, R. R., PRIVETTE, J. L., and RUNNING, S. W., 2000,Measuring fractional cover and leaf area index in arid ecosystems: digital camera,radiation transmittance, and laser altimetry methods. Remote Sensing of Environment,74, 45–57.
WIEGAND, C. L., MAAS, S. J., AASE, J. K., HATFIELD, J. L., PINTER, P. J. JR., JACKSON,R. D., KANEMASU, E. T., and LAPITAN, R. L., 1992, Multisite analysis of spectral–biophysical data for wheat. Remote Sensing of Environment, 42, 1–21.
Biophysical/spectral reflectance relationships 5445