Seasonal DOC accumulation in the Black Sea: a regional explanation for a general mechanism
13
Seasonal DOC accumulation in the Black Sea: a regional explanation for a general mechanism Gustave Cauwet a, * , Gae ¨lle De ´liat a , Anton Krastev b , Galina Shtereva b , Sylvie Becquevort c , Christiane Lancelot c , Andre ´ Momzikoff d , Alain Saliot e , Adriana Cociasu f , Lucia Popa f a Laboratoire d’Oce ´anographie Biologique (UMR CNRS 7621), Observatoire Oce ´anologique, B.P. 44, 66651 Banyuls sur mer, Cedex, France b Institute of Oceanology, Bulgarian Academy of Sciences, PO Box 152, 9000 Varna, Bulgaria c Ecologie des Syste `mes Aquatiques, Universite ´ Libre de Bruxelles, Campus de la Plaine, CP 221, Boulevard du Triomphe, B-1050 Bruxelles, Belgium d Institut Oce ´anographique, URA CNRS 2077, 195 Rue Saint Jacques, F-75005 Paris, France e Laboratoire de Physique et Chimie Marines, ESA CNRS 7077, Universite ´ P. et M. Curie (Paris VI), 4 Place Jussieu, 75252 Paris cedex 05, France f Romanian Marine Research Institute, Brd Mamaia 300, 8700 Constanza, Romania Abstract During three cruises in the Black Sea, organised in July 1995 and April – May 1997, biological and chemical parameters that can influence the carbon budget were measured in the water column on the NW shelf, particularly in the mixing zone with Danube River waters. We observed in early spring (end of April–May) conditions an important input of freshwater organisms that enhanced the microbial activity in the low salinity range. High bacterial activity regenerates nitrogen in the form of nitrates, but is also responsible for an important consumption of ammonium and phosphate, leading to a high N/P ratio and a strong deficit in phosphorus. The consequence is a limitation of phytoplankton development but also a production of carbohydrates that accumulate all along the salinity gradient. These mechanisms are responsible for a seasonal accumulation of dissolved organic carbon (DOC) that increases from 210 AM in winter to about 280 AM in summer. All this excess DOC disappears during winter, probably degraded by bacterial activity. The degradation of carbon-rich organic matter increases the phosphorus demand by bacteria bringing limitation to phytoplankton primary production. D 2002 Published by Elsevier Science B.V. Keywords: Dissolved organic carbon; Carbon cycling; Accumulation; Productivity; Microbial loop; Nutrients consumption; Carbohydrates; Black Sea; Danube; Mixing zone 1. Introduction Dissolved organic matter (DOM) in seawater is now considered as a major focus to understand marine biogeochemical processes and must be considered as an important variable in global carbon cycling (Ducklow et al., 1995; Guo et al., 1996; Hansell and 0304-4203/02/$ - see front matter D 2002 Published by Elsevier Science B.V. PII:S0304-4203(02)00064-6 * Corresponding author. Tel.: +33-46888-7356; fax: +33-46888- 5946. E-mail address: [email protected] (G. Cauwet). www.elsevier.com/locate/marchem Marine Chemistry 79 (2002) 193 – 205
-
Upload
independent -
Category
Documents
-
view
0 -
download
0
Transcript of Seasonal DOC accumulation in the Black Sea: a regional explanation for a general mechanism
Seasonal DOC accumulation in the Black Sea: a regional
explanation for a general mechanism
Gustave Cauwet a,*, Gaelle Deliat a, Anton Krastev b, Galina Shtereva b,Sylvie Becquevort c, Christiane Lancelot c, Andre Momzikoff d,
Alain Saliot e, Adriana Cociasu f, Lucia Popa f
aLaboratoire d’Oceanographie Biologique (UMR CNRS 7621), Observatoire Oceanologique, B.P. 44, 66651 Banyuls sur mer, Cedex, FrancebInstitute of Oceanology, Bulgarian Academy of Sciences, PO Box 152, 9000 Varna, Bulgaria
cEcologie des Systemes Aquatiques, Universite Libre de Bruxelles, Campus de la Plaine, CP 221, Boulevard du Triomphe,
B-1050 Bruxelles, BelgiumdInstitut Oceanographique, URA CNRS 2077, 195 Rue Saint Jacques, F-75005 Paris, France
eLaboratoire de Physique et Chimie Marines, ESA CNRS 7077, Universite P. et M. Curie (Paris VI), 4 Place Jussieu,
75252 Paris cedex 05, FrancefRomanian Marine Research Institute, Brd Mamaia 300, 8700 Constanza, Romania
Abstract
During three cruises in the Black Sea, organised in July 1995 and April–May 1997, biological and chemical parameters that
can influence the carbon budget were measured in the water column on the NW shelf, particularly in the mixing zone with
Danube River waters. We observed in early spring (end of April–May) conditions an important input of freshwater organisms
that enhanced the microbial activity in the low salinity range. High bacterial activity regenerates nitrogen in the form of nitrates,
but is also responsible for an important consumption of ammonium and phosphate, leading to a high N/P ratio and a strong
deficit in phosphorus. The consequence is a limitation of phytoplankton development but also a production of carbohydrates
that accumulate all along the salinity gradient. These mechanisms are responsible for a seasonal accumulation of dissolved
organic carbon (DOC) that increases from 210 AM in winter to about 280 AM in summer. All this excess DOC disappears
during winter, probably degraded by bacterial activity. The degradation of carbon-rich organic matter increases the phosphorus
demand by bacteria bringing limitation to phytoplankton primary production.
D 2002 Published by Elsevier Science B.V.
Keywords: Dissolved organic carbon; Carbon cycling; Accumulation; Productivity; Microbial loop; Nutrients consumption; Carbohydrates;
Black Sea; Danube; Mixing zone
1. Introduction
Dissolved organic matter (DOM) in seawater is now
considered as a major focus to understand marine
biogeochemical processes and must be considered as
an important variable in global carbon cycling
(Ducklow et al., 1995; Guo et al., 1996; Hansell and
0304-4203/02/$ - see front matter D 2002 Published by Elsevier Science B.V.
PII: S0304 -4203 (02 )00064 -6
* Corresponding author. Tel.: +33-46888-7356; fax: +33-46888-
5946.
E-mail address: [email protected] (G. Cauwet).
www.elsevier.com/locate/marchem
Marine Chemistry 79 (2002) 193–205
Carlson, 1998; Jickells et al., 1995; Kirchman et al.,
1991; Toggweiler, 1992). From several recent studies,
we know that an important proportion of the carbon
fixed by phytoplankton through photosynthesis can be
released as DOM during blooms (Biddanda and Ben-
ner, 1997; Biersmith and Benner, 1998; Fajon et al.,
1999; Norrman et al., 1995; Strom et al., 1997). Several
authors have calculated the mean percentage of the
carbon fixed by photosynthesis that is rapidly released
as DOC, and the numbers proposed are ranging
between 10% and 20% (Chen and Wangersky, 1996;
Malinsky-Rushansky and Legrand, 1996; Passow et
al., 1994). In very extreme situation, like the mucilage
events occurring sometimes in northern Adriatic Sea,
the numbers can be more important, up to 70% (Ober-
nosterer andHerndl, 1995).Mucilage DOC is generally
utilised by bacteria (Smith et al., 1995) but there is also
evidence that the DOC released is frequently accumu-
lating in the euphotic zone during summer time (Bor-
sheim and Myklestad, 1997; Borsheim et al., 1999;
Williams, 1995). The net annual accumulation of DOC
in the euphotic zone was calculated by several authors.
In the Sargasso Sea, it was estimated at 0.99–1.21 mol
C m� 2 (Carlson et al., 1994), in the western Medi-
terranean Sea, at 1.23 mol C m � 2 (Copin-Montegut
and Avril, 1993) and up to 1.65–4.18 mol C m � 2 in
north Atlantic waters (Borsheim andMyklestad, 1997).
The accumulated DOM is mainly composed of carbon-
rich molecules like carbohydrates.
Williams (1995) pointed out that the export of C-
rich organic matter provokes a decoupling of the
carbon and nitrogen cycles that could be of some
importance from a geochemical point of view. To
perform the mineralisation of that carbon-rich DOM
in surface and coastal waters, bacteria will need
inorganic nitrogen and phosphorus and then compete
with phytoplankton for these nutrients.
The accumulation of DOM was generally evi-
denced in oligo- to meso-trophic environments (W.
Mediterranean, Sargasso Sea, North Atlantic) but
rarely in eutrophic nutrients-rich coastal environ-
ments. Due to an important inflow of freshwater from
several large rivers (Danube, Don, Dniepr, Dniestr
Rivers) the Black Sea is generally considered a
eutrophicated environment (Aubrey, 1992; Bodeanu,
1992; Gomoiu, 1992; Murray et al., 1991). The low
salinity ( < 20) and the reported high DOC concen-
trations (Coble et al., 1990; Mopper and Kieber, 1991;
Torgunova et al., 1992) make this environment attract-
ing to study the possible DOC accumulation in a rich
environment. In the present paper the DOC accumu-
lation was considered in relation to nutrients utilisa-
tion and recycling, organic carbon distribution and
bacterial activity under different seasonal conditions
(winter, spring and summer) in the NW Black Sea
from 1995 to 1997.
2. Materials and methods
2.1. Sampling
During summer 1995 (17 July–1 August) and in
April–May 1997, three cruises were organised in the
NW Black Sea (Fig. 1), onboard the RV ‘‘Professor
Vodyanitsky’’ (IBSS, Sevastopol, Ukraine). Water
samples were collected at different depths at respec-
tively 26 (July 1995), 50 (April 1997) and 25 (May
1997) stations, with a Go-Flo bottles rosette mounted
on a Mark III–Neil Brown CTD probe. During the
EROS-21 expedition (April–May 1997), three high-
resolution salinity gradients (from 10 to 11 samples)
were obtained between salinity of >0 and 18 in the
Danube River plume. Measurements in the plume
were compared to those within the Black Sea (salinity
>17, marine reference). Salinity sections were
sampled in front of two Danube delta branches. One
in front of the Chilia branch, the northernmost one (15
April) and two in front of the Sulina branch, the
central one (18 April and 2 May). The transect in
front of the Sulina branch was first sampled during
winter while the second one was performed under full
spring conditions. Sampling of each salinity gradient
was conducted ‘‘quasi-synoptically’’, within less than
6 h. Surface samples were collected with clean plastic
buckets or glass bottles and processed later aboard the
RV ‘‘Professor Vodyanitsky’’. We will use the term
‘‘mixing zone’’ for all samples collected at low to
intermediate salinity (0–18), while samples at higher
salinity (18–20), encountered only at depths higher
than 20 m, will be considered as ‘‘marine’’ samples.
2.2. DOC and POC
Water samples were filtered through pre-com-
busted glass fibre Whatman GF/F filters (porosity
G. Cauwet et al. / Marine Chemistry 79 (2002) 193–205194
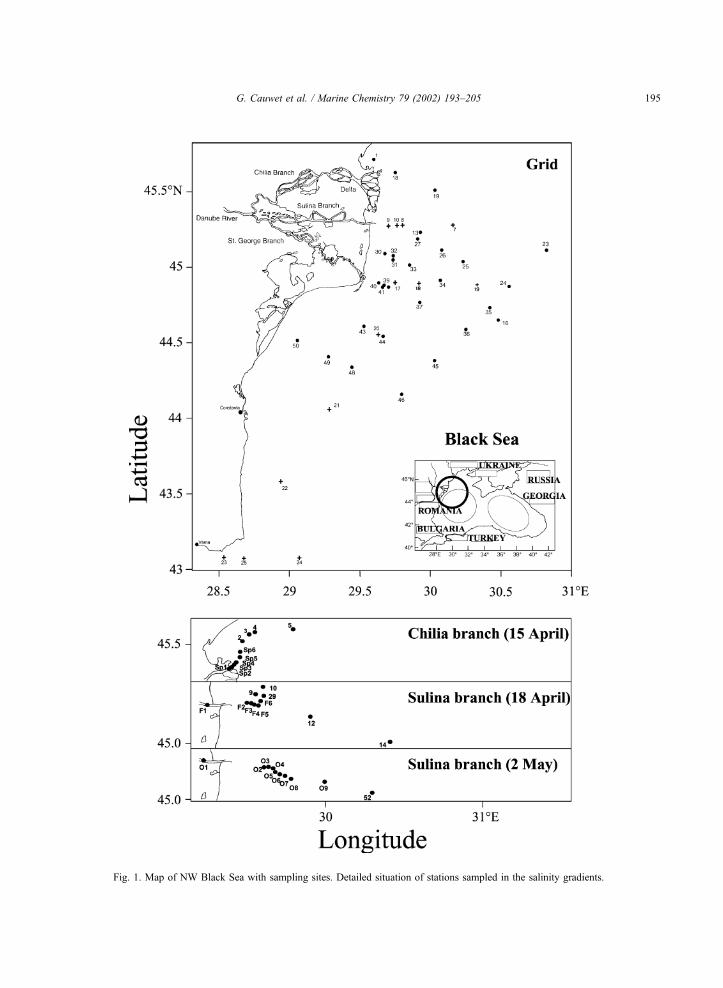
Fig. 1. Map of NW Black Sea with sampling sites. Detailed situation of stations sampled in the salinity gradients.
G. Cauwet et al. / Marine Chemistry 79 (2002) 193–205 195
0.7 Am), under gentle vacuum (200 mm Hg). Previous
tests have demonstrated that cell breakage and sub-
sequent DOC release are negligible in these condi-
tions (Cauwet, unpublished). The filtrate was stored in
glass tubes, poisoned with mercuric chloride (18.5
AM) and closed with Teflon lined screw caps. This
preservation method has proved to be efficient even
after several months storage. The concentration
chosen (18.5 AM) was determined to be perfectly
efficient on filtered samples without disturbing the
IR measurement. Metallic mercury (Hg0) is very
volatile and can easily form amalgams with many
metals, including gold that covers the inside of the IR
cell of the TOC analyser, but the proportion of that
reduced chemical form produced in the combustion
tube in very oxidative conditions is very low and the
copper wool utilised to trap halogens can also fix the
traces of mercury. Former experiments made in our
laboratory have shown a shifting of the IR baseline,
due to shadowing of the IR cell, when the concen-
tration of mercuric chloride was over 100 AM. No
disturbance was observed at 40 AM.
Further analysis of the dissolved organic carbon
(DOC) was performed using a high-temperature cata-
lytic oxidation (HTCO) technique (Shimadzu TOC
5000). Each filtrate was acidified to pH 2 by 5 N
phosphoric acid and bubbled for 10 min to eliminate
all the inorganic carbon. After CO2 elimination, 100
Al were directly injected into the vertical furnace,
filled with platinum coated silica, and oxidised at
680 jC. The CO2 formed was analysed with a non-
dispersive infrared detector (NDIR). The instrument
blank, estimated from the measurement of milli-
Q + pure water (TOC < 0.4 AM), was in the range
6–11 AM. The concentration was calculated from
the 4-point calibration curve, shifted to the origin
and the blank (average of 3–6 tubes) was subtracted
from this value. The precision is in the rage 2–3%
(Cauwet, 1994). Total dissolved nitrogen (TDN) was
analysed at the same time as DOC by coupling a
Sievers NOA 170B chemiluminescence detector to
the TOC analyser. This method, based on a lab-made
device has proved to be reliable and precise (better
than 2%) by the participation to international inter-
calibration exercises (Sharp and et al., 2000) and is
described elsewhere (Cauwet, 1999). The blanks were
in the range 0.3–0.6 AM and the method for calcu-
lation was the same as for DOC.
The filters were rinsed with milliQ water and dried
at 40–50 jC for 24 h before being analysed for
particulate organic carbon (POC) and nitrogen
(PON). POC and PON were analysed using the same
analytical system and method but with a different
furnace (900 jC+ catalyst). The filters were first
acidified with 5 N phosphoric acid in a silica boat
and dried in an oven at 40 jC for 24 h before being
analysed. The blanks, estimated from clean filters
acidified like samples were below the detection limit,
but filters combusted several weeks before and stored
protected from dust (polycarbonate boxes) but not
from atmosphere exhibited variable blanks from 0 to 7
Ag C. It was also observed that the phosphoric acid
solution utilised to destroy carbonates must be pre-
pared fresh each day, to avoid increasing nitrogen
blanks, which are probably due to the fixation of
ammonium in the atmosphere.
2.3. Nutrients
Inorganic nutrients (NO3, NO2, NH4 and PO4) were
measured onboard immediately after sampling. Nitrate
and nitrite concentrations were determined by spec-
trophotometry according to Grasshoff (1983). Deter-
mination of nitrite or the sum nitrite plus nitrate, after
reduction on a Cd column, is performed after the
formation of a diazonium salt, which couples with a
second aromatic amine to form an azo dye. Ammo-
nium and phosphate concentrations were deter-
mined by spectrophotometry according to Koroleff
(1983a,b). Phosphate was determined by forming a
phosphomolybdate complex, which was then reduced
to a coloured complex with ascorbic acid. Ammonium
reacts with hypochlorite in excess to give a monochlor-
amine which, in the presence of phenol and cataly-
tic amounts of nitroprusside ions, gives indophenol
blue.
2.4. Carbohydrates
The analysis of carbohydrates was performed on
the 0.2-Am filtered fraction, by the TPTZ method of
Myklestad et al. (1997) after a 0.1 N HCl hydrolysis
(100 jC, 20 h in nitrogen atmosphere). In this method,
reduced sugars (monosaccharides) are downgrading
Fe3 + to Fe2 + , which form a coloured complex with
2,4,6-tripyridyl-s-triazin (TPTZ).
G. Cauwet et al. / Marine Chemistry 79 (2002) 193–205196
2.5. Bacterial production
Bacterial production was estimated by incorporat-
ing 3H-thymidine into bacterial DNA (Fuhrman and
Azam, 1982). Some 10 ml of seawater samples were
incubated at an in situ temperature in the dark for 60
min with a saturating concentration of 40 nM 3H-
methyl-thymidine (48.2 Ci mmol � 1, Radiochemical
Centre, Amersham, England). After a 1-h incubation
period, cellular macromolecules were precipitated
with ice-cold trichloroacetic acid (TCA) (5%, final
concentration) over 5 min. The cold TCA insoluble
material was collected by filtration onto cellulose
acetate filters (Sartorius, 0.2 Am pore size) and rinsed
five times with 5 ml of ice-cold 5% TCA. The filters
were placed in scintillation vials, and counted by
liquid scintillation (Filtercount PackardR). The thy-
midine incorporation rate was converted into the
bacterial cell production rate, by using a conversion
factor of 0.5� 1018 bacteria produced per mole of
incorporated thymidine (experimentally determined
in this area; cf. Becquevort and Bouvier, unpublished
data). The bacterial biomass production rate was
estimated from the cell production rate by using the
bacterial carbon content estimated from epifluores-
cence microscopy analysis.
2.6. Ectoenzymatic activity
The utilisation of polymeric organic matter
demands a preliminary hydrolysis. To evaluate the
ability of bacteria to hydrolyse biopolymers, potential
ectoenzymatic activity was measured at 20 jC after
adding a saturating concentration of artificial sub-
strates that produce fluorescent products when hydro-
lysed by present ectoenzymes. Two ectoenzymatic
activities were tested: ectoprotease and ecto-h-gluco-sidase.
To determine ectoprotease activity, L-leucyl-2h-naphtylamine hydrochloride (LLhN) was used as
substrate for proteolytic ectoenzymes. It produces
fluorescent naphtylamine after hydrolysis of the pep-
tide-like bond. The experimental procedure was based
on that of Somville and Billen (1982). Water samples
(2 ml) were transferred into a sterile quartz fluorimeter
cell kept at 20 jC; 50 Al of a sterile 40 mM solution
(1000 Am final concentration) of L-leucyl-2h-naphty-lamide was added and the increase of fluorescence at
410- under 340-nm excitation (Kontron SFM 25
fluorimeter) was measured as a function of time over
25–30 min. Enzyme activity was estimated from the
initial slope. Fluorescence of a standard naphtylamine
solution was used for calibration.
To determine ectoglucosidase activity, 4-methyl-
umbelliferyl-h-glucoside (MUF-GLU) was used as a
substrate for h-glucosidase, which produces fluores-
cent 4-methylumbelliferone after hydrolysis of h-linked (1–2, 1–3, 1–4, 1–6) disaccharides of glucose,
celluhexose and carboxymethyl cellulose (Barman,
1969). The procedure was adapted from the protocol
of Hoppe (1983) and Somville (1984). Two-milliliter
water samples were transferred into sterile quartz fluo-
rimeter cells and kept at 20 jC; 250 Al of a sterile 6 mM
solution of 4-methylumbelliferyl-h-glucoside was
added. The increase of fluorescence at 445 nm under
360-nm excitation was again measured as a function of
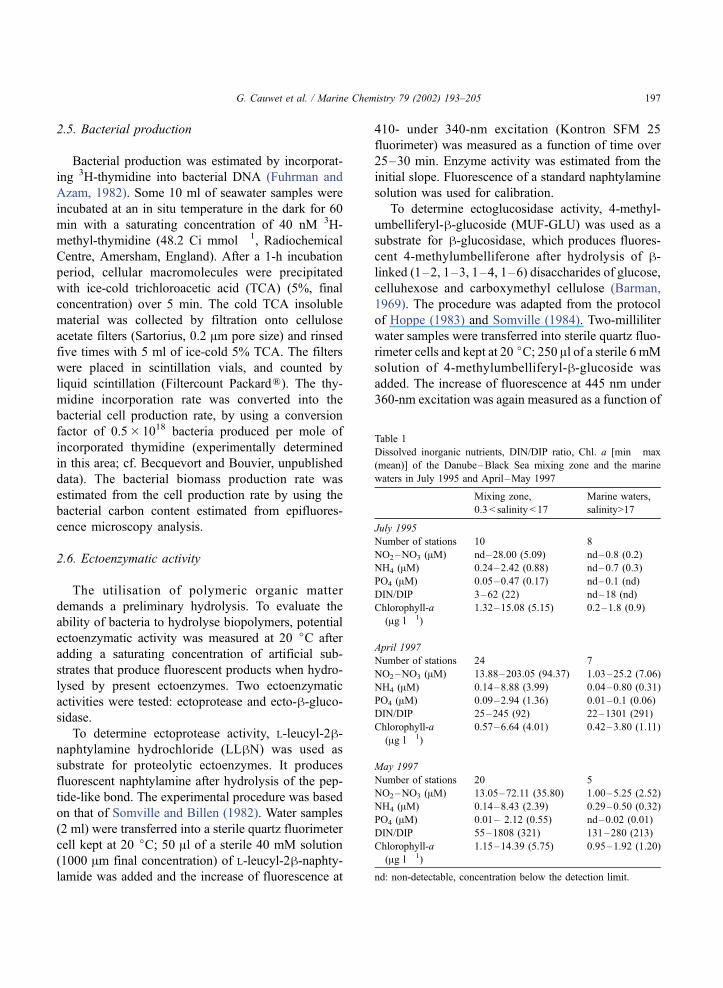
Table 1
Dissolved inorganic nutrients, DIN/DIP ratio, Chl. a [min�max
(mean)] of the Danube–Black Sea mixing zone and the marine
waters in July 1995 and April–May 1997
Mixing zone,
0.3 < salinity < 17
Marine waters,
salinity>17
July 1995
Number of stations 10 8
NO2–NO3 (AM) nd–28.00 (5.09) nd–0.8 (0.2)
NH4 (AM) 0.24–2.42 (0.88) nd–0.7 (0.3)
PO4 (AM) 0.05–0.47 (0.17) nd–0.1 (nd)
DIN/DIP 3–62 (22) nd–18 (nd)
Chlorophyll-a
(Ag l� 1)
1.32–15.08 (5.15) 0.2–1.8 (0.9)
April 1997
Number of stations 24 7
NO2–NO3 (AM) 13.88–203.05 (94.37) 1.03–25.2 (7.06)
NH4 (AM) 0.14–8.88 (3.99) 0.04–0.80 (0.31)
PO4 (AM) 0.09–2.94 (1.36) 0.01–0.1 (0.06)
DIN/DIP 25–245 (92) 22–1301 (291)
Chlorophyll-a
(Ag l� 1)
0.57–6.64 (4.01) 0.42–3.80 (1.11)
May 1997
Number of stations 20 5
NO2–NO3 (AM) 13.05–72.11 (35.80) 1.00–5.25 (2.52)
NH4 (AM) 0.14–8.43 (2.39) 0.29–0.50 (0.32)
PO4 (AM) 0.01– 2.12 (0.55) nd–0.02 (0.01)
DIN/DIP 55–1808 (321) 131–280 (213)
Chlorophyll-a
(Ag l� 1)
1.15–14.39 (5.75) 0.95–1.92 (1.20)
nd: non-detectable, concentration below the detection limit.
G. Cauwet et al. / Marine Chemistry 79 (2002) 193–205 197

time over 25–50 min. Enzyme activity was estimated
from the initial slope. Fluorescence of a standard 4-
methylumbelliferone solution was used for calibration.
3. Results
3.1. Environmental conditions
During the April–May 1997 cruise, meteorological
conditions shifted from winter to full spring. Until 25
April, typical winter meteorological conditions pre-
vailed. The river discharge was around 9000 m3 s� 1
(A. Cociasu, personal communication), and the wind
speed varied between 6 and 11 m s� 1 (average 8.5 m
s� 1) with a south–southwestern or north–northwest-
ern direction. No real river plume was formed and the
extension of the mixing zone influenced by Danube
Riverwas less than10milesoffshore.Temperature in the
surface mixed layer ranged between 5.7 and 8.0 jC.
Fig. 2. Distribution of inorganic nutrients (NO3, NH4, PO4) along the salinity gradients at different periods of the year. The line indicates perfect
mixing dilution.
Fig. 3. Dissolved inorganic N/P ratio evolution along the salinity
gradient at different seasons.
G. Cauwet et al. / Marine Chemistry 79 (2002) 193–205198

After 25 April, stable meteorological conditions
prevailed. Danube River discharge decreased to
8200–8400 m3 s� 1. The predominant south–south-
eastern wind ranged between 0 and 6 m s� 1 (aver-
age 3 m s� 1), enhancing the vertical stratification
and the river plume extended over the shelf up to a
distance of 40 miles offshore. Temperature in the
wind mixed layer ranged between 8.1 and 12.0 jC(average 9.2 jC).
During the July 1995 cruise, river discharge was
around 8000 m3 s� 1. Due to changing wind con-
ditions (predominant south wind speed ranged
between 0 and 12 m s � 1), the river plume was
sometimes destroyed but it rapidly reformed with a
great extension. Temperature in the wind mixed layer
ranged between 22.8 and 25.6 jC (average 24.3 jC).
3.2. Nutrients
In marine waters, the concentration of all nutrients
was never really high but was specially low in July
1995 (Table 1). Concentration in chlorophyll did not
reach 2 Ag l� 1 (with one exception). It was different
in the mixing zone where the river inputs have a great
influence, giving rise to important concentration gra-
dients. Nitrate concentration in the river was very
variable, exceeding 200 AM in April, and only about
Fig. 4. Total suspended matter along the salinity gradient in early
May 1997 (Sulina 2).
Fig. 5. Particulate organic carbon and nitrogen and their ratio in the salinity gradient in April (Sulina 1) and early May 1997 (Sulina 2).
G. Cauwet et al. / Marine Chemistry 79 (2002) 193–205 199

70 AM in May and 30 AM in July. In any condition
there was a dilution along the salinity gradient with
low values at high (!) salinity. The same observation
can be made for ammonium and phosphate, where the
highest values are observed in April (8.8 and 2.9 AM,
respectively) and May (8.4 and 2.1 AM, respectively),
much lower in July (2.4 and 0.4 AM, respectively).
But the major difference between seasons for all
nutrients is in the distribution patterns observed along
the salinity gradient (Fig. 2). In winter conditions, the
mixing zone is dominated by the dilution process, and
all nutrients concentrations plotted versus salinity,
fitting very well with the simple conservative mixing.
In contrast with this observation, these parameters did
not follow the dilution curve in May and July. Nitrates
exhibit an excess concentration in the first part of the
gradient and a deficit in the second part. Ammonium
and phosphates show an important consumption in
May (spring conditions). In July, the same behaviour
is observed for phosphate, ammonium being very low
at all times (below 1 AM).
Another interesting observation is the variation of
the inorganic N/P ratio in the river and in the mixing
zone. In the river, it decreased from winter to summer,
passing from 69 in April to 56 in May and to 33 in
summer. In the mixing zone, it remains almost con-
stant in winter conditions (50–80) but increased in
May and July in the first part of the salinity gradient,
reaching values close to 200 at salinity 10 (May 1997,
Sulina branch) and decreased afterwards (Fig. 3).
3.3. Particulate and dissolved organic carbon
Total particulate organic carbon, including detritus
and living organisms, globally decreases with turbid-
ity along the salinity gradient, as can be observed in
most estuaries due to sinking of riverine particles
(Cauwet et al., 1990; Cauwet and Mackenzie, 1993;
Cauwet and Sidorov, 1996; Meybeck, 1989; Milliman
et al., 1984). Variations of POC are visible during the
two conditions, with some increases at higher salinity
(10–15) probably due to marine production (Figs. 4
and 5). While remaining almost constant during
winter (April), the C/N ratio rapidly decreases in the
first part of the gradient (salinity < 3), and then con-
stantly increases up to salinity 15.
DOC behaviour is completely different from what
can be expected along a salinity gradient (Fig. 6).
Whatever is the season, it exhibits almost constant
values all along the mixing zone (salinity, from 0 to
17). While the true marine values, measured at high
(18–20) salinity and in deep-water samples, are about
constant (around 200 AM or slightly less in the central
deep basin), the mean concentration in surface sam-
ples of the mixing zone varies with time. From about
210 AM in April, it increases up to 220–230 AM in
May to reach almost 300 AM in summer.
3.4. Bacterial production and activity
Bacterial production and specific growth rate were
maximal (76.4 mgC m � 3 day � 1 and 3.3 day � 1) in
the Danube–Black Sea mixing zone and decreased in
marine waters. Depending on which area is being
Fig. 6. DOC distribution vs. salinity during the three cruises: April
1997, May 1997, July 1995. Some data from the April cruise belong
to the spring conditions and are slightly higher (240–270 AM).
G. Cauwet et al. / Marine Chemistry 79 (2002) 193–205200
considered, bacterial production and growth increased
sharply in July 1995. No clear spatial variations of
bacterial biomass were reported, however, and the
biomass was lower in April–May 1997 than in July
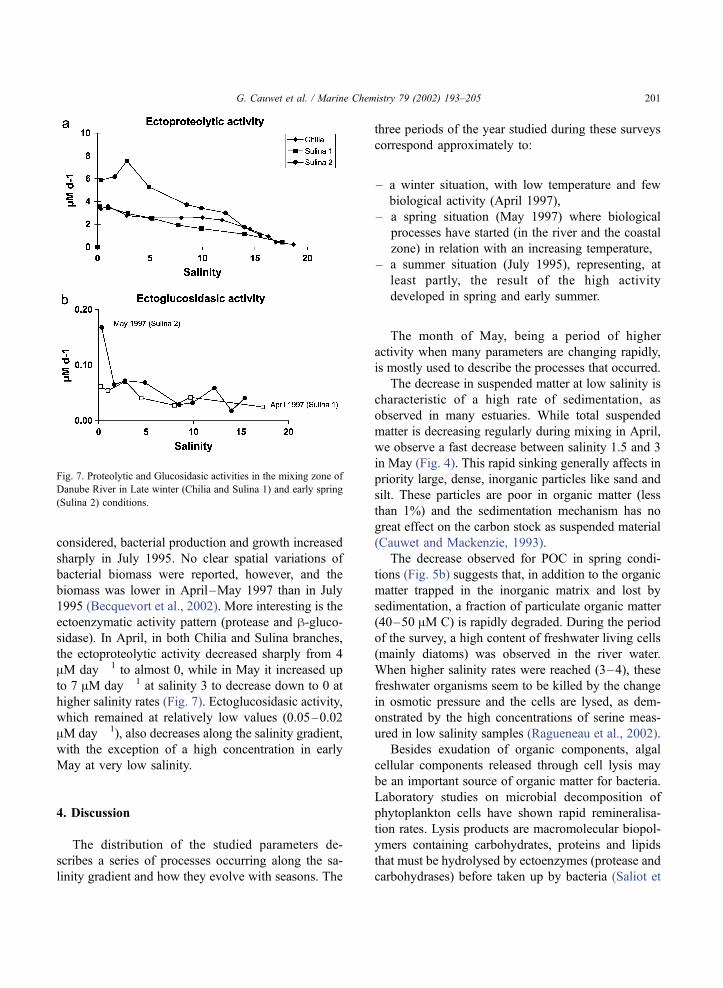
1995 (Becquevort et al., 2002). More interesting is the
ectoenzymatic activity pattern (protease and h-gluco-sidase). In April, in both Chilia and Sulina branches,
the ectoproteolytic activity decreased sharply from 4
AM day � 1 to almost 0, while in May it increased up
to 7 AM day � 1 at salinity 3 to decrease down to 0 at
higher salinity rates (Fig. 7). Ectoglucosidasic activity,
which remained at relatively low values (0.05–0.02
AM day � 1), also decreases along the salinity gradient,
with the exception of a high concentration in early
May at very low salinity.
4. Discussion
The distribution of the studied parameters de-
scribes a series of processes occurring along the sa-
linity gradient and how they evolve with seasons. The
three periods of the year studied during these surveys
correspond approximately to:
– a winter situation, with low temperature and few
biological activity (April 1997),
– a spring situation (May 1997) where biological
processes have started (in the river and the coastal
zone) in relation with an increasing temperature,
– a summer situation (July 1995), representing, at
least partly, the result of the high activity
developed in spring and early summer.
The month of May, being a period of higher
activity when many parameters are changing rapidly,
is mostly used to describe the processes that occurred.
The decrease in suspended matter at low salinity is
characteristic of a high rate of sedimentation, as
observed in many estuaries. While total suspended
matter is decreasing regularly during mixing in April,
we observe a fast decrease between salinity 1.5 and 3
in May (Fig. 4). This rapid sinking generally affects in
priority large, dense, inorganic particles like sand and
silt. These particles are poor in organic matter (less
than 1%) and the sedimentation mechanism has no
great effect on the carbon stock as suspended material
(Cauwet and Mackenzie, 1993).
The decrease observed for POC in spring condi-
tions (Fig. 5b) suggests that, in addition to the organic
matter trapped in the inorganic matrix and lost by
sedimentation, a fraction of particulate organic matter
(40–50 AM C) is rapidly degraded. During the period
of the survey, a high content of freshwater living cells
(mainly diatoms) was observed in the river water.
When higher salinity rates were reached (3–4), these
freshwater organisms seem to be killed by the change
in osmotic pressure and the cells are lysed, as dem-
onstrated by the high concentrations of serine meas-
ured in low salinity samples (Ragueneau et al., 2002).
Besides exudation of organic components, algal
cellular components released through cell lysis may
be an important source of organic matter for bacteria.
Laboratory studies on microbial decomposition of
phytoplankton cells have shown rapid remineralisa-
tion rates. Lysis products are macromolecular biopol-
ymers containing carbohydrates, proteins and lipids
that must be hydrolysed by ectoenzymes (protease and
carbohydrases) before taken up by bacteria (Saliot et
Fig. 7. Proteolytic and Glucosidasic activities in the mixing zone of
Danube River in Late winter (Chilia and Sulina 1) and early spring
(Sulina 2) conditions.
G. Cauwet et al. / Marine Chemistry 79 (2002) 193–205 201

al., 2002). The relatively high concentration in pro-
tease (Fig. 7) demonstrates that this activity is impor-
tant, suggesting the presence of a rich protein
substrate. The maximum of proteolytic activity in
May appears at salinity 2.8 where the lysis seems to
be at its maximum rate and decreases downstream,
while it was much lower originally and regularly
decreases in April (Fig. 7). At the opposite, the
glucosidase concentration is relatively high at salinity
0 but rapidly decreases down to very low values. The
first consequence is an evolution of the nature of
particulate organic matter, particularly the protein
matter. The increase of the particulate C/N ratio
observed between salinity 2.9 and 15.5 is due, at least
partly, to this selective degradation (Fig. 5b). The
second consequence is the visible change in the
concentration of nutrients. In May, NO3 and PO4
decreased in the river end member by 20–30%
compared to the concentrations measured in April.
In contrast, NH4 increased by 50%. These data
suggest the occurrence of significant biological pro-
cesses of nutrient uptake, elimination and regeneration
in the Danube River and leads to a high planktonic
production corroborating the richness of freshwater
inputs in living cells. Combined with river processes,
hydrolysis and degradation of protein organic matter
at low salinity is regenerating inorganic nitrogen in
the form of nitrates, as demonstrated by the excess
concentration noticed up to salinity 10 (Fig. 2).
Ammonium and phosphate exhibit opposite behav-
iour. The utilisation of these two inorganic nutrients
by algal and bacterial activity is more rapid than the
regeneration rate and the concentration profile shows
an important consumption all along the salinity gra-
dient, to rapidly reach very low concentrations at
higher salinity rates.
These processes, occurring immediately at the river
mouth, have a dramatic importance for the biological
activity in the coastal zone and the carbon budget of
the entire Black Sea. Due to the consumption of
phosphate by microbial loop, phosphorus concentra-
tion is rapidly falling down to extremely low values at
salinity rates higher than 7–10. This low phosphorus
content is not very favourable for primary production
and explains the relatively low chlorophyll concen-
tration measured in this area. It was observed (Rague-
neau et al., 2002) that the planktonic population at
high salinity (10–15) contains a high proportion of
small organisms (picoplankton), which is character-
istic of oligotrophic waters. Moreover, correlation
analyses show a PO4 control on the significance of
the classical food web versus microbial food web in
the NW Black Sea.
Another consequence of these processes is the
increase of the inorganic N/P ratio. It was observed
several times that when the inorganic N/P ratio is
high, while nitrogen and phosphorus are at low
concentration, phytoplankton tends to produce car-
bon-rich organic matter like carbohydrates (Fajon et
al., 1999; Søndergaard et al., 2000). The results
previously obtained during mesocosm experiments
(Fajon et al., 1999) describe this mechanism well
(Fig. 8). If this is occurring here, we should observe
higher carbohydrates concentration in May than in
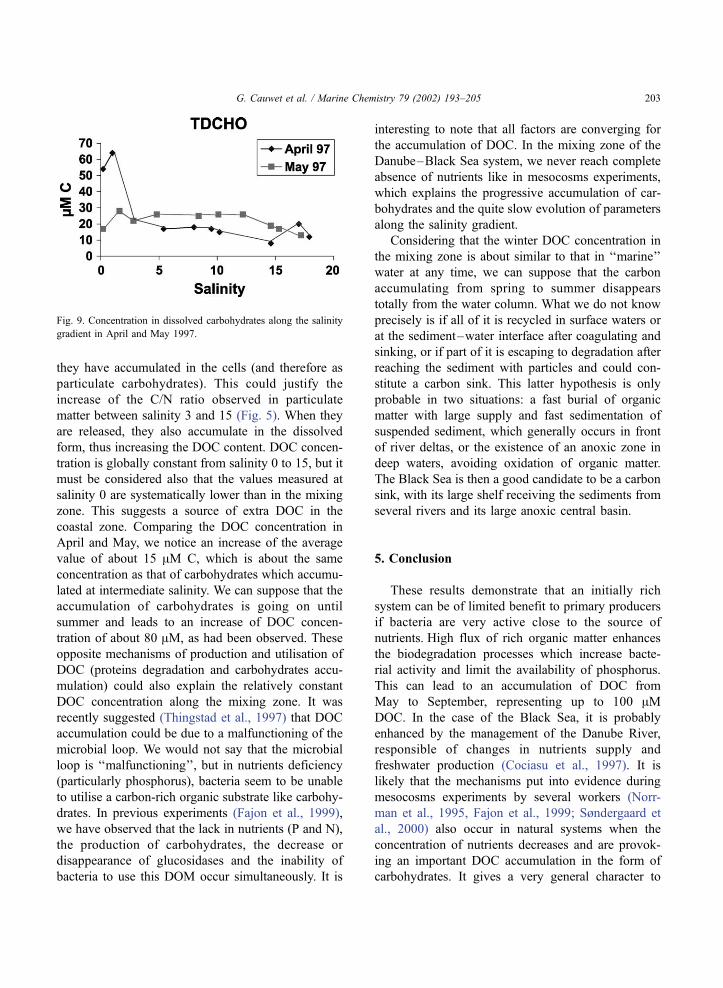
April, and possibly even more in July. Unfortunately,
carbohydrates were not measured in July but when we
compared the concentration of total dissolved carbo-
hydrates in April and May 1997, we observed a
decrease from 25 to 8 AM C in April (from salinity
2 to salinity 15) and an almost constant value around
27 AM C in May for the same salinity range (Fig. 9).
Obviously, the dissolved carbohydrates present in
April are slowly consumed along the gradient while
they are accumulating during spring (and low phos-
phorus) conditions. The quasi-absence of phosphorus
prevents bacteria from using that carbon-rich organic
matter, as demonstrated in other situations (Fajon et
al., 1999; Søndergaard et al., 2000; Williams, 1995).
The release of carbohydrates by phytoplankton is
generally a second-phase mechanism that occurs after
Fig. 8. Relation between nutrients depletion and the production of
polysaccharides during a mesocosm experiment.
G. Cauwet et al. / Marine Chemistry 79 (2002) 193–205202
they have accumulated in the cells (and therefore as
particulate carbohydrates). This could justify the
increase of the C/N ratio observed in particulate
matter between salinity 3 and 15 (Fig. 5). When they
are released, they also accumulate in the dissolved
form, thus increasing the DOC content. DOC concen-
tration is globally constant from salinity 0 to 15, but it
must be considered also that the values measured at
salinity 0 are systematically lower than in the mixing
zone. This suggests a source of extra DOC in the
coastal zone. Comparing the DOC concentration in
April and May, we notice an increase of the average
value of about 15 AM C, which is about the same
concentration as that of carbohydrates which accumu-
lated at intermediate salinity. We can suppose that the
accumulation of carbohydrates is going on until
summer and leads to an increase of DOC concen-
tration of about 80 AM, as had been observed. These
opposite mechanisms of production and utilisation of
DOC (proteins degradation and carbohydrates accu-
mulation) could also explain the relatively constant
DOC concentration along the mixing zone. It was
recently suggested (Thingstad et al., 1997) that DOC
accumulation could be due to a malfunctioning of the
microbial loop. We would not say that the microbial
loop is ‘‘malfunctioning’’, but in nutrients deficiency
(particularly phosphorus), bacteria seem to be unable
to utilise a carbon-rich organic substrate like carbohy-
drates. In previous experiments (Fajon et al., 1999),
we have observed that the lack in nutrients (P and N),
the production of carbohydrates, the decrease or
disappearance of glucosidases and the inability of
bacteria to use this DOM occur simultaneously. It is
interesting to note that all factors are converging for
the accumulation of DOC. In the mixing zone of the
Danube–Black Sea system, we never reach complete
absence of nutrients like in mesocosms experiments,
which explains the progressive accumulation of car-
bohydrates and the quite slow evolution of parameters
along the salinity gradient.
Considering that the winter DOC concentration in
the mixing zone is about similar to that in ‘‘marine’’
water at any time, we can suppose that the carbon
accumulating from spring to summer disappears
totally from the water column. What we do not know
precisely is if all of it is recycled in surface waters or
at the sediment–water interface after coagulating and
sinking, or if part of it is escaping to degradation after
reaching the sediment with particles and could con-
stitute a carbon sink. This latter hypothesis is only
probable in two situations: a fast burial of organic
matter with large supply and fast sedimentation of
suspended sediment, which generally occurs in front
of river deltas, or the existence of an anoxic zone in
deep waters, avoiding oxidation of organic matter.
The Black Sea is then a good candidate to be a carbon
sink, with its large shelf receiving the sediments from
several rivers and its large anoxic central basin.
5. Conclusion
These results demonstrate that an initially rich
system can be of limited benefit to primary producers
if bacteria are very active close to the source of
nutrients. High flux of rich organic matter enhances
the biodegradation processes which increase bacte-
rial activity and limit the availability of phosphorus.
This can lead to an accumulation of DOC from
May to September, representing up to 100 AMDOC. In the case of the Black Sea, it is probably
enhanced by the management of the Danube River,
responsible of changes in nutrients supply and
freshwater production (Cociasu et al., 1997). It is
likely that the mechanisms put into evidence during
mesocosms experiments by several workers (Norr-
man et al., 1995, Fajon et al., 1999; Søndergaard et
al., 2000) also occur in natural systems when the
concentration of nutrients decreases and are provok-
ing an important DOC accumulation in the form of
carbohydrates. It gives a very general character to
Fig. 9. Concentration in dissolved carbohydrates along the salinity
gradient in April and May 1997.
G. Cauwet et al. / Marine Chemistry 79 (2002) 193–205 203

the phenomenon and concerns most of oceanic
areas, with probably variable amplitude. There is
evidence that most of the accumulated DOC dis-
appears during winter but we are unable to give a
precise estimation of the fate of this organic supply.
If we can estimate that most of it is recycled
through the microbial loop in surface waters, it
could be of some interest to know how much can
reach the deep ocean, in the dissolved form by
vertical mixing, but also after aggregation as partic-
ulates. In that case, it could be an important vertical
flux of fresh, carbon-rich, DOC, which is rapidly
transferred to the deep ocean and could constitute a
non-negligible carbon sink.
Acknowledgements
We are very grateful to all EROS participants for
their involvement with a special mention to the co-
ordinators N. Panin and J.-M. Martin, to the crew of
the RV «Professor Vodyanitsky» and the Ukrainian
and Romanian pilot boats «Spruit» and «Filioara»,
and to the Chiefs Scientists during the cruises, C.
Lancelot and V. Egorov. We kindly acknowledge the
support of the European Commission under the 4th
Environment Programme (ENV4 CT96-0286). Many
thanks also to the anonymous reviewers who made
very useful comments and suggestions.
References
Aubrey, D.G., 1992. The Black Sea. Threatened by nature and
civilization. Oceanus 35 (1), 82–84.
Barman, T.E., 1969. Enzyme Handbook, vol. 2. Springer Verlag,
Berlin 928 pp.
Becquevort, S., et al., 2002. The seasonal modulation of organic
matter utilization by bacteria in the Danube–Black Sea mixing
zone. Estuarine, Coastal and Shelf Science 54 (3), 337–354.
Biddanda, B., Benner, R., 1997. Carbon, nitrogen, and carbohydrate
fluxes during the production of particulate and dissolved organic
matter by marine phytoplankton. Limnology and Oceanography
42 (3), 506–518.
Biersmith, A., Benner, R., 1998. Carbohydrates in phytoplankton
and freshly produced dissolved organic matter. Marine Chem-
istry 63 (1–2), 131–144.
Bodeanu, N., 1992. Algal blooms and development of the main
phytoplanktonic species at the Romanian Black Sea littoral in
conditions of intensification of the eutrophication process. In:
Vollenweider, R.A., Marchetti, R., Viviani, R. (Eds.), Marine
Coastal Eutrophication. Elsevier, Amsterdam, pp. 881–906.
Borsheim, K.Y., Myklestad, S.M., 1997. Dynamics of DOC in the
Norwegian Sea inferred from monthly profiles collected during
3 years at 66 degrees N, 2 degrees E. Deep-Sea Research. Part I.
Oceanographic Research Papers 44 (4), 593–601.
Borsheim, K.Y., Myklestad, S.M., Sneli, J.A., 1999. Monthly pro-
files of DOC, mono- and polysaccharides at two locations in the
Trondheim fjord (Norway) during two years. Marine Chemistry
63, 255–272.
Carlson, C.A., Ducklow, H.W., Michaels, A.F., 1994. Annual flux
of dissolved organic carbon from the euphotic zone in the north-
western Sargasso Sea. Nature 371, 405–408.
Cauwet, G., 1994. HTCO method for dissolved organic carbon
analysis in seawater: influence of catalyst on blank estimation.
Marine Chemistry 47 (1), 55–64.
Cauwet, G., 1999. Determination of dissolved organic carbon
(DOC) and nitrogen (DON) by high temperature combustion.
In: Grashoff, K., Kremling, K., Ehrhardt, M. (Eds.), Methods
of Seawater Analysis, 3rd ed. Wiley-VCH, Weinheim, pp.
407–420.
Cauwet, G., Mackenzie, F.T., 1993. Carbon inputs and distribution
in estuaries of turbid rivers: the Yangtze and Yellow Rivers
(China). Marine Chemistry 43 (1–4), 235–246.
Cauwet, G., Sidorov, I., 1996. The biogeochemistry of Lena River:
organic carbon and nutrients distribution. Marine Chemistry 53
(3–4), 211–227.
Cauwet, G., Gadel, F., de Souza Sierra, M.M., Donard, O., Ewald,
M., 1990. Contribution of the Rhone River to organic carbon
inputs to the northwestern Mediterranean Sea. Continental Shelf
Research 10 (911), 1025–1037.
Chen, W.H., Wangersky, P.J., 1996. Production of dissolved organic
carbon in phytoplankton cultures as measured by high temper-
ature catalytic oxidation and ultraviolet photo-oxidation meth-
ods. Journal of Plankton Research 18 (7), 1201–1211.
Coble, P.G., Green, S.A., Blough, N.V., Gagosian, R.B., 1990.
Characterization of dissolved organic matter in the Black Sea
by fluorescence spectroscopy. Nature 348 (6300), 432–435.
Cociasu, A., et al., 1997. The nutrient stock of the Romanian shelf
of the Black Sea during the last three decades. In: Ozsoy, E.,
Mikaelyan, J. (Eds.), Sensitivity of North Sea, Baltic Sea and
Black Sea to Anthropogenic and Climatic Changes. NATO Ser.
Kluwer Academic Publishing, Berlin, pp. 49–65.
Copin-Montegut, G., Avril, B., 1993. Vertical distribution and tem-
poral variation of dissolved organic carbon in the north-western
Mediterranean Sea. Deep-Sea Research 40, 1963–1972.
Ducklow, H.W., Carlson, C.A., Bates, N.R., Knap, A.H., Michaels,
A.F., 1995. Dissolved organic carbon as a component of the
biological pump in the North Atlantic ocean. Philosophical
Transactions of the Royal Society of London. Series B, Bio-
logical Sciences 348 (1324), 161–167.
Fajon, C., et al., 1999. The accumulation and release of polysac-
charides by planktonic cells and the subsequent bacterial re-
sponse during a controlled experiment. FEMS Microbiology
Ecology 29 (4), 351–363.
Fuhrman, J.A., Azam, F., 1982. Thymidine incorporation as a meas-
ure of heterotrophic bacterioplankton production in marine sur-
face waters: evaluation and field results. Marine Biology 66,
109–120.
G. Cauwet et al. / Marine Chemistry 79 (2002) 193–205204
Gomoiu, M.T., 1992. Marine eutrophication syndrome in the north-
western part of the Black Sea. In: Vollenweider, R.A., Marchetti,
R., Viviani, R. (Eds.), Marine Coastal Eutrophication. Elsevier,
Amsterdam, pp. 683–692.
Grasshoff, K., 1983. Determination of nitrate. In: Grasshoff, K.,
Kremling, K., Ehrhardt, M. (Eds.), Methods of Seawater Anal-
ysis. Verlag Chemie, Basel, pp. 143–150.
Guo, L.D., Santschi, P.H., Cifuentes, L.A., Trumbore, S.E., South-
on, J., 1996. Cycling of high-molecular-weight dissolved organ-
ic matter in the Middle Atlantic bight as revealed by carbon
isotopic (c-13 and c-14) signatures. Limnology and Oceanogra-
phy 41 (6), 1242–1252.
Hansell, D.A., Carlson, C.A., 1998. Deep-ocean gradients in the
concentration of dissolved organic carbon. Nature 395 (6699),
263–266.
Hoppe, H.G., 1983. Significance of exoenzymatic activities in the
ecology of brackish water, measurements by means of methyl-
umbelliferyl-substrates. Marine Ecology Progress Series 11,
299–308.
Jickells, T., Ducklow, H.W., Williams, P.J.L., McCave, I.N., 1995.
Dissolved organic carbon as a component of the biological
pump in the North Atlantic ocean—discussion. Philosophical
Transactions of the Royal Society of London. Series B, Bio-
logical Sciences 348 (1324), 167.
Kirchman, D.L., Suzuki, Y., Garside, C., Ducklow, H.W., 1991.
High turnover rate of dissolved organic carbon during a spring
phytoplankton bloom. Nature 352, 614–621.
Koroleff, F., 1983a. Determination of ammonia. In: Grasshoff, K.,
Kremling, K., Ehrhardt, M. (Eds.), Methods of Seawater Anal-
ysis. Verlag Chemie, Basel, pp. 150–157.
Koroleff, F., 1983b. Determination of phosphorus. In: Grasshoff, K.,
Kremling, K., Ehrhardt, M. (Eds.), Methods of Seawater Anal-
ysis. Verlag Chemie, Basel, pp. 125–139.
Malinsky-Rushansky, N.Z., Legrand, C., 1996. Excretion of dis-
solved organic carbon by phytoplankton of different sizes and
subsequent bacterial uptake. Marine Ecology Progress Series
132 (1–3), 249–255.
Meybeck, M., 1989. Organic carbon and nutrients delivery by riv-
ers. 1990 AAAS Annual Meeting Abstracts, 76.
Milliman, J.D., Qinchun, X., Zuosheng, Y., 1984. Transfer of par-
ticulate organic carbon and nitrogen from the Yang Tze River to
the ocean. American Journal of Science 284, 824–834.
Mopper, K., Kieber, D., 1991. Distribution and biological turnover
of dissolved organic compounds in the water column of the
Black Sea. Deep-Sea Research 38 (Suppl. 2), S1021–S1047.
Murray, J.W., Top, Z., Ozsoy, E., 1991. Hydrographic properties
and ventilation of the Black Sea. Deep-Sea Research 38
(Suppl. 2), S663–S689.
Myklestad, S., Skanoy, E., Hestmann, S., 1997. A sensitive and
rapid method for analysis of dissolved mono- and polysacchar-
ides in seawater. Marine Chemistry 56, 279–286.
Norrman, B., Zweifel, U.L., Hopkinson Jr., C.S., Fry, B., 1995.
Production and utilisation of dissolved organic carbon during
an experimental diatom bloom. Limnology and Oceanography
40, 898–907.
Obernosterer, I., Herndl, G.J., 1995. Phytoplankton extracellular
release and bacterial growth: dependence on the inorganic N/P
ratio. Marine Ecology Progress Series 116 (1–3), 247–257.
Passow, U., Alldredge, A.L., Logan, B.E., 1994. The role of partic-
ulate carbohydrate exudates in the flocculation of diatoms
blooms. Deep-Sea Research I 41 (2), 335–357.
Ragueneau, O., et al., 2002. Biogeochemical transformations of
inorganic nutrients in the mixing zone between the Danube
River and the north-western Black Sea. Estuarine, Coastal and
Shelf Science 54 (3), 321–336.
Saliot, A., et al., 2002. Winter and spring characterization of parti-
culate and dissolved organic matter in the Danube-Black Sea
mixing zone. Estuarine, Coastal and Shelf Science 54 (3),
355–367.
Sharp, J.H., et al., 2000. Intercalibration. . . ASLO meeting, Copen-
hagen.
Smith, D.C., Steward, G.F., Long, R.A., Azam, F., 1995. Bacterial
mediation of carbon fluxes during a diatom bloom in a meso-
cosm. Deep-Sea Research. Part II—Topical Studies in Ocean-
ography 42 (1), 75–97.
Somville, M., 1984. Measurement and study of substrate specificity
of exoglucosidase activity in eutrophic water. Applied Environ-
mental Microbiology 48, 1181–1185.
Somville, M., Billen, G., 1982. A method for determining exopro-
teolytic activity in natural waters. Limnology and Oceanography
28 (1), 190–193.
Søndergaard, M., et al., 2000. Organic carbon partitioning and DOC
accumulation in marine plankton communities: controls, flux
and fate of DOC in a mesocosm experiment. Limnology and
Oceanography 45, 1097–1111.
Strom, S.L., Benner, R., Ziegler, S., Dagg, M.J., 1997. Plank-
tonic grazers are a potentially important source: of marine
dissolved organic carbon. Limnology and Oceanography 42
(6), 1364–1374.
Thingstad, T.F., Hagstrom, A., Rassoulzadegan, F., 1997. Accumu-
lation of degradable DOC in surface waters: is it caused by a
malfunctioning microbial loop? Limnology and Oceanography
42, 398–404.
Toggweiler, J.R., 1992. Catalytic conversions. Nature 356, 665–666.
Torgunova, N.I., Agatova, A.I., Kozlov, Y.I., 1992. Distribution of
dissolved and suspended organic matter and its biochemical
components in the coastal zone of the Black Sea. Ecology of
The Black Sea Coastal, 306–319.
Williams, P.J.L., 1995. Evidence for the seasonal accumulation of
carbon-rich dissolved organic material, its scale in comparison
with changes in particulate material and the consequential effect
on net C/N assimilation ratios. Marine Chemistry 51 (1), 17–29.
G. Cauwet et al. / Marine Chemistry 79 (2002) 193–205 205