Seasonal and Spatial Patterns of Ecotoxicological ... - MDPI
21
diversity Article Seasonal and Spatial Patterns of Ecotoxicological Indices of Trace Elements in Superficial Sediments of the Marchica Lagoon Following Restoration Actions during the Last Decade Bouchra Oujidi 1, *, Mohammed El Bouch 2 , Mounia Tahri 3 , Mostafa Layachi 4 , Soilam Boutoumit 1,5 , Rachid Bouchnan 6 , Hassan Ouahidi 2 , Moussa Bounakhla 3 , Najib El Ouamari 4 , Mohamed Maanan 5 , Hocein Bazairi 1 , Nadia Mhammdi 7 and Maria Snoussi 1 Citation: Oujidi, B.; El Bouch, M.; Tahri, M.; Layachi, M.; Boutoumit, S.; Bouchnan, R.; Ouahidi, H.; Bounakhla, M.; El Ouamari, N.; Maanan, M.; et al. Seasonal and Spatial Patterns of Ecotoxicological Indices of Trace Elements in Superficial Sediments of the Marchica Lagoon following Restoration Actions during the Last Decade. Diversity 2021, 13, 51. https://doi.org/10.3390/d13020051 Academic Editor: Alan Christian Received: 21 December 2020 Accepted: 21 January 2021 Published: 29 January 2021 Publisher’s Note: MDPI stays neutral with regard to jurisdictional claims in published maps and institutional affil- iations. Copyright: © 2021 by the authors. Licensee MDPI, Basel, Switzerland. This article is an open access article distributed under the terms and conditions of the Creative Commons Attribution (CC BY) license (https:// creativecommons.org/licenses/by/ 4.0/). 1 Faculty of Sciences, Mohammed V University in Rabat, 4 Avenue Ibn Battouta, BP 1014 R.P., 10000 Rabat, Morocco; [email protected] (S.B.); [email protected] (H.B.); [email protected] (M.S.) 2 National Laboratory for Studies and Pollution Monitoring (LNESP), Av. Mohamed Ben AbdellahErregragui Madinat Al-Irfane, 10112 Rabat, Morocco; [email protected] (M.E.B.); [email protected] (H.O.) 3 National Center for Energy, Sciences and Nuclear Techniques (CNESTEN), BP 1382 R.P., 10001 Rabat, Morocco; [email protected] (M.T.); [email protected] (M.B.) 4 National Institute of Fisheries Research (INRH), 13Bd Zerktouni, BP 493, 62000 Nador, Morocco; [email protected] (M.L.); [email protected] (N.E.O.) 5 LETG, UMR 6554, University of Nantes, BP 81227, Bâtiment IGARUN, 1 rue de la Noë, 44300 Nantes, France; [email protected] 6 Higher Normal School, Abdelmalek Essaadi University in Tetouan, Av. Hassan II, BP 209, 93150 Poste Princi-pale–Martil, Morocco; [email protected] 7 GEOPAC Research Center, Geophysic and Naturels Hazards Laboratory, Institut Scientifique, Mohammed V University, 10000 Rabat, Morocco; [email protected] * Correspondence: [email protected] Abstract: Marchica Lagoon, a Ramsar site on the Mediterranean coast of Morocco, is experiencing the impacts of watershed pollution, which includes pollutants from the domestic, agricultural, industrial, and mining sectors. Restoration actions were undertaken around this lagoon during the last decade in order to protect its ecological value and to develop tourist activity. To conserve the biodiversity in the lagoon, it is important to assess the environmental state of this ecosystem. This study aims to evaluate the ecotoxicological state of sediments through the post restoration characterization of the trace elements Pb, Cu, Zn, Cr, Co, and Ba, as well as their correlation to the major elements, grain size, and total organic carbon, sampled during two campaigns (the wet and dry seasons of 2018) across a sampling network of thirteen stations. Multivariate analysis and ecotoxicological risk assessment of the trace elements using the sediment quality guidelines and five pollution indices (geoaccumulation index (Igeo), enrichment factor (EF), contamination factor (CF), pollution-load index (PLI), and mean effect range median quotient (m-ERM-Q)) revealed contamination of the lagoon by Pb, Zn, and Cu, and minimal pollution by Cr, Co, and Ba. The distribution of the biological-risk index reveals that four zones of the lagoon may present a high probability of toxicity, thus constituting potential risk areas for aquatic organisms: during the wet season, the area in the northwestern sandbar border, the southwest eutrophication zone, and the mouth of the stream valley conveying industrial discharges; and during dry season, the northwestern eutrophication zone. Despite the restoration actions achieved around the lagoon, the lead, zinc, and copper concentrations increased, and their variation was significant between group stations. The biodiversity conservation of Marchica Lagoon requires continuous monitoring and assessment, as well as the implementation of an integrated management plan with restoration actions, not only around the lagoon, but also at its watershed level. Keywords: Mediterranean Sea; coastal lagoon; sediment contamination; ecotoxicological state; monitoring network Diversity 2021, 13, 51. https://doi.org/10.3390/d13020051 https://www.mdpi.com/journal/diversity
-
Upload
khangminh22 -
Category
Documents
-
view
4 -
download
0
Transcript of Seasonal and Spatial Patterns of Ecotoxicological ... - MDPI

diversity
Article
Seasonal and Spatial Patterns of Ecotoxicological Indices ofTrace Elements in Superficial Sediments of the MarchicaLagoon Following Restoration Actions during the Last Decade
Bouchra Oujidi 1,*, Mohammed El Bouch 2, Mounia Tahri 3 , Mostafa Layachi 4, Soilam Boutoumit 1,5,Rachid Bouchnan 6, Hassan Ouahidi 2, Moussa Bounakhla 3, Najib El Ouamari 4, Mohamed Maanan 5,Hocein Bazairi 1 , Nadia Mhammdi 7 and Maria Snoussi 1
�����������������
Citation: Oujidi, B.; El Bouch, M.;
Tahri, M.; Layachi, M.; Boutoumit, S.;
Bouchnan, R.; Ouahidi, H.;
Bounakhla, M.; El Ouamari, N.;
Maanan, M.; et al. Seasonal and
Spatial Patterns of Ecotoxicological
Indices of Trace Elements in
Superficial Sediments of the Marchica
Lagoon following Restoration
Actions during the Last Decade.
Diversity 2021, 13, 51.
https://doi.org/10.3390/d13020051
Academic Editor: Alan Christian
Received: 21 December 2020
Accepted: 21 January 2021
Published: 29 January 2021
Publisher’s Note: MDPI stays neutral
with regard to jurisdictional claims in
published maps and institutional affil-
iations.
Copyright: © 2021 by the authors.
Licensee MDPI, Basel, Switzerland.
This article is an open access article
distributed under the terms and
conditions of the Creative Commons
Attribution (CC BY) license (https://
creativecommons.org/licenses/by/
4.0/).
1 Faculty of Sciences, Mohammed V University in Rabat, 4 Avenue Ibn Battouta, BP 1014 R.P., 10000 Rabat,Morocco; [email protected] (S.B.); [email protected] (H.B.); [email protected] (M.S.)
2 National Laboratory for Studies and Pollution Monitoring (LNESP), Av. Mohamed Ben Abdellah ErregraguiMadinat Al-Irfane, 10112 Rabat, Morocco; [email protected] (M.E.B.); [email protected] (H.O.)
3 National Center for Energy, Sciences and Nuclear Techniques (CNESTEN), BP 1382 R.P., 10001 Rabat,Morocco; [email protected] (M.T.); [email protected] (M.B.)
4 National Institute of Fisheries Research (INRH), 13Bd Zerktouni, BP 493, 62000 Nador, Morocco;[email protected] (M.L.); [email protected] (N.E.O.)
5 LETG, UMR 6554, University of Nantes, BP 81227, Bâtiment IGARUN, 1 rue de la Noë, 44300 Nantes, France;[email protected]
6 Higher Normal School, Abdelmalek Essaadi University in Tetouan, Av. Hassan II, BP 209,93150 Poste Princi-pale–Martil, Morocco; [email protected]
7 GEOPAC Research Center, Geophysic and Naturels Hazards Laboratory, Institut Scientifique,Mohammed V University, 10000 Rabat, Morocco; [email protected]
* Correspondence: [email protected]
Abstract: Marchica Lagoon, a Ramsar site on the Mediterranean coast of Morocco, is experiencing theimpacts of watershed pollution, which includes pollutants from the domestic, agricultural, industrial,and mining sectors. Restoration actions were undertaken around this lagoon during the last decadein order to protect its ecological value and to develop tourist activity. To conserve the biodiversity inthe lagoon, it is important to assess the environmental state of this ecosystem. This study aims toevaluate the ecotoxicological state of sediments through the post restoration characterization of thetrace elements Pb, Cu, Zn, Cr, Co, and Ba, as well as their correlation to the major elements, grain size,and total organic carbon, sampled during two campaigns (the wet and dry seasons of 2018) across asampling network of thirteen stations. Multivariate analysis and ecotoxicological risk assessment ofthe trace elements using the sediment quality guidelines and five pollution indices (geoaccumulationindex (Igeo), enrichment factor (EF), contamination factor (CF), pollution-load index (PLI), and meaneffect range median quotient (m-ERM-Q)) revealed contamination of the lagoon by Pb, Zn, and Cu,and minimal pollution by Cr, Co, and Ba. The distribution of the biological-risk index reveals that fourzones of the lagoon may present a high probability of toxicity, thus constituting potential risk areas foraquatic organisms: during the wet season, the area in the northwestern sandbar border, the southwesteutrophication zone, and the mouth of the stream valley conveying industrial discharges; and duringdry season, the northwestern eutrophication zone. Despite the restoration actions achieved aroundthe lagoon, the lead, zinc, and copper concentrations increased, and their variation was significantbetween group stations. The biodiversity conservation of Marchica Lagoon requires continuousmonitoring and assessment, as well as the implementation of an integrated management plan withrestoration actions, not only around the lagoon, but also at its watershed level.
Keywords: Mediterranean Sea; coastal lagoon; sediment contamination; ecotoxicological state;monitoring network
Diversity 2021, 13, 51. https://doi.org/10.3390/d13020051 https://www.mdpi.com/journal/diversity
Diversity 2021, 13, 51 2 of 21
1. Introduction
Coastal lagoons are very important ecosystems, characterized as the most valuableglobal coastal habitats, providing valuable ecosystem goods and services to humans [1–3].These semi enclosed ecosystems have not only economic value, but also heritage, societal,aesthetic, and scientific importance [4–6]. Nevertheless, these vulnerable areas are amongthe world’s most altered and threatened natural systems [2,7]. Coastal lagoons face signifi-cant issues, including pollution, overexploitation, biological invasions, habitat destruction,and biodiversity changes [8–10]. They are sensitive to land–sea interactions and can beseverely affected by anthropogenic pollutants [11–15].
Trace elements are among the many anthropogenic contaminants reaching coastallagoons, particularly those located in watersheds containing mines and mining indus-tries. Their cumulative impact on biota can have a harmful effect on the health of marineecosystems and humans [16,17]. The distribution of trace elements in coastal marine ar-eas is affected by hydrodynamic and biogeochemical processes, thereby modifying traceelement bioavailability and associated environmental risks [18,19]. Sediment provides acompartment that records the temporal variation of anthropogenic inputs into the environ-ment since the Industrial Revolution [20], and allows for an ecotoxicological evaluation oftrace elements.
The Marchica Lagoon, a unique coastal lagoon on the Mediterranean coast of Morocco,and the second largest in North Africa, is an example of these vulnerable ecosystems.Besides its ecological value as a Ramsar site and socioeconomic services [21–24], the lagoonand its immediate surroundings have been undergoing major socioeconomic changes(tourism projects, construction of marinas, etc.). The strong urbanization of its shorelinehas caused disturbances of various kinds, such as pollution and loss of habitat, which havehad repercussions on the ecological values of the ecosystem. The current challenge is toreach a consensus between the conservation issues of its heritage values and the increasingdevelopment and amenities that the region is experiencing. The lagoon has qualified asan environmental hotspot on the Mediterranean coast, as it presents a eutrophicationproblem [25,26]. Restoration actions were undertaken during the last decade by Moroccanauthorities to protect the valuable qualities of the Marchica Lagoon, with the main actionsrelated to the construction of a channel between the lagoon and sea, the installation of twowastewater treatment plants around the lagoon, and an operation to remediate lagoonwater quality, which includes the collection of solid waste and dredging where wadis(intermittent stream valleys) enter the lagoon [27].
The objectives of this study were to:
1. characterize the variation in trace element concentrations of Pb, Cr, Zn, Cu, Co, andBa and their correlation to major elements Si, Al, Fe, Mn, Ca, Ti, K, and P, grain size,and total organic carbon (TOC) in the surface sediments of the Marchica Lagoonfollowing restoration actions during the wet and dry seasons, in order to establish themain factors controlling the distribution of some toxic metals;
2. assess the ecotoxicological risk by comparing the concentration of trace elementswith sediment-quality guidelines (SQGs) and assessment indices as good indica-tors: contamination factor (CF), pollution-load index (PLI), enrichment factor (EF),geoaccumulation index (Igeo), and the mean sediment-quality-guidelines quotient(m-ERM-Q) to examine the potential biological effects of the toxicity of trace elementsin surface sediment [28–34];
3. determine the potential sources of trace elements in the sediment;4. identify highly polluted areas by clustering the stations with pollution similarity and
comparing the distribution with previous studies.
2. Materials and Methods2.1. Site Description
The Marchica Lagoon (02◦45′–02◦55′ and 35◦16′–35◦06′), also called Sabkha Bou-Aregor Nador, is the largest lagoon in Morocco, with a surface area of 115 km2 and maximal
Diversity 2021, 13, 51 3 of 21
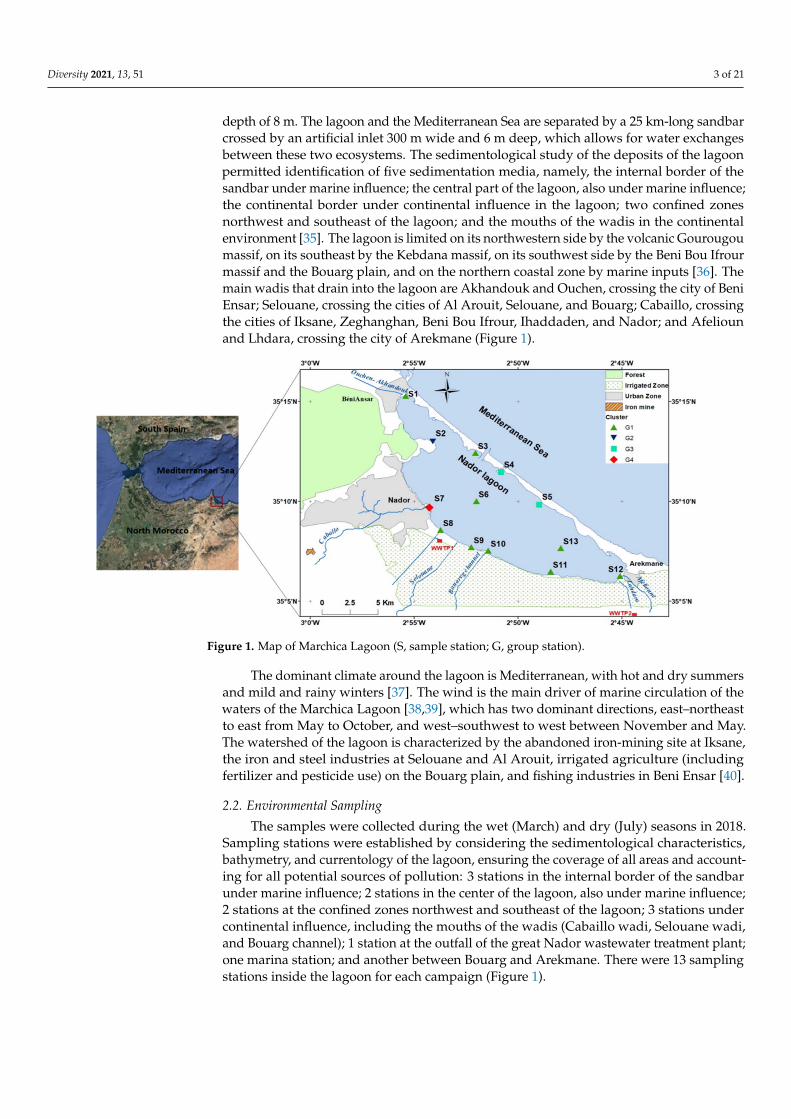
depth of 8 m. The lagoon and the Mediterranean Sea are separated by a 25 km-long sandbarcrossed by an artificial inlet 300 m wide and 6 m deep, which allows for water exchangesbetween these two ecosystems. The sedimentological study of the deposits of the lagoonpermitted identification of five sedimentation media, namely, the internal border of thesandbar under marine influence; the central part of the lagoon, also under marine influence;the continental border under continental influence in the lagoon; two confined zonesnorthwest and southeast of the lagoon; and the mouths of the wadis in the continentalenvironment [35]. The lagoon is limited on its northwestern side by the volcanic Gourougoumassif, on its southeast by the Kebdana massif, on its southwest side by the Beni Bou Ifrourmassif and the Bouarg plain, and on the northern coastal zone by marine inputs [36]. Themain wadis that drain into the lagoon are Akhandouk and Ouchen, crossing the city of BeniEnsar; Selouane, crossing the cities of Al Arouit, Selouane, and Bouarg; Cabaillo, crossingthe cities of Iksane, Zeghanghan, Beni Bou Ifrour, Ihaddaden, and Nador; and Afeliounand Lhdara, crossing the city of Arekmane (Figure 1).
Figure 1. Map of Marchica Lagoon (S, sample station; G, group station).
The dominant climate around the lagoon is Mediterranean, with hot and dry summersand mild and rainy winters [37]. The wind is the main driver of marine circulation of thewaters of the Marchica Lagoon [38,39], which has two dominant directions, east–northeastto east from May to October, and west–southwest to west between November and May.The watershed of the lagoon is characterized by the abandoned iron-mining site at Iksane,the iron and steel industries at Selouane and Al Arouit, irrigated agriculture (includingfertilizer and pesticide use) on the Bouarg plain, and fishing industries in Beni Ensar [40].
2.2. Environmental Sampling
The samples were collected during the wet (March) and dry (July) seasons in 2018.Sampling stations were established by considering the sedimentological characteristics,bathymetry, and currentology of the lagoon, ensuring the coverage of all areas and account-ing for all potential sources of pollution: 3 stations in the internal border of the sandbarunder marine influence; 2 stations in the center of the lagoon, also under marine influence;2 stations at the confined zones northwest and southeast of the lagoon; 3 stations undercontinental influence, including the mouths of the wadis (Cabaillo wadi, Selouane wadi,and Bouarg channel); 1 station at the outfall of the great Nador wastewater treatment plant;one marina station; and another between Bouarg and Arekmane. There were 13 samplingstations inside the lagoon for each campaign (Figure 1).

Diversity 2021, 13, 51 4 of 21
2.3. Analysis Methods
Superficial sediment cores (5 cm) were sampled and conserved at a temperature ofabout −4 ◦C in an airtight transparent plastic container. The position and depth of thesamples collected were determined using an equipment board of the National Instituteof Fisheries Research (INRH) Zodiac with reference FURUNO FCV-627/587 Fish Finder,including a global positioning system (GPS) receiver and depth-probe GPS [41]. For eachstation, the surface sediment samples were separated into four subsamples, one for particlesize analysis, one for the total organic carbon (TOC) analysis, and two others for chemicalanalysis of the major and trace elements. A WTW Multi-parameter Meter, model 3430,was used in situ to measure the physicochemical parameters (temperature, salinity, pH,and dissolved oxygen) of the water (0.5 m under the surface water of the lagoon foreach station).
Sediment granulometry was measured with a laser particle size analyzer (MalvernMastersizer 2000 ©) after preparing the sediments in a sodium hexametaphosphate solu-tion [42]. The particle-size distribution was calculated using Gradistat © Excel software [43]after each measurement and expressed as relative proportions (%) of sand (2 mm–63 µm),silt (63–2 µm), and clay (< 2 µm). TOC was measured with a LECO © carbon analyzer thatestimates the percentages of CO2 after a combustion of oxygen at 1400 ◦C and a mineral de-carbonization with a sulfuric acid solution [44]. Two analyses were used and the precisionof the total carbon data is expressed by the range of standard deviations and estimated to0.001–0.042. Granulometry and TOC were analyzed at LETG-Nantes, France [45].
The major elements were analyzed using a Bruker S1 Turbo SD hand-held X-rayfluorescence (HHXRF) spectrometer (Bruker AXS GmbH) using the certified standardreference material NIST 2702 at the National Center for Energy, Sciences and NuclearTechniques [46]. The principle of the HHXRF technology is based on the fact that theincident rays eject electrons from the atoms of the elements in the sample, resulting inthe emission of X-rays with energies that are characteristic of the elements present inthe sample. The emitted X-rays are analyzed using a silicon drift detector. The resultsare immediately displayed and stored. All the sediment samples were analysed in tworeplicates. The recovery (%) and the relative standard deviation (RSD%) of the majorelements from the Certified Reference Material (CRM) were 100.4–7.77 for Al, 83.8–2.72 forP, 108.2–2.85 for K, 112.5–9.33 for Ca, 99.9–5.61 for Ti, 99.6–3.13 for Mn, and 96.7–3.85 for Fe.Detection limits (ppm) of the analyzed elements were 1058 for Al, 16 for Fe, 10 for Mn, 795for Si, 87 for P, 51 for K, 50 for Ca, and 23 for Ti.
Trace elements were analyzed using an Agilent 4200 microwave plasma atomic emis-sion spectrometer (MP-AES) according to the NFX 31-147 standard analysis methods at theNational Laboratory of Studies and Monitoring of Pollution [47]. Sediments and CertifiedReference Material (CRM) were digested in a microwave digestion system with mineral-ization by attack of 65% nitric acid HN03 (9 mL) and with hydrochloric acid HCL at 37%(2 mL) in a microwave oven of the “ETHOS One” type for digestion of the samples at atemperature of 180 ◦C for 40 min. A blank was included in each digestion. The CRMswere analyzed every 10 samples. The recovery (%) and RSD (%) of the trace elements fromCRM were 110–1.25 for Cu, 100–0.53 for Pb, 105–1.24 for Zn, 95–0.54 for Cr, 105–0.63 forCo, and 110–0.26 for Ba. Detection limits (mg/kg) of the analyzed elements were 0.0003 forCr, 0.0003 for Cu, 0.0044 for Pb, 0.0028 for Zn, 0.0031 for Co, and 0.0002 for Ba.
2.4. Statistical Methods
To test the season’s effect, significant differences between the mean values of eachparameter (major and trace elements, grain size, TOC, and physico-chemical parameters)between the wet and dry seasons were tested using the Kruskal–Wallis test; the normalitybeing not verified overall (Shapiro–Wilk test, p > 0.5). Spearman’s rank coefficient wascalculated to test the relationship between the above parameters.
The data matrix by season (parameters values x sampling stations) was fourth-roottransformed and the Pearson similarity calculated between the stations. Principal compo-

Diversity 2021, 13, 51 5 of 21
nent analysis (PCA) was conducted on the environmental variables to explore the maingradients in the study area [48]. To identify the affinity groups of the stations, cluster analy-sis (CA) based on squared Euclidean distance and Ward’s method as well as the SIMPROFtest of similarity profile were used. The significance of the differences between the groupstations and between seasons for all the parameters was investigated with permutationalmultivariate ANOVA (PERMANOVA).
The Shapiro–Wilk and Kruskal–Wallis tests were performed using IBM SPSS Statisticssoftware version 20 while the Spearman test was performed using the R program. PCA andCA were performed with PRIMER v.6 software [49]. All statistical methods were appliedwith a confidence level of 95% (p < 0.05).
The maps of the lagoon were produced with ESRI software ArcGIS Desktop 10.
2.5. Sediment Contamination and Risk Assessment Indices
Ecological risk was assessed using various indices (Table 1): enrichment factor(EF) [29], contamination factor (CF) [32], pollution-load index (PLI) [33], and geoaccu-mulation index (Igeo) [34]. For the EF calculation, normalization was used to quantify theanthropogenic metal pollution from the natural variability of trace elements. The majorconservative elements commonly used for geochemical normalization are Al [50–52] andFe [53–56], two of the most abundant elements on earth. In this study, Fe was selected asthe reference element for calculation. Local background values (LBV) were elaborated froma previous study for some trace elements [57]. In order to study the ecological risk for thetrace elements Pb, Cr, Zn, Cu, Co, and Ba, reference values were taken from Rudnick andGao (2003) [58]. Sediment concentrations were compared with sediment-quality guidelines(SQGs) for marine ecosystems to evaluate the ecotoxicological risk [28,30,31,59,60]: valuesbelow the effect range low (ERL) and threshold effect level (TEL) refer to essentially uncon-taminated samples presenting a limited risk of toxicity. Mean sediment-quality guidelinequotients (m-ERM-Q) were applied [28,59] to examine the potential biological effects of thetoxicity of the trace elements in the surface sediment.

Diversity 2021, 13, 51 6 of 21
Table 1. Metal pollution index and descriptions.
Pollution Index. Formulation Ecotoxicological Assessment
Enrichment factor (EF) (CTrace metal/CFe)Sample/(CTrace metal/CFe)Background EF < 2 2 < EF < 5 5 < EF < 20 20 < EF < 40 EF > 40
[29] Minimal pollution Moderatepollution
Significantpollution
Very strongpollution Extreme pollution
Geoaccumulation index(Igeo)
log2 (CTrace metal/1.5 CBackground) Igeo < 0 0 < Igeo < 1 1 < Igeo < 2 2 < Igeo < 3 3 < Igeo < 4 4 < Igeo < 5 Igeo > 5
[34,61] UnpollutedUnpolluted to
moderatelypolluted
Moderatelypolluted
Moderately tostronglypolluted
Strongly pollutedStrongly toextremelypolluted
Extremelypolluted
Contamination factor(CF) CTracemetalSamplen/CTracemetalBackground CF < 1 1 ≤ CF < 2 2 ≤ CF < 3 CF ≥ 3
[32] Not polluted Mildly polluted Moderatelypolluted
Stronglypolluted
Pollution-load index(PLI) PLI = (CF1 × CF2 × CF3 × CFn)1/n PLI < 1 1 ≤ PLI < 2 2 ≤ PLI < 3 PLI ≥ 3
[33] Unpolluted Moderatelypolluted
Stronglypolluted
Very stronglypolluted
Mean effect rangemedium quotient
(m-ERM-Q)[28]
∑ (CTracemetalSamplei/ERMi)/n ERM i:values of effects range–median guidelines
for metal I [31]
< 0.1 9%probabilityof toxicity
0.1–0.5 21%probabilityof toxicity
0.5–1.5 49%probabilityof toxicity
> 1.5 76%probabilityof toxicity

Diversity 2021, 13, 51 7 of 21
3. Results3.1. Seasonal Distribution of the Geochemical Parameters in Marchica Lagoon Sediment3.1.1. Physicochemical Lagoon Parameters
The physicochemical parameters of the surface waters in the lagoon during the wetand dry seasons shown in Table 2 revealed seasonal variation in temperature (T ◦C)(p < 0.05), with values fluctuating from 16.7 to 18.4 during the wet season and from 26 to28.2 during the dry season. No differences (p > 0.05) for pH were found, with variationfrom 7.64 to 8.54 during the wet season and from 7.82 to 8.72 during the dry season. Salinity(Sal) varied from 22.1 to 36.9 during the wet season and from 34.5 to 38.5 during the dryseason, with seasonal variation (p < 0.05). For dissolved oxygen (O2), significant differencewas observed (p < 0.05), with variation from 4.9 to 11.83 during the wet season and 4.91 to7.33 during the dry season. The depth of the sediment samples varied from 0.5 near theborder to 6.7 at the lagoon center.
Table 2. Physicochemical parameters of the surface waters in the lagoon during the wet and dry seasons.
T ◦C pH O2 (mg/l) Sal (g/l)
WetSeason
Min–Max 16.7–18.4 7.64–8.54 4.9–11.83 22.1–36.9Mean ± SD 17.52 ± 0.46 8.25 ± 0.21 9.64 ± 1.58 35.28 ± 3.98
DrySeason
Min–Max 26–28.2 7.82–8.72 4.91–7.33 34.5–38.5Mean ± SD 27.09 ± 0.75 8.38 ± 0.29 6.57 ± 0.73 37.21 ± 0.97
Min: minimum, Max: maximum and SD: standard deviation.
3.1.2. Granulometry and TOC
The seasonal granulometric distribution and TOC sediment in the lagoon during 2018are shown in Table 3. The sediment particle grain size analysis indicated seasonal variation(p < 0.05), while the analyzed TOC contents in the surface sediment were not affectedseasonally (p > 0.05).
Seven sampling stations were classified as muddy sand facies during the wet seasonand sandy mud during the dry season: near the eutrophication zone of the Beni Ensarlagoon side (S1); near the Beni Ensar sandbar border side (S3); near the marina zone (S2);near the area of the great Nador wastewater treatment plant outfall (S8); near the Selouanewadi (S9); in the area between Bouarg and Arekmane (S11); and center of the Arekmanelagoon side (S13). The area near the Arekmane sandbar border side (S4 and S5) and thearea near the Cabaillo wadi (S7) were characterized as sand facies during both seasons.The center of the lagoon (S6) was sand facies during the wet season and sandy mud duringthe dry season. The eutrophication zone side of Arekmane (S12) was muddy sand faciesduring the wet season and mud (fine silt) during the dry season. Near the Bouarg channel,characterized by agricultural effluents (S10), sediments were muddy sand facies during thewet season and sand during the dry season.
The TOC results ranged from 0.17% to 6.19% during wet season and from 0.38% to6.5% during dry season. An elevated TOC value was observed near the sandbar borderside of Beni Ensar (S3; depth: 2.85 m) during the wet and dry seasons.

Diversity 2021, 13, 51 8 of 21
Table 3. Seasonal and spatial concentrations of the grain size fractions (%), total organic carbon (TOC; %), major elements (%), and trace elements (mg/kg).
Station Season Granulometry (%) TOC% Facies Group Major Elements (%) Trace Elements (mg/kg)
Sand Silt Clay Al Fe Mn Si Ti Ca P K Cu Zn Pb Cr Co Ba
S1Wet 80.7 18.6 0.7 3.20 Muddy Sand 4.86 4.00 0.049 14.10 0.35 12.11 0.14 1.94 15.37 3.42 204.58 24.86 < DL 179.56Dry 36.2 62.7 1.1 3.26 Sandy Mud 5.41 4.06 0.052 14.24 0.36 12.54 0.13 1.86 33.14 6.75 3039.51 30.92 8.61 197.23
S2Wet 64.4 34.6 1.1 3.95 Muddy Sand 7.98 10.49 0.094 16.36 0.35 4.87 0.05 1.78 297.87 191.13 320.96 75.06 < DL 296.69Dry 16.7 81.1 2.3 2.93 Sandy Mud 8.89 10.56 0.099 16.29 0.35 4.90 0.05 1.87 651.72 346.36 291.58 94.44 < DL 415.23
S3Wet 87.4 12.4 0.2 6.19 Muddy Sand 3.25 3.12 0.037 14.39 0.28 16.14 0.13 1.42 8711 40.17 192.06 53.85 < DL 207.60Dry 24.0 74.6 1.3 6.50 Sandy Mud 3.46 3.15 0.036 14.72 0.28 16.82 0.12 1.43 86.4 39.75 175.97 45.22 7.47 186.34
S4Wet 95.1 4.9 0.1 5.34 Sand 0.21 1.07 0.039 9.06 0.09 33.50 0.18 0.29 10.01 2.68 145.15 20.96 < DL 65.31Dry 100.0 0.0 0.0 4.11 Sand 0.23 1.07 0.038 9.36 0.09 33.10 0.19 0.29 13.39 2.14 112.46 7.43 10.43 66.84
S5Wet 95.0 4.9 0.1 5.43 Sand 0.47 1.77 0.049 9.53 0.10 33.53 0.16 0.45 13.51 2.43 131.83 6.25 <DL 89.30Dry 100.0 0.0 0.0 3.86 Sand 0.56 1.73 0.048 9.18 0.10 33.06 0.16 0.44 16.59 8.27 123.86 8.60 11.08 80.65
S6Wet 94.3 5.5 0.2 5.30 Sand 5.34 4.29 0.054 18.48 0.37 9.95 0.08 2.16 12.41 2.54 146.19 2.24 < DL 97.60Dry 10.9 85.5 3.5 2.08 Sandy Mud 4.97 4.31 0.055 18.57 0.37 9.37 0.09 2.09 98.73 34.95 155.62 63.70 8.85 250.87
S7Wet 90.5 9.1 0.4 0.17 Sand 6.80 11.78 0.102 20.20 0.52 4.19 0.08 2.58 200.4 63.48 225.34 35.54 < DL 986.22Dry 92.6 7.0 0.3 0.38 Sand 6.94 11.61 0.104 20.37 0.53 4.32 0.11 2.78 209.69 65.96 141.53 33.29 < DL 924.62
S8Wet 75.9 23.6 0.5 5.89 Muddy Sand 3.84 3.86 0.039 18.13 0.40 13.14 0.11 1.87 89.48 22.67 165.52 26.97 < DL 464.99Dry 15.2 83.0 1.9 1.84 Sandy Mud 3.66 3.94 0.040 18.22 0.41 13.21 0.11 2.06 97.15 44.19 140.13 37.56 19.80 482.91
S9Wet 78.5 20.6 0.9 1.94 Muddy Sand 3.59 3.59 0.035 17.89 0.40 14.01 0.11 1.50 58.75 8.40 2389.36 36.56 < DL 243.14Dry 42.3 55.5 2.2 2.09 Sandy Mud 3.92 3.61 0.036 18.22 0.40 14.06 0.10 1.61 39.79 9.40 130.27 38.2 13.12 203.24
S10Wet 70.7 27.7 1.5 2.36 Muddy Sand 2.71 3.19 0.048 14.65 0.30 21.05 0.13 1.33 34.92 3.69 156.50 25.84 < DL 257.20Dry 91.8 7.3 0.8 2.03 Sand 2.89 3.35 0.048 15.12 0.30 20.92 0.13 1.24 25.59 4.35 121.50 8.33 11.33 307.42
S11Wet 62.0 36.6 1.3 2.20 Muddy Sand 4.39 3.68 0.037 20.27 0.40 11.27 0.09 2.12 67.28 18.45 179.79 77.17 < DL 205.68Dry 20.4 77.2 2.4 2.79 Sandy Mud 4.82 3.76 0.037 20.63 0.40 11.46 0.09 1.91 73.55 30.00 120.86 65.27 18.2 181.75
S12Wet 60.5 38.9 0.6 1.74 Muddy Sand 4.50 3.62 0.035 18.86 0.42 11.95 0.08 1.80 6448 16.57 156.27 64.82 < DL 195.65Dry 9.2 87.0 3.8 2.35 Mud 4.37 3.67 0.035 19.13 0.42 11.85 0.08 2.04 58.89 21.31 124.12 76.89 13.02 207.51
S13Wet 60.3 38.6 1.1 3.63 Muddy Sand 4.81 4.04 0.047 18.76 0.40 11.25 0.08 2.03 74.28 26.9 163.14 59.04 < DL 157.17Dry 11.9 83.6 4.4 1.93 Sandy Mud 5.44 4.10 0.048 18.82 0.40 10.50 0.09 2.16 97.86 33.05 135.93 87.40 11.08 227.57
Diversity 2021, 13, 51 9 of 21
3.1.3. Major and Trace Elements
Seasonal variation of the major and trace sediment elements in the lagoon during2018 are reported in Table 3. Except for Pb (p < 0.05), no significant differences for theseelements among seasons were observed (p > 0.05), while Co was below the detection limitduring the wet season.
The mean concentrations of the major elements during the wet and dry seasons were,in descending order, Si (16.29%) > Ca (15.12%) > Fe (4.52%) > Al (4.17%) > K (1.66%) > Ti(0.34%) > P (0.11%) > Mn (0.05%). The mean concentrations of the trace elements were,in descending order, Zn (674.45 mg/kg) > Pb (361.16 mg/kg) > Ba (276.09 mg/kg) > Cr(42.55 mg/kg) > Cu (40.35 mg/kg) > Co (5.12 mg/kg).
The concentration ranges of the major elements Al, Fe, Mn, Si, Ti, Ca, K, and P(%) during the two seasons were, respectively, 0.22–8.43, 1.07–11.70, 0.04–0.10, 9.21–20.45,0.09–0.52, 4.25–33.30, 0.29–2.68, and 0.05–0.18, with maximal concentrations near the mouthof the Cabaillo wadi and the marina zone (S2 and S7) for Al, Fe, and Mn; near the mouth ofCabaillo wadi (S7) for Si, Ti, and K; and at the sandbar border near the inlet (S4 and S5)for Ca.
The concentration ranges of the trace elements (mg/kg) Zn, Pb, Ba, Cr, Cu, and Coduring the two seasons were, respectively, 11.70–4398.70, 127.85–1622.05, 66.08–955.42,7.43–84.75, 2.41–268.75, and <LD–9.90 (LD, limit of detection), with maximal concentrationsat the sandbar border side of Beni Ensar and the eutrophication zone of Arekmane (S3 andS12) for Zn; at the eutrophication zone of Beni Ensar and near the Selouane wadi (S1 andS9) for Pb; at the Cabaillo wadi (S7) for Ba; at the marina zone (S2) for Cr and Cu; and themaximum near the outfall of the wastewater treatment plant (S8), and the minimum at S2and S7 for Co.
3.2. Spatial Pattern and Correlation of the Geochemical Parameters, Granulometry, and TOC inMarchica Lagoon Sediment
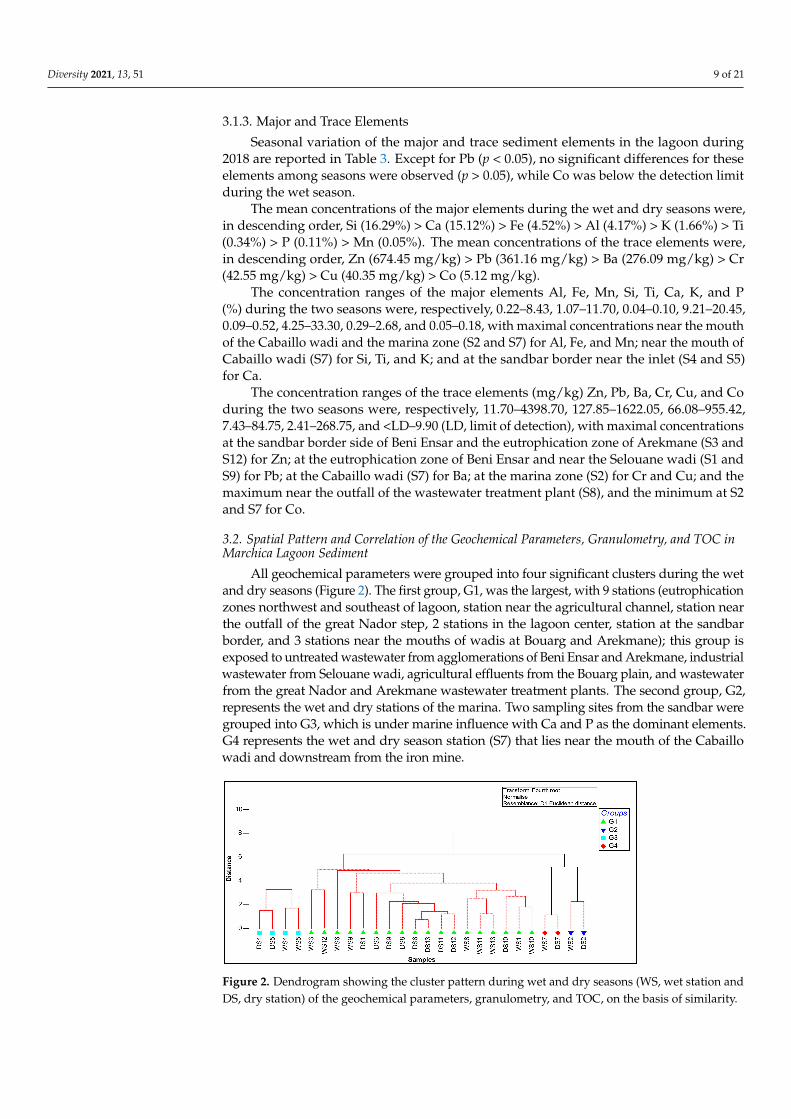
All geochemical parameters were grouped into four significant clusters during the wetand dry seasons (Figure 2). The first group, G1, was the largest, with 9 stations (eutrophicationzones northwest and southeast of lagoon, station near the agricultural channel, station nearthe outfall of the great Nador step, 2 stations in the lagoon center, station at the sandbarborder, and 3 stations near the mouths of wadis at Bouarg and Arekmane); this group isexposed to untreated wastewater from agglomerations of Beni Ensar and Arekmane, industrialwastewater from Selouane wadi, agricultural effluents from the Bouarg plain, and wastewaterfrom the great Nador and Arekmane wastewater treatment plants. The second group, G2,represents the wet and dry stations of the marina. Two sampling sites from the sandbar weregrouped into G3, which is under marine influence with Ca and P as the dominant elements.G4 represents the wet and dry season station (S7) that lies near the mouth of the Cabaillowadi and downstream from the iron mine.
Figure 2. Dendrogram showing the cluster pattern during wet and dry seasons (WS, wet station andDS, dry station) of the geochemical parameters, granulometry, and TOC, on the basis of similarity.

Diversity 2021, 13, 51 10 of 21
Principal component analysis (PCA) was used to evaluate the geochemical processesin Marchica Lagoon and distinguish the potential sources of trace elements in the sediment(Figure 3). Two axes, PC1 and PC2, explained 68.1% of total variance. The first accountedfor 52.7% of total variance, and showed positive loadings on Al, Fe, Mn, Si, Ti, K, silt, clay,Cu, Zn, Pb, Cr, and Ba, and negative loadings on Ca, P, TOC, sand, and Co. The secondcomponent accounted for 15.4% of total variance, and showed positive loadings on sand,and negative loadings on TOC and Co. PC1 suggested that the pressure exerted on G1, G2,and G4 could be attributed to Cu, Zn, Pb, Cr, and Ba in correlation with Al, Fe, Mn, Si, Ti,K, silt, and clay, with the maximal concentration at G4 and a decrease at G1. However, thepressure exerted on G3 was attributed to marine influence.
Figure 3. Principal component analysis (PCA) of the wet and dry seasons (WS, wet station and DS, dry station) for thegeochemical parameters, granulometry, and TOC.
The PERMANOVA conducted for all the geochemical parameters, granulometry,and TOC in the lagoon revealed significant differences between group stations, whilefor seasonality this was not found; also, groups G2 and G4 were similar in the pairwisecomparison, making them constitute a single group.
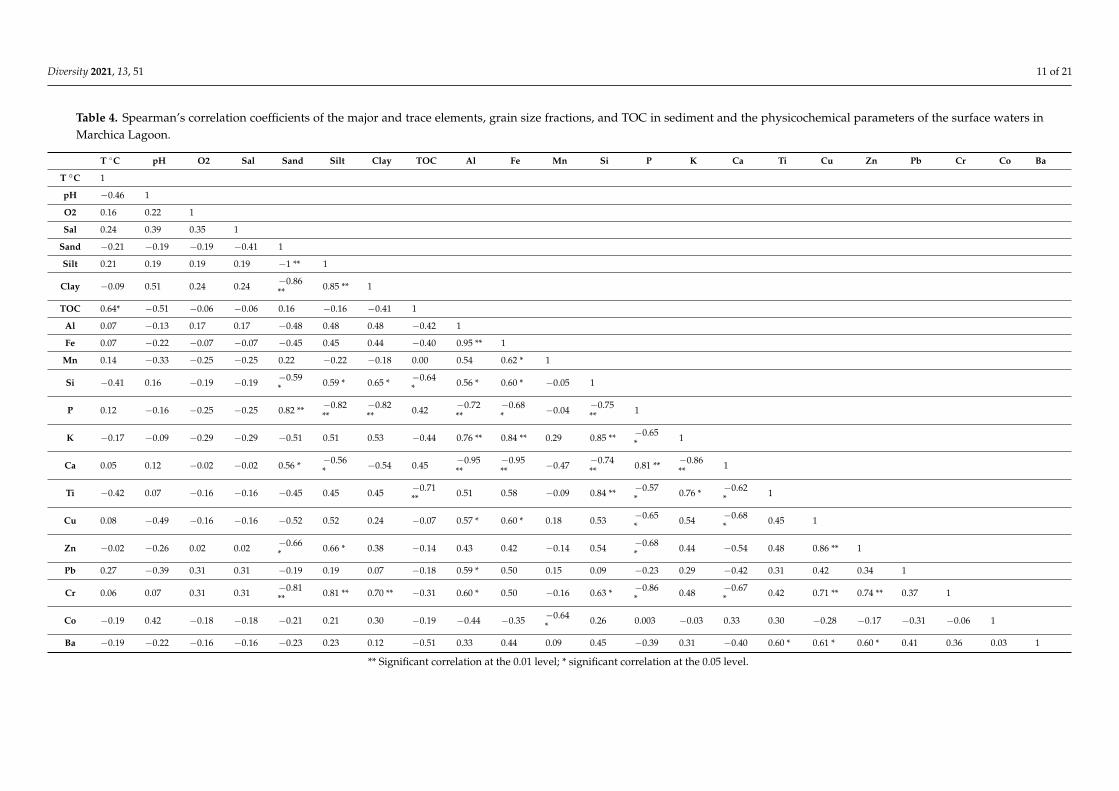
Spearman’s correlation analysis was conducted to explore the relationship betweenthe grain size, TOC, and major and trace elements in sediment and the physicochemicalparameters of the surface waters (Table 4). All trace elements except Co showed a positivecorrelation with Al and Fe. A strong positive correlation was found between Al and Fe(ρ = 0.95, p < 0.01), K (ρ = 0.76, p < 0.01), Si (ρ = 0.56, p < 0.05), Cu (ρ = 0.57, p < 0.05),Pb (ρ = 0.59, p < 0.05), and Cr (ρ = 0.60, p < 0.05). Strongly positive correlation was alsofound between Fe and Mn (ρ = 0.62, p < 0.05), K (ρ = 0.84, p < 0.01), Si (ρ = 0.60, p < 0.05),and Cu (ρ = 0.60, p < 0.01). Highly positive correlation was found between Cu and Zn(ρ = 0.86, p < 0.01), Cr (ρ = 0.71, p < 0.01), and Ba (ρ = 0.61, p < 0.05); and between Zn andCr (ρ = 0.74, p < 0.01) and Ba (ρ = 0.60, p < 0.05). Except for TOC with temperature, whichshows a significant correlation (ρ = 0.65. p < 0.05), no other significant correlation wasobserved between the surface waters’ physicochemical parameters (T ◦C, pH, O2, and Sal)and TOC, granulometry, and the major and trace elements.
Diversity 2021, 13, 51 11 of 21
Table 4. Spearman’s correlation coefficients of the major and trace elements, grain size fractions, and TOC in sediment and the physicochemical parameters of the surface waters inMarchica Lagoon.
T ◦C pH O2 Sal Sand Silt Clay TOC Al Fe Mn Si P K Ca Ti Cu Zn Pb Cr Co Ba
T ◦C 1
pH −0.46 1
O2 0.16 0.22 1
Sal 0.24 0.39 0.35 1
Sand −0.21 −0.19 −0.19 −0.41 1
Silt 0.21 0.19 0.19 0.19 −1 ** 1
Clay −0.09 0.51 0.24 0.24 −0.86** 0.85 ** 1
TOC 0.64* −0.51 −0.06 −0.06 0.16 −0.16 −0.41 1
Al 0.07 −0.13 0.17 0.17 −0.48 0.48 0.48 −0.42 1
Fe 0.07 −0.22 −0.07 −0.07 −0.45 0.45 0.44 −0.40 0.95 ** 1
Mn 0.14 −0.33 −0.25 −0.25 0.22 −0.22 −0.18 0.00 0.54 0.62 * 1
Si −0.41 0.16 −0.19 −0.19 −0.59* 0.59 * 0.65 * −0.64
* 0.56 * 0.60 * −0.05 1
P 0.12 −0.16 −0.25 −0.25 0.82 ** −0.82**
−0.82** 0.42 −0.72
**−0.68* −0.04 −0.75
** 1
K −0.17 −0.09 −0.29 −0.29 −0.51 0.51 0.53 −0.44 0.76 ** 0.84 ** 0.29 0.85 ** −0.65* 1
Ca 0.05 0.12 −0.02 −0.02 0.56 * −0.56* −0.54 0.45 −0.95
**−0.95** −0.47 −0.74
** 0.81 ** −0.86** 1
Ti −0.42 0.07 −0.16 −0.16 −0.45 0.45 0.45 −0.71** 0.51 0.58 −0.09 0.84 ** −0.57
* 0.76 * −0.62* 1
Cu 0.08 −0.49 −0.16 −0.16 −0.52 0.52 0.24 −0.07 0.57 * 0.60 * 0.18 0.53 −0.65* 0.54 −0.68
* 0.45 1
Zn −0.02 −0.26 0.02 0.02 −0.66* 0.66 * 0.38 −0.14 0.43 0.42 −0.14 0.54 −0.68
* 0.44 −0.54 0.48 0.86 ** 1
Pb 0.27 −0.39 0.31 0.31 −0.19 0.19 0.07 −0.18 0.59 * 0.50 0.15 0.09 −0.23 0.29 −0.42 0.31 0.42 0.34 1
Cr 0.06 0.07 0.31 0.31 −0.81** 0.81 ** 0.70 ** −0.31 0.60 * 0.50 −0.16 0.63 * −0.86
* 0.48 −0.67* 0.42 0.71 ** 0.74 ** 0.37 1
Co −0.19 0.42 −0.18 −0.18 −0.21 0.21 0.30 −0.19 −0.44 −0.35 −0.64* 0.26 0.003 −0.03 0.33 0.30 −0.28 −0.17 −0.31 −0.06 1
Ba −0.19 −0.22 −0.16 −0.16 −0.23 0.23 0.12 −0.51 0.33 0.44 0.09 0.45 −0.39 0.31 −0.40 0.60 * 0.61 * 0.60 * 0.41 0.36 0.03 1
** Significant correlation at the 0.01 level; * significant correlation at the 0.05 level.
Diversity 2021, 13, 51 12 of 21
3.3. Ecological Risk of the Trace Elements in Marchica Lagoon Sediment
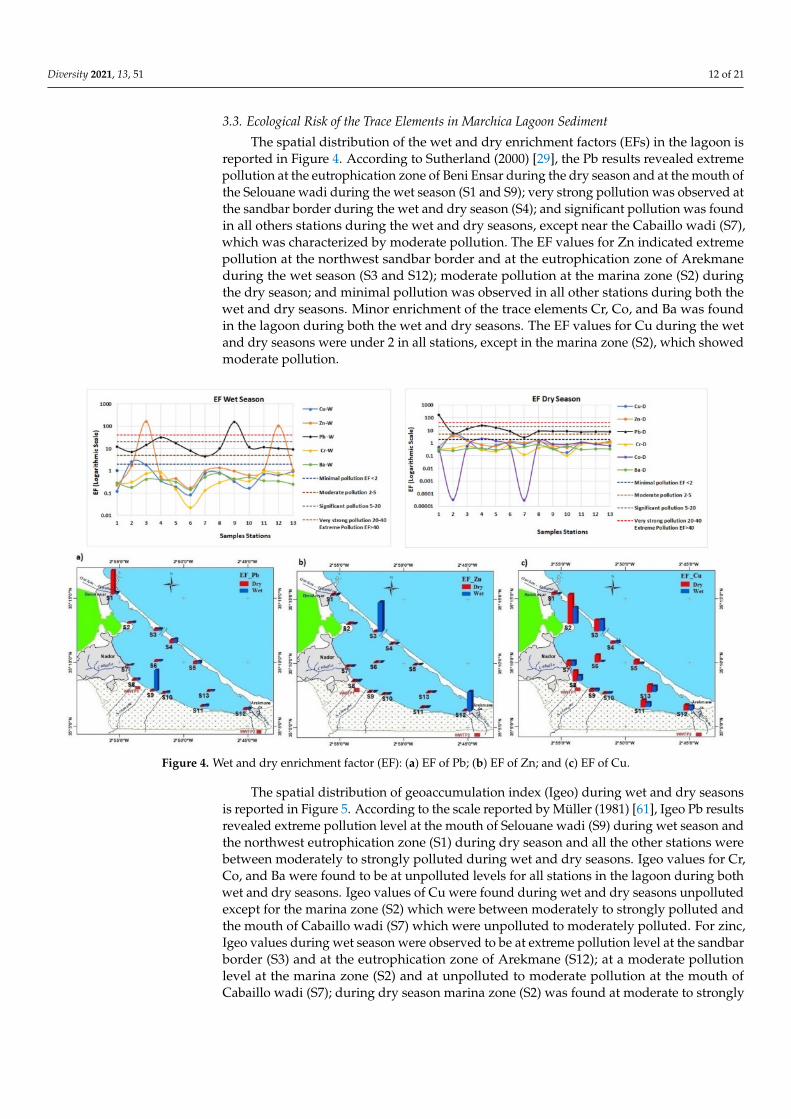
The spatial distribution of the wet and dry enrichment factors (EFs) in the lagoon isreported in Figure 4. According to Sutherland (2000) [29], the Pb results revealed extremepollution at the eutrophication zone of Beni Ensar during the dry season and at the mouth ofthe Selouane wadi during the wet season (S1 and S9); very strong pollution was observed atthe sandbar border during the wet and dry season (S4); and significant pollution was foundin all others stations during the wet and dry seasons, except near the Cabaillo wadi (S7),which was characterized by moderate pollution. The EF values for Zn indicated extremepollution at the northwest sandbar border and at the eutrophication zone of Arekmaneduring the wet season (S3 and S12); moderate pollution at the marina zone (S2) duringthe dry season; and minimal pollution was observed in all other stations during both thewet and dry seasons. Minor enrichment of the trace elements Cr, Co, and Ba was foundin the lagoon during both the wet and dry seasons. The EF values for Cu during the wetand dry seasons were under 2 in all stations, except in the marina zone (S2), which showedmoderate pollution.
Figure 4. Wet and dry enrichment factor (EF): (a) EF of Pb; (b) EF of Zn; and (c) EF of Cu.
The spatial distribution of geoaccumulation index (Igeo) during wet and dry seasonsis reported in Figure 5. According to the scale reported by Müller (1981) [61], Igeo Pb resultsrevealed extreme pollution level at the mouth of Selouane wadi (S9) during wet season andthe northwest eutrophication zone (S1) during dry season and all the other stations werebetween moderately to strongly polluted during wet and dry seasons. Igeo values for Cr,Co, and Ba were found to be at unpolluted levels for all stations in the lagoon during bothwet and dry seasons. Igeo values of Cu were found during wet and dry seasons unpollutedexcept for the marina zone (S2) which were between moderately to strongly polluted andthe mouth of Cabaillo wadi (S7) which were unpolluted to moderately polluted. For zinc,Igeo values during wet season were observed to be at extreme pollution level at the sandbarborder (S3) and at the eutrophication zone of Arekmane (S12); at a moderate pollutionlevel at the marina zone (S2) and at unpolluted to moderate pollution at the mouth ofCabaillo wadi (S7); during dry season marina zone (S2) was found at moderate to strongly

Diversity 2021, 13, 51 13 of 21
polluted and (S7) was at unpolluted to moderate pollution as during the wet season; theother stations were unpolluted during both wet and dry seasons.
Figure 5. Wet and dry geoaccumulation index (Igeo): (a) Igeo of Pb; (b) Igeo of Zn; and (c) Igeo of Cu.
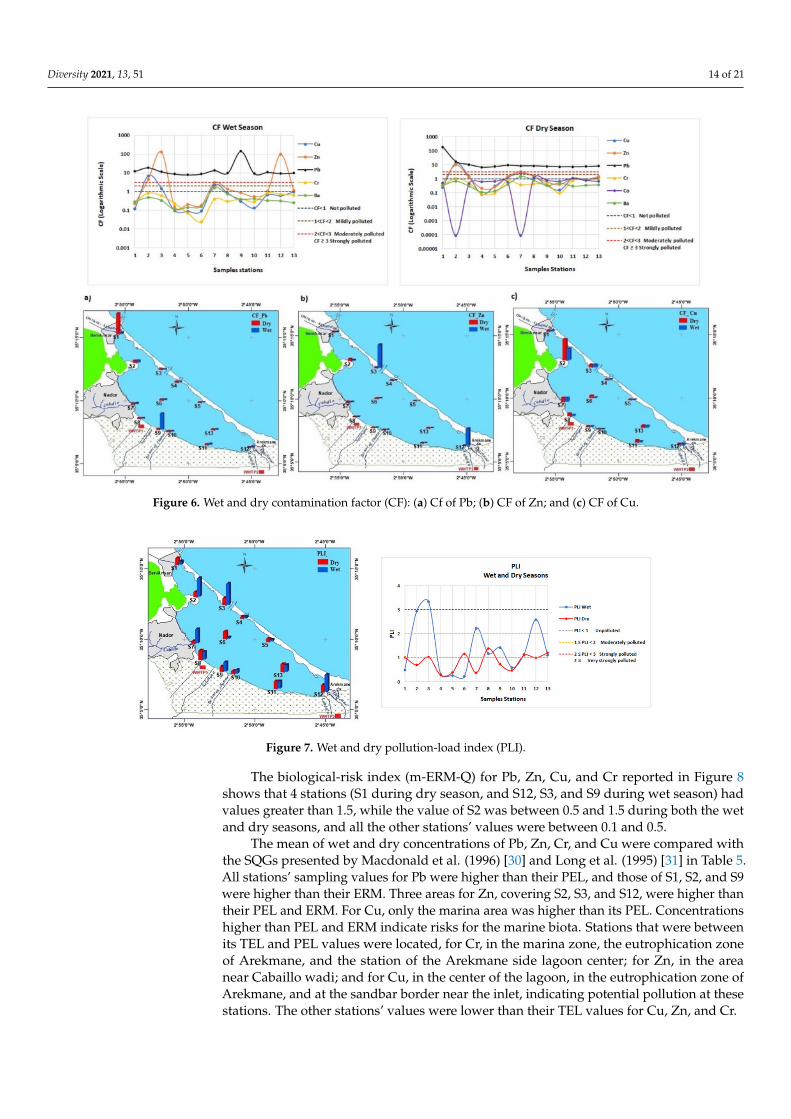
The spatial distribution of the contamination factor (CF) during the wet and dryseasons in the superficial sediment in the lagoon is presented in Figure 6. The resultsindicated that all CF values of Pb during the wet and dry seasons were greater than 3,suggesting the presence of strong lead pollution in the study areas. For the CF values ofzinc, 3 stations during the wet season (S2, S3 and S12) and 2 others (S2 and S7) during thedry season were observed to be strongly polluted, 1 station was found to be moderatelypolluted during the wet season (S7), 3 stations during the wet and dry seasons (S8, S11 andS13), and 2 others during the dry seasons (S3 and S6) were found mildly polluted—theother stations were not polluted. The CF values of Cu indicated strong pollution at S2during the wet and dry seasons, moderate pollution at S7 during the wet and dry seasons,mild pollution at S3 during the wet and dry seasons and at S8, S6, and S13 during the dryseason, and no pollution in the other study areas. The CF values of Co during the dryseason showed that no pollution was found except at 2 stations (S8 and S11), which weremildly polluted. The CF values of Cr were less than 1, suggesting no pollution in the studyarea except at the Marina zone during the dry season, which was mildly polluted. The CFvalues of Ba also showed no pollution except for S7 during the wet and dry seasons, wherethe CF values showed mild pollution.
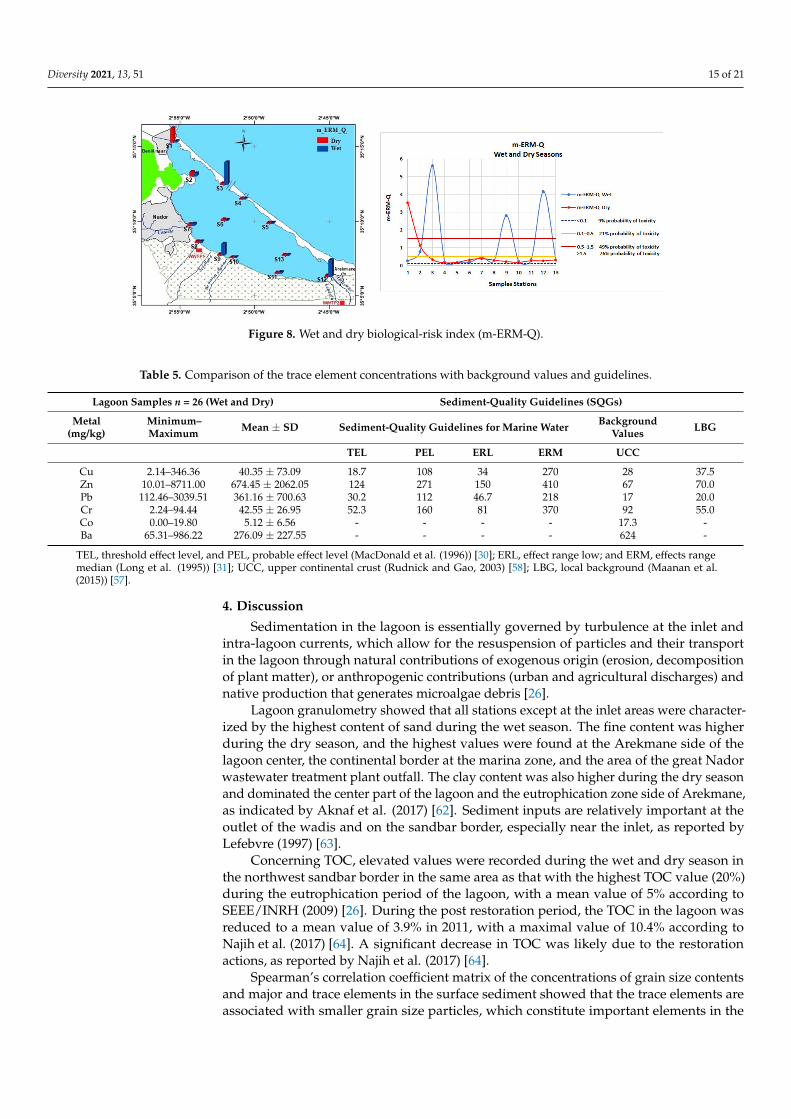
The pollution-load index (PLI) values in the lagoon, reported in Figure 7, ranged from0.22 to 3.33 during the wet season and from 0.27 to 1.39 during the dry season. The highestPLI value was observed at the station in the sandbar border (S3) during the wet season.
Diversity 2021, 13, 51 14 of 21
Figure 6. Wet and dry contamination factor (CF): (a) Cf of Pb; (b) CF of Zn; and (c) CF of Cu.
Figure 7. Wet and dry pollution-load index (PLI).
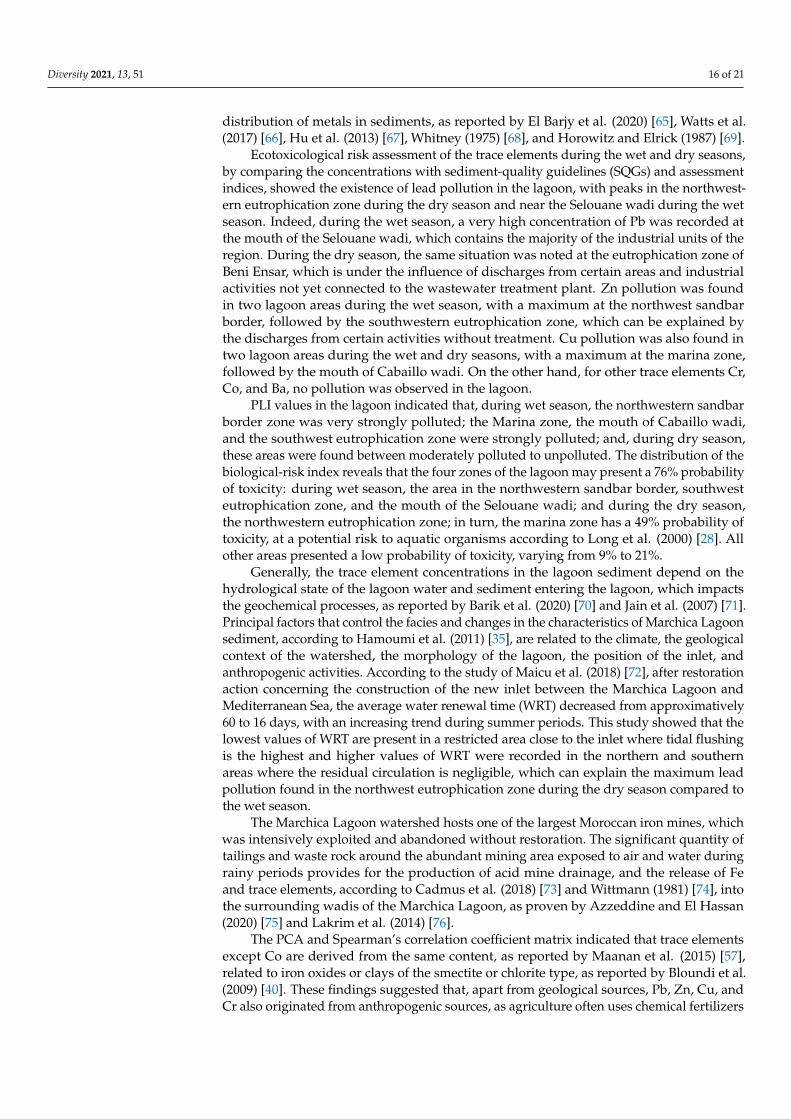
The biological-risk index (m-ERM-Q) for Pb, Zn, Cu, and Cr reported in Figure 8shows that 4 stations (S1 during dry season, and S12, S3, and S9 during wet season) hadvalues greater than 1.5, while the value of S2 was between 0.5 and 1.5 during both the wetand dry seasons, and all the other stations’ values were between 0.1 and 0.5.
The mean of wet and dry concentrations of Pb, Zn, Cr, and Cu were compared withthe SQGs presented by Macdonald et al. (1996) [30] and Long et al. (1995) [31] in Table 5.All stations’ sampling values for Pb were higher than their PEL, and those of S1, S2, and S9were higher than their ERM. Three areas for Zn, covering S2, S3, and S12, were higher thantheir PEL and ERM. For Cu, only the marina area was higher than its PEL. Concentrationshigher than PEL and ERM indicate risks for the marine biota. Stations that were betweenits TEL and PEL values were located, for Cr, in the marina zone, the eutrophication zoneof Arekmane, and the station of the Arekmane side lagoon center; for Zn, in the areanear Cabaillo wadi; and for Cu, in the center of the lagoon, in the eutrophication zone ofArekmane, and at the sandbar border near the inlet, indicating potential pollution at thesestations. The other stations’ values were lower than their TEL values for Cu, Zn, and Cr.
Diversity 2021, 13, 51 15 of 21
Figure 8. Wet and dry biological-risk index (m-ERM-Q).
Table 5. Comparison of the trace element concentrations with background values and guidelines.
Lagoon Samples n = 26 (Wet and Dry) Sediment-Quality Guidelines (SQGs)
Metal(mg/kg)
Minimum–Maximum Mean ± SD Sediment-Quality Guidelines for Marine Water Background
Values LBG
TEL PEL ERL ERM UCC
Cu 2.14–346.36 40.35 ± 73.09 18.7 108 34 270 28 37.5Zn 10.01–8711.00 674.45 ± 2062.05 124 271 150 410 67 70.0Pb 112.46–3039.51 361.16 ± 700.63 30.2 112 46.7 218 17 20.0Cr 2.24–94.44 42.55 ± 26.95 52.3 160 81 370 92 55.0Co 0.00–19.80 5.12 ± 6.56 - - - - 17.3 -Ba 65.31–986.22 276.09 ± 227.55 - - - - 624 -
TEL, threshold effect level, and PEL, probable effect level (MacDonald et al. (1996)) [30]; ERL, effect range low; and ERM, effects rangemedian (Long et al. (1995)) [31]; UCC, upper continental crust (Rudnick and Gao, 2003) [58]; LBG, local background (Maanan et al.(2015)) [57].
4. Discussion
Sedimentation in the lagoon is essentially governed by turbulence at the inlet andintra-lagoon currents, which allow for the resuspension of particles and their transportin the lagoon through natural contributions of exogenous origin (erosion, decompositionof plant matter), or anthropogenic contributions (urban and agricultural discharges) andnative production that generates microalgae debris [26].
Lagoon granulometry showed that all stations except at the inlet areas were character-ized by the highest content of sand during the wet season. The fine content was higherduring the dry season, and the highest values were found at the Arekmane side of thelagoon center, the continental border at the marina zone, and the area of the great Nadorwastewater treatment plant outfall. The clay content was also higher during the dry seasonand dominated the center part of the lagoon and the eutrophication zone side of Arekmane,as indicated by Aknaf et al. (2017) [62]. Sediment inputs are relatively important at theoutlet of the wadis and on the sandbar border, especially near the inlet, as reported byLefebvre (1997) [63].
Concerning TOC, elevated values were recorded during the wet and dry season inthe northwest sandbar border in the same area as that with the highest TOC value (20%)during the eutrophication period of the lagoon, with a mean value of 5% according toSEEE/INRH (2009) [26]. During the post restoration period, the TOC in the lagoon wasreduced to a mean value of 3.9% in 2011, with a maximal value of 10.4% according toNajih et al. (2017) [64]. A significant decrease in TOC was likely due to the restorationactions, as reported by Najih et al. (2017) [64].
Spearman’s correlation coefficient matrix of the concentrations of grain size contentsand major and trace elements in the surface sediment showed that the trace elements areassociated with smaller grain size particles, which constitute important elements in the
Diversity 2021, 13, 51 16 of 21
distribution of metals in sediments, as reported by El Barjy et al. (2020) [65], Watts et al.(2017) [66], Hu et al. (2013) [67], Whitney (1975) [68], and Horowitz and Elrick (1987) [69].
Ecotoxicological risk assessment of the trace elements during the wet and dry seasons,by comparing the concentrations with sediment-quality guidelines (SQGs) and assessmentindices, showed the existence of lead pollution in the lagoon, with peaks in the northwest-ern eutrophication zone during the dry season and near the Selouane wadi during the wetseason. Indeed, during the wet season, a very high concentration of Pb was recorded atthe mouth of the Selouane wadi, which contains the majority of the industrial units of theregion. During the dry season, the same situation was noted at the eutrophication zone ofBeni Ensar, which is under the influence of discharges from certain areas and industrialactivities not yet connected to the wastewater treatment plant. Zn pollution was foundin two lagoon areas during the wet season, with a maximum at the northwest sandbarborder, followed by the southwestern eutrophication zone, which can be explained bythe discharges from certain activities without treatment. Cu pollution was also found intwo lagoon areas during the wet and dry seasons, with a maximum at the marina zone,followed by the mouth of Cabaillo wadi. On the other hand, for other trace elements Cr,Co, and Ba, no pollution was observed in the lagoon.
PLI values in the lagoon indicated that, during wet season, the northwestern sandbarborder zone was very strongly polluted; the Marina zone, the mouth of Cabaillo wadi,and the southwest eutrophication zone were strongly polluted; and, during dry season,these areas were found between moderately polluted to unpolluted. The distribution of thebiological-risk index reveals that the four zones of the lagoon may present a 76% probabilityof toxicity: during wet season, the area in the northwestern sandbar border, southwesteutrophication zone, and the mouth of the Selouane wadi; and during the dry season,the northwestern eutrophication zone; in turn, the marina zone has a 49% probability oftoxicity, at a potential risk to aquatic organisms according to Long et al. (2000) [28]. Allother areas presented a low probability of toxicity, varying from 9% to 21%.
Generally, the trace element concentrations in the lagoon sediment depend on thehydrological state of the lagoon water and sediment entering the lagoon, which impactsthe geochemical processes, as reported by Barik et al. (2020) [70] and Jain et al. (2007) [71].Principal factors that control the facies and changes in the characteristics of Marchica Lagoonsediment, according to Hamoumi et al. (2011) [35], are related to the climate, the geologicalcontext of the watershed, the morphology of the lagoon, the position of the inlet, andanthropogenic activities. According to the study of Maicu et al. (2018) [72], after restorationaction concerning the construction of the new inlet between the Marchica Lagoon andMediterranean Sea, the average water renewal time (WRT) decreased from approximatively60 to 16 days, with an increasing trend during summer periods. This study showed that thelowest values of WRT are present in a restricted area close to the inlet where tidal flushingis the highest and higher values of WRT were recorded in the northern and southernareas where the residual circulation is negligible, which can explain the maximum leadpollution found in the northwest eutrophication zone during the dry season compared tothe wet season.
The Marchica Lagoon watershed hosts one of the largest Moroccan iron mines, whichwas intensively exploited and abandoned without restoration. The significant quantity oftailings and waste rock around the abundant mining area exposed to air and water duringrainy periods provides for the production of acid mine drainage, and the release of Feand trace elements, according to Cadmus et al. (2018) [73] and Wittmann (1981) [74], intothe surrounding wadis of the Marchica Lagoon, as proven by Azzeddine and El Hassan(2020) [75] and Lakrim et al. (2014) [76].
The PCA and Spearman’s correlation coefficient matrix indicated that trace elementsexcept Co are derived from the same content, as reported by Maanan et al. (2015) [57],related to iron oxides or clays of the smectite or chlorite type, as reported by Bloundi et al.(2009) [40]. These findings suggested that, apart from geological sources, Pb, Zn, Cu, andCr also originated from anthropogenic sources, as agriculture often uses chemical fertilizers

Diversity 2021, 13, 51 17 of 21
and pesticides that contain these elements, so too industrialization, as reported by Alloway(2013) [77] and Nriagu and Pacyna (1988) [78]. According to De Lacerda (1994) [19], thehigher lead concentrations recorded in the lagoon may have also originated from marineactivities related to fishing boats, as mentioned by Najih et al. (2015) [22].
Previous studies conducted by Maanan et al. (2015) [57], Bloundi et al. (2009) [40],Gonzalez et al. (2007) [79], and Ruiz et al. (2006) [80] (Table 5) confirmed that the surfacesediment of the Marchica Lagoon is polluted by lead, zinc, and copper. For Inani (1995) [81],the concentrations exceeding the SQGs in Marchica Lagoon mainly concern zinc andcopper. This study confirmed that concentrations of these trace elements have significantlyincreased despite the restoration actions realized during the last decade, as proved by theMarchica Lagoon water quality assessment study [82].
In order to place the Marchica Lagoon in a regional context of trace-element pol-lution status, a comparison was made with other Mediterranean lagoons (Table 6). Thecomparison showed that the maximal concentrations of Pb, Zn, and Cu recorded in theMarchica Lagoon were higher than those in Bizerte Lagoon, as reported by Barhoumi et al.(2016) [83]; Berre Lagoon, as reported by Arienzo et al. (2013) [84]; Izmit Bay, as reported byTan et al. (2020) [85]; Prokopos Lagoon, as reported by Katsaros et al. (2017) [86]; MálagaBay, as reported by Castillo et al. (2013) [13]; Santa Gilla Lagoon, as reported by Atzori et al.(2018) [87]; Burullus Lake, as reported by Melegy et al. (2019) [88]; and Gialova Lagoon, asreported by Kanellopoulos et al. (2020) [89].
Table 6. Comparison of the minimum and maximum trace elements (mg/kg) in sediment of Marchica Lagoon with previousstudies and with others lagoons in the Mediterranean Sea.
Locality Pb Zn Cr Cu Co References
Prev
ious
Stud
y Marchica Lagoon, Morocco 131.83–2389.36 10.01–8711 2.24–77.17 2.43–191.13 <LD Present Study (Wet Season)112.46–3039.51 13.39–651.72 7.43–94.44 2.14–346.36 <LD−19.80 Present Study (Dry Season)15–362 55.1–1250 22.4–172 10.2–398.4 - [57]11–297 4–1190 9–139 4–466 0–120 [40]3–416 13–1190 - 6–466 - [80]2.8–14 62–303 46–92.7 20–163 - [81]
Med
iter
rane
anSe
a Berre lagoon. France 12–104 56.5–215 17.1–119 7–60.7 - [84]Málaga Bay. Spain 7.92–37.1 - 4.31–26.0 6.57–21.2 - [13]Bizerte Lagoon. Tunisia 62.8–211.2 318.6–1825.5 7.2–30.8 4.0–45.2 - [83]Burullus Lake. Egypt 5–42 35–190 23–144 15–80 - [88]Izmit Bay. Turkey 10–33.8 123.6–363.2 40.9–120.8 49.9–105.3 - [85]Santa Gillalagoon. Sardinia 45.8–216 51–140 12.1–52 - - [87]Prokoposlagoon. Greece 4.86–22.18 14.87–60.22 17.88–117.97 6.44–27.92 - [86]Gialova Lagoon, Greece 10–31 20–51 99–154 15–40 5–15 [89]
5. Conclusions
This post restoration characterization of the trace elements Pb, Cu, Zn, Cr, Co, and Ba,and their correlation to the major elements Si, Al, Fe, Ti, Mn, K, P, Ca, grain size, and TOCin the surface sediment of the Marchica Lagoon during the wet and dry seasons, revealedthat element abundance is regulated by the sediment grain size characteristics, and traceelements tend to be concentrated in finer sediment particles. Multivariate analysis andecotoxicological risk assessment of the trace elements using sediment-quality guidelines(SQGs) and the pollution indices EF, Igeo, and CF revealed the contamination of MarchicaLagoon by Pb as the primary pollutant in all study areas, with two peaks in the mouth ofthe Selouane wadi during the wet season and the northwestern eutrophication zone duringthe dry season. Zn constituted a secondary pollutant, with two peaks in the northwestsandbar border and southwest eutrophication zone during the wet season and the mouthof the Cabaillo wadi during the dry season. Cu pollution was found in the marina zone andthe mouth of the Cabaillo wadi during both the wet and dry seasons. Minimal pollutionwas found for Cr, Co, and Ba. The pollution-load index in the lagoon indicated that, duringthe wet season, the northwest sandbar border zone was very strongly polluted, and that theMarina zone, the mouth of the Cabaillo wadi, and the southwest eutrophication zone werestrongly polluted; during dry season, these areas were found to be between moderatelypolluted and unpolluted. The biodiversity conservation of Marchica Lagoon requires an
Diversity 2021, 13, 51 18 of 21
integrated environmental management plan that addresses watershed activities, especiallythe restoration of the abandoned iron mining site, as well as a continuous monitoringnetwork with control and assessments, including all areas that were identified as polluted.
Author Contributions: Conceptualization: B.O., M.L. and N.E.O.; data curation, B.O. and H.B.;formal analysis, R.B. and H.B.; investigation, B.O., M.E.B., M.L., H.O. and N.E.O.; methodology, B.O.,M.L. and N.E.O.; resources, M.E.B., M.T., S.B., H.O., M.B. and M.M.; software, H.B.; supervision, N.M.and M.S.; writing—original draft, B.O.; writing—review and editing, M.E.B., M.T., M.L., S.B., H.O.,M.B., N.E.O., M.M., H.B., N.M. and M.S. All authors have read and agreed to the published versionof the manuscript.
Funding: This research received no external funding.
Institutional Review Board Statement: Not applicable.
Informed Consent Statement: Not applicable.
Data Availability Statement: Data available on request.
Acknowledgments: The author thanks all partners of the Lag-Nad 2016 project that supported thisstudy. We are grateful to the editors and reviewers who contributed to the improvement of thequality of this manuscript.
Conflicts of Interest: The authors declare no conflict of interest.
References1. Pérez-Ruzafa, A.; Pérez-Ruzafa, I.M.; Newton, A.; Marcos, C. Coastal lagoons: Environmental variability, ecosystem complexity,
and goods and services uniformity. In Coasts and Estuaries; Elsevier: Amsterdam, The Netherlands, 2019; pp. 253–276.2. Newton, A.; Brito, A.C.; Icely, J.D.; Derolez, V.; Clara, I.; Angus, S.; Schernewski, G.; Inácio, M.I.; Lillebø, A.; Sousa, I.A.; et al.
Assessing, quantifying and valuing the ecosystem services of coastal lagoons. J. Nat. Conserv. 2018, 44, 50–65. [CrossRef]3. Velasco, A.M.; Pérez-Ruzafa, A.; Martínez-Paz, J.M.; Marcos, C. Ecosystem services and main environmental risks in a coastal
lagoon (Mar Menor, Murcia, SE Spain): The public perception. J. Nat. Conserv. 2018, 43, 180–189. [CrossRef]4. De Groot, R.; Brander, L.; Van Der Ploeg, S.; Costanza, R.; Bernard, F.; Braat, L.; Christie, M.; Crossman, N.; Ghermandi, A.;
Hein, L.; et al. Global estimates of the value of ecosystems and their services in monetary units. Ecosyst. Serv. 2012,1, 50–61. [CrossRef]
5. Kennish, M.J.; Paerl, H.W. Coastal Lagoons: Critical Habitats of Environmental Change; CRC Press: Boca Raton, FL, USA, 2010;pp. 1–15.
6. Levin, L.A.; Boesch, D.F.; Covich, A.; Dahm, C.; Erséus, C.; Ewel, K.C.; Kneib, R.T.; Moldenke, A.; Palmer, M.A.;Weslawski, J.M.; et al. The function of marine critical transition zones and the importance of sediment biodiversity. Ecosystems2001, 4, 430–451. [CrossRef]
7. Eisenreich, S.J.; Bernasconi, C.; Campostrini, P. Climate Change and the European Water Dimension; EU Report No. 21553; JointResearch Centre, European Commission: Ispra, Italy, 2005.
8. Halpern, B.S.; Walbridge, S.; Selkoe, K.A.; Kappel, C.V.; Micheli, F.; D’Agrosa, C.; Watson, R. A global map of human impact onmarine ecosystems. Science 2008, 319, 948–952. [CrossRef]
9. Halpern, B.S.; Selkoe, K.A.; Micheli, F.; Kappel, C.V. Evaluating and ranking the vulnerability of global marine ecosystems toanthropogenic threats. Conserv. Biol. 2007, 21, 1301–1315. [CrossRef]
10. Millennium Ecosystem Assessment. Ecosystems and Human Well-Being; Island press: Washington, DC, USA, 2005; Volume 5,p. 563.
11. Zhang, H.; Walker, T.R.; Davis, E.; Ma, G. Ecological risk assessment of metals in small craft harbour sediments in Nova Scotia,Canada. Mar. Pollut. Bull. 2019, 146, 466–475. [CrossRef]
12. Newton, A.; Icely, J.; Cristina, S.; Brito, A.; Cardoso, A.C.; Colijn, F.; Riva, S.D.; Gertz, F.; Hansen, J.; Holmer, M.; et al. An overviewof ecological status, vulnerability and future perspectives of European large shallow, semi-enclosed coastal systems, lagoons andtransitional waters. Estuar. Coast. Shelf Sci. 2014, 140, 95–122. [CrossRef]
13. Castillo, M.A.; Trujillo, I.S.; Alonso, E.V.; de Torres, A.G.; Pavón, J.C. Bioavailability of heavy metals in water and sediments froma typical Mediterranean Bay (Málaga Bay, Region of Andalucía, Southern Spain). Mar. Pollut. Bull. 2013, 76, 427–434. [CrossRef]
14. Affian, K.; Robin, M.; Maanan, M.; Digbehi, B.; Djagoua, E.V.; Kouamé, F. Heavy metal and polycyclic aromatic hydrocarbons inEbrié lagoon sediments, Côte d’Ivoire. Environ. Monit. Assess. 2009, 159, 531–541. [CrossRef]
15. Pérez-Ruzafa, A.; Fernández, A.I.; Marcos, C.; Gilabert, J.; Quispe, J.I.; García-Charton, J.A. Spatial and temporal variations ofhydrological conditions, nutrients and chlorophyll a in a Mediterranean coastal lagoon (Mar Menor, Spain). Hydrobiologia 2005,550, 11–27. [CrossRef]
16. Boutahar, L.; Maanan, M.; Bououarour, O.; Richir, J.; Pouzet, P.; Gobert, S.; Bazairi, H. Biomonitoring environmental status insemi-enclosed coastal ecosystems using Zostera noltei meadows. Ecol. Indic. 2019, 104, 776–793. [CrossRef]

Diversity 2021, 13, 51 19 of 21
17. Wei, X.; Han, L.; Gao, B.; Zhou, H.; Lu, J.; Wan, X. Distribution, bioavailability, and potential risk assessment of the metals intributary sediments of Three Gorges Reservoir: The impact of water impoundment. Ecol. Indic. 2016, 61, 667–675. [CrossRef]
18. Duan, K.; Li, K.; Liang, S.; Li, Y.; Su, Y.; Wang, X. Optimizing a coastal monitoring network using a water-quality response grid(WRG)-based sampling design for improved reliability and efficiency. Mar. Pollut. Bull. 2019, 145, 480–489. [CrossRef]
19. De Lacerda, L.D. Biogeochemistry of heavy metals in coastal lagoons; Elsevier Oceanography Series; Elsevier: Amsterdam, TheNetherlands, 1994; Volume 60, pp. 221–241.
20. Farmer, J.G. The perturbation of historical pollution records in aquatic sediments. Environ. Geochem. Health 1991, 13, 76–83. [CrossRef]21. Selfati, M.; El Ouamari, N.; Franco, A.; Lenfant, P.; Lecaillon, G.; Mesfioui, A.; Bazairi, H. Fish assemblages of the Marchica lagoon
(Mediterranean, Morocco): Spatial patterns and environmental drivers. Reg. Stud. Mar. Sci. 2019, 32, 100896. [CrossRef]22. Najih, M.; Berday, N.; Lamrini, A.; Nachite, D.; Zahri, Y. Situation de la pêche aux petits métiers après l’ouverture du nouveau
chenal dans la lagune de Nador. Rev. Maroc. Sci. Agron. Vét. 2015, 3, 19–30.23. Dakki, M. Diagnostic pour l’aménagement des zones humides du nord-est du Maroc: Sebkha Bou Areg (lagune de Nador); final report,
UNEP/Secr. Etat Env./Départ. Eaux & Forêt, Maroc; MedWetCoast project Morocco: Arles, France, 2003; p. 55.24. Malouli, I.M.; Zahri, Y.; Houssa, R.; Abdelaoui, B.; El Ouamari, N. Pêche artisanale dans la lagune de Nador: Exploitation et
aspects socio-économiques. Available online: http://webco.faocopemed.org/old_copemed/vldocs/0000762/case_std_nador.pdf(accessed on 28 November 2020).
25. UNEP; EEA. Priority Issues in the Mediterranean Environment; Report No 4; United Nations Environment Program; EuropeanEnvironment Agency: Nairobi, Kenya; Copenhagen, Denmark, 2006.
26. SEEE; I.N.R.H. Eutrophication Study of Nador Lagoon; UNEP Report; (MEDPOL program): Nairobi, Kenya, 2009; p. 71.27. Agency for the Development of the Marchica Lagoon. 2010. Available online: http://www.agencemarchica.gov.ma/ (accessed
on 28 November 2020).28. Long, E.R.; MacDonald, D.D.; Severn, C.G.; Hong, C.B. Classifying probabilities of acute toxicity in marine sediments with
empirically derived sediment quality guidelines. Environ. Toxicol. Chem. Int. J. 2000, 19, 2598–2601. [CrossRef]29. Sutherland, R.A. Bed sediment-associated trace metals in an urban stream, Oahu, Hawaii. Environ. Geol. 2000, 39, 611–627. [CrossRef]30. Macdonald, D.D.; Carr, R.S.; Calder, F.D.; Long, E.R.; Ingersoll, C.G. Development and evaluation of sediment quality guidelines
for Florida coastal waters. Ecotoxicology 1996, 5, 253–278. [CrossRef]31. Long, E.R.; MacDonald, D.D.; Smith, S.L.; Calder, F.D. Incidence of adverse biological effects within ranges of chemical
concentrations in marine and estuarine sediments. Environ. Manag. 1995, 19, 81–97. [CrossRef]32. Hakanson, L. An ecological risk index for aquatic pollution control. A sedimentological approach. Water Res. 1980,
14, 975–1001. [CrossRef]33. Tomlinson, D.L.; Wilson, J.G.; Harris, C.R.; Jeffrey, D.W. Problems in the assessment of heavy-metal levels in estuaries and the
formation of a pollution index. Helgol. Meeresunters. 1980, 33, 566–575. [CrossRef]34. Müller, G. Heavy metals in the sediment of the Rhine-Changes Seity. Umsch. Wiss. Tech. 1979, 79, 778–783.35. Hamoumi, N.; Hourimeche, A.; Chafik, M.; Hazim, M.E.; Terhzaz, L.; Kharbaoui, R.; Louaya, A. Contrôle et évolution des Milieux
Sédimentaires de la Lagune de Nador (Littoral Méditerranéen Oriental, Maroc). In Proceedings of the Second Coastal and MaritimeMediterranean Conference, Tangier, Morocco, 22–24 November 2011; pp. 177–180. Available online: http://www.paralia.fr(accessed on 28 November 2020).
36. Karim, B.M. Etude Géochimique de la Lagune de Nador (Maroc Oriental): Impacts des Facteurs Anthropiques. Ph.D. Thesis,Université Mohamed V-Agdal, Rabat, Morocco, 2005.
37. Raji, O.; Dezileau, L.; Tessier, B.; Niazi, S.; Snoussi, M.; Von Grafenstein, U.; Poujol, A. Climate and tectonic-drivensedimentary infill of a lagoon as revealed by high resolution seismic and core data (the Nador lagoon, NE Morocco). Mar.Geol. 2018, 398, 99–111. [CrossRef]
38. Karim, H.; Ahmed, D.M.; Mohammed, I.; Benyounes, D.A. Circulation marine de la lagune de Nador (Maroc) par modélisationhydrodynamique. Eur. Sci. J. 2015, 11, 418–428.
39. Guelorget, O.; Perthuisot, J.P.; Frisoni, G.F.; Monti, D. The role of confinement in the biogeological organization of Nador Lagoon(Morocco). Oceanol. Acta 1987, 10, 435–444.
40. Bloundi, M.K.; Duplay, J.; Quaranta, G. Heavy metal contamination of coastal lagoon sediments by anthropogenic activities: Thecase of Nador (East Morocco). Environ. Geol. 2009, 56, 833–843. [CrossRef]
41. National Institute of Fisheries Research. Morocco. Available online: https://www.inrh.ma (accessed on 28 November 2020).42. Gee, G.W.; Or, D. 2.4 Particle-size analysis. Methods Soil Anal. Part 4 Phys. Methods 2002, 5, 255–293.43. Blott, S.J.; Pye, K. GRADISTAT: A grain size distribution and statistics package for the analysis of unconsolidated sediments.
Earth Surf. Process. Landf. 2001, 26, 1237–1248. [CrossRef]44. Andrews, J.E.; Samways, G.; Shimmield, G.B. Historical storage budgets of organic carbon, nutrient and contaminant elements in
saltmarsh sediments: Biogeochemical context for managed realignment, Humber Estuary, UK. Sci. Total Environ. 2008, 405, 1–13.[CrossRef] [PubMed]
45. Littoral - Environnement - Télédétection – Géomatique, (LETG), UMR 6554, University of Nantes. Available online: https://letg.cnrs.fr(accessed on 28 November 2020).
46. National Center for Energy, Sciences and Nuclear Techniques. Morocco. Available online: https://www.cnesten.org.ma(accessed on 28 November 2020).
Diversity 2021, 13, 51 20 of 21
47. National Laboratory of Studies and Monitoring of Pollution. Morocco. Available online: https://labo.environnement.gov.ma(accessed on 28 November 2020).
48. Jackson, J.E. A User’s Guide to Principal Components; John Wiley & Sons: Hoboken, NJ, USA, 2005; Volume 587.49. Clarke, K.R.; Gorley, R. PRIMER v6: User Manual/Tutorial. PRIMER-E: Plymouth; Plymouth Marine Laboratory: Plymouth, UK.50. Niencheski, L.F.; Windom, H.L.; Smith, R. Distribution of particulate trace metal in Patos Lagoon Estuary (Brazil). Mar. Pollut.
Bull. 1994, 28, 96–102. [CrossRef]51. Schropp, S.J.; Lewis, F.G.; Windom, H.L.; Ryan, J.D.; Calder, F.D.; Burney, L.C. Interpretation of metal concentrations in estuarine
sediments of Florida using aluminum as a reference element. Estuaries 1990, 13, 227–235. [CrossRef]52. Bruland, K.W.; Bertine, K.; Koide, M.; Goldberg, E.D. History of metal pollution in southern California coastal zone. Environ. Sci.
Technol. 1974, 8, 425–432. [CrossRef]53. Okay, O.S.; Ozmen, M.; Güngördü, A.; Yılmaz, A.; Yakan, S.D.; Karacık, B.; Schramm, K.W. Heavy metal pollution in sediments
and mussels: Assessment by using pollution indices and metallothionein levels. Environ. Monit. Assess. 2016, 188, 352. [CrossRef]54. Maanan, M.; Landesman, C.; Maanan, M.; Zourarah, B.; Fattal, P.; Sahabi, M. Evaluation of the anthropogenic influx of metal and
metalloid contaminants into the Moulay Bousselham lagoon, Morocco, using chemometric methods coupled to geographicalinformation systems. Environ. Sci. Pollut. Res. 2013, 20, 4729–4741. [CrossRef]
55. Blomqvist, S.; Larsson, U.; Borg, H. Heavy metal decrease in the sediments of a Baltic Bay following tertiary sewage treatment.Mar. Pollut. Bull. 1992, 24, 258–266. [CrossRef]
56. White, K.D.; Tittlebaum, M.E. Metal distribution and contamination in sediments. J. Environ. Eng. 1985, 111, 161–175. [CrossRef]57. Maanan, M.; Saddik, M.; Maanan, M.; Chaibi, M.; Assobhei, O.; Zourarah, B. Environmental and ecological risk assessment of
heavy metals in sediments of Nador lagoon, Morocco. Ecol. Indic. 2015, 48, 616–626. [CrossRef]58. Rudnick, R.L.; Gao, S.; Holland, H.D.; Turekian, K.K. Composition of the continental crust. Crust 2003, 3, 1–64.59. Long, E.R.; Field, L.J.; MacDonald, D.D. Predicting toxicity in marine sediments with numerical sediment quality guidelines.
Environ. Toxicol. Chem. Int. J. 1998, 17, 714–727. [CrossRef]60. Long, E.R.; MacDonald, D.D. Recommended uses of empirically derived, sediment quality guidelines for marine and estuarine
ecosystems. Hum. Ecol. Risk Assess. 1998, 4, 1019–1039. [CrossRef]61. Muller, G. The heavy metal pollution of the sediments of Neckars and its tributary: A stocktaking. Chem. Zeit 1981, 105, 157–164.62. Aknaf, A.; Akodad, M.; Hmeid, H.A.; Layachi, M.; Mesfioui, A.; Andich, K.; Baghour, M. Granulometric Analysis and Environt-
ment of Deposits of Surface Sediments of the Marchica Lagoon (North-East of Morocco). In Euro-Mediterranean Conference forEnvironmental Integration; Springer: Cham, Switzerland, 2017; pp. 1677–1678.
63. Lefebvre, A.; Guelorget, O.; Perthuisot, J.P.; Dafir, J.E. Évolution biologique de la lagune de Nador (Maroc) au cours de la période1982–1993. Ocean. Acta 1997, 20, 371–385.
64. Mohamed, N.; Driss, N.; Nadia, B.; Roberto, P.; Abdeljaouad, L.; Nor-Dine, R. Charactérization of the new status of Nador lagoon(Morocco) after the implementation of the management plan. J. Mar. Sci. Eng. 2017, 5, 7. [CrossRef]
65. El Barjy, M.; Maanan, M.; Maanan, M.; Salhi, F.; Tnoumi, A.; Zourarah, B. Contamination and environmental riskassessment of heavy metals in marine sediments from Tahaddart estuary (NW of Morocco). Hum. Ecol. Risk Assess. Int. J.2020, 26, 87–102. [CrossRef]
66. Watts, M.J.; Mitra, S.; Marriott, A.L.; Sarkar, S.K. Source, distribution and ecotoxicological assessment of multielements in superficialsediments of a tropical turbid estuarine environment: A multivariate approach. Mar. Pollut. Bull. 2017, 115, 130–140. [CrossRef]
67. Hu, B.; Cui, R.; Li, J.; Wei, H.; Zhao, J.; Bai, F.; Ding, X. Occurrence and distribution of heavy metals in surface sediments of theChanghua River Estuary and adjacent shelf (Hainan Island). Mar. Pollut. Bull. 2013, 76, 400–405. [CrossRef]
68. Whitney, P.R. Relationship of manganese-iron oxides and associated heavy metals to grain size in stream sediments. J. Geochem.Explor. 1975, 4, 251–263. [CrossRef]
69. Horowitz, A.J.; Elrick, K.A. The relation of stream sediment surface area, grain size and composition to trace element chemistry.Appl. Geochem. 1987, 2, 437–451. [CrossRef]
70. Barik, S.S.; Prusty, P.; Singh, R.K.; Tripathy, S.; Farooq, S.H.; Sharma, K. Seasonal and spatial variations in elementaldistributions in surface sediments of Chilika Lake in response to change in salinity and grain size distribution. Environ.Earth Sci. 2020, 79, 1–18. [CrossRef]
71. Jain, C.K.; Malik, D.S.; Yadav, R. Metal fractionation study on bed sediments of Lake Nainital, Uttaranchal, India. Environ. Monit.Assess. 2007, 130, 129–139. [CrossRef] [PubMed]
72. Maicu, F.; Abdellaoui, B.; Bajo, M.; Hilmi, K.; Umgiesser, G. The use of the SHYFEM numerical model to assess the improvement inthe hydrodynamics and in the water renewal of the Nador Lagoon (Morocco) after the construction of a new inlet. In Proceedingsof the 20th EGU 2018 General Assembly Conference, Vienna, Austria, 4–13 April 2018; p. 12657.
73. Cadmus, P.; Brinkman, S.F.; May, M.K. Chronic toxicity of ferric iron for North American aquatic organisms: Derivation ofa chronic water quality criterion using single species and mesocosm data. Arch. Environ. Contam. Toxicol. 2018, 74, 605–615.[CrossRef] [PubMed]
74. Wittmann, G. Toxic metals. In Metal Pollution in The Aquatic Environment; Springer: Berlin/Heidelberg, Germany, 1981; pp. 3–70.75. Azzeddine, K.; El Hassan, T. Assessment of Metallic Contamination of Water Resources in the Area Around the Abandoned
Mining Site of Ouixane (North East Morocco). In Proceedings of the 4th Edition of International Conference on Geo-IT and WaterResources 2020, Geo-IT and Water Resources 2020, Al-Hoceima, Morocco, 11–12 March 2020; pp. 1–6.
Diversity 2021, 13, 51 21 of 21
76. Lakrim, M.; Mesrar, L.; El Aroussi, O.; Lahrach, A.; Beaabidate, L.; Garouani, A.; Chaouni, A.; Tabyaoui, H.; Jabrane, R. ImpactStudy of Mining Waste of the Nador Mine on the Environment (North-Eastern of Morocco). Rev. Ljee 2014.
77. Alloway, B.J. Sources of heavy metals and metalloids in soils. In Heavy Metals in Soils; Springer: Dordrecht, The Netherlands,2013; pp. 11–50.
78. Nriagu, J.O.; Pacyna, J.M. Quantitative assessment of worldwide contamination of air, water and soils by trace metals. Nature1988, 333, 134–139. [CrossRef]
79. González, I.; Águila, E.; Galán, E. Partitioning, bioavailability and origin of heavy metals from the Nador Lagoon sediments(Morocco) as a basis for their management. Environ. Geol. 2007, 52, 1581–1593. [CrossRef]
80. Ruiz, F.; Abad, M.; Olías, M.; Galán, E.; González, I.; Aguilá, E.; Cantano, M. The present environmental scenario of the NadorLagoon (Morocco). Environ. Res. 2006, 102, 215–229. [CrossRef]
81. Inani, I. Dynamique sédimentaire et pollution dans la lagune de Nador. Ph.D. Thesis, Université Mohammed V-Agdal, Rabat,Morocco, 1995.
82. Oujidi, B.; Tahri, M.; Layachi, M.; Abid, A.; Bouchnan, R.; Selfati, M.; Snoussi, M. Effects of the watershed on the seasonalvariation of the surface water quality of a post-restoration coastal wetland: The case of the Nador lagoon (Mediterranean sea,Morocco). Reg. Stud. Mar. Sci. 2020, 35, 101127. [CrossRef]
83. Barhoumi, B.; Elbarhoumi, A.; Clérandeau, C.; Al-Rawabdeh, A.M.; Atyaoui, A.; Touil, S.; Cachot, J. Using an integrated approach toassess the sediment quality of an Mediterranean lagoon, the Bizerte lagoon (Tunisia). Ecotoxicology 2016, 25, 1082–1104. [CrossRef]
84. Arienzo, M.; Masuccio, A.A.; Ferrara, L. Evaluation of sediment contamination by heavy metals, organochlorinated pesticides,and polycyclic aromatic hydrocarbons in the Berre coastal lagoon (southeast France). Arch. Environ. Contam. Toxicol. 2013,65, 396–406. [CrossRef]
85. Tan, I.; Aslan, E. Metal pollution status and ecological risk assessment in marine sediments of the inner Izmit Bay. Reg. Stud. Mar.Sci. 2020, 33, 100850. [CrossRef]
86. Katsaros, D.; Panagiotaras, D.; Kontopoulos, N.; Avramidis, P. Sediments characteristics and heavy metals distribution of a veryshallow protected coastal lagoon, Prokopos Lagoon, Mediterranean Sea Western Greece. Feb-Fresenius Environ Bull. 2017, 26, 6093.
87. Atzori, G.; Aru, V.; Marincola, F.C.; Chiarantini, L.; Medas, D.; Sarais, G.; Cabiddu, S. Sediments distribution of trace metals ina coastal lagoon (Southern Sardinia, Mediterranean Sea): Assessment of contamination and ecological risk. Chem. Ecol. 2018,34, 727–746. [CrossRef]
88. Melegy, A.A.; El-Bady, M.S.; Metwally, H.I. Monitoring of the changes in potential environmental risk of some heavy metals inwater and sediments of Burullus Lake, Egypt. Bull. Natl. Res. Cent. 2019, 43, 1–13. [CrossRef]
89. Kanellopoulos, T.D.; Eleftheriadi, E.; Karageorgis, A.P.; Kambouri, G.; Papageorgiou, A.; Stavrakaki, I. Sediment grain size andelemental geochemistry in the coastal area of SW Messinia and the Gialova Lagoon. In COASTAL H2020 Programme 2020, The SWMessinia Case Study: Environmental Assessment of the Freshwater and Marine Systems; Karageorgis, A.P., Kanellopoulos, T.D., Eds.;Final Scientific Report; Hellenic Centre for Marine Research: Anavyssos, Greece; pp. 48–54.