Screening of catalysts and effect of temperature for kinetic degradation studies of aromatic...
10
Screening of catalysts and effect of temperature for kinetic degradation studies of aromatic compounds during wet oxidation Rodrigo J.G. Lopes, Adria ´n M.T. Silva, Rosa M. Quinta-Ferreira * Department of Chemical Engineering, University of Coimbra, Po ´lo II-Rua Sı ´lvio Lima, 3030-790 Coimbra, Portugal Received 14 August 2006; received in revised form 23 November 2006; accepted 28 November 2006 Available online 29 December 2006 Abstract Catalytic wet air oxidation (CWO) of six model phenolic acids: syringic, vanillic, 3,4,5-trimethoxybenzoic, veratric, protocatechuic and trans- cinnamic acid present in wastewaters from olive oil mills was studied at different temperatures. Experiments completed in the presence of four commercially available catalysts, CuO-MnO x /Al 2 O 3 , CuO-ZnO/Al 2 O 3 , Fe 2 O 3 -MnO x and CuO-MnO x were compared with the ones related to various catalysts prepared in our laboratory (Ag-Ce-O, Mn-Ce-O, Mn-O, Ce-O). These catalysts showed a higher effective reduction of the total organic carbon (TOC) especially when the experiments were carried out with manganese oxide supported on ceria, an alternative and powerful catalyst to treat highly contaminated wastewaters containing phenolic compounds. Along the oxidation, acetic acid and phenol were detected and quantified by HPLC as the main intermediate species. Leaching, carbon adsorption as well as texture and morphology by SEM were analyzed and formation of whiskers at the catalyst surface was observed. Moreover, the kinetic parameters were obtained and co-oxidation of the phenolic compounds in the mixture was identified in our studies. # 2006 Elsevier B.V. All rights reserved. Keywords: Wastewater reaction engineering; Catalytic wet oxidation; Phenolic acids; Catalyst characterization; Kinetics 1. Introduction Olive oil mill wastewaters (OOMW) are characterized by a high chemical oxygen demand (COD) imposing serious problems at the time of proper management and disposal. COD of this type of effluents ranges between 25 and 300 g O 2 L 1 in the worst of the cases. The olive oil extraction industries in the Mediterranean countries generate each year an increasing volume of wastewaters with a great pollutant influence. It is mainly due to the high organic fraction including sugars, tannins, acids, pectins, lipids, and especially phenols and polyphenols which are not amenable to conventional biological oxidation [1,2]. It is estimated that the production passes beyond 30 million m 3 /year [3]. Among the different methods traditionally used to dispose OOMW, the following have been mainly applied—(a) evaporation ponds: they are meant to remove water with the aid of solar energy avoiding anaerobic fermentation (low deep ponds); however, evaporation ponds are useful only for small factories and alternative solutions should be investigated; (b) disposal in soil: wastewater from olive mills has been used as a fertilizer and in the irrigation of some kind of crops; (c) incineration: given the high organic load of OOMW, incineration may constitute an appealing method to treat these residues though inherent disadvantages of incinerators (fuel costs, gas emissions, etc.) have to be balanced; (d) other uses: effluents of olive mills have been utilized as a source of fermentation products, such as fat and oils preservatives. In recent times, most of the studies about OOMW treatments are focused on aerobic [2,4] or anaerobic digestion [5,6]. However, many problems concerning the high toxicity and the biodegradability of the effluents have been encountered during these anaerobic treatments [2,7], and the experimental results are not satisfactory: they must be conducted on a highly dilute substrate once the aromatic and phenolic compounds are toxic for methanogenic bacteria [8,9]. Wet oxidation (WO) is a promising alternative that has been investigated in order to decrease the amount of phenolic compounds contained in the OOMW [10]. Although the www.elsevier.com/locate/apcatb Applied Catalysis B: Environmental 73 (2007) 193–202 * Corresponding author. Tel.: +351 239798723; fax: +351 239798703. E-mail addresses: [email protected] (R.J.G. Lopes), [email protected] (R.M. Quinta-Ferreira). 0926-3373/$ – see front matter # 2006 Elsevier B.V. All rights reserved. doi:10.1016/j.apcatb.2006.11.013
-
Upload
independent -
Category
Documents
-
view
0 -
download
0
Transcript of Screening of catalysts and effect of temperature for kinetic degradation studies of aromatic...

www.elsevier.com/locate/apcatb
Applied Catalysis B: Environmental 73 (2007) 193–202
Screening of catalysts and effect of temperature for kinetic degradation
studies of aromatic compounds during wet oxidation
Rodrigo J.G. Lopes, Adrian M.T. Silva, Rosa M. Quinta-Ferreira *
Department of Chemical Engineering, University of Coimbra, Polo II-Rua Sılvio Lima, 3030-790 Coimbra, Portugal
Received 14 August 2006; received in revised form 23 November 2006; accepted 28 November 2006
Available online 29 December 2006
Abstract
Catalytic wet air oxidation (CWO) of six model phenolic acids: syringic, vanillic, 3,4,5-trimethoxybenzoic, veratric, protocatechuic and trans-
cinnamic acid present in wastewaters from olive oil mills was studied at different temperatures. Experiments completed in the presence of four
commercially available catalysts, CuO-MnOx/Al2O3, CuO-ZnO/Al2O3, Fe2O3-MnOx and CuO-MnOx were compared with the ones related to
various catalysts prepared in our laboratory (Ag-Ce-O, Mn-Ce-O, Mn-O, Ce-O). These catalysts showed a higher effective reduction of the total
organic carbon (TOC) especially when the experiments were carried out with manganese oxide supported on ceria, an alternative and powerful
catalyst to treat highly contaminated wastewaters containing phenolic compounds. Along the oxidation, acetic acid and phenol were detected and
quantified by HPLC as the main intermediate species. Leaching, carbon adsorption as well as texture and morphology by SEM were analyzed and
formation of whiskers at the catalyst surface was observed. Moreover, the kinetic parameters were obtained and co-oxidation of the phenolic
compounds in the mixture was identified in our studies.
# 2006 Elsevier B.V. All rights reserved.
Keywords: Wastewater reaction engineering; Catalytic wet oxidation; Phenolic acids; Catalyst characterization; Kinetics
1. Introduction
Olive oil mill wastewaters (OOMW) are characterized by a
high chemical oxygen demand (COD) imposing serious
problems at the time of proper management and disposal.
COD of this type of effluents ranges between 25 and
300 g O2 L�1 in the worst of the cases. The olive oil extraction
industries in the Mediterranean countries generate each year an
increasing volume of wastewaters with a great pollutant
influence. It is mainly due to the high organic fraction including
sugars, tannins, acids, pectins, lipids, and especially phenols
and polyphenols which are not amenable to conventional
biological oxidation [1,2]. It is estimated that the production
passes beyond 30 million m3/year [3].
Among the different methods traditionally used to dispose
OOMW, the following have been mainly applied—(a)
evaporation ponds: they are meant to remove water with the
* Corresponding author. Tel.: +351 239798723; fax: +351 239798703.
E-mail addresses: [email protected] (R.J.G. Lopes), [email protected]
(R.M. Quinta-Ferreira).
0926-3373/$ – see front matter # 2006 Elsevier B.V. All rights reserved.
doi:10.1016/j.apcatb.2006.11.013
aid of solar energy avoiding anaerobic fermentation (low deep
ponds); however, evaporation ponds are useful only for small
factories and alternative solutions should be investigated; (b)
disposal in soil: wastewater from olive mills has been used as a
fertilizer and in the irrigation of some kind of crops; (c)
incineration: given the high organic load of OOMW,
incineration may constitute an appealing method to treat these
residues though inherent disadvantages of incinerators (fuel
costs, gas emissions, etc.) have to be balanced; (d) other uses:
effluents of olive mills have been utilized as a source of
fermentation products, such as fat and oils preservatives.
In recent times, most of the studies about OOMW treatments
are focused on aerobic [2,4] or anaerobic digestion [5,6].
However, many problems concerning the high toxicity and the
biodegradability of the effluents have been encountered during
these anaerobic treatments [2,7], and the experimental results
are not satisfactory: they must be conducted on a highly dilute
substrate once the aromatic and phenolic compounds are toxic
for methanogenic bacteria [8,9].
Wet oxidation (WO) is a promising alternative that has been
investigated in order to decrease the amount of phenolic
compounds contained in the OOMW [10]. Although the

R.J.G. Lopes et al. / Applied Catalysis B: Environmental 73 (2007) 193–202194
uncatalyzed oxidation study provides us with a useful insight
into the partial oxidation of each acid, a more promising
process for industrial application is the use of a catalyst to
promote the oxidation at shorter reaction times and milder
operating conditions [11,12]. In fact, different excellent reviews
regarding WO and CWO processes have been published
[12–18].
Homogeneous catalysts, particularly copper salts, are in
general more effective than heterogeneous oxidation catalysts
[18–21] but their use needs a separation step such as
precipitation or membrane separation to remove the toxic
catalyst ions from the final effluent. In this context,
heterogeneous catalysts have been mostly investigated. For
instance, the catalytic oxidation of phenol and substituted
phenols over mixed copper, zinc and cobalt oxide catalysts was
studied [22] and these catalysts were effective for the
destruction of phenol and substituted phenols. Recently [18],
the catalytic effect of noble metals on wet oxidation of phenols
and other model pollutant compounds was systematized and it
was found that Ru, Pt and Rh were also more active than a
homogeneous copper catalyst. In particular, high performance
has been attributed to activated carbon when used as catalyst
support and impregnated with different noble metals (Pd, Pt,
Ru, Rh, Ir, Au) or even with more economical species, such as
metal oxides (Cu, Fe, Mo, Ce), during decontamination of
synthetic and actual wastewaters [23–25]. In fact, noble metals
have shown to be effective for degradation of phenolics
compounds contained in OOMW such as p-coumaric acid [12].
Nevertheless, the high cost of this kind of materials makes
important to investigate more economical catalyst.
Cu, Zn and Mn have shown good catalytic properties when
applied in the CWO technology [14] and in particular, Mn-Ce-
O has been active for degradation of different species
appertaining to different chemical groups: phenols, aldehydes,
carboxylic acids and alcohols [15,26–29].
Therefore, the main objective of this work addresses the
search for an active, stable and economical catalyst for the
treatment of OOMW, as well as the characterization of the
reaction system through kinetic analysis, using various
catalysts prepared in the laboratory or obtained commercially.
The efficiency of the non-catalytic and catalytic wet air
oxidation of OOMW was studied for the selected acids, major
pollutants in OOMW [30], namely syringic (4-hydroxy-3,5-
dimethoxybenzoic), vanillic (4-hydroxy-3-methoxybenzoic),
3,4,5-trimethoxybenzoic, veratric (3,4-dimethoxybenzoic),
protocatechuic (3,4-dihydroxybenzoic) and trans-cinnamic.
The kinetic expressions in terms of TOC (total organic carbon)
were established aiming the successful design and operation of
continuous CWO multiphasic chemical reactors in wastewaters
treatment plants.
2. Experimental
2.1. Material and catalysts
Syringic, vanillic, 3,4,5-trimethoxybenzoic, veratric, proto-
catechuic and trans-cinnamic acids were obtained from Sigma–
Aldrich. Commercial catalysts were supplied by the Sud-
Chemie Group, Munich: CuO-ZnO/Al2O3 (G66A: CuO-41%;
ZnO-47%), Fe2O3-MnOx (N-150: Fe2O3-60%; MnOx-30%),
CuO-MnOx/Al2O3 (SG2216: CuO > 25%; MnOx > 25%) and
CuO-MnOx (N-140: CuO-22%; MnOx-50%). Mn-Ce-O and
Ag-Ce-O were prepared by co-precipitation, by mixing
aqueous solutions of the respective metal salts using the
corresponding metal nitrates as precursors (Riedel-de-Haen
and Labsolve). For Ag-Ce-O, NaOH 3 M was added until pH
was equal to 10; the precipitate formed was then filtrated,
washed three times with ultra pure water and dried over night at
100 8C, followed by calcination at 300 8C. For Mn-Ce-O the
mixture of aqueous solutions was poured into 200 mL of a 3 M
NaOH solution, the precipitate was filtrated and washed five
times with 500 mL of ultra pure water, dried over night at
100 8C and finally calcinated at 300 8C. Two different molar
composition ratios were studied, 70 and 22% for the active
metal (Mn) and, 30 and 78% for the support (Ce), respectively.
Catalytic properties of individual oxides, Mn-O and Ce-O were
also investigated. Before the experiments all the catalysts used
in this work were crushed in a fine powder (125–250 mm
particle size) with the aim to provide maximum specific surface
area for reaction.
2.2. Oxidation reactor and procedure
The experiments were performed in a high-pressure 1 L
autoclave of 316-SS (4531M Parr model) described elsewhere
[31], equipped essentially with a two six-bladed mechanically
driven turbine agitator and a PID temperature controller (4842
Parr model). For the catalytic screening studies, the solution of
phenolic acids (1200 mg/L, 200 mg/L for each phenolic acid:
syringic, vanillic, 3,4,5-trimethoxybenzoic, veratric, protoca-
techuic and trans-cinnamic) was introduced in the system with
the powder catalyst (6 g L�1) and preheated up to the operating
temperature (160–220 8C) under different agitation velocities
from 50 to 350 rpm. For kinetic studies six solutions of each
phenolic acid with a concentration about 200 mg/L were
prepared. CWO experiments were carried out at 15 bar pure air
(99.999%) partial pressure which performs 30 bar total pressure
with solution vapour pressure and this instant was taken as the
‘‘zero’’ time for reaction. Samples were withdrawn periodically
from the reactor and special attention was given to the liquid
sampling procedure to avoid contamination of the samples and
losses of the liquid phase and/or catalyst. Liquid samples were
immediately filtered and then analyzed for total organic carbon
(TOC).
2.3. Analytical techniques
TOC was measured with a Shimadzu 5000 TOC Analyser,
which operates based on the combustion/non-dispersive
infrared gas analysis method. Total carbon (TC) was first
measured followed by the measurement of the inorganic carbon
(IC). The TOC was then determined by subtracting IC from TC.
pH was monitored along the reactions with a HANNA
instrument-HI8711E.

R.J.G. Lopes et al. / Applied Catalysis B: Environmental 73 (2007) 193–202 195
Reaction intermediates were analyzed in a Knauer HPLC
system equipped with a WellChrom K-1001 pump. The oven
from Jones Chromatography (model 7971) was set at 75 8C and
a SS-Column 300 mm � 8 mm inside diameter was used
(10 mm particle size of a sulfonated cross-linked styrene-
divinylbenzene copolymer). 100% of 0.01N H2SO4 at a flow
rate of 1 mL/min was used as the mobile phase. The injection
volume was 20 mL while detection was typically at 280 nm.
Running external standards at various concentrations the
linearity between absorbance and concentration (as described
by the Beer–Lambert law) was observed over the whole range
of concentrations under consideration, leading to the calibra-
tion curve. Blank samples were run between two consecutive
HPLC runs to ensure that no residuals from the previous run
were carried over to the next one. Both the standards and the
samples were periodically run in duplicate to test the
reproducibility of the measurements.
Elemental analysis was used to detect carbon adsorption in
catalysts with a Fisons Instruments EA 1108 CHNS-O equipped
with a pre-packed ox/red quartz reactor, operating with a flash
combustion and using a thermal conductivity detector (TCD);
standard solutions of phenanthrene, sulfanilamide, and 2,5-bis(5-
tert-butylbenzoxazol-2-yl)thiophen (BBOT) were obtained from
Fig. 1. Normalized TOC concentration reduction (%) as a function of time at 200 8Cand alumina supported catalysts, (b) different commercial and laboratorial catalysts,
Fisons Instruments. Atomic absorption in a spectrometer Perkin-
Elmer 3300, with hollow cathode lamps (Cathodeon) and
standard solutions from BSB-Spectrol, was used to measure the
leaching of manganese to the liquid phase.
The catalyst Brunauer–Emmett–Teller (BET) surface area
analysis (SBET) and respective isotherm were determined with
an accelerated surface area and porosimetry analyzer (ASAP
2000) from Micrometrics using nitrogen at a constant
temperature (�196 8C). Scanning electron microscopy
(SEM) analysis at different scales/magnifications was per-
formed in a JEOL JSM-5310 scanning microscope.
3. Results and discussion
3.1. Catalyst screening
A preliminary experiment was performed at 200 8C in the
absence of oxygen and no degradation was detected, high-
lighting the important role of oxygen in the oxidation process.
Fig. 1(a–c) represents the TOC reduction for the non-catalytic
WO and the catalytic process when using different commercial
catalyst as well as laboratorial cerium-based catalysts with
molar ratios of 70/30 and 22/78 for Mn-Ce-O and 70/30 for
, 15 bar air and 3 g/L catalyst concentration for (a) non-catalytic wet oxidation
(c) cerium-based laboratorial catalysts and respective oxides: Mn-O and Ce-O.
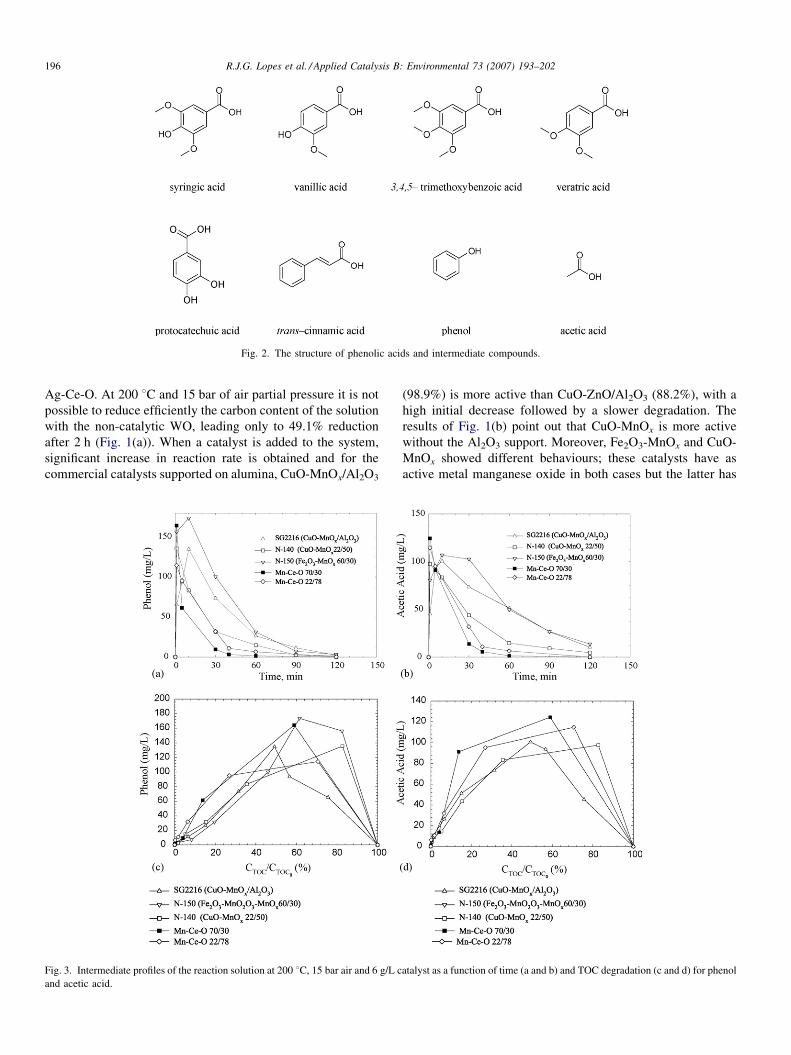
Fig. 2. The structure of phenolic acids and intermediate compounds.
R.J.G. Lopes et al. / Applied Catalysis B: Environmental 73 (2007) 193–202196
Ag-Ce-O. At 200 8C and 15 bar of air partial pressure it is not
possible to reduce efficiently the carbon content of the solution
with the non-catalytic WO, leading only to 49.1% reduction
after 2 h (Fig. 1(a)). When a catalyst is added to the system,
significant increase in reaction rate is obtained and for the
commercial catalysts supported on alumina, CuO-MnOx/Al2O3
Fig. 3. Intermediate profiles of the reaction solution at 200 8C, 15 bar air and 6 g/L c
and acetic acid.
(98.9%) is more active than CuO-ZnO/Al2O3 (88.2%), with a
high initial decrease followed by a slower degradation. The
results of Fig. 1(b) point out that CuO-MnOx is more active
without the Al2O3 support. Moreover, Fe2O3-MnOx and CuO-
MnOx showed different behaviours; these catalysts have as
active metal manganese oxide in both cases but the latter has
atalyst as a function of time (a and b) and TOC degradation (c and d) for phenol

Fig. 4. pH profiles of the reaction solution at 200 8C, 15 bar air and 3 g/L
catalyst concentration for (a) non-catalytic WO and alumina supported cata-
lysts, (b) different commercial catalysts and cerium-based catalysts.
R.J.G. Lopes et al. / Applied Catalysis B: Environmental 73 (2007) 193–202 197
more significant activity along 60 min with respect to the TOC
abatement. The cerium support (Ce-O) with two different active
metals, manganese and silver, revealed strong catalytic
properties leading practically to complete TOC reduction at
60 min. Nevertheless, Mn-Ce-O 70/30 was even more active
than Ag-Ce-O 70/30 for shorter times, as for instance at 30 min,
TOC reductions of 95.9 and 92.7% were, respectively,
obtained. Therefore, while phenolic solutions are not totally
oxidized in terms of TOC without the use of catalyst, reaching
an asymptotic value, cerium-based catalysts showed significant
activities with complete TOC removal and higher conversions
than those detected for the commercial catalysts.
The activity of the Ce-O support is shown in Fig. 1(c) as well
as for Mn-O. In previous CWO works Ce-O showed catalytic
properties during the degradation of formaldehyde [27] and
acrylic acid [28], while degradation was practically not observed
when ethylene glycol was treated [29]. Regarding the aromatic
mixture used in this study, Ce-O alone present catalytic activity
and probably play an important role in the catalytic activity of the
Mn-Ce-O catalyst, due to the high ability of Ce-O as promoter of
stored oxygen. In fact, the activity of Mn-O is increased when
combined with Ce-O. Moreover, the molar ratio of Mn and Ce in
the catalyst was also evaluated for 70/30 and 22/78 contents, and
TOC reduction from 96.6 to 93.1% in 30 min was observed when
the amount of Mn was decreased The efficiency of Mn-Ce-O 70/
30 when compared to Ce-O and Mn-O has been explained in the
literature as a consequence of different factors. When the cerium
is mixed with the manganese the concentration of Ce4+ increases
in detriment of Ce3+ and the electrons of cerium seems to be
transferred to Mn, enhancing then efficient mobility of electrons
and explaining the higher activity for bimetallic Mn-Ce-O
catalysts. This efficiency is also related with the presence of more
non-lattice oxygen (OII) species in mixed oxides, which are more
active than the lattice oxygen (OI) [32,33].
Therefore, Mn showed to be the best metal to be combined
with Ce in terms of catalytic activity and, in particular, Mn-Ce-
O 70/30 showed higher efficiency and higher TOC reductions in
the first 30 min. When scaling-up a chemical reactor, time is a
cost variable in continuous treatment, which emphasizes the
great interest on the Mn-Ce-O catalyst for the CWO
technology.
3.2. Intermediate compounds and pH
During the course of phenolic acids oxidation over Mn-Ce-O
70/30 various species were detected: (i) aromatic compounds,
namely phenol and p-hydroxybenzoic acid; (ii) ring cleavage
products, namely acetic acid. Fig. 2 shows the molecular
formula of the compounds used in this study and the two
representative intermediates, phenol and acetic acid.
Fig. 3(a–b) shows the concentration-time profiles for phenol
and acetic acid at 200 8C, respectively, whereas in Fig. 3(c–d) it
is presented the intermediates distribution as a function of TOC
degradation where we can infer that during the first 10 min of
oxidation the initial phenolic acids suffer a rapid conversion
into intermediate compounds which are degraded slowly
afterwards. Mn-Ce-O 70/30 proved once again to be the
catalyst which gave faster oxidation. Observation of inter-
mediate compounds such as phenol and acetic acid allowed to
conclude that the mechanism was followed through two routes:
the decarboxylation reaction of aromatic end groups leading to
phenol formation (Fig. 3(a)) and an oxygen attack to the
aromatic double bond to form open ring intermediate
compounds such as acetic acid (Fig. 3(b)).
Fig. 4 shows a pH behaviour usually involving an initial slight
decrease, probably due to formation of low weight carboxylic
acids, followed by the pH growth tending to neutrality which may
correspond to the high mineralization of TOC discussed early.
This expected behaviour was observed for all catalysts showing,
however, different rates to achieve a neutral pH.
3.3. Catalyst characterization in terms of leaching and
carbon adsorption
In order to evaluate the leaching of active species to the
liquid phase that may become a second pollution source and an
important catalytic deactivation factor that has to be avoided,
the manganese metal was measured in terms of leaching for the
R.J.G. Lopes et al. / Applied Catalysis B: Environmental 73 (2007) 193–202198
experiments at 200 8C and 6 g/L of Mn-Ce-O initial
concentration. After 2 h, more Mn for Mn-Ce-O 70/30
(2.67 mg/L) than for Mn-Ce-O 22/78 (1.51 mg/L) was detected
in the liquid phase. The value related to Mn-Ce-O 70/30
corresponds to 0.05% of the initial Mn concentration (2.87 g/
L). Leaching of Mn with the phenolic mixture was higher than
those observed in other works at the same conditions for
ethylene glycol [29], acrylic acid [28] and formaldehyde [27],
respectively, 0.318, 1.697 and 0.009 mg/L.
Moreover, the carbon adsorption for the Mn-Ce-O labor-
atorial catalyst was evaluated since deactivation has been also
attributed to the formation of carbonaceous deposits on the
catalyst surface irreversibly adsorbed on active sites [23].
However, in our study low values of carbon were detected in the
recovered Mn-Ce-O catalyst: 3.15 and 2.67% C (w/w) for Mn-
Ce-O 70/30 and Mn-Ce-O 22/78, respectively, which corre-
sponds to 94.5 and 80.1 mg/L of carbon in the 6.0 g/L of
catalyst initially charged in the reactor and approximately 6.7
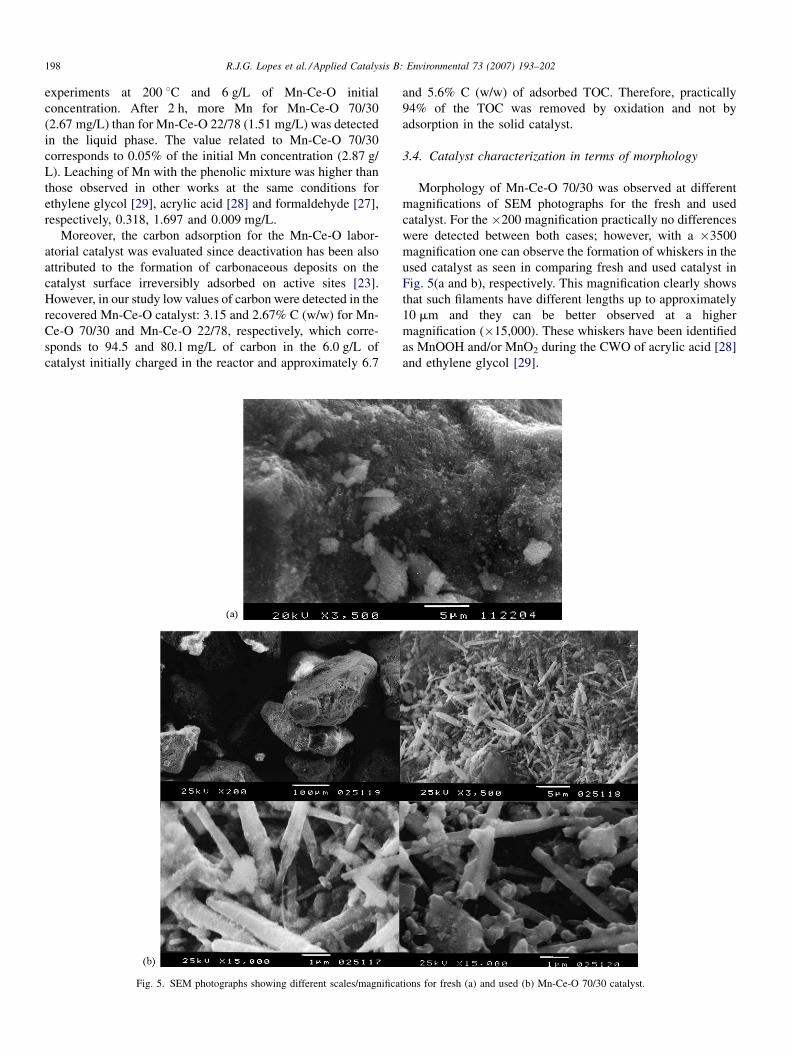
Fig. 5. SEM photographs showing different scales/magnifica
and 5.6% C (w/w) of adsorbed TOC. Therefore, practically
94% of the TOC was removed by oxidation and not by
adsorption in the solid catalyst.
3.4. Catalyst characterization in terms of morphology
Morphology of Mn-Ce-O 70/30 was observed at different
magnifications of SEM photographs for the fresh and used
catalyst. For the �200 magnification practically no differences
were detected between both cases; however, with a �3500
magnification one can observe the formation of whiskers in the
used catalyst as seen in comparing fresh and used catalyst in
Fig. 5(a and b), respectively. This magnification clearly shows
that such filaments have different lengths up to approximately
10 mm and they can be better observed at a higher
magnification (�15,000). These whiskers have been identified
as MnOOH and/or MnO2 during the CWO of acrylic acid [28]
and ethylene glycol [29].
tions for fresh (a) and used (b) Mn-Ce-O 70/30 catalyst.

Fig. 6. Brunauer–Emmett–Teller (BET) isotherm plot for the used Mn-Ce-O
70/30 catalyst in the CWO of phenolic acids.
Fig. 7. Lumped reaction pathways diagram for (a) MGKM and (b) GKM.
R.J.G. Lopes et al. / Applied Catalysis B: Environmental 73 (2007) 193–202 199
The nitrogen adsorption isotherm, presented in Fig. 6 for
used Mn-Ce-O 70/30, shows a type IV isotherm with a
hysteresis loop in the high range of relative pressure and
suggests an intermediate behaviour between hysteresis type H1
and H3 (according to IUPAC classification [30]). Therefore, for
relative pressures higher than 0.8, condensation takes place
giving a sharp adsorption volume increase, corresponding to
mesoporous (20–500 A pore diameter). The initial part of the
type IV isotherm is attributed to monolayer–multilayer
adsorption. The determined Brunauer–Emmett–Teller (BET)
surface area (SBET), 109.3 m2/g, is similar to the one obtained
for the fresh catalyst (102.5 m2/g). Moreover, the average pore
diameter was 151.4 A which is in agreement with the range of
mesoporous associated to the isotherm.
3.5. Kinetic studies of phenolic acids with the Mn-Ce-O
70/30 catalyst
In what concerns the kinetic studies of WO reactions,
lumped kinetic models have been widely used in order to
represent the experimental TOC results. The modified general-
ized kinetic model (MGKM) [31] schematized in Fig. 7(a) is a
global model that considers four types of compounds: easier
degraded reactants (A); intermediates with difficult degradation
(B); desired end products, namely carbon dioxide and water
(C); and non-oxidizable matter (D). In the oxidation process of
the phenolic solutions with Mn-Ce-O 70/30, phenol and acetic
acid were formed as intermediate compounds, being totally
degraded during the treatment and the overall TOC practically
reduced to zero. In this context non-oxidizable matter (D) was
not detected and the MGKM can be simplified to the
generalized kinetic model (GKM) [31] presented in
Fig. 7(b). This model takes into account the degradation of
A to C through a direct step (first step), and a parallel step
(second step) for the degradation of A to B, which is
consequently degraded (by the third step) in C. In this model
presented in Fig. 7(b), the reactions are considered as first order
with respect to the TOC concentration of the reactant involved
in each step j (mj = 1; j = 1–3) and, in this context, the reaction
rates of A and B are given by Eq. (1), resulting its integration
and arrangement in Eq. (2).
�rTOCA¼ � dCTOCA
dt¼ ðk01 þ k02ÞCTOCA
;
� rTOCB¼ dCTOCB
dt¼ k03CTOCB
� k02CTOCA
(1)
CTOC
CTOC0
¼ k02k01 þ k02 � k03
e�k03t þ k01 � k03k01 þ k02 � k03
e�ðk01þk02Þt (2)
where k0j is related to the apparent reaction rate constant. The
apparent pre-exponential factor of each step j (Aj) and the
activation energy ðEa jÞ are given by the linearization of the
Arrhenius equation.
This model presupposes negligible mass-transfer resistance
in the gas–liquid film, which was confirmed by the similar
results of TOC reduction that were obtained under different
agitation velocities from 50 to 350 rpm. Moreover, the solid
was used in the original form obtained from the preparation
procedure (particle size approximately up to 800 mm) and when
using diameter equivalent particles in the range of 250–
350 mm, similar TOC results were also obtained demonstrating
the chemical regime. The good reproducibility of the
experiments verified by performing different runs at the same
conditions guaranteed the elimination of the experimental
uncertainty transmission through kinetic calculations.
In Fig. 8 one can observe the different oxidation rates in
terms of TOC reduction for each one of the compounds present
in the simulated solution when submitted separately to the
CWO process. As can be inferred, these results show a crescent
difficult on the degradation of those compounds by means of
CWO over Mn-Ce-O by the following order: syringic
acid < vanillic acid < 3,4,5-trimethoxybenzoic acid < veratric
veratric acid < protocatechuic acid < trans-cinnamic acid.
However, our results concerning the CWO of the global
solution containing all the phenolic acids simultaneously over
the manganese oxide catalyst showed a complete reduction

Fig. 8. Normalized TOC concentration (%) as a function of time at different temperatures (3 g/L of Mn-Ce-O 70/30) and adjustment of the GKM: (a) syringic acid,
(b) vanillic acid, (c) 3,4,5-trimethoxybenzoic acid, (d) veratric acid, (e) protocatechuic acid, (f) trans-cinnamic acid.
R.J.G. Lopes et al. / Applied Catalysis B: Environmental 73 (2007) 193–202200
according to Fig. 1(c). Therefore, a different oxidation
behaviour is observed when an isolated pollutant is treated
and when is mixed with others. In fact, this behaviour has been
also reported in some studies on CWO [18] and can be
explained by a co-oxidation process. This phenomenon
involves the enhancement of the degradation of a given
organic compound through the free-radical intermediates
produced from the oxidation of other organic compounds.
As a consequence the observed rate of oxidation for a mixture
of phenolic acids is much higher than the isolated compounds
theoretical rate, which suggests that the oxidation reaction is
free radical in nature with the active free-radical species
produced from the mixture accelerating the reaction. This
seems to point out that some of the results obtained in

Table 1
Kinetic model parameters of the GKM for individual phenolic acids with Mn-Ce-O
Syringic acid Vanillic acid
k01 (min�1) k02 (min�1) k03 (min�1) R2 k01 (min�1) k02 (min�1) k03 (min�1) R2
160 8C 0.0451 0.0448 0.0151 0.9997 0.0451 0.0012 0.0148 0.9995
170 8C 0.0650 0.0012 0.0150 0.9998 0.0647 0.0011 0.0150 0.9984
190 8C 0.1009 0.0048 0.0152 0.9985 0.0802 0.0013 0.0151 0.9987
200 8C 0.2003 0.0004 0.0149 0.9988 0.1003 0.0012 0.0152 0.9994
220 8C 0.2002 0.0005 0.0149 0.9998 0.1504 0.0005 0.0147 0.9996
Ea (kJ/mol) 16.57 19.85 53.71 18.33 24.18 67.94
A (min�1) 0.61 � 102 2.46 � 101 7.93 � 105 0.68 � 102 3.17 � 101 5.85 � 106
R2 0.9563 0.9855 0.9628 0.9673 0.9678 0.9548
3,4,5-Trimethoxybenzoic acid Veratric acid
k01 (min�1) k02 (min�1) k03 (min�1) R2 k01 (min�1) k02 (min�1) k03 (min�1) R2
160 8C 0.0182 0.0009 0.0001 0.9998 0.0999 0.0506 0.0108 0.9985
170 8C 0.0231 0.0010 0.0001 0.9994 0.1012 0.1901 0.0157 0.9994
190 8C 0.0305 0.0013 0.0002 0.9996 0.1016 0.1503 0.0171 0.9983
200 8C 0.0404 0.0010 0.0003 0.9957 0.1021 0.1016 0.0173 0.9997
220 8C 0.0501 0.0017 0.0003 0.9978 0.1020 0.0506 0.0151 0.9997
Ea (kJ/mol) 53.65 30.91 83.64 47.03 58.43 96.31
A (min�1) 1.07 � 102 6.37 � 101 7.13 � 106 3.58 � 102 2.87 � 102 4.15 � 106
R2 0.9563 0.9575 0.9461 0.9468 0.9857 0.9863
Protocatechuic acid trans-Cinnamic acid
k01 (min�1) k02 (min�1) k03 (min�1) R2 k01 (min�1) k02 (min�1) k03 (min�1) R2
160 8C 0.0302 0.0211 0.0056 0.9992 0.0291 0.0504 0.0015 0.9974
170 8C 0.0397 0.0216 0.0056 0.9968 0.0362 0.0505 0.0020 0.9998
190 8C 0.0463 0.0202 0.0057 0.9997 0.0427 0.0505 0.0023 0.9996
200 8C 0.0534 0.0208 0.0058 0.9965 0.0491 0.0506 0.0029 0.9954
220 8C 0.0649 0.0207 0.0058 0.9985 0.0587 0.0505 0.0030 0.9991
Ea (kJ/mol) 63.76 67.72 106.04 67.62 81.56 157.74
A (min�1) 1.38 � 103 6.17 � 101 4.52 � 108 1.46 � 105 0.48 � 102 6.15 � 108
R2 0.9869 0.9773 0.9578 0.9861 0.9728 0.9611
Table 2
Kinetic model parameters of the GKM at 200 8C for phenolic mixture with
Mn-Ce-O
k01 (min�1) k02 (min�1) k03 (min�1)
Syringic acid 0.2003 0.0004 0.0149
Vanillic acid 0.1003 0.0012 0.0152
3,4,5-Trimethoxybenzoic acid 0.0404 0.0010 0.0003
Veratric acid 0.1021 0.1016 0.0173
Protocatechuic acid 0.0534 0.0208 0.0058
trans-Cinnamic acid 0.0491 0.0506 0.0029
Phenolic mixture 0.5797 0.1843 0.0588
R.J.G. Lopes et al. / Applied Catalysis B: Environmental 73 (2007) 193–202 201
laboratorial studies with individual species can be improved in
real situations due to the potential interactions with other
compounds, which can favour the final treatment.
The adjustment of the kinetic model by fitting Eq. (2) to the
experimental points showed in Fig. 8 at different temperatures
gives the parameters, derived by means of GKM model,
presented in Table 1 for the six phenolic acids where the pre-
exponential factor and the activation energy are also referred.
The adjustments to the experimental points are quite good with
high correlation coefficients (R2 from 0.9954 up to 0.9998).
Oxidation of phenolic acids can occur whether directly to C (first
step) or indirectly to intermediate products B and then to C.
In general k0 values increase with temperature, and usually
k01 > k02 > k03, what means that direct oxidation to carbon dioxide
and water is more predominant than the parallel reaction to
originate intermediate products, which are subsequently
degraded to end products at lower reaction rate. Nevertheless,
two deviations were observed: (i) for syringic and vanillic acids
k01 > k03 > k02, indicating that when the intermediates are produced
by second step, they are quickly degraded to carbon dioxide and
water by the third step; (ii) for trans-cinnamic acid k02 > k01 > k03,
pointing out that reaction proceeds preferentially by formation of
intermediates which are difficult to be degraded (B) than by the
first step. Therefore, intermediates generated by oxidation of
trans-cinnamic acid will be present in higher amounts and further
degradation will be more difficult than the one related to
intermediates produced from other acids. The calculated
activation energies confirm the order presented above concerning
the difficulty to oxidize the TOC content related to each phenolic
acid: values from 16.57 kJ/mol (for syringic acid) up to
157.74 kJ/mol (for trans-cinnamic acid) were obtained. Regard-
ing the experiments with Mn-Ce-O 70/30 at 200 8C, Table 2
resumes the k0 values obtained with the GKM for the reaction of
single phenolic components (Fig. 8) as well as this table shows
the k0 values related to the phenolic mixture (obtained by fitting
the model represented by dotted line to the experimental data in
R.J.G. Lopes et al. / Applied Catalysis B: Environmental 73 (2007) 193–202202
Fig. 1(c). By comparison, higher values from the kinetic
determination are obtained with the phenolic mixture; this fact
allows reinforcing that co-oxidation process occurs, leading to a
faster oxidation due to the synergism between species.
4. Conclusions
Using non-catalytic WO at 200 8C and 15 bar of air it is not
possible to oxidize phenolic acid more than 50% of the initial
TOC. Among all the several commercial catalysts tested
(G66A, SG2216, N140 and N150) as well as the ones prepared
in our laboratory the Mn-Ce-O and Ag-Ce-O catalyst showed
the higher activity in TOC reduction for total oxidation of
polyphenols and complete abatement of the intermediate
compounds formed in the reaction. The crescent order for the
difficulty of degradation of the phenolic acids is syringic,
vanillic, 3,4,5-trimethoxybenzoic, veratric, protocatechuic and
trans-cinnamic acid.
Manganese oxide supported in ceria showed to be a viable
alternative of an heterogeneous catalyst to homogeneous
catalysis in the total abatement of toxic organic load due to
phenols, which are present in a significant amount in olive oil
wastewaters. The carbon content in the solution was successfully
removed by catalytic wet air oxidation at 200 8C and 30 bar total
pressure and two main intermediate compounds, phenol and
acetic acid, were detected. Slight leaching of Mn was identified
and the carbon content in the solution was removed by oxidation
and not by adsorption on the solid catalyst.
The morphology of Mn-Ce-O 70/30 observed at different
magnifications of SEM photographs revealed the formation of
whiskers in the used catalyst. Therefore, in order to scale-up
this technology more studies have to be done specifically
related to catalytic stability of Mn-Ce-O to measure its life
time in a continuous treatment. Finally, the kinetic parameters
were obtained and this study highlighted a quite interesting
phenomenon coming from the simultaneous treatment of
various pollutants, clearly showing that the co-oxidation
process is able to enhance the individual degradation of some
compounds, which reinforces our strong belief on the success
of this technology for real wastewaters.
Acknowledgements
The Fundacao para a Ciencia e Tecnologia, Portugal,
is gratefully acknowledged for the financial support and
the Sud-Chemie Group, Munich, for providing their
catalysts.
References
[1] V. Balice, C. Carrieri, O. Cera, Riv. Ital. Sostanze Grasse 67 (1990) 9.
[2] M. Hamdi, Bioprocess. Eng. 8 (1993) 209.
[3] J.A. Fiestas, R. Borja, Grasas Aceites 43 (1992) 101.
[4] S.G. Velioglu, K. Curi, S.R. Camlilar, Water Res. 26 (1992) 1415.
[5] N. Gharsallah, Bioprocess. Eng. 10 (1994) 29.
[6] A. Martin, R. Borja, C.J. Banks, J. Chem. Technol. Biotechnol. 60 (1994)
7.
[7] M.D. Gonzalez, E. Moreno, J. Quevedo-Sarmiento, A. Ramos-Cormen-
zana, Chemosphere 20 (1990) 423.
[8] G. Boari, A. Brunetti, R. Passino, A. Rozzi, Agric. Wastes 10 (1984) 161.
[9] M. Hamdi, Bioresour. Technol. 36 (1991) 173.
[10] D. Mantzavinos, R. Hellenbrand, I.S. Metcalfe, A.G. Livingston, Water
Res. 30 (1996) 2969.
[11] D. Mantzavinos, R. Hellenbrand, A.G. Livingston, I.S. Metcalfe, IChemE
75 (1997) 87.
[12] D.P. Minh, P. Gallezot, M. Besson, Appl. Catal. B 63 (2006) 68.
[13] V.S. Mishra, V.V. Mahajani, J.B. Joshi, Ind. Eng. Chem. Res. 34 (1995) 2.
[14] Y.I. Matatov-Meytal, M. Sheintuch, Ind. Eng. Chem. Res. 37 (1998) 309.
[15] S. Imamura, Ind. Eng. Chem. Res. 38 (1999) 1743.
[16] F. Luck, Catal. Today 53 (1999) 81.
[17] S.T. Kolaczkowski, P. Plucinski, F.J. Beltran, F.J. Rivas, D.B. McLurgh,
Chem. Eng. J. 73 (1999) 143.
[18] S.K. Bhargava, J. Tardio, J. Prasad, K. Foger, D.B. Akolekar, S.C. Grocott,
Ind. Eng. Chem. Res. 45 (2006) 1221.
[19] Y. Taghasira, H. Takagi, K. Inagaki, Chem. Abstr. 84 (1975) 79359.
[20] S. Goto, J. Levec, J.M. Smith, Catal. Rev. Sci. Eng. 15 (1977) 187.
[21] S. Imamura, A. Hirano, N. Kawabata, Ind. Eng. Chem. Prod. Res. Dev. 21
(1982) 570.
[22] A. Pintar, J. Levec, J. Catal. 134 (1992) 345.
[23] A. Santos, P. Yustos, A. Quintanilla, G. Ruiz, F. Garcia-Ochoa, Appl.
Catal. B 61 (2005) 323.
[24] F. Stuber, J. Fonta, A. Fortuny, C. Bengoa, A. Eftaxias, A. Fabregat, Top.
Catal. 33 (2005) 1–4.
[25] J. Garcia, H.T. Gomes, Ph. Serp, Ph. Kalck, J.L. Figueiredo, J.L. Faria,
Carbon 44 (2006) 2384.
[26] F. Larachi, Top. Catal. 33 (2005) 109.
[27] A.M.T. Silva, I. Castelo-Branco, R.M. Quinta-Ferreira, J. Levec, Chem.
Eng. Sci. 58 (2003) 963.
[28] A.M.T. Silva, R.R.N. Marques, R.M. Quinta-Ferreira, Appl. Catal. B 47
(2004) 275.
[29] A.M.T. Silva, A.C.M. Oliveira, R.M. Quinta-Ferreira, Chem. Eng. Sci. 59
(2004) 5291.
[30] V. Balice, O. Cera, Grasas Aceites 35 (1984) 178.
[31] A.M.T. Silva, R.M. Quinta-Ferreira, J. Levec, Ind. Eng. Chem. Res. 42
(2003) 5099.
[32] A.M.T. Silva, Treatment of liquid pollutants by catalytic wet oxidation,
Ph.D. Dissertation, Coimbra, 2005.
[33] H. Chen, A. Sayari, A. Adnot, F. Larachi, Appl. Catal. B 32 (2001) 195.