Alma Mater Studiorum - AMS Dottorato - Università di Bologna
Upload
khangminh22Category
view
3download
0
AALLMMAA MMAATTEERR SSTTUUDDIIOORRUUMM –– UUNNIIVVEERRSSIITTÀÀ DDII BBOOLLOOGGNNAA
DOTTORATO DI RICERCA IN
SCIENZE E BIOTECNOLOGIE DEGLI ALIMENTI
CICLO XXIV
Settore Concorsuale di afferenza: 07/F1 Scienze e Tecnologie Alimentari
Development of instrumental and sensory analytical methods of food obtained by traditional
and emerging technologies
Presentata da: Patrizia Comandini Coordinatore Dottorato Relatore
Prof. Claudio Cavani Dott.ssa Tullia Gallina Toschi
Correlatore
Dott. Giampaolo Blanda
Esame finale anno 2012

I
Preface
The consumer demand for natural, minimally processed, fresh like and functional food has
lead to an increasing interest in emerging technologies. Novel processing techniques are
attracting the attention of academic as well as industrial research, becoming commercially
very important.
The aim of this PhD project was to study three innovative food processing
technologies currently used in the food sector. Ultrasound-assisted freezing, vacuum
impregnation and pulsed electric field have been investigated. Furthermore, analytical and
sensory techniques have been developed in order to evaluate the quality of food and vegetable
matrix obtained by traditional and emerging processes.
This thesis has a compilation structure, and the research articles produced during the
PhD project have been enclosed and discussed. Owing to the extent of the topics investigated,
technological and sensory aspects have been split in different chapters.
The first two chapters contains the list of publications produced and the abbreviations
used in the text.
Chapter 3 describes the innovative technologies studied: ultrasound assisted freezing
of potatoes, aroma enrichment of apple sticks through vacuum, ultrasound and atmospheric
impregnation technologies and pulsed electric field treatment of melon juice. The papers
produced are attached at the end of each paragraph.
Chapter 4 details the chromatographic analysis developed: phenolic composition of
vegetable matrix as olive mill waste water and chestnut bark extracts have been described.
Finally, in chapter 5, sensory techniques are discussed. In particular the development
of quantitative-descriptive methods for the evaluation of sensory profile of boiled potatoes
and the investigation of the volatile fraction of raw and processed potatoes are reported.

II

III
Table of contents 1. List of publications 1
2. Abbreviation used 5
3. Emerging technologies in food processing 7
3.1 Ultrasound-assisted freezing 7
3.1.1 Overview of ultrasound applications in food industry 7
3.1.2 Ultrasonic cavitation 8
3.1.3 The role of cavitation on ice nucleation 11
3.1.4 Application of power ultrasound during food freezing 12
Research article 1 Ultrasound assisted freezing: investigation of the effects
on supercooled potatoes
14
3.2 Impregnation technologies 30
3.2.1 Impregnation process: atmospheric pressure vs. vacuum application 30
3.2.2 Aroma enrichment of food through impregnation technology 32
Research article 2 Impregnation techniques for aroma enrichment of apple
sticks: a preliminary study
34
3.3 Pulsed electric field 40
3.3.1 Investigation of the effects of pulsed electric fields on total phenol
content and on polyphenoloxidase and pectin methylesterase activity of
melon (Cucumis melo L.) juice
40
3.4 References 48
4. Instrumental analysis: polyphenols in vegetable matrix 53
4.1 Definition and classification 53
4.2 Main phenol compounds in olive mill waste water (OMWW) 57
Research article 3 Phenolic profiles of olive mill wastewaters treated by
membrane filtration systems
59
4.3 Phenolic composition of chestnut bark extract 80
Research article 4 Tannin analysis of chestnut bark extracts (Castanea sativa
Mill.) by HPLC-DAD-MS
82
4.4 References 100

IV
5. Sensory analysis 105
5.1 Potato flavour: background and updates of literature 107
Research article 5 Characterization of potato flavours: an overview of volatile
profiles and analytical procedures
109
5.2 Investigation of off-odour and off-flavour development in boiled potatoes:
study on Italian and Mexican varieties
121
Research article 6 Investigation of off-odour and off-flavour development in
boiled potatoes
123
Research article 7 Sensory profile of three Mexican potato cultivars and
off-odors development after boiling
131
5.3 Development of a sensory lexicon 151
5.4 References 152
6. Conclusions 154

Chapter 1
1
1. LIST OF PUBLICATIONS
Research article 1. Comandini P., Blanda G., Soto-Caballero M.C., Sala V., Tylewicz U.,
Mujica-Paz H., Gallina Toschi T. Ultrasound assisted freezing: investigation of the effects on
supercooled potatoes. To be submitted to Journal of Food Engineering.
Research article 2. Comandini P., Blanda G., Mújica Paz H., Valdez Fragoso A., Gallina
Toschi T. (2010). Impregnation techniques for aroma enrichment of apple sticks: a
preliminary study. Food and Bioprocess Technology 3, 861-866.
Research article 3. Comandini P., Lerma-García M. L., Massanova P., Simó-Alfonso E. F.,
Gallina Toschi T. Phenolic profiles of olive mill wastewaters treated by membrane filtration
systems. To be submitted to Water Research.
Research article 4. Comandini P., Lerma-García M. L., Simó-Alfonso E. F., Gallina Toschi
T. Tannin analysis of chestnut bark extracts (Castanea sativa Mill.) by HPLC-DAD-MS. To
be submitted to Food Chemistry.
Research article 5. P. Comandini, L. Cerretani, G. Blanda, A. Bendini, T. Gallina Toschi
(2011). Characterization of potato flavours: an overview of volatile profiles and analytical
procedures. Food 5 (SI1): 1-14.
Research article 6. Blanda G., Cerretani L., Comandini P., Gallina Toschi T., Lercker G.
(2010). Investigation of off-odour and off-flavour development in boiled potatoes. Food
Chemistry 118, 283-290.
Research article 7. Comandini P., Blanda G., Soto Caballero M.C., Mujica-Paz H., Valdez
Fragoso A., Gallina Toschi T. Sensory profile of three Mexican potato cultivars and off-odors
development after boiling. To be submitted to Journal of Sensory Studies.

Chapter 1
2
OTHER PUBLICATIONS
Comandini P., Blanda G., Mújica Paz H., Valdez Fragoso A., Gallina Toschi T. (2009).
Impregnation techniques for aroma enrichment of apples: a preliminary study. Proceedings of
the 5th International technical symposium on food processing, monitoring technology in
bioprocesses and food quality management, Potsdam, Germany, 31st August – 2nd September
2009. (ISBN 978-3-00-028811-1, pp. 116-121).
Comandini P., Blanda G., Soto Caballero M. C., Gallina Toschi T. (2009). Surgelazione degli
alimenti tramite sonocristallizzazione: principi e potenzialità. Proceedings VII Convegno
AISSA “Agricoltura, Qualità dell’Ambiente e Salute” - Ancona 2nd-4th December 2009 (pp.
105-106).
Cerretani L., Comandini P., Gallina Toschi T. (2010). Gramolature a ultrasuoni. Uno studio
da approfondire. Olivo e olio, 8, 52-53.
Comandini P., Soto Caballero M. C., Mújica Paz H., Valdez Fragoso A., Blanda G., Gallina
Toschi T. (2010). L’impregnazione sottovuoto come tecnica di funzionalizzazione della
frutta: studio sulle mele cotogne. Proceedings I Congresso Nazionale della Società Italiana di
Nutraceutica (SINut), Milano, 11th-13th February 2010.
Torres S.S., Comandini P., Gallina Toschi T., Valdez Fragoso A., Welti Chanes J., Mújica
Paz H. (2011). Impregnación de agentes antioscurecimiento en manzana entera para conservar
el color del jugo. Proceedings XXXII Encuentro Nacional y 1er. Congreso Internacional de
la Amidiq, Cancun (Mexico), 3rd-6th May 2011.
Comandini P., Lerma-García M.J., Massanova P., Herrero-Martínez J.M., Simó-Alfonso E.F.,
Gallina Toschi T. (2011). HPLC-DAD-MS evaluation of phenolic profiles of olive mill
wastewaters treated by membrane filtration systems. 36th International Sysmposium on High-
Performance Liquid Phase Separations and Related Techniques, 19th-23rd June 2011,
Budapest, Hungary.

Chapter 1
3
Comandini P., Lerma-García M.J., Massanova P., Herrero-Martínez J.M., Simó-Alfonso E.F.,
Gallina Toschi T. (2011). Tannin analysis by HPLC-DAD-MS of chestnut bark extracts
(Castanea sativa Mill.). 36th International Sysmposium on High-Performance Liquid Phase
Separations and Related Techniques, 19th-23rd June 2011, Budapest, Hungary.
Comandini P., Valdez Fragoso A., Soto Caballero M.C., Soria Hernández C.G., Mujica-Paz
H., Gallina Toschi T., Welti Chanes J. (2011). Effects of pulsed electric fields on total phenol
content of melon (Cucumis melo L.) juice. Innovation Food Conference 2011, 12th-14th
October 2011, Osnabrück, Germany.
Comandini P., Valdez Fragoso A., Soto Caballero M.C., Soria Hernández C.G., Mujica-Paz
H., Gallina Toschi T., Welti Chanes J. (2011). Polyphenoloxidase and pectin methylesterase
activity in melon (Cucumis melo L.) juice treated by pulsed electric fields. Innovation Food
Conference 2011, 12th-14th October 2011, Osnabrück, Germany.
Comandini P., Soto Caballero M. C., Blanda G., Gallina Toschi T. Freezing by means of
sonocrystallization. A learning procedure on distilled and sparkling water. To be submitted to
Journal of Food Science Education.
DISSEMINATION EVENTS
Gallina Toschi T., Comandini P. (2010). “È una montatura! Gli ultrasuoni e la maionese
light” La Notte dei ricercatori, 24th September 2010, Cesena, Italy.
Gallina Toschi T., Ragni L., Bonaga G., Amadori S., Berardinelli A., Cardenia V., Cevoli C.,
Comandini P. (2011). “Maionese shakerata, maionese tagadà, maionese cosa sa?” Questione
di chimica, 23rd-27th September 2011, Bologna, Italy.

Chapter 1
4
Chapter 2
5
2. ABBREVIATIONS USED
US Ultrasound
PB Blake threshold
Pv Vapour pressure
Σ Surface tension
R0 Initial nanobubble radius
P0 System pressure
VI Vacuum impregnation
AI Atmospheric impregnation
HDM Hydrodynamic mechanism
Χ Volume fraction of the sample impregnated
r Compression ratio
ϵe Effective porosity
ρ1 Initial gas pressure in the pores
ρ2 External system and capillary pressure
DRP Deformation-relaxation phenomenon
γ Sample volume deformation at the end of the
impregnation process
γ1 Sample volume deformation at the end of the
vacuum application
USI Impregnation assisted by ultrasound
VUSI Impregnation assisted by vacuum and ultrasound
PEF Pulsed electric field
PME Pectin methylesterase
PPO Polyphenoloxidase
LOX Lipoxygenase
PG Polygalacturonase
POD Peroxidase
TP Total phenol
aw Water activity
E Electric field
F Pulse frequency
T Treatment time

Chapter 2
6
RA Relative residual enzyme activity
At Enzyme activity units after treatment
A0 Enzyme activity units before treatment
PC Phenolic compounds
OMWW Olive mill waste water
MF Microfiltration
UF Ultrafiltration
NF Nanofiltration
RO Reverse osmosis
HHDP Hexahydroxydiphenic acid
HPLC High performance liquid chromatography
DAD Diode array detector
ESI-MS Electrospray ionization-mass spectrometry
SDE Simultaneous distillation and extraction
SPME Solid-phase microextraction
GC-MS Gas chromatography-mass spectrometry
GC/O Gas chromatography/olfactometry
GC-FID/O Gas chromatography-flame ionization
detector/olfactometry
GC-MS/O Gas chromatography-mass
spectrometry/olfactometry
QDA® Quantitative descriptive analysis

Chapter 3
7
3. EMERGING TECHNOLOGIES IN FOOD PROCESSING
3.1 ULTRASOUND-ASSISTED FREEZING
3.1.1 Overview of ultrasound applications in food industry
The use of ultrasound within the food industry has been a subject of research and
development for many years and the sound ranges used can be basically divided into
diagnostic (5 MHz – 10 MHz) and power ultrasound (20-100 kHz) (Mason, 1998).
In table 3.1.1 are listed some uses of power ultrasound in food technology which have
been widely described in several reviews (McClements, 1995, 1997; Mason et al., 1996;
Povey and Mason, 1998; Li and Sun, 2002; Knorr et al., 2004; Zheng and Sun, 2006;
Dolatowski et al., 2007; Ulusoy et al., 2007; Feng et al., 2008; Patist and Bates, 2008;
Chemat et al., 2011).
Table 3.1.1 Some uses of power ultrasound in food processing (Mason, 1998).
Mechanical effects Crystallization of fats, sugars, etc.
Degassing Destruction of foams
Extraction Filtration and drying
Freezing Mixing, homogenization and emulsification
Precipitation of airborne powders Tenderization of meats
Brining, pickling and marinating Chemical and biochemical effects
Bactericidal action Effluent treatment
Modification of growth of living cells (stimulation/destruction)
Alteration of enzyme activity Oxidation processes
Sterilization of equipment

Chapter 3
8
The energy amount of the sound field is an important criterion for the classification of
ultrasound applications. High-intensity ultrasound parameters include sound power (W),
sound intensity (W/m2), sound energy density (Ws/m3), treatment temperature, and treatment
time (Knorr et al., 2004; Bermúdez-Aguirre et al., 2011).
Low energy ultrasound applications frequently range at intensities lower than 1 W/cm2
and at frequencies higher than 100 kHz. They are used for non-invasive detection (process
control) and for characterizing physicochemical properties of food material (product
assessment or control) (Mason and Luche, 1996; Villamiel and De Jong, 2000).
High energy ultrasound applications are usually found at intensities higher than 1
W/cm2 and at frequencies between 18 and 100 kHz (McClements, 1995; Povey and Mason,
1998; Villamiel and De Jong, 2000) however, the majority are restricted to the range 20-40
kHz, i.e. the traditional ranges employed for cleaning, cell disruption and plastic welding
(Mason, 1998).
3.1.2 Ultrasonic cavitation
The application of power ultrasound in food processing takes advantage of the chemical and
the mechanical effects of cavitation.
As the ultrasonic pressure wave passes through the medium, regions of high and low
pressure are created. The size of these pressure variations are referred to as the amplitude of
the pressure wave or the acoustic pressure, and they are directly proportional to the amount of
energy applied to the system. In compressible fluids (such as air) or at low intensity ultrasonic
waves this pressure will induce motion and mixing within the fluid (acoustic streaming) and
this movement is sufficient to accommodate these pressure variations (Kentish and
Ashokkumar, 2011).
However, most liquids are inelastic and incompressible and thus cannot respond as
easily in this manner. If the changes in pressure are great enough, the local pressure in the
expansion phase of the cycle falls below the vapour pressure of the fluid, causing
microbubbles of gas and vapour or cavities to grow; they relieve the tensile stresses created by
the pressure wave. Scientific theory would suggest that the acoustic pressure variation
required for this to occur is very large, up to 3,000 MPa. However, in practice, these
microbubbles form at relatively mild acoustic pressures. It is generally believed that this is
because any liquid already contains cavities of gas or nanobubbles, and that these nuclei assist
in the formation of microbubbles (Suslick, 1991; Kentish and Ashokkumar, 2011). The
bubble formation process is known as cavitation: in the rarefaction phase of the pressure
wave, a bubble is created by the local fluid tension, or is expanded due to the decrease in

Chapter 3
9
pressure. During compression, the increase in pressure either contracts the void or bubble to a
smaller size, or eliminates it by implosion (figure 3.1.1). Generally, these processes are
nonlinear because the changes in the radius of the void are not proportional to the variation in
acoustic pressure (Young, 1989).
Figure 3.1.1 Sound transmission through a medium and generation of a cavitation
bubble.
Cavitation is observed to occur above a definite threshold in ultrasonic intensity.
Intensity, in this context, refers to the mechanical-power density supplied by the ultrasound
device, and may vary spatially owing to the geometry of the container and the configuration
of the point at which ultrasound is delivered. For example, if ultrasound is delivered by a
probe the intensity is high near the tip, and falls off dramatically as the distance increases
(McCausland et al., 2001).
The lowest acoustic pressure at which cavitation is observed is called cavitation or
Blake threshold (PB), and is a function of the solution vapour pressure (Pv), the surface
tension (σ), the initial nanobubble radius (R0), and the system pressure (P0) (Leighton, 1994;
Kentish and Ashokkumar, 2011):
30
00
0
)2(3
2
3
4
RPR
PPPP
v
vB
−++−= σ
σσ
Bubbles formation Bubbles growing Violent collapse
Rarefaction Compression
Compression CompressionCompressionCompression
RarefactionRarefactionRarefaction

Chapter 3
10
The voids or cavities generated by ultrasound can be stable or transient. Stable cavities
exist for a number o sonic pressure cycles and oscillate, usually nonlinearly, around some
mean equilibrium size; usually their growth rate during rarefaction is equivalent to their rate
of contraction during the compression phase (Thompson and Doraiswamy, 1999). Transient
cavities exist for a single or a few acoustic cycles. They may enlarge several times, becoming
larger than their original size during expansion, and collapsing violently during compression.
This mechanism creates extreme temperatures and pressures (McCausland et al., 2001). The
order of temperature and pressure variations can be, respectively, of 5500°C and 50 MPa
(Leighton, 1998). In the small spatial regions where cavitation occurs, also called “hot spots”
(Henglein, 1987), the temperature can change at a rate of about 109°C/s (Suslick, 1991). In
any cavitation field, the majority of visible bubbles are in stable oscillation, causing acoustic
micro-streaming. However, the relationships between stable and unstable cavitation are quite
complex and time-dependent, and stable cavities may evolve into transient ones via a number
of mechanism (Young, 1989).
The cavitation has a variety of effects within the liquid medium depending upon the
type of system in which it is generated. These systems can be broadly divided into
homogeneous liquid, heterogeneous solid/liquid and heterogeneous liquid/liquid phase
systems (Suslick, 1997).
When cavitation occurs in an homogeneous liquid-phase system, the rapid collapse of the
bubble generates shear forces, which can produce mechanical effects in the bulk liquid
immediately surrounding the cavity. Instead, the extreme conditions of temperature and
pressure inside the collapsing bubble can produce chemical effects, reacting with any species
introduced inside.
As regards heterogeneous solid-liquid systems, two main situations are considered: the
presence of a solid surface in the liquid phase or the presence of dispersed powder.
The collapse of a cavitation bubble near a surface is non-symmetric (figure 3.1.2)
because the surface provides resistance to liquid flow from its side. The powerful jet targeted
at the surface can dislodge dirt and bacteria, determining the decontamination also of crevices
that are not easily to clean by conventional methods (Mason et al., 1996). This effect can also
activate solid catalysts and increase mass and heat transfer to the surface by disruption of the
interfacial boundary layers.

Chapter 3
11
Figure 3.1.2 Cavitation bubble collapsing near a solid surface
(www.sonochemistry.info).
When acoustic cavitation occurs in liquids containing suspended powders, dramatic
effects may occur. In fact the powders (as well as the trapped gas) can act as nuclei for
cavitation bubble formation and the subsequent collapse can lead to shock waves which break
the particle. Cavitation bubble collapse in the liquid phase near to a particle can force it into
rapid motion. Under these circumstances the general dispersive effect is accompanied by
interparticle collisions which can lead to erosion, surface cleaning and wetting of the particles
and particle size reduction.
In heterogeneous liquid-liquid systems, cavitational collapse at or near the interface cause its
disruption and the liquid mixing, resulting in the formation of very fine emulsions.
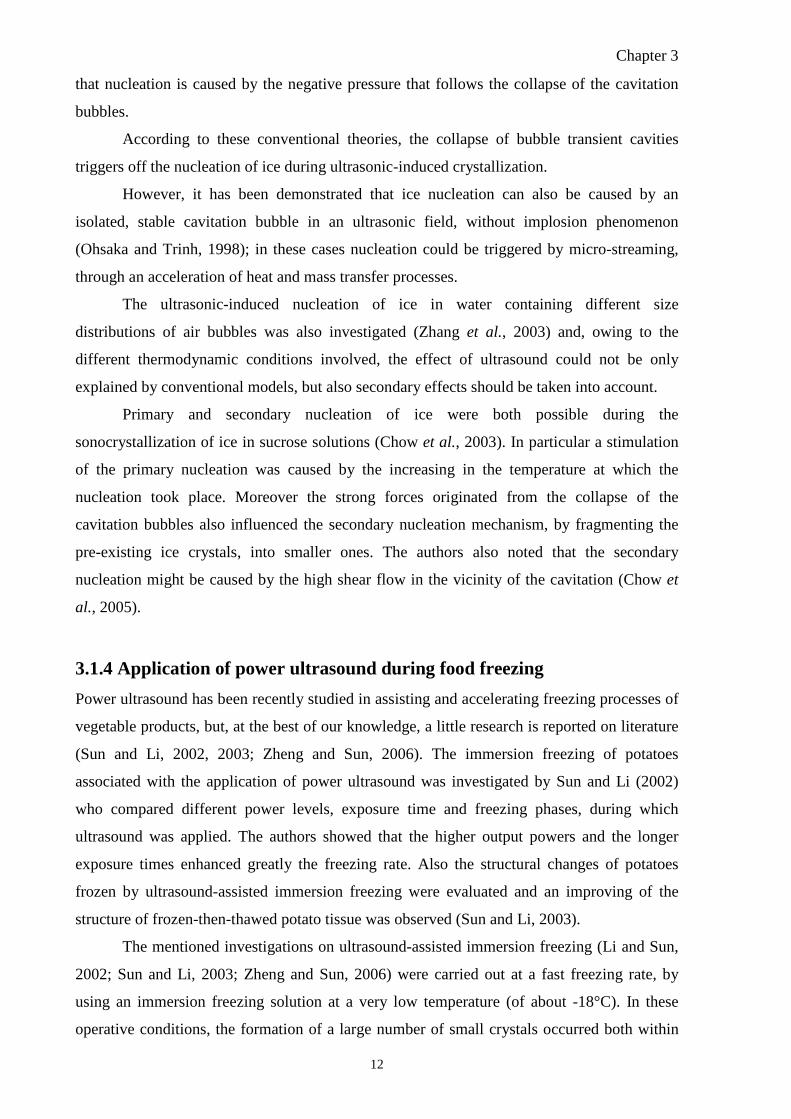
3.1.3 The role of cavitation on ice nucleation
One of the first applications of ultrasound was sonocrystallization, that is the crystallization of
ice due to ultrasonic irradiation. Sonocrystallization of supercooled water has been studied
since 1965 and a significant body of literature is available (Hickling, 1965; Hunt and Jackson,
1966; Ohsaka and Trinh 1998; Inada et al. 2001; Chow et al. 2005), however, the exact action
mechanism that explains the ultrasound effect is not yet well known. Different theories have
been formulated and the most important mechanism by which ultrasonic irradiation can
influence crystallization is ultrasonic cavitation (Hickling, 1965; Hunt and Jackson, 1966).
According to the model formulated by Hickling (1965), the positive pressures
produced during the final stage of collapse of bubble cavitation (greater than 1 GPa) increase
the equilibrium freezing temperature of water, and thus increase the supercooling degree,
enhancing the rate of ice nucleation. Another model (Hunt and Jackson, 1966), instead, states
Inrush of liquid from one side of the collapsing bubble produces powerful
jet of liquid targeted at surface.
Boundary layer
Solidsurface
Chapter 3
12
that nucleation is caused by the negative pressure that follows the collapse of the cavitation
bubbles.
According to these conventional theories, the collapse of bubble transient cavities
triggers off the nucleation of ice during ultrasonic-induced crystallization.
However, it has been demonstrated that ice nucleation can also be caused by an
isolated, stable cavitation bubble in an ultrasonic field, without implosion phenomenon
(Ohsaka and Trinh, 1998); in these cases nucleation could be triggered by micro-streaming,
through an acceleration of heat and mass transfer processes.
The ultrasonic-induced nucleation of ice in water containing different size
distributions of air bubbles was also investigated (Zhang et al., 2003) and, owing to the
different thermodynamic conditions involved, the effect of ultrasound could not be only
explained by conventional models, but also secondary effects should be taken into account.
Primary and secondary nucleation of ice were both possible during the
sonocrystallization of ice in sucrose solutions (Chow et al., 2003). In particular a stimulation
of the primary nucleation was caused by the increasing in the temperature at which the
nucleation took place. Moreover the strong forces originated from the collapse of the
cavitation bubbles also influenced the secondary nucleation mechanism, by fragmenting the
pre-existing ice crystals, into smaller ones. The authors also noted that the secondary
nucleation might be caused by the high shear flow in the vicinity of the cavitation (Chow et
al., 2005).
3.1.4 Application of power ultrasound during food freezing
Power ultrasound has been recently studied in assisting and accelerating freezing processes of
vegetable products, but, at the best of our knowledge, a little research is reported on literature
(Sun and Li, 2002, 2003; Zheng and Sun, 2006). The immersion freezing of potatoes
associated with the application of power ultrasound was investigated by Sun and Li (2002)
who compared different power levels, exposure time and freezing phases, during which
ultrasound was applied. The authors showed that the higher output powers and the longer
exposure times enhanced greatly the freezing rate. Also the structural changes of potatoes
frozen by ultrasound-assisted immersion freezing were evaluated and an improving of the
structure of frozen-then-thawed potato tissue was observed (Sun and Li, 2003).
The mentioned investigations on ultrasound-assisted immersion freezing (Li and Sun,
2002; Sun and Li, 2003; Zheng and Sun, 2006) were carried out at a fast freezing rate, by
using an immersion freezing solution at a very low temperature (of about -18°C). In these
operative conditions, the formation of a large number of small crystals occurred both within
Chapter 3
13
and outside the cells, ensuring the maintenance of tissue integrity and minimizing drip loss
during thawing. However, the supercooling process, which is the sample cooling below the
initial freezing point without ice formation (Rahman et al., 2002), was not observed.
The aim of the investigation carried out (research article 1) was to delve into the study
of ultrasound-assisted immersion freezing of potato cubes, with particular attention to the
effects of the application of ultrasound during the supercooling phase.
Moreover in several of the investigations published on ultrasound assisted freezing,
the main ultrasound effect involved was the enhancement of heat transfer produced by
sonication (Chemat et al., 2011; Li and Sun, 2002). A second aim we followed was to verify
if the application of ultrasound on supercooled potatoes could trigger off the freezing through
cavitation on the surface of the sample, causing an anticipation of the beginning of the
freezing process.
Ultrasound was applied in different times of the freezing process and the freezing
parameters, as nucleation temperature and time, initial freezing temperature, transition phase
and global freezing duration, were evaluated and discussed.

Research article 1
14
Ultrasound assisted freezing: investigation of the effects on supercooled 1
potatoes 2
3
P. Comandinia*, G. Blandaa, M. C. Soto-Caballeroa,1, V. Salab, U. Tylewicza, H. Mujica-4
Pazc, T. Gallina Toschia 5 a University of Bologna, Department of Food Science, Piazza Goidanich 60, Cesena, 47521, 6
Italy 7 b Startec Ultrasuoni S.r.l., Viale Lombardia, 148, Brugherio, 20047, Italy 8 c Instituto Tecnológico y de Estudios Superiores de Monterrey, Departamento Biotecnología e 9
Ingeniería de Alimentos, Eugenio Garza Sada 2501, Monterrey, Nuevo León 64849, México 10
11
*Corresponding author. Tel.: +39-0547-338121; fax: +39-0547-382348. 12
E-mail address: [email protected] (P.Comandini). 13
14
Key words: Freezing, Nucleation, Potato, Ultrasound, Supercooling 15
16
Running title: Ultrasound assisted freezing of potato 17
18
Abstract 19
Ultrasound has attracted great interest in recent years and its application in food freezing has 20
shown promising advantages. In the present study the application of ultrasound during 21
immersion freezing of potato cubes was studied and particular attention was given to the 22
effects on supercooling process. Ultrasound, produced through a 35 kHz sonotrode, was 23
applied when the temperature in the geometrical center of potato sample was in the range 24
from -0.1 to -3.0°C. Several freezing parameters, as nucleation temperature and time, initial 25
freezing temperature, transition phase and global freezing duration, were evaluated and 26
discussed. 27
A significant anticipation of the nucleation process was detected when the ultrasound 28
application temperature was lower than -0.1°C, moreover a reduction in freezing time was 29
recorded when ultrasound was applied at -2.0°C. 30
31
1. Introduction 32
1 Present address: Departamento Biotecnología e Ingeniería de Alimentos, Instituto Tecnológico y de Estudios Superiores de Monterrey. Eugenio Garza Sada 2501. Monterrey, Nuevo León 64849, México

Research article 1
15
Ultrasound is a pressure wave oscillating at a frequency above the threshold of human 33
hearing, in the range from 20 kHz to about 10 MHz (Denbow, 2001). Besides medicine and 34
chemistry, ultrasound is used in several industrial sectors including food science and 35
technology (Chemat et al., 2011). Ultrasound employed in the food industry can be mainly 36
classified into two different fields: high frequency - low energy (diagnostic ultrasound) in the 37
MHz range and low frequency - high energy (power ultrasound) in the kHz range (Mason et 38
al., 1996; Zheng and Sun, 2006). The application of the first one is focused on non-destructive 39
food inspection, assurance of product quality and process control. Power ultrasound is used to 40
promote chemical and physical modification of processes and products. It has been applied to 41
improve cleaning, microbial destruction and enzymatic inactivation, and to enhance 42
extraction, drying and filtration (Mulet et al., 2002; Albu et al., 2004; Bermúdez-Aguirre and 43
Barbosa-Cánovas, 2008). Power ultrasound is a promising technique also in freezing process 44
thanks to its direct effect on heat transfer and on crystallization (Mason, 1998; Li and Sun, 45
2002; Sigfusson et al., 2004). 46
Sonocrystallization of supercooled water has been studied since 1965 and a significant body 47
of literature is available (Hickling, 1965; Hunt and Jackson, 1966; Ohsaka and Trinh 1998; 48
Inada et al. 2001; Chow et al. 2005), however, the exact action mechanism that explains the 49
ultrasound effect is not yet well known. Different theories have been formulated and acoustic 50
cavitation, which consists of the formation, growth and violent collapse of low-pressure 51
bubbles in liquids, seems to be the most important effect involved in water sonocrystallization 52
(Hickling, 1965; Hunt and Jackson, 1966). 53
According to the model formulated by Hickling (1965), the positive pressures produced 54
during the final stage of collapse of bubble cavitation increase the equilibrium freezing 55
temperature of water, and thus increase the supercooling degree, enhancing the rate of ice 56
nucleation. Another model (Hunt and Jackson, 1966), instead, states that nucleation is caused 57
by the negative pressure that follows the collapse of the cavitation bubbles. 58
According to these conventional theories, the collapse of bubble transient cavities triggers off 59
the nucleation of ice during ultrasonic-induced crystallization. However, it has been 60
demonstrated that ice nucleation can also be caused by an isolated, stable cavitation bubble in 61
an ultrasonic field, without implosion phenomenon (Ohsaka and Trinh, 1998); in these cases 62
nucleation could be triggered by micro-streaming. 63
The ultrasonic-induced nucleation of ice in water containing different size distributions of air 64
bubbles was also investigated (Zhang et al., 2003) and, owing to the different thermodynamic 65
conditions involved, the effect of ultrasound could not be only explained by conventional 66
models, but also secondary effects should be taken into account. 67

Research article 1
16
Primary and secondary nucleation of ice were both possible during the sonocrystallization of 68
ice in sucrose solutions (Chow et al., 2003). In particular a stimulation of the primary 69
nucleation was caused by the increasing in the temperature at which the nucleation took place. 70
Moreover the strong forces originated from the collapse of the cavitation bubbles also 71
influenced the secondary nucleation mechanism, by fragmenting the pre-existing ice crystals, 72
into smaller ones. The authors also noted that the secondary nucleation might be caused by 73
the high shear flow in the vicinity of the cavitation (Chow et al., 2005). 74
Freezing is an important way to preserve food during the time, maintaining the characteristics 75
of fresh products, as in the case of vegetables. Nucleation and crystal growth are the main 76
steps of ice crystallization, which affect the quality, the stability and the sensory properties of 77
frozen foods. 78
It has been reported that a fast nucleation and a production of small and uniform crystals 79
occur during sonocrystallization (Luque de Castro and Priego-Capote, 2007). 80
Power ultrasound has been recently studied in assisting and/or accelerating freezing processes 81
of vegetable products, but a little research is reported on literature (Sun and Li, 2002, 2003; 82
Zheng and Sun, 2006). The immersion freezing of potatoes associated with the application of 83
power ultrasound was investigated by Sun and Li (2002), who compared different power 84
levels, exposure time and freezing phases during which ultrasound was applied. The authors 85
showed that the higher output powers and longer exposure times enhanced greatly the 86
freezing rate. Also the structural changes of potatoes frozen by ultrasound-assisted immersion 87
freezing were evaluated and an improving of the structure of frozen-then-thawed potato tissue 88
was observed (Sun and Li, 2003). 89
The mentioned investigations on ultrasound-assisted immersion freezing (Li and Sun, 2002; 90
Sun and Li, 2003; Zheng and Sun, 2006) were carried out at a fast freezing rate, by using an 91
immersion freezing solution at a very low temperature (of about -18°C). In these operative 92
conditions, the formation of a large number of small crystals occurred both within and outside 93
the cells, ensuring the maintenance of tissue integrity and minimizing drip loss during 94
thawing. However, the supercooling process, which is the sample cooling below the initial 95
freezing point without ice formation (Rahman et al., 2002), was not observed. 96
Supercooling process has an important role in freezing food, because its extent influences 97
both the rate of ice nuclei formation and their dimensions (Crivelli, 1992) and consequently 98
affects the properties of frozen products. 99
The aim of this investigation was to delve into the study of ultrasound-assisted immersion 100
freezing of potato cubes, with particular attention to the effects during the supercooling phase. 101
In spite of the formation of a limited number of large ice crystals between cells, and the high 102

Research article 1
17
structural damage caused, a slow freezing rate was chosen, in order to obtain a clear 103
visualization of the freezing curve and of the supercooling phenomenon in potato cubes 104
(James et al., 2009).The capacity of ultrasound to promote the beginning of crystallization in 105
supercooled potato cubes was investigated. Ultrasound was applied in different moments of 106
the freezing process and the freezing parameters, as nucleation temperature and time, initial 107
freezing temperature, transition phase and global freezing duration, were evaluated and 108
discussed. 109
110
2. Materials and methods 111
2.1 Ultrasonic equipment 112
An ultrasound processor (300 W), working at a frequency of 35 kHz and equipped with a 113
cone titanium sonotrode (Startec S.r.l., Milano, Italy) was used. The generator allowed to 114
adjust the vibration amplitude from 0 % to 100 %. Treatment time was of 8 sec, with pulses 115
duration of 1 sec. 116
Owing to the thermal effect, the absorption of ultrasonic power by the freezing solution 117
caused a temperature increase, and a loss of nominal energy. Actual power transferred to 118
freezing solution during sonication was measured calorimetrically by recording the 119
temperature rise against the time of ultrasound application. Heat development was estimated 120
from the slope of the straight portion of the line obtained. According to Raso et al. (1999) 121
power output (P) was then calculated using the equation: 122
Mcdt
dTP p= 123
where dT/dt is the slope of the line representing the variation of temperature during the time 124
(K s-1), cp is liquid medium heat capacity (kJ kg-1 K-1) and M is the amount of sample 125
treated (kg). Power output was 21.1 W when the sonotrode operated at 100% of vibration 126
amplitude. 127
128
2.2 Sample preparation 129
Potatoes (Solanum tuberosum L. cv. Safrane) were bought on local market in Cesena and 130
stored at room temperature. Fresh potatoes were cut in cubes (1.5 cm3 size) of about 8 g each 131
one and immediately refrigerated until a temperature of 9 ± 1°C. After sample refrigeration, 132
two thermocouples were positioned in each cube, one in the geometric centre and one close to 133
the surface of the sample. T-type thermocouples (mod. GG-30-KK; Tersid, Milano, Italy) 134
connected to a data acquisition system (mod. 2700; Keithley, Cleveland, USA) were used. 135
About 1.5 g of dough (made with commercial wheat flour and water) was used to seal the 136

Research article 1
18
thermocouples incoming points and prevent the freezing solution to soak inside the potato 137
cube during the immersion freezing. 138
139
2.3 Ultrasound assisted immersion freezing 140
Two potato cubes, cut from the same tuber, were frozen with and without ultrasound 141
application, respectively. A solution of glycerol and water (50/50, w/w) was used for 142
immersion freezing at a temperature of -6°C. Experiments were carried out in two vessels 143
containing 1 kg of cooling solution each one (Fig. 1): in vessel A the immersion freezing was 144
carried out without ultrasound application (control sample) and in vessel B the ultrasound-145
assisted immersion freezing was realized (US sample). In order to maintain the potato cubes 146
in the same position inside the cooling solution, a retaining structure was used. Each sample 147
was positioned in the centre of the vessel at a 2.5 cm depth in the freezing solution. The 148
ultrasonic probe was lined up with the sample, and a distance of 1.5 cm, between the top of 149
the ultrasonic probe and the sample, was maintained. 150
Control and US samples were immersed at the same time in the cooling solutions and when 151
the geometric centre of potato cube reached the planned temperature (Table 1), 8 ultrasonic 152
pulses (1 sec each) were applied to the ultrasound treated sample. As reported in Table 1, 153
ultrasound effects were tested in 6 different moments of the freezing process: near 0°C (US-154
0.1), at temperatures higher (US-1.1, US-1.6, US-2.1) and lower (US-3.0) and near (US-2.6) 155
to the initial freezing temperature of potato. 156
Immediately after the application of ultrasound, control and US samples, inside their own 157
vessels, were put at - 45°C to complete the freezing process. Each experiment was repeated 5 158
times. 159
160
2.4 Statistical analysis 161
Data were analyzed using Statistica 8.0 (Statsoft Inc., Tulsa, OK); significant differences in 162
the treatments were assessed by one-way analysis of variance (ANOVA, 95% significance 163
level) and Fisher’s least significant differences test was applied (P < 0.05). 164
165
3. Results and discussion 166
3.1. Preliminary experiments on water sonocrystallization and supercooling of potato 167
cubes 168
Before ultrasound-assisted freezing of potato cubes, some preliminary studies were made in 169
order to verify if the ultrasound equipment at our disposal was able to induce water 170
sonocrystallization, and find the best operative conditions. Distilled and sparkling water were 171

Research article 1
19
undercooled until -1.5, -2.0 and -3.0°C and ultrasound was applied for 4 sec. The experiment 172
was carried out for different volumes (50 and 500 mL) of water. 173
Ultrasound application promoted crystallization of distilled and sparkling water when the 174
sample was undercooled until -2.0°C. The ice crystals formation was more evident in 175
sparkling water, thanks to the high concentration of dissolved gases. An undercooling 176
temperature of -1.5°C was not sufficient to promote ice crystallization by the application of 177
ultrasound. On the other hand, when water was supercooled, until -3.0°C, the sample became 178
very unstable, and crystallization was caused by little movements of the sample, before 179
ultrasound application. 180
After observing the sonocrystallization of water, ultrasound was decided to be applied to 181
supercooled potatoes, in order to evaluate the effects promoted on a solid matrix. 182
Previous studies on ultrasound-assisted immersion freezing of vegetable products (Li and 183
Sun, 2002; Sun and Li, 2003) highlighted the capacity of power ultrasound to improve the 184
freezing process by reducing the characteristic freezing time. These effects were due to an 185
enhancement of heat transfer induced by acoustic streaming and cavitation of the coolant 186
liquid at the interface with the product treated. However, the heat produced by ultrasound 187
transmission through the medium limited the power applied and the exposure time. For these 188
reasons, an efficient cooling system, able to remove the heat developed by ultrasound was 189
used (Li and Sun, 2002; Sun and Li, 2003). In a following investigation, concerning the 190
application of power ultrasound on immersion freezing of apples, the improvement of heat 191
transfer was found to be an important mechanism of ultrasonic action, but also some evidence 192
of power ultrasound to induce primary nucleation was observed. 193
Ultrasound has been used for a long time to initiate nucleation in supercooled aqueous 194
solutions (Chalmers, 1964). For these reasons it was decided to operate in conditions that 195
permitted to supercool potato cubes during the freezing process. In order to reach the highest 196
supercool degree, a slow freezing rate was selected (Reid, 1998). Potato cubes were firstly 197
refrigerated at about 8°C and then were frozen in a cooling solution having a temperature of -198
6.0°C. Different from previous experiments, where the coolant temperature was set at -18 or -199
20°C (Li and Su 2002; Sun and Li, 2003), the freezing rate was reduced by the higher 200
temperature of the cooling solution used (-6°C), but a high supercooling of about 5.6°C could 201
have been reached. Ultrasound application was tested before and during supercooling, as 202
previously described. 203
Another important difference respect to previous investigations is related to the duration of 204
ultrasound application, in fact owing to the absence of a cooling system able to remove the 205
heat produced by ultrasound, it was decided to reduce as more as possible the duration of 206

Research article 1
20
ultrasonic exposure. Analyzing the results obtained during the preliminary experiments on 207
water sonocrystallization, 8 seconds appeared to be the best choice. 208
209
3.2. Freezing parameters evaluated 210
The immersion freezing of control samples, without ultrasound application, was compared to 211
ultrasound-assisted one. As summarized in Table 1, ultrasound was applied when the 212
temperature of the geometrical centre of the potato cube was in the range from - 0.1°C to - 213
3.0°C. Both temperatures at the surface and at the geometrical centre were recorded. 214
However, the temperature on the potato cube surface was very variable, because of handling 215
the samples during the introduction and the positioning of the thermocouples; for these 216
reasons it was not taken into account. 217
The freezing curve is one of the most accurate and widely adopted methods to determine the 218
freezing point and other food freezing parameters (Rahman et al., 2002), thanks to its easy 219
and cheap use. Freezing curves recorded in the geometrical centre of ultrasound immersion 220
freezing and control samples were analyzed and the following characteristic factors of the 221
freezing process were evaluated: nucleation temperature, initial freezing temperature (NTem 222
and IFT respectively), nucleation time (Ntime), transition phase time (TPtime) and global 223
freezing process time (Ftime). 224
A typical freezing curve obtained by immersion freezing of a potato cube and illustrating the 225
parameters evaluated, is reported in Fig. 2. The effects of ultrasound application on these 226
factors, summarized in Table 2, are individually discussed. 227
228
3.2.1 Nucleation temperature (NTem) and time (Ntime) 229
The nucleation temperature (NTem) is the lowest temperature, reached by the sample during 230
the cooling phase, without ice formation. When crystal nuclei dimensions exceed the critical 231
radius for nucleation, the cooling process stops and nucleation begins by releasing latent heat 232
in the system. This phenomenon is associated with a rapid increase of temperature from the 233
NT to the initial freezing temperature (IFT) (Rahman et al., 2002), generating the nucleation 234
peak in the freezing curve. The time of appearance of the nucleation peak is defined 235
nucleation time (Ntime). The term supercooling is referred to the number of degrees below 236
the freezing point reached during the cooling phase without freezing, thus a higher value of 237
supercooling corresponds to a lower nucleation temperature. 238
Although there is a significant body of literature concerning the sonocrystallization of ice, the 239
mechanisms involved are still not completely clarified. In general sonocrystallization induces 240
a faster primary nucleation (Sun and Li, 2003), accelerating the crystallization of a solution 241
Research article 1
21
free of nucleation seeds; it has been demonstrated that primary nucleation of ice in sucrose 242
solution can be achieved at higher nucleation temperatures in the presence of ultrasound 243
(Chow et al., 2003). Ultrasound application can also initiate the secondary nucleation, 244
determining the production of smaller crystals with better size uniformity (Chow et al., 2005). 245
In this investigation an early primary nucleation of potato cubes was noted when ultrasound 246
was applied. The main effect of ultrasound application was the interruption of the 247
supercooling process and the beginning of nucleation. When ultrasound was applied in the 248
range -1.1 - -3.0°C, higher nucleation temperatures (and a lower supercooling) were recorded 249
(Table 2). 250
The consequence of the abort of supercooling process was the anticipation of the beginning of 251
nucleation process, as revealed Ntime results. The nucleation peak in ultrasound samples 252
appeared before than in the control and it was anticipated from 26.12 min (control sample) to 253
about 9.23 min (US-3 samples). Also in this case, the US-0.1 sample was not significantly 254
different from the control. 255
In the experimental conditions used, ultrasound could cause a rapid nucleation of ice in the 256
outer layers of the sample; this phenomenon was evident also thanks to the formation of a thin 257
stratification of ice on the surface of the sample, during and immediately after the acoustic 258
exposure. Next, ice propagation carried on toward the centre of the product by determining an 259
early nucleation peak formation. If ultrasound application had had an immediate effect on the 260
whole mass of the product, the comparison of the nucleation peak in the geometrical centre of 261
potato cubes would have been recorded immediately after ultrasound exposure, but this event 262
did not occurred. Maybe the transmission of ultrasound inside potato tissues was limited by 263
the low intensity of the acoustic waves. 264
When ultrasound was applied at -0.1°C, no significant differences were observed, in NTem 265
and Ntime, respect to the control sample (Table 2), probably owing to the too high 266
temperature of ultrasound application. 267
268
3.2.2 Initial freezing temperature (IFT) 269
As foodstuffs are a mixture of different constituents, they do not have a single freezing point, 270
but a freezing range. The ‘freezing point’ of potato was considered as the initial freezing 271
temperature (IFT), the temperature at which ice growing started following supercooling 272
(Comini et al., 1974). In particular, as shown in Fig. 2, the IFT was considered as the initial 273
temperature of the plateau formed after the end of supercooling process. Owing to the growth 274
of ice crystals and the release of latent heat, the slowest rate of change of temperature is 275
observed in this area of the freezing curve (James et al., 2009). 276

Research article 1
22
According to theoretical models concerning the cavitation-induced nucleation of ice, the high 277
positive pressure at the end of the collapse or the negative pressure that follows the collapse 278
of a cavitation bubble, increases the equilibrium freezing temperature of water, causing the 279
nucleation of ice (Hickling, 1965; Hunt and Jackson, 1966). At the best of our knowledge no 280
scientific information is reported on the variation of the freezing point of ultrasound-assisted 281
frozen food. 282
Some publications concerning the evaluation of physico-chemical properties of food 283
components, as a-lactalbumin (Jambrak et al., 2010) and whey proteins (Krešić et al., 2008), 284
have shown that acoustic waves caused a freezing point depression. 285
The IFTs of ultrasound treated samples, in particular US-1.1, US-1.5, US-2.0, were 286
significantly higher than the control (IFT -2.7°C), as reported in Table 2. A slight IFT 287
variation was also recorded for US-2.6 , US-3.0 and US-0.1, in the last case ultrasound had 288
not have a significant effect on NT and Ntime. Ultrasound was supposed to have caused a 289
slight increase of cooling solution temperature (about 0.5°C), reducing the freezing rate of the 290
potato cubes. This could have facilitated the freezing of extracellular water, which has a lower 291
solute concentration, determining a higher initial freezing temperature of potato cubes. 292
According to a different hypothesis the rise of IFT could be a consequence of physical, 293
chemical or structural modifications caused by ultrasound on potato cubes, but a direct effect 294
of ultrasound on freezing transition phase was excluded. 295
296
3.2.3 Transition phase and global freezing duration 297
The freezing time (Ftime) was expressed as the duration of the whole freezing process, 298
starting from the beginning of the cooling phase until the end of freezing (Fig. 2). The end 299
point of freezing was evaluated as the moment when the freezing curve reached the maximum 300
slope after crystallization (Rahman et al., 2002). 301
The duration of the temperature plateau after sample supercooling, on the plot time-302
temperature and having a slope near zero, was identified as transition phase time (TPtime); it 303
was calculated as the distance between Ntime and Ftime. 304
Ftime and TPtime values were significantly affected by the heat produced by ultrasound, 305
which could not be efficiently removed from the system. 306
Although such preface, the total Ftime of control sample was statistically identical to the 307
ultrasound-treated ones, unless US-2 sample that froze more quickly. The lowest freezing 308
time of US-2 (53.39 min) was due to the fact that it had started before the nucleation process, 309
as occurred for the samples US-1.1, -1.5, -2.6, -3.0, but unlike the other US treated samples, 310
its transition phase time was slightly lower, determining the lowest FTime value. 311

Research article 1
23
The application of ultrasound caused an increase in TPtime, respect to control samples. This 312
result could be explained by the lower supercooling reached by these samples. 313
In this regard, further investigations are required to verify the effect of ultrasound on the 314
quality parameters of frozen and thawed potatoes. In particular, it is necessary to evaluate if 315
the anticipation of the nucleation is accompanied by the formation of smaller ice crystals, or if 316
the effect of ultrasound is only a mechanical interruption of the supercooling process, without 317
affecting the ice crystal structure and distribution inside vegetable tissue. Texture and sensory 318
studies of the products obtained by ultrasound-assisted freezing should be evaluated. 319
4. Conclusions 320
The application of ultrasound during immersion freezing of potatoes modified important 321
freezing parameters, as revealed by the analysis of the freezing curves. 322
The acoustic waves exposure caused an anticipation of the nucleation beginning, when the 323
temperature of ultrasound application in the centre of the sample was lower than -0.1°C. 324
Despite an efficient removing of the heat developed by ultrasound was not possible, owing to 325
instrumental limitations, when ultrasound was applied at -2.0°C the freezing time resulted 326
significantly lowered respect with the control samples. 327
The anticipation of nucleation beginning and the reduction of freezing time could have a great 328
impact for food industry. However further investigations are necessary in order to better 329
explain the effect of acoustic waves on food immersion freezing, and evaluate quality 330
properties of the product treated. 331
332
333
Acknowledgements 334
The authors would like to thank Startec S.r.l. for the ultrasonic equipment and for the precious 335
help given to the investigation. 336
337
338
Research article 1
24
References 339
Albu, S., Joyce, E., Paniwnyk, L., Lorimer, J.P., & Mason, T.J.( 2004). Potential for the use 340
of ultrasound in the extraction of antioxidants from Rosmarinus officinalis for the food and 341
pharmaceutical industry. Ultrasonics Sonochemistry, 11, 261-265. 342
343
Bermúdez-Aguirre, D., & Barbosa-Cánovas, G.V. (2008). Study of butter fat content in milk 344
on the inactivation of Listeria innocua ATCC 51742 by thermo-sonication. Innovative Food 345
Science and Emerging Technologies, 9, 176-185. 346
347
Chalmers B. (1964). Principles of solidification (pp. 62–90). John Wiley and Sons, Inc., New 348
York. 349
350
Chemat, F., E-Huma, Z., & Khan, M.K. (2011). Applications of ultrasound in food 351
technology: Processing, preservation and extraction. Ultrasonics Sonochemistry, 18, 813-835. 352
353
Chow, R., Blindt, R., Chivers, R., & Povey, M. (2003). The sonocrystallisation of ice in 354
sucrose solutions: primary and secondary nucleation. Ultrasonics, 41, 595–604. 355
356
Chow, R., Blindt, R., Chivers, R., & Povey, M. (2005). A study on the primary and secondary 357
nucleation of ice by power ultrasound. Ultrasonics, 43, 227-230. 358
359
Comini, G., Del Guidice, S., Lewis, R.W., & Zienkiewicz, O.C. (1974). Finite element 360
solution of non-linear heat conduction problems with special reference to phase change. 361
International Journal for Numerical Methods in Engineering, 8, 613-624. 362
363

Research article 1
25
Crivelli, G. (1992). La surgelazione dei prodotti ortofrutticoli (pp. 3-69). Edagricole (Ed.), 364
Bologna. 365
366
Delgado, A.E., Zheng, L., & Sun, D.W. (2009). Influence of ultrasound on freezing rate of 367
immersion frozen apples. Food Bioprocess Technology, 2, 263-270. 368
369
Denbow, N. (2001). Ultrasonic instrumentation in the food industry. In E. Kress-Rogers and 370
C.J.B Brimelow (Eds.), Instrumentation and sensors for the food industry (pp. 326-402). 371
Woodhead Publishing Ltd, Cambridge. 372
373
Hickling, R. (1965). Nucleation of freezing by cavity collapse and its relation to cavitation 374
damage. Nature, 206, 915-917. 375
376
Hunt, J.D., & Jackson, K.A. (1966). Nucleation of solid in an undercooled liquid by 377
cavitations. Journal of Applied Physics, 37, 254-257. 378
379
Inada, T., Zhang, X., Yabe, Y., & Kozawa, Y. (2001). Active control of phase change from 380
supercooled water to ice by ultrasonic vibration. 1. Control of freezing temperature. 381
International Journal of Heat and Mass Transfer, 44, 4523-4531. 382
383
Jambrak, R.A., Mason, T.J., Lelas, V., & Krešić, G. (2010). Ultrasonic effect on 384
physicochemical and functional properties of α-lactalbumin. LWT-Food Science and 385
Technology, 43, 254-262. 386
387
James, C., Seignemartin, V., & James, S.J. (2009). The freezing and supercooling of garlic 388
(Allium sativum L.). International Journal of Refrigeration, 32, 253-260. 389

Research article 1
26
Krešić, G., Lelas, V., Režek Jambrak, A., Herceg, Z., & Rimac Brnčić, S. (2008). Influence of 390
novel food processing technologies on the rheological and thermophysical properties of whey 391
proteins. Journal of Food Engineering, 87, 64-73. 392
393
Luque de Castro, M.D., & Priego-Capote, F. (2007). Ultrasound-assisted crystallization 394
(sonocrystallization). Ultrasonics Sonochemistry, 14, 717-724. 395
396
Li, B., & Sun, D.W. (2002). Effect of power ultrasound on freezing rate during immersion 397
freezing of potatoes. Journal of Food Engineering, 55, 277-282. 398
399
Mason, T.J. (1998). Power ultrasound in food processing–The way forward. In M.J.W. Povey 400
& T.J. Mason (Eds.), Ultrasound in food processing (pp. 104-124). Blackie Academic & 401
Professional, Glasgow. 402
403
Mason, T.J., Paniwnyk, L., & Lorimer, J.P. (1996). The uses of ultrasound in food 404
technology. Ultrasonic Sonochemistry, 3, S253-S260. 405
406
Mulet, A., Cárcel, J.A., Benedito, J., & Sanjuan, N. (2002). Applications of low-intensity 407
ultrasonics in the dairy industry. In J. Welti-Chanes, G. Barbosa-Canovas, J. Aguilera (Eds.), 408
Engineering and Food for the 21st Century (pp.764-780). CRC Press, New York. 409
410
Ohsaka, K., & Trinh, E.H. (1998). Dynamic nucleation of ice induced by a single stable 411
cavitation bubble. Applied Physics Letters, 73, 129-131. 412
413

Research article 1
27
Rahman, M.S., Guizani, N., Al-Khaseibi M., Al-Hinai, S.A., Al-Maskri, S.S., & Al-414
Hamhami, K. (2002). Analysis of cooling curve to determine the end point of freezing. Food 415
Hydrocolloid, 16, 653-659. 416
417
Raso, J., Manas, P., Pagan, R., & Sala, F.J. (1999). Influence of different factors on the output 418
power transferred into medium by ultrasound. Ultrasonics Sonochemistry, 5, 157-162. 419
420
Reid, D. (1998). Freezing preservation of fresh foods: quality aspects. In: I.A. Taub, R.P. 421
Singh (Eds.), Food Storage Stability (pp. 387-396). CRC Press Inc, Baton Rouge. 422
423
Sigfusson, H., Ziegler, G.R., & Coupland, J.N. (2004). Ultrasonic monitoring of food 424
freezing. Journal of Food Engineering, 62, 263-269. 425
426
Sun, D.W, & Li, B. (2003). Microstructural change of potato tissues frozen by ultrasound-427
assisted immersion freezing. Journal of Food Engineering, 57, 337-345. 428
429
Zhang, X., Inada, T., & Tezuka, A. (2003). Ultrasonic-induced nucleation of ice in water 430
containing air bubbles. Ultrasonics Sonochemistry, 10, 71-76. 431
432
Zheng, L., & Sun, D.W. (2006). Innovative applications of power ultrasound during food 433
freezing processes-a review. Trends in Food Science & Technology, 17, 16-23. 434
435

Research article 1
28
Figure 1 Schematic representation of the experimental equipment for control (A) and 436
ultrasound-assisted immersion freezing (B). 437
438
439
Figure 2 Freezing curve of a potato sample and freezing parameters evaluated. 440
441
442
443
444
Sonotrode
Transducer
Retaining needle
Ultrasound generator
Thermocouples
Data logger
A - Control sample
Potato cubes
Cooling solution (-6°C)
B - US sampleCooling solution
(-6°C)
-10
-5
0
5
10
0 10 20 30 40 50 60 70 80
Nucleation Temperature
(NTem)
Initial Freezing
Temperature (IFTem)
Nucleation Time
(Ntime)
Freezing Time
(Ftime)
Transition Phase Time (Tptime)
Time (min)
Tem
per
atu
re (°C
)

Research article 1
29
Table 1 445
Immersion freezing treatments. 446
Sample ID USA temperature (°C)
Control US not applied
US-0.1 -0.13 ± 0.11
US-1.1 -1.12 ± 0.13
US-1.6 -1.54 ± 0.09
US-2.1 -2.08 ± 0.08
US-2.6 -2.58 ± 0.12
US-3.0 -3.00 ± 0.03 All values are means ± standard deviation. 447
A US: ultrasound. 448
449
450
Table 2 451
Freezing parameters of control and ultrasound-assisted samples. 452
Treatments Freezing parameters
NTA (°C) NtimeB (min) IFTC (°C) TPtimeD (min)
FtimeE (min)
Control -5.67 ± 1.03c 26.12 ± 6.08a -2.70 ± 0.37d 39.21 ± 3.33c 62.44 ± 10.15a
US-0.1 -5.49 ± 0.42bc
24.95 ± 3.16a -2.33 ± 0.28abcd
41.55 ± 5.29bc
66.50 ± 4.58a
US-1.1 -4.01 ± 0.87ac
17.37± 3.52b -2.26 ± 0.25abc
47.83 ± 6.67a 60.51 ± 5.83ab
US-1.5 -3.74 ± 0.95a 9.63 ± 3.79c -2.17 ± 0.47a 46.60 ± 6.73ab
58.99 ± 7.66ab
US-2.0 -3.62 ± 1.22a 8.64 ± 3.90c -2.11 ± 0.48ab
41.50 ± 6.59c 53.39 ± 5.19b
US-2.6 -3.85 ± 0.98a 11.44 ± 3.82bc -2.53 ± 0.21bcd
51.27 ± 5.83a 64.32 ± 7.16a
US-3.0 -3.73 ± 1.08a 9.23 ± 2.96c -2.47 ± 0.48cd
50.01 ± 4.18a 62.23 ± 8.82a
All values are means ± standard deviation. Means within columns with different letters are 453
significantly different (P < 0.05). 454
A NT: nucleation temperature (°C). 455
B Ntime: nucleation time (min). 456
C IFT: initial freezing temperature (°C). 457
D TPtime: transition phase time (min). 458
E Ftime: freezing time (min). 459

Chapter 3
30
3.2. IMPREGNATION TECHNOLOGIES
3.2.1 Impregnation process: atmospheric pressure vs. vacuum application
Impregnation technologies can be used to incorporate physiologically active compounds into
fresh food, thus obtaining functional foods. In this way, the product composition, as well as
its physical and chemical properties may be changed in order to improve its characteristics
(Fito and Chiralt, 2000; Fito et al., 1996, 2000, 2001). Impregnation processes can be carried
out at atmospheric pressure (atmospheric impregnation, AI), under vacuum conditions
(vacuum impregnation, VI) or by a combination of vacuum impregnation followed by large
periods at atmospheric pressure (Anino et al., 2005).
The operating pressure is one of the factors affecting the composition and the
structural characteristics of the final product. During AI, plant cellular structure acts as a
semi-permeable membrane and water and solutes fluxes are usually considered as diffusion
driven. When AI is applied, longer treatment times are required but a great solute final
concentration can be achieved (Anino et al., 2005).
In VI process, a porous product is immersed in an adequate liquid phase and is
submitted to a two step pressure change. First, a vacuum pressure promotes the gas flow
throughout the porous product until mechanical equilibrium is achieved. In this moment,
capillary penetration will be higher than at atmospheric pressure. When atmospheric pressure
is restored in a second step, residual gas compression leads to the external solution inflow
while pressure gradients persist. This phenomenon, explained for the first time by Fito (1994),
is called (hydrodynamic mechanism, HDM).
From the HDM model it is possible to predict the amount of liquid that can be
introduced into a porous food (Fito and Chiralt, 1995). The volume fraction of the initial
sample (χ) impregnated by the external liquid, when mechanical equilibrium is achieved in
the sample, has been modeled in a simplified way for stiff products, as a function of the
compression ratio (r), sample effective porosity (ϵe), initial gas pressure in the pores (ρ1) and
external system and capillary pressure (ρ2), as described in the following equations (Fito,
1994):
−=re
11εχ
Where
1
2
ρρ=r

Chapter 3
31
These equations permit to evaluate the amount of sample volume that will be occupied
by an external liquid of a determined composition at the mechanical equilibrium status, in
terms of the product porosity and the and the compression ratio, when the porosity remains
constant during compression, that is the relative deformation is unimportant (Fito and Chiralt,
2000).
Figure 3.2.1 HDM mechanism in a vegetable food immersed in a liquid system.
The HDM was extended for viscoelastic porous products, where pressure changes
cause not only gas or liquid flow but also solid matrix deformation-relaxation phenomena
(DRP). In viscoelastic materials expansion-compression processes lead to changes in pore
volume, which will be time-dependent. During the first VI step, product volume usually
swells, associated with gas expansion, and, afterward, the solid matrix relaxes; capillary
penetration or expelling of internal liquid also occurs in this period. In the second step,
compression causes volume deformation and subsequent relaxation, coupled with the external
liquid penetration in the pores. Mechanical properties of the solid matrix and flow properties
of the penetrating liquid in the pores will define characteristic penetration and deformation-
relaxation times responsible for the final impregnation and deformation status of the sample at
equilibrium. The following equation describes the relation between the compression ratio (r),
the initial sample porosity (ϵe), the final sample volume fraction impregnated by the external
solution (χ) and the sample volume deformations at the end of both the process (γ) and the
vacuum step (γ1) (all of these are referred to the sample initial volume):
(Fito et al., 1996; Zhao y Xie, 2004)
The gas in the pores flows out.
External liquid enters the pore as an effect of capillary pressure. Remaining gas compresses until equilibrium is reached.
Differences between external and internal pressures produce both solid matrix deformations and hydrodynamic mechanism.
1. Vacuum is applied 2. Equilibrium pressure is reached
3. Atmospheric pressure is restored

Chapter 3
32
( ))1(
1
−+−
=r
re
γγχε
The substitution of internal gases by a liquid phase allows direct formulation of a food,
without exposing the food structure to the stress due to the long exposure to gradient solute
concentration as in atmospheric process (Chiralt et al., 1999).
HDM can allow in some cases a great mass transfer velocity and a better quality
product, although the effectiveness of VI for the incorporation of a specific component is
limited by its solubility and/or by the vegetable matrix porosity (Anino et al., 2005).
VI efficiency has been reported to depend on:
-process parameters, including vacuum level and time, holding time in the
impregnation solution after pressure release (Hoover and Miller, 1975);
-food matrix, including effective porosity (Mujica-Paz et al., 2003a) and tortuosity;
-impregnation solution properties, such as osmolarity (Mujica- Paz et al., 2003b) and
viscosity (Barat et al., 2001; Guillemin et al., 2008).
Impregnation technologies have been used to fortify fruit and vegetable matrices with
probiotics and minerals (Alzamora et al., 2005), such as calcium (Mujica-Paz et al., 2002;
Gras et al., 2003) and zincum (Tapia et al., 2003; Zhao and Xie 2004). Some of these
applications aimed to improve also the texture characteristics, through the incorporation of
calcium salts and chitosan-based edible coatings (Anino et al., 2005; Vargas et al., 2009).
3.2.2 Aroma enrichment of food through impregnation technology
Vacuum impregnation technology can also be used to change the food matrix composition
with the final aim of improving its sensory characteristics (Fito et al., 2001). Modifying the
flavour of foods is a longstanding practice that has been developed in response to various
factors, starting with an initial attempt to ensure survival of the human race and now to deliver
the desired properties to the foods (Reineccius, 2006).
Fruit preparations, which are important ingredients of several milk products, are often
added of natural or artificial flavourings, but to the best of our knowledge, there are no
methods for the production of food ingredients enriched with aromas; for these reasons it was
decided to investigate the enrichment of apple sticks with green apple aroma, by comparing
traditional techniques such as AI and VI, with more innovative technologies such as
impregnation assisted by ultrasound (USI) and the combination of vacuum plus ultrasound
technologies (VUSI).

Chapter 3
33
Ultrasound is extremely effective in accelerating heat and mass transfer kinetics
(Kentish and Ashokkumar, 2011); recently high power ultrasound has been used to improve
osmotic dehydration (Fernandes et al. 2008), prickling and marinating processes (Kingsley
and Farkas, 1990; Carcel et al., 2007; Hatloe, 1995; Sanchez et al., 1999).

Research article 2
34

Research article 2
35

Research article 2
36

Research article 2
37

Research article 2
38

Research article 2
39

Chapter 3
40
3.3 PULSED ELECTRIC FIELDS
3.3.1 Investigation of the effects of pulsed electric fields on total phenol
content and on polyphenoloxidase and pectin methylesterase activity of
melon (Cucumis melo L.) juice
Introduction
Thermal processing is the most common method to extend the shelf-life of fruit and vegetable
juices, however, these treatments reduce the sensory and nutritional qualities of food products.
Melon (Cucumis melo L.) is a commercially important crop in many countries. Owing to its
high pH and low acidity, freshly cut melon or minimally-processed melon-based products
have a short shelf-life. Moreover, the heat treatment of melon juice is a difficult issue because
this fruit is thermosensitive, and a cooked off-odour is produced during thermal process.
Other undesirable changes of fruit juices are related to color, viscosity and flavour
alterations. Many of these reactions are catalyzed by enzymes such as polyphenoloxidase
(PPO), peroxidase (POD), lipoxygenase (LOX), pectin methylesterase (PME) and
polygalacturonase (PG).
Non-thermal technologies, such as pulsed electric field (PEF) might be a valid
alternative to heat treatment to obtain a cold pasteurization of melon juice. PEF treatment
might reduce the quality losses of melon juice thanks to a small heat production. To date, only
a little number of investigations have been carried out on the application of PEF on melon
juice, and much of these researches have focused on microbial inactivation on inoculated
products.
The objectives of our study were to investigate the effects of PEF on the total phenol
(TP) content of melon juice treated by PEF and to compare it with non-treated juice.
Moreover PME and PPO relative activities of fresh melon juice were evaluated through
potentiometric and spectrophotometric techniques and were compared to those of melon juice
treated by PEF.
Material and methods
Sample preparation for PEF treatment
Batches of melon (Cucumis melo L. - var. Chino) were bought on the local market in
Monterrey. Fruits were washed with tap water, and with a disinfection solution of sodium
hypochlorite, then they were rinsed with water and dried. In order to obtain melon juice they
were peeled, cut and homogenized with a mixer. The obtained puree was filtered before PEF
treatment.

Chapter 3
41
Physico-chemical properties of fresh fruits
Three fruits were randomly selected from the batch used to produce melon juice. They were
treated in the same way described in the previous paragraph for melon juice production.
Titrable acidity was determined according to AOAC (1984) and expressed as g citric acid on
100 g of melon juice. Soluble solids (°Brix) were measured with an Atago Hand refractometer
(ATAGO, Co. Osaka, Japan). Water activity was determined with a Decagon CX-1
hygrometer (Decagon Devices Inc., Pullman, Washington); the pH was evaluated with a
Beckman pH-meter.
PEF equipment
An ELCRACK HVP5 apparatus was used to process melon juice. Pulsed electric field
strength, pulse frequency and treatment time were ranged by applying a central composite
design (three numeric factors, n = 3). A total of 20 experiments, including 14 non-center and
6 center points, were carried out in duplicate. Appropriate values of pulsed electric field
strength (18.75-23.75 kV/cm), pulse frequency (100-900 Hz) and treatment time (4-8 µs)
were selected in order to obtain the lowest heating effects; the highest temperature increase
obtained in the product after treatment was 17°C.
Experimental design and statistical analysis
A central composite design was used to determine the effect of the voltage, frequency and
treatment time on total phenol content, PME and PPO residual activity of melon juice treated
by PEF. Experimental conditions are presented in table 3.3.1.
Table 3.3.1 Coded and real values of the independent variables in a central composite design.
Coded value -1 0 1 E (kV/cm) 21.3 19.8 22.8 Frequency (Hz) 262 500 738 Time (µsec) 5 6 7
A total of 20 experiments, including 14 non-center and 6 center points, were carried
out in duplicate, as reported in table 3.3.2. The experimental design allowed to establish a
second order polynomial by:
y = b0 + b1x1 + b2x2 + b3x3 + b12x1x2 + b13x1x3 + b23x2x3 + b1x12 + b2x2
2 + b3x32
The statistical analysis was performed using Design Expert V.5.0.3 (1996) to obtain
the coefficients of the polynomial, the error probabilities (p), and the explained variability

Chapter 3
42
percentage (R2), which allows the evaluation of the global fitting of the model to the
experimental values of independent variables.
Table 3.3.2 Central composite design followed to process Cucumis melo juice with different
PEF treatments.
Experiment E (kV/cm) F (Hz) t (µs) 1 22.8 262 5 2 19.8 262 7 3 22.8 738 7 4 21.3 500 6 5 18.8 500 6 6 21.3 900 6 7 21.3 500 8 8 19.8 738 5 9 21.3 100 6 10 19.8 262 5 11 21.3 500 6 12 19.8 738 7 13 22.8 262 7 14 22.8 738 5 15 21.3 500 6 16 21.3 500 6 17 21.3 500 6 18 23.8 500 6 19 21.3 500 6 20 21.3 500 4
Colorimetric determination of total phenol (TP) content
The total phenol (TP) content of melon juice was determined by the Folin–Ciocalteau method
at 750 nm (Singleton & Rossi, 1965), using a multimode microplate reader (Biotek Sinergy
HT, Biotek Instruments, Vermont, USA). TPs were calculated as gallic acid equivalent (GAE)
from the calibration curve of gallic acid standard solutions (r2 = 0.9996) and expressed as mg
GAE/L of melon juice. The analyses were done in triplicate; and the mean values and the
standard deviations were calculated.
PPO and PME measurements
For the assay of PPO, 0.5 mL of the sample, previously centrifuged and filtered through 0.45
µm nylon filters, was mixed with 2.0 mL 0.05 mol/L sodium phosphate buffer (pH=6.8). The
sample was kept for 15 min at 30°C and then 1 mL of 0.2 mol/L catechol was added. PPO
activity was determined by measuring absorbance of the mixture at 420 nm, using a

Chapter 3
43
multimode microplate reader (Biotek Sinergy HT, Biotek Instruments, Vermont, USA) at
32°C.
The absorbance was acquired every 20 s for 30 min. The data obtained was plotted
against time and the PPO activity was calculated from the slope of the initial linear part of the
curves.
One unit of PPO activity was defined as the change in absorbance at 420 nm/min and
per millilitre of melon juice.
PME activity was measured by adapting the method described by Elez-Martínez et al.
(2007). A 10 mL aliquot of melon juice was added with 10 mL of NaCl 2 N, then the mixture
was tempered at 30°C for 10 min. 10 mL of the diluted sample was mixed 40 mL of 1%
pectin–salt substrate (also at 30°C) and incubated at 30°C. The solution was adjusted to pH
7.0 with 2.0 N NaOH, and then the pH of the solution was readjusted to pH 7.7 with 0.05 N
NaOH. After the pH reached 7.7, 0.05 mL of 0.125 N NaOH was added. The time required
for the solution pH to return to 7.7 was measured.
Both enzyme (PPO and PME) were expressed as activity units and the relative residual
activity (RA%) of PPO and PME was calculated as the activity after treatment divided by the
activity before the treatment. The residual activity was obtained with the following equation:
100(%)0
⋅=A
ARA t
where:
At: enzyme activity units of melon juice after PEF
A0: enzyme activity units of untreated melon juice
Results and discussion
The physic-chemical properties of melon juice analyzed are presented in table 3.3.3. Each
value is the mean of three measurements (n = 3).
Table 3.3.3 Physico-chemical properties of melon juice treated (mean value ± standard
deviation).
Property Value
aw 0.97 ± 0.02
pH 7.20 ± 0.01
Aciditya 0.98 ± 0.01
Soluble solidsb 9.90 ± 0.02 a g citric acid/100 g melon juice. b °Brix.

Chapter 3
44
The analysis of variance of the results obtained showed that the second order models
were well adjusted to the experimental data for both total phenols and enzyme activity (p ≤
0.05), as reported on table 3.3.4. The results obtained indicated that more than 95% of
behavior variation of TPs could be explained by the quadratic fitted model; although lower R2
were obtained for the residual enzymatic activities, the explained variation was respectively
74.8 and 88.0 for PPO and PME. The bold characters indicate that the corresponding
parameters have a significant effect on y (p < 0.05).
Table 3.3.4 Analysis of variance for TPs, PME and PPO (y), using coded variables (x1: voltage; x2: frequency; x3: time).
Source SS df MS F p(F) Model for TPs: y = 301.44 - 5.63x1 + 1.61x2 -1.63x3 - 2.54x1x2 + 7.20x1x3 - 3.05x2x3 - 11.52x1
2 -15.86x22 - 13.19x3
2 (R2 = 0.9791)
Model 7791.7 9 865.7 52.02 < 0.0001 Residual 166.4 10 16.6 Model for PME: y = 94.28 + 1.08x1 - 0.08x2 + 0.48x3 + 0.24x1x2 - 1.27x1x3 + 0.76x2x3 + 1.45x1
2 + 3.11x22 + 1.82x3
2 (R2 = 0.8804)
Model 224.38 9 24.9 8.18 0.0015 Residual 30.49 10 3.05 Model for PPO: y = 92.99 + 4.31x1 + 7.24x2 + 0.74x3 + 7.44x1x2 - 3.36x1x3 - 6.51x2x3 + 1.39x1
2 - 2.81x22 + 2.37x3
2 (R2 = 0.7483)
Model 2095.82 9 232.87 3.30 0.0382 Residual 705.10 10 70.51
The TPs content of melon juice treated with PEF was well fitted with a quadratic
model, as illustrated in figure 3.3.3.

Chapter 3
45
Figure 3.3.3 Surface response of the effect of pulse frequency and electric field strength on
TP content of melon juice treated by PEF. Duration of electric pulse: 6 µs (R2 = 0.9791).
PEF conditions corresponding to the central point of the experimental design (21.3
kV/cm, 500 Hz, 6 µs) determined the highest TP concentration, respect to non-treated melon
juice.
As illustrated in figure 3.3.4, the TP content in fresh non-treated melon juice was
initially 266.5 ppm, and it reduced to 231.4 and 222.5 ppm, after 3 and 6 days of storage,
respectively. TP content of PEF treated juice resulted 13.2 %, 25.9% and 29.9% higher than
non-treated sample, at 0, 3 and 6 days of storage, respectively.
Figure 3.3.4 Comparison of TP content of melon juice non-treated and treated by PEF (21.3
kV/cm, 500 Hz, 6 µs), at different storage times.
19.120.5
21.322.0
22.7
262.1 381.0
500.0 618.9
737.8
267.0
275.8
284.5
293.3
302.0
Tota
l p
he
no
lic
(pp
m)
Electric field (kV/cm) Pulse frequency (Hz)
0
50
100
150
200
250
300
350
400
Time 0 Time 3 Time 6
TP
(p
pm
ga
llic a
cid
)
Storage time (days)
Non-treated melon juice Melon juice treated with PEF

Chapter 3
46
PME results fitted well with a surface quadratic model design (R2: 0.8804, p<0.05); a
maximum reduction of the enzymatic activity was obtained in correspondence of the central
point (21.3 kV, 500 Hz, 6 µs), as illustrated in figure 3.3.5.
Figure 3.3.5 Surface response of the effect of pulse frequency and electric field strength on
relative PME activity; pulse duration: 6 µs.
Also PPO activity was fitted well by a quadratic model (R2: 0.7483, p<0.05). In
several experimental conditions tested, the PPO relative activity was increased by PEF
process, with respect to the correspondent non-treated melon juice. The highest PPO activity
reduction was obtained with electric pulses of low frequency and high duration (5-6 µs), as
reported in figure 3.3.6.
Figure 3.3.6 Surface response of the effect of pulse frequency and electric field strength on
relative PPO activity; pulse duration: 6 µs.
18.7520.00
21.2522.50
23.75
100.00 300.00
500.00 700.00
900.00
94.0
98.0
102.0
106.0
110.0 R
elat
ive
PM
E a
ctiv
ity(%
)
Electric field(kV/cm)
Pulse frequency(Hz)
18.7520.00
21.2522.50
23.75
100.00 300.00
500.00 700.00
900.00
63.0
79.2
95.5
111.7
128.0
Rel
ativ
e P
PO
act
ivity
(%)
Electric field(kV/cm)
Pulse frequency(Hz)
Chapter 3
47
Conclusions
A central composite design was used to compare the TP content, PME and PPO of melon
juice treated by PEF to a non–treated product.
TPs of melon juice treated with PEF were well fitted with quadratic surfaces; PEF condition
corresponding to the central point of the experimental design determined the highest TP
content in PEF melon juice at each storage time (0, 3 and 6 days).
PME and PPO relative activities of melon juice treated by PEF were well fitted by
quadratic surfaces. The maximum reduction of the PME activity was obtained in
correspondence of the central point of the experimental design. The relative activity of PPO
was increased or reduced respect to the un-treated melon juice, depending on the PEF
conditions applied. Further studies are necessary in order to explain the variations detected.

Chapter 3
48
3.4 REFERENCES
Anino S.V., Salvatori D.M., Alzamora S.M. (2005). Changes in calcium level and mechanical
properties of apple tissue due to impregnation with calcium salts. Food Research
International.
AOAC. (1984). Official methods of analysis (14th ed.). Washington, DC: Association of
Official Analytical Chemists.
Barat J.M., Fito P., Chiralt A. (2001). Modelling of simultaneous mass transfer and structural
changes in fruit tissues. Journal of Food Engineering 49, 77-85.
Bermúdez-Aguirre D., Mobbs T., Barbosa-Cánovas G.V. (2011). Ultrasound Applications in
Food Processing. In H. Feng, G.V. Barbosa-Cánovas, J. Weiss (Eds.). Ultrasound
technologies for food and bioprocessing (pp. 65-105) Springer Science+Business Media: New
York Dordrecht Heidelberg London.
Carcel J.A., Benedito J., Bon J., Mulet A. (2007). High intensity ultrasound effects on meat
brining. Meat Science 76, 611-619.
Chemat F., e-Huma Z., Kamran Khan M. (2011). Applications of ultrasound in food
technology: Processing, preservation and extraction. Ultrasonics Sonochemistry 18, 813–835.
Chiralt A., Fito P., Andrés A., Barat J.M., Martínez-Monzó J., Martínez-Navarrete N. (1999).
Vacuum impregnation: A tool in minimally processing of foods. In F.A.R. Oliveira, & J.C.
Oliveira (Eds.). Processing of foods: Quality optimization and process assessment (pp. 341-
356). Boca Raton, FL: CRC Press.
Chow R., Blindt R., Chivers R., Povey M. (2003). The sonocrystallisation of ice in sucrose
solutions: primary and secondary nucleation. Ultrasonics 41, 595-604.
Chow R., Blindt R., Chivers R., Povey M. (2005). A study on the primary and secondary
nucleation of ice by power ultrasound. Ultrasonics 43, 227-230.
Design Expert. (1996). Stat-Ease Corporation, Minneapolis.
Dolatowski Z.J., Stadnik J., Stasiak D. (2007). Applications of ultrasound in food technology.
ACTA Scientiarum Polonorum - Technologia Alimentaria 6, 89-99.
Elez-Martínez P., Suárez-Recio M., Martín-Belloso O. (2007). Modeling the reduction of
pectin methyl esterase activity in orange juice by high intensity pulsed electric fields. Journal
of Food Engineering 78, 184-193.

Chapter 3
49
Feng H., Yang W., Hielscher T. (2008). Power Ultrasound. Food Science and Technology
International l14, 433–436.
Fernandes F.A.N., Oliveira F.I.P., Rodrigues S. (2008). Use of Ultrasound for Dehydration of
Papayas. Food and Bioprocess Technology 1, 339-345.
Fito P. (1994). Modelling of vacuum osmotic dehydration of food. Journal of Food
Engineering 22, 313-328.
Fito P., Andrés A., Chiralt A., Pardo P. (1996). Coupling of hydrodynamic mechanism and
deformation relaxation phenomena during vacuum treatments in solid porous food-liquid
systems. Journal of Food Engineering 27, 229-240.
Fito P., Chiralt A. (2000). Vacuum impregnation of plant tissues. In S.M. Alzamora, M.S.
Tapia, & A. López-Malo (Eds.). Minimally processed fruits and vegetables (pp. 189-201).
Maryland: Aspen Publishers.
Fito P., Chiralt A., Barat J.M., Martínez-Monzó J. (2000). Vacuum impregnation in fruit
processing. In J.E. Lozano, G. Barbosa-Cánovas, E. Parada Arias, & M.C. Asimmón (Eds.).
Trends in food engineering (pp. 149-164). Maryland: Aspen Publishers.
Fito P., Chiralt A., Betoret N., Gras M., Cháfer M., Martínez-Monzó J., Andrés A., Vidal D.
(2001). Vacuum impregnation and osmotic dehydration in matrix engineering. Application in
functional fresh food development. Journal of Food Engineering 49, 175-183.
Gras M.L., Vidal D., Betoret N., Chiralt A., Fito P. (2003). Calcium fortification of
vegetables by vacuum impregnation Interactions with cellular matrix. Journal of Food
Engineering 56, 279-284.
Guillemin A., Degraeve P., Noël C., Saurel R. (2008). Influence of impregnation solution
viscosity and osmolarity on solute uptake during vacuum impregnation of apple cubes (var.
Granny Smith). Journal of Food Engineering 86, 475-483.
Hatloe J. (1995). Methods for pickling and/or marinating non-vegetable foodstuff raw
material. International Patent WO 9518537.
Henglein A. (1987). Sonochemistry: Historical developments and modern aspects.
Ultrasonics 25, 6-16.
Hickling R. (1965). Nucleation of freezing by cavity collapse and its relation to cavitation
damage. Nature 206, 915-917.

Chapter 3
50
Hoover M.W., Miller N.C. (1975). Factors influencing impregnation of apple slices and
development of a continuous process. Journal of Food Science 40, 698-700.
Hunt J.D., Jackson K.A. (1966). Nucleation of solid in an undercooled liquid by cavitations.
Journal of Applied Physics 37, 254-257.
Inada T., Zhang X., Yabe Y., Kozawa Y. (2001). Active control of phase change from
supercooled water to ice by ultrasonic vibration. 1. Control of freezing temperature.
International Journal of Heat and Mass Transfer 44, 4523-4531.
Kentish S., Ashokkumar M. (2011). The Physical and Chemical Effects of Ultrasound. In H.
Feng, G.V. Barbosa-Cánovas, J. Weiss (Eds.). Ultrasound technologies for food and
bioprocessing (pp. 1-12). Springer Science-Business Media: New York.
Kingsley I.S., Farkas P. (1990). Pickling process and product, International Patent WO
1990/005458, 1990.
Knorr D., Zenker M., Heinz V., Lee D.U. (2004). Applications and potential of ultrasonics in
food processing. Trends in Food Science & Technology 15, 261-266.
Leighton T. (1998). The principles of cavitation. In M.J.W. Povey & T.J. Mason (Eds.).
Ultrasound in food processing (pp. 151–182). London: Blackie Academic & Professional.
Li B., Sun D.W. (2002). Effect of power ultrasound on freezing rate during immersion
freezing of potatoes. Journal of Food Engineering 55, 277-282.
Li B., Sun D.W. (2002). Novel methods for rapid freezing and thawing of foods – a review.
Journal of Food Engineering 54, 175-182.
Mason T.J. (1998). Power ultrasound in food processing – the way forward. In M.J.W. Povey
& T.J. Mason (Eds.). Ultrasound in food processing (pp. 105–126). London: Blackie
Academic & Professional.
Mason T.J., Luche J.L. (1996). Ultrasound as a new tool for synthetic chemists. In R. Van
Eldik & C.D. Hubbard (Eds.). Chemistry under extreme or non classical conditions (pp. 317–
380). New York: John Wiley & Sons - Inc. and Spektrum Akademischer Verlag.
Mason T.J., Paniwnyk L., Lorimer J.P. (1996). The uses of ultrasound in food technology.
Ultrasonics Sonochemistry 3, S253-S260.

Chapter 3
51
McCausland L.J., Cains P.W., Martin P.D. (2001). Use of the power of sonocrystallization for
improved properties. Chemical Engineering Progress 97, 56-61.
McClements D.J. (1995). Advances in the application of ultrasound in food analysis and
processing. Trends in Food ,Science & Technology 6, 293-299.
McClements D.J. (1997). Ultrasonic characterization of food and drinks: principles, methods
and applications. Food Science and Nutrition 37, 1-46.
Mujica-Paz H., Hernández-Fuentes M.A., López-Malo A., Palou E., Valdez-Fragoso A.,
Welti-Chanes J. (2002). Incorporation of minerals to apple slabs through vacuum
impregnation and osmotic dehydration. In 2002 IFT Annual Meeting Book of abstracts (pp.
74), Anaheim, CA.
Mujica-Paz H., Valdez-Fragoso A., Lopez-Malo A., Palou E., Welti-Chanes J. (2003a).
Impregnation properties of some fruits at vacuum pressure. Journal of Food Engineering 56,
307-314.
Mujica-Paz H., Valdez-Fragoso A., Lopez-Malo A., Palou E., Welti-Chanes J. (2003b).
Impregnation and osmotic dehydration of some fruits: Effect of the vacuum pressure and
syrup concentration. Journal of Food Engineering 57, 305-314.
Ohsaka, K., & Trinh, E.H. (1998). Dynamic nucleation of ice induced by a single stable
cavitation bubble. Applied Physics Letters 73, 129-131.
Patist A., Bates D. (2008). Ultrasonic innovations in the food industry: From the laboratory to
commercial production. Innovative Food Science and Emerging Technologies 9, 147–154.
Povey J.W., Mason T. (1998). Ultrasound in food processing. Blackie Academic &
Professional: London, Weinheim, New York, Tokyo, Melburne, Madras.
Sanchez E.S., Simal S., Femenia A., Benedito J., Rossello C. (1999). Influence of ultrasound
on mass transport during cheese brining. European Food Research and Technology 209, 215-
219.
Sun D.W, Li B. (2003). Microstructural change of potato tissues frozen by ultrasound-assisted
immersion freezing. Journal of Food Engineering 57, 337-345.
Suslick K.S. (1991). The temperature of cavitation. Science 253, 1397-1398.

Chapter 3
52
Suslick K.S. (1997). Sonocatalysis. In: G. Ertl, H. Knozinger, J. Weitkamp (Eds.). Handbook
of Hetereogenous Catalysis (pp. 1350-1357). Wiley-VCH: Weinheim.
Tapia M.S., Schulz E., Gómez V., López-Malo A., Welti-Chanes J. (2003). A new approach
to vacuum impregnation and functional foods: Melon impregnated with calcium and zinc. In
2003 IFT Annual Meeting. Technical program abstracts (60D-2), Chicago, USA.
Thompson L.H., Doraiswamy L.K. (1999). Sonochemistry: science and engineering.
Industrial & Engineering Chemistry Research 38, 1215-1249.
Ulusoy B.H., Colak H., Hampikyan H. (2007). The use of ultrasonic waves in food
technology. Research Journal of Biological Sciences 2, 491-497.
Vargas M., Chiralt A., Albors A., González-Martínez C. (2009). Effect of chitosan-based
edible coatings applied by vacuum impregnation on quality preservation of fresh-cut carrot.
Postharvest Biology and Technology 51, 263-271.
Villamiel M., de Jong P. (2000). Influence of high-intensity ultrasound and heat treatment in
continuous flow on fat, proteins and native enzymes of milk. Agriculture and Food Chemistry
48, 472-478.
Wu H., Hulbert G.J., Mount J.R. (2001). Effects of ultrasound on milk homogenisation and
fermentation with yougurt starter. Innovative Food Science and Emerging Technologies 1,
211-218.
Young F.R. (1989). Cavitation. McGraw-Hill, New York.
Zhang X., Inada T., Tezuka A. (2003). Ultrasonic-induced nucleation of ice in water
containing air bubbles. Ultrasonics Sonochemistry 10, 71-76.
Zhao Y., Xie J. (2004). Practical applications of vacuum impregnation in fruit and vegetable
processing. Trends in Food Science & Technology 15, 434-451.
Zheng L., Sun D.W. (2006). Innovative applications of power ultrasound during food freezing
processes-a review. Trends in Food Science & Technology 17, 16-23.

Chapter 4
53
4.INSTRUMENTAL ANALYSIS: POLYPHENOLS IN VEGETABLE MATRIX
4.1 DEFINITION AND CLASSIFICATION
Phenolic compounds (PCs) are chemically defined by the presence of at least one aromatic
ring bearing one (phenols) or more (polyphenols) hydroxyl substituents, including their
functional derivatives (e.g. esters and glycosides) (Hättenschwiler and Vitousek, 2000).
PCs are the most widely distribute secondary metabolites of plants, in which they can
act as natural antimicrobial agents, defensive compounds against herbivores, inhibitors of pre-
harvest seed germination, or also as attracting agent for pollulants or UV protective agents
(Haslam and Lilley, 1988; Haslam, 1998; Bravo, 1998).
Over 8000 phenolic compounds are currently known (Bravo, 1998) and they can be
classified in a number of ways. Harbourne (1989) suggested a classification based on the
number of carbons in the molecule (table 4.1.1).
Table 4.1.1 Classification of phenolic compounds (Harbourne, 1989).
Structure Class Molecule
C6
Simple phenolics
Benzoquinones
C6-C1
Phenolic acids and related
compounds
C6-C2
Acetophenones
Phenylacetic acids
OH
O O
O
OH
O
CH3
O
OH

Chapter 4
54
Table 4.1.1 Continued
Structure Class Molecule
C6-C3
Cinnamic acids, cinnamyl
aldehydes, cinnamyl
alcohols
Phenylpropenes
Coumarins, isocoumarins
Chromones
C6-C4
Napthoquinones
C6-C1-C6
Xanthones
C6-C2-C6
Stilbenes
Anthraquinones
O
OH
CH2
CH CH2
O O
O
O
O
O
O
O
O
O
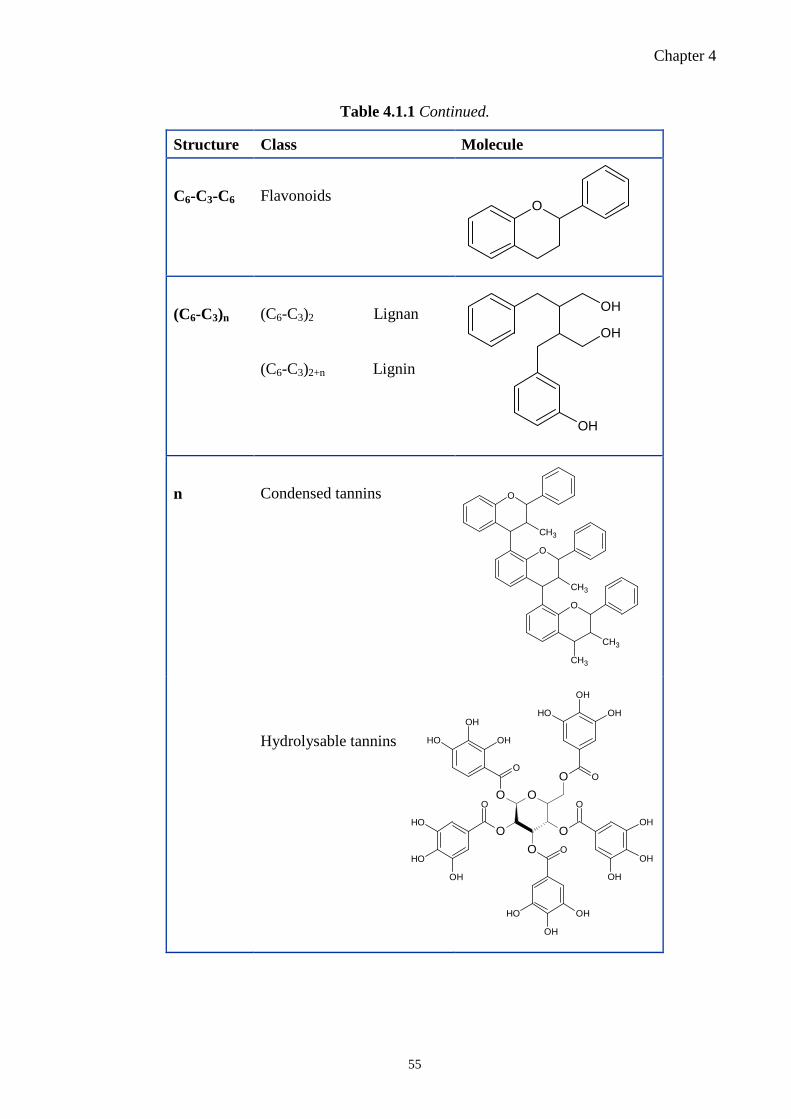
Chapter 4
55
Table 4.1.1 Continued.
Structure Class Molecule
C6-C3-C6
Flavonoids
(C6-C3)n
(C6-C3)2 Lignan
(C6-C3)2+n Lignin
n
Condensed tannins
Hydrolysable tannins
O
OH
OH
OH
O
CH3
O
CH3
O
CH3
CH3
O
OH
OH
OH
OH
OH
OH
OH
OH
OH
O
OH
OH
OH
OO
O
O
O
O
O
O
O
OH
OH
OH

Chapter 4
56
High molecular weight PCs include lignin (polymers of C6–C3 hydroxycinnamate-
type compounds), condensed tannins (polymers of flavanols formed by oxidative
condensation between the C-4 of the heterocyclic ring and the C-6 and C-8 carbons of the
adjacent rings) and hydrolysable tannins (gallic acid, 3-digallic acid or hexahydrohydiphenic
acid esterified to a polyol such as glucose or quinic acid(O’Connell and Fox, 2001).
An alternative classification has been used by Swain and Bate-Smith (1962), who
grouped the phenols in “common” and “less common” categories. Ribéreau-Gayon (1972)
grouped phenolic compounds into three families as follows:
1. Widely distributed phenols – ubiquitous to all plants, or of importance for a specific
plant.
2. Phenols that are less widely distributed – limited number of compounds known.
3. Phenolic constituents present as polymers.
Polyphenols are important components of common foods, including tea, red wine,
fruits, vegetables, beverages and various medicinal plants. The importance of polyphenols
arises from their effects on sensory properties, including astringency and colour, and on the
possible health effects that they may have (Vekiari et al., 2008). In fact these molecules
posses anti-tumoral, anti-allergic, anti-platelet, anti-ischemic, and anti-inflammatory
properties, and most of these effects are believed to be due to their antioxidant capacity
(Moure et al., 2001). The antioxidant compounds from natural sources could be used for
increasing the stability of foods by preventing lipid peroxidation and also for protecting
oxidative damage in living systems by scavenging oxygen radicals. Natural antioxidants have
been also proposed for use in topical pharmaceutical and cosmetic compositions (Moure et
al., 2001).
Increasing interest in the replacement of synthetic antioxidants has led to research into
natural sources of antioxidants, especially in plant materials (Vázquez et al., 2008).
Because purified phenolic compounds are difficult to obtain and because extracts
sometimes have antioxidant activities higher than those of pure molecules, there is a growing
interest for the use of plant extracts (Calliste et al., 2005).
The vegetable matrix that have been analysed in the following investigations (research
articles 3 and 4) are olive mill waste water (OMWW) and chestnut bark extracts. The first is
rich in simple phenols, while in the latter the main components are represented by complex
molecules belonging to the class of hydrolysable tannins.

Chapter 4
57
4.2 MAIN PHENOL COMPOUNDS IN OLIVE MILL WASTE WATER
(OMWW)
OMWW is an important by-product of olive oil industry obtained in three-phase systems; it is
the combination of the aqueous phase released by olives, and of the water used to process the
fruits during extraction of oil (Bazoti et al., 2006). Their phenolic composition has attracted
great attention recently, in fact the isolation of phenolic bioactive compounds and the
employment in pharmaceutical, cosmetic, food and other industrial sectors, has been proposed
as a viable alternative for valorising this by-product (Obied et al., 2005c; Russo, 2007).
Moreover, the development of a low-cost processing method for these residues could lead to
the generation of valuable co-products, reducing the overall extra virgin olive oil processing
costs, and thus increasing the competitiveness and economic profits for mill companies.
In addition to solvent extraction techniques used to fractionate and recover
polyphenols in small scale experiments (Lesage-Meessen et al., 2001; De Marco et al., 2007;
Galanakis et al., 2010), the development of membrane technology adopting different filtration
techniques, such as microfiltration (MF), ultrafiltration (UF), nanofiltration (NF) and reverse
osmosis (RO), has been proposed, as an alternative to traditional physical-chemical,
biological and thermal treatments (Paraskeva and Diamadopoulos, 2006), with the objective
of reducing environmental pollution while simultaneously recovering and concentrating
OMWW useful by-products (Paraskeva et al., 2007; Russo, 2007; Bódalo et al., 2008;
Akdemir and Ozer, 2009; Coskun et al., 2010; Garcia-Castello et al., 2010).
Other recent studies concerned the treatment of olive mill waste water in vertical
subsurface flow constructed wetlands (Yalcuk et al., 2010) and the investigation of the
addition of OMWW concentrates to extra virgin olive oils (Zunin et al., 2011).
The phenolic composition of OMWW has been widely studied in the last few years.
Several aspects, ranging from extraction, analysis, identification and quantification
procedures (Bazoti et al., 2006; Bianco et al., 2003; Della Greca et al., 2004; Mulinacci et al.,
2001; Obied et al. 2005a; Obied et al., 2005c; Zafra et al., 2006) to the evaluation of phenol
antioxidant (Lesage-Meessen et al., 2001; Visioli et al, 1999), antimicrobial (Ramos-
Cormenzana et al., 1996) and molluscicidal activities (Obied et al., 2005b) have been taken
into account. A list of the bioactivity of the major biophenols in OMWW could be found also
in Obied et al. (2005c). Gómez-Caravaca et al. (2011) studied different hydrolysis processes
of OMWW and found that hydrolysis with hydrochloric and citric acids had a good efficiency
and proposed them as a pretreatment to recover antioxidant compounds from OMWW.
Recently, the phenolic composition of solid and liquid wastes generated during the
storage of extra virgin olive oil was studied (Lozano-Sanchez et al., 2011) and, as previously
Chapter 4
58
reported for OMWW (Servili et al., 1999; De Marco et al., 2007; Obied et al., 2007) an high
amount of hydroxytyrosol was found, together with other phenolic alcohols and acids,
secoiridoids, lignans and flavones, whose origin was tentatively established based on
proposed degradation pathways.
In research article 3, the composition of OMWW treated with a semi-industrial
membrane filtration system, including UF and RO modules, was investigated. The
determination of phenol and antioxidant content of OMWW treated with different filtration
systems was studied, with particular attention to the qualitative and quantitative phenol
composition of UF and RO permeates and retentates.
Research article 3
59
Phenolic Profiles of Olive Mill Wastewaters Treated by Membrane Filtration Systems 1
2
PATRIZIA COMANDINI, *,† MARÍA J. LERMA-GARCÍA,§ PIETRO MASSANOVA,† 3
ERNESTO F. SIMÓ-ALFONSO,# AND TULLIA GALLINA TOSCHI † 4
5
†Department of Food Science, University of Bologna, Piazza Goidanich 60, I-47521 Cesena, 6
FC, Italy 7
§Department of Analytical Chemistry and Food Technology, University of Castilla – La 8
Mancha, Avda. Camilo José Cela 10, E-13004, Ciudad Real, Spain 9
#Department of Analytical Chemistry, University of Valencia, Doctor Moliner 50, E-46100, 10
Burjassot, Valencia, Spain 11
12
*Corresponding author (telephone +390547338121, fax +390547382348, e-mail 13
[email protected]). 14
15

Research article 3
60
ABSTRACT 16
Olive mill wastewater (OMWW) is an important by-product obtained during the extraction of 17
olive oil. In this investigation, the phenolic composition of OMWW treated with a semi-18
industrial membrane filtration system, including ultrafiltration (UF) and reverse osmosis (RO) 19
modules, was studied. In particular, the composition of untreated OMWW was compared to 20
the permeate and to concentrate fractions obtained at each filtration step. 3,4-21
(dihydroxyphenyl) ethanol and p-(hydroxyphenyl) ethanol were found as the main 22
compounds of all OMWW analyzed. A total of 32 compounds detected at 240 or 280 nm by 23
HPLC-DAD were considered for quantification of phenols. UF reduced phenol concentration 24
by about 40% with respect to the initial level; in the permeate of RO, the phenol concentration 25
ranged from 0 to 1% of the initial content. In contrast, the content of phenolic compounds was 26
increased of about 2.6 fold in RO concentrate. The same phenolic profile, more or less 27
intense, was obtained at all stages of filtration. 28
29
Keywords: Olive mill waste water (OMWW); phenolic compounds; reverse osmosis; 30
ultrafiltration 31
32

Research article 3
61
INTRODUCTION 33
Olive mill waste water (OMWW) is an important by-product of olive oil industry obtained 34
in three-phase systems; it is the combination of the aqueous phase released by olives, and of 35
the water used to process the fruits during extraction of oil (1). In addition to OMWW, other 36
olive mill wastes (OMWs) include pomace (solid waste produced in the three-phase systems) 37
and alperujo (semi-solid waste generated by two-phase systems). 38
The composition of OMW has been widely investigated (2, 3) and the main components of 39
the organic fraction comprise sugars, tannins, phenolic compounds, polyalcohols, pectins and 40
lipids (4, 5). 41
Several aspects of OMW composition have been investigated, ranging from extraction, 42
analysis, identification and quantification of phenols (1, 6‒10), and evaluation of their 43
antioxidant (11‒13), antimicrobial (14) and molluscicidal activities (15). Several analytical 44
methods used to characterize the major biophenols in OMW, and their bioactivity has been 45
reviewed by Obied et al. (16). 46
Secoiridoid derivatives, namely, 3,4-(dihydroxyphenyl) ethanol (hydroxytyrosol, HYTY) 47
and p-(hydroxyphenyl) ethanol (tyrosol, TY) are the main compounds of OMWW, whereas 48
secoiridoid glycosides are present at high concentrations in pomace and olive fruit (17). 49
However, the phenolic composition of OMW is characterized by a large complexity; in fact, 50
Obied et al. (18), using reversed phase HPLC coupled with photodiode array detection 51
(DAD), electrospray ionisation mass spectrometry (ESI-MS) and fluorimetric detection 52
(FLD), confirmed the presence of 52 phenolic compounds in olive extracts and 44 in OMW, 53
which belonged to the classes of simple phenols, benzoic and cinnamic acids, flavonoids and 54
secoiridoids. 55
Owing to the toxicity of OMWW (19) and its antimicrobial (20‒21) and degradation 56
properties (22), initial studies on OMWW phenol fraction were aimed to remove these 57
compounds through physico-chemical and biological treatments. More recently, the isolation 58
of phenolic bioactive compounds and their employment in pharmaceutical, cosmetic, food and 59
other industrial sectors, has been proposed as a viable alternative for valorizing this by-60
product (16, 23). In addition to solvent extraction techniques used to fractionate and recover 61
polyphenols in small scale experiments (11, 24‒25), the development of membrane 62
technology adopting different filtration techniques, such as microfiltration (MF), 63
ultrafiltration (UF), nanofiltration (NF) and reverse osmosis (RO), has been proposed for both 64

Research article 3
62
pre-treatment of OMWW, reducing their polluting load (26‒30), and for the recovery and 65
fractionation of polyphenols (23, 31). 66
In particular, De Marco et al. (24) were able to purify HYTY from all other biophenols of 67
OMWW, yielding 1 g of pure HYTY from 1 liter of OMWW. Several methods for obtaining 68
HYTY from OMWW and other by-products derived from olive trees have also been patented 69
(32‒34). 70
In this investigation, the composition of OMWW treated with a semi-industrial membrane 71
filtration system, including UF and RO modules, was studied. The aim of this work was the 72
determination of phenol and antioxidant content of OMWW treated with different filtration 73
systems. In particular, the concentration of phenols in the retentate and permeate of UF and 74
RO were evaluated and compared with the untreated sample. Qualitative and quantitative 75
phenol composition of UF and RO permeates were compared to the initial sample (OMWW 76
before filtration) to determine the selectivity of these membranes towards one or more 77
phenolic classes. 78
79
MATERIALS AND METHODS 80
Reagents and standards. The standards and reagents used for the quantification of phenols 81
by spectrophotometry (gallic acid (GA), Folin-Ciocalteau reagent, sodium molybdate 82
dihydrate), HPLC (3-hydroxyphenylacetic acid (3-HPA), vanillin (VAN), vanillic acid (VA), 83
hydroxytyrosol (HYTY), oleuropein (OLE), ferulic acid (FA), cinnamic acid (CIN), (-)-84
epicatechin (EPI), (+)-catechin (CAT), caffeic acid (CAF), p-coumaric (p-COUM) and 85
syringic acid (SYR)) and for the evaluation of the antioxidant capacity (6-hydroxy-2,5,7,8-86
tetramethylchroman-2-carboxylic acid (Trolox), 2,2-azinobis(3-ethylbenzothiazoline)-6-87
sulfonic acid diammonium salt (ABTS•+) and potassium persulfate) were obtained from 88
Sigma-Aldrich (St. Louis, MO, USA). Other solvents used were: n-hexane, methanol, ethyl 89
acetate (Sigma-Aldrich, St. Louis, MO, USA); acetonitrile, formic acid and ethanol (Merck, 90
Darmstadt, Germany). Deionized water was obtained with a Barnstead deionizer (Sybron, 91
Boston, MA). 92
Samples. OMWW samples were collected during the 2009-2010 production years from a 93
three-phase olive oil mill in Emilia-Romagna (Italy). After collection, OMWW samples were 94
pretreated with a semi-industrial membrane filtration system, including UF and RO. The 95
following abbreviations have been used: FEED, initial OMWW before filtration; UF Perm, 96

Research article 3
63
OMWW permeate from ultrafiltration module; RO Perm, OMWW permeate from reverse 97
osmosis module; RO RET, OMWW retentate from reverse osmosis. 98
Dry matter pH measurements. Dry matter (DM) was determined by drying about 50 g of 99
OMWW samples at 105°C until a constant weight was reached. pH was measured on 100
OMWW samples previously centrifuged (3000 rpm, 5 min) and filtered (cellulose acetate 101
filter 0.45 µm). The pH-meter was a Basic 20 model (Crison Instrument, Barcelona, Spain). 102
Spectrophotometric determination of total phenol (TP) content. Before each 103
photometric determination (TP, o-DPH content, ABTS•+ and COD evaluation), OMWW 104
samples were centrifuged (3000 rpm, 5 min), filtered through cellulose filters (0.45 µm) and 105
the oil residues were removed by washing the samples three times with n-hexane. The TP 106
content of the extracts was determined by adapting a previously published method (35). After 107
suitable dilution of the samples, TP content was determined using the Folin-Ciocalteau 108
reagent and measuring the absorbance at 750 nm (Shimadzu Spectrophotometer UV-VIS 109
1204, Kyoto, Japan). Total phenols were expressed as mg GA mL-1 sample (calibration curve 110
with r2 = 0.9932). Spectrophotometric analyses were repeated three times for each OMWW 111
sample. 112
Spectrophotometric determination of o-diphenols (o-DPH). 4 mL of a solution prepared 113
by mixing 0.5 mL of pretreated OMWW sample and 5 mL of methanol/water (1:1 v/v) were 114
added to 1 mL of a 5% solution of sodium molybdate dihydrate in ethanol/water (1:1 v/v) and 115
vigorously shaken. After 10 min at room temperature, the mixture was centrifuged for 5 min 116
at 3000 rpm and the absorbance of the supernatant was measured at 370 nm. The calibration 117
curve (r2 = 0.9954) was constructed with GA solutions. The results were expressed in mg GA 118
mL-1 sample. The spectrophotometric analysis was repeated three times for each sample. 119
ABTS•+ scavenging activity of OMWW. An aqueous solution of ABTS•+ (concentration 120
of 7 mM) was prepared. The radical cation of ABTS was obtained by reaction with potassium 121
persulphate until it reached a final concentration of 2.45 mM, while maintaining the stock 122
solution in the dark at room temperature for at least 12 h. Before use, the ABTS•+ solution was 123
diluted with ethanol to reach an absorbance of 0.70 ± 0.02 at 734 nm at 30°C. Next, 1 mL of 124
the diluted ABTS•+ solution was added to 0.01 mL of pretreated OMWW sample and the 125
decrease in absorbance was recorded for 10 min (36). Absorbance values were corrected for 126
radical decay using a blank solution (0.01 mL of 50% aqueous methanol). Measurements 127
were made in triplicate and the antioxidant activity was calculated as Trolox Equivalent 128

Research article 3
64
Antioxidant Capacity (TEAC, mmol Trolox L-1 sample), using a calibration curve with r2 = 129
0.9811. 130
Chemical oxygen demand (COD). COD of OMWW was determined using a 131
multiparameter bench photometer dedicated for COD analysis (HI 839800, Hanna 132
Instruments United States Inc., Woonsocket, RI, USA). OMWW samples, previously 133
centrifuged and filtered, were appropriately diluted with distilled water and analyzed using 134
reagents for measurement of high range COD (0 - 15 g O2 L-1). Samples were added to the 135
reagent vials, mixed and heated for 2 h at 150°C. At the end of the digestion, when room 136
temperature was reached, the photometric measurement was made. Distilled water was used 137
as blank. 138
Extraction of phenolic compounds. According to Gómez-Caravaca et al. (37), about 10 g 139
of OMWW were centrifuged (3000 rpm, 10 min), the supernatant was filtered through nylon 140
filters (0.45 µm) and washed three times with n-hexane. 5 mL of OMWW were extracted 141
three times with 7.5 mL of ethyl acetate. Next, the three extractions were combined and 142
evaporated under nitrogen to complete dryness. The concentrated extract was dissolved in 1 143
mL of aqueous methanol (50%), filtered through 0.20 µm nylon filters and injected in HPLC. 144
Instrumentation and working conditions. A 1100 series liquid chromatograph provided 145
with a quaternary pump and UV–Vis diode array detection (Agilent Technologies, 146
Waldbronn, Germany), was used. Separation was carried out with a reverse phase C18 (2) 147
100A Luna column (5 µm, 150 x 4.60 mm I.D., Phenomenex, Torrance, CA, USA). The 148
mobile phase was composed of solvent A (0.5% v/v formic acid in HPLC-grade water) and 149
solvent B (acetonitrile). Solutions were filtered through 0.20 µm cellulose acetate filter discs 150
(Albet, Barcelona, Spain) and sonicated for 10 min before use. The following linear gradient 151
elution was employed: from 0 to 27 min solvent B increased from 5 to 18%, at 50 min solvent 152
B reached 25%, and finally at 72 min solvent B was 95%; at 77 min 5% solvent B was 153
restored. A 5 min post-run equilibration was performed. An injection volume of 10 µL and a 154
flow rate of 0.5 mL min-1 were used. Absorption spectra were recorded in the range of 200–155
600 nm, while the detector wavelength was set at 240, 280 and 320 nm. Peak quantification 156
was carried out at 240 and 280 nm. The main phenolic compounds were identified by 157
comparison with the relative retention times of reference standards, when available, or by 158
comparing the relative elution order and UV spectra with those reported in literature. The 159
identity of each peak was also confirmed by HPLC-MS. In fact, the liquid chromatograph was 160
also coupled (in series with the UV–vis detector) to the ESI source of an HP 1100 series ion 161
trap mass spectrometer (ITMS) (Agilent). The ITMS working conditions were: nebulizer gas 162

Research article 3
65
pressure, 0.24 MPa (35 psi); drying gas flow, 7 L min−1 at 300°C; capillary voltage, 2.5 kV; 163
voltages of skimmers 1 and 2, −41.0 and −6.0 V, respectively. Nitrogen was used as nebulizer 164
and drying gas (Gaslab NG LCMS 20 generator, Equcien, Madrid, Spain). The mass 165
spectrometer was scanned within the m/z 100–900 range in the negative and positive ion 166
mode. Maximum loading of the ion trap was 3×10⁴ counts, and maximum collection time was 167
300 ms. To enhance the sensitivity of detection, a flow divisor of 1:10 ratio located after the 168
UV–Vis detector and before the ESI source was used. Total ion chromatograms (TIC) and 169
extracted ion chromatograms (EIC) were smoothed using a Gaussian filter set at 9 points. 170
Quantification of phenolic compounds in HPLC was achieved by comparing the peak areas 171
with those of HYTY as external standard, according to the procedure described by Tsimidou 172
et al. (38). Data were expressed as mg HYTY kg-1 OMWW for both simple and hydrolysable 173
phenolic compounds. 174
Moreover, a cumulative quantification of phenols detected at 240 and 280 nm was made. 175
The compounds detected at 240 nm were kept separate from those detected at 280 nm to 176
monitor the behavior of the different classes of phenols to filtration. These results were 177
expressed in percentages with respect to the feed sample, which was considered 100%. 178
Statistical analysis. All experiments were performed in triplicate. Data were expressed as 179
means ± standard deviation (SD) and analysed using Statistica 8.0 (Statsoft Inc.,Tulsa, OK). 180
Analysis of variance (ANOVA) was used to determine if significant differences existed at a 181
level of confidence of p < 0.05 (Honestly Significant Differences or HSD by Tukey). 182
183
RESULTS AND DISCUSSION 184
The composition of OMWW during the different stages of filtration is reported in Table 1. 185
Filtration caused a reduction of the DM of samples from 3.02 % (FEED) to 0.08 % (RO 186
PERM); DM of RO RET was almost doubled with respect to the initial sample (FEED), 187
indicating the level of concentration reached in the retentate of RO during filtration. The 188
treatments reduced the COD values of OMWW by about 80 %, from 38.89 g O2 L-1 (FEED) 189
to 7.86 g O2 L-1 (RO PERM) at the end of the process. The COD of RO RET was almost 1.4 190
times greater than in the FEED sample. The filtration treatments did not affect the pH of the 191
samples. pH values were very close to the pH range (5.5-9.5) requested by Italian regulations 192
(39) to discharge OMWW in sewer or surface water. 193

Research article 3
66
As shown in Figure 1, filtration caused a significant reduction of the phenolic content and 194
antioxidant capacity of the permeates. In particular, a significant reduction of TP and a slight 195
decrease of o-DPH in UF PERM respect to FEED was recorded; in the last fraction obtained 196
at the end of membrane filtration system (RO PERM), both o-DPH and TP were nearly zero. 197
Regarding RO RET, o-DPH and TP were two and three times higher than those of FEED 198
sample, respectively. A similar trend was recorded for the antioxidant capacity (ABTS•+). 199
The composition was also evaluated by HPLC analysis and the main simple and complex 200
phenolic compounds were quantified using the external standard method. The quantification 201
was aimed to compare the composition of the different fractions of OMWW collected during 202
the sequential filtrations. 203
Phenolic compounds were detected at 240, 280 and 330 nm, but quantification and 204
identification were made at 240 or 280 nm at the highest absorption wavelength of each 205
compound; none of the main phenolic components of OMWW showed appreciable 206
absorbance at 330 nm. 207
The chromatograms of an OMWW sample before filtration treatments, recorded at 240 and 208
280 nm are shown in Figure 2A and 2B, respectively. 209
The main 32 compounds detected at 240 and 280 nm were considered for the comparison 210
of the phenolic amounts in the different OMWW permeates and retentates; 19 compounds 211
were evaluated at 240 nm and 13 at 280 nm; their concentrations were expressed as mg kg-1 of 212
HYTY, as reported in Table 2. The main phenols of Table 2 are also indicated in Figure 2. 213
As can be seen in Table 2, RO PERM and RO RET showed, respectively, the lowest and 214
the highest phenolic concentrations, for all compounds evaluated. Additionally, in UF PERM 215
a significant reduction in phenol content in comparison to FEED was detected for the majority 216
of phenols. The most abundant components, reported in bold italic (peaks 2 and 4), were 217
identified as HYTY and TY, as discussed later. 218
For each sample, the mean percentage content of phenolic compounds quantified in HPLC 219
was compared with the initial content (FEED), which was fixed at 100%, as is shown in 220
Figure 3. The UF PERM showed a phenol concentration that was significantly lower than the 221
FEED sample (about 40% lower) at both 240 and 280 nm; in RO PERM, the phenol 222
concentration was about 0.5% of the initial content of FEED at both wavelengths. In the RO 223
RET, however, the concentration of phenolic compounds appeared to be increased by 2.55 224
and 2.86 times, at 240 and 280 nm respectively, compared to the initial FEED sample. 225

Research article 3
67
Based on HPLC analyses at 240 and at 280 nm and on the quantization of the 32 selected 226
phenols, the UF treatment employed did not have a selective behavior on the single and 227
complex phenols considered (about 130 – 600 g mol-1). 228
The trend of phenols detected by HPLC was similar to the TP and o-DHP determined by 229
spectrophotometric analysis; moreover, it was strictly proportional to the antiradical capacity 230
previously evaluated (Figure 1). A slight reduction in phenols by UV analysis and antiradical 231
capacity in UF PERM, and their disappearance in RO PERM, were observed. 232
Of the 32 compounds used for quantitative evaluation, 11 compounds were identified (Table 233
3). The main compounds of OMWW were identified basing on reference standards, mass 234
spectrometry, UV and bibliography data (6, 18). HYTY and TY were the main components 235
with concentrations in FEED samples of 183.9 and 47.0 mg kg-1, respectively. Other 236
compounds, such as EPI, CAT, and FER and OE, not reported in Table 3, were detected only 237
at trace levels in RO RET samples. Some phenolic molecules, usually detected in OMWW, as 238
CAF, p-COU, CIN and SYR (6, 13) were not found. Their absence was confirmed by the 239
injection of reference standards. OMWW collected at the end of the oil season and during 240
storage may have led hydrolytic processes and microbiological degradation, explaining the 241
high concentration of simple phenols and the absence of the previously cited molecules (5). 242
As reported in the Material and Methods section, OMWW were sampled from the storage 243
tank where they were usually stored during seasonal oil production, as during normal 244
handling before disposal. This choice was made to verify the qualitative and quantitative 245
composition of OMWW produced on an industrial scale and the effect of different filtration 246
treatments. The results obtained showed that, even in absence of optimal storage conditions of 247
OMWW, filtration by RO gave a retentate fraction that was rich in phenols and a permeate 248
with concentration of phenolic substances near the limits of detection. 249
In particular, RO PERM could be recycled and reused in the oil mill, for washing or for 250
other operations, contributing to reduce water consumption and disposal costs of OMWW. 251
For this purpose, the draft guidelines proposed by the Codex Alimentarius Commission (40), 252
concerning the hygienic reuse of processing water in food plants, should be followed. For 253
evaluation of microbiological, chemical, physical and sensory properties, specific limits 254
defined by each country should be respected, taking into account the specific category of 255
reuse of OMWW. 256
The RO RET, which is characterized by a high phenolic content, could be used in animal 257
breeding through direct utilization as animal feed or following protein enrichment (41); 258

Research article 3
68
OMWW could also be processed and further employed in cosmetic formulations, or used as 259
functional ingredient in pharmaceutical or food products. With reference to the last 260
applications, further studies are necessary to fully characterize the composition of crude 261
OMWW extracts and verify which treatments are necessary to convert raw OMWW to a food 262
or pharmaceutical grade. In addition to the microbiological aspects and the concentration of 263
phenolic substances, it will be necessary to eliminate compounds responsible for off-odor 264
development and their precursors. 265
In conclusion, TP content, o-DHP and antioxidant capacity showed a similar trend, with a 266
progressive reduction of their values in the UF and RO permeates, and a significant increase 267
in the retentate fraction of the RO. HPLC data confirmed these results: the concentration of 268
phenolic compounds in the permeate of UF was about 40% lower compared to the untreated 269
sample; in RO PERM, however, the phenol content approached zero. The RO RET had a 270
phenol content that was 2.6 times higher than that in the untreated sample. 271
The main components of OMWW were secoiridoid derivatives, namely, hydroxytyrosol, 272
tyrosol and oxidized elenolic acid; however, further studies are necessary to determine the 273
nature of several yet unidentified compounds in OMWW. 274
All the compounds detected at 240 and 280 nm had a similar behaviour during filtration, 275
showing that neither UF nor RO membranes had a selective effect on the retention of phenols 276
present in OMWW. 277
The filtration membranes used in this investigation showed a good capacity both to 278
concentrate phenols in the osmotic retentate fraction and to produce a final water waste that 279
was poor in phenolic substances, as indicated by spectrophotometric and chromatographic 280
analyses. 281
ABBREVIATIONS USED 282
3-HPA, 3-Hydroxyphenyl acetic acid; CAF, caffeic acid; CAT, (+)-catechin; CIN, 283
cinnamic acid; COD, chemical oxygen demand; DAOA, deacetoxy oleuropein aglycon; 284
DHPG, 3,4-dihydroxyphenylglycol; Di-HBA, Di-hydroxybenzoic acid; EPI, (-)-epicatechin; 285
ESI, electrospray ionization; FA, ferulic acid; GA, gallic acid; HYTY, hydroxytyrosol; LA, 2-286
(5-ethylidene-2-oxo-tetrahydro-2H-pyran-4-yl) acetic acid; MW, molecular weight; p-287
COUM, p-coumaric acid; o-DPH, orto-diphenol; OMWW, olive mill waste water; OLE, 288
oleuropein; OxEA, oxidized elenolic acid; SYR, syringic acid; TP, total phenol; TY, tyrosol; 289
VA, vanillic acid; VAN, vanillin. 290

Research article 3
69
ACKNOWLEDGMENT 291
This work was supported by Project CTQ2010-15335/BQU (MEC and Feder funds). M.J. 292
Lerma-García thanks the Junta de Comunidades de Castilla – La Mancha and the Fondo 293
Social Europeo for a research post-doc fellowship. 294
295

Research article 3
70
LITERATURE CITED 296
(1) Bazoti, F. N.; Gikas, E.; Skaltsounis, A. L.; Tsarbopoulos, A. Development of a liquid 297
chromatography–electrospray ionization tandem mass spectrometry (LC–ESI MS/MS) 298
method for the quantification of bioactive substances present in olive oil mill 299
wastewaters. Anal. Chim. Acta 2006, 573–574, 258–266. 300
(2) Capasso, R.; Cristinzio, G.; Evidente, A.; Scognamiglio, F. Isolation, spectroscopy and 301
selective phytotoxic effects of polyphenols from vegetable waste waters. 302
Phytochemistry 1992, 31, 4125–4128. 303
(3) Sciancalepore, V.; Colangelo, M.; Sorlini, C.; Ranalli, G. Composting of effluent from 304
a new two-phases centrifuge olive mill. Microbial characterization of the compost. 305
Toxicol. Environ. Chem. 1996, 55, 145–158. 306
(4) Balice, V.; Cera, O. Acidic phenolic fraction of the olive vegetation water determined 307
by a gas chromatography method. Grasas Aceites 1984, 35, 178–180. 308
(5) D’Annibale, A.; Crestini, C.; Vinciguerra, V.; Giovannozzi Sermanni, G. The 309
biodegradation of recalcitrant effluents from an olive mill by a whit-rot fungus. J. 310
Biotechnol. 1998, 61, 209–218. 311
(6) Bianco, A.; Buiarelli, F.; Cartoni, G.; Coccioli, F.; Jasionowska, R.; Margherita, P. 312
Analysis by liquid chromatography tandem mass spectrometry of biophenolic 313
compounds in olives and vegetation waters, Part I. J. Sep. Sci. 2003, 26, 409–416. 314
(7) Della Greca, M.; Previtera, L.; Temessi, F.; Carrelli, A. Low molecular- weight 315
components of olive oil mill waste-waters. Phytochem. Analysis 2004, 15, 184–188. 316
(8) Mulinacci, N.; Romani, A.; Galardi, C.; Pinelli, P.; Giaccherini, C.; Vincieri, F. F. 317
Polyphenolic content in olive oil waste waters and related olive samples. J. Agr. Food 318
Chem. 2001, 49, 3509–3514. 319
(9) Obied, H. K.; Allen, M. S.; Bedgood, D. R.; Prenzler, P. D.; Robards, K. Investigation 320
of Australian olive mill waste for recovery of biophenols. J. Agr. Food Chem. 2005a, 321
53, 9911–9920. 322
(10) Zafra, A.; Juárez, M. J. B.; Blanc, R.; Navalón, A.; González, J.; Vílchez J. L. 323
Determination of polyphenolic compounds in wastewater olive oil by gas 324
chromatography–mass spectrometry. Talanta 2006, 70, 213–218. 325
(11) Lesage-Meessen, L.; Navarro, D.; Maunier, S.; Sigoillot, J-C.; Lorquin, J.; Delattre, 326
M.; Simon, J-L.; Asther, M.; Labat, M. Simple phenolic content in olive oil residues as 327
a function of extraction systems. Food Chem. 2001, 75, 501–507. 328
(12) Visioli, F.; Vinceri, F. F.; Galli, C. Wastewaters from olive oil production are rich in 329
natural antioxidants. Experientia 1995, 51, 32–34. 330
Research article 3
71
(13) Visioli, F.; Romani, A.; Mulinacci, N.; Zarini, S.; Conte, D.; Vincieri, F. F.; Galli C. 331
Antioxidant and other biological activities of olive mill waste waters. J. Agric. Food 332
Chem. 1999, 47, 3397–3401. 333
(14) Ramos-Cormenzana, A.; Juárez-Jiménez, B.; Garcia-Pareja, M. P. Antimicrobial 334
activity of olive mill wastewaters (alpechin) and biotransformed olive oil mill 335
wastewater. Int. Biodeter. Biodegr. 1996, 38, 283–290. 336
(15) Obied, H. K.; Bedgood, D. R.; Prenzler, P. D.; Robards, K. Bioscreening of Australian 337
olive mill waste extracts: Biophenol content, antioxidant, antimicrobial and 338
molluscicidal activities. Food Chem. Toxicol. 2005b, 45, 1238–1248. 339
(16) Obied, H. K.; Allen, M. S.; Bedgood, D. R.; Prenzler, P. D.; Robards, K.; Stockmann, 340
R. Bioactivity and analysis of biophenols recovered from olive mill waste J. Agric. 341
Food Chem. 2005c, 53, 823–837. 342
(17) Servili, M.; Baldioli, M.; Selvaggini, R.; Miniati, E.; Macchioni, A.; Montedoro, G. 343
High-performance liquid chromatography evaluation of phenols in olive fruit, virgin 344
olive oil, vegetation waters and pomace and 1D- and 2D-Nuclear Magnetic Resonance 345
characterization. J. Am. Oil Chem. Soc. 1999, 76, 873–882. 346
(18) Obied, H. K.; Bedgood, D. R.; Prenzler, P. D.; Robards, K. Chemical screening of 347
olive biophenol extracts by hyphenated liquid chromatography. Anal. Chim. Acta 348
2007, 603, 176–189. 349
(19) Hamdi, M. Toxicity and biodegradability of olive mill wastewaters in batch anaerobic 350
digestion. Appl. Biochem. Biotechnol. 1992, 37, 155–163. 351
(20) Bisignano, G.; Tomaino, A.; Lo Cascio, R.; Crisafi, G.; Uccella, N.; Saija, A.; On the 352
in-vitro antimicrobial activity of oleuropein and hydroxytyrosol. J. Pharm. 353
Pharmacol. 1999, 51, 971–974. 354
(21) Borja, R.; Alba, J.; Banks, C. J. Impact of the main phenolic compounds of olive mill 355
wastewaters (OMW) on the kinetics of acetoclastic methanogenesis. Process Biochem. 356
1997, 32, 121–133. 357
(22) Hamdi, M.; Garcia, J. L.; Ellouz, R. Integrated biological process for olive mill 358
wastewater treatment. Bioproc. Biosyst. Eng. 1992, 8, 79–84. 359
(23) Russo, C. A new membrane process for the selective fractionation and total recovery 360
of polyphenols, water and organic substances from vegetation waters (VW). J. 361
Membrane Sci. 2007, 288, 239–246. 362
(24) De Marco, E.; Savarese, M.; Paduano, A.; Sacchi, R. Characterization and 363
fractionation of phenolic compounds extracted from olive oil mill wastewaters. Food 364
Chem. 2007, 104, 858–867. 365

Research article 3
72
(25) Galanakis, C. M.; Tornberg, E.; Gekas, V. Recovery and preservation of phenols from 366
olive waste in ethanolic extracts. J. Chem. Technol. Biotechnol. 2010, 85, 1148–1155. 367
(26) Akdemir, E. O.; Ozer, A. Investigation of two ultrafiltration membranes for treatment 368
of olive oil mill wastewater. Desalination 2009, 249, 660–666. 369
(27) Bódalo A.; Gómez, J. L.; Gómez, M.; León, G.; Hidalgo, A. M.; Ruíz, M. A. Phenol 370
removal from water by hybrid processes: study of the membrane process step. 371
Desalination 2008, 223, 323–329. 372
(28) Coskun, T.; Debik, E.; Demir, N. M. Treatment of olive mill wastewaters by 373
nanofiltration and reverse osmosis membranes. Desalination 2010, 259, 65–70. 374
(29) Paraskeva, C. A.; Papadakis, V. G.; Tsarouchi, E.; Kanellopoulou, D. G.; Koutsoukos, 375
P. G. Membrane processing for olive mill wastewater fractionation. Desalination 376
2007, 213, 218–229. 377
(30) Turano, E.; Curcio, S.; De Paola, M. G.; Calabrò, V.; Iorio, G. An integrated 378
centrifugation–ultrafiltration system in the treatment of olive mill wastewater. J. 379
Membrane Sci. 2002, 209, 519–531. 380
(31) Garcia-Castello, E.; Cassano, A.; Criscuoli, A.; Conidi, C.; Drioli, E. Recovery and 381
concentration of polyphenols from olive mill wastewaters by integrated membrane 382
system. Water Res. 2010, 44, 3883–3892. 383
(32) Crea, R. Method of obtaining hydroxytyrosol-rich composition from vegetation water. 384
US Patent 7261909, 2007. 385
(33) Guzman, J. F.-B.; Moreno, A. H.; Gutierrez, G. R.; Arcos, R. R.; Araujo, A. J.; 386
Bejarano, R. G. Method for obtaining purified hydroxytyrosol from products and by-387
products derived from the olive tree. US Patent 6849770, 2005. 388
(34) Villanova, L.; Villanova, L.; Fastello, G. ; Merendino, A.; Lachifarma S.r.l. Process 389
for the recovery of tyrosol and hydroxytyrosol from olive mill wastewaters and 390
catalytic oxidation method in order to convert tyrosol in hydroxytyrosol. Eur. Patent 391
EP1623960, 2006. 392
(35) Pirisi, F. M.; Cabras, P.; Falqui Cao, C.; Migliorini, M.; Mugelli, M. Phenolic 393
compounds in virgin olive oil. 2. Reappraisal of the extraction, HPLC separation, and 394
quantification procedures. J Agric Food Chem. 2000, 48, 1191–1196. 395
(36) Bendini, A.; Cerretani, L.; Pizzolante, L.; Gallina Toschi, T.; Guzzo, F.; Ceoldo, S.; 396
Marconi, A. M.; Andreetta, F.; Levi, M. Phenol content related to antioxidant and 397
antimicrobial activities of Passiflora spp. Extracts. Eur. Food Res. Technol. 2006, 398
223,102–109. 399

Research article 3
73
(37) Gómez-Caravaca, A.; Cerretani, L.; Segura-Carretero, A.; Fernández-Gutiérrez, A.; 400
Lercker, G.; Gallina Toschi, T. Qualitative phenolic profile (HPLC-DAD-MS) from 401
olive oil mill waste waters at different states of storage and evaluation of hydrolysis 402
process as a pretreatment to recover their antioxidants. Prog. Nutr. 2011, 13, 22–30. 403
(38) Tsimidou, M.; Papadopoulos, G.; Boskou, D. Determination of phenolic compounds 404
in virgin olive oil by reversed phase HPLC with emphasis on UV detection. Food 405
Chem. 1992, 44, 53–60. 406
(39) Decreto Legislativo 152/2006. Norme in materia ambientale. Gazzetta Ufficiale n. 88, 407
Supplemento Ordinario n. 96 (2006). 408
(40) Codex Alimentarius Commission. Report of the 33rd session of the codex committee 409
on food hygiene. Proposed draft guidelines for the hygienic reuse of processing water 410
in food plants. ALINORM 01/13A, pp 103–110 (2001). 411
(41) Morillo, J. A.; Antizar-Ladislao, B.; Monteoliva-Sánchez, M.; Ramos-Cormenzana, 412
A.; Russell, N. J. Bioremediation and biovalorisation of olive-mill wastes. Appl. 413
Microbiol. Biot. 2009, 82, 25–39. 414
415

Research article 3
74
TABLES 416
Table 1. Composition of OMWW Processed by Different Membrane Systemsa
Parameter FEED UF PERM RO PERM RO RET
DMb (%) 3.02±0.06 b 2.39±0.17 c 0.08±0.04 d 5.61±0.09 a
CODc (g O2 L-1) 38.89±0.49 b 20.09±0.12 c 7.86±0.01 d 54.53±0.32 a
pH 4.98±0.02 a 4.80±0.32 ab 4.39±0.01 b 5.14±0.02 a
aMean values (n = 3). Different letters in the same row indicate statistically significant
differences (p < 0.05). bDM Dry matter. cCOD Chemical oxygen demand.

Research article 3
75
Table 2. Content of Phenolic Compounds in OMWW Samplesa
Peak tr (min) λ (nm)
Concentration (mg HYTY kg-1)
FEED UF PERM RO PERM RO RET
1 5.58 280 6.7 ±0.23 b 5.4 ± 0.83 b 0.1 ± 0.02 c 23.7± 0.24 a
2 15.11 280 183.9 ± 5.63 b 119.3 ± 0.35 c 2.0 ± 0.20 d 398.7 ± 1.25 a
3 18.95 280 0.9 ± 0.02 b 0.8 ± 0.26 b 0.0 ± 0.00 c 2.8 ± 0.15 a
4 21.90 280 47.0 ± 0,71 b 34.1 ± 0.05 c 0.5 ± 0.08 d 134.0 ± 1.96 a
5 24.14 240 4.7 ± 0.04 b 3.4 ± 0.09 c 0.0 ± 0.00 d 13.5 ± 0.12 a
6 25.42 280 3.0 ± 0.03 b 2.2 ± 0.16 c 0.0 ± 0.00 d 9.3 ± 0.04 a
7 26.41 280 1.8 ± 0.06 b 1.4 ± 0.05 c 0.0 ± 0.00 d 5.2 ± 0.06 a
8 27.43 280 8.0 ± 0.16 b 5.7 ± 0.03 c 0.0 ± 0.00 d 22.1 ± 0.16 a
9 27.79 240 2.9 ± 0.21 b 1.9 ± 0.26 c 0.0 ± 0.00 d 5.6 ± 0.01 a
10 29.97 280 1.3 ± 0.09 b 1.0 ± 0.03 c 0.0 ± 0.00 d 3.6 ± 0.07 a
11 32.65 240 2.2 ± 0.02 b 1.9 ± 0.67 b 0.0 ± 0.00 c 4.8 ± 0.08 a
12 33.72 280 6.2 ± 0.13 b 4.5 ± 0.17 c 0.0 ± 0.00 d 17.7 ± 0.02 a
13 36.22 240 3.2 ± 0.12 b 2.2 ± 0.19 c 0.0 ± 0.00 d 8.5 ± 0.05 a
14 38.06 240 10.5 ± 3.22 b 4.8 ± 1.97 bc 0.0 ± 0.00 c 34.0 ± 0.81 a
15 38.41 280 21.2 ± 0.5 b 14.7 ± 0.13 c 0.0 ± 0.00 d 58.1 ± 0.22 a
16 39.46 240 34.4 ± 0.3 b 21.9 ± 0.18 c 0.0 ± 0.00 d 74.9 ± 0.73 a
17 42.86 240 1.6 ± 0.09 b 1.0 ± 0.03 c 0.0 ± 0.00 d 4.5 ± 0.01 a
18 47.69 240 5.4 ± 0.26 b 4.2 ± 0.25 b 0.0 ± 0.00 d 14.3 ± 0.63 a
19 48.28 280 3.1 ± 0.43 b 1.9 ± 0.06 c 0.0 ± 0.00 d 8.4 ± 0.08 a
20 51.86 240 8.7 ± 2.25 b 3.6 ± 1.44 bc 0.0 ± 0.00 c 29.6 ± 0.95 a
21 53.33 240 14.8 ± 1.83 ab 11.2 ± 4.27 b 0.0 ± 0.00 c 24.4 ± 1.60 a
22 54.32 240 23.6 ± 0.18 b 14.4 ± 0.37 c 0.0 ± 0.00 d 57.5 ± 0.01 a
23 55.74 240 2.6 ± 0.38 b 2.2 ± 0.25 b 0.0 ± 0.00 b 10.6 ± 1.40 a
24 57.06 280 14.2 ± 0.04 b 10.4 ± 0.18 c 0.0 ± 0.00 d 39.3 ± 1.53 a
25 57.73 240 1.2 ± 0.07 b 0.9 ± 0.10 c 0.0 ± 0.00 d 3.7 ± 0.01 a
26 57.98 240 1.3 ± 0.03 b 0.9 ± 0.05 c 0.0 ± 0.00 d 3.7 ± 0.01 a
27 58.10 240 3.8 ± 0.03 b 2.5 ± 0.02 c 0.0 ± 0.00 d 7.7 ± 0.01 a
28 58.85 240 3.8 ± 0.09 ab 3.0 ± 0.43 b 0.0 ± 0.00 c 3.9 ± 0.11 a
29 58.97 240 7.8 ± 1.15 b 6.2 ± 0.03 b 0.0 ± 0.00 c 16.7 ± 0.08 a
30 59.10 240 3.4 ± 0.31 b 1.7 ± 2.40 b 0.0 ± 0.00 b 12.0 ± 1.54 a
31 59.38 240 13.3 ± 1.84 b 10.7 ± 4.53 b 0.0 ± 0.00 c 23.9 ± 1.45 a
32 59.85 280 0.7 ± 0.07 b 0.5 ± 0.21 bc 0.0 ± 0.00 c 2.1 ± 0.15 a
a Mean values (n = 3). Different letters in the same row indicate statistically significant
differences (p < 0.05). Values are expressed as mg kg-1 of HYTY.

Research article 3
76
Table 3. Retention Times, UV Absorbance Maxima, Molecular Weights (MW), and MS Fragmentation Patterns of the main Phenolic Compounds of OMWW
Major fragments ESI positive Major fragments ESI negative
Peak Analyte tr (min) λmax (nm) MW [M + H]+ [M + Na]+ [M – H2O + H]+ Other fragments [M - H]- [2M - H]- Other fragments
1 3,4-DHPG 5.6 232/280 170 193.1 (76.9) 153.1 (100) 275.1 (86.0) 169.1 (100) 339.1 (67.9) 205.0 (20) – 232.0 (36.6)
2 HYTY 15.1 236/280 154 137.1 (100) 177.1 (24.2) - 251.1 (87.5) 153.0 (100) 307.0 (69.4)
3 CATHECOL 18.9 230/276 110 109.1 (100) 219.1 (24.9) 155[M+HCOO-]- (10.2); 187.1 (6.8); 459.5 (7.1)
4 TY 21.9 234/278 138 121.1 (100) 193.1 (13.2)
5 Di-HBA 24.1 220/256/295 154 155.1 (100) 137.1 (14.3)
6 3-HPA 25.4 230/275 152 153.1 (100.0)
107.1 (42.9)- 193.1 (57.5) - 251.1 (38.8) -283.1 (41.2)
151.1 (100) 107.1 (14.4)
9 VA 27.4 230/261/292 168 169.1 (100) 151.1 (47.4) 167.1 (100)
10 3,4,5 TMBA 36.2 233/274 212 213.1 (100) 235.1 (20.3) 195.1 (8.8) 447.1 (7.0) [2M+Na]+
15 unknown 38.4 228/273 166 189.0 (7.8) 149.1 (100) 186.0 (30.3) - 251.1 (75.1) - 371.0 (25.2) [2M+K]+
165.1 (33.0) 331.1 (100) 211.1 (83.6) [M+HCOO-]-
16 unknown 39.5 240 244 245.1 (50.1) 267.0 (30.2) 227.1 (80.6) 213.1 (100)-386.1 (50.5) 243.1 (100) 197.1 (6.4)
20 OxEA 51.9 242 258 259.1 (70.1) 281.1 (23.8) 213.1 (100) [M-COOH]+ 241.1 (68.9) [M-OH] + - 407.1 (38.3) -539.2 (12.9)[2M+Na]+ - 555.2 (5.8) [2M+K] +
257.1 (100) 381.0 (13.6) - 444.1 (19.5)
21 unknown 53.3 240 195.1 (12.5) - 227.1 (100) /249.1 (12.5) /359.1 (5.9) /475.1 (9.3)
22 OxEA 54.3 240 258 259.1 (100) 281.1 (17.2) 213.1 (61.2) [M-COOH]+ - 241.1 (36.2) [M-OH]+ - 407.0 (6.0) - 539.2 (9.7) [2M+Na]+
257.1 (100) 113.0 (5.3) – 723.5 (11.5) – 740.5 (30.2)
24 4-HBA / 3,4-hydroxybenzaldehyde
57.1 230/282 138 139.1 (43.2) 227.1 (100) – 259.1(36.9) – 281.0 (28.6)
137.1 (100) 275.1 (12.7) 113.0 (5.5) - 183.1 (11.1) [M+HCOO-] -
27 unknown 58.1 240/282 188 189.2 (20.3) 211.1 (15.5) 171.1 (100) 153.1 (25.6)
143.1 (42.1) [M-COOH]+- 208.1 (26.4) – 227.1 (5.1) [M + K]+- 363.1 (9.8) [2M + Na]+ - 415.2 (17.6) [M + K]+
187.1 (100) 269.1 (36.3) - 379.1 (15.4) - 442.0 (25.4)
29 DAOA 59.0 232/282 320 321.1 (54.3) 343.1 (81.1) 137.1 (100) [loss acidic group] - 200.6 (21.7) - 221.0 (20.9) - 359.0 (10.4) [M+K] + - 500.1 (25.9)
319.1 (100) 639.2 (24.5) 355.0 (10.4) - 382.1 (59.5)-433.0 (8.4)
31 unknown 59.4 240 240 241.1 (100) 263.1 (10.4) 503.1 (5.2) [2M + Na]+
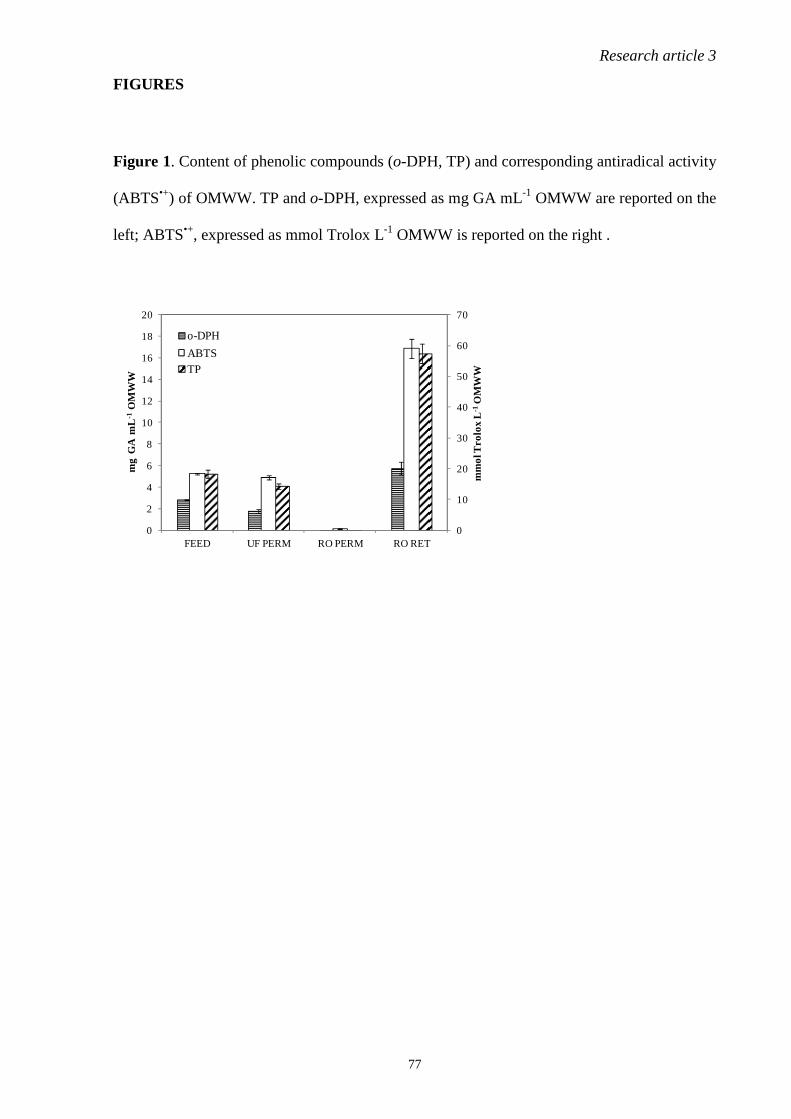
Research article 3
77
FIGURES
Figure 1. Content of phenolic compounds (o-DPH, TP) and corresponding antiradical activity
(ABTS•+) of OMWW. TP and o-DPH, expressed as mg GA mL-1 OMWW are reported on the
left; ABTS•+, expressed as mmol Trolox L-1 OMWW is reported on the right .
0
10
20
30
40
50
60
70
0
2
4
6
8
10
12
14
16
18
20
FEED UF PERM RO PERM RO RET
mm
ol T
rolo
x L
-1O
MW
W
mg
GA
mL
-1O
MW
W
o-DPH
TP
ABTS
o-DPH
ABTSTP

Research article 3
78
Figure 2. UV chromatograms of an OMWW (FEED) sample recorded at 240 nm (A) and 280 nm (B).
0
200
400
600
800
56 57 58 59 60 61
Time (min)
-200
200
600
1000
1400
0 10 20 30 40 50 60
Abs
(mA
U)
2A
25
27
29
31
16
0
50
100
150
200
250
300
350
400
4 14 24 34 44 54
Abs
(mA
U)
Time (min)
5
9
1114
16
20
21
22
28
26
30
1813
-50
450
950
1450
1950
2450
0 10 20 30 40 50 60
Abs
(m
AU
)
Time (min)
2B
-50
0
50
100
150
200
250
300
350
4 9 14 19 24 29 34 39 44 49 54
Abs
(mA
U)
Time (min)
-50
50
150
250
350
450
550
56 57 58 59 60 61
Time (min)
1
24
6
8
12
15
24
2
4
15
24
19

Research article 3
79
Figure 3. HPLC quantification of phenols at 240 and 280 nm. Results are expressed in percentages; the phenol content of the FEED sample was considered 100%.
0
50
100
150
200
250
300
350
FEED UF PERM RO PERM RO RET
Phe
nolic
co
nten
t (%
)
240 nm 280 nm

Chapter 4
80
4.3 PHENOLIC COMPOSITION OF CHESTNUT BARK EXTRACT
Vegetable tannins have been defined as water-soluble polyphenolic compounds having
relative molecular mass between 500 and 3000 and besides giving the natural, usual phenol
reactions, they have some special properties such as the ability to precipitate alkaloids,
gelatine, and other proteins from solution (Tang et al., 1992).
Basing on the behaviour with base or acid treatment, and on spectral and
chromatographic data, tannins have been classified into three groups: condensed tannins
(proanthocyanidins), which have the general polymeric flavan-3-ol structure, hydrolizable
tannins which are generally glucose esters of gallic acid and hexahydroxydiphenic acid
(HHDP) and complex tannins, which possess both condensed and hydrolysable characters
(Tang et al., 1992).
The composition of tannins obtained from chestnut wood (Pasch and Pizzi, 2002),
bark (Garro-Gálvez et al., 1997) and flesh (Hwang et al., 2001) has been determined and its
components mainly belong to the group of hydrolysable tannins (Vázquez et al., 2009). In
particular, sweet chestnut contains high amounts of ellagitannins; these molecules produce
ellagic acid after hydrolysis.
Gallic acid is a tri-hydroxybenzoic acid and its molecule is characterized by the
presence of a carboxyl group substituted on a phenol with 3 hydroxyl substituent (figure
4.3.1).
Figure 4.3.1 Gallic acid structure.
Ellagic acid is a dimeric derivative of gallic acid and it mainly exists in higher plants,
combined with its precursor, the HHDP (Amakura et al., 2000; Vekiari et al., 2008). Ellagic
acid is formed spontaneously from HHDP which, in aqueous solution, undergo to
lactonization reaction, as represented in figure 4.3.2.
OH
OH
OH
OOH

Chapter 4
81
Figure 4.3.2 Lactonization of HHDP to ellagic acid.
In the past various chromatographic and spectral methods have been developed to
analyse vegetable tannins in plant extracts (Tang et al., 1992; Vivas et al., 1993a, 1993b,
1996), food and beverages, but nowadays, reversed-phase HPLC with UV and mass detection
is one of the most frequently used (Zywicki et al., 2002).
In research article 4 the composition of chestnut bark extracts was studied through
HPLC-DAD/ESI-MS. A complete qualitative and quantitative analysis of the tannin
compounds was carried out. A preliminary quantitative tannin estimation was obtained thanks
to a Folin Ciocalteau test.
OH
OH
OH OH
O
OH
OH
OHOH
O O
OH
OH O
O
O OH
OH
HHDP Ellagic acid
Research article 4
82
Tannin analysis of chestnut bark extracts (Castanea sativa Mill.) by HPLC-DAD-MS 1
Patrizia Comandini,*,† Maria Jesus Lerma-Garcia,§ Ernesto Francisco Simó-Alfonso,# 2
and Tullia Gallina Toschi† 3
4
†Department of Food Science, University of Bologna, Piazza Goidanich 60, I-47521 Cesena, 5
FC, Italy 6
§Department of Analytical Chemistry and Food Technology, University of Castilla – La 7
Mancha, Avda. Camilo José Cela 10, E-13004, Ciudad Real, Spain 8
#Department of Analytical Chemistry, University of Valencia, Doctor Moliner 50, E-46100, 9
Burjassot, Valencia, Spain 10
11
12
Running title: HPLC-DAD-MS tannin analysis 13
Key words: Chestnut bark extract, Ellagitannins, HPLC, Mass spectrum 14
15
*Author to whom correspondence should be addressed: 16
Patrizia COMANDINI, Dipartimento di Scienze degli Alimenti, Università di Bologna 17
P.zza Goidanich, 60, 47521 Cesena (FC), Italy 18
Telephone +390547338121, fax +390547382348 19
e-mail: [email protected] 20

Research article 4
83
Abstract 21
Numerous kind of commercial tannin extracts are available on the market and an important 22
fraction is obtained from Castanea sativa Mill. 23
Tannin extracts are used for animal feed and by many industries, such as the leather industry, 24
the food industry, and especially in wine and spirit production. Owing to the numerous uses 25
of tannin extracts, a rapid, reliable, and complete characterization of the phenolic and in 26
particular of the tannin fraction of chestnut bark extracts is advisable. 27
In this investigation an HPLC-DAD/ESI-MS method for the complete analysis of tannin 28
composition of chestnut bark extracts was developed. Seven phenolic compounds (vescalin, 29
castalin, gallic acid, vescalagin, 1-O-galloyl castalagin, castalagin and ellagic acid) were 30
isolated from chestnut bark extracts. 1-O-galloyl castalagin was found for the first time in 31
chestnut bark extracts. The phenolic components of four commercial chestnut bark extracts 32
were quantified and compared. 33

Research article 4
84
1. Introduction 34
Tannins are complex polyphenols synthesized by a wide range of plants and trees (Muller-35
Harvey, 2001); thanks to their ability to precipitate gelatin and other proteins from solutions 36
(Mehansho, Butler, & Carlson, 1987), they are proposed to play key roles in the chemical 37
defences of the plant species against biological decay. This property influenced all the other 38
characteristics such as taste and toxicity and some pharmacological effects (Vivas, Bourgeois, 39
Vitry, & Glories, 1996). 40
Based on their structure, tannins are conventionally divided into condensed and hydrolysable 41
tannin molecules. Condensed tannins have a flavonoid core as a basic skeleton, and 42
hydrolysable tannins are esters of a polyol (most often β-D-glucose) with either gallic acid 43
(gallotannins) or hexahydroxydiphenic acid (HHDP, ellagitannins) (Salminen, Ossipov, 44
Loponen, Haukioja, & Pihlaja, 1999; Mämmelä, Savolainen, Lindroos, Kangas, & Vartiainen, 45
2000). Several species, such as Acacia, Acer, Quercus and Castanea sp. are well known for 46
having both condensed and hydrolysable tannins (Muller-Harvey, 2001; Živković, Mujić, 47
Zeković, Nikolić, Vidović, & Muji ć, 2009). 48
Castanea genera belongs to the Fagaceae family and Castanea sativa Mill. is one of the most 49
cultivated chestnut species (De Vasconcelos, Bennett, Rosa, & Ferreira Cardoso, 2007). 50
The composition of tannins obtained from chestnut wood (Pasch & Pizzi, 2002), bark (Garro-51
Gálvez, Riedl, & Conner, 1997) and flesh (Hwang, Hwang, & Park, 2001) has been 52
determined and the components mainly belong to the group of hydrolysable tannins (Vázquez, 53
González-Alvarez, Santos, Freire, & Antorrena, 2009). In particular, sweet chestnut contains 54
high amounts of ellagitannins and the main structures found are castalin and vescalin (Peng, 55
Scalbert, & Monties, 1991), castalagin and vescalagin (Viriot, Scalbert, Hervé du Penhoat, & 56
Moutounet, 1994), kurigalin, 5-O-galloylhamamelose, (3’, 5’-dimethoxy-4’-hydroxyphenol)-57
1-O-β-D-(6-O-galloyl)glucose, chestanin and acutissimin A (Lampire, Mila, Raminosoa, 58
Michon, Du Penhoat, Faucheur, Laprevote, & Scalbert, 1998; Peng et al., 1991). 59
Industry uses various plant materials (leaves, fruit, galls, bark and wood) to produce 60
numerous kind of commercial tannin extracts. Several thousand tons of sweet chestnut tannins 61
are produced every year in Europe (Vivas et al., 1996). These commercial tannin extracts are 62
used for animal feed (Muller-Harvey, 2001) and by the leather (Scalbert, Monties, & Janin, 63
1989) and the food industry, especially in wine and spirit production (Vivas et al., 1996; Sanz, 64
Cadahia, Esteruelas, Munoz, De Simon, Hernández, & Estrella, 2010). 65

Research article 4
85
One of the first contributions to the analysis of commercial tannin extracts was provided by 66
Tang, Hancock, & Covington (1992) who studied the composition and the structure of 67
commercial chestnut tanning agents. In particular castalagin and vescalagin were isolated by 68
thin layer and column chromatography; then their structure was established by means of 69
nuclear magnetic resonance and fast atom bombardment mass spectroscopy. The authors also 70
found some other compounds, but their structures were not defined. 71
In 1993 Vivas and collaborators (Vivas, Chauvet, Glories, & Sudraud, 1993a; Vivas, Chauvet, 72
Sudraud, & Glories, 1993b; Vivas et al., 1996) realized a study on the major commercial 73
tannin extracts with the aim of determining their botanical origin by the analysis of specific 74
species-markers (phenolic acids and coumarins) of the plant sources and the extraction 75
solvents used. They also developed a method in liquid secondary ion mass spectrometry for 76
the determination of the qualitative composition of commercial tannin extracts (Vivas et al., 77
1996). In 2002 Zywicki, Reemtsma, & Jekel analysed hydrolysable and condensed tannins in 78
commercial vegetable tanning agents and in tannery wastewaters by reversed-phase liquid 79
chromatography-electrospray ionization-tandem mass spectrometry. 80
Chestnut bark extracts are widely used by industry and at the best of our knowledge there are 81
only limited information on the qualitative and quantitative characterization of the phenolic 82
fraction. 83
In this investigation a rapid HPLC-DAD/ESI-MS method for the complete analysis of tannin 84
composition of chestnut bark extracts was developed. In order to have a preliminary 85
quantitative tannin estimation, a colorimetric assay for the determination of the total phenol 86
content was made. Folin-Ciocalteau test was chosen thanks to its ability to react with all kind 87
of tannins, both condensed and hydrolizable. 88
89
2. Experimental 90
2.1. Chemicals and samples 91
Methanol (p.a.), monohydrate gallic acid (assay 99.1 %) and ellagic acid (assay ≥ 96 %) were 92
obtained from Sigma-Aldrich (St. Louis, MO, USA). Acetonitrile (gradient grade, for HPLC) 93
was from VWR (Milano, Italy), formic acid (assay 98-100%) was from Merck (Darmstadt, 94
Germany). Deionized water was obtained from an Elix 10 water purification system from 95
Millipore (Bedford, MA, USA). Sodium molybdate dihydrate was from Carlo Erba (Rodano, 96

Research article 4
86
Milano, Italy). Na2CO3 was from BDH AnalaR (Poole, U.K.). Folin−Ciocalteu reagent was 97
purchased from Merck. 98
Four different chestnut bark extracts, reported as TAN1, TAN2, TAN3 and TAN4, have been 99
analysed. All samples were bought from local markets in Emila-Romagna region (Italy). 100
101
2.2. Sample preparation 102
Several solvents have been compared in order to obtain the best tannin extraction. 103
According to the method described by Vekiari, Gordon, García-Macías, and Labrinea (2008) 104
and Bianco, Handaji, and Savolainen (1999), an amount of 350 mg of chestnut bark extract 105
was weighted and dissolved in 20 mL of methanol. The mixture was vortexed for 1 min and 106
kept at ambient temperature for 30 min and then it was sonicated for 30 min. The extract was 107
filtered on cellulose acetate filters (0.45 µm) and diluted 1:2 with water. 108
The same extraction procedure was repeated by using different solvents: water, a mixture of 109
methanol/water (50/50, v/v) and a mixture of acetone/water (70/30, v/v) were compared. 110
The extraction procedures were tested on sample TAN1 in order to choose the best method of 111
dissolution. The samples were stored at -18°C until analysis. 112
113
2.3. Colorimetric determination of total phenol (TP) content 114
The total phenol (TP) content of the extracts was determined by the Folin–Ciocalteau method 115
at 750 nm (Singleton & Rossi, 1965), using a Shimadzu Spectrophotometer UV-VIS 1204 116
(Kyoto, Japan). TPs were calculated as gallic acid equivalent (GAE) from the calibration 117
curve of gallic acid standard solutions (r2 = 0.9998) and expressed as g GAE/100 g of extract 118
(on a dry basis). The analyses were done in triplicate; and the mean values and the standard 119
deviations were calculated. 120
121
2.4. HPLC–DAD-MS equipment 122
HPLC analysis were carried out on an HP 1100 Series (Agilent Technologies, Palo Alto, CA, 123
USA), equipped with a binary pump delivery system, a degasser, an autosampler, a HP diode-124
array UV–Vis detector and a HP mass spectrometer. A C18 Luna column 5-µm particle size, 125

Research article 4
87
25 cm×3.00 mm I.D. (Phenomenex, Torrance, CA, USA) was used. All solvents were filtered 126
through a 0.45-µm filter disk (Millipore). MS analyses were carried out using an electrospray 127
(ESI) interface operating both in positive and in negative mode. 128
129
2.4. HPLC–DAD-MS analysis 130
Two elution gradients were compared: 131
1. According to Vekiari et al. (2008) the first linear elution gradient tested was: from 0 to 132
8 min 7% B; from 8 to 25 min, 7 to 32% B; from 25 to 30 min, 32 to 35% B; from 30 to 35 133
min, 35 to 7% B, followed by a re-equilibration of the column for 5 min in the initial 134
conditions. 135
2. According to Sandhu & Gu (2010) the second linear elution gradient tested was: from 136
0 to 2 min, 5% B; from 2 to 10 min, 5 to 20% B; from 10 to 15 min, 20 to 30% B; from 15 to 137
20 min, 30 to 35% B; from 20 to 60 min, 35 to 80 %B; from 60 to 65 min, 80 to 85% B; from 138
65 to 70 min, 85 to 5% B, followed by a re-equilibration of the column for 5 min in the initial 139
conditions. 140
In both cases the following solvent system was used: mobile phase A, water–formic acid 141
(99.5:0.5, v/v); mobile phase B, acetonitrile. All solvent used were of HPLC grade. The flow-142
rate was 0.5 mL/min. The injection volumes was 10 µL. All the analyses were carried out at 143
room temperature. 144
The following conditions of ESI interface were used: drying gas flow, 9.0 L/min; nebulizer 145
pressure, 35 psig; gas drying temperature, 350 °C; capillary voltage, 3000 V; fragmentor 146
voltage, 60 V. 147
Phenolic and tannin compounds were identified comparing retention times, UV and MS 148
spectra of the detected peaks with those of commercial standards (gallic and ellagic acid); if 149
reference compounds were not available a tentative identification was made by analyzing and 150
comparing elution order, spectroscopic and spectrometric information with literature data. 151
The quantification of each compound was performed using eight-point regression curves 152
obtained using gallic (r2 = 0.9993) or ellagic acid (r2 = 0.9992). Gallic acid amount was 153
calculated at 280 nm with gallic acid as reference standard; ellagic acid and ellagitannins 154
(vescalin, castalin, vescalagin, castalagin and 1-O-galloyl-vescalagin) amounts were 155
quantified at 254 nm, using the ellagic acid calibration curve. For vescalin and castalin, a 156
correction of molecular weight with a multiplication factor of 632/302 was applied; for 157

Research article 4
88
vescalagin and castalagin a multiplication factor of 934/302 was used; finally for 1-O-galloyl 158
castalagin the correction of molecular weight with a multiplicative factor of 1086/302 was 159
calculated. 160
161
2.5. Statistical analysis 162
The analytical results was evaluated by the software Statistica 8.0 (Statsoft Inc.,Tulsa, OK). 163
Analysis of variance (ANOVA) was used to determine if significant differences existed at a 164
level of confidence of p <0.05 (Honestly Significant Differences or Tukey’s HSD multiple 165
comparison). 166
167
3. Results and discussion 168
3.1 Sample dissolution tests 169
As reported in Section 2.2, different solvents have been compared, in order to obtain the best 170
dissolution and the highest spectrophotometric response of samples. In particular the sample 171
TAN 1 was dissolved with methanol, water, methanol/water (50/50), and acetone/water 172
(70/30) mixtures. 173
The methanolic sample had some precipitate at the bottom of the flask; with the others 174
solvents the tannin extract was completely dissolved, but different clearness levels were 175
obtained. When the tannin extract was dissolved in methanol and acetone/water mixture it 176
was most cloudy, instead when water was used, the sample obtained was clear and well 177
dissolved. 178
A preliminary spectrophotometric evaluation of the different dissolution procedures was 179
made. The unitary net absorbance of each solvent tested were calculated by using the 180
following formula: 181
Aun = (As-Ab)/Ws 182
183
Where Aun: unitary net absorbance (AU/g) 184
As: sample absorbance (AU) 185

Research article 4
89
Ab: blank absorbance (AU) 186
Ws: sample weight (g) 187
188
The blank was obtained by reading the absorbance of the pure solvent or of the mixture used 189
for the dissolution. As reported in table 1, the unitary net absorbance obtained by using 190
methanol was almost double respect to water, and it was, respectively, 75% and 45% higher 191
than methanol/water and acetone/water mixtures. 192
By considering the dissolution test and the spectrophotometric results, the following 193
analytical determinations were made on chestnut bark samples dissolved with methanol. 194
195
196
3.2 Spectrophotometric determination of the total phenol (TP) content 197
A very large number of hydrolysable tannins exist in nature and many structural variations 198
among them are caused by oxidative coupling reactions of acid units or by oxidation of 199
aromatic rings. Numerous colorimetric tests have been proposed for the analysis of 200
hydrolysable tannins, such as those based on the KIO3, rhodanine, NaNO2 reagents, but most 201
of them can only detect the galloyl or the HHDP groups, without considering the more 202
complex oxidation products. As a consequence many hydrolysable tannins might not be 203
quantified through colorimetric test (Muller-Harvey, 2001). 204
In this investigation it was decided to make a spectrophotometric test in order to have an 205
evaluation of the content of total phenols of different chestnut bark extracts and to verify if a 206
preliminary discrimination of the sample was possible. Table 2 reports the total phenol 207
content of the chestnut bark tannin extracts analysed. 208
TP content of chestnut bark extracts ranged from 23.9 and 56.1 g GAE/100 g dry extract. 209
TAN 1 and TAN 4 resulted the samples with the highest TP content. The mean concentration 210
of TPs in commercial samples was quite uniform, with the exception of TAN 3, whose 211
content was about 47% of the other samples analysed. 212
213
214

Research article 4
90
3.3 Gradient development and HPLC-DAD-MS analysis 215
Two elution gradients were tested and the HPLC chromatograms obtained are reported on 216
Figure 1. In both cases it was possible to separate 7 main compounds, numerated in the 217
Figure. The best separation was obtained with the gradient adapted by Sandhu & Gu (2010) 218
(Figure 1 B), moreover this elution gradient enabled to reduce the separation time of about 7 219
minutes, so it was adopted for the following analysis. 220
In table 3 are reported the spectroscopic and spectrometric information on the compounds 221
separated and their identification. The main peak in the mass spectra of chestnut bark extract 222
tannins, obtained in the negative ion ESI-MS mode, was the deprotonated molecule [M-H]- 223
and the ion [M-2H]2-, as previously reported for other hydrolysable tannins (Salminen et al., 224
1999; Juang, Sheu, & Lin, 2004). 225
Vescalin and castalin isomers (peaks 1 and 2) provided [M-H]- ions at m/z 631 and peaks of 226
m/z 331 and 481 corresponding respectively to the monogalloyl-glucose ([Galloyl-glu-H]-) 227
and HHDP-glucose ([HHDP-glu-H]-) produced during the hydrolysis of the molecules. 228
Moreover a low intensity peak of m/z of 301, was obtained for both compounds, 229
corresponding to the liberation of ellagic acid [EA-H]-. 230
Peak 3 was assigned to gallic acid thanks to both molecular ion [M-H]- and the ion at m/z 231
125.0 generated from the loss of a CO2 group from the carboxylic acid moiety [M-H-CO2]-. 232
The presence of gallic acid in chestnut bark tannin extracts might be quite questionable 233
(Canas, Leandro, Spranger, & Belchior, 1999). In fact the occurrence of gallotannins in wood 234
can not be excluded (Seikel, Hostettler, & Niemann, 1971; Vivas et al., 1993b), but it has 235
never been confirmed. An acceptable hypothesis (Canas et al., 1999) suggests that gallic acid 236
has derived from the hydrolysis of some galloyl esters associated with the parietal composites 237
of the cells (Viriot et al., 1994). 238
In the case of vescalagin and castalagin (peak 4 and 6), that differ only in the stereochemistry 239
in position C6, the molecular ions at m/z 933 were detected, together with the fragments at 240
m/z 466, associated to the pattern [M-2H]2-. 241
Peak 5 was assimilated to an ellagitannin, based on the similarity to the UV-visible spectra, 242
characterized by a maximum at about 245 nm and a shoulder at 280 nm, as showed in figure 243
2. Analyzing the mass spectrum, it was deducted that this molecule could be originated from 244
the esterification of castalagin or vescalagin with a gallic acid residue, giving a molecule with 245
a galloyl-HHDP-glucose structure. In particular it was tentatively identified as 1-O-galloyl-246

Research article 4
91
castalagin, an hydrolysable tannin with molecular weight of 1086, previously identified in 247
Eugenia grandis (Nonaka, Ishimaru, Watanabe, Nishioka, Yamauchi, & Wan, 1987). As for 248
the other ellagitannins, the main fragments detected were the molecular ion, with m/z 1085 249
and the residue with m/z 542.1 corresponding to the pattern [M-2H]-2. 250
Peak 7, with retention time of 18.9 min, was ellagic acid as its mass spectrum had only one 251
major peak with m/z 301; its UV spectrum, showed a maximum absorbance at 254 nm. 252
The identification made were confirmed also by the analysis in ESI positive mode (data not 253
shown). 254
Gallic and ellagic acid gave [M+H]+ fragment. While castalin, vescalin, castalagin, 1-O-255
galloyl-castalagin and vescalagin identifications were characterised by the presence of the 256
fragments [M+H]+ and [M+H2O]+. 257
Although chestnut bark extracts are classified as elagitannin extracts they may, nevertheless, 258
contain gallotannins, because ellagitannins are biologically formed from pentagalloyl-glucose 259
(gallotannin) (Zywicki et al., 2002). 260
Besides the seven compounds previously identified, other mass spectra of minor compounds 261
have been detected in the chestnut bark extracts. The m/z data obtained in ESI negative mode 262
showed that all these components belonged to the gallotannin class, with the exception of 263
roburine E/grandinin (table 4). These compounds were detected at a trace level, and were not 264
always quantifiable in the chestnut extracts, for this reason the quantitative analysis was made 265
on the seven compounds initially separated. 266
In table 5 are reported the concentrations of each compound and the total concentration of 267
tannins in each extract. 268
In all samples analysed castalagin and vescalagin isomers, in free or hydrolysed form, were 269
the main components. In particular, in TAN 1 and TAN 2 vescalagin and castalagin were the 270
most abundant compounds, followed by 1-O-galloyl castalagin; in TAN 3 and TAN 4, 271
instead, 1-O-galloyl castalagin was present with a concentration superior to the other 272
compounds. 273
The global amount of castalin and vescalin, was always lower than the sum of castalagin and 274
vescalagin, however the proportion between castalin and vescalin isomers were different in 275
the extracts analysed. 276

Research article 4
92
In each extract the concentration of gallic acid was higher than ellagic acid and resulted 277
always the superior to castalin and vescalin amounts. 278
Analysing the global amount of tannins in each sample it is possible to note that the 279
concentration of tannins and phenolic compounds in the sweet chestnut bark extracts analysed 280
was quite wide, ranging from 4.75 to 16.73 g/100 g dry extract. 281
282
4. Conclusions 283
A rapid HPLC-DAD/MS method for the analysis of tannin components of chestnut bark 284
extracts was developed. Four commercial chestnut bark extracts were analysed and seven 285
compounds (vescalin, castalin, gallic acid, vescalagin, 1-O-galloyl castalagin, castalagin and 286
ellagic acid) were isolated and quantified. 1-O-galloyl castalagin was for the first time found 287
in chestnut bark exctracts. 288
289

Research article 4
93
References 290
Bianco, M. A., Handaji, A., & Savolainen, G. (1999). Quantitative analysis of ellagic acid in 291
hardwood samples. The Science of the Total Environment, 222, 123-126. 292
Canas, S., Leandro, M. C., Spranger, M. I., & Belchior, A. P. (1999). Low molecular weight 293
organic compounds of chestnut wood (Castanea sativa L.) and corresponding aged 294
brandies. Journal of Agricultural and Food Chemistry, 47, 5023-5030. 295
De Vasconcelos, M. D. C. B. M., Bennett, R. N., Rosa, E. A. S., & Ferreira Cardoso, J. V. 296
(2007) Primary and secondary metabolite composition of kernels from three cultivars 297
of portuguese chestnut (Castanea sativa Mill.) at different stages of industrial 298
transformation. Journal of Agricultural and Food Chemistry, 55, 3508-3516. 299
Garro-Gálvez, J. M., Riedl, B., Conner, A. H. (1997). Analytical studies on Tara tannins. 300
Holzforschung, 51, 235-243. 301
Hwang, J. Y., Hwang, I. K., & Park, J. B. (2001). Analysis of physicochemical factors related 302
to the automatic pellicle removal in Korean chestnut (Castanea crenata). Journal of 303
Agricultural and Food Chemistry, 49, 6045-6049. 304
Juang, L. J., Sheu, S. J., & Lin, T. C. (2004). Determination of hydrolyzable tannins in the 305
fruit of Terminalia chebula Retz. by high-performance liquid chromatography and 306
capillary electrophoresis. Journal of Separation Science, 27, 718–724. 307
Lampire, O., Mila, I., Raminosoa, M., Michon, V., Du Penhoat, C. H., Faucheur, N., 308
Laprevote, O., & Scalbert, A. (1998). Polyphenols isolated from the bark of Castanea 309
sativa Mill. Chemical structures and auto-association. Phytochemistry, 49, 623-631. 310
Mämmelä, P., Savolainen, H., Lindroos, L., Kangas, J., & Vartiainen, T. (2000). Analysis of 311
oak tannins by liquid chromatography-electrospray ionisation mass spectrometry. 312
Journal of Chromatography A, 891, 75-83. 313
Mehansho, H., Butler, L. G., & Carlson, D. M. (1987). Dietary tannins and salivary proline-314
rich proteins: interactions, induction and defense mechanisms. Annual Review of 315
Nutrition, 7, 423-440. 316
Mueller-Harvey, I. (2001). Analysis of hydrolysable tannins. Animal Feed Science and 317
Technology, 91, 3-20. 318

Research article 4
94
Nonaka, G. I., Ishimaru, K., Watanabe, M., Nishioka, I., Yamauchi, T., & Wan, A. S. C. 319
(1987). Tannins and related compounds. LI. Elucidation of the stereochemistry of the 320
triphenoyl moiety in castalagin and vescalagin, and isolation of 1-O-galloyl castalagin 321
from Eugenia grandis. Chemical & Pharmaceutical Bulletin, 35, 217-220. 322
Pasch, H., & Pizzi, A. (2002). Considerations on the macromolecular structure of chestnut 323
ellagitannins by matrix-assisted laser desorption/ionization-time-of-flight mass 324
spectrometry. Journal of Applied Polymer Science, 85, 429-437. 325
Peng, S., Scalbert, A., & Monties, B. (1991). Insoluble ellagitannins in Castanea sativa and 326
Quercus petraea woods. Phytochemistry, 30, 775-778. 327
Salminen, J. P., Ossipov, V., Loponen, J., Haukioja, E., & Pihlaja, K. (1999). Characterisation 328
of hydrolysable tannins from leaves of Betula pubescens by high-performance liquid 329
chromatography–mass spectrometry. Journal of Chromatography A, 864, 283-291. 330
Sandhu, A. K., & Gu, L. (2010). Antioxidant capacity, phenolic content, and profiling of 331
phenolic compounds in the seeds, skin, and pulp of Vitis rotundifolia (muscadine 332
grapes) as determined by HPLC-DAD-ESI-MSn. Journal of Agricultural and Food 333
Chemistry, 58, 4681–4692. 334
Sanz, M., Cadahia, E., Esteruelas, E., Munoz, A. M., De Simon, B. F., Hernández, T., & 335
Estrella, I. (2010). Phenolic compounds in chestnut (Castanea sativa Mill.) heartwood. 336
Effect of toasting at cooperage. Journal of Agricultural and Food Chemistry, 58, 337
9631-9640. 338
Scalbert, A., Monties, B., & Janin G. (1989). Tannins in wood: comparison of different 339
estimation methods. Journal of Agricultural and Food Chemistry, 37, 1324-1329. 340
Seikel, M., Hostettler, F. D., & Niemann, G. J. (1971). Phenolics of Quercus rubra wood. 341
Phytochemistry, 10, 2249-2251. 342
Singleton, V. L., & Rossi, J. A. (1965). Colorimetry of total phenolics with 343
phosphomolybdic-phosphotungstic acid reagents. American Journal of Enology and 344
Viticulture, 16, 144-158. 345
Tang, H. R., Hancock, R. A., Covington, A. D. (1992). Study on the composition and 346
structure of commercial chestnut tanning agent. In R. W., Hemingay, P. E., Laks 347
(Eds.), Plant Polyphenols (pp. 221-243). New York: Plenum Press. 348

Research article 4
95
Vázquez, G., González-Alvarez, J., Santos, J., Freire, M. S., Antorrena, G. (2009). Evaluation 349
of potential applications for chestnut (Castanea sativa) shell and eucalyptus 350
(Eucalyptus globulus) bark extracts. Industrial Crops and Products, 29, 364-370. 351
Vekiari, S. A., Gordon, M. H., García-Macías, P., & Labrinea H. (2008). Extraction and 352
determination of ellagic acid content in chestnut bark and fruit. Food Chemistry, 110, 353
1007-1011. 354
Viriot, C., Scalbert, A., Hervé du Penhoat, C. L. M., & Moutounet, M. (1994). Ellagitannins 355
in woods of sessile oak and sweet chestnut. Dimerization and hydrolysis during wood 356
aging. Phytochemistry, 36, 1253-1260. 357
Vivas, N., Chauvet, S., Glories, Y., Sudraud, P. (1993a). Caractérisation et définition des 358
préparations commerciales de tannins oenologiques. Industries alimentaires et 359
agricoles, 110, 705-713. 360
Vivas, N., Chauvet, S., Sudraud, P., & Glories, Y. (1993b). Techniques de controle et 361
d’évaluation de la qualité des tanins oenologiques. Annales des falsifications, de 362
l'expertise chimique et toxicologique, 86, 215-222. 363
Vivas, N., Bourgeois, G., Vitry, C., & Glories, Y. (1996). Determination of the composition 364
of commercial tannin extracts by liquid secondary ion mass spectrometry (LSIMS). 365
Journal of the Science of Food and Agriculture, 72, 309-317. 366
Živković, J., Mujić, I., Zeković, Z., Nikolić, G., Vidović, S., & Mujić, A. (2009). Extraction 367
and analysis of condensed tannins in Castanea sativa Mill. Journal of Central 368
European Agriculture, 10, 283-288. 369
Zywicki, B., Reemtsma, T., & Jekel, M. (2002). Analysis of commercial vegetable tanning 370
agents by reversed-phase liquid chromatography–electrospray ionization–tandem mass 371
spectrometry and its application to wastewater. Journal of Chromatography A, 970, 372
191-200. 373
374

Research article 4
96
Figures 375
376
Figure 1. Chromatograms obtained with gradient 1 (A) and 2 (B). See text for further details. 377
The compounds separated are indicated on Table 3. 378
379
380
381
Figure 2. UV and mass spectra of peak 5, identified as 1-O-galloyl castalagin. 382
383
384
-100
400
900
1400
1900
2400
2900
3400
3900
0 5 10 15 20 25 30
Abs
(mA
U)
Time (min)
1
23
45
6
7
A
-100
400
900
1400
1900
2400
2900
3400
3900
0 5 10 15 20 25 30
Abs
(mA
U)
Time (min)
1
2
3
4
5
67
B
m/z0 200 400 600 800 1000 1200
0
20
40
60
80
100 1085
.1
542.
1
1086
.1
543.
2
nm250 300 350
240 nm
280 nm

Research article 4
97
Tables 385
386
Table 1. Unitary net absorbance (AU/g) obtained with different solvents. Values are means ± 387
standard deviations (n=3). Different letters in the same row indicate statistically significant 388
differences (p < 0.05). 389
390
Solvent tested Unitary net absorbance (AU/g)
Methanol 5.94a ± 0.13
Water 3.04d ± 0.03
Methanol/water (50/50) 3.38c ± 0.05
Acetone/water (70/30) 4.08b ± 0.06
391
392
393
Table 2. TP content (g GAE/100 g dry extract) of the commercial tannin extracts analyzed. 394
Values are means ± standard deviations (n=3). Different letters in the same row indicate 395
statistically significant differences (p < 0.05). 396
397
Sample TP content (g GAE/100 g dry extract)
TAN 1 54.9a ± 3.2
TAN 2 43.2b ± 1.4
TAN 3 23.9c ± 0.9
TAN 4 56.1a ± 2.9

Research article 4
98
Table 3. Retention times, spectral characteristics (maximum absorption wavelength), ESI negative mass fragmentation patterns and identification of
the components of chestnut bark extracts separated by HPLC-DAD-MS.
Peak
No.
tr
(min)
λmax (nm) MW Major fragments ESI negative Identification
[M - H] - Other fragments
1 2.5 245/275sh 632 631.0 331.0 [Galloyl-glu-H]-/481.0 [HHDP-glu-H]- Vescalin
2 3.6 246/280sh 632 631.1 331.0 [Galloyl-glu-H]-/481.0 [HHDP-glu-H]- Castalin
3 6.6 232/272 170 169.0 125.0 [M-H-CO2]- Gallic acid
4 9.5 245/280sh 934 933.0 466.0 [M-2H]2- Vescalagin
5 10.7 240/280sh 1086 1085.1 520.2/542.1 [M-2H]2- 1-O-Galloyl castalagin
6 11.1 248/280sh 934 933.0 181.1/466.0[M-2H]2-/996.0 Castalagin
7 18.9 254/302/368 302 301.0 - Ellagic acid
sh, shoulder.

Chapter 4
99
Table 4. m/z fragments of minor compounds detected in ESI negative mode.
Analyte m/z
Monogalloyl-glucose 331.0
Roburine E/grandinin 1065.1
Digalloyl-glucose 483.0
Digalloyl-HHDP-glucose 785.2
Digallic acid 321.0
Trigalloyl-glucose/kurigalin 635.0
Trigalloyl-HHDP-glucose 937.3
Tetragalloyl-glucose 787.2
Table 5. Concentration of tannins and phenolic compounds in sweet chestnut bark extracts,
expressed as g/100 g dry extract. Values are means ± standard deviations (n=3). Different
small letters in the same row indicate statistically significantly differences (Honestly
Significant Differences or HSD by Tukey p<0.05). Different capital letters in the same
column indicate statistically significantly differences (Honestly Significant Differences or
HSD by Tukey p<0.05).
g/100 g dry extract
TAN1 TAN2 TAN3 TAN4
Vescalin 1.19 a E ± 0.06 1.05 b D ± 0.09 0.44 c D ± 0.01 1.22 a D ± 0.02
Castalin 0.73 b F ± 0.05 0.67 b E ± 0.02 0.31 c E ± 0.01 1.00 a E ± 0.03
Gallic acid 2.80 a D ± 0.09 1.56 c C ± 0.02 0.65 d C ± 0.01 1.80 b C ± 0.03
Vescalgin 4.08 a A ± 0.03 3.46 b A ± 0.19 0.29 d E ± 0.01 0.56 c G ± 0.01
1-O-Galloyl castalagin
3.20 b C ± 0.12 2.46 c B ± 0.18 1.58 d A ± 0.03 5.39 a A ± 0.06
Castalgin 3.80 a B ± 0.16 3.41 b A ± 0.06 1.05 d B ± 0.09 2.20 c B ± 0.11
Ellagic acid 0.93 a F ± 0.02 0.61 c E ± 0.04 0.43 d D ± 0.01 0.80 b F ± 0.02
Total 16.73 a ± 0.43 13.22 b ± 0.52 4.75 c ± 0.05 12.96 b ± 0.27

Chapter 4
100
4.4 REFERENCES
Akdemir E.O., Ozer A. (2009). Investigation of two ultrafiltration membranes for treatment of
olive oil mill wastewater. Desalination 249, 660-666.
Amakura Y., Okada M., Tsuji S., Tonogai Y. (2000). High performance liquid
chromatographic determination with photodiode array detection of ellagic acid in fresh and
processed fruits. Journal of Chromatography 896, 87-93.
Bazoti F.N., Gikas E., Skaltsounis A.L., Tsarbopoulos A. (2006). Development of a liquid
chromatography–electrospray ionization tandem mass spectrometry (LC–ESI MS/MS)
method for the quantification of bioactive substances present in olive oil mill wastewaters.
Analytica Chimica Acta 573-574, 258-266.
Bianco A., Buiarelli F., Cartoni G., Coccioli F., Jasionowska R., Margherita P. (2003).
Analysis by liquid chromatography tandem mass spectrometry of biophenolic compounds in
olives and vegetation waters, Part I. Journal of Separation Science 26, 409-416.
Bódalo A., Gómez J.L., Gómez M., León G., Hidalgo A.M., Ruíz M.A. (2008). Phenol
removal from water by hybrid processes: study of the membrane process step. Desalination
223, 323-329.
Bravo L. (1998). Polyphenols: Chemistry, dietary sources, metabolism and nutritional
significance. Nutrition Reviews 56, 317-333.
Calliste C.A., Trouillas P., Allais D.P., Duroux J.L. (2005). Castanea sativa Mill. leaves as
new sources of natural antioxidant: an electronic spin resonance study Journal of Agricultural
and Food Chemistry 53, 282-288.
Coskun T., Debik E., Demir N.M. (2010). Treatment of olive mill wastewaters by
nanofiltration and reverse osmosis membranes. Desalination 259, 65-70.
De Marco E., Savarese M., Paduano A., Sacchi R. (2007). Characterization and fractionation
of phenolic compounds extracted from olive oil mill wastewaters. Food Chemistry 104, 858-
867.
Della Greca M., Previtera L., Temessi F., Carrelli A. (2004). Low molecular-weight
components of olive oil mill waste-waters. Phytochemical Analysis 15, 184-188.
Galanakis C.M., Tornberg E., Gekas V. (2010). Recovery and preservation of phenols from
olive waste in ethanolic extracts. Journal of Chemical Technology and Biotechnology 85,
1148-1155.

Chapter 4
101
Garcia-Castello E., Cassano A., Criscuoli A., Conidi C., Drioli E. (2010). Recovery and
concentration of polyphenols from olive mill wastewaters by integrated membrane system.
Water Research 44, 3883-3892.
Garro-Gálvez J.M., Riedl B., Conner A.H. (1997). Analytical studies on Tara tannins.
Holzforschung 51, 235-243.
Gómez-Caravaca A., Cerretani L., Segura-Carretero A., Fernández-Gutiérrez A., Lercker G.,
Gallina Toschi T. (2011). Qualitative phenolic profile (HPLC-DAD-MS) from olive oil mill
waste waters at different states of storage and evaluation of hydrolysis process as a
pretreatment to recover their antioxidants. Progress in Nutrition 13, 22-30.
Harbourne J.B. (1989). Methods in plant biochemistry. 1. Plant phenolics. London, United
Kingdom: Academic Press.
Haslam E. (1998). Practical polyphenolics: from structure to molecular recognition and
physiological action (pp. 1-76). Cambridge, United Kingdom: Cambridge University press.
Haslam E., Lilley T.H. (1988). Natural astringency in foodstuffs—A molecular interpretation.
CRC Critical Reviews in Food Science and Nutrition 27, 1-40.
Hwang J.Y., Hwang I.K., Park J.B. (2001). Analysis of physicochemical factors related to the
automatic pellicle removal in Korean chestnut (Castanea crenata). Journal of Agricultural
and Food Chemistry 49, 6045-6049.
Lesage-Meessen L., Navarro D., Maunier S.; Sigoillot J.C., Lorquin J., Delattre M., Simon
J.L., Asther M., Labat M. (2001). Simple phenolic content in olive oil residues as a function
of extraction systems. Food Chemistry 75, 501-507.
Lozano-Sanchez J., Giambanelli E., Quirantes-Piné R., Cerretani L., Bendini A., Segura-
Carretero A., Fernandez-Gutierrez A. (2011).Wastes generated during the storage of extra
virgin olive oil as a natural source of phenolic compounds. Journal of Agricultural and Food
Chemistry 59, 11491-11500.
Moure A., Cruz J.M., Franco D., Domínguez J.M., Sineiro J., Domínguez H., José Núñez M.,
Parajó J.C. (2001). Natural antioxidants from residual sources. Food Chemistry 72, 145-171.
Mulinacci N., Romani A., Galardi C., Pinelli P., Giaccherini C., Vincieri F.F. (2001).
Polyphenolic content in olive oil waste waters and related olive samples. Journal of
Agricultural and Food Chemistry 49, 3509-3514.

Chapter 4
102
Obied H.K., Allen M.S., Bedgood D.R., Prenzler P.D., Robards K. (2005a). Investigation of
Australian olive mill waste for recovery of biophenols. Journal of Agricultural and Food
Chemistry 53, 9911-9920.
Obied H.K., Bedgood D.R., Prenzler P.D., Robards K. (2005b). Bioscreening of Australian
olive mill waste extracts: Biophenol content, antioxidant, antimicrobial and molluscicidal
activities. Food and Chemical Toxicology 45, 1238-1248.
Obied H.K., Allen M.S., Bedgood D.R., Prenzler P.D., Robards K., Stockmann R. (2005c).
Bioactivity and analysis of biophenols recovered from olive mill waste. Journal of
Agricultural and Food Chemistry 53, 823-837.
Paraskeva C.A., Papadakis V.G., Tsarouchi E., Kanellopoulou D.G., Koutsoukos P.G. (2007).
Membrane processing for olive mill wastewater fractionation. Desalination 213, 218-229.
Paraskeva P., Diamadopoulos E. (2006). Technologies for olive mill wastewater (OMW)
treatment: a review. Journal of Chemical Technology and Biotechnology 81, 1475-1485.
Pasch H., Pizzi A. (2002). Considerations on the macromolecular structure of chestnut
ellagitannins by matrix-assisted laser desorption/ionization-time-of-flight mass spectrometry.
Journal of Applied Polymer Science 85, 429-437.
Ramos-Cormenzana A., Juárez-Jiménez B., Garcia-Pareja M.P. (1996). Antimicrobial activity
of olive mill wastewaters (alpechin) and biotransformed olive oil mill wastewater.
International Biodeterioration & Biodegradation 38, 283-290.
Ribéreau-Gayon P. (1972). Plant Phenolics (pp. 254). Edinburgh, United Kingdom: Oliver
and Boyd.
Russo C. (2007). A new membrane process for the selective fractionation and total recovery
of polyphenols, water and organic substances from vegetation waters (VW). Journal of
Membrane Science 288, 239-246.
Servili M., Baldioli M., Selvaggini R., Miniati E., Macchioni A., Montedoro G. (1999). High-
performance liquid chromatography evaluation of phenols in olive fruit, virgin olive oil,
vegetation waters and pomace and 1D- and 2D-Nuclear Magnetic Resonance characterization.
Journal of the American Oil Chemists' Society 76, 873-882.
Shahidi F., Naczk M. (2011). Analysis of Polyphenols in Foods. In S. Otles (Ed.) Methods of
Analysis of Food Components and Additives (pp. 253-308) Boca Raton, FL: CRC Press.

Chapter 4
103
Swain T., Bate-Smith E.C. (1962). Flavonoid compounds. In: M. Florkin and H.S. Mason
(Eds.) Comparative Biochemistry Vol. III (pp. 755-809). New York, NY: Academic Press.
Vázquez G., Fontenla E., Santos J., Freire M.S., González-Álvarez J., Antorrena G. (2008).
Antioxidant activity and phenolic content of chestnut (Castanea sativa) shell and eucalyptus
(Eucalyptus globulus) bark extracts. Industrial Crops And Products 28, 279-285.
Vázquez, G., González-Alvarez, J., Santos, J., Freire, M. S., Antorrena, G. (2009). Evaluation
of potential applications for chestnut (Castanea sativa) shell and eucalyptus (Eucalyptus
globulus) bark extracts. Industrial Crops and Products 29, 364-370.
Vekiari S.A., Gordon M.H., García-Macías P., Labrinea H. (2008). Extraction and
determination of ellagic acid content in chestnut bark and fruit. Food Chemistry 110, 1007-
1011.
Visioli F.. Romani A., Mulinacci N., Zarini S., Conte D., Vincieri F.F., Galli C. (1999).
Antioxidant and other biological activities of olive mill waste waters. Journal of Agricultural
and Food Chemistry 47, 3397-3401.
Vivas N., Bourgeois G., Vitry C., Glories Y. (1996). Determination of the composition of
commercial tannin extracts by liquid secondary ion mass spectrometry (LSIMS). Journal of
the Science of Food and Agriculture 72, 309-317.
Vivas N., Chauvet S., Glories Y., Sudraud P. (1993a). Caractérisation et définition des
préparations commerciales de tannins oenologiques. Industries alimentaires et agricoles 110,
705-713.
Vivas N., Chauvet S., Sudraud P., Glories Y. (1993b). Techniques de controle et d’évaluation
de la qualité des tanins oenologiques. Annales des falsifications, de l'expertise chimique et
toxicologique 86, 215-222.
Yalcuk A., Pakdil N.B., Turan S.Y. (2010). Performance evaluation on the treatment of olive
mill waste water in vertical subsurface flow constructed wetlands. Desalination 262, 209-214.
Zafra A., Juárez M.J.B., Blanc R., Navalón A., González J., Vílchez J L. (2006).
Determination of polyphenolic compounds in wastewater olive oil by gas chromatography–
mass spectrometry. Talanta 70, 213-218.

Chapter 4
104
Zywicki B., Reemtsma T., Jekel M. (2002). Analysis of commercial vegetable tanning agents
by reversed-phase liquid chromatography–electrospray ionization–tandem mass spectrometry
and its application to wastewater. Journal of Chromatography A 970, 191-200.
Chapter 5
105
5. SENSORY ANALYSIS: STUDY OF VOLATILE PROFILE OF POTATOES
5.1 POTATO FLAVOUR: BACKGROUND AND UPDATES OF
LITERATURE
Potato flavour, which is defined as the combined perception of aroma, taste and mouthfeel
sensations, has a great importance because it is one of the main qualitative criteria in
assigning different potato varieties to a fresh or processed food market (Petersen et al., 1998).
The volatile profile of potatoes has been widely investigated (Maga, 1994; Dresow
and Böhm, 2009; Jansky, 2010). Recent studies gave emphasis on the role of agricultural
environments on flavour compounds (Dresow and Böhm, 2009; Jansky, 2010) and on the
occurrence, formation and control procedures of volatile and non-volatile flavour components
of raw and processed potatoes (Maga, 1994).
A mini-review concerning the sensory and instrumental analysis of the volatile
fraction of raw and processed potatoes has been written (research article 5). This investigation
aims to update the information on the volatile components of potato tubers, giving particular
attention to the cooking or processing method.
This study takes into account both the main extraction (simultaneous distillation and
extraction (SDE), solvent and direct solvent extraction techniques, headspace analysis, 4.
solid-phase microextraction (SPME)) and analytical techniques (gas chromatography - mass
spectrometry (GC-MS), gas chromatography/olfactometry (GC/O) or gas chromatography-
FID/olfactometry (GC-FID/O) gas chromatography-MS/olfactometry (GC-MS/O)) used in
potato flavour analysis and the sensory analysis of potatoes, with particular attention to the
findings concerned with the volatile profile.
As regards the sensory evaluation of a food, it can be made through discriminative,
descriptive or affective tests. Discriminative tests investigate whether there is a sensory
difference between samples (Stone and Sidel 1992), such as the triangle test, the duo-trio test
and the paired comparison test.
Descriptive tests involve the detection and description of both qualitative and
quantitative sensory components of a product by trained panels. The main methods of
descriptive analysis are the Flavour Profile and the Quantitative Descriptive Analysis
(QDA®).
Chapter 5
106
The affective tests have the primary goal to assess the personal response of users or
potential users of a product (acceptance, preference, or consumer tests). A large number of
individuals are required to take part in a sensory acceptance test (> 100). Preference can be
measured directly by comparing two or more products with each other, or indirectly by
determining which product is the most appreciated in a multiproduct test. The two most
widely used methods to measure preference and acceptance are the paired comparison and the
9-point hedonic scale tests.
With reference to the evaluation of raw and processed potatoes, the sensory tests most
frequently used are the Flavour Profile, the QDA® and the preference tests, as detailed in
research article 5.

Chapter 5
107

Received: 28 April, 2010. Accepted: 2 December, 2010. Invited Review
Food ©2011 Global Science Books
Characterization of Potato Flavours: An Overview of Volatile Profiles and Analytical Procedures
Patrizia Comandini • Lorenzo Cerretani* • Giampaolo Blanda •
Alessandra Bendini • Tullia Gallina Toschi
Alma Mater Studiorum – Università di Bologna, Dipartimento di Scienze degli Alimenti, P.zza Goidanich, 60 – I-47521 – Cesena (FC), Italy
Corresponding author: * [email protected]
ABSTRACT
Potatoes may be cooked by several methods such as boiling, baking and frying; they are also used as an ingredient for numerous home-made and mass-produced foods like sticks, chips and other snacks. An important factor affecting consumer preferences of these products is their flavour, which is defined as the combined perception of aroma, taste and mouthfeel sensations. Flavour, and in particular the volatile profile of potatoes, has been widely investigated in the last few years, and complex patterns have been found. Although raw potatoes possess little aroma, more than 140 volatile compounds have been identified in boiled potatoes, whereas over 250 have been found in baked potatoes and more than 500 compounds have been isolated in French fries. Among these, many lipid oxidation and Maillard reaction products have been reported, together with smaller amounts of indigenous flavour compounds. Many extraction methods have been developed to characterize the aroma of potatoes, with the goal of reducing analytical detection limits, avoiding formation of artefacts during isolation and reducing analysis cost and time; among these are distillation techniques, solvent and direct solvent extraction techniques, static and dynamic headspace methods and solid-phase microextraction. As regard isolation and quantification of potato volatiles, gas chromatography-mass spectrometry and gas chromatography/olfactometry are frequently used. The analytical approach is often completed with the sensory evaluations. This review describes the flavour profile of the main forms of cooked potatoes, taking into account their mechanism of generation; extraction and analysis procedures are also considered, reporting both conventional and innovative methods.
_____________________________________________________________________________________________________________
Keywords: analytical techniques, characterization, extraction, flavour, potatoes CONTENTS INTRODUCTION.......................................................................................................................................................................................... 1 INSTRUMENTAL ANALYSIS ..................................................................................................................................................................... 2
Extraction and concentration techniques ................................................................................................................................................... 2 Separation and identification techniques ................................................................................................................................................... 3 SENSORY ANALYSIS ............................................................................................................................................................................ 4
VOLATILE COMPOUNDS IN RAW POTATOES ....................................................................................................................................... 5 VOLATILE COMPOUNDS IN PROCESSED POTATOES.......................................................................................................................... 5
Boiled potatoes .......................................................................................................................................................................................... 5 Baked potatoes........................................................................................................................................................................................... 8 Potato chips and French fries..................................................................................................................................................................... 9 Potato crisps ............................................................................................................................................................................................ 11 Dehydrated potato products..................................................................................................................................................................... 11 Extruded potato products......................................................................................................................................................................... 12 Other potato-based products .................................................................................................................................................................... 12
REFERENCES............................................................................................................................................................................................. 12 _____________________________________________________________________________________________________________
INTRODUCTION
Potato (Solanum tuberosum L.) cultivation is widespread worldwide as a result of its appreciated sensory and nut-ritional properties, in addition to its adaptability to different climatic conditions. Potatoes may be cooked in many dif-ferent ways such as boiling, baking or frying; various potato-based products are also produced, including extruded, dehydrated and potato snacks. Recently, the ready-to-use and ready-to-eat market has extensively utilized potato preparations.
One of the most important qualitative criteria in assign-ing different potato varieties to a fresh or processed food market is the flavour profile. The volatile profile of raw potatoes is weak, but is quite different from that of cooked
potatoes. Additionally, the volatiles produced from major cooking procedures differ significantly each other (Whit-field and Last 1991). Therefore, when studying the volatile fraction of potato tubers a distinction must be made bet-ween raw (Petersen et al. 1998), boiled (Nursten and Sheen 1974; Josephson and Lindsay 1987; Petersen et al. 1998; Oruna-Concha et al. 2002b), baked (Buttery et al. 1973; Coleman and Ho 1980; Coleman et al. 1981; Duck-ham et al. 2001, 2002), microwaved (Oruna-Concha et al. 2002a, 2002b), fried (Carlin et al. 1986; Wagner and Grosch 1997, 1998) and manufactured products such as extruded (Maj-cher and Jelén 2009) and dehydrated (Nissen et al. 2002; Laine et al. 2006) potatoes.
Sugars, amino acids and lipids are the main precursors of potato volatile compounds (Whitfield and Last 1991);
®
Food 5 (Special Issue 1), 1-14 ©2011 Global Science Books
their formation can be due to enzymatic or chemical reac-tions that have been recently overviewed (Dresow and Böhm 2009). The flavour profile of potatoes depends both on the cooking procedure and numerous other factors like cultivar selection, agronomic and storage conditions. More-over, the extraction technique used during the analysis may affect the nature and the quantity of volatiles isolated.
Potato flavour has been widely investigated in recent reviews by Dresow and Böhm (2009) and by Jansky (2010), with emphasis on the role of agricultural environments on flavour compounds. In 1994, Maga described the occur-rence, formation and control procedures of volatile and non-volatile flavour components of raw and processed potatoes.
The present review updates the information on the volatile components of potato tubers, and gives particular attention to the cooking or processing method. In the first part, a brief summary of the main extraction and analytical techniques used in potato flavour analysis is presented. As this study takes into account the sensory analysis of pota-toes, and the findings concerned with the volatile profile are reported, a brief explanation of the definitions used should be made. “Flavour” is usually defined as the complex com-bination of the olfactory (orthonasal and retronasal percep-tions), gustatory and trigeminal sensations perceived during tasting. Volatile, non-volatile components and mouthfeel sensations interact to determine food flavour. The term “Odour” refers to the direct olfactory component of flavour (orthonasal perception), while “Aroma” describes the attrib-utes perceptible by the olfactory organ via the back of the nose (International Standard ISO 5492, 2008-10-15). How-ever, these terms are sometimes used with different mean-ings, e.g. “Flavour” may refer to the volatile profile only or to the retronasal olfactory perception during tasting. For accuracy, in this review focusing on the sensory and ins-trumental analysis of the volatile fraction of raw and pro-cessed potatoes, the terms aroma and flavour are used syn-onymously, limiting them to the olfactory stimuli, without taking into account taste and mouthfeel sensations. INSTRUMENTAL ANALYSIS
To determine which compounds are responsible for the flavour of a food product, one crucial step is to select a suitable method for their isolation. This procedure should allow the extraction of all compounds that contribute to flavour of the food product, but not alter the profile of characteristic volatiles, and in particular it should not form artefacts. An additional difficulty in the isolation of volatile compounds is their presence in a wide range of concentra-tions from ng/kg to mg/kg, and their odour thresholds, which are often below detection limits using conventional GC detectors. Therefore, GC-MS and gas chromatography–olfactometry (GC–O) are usually used to characterize the aroma profile of a food product. Several extraction methods for isolating crucial compounds of potatoes have been used; among these are distillation techniques like simultaneous distillation and extraction (SDE) (Nickerson and Likens 1966), solvent extraction techniques such as solvent-
assisted flavour evaporation (SAFE) (Engel et al. 1999), headspace methods such as static and dynamic headspace and solid-phase microextraction (SPME) (Pawliszyn 1997). Extraction and concentration techniques 1. Simultaneous distillation and extraction (SDE) The SDE method, developed by Nickerson and Likens in 1966, was essentially based on steam distillation of volatile compounds at high temperatures for extended times, but it has been performed with numerous variations from the original version (Buttery et al. 1970; Nursten and Sheen 1974; Mutti and Grosch 1999; Ulrich et al. 2000).
Due to the analytical conditions required, this process may lead to the creation of new aromatic substances, espe-cially during extended treatments. This extraction is per-formed with dedicated equipment and assures good detec-tion limits. Table 1 reports recent SDE applications in potato analysis. 2. Solvent and direct solvent extraction techniques Solvent extraction is a simple and efficient technique for aroma isolation. The major limitation of this method is that if the food contains lipids, they will also be extracted along with the aroma constituents, and consequently they must be removed prior to further analysis. The separation of aroma components from extracts containing lipids can be per-formed via molecular distillation, steam distillation and dynamic headspace. Despite bias added by further distil-lation procedures, this combination (solvent extraction fol-lowed by distillation) has been widely applied due to its efficiency at isolating a broad range of volatiles. Engel et al. (1999) developed a much more rapid and yet highly effici-ent Solvent Assisted Flavour Evaporation (SAFE) distil-lation head, which is now widely used.
The extraction procedure has been employed in several investigations by Petersen et al. (1998, 1999, 2003) to ex-plore the volatile fraction of raw shredded and boiled pota-toes. They developed a mild extraction procedure in which a large quantity of sample (from 150 to 280 g of food mat-rix) was homogenized with variable amounts of tap water to ensure sufficiently low viscosity prior to extraction with diethyl ether/pentane (1: 1). The sample was stirred until an emulsion was created, frozen and non-frozen organic phases were discarded. After drying by adding Na2SO4, the sample was concentrated and finally analyzed by GC-MS and GC-O.
In order to reduce the interference of starch and oils and increase the concentration of the extract, Petersen (1999) also evaluated the vacuum distillation of volatiles. In this case, a large quantity of boiled potatoes (333 g) was mixed with water and the suspension was distilled at 36-39°C at a vacuum pressure of 20 mbar. The distillate was extracted with ether/pentane under magnetic stirring, the phases were separated using a funnel and the organic phase dried and concentrated by blowing nitrogen on the surface. A similar
Table 1 Current SDE applications in potato volatiles analysis.
Sample Distillation
(t-T)a
Extraction solvent Instrumental techniqueb Reference
30 min - n.a. Diethyl ether/pentane (1:1) GC-MS (DB-WAX; 68.3 min) Jensen et al. 1999
120 min - 100°C Dichloromethane GC-MS (INNO-Wax; 90 min)
GC-PND (INNO-Wax; 90 min)
GC-O (INNO-Wax; 43.3 min)
Ulrich et al. 2000
Boiled potatoes
n.a. - 60°C Dichloromethane GC-MS (FFAP; 70 min) Blanch et al. 2009
Baked potatoes 120 min - n.a. Pentane/diethyl ether (9:1) GC-MS (BPX-5; 66.75 min) Oruna-Concha et al. 2001
Extruded potato snacks 120 min - 100°C Ethyl ether/pentane (1:1) GC-O and GC-MS (SBP-5; 30 min -
Supelcowax 10; 40.5 min)
Majcher and Jelén 2009
Potato flakes 30 min - n.a. Diethyl ether GC-MS (n.a.) Nissen et al. 2002 a Distillation time (min) and temperature (°C) b Separation and detection technique (column stationary phase; analysis time, min) n.a. Not available data
2

Advances in potato flavour. Comandini et al.
procedure was used by Majcher and Jelén (2009) who ap-plied the SAFE technique to extruded and dried potato snacks by using a small amount of sample to extract volatile compounds (20 g).
Direct solvent extraction is a very simple and conveni-ent technique, and it is frequently carried out with a Soxhlet extractor. It has been applied to isolate potent odorant from both boiled potatoes (Mutti and Grosch 1999) and French fries (Wagner and Grosch 1997, 1998).
Samples were dried, ground finely, placed in a Soxhlet thimble and extracted with dichloromethane (Wagner and Grosch 1998; Mutti and Grosch 1999) or diethyl ether (Wagner and Grosch 1997). The extract was concentrated by distilling off the solvent; the aromatic fraction and the solvent were purified by distillation under high vacuum, using the apparatus reported by Sen et al. (1991) and Jung et al. (1992). Next, volatiles were separated into neutral/ basic and acidic fractions before their identification on HRGC/MS and HRGC/O equipments. 3. Headspace analysis The original headspace procedure, named Static Headspace (SH), involves static recovery in which the sample is equi-librated in a sealed container at a controlled temperature; however, low sensitivities are usually obtained (Sides et al. 2000). The Dynamic Headspace (DH) technique, in contrast, is based on the stripping of volatile components with a flow of inert gas (e.g. N2, He), their subsequent adsorption by polymers and desorption in GC. Quantitative extraction is granted by high temperatures, such as those employed by Salinas et al. (1994), who extracted the aromatic com-pounds from cooked and reconstituted dehydrated potatoes at 100°C for 1 h, or by extended treatments such as those described by Josephson and Lindsay (1987) who performed extraction for 15 h at 21°C. Under these conditions, enzy-matic reactions may take place and synthesize ex novo aro-matic components that were not present before the extrac-tion. The DH is extensively used in volatile extraction from potato samples and current applications are shown in Table 2. In all applications, the carrier gas used is nitrogen, and the flask containing the sample was frequently held in a water bath at 37°C during extraction.
Only three applications of SH have been recently reported in potato flavour analysis. Limbo and Piergiovanni (2007) used a static headspace analyser to extract volatiles from raw potatoes; Wagner and Grosch (1998), moreover, applied the SH analysis to isolate methylpropanal, 2,3-butanedione and methanethiol from frozen French fries; a similar technique was applied to investigate perceivable odours in fresh and stored French fries (Wagner and Grosch 1997).
4. Solid-Phase Microextraction (SPME) In 1990, solid-phase microextraction (SPME) was deve-loped by Arthur and Pawliszyn as a sample pre-concentra-tion method, as an alternative to DH, before chromatogram-phic analysis. In this technique, an inert fibre, coated with a stationary phase, is placed in the headspace of the sample (Headspace Solid-Phase Microextraction, HS-SPME) or in-side the sample itself if the liquid (Direct Immersion Solid-Phase Microextraction, DI-SPME) allows volatile adsorp-tion. The loaded fibre is thermally desorbed into a GC car-rier gas flow, and the volatiles released are analyzed (Rei-neccius 2006). The optimization of solid-phase microex-traction conditions includes, in addition to the selection of the operative mode (HS-SPME and DI-SPME) and the fibre coatings, the equilibration, adsorption and desorption condi-tions (temperature and duration). With regards to the fibre coatings, different stationary phases are available, including polydimethylsiloxane (PDMS) carbowax/divinylbenzene (CW/DVB), divinylbenzene/carboxen/polydimethylosilox-ane (DVB/CAR/PDMS), carboxen/polydimethylsiloxane (CAR/PDMS) and polydimethylsiloxane/divinylbenzene (PDMS/DVB).
This technique has been applied to various food flavour and off-flavour analyses (vegetables and fruits, beverages, dairy products, oils and other food), pesticides, agrochemi-cals and food contaminants (Kataoka et al. 2000). To the best of our knowledge, only the headspace operative mode (HS-SPME) has been used in volatile analysis of potatoes, as summarized in Table 3.
Separation and identification techniques 1. Gas Chromatography - Mass Spectrometry (GC-MS) Mass spectrometry is used to either determine the identity of an unknown volatile compound or can also act as a mass-selective GC detector. It is advisable that MS identifications are supported by other data such as GC retention data, infra-red spectroscopy or nuclear magnetic resonance. MS can be operated in selected ion detection mode (SIM), multiple-ion mode (MIM) or full scan mode. In the SIM or MIM mode, the MS measures only selected ions at very short time inter-vals throughout a GC run, leading to greater sensitivity and a larger number of scans than full scan detection mode.
The magnetic sector or quadrupole requires significant time to scan a typical mass range, while ion trap (GC-ITMS) and time-of-flight (GC-TOFMS) MS detectors, in contrast, can collect spectra much faster (ion trap about 10–15 spectra/sec and TOF up to 500 spectra/sec). The TOF instrument can take a large number of spectra across a GC peak and reduce noise, thereby improving both sensitivity and detection limits. Another advantage is the deconvolu-tion of mixed spectra, i.e. the resolution of the MS data of
Table 2 Current DH applications in potato volatiles analysis.
Sample Ext. gasa Ext.
timeb
Adsorption
polymer
Trap dimensions Desorption
conditions
Instrumental techniquec Reference
120 mL/min 20 min Tenax TA (85 mg) 105 mm - 3 mm 10 min - 260°C GC-MS (CP-SIL 8 CB
low bleed; 70.5 min)
Oruna-Concha et al.
2002b
Boiled potatoes
200 mL/min 60 min Tenax (100 mg) n.a. n.a. GC-MS (J&W DB-Wax;
68.3 min)
Thybo et al. 2006
Baked potatoes 120 mL/min 20 min Tenax TA (85 mg) 105 mm - 3 mm 10 min - 260°C GC-MS (CP-SIL 8 CB
low bleed; 70.5 min)
Duckhman et al. 2001,
2002; Oruna-Concha et
al. 2002a, 2002b
50 mL/min 30 min Tenax TA (100 mg) 100 mm - 3 mm 5 min - 245°C GC-FID, GC-MS, GC-O
(MDN-5S; 66.5 min)
Van Loon et al. 2005 Fried potatoes
40 mL/min 60 min Tenax TA (85 mg) 155 mm - 3 mm 5 min - 280°C GC-MS (Cp-Sil8; 62 min) Martin and Ames 2001
Potato flour 40 mL/min 45 min Tenax TA (85 mg) 3.5 in. - 0.25 in. 10 min - 300°C GC-MS (DB-5; VF-
WAXms; 54.5 min)
Elmore et al. 2010
a Flow of the extraction gas (mL/min) b Extraction time (min) c Separation and detection technique (column stationary phase; analysis time, min)
3

Food 5 (Special Issue 1), 1-14 ©2011 Global Science Books
one compound from a mixture of compounds that co-elute. The deconvolution process may also be implemented using two-dimensional GC, which involves collecting part of a GC run and re-chromatographing it on a different chromato-graphic phase. These systems typically permit the collection of a selected part of several GC runs, improving sensitivity (Reineccius 2006). All these techniques have been used for analysis of raw and processed potato volatiles, as shown in Tables 1-3. 2. Gas Chromatography/Olfactometry (GC/O), Gas Chromatography-FID/Olfactometry (GC-FID/O), Gas Chromatography-MS/Olfactometry (GC-MS/O) In GC/O, the human nose is used as a selective and sen-sitive detector of volatile compounds, and the odour charac-ter of GC peaks is shown in an aroma profile. The effluent from the GC column is mixed with air and water vapour and is perceived by human assessors who identify the odours of compounds eluting from the column. Several parameters have to be considered in the optimisation process, but usually the most significant error factors are those that affect the perception of aromas by sensory panellists (Reid 2003). The GC column effluent can be split in two portions, one going to a sniffing port and the re-mainder going to a flame ionization (FID) or a mass (MS) detector. In alternative, the GC run may be made by passing all of the GC column effluent to the nose at one time: the column is then connected to the instrument detector, and a second run made (Reineccius 2006).
Although a large number of volatile compounds are present in foods, not all contribute to aroma. Patton and Josephson (1957) proposed to estimate the importance of an aroma compound in defining the sensory character of a food by calculating the ratio of the concentration of the com-pound to its sensory threshold in that food. This ratio is
known as the odour activity value (OAV) (also referred to as odour value, odour unit, flavour unit, or aroma value). Only compounds present above their sensory threshold con-centrations in a food are likely to be significant contributors to aroma.
The major screening procedures for determining the key odorants in food are based on Aroma Extract Dilution Ana-lysis (AEDA), developed by Ullrich and Grosch (1987), Aroma Extract Concentration Analysis (AECA), described by Kerscher and Grosch (1997), and CHARM Analysis developed by Acree and Barnard (1984). Diluted (or con-centrated) samples, prepared by using one of the extraction techniques previously described, are evaluated by GC/O. The occurrence of an aroma (its retention time or Kovats index) is recorded in each dilution, and a greater number of dilutions in which an odorant is detected, is reflected in a higher CHARM or Dilution Value. AEDA has been used to identify the major odorants from boiled potatoes (Mutti and Grosch 1999) and French fries (Wagner and Grosch 1997, 1998).
SENSORY ANALYSIS The sensory evaluation of a food can be made through dis-criminative, descriptive or affective tests. Discriminative tests investigate whether there is a sensory difference bet-ween samples (Stone and Sidel 1992). The most common are the triangle test, duo-trio test and paired comparison test.
Descriptive tests involve the detection and description of both qualitative and quantitative sensory components of a product by trained panels. Descriptive tests can establish relationships between descriptive sensory and instrumental or consumer preference measurements. There are several different methods of descriptive analysis, such as Flavour Profile and the Quantitative Descriptive Analysis (QDA).
The affective tests have the primary objective to assess
Table 3 Current HS-SPME applications in potato volatiles analysis.
Sample Fiber Equilibration
(t-T)a
Extraction
(t-T)b
Desorption
(t-T)c
Instrumental techniqued Reference
Raw potatoes DVB/CAR/PDMS
(50/30 �m)
5 min - 80°C 20 min - 60°C 5 min - 250°C GC-MS (Rtx-1; 86.7
min)
Longobardi et al. 2010
Boiled potatoes DVB/CAR/PDMS
(50/30 �m)
10 min - 37°C 30 min - 37°C 3 min - 250°C GC-MS (ZB-WAX; 63.3
min)
Blanda et al. 2010
Steamed potatoes PDMS (85 �m) n.a. 20 min - 50°C 2 min - 280°C GC-MS (DB1701; 42
min)
Morris et al. 2010
PDMS (100 �m)
CW/DVB (65 �m)
DVB/CAR/PDMS (30/50 �m)
PDMS/DVB (65 �m)
5 min - 30°C 60 min - 30°C 5 min - 250°C
2 min - 250°C
GC-ITMS (HP-VOC
fused silica; 41 min)
GC-TOFMS (HP-VOC
fused silica; 38 min)
GC x GC-TOFMS
(HP-VOC fused silica
and Supelcowax 10;
38 min + 38 min)
Lojzova et al. 2009 Potato chips
DVB/CAR/PDSM (50/30 �m)
PDMS/DVB (65 �m)
n.a. 15 min - 60°C 3 min - 250°C GC-FID (SP2330 fused
silica; 35 min)
Pangloli et al. 2002
DVB/CAR/PDSM (50/30 �m) 5 min - 70°C 20 min - 70°C 5 min - 250°C GC-MS (DB-5; 22 min) Sanches-Silva et al.
2004
Potato crisps
CAR/PDMS (75 �m)
PDMS/DVB (65 �m)
DVB/CAR/PDMS (50/30 �m)
5 min - 70°C 20 min - 70°C 3 min - 260°C GC-MS (DB-5; 22 min) Sanches-Silva et al.
2005
Extruded potato
snacks
PDMS
CW/DVB
DVB/CAR/PDMS
PDMS/DVB
CAR/PDMS
10 min - 50°C 30 min - 50°C 5 min GC-O and GC-MS (SBP-
5; 30 min - Supelcowax
10; 40.5 min)
Majcher and Jelén
2009
Potato flakes PDMS
CAR/PDMS/DVB
PDMS/DVB
CAR/PDMS
10 min - 35°C 60 min - 35°C 270°C GC-MS (CP-WAX 52
CB; 35.5 min)
Laine et al. 2006
a Equilibration conditions: time (min) and temperature (°C) b Extraction conditions: time (min) and temperature (°C) c Desorption conditions: time (min) and temperature (°C) d Separation and detection technique (column stationary phase; analysis time, min)
4

Advances in potato flavour. Comandini et al.
the personal response from users or potential users of a product (acceptance, preference, or consumer tests). A large number of individuals are required to take part in a sensory acceptance test (> 100). Preference can be measured directly by comparing two or more products with each other, or indirectly by determining which product is the most ap-preciated in a multiproduct test. The two most widely used methods to measure preference and acceptance are the paired comparison and the 9-point hedonic scale tests.
The sensory tests most frequently used for the evalua-tion of raw and processed potatoes are the Flavour Profile, QDA and the preference tests, as detailed in the following paragraphs.
VOLATILE COMPOUNDS IN RAW POTATOES
About 159 volatile compounds have been identified in raw potatoes (Dresow and Böhm 2009), but their aromatic pro-file has not been widely studied. Most investigations have focused on cut or sliced potatoes, and the main volatiles identified were those derived from oxidation and enzymatic activity. In particular, many compounds such as aldehydes, ketones and alcohols, derived from the lipoxygenase acti-vity on unsaturated fatty acids were detected (Mazza and Pietrzak 1990; Maga 1994; Petersen et al. 1998). Signifi-cant products of potato lipid oxidation are hexanal, octenal and isomeric forms of 2,4-decadienal (Maga 1994). Some alcohols, like 2-methyl and 3-methylbutanol derived from leucine and isoleucine metabolism (Drawert et al. 1975). Other compounds identified in raw potatoes, and responsi-ble for vegetable-like odours are methoxypyrazines. Their mechanism of formation has been investigated, and the biosynthetic pathway in potato tubers, or production from microflora present in soil or on the potato surface, have been hypothesized (Maga 1994; Dresow and Böhm 2009).
Longobardi et al. (2011) carried out HS-SPME/GC-MS on three potato cultivars (‘Arinda’, ‘Sieglinde’, and ‘Red Cetica’) produced in three different locations in Italy (Sicily, Apulia, Tuscany). 32 volatile compounds were identified and a discriminant function analysis (DFA) was applied on normalized data. The complete separation of potato samples of different geographical origin was achieved and the recog-nition ability was 100% for each class. The prediction abil-ity was 91.7% and among 36 samples analysed, only four samples were incorrectly classified. The same classification results were obtained applying these statistical methods on the complete data set, including also isotopic data.
Recently, increasing attention has been given to ready-to-eat and ready-to-use vegetables with the specific aim of increasing the shelf life of these products since manufac-turing operations promote the development of enzymatic browning and microbial growth (Beltrán et al. 2005). Modi-fied atmospheres, in particular high oxygen partial pres-sures (10, 55 and 100 kPa O2) in combination with ascorbic and citric acid dipping, have been applied to potato slices; the accumulation of volatile compounds (ethanol, acetal-dehyde and hexanal) has been studied after 3, 7 and 10 days of storage at 5°C (Limbo et al. 2007). The higher pressures applied (55 and 100 kPa) had an inhibitory effect on the production of anaerobic volatiles (acetaldehyde and etha-nol). In contrast, the lowest hexanal accumulation was ob-tained at 10 kPa O2, and a substantial increase was recorded in potatoes that were not submitted to the treatment solution and stored at 100 kPa.
The sensory quality of fresh cut potatoes was inves-tigated also by Beltrán et al. (2005) who evaluated the effect of traditional and non-traditional sanitizers on potato strips stored under modified atmosphere and vacuum pack-aging. Sodium hypochlorite, sodium sulphite, peroxyacetic acid and ozone were used either alone or in combination. The aroma of the strips was evaluated by an expert panel after 5, 11 and 14 days of storage. The best sensory charac-teristics, were obtained with vacuum packaging. When the modified atmosphere was used, the application of sodium sulphite prevented browning, but it conferred off-odours to
potato strips. When the dipping process was carried out in ozonated water and in ozone plus peroxyacetic acid solu-tions, potato strips stored under vacuum conditions main-tained the typical full aroma even after storage for 14 days at 4°C; the authors concluded that the latter treatment was optimal as it could also preserve the microbial quality of the potato strips.
VOLATILE COMPOUNDS IN PROCESSED POTATOES The sensory profile of processed potatoes is related to the way of cooking but also cultivar selection has an important role, as reported in the following investigations. Sensory properties of different potato varieties have been evaluated by Pardo et al. (2000) through the assessment of satisfac-tion on a verbal hedonic scale. The authors compared 7 varieties (‘Bartina’, ‘Caesar’, ‘Desirée’, ‘Agria’, ‘Edzina’, ‘Monalisa’ and ‘Victoria’) and found that ‘Bartina’ was preferred for the flavour in fried products, while ‘Victoria’ and ‘Desirée’ were best in terms of flavour for boiled pota-toes. These different scores, depending on frying or boiling, suggest a specific use for each potato variety.
Seefeldt et al. (2011a) investigated visual, texture, taste and flavour attributes of 11 potato varieties (‘Asparges’, ‘Ballerina’, ‘Bintje’, ‘Ditta’, ‘Folva’, ‘Hamlet’, ‘Liva’, ‘Spunta’, ‘Sava’, ‘Saturna’ and ‘Vivi’) grown in loamy and sandy locations and used for three culinary preparations (mashed, oven-fried and boiled potatoes). They found that texture and appearance were the most important attributes for the sensory evaluation of the different culinary prepara-tions, whereas flavour played a minor role for describing potato quality. Also the effect of soil type on flavour and taste was relatively low for all preparations.
Relevant investigations carried out after 1995 and con-cerning the volatile profile of boiled, baked, fried, dehyd-rated and extruded potato products are presented. In Table 4 are reported new volatile compounds detected in boiled potatoes respect those summarized by Dresow and Böhm (2009); advances in the aromatic profile of fried (chips, French fries and crisps), dehydrated and extruded potatoes are also shown, updating the results reported by Maga (1994). Boiled potatoes The aroma of boiled potatoes is weak, although it is distinct and very different from the aroma of raw potatoes. Several mechanisms are responsible for the thermal formation of aroma compounds in boiled potatoes, including lipoxy-genase-initiated reactions of unsaturated fatty acids that take place after disruption of cells and create large amounts of 2,4-decadienal, (E)-2-octenal and hexanal; the autoxida-tion reactions are responsible for pentanal generation and the Maillard and Strecker reactions lead to components like pyrazines, phenylacetaldehyde and methional (Maga 1994).
Petersen et al. (1998) compared the aroma of raw and boiled potatoes of the ‘Bintje’ variety using a mild extrac-tion technique to ensure major preservation of the more labile compounds of potato aroma. 29 and 25 compounds were identified in raw and boiled extracts, respectively, by GC-MS. The results were in agreement with those previ-ously reported by Josephson and Lindsay (1987), who found that raw shredded potatoes contained relatively high amounts of 2,4-decadienal, (E)-2-octenal and hexanal. After boiling, the concentration of the first two compounds decreased, while hexanal increased to become the dominant volatile. Moreover, GC odour profiling of raw and boiled potatoes was performed by evaluating the odour quality and intensity of potato extracts after separation on GC column. 33 odour impressions were detected in boiled potatoes: 8 of them were identified by GC-MS (2-ethyl furan, hexanal, heptanal, (E)-2-heptenal, acetic acid, methional, (E,Z)-2,6- nonadienal and phenylacetaldehyde) and 4 by the retention index and quality odour ((Z)-4-heptenal, 2-heptanol, 2-
5

Food 5 (Special Issue 1), 1-14 ©2011 Global Science Books
Table 4 New volatile compounds identified in processed potatoes.
Boileda Friedb Ext-Dec Boileda Friedb Ext-Dec
Hydrocarbons Undecanal 9
Propylcyclopentane 5 2-Undecenal 9
Butylcyclopentane 5 4-Ethylbenzaldehyde 9
Propylcyclohexane 5 2-Hydroxybenzaldehyde 5
2,2,4,6,6-Pentamethyl heptane 3 4-Hydroxy-3-methoxybenzaldehyde 7
Bicyclo-2,2,2-1-methyloctane 11 5-Ethyl-1-cyclopentene-1-carboxaldehyde 5
Hexadecane 9 Ketones
3-Ethyl-2-methyl-1,3-hexadiene 9 2,3-Butanedione 4
1-Heptene 5 6-Methyl-5-penten-2-one 6
6-Methyl-1-heptene 11 2-Methyl-3-hexanone 5
1-Octene 5 1-Octen-3-one 7;8
(E)-2-Octene 5 3-Octen-2-one 9 3
(Z)-2-Octene 5 (E)-3-Octen-2-one 11
Styrene 5 1,5-Octadien-3-one 4
�-Ionone 3 (Z)-1,5-Octadien-3-one 7
�-Curcumene 3 3,5-Octadien-2-one 3
Alcohols 3-Nonen-2-one 11
Ethanol 4 6-Undecanone 9
2-Propanol 5 6-Dodecanone 9
1-Undecanol 5 �-Damascenone 4
Dodecanol 6 Esters
1-Dodecen-3-ol 9 Pentyl methanoate 11
Tetradecanol 6 Methyl acetate 5
1,5-Heptadiene-3,4-diol 11 n-Hexyl acetate 9
Acids Methyl 2-propenoate 5
2-Octenoic acid 11 Hexyl-propanoate 9
Phenyletanoic acid 7 Methyl butanoate 9
Aldehydes (E)-Methyl 2-butenoate 5
Acetaldehyde 1 Butyl butanoate 9
Propanal 1 Methyl 3-methylbutanoate 5
Methylpropanal 2 Methylbutyl butanoate 9
2-Methyl propanal 3 Hexyl-butanoate 9
Butanal 4 Butyl hexanoate 9
2-Methyl butanal 3 Pentyl hexanoate 11
3-Methyl butanal 3 Hexyl hexanoate 9
(E)-2-Ethyl-2-butenal 5 Ethyl octanoate 9
Pentanal 6 3 Lactones
Hexanal 1;3;4 �-Octalactone 8
(E)-2-Hexenal 4 �-Nonalactone 8
Heptanal 4 �-Decalactone 8
2-Heptenal 3 �-Decalactone 8
(E,Z)-2,4-Heptadienal 5 4-Hydroxynonanoic acid lactone 7
Octanal 4 4-Hydroxy-2-nonenoic acid lactone 7
(E)-2-Octenal 4 Pyrrole compounds
Nonanal 4 Pyrrole 5;10
(Z)-3-Nonenal 7 2-Acetylpyrrole 10
(E,E)-2,4-Nonadienal 1 3-Acetyl-1-methylpyrrole 10
(E,Z)-2,6-Nonadienal 7 2-Methylpyrrole 5
2,6-Nonadienal 4 2-Methyl-1(H)-pyrrole 10
trans-4,5-Epoxy-(E)-2-nonenal 7 3-Methyl-1(H)-pyrrole 10
(E)-2-Decenal 7 1-Ethylpyrrole 5
(E)-4,5-Epoxy-(E)-2-decenal 7;8 1-Ethyl-1(H)-pyrrole 10
(E,E)-2,4-Decadienal 1 2-Ethyl-1(H)-pyrrole 10
1-Butyl-1-(H)-pyrrole 10 2-Acetylpyrazine 7 4
1-Pentyl-1(H)-pyrrole 10 2-Acetyl-6-methylpyrazine 10
2-Pyrrolidinone 10 2-Butyl-3-methylpyrazine 10
1-Methyl-2-pyrrolidinone 5;10 2-Ethenyl-3-ethyl-5-methylpyrazine 7;8
2-Acetyl-1-pyrroline 4 2-Ethenyl-5-methylpyrazine 10
1-(H)-pyrrole-2-carboxaldehyde 10 2-Ethenyl-6-methylpyrazine 10
1-Methyl-1(H)-pyrrole-2-carboxaldehyde 10 2-Isobutyl-3-methoxypyrazyne 7
1-Pyrrolidinecarboxaldehyde 10 2-Methyl-3,5-diethylpyrazine 4
Oxazoles 2-Methyl-5-(1-propenyl)-pyrazine 10
4,5-Dimethyloxazole 5 2-Vinyl-6-methylpyrazine 2
Indols 3,5-Diethyl-2-methyl-pyrazine 10
2,3-Dihydroindole 5 3,5-Dimethyl-2-isobutyl-pyrazine 10
Furan compounds 3-Isobutyl-2-methoxypyrazine 8
2-Methylfuran 5 5-Ethyl-2,3-dimethylpyrazine 5
2-Ethylfuran 5 5-Methyl-2,3-diethylpyrazine 4
2-Ethyl-5-methylfuran 5 5-Methyl-5(H)-cyclopentan-pyrazine 10
2-Vinylfuran 5 Dimethylisobutylpyrazine isomer 5
2,5-Dihydro-3,4-dimethylfuran 5 Ethenylpyrazine 10
6

Advances in potato flavour. Comandini et al.
methoxy-3-isopropylpyrazyne and 2-methoxy-3-isobutyl-pyrazine). The remaining odours were not found because they were present at concentrations below the detection limits of GC-MS.
In 1999, Mutti and Grosch evaluated the potent odo-rants of boiled potatoes (variety ‘Sieglinde’) by aroma ex-tract dilution analysis, aroma extract concentration analysis and GCO of static headspace samples. The volatiles isolated from potato samples were separated into neutral/basic and acidic fractions. In the neutral/basic fraction, 29 odorants were detected and the most odour active compounds were found to be methional (boiled potato odour) and 4,5-epoxy-(E)-2-decenal (metallic odour), evaluated on the basis of the flavour dilution (FD) factor. In the acidic fraction, the high-est FD factor was shown by vanillin.
Ulrich et al. (2000) used sensory techniques and instru-mental analysis to illustrate the differences in aroma among
3 German varieties (‘Adretta’, ‘Likaria’ and the breeding clone St 1,365) of potato after boiling. The off-flavours components contributed more than the positive ones to differentiate the aroma of the varieties tested, and the main compounds implicated in these differences included (E)-2-pentenal, 2-methylbutanol, 2-pentylfuran, pyrrole and dif-ferent dienals. Essential aroma compounds, similar between the three varieties, were methional, diacetyl and 5 substi-tuted pyrazines, in agreement with former investigations (Salinas et al. 1994; Ulrich et al. 1997, 1998).
A sensory profiling of several Danish potato varieties grown in different locations has recently been carried out (Kreutzmann et al. 2011). A tailor-made sensory profile was developed for different cooking procedures: boiled, mashed, oven-fried and oven-cooked potatoes. The study showed that flavour and taste attributes were significantly correlated and they had a great importance in describing the variations between potato cultivars. In particular, the flavour of boiled potatoes was correlated to the bitterness attribute, while in mashed potatoes potato the flavour was found to be in-versely correlated to graininess. The relevance of using sen-sory descriptors to define appropriateness of potato culti-vars for different culinary preparations has been discussed also by Seefeldt et al. (2011b).
Currently, several investigations have been carried out concerning off-flavour development in potatoes, and mostly related their development during storage of raw potatoes, and dehydrated potato products (Maga 1994). Moreover, it was noted that when boiled potatoes are stored they rapidly develop off-flavours, one of the most important of which is described as a cardboard-like note. Petersen et al. (1998) performed a sensory evaluation of freshly boiled and boiled stored potatoes, followed by GC-MS and GC-sniffing to identify and quantify the compounds responsible for potato off-flavours (POF). Eight compounds (pentanal, hexanal, nonanal, (E)-2-octenal, 2,4-heptadienal, (E)-2-nonenal, (E,E)-2,4-nonedienal and 2,4-decadienal) were identified as potential contributors to POF.
The authors assumed that such potato off-flavours, mainly represented by aldehydes and some alcohols, were produced during 24 h storage from the breakdown of hydroperoxides, resulted from lipoxygenase initiated oxi-dation of linoleic and linolenic acid during boiling.
To better explain the mechanism of formation of off-flavours in boiled potatoes, with particular emphasis to lipoxygenase activity, Petersen et al. (2003) monitored lipoxygenase activity and the content of volatile compounds mainly responsible for the formation of off-flavour (penta-nal, hexanal, (E)-2-octenal, (E)-2-nonenal, (E,E)-2,4-nona-dienal and (E,E)-2,4-decadienal) in potatoes during winter storage. Aroma compounds were determined at 3, 4 and 7 months after harvest in raw, freshly boiled and in boiled potatoes refrigerated for 24 h. It was found that lipoxy-genase activity increased during long-term storage of raw potatoes, starting from 4 months after harvest. However, the increasing lipoxygenase activity during winter storage was accompanied by a decrease in production of the off-flavour compounds when potatoes were stored after boiling. The production of off-flavours during storage of boiled potatoes could not be explained by changes in lipoxygenase activity, and the authors highlighted the needing for further inves-tigations on the availability of substrates leading to produc-tion of important aroma compounds in boiled potatoes.
Conventionally, potatoes are stored for long periods after harvest in order to provide a yearlong supply for in-dustry and final consumers. Storage conditions before cooking is an important factor in determining the composi-tion of sensory characteristics of boiled potatoes. In fact, several modifications occur in tuber composition during storage: fatty acids, sugars and amino acids are particularly involved in these changes.
Blanch et al. (2009) studied the effect of storage tem-perature before cooking on boiled potato lipid and sugar-derived volatile constituents by comparing 2 genotypes of S. phureja and one of S. tuberosum, stored at 4 and 8°C. It was
Table 4 (Cont.)
Boileda Friedb Ext-Dec
Tetrahydrofuran 5
Tetrahydro-2-methyl furan 11
5-Ethyl-dihydro-2(3)-furanone 11
5-Pentyl-2(5)-furanone 11
5-Hexylhydro-2(3)-furanone 11
3-Hydroxy-4,5-dimethyl-2(5H)-furanone 7;8 4
4-Hydroxy-2,5-dimethyl-3(2H)-furanone 7;8 4
2,5-Furandione 5
2-Furfurylthiol 4
2,5-Dimetyl-3-furanthiol 4
Pyrane compounds
trans-Tetrahydro-5,6-dimethyl-2(H)-2-
pyranone
11
3-Hydroxy-2-methylpyran-4-one 7
Pyridine compounds
Pyridine 10
2-Methyl pyridine 10
3-Methyl pyridine 10
2,6-Dimethyl pyridine 10
3-Ethyl pyridine 10
Acetyl pyridine 10
n-Acetyl-4(H)-pyridine 10
1-Acetyl-1,2,3,4-tetrahydro-pyridine 10
1-(2-Pyridinyl)-1-propanone 10
2-Pyridinecarboxaldehyde 10
Pyrazines
(1-Methylethenyl)-pyrazine 10
2-(n-Propyl)-pyrazine 10
2,3,5,6-Tetramethylpyrazine 10
2,3-Diethylpyrazine 5;10
Ethylpyrazine 2;5;10
Isopropenylpyrazine 5
Tetramethylpyrazine 10
Vinylpyrazine 2
5,6,7,8-Tetrahydroquinoxaline 10
Sulphur compounds
Methanethiol 3;4
Phenyl methanethiol 4
Dimethyl disulfide 3
Dimethyl trisulfide 4
2-Methylthiophene 5
3-Methylthiophene 5 a New volatiles in boiled potatoes respect Dresow and Böhm (2009) b New volatiles in chips, French fries and crisps respect Maga (1994) c New volatiles in extruded an dehydrated potato products respect to Maga (1994)
1 Nissen et al. 2002 2 Martin and Ames 2001
3 Laine et al. 2006
4 Majcher and Jelén 2009 5 Van Loon et al. 2005
6 Blanch et al. 2009
7 Wagner and Grosch 1997 8 Wagner and Grosch 1998
9 Blanda et al. 2010
10 Lojzova et al. 2009 11 Sanches-Silva et al. 2005
7

Food 5 (Special Issue 1), 1-14 ©2011 Global Science Books
found that the storage temperature affected lipid-derived volatile components, on the basis of the variety studied, but in general the sugar-derived volatile constituents increased when lower temperatures were used, probably due to a slow metabolism. These conditions inhibited lipid oxidation and lowered the levels of lipid-derived compounds in the final product. The authors recommended to store potato tubers at 8°C since the formation of Maillard products was mini-mised and no signal of sprouts was observed.
Several agronomic factors may influence the sensory quality of boiled potatoes in addition to variety, including the type of fertilizer and method of application, soil type and climatic factors. Thybo et al. (2002) investigated the ef-fect of 6 different organic treatments (cattle slurry and cattle deep litter applied in three ways, corresponding to an equal supply of total nitrogen) on the chemical, rheological and sensory quality of cooled potatoes. Regarding sensory qual-ity, minor differences were found among the organic treat-ments investigated. Despite such small differences, statis-tical analysis showed that compared with deep litter, slurry increased the off-odour perception and decreased the typical potato odour and flavour, probably due to the delay in matu-ration retarding the production of the flavour components. Moreover, potatoes matured with slurry had slightly higher off-odour and off-flavour, but the differences were ex-tremely small.
Minimally-processed potatoes have been studied in recent years with regards to sensory quality and chemical components, some applications of which include raw pre-peeled and precooked vacuum-packed potatoes. Thybo et al. (2006) compared 6 different cultivars (‘Berber’, ‘Arkula’, ‘Marabel’, ‘Sava’, ‘Folva’ and ‘Agria’) and evaluated their suitability to be processed as pre-peeled potatoes, taking into account the effects of wound healing and storage time. Concerning the volatile profile, variations in several aroma components were found, such as methional, linalool, p-cymene, nonanal and decanal, mainly caused by the effects of cultivar and storage. The highest concentrations of nona-nal and decanal were found in the ‘Marabel’ and ‘Berber’ cultivars, which showed a high intensity of rancidness and a low intensity in potato flavour. Owing to the high moistness and the low firmness, the ‘Marabel’ variety seemed to be a less appropriate cultivar for this type of product.
Jensen et al. (1999) used precooked vacuum-packed potatoes to evaluate the development of potato off-flavours (POF) in 4 varieties (‘Jutlandia’, ‘Bintje’, ‘Sava’ and ‘Dali’) grown in two different locations in Denmark. They found statistically significant differences in the content of POF compounds between the growing location (mainly for ‘Jut-landia’ and ‘Sava’) among some of the varieties. The grow-ing location effect can be explained by the environmental conditions throughout the period of growing, harvest and storage. The most potent POF compounds, evaluated on the basis of their aroma values (Rothe and Thomas 1963), were (E,E)-2,4-nonadienal and (E,E)-2,4-decadienal, followed by hexanal, (E)-2-octenal and (E)-2-nonenal. The results of this study showed that agronomic conditions can influence POF formation in precooked vacuum-packed potatoes.
Off-flavour development in boiled potato slices has also been studied by Blanda et al. (2010). The authors per-formed a sensory evaluation system, using a quantitative-descriptive analysis (QDA) scheme, and defined the odour, flavour and texture features of boiled potato slices. A HS-SPME-GC-MS method was developed to determine the volatile components in boiled potatoes, and investigation of the mechanism of generation of off-odours and off-flavours during storage showed that they did not increase linearly with time, but reached a maximum value after 6 h of sto-rage, further decreasing after 8 and 10 h and finally increa-sing again after 24 h of storage. This trend was explained by a kinetic mechanism involving the formation of hydro-peroxides during the first hours of storage. POF formation was strongly correlated with a high content of aldehydes such as 2-penthylfuran, 2-pentenal, 2-hexenal, 2-heptenal and 2-decenal, and good agreement between the sensory
evaluation and the HS-SPME/GC-MS analysis was found. Treatment of potato slices with several food additives (as-corbic acid, citric acid, sodium acid pyrophosphate and meta-bisulphite) after cooking was also investigated. Interestingly, ascorbic acid and citric acid did not prevent the formation of POF, but actually enhanced it; although potassium meta-bisulphite prevented POF formation, it caused the formation of other off-flavours. The best additive was sodium pyrophosphate, which did not change the fla-vour of potato slices during storage.
The impact of volatile and non-volatile metabolites on potato flavour attributes was investigated by Morris et al. (2010). Tubers (S. tuberosum group Phureja and S. tubero-sum group Tuberosum) were sampled at harvest and fol-lowing 3 months’ storage. Quantitative descriptive analysis (QDA) was carried out on boiled potatoes by a trained panel and aroma related attributes were evaluated. More-over the cooked tuber volatile profile was analysed by SPME/GC-MS.
The authors found that hexanal and 2-methylbutanoic acid methyl ester were strongly negatively correlated with aroma intensity but positively correlated with flavour inten-sity, creaminess and savouriness. Conversely, metabolites positively associated with aroma intensity such as 2-methyl-butanal, 3-methylbutanal, and furan were strongly nega-tively correlated with flavour intensity, savouriness and creaminess. Significant changes in flavour were related to storage: several aldehydes were found at higher levels after storage. Baked potatoes One of the most popular ways to cook fresh potatoes is by baking (Lin and Yen 2004). However, unlike boiled pota-toes, which have been thoroughly investigated, baked potato flavour has been somewhat neglected, and up to 1994, only 11 publications have been reported (Maga 1994).
Volatiles from baked potatoes are usually classified based on the mechanism of formation. Fatty acids, sugars and amino acids are the main precursors of the compounds responsible for the flavour of baked potatoes (Whitfield and Last 1991). A high proportion of the compounds identified came from lipid oxidation, and many volatiles are formed from the Maillard reaction, with or without the involvement of sulphur-containing amino acids. Smaller amounts of indi-genous flavour compounds such as terpenes and methoxy-pyrazines have also been identified.
Recent studies on baked potatoes have investigated the different flavour profile of skin and flesh potatoes, as well as the effect of storage, varietal and environmental factors on final aroma. Additionally, new cooking methods such as microwave baking have been studied and compared to trad-itional ones.
Oruna-Concha et al. (2001) reported the volatile flavour compounds of 4 different potato cultivars (‘Cara’, ‘Mar-fona’, ‘Fianna’ and ‘Nadine’) after baking and separately studied the volatile composition of skin and flesh. It was reported that their composition varied quantitatively and qualitatively among cultivars grown at different sites. Sugar degradation and/or the Maillard reaction were the major sources of volatiles in skin, largely due to pyrazines, in ‘Cara’, ‘Marfona’ and ‘Fianna’ cultivars. Solavetivone was the major volatile in ‘Nadine’ skins, suggesting that tubers of this cultivar were under stress during storage. Pyrazines, including 2,5- and/or 2,6-dimethylpyrazine, were the most abundant representatives in every cultivar.
‘Fianna’ gave the weakest volatile profile in flesh (85 ng/g), whereas ‘Cara’ gave the strongest (869 ng/g); lipid degradation was the predominant source of volatiles in ‘Cara’ (93% of the total volatiles, corresponding to 810 ng/g), and a major source in ‘Fianna’ (75% corresponding to 64 ng/g), but accounted only for 15% (14 ng/g) and 19% (21 ng/g), respectively, of the total volatiles in ‘Nadine’ and ‘Marfona’. Levels of volatiles from sugar degradation and/or the Maillard reaction were similar (14-58 ng/g) in
8

Advances in potato flavour. Comandini et al.
the analysed cultivars. The odour unit values were taken into account to select
the key aroma compounds of skin and flesh baked potatoes. For skin, 2-isopropyl-3-methoxypyrazine has the highest odour unit value and has an important contribution to aroma only in ‘Marfona’, clearly distinguishing this cultivar from others. In flesh, (E,E)-2,4-decadienal appeared to be the most important contributor to aroma in ‘Cara’ and ‘Fianna’. ‘Marfona’ was distinguished from the other cultivars by the contribution of dimethyl disulphide.
A varietal study was also carried out by Duckman et al. (2001) who examined the volatile flavour components in the flesh of 11 potato cultivars (‘Nadine’, ‘Golden Wonder’, ‘Fianna’, ‘Estima’, ‘Cara’, ‘Saxon’, ‘Kerr's Pink’, ‘Maris Piper’, ‘Desiree’, ‘Marfona’ and ‘Pentland Squire’) grown in the same location in Spalding. 81 volatile compounds were identified in this study and semiquantitative results, represented by relative GC peak area units, were reported.
Lipid oxidation and Maillard reaction were found to be the major sources of flavour compounds of baked potato flesh, even though other components (sulphur compounds, methoxypyrazines and terpenes) were also present at lower levels. Abundant representatives of lipid-derived products were hexanal, nonanal and decanal. The most abundant rep-resentatives of the Maillard reaction and/or sugar degrada-tion were the Strecker aldehydes of isoleucine and leucine, i.e., 2- and 3-methylbutanal, which were identified in every cultivar and contributed to 75-96% of the volatiles in this category. 3,5-dimethyl-2-(2-methylpropyl)pyrazine was first reported in this study. Methional, considered to be one of the most important contributors to the aroma of baked potatoes (Whitfield and Last 1991), has been identified in only 5 cultivars (‘Nadine’, ‘Desiree’, ‘Marfona’, ‘Maris Piper’ and ‘Pentland Squire’). In contrast, dimethyl disul-phide (which can form from methional) was present in all cultivars and dimethyl trisulphide was reported in all except ‘Golden Wonder’.
14 terpenes were identified, and 11 (�-pinene, Z-oci-mene, E-ocimene, linalool, isophorone, �-cyclocitral, �-damascenone, �-copaene, geranyl acetone, �-aromaden-drene and �-guaiene) had not previously reported to be components of baked potato aroma.
2-isobutyl-3-methoxypyrazine, 2-isopropyl-3-methoxy-pyrazine, �-damascenone, dimethyl trisulphide, decanal and 3-methylbutanal were found to be major contributors to flavour in at least one cultivar.
Few studies have examined the effect of storage on fla-vour development after cooking. An extensive investigation was carried out by Duckham et al. (2002), who examined the effects of storage time (2, 3 and 8 months at 4°C) on the amounts of selected volatile flavour components in baked potatoes. Five potato cultivars (‘Estima’, ‘Saxon’, ‘Golden Wonder’, ‘Kerr’s pink’ and ‘Desiree’) grown in different sites were analysed, and several significant differences were found in the levels of individual compounds, compound classes and total monitored compounds in terms of the individual effects of cultivar and storage time and their two-way interactions. A significant increase in the total amount of compounds between 2 and 3 months and between 3 and 8 months storage was recorded. The compounds derived primarily from lipids increased with storage time, as well as the total levels of Maillard/sugar-derived compounds. Indi-vidual terpenes (except 3-carene) and 2-isopropyl-3-methoxypyrazine were significantly higher after 3 months compared to the other storage times. Methional was the only sulphur compound that showed a significant storage time effect, decreasing between 3 and 8 months.
The authors suggested that cultivar, agronomic factors and tuber storage conditions affected the levels of flavour precursors and activities of enzymes that mediated the for-mation of flavour compounds.
Oruna Concha et al. (2002b) investigated the effects of 3 cooking procedures, boiling, conventional baking and microwave baking, on the profiles of flavour compounds of 2 cultivars of potato (‘Estima’ and ‘Maris Piper’) and iden-
tified 95 flavour compounds. The authors noted that micro-wave-baked potatoes had the weakest isolates of volatiles compounds among tested procedures. In particular, the total amounts of compounds derived from sugar degradation and/ or the Maillard reaction, largely represented by 2- and 3-methylbutanal, were highest for conventionally-baked pota-toes. However, the lipid-derived compounds were 1.2-1.5-fold higher with microwave baking. Sulphur compounds, such as terpenes and methoxypyrazine, showed no signi-ficant differences between conventional and microwave baking. The quantitative and qualitative differences for the flavour compounds were explained by variations in heat and mass transfer processes.
Oruna-Concha et al. (2002a) evaluated the effect of cul-tivar on volatile flavour compounds in potato baked in a microwave oven. The flavour components of the flesh of 8 cultivars (‘Marfona’, ‘Desiree’, ‘King Edward’, ‘Fianna’, ‘Nadine’, ‘Pentland Squire’, ‘Saxon’ and ‘Cara’) were iso-lated by headspace trapping onto Tenax and analysed by GC-MS. Each potato cultivar possessed a unique profile of volatile compounds. Cara had the lowest overall total amount of all categories of compounds, while King Edward had the highest. 80 compounds were identified in this study: 60 were lipid-derived, in contrast to 33 reported by the same authors from conventionally-baked potatoes (Oruna-Concha et al. 2001). Seven terpenes (one monoterpene and 6 sesquiterpenes), which were tentatively identified, had not been previously reported as volatile components of potatoes. No alkylpyrazines were identified in the microwave-baked potatoes, since they were more favoured by the conditions encountered during conventional baking of potato tubers. The authors suggested that total levels of compounds and variations among their profiles could be attributed to dif-ferences in the activities of lipid enzymes and levels of fla-vour precursors considering the range of cultivars inves-tigated. Moreover, they recommended sensory analysis to identify the best cultivar for microwave baking.
Jansky (2008) evaluated the contributions of genotype and environment on the sensory properties of baked pota-toes, including “potato-like” flavour and off-flavour inten-sities. Moreover, the relationship between the individual flavour components and the overall quality perception was determined. A trained panel evaluated 16 potato cultivars (russets, whites, reds and specialty clones) grown in dif-ferent locations and stored for 2 years. Several differences among cultivars and production environments were found. Stored potatoes received higher quality perception scores than fresh potatoes. Potato-like flavour intensity was posi-tively associated with quality perception, and a strong nega-tive association between off-flavour and quality perception was also detected.
The sensory properties of organically farmed and con-ventionally produced potatoes have been recently inves-tigated by Gilsenan et al. (2010), Hajšlová et al. (2005) and Wszelaki et al. (2005). No significant differences between organic and conventional cooked potatoes for aroma attrib-utes were found. Potato chips and French fries Deep-fat frying is one of the oldest processes of food pre-paration, and consists in the immersion of food pieces in hot oil. The high temperature causes the evaporation of water, which moves away from the food into the surrounding oil that replaces some of the lost water. The aim of deep-fat frying is to seal the food by immersing it in hot oil so that all flavours and juices are retained by the crisp crust (Moreira et al. 1995).
The flavour of potato chips is influenced not only by potato tuber cultivar, but also by frying oil composition, temperature and time of frying (Martin and Ames 2001). More than 500 compounds have been identified in the vola-tile fraction of French fries and potato chips showing a similar aroma.
Wagner and Grosch (1997) identified potent odorants in
9

Food 5 (Special Issue 1), 1-14 ©2011 Global Science Books
French fries by application of both aroma extract dilution analysis (AEDA) and GC-O of headspace samples. Potato strips of the Agria variety were fried in palm oil, and a total of 48 odorants were revealed; 23 components were reported for the first time as components of fried potatoes, also due to a difference in the analytical strategy employed, which enabled them to identify odorants that were not visible as peaks in the gas chromatogram. Among the odorants show-ing higher (FD) factors, methional, 2,3-diethyl-5-methyl-pyrazine, (E,E)-2,4-decadienal, 4-hydroxy-2,5-dimethyl-3 (2H)-furanone and 3-methylbutanal were used as reference stimuli for flavour profile analysis of French fries. The deep-fried note (caused by (E,E)-2,4-decadienal) predomi-nated when French fries were nasally evaluated, whereas the deep-fried and boiled potato-like smells (caused by methional) were mainly perceived in the retronasal test.
In 1998, the same authors (Wagner and Grosch) eval-uated the main contributors to the flavour of French fries prepared in palm oil (PO) and coconut fat (CF). The coco-nut-like note in the flavour profile of CF was mainly sti-mulated by �-lactones with 8 and 10 carbon atoms, while the character impact odorants of PO were 2-ethyl-3,5-di-methylpyrazine, 3-ethyl-2,5-dimethylpyrazine, 2,3-diethyl-5-methylpyrazine and 3-isobutyl-2-methoxypyrazine (ear-thy odour); (E,Z)-2,4-decadienal, (E,E)-2,4-decadienal and (E)-4,5-epoxy-(E)-2-decenal (stimulating the deep fried impression); 4-hydroxy-2,5-dimethyl-3(2H)-furanone (cara-mel-like note); methylpropanal, 2-methylbutanal and 3-methylbutanal (malty notes); and methanethiol (sulphurous, cabbage-like odour). The odorants showing relatively high OAV were dissolved in sunflower oil to give two model systems, and a sensory study was undertaken. The flavour profile of the model obtained (MPO) was compared to that of the real PO for similarity. Furthermore, changes in the overall flavour of MPO were evaluated after omission of one or more odorants to determine their contributions to the flavour of PO. The absence of methional in MPO was not perceived by the sensory panel, supposing that this mole-cule did not contribute to the flavour of French fries, while a greater impact on flavour was imparted by methanethiol, another degradation product of methionine.
Martin and Ames (2001) evaluated the effect of frying oils (palmitolein and silicone fluid) on flavour compounds formed in chips. The flavour profile was examined in rela-tion to the heat-transfer process and precursor formation from frying medium. Strecker aldehydes and sulphur com-pounds did not differ significantly between the frying media. Potatoes were presumed to provide all the precursors re-quired for the formation of these compounds. Although pyrazines were significantly lower when potato slices were fried in silicone fluid, comparing the percentage relative amount of pyrazines in chips fried in palm olein or silicone fluid it was observed that the amount of total pyrazine was similar in the two frying media. The authors suggested that the reaction pathways leading to pyrazine formation in palm olein and silicone fluid were the same, and palm olein did not provide a source of flavour precursors. However, the kinetics of pyrazine formation appeared to be different, probably due to differences in heat transfer in potato slices. With regard to lipid oxidation products, the amounts of 2,4-decadienal were significantly higher in palm olein-fried chips, but there was no significant difference in hexanal levels between samples.
Hawrysh et al. (1996) evaluated the quality and storage stability of potato chips deep fried in canola (CO), partially hydrogenated canola (PHCO), soybean (SBO), and cotton-seed oils (CSO). Sensory evaluation was made after accele-rated (0, 6, and 12 days at 60°C) and practical storage (18 weeks at 23°C). The quality of potato chips was influenced by frying oil and storage conditions. Fresh CO and CSO chips had higher characteristic potato chip odour and lower off odour/flavour than SBO and PHCO chips. During ac-celerated storage, chips developed off odour/flavour depen-ding on frying oil. At practical storage conditions, CO chips had higher characteristic potato chip odour/flavour and
lower off odour/flavour than other chips. The results of this study indicate considerable potential for CO and PHCO as suitable alternative frying oils for snack food manufacture.
Pangloli et al. (2002) evaluated the flavour stability of potato chips fried in cottonseed, sunflower oils and palm olein/sunflower oil blends. All the potato chips contained abundant and similar amounts of hexanal and (E,E)-2,4-decadienal, deriving from the oxidation of linoleic acid, which was the most abundant fatty acid found in the frying oils. Sensory evaluation showed that the intensity of potato chip flavour was similar among oils and blends and did not change during storage; however oxidative rancidity and off-flavour increased in chips fried in cottonseed oil after 6 weeks storage. This off-flavour was due to 1-decyne, iden-tified by SPME analysis. The authors found that the ad-dition of 20 or 40% of palm olein oil to sunflower oil pro-duced chips more stable to oxidation during storage, with-out losing the characteristic potato chip flavour.
Warner et al. (1997) determined the effects of fatty acid composition of frying oils on intensities of fried-food fla-vour and off-flavours in potato chips and french-fried potatoes. Cottonseed oil (CSO) and high-oleic sunflower oil (HOSUN) were blended to produce oils with 12 to 55% linoleic acid and 16 to 78% oleic acid. Hexanal, pentanal, 2,4-decadienal, octanal, and nonanal were used to monitor oxidation of the oil during potato chip storage. Volatile compounds were monitored in fresh and aged (6 months at 25°C) potato chips. Analytical sensory panels evaluated french-fried potatoes and pilot plant-processed potato chips; fried-food flavour intensity was the best indicator of overall flavour quality in fresh potato chips. The authors found that the fried-food flavour decreased with decreasing levels of linoleic acid and 2,4-decadienal, a breakdown product of linoleic acid oxidation. HOSUN (78% oleic acid) produced the lowest levels of hexanal and pentanal, indicating greater frying oil stability and oxidative stability of the food. How-ever, fresh potato chips fried in HOSUN had the lowest intensities of fried-food flavour and lowest overall flavour quality. No oil analysis could predict flavour stability of aged potato chips.
Brewer et al. (1999) assessed selected volatiles (penta-nal, hexanal, (E)-2-hexenal, heptanal, (E)-2-heptenal, 2-pentylfuran, (E)-2-octenal, nonal, (E, E)-2,4-decadienal) and sensory characteristics of frying fats (low linolenic acid soybean oil, creamy partially hydrogenated soybean oil, liquid low linolenic acid hydrogenated soybean oil, and liquid partially hydrogenated soybean oil) and of French fries fried in those fats. Odour characteristics of French fries reflected those of the oils in which they were fried. Hexanal in the French fries was an indicator of loss of “positive” odour attributes and development of rancid, grassy, painty and acrolein odours. Hexanal content in French fries was highest for those fried in low linolenic acid soybean oil and lowest for those cooked in low linolenic acid hydrogenated soybean oil.
Van Loon et al. (2005) identified odour active com-pounds in French fries (Agria variety) at mouth conditions, created to mimic release of volatile compounds from the food to the nose epithelia, where odour is sensed. The amount of product in relation to mouth volume, the tempe-rature and the mixing of the product with artificial saliva were taken into account. 122 compounds were identified by GC-MS: 85% of them originated from sugar degradation and/or Maillard reaction. 2-Methylpropanal, 2-methylbuta-nal, 3-methylbutanal were the main representatives. 26 pyrazines were found of which 5 had not been previously reported from potato (Table 4). Fifteen percent of the vola-tiles were lipid-derived and ethanol, 2-propanol, hexanal, and nonanal showed the highest relative areas of this group. About 50 odour active compounds were responsible for 41 odours perceived by the panel. The compounds with the highest detection frequencies caused strong malty and fried potato notes, combined with caramel/buttery, green, spicy and deep-fried notes. Chemical and sweaty odours were also observed.
10

Advances in potato flavour. Comandini et al.
Several methods have been developed by Lojzova et al. (2009) for the analysis of substituted pyrazines and other aromatic compounds formed during the Maillard reaction in potato chips. The original aim of this study was to find possible volatile markers of acrylamide formation during potato chips preparation, and as previously reported, the release of alkylpyrazines was shown to correlate with acryl-amide formation. After HS-SPME, the authors compared 3 different separation/detection approaches: gas chromatog-raphy–ion trap mass spectrometry (GC–ITMS), gas chromatography–time-of-flight mass spectrometry (GC–TOFMS) and comprehensive two-dimensional gas chroma-tography–time-of-flight mass spectrometry (GC×GC–TOFMS). They identified 13 target alkylpyrazines (Table 4). The major problem encountered was the resolution of 3 iso-meric pyrazine pairs (2,5/6-dimethylpyrazine, 2-ethyl-5/6-methylpyrazine with 2,3,5-trimethylpyrazine and 2-ethyl-3,5/6-dimethylpyrazine with 2,3-diethylpyrazine). Full chromatographic resolution of all isomeric pairs could not be achieved in any of the systems tested, but the use of GC×GC–TOFMS offered the best solution, mainly because of the lower limits of quantification (LOQs) and better sig-nal-to noise ratio.
In addition to the target pyrazines, another 46 nitrogen-containing heterocyclic compounds (pyrazines, pyrrols, pyridines, pyrrolidinones, and tetrahydropyridines) were tentatively identified in potato chips by GC(x GC)-TOFMS, and only 13 had been previously reported in earlier studies.
The effect of chemical and biological pre-treatments were tested by Anese et al. (2009) in order to reduce acryl-amide formation and favour the development of the desired sensory properties of deep-fried potatoes. Lactic fermen-tation in the presence or in the absence of glycine, as well as immersion in an aqueous solution of the amino acid alone, was considered as pre-treatments for potato cubes before deep-frying. The effects of each pre-treatment on deep-fried potatoes were also compared by evaluating sensory attributes and preference. All pre-treatments signifi-cantly reduced acrylamide formation in deep-fried potatoes, but lactic acid fermentation in the presence of glycine was the most effective. The dipping treatments did not signifi-cantly affect the flavour of deep-fried potatoes; the same result was obtained by a pair comparison preference test carried out on consumers, which showed no differences in preferences between water and chemical or biological dip-ping.
The sensory effects of different pre-treatments of potato slices (Panda and Desirée varieties) before vacuum and atmospheric frying were also evaluated by Troncoso et al. (2009). Control or unblanched slices without pre-drying were analysed; blanched slices in hot water at 85°C for 3.5 min and air-dried at 60°C until a final moisture content of 0.6 kg water/kg dry solid; control slices soaked in a sodium meta-bisulphite solution (pH 3) at 20°C for 3 min. Pre-treated slices were then fried at 120 and 140°C under vacuum conditions (5.37 kPa, absolute pressure) and under atmospheric pressure until they reached a final moisture content of 1.8 kg water/100 kg. Concerning the sensory results, the best flavour was obtained for control potato chips, but no significant differences were found in terms of overall quality between control and chips pre-treated with meta-bisulphite. Potato crisps Few investigations have been published on the flavour pro-file of potato crisps. As for chips, potato crisps also contain a significant amount of frying oil that provides substantial vulnerability to oxidative rancidity. Notable attention has been paid to the study of flavour profile generated by oxi-dation processes.
Sanches-Silva et al. (2005) developed a SPME samp-ling method for the investigation of volatile compounds released during storage of potato crisps. Crisps were pack-aged in a transparent film in order to evaluate the changes
in the profile of volatiles under accelerated oxidation. After 3 months, 31 compounds were identified. From a quantita-tive point of view, carboxylic acids were the most important volatiles identified, mainly represented by hexanoic acid. The second most important class of compounds was alde-hydes, followed by alcohols, ketones, furans and other com-pounds that resulted from degradation/rearrangement of lipids and carbohydrates. Hexanal, formed during the oxi-dation of linoleic acid via the 13-hydroperoxide, was also studied as an indicator of lipid oxidation in potato crisps, stored in darkness or with natural light at room temperature (Sanches-Silva et al. 2004). The authors noted that there was a relevant increase of hexanal, starting from 8 days only in samples stored under light conditions.
Another problem arising during the frying of crisps is acrylamide formation. The sensory properties of potato crisps were evaluated when several additives, mitigating acrylamide formation, were added to blanching water (Mestdagh et al. 2008). The authors found that some sen-sory defects occurred when some acrylamide-lowering additives were used, leading to rejection of product by the panel. In particular, citric acid and acetic acid plus L-lysine induced suppression of the regular taste of potato crisps and enhanced sourness and the perception of popcorn-like flavours, respectively, leading to unacceptable final product quality. Dehydrated potato products In the potato industry, potato flakes are a crucial by-product obtained with a raw material that can not be used by other means. Unfortunately, non-enzymatic browning reactions occur during processing, and oxidative reactions occurring during storage lead to off-flavour formation (Sapers 1975) with important economic losses. Although potato flakes have a low lipid content, oxidation is important for limiting the deterioration of quality (Löliger and Jent 1983). In fact, the lipid fraction is composed primarily of linoleic and lino-lenic acids that are quite susceptible to oxidation in pre-sence of air (Buttery et al. 1961). Few papers on volatile compound analysis in potato flakes are available, but up to now several aspects have been taken into consideration, such as the detection of non-enzymatic browning and oxi-dative compounds, the improvement of flavour in dehyd-rated potatoes, and the evolution of off-flavours during sto-rage.
Laine et al. (2006) evaluated the volatile profile of potato flakes (cultivar ‘Bintje’) by SPME-GC-MS, and in particular, studied off-flavour formation during 6 months of storage. Thirteen volatile compounds were identified at very low levels, and hexanal was the main compound that ap-peared from the 12
th to the 24
th week of storage. The non-
enzymatic formation of hexanal, mainly derived from lino-leic acid hydroperoxide, was demonstrated after the ana-lysis of lipoxygenase activity in potato flakes.
Nissen et al. (2002) also evaluated the oxidative status of potato flakes. In particular, they evaluated the potential use of electron spin resonance spectroscopy and investi-gated the development of oxidation during storage, detec-ting differences between products protected by different natural antioxidants (i.e. rosemary, green tea, coffee, and grape skin extracts). The oxidative deterioration of dried potato flakes during storage was also monitored by mea-surement of volatile compounds, at the beginning of storage and after 12 weeks, using headspace GC. Sensory analysis was carried out as a quantitative sensory profiling to eval-uate the intensities of a number of defined descriptors for the smell and taste characteristics. Longer chain compounds (e.g. decadienal) decreased during storage, while shorter chain compounds (such as hexanal) derived from break-down of secondary lipid oxidation products, increased. Sen-sory evaluation was found to be inconclusive as no signifi-cant variations with storage time or treatment were detec-ted; the authors supposed that these results could be due to the oxidative changes in unprotected potato flakes during
11

Food 5 (Special Issue 1), 1-14 ©2011 Global Science Books
storage and to the protection of potato flakes by antioxi-dants. Extruded potato products Much attention has been paid to the formation of flavour compounds via the Maillard reaction during the extrusion process and the potential loss of flavour volatiles during steam distillation after extrusion. The formation of alkyl-pyrazines in potato flakes, due to the interaction of reducing sugars and free amino acids, was related to this manufacture step (Maga 1994).
Majcher and Jelén (2009) compared the utility of three extraction methods: SPME (solid-phase microextraction), SAFE (solvent-assisted flavour evaporation) and SDE (sim-ultaneous distillation and extraction) for characterization of flavour compounds from extruded potato snacks. Isolated compounds were analyzed using GC–O and GC/MS. The results showed that for GCO analysis the most suitable extraction method was SAFE, which led to identification of 25 most potent odorants out of 30 (identified by mass spec-trometry). Due to the low temperature of extraction applied (40° C), SAFE avoided formation of artefacts, in contrast to SDE. The SAFE method also proved to be adequate for identification of flavour components by GC/MS, showing high precision with adequate limits of detection.
SPME was not able to reveal 7 important components at olfactometry port (1-octen-3-ol, 2-ethyl-3,5-dimethylpyra-zine, 4-hydroxy-2,5-dimethyl-3(2H)-furanone, 3-hydroxy-4,5-dimethyl-2(5H)-furanone, 5-methyl-2,3-diethylpyrazine, �-damascenone and an unknown with a flavour of fresh pepper), but it was suitable for the identification of the highest number of volatiles (13 in SPME, compared to 12 and 11 in SAFE and SDE, respectively). In contrast to SDE and SAFE, SPME extraction identified low boiling com-pounds that co-elute with solvents used in other methods. Additionally, SPME was able to attain very low detection limits (reaching values of 0.2 - 0.3 ppb for hexanal, hep-tanal 2-ethyl-3,5-dimethyl pyrazines), which made it highly suitable for identification of flavour compounds present at trace levels.
The authors confirmed that SDE should not be used for food products that are rich in carbohydrates, amines or un-saturated fatty acids, which can serve as flavour precursors during long-term heat treatment used in SDE extraction; in this investigation, 2-furfurylthiol, 2,5-dimethyl-3-furanthiol, octanal, (E)-2-octenal and nonanal were recognized as arte-facts. SPME and SAFE extraction methods were recom-mended for full characterization of odour-active compounds in extruded potato snacks. Other potato-based products Ogunjobi et al. (2005) evaluated the sensory properties of Irish potato (Solanum tuberosum) slices after fermentation in 2.0% brine solution for 5 days at room temperature. A trained panel of 15 assessors evaluated several sensory traits, including the aroma and overall acceptability, of fer-mented and fresh potato slices cooked by boiling, frying with palm oil or a different vegetable oil and roasting.
The result of sensory evaluation revealed that the fla-vour of roasted fermented potato was not different from the fresh control. The flavour and the general acceptability of both fried samples (palm and vegetable oil) were preferred by the panel over controls. Boiled fermented potatoes, in contrast, had the lowest scores.
Elmore et al. (2010) studied the effect of sulphur dep-rivation on the formation of acrylamide and volatile com-pounds in cooked potato flour. Potato flour was heated at 180°C for 20 min and volatile compounds of three varieties (‘King Edward’, ‘Prairie’ and ‘Maris Piper’), grown with and without sulphur fertilizer, were compared.
49 compounds were present in at least one of the head-space extracts of the heated flour. 41 compounds were affected by sulphur treatment and 42 compounds were
affected by variety. For freshly-harvested potatoes, sulphur deprivation during cultivation resulted in reduced acryl-amide formation in cooked tuber flour and an overall in-crease in aroma volatiles. Many of such compounds were Strecker aldehydes and molecules formed from their con-densation, whereas benzaldehyde was found at higher con-centrations in the sulphur-sufficient flour, as acrylamide.
PERSPECTIVES
The aroma profile of food products is a key factor for the determination of consumer preference. The volatile profile of raw and processed potatoes has been widely investigated with several analytical techniques, but a detailed characteri-zation of aroma components is difficult to obtain.
The main biochemical components of processed potato flavour have been identified and classified according to their mechanism of formation. However many aromatic molecules are strictly related to a specific culinary prepa-ration; moreover also agronomical measures (varieties, agri-cultural systems, fertilization and storage conditions) have to be taken into account.
These prefaces highlight the need of further investiga-tion on the factors that can influence the volatile fraction formation, mainly in processed potatoes. The results ob-tained could led to the use of certain potato cultivars for specific food preparations, owing to their aromatic profile. Investigations on volatile profiles should always be ac-companied by sensory analysis in order to take into account the perception of the volatile molecules during tasting and their global effect on product acceptability.
REFERENCES Acree TE, Barnard J, Cunningham DG (1984) A procedure for the sensory
analysis of gas chromatographic effluents. Food Chemistry 14, 273-286
Anese M, Bortolomeazzi R, Manzocco L, Manzano M, Giusto C, Nicoli MC
(2009) Effect of chemical and biological dipping on acrylamide formation
and sensory properties in deep-fried potatoes. Food Research International
42, 142-147
Arthur CL, Pawliszyn J (1990) Solid phase microextraction with thermal de-
sorption using fused silica optical fibres. Analytical Chemistry 62, 2145-2148
Beltrán D, Selma MV, Tudela JA, Gil MI (2005) Effect of different sanitizers
on microbial and sensory quality of fresh-cut potato strips stored under
modified atmosphere or vacuum packaging. Postharvest Biology and Tech-
nol-ogy 37, 37-46
Blanch GP, Flores G, Ruiz del Castillo ML (2009) Effect of temperature on
lipid-derived volatile compounds in boiled potato during storage. Journal of
the Science of Food and Agriculture 89, 1012-1017
Blanda G, Cerretani L, Comandini P, Gallina Toschi T, Lercker G (2010)
Investigation of off-odour and off-flavour development in boiled potatoes.
Food Chemistry 118, 283-290
Brewer MS, Vega JD, Perkins EG (1999) Volatile compounds and sensory
characteristics of frying fats. Journal of Food Lipids 6, 47-61
Buttery RG, Hendel CE, Boggs MM (1961) Off-flavors in potato products,
autoxidation of potato granules. Journal of Agricultural and Food Chemistry
9, 245-252
Buttery RG, Guadagni DG, Ling LC (1973) Volatile compounds of baked
potatoes. Journal of the Science of Food and Agriculture 24, 1125-1131
Carlin JT, Jin QZ, Huang T-C, Ho C-T, Chang SS (1986) Identification of
alkyloxazoles in the volatile compounds from French-fried potatoes. Journal
of Agricultural and Food Chemistry 34, 621-623
Coleman EC, Ho C-T (1980) Chemistry of baked potato flavor. 1. Pyrazines
and thiazoles identified in the volatile flavor of baked potato. Journal of
Agricultural and Food Chemistry 28, 66-68
Coleman EC, Ho C-T, Chang SS (1981) Isolation and identification of volatile
compounds from baked potatoes. Journal of Agricultural and Food Chemis-
try 29, 42-48
Drawert F, Tressl R, Holzer M, Apetz M, Badings HT, Kleipool RJC, Tas
AC, Neeter R, ten Noever de Brauw MC, Grosch W, Laskawy G, Fischer
KH, Bemelmans JMH (1975) Biochemical formation of aroma components.
In: Groenen PJ, Maarse H (Eds) Aroma Research: Proceedings of the Inter-
national Symposium on Aroma Research, held at the Central Institute for Nut-
rition and Food Research TNO, Zeist, the Netherlands, Wageningen: PUDOC,
pp 13-39
Dresow JF, Böhm H (2009) The influence of volatile compounds of the flavour
of raw, boiled and baked potatoes: Impact of agricultural measures on the
volatile components. Landbauforschung - vTI Agriculture and Forestry Re-
search 4, 309-338
Duckham SC, Dodson AT, Bakker J, Ames JM (2001) Volatile flavour com-
12

Advances in potato flavour. Comandini et al.
ponents of baked potato flesh: a comparison of eleven potato cultivars. Nah-
rung 45, 317-323
Duckham SC, Dodson AT, Bakker J, Ames JM (2002) Effect of cultivar and
storage time on the volatile flavour components of baked potato. Journal of
Agricultural and Food Chemistry 50, 5640-5648
Elmore JS, Dodson AT, Muttucumaru N, Halford NG, Parry MAJ, Mott-
ram DS (2010) Effects of sulphur nutrition during potato cultivation on the
formation of acrylamide and aroma compounds during cooking. Food Che-
mistry 122, 753-760
Engel W, Bahr W, Schieberle P (1999) Solvent assisted flavour evaporation –
a new and versatile technique for the careful and direct isolation of aroma
compounds from complex food matrices. European Food Research and Tech-
nology 209, 237-241
Gilsenan C, Burke RM, Barry-Ryan C (2010) A study of the physicochemical
and sensory properties of organic and conventional potatoes (Solanum tube-
rosum) before and after baking. International Journal of Food Science and
Technology 45, 475-481
Hajšlová J, Schulzová V, Slanina P, Janné K, Hellenäs KE, Andersson CH
(2005) Quality of organically and conventionally grown potatoes: four-year
study of micronutrients, metals, secondary metabolites, enzymic browning
and organoleptic properties. Food Additives and Contaminants 22, 514-534
Hawrysh ZJ, Erin MK, Kim S, Hardm RT (1996) Quality and stability of
potato chips fried in canola, partially hydrogenated canola, soybean and
cottonseed oils. Journal of Food Quality 19, 107-120
Jansky SH (2008) Genotypic and environmental contributions to baked potato
flavour. American Journal of Potato Research 85, 455-465
Jansky SH (2010) Potato flavour. American Journal of Potato Research 87,
209-217
Jensen K, Petersen MA, Poll L, Brockhoff PB (1999) Influence of variety and
growing location on the development of off-flavour in precooked vacuum-
packed potatoes. Journal of Agricultural and Food Chemistry 47, 1145-1149
Josephson DB, Lindsay RC (1987) c4-Heptenal: an influential volatile com-
pound in boiled potato flavour. Journal of Food Science 52, 328-331
Jung HP, Sen A, Grosch W (1992) Evaluation of potent odorants in parsley
leaves (Petroselium crispum (Mill.) Nym. ssp. crispum) by aroma extract
dilution analysis. Lebensmittel, Wissenschaft und Technologie 25, 55-60
Kataoka H, Lord HL, Pawliszyn J (2000) Applications of solid-phase micro-
extraction in food analysis. Journal of Chromatography A 880, 35-62
Kerscher R, Grosch W (1997) Comparative evaluation of potent odorants of
boiled beef by aroma extract dilution and concentration analysis. Zeitschrift
für Lebensmitteluntersuchung und Forschung A 204, 3-6
Kreutzmann S, Bassompierre M, Thybo AK, Buch L, Engelsen SB (2011)
Exploratory study of potato cultivar differences in sensory and hedonistic
applicability tests. Potato Research 54, 13-28
International Standard (ISO) 5492 (2008-10-15) Second edition
Laine G, Göbel C, du Jardin P, Feussner I, Fauconnier ML (2006) Study of
precursors responsible for off-flavour formation during storage of potato
flakes. Journal of Agricultural and Food Chemistry 54, 5445-5452
Limbo S, Piergiovanni L (2007) Minimally processed potatoes. Part 2. Effects
of high oxygen partial pressures in combination with ascorbic and citric acid
on loss of some quality traits. Postharvest Biology and Technology 43, 221-
229
Lin BH, Yen ST (2004) U.S. potato consumption: Looking ahead to 2020.
Journal of Food Products Marketing 10, 49-65
Lojzova L, Riddellova K, Jana Hajslova, Zrostlikova J, Schureka J, Cajka
T (2009) Alternative GC–MS approaches in the analysis of substituted pyra-
zines and other volatile aromatic compounds formed during Maillard reaction
in potato chips. Analytica Chimica Acta 641, 101-109
Löliger J, Jent A (1983) Analytical methods for quality control of dried potato
flakes. American Potato Journal 60, 511-525
Longobardi F, Casiello G, Sacco D, Tedone L, Sacco A (2011) Characterisa-
tion of the geographical origin of Italian potatoes, based on stable isotope and
volatile compound analyses. Food Chemistry 124, 1708-1713
Maga JA (1994) Potato flavour. Food Reviews International 10, 1-48
Majcher M, Jele� HH (2009) Comparison of suitability of SPME, SAFE and
SDE methods for isolation of flavour compounds from extruded potato
snacks. Journal of Food Composition and Analysis 22, 606-612
Martin FL, Ames JM (2001) Comparison of flavor compounds of potato chips
fried in palmolein and silicone fluid. Journal of the American Oil Chemists'
Society 78, 863-866
Mazza G, Pietrzak EM (1990) Headspace volatiles and sensory characteristics
of earthy, musty flavoured potatoes. Food Chemistry 36, 97-112
Mestdagh F, De Wilde T, Delporte K, Van Peteghem C, De Meulenaer B
(2008) Impact of chemical pre-treatments on the acrylamide formation and
sensorial quality of potato crisps. Food Chemistry 106, 914-922
Moreira RG, Palau JE, Sun XZ (1995) Deep-fat frying of tortilla chips: An
engineering approach. Food Technology 49, 146-50
Morris WL, Shepherd T, Verrall SR, McNicol JW, Taylor MA (2010) Rela-
tionships between volatile and non-volatile metabolites and attributes of pro-
cessed potato flavor. Phytochemistry 71, 1765-1773
Mutti B, Grosch W (1999) Potent odorants of boiled potatoes. Nahrung 43,
302-306
Nickerson GB, Likens ST (1966) Gas chromatographic evidence for the occur-
rence of hop oil components in beer. Journal of Chromatography 2, 677-678
Nissen LR, Huynh-Ba T, Petersen MA, Bertelsen G, Skibsted LH (2002)
Potential use of electron spin resonance spectroscopy for evaluating the oxi-
dative status of potato flakes. Food Chemistry 79, 387-394
Nursten HE, Sheen MR (1974) Volatile flavour components of cooked potato.
Journal of the Science of Food and Agriculture 25, 643-663
Ogunjobi AA, Adebayo-Tayo BC, Ogunshe AA (2005) Microbiological, pro-
ximate analysis and sensory evaluation of processed Irish potato fermented in
brine solution. African Journal of Biotechnology 4, 1409-1412
Oruna-Concha MJ, Duckham SC, Ames JH (2001) Comparison of volatile
compounds isolated from the skin and flesh of four potato cultivars after
baking. Journal of Agricultural and Food Chemistry 49, 2414-2421
Oruna-Concha MJ, Bakker J, Ames JM (2002a) Comparison of the volatile
components of eight cultivars of potato after microwave baking. Lebens-
mittel-Wissenschaft Und-Technologie-Food Science and Technology 35, 80-
86
Oruna-Concha MJ, Bakker J, Ames JM (2002b) Comparison of the volatile
components of two cultivars of potato cooked by boiling, conventional
baking and microwave baking. Journal of the Science of Food and Agricul-
ture 82, 1080-1087
Pangloli P, Melton SL, Collins JL, Penfield MP, Saxton AM (2002) Flavor
and storage stability of potato chips fried in cottonseed and sunflower oils
and palm olein/sunflower oil blends. Journal of Food Science 67, 97-103
Pardo JE, Alvarruiz A, Pérez JI, Gómez R, Varón R (2000) Physical-chemi-
cal and sensory quality evaluation of potato varieties (Solanum tuberosum L.).
Journal of Food Quality 23, 149-160
Patton S, Josephson DV (1957) A method for determining significance of
volatile flavour compounds in foods. Journal of Food Science 22, 316-318
Pawliszyn J (1997) Solid Phase Microextraction. Theory and Practice, Wiley-
VCH, New York, 247 pp
Petersen MA, Poll L, Larsen ML (1998) Comparison of volatiles in raw and
boiled potatoes using a mild extraction technique combined with GC odour
profiling and GC-MS. Food Chemistry 61, 461-466
Petersen MA, Poll L, Larsen ML (1999) Identification of compounds con-
tributing to boiled potato off-flavour (‘POF’). Lebensmittel Wissenschaft und
Technologie - Food Science and Technology 32, 32-40
Petersen MA, Poll L, Larsen ML (2003) Changes in flavour-affecting aroma
compounds during potato storage are not associated with lipoxygenase acti-
vity. American Journal of Potato Research 80, 397-402
Reid WJ (2003) Instrumental methods in detecting taints and off-flavours. In:
Baigrie B (Ed) Taints and Off-flavours in Food, Woodhead Publishing Ltd.,
Abington Hall, England, pp 31-63
Reineccius G (2006) Flavor Chemistry and Technology, CRC Press, Boca
Raton, FL, pp 33-72
Rothe M, Thomas B (1963) Aromastoffe des brotes. Zeitschrift für Lebens-
mitteluntersuchung und Forschung A 119, 302-310
Salinas JP, Hartman TG, Karmas K, Lech J, Rosen RT (1994) Lipid-derived
aroma compounds in cooked potatoes and reconstituted dehydrated potato
granules. In: Ho CT, Hartmann TG (Eds) Lipids in Food Flavours, American
Chemical Society, Washington DC, pp 108-129
Sanches-Silva A, Rodríguez-Bernaldo de Quirós A, López-Hernández J,
Paseiro-Losada P (2004) Determination of hexanal as indicator of the lipidic
oxidation state in potato crisps using gas chromatography and high-perfor-
mance liquid chromatography. Journal of Chromatography A 1046, 75-81
Sanches-Silva A, López-Hernández J, Paseiro-Losada P (2005) Profiling fla-
vour compounds of potato crisps during storage using solid-phase microex-
traction. Journal of Chromatography A 1064, 239-245
Sapers GM (1975) Flavor and stability of dehydrated potato products. Journal
of Agricultural and Food Chemistry 23, 1027-1032
Seefeldt HF, Tønning E, Thybo AK (2011a) Exploratory sensory profiling of
three culinary preparations of potatoes (Solanum tuberosum L.). Journal of
the Science of Food and Agriculture 91, 104-112
Seefeldt HF, Tønning E, Wiking L, Thybo AK (2011b) Appropriateness of
culinary preparations of potato (Solanum tuberosum L.) varieties and relation
to sensory and physicochemical properties. Journal of the Science of Food
and Agriculture 91, 412-420
Sen A, Laskawy G, Schieberle P, Grosch W (1991) Quantitative determination
of �-damascenone in foods using a stable isotope dilution assay. Journal of
Agricultural and Food Chemistry 39, 757-759
Sides A, Robards K, Helliwell S (2000) Developments in extraction techniques
and their application to analysis of volatiles in foods. Trends in Analytical
Chemistry 19, 322-329
Stone H, Sidel JL (1992) Sensory Evaluation Practices, Academic Press, Inc.,
Orlando, FL, 338 pp
Thybo AK, Christiansen J, Kaak K, Petersen MA (2006) Effect of cultivars,
wound healing and storage on sensory quality and chemical components in
pre-peeled potatoes. LWT - Food Science and Technology 39, 166-176
Thybo AK, Molgaard JP, Kidmose U (2002) Effect of different organic grow-
ing conditions on quality of cooked potatoes. Journal of the Science of Food
and Agriculture 82, 12-18
Troncoso E, Pedreschi F, Zúñiga RN (2009) Comparative study of physical
and sensory properties of pre-treated potato slices during vacuum and atmos-
pheric frying. LWT - Food Science and Technology 42, 187-195
13

Food 5 (Special Issue 1), 1-14 ©2011 Global Science Books
Ullrich F, Grosch W (1987) Identification of the most intense volatile flavour
compounds formed during autoxidation of linoleic acid. Zeitschrift für
Lebensmitteluntersuchung und Forschung A 184, 277-282
Ulrich D, Hoberg E, Neugebauer W, Tiemann H, Darsow U (2000) Inves-
tigation of the boiled potato flavour by human sensory and instrumental
methods. American Journal of Potato Research 77, 111-117
Ulrich D, Hoberg E, Tiemann H (1997) Determination of aroma impact com-
pounds in extracts of cooked potatoes by GC-sniffing experiments. In:
Schreier P, Herderich M, Humpf HU, Schwab W (Eds) Natural Product Ana-
lysis, Vieweg, Braunschwelg/Wiesbaden, pp 63-65
Ulrich D, Hoberg E, Tiemann H (1998) The aroma of cooked potatoes. Beitr
Züchtungsforsch 4, 204-209
Van Loon WAM, Linssen JPH, Legger A, Posthumus MA, Voragen AGJ
(2005) Identification and olfactometry of French fries flavour extracted at
mouth conditions. Food Chemistry 90, 417-425
Wagner R, Grosch W (1997) Evaluation of potent odorants of French fries.
Lebensmittel Wissenschaft und Technologie 30, 164-169
Wagner R, Grosch W (1998) Key odorants in French fries. Journal of the
American Oil Chemists' Society 75, 1385-1392
Warner K, Orr P, Glynn M (1997) Effect of fatty acid composition of oils on
flavor and stability of fried foods. Journal of the American Oil Chemists'
Society 74, 347-356
Whitfield FB, Last JH (1991) Vegetables. In: Maarse H (Ed) Volatile Com-
pounds in Foods and Beverages, Marcel Dekker Inc., New York, pp 222-231
Wszelaki AL, Delwiche JF, Walker SD, Liggett RE, Scheerens JC, Klein-
henz MD (2005) Sensory quality and mineral and glycoalkaloid concentra-
tions in organically and conventionally grown redskin potatoes (Solanum
tuberosum). Journal of the Science of Food and Agriculture 85, 720-726
14

Chapter 5
121
5.2 INVESTIGATION OF OFF-ODOUR AND OFF-FLAVOUR
DEVELOPMENT IN BOILED POTATOES: STUDY ON ITALIAN AN D
MEXICAN VARIETIES
The flavour of boiled potatoes is quite little and more than 140 volatile compounds have been
identified. The typical aroma of boiled potatoes is mainly due to the presence of essential
compounds such as methional and various pyrazines produced by the Maillard reaction and
Strecker degradation (Ulrich et al., 2000).
One of the main problems of ready-to-eat or ready-to-cook foodstuffs that contain
boiled potatoes is the development of an off-flavour called cardboard-like. Petersen et al.
(1999) found that the production of cardboard-like off-flavour occurs within a few hours from
the preparation of boiled potatoes, and is probably due to lipid oxidation. In fact the
production of this off-flavour is dependent upon the oxygen availability and it might be
initiated by the lipoxygenase activity (Galliard, 1973; Petersen et al., 1999).
The lipoxidase enzymes (lipoxygenase and lipoperoxidase), released from the
disrupted cells during the peeling and the cutting process and during the first time of boiling,
convert the unsaturated fatty acids, mainly from the cell membranes, to the corresponding
hydroperoxides. These precursors of volatile compounds can slowly break down into volatile
carbonyl compounds (for instance aldehydes), even after the heat inactivation of lipoxygenase
enzyme. This problem is pronounced in pre-cooked potatoes, but can also arise when freshly
boiled potatoes are allowed to stand for some time between cooking and serving (Petersen et
al., 1998, 2003).
Research article 6 focused on the development of a QDA® scheme to define the
sensory attributes of boiled potato slices. Moreover the volatile components in boiled potatoes
were investigated through a HS-SPME–GC–MS technique. Finally, the generation
mechanism of off-odours and off-flavours in boiled potatoes and the effects of food additives
(ascorbic acid, citric acid, sodium acid pyrophosphate and meta-bisulphite) after cooking were
examined.
In this first investigation the Marabel cultivar was used, owing to its marked tendency
to develop the cardboard-like off-flavour and rancidity (Thybo et al., 2006).
The development of off-flavours in boiled potatoes depend on various factors, as
cultivar (Jensen et al. 1999; Thybo et al. 2006), agronomic techniques (Thybo et al. 2002)
and storage conditions before cooking (Blanch et al. 2009).
In research article 7 the sensory profiles of three Mexican potato cultivars (Alpha,
Chica and Gallo) of boiled potatoes were investigated through a QDA® method; the
development of off-odours was also studied during 57-hours refrigerated storage. A different

Chapter 5
122
behaviour was observed with reference to the kind of off-odour developed and its time of
appearance.
Research article 6
123

Research article 6
124

Research article 6
125

Research article 6
126

Research article 6
127

Research article 6
128

Research article 6
129

Research article 6
130

Research article 7
131
SENSORY PROFILE OF THREE MEXICAN POTATO CULTIVARS A ND OFF-1
ODORS DEVELOPMENT AFTER BOILING 2
3
Short Running title: Sensory profile of Mexican potato cultivars 4
5
6
PATRIZIA COMANDINI 1,3, GIAMPAOLO BLANDA1, MAYRA CRISTINA SOTO 7
CABALLERO2, HUGO MUJICA-PAZ2, AURORA VALDEZ FRAGOSO2, TULLIA 8
GALLINA TOSCHI1 9
10 1 Dipartimento di Scienze degli Alimenti, Università di Bologna, P.zza Goidanich, 60, 47521 11
Cesena (FC), Italy. 12
13 14
2 Departamento de Biotecnología y Ingeniería de Alimentos, ITESM, Av. Eugenio Garza 15
Sada, 2501 Sur, 64849 Monterrey, N.L. México. 16
17 18
19 3 Corresponding author. TEL: +39 0547 338121; FAX: +39 0547 382348; EMAIL: 20
22

Research article 7
132
ABSTRACT 23
The flavor of boiled potato is rather weak and changes rapidly during storage; one of the 24
most important off-flavors, described as cardboard-like note, can be generated within a few 25
hours from cooking. Its production depends on different factors and represent a big problem 26
for the production of potato-based foodstuffs. The present study focused on the sensory 27
profiling of boiled potato slices of three Mexican cultivars (Alpha, Chica and Gallo) by a 28
quantitative-descriptive analysis (QDA) and on off-odors produced during their refrigerated 29
storage. The formation of cardboard-like off-odor was detected only in cultivars Alpha and 30
Chica. The appearance of cardboard-like off-odor in cultivar Chica was detected several 31
hours after cooking (24 h) and its level was significantly lower than cultivar Alpha (about 30 32
% lower after 24 and 33 h of storage). Cultivar Gallo presented different oxidation olfactory 33
perceptions described by the assessors as “burnt” note, detected after 5 h of refrigerated 34
storage. 35
36
Key words: Boiling, Mexican cultivars, Potato, Off-odors, Sensory analysis 37
38

Research article 7
133
INTRODUCTION 39
An important qualitative criteria in assigning a certain potato cultivar to the fresh or 40
processed food market is its aromatic profile. 41
The flavor of boiled potatoes is rather weak, although more than 140 volatile compounds 42
have been identified (Ulrich et al. 2000); they have been especially generated from chemical 43
precursors typical of raw tubers (Petersen et al. 1998). 44
Boiled potato flavor changes rapidly during storage owing to lipid oxidation; one of the 45
most important off-flavors, described as cardboard-like note, is produced within a few hours 46
from cooking (Blanda et al. 2010; Petersen et al. 1999). This phenomenon is particularly 47
significant when pre-cooked vacuum-packed potatoes are produced, but also for freshly 48
boiled potatoes, when there is some time of standing between cooking and serving (Petersen 49
et al. 1999). 50
Pentanal, hexanal, nonanal, (E)-2-octenal, 2,4-heptadienal, (E)-2-nonenal, (E,E)-2,4-51
nonedienal and 2,4-decadienal have been identified as potential contributors to potato off-52
flavors; they probably appeared during boiling as a result of lipoxygenase initiated oxidation 53
reactions of linoleic and linolenic acids, and increased during storage (Petersen et al. 1998, 54
1999). 55
The formation of boiled potato off-flavors is influenced by several factors as cultivar 56
(Jensen et al. 1999; Thybo et al. 2006), agronomic techniques (Thybo et al. 2002) and storage 57
conditions before cooking (Blanch et al. 2009). 58
In particular, the qualitative and quantitative lipid composition of potatoes, as well as the 59
content of lipid-degrading enzymes (hydrolytic or oxidising) seem to be the major causes of 60
off-flavors formation (Galliard, 1973; Galliard and Matthew 1973). However, up to now a 61
direct correlation between the appearance of oxidation compounds, such as aldehydes and 62
alcohols, during the storage of boiled potatoes and the lipoxygenase activity has not been 63
found (Petersen et al. 2003). 64
The aims of this investigation was to carry out a Quantitative Descriptive Analysis (QDA) 65
of boiled potato slices of three Mexican cultivars (Alpha, Chica and Gallo) and to trace their 66
sensory profiles. Cardboard-like off-odor and other olfactory defects, developed during their 67
refrigerated storage were also investigated. 68
69
70
71

Research article 7
134
MATERIALS AND METHODS 72
Samples 73
Potatoes (Solanum tuberosum L.) of Alpha, Chica and Gallo cultivars were bought at a 74
local market in Chihuahua (Mexico). Potatoes of cv. Marabel, used as reference for the 75
formation of cardboard-like off-odor, where bought in Italy. The tubers had different weights, 76
ranging from 300 to 400 g for cvs. Marabel and Alpha and from 200 to 250 g for cvs. Chica 77
and Gallo. 78
Potatoes were washed with tap water to remove soil residue before manual peeling. The 79
central portion of each tuber was cut into 5–10 slices (5 mm thickness), depending on its 80
dimensions, and the rest of the tuber was rejected in order to obtain slices of similar sizes. 81
About 200 g of potato slices of each cultivar were boiled separately in 1.5 L of tap water for 82
optimal cooking times (15 min for cvs. Alpha and Chica and 14 min for cv. Gallo cv.). 83
After boiling, slices were cooled for 15 min at room temperature (24°C). Potato samples 84
were analyzed immediately after equilibration with room temperature and after storing in 85
refrigerated conditions (temperature of 4°C and air exposed) for different times, as detailed in 86
the following paragraph. 87
88
Sensory analysis 89
Quantitative Descriptive Analysis (QDA, Stone and Sidel 1993; Stone et al. 1974) was 90
carried out in the laboratory of sensory analysis at the University of Chihuahua (Mexico). A 91
panel of ten judges was specifically trained to carry out QDA of boiled potatoes. 92
The sensory procedure and the attributes developed by Blanda et al. (2010) were modified 93
(Table 1) and used to describe Mexican boiled potatoes. Only significant attributes were used 94
to trace the sensory profile of freshly boiled potatoes, as explained in the Results and 95
discussion session. The descriptors were evaluated on a continuous scale from 1 (no 96
detectable perception) to 9 (maximum perception) points. Four training sessions were held to 97
enhance the ability of each panel member to recognize and quantify the descriptors previously 98
stated. 99
Potatoes of the cv. Marabel were boiled and stored for 6 hours in refrigerated conditions. 100
These samples were used to calibrate cardboard-like off-odor and flavor, due to their marked 101
tendency to develop cardboard-like note, within a few hours from cooking (Blanda et al. 102
2010; Thybo et al. 2006). Typical fragrance of boiled potatoes was calibrated by tasting 103
boiled potatoes freshly cooked (cv. Chica). Potato samples (cv. Chica) cooked for increasing 104
times (from 5 to 18 min) were used to calibrate the panelists for hardness; moreover, 105

Research article 7
135
increasing concentrations of sucrose (0 – 3 % w/v) were added to the cooking water of 106
potatoes (cv. Alpha) to calibrate the sweetness attribute. When reference standards were not 107
available, descriptors, learning and alignment procedure were realized as reported by Sulmont 108
et al. (1999). After attributes calibration, three complete training sessions were carried out in 109
order to improve panel repeatability. 110
Sensory evaluation of boiled potatoes was carried out following a specific and 111
standardized test: each potato slice was cut into quarters, and each piece was served to the 112
assessors in plastic dishes. Sensory analysis was made in individual booths. After tasting each 113
sample, the judges rinsed their mouth with water. Each sample was analyzed three times. 114
As reported in Table 2 a complete sensory analysis (all the significant attributes evaluated) 115
was carried out on freshly boiled potato slices (not stored, 0 h samples) and on potato slices 116
stored for 5 and 9 h, in refrigerated conditions (4°C). Particular attention was paid to the 117
aromatic profile, and the olfactory analysis was carried out also at 24, 33, 48 and 57 h, to 118
determine when aromatic alterations appeared, as detailed in Table 2; Typical odor, Other 119
odors, Cardboard-like off-odor and Other off-odors attributes were evaluated during olfactory 120
analysis. 121
122
Statistical analysis 123
Data were analyzed using PanelCheck software (ver. 1.4.0), following the workflow 124
scheme proposed by Tomic et al. (2010) and including mixed model ANOVA, multivariate 125
(Tucker-1 model) and univariate (F, p, and MSE values) analysis and a consensus approach 126
based on principal component analysis (PCA) for the evaluation of Mexican potato cultivars. 127
Statistica 7.0 (Statsoft Inc., Tulsa, OK, USA) statistical software was also used. 128
129
RESULTS AND DISCUSSION 130
The first part of this work aimed to trace the sensory profile of boiled potato slices from 131
three Mexican cultivars (Alpha, Chica and Gallo). With this purpose the samples were tasted 132
immediately after cooking. The second part of this investigation dealt with the study of the 133
evolution of boiled potato aromatic profiles after a refrigerated storage. A specific goal was to 134
find the time of appearance of aromatic alterations, with particular attention to the cardboard-135
like note. 136
The sensory analysis was performed by training 10 assessors, however only the results of 137
the eight best performers have considered for data computation. The sensory data have been 138

Research article 7
136
elaborated following the workflow proposed by Tomic et al. (2010), taking into account the 139
panel performance and then the evaluation of the samples. 140
141
Assessing the importance of the attributes 142
A mixed model ANOVA was computed first to assess the importance of attributes. It was 143
decided to use a 3-way ANOVA, modeling samples, assessors, replicates and their 144
interactions, because each replicate was served to the assessors in different sessions. In this 145
way the systematic variations, due to the replicate effect, have been taken into account. 146
The results are shown in Fig. 1 and over the 12 attributes evaluated, 8 were significant at p 147
< 0.05. The attributes: Cardboard-like off-odor, Other off-odors, Cardboard-like off-flavor 148
and Other off-flavors were not detected in any of the samples tasted immediately after 149
cooking. Such attributes were not significant for product effect and it was decided to exclude 150
them from the analysis in the first part of the investigation. The following evaluations related 151
to panel performance have been carried out only on the significant attributes (p < 0.05). 152
By analyzing the replicate effect plot (not shown), it has not been detected any session based 153
variation for all the attributes evaluated. 154
155
Panel agreement and discriminative capacity 156
The multivariate analysis (Tucker-1 test) has been applied in order to get an overview 157
over assessors performances using multiple attributes. The common score and the loading 158
plots have been examined. The sample tasted were well distributed in the multivariate space 159
and the panel could distinguish between them (data not shown). 160
The correlation loading plot generated by PCA on the unfolded matrix has been used to 161
visualize the performance of individual assessors of the panel. The assessors showed a good 162
agreement in the evaluation of the 8 attributes identified as significant in the samples tasted 163
immediately after cooking (Fig. 1, p < 0.05); as shown in Fig. 2, all the judge scores were 164
well clustered at the outer ellipses of the graphs. 165
166
Repeatability and discrimination capacity of individual assessors 167
After the panel agreement, the repeatability and the discrimination capacity were 168
determined following a one-way ANOVA model, as proposed by Naes and Solheim (1991). 169
Three statistical quantities were calculated, F, p and MSE (Mean Square Error) values, the 170
first two providing information on the ability of assessors to discriminate between samples 171
and the third on their reproducibility. 172
Research article 7
137
The F test showed that each assessors could discriminate the three cultivars, at least for 6 173
attributes (p < 0.05), as reported in Fig. 3a. 174
Each assessor MSE values were lower than 1.25, for all the attributes tested (Fig. 3b). This 175
indicates a good reproducibility of the analysis. Moreover, for all the 8 attributes identified as 176
significant in the samples tasted immediately after cooking (Fig. 1, p<0.05), the CVr% was 177
considered acceptable being always lower than 20% (Giomo 2000). 178
Analyzing the F, MSE and p*MSE graph (not shown), it was noted that the lowest 179
discrimination power was obtained for the attribute Other odors; in fact only three assessors 180
could discriminate between samples considering this attribute. The reason could be due to the 181
low intensity of Other odors in all the cultivars tested; moreover, its perception was reduced 182
by the higher impact of the Typical odor attribute. 183
184
Evaluation of ranking capacity 185
Profile plots (Fig. 4) showed a good agreement for several of the attributes evaluated. 186
Some disagreement was found for Typical odors and Hardness attributes. The profiles of 187
attributes Mealiness, Adeshiviness and Typical flavor were very alike for most of the 188
assessors, with few exceptions. As an example, for the attribute Mealiness assessor A6 rated 189
cv. Gallo higher than the other assessors. For the attribute Adhesiviness assessor A8 rated cv. 190
Gallo higher than the rest of the panel; assessor A1, instead, for the same attribute rated lower 191
cv. Alpha. Finally, the attribute Typical flavor was rated lower by assessor A8 only for cv. 192
Gallo. 193
Considering the lacking of previous experience on potato sensory analysis, the panel 194
performance might be considered good and adequate for the following sensory evaluation of 195
boiled Mexican potatoes. 196
197
Sensory profiles of Alpha, Chica and Gallo cultivars 198
After verifying that the panel was trained, a consensus procedure on the raw data was 199
made through a plain PCA analysis. Scores, loadings and explained variances for the first two 200
principal components were evaluated. 201
Fig. 5 reports the results of PCA. The first axis discriminates between cv. Alpha (on the 202
left side) and cvs. Chica and Gallo (on the right). With reference to PC1 cv. Alpha was 203
characterized by the highest values for textural characteristics as Mealiness and Adhesiviness; 204
however it had the lowest values of Typical flavor, Typical odors and Sweetness that were 205

Research article 7
138
higher in cvs. Chica and Gallo. As regard PC2, cv. Gallo was well distinguishable from the 206
other samples thanks to the highest concentration of the attribute Other flavors. 207
The first two principal components explained 100% of the variance of the data. 208
A spiderplot illustrating the sensory profiles of the three Mexican potato cultivars is 209
reported in Fig. 6. Cv. Gallo showed high Typical odor and flavor intensities. Besides these 210
typical olfactory and retro-olfactory sensations, assessors detected other odors and flavors, 211
described as hints of raw tuber, green beans and hay notes. In order to quantify these 212
perceptions, the attributes Other odors and Other flavors were added to the sensory score 213
sheet initially used. Cv. Gallo was the sweetest, as opposed to Alpha, which was the least 214
sweet, but with the most defined textural properties (Hardness, Mealiness, Adhesiveness). Cv. 215
Chica had mean values of olfactory and textural attributes. 216
217
Study of off-odors development after boiling 218
The development of the olfactory profile of boiled potato slices was studied during 219
refrigerated storage and a particular attention was paid to the formation of off-odors. 220
Olfactory tests, in particular the assessment of Cardboard-like off-odor and Other off-221
odors attributes, were made up to 57 hours, or whenever off-odors were developed in each 222
cultivar, as specified in Table 2. 223
The performance of the panel in detecting the formation of off-odors in boiled potato 224
slices was evaluated following the same procedure used above for the sensory profiles. 225
Briefly, both attributes were significant at p < 0.001 as measured in three-way ANOVA 226
model. F values were respectively 359.51 and 359.84 for Cardboard-like and Other off-odors 227
attributes. The multivariate analysis through Tucker-1 model showed a good separation of the 228
samples tested and a high agreement between the panel assessors in the evaluation of the two 229
attributes. Finally, an univariate approach was carried out to evaluate repeatability, 230
discriminant and ranking capacity. In Table 3 are reported the results of F, p and MSE values, 231
calculated using a one-way ANOVA, highlighting discriminant and repeatability capacity of 232
each assessors. 233
The profile plots, visualizing sample intensity and rankings for each assessors, showed a 234
good agreement between panel members, as illustrated in Fig. 7. 235
The formation of Cardboard-like off-odor was detected only in cvs. Alpha and Chica 236
(Table 4). Olfactory analysis of cv. Alpha was stopped at 33 h, when the formation of 237
Cardboard-like off-odor had been clearly detected. The formation of Cardboard-like off-odor 238
in cv. Chica started several hours after cooking (24 h) and its level was significantly lower 239
than in cv. Alpha. These interesting olfactory differences should be investigated in terms of 240

Research article 7
139
volatile components produced during refrigerated storage; a low level of off-odors 241
development during storage could be related with a different composition of lipid fraction or 242
of enzymatic patterns. Anyway, considering its sensory profile, the use of cv. Chica as boiled 243
ingredient of ready to eat products can be suggested. 244
Cv. Gallo presented a different oxidation olfactory perception, described by the assessors 245
as burnt and recorded as Other off-odors attribute. This alteration was significantly detected 246
after 5 hours of refrigerated storage (Table 5) and attribute was not detected in cvs. Alpha and 247
Chica. 248
249
CONCLUSIONS 250
A sensory panel, without previous experience in sensory analysis of boiled potatoes, has 251
been trained and the sensory profiles of three Mexican potato cultivars (Alpha, Chica and 252
Gallo) have been carried out. 253
Different kinds and levels of off-odors were detected in the samples analyzed during 254
refrigerated storage. The development of Cardboard-like off-odor in cv. Chica started later 255
than in cv. Alpha (24 h vs. 9 h respectively). The development of Cardboard-like off-odor in 256
cv. Alpha was more similar to the Italian cv. Marabel previously investigated, where this 257
alteration was perceived after 6 h of refrigerated storage. 258
Cv. Gallo developed an olfactory alteration, different from the cardboard-like note, 259
identified as “burnt” note, after 5 h of storage. 260
Further determinations, such as an analytical quantification of the molecules responsible 261
for different odors and off-odors in the three Mexican boiled potato slices, can be useful to 262
complete their characterization and to understand if such results might be related to different 263
metabolic or enzymatic patterns. 264
265
266
ACKNOWLEDGEMENTS 267
The authors would like to thank all the panel members, Anaís Armendariz Ponce, Arturo 268
Becerra, Claudia Contreras Godinez, Samatha Duque Alarcón, Georgina Hernández Espejo, 269
Lucia Moreno Castro, Mireya Sáenz Hernández, Daniela Sánchez Aldana Villarruel, Ludmila 270
Vazquez Grado for their valued help in sensory evaluation. 271
272

Research article 7
140
REFERENCES 273
AMERINE, M.A., PANGBORN, R.M., and ROESSLER, E.B. 1965. Principles of sensory 274
evaluation of food. Chap. 1, pp. 1–4, Chap.9, pp. 144–145, 3rd ed. Academic Press, New 275
York, NY, USA. 276
BLANCH, G.P., FLORES, G., and RUIZ DEL CASTILLO, M.L. 2009. Effect of temperature 277
on lipid-derived volatile compounds in boiled potato during storage. J. Sci. Food Agric. 278
89, 1012-1017. 279
BLANDA, G., CERRETANI, L., COMANDINI, P., GALLINA TOSCHI, T., and 280
LERCKER, G. 2010. Investigation of off-odour and off-flavour development in boiled 281
potatoes. Food Chem. 118, 283-290. 282
GAILLARD, T. 1973. Lipids of potato tubers. I. Lipid and fatty acid composition of tubers 283
from different varieties of potato. J. Sci. Food Agric. 24, 617-622. 284
GALLIARD, T., and MATTHEW, J.A. 1973. Lipids of potato tubers. II. Lipid-degrading 285
enzymes in different varieties of potato tuber. J. Sci. Food Agric. 24, 623-627. 286
GIOMO, A. 2000. Organoleptic assessment of virgin olive oil. COI/ T.20/Doc. N.15/ Rev.1: a 287
new robust statistical approach to classify the oils. In, European Conference “Food 288
Industry and Statistics”. 289
JENSEN, K., PETERSEN, M.A., POLL, L., and BROCKHOFF, P.B. 1999. Influence of 290
variety and growing location on the development of off-flavour in precooked vacuum-291
packed potatoes. J. Agric. Food Chem. 47, 1145-1149. 292
LAWLESS, H.T., and HEYMANN, H. 1998. Sensory evaluation of food: Principles and 293
practices. Chap. 2, pp. 28–82, 1st ed. Chapman and Hall, New York, NY, USA. 294
NÆS, T., and SOLHEIM, R. 1991. Detection and interpretation of variation within and 295
between assessors in sensory profiling. J. Sens. Stud. 6, 159-177. 296
PETERSEN, M.A., POLL, L., and LARSEN, M.L. 1998. Comparison of volatiles in raw and 297
boiled potatoes using a mild extraction technique combined with GC odour profiling 298
and GC-MS. Food Chem. 61, 461-466. 299
PETERSEN, M.A., POLL, L., and LARSEN, M.L. 1999. Identification of compounds 300
contributing to boiled potato off-flavour (‘POF’). LWT-Food Sci. Technol. 32, 32-40. 301
STONE, H., SIDEL, J.L., OLIVER, J., WOOLSEY A., and SINGLETON, R.C. (1974). 302
Sensory evaluation by quantitative descriptive analysis. Food Technol. 28, 24–34. 303
STONE, H., and SIDEL, J.L. (1993). Sensory evaluation practices. pp. 202–242, 2nd ed. 304
Academic Press, San Diego, CA, USA. 305

Research article 7
141
SULMONT, C., LESSCHAEVE, I., SAUVAGEO, F., and ISSANCHOU, S. 1999. 306
Comparative training procedures to learn odor descriptors: effects on profiling 307
performance. J. Sens. Stud. 14, 467-490. 308
THYBO, A.K., CHRISTIANSEN, J., KAAK, K., and PETERSEN, M.A. 2006. Effect of 309
cultivars, wound healing and storage on sensory quality and chemical components in 310
pre-peeled potatoes. LWT-Food Sci. Technol. 39, 166-176. 311
THYBO, A.K., MOLGAARD, J.P., and KIDMOSE, U. 2002. Effect of different organic 312
growing conditions on quality of cooked potatoes. J. Sci. Food Agric. 82, 12-18. 313
THYGESEN, L.G., THYBO, A.K., and ENGELSEN, S.B. 2001. Prediction of sensory 314
texture quality of boiled potatoes from low-field 1H NMR of raw potatoes. The role of 315
chemical constituents. LWT-Food Sci. Technol. 34, 469-477. 316
TOMIC, O., LUCIANO, G., NILSEN, A., HYLDIG, G., LORENSEN, G., and NÆS, T. 317
2010. Analysing sensory panel performance in a proficiency test using the PanelCheck 318
software. Eur. Food Res. Technol. 230, 497-511. 319
ULRICH, D., HOBERG, E., NEUGEBAUER, W., TIEMANN, H., and DARSOW, U. 2000. 320
Investigation of the boiled potato flavor by human sensory and instrumental methods. 321
Am. J. Potato Res. 77, 111-117. 322

Research article 7
142
Figures 323
324
FIG. 1. PRODUCT EFFECT IN THE THREE-WAY ANOVA MODEL BASED ON 10 325
ASSESSORS. 326
Abbreviations: Typ. = Typical; Ot. = Other; Cl = Cardboard-like 327
328
329

Research article 7
143
FIG. 2. TUCKER-1 LOADING PLOTS BASED ON SAMPLES AVERAGES. EACH PLOT IS REFERRED TO ONE OF THE EIGHT 330
ATTRIBUTES USED IN THE PROFILING 331
332
333

Research article 7
144
FIG. 3. F PLOTS VISUALIZING THE ASSESSORS’ ABILITY TO DISCRIMINATE 334
BETWEEN THE TESTED SAMPLES FOR EACH ATTRIBUTE. 335
The horizontal lines indicate f values at significance level 1 and 5% 336
337
338
339
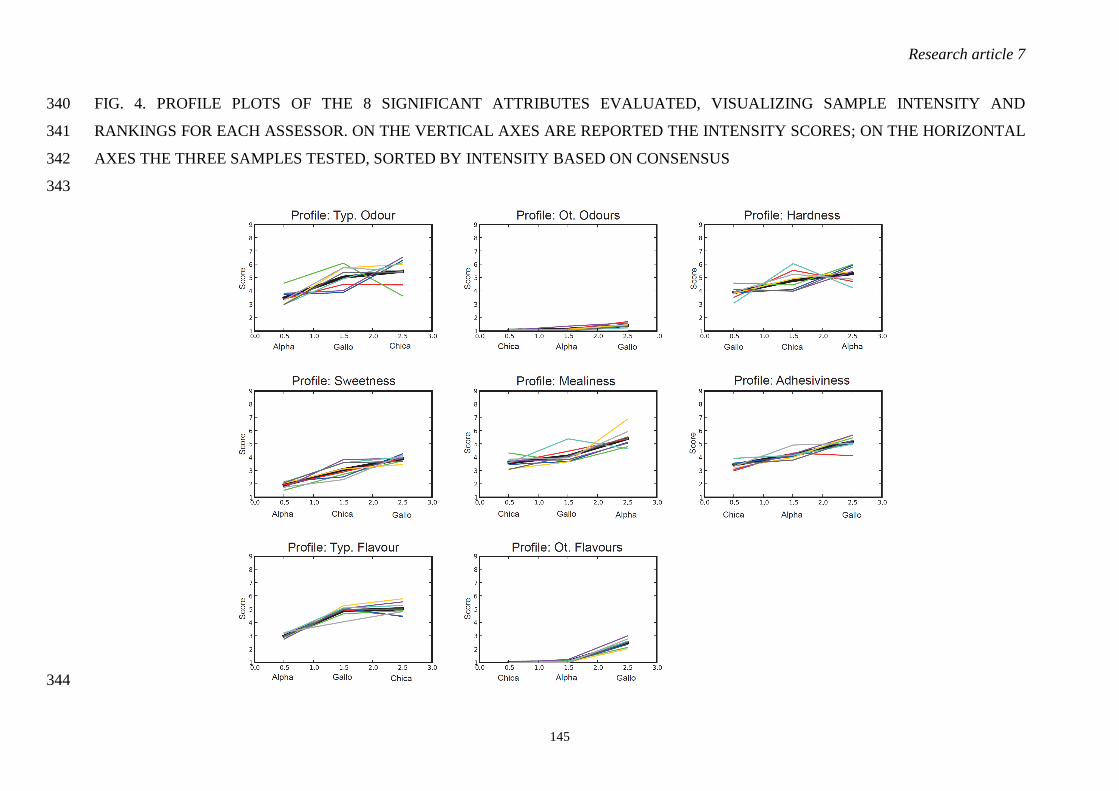
Research article 7
145
FIG. 4. PROFILE PLOTS OF THE 8 SIGNIFICANT ATTRIBUTES EVALUATED, VISUALIZING SAMPLE INTENSITY AND 340
RANKINGS FOR EACH ASSESSOR. ON THE VERTICAL AXES ARE REPORTED THE INTENSITY SCORES; ON THE HORIZONTAL 341
AXES THE THREE SAMPLES TESTED, SORTED BY INTENSITY BASED ON CONSENSUS 342
343
344

Research article 7
146
FIG. 5. PRINCIPAL COMPONENT ANALYSIS OF SENSORY ANALYSIS RESULTS OF
BOILED POTATO SLICES. SCORES ARE REPORTED IN BOLD ITALIC FORMAT
FIG. 6. SENSORY PROFILES OF BOILED POTATO SLICES (CVS. ALPHA, CHICA
AND GALLO)

Research article 7
147
FIG. 7. PROFILE PLOTS OF CARDBOARD-LIKE AND OTHER OFF-ODORS. ON THE
VERTICAL AXES ARE REPORTED THE INTENSITY SCORES; ON THE
HORIZONTAL AXES ARE INDICATED THE THREE SAMPLES TESTED, SORTED BY
INTENSITY BASED ON CONSENSUS
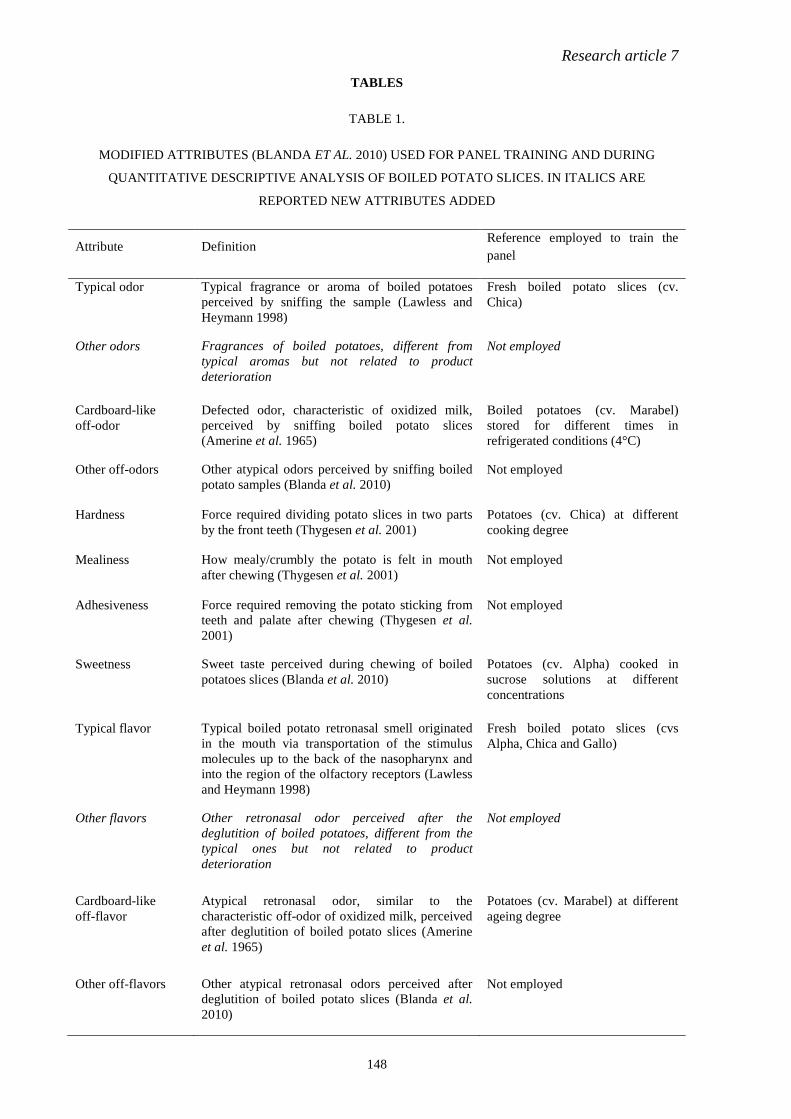
Research article 7
148
TABLES
TABLE 1.
MODIFIED ATTRIBUTES (BLANDA ET AL. 2010) USED FOR PANEL TRAINING AND DURING
QUANTITATIVE DESCRIPTIVE ANALYSIS OF BOILED POTATO SLICES. IN ITALICS ARE
REPORTED NEW ATTRIBUTES ADDED
Attribute Definition Reference employed to train the panel
Typical odor Typical fragrance or aroma of boiled potatoes perceived by sniffing the sample (Lawless and Heymann 1998)
Fresh boiled potato slices (cv. Chica)
Other odors Fragrances of boiled potatoes, different from typical aromas but not related to product deterioration
Not employed
Cardboard-like off-odor
Defected odor, characteristic of oxidized milk, perceived by sniffing boiled potato slices (Amerine et al. 1965)
Boiled potatoes (cv. Marabel) stored for different times in refrigerated conditions (4°C)
Other off-odors Other atypical odors perceived by sniffing boiled potato samples (Blanda et al. 2010)
Not employed
Hardness Force required dividing potato slices in two parts by the front teeth (Thygesen et al. 2001)
Potatoes (cv. Chica) at different cooking degree
Mealiness How mealy/crumbly the potato is felt in mouth after chewing (Thygesen et al. 2001)
Not employed
Adhesiveness Force required removing the potato sticking from teeth and palate after chewing (Thygesen et al. 2001)
Not employed
Sweetness Sweet taste perceived during chewing of boiled potatoes slices (Blanda et al. 2010)
Potatoes (cv. Alpha) cooked in sucrose solutions at different concentrations
Typical flavor Typical boiled potato retronasal smell originated in the mouth via transportation of the stimulus molecules up to the back of the nasopharynx and into the region of the olfactory receptors (Lawless and Heymann 1998)
Fresh boiled potato slices (cvs Alpha, Chica and Gallo)
Other flavors Other retronasal odor perceived after the deglutition of boiled potatoes, different from the typical ones but not related to product deterioration
Not employed
Cardboard-like off-flavor
Atypical retronasal odor, similar to the characteristic off-odor of oxidized milk, perceived after deglutition of boiled potato slices (Amerine et al. 1965)
Potatoes (cv. Marabel) at different ageing degree
Other off-flavors Other atypical retronasal odors perceived after deglutition of boiled potato slices (Blanda et al. 2010)
Not employed

Research article 7
149
TABLE 2. SENSORY EVALUATION PLANNING OF BOILED POTATO SLICES, FROM THE
THREE MEXICAN CULTIVARS Sensory test Storage time (h)
0 5 9 24 33 48 57
Complete QDA A, C, G A, C, G A, C, G - - - -
Olfactory analysis - - - A, C, G C, G C, G C, G
Abbreviations: A = cv. Alpha; C = cv. Chica; G = cv. Gallo.
TABLE 3.
F, P AND MSE VALUES OF CARDBOARD-LIKE OFF-ODOR AND OTHER OFF-
ODORS ATTRIBUTES
Assessors Cardboard-like off-odor Other off-odors F value p value MSE value F value p value MSE value
A1 86.66 0.000 0.10 49.95 0.000 0.16 A2 42.38 0.000 0.19 41.42 0.000 0.23 A3 61.68 0.000 0.14 44.75 0.000 0.21 A4 36.97 0.000 0.21 34.92 0.000 0.26 A5 28.07 0.000 0.23 49.56 0.000 0.16 A6 70.71 0.000 0.11 32.35 0.000 0.24 A7 52.45 0.000 0.18 31.96 0.000 0.32 A8 62.72 0.000 0.15 40.92 0.000 0.23 The significant level of F values at 1% and 5% were respectively 2.45 and 1.89.
TABLE 4.
CARDBOARD-LIKE OFF-ODOR DEVELOPMENT DURING REFRIGERATED
STORAGE OF BOILED POTATO SLICES
Storage time (h)
0 5 9 24 33 48 57
Alpha 1.0 (0.0) d 1.2 (13.6) d 2.4 (19.8) c 5.3 (19.3) b 6.9 (12.6) a
Chica 1.0 (0.0) d 1.1 (15.2) d 1.1 (14.9) d 1.5 (12.6) b 2.1 (17.2) c 2.2 (18.6) c 3.8 (18.0) a
Gallo 1.0 (6.1) a 1.0 (5.2) a 1.1 (10.8) a 1.0 (8.0) a 1.1 (11.4) a 1.1 (12.9) a 1.1 (12.3) a
Olfactory data reported are means of 24 values (8 judges and 3 replicates); in brackets CVr%
are reported. Different letters in the same row indicate statistically significantly differences
(Honestly Significant Differences or HSD by Tukey p < 0.01).

Research article 7
150
TABLE 5.
OTHER OFF-ODORS DEVELOPMENT DURING REFRIGERATED STORAGE OF
BOILED POTATO SLICES
Storage time (h)
0 5 9 24 33 48 57
Alpha 1.1 (17.4) a 1.1 (10.1) a 1.2 (18.8) a 1.1 (21.6) a 1.1 (16.6) a
Chica 1.1 (9.3) c 1.1 (14.3) c 1.1 (16.2) c 1.4 (19.7) b 1.4 (20.8) b 1.6 (20.0) b 1.9 (21.3) a
Gallo 1.5 (19.4) e 2.1 (17.2) d 3.1 (15.2) c 5.7 (15.2) a 5.7 (15.1) a 5.1 (14.8) b 4.8 (15.7) b
Olfactory analysis results reported are means of 24 values (8 judges and 3 replicates); in
brackets CVr% are reported. Different letters in the same row indicate statistically
significantly differences (Honestly Significant Differences or HSD by Tukey p < 0.01).

Chapter 5
151
5.3 DEVELOPMENT OF A SENSORY LEXICON
The topic of sensory analysis has been deepen with the participation to the European
project Ecropolis. This project deals with sensory properties of organic food and its main aim
is to collect data about sensory profiles from organic products all over Europe in an
interactive multilingual online database, called OSIS (Organic Sensory Information System).
OSIS serves as a marketing tool providing sensory information of organic food for
consumers, retailers/wholesalers and producers in an easy and traceable way.
The project started in 2009 and partners from France, Germany, Italy, Poland,
Switzerland, and The Netherlands are involved in the research activity. To reach the overall
goal and objectives of the project and to ensure an efficient and well-timed implementation,
the ECROPOLIS project has been divided into six work packages (WP1-6) and one
management cluster.
In particular the WP1 produces the necessary information about previous research on
sensory characteristics of organic food, the regulatory framework, operators' market needs
regarding sensory characteristics, and consumer expectations, perceptions and attitudes about
sensory characteristics of organic food. One of the activities of WP1 was the drafting of a
sensory glossary including general definitions and specific terms related to organic products.
The applicant participated to the sensory glossary writing, that will be published on the
Ecropolis website (www.ecropolis.eu). The bibliographic sources used to write the sensory
glossary have been published on Aigaion, a shared database of the literature about consumers'
expectations, marketing and sensory issues (www.deiagra.unibo.it/ecropolis).

Chapter 5
152
5.4 REFERENCES
Blanch G.P., Flores G., Ruiz Del Castillo M.L. (2009). Effect of temperature on lipid-derived
volatile compounds in boiled potato during storage. Journal of the Science of Food and
Agriculture 89, 1012-1017.
Dresow J.F., Böhm H. (2009). The influence of volatile compounds of the flavour of raw,
boiled and baked potatoes: Impact of agricultural measures on the volatile components.
Landbauforschung - vTI Agriculture and Forestry Research 4, 309-338.
Galliard T. (1973). Lipids of potato tubers. 1. Lipid and fatty acid composition of tubers from
different varieties of potato. Journal of the Science of Food and Agriculture 24, 617-622.
Jansky S.H. (2010). Potato flavour. American Journal of Potato Research 87, 209-217.
Jensen K., Petersen M.A., Poll L., Brockhoff P.B. (1999). Influence of variety and growing
location on the development of off-flavour in precooked vacuum-packed potatoes. Journal of
Agricultural and Food Chemistry 47, 1145-1149.
Maga J.A. (1994). Potato flavour. Food Reviews International 10, 1-48.
Petersen M.A., Poll L., Larsen M.L. (1998). Comparison of volatiles in raw and boiled
potatoes using a mild extraction technique combined with GC odour profiling and GC–MS.
Food Chemistry 61, 461-466.
Petersen M.A., Poll L., Larsen M.L. (1999). Identification of compounds contributing to
boiled potato off-flavour (‘POF’). Lebensmittel-Wissenschaft Und-Technologie-Food Science
and Technology 32, 32-40.
Petersen M.A., Poll L., Larsen M.L. (2003). Changes in flavor-affecting aroma compounds
during potato storage are not associated with lipoxygenase activity. American Journal of
Potato Research 80, 397-402.
Stone H., Sidel J.L. (1992). Sensory Evaluation Practices. Orlando (FL): Academic Press,
Inc. Publishers.
Thybo A.K., Christiansen J., Kaak K., Petersen M.A. (2006). Effect of cultivars, wound
healing and storage on sensory quality and chemical components in pre-peeled potatoes. LWT
39, 166-176.

Chapter 5
153
Thybo A.K., Molgaard J.P., Kidmose U. (2002). Effect of different organic growing
conditions on quality of cooked potatoes. Journal of the Science of Food and Agriculture 82,
12-18.
Ulrich D., Hoberg E., Neugebauer W., Tiemann H., Darsow U. (2000). Investigation of the
boiled potato flavour by human sensory and instrumental methods. American Journal of
Potato Research 77, 111-117.

Chapter 6
154
6. CONCLUSIONS
In the first part of this research project innovative food process technologies have been
studied, through laboratory scale systems (ultrasound and vacuum technologies) and semi-
industrial pilot plants (pulsed electric field).
Ultrasound has been found to be a valuable technique to improve the freezing process
of potatoes, anticipating the beginning of the nucleation process, mainly when applied during
the supercooling phase. The shorter freezing time obtained thanks to sonication may cause an
improving of sensory and texture properties during thawing and cooking. However, in order
to obtain such results an efficient removal of heat developed by sonication is required.
Another technique that can be applied to preserve fruit and vegetable liquid food,
assuring microbiological safety and preserving their sensory properties is pulsed electric field.
In this research project a study of the effects of pulsed electric fields on phenol and enzymatic
profile of melon juice has been realized. The statistical treatment of data was carried out
through a response surface method, and the experimental design chosen was the central
composite design.
Next, impregnation of apple sticks with aroma was investigated. Flavour enrichment
has been realized applying different techniques, as atmospheric, vacuum, ultrasound
technologies and their combinations. The use of the obtained enriched products as ingredient
in industrial preparations or as ready-to-eat food has been proposed.
The second section of the thesis deals with the development of analytical methods for
the discrimination and quantification of phenol compounds in vegetable matrix, as chestnut
bark extracts and olive mill waste water. With reference to the second application, the
management of waste disposal in mill sector has been approached with the aim of reducing
the amount of waste generated, producing water to be re-used, and at the same time
recovering valuable by-products, as phenol concentrates, to be used in different industrial
sectors. In particular filtration systems, based on ultrafiltration and reverse osmosis modules
have been proposed for the treatment of olive mill waste water.
Finally, the sensory analysis of boiled potatoes has been carried out through the
development of a quantitative descriptive procedure for the study and the comparison of
Italian and Mexican potato varieties.
An update on flavour development in fresh and cooked potatoes has been realized,
through the revision of the scientific literature and the redaction of a mini-review. Last, a

Chapter 6
155
sensory glossary including general and specific definitions related to organic products, used in
the European project Ecropolis, has been drafted.
Copyright © 2022 FDOKUMEN