Science-Based Management of Data-Limited Fisheries: A Supplement to the Catch Share Design Manual.
27
Ashley M. Apel, Rod Fujita and Kendra Karr Science-Based Management of Data-Limited Fisheries A SUPPLEMENT TO THE CATCH SHARE DESIGN MANUAL
Transcript of Science-Based Management of Data-Limited Fisheries: A Supplement to the Catch Share Design Manual.
Ashley M. Apel, Rod Fujita and Kendra Karr
Science-Based Management of Data-Limited Fisheries
A S U P P L E M E N T T O T H E
C A T C H S H A R E D E S I G N M A N U A L

Ashley M. Apel, Rod Fujita and Kendra Karr
Science-Based Management of Data-Limited Fisheries
A S U P P L E M E N T T O T H E
C A T C H S H A R E D E S I G N M A N U A L
ACKNOWLEDGEMENTS
Environmental Defense Fund gratefully acknowledges the Gordon and Betty
Moore Foundation, the Heising-Simons Foundation and the Walton Family
Foundation for their generous support of this project.
CONTRIBUTORS
Kate Bonzon, Sarah Poon, C. Kent Strauss, Jeff Young
Any views expressed in the Design Manual are those of the authors and do not
necessarily represent those of the contributors or their organizations. Any errors are
those of the authors.
Copyright © 2013 Environmental Defense Fund. All rights reserved.
Apel, A. M., Fujita, R. and Karr, K. (2013). Science-Based Management of
Data-Limited Fisheries: A Supplement to the Catch Share Design Manual.
Environmental Defense Fund.
Table of Contents
Introduction | 1
Six-Step Integrated Framework | 2
Step 1 – Assess the Ecosystem Status and Impacts of Fishing | 2
Step 2 – Assess the Vulnerability of Stocks to Fishing Pressure | 5
Step 3 – Estimate the Level of Stock Depletion | 5
Step 4 – Prioritize Stocks for Further Assessment and Precautionary Management | 7
Step 5 – Assess Priority Stocks | 7
Step 6 – Collect More Data for Future Stock Assessments | 9
Conclusion | 9
References | 12
Glossary | 16
Figures and Tables
Figure
1 Integrated Framework for Data-Limited Stock Assessments | 3
Tables
1 Thresholds for Coral Reefs in the Indian Ocean | 4
2 Potential Ecosystem Thresholds for Caribbean Coral Reefs | 4
3 Data-Limited Assessment Methods to Determine Depletion of Target Stocks | 6
4 Prioritization Matrix | 7
5 Data-Limited Assessment Methods to Set Management Targets | 8
1
Introduction
Fisheries around the world are in need of biological assessment. Global statistics
on the status of fisheries indicate that 30% are depleted or being overfished,
57% are at maximum sustainable yield (MSY) and 13% are underexploited (FAO,
2012). However, these statistics are based on the small fraction of fish stocks in
the world that have been scientifically assessed; the vast majority have not. As
many as 10,000 stocks may be subject to fishing globally, and many of those may
lack catch data or management of any kind. A recent study suggests that most
unassessed small-scale fisheries may be overfished (Costello et al., 2012). While
this analysis provides a more complete picture of global fish stock status, it is
limited by the dearth of catch data and hence, includes only a small portion of
the world’s fisheries (Costello et al., 2012).
Most assessed fish stocks are managed by industrialized nations and produce
large volumes of catch and/or generate high revenues, justifying the significant
costs of scientific monitoring and assessment. Many unassessed stocks are
being fished in developing countries that have limited resources to conduct
monitoring or assessments. It is important to note, however, that many stocks
remain unassessed even in industrialized countries: for example, fewer than
half of all federally managed stocks in the United States have been assessed
(NMFS, 2012).
Failure to assess the status and productivity of fish stocks can increase the risk
of stock collapse and lead to loss of social and economic benefits associated
with sustainable yield. One obstacle to increasing the number of stocks that
are assessed is cost: in many cases, the costs of data collection and stock
assessments may be near to, or even exceed, revenues generated by the fishery.
Another obstacle is often the need for historically rich data records.
In order to overcome these obstacles, fishery scientists have developed a suite
of new assessment methods—“data-limited methods”—that do not require
historical data records and can be done rapidly and cheaply. The field of data-
limited assessment is growing rapidly, and new methods appear regularly in the
literature (Prince et al., 2011; Cope, 2012; Martell and Froese, 2012). Honey et al.
(2010) and the California Sea Grant College Program (2008) provide a summary
of some data-limited methods. Comparisons of the results from data-limited
2
methods and complex stock assessment models using the
same data show that three peer-reviewed, data-limited
methods1 yield reliable fishery management guidance
(e.g., overfishing limits and sustainable yield levels) under
certain conditions (Honey et al., in prep). Overfishing
thresholds generated from two data-limited methods
(Depletion-Corrected Average Catch and Depletion-Based
Stock Reduction Analysis) are now being used to manage
48 stocks off the West Coast of the U.S. (J. DeVore, personal
communication, 2012). Due to the data-limited nature
of these methods, multiple models are often used to
corroborate results.
While data-limited methods tend to produce results that
call for precautionary management decisions (Honey et al.,
in prep), and many do not generate conventional reference
points such as maximum sustainable yield, arguably the
risks and consequences of fishery collapse are great enough
to justify using these methods in unassessed and/or unman-
aged fisheries. Data collection and analytical costs are much
lower using data-limited assessment methods than using
data-rich methods. Data-limited assessment techniques are
also available to qualitatively determine the status of eco-
systems that support fisheries and ecological risks posed by
fishing (Hobday et al., 2011; McClanahan et al., 2011).
Due to the complexity of data-limited stock assessments,
we have developed a six-step framework that produces
rapid, adaptive and precautionary management guidance
to help make use of the growing number of assessment
methods. Data-limited methods require different types
of data than the more heavily used data-rich methods
and generate different types of management guidance.
This framework is designed to help ease the intricate
assessment process by combining multiple methods (and
their various data requirements) into a structured step-by-
step process. The information produced via the assessment
models found in this integrated framework can serve as
the scientific basis for managing data-limited fisheries.
While the framework does not provide an instruction
manual on each data-limited assessment method, a more
thorough discussion can be found in the primary literature
referenced throughout.
1 The stock assessment methods compared are Depletion-Corrected Average Catch, Depletion-Based Stock Reduction Analysis and Length-Based Reference Point.
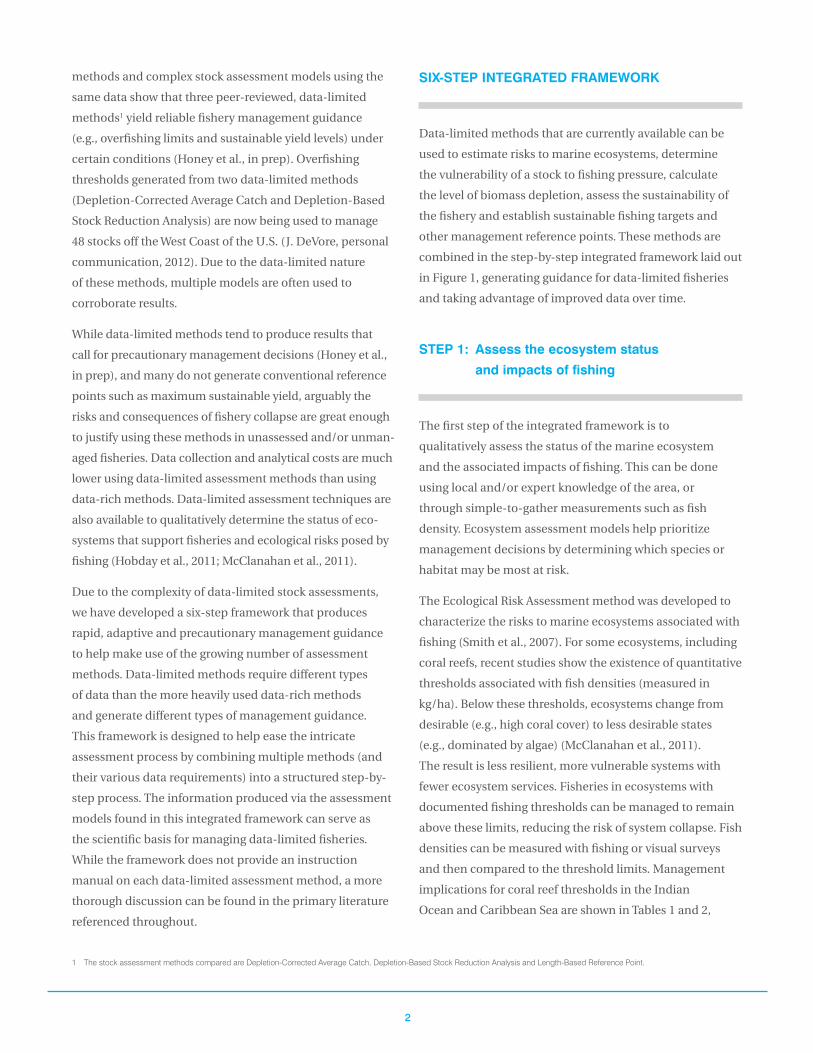
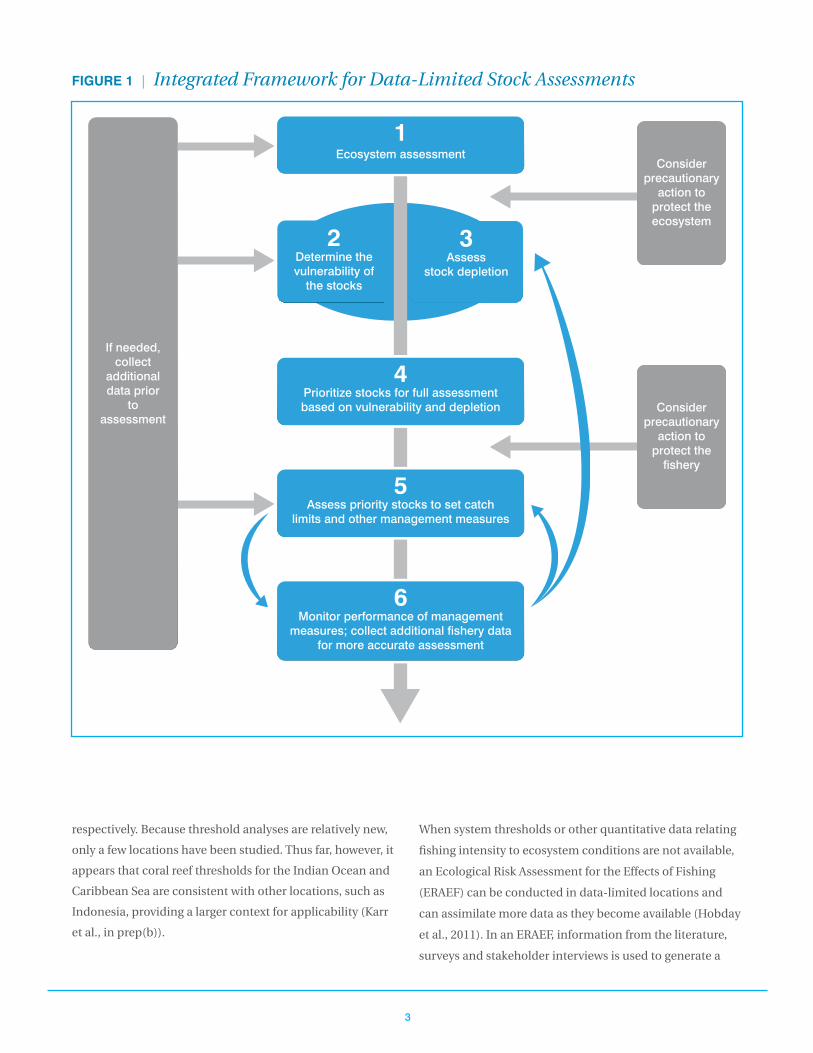
SIX-STEP INTEGRATED FRAMEWORK
Data-limited methods that are currently available can be
used to estimate risks to marine ecosystems, determine
the vulnerability of a stock to fishing pressure, calculate
the level of biomass depletion, assess the sustainability of
the fishery and establish sustainable fishing targets and
other management reference points. These methods are
combined in the step-by-step integrated framework laid out
in Figure 1, generating guidance for data-limited fisheries
and taking advantage of improved data over time.
STEP 1: Assess the ecosystem status
and impacts of fishing
The first step of the integrated framework is to
qualitatively assess the status of the marine ecosystem
and the associated impacts of fishing. This can be done
using local and/or expert knowledge of the area, or
through simple-to-gather measurements such as fish
density. Ecosystem assessment models help prioritize
management decisions by determining which species or
habitat may be most at risk.
The Ecological Risk Assessment method was developed to
characterize the risks to marine ecosystems associated with
fishing (Smith et al., 2007). For some ecosystems, including
coral reefs, recent studies show the existence of quantitative
thresholds associated with fish densities (measured in
kg/ha). Below these thresholds, ecosystems change from
desirable (e.g., high coral cover) to less desirable states
(e.g., dominated by algae) (McClanahan et al., 2011).
The result is less resilient, more vulnerable systems with
fewer ecosystem services. Fisheries in ecosystems with
documented fishing thresholds can be managed to remain
above these limits, reducing the risk of system collapse. Fish
densities can be measured with fishing or visual surveys
and then compared to the threshold limits. Management
implications for coral reef thresholds in the Indian
Ocean and Caribbean Sea are shown in Tables 1 and 2,
3
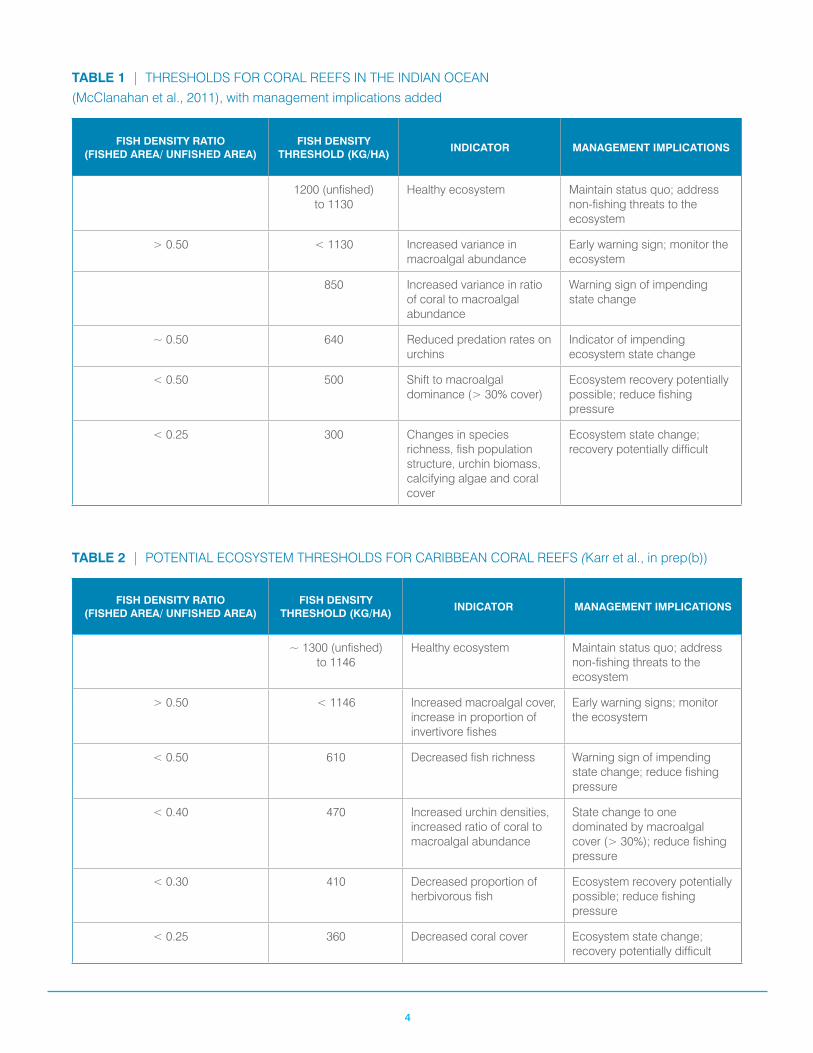
respectively. Because threshold analyses are relatively new,
only a few locations have been studied. Thus far, however, it
appears that coral reef thresholds for the Indian Ocean and
Caribbean Sea are consistent with other locations, such as
Indonesia, providing a larger context for applicability (Karr
et al., in prep(b)).
Monitor performance of managementmeasures; collect additional fishery data
for more accurate assessment
6
Assess priority stocks to set catchlimits and other management measures
5
Prioritize stocks for full assessmentbased on vulnerability and depletion
4
Ecosystem assessment1
Determine thevulnerability of
the stocks
2Assess
stock depletion
3
If needed,collect
additionaldata prior
toassessment
Considerprecautionary
action toprotect theecosystem
Considerprecautionary
action toprotect the
fishery
FIGURE 1 | Integrated Framework for Data-Limited Stock Assessments
When system thresholds or other quantitative data relating
fishing intensity to ecosystem conditions are not available,
an Ecological Risk Assessment for the Effects of Fishing
(ERAEF) can be conducted in data-limited locations and
can assimilate more data as they become available (Hobday
et al., 2011). In an ERAEF, information from the literature,
surveys and stakeholder interviews is used to generate a
4
TABLE 1 | THRESHOLDS FOR CORAL REEFS IN THE INDIAN OCEAN (McClanahan et al., 2011), with management implications added
FISH DENSITY RATIO (FISHED AREA/ UNFISHED AREA)
FISH DENSITY THRESHOLD (KG/HA)
INDICATOR MANAGEMENT IMPLICATIONS
1200 (unfished) to 1130
Healthy ecosystem Maintain status quo; address non-fishing threats to the ecosystem
> 0.50 < 1130 Increased variance in macroalgal abundance
Early warning sign; monitor the ecosystem
850 Increased variance in ratio of coral to macroalgal abundance
Warning sign of impending state change
~ 0.50 640 Reduced predation rates on urchins
Indicator of impending ecosystem state change
< 0.50 500 Shift to macroalgal dominance (> 30% cover)
Ecosystem recovery potentially possible; reduce fishing pressure
< 0.25 300 Changes in species richness, fish population structure, urchin biomass, calcifying algae and coral cover
Ecosystem state change; recovery potentially difficult
TABLE 2 | POTENTIAL ECOSYSTEM THRESHOLDS FOR CARIBBEAN CORAL REEFS (Karr et al., in prep(b))
FISH DENSITY RATIO (FISHED AREA/ UNFISHED AREA)
FISH DENSITY THRESHOLD (KG/HA)
INDICATOR MANAGEMENT IMPLICATIONS
~ 1300 (unfished) to 1146
Healthy ecosystem Maintain status quo; address non-fishing threats to the ecosystem
> 0.50 < 1146 Increased macroalgal cover,increase in proportion of invertivore fishes
Early warning signs; monitor the ecosystem
< 0.50 610 Decreased fish richness Warning sign of impending state change; reduce fishing pressure
< 0.40 470 Increased urchin densities, increased ratio of coral to macroalgal abundance
State change to one dominated by macroalgal cover (> 30%); reduce fishing pressure
< 0.30 410 Decreased proportion of herbivorous fish
Ecosystem recovery potentially possible; reduce fishing pressure
< 0.25 360 Decreased coral cover Ecosystem state change; recovery potentially difficult
5
risk assessment that identifies the most vulnerable parts of
the system (i.e., target species, bycatch species, threatened
species, habitats, ecological communities). This analysis is
used to detect high-risk activities that require immediate
management attention and to screen out low-risk activities
from further analysis.
STEP 2: Assess the vulnerability of stocks to
fishing pressure
The second step of the framework is to assess the
vulnerability of target stocks to fishing pressure using basic
biological and fishery information. This is most often done
using the Productivity and Susceptibility Analysis (PSA)
model (Patrick et al., 2009). Even if fishery data such as
landings, effort or length frequency of the catch are not
available, a PSA can inform management decisions by
indicating which stocks should be prioritized for further
assessment and precautionary management.
The PSA requires information on the life history of a
species, including the length at first maturity, maximum
length, fecundity, breeding strategy, growth rate and
natural mortality. This information is used to estimate
the biological productivity of the stock. These parameters
can typically be obtained from the literature or online
databases, but when possible, information from local
studies and stakeholder/expert interviews should be
used. Qualitative information may be used if specific
measurements are lacking. All values should be vetted with
local biologists and fishermen to increase reliability.
Information on the nature of the fishery, including the
geographic overlap of the fishery and fish stocks, current
management practices, value of the fishery and impacts
on habitat is needed to estimate the susceptibility of the
stock to overfishing. Again, much of this information can
be qualitative and gleaned from interviews with fishermen
and managers. Software for conducting a PSA is available
free of charge from the NOAA Fisheries Toolbox (http://nft.
nefsc.noaa.gov/). Scores from the PSA can be grouped into
low, medium and high vulnerability categories to facilitate
integration with other analyses.
STEP 3: Estimate the level of stock depletion
After conducting a PSA on target species, the next step is
to determine whether target stocks are overfished and if
so, by how much. Several data-limited methods can be
used to estimate the degree of stock depletion relative to
unfished levels. If catch records are not available, if records
do not include catches early in the history of the fishery
or if important changes in management and fishing effort
have occurred (thus confounding the relationship between
catch and stock size), depletion status can be estimated
using three sources: fish density data from inside and
outside well-enforced references areas, catch-based length
information and/or visual survey data (see Table 3).
No-take marine protected areas (MPAs) and other well-
enforced reference areas provide excellent baselines against
which to compare fished stocks—better in many respects
than even the longest of catch histories. This is because
they provide empirical information on the unfished density
and length structure of the stock, rather than estimates.
Fish densities (measured in kg/ha) inside and outside the
MPA can be estimated from the results of fishing or visual
surveys. The MPA Density Ratio (fished/unfished fish
density) can then be calculated to serve as an indicator
of stock status (Babcock and MacCall, 2011). Effort-based
harvest control rules can be generated directly (Babcock
and MacCall, 2011), or the results of the analysis can be
used in conjunction with PSA results to prioritize stocks for
further assessment in order to set catch limits and other
management measures.
Length-based methods can also be used to estimate degree
of stock depletion. Sustainable fishing practices generally
require fishermen to leave large proportions of juveniles in
the water so they can spawn at least once to avoid growth
overfishing. Large, highly fecund adults should also remain
in the water to reduce the risk of recruitment overfishing.
Because of this, the length frequency of fish in the catch can
be used to calculate indicators of whether or not fishing is
sustainable (Froese, 2004). A recent improvement on this
method accounts for differences in the selectivity of the
fishery (Cope and Punt, 2009).
6
Length-based assessment methods may be difficult to
use with some fish species, including those whose growth
patterns do not allow easy categorization of length classes
into juvenile, adult and highly fecund megaspawners. This
is fairly typical in coral reef fishes such as butterflyfish.
Length-based assessment is also difficult for species
that show little difference in size between length classes
(Cope and Punt, 2009), or suffer low rates of natural
mortality (e.g., some shark species, for which it may be
more appropriate to protect older juveniles than young
juveniles) (B. Hueter, personal communication, 2012). In
some cases, the spawning potential ratio (SPR, or average
fecundity of a recruit over its lifetime) of the stock can be
estimated from length frequency data if the relationship
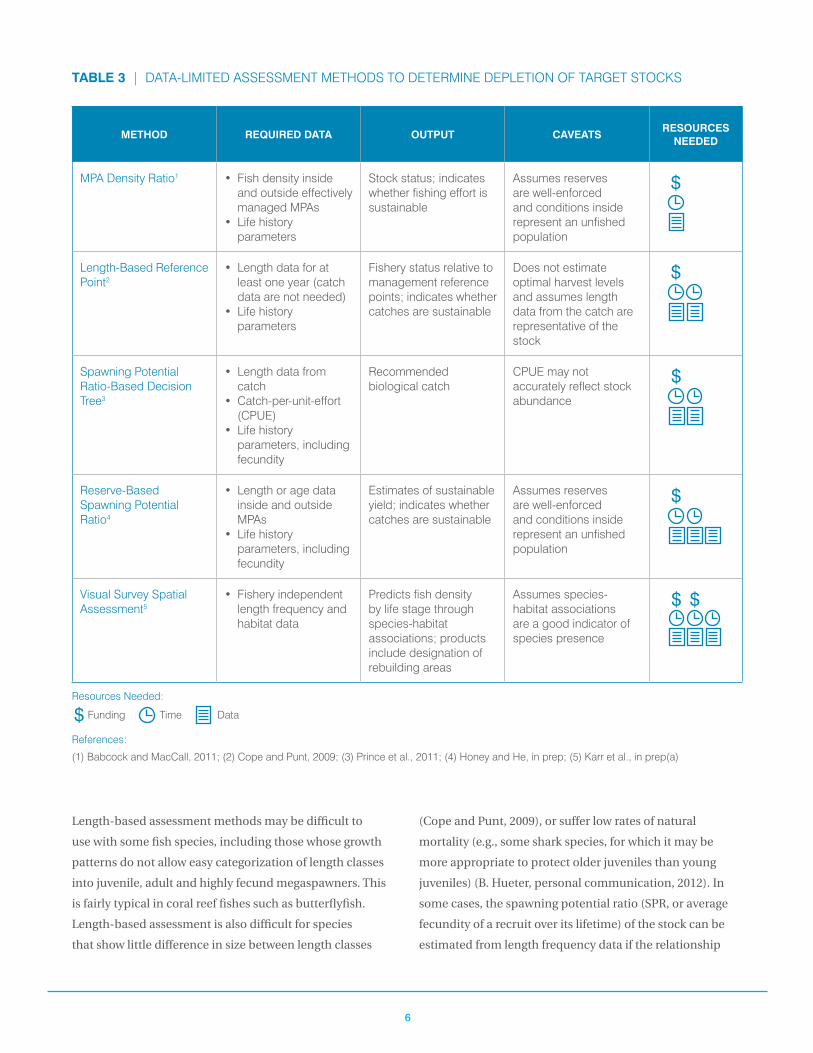
TABLE 3 | DATA-LIMITED ASSESSMENT METHODS TO DETERMINE DEPLETION OF TARGET STOCKS
METHOD REQUIRED DATA OUTPUT CAVEATSRESOURCES
NEEDED
MPA Density Ratio1 • Fish density inside and outside effectively managed MPAs
• Life history parameters
Stock status; indicates whether fishing effort is sustainable
Assumes reserves are well-enforced and conditions inside represent an unfished population
$
Length-Based Reference Point2
• Length data for at least one year (catch data are not needed)
• Life history parameters
Fishery status relative to management reference points; indicates whether catches are sustainable
Does not estimate optimal harvest levels and assumes length data from the catch are representative of the stock
$
Spawning Potential Ratio-Based Decision Tree3
• Length data from catch
• Catch-per-unit-effort (CPUE)
• Life history parameters, including fecundity
Recommended biological catch
CPUE may not accurately reflect stock abundance
$
Reserve-Based Spawning Potential Ratio4
• Length or age data inside and outside MPAs
• Life history parameters, including fecundity
Estimates of sustainable yield; indicates whether catches are sustainable
Assumes reserves are well-enforced and conditions inside represent an unfished population
$
Visual Survey Spatial Assessment5
• Fishery independent length frequency and habitat data
Predicts fish density by life stage through species-habitat associations; products include designation of rebuilding areas
Assumes species-habitat associations are a good indicator of species presence
$ $
Resources Needed:
$ Funding Time Data
References:
(1) Babcock and MacCall, 2011; (2) Cope and Punt, 2009; (3) Prince et al., 2011; (4) Honey and He, in prep; (5) Karr et al., in prep(a)
7
between length and weight and/or age is known (Prince et
al., 2011). If a well-enforced MPA is available, SPR analysis
can be improved since length frequency information from
the MPA (obtained with fishing surveys) provides a baseline
(unfished SPR) to which SPR of the fished population can
be compared (Honey and He, in prep).
In fisheries that lack catch data, fishery-independent
visual survey data can be used to assess stock status, using
estimates of fish density by life stage in each habitat type.
Density estimates allow managers to create regulations
that limit fishing mortality in specific locations to rebuild
depleted fish stocks. These rebuilding areas are designed
to protect appropriate densities of each life stage and may
shrink as rebuilding proceeds (Karr et al., in prep (a)).
The results of stock depletion analyses can be grouped into
low, medium and high depletion categories so they can be
integrated with the results of other analyses.
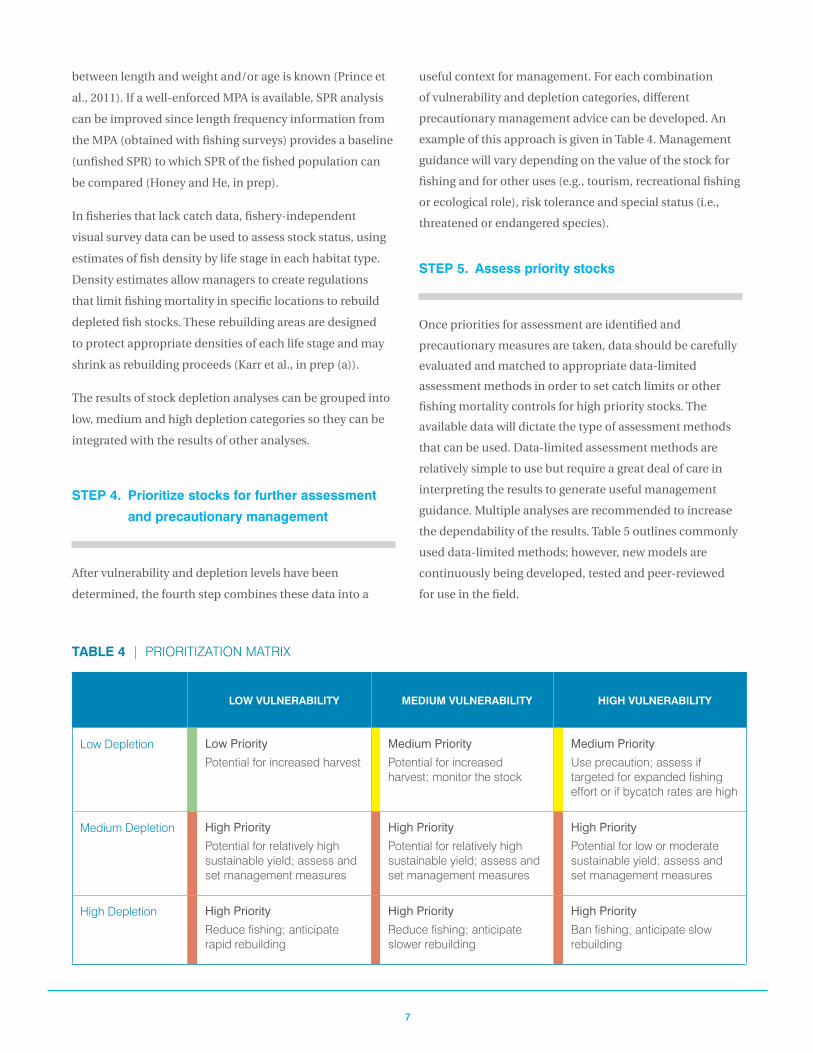
STEP 4. Prioritize stocks for further assessment
and precautionary management
After vulnerability and depletion levels have been
determined, the fourth step combines these data into a
useful context for management. For each combination
of vulnerability and depletion categories, different
precautionary management advice can be developed. An
example of this approach is given in Table 4. Management
guidance will vary depending on the value of the stock for
fishing and for other uses (e.g., tourism, recreational fishing
or ecological role), risk tolerance and special status (i.e.,
threatened or endangered species).
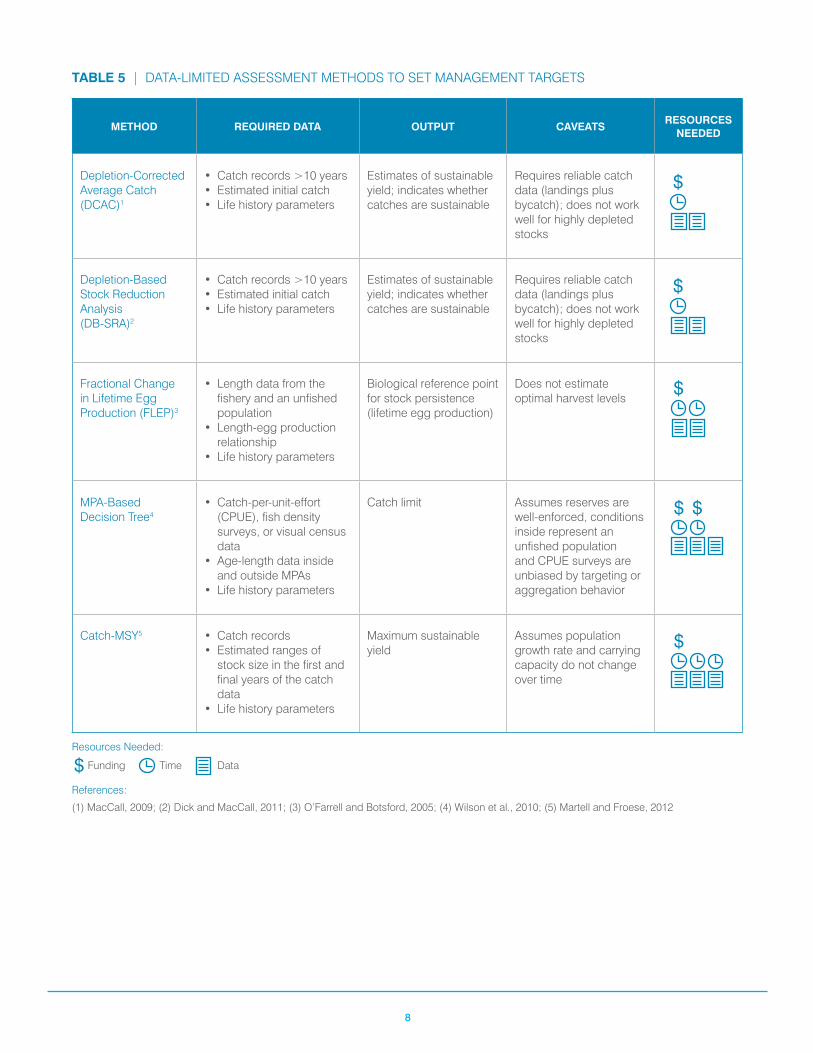
STEP 5. Assess priority stocks
Once priorities for assessment are identified and
precautionary measures are taken, data should be carefully
evaluated and matched to appropriate data-limited
assessment methods in order to set catch limits or other
fishing mortality controls for high priority stocks. The
available data will dictate the type of assessment methods
that can be used. Data-limited assessment methods are
relatively simple to use but require a great deal of care in
interpreting the results to generate useful management
guidance. Multiple analyses are recommended to increase
the dependability of the results. Table 5 outlines commonly
used data-limited methods; however, new models are
continuously being developed, tested and peer-reviewed
for use in the field.
TABLE 4 | PRIORITIZATION MATRIX
LOW VULNERABILITY MEDIUM VULNERABILITY HIGH VULNERABILITY
Low Depletion Low Priority
Potential for increased harvest
Medium Priority
Potential for increased harvest; monitor the stock
Medium Priority
Use precaution; assess if targeted for expanded fishing effort or if bycatch rates are high
Medium Depletion High Priority
Potential for relatively high sustainable yield; assess and set management measures
High Priority
Potential for relatively high sustainable yield; assess and set management measures
High Priority
Potential for low or moderate sustainable yield; assess and set management measures
High Depletion High Priority
Reduce fishing; anticipate rapid rebuilding
High Priority
Reduce fishing; anticipate slower rebuilding
High Priority
Ban fishing; anticipate slow rebuilding
8
TABLE 5 | DATA-LIMITED ASSESSMENT METHODS TO SET MANAGEMENT TARGETS
METHOD REQUIRED DATA OUTPUT CAVEATSRESOURCES
NEEDED
Depletion-Corrected Average Catch (DCAC)1
• Catch records >10 years• Estimated initial catch• Life history parameters
Estimates of sustainable yield; indicates whether catches are sustainable
Requires reliable catch data (landings plus bycatch); does not work well for highly depleted stocks
$
Depletion-Based Stock Reduction Analysis (DB-SRA)2
• Catch records >10 years• Estimated initial catch• Life history parameters
Estimates of sustainable yield; indicates whether catches are sustainable
Requires reliable catch data (landings plus bycatch); does not work well for highly depleted stocks
$
Fractional Change in Lifetime Egg Production (FLEP)3
• Length data from the fishery and an unfished population
• Length-egg production relationship
• Life history parameters
Biological reference point for stock persistence (lifetime egg production)
Does not estimate optimal harvest levels
$
MPA-Based Decision Tree4
• Catch-per-unit-effort (CPUE), fish density surveys, or visual census data
• Age-length data inside and outside MPAs
• Life history parameters
Catch limit Assumes reserves are well-enforced, conditions inside represent an unfished population and CPUE surveys are unbiased by targeting or aggregation behavior
$ $
Catch-MSY5 • Catch records• Estimated ranges of
stock size in the first and final years of the catch data
• Life history parameters
Maximum sustainable yield
Assumes population growth rate and carrying capacity do not change over time
$
Resources Needed:
$ Funding Time Data
References:
(1) MacCall, 2009; (2) Dick and MacCall, 2011; (3) O’Farrell and Botsford, 2005; (4) Wilson et al., 2010; (5) Martell and Froese, 2012
9
STEP 6. Collect more data for
future stock assessments
As sufficient resources become available, additional
fisheries data can be collected and used to drive more
sophisticated stock assessments that determine reference
points for maximum sustainable yield, maximum economic
yield or other management goals. Additional data will need
to be gathered in some cases in order to estimate stock
depletion levels (Step 3); in others, this may need to occur
before stocks can be further assessed (Step 5).
Data collection systems should be designed to continuously
improve the quality and quantity of data available for
assessment and management, within the cost and capacity
constraints of the fishery. It is important to carefully design
data collection systems to match assessment methods and
management needs. Many data collection systems have
required much effort and cost but have not yet resulted in
useful data.
Well-designed collection programs should include data on
the biological, social and economic aspects of the fishery.
While biological data have long been considered necessary
to determine the status of the fishery, social and economic
data have not routinely been a part of data collection
programs. Information such as market prices, fishing costs
and revenues and employment characteristics can be highly
informative and useful for determining the economic
and social health of fishing communities. Poor economic
health may be an indicator of declining fish populations.
Information on fishing costs and revenue is also necessary
to estimate maximum economic yield.
Biological data should encompass both fishery dependent
and independent data to fully assess the status of the
fish stocks (Ocean Studies Board, 2000; Sparre, 2000).
Fishery dependent data of total catch, landings and fishing
effort can be gathered through the use of logbooks and
representative dockside samples of length and weight.
Unbiased scientific fishing surveys and underwater visual
surveys of fish species, density and individual fish lengths,
along with habitat types in both fished and unfished areas,
also produce important fishery independent records.
Additional biological data such as size at maturity and
fecundity are also highly useful and can often be collected
through relatively simple sampling programs.
In many locations, fishermen and local community
members help design and carry out data collection and
sampling programs. Incorporating the knowledge and
manpower of local fishermen and their families can help
reduce data collection costs (Danielsen et al., 2008), and
the community-based approach may help increase the
likelihood of successful management outcomes (Pomeroy,
1995; Defeo and Castilla, 2005).
CONCLUSION
Thousands of commercial and recreational fisheries exist
worldwide, but the status of most stocks is unknown,
increasing the risk of stock collapse and the loss of the
social, ecological and economic benefits associated with
sustainable fisheries. Fishery managers often have very
little, if any, data concerning the health of the marine
ecosystem and/or target fish stocks, leading to uninformed
management decisions that allow fisheries to approach
and surpass sustainable levels of fishing. Data-limited
stock assessment methods provide managers with the
tools they need to take appropriate management actions
in order to maintain sustainable yields over time. This
six-step framework provides guidance for how and when
to use specific data-limited methods. As the global needs
for food security and healthy ocean ecosystems increase,
understanding the status of fish populations will become
ever more important. The use of data-limited analytical
methods can help keep fisheries ecologically sustainable
and economically profitable.


Ref
eren
ces
12
References
Babcock, E. A. and MacCall, A. D. (2011). How useful is the ratio of fish density outside versus inside no-take marine reserves as a metric for
fishery management control rules? Canadian Journal of Fisheries and Aquatic Sciences, 68, 343-359.
Blackhart, K. Stanton, D. and Shimada A. (2006). NOAA Fisheries Glossary. NOAA Technical Memorandum NMFS-F/SPO-69. National
Oceanic and Atmospheric Administration. Silver Spring, Maryland. Retrieved from http://www.st.nmfs.noaa.gov/st4/documents/
FishGlossary.pdf
California Sea Grant College Program (2008). Managing Data-Poor Fisheries: Case Studies, Models & Solutions. Managing Data-Poor
Fisheries Workshop, December 1-4, 2008, Berkeley, CA.
Cope, J. M. (2012). Implementing a statistical catch-at-age model (Stock Synthesis) as a tool for deriving overfishing limits in data-limited
situations. Fisheries Research, in press.
Cope, J. M. and Punt, A. E. (2009). Length-based reference points for data-limited situations: applications and restrictions. Marine and
Coastal Fisheries: Dynamics, Management, and Ecosystem Science, 1, 169-186.
Costello, C., Ovando, D., Hilborn, R., Gaines, S. D., Deschenes, O. and Lester, S. E. (2012). Status and solutions for the world’s unassessed
fisheries. Science Express Reports, September 27, 1-4.
Danielsen, F., Burgess, N. D., Balmford, A., Donald, P. F., Funder, M., Jones, J. P. G., Alviola, P., Balete, D. S., Blomley, T., Brashares, J., Child, B.,
Enghoff, M., Fjeldså, J., Holt, S., Hübertz, H., Jensen, A. E., Jensen, P. M., Massao, J., Mendoza, M. M., Ngaga, Y., Poulsen, M. K., Rueda,
R., Sam, M., Skielboe, T., Stuart-Hill, G., Topp-Jørgensen, E. and Yonten, D. (2008). Local participation in natural resource monitoring: a
characterization of approaches. Conservation Biology, 23(1), 31-42.
Defeo, O. and Castilla, J. (2005). More than one bag for the world’s fishery crisis and keys for co-management successes in select artisanal
Latin American shellfisheries. Fish Biology and Fisheries, 14, 265-283.
Dick, E. J. and MacCall, A. D. (2011). Depletion-based stock reduction analysis: a catch-based method for determining sustainable yields for
data-poor fish stocks. Fisheries Research, 110, 331-341.
Food and Agriculture Organization of the United Nations (FAO) (n.d.). Fisheries Glossary. Food and Agriculture Organization of the United
Nations. Retrieved from http://www.fao.org/fi/glossary/default.asp
Food and Agriculture Organization of the United Nations (FAO) (2012). The state of world fisheries and aquaculture. Fisheries and
Aquaculture Department, Food and Agriculture Organization of the United Nations. Rome. Retrieved from http://www.fao.org/
docrep/016/i2727e/i2727e00.htm
Froese, R. (2004). Keep it simple: three indicators to deal with overfishing. Fish and Fisheries, 5, 86-91.
Hobday, A. J., Smith, A. D. M., Stobutzki, I. C., Bulman, C., Daley, R., Dambacher, J. M., Deng, R. A., Dowdney, J., Fuller, M., Furlani, D.,
Griffiths, S. P., Johnson, D., Kenyon, R., Knuckey, I. A., Ling, S. D., Pitcher, R., Sainsbury, K. J., Sporcic, M., Smith, T., Turnbull, C., Walker,
T. I., Wayte, S. E., Webb, H., Williams, A., Wise, B. S. and Zhou, S. (2011). Ecological risk assessment for the effects of fishing. Fisheries
Research, 108, 372-384.
Honey, K., Apel, A. M., Cope, J., Dick, E. J., MacCall, A. and Fujita, R. In prep. Rags to fishes II: quantitative comparison of data-poor methods
for fisheries management.
Honey, K. T., Moxley, J. H. and Fujita, R. M. (2010). From rags to fishes: data-poor methods for fishery managers. In Managing Data-Poor
Fisheries: Case Studies, Models and Solutions (pp. 159-184). California Sea Grant College Program.
Honey, K. T. and He, X. In prep. Application of dynamic SPR and mean weight from marine reserves for information-limited fisheries
management.
Karr, K., Fujita, R., Kritzer, J. and Babcock, B. In prep(a). Using visual survey data to assess and manage nearshore data-poor coral reef
fisheries.
Karr, K., Halpern, B., Kappel, C., Crowder, L., Samhouri, J., Selkoe. K. and Fujita, R. In prep(b). Coral reef assessment and management using
generic ecosystem thresholds as reference points for phase shifts in the Caribbean Sea.
MacCall, A. D. (2009). Depletion-corrected average catch: a simple formula for estimating sustainable yields in data-poor situations. ICES
Journal of Marine Science, 66, 2267-2271.
13
Martell, S. and Froese, R. (2012). A simple method for estimating MSY from catch and resilience. Fish and Fisheries, in press.
McClanahan, T. R., Graham, N. A. J., MacNeil, M. A., Muthiga, N. A., Cinner, J. E., Bruggemann, J. H. and Wilson, S. K. (2011). Critical
thresholds and tangible targets for ecosystem-based management of coral reef fisheries. Proceedings of the National Academy of
Sciences of the United States of America, 108(41), 17230-17233.
National Marine Fisheries Service (NMFS) (2012). Status of stocks: report on the status of U.S. fisheries for 2011. National Oceanic and
Atmospheric Administration. Retrieved from http://www.nmfs.noaa.gov/sfa/statusoffisheries/SOSmain.htm
National Research Council (NRC) (1999). Sharing the Fish: Toward a National Policy of Individual Fishing Quotas. The National Academies
Press. Washington, D.C.
Ocean Studies Board (2000). Improving the Collection, Management, and Use of Marine Fisheries Data. National Research Council. The
National Academies Press. Washington, D.C.
O’Farrell, M. R. and Botsford, L. W. (2005). Estimation of change in lifetime egg production from length frequency data. Canadian Journal of
Fisheries and Aquatic Sciences, 62(7), 1626-1639.
Patrick, W. S., Spencer, P., Ormseth, O., Cope, J., Field, J., Kobayashi, D., Gedamke, T., Cortés, E., Bigelow, K., Overholtz, W., Link, J. and
Lawson, P. (2009). Use of productivity and susceptibility indices to determine stock vulnerability, with example applications to six U.S.
fisheries. U.S. Department of Commerce. NOAA Technical Memo. NMFS-F/SPO-101. 90 pp. Retrieved from http://www.pifsc.noaa.gov/
library/pubs/NOAA_TM_NMFS_F-SPO_101.pdf
Pomeroy, R. S. (1995). Community-based and co-management institutions for sustainable coastal fisheries management in Southeast
Asia. Ocean & Coastal Management, 27(3), 143-162.
Prince, J. D., Dowling, N. A., Davies, C. R., Campbell, R. A. and Kolody, D. S. (2011). A simple cost-effective and scale-less empirical approach
to harvest strategies. ICES Journal of Marine Science, 68(5), 947-960.
Smith, A. D. M., Fulton, E. J., Hobday, A. J., Smith, D. C. and Shoulder, P. (2007). Scientific tools to support the practical implementation of
ecosystem-based fisheries management. ICES Journal of Marine Science, 64, 633-639.
Sparre, P. J. (2000). Manual on sample-based data collection for fisheries assessment: examples from Viet Nam. FAO Fisheries Technical Paper.
No. 398. Rome. 171 pp. Retrieved from http://www.fao.org/docrep/005/x8923e/x8923e00.HTM
Wilson, J. R., Prince, J. D. and Lenihan, H. S. (2010). A management strategy for sedentary nearshore species that uses marine protected
areas as a reference. Marine and Coastal Fisheries: Dynamics, Management, and Ecosystem Science, 2, 14-27.


Glo
ssar
y
16
Glossary
Age-length data – Data comparing the length of an individual fish with its age.
Breeding strategy – Provides an indication of the level of natural mortality that may be expected for offspring in the first stages of life. Includes placement of larvae, level of parental protection and length of gestational period (Patrick et al., 2009).
Bycatch (syns.: Incidental catch, Non-target catch/species) – Fish other than the primary target species that are caught incidental to the harvest of those species. Bycatch may be retained or discarded. Discards may occur for regulatory or economic reasons (NRC, 1999).
Carrying capacity – The maximum population of a species that an area or specific ecosystem can support indefinitely without deterioration of the character and quality of the resource (Blackhart et al., 2006).
Catch (syn.: Harvest) – The total number (or weight) of fish caught by fishing operations. Catch includes all fish killed by the act of fishing, not just those landed (FAO, n.d.).
Catchability (syn.: Vulnerability) – 1. The extent to which a stock is susceptible to fishing. Catchability changes depending upon fish behavior and abundance and the type and deployment of fishing gear (Blackhart et al., 2006). 2. The fraction of a fish stock which is caught by a defined unit of the fishing effort (FAO, n.d.).
Catch limit (syn.: Total allowable catch) – The scientifically determined, acceptable level of fishing mortality.
Catch-per-unit-effort (CPUE) - The weight or number of fish caught with a specific unit of fishing effort (e.g., time and/or gear used).
Ecosystem services – The benefits people obtain from ecosystems. These include provisioning services, such as food and water; regulating services, such as flood and disease control; cultural services, such as spiritual and cultural benefits; and supporting services, such as nutrient cycling, that maintain the conditions for life on Earth (FAO, n.d.).
Fecundity – The potential reproductive capacity of a fish species, usually represented by the number of eggs produced in a reproductive cycle. Fecundity often increases with age and size (Blackhart et al., 2006).
Fishing mortality (syn.: Mortality) – A measurement of the rate of fish removal from a population by fishing. Fishing mortality can be reported as either annual or instantaneous. Annual mortality is the percentage of fish dying in one year. Instantaneous mortality is the percentage of fish dying at any given point in time (Blackhart et al., 2006).
Growth overfishing – Occurs when juvenile fish are harvested before their growth potential is fully reached. Restricts fisheries from producing their maximum poundage (Blackhart et al., 2006).
Length at maturity – See: Size at maturity.
Length-based data – Data based on the length of fish (e.g., length at maturity and maximum length).
Life-history parameters – Basic biological information such as size and age at maturity, natural mortality and fecundity for a specific species.
Macroalgae – Large, multi-celled, photosynthetic algae. Commonly called seaweed.
Marine reserve (syn.: Marine protected area) – A geographically defined space in the marine environment where special restrictions are applied to protect some aspect of the marine ecosystem including plants, animals and natural habitats (Blackhart et al., 2006). No-take reserves are a type of marine reserve.
Maximum Economic Yield (MEY) – The catch level that corresponds to the highest amount of profit that could be earned from a fishery (Blackhart et al., 2006).
Maximum length – The biggest fish, length-wise, in a sample or catch, or the biggest fish recorded for a specific species.
Maximum Sustainable Yield (MSY) – The largest average catch that can be taken continuously (sustained) from a stock under average environmental conditions. This is often used as a management goal (Blackhart et al., 2006).
Megaspawner – A highly fecund, older female fish (Froese, 2004).
Mortality – A measurement of the rate of death of fish, resulting from several factors but mainly predation and fishing.
17
No-take reserve (syn.: No-take zone) – A defined marine area in which fishing and other extractive activities are prohibited.
Recruit – An individual fish entering the fishable stage of its life cycle.
Recruitment – The number of fish added to a fishable stock each year due to growth and/or migration into the stock.
Recruitment overfishing – When high rates of fishing mortality result in low annual recruitment, a reduced spawning stock and decreased proportion of older fish in the catch. May result in stock collapse (Blackhart et al., 2006).
Size at maturity – The weight or length at which 50% of fish of a given sex reach reproductive maturity.
Spawning potential ratio – The number of eggs that could be produced by an average recruit in a fished stock divided by the number of eggs that could be produced by an average recruit in an unfished stock (Blackhart et al., 2006).
Vulnerability (syn.: Catchability) – Equivalent to catchability, but usually applied to a specific part of the fish stock, such as individuals of a specific size or length (Blackhart et al., 2006).


Environmental Defense Fund, a leading national nonprofit organization, creates transformational solutions to the most serious
environmental problems. EDF links science, economics, law and innovative private-sector partnerships.
EDF Offices
New York (National Headquarters) / 257 Park Avenue South / New York, NY 10010 / T 212.505.2100
Austin / 301 Congress Ave., Suite 1300, Austin, TX 78701 / T 512.478.5161
Beijing / C-501, No. 28 East Andingmen Street, Beijing, 100007 China / T +86.106.409.7088
Bentonville / 1116 South Walton Boulevard, Suite 167 / Bentonville, AR 72712 / T 479.845.3816
Boston / 18 Tremont Street, Suite 850 / Boston, MA 02108 / T 617.723.2996
Boulder / 2060 Broadway, Suite 300, Boulder, CO 80302 / T 303.440.4901
La Paz / Revolución No. 345 / E/5 de Mayo y Constitución / Col. Centro, CP 23000 / La Paz, Baja California Sur, Mexico / T +52.612.123.2029
London / 50 Broadway, Westminster, London, United Kingdom SW1H 0RG / T +44.207.152.4433
Raleigh / 4000 Westchase Boulevard, Suite 510 / Raleigh, NC 27607 / T 919.881.2601
Sacramento / 1107 9th Street, Suite 540 / Sacramento, CA 95814 / T 916.492.7070
San Francisco / 123 Mission Street, 28th Floor / San Francisco, CA 94105 / T 415.293.6050
Washington, DC / 1875 Connecticut Ave., NW / Washington, DC 20009 / T 202.387.3500
For more information visit www.catchshares.edf.org