school of commerce - department of marketing management
83
SCHOOL OF COMMERCE DEPARTMENT OF MARKETING MANAGEMENT EXTENSION GRADUATE PROGRAM EFFECT OF IN-STORE PROMOTIONS ON BRAND AWARENESS- the Case of Bajaj & TVS Motorcycle in Ethiopia By: DEREJE TAFFESE ABEBE I.D No.: GSE/8160/09 Advisor: GETIE ANDUALEM (PhD) Date: June, 2019 ADDIS ABABA, ETHIOPIA
-
Upload
khangminh22 -
Category
Documents
-
view
4 -
download
0
Transcript of school of commerce - department of marketing management

SCHOOL OF COMMERCEDEPARTMENT OF MARKETING
MANAGEMENT
EXTENSION GRADUATEPROGRAM
EFFECT OF IN-STORE PROMOTIONS ON BRAND
AWARENESS- the Case of Bajaj & TVS Motorcycle in
Ethiopia
By: DEREJE TAFFESE ABEBE
I.D No.: GSE/8160/09
Advisor: GETIE ANDUALEM (PhD)
Date: June, 2019
ADDIS ABABA, ETHIOPIA

Addis Ababa University
School of Commerce
Department of Marketing Management
Graduate Program
Effect of In-Store Promotions on Brand Awareness- The Case of
Bajaj & TVS Motorcycle in Ethiopia
A thesis submitted to the school of graduate studies of Addis
Ababa University School of Commerce in partial fulfillment for
the award of Master of Arts Degree in Marketing Management.
By
Dereje Taffese
Advisor:
Getie Andualem (Ph.D.)

Addis Ababa University
School of Commerce
Department of Marketing Management
Graduate Program
This is to certify that the thesis is prepared by Dereje Taffese, entitled; Effects of In-Store
Promotions on Brand Awareness- The Case of Bajaj & TVS Motorcycle in Ethiopia, In partial
fulfillment of the requirements for the award of the Degree of Master of Arts in Marketing
Management with the regulation of the University and the accepted standards with respect to
originality.
Approved by board of examiners
____________ ________ ___________________
Advisor Signature
____________ ________ ___________________
Examiner Signature
____________ ________ ___________________
Examiner Signature

Declaration
I hereby declare that this study entitled “Effects of In-Store Promotions on Brand Awareness-
The Case of Bajaj & TVS Motorcycle in Ethiopia” is my original work prepared under the
guidance of my advisor, Dr. Getie Andualem. This paper is submitted in partial fulfillment of the
requirement for the Award of Master of Arts Degree in Marketing Management and it has not
been previously submitted to any diploma or degree in any college or university. I would like
also to confirm that all the sources of materials used in this study are duly acknowledged.
Name: - Dereje Taffese
Sig.:- _________________
Date:-_________________

Statement of Certification
This is to certify that Dereje Taffese has carried out his research work entitled “Effects of In-
Store Promotions on Brand Awareness- The Case of Bajaj & Tvs Motorcycle Market in
Ethiopia” in partial fulfillment of the requirement for the Award of Master of Arts Degree in
Marketing Management at Addis Ababa University College of Business and Economics School
of Commerce. This paper is an original work and has not been submitted to any diploma or
degree in any college or university.
_________________________
Dr. Getie Andualem

i
Table of Contents
LIST OF TABLES.......................................................................................................................................v
LIST OF FIGURE......................................................................................................................................vi
ACKNOWLEDGEMENTS ........................................................................................................................vii
ABSTRACT ...............................................................................................................................................viii
CHAPTER ONE............................................................................................................................................1
INTRODUCTION.........................................................................................................................................1
1.1 Background of the Study ...............................................................................................................3
1.2 Statement of the Problem ..............................................................................................................5
1.3 Research Questions .......................................................................................................................7
1.4 Objective of the Study ...................................................................................................................8
1.5 Significance of the Study...............................................................................................................9
1.6 Delimitation/Scope of the Study ................................................................................................ 10
1.7 Definition of Terms .................................................................................................................... 11
1.7.1 Conceptual Definition ............................................................................................................ 11
1.7.2 Operational Definition............................................................................................................ 11
1.8 Organization of the Study........................................................................................................... 12
CHAPTER TWO........................................................................................................................................ 13
REVIEW OF RELATED LITERATURE.............................................................................................. 13
2.1 Theoretical Review..................................................................................................................... 13
2.1.1 Managing Brand Equity ......................................................................................................... 13
2.1.2 In-store Marketing .............................................................................................................. 14
2.1.3 Branding the Stores ............................................................................................................ 15
2.1.4 Brand Awareness................................................................................................................ 15

ii
2.2 Empirical Review ....................................................................................................................... 17
2.2.1 Store Design and Brand Awareness ....................................................................................... 17
2.2.2 Store Talent and Brand Awareness ........................................................................................ 18
2.3 Proposed Conceptual Framework............................................................................................... 20
CHAPTER THREE .................................................................................................................................... 21
RESEARCH DESIGN & METHODOLOGY ........................................................................................... 21
3.1 Description of the Study Area .................................................................................................... 21
3.2 Research Approach..................................................................................................................... 22
3.3 Research Design ......................................................................................................................... 22
3.4 Population and Sample ............................................................................................................... 22
3.5 Data Sources and Types ............................................................................................................. 24
3.6 Sampling Procedure.................................................................................................................... 24
3.7 Data Collection Procedure.......................................................................................................... 24
3.8 Ethical Consideration ................................................................................................................. 25
3.9 Data Analysis ............................................................................................................................. 25
3.9.1 Survey Questionnaire ............................................................................................................. 26
3.9.2 Reliability and Validity .......................................................................................................... 26
3.9.3 Data Analysis Techniques ...................................................................................................... 28
3.9.3.1 Descriptive statistics ............................................................................................................... 28
3.9.3.2 Test/Model Assumption for Inferential Statistics................................................................... 28
3.9.3.2.1 Normality Test.................................................................................................................... 28
3.9.3.2.2 Linearity Test...................................................................................................................... 29
3.9.3.2.3 Multi-Collinearity test ........................................................................................................ 29
3.9.3.2.4 Correlation analysis ............................................................................................................ 29
3.9.3.3 Inferential Statistics - Regression analysis ............................................................................. 30

iii
CHAPTER FOUR ...................................................................................................................................... 31
DATA PRESENTATION, ANALYSIS AND INTERPRETATIONS...................................................... 31
4.1 Respondents’ profile................................................................................................................... 31
4.2 Descriptive Statistics .................................................................................................................. 33
4.2.1 Descriptive Analysis............................................................................................................... 33
4.2.1.1 Store Decorations ................................................................................................................... 33
4.2.1.2 Store Product Assortment....................................................................................................... 34
4.2.1.3 Store Feature Area .................................................................................................................. 35
4.2.1.4 Light and Color of the Store ................................................................................................... 35
4.2.1.5 Store Employee Appearance .................................................................................................. 36
4.2.1.6 Store Employee Professionalability........................................................................................ 37
4.2.1.7 Store Brand Awareness .......................................................................................................... 37
4.3 Inferential Statistics .................................................................................................................... 38
4.3.1 Correlation Analysis ............................................................................................................... 38
4.3.2 Test for Linear Regression Model Assumptions .................................................................... 40
4.3.2.1 Normality Test........................................................................................................................ 40
4.3.2.2 Linearity Test.......................................................................................................................... 41
4.3.2.3 Multi-Collinearity Test ........................................................................................................... 41
4.3.3 Multiple Linear Regression Analysis ..................................................................................... 41
4.3.4 ANOVA.................................................................................................................................. 42
4.4 Hypothesis Testing and Interpretation of Results....................................................................... 45
4.5 Discussion of the Findings ......................................................................................................... 46
CHAPTER FIVE ........................................................................................................................................ 50
SUMMARY, CONCLUSION AND RECOMMENDATIONS ................................................................ 50
5.1 Summary of Findings ................................................................................................................. 50

iv
5.2 Conclusion.................................................................................................................................. 51
5.3 Recommendations ...................................................................................................................... 52
5.4 Limitations and Suggestion for future research.......................................................................... 53
BIBILIOGRAPHY ..................................................................................................................................... 54
APPENDICES................................................................................................................................................I
አባሪ ............................................................................................................................................................. XI

v
LIST OF TABLES
Table 3.4. 1Total Number of Motorcycles per Town ..............................................................23
Table 3.9. 2 Reliability Test Result ................................................................................... 27
Table 4.1.3 Demographic profile of respondents ....................................................... 31
Table 4.1. 4 Preferred Brand ....................................................................................................... 32
Table 4.1.5 Town Bought............................................................................................................. 32
Table 4.1.6 Environmental Cues ................................................................................................. 33
Table 4.2.1.7 Store Decorations Descriptive Analysis ................................................................ 34
Table 4.2.1.8 Store Product Assortment Descriptive Analysis ................................................... 34
Table 4.2.1.9 Store Feature Area Descriptive Analysis .............................................................. 35
Table 4.2.1.10 Light & Color of Store Descriptive Statistics..................................................... 36
Table 4.2.1.11 Employee Appearance Descriptive Statistics ...................................................... 36
Table 4.2.1.12 Employee Professionalability Descriptive Statistics ........................................... 37
Table 4.2.1.13 Store Brand awareness Descriptive Statistics ..................................................... 37
Table 4.3.14 Correlation Analysis Result.................................................................................... 39
Table 4.3.15 Skewness and Kurtosis for normality of data ........................................................ 40
Table 4.3.16 Multi-Collinearity Test Result ................................................................................ 41
Table 4.3.17 Multiple Regression Analysis Model Summaryb ................................................... 41
Table 4.3.18 F-Test result of ANOVAa........................................................................................ 43
Table 4.3.19 Multiple Linear Regression Analysis Result Coefficientsa ................................... 43
Table 4.4.18: Hypothesis Testing Based on Multiple regressions Analysis Result ................... 45
Table 4.5.21 In-Store Promotion Dimensions’ Descriptive Statistics ...................................... 47

vi
LIST OF FIGURE
Figure 1: Proposed conceptual framework................................................................................. 20

vii
ACKNOWLEDGEMENTS
My first and foremost acknowledgement goes to Almighty God who has helped me not only in
doing this research but also in any step of my life.
I would like to express my heartfelt gratitude to Dr. Getie Andualem, my advisor for his critical
comments and feedback throughout the writing process of this thesis. I also would like to say
thanks and appreciate the contribution of participants of this study.
Finally, I would like to extend special thanks to Mamiyeee and my best friend Fiseha Teshome
who have kept supporting me.

viii
ABSTRACT
Aimed to measure the effect of in-store promotion on brand awareness of motorcycle market inEthiopia with specific emphasis to Bajaj and TVS brands, using the M-R theory of S-O-R, andBaker et al., (2002) model, the study was conducted to measure the two basic dimensions- storedesign dimensions (store decoration, store product assortment, store feature area, store light &color, and store social/talent dimensions (store employee appearance, and store employeeprofessionalability)using quantitative approach of explanatory research design implemented toshow the causal links between constructs taking sample of 384 respondents who either deal,retail, or bought, or own Bajaj and/or TVS motorcycle brands selected on nonprobabilitypurposive sampling technique. Data were collected using structured survey questionnairedesigned to measure the extent of influence exhibited in the minds of the respondents as to eachof the constructs/variables is concerned and their level of brand awareness resulted from thesein-store promotions. A total of 422 questionnaires were distributed, out of which 384questionnaires with no missing spaces and inconsistencies were selected for the analysis. Fromthe demographic analysis of respondents, store design cue has got 55.5% to be used asenvironmental cue to locate the motorcycle stores followed by 42.7% for store social/talent. Thestore atmospheric cue showed almost negligible result which may be attributed to the nature ofthe product being high value good. Moderate and strong correlation of variables was foundwhich are all significant at a 0.01 level of significance.
Multiple linear regression analysis of the data collected showed only store decoration, storefeature area, and store light & color have shown positive significant relationship with thedependent variable, store brand awareness. Store feature area was found the most influentialpredictor of brand awareness, the least insignificant being store employee professionalability.Therefore, heavy investment on the in-store promotion related to store feature area can result inincreased brand awareness of motorcycle market in Ethiopia.
Key words: In-store promotion, brand awareness, store design, store social/talent

1
CHAPTER ONE
INTRODUCTION
These days, it is not very uncommon to see two wheeler motorcycles ridden mostly by young
age group drivers in at least five to ten minutes of walk in Addis Ababa. The number and
frequency of traffic by these two wheeler motorcycles is increasing from time to time. Even in
the surrounding areas and towns of Addis Ababa, both the two wheeler motorcycles and three
wheeler motorcycles are the most common modes of taxi transport. This phenomenon gets
greater weight as you go out of Addis Ababa to almost any rural or urban areas of Ethiopia along
the four corners (Report from Ministry of Transport, May , 2017).
As per the researcher’s personal observation and survey, if you just stand somewhere and notice
both the two wheelers and the three wheelers motorcycles (commonly known as Bajaj), they are
of not more than ten brands including the old ones, especially for the three wheelers, you can
name not more than five brands, most of the brands being Indian origin.
Motorcycles are high value products to low income countries like Ethiopia for their unit prices
are high ranging from Birr 33,000 to Birr 220,000 which can only be afforded by middle and
high income individuals after even getting some years of savings and loans from financial
institutions (Report by Micro & Small Scale Enterprises Authority of Ethiopia in Partnership
with Partnership for Economic Policy, Mar 2017). Hence, purchase decision is mostly taking
critical evaluation of the available brands, durability and performance of the vehicles, technical
service and spare availability after purchase, etc. This requires paying a visit to the brick and
mortar store to get this information in depth.
The country is investing and improving its road network coverage which has been reported
121,171 km, including gravel road, in the year 2017 and planned to achieve 200,000km at the
end of the second transformation plan which is by the year 2020. (Report from Ministry of
Transport, May 29, 2017) which will further push the demand for those mentioned transport
vehicles upward.
The stiff competition among different market players competing to win more market share has
brought new challenges to marketers through products and brands. These new challenges force
the market players to have a clear understanding of both their consumers and competitors with

2
special emphasis on the needs and interests of consumers. Thus, consumer behavior has become
an increasingly indispensible subject in today’s marketing and management areas.
With all the efforts made by marketers to ‘pre-sell’ consumers through advertising, most of the
buying decisions made by the shoppers are made inside the stores. For instance, Hein (2009)’s
online “the Elements Report” released in Oct. 20th, 2009 which demonstrated that nearly a third
(32 percent) of the 999 shoppers polled online in March of 2009 said that in-store marketing is
"very effective." Such fact ignites marketers to continually realize the important influence store
environments exert on many purchases. Thus, the in-store promotions attached by different
stimulus have been extensively used as efficient tools to help the stores to increase sales.
The impulse buying mentioned above according to the previous research will be taken in two
forms; brand switching and brand substitution. Brand switching refers to the consumers who
switch from brand A to brand B because of the stimulus attached in-store promotions (Baohong
S., Scott A. N., and Kannan S 2003).
Brand substitution refers to the degree of likelihood that the customer will purchase another
brand if their preferred brand is not available. When the substitution is low or nonexistent, a
customer would leave the store without making the purchase if their preferred brand is not
available (Brandeo 2009). Those two views show that retail management has an enormous
opportunity to affect and guide consumer behavior, influencing consumers to behave in a way
that benefits the retailer, for instance, only increasing sales (Elvin & Mehran 2008).
Physical stores are not only interesting from a sales perspective, but from a branding perspective
as well. In other words, besides for merchandise, the store is thought to be capable of building
the consumer-brand relationship too. In today’s consumer culture, where people are constantly
being bombarded with all kinds of advertising messages 24/7, the store environment offers one
of the few possibilities to get the consumer in a three-dimensional environment that is entirely
controlled by the brand. Brands invest massive amounts of money in creating the right store
environment to draw consumers in and get them handling over their hard-earned cash. The
systematic connection between design and brand management can in turn be traced back to the
‘corporate image’ work performed by design agencies (Arvidsson, 2005).
The in-store environment comprises various elements that are able to influence human emotions,
cognitions, and behaviors, as shown by many researchers in the field of environmental
psychology and atmospherics (e.g., Baker,2002; Grewal & Parasuraman, 2014; Donovan &

3
Rossiter, 1982; Mehrabian & Russell, 1974). To indicate the potential of the physical store
environment, Kotler (2014, p. 48) argues that “the atmosphere of the place is more influential
than the product itself, in the purchase decision”. He coined the term atmospherics to describe
the design of store environments to produce certain effects in the shopper’s mind (Kotler, 2014).
Turley and Milliman (2000) uncovered external variables, general interior variables, layout and
design variables, point-of-purchase and decoration variables, and human variables to describe the
store environment design. Under these atmospheric variables, a number of subcategories are
distinguished, like colors, lighting, music, scent, and artwork. Altogether, it shows that there are
many variables that can be used to influence consumers’ in-store experiences, and along with
that, their affective, cognitive and behavioral reactions.
Whether is it to purchase a product or just to ‘look around’, people shop for a reason. They
always walk over the store’s threshold with a motive. The researcher proposes that the
communication message that the in-store promotion conveys should understand, and speak to
these motives in order to be most successful in developing brand awareness.
1.1Background of the Study
Unlike the times when marketers promoted products through outdoor mass media, today in-store
promotion has been commonly used by retailers as a way of temporarily increasing sales. This
fact may even be most powerful short-term tool available to low involvement store management
(Wilkinson, 1982).
It can be shown that the reason for why In-store promotion is becoming more efficient should
attribute to the feedback from the consumers who consider it a new trend in recent years due to
its ‘touch and feel’ characteristics, namely, the stimulus attached on in-store promotions, for
another example accounts for the growth of in-store promotions by the increase of self-service
retailing and the proliferation of brands which have themselves caused a number of changes in
the market place environment. First, the shopper is faced with an increasing range of brands from
which he must make his choice without the help of the retailer. Second, since today’s
competition brands are virtually the same product, competition for shelf space and attention has
forced the manufacturer or retailers to develop display material and distribution channel which, it
is hoped, will benefit the product at the point of sale and might even create referral(s).

4
By contrast, high-involvement decisions carry a higher risk to buyers if they fail, are complex,
and/or have high price tags. A car, a house, and an insurance policy are examples. These items
are not purchased often but are relevant and important to the buyer. Buyers don’t engage in
routine response behavior when purchasing high-involvement products like motorcycles. Instead,
consumers engage in what’s called extended problem solving, where they spend a lot of time
comparing different aspects such as the features of the products, prices, technical features, after
sales services, experiences of previous purchasers and warranties.
High-involvement decisions can cause buyers a great deal of postpurchase dissonance (anxiety)
if they are unsure about their purchases or if they had a difficult time deciding between two
alternatives. Companies that sell high-involvement products are aware that post-purchase
dissonance can be a problem. Frequently, they try to offer consumers a lot of information about
their products, including why they are superior to competing brands and how they won’t let the
consumer down, after sales services, etc. Salespeople may be utilized to answer questions and do
a lot of customer “hand-holding.” (Kotler, Marketing 3.0, 2010).
Direct consumer contact is an advantage for retailers, as 70% of shoppers make purchase
decisions in stores and are thus open to last-minute persuasion. The physical presence of shops
following a uniform design, name, logo and style is equivalent to a permanent poster campaign
on premium advertising sites, perfectly targeted. When shoppers enter the stores, they form a
strong impression, and each visit provides the retailer with an opportunity to communicate and
tangibly demonstrate something about the company and products.
Many retailers are becoming increasingly involved with in-store advertising: interactive touch
screens, motion graphics and floor and ceiling displays are common in developed markets. In-
store scent and sensory marketing is also becoming popular. In June 2011, Schick launched the
first scented men’s razor, the Xtreme3 Refresh. Scent is embedded in the handle, but they are
also using ambient scenting in-store. They want to establish brand awareness and loyalty through
emotions, as fragrances can create positive experience with brands on the subconscious level by
influencing perception, mood and shopping behavior.
As opposed to the time before the turn of the twentieth century when manufacturers had
exclusivity over branding rights, after wards, retailers have shown that they can procure high-
quality goods and deliver them with very effective branding, garnering considerable shelfspace
and mindspace. Brand awareness creation and brand loyalty is not dead; it has just shifted to
5
another player in the value chain as retailers are challenging manufacturers for control of their
traditional source of profit: mindspace. But the battle is tilted in favor of the retailers, who have
continued to build their use of media-type strategies (creating awareness via stores, backed up
with communication in-store) making the time for manufacturers to reach their consumers harder
and harder. (Greg Thain and John Bradley, 2012 Pp 83-102)
It is inevitable to notice the effect of in-store promotions helping and guiding customers about
the decision they are going to make of the product or brand they are made available to. The
question is, what are those effects played by in-store promotions in creating part of the decision
variables utilized by customers of those high-involvement products like motorcycles?
Although there are a number of studies regarding the importance of in-store promotions in
general or each kind of in-store promotions, for instance about their effects on increasing sales;
there seems to be little research concerning the effect in-store promotions have on consumers’
brand awareness.
The little attention attached to the subject and the totally dissimilar product stores noticed in
Ethiopia for the product under consideration (noticed during preliminary survey) make it
necessary for the researcher to take brand into consideration when studying the in-store
promotion by investigating the effects on brand awareness. It should be of relevance to brand
owners, retailers as well as marketers to understand the effect as well.
1.2 Statement of the ProblemThe power of in-store promotion activities to increase sales at the point of sales has been
discussed by many scholars and researchers and these activities are used from sales perspectives.
As per the researcher’s knowledge so far and various articles reviewed, studies regarding in-store
promotions have lack of researches regarding their effects on brand awareness especially in the
motorcycle market. This implies a great opportunity to cover this emperical gap by developing a
new study in order to discover new implications for in-store promotion due the great importance
of brand awareness for the marketing, marketers and the great impact it has on consumer buying
decision for the envisaged products. Brand awareness is essential in buying decision-making as it
is important that consumers recall the brand in the context of a given specific product category,
awareness increasing the probability that the brand will be a member of the consideration set, the
handful of brands that receive serious consideration for purchase (Keller K.L 2013).

6
By and large, Baker, Parasurman, Grewal, & Voss (2002), in their study of the influence of
multiple store environment cues on perceived merchandize value and patronage intentions, have
found that there exist positive and significant relationships between store environmental cues and
perceived merchandize value and patronage intentions in the US and UK markets for grocery
products. Mattila & Wirtz (2001) have found convergence of results in their investigation of the
effects of store scent and music as a driver to the in-store evaluations and customer behavior.
Many scholars and researchers found similar results as to the effect or influence of store
environmental variables (in-store promotion constructs) on either increasing sales or brand
loyalty or store patronage or etc. Some of the researchers to mention are Bitner (1992); Marike
Venter de Villiers, Richard Chinomona & Tinashe Chuchu (2018); Iyer (1989); Elvin & Mahran
(2008); David L.M et al,.(2015); Turley & Millinam (2000); etc, all being conducted in countries
like Taiwan, USA, UK, India, Sri-Lanka, Australia, South Africa, etc.
On the contrary, Chan & Tai (2001); Sayed Farrag & Berk (2003); and Tang, Chan & Tai
(2001); in their study of the effect of servicecape/atmospherics (ambience, design and layout) on
consumer behavior in the nonwestern cultures, specifically China, have found that Chinese
consumers mostly rely not on the impulse sense created by the atmospheric variables for their
brand preference, choice and awareness rather they heavily depend on the quality and
performance parameters of the product itself. Hence, Chinese consumers are not responsive to
the in-store promotions portrayed through the store atmospherics/environmental cues/variables.
Sayed et al., (2003) also found that Egyptians tend not to be keen observers; retail settings in
Egypt are so crowded that consumers seem to be more influenced by elements like
environmental music than store design and layout. Massara, Liu & Merala (2010), investigated
and concluded that there is no direct effect of atmospherics on consumer emotions, rather, they
said, are merely a product of cognition. Hence, environmental atmospherics do not have effect
on consumer emotions of product purchase rather they have effect on the product and brand
cognition which in turn will sooner or later result in certain emotions either to purchase or reject
the product.
In order to clarify such differing results found by various researchers across various
demographics and products, the researcher preferred totally dissimilar product, Motorcycle, and
the country setting being Ethiopia. To proceed with the investigation, preliminary survey of the
market in different parts of the country was made in order to see the rough appearance of
7
motorcycle stores found in towns like Addis Ababa, Adama, Bishoftu, Ziway, Shashemene,
Hawasa, Mekelle, Dessie, & Debreberhan) and found that it was very difficult to easily locate
most of the motorcycles retail stores itself let alone obtain some cues related to the brands they
handle. A person who is familiar with Toyota automobiles can easily identify authorized
company’s store through some of the brand related store designs and environments (Evidenced
from the Addis Ababa, Hawasa, Mekelle and Adama Toyota store visit during the preliminary
survey). Similarly, it can easily be identified that if one is exposed to one of the branches of, say,
Zemen Bank of Ethiopia, even in the absence of the name and logo on it. However, in Ethiopia,
it is very difficult to tell some or even one store selling motorcycle brands belong to some known
brand.
Store specific knowledge and store environmental cues in relation to brand awareness of
consumers has to be uncovered so that the problems listed and the contradicting results found by
different researchers in different demographics can get relief.
Hence, what and how consumers in Ethiopia use in-store promotion variables to recognize and
recall motorcycle brands dealt by various retail stores is worth studying.
1.3 Research Questionsi. What environmental cues related to the stores help them locate those stores?
ii. Can the consumers who are exposed to the in-store promotions (store decoration, store
product assortment, store feature area, store light & color, store employee appearance,
and store employee professionalability) recall/remember the brand being promoted?
iii. Will the consumers who paid attention to the in-store promotions (store decoration, store
product assortment, store feature area, store light & color, store employee appearance,
and store employee professionalability) could recognize the brand being promoted?
iv. Will the consumers brand awareness be influenced by in-store promotions (store
decoration, store product assortment, store feature area, store light & color, store
employee appearance, and store employee professionalability) variables?
v. Which of the in-store promotion variables exert most significant effect on brand
awareness of consumers?

8
1.4 Objective of the Study
General Objective
The general objective of this study is to identify the effects that in-store promotions have on
consumers’ brand awareness of motorcycle market in Ethiopia, with specific emphasis to the two
dominant brands, Bajaj and TVS brands
Specific Objectives
The specific objectives of the study are the following:
i. To identify what environmental variables are used by consumers to locate motorcycle
retail store in their vicinity.
ii. To assess whether consumers can recall/remember the brand being portrayed by each of
the in-store promotion variables under consideration (store decoration, store product
assortment, store feature area, store light & color, store employee appearance, and store
employee professionalability)
iii. To assess whether consumers can recognize the brand being portrayed by each of the in-
store promotion variables under consideration (store decoration, store product assortment,
store feature area, store light & color, store employee appearance, and store employee
professionalability)
iv. To assess the effects of in-store promotion variables under consideration (store
decoration, store product assortment, store feature area, store light & color, store
employee appearance, and store employee professionalability) on consumers’ brand
awareness.
v. To find out which in-store promotion dimension under consideration (store decoration,
store product assortment, store feature area, store light & color, store employee
appearance, and store employee professionalability) has the most significant effect on
consumers brand awareness.

9
1.5 Significance of the Study
Many of the literatures regarding the study area deal extensively on the elements of store
atmospherics and their effect on consumer purchase decision, store choice decisions, etc
focusing on the retail industries of supermarkets, apparel and services sector. Still many of the
studies have focused on different in-store promotion variables such as the store design variables
like lay out, signage, walk ways, etc; store atmospheric variables like lighting, sound, scent,
etc; and their effect on customers’ mood, satisfaction, purchasing behavior, brand patronage,
etc.
It is therefore clear that the term “in-store promotion” has been investigated in various ways,
but, to the best knowledge of the researcher, none of the studies focused on the motorcycle
industry or on all the in-store promotion elements such as design lay out, fascia, feature areas,
color, lighting, scent, sound, touch (technology & texture), talent or personnel, merchandise,
prices, etc. Much of the studies have focused on the individual factors of store environment
such as music and lighting, but none has focused on the overall store environment cues. All of
the studies reviewed were conducted in different parts of the world, especially in Taiwan, USA,
India, Sri Lanka, China, Egypt, Australia and South Africa but as far as could be established, no
studies have been done in Ethiopia. There exist contradictions in the findings or results of the
various researchers across cultures, specifically, between western markets; African Markets;
East Asian countries like India, Sri-Lanka, etc; and China. A gap in the existing literature was
therefore identified and the opportunity was taken to investigate the effect of in-store
promotions (Store Design- Decorations, Product Assortment, Feature areas and Light & Color;
and Store Talent- Appearance and Professionalability) on brand awareness in motorcycle stores
in Ethiopia.
The little attention attached to the subject and the totally dissimilar product stores noticed in
Ethiopia for the product under consideration make it necessary for the researcher to take brand
into consideration when studying the in-store promotion by investigating the effects on brand
awareness. It should be of relevance to brand owners, retailers as well as marketers to understand
the effect as well.
This study took a consumer-centered response approach to in-store promotions in an attempt to
holistically consider this area of the motorcycle market which has received very little attention in
the previous studies. Hence, it will benefit motorcycle manufacturers and traders in Ethiopia by

10
indicating the way consumers’ brand awareness is influenced by in-store promotion variables
and help them take necessary strategic decision.
The study also help clarify the gap noticed among the findings of various researchers in various
parts of the world and assisted to see what was the case in Ethiopia. It also helps indicate some
researchable areas both within the automotive industry and other areas of businesses.
1.6 Delimitation/Scope of the Study
There are different possible limitations of this research study. The fact that a non-probability
purposive sampling method used in this study can in itself be seen as a limitation, as the findings
could not be generalized to the greater population but further researches can be done in the future
by using a more representative sample. Similarly, the sample will be drawn from consumers
living in the major towns of Ethiopia such as Addis Ababa, Hawassa, Jimma, Mekelle, Bahir-
Dar, Adama, Harar, Nekemtie and Jigjiga and therefore will not geographically be
representative. As the main purpose of this study is to provide the motorcycle industry in
Ethiopia with a clear understanding of the causal link that could exist between in-store
promotions and brand awareness, it is in line with the study being quantitative in nature.
Moreover, due to time and resource constraints, there exist limitation of variables considered as
this research focused on major variables such as Store Design- Decorations, Product
Assortment, Feature areas and Light & Color; and Store Talent- Appearance and
Professionalability. But, other variables were not considered in this study which are like Store
Atmospherics- sound (noise & music), scent (smell & fragrance), touch/texture (cleanliness,
display, and comfort & seat), store location, proximity to the customer, surrounding
infrastructure, product quality, commercials, price, parking area, etc and these variables may
have influence on the brand awareness. This study may yield different results across other
industries that may be of interest to a broader range of retailers.
The lack of ample literatures in the area and access to some sources has also created enormous
problems to compile and establish tangible and confined concepts. The university has not
provided any mechanism by which students can get some references from some online sources of
journals and researches.

11
The time scope of the study was also cross sectional only and hence, no consideration for
longitudinal time series data which may yield varying findings.
1.7 Definition of TermsFor the purpose of this study the following terms are conceptually and operationally defined:
1.7.1 Conceptual Definition
Below-the-line (BTL) advertising is an advertising strategy in which a product is promoted in
mediums other than radio, television, billboards, print and film. Types of below-the-line
advertising commonly include direct mail campaigns, trade shows and catalogs, targeted search
engine marketing and in-store activities. (https://www.investopedia.com/terms/b/below-the-line-
advertising.asp, accessed on May 29, 2018)
Motorcycle: a vehicle having a seat or saddle for the use of the rider and designed to travel on
not more than three wheels in contact with the ground; the term does not include a tractor
(http://www.duhaime.org, 2018)
Brand: a name, term, sign symbol (or a combination of these) that identifies the maker or seller of the
product (Philip Kotler & Gray Armstrong, 2014)
Emotions: Can be defined as “oral expression of feelings and as a personal, subjective
psychological state” (Baker J et al, 2002).
Talent: A natural ability to excel at a duty or action. A group of people, such as employees, who
have a particular aptitude for certain tasks like product and service knowledge and description,
sales, appearance, etc (BusinessDictionary.com, 2018). By inference, Store Talent is the
professional ability of a store person.
1.7.2 Operational Definition
Atmospherics: The physical characteristics of a store that are used to develop an image in order
to attract consumers (Berman & Evans, 2010:508).
Feature areas: Those areas in a store that are specifically designed in order to grab consumers’
attention including the different types of equipment used to display merchandise (Levy, Weitz &
Beitelspacher, 2012:479). The effective flow of used space, traffic control and sales productivity
of a retail store in order to ensure that consumers are comfortable while shopping and that the
overall appearance of a store is attractive (Levy et al., 2012:473).

12
Store atmospherics: A store’s physical characteristics such as sound (noise & music); scent
(smell & fragrance); touch/texture (cleanliness, displays, comfort and seat availability, etc); and
much more that are used to develop an image and draw customers (Berman et al., 2010:605).
Store design: The interior and the exterior design of a store where goods are sold to the
community. The goal of store design is to make the store space more appealing and inviting to
customers, it includes store decorations, inside the store product assortment, feature areas, the
lighting & color match ups, the walk-ins, etc (Burns, 2012).
1.8 Organization of the StudyThe research was organized in five main chapters as follows:
Chapter 1: Introduction: -This chapter contained background of the study, statement of
the problem, objectives of the study, significance of the study, and delimitation/scope of
the study.
Chapter 2: Literature Review: -This chapter discussed the literature relevant to the
research with emphasis to the theoretical, empirical review and the conceptual frame.
Chapter 3: Methodology of the Study: -It describes the type and design of research; data
sources and methods of data collection; data collection tools; and data processing and
analysis implemented.
Chapter 4: Discussion, Analysis and Interpretation: - This chapter has been organized
to summarize the results or findings of the study; analysis and interpretation of the
findings.
Chapter 5: Conclusion and Recommendation: -This being the last chapter of the study,
presents the conclusions drawn from the study and builds recommendations relevant to
the statement of the problems and objectives of the study.

13
CHAPTER TWO
REVIEW OF RELATED LITERATURE
2.1Theoretical Review
2.1.1 Managing Brand EquityAs per Aeker D (1996), managing brand equity requires taking a broad, long term perspective of
brands. A broad view of brand equity is critically important, especially when firms are selling
multiple products and brands in multiple markets. Here, brand hierarchies must define common
and distinct brand elements among various nested products. New products and brand extension
strategies must also ensure that we have optimal brand and product portfolios. Finally, we need
to manage these brands and products effectively over geographic boundaries and target market
segments by creating brand awareness and positive brand image in each market in which the
brand is sold. We need a long term view of brand equity because changes in the current
marketing programs and activities and in the marketing environment can affect consumers’ brand
knowledge structures and thus their response to future marketing programs and activities.
Managing brands over time requires reinforcing the brand meaning and adjusting the branding
programs as needed to create brand awareness.
Keller (2013) and Berman B & Evans J.R. (2010) described brand awareness being related to the
strength of the brand node in the consumers’ memory, as reflected by the consumers’ ability to
recall and recognize the brand under different conditions. Brand recall is the ability of consumers
to retrieve the actual brand element from memory when given some related probe or cue, like in-
store promotion variables, while brand recognition refers to the ability of consumers to identify
the brand under a variety of circumstances and can rest on the identification of any of the brand
elements.
Kotler (2014) paraphrased the definition of a contact given by Schultz, Tannenbaum, &
Lautersborn as, a contact is any form of information bearing experience that a customer or
prospect has with the brand, needs to be favorable for a positive brand awareness to flourish. A
person can come in contact with a brand in numerous ways including friends’ & neighbors’
comments, packaging, newspaper, magazine, TV information, ways the customer is treated in
store, product shelving, signage type appearing in the store, store design, store atmospherics, etc.

14
Experiential marketing is any form of customer focused marketing activity, at various touch
point, that create sensory-emotional connection to the customers. There are basically five
different types of marketing experiences that are becoming increasingly vital to consumers’
perception of brands: those that appeal to senses, feelings, thinking, acting, and relate marketing.
Customers want to be entertained, stimulated, emotionally affected, and creatively challenged.
These can all easily be done by strategically using in-store marketing targeted to branding.
2.1.2 In-store Marketing
To be able to understand the effect in-store promotion has on consumers’ brand awareness, it is
important to understand the general theories of in-store marketing and how it affects consumers’
shopping experience.
According to Keller (2013), the appeal of in-store marketing lies in the fact that consumers many
times make their final brand decisions inside the store.
Previous studies concerning in-store marketing have put a lot of emphasis on in-store stimulus,
or atmospherics. For instance, According to Turley and Millinam (2000), creating influential
atmospheres is an imperative marketing strategy. Kotler also claimed that “atmospherics” can be
used as a term to describe the intentional control and manipulation of environmental cues
(Kotler, 2014)
According to Iyer (1989), as the exposure to in-store marketing extends/increases, latent needs
recognition also increases, resulting in further increase in the opportunities for a brand to
influence the consumer towards a purchase, regardless of whether it has been written on the
shopping list or not and hence brand awareness boosts. There exists several terms for in-store
marketing. For instance, in-store stimuli, in-store displays, end-of-aisle (Wilkinson et al. 1982;
Elvin& Mehran 2008), and point-of-purchase display (David L.M et al. 2015; Elvin& Mehran
2008) all of which have revealed that the activities shown to increase sales for the promoted
products.
Nonetheless to say, to the best of the researcher’s knowledge, almost none of the studies before
have paid attention to how these activities can affect promotion of the brands. Because of this
theoretical gap in the existing theories concerning the study, issues will be employed to generate
statements.

15
2.1.3 Branding the Stores
Retailers or other channel intermediaries (stores) can affect the brand equity of products they sell
by establishing brand awareness and associations to their product assortment. This can be done
through branding the store as a whole, as well as individual departments, classes of services, or
any other noteworthy aspects of the shopping service or shopping experiences. Consumers must
have rewarding shopping experiences in searching, choosing, paying for, and receiving products
including after sales services defined by the store design and store atmospherics so that these
experiences can turn out to be the valuable points of parity with respect to competitors. (Keller,
2013, Pp 572-573; and Greg Thain and John Bradley, 2012, Pp 83-84). Moreover, the above
listed store branding activities need to be backed by memorable marketing, sales and after sales
talent of employees from the store gate to the far back end which is technical support and after
sales service providers.
2.1.4 Brand Awareness
Even though the strategic goal for a brand is the brand’s identity, the brand image that actually
resided in the consumers’ mind about the brand could be very different from that goal.
According Keller (2013), such a variation is due to the differential brand knowledge structures of
individual consumers as revealed by the levels of brand awareness (Chan-Olmsted, 2008).
Within the scope of brand management, brand awareness is contemporarily widely researched by
both academic researchers and organizational practitioners. According to Alba and
Chattopadhyay (1985) brand awareness is related to the strength of the brand as reflected by
consumers’ ability to identify the brand from among various brands under different conditions.
The indispensable role that brand awareness is playing in the consumers purchase decision have
been tried to be explored by many researchers. For instance, brand awareness can provide a host
competitive advantages. As per the study made by Macdonald and Sharp (2002) about the
relationship between brand awareness and consumer decision making process, brand awareness
impacts on consumer’s decision making by influencing which brands enter the consideration set,
which of the brands in the consideration set are used as a heuristic, and the quality perception.
According Aeker & McLoughlin (2010), first, to both industrial and consumer buyers of high
value/durable products, name recognition can be an indication of commitment, presence and
attributes that can be very important. Second, brand awareness can provide sense of familiarity

16
or recall and driver to the buying decision. Logically speaking, there should be a reason if a
name is recognized because human beings are assumed to be rational.
Based on the above discussions, it is easy to notice that by frequently overlooking in discussions
of advertising strategy, brand awareness is a crucial consideration (Percy and Rossiter 1992),
however, the majority of the studies regarding the effect on brand awareness were about outdoor
advertising, or mass media advertising vitally because visual and verbal effects created by mass
media advertising can help entrench the brand name in the consumer’s memory; through creation
of enough consumers brand experience by helping them the chance to see, hear, think about it,
etc, the brand will take root in memory (Z. Ahmed and M. Umar 2009). Although important as
brand awareness is, few studies have researched on the effect in-store marketing as a form of
BTL advertising has on brand awareness, but only concerning in-store promotions as the tools
increasing sales. However, as in-store marketing is becoming a trend for marketers for its
efficiency, it is reasonable to assume that once brand awareness can also be affected by in-store
promotions, and then in-store promotions can be beneficial for both promoting brands and
increasing sales, which is considered as a long-term strategy as mentioned by previous studies.
According Hawkins (Consumer Behavior: Building Marketing Strategy (13th Ed). New York:
McGraw-Hill.), the stimuli that pertain to store attributes include store design, store
atmospherics, in-store service- accessibility, reputation, facilities and post-transaction service.
Keller (2013, P. 73), asserted that brand awareness consists of brand recognition and brand
recall performance:
Brand recognition is consumers’ ability to confirm prior exposure to the brand when
given the brand as a cue. In other words, when they go to the store, will they be able to
recognize the brand as one to which they have already been exposed?
Brand recall is consumers’ ability to retrieve the brand from memory when given the
product category, the needs fulfilled by the category, or a purchase or usage situation as a
cue. In other words, consumers’ recall of Kellogg’s Corn Flakes will depend on their
ability to retrieve the brand when they think of the cereal category or of what they should
eat for breakfast or a snack, whether at the store when making a purchase or at home
when deciding what to eat.
Hence, consumers brand awareness is measured through the mediating or moderating variables,
brand recognition and brand recall of the specific brand under varying conditions.

17
2.2 Empirical ReviewThis research followed Baker et al. (2002) in using two different environment cues as the in-storepromotion dimension: Store Design, and Store Talent.
2.2.1 Store Design and Brand AwarenessBrand awareness can be built by creating an environment to further maximize the potential of the
business. Visual merchandising improves the retail design by taking into account all the elements
through which imagery can be created: lightning, color, management of space, product
information, or interactive installations. The strategies are directed either to exterior design, or
interior.
Focusing both on interior and exterior aesthetics has two major advantages: we can lure people
inside and make them stay. If the window displays are enough appealing, we can transform
passers-by into potential customers. The interior design is also important. Once you addressed an
“invitation”, you need to ensure that your “guests” are satisfied; this has as an outcome beneficial
purchase decisions and brand referrals by having brand awareness and loyalty.
In past literature, definitions and categorizations of store environments are highly varied and
complicated. A study by Mehrabian & Russell (1974) was one of the first to be based on the
stimulus-organic body-response (SOR) theory to construct the M-R environmental psychology
model and explore the influence of the “buying environment” on customer purchases. The M-R
environmental psychology model suggests that, when individuals face the external environment,
there are two opposing behaviors: approach and avoidance. The “pleasure emotion” and “arousal
emotion” induced by the environment can cause the customer to remain longer in the store and
experience a greater buying impulse.
“Store design” refers to all aesthetic-related objects; tangible and visible environment
components exist in the forefront of the consumer’s perception; such are the more
obvious sources of visual stimulation/cue to the customer, and include internal and
external architecture – decorations, product arrangement/assortment, feature areas -
space arrangement & signs; sight - light & color.
Kumar and Kim (2014), in their study of The store-as-a-brand strategy: The effect of store
environment on customer responses in the USA apparel industry, argue that consumers tend to
develop a negative attitude towards the brand when elements in the store environment (store
design) imply that the store is attempting to mislead the consumers in some way. When

18
consumers’ initial perceptions of the store design are negative, there is a tendency for them to
rate their overall brand experience as less fulfilling than those who perceived positively and
hence the power of the emotion resulted in the consumers mind to recognize or recall the brand
is affected in some way. Holmqvist and Lunardo (2015), in their research titled The impact of an
exciting store environment on consumer pleasure and shopping intentions of France women
shoppers, have also similarly found that exciting store design/environments tend to elevate
consumer pleasure with their brand experience; store design has significant role to play in
shaping consumers’ perceptions of the brand, which can result in consumers purchasing the
brand and become brand loyal. Kirby & Kent (2010), in their study of architecture as brand: store
design and brand identity in UK, found that store design as portrayed by store layout and
decorations has significant effect on boosting consumers brand awareness and retail store
identity. On the contrary, Chan & Tai (2001) have found insignificant effect of the store
environmental exposure of Chinese consumers as opposed to westerns on their emotions,
impulses and shopping behaviors and outlets. Chinese consumers tend to be more quality &
performance of the product driven rather than such external stimulus.
Based on the aforementioned findings and contradictions, the researcher has hypothesized the
following;
H0a: Store Decorations has no significant effect on consumer’s brand awareness of motorcycles
in Ethiopia
H0b: Store Product Assortment has no significant effect on consumer’s brand awareness of
motorcycles in Ethiopia
H0c: Store Feature Area has no significant effect on consumer’s brand awareness of
motorcycles in Ethiopia
H0d: Store Light & Color has no significant effect on consumer’s brand awareness of
motorcycles in Ethiopia
2.2.2 Store Talent and Brand Awareness
Clarke et al. (2012), in their research on sensory retail environment of small fashion boutiques in
UK, underlined that it is not just tangible things that can affect shopper’s experience like store
traits such as walk ins, signage, cleanliness, etc but more than anything is presence of owner-

19
manager can highly influence consumer’s brand experience. Store employee cues are expected to
have a positive influence on merchandise quality perceptions. Two studies that include
descriptions of store employees as part of the overall store scenario find a positive influence of
store environment on merchandise quality perceptions. Gardner and Siomkos (1985) depict
salespeople as either sloppily dressed, nasty, and uncooperative; or sophisticated, friendly, and
cooperative. Akhter, Andrews, and Durvasula (1994) describe store employees in terms of their
friendliness and knowledge.
“Store employee/talent” refers to the level of feeling related to stimulation from
employees, including employee appearance, professional ability as described by the
product knowledge and technical capacity ...etc.
Service quality as expressed by store employee appearance and professionalability can show
customers how much they are valued within stores based on how attentive employees are to
customers during their shopping experience (Bhukya 2016, Erasmus 2013, Tynan 2014, Hassan
2015). Stores with higher prices on their products generally have more advanced customer
services (Baker 2002, Dalwadi 2010, Hasan 2015, Tynan 2014 Schielke 2015). This is due to
the fact that stores are trying to justify their prices by providing services that match their
products’ values (Madzharov 2015, Schielke 2015, Tynan 2014). This is showcasing how more
elite products with higher prices will need more attention, in order to showcase their value to the
customers (Baker 2002, Madzharov 2015, Schielke 2015, Tynan 2014).
Based on the discussions aforementioned, the following were hypothesized;
H0e: In–store employee appearance has no significant effect on consumer’s brand awareness of
motorcycles market in Ethiopia.
H0f: In–store employee professionalability has no significant effect on consumer’s brand
awareness of motorcycles market in Ethiopia.
20
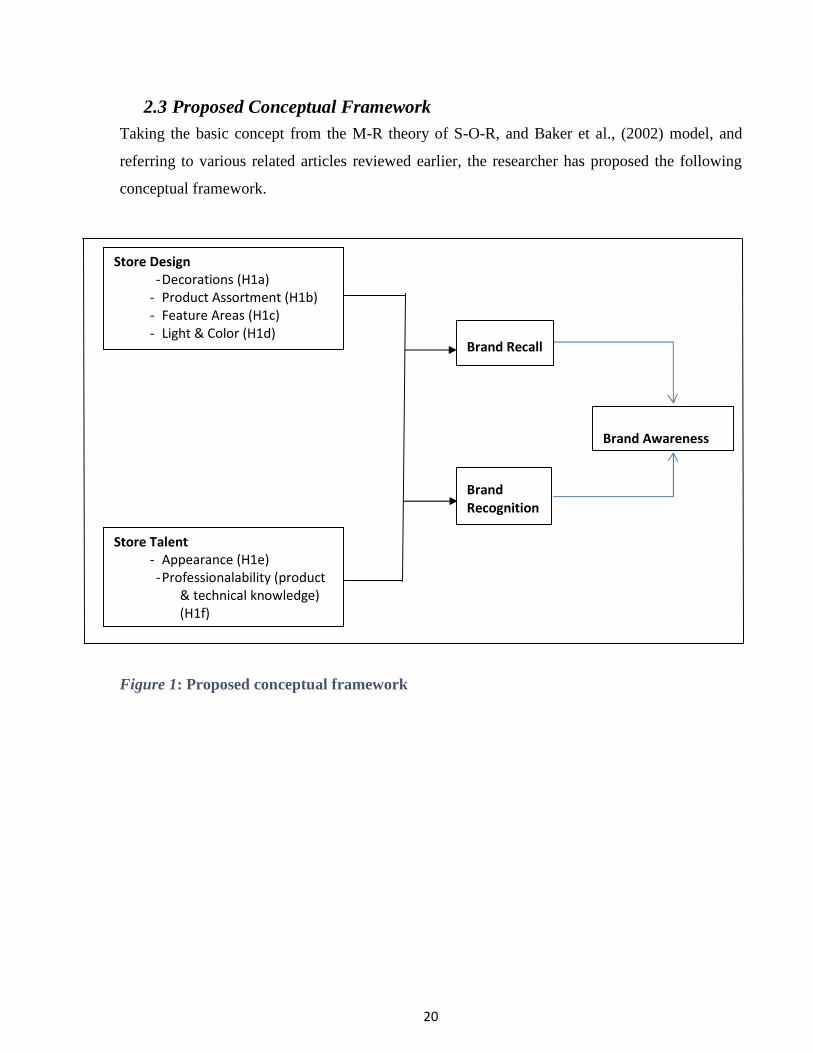
2.3 Proposed Conceptual FrameworkTaking the basic concept from the M-R theory of S-O-R, and Baker et al., (2002) model, and
referring to various related articles reviewed earlier, the researcher has proposed the following
conceptual framework.
Figure 1: Proposed conceptual framework
Store Design-Decorations (H1a)
- Product Assortment (H1b)- Feature Areas (H1c)- Light & Color (H1d)
Store Talent- Appearance (H1e)-Professionalability (product
& technical knowledge)(H1f)
Brand Awareness
Brand Recall
BrandRecognition

21
CHAPTER THREE
RESEARCH DESIGN & METHODOLOGY
3.1 Description of the Study Area
This study is to be conducted in Ethiopia with specific focus to Bajaj and TVS motorcycles
market. Ethiopia being located in “the Horn of Africa” shares boundaries with South and North
Sudan on the west, Somalia and Djibouti on the east, Eritrea on the north and north west and
Kenya on the south. The country’s proximity to Middle east and Europe has made it strategically
important for international trade enhancement. It is a country of great geographic diversity
containing high and rugged mountains, flat topped plateaus, deep gorges, valleys and vast rolling
plains. It has tropical rainy, dry and warm temperature rainy climates. The country is endowed
with both natural and manmade tourist attraction centers ranging from cultural to religious
centers and covering its beautiful and greatly varying topographies.
In Ethiopia, road transport is the dominant infrastructure for both freight and public transport
services. The largest budget of the country goes to the road infrastructure development in the
view to connect the mostly agrarian society to the market and other service centers.
Ethiopia desperately needs a new fleet of vehicles. The streets of Addis Ababa, its capital, are
filled with dilapidated vehicles. Some of the ubiquitous blue and white taxies are rattling soviet-
era ladas built in the 1980s. Many of the country’s imports are used vehicles
(www.ethiopia.gov.et/geography).
According to ERCA data, Ethiopia has imported 23,758 units of two wheeler motorcycles only
in the year 2013 which has grown to almost double (43,856 units) in the year 2015. The major
imports are Indian origins.
From the data collected from the annual vehicle inspection data available at the Federal
Transport Authority database, concentration of motorcycles is analyzed and the study area is
specified accordingly. Hence, from the towns of the country, Addis Ababa, Hawassa, Adama,
Jimma, Mekelle, Bahir-Dar, Dire-Dawa, Nekemtie, Harar and Jigjiga are selected and focused.

22
3.2 Research Approach
This study used quantitative research approach where data were collected, organized, analyzed,
interpreted and conclusions were drawn from. In this study, the data collected were
quantitatively analyzed using statistical software SPSS 24 in such a way as to indicate the causal
relationships that existed between the variables considered.
3.3 Research Design
As the main aim of explanatory research is to identify any causal links between the factors or
variables that pertain to the research problem, the researcher used explanatory research design
for this study to identify the causal links between the variables considered.
The study is mainly an explanatory research since it tries to examine the effect of in-store
promotion on brand awareness and hence enable motorcycle dealers in Ethiopia to have a better
in-depth understanding of their consumers’ needs and wants in terms of in-store promotions and
its effect on consumers’ brand awareness. The study used primary quantitative data collected
through survey using self-administered questionnaire.
3.4 Population and Sample
All motorcycle customers and dealers (importers, assemblers, distributors, and retailers) of Bajaj
and TVS brand motorcycles were the target population of the study considered. Among this
population, samples of customers, drivers, dealers were randomly selected and included in the
study from purposively selected shops and passer byes who are located in the purposively
selected towns of the country, namely, Addis Ababa, Hawassa, Jimma, Mekelle, Bahir-Dar,
Adama, Dire-Dawa, Harar, Nekemtie and Jigjiga. Therefore, the population considered was
infinite. Thus, for the study being quantitative, sample size determination formula and
calculation method suggested by Cochran (1963) inferring to the infinite number of population
and confidence level at 95% was used.

23
ss = z2pq
e2
Where,
ss= sample size
z= the standardized value
p= level of variability
q=1-p
e= the level of precision
ss = 1.962 *0.5*0.5
(0.05)2
= 384
Using the formula, the sample size of the study with 95 confidence level and 0.5 level of
variability was calculated to be 384.
From the type of vehicles and number in towns registration database of the Federal Transport
Authority of Ethiopia, motorcycle distribution in the towns of Adama, Addis Ababa, Bahir-Dar,
Dire-Dawa, Harar, Hawassa, Jigjiga, Jimma, Mekelle, and Nekemtie were extracted and
tabulated below, proportional 0.2% samples were drawn to come up with a sum of 384 sample
size determined above. Hence, the survey questionnaires were distributed in each of these towns
accordingly.
Table 3.4. 1Total Number of Motorcycles per Town
Towns Number of Motorcycles 0.2% Sample SizeADAMA 35011 70AA 42000 84BD 17523 35DD 7500 15HARAR 5001 10HAWASSA 42570 85JIGJIGA 5049 10JIMMA 15103 30MEKELLE 12508 25NEKEMTIE 10200 20TOTAL 192465 384
Source: Federal Transport Authority Vehicle Registration Database, April, 2019

24
3.5 Data Sources and Types
In this study, both primary and secondary data sources were used. The primary data used are the
data collected directly from purposively selected concerned officials from motorcycle importers
and assemblers/manufacturers of Bajaj and TVS brands; and those motorcycle owners/drivers
randomly selected from customers of purposively selected stores of each of the towns, Addis
Ababa, Hawassa, Jimma, Mekelle, Bahir-Dar, Adama, Dire-Dawa, Harar, Nekemtie and Jigjiga,
and included to participate in the structured questionnaire. However, secondary data relating to
the volume of trade each dealer (shopper) is trading per year to determine whether that shop is to
be included in the sample or not, the density/distribution of motorcycle market in the country, etc
were collected from Customs database, importers and distributors of motorcycle in Ethiopia,
assembler/manufacturers of motorcycles in the country, annual vehicle inspection database of
Transport Authority, etc.
The data types collected and used in this study were quantitative types that show existence or
nonexistence of causal links between the variables considered.
3.6 Sampling Procedure
For the purpose of this research the sampling procedure employed was that first sample towns of
the country where denser motorcycle markets and retail shops found were selected purposively
based on the data obtained from Ministry of Transport of annual vehicle inspection database
report. From these towns, stores which are ranked higher sellers of the stated brand motorcycles
were selected based on sales performance reports of the sole agents of the two brands in
Ethiopia. From customers of the selected stores, participants were purposively approached and
included in the survey.
3.7 Data Collection Procedure
Both primary and secondary data were used in this research. Primary data were collected through
designed and self-administered structured questionnaire presented to participants comprising of
randomly selected owners and marketing managers of motorcycle importers and manufacturers,
dealers and retailers of Bajaj and TVS brands found in the various regions of Ethiopia, and
motorcycle owners/drivers approached to provide some relevant information to the study. In
carrying out primary data collection, however, some of the questionnaire might not be returned

25
and the returned questionnaire may also even contain some inconsistent responses which is very
common in such survey type researches. To curb such a problem, contingency of 10% of the
sample size determined above is commonly used and therefore the total number of questionnaire
to be distributed approximately becomes 422. The researcher has also distributed the same
number of questionnaires, out of which those containing incomplete responses, inconsistencies,
etc were dropped and only sample of 384 was used for the analysis. The secondary data were
collected from all relevant materials both published and unpublished documents such as previous
studies on similar areas and International Automotive Fair (IAF), Federal Transport Authority
(TA), National Bank of Ethiopia (NBE), Ethiopian Revenue and Customs Authority (ERCA),
Annual reports of the major importers/assemblers/or manufacturers of motorcycles and Central
Statistics Agency (CSA) bulletins and documents, etc. In carrying out the work relating to this
section of the report a variety of reports, documents and articles were reviewed.
3.8 Ethical ConsiderationIn this study, the safety and the rights of respondents and those that participate in the research
and data collection, processing and analysis was highly guaranteed. No exposure to stress,
physical or psychological harm, etc. It was completely based on the individual’s willingness
that s/he was included in the study and information provided by every respondent was
confidential to the maximum.
3.9 Data AnalysisThe data collected and structured from the self-administered questionnaire were categorized
according to the major study objectives and questions. The data were analyzed using descriptive
statistics, frequency distribution, correlation and regression analysis with the help of statistical
tool, SPSS 24. Information organized under relevant themes or categories was utilized to
carryout analysis and draw lessons and recommendations.
Using descriptive statistics, the demographic data of the respondents were organized and
summarized to provide relevant and simplified information.
On the other hand, multiple regression analysis was used to measure the effect of in-store
promotions on brand awareness of motorcycle market in Ethiopia with the specific emphasis on
Bajaj and TVS brands.
26
3.9.1 Survey QuestionnaireTwo parts being contained in the survey questionnaire of this study, the first part was designed
to gather demographic profile of respondents’ like Gender, Monthly Income, Age, their
preferred brand of motorcycle, town where they bought the motorcycle, and environmental cue
that helped them locate the motorcycle store. The second part of the questionnaire was designed
to gather basic information which includes items that are important to measure in-store
promotions of motorcycle stores in Ethiopia (i.e. items related to store design- interior decoration
of the store, exterior decoration of the store, feature areas (partitions, walk-ins, etc), and light &
color composition of the store; points related to store talents – appearance & interactions of
employees, and professionalability of the store employees) and to measure respondents’ brand
awareness of motorcycle market in Ethiopia.
In-store promotions and brand awareness measuring parts of the survey questionnaire were
developed on five point Likert scale defined by 1=strongly disagree, 2=disagree, 3=neutral,
4=agree and 5=strongly agree.
The questionnaires were mainly adopted and customized from (Baker, J. et al., 2002 and Van
Rompay et al., 2008). To avoid understanding and language barriers for the respondents, the
questionnaires were translated into Amharic language by the researcher. The Amharic version
of the questionnaire was intended for those respondents who have low proficiency in the
English language.
3.9.2 Reliability and ValidityFor any research out come to be acceptable, checking reliability and validity of the research
instrument is very important. Reliability means that a measure (in this study survey
questionnaire) should consistently reflect the construct/survey question that it is measuring thus
the instrument can be interpreted consistently across different situations and validity confirms
whether the research instrument actually measures what it sets out to measure (Field, 2013);
hence, internal consistency of the research instrument prevail. Very commonly, technique of
Cronbach’s alpha test is used to check the internal consistency of variables in the research. In
this research also, the researcher used Cronbach’s alpha to assess the internal consistency
of variables in the research instrument. According to Field (2013), Cronbach’s Alpha
coefficient of 0.7 or higher is considered acceptable and adequate to determine reliability in most

27
social science research studies. Thus, for this study, Cronbach’s alpha score of 0.7 or
higher has been considered adequate to determine reliability. The result of reliability test of this
study presented as follows;
Table 3.9. 2 Reliability Test Result
Source: Own Survey, 2019
As shown in the above table, all the variables fulfilled the recommended minimum point of the
Cronbach’s alpha value, i.e. 0.7. Therefore, all the variables were confirmed reliable variables
and signified further analysis using the scale was acceptable.
As per Kothari (2004), Validity is the extent to which differences found with a measuring
instrument reflect true differences among those being tested. In this sense, Validity is the most
critical criterion and indicates the degree to which an instrument measures what it is supposed to
measure. In order to ensure the quality of the research design, validity of the research instrument
will be checked as to whether the measuring instrument provides adequate coverage of the topic
under investigation, Content Validity, which is addressed through using the instrument
containing representative sample of the universe so that the content validity is good. Its
determination is primarily judgmental and intuitive. It can also be determined by using a panel of
persons who shall judge how well the measuring instrument meets the standards, but there is no
numerical way to express it. Based on this, the content validity was verified by the professionals.
The instrument utilized for this research has, hence forth, got approval from the research advisor
to amplify the content validity.
Measurement No of item Cronbach’s Alpha
Store Decoration 4 0.758
Product Assortment 4 0.935
Store Feature Area 4 0.867
Store Light & Color 4 0.789
Employee Appearance 4 0.780
Employee Professionalability 3 0.747
Brand Awareness 1 1.000
Overall reliability 24 0.920
28
Moreover, for good validity, the researcher adopted & developed constructs referring different
published articles like (Baker et al., 2002), and (Van Rompay et al., 2008).
3.9.3 Data Analysis TechniquesThe researcher implemented Statistical Package for Social Science (SPSS) tools to analyze
demographic characteristics of respondents, to determine the strength & nature of the
relationship between constructs, and to test & validate the proposed hypothesis.
Data analysis help to organize, provide structure, and produce meaning from research data
(Tesfaye, 2017) and in here examining the surveys for accuracy, appropriateness and
completeness; coding and entering data into SPSS 24 database; and performing analysis of
responses according to frequency distribution, descriptive and inferential statistics were made.
For dependable outcome of the study reliability, normality, linear relation, variance
homogeneity, errors as well as multi-collinearity were also checked.
Following analyses were performed on the data with the help of SPSS version 24 package
software;
3.9.3.1 Descriptive statisticsUsing descriptive statistical analysis like; frequencies and percentages,; general information and
demographic characteristics of respondents were summarized and presented.
3.9.3.2 Test/Model Assumption for Inferential Statistics
3.9.3.2.1 Normality Test
Among the others, one of the assumptions before running analysis of the data was testing
normality of the data with Skewness and Kurtosis (Yodit, 2017).
According to (Field, 2013), normally distributed data assumed that the data are from one
or more normally distributed populations. Hypothesis testing depends on having normally
distributed populations and so if these assumptions are not met then it is difficult to perform
hypothesis testing. Therefore, performing normality test is mandatory.
As per (Field, 2013) normality test could be performed by computing the Skewness and Kurtosis,
and their respective standard errors. A value between -2 and +2 score in absolute terms for

29
Skewness and Kurtosis is expected to be significant at p<0.05. Large sample will give rise to
small standard errors and so when sample sizes are big, significant values arise from even small
deviations from normality for both skewness and Kurtosis (Field, 2013).
3.9.3.2.2 Linearity Test
According to (Field, 2013), normally distributed data assumed that the data are from one
or more normally distributed populations and hence there exist linearity between the cumulative
probability distribution of outcome variable and cumulative probability of predictor variable(s)
distribution. This can be handled by analyzing the Q-Q plots of the variables of concern. A fairly
normally distributed data yields dots hover or snake very close to the model fit
(diagonal) line. If values fall on the diagonal of the plot then the variable shares the
same distribution as the one specified. Deviations from the diagonal line show
deviations from the distribution of interest.
3.9.3.2.3 Multi-Collinearity test
A situation in two or more independent variables are highly correlated refers to condition of
Multi-Molinearity. When the independent variables are multi-co linear, there is overlap or
sharing of predictive power of the independent variables and it will be very difficult to estimate
dependent variable using regression model. Moreover, independent variables are correlated
among themselves, the unique contribution of each variable is difficult to assess. This is because
of the overlapped or shared variance between themselves, i.e., they are multi-collinear.
Reviewing the Variance Inflation Factors (VIF) and the Tolerance Values, multi-collinearity
existence could be addressed. VIF values above 10 and tolerance value below 0.10 indicate
multi-collinearity (Field, 2013). Therefore, both the “tolerance” values (greater than 0.10) and
the “VIF” values (less than 10) are all quite acceptable.
3.9.3.2.4 Correlation analysis
Correlation is a statistical device used to measure the strength or degree of a supposed linear
association between two or more variables. So that, Pearson correlation analysis was made to see
the direction and strength of relation between independent variables (i.e. store decoration, store
product assortment, feature area, light & color of store, employee appearance and employee
professionalability) and the dependent variable, brand awareness of motorcycle stores. The
strength of a linear relationship (i.e., how close the association is to being a perfectly straight

30
line) and the direction of a linear relationship (increasing or decreasing) were performed. All the
necessary requirements (i.e. continuous variables, case value on both variables, linear
relationship between variables, independent cases, normality, random sample data, no outlier for
analysis of correlation using Pearson correlation were performed and the data found to be
suitable for analysis.
As per Field (2013), the strength (value of Pearson correlation analysis) of the correlation value
could be interpreted using the following rule of thumb;
0.1 < | r | < 0.3 … small / weak correlation
0.3 < | r | < 0.5 … medium / moderate correlation
0.5 < | r | < 1.0 … large / strong correlation
3.9.3.3 Inferential Statistics - Regression analysis
The extent to which independent variables (store decoration, store product assortment, feature
area, light & color of store, employee appearance and employee professionalability) influence
the dependent variable (brand awareness) was investigated using regression analysis. Regression
analysis help fit a predictive model for dependent variable (brand awareness) from independent
variables (store decoration, store product assortment, feature area, light & color of store,
employee appearance and employee professionalability). It also help generate inference to test
the hypothesis. Hence, in order to see the effect of in-store promotions on brand awareness of
motorcycle store, multiple linear regression analysis was employed. Multiple Linear regression
estimates the coefficient of the linear equation, involving all independent variables (store
decoration, store product assortment, feature area, light & color of store, employee appearance
and employee professionalability) that best predict the value of the outcome variable (brand
awareness).

31
CHAPTER FOUR
DATA PRESENTATION, ANALYSIS AND INTERPRETATIONS
4.1 Respondents’ profileA total of 384 respondents were participated in this research. Summary of the demographic
profiles of these respondents was shown in the following tables. Most of the motorcycle
customers/respondents were males (68%). Most of the respondents are between the ages of 31
years and 45 years with major monthly income groups being above 10,000 birr and below 20,000
birr.
Table 4.1.3 Demographic profile of respondents
Frequency PercentValid
PercentCumulative
PercentFrequency
Gender Male 261 68.0 68.0 68.0Female 123 32.0 32.0 100.0
Total 384 100.0 100.0
Income Below 3,000 108 28.1 28.1 28.1Birr 3,001 to 10,000 118 30.7 30.7 58.9
Birr 10,001 to 20,000 158 41.1 41.1 100.0
Total 384 100.0 100.0
Age 18 to 30 Yrs 94 24.5 24.5 24.531 to 45 Yrs 186 48.4 48.4 72.9
46 to 60 Yrs 104 27.1 27.1 100.0
Total 384 100.0 100.0
Source: Own survey, 2019
Although respondents were asked to just either list or write the motorcycle brand they prefer,
unfortunately there existed no respondent that either wrote both brands or other brands (may be
this is because of the fact that respondents were selected purposively).
The respondents’ preferred brand between Bajaj and TVS is also extracted and summarized here
in the below table, where many of the respondents (61.5%) preferred Bajaj brand.

32
Table 4.1. 4 Preferred Brand
Frequency Percent Valid Percent Cumulative PercentValid Bajaj 236 61.5 61.5 61.5
TVS 148 38.5 38.5 100.0Total 384 100.0 100.0
Source: Own survey, 2019
As can be seen in the table below, most of the motorcycle markets and customers were located in
the SNNP region mainly Hawassa (22.1%) followed by the capital of the country Addis Ababa
(21.9%).
Table 4.1.5 Town Bought
Frequency Percent Valid PercentValid Adama 70 18.2 18.2
AddisAbaba
84 21.9 21.9
Bahir Dar 35 9.1 9.1Dire Dawa 15 3.9 3.9Harar 10 2.6 2.6Hawassa 85 22.1 22.1Jigjiga 10 2.6 2.6Jimma 30 7.8 7.8Mekelle 25 6.5 6.5Nekemtie 20 5.2 5.2Total 384 100.0 100.0
Source: Own survey, 2019
Respondent were also asked as what environmental cues help them find the motorcycle store
from which they bought their motorcycles and the response obtained is summarized and
tabulated below. As can be seen, most of the respondents (55.5%) relied on Sore Design and an
environmental cue locating the stores followed by store employee (42.7%). As can be seen from
the data collected using the survey, store atmospherics obtained the least response (7%) which
may be attributed to the insignificant attention paid by motorcycle stores in the country or
respondents are at vague understanding the issue at all to use as environmental cues to find the

33
stores because of which the researcher has deliberately omitted variables related this
environmental cue from further analysis.
Table 4.1.6 Environmental Cues
Frequency Percent
ValidPercent
CumulativePercent
Valid Store Design 213 55.5 55.5 55.5Store Employee 164 42.7 42.7 98.2Store Atmospherics 7 1.8 1.8 100.0Total 384 100.0 100.0
Source: Own survey, 2019
4.2 Descriptive Statistics
4.2.1 Descriptive AnalysisIn the following 7 consecutive tables, descriptive statistical analysis of variable dimensions used
as a measure of in-store promotions and brand awareness is performed and presented. Table
4.2.1.6 to Table 4.2.1.12 presents results of descriptive analysis from store decoration, store
product assortment, store feature area, light & color of store, store employee appearance, store
employee professionalability, and store brand awareness; followed by comparison of the
descriptive mean score and standard deviations of the four store design dimensions and the two
store talent (social) dimensions. All parts of the dimensions are processed, analyzed and
interpreted in order to achieve the desired result as follows.
4.2.1.1 Store DecorationsThe respondents were asked 4 questions related to store decorations. The Table 4.2.1.6 below
presents respondents’ result of store decorations with mean and standard deviation values for
each item.
As it can be seen from table 4.2.1.6 below, the mean value of store decorations is 3.44 and
the highest mean score is obtained for the item “I can easily recognize the decoration of this
store from among other store decorations” with a mean score of 3.58 while “This store decoration
comes to my mind whenever I think of buying/using this brand of motorcycle” scored the lowest with a
mean score of 3.27. From the table, one can easily notice that respondents provide more or less
similar wait to each of the store decoration constructs.

34
Table 4.2.1.7 Store Decorations Descriptive Analysis
N MeanStd.Deviation
The interior decoration of the store selling the brand of motorcycle I’musing/bought let me feel pleasant atmosphere 384 3.37 1.395
The exterior decoration of the store selling the brand of motorcycle I’musing/bought let me feel pleasant atmosphere 384 3.56 1.345
This store decoration comes to my mind whenever I think ofbuying/using this brand of motorcycle 384 3.27 1.355
I can easily recognize the decoration of this store from among otherstore decorations 384 3.58 1.357
Store Decoration 384 3.44 1.038Valid N (listwise) 384Source: Own survey, 2019
4.2.1.2 Store Product AssortmentThe respondents were asked 4 questions related to product assortment. The Table 4.2.1.7 below
shows respondents’ descriptive statistics results of product assortment with mean and standard
deviation values for each item.
In the above table below, the mean value of store product assortment is 3.59 and the highest
mean score is obtained for the construct “This store provides variety of products” with a
mean score of 3.64. Here also, all the constructs reveal similar responses of the respondents.
Table 4.2.1.8 Store Product Assortment Descriptive Analysis
N MeanStd.
Deviation
This store provides variety of products 384 3.64 1.392
Products in this store are conveniently stocked and ordered in such away as new models separated from custom ones
384 3.57 1.458
I can easily remember the product assortment of this store whenever Ithink of this brand of motorcycle
384 3.54 1.403
I can easily recognize the product assortment of this store fromamong other stores
384 3.59 1.402
Store Product Assortment 384 3.59 1.293
Valid N (listwise) 384Source: Own survey, 2019

35
4.2.1.3 Store Feature AreaFour questions related to store feature area were provided to the respondents which is
represented in the following table descriptive statistics summary of mean and standard deviation
values for each of the items.
Table 4.2.1.9 Store Feature Area Descriptive Analysis
NMea
nStd.
Deviation
This store is designed in such a way that it allows visitors servethemselves, having walk-ins with signage labeled
384 3.47 1.568
This store is designed in such a way that the internal featureareas (like motorbike area, reception, spare parts area, servicecenter, etc) are separately located within
384 3.39 1.668
I remember the feature areas of this store whenever I think ofthis brand of motorcycle
384 3.29 1.571
I can easily recognize the feature areas of this store from amongother store feature areas
384 3.47 1.514
Store Feature Area 384 3.40 1.337
Valid N (listwise) 384Source: Own survey 2019
As it can be seen from table 4.2.1.8 above, the mean value of Store Feature Area is 3.40
and the highest mean score is obtained for the construct “This store is designed in such a
way that it allows visitors serve themselves, having walk-ins with signage labeled” and “I can
easily recognize the feature areas of this store from among other store feature areas” with a
mean score of 3.47 while the construct " I remember the feature areas of this store whenever I
think of this brand of motorcycle” scored the lowest with a mean score of 3.29.
4.2.1.4 Light and Color of the StoreRespondents were asked 4 questions related to light and color of the store. Table 4.2.1.9 below
presents respondents SPSS results of light and color of store with mean and standard deviation
values for each item. The mean score of light and color of store is 3.56.

36
Table 4.2.1.10 Light & Color of Store Descriptive Statistics
N MeanStd.
Deviation
I like the light & color composition of this store 384 3.53 1.348The light & color of this store goes in line with the brand itdeals
384 3.55 1.368
The light & color composition of this store comes to mindwhenever I think of motorcycle brands
384 3.64 1.324
I can easily identify the light & color composition of thisstore from any given alternative of motorcycle stores’ light& color composition
384 3.53 1.363
Light & Color of Store 384 3.56 1.057
Valid N (listwise) 384Source: Own survey, 2019
4.2.1.5 Store Employee AppearanceBeing asked four questions related to store employee appearance, the mean scores and standard
deviations of respondents’ response to each of the constructs were summarized and put in the
table below.
Table 4.2.1.11 Employee Appearance Descriptive Statistics
N MeanStd.
Deviation
This store’s employees are attractively dressed 384 3.39 1.338The quality of my interaction with this store employees isexcellent
384 3.44 1.317
This store’s employees appear in such a way that helps meremember the motorcycle brand sold in the store whenever Ithink of buying/using of such a product
384 3.46 1.310
This store’s employees appear in such a way that helps merecognize the motorcycle brand sold in the store from otherbrands
384 3.41 1.339
Employee Appearance 384 3.43 1.029
Valid N (listwise) 384Source: Own survey, 2019
The mean score of store employee appearance is 3.43 while the highest mean score was obtained
for the question “The quality of my interaction with this store employee is excellent” indicating
that the employee’s quality of interaction with customers in the motorcycles store creates more
favorable memory to the customers.

37
4.2.1.6 Store Employee ProfessionalabilityBeing asked three questions related to store employee Professionalability, the mean scores and
standard deviations of respondents’ response to each of the constructs were summarized and put
in the table below.
Table 4.2.1.12 Employee Professionalability Descriptive Statistics
N MeanStd.
DeviationThe store personnel (from front office to the aftersales team)have good product and technical knowledge
384 3.64 1.281
This store’s employees professional knowledge aboutmotorcycles help me remember the motorcycle brand thestore deals
384 3.67 1.290
This store’s employees professional knowledge aboutmotorcycles help me easily recognize the motorcycle brandthe store deals from others
384 3.82 1.289
Employee Professionalability 384 3.71 1.048
Valid N (listwise) 384
Source: Own survey, 2019
The mean score of store employee Professionalability is 3.71 while the highest mean score was
obtained for the question “This store’s employees professional knowledge about motorcycles
help me easily recognize the motorcycle brand the store deals from others” indicating that the
employees professional knowledge about motorcycles in the motorcycles store helps respondents
easily recognize the motorcycle brands dealt in the store from others.
4.2.1.7 Store Brand AwarenessRespondents were asked if they are aware of the motorcycle brand they had in view of the store
design and store talent and their mean score response revealed 3.57.
Table 4.2.1.13 Store Brand awareness Descriptive Statistics
N Mean Std. Deviation
In view of the store design and store talent, I can say, I’m aware ofthe brand of motorcycle I had or deal
384 3.57 .888
Valid N (listwise) 384
Source: Own survey, 2019
38
4.3 Inferential Statistics
4.3.1 Correlation AnalysisAll basic constructs were included in the correlation analysis and a bivariate two-tailed
correlation analysis with significance level of 95%, p<0.05 was made. Table 4.3.13 below
indicates the Pearson correlation between each in-store promotion dimensions and brand
awareness of motorcycles in Ethiopia.
As the table below demonstrates, Pearson correlation coefficients of independent variables (store
decoration, store product assortment, store feature area, light & color of store, store employee
appearance, and store employee professionalability) found to be positively and significantly
related with in themselves and also to the dependent variable, store brand awareness at p<0.01
level of significance. The correlation between store feature area and store employee appearance
was found to be WEAK correlation, while the correlation among other variables was found to be
MODERATE to STRONG correlation.
In general, the correlation analysis test signified that all the correlations between the variables
was found to be positive and significant at significance level of P<0.01 with the majority of the
association/correlation being strong.

39
Table 4.3.14 Correlation Analysis Result
Store
Decorati
on
Store
Product
Assortment
Store
Feature
Area
Light &
Color of
Store
Employee
Appearance
Employee
Professional
ability
Store Brand
Awareness
Store Decoration Pearson
Correlation
1
Sig. (2-tailed)
N 384
Store Product
Assortment
Pearson
Correlation
.403** 1
Sig. (2-tailed) .000
N 384 384
Store Feature
Area
Pearson
Correlation
.343** .341** 1
Sig. (2-tailed) .000 .000
N 384 384 384
Light & Color of
Store
Pearson
Correlation
.578** .602** .423** 1
Sig. (2-tailed) .000 .000 .000
N 384 384 384 384
Employee
Appearance
Pearson
Correlation
.464** .340** .289** .457** 1
Sig. (2-tailed) .000 .000 .000 .000
N 384 384 384 384 384
Employee
Professionalabilit
y
Pearson
Correlation
.580** .365** .331** .531** .461** 1
Sig. (2-tailed) .000 .000 .000 .000 .000
N 384 384 384 384 384 384
Store Brand
Awareness
Pearson
Correlation
.551** .476** .656** .618** .421** .460** 1
Sig. (2-tailed) .000 .000 .000 .000 .000 .000
N 384 384 384 384 384 384 384
**. Correlation is significant at the 0.01 level (2-tailed).
Source: Own survey, 2019

40
4.3.2 Test for Linear Regression Model Assumptions
4.3.2.1 Normality TestAs can be seen from the Histogram (see Appendix A), all independent variables had normal (bell
shaped) distribution curve, witnessing the data to the normality assumption. Additionally, the
Skewness and Kurtosis analysis were also performed and the results presented as follows;
It is observed from below table that all the absolute values of the Skewness and Kurtosis lie
between -2 and +2.
Table 4.3.15 Skewness and Kurtosis for normality of data
N Skewness Kurtosis
Statistic Statistic Std. Error Statistic Std. Error
Store Decoration 384 -.242 .125 -.715 .248
Store Product Assortment 384 -.607 .125 -.878 .248
Store Feature Area 384 -.153 .125 -1.472 .248
Light & Color of Store 384 -.148 .125 -1.118 .248
Employee Appearance 384 -.262 .125 -.237 .248
Employee Professionalability 384 -.597 .125 -.273 .248
Store Brand Awareness 384 .183 .125 -.804 .248
Valid N (listwise) 384
Source: Own survey, 2019
The Skewness results were found to range from -0.597 to -0.148 while the Kurtosis results range
from -1.118 to -0.237. Therefore, both the histogram analysis in the appendix and review of
Skewness & Kurtosis of the data affirmed that the data is normally distributed.

41
4.3.2.2 Linearity TestAs can be seen from the Q-Q Plot (see Appendix B), as the dots for all independent variables and
the dependent variable hover or snake very close to the model fit (diagonal) line, the variables
share the same distribution as the one specified. This confirms linearity of all the variables
considered and hence running linear regression is guaranteed.
4.3.2.3 Multi-Collinearity TestThe multicollinearity test result of this study revealed that the tolerance value ranges from 0.450
to 0.787 which all are above 0.1 and the values of Variance Inflation Factor (VIF) of all the
independent variables lied within the range of 1.271 and 2.222 which all are below 10. Thus the
result confirmed that there is no significant indication for existence of multi collinearity among
the independent variables.
Table 4.3.16 Multi-Collinearity Test Result
Model
Collinearity Statistics
Tolerance VIF
1 (Constant)
Store Decoration .540 1.854
Store Product Assortment .623 1.605
Store Feature Area .787 1.271
Light & Color of Store .450 2.222
Employee Appearance .695 1.439
Employee Professionalability .577 1.733Source: Own Survey, 2019
4.3.3 Multiple Linear Regression AnalysisConsidering normal distribution and no significant multicollinearity indication, the researcher
performed multiple regression analysis and the result presented as follows.
Table 4.3.17 Multiple Regression Analysis Model Summaryb
Model R R Square Adjusted R Square Std. Error of the Estimate Durbin-Watson
1 .782a .612 .606 .557 2.246
a. Predictors: (Constant), Employee Professionalability, Store Feature Area, Store ProductAssortment, Employee Appearance, Store Decoration, Light & Color of Store
b. Dependent Variable: Store Brand AwarenessSource: Own survey, 2019

42
As can be seen in the regression table above, the value of Durbin-Watson test 2.246 shows that
the possibility of autocorrelation is very minimal meaning that adjacent residuals (errors) are
uncorrelated. Moreover, R Square value 0.612 signifies that 61.2% of the variation in the
outcome/dependent variable, Store Brand Awareness, can statistically be explained by the
independent variables (Store decoration, store product assortment, store feature area, store light
& color, store employee appearance, and store employee professionalability).
4.3.4 ANOVAAs the main aim of this study is to identify the effect of in-store promotion (independent
variables – represented by store decoration, store product assortment, store feature area, store
light & color, store employee appearance, and store employee professionalability) on store brand
awareness (dependent variable), the predictive power of each predictors (independent variables)
affecting the criterion (dependent variable) had to be investigated.
According to Field (2013), the most important part of the ANOVA table like above is the F-
ratio and the associated significance value of that F-ratio. The significant level in the
ANOVA table below signifies that the combination of variables significantly predict the
dependent variable (P < 0.05). ANOVA that tests whether the model is significantly better at
predicting the outcome than using the mean as a best guess; specifically, the F-ratio represents
the ratio of the improvements in prediction that results from fitting the model, relative to the
inaccuracy that still exists in the model. For these data, F is 99.133, which is significant at p <
0.001. This result tells us that there is less than a 0.1% chance that an F-ratio larger would
happen by chance alone. Therefore, we can say that our regression model results in significantly
better prediction of brand awareness than if we used the mean value of customers’ brand
awareness.

43
Table 4.3.18 F-Test result of ANOVAa
ModelSum ofSquares df
MeanSquare F Sig.
1 Regression 184.816 6 30.803 99.133 .000b
Residual 117.142 377 .311
Total 301.958 383
a. Dependent Variable: Store Brand Awareness
b. Predictors: (Constant), Employee Professionalability, Store Feature Area,Store Product Assortment, Employee Appearance, Store Decoration, Light &Color of Store
Source: Own survey, 2019
In order to do this, we have to see the ANOVA table presented below and if the regression model
is significant in predicting the criterion variable, it is via the unstandardized ẞ coefficients that
the extent of predictive power of predictors on the criterion estimated.
Once we have confirmed that the regression model was significantly able to predict the
dependent variable, it is worth analyzing the regression coefficients table to see the predictive
power of each of the predictors in the model. The regression coefficient (ẞ) explains the average
amount of change in the dependent variable that is caused by a unit change in the independent
variable. Independent Variable with higher value of unstandardized coefficient was the one that
affects the dependent variable highly and it is more important in predicting the dependent
variable. The result of the multiple regression analysis made with SPSS is presented in the
following table.
Table 4.3.19 Multiple Linear Regression Analysis Result Coefficientsa
Unstandardized Coefficients Standardized Coefficientst Sig.B Std. Error Beta
(Constant) .869 .128 6.787 .000
Store Decoration .164 .037 .191 4.383 .000
Store ProductAssortment
.054 .028 .079 1.940 .053
Store Feature Area .292 .024 .439 12.148 .000
Light & Color of Store .197 .040 .234 4.901 .000
Employee Appearance .052 .033 .061 1.573 .117
Employee Professionalability .019 .036 .023 .544 .587Source: own survey, 2019

44
The result of the regression analysis showed that the level of influence each of the independent
variables have on the dependent variable is different, store feature area having the major positive
influence on store brand awareness with ẞ value of 0.292 and employee professionalability
being the least influential construct in this model with ẞ value of 0.19. With the exceptions of
store product assortment, employee appearance, and employee professionalability, all the
independent variables were found statistically significant in predicting store brand awareness of
motorcycle market in Ethiopia.
The objective of the regression in this study is to find such an equation that could be used to find
the impact of predictors/construct variables/ on the dependent variable. The specified regression
equation takes the following linear form:
Y=ẞ0+ ẞ1X1+ ẞ2X2+ ẞ3X3+ . . . + ẞn Xn + Ꜫ
In the above equation, predictor variables Xi may represent independent variables or covariates
(control variables). Covariates are variables that are not of theoretical interest but may have some
impact on the dependent variable Y and should be controlled, so that the residual effect of the
independent variables of interest are detected more precisely. Covariates capture systematic
errors in a regression equation while the error term (Ꜫ) captures random errors (Bhattacherjee,
2012).
The Equation takes the form;
Y= ẞ0 + ẞ1(Store Decoration) + ẞ2(Store Product Assortment) + ẞ3(Store Feature Area) +
ẞ4(Store Light & Color) + ẞ5(Employee Appearance) + ẞ6(Employee Professionalability)
Where,
Y is Store Brand Awareness
So our model equation becomes;
Brand Awareness = 0.869 + 0.164(Store Decoration) + 0.054(Store Product Assortment) +
0.292(Store Feature Area) + 0.197(Store Light & Color) + 0.052(Employee Appearance) +
0.019(Employee Professionalability)
Therefore, to increase brand awareness of motorcycle market in Ethiopia, it is advisable to
implement in-store promotions especially via store’s feature areas like walk-ins, signages,
separate places for separate model motorcycles, etc inside the stores.

45
4.4 Hypothesis Testing and Interpretation of Results
Table 4.4.20: Hypothesis Testing Based on Multiple regressions Analysis Result
Hypothesis Statement of the Hypothesis Result Reason
H0aStore Decorations has no positive andsignificant effect on consumer’s brandawareness of motorcycles in Ethiopia
H1a supported ß = 0.164, P<0.05
H1aStore Decorations has positive and significanteffect on consumer’s brand awareness ofmotorcycles in Ethiopia
H0bStore Product Assortment has no positive andsignificant effect on consumer’s brandawareness of motorcycles in Ethiopia
H0b supported ß = 0.054, P>0.05
H1bStore Product Assortment has positive andsignificant effect on consumer’s brandawareness of motorcycles in Ethiopia
H0cStore Feature Area has no positive andsignificant effect on consumer’s brandawareness of motorcycles in Ethiopia
H1c supported ß = 0.292, P<0.05
H1cStore Feature Area has positive and significanteffect on consumer’s brand awareness ofmotorcycles in Ethiopia
H0dStore Light & Color has no positive andsignificant effect on consumer’s brandawareness of motorcycles in Ethiopia
H1d supported ß = 0.197, P<0.05
H1dStore Light & Color has positive and significanteffect on consumer’s brand awareness ofmotorcycles in Ethiopia

46
Hypothesis Statement of the Hypothesis Result Reason
H0eIn–store employee appearance has no positiveand significant effect on consumer’s brandawareness of motorcycles market in Ethiopia.
H0b supported ß = 0.052, P>0.05
H1eIn–store employee appearance has significantpositive effect on consumer’s brand awarenessof motorcycles market in Ethiopia.
H0f
In–store employee professionalability has nopositive and significant effect on consumer’sbrand awareness of motorcycles market inEthiopia.
H0b supported ß = 0.019, P>0.05
H1f
In–store employee professionalability haspositive and significant effect on consumer’sbrand awareness of motorcycles market inEthiopia.
Source: Own survey, 2019
As results of the study summarized in Table 4.4.19 above, three of the null hypotheses were
rejected while the other three were supported. Hence, store decoration, store feature area, and
store light & color have positive and significant effect on consumer’s brand awareness of
motorcycle market in Ethiopia. On the other hand, store product assortment, store employee
appearance, and store employee professionalability do not have significant effect on brand
awareness of motorcycle market in Ethiopia.
4.5 Discussion of the FindingsThe purpose of this study was to measure the effect of in-store promotions on brand awareness of
motorcycle market in Ethiopia. Using structured survey questionnaire, relevant data were
collected. Target population of the study considered was all motorcycle customers and dealers
(importers, assemblers, distributors, and retailers) of Bajaj and TVS brand motorcycles. The
survey questionnaires were grouped in to three parts, the first part structured to gather
demographic profile of respondents. Based on the collected demographic data, analysis &
summery as per the tables in section 4.1 above, the demographic data were dominated by male

47
adults with more preferred brand being Bajaj brand. As can be noticed from Table 4.1.4 above,
the market for Bajaj and TVS brand motorcycles is dominant on the road from the capital city,
Addis Ababa, to SNNPR; i.e. Addis Ababa, Adama and Hawassa have got largest respondents in
the survey.
The second part of the questionnaires was structured to collect information about respondents’
attitude toward in-store promotion dimension constructs. Based on the data collected, analysis &
summery as per Table 4.5.20 below, it can be seen that the mean scores of all the in-store
promotional dimensions stated have shown more than 3.40 which is inclined towards positive.
This shows that in-store promotions of motorcycle market in Ethiopia is getting growing value in
the minds of customers of the stated brand products.
Table 4.5.21 In-Store Promotion Dimensions’ Descriptive Statistics
N Mean Std. DeviationStore Decoration 384 3.44 1.038Store ProductAssortment
384 3.59 1.293
Store Feature Area 384 3.40 1.337Light & Color of Store 384 3.56 1.057Employee Appearance 384 3.43 1.029EmployeeProfessionalability
384 3.71 1.048
Valid N (listwise) 384
Source: Own Survey, 2019
In the third part, respondents were asked about their level of awareness of motorcycle brands in
consideration to the in-store constructs inquired in the second part of the questionnaire and
obtained mean score of 3.57 which indicates that overall store brand awareness of respondents is
positive and good which can be an indication of the effect of in-store promotions so far
employed.
The finding from the correlation result reveals that, some of the constructs have positive and
significant strong relationship among the in-store promotion dimensions and store brand
awareness that goes with the work of many researchers (Baker et al., 1994; Baker et al., 2002;
Singh, 2006; Halpern & Odell, 2010; Floor, 2007; Kishore, 2014; etc). By and large, some of the
in-store promotion constructs showed moderate relationship among the in-store promotion

48
dimensions and with brand awareness as well; which is in line with the work of Ricky Y. K.
Chan & Susan Tai (2001).
Multiple regression analysis revealed that three independent variables (store decoration, store
feature area and store light & color) exhibited positive & significant influence on brand
awareness; of course with their dissimilar magnitude of influence.
The results of the regression analysis outcome comply with different studies performed by other
researchers.
Summary of previous studies findings in line with this study;
Floor (2007) found that the design appearance of stores through striking design, unique
look and feel significantly and positively affect customers cognitive evaluations of brand
awareness.
A.E Kirby & A.M Kent (2010), in their study of Architecture as brand: store design &
identity in UK, revealed that store design as conveyed by the store feature areas and
decorations has significant positive effect on leveraging consumers brand awareness and
identity of the retail store.
Holmquist & Lunardo (2015), found convergent result in which exciting store
environments tend to elevate consumers pleasure with their brand preference. Store
design portrayed by store decorations, store feature areas, and store light and color have
all significant role to play in shaping consumers’ perceptions of the brand, which can
result in consumers purchasing the brand and become brand aware and loyal.
Modern and remarkable decorations of store signify positive attitudinal effect on
customers brand awareness (Nistroscu T, 2008).
Well-designed lighting and color systems can bring an added dimension to an interior
design, guide consumers’ eyes to key sales points, create an atmosphere of excitement,
and induce positive affect and increased brand awareness (Yoo, Park, & MacInnis, 1998).
Kahn & Deng (2010) have also argued that graphic designs (color composition) of a store
have significant effect in strengthening of brand awareness and association.
Brakus, Schmitt & Zarantonell (2014), in their study focused on fashion (apparel)
industry in South Africa, found that pleasant in-store environment such as light & color
of the store tend to positively and significantly affect customers attitude toward the brand.
49
Venter de Villiers, M., Chinomona, R., & Chuchu T., (2018), in their study entitled “the
influence of store environment on brand attitude, brand experience, and purchase
intention of fashion retailing in South Africa, have found that store environments such as
light & color positively and significantly influence brand attitude and awareness.
Some researchers have also found opposing results;
Ricky Y. K. Chan & Susan Tai, (2001), in their investigation entitled “How Do In-Store
Environmental Cues Influence Chinese Shoppers?”, found that store design and other
environmental elements of a store exert insignificant role to impact Chinese consumers
shopping behaviors and their brand awareness.
Ismail M. El Sayed , Dalia A. Farrag & Russell W. Belk (2003), in their study of “The
Effects of Physical Surroundings on Egyptian Consumers' Emotional States and Buying
Intentions” have found that Egyptian consumers are less responsive to store
environmental variables such as store design, lighting & color, social cues (like employee
appearance & professionalism, and availability of other customers) to evoke their brand
preference and awareness.
Kirshina K et al., (2012), in their study “Innovation in In-Store Promotions: effect of
consumer purchase decision” have shown that in-store employee appearance, and their
interaction and professionalism (knowledge ability) significantly affect consumers brand
perceptions and awareness there by enhance purchase.
A smiley and easily available store employee induces positive affect which results in
increased brand awareness (Manttila & Enz, 2002).
Daniel Wade Clarke, Patsy Perry, Hayley Denson, (2012) in their study of "The sensory
retail environment of small fashion boutiques", the intangible store traits such as lighting
& color, and employee appearance & professionalism significantly affect consumer’s
shopping experience and hence brand awareness.
Hence, previous researches affirm the findings of this study, i.e. store decorations, store feature
areas, store light & color positively and significantly influence brand awareness of consumers
while store product assortment, store employee appearance & professionalability have
insignificant effect.

50
CHAPTER FIVE
SUMMARY, CONCLUSION AND RECOMMENDATIONS
5.1 Summary of FindingsAs the main goal of this study is to understand the effect of in-store promotion on brand
awareness of motorcycle in Ethiopia with specific emphasis to Bajaj and TVS brand, it is
important to understand/measure whether consumers could recall and recognize the brand of
motorcycle conveyed through the in-store promotion variables because brand awareness
measures are made through these mediating variables. The results of the study revealed
interesting findings. The three independent variables, store decoration, store feature area, and
store light & color have shown positive and significant effect on brand awareness while the other
three variables; store product assortment, store employee appearance, and store employee
professionalability were found insignificant.
The results of the study indicated that the consumers have shown to use some of the
environmental cues by which in-store promotions were made to recall and recognize the brand
being portrayed.
In addition, this study also tried to answer the research hypotheses formulated in chapter two of
this study. To this end the researcher considered quantitative explanatory research design and
simple random sampling technique to collect data from 384 sample size of motorcycle
customers, dealers, assemblers and importers. Based on the theoretical frame work and
objectives of the study, 24 questions were provided in a 5 point Likert scale to the respondents.
The gathered data was analyzed by using both descriptive statistics (like mean, frequency,
percentage) and inferential statistics (correlation and multiple linear regressions) by the use of
SPSS version 24.
The results of descriptive analysis showed, the mean value of all dimensions is above 3.27
signifying the respondents have positive perceptions towards the studied motorcycle brands’ in-
store promotions and their respective brand awareness.

51
The output from Pearson's Correlation analysis indicated that all the six independent variables
considered in this study had a positive correlation with store brand awareness. The Pearson
coefficients indicated that the variables have different magnitudes of correlation with the
dependent variable.
Accordingly, store feature area showed the strongest positive correlation (r=0.658, p<0.01)
followed by store light & color (r=0.618, p<0.01) and the least correlation to the dependent
variable being exhibited by store employee appearance (r=0.421, p<0.01). The study also
revealed existence of positive inter-correlation between the in-store promotions constructs
considered in this survey.
One of the objectives of this study was to find out which in-store promotion dimension has the
most significant effect on consumers brand awareness of the stipulated motorcycle brands in
Ethiopia. The multiple linear regression analysis revealed that store feature area such as layout,
walk-ins, signages, etc has the most significant positive effect on brand awareness (ẞ=0.292,
p<0.05); the least and insignificant effect being exerted by store employee professionalability
such as employee product & technical knowledge.
5.2 ConclusionIt is known that brand awareness is one of the concepts in brand management, as well as in
marketing practice. Consumers are, now a days bombarded with enormous advertisings by
marketers in their intention to boost consumers’ awareness and develop brand equity. However,
in a stiff competition market like motorcycles market in Ethiopia, creating brand awareness
through advertising is the simplest method to be copied by rivals. Hence, use of BTL marketing
like in-store promotions to be unique and own high brand value in the minds of customers is the
current way out. Use of in-store promotions, though it is at its infant stage in Ethiopia, by
retailer, distributors, and marketers to create brand memory that the customer can retrieve when
thinking of the product category help increase brand awareness by differentiating from their
competitors in order to gain the competitive advantage in the market.
Based on the descriptive & inferential analysis result of this study, the following conclusions
were drawn;

52
Most respondents provide higher degree of awareness for Bajaj brand than TVS
signifying their relative market share.
Store design constructs have relatively higher effect on brand awareness under
investigation.
The internal design of store described by feature area like layout, walk-ins, separate areas
for various products, etc was found the most significant construct influencing brand
awareness
Store talent ( employee related variables) was found insignificant in this study which may
be attributed to the reason that most of the employees working with any other brand than
Bajaj and TVS motorcycles have similar behavior and product knowledge and hence
those employees in the surveyed stores were not uniquely attached to these brands.
5.3 RecommendationsDepending on the findings of the study and the conclusions made, the following possible
recommendations were forwarded for the concerned body:
Retailers dealing Bajaj and TVS brand motorcycles in Ethiopia should invest more on the
interior design of their stores to magnify the store’s layout, walk-ins, separate area for
different models, etc so as to effectively influence store brand awareness of their
customers.
Store owners of Bajaj and TVS brand motorcycles in Ethiopia should design their store
decoration in such a way as to provide customers with a feeling of pleasant atmosphere
so that their brand awareness be affected.
The light and color of stores dealing Bajaj and TVS brand motorcycles in Ethiopia should
be designed in such a way to go in line with the brand they deal so that it becomes brand
recall and recognition cue to the customers.
Stores should provide their employees with uniforms of the brand so that their
appearance would affect the respective brand awareness.
Store should train their employees from the store front to the back end in such a way that
customers can find these employees uniquely representing the brand they handle.

53
As the way of increasing brand awareness through advertising can simply be copied by
competitors, brand owners, retailers, and store owners working on in-store promotions
can obtain unique brand value in the minds of their customers.
To increase brand awareness, stores dealing Bajaj and TVS brands should be designed in
such a way that it uniquely be related to the brand being handled and if all stores across
the country dealing similar products were made to have similar design, much higher level
of brand awareness can be achieved.
5.4 Limitations and Suggestion for future researchAs student research, this study had some limitations mainly resulting from sampling method,
purposive random sampling (nonprobability). Data was gathered from some of the towns of the
country only & at random and not cover the whole Ethiopia. The result may have been different
if large samples from all across the nation were collected. Hence, further research investigation
can be done to include all or more towns and rural areas as well so that the findings could be
generalized to the country at large.
However, this study can be used as a bench mark for dealers, retailers and marketers from which
they can get some basic information as to what the brand awareness levels and in-store
promotion significances are.
With due focus on store design and store social variables only, the study has shown some
remarkable and notable results and findings discussed above. However, future research including
the other environmental variable, store atmospherics and other exogenous variables like parking
area, proximity, location etc, needs to be conducted as an addition and better qualification to this
study.

54
BIBILIOGRAPHY
Aaker D, (1996). ‘Measuring Brand Equity Across Products and Markets’. California
Management Review, Vol 38. No. 3.
Abu B & Krishana K. S., (2015). ‘Consumer Purchase Intention and Store Attributes: A
Study of Delhi & Ncr’. International Journal of Marketing & Financial Management,
Vol 3, Issue 03.
Ahmad Z & Umar M, (2009). ‘A comparison of brand awareness in high-involvement and
low-involvement products: A case of university of Gujrat’. Accessed at:
https://www.researchgate.net/publication/266736668 on Jan 03, 2019
Arvidsson A, (2005). ‘Brands: A critical perspective’. Journal of Consumer Culture, 5 (2),
235-258.
Baker J et al, (2002). ‘The Influence of Multiple Store Environment Cues on Merchandize
Value and Patronage Intentions’. Journal of Marketing, Vol 66, No. 2.
Baohong S et al, (2003). ‘Measuring the Impact of Promotions on Brand Switching when
Consumers are Forward Looking’. Journal of Marketing Research, Vol 40/10.1509
Berman B & Evans J.R., (2010). Retail Management: A Strategic Approach 11th ed, New
Jersey: Prentice Hall
Bhukya, R., & Singh, S. (June 2016). ‘Factors Affecting Shoppers’ Brand Preference
Towards Choosing Retail Stores’. The IUP of Brand Management, XIII (2), 75-86.
BRCIC
Chan-Olmsted (2008). ’Competitive Strategy for Media Firms: Strategic and Brand
Management in Changing Media Markets’. Lawrence Erlbaum Associates, Inc.
Corinne N et al.., (2013). ‘Exploring the influence of store atmospherics on consumers’
buying behavior in apparel retail stores: An exploratory study in Tshwane’. University
of South Africa
Daniel Wade Clarke, Patsy Perry, Hayley Denson, (2012). ‘The sensory retail environment of
small fashion boutiques’. Journal of Fashion Marketing and Management: An
International Journal, Vol. 16 Issue: 4, pp.492-510
55
David A, and Damien McLoughlin. Strategic Market Management: Global
Perspectives. Hoboken, N.J.: Wiley, 2010.
David L. M & Hawkins D.I, (2016). Consumer Behavior: Building Marketing Strategy. 13th
ed. New York: McGraw-Hill Education.
Dunne P.M. & Lusch R.F., (2010). Retailing 7th ed, USA: Thomson South Western
University Pub
Elvin P & Mehran N, (2008). ‘Influencing Consumers Decision through In-Store
Demonstrations’. Stockholm School of Economics
Erasmus,A. C., & Grabowski, A. (2013). ‘Female customers' expectation of the service
offering and their perception of the service quality in an emerging clothing market’.
International Journal of Consumer Studies, 37(1), 2-12.
Eric R. S et al.., (2010). ‘Improving the Store Environment: Do Olfactory Cues Affect
Evaluations and Behaviors?’. Journal of Marketing; Vol. 60, No. 2, PP 67-80
Ferrell O.C & Hartline M.D, (2013). Marketing Strategy: Text and Cases. 6th ed. USA:
South-Western, Cengage Learning.
Hasan, A., & Mishra, S. (2015). ‘Key Drivers Influencing Shopping Behavior in Retail
Store’. IUP Journal of Marketing Management, 14(3), 7-36.
Hussain R & Ali M., (2015). ‘Effect of Store Atmosphere on Consumer Purchase Intention’.
International Journal of Marketing Studies; Vol. 7, No. 2
Ismail M. El Sayed et al., (2003) ‘The Effects of Physical Surroundings on Egyptian
Consumers' Emotional States and Buying Intentions’. Journal of International
Consumer Marketing, 16:1, 5-27
Keller L.K, (2013).Strategic Brand Management: Building, Measuring, and Managing Brand
Equity. 4th ed. Edinburgh Gate Harlow Essex CM20 2JE England: Pearson Education
Ltd.
Kishore K et al.., (2012). ‘Innovation in In-Store Promotions: Effects on Consumer Purchase
Decision’. European Journal of Business and Management; Vol. 4, No.9
Kirby A.E & Kent A.M, (2010). ‘Architecture as Brand: Store Design and Brand Identity’.
Journal of Product & Brand Management; Vol. 19/6, 432–439
Kotler P. and Armstrong G, (2014). Principles of marketing. 14th ed. Europe : Prentice Hall.

56
Kotler P et al.., (2010). Marketing 3.0: From Products to Customers to the Human Spirit,
Hoboken, New Jersey: John Wiley & Sons, Inc.
Joseph W. Alba & Chatiopadhyay A, (2005). ‘Effects of Context and Part-Category Cues on
Recall of Competing Brands’. Journal of Marketing Research; Vol. 22, 340-49
Loya S et al., (2015). ‘Impact of In-Store Display on Sales: A Comparative Study among
New and Mature Product’. International Journal of Humanities and Social Science
Vol. 5, No. 11
Macdonald E. K & Sharp B. M, (2000). ‘Brand Awareness Effects on Consumer Decision
Making for a Common, Repeat Purchase Product: A Replication’. Journal of Business
Research; Vol. 48, PP 5–15
Percy L & Rossiter J.R, (1992). ‘A Model of Brand Awareness and Brand Attitude
Advertising Strategies’. Journal of Psychology & Marketing; Vol. 9(4): 263-274.
Rantung W et al.., (2014). ‘The Influence of Brand Loyalty, Brand Awareness, and Perceived
Quality on Consumer Buying Decision of Yamaha Vixion Motorcycle in Manado’.
Journal of EMBA; Vol.2 No.3: 058-067
Tynan, C., McKechnie, S., & Hartley, S. (2014). ‘Interpreting value in the customer service
experience using customer-dominant logic’. Journal of Marketing Management, 30(9-
10), 1058-1081.
Torres A & Bijmolt T, (2005). ‘Assessing Brand Image through Communalitites and
Asymmetries in Brand-to-Attribute and Attribute-to-Brand Associations’. Journal of
Marketing Research, 40(9-10), 1063-1078.
Turley L.W & Milliman R.E, (2000). ‘Atmospheric Effects on Shopping Behavior: A
Review of the Experimental Evidence’. Journal of Business Research; Vol. 49: 193–
211
Venter de Villiers M et al, (2018). ‘The Influence of Store Environment on Brand Attitude,
Brand Experience and Purchase Intention’. South African Journal of Business
Management, vol 49(1)

I
APPENDICES
Appendix A
Histogram (Normality test graph)

II
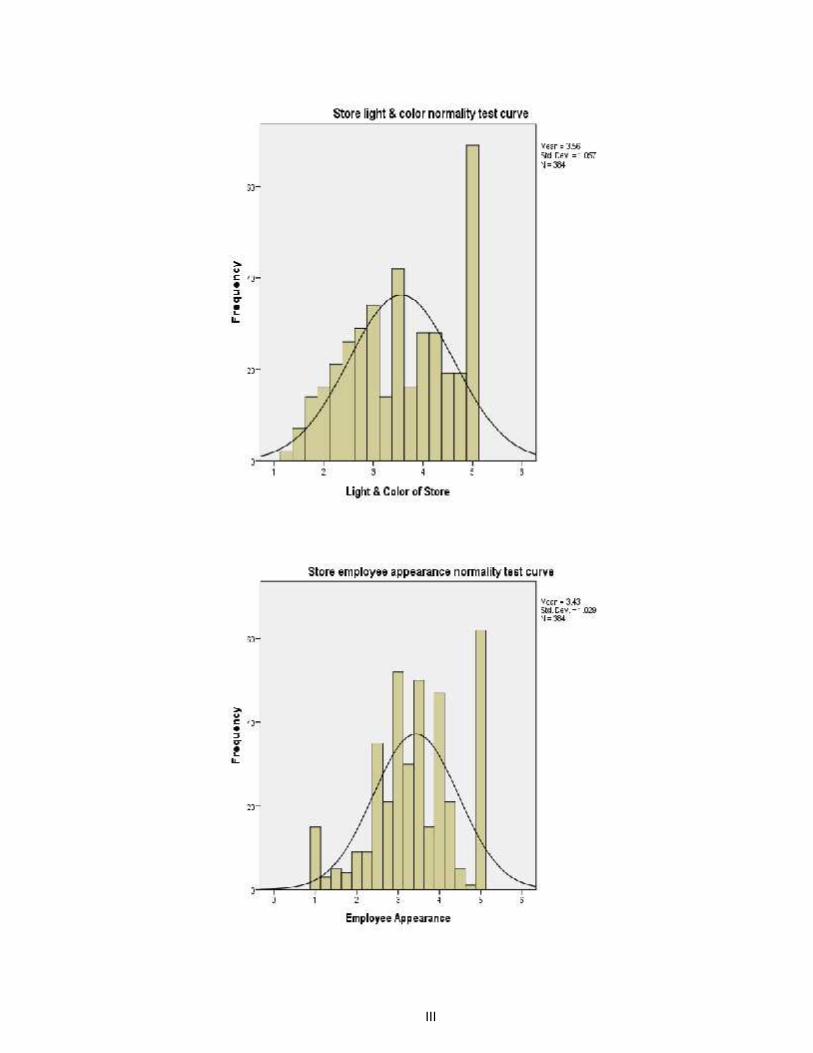
III

IV

V
Appendix B

VI

VII
Appendix C
QUESTIONNAIREADDIS ABABA UNIVERSITY SCHOOL OF COMMERCE
DEPARTMENT OF MARKETING MANAGEMENT
GRADUATE PROGRAM
Dear respondents:
My name is Dereje Taffese, a candidate graduate student at Addis Ababa University School
of Commerce. I am conducting my research thesis entitled “Effects of In-Store Promotions
on Brand Awareness: In The Case of Bajaj & TVS Motorcycle Market in Ethiopia” as
partial fulfillment of the requirements for the completion of my Master’s Degree in
Marketing Management.
The main reason you are chosen as a respondent for the study is that your perception on the in-
store promotions’ contribution to brand awareness is believed to be help draw valid conclusions
on the effect of in-store promotions on brand awareness: in The Case of Bajaj & TVS
Motorcycle Market in Ethiopia.
Participation is absolutely voluntary. If you choose to participate in this research, please take
a few minutes of your time to answer the entire questionnaire honestly about your exact
feeling on each of the questions. I really appreciate your willingness and cooperation in giving
genuine information for this questionnaire in advance, and I hereby declare and promise
you that the information you provide will be kept confidential and only be used for
academic purposes. For any clarification you may contact me through my personal phone
number 0911-819904/0902-191919 or [email protected].
Thank you for your cooperation in sharing your highly valuable opinion for the study in advance.
NB: No need of writing your, address or the name of your organization.

VIII
I. General Information
1. Gender (please mark with X in the front box)
Male Female
2. Your monthly income (please mark with X in the front box)
Below birr 3000 Birr 3001 – 10,000 Birr 10,001 – 20,000
More than 20,000 birr
3. Your age group (please mark with X in the front box)
18 to 30 years 31 to 45 years 46 to 60 years
More than 60 years
4. What is your preferred motorcycle brand?
5. Where did you buy your motorcycle?
Town
6. What environmental cues help you find this motorcycle store?
Store Design Store Texture Store Employee/Sales Person

IX
II. Components of in-store promotions
Please fill the questionnaire by ticking the most appropriate level of agreement for the inquiries. (fromStrongly Disagree to Strongly Agree)
1. Store Design
Nam
e
Stor
eL
abel
Str
ongl
yD
isag
ree
Dis
agre
e
Neu
tral
Agr
ee
Str
ongl
yA
gree
-
Stor
e D
esig
n
Decorations
The interior decoration of the store selling the brand ofmotorcycle I’m using/bought let me feel pleasantatmosphereThe exterior decoration of the store selling the brandof motorcycle I’m using/bought let me feel pleasantatmosphere
This store decoration comes to my mind whenever Ithink of buying/using this brand of motorcycle
I can easily recognize the decoration of this store fromamong other store decorations
ProductAssortment
This store provides variety of productsProducts in this store are conveniently stocked andordered in such a way as new models separated fromcustom onesI can easily remember the product assortment of thisstore whenever I think of this brand of motorcycleI can easily recognize the product assortment of thisstore from among other stores
Feature Areas
This store is designed in such a way that it allowsvisitors serve themselves, having walk-ins withsignage labeledThis store is designed in such a way that the internalfeature areas (like motorbike area, reception, spareparts area, service center, etc) are separately locatedwithinI remember the feature areas of this store whenever Ithink of this brand of motorcycleI can easily recognize the feature areas of this storefrom among other store feature areas
I like the light & color composition of this store
Light & color
The light & color of this store goes in line with thebrand it dealsThe light & color composition of this store comes tomind whenever I think of motorcycle brandsI can easily identify the light & color composition ofthis store from any given alternative of motorcyclestores’ light & color composition

X
2. Store TalentN
ame
Stor
eL
abel
Stro
ngly
Dis
agre
e
Dis
agre
e
Neu
tral
Agr
ee
Stro
ngly
Agr
ee
Stor
e T
alen
t
Appearance
This store’s employees are attractively dressedThe quality of my interaction with this store employees isexcellentThis store’s employees appear in such a way that helps meremember the motorcycle brand sold in the store whenever Ithink of buying/using of such a productThis store’s employees appear in such a way that helps merecognize the motorcycle brand sold in the store from otherbrands
Professionalability
The store personnel (from front office to the aftersales team)have good product and technical knowledgeThis store’s employees professional knowledge aboutmotorcycles help me remember the motorcycle brand the storedealsThis store’s employees professional knowledge aboutmotorcycles help me easily recognize the motorcycle brand thestore deals from others
3. Awareness
Nam
e
Stor
eL
abel
Stro
ngly
Dis
agre
e
Dis
agre
e
Neu
tral
Agr
ee
Stro
ngly
Agr
ee
AwarenessIn view of the store design, atmospherics and talent, I can say,I’m aware of the brand of motorcycle I had or deal
Thank You for Your Highly Valuable Participation in the Study

XI
አባሪበአዲስ አበባ ዩኒቨርሲቲ የኮሜርስ ት/ቤት፤ በማርኬቲንግ ማናጅመንት የሁለተኛ ዲግሪ ፕሮግራም
ይህ መጠይቅ በመሸጫ ሱቅ ውስጥ የሚደረግ ማስታወቂያ ለምርቱ ብራንድ መታወቅ ያለውንሚና ለማጥናት የተዘጋጀ መጠይቅ ሆኖ ትኩረት የሚያደርገውም በኢትዮጵያ የባጃጅና ቲቪኤስሞተርሳይክል ገበያን ነው፡፡
ውድ መላሻችን፤
ይህ መጠይቅ የተዘጋጀው በመሸጫ ሱቅ ውስጥ የሚደረግ ማስታወቂያ ለምርቱ ብራንድ መታወቅ ያለውን ሚናለማጥናት የተዘጋጀ መጠይቅ ሆኖ በኢትዮጵያ የባጃጅና ቲቪኤስ ሞተርሳይክል ገበያን ትኩረት ያደረገ ጥናትለማድረግ ታስቡ የተዘጋጀ ነው፡፡ የጥናቱ ውጤትም (ግኝትም) ለትምህርት ዓላማ ብቻ የሚውል ሲሆን በመሸጫሱቅ ውስጥ የሚደረግ ማስታወቂያ በደንበኞች ዘንድ ለምርቱ ብራንድ መታወቅ ያለውን ሚና ለማጥናት ተፈልጎበኢትዮጵያ የባጃጅና ቲቪኤስ ሞተርሳይክል ገበያን ለመዳሰስ ብቻ ነው፡፡ በጣም ከፍተኛ ግምት የምንሰጠውን ውድሃሳብዎን ስላካፈሉን በቅድሚያ እናመሰግናለን፡፡

XII
I. አጠቃላይመረጃ
1. ጾታ (እባክዎ የ “X” ምልክት በማድረግ ይግለፁ)
ወንድ ሴት
2. አማካኝ የወር ገቢ መጠን (እባክዎ የ “X” ምልክት በማድረግ ይግለፁ)
ከ 3000 ብር በታች ከብር 3001 – 10,000 ከብር 10,001 – 20,000
ከ 20,000 ብር በላይ
3. እድሜ (እባክዎ የ “X” ምልክት በማድረግ ይግለፁ)
ከ18 - 30 ዓመት ከ 31 - 45 ዓመት ከ 46 - 60 ዓመት
ከ 60 ዓመት በላይ
4. የሚመርጡትን የሞተር ሳይክል ብራንድ ይግለፁልን?
5. ሞተርሳይክሎትን የገዙበት በታ?
ከተማ
6. ሞተርሳይክሎትን የገዙበትን ሱቅ ለማግኘት (ለማመላከት) የረዳዎት አመላካጭ ነገር ምንድነው?
የሱቁ ዲዛይን የሱቁ መገለጫ (ነባራዊ ሁኔታ) የሱቁ የሽያጭ ሰራተኞች

XIII
II. የመሸጫ ሱቅውስጥማስታወቂያ ይዘቶች
እባክዎ ቀጥሎ ለተዘረዘሩት እያንዳንዱ ጥያቄዎች ፊትለፊታቸው ከሚገኙት አማራጮች ውስጥ ምን ያህልእንደሚስማሙ የ “X” ምልክት በማድረግ ይግለፁ (አማራጮቹ ከበጣም አልስማም እስከ በጣምእስማማለሁ በሚል የቀረቡ ናቸው)
1. የሱቁ ዲዛይን
ስም የሱቁ
ምልክት
በጣም
አልስማ
ም
አልስማ
ም
ገለልተ
ኛ ነኝ
እስማ
ማለሁ
በጣም
እስማ
ማለሁ
የሱቁ
ዲዛይ
ን
ማስዋቢያዎች
እኔ የገዛሁት ሞተርሳይክል ብራንድ የሚሸጥበት ሱቅ የውስጥማስዋቢያዎች ጥሩ ስሜት ይፈጥሩብኛልእኔ የገዛሁት ሞተርሳይክል ብራንድ የሚሸጥበት ሱቅ የውጭማስዋቢያዎች ጥሩ ስሜት ይፈጥሩብኛልሞተር ሳይክል ለመግዛት ሳስብ የዚህ ሱቅ ማስዋቢያዎች ትዝይሉኛልከሌሎች የሞተርሳይክል ሱቆች ማስዋቢ ውስጥ የዚህ ሱቅ ለይቼአውቀዋለሁ
የምርትአቀማመጥ
ይህ ሱቀ የሞተርሳይክል ምርት አማራጮች አሉትበዚህ ሱቅ ውስጥ ምርቶች በአይነት በሞዴልና በአገባባቸውቅደም ተከተል መሰረት ነው ሚቀመጡትሞተርሳይክል መግዛት ሳስብ ገና የዚህን ሱቅ የምርት አቀማመጥነው የማስታውሰውየዚህን ሱቅ የምርት አቀማመጥ ከሌሎች ሱቆች የምርትአቀማመጥ ውስጥ በቀላሉ ለየዋለሁ
የውስጥ ክፍሎችአቀማመጥ
የህ ሱቅ ጎብኝዎች ራሳቸውን ማስተናገድ እንዲችሉ ተደርጎመተላለፊያና ጠቋሚ ምልክቶች እንዲኖሩት ተደርጎ ዲዛይንተደርጓልእዚህ ሱቅ ውስጥ የተለያዩ ክፍሎች ማለትም የእንግዳ መቀበያ፤ሞተርሳይክል እና መለዋወጫ ማስቀመጫ፤ እንዲሁም የጥገናአገልግሎት መስጫ ቦታዎች አቀማመጣቸው ተለይተው ነውየዚህን ሞተርሳይክል ብራንድ ሳስብ በሱቁ ውስጣ ያሉ ክፍሎችአቀማመጥ ትዝ ይለኛልየዚህን ሱቅ የውስጥ ክፍሎች አቀማመጥ በቀላሉ ለይቼአውቃቸዋለሁየዚህ ሱቅ የብርሃንና ቀለም ውህደት ደስ ይለኛል
ብርሃንና እናቀለም
የዚህ ሱቅ ብርሃንና ቀለም ከሚይዛቸው ብራንድ ጋር አብሮየሚሄድ ነውየሞተርሳይክል ብራንዶችን ሳስብ የዚህ ሱቅ የብርሃንና ቀለምውህደት በአእምሮዬ ድቅን ይልብኛልየዚህ ሱቅ የብርሃንና ቀለም ውህደት ከሌሎች ሱቆች የተለየ ነው

XIV
2. የሱቅ ውስጥ ሙያተኞች
ስም የሱቁ
ምልክት
በጣም
አልስማ
ም
አልስማ
ም
ገለልተ
ኛ ነኝ
እስማ
ማለ
ሁ በጣም
እስማ
ማለ
ሁ
የሱቅ
ውስጥ
ሙያተ
ኞች
ገፅታ
ሙያተኞቹ የሚስብ አለባበስ ይለብሳሉከሱቅ የውስጥ ሰራተኞቸ ጋር የነበረኝ ግንኙነት ማራኪና ቆንጆ ነበርሞተርሳይክል መግዛት ሳስብ የዚህ ሱቅ ሰራተኞች አለባበስ ትዝይለኛልየዚህን ሱቅ ሰራተኞች አለባበስ በቀላሉ መለየት ችላለሁ
ሙያ
ከፊትለፊት እስከድህረ ሽያጭ ድረስ ያሉት የዚህ ሱቅ ሰራተኞችስለሚሰሩት ስራና ሞተርሳይክል በቂ እውቀትና የቴክኒክ ችሎታአላቸውሞተርሳይክል መግዛት ሳስብ የዚህ ሱቅ ሰራተኞች ሙያዊ ብቃትናችሎታ በአእምሮዬ ድቅን ይላልየዚህን ሱቅ ሰራተኞች ሙያዊ ብቃትና ችሎታ ከሌሎች ተመሳሳይባለሙያዎች በቀላሉ ለይቼ አውቀዋለሁ
3. እውቀት
ስም የሱቁ
ምልክት
በጣም
አልስማ
ም
አልስማ
ም
ገለልተ
ኛ ነኝ
እስማ
ማለሁ
በጣም
እስማ
ማለሁ
እውቀትከመሸጫ ሱቁ ዲዛይን፤ ይዘትና በውስጡ ካሉት ባለሙያዎች አንጻርስልሚሸጠው ሞተርሳይክል ብራንድ እውቀት አለኝ ብዬ አስባለሁ
ውድ ጊዜዎትን ሰጥተውመጠይቁን በመሙላት ስለተባበሩኝ አመሰግናለሁ