SCCH'09 - Scientific Computing & Cultural Heritage
118
SCCH 2009 2nd Conference Scientific Computing and Cultural Heritage BOOK OF ABSTRACTS November 16th – 18th, 2009 Heidelberg University, BIOQUANT, INF 267 SCCH 2009
-
Upload
uni-heidelberg -
Category
Documents
-
view
0 -
download
0
Transcript of SCCH'09 - Scientific Computing & Cultural Heritage

SCCH 20092nd Conference Scientific Computing and Cultural Heritage
BOOK OF ABSTRACTS
November 16th – 18th, 2009Heidelberg University, BIOQUANT, INF 267
SCCH 2009

Organizing Committee
Hans Georg Bock Willi Jäger Hubert Mara Michael J. Winckler
Cover design
Elisabeth Pangels
komplus GmbH
Copy Editing
Elisabeth Trinkl
Heidelberg Graduate School of Mathematical and Computational Methods for the Sciences
Prof. Dr. Dr. h.c. Hans Georg BockInterdisciplinary Center for Scientific ComputingHeidelberg University Im Neuenheimer Feld 36869120 Heidelberg, Germany
Dr. Michael J. WincklerInterdisciplinary Center for Scientific ComputingHeidelberg University Im Neuenheimer Feld 36869120 Heidelberg, GermanyT + 49 - 6221 54 - 4981email [email protected]
Oktavia Klassen / Ria Hillenbrand-LynottIm Neuenheimer Feld 368, Room 50769120 Heidelberg, GermanyT + 49 - 6221 54 - 4944email [email protected]
Office Hours for HGS MathComp: Mon – Thu 09:00 – 12:00 & 13:00 – 16:00
Helpdesk for applications etc.: Tue, Thu 10:00 – 12:00
Chairman
Administrative Director
Office

BOOK OF ABSTRACTS
SCCH 2009
2nd Conference
Scientific Computing and
Cultural Heritage
November 16th – 18th, 2009
Heidelberg University

SCHEDULE
Monday,
November 16th
Tuesday,
November 17th
Wednesday,
November 18th
09:00-
10:40
Invited Lecture
Session 3
09:00-
10:40
Invited Lecture
Session 5
10:30-
11:15Registration
10:40-
11:00Coffee Break
10:40-
11:00Coffee Break
11:15-
12:30
Opening
Invited Lecture
11:00-
12:20Session 4
12:30-
14:00Lunch Break
12:20-
14:00Lunch Break
11:00-
12:20
Session 6
Best Student
Presentation Award
Closing Remarks
14:00-
15:40Session 1
15:30-
16:10Coffee Break
16:10-
17:30Session 2
17:30-
19:00
Poster Session
Welcome Reception
14:00-
18:30
Guided Tour:
City of Speyer
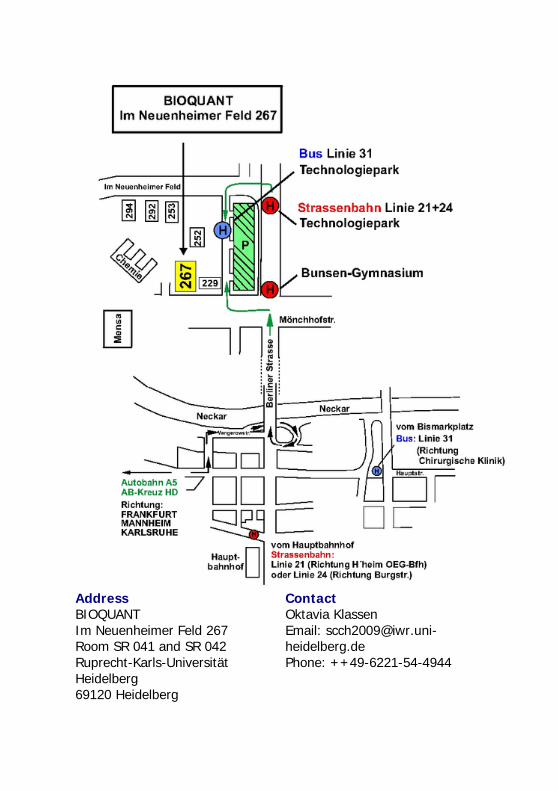
Address
BIOQUANT
Im Neuenheimer Feld 267
Room SR 041 and SR 042
Ruprecht-Karls-Universität
Heidelberg
69120 Heidelberg
Contact
Oktavia Klassen
Email: [email protected]
heidelberg.de
Phone: ++49-6221-54-4944

4
How to get to BIOQUANT
By car
• Coming from the motorway
Turn left towards "Chirurgie", cross the Neckar on Ernst-Waltz-
Brücke and follow Berliner Straße till the 2nd
traffic light (in front of
the Shell petrol station). There turn left to the institutes.
• Coming from Neckargemünd
Follow "Uferstraße", then turn into "Posseltstraße" ("Jahnstraße"
respectively); at the traffic light turn right into "Berliner Straße" and
follow the road till the 2nd
traffic light (in front of the "Shell" petrol
station). There turn left to the institutes.
By public transport
• From city center (Bismarckplatz)
Take bus number 31 towards Neuenheim, "Chirurgische Klinik" and
get out at "Technologiepark".
You can also take tram number 21 towards Weinheim and get out at
"Bunsengymnasium".
• From main station
Take tram number 21 towards Handschuhsheim, "OEG-Bahnhof" or
tram number 24 towards Handschuhsheim, "Burgstraße" and get out
at "Bunsengymnasium".
Social events
Welcome Reception – Monday, November 16th
Time: 5.30 pm
Location: BIOQUANT
Im Neuenheimer Feld 267
Ground Floor
Guided Tour: City of Speyer – Tuesday, November 17th
Departure in Heidelberg
Time: 2.00 pm
Location: in front of the BIOQUANT building
Departure in Speyer
Time: 6.00 pm

ABSTRACTS

Session 1
6
BAATZ W., FORNASIER M., HASKOVEC J., SCHÖNLIEB C.-B.
Mathematical methods for spectral image reconstruction
In old frescos, the visible colour information might be completely or
partially lost in some parts of the painting. This is due to specific
chemical reactions of the pigments, which modify their absorption of
visible light. However, if these reactions do not largely influence the
absorption of the pigments in invisible parts of the spectra (UV and
IR), there is a hope that the original colour information can be
faithfully recovered, using the information from the well conserved
parts of the painting. We demonstrate how mathematical methods
for sparse matrix recovery can be used for this task. As shown by
Candès and Recht (2009), the missing data can be exactly recon-
structed with very high probability (i. e., for “almost all” matrices),
given only a mild lower bound on the number of sampled entries.
Quite recently, two numerical algorithms have been proposed for
sparse matrix recovery: The singular value thresholding (SVT)
algorithm by Cai, Candès and Shen (2008), and the iteratively re-
weighted least squares minimization (IRWLSM) by Daubechies,
DeVore, Fornasier and Güntürk (2009). In addition to these two
algorithms, which are iterative in nature, we propose a third method
(block completion, BC) for recovery of the missing elements of a low-
rank matrix, which, although based on a trivial algebraic
manipulation, delivers very competitive results. However, this
method can only be used if the matrix rows and columns can be
permuted such that the missing elements constitute a block; in our
case this is always possible.
To demonstrate the performance of these three methods, we use a
sample painting consisting of linear combinations or red, yellow and
blue (Fig. 1, top). We divide the painting into a grid of 20×20
rectangles, and on each of these rectangles we measure the
absorption spectra in the range 307 – 1130 nm; a typical human eye
will respond to wavelengths from about 380 to 750 nm, wavelengths
below 380 nm and, resp., above 750 nm correspond to UV, resp. IR.
From the visible spectral data, we reconstruct a rough approximation
of the original painting (Fig. 1, bottom). For our experiment, we pick
randomly a certain portion of the rectangles (50%) and delete the
visible parts of the measured spectra, while keeping the UV and IR

Session 1
7
regions (Fig. 2, top). We represent these data as a matrix, where
each row corresponds to one measured spectra, and test the
performance of the three algorithms (SVT, IRWLSM, BC) for recovery
of the deleted information. The performance is measured in terms of
the relative error of the recovered visible spectra with respect to the
original data. We show that the SVT algorithm typically reaches a
relative error of approx. 30% before the convergence drastically
slows down, while the IRWLSM usually goes down to 20% or even
better. The BC method typically does even better (10%), and,
moreover, has the advantage of being extremely simple to
implement and non-iterative, and, therefore, very fast. The result
after applying the BC method is shown in Fig. 2, bottom. Finally, we
make the experiment of deleting the whole lower part of the
painting, such that the information about the visible spectra
corresponding to the blues is completely lost (Fig. 3, top).
Surprisingly, it was possible to recover the missing parts quite well
(Fig. 3, bottom), where again the IRWLSM and BC methods gave
best results.
Fig. 1: Sample fresco
painting (top) and its
projection on the 20 × 20
rectangular grid (bottom)
Fig. 2: Random deletion of
50% of the elements (top)
and recovery by the BC
method (bottom)
Fig. 3: Deletion of the
lower part of the image
(top) and recovery by the
BC method (bottom)
Poster
8
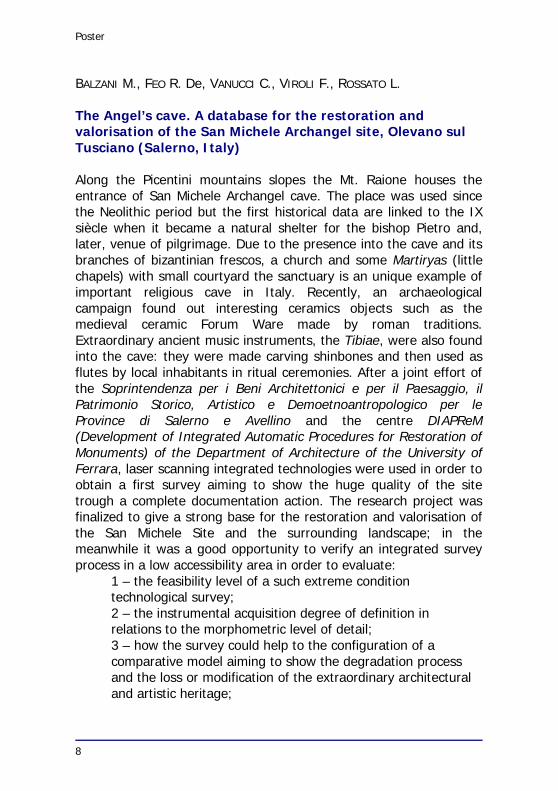
BALZANI M., FEO R. De, VANUCCI C., VIROLI F., ROSSATO L.
The Angel’s cave. A database for the restoration and
valorisation of the San Michele Archangel site, Olevano sul
Tusciano (Salerno, Italy)
Along the Picentini mountains slopes the Mt. Raione houses the
entrance of San Michele Archangel cave. The place was used since
the Neolithic period but the first historical data are linked to the IX
siècle when it became a natural shelter for the bishop Pietro and,
later, venue of pilgrimage. Due to the presence into the cave and its
branches of bizantinian frescos, a church and some Martiryas (little
chapels) with small courtyard the sanctuary is an unique example of
important religious cave in Italy. Recently, an archaeological
campaign found out interesting ceramics objects such as the
medieval ceramic Forum Ware made by roman traditions.
Extraordinary ancient music instruments, the Tibiae, were also found
into the cave: they were made carving shinbones and then used as
flutes by local inhabitants in ritual ceremonies. After a joint effort of
the Soprintendenza per i Beni Architettonici e per il Paesaggio, il
Patrimonio Storico, Artistico e Demoetnoantropologico per le
Province di Salerno e Avellino and the centre DIAPReM
(Development of Integrated Automatic Procedures for Restoration of
Monuments) of the Department of Architecture of the University of
Ferrara, laser scanning integrated technologies were used in order to
obtain a first survey aiming to show the huge quality of the site
trough a complete documentation action. The research project was
finalized to give a strong base for the restoration and valorisation of
the San Michele Site and the surrounding landscape; in the
meanwhile it was a good opportunity to verify an integrated survey
process in a low accessibility area in order to evaluate:
1 – the feasibility level of a such extreme condition
technological survey;
2 – the instrumental acquisition degree of definition in
relations to the morphometric level of detail;
3 – how the survey could help to the configuration of a
comparative model aiming to show the degradation process
and the loss or modification of the extraordinary architectural
and artistic heritage;

Poster
9
4 – how the morphometric database could be enquired in
order to define further scenarios of conservation and
valorisation of the site.
The survey started with the main branch of the cave where a laser
scanner Leica HDS 3000 (based on a time-flight technology which
allow data collection of big volumetric complexes acquiring circa
1000 points per second with an accuracy of 6 mm) was used to
obtain the needed information. The three-dimensional data were
then integrated by a topographic survey to realize a model made of
55.000.000 acquired points by the which was possible to drawn up
the cave plans, sections and façades and a scaled plaster model. The
output will be useful to build a structured collection of records
organized on several layers thought for information exchange,
divulgation and for the realisation of revitalization project of this
extraordinary site.

Poster
10
BALZANI M., MAIETTI F., GALVANI G., SANTOPUOLI N.
The 3D morphometric survey as efficient tool for documen-
tation and restoration in Pompeii: the research project of Via
dell’Abbondanza
The project titled From Asellina to Verecundus: research, restoration,
and monitoring addressing painting on certain famous Pompeian
botteghe in Via dell’Abbondanza (Regio IX, Insulae 7 and 11) was
characterised by close collaboration between the Soprintendenza
Archeologica di Pompei, the “Valle Giulia” School of Architecture at
the University of Rome “La Sapienza”, the School of Architecture and
the DIAPReM Centre of the University of Ferrara, and the School of
Engineering II of the University of Bologna (Forlì campus). Its
primary objectives were the safeguarding of famous architectural re-
mains and experimentation with restoration methodologies and
materials.
The restoration work addressed a number of façades along the
stretch of the Decumanus Maxiumus between the Forum and the
Sarnus Gate (a stretch known today as via dell’Abbondanza). The
façades were unearthed in 1912 during excavation work under the
direction of Spinazzola.
After the collection of numerous notes from previous archaeological
investigations and from visual inspections about architectural
morphology, materials and state of conservation, surveys of ancient
façades were carried out and measurement data were collected. The
survey by means of 3D laser scanner of the varied and complex
architectures have been characterized by an attempt to focus efforts
on contributing representational knowledge of the existing site
elements.
The comparison between Pompeii as it once was and Pompeii as it
now is and observations of how it changes, decays, and mutates day
by day offer an extraordinary arena for experimentation and re-
search. The nearly ten years of research and experimentation at
Pompeii have been characterised by an attempt to focus efforts on
contributing representational knowledge of existing site elements.
The chosen research field, which nevertheless remains open to inter-
disciplinary approaches, is archaeological excavation and restoration
and problems of conserving our cultural heritage.

Poster
11
Cross section of Via dell’Abbondanza and long section of the House of Paquius Pro-
culus obtained by the 3D database. The survey context involved via dell’Abbondanza
and the house of Paquius Proculus, on the opposite side of the restoration project
area. The survey of the entire exteriors and interiors has been performed mainly by
means of laser scanners using time-of-flight technology. These scanners are able to
rapidly acquire a high definition 3D point cloud (accurate to 5–6 mm) and are highly
reliable instruments on the monumental and urban scale.
The newly developed technologies for the automatic acquisition of
geometrical data are innovative elements that allow us to create
databases of high definition, three-dimensional morphometric data.
These archives of architectural and archaeological data are a
valuable research tool for archaeologists, architects, and historians of
art and architecture, but also, and above all, they serve the purpose
of protecting and conserving cultural heritage sites and provide sup-
port to restoration processes and training programmes. The data-
base contains 3D models obtained by use of the laser scanner and
all the topographical, photographic, diagnostic, and structural data
associated with them. The database allows users to consult and
update all data. This provides an important foundation for the
management, conservation, maintenance, and enhancement of
Pompeii’s extensive, complex, and diversified urban, architectural,
and monumental legacy.
The experimentation addressed critical historical aspects, restoration
methods and materials, and the protection and maintenance of
painted and architectural surfaces. It’s our opinion that the critically
study of Pompeii still shows in a manner that is in some ways unique
the history of the methods of archaeology and restoration, up to the
use of the most modern technologies that in certain case are truly
transforming it in a kind of advanced laboratory.
Session 3
12
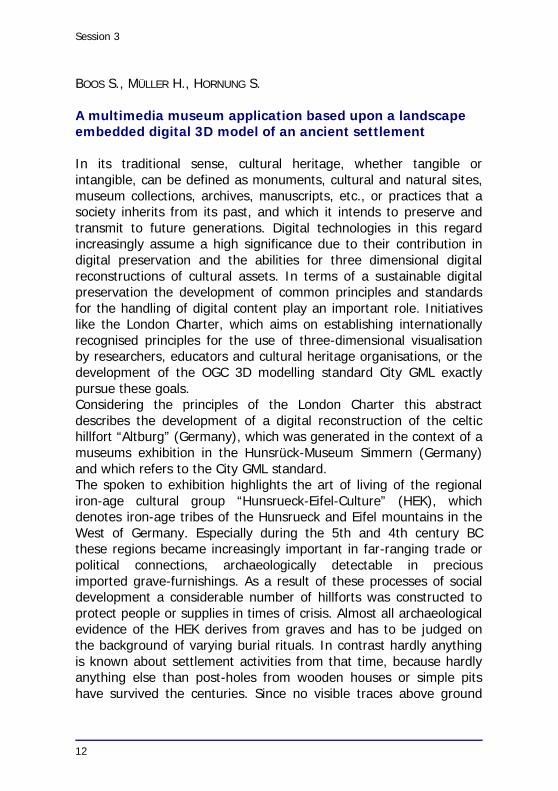
BOOS S., MÜLLER H., HORNUNG S.
A multimedia museum application based upon a landscape
embedded digital 3D model of an ancient settlement
In its traditional sense, cultural heritage, whether tangible or
intangible, can be defined as monuments, cultural and natural sites,
museum collections, archives, manuscripts, etc., or practices that a
society inherits from its past, and which it intends to preserve and
transmit to future generations. Digital technologies in this regard
increasingly assume a high significance due to their contribution in
digital preservation and the abilities for three dimensional digital
reconstructions of cultural assets. In terms of a sustainable digital
preservation the development of common principles and standards
for the handling of digital content play an important role. Initiatives
like the London Charter, which aims on establishing internationally
recognised principles for the use of three-dimensional visualisation
by researchers, educators and cultural heritage organisations, or the
development of the OGC 3D modelling standard City GML exactly
pursue these goals.
Considering the principles of the London Charter this abstract
describes the development of a digital reconstruction of the celtic
hillfort “Altburg” (Germany), which was generated in the context of a
museums exhibition in the Hunsrück-Museum Simmern (Germany)
and which refers to the City GML standard.
The spoken to exhibition highlights the art of living of the regional
iron-age cultural group “Hunsrueck-Eifel-Culture” (HEK), which
denotes iron-age tribes of the Hunsrueck and Eifel mountains in the
West of Germany. Especially during the 5th and 4th century BC
these regions became increasingly important in far-ranging trade or
political connections, archaeologically detectable in precious
imported grave-furnishings. As a result of these processes of social
development a considerable number of hillforts was constructed to
protect people or supplies in times of crisis. Almost all archaeological
evidence of the HEK derives from graves and has to be judged on
the background of varying burial rituals. In contrast hardly anything
is known about settlement activities from that time, because hardly
anything else than post-holes from wooden houses or simple pits
have survived the centuries. Since no visible traces above ground

Session 3
13
remain from these iron-age farmsteads, it is very hard to locate
them and therefore only few sites are known. For that reason it
became clear that in order to convey a picture of the circumstances
of life about 2500 years ago, the exhibition relies mainly on
reconstructions.
Besides reconstructions of contemporary objects like costumes,
jewellery, an authentic replica of a post-built granary and cinematic
re-enactments of life and craftsmanship in Celtic times, a multi-
media based application serves as a platform for detailed information
about the HEK. In this regard a 3D-model of the celtic hillfort
“Altburg” near Bundenbach (RhinelandPalatinate) was developed, a
site belonging to the best preserved remains of that kind. Several
excavation campaigns in the 1970ies could ascertain four building
phases of the hillfort and due to the excellent preservation of the
site, which is manifested in the remains of postholes and ditches in
the subsoil a very detailed image of the hillfort could be derived. In
the first building phase (ca. 300 BC) the Altburg consisted of few
larger houses, where its inhabitants lived, a number of granaries for
food-storage and a round-house of maybe public character, whose
precise purpose is not yet known. The settlement was surrounded by
a simple wooden palisade guarded by a fortified gateway. Since
archaeological sources are outstanding, the community of
Bundenbach decided to reconstruct the settlement of one of the later
settlement phases at the original location, using even the excavated
post-holes for the buildings.
Unfortunately this reconstruction is neither complete, nor does it
succeed in conveying an authentic impression of the iron-age
settlement. The valley below is nowadays densely wooded, so that
the Altburg seems remote, but back in the iron-age all trees and
undergrowth would have been cleared to make the settlement a
visible landmark. Therefore the only way to convey an impression of
the earliest settlement seems to create a virtual 3D-model of its
building phase I.
With regard to the London Charter and the requirements of the City
GML standard, which defines several Levels of Detail (LOD) for multi-
scale 3D modelling, the decision was taken to define both the
landscape model and the model containing the ancient buildings as
close as possible according to the CityGML standard. The imple-
mentation, however, was done by using different off-the-shelf

Session 3
14
software. Thus in a first step the digital landscape and the digital
reference for the 3D models of the buildings is generated. The input
data consist of:
• Digital Elevation Model (DEM) with a resolution of 10 m
• Ortho image with a ground resolution of 20 cm
• True scaled finding plan in a 1/400 scale
The ortho image is used for georeferencing the finding plan and the
plan in turn is used to assess the positions of the single buildings by
creating point features, which are positioned in the center of the
digital footprints of the buildings. The results of these steps are
visualised in the 2,5 environment of the software ESRI ArcScene.
Finally the hillfort buildings, which are constructed and textured in
the 3D sketching software Google Sketchup are imported as 3D
marker symbols and are adjusted to their orientation and the
topographical situation (Fig.).
Fig.: 3D Model of the celtic hillfort “Altburg”
In order to acquaint the museums visitors closer with the historical
scenery an animation was generated in ArcScene in the form of a
retrospective virtual flight over the landscape and around the mount,
where the hillfort was situated. To achieve this objective the land
use presentation sequentially changes from today’s situation into the
presumed ancient celtic time. Afterwards transitions as well as

Session 3
15
textual information in the form of a lead text, subtitles and end titles
are added by use of the software Windows Movie Maker. Additionally
a painted representation of the hillfort scenery was created and
appended to the animation in form of a slow cross fade after the last
frame of the animation to the artistic representation. Finally the
video product is integrated into an overall multimedia presentation
about the HEK, which is developed by means of HTML and
JavaScript techniques.
Session 3
16
BROSCHART J.
Data, Science, and the Media
There is a growing interest for science among people outside of
academia. This has positive and negative side effects. While it is
good for scientists to relate to the general public in order to account
for their work and the money they get for it, there is often a clash
between scientific interests and what appeals to laypersons. As a
consequence, what eventually gets published in the media is
frequently unsatisfactory from a scientist's point of view. On the
other hand, it is often the case that the scientists in question fail to
provide the relevant information. In his talk, Jürgen Broschart, who
works as editor of the science news section of GEO magazine, will
illustrate the basic pitfalls in science-media interaction. With respect
to the topic of the conference, good and bad examples of data
presentation will be discussed, and what can be done to enhance the
aesthetic appeal of scientific data.

Session 5
17
CHRIST G.
A Collaborative GIS-based Cue Card System for the
Humanities
The junior research group “Trading Diasporas in the Mediterranean
1350–1450” and the other groups in the Special Research Program
“Transcultural Studies” at the University of Heidelberg is involved in
the development of the software litlink, a multi-role database system
for the management of literature, different types of sources, meta
information and research design. This paper explains the importance
of such a system sketching out the history of knowledge manage-
ment in the humanities since the early modern times. Then, it gives
an account of what has been achieved so far and an outline of what
is planned for the future: The development of a server-based col-
laborative multi-role research environment with an advanced GIS
interface.
Problem
Human society changes over place and time. This is the realm of
historical research. Historians map historical change over place and
time. Traditionally, they did this on paper and on large format maps
familiar from geography and history classes.
Historical research is based on two key ingredients: sources (com-
prising: documents, pictures, objects, archaeological evidence) and
research literature (books, articles etc.). Traditionally, historians
stored this material either in a system of notebooks or on cue cards
(cf. the notebook system (loci method) of Erasmus of Rotterdam or
the cue card systems of Niklas Luhmann or Umberto Eco). The cue
card systems of the latter reach a high level of sophistication:
Besides cards with bibliographical data, excerpts and citations, the
system comprised thematical cards, author cards and workflow
cards. With this system of cards link to each other by a sophisticated
keyword-system expressed in a code of numbers and letters, he
succeeded in creating a very efficient and highly intuitive system of
knowledge management. His system gained its own dynamism
growing up to a certain size and could produce links and innuendos
the individual researcher’s brain would not be able to produce.

Session 5
18
However, since then, the introduction of IT in the humanities
generally seemed to have led to a regress rather than a progress in
knowledge management. Word processers replaced the cue card
system and information was now stored again in serial (MS-word)
files. Furthermore, lack of geographical analysis and reluctance to
work collaboratively hamper historical research furthermore.
Solution
We tested different IT solutions to remedy this unsatisfactory
situation: We found that on the one hand there is bibliographical
software: most popular ranks the commercial software endnotes. On
the other hand, there are several smaller projects, which focus on
the classical cue card functions: storing and linking ideas intuitively.
Only one software tries to combine the two functions, bibliographical
database (with the possibility to retrieve information from library
catalogues etc.) and cue cards. This is the filemaker-based freeware
litlink (www.litlink.ch). Litlink is a cooperative project between Prof.
P. Sarasin, PD Dr. Haber and Nicolaus Busch (programmer) and,
increasingly, our research group at the University of Heidelberg.
So far, the system is able to process
• Literature
• Archival documents
• Objects
• Events
• Persons/Groups

Session 5
19
• Cue cards linked to all the categories above
• Ideas and Projects
Thus, litlink in its present form allows not only for the storing of
bibliographical information, archival sources, objects and the
respective excerpts and notes but also of places, persons
(prosopographical database), ideas and projects, linked in an
intuitive system based on a routine comparing the different items by
their keywords.
Perspectives-GIS
There is also server-version of litlink. As it stands, it is the same
database system as in the stand-alone version: There is neither the
possibility to define differentiated access rights, say for guests,
standard users and administrators nor to differentiate the rights of
use: reading only, reading and writing, etc. This is a problem: For
the humanity’s research culture tends to be highly conservative and
suspicious, the individual researcher is reluctant to upload his
material on a shared database unless he can control it. He wants to
define exactly who can see, comment or even edit “his” items.
Consequently, we are planning currently how to overcome these
obstacles and to gear up litlink adequately for use by a research
group and its connected knowledge community.
Since the interaction with other databases as Jstor, library
catalogues etc. or with other bibliographical software as endnotes is
presently rather weak, we aim at improving litlink’s functionality
honing its interactive capabilities with such databases.
Currently, litlink is able to store places with the respective
geographical information in order to visualize a given output.
Extracting a set of data, say the list of events forming the biography
of a historical personality, in a GIS system (for instance) google
earth the user can plot the data on a map.
The aim is to improve the geographical representation by importing
it into more sophisticated state-of-the-art GIS software as for
instance GRASS. Maybe, eventually, it might prove helpful to rebuild
the whole database system (currently realized in litlink) on such a
GIS base. This re-engineered would at the same token transfer the
research environment into a state-of-the-art sql-database-system.
This would allow for the integration of web 2.0 features and further
improvement of collaborative research.

Poster
20
FELICIATI P.
MAG, an Italian XML application profile for submission and
transfer of metadata and digitised cultural content
MAG (Metadati amministrativi gestionali, see http://www.iccu.sbn.it/
genera.jsp?id=267) is an Italian metadata application profile totally
compliant to international standards, developed with the main goal
of promoting among cultural organizations the aggregation of a
“least common” set of technical and management metadata to
guarantee the good submission and transfer of metadata and
cultural digital objects (text, images, audio, video) in local or
distributed digital libraries (SIP and DIP phases of OAIS model).
MAG, developed in the framework of the national digitalization plan
“Biblioteca Digitale Italiana” in 2001 by the Central Institute for
Unique Catalogue and is maintained since that time by an ad hoc
Committee. The application profile, presently available in its 2.01
release, was adopted in the last 8 years by many cultural heritage
digitalization projects, especially in Libraries and in Archives.
MAG enables the full use of metadata maintained and defined in
other schemas (Dublin Core and NISO) in association with specific
metadata defined for the particular context of cultural digitalization
projects (where it wasn't possible to find a full answer in existing
profiles). The XML schema covers general informations on the
project and the type of digitalization adopted, descriptive metadata
about the analogical object digitized, structural metadata describing
the logic structure of the digitized object, five sections dedicated to
record technical informations about digital objects (images, audio,
video, text, ocr) and one section developed to collect some
information on objects availability and access in order to enable their
dissemination.
The wide dissemination of MAG standard in Italy created the
conditions for the developing of several applications by software
private companies – conceived to manage cultural heritage digiti-
zation projects in every phase, from data capture to web publication.
As regards the relationships between MAG and other metadata
application profiles, in some cases the Italian standard was used –
correctly as a sort of extension of METS “packaging schema”, a
powerful metadata management tool but with no direct solutions to

Poster
21
some of the technical and practical requirements MAG aims to face
effectively. Moreover, two groups inside the MAG Committee are
presently developing the mapping references MAGMETS and
MAGPREMIS, to guarantee the longterm preservation of MAGbased
cultural digital repositories. The MAG reference document is going to
be published in english in order to be available in September, before
the conference.
The paper will present synthetically the MAG standard's goals, its
structure and elements, presenting indeed some good practices in its
application.

Session 5
22
FERSCHIN P., KULITZ I.
Archaeological Information Systems
Large amounts of data arise out of excavations. The documentation
of this multifaceted information can materialize in different kinds of
media, e.g. photographs and excavation diaries etc. In the course of
the subsequent research work the data will be interpreted, analysed
and supplemented with additional information. At the end of ar-
chaeological research a book is usually published. The texts and
images, such as plans, drawings of findings, diagrams, photographs
etc., of which the book is comprised, mirror the current state of
research as accurately as possible.
If one wishes to have a general idea of the excavation data or create
a digital reconstruction of a building or urban structure, a quite time-
consuming process occurs in which the relevant data from the
publications is extracted and accordingly compiled.
Often experts of diverse disciplines, e.g. archaeology, architecture,
computer science etc., collaborate together on the conception of a
virtual reconstruction using numerous modern digital documentation
methods such as photogrammetry, photography, videos and 3D
documentation techniques. Thus, their information is also incor-
porated into the data and media pool.
Platforms are becoming necessary that make it possible to integrate
the diverse data as well as utilise its visual structure in addition to
simplifying the information and data exchange between distant
researchers.
In this work visual archaeological information systems are being
developed with particular consideration of space and time with the
following goals:
• Concentration of information (“Visual Index“)
• Integration of diverse media
• Publication medium
The purpose of the visualisations is to take the three-dimensional
data from the excavations and restore it to its three-dimensionality
as well as to virtually reconstruct its spatiotemporal basis (four-
dimensionality).
Furthermore, the virtual space should be utilised for the depiction of
additional information. Thus, all the information from the remains,

Session 5
23
such as spatial and temporal references, dimensions and levels,
building materials, finds, excavation photographs, bibliographies etc.,
can be clearly and visually consolidated.
Often the archaeological indices are not present or do not suffice for
a digital reconstruction. Many questions remain open and can be
answered only partially. Therefore, in addition to the depiction of the
findings the following information will be integrated into the
visualisations:
• Differentiation between remains and reconstruction
• Photographs and panoramic images documenting the current
status
• Digital videos with annotations as excavation diaries
• Links to comparative objects
• Digital publications und references
• 2D and 3D-sections
• Variations of reconstruction
• Visual differentiation between certain and uncertain
reconstruction
Examples of archaeological information systems were realised with
Google Earth and 3D-PDF. Google Earth ensures the spatiotemporal
display of information and different media as well as providing a
working and publication platform that could be accessed via the
internet. 3D-PDF allows the easy switching between structured
layers of 3D models to show temporal developments or the archaeo-
logical interpretation and translation of inscriptions. Furthermore it is
very well suited to be included into digital publications.
The archaeological data originated from the excavations of the
German Archaeological Institute / Department of Cairo with which
the IEMAR cooperate in the area of virtual archaeology.

Session 6
24
FLÜGEL Ch., SCHALLER K., UHLIR Ch.
“Archäologische Museen vernetzt” – An Information System
for the Archaeological Museums in Bavaria
The project is based on a common initiative of the Archäologische
Staatssammlung and the Landesstelle für die nichtstaatlichen
Museen in Bayern. It is aimed at the development of an innovative
module-based internet application. Technical concepts, development
and implementation are conducted by CHC – Research Group for
Archaeometry and Cultural Heritage Computing, University of
Salzburg, funding is provided by Bayerische Sparkassenstiftung. The
database driven information system supports the user in exploring
the services made available by the archaeological museums. Based
on a highly flexible data model the unique emphases of the
individual museums will be clearly represented.
Modules of the information system “Archäologische Museen vernetzt”
Testbed Mainlimes
The information system offers spatially structured and harmonized
views on all information offers provided by supra-regional and
regional museums and collections, visualising also the strong ties
between the museums and the extramural (architectural) monu-
ments that are already part of the Limes world heritage.
In a first phase the area covered will be confined to the Mainlimes
territory in Hessen and Northern Bavaria from Groß-Krotzenburg to
Miltenberg. This sector of the Obergermanischer Limes forms a

Session 6
25
testbed to create best practice for designing and operating the inter-
active information system. Later on a diversification to others than
archaeological museums and other regions in Bavaria is planned.
Further on the system will form a link between local museum
internet pages and the information platform offered by
www.museenin-bayern.de, run by the Landesstelle für die nicht-
staatlichen Museen in Bayern.
The archaeological museums at the Mainlimes are an ideal environ-
ment for developing innovative web-based access strategies, as only
a small number of them are strictly confined to archaelogical topics
alone and the information provided by them varies significantly in
terms of quantity and quality.
Basic elements of the information system
• presentation of spatial correlations between museums and
extramural monuments based on highly flexible interactive
cartography
• presentation of all available information material, including
printed matter, (virtual) reconstructions, multimedia based
information and educational services provided by the
museums
• user friendly access provided by theme clustering,
storytelling and stepwise graded depth of information
• integration of external web resources (e.g. the Ubi Erat Lupa
monument database)
• representation of the main focuses of the individual
collections combined with easy to use tools for the creation
of interactive theme clustering and virtual exhibitions
The technical implementation is based on guidelines edited by the
European Union for the presentation of Cultural Heritage content
providing barrier-free access, technical robustness based on open
source technology and avoidance of PlugIns to a possibly wide
extent.
Basic functions like the creation of virtual exhibitions, updating the
calendar of events and integration of multimedia-based content will
be provided by tools that need no expert knowledge.
To provide long term availability and data storage the application will
finally be hosted by the Bavarian State Library in Munich within the
framework of the BLO (Bayerische Landesbibliothek Online) portal.

Session 4
26
GROSMAN L., GOLDMAN T., SMIKT O., SHARON G., SMILANSKY U.
Computerized 3D modeling – a new approach to quantify
post-depositional damage in Paleolithic stone artifacts
The morphological typology of lithic artifacts (handaxes, cleavers,
etc.) is the main tool for following the cognitive development and the
technical skills of the early humans and to distinguish between sites,
regions and cultural phases. Yet various agencies can modify the
artifacts during the long time which elapsed between their deposition
and present day. They can be subjected to e. g., rolling and batter-
ing while in floods and sea waves, or by the action of modern con-
struction and agricultural machinery. Thus, it is imperative to under-
stand quantitatively the damage patterns so that the archaeological
analysis could be (at least statistically) corrected for these effects.
We simulated damaging by battering by placing 8 recently produced
handaxes in a barrel together with basalt pebbles. The damage
occurred by turning the barrel, and it was monitored by scanning the
handaxes in 3D after 5, 10, 20, 40, 60, 100, and 200 turns. Thus,
the complete damage history was recorded. We shall present our
results which quantify the effect of battering on various mor-
phological parameters, and discuss the consequences of our findings
within the methodological context of pre-historical research.
Figure: Damage history of 8 handaxes rolled in the barrel as expressed by their profile
variations

Session 4
27
Our results show that the damage patterns resulting from rolling the
tools in a battering environment are distinct, definable and, most
importantly, different from the patterns of controlled intentional
knapping by humans. Bifacial tools are produced by a rational de-
liberate reduction sequence that involves mainly the use of bifacial
retouch for the homogeneous shaping of the tool edges. Yet after
quantifying the various morphological parameters of the battered
experimental handaxes our findings show that the edges are heavily
battered with sporadic deep concave scars along them and most of
the damage occurs in the area of the handaxe’s tip.
For the archaeologist who specialize in the study of handaxes the
barrel experiment is a “shocking” experience. The resulting breakage
patterns, scar removals, edge retouch and the flakes removed are all
known from many archaeological assemblages studied in the past. In
many ways by following the history of damage many past obser-
vations regarding biface morphology may become questionable.

Session 3
28
HAUCK O., NOBACK A.
Computing the “Holy Wisdom”
The church of Saint Sophia (Holy Wisdom) in Istanbul – formerly
known as Constantinople – was the cathedral of the city. This unique
building with its wide cupola was built by emperor Justinian I (527–
565) between 532 and 537.
The first design by Anthemios of Tralles and Isidor of Milet had to be
changed during the construction phase because of statical problems.
During the following centuries, many windows had to be filled with
brickwork because of structural collapses after several earthquakes.
For the project “The Saint Sophia of Justinian in Constantinople as a
scene of profane and secular performance in late antiquity” which
was funded by the Deutsche Forschungsgemeinschaft (German
Research Foundation) in the framework of the priority programme
“theatricality” a CAD model of this first design of Saint Sophia in
Istanbul has been generated at Technische Universität Darmstadt’s
faculty of architecture. This model is based on the architectural
survey of the American Robert van Nice as well as on personal
inspection of the actual building and the ancient calculating
geometry of Hero Alexandrinus.

Session 3
29
We found out very quickly that for recreating the light effects of the
architectural concept it is as essential to reconstruct the number and
location of the windows as to gather all the surfaces accurately. The
whole building is a highly complex interaction between the occurring
daylight and the window openings, the materials, and even some of
the detail geometry. The vaults which are mainly covered by gold
mosaics are a major component of the light effects. The vaults
reflect the daylight which occurs mostly through the openings of the
aisles into the nave. This was the reason why these vaults but also
all the other surfaces of the internal architecture of the building had
to be reconstructed concerning their original geometry as well as
light reflecting qualities.
We would like to present three major aspects of our work at your
conference:
• The role of ancient mathematics (e.g. Hero Alexandrinus‘
Metrica and Stereometrica) for making the building
computable
• The collection of accurate data and the application of
material descriptions to the computer model
• The use of a lighting simulation software (Radiance) for
imaging.

Session 2
30
HEIN A., MÜLLER N. S., KILIKOGLOU V.
Heating efficiency of archaeological cooking pots: Computer
models and simulation of heat transfer
Studies of archaeological cooking pots revealed a large variety of
vessel shapes and, furthermore, diverse methods of clay paste
preparation, which have been used for their production. Shape-
related parameters concern for example wall thickness, diameter,
curvature and height, while material-related parameters include the
base clay – or base clays in the case of mixing – non-plastic
materials used for tempering and the firing conditions. All these
parameters are known or suspected to affect the performance of
ceramic vessels. In order to be able to address issues, such as raw
material choice and vessel suitability, it is necessary to investigate
how these parameters influence the performance of a cooking
vessel, and which of the performance characteristics are affected
when varying selected parameters.
In former technological studies of archaeological cooking pots,
different performance properties were investigated, mainly focusing
on strength, toughness, thermal shock resistance and the so-called
‘heating effectiveness’. The latter was a first approach to quantify
the heat transfer in cooking pots: replicas of archaeological cooking
pots were manufactured, which were subject to heating experiments
under controlled conditions, examining the rate with which the
temperature of the pot’s content was raised. The ‘heating effective-
ness’ determined in this way, however, is a rather complex para-
meter, depending on thermal conductivity, heat capacity, per-
meability and vessel shape.
This paper presents a novel approach to systematically quantify the
heating efficiency of archaeological ceramics, using computer
models. Digital models of cooking pots were investigated with
numerical methods, such as the finite element method (fig.), which
was recently already applied to other ceramic types. Material data
were used, that had been collected in a recent study on the material
properties of Bronze Age cooking ware. A model of a cooking pot
and its content is exposed to simulated heat loads and the tem-
perature development in the entire system is calculated. The method
allows for straightforward estimation of the heating efficiency, which

Session 2
31
is the ratio of the heating energy which reaches the content and the
heating energy which is applied to the cooking pot. The advantage
of the simulation approach is that models of any cooking pot can be
tested, in terms of ceramic fabric or shape. Furthermore, the
constraints of the cooking process can be freely selected and varied,
such as the temperature of the heat source, temperature of the
environment and properties of the content. Importantly, the
influence of selected parameters on heating rates and times can be
singled out, overcoming some of the shortcomings of the replication
approach described above. Also, since heating efficiency is directly
related to energy efficiency, different makes of cooking vessels can
be compared in terms of their energy consumption.
The present approach allows for the estimation of heating efficiency
and the evaluation of the particular parameters and variation
therein, such as shape and material properties, in a straightforward
way. Furthermore, different kind of cooking processes can be
simulated, allowing the assessment of the suitability of various
cooking pots for different methods of food preparation.

Session 6
32
HOHMANN G., SCHIEMANN B.
Das Projekt WissKI
Wissenschaftliche Forschungsprojekte im Bereich der Museen er-
zeugen ausgehend von den verwalteten Objekten umfangreiche
Sammlungen primärer Grundinformationen, die die Grundlage
jeglicher weitergehender Forschung darstellen. Die Identifikation,
Erschließung und Katalogisierung der Objekte und das inhaltliche
Verlinken der Information bilden die Grundlage musealwissenschaft-
licher Informationsdatenbanken. Das von der Deutschen Forschungs-
gemeinschaft von 2009 bis 2011 geförderte Projekt WissKI
(Wissenschaftliche KommunikationsInfrastruktur) erweitert das Wiki-
Konzept um Komponenten, die es Kuratoren/-innen und
wissenschaftlichen Mitarbeitern/-innen von Museen ermöglichen
sollen, diese Informationen zu erstellen und deren Publikation zu
unterstützen. Die im wissenschaftlichen Arbeitsprozess entstehenden
Stoffsammlungen, die nach außen als Kataloge oder Korpora
(Primärinformation) in Erscheinung treten, sind in aller Regel so
umfangreich, dass aus Kostengründen meist nur eine Auswahl aus
den Daten für den Druck bzw. die Publikation berücksichtigt werden
kann. Ein beträchtlicher Teil der Primärinformation geht mit Ab-
schluss des jeweiligen Projekts für weitere Forschung verloren, da
weitergehende Nutzungskonzepte fehlen. Das im Projekt entwickelte
System soll diesem Problem begegnen, indem es einen
demokratischen Redaktions- und Publikationsprozess für wissen-
schaftliche Information unterstützt, eine Kommunikationsplattform
für die beteiligten Akteure schafft und die Langzeitverfügbarkeit der
gesammelten Informationen ermöglicht. Dies wird u. a. durch die
Berücksichtigung folgender Komponenten gewährleistet: Granulares
Rechte- und Moderationsmanagement, Sicherstellung der Identität
der Autorenschaft, Sicherstellung der Authentizität der Information,
Herstellung der Zitierfähigkeit der Beiträge, Tiefenerschließung durch
Textanalyse und semantischer Repräsentation, Aufbau eines geringe
Kosten verursachenden Veröffentlichungsprozesses. Durch den
dauerhaften Urhebernachweis der Beiträge werden wissenschaftliche
Gratifikationssysteme wie der Citation-Index unterstützt.
Damit eine semantische Verknüpfung dieser Inhalte werkzeug-
unterstützt möglich wird, ist eine inhaltliche Annotation notwendig.
Session 6
33
Zur Realisierung setzt das Projekt daher vollständig auf semantische
Technologien zur Wissensrepräsentation und Tiefenerschließung. Als
Referenzontologie für das gesamte System wird das CIDOC
Conceptual Reference Model (CRM) herangezogen. Das CRM ist eine
Ontologie für den Bereich des Kulturellen Erbes, die seit über 10
Jahren von einer Arbeitsgruppe des International Committee for
Documentation (CIDOC) des International Council of Museums
(ICOM) weiterentwickelt wird. Die aktuelle Version 5.0.1 verzeichnet
86 Entitäten (Klassen) sowie 137 Eigenschaften (Relationen). Seit
das CRM 2006 in der Version 3.4.9 als ISO 21127 zertifiziert wurde,
wird es in kulturwissenschaftlichen Informationssystemen
zunehmend berücksichtigt. Zur Verwendung in Softwaresystemen
liegt das CRM in einer OWL-DL-Implementierung vor, die als
Erlangen CRM (ECRM) in Erlangen von den Projektpartnern ent-
wickelt wurde.
CRM und ECRM verfolgen einen ereignisbasierten Beschreibungs-
ansatz, der es erlaubt, auch die zeitliche Dimension von musealen
Ausstellungsobjekten detailliert zu erfassen. So wird beispielweise
ein Objekt nicht einfach mit einem Herstellungsdatum versehen,
sondern mit einem Herstellungsereignis verknüpft, welches
Ausdehnung in Raum und Zeit haben kann. So lassen sich alle
Ereignisse in der Historie eines Objekts (Modifikation, Verkauf,
Zerstörung etc.) auf einem Zeitstrahl anordnen und mit Personen
und Orten verknüpfen. Im Projekt wird das ECRM als Referenz-
ontologie genutzt, die in einer WissKI-Basisontologie erweitert und
spezifiziert wird. Als Ausgangspunkt zur Modellierung dieser
Basisontologie diente Museumdat10, ein XML-basierter Metadaten-
standard, der zukünftig den Datentransfer zwischen den Museen in
Deutschland vereinheitlichen soll. Museumdat, in weiten Teilen eine
Übernahme des bekannteren Usamerikanischen Standards CDWA-
Lite11, wird im System auch als Import/Export-Format für die Daten
verwendet, die über eine OAI-PMH-Schnittstelle12 kommuniziert
werden. Dieser Import/Export basiert in WissKI auf den seman-
tischen Definitionen der Basisontologie, welche bereits in diesem
frühen Projektstadium als vorläufige Version vorliegt. Weitere
Konzepte und Rollen erweitern die Basisontologie projektspezifisch,
um eine möglichst gute und detaillierte semantische Beschreibung zu
erreichen.

Session 6
34
Eine zentrale Komponente der WissKI-Plattform ist die Verknüpfung
der wissenschaftlichen Texte mit den Konzepten und Rollen der
Ontologien. Dazu ist ein semi-automatischer Annotationsprozess der
natürlichsprachlichen Texte vorgesehen, welcher von den Kura-
toren/-innen und wissenschaftlichen Mitarbeitern/-innen durch-
geführt werden soll. Der WissKI-Prototyp umfasst einen WYSWYG-
Editor für die Eingabe, der zusätzlich als Schnittstelle zwischen den
Analyseverfahren für den natürlichsprachlichen Text und den Be-
nutzern dient. Weitere notwendige oder zusätzliche Annotationen
werden in tabellarischer Form ausgefüllt und stehen damit der Ver-
knüpfung mit anderen Inhalten zur Verfügung. Zur Unterstützung
der automatischen Annotationskomponente und zur Normierung
manueller Eingaben werden etablierte Normdaten (Getty Vokabulare,
Normdaten der Deutschen Nationalbibliothek etc.) teilweise in das
System integriert.
Um die oben aufgezählten Ziele zu erreichen und die verschiedenen
semantischen Integrationsprozesse umzusetzen, bedarf es einer
flexiblen, skalierbaren, frei verfügbaren Basissoftware. Dafür wurde
das Content Management System Drupal ausgewählt. Drupal bietet
neben einer Benutzerschnittstelle, die an Wiki-Software angelehnt
ist, umfangreiche Funktionen (Nutzerverwaltung, Medieneinbindung,
Revisionsmanagement etc.), die über eine einheitliche Schnittstelle
zugreifbar und programmierbar sind. Die projektspezifischen Kom-
ponenten werden als Drupal-Module der Basissoftware beigefügt.
Dazu gehört unter anderem ein einheitlicher RDF-Triple-Store, in
dem sowohl die Ontologien als auch die Annotationsergebnisse
(Instanzen) verwaltet werden, eine umfangreiche OWL-DL/RDF-Ver-
arbeitungschicht inklusive Import/Export und ein WYSWYG-Editor
mit Komponenten zur halbautomatischen Annotation von Freitexten.
Um die Übertragbarkeit der WissKI-Projektergebnisse auf andere
Projekte zu gewährleisten, sind drei unterschiedliche Anwendungs-
szenarien vorgesehen: Der WissKI-Prototyp wird mit den vollstän-
digen Primärdaten eines DFG-Projekts zur Nürnberger Goldschmiede-
kunst, Primärdaten des gerade angelaufenen Projekts zur Dürer-
forschung am GNM sowie mit Primärdaten des BIOTA E15-Projekts
zur Biodiversitätsforschung aus dem ZFMK versehen. Anhand dieser
Szenarien sind verschiedene Tests mit wissenschaftlichen Mit-
arbeitern/-innen geplant.

Poster
35
HOPPE Ch., KRÖMKER S.
Towards an Automated Texturing of Adaptive Meshes from
3D Laser Scanning
Mid range 3D laser scanners become more and more popular espe-
cially for surveying and measuring construction sites, in the field of ar-
chitecture and for preservation of monuments. The data we used
were recorded by a CALLIDUS precision systems CP 3200 using an ex-
tremely short laser pulse emitted by the scanner. The measured time
of flight is proportional to the distance between scanner and object.
Figure 1. Point cloud of the Heidelberg Tun (German: Grosses Fass) in true color RGB-
values.
During the measuring procedure, the laser scanner integrated in the
measuring head rotates by 360º along the horizontal plane with a
resolution of 0.25º. By means of a rotating mirror, the laser beam is
emitted in the shape of vertical fans and thus covers of 140º in the
vertical plane with the same resolution. The measuring shadow on
the ground depends on the height of the measuring head. We deal
with data, which were combined from up to ten or twenty sets of
360º full scans in order to avoid shadows in complex buildings and ar-
cheological excavations. With a CCD-camera (variable focal length)
also integrated in the system, it is possible to record panorama or
detail images that are then available for documenting the scanned
object. Due to simultaneously taking photos while scanning the
scene, true color RGB-values can be assigned to the geometric
XYZdata. By referring to the adjacent points while scanning, normal
directions are determined for the virtual surfaces and are encoded as

Poster
36
so-called compass-colors at each point in the cloud. As these
scanners can only record discrete data sets (point clouds), it is
necessary to mesh these sets for getting surface models.
The meshing process is a complex issue and in the last years a lot of
algorithms were developed to solve this problem. We present an ap-
proximating algorithm for data reduction, which is based on a quadri-
lateral grid. Thus we are able to employ a continuous Level-of-Detail
(LOD) algorithm, from which a simplified 3D surface model can be
created. We start with generating a height map by projecting the
point data onto a plane orthogonal to the color-coded normal field.
The grade of simplification is determined by an error tolerance based
on a measure similar to the Hausdorffdistance. This algorithm is not
a dynamic (view-dependent) LOD mesh simplification, but a nonre-
dundant approximation of point clouds by surface patches. It is a
simple and extendable meshing algorithm, which is made up of
techniques adapted from popular terrain-LOD algorithms. Cracks and
T-junctions are eliminated by merge and split operations. Starting
from a regular meshing of an arbitrary rectangular cutout of point data
a textured surface model can be generated. The resulting model is
composed of a minimal number of triangles for a user defined error
tolerance due to a top-down subdivision algorithm. The presented al-
gorithm is implemented in our OpenGL based editing tool for 3D point
clouds called PointMesh, which will be explained in detail. The sur-
face models then can be exported in VRML-format. For different cutouts
a performance comparison of the regular mesh to various 4-8-meshes
with different error tolerances is given in terms of frame rates.
According to the true color values a texture is automatically produced
on the basis of the finest grid. Coarser grids use the same texture
and appear as complex such that there is almost no loss of informa-
tion during the grid simplification step while the number of triangles
reduces by a factor of five. Automated texturing is possible due to
the color-coded normal field, which allows for a meaningful projec-
tion of curved surfaces onto a plane. This forms the basis for a
screenshot of the texture to be mapped onto this part of the surface
via classical UV-mapping.
We present examples from an excavation site (church rest of Lorsch
Abbey, Germany), the inner part of the Heidelberg Tun (German:
Großes Fass, an extremely large wine vat), and the Old Bridge gate,
Heidelberg.
Session 2
37
HÖRR Ch.
Boon and Bane of High Resolutions in 3D Cultural Heritage
Documentation
Within the past 20 years, optical range scanning devices have
continuously become more accurate, both in terms of lateral and
depth resolution. High-end systems will soon tackle the physical
border that is simply set by the wavelength of visible light. However,
as a matter of fact, increasing resolutions immediately lead to bigger
amounts of data. Hence, even in the view of Moore’s law, it seems
appropriate to weigh up the prospects and problems coming along
with this development. In this paper, we try to figure out, if there is
something like an optimal point cloud density for 3D (and of course
2D) documentation of archaeological finds and which criteria have an
influence thereon.
For the sake of simplicity we will illustrate our arguments using three
fictitious example objects.
• Object 1 shall have a volume of about 1m3, e.g. a head-high
sculpture or column.
• Object 2 shall have a volume of about 1 dm3, e.g. a
mediumsize ceramic vessel.
• Object 3 shall have a volume of about 1 cm3, e.g. a coin or
tooth.
We can roughly estimate the magnitude of the surface area by as-
suming these objects to be a sphere with the denoted volume (1m3,
1 dm3, 1 cm
3). More generally, we refer to one length unit as u.
V =
6
1
πd
3
d = 3
6
π
V
(V
!
= 1[u]3)
d
A = πd
2
A 2
Let us further assume, that three typical optical measuring systems
are available:
• System A shall have a sampling rate of 1 point/mm2
(e. g.
Konica Minolta VI-910 with a field of view of 640x480 mm).

Session 2
38
• System B shall have a sampling rate of 25 points/mm2
(e. g.
Konica Minolta VI-910 with a field of view of 128x96 mm).
• System C shall have a sampling rate of 2500 points/mm2
(e. g. Breuckmann stereoSCAN 3D-HE with a field of view of
48x36 mm).
At first we like to estimate how many single scans are necessary to
capture the whole object. To this end, it may not be sufficient to
calculate the ratio of surface area and field of view, since due its
shape the object may not take the whole measuring area and
therefore several round scans might become necessary. Insofar, the
minimum number of partial scans can be estimated by 10 to 12
independent from the object’s shape. However, the greater the ratio
of object size and field of view becomes the more the tiling effect
comes to the fore. Additionally, we have to assume a realistic
overlapping rate of 50 if not 100% in order to perform a robust
registration [McPherron et al. 2009]. The following table shows a
rough estimation of the number of necessary scans.
Object 1
(4,8 cm2)
Object 2
(4,8 cm2)
Object 3
(4,8 cm2)
System A (3000 cm2) 32 > 10 > 10
System B (120 cm2) 800 > 10 > 10
System C (17 cm2) 6000 60 > 10
While the tasks A1 and C2 can still be handled and realized within
one day, B1 and especially C1 are however questionable simply for
economical reasons. As denoted in the next table, the amount of
acquired data is another big challenge, because after registration
and merging the arising point clouds may become very big.
Object 1 Object 2 Object 3
System A 4,800,000 48,000 480
System B 120,000,000 1,200,000 12,000
System C 12,000,000 000 120,000,000 1,200,000
It can be seen that the number of vertices varies within several
orders of magnitude depending on the object size and acquisition
system. If we assume a memory demand of at least 44 bytes per
vertex, we get the following:

Session 2
39
Object 1 Object 2 Object 3
System A 202.9 MB 2.03 MB 20.8 kB
System B 4.95 GB 50.7 MB 519.5 kB
System C 495.4 GB 4.95 GB 50.7 MB
While the combinations B2 and C3 are already above average, A1 is
a high-density model even from today’s scales. In order to process
4.95 GB of data (B1 and C2) an up-to-date 64 bit system is required
and serious difficulties concerning interactive visualization arise. A
data amount of 500 GB for scenario C1 seems to be an utopic one
even for the near future.
Independent from the limits set by current hardware, the object’s
sampling rate should also be limited with regard to the intended
visualization purpose. Here, essentially four scenarios are
conceivable:
1. The visualization shall be performed on a screen or via beamer.
Even on current HD-ready devices the 2 megapixel border is not
crossed. Consequently, no information gain is achieved above a
vertex count of about 4,000,000, unless highly magnified details
shall be shown.
2. A big poster or an oversize canvas shall be printed. This is mostly
done for popular scientific or marketing purposes for which in most
cases a photograph would have been sufficient as well. Without
doubt, macroscopic properties shall be highlighted and the viewing
distance will in general be several meters.
3. An image in a catalogue of findings shall be generated for
scientific purposes [Hörr et al. 2008]. Usually a scale between 1 : 1
and 1 : 4, for bigger objects sometimes 1 : 10 or even more is
chosen. Plastic details are clearly visible in a normal viewing distance
of 30 to 50 cm.
4. An especially filigree object or a detail view of the object’s surface
shall be magnified true to scale in order to better depict mesoscopic
properties that would not or only hardly have been visible in the
1 : 1 view.
Of course, this enumeration could have been proceeded towards the
microscopic scale, but then a totally different question would be
present that with purely optical measuring systems could not be
processed anyway. In this case a sample scan instead of scanning
the whole surface would be much more convenient.
Session 2
40
Which sampling rate is necessary for pictorial object documentation
(i.e. scenarios 3 and 4), finally depends on two parameters: the
resolution of the printing hardware and the resolution of the human
eye. Current ink jet and laser printers achieve 300 dpi across the
board. Although technically much higher resolutions would be
feasible as well, these are often realized only in high-quality print
media. This is mainly due to the fact that the resolving power of the
human photoreceptors is restricted to approximately one arc minute
even under optimal conditions. Hence, for a distance of 50 cm two
points can barely be distinguished if they are 0.15mm apart
(corresponding to a resolution of 170 dpi). For a distance of 3
meters this value is still 0.9mm (28 dpi).
So if r is the image resolution in dpi and s is the image’s scale, the
necessary (and sufficient!) point distance in object space is
d=1/(r·s). In this case every sample corresponds to at most one
pixel. For a typical resolution of 300 dpi and a scale of 1 : 3 this
would require for example a point distance of about 0.25mm
(acquisition system B). Finally, it should be mentioned however, that
using interpolatory shading techniques such as Gouraud or Phong
shading good results can be obtained even for lower resolutions.

Session 2
41
JUNGBLUT D., KARL St., MARA H., KRÖMKER S., WITTUM G.
Automated GPU-based Surface Morphology Reconstruction
of Volume Data for Archeology
Motivated by new demands of the vast area of ceramics classification
in archeology, we are proposing a novel method to segment volume
data of ancient artifacts using their materials density. This kind of
data can be acquired using industrial Computer Tomography (CT).
Thanks to decreasing costs, CT becomes a more and more reason-
able tool for archaeological surveys. Therefore objects can be in-
vestigated without damage – even without removing the transport
packaging. As segmentation methods of volume data are available in
industry and medicine, we show the adaption of a novel high-per-
formance analysis and visualization method using parallel computing.
The so-called Neuron Reconstruction Algorithm (NeuRA) was
originally designed for reconstructing the surface morphology from
three dimensional images containing neuron cells or networks from
neuron cells. Fortunately, NeuRA also provides the fully automatic
generation of triangular surface meshes from computer tomography
image stacks of archaeology data, like ceramic vases and other
pottery. Figure 1a shows a mesh of a reconstructed ceramic. NeuRA
uses a sophisticated combination of noise reducing and structure
enhancing filters, as well as segmentation methods, a marching
cubes mesh generator and mesh optimization methods. The output
are triangular meshes in different resolution levels. To reconstruct
data sets of several hundreds of megabytes within a few minutes, a
highly parallelized implementation for Nvidia Tesla high performance
computing processors using the supplied Compute Unified Device
Architecture (CUDA) programming library was developed.
Real time rendering of the generated triangular meshes enables
interactive viewing of ceramics. Since the processed data generally
exceeds the device memory of state-of-the art graphic processing
units (GPUs), applying volume rendering techniques is still a
challenge. Performing high data throughputs enables the systematic
reconstruction of arbitrary items. Another benefit is the automated
segmentation of density, which allows to isolate different areas of
interest used as features for archaeological classification. Figure 1b
shows ancient applications of bronze-scales, which are a charac-

Session 2
42
teristic feature of the Este-pottery. The Figure also shows a hidden
metal part supporting the structural integrity of the object.
Figure 1. Reconstructed triangular mesh from a computer tomography scan of a (a)
ceramic vessel and (b) ancient applications (spheres) and a and a metal pin of an old
restauration inside (disc shape).
Presently, the reconstructed meshes only contain information about
the vertex positions and the triangulation. Consequently, future re-
search will include the automatic attachment of textures to the
meshes to provide additional features, like surface colours. Having
widely used 3D-meshes, databases can be established to exchange
the reconstructions among scientists around the world; virtual
exhibitions in museums can be created or access via the world wide
web can be provided.

Session 6
43
KLEPO V., PASKALEVA G.
Artifact Cataloging System as a Rational Translator from
Unstructured Textual Input into Multi-dimensional Vector
Data
Remarkable discoveries are made even at the beginning of the
process of data analysis. Especially by simply trying to sort the
gathered information fragments, not even referring to the more
advanced level of sorting the artifacts. There can be countless ways
in which the information can be organized, but there are only a few
possibilities for sorting the artifacts, in order for them to reveal the
most probable conclusion. The main difficulty lies in fining them.
During my work on the doctoral thesis “Architectural History of Medi-
terranean Lighthouses” I have come across a number of artifacts
which suggested the past of certain buildings might have included
them functioning as lighthouses. Precisely this broad research area
that encompasses the history of so many buildings (in the
Mediterranean coastal region), which are instrumental in the
analytical identification of lighthouses, is a good starting point for
this small scientific research. In this cluster of interrelated artefacts
and information fragments the use of computer technology is of an
essential importance. The beginning of any research activity lies
within the defining of goals, but the true explorer would start one
step ahead. That adventurer would begin with defining the object to
be explored itself. In this case it is the lighthouse. That definition will
be used as the basis of a translating agent.
Due to constructive similarities lighthouses share basic definition
characteristics with towers. The distinguishing features of light-
houses are the specific functions which they had to meet. For
example navigation and signalization have determined the topo-
graphic locations of these structures. So if one should observe more
closely, the idea of the lighthouse does not rest in the architectural
form of the tower, but in the use for which the structure was built.
In the course of history those functions lead a multitude of
architectural types to develop into the form of the tower.
After this introduction, the meaning of the concept of a lighthouse is
easier to grasp. One way in which the historical artifacts concerning
the architectural history of Mediterranean lighthouses could be

Session 6
44
organized, would be to simply follow the chronological order of their
creation. However, such one-sided catalogue would be of no further
use as the development would end with the last added historical
artifact. This thesis suggests an interactive and creative artifact
database. Exactly here the previous definition of the concept of a
lighthouse provides the needed inspiration.
The cataloging should not be based on one or more static criteria.
Instead it should be based on states containing such information as
time, architectural form and uses. These basic elements could be
complemented by building materials, locations (different parts of the
Mediterranean coastal region), whether the structure is part of the
port urban planning or stands alone, etc If these states are then
subjected to transformations by actions designed to achieve a
classification goal based on a few chosen parameters, they could
help formulate new dynamic hypotheses concerning, among others,
the most probable locations of the sites where the lighthouses
existed in the past. The newly organized evidence can be then
translated into, for example, a probable appearance of the
lighthouse under study.
For a person with significant scientific experience in the field of
historical development of cultural heritage most of the historical
artifacts are easily analyzed through named categories and implicit
and even subconscious associations. One of the most significant
tasks of the translating agent would be to transfer the implicit into
explicitly formulated grammar rules of a multi-dimensional recon-
structive language. Thus the more tedious information processing
tasks can be transferred to a computer while leaving the expert and
the interested layperson the opportunity to be as creative as the
human imagination allows. The translating agent can be easily
manipulated to operate on a diverse set of category definitions and
an ever expanding set of language elements, including two- and
three- dimensional vector representation of the gathered artifacts.
This small pilot project attempts to show a way in which artificial
intelligence can be used to satisfy an ever growing need for visual
presentation and accessibility in the field of cultural heritage project
development. It is intended to facilitate decision-making and expert
analysis in order to motivate further work in the area.

Session 4
45
KOR S., BOU V., PHAL D., NGUONPHAN P., WINCKLER M. J.
Practical Experiences with a Low-Cost Laser Scanner
3D laser scanner has become more and more important in the field
of archeology and in other fields in humanities worldwide. In
Cambodia, 3D scanning is being needed to create a virtual museum
for the National Museum of Cambodia in which a large number of
artifacts were not able to present to visitors because of limited area
for exhibition. Above all, an actual preservation and conservation
project of the Banteay Chhmar temple in the northern Cambodia
funded by the Global Heritage Fund, is focusing on scanning temple
stone blocks in order to simulate the reconstruction and
reassembling the stones virtually.
In order to achieve this goal, 3D laser scanner are demanded in
order to reconstruct or record the artifacts and the stone blocks of
the temple. With this project we mainly want to contribute the
Banteay Chhmar Project by supporting some of our first experiences
in 3D laser scanning of the temple stone blocks. We want to discuss
the usefulness of a low-cost 3D laser scanner called David sponsored
by the Interdisciplinary Center for Scientific Computing (IWR) –
University of Heidelberg.
Our team in the Information Technology Center (ITC), Royal Uni-
versity of Phnom Penh, has earlier been awarded a research stipend,
also sponsored by the IWR, on “Investigation of a 3D scanner under
real-life conditions”. With this research, we have scanned a wide
range of objects in completely different environment.

Poster
46
MEIER Th., CASSELMANN C., VAN DE LÖCHT J., KUCH N., ALTENBACH H.
A new approach to the surveying of archaeological
monuments in academic teaching
A main issue concerning application-oriented academic teaching in
archaeology is the training in different excavation techniques. To
mediate this knowledge, the Institut für Ur- und Frühgeschichte und
Vorderasiatische Archäologie at the Ruprecht-Karls-Universität
Heidelberg offers training excavations. Here, students learn how to
deal with the methods and techniques needed in archaeological field
research in a practical setting.
The academic training of archaeologists also includes a basic
knowledge of geodesy. Hence, courses in surveying methods are
offered for students of all archaeological subjects. This training is
divided in three different modules. In the first, the students acquire
a basic theoretical knowledge of geodesy. In the second, the
students use this theoretical knowledge in different practical
exercises. The aim of the third is to broaden the basic knowledge
won in the first two modules. In this hands-on seminar, an
archaeological monument is measured with an electro-optical
theodolite also known as a total station. Afterwards, the data is
edited into a complete mapping using a Computer Aided Design
(CAD) application.
Since the summer of 2009, a Topcon Imaging Station (IS) is avail-
able to our institute. This new total station serves for conventional
tachymetry as well as for laser scanning and photogrammetry. The
software (ImageMaster Pro) allows the rendering of stereoscopic
pictures of the measured monument during the post-processing in
texturised triangular polygons. The first measured monument was a
medieval castle situated in a cave in the Luegsteinwand near Ober-
audorf (Rosenheim district, Upper Bavaria).
West of the village Oberaudorf, there is the Luegsteinwand, a face
that raises perpendicularly up to a hight of 300 meters above the
valley floor. The measured cave with a width of approx. 14 meters
and a height of nearly 7 meters lies almost in the middle of the face,
extending nearly 25 meters into the rock. Visitors may reach the
cave by means a steep path and a rope as well as a ladder with a
height of 6 meters. The first excavations took place in the years of

Poster
47
1967 and 1968 and were led by the local pastor. In 2008, Thomas
Meier led the first professional archaeological excavation, during
which this a floor plan was drawn using a total station. Since it would
cost considerable effort to geo-reference the site into the Gauss-
Krüger coordinate system, we used a local coordinate system.
The cave yielded mostly medieval pottery dated between the 11th
and 13th century. Greyware, which is typical for the late medieval
times and the renaissance, is totally missing. Moreover, some
fragments of historical and early medieval pottery occurred. The
most impressive of the few preserved building remains is the front
wall of the cave, which reaches over 5 meters in height with a heavy
thickness of 1.3 meters. This wall sealed the cave sand prevented
erosion of the archaeological layers. 14
C-samples of the pits
belonging to the cave dated the 11th and the beginning of the 12
th
century which correspond with the pottery findings.
Based on the results of the survey of 2008, in the summer of 2009
extended the surveying. This time, a three-dimensional measure-
ment was made possible by using the new IS. Carsten Casselmann
led the survey within the Vermessungskunde III seminar mentioned
above. The individual structures were measured from different
positions using the IS contact-free laser sampling over the whole
surface of the cave. The density of the measured points was
adjusted to the structure as well as to the different positions of the
total station that determined the measurement angle. Two days of
measuring produced a cloud consisting of more than 500,000 points.
The irregularities of the cave wall really put the instrument and
engineer to the test. In a post-recording step on the computer these
points were meshed into triangular polygons and overlayed with a
texture skin. Hidden edges or naturally cavities remained minor un-
solved problems. The vegetation posed a further problem, because
the IS could not discriminate the ceiling and the walls from the
plants. We edited the vegetation out of the ground, but this proved
impossible in the time alotted for the walls and ceiling. Thus, the IS
could not differ between the plants hanging the roof and the
stalactites. Owing to weak illumination, the photos made auto-
matically by the IS were useless. Instead we constructed an artificial
texture in the reconstruction.
Despite the difficulties, in all the results of the measuring was
adequate. In other such laser measurements, such as scans of

Poster
48
architecture or archaeological excavations, such extreme conditions
need not be a problem.
The models created will be integrated in a new trail, which is part of
the local tourist attraction program sponsored be the EU-Leader+
Program.
3-D-View of the cave from E to W 3-D-View of the cave from W to E
Session 1
49
NEMES P., GORDAN M., VLAICU A.
Color Restoration in Cultural Heritage Images Using Support
Vector Machines
Introduction
Color restoration in digital images is necessary because of physical
degradation and of imperfections generated during the acquisition or
visualization process. The color restoration process implies either a
physical model of the deterioration process, or the derivation of the
correction function from examples (in case an estimation is difficult
to make – often the case in practice). Research is done in both
directions; but, in the second case, there is the advantage of a more
flexible method, if one assumes the same degradation conditions. In
this case we can have highly nonlinear correction functions. The
color restoration function can be defined as transformation of a
“deformed” color space into a “correct”, ideal, space. It can be
defined either as a set of three scalar functions, component-wise, or
as a vector function, if the three color components are correlated.
This paper aims at examining the efficiency of supervised learning
methods in the derivation of color correction functions. From the
existing supervised learning techniques, some of the most appealing
in this field are: neural networks; support vector machines (SVMs)
used for regression. In the last decade, SVMs are especially used on
a large scale in classification and regression, but their use in color
restoration of digital paintings, affected by various ill-defined types
of degradations, is still limited; however, as research shows, they
can be a promising alternative to other restoration methods. That is
why we focused on their use for color restoration of degraded
paintings, examining their performance as compared to the experts’
restoration.
The proposed approach to color restoration in digital paintings by
support vector regression
SVMs are based on a powerful learning paradigm based on the
structural risk minimization. The ability of SVMs to learn from a
relatively sparse and reduced set of training data with good
generalization and recall performance could make them an excellent
alternative to other machine learning methods for color restoration in

Session 1
50
digital paintings – which is a mathematically hard to define problem,
and where often the set of training data can be considered sparse
(the set of training samples in the form of degraded – physically
restored image is limited). Initially defined as binary classifiers, the
SVMs were extended for the regression issue (SVR – Support Vector
Regression). Starting from a pair of vector input – scalar output
training data set (typically denoted by (x,y), with x – the input
vector in ℜN
, N y – the real valued scalar output), SVM
learns the functional dependency between the possible values of x
and y, in the form of a function f(x): ℜN
→ ℜ .
Let us consider a color deteriorated image (preferably one with a
large color spectrum in order to cover as much of the color space as
possible) and let us assume that the restored (desired) image is
available (in the case of degradation of the paintings physical
support – the image restored by experts). For restoring any other
image degraded in the same manner, one must identify the
transformation function of the color space (in vector form or on each
component, if the color components are decorrelated) – which can
be provided by SVR. Since the default SVR result f is not vector
valued but real valued, the color vector mapping cannot be obtained
directly; instead we derive three color mapping functions, one for
each color space component, using a rather decorrelated color
space, as e.g. YCbCr. The best performance was experimentally
obtained using scalar input – scalar output mappings by three SVRs
on each component individually, denoted by fY(Y), fCb(Cb), fCr(Cr)),
and non-linear SVRs (especially with Gaussian RBF kernels). This
restoration scheme is illustrated in Fig. 1.
Fig 1. The support vector regression based restoration scheme
The training set of the three SVRs was generated by selecting a
representative pair of corresponding patches depicted from a
degraded and a restored painting (spatially aligned at pixel level).

Session 1
51
The set of values of the three color components from the given
degraded image and from the restored image were used to generate
the three training sets (one per color component: Y, Cb, Cr). After
training three SVRs on each set, the resulting mappings fY(Y),
fCb(Cb), fCr(Cr)) are applied to the each color in the degraded
painting, to obtain the color restored painting accordingly.
Implementation and results
The implementation of the proposed SVR based color restoration
scheme was done in Matlab, using a publicly available SVM toolbox.
For training and testing, some degraded and restored painting
images provided by K. Nicolaus (1999) were used; the patches
depicted to generate the training data were approximately 20×30
pixels. Several SVM configurations were examined, with different
kernels: linear, polynomial, Gaussian RBF and exponential RBF. The
Gaussian RBF kernel SVR provided the best performance in respect
to the error and to the visual similarity between the SVR and expert
restored image. An example of a degraded painting, its expert
restored version and the result of the proposed SVR based
restoration is presented in Fig. 3. The training patches used for the
restoration of the image in Fig. 3.a) are shown in Fig. 2.
Fig. 2 Training images: a) input image (degraded), b) output image (physically
restored); the results of the restoration process applied on the input training image
using the regression functions applied simultaneously on Y, Cb and Cr with: c) liniar
kernel; d) polynomial kernel; e) gaussian RBF kernel
Experiments were run on four digital paintings from the same
source, with different color palettes and degradation levels. As
expected, the color restoration performance decreases dramatically
for very faded colors. In numerical terms, the average error between
the SVR color restoration result and the expert restoration result
over the test set decreases from 10.8% in the linear SVM case to
4.1% in the case of Gaussian RBF kernel based SVM.

Session 1
52
Fig. 3. An example result, showing: the degraded image (a); the restored images
obtained by applying the regression functions on the Y, Cb, Cr channels of the
degraded image (b) through d)), using an SVM with: b) linear kernel; c) polynomial
kernel of degree 2; d) gaussian RBF kernel. The last image (e) shows the result of the
physical (expert) restoration.
Conclusion
The work presented here proposes a simple nonlinear color re-
storation approach for digital paintings, based on support vector
regression in the YCbCr color space. The experimental results show
that SVR application on cultural heritage image restoration has great
potential and further approaches for color restoration based on SVR
worth investigated. Future work should address the issues of finding
the optimal color space, selecting optimally the training set, and to
derive more advanced SVR architectures that could optimize the
color restoration performance in cultural heritage images–able to
adapt to the specific painting palette and degradation.

Poster
53
NICCOLUCCI F., NYS K., FELICETTI A., HERMON S.
The Hala Sultan Tekke site and its innovative documentation
system
Hala Sultan Tekke (HST) is a Late Bronze Age site located near
Larnaca, Cyprus. The site was explored by two British expeditions at
the end of the 19th century, yielding a rich set of objects of gold,
silver, bronze, faience, ivory and pottery. Some tombs were investi-
gated by the Cypriot Department of Antiquities in the ’60s, under the
direction of Prof. Karageorghis. Extensive research on the site has
been conducted by the Swedish Prof. Paul Åström since 1971 until
his death in 2008, with the publication of an impressive corpus of
reports. Since 2001, Prof. Karin Nys has been the Assistant Director
and currently she in charge of all the archaeological research on the
site, in particular of the publication of the results of the most recent
campaigns directed by Prof Åström that remained unpublished due
to his death. Records consist of notes taken by him and the trench
masters using “forms” for finds and features, which were filled rather
freely with their observations, frequently regardless of the headings
present in the form and almost always handwritten. They also
include photos, drawings, plans and maps. Notes are more similar to
free text than to structured forms, and geographical and spatial
information is very often included.
A simplistic solution trying to summarize the notes into a structured
repository such as a DBMS would filter data accepting what is
deemed as “relevant” and forcing it into the grid of the data
structure, arbitrarily superimposed on the information recorded on
the field. Such a solution would prevent distinguishing the selection
operated now from the original archaeological record. On the other
hand, recording the notes just as simple text would reduce queries
to free-text search only, and exclude any possibility of geo-
referencing. An innovative solution must then be implemented.
Therefore two design decision were taken:
1) Use a markup solution for the notes, annotating the text deriving
from their transcription basing on a CIDOC-CRM compliant ontology,
preserving the richness of the text, enabling semantic queries and
basing markup on a standard.

Poster
54
2) Create a system based on Open Source software, enabling geo-
referencing of such elements in a true GIS system.
The first step consisted in defining a task ontology. The HST
ontology is a subset of CIDOC-CRM, with the geographic extension
incorporating GML, the Geographic Markup Language. The HST
ontology includes all the semantic elements used in the records.
However, if additional elements will be necessary in the future, the
annotation procedure will easily incorporate such new elements from
then on. Although notes appear to use a consistent terminology, the
system includes a thesaurus to associate preferred terms, and a
gazetteer listing infra-site location names or codes currently use, for
easy and standardized reference.
An annotation tool was created for data input. It allows to markup
text while typing it or to apply markup to already typed text,
selecting the relevant text and choosing the appropriate element
from a list, storing this information in an efficient retrieval system. A
similar procedure takes place for properties, i.e. relations among
marked elements, providing a way to resolve cross- and co-
references. Through these tools, a conceptual semantic layer is
superimposed on top of the base text, i.e. the original records
(actually, their faithful transcription), which will remain untouched.
The association to designated areas in the GIS works in a similar
way. Areas, lines or points to be referred need prior definition –
possibly interspersed with text markup, temporarily activating the
GIS module when necessary. Then they can be associated to text
when they are referenced in the text records, implicitly or explicitly.
The system includes several modules: the already mentioned one for
text encoding (Annotation Tool), a second one for searching the
repository (Query Interface) and modules for interfacing the GIS.
As GIS engine, we chose QuantumGIS, a multi-platform open-source
GIS, for the flexibility of its modular architecture of core functions
and plug-ins, allowing a high degree of personalization and
integration with other frameworks.
The resulting system allows any complex query, but to facilitate non-
specialist users some have been incorporated in the Query Interface.
This includes: a simple text query builder, relying on the thesaurus
and gazetteer; a semantic query builder, using all the classes and
properties provided by the HST Ontology and by CIDOC-CRM,
optionally refined by adding a string for domain or range entities;
Poster
55
and a “faceted” browser, i. e. for searching the repository by
progressively narrowing the scope of the quest.
Since geographic information is stored as GML, these operations
include also geographic queries. On the other hand, the GIS may be
used to visualize the outcome of a query.
So far, the system has been tested on a subset of data. The
completion of data input will require rather a long time for the large
amount of records to be transcribed, while encoding will not delay it
substantially.
If the system will work as expected and as confirmed by tests, it will
be a general-purpose tool useful in all those cases in which the
source is a text, for example an excavation diary or a report. It may
be applied to historical sources as well, and mix different and rather
inhomogeneous sources – even with different underlying ontologies,
as CIDOC-CRM provides the semantic glue to join them. Inclusion of
GIS features adds a spatial dimension, which is paramount not only
for archaeology. In a similar spirit, the general system in the future
may include any external viewer, for example for 3D objects, as long
as the related ontology is incorporated into CIDOC-CRM and the
package allows customization to add the necessary plug-ins.
Additional plug-ins may finally allow heterogeneous query
combinations, for example mixing pattern recognition with text-
based queries.

Poster
56
PECCHIOLI L., CARROZZINO M., MOHAMED F.
ISEE: retrieve information in Cultural Heritage navigating in
3D environment
Access to information enables knowledge to be shared among
people; it is therefore becoming increasingly important. Moreover
our notion of space is changing, as is the way we see it.
Cultural heritage is an interdisciplinary field that draws together
several different professions. Information is gained from different
sources and in varying formats. Furthermore, the relationship
between the conservation managers, who are often unfamiliar with
current documentation techniques, and the providers of the
information, who tend to be highly technical practitioners without
expertise in cultural heritage, is not easy to handle. Moreover, in
Cultural Heritage objects often have a strong 3D component, and
cannot be easily represented with conventional data management
frameworks like Geographic Information System (GIS). The use of a
3D framework may allow a closer adherence to the real world, as it
respects the spatial relationships among various parts.
Starting from these important points, we developed a method called
ISEE (“I see”). It has been the result of a Doctor Europeans in
Technology and Management in Cultural Heritage, “Accessing
Information Navigating in a 3D Interactive Environment”.
This method allows spatial information to be accessed through the
interactive navigation of a synthetic 3D model, reproducing the main
features of a corresponding real environment. The user can get the
pieces of information more relevant where he/she is looking at it.
The system can be used with standard Web browsers, allowing
access to a wider audience without any special requirements1.
The information is naturally embedded in 3D spatial contexts, and
the most natural way of behaving in such a context is to just look
around; indeed, seeing is an essential action common to humans
and in our natural behavior since birth. By using sight we naturally
focus on something (the origin of the name of the method);
therefore, we propose to use this action as a common language
which people can use to understand, query and insert information.
This is the core of the method: using sight to actively query and
insert information. This realizes one of the most important goals in

Poster
57
our approach: to ease everybody’s access to information. The
complexity dictated by the type of data is simplified in a few easy
moves (touching a model in a device and looking around); moreover,
we think that this involves also an amusement component which
helps users in getting more involved in the experience (Fig.)
Fig.: the last version of ISEE
The use of extended zones gives to the proposed ranking algorithm
a superior performance than rankings based only the distance or
selection methods. The system has been applied to selected case
studies related both to outdoor and indoor environments, proving
potentially to be also an interesting prototype as a smart guide with
the use of augmented reality technologies.
We extend our previous work on the ISEE method to link information
to 3D space to a mobile platform.
Our goal is to use it in a mixed reality setting where the user can
retrieve information about his/her current context using the GPS
information given by the device for the outdoor application, and
marker-based mixed reality for indoor environments.
The actual prototype is focused on an application in Berlin using a
smart device. The approach predicts a platform for a common device
provided of graphic interface to visualize Google Maps, or of the
performances to receive the position and so to visualize the list of
the information. In particular we are working already analyzing
performances of the Iphone 3G. The relatively low accuracy of the

Poster
58
localization information has to be kept into account in the design of
the interface.
We allow the user to correct his location and explore the surrounding
of the location returned by the GPS freely, while continuously
integrating the changes of position given by the GPS. The user has
access to the relevant information for the current context, in a
similar way as done previously in the ISEE Web application, but with
a slightly modified interface to take advantage for example of the
touch screen of the device, and to keep into account the smaller size
of the display. The data itself is gathered and stored using a REST
interface to the ISEE Web server.
The goal of work is walking to retrieve a contextual information in
real time by an intuitive interaction. Information insertion is simple,
as the user can add in every moment specific data about his current
view. We hope in the future to let normal users add information,
fostering the creation of a community of active users able to deliver
information and share experiences.

Session 3
59
PEREIRA J., STRASSER A., STRASSER M., STRASSER Th.
Interactive Narratives for Exploring the Historical City of
Salzburg
This paper presents the main findings of the “Wanderbarer
Salzburgführer”, an interactive, mobile explorer for the historical city
of Salzburg. The city explorer was developed as part of the
INTERREG IIIB CADSES project Heritage Alive!, and aimed at
exploring and testing interactive narrative approaches in presenting
cultural heritage content to the residents of Salzburg. In particular
we wanted to test how interactive storytelling techniques can
improve the local residents’ experience in exploring their own city’s
cultural heritage. The city explorer presented six subjects, which
focused on less-prominent heritage of Salzburg:
• Salzburg Through the Ages;
• Georg Trakl: The Life and Works of a Salzburg Poet;
• Historical Taverns, Breweries and Hotels;
• Latin Inscriptions: What Inscriptions Tell Us;
• Historical Windows;
• Historical Doors.
The city explorer adopted a moderate constructivist narrative
approach. This approach includes elements of constructivism (i. e.
users actively construct an understanding of the world through
personal interests, experiences and notions) and elements of
instructive design to provide users with structured guidance and
support for creating knowledge. Key aspects of constructivist
learning include encouraging users to participate in active learning,
authentic learning and to provide them with multiple perspectives on
knowledge creation. To provide users with structured guidance and
support we followed the SOI model developed by Richard E. Mayer.
This model aims at fostering the cognitive processes of users in
knowledge construction in terms of selecting relevant information
(S), organizing information in a relevant way (O) and integrating
new information with users’ prior knowledge (I).
The interactive storytelling techniques applied included various
interactive features as well as a dynamic user navigation system.
The interactive features included quizzes, scavenger
hunts/geocaching, answering of single/multiple choice questions,
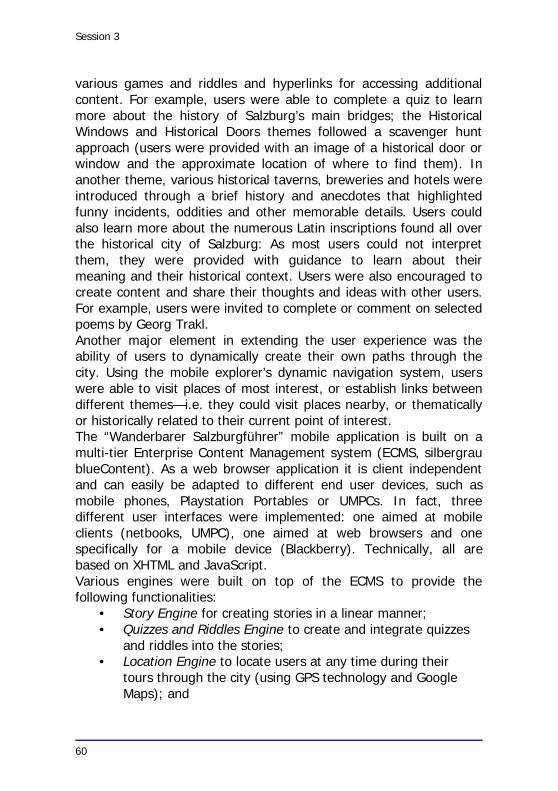
Session 3
60
various games and riddles and hyperlinks for accessing additional
content. For example, users were able to complete a quiz to learn
more about the history of Salzburg’s main bridges; the Historical
Windows and Historical Doors themes followed a scavenger hunt
approach (users were provided with an image of a historical door or
window and the approximate location of where to find them). In
another theme, various historical taverns, breweries and hotels were
introduced through a brief history and anecdotes that highlighted
funny incidents, oddities and other memorable details. Users could
also learn more about the numerous Latin inscriptions found all over
the historical city of Salzburg: As most users could not interpret
them, they were provided with guidance to learn about their
meaning and their historical context. Users were also encouraged to
create content and share their thoughts and ideas with other users.
For example, users were invited to complete or comment on selected
poems by Georg Trakl.
Another major element in extending the user experience was the
ability of users to dynamically create their own paths through the
city. Using the mobile explorer’s dynamic navigation system, users
were able to visit places of most interest, or establish links between
different themes—i.e. they could visit places nearby, or thematically
or historically related to their current point of interest.
The “Wanderbarer Salzburgführer” mobile application is built on a
multi-tier Enterprise Content Management system (ECMS, silbergrau
blueContent). As a web browser application it is client independent
and can easily be adapted to different end user devices, such as
mobile phones, Playstation Portables or UMPCs. In fact, three
different user interfaces were implemented: one aimed at mobile
clients (netbooks, UMPC), one aimed at web browsers and one
specifically for a mobile device (Blackberry). Technically, all are
based on XHTML and JavaScript.
Various engines were built on top of the ECMS to provide the
following functionalities:
• Story Engine for creating stories in a linear manner;
• Quizzes and Riddles Engine to create and integrate quizzes
and riddles into the stories;
• Location Engine to locate users at any time during their
tours through the city (using GPS technology and Google
Maps); and

Session 3
61
• Multi-relation Engine to provide the overall dynamic
navigation and link all digital content.
The mobile city explorer was trialled on a Medion UMPC by 15 test
users in the summer of 2007. Test users (the younger users in
particular) took advantage of the interactive features and dynamic
navigation to explore the City of Salzburg. They commented that
with the ability to switch views and themes effortlessly they were
able to quickly select their own path through the city. And they also
remarked, that with activities, such as searching for historical
windows and doors, or Latin inscriptions their experience of the
objects was more intense as though they were rediscovering the city
through “different eyes”.

Session 1
62
QUATEMBER U., THUSWALDNER B., KALASEK R., BATHOW C., BREUCKMANNB.
The Virtual and Physical Reconstruction of the Octagon and
Hadrian´s Temple in Ephesus
The Octagon is a tomb-monument situated at the western end of the
Curetes Street in the centre of the historic site of Ephesus and was
erected in the first century B.C. It was excavated in the early 20th
century under the direction of R. Heberdey. At that time the building
was regarded as a kind of trophy-monument. In 1926 M. Theuer
started an excavation on the top of the base of the structure and
discovered a barrel vault that contained a burial chamber. Inside,
they found a sarcophagus with the skeleton of a young woman.
According to the interpretation of H. Thür, there is sufficient
evidence that the unknown woman inside the sarcophagus is
Ptolemy Arsinoe IV, the youngest sister of the famous Cleopatra VII.
During the excavation of the base structure and the area of the
lower Curetes Street, numerous blocks of the ruined building were
found as well. Therefore W. Wilberg, who was the architect of the
original excavation, could already provide an initial reconstruction
plan of the building that does not differ very much from the current
one.
The Octagon was built on a quadratic base. In total, it is 13 meters
high and its front is subdivided into three parts: a pedestal, above
this the octagonal main structure - to which it owes its current name
“Octagon” - and finally a
steep pyramid-shaped roof.
Due to its historical
relevance and its prominent
location in the centre of the
excavation site next to the
Hadrian´s Temple and the
Library of Celsus there is an
increasing desire to rebuild
this fascinating building at
its original location. Most of
the fragments are currently
situated on the site, but two
columns and some parts of the cornice were transferred to Austria in

Session 1
63
the early 20th century and are now on display in the Ephesus
museum in Vienna. Modern 3D technologies provide the means to
digitally reassemble all of these fragments that are physically located
in different places.
For this reason the current project focuses on working out an
anastylosis in virtual space with the aid of highly detailed 3D-models
of all remaining components of the building. All building parts were
recorded computationally with help of 3D scanning technology.
Two different 3D-scanning systems were employed for data
acquisition, a time-of-flight laser scanning system for the entire en-
semble, and a structured-light triangulation scanner for more de-
tailed structures. From this data 3D-models of the remaining blocks
were generated which formed the basis to create a virtual ana-
stylosis of the entire building.
The so-called Hadrian’s
Temple with a size of
approx. 10 m x 10 m and
a height of about 8 m is
one of the most famous
monuments in the ancient
city of Ephesus and oc-
cupies a prominent lo-
cation in the western sec-
tion of Curetes Street,
one of the chief thorough-
fares of the site. Although
it was discovered in 1956,
this structure has never
been systematically analyzed, studied, or published.
As a result, it has remained a subject of controversy for over half a
century. Until now, scholars have been unable to ascertain its
chronology, function, and definitive architectural reconstruction. A
new project conducted at the Austrian Archaeological Institute and
funded by the Austrian Science Fund (FWF Project P20947-G02) is
designed to redress all these problems.
In the preliminary excavation report, Franz Miltner, the then ex-
cavation director, interpreted the building as an imperial cult temple
for the emperor Hadrian (117–138). However, this interpretation is
contradicted by a subsequent study of the building inscription. So

Session 1
64
far, a consensus concerning the function of the building has yet to
be established.
In the summer of 1957, the actual reconstruction work began. The
short period of time between discovery and the reconstruction of the
building left little time to study building history and phases. Until
now, only a plan and a restored elevation have been published.
Documentation of the architectural blocks is not available in the
archives of the Austrian Archaeological Institute. Before issues such
as interpretation and function can be addressed, it is of vital
importance to clarify the architectural history of the structure. The
first step towards this goal is to produce an up-to-date
documentation of the building. This will be achieved by 3D scanning
conducted by the Austrian Archaeological Institute in cooperation
with the Breuckmann GmbH.
The objective of
this project, which
has been carried
out in June/July
2009, is to produce
a high-definition
3D-scan of the
temple with a
resolution of half a
mm by using 3D-
scanners that utilize
fringe projection
technique in combi-
nation with photogrammetry.
The paper will start with a short introduction into the history of these
two buildings. It will then give a short overview about the
techniques, used for this challenging project. The second part will
present the virtual 3D-model of the Octagon and first results of the
scanning and the virtual reconstruction of the Hadrian´s temple.
Nearly 2000 scans have been recorded within 10 nights, most of
them on a scaffolding or crane in a height of about 8 m.
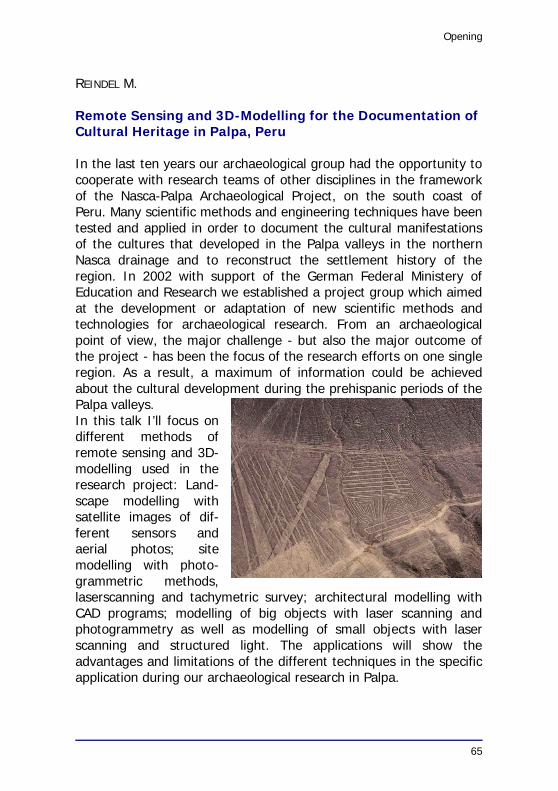
Opening
65
REINDEL M.
Remote Sensing and 3D-Modelling for the Documentation of
Cultural Heritage in Palpa, Peru
In the last ten years our archaeological group had the opportunity to
cooperate with research teams of other disciplines in the framework
of the Nasca-Palpa Archaeological Project, on the south coast of
Peru. Many scientific methods and engineering techniques have been
tested and applied in order to document the cultural manifestations
of the cultures that developed in the Palpa valleys in the northern
Nasca drainage and to reconstruct the settlement history of the
region. In 2002 with support of the German Federal Ministery of
Education and Research we established a project group which aimed
at the development or adaptation of new scientific methods and
technologies for archaeological research. From an archaeological
point of view, the major challenge - but also the major outcome of
the project - has been the focus of the research efforts on one single
region. As a result, a maximum of information could be achieved
about the cultural development during the prehispanic periods of the
Palpa valleys.
In this talk I’ll focus on
different methods of
remote sensing and 3D-
modelling used in the
research project: Land-
scape modelling with
satellite images of dif-
ferent sensors and
aerial photos; site
modelling with photo-
grammetric methods,
laserscanning and tachymetric survey; architectural modelling with
CAD programs; modelling of big objects with laser scanning and
photogrammetry as well as modelling of small objects with laser
scanning and structured light. The applications will show the
advantages and limitations of the different techniques in the specific
application during our archaeological research in Palpa.

Session 5
66
SAUERBIER M.
Image-based techniques in Cultural Heritage modeling
The importance of accurate and visually attractive documentation of
Cultural Heritage, be it single buildings, monuments or whole
landscapes, has grown more and more over the past years.
Compared to other 3D measurement techniques, image-based
methods provide the opportunity to produce photo-realistically
textured 3D models of such objects. Moreover, image-based
methods are quite flexible in terms of accuracy and the level of detail
required in different applications and therefore are more and more
being used in disciplines dealing with documentation but also
analysis of cultural
heritage, in par-
ticular in archaeo-
logy and architec-
ture. Based on
different case
studies accom-
plished in our
group an overview
of applications of
photogrammetric
reconstruction of
cultural heritage
objects will be
given. Furthermore, current topics of research and future trends in
the field of photogrammetry with potential benefit for the Cultural
Heritage community as well as the use of 3D models beyond mere
documentation will be briefly presented and discussed.

Session 5
67
SCHULTES K., BERNER K., GIETZ P., ARNOLD M.
GIS and Cultural Flows
The cultural flows which are researched in the Heidelberg Cluster of
Excellence “Asia and Europe” all exhibit both, a historical and a
spacial dimension. While browsing the factual data they involuntarily
are localized on everybody's mental map–which may be faulty or
incomplete. Therefore, the visualization of the key concepts in a
multidimensional way (geographical position plus timeline) may
foster the understanding of the data included in various database
projects established for the researchers of the project cluster
themselves as well as for the “interested public”.
The project uses Google Earth for which an increasing amount of
additional tools and interfaces are available. It’s main advantage is
its easy-to-use interface: Researchers in the humanities are in most
cases not familiar with specialised GIS-Software. This product is wide
spread and–for the users–available for free.
The Cluster project “Mapping the Flows” is using Google Earth's
"time series" software in two demos. One demo visualises how in-
scriptions were added over time to a Buddhist sutra passage at
mount Tai in Shandong province, China, beginning in the 6th
century.
The other demo is much more complex. It shows the travels of Ger-
man emperor Friedrich II and links each place to the passage of his
itinerary as recorded in the Regesta Imperii on-line database (http://
mdz1.bib-bvb.de/cocoon/regesta-imperii/kapitel/ri05_fic1881_kap10).
While coordinates for the demos were still entered manually we are
now working on a solution that automates this process. This includes
the digitisation and storing in a database of lists of place names
available in the Latin-English “Orbis Latinus”, and geographical
thesauri, like Getty’s Thesaurus of Geographical Names (TGN). It will
also include a tool to automatically assign geo-coordinates to places.
It has shown, that such a visualisation not only makes historical cul-
tural flows very intuitively accessible and understandable. In addi-
tion, this technology also opens new possibilities for validating the
data in respect to accuracy and probability. The paper will introduce
the demos and discuss possible ways of using Google Earth and how
these can provide new insights for the researchers in the under-
standing and analyzing of historical data.

Poster
68
SDYKOV M., SINGATULIN R.
IT of the Project "Virtual Ukek – Kyryk-Oba"
In 2001 on the territory of Uvek (Saratov) the research work was
carried out. The purpose of the researches was to search the traces
of medieval buildings with the help of advanced technologies. As tool
means there were used multispectral stereophotogrammetry
cameras. As a result of researches 81 structures and traces of more
ancient structures were revealed. On thermo graphic "traces" the
sites of stone buildings were identified. "Traces" of buildings were
used for reconstruction of topography of a medieval city. Archaeo-
logical work of 2002–2006 have proved the used decisions. The
impossibility to carry out the further researches in conditions of
modern city, complexity of legal and social character, have induced
to search new basic decisions. It has resulted in intensification of
virtual reconstruction of medieval city, realization of works on safety
of the territory with the help of Web-technologies and creation of an
infrastructure of the historical-tourist complex (the project "Virtual
Ukek", 2005). The correctness of statement of the research problem
was appreciated proceeding from physical-archaeological model of a
monument constructed on a priori information, determining depth of
researches, efficiency of application of various technologies. Taken
as a whole, this data formed the purposeful information bank with
the definite set of the entered data. Use of mathematical methods
(system analysis, the research of operations) has resulted not only in
high scientific results, but also in achieving large technical and
economic effect. The researches have specified an essential role of
information and communication technologies, especially when the
problems of reception of operative advice, performance of functions
of maintenance of security measures and other tasks. Occurred the
successful application of advanced technologies in the project
"Virtual Ukek", has allowed to use them in the extended version at
researches of medieval cities Bulgar and Buljar (the project "Virtual
medieval cities of the Volga region: Ukek-Bulgar-Buljar", 2006), and
also to set off to the research of the territory of the Zolotorevskoe
settlement (Penza, Russian Federation). In 2008 the working group
joins Western Kazakhstan archaeological Centre. In sphere of
scientific interests entered unique royal burial mounds "Kyryk-Oba"

Poster
69
(Fig.) and found in 2001 during the examination of the pipeline route
"Aksai-Atyrtau" the medieval settlement "Zhayik" in the suburb of
Uralsk (Republic Kazakhstan). For research, protection, and
reconstruction earlier proved technology of the project "Virtual Ukek"
are used.
Fig. 1: Reconstruction of the king’s burial mound «Kyryk-Oba»
The features of the used technical decisions on the basis of the Web-
appendices and multispectral stereophotogrammetry technologies
consist in an opportunity of realization of research works in con-
ditions of urbanism, in sharp decrease of cost of shooting, re-
gistration and data processing in a mode of real time. The expenses
for service, support, protection of monuments of a cultural heritage
are reduced. Essential stage of application of technologies is granting
access in virtual space, demonstration of results of application of
technologies. The works are carried out with the help of information-
measuring systems (multispectral stereophotogrammetry cameras)
and combination of methods of the spectral analysis of stereo
snapshots training classifications, construction of the index images,
visual and multispectral decoding etc. The synchronous work of the
Web-appendices and technology imposing threedimensional
archaeological models on modern environmental conditions with
identification of basic attributes (digital thematic databases) gives
opportunities of realization of joint researches in a mode of real time
and transition to ways of simultaneous study of objects with the help

Poster
70
"of a method of immersing". Advantages of offered technology are
based on the reception of the operative information in a mode of
real time as directly from the camera (by means of the protocol of
family IP), and through special video server, and also application of
the developed original software for accelerated photogrammetry of
processing of stereo pairs.
The project stipulates the use of the software complex PHOTOMOD,
which unites an extensive set of software for digital photogram-
metrical processing of the data of distance probe, allowing for
getting spatial information based on the images of practically all
commercially available shooting systems, such as digital and film
cameras, space scanning systems of high solution, use of scanned
archive photographs, etc. Thanks to the flexible module structure,
API for creation one’s own modules of extension (plug-ins),
extensive net of exchange formats PHOTOMOD may be used as a
local fully functional digital photogrammetrical station, a distributive
net media for the realization of big projects and conduction of more
labor-consuming processes. Testing information system with applica-
tion of high-speed networks of transfer of the data now is made. The
separate decision of used technologies is the opportunity of visuali-
zation of the reconstructed three-dimensional image directly on
objects of culture – that the user sees without any special
adaptations. At present the usage of the systems of virtual reality in
the project is one of the most interesting spheres of research and
designs in application of the computer graphics. The system inter-
acts with the images obtained from the multi-spectral photogram-
metrical cameras and with the archeological database and thus
models virtual media. It allows for the creation of the widened reality
with the visual identification of the placement, major indications,
properties and the material of the three-dimensional archeological
objects. The usage of specialized structures of virtual reality is not
obligatory for the project, but it essentially enlarges the effect of
"immersion".

Session 1
71
SIART Ch., EITEL B.
Digital Geoarchaeology – an approach to reconstructing
ancient landscapes at the human-environmental interface
Geospatial tools such as satellite remote sensing, GIS and 3D
visualisation have become more and more popular in modern
archaeology, most notably with regard to the reconstruction of
ancient landscapes and cultural heritage management. Their
strengths and limitations have still not been fully explored, though –
a fact which specifically holds true for the type of applied datasets in
terms of generation, quantity and quality. This aspect is of particular
importance since obtaining and developing useful environmental
data can be the most time consuming and costly aspect of
computerised archaeological projects. As there is a huge demand for
detailed knowledge about the environment, comprehensive data
bases are required in conjunction with proper ecosystematic
information to provide maximum representativeness of results.
The paper aims to bridge the gap between the acquisition of
profound geodata for archaeological issues, their processing and the
appropriate methodological background. Associated potentials and
pitfalls will be focused on from an operator’s perspective as well as a
geographical point of view. Several applications and results from an
interdisciplinary research project are presented. In this context, the
main objective is to reconstruct the Minoan landscape of the island
of Crete and its evolution during the Bronze-Age. Corresponding case
studies were carried out on the basis of satellite imagery, digital
elevation models, GPS data, geomorphological prospection and
literature surveys. As special attention is paid to human-
environmental interactions, the approach highlights the promising
prospects of digital geoarchaeology.
Preliminary investigations focused on reconstructing the socio-
economic and cultural landscape during the 2nd
millennium BC by
using GIS-based algorithms for deriving former roads and
connections between Minoan settlements. Therefore, least-cost
paths were calculated on the basis of GPS-mapped locations and
subsequently compared to communication routes known from
archaeological literature. For the first time, a hypothetical mesoscale

Session 1
72
road network of Central Crete gives an impression of the spatial
interconnections between different Bronze-Age sites.
Besides exploring the ancient landscape by calculating these linear
infrastructures, the main objective was to reveal hitherto unknown
areas of archaeological interest and associated remains. Since the
implementation of satellite imagery in recent archaeological research
proved to be very useful in this context, high resolution satellite tiles
(Quickbird) were used in the study area and subsequently evaluated
regarding their applicability. As demonstrated by the results, the
characteristic Mediterranean environmental conditions (e. g. sparse
vegetation cover, soil erosion, bare rock outcrops) occasionally
impede this prognostic detection to a large extent due to visual
complexity and similar spectral signatures of land surface cover
classes. Thus, we present a data integration approach to identify
ancient settlement locations and useful areas that might reveal new
insights into the colonization history of Crete. Potential archaeo-
logical candidate sites were identified on the basis of a multimethod
strategy using DEMs and Quickbird images. The detected areas are
characterised by favourable environmental conditions, which might
have been used for agricultural purposes, animal husbandry and
settlement activities. Prospective archaeological field surveying can
therefore be conducted time- and costefficiently by immediately
investigating these sites. Even though predictive modelling concepts
such as the one presented have been widely applied in archaeology
for decades, the present study predominantly addresses this topic
from a geoscientific point of view by highlighting a new
geoarchaeological approach for data development, archaeological
remote sensing and GIS analysis.
Taking one step further towards generating a comprehensive and
vivid landscape reconstruction, the Holocene environmental evolution
– particularly during the Bronze-Age – was modeled by terrain
visualisation software packages and geographical information sys-
tems. For this purpose, results from on-site and off-site prospection
in the study area with geophysical and geomorphological methods as
well as digital elevation models provided an appropriate database of
environmental and anthropogenic variables. Within a time series of
several images, the results illustrate the environmental changes that
– according to our geomorphological and archaeological findings –
occurred in Crete during the last 4000 years.

Session 1
73
As shown by the results from Crete, the presented digital tools
perform auspiciously and can be used for a broad range of research
issues, but still their imponderables must be considered. Since they
carry the risk of being manipulative and operator-biased, certain
precautions are required in order to achieve maximum repre-
sentativeness. In addition to the ways of acquiring and processing
appropriate datasets as well as their quality, the amount of input
variables used for the landscape reconstruction is crucial. This
exactly poses a future challenge, because a better understanding of
space and intensified analysis based on the integration of more
environmental data will offer more precise and comprehensive
outcomes. Corresponding tasks explicitly represent the strengths of
geography, which might support archaeological research sub-
stantially. Taking account of these premises, digital geospatial
techniques may significantly contribute to future studies at the
interface between geosciences and humanities. Both used as a single
application in order to consider particular aspects of ancient cultures
and their spatial implications (infrastructures, road networks) and in
combination with further applications (archaeological prospection,
detection of archaeological remains, 3D landscape visualisation) they
help gain better insights into the interactions between man and the
environment. The use of GIS, remote sensing and terrain
visualisation in archaeology thus constitutes the research field of
digital archaeology that offers promising prospects to future in-
vestigations, most notably in Mediterranean regions. Even though
cooperation between archaeology and geosciences is still uncommon
with regard to these methods, recent research points out the
steadily increasing interest in this topic. In addition to geophysical
and cartographical collaboration, computerised prospection is surely
one of the most promising tasks among interdisciplinary geoarch-
aeological research.

Poster
74
SINGATULIN R., YAKOVENKO O.
IT in the reconstruction of ceramics
Research, related to the reconstruction of vessels in its fragments, is
carried out over a long time. Before the advent of computers, all
similar works were reduced to a drawing of the profile of a vessel by
means of displaying its shadow on a screen, and the problem of
recover of the form and the size of a vessel (with the symmetry
property) was solved on one known or on several parameters of the
kept part of the vessel. The situation changed cardinally when
computers appeared. And now, the use of personal computers allows
the involvement of tested mathematical solutions to this problem.
Reconstructions of the forms of receptacles are standard tasks of the
processing of information – dividing the fragments into groups,
search for suitable fragments, sorting, comparison of the textures, of
the colors, etc.
Software and hardware allows the speeding up of the selection of
fragments, their rehabilitation, as well as ensuring the accuracy of
shape and of size of the reconstructed vessels.
The algorithms proposed for solution of these problems are usually
reduced to a full enumeration of pairs of fragments of a certain mea-
sure of conformity the so-called «complementarity». Different
methods are used here: the allocation of the most common sites of
borders of applied fragments, a direct comparison of the visual ob-
jects displayed on the fragments, the method of maximum like-
lihood, etc. These methods are limited a little by its capabilities, be-
cause they cover only one of the aspects of the problem of syn-
thesis. So «advanced» techniques add the global analysis of the
structure to the local analysis of pairs of fragments, which consist of
the connection the fragments to the constructed part. In case of
contradiction the algorithm produces a rollback to the last consistent
state.
However, the serial algorithm, proposed in the «expanded»
technique does not work in the absence of most of the fragments. It
is essential that the algorithms that are included in the above
methods are not able to adapt to the new task. In practice, the part
of the problem material is processed by experts, using a limited set
of heuristics. The systems KBS (knowledge-based systems),

Poster
75
simulating the actions of an expert, are good for solving such
problems. In such a system it is possible to allocate some categories
and to apply them to the problem fragments of ceramics:
analysis of fracture mechanics;
analysis reflecting the properties of the fragments;
analysis of geometric characteristics of boundaries of fragments;
analysis of color, decor, traces, texture of fragments.
Analysis of the destruction mechanics of the vessel allows one to
describe the dynamics, direction of impact force, strain, etc.
Analysis of the reflective properties of fragments of pottery could be
the key when the study is accompanied by a multispectral infor-
mation-measuring system with a wide range of operating frequen-
cies. In an infra-red range, thermal attributes of corresponding types
of fragments of pottery are distinctly allocated.
In the analysis of boundaries, the pair fragments are selected end-
to-end on the same butt length of the sides of polygons
approximating borders. Moreover, the pair fragments must have the
same physical size, such as thickness.
The color characteristics of the fragments provide the largest part of
the attribute information. It is often necessary to produce the
comparisons of fragments only under color histograms.
Optical-geometric characteristics of pottery fragments also give suf-
ficient information, which is defined by the mi rotexture surface, by
the decoration and track entities, of the relative positioning of
fragments. This system architecture of the optical-geometric syn-
thesis is based on the hierarchical streamlining heuristic of the
search of base pairs. Certain categories of base pairs are located on
the top branch of the hierarchical heuristics, which is responsible for
the rough and fast sorting of fragments. On the bottom branch of
the category, additional calculation are demanded for reliability. In
case of false definition, the raising of a fragment upwards on the
hierarchy (rollback) is also monitored and used to adapt by these
algorithms. Such a «mechanism», based on the environment of the
development of the expert systems CLIPS (Common List Processing)
with the connectivity of the package of numerical calculation Mathlab
was realized at the Moscow Technical University. A similar approach
were carried out at the Department of ISiTO (Information Systems
and Technology in teaching), Pedagogical Institute of Saratov State
University in 2006. The program tools of the developed system was

Poster
76
also implemented on the base of the environment of development of
the expert systems CLIPS. An essential difference was the realization
of independent package programs, related to a selective sampling of
fragments of pottery, to the analysis of histograms, to the construc-
tion of three-dimensional models of the vessel, etc. To create the
prototype, the formalization of some heuristics was done. Heuristics
are related to the qualitative analysis of the form of tracelogical con-
stitutions (It is carried out by means of palaeophonographical
technologies).
Fig. 1
A stereophotogrammetric survey of the attribute fragments of cera-
mics was made, on which was based a 3D model of a vessel, filled
with fixed fragments (Fig. 1). Special attention was paid to the deve-
lopment of a custom software interface that allows one in an ac-
cessible way to make automated processing of the fragments using a
flatbed scanner. The results of the produced researches permit us to
conclude that it is expedient to use the package of software
algorithms that simplify office processing of the mass material, raises
the quality and accuracy of processing of archaeological ceramics.

Poster
77
SIOTTO E., VISINTINI D.
3D Texture Modeling of an Important Cycle of Renaissance
Frescoes in Italy
The paper describes the steps of the 3D texture modeling of an
important cycle of Renaissance frescoes located in the Church of
Saint Anthony Abbot in San Daniele del Friuli (North East Italy), from
the surveying by means of a laser scanning and photogrammetric
integrated system to the final photorealistic 3D model in VRML/X3D
computer vision environment.
The first mentioned writings about the church go back to 1308, but
the earthquake of 1348 damaged it seriously and it was therefore
restructured and widened. After these restoration works, concluded
in 1441, the façade was rebuilt with Istria stone in a style resembling
Venetian late Gothic, with a lancet arch portal, a fret-worked rose
window with mosaic stained glass (1470). The church is nicknamed
the “Little Sistine Chapel of Friuli” since it keeps the most beautiful
and harmonious cycle of Renaissance frescoes of the Region, painted
by Pellerino da San Daniele (1467 or 1472–1547). That is why this
pictorial cycle has always raised a great interest and it has been
accurately studied. Giorgio Vasari firstly named it in the artistic
historiography and it has been found in the documents and
chronologies since the XIX century thanks to Fabio di Maniago and
Giovan Battista Cavalcaselle. The pictorial cycle has a complex and
interesting iconographic program including Christological stories, the
four Evangelists, Prophets, Doctors of the Church, stories and Biblical
characters, life episodes of Saint Anthony from Padua and Saint
Anthony Abbot. They are tied up to requirements of the cult of the
brotherhood Confraternita di Sant’Antonio, who has commissioned
the work of art. The frescoes are painted onto the triumphal arch
wall and the adjoining nave walls, the pillars and the intrados of the
presbytery arches, the presbytery and apse walls and domes.
For a detailed analysis of a so important monument, a Terrestrial
Laser Scanner (TLS) system integrated with a photogrammetric
camera surely is the State-of-the-Art surveying technique. Anyway,
once obtained such 3D points, the key problem is the extrapolation
of the geometry of the architectonical elements “imprisoned” within
the cloud with the maximum level of automation, namely the data

Poster
78
“interpretation” making possible the 3D photorealistic modeling. For
the inner and outer surveying of the church, the Riegl Z390I TLS
system integrated with a Nikon D200 photogrammetric digital
camera was employed. The TLS system was placed in suitable four
positions inside the church: from these, fourteen point clouds, with
different axis orientation, angular steps and distance ranges, were
collected in fully automatic way. From the same scanning stations, a
total number of 96 digital images were panoramically acquired with
the photogrammetric camera fixed on the top of the TLS system. In
the same way, the TLS and photogrammetric external surveying of
the principal façade was carried out. Summarizing, 33 millions of
3Dpoints (351 Mb) and 163 photogrammetric images (621 Mb) were
automatically acquired in few hours of surveying! In truth, other
images has been later manually acquired, since some of those
relating the window areas were very dark for exposure troubles;
nevertheless, this has required only one hour of photographic work
with the same camera without the TLS system.
The first step of the data processing, carried out by means of the
RiSCAN PRO® (Riegl) software has concerned the all-together
joining of the various scans (registration) in a unique cloud of 3D-
points.
Afterwards, the points have been processed with suitable tools of
cleaning, filtering, and resampling, and later the surfaces have been
reconstructed as TIN meshes by different commands of
triangulation. Particular care has been devoted to suitably smooth
and decimate such DDSM (Dense Digital Surface Model), in order to
obtain a 3D detailed model but with “few” triangles (tens of
thousands!). In addition, the automatic photogrammetric processes
of cloud colouring, image texturing and ortho-projection or
rectification onto the DDSM have been carried out. This processing
steps are fully automatically carried out, since the camera was fixed
on the TLS top, i.e. it is known the so-called photogrammetric
exterior orientation. This last is instead unknown for the “TLS-less”
acquired images, but it can be easily computed by exploiting a DDSM
textured with the first images and by recognizing, on it and in the
new images, some detail points in the frescoed figures.
The 3D model and the image textures have been exported as a WRL
file, so allowing interactive tours in the VRML/X3D virtual reality
space. The obtained VRML/X3D model is a computer science

Poster
79
instrument useful both to experts and to real or virtual visitor, since
the model will be accessible by web. It will be possible the free 3D
exploration and/or the choice of various thematic tours (chronologic,
restoration, technique, geographical and in the time), with a virtual
camera going exactly in front of the frescoed scene and subjects
(without angular roll) and at a variable distance in order to wholly
observe and them.
Furthermore, many VRML/X3D anchors have been suitably created,
so to link each frescoes scene with the corresponding informative
card of the web databases of S.I.R.Pa.C. (Regional Information Sys-
tem of the Cultural Heritage – http://www.sirpac-fvg.org/index.asp)
or Ar.I.S.T.O.S. (Database for the History of the Historical-Artistic
Objects Preservation – http://aristos2.mbigroup.it/) or S.I.Ca.R.
(Information System for the Restoration Yards – http://sicar.
mbigroup.it). This work of 3D modeling is thought in fact for a web
main use and fits within the regional project Computer Sciences and
Web for the Cultural Heritage: Mobile and 3D innovative services for
the Tourism of the University of Udine (http://www.infobc.uniud.it).
This project provides the creation of a complex GIS collecting and
integrating existing and new numerical 3D models and thematic
database, for the management, protection, utilization, and
enjoyment of the historical-artistic and archaeological heritage of the
Friuli Venezia Giulia Region. Screenshot of the 3D textured model of
the frescoes of St. Anthony Ab. Church in VRML/X3D environment.

Poster
80
SLIZEWSKI A.
NESPOS – Digitalizing Pleistocene People and Places
NESPOS (www.nespos.org) is an online database for archaeologists
and anthropologists that opens new possibilities of data sharing and
communication. The supporting organisation is the NESPOS Society
e.V. and it is located at the Neanderthal Museum in Mettmann,
Germany.
NESPOS was the result of the 24-months-project “TNT – The
Neanderthal Tools” which started in 2004 and was founded by the
European Union. The project was initiated by the Neanderthal
Museum and accomplished in close cooperation with the University
of Poitiers (France), the Croatian Museum of Natural History
(Zagreb), the Royal Belgium Institute of Natural Sciences (Brussels)
and the technical partners Hasso Plattner Institute, PXP and National
Geographic (Semal et al. 2004, Gröning et al. 2005).
NESPOS is an open platform, designed for paleoanthropologists and
archaeologists worldwide who can up- and download research
results. All data can be protected in a membership area. More
sensible data can be stored in personal security spaces which are
only accessible by the members who created them. For international
working groups, a security space can be made accessible to several
researchers. An example of such a working platform within NESPOS
is the European Virtual Anthropology Network (www.evan.at).
Within NESPOS all related data is linked to each other. By calling up
e.g. a single fossil you also get information on all other human re-
mains found in the same place, PDFs of literature, site data such as
stratigraphy, research history, fauna, archaeological features and
artefacts.
The software package VisiCore allows creation and handling of
6faces (Berens, Slizewski 2008) as well as voxel, polygonal, single
picture models and landscape or site models.
At the moment, the NESPOS membership area includes photos,
literature, CT data, surface scans (see e.g. Slizewski, Semal 2009)
and 6faces of human fossils and artefacts from more than 70 Asian
and European sites. Within an ongoing research project 50 sites from
the Iberian Peninsula will be added within the next two months.

Poster
81
NESPOS was originally designed for a limited number of researchers
and Neanderthal fossils. But during the last five years, the database
increased so much and proved to be such a good research tool that
in February 2009 an updating process was launched. Main goal was
a better usability of nespos.org to attract scientific users to provide
more data and to satisfy the growing public interest in NESPOS. On
19th
June 2009 the new version of NESPOS went online. In the
course of this relaunch, the database was broadened to all Pleisto-
cene sites and human fossils, now also including Palaeolithic art (Breuck-
mann et al. 2009), Australopithecines, Homo erectus, anatomically
modern humans and a huge collection of modern reference data.
Basic information on sites and fossils are now available to the public
in form of a digital encyclopaedia on the Palaeolithic. Only high
resolution 3D data and personal or security spaces remain restricted
to scientific members.
Embedded links to Wikipedia, interactive GoogleEarth maps, a
science daily feed and the possibility to create a RSS feed for
NESPOS complete the new Web 2.0 functionality of NESPOS.

Poster
82
SOTIROVA K.
Multimedia Galleries of Cultural Heritage – Piece of a Puzzle
or the Overall Picture?
2009 has been declared by EU as European year of creativity and
innovation. 2008 was year of the intercultural dialogue. The current
paper is trying to explore these European priorities in the context of
Digital Humanities research field with stress on various interactive
multimedia presentations of cultural heritage, EduTainment (techno-
logies).
The research topics in this paper is how we (scientific groups in
Digital Humanities area and cultural heritage holders) are addressing
intercultural content in our common, as we say, European heritage,
what story we offer by the way this content is presented online and
how multimedia EduTainment tools might challenge us and show
an innovative way for richer e-presentation.
Among the questions we are asking is what knowledge the
knowledge society of 21c. represents online and whether technology
development is what the cultural heritage holders and science
centers are missing to get full attendance. The technology (2D and
3D reconstruction, Computer Vision applications, Computer Tomo-
graphy, excavation's historical documentation from multimedia data
etc.) in general is developing so quickly that cultural heritage holders
are lacking time to make the digital recreation of their collections
more human-like and closer to the real visitors. Thanks to techno-
logy the digital heritage from Antiquity till today is more vivid, but
the storytelling, which is the most important aspect of all computer
generated worlds needs to be further developed. What needs to be
such a development? In our opinion it needs not more attractive-
ness, but more depth; depth in terms of challenging questioning and
different points of view presented, incl. the point of view of the
different Other (in historical context this is the Neighbour, the
Enemy, the political Partner, the opponent etc.).
Cultural heritage is one of the best reservoirs for different
multimedia EduTainment tools (playful learning) and games. The
virtual environments (especially cultural heritage ones) can learn a
lot from game design. A good example of dialogue between
technology and humanities is Virtual Warrane application and

Poster
83
Haemimont Ltd. European history based games. They both illustrate
a broader tendency – to capture indigenous knowledge on computer
systems, which can then be used to protect, preserve and promote a
specific-history-based heritage (culture). Protection, preservation
and promotion of cultural heritage is the first step of what we call
interactive intercultural dialogue with the different Other. The next
step is attractive e-presentation.
Story-telling is the most important element here and in any
playfull-learning application. The success of the best sold ever com-
puter game, SIMS, is interesting example, since it is based on a
story, which simulates the real life, where the player is not God-like
personage (like in many other games), but in some sense he is
limited by the actions of his ‘heroes’. Second life is another example,
where the search for ‘better-life-simulation’, which has to be closer
(and different at the same time) to the reality is very obvious. Con-
cluding, we assume that if the story told offers the player/museum
visitor to acquire some skill or/and knowledge while being in the
‘magic circle’ (K. Zimmerman) of the gameplay, then the goal is
achieved.
WEB2.0 and 3.0 and esp. domain ontologies are offering the techno-
logy for semantic search trying to satisfy the hunger for classified
information and tangible net. For now we cannot offer case studies
where semantic search is already incorporated in cultural heritage
related web site. The status quo shows that museum collections,
presented in institutional web portals in different countries show
one-and-only viewpoint *policy*. ‘Good’ example is British museum,
big part of whose collections are set out of their original contexts
(original land, culture, language). Another ex. is EUROPEANA portal,
where ‘view in original context’ link shows (in most of the cases) a
picture, i.e. the digital image without any text. The original context,
historical and cultural, is always presented inseparably from the
point of view of the presentation-author, i.e. object-owner. Inter-
cultural and interdisciplinary dialogue as well as knowledge
objectivity require showing at least one more *picture* of the same
heritage object.
Usually opposing multimedia presentations are absent in the web
portals of European museums. This gap can be perfectly filled up by
EduTainment multimedia tools. Serious storytelling, which we define
as interdisciplinary knowledge based (game)play is an alternative

Poster
84
and educative way for making a virtual gallery of linked stories, not
only mechanical sum of well textually explained heritage objects.
Imagine BAUHAUS (1919–1933), the most important school of
architecture, design and art
in the twentieth century,
presented in Weimar
Museum ONLY by its Fine
arts? Although showing the
context in Fine arts domain
is relatively easier from
technology and curators
point of view (see PRADO
PLAY section). It is much
more complex when the
heritage object is a relic from a war. Perfect bad example of one-
and-only point of view is Cold War Museum and Imperial War
Museum London. Their collections are relevant to various cultures,
but do not present intercultural links, nor opposing storytelling.
The PhD thesis of the author is following in practice the sketched
above scenario for presenting heritage along with challenging story-
telling, following ‘the rules of play’; the multimedia and Semantic
web technologies here are necessity, but the crucial part is Homo
Sapiens Ludens. Whereas in games world there is statistics for the
different profiles of users, such statistics is missing for cultural
heritage holders web sites. This is the first point we have to start
from in order to create more successful museum applications. As a
conclusion we would say that European (and not only) web portals,
combining collections of different museums, galleries and libraries
are hoping that Semantic web technologies will ‘do the work’ of
linking logics and semantics of the objects presented, as the story
telling in game applications do. We think though that such a hope is
over above the possible one technology can do, and we do need the
human storytelling, combining (in a playful way) different points of
view. Such combinations nowadays are missing and not thought
enough, even in research labs.

Session 6
85
UHLIR Ch., UNTERWURZACHER M., SCHALLER K.
Historic Quarries – the Database and Case Studies
Introduction
Historic quarries (HQ) as material sources for monuments,
architecture and consumer goods are part of our archaeological and
industrial heritage as well as cultural landscape. HQ´s are in danger
due to many factors: garbage dumps, modern quarries, enlargement
of urban areas, vandalism, looting, etc. At the moment its heritage
value is not properly recognized nor protection concepts are
developed. Recent investigations on antique quarries of Egypt show
that about 1/3 already have been destroyed within the last three
decades.
Historic Quarries, a European project led by the CHC – Research
Group for Archaeometry and Cultural Heritage Computing of
Salzburg University/Austria, is being implemented to collect sample
data and build up a database on a large number of individual HQ
sites and related monuments in Central Europe. The data comprise
historical and technical information, site and stone related data
(petrography) completed by images of the sites (historical views and
current use of the sites) and information about the historic
destination of the mined material (historic monuments, distribution
in Europe).
Definition
A historic quarry is a defined mining area within a suitable resource
of natural stone containing remains of the different mining processes
such as tool marks, dumps, semi-finished goods, infrastructure,
remains of workshops, tools as well as accommodations and social
facilities.
The Database
The petrographical, geotechnical and geochemical data of quarries
used in history as reference groups for provenancing monuments are
mostly unpublished or hidden in “grey literature”. These data which
also include photographs and maps should be made accessible to the
entire research community by the interdisciplinary information
system www.saxa-loquuntur.org.
Session 6
86
It consists of two main databases:
The quarry database: describes general quarry information,
localization, material, geological information, dating of quarrying
phases, quarry morphology, signs of treatment, historic infra-
structure, semi finished goods, archaeological findings, authors and
literature The sample database for quarries and monuments: de-
scribes sample information, material, macroscopical -, microscopical
-, geochemical -, X-ray data, material technical properties, authors
and literature. Because of the flexible structure of the analytical
section new methods easily can included.
For the communication between archaeological sciences and natural
sciences a simplified interactive rock thesaurus was developed on
the base of the IUGS rock nomenclature. Controlled vocabulary,
editable by content administrators, for various allows was
established.
Interlink between the sample database to various monument
databases enable a full interdisciplinary monument analysis.
At final stage the databases can be queried by simple and advanced
search methods. The information system will provide visualisation
tools for geochemical data, a photo board for the comparison of thin
sections and a cartographical visualisation of the search results.
Currently the quarry and sample database contains mainly
information and data of Roman used marbles from the Alpine and
Carpathian region. Within the course of the project the area of the
former Austrian Hungarian Empire will be examined.
Core Data
As result of a first data exploration within the project area an
amount of about 10.000 sites have been identified. As sources
mainly databases of national surveys and historic material collections
were used. To manage that huge amount of data within the time
frame of the project a dataset called “core data” has been
developed. This data set involves the name of the quarry or quarry
district, the physical localization by coordinates and the hierarchical
system of the country (Loc.Name/village/county/county), general
material information, a rough chronology of the quarry activities (if
known) and related literature. These core data sets will be the base
for further data exploration within follow-up projects.

Session 6
87
Outstanding Quarries
For each country full datasets will be collected for “outstanding”
quarries. The identification and selection of outstanding quarries will
be done by evaluating their historical significance using a system
which was developed for physical cultural heritage:
• Associative / symbolic value: a quarry itself and cultural
remains found in a quarry can deliver important cultural
information on the past and can be connected with the
collective memory of the people of adjacent areas.
• Informational value: using a multidisciplinary approach
various experts of different scientific fields investigate
quarries showing the “status quo“ on resources and the
overall locality, providing results that are suitable for further
investigations.
• Aesthetical value: the aesthetical value of a quarry can be
seen in combination with natural and manmade influences
on a resource in respect of its present-day appearance and
its development over time.
• Economic value: from the economic point of view often cost-
benefit analysis are made. Thus decisions on cultural
resources concerning conservation, research, exhibitions,
decay and destruction of a quarry landscape also have an
economic dimension.
• Social and spiritual value: this value is related to reverence
for the place. It is connected with room use for social
events, for pressure groups and associations.
For the selection of outstanding quarries also quarry specific para-
meters like material, time and space dimensions and the connection
with outstanding monuments will be used.
Case Studies
For the first case studies within Austria the quarry districts of the
Adnet - and Untersberg Marble have been chosen.

Session 4
88
VAR P., PHAL D., NGUONPHAN P., WINCKLER M. J.
3D Reconstruction of Banteay Chhmar Temple for Google
Earth
The Banteay Chhmar temple is one of the most significant Hindu-
Buddhist temples in Cambodia, established during the reign of King
Jayavarman VII in the second half of the 12th century and dedicated
to the king's son Srindrakumara (Sanday 2007). In the course of
time almost all of this magnificent temple has been ruined, making it
one of the most mysterious of the Khmer temples. Through the work
of the Global Heritage Fund, preservation and reconstruction of the
temple area were recently started. But people only begin to under-
stand (since the start of the project in 2007) the structure, the
concept and the amazing ancient Khmer architecture represented in
this building complex. A full 3D computer model, as proposed in our
work, for a temple as vast and diverse as this, is a great opportunity
to fill this gap. In cooperation with Google Earth we try to recreate a
model for the understanding of the whole area complex, featuring
the full scale of details of the original architecture and the stone
materials used, in order to explore structural and artistic properties
of the Banteay Chhmar style.
The basis of the project is formed by the work of Nguonphan. The
surveys of structural parts (see fig 1, 2) were done in high geometric
detail using the Angkor Temple Generator (APG) (Nguonphan 2009).
However, this model is geometrically too complex for a represen-
tation in online interactive viewing environments due to the immense
amount detail. The currently available models of similar buildings
(e.g. Google Earth) on the other hand feature only very little of the
geometry (e.g. Angkor Wat, see fig. 3; Krzysio 2007) and lack
essential information about Khmer architecture and style. In our
project we therefor will generate a virtual reconstruction of Banteay
Chhmar which is acceptable in geometric detail, architectural quality
and technical feasibility.
Using our experience from work at the IT center at the Royal
University of Phnom Penh (RUPP, Cambodia) and the Interdis-
ciplinary Center for Scientific Computing (IWR) at Heidelberg
University (Germany), we will incorporate methods from the Angkor
Temple Generator (based on AutoCAD), Google SketchUp and

Session 4
89
Google Earth to accomplish this task. The support from the Google
Workshop GCAMP@RUPP in June 2009 is also a major source for the
completion of our goals.
Figure 1–3
Our overall purpose of creating a 3D model of Banteay Chhmar is to
build a bridge between specialized techniques of information
technology and an application in the humanities, leading to a pro-
duct to educate people all around the world about ancient Khmer
architecture and the power of the ancestors of the Kingdom of
Wonder.

Poster
90
WAND E.
Hidden in the Sand! – The Famagusta Research Project.
One Land, One City, One Memory
The goal of the Famagusta Research Project is to call attention to a
period when the history of divided Cyprus stood still. At the same
time, however, it also intends to have an influence – directly or
indirectly – on people and protagonists: those who bear the respon-
sibility for the current state of affairs, those who may possibly have
had to experience this tragedy at first hand and those who hitherto
have been no more than mute spectators and remain mere extras –
in order to change their way of thinking, knowing and acting.
Thesis
Can a multimedia research project influence minds and effect
political changes? Can it touch hearts and effect emotional changes?
Will it be possible that latest communication technology enables the
former residents of Famagusta – now a refugee community scat-
tered world-wide – to get linked together in an online community
which maintains its demand after reunification through a virtual
environment.
Session 4
91
WULFF R., SEDLAZECK A., KOCH R.
3D Reconstruction of Archaeological Trenches from
Photographs
Summary
In this work, an image-based algorithm for the 3D reconstruction of
archaeological trenches is proposed. We extend the structure-from-
motion approach for general rigid scenes described by Pollefeys et
al. (2004) to better fit the archaeological needs.
The algorithm requires a calibrated digital camera for image ac-
quisition and a set of 3D points with well-known world coordinates.
The 3D points are needed to transform the scene into the absolute
coordinate system that was used at the excavation site. This allows
for measurements in the 3D model or for fusion with other objects
that share the same coordinate frame. In addition, a new algorithm
to minimise errors in pose estimation is introduced that exploits prior
knowledge about camera movement.
Background
When working in archaeological excavations, a detailed documen-
tation of the finds and features is very important. The main reason
being that the configuration will be destroyed when unveiling the
next layer. A wide variety of techniques is used for documentation,
including drawings, photography and photogrammetry, most of them
being very time-consuming. Although in photogrammetry 3D data is
already used, none of these methods aims at producing a complete
3D model of the trench. However, a 3D model can be very helpful in
the interpretation of the finds and features, because a 3D repre-
sentation is intuitive and pleasant to human perception. Further-
more, a 3D model allows for metric measurements in 3D space, even
after the destruction of the configuration, and can be used for
presentations to the general or academic public, e. g. in museums.
Recently, some methods have been proposed to reconstruct 3D
models in the field of archaeology. The designated use of the
methods introduced by Tsioukas et al. (2004) and Zheng et al.
(2008) is the reconstruction of small finds, so they are not applicable
to reconstructing trenches. A method for large-scale reconstruction
was suggested by Ioannides and Wehr (2002). The approach is

Session 4
92
based on laser scanners, and detailed models can be achieved.
There are two main drawbacks of this method: First, expensive
equipment is needed which is not part of the general documentation
process in archaeology. Second, the data acquisition can be very
time-consuming: The survey of a cave of size 7.2 x 7.2 x 4.35 m
took about 1.5 hours.
Our Work
The proposed method extends the general structure-from-motion
approach described by Pollefeys et al. (2004) to better fit the
archaeological needs, similar to the approaches taken by the 3D
Murale project (http://dea.brunel.ac.uk/project/murale/) and by the
ACVA'03 workshop (http://www.lems.brown.edu/vision/conferences/
ACVA03/). Based on an ordered sequence of photographs with
overlapping viewports in successive images, a 3D model represented
by a triangle mesh is generated. As a first and crucial step, the
special archaeological needs had to be figured out. This was done in
close collaboration with archaeologists of the University of Kiel,
Germany.
The main requirement was to allow for measurements in the recon-
structed model. In the classic structure-from-motion approach the
scene is reconstructed in an arbitrary coordinate system, so that its
scale, position and orientation can hardly be predicted. To allow for
measurements, we transform the scene into the absolute coordinate
system that was used at the excavation site. Additionally, the model
can easily be fused with arbitrary 3D objects that share the same co-
ordinate frame, e. g. with models of other trenches from the same
site. To compute the transformation, a set of 3D points with well-
known coordinates, so called photogrammetry points, are required.
These points are already part of the documentation process, e. g. for
computing pseudo-orthographic photographs, and can be reused
here.
Exploitation of prior knowledge about camera movement leads to a
new algorithm to minimise errors in pose estimation. If follows a
simple approach and we call it LoopClosing. The exploited assump-
tion is that the camera was moved in an orbit around the trench,
pointing inwards. Furthermore, we expect the first and the last
image of the sequence to overlap in the same range as all other
images of the sequence. This enables us to append the first image

Session 4
93
again at the end of the sequence. Then the geometry between the
last and the appended image can be estimated. In theory, the poses
of the first and the appended image will be identical, but the
estimation will yield a discrepancy between them. This discrepancy is
distributed amongst the poses of all images according to a weighting
function.
Figure 1: Visualisation of the reconstruction process. a) An input image. b) The
estimated camera poses and a sparse point cloud of 3D keypoints. Each pyramid
represents a camera. c) A depth map (dark=near, light=far, black=undefined). d) The
final model fused from four views.
The reconstruction algorithm iterates over the whole image se-
quence. In each step, distinctive keypoints are detected auto-
matically in the current image. These keypoints are then compared
to the two predecessors of the current image to obtain a set of 2D
correspondences. To initialise the structure, the 2D correspondences
of the first two images are used to estimate the epipolar geometry
between them. Based on that, a sparse set of 3D points is estimated.
These points are needed to compute the poses of the remaining
images using 2D-3D correspondences. After all input images have
been processed, the LoopClosing algorithm is applied. To minimise
the reprojection errors, a global bundle adjustment is performed
afterwards. Now we have a complete reconstruction of the camera

Session 4
94
path. The next step is to transform the scene into the absolute
coordinate frame mentioned above. Then for each view a dense
depth map is obtained by applying a multi view stereo algorithm
between each two successive views. From each depth map a 3D
model is built, textured by the corresponding input image. The last
step is to fuse these models to compensate for occlusion.
Outlook
The long term objective of the project is to develop a complete
system for 3D re-construction with special consideration of the needs
in archaeology, offering a tool for 3D measurement, segmentation,
and detailed visualisation of archaeological excavations.

Session 1
95
YARLAGADDA P., MONROY J. A., CARQUÉ B., OMMER B.
Towards a Computer-based Understanding of Medieval
Images
The grand goal of computer vision is to enable computers to auto-
matically understand images so that they can reason about objects
rather than being limited to a mere analysis of individual pixels.
Gaining access to the semantics of images is a necessary pre-
requisite for computers to support human users in many complex
tasks such as object search in image databases. In contrast to this,
current object retrieval systems that are bound to a text-based
search are significantly limited by the ambiguity of textual an-
notations. Problems of completeness and compatibility arise from dif-
ferent taxonomies, which are a result of different scientific cultures
and of the diverse goals that different observers of an image have.
Current algorithms for object retrieval require textual annotations of
images which fundamentally limits their usability due to a number of
reasons: i) A user can only find entities that have been previously
deemed important by the annotator of the dataset. ii) Textual
annotations do not provide localization information so that object
detection and reasoning about the (spatial) relationships between
objects becomes impossible. iii) Annotating the dataset is labor
intensive and so the approach is limited to small sets of images. To
deal with these shortcomings we present a system that can find
objects and analyze their variability directly in the images. In
contrast to text-based search, our approach learns object models
from few training images. Thereafter, the method can automatically
detect new object instances in large collections of novel, unlabeled
images.
Our contribution in this work is threefold, concerning i) bench-
marking, ii) object analysis, and iii) recognition.
Benchmarking: We have assembled a novel image dataset with
groundtruth segmentations that is highly significant for the
humanities due to its unusual completeness of late medieval
workshop production as well as for computer vision since it is the
first of its kind to enable benchmarking of object retrieval in pre-
modern tinted drawings. The primary source of our research are 27
late medieval paper manuscripts from Upper German origin archived

Session 1
96
by Heidelberg University library. These codices are illustrated with
more than 2,000 half- or full-page tinted drawings. We start from
object categories which are represented in sufficient numbers and
which have, at the same time, a high semantic validity since they
belong to the realm of medieval symbols of power. That way, we can
ensure right from the start that our approach has the highest
possible connectivity to the research questions of those disciplines
which work on medieval images – notably art history and history
with a focus on ritual practices or on material culture. To establish
groundtruth for object localization and classification, a tool that
gathers manual segmentations for datasets of medieval images has
been developed and applied to the dataset.
Object Analysis: Images are decomposed into preparatory drawings
(see illustration) and the coloration. That way, boundary information,
which is suitable for a shape-based representation, is separated from
appearance, which can be degraded significantly due to the aging of
images. To represent objects, the shape of extracted boundary
contours is described by capturing their local orientation distributions
in histograms on multiple coarseness scales. This representation is
robust to local distortions in the image and due to its multi-scale
nature, it captures characteristic, small details of objects. Based on
this object representation, our approach allows to analyze the
variability and interrelatedness of different instances of a category
and it gives scientists from the humanities a visualization of the
structure of object categories. In a first step, hierarchical, agglo-
merative clustering using Ward’s method (minimum variance
clustering) filters out duplicate samples from an object category.
Projecting the shape representations of these samples into a 2-D
subspace using multidimensional scaling (MDS) provides a direct
analysis of the relations between all the instances of a category in
the database in a single visualization (see illustration). Such an
automatic analysis and its visualization is of essential value for the
humanities as it combines data from large numbers of images that
could not be compared by a researcher. From the standpoint of the
humanities, the projection successfully clusters category instances
according to their semantic structure and relatedness and it brings
order into the high variability within a category. In particular, our
illustration for the category “crown” shows that to the simple crown
circlet further elements like arches, hats, or helmets are added.

Session 1
97
Current text-based classification systems do not take into account
this diversity of types, so that only the keyword ”crown” is
searchable. Since automated image-based search does not suffer
from the polysemy in annotation taxonomies, it becomes a crucial
instrument to assist with the detailed differentiation of subtypes. By
clustering segmented crowns according to the criterion of formal
congruencies, distinct clusters become apparent. These groups
feature different principles of artistic design, which are characteristic
for different teams of artists that have drawn the images. Group (A)
indicates the concise and accurate style of the Hagenan workshop of
Diebold Lauber; group (B) the more delicate and sketchy style of the
Swabian workshop of Ludwig Henfflin. The detection of specific
drawing styles of artists is a highly relevant starting point to
differentiate large-scale datasets by workshops, single teams within
a workshop, or even by individual draftsmen.

Session 1
98
Recognition: Based on our shape representation, we propose a
category-level retrieval system that can detect and classify objects in
novel images. Therefore, the shape descriptors in a test image are
compared against those from training images. Each descriptor then
casts a vote for the object location and category in the test image to
perform object detection. Our recognition results (see illustration)
show the potential of the approach.
The present case study on the Upper German illustrated manuscripts
of Heidelberg University library exemplarily demonstrates the deep
insight into medieval object representations and their artistic context
provided by automated image analysis: in their extensiveness and
detailedness, these observations are unmatched by the common
methods which are, up to now, available to research on cultural
heritage.

Poster
99
YULE P.
Laser Scanning of a Mauryan Column Complex in
Sisupalgarh, an Early Historic Fortress in Coastal
Orissa/India
Renowned in the context of Ashokan India (4th century BCE),
Sisupalgarh, the largest early historic fortress in the eastern part of
the Subcontinent (with exception of mere traces of Pataliputra,
present-day Patna), plays a role in virtually all discussions bout this
period. Its symmetrical plan and great size (130 ha, 1190 x 1150 m,
measured at the top of the glacis) reveal an architectural ideal for its
day. South Asia experts usually discuss it as an example of defensive
early history architecture, largely omitting any relation to prede-
cessors, relatives, or successors. Recent research conducted by a
team from the University of Heidelberg, Utkal University in
Bhubaneshwar and the University of Applied Sciences in Mainz has
rekindled the research largely of the 1940s, revealing the uniqueness
of Sisupalgarh and its role in the eastern part of India. To our
knowledge this is the first application of this kind of scanning in the
archaeology of the Subcontinent.
A mysterious group of columns and a hill, considered to be part of a
palace, were hardly even photographed although they were known
since the early 20th century. In 2005 we recorded the site shoal
khamba (16 columns) by means of a tachymeter and a laser
scanner.

Poster
100
The recording of the column complex and topography rests on some
15 million measurements recorded at a rate of nearly 1000 points
per second–a veritable cloud of laser-measured points. In order to
achieve a complete coverage, 20 scans were taken from different
observation stations. The single scans were registered to form a
common point cloud and thinned to the necessary resolution,
resulting in 3 million points which were connected by 6 million small
triangles which actually describe the surface. A dot-reducing
algorithm made the calculation manageable. A final step was to
render and animate the recorded data in order to make it “come to
life” and to convey render its spatial appearance more vividly than
possible simply with elevational lines.
The complex can be shown in any of a variety of ways including
animation.

Session 2
101
ZAMBANINI S., HERRMANN M., KAMPEL M.
An Automatic Method to Determine the Diameter of
Historical Coins in Images
Numismatics deals with various historical aspects of the
phenomenon money. The basic objects that numismatists deal with
are historical coins and in the numismatic community coins are
identified through their description, i.e. a set of features specifying
the type, minting place, etc. of the coin. Usually a coin description
also includes physical values like weight and maximum diameter.
This paper presents an automatic method for computing the
maximum diameter of coins by means of a ruler placed next to the
coin. The method consists of two steps:
1. Determination of the spatial resolution of the image, i. e. the
pixels’ real world size, from the ruler visible in the image.
2. Segmentation of the coin and computation of the maximum
diameter.
Such a method is of high interest for daily practical work of numis-
matists since it allows a much faster processing of coins. Ad-
ditionally, an automatic image-based measurement is more accurate
than a manual one using a caliper. Another need satisfied by an
automatic determination of the spatial resolution is the fast
preparation of coin images for publication. Usually coin images are
required to be published in a 1:1 scale to their real world size and
with a white background. The proposed method is able to deal with
an arbitrary orientation of the ruler and placement of the coin. Thus,
only minimal constraints on the image acquisition are necessary.
Usually, a camera mounted on a camera stand providing a constant
distance and parallelism between the coin and the camera’s image
plane is sufficient.
For the computation of the spatial resolution the Fourier transform is
used which is motivated by the fact that the ruler marks form a re-
gular pattern that produces ridges in the frequency domain of the
image. Ridges are detected in the power spectrum corresponding to
the marks on the ruler. The information about the ridge location in
the power spectrum allows calculating the frequency of the ruler
marks and thus the spatial resolution of the image. As a final step,
the inverse Fourier transform is applied solely to the ridges found

Session 2
102
before. This allows to determine the location of the ruler in the pic-
ture which can be used to give visual feedback to the user later on.
Coin segmentation is based on the assumption that the coin itself
possesses more local information content and details than the rest of
the image, i. e. the background. Therefore two filters are applied on
the image to highlight regions with high information content: the
local entropy and the local range of gray values. Local entropy
derives the measure of local information content from local gray
value histograms, whereas the local range of gray values is defined
as the difference of the maximum and minimum gray value of a local
neighborhood. The outputs of these two filters are summed-up to
build the final intensity image where a thresholding is applied on.
The method was evaluated on a set of 30 images gathered from the
Romanian National History Museum. For each image the ground
truth was obtained by manually segmenting the coin and measuring
the distance between ruler marks using a commercial image editing
program. Since the final output is the maximum diameter of the coin
this is determined by computing the maximum distance between
border points of the manual and automatic segmentation.
With an average error of 0.49 % for the segmentation and 1.00 %
for the spatial resolution determination it can be concluded that both
methods give accurate results for the given dataset. This also leads
to an accurate measurement of the real coin diameter with an
average error of 0.20 mm or 1.19 %. Furthermore, a maximum error
of 6.64 % emphasizes the robustness of the proposed method. The
robustness of the spatial resolution determination is also indicated by
a maximum error of 6.67 %. However, on the given dataset all rulers
were placed vertically in the image. Therefore, to verify the
robustness of the method for arbitrary rotated rulers, 10 randomly
selected images were rotated in 20 degree steps. Thereby, we
obtain 18 individual measurements for each image and the error is
evaluated by means of the coefficient of variation, i. e. the standard
deviation of the samples divided by their mean. As a result of the
experiment, the average coefficient of variation for all 10 images lies
at 0.52 % which shows the low sensitivity of the method to the ruler
orientation.
In summary, experiments have shown the gain of the method for
numismatists by improving both the accuracy and speed of coin
processing. The method is fully automatic except for the one-time
Session 2
103
manual adjustment of the unit length between two ruler marks for a
given ruler type. Since the proposed method for determining the
spatial resolution of images is in theory applicable on any type of
ruler, the method can be used to measure or scale other kinds of
objects as well, like skin lesions or initials and letters of ancient
documents. Though the experiments proofed the general robustness
of the method, in the future a more comprehensive evaluation with
images from several sources is planned to underline the usefulness
of the method for the numismatic community.

Notes
104

Notes
105

Notes
106

PARTICIPANTS

Participants
108
PARTICIPANTS
page
ALTENBACH Holger
Institut für Ur- und Frühgeschichte
und Vorderasiatische Archäologie
Ruprecht-Karls-Universität
Heidelberg
46
ARNOLD Matthias
Historisches Seminar, Zentrum für
Europäische Geschichts- und
Kulturwissenschaften. Ruprecht-
Karls-Universität Heidelberg
67
BAATZ Wolfgang
Institute for Conservation and
Restauration
Academy of Fine Arts Vienna
6
BALZANI Marcello
DIAPReM – Department of
Architecture, University of Ferrara
8
10
BATHOW Christiane
Breuckmann GmbH, Meersburg
62
BERNER Konrad
Historisches Seminar, Zentrum für
Europäische Geschichts- und
Kulturwissenschaften. Ruprecht-
Karls-Universität Heidelberg
67
BOCK Hans Georg
IWR – Interdisciplinary Center for
Scientific Computing, University
Heidelberg
BOOS Silke
Institute for Spatial Information
and Surveying Technology, Uni-
versity of Applied Sciences, Mainz
12
BOU Vannaren
Information Technology Center
Royal University of Phnom Penh
45
BREUCKMANN Bernd
Breuckmann GmbH, Meersburg
62
page
CARQUÉ Bernd
IWR & Transcultural Studies
University of Heidelberg
95
CARROZZINO Marcello
IMT – Institute for Advanced
Studies Lucca
56
CASSELMANN Carsten
Institut für Ur- und Frühgeschichte
und Vorderasiatische Archäologie
Ruprecht-Karls-Universität
Heidelberg
46
CHRIST Georg
Transcultural Studies
University of Heidelberg
17
EITEL Bernhard
Geographical Institute – Labora-
tory for Geomorphology and Geo-
ecology, University of Heidelberg
71
FELICETTI Achille
PIN, University of Florence, Prato
53
FELICIATI Pierluigi
MAG Committee
University of Macerata (IT)
20
FEO Rosalba De
Soprintendenza per i Beni Archi-
tettonici e per il Paesaggio, il Patri-
monio Storico, Artistico e Demo-
etnoantropologico per le Province
di Salerno e Avellino, Salerno
8
FERSCHIN Peter
IEMAR – Institute of Architectural
Science/Department Digital
Architecture and Planning
Vienna University of Technology
22
FLÜGEL Christof
Landesstelle für die nicht-
staatlichen Museen in Bayern
Munich
24

Participants
109
page
FORNASIER Massimo
RICAM, Austrian Academy of
Sciences, Linz
6
GALVANI Guido
DIAPReM – Department of
Architecture, University of Ferrara
10
GIETZ Peter
Historisches Seminar, Zentrum für
Europäische Geschichts- und
Kulturwissenschaften, Ruprecht-
Karls-Universität Heidelberg
67
GOLDMAN Thalia
Department of Physics of Complex
Systems, The Weizmann Institute
Rehovot
26
GORDAN Mihaela
Faculty of Electronics, Telecom-
munications and Information
Technology, Technical University
of Cluj-Napoca
49
GROSMAN Leore
Department of Physics of Complex
Systems, The Weizmann Institute
Rehovot
26
HAUCK Oliver
Fachbereich Architektur
Technische Universität Darmstadt
28
HEIN Anno
Institute of Materials Science,
N.C.S.R. “Demokritos”, Aghia
Paraskevi
30
HERMON Sorin
Science and Technology in
Archaeology Research Center, The
Cyprus Institute, Nicosia
53
HERRMANN Michael
Institute of Computer Aided
Automation
Vienna University of Technology
101
page
HOHMANN Georg
Referat für Museums- und
Kulturinformatik, Germanisches
Nationalmuseum, Nürnberg
32
HOPPE Christoph
IWR – Interdisciplinary Center for
Scientific Computing, University
Heidelberg
35
HÖRR Christian
Fakultät für Informatik
Technische Universität Chemnitz
37
JÄGER Willi
IWR – Interdisciplinary Center for
Scientific Computing, University
Heidelberg
JUNGBLUT Daniel
Goethe-Center for Scientific
Computing, Goethe University,
Frankfurt am Main
41
KALASEK Robert
Department of Spatial Develop-
ment and Infrastructure &
Environmental Planning, Vienna
University of Technology
62
KAMPEL Martin
Institute of Computer Aided
Automation, Vienna University of
Technology
101
KARL Stephan
Landesmuseum Joanneum, Ab-
teilung Archäologie & Münz-
kabinett, Schloss Eggenberg, Graz
41
KILIKOGLOU Vassilis
Institute of Materials Science,
N.C.S.R. “Demokritos”, Aghia
Paraskevi
30
KLEPO Višnja
Institut für Architektur- und
Kunstgeschichte, Bauforschung
und Denkmalpflege
Vienna University of Technology
43

Participants
110
page
KOCH Reinhard
Institute of Computer Science
Christian Albrechts University, Kiel
91
KOR Sokchea
Institute of Computer Science
Christian Albrechts University, Kiel
45
KRÖMKER Susanne
IWR – Interdisciplinary Center for
Scientific Computing, University
Heidelberg
35
41
KUCH Nora
Institut für Ur- und Frühgeschichte
und Vorderasiatische Archäologie
Ruprecht-Karls-Universität
Heidelberg
46
KULITZ Iman
IEMAR – Institute of Architectural
Science/Department Digital
Architecture and Planning
Vienna University of Technology
22
LANG-AUINGER Claudia
Institute for Studies of Ancient
Culture, Austrian Academy of
Sciences, Vienna
LÖCHT Joana van de
Institut für Ur- und Frühgeschichte
und Vorderasiatische Archäologie
Ruprecht-Karls-Universität
Heidelberg
46
MAIETTI Federica
DIAPReM – Department of
Architecture, University of Ferrara
10
MARA Hubert
IWR – Interdisciplinary Center for
Scientific Computing, University
Heidelberg
41
MEIER Thomas
Institut für Ur- und Frühgeschichte
und Vorderasiatische Archäologie
Ruprecht-Karls-Universität
Heidelberg
46
page
MOHAMED Fawzi
Institut für Chemie, Humboldt
Universität, Berlin
56
MONROY Antonio
IWR & Transcultural Studies,
University of Heidelberg
95
MÜLLER Hartmut
Institute for Spatial Information
and Surveying Technology, Uni-
versity of Applied Sciences Mainz
12
MÜLLER Noémi S.
Institute of Materials Science,
N.C.S.R. “Demokritos”, Aghia
Paraskevi
30
NEMES Paul
Faculty of Electronics, Telecom-
munications and Information
Technology, Technical University
of Cluj-Napoca
49
NGUONPHAN Pheakdey
IWR – Interdisciplinary Center for
Scientific Computing, University of
Heidelberg
45
88
NICCOLUCCI Franco
Science and Technology in
Archaeology Research Center, The
Cyprus Institute, Nicosia
53
NOBACK Andreas
Fachbereich Architektur
Technische Universität Darmstadt
28
NYS Karin
Mediterranean Archaeological
Research Institute, Vrije
Universiteit Brussel, Brussels
53
OMMER Bjoern
IWR & Transcultural Studies,
University of Heidelberg
95

Participants
111
page
PASKALEVA Galina
Institut für Architektur- und
Kunstgeschichte, Bauforschung
und Denkmalpflege
Vienna University of Technology
43
PECCHIOLI Laura
Institut für Geodäsie und
Geoinformationstechnik,
Technische Universität Berlin
56
PEREIRA John
Salzburg Research Forschungs-
gesellschaft m.b.H., Salzburg
59
PHAL Des
Information Technology Center,
Royal University of Phnom Penh
45
88
QUATEMBER Ursula
Österreichisches Archäologisches
Institut, Vienna
62
REINDEL Markus
German Archaeological Institute
Commission for Archaeology of
Non-European Cultures, Bonn
65
ROSSATO Luca
DIAPReM – Department of
Architecture, University of Ferrara
8
SANDAY John
Global Heritage Found, USA
SANTOPUOLI Nicola
Faculty of Architecture “Valle
Giulia”, La Sapienza, University of
Rome
10
SCHALLER Kurt
CHC – Research Group for Ar-
chaeometry and Cultural Heritage
Computing, University of Salzburg
24
85
SCHIEMANN Bernhard
Lehrstuhl Informatik 8 Künstliche
Intelligenz, Friedrich-Alexander-
Universität, Erlangen
32
page
SCHÖNLIEB Carola-Bibiane
DAMTP, Centre for Mathematical
Sciences, Cambridge
6
SCHULTES Kilian
Historisches Seminar, Zentrum für
Europäische Geschichts- und
Kulturwissenschaften, Ruprecht-
Karls-Universität Heidelberg
67
SDYKOV Murat
Public Foundation for Science and
Education «Akjol», Pedagogical
Institute, Saratov State University
Uralsk
68
SEDLAZECK Anne
Institute of Computer Science
Christian Albrechts University, Kiel
91
SHARON Gonen
The Archaeology Institute, The
Hebrew University, Jerusalem
26
SIART Christoph
Geographical Institute – Labora-
tory for Geomorphology and Geo-
ecology, University of Heidelberg
71
SINGATULIN Rustam
Public Foundation for Science and
Education «Akjol»
Pedagogical Institute of the
Saratov State University, Uralsk
68
74
SIOTTO Eliana
LIDA – Laboratory of Informatics
for Art Historical Research
University of Udine
77
SLIZEWSKI Astrid
Neanderthal-Museum, Mettmann
80
SMILANSKY Uzy
Department of Physics of Complex
Systems, The Weizmann Institute
Rehovot
26

Participants
112
page
SMIKT Oded
Department of Physics of Complex
Systems, The Weizmann Institute
Rehovot
26
SOTIROVA Kalina
Institute of Mathematics and
Informatics, Bulgarian Academy of
Sciences, Sofia
82
STRASSER Margareta
Center for Languages, University
of Salzburg
59
STRASSER Thomas
silbergrau Consulting Software
GmbH, Linz
59
THUSWALDNER Barbara
Österreichisches Archäologisches
Institut, Vienna
62
TRINKL Elisabeth
Institute for Studies of Ancient
Culture, Austrian Academy of
Sciences, Vienna
UHLIR Christian
CHC – Research Group for Ar-
chaeometry and Cultural Heritage
Computing, University of Salzburg
85
UNTERWURZACHER Michael
CHC – Research Group for Ar-
chaeometry and Cultural Heritage
Computing, University of Salzburg
85
VANUCCI Cristina
DIAPReM – Department of
Architecture, University of Ferrara
8
VAR Puthnith
Information Technology Center
Royal University of Phnom Penh
88
VIROLI Francesco
DIAPReM – Department of
Architecture, University of Ferrara
8
page
VISINTINI Domenico
Department of Georesources &
Territory, University of Udine
77
VLAICU Aurel
Faculty of Electronics, Telecom-
munications and Information
Technology, Technical University
of Cluj-Napoca
49
WAND Eku
Department of Communication
Design, Hochschule für Bildende
Künste Braunschweig
90
WINCKLER Michael J.
IWR – Interdisciplinary Center for
Scientific Computing, University of
Heidelberg
45
88
WITTUM Gabriel
Goethe-Center for Scientific
Computing, Goethe University,
Frankfurt am Main
41
WULFF Robert
Institute of Computer Science
Christian Albrechts University, Kiel
91
YAKOVENKO Olga
Public Foundation for Science and
Education «Akjol», Pedagogical
Institute, Saratov State University
Uralsk
74
YARLAGADDA Pradeep
IWR & Transcultural Studies
University of Heidelberg
95
YULE Paul
Institute of Prehistory and Near
Eastern Archaeology
Heidelberg University
99
ZAMBANINI Sebastian
Institute of Computer Aided
Automation, Vienna University of
Technology
101

113
ACKNOWLEDGMENTS
This publication was partially funded by the Heidelberg Graduate
School of Mathematical and Computational Methods for the Sciences
– DFG Graduate School 220.
Im Neuenheimer Feld 368
69120 Heidelberg, Germany
www.mathcomp.uni-heidelberg.de
The workshop was supported by Breuckmann GmbH.
Breuckmann GmbH
Torenstr. 14
88709 Meersburg
www.breuckmann.com

MONDAY, NOVEMBER 16TH
Welcome from the Organizers H. G. Bock11:15–12:30
Opening Remote Sensing and 3D-Modelling for the Documentation of Cultural
Heritage in Palpa, Peru
M. Reindel
Digital Geoarchaeology – an approach to reconstructing ancient
landscapes at the human-environmental interface
Ch. Siart
The Virtual and Physical Reconstruction of the Octagon and Hadrian’s
Temple in Ephesus
U. Quatember
Towards A Computer-based Understanding of Medieval Images P. Yarlagadda
Innovative mathematical techniques for image completion and
applications to art restoration
W. Baatz
14:00–15:40
Session 1
Scientifc
Computing I
Color Restoration in Cultural Heritage Images using Support Vector
Machines
P. Nemes
Heating efficiency of archaeological cooking pots: Computer models
and simulation of heat transfer
A. Hein
Automated GPU-based Surface Morphology Reconstruction of Volume
Data for Archeology
D. Jungblut
Boon and Bane of High Resolutions in 3D Cultural Heritage
Documentation
C. Hörr
16:10–17:30
Session 2
Scientifc
Computing II
An automatic method to determine the diameter of historical coins in
images
S. Zambanini
17:30–19:00
Welcome
Reception
Poster Session

TUESDAY, NOVEMBER 17TH
Data, Science, and the Media J. Broschart
Interactive Narratives for Exploring the Historical City of Salzburg J. Pereira
A multimedia museum application based upon a landscape embedded
digital 3D model of an ancient settlement
S. Boos
09:00–10:40
Session 3
Communicating
Sciences to the
Public Computing the “Holy Wisdom” O. Hauck
3D Reconstruction of Archaeological Trenches from Photographs R. Wulff
3D Reconstruction of Banteay Chhmar Temple for Google Earth P. Nguonphan
Practical experiences with a Low-cost Laser Scanner S. Kor
11:00–12:20
Session 4
3D-Reconstruction
and Modeling Computerized 3D modeling – A new approach to quantify post-
depositional damage in Paleolithic stone artifact
U. Smilansky
14:00–18:30 Guided Tour and Visit in Speyer
WEDNESDAY, NOVEMBER 18TH
Image-based techniques in Cultural Heritage modeling M. Sauerbier
GIS and Cultural Flows M. Arnold
A Collaborative GIS-based Cue Card System for the Humanities G. Christ
09:00-10:40
Session 5
GIS
Archaeological Information Systems I. Kulitz
“Archäologische Museen vernetzt“ – An Information System for the
Archaeological Museums in Bavaria
K. Schaller
Historic Quarries – the Database and Case Studies C. Uhlir
Das Projekt WissKI G. Hohmann
11:00-12:20
Session 6
Databases and
Information
Systems Artifact cataloging system as a rational translator from unstructured
textual input into multi-dimensional vector data
V. Klepo
12:20–12:40 Best Student Presentation Award
Closing Remarks

POSTER SESSION
The Angel’s cave - A database for the restoration and valorisation of
the San Michele Archangel site, Olevano sul Tusciano (Salerno, Italy)
M. Balzani, R. De Feo, C.
Vanucci, F. Viroli, L. Rossato
The 3D morphometric survey as efficient tool for documentation and
restoration in Pompeii: the research project of Via dell’Abbondanza
M. Balzani, F. Maietti, G. Galvani,
N. Santopuoli
MAG, an Italian XML application profile for submission and transfer of
metadata and digitised cultural content
P. Feliciati
Towards an Automated Texturing of Adaptive Meshes from 3D Laser
Scanning
Ch. Hoppe, S. Krömker
A new approach to the surveying of archaeological monuments in
academic teaching
Th. Meier, C. Casselmann, J. van
de Löcht, N. Kuch, H. Altenbach
The Hala Sultan Tekke site and its innovative documentation system F. Niccolucci, K. Nys, A. Felicetti,
S. Hermon
ISEE: retrieve information in Cultural Heritage navigating in 3D
environment
L. Pecchioli, M. Carrozzino, F.
Mohamed
IT of the PROJECT "VIRTUAL Ukek – Kyryk-Oba" M. Sdykov, R. Singatulin
IT in the reconstruction of ceramics R. Singatulin, O. Yakovenko
3D Texture Modeling of an important Cycle of Renaissance Frescoes in
Italy
E. Siotto, D. Visintini
NESPOS – Digitalizing Pleistocene People and Places E. Slizewski
Multimedia Galleries of Cultural Heritage – Piece of a Puzzle or the
Overall Picture?
K. Sotirova
One Land, One City, One Memory - Hidden in the Sand! – The
Famagusta Research Project
E. Wand
Laser scanning of a Mauryan Column Complex in Sisupalgarh, An
Early Historic Fortress in Coastal Orissa/India
P. Yule
DEMONSTRATION: Breuckmann GmbH, Meersburg