Daily Iowan (Iowa City, Iowa), 1939-09-08 - Daily Iowan: Archive
Upload
independentCategory
view
0download
0
University of Liège
Faculty of Applied Sciences
Aerospace and Mechanical Engineering Department (LTAS)
Oufti-1 : flight system
configuration and structural
analysis.Master Thesis − June 2009
Supervisor : Prof. Gaëtan Kerschen
Gauthier Pierlot2nd Master in Aerospace Engineering
Academic Year 2008− 2009


Abstract
OUFTI− 1 is the first satellite ever equipped with a recently developedamateur radio digital-communication technology: the D-STAR protocol.This system represents both the satellite’s communication system and itspayload.
This thesis focuses on the mechanical structure of OUFTI − 1. It in-tends to precise the structural functions and requirements according tothe mission objectives. It develops a flight system configuration that high-lights the environmental constraints due to the particular orbit imposedby the Vega Maiden Flight. Another objective of this thesis is to ensure thestructural reliability during launch as well as in orbit. Several finite ele-ment analysis demonstrate the ability of OUFTI − 1 to sustain the struc-tural loads. A free-free modal survey is carried out and the correspondingmodal analysis is correlated. The first vibrations tests on shaker are alsopresented.
Keywords : OUFTI-1, CubeSat, LEODIUM, D-STAR, amateur radio,STRU, Configuration, Structure.

Acknowledgment
First of all, I would like to express my gratitude to my advisor Profes-sor Gaëtan Kerschen for its precious help and support. I appreciated itsadvices and its confidence in me.
Many thanks go to Professors Grigorios Dimitriadis, Jean-ClaudeGolinval, Jacques Verly, and Amandine Denis who accepted to partici-pate in the examination committee of this master thesis. I am more thanthankful to Amandine for her comments and suggestions throughout thewriting of this dissertation.
I am pleased to acknowledge my friends of the OUFTI − 1 team whocreated a pleasant working atmosphere. Special thanks go to Jonathan andAmandine for their kindness and their motivation.
Finally and foremost, I would like to express my love and gratitude toAudrey for her constant help and for always being there for me duringthese five years.

Contents
Contents i
1 Introduction 11.1 Introduction . . . . . . . . . . . . . . . . . . . . . . . . . . . 11.2 CubeSat program . . . . . . . . . . . . . . . . . . . . . . . . 11.3 CubeSat concept . . . . . . . . . . . . . . . . . . . . . . . . . 21.4 State of art . . . . . . . . . . . . . . . . . . . . . . . . . . . . 31.5 OUFTI-1 Project . . . . . . . . . . . . . . . . . . . . . . . . . 4
1.5.1 Genesis . . . . . . . . . . . . . . . . . . . . . . . . . . . 41.5.2 Mission objectives . . . . . . . . . . . . . . . . . . . . . 41.5.3 CubeSat Kit and development philosophy . . . . . . . . 51.5.4 Requirements . . . . . . . . . . . . . . . . . . . . . . . . 6
1.6 Thesis outline . . . . . . . . . . . . . . . . . . . . . . . . . . 9
2 Flight System Configuration 102.1 Introduction . . . . . . . . . . . . . . . . . . . . . . . . . . . 102.2 Catia modeling . . . . . . . . . . . . . . . . . . . . . . . . . 10
2.2.1 Why a Catia modeling? . . . . . . . . . . . . . . . . . . 102.2.2 Implementation . . . . . . . . . . . . . . . . . . . . . . . 132.2.3 Frame . . . . . . . . . . . . . . . . . . . . . . . . . . . . 13
2.3 Mechanical components . . . . . . . . . . . . . . . . . . . 142.3.1 CubeSat structure . . . . . . . . . . . . . . . . . . . . . . 142.3.2 Feet . . . . . . . . . . . . . . . . . . . . . . . . . . . . . 142.3.3 Spring plungers . . . . . . . . . . . . . . . . . . . . . . 162.3.4 Deployment switch . . . . . . . . . . . . . . . . . . . . . 162.3.5 Spacers and endless screws . . . . . . . . . . . . . . . . 172.3.6 Midplane standoff . . . . . . . . . . . . . . . . . . . . . 172.3.7 Batteries’ PCB . . . . . . . . . . . . . . . . . . . . . . . . 182.3.8 Magnet and hysteresis rods . . . . . . . . . . . . . . . . 192.3.9 Solar panels . . . . . . . . . . . . . . . . . . . . . . . . . 202.3.10 Antennas . . . . . . . . . . . . . . . . . . . . . . . . . . 20
2.4 Electrical components and electronics . . . . . . . . . 212.4.1 PC-104 standard . . . . . . . . . . . . . . . . . . . . . . 212.4.2 Electronic cards . . . . . . . . . . . . . . . . . . . . . . . 222.4.3 Batteries . . . . . . . . . . . . . . . . . . . . . . . . . . . 232.4.4 Solar cells . . . . . . . . . . . . . . . . . . . . . . . . . . 24
2.5 OUFTI-1 Flight system configuration . . . . . . . . . . . 262.5.1 Objective and procedure . . . . . . . . . . . . . . . . . . 262.5.2 Groups . . . . . . . . . . . . . . . . . . . . . . . . . . . 262.5.3 Constraints . . . . . . . . . . . . . . . . . . . . . . . . . 262.5.4 OUFTI-1 flight system configuration . . . . . . . . . . . 32
i

2.5.5 Discussion . . . . . . . . . . . . . . . . . . . . . . . . . 372.6 Integration . . . . . . . . . . . . . . . . . . . . . . . . . . . . 38
2.6.1 Objectives and methodology . . . . . . . . . . . . . . . . 382.7 Concluding remarks . . . . . . . . . . . . . . . . . . . . . . 39
3 Structural Analysis 403.1 Introduction . . . . . . . . . . . . . . . . . . . . . . . . . . . 403.2 Mass budget . . . . . . . . . . . . . . . . . . . . . . . . . . . 40
3.2.1 Objective and methodology . . . . . . . . . . . . . . . . 403.2.2 Discussion . . . . . . . . . . . . . . . . . . . . . . . . . 40
3.3 Center of gravity and inertia . . . . . . . . . . . . . . . . 433.3.1 Objectives . . . . . . . . . . . . . . . . . . . . . . . . . . 433.3.2 Modeling strategy . . . . . . . . . . . . . . . . . . . . . 433.3.3 COG location . . . . . . . . . . . . . . . . . . . . . . . . 433.3.4 Inertia . . . . . . . . . . . . . . . . . . . . . . . . . . . . 45
3.4 Solar panels design . . . . . . . . . . . . . . . . . . . . . . . 453.4.1 State of art . . . . . . . . . . . . . . . . . . . . . . . . . 453.4.2 Requirements . . . . . . . . . . . . . . . . . . . . . . . . 463.4.3 Solar panel design . . . . . . . . . . . . . . . . . . . . . 483.4.4 Material selection . . . . . . . . . . . . . . . . . . . . . . 483.4.5 Thickness and radiative model . . . . . . . . . . . . . . . 563.4.6 Adhesive selection . . . . . . . . . . . . . . . . . . . . . 58
3.5 Batteries’ PCB . . . . . . . . . . . . . . . . . . . . . . . . . . 633.5.1 Assembly design . . . . . . . . . . . . . . . . . . . . . . 633.5.2 Material selection . . . . . . . . . . . . . . . . . . . . . . 643.5.3 Validation . . . . . . . . . . . . . . . . . . . . . . . . . . 67
3.6 Finite element analysis . . . . . . . . . . . . . . . . . . . . 673.6.1 Introduction . . . . . . . . . . . . . . . . . . . . . . . . 673.6.2 Static analysis . . . . . . . . . . . . . . . . . . . . . . . . 673.6.3 Modal analysis . . . . . . . . . . . . . . . . . . . . . . . 723.6.4 Batteries PCB model . . . . . . . . . . . . . . . . . . . . 73
3.7 Concluding remarks . . . . . . . . . . . . . . . . . . . . . . 77
4 Vibration testing 794.1 Introduction . . . . . . . . . . . . . . . . . . . . . . . . . . . 794.2 Free-free modal survey . . . . . . . . . . . . . . . . . . . . 79
4.2.1 Objective . . . . . . . . . . . . . . . . . . . . . . . . . . 794.2.2 Experimental procedure . . . . . . . . . . . . . . . . . . 794.2.3 Results and identification . . . . . . . . . . . . . . . . . 82
4.3 Correlation . . . . . . . . . . . . . . . . . . . . . . . . . . . 864.3.1 LSFD/Samcef . . . . . . . . . . . . . . . . . . . . . . . . 864.3.2 Connections modeling . . . . . . . . . . . . . . . . . . . 874.3.3 Lumped mass . . . . . . . . . . . . . . . . . . . . . . . . 884.3.4 Results . . . . . . . . . . . . . . . . . . . . . . . . . . . 88
4.4 Shaker testing . . . . . . . . . . . . . . . . . . . . . . . . . . 904.4.1 Objective . . . . . . . . . . . . . . . . . . . . . . . . . . 904.4.2 Structural model . . . . . . . . . . . . . . . . . . . . . . 904.4.3 Equipment . . . . . . . . . . . . . . . . . . . . . . . . . 914.4.4 Tests . . . . . . . . . . . . . . . . . . . . . . . . . . . . . 94
4.5 Concluding remarks . . . . . . . . . . . . . . . . . . . . . . 104
ii

5 Conclusions 1055.1 Summary of the accomplished work . . . . . . . . . . . . 1055.2 Perspectives . . . . . . . . . . . . . . . . . . . . . . . . . . . 1065.3 Personal point of view . . . . . . . . . . . . . . . . . . . . . 106
A PC-104 layout 109
B Solar panels design 110
C Batteries datasheets 111
D Interface design 112
Bibliography 113
iii

Abbreviated terms
ADCS Attitude determination and control systemAl AluminumATOX Atomic oxygenBOL Begin of lifeCalPoly California polytechnic state universityCOG Center of gravityCOM Electronic card for communicationCDS CubeSat design specificationCFRP Carbon fiber reinforced plasticCOTS Commercial off the shellCSG Centre spatial de GuyaneCSK CubeSat kitCSL Centre spatial de LiègeCTE Coefficient of thermal expansionCVCM Collected volatile condensable materialECFM Electronic card’s flight modelECSS European cooperation for space standarizationEMC Electromagnetic compatibilityEMI Electromagnetic interferenceEPS1 Main electrical power supplyEPS2 Experimental electrical power supplyESA European space agencyFEA Finite element analysisFEM Finite element modelFM430 Electronic flight module 430 cardFOS Factor of safetyFR4 Flame resistant 4GFRP Glass fiber reinforced plasticICD Interface control documentITD Ibrahim time domainKISS Keep It Simple and SmartKS Kill switchLEO Low earth orbitLiPo Lithium-polymer batteriesLSCE Least-squares complex exponentialLSFD Least-squares frequency domainLV Launch vehicleLPTM Low power transmission mode

MAC Modal Assurance CriterionMIAS Mission analysis subsystemMECH Antenna’s deployment subsystemMOS Margin of safetyMSO Midplane standoffMTP Mission test planOBC2 Second on-board computerPCB Printed circuit boardPFC Pass fail criteriaPSD Power spectral densityRBF Remove before flightRT Room temperatureSP Spring plungersSPOF Single point of failureSM Structural modelSNR Signal to noise ratioSTRU Structural subsystemTBD To be determinedTBC To be confirmedTID Total irradiation doseTML Total mass lossTHER Thermal subsystemUHF Ultra high frequencyVHF Very high frequency
i

1Introduction
1.1 Introduction
OUFTI − 1 is the first satellite developed at the University of Liège aswell as the first nanosatellite ever made in Belgium. The purpose of thisthesis is to present the developments and advancements in the structuralsubsystem of the OUFTI− 1 project during the academic year 2008− 2009at the University of Liège (ULg).
Written in the framework of the 2nd master in aerospace engineering,this master thesis develops the flight system configuration, the structuralstudy and the preliminary vibration testing of OUFTI− 1 in order to makeone step closer to its realization.
The mechanical structure plays a major role during the launch becauseit is the backbone of the mechanical system. It has to withstand the staticand dynamic loading as well as the noise during the flight and the shocksduring stage separation, ignition and fairing jettisoning. Once in orbit, thestructure will protect the main payload against the harsh space environ-ment : radiations, debris, thermal variations, etc. Therefore, a completestructural analysis is necessary to provide a pledge on the satellite struc-tural reliability.
1.2 CubeSat program
The CubeSat program, which started 10 years ago, aims to facilitate theaccess to space by creating a standard easier to design and develop suchit can be used as secondary payload on space launcher. This new trendwithin the aerospace community allows to flight a real spacecraft undermuch less cost and development time than many other solutions.
This program is jointly led by the California Polytechnic State Univer-sity, well-known for its ”learn by doing´´ principles, and Stanford Univer-sity. Year after year, it is becoming a complete success with the universitiesand the industries all over the world, and takes more and more extent inmany sectors. At the moment, at least 80 institutions are involved in aCubeSat project.
Moreover, seeing that the CubeSat program facilitates the space accessto a larger sector of developers such as the universities, it also promotes
1

1.3. CubeSat concept
the educational purposes by giving hands-on experience to engineeringstudents in aerospace. It is in this way that the University of Liège devel-ops its first nanosatellite called OUFTI − 1.
1.3 CubeSat concept
The fundamental features of the CubeSat standard are its physical con-straints : 1 kilogram mass in 1 dm3 volume with an average power of ap-proximately 1 watt. This small 10 x 10 x 10 cm unit represents a technicalchallenge just by those restrictions.
Figure 1.1 – CubeSat formats
3 formats come from this definition (Figure 1.1). 1 structural unit, themost simple and probably the most used. 2 structural units, simply ob-tained by stacking up 2 single structures, and finally the 3 units Cube-Sats, the largest format. Although many commercial structures exist (e.g.Pumpkin, Boeing, Isis, etc.), the most popular remains the CubeSat Kit(CSK) structure from Pumpkin.
The CubeSat philosophy is quite different compared to larger satellites.While a typical spacecraft often costs millions of dollars and needs manyyears to be designed and launched, a CubeSat project can start with abudget less than 100000e and 2 years of developments (19) (80), from thefirst steps to the launch.
This philosophy is also different in regard to the development pro-cess. Instead of using space qualified and very expensive technology, astudent nanosatellite tries as much as possible to integrate Commercial OfThe Shelf (COTS) materials and components to reduce the cost and thedevelopment time. For the same reasons, official requirements are light-ened. Thus, there is a management of failures rather than using expensivesolution to minimize them.
Gauthier Pierlot2nd Master in Aerospace Engineering
2 University of LiègeFaculty of Applied Sciences
Academic Year 2008− 2009

1.4. State of art
Since the beginning, CalPoly develops standards and procedures todesign, build and qualify structure for space launch. Thus, any nanosatel-lite has to respect several technical specifications and guidelines (47) tobe validated as a CubeSat. Those ensure that the CubeSat definition iscompatible with the launcher’s interface and that it will not interfere withother satellites or payloads by describing the requirements (e.g., outer di-mensions and restrictions, recommended materials).
CalPoly also develops a standard solution for the deployment inter-face : the P-POD or Poly Pico-Satellite Orbital Deployer (Figure 1.2). Itenables 1 to 3 units CubeSats to be deployed in orbit by a smart systemthat uses the under utilized space inside the launch vehicle. Its utilizationgreatly simplifies the CubeSats integration and limits the undesirable in-teractions with the surrounding environment. Further details can be foundin reference(6).
Figure 1.2 – Poly Pico Satellite Orbital Deployer (P-Pod)
1.4 State of art
CubeSats projects are now widespread and range from meteorologicalor space environment studies to telecommunications. The following list isnot exhaustive but it gives an overview of their applications (18).
SwissCube is the first nanosatellite developed at the Swiss FederalInstitute of Technology Lausanne (Switzerland). Its objective is to takeoptical measurements of the airglow phenomenon over all latitudes andlongitudes for at least 3 months. (66)
Gauthier Pierlot2nd Master in Aerospace Engineering
3 University of LiègeFaculty of Applied Sciences
Academic Year 2008− 2009

1.5. OUFTI-1 Project
Delfi-C3 is the first CubeSat student project from the Delft Universityof Technology (the Netherlands). It carries new thin film solar cells and anautonomous wireless sun sensor experiment. (54)
Compass-1 is developed at Aachen University of Applied Sciences, inGermany. The mission purpose is to allow everyone to take and downloadpictures of the earth (51).
Can-X2 tests a set of solutions (propulsion system, custom radios, at-titude sensors and actuators and a commercial GPS receiver) that will beused on their next satellites. It is the second CubeSat project initiated atthe University of Toronto (55).
C.A.P.E 1’s purpose is to gather data from terrestrial receivers in Gulfof Mexico and transmit them to the ground station at the University ofLouisiana at Lafayette. (53)
CP6 is made at its Californian cradle of CalPoly. This nanosatellite im-plements an attitude control system using magnetic torquers embeddedwithin the side panels. It also carries a scientific payload for electron mea-surements in orbit. (11)
Kumu A’o CubeSat is designed at the University of Hawaii. This Cube-Sat has only an educational purpose by providing opportunities to Hawai-ian engineering students to develop a real space project. (13)
CalPoly understood that the exchange of information is key to theCubeSat concept success. The CubeSat community was then created tofacilitate the communications between developers and official standard(12).
1.5 OUFTI-1 Project
1.5.1 Genesis
OUFTI − 1 project began in September 2007 following an idea of LucHalbach (Spacebel) : the use inside a nanosatellite of the innovative digitaltelecommunications protocol D-STAR. Within a few weeks, a team of stu-dents and academics was created and the project was on track : OUFTI− 1was born. OUFTI, which stands for Orbital Utility For Telecommunica-tions Innovations, is a common expression in Liège (Belgium) that means: ” WAW! ´´. At the moment, 13 students from three engineering schoolsare doing their master theses on OUFTI − 1.
1.5.2 Mission objectives
OUFTI− 1 intends to demonstrate in orbit the feasibility of 3 payloads(30) :
1. D-STAR digital telecommunications protocol
2. Azurspace’s solar cells with 30% efficiency BOL
3. An innovative electrical power system
Gauthier Pierlot2nd Master in Aerospace Engineering
4 University of LiègeFaculty of Applied Sciences
Academic Year 2008− 2009

1.5. OUFTI-1 Project
D-STAR, which stands for Digital Smart Technology for Amateur Ra-dio, is a digital protocol from the Japan Amateur Radio League (JARL)and is OUFTI − 1’s main payload . This protocol brings many advancescompared to conventional radio system such as a much better Signal toNoise Ratio (SNR), a simultaneous transmission of data (e.g. GPS data)and voice, and a direct connection to the internet thanks to the D-STARrepeater at ULg. Moreover, D-STAR is widespread within the ham-radiocommunity, especially in the United States and now in Europe.
A new digital power supply will be aboard OUFTI − 1. This powersupply, developed in collaboration with Thales Alenia Space (76), is basedon a fly back converter which is digitally controlled. It will supply the3, 3 V bus but it will never take the control over the main power supply.
Finally, high-efficiency solar cells will be tested. Provided byAzurspace (5), they have 30% efficiency at their begin of life (BOL)which is the highest efficiency available on the market at the moment.
1.5.3 CubeSat Kit and development philosophy
To accelerate the development of this challenging CubeSat, the Uni-versity of Liège bought a 1U CubeSat Kit last year (37). The structure isconform to the standard developed at CalPoly and integrates the first elec-tronic card (Figure 1.3). Because this kit has already flown, it is a reliablestarting point for the rest of the developments.
Figure 1.3 – CubeSat Kit Structure and Flight Module 430 card
The philosophy followed at ULg is KISS : Keep It Simple and Stupid.The simpler the concept, the better the solution! Many problems will bethen solved by choosing the simpler concept to save time and money.
Gauthier Pierlot2nd Master in Aerospace Engineering
5 University of LiègeFaculty of Applied Sciences
Academic Year 2008− 2009

1.5. OUFTI-1 Project
1.5.4 Requirements
The structural subsystem has to fulfill many functions to ensure mis-sion success. They are summarized in Figure 1.4. The division of the struc-tural subsystem is done with a primary structure, the CubeSat Kit (CSK),which cannot be manufactured easily. The secondary structure representsany part that will not directly sustain the structural loads from LaunchVehicle (LV), i.e. solar panels, screws, Printed Circuit Boards (PCBs), etc.Finally, the interface with P-POD includes the rails, the feet, a RemoveBefore Flight pin (RBF), etc.
Structural functions
Main structure (CSK) Secondary structure
Structural integrityduring launch and in orbit
Reliable configuration in regard of the subsystems
Attachement point for internal and external equipment
P-POD interface
Access within the P-Pod (RBF, serial/USB)
Shielding againstspatial environmentand thermal path
Maximum accessibility and maintability
Figure 1.4 – Structural functionalities
On the basis of these functions and reference (25), a set of structuralrequirements can be written in subsection 1.5.4.1.
The equipment necessary to the mission success (e.g. EPS, permanentmagnet and hysteresis rods) is added. It has to fulfill many requirementsfrom official institutions such as ESA (56), CalPoly (47) and ArianeSpace(7). These are presented in subsection 1.5.4.2, 1.5.4.3, 1.5.4.4 and 1.5.4.5.
1.5.4.1 Structural Requirements
1. STRU-1: Structural subsystem shall protect mechanically the space-craft equipment during launch.
2. STRU-2: Structural subsystem shall shield spacecraft equipmentagainst space environment.
3. STRU-3: Structural subsystem shall be designed to survive its tem-perature range as described in (35).
Gauthier Pierlot2nd Master in Aerospace Engineering
6 University of LiègeFaculty of Applied Sciences
Academic Year 2008− 2009

1.5. OUFTI-1 Project
4. STRU-4: Structural subsystem shall align the spacecraft according tothe ADCS purpose(31).
5. STRU-5: Structural subsystem shall integrate the spacecraft equip-ment.
6. STRU-6: Structural subsystem shall connect mechanically and elec-trically the spacecraft equipment.
7. STRU-7: Structural subsystem shall ensure the integration withinthe P-POD and test pod.
8. STRU-8: Structural subsystem shall apply the management choice.
1.5.4.2 Mass Requirements
1. STRU-MR-1: Each single CubeSat shall not exceed 1 kg mass (47).
2. STRU-MR-2: Center of mass shall be located within 2 cm of its geo-metric center (47).
1.5.4.3 Design Requirements
1. STRU-DR-1: The CubeSat shall have an access port area placed on aside face (61).
2. STRU-DR-2: The external components other than the rails shall nottouch the inside of the P-Pod (47).
3. STRU-DR-3: Components on shaded sides shall not extend morethan 6, 5 mm normal to the surface (47).
4. STRU-DR-4: Deployables shall be constrained by the CubeSat. Notethat the P-POD rails and walls are NOT to be used to constrain de-ployables (47).
5. STRU-DR-5: NASA/ESA approved materials should be used when-ever possible (47), (43).
6. STRU-DR-6: The use of Aluminum 7075− T73 or 6061− T6 is sug-gested for the main structure (47).
7. STRU-DR-7: Minimum safety factor shall be used for standardmetallic materials (56).
8. STRU-DR-8: Margins of safety (MOS) shall be positive (47).
9. STRU-DR-9: The CubeSats shall not generate any debris or separateparts during any post-delivery activity or during the flight missionon LARES System (Including release operations) (56).
10. STRU-DR-10: The max outgassing values for each material used onP-POD/CubeSat shall be (56) :
• TML : less than 0, 1 %
• CVCM : less than 0, 01 %
Gauthier Pierlot2nd Master in Aerospace Engineering
7 University of LiègeFaculty of Applied Sciences
Academic Year 2008− 2009

1.5. OUFTI-1 Project
1.5.4.4 Launcher Requirements
1. STRU-1-LR-1: The CubeSat shall support static acceleration from LV(7).
2. STRU-1-LR-2: The CubeSat shall not have structural modes at fre-quencies lower than to be determined (TBD) Hz in hard mountedconfiguration (56).
3. STRU-1-LR-3: Random vibrations spectrum, sine spectrum, shockresponse spectrum and acoustic vibrations spectrum shall be per-formed at the levels described by the current Interface Control Doc-ument (ICD) (56).
4. STRU-1-LR-4: Random vibration testing and shocks tests proce-dures shall be done in accord with ESA’s approach (28).
5. STRU-1-LR-5: The structural subsystem shall be able to support athermal test that simulate Vega’s mission profile (7).
6. STRU-1-LR-6: The structural subsystem shall be able to support athermal vacuum bake out to ensure proper outgassing of compo-nents. The test cycle and duration shall be outlined in the missiontest plan (MTP) (47), (56), (7).
7. STRU-1-LR-7: The depressurization rate under the fairing shall notexceed 5 kPa/s (7).
8. STRU-1-LR-8: CubeSats shall NOT be disassembled or modified af-ter qualification testing (56).
1.5.4.5 Operational Requirements
1. STRU-1-OR-1: CubeSats shall not present any danger to neighbor-ing CubeSats in the P-POD, the Launch Vehicle, or primary payloads(47), (7), (56).
2. STRU-1-OR-2: CubeSats with rechargeable batteries shall have thecapability to receive a transmitter shutdown command, as per Fed-eral Communications Commission (FCC) regulation (47).
3. STRU-1-OR-3: Time intervals for scheduled maintenance operationson CubeSats shall be no less than 3 months (56).
4. STRU-1-OR-4: Storage life shall be at least 24 months (with possiblemaintenance operations) (56).
5. STRU-1-OR-5: The CubeSats shall be completely passive during allground activities and during the flight mission before release (56).
6. STRU-1-OR-6: On ground only the CubeSats should be active onlyduring functional check-out/maintenance operations performed bythe P-POD/CubeSat provider (56).
7. STRU-1-OR-7: The Cubesats shall conform to a Class 100000 cleanenvironment (56).
Gauthier Pierlot2nd Master in Aerospace Engineering
8 University of LiègeFaculty of Applied Sciences
Academic Year 2008− 2009

1.6. Thesis outline
8. STRU-1-OR-8: The Cubesats shall conform to Guiana Space Center(CSG) safety regulations (56), (7).
9. STRU-1-OR-9: Cal Poly will conduct a minimum of one fit checkin which developer hardware will be inspected and integrated intothe P-POD. A final fit check will be conducted prior to launch. TheCubeSat Acceptance Checklist (CAC) will be used to verify compli-ance of the specifications (47).
1.6 Thesis outline
According its mission’s objectives, OUFTI − 1 intends to demonstratein orbit the D-STAR technology, Azruspace’s solar cells and an experimen-tal EPS.
To achieve this goal, the purpose of the structural subsystem is to de-sign a suitable and reliable mechanical structure, in accordance with theaforementioned requirements and functionalities. The starting point willbe the CSK structure and the components will be integrated in agreementwith the constraints from each subsystem.
Chapter 2 will start with a brief description of the different mechanicaland electrical components. The flight system configuration and the pro-posed integration procedure will then be discussed. A detailed structuralanalysis, which includes finite element computations, will be carried outin Chapter 3. These numerical results will be verified using preliminaryexperimental vibration tests in Chapter 4. Finally, the conclusions of thisstudy will be drawn in Chapter 5.
Gauthier Pierlot2nd Master in Aerospace Engineering
9 University of LiègeFaculty of Applied Sciences
Academic Year 2008− 2009

2Flight System Configuration
2.1 Introduction
This chapter gives a detailed description of the OUFTI − 1’s mechani-cal and electrical components. Another objective of this chapter is to definethe flight system configuration whose purpose is to arrange each com-ponent according to the existing requirements. Finally, this chapter willpresent and discuss the configuration of OUFTI − 1.
2.2 Catia modeling
A detailed geometric model was carried out using the commercial Ca-tia V5 software (74). This model, shown in Figures 2.1 and 2.2, gives adetailed view of OUFTI − 1 and of its components.
2.2.1 Why a Catia modeling?
A Catia model presents several important advantages for designing astructure, which certainly explains its widespread use in the mechanicalindustry.
Firstly, the study of the CSK with Catia allows a good understandingof the components included in the kit.
Secondly, Catia can be used to verify the suitability of new concepts.For example, if there are dimensional problems with a particular design,Catia modeling will warn the user by identifying the parts that may col-lide.
Catia can also calculate several physical properties such as the totalmass, the center of gravity (COG) location and the inertia properties. Acomplete material database has been created to enable Catia to calculatethese properties from the geometry.
Finally, the software facilitates the creation of technical drawings andthe FEM’s geometry which considerably simplifies the work.
10

2.2. Catia modeling
Figure 2.1 – Exploded view of OUFTI-1
Gauthier Pierlot2nd Master in Aerospace Engineering
11 University of LiègeFaculty of Applied Sciences
Academic Year 2008− 2009

2.2. Catia modeling
Figure 2.2 – Exploded view of OUFTI-1’s internal components
Gauthier Pierlot2nd Master in Aerospace Engineering
12 University of LiègeFaculty of Applied Sciences
Academic Year 2008− 2009

2.2. Catia modeling
2.2.2 Implementation
2 main sources of information were available regarding CSK’s dimen-sions : official drawings (38) (61) and step files downloaded from Pumpkinwebsite (37). For intellectual property, both are willingly amputated froma part of information.
Hence, the main dimensions were missing, and it was not possible tocreate a reliable model on this basis. Therefore, we decide to take measure-ments on our kit to establish an accurate model. As the CSK machiningtolerances are wider than any other space application, we decide to limitthe accuracy in the range of 1 to 5/100 mm.
The end result is presented in Figures 2.1 and 2.2 : 113 components(without washers), 253 location constraints and 262 contacts without anyinterference.
2.2.3 Frame
A frame must be defined to facilitate the description of the compo-nents’ location. Its origin is chosen at the Cubesat’s geometric center, ori-ented using a right hand set rule as shown in Figure 2.3.
Figure 2.3 – Reference frame
This particular frame presents 3 majors advantages :
1. it is the same as the one given in the official documents (61).
2. a direct evaluation of the center of gravity (COG) location in regardto the geometrical center can be done.
Gauthier Pierlot2nd Master in Aerospace Engineering
13 University of LiègeFaculty of Applied Sciences
Academic Year 2008− 2009

2.3. Mechanical components
3. each panel can be easily identified with the following rule : the nameassociated to the current panel is the name of its normal axis, accord-ing to its direction (e.g., the panel with the communication’s ports isreferred to as −X face).
2.3 Mechanical components
This section describes components with a mechanical function, even ifsome of them are strongly linked to electrical functions.
2.3.1 CubeSat structure
One year ago, the University of Liège bought a CSK structure to ac-celerate the developments of the OUFTI − 1 project. It is made to be asmultipurpose as possible and many commercial solutions exist to simplifythe advancements (14) (37). Thus, certain designs (e.g. solar panels) willalso be dictated by the existing structure.
The CubeSat Kit comprises 3 main parts, all made in Al − 5052 H32(38) :
1. an upper plate, also known as end plate, screwed on the chassis with4 M3 x 5 stainless steel screws. It supports 4 feet.
2. a chassis that is drilled on −X to create a serial/USB interface withthe FM430 electronic card. The remove before flight (RBF) pin andthe external electrical power supply are also located on this face.
3. a lower plate or base plate. It carries two important components :2 spring plungers and 1 deployment switch. It is screwed on thechassis with 6 M3 x 5 stainless steel screws.
The chassis’ corners and the feet are hard anodized to prevent coldwelding and to have good anti-friction properties. The remaining partsare alodined and constitute the electrical ground of the structure. Figures2.4 and 2.5 show the details of Pumpkin’s structure.
2.3.2 Feet
Feet are made of Al − 6061 T6, which is a common aluminum inaerospace industry and recommended by (47). A foot can be decomposedin 4 parts : the foot itself which is hard anodized, a stainless steel ”shym´´that has to be removed if OUFTI − 1 uses solar panels clips, a stainlesssteel screw and a grower washer (Figure 2.6). Note that their dimensionsare prescribed in (61).
The ”normal´´ feet are not drilled and have no protuberances at theirbasis. The CSK upper and base plates support 5 normal feet : 4 on the endplate and 1 on the base plate.
Gauthier Pierlot2nd Master in Aerospace Engineering
14 University of LiègeFaculty of Applied Sciences
Academic Year 2008− 2009

2.3. Mechanical components
Figure 2.4 – Mechanical structure provided with the CubeSat Kit
Figure 2.5 – Close-up of -X face
Gauthier Pierlot2nd Master in Aerospace Engineering
15 University of LiègeFaculty of Applied Sciences
Academic Year 2008− 2009

2.3. Mechanical components
Figure 2.6 – Left plot : assembled foot; right plot : different components of a foot
2.3.3 Spring plungers
Spring plungers, or more commonly spring loaded device, add valueto a classical spring by encapsulating it into a CubeSat foot and providinga plunger tip on one end. In this way, the spring plunger allows muchmore accurate and repeatable end force than an usual spring. Their aimis to provide a relative velocity to separate OUFTI − 1 from the 2 othersP-Pod’s CubeSats.
2 of the 4 base plate feet posses the spring plungers (Figure 2.1). Theirplacement inside the feet must respect a particular procedure to avoid anydamage (39). A spring plunger foot can also be decomposed in 4 parts : thefoot (hard anodized), a stainless steel ”shym´´, a M3 nut and the springplungers (Figure 2.7).
Figure 2.7 – Left plot : spring’s end tip; right plot : spring plunger’s components
2.3.4 Deployment switch
One requirement inside the P-Pod is that all satellite’s functions mustbe shutdown to avoid any problem (e.g. premature antennas deployment).
Gauthier Pierlot2nd Master in Aerospace Engineering
16 University of LiègeFaculty of Applied Sciences
Academic Year 2008− 2009

2.3. Mechanical components
This is the deployment switch purpose which disconnects the electricalcontacts when it is mechanically engaged. The CSK structure contains 2switch modules.
The first is placed on the FM430 electronic card from Pumpkin (Figure2.8, left plot) and can be switched on/off thanks to the RBF pin. It isused to disconnect batteries’ power supply during ground transportation,maintenance or tests.
The second is fixed on the base plate (in black in Figure 2.1) and isused inside the deployer, after the satellite integration.A small plastic shaftactivates the switch and cut off power supply when it is stacked inside thedeployer. Once in orbit, the deployment mechanism releases all CubeSatsand in the same time, the shaft and the switch. This mechanism is placedin the last foot on the lower plate, just at the corner −X/−Y.
Figure 2.8 – Left plot : switch mechanism with the RBF pin; Right plot : base plate’sswitch components
2.3.5 Spacers and endless screws
Spacers are represented in orange in Figure 2.1 and 2.2. They are madeof Al− 6061 T6 and have inner and outer diameter of 3 mm and 4, 5 mm re-spectively. Spacers are stacked up around M3 stainless steel endless screw,alternately with electronic cards. They can be 15 mm or 25 mm height (seePC-104 specifications (33)) and provide an equal distance between 2 adja-cent PCBs.
The endless screws spread from 4 lugs in the base plate until the mid-plane standoff. Their role is to provide a positioning pattern to the PC-104electronic card. Global view of both spacers and endless screw is presentedin Figure 2.9.
2.3.6 Midplane standoff
Midplanes are the mechanical connections between the endless screwsand the chassis. As the electronic cards’ positioning is not symmetric in-
Gauthier Pierlot2nd Master in Aerospace Engineering
17 University of LiègeFaculty of Applied Sciences
Academic Year 2008− 2009

2.3. Mechanical components
Figure 2.9 – Spacers of 15/25 mm and/around the endless screws
side the CubeSat structure, four different Al− 6061 T6 standoffs are used.They are named from A to D and their placement is described in reference(40).
Midplanes are drilled with 2 holes : one through the height and theother on the longer lateral side. The first is for the endless screw thatshould be bolted just above the midplane, and the second is used to screwthe midplane on the +/− Y chassis’ face. They are represented in Figure2.10.
Figure 2.10 – Left plot : the 4 different midplanes; right plot : midplane A duringmounting
2.3.7 Batteries’ PCB
A sixth PCB is mounted between EPS1 and EPS2. It supports and ther-mally insulates the batteries, as it can be shown in Figure 2.2.
Gauthier Pierlot2nd Master in Aerospace Engineering
18 University of LiègeFaculty of Applied Sciences
Academic Year 2008− 2009

2.3. Mechanical components
This PCB is attached to EPS2 via 4 titanium screws M3 x 20 mm boltedwith 4 self-blocking nuts (Figure 2.11). 16 polyamide washers are addedto the assembly to increase the thermal resistance. Four spacers of 9 mmheight (in pale blue in Figure 2.2),and also made of titanium, place thePCB to the right height.
1 heater is placed between each battery and the PCB, on or insidethe PCB (TBD) and a thermal sensor is placed on both batteries’ sidesto ensure they respect their temperature operating range. On the otherhand, PCB has to be large enough to support the heater control transistor,batteries’ protection circuit and charger connected to the external powersupply.
Figure 2.11 – Left plot : connection to EPS2; right plot : screws,nuts and washers
At the moment, this subsystem is still under design.
2.3.8 Magnet and hysteresis rods
OUFTI − 1′s attitude control system is based on the passive use of theearth’s magnetic field to create a 2 axis stabilization. Actually, one axis ofthe spacecraft will follow magnetic field’s line all along the orbit. Then,ADCS subsystem (31) defines the elements that will be taken on-board :one permanent magnet and a damping material.
The permanent magnet is made of Al− Ni− Co− 5, which are a com-mon ferrous alloy that can be found easily on the market. At the moment,the last evaluation of the ADCS subsystem leads to 1 cm3 as the neces-sary volume to align the spacecraft with a good accuracy. The permanentmagnet will be stuck or mechanically attached (TBD) because it cannot bedrilled without destroying the magnetic domains.
OUFTI − 1 has to use a damping material made of Hy−Mu− 80 orPermanorm 5000−H2, both being nickel-iron soft magnetic alloy. It drawsits energy into the rotating movement to travel through the material’s hys-teresis cycle. In this way, it decelerates the rotating movement and limitsthe modulation effect on ground station. Last assessments lead to 0, 1 cm3
of damping material. At least 2 hysteresis rods are placed on-board, at the+X face internal corners (Figure 2.1). They will be stuck or mechanicallyattached (TBD).
Gauthier Pierlot2nd Master in Aerospace Engineering
19 University of LiègeFaculty of Applied Sciences
Academic Year 2008− 2009

2.3. Mechanical components
2.3.9 Solar panels
The solar panels are made of Al − 7075− T73 and they provide thesurface for mounting the solar cells from AzurSpace (see Annex B). 3 kindsof panel are used :
• 3 side panels with a rectangular shape of 82 x 96 mm2, and a thick-ness of 1, 5 mm. These panels are drilled with 2 holes of 3 mm forthe cabling path.
• 1 top panel with a particular shape with external dimensions of90 x 96 mm2. This design is done to get a compromise between thecabling path and CSK dimensions, as explained later.
• 1 lower panel without any hole but similar to the upper panel’s form.
The first and second types are represented in Figure 2.12. Solar pan-els take also an important role in the OUFTI − 1 mission : they are alsodesigned to shield equipment against spatial radiations and thermal vari-ations.
Figure 2.12 – Aluminum substrate; Left plot : +Z panel ; right plot : +X and +/-Y panel
2.3.10 Antennas
The antennas’ deployment mechanism is managed by the MECH sub-system (81). Made of aluminum, the antennas’ panel is mounted on −Xand is hard anodized to ensure electrical insulation to the antennas.
As already mentioned, OUFTI − 1 has 2 channels of telecommunica-tions : the downlink transmission in the VHF band at 144 MHz and theuplink transmission in the UHF band at 433 MHz, both frequencies beingusual within the ham radio community.
The antennas are made of a cupro-beryllium alloy and correspond tothe frequencies by the quarter length wave : 50 cm for the downlink and
Gauthier Pierlot2nd Master in Aerospace Engineering
20 University of LiègeFaculty of Applied Sciences
Academic Year 2008− 2009

2.4. Electrical components and electronics
17 cm for the uplink. Concerning the width, it has been chosen to respectthe structural requirements and to create a simple system of deployment.
Antennas’ fixation on the aluminum panel is designed to be as reliableas possible. In addition to be bonded at the base of the guide rails,eachantenna can be folded in 2 notches created on the panel’s back side.
The deployment mechanism works as follows : both antennas arerolled around the guide rails and are attached thanks to a wire in”Dyneema´´, wich is a modified polyethylene. When appropriate, an elec-trical impulse from EPS1 will deliver a current to a thermal knife that willreach the Dyneema’s melting point. After its fusion, the antennas will de-ploy. The mechanical interface and the uplink antenna are represented inFigure 2.13.
Figure 2.13 – Deployment interface and uplink antenna
2.4 Electrical components and electronics
2.4.1 PC-104 standard
Electronic cards used in OUFTI − 1 project are all in the PC-104+ for-mat size (see Annex A). First of all, it should be noted that it exists slightdifferences between the consortium’s definition (33), Pumpkin PCB (62)and the real FM430 from the kit.
PCB are made of FR4, which stands for Flame Resistant 4, that belongsto the Glass Fiber Reinforced Plastic (GFRP) class of material. A PCB isproduced by inserting continuous glass woven fabric impregnated withan epoxy resin binder while forming the sheet under high pressure. Anusual PCB is often made with 4 to 6 layers and generally includes differentelectrical grounds. The electrical components can be connected to a par-ticular potential within the card or to the common ground on the chassis.On the other hand, the electronic cards can include special componentssuch as the ”via´´, in copper or aluminum, that spread thermal activity onthe whole PCB.
Each PCB has a common device : the PC-104 connector. This allows adirect connection with all cards through 104 pins welded in it. The connec-tors are made of GFRP and are 11 mm height (83). They can be extended to
Gauthier Pierlot2nd Master in Aerospace Engineering
21 University of LiègeFaculty of Applied Sciences
Academic Year 2008− 2009

2.4. Electrical components and electronics
21 mm thanks to an additional connector (82) (68). Note that all connectorsare chosen as the low insertion force versions to facilitate the integration.
Finally, it will be noted that these PCBs will be protected by a thin filmto avoid outgassing of sensitive components such as chemical capacitors.
2.4.2 Electronic cards
A preliminary assessment from Pumpkin’s drawings gives 62, 5 mm2 offree surface for the integration of components, with an estimated marginof security of 5%. As this area is large enough to support all the electricalfunctions, only 5 cards will be used : OBC1 (from CSK), OBC2, EPS1, EPS2and COM.
This section briefly describes the electronic card functionalities. Forfurther details, references (49) (77) (45) (75) (26) can be consulted.
FM430 card also known as OBC1.This card comes from the CSK andis a reliable solution. One note thatseveral functions will not be usedaboard (e.g. the MHX). This card ismanaged by OBC (75).
OBC2 card is developed to be re-dundant with OBC1. It integratesin an efficient way all the func-tions used on the OBC1 thanks to aMSP430. This card is also managedby OBC (75).
EPS1 card is the main power supply.It manages and supplies clients withthe power available from solar cells.Batteries must be integrated nearthis card. It is managed by EPS1 (77)and the measurements by reference(26).
Gauthier Pierlot2nd Master in Aerospace Engineering
22 University of LiègeFaculty of Applied Sciences
Academic Year 2008− 2009

2.4. Electrical components and electronics
EPS2 card or experimental EPS is adigitally controlled EPS with a fly-back module. It constitutes a sec-ondary payload, but it cannot sup-ply the overall system. A strong in-teraction with battery module arisesfrom thermal simulation (35). Thiscard is managed by EPS2 (45).
COM card integrates the AX −25 (32) and D-STAR telecommu-nication protocols. It brings highfrequencies that could disturb theOBC2. This card is managed by theCOM team (49) (34).
2.4.3 Batteries
The main criteria for the selection of this component are : mass, vol-ume, reliability and specific electrical capacity.
Lithium-polymer type has been chosen by EPS team, mainly becauseit provides the best specific capacity as well as a compact form. Thus,a complete set of COTS Li-Po batteries has been bought on the basis oftheir flight experience. They are presented in Table 2.1 and are listed bydescending order of preference.
Manufacturer Model Tested
Kokam603870H Done554374H Done
Panasonic CGA633450B OngoingVarta PLF 463759C Done
Table 2.1 – Batteries considered
Structural characteristics are described in details in datasheets (59),(60), (79) and (70), respectively (see Annex C). Protection circuits will beused too.
2 batteries will be used in the flight model as redundant solution. Anagreement was made between Dresde (52) and ULg to test different bat-teries : ULg performed a testing campaign on the electrical capacity of
Gauthier Pierlot2nd Master in Aerospace Engineering
23 University of LiègeFaculty of Applied Sciences
Academic Year 2008− 2009

2.4. Electrical components and electronics
Kokam’s batteries. Dresde will test the Panasonic battery using the sameprotocol and the results will be exchanged.
Figure 2.14 – Batteries and their protection circuits
Kokam batteries have good spatial experience on CubeSat (77). How-ever, the first tests performed at the CSL showed that thermal cycling com-bined with high vacuum induces large deformations of the cells’ envelope.To counteract this effect and avoid dramatical lost in performance, batter-ies will be placed inside an aluminum box. The space between cells andbox could be filled with epoxy resin. Besides the good protection againstspatial environment, this solution also brings a mechanical fastening ofthe batteries to the structure. Batteries could be thermally insulated fromthe main structure (TBD), depending on the experimental and theoreticalresults from thermal subsystem (35).
Panasonic’s batteries are tested at Dresde at the moment. They arethinner and narrower than Kokam’s batteries but have less capacity. De-pending on the results, this type could be used on OUFTI − 1. How-ever, mechanical design can be concentrated on Kokam’s batteries with acomfortable margin of security. Indeed, Kokam’s external dimensions aregreater than the Panasonic one.
It will be noted that Varta Polyflex batteries are of less interest becauseseveral uncertainties remain on their electrical capacity evolution in time.
2.4.4 Solar cells
Since 1964, AzurSpace powered more than 340 satellites such as XMM,Herschel, Planck or Mars Express (5). The most advanced solar cells tech-nology are developed on experience of more than 40 years and severalmillion solar cells. The range of products covers various types of siliconand I I I−V solar cells on germanium for space application (72). Therefore,its strong industrial experience is a reliable solution to power OUFTI − 1.
Gauthier Pierlot2nd Master in Aerospace Engineering
24 University of LiègeFaculty of Applied Sciences
Academic Year 2008− 2009

2.4. Electrical components and electronics
Figure 2.15 – OUFTI-1’s GaAs solar cells (30% efficiency BOL)
The new generation of triple-junction Gallium-Arsenide solar cell ofthirty percent BOL efficiency will be used on OUFTI − 1 and measure-ments will be done in orbit. On the other hand, integration on the mainstructure will be led by EADS Astrium, as recommended by AzurSpace.
Solar cells, whose size is 80 mm wide for 40 mm height with croppedcorners, are connected in series which explains their location on the panel.It is also recommended to use same cells on all panels to avoid any short-circuit problems within EPS1 subsystem. Once again, the simplest solutionis to integrate only new solar cells on-board.
Astrium has integrated cells on the aluminum substrate with the fol-lowing layout : aluminum panel - adhesive - Kapton - adhesive - solar cell -cover glass. Indeed, the complete surface is covered with 50 microns thickKapton foil for electrical insulation reason and the cover glass protects so-lar cells against space environment. All adhesives are typical silicone typeand have a thickness around 50 micron. Figure 2.15 presents 2 solar panelsafter integration.
It can be observed that upper and lower area are covered with elec-tronic pads to weld cables. One pad corresponds to the electrical masswhile the other represents the useful electrical voltage, both being con-nected to the EPS1. One pad has 6 mm height and around 60 mm wide.The interstice between cells is only 1 mm height.
Gauthier Pierlot2nd Master in Aerospace Engineering
25 University of LiègeFaculty of Applied Sciences
Academic Year 2008− 2009

2.5. OUFTI-1 Flight system configuration
2.5 OUFTI-1 Flight system configuration
2.5.1 Objective and procedure
The purpose of the flight system configuration is to arrange all thespacecraft elements by respecting a set of requirements. The first difficultyis then to define accurately the requirements.
For each group of components, the main problems involving the con-figuration (e.g. environmental, dimensional, physical) are investigated.The constraints associated to these problems are defined and translatedinto requirements that can be linked to the structural requirements (seesection 1.5.4.1).
Finally, a configuration will be proposed and discussed to see weitherthe requirements are satisfied. Note that this section only looks at theconfiguration problem. The discussion concerning the design, operationaland launch requirements will be done in chapters 3 and 4.
2.5.2 Groups
Six groups of elements can be defined :
1. The CSK structure which includes the main structure, endlessscrews and midplanes standoffs.
2. The 5 electronic cards and spacers associated.
3. The 2 batteries, cables, protection circuit and their mechanical con-nections.
4. The magnet and 2 hysteresis rods and their mechanical connections.
5. The solar panels which include the aluminum panel, solar cells, ca-bles and their mechanical connections.
6. The antenna’s deployment mechanism with its panel, both anten-nas, electrical and mechanical connections.
These groups are strongly mechanically, thermally and electrically in-terconnected. They also interact with the space environment, i.e. the ra-diation, thermal cycling and earth’s magnetic field. The next section willdescribe the main constraints associated to these elements.
2.5.3 Constraints
2.5.3.1 Product assurance constraints
The product assurance constraints concern the safety and the quality ofmaterial/product used. They ensure the satellite’s reliability and imposethe basic configuration layout.
Hence, the CSK structure will be used to integrate the Azurspace so-lar cells and the FM430 while the electronic cards will follow the PC-104format. The corresponding requirements are :
Gauthier Pierlot2nd Master in Aerospace Engineering
26 University of LiègeFaculty of Applied Sciences
Academic Year 2008− 2009

2.5. OUFTI-1 Flight system configuration
• STRU-8-PAR-1: The CubeSat structure shall be the CSK structure.
• STRU-8-PAR-2: The FM430 electronic card defined in reference (41)from the CSK shall be used.
• STRU-8-PAR-3: The PC-104 format shall be used as defined in ref-erence (33).
• STRU-8-PAR-4: The AzurSpace solar cells defined in reference (73)shall be used.
2.5.3.2 Environmental constraints
The environmental constraints are linked to the system environmentduring its life cycle. This includes the environment in orbit such as theradiations, thermal cycling and vacuum but also the environment in-duced within the satellite, i.e. the electromagnetic interferences (EMI),electronic’s thermal dissipation and the permanent magnet’s field.
Radiations in spaceWith an apogee altitude of 1447 km, the satellite’s revolutions through
the Van Allen inner belt can induce a total irradiation dose (TID) around10000 kilorads (9) without shielding. As OUFTI − 1’s lifetime will be de-termined by the shielding against these radiations , the solar panels andthe batteries, which represent the main hardening components, will belocated to ensure a total mission duration of 1 year.
• STRU-2-ENV-1: Solar panels shall shield electronic componentsagainst space radiations for 1 year lifetime.
• STRU-2-ENV-2: Batteries shall shield electronic components againstspace radiations for 1 year lifetime.
Space vacuumIn space, the pressure can lie between 10−11 to 10−15 Pa. The main
problem is linked with the batteries that can expand and lose more than15% of their mass (46), as shown in Figure 2.16. Thus, they will be encap-sulated within a thin aluminum box.
• STRU-2-ENV-3: Both batteries shall be encapsulated within an alu-minum box.
Electromagnetic compatibilityEven if accurate measurements within OUFTI − 1 are not yet avail-
able, the telecommunications card (49) (34) should generate strong elec-tromagnetic interferences (EMI) during D-Star functioning. The resultingbad signal to noise ratio (SNR) could lead to loss of data or erroneouscommand. These interferences varying as 1
D2 where D is the distance tothe COM card, they will be minimized if the COM is placed away fromthe other cards, i.e. in extremal position (nearest the base or end plate).
Gauthier Pierlot2nd Master in Aerospace Engineering
27 University of LiègeFaculty of Applied Sciences
Academic Year 2008− 2009

2.5. OUFTI-1 Flight system configuration
Figure 2.16 – Batteries during and after high vacuum test. Courtesy (52)
• STRU-2-ENV-4: COM card shall be nearest the base or end plate.
Thermal environment in spaceThe 14 revolutions per day may induce temperatures that can range
from −30◦C to 70◦C. The batteries are the most critical components andthey should be situated within [0◦C − 40◦C] during the charge andwithin [−20◦C − 60◦C] during the discharge. The thermal subsystem en-sures better thermal conditions if a sixth PCB is directly connected to anexisting electronic card. Moreover, its location near the geometric centershould contribute to limit the thermal variations.This batteries’ PCB shallbe thermally insulated from the electronic card.
• STRU-3-ENV-1: Batteries shall be situated at the center of the satel-lite.
• STRU-3-ENV-2: Batteries shall be integrated on a sixth PCB attachedto an electronic card.
• STRU-3-ENV-3: Batteries’ PCB shall be thermally insulated from theelectronic card.
Thermal environment induced by electronicsThe EPS1 card uses a dissipation transistor to transform in heat the
energy that cannot be stored during sunlight period (77). Its temperaturecan reach 120◦C which constitutes a problem for the batteries. It will beplaced in such a way that it will not heat up the batteries over 40◦C (35).Thermal subsystem ensures this condition if the transistor is connectedto the main structure on −X with an aluminum square and a ”patch´´resistor (35). In addition, batteries should be not be connected to the EPS1to limit the transistor influence.
• STRU-3-ENV-4: The dissipative transistor placed on the EPS1 shallbe connected to the −X panel with an aluminum square.
Gauthier Pierlot2nd Master in Aerospace Engineering
28 University of LiègeFaculty of Applied Sciences
Academic Year 2008− 2009

2.5. OUFTI-1 Flight system configuration
Figure 2.17 – Permanent magnet’s alignment and rods location
• STRU-3-ENV-5: The dissipative transistor placed on the EPS1 shallbe connected to the −X panel with a patch.
• STRU-3-ENV-6: The batteries shall not be connected to the EPS1.
Earth’s magnetic fieldThe plane defined by the omnidirectional antennas is taken as perpen-
dicular as possible to the nadir axis above latitude of Liège (around 50◦N)as shown in Figure 2.17. This is chosen to keep an antennas’ gain around1 dBi. The angle between nadir axis and the magnetic lines at this pointbeing around 15◦, we can consider them as similar (31) in a first approachand the permanent magnet axis can be set parallel to the normal X to alignthe spacecraft.
• STRU-4-ENV-1: The permanent magnet axis will be parallel to thenormal X.
Magnetic field induced by the permanent magnetIf the permanent magnet’s field induces the magnetic saturation in the
hysteresis rods, their efficiency decreases and the rods become useless.According to the ADCS (31), it is necessary to limit the magnetic field tovalues under 0, 1 A/m in the rods, which requires at least 5 cm betweenrods and magnet (Figure 2.17).
• STRU-4-ENV-2: Permanent magnet shall be situated at least 5 cmfrom the hysteresis rods.
2.5.3.3 Configuration constraints
In a strict sense, these constraints are linked to the composition of theproduct or its organization within the CubeSat format.
PC-104 format
Gauthier Pierlot2nd Master in Aerospace Engineering
29 University of LiègeFaculty of Applied Sciences
Academic Year 2008− 2009

2.5. OUFTI-1 Flight system configuration
The electronic cards, whose the external dimensions follow the PC-104 format (92 x 96 mm2), are integrated inside the 98 x 98 mm2 struc-ture. In addition to the 5 electronic cards, the PC-104 format should beslightly modified to let pass 1 permanent magnet (1 cm3), 2 hysteresisrods (0, 1 cm3), 1 deployment switch (1, 5 x 0, 6 cm2) and cables from solarcells. To ensure reliability, the batteries’ PCB will be attached mechanicallyusing screws (see Chapter 3). This implies 4 holes in the card that supportsthe batteries assembly.
• STRU-5-CONF-1: The PC-104 shall include notches of at least2 x 0, 25 cm2 for the cabling path.
• STRU-5-CONF-2: The PC-104 shall include a notch of at least2 x 0, 8 cm2 for the deployment switch.
• STRU-5-CONF-3: The PC-104 shall include notches of at least2 x 2 mm2 to let pass the hysteresis rods.
• STRU-5-CONF-4: The PC-104 shall include notches to let pass thepermanent magnet.
• STRU-5-CONF-5: The PC-104 that supports the batteries shall in-clude 4 holes (dimensions available in Chapter 3).
Hysteresis rodsThe hysteresis rods have to be perpendicular to the permanent magnet
polarization axis in order to stabilize the CubeSat during the transitionalphase (Figure 2.17).
• STRU-5-CONF-6: The magnet polarization axis will be perpendicu-lar to the hysteresis rods axis.
FM430The satellite has the data ports (i.e. the serial/USB port and 5 V power
supply) on −X panel. Thus, the FM430 has to be connected on the baseplate to allow external connections.
• STRU-5-CONF-7: FM430 shall be connected on the base plate.
2.5.3.4 Interface constraints
The interface constraints refer to the interconnections or relationshipcharacteristics between 2 devices. This definition includes electrical andmechanical interface.
Mechanical connectionsThe 2 rods and the magnet cannot be drilled without modifying their
magnetic properties and they will be bonded or attached (TBD). Each so-lar panel requires at least 93 x 80 mm2 for only 87 x 80 mm2 available on
Gauthier Pierlot2nd Master in Aerospace Engineering
30 University of LiègeFaculty of Applied Sciences
Academic Year 2008− 2009

2.5. OUFTI-1 Flight system configuration
−X side : it will be used to integrate the antennas’ deployment mecha-nism. The combination of Astrium’s integration layout and CSK structuredirectly interferes with the solar panels clips use (64). The clips cover up atleast one cell on the top/bottom panel, as shown in Figure 2.18. Therefore,adhesives will be used.
• STRU-6-INTER-1: The magnet shall be fixed rigidly within the satel-lite
• STRU-6-INTER-2: The hysteresis rods shall be fixed rigidly withinthe satellite.
• STRU-6-INTER-3: The solar panels shall be bonded on the satellite.
• STRU-6-INTER-4: The antennas’ deployment mechanism shall bebonded on the satellite.
Figure 2.18 – Top panel with solar clips
Electrical connectionsThe batteries require at least 6 cables while the solar panels need 10,
both will be connected to EPS1 whereas the antennas will be connected tothe COM by using one coaxial cable. They will be preferably the ribboncables with silver plate connectors described in reference (66). They aredesigned for ultrahigh vacuum up to 0, 5 · 10−10 mbar, resist to 104 kradwhereas they have a density of 1530 kg/m3.
• STRU-6-INTER-5: The batteries shall be connected to EPS1 using 6cables.
• STRU-6-INTER-6: The solar cells shall be connected to EPS1 using10 cables.
• STRU-6-INTER-7: The antennas’ deployment mechanism shall beconnected with the COM card using 1 coaxial cable.
Gauthier Pierlot2nd Master in Aerospace Engineering
31 University of LiègeFaculty of Applied Sciences
Academic Year 2008− 2009
2.5. OUFTI-1 Flight system configuration
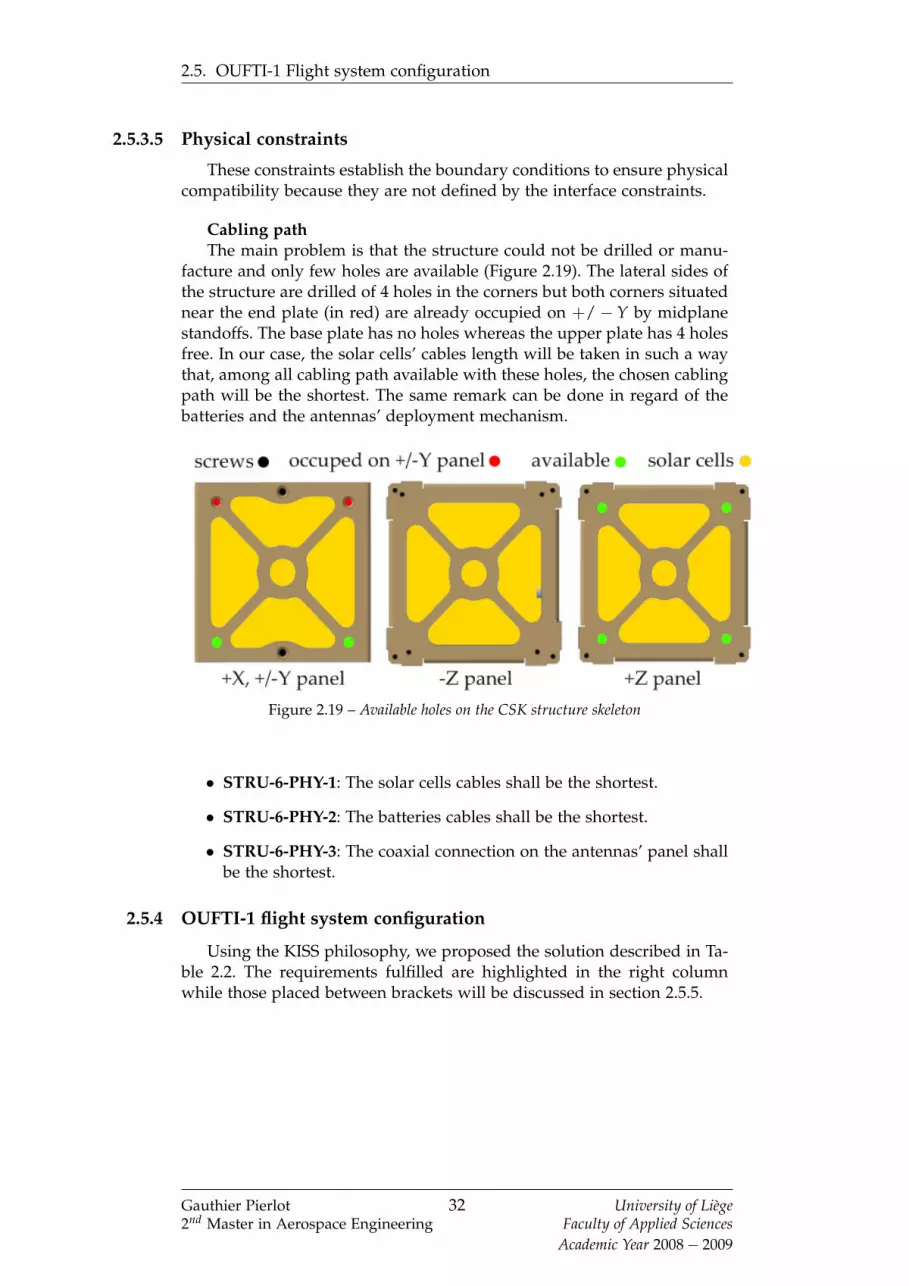
2.5.3.5 Physical constraints
These constraints establish the boundary conditions to ensure physicalcompatibility because they are not defined by the interface constraints.
Cabling pathThe main problem is that the structure could not be drilled or manu-
facture and only few holes are available (Figure 2.19). The lateral sides ofthe structure are drilled of 4 holes in the corners but both corners situatednear the end plate (in red) are already occupied on +/− Y by midplanestandoffs. The base plate has no holes whereas the upper plate has 4 holesfree. In our case, the solar cells’ cables length will be taken in such a waythat, among all cabling path available with these holes, the chosen cablingpath will be the shortest. The same remark can be done in regard of thebatteries and the antennas’ deployment mechanism.
Figure 2.19 – Available holes on the CSK structure skeleton
• STRU-6-PHY-1: The solar cells cables shall be the shortest.
• STRU-6-PHY-2: The batteries cables shall be the shortest.
• STRU-6-PHY-3: The coaxial connection on the antennas’ panel shallbe the shortest.
2.5.4 OUFTI-1 flight system configuration
Using the KISS philosophy, we proposed the solution described in Ta-ble 2.2. The requirements fulfilled are highlighted in the right columnwhile those placed between brackets will be discussed in section 2.5.5.
Gauthier Pierlot2nd Master in Aerospace Engineering
32 University of LiègeFaculty of Applied Sciences
Academic Year 2008− 2009

2.5. OUFTI-1 Flight system configuration
Electronic cardsDescription RequirementsThe 5 electronic cards are stack up through 4 endless screws fastened in the CSKstructure’s base plate. The FM430 card is placed with its components facing tothe base plate’s ports while the COM card is situated at the opposite, close tothe end plate. The EPS2 is situated just below the COM while EPS1 and OBC2are stacked on the FM430 (Figure 2.20).
(STRU-2-ENV-4);STRU-5-CONF-6;STRU-8-PAR-1/2
All cards (Figure 2.21) follow the format PC-104. They have upper and lowerright corners cropped to place hysteresis rods. Lower left corner is removed tolet pass the deployment switch module on OBC2 and can guide the cables onEPS1, EPS2 and COM. Notches are created in each side and serve as guidelineto the cables whereas EPS2 is drilled to integrate batteries’ module.
STRU-5-CONF-1/2/3/4/5; STRU-8-PAR-3
Solar cells connectors are placed at the EPS1 corners while the dissipation tran-sistor on EPS1 is placed near −X where it is mechanically connected to anten-nas’ panel thanks to an aluminum square and a patch resistor.
(STRU-3-ENV-4/5); STRU-5-INTER-1; STRU-6-PHY-1
BatteriesDescription RequirementsAs shown in Figure 2.20, the batteries are placed on each side of a PCB that isfixed on EPS2 thanks to 4 titanium screws and spacers. 16 polyamide washersare placed to the contact point. Batteries are encapsulated into an aluminumbox that surrounds the entire PCB and 6 cables directly connect the batteries toEPS1.
(STRU-2-ENV-2);(STRU-2-ENV-3); (STRU-3-ENV-1/2/3/6);STRU-6-INTER-5;STRU-6-PHY-2
Magnets and hysteresis rodsDescription RequirementsThe magnet is fixed on the lower side of batteries’ PCB near the −X face. Itspolarization axis is perpendicular to the −X face whereas the hysteresis rodsare situated at the opposite corners of +X as it can be shown on Figure 2.22.They will be bonded in the Z direction and will be perpendicular to the normalX.
STRU-4-ENV-1/2;STRU-5-CONF-6;STRU-6-INTER-1/2
Antenna’s deployment mecanismDescription RequirementsBonded on −X, the panel developed by MECH subsystem is connected to theCOM with 1 cable.
STRU-6-INTER-4;STRU-6-INTER-7;STRU-6-PHY-3
Solar panelsDescription RequirementsSolar cells from Azurspace are integrated on panels that are bonded on the CSKstructure +X, +/− Y and +/− Z panels.
(STRU-2-ENV-1);STRU-6-INTER-3;STRU-8-PART-4
The cables from the 3 lower solar cells on lateral panels and both cables fromthe −Z solar panel can pass through the 6 lower holes on the +/− Y and Xpanel. The upper part with 5 cables pass inside the structure by using 2 holeson the upper plate near +X side. Cabling path configuration is schematicallyrepresented in Figures 2.23 and 2.24.
STRU-6-INTER-6;STRU-6-PHY-1
Table 2.2 – OUFTI-1’s configuration description
Gauthier Pierlot2nd Master in Aerospace Engineering
33 University of LiègeFaculty of Applied Sciences
Academic Year 2008− 2009

2.5. OUFTI-1 Flight system configuration
Figure 2.20 – OUFTI-1 electronic cards’ configuration
Figure 2.21 – PC-104’s layout
Gauthier Pierlot2nd Master in Aerospace Engineering
34 University of LiègeFaculty of Applied Sciences
Academic Year 2008− 2009

2.5. OUFTI-1 Flight system configuration
Figure 2.22 – Magnet and rods configuration
Figure 2.23 – Cabling path on the lateral face
Gauthier Pierlot2nd Master in Aerospace Engineering
35 University of LiègeFaculty of Applied Sciences
Academic Year 2008− 2009

2.5. OUFTI-1 Flight system configuration
Figure 2.24 – Cabling path on the upper face
Gauthier Pierlot2nd Master in Aerospace Engineering
36 University of LiègeFaculty of Applied Sciences
Academic Year 2008− 2009

2.5. OUFTI-1 Flight system configuration
2.5.5 Discussion
2.5.5.1 Requirement STRU-2-ENV-2
The shielding is obtained on 5 faces with the solar panel and on thesixth face with the antennas’ panel. Their thickness will be chosen to pro-vide a 1 year lifetime to the electronic equipment in chapter 3. In additionto this, the solar panels’ material could be choose to limit the thermalvariations : this idea will be investigated in Chapter 3.
In addition to this global protection, the batteries can shield locallythe electronic equipment. It could be interesting to list the most sensitiveelectronic components (e.g. MSP430) in order to align them above and un-der the batteries area. Note that an individual protection with a sandwichsheet aluminum/tantalum/aluminum can also be envisaged.
2.5.5.2 Requirement STRU-2-ENV-4
If the FM430 and the COM card locations are fixed by the require-ments, the 3 remaining cards can be placed in the order of our choice.Seeing that EPS2 is not always switched on, it can be placed just belowthe COM card to limits the EMI. On the other hand, the EPS1 locationto limit the cable length to the batteries, which finally explains the cards’order proposed. However, a complete electromagnetic compatibility studyshould be performed as soon the COM card will be available to confirmthis order.
Note that the aluminum coverage of modulator/demodulatorADF7021 is interesting because it combines both radiations and EMIshielding. Thus, it should be investigated in the next steps of develop-ments.
2.5.5.3 Requirement STRU-3-ENV-1 to 3
The batteries’ assembly represents a concentrate mass that can be dan-gerous during the vibration tests and launch. A finite element model willbe performed in Chapter 3 to ensure its mechanical reliability. The me-chanical assembly will also be studied to ensure the thermal insulationrequired (see Chapter 3 too).
On the other hand, this assembly is the most compact and adjustablesolution to place the permanent magnet. Indeed, we can provide an accu-rate positioning by using the free volume under the PCB’s lower face andEPS1 (around 15 mm). This accuracy should not be possible on the mainstructure seeing the fixations availability.
2.5.5.4 Requirement STRU-3-ENV-4 to 6
Many problems arise from these requirements : the transistor has beenmoved near −X to dissipate its power, the batteries PCB has been relo-cated on the EPS2, an additional aluminum square and a patch resistorhave been placed on the antennas’ panel, which complicates greatly thefinal integration.
Gauthier Pierlot2nd Master in Aerospace Engineering
37 University of LiègeFaculty of Applied Sciences
Academic Year 2008− 2009
2.6. Integration
Thus, we can wonder if the dissipation circuit is really necessary andother solutions should be investigated in the next developments.
2.5.5.5 Requirement STRU-6-INTER-2
The hysteresis rods have been placed at the corners of +X, but therequirement STRU-DR-2 forbids any mechanical fastening on the corners.Therefore, the rods will be bond as well as the solar panels and we cangive a new requirement :
• STRU-6-INTER-2-DES-1: the hysteresis rods shall be bonded in thecorners of +X
2.6 Integration
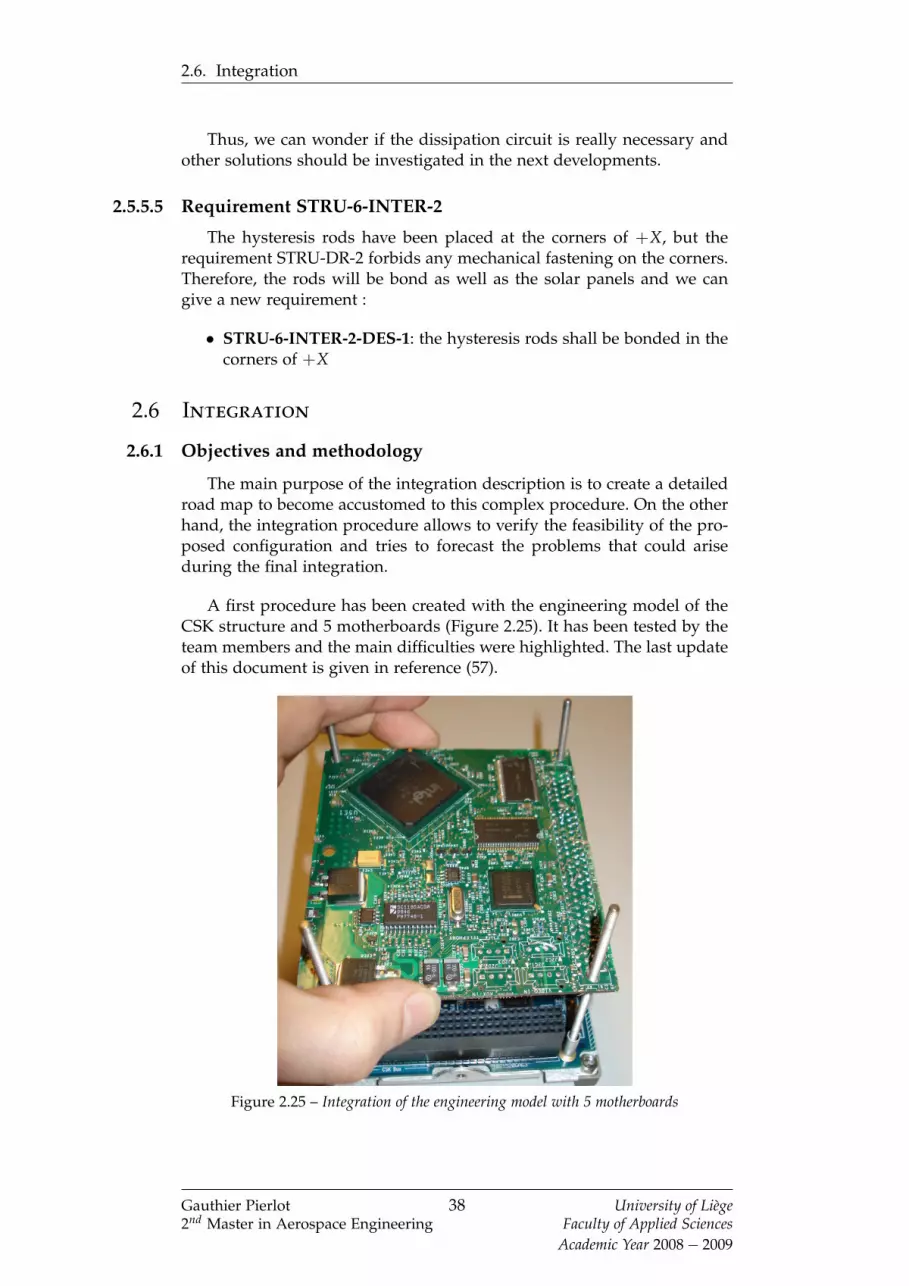
2.6.1 Objectives and methodology
The main purpose of the integration description is to create a detailedroad map to become accustomed to this complex procedure. On the otherhand, the integration procedure allows to verify the feasibility of the pro-posed configuration and tries to forecast the problems that could ariseduring the final integration.
A first procedure has been created with the engineering model of theCSK structure and 5 motherboards (Figure 2.25). It has been tested by theteam members and the main difficulties were highlighted. The last updateof this document is given in reference (57).
Figure 2.25 – Integration of the engineering model with 5 motherboards
Gauthier Pierlot2nd Master in Aerospace Engineering
38 University of LiègeFaculty of Applied Sciences
Academic Year 2008− 2009

2.7. Concluding remarks
2.7 Concluding remarks
The purpose of this chapter was to define a flight system configurationcompatible with the listed requirements.
After the presentation of the mechanical and electrical components,the interconnections’ problems associated to the assemblies were investi-gated. The constraints were identified and requirements have been writ-ten. The configuration proposed fulfills all these requirements and furtherconsiderations about the future improvements have been done. Finally, theintegration has verified that this concept was possible.
We can then conclude that the proposed flight system configurationis suitable and reliable. The next step consists in verifying the mass, thedesign and operational requirements described in section 1.5.4. The solarpanels’ material has to be defined as well as the dynamic behavior of theCSK structure and the batteries’ PCB.
Gauthier Pierlot2nd Master in Aerospace Engineering
39 University of LiègeFaculty of Applied Sciences
Academic Year 2008− 2009

3Structural Analysis
3.1 Introduction
This chapter outlines the structural analysis of satellite OUFTI − 1.It intends to assess the structural integrity and ensure that the satellitefulfills all the requirements defined in section 1.5.4.
This chapter starts with the verification of the mass requirement andthe calculation of the inertia properties. The solar panels design will bepresented. The choice of the material and adhesives will be studied. An-other objective is to discuss the batteries’ PCB design and to ensure itsthermal insulation and mechanical reliability. Finally, the first finite ele-ment analyses (FEA) will be presented.
3.2 Mass budget
3.2.1 Objective and methodology
According to the requirement STRU-MR-1, it is important to knowand update the satellite’s mass throughout the advances to ensure thatOUFTI − 1 does not exceed 1 kg mass.
All the components presented in Chapter 2 were weighted, but as somedesigns are not yet finished (e.g. COM card, batteries’ PCB) the -massbudget can variate greatly. Both worst and best case have been consideredwhereas the letter E represents an estimation when the elements are notyet available. The final result is presented in table 3.1.
The mass budget is divided into minor mass budgets for the subassem-blies and major components in order to identify main mass consumingparts. All the tables are rounded to nearest 0, 1 gr and then, the total val-ues may be inconsistent with the sum of the individual parts. The massbudget can be compared with data from reference (63).
3.2.2 Discussion
According to table 3.1, mass budget is large enough to get a comfort-able margin : more than 150 gr (15% of the total budget) remain in the bestcase, and just a bit less than 50 gr (5% of the total budget) in the worst case.Moreover, the ”general´´ category is voluntary inflated to stay in safety. Wecan consider that OUFTI − 1 meets the requirement STRU-MR-1.
40

3.2. Mass budget
Assemblies Part Number Best case (gr) Worst case (gr)
End plate
end plate 1 26,3 26,3foot 4 5,3 5,3
shym 4 0,6 0,6washer M3 4 0,2 0,2screw M3 4 1,5 1,5
Total 33,8 33,8
Base plate
base plate 1 35,9 35,9foot 1 1,3 1,3
drilled foot 3 3,6 3,6shym 4 0,6 0,6
spring plungers 2 1,2 1,2bolt M3 2 1,1 1,1washers 1 0,1 0,1
screw M3 1 0,4 0,4deployment switch 1 2,4 2,4
screw M1 1 0,4 0,4plastic shaft 1 0,1 0,1
Total 47,1 47,1
ContourContour 1 63,3 63,3
screw M3 10 3,2 3,2Total 66,5 66,5
Side panel
Side panel 3 94 94Solar cells 6 / /
Kapton film 3 / /Adhesive 3 / /
Coverglass 3 / /Total 125,3 125,3
Top panel
Top panel 1 33 33Solar cells 2 / /
Kapton film 1 / /Adhesive 1 / /
Coverglass 1 / /Total 41,9 41,9
Bottom panel
Bottom panel 1 37,5(E) 39,5(E)Solar cells 2 / /
Kapton film 1 / /Adhesive 1 / /
Coverglass 1 / /Total 48(E) 50(E)
FM430Card 1 51,1 51,1
Endless screw 4 14,6 14,6Spacers 15 4 1,1 1,1
Total 66,8 66,8
OBC2Card 1 50,4 50,4
Spacers 15 4 1,1 1,1Total 51,6 51,6
Gauthier Pierlot2nd Master in Aerospace Engineering
41 University of LiègeFaculty of Applied Sciences
Academic Year 2008− 2009

3.2. Mass budget
Assemblies Part Number Best case (gr) Worst case (gr)
EPS1Card 1 63,8 63,8
Bus extension 2 10,6 10,6Spacers 25 4 1,9 1,9
Total 76,3 76,3
Batteries
K603870H 2 70 70or K554374H 2 70 70
or Varta 2 42,8 42,8or Panasonic 2 54(E) 54(E)
Wires 4 8(E) 10(E)Total 50,8(E) 80(E)
Sixth PCB
PCB 1 13,3(E) 15,5(E)Ti M3 screw 4 2,9 2,9
Ti M3 nut 4 1 1Ti Standoff 4 8,5(E) 8,9(E)
Washers 16 1,1(E) 1,3(E)SC protection 2 2(E) 3(E)
Total 28,4(E) 32,6(E)
EPS2Card 1 54 54
Spacers 15 4 1,1 1,1Total 55,1 55,1COM Card 1 50(E) 70(E)Total 50(E) 70(E)
MSO
MSO 4 3,2 3,2M3 nuts 4 1,3 1,3
M3 screws 4 1,3 1,3Washers 4 0,4 0,4
Total 6 6
Antennas
433 Mhz 1 1,2(E) 1,4(E)144 Mhz 1 3,6(E) 3,8(E)
Panel 1 27,1(E) 27,3(E)PCB 1 1,5 1,5
Total 33,4(E) 34(E)
ADCSMagnet 1 7,5(E) 8,5(E)
Rods 2 0,8(E) 1,5(E)Fixation 3 5(E) 7(E)
Total 13,3(E) 17(E)Subtotal 794,3 854
GeneralAdhesive / 15(E) 30(E)Cabling / 15(E) 30(E)Sensors / 20(E) 40(E)
Total 50(E) 100(E)Total 844,3 954
Table 3.1 – Oufti-1 mass budget
Gauthier Pierlot2nd Master in Aerospace Engineering
42 University of LiègeFaculty of Applied Sciences
Academic Year 2008− 2009

3.3. Center of gravity and inertia
The solar panels system is the main mass consumer with around 20%of the mass budget, which can be explained by their radiation shieldingpurpose. The structure takes about 15% of the total which is little com-pared to its role of structural load path. The batteries PCB has also an im-portant part with more than 100 gr. Among electronic cards, EPS1 takesthe most important part with 8%.
3.3 Center of gravity and inertia
3.3.1 Objectives
The Center of gravity (COG) has to respect the requirement STRU-MR-2 that imposes its location within 2 cm of the CubeSat’s geometriccenter. On the other hand, the inertia properties are a fundamental fea-ture of a 3 dimensional body and are necessary to the ADCS subsystem’scalculus (31).
This section intends to calculate the satellite’s inertia and the COGlocation with a global accuracy of 5%.
3.3.2 Modeling strategy
The model is based on the assumption of an uniform density for themetallic parts (e.g. solar panels, CSK structure). The heavy components onelectronic cards (e.g. PC-104 connectors, 5V power supply) are weightedthanks to their geometry whereas the distribution of small components’mass (e.g. resistors, capacitors) is supposed uniform over the entire areaof PCB.
Only the parts with more than 1% of the total mass (10 gr) are weightedunder Catia with an error ≤ 2%, in accordance to the mass budget. Theothers components (e.g. screws, nuts, shyms) are taken into account, butwith an error that ranges from 3 to 5%.
When the real weight is estimated (letter E in table 3.1), the averagebetween best and worst cases is considered. Table 3.2 summarizes the mainmass consuming parts, their real and estimated weights and the model’serror.
A simple method to assess the model quality consists to compare themodeling’s weight with the mass budget. As Catia does not model the”general´´ category of the mass budget, it has to be compared to the subto-tal : 831, 6 gr for Catia while the mass budget mean is 822, 15 gr. With amass error of 1, 15% on the whole modeling, we can expect a good assess-ment.
3.3.3 COG location
Three cases are considered :
1. The batteries’ PCB upper face is situated at 10 mm from the EPS2(case 1)
Gauthier Pierlot2nd Master in Aerospace Engineering
43 University of LiègeFaculty of Applied Sciences
Academic Year 2008− 2009

3.3. Center of gravity and inertia
Part Mass budget (gr) Catia mass (gr) Error (%)End plate 26,3 26,4 + 0,4Base plate 35,9 36,6 + 1,9Contour 63,3 64,4 + 1,7
Side panel 125,3 126 + 0,6Top panel 41,9 41,8 - 0,2
Bottom panel 49(E) 49,4 + 0,8FM430 51,1 51,1 0
Endless screw 14,6 14,5 - 0,7OBC2 50,4 50,6 + 0,4EPS1 74,4 73,9 - 0,7
Kokam 70 69,6 - 0,6sixth PCB 14,4(E) 14,7 + 2
EPS2 54 54,1 + 0,7COM 60(E) 60,5 + 0,8
Antenna’s panel 27,2(E) 27,2 0
Table 3.2 – Catia modeling
2. The batteries’ PCB upper face is situated at 18 mm from the EPS2(case 2)
3. The batteries’ PCB upper face is situated at 5, 5 mm from the EPS2(case 3)
The first case presents the height used on the flight model, the secondcase has the lower battery on the EPS1 while the third case represents theupper battery on EPS2. The results are presented in table 3.3.
Axis Case 1 (mm) Case 2 (mm) Case 3 (mm)X 0,61 0,61 0,61Y -2,36 -2,36 -2,36Z 0,24 -0,66 0,75
Geometric center 2,45 2,52 2,55
Table 3.3 – COG location
OUFTI− 1’s COG is separated from its geometric center with less than2, 6 mm in the 3 cases. The COG location varies only of 1, 1 mm betweenboth extremal cases. This can be interpreted as a uniform distribution ofmass along the direction Z.
The COG location along Y axis can be explained by the unsymmetricalproperties of the electronic cards and particularly the PC-104’s connector.If necessary, this effect can be counteracted by moving the batteries’ PCBin +Y direction.
Along X axis, the slight difference can be explained with the massdifference between solar and antennas’ panel. From this result, we canconclude that the requirement STRU-MR-1 is largely fulfilled, regardlessof the configuration.
Gauthier Pierlot2nd Master in Aerospace Engineering
44 University of LiègeFaculty of Applied Sciences
Academic Year 2008− 2009

3.4. Solar panels design
3.3.4 Inertia
Inertia can be calculated from any point in the structure, but it is gen-erally preferred to define it from the COG. Thus, the inertia linked to theCOG and the frame XYZ are :
IG =
2, 082 −0, 057 −0, 012−0, 057 1, 765 −0, 096−0, 012 −0, 096 2, 018
· 106 g mm2 (3.1)
Moreover, principal moments and vectors can be found to define com-pletely the system :
A1 =
−0, 160, 940, 31
, M1 = 1, 723 · 106 g mm2 (3.2)
A2 =
0, 15−0, 290, 95
, M2 = 2, 049 · 106 g mm2 (3.3)
A3 =
0, 980, 2−0, 1
, M3 = 2, 092 · 106 g mm2 (3.4)
These values show that the mass distribution is quite uniform. Finally,note that the COG and inertia should be verified experimentally when acomplete spacecraft will be available. From this point of view, reference(71) provides a suitable experimental procedure that allows to retrieveboth COG coordinates and inertia from a complex three dimensional body.
3.4 Solar panels design
Solar cells are one of the most important points in a CubeSat design.Then, the structural subsystem shall be able to provide a suitable interfacewith the solar cells in orbit as well as during launch.
This section will start with a description of the state of art concerningthe solar panel. A design will be defined according to the requirementsand a material will then be chosen. Finally, a choice of adhesive will bepresented.
3.4.1 State of art
It is difficult to follow a guide line to the final design. To our knowl-edge, no CubeSat combines Azurspace solar cells with a Pumpkin’s struc-ture.
Swisscube is of first interest. They designed their own CFRP panels tosupport the Azurspace’s solar cells. Swiss team uses a mono-bloc frameas main structure and the solar panels will be screwed on it.
Gauthier Pierlot2nd Master in Aerospace Engineering
45 University of LiègeFaculty of Applied Sciences
Academic Year 2008− 2009

3.4. Solar panels design
Würzburg also uses Azurspace’s solar cells. They are integrated byAstrium on stainless steel panels as shown in Figure 3.1. Solar panels werescrewed on their ”home made´´ structure.
ClydeSpace sells ready-to-fly solutions destined to Pumpkin’s CSK.However, these solar panels integrate Spectrolab solar cells that are smallerthan ours (+/- 70 by 35 mm). Solar panels are made of PCB and can bescrewed on the main Pumpkin’s structure.
Pumpkin also sells ready-to-fly solution with solar cells from Spectro-lab. The integration is done on PCB which are fixed on Cubesat with aset of solar clips (64). This solution was used on the Colombian CubeSatLibertad-1 (Figure 3.2).
Figure 3.1 – Würzburg’s CubeSat - UWE-1
3.4.2 Requirements
It is worth recalling that some requirements were imposed on the solarpanels during the flight system configuration :
• STRU-2-ENV-1: Solar panels shall shield electronic componentsagainst space radiations to survive 1 year.
• STRU-6-INTER-3: The solar panels shall be bonded on the satellite.
• STRU-6-INTER-6: The solar cells shall be connected to EPS1 using10 cables.
• STRU-8-PAR-4: The AzurSpace solar cells defined in reference (73)shall be used.
Gauthier Pierlot2nd Master in Aerospace Engineering
46 University of LiègeFaculty of Applied Sciences
Academic Year 2008− 2009

3.4. Solar panels design
Figure 3.2 – Colombian CubeSat - Libertad-1
The solar panels shall also conform to the design requirements. In par-ticular :
1. STRU-DR-2: The external components other than the rails shall nottouch the inside of the P-Pod (47).
2. STRU-DR-3: Components on shaded sides shall not extend morethan 6, 5 mm normal to the surface (47).
3. STRU-DR-5: NASA/ESA approved materials should be used when-ever possible (47), (43).
4. STRU-DR-10: The max outgassing values for each material used onP-POD/CubeSat shall be (56) :
• TML : less than 0, 1 %
• CVCM : less than 0, 01 %
In addition, the solar panels shall be a reliable mechanical solution tothe solar cells equipment during launch and in orbit (STRU-1 and STRU-2). They shall be designed to survive their temperature range (STRU-3).
These requirements need to be improved because they are too generalto serve as guidelines during the design and the choice of material. Thenext section defines more precisely the constraints on the design.
Gauthier Pierlot2nd Master in Aerospace Engineering
47 University of LiègeFaculty of Applied Sciences
Academic Year 2008− 2009

3.4. Solar panels design
3.4.3 Solar panel design
3.4.3.1 STRU-6-INTER-6
• STRU-6-INTER-6-DES-1: The side solar panels shall be drilled with2 holes on their lower parts, according to the cabling path.
• STRU-6-INTER-6-DES-2: The top solar panel shall be drilled with 2holes on the +X side, according to the cabling path.
• STRU-6-INTER-6-DES-3: Each holes shall be at least 3 mm wide tolet pass 4 cables.
Note that the bottom solar panel is not drilled because its solar cellsuse the holes on the side panels.
3.4.3.2 STRU-8-PAR-4
Astrium requires a rectangular area of 80 x 93 mm2 to integrate thesolar cells.
• STRU-8-PAR-4-DES-1 Solar panels substrate shall provide a rectan-gular area of at least 80 x 93 mm2 to integrate the solar cells.
3.4.3.3 STRU-DR-2
• STRU-DR-2-DES-1 Solar panels shall be at the most 82 mm wide.
3.4.3.4 STRU-DR-3
• STRU-DR-3-DES-1 Solar panels shall be at the most 6 mm thick.
3.4.3.5 Solar panels
The layout of the top and side panels are presented in Figure3.3, but their thickness remains unknown. They fulfill all the require-ments (STRU-6-INTER-6-DES-1; STRU-6-INTER-6-DES-2; STRU-6-INTER-6-DES-3; STRU-8-PAR-4-DES-1; STRU-DR-2-DES-1; STRU-DR-3-DES-1)and then, the concept can be validated.
The next step is then the material selection of the panels’ substrate.
3.4.4 Material selection
Let us define accurately the requirements on the material.
3.4.4.1 STRU-1
The first feature of the panels’ substrate is its structural integrity dur-ing the launch. The solar cells are brittle and a rigid substrate will limitthe displacements under harsh vibrations while the strength will ensurethe structural integrity of the panel. The toughness is also an importantproperty to sustain the stage ignition/separation, fairing jettisoning andPOGO effects during launch.
Then, the general requirement can be expressed as :
Gauthier Pierlot2nd Master in Aerospace Engineering
48 University of LiègeFaculty of Applied Sciences
Academic Year 2008− 2009

3.4. Solar panels design
Figure 3.3 – Geometry of the top panel (left plot) and side panel (right plot)
• STRU-1-LR-1: Solar panels’ shall be a reliable mechanical substrateduring launch.
We can state more precisely :
• STRU-1-LR-1-DES-1: Solar panels’ material shall be rigid.
• STRU-1-LR-1-DES-2: Solar panels’ material shall be resistant in trac-tion/compression.
• STRU-1-LR-1-DES-3: Solar panels’ material shall have a toughnessof at least 25 MPa.m0,5.
3.4.4.2 STRU-2-ENV-1
According to the requirement STUR-2-ENV-1, the solar panels shallshield the equipment for 1 year lifetime.
• STRU-2-ENV-1-DES-1: Solar panels’ material shall shield electroniccomponents against space radiations for 1 year lifetime.
Note that the thickness of the panels will be defined during the studyof the radiative model.
3.4.4.3 STRU-3
The thermal subsystem (35) predicts important thermal variations inLEO that can disturb the batteries. The solar panel substrate can limitthese variations by choosing a material with a high thermal inertia. Dur-ing the eclipse leaving, the cold case simulation indicates that OUFTI − 1will limit these variations if the solar panels have also a good thermalconductivity.
The general requirement can be written as :
Gauthier Pierlot2nd Master in Aerospace Engineering
49 University of LiègeFaculty of Applied Sciences
Academic Year 2008− 2009

3.4. Solar panels design
• STRU-3-ENV-7: Solar panels’ material shall shield batteries againstthermal variations.
And then, typical values of specific heat and thermal conductivity canbe given :
• STRU-3-ENV-7-DES-1: Solar panels’ material shall have a specificheat higher than 750 J/kg.K .
• STRU-3-ENV-7-DES-2: Solar panels’ material shall have a thermalconductivity higher than 50 W/m.K.
The thermal cycling can also induce panels’ deformations by the adhe-sive weakening in the interaction structure-glue-panels. This effect can bemitigate if the panel’s coefficient of thermal expansion (CTE) is similar tothe CSK structure (Al − 5052 : 20− 25 µstrain/K).
• STRU-3-DES-3: Solar panels’ material shall have a CTE that rangesfrom 20 to 25 µstrain/K.
Finally, the operating range of the solar cells is typically of[−30◦C 70◦C]. The material should resist to those temperatures witha security margin of 10◦C.
• STRU-3-DES-4: Solar panels’ material shall resist to the tempera-tures range [−40◦C 80◦C].
3.4.4.4 STRU-DR-5
In addition to the radiations, another problem in low earth orbit (LEO)is the atomic oxygen which is an aggressive environment for materials.The main interaction between the high velocity oxygen atoms (around8 km/s) and the spacecraft is the erosion phenomenon that degrades thematerial properties and performances (optical, thermal, mechanical andelectrical). Erosion rates are usually quoted in terms of yield in units of1024 cm3/atom. Then, the material substrate will be chosen to resist theatomic oxygen erosion.
• STRU-DR-5-ENV-1: Solar panels’ material shall be resistant to theatomic oxygen erosion.
3.4.4.5 STRU-DR-10
The outgassing is also taken into account in the choice of the solarpanel material. It shall be stable under high vacuum and will be clean ofthe environmental pollutants. This last condition will be ensure by choos-ing a suitable post-processing. Further considerations about the adhesivesand their poor outgassing properties will be done later.
• STRU-DR-10-ENV-1: Solar panels’ material shall be conform to theoutgassing conditions.
• STRU-DR-10-ENV-2: Solar panels’ material shall be post-processed.
Gauthier Pierlot2nd Master in Aerospace Engineering
50 University of LiègeFaculty of Applied Sciences
Academic Year 2008− 2009

3.4. Solar panels design
3.4.4.6 Plasma
A spacecraft in orbit flies through a plasma of particles that are notneutral and can lead to the spacecraft charging, hence electric discharges.A common mean to counteract this effect is to connect electrically theouter surfaces to the same point or keep an electrical conduction on theexternal structure.
However, the electrical insulation between the solar cells and the struc-ture is made with a kapton foil which limits the surface conductivity. Inaddition, the adhesives are generally poor electrical conductors and theyreinforce the insulation between the panels and the structure. Thus, wecan wonder if an electrical conductivity is important seeing the surfaces’poor electrical properties. According to CSL, this effect is particularly im-portant for larger spacecraft of 1 meter or more and our CubeSat, with its10 by 10 cm structure, is not influenced by the electrical discharge phe-nomenon.
3.4.4.7 Methodology
The choice of a particular material and manufacturing process is aniterative and complex problem. The material selection is then done with asystematic procedure described in references (3),(4) and (44).
According to (4), 3 elements have to be defined to perform the materialselection :
1. The most important property, also known as objective function,which will be minimized or maximized. This element reflects theprincipal aim of the material selection, e.g. it can be a minimumcost, minimum mass or maximal rigidity.
2. The primary constraints that define one or several functional ma-terial limitations. In other words, primary constraints limit the ob-jective function’s evolutions to get a suitable result. For example, abeam with a minimum mass objective could lead to exotic solutionssuch as foam or nylon. However, if the primary constraint is the re-sistance, the process will limit solutions to titanium or aluminumalloy.
3. Finally, the secondary constraints describe the numerical limits (e.g.toughness) that are stated in the previous section.
After this complete definition of the problem, performance index canbe found from (3), depending on the target function, the primary con-straints and the structural purpose (e.g. bar, beam). This indicator reflectsthe important materials parameters in regard of their purposes.
For technical reasons, this procedure cannot integrate the requirementsconcerning the radiations (STRU-2-ENV-1-DES-1), atomic oxygen (STRU-DR-5) and outgassing (STRU-DR-10). Then, they will be verified after theselection process.
Gauthier Pierlot2nd Master in Aerospace Engineering
51 University of LiègeFaculty of Applied Sciences
Academic Year 2008− 2009

3.4. Solar panels design
3.4.4.8 Target function and primary constraints
The target function could be the weight minimization but this objectiveleads to an incompatibility with the radiation objective. An other draw-back is that this target function leads to many complicated and expensivesolution, in time and money, because the results fall in the range of veryhigh performances material.
A more convenient objective is to minimize the cost of material, whoseis in accord with the KISS philosophy definition. Indeed, many better so-lutions can be found as the overall price (e.g. material’s price, manufactureand finishing touches) of the product is often link to the production’s time.Then, the design is said to be ”at minimum cost´´.
Primary constraints are linked to the thin geometry of solar panels(≤ 1, 75 mm) and the most relevant parameter is the mechanical reliability.As we do not want to limit the material selection to one primary con-straint,two properties have been chosen : rigidity and strength. Then, theindex can be found by a ”stiffness or rigidity-limited design at minimumcost´´ in reference (3).
The constraints of second order come from the rest of technical re-quirements. They are summarized in table 3.4
Property Range/valueToughness 25 MPa.m0,5
Specific heat 750 J/kg.KThermal conductivity 50 W/m.K
CTE 20− 25 µstrain/KTemperature [−40◦C− 80◦C]
Table 3.4 – Operating limits
Thus, the problem is completely defined : find a cheap material (ob-jective), which is rigid and resistant (primary constraints), and which re-spects the requirements concerning the toughness, specific heat, thermalconductivity, CTE, and the temperature operating range (secondary con-straints).
3.4.4.9 CES Software
Material selection is simplified thanks to the powerful CES software.This complete material database is coupled with a program that classifiesmaterials from their performance index. CES Software allows a completeselection process in 2 steps :
• Graph stage: which allows the comparison of materials in regard ofthe objective function and the primary constraint through the per-formance index.
• Limit stage: which allows to define the secondary constraints.
Gauthier Pierlot2nd Master in Aerospace Engineering
52 University of LiègeFaculty of Applied Sciences
Academic Year 2008− 2009

3.4. Solar panels design
3.4.4.10 Selection with CES
According to the objective, the primary constraints and the structuralgoal, we can retrieve 2 index of performances from reference (3) :
Flat plate, stiffness-limited design at minimum cost Mrigidity = E1/3
ρ.Cm
Flat plate, strength-limited design at minimum cost Mresistance =σ1/2
y0ρ.Cm
Where M is the performance index, E is the Young’s modulus, σy0 isthe elastic limit, ρ the density and Cm the material cost per kg.
Figure 3.4 – Stiffness-limited design, first stage
Through CES, both graphics can be plotted in Figures 3.4 and 3.5. Theyare both given in logarithmic scale such that iso-performance line can bedrawn by the following procedure :
Mrigidity =E1/3
ρ.Cm(3.5)
gives in logarithmic scale :
log Mrigidity + log ρ.Cm =13· log E (3.6)
Then, equal performance of the objective function (i.e. M constant) canbe found by taking a line of slope 3. This one intersects all the materialsthat present the same performances. Similarly, a slope of 2 is founded forthe strength-limited design.
Gauthier Pierlot2nd Master in Aerospace Engineering
53 University of LiègeFaculty of Applied Sciences
Academic Year 2008− 2009

3.4. Solar panels design
Figure 3.5 – Strength-limited design, first stage
As shown in Figure 3.4 and 3.5, aluminum alloy seems to be the so-lution from both rigidity and strength criterion. As a matter of fact, alu-minium alloys are some of the basic building materials of existing space-craft and appear in many subsystems. They have a wide range of mechani-cal properties and can be used in heavily loaded structures in circumstanceranging from cryogenic conditions up to 200◦C.
The choice of a particular alloy is almost constrained by industrial’savailability, time delay, and overall price. For a first engineering model,the Al − 7075 T73 has been chosen.
3.4.4.11 Validation of material
Al − 7075 T73 is widely used in aerospace structures and recom-mended by reference (22). Its main mechanical features are displayed intable 3.5 where we can see that requirements STRU-1-LR-1-DES-3, STRU-2-ENV-1-DES-1, STRU-3-ENV-7-DES-1/2 and STRU-3-DES-3/4 are ful-filled. The method itself ensures a material with high specific strengthand rigidity satisfying the requirements STRU-1-LR-1-DES-1/2.
According to reference (22) (43), and (24), this aluminum alloy is wellestablished in aerospace industry, with many years of application and ser-vice experience. In particular, the references (15), (21) and (27) explainsthat aluminum coated kapton is one of the best hardened material againstatomic oxygen with an erosion yield of only 0, 05 ˙cm3/atom.
Vacuum does not affect aluminum alloys and the outgassing require-ment (STRU-10-DES-1) are then respected but a post-treatment is neces-
Gauthier Pierlot2nd Master in Aerospace Engineering
54 University of LiègeFaculty of Applied Sciences
Academic Year 2008− 2009

3.4. Solar panels design
Property Range/valueMain alloying element Zn (5,6%)
Young’s Modulus 71 GPaElastic limit 150 MPa
Fracture toughness 42 MPa.m1/2
Maximum service temperature 170◦CMinimum service temperature −273◦C
Specific Heat 920 J/Kg.KThermal Conductivity 160 W/m.K
CTE 23 µstrain/K
Table 3.5 – Aluminum 7075-T73 main properties. Courtesy (29)
sary to remove the doubtful layer of pollutant. It will be chosen in the nextsection.
Finally, and from the radiations point of view, reference (8) explainsthat aluminum is a common technique to shield electronic componentsin space environment. With this last verification, we conclude that thealuminum is a reliable choice according to the design and environmen-tal requirements. At this point, only the post-treatment and the thicknessremain unknown to definitively complete the design.
3.4.4.12 Post-treatment
The roles of post-treatment are numerous and many process exist, de-pending on the application (67). Two particular procedures are of commonuse for space applications : hard-anodizing and chemical film (”alodine´´).Both consist in removing the doubtful natural oxide Al2O3 and impuritiesfrom surface in order to create an other coating, much more uniform andstable, which is desirable for good adhesion and outgassing properties.
Hard-anodizing gives good anti-friction properties that are necessaryfor structural parts in contact with the P-Pod. The thin oxide layer is char-acterized by abrasion resistance and film hardness. Typical thick rangefrom 25 to 250 µm and thermal conductivity can be 30 times lower thanpure aluminum. Moreover, its melting point extend to more than 2000◦Cand gives good electrical insulation properties. Most process to hard an-odizing are based on sulfuric acid baths.
Alodine, or commonly chem film process, replaces the natural oxidelayer with an other one (7 µm in average). Contrarily to sulfuric process,alodine treatment’s properties are such as its influence is limited on themechanical properties of aluminum. The electrical and thermal conductionare also preserved. Although the friction coefficient is a bit better, abrasiveproperties are weaker than hard anodizing. This process gives a very goodsurface finishing to the bond process.
Chem film process is generally preferred because it is much more sim-ple and faster than hard-anodizing. Moreover, aluminum panels preserve
Gauthier Pierlot2nd Master in Aerospace Engineering
55 University of LiègeFaculty of Applied Sciences
Academic Year 2008− 2009

3.4. Solar panels design
a full thermal conduction and the surface finishing to be bonded. Hence,the solar panels substrate will be alodined.
3.4.5 Thickness and radiative model
There exist many different kinds of radiations, but none systematicprocedure to perform a radiative model. A common approach consist totake into account only the total irradiation dose (TID), which is an im-age of the overall radiations’ effects on the electronic devices (8) (2) (2)(27). The total irradiation dose is the addition of the effects of the trappedelectrons and protons within the radiation belts, the solar protons and theBremsstrahlung (9).
The only free variable is the solar panels’ thickness. It defines theamount of material available to shield OUFTI − 1 and it will be chosen toensure a mission lifetime of 1 year. The table 3.6 displays the aluminiumpanels’ mass compared to their thickness. We decided to limit the solarpanels mass to 200 gr. Then, the substrate shall have a thickness lowerthan 1, 75 mm to let a margin to the kapton, glue, pads and cells.
Thickness (mm) Total mass (mm)0,5 53,10,75 79,7
1 106,21,25 132,81,5 159,31,75 185,9
2 212,9
Table 3.6 – Solar panels thickness versus substrate’s mass
Then, requirements can be defined on the thickness :
• STRU-2-ENV-1-DES-2: Solar panels’ thickness shall be chosen for1 year mission lifetime.
• STRU-2-ENV-1-DES-3: Solar panels’ thickness shall be lower than175 gr.
The total irradiation dose as a function of equivalent aluminum shield-ing thickness is presented in Figure 3.6. The main assumptions on thisstudy is a maximum solar activity and a spherical shell shield configu-ration. The equivalent thickness is calculated as the thickness of a closedsphere of 7 cm radius which integrates the material volume of the CSKstructure, 5 solar panels and antennas’ panel.
After 1, 5 mm of aluminum panels’ thickness, each millimeters doesnot bring much more significant protection as the Bremsstrahlung plateauis progressively reach. Table 3.7 presents the evolution of the total dosewith the solar panel thickness.
Swiss team has already perform several tests on their sensitive devices,and in particular on the MSP430. They concluded that the first problems
Gauthier Pierlot2nd Master in Aerospace Engineering
56 University of LiègeFaculty of Applied Sciences
Academic Year 2008− 2009

3.4. Solar panels design
Figure 3.6 – Total irradiation dose for OUFTI-1’s orbit. Courtesy (76)
Thickness(mm) Equivalent (mm) Panels’ mass (gr) TID (krad)0,2 1,05 22,2 320,4 1,19 44,4 270,6 1,32 66,6 230,8 1,45 88,9 20,51 1,59 111,1 19
1,2 1,72 133,3 171,4 1,86 155,5 151,6 1,99 177,7 131,8 2,12 199.9 122 2,26 222.1 11
Table 3.7 – Total dose versus panel thickness
Gauthier Pierlot2nd Master in Aerospace Engineering
57 University of LiègeFaculty of Applied Sciences
Academic Year 2008− 2009

3.4. Solar panels design
arise around 25 krad. If we take a factor of safety (FOS) of 1, 8, the TIDallowed on OUFTI − 1 will be 14 krad and the panels’ thickness corre-sponding is 1, 5 mm. By taking this value, the total dose on our electronicequipment is limited to 14 krad a year and ensure 1 year mission lifetimewith a FOS of 1, 8. Then, the requirements STRU-2-ENV-1-DES-2/3 arefulfilled and this concludes the solar panels design (Technical drawingsavailable in annex).
An interesting comparison can be done with reference (1) that has per-formed an accurate radiative model. Spanish team uses 190 gr to shieldtheir CubeSat compared to 200 gr with OUFTI − 1 (5 solar panels and 1antennas’ panel).
Finally, let us discuss the quality modeling. A sphere represents a bet-ter repartition of mass than a cube and the radiations are underestimate.However, this effect is counteracted because the cube is completely in-cluded within the spheroid geometrical approximation : the equivalentthickness is thinner for the same shielding volume.
3.4.6 Adhesive selection
3.4.6.1 Objectives
The mechanical fastening is not always possible and an alternative canbe the use of adhesives.
The purpose of this section is the selection of suitable adhesives in bothfollowing case :
1. adhesive link between the CSK structure and the solar panels (re-quirement STRU-6-INTER-3).
2. adhesive link between the CSK structure and the hysteresis rods (re-quirement STRU-6-INTER-2-DES-1).
First, the general constraints concerning the adhesive bonding willbe presented. Two different types of adhesive will be presented and dis-cussed.
3.4.6.2 General constraints
The first rule to remember is that anything can be bonded, but noadhesive exists that can effectively bond everything (23). Successful joiningby adhesive bonding needs consideration of number factors, as shown inFigure 3.7.
Among these properties, the following factors are particularly impor-tant in our case :
• Cure temperature;
• Outgassing;
• Temperature range;
Gauthier Pierlot2nd Master in Aerospace Engineering
58 University of LiègeFaculty of Applied Sciences
Academic Year 2008− 2009

3.4. Solar panels design
Figure 3.7 – Factors influencing the adhesive bonding. Courtesy (23)
Gauthier Pierlot2nd Master in Aerospace Engineering
59 University of LiègeFaculty of Applied Sciences
Academic Year 2008− 2009

3.4. Solar panels design
• CTE;
• Thermal conductivity;
• Toughness;
Cure temperature
The cure process can be defined as the change of the physical proper-ties of a material by chemical reactions through condensation or additionpolymerization or by crosslinking (e.g. vulcanisation). Usually, it is accom-plished by the action of heat and catalysts, alone or in combination, withor without pressure.
Each adhesive is then characterized with a couple time/temperaturenecessary to complete the adhesive bonding. In general, the higher thetemperature, the lower the time to complete the cure process. However,under a certain temperature, the cure is not possible. In our case, this curetemperature should be low enough to avoid any damage of the batteries.
Outgassing
Adhesives are particularly sensitive to the outgassing. Even on Earthand at room temperature (RT), they release many pollutants during thecure process. In orbit, the combination of glue outgassing and ultra violetrays could lead to deposit on solar cells surfaces, resulting in a decreaseof their efficiency by obscuring them.
Then, and to obtain a reliable solution, our choice will be limited tothe adhesives recommended by ESA (22), or by Swisscube (66).
Temperature range
According to the thermal subsystem (35), temperature range from−50◦ to 70◦ and the adhesive should sustain these conditions.
CTE
According to the adhesive handbook (23), the thermal cycling in LEOcan cause the weakening of the adhesive, which can be explained with thedifference of CTE between the structure and the adhesive. Typically, theadhesives’ CTE range from 50 to 500 µstrain/K. As it depends strongly onthe nature of the adhesive, we can only say that the adhesive should havea CTE as close as possible to the adherents (23 µstrain/K).
Thermal conductivity
Another weakness of the adhesive is their low thermal conductivity(typically 1 W/mK). This additional thermal resistance depends on theapplication surface and thickness of the joint, hence the adhesive itself.Once again, we cannot quantify precisely the requirement and the onlyrule is to choose an adhesive with a good thermal conductivity. Note that
Gauthier Pierlot2nd Master in Aerospace Engineering
60 University of LiègeFaculty of Applied Sciences
Academic Year 2008− 2009

3.4. Solar panels design
this property is much more important for the solar panels than for hys-teresis rods.
Toughness
During launch, the CubeSat shall sustain the dynamic load and shocksfrom the LV. However, the molecular structure of the adhesive can lead tothe crazing effect which is a micro-weakening of the mechanical proper-ties. This can result in a failure of the adhesive.
Several modifications of the molecular structure exist to minimizedthis problem. In particular, the addition of micro rubber balls helps toabsorb much better the shocks and gives better properties. These adhesivesare then called ”tough´´.
3.4.6.3 Adhesives proposed
According to (23), adhesives are usually limited to epoxy-based, poly-imide and silicone. The principal characteristics of each one are shown inTable 3.8
Figure 3.8 – General characteristics and properties of adhesives. Courtesy (23)
Among several drawbacks, polyimide adhesives bring a rigidity thatwill be dangerous during vibration testing and a high cure temperaturethat would be critical to the electronic components. So, only the character-istics of the epoxy and silicones adhesives will be studied.
Epoxy
Epoxy is probably the most widespread adhesive used in spatial tech-nology, especially for metals and composite bonding. As a matter of fact,it presents several advantages such as :
1. a wide range of mechanical properties;
2. low shrinkage during bonding process;
3. good adhesion to many different substrate;
4. no by-product creating during cure;
Gauthier Pierlot2nd Master in Aerospace Engineering
61 University of LiègeFaculty of Applied Sciences
Academic Year 2008− 2009

3.4. Solar panels design
Moreover, elastomeric modifiers are often added to improve peelstrength as well as moisture resistance. These new varieties are formu-lated to be tougher, i.e. having improved impact resistance and higherfracture surface energies. These particular properties are very importantbecause the adhesive has to be flexible to resist in vibration. Thus, highshear strength can be combined with a flexible behaviour to enforce struc-tural integrity during launch. Cure temperature is an other advantage ofthe epoxy bonding : it can generally range from room temperature up to175◦, depending on the form.
Weak point of epoxy adhesives is that they can become brittle due tothe thermal cycling which is particularly important in LEO. Finally, theepoxy bond will not be subject to very hot/wet conditions. An exampleof typical spatial epoxy adhesive is the Epo-Tek 930 (21) and Epo-Tek H74(66).
Silicones
Silicones are synthetic polymers with a wide range of properties. Theirspecial molecular structures allow an unusual combination of organic andinorganic chemical properties. Among several properties, we can find :
1. A wide range of viscosities;
2. very good temperature resistance;
3. ability to withstand high temperatures for long periods, up to 200◦C;
4. resistance to UV and IR radiation;
5. resistance to oxydation.
Likewise epoxy adhesives, silicones can be classified as structural ad-hesive, even if their mechanical properties are less marked. Then, theyare widely used in so called ’soft-structural applications’ where adhesivestrength is needed to maintain component integrity or where flexibilityis necessary to accommodate strains or vibrations. An example of a ’soft-structural’ application is assembly of solar cells. CSL provides siliconesadhesives RTV-142, RTV-615 and RTV-651.
Discussion
Epoxy adhesives can be used to bond the solar panels on the mainstructure as they have high mechanical properties, but they need to betough to ensure the structural reliability during launch and thermallyconductive to keep the benefit of the aluminum panels’ properties. Thehysteresis rods could be bonded with a silicone which can facilitate thebonding process.
We have seen that is quite difficult to select a particular adhesive forspace use regarding all the problems that could occur. In particular, theCSL recommends to test the adhesives under vibrations to assess their
Gauthier Pierlot2nd Master in Aerospace Engineering
62 University of LiègeFaculty of Applied Sciences
Academic Year 2008− 2009

3.5. Batteries’ PCB
structural behavior. Then, the first interesting test could be a random qual-ification testing with an epoxy adhesive bonding of the top solar panel onthe CSK structure.
Another severe drawback of the use of adhesives is that they compli-cates strongly the integration process and that the disintegration is notpossible once in place. Indeed, the use of conventional solar panels clipscould damage the solar cells structure (see requirement STRU-6-INTER-3). A possibility could be a composite solution with an adhesive bondingof the upper and lower solar panels and the mechanical fastening of theside panels thanks to home made clips.
3.5 Batteries’ PCB
At this point, it is worth recalling a particular requirement from theChapter 2 :
• STRU-3-ENV-3: Batteries’ PCB shall be thermally insulated from theelectronic cards.
This section intends to verify this requirement. First, the batteries’ PCBdesign will be briefly presented while its requirements will be defined.After that, a material will be selected.
3.5.1 Assembly design
The sixth PCB is directly drawn one’s inspiration from Pumpkin’sPC − 104 stacking (Figure 3.9). Four screws provide the flexural rigiditybehavior, 4 spacers separate the EPS2 from the PCB and 4 ”self-stopping´´nuts ensure the reliability of the assembly. Screws and nuts are chosen inM3 format because they constitute compromise for the structural reliabil-ity while being a compact solution.
Figure 3.9 – Sixth PCB details
Gauthier Pierlot2nd Master in Aerospace Engineering
63 University of LiègeFaculty of Applied Sciences
Academic Year 2008− 2009

3.5. Batteries’ PCB
Mechanical purpose
Batteries are one of the heaviest components inside OUFTI − 1, anddynamic loading could be a problem if a resonance appears during Vega’slaunch. Then, the general requirement can be stated :
• STRU-1-LR-2: the batteries assembly shall be a reliable mechanicalassembly during launch.
And it can be defined more precisely :
• STRU-1-LR-2-DES-1: the screws, spacers and nuts shall be rigid.
• STRU-1-LR-2-DES-2: the screws, spacers and nuts shall be resistant.
• STRU-1-LR-2-DES-3: the screws, spacers and nuts shall have atoughness of at least 25 MPa.m0,5.
STRU-3-ENV-3
Space vacuum suppresses the convection from the heat equation andthe most important remaining process is the conduction. Then, the ther-mal conductivity between the EPS2 and batteries’ PCB will be as low aspossible. However, and to define a requirement, we can limit this value to10 W/m.K. If this value leads to problematic heat transfer with the simu-lation (35), thermal washers can be added to the assembly.
• STRU-3-ENV-3-DES-1: the screws, spacers and nuts shall have ther-mal conductivity less than 10 W/m.K.
3.5.2 Material selection
An additional requirement is necessary. Indeed, all along the previousdevelopments, we assumed that the final product, i.e. the screws, spac-ers and washers, were already available. However, it is important to takethis point during the material selection to avoid any exotic solutions as”concrete screw´´.
• STRU-1-LR-2-DES-1-DES-1: the material selected shall allow themanufacturing of screws, spacers and nuts.
The objective is to minimize the mass. Actually, it is not incompatiblewith the KISS philosophy as the material has to be found in the formof final product e.i. screws and nuts, what take into account the cheapproduct’s feature. This criterion will lead to a high performance solution,reliable from a mechanical point of view.
Once again, primary constraints can be taken as rigidity and strength.As the primal function is to ensure the assembly’s mechanical reliability,these criterion seem to be the most suitable.
Finally, the functional limitations can be defined in table 3.8. The lowertemperature is a bit different than from the solar panels (35) : the centerof the satellite will be warmer and reach −20◦C. The upper limit is set bythe EPS1 transistor that can reach 90◦.
Gauthier Pierlot2nd Master in Aerospace Engineering
64 University of LiègeFaculty of Applied Sciences
Academic Year 2008− 2009

3.5. Batteries’ PCB
Property Range/valueToughness 25 MPa.m0,5
Temperature [0◦C− 80◦C]Thermal conduction ≤ 10 W/m.K
Table 3.8 – Batteries PCB’s screws, nuts and spacers operating limits
Beam, stiffness-limited design at minimum mass Mrigidity = E1/2
ρ
Beam plate, strength-limited design at minimum mass Mresistance =σ2/3
y0ρ
The performance index can be found in reference (3). Screws can beviewed like beams with free section area, so :
Results from these definitions are presented in Figure 3.10 and 3.11.
Figure 3.10 – Design at minimum mass, rigidity
Titanium seems to be the best solution, both from a mechanical andthermal point of view. Titanium has good space experience and good cor-rosion resistance while having useful combination of low density and highstrength. Moreover, it does not require a protection in space environment.
Gauthier Pierlot2nd Master in Aerospace Engineering
65 University of LiègeFaculty of Applied Sciences
Academic Year 2008− 2009

3.5. Batteries’ PCB
Figure 3.11 – Design at minimum mass, strength
Gauthier Pierlot2nd Master in Aerospace Engineering
66 University of LiègeFaculty of Applied Sciences
Academic Year 2008− 2009

3.6. Finite element analysis
3.5.3 Validation
The result directly ensures the three structural requirements and thethermal conductivity. Moreover, a complete set of screws and end productmade of this material is available. As recommended by ESA, a Ti 6Al 4Vor more commonly Ti grade 5, will be used for screws, spacers and nuts.In this way, our 5 requirements are fully satisfied.
3.6 Finite element analysis
3.6.1 Introduction
The finite element analysis (FEA) is a powerful mathematical tool tostudy many problems in mechanical engineering. This method modelsand simplifies the real problem in order to obtain its structural features. Itsmain purpose is to facilitate the structural analysis by limiting the model-ing’s efforts. All the simulations proposed will be performed with Samcefand Samcef Field (69), a Finite Element Software made in Liège.
The main purpose of these FEA is the study of the structural behaviorof OUFTI − 1 aboard Vega Maiden Flight. This section investigates firstthe static loading case and the modal analysis. The structural integrity ofthe batteries’ PCB will be investigated and finally, a harmonic responsecalculation will be presented. The detailed model description will be donebefore each analysis as well as the different loading cases.
3.6.2 Static analysis
As described in reference (7), the spacecraft is subjected to quasi-staticloads during flight. This study’s aim is to define weither the main struc-tural parts are able to withstand the steady state acceleration and to cal-culate the factor and margin of safety.
Loading
Reference (56) defines the current CubeSats accommodation on thelauncher as represented in Figure 3.12. P-Pods are lay down horizontallyon the launcher’s interface and are mounted radially.
The maximal quasi-static acceleration is 6, 3 g along the launcher’s lon-gitudinal axis, during the lift-off. The maximal lateral acceleration is dueto the dynamic pressure and is 1, 2 g along the lateral axis. With a FOS(Factor Of Safety) of 1, 8, these accelerations become 11, 5 g and 2, 25 grespectively.
As lateral loads may act in any direction simultaneously with longitu-dinal loads, the structural model uses 3 static accelerations in the 3 spa-tial directions. Among various combination of static loads, two particularcases will be simulated :
1. CubeSat’s axis X represents the launcher’s longitudinal axis while Yand Z represent the lateral axis. (noted ”case 1´´).
Gauthier Pierlot2nd Master in Aerospace Engineering
67 University of LiègeFaculty of Applied Sciences
Academic Year 2008− 2009

3.6. Finite element analysis
Figure 3.12 – P-Pods configuration inside Vega
2. CubeSat’s axis Y represents the launcher’s longitudinal axis while Xand Z represent the lateral axis. (noted ”case 2´´).
These simulations are representative of real conditions as the P-Podis always in the horizontal position. The worst lateral case is defined inFigure 3.13. The CubeSat in position 1 undergoes the launcher’s longitu-dinal acceleration on X in case 1 and on Y in case 2. Along the P-Podaxis, CubeSat in position 1 shall support not only its own weight but alsothe weight of the 2 overlying picosatellites. The associated lateral forces isthen 2 x 1(kg) x 2, 25(g) x 9, 81 = 44, 15 N rounded to 45 N.
Figure 3.13 – Worst lateral case
Then, the worst case 1 and 2 can be summarized as :
1. Case 1 simulates an acceleration of 11, 5 g along X, 2, 25 g for bothY and Z. Four additional forces of 45
4 = 11, 25 N are placed on the 4base plate’s feet.
2. Case 2 simulates an acceleration of 11, 5 g along Y, 2, 25 g for bothX and Z. Four additional forces of 45
4 = 11, 25 N are placed on the 4base plate’s feet.
Gauthier Pierlot2nd Master in Aerospace Engineering
68 University of LiègeFaculty of Applied Sciences
Academic Year 2008− 2009

3.6. Finite element analysis
Note that an additional security is defined in both cases : the lateralacceleration resultant applied to the whole model is
√2 · 2, 25 = 3, 2 g
instead of only 2, 25 g. Moreover, the aforementioned steady-state accel-erations occur during different phases of the flight, i.e. the longitudinalacceleration is maximal during the third stage acceleration while the lat-eral loads are maximum during lift-off. The resulting model is thereforeconservative.
3.6.2.1 Model
To limit the modeling efforts, only the relevant structural parts will betaken into account.
All CSK structural parts are modeled using shells components. Thelow thickness of the plates (1, 52 mm) and the chassis (1, 27 mm), are neg-ligible with respect to the other dimensions (100 mm). Material propertiesof the Al − 5052 H32 is obtained via CES.
The deployment switch and all others geometrical prominent shapesare neglected in this analysis whereas linear structural behavior is as-sumed. The endless screws are used as stainless steel beams of an average2, 5 mm diameter with 8 cm length.
The electronic cards are modeled as shells (1, 6 mm thick). Accordingto reference (65), a typical modeling simplification consists of neglectingthe geometry of electronic components but by smearing their propertieson the shell representing the PCB. Then, a global mass smearing is usedby distributing the whole mass on the entire area of PCB. The PCBs areassumed to be isotropic with a Young’s modulus of 18, 5 GPa (66). The4 titanium screws of the batteries’ PCB are modeled as beams of 2, 5 mmdiameter. The stiffening effect of spacers are neglected but their mass areused.
The connections between the elements are considered as extremelyrigid. In reality, the pieces will be bolted and glued together resultingin extremely rigid unions validating this assumption.
The mounting of a CubeSat within the P-Pod is detailled in reference(10). Then, the boundaries conditions within the P-Pod are taken as fol-low :
• The 4 end plate’s feet are clamped to simulate the effect of the topand bottom panel on OUFTI − 1 feet.
• The 4 corner are locked on a line to simulate the rails.
3.6.2.2 Results
The main results are summarized in table 3.9. Figure 3.14 presents thedisplacements in the first case. The structure is pushed as a rigid body ina parallel direction to the P-POD while both upper and lower plated aredeformed at the feet location. The maximum displacement occurs on the
Gauthier Pierlot2nd Master in Aerospace Engineering
69 University of LiègeFaculty of Applied Sciences
Academic Year 2008− 2009

3.6. Finite element analysis
Loading Max. displacements (mm) Max. Von-Mises stress (MPa)X case 0, 053 9Y case 0, 052 8, 99
Table 3.9 – Static FEA results
base plate, at the forces’ application points. It has a value of 0, 053 mm.The second case presents the same results. This can be explained with theglobal symmetry of the CSK structure.
The maximal Von Mises stress appears on the CSK end plate, at thejoint with the chassis (Figure 3.15). The maximal equivalent stress on thebeams are only around 5 MPa as they are less loaded.
Figure 3.14 – Displacements on the structure;
According to the reference (20), we can define the margin of safety(MOS) :
MOS =allowableload
appliedload x FOS− 1 (3.7)
With a yield stress of 150 MPa and a FOS of 1, 8, the MOS in X and Ycase is 8, 26 in both cases. This means that OUFTI − 1 can support a load8, 26 times higher before entering the plastic zone.
Gauthier Pierlot2nd Master in Aerospace Engineering
70 University of LiègeFaculty of Applied Sciences
Academic Year 2008− 2009

3.6. Finite element analysis
Figure 3.15 – Maximal Von Mises stress on the structure
Gauthier Pierlot2nd Master in Aerospace Engineering
71 University of LiègeFaculty of Applied Sciences
Academic Year 2008− 2009

3.6. Finite element analysis
3.6.3 Modal analysis
On the long-term, the FE modal analysis intends to forecast the dy-namic behavior of OUFTI − 1 flight model. In so far as this is the firststeps of the modeling, only the Pumpkin’s structure will be considered inthis section and a complete modal survey will be presented on the samestructure, in the next chapter.
3.6.3.1 Model
The model is similar to the static model but the electronic cards and theendless screws are not considered. In particular, components such as thedeployment switch or the stainless steel ringlets on−X are not considered.It will be seen later that these components have a significant effect on themodal behavior.
No boundaries conditions are applied and a linear structural behavioris assumed. Damping is not considered in the FEM.
3.6.3.2 Results
6 modes are included in the modal basis under 1000 Hz. First numeri-cal results are shown in table 3.10.
Mode Punctual connection (Hz)1 522,62 5913 604,34 643,25 709,56 796
Table 3.10 – Modal parameters under 1000 Hz
The first frequency comes around 530 Hz while the 3 next are closerand range from 590 to 670 Hz. Fifth frequency comes near 715 Hz and thelast is situated not far from 800 Hz.
The CSK structure presents 2 typical modes :
1. Under 1000 Hz, each mode involves a vibration in phase of thepanel’s arms.
2. Above 1200 Hz, these vibrations change in a more complex defor-mation and the arms can vibrate out of phase.
Both kind of vibrations are shown in Figure 3.16.First 6 modes can be briefly described with the panels involved in the
vibration as well as their phases. The denomination ”in phase´´ means thatthe panels engaged in the description are getting closer or moving awayof the geometric center in the same time.
Mode 1 : 522 Hz
Gauthier Pierlot2nd Master in Aerospace Engineering
72 University of LiègeFaculty of Applied Sciences
Academic Year 2008− 2009

3.6. Finite element analysis
Figure 3.16 – Typical vibration of the CSK structure’s panels
The first mode is characterized by the oscillations in phase of +/ −Y while +X is out of phase compared to them. −X has only a slightdeformation.
Mode 2 : 591 HzThe second mode is quite similar to the first one. +/ − Y are out of
phase while +X is in phase with +Y, but with less intensity. Others panelsremain almost fixed.
Mode 3 : 604, 3 HzThe third mode presents oscillations in phase of +/−Y and +X. +/−
Z panels vibrate with a very slight deformation.
Mode 4 : 643, 2 HzThe fourth mode has dominant oscillations on +/ − X but out of
phase. +/− Z are in phase and have vibrations quite important.
Mode 5 : 696, 3 HzThe mode 5 has a local vibration of the panel +Z while the other faces
remain almost fixed.
Mode 6 : 808, 8 HzThe last mode is also characterized by a local vibration of the −Z face,
with a slight deformation of −X.
All these modes are represented in Figures 3.17, 3.18 and 3.19. It isquite interesting for the experimental free-free modal survey to under-stand that these modes are always localized on the faces’ center and thatthe feet are fixed.
3.6.4 Batteries PCB model
An important issue concerns the height of the batteries’ PCB. Indeed,its structural deflection could lead to a collision between the batteries andelectronic devices on EPS1 or EPS2.
The main purpose of this section is to develop a dynamic analysis ofthe batteries’ subassembly to determine the batteries’ displacement along
Gauthier Pierlot2nd Master in Aerospace Engineering
73 University of LiègeFaculty of Applied Sciences
Academic Year 2008− 2009

3.6. Finite element analysis
Figure 3.17 – Left plot : first mode of vibration; right plot : second mode
Figure 3.18 – Left plot : third mode of vibration; right plot : fourth mode
Figure 3.19 – Left plot : fifth mode of vibration; right plot : sixth mode
Gauthier Pierlot2nd Master in Aerospace Engineering
74 University of LiègeFaculty of Applied Sciences
Academic Year 2008− 2009

3.6. Finite element analysis
Z axis. The results should ensure that they will not touch or damage anyelectrical components on both EPS.
3.6.4.1 Model
As this study has been done during preliminary design, only a firstapproach to the problem will be presented. It follows the PCB’s modelingtechniques described in reference (65) by using a global distribution ofmass over the entire PCB.
The model is constituted of 6 parts : the EPS2’s PCB, the batteries’ PCBand the 4 screws while spacers, nuts and thermal washers are neglectedin first approach.
The distance from the batteries to the EPS1 and EPS2 are given in table3.11. The sixth PCB is situated in a middle position between the highestcomponent above EPS1 (4 mm) and the highest component under EPS2(1 mm). The Kokam 603870H represents the worst case with its greatestexternal dimensions.
Batteries Above EPS1 Under EPS2Kokam 603870H 6,9 3,4Kokam 554374H 8 4,5
Table 3.11 – Distance from batteries to EPS1 and EPS2
The screws can be modeled as titanium circular beams with a diameterof 2, 5 mm (M3). Their tips’ circumferences are connected on PCBs’ holesthanks to 8 rigid fixations, exactly as in the static analysis.
Each PCB is modeled as shells of 1, 6 mm thickness and a global masssmearing is used while the stiffness contribution of electronic devices (e.g.soldered joint, adhesive) is neglected. This technique has been chosen forits better accuracy during preliminary study and because it gives a con-servative model.
In particular :
1. EPS2 card weights 64 gr and has 83, 65 cm2 of area. So, ρ =4480 kg/m3 and is rounded to 4500.
2. Batteries and their PCB weight 113 gr, with an area of 47, 5 cm2 andthen ρ = 14860 kg/m3, rounded to 15000 kg/m3.
As explained in the static analysis, the PCBs are assumed to beisotropic with a Young’s modulus of 18, 5 GPa (66). This approximationis sufficient in a first approach even if, in reality, the PCBs are made ofcomposite material and present a significant amount of anisotropy.
According to reference (58), a modal damping of 2% is a quite repre-sentative value for a PCB because there exists a strong friction between
Gauthier Pierlot2nd Master in Aerospace Engineering
75 University of LiègeFaculty of Applied Sciences
Academic Year 2008− 2009

3.6. Finite element analysis
the composite’s layers. As this parameter strongly conditions the struc-tural deflection, only 1% will be included in the model to keep a securitymargin of 1%.
Finally, the connection to the endless screw can be modeled as fixedin the 3 spatial directions. The rotational stiffness exists but cannot bemeasured with a high degree of confidence in a preliminary design. Thus,the rotational degree of freedom are let free which will give a structuraldeflection overestimated.
3.6.4.2 Loading
Even if the only test requested is the random vibrations, it can be in-teresting to simulate the worst case in structural dynamic : the harmonicresponse of the structure.
The harmonic response analysis allows to predict and verify whetherthe proposed design will successfully resist harmful effects of forced vi-brations such as the resonance. This study is much more reassuring thanthe random vibration due to the steady-state effect of vibrations and itsconstant dynamic amplification.
Therefore, a sinusoidal load is considered. Its frequency sweeps withinthe range of the random spectrum, [20− 2000]Hz, and all the eigenfre-quencies which lie within the selected range are included in the calcula-tion of the forced response. Indeed, this is at the frequencies at which themodel can undergo the most severe damage.
The acceleration is defined in such a way that the harmonic analysisreflects the random vibration test. The root mean square (RMS) level ofthe qualification test, which is 14 g (1g = 9, 81 m/s2) (56), seems to be thesolution. With a FOS of 1, 25, the acceleration becomes 17, 5 g.
The worst case is defined in Z direction. Indeed, the mass of the batter-ies’ PCB reduces the first natural frequency of the assembly in Z direction.The mode shape associated to this frequency is critical because of the com-bination of a low frequency with a structural deflection along Z. Only theharmonic response in Z will then be considered.
3.6.4.3 Results
First of all, Samcef defines the modal parameters (frequency andshape) that will be used to calculate the harmonic response. As expected,the first mode presents a deflection on both PCBs along Z axis and comesat 250 Hz (see Figure 3.20).
The steady state response calculation indicates a maximal structuraldeflection of 0, 3 mm in −Z on the batteries’ PCB at 250 Hz. The structuraldeflection of EPS1 has to be taken into account. In the same conditions,it is limited under 0, 3 mm because it is lightweight than the assemblyEPS2/batteries. This leads to a higher frequency and then, to a lower dis-placement. But for the calculus, let us use 0, 3 mm in +Z.
Gauthier Pierlot2nd Master in Aerospace Engineering
76 University of LiègeFaculty of Applied Sciences
Academic Year 2008− 2009

3.7. Concluding remarks
Figure 3.20 – First mode of batteries’ PCB
The spacers between both cards (EPS1 and EPS2) can be consideredextremely rigid in their longitudinal axis : there is no relative motion be-tween EPS1/EPS2. The maximal distance between batteries and EPS1 isthen decreases of 0, 3 − (−0, 3) = 0, 6 mm at resonance. Even if a FOS of3 is used, the total displacement between the lower batteries and EPS1 is1, 8 mm. Because of there is 2, 9 mm between these latter, we can concludeon the reliability of the design.
On the other hand, the maximal Von Mises stresses are located at theconnection between EPS2 and the titanium screws. They can undergo31 MPa at the resonance (Figure 3.21), which is not a problem for thetitanium screws.
Figure 3.21 – Maximal Von mises stress on the batteries’ PCB
3.7 Concluding remarks
This chapter brings some certifications on the structural reliability ofOUFTI− 1. First, it has demonstrated the mass requirements (STRU-MR-1 and STRU-MR-2) and the inertia calculation necessary for the ADCS
Gauthier Pierlot2nd Master in Aerospace Engineering
77 University of LiègeFaculty of Applied Sciences
Academic Year 2008− 2009

3.7. Concluding remarks
(31) and MIAS (9) analysis. The solar panels’ design was established and amaterial was chosen in accordance to the environmental, design and con-figuration requirements. The panels’ thickness was also chosen to ensure 1year mission lifetime and a brief description of the adhesives requirementswas done. The batteries’ PCB was also studied to be thermally insulatefrom its environment and to withstand the launch vibration. Finally, someFEA were performed to simulate the structural behavior of OUFTI − 1during launch. The first analysis has ensured the mechanical reliabilityunder quasi-static loads while the main modal features were identified.The batteries’ PCB height was calculated to avoid any collision with bothEPS.
From this list of results, we can conclude that, at this level of develop-ment, the satellite OUFTI − 1 is a reliable solution in accordance with theconfiguration, design, environmental and launch requirements.
Gauthier Pierlot2nd Master in Aerospace Engineering
78 University of LiègeFaculty of Applied Sciences
Academic Year 2008− 2009

4Vibration testing
4.1 Introduction
The main problems associated to the previous simulations can be theirconstant simplifications which can lead to loss of important information.The results provided by the FEA could then be distorted or give a fuzzyidea of the real structural behavior.
On the contrary, the different tests available in structural dynamic al-low a complete identification of the structural’s parameters. Their purposeis to identify the real behavior of the structure and to update the mathe-matical model’s parameters.
This chapter starts with the presentation of a free-free modal sur-vey on the CSK structure. The modal FEA will then be correlated tothe modal survey with 2 different methods : Least-Squares ComplexExponential(LSCE)/Least-Squares Frequency Domain(LSFD) and IbrahimTime Domain(ITD). The model performed in the previous chapter will beupdated. After the study of the Test Pod boundary conditions, the first re-sults of the shaker random tests on the structural model of OUFTI− 1 willbe shown and discussed. Finally, the unscrewing effect will be presented.
4.2 Free-free modal survey
4.2.1 Objective
The free-free modal survey purpose is to characterize the dynamic be-havior of CSK structure and to correlate the corresponding FEM. Thisanalysis stands for the primary validation of the CSK structure. Furtherinvestigations will be performed next year and the model does not need adetailed finishing. Only the modal features under 1000 Hz will be identi-fied and correlated.
4.2.2 Experimental procedure
The CSK structure analyzed is constituted of the 3 metallic parts (i.e.the base plate, the chassis and the end plate), the deployment switch onthe base plate and the 8 feet. The tests were performed with the equipmentof ”Laboratoire d’identification des structures´´ at ULg.
79

4.2. Free-free modal survey
Three mains parameters are defined when performing a free-freemodal survey : the acquisition system, the support and the type of ex-citation. Each of them has a strong influence on the final results and cor-relation. They have to be chosen carefully.
Acquisition system
The acquisition system has to take measurements on the structurewithout disturbing it. Even if an accelerometer as light as 0, 4 gr is used,the shift in frequency can be 15 Hz and 20 Hz on the first and second fre-quency (Figure 4.1). Hopefully, the acquisition of modal parameters canbe performed using the laser transducer. Its main advantage is its abilityto take measurements with a laser beam without touch the CSK structure.However, this system restrains the allowable kind of support because itrequires an accurate pointing.
Figure 4.1 – Frequency shift due to the accelerometer
Support
The support is chosen to give a rigid body mode at a low frequencysuch that it can be distinguished from the real mode of the structure. Aspreviously mentioned, the laser restrains the different support because itneeds an accurate pointing on the structure. The structure is put downon its base plate’s feet and on a rigid plastic foam (see Figure 4.2). Aspresented in the previous modal analysis, this does not affect the mea-surements because the feet are almost situated on vibrations’ antinode.
In this configuration, only 5 of the 6 faces are accessible to the laser
Gauthier Pierlot2nd Master in Aerospace Engineering
80 University of LiègeFaculty of Applied Sciences
Academic Year 2008− 2009

4.2. Free-free modal survey
in one analysis. A complete study will be performed on +/− X, +/− Yand +Z. −Z will be measured separately to get additional information.
Figure 4.2 – CSK structure placed on the support
Excitation
The main criterion for the selection of the excitation are : simplicity, ra-pidity and inexpensive. The hammer excitation has been chosen. It short-ens the experiment’s setup and allows the study of a wide range of fre-quencies. The hammer chosen is the smallest available in the vibrationlaboratory. Its tip is made of stainless steel, a material hard enough to geta flat power spectral density (PSD) in the range [0− 1000] Hz.
It will be noted that no impact averaging has been performed. Actually,perform a series of impacts on the same point is difficult with a CubeSat.This is a small structure and any difference in the impact location has asignificant effect on the results : they are better without any average. Thefrequency sampling is 5120 Hz and the resolution 1, 25 Hz.
Ideally, the spatial and the frequency contributions are necessary toexcite a mode. However, the CubeSat response is good enough in the 3spatial directions, even if the excitation is performed in only one direction.The structure is then impacted in Z axis, on the end plate and at thebeginning of a diagonal arm (Figure 4.2).
The measurements are performed with 4 points per face, all situatedon the diagonal just before the central hole (Figure 4.2). The points ofimpact and measurements remain the same for the analysis on −Z.
Gauthier Pierlot2nd Master in Aerospace Engineering
81 University of LiègeFaculty of Applied Sciences
Academic Year 2008− 2009

4.2. Free-free modal survey
4.2.3 Results and identification
This section presents the results of experimental measurements. A briefanalysis of the frequency response function (FRF) will be carried out andthe identification with LSCE will be presented.
Frequency response function
Figure 4.3 – Sum of the FRFs on 5 faces of the CSK structure
Figures 4.3 and 4.4 represent the sum of the FRFs on the CSK struc-ture’s within [400 1000] Hz. 5 frequencies appear on +/−X, +/−Y, +Zand one additional on −Z. The table 4.1 summarizes the frequencies andcompares them to the modal FEA.
Mode Experimental (Hz) Samcef (Hz) Error (%)1 528,8 539,3 1,92 583,8 602,1 3,13 595 610,5 2,64 602,5 669 115 696,3 727,3 4,46 808,8 814,4 0,7
Table 4.1 – Frequency comparison between the experimental and numerical analysis
In order to compare the frequencies in the table, it is assumed that the
Gauthier Pierlot2nd Master in Aerospace Engineering
82 University of LiègeFaculty of Applied Sciences
Academic Year 2008− 2009

4.2. Free-free modal survey
Figure 4.4 – Sum of the FRFs on -Z face of the CSK structure
order in which the modes appear is the same for the experimental analysisand for the Samcef simulation. This hypothesis will be verified later.
From this table, it can be seen that only the fourth frequency has asignificant difference of 11% with its experimental homologous. The oth-ers frequencies show in average an error of less than 5% and no addi-tional frequency appears compared to the Samcef model. Furthermore,both experiment and modal FEA do not have any frequency between[850 − 1200] Hz.
LSCE Identification
A popular form of curve-fitting experimental data is the LSCE method.It calculates the damping and natural frequencies in the time domain bymaking use of impulse response functions (IRFs) obtained from FRFs byan inverse Fourier transform. A critical issue is the selection of the correctmodel order Oq which is related to the number of assumed degree-of-freedom. If the analyst assumes a model order higher than the one actu-ally present in the data, computational modes will result from the forcedfulfillment of the specified model order rather than from dynamic systemproperties (42). The stabilization diagram presents the solutions computedwith an increasing model order. In this way, the physical modes can thenbe easily separated from spurious modes by looking for poles which ap-
Gauthier Pierlot2nd Master in Aerospace Engineering
83 University of LiègeFaculty of Applied Sciences
Academic Year 2008− 2009

4.2. Free-free modal survey
pear at nearly identical frequencies for the different model orders consid-ered.
0 200 400 600 800 10000
1000
2000
3000
4000
5000
6000
7000
8000
9000
10000
Frequencies (Hz)
FR
Fs
sum
Stabilization diagram
Figure 4.5 – Stabilisation diagram on panel +/-X, +/-Y, +Z
The LSCE identification leads to the stabilization diagram presentedin Figure 4.5. It calculates the poles on the FRFs sum of +/ − X, +/ −Y and +Z until the order 20. The five frequencies identified during theFRF analysis are stabilized. A second stabilization diagram has also beenperformed on the FRFs sum of −Z (not represented) and the additionalpole (808 Hz) is identified. The frequencies presented in Table 4.1 are thenvalidated.
LSFD/ITD
LSCE method does not yield the modes shapes. In order to estimatethese latter, a second method called LSFD is considered and takes advan-tage of the knowledge of the natural frequencies and damping ratios (42).This method formulates the least-squares problem in the frequency do-main and leads to the modes shapes thanks to the decomposition of thefrequency response function.
Ibrahim Time Domain method is a method ables to get the modal pa-rameters (i.e. natural frequencies, damping factor and modes shapes) fromtemporal series. It considers free response time histories from the structureunder test in order to determine its modal characteristics. This methodhas been introduced to avoid problems, e.g. modal interference of closelyspaced modes, encountered using frequency domain.
In order to validate the experimental modal features and start a corre-
Gauthier Pierlot2nd Master in Aerospace Engineering
84 University of LiègeFaculty of Applied Sciences
Academic Year 2008− 2009

4.2. Free-free modal survey
lation procedure on reliable basis, a comparison between LSFD and ITDidentification has been performed.
Once the modes being defined with both methods, they can be com-pared by using the modal assurance criterion (MAC). The MAC is awidely used technique for comparing mode shapes (42). It gives quantita-tively a good idea of the closeness between two families of mode shapes :
MAC(x1, x2) = (xT
1 x2
‖x1‖ ‖x2‖)2 (4.1)
MAC values oscillate between 0 and 1, a unitary value meaning a per-fect correlation. In practice, a value greater than 0, 8 is acceptable to estab-lish the correspondence between 2 modes.
529 584.1 595.4 603.4 695.7
529.3
583.6
593.4
603.1
695.7
Crossing MAC LSFD/ITD
Natural frequencies LSFD
Nat
ural
freq
uenc
ies
ITD
0.1
0.2
0.3
0.4
0.5
0.6
0.7
0.8
0.9
0.95
0.97
0.99
0.99
0.75
Figure 4.6 – Crossing MAC matrix between LSFD and ITD results
Note that even if measurements on −Z are available, 4 points is notrepresentative of the overall structural behavior. It will not be included inthe MAC matrix. Modal parameters from LSFD and ITD are presented inFigure 4.6. Three remarks may be drawn regarding this figure :
• The natural frequencies are similar. The maximal relative error is0, 3% for the third frequency.
• The modes 1, 2, 3 and 5 have values upper or equal to 0, 95. Thisindicates a very good discrimination and a reliable modal identifica-tion.
• The concordance is less good with the mode 4 (0, 75).
Gauthier Pierlot2nd Master in Aerospace Engineering
85 University of LiègeFaculty of Applied Sciences
Academic Year 2008− 2009

4.3. Correlation
The last comment leads to the conclusion of a difficult modal identi-fication on the mode 4 as its characteristics are not well defined. A valuebetter than 0, 75 during the correlation should be difficult to discuss be-cause the lack of knowledge about its real shape. The LSFD representa-tion of mode 4 is given in Figure 4.7. The dominant deformations on −Xcould explain the bad correlation with this particular mode. Actually, −Xpresents an excrescence because it supports the data ports of communi-cations. This implies a contact on a larger area and a friction much morepronounced. The resulting mode shapes present an important complexbehavior.
−5
0
5
−5
0
5−5
0
5
Coordinates X
Mode n°4
Coordinates Y
Coo
rdin
ates
Z
Figure 4.7 – LSFD mode 4
As the FEM does not use any damping, its modes shape are real andthe approximation of the real LSFD modes shapes can lead to bad corre-lation.
With these results validation, we expect obtain a model with a meanvalue of MAC’s diagonal greater than 0, 85 and each diagonal’s terms witha value greater than 0, 8, except with mode 4.
4.3 Correlation
4.3.1 LSFD/Samcef
Figure 4.8 presents the crossing MAC between LSFD modes shapesand first Samcef model.
The modes 2 and 3 present values of 0, 96 and 0, 9. These values arerepresentative of good modeling quality. Mode 1 and 5 have a value of
Gauthier Pierlot2nd Master in Aerospace Engineering
86 University of LiègeFaculty of Applied Sciences
Academic Year 2008− 2009

4.3. Correlation
539 602 611 669 727
529
584.1
595.4
603.4
695.7
Crossing MAC SAMCEF/LSFD
Natural frequencies Samcef
Nat
ural
freq
uenc
ies
LSF
D
0.1
0.2
0.3
0.4
0.5
0.6
0.7
0.8
0.9
0.84
0.96
0.9
0.76
0.55
Figure 4.8 – Crossing MAC between LSFD results and Samcef simulation
0, 84 and 0, 76 respectively but they could be improved with additionalmodeling considerations. As expected, the mode 4 has a low value of 0, 55.
Other typical causes of bad correlation such as noisy data, presenceof non linearities and bad modal identification can be turned down as 2different modal identification have been tested. In order to get a bettermodeling, some investigations on the modeling error/uncertainties havebeen performed.
In particular, 2 improvements are considered :
1. Two types of connections between shells;
2. the addition of deployment switch and stainless steel ringlets’ masson the base plate.
4.3.2 Connections modeling
Due to the lack of knowledge about some physical parameters, severalsimplifications have been introduced in the first FEM.
Actually, a first important issue remains on the fixation’s modelingbetween chassis and plates. These connections could be considered ex-tremely rigid because we are only interested in the first vibration modes.However, the contacts between shells are not well defined. Then two lim-iting cases will be simulated :
Gauthier Pierlot2nd Master in Aerospace Engineering
87 University of LiègeFaculty of Applied Sciences
Academic Year 2008− 2009
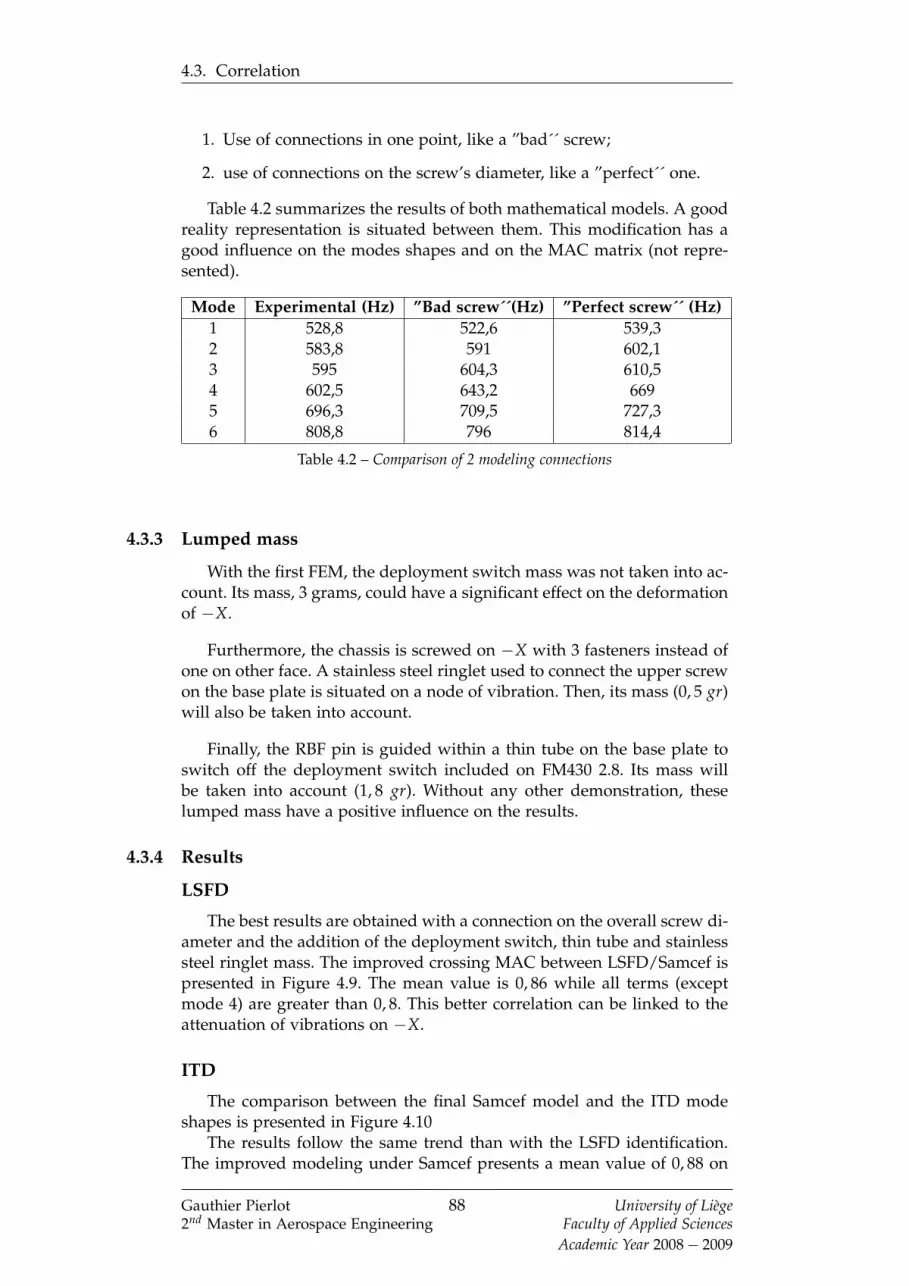
4.3. Correlation
1. Use of connections in one point, like a ”bad´´ screw;
2. use of connections on the screw’s diameter, like a ”perfect´´ one.
Table 4.2 summarizes the results of both mathematical models. A goodreality representation is situated between them. This modification has agood influence on the modes shapes and on the MAC matrix (not repre-sented).
Mode Experimental (Hz) ”Bad screw´´(Hz) ”Perfect screw´´ (Hz)1 528,8 522,6 539,32 583,8 591 602,13 595 604,3 610,54 602,5 643,2 6695 696,3 709,5 727,36 808,8 796 814,4
Table 4.2 – Comparison of 2 modeling connections
4.3.3 Lumped mass
With the first FEM, the deployment switch mass was not taken into ac-count. Its mass, 3 grams, could have a significant effect on the deformationof −X.
Furthermore, the chassis is screwed on −X with 3 fasteners instead ofone on other face. A stainless steel ringlet used to connect the upper screwon the base plate is situated on a node of vibration. Then, its mass (0, 5 gr)will also be taken into account.
Finally, the RBF pin is guided within a thin tube on the base plate toswitch off the deployment switch included on FM430 2.8. Its mass willbe taken into account (1, 8 gr). Without any other demonstration, theselumped mass have a positive influence on the results.
4.3.4 Results
LSFD
The best results are obtained with a connection on the overall screw di-ameter and the addition of the deployment switch, thin tube and stainlesssteel ringlet mass. The improved crossing MAC between LSFD/Samcef ispresented in Figure 4.9. The mean value is 0, 86 while all terms (exceptmode 4) are greater than 0, 8. This better correlation can be linked to theattenuation of vibrations on −X.
ITD
The comparison between the final Samcef model and the ITD modeshapes is presented in Figure 4.10
The results follow the same trend than with the LSFD identification.The improved modeling under Samcef presents a mean value of 0, 88 on
Gauthier Pierlot2nd Master in Aerospace Engineering
88 University of LiègeFaculty of Applied Sciences
Academic Year 2008− 2009

4.3. Correlation
529 584.1 595.4 603.4 695.7
539
602
611
669
727
Natural frequencies LSFD
Crossing MAC LSFD/Samcef
Nat
ural
freq
uenc
ies
Sam
cef
0.1
0.2
0.3
0.4
0.5
0.6
0.7
0.8
0.9
0.8
0.94
0.9
0.77
0.9
Figure 4.9 – Crossing MAC between LSFD identification and Samcef modelingimproved
529.3 583.6 593.4 603.1 695.7
539
602
611
669
727
Crossing MAC ITD/Samcef improved
Natural frequencies (ITD)
Nat
ural
freq
uenc
ies
(Sam
cef)
0.1
0.2
0.3
0.4
0.5
0.6
0.7
0.8
0.9
0,9
0,95
0,88
0,75
0,93
Figure 4.10 – Crossing MAC between ITD identification and Samcef modelingimproved
Gauthier Pierlot2nd Master in Aerospace Engineering
89 University of LiègeFaculty of Applied Sciences
Academic Year 2008− 2009

4.4. Shaker testing
the diagonal while all terms are greater or equal to 0, 88. Only the mode 4remains under 0, 8.
Summary
We have seen that 6 frequencies were identified but only the 5 firstmodes were investigated. The modal identification performed with bothLSCE/LSFD and ITD methods concludes to the same results exceptedwith the mode 4. This bad correlation has been explained as a greaterdeformation on −X which cannot be easily discriminated. The modal cor-relation between the improved FE modeling and the LSFD/ITD resultshas shown good results.
On the basis of those results, we can validate our model.
4.4 Shaker testing
4.4.1 Objective
This section presents the first sine sweep and random tests performedon a structural model (SM) of OUFTI − 1. The main purpose is to obtaininformation concerning the behavior of the electronic cards under harshlaunch’s vibrations.
More precisely, those tests intend to :
1. Analyze the influence of the boundary conditions introduced by theequipment, and more particularly, the effects of the integration in-side the test pod.
2. Measure the vibrations’ level on the electronic cards and the effectsof the components’ type used on it.
3. Analyze the unscrewing effect and its impact on vibration analysis.
On basis of the results, several guidelines could be drawn to productthe final electronic cards.
Firstly, the SM will be described in details and the differences with theflight model will be highlighted. The procedure and setup used duringtests will be described. The equipment, i.e. shaker, test pod and interface,will be briefly presented to give a technical background. Finally, the resultswill be presented, discussed and some guidelines to design the electroniccards will be proposed.
4.4.2 Structural model
The SM is constituted of :
1. The CSK structure that is identical to the flight model.
2. Four electronic cards that come from computer’s motherboards cutto the PC-104 external dimensions.
Gauthier Pierlot2nd Master in Aerospace Engineering
90 University of LiègeFaculty of Applied Sciences
Academic Year 2008− 2009

4.4. Shaker testing
3. One flight model of the electronic card (ECFM) with its PC-104 con-nector.
4. The endless screw, the spacers and the midplane standoffs to connectthe electronic cards to the structure.
All the electronic cards are connected like the current flight systemconfiguration (see Figure 2.20) and the ECFM is placed in third position,i.e. it simulates the EPS1, as represented in Figure 4.11.
Figure 4.11 – Mechanical engineering model tested
Compared to the complete flight model, the SM does not integrate thebatteries and their PCB, rods and permanent magnet, solar panels andantennas’ deployment mechanism. Furthermore, the motherboards do notintegrate the PC-104 connector.
4.4.3 Equipment
Test-pod
According to the Test-Pod User’s Guide (10), the Test-Pod representedin Figure 4.12 is to be used by CubeSat developers as an environmentalsimulation of the P-POD deployer. The Test-Pod interior is designed tosimulate the environment inside the P-POD deployer. It allows CubeSatdevelopers to test their satellites to the environment inside the P-PODdeployer rather than designing to the launch vehicle loads.
The mounting procedure and technical data related to its own vibra-tion frequency are also referenced the User’s Guide (10).
Gauthier Pierlot2nd Master in Aerospace Engineering
91 University of LiègeFaculty of Applied Sciences
Academic Year 2008− 2009

4.4. Shaker testing
Figure 4.12 – Test-Pod
Shaker
The tests will be performed on a shaker G&W 26 kN belonging to theUniversity of Liège. Its main technical characteristics are summarized inTable 4.3.
Properties Value UnitFrequency range [5 2000] Hz
Maximum peak force 26,6 kNMaximum RMS force 26,6 kNMaximum shock force 53,4 (6ms)/42,4(11ms) kN
Maximum acceleration (shaker) 40 gMaximum acceleration (shaker + table) 23,3 g
Maximum velocity 1,52 m/sMaximum displacement 25,4 mm
Moving mass 68,1 kgTable mass 48,2 kg
Admissible mass 500 kg
Table 4.3 – Main properties of the shaker 26 kN; Courtesy (50)
Interface
The shaker’s vibration table needs a suitable interface to connect theTest-Pod. According to reference (78), this interface has to answer to sometechnical criterion :
1. Support will simulate as close as possible the boundary conditions
Gauthier Pierlot2nd Master in Aerospace Engineering
92 University of LiègeFaculty of Applied Sciences
Academic Year 2008− 2009

4.4. Shaker testing
of the ARES interface. At the moment, the latest conditions are givenin the ICD (56).
2. The modal deformation of the support will not influence the tests.A rule of good practice (78) is to have a first vibration frequency 1, 5time higher than highest test frequency(2000 Hz).
3. Shaker must be able to provide the power to the test and the supportwill be as lightweight as possible.
4. The interface shall be usable on the G&W 26 kN, Ling 80 kN andLing 88 kN at CSL.
5. The interface shall be reusable.
The shaker’s interface is designed using the technical references (36),(17) and (10). The result is presented in Figure 4.13.
Figure 4.13 – Interface between Test-Pod and shaker
This support is representative of the mounting condition on the LARES(see Figure 3.12) and is designed to be used on the 3 shakers. The modalFEM shows a lower frequency of 6800 Hz, which is at 3, 4 times higherthan 2000 Hz.
It weights 3, 2 kg and is made of aluminum Al− Si− 1, a light, machin-able and easily available material. A common formula used to assess theacceleration available on a shaker is based on the Newton’s second law :
a =Maximum f orce
Mtotal(4.2)
According to the Table 4.3 on which the preliminary tests will be per-formed, one has :
Gauthier Pierlot2nd Master in Aerospace Engineering
93 University of LiègeFaculty of Applied Sciences
Academic Year 2008− 2009

4.4. Shaker testing
a =Maximum f orce
Mmobile + Mtable + Minter f ace + MTest−Pod + MCubeSat= 212, 6 m/s2
(4.3)As the G&W is the less powerful of the 3 shakers, we conclude that
the equipment is suitable. Finally, note that this support has been testedbefore first shaker’s run.
4.4.4 Tests
4.4.4.1 Boundaries conditions within Test-Pod
Procedure
As represented in Figure 4.14, the CubeSat’s corners are guided byTest-Pod’s rails. The pusher plate is then screwed on to place the springplungers in contact with the top plate.
This test intends to perform a sensitive analysis of the height H. It hasto be calculated as described in the Test-Pod user’s guide. The influenceof this height can be transformed in equivalent torque on the fasteners :
1. They are tighten using hands. There is no control on the torque(Noted case 1).
2. They are torqued in an alternating pattern to 1, 5 Nm thanks to a dy-namometer (value prescribed in the Test-Pod user guide (10), notedcase 2).
3. They are torqued in an alternating pattern to 2, 5 Nm (Noted case 3).
About 1/2 screw’s turn differentiates the first and the third case.
An accelerometer is placed on the ECFM using wax. The FRFs will beidentified with a sine sweep 0, 5 g, along CubeSat’s Z axis. The sweep rateis 2 octaves/min, within the frequency range [20 2000] Hz.
Results
Figure 4.15 represents the 3 different cases. Under 500 Hz, the 3 condi-tions are equivalent. Above this frequency, the first case (continuous line)begins to diverge significantly while the 2 others remain similar. It can benoted that it exists slight differences between 1, 5 Nm and 2, 5 Nm torquesat higher frequencies, even if the curves follow the same trend.
Two conclusions can be drawn :
1. The hand tightening does not give relevant boundary conditions andshall never be used to test the satellite under ”real´´ integration con-ditions.
2. The boundary conditions ensured with a torque of 1, 5 or 2, 5 Nmpresent the same results.
Gauthier Pierlot2nd Master in Aerospace Engineering
94 University of LiègeFaculty of Applied Sciences
Academic Year 2008− 2009

4.4. Shaker testing
Figure 4.14 – CubeSat integrated within the Test-Pod
Figure 4.15 – Integration with different couple on the screws
Gauthier Pierlot2nd Master in Aerospace Engineering
95 University of LiègeFaculty of Applied Sciences
Academic Year 2008− 2009

4.4. Shaker testing
Moreover, the first case is submitted to another problem : the unscrew-ing effect. This one will be studied later. To avoid any unscrewing or ex-cessive compression of spring plungers, the torque will be set to 1, 5 Nmduring all the following tests.
4.4.4.2 Random test
Procedure
Random vibration analysis focuses on determining the statistics re-sponse of an oscillator or structure to input forces that are definable onlyin terms of their statistics. The discipline of random vibration is born ofthe need to understand how structures respond to dynamic loads that aretoo complex to model deterministically.
The random vibration spectrum aboard Vega is defined in Table 4.4.It is decomposed in 3 levels of equal intensity. The lowest level rangesfrom 20 and 60 Hz. A second plateau exists between 70 and 200 while theCubeSat will undergo the most important vibrations from 300 to 700 Hz.Above this latter, the energy included in the input signal falls.
Frequency Acceptance PSD (g2/Hz) Qualification PSD (g2/Hz)20 0, 029 0, 072760 0, 029 0, 072770 0, 04 0, 1200 0, 04 0, 1300 0, 08 0, 2700 0, 08 0, 22000 0, 008 0, 02
Duration 2 minutes/axis 2, 5 minutes/axisRMS value 8, 81 13, 98
Table 4.4 – Random vibration spectrum
According to ESA’s approach (28), the random tests are performed byfollowing a particular procedure :
1. a first sine sweep of 0, 5 g, 2 octaves/min within the range[20 2000] Hz.
2. a random test based on the acceptance/qualification level of Vega(56) (8, 8 g RMS/14 g RMS).
3. a second sine sweep of 0, 5 g, 2 octaves/min within the range[20 2000] Hz.
The main purpose of this test is to analyze the accelerometer’s influ-ence on the PCB’s vibrations.
Both cases are performed in the same conditions. The SM is integratedwithin Test-Pod and the fasteners are screwed on to 1, 5 Nm. Two ac-celerometers are used :
Gauthier Pierlot2nd Master in Aerospace Engineering
96 University of LiègeFaculty of Applied Sciences
Academic Year 2008− 2009

4.4. Shaker testing
1. A micro ”PCB´´ accelerometer whose weight is 0, 4 gr (sensitivity :4, 58 mV/g).
2. a ”Dytran´´ accelerometer of 11, 7 gr (sensitivity : 10 mV/g).
They are placed at the ECFM’s center (Figure 4.16) to test their influ-ences on the PCB’s natural frequency.
Figure 4.16 – Accelerometer Dytran at the ECFM’s center
Results
2 temporal series are compared in Figure 4.17. The dotted line is asso-ciated to smallest accelerometer whereas the continuous line is associatedto the Dytran accelerometer. Both are representative of typical vibrationssamples on electronic cards at the acceptance level. Two observations canbe drawn :
1. The vibrations’ peak value range from 100 to 300 g. Note that somesamples indicate more than 400 g.
2. The peak value with the ”PCB´´ accelerometer is 2 times the peakvalue from ”Dytran´´ measurements.
Because of these levels, the electronic cards should be studied to mit-igate the vibrations’ effect on components. The next section discusses 2solutions.
Discussion
The first comment leads to particular attention on the choice of theelectronic devices and on their location on the cards. Indeed, componentssuch as quartz or connectors are sensitive to the vibration environment
Gauthier Pierlot2nd Master in Aerospace Engineering
97 University of LiègeFaculty of Applied Sciences
Academic Year 2008− 2009

4.4. Shaker testing
Figure 4.17 – Temporal series during acceptance test
Gauthier Pierlot2nd Master in Aerospace Engineering
98 University of LiègeFaculty of Applied Sciences
Academic Year 2008− 2009

4.4. Shaker testing
because their technology involves fragile material or fixations on the cards.At least 4 means exist to mitigate the vibration effects :
• Electronic components can be chosen in the ”automotive´´ category.These components are designed to resist to harsh vibration environ-ment in mechanical industry (e.g. on motors controlled with elec-tronics). Typically, they can support from 20 to 50 g.
• Sensitive components can be placed on locally stiffened area to limitthe dynamic amplification of the cards and ensure a maximal rigid-ity. For instance, the connectors on our electronic cards (Figure 2.21)are located near the endless screw, where the card is fixed.
• In addition to the soldering or brazing, the components can bebonded on the electronic cards. According to reference (2), a guide-line can be the bonding of components heavier than 3 gr (e.g. planartransformer on EPS2).
• If the dynamic amplification is too great, more complex dampingtechnology can be considered (48). For instance, the addition ofvisco-elastic ”damper´´ to the external surface of the circuit articleor the use of internal damping layer are 2 common techniques toshield electronics against harsh vibrations.
For the second comment, let us recall the main relationship of the spec-tral calculus for stationary signals :
Sxx(w) = |H(w)|2 S f f (w) (4.4)
where Sxx(w) is the output spectral density, S f f (w) the input spectraldensity and H(w) the frequency response function (16). To mitigate vibra-tions effects on electronic devices, the product in the right member has tobe reduced.
According to the equation 4.4, the Figures 4.18 and 4.19 should belinked through input spectral density defined in Table 4.4. Let us comparethis relation to our experimental results.
The sine sweep indicates that the 11, 3 grams of difference between”PCB´´ and ”Dytran´´ accelerometers induce a frequency shifting around130 Hz. The natural frequencies are 469 Hz and 333 Hz respectively. Ac-cording to Table 4.4, the input PSD is equivalent for both frequencies.
On the other hand, the ratio between output PSD is equal to 4 (Fig-ure 4.18). This difference can be explained with the frequency responsefunctions of Figure 4.19 which presents a ratio of 2 between peaks’ value.
Then, the equation 4.4 presents 2 common means to mitigate the vi-brations level on electronic cards :
1. as in the previous example, the FRF peak value can be reduced
2. the system’s natural frequencies are modified in such a way to placeits resonances within the low range of the input PSD or above700 Hz.
Gauthier Pierlot2nd Master in Aerospace Engineering
99 University of LiègeFaculty of Applied Sciences
Academic Year 2008− 2009

4.4. Shaker testing
Figure 4.18 – Comparison of output PSD with both accelerometers
Gauthier Pierlot2nd Master in Aerospace Engineering
100 University of LiègeFaculty of Applied Sciences
Academic Year 2008− 2009

4.4. Shaker testing
Figure 4.19 – FRF with both accelerometer
Gauthier Pierlot2nd Master in Aerospace Engineering
101 University of LiègeFaculty of Applied Sciences
Academic Year 2008− 2009

4.4. Shaker testing
A solution to achieve this latter comment could be to ballast the cardsif this can be allowed by the mass budget. However, one should keepin mind that the satellite shall have no resonance under a particular fre-quency, not yet defined by ICD. The dynamic amplification as a functionof mass, damping and stiffness is much more complex than a linear rela-tionship. A smart analysis should then be performed to combine the massbudget, a limited value of FRF, a lower first natural frequency in accor-dance to the previous requirements (i.g. radiations shielding) .
4.4.4.3 Unscrewing effect
Procedure
A common problem under harsh vibrations is the unscrewing effect.Actually, the screws, bolts and nuts are so shaken that they can unscrewand fall within the P-Pod.
In addition to the problems cause to the loss of stiffness on the mainstructure, these fasteners could travel and damage others fragile devices(e.g. solar cells, antennas) within the P-Pod. This effect can also interferewith a modal correlation as the structure is modified during tests. Finally,ESA requires a pass/fail criteria between first and second sine sweep anal-ysis of the previous random test : the frequency of the final resonancepeaks shall not change by more than 5%, and their amplitudes shall notchange by more than 3dB.
The purpose of this test is to defined weither the structural model ofOUFTI − 1 is subjected to the unscrewing effect.
Results
Figure 4.20 presents 2 sine sweeps conformed to the ESA approach,before and after the qualification testing (14 gRMS). A shift in frequencyof 20 Hz (5%) appears while the frequency response function decreaseswith a factor 2 (3 dB).
This effect can be associated to the unscrewing effect during vibrationtests. An example of this particular problem is the unscrewing of a mid-plane standoff during another test (Figure 4.21). If the screw is not so wellattached, the vibrations induce a relative motion between 2 parts whichleads to the progressive unscrew of fasteners. On the contrary, it shouldbe noted that unscrewing mitigates the vibrations effect as the system’sFRF decreases.
A common mean to counteract this phenomenon is to bond with asilicone adhesive the fasteners and screws on the flight model. Anothersolution consists to use a dynamometer key to obtain a controlled torqueon the chassis’ screws.
Guidelines
This section summarizes some guidelines for future vibration tests onbasis of these experiences.
Gauthier Pierlot2nd Master in Aerospace Engineering
102 University of LiègeFaculty of Applied Sciences
Academic Year 2008− 2009

4.4. Shaker testing
Figure 4.20 – Frequency shift due to the unscrewing effect
Figure 4.21 – A midplane unscrewed during the qualification testing
Gauthier Pierlot2nd Master in Aerospace Engineering
103 University of LiègeFaculty of Applied Sciences
Academic Year 2008− 2009

4.5. Concluding remarks
• The boundary conditions within Test Pod should be ensured with atorque of 1, 5 Nm on the pusher plate’s fasteners.
• All electronic devices should be chosen in the automotive category.
• All electronic devices heavier than 3 gr should be bonded in additionto the soldering or brazing.
• Sensitive components should be located near stiffened areas. How-ever, and if the components are also sensitive to the radiations, acompromise between its radiation shielding (i.e. on the center nearthe batteries) and the vibrations mitigations should be used. A par-ticular case could be to shield locally the components against radia-tions.
• Electronic cards’ damping should be considered in the worst cases.
• If possible, electronic cards should be stiffened or ballast, in accor-dance with the mass budget and the frequencies’ requirements.
• The screws and all the assembly mechanically attached should betorqued with a dynamometer key, especially if user expects a corre-lation under harsh vibration environment.
• The screws and all the assembly mechanically attached should bebonded on the flight model.
4.5 Concluding remarks
This chapter has presented the modal identification of the CSK struc-ture. The experimental procedure was explained and the results discussed.Two methods were used to identified the modal parameters. A correlationwas then investigated and a final model that respect our objectives wasproposed.
The first vibrations tests with a structural model were performed. Theboundary conditions within the Test Pod were studied and a rule concern-ing the pusher plate’s fasteners was formulated. The structural model hasbeen tested under random vibrations and some guidelines were drawn tothe future layout of electronics cards. Finally, the unscrewing effect wasstudied and basic precautions were stated.
Gauthier Pierlot2nd Master in Aerospace Engineering
104 University of LiègeFaculty of Applied Sciences
Academic Year 2008− 2009

5Conclusions
This master thesis developed the structural analysis and flight systemconfiguration of OUFTI − 1. The objective was to design a suitable andreliable mechanical structure, in accordance with typical requirements andfunctions of a satellite in orbit. This section discusses the results and theproject in general.
5.1 Summary of the accomplished work
The first part of this work constituted a presentation of the CubeSatstandard and general requirements associated to this definition. The struc-tural part’s functions were drawn. A basic list of requirements were thengiven to respect our objectives.
Chapter 2 presented both mechanical and electrical components aswell as their functions. The technical constraints concerning the flightsystem configuration were given, and the strong effect of environmen-tal requirements on the overall design was highlighted. A configurationconforms to these constraints was developed and discussed.
Chapter 3 developed an accurate mass budget and demonstrated thefulfillment of the mass requirement. Inertia and center of gravity wereassessed to provide reliable information to ADCS and MIAS subsystems.The complete solar panels design was performed in accordance to thedesign requirements. A particular material, the aluminum, was chosen toensure the structural reliability and the fulfillment of the environmentalconstraints (e.g. thermal, radiative). The panels’ thickness was defined toshield the spacecraft equipment during 1 year.
Then, first finite element analyses were performed to ensure the struc-tural requirements during launch. In particular, the batteries’ PCB wasstudied to sustain the dynamic loads and protect the electronic compo-nents on both EPS. A static case and a modal analysis were also performed.
Finally, the chapter 4 presented the modal survey of the CSK structureand its correlation to the modal analysis. Preliminary vibration tests wereperformed and some guidelines to the future electronic cards layout werestated.
At this point of the project, the structural subsystem fulfills all thedefined objectives. Indeed, the environmental constraints, the design andmass requirements as well as the structural integrity are ensured throughthis work. The future work could then be developed on this basis.
105

5.2. Perspectives
5.2 Perspectives
This section intends to give some guidelines to the future work on thestructural subsystem. Chapter after chapter, problems are highlighted inaccordance to the future project’s developments.
Concerning the flight system configuration, the next problem will bethe complete analysis of the EMC with the cards. They should be verifiedin anechoic room and the conclusions should confirm the actual cards’ or-der. On the other hand, the accurate antennas’ radiance diagram shouldbe taken into account to locate precisely the permanent magnet. The inte-gration procedure has to be continued, and the new developments has tobe integrated.
The accurate mass budget should be updated to obtain a more andmore refined definition of the mass consuming. The theoretical definitionof COG and inertia terms should also be verified as soon as a completeengineering model will be available. The EPS should chose definitivelythe batteries and the PCB electrical layout to allow a final design. Addi-tional FEM will be also necessary during the future work. In particular, themodal analysis with the electronic cards and a random analysis should beperformed.
Finally, the experimental modal survey of CubeSat and its electroniccards should be performed and correlated to its finite element model. Inaddition to this, further investigations on the vibrations mitigations onelectronic cards could be drawn.
5.3 Personal point of view
If the real objective of this project was ”fun and education´´, it wasdefinitely achieved.
OUFTI − 1 provided me with a unique opportunity to confront my-self with a real space project. This master thesis allowed me to venture offthe beaten track while learning a lot of lessons. OUFTI − 1 constituted aninteresting difference in my degree course with a hands-on project per-formed in a multidisciplinary team.
I learned a lot from the industrial framework : the external constraints(e.g. delivery time, availability of products), the work within a team with apleasant atmosphere, and almost the difference between theory and prac-tice, even if both are necessary one to the other.
This project gave me the opportunity of my first trip to California andto ESTEC in the Netherlands. I talk with the Belgian cosmonaut Frank DeWinne, and I met many interesting people.
I have learned a lot from all my friends, project managers and profes-sors, both from human and technical point of view. On the other hand,
Gauthier Pierlot2nd Master in Aerospace Engineering
106 University of LiègeFaculty of Applied Sciences
Academic Year 2008− 2009

5.3. Personal point of view
work with students from engineering schools was also a very good expe-rience, their approaches being complementary to the university’s.
The conclusions of all of this could be simply ”I learned´´. My technicalbackground is now much more important than I expected. I have anotherapproach to projects. From the master thesis writing to the thoughtfulfinding of technical solutions, I have also learned to be much more calm,rigorous and pragmatic. So, I just want to say to the future students : Justgo on!
Gauthier Pierlot2nd Master in Aerospace Engineering
107 University of LiègeFaculty of Applied Sciences
Academic Year 2008− 2009

Appendix
Contents
5.1 Summary of the accomplished work . . . . . . . . . . . . . . 1055.2 Perspectives . . . . . . . . . . . . . . . . . . . . . . . . . . . . . . 1065.3 Personal point of view . . . . . . . . . . . . . . . . . . . . . . . 106
108

APC-104 layout
109

BSolar panels design
110

CBatteries datasheets
111

DInterface design
112

Bibliography
[1] F. Aguado, “Status on xatcobeo,” CubeSat Developers’ Workshop, Apr2009. (Quoted page 58.)
[2] J. Aldeguer, “Conception de cartes pour équipements spatialisables,”Alcatel Space, Cannes, France, Tech. Rep., Aug 2005. (Quotedpages 56 et 99.)
[3] M. Ashby, Materials Selection in Mechanical Design. Butterworth-Heinemann, 1999. (Quoted pages 51, 52, 53 et 65.)
[4] ——, Materials, Engineering, Science, Processing and Design. Elsevier,2007. (Quoted page 51.)
[5] AzurSpace, “Azurspace’s website,” http://www.azurspace.com/.(Quoted pages 5 et 24.)
[6] V. Bashbush, “Characterization of the internal and external environ-ments of the cubesat p-pod and test pod,” California PolytechnicState University, San Luis Obispo, California, United States of Amer-ica, Tech. Rep., Jan 2004. (Quoted page 3.)
[7] C. Berna and M. Luron, Vega User’s Manual, Ariane Espace, Jan 2002.(Quoted pages 6, 8, 9 et 67.)
[8] V. Beukelaers, “Compte rendu de la réunion radiation au centre spa-tial de liège,” ULg, Liège, Belgique, Tech. Rep., Feb 2009. (Quotedpages 55 et 56.)
[9] ——, “From mission analysis to space flight simulation of the oufti-1nano-satellite,” ULg, Liège, Belgique, Tech. Rep., May 2009. (Quotedpages 27, 56 et 78.)
[10] J. Brown, “Test pod user’s guide rev 6,” California Polytechnic StateUniversity, Tech. Rep., jun 2006. (Quoted pages 69, 91, 93 et 94.)
[11] U. CalPoly, “Cp-x website,” http://polysat.calpoly.edu. (Quotedpage 4.)
[12] ——, “Cubesat community website,” http://cubesat.atl.calpoly.edu.(Quoted page 4.)
[13] J. Chan, “Kumu a o cubesat project,” CubeSat Developers’ Workshop,Apr 2009. (Quoted page 4.)
[14] ClydeSpace, “Clydespace’s website,” http://www.clyde-space.com/.(Quoted page 14.)
113

Bibliography
[15] A. De Rooy, “The degradation of metal surfaces by atomic oxygen,”ESA - Estec, Nov 1985. (Quoted page 54.)
[16] C. De Silva, Vibration and shock handbook. Taylor & Francis, 2005.(Quoted page 99.)
[17] J. Debongnie, Conception Mécanique. Aees, 2005. (Quoted page 93.)
[18] A. Denis, “Références techniques de cubesats récemment lancé,” ULg,May 2008. (Quoted page 3.)
[19] L. Dusseau, “Robusta, un satellite pédagogique,” EDP Science, Jan2009. (Quoted page 2.)
[20] N. ECSS, “Ecss-e-30 part 2a - space engineering, mechanical part 2 :structural,” ESA, Tech. Rep., Apr 2000. (Quoted page 70.)
[21] ——, “Ecss-q-70-71a rev. 1 - data for selection of space materials andprocesses,” ESA, Tech. Rep., June 2004. (Quoted pages 54 et 62.)
[22] ESA, “Esa materials website database,” http://esmat.esa.int. (Quotedpages 54 et 60.)
[23] ESTEC, Adhesive Handbook, ECSS-EHB-32-11 Draft 2. ESA, 2007.(Quoted pages 58, 59, 60 et 61.)
[24] ——, Materials Handbook, ECSS-HB-304 Draft 2. ESA, 2007. (Quotedpage 54.)
[25] ——, “Space engineering, technical requirements specifications,” ES-TEC, ECSS normalisation, Tech. Rep., 2009. (Quoted page 6.)
[26] N. Evrard, “Conception et réalisation du système de mesures dunanosatellite oufti-1,” Institut Gramme, Tech. Rep., Jun 2009. (Quotedpage 22.)
[27] P. Fortescue and al., Spacecraft Systems Engineering. Wiley, 2003.(Quoted pages 54 et 56.)
[28] P. Galeone, “Approach for the structural tests for the qualification ofthe cubesats/p-pods,” ESA-ESTEC, Apr 2009. (Quoted pages 8 et 96.)
[29] CES Selector, Granta Design Limited, Jan 2008. (Quoted page 55.)
[30] L. Halbach, “Oufti-1 project requirements, mission and system defi-nition,” ULg, Feb 2009. (Quoted page 4.)
[31] S. Hannay, “Attitude determination and control system of studentnanosatellite oufti-1 of university of liege,” ULg, Tech. Rep., May2009. (Quoted pages 7, 19, 29, 43 et 78.)
[32] J. Hardy, “Implémentation du protocole ax.25 à bord du nanosatelliteoufti-1,” Institut Gramme, Tech. Rep., Jun 2009. (Quoted page 23.)
[33] P. Haris, “Pc104 plus specification, v2.2,” PC104 consortium, Tech.Rep., Jan 2007. (Quoted pages 17, 21 et 27.)
Gauthier Pierlot2nd Master in Aerospace Engineering
114 University of LiègeFaculty of Applied Sciences
Academic Year 2008− 2009

Bibliography
[34] R. Henrard, “Design et implémentation du système de télécommu-nications du nanosatellite oufti-1,” Institut Supérieur Industriel Lié-geois, Tech. Rep., May 2009. (Quoted pages 23 et 27.)
[35] L. Jacques, “Thermal design of the oufti-1 nanosatellite,” ULg, Tech.Rep., May 2009. (Quoted pages 6, 23, 24, 28, 49, 60 et 64.)
[36] S. Jardon, “V2i, plan de table des shakers ling 80, gw 26 et ling csl,”V2i, Tech. Rep., Jul 2008. (Quoted page 93.)
[37] A. Kalman, “Pumpkin’s website,” http://www.cubesatkit.com/.(Quoted pages 5, 13 et 14.)
[38] ——, “Overview of the cubesat kit,” Pumpkin Inc., Tech. Rep., Jan2004. (Quoted pages 13 et 14.)
[39] ——, “Cubesat kit spring plunger feet,” Pumpkin Inc., Tech. Rep.,May 2005. (Quoted page 16.)
[40] ——, “Csk midplane standoff kit,” Pumpkin Inc., Tech. Rep., Mar2008. (Quoted page 18.)
[41] ——, “Cubesat kit. fm430 flight module, rev c,” Pumpkin Inc., Tech.Rep., Jun 2008. (Quoted page 27.)
[42] G. Kerschen and al., Experimental Modal Analysis. LTAS, 2008.(Quoted pages 83, 84 et 85.)
[43] C. Key, Materials selection list for space hardware systems. NASA, 1988.(Quoted pages 7, 47 et 54.)
[44] J. Lecomte, Sélection des matériaux. LTAS, 2008. (Quoted page 51.)
[45] P. Ledent, “Design and implementation of on-board digitaly con-troled electrical power supply of student nanosatellite oufti-1 of uni-versity of liege,” ULg, Tech. Rep., May 2009. (Quoted pages 22 et 23.)
[46] ——, “Test report, vacuum tests for varta and kokam batteries,” ULg,Liège, Belgique, Tech. Rep., May 2009. (Quoted page 27.)
[47] S. Lee, “Cubesat design specification rev. 11,” California PolytechnicState University, Feb 2008. (Quoted pages 3, 6, 7, 8, 9, 14 et 47.)
[48] J. MacCutcheon, “Internally damped circuit articles,” Minesota min-ing and manufacturing co., Tech. Rep., Sep 1996. (Quoted page 99.)
[49] F. Mahy, “Design and implementation of on-board telecommunica-tion system of student nanosatellite oufti-1 of university of liège,”ULg, Tech. Rep., May 2009. (Quoted pages 22, 23 et 27.)
[50] F. Marin, “V2i, shaker’s characteristics,” V2i, Tech. Rep., Sep 2008.(Quoted page 92.)
[51] U. of Applied Sciences Aachen, “Compass 1 website,” http://www.cubesat.de/. (Quoted page 4.)
Gauthier Pierlot2nd Master in Aerospace Engineering
115 University of LiègeFaculty of Applied Sciences
Academic Year 2008− 2009

Bibliography
[52] U. of Dresde, “Tud - faculty of computer science,” http://www.inf.tu-dresden.de. (Quoted pages 23 et 28.)
[53] U. of Louisiana, “Cape’s website,” http://cape.louisiana.edu.(Quoted page 4.)
[54] U. of Technology Delft, “Delfi-c3’s website,” http://www.delfic3.nl.(Quoted page 4.)
[55] U. of Toronto, “Can-x2 website,” http://www.utias-sfl.net. (Quotedpage 4.)
[56] J. Pedersen, “Vega cubesats icd iss 0 rev 4 draft,” ESA, pp. 18–25, Feb2009. (Quoted pages 6, 7, 8, 9, 47, 67, 76, 93 et 96.)
[57] G. Pierlot, “Oufti-1’s integration procedure,” ULg, Tech. Rep., Mar2009. (Quoted page 38.)
[58] J. Pitarresi, “Dynamic modeling and measurements of personal com-puter motherboards,” University of New-York, Tech. Rep., Feb 2008.(Quoted page 75.)
[59] E. Porter, “Cell specification data, slpb 554374h,” Kokam, Tech. Rep.,Feb 2007. (Quoted page 23.)
[60] ——, “Cell specification data, slpb 603870h,” Kokam, Tech. Rep., Feb2007. (Quoted page 23.)
[61] A. Reif, “Cubesat control document,” Pumpkin Inc., Tech. Rep., Dec2003. (Quoted pages 7, 13 et 14.)
[62] ——, “Cubesat kit pcb specification,” Pumpkin Inc., Tech. Rep., Sep2003. (Quoted page 21.)
[63] ——, “Cubesat kit system chart,” Pumpkin Inc., Tech. Rep., Aug 2007.(Quoted page 40.)
[64] ——, “Solar panel clips set data sheet rev. a,” Pumpkin Inc., Tech.Rep., May 2007. (Quoted pages 31 et 46.)
[65] G. Richardson, “Analysis of simplified fe models of pcbs exposedto random vibrations,” University of Southampton, Tech. Rep., Feb2008. (Quoted pages 69 et 75.)
[66] G. Roethlisberger, “Swisscube structural design and flight systemconfiguration, phase b,” EPFL, Lausanne, Switzerland, Tech. Rep.,Feb 2007. (Quoted pages 3, 31, 60, 62, 69 et 75.)
[67] J. Safrany, “Anodisation de l’aluminium et de ses alliages,” Les tech-niques de l’ingénieur, Feb 2003. (Quoted page 55.)
[68] Samtec, “High speed rugged/power, micro interconnects,” http://www.samtec.com/. (Quoted page 22.)
[69] Samcef User Manual, Samtech, Rue des chasseurs ardenais 4000 Liège,Oct 2008. (Quoted page 67.)
Gauthier Pierlot2nd Master in Aerospace Engineering
116 University of LiègeFaculty of Applied Sciences
Academic Year 2008− 2009

Bibliography
[70] H. Schnirch, “Plf 463759c technical specification,” Varta, Tech. Rep.,Aug 2007. (Quoted page 23.)
[71] Shibayama and al., “Identification of the center-of-gravity and inertiaterms of 3-dimensional body,” Oct 2006. (Quoted page 45.)
[72] G. Strobl, “Evolution of fully european triple gaas solar cell,” SeventhEuropean Space Power Conference, May 2005. (Quoted page 24.)
[73] ——, “Solar cells 3g28 data sheet,” Azurspace, Tech. Rep., apr 2007.(Quoted pages 27 et 46.)
[74] D. Systemes, “Dassault systemes : Catia - plm solution,” http://www.3ds.com/products/catia/welcome/. (Quoted page 10.)
[75] D. Teney, “Design and implementation of on-board processor andsoftware of student nanosatellite oufti-1 of university of liège,” ULg,Tech. Rep., May 2009. (Quoted page 22.)
[76] Thales, “Thales website,” http://www.thalesaleniaspace.com.(Quoted pages 5 et 57.)
[77] P. Thirion, “Design and implementation of on-board electrical powersupply of student nanosatellite oufti-1 of university of liege,” ULg,Tech. Rep., May 2009. (Quoted pages 22, 24 et 28.)
[78] J. Tock, “Règles de conception d’un support d’expérience pour essaisvibratoires,” ULg, Tech. Rep., Jun 1992. (Quoted pages 92 et 93.)
[79] K. Trusco, “Cga633450b technical specification,” Panasonic, Tech.Rep., Jan 2007. (Quoted page 23.)
[80] B. Twiggs, “Making it smaller,” CubeSat Developers’ Workshop, Apr2009. (Quoted page 2.)
[81] J. Wertz, “Conception et réalisation du système de déploiement desantennes du nanosatellite oufti-1,” Institut Gramme, Tech. Rep., Jun2009. (Quoted page 20.)
[82] I. Yang, “Elevated sockets datasheet,” Samtec, Tech. Rep., Sep 2008.(Quoted page 22.)
[83] ——, “Socket strip datasheet,” Samtec, Tech. Rep., Sep 2008. (Quotedpage 21.)
Gauthier Pierlot2nd Master in Aerospace Engineering
117 University of LiègeFaculty of Applied Sciences
Academic Year 2008− 2009

91.825.08
33.79
33.79
4.577.62
54.11
54.1185.47
88.25
89.34
85.34
85.09
81.28
44
76.2
Vue de faceEchelle : 1:1
Tolérances nonréférencées :+/− 0.05mm
Nb. Désignation Matériel1 Carte GFRP FR4Ech 1:1 PC104 +
Nom : PierlotG.
Note : / ULg, LTAS Date : 06/03/2009
H1
H2
H1
H2
1
2
1
1
2
Y
X
1.57
Vue de dessusEchelle : 1:1
5.08
72.9
95.89
90.81
2.92
2.92
90.4
58.08
37.8116.51
5.08
90.81
3.18
3.18
3.183.18
81.98
Vue de face[2]Echelle : 1:1
12.64

20.5
70.5
1 378
13
78
20.5
70.5
7 4
43
14
24
Vue de faceEchelle : 1:1
Les dimensions générales restant les mêmes,seuls les 4 trous du PCB batteries sont annotéesLa zone de l’espace batterie limite la hauteur des composants à 4mm
X
Y
Espace batterie
Tolérances nonréférencées :+/− 0.05mm
Nb. Désignation Matériel/ Carte GFRP FR4Ech 1:1 PC104 +
EPS2Nom : PierlotG.
Note : rev1 ULg, LTAS Date:14/03/2009

96
8 2
531
0.5
3 .5
10.5
3 .5
Vue de faceEchelle : 1:1
Tolérances nonréférencées :+/− 0.05mm
Nb. Désignation Matériel3 Panneau
solaireAl 7075−T73
Ech 1:1 +X,+/−Y Nom : PierlotG.
Note : / ULg, LTAS Date :25/01/2009
Vue de dessusEchelle : 1:1
Vue de gaucheEchelle : 1:1
1.5

90
80
46
6
77
73
5.5
11
3
5.5
11
5
Vue de faceEchelle : 1:1
Tolérances nonréférencées :+/− 0.05mm
Nb. Désignation Matériel1 Panneau
solaireAl 7075−T73
Ech 1:1 +Z Nom : PierlotG.
Note : / ULg, LTAS Date :25/01/2009
Vue de dessusEchelle : 1:1
1.5
96
82
Vue de gaucheEchelle : 1:1

Tolérances nonréférencées :+/− 0.05mm
Nb. Désignation Matériel1 Panneau
solaireAl 7075−T73
Ech 1:1 −Z Nom : PierlotG.
Note : / ULg, LTAS Date :25/01/2009
1.5
Vue de gaucheEchelle : 1:1
Vue de faceEchelle : 1:1
100
100
2.5R
2.5R
2.5R
9.5
9.5

Cell Specification Data
Kokam Co., Ltd.
SLPB 554374H

32.0 ± 1.0●● Weight (g)
73.5 ± 0.5Length (mm)
42.5 ± 0.5Width (mm)
5.4 ± 0.2Thickness (mm)●● Dimension
-20 ~ 60 ℃Discharge
0 ~ 40 ℃Charge●● Operating Temp.
> 500 Cycles●● Cycle Life
2.7 VCut-off Voltage
37.50 APeak Current
18.75 AContinuous Current●● DischargeCondition
4.2V ± 0.03 V Voltage
2.5 AMax. Current●● ChargeCondition
3.7 V●● Nominal Voltage
1.25 Ah●● Typical Capacity1)
Cell Specification
1) Typical Capacity : 0.5C, 4.2~2.7V @25OC

Cell Specification Data
Kokam Co., Ltd.
SLB 603870H

Cell Specification
32.0 ± 1.0●● Weight (g)
69.5 ± 0.5Length (mm)
37.5 ± 0.5Width (mm)
6.5 ± 0.2Thickness (mm)●● Dimension
-20 ~ 60 ℃Discharge
0 ~ 40℃Charge●● Operating Temp.
> 500 Cycles●● Cycle Life
2.7 VCut-off Voltage
24.0 APeak Current
12.0 AContinuous Current●● DischargeCondition
4.2V ± 0.03V Voltage
3.0 AMax. Current●● ChargeCondition
3.7 V●● Nominal Voltage
1.5 Ah●● Typical Capacity1)
1) Typical Capacity : 0.5C, 4.2 ~ 2.7V @25OC,

Cell Specification Data
Kokam Co., Ltd.
SLPB 723870H4

Cell Specification
37.0 ± 1.5●● Weight (g)
70.0 ± 0.5Length (mm)
37.5 ± 0.5Width (mm)
7.2 ± 0.2Thickness (mm)●● Dimension
-20 ~ 60 ℃Discharge
0 ~ 40 ℃Charge●● Operating Temp.
> 500 Cycles●● Cycle Life
2.7 VCut-off Voltage
60.0 APeak Current
30.0 AContinuous Current●● DischargeCondition
4.2V ± 0.03 V Voltage
3.0 AMax. Current●● ChargeCondition
3.7 V●● Nominal Voltage
1.5 Ah●● Typical Capacity1)
1) Typical Capacity : 0.5C, 4.2 ~ 2.7V @25OC

Vue de faceEchelle : 1:2
X
Y 1
2
34
5
6
7
89
10
11
REF. X Y Diamètre1 0 0 112 35.92 −35.92 113 35.92 35.92 114 −35.92 35.92 115 −35.92 −35.92 116 71.84 −71.84 117 101.6 0 118 71.84 71.84 119 −71.84 71.84 1110 −101.6 0 1111 −71.84 −71.84 11
X
Y
Les trous A,B,C,D,E,F sont taraudés M8Les trous de 1 à 11 sont passant
X
Y
X
Y
A
B
CD
E
F
X
Y
A
B
CD
E
F
REF. X Y DiamètreA 82,3 49,53 6,65B 82,3 0 6,65C 82,3 −49,53 6,65D −82,3 −49,53 6,65E −82,3 0 6,65F −82,3 49,53 6,65
A A
25
2.545
2.545
230
30
Vue de dessusEchelle : 1:2
175
Vue de gaucheEchelle : 1:2
18
1115
15
Coupe A−AEchelle : 1:2
Tolérances nonréférencées :+/− 0.1mm
Nb. Désignation Matériel
1 Support Aluminium
Echelle 1:2 Interfacetest−pod
Nom : PierlotG.
Note : / ULg, Département aérospatial Date :01/01/2009

Vue isométriqueEchelle : 1:2
Tolérances nonréférencées :+/− 0.1mm
Nb. Désignation Matériel
1 Support Aluminium
Echelle 1:2 Interfacetest−pod
Nom : PierlotG.
Note : / ULg, Département aérospatial Date :01/01/2009
Copyright © 2022 FDOKUMEN