
Updated as of: 09/20/2018 08:34 UTC Page: 1 - Forest Service
Upload
independentCategory
view
4download
0
Chapter 11The Basics of Capital Budgeting
Learning Objectives
After reading this chapter, students should be able to:
Discuss capital budgeting.
Calculate and use the major capital budgeting decision criteria, which are NPV, IRR, MIRR, and payback.
Explain why NPV is the best criterion and how it overcomes problems inherent in the other methods.
Chapter 11: The Basics of Capital Budgeting Learning Objectives 261

Lecture Suggestions
This is a relatively straight-forward chapter, and, for the most part, it is adirect application of the time value concepts first discussed in Chapter 5. We point out that capital budgeting is to a company what buying stocks or bonds is to an individual—an investment decision, when the company wants to know if the expected value of the cash flows is greater than the cost of the project, and whether or not the expected rate of return on the project exceedsthe cost of the funds required to do the project. We cover the standard capital budgeting procedures—NPV, IRR, MIRR, payback and discounted payback.
At this point, students who have not yet mastered time value concepts and how to use their calculator efficiently get another chance to catch on. Students who have mastered those tools and concepts have fun, because they cansee what is happening and the usefulness of what they are learning.
What we cover, and the way we cover it, can be seen by scanning the slides and Integrated Case solution for Chapter 11, which appears at the end of this chapter solution. For other suggestions about the lecture, please seethe “Lecture Suggestions” in Chapter 2, where we describe how we conduct our classes.
DAYS ON CHAPTER: 3 OF 58 DAYS (50-minute periods)
262 Lecture Suggestions Chapter 11: The Basics of Capital Budgeting

Answers to End-of-Chapter Questions
11-1 Project classification schemes can be used to indicate how much analysisis required to evaluate a given project, the level of the executive who must approve the project, and the cost of capital that should be used tocalculate the project’s NPV. Thus, classification schemes can increase the efficiency of the capital budgeting process.
11-2 The regular payback method has three main flaws: (1) Dollars received indifferent years are all given the same weight. (2) Cash flows beyond the payback year are given no consideration whatever, regardless of how large they might be. (3) Unlike the NPV, which tells us by how much theproject should increase shareholder wealth, and the IRR, which tells us how much a project yields over the cost of capital, the payback merely tells us when we get our investment back. The discounted payback corrects the first flaw, but the other two flaws still remain.
11-3 The NPV is obtained by discounting future cash flows, and the discounting process actually compounds the interest rate over time. Thus, an increase in the discount rate has a much greater impact on a cash flow in Year 5 than on a cash flow in Year 1.
11-4 Mutually exclusive projects are a set of projects in which only one of the projects can be accepted. For example, the installation of a conveyor-belt system in a warehouse and the purchase of a fleet of forklifts for the same warehouse would be mutually exclusive projects—accepting one implies rejection of the other. When choosing between mutually exclusive projects, managers should rank the projects based on the NPV decision rule. The mutually exclusive project with the highest positive NPV should be chosen. The NPV decision rule properly ranks theprojects because it assumes the appropriate reinvestment rate is the cost of capital.
11-5 The first question is related to Question 11-3 and the same rationale applies. A high cost of capital favors a shorter-term project. If the cost of capital declined, it would lead firms to invest more in long-term projects. With regard to the last question, the answer is no; the IRR rankings are constant and independent of the firm’s cost of capital.
11-6 The statement is true. The NPV and IRR methods result in conflicts onlyif mutually exclusive projects are being considered since the NPV is positive if and only if the IRR is greater than the cost of capital. Ifthe assumptions were changed so that the firm had mutually exclusive projects, then the IRR and NPV methods could lead to different
Chapter 11: The Basics of Capital Budgeting Answers and Solutions 263
conclusions. A change in the cost of capital or in the cash flow streams would not lead to conflicts if the projects were independent. Therefore, the IRR method can be used in lieu of the NPV if the projectsbeing considered are independent.
11-7 Payback provides information on how long funds will be tied up in a project. The shorter the payback, other things held constant, the greater the project’s liquidity. This factor is often important for smaller firms that don’t have ready access to the capital markets. Also,cash flows expected in the distant future are generally riskier than near-term cash flows, so the payback can be used as a risk indicator.
11-8 Project X should be chosen over Project Y. Since the two projects are mutually exclusive, only one project can be accepted. The decision rulethat should be used is NPV. Since Project X has the higher NPV, it should be chosen. The cost of capital used in the NPV analysis appropriately includes risk.
11-9 The NPV method assumes reinvestment at the cost of capital, while the IRR method assumes reinvestment at the IRR. MIRR is a modified version of IRR that assumes reinvestment at the cost of capital.
The NPV method assumes that the rate of return that the firm can invest differential cash flows it would receive if it chose a smaller project is the cost of capital. With NPV we are calculating present values and the interest rate or discount rate is the cost of capital. When we find the IRR we are discounting at the rate that causes NPV to equal zero, which means that the IRR method assumes that cash flows can be reinvested at the IRR (the project’s rate of return). With MIRR, since positive cash flows are compounded at the cost of capital and negative cash flows are discounted at the cost of capital, the MIRR assumes that the cash flows are reinvested at the cost of capital.
11-10 a. In general, the answer is no. The objective of management should be to maximize value, and as we point out in subsequent chapters, stock values are determined by both earnings and growth. The NPV calculation automatically takes this into account, and if the NPV of a long-term project exceeds that of a short-term project, the higher future growth from the long-term project must be more than enough to compensate for the lower earnings in early years.
b. If the same $100 million had been spent on a short-term project—one with a faster payback—reported profits would have been higher for a period of years. This is, of course, another reason why firms sometimes use the payback method.
264 Answers and Solutions Chapter 11: The Basics of Capital Budgeting

Solutions to End-of-Chapter Problems
11-1 Financial calculator solution: Input CF0 = -52125, CF1-8 = 12000, I/YR =12, and then solve for NPV = $7,486.68.
11-2 Financial calculator solution: Input CF0 = -52125, CF1-8 = 12000, and then solve for IRR = 16%.
11-3 MIRR: PV costs = $52,125.
FV inflows:PV FV0 1 2 3 4 5 6 7 8| | | | | | | | |
12,000 12,000 12,000 12,000 12,000 12,000 12,000 12,00013,44015,05316,85918,88221,14823,686
26,52852,125 MIRR = 13.89% 147,596
Financial calculator solution: Obtain the FVA by inputting N = 8, I/YR = 12, PV = 0, PMT = 12000, and then solve for FV = $147,596. The MIRR can be obtained by inputting N = 8, PV = -52125, PMT = 0, FV = 147596, and then solving for I/YR = 13.89%.
11-4 Since the cash flows are a constant $12,000, calculate the payback period as: $52,125/$12,000 = 4.3438, so the payback is about 4 years.
11-5 Project K’s discounted payback period is calculated as follows:Annual Discounted @12%
Period Cash Flows Cash Flows Cumulative 0 ($52,125) ($52,125.00) ($52,125.00)1 12,000 10,714.29 (41,410.71)2 12,000 9,566.33 (31,844.38)
Chapter 11: The Basics of Capital Budgeting Answers and Solutions 265
12%
1.12
(1.12)2
(1.12)3
(1.12)4
(1.12)5
(1.12)
(1.12)7

3 12,000 8,541.36 (23,303.02)4 12,000 7,626.22 (15,676.80)5 12,000 6,809.12 (8,867.68)6 12,000 6,079.57 (2,788.11)7 12,000 5,428.19 2,640.088 12,000 4,846.60 7,486.68
The discounted payback period is 6 + years, or 6.51 years.
11-6 a. Project A: Using a financial calculator, enter the following:CF0 = -25, CF1 = 5, CF2 = 10, CF3 = 17, I/YR = 5; NPV = $3.52.
Change I/YR = 5 to I/YR = 10; NPV = $0.58.
Change I/YR = 10 to I/YR = 15; NPV = -$1.91.
Project B: Using a financial calculator, enter the following:CF0 = -20, CF1 = 10, CF2 = 9, CF3 = 6, I/YR = 5; NPV = $2.87.
Change I/YR = 5 to I/YR = 10; NPV = $1.04.
Change I/YR = 10 to I/YR = 15; NPV = -$0.55.
b. Using the data for Project A, enter the cash flows into a financial calculator and solve for IRRA = 11.10%. The IRR is independent of theWACC, so it doesn’t change when the WACC changes.
Using the data for Project B, enter the cash flows into a financial calculator and solve for IRRB = 13.18%. Again, the IRR is independentof the WACC, so it doesn’t change when the WACC changes.
c. At a WACC = 5%, NPVA > NPVB so choose Project A.
At a WACC = 10%, NPVB > NPVA so choose Project B.
At a WACC = 15%, both NPVs are less than zero, so neither project would be chosen.
11-7 a. Project A:CF0 = -6000; CF1-5 = 2000; I/YR = 14.
Solve for NPVA = $866.16. IRRA = 19.86%.
266 Answers and Solutions Chapter 11: The Basics of Capital Budgeting

MIRR calculation:0 1 2 3 4 5| | | | | |
-6,000 2,000 2,000 2,000 2,000 2,0002,280.002,599.202,963.09
3,377 .92 13,220 .21
Using a financial calculator, enter N = 5; PV = -6000; PMT = 0; FV = 13220.21; and solve for MIRRA = I/YR = 17.12%.
Chapter 11: The Basics of Capital Budgeting Answers and Solutions 267
1.14
(1.14)2
(1.14)3
(1.14)4

Payback calculation:0 1 2 3 4 5| | | | | |
-6,000 2,000 2,000 2,000 2,000 2,000Cumulative CF:-6,000-4,000-2,000 0 2,000 4,000
Regular PaybackA = 3 years.
Discounted payback calculation:0 1 2 3 4 5| | | | | |
-6,000 2,000 2,000 2,000 2,000 2,000Discounted CF:-6,0001,754.391,538.941,349.941,184.161,038.74Cumulative CF:-6,000-4,245.61-2,706.67-1,356.73 -172.57 866.17
Discounted PaybackA = 4 + $172.57/$1,038.74 = 4.17 years.
Project B:CF0 = -18000; CF1-5 = 5600; I/YR = 14.
Solve for NPVB = $1,255.25. IRRB = 16.80%.
MIRR calculation:0 1 2 3 4 5| | | | | |
-18,000 5,600 5,600 5,600 5,600 5,6006,384.007,277.768,296.65
9,458 .18 37,016 .59
Using a financial calculator, enter N = 5; PV = -18000; PMT = 0; FV =37016.59; and solve for MIRRB = I/YR = 15.51%.
Payback calculation:0 1 2 3 4 5| | | | | |
-18,000 5,600 5,600 5,600 5,600 5,600Cumulative CF:-18,000-12,400-6,800-1,200 4,400 10,000
Regular PaybackB = 3 + $1,200/$5,600 = 3.21 years.
268 Answers and Solutions Chapter 11: The Basics of Capital Budgeting
1.14
(1.14)2
(1.14)3
(1.14)4
Discounted payback calculation:0 1 2 3 4 5| | | | | |
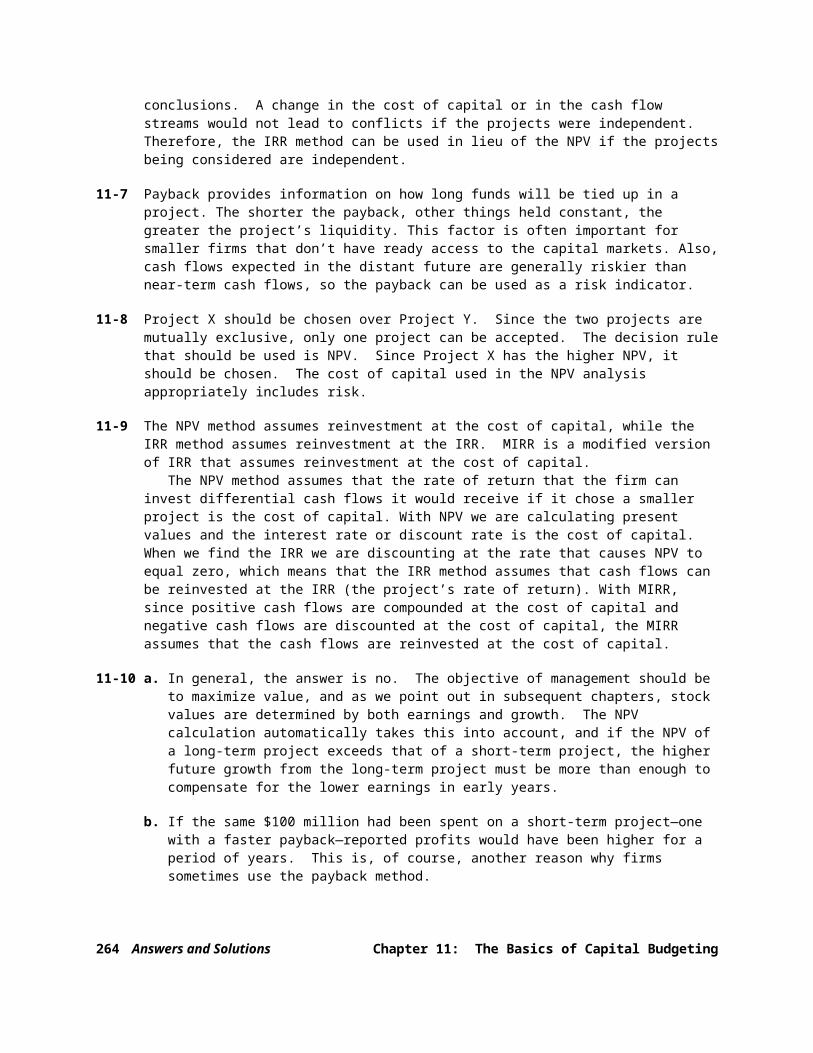
-18,000 5,600 5,600 5,600 5,600 5,600Discounted CF:-18,0004,912.284,309.023,779.843,315.652,908.46Cumulative CF:-18,000-13,087.72-8,778.70 -4,998.86-1,683.211,225.25
Discounted PaybackB = 4 + $1,683.21/$2,908.46 = 4.58 years.
Summary of capital budgeting rules results:Project A Project B
NPV $866.16 $1,225.25IRR 19.86% 16.80%MIRR 17.12% 15.51%Payback 3.0 years 3.21 yearsDiscounted payback 4.17 years 4.58 years
b. If the projects are independent, both projects would be accepted since both of their NPVs are positive.
c. If the projects are mutually exclusive then only one project can be accepted, so the project with the highest positive NPV is chosen. Accept Project B.
d. The conflict between NPV and IRR occurs due to the difference in the size of the projects. Project B is 3 times larger than Project A.
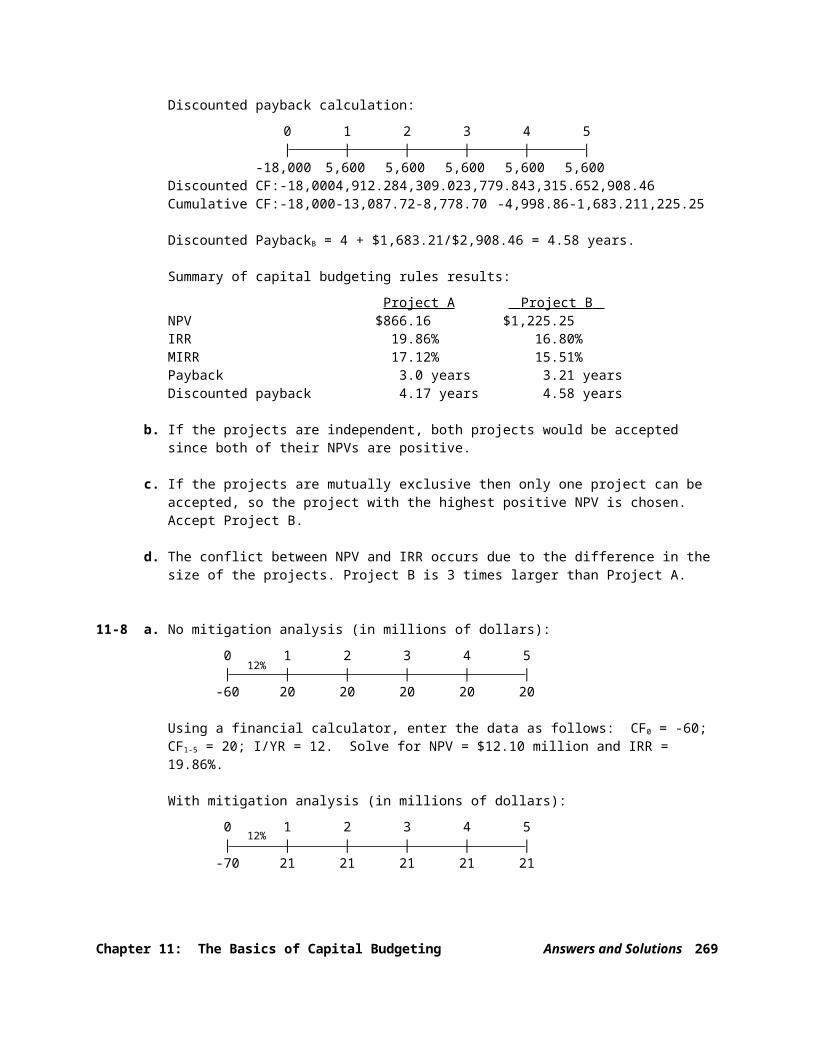
11-8 a. No mitigation analysis (in millions of dollars):0 1 2 3 4 5| | | | | |-60 20 20 20 20 20
Using a financial calculator, enter the data as follows: CF0 = -60; CF1-5 = 20; I/YR = 12. Solve for NPV = $12.10 million and IRR = 19.86%.
With mitigation analysis (in millions of dollars):0 1 2 3 4 5| | | | | |-70 21 21 21 21 21
Chapter 11: The Basics of Capital Budgeting Answers and Solutions 269
12%
12%

Using a financial calculator, enter the data as follows: CF0 = -70; CF1-5 = 21; I/YR = 12. Solve for NPV = $5.70 million and IRR = 15.24%.
b. The environmental effects if not mitigated could result in additionalloss of cash flows and/or fines and penalties due to ill will among customers, community, etc. Therefore, even though the mine is legal without mitigation, the company needs to make sure that they have anticipated all costs in the “no mitigation” analysis from not doing the environmental mitigation.
c. Even when mitigation is considered the project has a positive NPV, soit should be undertaken. The question becomes whether you mitigate ordon’t mitigate for environmental problems. Under the assumption that all costs have been considered, the company would not mitigate for the environmental impact of the project since its NPV is $12.10 million vs. $5.70 million when mitigation costs are included in the analysis.
11-9 a. No mitigation analysis (in millions of dollars):0 1 2 3 4 5| | | | | |
-240 80 80 80 80 80
Using a financial calculator, enter the data as follows: CF0 = -240; CF1-5 = 80; I/YR = 17. Solve for NPV = $15.95 million and IRR = 19.86%.
With mitigation analysis (in millions of dollars):0 1 2 3 4 5| | | | | |
-280 84 84 84 84 84
Using a financial calculator, enter the data as follows: CF0 = -280; CF1-5 = 84; I/YR = 17. Solve for NPV = -$11.25 million and IRR = 15.24%.
b. If the utility mitigates for the environmental effects, the project is not acceptable. However, before the company chooses to do the project without mitigation, it needs to make sure that any costs of “ill will” for not mitigating for the environmental effects have beenconsidered in that analysis.
270 Answers and Solutions Chapter 11: The Basics of Capital Budgeting

c. Again, the project should be undertaken only if they do not mitigate for the environmental effects. However, they want to make sure that they’ve done the analysis properly due to any “ill will” and additional “costs” that might result from undertaking the project without concern for the environmental impacts.
11-10 Project A: Using a financial calculator, enter the following data: CF0 = -400; CF1-3 = 55; CF4-5 = 225; I/YR = 10. Solve for NPV = $30.16.
Project B: Using a financial calculator, enter the following data: CF0 = -600; CF1-2 = 300; CF3-4 = 50; CF5 = 49; I/YR = 10. Solve for NPV = $22.80.
The decision rule for mutually exclusive projects is to accept the project with the highest positive NPV. In this situation, the firm wouldaccept Project A since NPVA = $30.16 compared to NPVB = $22.80.
11-11 Project S: Using a financial calculator, enter the following data: CF0
= -15000; CF1-5 = 4500; I/YR = 14. NPVS = $448.86.
Project L: Using a financial calculator, enter the following data: CF0
= -37500; CF1-5 = 11100; I/YR = 14. NPVL = $607.20.
The decision rule for mutually exclusive projects is to accept the project with the highest positive NPV. In this situation, the firm wouldaccept Project L since NPVL = $607.20 compared to NPVS = $448.86.
11-12 Input the appropriate cash flows into the cash flow register, and then calculate NPV at 10% and the IRR of each of the projects:Project S: CF0 = -1000; CF1 = 900; CF2 = 250; CF3-4 = 10; I/YR = 10. Solve for NPVS = $39.14; IRRS = 13.49%.
Project L: CF0 = -1000; CF1 = 0; CF2 = 250; CF3 = 400; CF4 = 800; I/YR = 10. Solve for NPVL = $53.55; IRRL = 11.74%.
Since Project L has the higher NPV, it is the better project, even though its IRR is less than Project S’s IRR. The IRR of the better project is IRRL = 11.74%.
11-13 Because both projects are the same size you can just calculate each project’s MIRR and choose the project with the higher MIRR.
Project X: 0 1 2 3 4
Chapter 11: The Basics of Capital Budgeting Answers and Solutions 271
12%

| | | | |-1,000 100 300 400 700.00
448.00376.32
140 .49 1,000 13.59% = MIRRX 1,664 .81
$1,000 = $1,664.81/(1 + MIRRX)4.
Project Y: 0 1 2 3 4| | | | |
-1,000 1,000 100 50 50.0056.00125.44
1,404 .93 1,000 13.10% = MIRRY 1,636 .37
$1,000 = $1,636.37/(1 + MIRRY)4.
Thus, since MIRRX > MIRRY, Project X should be chosen.
Alternate step: You could calculate the NPVs, see that Project X has the higher NPV, and just calculate MIRRX.
NPVX = $58.02 and NPVY = $39.94.
11-14 a. HCC: Using a financial calculator, enter the following data: CF0 = -600000; CF1-5 = -50000; I/YR = 7. Solve for NPV = -$805,009.87.
LCC: Using a financial calculator, enter the following data: CF0 = -100000; CF1-5 = -175000; I/YR = 7. Solve for NPV = -$817,534.55.
Since we are examining costs, the unit chosen would be the one that has the lower PV of costs. Since HCC’s PV of costs is lower than LCC’s, HCC would be chosen.
b. The IRR cannot be calculated because the cash flows are all one sign.A change of sign would be needed in order to calculate the IRR.
c. HCC: I/YR = 15; solve for NPV = -$767,607.75.
LCC: I/YR = 15; solve for NPV = -$686,627.14.
When the WACC increases from 7% to 15%, the PV of costs are now lowerfor LCC than HCC. The reason is that when you discount at a higher rate you are making negative CFs smaller and thus improving the results, unknowingly. Thus, if you were trying to risk adjust for a
272 Answers and Solutions Chapter 11: The Basics of Capital Budgeting
1.12
(1.12)2
(1.12)3
12%
1.12
(1.12)2
(1.12)3

riskier project that consisted just of negative CFs then you would use a lower cost of capital rather than a higher cost of capital and this would properly adjust for the risk of a project with only negative CFs.
11-15 a. Using a financial calculator, calculate NPVs for each plan (as shown in the table below) and graph each plan’s NPV profile.
Discount Rate NPV Plan A NPV Plan B 0% $2,400,000 $30,000,0005 1,714,286 14,170,64210 1,090,909 5,878,48412 857,143 3,685,83215 521,739 1,144,59616.7 339,332 020 0 -1,773,883
r (% )5 10 15 20 25
NPV(M illions of Dollars)
Plan B
Plan ACrossover Rate 16%
IRR A = 20%
0
2.4
6
12
18
24
30
IRR B = 16.7%
r (% )5 10 15 20 25
NPV(M illions of Dollars)
Plan B
Plan ACrossover Rate 16%
IRR A = 20%
0
2.4
6
12
18
24
30
IRR B = 16.7%
The crossover rate is approximately 16%. If the cost of capital is less than the crossover rate, then Plan B should be accepted; if the cost of capital is greater than the crossover rate, then Plan A is preferred. At the crossover rate, the two projects’ NPVs are equal.
b. Yes. Assuming (1) equal risk among projects, and (2) that the cost of capital is a constant and does not vary with the amount of capitalraised, the firm would take on all available projects with returns greater than its 12% WACC. If the firm had invested in all availableprojects with returns greater than 12%, then its best alternative would be to repay capital. Thus, the WACC is the correct reinvestment rate for evaluating a project’s cash flows.
11-16 a. Using a financial calculator, we get:
Chapter 11: The Basics of Capital Budgeting Answers and Solutions 273

NPVA = $14,486,808. NPVB = $11,156,893.IRRA = 15.03%. IRRB = 22.26%.
b. Using a financial calculator, calculate each plan’s NPVs at differentdiscount rates (as shown in the table below) and graph the NPV profiles.
Discount Rate NPV Plan A NPV Plan B 0% $88,000,000 $42,400,0005 39,758,146 21,897,21210 14,486,808 11,156,89315.03 0 4,997,15220 -8,834,690 1,245,25722.26 -11,765,254 0
NPV(M illions of Dollars)
5 10 15 20 25
20
40
60
80
0
-10
Crossover Rate 12%
IRR S = 22.26%
IRR A = 15.03%r (% )
NPV(M illions of Dollars)
5 10 15 20 25
20
40
60
80
0
-10
Crossover Rate 12%
IRR S = 22.26%
IRR A = 15.03%r (% )
The crossover rate is somewhere between 11% and 12%.
c. The NPV method implicitly assumes that the opportunity exists to reinvest the cash flows generated by a project at the WACC, while useof the IRR method implies the opportunity to reinvest at the IRR. The firm will invest in all independent projects with an NPV > $0. As cash flows come in from these projects, the firm will either pay them out to investors, or use them as a substitute for outside capital which, in this case, costs 10%. Thus, since these cash flowsare expected to save the firm 10%, this is their opportunity cost reinvestment rate.
The IRR method assumes reinvestment at the internal rate of returnitself, which is an incorrect assumption, given a constant expected future cost of capital, and ready access to capital markets.
11-17 a. Using a financial calculator and entering each project’s cash flows into the cash flow registers and entering I/YR = 12, you would
274 Answers and Solutions Chapter 11: The Basics of Capital Budgeting
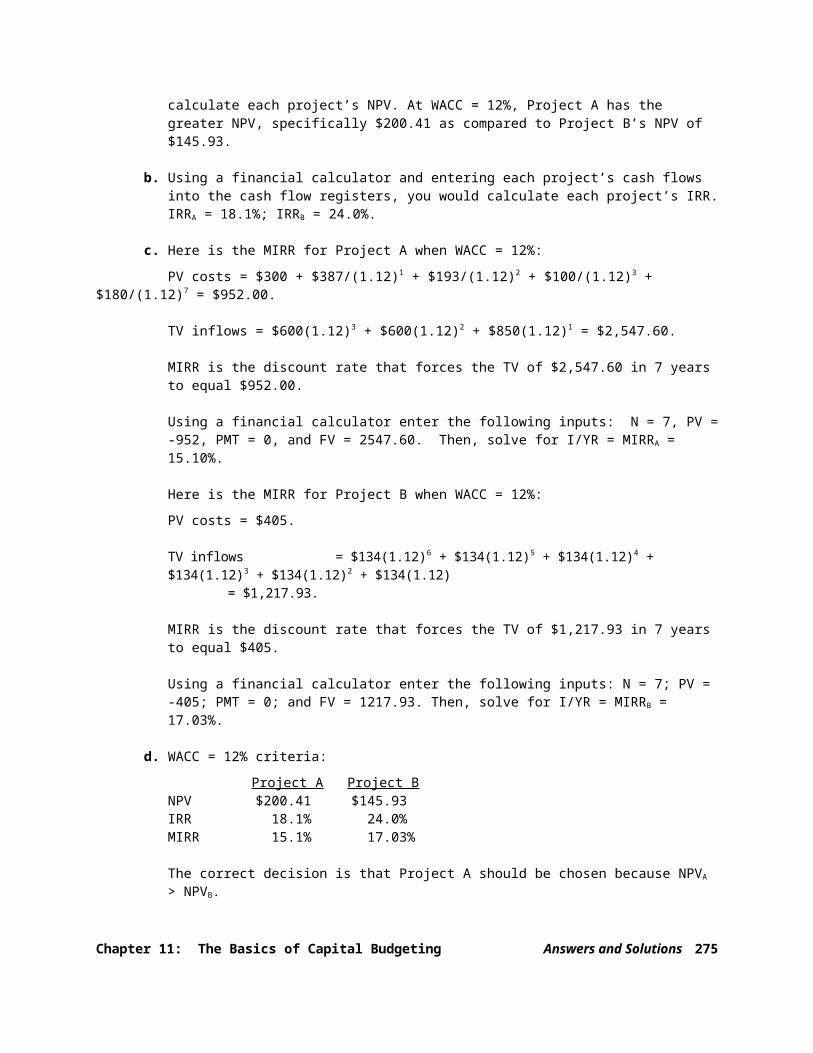
calculate each project’s NPV. At WACC = 12%, Project A has the greater NPV, specifically $200.41 as compared to Project B’s NPV of $145.93.
b. Using a financial calculator and entering each project’s cash flows into the cash flow registers, you would calculate each project’s IRR.IRRA = 18.1%; IRRB = 24.0%.
c. Here is the MIRR for Project A when WACC = 12%:PV costs = $300 + $387/(1.12)1 + $193/(1.12)2 + $100/(1.12)3 +
$180/(1.12)7 = $952.00.
TV inflows = $600(1.12)3 + $600(1.12)2 + $850(1.12)1 = $2,547.60.
MIRR is the discount rate that forces the TV of $2,547.60 in 7 years to equal $952.00.
Using a financial calculator enter the following inputs: N = 7, PV =-952, PMT = 0, and FV = 2547.60. Then, solve for I/YR = MIRRA = 15.10%.
Here is the MIRR for Project B when WACC = 12%:PV costs = $405.
TV inflows = $134(1.12)6 + $134(1.12)5 + $134(1.12)4 + $134(1.12)3 + $134(1.12)2 + $134(1.12)
= $1,217.93.
MIRR is the discount rate that forces the TV of $1,217.93 in 7 years to equal $405.
Using a financial calculator enter the following inputs: N = 7; PV = -405; PMT = 0; and FV = 1217.93. Then, solve for I/YR = MIRRB = 17.03%.
d. WACC = 12% criteria:Project A Project B
NPV $200.41 $145.93IRR 18.1% 24.0%MIRR 15.1% 17.03%
The correct decision is that Project A should be chosen because NPVA > NPVB.
Chapter 11: The Basics of Capital Budgeting Answers and Solutions 275

At WACC = 18%, using your financial calculator enter the cash flows for each project, enter I/YR = WACC = 18, and then solve for each Project’s NPV.
NPVA = $2.66; NPVB = $63.68.
At WACC = 18%, NPVB > NPVA so Project B would be chosen.
276 Answers and Solutions Chapter 11: The Basics of Capital Budgeting

e.
Discount Rate NPVA NPVB
0.0% $890 $39910.0 283 17912.0 200 14618.1 0 6220.0 (49) 4124.0 (138) 030.0 (238) (51)
f. Here is the MIRR for Project A when WACC = 18%:PV costs = $300 + $387/(1.18)1 + $193/(1.18)2 + $100/(1.18)3 + $180/(1.18)7 = $883.95.
TV inflows = $600(1.18)3 + $600(1.18)2 + $850(1.18)1 = $2,824.26.
MIRR is the discount rate that forces the TV of $2,824.26 in 7 years to equal $883.95.
Using a financial calculator enter the following inputs: N = 7; PV = -883.95; PMT = 0; and FV = 2824.26. Then, solve for I/YR = MIRRA = 18.05%.
Here is the MIRR for Project B when WACC = 18%:PV costs = $405.
TV inflows = $134(1.18)6 + $134(1.18)5 + $134(1.18)4 + $134(1.18)3 + $134(1.18)2 + $134(1.18)
Chapter 11: The Basics of Capital Budgeting Answers and Solutions 277

= $1,492.96.
MIRR is the discount rate that forces the TV of $1,492.26 in 7 years to equal $405.
Using a financial calculator enter the following inputs: N = 7; PV = -405; PMT = 0; and FV = 1492.26. Then, solve for I/YR = MIRRB = 20.48%.
11-18 Facts: 5 years remaining on lease; rent = $2,000/month; 60 payments left, payment at end of month.
New lease terms: $0/month for 9 months; $2,600/month for 51 months.
WACC = 12% annual (1% per month).
a. 0 1 2 59 60| | | | |
-2,000 -2,000 -2,000 -2,000
PV cost of old lease: N = 60; I/YR = 1; PMT = -2000; FV = 0; PV = ? PV = -$89,910.08.
0 1 9 10 59 60| | | | | |
0 0 -2,600 -2,600 -2,600
PV cost of new lease: CF0 = 0, CF1-9 = 0; CF10-60 = -2600; I/YR = 1. NPV = -$94,611.45.
Sharon should not accept the new lease because the present value of its cost is $94,611.45 – $89,910.08 = $4,701.37 greater than the old lease.
b. At t = 9 the FV of the original lease’s cost = -$89,910.08(1.01)9 = -$98,333.33. Since lease payments for months 0-9 would be zero, we cancalculate the lease payments during the remaining 51 months as follows: N = 51; I/YR = 1; PV = 98333.33; and FV = 0. Solve for PMT =-$2,470.80.
Check:0 1 9 10 59 60| | | | | |
0 0 -2,470.80 -2,470.80-2,470.80
278 Answers and Solutions Chapter 11: The Basics of Capital Budgeting
1%
1%
1%

PV cost of new lease: CF0 = 0; CF1-9 = 0; CF10-60 = -2470.80; I/YR = 1.NPV = -$89,909.99.
Except for rounding; the PV cost of this lease equals the PV cost of the old lease.
c. Period Old Lease New Lease Lease 0 0 0 01-9 -2,000 0 -2,00010-60 -2,000 -2,600 600
CF0 = 0; CF1-9 = -2000; CF10-60 = 600; IRR = ? IRR = 1.9113%. This is the periodic rate. To obtain the nominal cost of capital, multiply by 12: 12(0.019113) = 22.94%.
Check: Old lease terms:N = 60; I/YR = 1.9113; PMT = -2000; FV = 0; PV = ? PV = -$71,039.17.
New lease terms:CF0 = 0; CF1-9 = 0; CF10-60 = -2600; I/YR = 1.9113; NPV = ? NPV = -$71,038.98.
Except for rounding differences; the costs are the same.
11-19 a. The project’s expected cash flows are as follows (in millions of dollars):
Time Net Cash Flow0 ($ 2.0)1 13.02 (12.0)
We can construct the following NPV profile:
Chapter 11: The Basics of Capital Budgeting Answers and Solutions 279
NPV(M illions of Dollars)
1.5
1.0
0.5
0
-0.5
-1.00 100 200 300 400 500
W ACC (% )
NPV(M illions of Dollars)
1.5
1.0
0.5
0
-0.5
-1.00 100 200 300 400 500
W ACC (% )
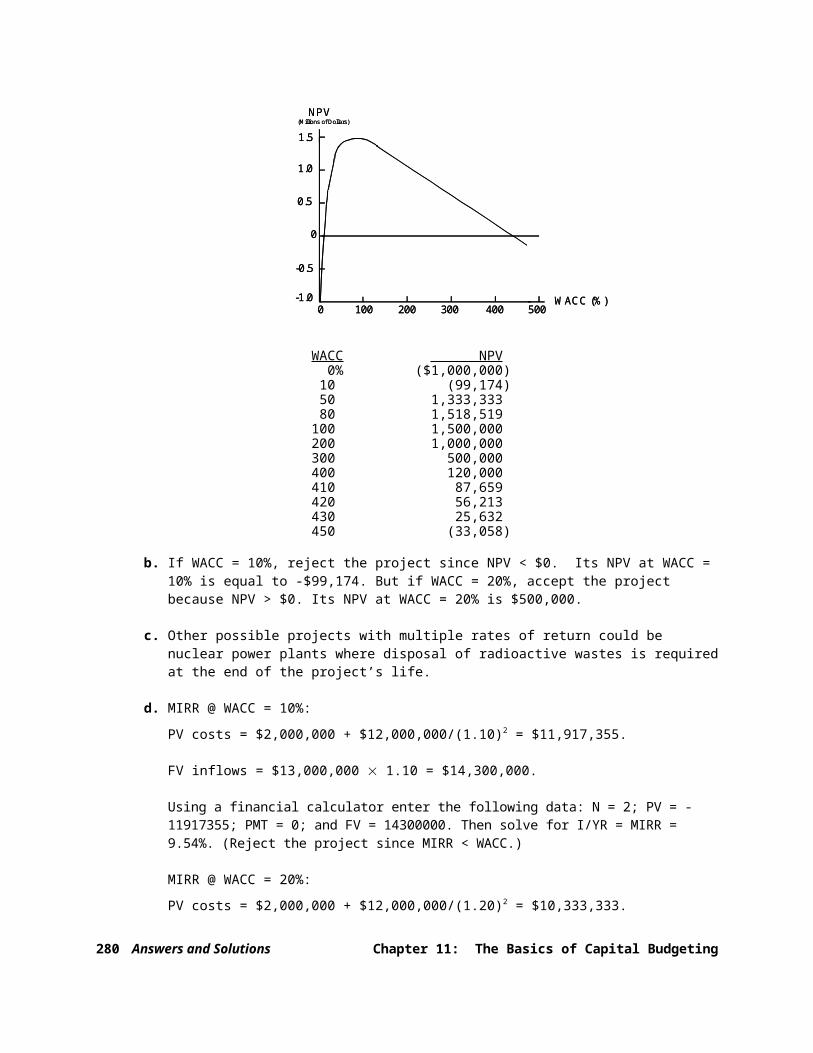
WACC NPV 0% ($1,000,000)10 (99,174)50 1,333,33380 1,518,519100 1,500,000200 1,000,000300 500,000400 120,000410 87,659420 56,213430 25,632450 (33,058)
b. If WACC = 10%, reject the project since NPV < $0. Its NPV at WACC = 10% is equal to -$99,174. But if WACC = 20%, accept the project because NPV > $0. Its NPV at WACC = 20% is $500,000.
c. Other possible projects with multiple rates of return could be nuclear power plants where disposal of radioactive wastes is requiredat the end of the project’s life.
d. MIRR @ WACC = 10%:PV costs = $2,000,000 + $12,000,000/(1.10)2 = $11,917,355.
FV inflows = $13,000,000 1.10 = $14,300,000.
Using a financial calculator enter the following data: N = 2; PV = -11917355; PMT = 0; and FV = 14300000. Then solve for I/YR = MIRR = 9.54%. (Reject the project since MIRR < WACC.)
MIRR @ WACC = 20%:PV costs = $2,000,000 + $12,000,000/(1.20)2 = $10,333,333.
280 Answers and Solutions Chapter 11: The Basics of Capital Budgeting

FV inflows = $13,000,000 1.20 = $15,600,000.
Using a financial calculator enter the following data: N = 2; PV = -10333333; PMT = 0; and FV = 15600000. Then solve for I/YR = MIRR = 22.87%. (Accept the project since MIRR > WACC.)
Looking at the results, this project’s MIRR calculations lead to the same decisions as the NPV calculations. However, the MIRR method will not always lead to the same accept/reject decision as the NPV method. Decisions involving two mutually exclusive projects that differ in scale (size) may have MIRRs that conflict with NPV. In those situations, the NPV method should be used.
11-20 Since the IRR is the discount rate at which the NPV of a project equals zero, the project’s inflows can be evaluated at the IRR and thepresent value of these inflows must equal the initial investment.
Using a financial calculator enter the following: CF0 = 0; CF1 = 7500; Nj = 10; CF1 = 10000; Nj = 10; I/YR = 10.98. NPV = $65,002.11.
Therefore, the initial investment for this project is $65,002.11. Usinga calculator, the project's NPV at the firm’s WACC can now be solved.
CF0 = -65002.11; CF1 = 7500; Nj = 10; CF1 = 10000; Nj = 10; I/YR = 9. NPV= $10,239.20.
11-21 Step 1: Determine the PMT:0 1 10| | |
-1,000 PMT PMT
The IRR is the discount rate at which the NPV of a project equals zero. Since we know the project’s initial investment, its IRR, thelength of time that the cash flows occur, and that each cash flow is the same, then we can determine the project’s cash flows by setting it up as a 10-year annuity. With a financial calculator, input N = 10, I/YR = 12, PV = -1000, and FV = 0 to obtain PMT = $176.98.
Step 2: Since we’ve been given the WACC, once we have the project’s cash flows we can now determine the project’s MIRR.
Calculate the project’s MIRR:
Chapter 11: The Basics of Capital Budgeting Answers and Solutions 281
12%

0 1 2 9 10| | | | |
-1,000 176.98 176.98 176.98 176.98194.68
.
.
.379.37
417 .31 1,000 10.93% = MIRR TV = 2,820 .61
FV of inflows: With a financial calculator, input N = 10, I/YR = 10, PV = 0, and PMT = -176.98 to obtain FV = $2,820.61. Then input N = 10, PV = -1000, PMT = 0, and FV = 2820.61 to obtain I/YR= MIRR = 10.93%.
11-22 The MIRR can be solved with a financial calculator by finding the terminal future value of the cash inflows and the initial present value of cash outflows, and solving for the discount rate that equatesthese two values. In this instance, the MIRR is given, but a cash outflow is missing and must be solved for. Therefore, if the terminalfuture value of the cash inflows is found, it can be entered into a financial calculator, along with the number of years the project lastsand the MIRR, to solve for the initial present value of the cash outflows. One of these cash outflows occurs in Year 0 and the remaining value must be the present value of the missing cash outflow in Year 2.
Cash Inflows Compounding Rate FV in Year 5 @ 10%CF1 =$202 (1.10)4 $ 295.75CF3 = 196 (1.10)2 237.16CF4 = 350 1.10 385.00CF5 = 451 1.00 451 .00
$1,368 .91
Using the financial calculator to solve for the present value of cash outflows: N = 5; I/YR = 14.14; PV = ?; PMT = 0; FV = 1368.91
The total present value of cash outflows is $706.62, and since the outflow for Year 0 is $500, the present value of the Year 2 cash outflowis $206.62. Therefore, the missing cash outflow for Year 2 is $206.62 ×(1.1)2 = $250.01.
282 Answers and Solutions Chapter 11: The Basics of Capital Budgeting
10%
1.10
(1.10)8
(1.10)9

Comprehensive/Spreadsheet Problem
Note to Instructors:The solution to this problem is not provided to students at the back of their text. Instructors can access the Excel file on the textbook’s web site or theInstructor’s Resource CD.
11-23 a. Project A:Using a financial calculator, enter the following data:CF0 = -30; CF1 = 5; CF2 = 10; CF3 = 15; CF4 = 20; I/YR = 10; and solve for NPVA = $7.74; IRRA = 19.19%.
Calculate MIRRA at WACC = 10%:Step 1: Calculate the NPV of the uneven cash flow stream, so
its FV can then be calculated. With a financial calculator, enter the cash flow stream into the cash flow registers, then enter I/YR = 10, and solve for NPV = $37.739.
Step 2: Calculate the FV of the cash flow stream as follows:Enter N = 4, I/YR = 10, PV = -37.739, and PMT = 0 to solve for FV = $55.255.
Step 3: Calculate MIRRA as follows:Enter N = 4, PV = -30, PMT = 0, and FV = 55.255 to solve for I/YR = 16.50%.
Payback A (cash flows in millions):Annual
Period Cash Flows Cumulative0 ($30) ($30)1 5 (25)2 10 (15)3 15 04 20 20
PaybackA = 3 years.
Discounted Payback A (cash flows in millions):Annual Discounted @10% Cumulative
Period Cash Flows Cash Flows Cash Flows 0 ($30) ($30.00) ($30.00)1 5 4.55 (25.45)2 10 8.26 (17.19)
Chapter 11: The Basics of Capital Budgeting Comprehensive/Spreadsheet Problem 283

3 15 11.27 (5.92)4 20 13.66 7.74
Discounted PaybackA = 3 + $5.92/$13.66 = 3.43 years.
Project B:Using a financial calculator, enter the following data:CF0 = -30; CF1 = 20; CF2 = 10; CF3 = 8; CF4 = 6; I/YR = 10; and solve for NPVB = $6.55; IRRB = 22.52%.
Calculate MIRRB at WACC = 10%:Step 1: Calculate the NPV of the uneven cash flow stream, so
its FV can then be calculated. With a financial calculator, enter the cash flow stream into the cash flow registers, then enter I/YR = 10, and solve for NPV = $36.55.
Step 2: Calculate the FV of the cash flow stream as follows:Enter N = 4, I/YR = 10, PV = -36.55, and PMT = 0 to solve for FV = $53.52.
Step 3: Calculate MIRRB as follows:Enter N = 4, PV = -30, PMT = 0, and FV = 53.52 to solve for I/YR = 15.57%.
Payback B (cash flows in millions):Annual
Period Cash Flows Cumulative0 ($30) ($30)1 20 (10)2 10 03 8 84 6 14
PaybackB = 2 years.
Discounted Payback B (cash flows in millions):Annual Discounted @10% Cumulative
Period Cash Flows Cash Flows Cash Flows 0 ($30) ($30.00) ($30.00)1 20 18.18 (11.82)2 10 8.26 (3.56)3 8 6.01 2.454 6 4.10 6.55
Discounted PaybackB = 2 + $3.56/$6.01 = 2.59 years.
Summary:
284 Comprehensive/Spreadsheet Problem Chapter 11: The Basics of Capital Budgeting

Project A Project B NPV $7.74 $6.55IRR 19.19% 22.52%MIRR 16.50% 15.57%Payback 3 years 2 yearsDiscounted Payback 3.43 years 2.59 years
b. If the two projects are independent, both projects will be accepted because their NPVs are greater than zero.
c. If the two projects are mutually exclusive, at WACC = 10% Project A should be chosen since NPVA > NPVB.
d. WACC NPV A NPV B 0% $20.00 $14.005 13.24 9.96
10 7.74 6.5515 3.21 3.6419.19 0 1.5220 (0.56) 1.1322.52 (2.23) 0
-5
0
5
10
15
20
25
0% 5% 10% 15% 20% 25%W ACC (% )
NPV ($)
Project A
Project B
e. At WACC = 5% and the two projects are mutually exclusive, NPVA > NPVB
so choose Project A. This doesn’t change our recommendation. At
Chapter 11: The Basics of Capital Budgeting Comprehensive/Spreadsheet Problem 285
IRR B
IRR A

WACC = 15% and the two projects are mutually exclusive, NPVB > NPVA so choose Project B. This does change our recommendation. Both of these decisions can be made from looking at the NPV profile in Part d.
f. The crossover rate is the cost of capital at which the NPV profiles of two projects cross and, thus, at which the projects’ NPVs are equal. At a cost of capital less than the crossover rate there is a conflict between NPV and IRR but at a cost of capital greater than the crossover rate there is no conflict between NPV and IRR.
g. It is not possible for conflicts between NPV and IRR when independent projects are being evaluated. NPV is greater than zero at all WACCs <IRR, so the NPV rule would accept these projects. At IRR > WACC, all projects meeting this criterion would be accepted by the IRR rule.
h. Looking at both the payback and discounted payback methods, Project Blooks better than A. The faster the payback, the more liquid and less risky the project.
i. The cutoff chosen for both payback periods is arbitrary—but usually based on specific information the firm has on past projects. However, the criteria for the NPV and the IRR methods are not arbitrary.
j. The MIRR is the discount rate at which the present value of a project’s cost is equal to the present value of its terminal value, where the terminal value is found as the sum of the future values of the cash inflows, compounded at the firm’s cost of capital. The difference between the IRR and MIRR is the reinvestment rate assumption. The reinvestment rate of the IRR is the project’s return, while the reinvestment rate of the MIRR is the firm’s cost ofcapital. Consequently, MIRR gives a better idea of the rate of return on the project.
k. Academics prefer NPV to IRR because NPV gives an estimate (a dollar value) of how much a potential project will contribute to shareholderwealth. However, executives tend to like IRR because it gives a measure of the project’s “bang for the buck” and gives information concerning a project’s safety margin.
286 Comprehensive/Spreadsheet Problem Chapter 11: The Basics of Capital Budgeting

Integrated Case
11-24Allied Components CompanyBasics of Capital Budgeting
You recently went to work for Allied Components Company, a
supplier of auto repair parts used in the after-market with
products from Daimler, Chrysler, Ford, and other automakers. Your
boss, the chief financial officer (CFO), has just handed you the
estimated cash flows for two proposed projects. Project L involves
adding a new item to the firm’s ignition system line; it would
take some time to build up the market for this product, so the
cash inflows would increase over time. Project S involves an add-
on to an existing line, and its cash flows would decrease over
time. Both projects have 3-year lives, because Allied is planning
to introduce entirely new models after 3 years.
Here are the projects’ net cash flows (in thousands of
dollars):
0 1 2 3| | | |
Project L -100 10 60 80Project S -100 70 50 20
Depreciation, salvage values, net working capital requirements,
and tax effects are all included in these cash flows.
Chapter 11: The Basics of Capital Budgeting Integrated Case 287

The CFO also made subjective risk assessments of each project,
and he concluded that both projects have risk characteristics
that are similar to the firm’s average project. Allied’s WACC is
10%. You must determine whether one or both of the projects
should be accepted.
A. What is capital budgeting? Are there any similarities
between a firm’s capital budgeting decisions and an
individual’s investment decisions?
Answer: [Show S11-1 through S11-3 here.] Capital budgeting is
the process of analyzing additions to fixed assets.
Capital budgeting is important because, more than
anything else, fixed asset investment decisions chart a
company’s course for the future. Conceptually, the
capital budgeting process is identical to the decision
process used by individuals making investment decisions.
These steps are involved:
1. Estimate the cash flows—interest and maturity value
or dividends in the case of bonds and stocks,
operating cash flows in the case of capital projects.
2. Assess the riskiness of the cash flows.
3. Determine the appropriate discount rate, based on the
riskiness of the cash flows and the general level of
288 Integrated Case Chapter 11: The Basics of Capital Budgeting
interest rates. This is called the project cost of
capital in capital budgeting.
4. Find (a) the PV of the expected cash flows and/or (b)
the asset’s rate of return.
5. If the PV of the inflows is greater than the PV of
the outflows (the NPV is positive), or if the
calculated rate of return (the IRR) is higher than
the project cost of capital, accept the project.
B. What is the difference between independent and mutually
exclusive projects? Between projects with normal and
nonnormal cash flows?
Answer: [Show S11-4 and S11-5 here.] Projects are independent if
the cash flows of one are not affected by the acceptance
of the other. Conversely, two projects are mutually
exclusive if acceptance of one impacts adversely the
cash flows of the other; that is, at most one of two or
more such projects may be accepted. Put another way,
when projects are mutually exclusive it means that they
do the same job. For example, a forklift truck versus a
conveyor system to move materials, or a bridge versus a
ferry boat.
Projects with normal cash flows have outflows, or
costs, in the first year (or years) followed by a series
of inflows. Projects with nonnormal cash flows have one
Chapter 11: The Basics of Capital Budgeting Integrated Case 289

or more outflows after the inflow stream has begun.
Here are some examples:
Inflow (+) or Outflow (-) in Year 0 1 2 3 4 5
Normal - + + + + +- - + + + +- - - + + +
Nonnormal - + + + + -- + + - + -+ + + - - -
C. (1) Define the term net present value (NPV). What is each
project’s NPV?
Answer: [Show S11-6 through S11-8 here.] The net present value
(NPV) is simply the sum of the present values of a
project’s cash flows:
NPV = .
Project L’s NPV is $18.79:
0 1 2 3| | | |
-100.00 10 60 809.0949.59
60 .11 18 .79 = NPVL
NPVs are easy to determine using a calculator with an NPV
function. Enter the cash flows sequentially, with outflows
290 Integrated Case Chapter 11: The Basics of Capital Budgeting
10%
1/(1.10)2
1/(1.10)3
1/1.10

entered as negatives; enter the WACC; and then press the
NPV button to obtain the project’s NPV, $18.78 (note the
penny rounding difference). The NPV of Project S is NPVS
= $19.98.
C. (2) What is the rationale behind the NPV method? According
to NPV, which project(s) should be accepted if they are
independent? Mutually exclusive?
Answer: [Show S11-9 here.] The rationale behind the NPV method
is straightforward: If a project has NPV = $0, then the
project generates exactly enough cash flows (1) to
recover the cost of the investment and (2) to enable
investors to earn their required rates of return (the
opportunity cost of capital). If NPV = $0, then in a
financial (but not an accounting) sense, the project
breaks even. If the NPV is positive, then more than
enough cash flow is generated, and conversely if NPV is
negative.
Consider Project L’s cash inflows, which total $150.
They are sufficient (1) to return the $100 initial
investment, (2) to provide investors with their 10%
aggregate opportunity cost of capital, and (3) to still
have $18.78 left over on a present value basis. This
$18.78 excess PV belongs to the shareholders—the
debtholders’ claims are fixed—so the shareholders’ wealth
Chapter 11: The Basics of Capital Budgeting Integrated Case 291

will be increased by $18.78 if Project L is accepted.
Similarly, Allied’s shareholders gain $19.98 in value if
Project S is accepted.
If Projects L and S are independent, then both should
be accepted, because both add to shareholders’ wealth,
hence to the stock price. If the projects are mutually
exclusive, then Project S should be chosen over L, because
S adds more to the value of the firm.
C. (3) Would the NPVs change if the WACC changed? Explain.
Answer: The NPV of a project is dependent on the WACC used. Thus,
if the WACC changed, the NPV of each project would
change. NPV declines as WACC increases, and NPV rises
as WACC falls.
D. (1) Define the term internal rate of return (IRR). What is
each project’s IRR?
Answer: [Show S11-10 here.] The internal rate of return (IRR) is
that discount rate which forces the NPV of a project to
equal zero:
0 1 2 3| | | |CF0 CF1 CF2 CF3PVCF1PVCF2PVCF3
0 = Sum of PVs = NPV.
292 Integrated Case Chapter 11: The Basics of Capital Budgeting

Expressed as an equation, we have:
IRR: = $0 = NPV.
Note that the IRR equation is the same as the NPV
equation, except that to find the IRR the equation is
solved for the particular discount rate, IRR, which
forces the project’s NPV to equal zero (the IRR) rather
than using the WACC in the denominator and finding NPV.
Thus, the two approaches differ in only one respect: In
the NPV method, a discount rate is specified (the
project’s WACC) and the equation is solved for NPV, while
in the IRR method, the NPV is specified to equal zero and
the discount rate (IRR) that forces this equality is
found.
Project L’s IRR is 18.1%:
0 1 2 3| | | |
-100.00 10 60 808.4743.02
48 .57 0 .06 $0 if IRRl = 18.1% is used as the
discount rate.
Therefore, IRRL ≈ 18.1%.
A financial calculator is extremely helpful when
calculating IRRs. The cash flows are entered
Chapter 11: The Basics of Capital Budgeting Integrated Case 293
18.1%
1/(1.181)2
1/(1.181)3
1/1.181

sequentially, and then the IRR button is pressed. For
Project S, IRRS ≈ 23.6%. Note that with many
calculators, you can enter the cash flows into the cash
flow register, also enter WACC = I/YR, and then
calculate both NPV and IRR by pressing the appropriate
buttons.
D. (2) How is the IRR on a project related to the YTM on a bond?
Answer: [Show S11-11 here.] The IRR is to a capital project what
the YTM is to a bond—it is the expected rate of return
on the project, just as the YTM is the promised rate of
return on a bond.
D. (3) What is the logic behind the IRR method? According to
IRR, which projects should be accepted if they are
independent? Mutually exclusive?
Answer: [Show S11-12 here.] IRR measures a project’s
profitability in the rate of return sense: If a
project’s IRR equals its cost of capital, then its cash
flows are just sufficient to provide investors with their
required rates of return. An IRR greater than WACC
implies an economic profit, which accrues to the firm’s
shareholders, while an IRR less than WACC indicates an
economic loss, or a project that will not earn enough to
cover its cost of capital.
294 Integrated Case Chapter 11: The Basics of Capital Budgeting
Projects’ IRRs are compared to their costs of
capital, or hurdle rates. Since Projects L and S both
have a hurdle rate of 10%, and since both have IRRs
greater than that hurdle rate, both should be accepted if
they are independent. However, if they are mutually
exclusive, Project S would be selected, because it has
the higher IRR.
D. (4) Would the projects’ IRRs change if the WACC changed?
Answer: IRRs are independent of the WACC. Therefore, neither
IRRS nor IRRL would change if WACC changed. However, the
acceptability of the projects could change—L would be
rejected if WACC were greater than 18.1%, and S would be
rejected if WACC were greater than 23.6%.
E. (1) Draw NPV profiles for Projects L and S. At what discount
rate do the profiles cross?
Answer: [Show S11-13 and S11-14 here.] The NPV profiles are
plotted in the figure below. Note the following points:
1. The Y-intercept is the project’s NPV when WACC = 0%.
This is $50 for L and $40 for S.
2. The X-intercept is the project’s IRR. This is 18.1%
for L and 23.6% for S.
Chapter 11: The Basics of Capital Budgeting Integrated Case 295

3. NPV profiles are curves rather than straight lines.
To see this, note that these profiles approach cost =
-$100 as WACC approaches infinity.
4. From the figure below, it appears that the crossover
rate is between 8% and 9%.
NPV($)
5 10 15 20 25
10
20
30
40
50
0
-10
Crossover Rate 9%
IRR S = 23.6%
IRR L = 18.1%W ACC (% )
Project S
Project L
NPV($)
5 10 15 20 25
10
20
30
40
50
0
-10
Crossover Rate 9%
IRR S = 23.6%
IRR L = 18.1%W ACC (% )
Project S
Project L
NPV($)
5 10 15 20 25
10
20
30
40
50
0
-10
Crossover Rate 9%
IRR S = 23.6%
IRR L = 18.1%W ACC (% )
Project S
Project L
WACC NPVL NPVS
0% $50 $405 33 2910 19 2015 7 1220 (4) 5
E. (2) Look at your NPV profile graph without referring to the
actual NPVs and IRRs. Which project(s) should be
accepted if they are independent? Mutually exclusive?
Explain. Are your answers correct at any WACC less than
23.6%?
Answer: [Show S11-15 here.] The NPV profiles show that the IRR
and NPV criteria lead to the same accept/reject decision
for any independent project. Consider Project L. It
296 Integrated Case Chapter 11: The Basics of Capital Budgeting

intersects the X-axis at its IRR, 18.1%. According to
the IRR rule, L is acceptable if WACC is less than
18.1%. Also, at any WACC less than 18.1%, L’s NPV
profile will be above the X-axis, so its NPV will be
greater than $0. Thus, for any independent project, NPV
and IRR lead to the same accept/reject decision.
Now assume that L and S are mutually exclusive. In
this case, a conflict might arise. First, note that IRRS
= 23.6% > 18.1% = IRRL. Therefore, regardless of the size
of WACC, Project S would be ranked higher by the IRR
criterion. However, the NPV profiles show that NPVL >
NPVS if WACC is less than the crossover rate. Therefore,
for any WACC less than the crossover rate, say WACC = 7%,
the NPV rule says choose L, but the IRR rule says choose
S. Thus, if WACC is less than the crossover rate, a
ranking conflict occurs.
F. (1) What is the underlying cause of ranking conflicts between
NPV and IRR?
Answer: [Show S11-16 here.] For normal projects’ NPV profiles to
cross, one project must have both a higher vertical axis
intercept and a steeper slope than the other. A
project’s vertical axis intercept typically depends on
(1) the size of the project and (2) the size and timing
pattern of the cash flows—large projects, and ones with
Chapter 11: The Basics of Capital Budgeting Integrated Case 297

large distant cash flows, would generally be expected to
have relatively high vertical axis intercepts. The
slope of the NPV profile depends entirely on the timing
pattern of the cash flows—long-term projects have
steeper NPV profiles than short-term ones. Thus, we
conclude that NPV profiles can cross in two situations:
(1) when mutually exclusive projects differ in scale (or
size) and (2) when the projects’ cash flows differ in
terms of the timing pattern of their cash flows (as for
Projects L and S).
F. (2) What is the reinvestment rate assumption, and how does it
affect the NPV versus IRR conflict?
Answer: [Show S11-17 here.] The underlying cause of ranking
conflicts is the reinvestment rate assumption. All DCF
methods implicitly assume that cash flows can be
reinvested at some rate, regardless of what is actually
done with the cash flows. Discounting is the reverse of
compounding. Since compounding assumes reinvestment, so
does discounting. NPV and IRR are both found by
discounting, so they both implicitly assume some discount
rate. Inherent in the NPV calculation is the assumption
that cash flows can be reinvested at the project’s cost
of capital, while the IRR calculation assumes
reinvestment at the IRR rate.
298 Integrated Case Chapter 11: The Basics of Capital Budgeting
F. (3) Which method is the best? Why?
Answer: Whether NPV or IRR gives better rankings depends on which
has the better reinvestment rate assumption. Normally,
the NPV’s assumption is better. The reason is as
follows: A project’s cash inflows are generally used as
substitutes for outside capital, that is, projects’ cash
flows replace outside capital and, hence, save the firm
the cost of outside capital. Therefore, in an
opportunity cost sense, a project’s cash flows are
reinvested at the cost of capital.
Note, however, that NPV and IRR always give the same
accept/reject decisions for independent projects, so IRR
can be used just as well as NPV when independent projects
are being evaluated. The NPV versus IRR conflict arises
only if mutually exclusive projects are involved.
G. (1) Define the term modified IRR (MIRR). Find the MIRRs for
Projects L and S.
Answer: [Show S11-18 and S11-19 here.] MIRR is that discount
rate which equates the present value of the terminal
value of the inflows, compounded at the cost of capital,
to the present value of the costs. Here is the setup for
calculating Project L’s modified IRR:
0 1 2 3| | | |
Chapter 11: The Basics of Capital Budgeting Integrated Case 299
WACC = 10%

PV of costs =(100.00) 10 60 80.0066.00
12 .10 TV of inflows =158 .10
PV of TV = 100.00MIRR = ?
$100 =
PV costs = .
After you calculate the TV, enter N = 3, PV = -100, PMT
= 0, FV = 158.1, and then press I/YR to get the answer,
MIRRL = 16.5%. We could calculate MIRRS similarly: MIRRS
= 16.9%. Thus, Project S is ranked higher than L. This
result is consistent with the NPV decision.
G. (2) What are the MIRR’s advantages and disadvantages vis-à-
vis the NPV?
Answer: [Show S11-20 here.] MIRR does not always lead to the
same decision as NPV when mutually exclusive projects
are being considered. In particular, small projects
often have a higher MIRR, but a lower NPV, than larger
projects. Thus, MIRR is not a perfect substitute for
NPV, and NPV remains the single best decision rule.
However, MIRR is superior to the regular IRR, and if a
rate of return measure is needed, MIRR should be used.
300 Integrated Case Chapter 11: The Basics of Capital Budgeting
(1.10)2
1.10

Business executives agree. Business executives
prefer to compare projects’ rates of return to comparing
their NPVs. This is an empirical fact. As a result,
financial managers are substituting MIRR for IRR in
their discussions with other corporate executives. This
fact was brought out in the October 1989 FMA meetings,
where executives from Du Pont, Hershey, and Ameritech,
among others, all reported a switch from IRR to MIRR.
H. (1) What is the payback period? Find the paybacks for
Projects L and S.
Answer: [Show S11-21 through S11-23 here.] The payback period is
the expected number of years required to recover a
project’s cost. We calculate the payback by developing
the cumulative cash flows as shown below for Project L
(in thousands of dollars):
Expected NCF Year Annual Cumulative0 ($100) ($100)1 10 (90)2 60 (30) Payback is between3 80 50 t = 2 and t = 3
0 1 2 3| | | |
-100 10 60 80-90 -30 50
Chapter 11: The Basics of Capital Budgeting Integrated Case 301

Project L’s $100 investment has not been recovered at
the end of Year 2, but it has been more than recovered
by the end of Year 3. Thus, the recovery period is
between 2 and 3 years. If we assume that the cash flows
occur evenly over the year, then the investment is
recovered $30/$80 = 0.375 ≈ 0.4 into Year 3. Therefore,
PaybackL = 2.4 years. Similarly, PaybackS = 1.6 years.
H. (2) What is the rationale for the payback method? According
to the payback criterion, which project(s) should be
accepted if the firm’s maximum acceptable payback is 2
years, if Projects L and S are independent, if Projects
L and S are mutually exclusive?
Answer: Payback represents a type of “breakeven” analysis: The
payback period tells us when the project will break even
in a cash flow sense. With a required payback of 2
years, Project S is acceptable, but Project L is not.
Whether the two projects are independent or mutually
exclusive makes no difference in this case.
H. (3) What is the difference between the regular and discounted
payback methods?
Answer: [Show S11-24 here.] Discounted payback is similar to
payback except that discounted rather than raw cash flows
are used.
302 Integrated Case Chapter 11: The Basics of Capital Budgeting

Optional Question
What is Project L’s discounted payback, assuming a 10% cost of
capital?
Answer: Expected Net Cash Flows Year Raw Discounted Cumulative0 ($100) ($100.00) $100.00)1 10 9.09 (90.91)2 60 49.59 (41.32)3 80 60.11 18.79
Discounted paybackL = 2 + ($41.32/$60.11) = 2.69 = 2.7
years.
Versus 2.4 years for the regular payback.
H. (4) What are the two main disadvantages of discounted payback?
Is the payback method of any real usefulness in capital
budgeting decisions? Explain.
Answer: Regular payback has three critical deficiencies: (1) It
ignores the time value of money. (2) It ignores the cash
flows that occur after the payback period. (3) Unlike
the NPV, which tells us by how much the project should
increase shareholder wealth, and the IRR, which tells us
how much a project yields over the cost of capital, the
payback merely tells us when we get our investment back.
Discounted payback does consider the time value of
money, but it still fails to consider cash flows after
the payback period and it gives us no specific decision
Chapter 11: The Basics of Capital Budgeting Integrated Case 303

rule for acceptance; hence, it has 2 basic flaws. In
spite of its deficiency, many firms today still
calculate the discounted payback and give some weight to
it when making capital budgeting decisions. However,
payback is not generally used as the primary decision
tool. Rather, it is used as a rough measure of a
project’s liquidity and riskiness.
I. As a separate project (Project P), the firm is
considering sponsoring a pavilion at the upcoming
World’s Fair. The pavilion would cost $800,000, and it
is expected to result in $5 million of incremental cash
inflows during its 1 year of operation. However, it
would then take another year, and $5 million of costs,
to demolish the site and return it to its original
condition. Thus, Project P’s expected net cash flows
look like this (in millions of dollars):
0 1 2| | |
-0.8 5.0 -5.0
The project is estimated to be of average risk, so its
WACC is 10%.
I. (1) What is Project P’s NPV? What is its IRR? Its MIRR?
Answer: [Show S11-25 here.] Here is the time line for the cash
flows, and the NPV:
304 Integrated Case Chapter 11: The Basics of Capital Budgeting

0 1 2| | |
-800,000 5,000,000 -5,000,000
NPVP = -$386,776.86.
We can find the NPV by entering the cash flows into the
cash flow register, entering I/YR = 10, and then
pressing the NPV button. However, calculating the IRR
presents a problem. With the cash flows in the register,
press the IRR button. An HP-10BII financial calculator
will give the message “error-soln.” This means that
Project P has multiple IRRs. An HP-17BII will ask for a
guess. If you guess 10%, the calculator will show IRR =
25%. If you guess a high number, such as 200%, it will
show the second IRR, 400%.1 The MIRR of Project P =
5.6%, and is found by calculating the discount rate that
equates the terminal value ($5.5 million) to the present
value of costs ($4.93 million).
I. (2) Draw Project P’s NPV profile. Does Project P have normal
or nonnormal cash flows? Should this project be
accepted? Explain.
Answer: [Show S11-26 through S11-28 here.] You could put the
cash flows in your calculator and then enter a series of
I/YR values, get an NPV for each, and then plot the 1 Looking at the figure below, if you guess an IRR to the left of the peak NPVrate, the lower IRR will appear. If you guess IRR > peak NPV rate, thehigher IRR will appear.
Chapter 11: The Basics of Capital Budgeting Integrated Case 305
10%

points to construct the NPV profile. We used a
spreadsheet model to automate the process and then to
draw the profile. Note that the profile crosses the X-
axis twice, at 25% and at 400%, signifying two IRRs.
Which IRR is correct? In one sense, they both are—both
cause the project’s NPV to equal zero. However, in
another sense, both are wrong—neither has any economic
or financial significance.
Project P has nonnormal cash flows; that is, it has
more than one change of signs in the cash flows. Without
this nonnormal cash flow pattern, we would not have the
multiple IRRs.
Since Project P’s NPV is negative, the project should
be rejected, even though both IRRs (25% and 400%) are
greater than the project’s 10% WACC. The MIRR of 5.6%
also supports the decision that the project should be
rejected.
306 Integrated Case Chapter 11: The Basics of Capital Budgeting

100 200 300 5000
125
250
375
-125
-250
-375
500
NPV(Thousands of Dollars)
r (% )100 200 300 5000
125
250
375
-125
-250
-375
500
400100 200 300 5000
125
250
375
-125
-250
-375
500
NPV(Thousands of Dollars)
r (% )100 200 300 5000
125
250
375
-125
-250
-375
500
400
Chapter 11: The Basics of Capital Budgeting Integrated Case 307
Copyright © 2022 FDOKUMEN