Scanning tunneling microscopy of ethanethiolate and n-octadecanethiolate monolayers spontaneously...
6
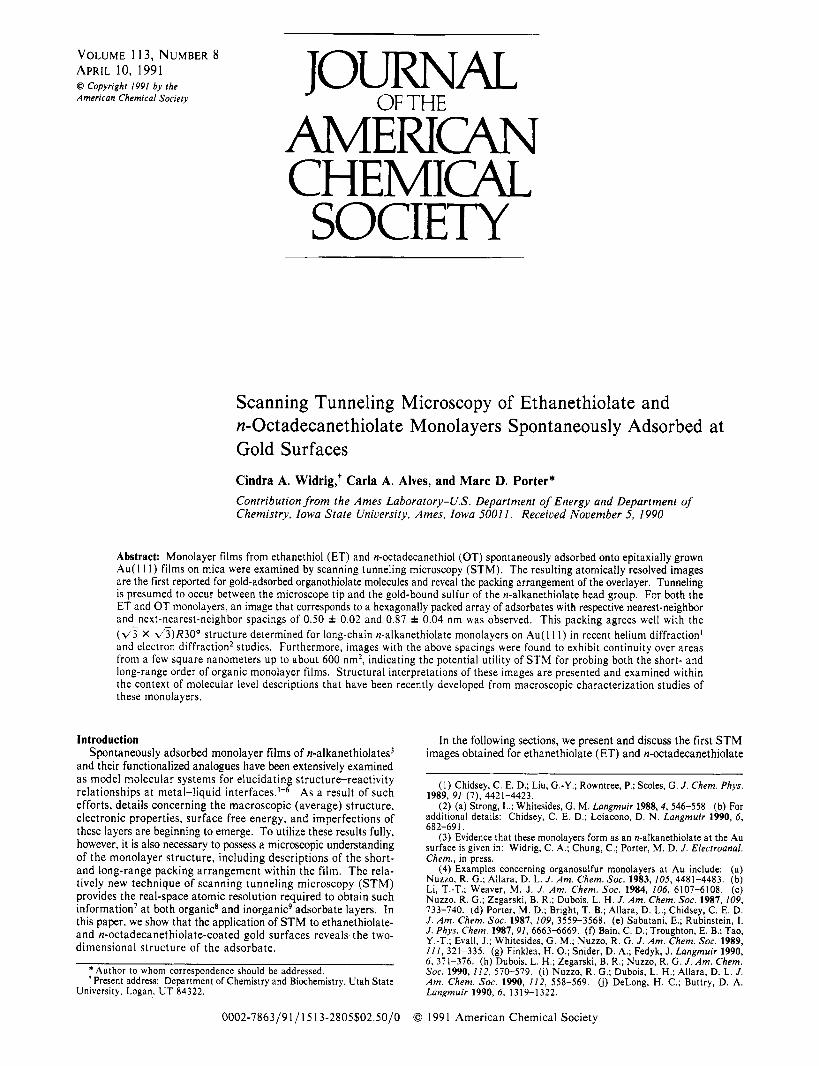
VOLUME 113, NUMBER 8 APRIL 10, 1991 0 Copyright 1991 by the American Chemical Society JOURNAL AME" CHEMIGU SOCIETY OF THE Scanning Tunneling Microscopy of Ethanethiolate and n-Octadecanethiolate Monolayers Spontaneously Adsorbed at Gold Surfaces Cindra A. Widrig,+ Carla A. Alves, and Marc D. Porter* Contribution from the Ames Laboratory-US. Department of Energy and Department of Chemistry, Iowa State University, Ames, Iowa 5001 1. Received November 5, 1990 Abstract: Monolayer films from ethanethiol (ET) and n-octadecanethiol (OT) spontaneously adsorbed onto epitaxially grown Au( 1 I I) films on mica were examined by scanning tunneling microscopy (STM). The resulting atomically resolved images are the first reported for gold-adsorbed organothiolate molecules and reveal the packing arrangement of the overlayer. Tunneling is presumed to occur between the microscope tip and the gold-bound sulfur of the n-alkanethiolate head group. For both the ET and OT monolayers, an image that corresponds to a hexagonally packed array of adsorbates with respective nearest-neighbor and next-nearest-neighbor spacings of 0.50 f 0.02 and 0.87 f 0.04 nm was observed. This packing agrees well with the (d? X d/5)R3O0 structure determined for long-chain n-alkanethiolate monolayers on Au(l11) in recent helium diffraction' and clcctron diffraction2 studies. Furthermore, images with the above spacings were found to exhibit continuity over areas from a few square nanometers up to about 600 nm2, indicating the potential utility of STM for probing both the short- and long-range order of organic monolayer films. Structural interpretations of these images are presented and examined within the context of molecular level descriptions that have been recently developed from macroscopic characterization studies of these monolayers. Introduction Spontaneously adsorbed monolayer films of n-alkanethi~lates~ and their functionalized analogues have been extensively examined as model molecular systems for elucidating structure-reactivity relationships at metal-liquid interfaces.'-6 As a result of such efforts, details concerning the macroscopic (average) structure, electronic properties, surface free energy, and imperfections of In the following sections, we present and discuss the first STM images obtained for ethanethiolate (ET) and n-octadecanethiolate (1) Chidsey, C. E. D.; Liu, G.-Y.; Rowntree, P.; Scoles, G. J. Chem. Phys. 1989, 91 (7), 4421-4423, (2) (a) Strong, L.; Whitesides, G. M. Langmuir 1988, 4, 546-558. (b) For additional details: Chidsey, C. E. D.; Loiacono, D. N. Langmuir 1990, 6, these layers are beginning to emerge. Toutilize these results fully, 682-6y1. (3) Evidence that these monolayers form as an n-alkanethiolate at the Au however, it is also necessary to possess a microscopic understanding surface is given in: Widrie. C. A,: Chune. C.: Porter. M. D. J. Electroanal. of the monolaver structure. includine descrbtions of the short- Chem.. inks. - I and longrang; packing arrangemenLwithin the film. The rela- tively new technique of scanning tunneling microscopy (STM) provides the real-space atomic resolution required to obtain such information' at both organic8 and inorganicg adsorbate layers. In this paper, we show that the application of STM to ethanethiolate- and n-octadecanethiolate-coated gold surfaces reveals the two- dimensional structure of the adsorbate. *Author to whom correspondence should be addressed. ' Present address: Department of Chemistry and Biochemistry. Utah State University, Logan, UT 84322. (4) Eximples concerning organosulfur monolayers at Au include: (a) Nuzzo, R. G.; Allara, D. L. J. Am. Chem. SOC. 1983,105,4481-4483. (b) Li, T.-T.; Weaver, M. J. J. Am. Chem. SOC. 1984, 106, 6107-6108. (c) Nuzzo, R. G.; Zegarski, B. R.; Dubois, L. H. J. Am. Chem. SOC. 1987, 109, 733-740. (d) Porter, M. D.; Bright, T. B.; Allara, D. L.; Chidsey, C. E. D. J. Am. Chem. SOC. 1987, 109, 3559-3568. (e) Sabatani, E.; Rubinstein, I. J. Phys. Chem. 1987,91,6663-6669. (f) Bain, C. D.; Troughton, E. B.; Tao, Y.-T.; Evall, J.; Whitesides, G. M.; Nuzzo, R. G. J. Am. Chem. SOC. 1989, Ill, 321-335. (g) Finklea, H. 0.; Snider, D. A,; Fedyk, J. Langmuir 1990, 6,371-376. (h) Dubois, L. H.; Zegarski, B. R.; Nuzzo, R. G. J. Am. Chem. SOC. 1990, 112, 570-579. (i) Nuzzo, R. G.; Dubois, L. H.; Allara, D. L. J. Am. Chem. SOC. 1990, 112, 558-569. (j) DeLong, H. C.; Buttry, D. A. Langmuir 1990, 6, 1319-1322. 0002-7863/91/ 15 13-2805$02.50/0 0 1991 American Chemical Society
-
Upload
independent -
Category
Documents
-
view
1 -
download
0
Transcript of Scanning tunneling microscopy of ethanethiolate and n-octadecanethiolate monolayers spontaneously...
VOLUME 113, NUMBER 8 APRIL 10, 1991 0 Copyright 1991 by the American Chemical Society
JOURNAL AME" CHEMIGU SOCIETY
OF THE
Scanning Tunneling Microscopy of Ethanethiolate and n-Octadecanethiolate Monolayers Spontaneously Adsorbed at Gold Surfaces Cindra A. Widrig,+ Carla A. Alves, and Marc D. Porter* Contribution from the Ames Laboratory-US. Department of Energy and Department of Chemistry, Iowa State University, Ames, Iowa 5001 1. Received November 5, 1990
Abstract: Monolayer films from ethanethiol (ET) and n-octadecanethiol (OT) spontaneously adsorbed onto epitaxially grown Au( 1 I I ) films on mica were examined by scanning tunneling microscopy (STM). The resulting atomically resolved images are the first reported for gold-adsorbed organothiolate molecules and reveal the packing arrangement of the overlayer. Tunneling is presumed to occur between the microscope tip and the gold-bound sulfur of the n-alkanethiolate head group. For both the ET and OT monolayers, an image that corresponds to a hexagonally packed array of adsorbates with respective nearest-neighbor and next-nearest-neighbor spacings of 0.50 f 0.02 and 0.87 f 0.04 nm was observed. This packing agrees well with the (d? X d/5)R3O0 structure determined for long-chain n-alkanethiolate monolayers on Au(l11) in recent helium diffraction' and clcctron diffraction2 studies. Furthermore, images with the above spacings were found to exhibit continuity over areas from a few square nanometers up to about 600 nm2, indicating the potential utility of STM for probing both the short- and long-range order of organic monolayer films. Structural interpretations of these images are presented and examined within the context of molecular level descriptions that have been recently developed from macroscopic characterization studies of these monolayers.
Introduction Spontaneously adsorbed monolayer films of n-alkanethi~lates~
and their functionalized analogues have been extensively examined as model molecular systems for elucidating structure-reactivity relationships at metal-liquid interfaces.'-6 As a result of such efforts, details concerning the macroscopic (average) structure, electronic properties, surface free energy, and imperfections of
In the following sections, we present and discuss the first STM images obtained for ethanethiolate (ET) and n-octadecanethiolate
( 1 ) Chidsey, C. E. D.; Liu, G.-Y.; Rowntree, P.; Scoles, G. J . Chem. Phys. 1989, 91 (7), 4421-4423,
(2) (a) Strong, L.; Whitesides, G. M. Langmuir 1988, 4, 546-558. (b) For additional details: Chidsey, C. E. D.; Loiacono, D. N. Langmuir 1990, 6, these layers are beginning to emerge. Toutilize these results fully,
682-6y1. (3) Evidence that these monolayers form as an n-alkanethiolate at the Au however, it is also necessary to possess a microscopic understanding surface is given in: Widrie. C. A,: Chune. C.: Porter. M. D. J . Electroanal. of the monolaver structure. includine descrbtions of the short- Chem.. i n k s .
- I
and longrang; packing arrangemenLwithin the film. The rela- tively new technique of scanning tunneling microscopy (STM) provides the real-space atomic resolution required to obtain such information' at both organic8 and inorganicg adsorbate layers. In this paper, we show that the application of STM to ethanethiolate- and n-octadecanethiolate-coated gold surfaces reveals the two- dimensional structure of the adsorbate.
*Author to whom correspondence should be addressed. ' Present address: Department of Chemistry and Biochemistry. Utah State University, Logan, UT 84322.
(4) Eximples concerning organosulfur monolayers at Au include: (a) Nuzzo, R. G.; Allara, D. L. J . Am. Chem. SOC. 1983,105,4481-4483. (b) Li, T.-T.; Weaver, M. J. J . Am. Chem. SOC. 1984, 106, 6107-6108. (c) Nuzzo, R. G.; Zegarski, B. R.; Dubois, L. H. J . Am. Chem. SOC. 1987, 109, 733-740. (d) Porter, M . D.; Bright, T. B.; Allara, D. L.; Chidsey, C. E. D. J . Am. Chem. SOC. 1987, 109, 3559-3568. (e) Sabatani, E.; Rubinstein, I . J . Phys. Chem. 1987,91,6663-6669. (f) Bain, C. D.; Troughton, E. B.; Tao, Y.-T.; Evall, J . ; Whitesides, G. M.; Nuzzo, R. G. J . Am. Chem. SOC. 1989, I l l , 321-335. (g) Finklea, H. 0.; Snider, D. A,; Fedyk, J. Langmuir 1990, 6,371-376. (h) Dubois, L. H.; Zegarski, B. R.; Nuzzo, R. G. J . Am. Chem. SOC. 1990, 112, 570-579. (i) Nuzzo, R. G.; Dubois, L. H.; Allara, D. L. J . Am. Chem. SOC. 1990, 112, 558-569. (j) DeLong, H. C.; Buttry, D. A. Langmuir 1990, 6, 1319-1322.
0002-7863/91/ 15 13-2805$02.50/0 0 1991 American Chemical Society

2806 J . Am. Chem. SOC., Vol. 113, No. 8, 1991 Widrig et al.
removed from the vacuum chamber, and immersed immediately in 1 mM ethanolic solutions of ET or O T to form the monolayers!b The substrates were left in solution for 2-24 h, immersed, and rinsed thoroughly with ethanol. Variation of the immersion time did not observably affect the resulting images. These monolayers are structurally comparable to those prepared at 4u films deposited at polished silicon wafers, as determined by infrared reflection spectroscopic, contact angle, and electrochemical capacitance measurements.' The ET was used as received (Aldrich); O T (Aldrich) was recrystallized twice from methanol.
Instrumentation. All images were acquired with a Digital Instruments Nanoscope I1 STM (Santa Barbara, CA). The instrument was equipped with a 450 nm X 450 nm scanning head and was operated in the labo- ratory ambient. With this instrument, the images are displayed as though the tip moves from right to left across the computer monitor; the figures in this paper maintain this presentation.
Images examining large (0.02-0.20 wm2) sections of the sample were recorded under conditions for constant current (the "height" mode of the Nanoscope 11). In this mode, a preselected tunneling current between the tip and sample is maintained via a feedback loop to a piezoelectric tube that adjusts the vertical position of the tip. The adjustments to maintain a constant tunneling current are recorded as the tip is rastered over the sample surface. Typical tunneling currents and bias voltages used for these images were 3 nA and +80 mV, respectively, with the sign of the bias voltage given with respect to the grounded substrate. The tips used for these large scans were fabricated from 0.010 in. diameter tungsten wire cut diagonally with wire cutters.
For atomically resolved images, conditions for constant height imaging were found more useful (the "current" mode of the Nanoscope 11). In this mode, the vertical position of the tip is held constant with variations in the tunneling current recorded as the tip moves across the sample surface. Images were obtained under a range of bias voltages (-200 to +200 mV) and tunneling currents (1-10 nA). The tips used for the atomically resolved images were fabricated by etching electrolytically a 0.010 in. diameter tungsten wire in a solution of 1 M KOH.12 Only those tips that readily provided well-defined images of highly ordered pyrolytic graphite (HOPG) were used. The lateral distances in these images were determined by using HOPG for calibration.
Results and Discussion To develop a basis for the discussion of our results, we first
describe t h e various control experiments performed to verify tha t our STM images result from the presence of the monolayer. We next present images for our uncoated Au films, which reveal both the topography and predominant (1 11) crystallinity of the surface. The la t te r images serve as a reference for t h e presentat ion and discussion of the images of the spontaneously adsorbed monolayers of ET and OT. We conclude with a structural assessment of these images in the context of molecular level descriptions t h a t have been developed from various macroscopic character izat ion tech- niques and a brief discussion of a possible mechanism t h a t gives rise t o these images.
1. Reproducibility of Imaging n-Alkanethiolates on Au with STM. To date , t h e tunneling condi t ions t h a t consistently allow the observation of a well-defined image have been difficult to define fully. We a t t r ibu te this primarily to preparative variability of t h e shape and/or composition of t h e tip. "Good" and "bad" tips were distinguished solely on t h e basis of their ability or inability to resolve a tomic s t ructure at HOPG. Once constructed, a good tip was often used repcatedly. Also, images recorded upon initial engagement of a good t ip a t the sample surface frequent ly show no evidence of recognizable surface structure; it is only with time, displacement of the tip, and/or var ia t ion of the tunnel ing con- ditions tha t periodic features at an a tomic level become apparent . I t is usual tha t once a structure is observed, successive scans over t h e same area reproduce the image for several minutes up to an hour, after which time the image gradually or suddenly disappears. Moderate variation in the tunneling current (0.5-10 nA) and bias voltage (A20 t o f300 m V ) during the time t h a t t h e image is "in focus" usually does not lead t o loss of t h e image. Instabilities in t h e t ip s h a p e or composition m a y cause this focusing and loss of atomical ly resolved I
Because of t h e above difficulties, we cannot directly conclude tha t our images are representative of the structure across the entire
(OT) monolayers spontaneously adsorbed on epitaxially grown A u ( 1 1 1) films. As discussed, we believe our images result from electrons tunnel ing between t h e microscope t ip and t h e sample surface through the gold-bound sulfur of the n-alkanethiolate head group. For both ET and O T , an image t h a t corresponds to a hexagonal ly packed adsorba te overlayer with respective near- est-neighbor and next-nearest-neighbor spacings of 0.50 (f0.02) and 0.87 (*0.04) nm was observed. The two-dimensional ar- rangement suggests that the surface is covered predominantly with a (dj X d3)R30° overlayer on an underlying A u ( 1 1 1) lattice. This a r r a n g e m e n t agrees with t h a t reported by helium' and transmission electron2 diffraction studies. In addition, images with t h e above spacings were found t o exhibi t cont inui ty over areas of a few square nanometers u p t o a b o u t 600 nm2. Such images suggest tha t STM can provide impor tan t evidence regarding t h e size and distribution of ordered domains within these monolayers. A structural interpretation of the images is presented and examined in t h e context of t h e molecular level descriptions t h a t have been developed from recent s tudies with various macroscopic charac- ter izat ion
Experimental Section Monolayer Preparation. Gold substrates with a predominant ( I 1 1 )
texturc were prepared by the epitaxial growth of 200-nm gold films onto freshly cleaved mica sheets.I0." The mica sheets were nominally 1 i n . by in. The deposition was carried out by resistive evaporation in a cryogenically pumped Edwards 306A vacuum chamber (West Sussex, England) a t a prcssurc of -2 X IOd Torr. Immediately prior to de- position. the mica was heated in vacuum at 200-300 OC for - l h. Gold was deposited onto the heated mica at a rate of 0.3-0.7 nm/s. Subse- quently. the substrates were allowed to cool radiatively to below 70 O C ,
( 5 ) (a) Sandroff, C . J . ; Garoff, S.; Leung, K . P. Chem. Phys. Lett. 1983, 96,547-551. (b) JOO, T. H.; Kim, K.; Kim, M. S. J . Phys. Chem. 1986, 90, 5816-5819. (c) Blackman, L. C. F.; Dewar, M. J. S.; Hampson, H. J . Appl. Chem. 1957. 7 , 160-171. (d) Prince, N. P.; Seymour, D. L. Woodruff, D. P.; Jones, R. G.; Walter, W. SurJ. Sci. 1989, 215, 566-576. (e) Sobocinski, R. L.; Bryant, M. A.; Pemberton, J . E. J . Am. Chem. SOC. 1990, 112, 6177-6183. (f) Walczak, M. M.; Chung, C.; Stole, S. M.; Widrig, C. A,; Porter, M. D. J . Am. Chem. Soc., in press.
(6) For additional leading references see: Whitesides, G. M.: Laibinis, P. E. Langmuir 1990, 6, 87-96.
(7) Binnig, G.; Rohrer, H. Surf. Sri. 1983, 126, 236-244. (8) See, for example: (a) Feng, L.; Hu, C. 2.; Andrade, J. D. J . Microsc.
1988, 152 (3). 81 1-816. (b) Hubacek, J . S.; Brockenbrough, R. T.; Gammie, G.; Skala. S. L.; Lyding. J. W.; Latten, J. L.; Shapley. J. R. J . Microsc. 1988, 152 ( I ) , 221-227. (c) Braun, H. G.; Fuchs, H.; Shrepp, W. ThinSolid Films 1988, 159.301-314. (d) Lang, C. A.; Horber, J . K. H.; Hansch, T. W.; Heckl, W. M.; Mohwald, H. J . Vat. Sci. Technol. A 1988.6 (2), 368-370. (e) Eng, L.; Hidber, H.-R.; Rosenthaler, L.; Staufer, U.; Wiesendanger, R.; Gunth- erodt, H.-J.; Tamm, L. J . Vac. Sci. Technol. A 1988, 6 (2), 358-359. (f) Smith, D. P. E.; Horber, H.; Gerber, Ch.; Binnig, G. Science 1989, 245.43-45. (g) Smith, D. P. E.; Horber, J . K . H.; Binnig, G.; Nejoh, H. Nature 1990, 344, 641-644. (h ) Foster, J. S.; Frommer, J. E. Nature 1988, 333, 542-545. (i) Smith, D. P. E.; Bryant, A.; Quate, C. F.; Rabe, J. P.; Gerber, Ch.; Swalen, J . P. Proc. Natl. Acad. Sci. U.S.A. 1987, 84, 969-972. (j) Horber, J. K . H.; Lang, C. A.; Hansch, T. W.; Heckl, W. M.; Mohwald, H. Chem. Phys. Let t . 1988, 145, 151-158. (k) Wu, X.-L.; Lieber, C. M. J . Phys. Chem. 1988, 92, 5556-5557. ( I ) Rabe, J . P.; Sano, M.; Batchelder, D.; Kalatchev, A. A. J . Microsc. 1988, 152 (2), 573-583. (m) Moller. R.; Cohen, R. Esslinger, A,; Koalowski, B. J . Vac. Sci. Technol. A 1990,8 ( I ) , 659-660. (n) Ohtani, H.; Wilson, R. J. ; Chiang, S.; Mate, C. M. Phys. Reu. Lett. 1988, 60 (23), 2398-2401. (0) McMaster, T. J.; Carr, H.; Miles, M. J . ; Cairns, P.; Morris, V . J. J . Vac. Sci. Technol. A 1990,8 ( I ) , 648-651, (p) Beebe, T. P.; Wilson, T. E.; Ogletree, D. F.; Katz, J. E.; Balhorn, R.; Salmeron, M. B.; Siekhaus, W. J . Science 1989, 243, 370-372. (9) Hameroff, S.; Simic-Krstic, Y.; Vernetti, L.; Lee, Y. C.; Sarid, D.; Wiedmann, J.; Elings, V.; Kjoller, K.; McCuskey, R. J . Vac. Sci. Technol. A 1990,8 (1). 687-691. (r) Sotobayashi, H.; Schilling, T.; Tesche, B. Langmuir 1990, 6, 1246-1250.
(9) See , for example: (a) Schardt, B. C.; Yau, S.-L.; Rinaldi, F. Science 1989, 243, 1050-1053. (b) Ogletree, D. F.; Oca], C.; Marchon, B.; Somorjai. G. A.; Salmeron, M.; Beebe, T.; Siekhaus, W. J . Vac. Sci. Techno/. A 1990, 8 ( I ) , 297-301. (c) Marchon, B.; Ogletree, D. F.; Bussell, M. E.; Somorjai, G. A.; Salmeron, M.; Siekhaus, W. J . Microsc. 1988, 152 (2), 427-439. (d) Tokumoto. H.; Miki, K.; Murakami, H.; Bando, H.; Ono, M.; Kajimura, K . J . Vac. Sci. Technol. A 1990,8 ( I ) , 255-258. (e) Avouris, Ph.; Wolkow, R. Phys. Reu. B 1989, 39 (8), 5091-5100.
(IO) Chidsey, C. E. D.; Loiacono, D. N.; Sleator, T.; Nakahara, S. Surf. Sci. 1988, 200, 45-66.
( I I ) (a) Hallmark, V. M.; Chiang, S.; Rabolt, J. F.; Swalen, J. D.; Wilson, R. J. Phys. Rec. Lett. 1987, 59 (25), 2879-2882. (b) Emch, R.; Nogami, J.; Dovek, M. M ; Lang, C. A.; Quate, C. F. J . Appl. Phys. 1989, 65, 79-84.
(12) Yau, S.-L.: Vitus, C. M.; Schardt, B. C. J . Am. Chem. Soc. 1990,112, 3677-3679.
STM of' Thiolate F i l m on Gold J . Ani. Chem. Soc.. Vol. 113. No. 8, 1991 2807
F i p m I . ST\ l irn;igc of ;I 450 rim X 450 11111 wcliori 0 1 ' ; i n iiiico.i[cd
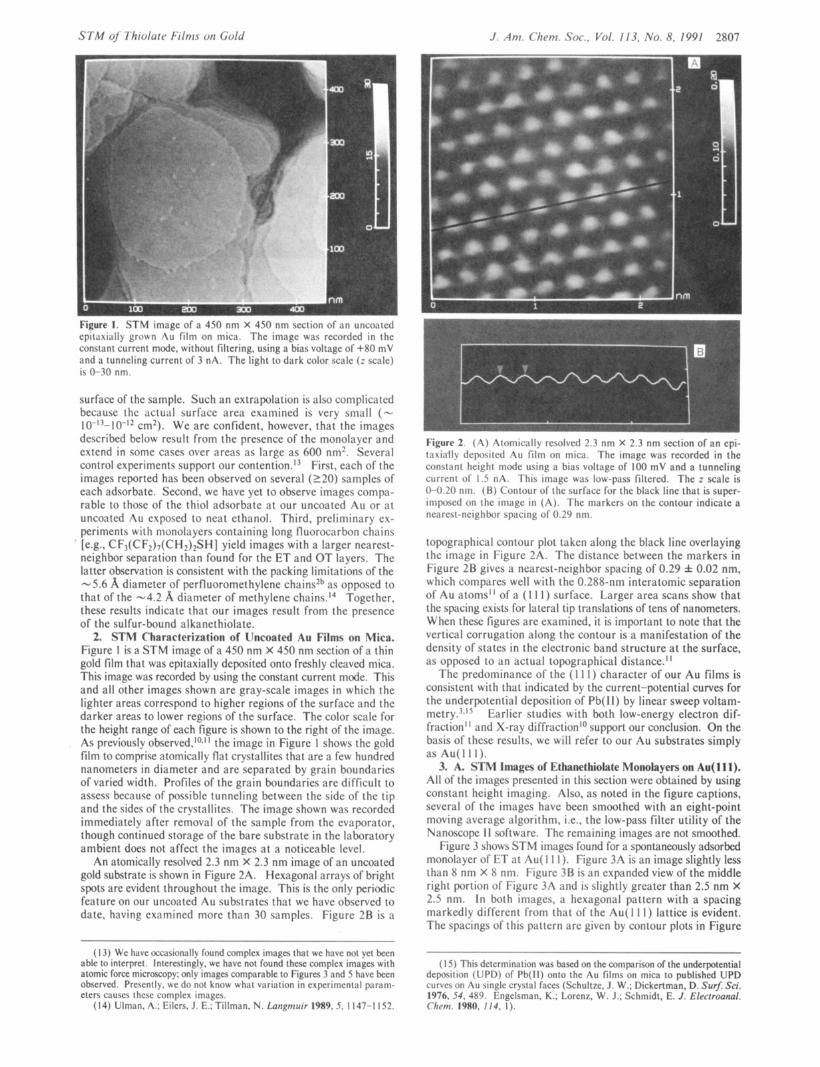
cpimiiillj grown :\t i film on mica. Thc imagc w;ts rccordcd in thc constant current mode, without filtering, using a bias voltage of +80 mV and a tunneling current of 3 nA. The light to dark color scale (: scale) is 0-30 nm.
surface of the sample. Such an extrapolation is also complicated because the actual surface area examined is very small (- 10-13-10-12 cm2). We are confident, however, that the images described below result from the presence of the monolayer and extend in some cases over areas as large as 600 nm?. Several control experiments support our ~0ntention.I~ First, each of the images reported has been observed on several (220) samples of each adsorbate. Second, we have yet to observe images compa- rable to those of the thiol adsorbate at our uncoated Au or at uncoated Au exposed to neat ethanol. Third, preliminary ex- periments with monolayers containing long fluorocarbon chains
' [e.g., CF3(CF2)7(CH2)2SH] yield images with a larger nearest- neighbor separation than found for the ET and OT layers. The latter observation is consistent with the packing limitations of the -5.6 %, diameter of perfluoromethylene chainsZb as opposed to that of the -4.2 diameter of methylene chains.I4 Together, these results indicate that our images result from the presence of the sulfur-bound alkanethiolate.
2. STU Characterization of Uncoated Au Films on Mica. Figure 1 is a STM image of a 450 nm X 450 nm section of a thin gold film that was epitaxially deposited onto freshly cleaved mica. This image was recorded by using the constant current mode. This and all other images shown are gray-scale images in which the lighter areas correspond to higher regions of the surface and the darker areas to lower regions of the surface. The color scale for the height range of each figure is shown to the right of the image. As previously observed.IoJ' the image in Figure 1 shows the gold film to comprise atomically flat crystallites that are a few hundred nanometers in diameter and are separated by grain boundaries of varied width. Profiles of the grain boundaries are difficult to assess because of possible tunneling between the side of the tip and the sides of the crystallites. The image shown was recorded immediately after removal of the sample from the evaporator, though continued storage of the bare substrate in the laboratory ambient does not affect the images at a noticeable level.
An atomically resolved 2.3 nm X 2.3 nm image of an uncoated gold substrate is shown in Figure 2A. Hexagonal arrays of bright spots are evident throughout the image. This is the only periodic feature on our uncoated Au substrates that we have observed to date, having examined more than 30 samples. Figure 2 R is a
F'igurc 2. (:I) .\tomic;ill! rcsol\.cd 2.3 nm x 1.7 nm section o f ;In cpi- t;iuia.lly depositcd Au film on mica. The image was recorded in the constant height mode using a bias voltage of I00 mV and a tunneling current of 1.5 nA. This imagc was low-pass filtered. The z scalc is 0-0.20 nm. ( B ) Contour of the surface for thc black line that is super- imposed on the imagc in (A). The markers on the contour indicate a nearest-neighbor spacing of 0.29 nm.
topographical contour plot taken along the black line overlaying the image in Figure 2A. The distance between the markers in Figure 2 B gives a nearest-neighbor spacing of 0.29 f 0.02 nm, which compares well with the 0.288-nm interatomic separation of Au atoms" of a ( I 1 I ) surface. Larger area scans show that the spacing exists for lateral tip translations of tens of nanometers. When these figures are examined, it is important to note that the vertical corrugation along the contour is a manifestation of the density of states in the electronic band structure at the surface, as opposed to an actual topographical distance."
The predominance of the ( 1 1 1 ) character of our Au films is consistent with that indicated by the current-potential curves for the underpotential deposition of Pb( I I ) by linear sweep voltam- metry."Is Earlier studies with both low-energy electron dif- fraction" and X-ray diffraction" support our conclusion. On the basis of these results, we will refer to our Au substrates simply asAu(l11).
3. A. STM Images of Ethanethiolate Monolayers on Au( 11 1). All of the images presented in this scction were obtained by using constant height imaging. Also, as noted in the figure captions, several of the images have been smoothed with an eight-point moving average algorithm, i.e., the low-pass filter utility of the Nanoscopc I I software. The remaining images are not smoothed.
Figure 3 shows STM images found for a spontaneously adsorbed monolayer of ET at Au( 1 I 1 ). Figure 3A is an image slightly less than X nm X X nm. Figure 3R is an expanded view of the middle right portion of Figure 3A and is slightly greater than 2.5 nm X 2.5 nm. In both images, a hexagonal pattern with a spacing markedly different from that of the Au( 1 1 1 ) lattice is evident. The spacings of this pattern arc given by contour plots in Figure
~~~
( I 3) We have occasionally found complex images that we have not yet been able to interpret. Interestingly. we have not found these complex images with atomic force microscopy: only images comparablc to Figures 3 and 5 have becn oherved. Presently, we do not know what variation in experimental param- eters causes these complex images.
(14) Ulman. A.; Filers. J. E.; Tillman. N. Lungmuir 1909. 5, I 147-1 152.
~~
( 1 5 ) This determination was based on the comparison of the underpotential deposition (UPD) of Pb(l1) onto the Au films on mica to published UPD curve$ on Au single crystal faces (Schultze. J. W.; Dickertman, D. Surf. Sci. 1976. 54. 489. 1:ngelsman. K.; Lorcnz. W. J.; Schmidt, E. J . Elecrroanol. ('hem. 19110, 114. I ) .
2808 J . Ani. C'hem. Soc., Vol. 113, No. 8. 1991 Widrig et al.
I .
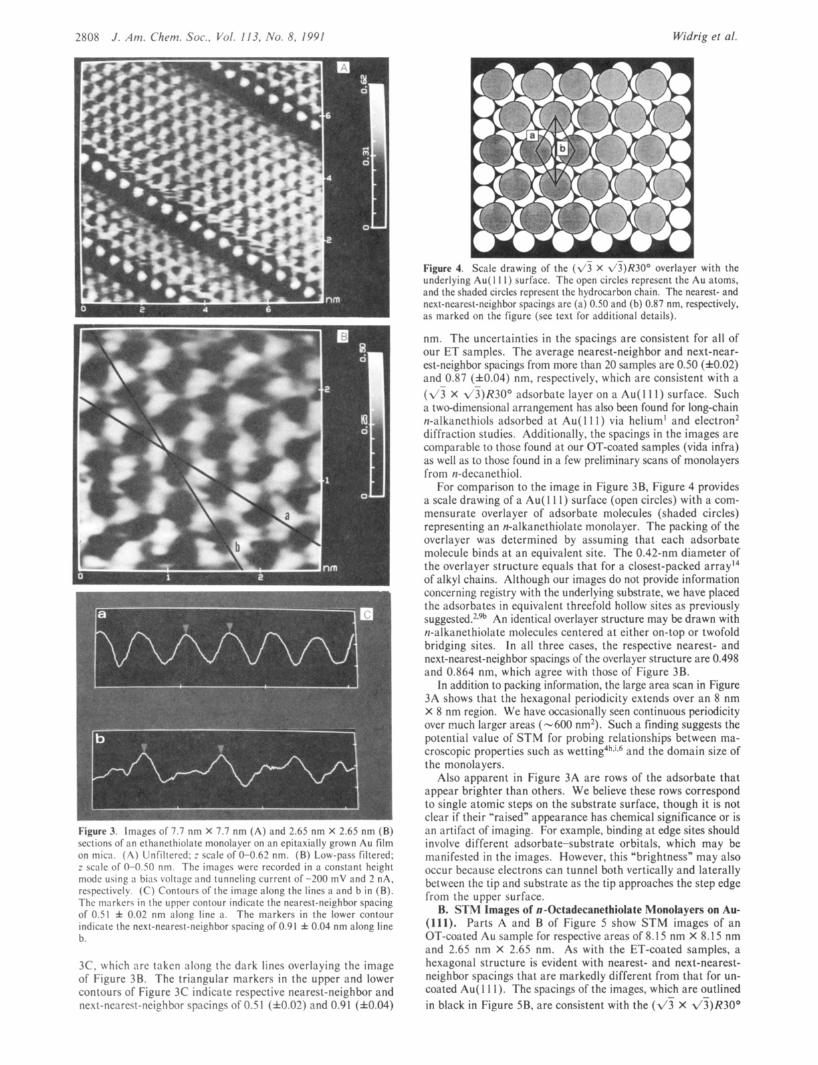
Figure 3 . Ini:i?c\ of 7.7 nm X 7.7 nm ( A ) and 2.05 nn7 X 3.65 nni ( R ) scctions of an cthancthiolate monolayer on an epitaxially grown Au film on mica. (.A) Lnfiltcrcd; : scale of 0-0.62 nm. ( R ) Low-pass filtered; z scale of 0-0.50 nm. The images were recorded in a constant height mode using :I bins volt;igc and tunneling current of -200 mV and 2 nA, respectively. (C) Contours of the image along the lines a and b in (€3). Thc marker< in the upper contour indicate the nearest-neighbor spacing of 0.51 f 0.02 nm along line a. The markers in the lower contour indicate the next-nearest-neighbor spacing of 0.91 f 0.04 nm along line b.
3C. which arc taken along the dark lines overlaying the image of Figure 3R. The triangular markers in the upper and lower contours of Figure 3C indicate respective nearest-neighbor and next-ncnrcst-neighbor spacings of 0.5 1 (10.02) and 0.91 (10.04)
Figure 4. Scale drawing of the ( \ 3 X \ ! ) K ! O o o\erla>er with the underlying Au( I 1 I ) surlace. The open circles rcprcscnt the Au atoms, and the shaded circles represent the hydrocarbon chain. The nearest- and next-nearcst-neighbor spacings are (a) 0.50 and (b) 0.87 nm. respectively, as marked on the figure (see text for additional details).
nm. The uncertainties in the spacings are consistent for all of our ET samples. The average nearest-neighbor and next-near- est-neighbor spacings from more than 20 samples are 0.50 (f0.02) and 0.87 (f0.04) nm, respectively, which are consistent with a (dj X dJ)R30° adsorbate layer on a Au( 1 1 1 ) surface. Such a two-dimensional arrangement has also been found for long-chain n-alkanethiols adsorbed at Au( 1 1 1) via helium' and electron* diffraction studies. Additionally, the spacings in the images are comparable to those found at our OT-coated samples (vida infra) as well as to those found in a few preliminary scans of monolayers from n-decanethiol.
For comparison to the image in Figure 3B, Figure 4 provides a scale drawing of a Au( 1 1 1 ) surface (open circles) with a com- mensurate overlayer of adsorbate molecules (shaded circles) representing an n-alkanethiolate monolayer. The packing of the overlayer was determined by assuming that each adsorbate molecule binds at an equivalent site. The 0.42-nm diameter of the overlayer structure equals that for a closest-packed array14 of alkyl chains. Although our images do not provide information concerning registry with the underlying substrate, we have placed the adsorbates in equivalent threefold hollow sites as previously ~uggested.'.'~ An identical overlayer structure may be drawn with n-alkanethiolate molecules centered at either on-top or twofold bridging sites. In all three cases, the respective nearest- and next-nearest-neighbor spacings of the overlayer structure are 0.498 and 0.864 nm, which agree with those of Figure 3B.
In addition to packing information, the large area scan in Figure 3A shows that the hexagonal periodicity extends over an 8 nm X 8 nm region. We have occasionally seen continuous periodicity over much larger areas (-6600 nm2). Such a finding suggests the potential value of STM for probing relationships between ma- croscopic properties such as ~ e t t i n g ~ ~ . ' . ~ and the domain size of the monolayers.
Also apparent in Figure 3A are rows of the adsorbate that appear brighter than others. We believe these rows correspond to single atomic steps on the substrate surface, though it is not clear if their "raised" appearance has chemical significance or is an artifact of imaging. For example, binding at edge sites should involve different adsorbate-substrate orbitals, which may be manifested in the images. However, this "brightness" may also occur because electrons can tunnel both vertically and laterally between the tip and substrate as the tip approaches the step edge from the upper surface. B. STM Images of n-Octadecanethiolate Monolayers on Au-
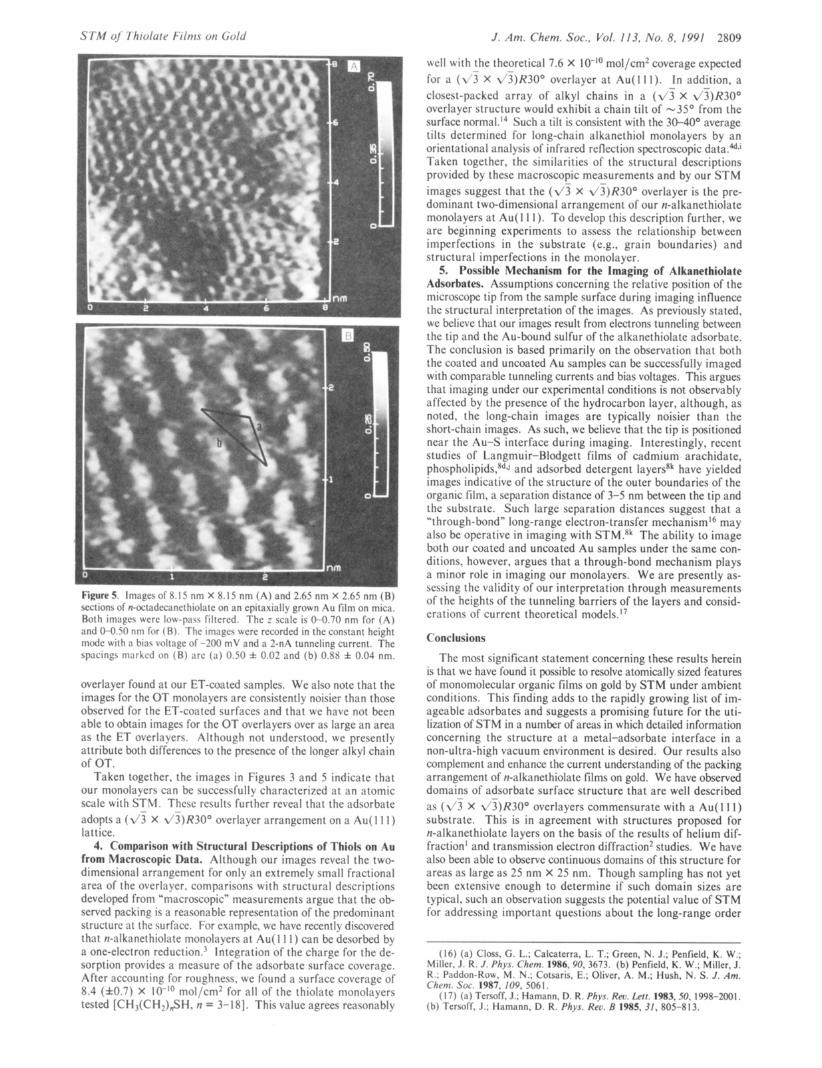
( 1 1 1 ) . Parts A and B of Figure 5 show STM images of an OT-coated Au sample for respective areas of 8.15 nm X 8. I5 nm and 2.65 nm X 2.65 nm. As with the ET-coated samples, a hexagonal structure is evident with nearest- and next-nearest- neighbor spacings that are markedly different from that for un- coated Au( 1 1 I ) . The spacings of the images, which are outlined in black in Figure 5R, are consistent with the (dj X d 3 ) R 3 0 °
STM of' 7'hiolare Pilnis oti Gold J . Am. Chem. SOC., Vol. 113. No. 8, I991 2809
FiRurc 5 . Iriiagc5 01's. I i nrii X S. I C n m (:I) a n d 2.05 rim X 2.65 rim ( 1 3 ) sections of n-octadccancthiolate on an epitaxially grown Au film on mica. Both images were low-pass filtered. The z scalc is 0-0.70 nm for ( A ) and 0-0.50 nm for ( R I . Thc images were recorded in the constant height mode with n bins voltngc of -200 mV and a 2-nA tunneling current. The spacings miirkcd on ( R ) ;ire ( a ) 0.50 f 0.02 and (b) 0.88 f 0.04 nm.
overlayer found at our ET-coated samples. We also note that the images for the OT monolayers are consistently noisier than those observed for the ET-coated surfaces and that we have not been able to obtain images for the OT overlayers over as large an area as the ET overlayers. Although not understood, we presently attribute both differences to the presence of the longer alkyl chain of OT.
Taken together, the images in Figures 3 and 5 indicate that our monolayers can be successfully characterized at an atomic scalc with STM. Thcsc results further reveal that the adsorbate adopts a (dj X d/3)R3Oo overlayer arrangement on a Au( 1 1 1 ) lattice.
4. Comparison with Structural Descriptions o f Thiols on Au from Macroscopic Data. Although our images reveal the two- dimensional arrangement for only an extremely small fractional area of the overlayer. comparisons wi th structural descriptions developed from "macroscopic" measurements argue that the ob- served packing is a reasonable representation of the predominant structure at the surface. For example. we have recently discovered that n-alkanethiolate monolayers at Au( I 1 I ) can be desorbed by a one-electron red~ct ion .~ Integration of the charge for the de- sorption provides a measure of the adsorbate surface coverage. After accounting for roughness. we found a surface coverage of 8.4 (f0.7) X mol/cm2 for all of the thiolate monolayers tested [CH3(CH2),,SH, n = 3-18]. This value agrees reasonably
u.cll with the theoretical 7.6 X mol/cm2 coverage expected for a (d3 X dT)R30' overlayer at Au(1 I I ) . I n addition, a closest-packed array of alkyl chains in a (d/3 X dS)R3O0 overlayer structure would exhibit a chain tilt of -35' from the surface norma1.l' Such a tilt is consistent with the 30-40' average tilts determined for long-chain alkanethiol monolayers by an orientational analysis of infrared rcflection spectroscopic Taken together, the similarities of the structural descriptions provided by these macroscopic measurements and by our STM images suggest that the (v'j X v'5)R30° overlayer is the pre- dominant two-dimensional arrangement of our n-alkanethiolate monolayers at Au( 1 1 1) . To develop this description further, we are beginning experiments to assess the relationship between imperfections in the substrate (e.g., grain boundaries) and structural imperfections in the monolayer.
5. Possible Mechanism for the Imaging of Alkanethiolate Adsorbates. Assumptions concerning thc relative position of the microscope tip from the sample surface during imaging influence the structural interpretation of the images. As previously stated, wc bclievc that our images result from electrons tunneling between the tip and the Au-bound sulfur of the alkanethiolate adsorbate. The conclusion is based primarily on the observation that both the coated and uncoated Au samples can bc successfully imaged with comparable tunneling currents and bias voltages. This argues that imaging under our experimental conditions is not observably affected by the presence of the hydrocarbon layer, although, as noted, the long-chain images are typically noisier than the short-chain images. As such, we believe that the tip is positioned near the Au-S interface during imaging. Interestingly, recent studies of Langmuir-Rlodgett films of cadmium arachidate, phospholipids,ndJ and adsorbed detergent layerssk have yielded images indicative of the structure of the outer boundaries of the organic film, a separation distance of 3-5 nm between the tip and thc substrate. Such large separation distances suggest that a "t hrough-bond" long-range electron-transfer mechanismt6 may also be operative in imaging with STM.Xk The ability to image both our coated and uncoated Au samples under the same con- ditions, however, argues that a through-bond mechanism plays a minor role in imaging our monolayers. We are presently as- sessing thc validity of our interpretation through measurements of the heights of the tunneling barriers of the layers and consid- crations of current theoretical model^.^'
Conclusions
The most significant statement concerning these results herein is that we have found it possible to resolve atomically sized features of monomolecular organic films on gold by STM under ambient conditions. This finding adds to the rapidly growing list of im- ageable adsorbates and suggests a promising future for the uti- hation of STM in a number of areas in which detailed information concerning the structure at a metal-adsorbate interface in a non-ultra-high vacuum environment is desired. Our results also complement and enhance the current understanding of the packing arrangement of n-alkanethiolate films on gold. We have observed domains of adsorbate surface structure that are well described as (dj X d j )R30° overlayers commensurate with a Au( I 1 1 ) substrate. This is in agreement with structures proposed for n-alkanethiolate layers on the basis of the results of helium dif- fraction' and transmission electron diffraction2 studies. We have also been able to observe continuous domains of this structure for areas as large as 25 nm X 25 nm. Though sampling has not yet been extensive enough to determine i f such domain sizes are typical, such an observation suggests the potential value of STM for addressing important questions about the long-range order
(16) (a) Closs, G. L.; Calcaterra. L. T.; Green, N. J.; Penfield, K. W.; Miller. J. R. J. Phys. Chem. 1986, 90. 3673. (b) Penfield. K. W.; Miller, J. K.; Paddon-Row. .M. N.; Cotsaris, E.; Oliver, A. M.; Hush, N. S. J . Am. C'hent. Soc. 1987, 109, 5061.
(17) (a) Tcrsoff. J.; Hamann. D. R. Phys. Reo. kif. 1983.50, 1998-2001. (b) Tersoff. J.; Hamann, D. R. Phys. Rec. B 1985.31, 805-813.
2810 J . Am. Chem. SOC. 1991, 113, 2810-2819
within the adsorbate layer. Experiments are underway to evaluate further the capability to image these and various other hydro- carbon-based monolayers.
also made to the donors of the Petroleum Research Fund, ad- ministered by the American Chemical Society, for support of this work. Ames Laboratory is operated for the U S . Department of Energy by Iowa State University under Contract No. W-7405- eng-82. This work was supported by the Office of Basic Energy Sciences, Chemical Science Division.
Acknowledgment. M.D.P. gratefully acknowledges the support of a Dow Corning Assistant Professorship. Acknowledgment is
OPLS Potential Functions for Nucleotide Bases. Relative Association Constants of Hydrogen-Bonded Base Pairs in Chloroform
Julianto Pranata, Scott G. Wierschke, and William L. Jorgensen* Contribution from the Department of Chemistry, Purdue University. West Lafayette, Indiana 47907. Received March 5 , 1990
Abstract: Potential functions in the OPLS format have been developed for the nucleotide bases and 2,6-diaminopyridine by fitting to the results of ab initio 6-31G(d) calculations for numerous base-water complexes. These potential functions yield dipole moments and base pair interaction energies in good agreement with available experimental data. The potential functions were tested further in Monte Carlo simulations with statistical perturbation theory to calculate the relative free energies of binding in chloroform for 9-methylguanine with 1 methylcytosine (G-C) versus 9-methyladenine with 1-methyluracil (A-U), and for G-C versus 1 -methyluracil with 2,6-diaminopyridine (U-DAP). The calculations predict the G-C complex to be more stablc than both the A-U and U-DAP complexes by about 5 kcal/mol. The similar stabilities for complexes like A-U and U-DAP are observed experimentally, though the quantitative enhancement in going to G-C appears to be exaggerated in the simulations. The large difference in association constants between G-C and the similarly triply hydrogen-bonded U-DAP is traced to the gas-phase interaction energies, which favors G-C by about 10 kcal/mol. This in turn is caused by the different arrangcmcnt of hydrogen bond donor and acceptor sites in the two complexes, which leads to secondary electrostatic interactions that disfavor U-DAP relative to G-C. The general importance of such secondary interactions for understanding variations in association is discussed.
Introduction The interaction between nucleotide bases is an important ele-
ment in the structure of DNA. Consequently, there have been numerous studies, experimentall-* and computa t i~naI ,~- '~ con- cerned with the association of nucleotide base pairs. The com- putational studies range from gas-phase energy minimizationse'* to Monte Carlo and molecular dynamics simulations in solu- tion.I3-l6 The work of Pohorille, Kollman, and co-workers is particularly r ~ o t a b l e . ~ ~ ~ ' ~ Pohorille et al. performed seminal Monte Carlo simulations of stacked and hydrogen-bonded base pairs in CC14 and in water.l5 However, only the interaction energies ( A E s ) were calculated, while the more relevant measure of association is the free energy, AG. The bases were not allowed to move relative to one another, and the interaction energies were calculated by computing the differences in the total energies for the complex in solution and for the individual bases. This involves computing a small difference between large fluctuating numbers which leads to difficulties with precision. Subsequently, Cieplak and Kollman carried out molecular dynamics calculations for the A-T and G-C base pairs in vacuo and in water.16a Free energy changes were now calculated using statistical perturbation theory. The calcu- lations featured arduous series of simulations in which each base and the complexes were made to vanish in water. It was correctly predicted that stacked structures were more stable than hydro- gen-bonded ones in water, though the nature of the perturbations and simulation times led to significant uncertainties for the free energy changes.
Recently, Dang and Kollman calculated the free energy of association of 9-methyladenine and 1 methylthymine in water using a different approach.t6b In this case the potential of mean
*Address correspondence to this author at the Department of Chemistry, Yale University, New Haven, CT 0651 I .
force (PMF) of the base pair was obtained from a series of sim- ulations in which the bases were gradually perturbed apart. Calculation of the association constant, K,, then involves an in- tegration of the PMF to a cutoff value that defines association.'' The relative orientation of the bases was forced to remain constant as they were separated. Though the preference for stacking
(1) Kyogoku, Y.; Lord, R. C.; Rich, A. Proc. Narl. Acad. Sci. U.S.A. 1967, 57, 250.
(2) Kyogoku, Y.; Lord, R. C.; Rich, A. Biochim. Biophys. Acta 1969, 179, IO.
(3) Iwahashi, H.; Kyogoku, Y. J . Am. Chem. SOC. 1977, 99,7761. Wa- tanabe, M.; Sugeta, H.; Iwahashi, H.; Kyogoku, y.; Kainosho, M. Eur. J . Biochem. 1981,117,553. Iwahashi, H.; Sugeta, H.; Kyogoku, Y.; Biochem- isfry 1982, 21, 631.
(4) Newmark, R. A.; Cantor, C. R. J. Am. Chem. SOC. 1968, 90, 5010. (5) Petersen, S. B.; Led, J. J . J . Am. Chem. SOC. 1981, 103, 5308. (6) Williams, L. D.; Chawla, B.; Shaw, B. R. Biopolymers 1987, 26, 591. (7) Williams, N. G.; Williams, L. D.; Shaw, B. R. J . Am. Chem. Soc.
1989, I l l , 7208. (8) Yanson, I . K.; Teplitsky, A. B.; Sukhodub, L. F. Biopolymers 1979,
18, 1149. (9) Pullman, B.; Claverie, P.; Caillet, J . Proc. Nafl. Acad. Sci. U.S.A. 1966,
55, 904. (IO) (a) Kudritskaya, 2. G.; Danilov, V. I. J . Theor. Biol. 1976, 59, 303.
(b) Langlet, J.; Claverie, P.; Caron, F.; Boeuve, J. C. In?. J . Quantum Chem. 1981, 19, 299.
( I 1 ) Hobza, P.; Sandorfy, C. J. Am. Chem. SOC. 1987, 109, 1302. (12) Aida, M. J. Compuf. Chem. 1988, 9, 362. (13) Danilov, V. 1.; Tolokh, I. S.; Poltev, V. I.; Malenkov, G. G. FEES
Leu. 1984, 167, 245. Danilov, V. 1.; Tolokh, 1. S.; Poltev, V. I. FEES Lett. 1984, 171, 325. Danilov, V. I.; Tolokh, I. S . FEES Lett. 1984, 173, 347.
(14) Egan, J. T.; Nir, S.; Rein, R.; MacElroy, R. I n f . J . Quantum Chem. Quantum Biol. Symp. 1978, 5, 433.
(15) Pohorille, A,; Pratt, L. R.; Burt, S. K.; MacElroy, R. D. J . Biomol. Strucf. Dyn. 1984, 1, 1257. Pohorille, A,; Burt, S. K.; MacElroy, R. D. J . Am. Chem. SOC. 1984, 106, 402.
(16) (a) Cieplak, P.; Kollman, P. A. J. Am. Chem. SOC. 1988, 110, 3734. (b) Dang, L. X.; Kollman, P. A. J . Am. Chem. SOC. 1990, 112, 503.
(17) Jorgensen, W. L. J. A m . Chem. SOC. 1989, 111, 3990.
0002-7863/9 1 / 15 13-28 10$02.50/0 0 199 1 American Chemical Society