Scaling of NO x emissions from a laboratory-scale mild combustion furnace
15
Combustion and Flame 154 (2008) 281–295 www.elsevier.com/locate/combustflame Scaling of NO x emissions from a laboratory-scale mild combustion furnace G.G. Szegö ∗ , B.B. Dally, G.J. Nathan School of Mechanical Engineering, The University of Adelaide, South Australia 5005, Australia Received 10 September 2007; received in revised form 2 February 2008; accepted 7 February 2008 Available online 6 March 2008 Abstract A systematic experimental campaign has been carried out to investigate the scaling of NO x emissions from a moderate or intense low-oxygen dilution (MILD) combustion furnace operating with a parallel jet burner system in which the reactants and the exhaust ports are all mounted on the same wall. Its maximum capacity was 20 kW from the fuel and 3.3 kW from air preheat, with a turndown ratio of 1:3. The burner system was configured to achieve high dilution of the incoming reactants. A comprehensive data set comprising 191 global measurements of temperature and exhaust gas emissions is presented, together with temperature contours on the furnace centerline plane. It was found that, although heat extraction, air preheat, excess air, firing rate, dilution, and fuel type all affect global NO x emissions, they do not control NO x scaling. The combined effects of these global parameters can be ultimately characterized by a furnace temperature and a global residence time. A temperature–time scaling approach, previously reported for open jet diffusion flames, proved to be a useful tool for comparison of NO x emissions from highly diluted furnace environments regardless of the furnace/burner geometries. Regression- based predictions found the characteristic temperature to correlate with 85% of the data with an accuracy of only ±50%. The leading-order approach also showed that the jet exit Froude number is of limited value for NO x scaling in the MILD regime. Because of the weak dependence on temperature observed in the data and the moderate magnitude of the measured temperatures, it is deduced that the prompt-NO and/or N 2 O-intermediate pathways are of significance comparable to that of the thermal-NO pathway. The analysis also suggests that NO x formation is controlled neither by kinetics nor by mixing, and hence the conditions inside this furnace approach or span the range in which Damköhler numbers are of order unity, Da = O(1). © 2008 The Combustion Institute. Published by Elsevier Inc. All rights reserved. Keywords: MILD furnace; Moderate temperatures; NO x scaling 1. Introduction Rising concentrations of atmospheric greenhouse gases, which are widely accepted to lead to climate * Corresponding author. Fax: +61 8 8303 4367. E-mail address: [email protected] (G.G. Szegö). change, have intensified discussions about the com- bustion of fossil and alternative fuels. Combustion- generated CO 2 emissions account for about 80% of anthropogenic greenhouse gases [1], so their mitiga- tion is vital, and an aim of policies around the world. Improving energy efficiency is often the most cost- effective way to reduce CO 2 emissions [2]. A wide range of low- or zero-carbon-emission technologies 0010-2180/$ – see front matter © 2008 The Combustion Institute. Published by Elsevier Inc. All rights reserved. doi:10.1016/j.combustflame.2008.02.001
Transcript of Scaling of NO x emissions from a laboratory-scale mild combustion furnace
Combustion and Flame 154 (2008) 281–295www.elsevier.com/locate/combustflame
Scaling of NOx emissions from a laboratory-scale mildcombustion furnace
G.G. Szegö ∗, B.B. Dally, G.J. Nathan
School of Mechanical Engineering, The University of Adelaide, South Australia 5005, Australia
Received 10 September 2007; received in revised form 2 February 2008; accepted 7 February 2008
Available online 6 March 2008
Abstract
A systematic experimental campaign has been carried out to investigate the scaling of NOx emissions from amoderate or intense low-oxygen dilution (MILD) combustion furnace operating with a parallel jet burner systemin which the reactants and the exhaust ports are all mounted on the same wall. Its maximum capacity was 20 kWfrom the fuel and 3.3 kW from air preheat, with a turndown ratio of 1:3. The burner system was configured toachieve high dilution of the incoming reactants. A comprehensive data set comprising 191 global measurements oftemperature and exhaust gas emissions is presented, together with temperature contours on the furnace centerlineplane. It was found that, although heat extraction, air preheat, excess air, firing rate, dilution, and fuel type allaffect global NOx emissions, they do not control NOx scaling. The combined effects of these global parameterscan be ultimately characterized by a furnace temperature and a global residence time. A temperature–time scalingapproach, previously reported for open jet diffusion flames, proved to be a useful tool for comparison of NOx
emissions from highly diluted furnace environments regardless of the furnace/burner geometries. Regression-based predictions found the characteristic temperature to correlate with 85% of the data with an accuracy of only±50%. The leading-order approach also showed that the jet exit Froude number is of limited value for NOx scalingin the MILD regime. Because of the weak dependence on temperature observed in the data and the moderatemagnitude of the measured temperatures, it is deduced that the prompt-NO and/or N2O-intermediate pathwaysare of significance comparable to that of the thermal-NO pathway. The analysis also suggests that NOx formationis controlled neither by kinetics nor by mixing, and hence the conditions inside this furnace approach or span therange in which Damköhler numbers are of order unity, Da = O(1).© 2008 The Combustion Institute. Published by Elsevier Inc. All rights reserved.
Keywords: MILD furnace; Moderate temperatures; NOx scaling
1. Introduction
Rising concentrations of atmospheric greenhousegases, which are widely accepted to lead to climate
* Corresponding author. Fax: +61 8 8303 4367.E-mail address: [email protected]
(G.G. Szegö).
0010-2180/$ – see front matter © 2008 The Combustion Institute.doi:10.1016/j.combustflame.2008.02.001
change, have intensified discussions about the com-bustion of fossil and alternative fuels. Combustion-generated CO2 emissions account for about 80% ofanthropogenic greenhouse gases [1], so their mitiga-tion is vital, and an aim of policies around the world.Improving energy efficiency is often the most cost-effective way to reduce CO2 emissions [2]. A widerange of low- or zero-carbon-emission technologies
Published by Elsevier Inc. All rights reserved.
282 G.G. Szegö et al. / Combustion and Flame 154 (2008) 281–295
are already available [3]. However, the abatementof pollutants often comes at the price of efficiencylosses. Moderate or intense low-oxygen dilution(MILD) combustion [4] is a credible candidate to si-multaneously meet thermal efficiency needs and pol-lutant emission restrictions. Under MILD conditions,reactants are highly diluted with hot combustion prod-ucts, causing reactions to occur in a distributed reac-tion zone with reduced peak temperatures [5]. As aconsequence, the temperature distribution is nearlyuniform, the net radiation flux can be enhanced, andpollutant emissions, NOx in particular, are lower thanthose from conventional flames.
Over the past few decades, MILD combustiontechnology has been implemented at full scale in var-ious industrial sectors [6] and tested at pilot scale inother applications [7–10] and for other fuel types [11].Nevertheless, despite considerable industrial success,important aspects of MILD combustion remain un-known. For example, little is known about the scalingrelations of NOx emissions in complex recirculatingflows with low oxygen concentrations at moderatetemperature ranges (800 ◦C < T < 1400 ◦C), typi-cally found in MILD conditions.
The scaling of NOx has been comprehensively in-vestigated in unconfined nonpremixed turbulent jetflames [12], and also given considerable attentionin enclosed furnace environments with conventionalcombustion systems [13–16]. These studies havefound a strong correlation of normalized NOx emis-sion indices with fuel jet exit Froude number and ofNOx formation rates with global temperatures andresidence times. These relationships are useful, notonly for understanding which geometrical or opera-tional parameters control pollutant formation, but alsofor assessing the relative importance of the alternativeNOx formation mechanisms.
More specifically related to the MILD regime, So-biesiak et al. [17] obtained an empirical correlationfor NOx emissions as a function of excess air, airpreheat temperature, burner turndown ratio, and ex-haust gas temperature. Although relatively few exper-imental data points were available for the analysis, apower-law type expression was used to show that theexhaust temperature term had the strongest effect onNOx emissions. Other researchers [18,19] attemptedto relate NOx emission trends to burner parameters,such as fuel injection angle and fuel-to-air velocity ra-tios. The aforementioned MILD combustion studiesfocused on minimizing NOx emissions of a particu-lar burner design and led to the patenting [20–22] andcommercialization of the technology.
To the best of our knowledge, the results of NOx
scaling relations have not been previously reportedfor MILD combustion conditions, either in enclosedor in open flame systems. The current work aims to
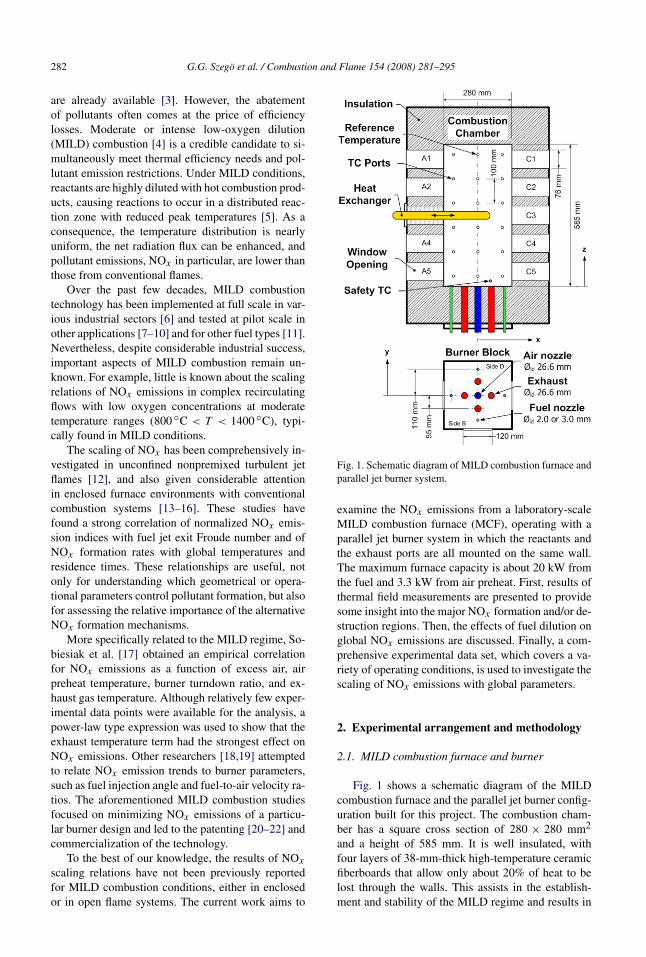
Fig. 1. Schematic diagram of MILD combustion furnace andparallel jet burner system.
examine the NOx emissions from a laboratory-scaleMILD combustion furnace (MCF), operating with aparallel jet burner system in which the reactants andthe exhaust ports are all mounted on the same wall.The maximum furnace capacity is about 20 kW fromthe fuel and 3.3 kW from air preheat. First, results ofthermal field measurements are presented to providesome insight into the major NOx formation and/or de-struction regions. Then, the effects of fuel dilution onglobal NOx emissions are discussed. Finally, a com-prehensive experimental data set, which covers a va-riety of operating conditions, is used to investigate thescaling of NOx emissions with global parameters.
2. Experimental arrangement and methodology
2.1. MILD combustion furnace and burner
Fig. 1 shows a schematic diagram of the MILDcombustion furnace and the parallel jet burner config-uration built for this project. The combustion cham-ber has a square cross section of 280 × 280 mm2
and a height of 585 mm. It is well insulated, withfour layers of 38-mm-thick high-temperature ceramicfiberboards that allow only about 20% of heat to belost through the walls. This assists in the establish-ment and stability of the MILD regime and results in
G.G. Szegö et al. / Combustion and Flame 154 (2008) 281–295 283
a warm-up time of about 3 h from a cold state un-til steady-state operation. The inner surfaces of thecombustion chamber were coated with a commercialproduct, “Kaowool J-Coat” rigidizer, to improve theresistance to erosion caused by high gas velocities.The MCF has full optical access through five open-ings (120 × 76 mm2) equally spaced along the ver-tical direction on three sides of the furnace. Theseopenings can accommodate interchangeable insulat-ing window plugs or UV-grade fused silica windows.The chamber is slightly pressurized to prevent airingress, and high-temperature gaskets were used toseal all surface joints for safety. A U-shaped cool-ing loop with variable heat exchange area was usedto control the heat load. The heat exchanger can beinserted through any of the five window openings (po-sitions A1–A5).
The configuration of reactants and exhaust portswas optimized using a computational fluid dynam-ics (CFD) modeling study [23]. The furnace was de-signed for a maximum capacity of 20 kW from thefuel and 3.3 kW from air preheat with a turndown ra-tio of 1:3. The air was preheated with a Leister LE3000 electrical air heater that has a built-in poten-tiometer for air temperature control. The burner con-sists of a single air nozzle on the axis of the furnace,and four exhaust ports and four fuel ports arrangedsymmetrically in ring patterns (see Fig. 1). The dis-tance between the center of the air nozzle and thecenters of the exhaust ports and fuel nozzles are 55and 110 mm, respectively. In this arrangement the in-coming air stream is separated from the fuel streamsby outgoing exhaust gases, much as in the fuel directinjection (FDI) concept introduced by Nakamachi etal. [24] and in the IFRF burner design [25]. Thisensures that the reactants are diluted with productsbefore any combustion reaction can occur. The finalstraight sections of the air and fuel supply lines havelength-to-diameter ratios of L/D ≈ 10 and L/d ≈ 18(�id = 2 mm), respectively.
2.2. Temperature and global emission measurements
Time-averaged temperatures were measured withbare, fine-wire type R (Pt/Pt–13% Rh) thermocou-ples of 254-µm-diameter wires and 1.2-mm-diameterbeads under steady-state conditions. This is sufficientfor reliable measurements of the mean temperatureafter correction for radiation, given the low temper-ature fluctuations in the MILD regime, and providessatisfactory spatial resolution while being sufficientlyrobust to avoid probe breakage. For accurate posi-tioning, the thermocouple wires were supported bya 6-mm-diameter rigid ceramic sheath, with the final5 mm left exposed. The differential voltage signal wascontinuously sampled at 1 Hz and automatically con-
verted to temperature units with a USB-TC data log-ger. According to the manufacturer’s specifications,the uncertainties associated with linearization, cold-junction compensation, and system noise produce amaximum error of ±1.07 ◦C in a measurement rangefrom 250 to 1768 ◦C. This represents only 0.13% er-ror in the worst case.
Eighteen thermocouple ports (see Fig. 1) wereequally spaced in the vertical direction, throughwhich a thermocouple could be traversed. Typically,temperatures were monitored simultaneously by fixedthermocouples in two regions of interest, one at thetop section and one at the bottom section of the com-bustion chamber. The center of the air nozzle exitplane is defined to be the origin of a Cartesian co-ordinate system (x, y, z). The top temperature wasmeasured on the furnace centerline (0,0,542.5) andwas denoted as the furnace reference temperature.The bottom temperature was measured flush withthe inner surface (0,140,42.5) and was denoted asthe reference wall temperature. Temperature profileswere also measured for a selected baseline case. Thethermocouple probes were traversed in the radial di-rection (y-direction) across different planes at eachhole to provide a total of 72 points.
The correction to the temperature measurementsfor radiation was determined from a steady-state en-ergy balance on the thermocouple bead surface. Theactual gas temperature (Tg) was determined from themeasured temperature (Ttcb) and net radiation fluxbetween diffuse-gray surfaces in an enclosure accord-ing to
(1)Tg = Ttcb + Atcbεtcb∑N
w=1 σG1w(T 4tcb − T 4
w)
h,
where Atcb is the thermocouple bead surface area,εtcb is the thermocouple bead surface emissivity, N
is the total number of surfaces (i.e., walls) in the en-closure, σ is the Stefan–Boltzmann constant, G1w isthe fraction of radiation emitted by the thermocouplebead that is incident on a particular wall surface w
in the furnace enclosure and is absorbed [26], Tw isthe surface temperature of wall w in the enclosure,and h is the convection coefficient calculated for asphere [27]. Catalytic and oxidation effects were ne-glected, as well as conductive heat transfer along theceramic sheath. The G1w correction factor was cal-culated for each probe position. The method led to amaximum correction of 9% and a typical correctionof less than 2% between raw and actual gas tempera-tures, so that the total uncertainty is within ±1.2%.
Exhaust gas composition was measured insidethe exhaust pipe with a TESTO 350XL portablegas analyzer. The gas analyzer was equipped withelectrochemical sensors with nominal accuracies,respectively, for CO (±5%: 0–2000 ppm, ±10%:
284 G.G. Szegö et al. / Combustion and Flame 154 (2008) 281–295
2001–10000 ppm), NO (±5 ppm: 0–99 ppm), NO2(±5 ppm: 0–99.9 ppm), O2 (±0.8%: 0–25%), andUHC (<400 ppm: 100–4000 ppm CH4) and witha nondispersive infrared (NDIR) sensor for CO2(±0.3% m.v. + 0.44: 0–25%). The analyzer waschecked with a calibration gas to yield total NOx
emission accuracies better than ±4 ppm for the rangefrom 0 to 70 ppm, in which all present data lie.The combustion products were cooled and filteredto remove moisture and particles before reaching thesensing cells. Total NOx emission (NO + NO2) con-centrations are reported by volume on a dry basiscorrected to 3% O2 concentration. Emission indicesare expressed as the ratio of pollutant formed to themass of fuel input [28]. The emission indices weredetermined from measured species concentrations as
EINOx [g/kg fuel] = XNOMWNO + XNO2 MWNO2
(XCO + XCO2 )MWCxHy
(2)× 1000,
EICO [g/kg fuel] = XCOMWCO
(XCO + XCO2)MWCxHy
(3)× 1000,
where EINOx is the NOx emission index, Xi is themole fraction of species i, and MW is the molec-ular weight of species i or of the hydrocarbon fuel(CxHy ). For most operating conditions, unburned hy-drocarbons (UHC) were either below the detectionlimit of 100 ppm or below the minimum O2 concen-tration (≈2%) required for a reliable measurement.Therefore, for consistency, UHC was neglected as apossible source of carbon in the formulation. Dueto the short length of the flue gas sampling probeand hose (≈2.5 m), the manufacturer reports that theamount of NO2 absorbed in the condensate trap is in-significant. Consequently, both measured componentsof NOx can be considered to be reliable.
2.3. Operating conditions
The parametric study investigated a total of 191measurement points under various test conditions. Inall cases, thermal equilibrium was ensured and sta-ble MILD combustion was achieved, based on therequirement of no visible flame and NOx emissionlevels being below 70 ppm throughout the experi-ment. The oxidant was air, whose temperature wasvaried from ambient to 780 ◦C. Either commercialnatural gas (NG) or liquefied petroleum gas (LPG)was used as the fuel to provide thermal inputs overthe range 7.5–20 kW. Table 1 shows typical compo-sition and properties of both fuels. Two alternative-sized fuel nozzles were employed, 2.0 or 3.0 mmin diameter. The global equivalence ratio (φ) ranged
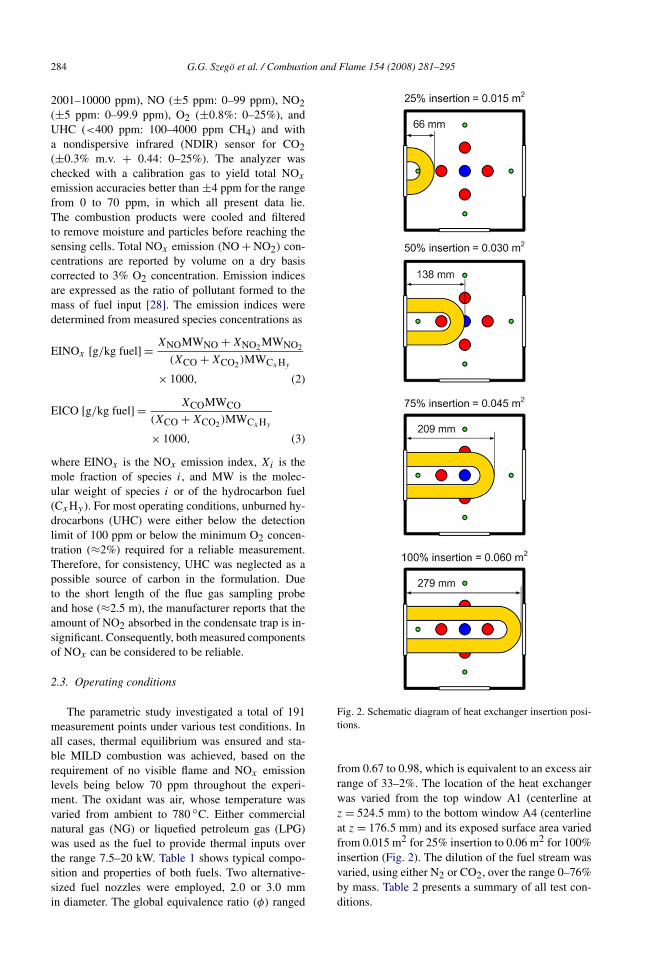
Fig. 2. Schematic diagram of heat exchanger insertion posi-tions.
from 0.67 to 0.98, which is equivalent to an excess airrange of 33–2%. The location of the heat exchangerwas varied from the top window A1 (centerline atz = 524.5 mm) to the bottom window A4 (centerlineat z = 176.5 mm) and its exposed surface area variedfrom 0.015 m2 for 25% insertion to 0.06 m2 for 100%insertion (Fig. 2). The dilution of the fuel stream wasvaried, using either N2 or CO2, over the range 0–76%by mass. Table 2 presents a summary of all test con-ditions.
G.G. Szegö et al. / Combustion and Flame 154 (2008) 281–295 285
Table 1Typical fuel properties and composition
Fuel LHVb (A/F)stc MWd N2
e CO2e CH4
e C2H6e C3H8
e C4H10e C5H12
e C6H14e
NGa 51.154 17.11 17.71 1.278 2.084 91.36 4.364 0.62 0.20 0.055 0.04LPGa 45.993 15.66 44.07 0.73 0.05 – 1.12 96.32 1.78 – –
a Gas analysis provided by Origin Energy Australia.b Lower heating value (MJ/kg).c Stoichiometric air-to-fuel ratio (kg/kg).d Molecular weight (kg/kmol).e Mole fraction (Xi) (%).
Table 2Summary of all test conditions
Fuel type Datapoints
d
(mm)Ydil(%)
Qfuel(kW)
φ Qhx(%)
Tair(◦C)
Tfurnace(◦C)
τG(s)
NG 145 2.0 0 7.6–20.4 0.67–0.98 17–51 20–780 768–1368 2.8–11.42 3.0 0 15.6 0.80 18 450 1295 3.9
NG/CO2 8 3.0 38–76 15.6 0.80 16–34 454 1053–1309 1.8–3.1NG/N2 3 2.0 41–70 7.9–10.5 0.80 25–29 23–445 951–1129 3.7–4.5
5 3.0 33–71 15.6 0.80 18 450 1285 1.6–3.0LPG 1 3.0 0 15.0 0.80 21 450 1290 3.9LPG/CO2 10 2.0 31–71 9.9–14.4 0.75–0.81 24–41 458 1031–1261 1.3–3.5
4 3.0 50–74 15.0 0.80 20 450 1268–1306 1.1–2.0LPG/N2 9 2.0 19–65 14.7 0.80 18–46 447 1046–1298 1.1–3.0
4 3.0 45–70 15.0 0.79 20 450 1285–1326 0.9–1.8
The baseline case of this project was defined as the2.0-mm burner with a 15-kW thermal input (Qfuel) ofnatural gas, an equivalence ratio of 0.80, and 450 ◦Cair preheat (Tair). For this condition the inlet jet ve-locities for air and fuel are U = 29.1 m/s and u =17.3 m/s, respectively. The reference position for theheat exchanger was position A3 (centerline at z =292.5 mm) with 25% insertion.
The furnace was started from a cold state with anonpremixed flame stabilized by a bluff body. Whenthe temperature at the lower corner of the furnace,which was identified as safety TC in Fig. 1, exceededautoignition (≈800 ◦C) and the exhaust temperatureexceeded a set threshold (≈600 ◦C), the furnace wasswitched to the MILD combustion mode.
3. Results
3.1. Temperature and pollutant emissions duringtransition
Fig. 3 shows the temperature and emissions mon-itored as a function of time for the baseline case. Thedashed line represents the time when MILD com-bustion was activated, the bluff-body was retracted,and no flame front was visible [29]. The successfultransition between the two regimes is evidenced by
the sudden decrease in furnace reference temperatureand by the fourfold drop in NOx emissions. The dif-ferences seen in the levels of O2, and consequentlyof CO2, during the transition to the MILD regimewere caused by a slight increase in pressure dropin the fuel supply system. However, it is clear thatthese changes did not significantly influence perfor-mance. Fine-tuning of the fuel flow rate was typicallyneeded to compensate for small pressure variationsin the supply line. For excess air levels of 25% ormore (φ � 0.8), CO and UHC emissions were be-low the detection limit. From the time the furnacewas switched to the MILD regime, about 1.5 h wasneeded to reach steady-state MILD combustion con-ditions. Under steady-state conditions, the tempera-ture difference between the top and the bottom sec-tions of the furnace was around 110 ◦C for the base-line case. The low temperature gradient throughoutthe furnace is an important characteristic of this com-bustion regime. The performance characteristics ofthe furnace/burner have been discussed previously inmore detail [29]. Together they demonstrate that thepresent furnace/burner configuration is able to sus-tain stable MILD combustion, while maintaining highmodulation ratios for various thermal input, heat ex-traction, and air preheat conditions. The investigationalso identified cases in which the MILD regime wasestablished without air preheat.
286 G.G. Szegö et al. / Combustion and Flame 154 (2008) 281–295
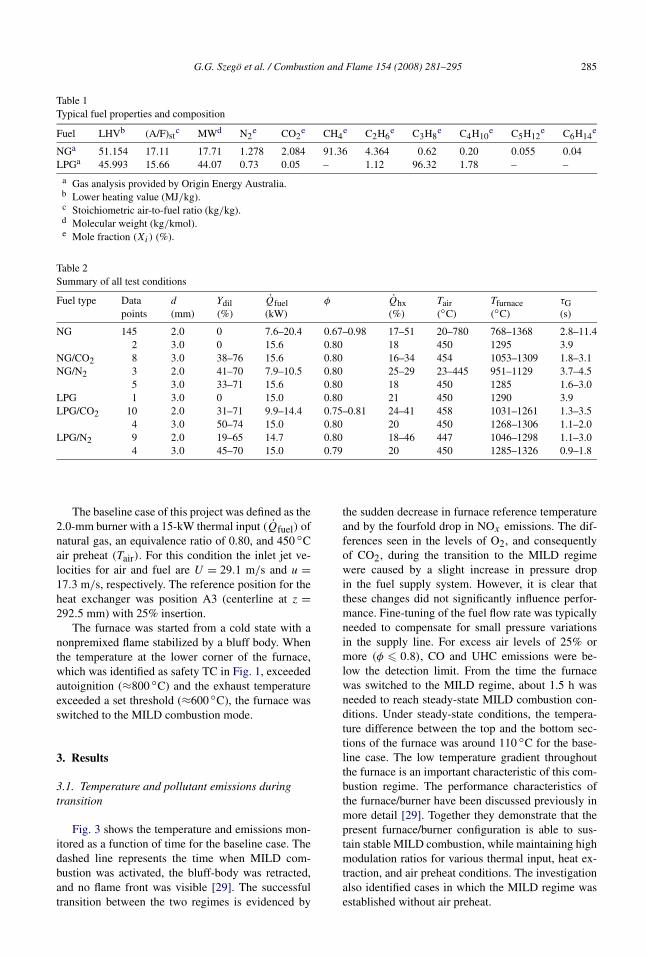
Fig. 3. Temperature and emissions recorded during the tran-sition from conventional to MILD combustion for the base-line operating conditions (d = 2.0 mm, Qfuel = 15 kW NG,φ = 0.80, Tair = 450 ◦C, 25% insertion at position A3).
3.2. Thermal field measurements
Measurement of the thermal field is a necessarystep in identifying and analyzing potential regions ofpollutant formation and/or destruction. Fig. 4 presentsthe measured temperature distribution for the base-line case in the x–z plane through the furnace cen-terline. The solid blue arrow represents the incomingair stream (x = 0 mm), the solid green arrows thefuel streams (x = −110 mm and x = 110 mm), andthe dotted red arrows the outgoing exhaust stream(x = −55 mm and x = 55 mm). The dashed lineshows the heat exchanger location (window A3) andinsertion length. The temperature contours were gen-erated using a Kriging-type interpolation algorithm[30] from the original measurement grid, which con-sisted of 3 × 4 × 6 points in each Cartesian direction.
A nonsymmetrical temperature field is noticeableinside the furnace and is attributed to the presenceof the heat exchanger inserted 25% through win-dow A3. The highest temperature region was mea-sured to be 1300 ◦C in the region 80 < x < 100 mmand 200 < z < 300 mm. The temperature differen-tial is only about 100 ◦C within about two-thirds ofthe furnace (z � 180 mm). This is consistent with the
Fig. 4. Measured temperature distribution (◦C) for the base-line case (d = 2.0 mm, Qfuel = 15 kW NG, φ = 0.80,Tair = 450 ◦C, 25% insertion at position A3) at plane y = 0.The arrows represent the incoming air (solid blue) and fuel(solid green) streams and the outgoing exhaust (dotted red)stream. The dashed line shows the heat exchanger (HX) lo-cation and insertion length. (For interpretation of the refer-ences to color in this figure legend, the reader is referred tothe web version of this article.)
temperature measurements presented in Fig. 3. Theuniformity suggests that a nonadiabatic global fur-nace temperature can reliably represent the reactionzone temperature. Nonetheless, the most representa-tive location for such a measurement will depend onthe heat exchanger location. The region in the vicinityof the heat exchanger is about 100 ◦C cooler than thaton the opposite side of the furnace. From the knowl-edge of heat extracted (Qhx) and material properties,the average heat exchanger surface temperature (Thx)
was calculated assuming one-dimensional conductionto be Thx ≈ 70 ◦C. Hence, local temperatures aroundthe heat exchanger are expected to be even lower than1175 ◦C. This will result in local extinction and par-tial oxidation near to the cold surface.
3.3. Effect of fuel dilution
A high degree of dilution of the reactants is one ofthe necessary conditions for establishing MILD com-
G.G. Szegö et al. / Combustion and Flame 154 (2008) 281–295 287
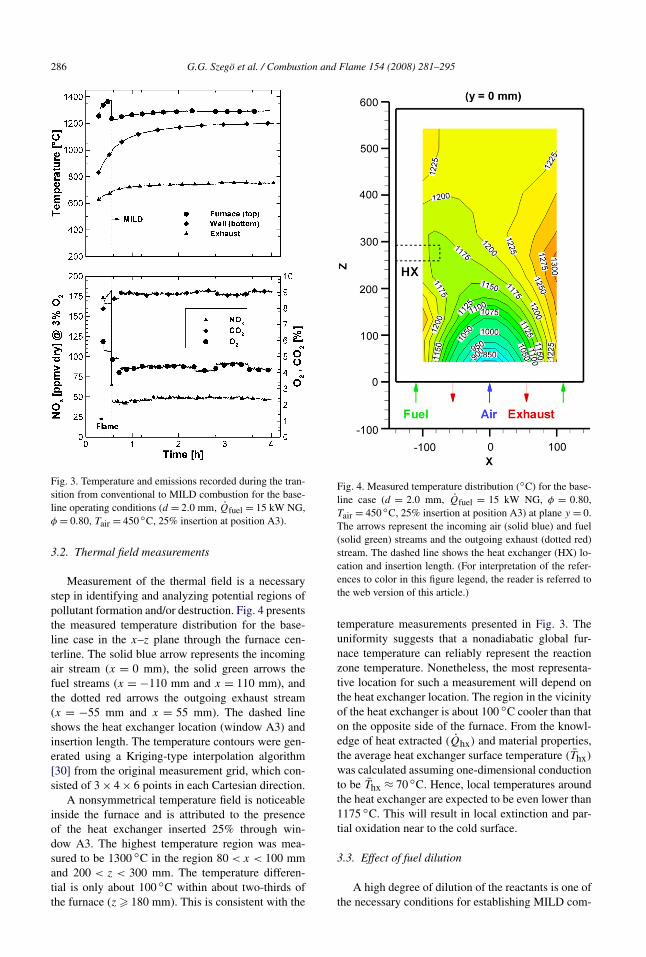
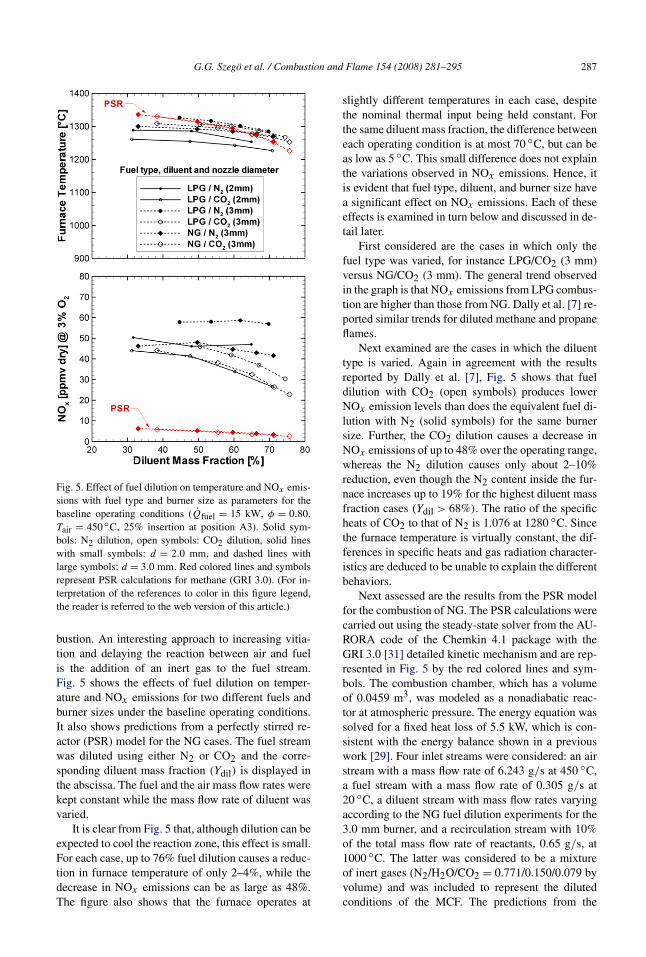
Fig. 5. Effect of fuel dilution on temperature and NOx emis-sions with fuel type and burner size as parameters for thebaseline operating conditions (Qfuel = 15 kW, φ = 0.80,Tair = 450 ◦C, 25% insertion at position A3). Solid sym-bols: N2 dilution, open symbols: CO2 dilution, solid lineswith small symbols: d = 2.0 mm, and dashed lines withlarge symbols: d = 3.0 mm. Red colored lines and symbolsrepresent PSR calculations for methane (GRI 3.0). (For in-terpretation of the references to color in this figure legend,the reader is referred to the web version of this article.)
bustion. An interesting approach to increasing vitia-tion and delaying the reaction between air and fuelis the addition of an inert gas to the fuel stream.Fig. 5 shows the effects of fuel dilution on temper-ature and NOx emissions for two different fuels andburner sizes under the baseline operating conditions.It also shows predictions from a perfectly stirred re-actor (PSR) model for the NG cases. The fuel streamwas diluted using either N2 or CO2 and the corre-sponding diluent mass fraction (Ydil) is displayed inthe abscissa. The fuel and the air mass flow rates werekept constant while the mass flow rate of diluent wasvaried.
It is clear from Fig. 5 that, although dilution can beexpected to cool the reaction zone, this effect is small.For each case, up to 76% fuel dilution causes a reduc-tion in furnace temperature of only 2–4%, while thedecrease in NOx emissions can be as large as 48%.The figure also shows that the furnace operates at
slightly different temperatures in each case, despitethe nominal thermal input being held constant. Forthe same diluent mass fraction, the difference betweeneach operating condition is at most 70 ◦C, but can beas low as 5 ◦C. This small difference does not explainthe variations observed in NOx emissions. Hence, itis evident that fuel type, diluent, and burner size havea significant effect on NOx emissions. Each of theseeffects is examined in turn below and discussed in de-tail later.
First considered are the cases in which only thefuel type was varied, for instance LPG/CO2 (3 mm)versus NG/CO2 (3 mm). The general trend observedin the graph is that NOx emissions from LPG combus-tion are higher than those from NG. Dally et al. [7] re-ported similar trends for diluted methane and propaneflames.
Next examined are the cases in which the diluenttype is varied. Again in agreement with the resultsreported by Dally et al. [7], Fig. 5 shows that fueldilution with CO2 (open symbols) produces lowerNOx emission levels than does the equivalent fuel di-lution with N2 (solid symbols) for the same burnersize. Further, the CO2 dilution causes a decrease inNOx emissions of up to 48% over the operating range,whereas the N2 dilution causes only about 2–10%reduction, even though the N2 content inside the fur-nace increases up to 19% for the highest diluent massfraction cases (Ydil > 68%). The ratio of the specificheats of CO2 to that of N2 is 1.076 at 1280 ◦C. Sincethe furnace temperature is virtually constant, the dif-ferences in specific heats and gas radiation character-istics are deduced to be unable to explain the differentbehaviors.
Next assessed are the results from the PSR modelfor the combustion of NG. The PSR calculations werecarried out using the steady-state solver from the AU-RORA code of the Chemkin 4.1 package with theGRI 3.0 [31] detailed kinetic mechanism and are rep-resented in Fig. 5 by the red colored lines and sym-bols. The combustion chamber, which has a volumeof 0.0459 m3, was modeled as a nonadiabatic reac-tor at atmospheric pressure. The energy equation wassolved for a fixed heat loss of 5.5 kW, which is con-sistent with the energy balance shown in a previouswork [29]. Four inlet streams were considered: an airstream with a mass flow rate of 6.243 g/s at 450 ◦C,a fuel stream with a mass flow rate of 0.305 g/s at20 ◦C, a diluent stream with mass flow rates varyingaccording to the NG fuel dilution experiments for the3.0 mm burner, and a recirculation stream with 10%of the total mass flow rate of reactants, 0.65 g/s, at1000 ◦C. The latter was considered to be a mixtureof inert gases (N2/H2O/CO2 = 0.771/0.150/0.079 byvolume) and was included to represent the dilutedconditions of the MCF. The predictions from the
288 G.G. Szegö et al. / Combustion and Flame 154 (2008) 281–295
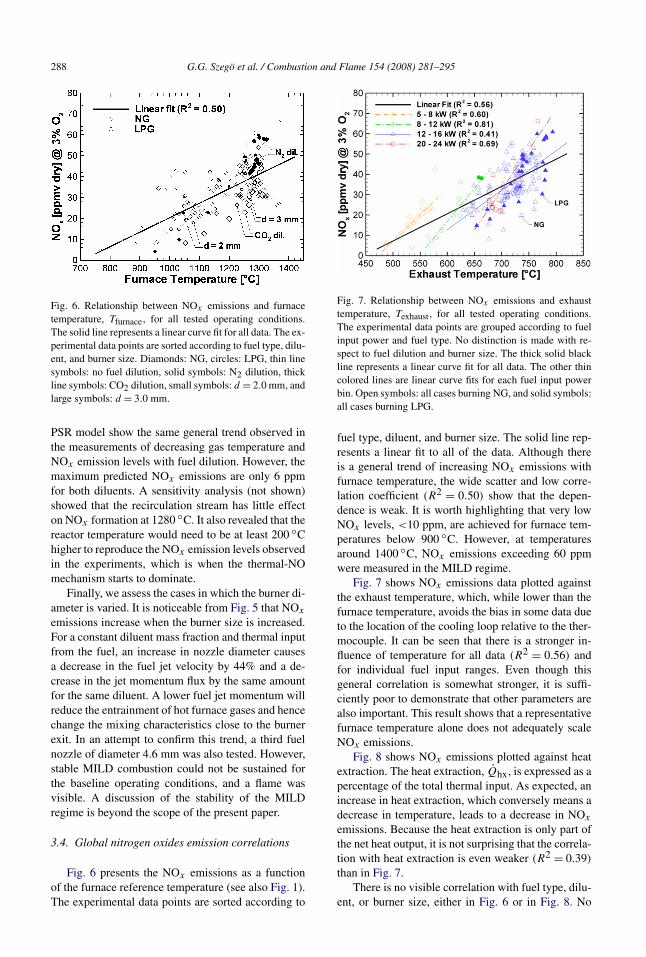
Fig. 6. Relationship between NOx emissions and furnacetemperature, Tfurnace, for all tested operating conditions.The solid line represents a linear curve fit for all data. The ex-perimental data points are sorted according to fuel type, dilu-ent, and burner size. Diamonds: NG, circles: LPG, thin linesymbols: no fuel dilution, solid symbols: N2 dilution, thickline symbols: CO2 dilution, small symbols: d = 2.0 mm, andlarge symbols: d = 3.0 mm.
PSR model show the same general trend observed inthe measurements of decreasing gas temperature andNOx emission levels with fuel dilution. However, themaximum predicted NOx emissions are only 6 ppmfor both diluents. A sensitivity analysis (not shown)showed that the recirculation stream has little effecton NOx formation at 1280 ◦C. It also revealed that thereactor temperature would need to be at least 200 ◦Chigher to reproduce the NOx emission levels observedin the experiments, which is when the thermal-NOmechanism starts to dominate.
Finally, we assess the cases in which the burner di-ameter is varied. It is noticeable from Fig. 5 that NOx
emissions increase when the burner size is increased.For a constant diluent mass fraction and thermal inputfrom the fuel, an increase in nozzle diameter causesa decrease in the fuel jet velocity by 44% and a de-crease in the jet momentum flux by the same amountfor the same diluent. A lower fuel jet momentum willreduce the entrainment of hot furnace gases and hencechange the mixing characteristics close to the burnerexit. In an attempt to confirm this trend, a third fuelnozzle of diameter 4.6 mm was also tested. However,stable MILD combustion could not be sustained forthe baseline operating conditions, and a flame wasvisible. A discussion of the stability of the MILDregime is beyond the scope of the present paper.
3.4. Global nitrogen oxides emission correlations
Fig. 6 presents the NOx emissions as a functionof the furnace reference temperature (see also Fig. 1).The experimental data points are sorted according to
Fig. 7. Relationship between NOx emissions and exhausttemperature, Texhaust, for all tested operating conditions.The experimental data points are grouped according to fuelinput power and fuel type. No distinction is made with re-spect to fuel dilution and burner size. The thick solid blackline represents a linear curve fit for all data. The other thincolored lines are linear curve fits for each fuel input powerbin. Open symbols: all cases burning NG, and solid symbols:all cases burning LPG.
fuel type, diluent, and burner size. The solid line rep-resents a linear fit to all of the data. Although thereis a general trend of increasing NOx emissions withfurnace temperature, the wide scatter and low corre-lation coefficient (R2 = 0.50) show that the depen-dence is weak. It is worth highlighting that very lowNOx levels, <10 ppm, are achieved for furnace tem-peratures below 900 ◦C. However, at temperaturesaround 1400 ◦C, NOx emissions exceeding 60 ppmwere measured in the MILD regime.
Fig. 7 shows NOx emissions data plotted againstthe exhaust temperature, which, while lower than thefurnace temperature, avoids the bias in some data dueto the location of the cooling loop relative to the ther-mocouple. It can be seen that there is a stronger in-fluence of temperature for all data (R2 = 0.56) andfor individual fuel input ranges. Even though thisgeneral correlation is somewhat stronger, it is suffi-ciently poor to demonstrate that other parameters arealso important. This result shows that a representativefurnace temperature alone does not adequately scaleNOx emissions.
Fig. 8 shows NOx emissions plotted against heatextraction. The heat extraction, Qhx, is expressed as apercentage of the total thermal input. As expected, anincrease in heat extraction, which conversely means adecrease in temperature, leads to a decrease in NOx
emissions. Because the heat extraction is only part ofthe net heat output, it is not surprising that the correla-tion with heat extraction is even weaker (R2 = 0.39)
than in Fig. 7.There is no visible correlation with fuel type, dilu-
ent, or burner size, either in Fig. 6 or in Fig. 8. No
G.G. Szegö et al. / Combustion and Flame 154 (2008) 281–295 289
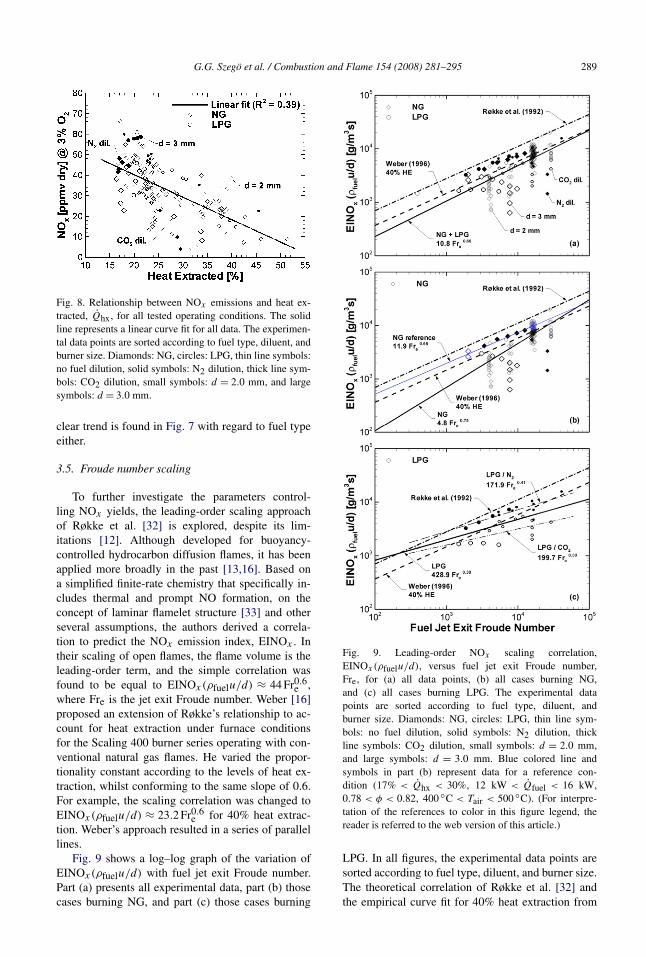
Fig. 8. Relationship between NOx emissions and heat ex-tracted, Qhx, for all tested operating conditions. The solidline represents a linear curve fit for all data. The experimen-tal data points are sorted according to fuel type, diluent, andburner size. Diamonds: NG, circles: LPG, thin line symbols:no fuel dilution, solid symbols: N2 dilution, thick line sym-bols: CO2 dilution, small symbols: d = 2.0 mm, and largesymbols: d = 3.0 mm.
clear trend is found in Fig. 7 with regard to fuel typeeither.
3.5. Froude number scaling
To further investigate the parameters control-ling NOx yields, the leading-order scaling approachof Røkke et al. [32] is explored, despite its lim-itations [12]. Although developed for buoyancy-controlled hydrocarbon diffusion flames, it has beenapplied more broadly in the past [13,16]. Based ona simplified finite-rate chemistry that specifically in-cludes thermal and prompt NO formation, on theconcept of laminar flamelet structure [33] and otherseveral assumptions, the authors derived a correla-tion to predict the NOx emission index, EINOx . Intheir scaling of open flames, the flame volume is theleading-order term, and the simple correlation wasfound to be equal to EINOx(ρfuelu/d) ≈ 44 Fr0.6
e ,where Fre is the jet exit Froude number. Weber [16]proposed an extension of Røkke’s relationship to ac-count for heat extraction under furnace conditionsfor the Scaling 400 burner series operating with con-ventional natural gas flames. He varied the propor-tionality constant according to the levels of heat ex-traction, whilst conforming to the same slope of 0.6.For example, the scaling correlation was changed toEINOx(ρfuelu/d) ≈ 23.2 Fr0.6
e for 40% heat extrac-tion. Weber’s approach resulted in a series of parallellines.
Fig. 9 shows a log–log graph of the variation ofEINOx(ρfuelu/d) with fuel jet exit Froude number.Part (a) presents all experimental data, part (b) thosecases burning NG, and part (c) those cases burning
Fig. 9. Leading-order NOx scaling correlation,EINOx(ρfuelu/d), versus fuel jet exit Froude number,Fre, for (a) all data points, (b) all cases burning NG,and (c) all cases burning LPG. The experimental datapoints are sorted according to fuel type, diluent, andburner size. Diamonds: NG, circles: LPG, thin line sym-bols: no fuel dilution, solid symbols: N2 dilution, thickline symbols: CO2 dilution, small symbols: d = 2.0 mm,and large symbols: d = 3.0 mm. Blue colored line andsymbols in part (b) represent data for a reference con-dition (17% < Qhx < 30%, 12 kW < Qfuel < 16 kW,0.78 < φ < 0.82, 400 ◦C < Tair < 500 ◦C). (For interpre-tation of the references to color in this figure legend, thereader is referred to the web version of this article.)
LPG. In all figures, the experimental data points aresorted according to fuel type, diluent, and burner size.The theoretical correlation of Røkke et al. [32] andthe empirical curve fit for 40% heat extraction from
290 G.G. Szegö et al. / Combustion and Flame 154 (2008) 281–295
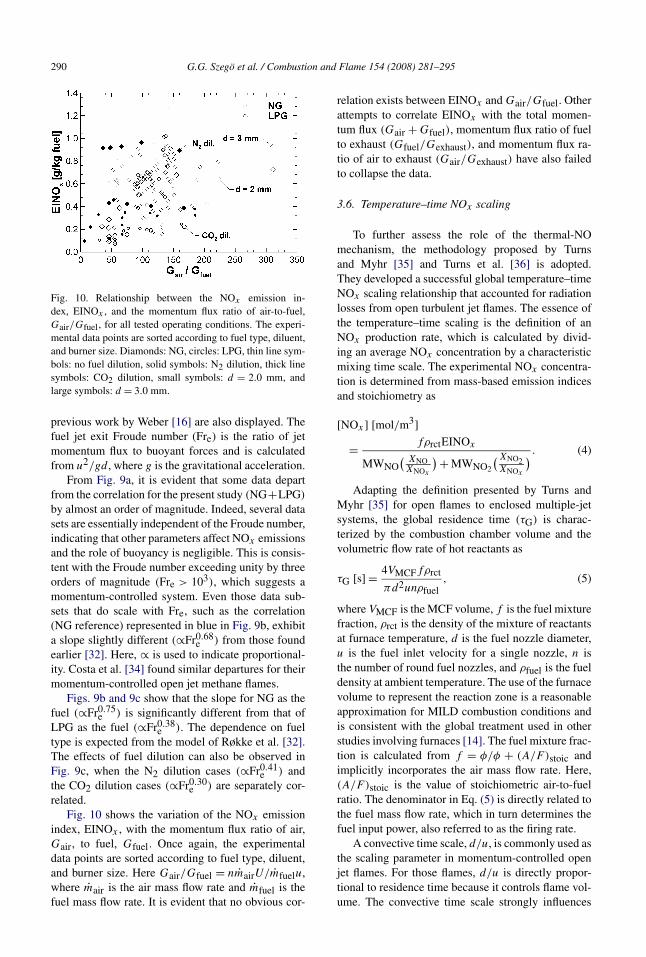
Fig. 10. Relationship between the NOx emission in-dex, EINOx , and the momentum flux ratio of air-to-fuel,Gair/Gfuel, for all tested operating conditions. The experi-mental data points are sorted according to fuel type, diluent,and burner size. Diamonds: NG, circles: LPG, thin line sym-bols: no fuel dilution, solid symbols: N2 dilution, thick linesymbols: CO2 dilution, small symbols: d = 2.0 mm, andlarge symbols: d = 3.0 mm.
previous work by Weber [16] are also displayed. Thefuel jet exit Froude number (Fre) is the ratio of jetmomentum flux to buoyant forces and is calculatedfrom u2/gd , where g is the gravitational acceleration.
From Fig. 9a, it is evident that some data departfrom the correlation for the present study (NG+LPG)
by almost an order of magnitude. Indeed, several datasets are essentially independent of the Froude number,indicating that other parameters affect NOx emissionsand the role of buoyancy is negligible. This is consis-tent with the Froude number exceeding unity by threeorders of magnitude (Fre > 103), which suggests amomentum-controlled system. Even those data sub-sets that do scale with Fre, such as the correlation(NG reference) represented in blue in Fig. 9b, exhibita slope slightly different (∝Fr0.68
e ) from those foundearlier [32]. Here, ∝ is used to indicate proportional-ity. Costa et al. [34] found similar departures for theirmomentum-controlled open jet methane flames.
Figs. 9b and 9c show that the slope for NG as thefuel (∝Fr0.75
e ) is significantly different from that ofLPG as the fuel (∝Fr0.38
e ). The dependence on fueltype is expected from the model of Røkke et al. [32].The effects of fuel dilution can also be observed inFig. 9c, when the N2 dilution cases (∝Fr0.41
e ) andthe CO2 dilution cases (∝Fr0.30
e ) are separately cor-related.
Fig. 10 shows the variation of the NOx emissionindex, EINOx , with the momentum flux ratio of air,Gair, to fuel, Gfuel. Once again, the experimentaldata points are sorted according to fuel type, diluent,and burner size. Here Gair/Gfuel = nmairU/mfuelu,where mair is the air mass flow rate and mfuel is thefuel mass flow rate. It is evident that no obvious cor-
relation exists between EINOx and Gair/Gfuel. Otherattempts to correlate EINOx with the total momen-tum flux (Gair + Gfuel), momentum flux ratio of fuelto exhaust (Gfuel/Gexhaust), and momentum flux ra-tio of air to exhaust (Gair/Gexhaust) have also failedto collapse the data.
3.6. Temperature–time NOx scaling
To further assess the role of the thermal-NOmechanism, the methodology proposed by Turnsand Myhr [35] and Turns et al. [36] is adopted.They developed a successful global temperature–timeNOx scaling relationship that accounted for radiationlosses from open turbulent jet flames. The essence ofthe temperature–time scaling is the definition of anNOx production rate, which is calculated by divid-ing an average NOx concentration by a characteristicmixing time scale. The experimental NOx concentra-tion is determined from mass-based emission indicesand stoichiometry as
[NOx ] [mol/m3](4)= fρrctEINOx
MWNO( XNOXNOx
) + MWNO2
(XNO2XNOx
) .
Adapting the definition presented by Turns andMyhr [35] for open flames to enclosed multiple-jetsystems, the global residence time (τG) is charac-terized by the combustion chamber volume and thevolumetric flow rate of hot reactants as
(5)τG [s] = 4VMCFfρrct
πd2unρfuel,
where VMCF is the MCF volume, f is the fuel mixturefraction, ρrct is the density of the mixture of reactantsat furnace temperature, d is the fuel nozzle diameter,u is the fuel inlet velocity for a single nozzle, n isthe number of round fuel nozzles, and ρfuel is the fueldensity at ambient temperature. The use of the furnacevolume to represent the reaction zone is a reasonableapproximation for MILD combustion conditions andis consistent with the global treatment used in otherstudies involving furnaces [14]. The fuel mixture frac-tion is calculated from f = φ/φ + (A/F)stoic andimplicitly incorporates the air mass flow rate. Here,(A/F)stoic is the value of stoichiometric air-to-fuelratio. The denominator in Eq. (5) is directly related tothe fuel mass flow rate, which in turn determines thefuel input power, also referred to as the firing rate.
A convective time scale, d/u, is commonly used asthe scaling parameter in momentum-controlled openjet flames. For those flames, d/u is directly propor-tional to residence time because it controls flame vol-ume. The convective time scale strongly influences
G.G. Szegö et al. / Combustion and Flame 154 (2008) 281–295 291
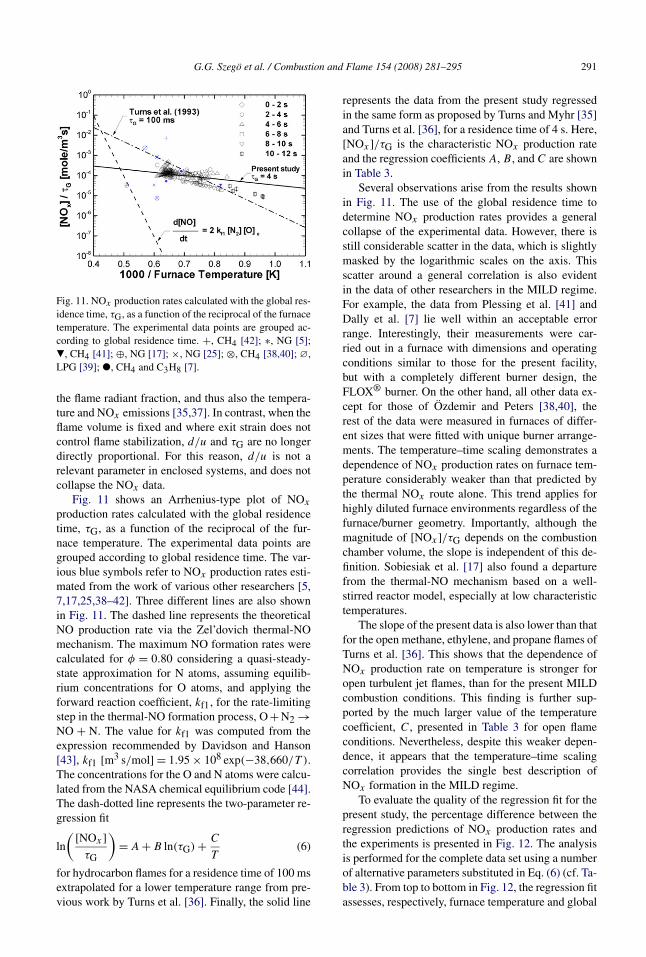
Fig. 11. NOx production rates calculated with the global res-idence time, τG, as a function of the reciprocal of the furnacetemperature. The experimental data points are grouped ac-cording to global residence time. +, CH4 [42]; ∗, NG [5];a, CH4 [41]; ⊕, NG [17]; ×, NG [25]; ⊗, CH4 [38,40]; ∅,LPG [39]; ", CH4 and C3H8 [7].
the flame radiant fraction, and thus also the tempera-ture and NOx emissions [35,37]. In contrast, when theflame volume is fixed and where exit strain does notcontrol flame stabilization, d/u and τG are no longerdirectly proportional. For this reason, d/u is not arelevant parameter in enclosed systems, and does notcollapse the NOx data.
Fig. 11 shows an Arrhenius-type plot of NOx
production rates calculated with the global residencetime, τG, as a function of the reciprocal of the fur-nace temperature. The experimental data points aregrouped according to global residence time. The var-ious blue symbols refer to NOx production rates esti-mated from the work of various other researchers [5,7,17,25,38–42]. Three different lines are also shownin Fig. 11. The dashed line represents the theoreticalNO production rate via the Zel’dovich thermal-NOmechanism. The maximum NO formation rates werecalculated for φ = 0.80 considering a quasi-steady-state approximation for N atoms, assuming equilib-rium concentrations for O atoms, and applying theforward reaction coefficient, kf1, for the rate-limitingstep in the thermal-NO formation process, O + N2 →NO + N. The value for kf1 was computed from theexpression recommended by Davidson and Hanson[43], kf1 [m3 s/mol] = 1.95 × 10⁸ exp(−38,660/T ).The concentrations for the O and N atoms were calcu-lated from the NASA chemical equilibrium code [44].The dash-dotted line represents the two-parameter re-gression fit
(6)ln
( [NOx ]τG
)= A + B ln(τG) + C
T
for hydrocarbon flames for a residence time of 100 msextrapolated for a lower temperature range from pre-vious work by Turns et al. [36]. Finally, the solid line
represents the data from the present study regressedin the same form as proposed by Turns and Myhr [35]and Turns et al. [36], for a residence time of 4 s. Here,[NOx ]/τG is the characteristic NOx production rateand the regression coefficients A, B , and C are shownin Table 3.
Several observations arise from the results shownin Fig. 11. The use of the global residence time todetermine NOx production rates provides a generalcollapse of the experimental data. However, there isstill considerable scatter in the data, which is slightlymasked by the logarithmic scales on the axis. Thisscatter around a general correlation is also evidentin the data of other researchers in the MILD regime.For example, the data from Plessing et al. [41] andDally et al. [7] lie well within an acceptable errorrange. Interestingly, their measurements were car-ried out in a furnace with dimensions and operatingconditions similar to those for the present facility,but with a completely different burner design, theFLOX® burner. On the other hand, all other data ex-cept for those of Özdemir and Peters [38,40], therest of the data were measured in furnaces of differ-ent sizes that were fitted with unique burner arrange-ments. The temperature–time scaling demonstrates adependence of NOx production rates on furnace tem-perature considerably weaker than that predicted bythe thermal NOx route alone. This trend applies forhighly diluted furnace environments regardless of thefurnace/burner geometry. Importantly, although themagnitude of [NOx ]/τG depends on the combustionchamber volume, the slope is independent of this de-finition. Sobiesiak et al. [17] also found a departurefrom the thermal-NO mechanism based on a well-stirred reactor model, especially at low characteristictemperatures.
The slope of the present data is also lower than thatfor the open methane, ethylene, and propane flames ofTurns et al. [36]. This shows that the dependence ofNOx production rate on temperature is stronger foropen turbulent jet flames, than for the present MILDcombustion conditions. This finding is further sup-ported by the much larger value of the temperaturecoefficient, C, presented in Table 3 for open flameconditions. Nevertheless, despite this weaker depen-dence, it appears that the temperature–time scalingcorrelation provides the single best description ofNOx formation in the MILD regime.
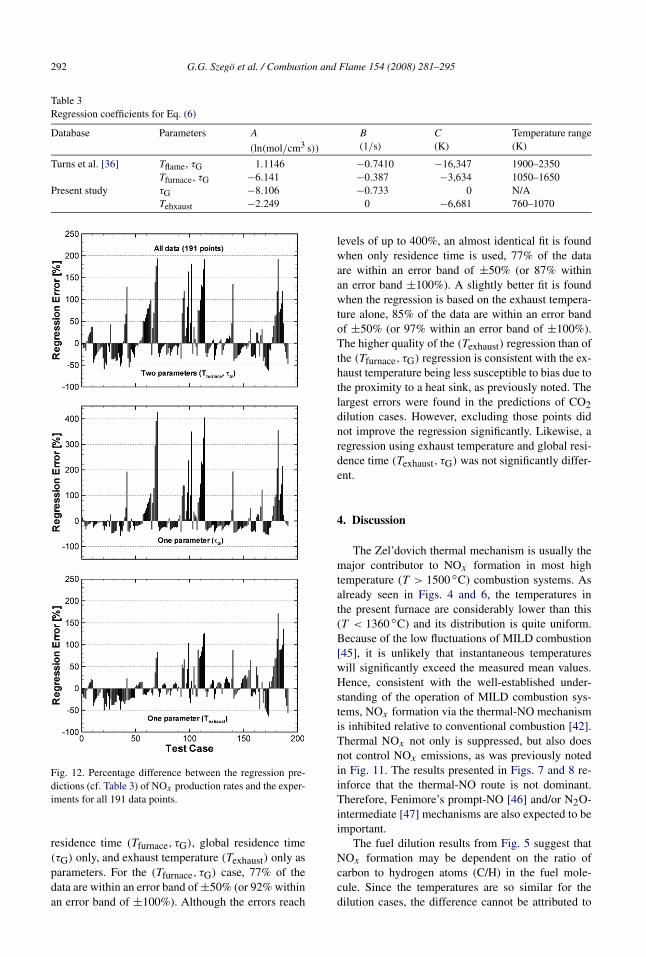
To evaluate the quality of the regression fit for thepresent study, the percentage difference between theregression predictions of NOx production rates andthe experiments is presented in Fig. 12. The analysisis performed for the complete data set using a numberof alternative parameters substituted in Eq. (6) (cf. Ta-ble 3). From top to bottom in Fig. 12, the regression fitassesses, respectively, furnace temperature and global
292 G.G. Szegö et al. / Combustion and Flame 154 (2008) 281–295
Table 3Regression coefficients for Eq. (6)
Database Parameters A
(ln(mol/cm3 s))
B
(1/s)C
(K)Temperature range(K)
Turns et al. [36] Tflame, τG 1.1146 −0.7410 −16,347 1900–2350Tfurnace, τG −6.141 −0.387 −3,634 1050–1650
Present study τG −8.106 −0.733 0 N/ATehxaust −2.249 0 −6,681 760–1070
Fig. 12. Percentage difference between the regression pre-dictions (cf. Table 3) of NOx production rates and the exper-iments for all 191 data points.
residence time (Tfurnace, τG), global residence time(τG) only, and exhaust temperature (Texhaust) only asparameters. For the (Tfurnace, τG) case, 77% of thedata are within an error band of ±50% (or 92% withinan error band of ±100%). Although the errors reach
levels of up to 400%, an almost identical fit is foundwhen only residence time is used, 77% of the dataare within an error band of ±50% (or 87% withinan error band ±100%). A slightly better fit is foundwhen the regression is based on the exhaust tempera-ture alone, 85% of the data are within an error bandof ±50% (or 97% within an error band of ±100%).The higher quality of the (Texhaust) regression than ofthe (Tfurnace, τG) regression is consistent with the ex-haust temperature being less susceptible to bias due tothe proximity to a heat sink, as previously noted. Thelargest errors were found in the predictions of CO2dilution cases. However, excluding those points didnot improve the regression significantly. Likewise, aregression using exhaust temperature and global resi-dence time (Texhaust, τG) was not significantly differ-ent.
4. Discussion
The Zel’dovich thermal mechanism is usually themajor contributor to NOx formation in most hightemperature (T > 1500 ◦C) combustion systems. Asalready seen in Figs. 4 and 6, the temperatures inthe present furnace are considerably lower than this(T < 1360 ◦C) and its distribution is quite uniform.Because of the low fluctuations of MILD combustion[45], it is unlikely that instantaneous temperatureswill significantly exceed the measured mean values.Hence, consistent with the well-established under-standing of the operation of MILD combustion sys-tems, NOx formation via the thermal-NO mechanismis inhibited relative to conventional combustion [42].Thermal NOx not only is suppressed, but also doesnot control NOx emissions, as was previously notedin Fig. 11. The results presented in Figs. 7 and 8 re-inforce that the thermal-NO route is not dominant.Therefore, Fenimore’s prompt-NO [46] and/or N2O-intermediate [47] mechanisms are also expected to beimportant.
The fuel dilution results from Fig. 5 suggest thatNOx formation may be dependent on the ratio ofcarbon to hydrogen atoms (C/H) in the fuel mole-cule. Since the temperatures are so similar for thedilution cases, the difference cannot be attributed to
G.G. Szegö et al. / Combustion and Flame 154 (2008) 281–295 293
the thermal-NO route. Rather, the fuel type depen-dence is further evidence that the prompt-NO mech-anism is significant. The dependence on fuel typehas also been observed in Fig. 9. The relevance ofthe prompt-NO pathway in the MILD regime hasbeen speculated on by a few researchers [5,17,25,48]. In the predictions of Mancini et al. [48], only5% of global NOx emissions were calculated to beof prompt-NO origin. On the other hand, it has beenobserved that the N2O-intermediate mechanism canrepresent up to 65% of the total NOx formation inlean-premixed methane combustion in a jet-stirred re-actor at atmospheric pressure in a temperature rangefrom 1140 to 1570 ◦C [49]. Further assessments arerequired to quantify the contributions of each path-way to the overall NOx emissions.
Several parameters seem to alter NOx formationin MILD combustion conditions and hence add to thecomplexity of the scaling problem. The previous sec-tions have outlined the influence of heat extraction, airpreheat, oxygen concentration, dilution, and fuel typeon global NOx emissions. While all these parametersare not independent from each other, the combinedeffect can be ultimately associated with a character-istic nonadiabatic temperature and residence time, asshown in Fig. 11. However, the fairly poor fit foundin the regression analysis presented in Fig. 12 demon-strates that temperature and residence time influence,but do not control, the scaling of NOx . It is not pos-sible to isolate one or two controlling parameters, be-cause many parameters seem to have an influence ofcomparable magnitude.
Although the Froude number has been used as ascaling parameter in furnace conditions with conven-tional flames [16], Fig. 9 suggests that it is not themost relevant parameter to scale NOx emissions fromfurnaces operating in the MILD regime. This is be-cause buoyancy forces are particularly weak in anenvironment with low temperature gradients. Never-theless, some dependence on Fre is evident, whichimplies that fuel jet momentum is still an importantparameter. The data for the two different burner sizesshown in Fig. 5 give further evidence of the influ-ence of momentum. A lower fuel jet momentum willlead to a change in the jet trajectory, much like that inthe strong-jet/weak-jet model of Grandmaison et al.[50], and hence reduce the amount of dilution withhot combustion products prior to mixing with the ox-idant stream. These changes will affect local speciesconcentrations and temperatures in the reaction zone,altering the ratio between mixing and reaction times,i.e., the local Damköhler number (Da = τmix/τchem).A low local Damköhler number can favor nonequilib-rium effects, such as superequilibrium O atoms [51].Both entrainment levels of hot combustion productsand nonequilibrium chemistry may account for the
differences between CO2 and N2 dilution. However,the results from Fig. 10 demonstrate that, althoughmixing has some influence, it does not control globalNOx yields. Therefore other effects, such as those dueto chemical kinetics, also influence the NOx forma-tion in this furnace.
The PSR calculations from Fig. 5 indicate that theassumption of a well-stirred reactor (Da 1) usedby some researchers [52,53] does not appear to bereasonable in the present MCF system. This is con-sistent with the recent modeling study of Mancini etal. [54]. They also found that the combustion chambercannot be considered simply as a well-stirred reac-tor. They proposed a reactor network model, whichconsisted of 22 PSRs, to predict NOx emissions froma semi-industrial-scale furnace. Their results empha-sized the importance of the mixing characteristicsclose to the burner exit. This implies that the NOx for-mation process is not controlled by chemical kinetics.
In summary, the analysis described above high-lights the fact that neither momentum nor kineticshas a controlling influence on NOx emissions, butthat rather both are important. This suggests that NOx
formation in the present furnace may be within theregime where mixing time scales are comparable tochemical time scales, and hence Damköhler numbersare of order unity, Da = O(1). Therefore, in order toaccurately predict NOx emissions from MILD com-bustion systems, any model will need to include theeffects of both mixing and chemistry.
5. Summary and conclusions
Global measurements of temperature and exhaustgas emissions obtained for 191 conditions in a 20-kWMILD combustion furnace operating with a paralleljet burner system have been presented. The main find-ings of the analysis are as follows:
1. The presence of a water-cooled heat exchangerdominated the temperature gradients and causeda nonsymmetrical temperature differential ofabout 100 ◦C across the furnace.
2. Overall NOx emission values as low as 5 ppmvdry at 3% O2 and as high as 66 ppmv dry at 3%O2 were recorded in the MILD regime for fur-nace temperatures of up to 1370 ◦C.
3. Fuel dilution of up to 76% by mass, with eitherCO2 or N2, reduced NOx emissions by up to48% and 10%, respectively. These levels of di-lution did not affect furnace temperatures signifi-cantly, with a maximum reduction of only 56 ◦C.The fuel type, diluent type, and fuel jet mo-mentum were all found to influence global NOx
yields. However, neither mixing nor chemistry
294 G.G. Szegö et al. / Combustion and Flame 154 (2008) 281–295
effects were found to be dominant, suggestingthat the characteristic Damköhler number spans,or is on the order of, unity. The failure of PSRcalculations to predict the NOx emissions furthersupports this hypothesis, as does the finding thatthe Froude number scaling revealed a limited de-pendence of NOx emissions on jet momentum.
4. A global NOx production rate, calculated basedon a global residence time and a characteris-tic furnace temperature, was found to give thebest scaling of the data across all conditions as-sessed. However, the dependence on temperaturewas found to be much weaker than that expectedbased on the thermal-NO mechanism alone. Thistrend also applied to other MILD combustionsystems, irrespective of the furnace/burner geom-etry. Furthermore, the regression analysis foundthat neither temperature nor global residencetime provides a sufficiently strong correlation tobe considered dominant. The leading-order ap-proach showed that, although the jet exit Froudenumber has been used in the past for enclosedconventional flames, it is not the appropriate pa-rameter for NOx scaling in the MILD regime.This is consistent with the weak role of buoyancyin a furnace with such low temperature gradients.
5. It is clear that no single NOx production mech-anism is dominant in the present MILD com-bustion conditions. The nondominant role of theZel’dovich thermal-NO mechanism is consistentwith the moderate furnace temperatures (800–1400 ◦C). Hence, it is deduced that the prompt-NO and/or N2O-intermediate pathways are ofsignificance comparable to that of the thermal-NO pathway.
Acknowledgments
The authors thank Graham Kelly and Bob Dyer fortheir technical support in all stages of this project. Thefinancial support of the Australian Research Council(ARC) and the School of Mechanical Engineering ofthe University of Adelaide is also gratefully acknowl-edged.
References
[1] IEA/OECD, CO2 Emissions from Fuel Combustion:1971–2000, Organisation for Economic Cooperationand Development and International Energy Agency,Paris, 2002.
[2] J.M. Beer, Prog. Energy Combust. Sci. 33 (2007) 107–134.
[3] S. Pacala, R. Socolow, Science 305 (2004) 968–972.
[4] A. Cavaliere, M. De Joannon, Prog. Energy Combust.Sci. 30 (2004) 329–366.
[5] M. Katsuki, T. Hasegawa, Proc. Combust. Inst. 27(1998) 3135–3146.
[6] H. Tsuji, M. Morita, A.K. Gupta, M. Katsuki, K. Kishi-moto, T. Hasegawa, High Temperature Air Combus-tion: From Energy Conservation to Pollution Reduc-tion, CRC Press, 2003.
[7] B.B. Dally, E. Riesmeier, N. Peters, Combust. Flame137 (2004) 418–431.
[8] M. Flamme, Appl. Therm. Eng. 24 (2004) 1551–1559.[9] P.R. Medwell, P.A.M. Kalt, B.B. Dally, Combust.
Flame 148 (2007) 48–61.[10] H. Zhang, G. Yue, J. Lu, Z. Jia, J. Mao, T. Fujimori, T.
Suko, T. Kiga, Proc. Combust. Inst. 31 (2007) 2779–2785.
[11] R. Weber, J.P. Smart, W. Van der Kamp, Proc. Com-bust. Inst. 30 (2004) 2623–2629.
[12] S.R. Turns, Prog. Energy Combust. Sci. 21 (1995) 361–385.
[13] A.D. Al-Fawaz, L.M. Dearden, J.T. Hedley, M. Mis-saghi, M. Pourkashanian, A. Williams, L.T. Yap, Proc.Combust. Inst. 25 (1994) 1027–1034.
[14] T.-C.A. Hsieh, W.J.A. Dahm, J.F. Driscoll, Combust.Flame 114 (1998) 54–80.
[15] A. Sayre, N. Lallemant, J. Dugue, R. Weber, Proc.Combust. Inst. 25 (1994) 235–242.
[16] R. Weber, Proc. Combust. Inst. 26 (1996) 3343–3354.[17] A. Sobiesiak, S. Rahbar, H.A. Becker, Combust.
Flame 115 (1998) 93–125.[18] J. Newby, B. Cain, T. Robertson, in: Proceedings of
the 2nd International Seminar on High TemperatureCombustion in Industrial Furnaces, Stockholm, Swe-den, 2000.
[19] M. Nishimura, T. Suzuki, R. Nakanishi, R. Kitamura,Energy Convers. Manage. 38 (1997) 1353–1363.
[20] F.K. Besik, S. Rahbar, H.A. Becker, A. Sobiesiak, U.S.Patent 5,772,421 (June 30, 1998).
[21] B.E. Cain, T.F. Robertson, J.N. Newby, U.S. Patent6,638,061 (October 28, 2003).
[22] T. Suzuki, K. Morimoto, U.S. Patent 4,439,137 (March27, 1984).
[23] G.G. Szegö, B.B. Dally, G.J. Nathan, F.C. Christo,in: Australian Symposium on Combustion and the 8thAustralian Flame Days, Melbourne, Australia, 8–9 De-cember 2003.
[24] I. Nakamachi, K. Yasuzawa, T. Miyahara, T. Nagata,U.S. Patent 4,945,841 (August 7, 1990).
[25] R. Weber, A.L. Verlaan, S. Orsino, N. Lallemant, J.Inst. Energy 72 (1999) 77–83.
[26] R. Siegel, J.R. Howell, Thermal Radiation Heat Trans-fer, fourth ed., Taylor and Francis, New York, 2002.
[27] F.P. Incropera, D.P. DeWitt, Fundamentals of Heat andMass Transfer, fourth ed., Wiley, New York, 1996.
[28] S.R. Turns, An Introduction to Combustion: Con-cepts and Applications, second ed., WCB/McGraw–Hill, Boston, 2000.
[29] G.G. Szegö, B.B. Dally, G.J. Nathan, F.C. Christo,in: The Sixth Asia–Pacific Conference on Combustion,Nagoya, Japan, 20–23 May 2007, pp. 231–234.
[30] J.C. Davis, Statistics and Data Analysis in Geology,Wiley, New York, 1986.
G.G. Szegö et al. / Combustion and Flame 154 (2008) 281–295 295
[31] Gas Research Institute, GRI-mech 3.0, available athttp://www.me.berkeley.edu/gri-mech/.
[32] N.A. Røkke, J.E. Hustad, O.K. Sonju, F.A. Williams,Proc. Combust. Inst. 24 (1992) 385–393.
[33] N. Peters, Prog. Energy Combust. Sci. 10 (1984) 319–339.
[34] M. Costa, C. Parente, A. Santos, Exp. Therm. FluidSci. 28 (2004) 729–734.
[35] S.R. Turns, F.H. Myhr, Combust. Flame 87 (1991) 319–335.
[36] S.R. Turns, F.H. Myhr, R.V. Bandaru, E.R. Maund,Combust. Flame 93 (1993) 255–269.
[37] G.J.R. Newbold, G.J. Nathan, D.S. Nobes, S.R. Turns,Proc. Combust. Inst. 28 (2000) 481–487.
[38] P.J. Coelho, N. Peters, Combust. Flame 124 (2001)503–518.
[39] S. Kumar, P.J. Paul, H.S. Mukunda, Proc. Combust.Inst. 29 (2002) 1131–1137.
[40] I.B. Özdemir, N. Peters, Exp. Fluids 30 (2001) 683–695.
[41] T. Plessing, N. Peters, J.G. Wuenning, Proc. Combust.Inst. 27 (1998) 3197–3204.
[42] J.A. Wünning, J.P. Wünning, Prog. Energy Combust.Sci. 23 (1997) 81–94.
[43] A.M. Dean, J.W. Bozzelli, in: W.C. Gardiner Jr.(Ed.), Gas-Phase Combustion Chemistry, second ed.,Springer-Verlag, 2000, p. 143.
[44] S. Gordon, B.J. McBride, Report No. NASA RP-1311,NASA Lewis Research Center, Cleveland, OH, 1994.
[45] M. Oberlack, R. Arlitt, N. Peters, Combust. TheoryModel. 4 (2000) 495–509.
[46] C.P. Fenimore, Proc. Combust. Inst. 13 (1970) 373–380.
[47] C.T. Bowman, Proc. Combust. Inst. 24 (1992) 859–878.
[48] M. Mancini, R. Weber, U. Bollettini, Proc. Combust.Inst. 29 (2002) 1155–1162.
[49] R.C. Steele, P.C. Malte, D.G. Nicol, J.C. Kramlich,Combust. Flame 100 (1995) 440–449.
[50] E.W. Grandmaison, I. Yimer, H.A. Becker, A. So-biesiak, Combust. Flame 114 (1998) 381–396.
[51] J.F. Driscoll, R.-H. Chen, Y. Yoon, Combust. Flame 88(1992) 37–49.
[52] M. De Joannon, A. Cavaliere, T. Faravelli, E. Ranzi,P. Sabia, A. Tregrossi, Proc. Combust. Inst. 30 (2005)2605–2612.
[53] M. De Joannon, A. Saponaro, A. Cavaliere, Proc. Com-bust. Inst. 28 (2000) 1639–1645.
[54] M. Mancini, P. Schwoppe, R. Weber, S. Orsino, Com-bust. Flame 150 (2007) 54–59.