PREDATORS, PREY REFUGES, AND THE SPATIAL SCALING OF DENSITY-DEPENDENT PREY MORTALITY
Journal of AnimalEcology 0888\57\ 59Ð61
Þ 0888 BritishEcological Society
59
Scale!dependent correlations between the abundance of
Bru�nnich|s guillemots and their prey
FRIDTJOF MEHLUM�\ GEORGE L[ HUNT JR$\ ZYGMUNT KLUSEK%and MARY BETH DECKER$�Norwegian Polar Institute\ PO Box 4961 Majorstua\ N!9290 Oslo\ Norway^ $Department of Ecology andEvolutionary Biology\ University of California\ Irvine\ California 81586\ USA^ and %Institute of Oceanology\Polish Academy of Sciences\ Powstankow Warszawy 44\ 70Ð856 Sopot\ Poland
Summary
0[ The foraging ecology of Bru�nnich|s guillemots Uria lomvia was studied during thebreeding season in south!eastern Svalbard[ In the region of Storfjorden there are twolarge breeding colonies comprising a total of about 439 999 individuals[ These birdsforage in the western part of Storfjorden and further to the south[ Their main preyare polar cod Boreogadus saida\ pelagic amphipods Parathemisto spp[ and euphausiidsThysanoessa inermis[1[ A ship!based transect survey was used to record bird abundance and the acous!tically determined biomass of presumed prey[ The _ve transects were divided into 22segments\ each 7Ð00 km in length[ The resolution of the survey was 049m\ andanalyses of correlations between predators and prey were performed at length scalesfrom 049m to 8 km[ We di}erentiated acoustic signals into aggregated and dispersedcategories according to the estimated horizontal distribution of presumed prey[2[ Foraging guillemots were consistently more strongly correlated with the aggregatedprey than with dispersed prey over scales ranging from 049m to 8 km[ Correlationswere weak at small scales "049m Ð 0 km# and increased and stabilized at scales of 1Ð2 km[ The spatial scale at which we obtained a shift from weak to strong correlationsbetween guillemots and their prey was similar to the scale at which the spatial variancesin both guillemot and prey abundance were high[3[ Guillemots showed low correlations with prey at low prey densities[ Similarly\correlations between guillemots and prey were low at low bird densities[ The datasupport the hypothesis that the birds associate with prey patches with densities abovea certain threshold\ and that {regional| prey abundances a}ect local use of patches[4[ The numerical aggregative response curves between guillemot and prey densitywere classi_ed as being neither hyperbolic "type II# or sigmoidal "type III# within therange of prey densities observed in this study[ The aggregative response curves weresensitive to spatial scales\ which suggest that studies of response curves should beconducted at a range of spatial scales[
Key!words] aggregative response\ Bru�nnich|s guillemots\ foraging ecology\ scaledependence\ Uria lomvia[
Journal of Animal Ecology "0888# 57\ 59Ð61
Introduction
Spatial variability in the abundance of foraging ani!mals and the spatial interactions between predators
�Present address and correspondence] Dr Fridtjof Mehlum\Zoological Museum\ Sarsgt[ 0\ N!9451 Oslo\ Norway[ Fax]¦36 11740726[ E!mail] fmehlumÝulrik[uio[no
and prey are fundamental themes in ecology[ Studiesexploring predatorÐprey interaction have been mainlylimited to a single spatial scale\ i[e[ the scale of asingle individual or that of the population "Horne +Schneider 0883#[ In recent years\ the need for selectionof appropriate spatial or temporal scales has beenacknowledged in the study of a number of di}erentecological interactions\ including density dependence"Ray + Hastings 0885# and social organization "Coul!
50
F[ Mehlum et al[
Þ 0888 BritishEcological SocietyJournal of AnimalEcology\ 57\ 59Ð61
son et al[ 0886#[ Investigations require the use of amultiscale approach if predator selection of foraginghabitat is to be identi_ed "Schneider + Du}y 0874^Schneider + Piatt 0875^ Hunt\ Harrison + Cooney0889^ Russell et al[ 0881^ Schneider 0882\ 0883#[ Theimportance of selecting the appropriate spatial scalesis illustrated by the observation that the sign of associ!ation between predators and prey may change frompositive to negative when the scale of observationdecreases "Fairweather\ Underwood + Moran 0873^Smith 0867^ Schmitt 0871\ 0874^ Fairweather 0877^Rose + Leggett 0889#[
The spatial associations between predators and preymay be considered as a special case of habitat selectionin which prey aggregations are patches within a largermatrix[ If the distribution and abundance of prey canbe assessed by the predator\ the spatial distribution ofa predator would be expected to follow the dispersionof the prey at _ne spatial scales as predicted by theideal free distribution model "Fretwell + Lucas 0869^Morris 0876#[ Alternatively\ if the prey cannot beassessed by the predator because of perceptual con!straints\ or if habitat selection is not related toresource exploitation\ the distribution of predatorsmay or may not be associated with that of their prey[
In predatorÐprey systems\ the numerical responsecurve between predator aggregation and prey densityis most often described as being nonlinear "Holling0848\ 0854^ Hassell + May 0863#[ This response curvemay be hyperbolic "type II# or sigmoidal "type III#\ thelatter being the most common for higher vertebrates"Goss!Custard 0869\ 0866^ Hassell + May 0863^ Piatt+ Methven 0881#[ Following Hassell + May "0863#the sigmoidal aggregative response curve may be inter!preted as follows] In areas with low prey density\predators do not _nd it worthwhile to search for prey\and thus the densities of predators will be low[ Inareas with increased prey density\ the predators canobtain their prey more easily\ and successful predatorsmay attract more predators and this reinforces theiraggregation[ However\ at a certain level of preydensity\ satiation in predator density is reached\ andthe response curve levels o}[
Seabirds are predators which are patchily dis!tributed while foraging at sea[ The patchiness of mar!ine birds and other predators at scales ³ 4 km hasbeen partially explained by patchiness in the dis!tribution of their prey and by the birds| selection offoraging habitats where prey could be most pro_tablyacquired "Hunt + Harrison 0889^ Hunt et al[ 0889^Hunt\ Heinemann + Everson 0881#[ At coarser scales\seabird distributions can to a large extent be explainedby hydrographic structure\ even though the under!lying cause of their distributions most likely is deter!mined by prey availability "Shuntov 0863^ Pock!lington 0868^ Brown 0879^ Hunt et al[ 0870^ Gri.ths\Siegfried + Abrams 0871^ Hunt + Schneider 0876^Veit 0877#[
Recent improvements in acoustic techniques for
measuring marine _sh and plankton densities haveallowed students to investigate the strength of associ!ations between the abundance of foraging seabirdsand their prey at multiple spatial scales[ There is con!siderable variation in the strength of correlationbetween seabird and prey abundance reported by vari!ous authors "see review by Hunt 0889^ Hunt et al[0881#[ Typically\ most investigations have reportedweak correlations at _ne scales "³ 4 km#\ and moststudies have shown increasingly stronger correlationsat larger scales[
Previous studies of distributions of marine avianpredators with respect to their prey have employedtechniques that integrated prey biomass over transectsegments varying in length from 9=0 km to 09 km[Mehlum et al[ "0885# analysed the spatial correlationbetween Bru�nnich|s guillemots Uria lomvia L[ andtheir presumed prey at the scale of ¼ 09 km in thevicinity of two large high arctic breeding colonies insouthern Spitsbergen[ They di}erentiated two classesof signals in their hydroacoustic data Ð aggregatedand dispersed[ They interpreted aggregated targets tore~ect schools of _sh or dense aggregations of largezooplankters\ whereas dispersed targets were re~ectedfrom scattered organisms[ By classifying echo types\Mehlum et al[ "0885# were able to show that whereascorrelations between seabirds and all prey combinedwere similar to the values found in studies reviewedby Hunt et al[ "0881#\ correlations between guillemotsand aggregated prey were among the strongest rec!orded for any study of seabirds[
This study focuses on associations between Bru�n!nich|s guillemots and di}erent classes of acousticallydetected prey at a range of spatial scales from 049 mto 8 km[ We reasoned that if guillemots were stronglyassociated with aggregated prey at relatively large spa!tial scales\ similarly strong correlations should befound at smaller scales down to the scale at which thepredators no longer di}erentiate between subsectionsof an aggregation "Kotliar + Wiens 0889#[ This mini!mum scale should be set by a combination of thedensity structure of an aggregation as well as by thespacing between schools within the aggregation[ Wealso investigate the shape of the aggregative responsecurve for Bru�nnich|s guillemots and their prey at mul!tiple spatial scales[
STUDY AREA
Storfjorden is a shallow fjord with depths ³ 079 mlocated in the south!eastern part of Svalbard "Fig[ 0a#[The most prominent bathymetric feature of the fjordis a northÐsouth orientated submarine ridge locatedin the western part of the fjord[ The study area isusually completely ice!covered during winter[ No seaice was present during our study in this portion ofStorfjorden[
Two large and several smaller breeding colonies ofBru�nnich|s guillemots are located on the western coast

51
Abundance ofguillemots andtheir prey
Þ 0888 BritishEcological SocietyJournal of AnimalEcology\ 57\ 59Ð61
Fig[ 0[ "a# Svalbard archipelago and the northern Barents Sea[ The study area in Storfjorden is indicated by a box[ The 099\199 and 499 m depth contours are given[ "b# The _ve eastÐwest seabird transects and sampling stations included in the study\which were located to the south of the two main breeding colonies in Storfjorden[ Each transect is separated in high "− themedian# and low "³ the median# guillemot density segments[ The 099 m bathymetry contours are shown[

52
F[ Mehlum et al[
Þ 0888 BritishEcological SocietyJournal of AnimalEcology\ 57\ 59Ð61
of Storfjorden "Mehlum et al[ 0885#[ The populationsof the two large colonies\ Stellingfjellet "66>95? N\06>19? E# and Kovalskifjellet "66>92? N\ 06>06? E#\have been recently estimated at about 349 999 and89 999 individuals\ respectively "Mehlum + Bakken0883#[ Birds from these colonies forage in Storfjordenand in waters further south in Storfjordrenna[ InStorfjorden\ most guillemots forage in relatively deepwaters in the western part\ coincident with a weaksubsurface front between warm Atlantic water andcold Arctic water "Mehlum et al[ 0885#[
Methods
SURVEY DESIGN
A ship!based transect study was conducted in an areawhere Bru�nnich|s guillemots from the two large breed!ing colonies of Stellingfjellet and Kovalskifjellet for!age "Mehlum et al[ 0885#[ The Bru�nnich|s guillemotwas the only abundant avian consumer of larger zoo!plankton and _sh in southern Storfjorden at the timeof the study[ To study relationships between guillemotabundances and prey distribution\ we selected _velatitudinal transects "48Ð57 km in length# that rangedeastward from shallow waters near the eastern coastof Spitsbergen to 19> 99? E\ at latitudes of 65> 24?\65> 39?\ 65> 34?\ 65> 49?\ and 66> 99? N "Fig[ 0b#[ Alltransects were surveyed once during the period 10Ð13July 0881[ The ship travelled at a speed of 4=9Ð4=4knots and traversed ¼ 049 m per minute[ The tran!sects were divided into segments\ each 7Ð00 km inlength\ corresponding to the distance between oceano!graphic sampling stations "Fig[ 0b#[ For the analysesin this paper\ data were not aggregated across oceano!graphic stations[
BIRDS
The abundance of Bru�nnich|s guillemots observed sit!ting on the sea surface was recorded from the bridgeof the research vessel Lance by standardized strip tran!sect methods as described by Tasker et al[ "0873#[ Birdobservations were made continuously between stopsat each station along transects[ A 299 m transect widthwas used and all birds observed within the transectwere entered directly into a _eld computer[ The lowestspatial resolution of bird abundance along transectswas set at 0 minute "or 049 m#[
ACOUSTICS
Details of the methods used for bioacoustical rec!ordings are described by Mehlum et al[ "0885#[ Weused a single beam:single frequency echo sounder"LAZ 3699 ELAC# operating at 29 kHz\ and recordedechoes on a ping by ping basis[ The transducer with abeam angle of 05> was mounted inside a V!_n bodytowed at a depth of 1Ð2=4 m[ Because we did not know
the target strength of the organisms detected by theecho sounder\ echo signals are represented as Volts1[Estimates of biomass are not essential in this studybecause we are interested in relative di}erences inacoustically detected biomass between di}erent partsof transects[ During most of the transects\ the sea wascalm "9Ð0 Beaufort scale#\ and unwanted noise andexcess attenuation of acoustical signals from bubbleswas low[
Post!processing of echo signals included _lteringout the ship|s echo sounder signals\ echo type recog!nition\ and integration of echo intensity at 0!min "049!m# intervals along the transects[ The sampling windowfor the quantitative analysis was in the interval from09 to 49 m depth[ The acoustic signals were classi_edinto two groups] dense concentrations of targets "echotype A Ð aggregated# and dispersed targets "echo typeD Ð dispersed#[ A simple algorithm for discriminatingbetween the two di}erent type of echoes wasdeveloped based on the dimension and the strength ofthe echoes[ The methods used for removing echoesfrom the ship|s depth sounder are described byMehlum et al[ "0885#[ The algorithm for dis!criminating between the two types of targets is pre!sented in Appendix 0[
ANALYSES
We analysed correlations between guillemot abun!dance and acoustic biomass along transects at scalesranging from 049 m to 8 km[ When calculating cor!relations within each transect segment "7Ð00 km#\ thelargest spatial scale "bin size# used was 1=9 km[ Foranalyses using a bin size of 1 km\ the number of binsper transect segment varied between 2 and 4[ Foranalyses using bin sizes smaller than 1 km\ the numberof bins per correlation statistic increased with decreas!ing bin size[ When combining data from all segments\the sample sizes permitted analyses at scales up to8 km "sample sizes ranged from 01 for 8 km segmentsto 0679 for 049 m segments#[
Statistical analyses of guillemot and acoustical datawere performed using STATISTICA vs[ 4=9 "Statsoft\Inc[ 0884#\ assuming 1nd order stationarity "i[e[expected value and variance constant for any subsetof a time series# in guillemot and prey abundancewithin each 7Ð00 km transect segment[ Because thePearson correlation method is not robust to {outliers|or asymmetry in data sets\ we preferred to use non!parametric Spearman rank correlations[ However\ asmost previous studies correlating seabird and preyabundances have used the Pearson method\ we alsopresent results using this method for comparative pur!poses in our initial analyses[ If the two methods yiel!ded similar results in the initial analyses\ we selectedthe Pearson method for the subsequent analyses[ Weused autocorrelation analysis to investigate serialdependency in the abundance of guillemots withintransect segments[

53
Abundance ofguillemots andtheir prey
Þ 0888 BritishEcological SocietyJournal of AnimalEcology\ 57\ 59Ð61
On transect segments with low bird densities weexpected to obtain no or only weak positive cor!relations between the abundance of guillemots andtheir prey because there would be too few birds toprovide proportional coverage of all prey patchesavailable[ We therefore selected transect segmentswith guillemot abundance − the median for furtheranalyses of correlations between bird and prey abun!dance[ To investigate the ability of the predator totrack prey patches\ we calculated cross!correlationsbetween guillemot and the aggregated type prey at thesmallest scale possible "049 m#[
To characterize the horizontal dimension of preypatches\ we used two di}erent methods[ In the _rstmethod\ we determined the upper 14)\ the median\and the lower 14) values of the distribution of acous!tic return in all 049 m bins "n � 0679# surveyed duringthe _ve transects[ These values were selected as thre!sholds for acoustic values above which we would class!ify the return as belonging to a prey patch[ We thenestimated the length of a patch "chord length# in atransect segment as the distance between contiguousbins with acoustic values above the threshold[ Simi!larly\ we estimated the interpatch distance as the dis!tance between contiguous bins below the acoustic thr!eshold[
The second method for characterizing prey patchdimensions was based on wavelet analysis "Bradshaw+ Spies 0881#[ We also used wavelet analysis fordescribing patch dimensions of foraging guillemots[This method is useful for analysing nonstationary ornonsinusoidal multifrequency data "Bradshaw +Spies 0881^ Bradshaw + McIntosh 0883#[ It can detectaggregative patterns in time series "or along transects#at di}erent scales which may be overlooked bymethods such as the Fourier spectral analysis[
We used the WaveLab 9=6 Toolbox "Stanford Uni!versity freeware# under MATLAB "MathWorks\ Inc[#for calculating the wavelet transform at di}erent spa!tial scales of aggregated prey and guillemot densities\respectively\ in each transect segment[ The selectedanalysing wavelet was {Sombrero|\ which is similar tothe {Mexican Hat| wavelet described by Daubechies"0877#[ The wavelet variance was applied for detectingthe spatial scales which dominated the spatial patternsin the data[ This function is given for a speci_c scaleas the average of the squares of the wavelet coe.cientsat every point along the transect at this scale "Brad!shaw + Spies 0881#[ Large wavelet variance at a scaleidenti_es this scale as important for describing thespatial pattern along the transect[
Results
NUMBERS AND DISTRIBUTION OF BRUÝ NNICH|S
GUILLEMOTS
The average number of Bru�nnich|s guillemotsobserved per minute in the 22 transect segments was
9=59 2 9=65 "SD# "or 9=07 2 9=12 individuals per km1#\and median guillemot abundance was 9=20 birds permin "or 9=00 birds per km1#[ The locations whereguillemot abundance was− the median "� high# isshown in Fig[ 0b[ Of the 07 transect segments in whichguillemot densities were − the median\ only two seg!ments showed signi_cant "P ³ 9=94# autocorrelationat a lag of 0 for the lowest bin size "0 min or 049 m#\but none of these autocorrelations was above 9=4[This indicated that the serial dependency of guillemotobservations at a bin size of 049 m was negligible[
SCALE!DEPENDENT CORRELATION BETWEEN
BIRD AND PREY ABUNDANCE
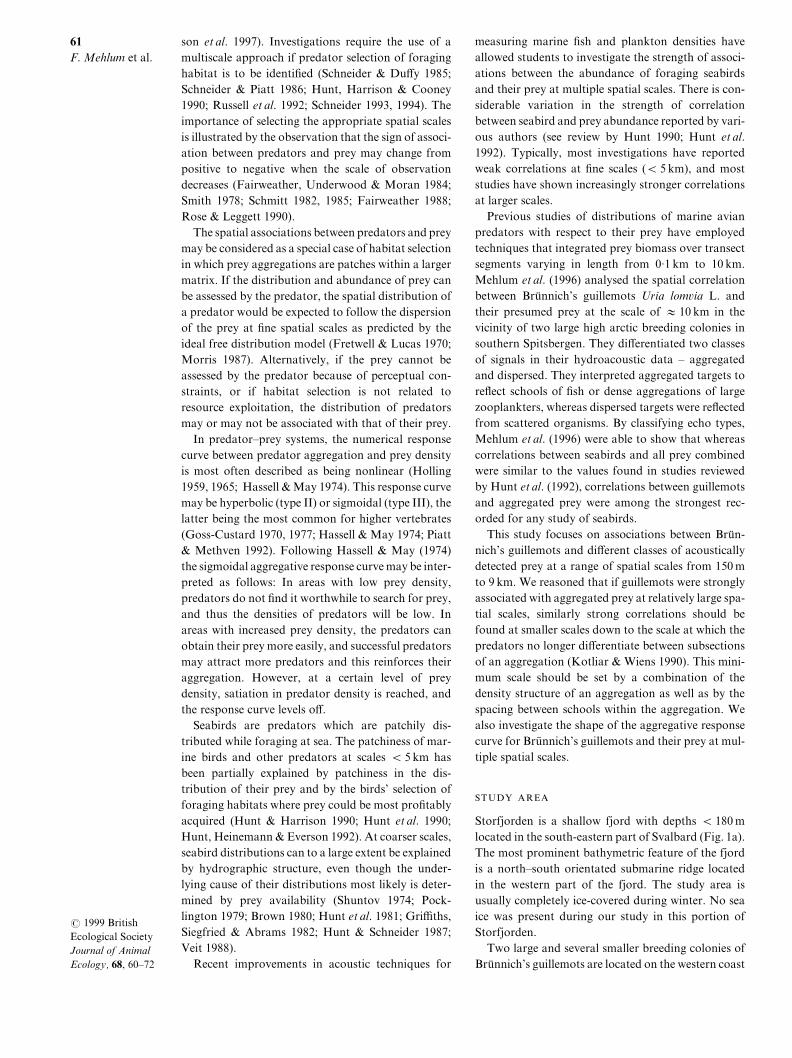
The strength of correlation between Bru�nnich|s guille!mots and the acoustically determined biomass of pre!sumed prey varied with bin size and whether preywere aggregated or dispersed[ Using data from all 22transect segments\ we found that correlations betweenbirds and acoustically detected biomass were weak atthe smallest bin sizes\ but increased\ and then more orless stabilized\ at bin sizes between 1 and 8 km "Fig[ 1#[Correlations between guillemots and acousticallydetected biomass were consistently stronger for aggre!gated biomass than for di}use biomass\ regardless ofbin size "Fig[ 1#[ The Pearson correlation coe.cientfor guillemots and aggregated biomass stabilized atabout r � 9=69 for bin sizes − 2 km[ The di}erencesin guillemot responses to biomass aggregation weremost striking when Pearson correlation|s were used\especially for bin sizes of 2Ð8 km[
DIFFERENCES IN BIRDÐPREY CORRELATIONS
AMONG TRANSECT SEGMENTS
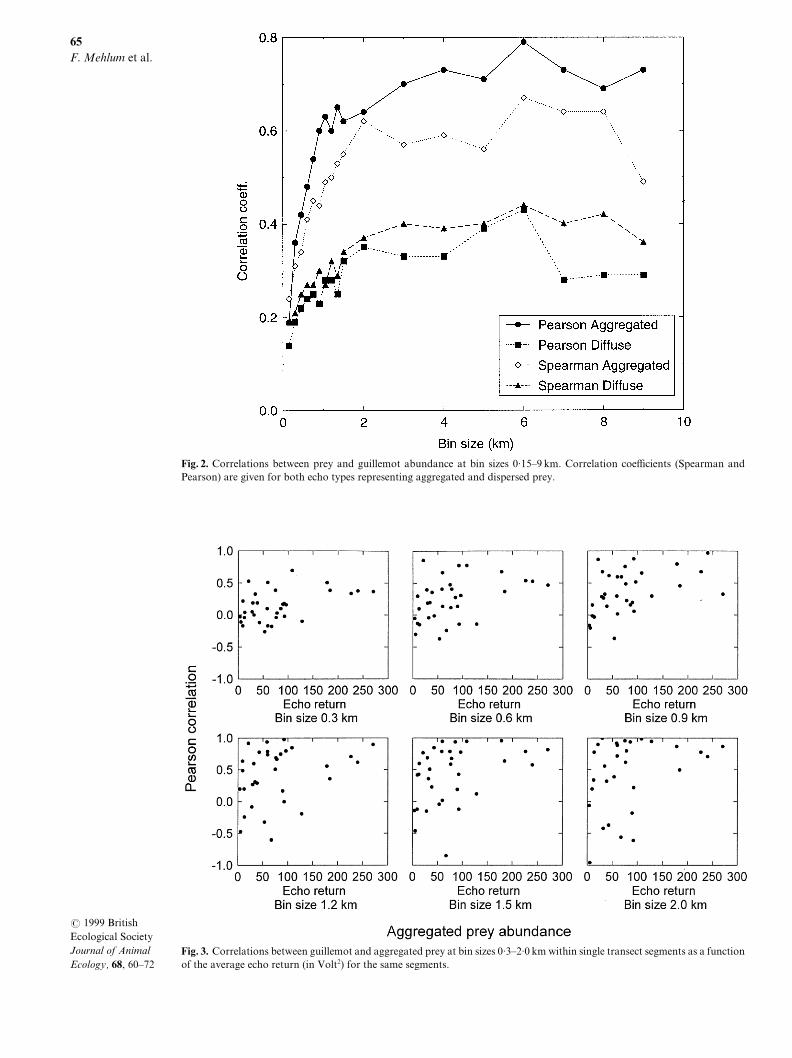
Correlations between guillemots and acousticallydetected biomass were sensitive to the total densityof prey "Fig[ 2# and the average density of foragingguillemots within each transect segment "Fig[ 3#[ Forbin sizes between 9=2 and 1=9 km\ scatter in the dis!tribution of Pearson correlation coe.cients for indi!vidual transect segments in relation to summed "aver!aged# acoustic return increased markedly once echoreturn values fell below about 099 V1 "Fig[ 2#[ Abovethis value\ correlation coe.cients increased graduallywith increasing acoustic biomass\ and the correlationswere consistently strong at relatively high acousticbiomass[ Similarly\ in transect segments where theaverage guillemot density was below about 9=1Ð9=2birds kmÐ1\ there was a wide scatter in Pearson cor!relation coe.cients between guillemots and acousticreturn^ the three data points above these valuesshowed strong correlations "r × 9=79# over a range ofbin sizes from 9=2 km to 1=9 km "Fig[ 3#[
We found di}erences between transect segments inthe strength of the correlations between guillemot andecho returns[ When calculating correlations betweenguillemots and aggregated biomass for each of the 22
54
F[ Mehlum et al[
Þ 0888 BritishEcological SocietyJournal of AnimalEcology\ 57\ 59Ð61
Fig[ 1[ Correlations between prey and guillemot abundance at bin sizes 9=04Ð8 km[ Correlation coe.cients "Spearman andPearson# are given for both echo types representing aggregated and dispersed prey[
Fig[ 2[ Correlations between guillemot and aggregated prey at bin sizes 9=2Ð1=9 km within single transect segments as a functionof the average echo return "in Volt1# for the same segments[

55
Abundance ofguillemots andtheir prey
Þ 0888 BritishEcological SocietyJournal of AnimalEcology\ 57\ 59Ð61
Fig[ 3[ Correlations between guillemot and aggregated prey at bin sizes 9=2Ð1=9 km within single transect segments as a functionof the average density of guillemots for the same segments[
transect segments separately\ we found that strongcorrelations "here de_ned as r − 9=5# were infrequentat bin sizes below 599 m\ but were encountered inbetween 29) and 37) of correlations computedusing larger bin sizes "Table 0#[ When we used the 07transect segments in which bird densities were − themedian for all segments\ strong correlations wereobtained in 22Ð 50) of segments when bin sizes were− 599 m[
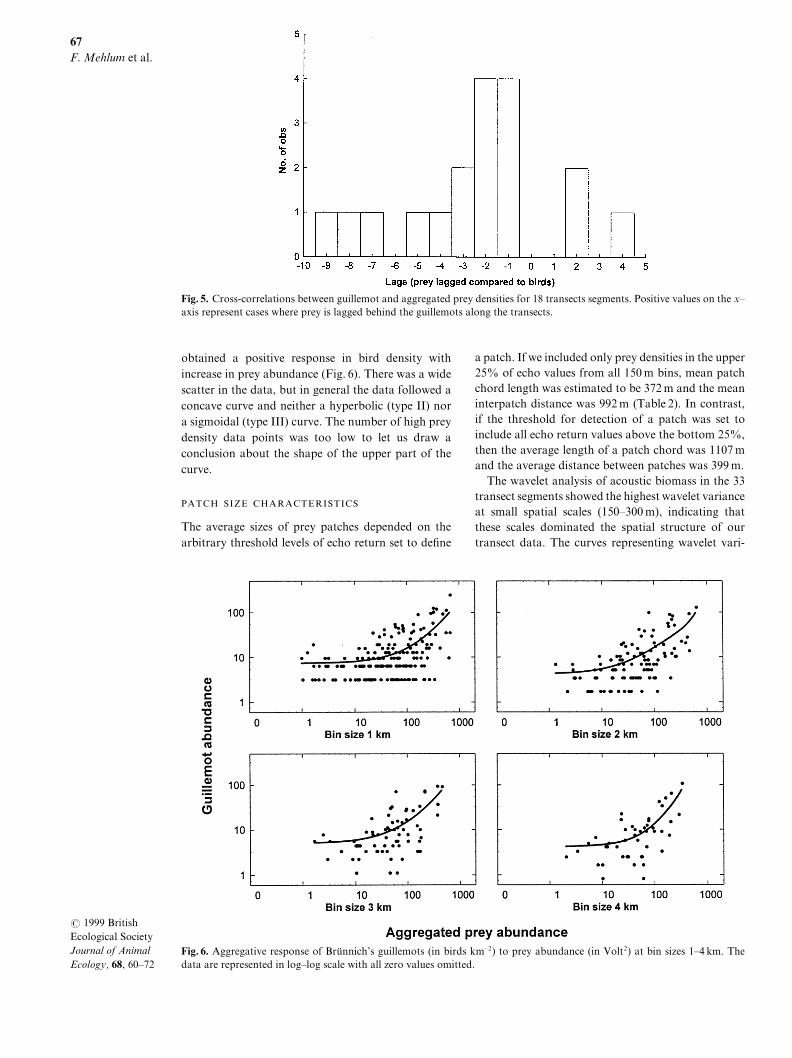
It is possible that our analyses underestimated theactual strength of the correlations reported abovebecause of imperfect match between predator andprey aggregations[ We performed cross!correlationanalyses at a bin size of 049 m for transect segmentswith guillemot densities − the median value[ Wefound that the aggregations of guillemots were o}setfrom prey aggregations in all 07 cases where signi_cant
Table 0[ Number of 7Ð00 km long transect segments with Pearson correlation coe.cient between guillemots and acousticreturns − 9=5 at di}erent bin sizes
Bin size "min# 0 1 2 3 4 5 6 7 8 09"km# 9=04 9=29 9=34 9=59 9=64 9=89 0=94 0=19 0=24 0=49
All segments"n � 22# 0 1 4 09 00 00 05 03 05Segments with − median birddensity "n � 07# 0 0 2 6 8 5 00 7 00
cross!correlations were encountered at lags ¾ 0=4 km"Fig[ 4#[ In 01 segments\ the strongest correlationswere obtained between Ð 2 and ¦ 1 lags\ equivalent tothe prey being lagged 349 behind and 299 m in frontof the birds along the transects\ respectively[ Exam!ination of the spatial distribution of these lags withrespect to the side of prey patches nearest the guille!mot breeding colonies showed no tendency of theguillemots to use preferentially either side of prey pat!ches "MannÐWhitney U!test\ U � 015=9\ P × 9=94#[
AGGREGATIVE RESPONSE OF BRUÝ NNICH|S
GUILLEMOT TO PREY DENSITY
The aggregative response of Bru�nnich|s guillemotsshowed no consistent pattern for low bin sizes"³ 0 km#\ but at larger bin sizes "0Ð3 km# we generally
56
F[ Mehlum et al[
Þ 0888 BritishEcological SocietyJournal of AnimalEcology\ 57\ 59Ð61
Fig[ 4[ Cross!correlations between guillemot and aggregated prey densities for 07 transects segments[ Positive values on the xÐaxis represent cases where prey is lagged behind the guillemots along the transects[
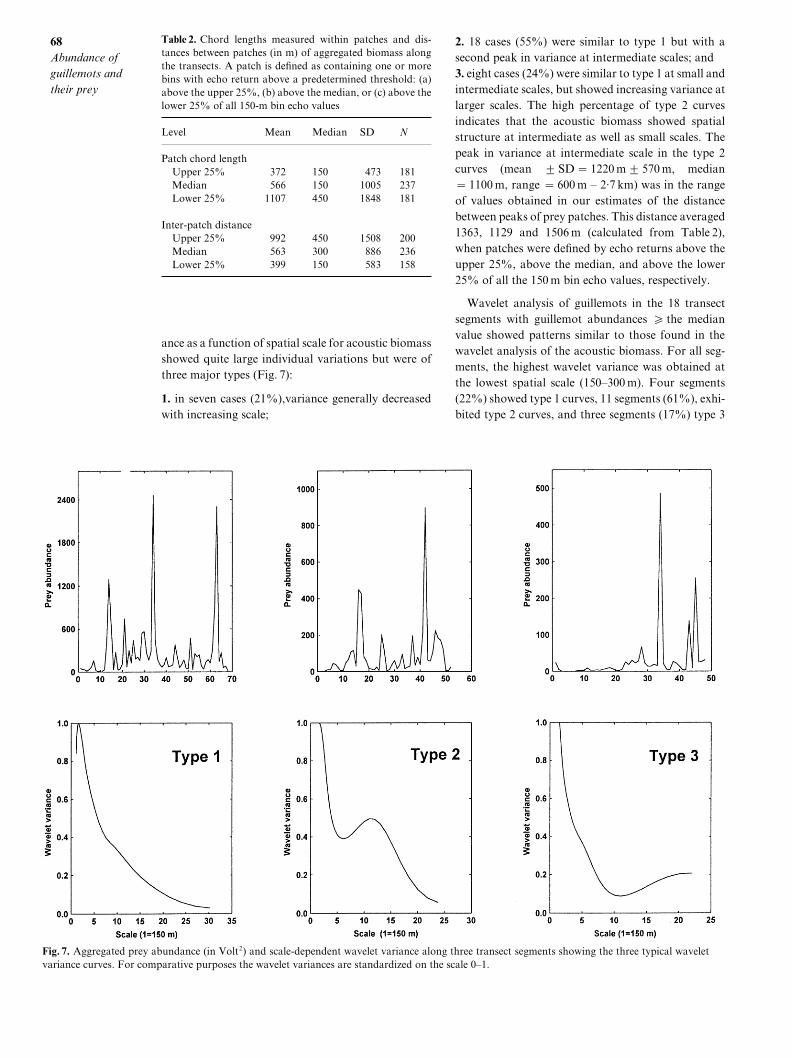
obtained a positive response in bird density withincrease in prey abundance "Fig[ 5#[ There was a widescatter in the data\ but in general the data followed aconcave curve and neither a hyperbolic "type II# nora sigmoidal "type III# curve[ The number of high preydensity data points was too low to let us draw aconclusion about the shape of the upper part of thecurve[
PATCH SIZE CHARACTERISTICS
The average sizes of prey patches depended on thearbitrary threshold levels of echo return set to de_ne
Fig[ 5[ Aggregative response of Bru�nnich|s guillemots "in birds kmÐ1# to prey abundance "in Volt1# at bin sizes 0Ð3 km[ Thedata are represented in logÐlog scale with all zero values omitted[
a patch[ If we included only prey densities in the upper14) of echo values from all 049 m bins\ mean patchchord length was estimated to be 261 m and the meaninterpatch distance was 881 m "Table 1#[ In contrast\if the threshold for detection of a patch was set toinclude all echo return values above the bottom 14)\then the average length of a patch chord was 0096 mand the average distance between patches was 288 m[
The wavelet analysis of acoustic biomass in the 22transect segments showed the highest wavelet varianceat small spatial scales "049Ð299 m#\ indicating thatthese scales dominated the spatial structure of ourtransect data[ The curves representing wavelet vari!
57
Abundance ofguillemots andtheir prey
Table 1[ Chord lengths measured within patches and dis!tances between patches "in m# of aggregated biomass alongthe transects[ A patch is de_ned as containing one or morebins with echo return above a predetermined threshold] "a#above the upper 14)\ "b# above the median\ or "c# above thelower 14) of all 049!m bin echo values
Level Mean Median SD N
Patch chord lengthUpper 14) 261 049 362 070Median 455 049 0994 126Lower 14) 0096 349 0737 070
Inter!patch distanceUpper 14) 881 349 0497 199Median 452 299 775 125Lower 14) 288 049 472 047
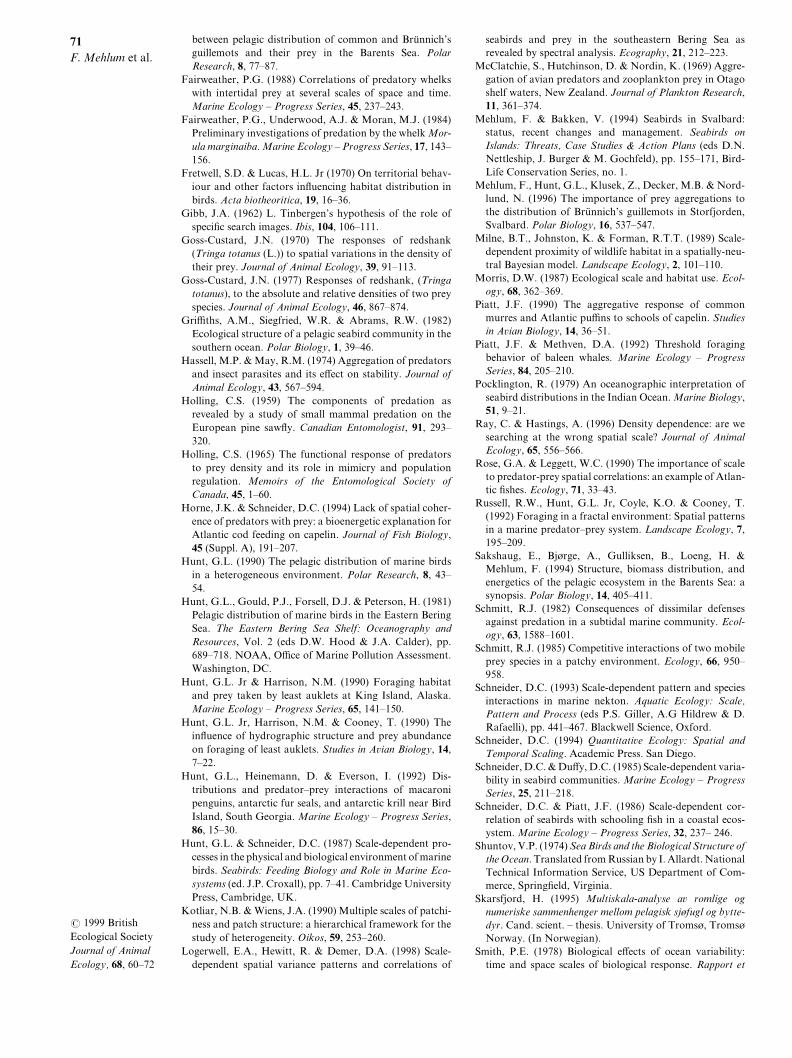
ance as a function of spatial scale for acoustic biomassshowed quite large individual variations but were ofthree major types "Fig[ 6#]
0[ in seven cases "10)#\variance generally decreasedwith increasing scale^
Fig[ 6[ Aggregated prey abundance "in Volt1# and scale!dependent wavelet variance along three transect segments showing the three typical waveletvariance curves[ For comparative purposes the wavelet variances are standardized on the scale 9Ð0[
1[ 07 cases "44)# were similar to type 0 but with asecond peak in variance at intermediate scales^ and2[ eight cases "13)# were similar to type 0 at small andintermediate scales\ but showed increasing variance atlarger scales[ The high percentage of type 1 curvesindicates that the acoustic biomass showed spatialstructure at intermediate as well as small scales[ Thepeak in variance at intermediate scale in the type 1curves "mean 2 SD � 0119 m2 469 m\ median� 0099 m\ range � 599 m Ð 1=6 km# was in the rangeof values obtained in our estimates of the distancebetween peaks of prey patches[ This distance averaged0252\ 0018 and 0495 m "calculated from Table 1#\when patches were de_ned by echo returns above theupper 14)\ above the median\ and above the lower14) of all the 049 m bin echo values\ respectively[
Wavelet analysis of guillemots in the 07 transectsegments with guillemot abundances − the medianvalue showed patterns similar to those found in thewavelet analysis of the acoustic biomass[ For all seg!ments\ the highest wavelet variance was obtained atthe lowest spatial scale "049Ð299 m#[ Four segments"11)# showed type 0 curves\ 00 segments "50)#\ exhi!bited type 1 curves\ and three segments "06)# type 2

58
F[ Mehlum et al[
Þ 0888 BritishEcological SocietyJournal of AnimalEcology\ 57\ 59Ð61
curves[ The predominance of transect segments withtype 1 curves of wavelet variance with peaks at scales599 m to 1=2 km "mean 2 SD � 0319 m2 489 m\median � 0249 m\ range � 599 m Ð 1=2 km# was inter!preted as an indication of a spatial structure of theguillemot distribution[ The scale of the intermediatepeak in predator wavelet variance in type 1 curves wassimilar to the scale at which there was a correspondingpeak in wavelet variance for acoustic biomass\ as wellas the distance between the centres of neighbouringprey patches "Table 1#[
Discussion
Diet analyses of Bru�nnich|s guillemots collected dur!ing the study period showed that crustaceans and _shwere the main prey items "Mehlum et al[ 0885#[ Thecrustaceans consisted mainly of two species of pelagicamphipods\ Parathemisto abyssorum and P[ libellula\and the euphausiid Thysanoessa inermis[ Of _shes\polar cod Boreogadus saida occurred most frequently\whereas capelin Mallotus villosus was encountered lessfrequently[ These prey species are the most abundantpelagic _sh and large zooplankton species in thenorthern Barents Sea region "Sakshaug et al[ 0883#[Although we had no information on the compositionof the biomass from which we obtained echoes\ weinterpreted the class of aggregated targets as beingfrom schools of _sh or dense aggregations of largezooplankters such as Parathemisto spp[ and Thy!sanoessa inermis[
Our results show that spatial correlations betweenaggregated determined biomass and Bru�nnich|s guille!mot densities along ship transects were weak at smallbin sizes and increased strongly at bin sizes between049 m and 0 km\ reaching a plateau at a bin size of 1Ð2 km[ Thus\ the transition region between low andhigh spatial association of guillemots and their preyoccurred at scales where the spatial variance in preybiomass was high "Fig[ 6#[ Our wavelet analysisshowed that the spatial variance of both guillemotdistribution and presumed prey biomass showed apeak at these scales[ Similarly\ Logerwell et al[ "0887#found peaks in spatial variance around 2 km and gre!ater for Bru�nnich|s guillemots and at 1 km and greaterfor prey in a study in the Bering Sea using spectralanalysis[ They found little spatial variance at smallerscales[
The increase in correlation strength with increasingbin size is in agreement with those of most otherworkers "see review by Hunt et al[ 0881#\ and may bethe result of reduction of the variance from aggre!gating data[ However\ the _nding that correlationvalues reached a plateau at a bin size of 1Ð2 km is new\and suggests that at least a portion of the change incorrelation strength with bin size re~ects the scale atwhich guillemots in this study were related to preydistributions[ Our transects were too short to docu!
ment the strength of association between guillemotsand their prey at scales larger than 8 km[
Our correlation analyses showed that there was alow spatial association between guillemots and theirprey at the smallest scales "³ 0 km#\ and our cross!correlation analysis showed that the guillemots didnot perfectly track the patches of prey at the smallestscales[ We interpret these results as indicating that theguillemots were indi}erent "Kotliar + Wiens 0889# topatches at these scales[ Thus\ in the terminology ofKotliar + Wiens "0889# we argue that the _rst!orderpatchiness\ or grain\ of prey patches as perceived bythe guillemots occurred at scales close to 0 km[ Alter!natively\ the lack of association between foraging sea!birds and their prey at small spatial scales might beexplained by the patches being too ephemeral for thebirds to track "Hunt + Schneider 0876#\ or that therewas a spatial shift or drift that resulted in a dis!placement of the predators subsequent to foraging ontheir prey "Veit\ Silverman + Everson 0882#[
In this study\ we split the echo signals into aggre!gated and dispersed biomass\ respectively[ Cor!relations between guillemots and aggregated preybiomass were much stronger than with di}usebiomass[ Also\ the correlations between guillemotsand aggregated prey were stronger compared to mostprevious studies\ where no di}erentiation betweenaggregated and di}use biomass had been made "Huntet al[ 0881#[ This result agrees with previous studieswhich have indicated that correlations between aggre!gated prey\ such as schooling _sh "capelin# or surfaceswarming zooplankton "McClatchie\ Hutchinson +Nordin 0858#\ and birds are stronger\ and often atsmaller bin sizes "Schneider + Piatt 0875^ Erikstad\Moum + Vader 0889# than correlations with prey thatform di}use patches "Hunt et al[ 0889\ 0881#[ In arecent study of association between guillemot Uriaspp[ density and acoustic biomass of capelin schools\Skarsfjord "0884# reported stronger correlationcoe.cients at scales of 04Ð30 km than those reportedfor Bru�nnich|s guillemots and aggregated prey in thepresent study "scales 1Ð8 km#[ As stated by Mehlumet al[ "0885#\ our results suggest that in future studiesit will be important to separate di}use biomass fromaggregated biomass[ This will require a ping by pingrecording of data for post processing of the acousticreturns\ something that has also been lacking in mostprevious studies which have integrated primary echoreturns over hundreds to thousands of meters[
Our results show that the strength of the spatialassociation between the guillemots and the presumedprey biomass is sensitive both to prey abundance\ asdid Veit et al[ "0882#\ and predator abundance[ Strongcorrelations between guillemots and prey were onlyfound when mean guillemot densities within transectsegments were above a threshold of 9=1Ð9=2 birds kmÐ1[At lower bird densities there may have been too fewbirds to provide a match between the abundances ofbirds and their prey[

69
Abundance ofguillemots andtheir prey
Þ 0888 BritishEcological SocietyJournal of AnimalEcology\ 57\ 59Ð61
When prey is scarce\ a high quality\ but isolated\patch has a lower probability of being used by a pred!ator than an intermediate quality patch in close prox!imity to a high quality patch "Milne\ Johnston + For!man 0878#[ Thus\ whether a prey patch is useddepends on the overall quality of the {region| withinwhich the prey patch is embedded[ Guillemots\ appar!ently did not select relatively dense prey patches intransect segments where average prey densities werebelow a biomass corresponding to the top third ofmaximum prey biomass recorded during this study[This pattern was evident for bin sizes of 9=2Ð1=9 km\but was most pronounced at the largest bin sizes[ Weinterpret this result to indicate that unless a regionhad a relatively high biomass of prey\ the guillemotsmade little e}ort to prospect it for patches of highdensity "see also Veit et al[ 0882#[ This may be similarto the foraging by {expectation| shown by Gibb "0851#\or it may represent threshold foraging\ where the thr!eshold is set for a region rather than for an individualpatch[ Threshold foraging behaviour at di}erent preydensities has been suggested for capelin predators suchas common guillemots Uria aalge and Atlantic pu.nsFratercula arctica "Piatt 0889# and guillemots Uriaspp[ "Erikstad et al[ 0889#\ and for baleen whales "Piatt+ Methven 0881#[
The numerical aggregative response curves "Fig[ 5#between guillemot and prey density were sensitive tospatial scale[ Consistent responses were not obtainedat small spatial scales "³ 0 km#\ but strong positiveresponses were evident at larger scales[ The responsecurves could not be classi_ed as being hyperbolic "typeII# or sigmoidal "type III# within the range of preydensities observed in this study[ As pointed out byHassell + May "0863#\ it is di.cult to resolve theshape of the upper part of the response curve withoutan adequate number of data points representing highprey density[ It is likely that Bru�nnich|s guillemotsin the study area sometimes encounter higher preydensities than those observed by us[ Under such cir!cumstances the aggregative response curve might levelo} and approach the sigmoidal type\ which is mostcommon for higher vertebrates "Goss!Custard 0869\0866^ Hassell + May 0863^ Piatt + Methven 0881#[Our results are similar to those obtained in a studyof several shorebird species "Bryant 0868#\ in whichstrong correlations were obtained between invert!ebrate prey density and the density of foraging birds[Bryant "0868# also observed no levelling o} of theaggregative response curves at high prey densities[
Our results illustrate that the aggregative responseof predators to di}erent prey densities should be stud!ied at a range of spatial scales "Horne + Schneider0883#[ Only a single spatial scale was considered inthe original descriptions of the aggregative responsecurve between predator and prey density "Holling0848\ 0854^ Hassell + May 0863#[ Piatt "0889# choosea single spatial scale of 1=4 km in his study of spatialassociation between two capelin predators\ common
guillemot and Atlantic pu.n\ and their prey[ Hefound a sigmoidal aggregative response in about one!third of his transects and suggested that the responsewas best resolved at spatial scales similar to the scale ofaggregations "¼ 1Ð3 km#[ Our data showed a similarstrong aggregative response within this range of spa!tial scales[
Ecologists have long recognized that predators aresensitive to the distribution and availability of prey[By using a continuous record of predator and preynumbers over long transect lengths\ we have been ableto demonstrate the range of distance scales over whichpredators show sensitivity to variation in prey density[Using these techniques we have also been able todemonstrate that {regional| prey abundances a}ectlocal use of patches[ Detection of these e}ects wouldhave been problematic using survey methods with dis!continuous sampling[ Our results are importantbecause they not only con_rm that there is a lowerlimit to the grain size that predators will discriminate\but also that predators respond to the major vari!ations in their resource landscape\ which correspondto the size and spacing of the major aggregations ofprey[
Acknowledgements
We thank the crew and colleagues on R[V[ Lance forassistance during the cruise[ We are indebted to E[Knudsen for his help with the wavelet analysis\ andto M[C[ Hustad for comments on a previous versionof the manuscript[ Funding for G[L[ Hunt and M[B[Decker was provided in part by the UCI School ofBiological Sciences\ by an O.ce of Polar Programs\National Science Foundation\ grant to G[L[ Hunt andby a National Aeronautics and Space AdministrationGlobal Change Fellowship to M[B[ Decker[ This isNorwegian Polar Institute Contribution No[ 211[
References
Bradshaw\ G[A[ + McIntosh\ B[A[ "0883# Detecting climate!induced patterns using wavelet analysis[ EnvironmentalPollution\ 72\ 024Ð031[
Bradshaw\ G[A[ + Spies\ T[A[ "0881# Characterizing canopygap structure in forests using wavelet analysis[ Journal ofEcology\ 79\ 194Ð104[
Brown\ R[G[B[ "0879# Seabirds as marine animals[ Behaviorof Marine Animals\ Vol[ 3[ Marine Birds "eds J[ Burger\B[L[ Olla + H[E[ Winn#\ pp[ 0Ð28[ Plenum Press\ NewYork[
Bryant\ D[M[ "0868# E}ects of prey density and site characteron estuary usage by over!wintering waders "Charadrii#[Estuarine and Coastal Marine Science\ 8\ 258Ð273[
Coulson\ T[\ Albon\ S[\ Guinness\ F[\ Pemberton\ J[ + Clut!ton!Brock\ T[ "0886# Population substructure\ localdensity\ and calf winter survival in red deer "Cervuselaphus#[ Ecology\ 67\ 741Ð752[
Daubechies\ I[ "0877# Orthonormal bases of compactly sup!ported wavelets[ Communications on Pure and AppliedMathematics\ 30\ 898Ð885[
Erikstad\ K[E[\ Moum\ T[ + Vader\ W[ "0889# Correlations
60
F[ Mehlum et al[
Þ 0888 BritishEcological SocietyJournal of AnimalEcology\ 57\ 59Ð61
between pelagic distribution of common and Bru�nnich|sguillemots and their prey in the Barents Sea[ PolarResearch\ 7\ 66Ð76[
Fairweather\ P[G[ "0877# Correlations of predatory whelkswith intertidal prey at several scales of space and time[Marine Ecology Ð Progress Series\ 34\ 126Ð132[
Fairweather\ P[G[\ Underwood\ A[J[ + Moran\ M[J[ "0873#Preliminary investigations of predation by the whelk Mor!ula marginaiba[ Marine Ecology Ð Progress Series\ 06\ 032Ð045[
Fretwell\ S[D[ + Lucas\ H[L[ Jr "0869# On territorial behav!iour and other factors in~uencing habitat distribution inbirds[ Acta biotheoritica\ 08\ 05Ð25[
Gibb\ J[A[ "0851# L[ Tinbergen|s hypothesis of the role ofspeci_c search images[ Ibis\ 093\ 095Ð000[
Goss!Custard\ J[N[ "0869# The responses of redshank"Tringa totanus "L[## to spatial variations in the density oftheir prey[ Journal of Animal Ecology\ 28\ 80Ð002[
Goss!Custard\ J[N[ "0866# Responses of redshank\ "Tringatotanus#\ to the absolute and relative densities of two preyspecies[ Journal of Animal Ecology\ 35\ 756Ð763[
Gri.ths\ A[M[\ Siegfried\ W[R[ + Abrams\ R[W[ "0871#Ecological structure of a pelagic seabird community in thesouthern ocean[ Polar Biology\ 0\ 28Ð35[
Hassell\ M[P[ + May\ R[M[ "0863# Aggregation of predatorsand insect parasites and its e}ect on stability[ Journal ofAnimal Ecology\ 32\ 456Ð483[
Holling\ C[S[ "0848# The components of predation asrevealed by a study of small mammal predation on theEuropean pine saw~y[ Canadian Entomologist\ 80\ 182Ð219[
Holling\ C[S[ "0854# The functional response of predatorsto prey density and its role in mimicry and populationregulation[ Memoirs of the Entomological Society ofCanada\ 34\ 0Ð59[
Horne\ J[K[ + Schneider\ D[C[ "0883# Lack of spatial coher!ence of predators with prey] a bioenergetic explanation forAtlantic cod feeding on capelin[ Journal of Fish Biology\34 "Suppl[ A#\ 080Ð196[
Hunt\ G[L[ "0889# The pelagic distribution of marine birdsin a heterogeneous environment[ Polar Research\ 7\ 32Ð43[
Hunt\ G[L[\ Gould\ P[J[\ Forsell\ D[J[ + Peterson\ H[ "0870#Pelagic distribution of marine birds in the Eastern BeringSea[ The Eastern Bering Sea Shelf] Oceanography andResources\ Vol[ 1 "eds D[W[ Hood + J[A[ Calder#\ pp[578Ð607[ NOAA\ O.ce of Marine Pollution Assessment[Washington\ DC[
Hunt\ G[L[ Jr + Harrison\ N[M[ "0889# Foraging habitatand prey taken by least auklets at King Island\ Alaska[Marine Ecology Ð Progress Series\ 54\ 030Ð049[
Hunt\ G[L[ Jr\ Harrison\ N[M[ + Cooney\ T[ "0889# Thein~uence of hydrographic structure and prey abundanceon foraging of least auklets[ Studies in Avian Biology\ 03\6Ð11[
Hunt\ G[L[\ Heinemann\ D[ + Everson\ I[ "0881# Dis!tributions and predatorÐprey interactions of macaronipenguins\ antarctic fur seals\ and antarctic krill near BirdIsland\ South Georgia[ Marine Ecology Ð Progress Series\75\ 04Ð29[
Hunt\ G[L[ + Schneider\ D[C[ "0876# Scale!dependent pro!cesses in the physical and biological environment of marinebirds[ Seabirds] Feeding Biology and Role in Marine Eco!systems "ed[ J[P[ Croxall#\ pp[ 6Ð30[ Cambridge UniversityPress\ Cambridge\ UK[
Kotliar\ N[B[ + Wiens\ J[A[ "0889# Multiple scales of patchi!ness and patch structure] a hierarchical framework for thestudy of heterogeneity[ Oikos\ 48\ 142Ð159[
Logerwell\ E[A[\ Hewitt\ R[ + Demer\ D[A[ "0887# Scale!dependent spatial variance patterns and correlations of
seabirds and prey in the southeastern Bering Sea asrevealed by spectral analysis[ Ecography\ 10\ 101Ð112[
McClatchie\ S[\ Hutchinson\ D[ + Nordin\ K[ "0858# Aggre!gation of avian predators and zooplankton prey in Otagoshelf waters\ New Zealand[ Journal of Plankton Research\00\ 250Ð263[
Mehlum\ F[ + Bakken\ V[ "0883# Seabirds in Svalbard]status\ recent changes and management[ Seabirds onIslands] Threats\ Case Studies + Action Plans "eds D[N[Nettleship\ J[ Burger + M[ Gochfeld#\ pp[ 044Ð060\ Bird!Life Conservation Series\ no[ 0[
Mehlum\ F[\ Hunt\ G[L[\ Klusek\ Z[\ Decker\ M[B[ + Nord!lund\ N[ "0885# The importance of prey aggregations tothe distribution of Bru�nnich|s guillemots in Storfjorden\Svalbard[ Polar Biology\ 05\ 426Ð436[
Milne\ B[T[\ Johnston\ K[ + Forman\ R[T[T[ "0878# Scale!dependent proximity of wildlife habitat in a spatially!neu!tral Bayesian model[ Landscape Ecology\ 1\ 090Ð009[
Morris\ D[W[ "0876# Ecological scale and habitat use[ Ecol!ogy\ 57\ 251Ð258[
Piatt\ J[F[ "0889# The aggregative response of commonmurres and Atlantic pu.ns to schools of capelin[ Studiesin Avian Biology\ 03\ 25Ð40[
Piatt\ J[F[ + Methven\ D[A[ "0881# Threshold foragingbehavior of baleen whales[ Marine Ecology Ð ProgressSeries\ 73\ 194Ð109[
Pocklington\ R[ "0868# An oceanographic interpretation ofseabird distributions in the Indian Ocean[ Marine Biology\40\ 8Ð10[
Ray\ C[ + Hastings\ A[ "0885# Density dependence] are wesearching at the wrong spatial scale< Journal of AnimalEcology\ 54\ 445Ð455[
Rose\ G[A[ + Leggett\ W[C[ "0889# The importance of scaleto predator!prey spatial correlations] an example of Atlan!tic _shes[ Ecology\ 60\ 22Ð32[
Russell\ R[W[\ Hunt\ G[L[ Jr\ Coyle\ K[O[ + Cooney\ T["0881# Foraging in a fractal environment] Spatial patternsin a marine predatorÐprey system[ Landscape Ecology\ 6\084Ð198[
Sakshaug\ E[\ Bjo�rge\ A[\ Gulliksen\ B[\ Loeng\ H[ +Mehlum\ F[ "0883# Structure\ biomass distribution\ andenergetics of the pelagic ecosystem in the Barents Sea] asynopsis[ Polar Biology\ 03\ 394Ð300[
Schmitt\ R[J[ "0871# Consequences of dissimilar defensesagainst predation in a subtidal marine community[ Ecol!ogy\ 52\ 0477Ð0590[
Schmitt\ R[J[ "0874# Competitive interactions of two mobileprey species in a patchy environment[ Ecology\ 55\ 849Ð847[
Schneider\ D[C[ "0882# Scale!dependent pattern and speciesinteractions in marine nekton[ Aquatic Ecology] Scale\Pattern and Process "eds P[S[ Giller\ A[G Hildrew + D[Rafaelli#\ pp[ 330Ð356[ Blackwell Science\ Oxford[
Schneider\ D[C[ "0883# Quantitative Ecology] Spatial andTemporal Scaling[ Academic Press[ San Diego[
Schneider\ D[C[ + Du}y\ D[C[ "0874# Scale!dependent varia!bility in seabird communities[ Marine Ecology Ð ProgressSeries\ 14\ 100Ð107[
Schneider\ D[C[ + Piatt\ J[F[ "0875# Scale!dependent cor!relation of seabirds with schooling _sh in a coastal ecos!ystem[ Marine Ecology Ð Progress Series\ 21\ 126Ð 135[
Shuntov\ V[P[ "0863# Sea Birds and the Biological Structure ofthe Ocean[ Translated from Russian by I[ Allardt[ NationalTechnical Information Service\ US Department of Com!merce\ Spring_eld\ Virginia[
Skarsfjord\ H[ "0884# Multiskala!analyse av romlige ognumeriske sammenhenger mellom pelagisk sjo�fugl og bytte!dyr[ Cand[ scient[ Ð thesis[ University of Tromso�\ Tromso�Norway[ "In Norwegian#[
Smith\ P[E[ "0867# Biological e}ects of ocean variability]time and space scales of biological response[ Rapport et
61
Abundance ofguillemots andtheir prey
Þ 0888 BritishEcological SocietyJournal of AnimalEcology\ 57\ 59Ð61
Poce�s!verbaux des Re�unions du Conseil Permanent Inter!nationale pour L|Exploration de la Mer\ 062\ 006Ð016[
Statsoft\ Inc[ "0884# Statistica for Windows\ Release 4[9[ Stat!soft Inc[\ Tulsa\ Oklahoma[
Tasker\ M[L[\ Hope Jones\ P[\ Dixon\ T[ + Blake\ B[F["0873# Counting seabirds from ships] a review of methodsemployed and a suggestion for a standardized approach[Auk\ 090\ 456Ð466[
Veit\ R[R[ "0877# Spatial dispersion patterns of AntarcticSeabirds[ PhD thesis\ University of California\ Irvine\ Irv!ine[
Veit\ R[R[\ Silverman\ E[D[ + Everson\ I[ "0882# Aggregationpatterns of pelagic predators and their principal prey\ Ant!arctic krill\ near South Georgia[ Journal of Animal Ecol!ogy\ 51\ 440Ð453[
Received 10 March 0886^ revision received 14 March 0887
Appendix 0
We de_ned an echo sample as ui\ j "where i � pingnumber\ j � sample number in the ping# expressedin voltage\ which could be transformed to acousticpressure#[ For discriminating between dense con!centrations of targets "echo type A Ð aggregated# andthe second\ dispersed targets "echo type D Ð dispersed#
we applied the following procedure[ At the _rst stagethe value si\j was calculated as]
si j �08
sk�0
k�−0
"pf0i¦k¦pf1i¦k¦pf2i¦k#
where si\ j is a two!dimensional "2 × 2# moving averageof voltages of echo signals around the point with i\ jindices\ and pf0 � value of previous echo pro_le\pf1 � value of present echo pro_le\ pf2 � value ofnext pro_le[
Echoes were classi_ed as aggregated if the followingconditions were ful_lled]0[ the si\ j values were larger than the thresholds pg0and pg1 "Mehlum et al[ 0885#[1[ the minimum number of samples surrounding theui\ j sample "among 7 surrounding samples# higher thanpg1 equalled 4[
Otherwise\ the echoes were classi_ed as dispersed[The _rst condition used the fact that the level of echofrom an aggregated patch was usually higher than theechoes from dispersed targets^ the second and thirdconditions that a patch of aggregated targets could beemersed in a layer of dispersed targets[
Copyright © 2022 FDOKUMEN