
Scalability in Broadband & OTT - SITI Cable
29
1 SITI Networks Ltd. Confidential 1 SITI Networks Ltd. Confidential SITI Networks Limited Formerly known as SITI Cable Network Limited BSE : 532795 | NSE : SITINET | Bloomberg : SCNL:IN | Reuters : SITI.NS www.sitinetworks.com Q2FY17 Investor Presentation
-
Upload
khangminh22 -
Category
Documents
-
view
1 -
download
0
Transcript of Scalability in Broadband & OTT - SITI Cable

1 SITI Networks Ltd. Confidential 1 SITI Networks Ltd. Confidential
SITI Networks Limited Formerly known as SITI Cable Network Limited
BSE : 532795 | NSE : SITINET | Bloomberg : SCNL:IN | Reuters : SITI.NS
www.sitinetworks.com
Q2FY17 Investor Presentation

2
Disclaimer
Some of the statements made in this presentation are forward-looking statements and are based on the current beliefs,
assumptions ,expectations, estimates, objectives and projections of the directors and management of SITI Networks Limited (SITI
Networks) about its business and the industry and markets in which it operates. These forward-looking statements include,
without limitation, statements relating to revenues and earnings. The words “believe”, “anticipate”, “expect”, “estimate”, “intend”,
“project” and similar expressions are also intended to identify forward looking statements. These statements are not guarantees of
future performance and are subject to risks, uncertainties and other factors, some of which are beyond the control of the
Company and are difficult to predict. Consequently, actual results could differ materially from those expressed or forecast in the
forward-looking statements as a result of, among other factors, changes in economic and market conditions, changes in the
regulatory environment and other business and operational risks. SITI Networks does not undertake to update these forward-
looking statements to reflect events or circumstances that may arise after publication.

3
Contents
Slno Section Pg no
1 Industry Overview 4
2 Company Overview 10
3 Broadband- Vision & Strategy 17
4 Financials 23
5 Regulatory Development- Likely Impact 27

4
Industry Overview

5
Source: TRAI; 1033MSOs Iinclude 229, which have permanent licences & 804 which have provisional licenses, as of 7th Nov. 2016
Industry size and projections , INR Bn
Others include Radio, Music, OOH, Animation and VFX, Gaming, Digital Advertising
Incremental Revenue addition CY20 vs CY15
Value, INR Bn Percentage
TV 555 58%
Print 120 13%
Films 81 9%
Others 271 28%
Total M&E Industry 955 100%
TV Subscriber ARPU in India is ~USD4-5, much less than USD10-25 for other Asian countries
Worldwide, 33% of Pay TV subscribers avail HD services. In India it is ~1.5%
4 national MSOs, 1033 over all MSOs, 60,000 LCOs, 5 national DTH Entities: Consolidation Imminent
TV industry to account for half of the incremental revenue addition
Indian TV industry-Expected CAGR Growth at 15.1%
542 617 710 823 957 1097.6 283
305 330
356 384
412.5
138 159
174 190
208 227.3
193 234
289 355
432
523
2015 2016P 2017P 2018P 2019P 2020P
TV Print Films Others
6
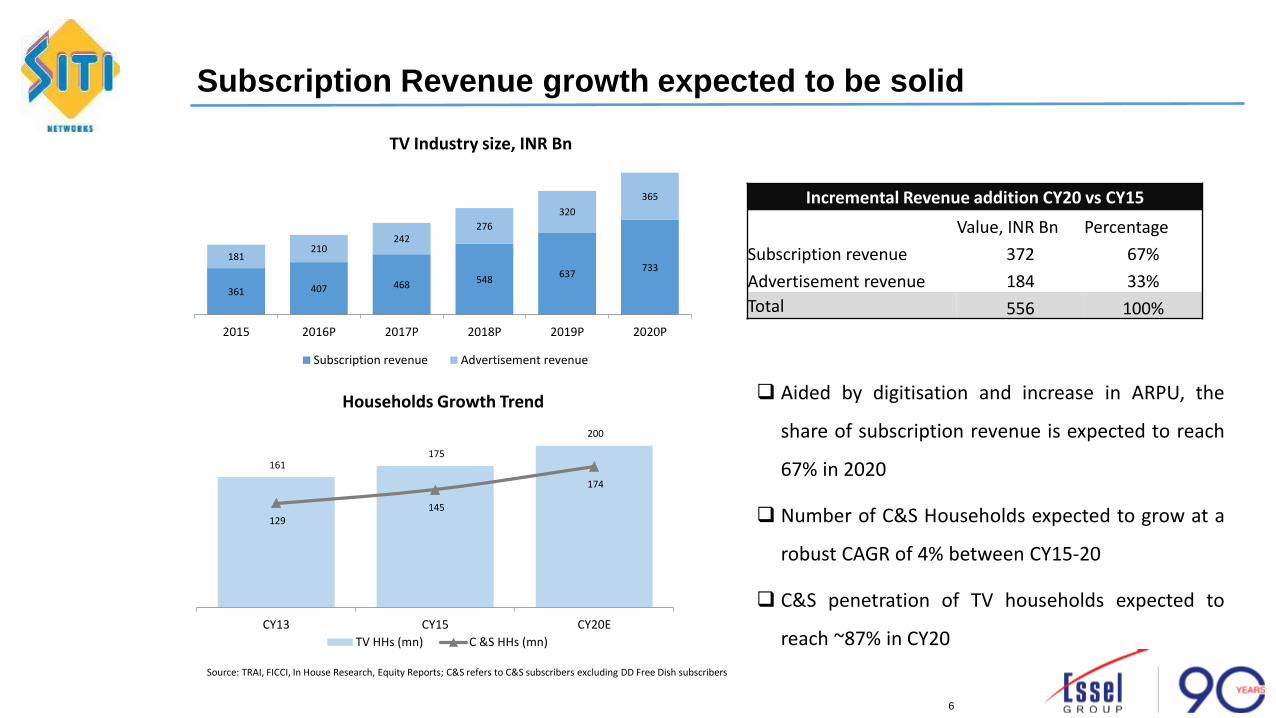
Subscription Revenue growth expected to be solid
Source: TRAI, FICCI, In House Research, Equity Reports; C&S refers to C&S subscribers excluding DD Free Dish subscribers
TV Industry size, INR Bn
Aided by digitisation and increase in ARPU, the
share of subscription revenue is expected to reach
67% in 2020
Number of C&S Households expected to grow at a
robust CAGR of 4% between CY15-20
C&S penetration of TV households expected to
reach ~87% in CY20
Incremental Revenue addition CY20 vs CY15
Value, INR Bn Percentage
Subscription revenue 372 67%
Advertisement revenue 184 33%
Total 556 100%
Households Growth Trend
361 407 468 548 637
733 181
210 242
276
320
365
2015 2016P 2017P 2018P 2019P 2020P
Subscription revenue Advertisement revenue
161 175
200
129 145
174
CY13 CY15 CY20E
TV HHs (mn) C &S HHs (mn)

7
Parameter DTH Digital Cable
Analog Cable
HITS IPTV
Broadband 0 4 0 4 4
Cost of Infrastructure 2 2 4 3 2
Number of Channels 3 5 1 3 2
Resistance to being affected by adverse weather
2 4 4 3 4
Regulatory framework 4 4 2 1 1
Agreements with Broadcasters 4 4 4 1 1
Two Way communication 1 4 0 4 4
Technical Assistance 4 4 1 3 4
Digital Cable, owing to its two way communication capability, localized nature of service and immunity to weather conditions is well placed to serve Indian households
Legend 0 – Bad, 1 – Poor, 2 – Fair, 3 – Good, 4 – Excellent
Distribution Platform: Digital Cable vs. Others

8
Strong Legal & Regulatory control frame work to support digitization. Ministry of I&B and TRAI closely monitoring developments
Digitization mandated by Parliament; Immune to changes in political environment
Size of Digitization Opportunity
Subscriber Universe, 170 Mn TV Households
Phase 1 (12 mn)
Phase 2 (22mn)
Phase 3 & Contiguous areas , (50 mn)
Phase 4, (86mn)
Area 4 metros – Mumbai, Delhi, Kolkata,
Chennai 38 cities with population > 1m 7,709 urban areas with a municipality Rest of India
Implementation Date
31st Oct 2012 (Delhi and Mumbai)
15th Feb 2013 (Kolkata) 31st Mar 2013 31st Jan 2017 31st March 2017
Status Mumbai , Delhi ,
Kolkata – Complete Complete except Hyderabad city Voluntary digitization taking place
DD Terrestrial, Free Dish, & IPTV
- - 5 11
Net Households 12 22 45 75
Cable (Mn)
Digital 23 30 4
Analog - 5 42
DTH (Mn) 11 10 29
Migration expected from DD terrestrial & Free Dish Source: TRAI, Primary Market Research & AIDCF

9
214 219 230 261 298
343
2015 2016P 2017P 2018P 2019P 2020P
ARPU (INR per month)
MSOs focusing on ARPU improvement & monetization to increase net realizations
ARPU is at an All India Level; Source: TRAI, FICCI, In House Research
Digitization has led to increased transparency in
subs declaration and improved ARPUs
ARPUs to be driven by packaging, package wise
collections, improved monetization from LCOs,
premium content, HD channels, Broadband and
VAS
ARPU, All Inclusive (INR per month)
Current status of MSO Realization
(INR/ Month/ Subscriber) Phase 1 Phase 2 Phase 3 Phase 4
Consumer ARPU, paid to LCO 225+ Tax 200+ Tax ~150-175
(All Inclusive) <150
(All Inclusive)
LCO to MSO 100-130 90 Fixed Pay-out
MSO Net Realization 103-105 78-90 15-50 5-10
Net billing happening across Phase 1,2,3 & 4 Phase 3 & 4 Realization on a derived basis; Phase 3 Realization to pick up after Digitization Deadline elapses

10
Company Overview

11
SITI Networks: A Pioneer in Indian Cable TV Distribution
Multi-System Operator (MSO) providing Digital/ Analog Cable TV and Broadband Services
12.2 Mn Cable Universe
8.7 Mn Digital Cable Subscribers
91,000 HD Subscribers
400 locations Presence
14.6 Lakh Broadband
Homes Passed
1,95,000 Broadband Subscribers
1st MSO to be Listed on Stock
Exchange
1st MSO in India, Launched
in 1992
1st MSO to launch Local
Channels 24,000+ Strong
Franchise Distribution
Network
~7 % TV Household Reach
1st MSO to give control to LCO through OYC
~31,000 km Fibre + Coaxial Cable
Network
Subscriber Universe (Mn)
2.05
1.60
5.00
3.55 DAS1
DAS2
DAS3&4
Analog

12
On a progressive growth path
1992 Cable business started by promoters 2006 Wire and Wireless (India) Ltd. Incorporated
2007 Implemented CAS in metros of Delhi, Mumbai & Kolkata ; Listed on the stock exchanges
2008 Initiated mass Digitization through HITS Services
2009 Right Issued of INR4500 mn fully subscribed
2010 India’s largest Multi System Operator (MSO) in the Cable Industry 2011 Expanded further across 54 key cities
2012 DAS implemented in Phase -1 Cities ; Delhi, Mumbai & Kolkata ; Offered 400 Standard Definition Channels; Consolidated Pan India presence through
expansions in UP and Central India Broadband started in Eastern region on EOC Technology
2013 DAS implemented in Phase -2 Cities ; Achieved 3 million digital subscriber base Operationalized ‘Own Your Customer’ Customer Management System Fund infusion of INR3240 Mn by Promoters
2014 Achieved 4 million digital subscriber base; Package wise Billing started in DAS Phase 1 cities Broadband launched in Delhi on DOCSIS 2/ 3 Technology Started providing 18 HD Channels
2015 Raised INR2210 Mn from the Secondary Market via QIP Route in Feb. 2015 Digital cable subscribers at 5.4 Mn with a cable universe of 10.5 Mn. Broadband subscribers at 70,100
2016 Achieved financial turnaround for first time in its history; Reported PAT of INR9 Crores & PBT of INR22 Crores in FY16 Fund infusion of INR5300 Mn by Promoters through OFCDs & Convertible Warrants Acquired majority stakes/ entered into strategic partnerships with regional MSO’s in Assam, Maharashtra, Gujarat and Odisha
2017 Chosen to be a constituent of the Morgan Stanley Capital International (MSCI) India Domestic & Global Small Cap Index Started providing OTT services in partnership with Ditto TV Established Broadband presence in 4 cities of Haryana namely Hissar , Karnal, Rohtak, and Panipat

13
Promoter Group - Corporate Structure
The Parent Group
Launched in 1976, the Parent Group (“Essel Group”) is one of India’s leading business houses, with a dominant presence in Media
India's leading vertically integrated media and entertainment group
Leading producer, aggregator and distributor of Indian programming across the world; 222,000+ hours of original Content
Group Market Cap (Listed entities under the Parent Group): ~USD9.6 Bn
Present in 171 countries, a reach of ~1bn+ viewers; Compelling bouquet of 73 Channels
Media Businesses Other Businesses
Content Distribution Print
ZEE Entertainment Zee Media Corp. Ltd. DISHTV SITI Networks DNA Newspaper
Launched in 1992 One of India’s largest media and general TV entertainment network Market Cap: INR 458bn
Launched in 1992 Strong presence in national and regional news genre Market Cap: INR 18bn
Launched in 2005 Asia’s largest DTH service provider Market Cap: INR 91bn
Launched in 1992 One of India’s largest MSO, presence across 400 locations Market Cap: INR 30bn
Launched in 2005 English broadsheet daily with presence across Mumbai, Bangalore, Pune, Ahmedabad, Jaipur & Indore
Other Businesses
Essel Infrastructure
Education: Zee Learn Limited
• Market Cap: INR 14bn
Packaging : Essel Propack
• Market Cap: INR 39bn
Theme Parks: ABC World and Waterpark
India’s first and largest online gaming company
Precious Metals: Shirpur Gold Refinery; Market Cap: INR3 bn
Healthy Lifestyle & Wellness
Exchange rate used USD1=INR68.00 Market cap as of 23rd Jan 2017
14
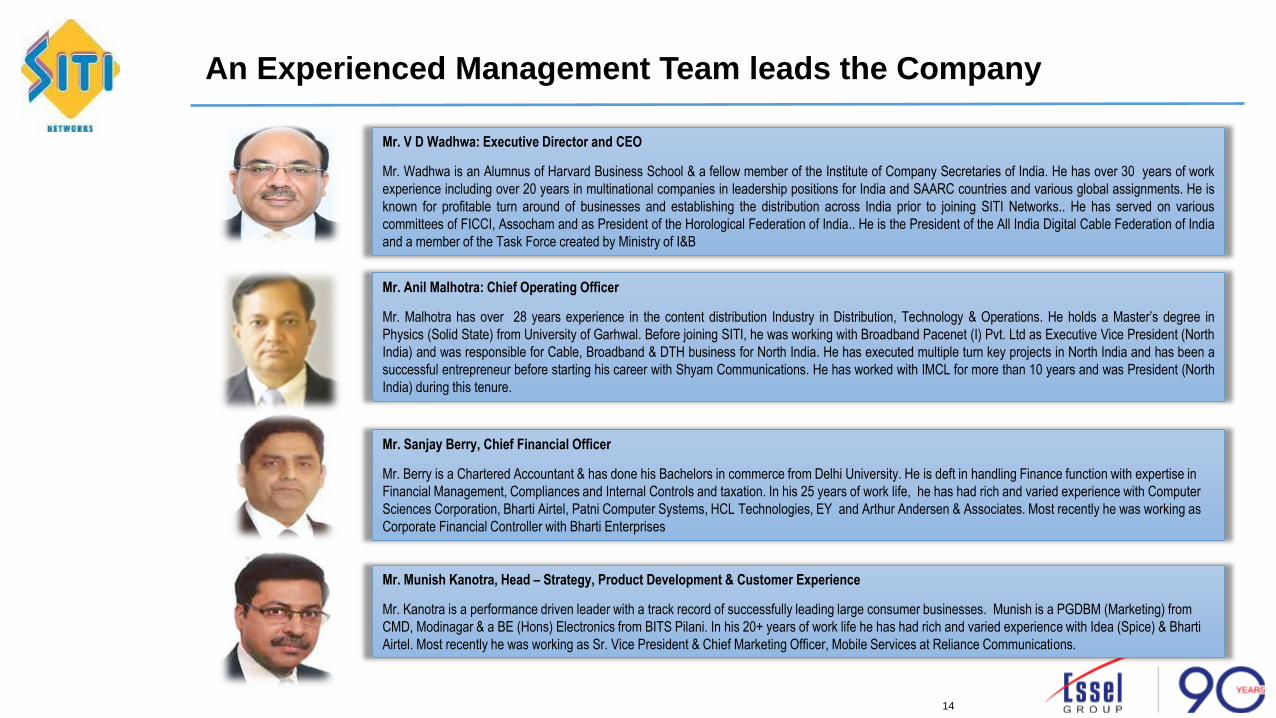
An Experienced Management Team leads the Company
Mr. V D Wadhwa: Executive Director and CEO
Mr. Wadhwa is an Alumnus of Harvard Business School & a fellow member of the Institute of Company Secretaries of India. He has over 30 years of work
experience including over 20 years in multinational companies in leadership positions for India and SAARC countries and various global assignments. He is
known for profitable turn around of businesses and establishing the distribution across India prior to joining SITI Networks.. He has served on various
committees of FICCI, Assocham and as President of the Horological Federation of India.. He is the President of the All India Digital Cable Federation of India
and a member of the Task Force created by Ministry of I&B
Mr. Sanjay Berry, Chief Financial Officer
Mr. Berry is a Chartered Accountant & has done his Bachelors in commerce from Delhi University. He is deft in handling Finance function with expertise in
Financial Management, Compliances and Internal Controls and taxation. In his 25 years of work life, he has had rich and varied experience with Computer
Sciences Corporation, Bharti Airtel, Patni Computer Systems, HCL Technologies, EY and Arthur Andersen & Associates. Most recently he was working as
Corporate Financial Controller with Bharti Enterprises
Mr. Anil Malhotra: Chief Operating Officer
Mr. Malhotra has over 28 years experience in the content distribution Industry in Distribution, Technology & Operations. He holds a Master’s degree in
Physics (Solid State) from University of Garhwal. Before joining SITI, he was working with Broadband Pacenet (I) Pvt. Ltd as Executive Vice President (North
India) and was responsible for Cable, Broadband & DTH business for North India. He has executed multiple turn key projects in North India and has been a
successful entrepreneur before starting his career with Shyam Communications. He has worked with IMCL for more than 10 years and was President (North
India) during this tenure.
Mr. Munish Kanotra, Head – Strategy, Product Development & Customer Experience
Mr. Kanotra is a performance driven leader with a track record of successfully leading large consumer businesses. Munish is a PGDBM (Marketing) from
CMD, Modinagar & a BE (Hons) Electronics from BITS Pilani. In his 20+ years of work life he has had rich and varied experience with Idea (Spice) & Bharti
Airtel. Most recently he was working as Sr. Vice President & Chief Marketing Officer, Mobile Services at Reliance Communications.
15
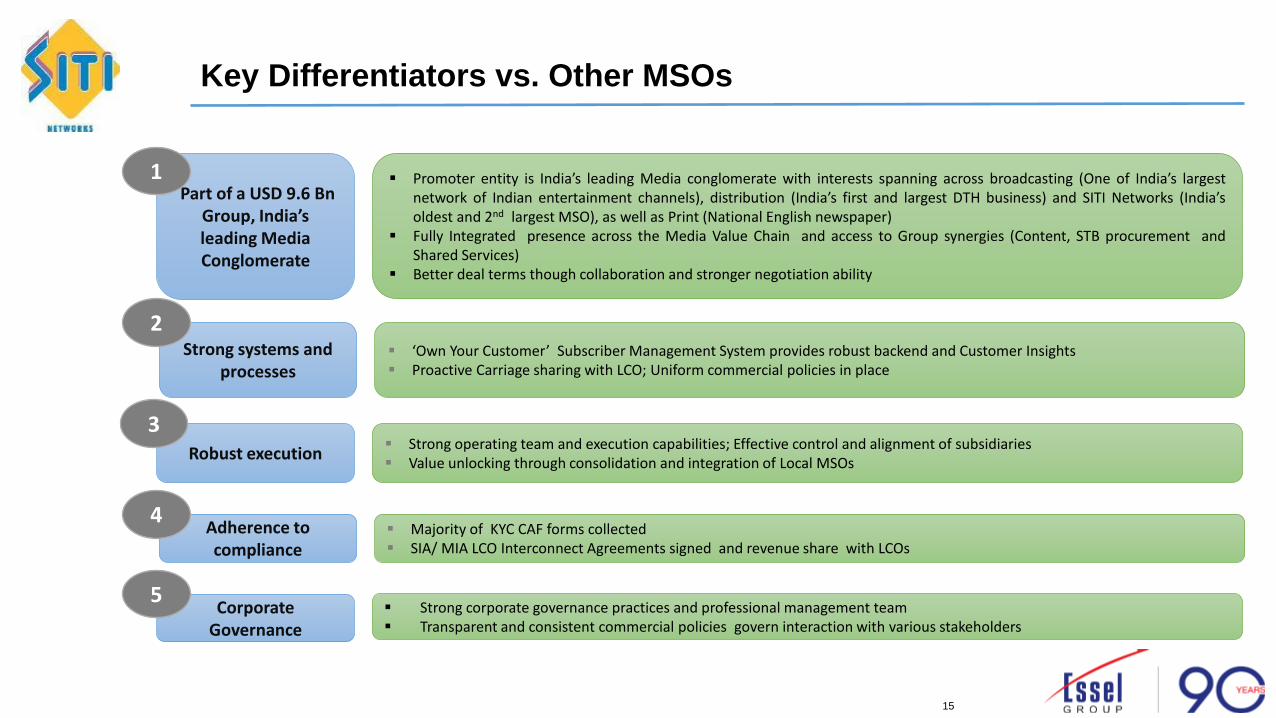
Key Differentiators vs. Other MSOs
Corporate Governance
Strong corporate governance practices and professional management team Transparent and consistent commercial policies govern interaction with various stakeholders
Part of a USD 9.6 Bn Group, India’s leading Media Conglomerate
Promoter entity is India’s leading Media conglomerate with interests spanning across broadcasting (One of India’s largest network of Indian entertainment channels), distribution (India’s first and largest DTH business) and SITI Networks (India’s oldest and 2nd largest MSO), as well as Print (National English newspaper)
Fully Integrated presence across the Media Value Chain and access to Group synergies (Content, STB procurement and Shared Services)
Better deal terms though collaboration and stronger negotiation ability
Strong systems and processes
‘Own Your Customer’ Subscriber Management System provides robust backend and Customer Insights Proactive Carriage sharing with LCO; Uniform commercial policies in place
Adherence to compliance
Majority of KYC CAF forms collected SIA/ MIA LCO Interconnect Agreements signed and revenue share with LCOs
1
2
4
5
Robust execution Strong operating team and execution capabilities; Effective control and alignment of subsidiaries Value unlocking through consolidation and integration of Local MSOs
3
16
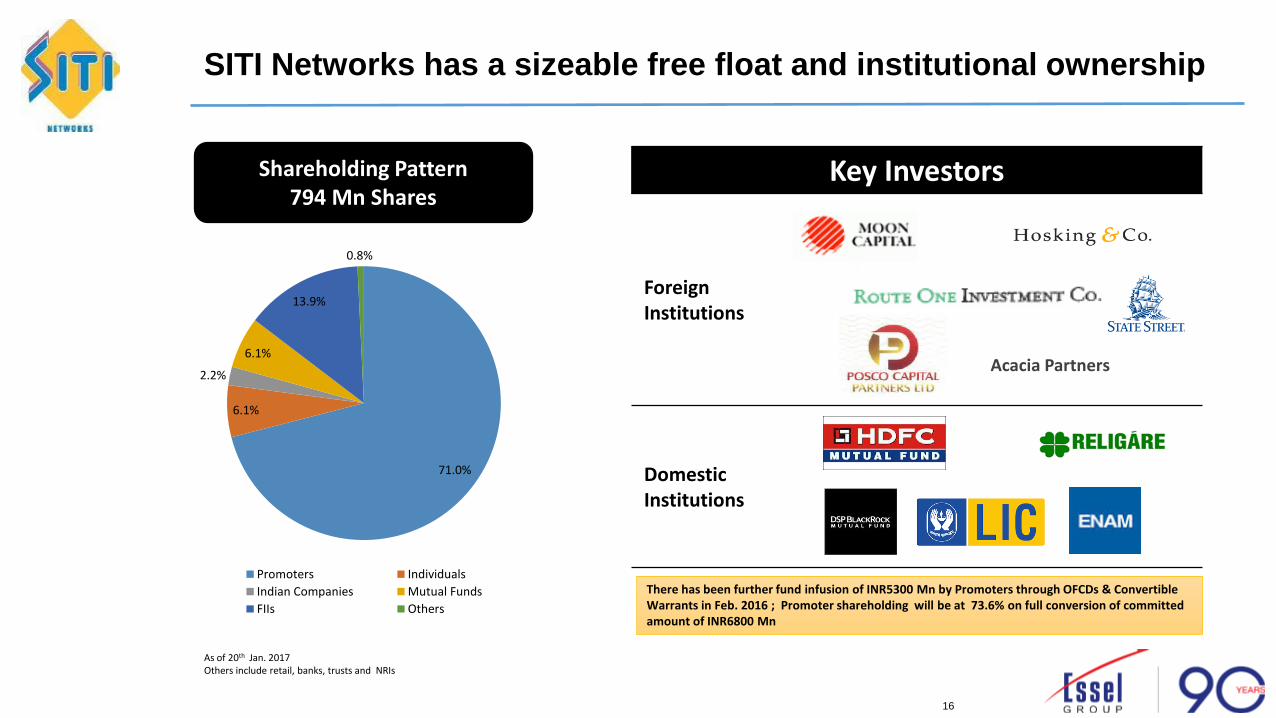
SITI Networks has a sizeable free float and institutional ownership
Shareholding Pattern 794 Mn Shares
Key Investors
Foreign Institutions
Domestic Institutions
As of 20th Jan. 2017 Others include retail, banks, trusts and NRIs
Acacia Partners
There has been further fund infusion of INR5300 Mn by Promoters through OFCDs & Convertible Warrants in Feb. 2016 ; Promoter shareholding will be at 73.6% on full conversion of committed amount of INR6800 Mn
71.0%
6.1%
2.2%
6.1%
13.9%
0.8%
Promoters Individuals
Indian Companies Mutual Funds
FIIs Others
17
Broadband- Vision & Strategy

18
Increase Digital Subscriber base
Expand in Phase 3 & 4 territories
via organic as well as inorganic Growth
Consolidate to derive synergies and value
Expand in high TAM/ BARC rated Cities
Broadband & VAS Margin Expansion
Vision: To be a leading Broadband Company in 5 years
Strategy
Digital Subs base at ~13-14 mn with inclusion of phase 3 & 4 at completion of Digitization
Focus cities – NCR, Select cities of Haryana, & Central India using primarily DOCSIS 2/3 technology
Offer HD Services and VAS such as VoD, MoD, others
~2.5 mn broadband subs by FY21E
Improve collections from LCOs Optimization of (Content-
Carriage) Cost; Optimization of resources
ARPU growth from package based billing and increase in package prices
Expansion of Operating EBITDA Margins

19
SITI Networks is the best of both worlds : GPON and DOCSIS
DOCSIS (Data Over Cable Service Interface Specification)
Advantages Leverage existing access to homes through cable
distribution channel Highly suited for overhead delivery Passive network for longer distances and easy
maintenance; Minimal active components even for long-distance service delivery
Future standards upto 10 Gbps VAS-ready e.g. OTT, Video, Triple-play
GPON (Gigabit Passive Optical Networks)
Advantages Completely passive optical network capable of
delivering 2.5 Gbps on single fiber No need of having active repeaters to extend reach or
bandwidth Scalable to 10 Gbps and other futuristic standards on
the fly
Lower cost of ownership and of acquisition*
Reduced pay back period*
Steady state EBITDA Margins of ~30%
Allows remote monitoring & scalability
Benchmark service experience
*As compared to FTTH
3
4
5
1
2

20
Future-ready Hybrid network conditioned for Indian environment
Features Hybrid (GPON + DOCSIS) GPON (FTTH)
Subscribers Acquisition Cost*
• ~INR3000 • ~INR30,000
CPE Cost • ~INR2000 • INR4000
Scalability • Very High • Moderate
Network Type • Last mile overhead • Mostly underground
Remote management • Fully manageable with high reliability • Fully manageable with high reliability
Pay Back Period (30% EBITDA Margin at ARPU OF 600)
• ~2.5 Years • ~14 Years
Environmental Factors • Sturdy and Hardier • Not sturdy; Suitable for underground
networks
Throughput • Upto 200 Mbps • Upto 100 Mbps
Value Added Services • OTT, Video (Linear, VoD, Catch-up) • OTT, Video (Linear, VoD, Catch-up)
*Assuming a Home Pass Cost of INR600 & penetration of 20% for SITI , excluding CPE

21
Key Drivers for Cable Broadband in India
Source: TRAI ; Cisco Visual Networking Index Global Forecast and Service Adoption
Projected Exponential increase in demand for Data
In India, internet traffic is expected to grow at a CAGR of 32% and reach 5.6 Exabyte's /month in 2020, up from 1.4 Exabyte's / month in 2015
1 Significant divergence in data rates
Currently, 1 GB of data on a 3G Network costs ~INR200 vs. ~INR45 on DOCSIS 3 (Data over Cable Service Interface Specification). Consumers would prefer to use latter for heavy usage
Scope for Value Added Services like Over-the-top Content (OTT), IPTV, Gaming others
2
Enabling Ecosystem for data usage
Over the next five years, India is expected to have 1.9 bn networked devices in 2020, up from 1.3 bn in 2015
Multiple screens leading to higher bandwidth consumption
3 Government Focus – Digital India
Against a Government target of achieving 175 Mn broadband connections by 2017 and 600 Mn by 2020, 162Mn achieved so far
4
Broadband data usage driven by Wireline
Wireline accounts for 11% of the total broadband users & ~75% of the broadband data consumption
Used primarily for Streaming, Calling and Gaming
5 Low Speeds
Almost 54% of internet subscribers on speeds <512kbps
6

22
330 388 470
564 671
792 21
23
25
28
30
33
As on 30thJune 2016
2016E 2017E 2018E 2019E 2020E
Wireless Connections Wireline Connections
SITI Networks targeting ~20% conversion of base by 2021
Source: FICCI- KPMG, TRAI, Narrowband- speed <512 kbps
Internet Subscribers as on 30th June 2016 [in millions]
Category Narrowband Broadband Total Internet
Wireline 3.4 17.3 20.8
Fixed Wireless 0.0 0.5 0.6
Mobile Wireless 185.0 144.2 329.1
Total 188.4 162.1 350.5
India Internet connections
Fixed Wireless includes Wi-Fi, Wi-Max, Radio & VSAT
Mobile Wireless includes Phone + Dongle
Wireline Subscribers By Technology Internet Subscribers per 100 population
Projected Connections Growth (Mn)
28
60
13
Total
Urban
Rural
6%
94%
Wired Wireless
64.1%
15.5%
12.5%
6.3% 1.6%
DSL
Dial Up
Ethernet/ LAN
Cable Modem
Fibre & Leaseline

23
Financials

24
495 283 458 677 1,329 0 1,231 806 624
2,135
-
80 175 265
486
2,238
2,035 2,271 2,490
2,568
910
1,207
3,395
5,313
5,612
FY12 FY13 FY14 FY15 FY16Others Activation Broadband Carriage Subscription
FY16 Financial Snapshot: Steady Progress
FY Consolidated Revenues (INR Mn)
3643
4837
7105
9370
12130
46%
21%
18%
4% 11%
Subscription
Carriage
Activation
Broadband
Others
FY16 Revenue Breakup
Revenue Streams CAGR
FY16 Vs. FY13
Subscription 66.9%
Broadband 82.5%
Carriage 8.1%
Activation 20.1%
Others 67.4%

25
192
(362)
453
1,060 1,095
FY12 FY13 FY14 FY15 FY16
192
870
1,259
1,684
3,230
FY12 FY13 FY14 FY15 FY16
FY16: A year of Profitable Turn- around
Operating EBITDA (INR Mn)
EBITDA excluding activation income
EBITDA (INR Mn)
EBITDA as per Investor release. EBITDA includes other income
PBT Trends (INR Mn)
-919
-562
-769 -853
221
FY12 FY13 FY14 FY15 FY16
-913
-641
-833
-1,019
90
FY12 FY13 FY14 FY15 FY16
PAT Trends (INR Mn)

26
FY Profit & Loss Statement
Income Statement
(INR Million)
FY 2016
Year Ended
CAGR
FY16 Vs. FY12 FY 2015 FY 2014 FY 2013 FY 2012
Net Operating Revenues 11,889 9,059 6,972 4,696 3,428
Other Income 241 311 131 140 214
Total Revenue 12,130 9,370 7,103 4,837 3,643 35.1%
Total Expenditure 8,900 7,686 5,844 3,967 3,451
EBITDA 3,230 1,684 1,259 870 192 102.5%
Margins 26.6% 18.0% 17.7% 18.0% 5.3%
Finance cost 1,378 1,209 1,191 864 566
Depreciation 1,632 1,328 838 563 304
PBT 221 (852) (769) (563) (919)
Tax 131 167 64 46 30
PAT 90 (1,019) (833) (609) (949)

27
Regulatory Development- Likely Impact

28
SITI well positioned to benefit from implementation of New Tariff Order
• Subscribers pay Phase neutral Minimum Rental of INR130 for 100
FTA SD channels; Can take additional FTA channels in bundles of
25 channels for INR20 each
• True A-La-Carte: Discounts on Bouquets restricted to 15% of
A-La-Carte price of Pay channels
• HD Channels priced at <=3 SD Price or Maximum price of Genre
• Premium channels only on A-la-Carte
• Broadcasters to provide 20% distribution fee for collection and
remittance of subscription
Sub
scri
pti
on
• Marketing & placement fee retained
• Carriage capped @ 20 paisa & @ 40 paisa / subscriber/ channel/
month for SD & HD Channels respectively
• >=5% to <10% - 75% of Base to be charged.
• >=10% to <15% - 50% of Base to be charged.
• >=15% to <10% - 25% of Base to be charged.
• >=20% - No Carriage Fee to be charged
Car
riag
e
Content costs linked
to Subscription & Consumer
Choice
Consumer ARPUs to rise
Minimum Return on
Capital Ensured
Increases dependence on Systems &
Processes
Increases transparenc
y and adherence
to compliance
Favours organized
Entities
Implementation of the network distribution model will shift the balance of power in favour of Distribution

29
Thank You