SBB STEEL MARKETS DAILY
33
Volume 14 / Issue 190 / September 25, 2020 SBB STEEL MARKETS DAILY www.platts.com www.twitter.com/PlattsSteel INSIDE THE ISSUE Iron ore market 2 Coking coal market 3 Scrap market 4 Exchanges 6 Ferroalloys market 6 Other News 6 Americas 7 Freight 8 Subscriber Notes 8 Assessment Rationales 11 Marketplace 12 ASSESSMENTS Platts daily iron ore assessments, September 25 2020 18 Per 1% differentials (Range 60-63.5% Fe, $/dmt) 18 Per 1% differentials (Range 55-60% Fe, $/dmt) 18 Rolling monthly average 18 Platts daily iron ore lump spot assessments 18 Pellet premiums 18 IOPEX: Platts daily port stock iron ore fines assessment, September 25 19 Platts daily iron ore seaborne brand assessments, September 25 19 Freight differentials to major import ports, $/wmt 19 TSI 62% Fe CFR North China derivative forward curve, September 25 19 Iron ore lump premium CFR China derivative forward curve, September 25 19 Platts daily metallurgical coal assessments, September 25 20 Platts daily Asia Pacific metallurgical coal relativities, September 25, 2020 21 Platts weekly metallurgical coal relativities, September 25, 2020 21 Europe and US cold-rolled coil assessments, September 25 21 Metallurgical Coke 22 Platts China PLV, met coke price differentials 22 TSI premium HCC FOB Australia derivative forward curve, September 25 22 Penalties & Premia: Differentials ($/mt) 22 FOB netbacks per route 22 Platts TSI ferrous scrap reference prices 23 HMS 1&2 80:20 CFR Turkey derivative forward curve, September 25 23 Rebar FOB Turkey derivative forward curve, September 25 23 SBB-SMD raw materials reference prices 24 Platts TSI steel industry assessments, September 25 24 Platts TSI steel assessments currency and unit comparisons, September 25 25 Scrap: iron ore ratios 25 Platts Turkey ARC Steel Tracker, September 25, 2020 25 Weekly Ferroalloy Prices 26 Monthly average steel prices: August 2020 27 Monthly average raw materials prices: August 2020 27 Trade Case Status Report 28 PLATTS TSI RAW MATERIAL ASSESSMENTS, SEPTEMBER 25 2020 Symbol Close Change % Chg IODEX Iron ore fines 62% Fe ($/dmt) CFR North China IODBZ00 116.05 0.15 0.13 Please see Platts complete iron price/netbacks table, p.2-3 Coking coal, premium low vol ($/mt) FOB Australia PLVHA00 139.00 3.50 2.58 CFR China PLVHC00 148.50 2.00 1.37 TSI Premium hard, Australian exports (FOB port) TS01034 137.40 1.40 1.03 Please see full metallurgical coal price/freight table, p.4 Ferrous scrap ($/mt) HMS 1/2 80:20 CFR Turkey TS01011 295.50 0.00 0.00 Please see full ferrous scrap price table, p.6 Speculative demand for Nov continues High portside inventories weigh on concentrate Singapore—Seaborne iron ore prices remained largely rangebound at the end of the week to Sept. 25 amid speculative demand for November-loading cargoes. S&P Global Platts assessed the 62% Fe Iron Ore Index at $116.05/ dry mt CFR North China on Sept. 25, up 15 cents from Sept. 24. Front-month October 62% Fe derivatives were up $0.35/dmt from Sept. 24 to $113.2/dmt on Sept. 25. Expectations of a shift in preference for medium grade fines on narrowing discounts for lower grade options supported buying interest for November-loading Pilbara Blend fines, an international trader said. There was also demand for alternative medium grade fines as they were viewed as increasingly more cost efficient than low grade fines, while serving as a cheaper alternative for end-users looking to cut production costs, a Chinese trader said. A tender for two cargoes of PBF loading in November and December was heard to have been concluded around $3.10/dmt CFR Seaborne iron ore prices mostly stable amid continued speculative demand (continued on page 2) US high-vol A met coal firm, Asia-Pacific market strong Market tighter with improved demand Still room for further increases Coke said to be in shorter supply in Europe London—US high-vol A met coal prices rose another $1/mt Sept. 25, pushed higher by continually strong Premium Low Vol prices in the Asia-Pacific market. Atlantic met coal prices have been supported in recent weeks by strong demand and tighter availability. A miner source said high-vol A prices were around $120/mt, adding that it was not easy to get spot out of the US, and particularly at fixed prices. “There is still room for further increases. That would be fresh air for US producers,” the miner said. “I'm not too bullish yet -- despite the increases, prices are not exciting yet. Only once [high-vol A] gets to $130-140/mt can producers start to invest in the future and in operations, keep the situation workable,” S&P Global Platts assessed Premium Low Vol up $3.50/mt Sept. 25 to $139/mt FOB Australia, while the Platts TSI Premium HCC reference price, used for settlement of the Singapore Exchange's coking coal futures, gained $1.40/mt to $137.40/mt FOB Australia.
-
Upload
khangminh22 -
Category
Documents
-
view
0 -
download
0
Transcript of SBB STEEL MARKETS DAILY

Volume 14 / Issue 190 / September 25, 2020
SBB STEEL MARKETS DAILY
www.platts.com www.twitter.com/PlattsSteel
InsIde the IssueIron ore market 2Coking coal market 3Scrap market 4Exchanges 6Ferroalloys market 6Other News 6Americas 7Freight 8Subscriber Notes 8Assessment Rationales 11Marketplace 12
AssessmentsPlatts daily iron ore assessments, September 25 2020 18Per 1% differentials (Range 60-63.5% Fe, $/dmt) 18Per 1% differentials (Range 55-60% Fe, $/dmt) 18Rolling monthly average 18Platts daily iron ore lump spot assessments 18Pellet premiums 18IOPEX: Platts daily port stock iron ore fines assessment, September 25 19Platts daily iron ore seaborne brand assessments, September 25 19Freight differentials to major import ports, $/wmt 19TSI 62% Fe CFR North China derivative forward curve, September 25 19Iron ore lump premium CFR China derivative forward curve, September 25 19Platts daily metallurgical coal assessments, September 25 20Platts daily Asia Pacific metallurgical coal relativities, September 25, 2020 21Platts weekly metallurgical coal relativities, September 25, 2020 21Europe and US cold-rolled coil assessments, September 25 21Metallurgical Coke 22Platts China PLV, met coke price differentials 22TSI premium HCC FOB Australia derivative forward curve, September 25 22Penalties & Premia: Differentials ($/mt) 22FOB netbacks per route 22Platts TSI ferrous scrap reference prices 23HMS 1&2 80:20 CFR Turkey derivative forward curve, September 25 23Rebar FOB Turkey derivative forward curve, September 25 23SBB-SMD raw materials reference prices 24Platts TSI steel industry assessments, September 25 24Platts TSI steel assessments currency and unit comparisons, September 25 25Scrap: iron ore ratios 25Platts Turkey ARC Steel Tracker, September 25, 2020 25Weekly Ferroalloy Prices 26Monthly average steel prices: August 2020 27Monthly average raw materials prices: August 2020 27Trade Case Status Report 28
PlAtts tsI rAw mAterIAl Assessments, sePtember 25 2020 symbol Close Change % Chg
IOdeX Iron ore fines 62% Fe ($/dmt)
CFR North China IODBZ00 116.05 0.15 0.13Please see Platts complete iron price/netbacks table, p.2-3
Coking coal, premium low vol ($/mt)
FOB Australia PLVHA00 139.00 3.50 2.58CFR China PLVHC00 148.50 2.00 1.37TSI Premium hard, Australian exports (FOB port) TS01034 137.40 1.40 1.03Please see full metallurgical coal price/freight table, p.4
Ferrous scrap ($/mt)
HMS 1/2 80:20 CFR Turkey TS01011 295.50 0.00 0.00Please see full ferrous scrap price table, p.6
�� speculative demand for nov continues�� high portside inventories weigh on concentrate
Singapore—Seaborne iron ore prices remained largely rangebound at the end of the week to Sept. 25 amid speculative demand for November-loading cargoes.
S&P Global Platts assessed the 62% Fe Iron Ore Index at $116.05/dry mt CFR North China on Sept. 25, up 15 cents from Sept. 24.
Front-month October 62% Fe derivatives were up $0.35/dmt from Sept. 24 to $113.2/dmt on Sept. 25.
Expectations of a shift in preference for medium grade fines on narrowing discounts for lower grade options supported buying interest for November-loading Pilbara Blend fines, an international trader said.
There was also demand for alternative medium grade fines as they were viewed as increasingly more cost efficient than low grade fines, while serving as a cheaper alternative for end-users looking to cut production costs, a Chinese trader said.
A tender for two cargoes of PBF loading in November and December was heard to have been concluded around $3.10/dmt CFR
seaborne iron ore prices mostly stable amid continued speculative demand
(continued on page 2)
us high-vol A met coal firm, Asia-Pacific market strong
�� market tighter with improved demand�� still room for further increases�� Coke said to be in shorter supply in europe
London—US high-vol A met coal prices rose another $1/mt Sept. 25, pushed higher by continually strong Premium Low Vol prices in the Asia-Pacific market.
Atlantic met coal prices have been supported in recent weeks by strong demand and tighter availability.
A miner source said high-vol A prices were around $120/mt, adding that it was not easy to get spot out of the US, and particularly at fixed prices.
“There is still room for further increases. That would be fresh air for US producers,” the miner said. “I'm not too bullish yet -- despite the increases, prices are not exciting yet. Only once [high-vol A] gets to $130-140/mt can producers start to invest in the future and in operations, keep the situation workable,”
S&P Global Platts assessed Premium Low Vol up $3.50/mt Sept. 25 to $139/mt FOB Australia, while the Platts TSI Premium HCC reference price, used for settlement of the Singapore Exchange's coking coal futures, gained $1.40/mt to $137.40/mt FOB Australia.
September 25, 2020Sbb Steel marketS Daily
2© 2020 S&P Global Platts, a division of S&P Global Inc. All rights reserved.
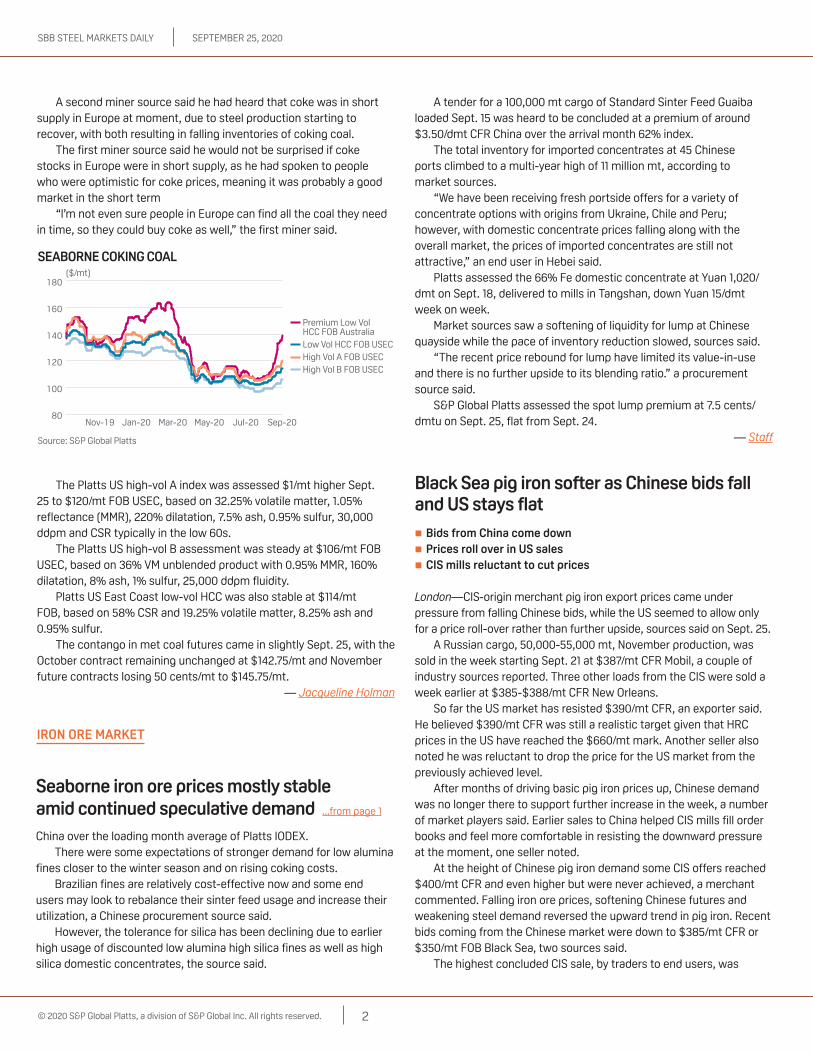
A second miner source said he had heard that coke was in short supply in Europe at moment, due to steel production starting to recover, with both resulting in falling inventories of coking coal.
The first miner source said he would not be surprised if coke stocks in Europe were in short supply, as he had spoken to people who were optimistic for coke prices, meaning it was probably a good market in the short term
“I’m not even sure people in Europe can find all the coal they need in time, so they could buy coke as well,” the first miner said.
The Platts US high-vol A index was assessed $1/mt higher Sept. 25 to $120/mt FOB USEC, based on 32.25% volatile matter, 1.05% reflectance (MMR), 220% dilatation, 7.5% ash, 0.95% sulfur, 30,000 ddpm and CSR typically in the low 60s.
The Platts US high-vol B assessment was steady at $106/mt FOB USEC, based on 36% VM unblended product with 0.95% MMR, 160% dilatation, 8% ash, 1% sulfur, 25,000 ddpm fluidity.
Platts US East Coast low-vol HCC was also stable at $114/mt FOB, based on 58% CSR and 19.25% volatile matter, 8.25% ash and 0.95% sulfur.
The contango in met coal futures came in slightly Sept. 25, with the October contract remaining unchanged at $142.75/mt and November future contracts losing 50 cents/mt to $145.75/mt.
— Jacqueline Holman
IrOn Ore mArket
black sea pig iron softer as Chinese bids fall and us stays flat
�� bids from China come down�� Prices roll over in us sales�� CIs mills reluctant to cut prices
London—CIS-origin merchant pig iron export prices came under pressure from falling Chinese bids, while the US seemed to allow only for a price roll-over rather than further upside, sources said on Sept. 25.
A Russian cargo, 50,000-55,000 mt, November production, was sold in the week starting Sept. 21 at $387/mt CFR Mobil, a couple of industry sources reported. Three other loads from the CIS were sold a week earlier at $385-$388/mt CFR New Orleans.
So far the US market has resisted $390/mt CFR, an exporter said. He believed $390/mt CFR was still a realistic target given that HRC prices in the US have reached the $660/mt mark. Another seller also noted he was reluctant to drop the price for the US market from the previously achieved level.
After months of driving basic pig iron prices up, Chinese demand was no longer there to support further increase in the week, a number of market players said. Earlier sales to China helped CIS mills fill order books and feel more comfortable in resisting the downward pressure at the moment, one seller noted.
At the height of Chinese pig iron demand some CIS offers reached $400/mt CFR and even higher but were never achieved, a merchant commented. Falling iron ore prices, softening Chinese futures and weakening steel demand reversed the upward trend in pig iron. Recent bids coming from the Chinese market were down to $385/mt CFR or $350/mt FOB Black Sea, two sources said.
The highest concluded CIS sale, by traders to end users, was
China over the loading month average of Platts IODEX.There were some expectations of stronger demand for low alumina
fines closer to the winter season and on rising coking costs.Brazilian fines are relatively cost-effective now and some end
users may look to rebalance their sinter feed usage and increase their utilization, a Chinese procurement source said.
However, the tolerance for silica has been declining due to earlier high usage of discounted low alumina high silica fines as well as high silica domestic concentrates, the source said.
seaborne iron ore prices mostly stable amid continued speculative demand ...from page 1
A tender for a 100,000 mt cargo of Standard Sinter Feed Guaiba loaded Sept. 15 was heard to be concluded at a premium of around $3.50/dmt CFR China over the arrival month 62% index.
The total inventory for imported concentrates at 45 Chinese ports climbed to a multi-year high of 11 million mt, according to market sources.
“We have been receiving fresh portside offers for a variety of concentrate options with origins from Ukraine, Chile and Peru; however, with domestic concentrate prices falling along with the overall market, the prices of imported concentrates are still not attractive,” an end user in Hebei said.
Platts assessed the 66% Fe domestic concentrate at Yuan 1,020/dmt on Sept. 18, delivered to mills in Tangshan, down Yuan 15/dmt week on week.
Market sources saw a softening of liquidity for lump at Chinese quayside while the pace of inventory reduction slowed, sources said.
“The recent price rebound for lump have limited its value-in-use and there is no further upside to its blending ratio.” a procurement source said.
S&P Global Platts assessed the spot lump premium at 7.5 cents/dmtu on Sept. 25, flat from Sept. 24.
— Staff
September 25, 2020Sbb Steel marketS Daily
3© 2020 S&P Global Platts, a division of S&P Global Inc. All rights reserved.
reported at $395/mt CFR China. Since then some 30,000 mt was sold by one CIS exporter in during the week ended Sept. 25 at $389/mt CFR China, loading in the Russian Far East, a couple of sources reported.
To sell at the same level from the European part of Russia or Ukraine, CIS mills would need to cut their prices to offset higher freight rates, meaning a $10-$15/mt drop from $365-$368/mt FOB achieved in the latest US bookings.
But CIS merchants were adamant to hastily lower prices for China. They believed that the lower activity was only a phase as China was going into a holiday week. After October 12, the market might rebound again, which put some CIS mills in a wait-and-see mode. November allocation from the CIS is also expected to be shorter than normal, buying CIS exporters time, a few sources noted. In the meantime, pig iron should be under pressure, with a likely small “technical” decrease, according to a sell-side source.
Asking prices in the Italian market were cited at $385/mt CIF Marghera, or $365/mt FOB Black Sea. Buyers were resisting even $380/mt CIF, a market participant said. A trader added that bids from Italian buyers were closer to $370/mt CIF.
— Wojtek Laskowski
COkIng COAl mArket
Coking coal prices to recover notably by year-end: kolmar
London—Russian metallurgical and energy coal mining company Kolmar believes coking coal prices will recover significantly by the year-end; they have already started to rise on both FOB Australia and CFR China basis.
Kolmar expects coking coal prices to get support from the end of the monsoon season in Asia and subsequent revival in construction activity in the region, its spokeswoman told S&P Global Platts.
On an FOB Australia basis, coking coal prices have gained $7/mt over the last seven days, rising to $136/mt on Sept. 24. The CFR China price moved up to $147/mt from $138/mt a week ago, according to Platts data.
The market was also buoyed by recent data on the manufacturing sector in India, whose Purchasing Managers' Index passed 50, signaling a more confident outlook for the industry. “Demand in the spot market outside of China is gradually picking up,” said the spokeswoman, adding steel mills have started to blow in blast furnaces suspended during the coronavirus pandemic’s first wave.
What also brings relief is a possible easing of quotas at the ports of China. There has been talk about it more and more and consumers are no longer afraid to start closing the gap between prices for local Chinese coal and imports, according to Kolmar.
The miner said prices would also gain from some tightness on the supply side, which is possible should the current weather forecasts for Australia come true.
According to the Australian Bureau of Meteorology, there is a 70% probability cyclone La Nina will form in the coming months with October-November likely to see precipitation above average levels.
The rain will primarily affect Queensland. So, Chinese consumers may encounter disruption in coking coal supply after the Golden Week holidays (Oct. 1-7).
“Looking further ahead, we have an upbeat view for China’s 13th and 14th five-year development cycles. The infrastructure plans they contain should boost coking coal prices from their current extremely low level,” said the spokeswoman.
What could adversely affect the coal market in the short term is the second wave of the pandemic currently gathering pace in a few regions, she said. Also, strong iron ore prices could be a factor, reducing steelmakers’ profitability and keeping coke prices in check.
Excessive inventories at mills and limited resources to finance public construction projects, for instance in India, are also factors not helping the market to recover at a faster pace.
Yet Kolmar hopes the bullish events will outweigh and prices will recover significantly by year-end.
The company recently launched the first stage of its new coking coal mine Inaglinskaya, and new coking coal washing plant Inaglinskaya-2, both in the Neryungri district of the Sakha Republic (Yakutia).
Inaglinskaya is expected to deliver 1.4 million mt of coal by the end of December, while the company targets 7.57 million mt output this year with the total comprised of both metallurgical and thermal coal.
— Ekaterina Bouckley
Asia met coal prices continue to rally on firm demand
�� higher PlV bid fails to draw offers�� Firm buying interest seen in spot market
Singapore—Asia-Pacific metallurgical coal prices continued the upward momentum on firm buying interest and positive outlook amid spot demand.
S&P Global Platts assessed Premium Low Vol up $3.50/mt at $139/mt FOB Australia Sept. 25, and PLV CFR China was up $2/mt at $148.50/mt CFR China.
The spot market saw continued strength in prices with higher firm bids for Premium Low Vol coals failing to draw firm offers from the market. Market sources said the outlook remains firm as spot demand is expected from India and China.
In China, the market saw thin trading activity as market participants adopted a wait-and-see mode, as both the sell and buy sides need some time to re-assess their expectations following the strength seen in the spot market, sources said.
“Many buyers stepped back from the market simply because the price moved up too fast in the past weeks. I think more demand will emerge after buyers come back from the Golden Week holiday,” a Chinese trader said.
Meanwhile, some also said that while strength in prices could be supported on firm buying interest, the pace of the price uptick could be mild in the near term as arbitrage narrows.
“Expectation on prices is firm, but we think price movements might be less dramatic as compared to previous two weeks, as buyers

September 25, 2020Sbb Steel marketS Daily
4© 2020 S&P Global Platts, a division of S&P Global Inc. All rights reserved.
become more cautious now,” a Chinese end-user said.Still in China, at Jingtang port, sources said that port stock
availability was moving lower as traders still face difficulties with port clearance. Platts assessed PLV ex-stock Jingtang up Yuan 10/mt at Yuan 1,440/mt on Sept. 25, equivalent to $182.52/mt CFR Jingtang, and HCC 64 Mid Vol ex-stock Jingtang up Yuan 10/mt at Yuan 1,310/mt, equivalent to $165.63/mt CFR Jingtang.
The market outside China saw thin liquidity as well, but the expectation on spot demand remains positive. In India, sources said the market continued to see inquires on spot cargoes as end-users plan to take October-November laycan cargoes to meet their restocking needs.
— Jessie Li, Yi-Le Weng
sCrAP mArket
China’s shagang cuts ferrous scrap prices by another Yuan 50/mt, high product inventory
Singapore—Eastern China’s largest scrap buyer Jiangsu Shagang Group has cut its bid for local ferrous scrap again Sept. 25, a day after its previous cut, amid high rebar and scrap inventories, a source from the mill said.
The company’s bid, effective Sept. 25, for scrap with minimum thickness of 6 mm, was Yuan 2,640 ($387/mt), down Yuan 50/mt from the last adjustment Sept. 24, and including 13% value added tax.
“The season for good sales is gone, and rebar inventories now remain on the higher side,” the source said. “Likewise for scrap inventories as well, so there’s no need to be paying premium prices in this situation.”
The Sept. 25 cut came immediately after a similar Yuan 50/mt cut on Sept. 24, and since entering the month of September, prices were down by a total of Yuan 160/mt.
Meanwhile, in the nearby actively traded Hangzhou market, rebar transacted prices fell another Yuan 10/mt on the day, and heard at Yuan 3,630/mt Sept. 25. This marked a total decrease of Yuan 130/mt since the beginning of the month.
Sentiment too continues to be weighted down by bearish movements within the futures market. Prices for January 2021 marked a Yuan 30/mt fall on the day, or a total of Yuan 252/mt since entering September.
— Samuel Chin, Analyst Chelsea Ye
taiwan containerized scrap prices slip as buyers in wait-and-see mode
�� hms I/II 80:20 offers down $5-$10/mt�� downside potential cited limited on better expected Q4 demand
Singapore—Containerized scrap prices to Taiwan slipped further during the trading week of Sept. 25, as buyers remained in wait-and-see mode, sources said.
The S&P Global Platts daily TSI HMS I/II 80:20 containerized scrap
spot price was assessed at $274/mt CFR Taiwan on Sept. 25, down $6/mt week on week.
Offers for USWC HMS I/II 80:20 cargoes to Taiwan were lower at $275/mt CFR on Sept. 25, from $280-$285/mt the week prior, with sellers saying they were seeing no interested takers even after the downward adjustment. Workable values, however, were cited in a range of $272-$275/mt CFR.
Trading continued to be lackluster throughout the week, with a 3,000 mt deal at $280/mt CFR on Sept. 22, prior to the mid-week retraction of interest from mill as they expected weaker prices after a cut in Taiwan’s domestic scrap prices.
"Buyers don't want to bid now while prices are still declining," a Taiwanese mill source said. "We will wait for subsequent weeks until levels are more stable."
Japanese H1:H2 50:50 offers to Taiwan similarly fell to $290-$295/mt CFR, down from $299-$303/mt the week before, with buyers also heard to be awaiting more competitive levels.
Despite recent weaker Asian indications and sentiments, some traders said the recent bearishness may only be short lived, as most saw better demand to come for Taiwanese mills begin in mid-October.
“I don't think the downside potential is a big one," a Taiwanese trader said. “Buyers are seeing a possible increase of production in the fourth quarter as the monsoon season wraps up, while electricity prices return to normal. Perhaps after the mid-autumn holidays [the first week of October], we might see some better construction demand as they rush to complete projects. So there could be more scrap demand returning."
— Marcus Ong, Samuel Chin
turkish import scrap stable, near-term sentiment mixed
�� bearish factors include lower euro-us dollar rate, soft finished steel market�� bullish factors include firm expected October scrap settlements in eu and us
London—Deepsea Turkish import scrap prices were stable Sept. 25 amid split sentiment toward the near-term price direction, sources said.
S&P Global Platts assessed Turkish imports of premium heavy melting scrap 1/2 (80:20) at $295.50/mt CFR, unchanged on the day.
“There is a stalemate in the market and I think we will see some movement next week,” a Turkish mill source said. He cited a tradable value for premium HMS 1/2 (80:20) at $290-$295/mt CFR and noting that confidential deals could have already been booked at this lower range.
A Turkish trading source also said $290-$295/mt CFR was likely to be workable for Baltic-origin material, while US sellers were still firm at $300/mt CFR.
“There are lots of scrap offers in the market and the Turkish domestic market is not so strong,” the trading source said. “Most mills were pushing for $290/mt CFR and they won’t follow the latest Samsun deals higher and start bidding at $295-$296/mt CFR, so the
September 25, 2020Sbb Steel marketS Daily
5© 2020 S&P Global Platts, a division of S&P Global Inc. All rights reserved.
market is silent and sellers are all stepping back.”Two Baltic-origin cargoes totaling around 52,500 mt were booked
on Sept 23 by a Samsun mill, The deals saw HMS 1/2 (80:20) calculated at $295.50/mt CFR, including a 50 cent/mt downward adjustment to reflect freight to Samsun, in line with Platts methodology.
The trader estimated that a further four-five cargoes are still required for end-October shipment from EU or Baltic sellers, while a Turkish agent source said around 7-8 cargoes are likely to be booked for the same shipment date.
Agents eye lower pricesA second Turkish agent source said $290/mt CFR maximum was
possible for EU-origin HMS 1/2 (80:20), and $293-$294/mt CFR for US- or Baltic-origin material, should recyclers decide to sell.
Baltic recyclers were expected to attempt to push HMS collection prices down to a $290/mt CFR no margin-equivalent, once September loading shipments are fulfilled, sources said. HMS collection prices in the St. Petersburg region were cited at around $297-298/mt CFR Turkey equivalent, down from $302/mt CFR earlier in the week.
“We all prefer the market to go down today, but with other sellers dropping the market, and then we can collect cheaper,” the second Turkish agent source said.
Market sources also cited the softer euro against the US dollar, which could put downward pressure on the US-dollar denominated CFR Turkey price. The euro was trading at $1.16203 as of 5 pm London time on Sept. 25, down from $1.18407 one week earlier.
Other bearish indicators pointed to by sources were lower iron ore prices ahead of the China mid-autumn holiday over Oct. 1-8. Platts assessed the 62% Fe Iron Ore Index at $116.05/dry mt CFR North China on Sept. 25, up 15 cents from Sept. 24, but down from $125.20/dmt one week earlier on Sept. 18.
This meant the Platts Turkey Scrap-Iron ore daily ratio was at 2.55 on Sept. 25, down slightly from 2.56 on Sept. 23, but hovering at its highest level since June 29.
However, other sell-side sources cited higher workable levels following the Samsun deals booked on Sept. 23.
The first Turkish agent cited a Baltic recycler target at $298-$299/mt CFR, while an EU trading source said $296-$298/mt CFR was workable for US- or Baltic-origin material.
“I believe sellers are firmer based on tighter than expected scrap availability and the [October] domestic settlement in the EU and USA are pointing upwards,” the EU trader said. “Plus, the Turks have to still finish their October buying and completely cover November.”
Early indications for US domestic October scrap settlements were heard to be sideways or up $10/lt on average across grades, while EU sellers are targeting Eur5-10/mt increases compared to September levels.
Another Turkish agent source said $297/mt CFR was workable for premium HMS 1/2 (80:20).
A UK trading source cited a near-term tradable value for premium material at closer to $300/mt CFR, while a US trader cited an offer for Venezuela-origin material at above $295/mt CFR, with US-origin material at $299-$300/mt CFR.
The Turkish longs melting margin -- the spread between Turkish export rebar and import scrap -- was assessed at $157/mt Sept. 25, down $1.50/mt on day.
— Viral Shah
India import shredded scrap prices soften, slack buying
�� weak demand and wider market sentiment keep buyers away�� Pound sterling and euro continue to soften against the dollar
London—Workable Indian import prices for containerized shredded scrap continued to soften over the week ending Sept. 25, as mills held back amid mixed sentiment over wider market direction.
S&P Global Platts assessed India import containerized shredded scrap at $312/mt CFR Nava Sheva Sept. 25, down $3 on the week.
“The market is very quiet and the wider sentiment is negative with buyers anticipating a big fall in prices so activity into Nava Sheva has totally halted,” an Indian trading source said.
A midweek softening in the benchmark Turkish import scrap price, coupled with weak buyer demand, affected sentiment in the Indian import shredded scrap market, a second trading source said.
Platts’ assessment of the benchmark Turkish import premium HMS 1/2 (80:20) had softened to $293/mt CFR on Sept. 23, before recovering to $295.50/mt CFR on Sept 24, following news of two fresh Baltic-origin deals.
Market sources cited tradable values ranging $310-$315/mt CFR Nava Sheva, with a majority of sources citing around $312/mt CFR as representative of market value. Indicative bids were cited around $300-$305/mt CFR Nava Sheva.
While the Indian import market was quiet, sources cited multiple deals at around similar levels into Pakistan.
A deal booked on Sept. 22 was cited at $315/mt CFR Port Qasim, while a UK-origin sale for 1,000 mt was booked at $312/mt CFR Qasim on Sept. 24. The same UK trader had also booked a deal at $310/mt CFR for 500 mt on Sept 24.
Following news of the rebound in the Turkish import scrap market, prices also firmed into Pakistan, with an EU-origin cargo totaling 1,000 mt heard booked at $312/mt CFR on Sept. 25.
Pound sterling also saw a sharp drop against the US dollar over the week ending Sept. 25, putting further downward pressure on the US-dollar denominated CFR price. Sterling was trading at $1.27501 at 5 pm London time on Sept. 25. This was down from $1.29194 on Sept. 18.
Similarly, the euro, also saw softening on week, trading at
Analytics
Visit spglobal.com/analytics-insight
Integrated, innovative. Across geography and across commodity.

September 25, 2020Sbb Steel marketS Daily
6© 2020 S&P Global Platts, a division of S&P Global Inc. All rights reserved.
$1.16203 as of 5 pm London time on Sept. 25, down from $1.18407 one week earlier.
New daily coronavirus cases totaled 85,919 on Sept. 24, down on week from 96,793 on Sept. 17, with total cases around 5.84 million mark.
— Viral Shah
eXChAnges
Futures wrAP: lme scrap, rebar contracts soften further on market uncertainty
London—The scrap and rebar forward curves on the London Metal Exchange both saw losses over the week to Sept. 24, amid mixed sentiment over near-term physical market direction.
The scrap forward curve moved lower, maintaining a backwardated structure, with losses apparent over September to December contracts.
September LME scrap futures were down $3.50/mt week on week at $295.50/mt on Sept. 24. The October contract dropped $5/mt over the week to $291.50/mt.The later-dated November contract fell $6/mt to $290/mt, while the December contract fell $5/mt week on week to $289.50/mt.
However, the Turkish import scrap market recovered on the day, following fresh ex-Baltic deals heard late on Sept. 24, which is likely to shift sentiment on near-term price direction. Spot prices for physical imports of premium heavy melting scrap 1/2 (80:20) were assessed at $295.50/mt CFR Turkey on Sept. 24, up $2.50/mt on the day, and up 50 cents/mt from Sept. 17.
Market participants pointed to a firm US domestic scrap market, and the hike in the Turkish benchmark interest rate, which could lower domestic lira-based rebar prices, and thus improve domestic rebar demand, which in turn could support scrap prices.
However, sources also pointed to the euro and pound sterling softening against the dollar, which could put downward pressure on US dollar-denominated CFR Turkey scrap prices. In addition, iron ore prices have also fallen week on week, while sentiment in China has turned bearish with futures.
The most actively traded January 2021 rebar futures contract on the Shanghai Futures Exchange closed at Yuan 3,522/mt on Sept. 25, down from Yuan 3,603/mt on Sept. 18.
Scrap futures trading volumes over the week to Sept. 24 sat at 90,740 mt, a sharp increase from 19,070 mt recorded last week, making it the highest weekly trading volume since late May. Scrap trading volumes over the year to date now total 3.96 million mt, the highest volume over a January-September period since the contract’s launch in late 2015.
The rebar forward curve on the London Metal Exchange shifted into backwardation over the week to Sept. 24, from a completely flat forward curve one week earlier.
The September contract rose $2/mt to $455.50/mt while the October contract fell $3/mt to $450.50/mt. The November rebar contract was assessed at $449.50/mt, dropping $4/mt week on week, and the December contract fell $6/mt to $447.50/mt on Sept. 24.
Platts assessment of Turkish exported rebar was down $1/mt over the week at $454/mt FOB Turkey Sept. 24, as some mills were heard to
consider lower workable levels in search for export demand.Rebar futures weekly trading volumes this week on the LME totaled
7,600 mt, down from 10,350 mt recorded last week.The Turkish longs melting margin -- the spread between Turkish
exported rebar and import scrap -- was down $1.50/mt week on week at $158.50/mt Sept. 24.
— Viral Shah
FerrOAllOYs mArket
molybdenum oxide slides as holidays near in China
�� market eyes next support level for molybdenum�� european ferromolybdenum testing $20/kg resistance
London—Molybdenum prices continued to slide Sept. 25 with market participants noting that buying interest was picking up as prices declined.
The Platts Daily Dealer Molybdenum Oxide assessment was at $8-$8.20/lb, from $8.10-$8.35/lb on Sept. 24.
“There were more inquiries in the afternoon," one Asian trader said. "European traders are restocking.”
Others said they had received lots of bids at $8-$8.10/lb in Asia but did not want to sell and preferred to wait while a second Asian trader said it was “not a good time to buy.”
In Europe, deals were concluded at $8/lb and $8.05/lb, which one European trader noting that sellers who had rejected low bids in the market on the previous day had come back in at lower levels.
With China’s autumn holidays approaching, market participants said they were not surprised that prices had continued to slip along with buying interest.
“Holidays are coming in Asia -- everyone anticipated the cooling off,” a second European trader said.
European ferromolybdenum prices, meanwhile, also felt pressure as deals to a mill in Austria were heard at $20.15/kg DDP and offers in Rotterdam at $20/kg.
Sources said while there were bids in Europe below $20/kg there were no keen sellers at this level.
— Jitendra Gill
Other news
Japan's August steel output climbs on month amid rise in demand: JIsF
�� Crude steel output up 6.6% on month�� Product output up 18.3% on month
Singapore—Japan’s crude steel production rose 6.6% on the month in August to reach 6.45 million mt, but was down 20.6% year on year, latest figures from the Japan Iron & Steel Federation showed Sept. 24.

September 25, 2020Sbb Steel marketS Daily
7© 2020 S&P Global Platts, a division of S&P Global Inc. All rights reserved.
1935-7354
SBB STEEL MARKETS DAILY
The names “S&P Global Platts” and “Platts” and the S&P Global Platts logo are trademarks of S&P Global Inc. Permission for any commercial use of the S&P Global Platts logo must be granted in writing by S&P Global Inc.
You may view or otherwise use the information, prices, indices, assessments and other related information, graphs, tables and images (“Data”) in this publication only for your personal use or, if you or your company has a license for the Data from S&P Global Platts and you are an authorized user, for your company’s internal business use only. You may not publish, reproduce, extract, distribute, retransmit, resell, create any derivative work from and/or otherwise provide access to the Data or any portion thereof to any person (either within or outside your company, including as part of or via any internal electronic system or intranet), firm or entity, including any subsidiary, parent, or other entity that is affiliated with your company, without S&P Global Platts’ prior written consent or as otherwise authorized under license from S&P Global Platts. Any use or distribution of the Data beyond the express uses authorized in this paragraph above is subject to the payment of additional fees to S&P Global Platts.
S&P Global Platts, its affiliates and all of their third-party licensors disclaim any and all warranties, express or implied, including, but not limited to, any warranties of merchantability or fitness for a
particular purpose or use as to the Data, or the results obtained by its use or as to the performance thereof. Data in this publication includes independent and verifiable data collected from actual market participants. Any user of the Data should not rely on any information and/or assessment contained therein in making any investment, trading, risk management or other decision. S&P Global Platts, its affiliates and their third-party licensors do not guarantee the adequacy, accuracy, timeliness and/or completeness of the Data or any component thereof or any communications (whether written, oral, electronic or in other format), and shall not be subject to any damages or liability, including but not limited to any indirect, special, incidental, punitive or consequential damages (including but not limited to, loss of profits, trading losses and loss of goodwill).
ICE index data and NYMEX futures data used herein are provided under S&P Global Platts’ commercial licensing agreements with ICE and with NYMEX. You acknowledge that the ICE index data and NYMEX futures data herein are confidential and are proprietary trade secrets and data of ICE and NYMEX or its licensors/suppliers, and you shall use best efforts to prevent the unauthorized publication, disclosure or copying of the ICE index data and/or NYMEX futures data.
Permission is granted for those registered with the Copyright Clearance Center (CCC) to copy material herein for internal reference or personal use only, provided that appropriate payment is made to the CCC, 222 Rosewood Drive, Danvers, MA 01923, phone 1-978-750-8400. Reproduction in any other form, or for any other purpose, is forbidden without the express prior permission of S&P Global Inc. For article reprints contact: The YGS Group, phone 1-717-505-9701 x105 (800-501-9571 from the U.S.).
For all other queries or requests pursuant to this notice, please contact S&P Global Inc. via email at [email protected].
SBB Steel Markets Daily is published daily by Platts, a division of S&P Global, registered office: 55 Water Street, 37th Floor, New York, N.Y. 10038.
Contact Platts support: [email protected]; Americas: 1-800-752-8878; Europe & Middle East: 44-20-7176-6111; Asia Pacific: 65-6530-6430
Australia:
Senior Managing EditorPaul Bartholomew (61 3963 12096)
London:
Editor-in-ChiefDiana Kinch (44 207 176 8390)
Senior Editor, Raw materials, analysisHector Forster (44 207 176 6285)
Senior Pricing Specialist, Ferrous ScrapViral Shah
Senior EditorBen Kilbey
Markets EditorJitendra Gill
Pittsburgh:
Senior EditorTom Balcerek (1 412 916 8476)
News and Markets EditorsJustine Coyne; Joe Eckelman; Michael Fitzgerald
Singapore:
Markets EditorsYoko Manabe; Weng Yi Le; Niki Wang; Lu Han; Jun Kai Heng; Samuel Chin; Marcus Ong
Shanghai:
Senior Managing Editor, Steel & Raw MaterialsKeith Tan (86 21 5110 5478)
Platts PresidentMartin Fraenkel
AdvertisingTel: 1-720-264-6618
Manager, Advertisement SalesBob Botelho
Officers of the Corporation: Charles E. Haldeman, Jr., Non-Executive Chairman; Doug Peterson, President and Chief Executive Officer; Ewout Steenbergen, Executive Vice President, Chief Financial Officer; Steve Kemps, Executive Vice President, General Counsel
© 2020 S&P Global Platts, a division of S&P Global Inc. All rights reserved.
Regional Pricing Director, Metals – Asia (Singapore)Julien Hall (65 6530 6531)
Associate Regional Pricing Director, EMEA – Metals (London)Scott Yarham (44 20 7176 8390)
Regional Pricing Director, Metals – Americas (Pittsburgh)Christopher Davis (1 412 431 0398)
Global Content Director, Metals and Agriculture (London)Ian Dudden (44 20 7176 6772)
Head of Pricing & Market InsightDave Ernsberger
ISSN:
Production in the first eight months of 2020 amounted to 54.72 million mt, down 19%.
Blast furnace output in August amounted to 4.89 million mt, up 10.9% from July, but down 22.9% from a year ago. On the other hand, production via electric furnaces in August was at 1.55 million mt, down 4.9% from July and down 12.2% year on year.
The August crude steel output rise on the month came as the Japanese economy made efforts to overcome the lingering effects of the COVID-19 pandemic.
The third-quarter outlook was expected to record a better performance than the previous quarter, as overall market activity was to see automakers and machinery manufacturers gear up from the easing of previous production cuts in the second quarter.
The au Jibun Bank Manufacturing Purchasing Managers' Index's reading for August stood at a seasonally adjusted 47.2, up from 45.2 in July.
Meanwhile, September is expected to be stable as the flash au Jibun Bank PMI for the month stood at 47.3, relatively sideways from August, IHS Markit said Sept. 23.
In terms of August steel product output, the hot-rolled sheet and plates category saw a month-on-month increase of 12.7% to 3.5 million mt, while the wire rod category was up 4.8% at 71,500 mt. Sections and bars, meanwhile, contracted on the month by 7.8% and 7.4%, respectively, to 378,900 mt and 653,100 mt.
Overall, supporting the August increase in demand for steel were new export orders for ships, which amounted to 579,400 gross tons, or nine vessels. This figure was up from 469,750 GT in July, or eight
vessels then, and a year-on-year improvement of 4.6%, Japan Ship Exporters’ Association data showed.
However, according to the Shipbuilders' Association of Japan, steel demand is projected to still see bearish figures this year of about 2.66 million mt, down from 3.34 million mt in 2019.
In terms of steel demand from vehicles, new car sales performance remained sluggish and totaled 326,436 units in August, down from 396,346 units in July and also lower from 388,600 units in August 2019, data from the Japan Automobile Manufacturers Association showed.
— Clement Choo, Samuel Chin
AmerICAs
steel scrap price expectations remain firm for us October buy
�� most expect up $10/lt on obsoletes in October�� Primes expected to be firmer
Pittsburgh—Market sources expect sideways to stronger pricing as the October buy week approaches in the US.
Most expect primes to be firmer than obsolete grades, as the material is still heard to be tight in the Midwest and the spread
September 25, 2020Sbb Steel marketS Daily
8© 2020 S&P Global Platts, a division of S&P Global Inc. All rights reserved.
between shredded scrap and the premium material remains historically narrow. Since October 2017 the average spread between prime scrap and shredded has been $42/lt. Prices on the two products currently sit at approximately half that spread.
"The market feels very firm, demand is strong it's just a matter of what kind of uptick we'll get on obsoletes, maybe more on primes," said one Midwest supplier.
"Prime has more upside chance because pig iron is so strong," said another Midwest supplier.
Many project shred will be sideways to up $10/lt, and up $20/lt at most.
"I think increases will be capped at $20/lt," said one Ohio Valley supplier. "I'm not sure we get up $20/lt, but it can’t go higher than that. I think mills are eager buyers at sideways," he added.
"I feel October is sideways at worst," said one Ohio Valley supplier who believed cut grades could be up $10 next month. "I would almost bet you my savings that $20 isn't in the playbook," he added.
"I'm not feeling it, I think this market has slipped. I think we're sideways," said a more pessimistic source. He added that one major mill buying group was heard to be trying to talk the market down. "Primes – there's a little bit more momentum there – but I think the [finished] steel price increase announcements are the tale wagging the dog a little bit."
"[The mill buying group] may try to put a lid on the market," agreed the first Midwest supplier.
— Joe Eckelman
FreIght
Capesize market takes a break after bustling week
�� Atlantic market muted before weekend amid standoff�� Pacific market cools off with freight rates edging down
The Capesize market took a breather on Sept. 25 after witnessing momentum since Sept. 18. The strong uptrend in the week to Sept. 25 was the second big jump in 2020 since the first one in June, a Europe-based shipbroker said.
A shipbroker said that it is unlikely Platts Cape T4 Index rates for
Capesize will exceed the year's high of $31,901/d reached on July 6.Trading activities cooled off before the weekend due to a subtle
sentiment change, starting from a softening freight derivative market. Ballast interest has been well-supported by the decent time charter equivalent returns on the key Brazil routes.
“The Capesize market is unpredictable, but personally I believe that next week maybe more upside,” a Chinese-ship operating source said.
The bunker market saw prices edging up, but failed to make waves in such a volatile freight market.
Atlantic marketDriven by the strong sentiment on the Brazil route, the short
term market outlook in Atlantic remained rosy. On the key Tubarao to Qingdao route, the trading day was sluggish without much activity. Fixture-wise, miner Vale was heard fixing a few ships late Sept. 24 for mid-October laycans, with freight rates at around $20/wmt. The freight indicated on the Brazil to China route was in the $19/wmt to $20.50/wmt range.
The freight rate for a Capesize ship to move 170,000 mt (plus/ minus 10%) of iron ore from Tubarao to Qingdao was assessed at $20.50/wmt, flat day on day.
Nothing fresh was heard out of South Africa. Some coal shipment from Richards Bay to India were heard to be split from Capesize to Panamax due to the current high Cape TCE rates, a ship-operating source said.
Freight rate for a Capesize ship to move 170,000 mt (plus/ minus 10%) of iron ore from Saldanha Bay to Qingdao was assessed at $15.40/wmt, unchanged from Sept. 24.
Pacific marketFreight rates inched down amid scant trading activities after a
slew of trades concluded in the previous days. In general, the shipping demand in Pacific remained healthy and constant while the port congestion in China ports was easing slowly. Among fixtures, miner Rio Tinto was heard to have fixed a ship for moving iron ore from west Australia to Qingdao for the Oct. 11-13 laycan at $8.70/wmt. The indicative freight heard on the west coast Australia to Qingdao route was in the $8.50/wmt to $9/ wmt range.
The freight rate for a Capesize ship to move 170,000 mt (plus/minus 10%) of iron ore on the Port Hedland-Qingdao route was assessed at $8.70/wmt, down 20 cents/wmt from Sept. 24.
— Carina Li
subsCrIber nOtes
Platts to merge tsI and Platts Premium hard Coking Coal Price seriesFollowing industry feedback, S&P Global Platts has decided to merge the TSI Premium Hard Coking Coal FOB East Coast Australia index (TS01034) and the Platts Premium Low Vol HCC FOB Australia assessment (PLVHA00), effective April 1, 2021.
The decision follows market feedback received for a first proposal published May 22 (http://plts.co/CzN430qVcSJ), and a second updated proposal published July 7 (https://bit.ly/3hzEU7Z).
The majority of feedback received from market participants was supportive of the proposed merger of the TSI PHCC and Platts PLV indices, which aims to simplify Platts suite of premium coking coal assessments, and further reinforce the robustness of the TSI PHCC index in times of market illiquidity.
Aligning the methodologies will mean that the TSI PHCC and Platts PLV HCC price series will be published as two identical values from April 1, 2021. This will have the added benefit of eliminating the basis risk for market participants looking to hedge their PLV HCC-linked physical coking coal exposure via derivatives contracts settling against the TSI PHCC index. Platts received widespread feedback from all segments of the market and geographies, including during open webinars run for the purpose of explaining the proposal.
dAtA treAtment: The newly merged assessments, which will follow Platts Market-on-Close principles, will reflect repeatable market value at the close of the assessment process, after incremental market testing. Platts tracks market price evolution during the entire day, and publishes a
September 25, 2020Sbb Steel marketS Daily
9© 2020 S&P Global Platts, a division of S&P Global Inc. All rights reserved.
wide range of data relating to market value, including firm bids and offers, transactions and indicative values Transparent data is prioritized in the assessment process, because it is available to the entire market for testing. The full description of the Platts assessments methodology and data hierarchy can be found here: https://www.spglobal.com/platts/plattscontent/_assets/_files/en/our-methodology/methodology-specifications/platts-assessments-methodology-guide.pdf
Affected price series: TSI Premium Hard Coking Coal Australia Export FOB East Coast Port (TS01034).
tImestAmP: To align the TSI PHCC index with other assessments across metallurgical coal and the ferrous value chain, including iron ore, steel and ferroalloys, the index after alignment will represent an end-day value with a timestamp of 5:30 pm Singapore time (0930 GMT). At present, the TSI PHCC index takes into account data reported until 6 pm Singapore time and is calculated as a volume-weighted average. Affected price series: TSI Premium Hard Coking Coal Australia Export FOB East Coast Port (TS01034).
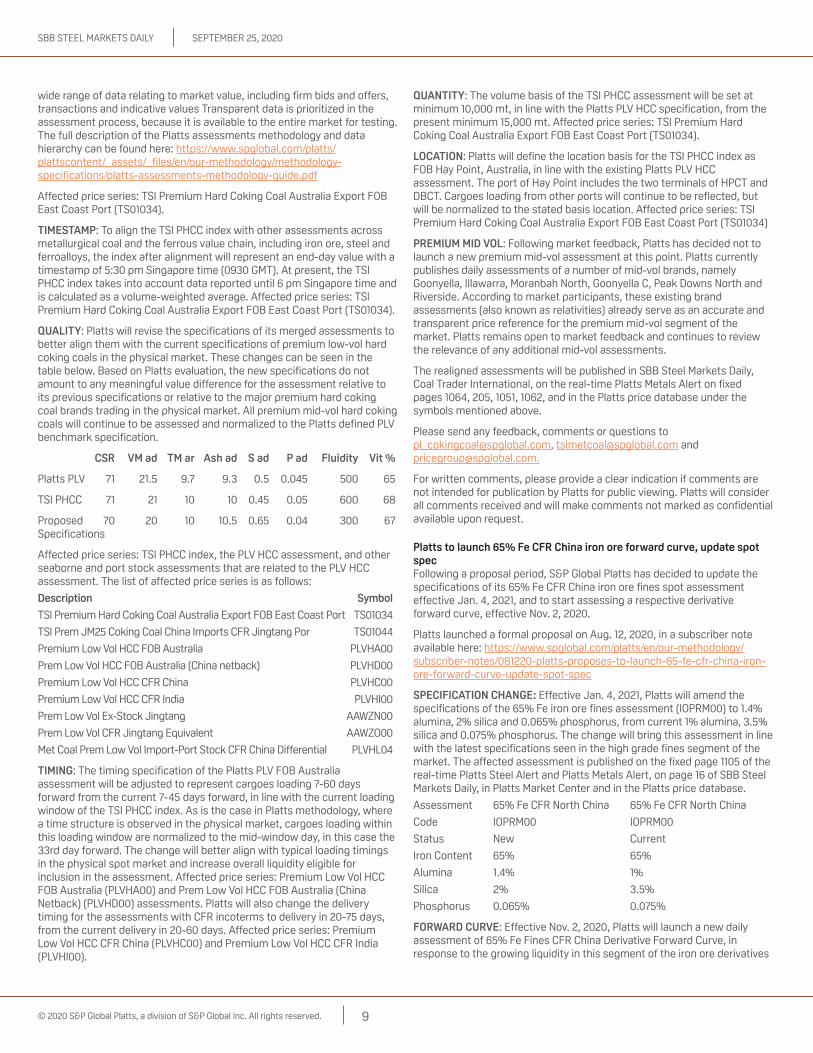
QuAlItY: Platts will revise the specifications of its merged assessments to better align them with the current specifications of premium low-vol hard coking coals in the physical market. These changes can be seen in the table below. Based on Platts evaluation, the new specifications do not amount to any meaningful value difference for the assessment relative to its previous specifications or relative to the major premium hard coking coal brands trading in the physical market. All premium mid-vol hard coking coals will continue to be assessed and normalized to the Platts defined PLV benchmark specification.
Csr Vm ad tm ar Ash ad s ad P ad Fluidity Vit %
Platts PLV 71 21.5 9.7 9.3 0.5 0.045 500 65
TSI PHCC 71 21 10 10 0.45 0.05 600 68
Proposed 70 20 10 10.5 0.65 0.04 300 67 Specifications
Affected price series: TSI PHCC index, the PLV HCC assessment, and other seaborne and port stock assessments that are related to the PLV HCC assessment. The list of affected price series is as follows:
description symbol
TSI Premium Hard Coking Coal Australia Export FOB East Coast Port TS01034
TSI Prem JM25 Coking Coal China Imports CFR Jingtang Por TS01044
Premium Low Vol HCC FOB Australia PLVHA00
Prem Low Vol HCC FOB Australia (China netback) PLVHD00
Premium Low Vol HCC CFR China PLVHC00
Premium Low Vol HCC CFR India PLVHI00
Prem Low Vol Ex-Stock Jingtang AAWZN00
Prem Low Vol CFR Jingtang Equivalent AAWZO00
Met Coal Prem Low Vol Import-Port Stock CFR China Differential PLVHL04
tImIng: The timing specification of the Platts PLV FOB Australia assessment will be adjusted to represent cargoes loading 7-60 days forward from the current 7-45 days forward, in line with the current loading window of the TSI PHCC index. As is the case in Platts methodology, where a time structure is observed in the physical market, cargoes loading within this loading window are normalized to the mid-window day, in this case the 33rd day forward. The change will better align with typical loading timings in the physical spot market and increase overall liquidity eligible for inclusion in the assessment. Affected price series: Premium Low Vol HCC FOB Australia (PLVHA00) and Prem Low Vol HCC FOB Australia (China Netback) (PLVHD00) assessments. Platts will also change the delivery timing for the assessments with CFR incoterms to delivery in 20-75 days, from the current delivery in 20-60 days. Affected price series: Premium Low Vol HCC CFR China (PLVHC00) and Premium Low Vol HCC CFR India (PLVHI00).
QuAntItY: The volume basis of the TSI PHCC assessment will be set at minimum 10,000 mt, in line with the Platts PLV HCC specification, from the present minimum 15,000 mt. Affected price series: TSI Premium Hard Coking Coal Australia Export FOB East Coast Port (TS01034).
lOCAtIOn: Platts will define the location basis for the TSI PHCC index as FOB Hay Point, Australia, in line with the existing Platts PLV HCC assessment. The port of Hay Point includes the two terminals of HPCT and DBCT. Cargoes loading from other ports will continue to be reflected, but will be normalized to the stated basis location. Affected price series: TSI Premium Hard Coking Coal Australia Export FOB East Coast Port (TS01034)
PremIum mId VOl: Following market feedback, Platts has decided not to launch a new premium mid-vol assessment at this point. Platts currently publishes daily assessments of a number of mid-vol brands, namely Goonyella, Illawarra, Moranbah North, Goonyella C, Peak Downs North and Riverside. According to market participants, these existing brand assessments (also known as relativities) already serve as an accurate and transparent price reference for the premium mid-vol segment of the market. Platts remains open to market feedback and continues to review the relevance of any additional mid-vol assessments.
The realigned assessments will be published in SBB Steel Markets Daily, Coal Trader International, on the real-time Platts Metals Alert on fixed pages 1064, 205, 1051, 1062, and in the Platts price database under the symbols mentioned above.
Please send any feedback, comments or questions to [email protected], [email protected] and [email protected].
For written comments, please provide a clear indication if comments are not intended for publication by Platts for public viewing. Platts will consider all comments received and will make comments not marked as confidential available upon request.
Platts to launch 65% Fe CFr China iron ore forward curve, update spot specFollowing a proposal period, S&P Global Platts has decided to update the specifications of its 65% Fe CFR China iron ore fines spot assessment effective Jan. 4, 2021, and to start assessing a respective derivative forward curve, effective Nov. 2, 2020.
Platts launched a formal proposal on Aug. 12, 2020, in a subscriber note available here: https://www.spglobal.com/platts/en/our-methodology/subscriber-notes/081220-platts-proposes-to-launch-65-fe-cfr-china-iron-ore-forward-curve-update-spot-spec
sPeCIFICAtIOn ChAnge: Effective Jan. 4, 2021, Platts will amend the specifications of the 65% Fe iron ore fines assessment (IOPRM00) to 1.4% alumina, 2% silica and 0.065% phosphorus, from current 1% alumina, 3.5% silica and 0.075% phosphorus. The change will bring this assessment in line with the latest specifications seen in the high grade fines segment of the market. The affected assessment is published on the fixed page 1105 of the real-time Platts Steel Alert and Platts Metals Alert, on page 16 of SBB Steel Markets Daily, in Platts Market Center and in the Platts price database.
Assessment 65% Fe CFR North China 65% Fe CFR North China
Code IOPRM00 IOPRM00
Status New Current
Iron Content 65% 65%
Alumina 1.4% 1%
Silica 2% 3.5%
Phosphorus 0.065% 0.075%
FOrwArd CurVe: Effective Nov. 2, 2020, Platts will launch a new daily assessment of 65% Fe Fines CFR China Derivative Forward Curve, in response to the growing liquidity in this segment of the iron ore derivatives

September 25, 2020Sbb Steel marketS Daily
10© 2020 S&P Global Platts, a division of S&P Global Inc. All rights reserved.
market. The assessments will reflect the daily values at 5:30 pm Singapore time for 65% Fe iron ore fines derivative contracts, on a CFR China basis, normalized to a minimum volume of 5,000 mt, in line with the standard industry practice. Platts will publish derivatives assessments for current month (Mo0), month one (Mo01), second month (Mo02) and third month (Mo03) strips, which roll on the first day of the month. Platts will collect trade information from active market participants and forward curves from brokers. Derivative bids/offers and trades will continue to be published in real time throughout the day on the Platts electronic information service and Platts Metals Alert (PMA), along with information in the physical market. The new assessments will be published on the fixed page 1113 of the real-time Platts Steel Alert and Platts Metals Alert, on page 17 of SBB Steel Markets Daily, in Platts Market Center and in the Platts price database.
Please send all comments, feedback and questions to [email protected] and [email protected].
For written comments, please provide a clear indication if comments are not intended for publication by Platts for public viewing.
Platts will consider all comments received and will make comments not marked as confidential available upon request.
Platts invites feedback on iron ore and metallurgical coal assessmentsAs part of its commitment to open and transparent pricing and product specifications, S&P Global Platts would like to invite feedback on its global iron ore and metallurgical coal assessments.
Platts reviews all methodologies and specifications annually to ensure they continue to reflect the physical markets. Platts regularly assesses the relevance of methodologies through continuous contact with the market. Feedback on methodologies is always welcomed by Platts.
Platts is committed to providing advance notice in a clear time frame that gives users sufficient opportunity to analyze and comment on the impact of such proposed changes. Time frames vary depending on Platts analysis of the overall circumstances of a particular change. Methodology changes that materially alter assessments and indices and require an update to the methodology specification are preceded by extensive bilateral discussions with market stakeholders and open public forums. Routine changes or clarifications, generally do not materially alter an assessment/index.
Platts holds open public forums in which material methodology changes and feedback are presented, and at which further feedback may be given.
Please send all comments, feedback and questions to [email protected] and [email protected]. For written comments, please provide a clear indication if comments are not intended for publication by Platts for public viewing. Platts will consider all comments received and will make comments not marked as confidential available upon request.
Platts proposes to rename hCC 64 mid Vol assessments to low Vol hCCS&P Global Platts proposes to rename the HCC 64 Mid Vol (also known as Hard Coking Coal) assessments to Low Vol HCC, effective April 1, 2021.
The purpose of the proposal is for the assessment names to better align with the underlying specifications defined in Platts methodology, which were changed in 2018. On June 1, 2018, specifications of HCC 64 Mid Vol (also known as Hard Coking Coal) FOB Australia (HCCAU00), CFR China (HCCCH00) and CFR India (HCCIN00) assessments were adjusted to: 62% coke strength after reaction, 21.5% volatile matter, 10.5% total moisture, 8% ash, 0.45% sulfur, 0.06% phosphorus, 100 ddpm max fluidity, 52% vitrinite. The subscriber note can be viewed at https://bit.ly/2CLzbfT.
The proposal does not affect the assessment methodology itself, or the qualities of coals whose pricing information is considered in those assessments.
Some of these assessments are globally-referenced benchmarks for generic (non-premium) hard coking coals. This prolonged notice period is to provide sufficient time for market participants who are using these assessments to make any necessary adjustments in their contracts.
The change would affect the following assessments and all their averages:
Current description Proposed description symbol
HCC 64 Mid Vol FOB Australia Low Vol HCC FOB Australia HCCAU00
HCC 64 Mid Vol CFR China Low Vol HCC CFR China HCCCH00
HCC 64 Mid Vol CFR India Low Vol HCC CFR India HCCIN00
HCC 64 Mid Vol Ex-Stock Low Vol HCC Ex-Stock AAWZP00 Jingtang Jingtang
HCC 64 Mid Vol CFR Jingtang Low Vol HCC CFR Jingtang AAWZQ00 Equivalent Equivalent
The affected prices are published in SBB Steel Markets Daily, Coal Trader International, on the real-time Platts Metals Alert and Platts Steel, Raw Materials Alert on fixed pages 1064, 205, and 1062 and in the Platts price database under the symbol mentioned above.
Please send comments, questions and other feedback on this proposal by October 9, 2020 to [email protected] and [email protected].
For written comments, please provide a clear indication if comments are not intended for publication by Platts for public viewing. Platts will consider all comments received and will make comments not marked as confidential available upon request.
s&P global Platts amends 58%-Fe iron ore CFr China specificationsEffective May 4, 2020 and as part of an overall revision of its iron ore coverage, S&P Global Platts has amended the specifications of the 58% iron ore fines assessment (IODFE00) to align them with the major Australian brands and reflect the average specification of global brands in this segment of the iron ore market.
The assessment now reflects material with 2.9% alumina, 6% silica and 0.06% phosphorus.
Platts first published the proposal on January 31, 2020 in a subscriber note available here: https://www.spglobal.com/platts/en/our-methodology/subscriber-notes/013120-sampp-global-platts-proposes-changes-to-its-58-fe-iron-ore-coverage. Market participants across the supply chain stated the amendments would be more reflective of current iron ore brands with iron content below 60% in the market, and that the change would allow for liquidity in this segment of the market to be pooled together around a single assessment.
Under the new specifications, all iron ore fines with iron content below 60% will be considered under the 58% iron ore fines CFR China index and normalized according to Value-in-Use (VIU) assessments and observed brand relativities. This includes the brands that currently fall under the assessment for 58% low-alumina iron ore fines CFR China index (IONC580 & TS01047). Going forward, Platts may consider spreads and dynamics in the Chinese portside market as indicative factors to help calibrate VIU adjustments for seaborne 58% iron ore fines assessment as well as changes to brand relativities.
As part of this change, Platts now also reflects the new specification in its 58% iron ore West India netback price (IODFA00). This price continues to be automatically calculated by deducting the assessed freight rate between West coast India and Qingdao for a 50,000 mt (Supramax) iron ore cargo from the 58% Fe iron ore fines CFR China assessment.
Separately, effective October 1, 2020, Platts will discontinue the Platts & TSI IO Fines 58% Fe low-alumina iron ore fines CFR China assessments
September 25, 2020Sbb Steel marketS Daily
11© 2020 S&P Global Platts, a division of S&P Global Inc. All rights reserved.
(IONC580 & TS01047) and respective averages to further consolidate the coverage of the iron ore fines with iron content below 60%. Platts will publish a separate subscriber note on the day of discontinuation to inform market participants of the change.
Assessment 58% 58% 58% Low-Alumina
Code IODFE00 IODFE00 IONC580, TS01047
Status Effective May 4 Before May 4 To discontinue on Oct 1
Iron content 58% 58% 58%
Alumina 2.9% 4% 1.5%
Silica 6% 5% 5.5%
Phosphorus 0.06% 0.05% 0.05%
The affected assessments are published on the fixed page PMA1105 and PMA1106 of the real-time Platts Metals Alert, on page 2 and 6 of the Steel Markets Daily, in the Platts Market Center and in the Platts price database.
Please send all comments, feedback and questions to [email protected] and [email protected].
For written comments, please provide a clear indication if comments are not intended for publication by Platts for public viewing. Platts will consider all comments received and will make comments not marked as confidential available upon request.
Platts clarifies us steel specifications following annual reviewAs part of its annual review of the ferrous metals specifications guide, S&P Global Platts wishes to clarify certain specification details for its US steel products and ferrous scrap assessments.
hOt-rOlled COIl: Platts TSI US HRC index (STHRI00) and all its conversions reflect a shipment window of three to eight weeks from the date of publication, while US HRC DDP Houston (STHRG00) import assessment and all its conversions reflect delivery eight to 14 weeks forward.
COld-rOlled COIl: Platts TSI US CRC index (STRRI00) and all its conversions reflect a shipment window of four to 12 weeks from the date of publication, while US CRC DDP Houston (STRRG00) import assessment and all its conversions reflect delivery 10-16 weeks forward.
hOt-dIP gAlVAnIZed COIl: Platts TSI US HDG index (ATSIA00) and US HDG (incl. G90) calculation (SB01123) reflect a shipment window of four to 12 weeks forward. The US HDG DDP Houston import assessment reflects 500-1,500 st clips delivered 12-18 weeks from the date of publication and payment within 30 days after delivery.
PlAte: All US plate prices reflect material conforming to ASTM A36/A36M or equivalent with the following parameters: width to 96 inches, thickness 0.375-2 inches, length to 240 inches. The Platts TSI US plate index (STPRI00) and its conversions reflect shipments four to 12 weeks forward in minimum 20-st clips shipped. The US plate DDP Houston import assessment (STPRG00) and its conversions represent deliveries eight to 14 weeks forward. Platts clarified the names of currency and UOM conversions to align them with the names of the main index and assessment.
sCrAP: All US scrap assessments, indexes and calculations (shredded FEMWD00, 10-day average TS11003, HMS ½ SB01135, plate and structural SB01174, #1 busheling SB01001) on a delivered basis reflect deliveries to the US Midwest mill within 30 days from the date of publication. FOB East Coast scrap assessments (shredded FEECD00 and HMS FEECH00) reflect deliveries five to 45 days forward and payment terms LC at sight. US HMS assessments reflect material conforming to ISRI 200-206 quality; plate and structural assessment - ISRI 231-232 quality, and #1 busheling assessment - ISRI 207 quality.
metAllICs: The US pig iron price (MMPNO04) was specified to be CIF New Orleans with a delivery window of five to 10 weeks. REBAR: US rebar assessments on EXW Southeast (STCBC00) and Midwest (SB01202) bases reflect a shipment window of four to 12 weeks forward, while the DDP Houston assessment (STCBG00) and all its conversions reflect deliveries eight to 14 weeks forward. WIRE ROD: US wire rod mesh quality assessment (SB01249) reflects a shipment window of four to 12 weeks forward. PIPE: The US OCTG ex-works domestic assessment (SB01253) reflects shipments two to eight weeks from the date of publication, while the DDP Houston import assessment (SB01254) reflects deliveries six to 12 weeks forward.
Please submit any feedback, comments or questions about this notice to: PL_Americas_Metal and pricegroup. For written comments, please provide a clear indication if comments are not intended for publication by Platts for public viewing. Platts will consider all comments received and will make comments not marked as confidential available upon request.
Assessment rAtIOnAles
Platts Asia Iron Ore IOdeX daily rationale & exclusionsS&P Global Platts assessed the 62% Fe Iron Ore Index at $116.05/dry mt CFR North China on Sept. 25, up 15 cents from Sept. 24, in line with a Pilbara Blend Fines (PBF) trade and supported by tradable values.
At 4.30 pm Singapore time, Rio Tinto sold a 170,000-mt cargo of PBF at a premium of $4.30/dmt over the November average of IODEX CFR Qingdao basis 62% Fe, on COREX, loading Oct. 28 to Nov. 6.
Taking into account the impurity adjustments, timing and the November swaps at $109.65/dmt around the trade timestamp, the PBF trade normalized to $116.05/dmt CFR China on IODEX specifications.
Industry sources said Pilbara Blend fines arriving between late October and early November was tradeable at $115-$116.5/dmt basis 62% Fe, which normalized to a range of $115.35-$116.85/dmt on IODEX basis, after accounting for impurity adjustments.
Platts used a physical backwardation structure of $3.3/dmt based on the physical structure between October and November.
The above rationale applies to Platts 62% FE IODEX & TSI Iron Ore Fines 62% CFR China with the associated data code: IODBZ00, TS01021Exclusions: No market data was excluded from the assessment process on Sept. 25.
Platts China Iron Ore lump Premium daily rationale & exclusionsS&P Global Platts assessed the spot lump premium at 7.5 cents/dmtu on Sept. 25, flat from Sept. 24, in line with tradable levels.
Industry sources said that the spot lump premium was tradable at around 7 to 8.25 cents/dmtu over the Platts 2-8 week delivery window on a CFR China basis.
Platts used a contango physical structure for lump premium between October and November based on the swaps structure.
No market data was excluded from the assessment process.
The above rationale applies to market data code: <IOCLP00>Exclusions: No market data was excluded from the Sept. 25 Platts Market on Close assessment process.
Platts CFr north China Iron Ore 65% Fe low Al Assessment rationaleS&P Global Platts assessed the 65% Fe North China Index at $127.40/dry mt CFR North China on Sept. 25, stable from Sept. 24, narrowing the spread between 65% Fe and 62% Fe iron ore indexes to $11.35/dmt.
Industry sources said the tradable spread between 65%-Fe and 62%-Fe iron ore indexes was around $11-$12/dmt.
No market data was excluded from the assessment process on Sept. 25.
This assessment rationale applies to the following market data codes: 65% Fe CFR North China: IOPRM00
September 25, 2020Sbb Steel marketS Daily
12© 2020 S&P Global Platts, a division of S&P Global Inc. All rights reserved.
Platts CFr north China Iron Ore 58% Fe low Al Assessment rationaleSingapore—S&P Global Platts assessed the 58% Fe Iron Ore Index at $108.65/dry mt CFR North China on Sept. 25, up 20 cents from Sept. 24, narrowing the spread between 58% Fe and 62% Fe iron ore index to $7.4/dmt.
No market data was excluded from the assessment process on Sept. 25.
The above rationale applies to Platts Iron Ore 58% Fe low Al CFR North China & TSI 58% Fe Fines, 1.5% Al, CFR Qingdao port, with the associated market data codes: IONC580; TS01047
Platts hard Coking Coal Premium low Vol CFr China daily rationaleSingapore—S&P Global Platts assessed Premium Low-Vol HCC up $2/mt on the day at $148.50/mt CFR China on Sept. 25.
The highest bid was indicated between $136-$137/mt CFR China for an Australian Premium Low Vol Saraji coal cargo assessed at parity to Platts PLV CFR China.
No data was excluded from the assessment.
The above rationale applies to Platts premium low vol CFR China assessment (PLVHC00) & TSI Prem JM25 CFR Jingtang (TS01044)
Platts hard Coking Coal Premium low Vol FOb Australia daily rationaleSingapore—S&P Global Platts assessed Premium Low-Vol HCC up $3.50/mt at $139/mt FOB Australia on Sept. 25.
The highest firm bid was heard at $138/mt FOB Australia for an 85,000-mt cargo of globalCOAL HCCLV Saraji, with October laycan, assessed at parity to Platts PLV FOB Australia.
A firm bid at $139/mt FOB Australia for an 85,000-mt cargo of globalCOAL HCCLV Saraji coal, with October laycan, was not considered for the Sept. 25 assessment process as it was reported to Platts after the Market On Close timestamp of 5:.30 pm Singapore time.
The above rationale applies to Platts premium low vol FOB Australia assessment, with the associated data code: PLVHA00
Platts emeA turkish Ferrous scrap daily rationaleLondon—S&P Global Platts assessed Turkish imports of premium heavy melting scrap 1/2 (80:20) at $295.50/mt CFR on Sept. 25, unchanged on the day.
Market sentiment was split, with one Turkish mill source citing a tradable value for premium HMS 1/2 (80:20) at $290-$295/mt CFR, and a trading
source citing the same level as workable for Baltic-origin material, while US sellers were still firm at $300/mt CFR.
A Turkish agent said $290/mt CFR maximum was possible for EU-origin HMS 1/2 (80:20), and $293-$294/mt CFR for US- or Baltic-origin material, should recyclers decide to sell.
A second Turkish agent cited a Baltic recycler target at $298-$299/mt CFR, while an EU trading source said $296-$298/mt CFR was workable for US- or Baltic-origin material. Another Turkish agent source said $297/mt CFR was workable for premium HMS 1/2 (80:20).
A UK trading source cited a near-term tradable value for premium material at closer to $300/mt CFR, while a US trader cited an offer for Venezuela-origin material at above $295/mt CFR, with US-origin material at $299-$300/mt CFR.
A Baltic-origin cargo booked on Sept. 23 by a Samsun mill, was heard late on Sept 24, with 12,000 mt HMS 1/2 (80:20), 10,000/mt shred, 1,000 mt bonus scrap, and 1,000 mt busheling scrap at a cargo average price of $299/mt. The deal was calculated at $295.50/mt CFR for HMS 1/2 (80:20), including a 50 cent adjustment to reflect freight to Samsun, in line with Platts methodology.
No data were excluded from the assessment.
The above rationale applies to Platts-TSI assessment of Turkish premium deep sea HMS 1/2 (80:20) imports, with the associated market data code: TS01011
us shredded scrap midwest daily rationalePittsburgh—The S&P Global Platts US shredded scrap index was calculated at $286/lt delivered Midwest Sept. 25, up $6.50 from Sept.18.
An Ohio Valley supplier indicated tradable value of up $10-$20/lt on obsolete grades from September pricing for October delivery in the Midwest. A Midwest supplier expected tradable value up $10-$20/lt on shredded scrap from September pricing for October delivery. Another Midwest supplier indicated tradable value up $10/lt on all grades from September pricing for October delivery, and a third Midwest supplier indicated tradable value for shredded scrap sideways from September pricing. Another Ohio Valley supplier indicated tradable value of up $10/lt from September pricing for October delivery in the Midwest. The above rationale applies to the daily Platts shredded scrap, delivered US Midwest index, with the associated market data code: FEMWD00.
mArketPlACe
Iron oretrade�■ Platts Iron Ore: 62.00% Fe Australian Jimblebar Fines trade reported done at Platts & Mysteel 62% Fe -$1.95/dmt CFR China 1-30 Nov Avg pricing on 25 Sep, on globalORE, sold by BHP, from Port Hedland delivery 1-30 Nov to Qingdao, 90,000 mt, traded at 3:45pm Singapore time.�■ Updated: Platts Iron Ore: 57.00% Fe Australian Yandi Fines trade reported done at Platts & Mysteel 62% Fe $1.80/dmt CFR China 1-30 Nov Avg pricing on 25 Sep, on COREX, sold by BHP, from Port Hedland delivery 1-30 Nov to Qingdao, 90,000 mt, traded at 3:51pm Singapore time.�■ Updated: Platts Iron Ore: 62.00% Fe Australian Pilbara Blend Fines trade reported done at IODEX 62% $4.30/dmt CFR China 1-30 Nov Avg pricing on 25 Sep, on COREX, sold by Rio Tinto, loading 28 Oct - 6 Nov from Dampier to Qingdao, 170,000 mt, trade concluded at 4:30pm Singapore time.�■ Platts Iron Ore: 62.00% Fe Australian Jimblebar Fines trade reported done at Platts & Mysteel 62% Fe -$1.70/dmt CFR China 1-30 Nov Avg
pricing on 25 Sep, on globalORE, sold by BHP, from Port Hedland delivery 1-30 Nov to Qingdao, 100,000 mt, traded at 4:16pm Singapore time.�■ Platts Iron Ore: 61.50% Fe Australian Pilbara Blend Fines trade heard done from End-user source at ¥880.00/wmt FOT Rizhao on 25 Sep, Inclusive of port charges and 13% VAT, traded in the morning.�■ Platts Iron Ore: 61.50% Fe Australian Pilbara Blend Fines trade heard done from End-user source at ¥887.00/wmt FOT Caofeidian on 25 Sep, Inclusive of port charges and 13% VAT.�■ Platts Iron Ore: 61.50% Fe Australian Pilbara Blend Fines trade heard done from End-user source at ¥896.00/wmt FOT Tianjin on 25 Sep, Inclusive of port charges and 13% VAT.�■ Platts Iron Ore: 61.50% Fe Australian Pilbara Blend Fines trade heard done from International trader source at around ¥875.00/wmt FOT China on 25 Sep, at Shandong, Inclusive of port charges and 13% VAT.�■ Platts Iron Ore: 61.50% Fe Australian Pilbara Blend Fines trade heard done from International trader source at around ¥880.00/wmt FOT Tangshan on 25 Sep, Inclusive of port charges and 13% VAT.

September 25, 2020Sbb Steel marketS Daily
13© 2020 S&P Global Platts, a division of S&P Global Inc. All rights reserved.
�■ Platts Iron Ore: 62.30% Fe Australian Newman Fines trade heard done from International trader source at around ¥899.00/wmt FOT Tangshan on 25 Sep, to Qingdao, Inclusive of port charges and 13% VAT.�■ Platts Iron Ore: 62.17% Fe Australian Pilbara Blend Lump trade reported done at ¥940.00/wmt FOT China on 25 Sep, on Ore S, at Jingtang, Inclusive of port charges and 13% VAT.�■ Platts Iron Ore: 62.17% Fe Australian Pilbara Blend Lump trade reported done at ¥940.00/wmt FOT China on 25 Sep, on Ore S, at Jingtang, Inclusive of port charges and 13% VAT.�■ Platts Iron Ore: 66% Fe domestic concentrates trade heard from end-user source at Yuan 1020/dmt at Hebei.�■ Platts Iron Ore: 66% Fe domestic concentrates trade heard from end-user source at Yuan 1005/dmt at Hebei.
bid/Offer�■ Platts Iron Ore: 62.00% Fe Australian Jimblebar Fines firm offer reported at Platts & Mysteel 62% Fe -$1.55/dmt CFR China 1-30 Nov Avg pricing on 25 Sep, on globalORE, offered by BHP, from Port Hedland delivery 1-30 Nov to Qingdao, 90,000 mt.�■ Platts Iron Ore: 57.00% Fe Australian Yandi Fines firm offer reported at Platts & Mysteel 62% Fe $2.10/dmt CFR China 1-30 Nov Avg pricing on 25 Sep, on COREX, from Port Hedland delivery 1-30 Nov to Qingdao, 90,000 mt.�■ Updated: Platts Iron Ore: 61.00% Fe Australian Pilbara Blend Fines firm offer reported at $112.15/dmt CFR China on 25 Sep, on COREX, loading 28 Oct - 6 Nov from Dampier to Qingdao, 170,000 mt.�■ Updated: Platts Iron Ore: 62.00% Fe Australian Pilbara Blend Fines firm offer reported at IODEX 62% $4.35/dmt CFR China 1-30 Nov Avg pricing on 25 Sep, on COREX, loading 28 Oct - 6 Nov from Dampier to Qingdao, 170,000 mt.�■ Platts Iron Ore: 62.00% Fe Australian Jimblebar Fines firm offer reported at Platts & Mysteel 62% Fe -$1.60/dmt CFR China 1-30 Nov Avg pricing on 25 Sep, on globalORE, offered by BHP, from Port Hedland delivery 1-30 Nov to Qingdao, 90,000 mt.�■ Platts Iron Ore: 62.00% Fe Australian Jimblebar Fines firm bid reported at Platts & Mysteel 62% Fe -$2.60/dmt CFR China 1-30 Nov Avg pricing on 25 Sep, on globalORE, from Port Hedland delivery 1-30 Nov to Qingdao, 90,000 mt.�■ Platts Iron Ore: 57.00% Fe Australian Yandi Fines firm bid reported at Platts & Mysteel 62% Fe $1.10/dmt CFR China 1-30 Nov Avg pricing on 25 Sep, on COREX, from Port Hedland delivery 1-30 Nov to Qingdao, 90,000 mt.�■ Platts Iron Ore: 62.00% Fe Australian Pilbara Blend Fines firm bid reported at IODEX 62% $4.00/dmt CFR China 1-30 Nov Avg pricing on 25 Sep, on COREX, loading 28 Oct - 6 Nov from Dampier to Qingdao, 170,000 mt.�■ Platts Iron Ore: 63.03% Fe Brazilian Standard Sinter Feed Guaiba (SSFG) Fines sell tender heard on 25 Sep, offered by Vale, final loading on 15 Sep from Guaiba Island Terminal to Qingdao, 100,000 mt.�■ Platts Iron Ore: 55.00% Fe Brazilian CSN IOH4 Fines indicative offer heard from International trader source at around IODEX 62% -$11.00/dmt CFR China 1-31 Oct Avg pricing on 25 Sep, from Brazil delivery 1-31 Oct to Qingdao.
�■ Platts Iron Ore: 62.00% Fe Australian Pilbara Blend Fines indicative offer heard from International trader source at around IODEX 62% $3.70/dmt CFR China 1-30 Nov Avg pricing on 25 Sep, loading 1-20 Nov from Dampier to Qingdao.�■ Platts Iron Ore: 62.00% Fe Australian Newman Fines indicative offer heard from End-user source at around IODEX 62% $4.00/dmt CFR China 1-30 Nov Avg pricing on 25 Sep, from Port Hedland delivery 1-30 Nov to Qingdao.�■ Platts Iron Ore: 62.00% Fe Australian Pilbara Blend Fines indicative offer heard from End-user source at IODEX 62% $3.50/dmt CFR China 1-31 Oct Avg pricing on 25 Sep, loading 2-11 Oct from Dampier to Qingdao, 170,000 mt.�■ Updated: Platts Iron Ore: 62.00% Fe Australian Pilbara Blend Fines indicative bid heard from International trader source at around IODEX 62% $3.00/dmt CFR China 1-30 Nov Avg pricing on 25 Sep, loading 1-20 Nov from Dampier to Qingdao.
tradeable�■ Platts Iron Ore: 62.00% Fe Australian Pilbara Blend Fines tradeable value heard from End-user source at IODEX 62% $3.00/dmt CFR China 1-31 Oct Avg pricing on 25 Sep, from Dampier delivery 1-31 Oct to Qingdao, 170,000 mt.�■ Platts Iron Ore: 62.00% Fe Australian Newman Fines tradeable value heard from End-user source at IODEX 62% $3.00/dmt CFR China 1-30 Sep Avg pricing on 25 Sep, from Port Hedland delivery 1-31 Oct to Qingdao, 80,000 mt.�■ Platts Iron Ore: 62.00% Fe Brazilian Blend Fines (BRBF) tradeable value heard from End-user source at IODEX 62% $3.00/dmt CFR China 1-30 Sep Avg pricing on 25 Sep, from Teluk Rubiah delivery 1-31 Oct to Qingdao, 170,000 mt.�■ Updated: Platts Iron Ore: 61.50% Fe Australian Pilbara Blend Fines tradeable value heard from International trader source at IODEX 62% $2.50/dmt CFR China 1-31 Oct Avg pricing on 25 Sep, loading 20-31 Oct from Dampier to Qingdao, 170,000 mt.�■ Updated: Platts Iron Ore: 61.50% Fe Australian Pilbara Blend Fines tradeable value heard from International trader source at $114.00/dmt CFR China on 25 Sep, loading 20-31 Oct from Dampier to Qingdao, 170,000 mt.�■ Updated: Platts Iron Ore: 62.00% Fe Australian Pilbara Blend Fines tradeable value heard from End-user source at IODEX 62% $4.00 to 4.50/dmt CFR China 1-30 Nov Avg pricing on 25 Sep, from Dampier delivery 1-30 Nov to Qingdao, 170,000 mt.�■ Platts Iron Ore: 60.80% Fe Australian Mining Area C (MAC) Fines tradeable value heard from End-user source at around IODEX 62% $1.35/dmt CFR China 1-30 Nov Avg pricing on 25 Sep, from Port Hedland delivery 1-30 Nov to Qingdao, 80,000 mt.�■ Platts Iron Ore: 60.50% Fe Australian Jimblebar Fines tradeable value heard from End-user source at around IODEX 62% $1.35/dmt CFR China 1-30 Nov Avg pricing on 25 Sep, from Port Hedland delivery 1-30 Nov to Qingdao, 90,000 mt.�■ Platts Iron Ore: 56.50% Fe Australian Super Special Fines tradeable value heard from End-user source at IODEX 62% -6.00 to -4.00% CFR China 1-31 Oct Avg pricing on 25 Sep, from Port Hedland delivery 1-31 Oct to Qingdao, 170,000 mt.

September 25, 2020Sbb Steel marketS Daily
14© 2020 S&P Global Platts, a division of S&P Global Inc. All rights reserved.
�■ Platts Iron Ore: 62.00% Fe Australian Pilbara Blend Fines tradeable value heard from End-user source at around IODEX 62% $3.50/dmt CFR China 1-30 Nov Avg pricing on 25 Sep, from Dampier delivery 1-15 Nov to Qingdao, 170,000 mt.�■ Platts Iron Ore: 62.00% Fe Australian Pilbara Blend Fines tradeable value heard from International trader source at $116.00/dmt CFR China on 25 Sep, from Dampier delivery 20-31 Oct to Qingdao, 170,000 mt.�■ Platts Iron Ore: 62.00% Fe Australian Pilbara Blend Fines tradeable value heard from Chinese trader source at $115.30/dmt CFR China on 25 Sep, from Dampier delivery 20-31 Oct to Qingdao, 170,000 mt.�■ Platts Iron Ore: 62.00% Fe Australian Pilbara Blend Fines tradeable value heard from Chinese trader source at $116.20/dmt CFR China on 25 Sep, from Dampier delivery 20-31 Oct to Qingdao, 170,000 mt.�■ Platts Iron Ore: 62.00% Fe Australian Pilbara Blend Fines tradeable value heard from International trader source at $115.00/dmt CFR China on 25 Sep, from Dampier delivery 20-31 Oct to Qingdao, 170,000 mt.�■ Platts Iron Ore: 65.00% Fe Brazilian Carajas (Expected) tradeable value heard from International trader source at $127.00/dmt CFR China on 25 Sep, from Ponta da Madeira delivery 1-31 Oct to Qingdao, 170,000 mt.�■ Updated: Platts Iron Ore: 62.00% Fe Australian Pilbara Blend Fines tradeable value heard from International trader source at around $115.00/dmt CFR China on 25 Sep, from Dampier delivery 25 Oct - 1 Nov to Qingdao.�■ Platts Iron Ore: 62.00% Fe Australian Pilbara Blend Fines tradeable value heard from Chinese trader source at around $115.00/dmt CFR China on 25 Sep, from Dampier delivery 25 Oct - 1 Nov to Qingdao.�■ Platts Iron Ore: 62.00% Fe Australian Pilbara Blend Fines tradeable value heard from International trader source at $115.50-116.00/dmt CFR China on 25 Sep, from Dampier delivery 25 Oct - 1 Nov to Qingdao.�■ Platts Iron Ore: 62.00% Fe Australian Pilbara Blend Fines tradeable value heard from End-user source at around $116.50/dmt CFR China on 25 Sep, from Dampier delivery 25 Oct - 1 Nov to Qingdao, 170,000 mt.�■ Updated: Platts Iron Ore: 57.00% Fe Australian Yandi Fines tradeable value heard from End-user source at IODEX 62% $1.80/dmt CFR China 1-30 Nov Avg pricing on 25 Sep, loading 1-30 Nov from Port Hedland to Qingdao, 90,000 mt.�■ Updated: Platts Iron Ore: 60.50% Fe Australian Jimblebar Fines tradeable value heard from End-user source at IODEX 62% -$1.95/dmt CFR China 1-30 Nov Avg pricing on 25 Sep, loading 1-30 Nov from Port Hedland to Qingdao, 90,000 mt.�■ Platts Iron Ore: 63.00% Fe Australian Newman Blend Lump tradeable value heard from End-user source at IODEX 62% $0.05 to 0.06/dmt CFR China 9 Oct - 20 Nov pricing on 25 Sep, from Port Hedland delivery 9 Oct - 20 Nov to Qingdao.�■ Platts Iron Ore: 63.00% Fe Australian Newman Blend Lump tradeable value heard from End-user source at IODEX 62% $0.07 to 0.08/dmt CFR China 9 Oct - 20 Nov pricing on 25 Sep, from Port Hedland delivery 9 Oct - 20 Nov to Qingdao.�■ Platts Iron Ore: 62.00% Fe Australian Pilbara Blend Lump tradeable value heard from End-user source at IODEX 62% $0.07 to 0.08/dmtu
CFR China 9 Oct - 20 Nov pricing on 25 Sep, from Dampier delivery 9 Oct - 20 Nov to Qingdao.�■ Platts Iron Ore: 63.00% Fe Australian Newman Blend Lump tradeable value heard from End-user source at around IODEX 62% $0.07/dmt CFR China 9 Oct - 20 Nov pricing on 25 Sep, from Port Hedland delivery 9 Oct - 20 Nov to Qingdao.�■ Platts Iron Ore: 65.00% Fe Brazilian Carajas (Expected) - 62.00% Fe Australian Pilbara Blend Fines spread tradeable value heard at around $12.00/dmt CFR China on 25 Sep.�■ Platts Iron Ore: 65.00% Fe Brazilian Carajas (Expected) - 62.00% Fe Australian Pilbara Blend Fines spread tradeable value heard at around $12.00/dmt CFR China on 25 Sep.�■ Platts Iron Ore: 65.00% Fe Brazilian Carajas (Expected) - 62.00% Fe Australian Pilbara Blend Fines spread tradeable value heard at around $11.00/dmt CFR China on 25 Sep.�■ Platts Iron Ore: 66% Fe domestic concentrates tradeable value heard from end-user source at Yuan 1060/dmt at Hebei.�■ Platts Iron Ore: 63.00% Fe Australian Newman Blend Lump tradeable value heard from international source at around IODEX 62% $0.0825/dmt CFR China 9 Oct - 20 Nov pricing on 25 Sep, from Port Hedland delivery 9 Oct - 20 Nov to Qingdao.
notional�■ Platts Iron Ore: 62%-Fe IODEX -- Notional value indicated on Sep 25 at $116.05/dmt CFR Qingdao for a cargo arriving on Oct 30�■ Platts Iron Ore: 65%-Fe Brazilian Carajas fines -- Notional value indicated on Sep 25 at $127.55/dmt CFR Qingdao for a cargo arriving on Oct 30 basis expected loadport specifications of 65% Fe, 1.7% SiO2 and 1.5% Al2O3�■ Platts Iron Ore: 63%-Fe Brazilian Blend fines -- Notional value indicated on Sep 25 at $117.80/dmt CFR Qingdao for a cargo arriving on Oct 30, basis expected loadport specifications of Al 1.5% and Si 5%�■ Platts Iron Ore: 62.3%-Fe Australian Newman fines -- Notional value indicated on Sep 25 at $116.25/dmt CFR Qingdao for a cargo arriving on Oct 30�■ Platts Iron Ore: 61%-Fe Australian Pilbara Blend fines -- Notional value indicated on Sep 25 at $113.85/dmt CFR Qingdao for a cargo arriving on Oct 30�■ Platts Iron Ore: 60.8%-Fe Australian Mining Area C fines -- Notional value indicated on Sep 25 at $111.05/dmt CFR Qingdao for a cargo arriving on Oct 30�■ Platts Iron Ore: 60.5%-Fe Australian Jimblebar fines -- Notional value indicated on Sep 25 at $107.80/dmt CFR Qingdao for a cargo arriving on Oct 30�■ Platts Iron Ore: 62%-Fe Australian Pilbara Blend lump -- Notional value indicated on Sep 25 at $0.0750/dmtu CFR Qingdao over average of Oct IODEX for a cargo arriving on Oct 30�■ Platts Iron Ore: 62%-Fe Australian Newman Blend lump -- Notional value indicated on Sep 25 at $0.0750/dmtu CFR Qingdao over average of Oct IODEX for a cargo arriving on Oct 30�■ Platts Iron Ore: 62%-Fe Brazilian Blend fines -- Notional value indicated on Sep 25 at $2.95/dmt CFR Qingdao of Oct average of Platts IODEX for a cargo arriving on Oct 30, basis expected loadport specifications of Fe 63%, Al 1.5% and Si 5%
September 25, 2020Sbb Steel marketS Daily
15© 2020 S&P Global Platts, a division of S&P Global Inc. All rights reserved.
�■ Platts Iron Ore: 62%-Fe Australian Newman fines -- Notional value indicated on Sep 25 at $2.70/dmt of Oct average of Platts IODEX for a cargo arriving on Oct 30�■ Platts Iron Ore: 62%-Fe Australian Pilbara Blend fines -- Notional value indicated on Sep 25 at $2.70/dmt of Oct average of Platts IODEX for a cargo arriving on Oct 30�■ Platts Iron Ore: 62%-Fe Australian Mining Area C fines -- Notional value indicated on Sep 25 at $0.25/dmt of Oct average of Platts IODEX for a cargo arriving on Oct 30�■ Platts Iron Ore: 62%-Fe Australian Jimblebar fines -- Notional value indicated on Sep 25 at -$2.55/dmt of Oct average of Platts IODEX for a cargo arriving on Oct 30�■ IODEX benchmark, Per Fe Differentials found on PMA 1105, Freight assessments, FOB netbacks found on PMA 1106, Market commentary on PMA 1107, OTC paper swaps on PMA 1113, Foreign Exchange on PMA 1112. Detailed methodology and specifications are found here:http://www.platts.com/MethodologyAndSpecifications/Metals
metallurgical Coal marketplace heards
�■ Coking Coal cargoes published on 25 Sep 2020
spread heards�■ Platts Met Coal: BMA's Australian Premium Low-Vol Peak Downs - BMA's Australian Premium Mid-Vol Goonyella spread tradeable value heard at $7.00-8.00/mt CFR China on 25 Sep.�■ Platts Met Coal: BMA's Australian Premium Low-Vol Saraji - BMA's Australian Premium Mid Vol Peak Downs North spread tradeable value heard at $6.00-7.00/mt CFR China on 25 Sep.
Premium hCC�■ Updated: Platts Met Coal: BMA's Australian Premium Low-Vol Peak Downs firm bid heard on 25 Sep from Chinese trader source at $125.00/mt FOB Australia, from Australia, laycan Dec, 75,000mt on Panamax, on globalCOAL (DBCT only).�■ Updated: Platts Met Coal: Australian Premium Low-Vol 71.0-73.0% CSR, 18.0-19.0% ad VM, 10.0-11.0% ad Ash firm bid heard on 25 Sep from International trader source at $138.00/mt FOB Australia, laycan Oct, 85,000mt on Panamax.�■ Platts Met Coal: Australian Premium Low-Vol 71.0-73.0% CSR, 18.0-19.0% ad VM, 10.0-11.0% ad Ash firm bid heard on 25 Sep from Chinese trader source at $139.00/mt FOB Australia, laycan Oct, 85,000mt on Panamax., on globalCOAL (Data point received after Platts' MOC).�■ Platts Met Coal: BMA's Australian Premium Low-Vol Peak Downs tradeable value heard on 25 Sep from Chinese trader source at $147.00-148.00/mt CFR China, from Australia, 75,000mt on Panamax.�■ Platts Met Coal: BMA's Australian Premium Low-Vol Saraji tradeable value heard on 25 Sep from Chinese trader source at below $150.00/mt CFR China, from Australia, 75,000mt on Panamax.�■ Platts Met Coal: BMA's Australian Premium Low-Vol Saraji tradeable value heard on 25 Sep from International trader source at $140.00/mt FOB Australia, from Australia, 75,000mt on Panamax.�■ Platts Met Coal: BMA's Australian Premium Low-Vol Riverside tradeable value heard on 25 Sep from International trader source at $130.00/mt FOB Australia, from Australia, 75,000mt on Panamax.
�■ Platts Met Coal: BMA's Australian Premium Low-Vol Saraji tradeable value heard on 25 Sep from Chinese trader source at $146.00-147.00/mt CFR China, from Australia, 75,000mt on Panamax.�■ Platts Met Coal: BMA's Australian Premium Low-Vol Saraji tradeable value heard on 25 Sep from Chinese steelmaker source at ¥1400.00/mt Ex-stock Jingtang China, from China.�■ Platts Met Coal: BMA's Australian Premium Low-Vol Peak Downs tradeable value heard on 25 Sep from Chinese steelmaker source at $150.00/mt CFR China, from Australia, 75,000mt on Panamax.�■ Platts Met Coal: BMA's Australian Premium Low-Vol Saraji tradeable value heard on 25 Sep from Chinese trader source at $140.00/mt FOB Australia, from Australia, 75,000mt on Panamax.�■ Platts Met Coal: BMA's Australian Premium Low-Vol Saraji indicative bid heard on 25 Sep from Chinese trader source at $136.00-137.00/mt CFR China, from Australia, 75,000mt on Panamax.�■ Platts Met Coal: Australian Premium Mid-Vol 67.0-69.0% CSR, 23.0-24.0% ad VM, 8.0-9.0% ad Ash firm bid heard on 25 Sep from Chinese trader source at $130.00/mt FOB Australia, laycan Dec, 80kt on Panamax, on globalCOAL (DBCT only).�■ Platts Met Coal: Australian Premium Mid-Vol 67.0-69.0% CSR, 23.0-24.0% ad VM, 8.0-9.0% ad Ash tradeable value heard on 25 Sep from Chinese trader source at $140.00-141.00/mt CFR China, 75,000mt on Panamax.�■ Platts Met Coal: Australian Premium Mid-Vol 67.0-69.0% CSR, 23.0-24.0% ad VM, 8.0-9.0% ad Ash tradeable value heard on 25 Sep from International trader source at $138.00/mt FOB Australia, 75,000mt on Panamax.�■ Platts Met Coal: BMA's Australian Premium Mid-Vol Goonyella tradeable value heard on 25 Sep from International trader source at $132.00-133.00/mt FOB Australia, from Australia, 75,000mt on Panamax.�■ Platts Met Coal: BMA's Australian Premium Mid-Vol Goonyella tradeable value heard on 25 Sep from Chinese trader source at around $141.00/mt CFR China, from Australia, 75,000mt on Panamax.�■ Platts Met Coal: BMA's Australian Premium Mid-Vol Goonyella tradeable value heard on 25 Sep from Chinese steelmaker source at ¥1350.00/mt Ex-stock Jingtang China, from China.�■ Platts Met Coal: BMA's Australian Premium Mid-Vol Goonyella tradeable value heard on 25 Sep from Chinese trader source at $135.00/mt FOB Australia, from Australia, 75,000mt on Panamax.�■ Platts Met Coal: BMA's Australian Premium Mid Vol Peak Downs North indicative bid heard on 25 Sep from Chinese trader source at $130.00/mt CFR China, from Australia, 75,000mt on Panamax.�■ Updated: Platts Met Coal: BMA's Australian Premium Mid Vol Goonyella C indicative bid heard on 25 Sep from International trader source at $130.00/mt FOB Australia, from Australia, 75,000mt on Panamax.
hard CC�■ Platts Met Coal: Jellinbah's Rangal HCC Lake Vermont HCC tradeable value heard on 25 Sep at $124.00/mt CFR China, from Australia, 75,000mt on Panamax.�■ Platts Met Coal: Jellinbah's Rangal HCC Lake Vermont HCC tradeable value heard on 25 Sep from International trader source at $114.00-115.00/mt FOB Australia, from Australia, 75,000mt on Panamax.

September 25, 2020Sbb Steel marketS Daily
16© 2020 S&P Global Platts, a division of S&P Global Inc. All rights reserved.
�■ Platts Met Coal: Jellinbah's Rangal HCC Lake Vermont HCC indicative bid heard on 25 Sep from Chinese trader source at $120.00/mt CFR China, from Australia, 75,000mt on Panamax.
PCI�■ Updated: Platts Met Coal: BMC's Australian Low-Vol PCI South Walker Creek No.1 tradeable value heard on 25 Sep from Chinese trader source at around $92.00/mt CFR China, from Australia, 75,000mt on Panamax.�■ Platts Met Coal: Australian Mid-Tier PCI 18.0-19.0% ad VM, 10.0-11.0% ad Ash tradeable value heard on 25 Sep from Chinese trader source at $89.00-90.00/mt CFR China, 75,000mt on Panamax.�■ Platts coking coal assessments found on PMA 1051, Freight on PMA 1058, Market commentary on PMA 1053, Foreign Exchange on PMA 1112. Detailed methodology and specifications are found here: http://www.platts.com/MethodologyAndSpecifications/Metals
Asia ferrous scrap�■ Asia Ferrous Scrap Marketplace Heards
deals�■ Platts Ferrous Scrap/ South Korea: Shindachi deal on Sept 25, Yen 31,000/mt ($295/mt) FOB, Japan-origin, bulk: <30,000mt mill source�■ Platts Ferrous Scrap/ South Korea: Shredded deal on Sept 25, Yen 30,500/mt ($290/mt) FOB, Japan-origin, bulk: <10,000mt, mill source�■ Platts Ferrous Scrap/ South Korea: HS deal on Sept 25, Yen 31,000/mt ($295/mt) FOB, Japan-origin, bulk: <30,000mt:, mill source�■ Platts Ferrous Scrap/ South Korea: H1 deal on Sept 25, Yen 28,000/mt ($266/mt) FOB, Japan-origin, bulk: <10,000mt, mill source�■ Platts Ferrous Scrap/ South Korea: H2 deal on Sept. 25, at Yen 27,000/mt ($256/mt) FOB, Japan-origin, bulk: mill source�■ Platts Ferrous Scrap/ South Korea: H2 deal on Sept. 24, at Yen 27,000/mt ($256/mt) FOB, Japan-origin, bulk: mill source�■ Platts Ferrous Scrap/ South Korea: Shredded heard deal on Sept. 25, at Yen 30,500/mt ($290/mt) FOB, Japan-origin, bulk, 12,000 mt: trading source�■ Platts Ferrous Scrap/ South Korea: Shindachi heard deal on Sept. 25, at Yen 31,000/mt ($294/mt) FOB, Japan-origin, bulk, 30,000 mt: trading source�■ Platts Ferrous Scrap/ South Korea: HS heard deal on Sept. 25, at Yen 31,000/mt ($294/mt) FOB, Japan-origin, bulk, 20,000 mt: trading source�■ Platts Ferrous Scrap/ Taiwan: HMS I/II 80:20 deal on Sept. 22, $280/mt CFR Taiwan, US-origin, container 40', 3,000 mt: mill source�■ Platts Ferrous Scrap/Vietnam: H2 heard deal on Sept 25, $292/mt CFR southern Vietnam, Japan-origin, Bulk: trading source�■ Platts Ferrous Scrap/Vietnam: H2 heard deal on Sept 25, $295/mt CFR southern Vietnam, Japan-origin, Bulk: trading source�■ Platts Ferrous Scrap/Vietnam: H2 deal on Sept 25, $295/mt CFR southern Vietnam, Japan-origin, Bulk, 5,000mt: trading source�■ Platts Ferrous Scrap/Vietnam: H2 deal on Sept 24, $295/mt CFR southern Vietnam, Japan-origin, Bulk, 5,000mt: trading source�■ Platts Ferrous Scrap/ Vietnam: H2 heard deal on Sept. 25, $292/mt CFR southern Vietnam, Japan-origin, bulk, 6,000 mt: trading source
�■ Platts Ferrous Scrap/ Vietnam: H2 deal on Sept. 24, $295/mt CFR southern Vietnam, Japan-origin, bulk, 8,000 mt: trading source�■ Platts Ferrous Scrap/ Bangladesh: HMS I/II 80:20 deal on Sept 21, $314/mt CFR Chittagong, Brazil/UK-origin, Container 20’, 1,500mt: trading source�■ Platts Ferrous Scrap/ Pakistan: Shredded deal on Sept 22, $315/mt CFR Qasim, Europe-origin, Container 20’, 1,000mt: trading source
Offers�■ Platts Ferrous Scrap/ Japan: HS offer on Sept. 25, at Yen 31,000/mt ($294/mt) FOB, Japan-origin, bulk: trading source�■ Platts Ferrous Scrap/ South Korea: H2 offer on Sept 25, Yen 28,000/mt ($265/mt) FOB Kanto, Japan-origin, bulk: mill source�■ Platts Ferrous Scrap/ South Korea: A3 offer on Sept. 25, at $301/mt CFR South Korea, Russia-origin, bulk: trading source�■ Platts Ferrous Scrap/South Korea: HMS I/II 80:20 offer on Sept 25, $280/mt CFR South Korea, US-origin, Container 40’ : mill source�■ Platts Ferrous Scrap/ South Korea: H2 offer on Sept 25, Yen 28,000-28,500/mt ($265-270/mt) FOB, Japan-origin, bulk: mill source�■ Platts Ferrous Scrap/Taiwan: HMS I/II 80:20 heard offer on Sept 25, $278-$280/mt CFR Taiwan, US-origin, Container 40’ : trading source�■ Platts Ferrous Scrap/Taiwan: HMS I/II 80:20 offer on Sept 25, $280/mt CFR Taiwan, US-origin, Container 40’ : trading source�■ Platts Ferrous Scrap/ Taiwan: H1:H2 50:50 heard offer on Sept 25, $295/mt CFR Taiwan, Japan-origin, bulk: trading source�■ Platts Ferrous Scrap/Taiwan: HMS I/II 80:20 heard offer on Sept 25, $275-$280/mt CFR Taiwan, US-origin, Container 40’ : trading source�■ Platts Ferrous Scrap/ Taiwan: H1:H2 50:50 heard offer on Sept 25, $295/mt CFR Taiwan, Japan-origin, bulk: trading source�■ Platts Ferrous Scrap/ Taiwan: H1:H2 50:50 offer on Sept. 25, $290/mt CFR Taiwan, Japan-origin, bulk: trading source�■ Platts Ferrous Scrap/ Taiwan: HMS I/II 80:20 offer on Sept. 25, $275/mt CFR Taiwan, US-origin, container 40': trading source�■ Platts Ferrous Scrap/ Taiwan: HMS I/II 80:20 offer* on Sept. 23, $278/mt CFR Taiwan, US-origin, container 40': trading source�■ Platts Ferrous Scrap/ Taiwan: H1:H2 50:50 offer on Sept. 25, $283/mt CFR Taiwan, Japan-origin, bulk: mill source�■ Platts Ferrous Scrap/ Taiwan: H1:H2 50:50 offer on Sept 25, $300/mt CFR Taiwan, Japan-origin, bulk: trading source�■ Platts Ferrous Scrap/Vietnam: H2 heard offer on Sept 25, $295-$300/mt CFR southern Vietnam, Japan-origin, Bulk: trading source�■ Platts Ferrous Scrap/ Vietnam: H2 offer on Sept. 25, $311/mt CFR northern Vietnam, Japan-origin, bulk: trading source�■ Platts Ferrous Scrap/Vietnam: HS offer on Sept 25, $331/mt CFR northern Vietnam, Japan-origin, Bulk: trading source�■ Platts Ferrous Scrap/Vietnam: H2 offer on Sept 25, $307/mt CFR northern Vietnam, Japan-origin, Bulk: trading source
bids�■ Platts Ferrous Scrap/ Japan: H2 tradable on Sept. 25, at Yen 28,500/mt ($271/mt) FOB Kanto region, Japan-origin, bulk: trading source�■ Platts Ferrous Scrap/Taiwan: HMS I/II 80:20 heard bid on Sept 25, $275/mt CFR Taiwan, US-origin, Container 40’ : mill source�■ Platts Ferrous Scrap/ Taiwan: H1:H2 50:50 indicative bid on Sept 25, $285/mt CFR Taiwan, Japan-origin, bulk: mill source
September 25, 2020Sbb Steel marketS Daily
17© 2020 S&P Global Platts, a division of S&P Global Inc. All rights reserved.
�■ Platts Ferrous Scrap/Vietnam: H2 bid on Sept 25, $292/mt CFR northern Vietnam, Japan-origin, Bulk: trading source�■ Platts Ferrous Scrap/ Indonesia: Bluesteel bid Sept. 24, $320/mt CFR Jakarta, Any-origin, container 20': trading source�■ Platts Ferrous Scrap/ Indonesia: Busheling bid Sept. 24, $320/mt CFR Jakarta, Any-origin, container 20': trading source�■ Platts Ferrous Scrap/ Indonesia: PNS bid Sept. 24, $315/mt CFR Jakarta, Any-origin, container 20': trading source�■ Platts Ferrous Scrap/ Bangladesh: HMS I/II 80:20 bid on Sept 24, $308/mt CFR Chittagong, Any-origin, Container 20’: trading source�■ Platts Ferrous Scrap/ Bangladesh: HMS I/II 80:20 bid on Sept 24, $305/mt CFR Chittagong, Any-origin, Container 20’: trading source�■ Platts Ferrous Scrap/ Bangladesh: HMS I/II 80:20 bid on Sept 24, $305/mt CFR Chittagong, Any-origin, Container 20’: trading source�■ Platts Ferrous Scrap/ Pakistan: Shredded bid on Sept 25, $310/mt CFR Qasim, Europe-origin, Container 20’: trading source�■ Platts Ferrous Scrap/ Pakistan: Shredded bid on Sept 25, $308/mt CFR Qasim, Europe-origin, Container 20’: trading source�■ Platts Ferrous Scrap/ India: Shredded bid on Sept 25, $305/mt CFR Nhava Sheva, UK-origin, Container 20’: trading source�■ Platts Ferrous Scrap/ India: Turnings bid on Sept 25, $260/mt CFR Mundra, UK-origin, Container 20’: trading source�■ Platts Ferrous Scrap/ India: HMS I/II 80:20 bid on Sept 25, $280/mt CFR Mundra, Any-origin, Container 20’: trading source�■ Platts Ferrous Scrap/ India: Shredded bid on Sept 25, $300-$305/mt CFR Nhava Sheva, UK-origin, Container 20’: trading source�■ Platts Ferrous Scrap/ India: Shredded tradable on Sept 25, $310-$315/mt CFR Nhava Sheva, UK-origin, Container 20’: trading source
tradables/Indicatives�■ Platts Ferrous Scrap/Taiwan: HMS I/II 80:20 tradable on Sept 25, $275/mt CFR Taiwan, US-origin, Container 40’ : trading source�■ Platts Ferrous Scrap/ Taiwan: H1:H2 50:50 indicative bid on Sept 25, $285/mt CFR Taiwan, Japan-origin, bulk: trading source
�■ Platts Ferrous Scrap/ Pakistan: Shredded tradable Sept. 25*, $295-300/mt CFR Pakistan, UK-origin, container 20': trading source�■ Platts Ferrous Scrap/ Pakistan: Shredded tradable Sept. 28, $295-300/mt CFR Pakistan, UK-origin, container 20': trading source
domestic�■ Platts Ferrous Scrap/ China: domestic minimum 10mm bid price heard Sept. 25, at Yuan 2,670/mt ($392/mt) delivered to Jiangsu mill, including 13% VAT: mill source�■ Platts Ferrous Scrap/ China: domestic minimum 6mm bid price heard Sept. 25, at Yuan 2,640/mt ($387/mt) delivered to Jiangsu mill, including 13% VAT: mill source�■ Platts Ferrous Scrap/ Japan: Kanto region HS domestic collection price heard Sept. 25 at Yen 29,500-30,500/mt FAS ($280-290/mt), Japan-origin, prompt: trading source�■ Platts Ferrous Scrap/ Japan: Kanto region Shindachi domestic collection price heard Sept. 25 at Yen 29,500-30,500/mt FAS ($280-290/mt), Japan-origin, prompt: trading source�■ Platts Ferrous Scrap/ Japan: Kanto region H2 domestic collection price heard Sept. 25 at Yen 27,000-27,500/mt FAS ($256-261/mt), Japan-origin, prompt: trading source�■ Platts Ferrous Scrap/ Japan: Kanto region Shindachi domestic collection price heard Sept 25, Yen 30,000-30,500/mt FAS ($284-$289/mt), Japan-origin, prompt: trading source�■ Platts Ferrous Scrap/ Japan: Kanto region HS domestic collection price heard Sept 25, Yen 30,000-30,500/mt FAS ($284-$289/mt), Japan-origin, prompt: trading source�■ Platts Ferrous Scrap/ Japan: Kanto region H2 domestic collection price heard Sept 25, Yen 27,000-27,500/mt FAS ($256-$261/mt), Japan-origin, prompt: trading source�■ Platts Ferrous Scrap/ Taiwan: domestic HMS I/II 80:20 buy price heard for Sept 25, T$8,200/mt ($280/mt) delivered to northern Taiwan mill: mill source

September 25, 2020Sbb Steel marketS Daily
18© 2020 S&P Global Platts, a division of S&P Global Inc. All rights reserved.
IrOn Ore
tsI dAIlY IrOn Ore IndICes, sePtember 25, 2020 symbol $/dmt Change % ChgTSI Iron Ore Fines 62% Fe CFR China TS01021 116.05 0.15 0.1358% Fe Fines, 1.5% Al, CFR Qingdao port TS01047 108.65 0.20 0.18
PlAtts dAIlY IrOn Ore Assessments, sePtember 25 2020 symbol $/dmt Change % Chg diff. to IOdeXIODEX 62% Fe CFR North China IODBZ00 116.05 0.15 0.1365% Fe CFR North China IOPRM00 127.40 0.00 0.00 11.3558% Fe Low Alumina CFR North China IONC580 108.65 0.20 0.18 -7.4058% Fe CFR North China IODFE00 104.40 0.20 0.19 -11.65
Per 1% dIFFerentIAls (range 60-63.5% Fe, $/dmt) symbol within min-max $/dmt ChangePer 1% Fe IOMGD00 60-63.5% Fe 1.90 0.00Per 1% Alumina IOADF10 1-2.5% Al2O3 1.00 0.00 IOALE00 2.5-4% Al2O3 1.80 0.00Per 1% Silica IOALF00 3-4.5% SiO2 0.50 0.00 IOPPS10 4.5-6.5% SiO2 1.20 0.00 IOPPS20 6.5-9% SiO2 1.50 0.00Per 0.01% Phosphorus IOPPR00 0.09-0.10% P 0.40 0.00 IOPPT00 0.10-0.11% P 2.20 0.00 IOPPU00 0.11-0.12% P 2.50 0.00 IOPPQ00 0.09-0.12% P* 1.70 0.00 IOPPV00 0.12-0.15% P 2.50 0.00
*0.09-0.12%P assessment is an arithmetical average of the 0.09-0.10%P, 0.10-0.11%P and 0.11-0.12%P assessment
Per 1% dIFFerentIAls (range 55-60% Fe, $/dmt) symbol within min-max $/dmt ChangePer 1% Fe TSIAD00 55-60% Fe 1.90 0.00Per 1% Alumina TSIAF00 <5% Al2O3 2.50 0.00Per 1% Silica TSIAI00 1.50 0.00
rOllIng mOnthlY AVerAge symbol $/dmtIODEX 62% Fe IODBZ04 124.65
$/dmtuSpot lump premium assessment IOCLZ03 0.0681
PlAtts dAIlY IrOn Ore lumP sPOt Assessments symbol $/dmtu midpoint ChangeLump premium IOCLP00 0.0700-0.0800 0.0750 0.0000 symbol $/dmt ChangeLump outright IOCLS00 116.30 0.15
Pellet PremIums symbol $/dmt ChangeWeekly CFR China 65% Fe spot assessment* IOBFC04 17.70 -0.35Weekly CFR China 64% Fe spot premium assessment IOCQS04 12.55 0.05Weekly CFR China 64% Fe spot fixed price assessment IOCQR04 128.00 -8.00
*Assessed September 23.
estimated contract provisional pricing
Atlantic Blast Furnace 65% Fe pellet premium (Sep) IOBFP00 28.50 0.00Atlantic Basin 65% Fe Blast Furnace pellet FOB Brazil (¢/dmtu) SB01095 211.39 23.81Direct Reduction 67.5% Fe pellet premium (Sep) IODRP00 29.25 -3.50Direct Reduction 67.5% Fe pellet premium (65% Fe basis) IODBP00 27.50 0.00Direct Reduction pellet 67.5% Fe FOB Brazil (¢/dmtu) IODBU00 212.29 18.80Direct Reduction pellet 67.5% Fe FOB Brazil (dmt) IODBR00 143.30 12.69

September 25, 2020Sbb Steel marketS Daily
19© 2020 S&P Global Platts, a division of S&P Global Inc. All rights reserved.
IrOn Ore
IOPeX: PlAtts dAIlY POrt stOCk IrOn Ore FInes Assessment, sePtember 25 symbol Yuan/wmt Change CFr China equiv. ($/dmt)
FOt north China (Caofeidian, Jingtang)IOPEX 62%-Fe FOT North China IOPBL00 899 0 123.51Pilbara Blend Fines FOT North China IOPBE00 880 0Newman High Grade Fines FOT North China IOPBF00 909 9IOPEX 62% Fe FOT North China rolling monthly avg. IOPBM00 949 -3
FOt east China (rizhao, Qingdao)IOPEX 62%-Fe FOT East China IOPBN00 894 -5 122.79Pilbara Blend Fines FOT East China IOPBG00 875 -5Newman High Grade Fines FOT East China IOPBH00 895 -5IOPEX 62% Fe FOT East China rolling monthly avg. IOPBO00 942 -3
Chinese Concentrate (Yuan/dmt)IO Concentrate 66% Fe DDP Tangshan VAT-inclusive* SB01159 1020 -15
*Assessed September 25 2020
PlAtts dAIlY IrOn Ore seAbOrne brAnd Assessments, sePtember 25 symbol $/dmt Change
Fixed (basis typical Fe)Pilbara Blend Fines (PBF) CFR Qingdao IOPBQ00 113.85 0.15Brazilian Blend Fines (BRBF) CFR Qingdao IOBBA00 117.80 0.15Newman High Grade Fines (NHGF) CFR Qingdao IONHA00 116.25 0.15Mining Area C Fines (MACF) CFR Qingdao IOMAA00 111.05 0.15Jimblebar Fines (JMBF) CFR Qingdao IOJBA00 107.80 0.1557% Fe Yandi Fines (YDF) CFR Qingdao IOYFA00 105.05 0.20
Floating (62% Fe-adjusted, expressed over m1)Pilbara Blend Fines (PBF) CFR Qingdao IOPBS00 2.50 -0.10Brazilian Blend Fines (BRBF) CFR Qingdao IOBBB00 2.75 -0.10Newman High Grade Fines (NHGF) CFR Qingdao IONHB00 2.50 -0.10Mining Area C Fines (MACF) CFR Qingdao IOMAB00 0.05 -0.10Jimblebar Fines (JMBF) CFR Qingdao IOJBB00 -2.75 -0.1057% Fe Yandi Fines (YDF) CFR Qingdao IOYFB00 1.00 0.00
brand differentials to IOdeXPilbara Blend Fines (PBF) CFR Qingdao IOPBT00 -2.20 0.00Brazilian Blend Fines (BRBF) CFR Qingdao IOBBC00 1.75 0.00Newman High Grade Fines (NHGF) CFR Qingdao IONHC00 0.20 0.00Mining Area C Fines (MACF) CFR Qingdao IOMAC00 -5.00 0.00Jimblebar Fines (JMBF) CFR Qingdao IOJBC00 -8.25 0.0057% Fe Yandi Fines (YDF) CFR Qingdao IOYFC00 -11.00 0.05
Freight diFFerentials to major import ports, $/wmtFrom Qingdao on a Free Out basisTo North China: Caofeidian, Tianjin & Xingang 0.24To East China: Beilun -0.29To South China: Zhanjiang & Fangcheng -0.49
tsI 62% Fe CFr nOrth ChInA derIVAtIVe FOrwArd CurVe, sePtember 25 symbol $/dmt Change % ChgSep-20 TSIPM00 123.500 0.050 0.04Oct-20 TSIPM01 113.200 0.250 0.22Nov-20 TSIPM02 109.850 0.300 0.27Dec-20 TSIPM03 106.750 0.300 0.28Q4 2020 TSIPQ01 109.950 0.300 0.27Q1 2021 TSIPQ02 101.500 0.300 0.30Q2 2021 TSIPQ03 94.950 0.250 0.262021 TSIPY01 93.300 0.150 0.16
IrOn Ore lumP PremIum CFr ChInA derIVAtIVe FOrwArd CurVe, sePtember 25 symbol $/dmtu Change % ChgSep-20 AAQUA00 0.0675 0.0015 2.27Oct-20 AAQUA01 0.0950 0.0050 5.56Nov-20 AAQUA02 0.1100 -0.0100 -8.33Dec-20 AAQUA03 0.1450 -0.0025 -1.69

September 25, 2020Sbb Steel marketS Daily
20© 2020 S&P Global Platts, a division of S&P Global Inc. All rights reserved.
COkIng COAl
PlAtts dAIlY metAllurgICAl COAl Assessments, sePtember 25
Asia-Pacific coking coal ($/mt)
FOb CFr CFr Change
Australia China India Australia China India
HCC Peak Downs Region 140.00 149.50 152.90 3.50 2.00 3.50
Premium Low Vol 139.00 148.50 151.90 3.50 2.00 3.50
HCC 64 Mid Vol 114.40 126.00 127.30 2.00 2.00 2.00
Low Vol PCI 81.90 93.50 94.80 1.00 1.00 1.00
Mid Tier PCI 78.90 90.50 91.80 1.00 1.00 1.00
Semi Soft 70.40 82.00 83.30 0.50 0.50 0.50
Premium Low Vol China Netback 136.90 2.00
tsI coking coal indices ($/mt)
TSI Premium Hard (PHCC) FOB Australia 137.40 1.40
Atlantic coking coal ($/mt)
FOb us
east Coast Change Vm Ash s
Low Vol HCC 114.00 0.00 19.25% 8.25% 0.95%
High Vol A 120.00 1.00 32.25% 7.5% 0.95%
High Vol B 106.00 0.00 36% 8% 1%
CFr
nw europe Change Vm Ash s
Premium Low Vol NetForward 150.50 3.65 21.5% 9.3% 0.50%
Detailed methodology and specifications are found here:http://platts.com/IM.Platts.Content/MethodologyReferences/MethodologySpecs/metcoalmethod.pdf
dry bulk freight assessments
route Vessel Class Freight rate ($/mt) Change
Australia-China Capesize 10.65 -0.05
Australia-Rotterdam Capesize 11.50 0.15
Australia-China Panamax 11.60 0.00
Australia-India Panamax 12.90 0.00
USEC-India Panamax 25.50 0.00
USEC-Rotterdam Panamax 10.50 0.00
USEC-Brazil Panamax 11.50 0.00
East Australia: basis Hay Point port. USEC: basis Hampton Roads. See methodology for further details.
PCC met (Platts China Coal – metallurgical) (Yuan/mt)*
Free-on ddP CFr China
ex-washplant -rail tangshan equiv. ($/mt)
PCC Met Shanxi Premium Low Vol 1260 1295 1495 178.23
PCC Met Shanxi High Sulfur Premium Low Vol 1010 1045 1245
PCC Met North China Fat Coal – – 1330
PCC Met Shanxi PCI 720 755 900
PCC Met Shandong Semi Soft 790 810 –
PCC Met Rail Freight Shanxi – Tangshan 230
PCC Met Truck Freight Shanxi – Tangshan 235
*Weekly (assessed September 23).
north China prompt port stock prices
ex-stock Jingtang CFr Jingtang
(Yuan/mt, incl VAt) equivalent ($/mt)**
Premium Low Vol* 1440.00 182.52
HCC 64 Mid Vol* 1310.00 165.63
*Weekly (assessed September 25), 20-day delivery from date. **Ex-stock price, net of port charges, import tax and VAT.
Source: S&P Global Platts

September 25, 2020Sbb Steel marketS Daily
21© 2020 S&P Global Platts, a division of S&P Global Inc. All rights reserved.
COkIng COAl
PlAtts dAIlY AsIA PACIFIC metAllurgICAl COAl relAtIVItIes, sePtember 25, 2020
symbol FOb Australia spread symbol CFr China spread spread $/mt vs PlV $/mt vs PlV vs hCC 64 FOb Australia CFr China CFr China
Premium Low Vol PLVHA00 139.00 100.00% PLVHC00 148.50 100.00%
Peak Downs HCPDA00 140.00 100.72% MCBAA00 149.50 100.67%
Saraji HCSAA00 139.00 100.00% MCBAB00 148.50 100.00%
Oaky North HCOKA00 137.50 98.92% MCBAR00 147.00 98.99%
Illawarra HCIWA00 135.25 97.30% MCBAH00 143.00 96.30%
Moranbah North HCMOA00 135.00 97.12% MCBAG00 142.50 95.96%
Goonyella HCGOA00 135.00 97.12% MCBAE00 142.50 95.96%
Peak Downs North HCPNA00 133.75 96.22% MCBAJ00 141.50 95.29%
Goonyella C HCGNA00 133.25 95.86% MCBAI00 141.50 95.29%
Riverside HCRVA00 133.75 96.22% MCRVR00 141.50 95.29%
GLV HCHCA00 133.00 95.68% MCBAF00 140.00 94.28%
HCC 64 Mid Vol HCCCH00 126.00 84.85% 100.00%
Lake Vermont HCC MCBAN00 126.00 100.00%
Carborough Downs MCBAO00 125.00 99.21%
Middlemount Coking MCBAP00 116.00 92.06%
Poitrel Semi Hard MCBAQ00 113.00 89.68%
September 25 freight rates. Australia to China: Panamax = $11.60/mt Capesize = $10.65/mt.
For further information about these assessments, please refer to the specifications guide: https://www.spglobal.com/platts/plattscontent/_assets/_files/en/our-methodology/methodology-specifications/metcoalmethod.pdf or contact [email protected].
Source: S&P Global Platts
PlAtts weeklY metAllurgICAl COAl relAtIVItIes, sePtember 25, 2020
FOb spread $/mt vs us lV
Blue Creek No. 7 138.00
Blue Creek No. 4 130.00
Beckley 117.75 103.29%
Low Vol FOB USEC 114.00 100.00%
Windber 111.50 97.81%
Buchanan 107.50 94.30%
September 25 Panamax freight rates. Hampton Roads to Rotterdam = $10.50/mt, Hampton Roads to Brazil = $11.50/mt, Mobile to Rotterdam = $13.25/mt.
For further information about this data please contact [email protected].
Source: S&P Global Platts
europe and us cold-rolled coil assessments, september 25 eur/mt Close/midpoint Change % ChgPlatts TSI North European CRC, EXW Ruhr 549.00 549.00 0.00 0.00CIF Antwerp 540.00-555.00 547.50 0.00 0.00
$/mtFOB Black Sea* 545.00-550.00 547.50 -7.50 -1.35
$/stPlatts TSI CRC EXW Indiana 776.00 776.00 0.00 0.00DDP, Houston 720.00 720.00 0.00 0.00*weekly (assessed September 23)

September 25, 2020Sbb Steel marketS Daily
22© 2020 S&P Global Platts, a division of S&P Global Inc. All rights reserved.
COkIng COAl
metAllurgICAl COkeseaborne
%Csr $/mt Change % ChgFOB North China 66/65 320.00 0.00 0.00 65/63 305.00 0.00 0.00 64/62 299.00 0.00 0.00 62/60 297.00 0.00 0.00CFR India 66/65 289.00 1.00 0.35 65/63 287.00 1.00 0.35 64/62 285.00 1.00 0.35 62/60 283.00 1.00 0.35
domestic
Yuan/mtDDP North China (weekly) 62 2010.00 40.00 2.03
$/mtFOB North China equivalent (DDP weekly) 62 303.41 4.24 1.42
PlAtts ChInA PlV, met COke PrICe dIFFerentIAlsPrice spreads $/mtImport-Shanxi Premium Low Vol CFR China -32.73Import-port stock Premium Low Vol CFR China -34.0262% CSR coke export-domestic FOB North China -6.41
tsI PremIum hCC FOb AustrAlIA derIVAtIVe FOrwArd CurVe, sePtember 25 symbol $/mt Change % ChgOct-20 MCPLM01 142.750 0.000 0.000Nov-20 MCPLM02 145.750 -0.500 -0.342Dec-20 MCPLM03 149.130 -0.120 -0.080Q4 2020 MCPLQ01 145.880 -0.410 -0.280Q1 2021 MCPLQ02 151.130 -0.620 -0.409Q2 2021 MCPLQ03 147.250 -1.000 -0.6752021 MCPLY01 146.850 -0.790 -0.5352022 MCPLY02 147.250 -0.500 -0.339
PenAltIes & PremIA: dIFFerentIAls ($/mt) within % of Premium low Vol FOb net value min-max Australia assessment price ($/mt)Per 1% CSR 67-74% 1.00% 1.39Per 1% VM (air dried) 18-27% 1.75% 2.43Per 1% TM (as received) 8-11% 1.00% 1.39Per 1% Ash (air dried) 7-10.5% 1.00% 1.39Per 0.1%S (air dried) 0.3-1% 1.00% 1.39
us low-vol hCC Penalties & Premia; differentials ($/mt)
within % of us low-vol hCC FOb net value min-max useC assessment price ($/mt)Per 1% CSR 50-64% 0.50% 0.57 40-49% 0.50% 0.57Per 0.1% S 0.70-1.05% 0.75% 0.86 1.06-1.25% 1.30% 1.48Per 1% TM (as received) 6.0-11.0% 1.00% 1.14Per 1% Ash 5.0-10.0% 1.25% 1.43
FOb netbACks Per rOute
basis IOdeX 62% Fe
route Vessel type Freight rate ($/wmt) moisture (%) IOdeX ($/dmt)Australia Capesize 8.70 8.03 106.59India West Panamax 12.80 8.11 102.12Brazil Capesize 20.50 9.00 93.52NW Europe (CFR) Capesize 8.35 9.00 102.70South Africa Capesize 15.40 3.00 100.17
basis 58%-Fe CFr Qingdao
route Vessel type Freight rate ($/wmt) moisture (%) FOb 58%-Fe ($/dmt)India West Supramax 13.35 11.00 89.40
basis 65% Fe CFr Qingdao
route Vessel type Freight rate ($/wmt) moisture (%) FOb 65% Fe ($/dmt)Brazil Capesize 20.50 8.5 105.00
Reference ports are Port Hedland, Mormugao, Haldia/Paradip, Tubarao, Rotterdam (CFR), Saldanha Bay. NW Europe IODEX netback is calculated by adding Tubarao to Rotterdam Capesize freight to IODEX Brazil netback.

September 25, 2020Sbb Steel marketS Daily
23© 2020 S&P Global Platts, a division of S&P Global Inc. All rights reserved.
FerrOus sCrAP
PlAtts tsI FerrOus sCrAP reFerenCe PrICes Price Change % Chg
scrap, europe/turkey (£/mt)
OA (plate & structural) - UK domestic, delivered** 227.50 0.00 0.00
($/mt)
HMS 1/2 80:20 CFR Turkey* 295.50 0.00 0.00
HMS 1/2 75:25 FOB Rotterdam* 266.00 -0.75 -0.28
HMS 1/2 75:25 CFR Turkey* 287.50 0.00 0.00
A3 CFR Turkey* 281.50 0.00 0.00
Shredded FOB East Coast* 288.50 0.00 0.00
HMS FOB East Coast* 283.50 0.00 0.00
Shredded - delivered - N. Europe domestic, delivered 279.68 10.52 3.91
Shredded - delivered - S. Europe domestic, delivered 292.52 12.53 4.48
scrap, Asia ($/mt)
HMS 1/2 80:20 Containerized CFR Taiwan* 274.00 -3.00 -1.08
H2 - del Okayama - Tokyo Steel purchase price, at works gate 240.87 21.02 9.56
H2 - del Utsunomiya - Tokyo Steel purchase price, at works gate 245.60 30.53 14.20
Heavy - Shanghai - China domestic 393.19 12.66 3.33
HMS 1/2 80:20 CFR - East Asia import** 305.00 -9.00 -2.87
Shredded Scrap CFR India** 312.00 -3.00 -0.95
Shindachi Bara - del Okayama - Tokyo Steel purchase (list) price 250.32 20.91 9.11
Shindachi Bara - del Utsunomiya -Tokyo Steel purchase (list) price 264.49 30.30 12.94
Shredded scrap A (auto) - del Okayama -Tokyo Steel purchase (list) price 245.60 20.97 9.34
Shredded scrap A (auto) - del Utsunomiya -Tokyo Steel purchase (list) price 250.32 30.47 13.86
H2 FOB Japan (Yen/mt)** 28000.00 -1000.00 -3.45
scrap, Americas ($/lt)
Shredded del Midwest US*** 286.00 6.50 2.33
Shredded, del Midwest US, 10-day average 283.00 48.00 20.43
#1 Busheling - N. America domestic, del, Midwest US** 297.50 0.00 0.00
HMS 1/2 - N. America domestic, del Midwest US** 257.50 0.00 0.00
Plate & Structural - N. America domestic, del Midwest US** 270.00 0.00 0.00
(real/mt)
HMS 1/2 - Brazil S.E. domestic, FOT** 950.00 0.00 0.00
Clean Steel Scrap - Brazil S.E. domestic, FOT** 1000.00 0.00 0.00
Turnings - Brazil S.E. domestic, FOT** 675.00 0.00 0.00Prices monthly unless otherwise noted. *Daily. **Weekly. ***Assessed daily during final week and first week of month. Assessed weekly thereafter.
hms 1&2 80:20 CFr turkeY derIVAtIVe FOrwArd CurVe, sePtember 25 symbol $/mt Change % Chg
Sep-20 ACTAB00 296.50 1.00 0.34
Oct-20 ACTAM01 293.00 1.50 0.51
Nov-20 ACTAM02 292.00 2.00 0.69
Dec-20 ACTAM03 289.00 -0.50 -0.17
rebAr FOb turkeY derIVAtIVe FOrwArd CurVe, sePtember 25 symbol $/mt Change % Chg
Sep-20 STRTB00 456.50 1.00 0.22
Oct-20 STRTB01 450.50 0.00 0.00
Nov-20 STRTB02 449.50 0.00 0.00
Dec-20 STRTB03 447.50 0.00 0.00
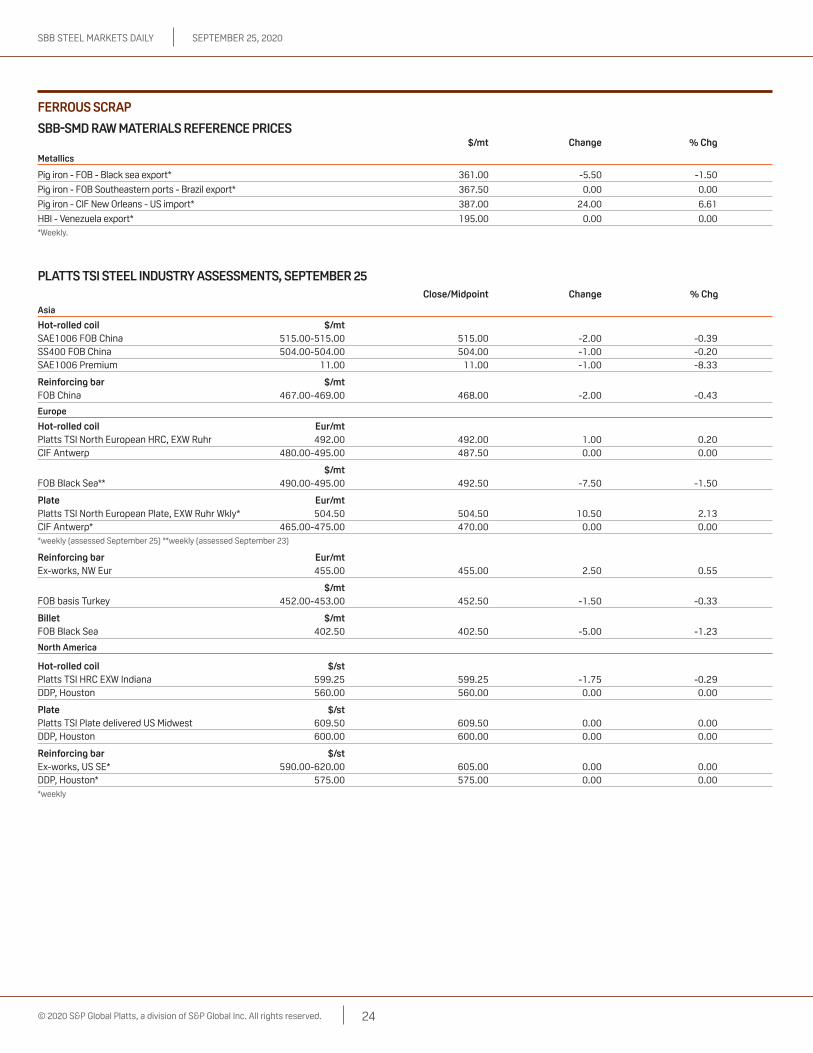
September 25, 2020Sbb Steel marketS Daily
24© 2020 S&P Global Platts, a division of S&P Global Inc. All rights reserved.
FerrOus sCrAP
sbb-smd raw materials reFerence prices $/mt Change % Chg
metallics
Pig iron - FOB - Black sea export* 361.00 -5.50 -1.50
Pig iron - FOB Southeastern ports - Brazil export* 367.50 0.00 0.00
Pig iron - CIF New Orleans - US import* 387.00 24.00 6.61
HBI - Venezuela export* 195.00 0.00 0.00*Weekly.
PlAtts tsI steel IndustrY Assessments, sePtember 25 Close/midpoint Change % Chg
Asia
hot-rolled coil $/mtSAE1006 FOB China 515.00-515.00 515.00 -2.00 -0.39SS400 FOB China 504.00-504.00 504.00 -1.00 -0.20SAE1006 Premium 11.00 11.00 -1.00 -8.33
reinforcing bar $/mtFOB China 467.00-469.00 468.00 -2.00 -0.43
europe
hot-rolled coil eur/mtPlatts TSI North European HRC, EXW Ruhr 492.00 492.00 1.00 0.20CIF Antwerp 480.00-495.00 487.50 0.00 0.00
$/mtFOB Black Sea** 490.00-495.00 492.50 -7.50 -1.50
Plate eur/mtPlatts TSI North European Plate, EXW Ruhr Wkly* 504.50 504.50 10.50 2.13CIF Antwerp* 465.00-475.00 470.00 0.00 0.00*weekly (assessed September 25) **weekly (assessed September 23)
reinforcing bar eur/mtEx-works, NW Eur 455.00 455.00 2.50 0.55
$/mtFOB basis Turkey 452.00-453.00 452.50 -1.50 -0.33
billet $/mtFOB Black Sea 402.50 402.50 -5.00 -1.23
north America
hot-rolled coil $/stPlatts TSI HRC EXW Indiana 599.25 599.25 -1.75 -0.29DDP, Houston 560.00 560.00 0.00 0.00
Plate $/stPlatts TSI Plate delivered US Midwest 609.50 609.50 0.00 0.00DDP, Houston 600.00 600.00 0.00 0.00
reinforcing bar $/stEx-works, US SE* 590.00-620.00 605.00 0.00 0.00DDP, Houston* 575.00 575.00 0.00 0.00*weekly

September 25, 2020Sbb Steel marketS Daily
25© 2020 S&P Global Platts, a division of S&P Global Inc. All rights reserved.
Find out more at spglobal.com/insight
Keeping you informed and entertained with the best of our news, pricing and analytics
PlAtts tsI steel Assessments CurrenCY And unIt COmPArIsOns, sePtember 25 Prior assessment eur/mt $/mt $/st $/Cwt $/mt $ change % change
hot-rolled coil
Platts TSI North European HRC, EXW Ruhr* 492.00*** 571.65 518.60 25.94 572.06 -0.41 -0.07%FOB Black Sea* 421.77 492.50*** 446.80 22.35 500.00 -7.50 -1.50%CIF Antwerp* 487.50*** 566.43 513.87 25.70 567.99 -1.56 -0.27%Platts TSI HRC EXW Indiana** 567.74 660.55 599.25*** 29.96 662.48 -1.93 -0.29%DDP Houston 530.55 617.28 560.00*** 28.00 617.28 0.00 0.00%
Cold-rolled coil
Platts TSI North European CRC, EXW Ruhr* 549.00*** 637.88 578.68 28.94 639.64 -1.76 -0.28%FOB Black Sea* 468.87 547.50*** 496.69 24.84 555.00 -7.50 -1.35%CIF Antwerp* 547.50*** 636.14 577.11 28.86 637.89 -1.75 -0.27%Platts TSI CRC EXW Indiana** 735.20 855.38 776.00*** 38.80 855.38 0.00 0.00%DDP Houston 682.14 793.65 720.00*** 36.00 793.65 0.00 0.00%
Plate
Platts TSI Plate delivered US Midwest** 577.46 671.85 609.50*** 30.48 671.85 0.00 0.00%DDP Houston 568.46 661.38 600.00*** 30.00 661.38 0.00 0.00%
reinforcing bar
Ex-works, Northwest Europe* 455.00*** 528.66 479.60 23.99 536.89 -8.23 -1.53%East Mediterranean, basis Turkey* 389.45 452.50*** 410.51 20.53 454.00 -1.50 -0.33%Ex-works, US Southeast** 573.19 666.89 605.00*** 30.25 666.89 0.00 0.00%DDP Houston 544.77 633.82 575.00*** 28.75 633.82 0.00 0.00%*EUR.USD (London close) = 1.1619; **USD.EUR (US close) = 0.8595. ***the primary assessments and have not been converted
Please note: All Platts and TSI CIF and CFR prices (US, Europe, Southern Europe, Persian Gulf and Turkey) represent freely traded values. This means they do not reflect any restrictions or duties as a result of trade cases. For detailed specifics, The Platts Weekly Trade Case Status report can be found on the last pages of this issue.
sCrAP: IrOn Ore rAtIOs ratio Previous ratio
HMS I/II 80:20 CFR Turkey: TSI 62% iron ore CFR North China 2.55 2.55US shredded delivered Midwest: TSI 62% iron ore CFR North China 2.37 2.37
PlAtts turkeY ArC steel trACker, sePtember 25, 2020 scrap billet rebar
vs 30-day 0.25% ($0.73) -1.23% (-$5.12) 1.04% ($4.70)vs 60-day 1.09% ($3.22) -2.06% (-$8.62) 1.08% ($4.90)
market direction: -1.51% (-$6.50) Industry Composite Index: 74.54
Price moves relative to each commodity measured vs 30-day and 60-day moving averages.
PLATTS TURKEY ARC STEEL TRACKER BASED ON 30-DAY AVERAGES(%)
Platts Turkey ARC is a relative strength indicator for Platts Turkey Rebar FOB, Platts Black Sea Billet CFR Turkey basis and Benchmark TSI Scrap CFR prices*. The daily index for each commodity shows the degree the price is over or below the average of price relationships with the others for the past 30 or 60 days, with 0 as equilibrium. Indices provide trading price signals for the commodity or for the wider complex, and potential changes in demand and supply for the steel industry. Historic 30-day and 60-day basis data through 2012 is available. Source: S&P Global Platts *e�ective March 1, 2016
-4
-2
0
2
4
6
25-Sep10-Sep25-Aug10-Aug24-Jul09-Jul24-Jun09-Jun22-May
Market direction
Scrap 30
Rebar 30
Billet 30

September 25, 2020Sbb Steel marketS Daily
26© 2020 S&P Global Platts, a division of S&P Global Inc. All rights reserved.
weeklY FerrOAllOY PrICes
Ferrochrome
cts/lb change/date assessedCharge Chrome 48-52% in-warehouse US. 110.000 / 120.000 09-23-20 / 09-23-2065% High Carbon in-warehouse US 97.000 / 105.000 09-23-20 / 09-23-20Low Carbon 0.05% in-warehouse US 210.000 / 212.000 09-23-20 / 09-23-20Low Carbon 0.10% in-warehouse US 167.000 / 169.000 09-23-20 / 09-23-20Low Carbon 0.15% in-warehouse US 155.000 / 160.000 09-23-20 / 09-23-20Charge Chrome 52% DDP NWE 70.000 / 80.000 09-24-20 / 09-24-2065% 6-8% High-Carbon DDP NWE 80.000 / 85.000 09-24-20 / 09-24-20Low Carbon 0.10% DDP NWE 147.000 / 158.000 -3.000 / -2.000Charge Chrome 48-52% CIF China 70.000 / 72.000 09-23-20 / 09-23-2058-60% High Carbon CIF China 70.000 / 71.000 09-23-20 / 09-23-2060-65% Spot CIF Japan 76.000 / 77.000 09-23-20 / 09-23-20
Ferromanganese
$/gt change/date assessedHigh Carbon 76% in-warehouse US 1090.000 / 1150.000 09-23-20 / 09-23-20
cts/lb change/date assessedMedium Carbon 85% Mn in-warehouse US 87.000 / 95.000 09-23-20 / 09-23-20
Ferromolybdenum
$/lb change/date assessedMW US FeMo 9.900 / 10.100 09-24-20 / 09-24-20
$/kg change/date assessedMW Europe 65% Ferromolybdenum 20.360 / 20.620 -0.400 / -0.45060% FeMo FOB China 22.000 / 23.000 09-24-20 / 09-24-2060% FeMo CIF Asia 20.000 / 21.000 09-24-20 / 09-24-20
Ferrosilicon
cts/lb change/date assessed75% Si in-warehouse US 82.000 / 84.000 09-23-20 / 09-23-20
$/mt change/date assessed75% Si CIF Japan 1040.000 / 1080.000 09-22-20 / 09-22-20
$/mt change/date assessed75% Si FOB China 1070.000 / 1120.000 -30.000 / 09-22-20
eur/mt change/date assessed75% Std DDP NWE 1000.000 / 1050.000 50.000 / 09-24-20
Ferrovanadium
$/lb change/date assessedFree Market V205 8.000 / 9.000 09-24-20 / 09-24-20US Ferrovanadium 9.700 / 9.800 -0.300 / -0.400
$/kg change/date assessedEurope Ferrovanadium 24.200 / 24.700 -0.400 / -0.300
manganese
$/mt change/date assessedElectrolytic 99.7% FOB China 1530.000 / 1560.000 09-25-20 / 09-25-20
manganese ore
$/dmtu change/date assessed44% Manganese Ore CIF Tianjin 4.400 09-25-2037% Manganese Ore CIF Tianjin 4.300 09-25-20
molybdenum
$/lb change/date assessedMW Dealer Oxide 8.200 / 8.440 -0.070 / -0.030
silicomanganese
cts/lb change/date assessed65% Mn in-warehouse US 50.000 / 51.000 09-23-20 / 09-23-20
$/mt change/date assessed65% Mn CIF Japan 880.000 / 890.000 09-22-20 / 09-22-20
eur/mt change/date assessed65:16 DDP NWE 940.000 / 980.000 70.000 / 40.000
Same-date references indicate there was no price change.
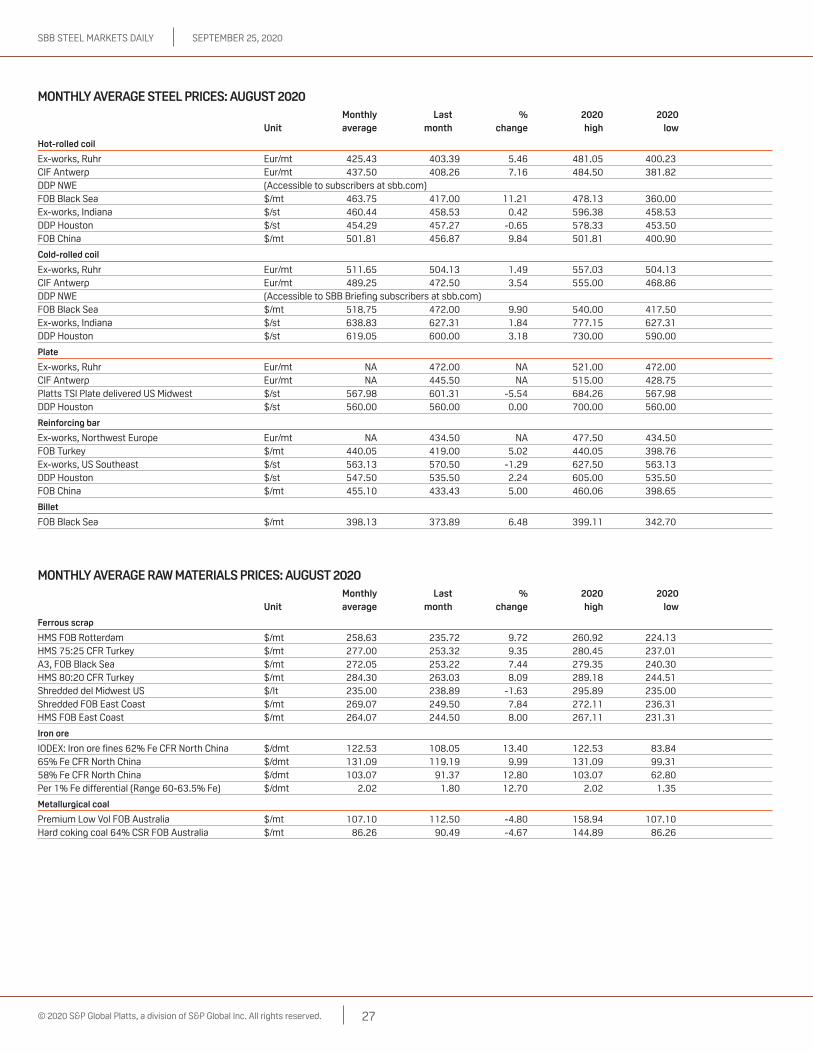
September 25, 2020Sbb Steel marketS Daily
27© 2020 S&P Global Platts, a division of S&P Global Inc. All rights reserved.
mOnthlY AVerAge steel PrICes: August 2020 monthly last % 2020 2020 unit average month change high low
hot-rolled coil
Ex-works, Ruhr Eur/mt 425.43 403.39 5.46 481.05 400.23CIF Antwerp Eur/mt 437.50 408.26 7.16 484.50 381.82DDP NWE (Accessible to subscribers at sbb.com)FOB Black Sea $/mt 463.75 417.00 11.21 478.13 360.00Ex-works, Indiana $/st 460.44 458.53 0.42 596.38 458.53DDP Houston $/st 454.29 457.27 -0.65 578.33 453.50FOB China $/mt 501.81 456.87 9.84 501.81 400.90
Cold-rolled coil
Ex-works, Ruhr Eur/mt 511.65 504.13 1.49 557.03 504.13CIF Antwerp Eur/mt 489.25 472.50 3.54 555.00 468.86DDP NWE (Accessible to SBB Briefing subscribers at sbb.com)FOB Black Sea $/mt 518.75 472.00 9.90 540.00 417.50Ex-works, Indiana $/st 638.83 627.31 1.84 777.15 627.31DDP Houston $/st 619.05 600.00 3.18 730.00 590.00
Plate
Ex-works, Ruhr Eur/mt NA 472.00 NA 521.00 472.00CIF Antwerp Eur/mt NA 445.50 NA 515.00 428.75Platts TSI Plate delivered US Midwest $/st 567.98 601.31 -5.54 684.26 567.98DDP Houston $/st 560.00 560.00 0.00 700.00 560.00
reinforcing bar
Ex-works, Northwest Europe Eur/mt NA 434.50 NA 477.50 434.50FOB Turkey $/mt 440.05 419.00 5.02 440.05 398.76Ex-works, US Southeast $/st 563.13 570.50 -1.29 627.50 563.13DDP Houston $/st 547.50 535.50 2.24 605.00 535.50FOB China $/mt 455.10 433.43 5.00 460.06 398.65
billet
FOB Black Sea $/mt 398.13 373.89 6.48 399.11 342.70
mOnthlY AVerAge rAw mAterIAls PrICes: August 2020 monthly last % 2020 2020 unit average month change high low
Ferrous scrap
HMS FOB Rotterdam $/mt 258.63 235.72 9.72 260.92 224.13HMS 75:25 CFR Turkey $/mt 277.00 253.32 9.35 280.45 237.01A3, FOB Black Sea $/mt 272.05 253.22 7.44 279.35 240.30HMS 80:20 CFR Turkey $/mt 284.30 263.03 8.09 289.18 244.51Shredded del Midwest US $/lt 235.00 238.89 -1.63 295.89 235.00Shredded FOB East Coast $/mt 269.07 249.50 7.84 272.11 236.31HMS FOB East Coast $/mt 264.07 244.50 8.00 267.11 231.31
Iron ore
IODEX: Iron ore fines 62% Fe CFR North China $/dmt 122.53 108.05 13.40 122.53 83.8465% Fe CFR North China $/dmt 131.09 119.19 9.99 131.09 99.3158% Fe CFR North China $/dmt 103.07 91.37 12.80 103.07 62.80Per 1% Fe differential (Range 60-63.5% Fe) $/dmt 2.02 1.80 12.70 2.02 1.35
metallurgical coal
Premium Low Vol FOB Australia $/mt 107.10 112.50 -4.80 158.94 107.10Hard coking coal 64% CSR FOB Australia $/mt 86.26 90.49 -4.67 144.89 86.26

September 25, 2020Sbb Steel marketS Daily
28© 2020 S&P Global Platts, a division of S&P Global Inc. All rights reserved. 28
trAde CAse stAtus rePOrtComplainant duties Product(s) Origin(s) status/commentsnorth AmericaUS Import tariff Steel Global The US implemented a 25% tariff on steel imports as of March 2018, excuding imports from
Australia. Canada and Mexico were exempted May 19, 2019. In December 2019 President Trump said tariffs on Brazil and Argentina would be reinstated; the countries have been subject to import quotas since 2018.
US Quota Steel South Korea An agreement was reached in March 2018 on changes to the US-Korea Free Trade Agreement, also known as KORUS. Imports of steel from South Korea will be subject to a product-specific quota equivalent to 70% of the average annual import volume of such products during the period of 2015-2017.
US Quota Steel Brazil Brazil in May 2018 accepted a hard quota system proposed by the US, which includes a 70% annual limit on finished steel exports to the US based on the average over 2015-2017. Semi-finished products are eligible for a 100% quota under the same scheme.
US AD HRC China In a final determination in September 2018, Commerce said that China's Baosteel, Shanghai Meishan Iron & Steel, and Union Steel China did not demonstrate the need to be assigned a separate rate and will therefore be subject to the China-wide rate of 90.83%
US AD HRC Australia, Brazil, Japan, Netherlands, Russia, South Korea, Turkey, UK
Final dumping margins set at 3.73% for the Netherlands, 73.59%-184.56% for Russia, 8.27%-11.1% for South Korea and 33.06% for the UK. Final AD rates set at 0% for Turkey in June 2019 and Japan in Sept. 2020
US CVD HRC Brazil, South Korea, Turkey Final duties applied at 11.09%-30.51% for Brazil. Negative determination made regarding Turkey. Final subsidy rates lowered to 0.54%-0.58% for South Korea in June 2019 following an administrative review. Hyundai Steel was assigned a preliminary de minimis subsidy rate of 0.45% in December 2019 on review
US AD CRC Brazil, China, India, Japan, Russia, South Korea, UK
The ITC found no injury from Russian imports. Final duties remain for China 265.79%, Japan 71.35%, Brazil 9.58%-35.43%, UK 5.4%-25.56% and India 7.6%. Final duties set at 321.71% for UK's Liberty Performance Steel in October 2019. Duties removed on South Korean CRC in July 2020
US CVD CRC Brazil, China, India, South Korea, Russia Final duties at 256.44% for China, 11.09%-11.31% for Brazil, 10% for India and 0.62-6.95% for Russia. Final subsidy rates for South Korean producers set at 0.54%-0.56% in July 2019 following an administrative review
US AD, CVD Corrosion-resistant steel Costa Rica, Guatemala, Malaysia, South Africa, UAE
Commerce issued a final determination in July 2020 finding that steel substrate shipped to Costa Rica and the UAE for minor processing, and then exported to the US as CORE, is circumventing the existing AD and CVD orders on CORE from China. It also preliminarily found that CORE from Malaysia made using Taiwanese substrate is circumventing US duties. Negative findings issued for Guatemala and South Africa
US AD, CVD CRC and corrosion-resistant steel Vietnam/China Final AD and CVD cash deposit rates for CORE produced in Vietnam using Chinese-origin substrate set at 199.43% and 39.05%, respectively, in line with those levied against China. AD and CVD cash deposits on CRC imports at 265.79% and 256.44%, respectively, in line with Chinese rates.
US AD, CVD CRC and corrosion-resistant steel Vietnam, South Korea, Taiwan Commerce in December 2019 issued a final affirmative circumvention determination. The rulings involve steel produced in South Korea and Taiwan that is then shipped to Vietnam for minor processing before being exported to the US. Applicable cash deposit rates as high as 456.23% depending on the origin of the substrate.
US AD, CVD Galvanized sheet China Commerce found a 199.43% dumping margin and a 39.05%-256.44% range of subsidy rates
US AD Rebar Japan, Taiwan, Turkey Final margins of 0%-7.26% for Turkey, 206.43%-209.46% for Japan, and 3.50%-32.01% for Taiwan set in 2017. Preliminary AD margin set at 4.01% for Taiwan's Power Steel in December 2019 on review.
US AD Rebar Mexico Preliminary AD margins set at 6.75%-7.25% in January 2020 on review; Commerce in June 2020 ruled rebar “bent at one or both ends (hooked or bent rebar)” and produced or exported by Deacero circumvent the existing AD order, with dumping duties of up to 7.25%
US CVD Rebar Turkey Preliminary AD rate for Habas set at 3.08% in September 2019 on review. Negligible preliminary AD rates set for Icdas and Kaptan Demir, preliminary all-others rate set at 2.76% in January 2020
US AD Rebar Belarus, China, Indonesia, Latvia, Moldova, Poland, Ukraine
After a third sunset review in October 2018, duties will remain in place at 114.53% for Belarus, 113% for China, 71.01% for Indonesia, 16.99% for Latvia, 232.86% for Moldova, 52.07% for Poland, and 41.69% for Ukraine
US AD Cut-to-length plate South Korea Commerce set final dumping margins of 2.26%-2.49% in May 2020 following an administrative review
US AD Cut-to-length plate Austria, Belgium, Brazil, China, France, Germany, Italy, Japan, South Korea, South Africa, Taiwan, Turkey
Prelim duty of 174.03% set for Germany's Salgitter in February 2019 on review; Austria's final duty lowered to 28.57% in March 2019. Final duties for Taiwan set at 2.59% in December 2019. Final duties of 4.75%-16.14% for Belgium and 1.44%-1.63% for Italy set in January 2020 following review
US CVD Cut-to-length plate Brazil, China, South Korea Final subsidy rate set at 251% for China. ITC terminated the Brazilian subsidy investigation. Subsidy rate for Jiangsu Tiangong Tools, Tiangong Aihe, Jiangsu Tiangong Group, and Jiangsu Tiangong Mould Steel R&D Center was lowered to 24.04%. Final subsidy rates for South Korea set at 0.25%-0.44% in August 2019 following administrative review
US AD Corrosion resistant steel Taiwan Final dumping margins set at 0.51%-6.84% in March 2020 on review
US AD Corrosion-resistant sheet China, India, Italy, South Korea, Taiwan Final AD duties of 199.43% for China; India 3.05%-22.57%, Italy 12.63%-92.12%, South Korea 0%-2.43% and Taiwan 2.15%-4.9%. Final AD rate for India's Uttam Galva set at 71.09% in June 2019 following administrative review
US CVD Corrosion-resistant sheet China, India, Italy, South Korea, Taiwan Final CVD margins of 11.3%-588.43% for India; de minimis to 38.51% for Italy; 0.44%-7.16% for South Korea (on review) and 0% for Taiwan
US CVD Structural tube Turkey Final subsidy rates of 15.08%-23.37% set in July 2016; Final subsidy rate for Ozdemir Boru Profil set at 1.18% in November 2018 following review
US AD Structural tube Mexico, South Korea, Turkey Final duties of 2.34%-3.82% for Korea, 3.83%-5.21% for Mexico and 17.73%-35.66% for Turkey
US AD Mechanical tube China, Germany, Italy, India, South Korea, Switzerland
Commerce set final dumping margins of 45.15%-186.89% for China, 3.11%-209.06% for Germany, 8.26%-33.80% for India, 47.87%-68.95% for Italy, 30.67%-48% for South Korea, and 7.66%-30.48% for Switzerland in June 2018
US CVD Mechanical tube China, India Final subsidy rate of 18.27%-21.41% for China and 8.02%-42.6% for India

September 25, 2020Sbb Steel marketS Daily
29© 2020 S&P Global Platts, a division of S&P Global Inc. All rights reserved. 29
Trade Case sTaTus reporT (continued)Complainant duties product(s) origin(s) status/comments
US AD, CVD Welded stainless pressure pipe India Final AD margins of 2.03%-7.19% set in May 2019 following an administrative review. Final subsidy rates of 3.13%-4.65%
US AD Welded carbon-quality steel pipe Oman, South Korea Final margins of 8.14%-10.91% set for South Korean producers in May 2019 following administrative review. Oman's Al Jazeera Steel Products Co. was assigned a preliminary AD margin of 1.04% in December 2019 on review
US AD, CVD Circular welded carbon-quality steel pipe
Oman, Pakistan, UAE Final dumping margins formalized for Oman at 7.24% and Pakistan at 11.8%. Preliminary dumping margins for UAE set at 2.49%-9.11% in February 2020
US AD Welded carbon steel standard pipe Turkey, India Final duties set at 9.99% for Turkey in January 2020 following administrative review; Toscelik Profil's rate set at zero as no sales were made in US during review period. India's final duties set at 11.83%-87.39% in January 2020 on review
US AD Circular welded steel pipe and tube Thailand In May 2019 Commerce set a preliminary weighted-average dumping margin of 5.32% for Saha Thai Steel Pipe and other producers
US CVD Seamless pipe China Duties extended for further five years in February 2016; Commerce said net subsidies of 13.66%-56.67% would continue or recur if duties were terminated
US AD Small-diameter seamless pipe Germany ITC affirmed duties will be extended for another five years in February 2018 as Commerce determined revocation of the duty would lead to a weighted-average dumping margins of up to 57.72%.
US CVD Circular welded pipe Turkey Commerce set preliminary subsidy rates of 0.92% for Borusan Mannesmann, 1.53% for Toscelik Profil, and 1.53% for all other Turkish producers in May 2019 in an administrative review
US AD Circular welded pipe China Dumping margins of up to 85.55% extended for another five years in April 2019 following sunset review
US AD Circular welded pipe and tube Taiwan Final duties of 2.73% set for Taiwan in January 2020 following administrative review
US AD Welded line pipe South Korea Preliminary dumping margins set at 3.45%-4.81% in February 2020 following administrative review
US AD Welded non-alloy steel pipe Mexico, South Korea Following an administrative review of the November 1, 2015- October 31, 2016 period, Commerce set a weighted-average dumping margin at 48.33% for Maquilacero, while Productos Laminados de Monterrey's dumping margin was set at zero. Final weighted dumping margins were set at 7.71%-30.85% for South Korea.
US AD Seamless standard, line and pressure pipe
Japan, Romania Duties extended for another five years in November 2017. Japan is under duties of 68.88%-107.8% for large and small diameter pipe. Romania faces 11.08%-15.15% for small diameter pipe.
US AD Stainless steel plate in coil Belgium, South Africa, Taiwan ITC extended AD and CVD duties for another five years in November 2017. AD duties at 8.54% for Belgium, 41.63% for South Africa and 10.2% for Taiwan
US AD, CVD Stainless sheet and strip China Final AD margins of 63.86% and 76.64% and final CVD duties of 75.6%-190.71%
US AD, CVD Stainless sheet and strip Japan, South Korea, Taiwan ITC extended duties of 57.89% for Japan, 58.79% for Korea and 21.1% for Taiwan for another five years in September 2017. South Korea assigned final subsidy rates of 0.54%-4.64%
US AD Stainless seamless pipe India Following a changed circumstances review, Commerce set a final weighted-average dumping margin of 30.92% for Viraj Profiles and Venus Wire Industries. The duties will also apply to companies affiliated with Venus Wire.
US AD Large-diameter welded line pipe Canada, China, Greece, India, South Korea, Turkey
Final dumping margins set at 12.32% for Canada, 132.63% for China, 9.96% for Greece, 50.55% for India, 7.03%-20.39% for South Korea and 2.57%-5.05% for Turkey
US CVD Large-diameter welded line pipe China, India, South Korea, Turkey Final rates at 541.5% for India and 0.01%-27.42% for South Korea. ITC voted to terminate CVD investigations on China and Turkey
US AD Stainless steel wire rod Japan, South Korea, Taiwan Dumping duties extended for an additional five years in August 2016 following sunset review
US AD Wire rod Mexico Preliminary dumping margins set at 6.7% in December 2019 on review
US AD Wire rod Belarus, Italy, Russia, South Africa, South Korea, Spain, Turkey, UAE, UK, Ukraine
Final dumping margins at 280.02% for Belarus, 12.41%-18.89% for Italy, 436.80%-756.93% for Russia, 135.46%-142.26% for S. Africa, 41.10% for S. Korea, 84.10% for UAE, 34.98%-44.03% for Ukraine, 10.11%-32.64% for Spain, 3.84%-6.09% for Turkey, 147.63% for UK
US CVD Wire rod Italy, Turkey Final subsidy rates set at 3.85-3.88% for Turkey and 4.16%-44.18% for Italy
US AD Stainless steel wire rod India Dumping margins of 48.8% to remain for another five years, after May 2017 sunset review
US AD, CVD OCTG South Korea Preliminary dumping margin of 17.04% set for SeAH Steel, 0.77% for Hyundai Steel and 13.16% for all other producers set in November 2019 on review
US AD OCTG Vietnam Preliminary dumping margin of 1.78% set for SeAH in November 2019 on review
US AD OCTG India In November 2018 the all others estimated weighted-average final dumping margin was set at set at 11.24%, up from 5.79% and in line with the rate set for India's Jindal SAW Ltd.
US AD OCTG Ukraine Commerce terminated a suspension agreement with Ukraine in July 2019; dumping margins set at 7.47%
US AD, CVD OCTG Turkey Following an administrative review of the September 1, 2016 - August 31, 2017 period, the all-others rate was lowered to 1.59% from 35.86%. Commerce found that Turkey's Tosçelik had no exports, sales, or entries of subject merchandise to the US during the period of review. Borusan Mannesmann's preliminary subsidy rate set at 1% on review in August 2019
US AD Light rectangular tubing Taiwan Duties of 40.97% upheld for another five years in August 2017 following sunset review
US AD Light-walled rectangular pipe and tube Mexico US Commerce Department set final dumping rates of 8.32%-17.65% in April 2019; Preliminary dumping rates of 2.48%-3.8% set in October 2019 on review
US AD Heavy -walled rectangular pipe and tube
Mexico, Turkey Final dumping margins of 1.43%-8.09% set for Mexico in May 2019 following review. Tuberia Nacional was found to have made no shipments. Prelim duties for Turkey set at 35.66% in July 2019 on review; Cinar Boru Profil was found to have made no shipments
US CVD Heavy -walled rectangular pipe and tube
Turkey Final CVD margin of 1.94% set for Turkey's Ozdemir in December 2019 following administrative review
US AD, CVD Threaded rod China, India, Taiwan and Thailand Final AD duties set at 20.83% for Thailand in October 2019; final AD duties set at 4.26%-59.45% for China and 2.47%-28.34% for India in February 2020; final CVD duties set at 6.07%-211.72% for India
US AD, CVD Stainless sheet, strip Vietnam The US self-initiated a circumvention inquiry involving Chinese substrate in May 2020
US AD, CVD Seamless pipe Czech Republic, Russia, South Korea, UkraineThe ITC launched an investigation into imports of seamless carbon and alloy steel standard, line and pressure pipe in July 2020

September 25, 2020Sbb Steel marketS Daily
30© 2020 S&P Global Platts, a division of S&P Global Inc. All rights reserved. 30
Trade Case sTaTus reporT (continued)Complainant duties product(s) origin(s) status/comments
Canada Safeguard Heavy plate, stainless steel wire Countries without a trade agreement Canada introduced tariff-rate quotas on these products in May 2019 that are intended to last through October 24, 2021
Canada AD Heavy plate Taiwan, Germany, South Korea, Malaysia, Turkey
Canada launched an investigation in May 2020
Canada AD Plate Brazil, Denmark, Indonesia, Italy, Japan & South Korea
The CBSA in October 2019 voted to continue duties of 28.9%-59.7% for Brazil, 1.9%-59.7% for South Korea, and 59.7% for Denmark, Indonesia, Italy and Japan
Canada AD Plate China The Canada Border Services Agency decided to continue duties of 27.3% in March 2018 following an expiry review
Canada AD, CVD Large line pipe China, Japan Final dumping margins set at 95% for China and 22.1%-95% for Japan. China's subsidy rate set at 30.3%
Canada AD Line pipe South Korea Final dumping margins of 4.1%-88.1%
Canada AD Welded pipe Taiwan Duties on Chung Hung and Shin Yang removed in September 2017. Duties against other Taiwanese exporters reduced to 29.6% from 54.2%
Canada AD Welded pipe Pakistan, Philippines, Turkey, Vietnam Final margins of 66.8% for Pakistan, 18.1%-66.8% for the Philippines, 3.3%-45.8% for Turkey and 3%-54.2% for Vietnam set in January 2019
Canada AD HRC Brazil, China, Ukraine 77% dumping margins extended for five years from August 2016
Canada CVD HRC India 3,500 rupees/mt ($52/mt) duty extended for five years from August 2016
Canada AD Rebar Belarus, Hong Kong, Japan, Taiwan, Portugal, Spain
Final determinations affirmed at 37.5% for Belarus, Taiwan 0%-108.5% , Hong Kong 54%, Portugal 2.4%, Spain 37%-108.5%, Japan 108.5%
Canada AD, CVD Fabricated structural steel China, South Korea, Spain The Canada Border Services Agency (CBSA) found weighted average dumping margins of 32.9%-45.8% for China, 1.9%-45.8% for South Korea and 0%-45.8% for Spain. CBSA set CVD of Yuan 152-11,656/mt for China
Canada AD, CVD Corrosion-resistant sheet Turkey, UAE and Vietnam Investigations launched in November 2019
Canada AD Corrosion-resistant sheet China, India, Taiwan and South Korea Final duties set at 3.6%-53.5% for China, 3.2%-33.2% for Taiwan, 9%-40% for South Korea and 40% for India in January 2019
Canada AD OCTG China, Taiwan, India, Indonesia, Philippines, South Korea, Thailand, Turkey, Ukraine, Vietnam
The CBSA in October 2019 initiated re-investigations to update the normal values and export prices of certain OCTG and seamless casing
Canada AD, CVD CR coil and sheet China, South Korea and Vietnam China received a final dumping margin of 91.9% and a subsidy rate of 11.6%, South Korea received a final dumping margin of 53% and subsidy rate of 11.3%, and Vietnam received a final dumping margin of 99.2% and subsidy rate of 6.5%.
Canada AD Rebar Algeria, Egypt, Indonesia, Italy, Malaysia, Singapore and Vietnam
The CBSA launched an investigation in September 2020
Mexico AD Wire rod China Definitive duty of 49 cents/kg
Mexico AD CR sheet China Duties of 65.99%-103.41% imposed
Mexico CVD CR sheet China Duties of up to 103.42% on boron-added imports
Mexico AD Coated sheets China, Taiwan Definite antidumping duties of 22.22%-76.33% for China and 22.26%-52.57% for Taiwan
Mexico CVD HRC Russia, Ukraine Duties of 21% for Russia and 25% for Ukraine
Mexico AD Plate Italy, Japan Duties of $0.236/kg for Japan and $0.023/kg for Italy set in April 2019
Mexico AD Plate Russia Duty of 29.3% renewed for another five years in May 2017
Mexico AD Seamless pipe Japan Existing duty of 99.9% renewed for a further five years in October 2016
Mexico AD Welded tube China Final duties of $0.356-$0.618/kg on imports of welded steel tube shipped by Chinese exporters, regardless of the country of origin
Mexico AD Seamless tubes India, South Korea, Spain, Ukraine Final duties set at $0.1312/kg for South Korea, $0.3785/kg for Spain, $0.1701 for Ukraine and $0.2067 for India
Mexico CVD Seamless tubes India, South Korea, Spain, Ukraine Definitive duties of 20.67 cents/kg for India, 13.12 cents/kg for South Korea, 37.85 cents/kg for Spain, and 17.01 cents/kg for Ukraine
Mexico Import tariff Slabs, plates, HRC, CRC, wire rod Countries without free-trade agreements Temporary import tariff of 15% extended in September 2019 to last through 2024. For some products, a gradual reduction in the tariff will be applied annually to 10%, 7% and 5% through September 22, 2023.
Mexico AD Cold-rolled stainless coil China, Taiwan The investigation officially started on March 27, 2019 and was published in the country’s official gazette on April 5.
south AmericaArgentina AD Welded and seamless pipes China The Commission of Foreign Trade imposed a 26% ad valorem anti-dumping tariff in May 2018
Argentina Export tariff All exports, including steel All domestic exporters For primary products, for every $1 exported, a duty of Argentinian Pesos 4 is charged, while for finished products, for every $1 exported a duty of Pesos 3 is charged.
Colombia AD Wire rod China AD duty issued in May 2016 for a period of five years and consists of a value corresponding to the difference between the FOB base price of $419/mt and the FOB price declared by the importer
Colombia AD Casing and tubing pipes China Duties extended for three years in July 2017. The duty consists of an amount of 15% ad valorem corresponding to the difference between the base price of $2,388.23/mt FOB and the FOB price value declared by the importer
Chile AD Wire rod All countries (China major importer) except Canada, Mexico, Peru and developing countries that account for no more than 3% of Chile's rod imports
Definitive duties of 28.08%-38% set in May 2017
Chile AD Steel bars for grinding balls production China Definitive duty of 8.2%-22.9% set in November 2017
Chile AD Steel grinding balls China Duty of 5.6% applied in May 2019 to last for one year
Brazil AD Heavy plate China, South Africa, South Korea, Ukraine Duties extended for an additional five years in October 2019
Brazil AD Hot-rolled bars China Definitive AD duty of $495.73/mt set in November 2016 to remain in place for five years
Brazil AD Steel wire, alloyed steel flat bar China The Ministry of Industry set duties of $199.19-$505.56/mt for imports of high-carbon steel wire and a duty of $495.73/mt on Chinese imports of alloyed steel flat bar
Brazil AD Austenitic stainless steel tubes Malaysia, Thailand, Vietnam Duties of $367-$740.02/mt for Malaysia, $747.56/mt for Thailand, and $782.11-$888.27/mt for Vietnam
Brazil AD Seamless pipes China, Romania Duties extended for five years, until August 2022. China subject to $743/mt duty and Romania subject to an ad valorem tariff of 14.3% over the CIF price

September 25, 2020Sbb Steel marketS Daily
31© 2020 S&P Global Platts, a division of S&P Global Inc. All rights reserved. 31
Trade Case sTaTus reporT (continued)Complainant duties product(s) origin(s) status/comments
Brazil CVD Hot-rolled flat steel China Camex trade secretariat imposed a duty of up to $425.22/mt for five years in May 2018, with application of the tariff delayed for up to one year.
Costa Rica Safeguard duties
Rebar All suppliers Costa Rica decided in December 2018 not to impose a safeguard duty
europe & turkeyEU Safeguard
dutiesSteel products All suppliers The European Commission introduced definitive tariff-rate quotas on a country-specific basis
on the biggest steel-supplying countries February 2, 2019. The EC moved to quarterly quotas in June 2020
EU AD Heavy plate China Final duties for heavy plate set at 65.1-73.7% in February 2017
EU AD HRC Brazil, Iran, Russia, Ukraine Definitive fixed duties per ton added on to the CFR price once the material arrives in Europe. €53.40-63.00/mt for Brazil, €57.50/mt for Iran, €17.60-96.50/mt for Russia and €60.50/mt for Ukraine
EU AD HRC Turkey The European Commission launched its investigation in May 2020
EU CVD HRC Turkey The European Commission launched its investigation in June 2020
EU AD,CVD HRC China AD & CVD total 18.1%-35.9% for China
EU AD CRC China, Russia Definitive retroactive duties of 19.7%-22.1% for China and 18.7%-36.1% for Russia
EU AD Corrosion-resistant coated steel China Antidumping duties of 17.2%-27.9% set in February 2018; duties extended to modified CORE imports in August 2020
EU AD Rebar China, Belarus Definitive duties of 18.4%-22.5% for China, with no retroactive duties. Definitive duty of 10.6% for Belarus. Deposits collected under the provisional duties are to be released for certain Belarusian rebar exempt from the definitive duties.
EU AD Grain-oriented electrical steel China, Russia, South Korea, US Definitive duties were set at 21.5%-36.6% for China, 35.9%-39.0% for Japan, 22.5% for South Korea, 21.6% for Russia and 22 for the US
EU AD Butt-weld tube & pipe fittings China Duties in place since 1996 extended
EU AD Seamless pipe China Final duties of 29.2%-54.9%
EU AD Seamless pipe & tube Russia, Ukraine After an expiry review in October 2018, the European Commission has decided to continue duties of 12.3%-25.7% for Ukraine and 24.1%-35.8% for Russia
EU AD HDG China Provisional anti-dumping duties of 46.2%-62.9%
EU AD Stainless steel seamless pipe China EU Commission has extended duties of 48.3%-71.9%
EU AD,CVD Organic coated sheet China Definitive CVD duties of 13.7%-44.7% and AD duties of 0%-26.1% continued in May 2019
EU AD Wire rod China Final duties of 24% to remain in place through October 2020, pending outcome of expiry review
EU AD Hot-rolled stainless sheet China, Indonesia, Taiwan The European Commission launched its investigation in August 2019
Turkey Import duty Finished & semi-finished steel Third country imports Customs duties on some alloy and non-alloy billet, slab, hot-rolled coil, cold rolled coil, coated coil, stainless steel, sections and some bar products have been increased by 5% effective April 18 from the previous range of 9%-15% up to 14%-20%. Duties extended to September 30, 2020 in July 2020
Turkey AD Heavy plate China Final duties of 16.89%-22.55% set in November 2017
Turkey Import duty HRC All suppliers Turkish re-rollers and welded pipe producers subject to 6% import duty, effectuive January 1, 2019. General HRC import duty set at 9%.
Turkey AD Seamless pipe China Final dumping margin of $100-$120/mt set in August 2016
Turkey AD PPGI China Final dumping margin determined at 23.4%
Turkey Import duty Rebar Third country imports Duty increased from 10% to 30%, effective April 18, 2019. Custom duties do not apply to the EU and countries with which Turkey has free trade agreements.
Turkey AD Stainless steel pipe Vietnam Turkey launched an investigation in June 2020
CIsEurasian Economic Union
AD HDG sheet Ukraine & China Investigation launched in July 2018
Ukraine AD Wire rod & rebar Russia Final duty of 51.21%, effective February 28, 2018
Africa & middle eastMorocco Safeguard
dutiesHRC All imports Investigation launched in May 2019
Morocco Safeguard duties
Rebar, wire rod All imports Duties of dirham 0.55/kilogram extended by three years from December 2015, investigation to extend duties launched in 2018
Morocco Safeguard duties
Welded pipe & tube All imports Investigation launched in October 2019
Morocco Safeguard duties
CRC, coated sheet All imports Duty rates are 22% for 2015, 20% for 2016, 18% for 2017 and 16% for 2018
Egypt Safeguard duties
Billet, rebar & wire rod All imports Tariffs of 16% on billet, 25% on rebar and 25% on wire rod applied October 12, 2019. Minimal payment requirements have also been adopted. The initial duty rates will stay in place until April 11, 2020. Then they will be decreasing on a yearly basis until expiration on April 11, 2022.
Egypt AD Rebar China, Turkey, Ukraine Temporary duties of 17% for China, 10-19% for Turkey and 15-27% for Ukraine to be maintained for another five years from December 6, 2017
Iran Import dutiesHRC & CRC (all thickness), plate, longs and semi-finished products
All suppliers Duties on most long products at 26%; duties on HRC & CRC at 10%-20%; duties at 5% for semi-finished products; API grade plate decreased to 10% from 15%, tinplate tariff reduced to 15% from 26%
Iran Export duty Iron ore pellet All suppliers Iran lifted the export duty on iron ore from 10% to 20%-25% starting September 23, 2019 in a bid to reduce shipments
Saudi Arabia Export duty Steel All exporters Saudi Arabia increased import duties on various semi-finished and finished iron and steel products to between 10% and 20% of product value, from earlier levels of 5% to 10%, in June 2020
South Africa Safeguard duties
HR coil & plate All suppliers Duties of 22% in 2017, 20% in 2018 and 18% in 2019
UAE Safeguard duties
Flat-rolled steel All suppliers UAE has implemented a definitive safeguard duty of $137/mt on imports of flat-rolled iron and non-alloy steel products effective July 19, 2020 to remain in place until May 14, 2021

September 25, 2020Sbb Steel marketS Daily
32© 2020 S&P Global Platts, a division of S&P Global Inc. All rights reserved. 32
Trade Case sTaTus reporT (continued)Complainant duties product(s) origin(s) status/comments
AsiaTaiwan AD Hot-dip galvanized coil/sheet China, South Korea Final duties in the range of 4.22%-77.3%, with producers from South Korea hit with the
heaviest penalty of 77.3%.
Taiwan AD CRC & stainless China, South Korea Duties of 38.11% for China and 37.65% fir South Korea extended for another five years in August 2019
Taiwan AD Heavy plate Brazil, China, India, Indonesia, South Korea, Ukraine
Final duties of 30.29%-59.73% for China, Brazil 31.1%, India 25.85%, Indonesia 46.84%, South Korea 8.66%-80.5% and Ukraine 26.57%
South Korea Import tariff Stainless steel bars Italy, Taiwan The Korea Trade Commission in March 2019 finalized duties of 9.47%-18.56% for Taiwan and 10.21%-13.74% for Italy for a period of five years
South Korea AD Stainless steel plate Japan The Korea Trade Commission has requested the Ministry of Trade extend 13.17% duty for three years
South Korea AD Galvanized steel wire China Final duty of 8.6% for five years, as of May 2018
Thailand AD HRC Brazil, Iran, Turkey Final duties of 34.4% for Brazil, Iran 7.25%-38.27% and Turkey 6.88%-38.23%, effective for five years from May 16 2017
Thailand AD HDG coil/sheet China, South Korea, Taiwan Investigation launched in September 2016
Thailand AD Al-Zn alloy coated sheet Vietnam Final duties of 6.20%-40.49% levied
Thailand AD Painted HDG, Painted Al-Zn alloy steel Vietnam Final duties of 4.3%-60.26% levied
Thailand AD Mild HRC, pickled coil & HR plate China, Malaysia Duties of 30.91% for China and 23.57%-42.51% for Malaysia extended for another five years, effective June 23 2017
Thailand AD Welded pipe China, South Korea Final duties of 3.22%-66.01% for China and 3.49%-53.88% for South Korea, effective for five years from July 19 2017
Thailand AD Alloy-added high-carbon Wire rod China Final duties of 12.26%-36.79%, effective from December 22 2016, for five years
Thailand AD Low-carbon Wire rod China Duties of 12.81%-31.15% no longer apply to products under the single HS code of 7227.9000.090
Thailand AD HRC 14 countries including South Korea, Japan, India, Taiwan, Russia
AD duties of 3.45%-128.11% extended for five years from May 2015.
Thailand AD Stainless steel pipes China, South Korea, Taiwan, Vietnam Duties of 310.74% for Vietnam, South Korea 11.96%-51.53%, China 145.31% and Taiwan 2.38%-29.04%
Malaysia AD HRC China Duties of 6.35%-12.19% imposed in February 2015
Malaysia AD CRC China, Japan, South Korea, Vietnam Malaysia imposed final duties ranging from 4.82%-26.38% in December 2019. Duties to be in place for five years
Malaysia AD Rebar Singapore, Turkey Malaysia imposed AD duties ranging from zero to 20.09% in January 2020. Duties to remain in place for five years
Malaysia Safeguard duties
Rebar, wire rod, deformed bar-in-coil 42 countries including China, Japan, US and EU countries
Final duties set in April 2017 at 13.42% for rebar in year one, down to 12.27% & 11.10% in years two & three; Wire rod & bar-in-coil 13.90% in year one, down to 12.90% & 11.90% in years two & three
Malaysia Import dutiesRebar, wire rod Importers 5% import tariff reinstated in June
Malaysia AD Color coated coil China, Vietnam Duties of 00.6% to 52.10% (all Chinese exporters) imposed in January 2016
Malaysia AD Hot-dipped galvanized sheet China, Vietnam Malaysia imposed antidumping duties of up to 16.13% on HDG from China and Vietnam for five years effective March 8, 2019
Malaysia AD CR stainless coil & sheet China, South Korea, Taiwan, Thailand Final duties of 2.68%-23.95% for China; 4.44%-7.27% for South Korea (Hyundai BNG Steel and Hyundai Steel Company are excluded); 2.79%-14.02% for Taiwan (China Far Industrial Factory and Yieh United Steel Corporation (YUSCO) are excluded ); 22.86%-111.61% for Thailand.
Malaysia AD Coated sheet China, South Korea, Vietnam Malaysia launched antidumping investigations into coated flat-rolled steel products from China, South Korea and Vietnam in March 2020
Vietnam AD CR plate China, Taiwan, Indonesia, Malaysia Duties imposed in September 2014
Vietnam Safeguard duties
Billet Malaysia, Kazakhstan Vietnam said it will impose a 17.3% safeguard duty on these products effective June 13, 2019
Vietnam Safeguard duties
Color coated sheet All importers Duty rate of 19% implemented in June 2017 if imports go above a specific import quota
Vietnam AD HDG and aluminum/zinc-coated steel China, South Korea Final duties of 3.17%-38.34% for China and 7.02%-19% for S. Korea, for five years effective April 14
Vietnam AD CRC China Vietnam initiated an AD investigation into cold-rolled coil and sheet from China in September 2019
Vietnam AD HDG, coated sheet China (including Hong Kong), South Korea Final duties set at 2.53%-34.27% for China and 4.71%-19.25% for South Korea in October 2019
Vietnam AD Wide-flange beams China Final duties of 20.48%-29.17%, effective September 5 2017
Vietnam AD PPGI/PPGL color-coated products China, South Korea Temporary duties of 3.45%-34.27% for China and 4.48%-19.25% for South Korea set in June 2019
Indonesia Import dutiesAll upstream steel products Most Favored Nations including India, South Korea, Japan, CIS, Latin America
HRC, CRC, plate & wire rod duties raised to 15%; galv & coated sheet raised to 20%; rebar raised to 17.5%
Indonesia AD Coated sheet China, Vietnam Indonesia launched an investigation into these imports in August 2019
Indonesia AD Plate China, Singapore, Ukraine Indonesia renewed antidumping duties on steel plates from China, Singapore and Ukraine for five years effective August 14, 2019
Indonesia Safeguard duty
Aluminum/zinc-coated sheet (Galvalume)
All suppliers Duties extend for three years. Initial rate of INR 2,891,858/mt will fall to INR 2,186,030/mt in year two and to INR 1,480,202/mt in year three.
China AD Grain-oriented electrical steel EU, Japan, South Korea Provisional AD duties of 39%-45.7% for Japan, 14.5%-29.5% for South Korea and 46.3% for EU mills
China AD Alloy seamless pipes EU, US China in May 2020 extended duties of 101%-147.8% for the US and 57.9%-60.8% for the EU for a period of five years
China AD Stainless steel billet & stainless plate EU, Japan, South Korea, Indonesia China imposed final duties ranging from 18.1% to 103.1% in July 2019; duties to remain in place for a five-year period
China Export duty Billet All suppliers China's finance ministry abolished the 10% export duty on steel billet, effective January 1, 2019.
Japan AD Carbon steel butt welding parts China, South Korea Preliminary dumping margins of 43.41%- 73.51% for South Korea and 60.84% for China
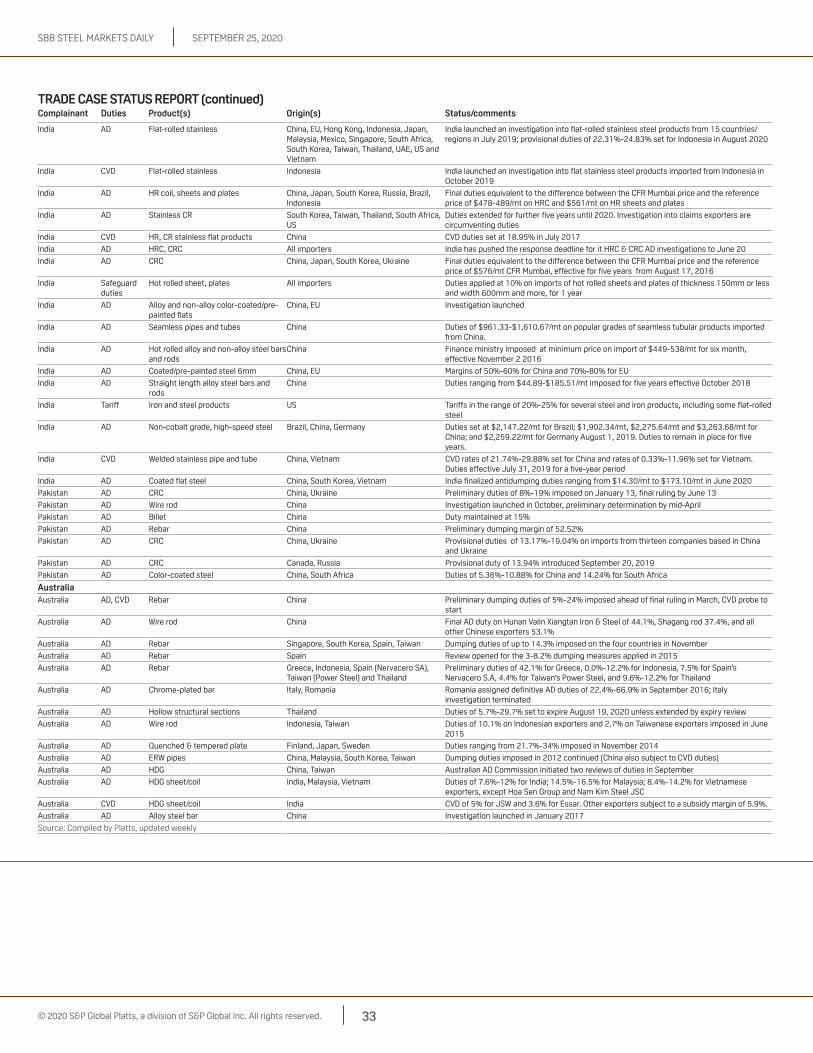
September 25, 2020Sbb Steel marketS Daily
33© 2020 S&P Global Platts, a division of S&P Global Inc. All rights reserved. 33
Trade Case sTaTus reporT (continued)Complainant duties product(s) origin(s) status/comments
India AD Flat-rolled stainless China, EU, Hong Kong, Indonesia, Japan, Malaysia, Mexico, Singapore, South Africa, South Korea, Taiwan, Thailand, UAE, US and Vietnam
India launched an investigation into flat-rolled stainless steel products from 15 countries/regions in July 2019; provisional duties of 22.31%-24.83% set for Indonesia in August 2020
India CVD Flat-rolled stainless Indonesia India launched an investigation into flat stainless steel products imported from Indonesia in October 2019
India AD HR coil, sheets and plates China, Japan, South Korea, Russia, Brazil, Indonesia
Final duties equivalent to the difference between the CFR Mumbai price and the reference price of $478-489/mt on HRC and $561/mt on HR sheets and plates
India AD Stainless CR South Korea, Taiwan, Thailand, South Africa, US
Duties extended for further five years until 2020. Investigation into claims exporters are circumventing duties
India CVD HR, CR stainless flat products China CVD duties set at 18.95% in July 2017
India AD HRC, CRC All importers India has pushed the response deadline for it HRC & CRC AD investigations to June 20
India AD CRC China, Japan, South Korea, Ukraine Final duties equivalent to the difference between the CFR Mumbai price and the reference price of $576/mt CFR Mumbai, effective for five years from August 17, 2016
India Safeguard duties
Hot rolled sheet, plates All importers Duties applied at 10% on imports of hot rolled sheets and plates of thickness 150mm or less and width 600mm and more, for 1 year
India AD Alloy and non-alloy color-coated/pre-painted flats
China, EU Investigation launched
India AD Seamless pipes and tubes China Duties of $961.33-$1,610.67/mt on popular grades of seamless tubular products imported from China.
India AD Hot rolled alloy and non-alloy steel bars and rods
China Finance ministry imposed at minimum price on import of $449-538/mt for six month, effective November 2 2016
India AD Coated/pre-painted steel 6mm China, EU Margins of 50%-60% for China and 70%-80% for EU
India AD Straight length alloy steel bars and rods
China Duties ranging from $44.89-$185.51/mt imposed for five years effective October 2018
India Tariff Iron and steel products US Tariffs in the range of 20%-25% for several steel and iron products, including some flat-rolled steel
India AD Non-cobalt grade, high-speed steel Brazil, China, Germany Duties set at $2,147.22/mt for Brazil; $1,902.34/mt, $2,275.64/mt and $3,263.68/mt for China; and $2,259.22/mt for Germany August 1, 2019. Duties to remain in place for five years.
India CVD Welded stainless pipe and tube China, Vietnam CVD rates of 21.74%-29.88% set for China and rates of 0.33%-11.96% set for Vietnam. Duties effective July 31, 2019 for a five-year period
India AD Coated flat steel China, South Korea, Vietnam India finalized antidumping duties ranging from $14.30/mt to $173.10/mt in June 2020
Pakistan AD CRC China, Ukraine Preliminary duties of 8%-19% imposed on January 13, final ruling by June 13
Pakistan AD Wire rod China Investigation launched in October, preliminary determination by mid-April
Pakistan AD Billet China Duty maintained at 15%
Pakistan AD Rebar China Preliminary dumping margin of 52.52%
Pakistan AD CRC China, Ukraine Provisional duties of 13.17%-19.04% on imports from thirteen companies based in China and Ukraine
Pakistan AD CRC Canada, Russia Provisional duty of 13.94% introduced September 20, 2019
Pakistan AD Color-coated steel China, South Africa Duties of 5.36%-10.88% for China and 14.24% for South Africa
AustraliaAustralia AD, CVD Rebar China Preliminary dumping duties of 5%-24% imposed ahead of final ruling in March, CVD probe to
start
Australia AD Wire rod China Final AD duty on Hunan Valin Xiangtan Iron & Steel of 44.1%, Shagang rod 37.4%, and all other Chinese exporters 53.1%
Australia AD Rebar Singapore, South Korea, Spain, Taiwan Dumping duties of up to 14.3% imposed on the four countries in November
Australia AD Rebar Spain Review opened for the 3-8.2% dumping measures applied in 2015
Australia AD Rebar Greece, Indonesia, Spain (Nervacero SA), Taiwan (Power Steel) and Thailand
Preliminary duties of 42.1% for Greece, 0.0%-12.2% for Indonesia, 7.5% for Spain’s Nervacero S.A, 4.4% for Taiwan’s Power Steel, and 9.6%-12.2% for Thailand
Australia AD Chrome-plated bar Italy, Romania Romania assigned definitive AD duties of 22.4%-66.9% in September 2016; Italy investigation terminated
Australia AD Hollow structural sections Thailand Duties of 5.7%-29.7% set to expire August 19, 2020 unless extended by expiry review
Australia AD Wire rod Indonesia, Taiwan Duties of 10.1% on Indonesian exporters and 2.7% on Taiwanese exporters imposed in June 2015
Australia AD Quenched & tempered plate Finland, Japan, Sweden Duties ranging from 21.7%-34% imposed in November 2014
Australia AD ERW pipes China, Malaysia, South Korea, Taiwan Dumping duties imposed in 2012 continued (China also subject to CVD duties)
Australia AD HDG China, Taiwan Australian AD Commission initiated two reviews of duties in September
Australia AD HDG sheet/coil India, Malaysia, Vietnam Duties of 7.6%-12% for India; 14.5%-16.5% for Malaysia; 8.4%-14.2% for Vietnamese exporters, except Hoa Sen Group and Nam Kim Steel JSC
Australia CVD HDG sheet/coil India CVD of 5% for JSW and 3.6% for Essar. Other exporters subject to a subsidy margin of 5.9%.
Australia AD Alloy steel bar China Investigation launched in January 2017
Source: Compiled by Platts, updated weekly