
Multi-Stage Platform for (Semi-)Automatic Planning in ... - MDPI
Upload
independentCategory
view
3download
0
Recent Patents on Space Technology, 2011, 1, 81-106 81
1877-6116/11 $100.00+.00 © 2011 Bentham Science Publishers
Satellite Image Automatic Mapper™ (SIAM™) - A Turnkey Software Executable for Automatic Near Real-Time Multi-Sensor Multi-Resolution Spectral Rule-Based Preliminary Classification of Spaceborne Multi-Spectral Images
Andrea Baraldi*
Department of Geography, University of Maryland, 4321 Hartwick Rd, Suite 209, College Park, Maryland, 20740, USA
Received: 17 March 2011; Revised: 03 May 2011; Accepted: 06 May 2011
Abstract: It is an unequivocal fact that to date the automatic or semi-automatic transformation of huge amounts of multi-
source multi-resolution remote sensing (RS) imagery into useful information (such as biophysical variables, categorical
maps, etc.) still remains far more problematic than might be reasonably expected. To invert this trend, a novel two-stage
stratified hierarchical hybrid remote sensing image understanding system (RS-IUS) was presented in recent literature to
encompass the four levels of analysis of an information processing device, namely, computational theory (system
architecture), knowledge/information representation, algorithm design and implementation. The proposed original RS-IUS
architecture comprises: (i) a first-stage pixel-based application-independent top-down (deductive, physical model-driven,
prior knowledge-based) preliminary classifier and (ii) a second-stage battery of stratified hierarchical context-sensitive
application-dependent modules for class-specific feature extraction and classification. The proposed implementation of
the prior knowledge-based preliminary classification first stage of a two-stage stratified hierarchical hybrid RS-IUS
consists of the original Satellite Image Automatic Mapper™ (SIAM™, University of Maryland Invention Disclosure No.
IS-2010-103, patent pending, © Andrea Baraldi & University of Maryland). SIAM™ is an operational automatic (turnkey,
good-to-go, press-and-go) software button (executable) for unsupervised near real-time per-pixel multi-source multi-
resolution application-independent spectral rule-based decision-tree classification of spaceborne multi-spectral imagery.
The goal of this patent review is to highlight the several degrees of novelty and operational advantages of the proposed
two-stage hybrid RS-IUS employing SIAM™ as its preliminary classification first stage in comparison with alternative
approaches, such as two-stage object-based RS-IUSs which, in spite of their lack of consensus and research, have recently
gained widespread popularity in both scientific and commercial RS image applications.
Keywords: Decision-tree classifier, deductive learning, image classification, inductive learning, prior knowledge, radiometric calibration, remote sensing.
1. INTRODUCTION
One traditional, albeit visionary goal of the remote sensing (RS) community is the development of operational (easy to use, accurate, fast, robust) satellite-based measurement systems suitable for automating the quantitative analysis of large-scale spaceborne multi-source multi-resolution image databases [1]. In past years this goal was almost exclusively dealt with in research programs involved with land cover (LC) and land cover change (LCC) detection at global scale [1] (pp. 451, 452). In fact, the majority of RS scientists and practitioners appears to be involved with RS data understanding problems at small spatial scale and coarse semantic granularity (equivalent to toy cognitive problems) where many RS data understanding approaches, e.g., supervised data learning Support Vector Machines (SVMs) [2], are capable of achieving satisfactory operational quality indicators (QIs), such as degree of automation, accuracy, efficiency, robustness to changes in
*Address correspondence to this author at the Department of Geography,
University of Maryland, 4321 Hartwick Rd, Suite 209, College Park,
Maryland, 20740, USA; Tel: (+1)301-314-1467; Fax: (+1)301-405-6806;
E-mail: [email protected]
input parameters, robustness to changes in the input data set, scalability, timeliness and economy.
In recent years the objective of developing operational satellite-based measurement systems has become increasingly urgent due to multiple drivers. While cost-free access to large-scale low spatial resolution (SR) (above 40 m) and medium SR (from 40 to 20 m) spaceborne image databases has become a reality [1, 3-7], in parallel, the demand for high SR (between 20 and 5 m) and very high SR (VHR, below 5 m) commercial satellite imagery has continued to increase in terms of data quantity and quality, which has boosted the rapid growth of the commercial VHR satellite industry [5].
In this scientific and commercial context, an increasing number of on-going international research projects aim at the development of operational services requiring harmonization and interoperability of Earth observation (EO) data and derived information products generated from a variety of spaceborne imaging sensors at all scales - global, regional and local. Among these on-going programs it is worth mentioning the Global EO System of Systems (GEOSS) conceived by the Group on Earth Observations (GEO) [6, 7], the Global Monitoring for the Environment and Security (GMES), which is an initiative led by the European Union

82 Recent Patents on Space Technology, 2011, Volume 1, No. 2 Andrea Baraldi
(EU) in partnership with the European Space Agency (ESA) [8-9], the National Aeronautics and Space Administration (NASA) Land Cover and Land Use Change (LCLUC) program [1] (p. 3) and the U.S. Geological Survey (USGS)-NASA Web-Enabled Landsat Data (WELD) project [10].
Unfortunately, based on unequivocal sources of converging evidence it is possible to infer that to date the automatic or semi-automatic transformation of huge amounts of multi-source multi-resolution RS imagery into information still remains far more problematic than might be reasonably expected. This thesis is perfectly in line with a well-known opinion by Zamperoni according to which, to date, scientific disciplines such as Computer Vision (CV), Artificial Intelligence (AI)/Machine Intelligence (MAI) and Cybernetics/Machine Learning (MAL), whose origins dates back to the late 1950s, appear inadequate to provide their cognitive objectives with operational solutions [11]. To support the aforementioned thesis, consider the following facts.
• The percentage of data downloaded by stakeholders from the ESA EO databases is estimated at about 10% or less (!) [12]. Does the interested reader know of any other public or private sector, with the exception of RS, where the exploitation index of valuable and expensive resources (e.g., RS data) is as low as 10% or less?
• The Ministry of Science and Technology of the People’s Republic of China has recently approved the launching of a new global land cover mapping project at the 30 m resolution level where primary sources of spaceborne images are the MODIS sensor, for data acquired around the year 2000, and Landsat-class sensors primarily acquired around the year 2010 [13]. In terms of data processing system architecture, a stratified hierarchical land cover classification approach will be adopted, with eco-region classification done first and more detailed land cover
classification performed within each eco-region. Both computer-based image classification algorithms and manual (!) image interpretation techniques will be assessed, selected and employed for different types of eco-regions. To summarize, in the year 2011 the second-largest economy in the world considers manual image interpretation a still-competitive and viable solution in practical RS data mapping problems at global scale.
• In the framework of the Global Forest Cover Change (GFCC) Project [14], an SVM model selection strategy is run for each (!) image of a multi-temporal image mosaic at global scale. This site-specific model selection approach is extremely time-consuming, to counterbalance the well-known limitation of statistical models which are effective for summarizing local data exclusively, i.e., they are usually (always?) site-specific [15]. In addition, it is well-known that supervised (labeled) data learning algorithms, whether context-insensitive (e.g., pixel-based) or context-sensitive (e.g., (2-D) object-based), require the collection of reference training samples which are typically scene-specific, expensive, tedious and difficult or impossible to collect [1]. This means that, in RS common practice where supervised data learning algorithms are employed, the cost, timeliness, quality and availability of adequate reference (training/testing) datasets derived from field sites, existing maps and tabular data have turned out to be the most limiting factors on RS data product generation and validation [1].
• Emanuel Diamant asks: when did AI, MAL and CV derail from their original and ambitious goals? To make their cognitive problem domain more “tractable”, these scientific disciplines were fragmented into many partial tasks and goals. Diamant's answer to his own question is: These
Table 1. Existing Commercial RS-IUSs and their Degree of Match with the International QA4EO Guidelines
Commercial RS-IUSs
Sub-symbolic (Asemantic) Versus Symbolic
(Semantic) Information Primitives, Namely,
Pixels/(2-D) Objects (Regions, Segments)/Strata
Radiometric Calibration (RAD. CAL.) Requirement
According to the International QA4EO Guidelines [7]
PCI Geomatics GeomaticaX Sub-symbolic pixels NO RAD. CAL. semi-automatic and site-specific
eCognition Server by Definiens AG
Unsupervised data learning sub-symbolic objects NO RAD. CAL. semi-automatic and site-specific
Pixel- and Segment-based versions of the Environment for Visualizing Images (ENVI) by
ITT VIS
Either sub-symbolic pixels or unsupervised data learning sub-symbolic objects
NO RAD. CAL. semi-automatic and site-specific
ERDAS IMAGING Objective Supervised data learning symbolic objects NO RAD. CAL. semi-automatic and site-specific
ERDAS Atmospheric Correction-3 (ATCOR-3) [25]
Sub-symbolic pixels Consistent with the QA4EO recommendations: surface reflectance, SURF inherently ill-posed atmospheric
correction first stage semi-automatic and site-specific.
Novel two-stage stratified hierarchical RS-IUS employing
SIAM™ as its preliminary classification first stage
Prior knowledge-based symbolic pixels symbolic objects symbolic strata (layers)
Consistent with the QA4EO recommendations: top-of-atmosphere (TOA) reflectance (TOARF) or surface
reflectance (SURF) values, with TOARF SURF atmospheric correction is optional. Automatic and robust to
changes in RS optical imagery acquired across time, space and sensors.

Satellite Image Automatic Mapper™ - SIAM™ Recent Patents on Space Technology, 2011, Volume 1, No. 2 83
disciplines derailed right at their origin dating back to the late 1950s. For example, Diamant reports that Steve Grand said: “Rodney Brooks has a copy of a (1956's) memo from Marvin Minsky (one of the founders of AI) in which he suggested charging an undergraduate for a summer project with the task of solving vision. I don’t know where that undergraduate is now, but I guess he hasn’t finished yet” [16].
• The international Quality Assurance Framework for Earth Observation (QA4EO), led by the Committee of Earth Observations (CEOS) Working Group on Calibration and Validation (WGCV) in the context of the GEOSS program, considers mandatory an appropriate coordinated program of calibration and validation (Cal/Val) activities throughout all stages of a spaceborne mission, from sensor building to end-of-life [7]. This ensures the harmonization and interoperability of multi-source observational data and derived products. In spite of the QA4EO recommendations and although it is regarded as common knowledge in the RS community, radiometric calibration, i.e., the transformation of dimensionless digital numbers (DNs) into a physical unit of measure related to a community-agreed radiometric scale, is often neglected in literature and surprisingly ignored by scientists, practitioners and institutions involved with RS common practice including large-scale spaceborne image mosaicking and mapping [17-24]. For example, in disagreement with the QA4EO guidelines, most existing scientific and commercial RS-IUSs, such as those listed in Table 1, do not require RS images to be radiometrically calibrated and validated. As a
consequence, these RS-IUSs are semi-automatic and/or site-specific, refer to Section 5.
To summarize, according to the aforementioned sources of evidence it is possible to state that to date productivity in terms of quality, quantity and value of high-level output products generated from input EO imagery remains unexpectedly low in both scientific and commercial applications. This is tantamount to saying that existing scientific and commercial RS image understanding (classification) systems (RS-IUSs), such as [25-27], score poorly in operational contexts. If this conjecture holds in general, it applies in particular to two-stage segment-based RS-IUSs (see Fig. 1), whose conceptual foundation is well-known in literature as (2-D) object-based image analysis (OBIA) [28]. Due to the availability of a commercial OBIA software developed by a German company [26-27], OBIA approaches are currently considered the state-of-the-art in both scientific and commercial RS image mapping applications. However, in spite of its commercial success, OBIA remains affected by a lack of general methodological consensus and research [28].
To outperform existing scientific and commercial image understanding systems there is a new trend in both computer vision [29] and RS literature [15, 30]. This novel trend deals with the development of hybrid models for retrieving sub-symbolic continuous variables (e.g., leaf area index) and symbolic categorical discrete variables (e.g., land cover composition) from optical multi-spectral (MS) imagery. By definition, hybrid models combine both statistical (bottom-up, fine-to-coarse, driven-without-knowledge, inductive learning-by-example) and physical (top-down, coarse-to-fine, prior knowledge-based, deductive learning-by-rule) models to take advantage of the unique features of each and overcome their shortcomings [15, 29, 30].
Fig. (1). Two-stage segment-based RS-IUS architecture adopted, for example, by the eCognition commercial software toolbox [13]. This
data flow diagram (DFD) shows processing blocks as rectangles and sensor derived data products as circles [50]. Preliminary image
simplification is pursued by means of an (ill-posed hierarchical) image segmentation approach which generates as output a segmented
(discrete) map, either single-scale or multi-scale. Worthy of note is that first-stage output sub-symbolic informational primitives, namely,
labeled segments (2-D objects, parcels), e.g., segment 1, segment 2, etc., are provided with no semantic meaning.
(Ill-posed) Hierarchical piecewise constant image segmentation (includes no texture
model)
Class 1-specific Fuzzy Rule-based Classifier
Inter-segment spatial non-topological
relationships
Chromatic or achromatic Input
Image
Segment-based color/achromatic
features
Segment-based morphological
features
Segment-based texture features
Segment-based geometric features
Inter-segment spatial topological
relationships
Class 3-specific Fuzzy Rule-based Classifier
Defuzzification (Crisp 1-of-3 class label)
Class 2-specific Fuzzy Rule-based Classifier
2 31

84 Recent Patents on Space Technology, 2011, Volume 1, No. 2 Andrea Baraldi
Accomplished by the author of the present work, novel achievements in the development of an operational automatic (turnkey, good-to-go, press-and-go) hybrid RS-IUS were recently published in RS literature [17-24]. These new developments encompass the four levels of analysis of an information processing device [18, 21], namely: (i) computational theory (system architecture), (ii) knowledge/ information representation, (iii) algorithm design and (iv) implementation. In particular, a novel two-stage stratified hierarchical hybrid RS-IUS architecture was proposed (see Fig. 2). It comprises:
(i) a first-stage pixel-based application-independent top-down (physical model-driven, prior knowledge-based) preliminary classifier and
(ii) a second-stage battery of stratified hierarchical context-sensitive application-dependent modules for class-specific feature extraction and classification.
It is noteworthy that, since it employs a first-stage physical model rather than a first-stage statistical model like traditional OBIA systems, the proposed two-stage stratified hierarchical hybrid RS-IUS architecture encompasses a change in the learning paradigm at first stage from inductive
Machine-Learning (MAL)-from-data to deductive Machine-Teaching (MAT)-by-rules [16, 47].
The proposed original implementation of the aforementioned first-stage preliminary classifier consists of the Satellite Image Automatic Mapper™ (SIAM™, University of Maryland Invention Disclosure No. IS-2010-103, patent pending, © Andrea Baraldi & University of Maryland) [17-24]. SIAM™ is an operational automatic (turnkey, good-to-go, press-and-go) software button (executable) for unsupervised near real-time per-pixel multi-source multi-resolution application-independent spectral rule-based decision-tree classification of spaceborne MS imagery. To the best of this author’s knowledge, SIAM™ provides the first operational example of an automatic multi-sensor multi-resolution EO system of systems envisaged under on-going international research programs such as the GEOSS [6, 7].
The goal of this patent review is to highlight the several degrees of novelty and operational advantages of the proposed two-stage hybrid RS-IUS (see Fig. 2) employing SIAM™ as its preliminary classification first stage in comparison with alternative approaches, such as two-stage segment-based RS-IUSs (see Fig. 1) which, in spite of their
Fig. (2). Novel hybrid two-stage stratified hierarchical RS-IUS architecture, related to original works by Shackelford and Davis [42, 43].
This DFD (refer to Fig. 1) shows processing blocks as rectangles and sensor-derived data products as circles. In this example, a 10 m
resolution SPOT-5 multi-spectral (MS) image is adopted as input, where anthropic structures (e.g., roads, buildings) are visible. According to
the sole SIAM™ input data requirement, input digital numbers (DNs) are radiometrically calibrated into top-of-atmosphere (TOA)
reflectance (TOARF) values or surface reflectance (SURF), with TOARF SURF, the latter being an ideal (atmospheric noise-free) case of
the former. The panchromatic (PAN) image can be generated as a linear combination of the multi-spectral (MS) bands. The MS image is
input to the preliminary classification first stage and, if useful, to second-stage class-specific classification modules. The PAN image is
exclusively employed as input to second-stage stratified class-specific context-sensitive feature extractors and classification modules, where
color information is dealt with by stratification. For example, stratified (driven-by-knowledge, better-posed) texture detection is computed in
the PAN image domain, which reduces computation time. It is noteworthy that a stratified image segmentation module is run at the second
stage only where required, namely, in the image candidate areas where the presence of anthropic structures featuring salient geometric
properties (e.g., roads, building, impervious surfaces) is feasible. It is noteworthy that as output of the first-stage SIAM™ preliminary
classifier, symbolic pixels in symbolic segments in symbolic strata (layers) co-exist. In other words, three spatial types (pixel, segment and
stratum) co-exist as output of the first-stage SIAM™, which overcomes the typical duality of sub-symbolic pixels versus sub-symbolic
segments in OBIA systems (see Fig. 1).
���������������� � ������������������������� ���
������������� �������!� ����"���#�$ ���$ �%�
������������ �������!� ����"���#�$ ���$ �%�
������������ ����������������������� ��������� ���
�� ������������ �� ��������� ���������������� ��!
�
��"�����"����������� ���#���$���%����#&����#����'"�(��"
���� �%����
&������������'
���� ���#�������(�))*+���"���������!�!��
,�� � !�� �-
���� �.(�))*�+���"����
�����!�!��,�� � !�� �-
���� �/�#�������(�))*+���"���������!�!��
,�� � !�� �-
���� �0�,"��������-
��% � �!�
+����1�!��! %1���� ��� �����'
���� �0�����������(�))*+���"���������!�!��
,�� � !�� �-
+���������#����,��%��� �#����'2��������'�����-
3���������#���'
4���))!�!��!� �,��!������5���������"��-
���
������ � � � � �

Satellite Image Automatic Mapper™ - SIAM™ Recent Patents on Space Technology, 2011, Volume 1, No. 2 85
lack of consensus and research [28], have recently gained widespread popularity in both scientific and commercial RS image applications [26, 27].
The rest of this paper is organized as follows. Operational properties of SIAM™ are summarized in Section 2. Section 3 presents SIAM™ as a system of systems eligible for use with nearly all existing spaceborne optical imaging sensors. The novel two-stage stratified hierarchical hybrid RS-IUS instantiation employing SIAM™ as preliminary classification first stage, proposed in [17-24], is sketched in Section 4. Section 5 compares the proposed two-stage stratified hierarchical hybrid RS-IUS design with existing RS-IUS architectures. SIAM™ application examples are shown in Section 6. Add on modules to be employed in series with SIAM™ are discussed in Section 7. In Section 8, new interdisciplinary research and market opportunities opened up by SIAM™ are explored. Section 9 compares SIAM™ with recent patents on space technology. Future developments are reported in Section 10.
2. MAIN FUNCTIONAL PROPERTIES OF THE SIAM™ PRELIMINARY CLASSIFIER
SIAM™ consists of an operational automatic (turnkey, good-to-go, press-and-go) preliminary Spectral Rule-based Classifier (SRC), equivalent to a non-adaptive (to data) decision-tree classifier, presented in RS literature in recent years [17-24].
As input, SIAM™ requires a multi-spectral (MS) image radiometrically calibrated into top-of-atmosphere (TOA) (planetary) reflectance (TOARF) values or surface reflectance (SURF) values, where TOARF SURF, the latter being an ideal (atmospheric noise-free) case of the former when atmospheric effects are removed [25] or considered negligible [59]. This allows SIAM™ to consider the inherently ill-posed atmospheric correction of an input MS image as an optional rather than compulsory pre-processing stage, unlike competitive commercial RS-IUSs such as ERDAS ATCOR-3 [25] (also refer to Table 1).
As output, SIAM™ generates a preliminary classification map or primal sketch in the Marr sense [31]. This preliminary classification map consists of a discrete finite set of mutually exclusive and totally exhaustive spectral-based semi-concepts, also called spectral categories. Each spectral category is equivalent to a land cover class set. For example, spectral category ‘vegetation’ is an or-combination (union) of land cover classes ‘either woody vegetation or cropland or grassland (herbaceous vegetation) or (shrub and brush) rangeland’. To summarize, the semantic meaning of a spectral category is:
• superior to zero, which is the semantic value of traditional sub-symbolic image segments and unlabeled data clusters, and
• equal or inferior to the semantic meaning of target (3-D) land cover classes, also called concepts or (3-D) object-models [30].
Thus, spectral-based semi-concepts are eligible for filling in the well-known information gap between stable percepts (semantic information) and varying sensations (sensory data) [30]. In practice, “we are always seeing objects we have
never seen before at the sensation level, while we perceive familiar objects everywhere at the perception level” [30]. In particular, spectral-based semi-concepts (e.g., vegetation) fill in the gap between symbolic concepts (e.g., land cover classes) in the (3-D) scene (e.g., broad-leaf forest) and sub-symbolic (non-semantic) features in the (2-D) image such as sub-symbolic pixels and sub-symbolic (2-D) regions (segments) or, vice versa, region boundaries (since boundary detection is the dual task of 2-D region extraction). It is well known that (2-D) image segments are affected by the uncertainty principle according to which, for any contextual (neighborhood) property, we cannot simultaneously measure that property while obtaining accurate localization [32, 33]. This is tantamount to saying that image segmentation, namely, region extraction and its dual problem, contour detection, is an ill-posed (subjective) task (for further discussions on this important issue, which is often underestimated or neglected by the CV and RS communities, refer to Section 5).
Spectral categories generated as output by SIAM™
belong to six parent spectral categories (also called super-categories) or major spectral end members which are listed below.
I. ‘Clouds’.
II. ‘Either snow or ice’.
III. ‘Either water or shadow’.
IV. ‘Vegetation’, equivalent to the land cover class set ‘either woody vegetation or cropland or grassland (herbaceous vegetation) or (shrub and brush) rangeland’.
V. ‘Either bare soil or built-up’.
VI. ‘Outliers’.
In terms of operational quality indexes (QIs), SIAM™ appears superior to existing commercial RS-IUSs [17-24] (also refer to Section 5). In operational contexts a RS-IUS is defined as a low performer if at least one among several operational QIs scores low. Typical operational QIs of a RS-IUS encompass the following (also refer to Table 6).
1. Degree of automation. A data processing system is termed automatic when it requires no user-defined parameter to run, therefore its user-friendliness cannot be surpassed. When a data processing system requires neither user-defined parameters nor reference data samples to run, then it is termed “fully automatic” [17-24]. For example, the prior knowledge-based SIAM™ is fully automatic. Therefore, its ease of use cannot be surpassed.
2. Effectiveness, e.g., classification accuracy. For example, in recent years SIAM
™ has been subjected
to independent scientific scrutiny for validation over a wide range of spatial conditions, time periods, optical imaging sensors and geographic extents ranging from local to regional and continental scales [17-24].
3. Efficiency, e.g., computation time, memory occupation, etc. For example, SIAM
™ is near real-
time, namely, it takes 5 minutes to map a Landsat scene on a standard laptop computer.
86 Recent Patents on Space Technology, 2011, Volume 1, No. 2 Andrea Baraldi
4. Robustness to changes in the input data set acquired across time, space and sensors, e.g., changes due to noise in the data. For example, SIAM™ is eligible for use with nearly all existing spaceborne optical sensors (refer to Table 2).
5. Robustness to changes in input parameters, if any exist. For example, SIAM™ employs no input parameter to be user-defined, therefore its robustness to changes in input parameters cannot be surpassed.
6. Maintainability/scalability/re-usability to keep up with changes in users’ needs and sensor properties. For example, to scale to different spectral resolutions of spaceborne optical sensors SIAM™ consists of six sub-systems (refer to Table 2).
7. Timeliness, defined as the time span between data acquisition and product delivery to the end user. It increases monotonically with manpower, e.g., the manpower required to collect site-specific training samples. For example, SIAM™ reduces timeliness (from data acquisition to preliminary map generation) to approximately zero.
8. Economy (costs). Related to manpower and computing power. For example, open source solutions are welcome to reduce costs of software licenses. In the case of SIAM™ costs of manpower (equal to zero since SIAM™ is fully automatic) and computing power (equal to 5 minutes to classify a a Landsat scene on a standard laptop computer) are negligible.
In addition SIAM™
is:
• pixel-based, i.e., it works at the sensor spatial resolution. In other words SIAM
™ is spatial
resolution-independent;
• application-independent. In other words SIAM™
provides a unifying preliminary classification first stage independent of the MS image classification problem at hand.
3. THE SIAM™ SYSTEM OF SYSTEMS
To the best of this author's knowledge SIAM™ provides the first example of operational automatic (turnkey, good-to-go, press-and-go) multi-sensor multi-resolution EO system of systems in line with the visionary goal of the GEOSS international research program (refer to Section 1) [6, 7]. In particular, SIAM™ consists of six sub-systems, comprising one master 7-band Landsat-like SIAM™ (L-SIAM™) plus five down-scaled L-SIAM™ subsystems whose spectral resolution overlaps with, but is inferior to, Landsat’s.
The six SIAM™ sub-systems are identified as follows (see Table 2).
1. 7-band [namely, channel Blue (B), Green (G), Red (R), Near Infra-Red (NIR), Medium IR1 (MIR1), Medium IR2 (MIR2), and Thermal IR (TIR)] L-SIAM
™.
2. 4-band (channels G, R, NIR, MIR1) SPOT-like SIAM
™ (S-SIAM
™).
3. 4-band (channels R, NIR, MIR1, and TIR) Advanced Very High Resolution Radiometer (AVHRR)-like SIAM
™ (AV-SIAM
™).
4. 5-band (channels G, R, NIR, MIR1, and TIR) ENVISAT Advanced Along-Track Scanning Radiometer (AATSR)-like SIAM
™ (AA-SIAM
™).
5. 4-band (channels B, G, R, and NIR) IKONOS-like SIAM
™ (I-SIAM
™).
6. 3-band (channels G, R, and NIR) Disaster Monitoring Constellation (DMC)-like SIAM
™ (D-SIAM
™).
The output spectral categories detected by the six SIAM™
sub-systems described in Table 2 are summarized in Table 3. Two examples of map legends adopted by SIAM
™, namely,
the L-SIAM™
and the I-SIAM™
legend at fine semantic granularity, consisting of 95 and 52 spectral categories respectively, are provided in Tables 4 and 5.
4. NOVEL TWO-STAGE HYBRID REMOTE SENSING IMAGE UNDERSTANDING SYSTEM (RS-IUS)
ARCHITECTURE
SIAM™
is based on prior spectral knowledge exclusively, i.e., its knowledge is available before looking at the sensory data at hand. This is tantamount to saying that SIAM
™ is
non-adaptive to input data. Thus, SIAM™
belongs to the family of so-called top-down, physical model-based or deductive learning-by-rule inference systems (see Section 1) [15].
In terms of computational theory (system architecture), the top-down (deductive) SIAM
™ is not alternative, but
complementary in nature to traditional bottom-up, inductive learning-from-examples algorithms, such as statistical kernel-based classifiers (e.g., SVMs [2]), non-parametric neural networks, image segmentation algorithms, unlabeled data clustering algorithms, etc. [34-36].
In RS common practice, rather than as a standalone classifier, SIAM
™ is eligible for use as the automatic pixel-
based preliminary classification first stage of a novel two-stage stratified hierarchical hybrid RS-IUS architecture proposed in [17-24], see Fig. (2). According to Marr [31], the linchpin of success in attempting to solve the computer vision problem involves computational theory (system architecture) rather than algorithms or implementations. In other words, if the vision device architecture is inadequate, even sophisticated algorithms can produce low-quality outputs. On the contrary, improvement in the vision system architecture might achieve twice the benefit with half the effort.
The novel RS-IUS architecture shown in Fig. (2) combines a first-stage top-down context-insensitive (pixel-based) application-independent (general-purpose) preliminary classifier with second-stage bottom-up context-sensitive application-specific classification modules. Since it combines top-down with bottom-up inference strategies, this original RS-IUS model is termed hybrid (refer to Section 1). This is in line with a new trend in research in both computer vision and remote sensing where hybrid quantitative models are developed to combine benefits from both statistical

Satellite Image Automatic Mapper™ - SIAM™ Recent Patents on Space Technology, 2011, Volume 1, No. 2 87
(learning-from-data) and physical (learning-by-rule) models while overcoming shortcomings of each [15, 29, 30].
In the novel RS-IUS architecture shown in Fig. (2), traditional inductive data learning algorithms, such as supervised data learning classifiers and unsupervised data
Table 2. SIAM™ System of Systems. List of Spaceborne Optical Imaging Sensors Eligible for Use
Legend. Y: Yes, N: No, C: Complete, I: Incomplete (radiometric calibration offset parameters are set to zero), (E)TM: (Enhanced) Thematic Mapper, B: Blue, G: Green, R: Red,
NIR: Near Infra-Red, MIR: Medium IR, TIR: Thermal IR, SR: Spatial Resolution, Pan: Panchromatic (for interpretation of the references to color in this table Caption, the reader is
referred to the web version of this paper).
Blue columns: visible channels typical of water and haze. Green column: NIR band typical of vegetation. Brown columns: MIR channels characteristics of bare soils. Red column: TIR channel.
SIAM™
System of
Systems
B –
(E)TM1,
0.45-0.52
(μm)
G –
(E)TM2,
0.52-0.60
(μm)
R –
(E)TM3,
0.63-0.69
(μm)
NIR –
(E)TM4,
0.76-0.90
(μm)
MIR1 –
(E)TM5,
1.55-1.75
(μm)
MIR2 –
(E)TM7,
2.08-2.35
(μm)
TIR –
(E)TM6,
10.4-12.5
(μm)
SR
(m)
Rad.
Cal.
Y/N,
C/I
Pan
SR
(m)
Notes
Landsat-4/-5 TM 30 Y-C Refer to Table I in [17].
L-
SIAM™
Landsat-7 ETM+ 30 Y-C 15 Same as above.
(95/47/
18 MODIS
250,
500, 1000
Y-C Same as above.
Sp.
Cat.) ASTER
15-
30 Y-C Same as above.
CBERS-2B N
SPOT-4 HRVIR 20 Y-I 10 Refer to Table II
in [17].
SPOT-5 HRG 10 Y-I 2.5 -
5 Same as above.
SPOT-4/-5 VMI 1100 Y-I Same as above.
IRS-1C/-1D LISS-
III 23.5 Y-I
IRS-P6 LISS-III 23.5 Y-I
S-
SIAM™
(68/40/15 Sp.
Cat.)
IRS-P6 AWiFS 56 Y-I
AV-
SIAM™
NOAA AVHRR 1100 Y
Refer to Table II
in [17].
(82/42/
16 Sp. Cat.)
MSG 3000 Y Same as above.
ENVISAT AATSR 1000 Y Same as above. AA-
SIAM™
(82/42/16Sp.
Cat.)
ERS-2 ATSR-2 1000 Y
IKONOS-2 4 Y 1
QuickBird-2 2.4 Y 0.61
WorldView-2 2.0 Y 0.5
I-
SIAM™
GeoEye-1 1.64 Y 0.41
(52/28/ OrbView-3 4 Y 1
12Sp. RapidEye-1 to -5 6.5 Y-I
Cat.) ALOS AVNIR-2 10 Y
KOMPSAT-2 4 N 1
TopSat 5 N 2.5
FORMOSAT-2 8 N 2
Landsat-1/-2/-3/-4/-5 MSS
79 Y
IRS-P6 LISS-IV 5.8 Y-I
SPOT-1/-2/-3 HRV
20 Y-I 10
D-
SIAM™
(52/28/12Sp.
Cat.)
DMC 22-
32 N

88 Recent Patents on Space Technology, 2011, Volume 1, No. 2 Andrea Baraldi
learning image segmentation algorithms, are employed at second stage on a stratified (driven-by-knowledge) basis. The idea of stratification is well known in statistics. Its advantage is that “stratification will always achieve greater precision provided that the strata have been chosen so that members of the same stratum are as similar as possible in respect of the characteristic of interest” [37]. Hence, statistical models (inductive data learning algorithms) are never made worse (i.e., they are improved or left the same) by incorporating the “stratified” or “layered” approach, which is typical of decision-trees [36].
5. COMPARISON WITH EXISTING RS-IUS MODELS
Due to the availability of commercial software developed by a German company [26, 27], OBIA has recently gained widespread popularity and is currently considered the state-of-the-art in both scientific and commercial RS image mapping application domains. Unfortunately, together with their increasing diffusion commercial two-stage segment-based RS-IUSs show an increasing lack of productivity [38], consensus and research [28].
To overcome these shortcomings many researchers in the field of cognitive psychology believe that object segmentation cannot be achieved in a completely bottom-up manner, which is tantamount to saying that segmentation and
Table 3. SIAM™ Systems of Systems
Preliminary Classification Map Output Products: Number of Output Spectral Categories
SIAM™
Input bands Fine Semantic
Granularity
Intermediate
Semantic Granularity
Coarse Semantic
Granularity
Inter-Sensor Semantic
Granularity (*)
L-SIAM™ 7 – B, G, R, NIR, MIR1, MIR2, TIR 95 47 18
S-SIAM™ 4 – G, R, NIR, MIR1 68 40 15
AV-SIAM™ 4 – R, NIR, MIR1, TIR 82 42 16
AA-SIAM™ 5 – G, R, NIR, MIR1, TIR 82 42 16
I-SIAM™ 4 – B, G, R, NIR 52 28 12
D-SIAM™ 3 – G, R, NIR 52 28 12
33
Summary of Input Bands and Output Spectral Categories Reported in Table 2.
(*) Employed in Sensor-independent Bi-temporal Land Cover Change Detection.
Table 4. Preliminary Classification Map Legend Adopted by L-SIAM™ at Fine Semantic Granularity, Refer to Table 3
Pseudo-colors of the 95 Spectral Categories Are Gathered Based on Their Spectral End Member (e.g., Bare Soil or Built-up) or Parent Spectral Category (e.g., “High” LAI
Vegetation Types). The Pseudo-Color of a Spectral Category is Chosen as to Mimic Natural Colors of Pixels Belonging to that Spectral Category (for interpretation of the references
to color in this table caption, the reader is referred to the web version of this paper).
Table 5. Preliminary Classification Map Legend Adopted by I-SIAM™ at Fine Semantic Granularity, Refer to Table 3
Pseudo-colors of the 52 Spectral Categories Are Gathered Based on Their Spectral End Member (e.g., Bare Soil or Built-up) or Parent Spectral Category (e.g., “High” LAI
Vegetation Types). The Pseudo-Color of a Spectral Category is Chosen as to Mimic Natural Colors of Pixels Belonging to that Spectral Category (for interpretation of the references
to color in this table caption, the reader is referred to the web version of this paper).
"High" leaf area index (LAI) vegetation types (LAI values decreasing left to right)
"Medium" LAI vegetation types (LAI values decreasing left to right)
Shrub or herbaceous rangeland
Other types of vegetation (e.g., vegetation in shadow, dark vegetation, wetland)
Bare soil or built‐up
Deep water, shallow water, turbid water or shadow
Thick cloud and thin cloud over vegetation, or water, or bare soil
Thick smoke plume and thin smoke plume over vegetation, or water, or bare soil
Snow and shadow snow
Shadow
Flame
Unknowns
"High" leaf area index (LAI) vegetation types (LAI values decreasing left to right)"Medium" LAI vegetation types (LAI values decreasing left to right)
Shrub or herbaceous rangeland
Other types of vegetation (e.g., vegetation in shadow, dark vegetation, wetland)
Bare soil or built‐up
Deep water or turbid water or shadow
Smoke plume over water, over vegetation or over bare soil
Snow or cloud or bright bare soil or bright built‐up
Unknowns
Satellite Image Automatic Mapper™ - SIAM™ Recent Patents on Space Technology, 2011, Volume 1, No. 2 89
classification are strongly linked [28]. In particular, Vecera and Farah proved that the process of human visual segmentation can be strongly influenced by top-down human (subjective) factors such as prior knowledge of the image at hand in addition to desires and expectations of an external observer [39]. To date, the inherent ill-posedness of any image region extraction/boundary detection algorithm (where image segmentation and boundary detection are dual problems - in fact they are both inherently ill-posed, i.e., subjective in nature) is acknowledged by a relevant portion of the CV and RS communities [28, 30, 32, 33, 40, 41].
Unfortunately, in spite of the abovementioned contributions found in existing literature, the majority of the CV and RS communities appears to ignore the inherently ill-posed (subjective) nature of the image segmentation problem. As a consequence, literally dozens of “novel” segmentation (region extraction/contour detection) algorithms are published each year, apparently searching for “the best” segmentation algorithm which cannot exist in practice.
Table 1 reports on the relationship existing between commercial RS-IUSs and the radiometric calibration constraint considered mandatory by the international
QA4EO guidelines [7]. Table 1 shows that firstly, no existing commercial RS-IUS software, except for the ERDAS Atmospheric Correction-3 (ATCOR3) software module [25], requires radiometric calibration pre-processing. In recent papers the present author highlighted the fact that by making RS data well behaved and well understood, radiometric calibration not only ensures the harmonization and interoperability of multi-source observational data according to the QA4EO guidelines, but is a necessary, although insufficient, condition for automating the quantitative analysis of EO data [17-24].
Briefly stated, in disagreement with the QA4EO guidelines, most existing scientific and commercial RS-IUSs, such as those listed in Table 1, do not require RS images to be radiometrically calibrated and validated. As a consequence, according to the aforementioned necessary condition for automating the quantitative analysis of EO data, these RS-IUSs are semi-automatic and/or site-specific (since one scene may represent, say, apples, while any other scene, even if contiguous or overlapping, may represent, say, oranges), refer to Table 1.
Table 6. Operational QIs of SIAM™ in Comparison With Those of Commercial State-of-the-Art RS-IUSs
Legend of Fuzzy Sets: Very Low (VL), Low (L), Medium (M), High (H), Very High (VH), Red highlight: Poor, Blue highlight: Medium, Green highlight: Good (for
interpretation of the references to color in this table caption, the reader is referred to the web version of this paper).
Quality Indicators (Qis) State-of-the-art RS-IUSs SIAM™
Degree of automation: (a) number, physical
meaning and range of variation of user-defined
parameters, (b)collection of the required training data
set, if any.
VL, L VH (fully automatic, it cannot
be surpassed)
Effectiveness : (a) semantic accuracy and (b) spatial
accuracy.
M, H, VH VH
Semantic information level Land cover class (e.g., deciduous forest)
Spectral semi-concept (e.g.,
vegetation)
Efficiency: (a) computation time and (b) memory
occupation.
VL, L in training (hours per
images)
VH (5 m to 30 s per Landsat
image in a laptop)
Robustness to changes in input image VL (specific training per image) VH
Robustness to changes in input parameters VL VH (it cannot be surpassed)
Scalability to changes in the sensor’s
specifications or user’s needs.
VL VH (it works with any existing
spaceborne sensor)
Timeliness (from data acquisition to high-level
product generation, increases with manpower and
computing power).
VH (e.g., the collection of
reference samples is a difficult
and expensive task)
VL, i.e., timeliness is negligible
(≈ 5 min of computation time in
a laptop computer)
Economy (inverse of costs increasing with
manpower and computing power).
VL, L, high costs in manpower
and also computing power
VH, i.e., costs in manpower and
computing power are reduced
to almost zero (no manpower,
≈ 5 min of computation time in
a laptop computer)

90 Recent Patents on Space Technology, 2011, Volume 1, No. 2 Andrea Baraldi
Secondly, Table 1 shows that unlike SIAM™ the ERDAS ATCOR3 requires as input an MS image radiometrically calibrated into surface reflectance (SURF) values. This implies that the ERDAS ATCOR3 software considers mandatory the inherently ill-posed and difficult-to-solve MS image atmospheric correction pre-processing stage, which requires user intervention to make it better posed. Thus, unlike SIAM™, the ERDAS ATCOR3 satisfies the necessary condition for automating the quantitative analysis of EO data, but is insufficient to provide a RS image classification problem with an automatic workflow requiring no user-defined empirical parameter based on heuristic criteria.
Table 6 shows that, based on existing literature [17-24], operational QIs of the prior knowledge-based SIAM™ (refer to Section 2) are superior to those of existing inductive data learning algorithms (e.g., supervised data learning classifiers, unsupervised data learning clustering algorithms, image segmentation algorithms, etc. [34-36]) adopted at the first stage of existing commercial RS-IUSs such as those listed in Table 1.
For example, with regard to the SIAM™ quantitative accuracy assessment found in existing literature [17-24], in the framework of the JRC-INFOREST project, whose aim is to generate a forest/nonforest binary classification map at pan-European scale, a vegetation/nonvegetation (V/NV) binary map was generated by SIAM™ from a Landsat 7 ETM+ scene acquired on August 3, 2001, depicting a test area located in central Italy [17]. The accuracy of the V/NV binary classification was assessed by means of a reference data set consisting of 500 testing samples, extracted according to a simple random sampling technique on a mosaic of forty-six panchromatic orthophotos acquired at 1m resolution during the Agea flight campaign in 1998 and covering a surface area of approximately 2000 Km
2 (which is approximately equivalent to
a 28.5m resolution Landsat image of 1200 2000 pixels). At regional scale, the tested V/NV binary classification map was considered accurate (featuring a classification Overall Accuracy, OA, equal to 98.2%± 0.0%) and robust against the presence of shadow areas and large within-class spectral variations.
6. SIAM™ APPLICATION EXAMPLES
Figs. 3-12 show application examples of the L-, S-, AV- and I-SIAM
™ sub-systems employing as input spaceborne optical
images ranging from low ( 3 km) to medium ( 30 m), high ( 10 m) and very high (< 5 m) spatial resolution at geographic extents ranging from local to continental scales.
For quantitative accuracy assessment of SIAM™, refer to Section 5 and existing literature [17-24].
7. ADD ON MODULES IN SERIES WITH THE SIAM™
A broad set of original (novel) EO data processing modules has been developed to be employed in series with the SIAM™ cross-platform. In RS common practice, without the SIAM™ first stage these second-stage EO data processing modules lose operational qualities in terms of accuracy or robustness to changes in the input data set. For example, whereas image segmentation in the sensory data space is an inherently ill-posed (subjective) problem [28, 30, 32, 33, 40, 41] (refer to Section 5), map segmentation in the symbolic map domain is well posed
(i.e., there is a unique segmentation map generated from a given classification map), e.g., refer to Fig. (8).
7.1. Second-Stage Semantic-Driven (Stratified) Image
Enhancement
By definition, an image enhancement process employs an image as input and generates as output an image of enhanced quality, e.g., in radiometric or geometric terms.
In series with the SIAM™, a set of original semantic-driven (stratified) image enhancement modules has been developed to be employed in an EO data processing chain provided with a feedback mechanism.
These original semantic-driven (stratified) image enhancement modules are listed below.
1. Semantic-driven texture enhancement based on morphology - Top-hat of opening (bright over dark), Top-hat of closing (dark over bright).
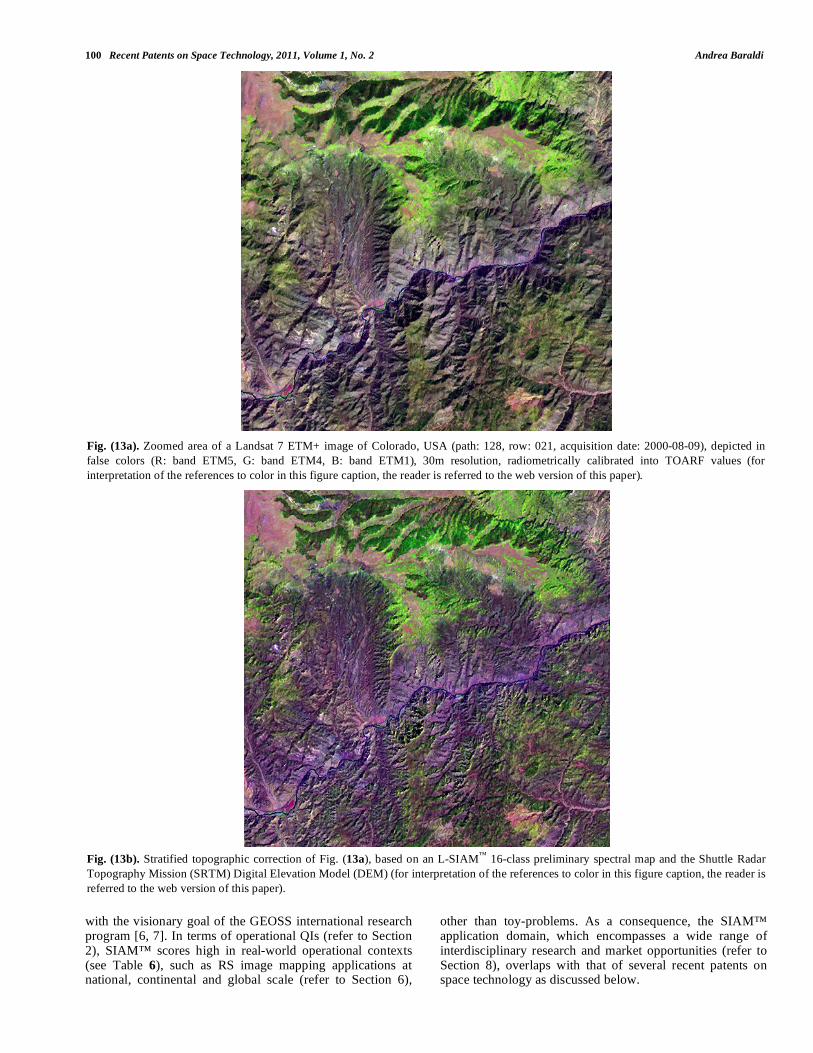
2. Operational automatic semantic-driven image topographic correction. To the best of this author's knowledge, this is the only example of operational automatic topographic corrector found in existing literature [23]. See Fig. (13).
3. Automatic semantic-driven master-slave image mosaic enhancement. See Fig. (14).
4. Semantic-driven piecewise constant approximation of the multi-spectral input image generated from the preliminary classification map domain at the fine level of semantic granularity, refer to Fig. (8). If the piecewise constant image reconstruction generated from the classification map is capable of preserving small, but genuine image details, then the classification map is equivalent to a lossless mapping of the image data onto a discrete and finite set of symbolic concepts (equivalent to quantization levels in a continuous data quantization problem).
7.2. Second-Stage Semantic-Driven (Stratified) Context-
Sensitive Feature Extraction Modules
In series with the SIAM™, a set of original semantic-driven (stratified) context-sensitive feature extraction modules has been developed to be employed at the second stage of the two-stage stratified hierarchical RS-IUS archi-tecture shown in Fig. (2). These original (novel) modules are listed below.
(i). Well-posed semantic-driven segmentation in the pre-liminary classification map domain at fine/intermediate/ coarse levels of semantic granularity, refer to Fig. (8).
(ii). Well-posed semantic-driven contour detection of segments in the preliminary classification map domain at fine/intermediate/coarse levels of semantic granularity. For example, see Fig. (8c). It is noteworthy that traditional ill-posed contour detection in the (2-D) image domain is the dual problem of ill-posed segmentation in the (2-D) image domain.
(iii). Parallelized semantic-based texture detection in the signal space by means of a semantic-based (stratified, masked) multi-scale multi-orientation wavelet filter bank with mirror padding. See Fig. (15).

Satellite Image Automatic Mapper™ - SIAM™ Recent Patents on Space Technology, 2011, Volume 1, No. 2 91
Fig. (3). MSG SEVIRI image acquired on May 16, 2007, at 12.30, depicted in false colors (R: band 3, G: band 2, B: band 1), spatial
resolution: 3 km (for interpretation of the references to color in this figure caption, the reader is referred to the web version of this paper).
Fig. (4). Preliminary output map generated from Fig. (3) by AV-SIAM™
. Output spectral categories are depicted in pseudo colors. Map
legend: similar to Table 4 (for interpretation of the references to color in this figure caption, the reader is referred to the web version of this
paper).

92 Recent Patents on Space Technology, 2011, Volume 1, No. 2 Andrea Baraldi
Fig. (5). 4-band GMES-IMAGE2006 Coverage 1 mosaic, consisting of approximately two thousand 4-band IRS-P6 LISS-III, SPOT-4, and
SPOT-5 images, mostly acquired during the year 2006, depicted in false colors: Red – Band 4 (Short Wave InfraRed, SWIR), Green – Band
3 (Near IR, NIR), Blue – Band 1 (Visible Green). Down-scaled spatial resolution: 25 m (for interpretation of the references to color in this
figure caption, the reader is referred to the web version of this paper).
Fig. (6). Preliminary classification map automatically generated by S-SIAM™
from the mosaic shown in Fig. (5). To the best of this author’s
knowledge, this is the first example of such a high-level product automatically generated at the European Commission – Joint Research
Center (EC-JRC). Output spectral categories are depicted in pseudo colors. Map legend: similar to Table 4 (for interpretation of the
references to color in this figure caption, the reader is referred to the web version of this paper).
Satellite Image Automatic Mapper™ - SIAM™ Recent Patents on Space Technology, 2011, Volume 1, No. 2 93
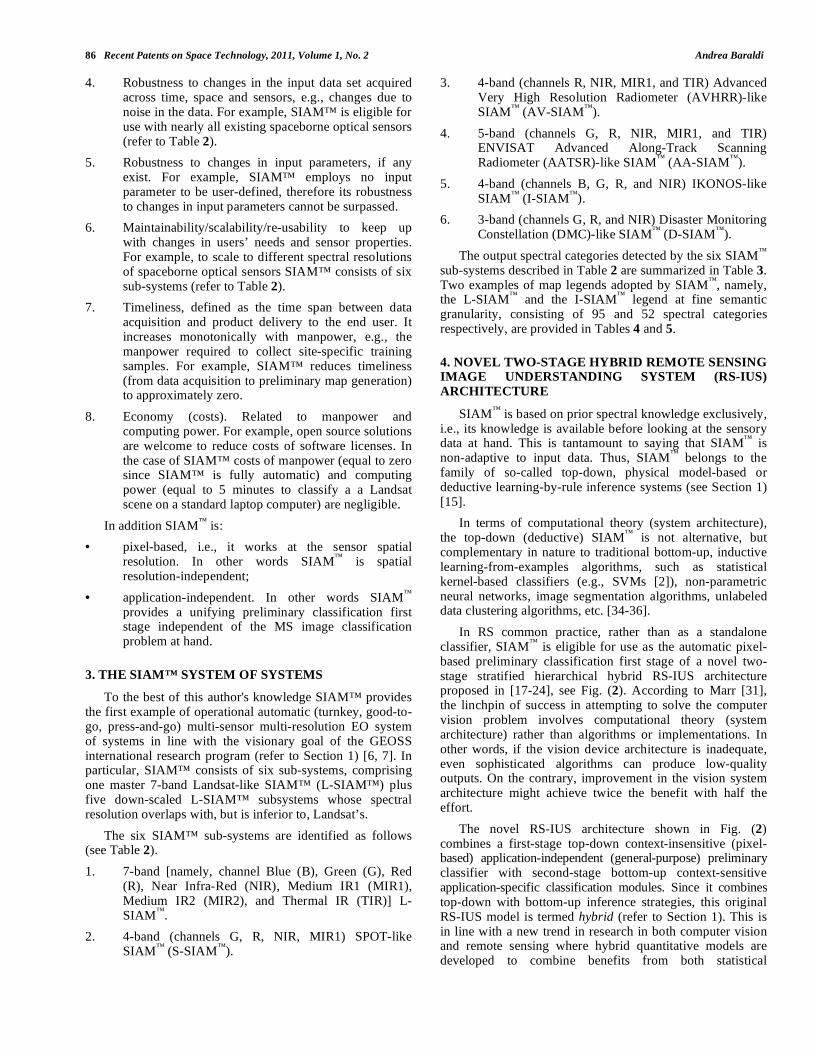
Fig. (7a). Web-Enabled Landsat Data (WELD) Project (http://landsat.usgs.gov/WELD.php). This is a joint NASA and USGS project
providing seamless consistent mosaics of fused Landsat-7 Enhanced TM Plus (ETM+) and MODIS data radiometrically calibrated into top-
of-atmosphere reflectance (TOARF) and surface reflectance. These mosaics are made freely available to the user community. Each consists
of 663 fixed location tiles. Spatial resolution: 30 m. Area coverage: Continental USA and Alaska. Period coverage: 7-year. Product time
coverage: weekly, monthly, seasonal and annual composites (for interpretation of the references to color in this figure caption, the reader is
referred to the web version of this paper).
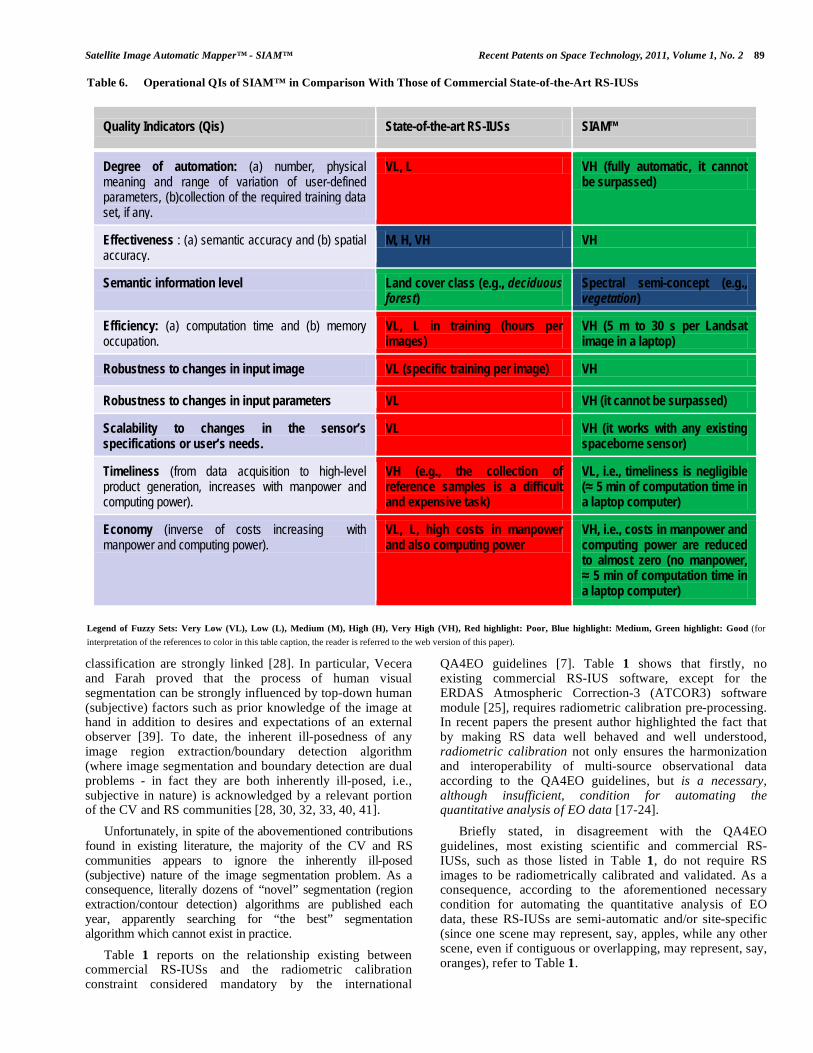
Fig. (7b), including the map of Alaska at the top. Preliminary classification map automatically generated by L-SIAM™ from the 2008
annual WELD mosaic shown in Fig. (7a). Output spectral categories are depicted in pseudo colors. L-SIAM™ was run overnight by L.
Boschetti (Univ. of Maryland) in Dec. 2010. To the best of this author’s knowledge, this is the first example of such a high-level product
automatically generated at both the NASA and USGS. Map legend: refer to Table 4 (for interpretation of the references to color in this figure
caption, the reader is referred to the web version of this paper).

94 Recent Patents on Space Technology, 2011, Volume 1, No. 2 Andrea Baraldi
(iv). Semantic-driven texture detection in the classification map domain by means of multi-scale moving windows and first-order distribution entropy estimation [21].
(v). Semantic-driven differential morphological profile (DMP) computation and DMP contrast and autocorrelation estimation [61].
(vi). Segment-based skeletonization: skeleton endpoints, angles and inter-point distance [42, 43].
(vii). Assessment of the straightness of region boundaries [44].
(viii). Semantic-driven multi-temporal multi-source contour detection.
(ix). Semantic-driven segment extraction from non-connected contours [45].
7.3. Second-Stage Semantic-Driven (Stratified) Bi-Temporal Change/No-Change Detection
Two dates of SIAM™ products generated from a bi-temporal spaceborne image pair featuring the same spatial resolution and the same geographic footprint can be adopted for automatic bi-temporal change detection. In this case the following equation holds.
Fig. (8a-d), from left to right and top to bottom. L-SIAM™ mapping of a single fixed location tile of the WELD mosaic shown in Figs. (5, 6).
Top left, Fig. (8a): 7-band Landsat image tile in TOARF values, depicted in false colors, Red – Band 5 (Medium InfraRed, MIR1), Green – Band 4
(Near IR, NIR), Blue – Band 1 (Visible Blue), extracted from the Web-Enabled Landsat Data (WELD) Project (http://landsat.usgs.gov/WELD.php).
Spatial resolution: 30 m.
Top right, Fig. (8b): SIAM™
Preliminary classification map, depicted in pseudo colors (same pseudo colors as in Fig. (3-1b)), generated
from the Landsat image shown in Fig. (8a). Map legend: refer to Table 4.
Bottom left, Fig. (8c). Image of segment contours. Segments are detected in the L-SIAM™
output map shown in Fig. (8b).
Bottom right, Fig. (8d): Segment-based piecewise constant image reconstruction of the 7-band input image, depicted in false colors (same
false colors as in Fig. (8a)). Genuine but small image details of Fig. (8a) are well preserved in Fig. (8d). In practice, the SIAM™
works as a
successful edge-preserving smoothing filter. Fig. (8d), the segment-based piecewise constant approximation of the input image shown in Fig.
(8a), provides an intuitive (qualitative, visual) tool to assess the quality of the preliminary classification map shown in Fig. (8b) (for
interpretation of the references to color in this figure caption, the reader is referred to the web version of this paper).
Satellite Image Automatic Mapper™ - SIAM™ Recent Patents on Space Technology, 2011, Volume 1, No. 2 95
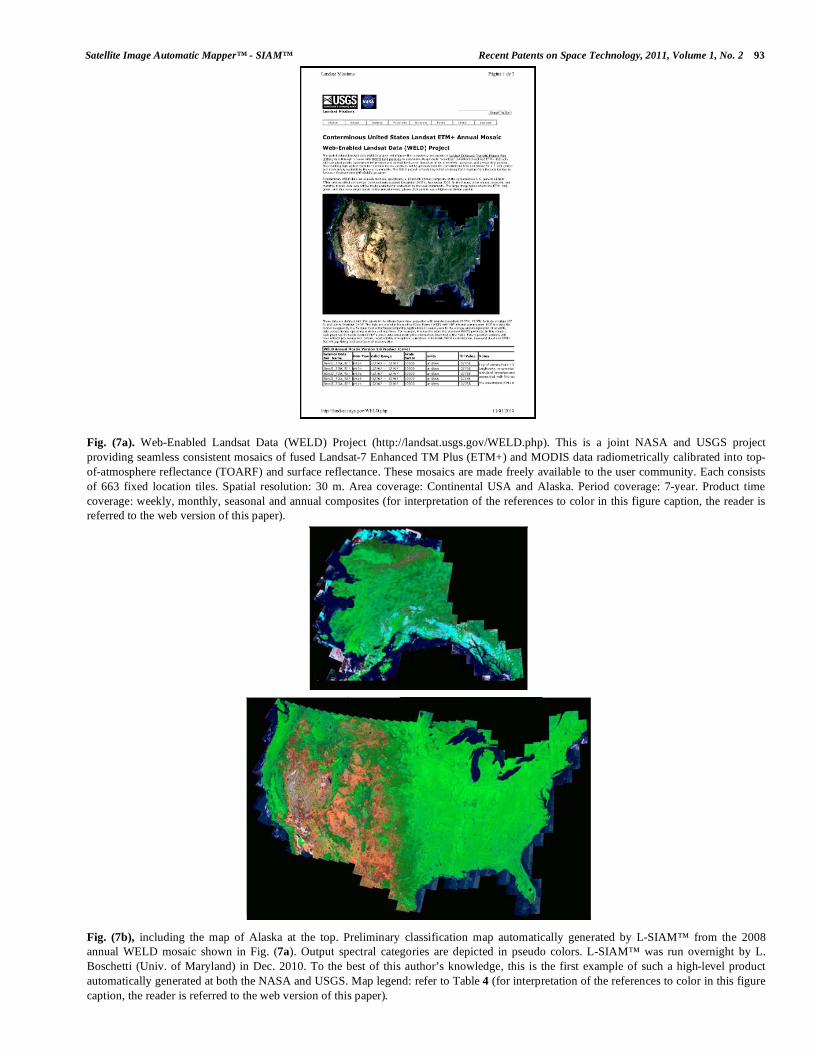
Fig. (9). WorldView-2 image, 2 m spatial resolution, acquisition date 2010-08-04, at 13:32 GMT, radiometrically calibrated into TOARF
values, depicted in false colors (R: 5, G: 7, B: 2). Default image histogram stretching: ENVI linear stretching 2% (for interpretation of the
references to color in this figure caption, the reader is referred to the web version of this paper).

96 Recent Patents on Space Technology, 2011, Volume 1, No. 2 Andrea Baraldi
Fig. (10). I-SIAM™ preliminary map of the WorldView-2 image shown in Fig. (9). Spectral categories are depicted in pseudo colors. Map
legend: refer to Table 5 (for interpretation of the references to color in this figure caption, the reader is referred to the web version of this
paper).

Satellite Image Automatic Mapper™ - SIAM™ Recent Patents on Space Technology, 2011, Volume 1, No. 2 97
Accuracy of the bi-temporal change/no-change detection map (Map accuracy at time T1 Map accuracy at time T2).
For example, if Map accuracy at time T1 = Map accuracy at time T2 = 0.9, then Accuracy of the bi-temporal change/no-change detection map 0.81.
The SIAM™ bi-temporal change/no-change detection generates two output products.
1. Bi-temporal SIAM™
-based semantic-driven change/no-change of spectral categories. The bi-temporal change/no-change map legend is shown in Table 7.
2. Bi-temporal SIAM™
-based semantic-driven change/no-change of spectral indexes (e.g., greenness). For example, a continuous greenness index change ( GR) image is such that: (i) GR < 0 if (GR2 < GR1); (ii) GR > 0 if(GR2 > GR1); and
Fig. (11). 4-band QuickBird-2 VHR image of the city area of Brazilia, Brazil, acquired on 2010-03-16, at 13:25 GMT, depicted in false
colors (R: band R, G: band NIR1; B: band B) (provided by Digitalglobe, 8-band Challenge), radiometrically calibrated into TOARF values.
Spatial resolution: 2.4 m (for interpretation of the references to color in this figure caption, the reader is referred to the web version of this
paper).

98 Recent Patents on Space Technology, 2011, Volume 1, No. 2 Andrea Baraldi
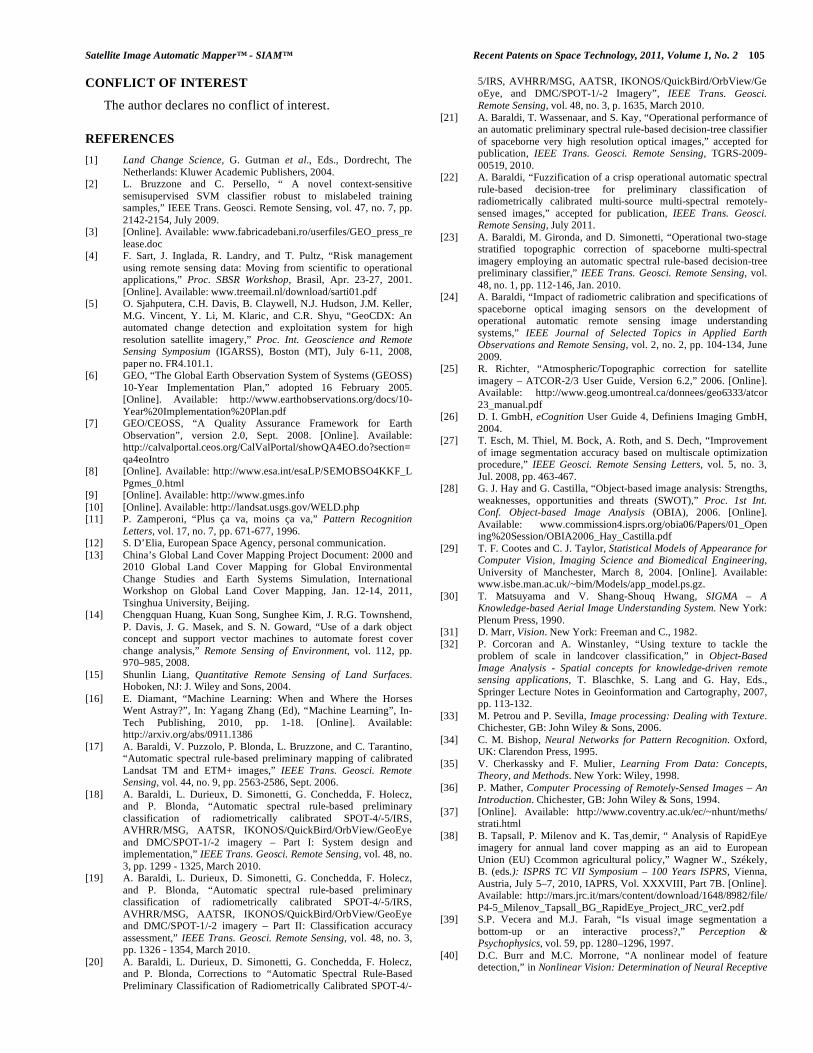
(iii) dumb negative value (= - 150) if((GR1 == 0)AND(GR2 == 0)), equivalent to the “never vegetation” condition.
As an example of the pair of SIAM™ bi-temporal change/no-change detection products, see Fig. (16).
8. NEW INTERDISCIPLINARY RESEARCH AND MARKET OPPORTUNITIES
In operational contexts, SIAM™ opens up new inter-disciplinary research and market opportunities such as those listed below.
• SIAM™ is eligible for bridging two major gaps between RS imagery and Geographic Information Systems (GIS) by transforming: (a) sub-symbolic data into symbolic information and (b) raster data into vector 2-D objects. This means that SIAM™ provides an operational tool for the seamless integration of RS (sub-symbolic raster) imagery with (symbolic vector) geospatial information managed by GIS (see Fig. 17).
• Automatic multi-temporal (MT) spaceborne image land cover (LC) classification and change (LCC) detection. In particular, SIAM™ can provide a time series of single-date preliminary classification maps suitable for:
Fig. (12). I-SIAM™ preliminary map of the QuickBird-2 image shown in Fig. (11). Spectral categories are depicted in pseudo colors. Map legend:
refer to Table 5 (for interpretation of the references to color in this figure caption, the reader is referred to the web version of this paper).

Satellite Image Automatic Mapper™ - SIAM™ Recent Patents on Space Technology, 2011, Volume 1, No. 2 99
o Efficient rule-based extraction of land cover classes (e.g., agricultural fields) in the symbolic preliminary classification map domain rather than in the traditional sub-symbolic signal domain.
o Change detection in the symbolic preliminary classification map domain rather than in the traditional sub-symbolic signal domain, refer to Table 7 and Fig. (16).
• Integration of internet-based satellite mapping on demand with virtual earth geo-browsers such as the hugely popular Google Earth, NASA’s World Wind and Microsoft Virtual Earth (see Fig. 18).
• Development of operational automatic near real-time satellite-based measurement systems such as those envisaged under on-going international research programs, such as GEOSS [6], GMES [9], USGS-NASA WELD [10] and LCLUC [1] (refer to Section 1).
• Development of semantic querying systems of large-scale multi-source RS image databases where SIAM™ can be exploited as an automatic source of reference classification maps. This would represent a
dramatic improvement over non-semantic query modes currently available in image database retrieval systems based on text-driven query strategies and query by either an image, object or multi-object example.
• Development of so-called fourth generation future intelligent earth observation satellites (FIEOSs, [46]) where the operational automatic near-real time RS-IUS software proposed herein can be mounted on board. The same consideration holds for ground receiving stations which could be provided with an operational automatic “intelligent” data processing chain.
• Dissemination of advanced EO expertise, science and technology capacity in developing countries and emerging countries.
9. RELATED PATENT REVIEW
As already mentioned in Section 1, to the best of this author's knowledge SIAM™ provides the first example of an operational automatic (turnkey, good-to-go, press-and-go) multi-sensor multi-resolution EO system of systems in line
Table 7. Legend of the Post-Classification SIAM™-Based Automatic Bi-Temporal Change/No-Change Detection Map
(for interpretation of the references to color in this table caption, the reader is referred to the web version of this paper).
1 Constant vegetation2 Vegetation decrease3 Vegetation increase4 Vegetation total gain from bare soil or built-up or fire5 Vegetation total loss into bare soil or built-up6 Vegetation total gain from water (or shadow)7 Vegetation total loss into water (or shadow)8 Single-date vegetation (affected by data noise at either T1 or T2)9 Bare soil or built-up total gain from water (or shadow)10 Bare soil or built-up total loss into water (or shadow)11 Constant water (or shadow)12 Single-date water (or shadow) (affected by data noise at either T1 or T2)13 Constant bare soil or built-up14 Within-bare soil or built-up change15 Single-date bare soil (affected by data noise at either T1 or T2)16 Constant cloud or single-date cloud (affected by noise at either T1 or T2)17 Constant snow (or bright bare soil/built-up or cloud in VHR imagery)18 Single-date snow (or shadowed snow) (affected by data noise at either T1 or T2)19 Snow total gain20 Vegetation from snow21 Bare soil or built-up from snow22 Water (or shadow) from snow23 Constant shadowed snow24 Single-date shadowed snow (affected by data noise at either T1 or T2)25 Constant shadow26 Constant flame27 Single-date flame (affected by data noise at either T1 or T2)28 Active flame29 Constant unknown or noisy
100 Recent Patents on Space Technology, 2011, Volume 1, No. 2 Andrea Baraldi
with the visionary goal of the GEOSS international research program [6, 7]. In terms of operational QIs (refer to Section 2), SIAM™ scores high in real-world operational contexts (see Table 6), such as RS image mapping applications at national, continental and global scale (refer to Section 6),
other than toy-problems. As a consequence, the SIAM™ application domain, which encompasses a wide range of interdisciplinary research and market opportunities (refer to Section 8), overlaps with that of several recent patents on space technology as discussed below.
Fig. (13a). Zoomed area of a Landsat 7 ETM+ image of Colorado, USA (path: 128, row: 021, acquisition date: 2000-08-09), depicted in
false colors (R: band ETM5, G: band ETM4, B: band ETM1), 30m resolution, radiometrically calibrated into TOARF values (for
interpretation of the references to color in this figure caption, the reader is referred to the web version of this paper).
Fig. (13b). Stratified topographic correction of Fig. (13a), based on an L-SIAM™
16-class preliminary spectral map and the Shuttle Radar
Topography Mission (SRTM) Digital Elevation Model (DEM) (for interpretation of the references to color in this figure caption, the reader is
referred to the web version of this paper).

Satellite Image Automatic Mapper™ - SIAM™ Recent Patents on Space Technology, 2011, Volume 1, No. 2 101
Fig. (14a). Mosaic of four radiometrically calibrated Landsat 7
ETM+ images: Emilia-Romagna, Veneto, Friuli regions in
Northern Italy. Spatial resolution: 30 m. An image boundary effect
is clearly visible (for interpretation of the references to color in this
figure caption, the reader is referred to the web version of this
paper).
Fig. 14(b). Mosaic of four preliminary output maps, depicted in pseudo
colors, extracted from the four images shown in Fig. (14a) by L-
SIAM™
. Map legend: refer to Table 4. A map boundary effect is clearly
visible (for interpretation of the references to color in this figure
caption, the reader is referred to the web version of this paper).
The SIAM-based semantic querying system of large-scale multi-source RS image databases (refer to Section 8) is alternative to the non-semantic image database retrieval system based on a selected query image as proposed in [48] and [55].
Fig. (14c). Mosaic of the four radiometrically calibrated Landsat 7
ETM+ images shown in Fig. (14a) after semantic-driven (stratified)
histogram matching between a “master” image (say, Veneto) and
the remaining “slave” images (Emilia-Romagna and Friuli). No
image boundary effect is now visible (for interpretation of the
references to color in this figure caption, the reader is referred to the
web version of this paper).
The sole SIAM™ requirement is to employ as input RS images radiometrically calibrated into TOARF or SOARF values (refer to Section 2). A radiometric calibration sub-system of a spaceborn optical imaging system is proposed in [56].
In [49], semantic nets are generated from ontologies. These prior knowledge-based semantic nets can be adopted at the context-sensitive second stage of a two-stage automatic stratified hierarchical hybrid RS-IUS employing SIAM™ as its preliminary classification first stage (refer to Fig. 2). The same consideration holds for the multi-band texture feature extractor proposed in [53].
The mutually exclusive and totally exhaustive SIAM™ decision-tree classifier, which includes as output the parent spectral category 'clouds', is alternative to the empirically-derived land cover-dependent thresholds for classifying pixels as either cloud or non-cloud using visible, near-infrared and short wavelength infrared data proposed in [51]. Whereas SIAM™ includes a cloud detector, in [50] a pixel is classified as either shadow-covered or non-shadow covered based on the comparison of at least one visible, one near-infrared and one short wavelength infrared data vector with a spectral data threshold. In [52], a pixel is classified as a sub-visible cloud point if the a cirrus-band reflectance value exceeds a sub-visible cirrus band reflectance threshold.
In [54], the structure of a decision-tree classifier is mapped into a 3-D decision-tree visualization system.
In [57] a decision-tree provides a description of the sensitivity of a model (such as SIAM™) in subspaces of the input space.

102 Recent Patents on Space Technology, 2011, Volume 1, No. 2 Andrea Baraldi
Fig. (15a). Zoomed area of a Landsat 7 ETM+ image of Virginia,
USA (path: 16, row: 34, acquisition date: 2002-09-13), depicted in
false colors (R: band ETM5, G: band ETM4, B: band ETM1), 30 m
resolution, radiometrically calibrated into TOARF values (for
interpretation of the references to color in this figure caption, the
reader is referred to the web version of this paper).
Fig. (15b). Preliminary output map, generated from Fig. (15a) by
L-SIAM™, depicted in pseudo colors. Map legend: refer to Table 4
(for interpretation of the references to color in this figure caption,
the reader is referred to the web version of this paper).
Fig. (15c). 2nd-stage classification in series with the SIAM first
stage, see Fig. (9b), generated from Fig. (15a). This 2nd-stage map
consists of 11 vegetated land cover classes (in black: non-vegetated
pixels), depicted in pseudo-colors, including: cropland or grassland,
broad-leaf forest, needle-leaf forest, mixed forest and shrubland.
Input features are: colors (mapped by SIAM™ into a discrete and
finite set of spectral categories), brightness and multi-scale isotropic
texture (for interpretation of the references to color in this figure
caption, the reader is referred to the web version of this paper).
Fig. (15d). 2nd-stage classification map generated as a semantic-
driven aggregation of vegetated land cover classes found in Fig.
(15c). It consists of 7 vegetated land cover classes (in black: non-
vegetated pixels), depicted in pseudo-colors, including: cropland or
grassland, broad-leaf forest, needle-leaf forest, mixed forest and
shrubland according to the International Geosphere-Biosphere
Programme (IGBP) DISCover Land Cover taxonomy [60] (for
interpretation of the references to color in this figure caption, the
reader is referred to the web version of this paper).
Finally, it is noteworthy that SIAM™, where all input bands are investigated simultaneously, is alternative the RS multi-spectral image classifier proposed in [58]. The latter requires as input different selections of three bands including one near-infrared, one mid-infrared and one visible band. Each three-band input data set is mapped onto a ternary diagram (equivalent to an equilateral triangle) where the three input variables (also called spectral end-members) are related in a manner such that they sum to unity. In this ternary diagram vegetation and mineral clusters are separated effectively. Schemas can be constructed to classify an image into themes.
10. CONCLUSIONS AND FUTURE DEVELOPMENTS
This patent review summarizes the degrees of novelty of SIAM™, an operational automatic (turnkey, good-to-go, press-and-go) prior knowledge-based decision-tree classifier adopted as the preliminary classification first stage in a novel two-stage stratified hierarchical hybrid RS-IUS architecture, refer to Fig. (2).
SIAM™ is a deductive inference system. In literature, deductive inference systems are also called inference systems capable of learning-by-rules, top-down, coarse-to-fine, model-driven, prior knowledge-based, driven-by-knowledge, physical models, physical pattern recognition systems [15]. Physical models are abstracts of reality. They consist of prior knowledge concerning the physical laws of the (3-D) world which is available before (prior to) looking at the objective sensory data at hand. In particular, cognitive systems driven-by-prior-knowledge are well posed, but subjective in nature (in fact terms semantic and subjective are synonyms).
Physical models follow the physical laws of the real (3-D) world to establish cause-effect relationships. They have to be learnt by a human expert based on intuition, expertise
Satellite Image Automatic Mapper™ - SIAM™ Recent Patents on Space Technology, 2011, Volume 1, No. 2 103
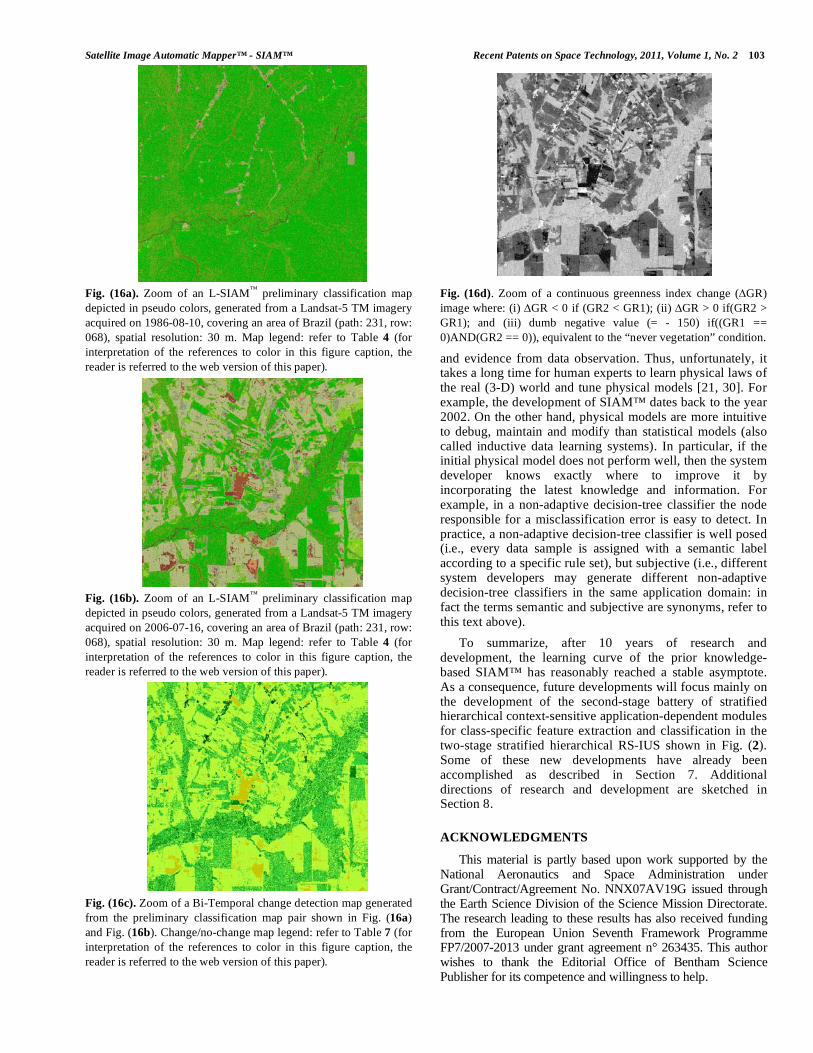
Fig. (16a). Zoom of an L-SIAM™
preliminary classification map
depicted in pseudo colors, generated from a Landsat-5 TM imagery
acquired on 1986-08-10, covering an area of Brazil (path: 231, row:
068), spatial resolution: 30 m. Map legend: refer to Table 4 (for
interpretation of the references to color in this figure caption, the
reader is referred to the web version of this paper).
Fig. (16b). Zoom of an L-SIAM™
preliminary classification map
depicted in pseudo colors, generated from a Landsat-5 TM imagery
acquired on 2006-07-16, covering an area of Brazil (path: 231, row:
068), spatial resolution: 30 m. Map legend: refer to Table 4 (for
interpretation of the references to color in this figure caption, the
reader is referred to the web version of this paper).
Fig. (16c). Zoom of a Bi-Temporal change detection map generated
from the preliminary classification map pair shown in Fig. (16a)
and Fig. (16b). Change/no-change map legend: refer to Table 7 (for
interpretation of the references to color in this figure caption, the
reader is referred to the web version of this paper).
Fig. (16d). Zoom of a continuous greenness index change ( GR)
image where: (i) GR < 0 if (GR2 < GR1); (ii) GR > 0 if(GR2 >
GR1); and (iii) dumb negative value (= - 150) if((GR1 ==
0)AND(GR2 == 0)), equivalent to the “never vegetation” condition.
and evidence from data observation. Thus, unfortunately, it takes a long time for human experts to learn physical laws of the real (3-D) world and tune physical models [21, 30]. For example, the development of SIAM™ dates back to the year 2002. On the other hand, physical models are more intuitive to debug, maintain and modify than statistical models (also called inductive data learning systems). In particular, if the initial physical model does not perform well, then the system developer knows exactly where to improve it by incorporating the latest knowledge and information. For example, in a non-adaptive decision-tree classifier the node responsible for a misclassification error is easy to detect. In practice, a non-adaptive decision-tree classifier is well posed (i.e., every data sample is assigned with a semantic label according to a specific rule set), but subjective (i.e., different system developers may generate different non-adaptive decision-tree classifiers in the same application domain: in fact the terms semantic and subjective are synonyms, refer to this text above).
To summarize, after 10 years of research and development, the learning curve of the prior knowledge-based SIAM™ has reasonably reached a stable asymptote. As a consequence, future developments will focus mainly on the development of the second-stage battery of stratified hierarchical context-sensitive application-dependent modules for class-specific feature extraction and classification in the two-stage stratified hierarchical RS-IUS shown in Fig. (2). Some of these new developments have already been accomplished as described in Section 7. Additional directions of research and development are sketched in Section 8.
ACKNOWLEDGMENTS
This material is partly based upon work supported by the National Aeronautics and Space Administration under Grant/Contract/Agreement No. NNX07AV19G issued through the Earth Science Division of the Science Mission Directorate. The research leading to these results has also received funding from the European Union Seventh Framework Programme FP7/2007-2013 under grant agreement n° 263435. This author wishes to thank the Editorial Office of Bentham Science Publisher for its competence and willingness to help.

104 Recent Patents on Space Technology, 2011, Volume 1, No. 2 Andrea Baraldi
Fig. (17). Seamless integration of sensory digital RS imagery with semantic vector geographic information systems (GIS) through SIAM™
.
In particular, SIAM™
bridges two major gaps between sensory digital RS data and semantic vector GIS information by transforming: (a) sub-
symbolic data into symbolic information and (b) raster data into vector 2-D objects (for interpretation of the references to color in this figure
caption, the reader is referred to the web version of this paper).
Fig. (18). Preliminary spectral map, depicted in pseudo colors, generated by L-SIAM™
from a 30 m resolution Landsat 7 ETM+ image of the
Veneto region, Italy, radiometrically calibrated into TOARF values. Map legend: refer to Table 4. The L-SIAM™
map is transformed into the
kml data format and loaded as a thematic layer in a commercial 3-D earth viewer (e.g., Google Earth) (for interpretation of the references to
color in this figure caption, the reader is referred to the web version of this paper).
Preliminary
SIAM first stage
(fully automated)
Semantic-driven
segmentation maps
– Fine / Intermediate
/ Coarse (symbolic,
2-D object-based)
Multi-spectral
image (sub-
symbolic, raster)
GIS
(symbolic,vector
geospatial data)
Spectral-based
preliminary
classification maps
at Fine / Intermediate
/ Coarse semantic
granularity
(symbolic, raster)
Well-posed segmentation in
the preliminary classification
map domain
Satellite Image Automatic Mapper™ - SIAM™ Recent Patents on Space Technology, 2011, Volume 1, No. 2 105
CONFLICT OF INTEREST
The author declares no conflict of interest.
REFERENCES
[1] Land Change Science, G. Gutman et al., Eds., Dordrecht, The
Netherlands: Kluwer Academic Publishers, 2004. [2] L. Bruzzone and C. Persello, “ A novel context-sensitive
semisupervised SVM classifier robust to mislabeled training samples,” IEEE Trans. Geosci. Remote Sensing, vol. 47, no. 7, pp.
2142-2154, July 2009. [3] [Online]. Available: www.fabricadebani.ro/userfiles/GEO_press_re
lease.doc [4] F. Sart, J. Inglada, R. Landry, and T. Pultz, “Risk management
using remote sensing data: Moving from scientific to operational applications,” Proc. SBSR Workshop, Brasil, Apr. 23-27, 2001.
[Online]. Available: www.treemail.nl/download/sarti01.pdf [5] O. Sjahputera, C.H. Davis, B. Claywell, N.J. Hudson, J.M. Keller,
M.G. Vincent, Y. Li, M. Klaric, and C.R. Shyu, “GeoCDX: An automated change detection and exploitation system for high
resolution satellite imagery,” Proc. Int. Geoscience and Remote Sensing Symposium (IGARSS), Boston (MT), July 6-11, 2008,
paper no. FR4.101.1. [6] GEO, “The Global Earth Observation System of Systems (GEOSS)
10-Year Implementation Plan,” adopted 16 February 2005. [Online]. Available: http://www.earthobservations.org/docs/10-
Year%20Implementation%20Plan.pdf [7] GEO/CEOSS, “A Quality Assurance Framework for Earth
Observation”, version 2.0, Sept. 2008. [Online]. Available: http://calvalportal.ceos.org/CalValPortal/showQA4EO.do?section=
qa4eoIntro [8] [Online]. Available: http://www.esa.int/esaLP/SEMOBSO4KKF_L
Pgmes_0.html [9] [Online]. Available: http://www.gmes.info
[10] [Online]. Available: http://landsat.usgs.gov/WELD.php [11] P. Zamperoni, “Plus ça va, moins ça va,” Pattern Recognition
Letters, vol. 17, no. 7, pp. 671-677, 1996. [12] S. D’Elia, European Space Agency, personal communication.
[13] China’s Global Land Cover Mapping Project Document: 2000 and 2010 Global Land Cover Mapping for Global Environmental
Change Studies and Earth Systems Simulation, International Workshop on Global Land Cover Mapping, Jan. 12-14, 2011,
Tsinghua University, Beijing. [14] Chengquan Huang, Kuan Song, Sunghee Kim, J. R.G. Townshend,
P. Davis, J. G. Masek, and S. N. Goward, “Use of a dark object concept and support vector machines to automate forest cover
change analysis,” Remote Sensing of Environment, vol. 112, pp. 970–985, 2008.
[15] Shunlin Liang, Quantitative Remote Sensing of Land Surfaces. Hoboken, NJ: J. Wiley and Sons, 2004.
[16] E. Diamant, “Machine Learning: When and Where the Horses Went Astray?”, In: Yagang Zhang (Ed), “Machine Learning”, In-
Tech Publishing, 2010, pp. 1-18. [Online]. Available: http://arxiv.org/abs/0911.1386
[17] A. Baraldi, V. Puzzolo, P. Blonda, L. Bruzzone, and C. Tarantino, “Automatic spectral rule-based preliminary mapping of calibrated
Landsat TM and ETM+ images,” IEEE Trans. Geosci. Remote Sensing, vol. 44, no. 9, pp. 2563-2586, Sept. 2006.
[18] A. Baraldi, L. Durieux, D. Simonetti, G. Conchedda, F. Holecz, and P. Blonda, “Automatic spectral rule-based preliminary
classification of radiometrically calibrated SPOT-4/-5/IRS, AVHRR/MSG, AATSR, IKONOS/QuickBird/OrbView/GeoEye
and DMC/SPOT-1/-2 imagery – Part I: System design and implementation,” IEEE Trans. Geosci. Remote Sensing, vol. 48, no.
3, pp. 1299 - 1325, March 2010. [19] A. Baraldi, L. Durieux, D. Simonetti, G. Conchedda, F. Holecz,
and P. Blonda, “Automatic spectral rule-based preliminary classification of radiometrically calibrated SPOT-4/-5/IRS,
AVHRR/MSG, AATSR, IKONOS/QuickBird/OrbView/GeoEye and DMC/SPOT-1/-2 imagery – Part II: Classification accuracy
assessment,” IEEE Trans. Geosci. Remote Sensing, vol. 48, no. 3, pp. 1326 - 1354, March 2010.
[20] A. Baraldi, L. Durieux, D. Simonetti, G. Conchedda, F. Holecz, and P. Blonda, Corrections to “Automatic Spectral Rule-Based
Preliminary Classification of Radiometrically Calibrated SPOT-4/-
5/IRS, AVHRR/MSG, AATSR, IKONOS/QuickBird/OrbView/Ge
oEye, and DMC/SPOT-1/-2 Imagery”, IEEE Trans. Geosci. Remote Sensing, vol. 48, no. 3, p. 1635, March 2010.
[21] A. Baraldi, T. Wassenaar, and S. Kay, “Operational performance of an automatic preliminary spectral rule-based decision-tree classifier
of spaceborne very high resolution optical images,” accepted for publication, IEEE Trans. Geosci. Remote Sensing, TGRS-2009-
00519, 2010. [22] A. Baraldi, “Fuzzification of a crisp operational automatic spectral
rule-based decision-tree for preliminary classification of radiometrically calibrated multi-source multi-spectral remotely-
sensed images,” accepted for publication, IEEE Trans. Geosci. Remote Sensing, July 2011.
[23] A. Baraldi, M. Gironda, and D. Simonetti, “Operational two-stage stratified topographic correction of spaceborne multi-spectral
imagery employing an automatic spectral rule-based decision-tree preliminary classifier,” IEEE Trans. Geosci. Remote Sensing, vol.
48, no. 1, pp. 112-146, Jan. 2010. [24] A. Baraldi, “Impact of radiometric calibration and specifications of
spaceborne optical imaging sensors on the development of operational automatic remote sensing image understanding
systems,” IEEE Journal of Selected Topics in Applied Earth Observations and Remote Sensing, vol. 2, no. 2, pp. 104-134, June
2009. [25] R. Richter, “Atmospheric/Topographic correction for satellite
imagery – ATCOR-2/3 User Guide, Version 6.2,” 2006. [Online]. Available: http://www.geog.umontreal.ca/donnees/geo6333/atcor
23_manual.pdf [26] D. I. GmbH, eCognition User Guide 4, Definiens Imaging GmbH,
2004. [27] T. Esch, M. Thiel, M. Bock, A. Roth, and S. Dech, “Improvement
of image segmentation accuracy based on multiscale optimization procedure,” IEEE Geosci. Remote Sensing Letters, vol. 5, no. 3,
Jul. 2008, pp. 463-467. [28] G. J. Hay and G. Castilla, “Object-based image analysis: Strengths,
weaknesses, opportunities and threats (SWOT),” Proc. 1st Int. Conf. Object-based Image Analysis (OBIA), 2006. [Online].
Available: www.commission4.isprs.org/obia06/Papers/01_Open ing%20Session/OBIA2006_Hay_Castilla.pdf
[29] T. F. Cootes and C. J. Taylor, Statistical Models of Appearance for Computer Vision, Imaging Science and Biomedical Engineering,
University of Manchester, March 8, 2004. [Online]. Available: www.isbe.man.ac.uk/~bim/Models/app_model.ps.gz.
[30] T. Matsuyama and V. Shang-Shouq Hwang, SIGMA – A Knowledge-based Aerial Image Understanding System. New York:
Plenum Press, 1990. [31] D. Marr, Vision. New York: Freeman and C., 1982.
[32] P. Corcoran and A. Winstanley, “Using texture to tackle the problem of scale in landcover classification,” in Object-Based
Image Analysis - Spatial concepts for knowledge-driven remote sensing applications, T. Blaschke, S. Lang and G. Hay, Eds.,
Springer Lecture Notes in Geoinformation and Cartography, 2007, pp. 113-132.
[33] M. Petrou and P. Sevilla, Image processing: Dealing with Texture. Chichester, GB: John Wiley & Sons, 2006.
[34] C. M. Bishop, Neural Networks for Pattern Recognition. Oxford, UK: Clarendon Press, 1995.
[35] V. Cherkassky and F. Mulier, Learning From Data: Concepts, Theory, and Methods. New York: Wiley, 1998.
[36] P. Mather, Computer Processing of Remotely-Sensed Images – An Introduction. Chichester, GB: John Wiley & Sons, 1994.
[37] [Online]. Available: http://www.coventry.ac.uk/ec/~nhunt/meths/ strati.html
[38] B. Tapsall, P. Milenov and K. Tas¸demir, “ Analysis of RapidEye imagery for annual land cover mapping as an aid to European
Union (EU) Ccommon agricultural policy,” Wagner W., Székely, B. (eds.): ISPRS TC VII Symposium – 100 Years ISPRS, Vienna,
Austria, July 5–7, 2010, IAPRS, Vol. XXXVIII, Part 7B. [Online]. Available: http://mars.jrc.it/mars/content/download/1648/8982/file/
P4-5_Milenov_Tapsall_BG_RapidEye_Project_JRC_ver2.pdf [39] S.P. Vecera and M.J. Farah, “Is visual image segmentation a
bottom-up or an interactive process?,” Perception & Psychophysics, vol. 59, pp. 1280–1296, 1997.
[40] D.C. Burr and M.C. Morrone, “A nonlinear model of feature detection,” in Nonlinear Vision: Determination of Neural Receptive

106 Recent Patents on Space Technology, 2011, Volume 1, No. 2 Andrea Baraldi
Fields, Functions, and Networks, R. B. Pinter and N. Bahram, Eds.,
Boca Raton, FL: CRC Press, 1992, pp. 309-327. [41] L. Delves, R. Wilkinson, C. Oliver and R. White, “Comparing the
performance of SAR image segmentation algorithms,” Int. J. Remote Sensing, vol. 13, no. 11, pp. 2121-2149, 1992.
[42] A.K. Shackelford and C.H. Davis, “A hierarchical fuzzy classification approach for high-resolution multispectral data over
urban areas, “ IEEE Trans. Geosci. Remote Sensing, vol. 41, no. 9, pp. 1920 – 1932, Sept. 2003.
[43] K. Shackelford and C. H. Davis, “A combined fuzzy pixel-based and object-based approach for classification of high-resolution
multispectral data over urban areas, “ IEEE Trans. Geosci. Remote Sensing, vol. 41, no. 10, pp. 2354 – 2363, Oct. 2003.
[44] M. Nagao and T. Matsuyama, A Structural Analysis of Complex Aerial Photographs. New York: Plenum Press, 1980.
[45] A. Baraldi and F. Parmiggiani, “A refined Gamma MAP SAR speckle filter with improved geometrical adaptivity,” IEEE Trans.
Geosci. Remote Sensing, vol. 33, no. 5, pp. 1245-1257, Sept. 1995. [46] G. Zhou and M. Kafatos, “Future intelligent earth observing
satellites (FIEOS),” Proc. ISPRS/FIEOS Conference, 2002. [Online]. Available: http://www.isprs.org/commission1/proceeding
s02/paper/00031.pdf. [47] A. Baraldi, Vision goes symbolic without loss of information within
the preattentive vision phase: The need to shift the learning paradigm from Machine-Learning (from examples) to Machine-
Teaching (by rules) at the first stage of a two-stage hybrid remote sensing image understanding system, Part I: Introduction, Part II:
Novel developments and conclusions, to be published in the InTech book project entitled “Earth Observation”, ISBN: 978-953-307-
655-3, 2011. [48] M. Iwasaki, “Image Classification Method, Image Feature Space
Displaying Method, Program and Recording Medium,” U.S. 0024758, 2004.
[49] S.A. Elfayoumy, and R. Mohan, “Method and Computer Program for Converting Ontologies into Concept Semantic Networks,” U.S.
7676485, 2010.
[50] A.L. Boright and J.C Sluder, “Cloud Shadow Detection: VNIR-
SWIR,” U.S. 7184890, 2007. [51] A.L. Boright and J.C Sluder, “Cloud Cover Assessment: VNIR-
SWIR,” U.S. 6990410, 2006. [52] A.L. Boright and J.C Sluder, “Sub-Visible Cloud Cover
Assessment: VNIR-SWIR,” U.S. 7058511, 2006. [53] C. Muenzenmayer, T. Wittenberg, R. Couronne, H. Kuziela, M.
Grobe and K. Spinnler, “Method for Extracting Texture Features from a Multichannel Image,” U.S. 7130465, 2006.
[54] R. Kohavi and J.D. Tesler, “Method, System, and Computer Program Product for Visualizing a Decision-Tree Classifier,” U.S.
6278464, 2001. [55] M. Iwasaki, K. Yokohama-shi, “Image Classification Method,
Image Feature Space Displaying Method, Program and Recording Medium,” EP 1387303, 2005.
[56] T.W. Dey and K.L. Mason, “Radiometric Calibration System,” U.S. 5659168, 1997.
[57] A. Passera, “Computer System and Process For Explaining Behavior of a Model That Maps Input Data To Output Data,”. U.S
6272449, 2001. [58] C.H. Spencer, “Method for Creating Thematic Maps Using
Segmentation and Ternary Diagrams,” U.S. 6356464, 2002. [59] P.S. Chavez, “An improved dark-object subtraction technique for
atmospheric scattering correction of multispectral data,” Remote Sensing of Environment, 1988; 24: 459-479.
[60] Belward AS (ed.). The IGBP-DIS Global 1 Km Land Cover Data Set “DISCover” Proposal and Implementation Plans. Report of the
Land Cover Working Group of IGBP-DIS, IGBP-DIS Working Paper 13, IGBP Data and Information System Office, Tolouse,
France, 1996. [61] M. Pesaresi and J. A. Benediktsson, “A new approach for the
morphological segmentation of high-resolution satellite imagery,” IEEE Trans. Geosci. Remote Sens., vol. 39, no. 2, pp. 309–320,
Feb. 2001.
Copyright © 2022 FDOKUMEN