Satb1 Ablation Alters Temporal Expression of Immediate Early Genes and Reduces Dendritic Spine...
15
Satb1 Ablation Alters Temporal Expression of Immediate Early Genes and Reduces Dendritic Spine Density during Postnatal Brain Development Michael A. Balamotis, a Nele Tamberg, a,b Young Jae Woo, a Jingchuan Li, a Brian Davy, a Terumi Kohwi-Shigematsu, a and Yoshinori Kohwi a Lawrence Berkeley National Laboratory, University of California, Berkeley, California, USA a and Institute of Molecular and Cell Biology, University of Tartu, Tartu, Estonia b Complex behaviors, such as learning and memory, are associated with rapid changes in gene expression of neurons and subsequent formation of new synaptic connections. However, how external signals are processed to drive specific changes in gene expression is largely unknown. We found that the genome organizer protein Satb1 is highly expressed in mature neurons, primarily in the cerebral cortex, dentate hilus, and amygdala. In Satb1-null mice, cortical layer morphology was normal. However, in postnatal Satb1-null corti- cal pyramidal neurons, we found a substantial decrease in the density of dendritic spines, which play critical roles in synaptic transmis- sion and plasticity. Further, we found that in the cerebral cortex, Satb1 binds to genomic loci of multiple immediate early genes (IEGs) (Fos, Fosb, Egr1, Egr2, Arc, and Bdnf) and other key neuronal genes, many of which have been implicated in synaptic plasticity. Loss of Satb1 resulted in greatly alters timing and expression levels of these IEGs during early postnatal cerebral cortical development and also upon stimulation in cortical organotypic cultures. These data indicate that Satb1 is required for proper temporal dynamics of IEG ex- pression. Based on these findings, we propose that Satb1 plays a critical role in cortical neurons to facilitate neuronal plasticity. N euronal circuits are capable of executing complex functions, such as storing memories and influencing behaviors in re- sponse to a variety of stimuli. These unique properties are based on highly plastic mechanisms that control expression of multiple genes in each individual neuron (20, 28). Environmental stimuli induce neurons to become depolarized, triggering Ca 2 influx and cAMP production (51, 54), leading to activation of specific signaling cascades, inducing rapid and major changes in gene ex- pression that result in synaptic activity (9, 38). Because neurons are specialized cells that must continuously reprogram gene expression in response to stimulation, they may be equipped with mechanisms to regulate genome-wide gene ex- pression at the level of nuclear architecture to facilitate this pro- cess. We hypothesized that Satb1 may play a role in reprogram- ming gene expression in neurons. We previously identified Satb1 (the mouse version of the protein) as a T cell factor which is es- sential for T cell activation (3, 14, 23). Satb1 targets specialized DNA sequences onto the Satb1 regulatory network and functions in chromatin organization and epigenomic modification (13, 94). Specialized DNA sequences are found throughout the genome and are characterized by ATC sequence contexts highly potenti- ated for nucleotide base unpairing (7, 23, 46, 66). One such se- quence, located 3= of the immunoglobulin heavy chain gene (IgH) enhancer, corresponding to a matrix attachment region (MAR) (19), was used to clone SATB1 (the capital letters indicate the human version of the protein) (7, 23, 46, 66). In human breast cancer cells, SATB1 reprograms the expression profile of 1,000 genes, promoting breast cancer metastasis (33). We previously showed that mice in which the Satb1 gene is knocked out (Satb1-null mice) (3) exhibit by 2 weeks of age a hind limb-clasping reflex, indicating neurological disorder. Unlike Satb1-null mice, Satb2-null mice do not survive past postnatal day 0 (P0), indicating the essential role of Satb2 (a Satb1 homolog) in embryonic development (2). In the mouse brain, Satb1 and Satb2 are expressed in the embryonic stage, beginning at embryonic day 13.5 (E13.5) and E11.5, respectively (11, 27). In the developing cerebral cortex (Cx), Satb2 regulates callosal projection neuron identity by repressing Ctip2, a gene required for the formation of the corticospinal tract. In the Satb2-null cortex, at E18.5, the layer identity is altered (2, 12, 27). In wild-type mice, Satb2 expression quickly disappears from the brain after birth (11). However, there have been no reports regarding Satb1 expression and activity in the postnatal brain. We found that Satb1 is the major Satb-family protein in post- natal brains and is expressed exclusively in a subset of mature neurons. To understand the roles of Satb1 in the postnatal brain, we analyzed the cortices of wild-type and Satb1-null mice, aiming to identify its target genes. In this study, we focused on genes with key functions in neuronal plasticity: cAMP-responsive element (CRE)-, serum-responsive element (SRE)-, and Ca 2 -responsive element (CaRE)-containing genes, which are activated in neurons upon stimulation (51, 54), including immediate early genes (IEGs). IEGs are known to be induced transiently and rapidly at the transcriptional level in response to a diverse array of extracel- lular stimuli and play critical roles in synaptic plasticity and ulti- mately in learning and memory (63). Here we have shown that Satb1 binds to genomic loci of multiple IEGs and is required for proper temporal expression and levels of these genes during post- natal cortical development. We also found a significant decrease in Received 7 July 2011 Returned for modification 30 July 2011 Accepted 30 October 2011 Published ahead of print 7 November 2011 Address correspondence to Yoshinori Kohwi, [email protected], or Terumi Kohwi- Shigematsu, [email protected]. M. A. Balamotis and N. Tamberg contributed equally to this work. Supplemental material for this article may be found at http://mcb.asm.org/. Copyright © 2012, American Society for Microbiology. All Rights Reserved. doi:10.1128/MCB.05917-11 The authors have paid a fee to allow immediate free access to this article. 0270-7306/12/$12.00 Molecular and Cellular Biology p. 333–347 mcb.asm.org 333 on June 30, 2016 by guest http://mcb.asm.org/ Downloaded from
-
Upload
independent -
Category
Documents
-
view
1 -
download
0
Transcript of Satb1 Ablation Alters Temporal Expression of Immediate Early Genes and Reduces Dendritic Spine...

Satb1 Ablation Alters Temporal Expression of Immediate EarlyGenes and Reduces Dendritic Spine Density during PostnatalBrain Development
Michael A. Balamotis,a Nele Tamberg,a,b Young Jae Woo,a Jingchuan Li,a Brian Davy,a Terumi Kohwi-Shigematsu,a and Yoshinori Kohwia
Lawrence Berkeley National Laboratory, University of California, Berkeley, California, USAa and Institute of Molecular and Cell Biology, University of Tartu, Tartu, Estoniab
Complex behaviors, such as learning and memory, are associated with rapid changes in gene expression of neurons and subsequentformation of new synaptic connections. However, how external signals are processed to drive specific changes in gene expression islargely unknown. We found that the genome organizer protein Satb1 is highly expressed in mature neurons, primarily in the cerebralcortex, dentate hilus, and amygdala. In Satb1-null mice, cortical layer morphology was normal. However, in postnatal Satb1-null corti-cal pyramidal neurons, we found a substantial decrease in the density of dendritic spines, which play critical roles in synaptic transmis-sion and plasticity. Further, we found that in the cerebral cortex, Satb1 binds to genomic loci of multiple immediate early genes (IEGs)(Fos, Fosb, Egr1, Egr2, Arc, and Bdnf) and other key neuronal genes, many of which have been implicated in synaptic plasticity. Loss ofSatb1 resulted in greatly alters timing and expression levels of these IEGs during early postnatal cerebral cortical development and alsoupon stimulation in cortical organotypic cultures. These data indicate that Satb1 is required for proper temporal dynamics of IEG ex-pression. Based on these findings, we propose that Satb1 plays a critical role in cortical neurons to facilitate neuronal plasticity.
Neuronal circuits are capable of executing complex functions,such as storing memories and influencing behaviors in re-
sponse to a variety of stimuli. These unique properties are basedon highly plastic mechanisms that control expression of multiplegenes in each individual neuron (20, 28). Environmental stimuliinduce neurons to become depolarized, triggering Ca2� influxand cAMP production (51, 54), leading to activation of specificsignaling cascades, inducing rapid and major changes in gene ex-pression that result in synaptic activity (9, 38).
Because neurons are specialized cells that must continuouslyreprogram gene expression in response to stimulation, they maybe equipped with mechanisms to regulate genome-wide gene ex-pression at the level of nuclear architecture to facilitate this pro-cess. We hypothesized that Satb1 may play a role in reprogram-ming gene expression in neurons. We previously identified Satb1(the mouse version of the protein) as a T cell factor which is es-sential for T cell activation (3, 14, 23). Satb1 targets specializedDNA sequences onto the Satb1 regulatory network and functionsin chromatin organization and epigenomic modification (13, 94).Specialized DNA sequences are found throughout the genomeand are characterized by ATC sequence contexts highly potenti-ated for nucleotide base unpairing (7, 23, 46, 66). One such se-quence, located 3= of the immunoglobulin heavy chain gene (IgH)enhancer, corresponding to a matrix attachment region (MAR)(19), was used to clone SATB1 (the capital letters indicate thehuman version of the protein) (7, 23, 46, 66). In human breastcancer cells, SATB1 reprograms the expression profile of �1,000genes, promoting breast cancer metastasis (33).
We previously showed that mice in which the Satb1 gene isknocked out (Satb1-null mice) (3) exhibit by 2 weeks of age a hindlimb-clasping reflex, indicating neurological disorder. UnlikeSatb1-null mice, Satb2-null mice do not survive past postnatal day0 (P0), indicating the essential role of Satb2 (a Satb1 homolog) inembryonic development (2). In the mouse brain, Satb1 and Satb2are expressed in the embryonic stage, beginning at embryonic day13.5 (E13.5) and E11.5, respectively (11, 27). In the developing
cerebral cortex (Cx), Satb2 regulates callosal projection neuronidentity by repressing Ctip2, a gene required for the formation ofthe corticospinal tract. In the Satb2-null cortex, at E18.5, the layeridentity is altered (2, 12, 27). In wild-type mice, Satb2 expressionquickly disappears from the brain after birth (11). However, therehave been no reports regarding Satb1 expression and activity inthe postnatal brain.
We found that Satb1 is the major Satb-family protein in post-natal brains and is expressed exclusively in a subset of matureneurons. To understand the roles of Satb1 in the postnatal brain,we analyzed the cortices of wild-type and Satb1-null mice, aimingto identify its target genes. In this study, we focused on genes withkey functions in neuronal plasticity: cAMP-responsive element(CRE)-, serum-responsive element (SRE)-, and Ca2�-responsiveelement (CaRE)-containing genes, which are activated in neuronsupon stimulation (51, 54), including immediate early genes(IEGs). IEGs are known to be induced transiently and rapidly atthe transcriptional level in response to a diverse array of extracel-lular stimuli and play critical roles in synaptic plasticity and ulti-mately in learning and memory (63). Here we have shown thatSatb1 binds to genomic loci of multiple IEGs and is required forproper temporal expression and levels of these genes during post-natal cortical development. We also found a significant decrease in
Received 7 July 2011 Returned for modification 30 July 2011Accepted 30 October 2011
Published ahead of print 7 November 2011
Address correspondence to Yoshinori Kohwi, [email protected], or Terumi Kohwi-Shigematsu, [email protected].
M. A. Balamotis and N. Tamberg contributed equally to this work.
Supplemental material for this article may be found at http://mcb.asm.org/.
Copyright © 2012, American Society for Microbiology. All Rights Reserved.
doi:10.1128/MCB.05917-11
The authors have paid a fee to allow immediate free access to this article.
0270-7306/12/$12.00 Molecular and Cellular Biology p. 333–347 mcb.asm.org 333
on June 30, 2016 by guesthttp://m
cb.asm.org/
Dow
nloaded from

dendritic spine density in Satb1-null cortices. Together, our re-sults suggest that Satb1 plays an important role in neuronal func-tion, both by affecting the formation of dendritic spines and bymodulating the expression of IEGs.
MATERIALS AND METHODSTissue processing. All mice were euthanized by CO2 gas. Brains used forRNA or protein extraction were quickly removed and frozen on dry ice.Mice were treated according to Lawrence Berkeley National Laboratory’sAnimal Care and Use Program. The animal protocol was approved by theAnimal Welfare and Regulatory Committee at Lawrence Berkeley Labo-ratory (AWRC no. 12403 and 12501).
IF staining. Ten-micrometer-thick fresh frozen sections were fixed in4% buffered paraformaldehyde and incubated for 30 min with blockingsolution (1% bovine serum albumin [BSA], 0.1% cold fish gelatin, 0.1%Triton X-100, 0.05% Tween 20 in phosphate-buffered saline [PBS]), fol-lowed by incubation with primary antibody at 4°C overnight and withproper secondary antibody (Alexa 594 conjugated for red color and Alexa488 conjugated for green color from Bio-Rad; 1:500 dilution in 0.05%Tween 20 in PBS) at room temperature for 1 h. The following dilutions forprimary antibodies were used: rat anti-Ctip2 antibody (1:250; Abcam),rabbit anti-Tbr1 antibody (1:250; Abcam), mouse anti-Fos antibody (1:50; Santa Cruz Biotechnology), mouse anti-NeuN monoclonal antibody(MAb) (1:500; Chemicon), mouse anti-Gfap MAb (1:500; Chemicon),rabbit anti-Satb1 polyclonal 1583 (preabsorbed with Satb1-null mousebrain [1:1,000], resulting in Satb1 specificity) and commercial anti-Satb1antibody 49061 (Abcam; also purified-Satb1 specific), rabbit anti-Satb2(1:1,000, in-house preparation, no cross-reactivity to Satb1, showingSatb2 specificity), as well as mouse anti-vGlut2 monoclonal antibody (1:200; Abcam) and mouse anti-Gad67 (1:500; Millipore). 4=,6-Diamidino-2-phenylindole (DAPI) (1 �g/ml in PBS) was used for counterstaining for1 min, followed by PBS washing. Immunofluorescence (IF) images werecaptured by an upright microscope (Olympus BX51) using 10� and 20�objectives with a digital camera (Spot RT Slider; Diagnostic). Three-dimensional images were captured by an inverted microscope (OlympusIX71 Delta) using a 100� objective with a digital camera (Cool Snap HQ2;Photometrics), analyzed by DeltaVision deconvolution microscopy(10-�m thickness by 20 images captured; Applied Precision), and pre-sented as stacked images.
RNA fluorescent in situ hybridization (FISH). To amplify Satb1- orSatb2-specific cDNA fragments, the following primers were used:SB1_5UTR_IS-F (5=-GGGAAGAGAAAATAATACA-3), SB1_5UTR_IS-R(5=-TTTCCTAAGGTTGGTTTTC-3=), SB2_5UTR_IS-F (5=-ATCATCATCATAACAACCATCTCC-3=), SB2_5UTR_IS-R (5=-GCTCCAGCCGGGCCACCTTCAC-3=), SB2_3UTR_IS-F (5=-GAGATGTACAAAGTGGAGGCTGAG-3=), and SB2_3UTR_IS-R (5=-CTGTGAAGTGGTATTAGTTTTTAT-3=). Linearized plasmids containing cloned cDNA fragmentswere used as templates for antisense and sense cRNA probe synthesis withT7 and T3 polymerase (Promega) and premixed RNA-labeling nucleotidemixes containing digoxigenin or fluorescein (Roche Molecular Biochem-icals). Ten-micrometer-thick frozen sections were fixed in 4% bufferedparaformaldehyde followed by 1.35% triethanolamine (pH 8.0) and0.25% acetic anhydride treatment and then incubated with prehybridiza-tion buffer (50% formamide, 5� SSC [1� SSC is 0.15 M NaCl plus 0.015M sodium citrate], and salmon sperm DNA [40 �g/ml]). Fluorescein-labeled Satb1 5= untranslated region (5=UTR)-specific and digoxigenin-labeled Satb2 3=UTR- and 5=UTR-specific riboprobes in hybridizationbuffer were added to sections and hybridized at 65°C for 16 h. After hy-bridization, sections were washed, equilibrated, and blocked with 0.5%blocking reagent (Perkin Elmer Life Science) for 30 min. We incubatedslides with rabbit antibody against fluorescein conjugated to peroxidase(1:500; Roche) at room temperature for 1 h, washed slides with TN buffercontaining 0.05% Tween 20, and visualized the signal by using fluoresceintyramide (TSA-Plus fluorescence system; Perkin Elmer Life Science). Wequenched the remaining peroxidase activity by incubating slides with 3%
H2O2 solution in PBS for 60 min. To generate a Satb2-specific signal, weused rabbit antibody against digoxigenin conjugated to peroxidase (1:500;Roche) and tetramethyl rhodamine isocyanate (TRITC) tyramide (TSA-Plus fluorescence system; Perkin Elmer Life Science) as described above.Slides were mounted in fluorescent mounting medium containing DAPI(Vector Laboratories).
Western assay and anti-Satb1 antibodies. We extracted proteinsfrom whole cortex (after carefully removing the hippocampus) of P13-P14 Satb1-null and wild-type mouse brains in RIPA buffer without SDS(50 mM Tris, pH 8.0, 0.15 M NaCl, 1% NP-40, 0.5% Na-Deoxycholate).The samples were centrifuged at 15,000 rpm for 5 min using a Tomymicrocentrifuge, and supernatant was either directly used or aliquotedand frozen at �80°C. Equal amounts of extracts based on the level oftubulin were boiled in buffer containing SDS, electrophoresed on an8% polyacrylamide gel containing 0.1% SDS, and transferred toImmobilon-P membranes (Millipore). The blots probed with primaryantibodies were then incubated with peroxidase-conjugated goat anti-rabbit or anti-mouse IgGs (1:5,000 to 1:15,000; Bio-Rad). Blots werewashed, and Western blots were developed using ECL reagents (Pierce).The chemiluminescence signal was detected either by X-ray film exposureor by using a Kodak imager (Image Station 4000MM). Satb1-specific an-tibody was prepared as follows: anti-Satb1 rabbit antiserum (in-houseprepared; no. 1583) was absorbed with acetone powder of Satb1-nullmouse brains (2 weeks old; equivalent of 3 mice) and tested for reactivityto wild-type and Satb1-null mouse brains by IF (1:1,000 final dilution) (asshown in Fig. 1) or by Western assay (1:1,000 final dilution) (see Fig. 1).Anti-Satb2 antibodies (in-house prepared; no. 3356) were used withoutany further purification (1:1,000 dilution in IF and Western assay). Mouseanti-Satb1 monoclonal antibody (BD Biosciences), which shows cross-reactivity to Satb2, was also used in a Western assay at a 1:200 dilution.Purified anti-Satb1 polyclonal antibody (Abcam) also showed Satb1 spec-ificity in IF and Western assays.
RNA isolation and quantitative real-time PCR (qPCR). We extractedtotal RNA from whole cortex of P13-P14 Satb1-null and wild-type mice inTrizol (Sigma). We used 2 �g of each total RNA for first-strand cDNAsynthesis, with oligo(dT)15 primer mixed with random hexamers andSuperscript II RNase H reverse transcriptase (Invitrogen), following themanufacturer’s protocol. For detailed analysis of genes related to thecAMP/Ca2� signaling pathway, an RT2 Profiler PCR array (SABiosci-ences) was used according to the manufacturer’s protocol. A combinationof three different housekeeping genes (Gusb, Hprt, and Hsp90ab1) wasused to normalize the data.
ChIP-qPCR assay for in vivo DNA binding. Our previously describedurea chromatin immunoprecipitation (ChIP) followed by qPCR (urea-ChIP-qPCR) (36) was carefully modified for brain-ChIP-qPCR experi-ments in this study. First, we prepared single-cell suspensions from P13 toP14 wild-type brains by scraping the tissue through a 70-�m strainer (BDBiosciences) and cross-linked chromatin by incubating cells in Dulbecco’sphosphate-buffered saline (D-PBS) containing 1% formaldehyde (meth-anol free; Thermo Scientific) for 5 min at 37°C in a water bath. The cross-linked chromatin was purified from proteins and RNA by 8 M urea gra-dient centrifugation (Beckman ultracentrifuge TL100 using a swing rotorat 20°C for 8 h at 50,000 rpm), and the precipitated chromatin was sub-jected to sonication by a BioRuptor instrument (diagenode/UCD200, onhigh, 7� pulse) or BfuC1 restriction enzyme digestion (New EnglandBiolabs) and preabsorption by incubating with protein A Dynabeads (In-vitrogen). The ChIP was performed as follows: the precleaned chromatin(40 �g) was mixed with anti-Satb1 antibody (1:100 dilution) or preim-mune serum as a control for 1 h at room temperature, followed by anovernight incubation at 4°C with protein A Dynabeads. The chromatinfragments on beads were washed four times with 1% NP-40 in 1� PBSand two times with washing buffer (10 mM Tris-HCl, pH 8.0, 250 mMLiCl, 0.5% NP-40, 0.5% sodium deoxycholate, and 1 mM EDTA). Thechromatin DNAs were recovered from the Dynabeads in 40 �l of Tris-EDTA (TE) at 95°C for 10 min and then subjected to qPCR without
Balamotis et al.
334 mcb.asm.org Molecular and Cellular Biology
on June 30, 2016 by guesthttp://m
cb.asm.org/
Dow
nloaded from

further purification. For putative Satb1 target genes we designed primersequences which focused mainly on the promoter regions of each gene(20-kb upstream area and the first intron). Primers were designed to am-plify regions containing potential Satb1-binding loci (ATC sequences)(22), marked by red numbers under the genomic sequence map in Fig. 4,as well as regions lacking such loci as potential negative controls. TheSatb1-binding sites are marked by red stars on columns in Fig. 4; thosesites determined as Satb1 binding positive show more than 3-fold-highersignal amplification compared to an internal negative site.
Cortical explant cultures. Cortical explant cultures (P7 cerebral cor-tex dissected into 300-�m cubes) were performed on a culture insert (0.4�m, Millicell-CM; Millipore) immersed in medium (25% horse serum,0.25� Hanks balanced salt solution, 25 mM HEPES in Dulbecco’s mod-ified Eagle medium [DMEM]) in 6-well plates. After 10 days of culture,treatment with 25 �M forskolin (FK) (Sigma) in 0.1% dimethyl sulfoxide(DMSO) was used to induce elevated levels of cAMP. Treatment with0.1% DMSO was used as a control (0 h). Total RNA was extracted fromtreated cultures, followed by cDNA synthesis as described above. The RT2
Profiler PCR array qPCR system (cAMP/Ca2� signaling pathway; SABio-sciences) was used to determine the expression levels of cAMP/Ca2�-responsive genes at different time points in wild-type and Satb1-null braincultures.
Golgi-Cox staining. Male mice (wild-type and Satb1-null, 4 each)were euthanized with CO2 gas inhalation, and brains were immersed infreshly prepared impregnation solution (FD Rapid GolgiStain kit; FDNeurosciences). Brains were processed according to the protocol pro-vided by the company. Neurons were first identified at a lower power(10� objective) under a light microscope, and then four completelystained neurons in each selected brain region (M1 and AuV regions of thecerebral cortex) were traced under a 20� objective using the “cameralucida” method. Cells to be drawn were randomly selected for each draw-ing. For a cell to be included in the analysis, the overall cellular morphol-ogy had to be that of a cortical pyramidal neuron; the dendritic tree waswell impregnated, not obscured by stain precipitate, blood vessels, or as-trocytes, and appeared largely intact and visible in the focal plane of thesection. Spine density was quantified by counting spines on dendrites.Statistical analyses were performed on averages across cells per region foreach animal. Group differences were assessed using an unpaired Student ttest (P � 0.01).
RESULTSSatb1 and Satb2 expression are region specific in mature neu-rons in the postnatal brain. To study the role of Satb1 in thepostnatal mouse brain, we first determined the expression pat-terns of Satb1 and Satb2 in coronal (representative images in Fig.1) and sagittal (data not shown) sections of wild-type and Satb1-null mouse brains at P13-P14, using immunostaining and RNAfluorescent in situ hybridization (RNA FISH) methods. Satb1-nullmice are generally small but remain active up to 2 weeks of age,though their health rapidly declines after 2.5 weeks and they fail tosurvive after weaning (3).
We employed polyclonal rabbit antibodies specific for Satb1and Satb2 for immunofluorescence (IF) assay with mouse brainsections (see Materials and Methods). In wild-type brain, we de-tected strong and widely distributed Satb1-specific signals in thecortex and amygdala as shown in Fig. 1A (amygdala is shown withan arrow). In the hippocampus, hilar cells of the dentate gyruswere uniquely and strongly stained by Satb1-specific antibody,along with some cells in the radial and stratum oriens layers of thehippocampus (Fig. 1A, dashed box; high magnification is shownon the right). In contrast, our purified anti-Satb1 antibody did notdetect any signal in Satb1-null mice (see Fig. S1A, Satb1-null, inthe supplemental material), confirming its specificity to Satb1. In
addition, the immunostained signals in the wild-type amygdalaand dentate hilar cells were Satb1 positive but Satb2 negative, in-dicating that these regions specifically and exclusively expressSatb1 (Fig. 1A and B, amygdala indicated with an arrow). In thehippocampus, Satb2 is expressed in the CA1 region and not in thehilar cells (Fig. 1B). Satb1 nuclear distribution was found to re-semble that of a finely spread spider web in both amygdala (Fig.1C) and cortical neurons (data not shown). Satb1 distributionappears restricted to the DAPI-light region, avoiding the DAPI-dense region (presumably heterochromatin), similar to its distri-bution in thymocytes (13). To study whether any cells in the cor-tex express both Satb1 and Satb2, we employed two color RNAFISH (Fig. 1D) to distinguish Satb1 and Satb2 transcripts andconfirmed that cells in the amygdala express Satb1 (Fig. 1D, green,indicated by an arrow) but not Satb2 (Fig. 1D, red, indicated by anarrow). We also confirmed that the cortex contains cells express-ing either Satb1 or Satb2 (Fig. 1D, green for Satb1 and red forSatb2) and a subpopulation of cells expressing both Satb1 andSatb2 RNAs (Fig. 1D, dashed box, high magnification on theright). RNA FISH for Satb1 gave no signal in Satb1-null mousebrain, validating its specificity for Satb1 (data not shown). BothSatb1 and Satb2 expression were detected in the early postnatalcortex, and yet primary expression sites were significantly differ-ent for the two proteins (Fig. 1A and B). Satb1 is minimal in theouter and innermost layers, and its expression is more concen-trated in the middle layers (Fig. 1A and 1D, green), while Satb2signals are more intense in the outer and innermost layers (Fig. 1Band 1D, red). A large number of cells express only Satb1 or Satb2,suggesting specific roles in the cortex for each family member.
To test whether Satb1 is expressed in neurons, we performeddouble immunostaining with anti-Satb1-specific antibody and anantibody either for the neuronal marker NeuN or for the astrocytemarker Gfap. All cells expressing Satb1 were also NeuN positive inall brain areas examined, including the cortex and dentate gyrus,but we did not detect any coexpression of Gfap and Satb1 (see Fig.S1C and S1D in the supplemental material). Together with find-ings from FISH and IF experiments (Fig. 1), these data indicatethat Satb1 is expressed exclusively in neurons in a subregion-specific manner in the postnatal brain.
Satb1 is expressed at high levels in the postnatal brain. Weused an immunoblot to compare the relative cortical expressionlevels of Satb1 and Satb2 at different postnatal time points. Al-though it is difficult to directly compare between Satb1 and Satb2protein levels because two different antibodies were used for eachprotein, the data are consistent with previous reports that Satb2 isquickly downregulated postnatally within 1 week (11), whileSatb1 protein is maintained at high levels (Fig. 1E). We next ana-lyzed the relative levels of Satb1 and Satb2 transcripts by qPCR,using primer sets specifically designed to make a direct compari-son of their transcript levels (RT2 qPCR primer; SABiosciences).The transcript level of Satb1 peaked at the first week postnatally.Past this time and through the remaining early phase of postnatallife, this level remained constant at 60 to 70% of the initial levelobserved at 1 day old (1d) (Fig. 1F). In stark contrast, the tran-script levels of Satb2, which started low (30% of Satb1 at 1d),immediately decreased even further after birth, consistent withthe rapid downregulation of the Satb2 protein (11, 27). Satb2 re-mained at a very low level thereafter (less than 10% of the level at1d). After 1 postnatal week, the transcript levels of Satb1 wereconsistently �10 times those of Satb2. The results for Satb1 and
Alteration of Dendritic Spine Formation by Satb1
January 2012 Volume 32 Number 2 mcb.asm.org 335
on June 30, 2016 by guesthttp://m
cb.asm.org/
Dow
nloaded from

Satb2 transcript patterns in the early postnatal cortex are consis-tent with those for their protein expression (Fig. 1E and F). Theresults show that Satb1 is the primary Satb-family protein ex-pressed in the early postnatal cerebral cortex, peaking at 1 weekafter birth. Therefore, for the remainder of this study, we focusedon the function of Satb1 in the postnatal cortex.
Satb1 ablation does not alter cortical layer morphology. Inthe embryonic cerebral plate, it has been reported that Satb2 di-
rectly regulates Ctip2 and that Ctip2-positive neurons are signifi-cantly expanded in layer 5/6 of Satb2-null mice at E18.5, leading tothinning of the cerebral wall in Satb2-null mice compared to wild-type mice (2). Although Satb2-null mice die at P0 whereas Satb1-null mice survive until 2.5 to 3 postnatal weeks, both proteins areexpressed in the brain early during development, E11.5 to E13.5.Therefore, we first asked whether Satb1 has any role similar to thatof Satb2 in regulating cortical layer identity and architecture. We
FIG 1 Satb1 levels are much higher in discrete regions in postnatal mouse brain than Satb2 levels. Immunostaining of P13 wild-type brain coronal sections withSatb1-specific (A) or Satb2-specific (B) antibodies counterstained with DAPI is shown. The boxed area of the hippocampus in panels A and B is magnified forSatb1 and Satb2 at the right. Representative images of nuclear localization of Satb1 in wild-type brain are shown (C, basolateral amygdala neuron). RNA FISHof P13 wild-type coronal sections with Satb1-specific (green in panel D) and Satb2-specific (red in panel D) antisense riboprobes and a merged image of thesestainings (D) is shown. The boxed area in panel D (cerebral cortex) is magnified at the right, indicating that Satb1 and Satb2 have a distinct distribution in thecortex. Satb1 is specific in the amygdala, as indicated with arrows (A and B [for IF] or D [for FISH]). Scale bar, 500 �m (A, B, and D) or 5 �m (C). (E) Satb1 andSatb2 cortical protein levels in wild-type mice were determined at different ages by Western blotting using anti-Satb1 mouse monoclonal antibody (a) (BDBiosciences; reacts with both Satb1 and Satb2 proteins), purified anti-Satb1 rabbit polyclonal antibody (b) (Satb1-specific), or anti-Satb2 polyclonal antibody (c)(Satb2 specific) (see Materials and Methods). Anti-tubulin-� antibody was used for loading control measurement. (F) Relative transcript levels of Satb1 and Satb2in cortex at different ages (1 day [1d] to 5 weeks [5w]) were measured by qPCR (RT2 qPCR primers; SABiosciences). The value for each time point represents theaverage for three replicates. These data indicate that Satb1 is the major component of the Satb family in the postnatal cerebral cortex.
Balamotis et al.
336 mcb.asm.org Molecular and Cellular Biology
on June 30, 2016 by guesthttp://m
cb.asm.org/
Dow
nloaded from

examined the cortical layers using layer-specific markers (6).Mouse cortical sections prepared from Satb1-null and wild-typelittermates were immunostained with antibodies for Satb1 and itshomolog Satb2, as well as the layer-specific markers Tbr1 for layer6 and Ctip2 for layer 5/6, as shown in Fig. 2A. At 2 postnatal weeks,we found no difference between Satb1-null and wild-type litter-mate in the thickness of the cerebral cortex (Cx) or in layer devel-opment. In wild-type Cx (Fig. 2A: Satb1, �/�), Satb1 was de-tected mainly in layer 4/5 and weakly in layers 2/3 and 6 (Fig. 2A,Satb1, in red), while Satb2 was detected in layers 2 through 6relatively uniformly (Fig. 2A, Satb2, in red). In Satb1-null Cx (Fig.2A, Satb1, �/�), the loss of Satb1 expression did not change theexpression profiles or thicknesses of Satb2-, Tbr1-, or Ctip2-positive layers. Unlike the case with Satb2, which regulates corticallayer-specific development in the embryo (2), our data show thatSatb1 is dispensable for such regulation in the brain. We furthertested cortical layer marker gene expression in Satb1-null mousecortex compared with that in wild-type mice (Fig. 2B, top row).This study included Ctip2, Tbr1, Satb1, and Satb2, as well as Fezf2,which is a gene regulator for Ctip2 (52), and Foxp2 (layer 6marker) by qPCR. Consistent with the immunostaining results(Fig. 2A), no difference was detected at the transcript level forlayer-specific markers (Tbr1, Ctip2, Fezf2, and FoxP2) and Satb2between wild-type and Satb1-null cortex.
Satb1 is required for proper temporal expression of IEGsduring postnatal development. Given the peak of Satb1 expres-sion in the early postnatal brain, we hypothesized that Satb1 mayplay a role in regulating changes in gene expression associatedwith early postnatal brain development. In mammals, the cerebralcortex is not fully developed at birth, and its adult configuration isacquired during early postnatal life in response to external stimuli(40). It has been previously shown that Satb1 regulates induciblegenes, such as cytokine genes upon T cell activation and the c-Mycgene in mitogen-stimulated thymocytes (13, 14, 94). Therefore,we explored whether, in the brain, Satb1 contributes to regulatingexpression of IEGs, which have been implicated in modulatinggenomic responses in neurons that facilitate a variety of cellularprocesses, including growth, differentiation, and learning andmemory (44). IEGs have been categorized into two groups: (i)regulatory transcription factors (RTFs) (e.g., Fos, Jun, and Egr),which control transcription of hundreds of downstream genes,and (ii) effector IEGs (e.g., Arc and Bdnf), which directly modifyneural morphogenesis and plasticity (4, 53, 63, 88). We first ana-lyzed Fos gene expression, which is activated during neuronal ac-tivity and plasticity (42). The Fos gene was significantly downregu-lated in Satb1-null brain compared with results for wild-typebrain at 2 weeks of age (Fig. 2B, bottom row). We confirmed thisby double immunostaining of the cortical region (layer 4) forSatb1 and Fos. In wild-type brain, most Fos-positive cells coex-pressed Satb1, but Fos-positive cell numbers were decreased in theSatb1-null brain, (see Fig. S2 in the supplemental material). Wefound a similar reduction in the basal expression levels, by �2-fold, of several other IEGs (Fosb, Egr1, Egr2, Arc, and Bdnf) (Fig.2B, bottom row).
To further examine the effect of Satb1 loss on IEG expression inthe early postnatal brain, we investigated the expression levels ofsix IEGs (Fos, Fosb, Egr1, Egr2, Arc, and Bdnf) at multiple timepoints during early postnatal cortical development in wild-typeand Satb1-null cortex. As a comparison, we also examined geneexpression patterns for regulators of cortical layer development
(Ctip2, Tbr1, Fezf2, and FoxP2). Due to the relatively early lethalityof Satb1-null mice, around P16 to P21, we were able to monitorgene expression only up to 13 days, when all mice typically ap-peared healthy, although we collected data for wild-type mice upto 56 days. As predicted by the normal cortical layer developmentin Satb1-null mice, expression of Ctip2, Tbr1, Fezf2, and FoxP2was similar to that in age-matched wild-type siblings, indicatingthese genes are not strictly Satb1 dependent (Fig. 2C, top row).Surprisingly, all six IEGs in Satb1-null cortex showed marked al-teration in not only the levels but also the timing of their expres-sion; in Satb1-null cortex, their expression peaked at 10 days, 3days earlier than in wild-type mice, and abruptly declined on day13 (Fig. 2C, bottom row). Data for the P10 time point came from4 independent mice from three different litters. This is in sharpcontrast to expression of these IEGs in wild-type cortex, wheretheir maximum levels were reached later and were sustained lon-ger, typically 13 to 21 days, declining at 56 days (except for Fosb,which still maintained high levels, and Bdnf, which declined ear-lier, at 21 days). This difference in the temporal expression patternof IEGs culminated in the �2-fold-reduced expression in Satb1-null cortex compared to wild-type cortex on P13, consistent withour results shown in Fig. 2B. Interestingly, Egr2, Fos, and Fosb geneexpression in Satb1 null mice was 3- to 6-fold above wild-typelevels at P10. These data indicate that Satb1 is required for propertemporal induction and for the maximal expression levels of IEGsduring the critical period of postnatal brain development.
Satb1 is required for other neuronal gene expression. In ad-dition to the six IEGs described above, we searched for neuronalgenes whose basal level of expression is dependent on Satb1. Westudied SRE-, CRE-, and CaRE-containing genes, similar to theabove six IEGs, by using commercially available qPCR arrays (SABiosciences). We compared RNA collected from the cerebral cor-tex of P13-P14 Satb1-null mice and their wild-type littermates.The array results confirmed our studies of RTF IEGs (Egr1, Egr2,Fos, and Fosb), and effector IEGs (Arc and Bdnf) (Fig. 2B), as wellas identifying new genes that were downregulated in Satb1-nullmice: the neurotransmitter-related genes encoding somatostatin(Sst) and tyrosine hydroxylase (Th), the growth factor-relatedgene for amphiregulin (Areg), the gene for corticotropin-releasinghormone (Crh), and a Ca2�-responsive gene, for calbindin 2(Calb2) (also known as calretinin), as listed in Table 1. Four geneswere identified as being significantly upregulated in the Satb1-null cortex. These Satb1-repressed genes encode two calcium-binding proteins (S100a8 and S100a9), a cytokine (Il6), andtumor necrosis factor (Tnf) (Table 1). S100a8 and Il6 functionin inflammation and fever in the brain. Tnf shows divergentroles for neuronal death and survival. Increased expression ofinflammation-related genes might cause neuronal death (15).However, we confirmed by terminal deoxynucleotidyltrans-ferase-mediated dUTP-biotin nick-end labeling (TUNEL) as-say in P13-P14 brain that cell death was similar between Satb1-null and wild type brain (data not shown). The remaining 67genes of the microarray had similar expression levels in bothwild-type and Satb1-null mouse samples (see Table S1 in thesupplemental material for a summary of data for 83 genes plusGapdh as an additional control). These data indicate that inaddition to IEGs, basal-level expression of several other SRE/CRE/CaRE-containing genes is affected by Satb1 expression inthe 2-week-old cerebral cortex.
Satb1 affects inducibility of IEGs and other neural genes in
Alteration of Dendritic Spine Formation by Satb1
January 2012 Volume 32 Number 2 mcb.asm.org 337
on June 30, 2016 by guesthttp://m
cb.asm.org/
Dow
nloaded from

FIG 2 Satb1 depletion results in no alteration in gross morphological development but significant alteration of IEG expression in the cerebral cortex. (A)Mouse coronal sections prepared from Satb1-null and wild-type littermates were immunostained with antibodies for Satb1 and its homolog Satb2 (inred), as well as Tbr1 for layer 6 and Ctip2 for layer 5/6 (in green). There is no difference in layer-specific markers and cortical thickness between wild-typeand Satb1-null mice. Scale bar, 100 �m. (B) Relative levels of transcripts of Satb1, Satb2, Ctip2, Tbr1, Fezf2 (gene regulator for Ctip2), and Foxp2 (layer6 marker) (top row), as well as IEGs (Fos, Fosb, Egr1, Egr2, Arc, and Bdnf) (bottom row), in the cerebral cortex of wild-type and Satb1-null mice (13 daysold) were analyzed by qPCR. Layer-specific modulator genes were not altered in Satb1-null mice (red bar) compared with those in wild-type mice (bluebar). However, all IEGs tested were significantly altered in Satb1-null mice. Values represent mean values � SE; �, P � 0.05 (for the wild type, n � 4; forSatb1 null, n � 4). (C) The temporal and relative levels of gene expression during postnatal cortical development for layer-specific modulators (Ctip2,Tbr1, Fezf2, and FoxP2) and IEGs (Fos, Fosb, Egr1, Egr2, Arc, and Bdnf) were analyzed in wild-type mice (between 7 days and 56 days; blue line with circles)and Satb1-null mice (between 7 days and 13 days; red line with squares). Levels of gene expression of layer-specific modulators showed no differencebetween wild-type mice and Satb1-null mice (top row). On the other hand, Satb1-null mice showed significant alteration in temporal and expressionlevels of IEGs (bottom row). Day 21, shown in red, is the maximum time of Satb1-null mouse survival. �, P � 0.01 (n � 3 or 4 at each time point).
Balamotis et al.
338 mcb.asm.org Molecular and Cellular Biology
on June 30, 2016 by guesthttp://m
cb.asm.org/
Dow
nloaded from

cortical explant cultures. Next, to examine Satb1’s potential toaffect the inducibility of other key neuronal genes upon stimula-tion, we employed an in vitro culture system. Because Satb1-nullmice die before weaning, they are unfortunately not suitable forexamining activity-dependent gene expression in vivo. We pre-pared cortical organotypic cultures from wild-type and Satb1-nullbrain and stimulated them with forskolin (FK) to study the impactof Satb1 on stimulation-dependent induction of the SRE/CRE/CaRE-containing genes. It is important to note that our in vitroculture assay system took a subset of the brain tissue out of thecontext of the whole brain, and as such, the cells for which wemeasured stimulation-dependent responses may lack the regula-tory contributions of inhibitory neurons and/or synaptic inputfrom other parts of the brain. Therefore, we used the in vitro cul-ture assay merely to test Satb1’s potential to affect the inducibilityof multiple key neuronal genes in response to stimulation, ratherthan as an assay to measure stimulation-induced gene expressionlevels. FK activates adenylate cyclase in the cell, which results inelevated levels of cAMP, leading to synaptic potentiation throughactivation of cAMP-dependent gene expression (62). The organo-typic cortical explant cultures from 6- to �7-day-old Satb1-nulland wild-type littermates were maintained for 10 days (to mini-mize the effects of dissection and culture stress on the cells’ geneexpression patterns) then FK (25 �M) was added to the cultures,and total RNA was harvested. Using the same qPCR-based arraydescribed above, we determined the expression levels of SRE/CRE/CaRE- containing genes (including Arc and Bdnf, whichwere individually added to the study to make a total of 84 genes) atearly (1 h) and later time points (2 h and 4 h) after stimulation.Each expression level was normalized to the average for threehousekeeping genes (Gusb, Hsp90ab1, and Hprt). Data shown inFig. 3 represent the averages for at least 4 independent wild-typeand 4 Satb1-null brain cultures. Of the 84 genes analyzed, 80 wereexpressed at detectable levels (see Table S2 in the supplementalmaterial). Among those, some genes, such as Egr1, Fos, and Bdnf,did not show any difference in fold induction between wild-typeand Satb1-null brain. However, we found a total of 13 genes (Egr2,Fosb, Arc, Sst, Calb2, Il6, Atf3, Calr, Tacr1, Thbs, Penk1, Pmaip1,and Calb1) that exhibited a significantly altered induction patternin response to FK stimulation in Satb1-null compared to wild-type cortical explant cultures (Fig. 3A and B; see also Table S2).Our in vitro assay revealed the important contribution of Satb1 to
the inducibility of these genes by FK stimulation and identified 7new genes whose regulation by Satb1 had gone undetected by ourin vivo analysis (e.g., Thbs1, Atf3, Penk1, Tacr1, Calb1, Calr, andPmaip1, as shown in Table S2).
In addition to FK stimulation, we tested the effects of kainicacid (KA) (50 �M) stimulation on 6 IEGs (Fos, FosB, Egr1, Egr2,Arc, and Bdnf). KA is a glutamate agonist that binds specifically tothe kainate receptor class of ionotropic glutamate receptors,which play important roles in synaptic plasticity (37, 48). Wefound that 4 genes (Egr1, Egr2, Fosb, and Arc) were induced athigher rates in Satb1-null cortical culture, while Fos and Bdnf ex-pression were similar to that in wild-type controls (see Fig. S3).The results of KA stimulation were mostly consistent with thosedescribed for FK. Of particular note, the in vitro stimulation sys-tem likely does not faithfully recreate an in vivo activity-dependentneuronal response, maybe due to lacking the full connectivity ofthe in vivo circuit.
Taken together, our in vivo and in vitro data indicate that Satb1is required to regulate the proper levels and timing of basal andactivity-dependent expression of multiple neuronal genes thatplay important roles in neuronal function. These genes includeIEGs (Fos, Fosb, Egr1, Egr2, Arc, and Bdnf), genes involved in syn-aptogenesis (Sst, Areg, and Thbs1) and stress, the fear/anxiety re-sponse or hyperactive behavior (Th, Crh, Atf3, Penk1, and Tacr1),and the Ca2� binding and damage/inflammation response (Calb1,Calb2 [Calretinin], Calr, Pmaip [also known as NoxA], S100a8,S100a9, Tnf, and Il6).
Satb1 binds genomic loci of target IEGs and other key neuralgenes. We next set out to determine whether Satb1 binds to itsneuronal target loci. We employed urea-chromatin immunopre-cipitation (urea-ChIP), followed by quantitative PCR (qPCR) (seeMaterials and Methods). Chromatin fragments were preparedfrom P13-P14 wild-type cortex, followed by immunoprecipita-tion using rabbit polyclonal anti-Satb1 antibody 1583 (or Abcamanti-Satb1 antibody). The chromatin recovered from this step wasthen subjected to qPCR using primers designed to examine DNAfragments containing potential Satb1-binding sequences (theATC sequence context; see Materials and Methods for details), aswell as nearby control DNA sequences not expected to bind Satb1.All primers were designed to examine DNA fragments within an�20-kb region upstream from the transcription start site of eachgene locus analyzed. We first analyzed whether Satb1 binds gene
TABLE 1 Altered levels of gene expression in cyclic AMP-, serum-, or Ca2�-dependent genes other than IEGs in Satb1-null mouse brain relative tothat in wild-type micea
Gene Product Enhancerb Functionc Fold changed
Th Tyrosine hydroxylase CRE N �2.13*Calb2 Calbindin 2 CaRE �1.82*Crh Corticotropin releasing hormone CRE G �1.73*Sst Somatostatin CRE N �1.62*Areg Amphiregulin CRE G �1.59*S100a8 S100 calcium binding protein A8 CRE N �1.94*Tnf Tumor necrosis factor CRE G �2.07*Il6 Interleukin 6 CRE I �2.19*S100a9 S100 calcium binding protein A9 CRE N �2.28*a The relative expression level was obtained by using the average values of three different housekeeping genes (Gusb, Hprt, and Hsp90ab1) for normalization. The fold difference foreach gene represents the relative expression level in Satb1-null cortex compared to that in wild-type cortex.b Sequence on gene promoter: SRE or SRE-like enhancer (SRE), CRE enhancer (CRE), or Ca2�-responsive element (CaRE).c Functional categories: neuropeptides/neurotransmitters (N), growth factors (G), and immune regulation (I).d �, P value � 0.05 (wt, n � 5 or 6; KO, n � 5 or 6), analyzed by using SuperArray plates. Complete information for all 82 genes is listed in Table S1 in the supplemental material.
Alteration of Dendritic Spine Formation by Satb1
January 2012 Volume 32 Number 2 mcb.asm.org 339
on June 30, 2016 by guesthttp://m
cb.asm.org/
Dow
nloaded from

loci of 4 IEG transcription factors (Egr1, Egr2, Fosb, and Fos) and 2effector IEGs (Arc and Bdnf) which showed altered expression inSatb1-null samples in vivo (Fig. 2B). We found that Satb1 binds toall six IEGs at single or multiple sites containing the ATC sequencecontext within the region tested (Fig. 4A). We also detected Satb1bound to the non-IEG SRE/CRE/CaRE-containing genes Sst, Crh,and Calb2 (Fig. 4B), which also exhibited altered expression inSatb1-null brains (Table 1). On the other hand, multiple ATCsequence stretches identified within the Hprt1, Hbb-b1, andGapdh genes were not bound by Satb1 (Fig. 4C; also Gapdh datanot shown), indicating the specificity of Satb1 binding to IEGs andother SRE/CRE/CaRE-containing genes. These data from urea-ChIP-qPCR and transcription analyses strongly suggest that Satb1is required for proper stimulation-induced expression of multipleSRE/CRE/CaRE-containing genes in vivo.
Satb1 is expressed in both excitatory and inhibitory neuronsin the cerebral cortex. By immunostaining brain sections andfocusing on layers 4 and 5, where Satb1-expressing neurons aremost abundant (51% of DAPI� cells were Satb1�), we found thatSatb1 is expressed by both inhibitory (Gad67� [18]) and excit-atory (vGlut2� [39]) cells (Fig. 5A to C). We found that 15% of theSatb1� cells also expressed Gad67, whereas all Gad67� cells (9%of the DAPI� cells) expressed Satb1 (Fig. 5A and B). Sixty percentof the Satb1� population coexpressed vGlut2 (Fig. 5C), whereas
40% of the vGlut2� cell population (45% of all DAPI� cells) ex-pressed Satb1.
Dendritic spine density is significantly reduced by Satb1 de-pletion in the brain. Given the important roles of IEGs in synapseformation, taken together with our finding that Satb1 binds loci ofIEGs and other important neuronal factor genes which are aber-rantly altered by the loss of Satb1, we hypothesized that Satb1might play a role in neuronal structures, especially synapse forma-tion. Dendritic spines are postsynaptic structures where most syn-aptic communication between neurons occurs and can rapidlychange in shape, volume, and number in response to incomingstimuli (67, 96). As such, changes in dendritic spine formation canbe indicators of synaptic plasticity. By the Golgi-Cox stainingtechnique, we analyzed morphology of excitatory pyramidal neu-rons in the cerebral cortex.
The brains from four male Satb1-null and four male wild-typecontrol mice at P13-P14 were processed for Golgi-Cox stainingusing standard procedures (FD Neurosciences). From each mousebrain, dendrite length, branching pattern, and spine shape anddensity were measured in 4 neurons each from the M1 (primarymotor cortex) and AuV (secondary auditory cortex) regions of thecerebral cortex (a total of 16 neurons/region/mouse group). Allcells analyzed were identified morphologically under low magni-fication as pyramidal neurons (representative images are shown in
FIG 3 Satb1 is required for multiple neuronal genes in response to forskolin stimulation in vitro. Organotypic cortical explant cultures prepared from Satb1-nullor wild-type brains were treated with 25 �M forskolin (FK) for 1 h, 2 h, and 4 h or from 0.1% DMSO-treated samples as a control (0 h). qPCR was used todetermine the expression levels of SRE/CRE/CaRE- containing genes in cultures. Fold induction of gene expression at different time points relative to inductionat 0 h was calculated. Representative genes with significantly different fold inductions in Satb1-null brain samples (red) compared to wild-type brain samples(blue) are presented (IEGs [A] or non-IEGs [B]). The data for Penk1, Thbs1, Pmaip1, and Calb1 are not shown. However, the responses of Penk1 and Thbs1 toFK are similar to that of Sst. Pmaip1 is similar to Arc. Calb1 is similar to Calb2. Each data point represents the mean value � SE for four experimental replicates.�, P � 0.05.
Balamotis et al.
340 mcb.asm.org Molecular and Cellular Biology
on June 30, 2016 by guesthttp://m
cb.asm.org/
Dow
nloaded from

Fig. 5D), and multiple basal dendrites, excluding apical dendrites,were analyzed within a uniform distance from their soma. Resultswere compared statistically between the Satb1-null and wild-typebrain groups. Dendritic branch complexity of cortex neurons wasnot significantly altered between the two groups of mice by Shollanalysis (data not shown, but a representative morphology isshown in Fig. 5D, middle and right columns). Also, the shapes ofdendritic spines were not significantly altered in the Satb1-nullcortex (Fig. 5E, representative morphology in M1 region). How-ever, the dendritic spine density of the Satb1-null mouse brain wassignificantly reduced, by roughly 50%, from that of wild-typemice at two different regions in cerebral cortex pyramidal cells(Fig. 5F, 1-M1 region and 2-AuV region, Cx-Py). In contrast, thespine density of hippocampal neurons showed no difference be-tween the Satb1-null and wild-type mice (Fig. 5F, Hip-Py). Be-cause we showed that the level of Satb1 in the hippocampus CA1of wild-type mice is virtually undetectable (Fig. 1A) and its expres-sion is restricted to the dentate hilar cells (see Fig. S1A in thesupplemental material), these data indicate that Satb1 expressionhas a major impact on the spine density in neurons in a brain
region-specific manner. The above results strongly suggest thatSatb1 plays an important role in regulating synapse formation inthe cerebral cortex during postnatal development.
DISCUSSION
We show that the nuclear architectural protein Satb1 is expressedin terminally differentiated neurons in the postnatal brain, mainlyat the cerebral cortex and amygdala, and binds in vivo to genomicloci of IEGs and several other SRE/CRE/CaRE-containing genesexamined (summarized in Table 2). Induction of IEGs is highlycorrelated with brain plasticity (4, 63), and they are expressedprominently in the cerebral cortex, where synaptic formation andremodeling are guided by extracellular influences in early postna-tal life during specific windows of time, known as critical periods(4, 57, 78). We found that Satb1 is essential for the proper tempo-ral expression and levels of RTF-IEGs (Fos, Fosb, Egr1, and Egr2)and effector IEGs (Arc and Bdnf) during postnatal cortical devel-opment.
Similar to findings of a study in rats (41), we found that expres-sion of multiple IEGs in wild-type mouse cortex significantly in-
FIG 4 Satb1 binds IEGs and other neuronal genes in vivo. Urea-chromatin immunoprecipitation (Urea-ChIP) was carried out with either anti-Satb1 antibodyor preimmune serum. qPCR was used to determine relative fold enrichment of 5 or 6 different genomic sites in anti-Satb1 ChIP samples for each gene (anindication of Satb1 binding). Potential Satb1-binding loci (containing ATC sequences) are marked by numbers in red under the genomic sequence, and potentialnon-Satb1-binding loci are marked by numbers in black as controls. Red stars label significant fold enrichment relative to that for the internal control sitedetermined by this assay, indicating Satb1 was bound to these sites. Exons for each genomic sequence are marked by green boxes, and translation initiation sitesare marked by black arrows. As expected for Satb1-independent genes in the brain, all potential Satb1 binding sites for such genes (C) (Hbb-b1 and Hprt1) werenot bound by Satb1, indicating that the gene is either not expressed (Hbb-b1) or not Satb1 dependent (Hprt1) in the cerebral cortex.
Alteration of Dendritic Spine Formation by Satb1
January 2012 Volume 32 Number 2 mcb.asm.org 341
on June 30, 2016 by guesthttp://m
cb.asm.org/
Dow
nloaded from
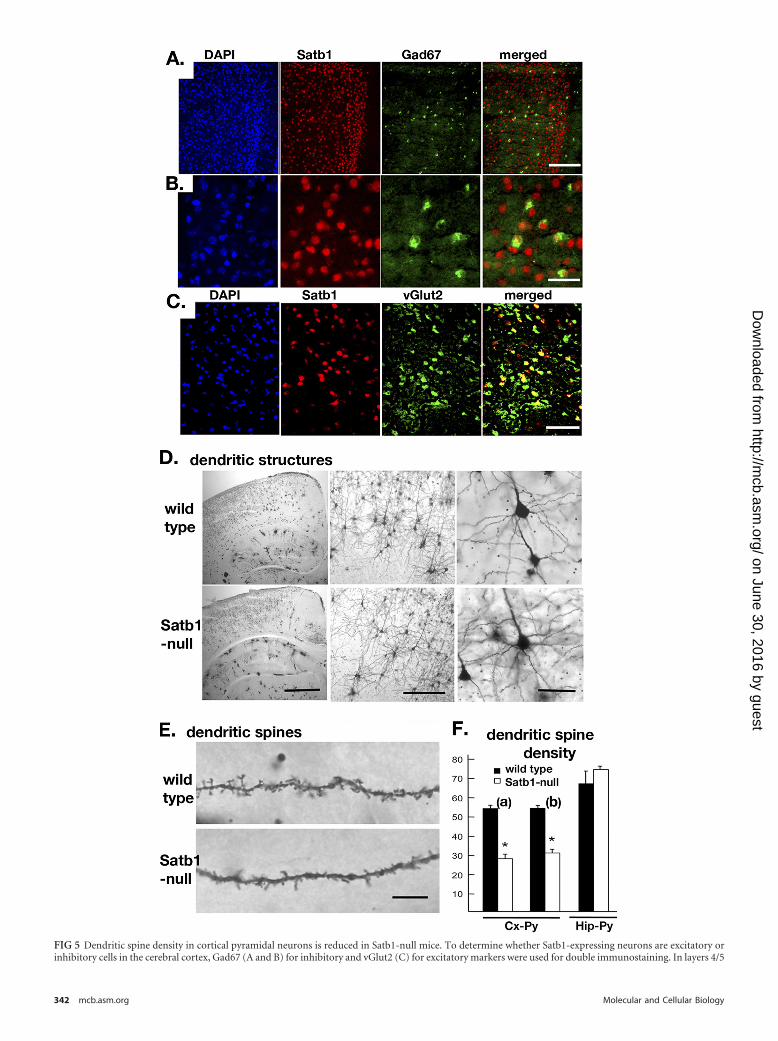
FIG 5 Dendritic spine density in cortical pyramidal neurons is reduced in Satb1-null mice. To determine whether Satb1-expressing neurons are excitatory orinhibitory cells in the cerebral cortex, Gad67 (A and B) for inhibitory and vGlut2 (C) for excitatory markers were used for double immunostaining. In layers 4/5
342 mcb.asm.org Molecular and Cellular Biology
on June 30, 2016 by guesthttp://m
cb.asm.org/
Dow
nloaded from

creases in the second week and is sustained at higher basal levelsthrough the third postnatal week, declining in expression thereaf-ter (Fig. 2C). Satb1 expression peaks at 1 week postnatally, beforeIEG expression is elevated (Fig. 1F). Upon Satb1 ablation, IEGexpression peaks almost synchronously for all tested IEGs at anabnormally earlier stage at P10 in the cortex and rapidly decreasesby P13, to roughly half the levels for wild-type cortex. Together,these data show that IEG expression in the early postnatal mam-malian brain is dynamic, showing rapid changes in expressionwithin the first few postnatal weeks, and that loss of Satb1 resultsin changes in the dynamics of IEG induction. Consistent with thisin vivo alteration, in vitro, where cellular responses to externalstimulation can be monitored in a controlled cortical organotypicculture system, the stimulation-dependent induction of IEG ex-pression is altered in Satb1-null brain cultures. Curiously, someIEGs with reduced basal levels in 2-week old Satb1-null brain ex-hibited increased induction upon stimulation in vitro comparedto wild-type control results. The in vitro explant culture likely doesnot reproduce the full connectivity of the in vivo circuit and there-fore might not recreate the in vivo dynamics. Nevertheless, theresults from the in vitro experiment show that the inducibility ofIEGs is not regulated properly in the absence of Satb1, and this isconsistent with the altered temporal dynamics of IEG induction inthe early time point for Satb1-null postnatal brain. We demon-strated that Satb1 binds in vivo to multiple specialized ATC se-quences specifically recognized by Satb1 within the genomic lociof each of the IEGs we examined. Satb1 has an important functionin assembling transcription factors and chromatin remodelingfactors on its target gene loci once Satb1 binds to the loci throughspecialized ATC sequences (13, 14, 94). In the absence of Satb1,specific regulators responsible for regulating IEGs might not beproperly assembled on their IEG loci at the correct time duringdevelopment or in response to simulation, leading to overexpres-sion or insufficient activation. Such activity of Satb1 could under-lie the dysregulation of temporal expression and inducibility ofIEG in vivo observed after Satb1 ablation. We interpret the resultsof Satb1 effects on IEG expression to mean that Satb1 is not re-quired for IEG expression per se but plays a critical role in modu-lating the temporal dynamics as well as overall levels of IEG in-duction, affecting the downstream genes of IEG-dependentneuronal factors.
In contrast to findings for the IEGs, we found no changes inexpression for layer-specific regulators (Ctip2, Tbr1, Fezf2, andFoxP2) in Satb1-null brains during this period. Without alterationof expression of those layer-specific regulators, cortical layer mor-phology was largely normal in the Satb1-null brain, in stark con-trast to the Satb2-null brain. Therefore, Satb2 is essential for spec-ification of cortical layers during embryonic development,whereas Satb1 is dispensable for this. On the other hand, Satb1ablation alters cortical dendritic spine density in the postnatalbrain, suggesting a critical role for Satb1 in synaptic plasticity.
However, given the low level of expression of Satb2 in the earlypostnatal brain, our results do not rule out the potentially redun-dant role for Satb2 in participation in IEG expression and den-dritic spine formation. A rigorous study comparing the roles ofSatb1 and Satb2 in the postnatal brain awaits the generation andcomparison of Satb2 single and Satb1/Satb2 double-conditionalknockout mice.
Dendritic spines are postsynaptic sites of most excitatory syn-apses and play critical roles in synaptic transmission and plasticity(67). Alteration of dendritic spines and synaptic connections inthe cortex in an activity-dependent manner has been documented(86). In the absence of Satb1, dendritic spine density in corticalexcitatory pyramidal cells in 2-week-old Satb1-null mice is signif-icantly reduced compared to that in wild-type mice. However, thedensity remained unaltered in the hippocampus pyramidal cells,where Satb1 expression is undetectable in the same wild-typemice. This high correlation of Satb1 expression and dendriticspine density in pyramidal cells strongly suggests that Satb1 playsa role in synapse formation in the cerebral cortex during earlymouse postnatal life. In the cortex, we showed that both excitatoryand inhibitory neurons express Satb1. Therefore, the decrease inspine density in cortical excitatory pyramidal cells we observedcould be due to cell-autonomous effects of Satb1 and/or due tonon-cell-autonomous effects of Satb1 in inhibitory cortical in-terneurons. Interestingly, it was recently reported that the major-ity of spines formed early during development, together with asmall fraction of new spines induced by novel experience, are pre-served and provide a structural basis for memory retentionthroughout the animal’s entire life (90, 92, 93). Therefore, a sig-nificant reduction in spines formed in the early postnatal stage ofSatb1-null mice may lead to defects in learning and memory andmay thus affect lifelong behavior.
It has been reported that individual IEG knockout mice (e.g.,Arc and Homer-1a) exhibit no effects on dendritic spine density(73, 87). A recent analysis on the effect of Arc ablation revealedchanges in spine morphology in a specific hippocampal region(72). On the other hand, major alterations in dendritic spine mor-phology are found in human patients with neurodegenerative dis-eases (e.g., fragile X syndrome, Huntington’s disease, and Alzhei-mer’s disease) and in corresponding mouse models in whichmultiple transcription factors are dysregulated (5, 32, 43, 69). Thealtered timing and expression levels of IEGs in the Satb1-null cor-tex during the early phase of postnatal cerebral cortex develop-ment may be one molecular mechanism that could contribute toreduced dendritic spine density. Future experiments will revealwhether the dendritic spine phenotype observed in the Satb1-nullcortex is a direct result of Satb1 regulation of specific IEGs and, ifso, which Satb1 target IEGs are required for this process.
We demonstrated that many important neuronal genes, in-cluding IEGs and those involved in synaptogenesis, stress, thefear/anxiety response, or hyperactive behavior, depend on Satb1
in the cortex, Gad67-positive cells (9% of DAPI� cells) were almost all Satb1-positive cells (A and B), and 60% of Satb1-positive cells (51% of DAPI� cells) werealso vGlut2 positive (C). Scale bar, 225 �m (A), 50 �m (B), or 150 �m (C). (D) Representative images of Golgi-Cox-stained morphology in the cerebral cortex(Cx) in wild-type and Satb1-null mice. Dendrite complexity is not significantly altered between wild-type and Satb1-null neurons (Sholl analysis; data notshown). Scale bar, 1,000, 500, or 50 �m (left to right, respectively). (E) Representative images of Golgi-stained dendrites from cerebral cortex-pyramidal cells(Cx-Py, M1 region) in wild-type and Satb1-null mice. A clear reduction in spine number is observed in Satb1-null mice. Scale bar, 10 �m. (F) Dendritic spinedensity in two distinct cortical regions (M1 [a] and AuV [b]) is reduced �50% in Satb1-null mice but not in the hippocampus (Hip-Py). The hippocampalpyramidal cells have undetectable level of Satb1 expression in wild-type mice and show no difference in dendritic spine density between wild-type and Satb1-nullmice. n � 4 mice � 4 cells for each region (total, 16 neurons/site). �, P � 0.01.
Alteration of Dendritic Spine Formation by Satb1
January 2012 Volume 32 Number 2 mcb.asm.org 343
on June 30, 2016 by guesthttp://m
cb.asm.org/
Dow
nloaded from

TABLE 2 Satb1-dependent genes selected from 82 SRE/CRE/CaRE genes tested
Category and gene Description or product Enhancer
Expression(KO/wt)a Satb1-
ChIPresultb Function Reference(s)In vivo In vitro
IEGsFos FBJ osteosarcoma
oncogeneCRE, SRE Down No (�) Transcription factor; regulates neuronal
excitability; Fos-KO mice show decreasinganxiety and hyperactivity
89, 95
Fosb FBJ osteosarcomaoncogene B
SRE Down Enhance (�) Transcription factor; FosB-KO mice showabnormal nursing
49, 83
Egr1 Early growth response 1 CRE, SRE Down No (�) Transcription factor; modulates synapticplasticity by regulating Arc; Egr1-KO micelook normal in nervous system
53, 61
Egr2 Early growth response 2 CRE, SRE Down Enhance (�) Transcription factor; may have antagonisticfunctions in brain against Egr1,3; Egr2-KOmice show abnormal eating behavior
74
Arc Activity regulatedcytoskeletalassociated
CRE Down Enhance (�) Effector IEG; plays roles in multiple forms ofneuronal plasticity; Arc-KO mice showdecreasing fear response
10, 73
Bdnf Brain-derivedneurotrophic factor
CRE Down No (�) Effector IEG; plays roles in neuronal survival/growth and differentiation of neurons andsynapses; Bdnf-KO mice show abnormalmotor coordination and hyperactivity andabnormal sensory neuron innervations
17, 29
Synaptogenesis,developmentalresponse
Sst Somatostatin CRE Down Enhance (�) Neuropeptide; inhibits release ofsomatotropin (growth hormone);downregulation of Sst may trigger amyloidbeta accumulation in Alzheimer’s disease.Sst-KO mice show abnormal postsynapticpotential
55, 79
Areg Amphiregulin CRE Down No ND Autocrine growth factor; as well as mitogenfor broad range of target cells, includingadult neural stem cells; Areg-KO mice showabnormal mammary gland growth
24, 56
Thbs1 Thrombospondin 1(TSP-1)
SRE No Enhance ND Angiostatic factor; Thbs are implicated incontrol of synaptogenesis and neuritegrowth; Thbs1-KO mice show abnormalpancreas morphology
21
Stress, fear/anxiety-relatedresponse
Th Tyrosine hydroxylase CRE Down No ND Neurotransmitter catecholamine biosynthesis;plays an important role in the physiology ofadrenergic neurons; lethality in TH-KOmice
45
Crh Corticotropin releasinghormone
CRE Down No (�) Growth factor; this hormone fromhypothalamus regulates the release ofcorticotropin from pituitary gland; Crh-KOmice show abnormal food intake
64
Atf3 Activating transcriptionfactor 3
CRE No Enhance ND Transcription factor; ATFs regulate emotionalreactivity and depression-like behavior;Atf3-KO mice show abnormal pancreaticislet and increased IL-4, -5, -13
31, 34
Penk1 Preproenkephalin 1 CRE No Enhance ND Neurotransmitter; plays roles in painperception and responses to stress; Penk1-KO mice show increased anxiety response
68, 76
Tacr1 Tachykinin receptor 1 CRE No Enhance (�) Neurotransmitter receptor; belongs to theG-protein-coupled receptor 1 family;Tacr1-KO mice show hyperactive,resembling to ADHD
50, 91
Continued on following page
Balamotis et al.
344 mcb.asm.org Molecular and Cellular Biology
on June 30, 2016 by guesthttp://m
cb.asm.org/
Dow
nloaded from

for their expression in cortical neurons, as summarized in Table 2.Although many genes are activated in neurons in response to en-vironmental stimulations, it remains unknown how such activity-dependent gene expression is coordinated, leading to changes inbehaviors (28). Epigenetic mechanisms might be involved in thoseprocesses (8, 30, 47, 58). To date, Satb1 has been found in a num-ber of progenitor cells, including thymocytes, osteoblasts, thebasal layer of the epidermis, amyloblasts, and embryonic stemcells (3, 26, 81) but not in mature, differentiated cells, except for Tcells upon activation (14). Upon activation of T cells in responseto stimulation, Satb1 is induced, bringing distal cytokine genestogether by chromatin looping, assembling these cytokine geneswith chromatin remodeling/transcription factors to coordinatelyactivate their expression (14). In breast cancer, SATB1 plays a
determinant role in metastasis, where it regulates expression of�1,000 genes and establishes metastasis-promoting gene expres-sion profiles, driving cancer cells to acquire metastatic phenotypes(33). Similarly, neurons rapidly regulate a multitude of genesupon stimulation, which can necessitate the function of a globalgene regulator like Satb1 to coordinate this process. Although itwould be technically challenging given the diversity of neuronalsubtypes and the difficulty of purifying them for biochemical ex-periments, it will be important in the future to determine howSatb1 regulates IEG loci in the postnatal brain by determiningwhether the effects are mediated through formation of higher-order chromatin structures in neurons and identifying some keyregulatory factors that are recruited, as we have previously shownfor T cells (14). Large-scale expression studies, including genome-
TABLE 2 (Continued)
Category and gene Description or product Enhancer
Expression(KO/wt)a Satb1-
ChIPresultb Function Reference(s)In vivo In vitro
Ca2� binding,damage/inflammationresponseCalb2 Calbindin 2 (calretinin) CaRE Down Enhance (�) Ca2� binding protein; abundant in auditory
neurons; Calb2-KO mice show impairmentof motor coordination
82
Calb1 Calbindin 1 CaRE No Enhance ND Ca2� binding protein; Calb1-KO mice showataxia and abnormal Purkinje cellmorphology
1, 25, 85
Calr Calreticulin CaRE No Enhance ND Ca2� binding protein, essential for heart andbrain development during embryogenesisin mice and required for stress response inC. elegans; Calr-KO mice show lethalitythroughout fetal growth
70, 77
Pmaip1 Phorbol-12-myristate-13-acetate-inducedprotein (NoxA)
CRE No Enhance ND Cell survival; proapoptotic member of Bcl-2family and regulated by p53; in brainischemia, NF-�B becomes activated,leading to NoxA induction; NoxA-KO miceshow normal nervous system
80
S100a8 Calgranulin A CRE Up No ND Ca2� binding protein; has maximalchemotactic activity for neutrophils;exhibits cytokine-like extracellularfunctions related to inflammation; S100a8-KO is embryonic lethality
35, 71
Tnf Tumor necrosis factor CRE Up No ND Growth factor: shows divergent roles forneuronal death and survival; ischemia andtrauma induce Tnf in brain; Tnf-KO miceshow impaired coordination and abnormalcerebral cortex morphology
60, 84
Il6 Interleukin 6 CRE Up Enhance ND Il6 induction in brain is essential fordevelopment of fever; CRH regulates Il6 ininflammation; Il6-KO mice show increasedanxiety/fear response and hyperactivity
16, 65, 75
S100a9 Calgranulin B CRE Up No ND Ca2� binding protein, similar to S100a8, maybe involved in Alzheimer’s disease; S100a9-KO mice show decreased circulating Tnflevel
59
a Expression, KO/wt, in vivo: the basal level of each gene in Satb1-null mouse cortex (designated KO) was compared with that in wild-type mouse cortex (designated wt), as shownin Fig. 2B and Table 1; “Down” represents downregulation in KO, “Up” represents upregulation in KO, and “No” indicates no difference between the two groups. Expression, invitro, KO/wt, FK: FK stimulation in cortical organotypic cultures was studied, as shown in Fig. 3; “Enhance” represents overinduction of the gene expression in KO cultures at anytime point (1 h or 4 h) with FK treatment, and “No” represents no alteration of the gene expression in KO cultures relative to that in wt cultures.b Satb1 ChIP was performed, followed by qPCR detection, as shown in Fig. 4; “(�)” represents significant Satb1 binding on the gene locus. ND, not determined.
Alteration of Dendritic Spine Formation by Satb1
January 2012 Volume 32 Number 2 mcb.asm.org 345
on June 30, 2016 by guesthttp://m
cb.asm.org/
Dow
nloaded from

wide transcriptome studies, are under way to better understandthe effects of Satb1 on expression of many other genes in the post-natal brain. Together, these experiments will help identify otherSatb1 neuronal targets and determine the mechanisms of Satb1gene expression in the early postnatal mammalian brain.
The emerging picture of Satb1 function in the brain is that itplays an important role in facilitating the coordinate temporalinduction of IEGs as well as formation or maintenance of den-dritic spines, both of which are likely to have important conse-quences in brain function. Consistently, conditional Satb1 defi-ciency in the adult brain results in dramatic behavioralabnormalities (data not shown).
ACKNOWLEDGMENTS
This work was supported by NIH-RO1 (CA39681 and GM63026; to T.K.-S.) and NIH-RO1 (NS41128; to Y.K.) and by the Director, Office of Sci-ence, Office of Basic Energy Sciences of the U.S. Department of Energyunder contract no. DE-AC02-05CH11231.
We especially appreciate the critical review and constructive sugges-tions for the manuscript provided by Rui Galvao and Minoree Kohwi. Wethank Shutao Cai for his help in brain ChIP analysis. We are also gratefulto S. A. Regmi, E. Peiffer, undergraduate students from UC Berkeley (B.Dang, U. Awan, J. Yoon, K. Kothandapani, M. Jen, D. Eum, and M. Lobo),and M. Miyano for technical assistance and mouse care. We thank KevinPeet for editorial assistance.
REFERENCES1. Airaksinen MS, et al. 1997. Ataxia and altered dendritic calcium signaling
in mice carrying a targeted null mutation of the calbindin D28k gene.Proc. Natl. Acad. Sci. U. S. A. 94:1488 –1493.
2. Alcamo EA, et al. 2008. Satb2 regulates callosal projection neuron iden-tity in the developing cerebral cortex. Neuron 57:364 –377.
3. Alvarez JD, et al. 2000. The MAR-binding protein SATB1 orchestratestemporal and spatial expression of multiple genes during T-cell develop-ment. Genes Dev. 14:521–535.
4. Andreasson KI, Kaufmann WE. 2002. Role of immediate early geneexpression in cortical morphogenesis and plasticity. Results Probl. CellDiffer. 39:113–137.
5. Beckel-Mitchener A, Greenough WT. 2004. Correlates across the struc-tural, functional, and molecular phenotypes of fragile X syndrome. Ment.Retard. Dev. Disabil. Res. Rev. 10:53–59.
6. Bedogni F, et al. 2010. Tbr1 regulates regional and laminar identity ofpostmitotic neurons in developing neocortex. Proc. Natl. Acad. Sci.U. S. A. 107:13129 –13134.
7. Bode J, et al. 1992. Biological significance of unwinding capability ofnuclear matrix-associating DNAs. Science 255:195–197.
8. Borrelli E, Nestler EJ, Allis CD, Sassone-Corsi P. 2008. Decoding theepigenetic language of neuronal plasticity. Neuron 60:961–974.
9. Bozon B, et al. 2003. MAPK, CREB and zif268 are all required for theconsolidation of recognition memory. Philos. Trans. R. Soc. Lond. B Biol.Sci. 358:805– 814.
10. Bramham CR, Worley PF, Moore MJ, Guzowski JF. 2008. The imme-diate early gene arc/arg3.1: regulation, mechanisms, and function. J. Neu-rosci. 28:11760 –11767.
11. Britanova O, Akopov S, Lukyanov S, Gruss P, Tarabykin V. 2005. Noveltranscription factor Satb2 interacts with matrix attachment region DNAelements in a tissue-specific manner and demonstrates cell-type-dependent expression in the developing mouse CNS. Eur. J. Neurosci.21:658 – 668.
12. Britanova O, et al. 2008. Satb2 is a postmitotic determinant for upper-layer neuron specification in the neocortex. Neuron 57:378 –392.
13. Cai S, Han HJ, Kohwi-Shigematsu T. 2003. Tissue-specific nuclear ar-chitecture and gene expression regulated by SATB1. Nat. Genet. 34:42–51.
14. Cai S, Lee CC, Kohwi-Shigematsu T. 2006. SATB1 packages denselylooped, transcriptionally active chromatin for coordinated expression ofcytokine genes. Nat. Genet. 38:1278 –1288.
15. Campbell A. 2004. Inflammation, neurodegenerative diseases, and envi-ronmental exposures. Ann. N. Y. Acad. Sci. 1035:117–132.
16. Chai Z, Gatti S, Toniatti C, Poli V, Bartfai T. 1996. Interleukin (IL)-6gene expression in the central nervous system is necessary for fever re-sponse to lipopolysaccharide or IL-1 beta: a study on IL-6-deficient mice.J. Exp. Med. 183:311–316.
17. Chan JP, Unger TJ, Byrnes J, Rios M. 2006. Examination of behavioraldeficits triggered by targeting Bdnf in fetal or postnatal brains of mice.Neuroscience 142:49 –58.
18. Chattopadhyaya B, et al. 2007. GAD67-mediated GABA synthesis andsignaling regulate inhibitory synaptic innervation in the visual cortex.Neuron 54:889 –903.
19. Cockerill PN, Yuen MH, Garrard WT. 1987. The enhancer of the im-munoglobulin heavy chain locus is flanked by presumptive chromosomalloop anchorage elements. J. Biol. Chem. 262:5394 –5397.
20. Cohen S, Greenberg ME. 2008. Communication between the synapse andthe nucleus in neuronal development, plasticity, and disease. Annu. Rev.Cell Dev. Biol. 24:183–209.
21. Crawford SE, et al. 1998. Thrombospondin-1 is a major activator ofTGF-beta1 in vivo. Cell 93:1159 –1170.
22. de Belle I, Cai S, Kohwi-Shigematsu T. 1998. The genomic sequencesbound to special AT-rich sequence-binding protein 1 (SATB1) in vivo inJurkat T cells are tightly associated with the nuclear matrix at the bases ofthe chromatin loops. J. Cell Biol. 141:335–348.
23. Dickinson LA, Joh T, Kohwi Y, Kohwi-Shigematsu T. 1992. A tissue-specific MAR/SAR DNA-binding protein with unusual binding site rec-ognition. Cell 70:631– 645.
24. Falk A, Frisen J. 2002. Amphiregulin is a mitogen for adult neural stemcells. J. Neurosci. Res. 69:757–762.
25. Farre-Castany MA, et al. 2007. Differences in locomotor behavior re-vealed in mice deficient for the calcium-binding proteins parvalbumin,calbindin D-28k or both. Behav. Brain Res. 178:250 –261.
26. Fessing MY, et al. 2011. p63 regulates Satb1 to control tissue-specificchromatin remodeling during development of the epidermis. J. Cell Biol.194:825– 839.
27. FitzPatrick DR, et al. 2003. Identification of SATB2 as the cleft palate geneon 2q32-q33. Hum. Mol. Genet. 12:2491–2501.
28. Flavell SW, Greenberg ME. 2008. Signaling mechanisms linking neuro-nal activity to gene expression and plasticity of the nervous system. Annu.Rev. Neurosci. 31:563–590.
29. Galvao RP, Garcia-Verdugo JM, Alvarez-Buylla A. 2008. Brain-derivedneurotrophic factor signaling does not stimulate subventricular zone neu-rogenesis in adult mice and rats. J. Neurosci. 28:13368 –13383.
30. Graff J, Mansuy IM. 2008. Epigenetic codes in cognition and behaviour.Behav. Brain Res. 192:70 – 87.
31. Green TA, et al. 2008. Induction of activating transcription factors(ATFs) ATF2, ATF3, and ATF4 in the nucleus accumbens and their regu-lation of emotional behavior. J. Neurosci. 28:2025–2032.
32. Guidetti P, et al. 2001. Early degenerative changes in transgenic miceexpressing mutant huntingtin involve dendritic abnormalities but no im-pairment of mitochondrial energy production. Exp. Neurol. 169:340 –350.
33. Han HJ, Russo J, Kohwi Y, Kohwi-Shigematsu T. 2008. SATB1 repro-grammes gene expression to promote breast tumour growth and metas-tasis. Nature 452:187–193.
34. Hartman MG, et al. 2004. Role for activating transcription factor 3 instress-induced beta-cell apoptosis. Mol. Cell. Biol. 24:5721–5732.
35. Heizmann CW, Fritz G, Schafer BW. 2002. S100 proteins: structure,functions and pathology. Front. Biosci. 7:d1356 – d1368.
36. Horike S, Cai S, Miyano M, Cheng JF, Kohwi-Shigematsu T. 2005. Lossof silent-chromatin looping and impaired imprinting of DLX5 in Rettsyndrome. Nat. Genet. 37:31– 40.
37. Huettner JE. 2003. Kainate receptors and synaptic transmission. Prog.Neurobiol. 70:387– 407.
38. Kandel ER. 2001. The molecular biology of memory storage: a dialoguebetween genes and synapses. Science 294:1030 –1038.
39. Kashani A, Betancur C, Giros B, Hirsch E, El Mestikawy S. 2007. Alteredexpression of vesicular glutamate transporters VGLUT1 and VGLUT2 inParkinson disease. Neurobiol. Aging 28:568 –578.
40. Katz LC, Shatz CJ. 1996. Synaptic activity and the construction of corticalcircuits. Science 274:1133–1138.
41. Kaufmann WE, Yamagata K, Andreasson KI, Worley PF. 1994. Rapidresponse genes as markers of cellular signaling during corticalhistogenesis: their potential in understanding mental retardation. Int. J.Dev. Neurosci. 12:263–271.
Balamotis et al.
346 mcb.asm.org Molecular and Cellular Biology
on June 30, 2016 by guesthttp://m
cb.asm.org/
Dow
nloaded from

42. Knapska E, Radwanska K, Werka T, Kaczmarek L. 2007. Functionalinternal complexity of amygdala: focus on gene activity mapping afterbehavioral training and drugs of abuse. Physiol. Rev. 87:1113–1173.
43. Knobloch M, Mansuy IM. 2008. Dendritic spine loss and synaptic alter-ations in Alzheimer’s disease. Mol. Neurobiol. 37:73– 82.
44. Knoll B, Nordheim A. 2009. Functional versatility of transcription factorsin the nervous system: the SRF paradigm. Trends Neurosci. 32:432– 442.
45. Kobayashi K, et al. 1995. Targeted disruption of the tyrosine hydroxylaselocus results in severe catecholamine depletion and perinatal lethality inmice. J. Biol. Chem. 270:27235–27243.
46. Kohwi-Shigematsu T, Kohwi Y. 1990. Torsional stress stabilizes extendedbase unpairing in suppressor sites flanking immunoglobulin heavy chainenhancer. Biochemistry 29:9551–9560.
47. Kohyama J, et al. 2008. Epigenetic regulation of neural cell differentiationplasticity in the adult mammalian brain. Proc. Natl. Acad. Sci. U. S. A.105:18012–18017.
48. Kristensen BW, et al. 1999. Excitotoxic effects of non-NMDA receptoragonists in organotypic corticostriatal slice cultures. Brain Res. 841:143–159.
49. Kuroda KO, Ornthanalai VG, Kato T, Murphy NP. 2010. FosB nullmutant mice show enhanced methamphetamine neurotoxicity: potentialinvolvement of FosB in intracellular feedback signaling and astroglialfunction. Neuropsychopharmacology 35:641– 655.
50. Laird JM, et al. 2000. Deficits in visceral pain and hyperalgesia of micewith a disruption of the tachykinin NK1 receptor gene. Neuroscience 98:345–352.
51. Lanahan A, Worley P. 1998. Immediate-early genes and synaptic func-tion. Neurobiol. Learn Mem. 70:37– 43.
52. Leone DP, Srinivasan K, Chen B, Alcamo E, McConnell SK. 2008. Thedetermination of projection neuron identity in the developing cerebralcortex. Curr. Opin. Neurobiol. 18:28 –35.
53. Li L, Carter J, Gao X, Whitehead J, Tourtellotte WG. 2005. Theneuroplasticity-associated arc gene is a direct transcriptional target ofearly growth response (Egr) transcription factors. Mol. Cell. Biol. 25:10286 –10300.
54. Lonze BE, Ginty DD. 2002. Function and regulation of CREB familytranscription factors in the nervous system. Neuron 35:605– 623.
55. Low MJ, et al. 2001. Somatostatin is required for masculinization ofgrowth hormone-regulated hepatic gene expression but not of somaticgrowth. J. Clin. Invest. 107:1571–1580.
56. Luetteke NC, et al. 1999. Targeted inactivation of the EGF and amphi-regulin genes reveals distinct roles for EGF receptor ligands in mousemammary gland development. Development 126:2739 –2750.
57. Majdan M, Shatz CJ. 2006. Effects of visual experience on activity-dependent gene regulation in cortex. Nat. Neurosci. 9:650 – 659.
58. Malvaez M, Barrett RM, Wood MA, Sanchis-Segura C. 2009. Epigeneticmechanisms underlying extinction of memory and drug-seeking behav-ior. Mamm. Genome 20:612– 623.
59. Manitz MP, et al. 2003. Loss of S100A9 (MRP14) results in reducedinterleukin-8-induced CD11b surface expression, a polarized microfila-ment system, and diminished responsiveness to chemoattractants in vitro.Mol. Cell. Biol. 23:1034 –1043.
60. Marino MW, et al. 1997. Characterization of tumor necrosis factor-deficient mice. Proc. Natl. Acad. Sci. U. S. A. 94:8093– 8098.
61. Mataga N, Fujishima S, Condie BG, Hensch TK. 2001. Experience-dependent plasticity of mouse visual cortex in the absence of the neuronalactivity-dependent marker egr1/zif268. J. Neurosci. 21:9724 –9732.
62. Mayer P, et al. 2002. Gene expression profile after intense second mes-senger activation in cortical primary neurones. J. Neurochem. 82:1077–1086.
63. Miyashita T, Kubik S, Lewandowski G, Guzowski JF. 2008. Networks ofneurons, networks of genes: an integrated view of memory consolidation.Neurobiol. Learn. Mem. 89:269 –284.
64. Muglia L, Jacobson L, Dikkes P, Majzoub JA. 1995. Corticotropin-releasing hormone deficiency reveals major fetal but not adult glucocor-ticoid need. Nature 373:427– 432.
65. Murphy PG, et al. 1999. Endogenous interleukin-6 contributes to hyper-sensitivity to cutaneous stimuli and changes in neuropeptides associatedwith chronic nerve constriction in mice. Eur. J. Neurosci. 11:2243–2253.
66. Nakagomi K, Kohwi Y, Dickinson LA, Kohwi-Shigematsu T. 1994. Anovel DNA-binding motif in the nuclear matrix attachment DNA-binding protein SATB1. Mol. Cell. Biol. 14:1852–1860.
67. Nimchinsky EA, Sabatini BL, Svoboda K. 2002. Structure and functionof dendritic spines. Annu. Rev. Physiol. 64:313–353.
68. Noble F, Benturquia N, Bilkei-Gorzo A, Zimmer A, Roques BP. 2008.Use of preproenkephalin knockout mice and selective inhibitors of en-kephalinases to investigate the role of enkephalins in various behaviours.Psychopharmacology (Berl.) 196:327–335.
69. Palop JJ, et al. 2005. Vulnerability of dentate granule cells to disruption ofarc expression in human amyloid precursor protein transgenic mice. J.Neurosci. 25:9686 –9693.
70. Park BJ, et al. 2001. Calreticulin, a calcium-binding molecular chaper-one, is required for stress response and fertility in Caenorhabditis elegans.Mol. Biol. Cell 12:2835–2845.
71. Passey RJ, et al. 1999. A null mutation in the inflammation-associatedS100 protein S100A8 causes early resorption of the mouse embryo. J.Immunol. 163:2209 –2216.
72. Peebles CL, et al. 2010. Arc regulates spine morphology and maintainsnetwork stability in vivo. Proc. Natl. Acad. Sci. U. S. A. 107:18173–18178.
73. Plath N, et al. 2006. Arc/Arg3.1 is essential for the consolidation ofsynaptic plasticity and memories. Neuron 52:437– 444.
74. Poirier R, et al. 2007. Paradoxical role of an Egr transcription factor family mem-ber, Egr2/Krox20, in learning and memory. Front. Behav. Neurosci. 1:6.
75. Poli V, et al. 1994. Interleukin-6 deficient mice are protected from boneloss caused by estrogen depletion. EMBO J. 13:1189 –1196.
76. Ragnauth A, et al. 2001. Female preproenkephalin-knockout mice displayaltered emotional responses. Proc. Natl. Acad. Sci. U. S. A. 98:1958–1963.
77. Rauch F, Prud’homme J, Arabian A, Dedhar S, St-Arnaud R. 2000.Heart, brain, and body wall defects in mice lacking calreticulin. Exp. CellRes. 256:105–111.
78. Rosen KM, McCormack MA, Villa-Komaroff L, Mower GD. 1992. Briefvisual experience induces immediate early gene expression in the cat visualcortex. Proc. Natl. Acad. Sci. U. S. A. 89:5437–5441.
79. Saito T, et al. 2005. Somatostatin regulates brain amyloid beta peptide Abeta42through modulation of proteolytic degradation. Nat. Med. 11:434–439.
80. Sarnico I, et al. 2009. NF-kappaB dimers in the regulation of neuronalsurvival. Int. Rev. Neurobiol. 85:351–362.
81. Savarese F, et al. 2009. Satb1 and Satb2 regulate embryonic stem celldifferentiation and Nanog expression. Genes Dev. 23:2625–2638.
82. Schiffmann SN, et al. 1999. Impaired motor coordination and Purkinjecell excitability in mice lacking calretinin. Proc. Natl. Acad. Sci. U. S. A.96:5257–5262.
83. Shiromani PJ, et al. 2000. Sleep and wakefulness in c-fos and fos B geneknockout mice. Brain Res. Mol. Brain Res. 80:75– 87.
84. Sriram K, O’Callaghan JP. 2007. Divergent roles for tumor necrosisfactor-alpha in the brain. J. Neuroimmune Pharmacol. 2:140 –153.
85. Stadler F, Schmutz I, Schwaller B, Albrecht U. 2010. Lack of calbindin-D28k alters response of the murine circadian clock to light. Chronobiol.Int. 27:68 – 82.
86. Sur M, Rubenstein JL. 2005. Patterning and plasticity of the cerebralcortex. Science 310:805– 810.
87. Thomas U. 2002. Modulation of synaptic signalling complexes by Homerproteins. J. Neurochem. 81:407– 413.
88. Tzingounis AV, Nicoll RA. 2006. Arc/Arg3.1: linking gene expression tosynaptic plasticity and memory. Neuron 52:403– 407.
89. Watanabe Y, et al. 1996. Null mutation of c-fos impairs structural and functionalplasticities in the kindling model of epilepsy. J. Neurosci. 16:3827–3836.
90. Xu T, et al. 2009. Rapid formation and selective stabilization of synapsesfor enduring motor memories. Nature 462:915–919.
91. Yan TC, et al. 2010. NK1 (TACR1) receptor gene ‘knockout’ mousephenotype predicts genetic association with ADHD. J. Psychopharmacol.24:27–38.
92. Yang CH, Huang CC, Hsu KS. 2006. Novelty exploration elicits a reversalof acute stress-induced modulation of hippocampal synaptic plasticity inthe rat. J. Physiol. 577:601– 615.
93. Yang G, Pan F, Gan WB. 2009. Stably maintained dendritic spines areassociated with lifelong memories. Nature 462:920 –924.
94. Yasui D, Miyano M, Cai S, Varga-Weisz P, Kohwi-Shigematsu T. 2002.SATB1 targets chromatin remodelling to regulate genes over long dis-tances. Nature 419:641– 645.
95. Zhang J, et al. 2002. c-fos regulates neuronal excitability and survival.Nat. Genet. 30:416 – 420.
96. Zuo Y, Lin A, Chang P, Gan WB. 2005. Development of long-term dendriticspine stability in diverse regions of cerebral cortex. Neuron 46:181–189.
Alteration of Dendritic Spine Formation by Satb1
January 2012 Volume 32 Number 2 mcb.asm.org 347
on June 30, 2016 by guesthttp://m
cb.asm.org/
Dow
nloaded from