Safety, Quality and Processing of Fruits and Vegetables - MDPI
194
Safety, Quality and Processing of Fruits and Vegetables Printed Edition of the Special Issue Published in Foods www.mdpi.com/journal/foods Urszula Tylewicz, Silvia Tappi, Malgorzata Nowacka and Artur Wiktor Edited by
-
Upload
khangminh22 -
Category
Documents
-
view
4 -
download
0
Transcript of Safety, Quality and Processing of Fruits and Vegetables - MDPI

Safety, Quality and Processing of Fruits and Vegetables
Printed Edition of the Special Issue Published in Foods
www.mdpi.com/journal/foods
Urszula Tylewicz, Silvia Tappi, Malgorzata Nowacka and Artur Wiktor
Edited by Safety, Q
uality and Processing of Fruits and Vegetables • Urszula Tylew
icz, Silvia Tappi, Malgorzata N
owacka and Artur W
iktor

Safety, Quality and Processing of Fruitsand Vegetables


Safety, Quality and Processing of Fruitsand Vegetables
Special Issue Editors
Urszula Tylewicz
Silvia Tappi
Malgorzata Nowacka
Artur Wiktor
MDPI • Basel • Beijing • Wuhan • Barcelona • Belgrade

Silvia Tappi University of Bologna Italy
Special Issue Editors
Urszula Tylewicz
University of Bologna
Italy
Malgorzata NowackaWarsaw University of Life Sciences Poland
Artur Wiktor
Warsaw University of Life Sciences Poland
Editorial Office
MDPISt. Alban-Anlage 66
4052 Basel, Switzerland
This is a reprint of articles from the Special Issue published online in the open access journal
Foods (ISSN 2304-8158) in 2019 (available at: https://www.mdpi.com/journal/foods/special issues/
Fruits Vegetables).
For citation purposes, cite each article independently as indicated on the article page online and as
indicated below:
LastName, A.A.; LastName, B.B.; LastName, C.C. Article Title. Journal Name Year, Article Number,
Page Range.
ISBN 978-3-03928-086-5 (Hbk) ISBN 978-3-03928-087-2 (PDF)
c© 2020 by the authors. Articles in this book are Open Access and distributed under the Creative
Commons Attribution (CC BY) license, which allows users to download, copy and build upon
published articles, as long as the author and publisher are properly credited, which ensures maximum
dissemination and a wider impact of our publications.
The book as a whole is distributed by MDPI under the terms and conditions of the Creative Commons
license CC BY-NC-ND.

Contents
About the Special Issue Editors . . . . . . . . . . . . . . . . . . . . . . . . . . . . . . . . . . . . . vii
Urszula Tylewicz, Silvia Tappi, Malgorzata Nowacka and Artur Wiktor
Safety, Quality, and Processing of Fruits and VegetablesReprinted from: Foods 2019, 8, 569, doi:10.3390/foods8110569 . . . . . . . . . . . . . . . . . . . . 1
Artur Wiktor, Ronit Mandal, Anika Singh and Anubhav Pratap Singh
Pulsed Light treatment below a Critical Fluence (3.82 J/cm2) minimizes photo-degradation andbrowning of a model Phenolic (Gallic Acid) SolutionReprinted from: Foods 2019, 8, 380, doi:10.3390/foods8090380 . . . . . . . . . . . . . . . . . . . . . 5
Juan A. Tomas-Egea, Pedro J. Fito and Marta Castro-Giraldez
Analysis of Apple Candying by Microwave SpectroscopyReprinted from: Foods 2019, 8, 316, doi:10.3390/foods8080316 . . . . . . . . . . . . . . . . . . . . . 18
Abdul Ghani Dars, Kai Hu, Qiudou Liu, Aqleem Abbas, Bijun Xie and Zhida Sun
Effect of Thermo-Sonication and Ultra-High Pressure on the Quality and Phenolic Profile ofMango JuiceReprinted from: Foods 2019, 8, 298, doi:10.3390/foods8080298 . . . . . . . . . . . . . . . . . . . . . 32
Malgorzata Nowacka, Artur Wiktor, Magdalena Dadan, Katarzyna Rybak, Aleksandra Anuszewska, Lukasz Materek and Dorota Witrowa-Rajchert
The Application of Combined Pre-Treatment with Utilization of Sonication and Reduced Pressure to Accelerate the Osmotic Dehydration Process and Modify the Selected Properties of CranberriesReprinted from: Foods 2019, 8, 283, doi:10.3390/foods8080283 . . . . . . . . . . . . . . . . . . . . . 45
Maria Paciulli, Ilce Gabriela Medina Meza, Massimiliano Rinaldi, Tommaso Ganino, Alessandro Pugliese, Margherita Rodolfi, Davide Barbanti, Michele Morbarigazzi and Emma Chiavaro
Improved Physicochemical and Structural Properties of Blueberries by High Hydrostatic Pressure ProcessingReprinted from: Foods 2019, 8, 272, doi:10.3390/foods8070272 . . . . . . . . . . . . . . . . . . . . . 61
Zoran Stamenkovic, Ivan Pavkov, Milivoj Radojcin, Aleksandra Tepic Horecki, Krstan Keselj, Danijela Bursac Kovacevic and Predrag Putnik
Convective Drying of Fresh and Frozen Raspberries and Change of Their Physical and Nutritive PropertiesReprinted from: Foods 2019, 8, 251, doi:10.3390/foods8070251 . . . . . . . . . . . . . . . . . . . . . 76
Irena Zuntar, Predrag Putnik, Danijela Bursac Kovacevic, Marinela Nutrizio, Filip Supljika,
Andreja Poljanec, Igor Dubrovic, Francisco J. Barba and Anet Rezek Jambrak
Phenolic and Antioxidant Analysis of Olive Leaves Extracts (Olea europaea L.) Obtained by HighVoltage Electrical Discharges (HVED)Reprinted from: Foods 2019, 8, 248, doi:10.3390/foods8070248 . . . . . . . . . . . . . . . . . . . . . 90
Malgorzata Nowacka, Silvia Tappi, Artur Wiktor, Katarzyna Rybak, Agnieszka Miszczykowska, Jakub Czyzewski, Kinga Drozdzal, Dorota Witrowa-Rajchert and Urszula Tylewicz
The Impact of Pulsed Electric Field on the Extraction of Bioactive Compounds from BeetrootReprinted from: Foods 2019, 8, 244, doi:10.3390/foods8070244 . . . . . . . . . . . . . . . . . . . . . 119
v

Trond Løvdal, Bart Van Droogenbroeck, Evren Caglar Eroglu, Stanislaw Kaniszewski,
Giovanni Agati, Michel Verheul and Dagbjørn Skipnes
Valorization of Tomato Surplus and Waste Fractions: A Case Study Using Norway, Belgium,Poland, and Turkey as ExamplesReprinted from: Foods 2019, 8, 229, doi:10.3390/foods8070229 . . . . . . . . . . . . . . . . . . . . . 131
Setya B.M. Abduh, Sze Ying Leong, Dominic Agyei and Indrawati Oey
Understanding the Properties of Starch in Potatoes (Solanum tuberosum var. Agria) after BeingTreated with Pulsed Electric Field ProcessingReprinted from: Foods 2019, 8, 159, doi:10.3390/foods8050159 . . . . . . . . . . . . . . . . . . . . . 152
Benjamin Opuko Wayumba, Hyung Sic Choi and Lim Young Seok
Selection and Evaluation of 21 Potato (Solanum Tuberosum) Breeding Clones for ColdChip ProcessingReprinted from: Foods 2019, 8, 98, doi:10.3390/foods8030098 . . . . . . . . . . . . . . . . . . . . . 173
vi

About the Special Issue Editors
Urszula Tylewicz is Junior Assistant Professor at the Department of Agricultural and Food Sciences,
University of Bologna (Italy). She obtained her M.Sc. degree in Food Technology at the Warsaw
University of Life Science, Poland, in 2006, and her Ph.D. degree in Food Science and Biotechnology
at the University of Bologna, Italy, in 2011. Her research activity is mainly focused on the application
of nonthermal technologies for fruit and vegetable processing (pulsed electric field, ultrasound,
vacuum impregnation, osmotic dehydration). She is member of the ISEKI Food Association (IFA)
“Integrating Food Science and Engineering Knowledge into the Food Chain” and the International
Society for Electroporation-Based Technologies and Treatments (ISEBTT). She was a chair of the 6th
PEF School (3–7.06.2019, Cesena, Italy). She has authored and co-authored more than 50 publications
in peer-viewed international journals and 4 book chapters.
Silvia Tappi is a food technologist with a Ph.D. in Food Science and Biotechnology, obtained at the
University of Bologna in 2016. She is currently Research Fellow at the Interdepartmental Centre
for Industrial Research (CIRI-Agro) of the University of Bologna, where she is mainly focused on
the optimization and scaling up of emerging mild/nonthermal technologies for food processing for
the stabilization and quality improvement of food products and for byproduct valorisation, with a
particular focus on process/product sustainability and product innovation. She is author of more
than 35 publications in peer-reviewed international journals and 2 book chapters.
Malgorzata Nowacka is Associate Professor at the Institute of Food Science at the Warsaw
University of Life Sciences (WULS-SGGW). Her research area is connected with water removal from
plant products using innovative technologies (novel drying methods, osmotic dehydration) and
innovative methods of pretreatment such as ultrasound processing, pulsed electric field, etc., prior to
technological processes occurring in food technology, i.e., mainly processes of mass transfer. In 2009,
she received a PhD degree in agricultural sciences in the discipline of food technology and nutrition,
and in 2018, she completed habilitation. She is an author or co-author of more than 45 publications
in peer-reviewed international journals and numerous book chapters.
Artur Wiktor is Assistant Professor at the Warsaw University of Life Sciences (WULS-SGGW). His
main research activity is on the utilization of nonthermal technologies (such as pulsed electric field,
ultrasound, cold plasma) in order to enhance mass and heat transfer-based unit operations or to
improve the quality of final products. A big part of his scientific activity concerns drying, osmotic
dehydration, freezing of plant tissue, and extraction of bioactive compounds from food matrices.
He is a member of the International Society for Electroporation-Based Technologies and Treatments
(ISEBTT) and Polish Society of Food Technologists. He has authored or co-authored more than 40
publications in peer-reviewed international journals and numerous book chapters.
vii


foods
Editorial
Safety, Quality, and Processing of Fruitsand Vegetables
Urszula Tylewicz 1,2,*, Silvia Tappi 2, Malgorzata Nowacka 3 and Artur Wiktor 3
1 Department of Agricultural and Food Sciences, University of Bologna, P.zza Goidanich 60, 47521 Cesena,Italy
2 Interdepartmental Centre for Agri-Food Industrial Research, University of Bologna, Via Quinto Bucci 336,47521 Cesena, Italy; [email protected]
3 Department of Food Engineering and Process Management, Faculty of Food Sciences, Warsaw University ofLife Sciences, Nowoursynowska 159c, 02-776 Warsaw, Poland; [email protected] (M.N.);[email protected] (A.W.)
* Correspondence: [email protected]; Tel.: +39-0547-338-120
Received: 8 October 2019; Accepted: 11 November 2019; Published: 13 November 2019
Abstract: Nowadays, one of the main objectives of the fruit and vegetable industry is to developinnovative novel products with high quality, safety, and optimal nutritional characteristics in order torespond with efficiency to the increasing consumer expectations. Various emerging, unconventionaltechnologies (e.g., pulsed electric field, pulsed light, ultrasound, high pressure, and microwavedrying) enable the processing of fruits and vegetables, increasing their stability while preserving theirthermolabile nutrients, flavour, texture, and overall quality. Some of these technologies can also beused for waste and by-product valorisation. The application of fast noninvasive methods for processcontrol is of great importance for the fruit and vegetable industry. The following Special Issue “Safety,Quality, and Processing of Fruits and Vegetables” consists of 11 papers, which provide a high-valuecontribution to the existing knowledge on safety aspects, quality evaluation, and emerging processingtechnologies for fruits and vegetables.
Keywords: fruit; vegetable; safety; quality; emerging technologies; unconventional processing
In the last few years, consumers have become more exigent and demand high-quality andconvenient food products with natural flavours and taste, free from additives and preservatives [1].Therefore, the challenge for the fruit and vegetable industry is to develop such products, takinginto account quality and safety aspects along with consumer acceptance. Emerging, unconventionalprocessing of fruit and vegetables is more and more studied in order to develop products rich inbioactive compounds, paying attention at the same time to waste and by-product valorisation [2–4].This Special Issue “Safety, Quality, and Processing of Fruits and Vegetables” gives an overview of theapplication of emerging, unconventional technologies to obtain high-quality fruit juice, semi-dried anddried products, waste valorisation, and process control. It also provides some insights into principlesand fundamentals of nonthermal technologies.
The importance of the quality standards for potatoes intended for the processing industry isexplained by Wayumba et al. [5]. This study was designed with the purpose of identifying specializedpotato clones with acceptable qualities for processing chips, as compared to two selected controlvarieties, Dubaek and Superior. From this study, the authors concluded that for quality processing ofpotato chips, clones with combined traits of high dry matter, low levels of glycoalkaloids and reducingsugars, should be used as raw materials along with the acceptable chip colour [5]. Starch is the majorcomponent in potato, that contributes to its nutritional and technological quality. Different foodprocessing techniques including boiling, cooling, reheating, conventional frying, and air frying have
Foods 2019, 8, 569; doi:10.3390/foods8110569 www.mdpi.com/journal/foods1

Foods 2019, 8, 569
been shown to change the digestibility of starch. In the paper by Abduh et al. [6], the effect of emergingprocessing using pulsed electric field (PEF)—usually used for structure modification in fruit andvegetables—on the properties of starch in potatoes was investigated, showing that PEF did not changethe properties of starch within the potatoes, but it narrowed the temperature range of gelatinisationand reduced the digestibility of starch collected from the processing medium. Therefore, this studyconfirms that, when used as a processing aid for potato, PEF does not result in detrimental effects onthe properties of potato starch [6]. PEF has been shown to be effective in the extraction of bioactivecompounds (mainly betalains) from beetroot, increasing the extraction yield [7]. The greatest increasein the content of betalain compounds in the red beet extract was noted when an electric field at4.38 kV/cm was applied [7]. The increase in the extraction rate of polyphenols from olive leaves wasalso observed by using high-voltage electrical discharges (HVED) as a green technology [8]. HVEDparameters included different green solvents (water, ethanol), treatment times (3 and 9 min), gases(nitrogen, argon), and voltages (15, 20, 25 kV). The highest yield of phenolic compounds was obtainedfor the sample treated with argon/9 min/20 kV/50% (3.2 times higher as compared to conventionalextraction (CE)). In general, HVED presents an excellent potential for phenolic compound extractionfor further application in functional food manufacturing [8].
Valorisation of waste and by-products is the topic of the paper by Løvdal et al. [9]. It provides anoverview of tomato production in Europe and the strategies employed for processing and valorisationof tomato side streams and waste fractions. Special emphasis was put on the four tomato-producingcountries Norway, Belgium, Poland, and Turkey. These countries are very different with regard totheir climatic preconditions for tomato production and volumes produced and represent the extremesamong European tomato producing countries.
Osmotic dehydration and drying of berries were the objective of papers by Nowacka et al. [10]and Stamenkovic et al. [11]. In the paper by Nowacka et al. [10], osmotic dehydration of cranberrieswas combined with blanching, ultrasound, and vacuum application. Unconventional pretreatment ofcranberries caused a significant increase of osmotic dehydration effectiveness. Cranberries subjected tocombined treatment, in particular to ultrasounds, had comparable or higher polyphenolic, anthocyanin,and flavonoid content than a blanched tissue subjected to osmotic dehydration alone. Taking intoaccount the evaluated physical and chemical properties of dehydrated cranberries and the osmoticdehydration process, it has been concluded that the best combined pretreatment method was a 20 minsonication followed by a 10 min lowered pressure treatment. In the paper by Stamenkovic et al. [11],the effectiveness of convective drying of Polana raspberries was compared to freeze-drying, whichallows producers to obtain products of high quality but also with high cost. The authors concludedthat convective drying of Polana raspberry with air temperature of 60 ◦C and air velocity of 1.5 m·s−1,may be considered as a sufficient alternative to freeze-drying [11].
Another emerging nonthermal technology studied on fruits and vegetables is high-pressureprocessing, with the aim of better preserving nutritional and organoleptic properties. In fact, the resultspresented in the paper by Paciulli et al. [12] revealed the mild impact of high-pressure treatments on theorganoleptic properties of blueberries along with better texture and colour maintenance. The effects ofultra-high pressure (UHP) and thermo-sonication (TS) were also tested on quality of mango juice [13].Both treatments had minimal effects on the total soluble solids, pH, and titratable acidity of mango juice.The residual activities of three enzymes (polyphenol oxidase, peroxidase, and pectin methylesterase),antioxidant compounds (vitamin C, total phenolics, mangiferin derivatives, gallotannins, and quercetinderivatives) and antioxidant activity sharply decreased with the increase in the temperature of the TStreatment. Nevertheless, the UHP treatment retained antioxidants and antioxidant activity at a highlevel. The UHP process is apparently superior to TS in bioactive compound and antioxidant activitypreservation. Therefore, the mango juice products obtained by ultra-high-pressure processing mightbe more beneficial to health [13].
In the paper by Wiktor et al. [14], instead, the effect of pulsed light treatment with differentfluence was studied on a gallic acid aqueous solution—as a model system of phenolic abundant
2

Foods 2019, 8, 569
liquid food matrices. It was demonstrated that pulsed light can modify the optical properties ofgallic acid and cause reactions and degradation of gallic acid. However, application of pulsed lightdid not significantly alter the overall quality of the model gallic acid solution at low fluence levels.Cluster analysis revealed that below 3.82 J/cm2, changes in gallic acid were minimal, and this fluencelevel could be used as the critical level for food process design aiming to minimize nutrient loss.
Finally, Tomas-Egea et al. [15] studied the importance of process control in the industry, whichrequires fast, safe, and easily applicable methods. In this sense, the use of dielectric spectroscopy in themicrowave range can be a great opportunity to monitor processes in which the mobility and quantityof water is the main property to produce a high-quality and safe product, such as candying of fruits.They demonstrated that the use of dielectric properties in γ-dispersion at relaxation frequency allowedus not only to monitor the osmotic drying and hot-air-drying processes of the apple candying, but alsoto predict the supersaturation state of the liquid phase until vitrification.
Conflicts of Interest: The authors declare no conflict of interest.
References
1. Tylewicz, U.; Tappi, S.; Mannozzi, C.; Romani, S.; Dellarosa, N.; Laghi, L.; Ragni, L.; Rocculi, P.; Dalla Rosa, M.Effect of pulsed electric field (PEF) pre-treatment coupled with osmotic dehydration on physico-chemicalcharacteristics of organic strawberries. J. Food Eng. 2017, 213, 2–9. [CrossRef]
2. Barba, F.J.; Parniakov, O.; Pereira, S.A.; Wiktor, A.; Grimi, N.; Boussetta, N.; Saraiva, J.; Raso, J.;Martin-Belloso, O.; Witrowa-Rajchert, D.; et al. Current applications and new opportunities for theuse of pulsed electric fields in food science and industry. Food Res. Int. 2015, 77, 773–798. [CrossRef]
3. Deng, L.-Z.; Mujumdar, A.S.; Zhang, Q.; Yang, X.-H.; Wang, J.; Zheng, Z.-A.; Gao, Z.-J.; Xiao, H.-W. Chemicaland physical pretreatments of fruits and vegetables: Effects on drying characteristics and quality attributes–acomprehensive review. Crit. Rev. Food Sci. 2019, 59, 1408–1432. [CrossRef] [PubMed]
4. Putnik, P.; Lorenzo, J.M.; Barba, F.J.; Roohinejad, S.; Režek Jambrak, A.; Granato, D.; Montesano, D.;Kovacevic, D.B. Novel food processing and extraction technologies of high-added value compounds fromplant materials. Foods 2018, 7, 106. [CrossRef] [PubMed]
5. Wayumba, B.O.; Choi, H.S.; Seok, L.Y. Selection and Evaluation of 21 Potato (Solanum Tuberosum) BreedingClones for Cold Chip Processing. Foods 2019, 8, 98. [CrossRef] [PubMed]
6. Abduh, S.B.; Leong, S.Y.; Agyei, D.; Oey, I. Understanding the Properties of Starch in Potatoes (Solanumtuberosum var. Agria) after Being Treated with Pulsed Electric Field Processing. Foods 2019, 8, 159. [CrossRef][PubMed]
7. Nowacka, M.; Tappi, S.; Wiktor, A.; Rybak, K.; Miszczykowska, A.; Czyzewski, J.; Drozdzal, K.;Witrowa-Rajchert, D.; Tylewicz, U. The Impact of Pulsed Electric Field on the Extraction of BioactiveCompounds from Beetroot. Foods 2019, 8, 244. [CrossRef] [PubMed]
8. Žuntar, I.; Putnik, P.; Bursac Kovacevic, D.; Nutrizio, M.; Šupljika, F.; Poljanec, A.; Dubrovic, I.; Barba, F.J.;Režek Jambrak, A. Phenolic and Antioxidant Analysis of Olive Leaves Extracts (Olea europaea L.) Obtainedby High Voltage Electrical Discharges (HVED). Foods 2019, 8, 248. [CrossRef] [PubMed]
9. Løvdal, T.; Van Droogenbroeck, B.; Eroglu, E.C.; Kaniszewski, S.; Agati, G.; Verheul, M.; Skipnes, D.Valorization of Tomato Surplus and Waste Fractions: A Case Study Using Norway, Belgium, Poland, andTurkey as Examples. Foods 2019, 8, 229. [CrossRef] [PubMed]
10. Nowacka, M.; Wiktor, A.; Dadan, M.; Rybak, K.; Anuszewska, A.; Materek, L.; Witrowa-Rajchert, D. TheApplication of Combined Pre-Treatment with Utilization of Sonication and Reduced Pressure to Acceleratethe Osmotic Dehydration Process and Modify the Selected Properties of Cranberries. Foods 2019, 8, 283.[CrossRef] [PubMed]
11. Stamenkovic, Z.; Pavkov, I.; Radojcin, M.; Tepic Horecki, A.; Kešelj, K.; Bursac Kovacevic, D.; Putnik, P.Convective Drying of Fresh and Frozen Raspberries and Change of Their Physical and Nutritive Properties.Foods 2019, 8, 251. [CrossRef] [PubMed]
12. Paciulli, M.; Medina Meza, I.G.; Rinaldi, M.; Ganino, T.; Pugliese, A.; Rodolfi, M.; Barbanti, D.;Morbarigazzi, M.; Chiavaro, E. Improved Physicochemical and Structural Properties of Blueberries by HighHydrostatic Pressure Processing. Foods 2019, 8, 272. [CrossRef] [PubMed]
3

Foods 2019, 8, 569
13. Dars, A.G.; Hu, K.; Liu, Q.; Abbas, A.; Xie, B.; Sun, Z. Effect of Thermo-Sonication and Ultra-High Pressureon the Quality and Phenolic Profile of Mango Juice. Foods 2019, 8, 298. [CrossRef] [PubMed]
14. Wiktor, A.; Mandal, R.; Singh, A.; Pratap Singh, A. Pulsed Light treatment below a Critical Fluence (3.82J/cm2) minimizes photo-degradation and browning of a model Phenolic (Gallic Acid) Solution. Foods 2019, 8,380. [CrossRef] [PubMed]
15. Tomas-Egea, J.A.; Fito, P.J.; Castro-Giraldez, M. Analysis of Apple Candying by Microwave Spectroscopy.Foods 2019, 8, 316. [CrossRef] [PubMed]
© 2019 by the authors. Licensee MDPI, Basel, Switzerland. This article is an open accessarticle distributed under the terms and conditions of the Creative Commons Attribution(CC BY) license (http://creativecommons.org/licenses/by/4.0/).
4

foods
Article
Pulsed Light treatment below a Critical Fluence(3.82 J/cm2) minimizes photo-degradation andbrowning of a model Phenolic (Gallic Acid) Solution
Artur Wiktor 1,2, Ronit Mandal 1, Anika Singh 1 and Anubhav Pratap Singh 1,*
1 Food, Nutrition and Health, University of British Columbia, 2205, East Mall, Vancouver, BC V6T 1Z4, Canada2 Faculty of Food Sciences, Department of Food Engineering and Process Management, Warsaw University of
Life Sciences (WULS-SGGW), Nowoursynowska 159c, 02-776 Warsaw, Poland* Correspondence: [email protected]; Tel.: +1-604-822-5944
Received: 7 July 2019; Accepted: 30 August 2019; Published: 1 September 2019
Abstract: Pulsed light (PL) is one of the most promising non-thermal technologies used in foodpreservation and processing. Its application results in reduction of microbial load as well as influencesthe quality of food. The data about the impact of PL on bioactive compounds is ambiguous, thereforethe aim of this study was to analyze the effect of PL treatment of a gallic acid aqueous solution—as amodel system of phenolic abundant liquid food matrices. The effect of PL treatment was evaluatedbased on colour, phenolic content concentration and antioxidant activity measured by DPPH assayusing a design of experiments approach. The PL fluence (which is the cumulative energy input) wasvaried by varying the pulse frequency and time. Using Response Surface Methodology, predictionmodels were developed for the effect of fluence on gallic acid properties. It was demonstrated that PLcan modify the optical properties of gallic acid and cause reactions and degradation of gallic acid.However, application of PL did not significantly alter the overall quality of the model gallic acidsolution at low fluence levels. Cluster analysis revealed that below 3.82 J/cm2, changes in gallic acidwere minimal, and this fluence level could be used as the critical level for food process design aimingto minimize nutrient loss.
Keywords: pulsed light; fluence; gallic acid; non-thermal treatment
1. Introduction
For a long time, the food industry has been using thermal methods like pasteurization, sterilization,etc. for preservation of foods and extension of their shelf life. However, thermal processing operationshave drawbacks associated with them. For instance, due to the high processing temperature, thenutrients may be destroyed. Also, the sensory characteristics may be affected [1]. Modern dayconsumers are more aware than ever before. They continuously demand food which is safe, of goodeating quality and nutritionally sound. This has led the food processing scientists to seek and researchfood processing methods which can make the food safe, while keeping the nutritional properties intact.
Pulsed light (PL) technology has now been widely explored as a novel non-thermal foodpreservation method that uses a form of energy other than heat for achieving food preservation. PL useshigh-intensity short duration white light (wavelength of 200–1100 nm) for microbial inactivation [2].The electrical energy is stored in capacitors and discharged in short bursts or pulses of high intensity.The ultra-violet (UV) fraction of the spectrum is associated with microbial inactivation as well as otherchemical changes in food products.
A multitude of phenolic compounds like ellagic acid, ferulic acid, gallic acid, etc. are synthesizedby plants’ fruits, vegetables, as part of their secondary metabolism. In the early 1960s these phenoliccompounds were considered as by-products of the plant metabolism, which were present in the
Foods 2019, 8, 380; doi:10.3390/foods8090380 www.mdpi.com/journal/foods5

Foods 2019, 8, 380
vacuoles of cells. These compounds act as complex constituents of pigments, antioxidants, flavoringagents, in plants and plant-based foods. Thus, they form a major part of our diet. Apart from that,they are also bioactive compounds that are anti-inflammatory, anticarcinogenic, can decrease bloodsugar levels, reduce body weight and ageing [3].
The light sensitivity of phenolics is a topic of utmost importance for studying the processing offoods using light. The photoinduced degradation of gallic acid (a model system representing plantphenolics) was reported earlier in [4,5]. Benitez et al. [5] demonstrated that gallic acid subjected toUV radiation degrades following first-order kinetics reaction. Thus, UV radiation could be usedin the wastewater treatment process after cork production. However, the authors pointed out thatUV- provoked photolysis of gallic acid was a rather slow process—after 90 min of radiation theconcentration of gallic acid decreased from 50 to 10–40 ppm, depending on pH. Also, the progress ofthe process may be different depending on the wavelength spectrum of the light used. A photoinduceddecrease in total phenolic content was also observed for real food systems, i.e., pineapple juicesubjected to UV-C treatment with a dose 10.76 mJ/cm2 [6] or pumelo juice treated with a UV-C doseof 15.45–27.63 mJ/cm2 [7]. It should be emphasized therefore that the data about the impact of UVlight treatment of food on its bioactive compounds is ambiguous. There are articles which report nosignificant changes of phenolics after exposure of juices or solid food matrices to UV light or PL [8–10].Similar statements can be made regarding the antioxidant activity. Thus, the data concerning theimpact of PL on model systems becomes even more important to understand the basic mechanisms ofeffects and in designing proper PL processing systems for foods rich in phenolics.
PL technology is still in its infancy and therefore there are a limited number of studies that havebeen carried out on the effect of PL on nutrient attributes, while most available studies focus onthe microbiological safety aspect of PL [11]. It is a matter of immense importance that this novelprocess ensures food safety while retaining the bioactive compounds in food and keeping the sensoryproperties intact. To the best of our knowledge, there is no literature available on the effect of PLon model polyphenolic solutions like gallic acid. Also, the literature on the effect of PL on liquidfoods is scarce. In accordance, the aim of this study was to evaluate the effect of PL processing on thephysicochemical properties of a model gallic acid solution using an experimental setup designed forthin-profile treatment of liquid foods.
2. Materials and Methods
2.1. Material
Gallic Acid (3,4,5-trihydroxybenzoic acid; Sigma Aldrich Co., Oakville, ON, Canada) was used toprepare a model solution with a concentration of 0.5 mg/mL. Methanol (≥99.8%) and Folin-Ciocalteureagents were purchased from Merck KGaA (Darmstadt, Germany). Ethanol, 2,2-diphenyl-1-picrylhydrazyl(DPPH) free radical and Na2CO3 were purchased from Alfa Aesar, Thermo Fisher Scientific Chemicals,Inc. (Ward Hill, MA, USA). (±)-6-Hydroxy-2,5,7,8-tetramethylchromane-2-carboxylic acid (TroloxTM)was purchased from Sigma-Aldrich Co. (Oakville, ON, Canada).
2.2. Pulsed Light Equipment
The experiments were carried out in a bench-top pulsed light equipment designed at the Facultyof Land and Food Systems, University of British Columbia in collaboration with Solaris DisinfectionInc. (Mississauga, ON, Canada). The equipment consisted of two parts: (1) a cylindrical annularchamber built of quartz glass for thin profile liquid treatment. The chamber has an inlet and an outletfor flowing liquid in and out of the chamber; (2) a xenon flashlamp placed at the axial center of thecylindrical chamber that emits light pulses for liquid treatment. The annular volume of the treatmentchamber was 75 mL and its average distance from the lamp axis was 2 cm. The liquid thickness in thechamber was around 1 mm. Pulsed light lamps emitted 30 J of light energy per pulse (comprising
6

Foods 2019, 8, 380
wavelengths ranging from far UV to near IR in the electromagnetic spectrum) on a chamber area(impact surface) of 675 cm2. A schematic diagram of the equipment is given in Figure 1.
Figure 1. PL processing chamber. The chamber has an annular design inside which the liquid is housedand treated by PL lamps placed at the axis of chamber. Suitable for batch or continuous processing.
2.3. Design of Experiment
Table 1 shows the plan of the experiments. The response surface methodology approach wasused for the experimental design to evaluate the effect of pulsed light treatment parameters on thephysicochemical properties of gallic acid solutions. The central composite rotatable design (CCRD)used (α = k1/2 with two numeric factors k = 2 − frequency of pulses and treatment time) was preparedutilizing Statistica 13 Design (Statsoft Inc., Tulsa, OK, USA). It was composed of 10 experimental trialswith two separate replicates in the central point (run 9 (C) and 10 (C)). Frequency varied from 1 to 10Hz whereas time ranged from 5 to 50 s.
Energy input (in terms of fluence) depended on the parameters pulse frequency and treatmenttime and it was equal to 1.07–17.2 J/cm2, since the device applied 30 J with one single pulse regardless ofthe frequency. The boundary conditions of treatment were selected based on literature data consideringthe energy necessary to inactivate microorganisms [11,12]. Each run was performed in two separatereplicates, which means that central point was repeated four times in total. The responses described insubsequent sections were evaluated for these treatments and also for the untreated sample.
Table 1. The set-up of the performed experiment with fluence during PL treatment.
Run *Factor A Factor B
Fluence (J/cm2)Coded Value Frequency (Hz) Coded Value Time (s)
1 −1 2 −1 12 1.12 −1 2 1 43 3.83 1 9 −1 12 4.84 1 9 1 43 17.25 −1.41 1 0 28 1.26 1.41 10 0 28 12.47 0 5 −1.41 5 1.18 0 5 1.41 50 11.1
9 (C) 0 5 0 28 6.210 (C) 0 5 0 28 6.2
* Where (C) is the center point of the design. Additionally, untreated samples were also evaluated for thesame responses.
2.4. Temperature Increment Measurement
The emitted light energy was absorbed by the solution as heat. The amount of heat absorbedwas calculated for each run. The temperature changes for the gallic acid solution were recordedimmediately after each treatment. A temperature measuring RTD (ThermoProbe Inc., Jackson, MS,USA) was used to measure the temperature. The initial solution temperature was recorded to be
7

Foods 2019, 8, 380
21.2 ◦C. The measurements were duplicated for each observation and the temperature change % andheat gain [13] were calculated using Equations (1) and (2):
Temp. increase % = (Tf − Ti)/Ti × 100 (1)
Heat gain (J/cm2) = [4.19 × (Tf − Ti) × V × �]/A (2)
where, Tf, Ti are final and initial temperature (◦C); V = chamber volume (m3); � = liquid density(kg/m3), A = area [cm2]. The constant 4.19 (kJ/kg-K) is taken as the specific heat of the gallic acidsolution which is assumed equal to that of water [13].
2.5. Colour
The colour of the treated and untreated samples was measured using a colorimeter (HunterLab,model LabScanTM XE Plus, Hunter Associates Laboratory, Reston, VA, USA). Colour was expressedin CIE L* (whiteness or brightness), a* (redness/greenness) and b* (yellowness/blueness) coordinates.Two replicate measurements were performed, and results were averaged. The total colour difference(ΔE) and browning index (BI) were calculated [14] using the following Equations (3) and (4):
ΔE = ((L − Lo)2 + (a − ao)2 + (b − bo)2)1/2 (3)
BI = 100 × (x − 0.31)/0.172 (4)
where:x = (a* + 1.75 × L*)/(5.645 × L* + a* − 3.012 × b*) (5)
In Equation (3), the Lo, ao and bo are the colour values for untreated samples, and the constants inEquations (4) and (5) were taken from the literature [14].
2.6. Total Phenolic Content, Gallic Acid Content and Antioxidant Activity Determination
Total phenolic content (TPC) were estimated using the Folin–Ciocalteau’s (FC) method withmodifications [15]. Briefly, an aliquot (5 mL) of the gallic acid solution was transferred to a glass tube;reactive 10−1 diluted FC reagent (20 mL) is added after 5 min; sodium carbonate (Na2CO3, 5 mL,7.5% w/v) was added and the mixture shaken. After 30 min of incubation at ambient temperaturein the dark, 200 μL samples were placed in 96-well plates. Finally, the absorbances were measuredin a spectrophotometer (Infinite Pro M200 series, TecanTM, Männedorf, Switzerland) at 765 nm andcompared to a gallic acid calibration curve for TPC (prepared using 0 to 1 mg/mL concentration gallicacid solution). Results were expressed as mg gallic acid equivalent (GAE)/100 mL. All measurementswere done in duplicate.
Gallic acid content (GAC) was determined using HPLC (Agilent 1100 system, Agilent Technologies,Santa Clara, CA, USA) equipped with a Zorbax SB-C18 column according to the methodology presentedin [16]. This was carried out to measure the changes in gallic acid concentration due to photodegradation.Results were expressed as mg GAC/100 mL solution.
To determine the antioxidant activity (AA) of gallic acid solutions, 2,2-diphenyl-1-picrylhydrazyl(DPPH) free radical scavenging assay was used. A standard curve was constructed using TroloxTM
(20 μM) solution. For sample wells, gallic acid (20 μL) was added. In both standard and sample wellsof a 96-well microtiter plate, 1 mM DPPH (20 μL) was added. The blank well consisted of HPLC grademethanol (200 μL). The plate was incubated for 10 min at room temperature in the dark. Then the plateabsorbances were read at 519 nm by a microtiter plate reader (TecanTM Infinite M200 Pro). All reagentswere dissolved in HPLC grade methanol. Antioxidant capacity reported in mM TroloxTM equivalents(TE) per mL of solution.
8

Foods 2019, 8, 380
2.7. Statistical Analysis
All the data were expressed as mean ± SD after carrying out technical and biological replicateexperiments. Tukey’s test was used to test for differences at a significance level of p ≤ 0.05 whereappropriate. The Pearson’s correlation analysis was employed to assess the relationship betweenselected parameters and variables. The comprehensive statistical analyses of all obtained results wereperformed by Hierarchical Cluster Analysis using Ward method. The significance of the impact ofpulsed light treatment parameters was evaluated using response surface methodology (RSM) approach.All statistical analyses were performed using Statsoft Inc’s Statistica 13 software (Tulsa, OK, Canada).
3. Results
3.1. Impact of PL on the Temperature Increment of Gallic Acid Solutions
This test was carried out to quantify the energy imparted to gallic acid solutions by PL application.The heat energy absorbed by gallic acid solution and thereby temperature increment due to volumetricheating showed a proportionality with the fluence delivered. There was a strong and significantpositive correlation between the temperature increment % and fluence of PL treatment as shown inFigure 2 (r = 0.974; p < 0.05). The temperature increment was the lowest (10.6%) in case of fluence levelof 1.07 J/cm2. Similarly, the increment was highest (65.3%) in case of highest fluence level of 17.2 J/cm2.The heat absorbed by gallic acid solution after PL application varied from 0.884 to 5.44 J/cm2.
0
1
2
3
4
5
6
0 5 10 15 20
Abs
orbe
d he
at (J
/cm
2 )
T (%
)
Fluence (J/cm2)
T (%) Absorbed heat (J/cm2)
Figure 2. The impact of PL on temperature increment of gallic acid aqueous solution.
The temperature increment during PL treatment can be attributed to energy absorption by samplesby virtue of the photothermal effect, which shows an increase in temperature by light absorption.Whenever light interacts with a sample, it decays exponentially as per the Beer-Lamberts law and thusget converted into heat energy in the sample [2]. Similar observations have been made by researchersdoing experiments with milk [17], fruit juices [18].
3.2. Colour Measurement of PL Treated Gallic Acid Solution
The L* and b* colour parameters of all PL treated gallic acid solutions were significantly different(p < 0.05) from that of untreated sample (Figure 3). In the case of the a* coordinate the vast majority ofthe PL-treated samples exhibited significantly different values. Only the sample treated by 1.070 J/cm2
did not differ from the control. More specifically, the L* parameter was equal to 93.49–95.78 and 96.96 inthe case of PL treated and untreated solution, respectively. In the case of the a* colour parameter, whichrepresents the share of red and green colour, the changes were smaller. For instance, the untreatedgallic acid solution was characterized by a* = 1000 whereas PL application resulted in increment of this
9

Foods 2019, 8, 380
coordinate to 1.84 and 1.80 in the case of fluence 11.10 and 17.20 J/cm2, respectively. The differencebetween these samples expressed by changes of red/green share was statistically irrelevant (p > 0.05).As aforementioned, the b* component of colour of gallic acid solution was significantly affected byPL application. The highest fluence (17.20 J/cm2) resulted in the biggest change of blue/yellow colourshare −7.62. For comparison, the b* of untreated gallic acid solution was equal to 0.54.
0123456789
80828486889092949698
100
0 5 10 15 20
a*, b
*
L*
Fluence (J/cm2)
L*
a*
b*
Figure 3. The impact of pulsed light on L*, a* and b* colour parameters of gallic acid aqueous solution.
The Pearson’s correlation analysis proved that the relation between a* and fluence had significantand positive character with r = 0.820 (p < 0.05). In turn, the Pearson’s correlation coefficientestablished for the relation between b* and fluence was even bigger—r = 0.950 (p < 0.05). To thecontrary, no significant linear dependency was found between fluence and L* (r = −0.456; p > 0.05).The changes of optical parameters clearly demonstrate that PL provoked browning of gallic acidsolution. The total colour difference (ΔE) and browning index (BI) depended strongly on fluence aspresented in Figure 4. The Pearson’s correlation coefficient for the relationship with fluence was equalto r = 0.967 and r = 0.902, for ΔE and BI, respectively. These changes of colour may be attributed to thephotodegradation of gallic acid by the UV light component of PL [19]. The possible mechanism thatcould be involved in browning may be related to the production of reactive oxygen species (ROS) dueto the presence of oxygen in the gallic acid solutions. ROS may oxidize gallic acid and form quinonesor semiquinones [20]. These products may undergo further different reactions, i.e., polymerization,and form brown pigments [21]. The temperature increment may also play a role in browning of gallicacid solution, since the correlation between colour changes expressed by BI and ΔE was significant(p < 0.05) and positive (r = 0.926 and r = 0.953, respectively).
0.312
0.312
0.313
0.313
0.314
0.314
0
10
20
30
40
50
60
0 5 10 15 20
BIE
Fluence (J/cm2)
E
BI
Figure 4. The impact of pulsed light on total colour difference (ΔE) and browning index (BI) of gallicacid aqueous solution.
10

Foods 2019, 8, 380
3.3. Impact of PL on Total Polyphenol Content and Antioxidant Activity Expressed by DPPH Assay
Table 2 presents the gallic acid content (GAC), total phenolics content (TPC) and antioxidantactivity of all investigated gallic acid solution samples. Almost all samples treated by PL exhibitedsmaller concentrations of gallic acid as measured by the HPLC method. However, the difference wassignificant only for samples that were treated by 3.82 J/cm2. In this case the concentration of gallicacid was equal to 43.15 mg/100 mL, which means that it was 13.7% lower in comparison to untreatedsolution. Interestingly, the delivery of higher fluence did not necessarily cause higher degradationof gallic acid as measured by the HPLC method against TPC. It could indicate that there exist someoptimal parameters for gallic acid decomposition by light.
Table 2. Total phenolics content (TPC) and antioxidant activity measured by DPPH assay due toPL treatment.
Run Fluence (J/cm2) TPC (mg GAE/100 mL) * GAC (mg /100 mL) * Antioxidant Activity (mM TEAC/mL) *
Untreated 0.0 50.6 ± 1.07 a 50.00 ± 0.58 ab 10.29 ± 0.88 a
1 1.07 47.23 ± 0.33 b 50.64 ± 2.32 b 9.55 ± 1.01 ac
2 3.82 46.63 ± 0.57 b 43.15 ± 0.78 c 9.4 ± 0.5 abc
3 4.80 45.99 ± 1.19 b 49.67 ± 0.88 ab 9.26 ± 0.01 bc
4 17.20 41.27 ± 0.37 c 46.65 ± 0.74 ac 8.22 ± 0.76 b
5 1.24 46.8 ± 1.32 b 48.02 ± 0.87 ab 9.29 ± 0.17 abc
6 12.44 44.82 ± 0.37 b 47.90 ± 0.85 ab 9.31 ± 0.22 abc
7 1.11 45.77 ± 0.97 b 49.83 ± 0.86 ab 9.75 ± 0.35 a
8 11.11 45.61 ± 1.11 b 47.44 ± 0.86 ab 9.27 ± 0.92 bc
9 (C) 6.22 45.99 ± 0.59 b 48.02 ± 0.85 ab 9.96 ± 0.21 a
10 (C) 6.22 46.47 ± 0.56 b 47.89 ± 0.86 ab 9.92 ± 0.09 a
* Values expressed as mean ± SD followed by letters a–c wherein, means followed by same letter are not significantlydifferent (p > 0.05).
These results are very interesting especially when compared to TPC results since they indicatethat even if the gallic acid content was not changed, the TPC was altered. The TPC of control samplewas 50.6 mg GAE/100 mL. All samples subjected to PL treatment were characterized by significantly(p < 0.05) smaller TPC which ranged between 41.27 and 47.23 mg GAE/100 mL. The biggest decline ofTPC, equal to 18.4% in comparison to the reference sample, was found for the trial with the highestdelivered fluence (17.2 J/cm2).
The smallest applied fluence (1.07 J/cm2) also contributed to a significant decrease of TPC by6.6% when compared to the control solution. It means that the reactions gallic acid can undergoare very photosensitive. Even though there was no degradation of gallic acid under this conditionsome compounds that could react with FC reagent were formed. However, within the fluence rangeof 1.07–12.44 J/cm2 the TPC remained the same from statistical point of view. It means that despitehigh photosensitivity of gallic acid, there is a wide spectrum of fluence that cause similar degradationlevel. Such information is extremely important when designing PL-based technology of processingphenolic-abundant products. It is worth emphasizing that the degradation of gallic acid maintained anegative linear relation with fluence. The Pearson’s correlation coefficient for this dependency wasr = −0.856 (p < 0.05). What’s more, the relationship between TPC and b*, ΔE and BI was significantas well (p < 0.05) and correlation coefficients were equal to −0.771; −0.851 and −0.654, respectively.Indeed, it indicates that products of degradation of gallic acid contribute directly to browning ofthe investigated solution [4]. The photoinduced decomposition of gallic acid was also reported byBenitez et al. [5].
Further, it must be mentioned that we observed the measured TPC was slightly lower than themeasured gallic acid content for all samples. Ideally, as the model gallic acid solution did not hadany other component, the TPC should be equal to the gallic acid content. It has been previouslyreported [22] that radiation by UV, which is also a constituent of pulsed light, may create reactiveoxygen species by photooxidation of oxygen which is dissolved in water. These intermediates canform other reactive molecules like hydroxyl radicals and hydrogen peroxide, which included with theproducts of photodecomposition of gallic acid, have been reported to interfere with the Folin–Ciocalteu
11

Foods 2019, 8, 380
reagent. For instance, hydrogen peroxide can lead to lower TPC values if present in the system togetherwith gallic acid, as found by Rangel et al. [23].
In the current study, almost all samples exhibited antioxidant activity similar to control solution.The decrease of free radical scavenging activity was found only for sample treated by the highestfluence – 17.2 J/cm2. Comparing these results with gallic acid concentration it can be stated thatwithin the fluence range of 1.07 to 12.4 J/cm2 the products of gallic acid oxidation exhibited someantioxidant potential. Similar results were reported by Oms-Oliu et al. [24] for mushrooms subjectedto PL. The authors have found that depending on the fluence the antioxidant activity can be decreasedor increased which is related with decomposition of phenolics and polymerization reaction of thequinones. Also, Llano et al. [25] reported that application of PL with fluence 8–16 J/cm2 helps tomaintain the antioxidant activity of fresh-cut apples.
3.4. Response Surface Methodology (RSM) and Cluster Analysis
RSM analysis was applied to estimate the values of investigated variables of gallic acid solutiondepending on frequency (x) and time (y) of PL treatment. Equations (6–11) depict the response modelequation, wherein, a significant model was obtained for all responses, with a high coefficient ofregression R2 (>0.9) for temperature increment, color change and browning index responses. The gallicacid content model showed lowest R2 (0.74), whereas R2 of total phenolic content and antioxidantactivity were within acceptable range (0.8–0.9). The results of the analysis of variance (ANOVA) for theresponse surface models are given in Table 3. The model itself was found significant for all responses(p < 0.05) and was adequate for navigating the design space. The plots of RSM have been given inFigure 5:
ΔT (%) = −1.208 + 5.443x − 0.449x2 + 0.143y − 0.0006y2 + 0.1245xy, R2 = 0.98 (6)
ΔE = −1.279 + 1.342x − 0.082x2 + 0.398y − 0.0034y2 + 0.089xy, R2 = 0.95 (7)
BI = 0.311 + 0.0003x − 0.00002x2 + 0.0001y − 0.000001y2 + 0.0000003xy, R2 = 0.99 (8)
TPC (mg GAE/100 ml) = 44.474 + 0.466x − 0.240x2 + 0.145y − 0.0015y2 − 0.0202 xy, R2 = 0.82 (9)
GAC (mg/100 mL) = 52.742 − 0.108x − 0.027x2 − 0.227y − 0.0004y2 + 0.018xy, R2 = 0.74 (10)
AA (mM TEAC/mL) = 8.096 + 0.382x − 0.031x2 + 0.095y − 0.0019y2 − 0.004xy, R2 = 0.88 (11)
Based on the ANOVA results in Table 3, it could be concluded that individual interactionsof both PL frequency (x) and PL treatment time (y) significantly affected (p < 0.005) temperaturechange, total color change and browning index. Based on the signs of the corresponding coefficient inEquations (6)–(8), it could be concluded that higher PL frequency and higher PL time led to highervalues of temperature change, total color change and browning index. Total phenolic content wassignificantly affected by only PL frequency (0.005 < p < 0.05) and not PL treatment time (p > 0.05),whereas gallic acid content and antioxidant activity were significantly affected by only PL treatmenttime (0.005 < p < 0.05) and not PL frequency (p > 0.05).
The effect of the mutual interaction of PL frequency and PL treatment time (x*y), which describesthe PL fluence that governs the microbial lethality level during the PL process, was only significant(0.005 < p < 0.05) for temperature change, and did not affect other responses. Based on this, it couldbe inferred that even a process requiring high fluence could be optimized to minimize quality loss(at same levels of microbial lethality) by understanding the relative importance of PL frequency andtime on the response. The effect of the quadratic interaction of PL frequency (x2) was only significant(0.005 < p < 0.05) for temperature change and browning index, while that of PL treatment time (y2) wasonly significant (0.005 < p < 0.05) for antioxidant activity and browning index. This is often indicativeof the curvilinear relationship between the parameters.
12
Foods 2019, 8, 380
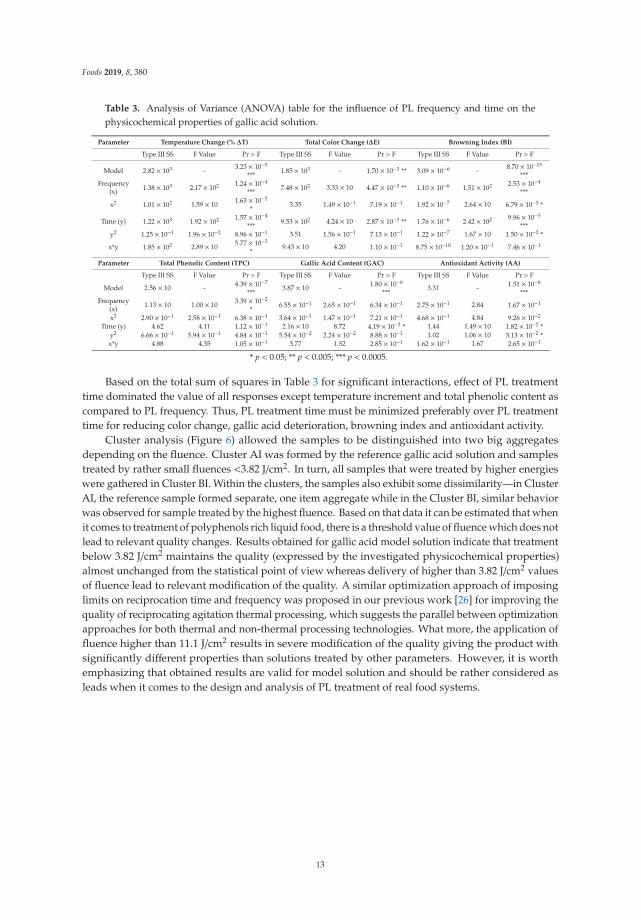
Table 3. Analysis of Variance (ANOVA) table for the influence of PL frequency and time on thephysicochemical properties of gallic acid solution.
Parameter Temperature Change (% ΔT) Total Color Change (ΔE) Browning Index (BI)
Type III SS F Value Pr > F Type III SS F Value Pr > F Type III SS F Value Pr > F
Model 2.82 × 10³ - 3.23 × 10⁻⁵
*** 1.85 × 10³ - 1.70 × 10⁻³ ** 3.09 × 10⁻⁶ - 8.70 × 10⁻¹⁵
***Frequency
(x) 1.38 × 10³ 2.17 × 10² 1.24 × 10⁻⁴
*** 7.48 × 10² 3.33 × 10 4.47 × 10⁻³ ** 1.10 × 10⁻⁶ 1.51 × 10² 2.53 × 10⁻⁴
***
x2 1.01 × 10² 1.59 × 10 1.63 × 10−2
*3.35 1.49 × 10⁻¹ 7.19 × 10⁻¹ 1.92 × 10⁻⁷ 2.64 × 10 6.79 × 10⁻³ *
Time (y) 1.22 × 10³ 1.92 × 10² 1.57 × 10⁻⁴
*** 9.53 × 10² 4.24 × 10 2.87 × 10⁻³ ** 1.76 × 10⁻⁶ 2.42 × 10² 9.96 × 10⁻⁵
***y2 1.25 × 10⁻¹ 1.96 × 10⁻² 8.96 × 10⁻¹ 3.51 1.56 × 10⁻¹ 7.13 × 10⁻¹ 1.22 × 10⁻⁷ 1.67 × 10 1.50 × 10⁻² *
x*y 1.85 × 10² 2.89 × 10 5.77 × 10−3
*9.43 × 10 4.20 1.10 × 10⁻¹ 8.75 × 10⁻¹⁰ 1.20 × 10⁻¹ 7.46 × 10⁻¹
Parameter Total Phenolic Content (TPC) Gallic Acid Content (GAC) Antioxidant Activity (AA)
Type III SS F Value Pr > F Type III SS F Value Pr > F Type III SS F Value Pr > F
Model 2.56 × 10 - 4.39 × 10⁻⁷
***3.87 × 10 - 1.80 × 10⁻⁶
***3.31 - 1.51 × 10⁻⁶
***Frequency
(x) 1.13 × 10 1.00 × 10 3.39 × 10−2
* 6.55 × 10−1 2.65 × 10⁻¹ 6.34 × 10⁻¹ 2.75 × 10⁻¹ 2.84 1.67 × 10−1
x2 2.90 × 10⁻¹ 2.58 × 10⁻¹ 6.38 × 10⁻¹ 3.64 × 10⁻¹ 1.47 × 10⁻¹ 7.21 × 10⁻¹ 4.68 × 10⁻¹ 4.84 9.26 × 10⁻²
Time (y) 4.62 4.11 1.12 × 10⁻¹ 2.16 × 10 8.72 4.19 × 10−2 * 1.44 1.49 × 10 1.82 × 10⁻² *y2 6.66 × 10⁻¹ 5.94 × 10⁻¹ 4.84 × 10⁻¹ 5.54 × 10⁻² 2.24 × 10⁻² 8.88 × 10⁻¹ 1.02 1.06 × 10 3.13 × 10⁻² *x*y 4.88 4.35 1.05 × 10⁻¹ 3.77 1.52 2.85 × 10⁻¹ 1.62 × 10⁻¹ 1.67 2.65 × 10⁻¹
* p < 0.05; ** p < 0.005; *** p < 0.0005.
Based on the total sum of squares in Table 3 for significant interactions, effect of PL treatmenttime dominated the value of all responses except temperature increment and total phenolic content ascompared to PL frequency. Thus, PL treatment time must be minimized preferably over PL treatmenttime for reducing color change, gallic acid deterioration, browning index and antioxidant activity.
Cluster analysis (Figure 6) allowed the samples to be distinguished into two big aggregatesdepending on the fluence. Cluster AI was formed by the reference gallic acid solution and samplestreated by rather small fluences <3.82 J/cm2. In turn, all samples that were treated by higher energieswere gathered in Cluster BI. Within the clusters, the samples also exhibit some dissimilarity—in ClusterAI, the reference sample formed separate, one item aggregate while in the Cluster BI, similar behaviorwas observed for sample treated by the highest fluence. Based on that data it can be estimated that whenit comes to treatment of polyphenols rich liquid food, there is a threshold value of fluence which does notlead to relevant quality changes. Results obtained for gallic acid model solution indicate that treatmentbelow 3.82 J/cm2 maintains the quality (expressed by the investigated physicochemical properties)almost unchanged from the statistical point of view whereas delivery of higher than 3.82 J/cm2 valuesof fluence lead to relevant modification of the quality. A similar optimization approach of imposinglimits on reciprocation time and frequency was proposed in our previous work [26] for improving thequality of reciprocating agitation thermal processing, which suggests the parallel between optimizationapproaches for both thermal and non-thermal processing technologies. What more, the application offluence higher than 11.1 J/cm2 results in severe modification of the quality giving the product withsignificantly different properties than solutions treated by other parameters. However, it is worthemphasizing that obtained results are valid for model solution and should be rather considered asleads when it comes to the design and analysis of PL treatment of real food systems.
13

Foods 2019, 8, 380
Figure 5. RSM plots showing the impact of PL on the properties of gallic acid aqueous solution. fromtop to bottom: (a) temperature change, ΔT; (b) total colour difference, ΔE; (c) browning index, BI;(d) Total phenolic content, TPC; (e) Gallic acid content, GAC; (f) antioxidant capacity.
14

Foods 2019, 8, 380
Figure 6. Results of the cluster analysis performed based on of all investigated variables.
4. Conclusions
Pulsed light (PL) processing happens to be a promising non-thermal technology for foodpreservation and processing. It has been shown to have great potential for decontaminating foodproducts by destroying pathogenic microorganisms. However, the effect of PL on food bioactive andnutritional compounds is unclear. The aim of this study was to understand how the PL treatmentaffects the gallic acid aqueous solution, which is taken as a model system of phenolic-abundant liquidfood matrices. Several parameters of the gallic acid solution were tested by a design of experimentsapproach for the effect of PL processing-colour, total phenolic concentration, antioxidant activity usingDPPH free radical assay. It was found that PL can modify the optical properties of gallic acid andcause reactions and degradation of gallic acid. The absorbed light energy resulted in a proportionaltemperature increase. The L* and b* color values decreased significantly, with an increase in thebrowning index on PL treatment. The gallic acid content and the total polyphenol content changedinitially, but remained constant after a critical fluence was reached, whereas the antioxidant activity didnot vary significantly, except at the highest fluence level tested (17.20 J/cm2). This suggests that despitethe photosensitivity of the gallic acid, the degradation products still had similar antioxidant potentialeven at relatively high fluences. Based on a cluster analysis, a critical fluence level (<3.82 J/cm2) wassuggested, below which PL shall have minimal effect on the overall quality of model gallic acid solution.With less than 10% degradation of gallic acid and less than 20% degradation of the antioxidant activity,it can be said that the PL technology has excellent ability to process liquid foods rich in polyphenolsand antioxidants.
Author Contributions: Conceptualization, A.W. and A.P.S.; methodology, A.W., A.P.S., A.S.; formal analysis, A.W.;investigation, A.W., R.M., A.P.S., A.S.; writing—original draft preparation, R.M.; writing—review and editing,A.W.; visualization, A.W., R.M.; supervision, A.P.S.
Funding: This research was funded by the National Science and Engineering Research Council of Canada (NSERC)Discovery Grant Number RGPIN-2018-04735 and NSERC Collaborative Research and Development Grant NumberCRDPJ-522364-17 in collaboration with Solaris Disinfection Inc., Mississauga, ON, Canada.
Acknowledgments: Artur Wiktor would like to acknowledge the financial support of the Dekaban Foundation.
Conflicts of Interest: The authors declare no conflict of interest. The funders had no role in the design of thestudy; in the collection, analyses, or interpretation of data; in the writing of the manuscript, or in the decision topublish the results.
15

Foods 2019, 8, 380
References
1. Rahman, M.S. Handbook of food preservation, 2nd ed.; CRC Press: Boca Raton, FL, USA, 2007. [CrossRef]2. Palmieri, L.; Cacace, D. High intensity pulsed light technology. In Emerging Technologies for Food Processing;
Academic Press: Amsterdam, The Netherlands, 2005; pp. 279–306. [CrossRef]3. Bernal, J.; Mendiola, J.A.; Ibáñez, E.; Cifuentes, A. Advanced analysis of nutraceuticals. J. Pharm. Biomed.
Anal. 2011, 55, 758–774. [CrossRef]4. Li, H.; Guo, A.; Wang, H. Mechanisms of oxidative browning of wine. Food Chem. 2008, 108, 1–13. [CrossRef]5. Benitez, F.J.; Real, F.J.; Acero, J.L.; Leal, A.I.; Garcia, C. Gallic acid degradation in aqueous solutions by
UV/H2O2 treatment, Fenton’s reagent and the photo-Fenton system. J. Hazard Matter. 2005, 126, 31–39.[CrossRef]
6. Shamsudin, R.; Noranizan, M.A.; Yap, P.Y.; Mansor, A. Effect of repetitive ultraviolet irradiation on thephysico-chemical properties and microbial stability of pineapple juice. Innov. Food Sci. Emerg. Technol. 2014,10, 166–171. [CrossRef]
7. Shah, N.N.A.K.; Rahman, R.A.; Shamsudin, R.; Adzahan, N.M. Furan development in Dean Vortex UV-CCtreated pummelo (Citrus Grandis L. Osbeck) fruit juice. In Proceedings of the International Conference onSustainable Agriculture for Food, Energy and Industry in Regional and Global Context, Serdang, Malaysia,25–27 August 2015.
8. Caminiti, I.M.; Palgan, I.; Muñoz, A.; Noci, F.; Whyte, P.; Morgan, D.J.; Lyng, J.G. The effect of ultravioletlight on microbial inactivation and quality attributes of apple juice. Food Bioproc. Technol. 2012, 5, 680–686.[CrossRef]
9. Feng, M.; Ghafoor, K.; Seo, B.; Yang, K.; Park, J. Effects of ultraviolet-C treatment in Teflon coil on microbialpopulations and physic-chemical characteristics of watermelon juice. Innov. Food Sci. Emerg. Technol. 2013, 9,133–139. [CrossRef]
10. Charles, F.; Vidal, V.; Olive, F.; Filgueiras, H.; Sallanon, H. Pulsed light treatment as new method to maintainphysical and nutritional quality of fresh-cut mangoes. Innov. Food Sci. Emerg. Technol. 2013, 18, 190–195.[CrossRef]
11. Pollock, A.M.; Pratap Singh, A.; Ramaswamy, H.S.; Ngadi, M.O. Pulsed light destruction kinetics of L.monocytogenes. LWT 2017, 84, 114–121. [CrossRef]
12. Pataro, G.; Muñoz, A.; Palgan, I.; Noci, F.; Ferrari, G.; Lyng, J.G. Bacterial inactivation in fruit juices using acontinuous flow pulsed light (PL) system. Food Res. Int. 2011, 44, 1642–1648. [CrossRef]
13. Singh, R.P.; Heldman, D.R. Introduction to Food Engineering, 5th ed.; Academic Press: San Diego, CA, USA,2014. [CrossRef]
14. Kasim, R.; Kasin, M.U. Biochemical changes and color properties of fresh-cut green bean (Phaseolus vulgarisL. cv. gina) treated with calcium chloride during storage. Food Sci. Technol. 2015, 35, 266–272.
15. Vega-Gálvez, A.; Di Scala, K.; Rodríguez, K.; Lemus-Mondaca, R.; Miranda, M.; López, J.; Perez-Won, M.Effect of air-drying temperature on physico-chemical properties, antioxidant capacity, colour and totalphenolic content of red pepper (Capsicum annuum, L. var. Hungarian). Food Chem. 2009, 117, 647–653.[CrossRef]
16. Sawant, L.; Prabhakar, B.; Pandita, N. Quantitative HPLC analysis of ascorbic acid and gallic acid inPhyllanthus emblica. J. Anal. Bioanal. Tech. 2010, 1, 2. [CrossRef]
17. Innocente, N.; Segat, A.; Manzocco, L.; Marino, M.; Maifreni, M.; Bortolomeoli, I.; Ignat, A.; Nicoli, M.C.Effect of pulsed light on total microbial count and alkaline phosphatase activity of raw milk. Int. Dairy J.2014, 39, 108–112. [CrossRef]
18. Ferrario, M.; Alzamora, S.M.; Guerrero, S. Inactivation kinetics of some microorganisms in apple, melon,orange and strawberry juices by high intensity light pulses. J. Food. Eng. 2013, 118, 302–311. [CrossRef]
19. Du, Y.; Chen, H.; Zhang, Y.; Chang, Y. Photodegradation of gallic acid under UV irradiation: Insightsregarding the pH effect on direct photolysis and the ROS oxidation-sensitized process of DOM. Chemosphere2014, 99, 254–260. [CrossRef]
20. Eslami, A.C.; Pasanphan, W.; Wagner, B.A.; Buettner, G.R. Free radicals produced by the oxidation of gallicacid: An electron paramagnetic resonance study. Chem. Cent. J. 2010, 4, 15. [CrossRef] [PubMed]
21. Altunkaya, A.; Gökmen, V. Effect of various inhibitors on enzymatic browning, antioxidant activity and totalphenol content of fresh lettuce (Lactuca sativa). Food Chem. 2008, 107, 1173–1179. [CrossRef]
16

Foods 2019, 8, 380
22. Song, K.; Mohseni, M.; Taghipour, F. Application of ultraviolet light-emitting diodes (UV-LEDs) for waterdisinfection: A review. Water Res. 2016, 94, 341–349. [CrossRef] [PubMed]
23. Sánchez-Rangel, J.C.; Benavides, J.; Heredia, J.B.; Cisneros-Zevallos, L.; Jacobo-Velázquez, D.A.The Folin–Ciocalteu assay revisited: improvement of its specificity for total phenolic content determination.Anal. Methods 2013, 5, 5990–5999.
24. Oms-Oliu, G.; Aguiló-Aguayo, I.; Martín-Belloso, O.; Soliva-Fortuny, R. Effects of pulsed light treatments onquality and antioxidant properties of fresh-cut mushrooms (Agaricus bisporus). Postharvest Biol. Technol. 2010,56, 216–222. [CrossRef]
25. Llano, K.R.A.; Marsellés-Fontanet, A.R.; Martín-Belloso, O.; Soliva-Fortuny, R. Impact of pulsed lighttreatments on antioxidant characteristics and quality attributes of fresh-cut apples. Innov. Food Sci. Emerg.Technol. 2016, 33, 206–215. [CrossRef]
26. Singh, A.; Pratap Singh, A.; Ramaswamy, H.S. A controlled agitation process for improving quality of cannedgreen beans during agitation thermal processing. J. Food Sci. 2016, 81, E1399–E1411. [CrossRef] [PubMed]
© 2019 by the authors. Licensee MDPI, Basel, Switzerland. This article is an open accessarticle distributed under the terms and conditions of the Creative Commons Attribution(CC BY) license (http://creativecommons.org/licenses/by/4.0/).
17

foods
Article
Analysis of Apple Candying by MicrowaveSpectroscopy
Juan A. Tomas-Egea, Pedro J. Fito and Marta Castro-Giraldez *
Instituto Universitario de Ingeniería de Alimentos para el Desarrollo, Universitat Politècnica de València,Camino de Vera s/n, 46022 Valencia, Spain* Correspondence: [email protected]
Received: 28 June 2019; Accepted: 2 August 2019; Published: 4 August 2019
Abstract: Process control in the industry requires fast, safe and easily applicable methods. In thissense, the use of dielectric spectroscopy in the microwave range can be a great opportunity to monitorprocesses in which the mobility and quantity of water is the main property to produce a quality andsafety product. The candying of fruits is an operation in which the samples are first osmoticallydehydrated and then exposed to a hot air-drying operation. This process produces changes in boththe structure of the tissue and the relationships between water, the solid matrix and the addedsoluble solids. The aim of this paper is to develop a dielectric tool to predict the water/sucrose statesthroughout the candying of apple, by considering the complexity of the tissue and describing thedifferent transport phenomena and the different transition processes of the sucrose inside the sample.
Keywords: dielectric spectroscopy; permittivity; dehydration; candying; hot air drying;isotherms; sucrose
1. Introduction
Dehydration is probably one of the most important methods of foods preservation. The mainobjective in dehydrating agricultural products is the removal of water in the foods up to a certain levelof water activity, at which microbial spoilage and deterioration chemical reactions are minimized [1].Apples are consumed either fresh or in the form of various processed products such as juice, jam,marmalade and dried products [2], being the dried apples in extensive demand. Candying is anindustrial operation, which consists on osmotic dehydration (OD) followed by a hot-air drying (HAD)treatment. OD consists of the immersion of foods in hypertonic solutions with the objective ofproducing a water flow out of the food and a simultaneous flow of solutes inside the tissue. In fruits,these mass transfer phenomena affect the apple structure. Fruits are formed by vegetal cells, conformingthe parenchyma tissue, which is a complex structure with intercell connections (plasmodesmata),intracellular and extracellular spaces [3–5]. Intracellular volume is mainly occupied by vacuoles,which are fundamentally a water solution with multiple solutes. The membrane of the cell is namedprotoplast, it is selectively permeable (active and passive protein channels) and controls turgor andthe cell growth [6]. The cell membrane has protein channels named aquaporin and calcium proteinchannel that are responsible of the water transport and the cell homeostasis [7]. The cell wall providesmechanical resistance to the cell. In the union between cell walls and protoplast are bonds of Na+,protein microtubules and conduits named plasmodesmata that allow the transport between the adjacentcells (symplastic pathways). Extracellular volume comprehends the cell wall and the spaces betweencells [3]. OD produces different phenomena in the cellular tissue, first dehydration with shrinkageand solute intake in extracellular space. Continuous shrinkage produces a breakdown between walland protoplast called plasmolysis causing mechanical driving forces (swelling/shrinkage) [8–11]. Thechanges in cellular tissue affect the water mobility and its distribution [12].
Foods 2019, 8, 316; doi:10.3390/foods8080316 www.mdpi.com/journal/foods18

Foods 2019, 8, 316
HAD influences on fruit quality because it produces chemical, physical and biological changesin food [13]. Moreover, the internal structure undergoes deformation and could be locally damaged.Removal of water adds rigidity to the external layers and simultaneously builds up moisture gradients,which create shrinkage stresses [14]. The understanding of these effects is still limited, and morestudies are necessary in this field in order to improve food quality and nutritional characteristics ofdehydrated foods.
During the candying process, crystallization of sucrose occurs. Sucrose crystallizes insupersaturated aqueous solutions. The sucrose molecule has eight hydroxyl groups, which canbe involved in hydrogen bond formation. In sufficiently diluted aqueous solutions, all the hydroxylgroups form hydrogen bonds with water molecules. If the concentration increases, the moleculesstart to interact forming an intramolecular bond and then two intermolecular bonds [15]. If sucroseconcentration in the solution increases, aggregation phenomena occur between sucrose molecules,leading to stable three-dimensional nucleus [16]. After nucleus formation, the crystal growth consists inthe incorporation of sucrose molecules to the crystal lattice, which requires the migration of hydrationwater from the crystal surface to the solution [17].
The analysis of the electromagnetic field (EMF) properties in range of microwaves could bea good tool to monitor and improve apple candying. The development of sensors to determinethe dielectric properties of biological tissues, in range of radiofrequency and microwaves, has beendemonstrated to be a useful tool for monitoring the quality of many products: Poultry [18–22],pork [23–27], beef [28], goat [29], meat products [30], cheese [31], mandarin [32], potato [33], wheat [34],agricultural products [35–37], pomegranate [38] and apple [39–41], and for monitoring processes ofpork meat HAD [42] and salting [43], orange peel drying [44], cheese salting [45], brewing [46], puffingof amaranth seeds [47], OD of kiwi [48] and apple [49].
The EMF is a flux of photons [50] and the interaction with matter can be modeled by Schrodinger’sequation [51] attending to the quantum theory. However, at the macroscopic level, it is possible toapply the Maxwell’s equations [52], where the physical property that describes the electric effectis the complex permittivity and for the magnetic effect is the complex permeability [50]. In themicrowave range (1.24·10−6 to 1.24·10−3 eV or 300 MHz to 300 GHz), these interactions are describedby γ-dispersion and ionic conductivity. γ-dispersion is caused by the induction and orientation ofdipolar molecules, being water the most important in biological systems [53]. These phenomenagenerate electric energy accumulation caused mainly by water spin reorientation and it is representedby the real part of the permittivity (ε′). On the other hand, a part of the electrical energy of photons istransformed in other energies (mechanical or calorific) due to the collisions or frictions associated tothe increase of molecular mobility; this part of the electric energy is called the loss factor (ε”). In themicrowave range, the vibration of chemical species with very high ionic strength causes a part of thelosses of electrical energy; this is called ionic conductivity (σ) [54].
The aim of this paper is to develop a dielectric tool to predict the water/sucrose states throughoutthe candying of apple, by considering the complexity of the tissue and describing the different transportphenomena and the different transition processes of the sucrose inside the sample.
2. Materials and Methods
Apples (var. Granny Smith) were bought from a local supermarket and kept refrigerated until use.The apples were cut with a caliper and a cork borer in cylinders (1 cm thickness, 2 cm diameter) fromthe parenchymatic tissue. There were prepared 126 samples in order to obtain 7 isotherms (Figure 1).Eighteen samples were used to obtain the isotherm of raw apple (I0): Three samples to characterize theraw material, it is without hot air dehydration, and 15 exposed to hot air dehydration. The remaining108 samples were dehydrated osmotically to obtain six isotherms (I1 to I6); 18 samples were used foreach selected time of OD: Three samples to characterize osmotic dehydrated samples, it is without hotair dehydration, and 15 exposed to hot air dehydration. In conclusion, seven isotherms were obtained,considering that the samples of an isotherm have the same solid matrix/sucrose weight relation.
19

Foods 2019, 8, 316
Figure 1. Flow diagram of the experimental procedure, where I represents each isotherm, subindices ifrom 0 to 6 of each isotherm represent a concrete sucrose/solid matrix weight relation, t1 to t6 representthe different times of hot-air drying (HAD).
Sucrose solution (65% w/w, 30 ◦C), prepared with commercial sugar and distilled water, wasused as an osmotic agent. The relation between the fruit and the osmotic solution was of 1:20 (w/w)to avoid changes in the solution during the process. The system was maintained at 30 ◦C in aconstant-temperature chamber. To prevent evaporation the vessel was covered with a sheet of plasticwrap. Preliminary kinetic studies were done at the same working conditions in order to select the ODtreatment times. The OD treatment times in the preliminary studies were: 180, 360, 720, 1463, 1577,1722, 3375, 4320, 7200, 8640, 10270, 14590 and 23230 min. Based on the results [54], OD treatment timeswere selected for this research: 0, 360, 720, 1722, 3375, 4320 and 10270 min. After the treatment, thesamples were removed from the solution and blotted with a paper to remove the superficial osmoticsolution. Then, the samples were kept at 30 ◦C for 24 h, on AquaLab disposable sample containers,closed with parafilm®. The mass, volume and water activity of the 126 samples were measured afterthe repose. Moreover, permittivity, moisture and soluble solids content (◦Brix) of three samples of eachOD treatment time were measured to characterize each sucrose/solid matrix weight relation (xS/xSM),considering as the solid matrix mass is neither water nor solutes. The remaining samples in eachisotherm were hot air dried (times of HAD treatment: 30, 60, 120, 955 and 1368 min). Three sampleswere used in each HAD treatment time. The drying experiments were carried out at 40 ◦C dryingair temperature. The convective dryer was designed and built in the Food Technology Departmentof Universitat Politècnica de València, has a control unit for setting the velocity and temperatureof air, which is heated through electrical resistances. Air velocity was kept at a constant value of1.5 ± 0.2 m s−1 in all experiments.
After the drying treatment, samples were maintained at 30 ◦C for 24 h, on AquaLab disposablesample containers, closed with parafilm®®. After this repose time, the permittivity, mass, volume,water activity, moisture and soluble solids content were measured.
20

Foods 2019, 8, 316
Volume measurements were analyzed by image analysis and the software Adobe Photoshop®®
CS5 (Adobe Systems Inc., San Jose, CA, USA) to get the diameter and the thickness of the samples.The images of the samples were obtained with a digital camera (Canon EOS 550D, with a size of2592 × 1728 pixels and a resolution of 16 pixel/mm).
Mass was determined by using a Mettler Toledo Balance (±0.0001 g; Mettler-Toledo, Inc., Columbus,OH, USA). Measurements were done in structured samples (not minced), thus the obtained aw isconsidered to be the surface aw [54].
Water activity was measured in the structured samples with a dew point hygrometer Decagon(Aqualab®® series 3TE) with precision ±0.003.
Moisture content in the apple cylinders was determined gravimetrically at 60 ◦C in a vacuumoven until constant weight was reached [55]. Sugar content was determined in a refractometer (ABBE,ATAGO Model 3-T, Tokyo, Japan).
The system used to measure permittivity consists of an Agilent 85070E open-ended coaxial probe(Agilent, Santa Clara, CA, USA) connected to an Agilent E8362B Vector Network Analyzer (Agilent,Santa Clara, CA, USA). The system was calibrated using three different types of loads: Open (air),short-circuit and 30 ◦C Milli-Q water. Once the calibration was carried out, 30 ◦C Milli-Q water wasmeasured again to check calibration suitability. Permittivity was measured from 500 MHz to 20 GHz.The measurements were performed in triplicate. Dielectric constant (ε′) was modeled adjusting theexperimental data using Traffano-Schiffo model [20] (Equation (1)) in order to obtain information ofγ-dispersion:
logε′(ω) = logε′∞ +3∑
n=1
Δlogε′n1 + e(logω2−logτ2
n)·αn, (1)
where n represents α, β or γ dispersion, logε′ represents the decimal logarithm of the dielectric constant,logε′∞ the logarithm of the dielectric constant at high frequencies, logω represents the decimal logarithmof the angular velocity (obtained from the frequency), Δlogε′n (Δlε′n = log ε′n − log ε′n−1) the amplitudeof the n dispersion, logτn the logarithm of the angular velocity at relaxation time for each n dispersionand αn are the dispersion slopes. In this work, this model was applied for γ-dispersion only.
3. Results
In order to understand the mechanisms that govern the relationship between water and sucrosein plant tissue matrix during OD and HAD treatments, and thus develop dielectric predictive toolsthat not only explain the water state but also explain the state of the whole internal liquid phase of thevegetal tissue, a kinetic analysis of the variation of overall mass, water and sucrose was proposed as afirst step. Overall mass, water and sucrose mass variations throughout the OD treatment are shown inFigure 2. These parameters were estimated by Equations (2)–(4), respectively.
ΔM =Mt −M0
M0, (2)
ΔMw =Mtxwt −M0xw0
M0, (3)
ΔMs =Mtxst −M0xs0
M0(4)
where M represents the mass (kg), xi is the mass fraction of the compound i (kgi/kgT), being thedifferent compounds represented by subscripts: w the water, and s the soluble solids; moreover, thesubscripts t represent the treatment time, being 0 the initial value.
In Figure 2, it can be observed that the greatest loss of mass occurs during the first 1722 min of theOD treatment. From that moment, there was no variation in the total mass of the sample or in the massof water. In contrast, the increase in soluble solids occurred during the first 720 min, being this contentstabilized from this point.
21

Foods 2019, 8, 316
Figure 2. Evolution of overall mass (�), water mass (�) and sucrose mass (�) through theosmotic treatment.
The mass variation evolution does not allow us to observe correctly the chemical equilibriumthat happens when the plasmolysis occurs [54]. The plasmolysis or breakdown the bonds between theprotoplast and the wall precedes tissue shrinkage and swelling [56], and these phenomena change theamount of liquid phase but not its composition. For this reason, the relationship between the sucrosecontent and the solid matrix with respect to the treatment time is shown in Figure 3.
In Figure 3, it is possible to observe how the sucrose/solid matrix weight relation reaches amaximum (cellular plasmolysis) at 1722 min. Seven different osmodehydration treatment times wereselected which correspond to seven different sucrose/solid matrix weight relations: 0 min of OD(1.33 kgsucrose/kgsolid matrix), 360 min of OD (3.58 kgsucrose/kgsolid matrix), 720 min of OD (4.27 kgsucrose/
kgsolid matrix), 1722 min of OD (7.28 kgsucrose/kgsolid matrix), 3375 min of OD (4.31 kgsucrose/kgsolid matrix),4320 min of OD (3.20 kgsucrose/kgsolid matrix) and 10,270 min of OD (6.82 kgsucrose/kgsolid matrix). TwoOD treatment times were selected before the plasmolysis in order to study the samples before thechemical equilibrium. After the plasmolysis, the samples suffered mechanical phenomena (swellingand shrinkage), which were responsible for the osmotic solution intake or outflow; from this time therewere no longer diffusional driving forces. After 1722 min of OD, the samples suffered a shrinkagecausing the outflow of liquid phase, and therefore the decrease in the sucrose content (decrease in theweight relation sucrose/solid matrix). Two OD treatment times were selected in this period (3375 and4320 min of OD). After the shrinkage, the swelling phenomenon occurred, which could be observedby the increase of sucrose/solid matrix weight relation. One OD treatment time was selected in thisperiod: 10,270 min.
Figure 4 shows the relationship between the water activity of samples in equilibrium (24 h afterHAD treatment) and moisture expressed in dry matter (xw/1 − xw), or isotherm at 30 ◦C. Moreover,Figure 4 shows the isotherm of pure water/sucrose solution at 30 ◦C from [57], where it is possible to
22

Foods 2019, 8, 316
observe that the apple isotherm data are around the isotherm of pure solution. The range of wateractivity measured covers some state transitions associated with water and sucrose. Thus, it is necessaryto analyze the possible transitions that occur during the HAD treatment.
Figure 3. Sucrose/solid matrix relation with regard to osmotic dehydration (OD) time. Dotted linesrepresent the OD samples times chosen for the samples that will be dehydrated later by HAD.
Figure 4. Moisture (kg water/kg dry matter) with regard to the water activity, where: (—)represents a water-sucrose solution [57], (�) 1.33 kgsucrose/kgsolid matrix, (�) 3.58 kgsucrose/kgsolid matrix,(�) 4.27 kgsucrose/kgsolid matrix, (�) 7.28 kgsucrose/kgsolid matrix, (x) 4.31 kgsucrose/kgsolid matrix, (�) 3.20kgsucrose/kgsolid matrix and (�) 6.82 kgsucrose/kgsolid matrix.
23

Foods 2019, 8, 316
Figure 5 shows the diagram state of the sucrose–water solution represented as water activityversus temperature. In this figure, it is possible to observe how at 30 ◦C the samples crossed thesaturation and supersaturation curve as the viscosity of the liquid phase increased. This representsthat the liquid phase analyzed could be in the stable, metastable or supersaturated region. Therefore,when developing a predictive tool for the water state during an OD or HAD treatment, it is importantto predict not only the composition but also to predict the water mobility or the state of the liquidphase of the tissue being treated.
Figure 5. Diagram state of sucrose solution represented as water activity vs. temperature, where(( ) and (( ) lines represent the saturation and supersaturation curves obtained from [16], (( ) linesrepresent different values of viscosity obtained from Lewis (1990) [58], and (�) represent the differentexperimental values of samples with OD and HAD treatments.
In order to develop a tool to predict the state of the liquid phase throughout the treatment of ODor HAD, the dielectric properties were analyzed in the range of microwaves, where the γ (dipolareffect) affects mainly the water molecules, generating an orientation and induction effect that wasgreater when the mobility of the molecules was greater.
Figure 6 shows the dielectric constant and loss factor spectra of samples treated 360 min with ODand different HAD treated times, as an example of spectra variation throughout the HAD treatment.The dielectric phenomena by orientation and induction occurred in the range of radiofrequencyand microwaves. The phenomena were three, α, β and γ and occurred in a large frequency range.It is considered that each phenomenon has a maximum effect when the losses are maximum andthe frequency at which the maximum effect occurs are called the relaxation frequency. In order tounderstand the relationship of each phenomenon with the molecules affected, it is necessary to adjustthe spectrum to a model that obtains the relaxation values of each phenomenon. The Traffano-Schiffo
24

Foods 2019, 8, 316
model [20] has been applied to obtain the relaxation values in the γ-dispersion. In Figure 6, it ispossible to observe some relaxation frequencies decreasing with the HAD treatment time.
εε
ε
ε
εε
Figure 6. Dielectric constant and loss factor spectra of samples treated 360 min with OD and differentHAD treatment times (tHAD), where: fR is the relaxation frequency, and sub-indices R1, R2 and R3 referto the relaxation of γ-dispersion of samples dehydrated 0, 30 and 60 min, respectively.
The dielectric constant is the part of the permittivity that describes the orientation (electricalstorage) of the water molecule. Dielectric constant is higher when the movement capacity of the watermolecules is greater, as well as higher the number of water molecules is.
Figure 7 shows the relation between the dielectric constant at relaxation frequency and the wateractivity, where it is possible to observe a linear relation between the dielectric constant at the relaxationfrequency and the water activity, regardless of the sucrose/solid matrix weight relation, the structurechanges or the rheologic transitions. Therefore, only the water mobility affected the water orientation,and thus, dielectric constant in relaxation frequency represents an excellent tool to predict the wateractivity but not the transitions of water/sucrose.
The linear regression obtained was (R2 = 0.944):
aw = 0.0346·ε′relaxation + 0.2363. (5)
The constant of the equation (0.2363), which represents the activity of water for a null dielectricconstant or null water capacity for orientation, coincides with the water activity at which sucrosecrystallizes (0.23) [59].
Figure 8 shows the relationship between the moisture in dry basis and the relaxation frequency inthe different regions described in Figure 5. As it is possible to observe in this figure, only the samplesthat were in the stable region showed a linear relation, in this region the liquid phase had great mobilityand the viscosity was low. Samples located in a metastable or supersaturated region moved away
25

Foods 2019, 8, 316
from linearity. This meant that it was possible to discriminate the regions of the state diagram ofsucrose/water by analyzing the frequency of relaxation.
ε
Figure 7. Relation between the dielectric constant at the relaxation frequency and the water activity.
Figure 8. Relation between the moisture in dry basis (kgwater/kgdry matter) with the relaxation frequency,where (�) represents the samples in stable region, (�) represents the samples in metastable region and(�) the samples in the supersaturated region.
26

Foods 2019, 8, 316
With the purpose of being able to use dielectric measurements in the microwave range to predictthe sorption isotherm of apples in the process of OD and HAD, besides being able to correctly describethe water/sucrose state, the frequency of relaxation was compared with the loss factor.
Figure 9 shows the semilogarithmic relationship of the relaxation frequency and the loss factorat relaxation frequency, segregated according to the stability region. As it is possible to observe therelation between both was linear in all the regions, and did not allow the separation. Nevertheless, atthe very low mobility zone in the supersaturated region, new behavior appeared because the relaxationfrequency remained constant while the loss factor was reduced, this might be due to the vitrificationprocess (glass transition).
ε
Figure 9. Semi-logarithmic relation between the relaxation frequency and the loss factor at relaxationfrequency, where (�) represents the samples in stable region, (�) represents the samples in metastableregion, (�) the samples in the supersaturated region and (—) represents the linear regression of alldata together.
4. Discussion
The treatment of OD produces compositional and structural transformations within the tissueand the HAD treatments produce water losses, structural transformations and transitions in the liquidphase. In order to analyze the two treatments it is necessary to include several critical points of bothprocesses such as plasmolysis, compression/relaxation phenomena or saturation and supersaturationof the liquid phase. In Figure 3, it is possible to observe how the sucrose/solid matrix weight relationreaches a maximum (plasmolysis) at 1722 min.
Samples treated with OD and HAD, plasmolyzed or not, cross the saturation and supersaturationcurve as the viscosity of the liquid phase increases. This represents that the liquid phase of samplesanalyzed could be in the stable, metastable or supersaturated region. Therefore, when developing apredictive tool for describing the water state during an OD or HAD treatment, it is important to predict
27

Foods 2019, 8, 316
not only the composition but also to predict the water mobility or the state of the liquid phase of thetissue being treated.
The Traffano-Schiffo model allows obtaining the relaxation values in the microwave range, it allowsus to represent the dielectric constant at relaxation frequency versus the water activity, where it ispossible to observe a linear relation between both variables. Therefore, only the water mobility affectsto the water orientation, and thus, dielectric constant in relaxation frequency represents an excellenttool to predict the water activity but not the transitions of water/sucrose. Moreover, the good fit of thedata is shown in the good values of the correlation coefficient and also in the coincidence between theconstant of the equation and the water activity at which sucrose crystallizes (0.23).
The relationship between the moisture in the dry basis and the relaxation frequency in the differentregions described shows that only the samples that are in the stable region have a linear relation. In thisregion, the liquid phase has great mobility and the viscosity is low. Samples located in a metastable orsupersaturated region move away from linearity. This means that it is possible to discriminate theregions of the state diagram of sucrose/water by analyzing the frequency of relaxation.
The relaxation frequency and the loss factor at the relaxation frequency had a semilogarithmic,relationship in all the regions, and did not allow the separation. Nevertheless, at the very lowmobility zone in the supersaturated region, new behavior appeared because the relaxation frequencyremained constant while the loss factor was reduced, this might be due to the vitrification process(glass transition).
In the dielectric analysis in γ-dispersion, samples before and after the OD plasmolysis showed nodifferences, therefore, in this case of parenchymatic tissue, the effect of membrane plasmolysis had noeffect in the water orientation or induction. Therefore, in similar fruit tissue, with high quantity ofparenchymatic tissue and low vascular tissue, the behavior could be expected to be similar.
5. Conclusions
The use of specific frequencies of the dielectric properties in γ-dispersion did not allow us tocorrectly analyze the mobility of water and it makes it necessary to determine the dielectric propertiesat the relaxation frequency. It was demonstrated that the dielectric constant (at relaxation frequency)was linearly related to the water activity and not to the moisture, it means that it was affected bywater mobility and therefore by the structure. In addition, it was possible to determine sucrosesupersaturation processes by analyzing the relaxation frequency, which depends on the deformation ofthe water molecule. Therefore, it was demonstrated that the use of dielectric properties in γ-dispersionat relaxation frequency allowed us not only to monitor the OD and HAD processes of the applecandying, but also to predict the supersaturation state of the liquid phase until vitrification.
Author Contributions: All the authors contributed to the same extent in the experimental part, in the analysis ofthe data and in the subsequent writing of the manuscript.
Funding: This research was funded by THE SPANISH MINISTERIO DE ECONOMÍA, INDUSTRIA YCOMPETITIVIDAD, Programa Estatal de I+D+i orientada a los Retos de la Sociedad AGL2016-80643-R, AgenciaEstatal de Investigación (AEI) and Fondo Europeo de Desarrollo Regional (FEDER).
Acknowledgments: The author Juan Ángel Tomás-Egea wants to thank the FPI Predoctoral Program of theUniversidad Politécnica de Valencia for its support.
Conflicts of Interest: The authors declare no conflict of interest. The funders had no role in the design of thestudy; in the collection, analyses, or interpretation of data; in the writing of the manuscript, or in the decision topublish the results.
References
1. Krokida, M.K.; Marinos-Kouris, D. Rehydration kinetics of dehydrated products. J. Food Eng. 2003, 57, 1–7.[CrossRef]
2. Sacilik, K.; Elicin, A.K. The thin layer drying characteristics of organic apple slices. J. Food Eng. 2006, 73,281–289. [CrossRef]
28

Foods 2019, 8, 316
3. Ahmed, I.; Qazi, I.M.; Jamal, S. Developments in osmotic dehydration technique for the preservation of fruitsand vegetables. Innov. Food Sci. Emerg. Technol. 2016, 34, 29–43. [CrossRef]
4. Castro-Giraldez, M.; Tylewicz, U.; Fito, P.J.; Dalla Rosa, M.; Fito, P. Analysis of chemical and structuralchanges in kiwifruit (Actinidia deliciosa cv Hayward) through the osmotic dehydration. J. Food Eng. 2011,105, 599–608. [CrossRef]
5. Fito, P.; LeMaguer, M.; Betoret, N.; Fito, P.J. Advanced food process engineering to model real foods andprocesses: The “SAFES” methodology. J. Food Eng. 2007, 83, 173–185. [CrossRef]
6. Salisbury, F.; Ross, C. Plant Physiology. In Plant Physiology and Plant Cells, 4th ed.; Salisbury, F., Ross, C., Eds.;Wadsworth Pub. Co.: Belmont, CA, USA, 1991; pp. 3–26.
7. Agre, P.; Bonhivers, M.; Borgnia, M.J. The aquaporins, blueprints for cellular plumbing systems. J. Biol. Chem.1998, 273, 14659–14662. [CrossRef] [PubMed]
8. Nieto, A.B.; Vicente, S.; Hodara, K.; Castro, M.A.; Alzamora, S.M. Osmotic dehydration of apple: Influenceof sugar and water activity on tissue structure, rheological properties and water mobility. J. Food Eng. 2013,119, 104–114. [CrossRef]
9. Vicente, S.; Nieto, A.B.; Hodara, K.; Castro, M.A.; Alzamora, S.M. Changes in structure, rheology, and watermobility of apple tissue induced by osmotic dehydration with glucose or trehalose. Food Bioprocess. Technol.2012, 5, 3075–3089. [CrossRef]
10. Mavroudis, N.E.; Dejmek, P.; Sjöholm, I. Osmotic-treatment-induced cell death and osmotic processingkinetics of apples with characterised raw material properties. J. Food Eng. 2004, 63, 47–56. [CrossRef]
11. Alzamora, S.M.; Castro, M.A.; Nieto, A.B.; Vidales, S.L.; Salvatori, D.M. The role of tissue microstructurein the textural characteristics of minimally processed fruits. In Minimally Processed Fruits and Vegetables;Alzamora, S.M., Tapia, S., Lopez-Malo, A., Eds.; Aspen Publishers Inc.: Frederick, MD, USA, 2000; pp. 153–171.
12. Mauro, M.A.; Dellarosa, N.; Tylewicz, U.; Tappi, S.; Laghi, L.; Rocculi, P.; Dalla Rosa, M. Calcium and ascorbicacid affect cellular structure and water mobility in apple tissue during osmotic dehydration in sucrosesolutions. Food Chem. 2016, 195, 19–28. [CrossRef]
13. Lewicki, P.P. Design of hot air drying for better foods. Trends Food Sci. Technol. 2006, 17, 153–163. [CrossRef]14. Lewicki, P.P.; Jakubczyk, E. Effect of hot air temperature on mechanical properties of dried apples. J. Food
Eng. 2004, 64, 307–314. [CrossRef]15. Mathlouthi, M. X-ray diffraction study of the molecular association in aqueous solutions of d-fructose,
d-glucose, and sucrose. Carbohydr Res. 1981, 91, 113–123. [CrossRef]16. Mathlouthi, M.; Genotelle, J. Role of water in sucrose crystallization. Carbohydr. Polym. 1998, 37, 335–342.
[CrossRef]17. Mathlouthi, M. Amorphous sugar. In Sucrose; Mathlouthi, M., Reiser, P., Eds.; Springer: Boston, MA, USA,
1995; pp. 75–100.18. Traffano-Schiffo, M.V.; Castro-Giraldez, M.; Colom, R.J.; Fito, P.J. Innovative photonic system in radiofrequency
and microwave range to determine chicken meat quality. J. Food Eng. 2018, 239, 1–7. [CrossRef]19. Traffano-Schiffo, M.V.; Castro-Giraldez, M.; Herrero, V.; Colom, R.J.; Fito, P.J. Development of a non-destructive
detection system of Deep Pectoral Myopathy in poultry by dielectric spectroscopy. J. Food Eng. 2018, 237,137–145. [CrossRef]
20. Traffano-Schiffo, M.V.; Castro-Giraldez, M.; Colom, R.J.; Fito, P.J. Development of a spectrophotometricsystem to detect white striping physiopathy in whole chicken carcasses. Sensors 2017, 17, 1024. [CrossRef]
21. Trabelsi, S.; Roelvink, J. Investigating the influence of aging on radiofrequency dielectric properties of chickenmeat. J. Microw. Power Electromagn. Energy 2014, 48, 215–220. [CrossRef]
22. Samuel, D.; Trabelsi, S.; Karnuah, A.B.; Anthony, N.B.; Aggrey, S.E. The use of dielectric spectroscopy as atool for predicting meat quality in poultry. Int. J. Poult. Sci. 2012, 11, 551. [CrossRef]
23. Castro-Giraldez, M.; Toldrá, F.; Fito, P. Development of a dielectric spectroscopy technique for thedetermination of key bichemical markers of meat quality. Food Chem. 2011, 127, 228–233. [CrossRef]
24. Castro-Giraldez, M.; Toldrá, F.; Fito, P. Low frequency dielectric measurements to assess post-mortem ageingof pork meat. LWT Food Sci. Technol. 2011, 44, 1465–1472. [CrossRef]
25. Castro-Giraldez, M.; Toldrá, F.; Fito, P. Low-frequency dielectric spectrum to determine pork meat quality.Innov. Food Sci. Emerg. Technol. 2010, 2, 376–386. [CrossRef]
26. Castro-Giráldez, M.; Aristoy, M.C.; Toldrá, F.; Fito, P. Microwave dielectric spectroscopy for the determinationof pork meat quality. Food Res. Int. 2010, 1, 2369–2377. [CrossRef]
29

Foods 2019, 8, 316
27. Kent, M.; Peymann, A.; Gabriel, C.; Knight, A. Determination of added water in pork products usingmicrowave dielectric spectroscopy. Food Control. 2002, 13, 143–149. [CrossRef]
28. Brunton, N.P.; Lyng, J.; Zhang, L.; Jacquier, J.C. The use of dielectric properties and other physical analysesfor assessing protein denaturation in beef biceps femoris muscle during cooking from 5 to 85 ◦C. Meat Sci.2006, 72, 236–244. [CrossRef]
29. Mohiri, A.; Burhanudin, Z.A.; Ismail, I. Dielectric properties of slaughtered and non-slaughtered goat meat.In Proceedings of the RF and Microwave Conference (RFM), IEEE International, Seremban, Negeri Sembilan,Malaysia, 12–14 December 2011; pp. 393–397.
30. Lyng, J.G.; Zhang, L.; Brunton, N.P. A survey of the dielectric properties of meats and ingredients used inmeat product manufacture. Meat Sci. 2005, 69, 589–602. [CrossRef]
31. Everard, C.D.; Fagan, C.C.; O’Donell, C.P.; O’Callaghan, D.J.; Lyng, J. Dielectric properties of process cheesefrom 0.3 to 3GHz. J. Food Eng. 2006, 75, 415–422. [CrossRef]
32. Traffano-Schiffo, M.V.; Castro-Giraldez, M.; Colom, R.J.; Fito, P.J. New Spectrophotometric System toSegregate Tissues in Mandarin Fruit. Food Bioprocess. Technol. 2018, 2, 399–406. [CrossRef]
33. Cuibus, L.; Castro-Giraldez, M.; Fito, P.J.; Fabbri, A. Application of infrared thermography and dielectricspectroscopy for controlling freezing process of raw potato. Innov. Food Sci. Emerg. Technol. 2014, 1, 80–87.[CrossRef]
34. Nelson, S.O.; Trabelsi, S. Dielectric spectroscopy of wheat from 10 MHz to 1.8 GHz. Meas. Sci. Technol. 2006,17, 2294–2298. [CrossRef]
35. Venkatesh, M.S.; Raghavan, G.S.V. An overview of microwave processing and dielectric properties ofagri-food materials. Biosyst. Eng. 2004, 88, 1–18. [CrossRef]
36. Nelson, S.O. Dielectric spectroscopy in agriculture. J. Non Cryst. Solids 2005, 351, 2940–2944. [CrossRef]37. Nelson, S.O. Dielectric properties of agricultural products and some applications. Res. Agric. Eng. 2008, 54,
104–112. [CrossRef]38. Castro-Giraldez, M.; Fito, P.J.; Ortola, M.D.; Balaguer, N. Study of pomegranate ripening by dielectric
spectroscopy. Postharvest Biol. Technol. 2013, 86, 346–353. [CrossRef]39. Shang, L.; Guo, W.; Nelson, S.O. Apple variety identification based on dielectric spectra and chemometric
methods. Food Anal. Methods 2015, 8, 1042–1052. [CrossRef]40. Castro-Giraldez, M.; Fito, P.J.; Chenoll, C.; Fito, P. Development of a dielectric spectroscopy technique for
determining key chemical components of apple maturity. J. Agric. Food Chem. 2010, 6, 3761–3766. [CrossRef]41. Castro-Giraldez, M.; Fito, P.J.; Chenoll, C.; Fito, P. Development of a dielectric spectroscopy technique for the
determination of apple (Granny Smith) maturity. J. Food Eng. 2010, 4, 749–754. [CrossRef]42. Traffano-Schiffo, M.V.; Castro-Giraldez, M.; Colom, R.J.; Fito, P.J. Study of the application of dielectric
spectroscopy to predict the water activity of meat during drying process. J. Food Eng. 2015, 166, 285–290.[CrossRef]
43. Castro-Giraldez, M.; Fito, P.J.; Fito, P. Application of microwaves dielectric spectroscopy for controlling porkmeat (Longissimus dorsi) salting process. J. Food Eng. 2010, 4, 484–490. [CrossRef]
44. Talens, C.; Castro-Giraldez, M.; Fito, P.J. Study of the effect of microwave power coupled with hot air dryingon orange peel by dielectric spectroscopy. LWT Food Sci. Technol. 2016, 66, 622–628. [CrossRef]
45. Velazquez-Varela, J.; Castro-Giraldez, M.; Cuibus, L.; Tomas-Egea, J.A.; Socaciu, C.; Fito, P.J. Study of thecheese salting process by dielectric properties at microwave frequencies. J. Food Eng. 2018, 224, 121–128.[CrossRef]
46. Velazquez-Varela, J.; Castro-Giraldez, M.; Fito, P.J. Control of the brewing process by using microwavesdielectric spectroscopy. J. Food Eng. 2013, 119, 633–639. [CrossRef]
47. Castro-Giraldez, M.; Fito, P.J.; Andrés, A.M.; Fito, P. Study of the puffing process of amaranth seeds bydielectric spectroscopy. J. Food Eng. 2012, 11, 298–304. [CrossRef]
48. Castro-Giraldez, M.; Fito, P.J.; Fito, P. Application of microwaves dielectric spectroscopy for controllingosmotic dehydration of kiwifruit (Actinidia deliciosa cv Hayward). Innov. Food Sci. Emerg. Technol. 2011, 12,623–627. [CrossRef]
49. Castro-Giraldez, M.; Fito, P.J.; Fito, P. Application of microwaves dielectric spectroscopy for controlling longtime osmotic dehydration of parenchymatic apple tissue. J. Food Eng. 2011, 2, 227–233. [CrossRef]
50. Baker-Jarvis, J.; Kim, S. The Interaction of Radio-Frequency Fields with Dielectric Materials at Macroscopicto Mesoscopic Scales. J. Res. Natl. Inst. Stand. Technol. 2012, 117, 1–60. [CrossRef]
30

Foods 2019, 8, 316
51. Roychoudhuri, C.; Kracklauer, A.F.; Creath, K. The Nature of Light: What Is a Photon; CRC Press: New York,NY, USA, 2008. [CrossRef]
52. Horie, K.; Ushiki, H.; Winnik, F.M. Molecular Photonics; Wiley: New York, NY, USA, 2000. [CrossRef]53. Crane, C.A.; Pantoya, M.L.; Weeks, B.L. Spatial observation and quantification of microwave heating in
materials. Rev. Sci. Instrum. 2013, 84, 084705. [CrossRef]54. Castro-Giraldez, M.; Fito, P.J.; Fito, P. Nonlinear thermodynamic approach to analyze long time osmotic
dehydration of parenchymatic apple tissue. J. Food Eng. 2011, 102, 34–42. [CrossRef]55. AOAC. Official Method 934.06 Moisture in Dried Fruits; AOAC: Rockville, MD, USA, 2000.56. Tylewicz, U.; Fito, P.J.; Castro-Giraldez, M.; Fito, P.; Dalla Rosa, M. Analysis of kiwifruit osmodehydration
process by systematic approach systems. J. Food Eng. 2011, 104, 438–444. [CrossRef]57. Starzak, M.; Mathlouthi, M. Temperature dependence of water activity in aqueous solutions of sucrose. Food
Chem. 2006, 96, 346–370. [CrossRef]58. Lewis, D.F. Structure of sugar confectionery. In Sugar Confectionery Manufacture; Jackson, E.B., Ed.; Blackie:
Glasgow, UK, 1990; pp. 331–350.59. Roos, Y.; Karel, M. Water and molecular weight effects on glass transitions in amorphous carbohydrates and
carbohydrate solutions. J. Food Sci. 1991, 56, 1676–1681. [CrossRef]
© 2019 by the authors. Licensee MDPI, Basel, Switzerland. This article is an open accessarticle distributed under the terms and conditions of the Creative Commons Attribution(CC BY) license (http://creativecommons.org/licenses/by/4.0/).
31
foods
Article
Effect of Thermo-Sonication and Ultra-High Pressureon the Quality and Phenolic Profile of Mango Juice
Abdul Ghani Dars 1,†, Kai Hu 1,†, Qiudou Liu 1, Aqleem Abbas 2, Bijun Xie 1 and Zhida Sun 1,*
1 College of Food Science and Technology, Huazhong Agricultural University, Wuhan 430070, China2 Department of Plant Pathology, College of Plant Science and Technology, Huazhong Agricultural University,
Wuhan 430070, China* Correspondence: [email protected]; Tel.: +86-27-8728-3201; Fax: +86-27-8728-2966† These authors contributed equally to this work.
Received: 15 June 2019; Accepted: 26 July 2019; Published: 29 July 2019
Abstract: Consumer demand for safe and nutritious fruit juices has led to the development of a numberof food processing techniques. To compare the effect of two processing technologies, thermo-sonication(TS) and ultra-high pressure (UHP), on the quality of mango juice, fresh mango juice was treated withTS at 25, 45, 65 and 95 ◦C for 10 min and UHP at 400 MPa for 10 min. The phenolic profile of mangowas also analyzed using the newly developed ultra-performance liquid chromatography-electrosprayionization-quadrupole time of flight-mass spectrometry (UPLC-Q-TOF-HRMSn) and, based on thisresult, the effect of TS and UHP on the phenolics of mango juice was evaluated. Both treatmentshad minimal effects on the oBrix, pH, and titratable acidity of mango juice. The residual activities ofthree enzymes (polyphenol oxidase, peroxidase, and pectin methylesterase), antioxidant compounds(vitamin C, Total phenolics, mangiferin derivatives, gallotannins, and quercetin derivatives) andantioxidant activity sharply decreased with the increase in the temperature of the TS treatment.Nevertheless, the UHP treatment retained antioxidants and antioxidant activity at a high level. TheUHP process is likely superior to TS in bioactive compounds and antioxidant activity preservation.Therefore, the mango juice products obtained by ultra-high-pressure processing might be morebeneficial to health.
Keywords: mango juice; thermo-sonication; ultra-high pressure; physicochemical property;phenolic compounds
1. Introduction
Mango (Mangifera indica L.) is one of the most economically important and popular tropical fruitsand is widely recognized worldwide for its admirable sensorial characteristics (sweet taste, brightcolor, and delicious flavor) and nutritional composition (carbohydrates such as glucose, fructose andsucrose, vitamins, minerals, fiber, and phytochemical), as well as its popularity and high production.Mango is considered as a ‘king of fruits’ due to extensive appeal across Africa, the Americas, Australia,Europe and Asia [1,2].
Mango is consumed as fresh fruit as well as processed products, like juice, pulp, powder,mash, pickles and syrup [2,3] and, among these products, juice has the higher consumption andhigher economic value [2,4]. Due to a higher consumption, the mango juice market has increasedconsiderably [5,6]. As for fruit juice processing, a number of studies have focused on the effects ofprocessing technologies on juice quality [2,3,7,8]. Among them, thermal processing was widely appliedin the food industries to preserve juice. However, since fruits are usually susceptible to thermalprocessing, this can lead to considerable damage to bioactive constituents and sensory characteristics offruit products. Studies on non-thermal processing technologies such as ultraviolet, pulsed electric field,ultrasound and ultra-high pressure (UHP) are being carried out because they cater to the consumer
Foods 2019, 8, 298; doi:10.3390/foods8080298 www.mdpi.com/journal/foods32

Foods 2019, 8, 298
demand of fresh-like, minimally processed foods. When high power ultrasound at low frequencies(20–100 kHz) propagates in liquid, cavitation (formation and collapse of bubbles) occurs. As a result,elevation of localized pressure and temperature causes the alteration of the properties of food productseither physically or chemically [7,8]. Individual ultrasound processing effects on juice products werewidely reported in different fruit cultivars [8–10]. However, few papers about the combinative effectsof ultrasound and heat on fruit juice quality are available. UHP is a promising processing technologyto meet the needs of fresh juice. At present, the studies are mainly focused on the influence of thetechnology on macromolecular substances such as protein, pectin and fiber. However, the effect onbioactive components (small molecule) is rarely reported [11].
Mango is rich in antioxidants such as polyphenols, flavonoids and other phytochemicals [12].Previous reports have shown that polyphenols can modulate immune response activities [13,14].In addition, polyphenols prevent genetic toxicity by reducing the exposure to oxidative and carcinogenicfactors [15,16]. Regular consumption of mango fruits supplies a considerable number of polyphenolswhich have beneficial physiological effects [17–19]. Mango polyphenols exhibit anti-inflammatoryand cancer cytotoxic properties in multiple cancer types, including malignancies of the colon andbreast [13,15,16]. A previous study showed that the content of polyphenols in mango peel is higherthan that in pulp [14]. Mango polyphenolics are mainly rich in gallic acid, gallotannins, galloylglycosides, and flavonoids [12,20]. It has been proved that these phenolic compounds in mango arethe main bioactive ingredients beneficial to health [19]. However, no information about the effect of TSand UHP treatments on the phenolic profile of mango juice is available. Current consumers look forhealthy food products, maintaining mango juice’s inherent physical and chemical properties of interest(e.g., texture, pH, titratable acidity, total soluble solids, total phenolics, total carotenoids and vitamin C)and nutritional quality during its processing. Hence, the objective of the present study was to evaluatethe effects of TS and UHP treatments on the quality and phenolic profile of mango juice.
2. Materials and Methods
2.1. Preparation of Juice Samples
Chinese mangoes cv. Kensington Pride were purchased from a producer in Hainan provinceand brought to full ripeness by maintaining at 20–23 ◦C and 90% relative humidity (RH). Mangoeswere washed with tap water, then dried and cut into small pieces. Kernel and bruised portionswere discarded. Peel and a small part of pulp were collected and stored at −20 ◦C for phenolicidentification within two weeks. The remaining pulp was used to obtain juice by a domestic juiceextractor (AUX-PB953, Foshan Haixun Electric Appliances Co., Ltd., Foshan, China). After filtrationusing a sterilized double-layered muslin cloth, the juice was vortex mixed and stored in 50-mLpre-sterilized PET bottles at 4 ◦C for further treatment within 2 h.
2.2. Thermo-Sonication (TS) and Ultra-High Pressure (UHP) Treatment
TS treatment was performed using a 250-W ultrasonic processor (Ningbo Xingzhi BiotechnoligyCo., Ltd., Ningbo, China) at four different temperatures 25, 45, 65, and 95 ◦C for 10 min. UHP treatmentwas carried out using an ultra-high pressure processor (Bao Tou KeFa High Pressure TechnologyCo., Ltd., Baotou, China) at 400 MPa for 10 min (based on previous optimization). The juice withouttreatment was considered as control. All treatments were conducted in triplicate. Brix, pH, acidity,polyphenol oxidase (PPO), peroxidase (POD), and pectin methylesterase (PME) were measuredimmediately after treatment. The remaining juice was stored at −20 ◦C until further analysis forvitamin C, total phenolic content, antioxidant activity and quantification of phenolic compoundswithin two weeks.
33

Foods 2019, 8, 298
2.3. Determination of oBrix, pH, and Acidity
A hand refractometer WYT-80 (Quanzhou Wander Experimental Instrument Co., Ltd., Quanzhou,China) was used to measure oBrix. A digital pH meter (Delta 320 pH meter, Metller Toledo InstrumentsCo., Ltd., Shanghai, China) was used to measure pH. The titratable acidity was measured according tothe method suggested by the “Association of Official Analytical Chemists” (AOAC, 2000) with a 0.1 MNaOH solution as the titration solution.
2.4. Determination of PPO, POD and PME Residual Activities
The samples of mango juice were centrifuged at 8000 rpm for 15 min at 4 ◦C for the enzymeactivity assay. Polyphenol oxidase (PPO) and peroxidase (POD) activity were measured according tothe protocol of Macdonald and Schanchke [21]. For the determination of PPO, 1.5 mL supernatantwas mixed with 0.5 mL catechol (0.5 mol/L) and 3.0 mL potassium phosphate buffer (0.2 mol/L, pH6.8). The absorbance was recorded at 410 nm within 3 min. With respect to POD, 0.32 mL potassiumphosphate buffer (0.2 mol/L, pH 6.8), 0.32 mL pyrogallol (5 g/100 mL) and 0.6 mL H2O2 (0.147 mol/L)were mixed and variation in absorbance at 420 nm within 3 min was noted. Pectinmethylesterase(PME) assay was conducted according to the method used by Saeeduddin et al. [7]. Briefly, 10 mLsupernatant was mixed with 40 mL pectin solution (1 g/100 mL) containing 0.15 mol/L NaCl. The pHwas adjusted to 7.7 by the addition of 0.05 mol/L NaOH and the time taken was recorded. The reactionsystem was incubated at 50 ± 2 ◦C. Residual activities of PPO, POD and PME were calculated usingthe following equation:
Enzyme activity (%) = 100At/A0 (1)
where A0 and At are the enzyme activities of the control and treatment samples respectively.
2.5. Determination of Total Phenolic Content
The total phenolic content was determined according to the method carried out by Tong et al. [22].Approximately 100 μL mango juice from each sample was mixed with 0.4 mL distilled water and0.5 mL diluted Folin–Ciocalteu reagent (1:10, v:v). The mixtures were incubated for 5 min at roomtemperature and 1 mL 7.5% sodium carbonate (w/v) was added. The absorbance was measured at765 nm after maintaining at 30 min in dark. A standard curve was obtained with gallic acid and theresult was expressed as mg of gallic acid equivalents (GAE)/mL juice.
2.6. Determination of Vitamin C
Vitamin C content was determined using a simplified method reported by Sulaiman and Ooi [23].Approximately 25 mL of diluted solution was titrated against 0.1%� 2, 6-dichlorophenolindophenolsodium (DCIPS) until the solution became a light pink color and persisted for 15 s. The calibration of0.1%� DCIPS solution was performed with 1 mg/mL ascorbic acid. The results were calculated andexpressed as mgL−1 juice.
2.7. Determination of Total Antioxidant Activity
The total antioxidant activity assay was tested using the method reported by Li et al. [24] Thejuice (0.4 mL) was centrifuged and mixed with 4 mL reagent mixture (sulfuric acid (0.6 mol/L), sodiumphosphate (28 mmol/L) and ammonium molybdate (4 mmol/L)). The mixture was kept at 95 ◦C for90 min and the absorbance was measured at 695 nm. Ascorbic acid was used as standard and the resultwas presented as mg ascorbic acid equivalent/mL juice.
2.8. Extraction of Polyphenolic Compounds for UPLC/UPLC-Q-TOF-HRMSn
Mango pulp was thawed and homogenized in an appropriate ratio of 10 g of pulp to 30 mLof a solvent mixture (ethanol/methanol/acetone, 1/1/1). Similarly, mango peel was thawed and
34

Foods 2019, 8, 298
homogenized in a ratio of 5 g of peel to 15 mL of a solvent mixture (ethanol/methanol/acetone, 1/1/1).For the quantification analysis of polyphenolics in mango juice before and after different treatments,the extraction was conducted using the same method used for mango pulp. Afterwards, the resultantsolution of pulp, peel and juice was filtered through cheese cloth. The solvents were removed at 40 ◦Cby rotary evaporation under reduced pressure, and the aqueous residue was centrifuged to removeinsoluble precipitates. Polyphenolics were partitioned in a 20-mL Waters C18 cartridge. Compoundsnot adsorbed to the cartridge were partitioned into ethyl acetate using a separatory funnel. The ethylacetate phase was combined with the methanol elute from the C18 cartridges, and the solvent wereremoved under reduced pressure. The residual was dissolved in chromatographic acetonitrile andused for UPLC and UPLC-Q-TOF-HRMSn.
2.9. The Quantification and Identification of Polyphenolic Compounds in Mango byUPLC/UPLC-Q-TOF-HRMSn
For the quantification and identification of polyphenolic compounds, LC analysis was conductedusing Acquity Ultra Performance Liquid Chromatography system (Waters, Milford, MA, USA),equipped with a C18 column (2.1 × 100 mm, 1.7 μm, Waters, Milford, MA, USA). The column, constantat 40 ◦C, was eluted with a linear gradient mobile phase at 0–28 min: 2–50% B, 28–28.5 min: 50–100%B, 28.5–30.5 min: 100% B, 30.5–32 min: 100–2% B, 32–34 min: 2% B, where A = water with 0.1% aceticacid and B = acetonitrile. The flow rate was 0.3 mL/min, and the injected volume was 1 μL.
The mass spectrometric data of the full scan mode was collected using a G2-XS QT of MS (Waters,Milford, MA, USA). The scan range was from m/z 100 to 2000 with a scan time of 0.3 s. The sourcetemperature was set at 120 ◦C with a cone gas flow of 50 L/h. The gas flow was set to 800 L/h at atemperature of 400 ◦C. The capillary was set at 1 kV for ESI− mode with the cone voltage at 40 V.The MSn analysis was carried out on a Waters-Micro mass Quattro Premier triple quadrupole massspectrometer. The collision energy was optimized according to the specific precursor ions.
2.10. Statistical Analysis
All tests were performed in triplicate and data were expressed as the means ± the standarddeviation. One-way analysis of variance (ANOVA) followed by LSD multiple comparison wereconducted using the SPSS 20 (IBM, Armonk, NY, USA). Differences with a p value < 0.05 wereconsidered significant.
3. Results and Discussion
3.1. Effects of TS and UHP on oBrix, pH and Titratable Acidity
The effects of TS and UHP on oBrix, pH and titratable acidity are shown in Table 1. All treatmentswere not significantly different from each other when addressing the oBrix, pH and titratable acidity ofmango juice. These results are in consistent with the previous reports [9,10,25]. These previous studiesshowed no significant variations in the oBrix, pH and titratable acidity of other fruit juices as a resultof various non-thermal processing food technology. This indicated that TS and UHP are promisingtools since they improved the quality of fruit juice without causing the significant change of basicphysicochemical indexes.
3.2. Effects of TS and UHP on Inactivation of PPO, POD and PME
The effects of different TS treatments on PPO, POD and PME in mango juice are shown in Table 2.The highest enzyme inactivation was exhibited in the sample treated with TS at 95 ◦C, which showedthe residual activities of PPO, POD and PME as 3.47, 1.61 and 2.24% respectively. The increase intemperature interval significantly deactivates PPO, POD and PME as described in previous report [26].The time duration of the ultrasonic treatment causes the formation of free radicals, which are theninvolved in inactivation of enzyme activities [27]. The formation of cavities due to bubbles development
35

Foods 2019, 8, 298
and disappearance is related to enzyme inactivation [28]. This can induce sharp increase in temperatureand pressure in a localized ultrasound generating area, which may be a major factor in enzymedeactivation. As a result, the temperature and other mechanical forces during ultrasonic pasteurizationhave a combined role in the enzyme inactivation. The mango juice was treated with UHP treatment at400 MPa for 10 min. However, just a slight effect on the enzyme inactivation was recorded. These threeenzymes were likely pressure resistant, and the corresponding mechanism needs to be further studied.
3.3. Effects of TS and UHP on Antioxidant Compounds and Antioxidant Capacity
The effects of thermo-sonication on ascorbic acids and total phenolics are mentioned in Table 3.The amount of ascorbic acid in fresh mango juice (control) was 117.47 ± 1.12 mg/L. It sharply decreasedfrom 116.26± 0.89 to 33.12± 1.35 mg/mL with the temperature increasing from 25 to 95 ◦C, correspondingto 98.97, 64.22, 47.16 and 28.19% of residual quantity when TS treatments were conducted at 25, 45, 65and 95 ◦C, respectively. There is no significant difference between the vitamin C contents of controland TS at 25 ◦C. This means TS at normal temperature has no effect on the vitamin C contents ofmango juice. However, it exerts a significant effect of decomposition or oxidation of vitamin C whenthe temperature is high (>45 ◦C) and, with the increase in temperature, the loss of vitamin C becomesmore prominent. Similar results were reported in apple juice and watermelon juice when treatedwith TS at different temperatures [29,30]. From Table 3, vitamin C content was 114.16 ± 1.02 mg/mLwhen treated with UHP at 400 MPa, showing a slight reduction (2.82%) compared with control. It islikely that the density of the reactive system increased during UHP treatment, which promoted thedecomposition of vitamin C. The total phenolic content of the control sample was 1.76 ± 0.08 mg/mL.It decreased from 1.73 ± 0.05 to 0.592 ± 0.005 mg GAE/mL, with the temperature increasing from 25 to95 ◦C, reducing by 1.70, 51.36, 58.86 and 66.36% respectively. This suggests that TS at relatively lowtemperature has no significant effect on total phenolic content of mango juice, but significantly reduceit when temperature is high. A similar result was obtained in pear juice [7]. Mango juice treated withUHP at 400 MPa showed a higher total phenolic content (1.82 ± 0.003) than the control, though this isnot significant. The increase in the content of phenolic compounds during UHP treatment might bedue to the secretion of the bound forms of these compounds in juice [4,31]. At 25 ◦C, vitamin C andpolyphenol content hardly changed after ultrasonic treatment as compared to control. This indicatedsonication only exerted a minor effect on antioxidants. Nevertheless, the high reduction in the contentof ascorbic acid and total phenols at 45–95 ◦C indicates that both entities were highly heat sensitive.UHP is a promising non-thermal technology for food processing and can effectively protect bioactivecomponents and avoid losses caused by heat treatment.
The effects of TS on the antioxidant capacity of mango juice are shown in Table 3. There was nosignificant difference in total antioxidant activity between control (0.867 ± 0.006 mg AAE/mL) andTS25 (0.862 ± 0.008 mg AAE/mL) samples. However, with the increase in temperature from 45 ◦C to95 ◦C, the total antioxidant activity decreased from 0.792 ± 0.006 to 0.572 ± 0.005 mg AAE/mL, leadingto 8.65–34.03% loss. The antioxidant capacity of fruit juice is attributed to the presence of antioxidantcompounds such as ascorbic acid and total phenol [9]. The decreasing trend of the antioxidant capacityof samples is consistent with the decrease in vitamin C and polyphenol content by TS treatments athigh temperature. However, ultra-high-pressure treatment was found to retain the antioxidant activity(0.831 ± 0.003 mg AAE/mL) of mango juice at a high level of 95.85%, which indicates that UHP is apromising technique for the protection of antioxidant and free radical scavenging capacity.
3.4. Identification of Polyphenolic Compounds
The polyphenols in mango pulp and peel were identified by UPLC-Q-TOF-HRMSn (SupportingInformation, Figures S1 and S2), and the results are shown in Tables 4 and 5 respectively.Approximately 22 compounds from the peel and 14 compounds from the pulp were identified usingthe UPLC-Q-TOF-HRMSn technique. All of the phenolic compounds identified in mango pulp, exceptfor iriflophenone di-O-galloyl-glucoside, were included in those of peel. Therefore, the MSs of phenolic
36

Foods 2019, 8, 298
compounds in mango peel are discussed here (Table 4). Among these compounds, five compounds,i.e., 2, 4, 9, 10 and 11, were identified as benzophenone derivatives (Table 4). The molecule ions at m/z575.1039, 727.1071 and 879.1256 were identified as maclurin mono-O-galloyl-glucoside (compound2), maclurin-di-O-galloyl-glucoside (Compounds 4, 10 and 11) and maclurin tri-O-galloyl-glucoside(Compound 9). The fragment ions were obtained by the successive loss of galloyl or H2O. The MS 2
results showed that the fragment ions of compound 2 were found at m/z 423.09, 303.05, 285.04, 261.04and 193.02, corresponding to the loss of galloy moiety, 272.0469 Da ion, H2O, 2H2O and 110.0352 Daion, respectively. Similar fragment loss was found in compounds 4, 9, 10 and 11. The above resultsshow that benzophenone derivatives in mango were all maclurin-gallic glucosides with differentsubstitution degrees. Compounds 3, 6 and 7 were identified as mangiferin and their derivatives (Table 4).Compound 3 was identified and detected as mangiferin at m/z 421.0771 ([M − H]−). Mangiferin isa glycosylated xanthine found in several varieties of mango. It is reported to be not only a typicalbiomarker for resistance against Fm infection but also have pharmacological activities in differentorgans and tissues, such as protecting the heart, neurons, liver, and kidneys and preventing or delayingthe onset of diseases [32]. Compounds 6 and 7 were identified as mangiferin gallate and iso-mangiferingallate as a result of the loss of galloyl moiety and H2O. In this study, five tannins, compounds 1, 5,8, 16 and 20, were identified as gallic acid, tetra-O-galloyl-glucoside, iso-tetra-O-galloyl-glucoside,penta-O-galloyl-glucose and hexa-O-galloyl-glucose, respectively. Gallic acid is a widespread tannin inmangoes and has been recognized in other cultivars of mangoes [32]. In common, for most ions, neutrallosses of the galloyl fraction (152 Da) and of gallic acid (170 Da) were shown in Table 4. The fragmentationprofile created for these polyphenolic compounds were related to gallotannins and benzophenonederivatives [12]. Compounds 12, 13, 14, 15, 17, 18, 19, 21 and 22 were found to be flavonoids andidentified as quercetin 3-O-galactoside, quercetin 3-O-glucoside, iso-quercetin 3-O-glucoside, quercetin3-O-xyloside, iso-quercetin 3-O-glucoside, iso-quercetin 3-O-xyloside, kaempferol 3-O-glucoside,quercetin 3-O-rhamnoside and iso-quercetin 3-O-rhamnoside, respectiviely. These flavonoids weremainly of different forms of glycosides. Among them, the quercetin compound was the major aglycone.The phenolic compounds identified in pulp are quite similar to the compounds of peel. However,one compound in pulp was different from peel. This compound was identified as iriflophenonedi-O-galloyl-glucoside at m/z 711.1124 ([M − H]−). Specific fragmentation patterns of all the identifiedcompounds are shown in the Supplementary Materials.
3.5. Effects of TS and UHP on Phenolic Groups
Based on the analysis of UPLC/UPLC-Q-TOF-HRMSn, as well as the distribution and structurecharacteristics of phenolic compounds in the chromatogram, the phenolic compounds in mango juicewere divided into three main groups, (i) mangiferin/derivatives, (ii) gallotannins, and (iii) quercetinderivatives. Each group was relatively quantified by peak area to study its variation during TS andUHP treatments. As shown in Figure 1, all three phenolic groups exhibited a generally decreasing trendwith the development of temperature, which was in accordance with the changes of total phenolics.When treated with TS at 95 ◦C, the content of phenolic groups in mango juice was lowest. However,quercetin derivatives showed an ultrasonic-resistant ability at low treated temperature (25 ◦C), but othertwo kinds of phenolic compounds were unstable under ultrasound treatment, likely due to oxidationand degradation induced by the ultrasonic cavitation effect. In addition, all three phenolic groupswere temperature-sensitive. A previous study showed that thermal processing significantly (p < 0.05)affected individual phenolic acids, anthocyanins, flavan-3-ols, and flavonols, significantly (p < 0.05)reduced total phenolic acid contents in both pinto and black beans and total flavonol contents in pintobeans, and dramatically reduced anthocyanin contents in black beans [33]. The flavonols rutin andquercetin also degraded under thermal processing in an aqueous model system [34]. The combinedmangiferin/derivatives may be released by UHP. This shows that ultra-high pressure could be anexcellent process technology of mango juice, with a high retention rate of phenolic groups (Figure 1).
37

Foods 2019, 8, 298
Ta
ble
1.
Effec
tofd
iffer
entt
reat
men
tson
Brix
,pH
,tit
rata
ble
acid
ity
inm
ango
juic
ea .
Tre
atm
en
tsb
oB
rix
pH
Tit
rata
ble
Aci
dit
y(%
)
Con
trol
11.8
0±0
.02a
4.75±0
.03a
0.16±0
.01a
TS25
11.8
0±0
.01a
4.74±0
.03a
0.16±0
.01a
TS45
11.7
2±0
.02a
4.73±0
.01a
b0.
17±0
.01a
TS65
11.6
0±0
.03a
4.69±0
.02b
0.17±0
.01a
TS95
11.5
4±0
.06a
4.67±0
.02b
c0.
17±0
.01a
UH
P400
11.6
2±0
.04a
4.70±0
.02c
0.17±0
.01a
aD
ata
are
pre
sent
edas
mea
ns±t
hest
and
ard
dev
iati
on.
Mea
nsw
ith
diff
eren
tlet
ters
wit
hin
aco
lum
nar
esi
gnifi
cant
lyd
iffer
ent(
LSD
test
)atp<
0.05
.b
TS2
5,T
S45,
TS6
5an
dT
S95
repr
esen
tthe
rmo-
soni
cati
ontr
eatm
enta
t25,
45,6
5an
d95◦ C
.UH
P400
repr
esen
tsul
tra-
high
pres
sure
at40
0M
Pafo
r10
min
.
Ta
ble
2.
Effec
tofd
iffer
entt
reat
men
tson
the
resi
dual
acti
vity
perc
enta
geof
POD
,PPO
and
PME
inm
ango
juic
ea .
Tre
atm
en
tb
PO
D(R
esi
du
al
Act
ivit
y%
)P
PO
(Re
sid
ua
lA
ctiv
ity
%)
PM
E(R
esi
du
al
Act
ivit
y%
)
Con
trol
100.
00±0
0a10
0.00±0
0a10
0.00±0
0aTS
2592
.57±0
.94c
87.7
3±1
.30c
90.7
6±1
.82c
TS45
51.4
2±1
.22d
45.4
4±2
.11d
48.3
6±1
.10d
TS65
37.4
5±1
.15e
31.3
9±1
.71e
34.5
2±0
.77e
TS95
3.47±0
.68f
1.61±0
.57f
2.24±0
.57f
UH
P400
98.1
8±0
.80b
93.2
6±0
.82b
96.4
6±1
.76b
aD
ata
are
pre
sent
edas
mea
ns±t
hest
and
ard
dev
iati
on.
Mea
nsw
ith
diff
eren
tlet
ters
wit
hin
aco
lum
nar
esi
gnifi
cant
lyd
iffer
ent(
LSD
test
)atp<
0.05
.b
TS2
5,T
S45,
TS6
5an
dT
S95
repr
esen
tthe
rmo-
soni
cati
ontr
eatm
enta
t25,
45,6
5an
d95◦ C
.UH
P400
repr
esen
tsul
tra-
high
pres
sure
at40
0M
Pafo
r10
min
.
38

Foods 2019, 8, 298
Ta
ble
3.
Effec
tofd
iffer
entt
reat
men
tson
anti
oxid
ants
com
poun
dsan
dan
tiox
idan
tact
ivit
ya .
Tre
atm
en
tb
Vit
am
inC
(mg/L
)T
ota
lP
he
no
lic
Co
nte
nt
(mg
GA
E/m
L)
cT
ota
lA
nti
ox
ida
nt
Ca
pa
city
(mg
AA
E/m
L)
d
Con
trol
117.
47±1
.12a
1.76±0
.08a
b0.
867±0
.006
aTS
2511
6.26±0
.89a
b1.
73±0
.05b
0.86
2±0
.008
aTS
4575
.45±1
.04c
0.85
6±0
.006
c0.
792±0
.004
cTS
6555
.40±0
.71d
0.72
4±0
.008
d0.
716±0
.008
dTS
9533
.12±1
.35e
0.59
2±0
.005
e0.
572±0
.005
eU
HP4
0011
4.16±1
.02b
1.82±0
.003
a0.
831±0
.003
ba
Dat
aar
ep
rese
nted
asm
eans±t
hest
and
ard
dev
iati
on.
Mea
nsw
ith
diff
eren
tlet
ters
wit
hin
aco
lum
nar
esi
gnifi
cant
lyd
iffer
enta
t(L
SDte
st)p<
0.05
.b
TS2
5,T
S45,
TS6
5an
dT
S95
rep
rese
ntth
erm
o-so
nica
tion
trea
tmen
tat
25,4
5,65
and
95◦ C
.UH
P40
0re
pre
sent
su
ltra
-hig
hp
ress
ure
at40
0M
Pa
for
10m
in.
cTo
talp
heno
licco
nten
tex
pre
ssed
asm
gga
llic
acid
equi
vale
ntpe
rm
Lju
ice.
dTo
tala
ntio
xida
ntca
paci
tyex
pres
sed
asm
gas
corb
icac
ideq
uiva
lent
per
mL
juic
e.
39

Foods 2019, 8, 298
Ta
ble
4.
Iden
tific
atio
nof
poly
phen
olic
com
poun
dsin
Ken
sing
ton
Prid
em
ango
peel
byU
PLC
-Q-T
OF-
HR
MSn
.
Co
mp
ou
nd
Re
ten
tio
nT
ime
(min
)Id
en
tity
Fo
rmu
laC
alc
ula
ted
[M−H
]m/z
Ob
serv
ed
[M−H
]m/z
Err
or
(pp
m)
Ion
Fra
gm
en
t
11.
82G
allic
acid
C7H
6O5
169.
0137
169.
0218
47.9
312
5.03
25,9
7.03
74
26.
822
mac
luri
nm
ono-
O-g
allo
yl-g
luco
side
C26
H24
O15
575.
1037
575.
1039
0.35
303.
057,
285.
0470
,261
.047
2,42
3.09
66,1
93.0
218
38.
22m
angi
feri
nC
19H
18O
1142
1.07
7142
1.08
1410
.21
48.
283
mac
luri
ndi
-O-g
allo
yl-g
luco
side
C33
H28
O19
727.
1147
727.
1071
−10.
45
58.
956
tetr
a-O
-gal
loyl
-glu
cose
C34
H28
O22
787.
0994
787.
0882
−14.
2363
5.08
50,6
17.0
764
69.
567
man
gife
rin
galla
teC
26H
22O
1557
3.08
857
3.08
67−2
.27
403.
0731
710
.009
iso-
man
gife
rin
galla
teC
26H
22O
1557
3.08
857
3.09
7416
.40
421.
0774
810
.177
iso-
tetr
a-O
-gal
loyl
-glu
cose
C34
H28
O22
787.
0994
787.
0882
−14.
2363
5.08
54,6
17.0
757
910
.33
mac
luri
ntr
i-O
-gal
loyl
-glu
cosi
deC
40H
32O
2387
9.12
5687
9.12
14−4
.78
727.
1166
10
10.4
77m
aclu
rin
di-O
-gal
loyl
-glu
cosi
deC
33H
28O
1972
7.11
4772
7.10
71−1
0.45
421.
0774
,403
.070
6
11
10.6
82is
o-m
aclu
rin
di-O
-gal
loyl
-glu
cosi
deC
33H
28O
1972
7.11
4772
7.10
71−1
0.45
421.
0774
,403
.070
6
12
10.7
8qu
erce
tin
3-O
-gal
acto
side
C21
H20
O12
463.
0877
463.
0908
6.69
301.
0396
,300
.033
0,1
311
.03
quer
ceti
n3-
O-g
luco
side
C21
H20
O12
463.
0877
463.
0909
6.91
301.
0396
,300
.033
01
411
.439
iso-
quer
cetin
3-O
-glu
cosi
deC
21H
20O
1246
3.08
7746
3.09
096.
9130
1.03
96,3
00.0
330
15
11.6
24qu
erce
tin
3-O
-xyl
osid
eC
20H
18O
1143
3.07
7143
3.08
119.
2430
1.03
96,3
00.0
330
16
11.6
76pe
nta-
O-g
allo
yl-g
luco
seC
41H
32O
2693
9.11
0493
9.10
1−1
0.01
787.
0900
,769
.081
3,61
7.07
641
711
.906
iso-
quer
cetin
3-O
-glu
cosi
deC
21H
20O
1246
3.08
7746
3.09
096.
9130
1.03
97,3
00.0
333
18
12.0
81qu
erce
tin
3-O
-xyl
osid
eC
20H
18O
1143
3.07
7143
3.08
119.
2430
1.03
96,3
00.0
330
19
12.1
96ka
empf
erol
3-O
-glu
cosi
deC
21H
20O
1144
7.09
2744
7.09
638.
0528
5.04
55,2
84.0
391,
255.
0366
20
12.2
06he
xa-O
-gal
loyl
-glu
cose
C48
H36
O30
1091
.121
310
91.1
174
−3.5
793
9.09
162
112
.217
quer
ceti
n3-
O-r
ham
nosi
deC
21H
20O
1144
7.09
2744
7.09
67.
3830
0.03
31
22
12.3
18is
o-qu
erce
tin
3-O
-rha
mno
side
C21
H20
O11
447.
0927
447.
096
7.38
300.
034
40

Foods 2019, 8, 298
Ta
ble
5.
Iden
tific
atio
nof
poly
phen
olic
com
poun
dsin
Ken
sing
ton
Prid
em
ango
pulp
byU
PLC
-Q-T
OF-
HR
MSn
.
Co
mp
ou
nd
Re
ten
tio
nT
ime
(min
)Id
en
tity
Fo
rmu
laC
alc
ula
ted
[M−H
]m/z
Ob
serv
ed
[M−H
]m/z
Err
or
(pp
m)
Ion
Fra
gm
en
t
11.
811
Gal
licac
idC
7H6O
516
9.01
3716
9.02
2149
.70
125.
0325
26.
791
mac
luri
nm
ono-
O-g
allo
yl-g
luco
side
C26
H24
O15
575.
1037
575.
103
−1.2
230
3.06
2
38.
321
mac
luri
ndi
-O-g
allo
yl-g
luco
side
C33
H28
O19
727.
1147
727.
1057
−12.
38
49.
587
man
gife
rin
galla
teC
26H
22O
1557
3.08
857
3.08
80.
0030
1.00
57
59.
783
irifl
ophe
none
di-O
-gal
loyl
-glu
cosi
deC
33H
28O
1871
1.11
9771
1.11
24−1
0.27
610
.187
tetr
a-O
-gal
loyl
-glu
cose
C34
H28
O22
727.
1147
787.
0897
−12.
3263
5.08
34,6
17.0
766
710
.445
tetr
a-O
-gal
loyl
-glu
cose
C34
H28
O22
727.
1147
787.
0897
−12.
3263
5.08
34,6
17.0
766
810
.787
quer
ceti
n3-
O-g
alac
tosi
deC
21H
20O
1246
3.08
7746
3.08
953.
8930
0.03
2,30
1.03
939
11.0
55qu
erce
tin
3-O
-glu
cosi
deC
21H
20O
1246
3.08
7746
3.09
025.
4030
0.03
2,30
1.03
93
10
11.4
39qu
erce
tin
3-O
-ara
bino
pyra
nosi
deC
20H
18O
1143
3.07
7143
3.07
965.
7730
0.03
34
11
11.7
6qu
erce
tin
3-O
-rha
mno
side
C21
H20
O11
447.
0927
447.
0951
5.37
301.
0034
12
12.2
17ka
empf
erol
3-O
-glu
cosi
deC
21H
20O
1144
7.09
2744
7.09
546.
0428
4.02
97,2
55.0
339
13
14.2
15pe
nta-
O-g
allo
yl-g
luco
seC
41H
32O
2693
9.11
0493
9.10
05−1
0.54
769.
0818
14
16.8
58m
aclu
rin
tri-
O-g
allo
yl-g
luco
side
C40
H32
O23
879.
1256
879.
1292
4.09
41

Foods 2019, 8, 298
Figure 1. Effects of thermo-sonication (TS) and ultra-high pressure (UHP) on phenolic groups,mangiferin and its derivatives, quercetin derivatives and gallotannins. TS25, TS45, TS65 and TS95represent thermo-sonication treatment at 25, 45, 65 and 95 ◦C. UHP400 represents ultra-high pressureat 400 MPa for 10 min. Each column represents a mean and the vertical bars indicate the standarddeviation. Means with different letters within the same color columns are significantly different (LSDtest, p < 0.05).
4. Conclusions
TS and UHP had a minor effect on the basic physicochemical properties of mango juice. TS athigh temperature significantly reduced the enzyme activities of PPO, POD and PME. The effectsof TS treatment on vitamin C, total phenolics and antioxidant activity were significant, and mainlydegradative or oxidative action. However, UHP treatment gave a high level of antioxidants andantioxidant activity of mango juice. The Kensington Pride mango researched in this study was cultivatedin Hainan, the southernmost province of China. Abundant phenolic compounds from mango wereidentified and the effects of TS and UHP on the phenolic profile were analyzed. We find that TS inducedthe significant degradation of phenolic groups, mangiferin/derivatives, gallotannins, and quercetinderivatives. The UHP treatment was likely superior to TS in bioactive compounds and antioxidantactivity preservation except for browning-related enzymes, which needs further study. The mangojuice products obtained by ultra-high-pressure processing are more beneficial to health.
Supplementary Materials: The following are available online at http://www.mdpi.com/2304-8158/8/8/298/s1,Figure S1: Identification of polyphenolic compounds in Kensington Pride mango peel by UPLC-Q-TOF-HRMSn,Figure S2: Identification of polyphenolic compounds in Kensington Pride mango pulp by UPLC-Q-TOF-HRMSn.
Author Contributions: A.G.D. and K.H. designed the study and interpreted the results. Q.L. collected test data.B.X. and A.A. drafted the manuscript. Z.S., as a corresponding author, supervised the experiment.
Funding: This research was funded by the Hubei province program of agricultural products processing andcomprehensive utilization.
42

Foods 2019, 8, 298
Acknowledgments: This work was supported by the Hubei province program of agricultural products processingand comprehensive utilization. The author Dars is also thankful to the Chinese Govt Scholarship (CSC) forproviding funds for PhD studies.
Conflicts of Interest: The authors declare no conflict of interest.
References
1. Barbosa Gamez, I.; Caballero-Montoya, K.P.; Ledesma, N.; Sayago-Ayerdi, S.G.; Garcia-Magana, M.L.;Bishop-von-Wettberg, E.J.; Montalvo-Gonzalez, E. Changes in the nutritional quality of five Mangifera speciesharvested at two maturity stages. J. Sci. Food Agric. 2017, 97, 4987–4994. [CrossRef] [PubMed]
2. Liu, F.; Li, R.; Wang, Y.; Bi, X.; Liao, X. Effects of high hydrostatic pressure and high-temperature short-timeon mango nectars: Changes in microorganisms, acid invertase, 5-hydroxymethylfurfural, sugars, viscosity,and cloud. Innov. Food Sci. Emerg. Technol. 2014, 22, 22–30. [CrossRef]
3. Hoang-Hai, N.; Shpigelman, A.; Van Buggenhout, S.; Moelants, K.; Haest, H.; Buysschaert, O.; Van-Loey, A.The evolution of quality characteristics of mango piece after pasteurization and during shelf life in a mangojuice drink. Eur. Food Res. Technol. 2016, 242, 703–712.
4. Zapata Londono, M.B.; Chaparro, D.; Alberto Rojano, B.; Alzate Arbelaez, A.F.; Restrepo Betancur, L.F.;Maldonado Celis, M.E. Effect of storage time on physicochemical, sensorial, and antioxidant characteristics,and composition of mango (cv. Azucar) juice. Emir. J. Food Agric. 2017, 29, 367–377.
5. Kaur, C.; Kapoor, H.C. Antioxidants in fruits and vegetables: The millennium’s health. Int. J. Food Sci. Technol.2001, 36, 703–725. [CrossRef]
6. Ulla, A.; Rahman, M.T.; Habib, Z.F.; Rahman, M.M.; Subhan, N.; Sikder, B.; Alam, M.A. Mango peel powdersupplementation prevents oxidative stress, inflammation, and fibrosis in carbon tetrachloride inducedhepatic dysfunction in rats. J. Food Biochem. 2017, 41, e12344. [CrossRef]
7. Saeeduddin, M.; Abid, M.; Jabbar, S.; Wu, T.; Hashim, M.M.; Awad, F.N.; Zeng, X. Quality assessment of pearjuice under ultrasound and commercial pasteurization processing conditions. LWT Food Sci. Technol. 2015,64, 452–458. [CrossRef]
8. Santhirasegaram, V.; Razali, Z.; Somasundram, C. Effects of thermal treatment and sonication on qualityattributes of Chokanan mango (Mangifera indica L.) juice. Ultrason. Sonochem. 2013, 20, 1276–1282. [CrossRef][PubMed]
9. Abid, M.; Jabbar, S.; Wu, T.; Hashim, M.M.; Hu, B.; Lei, S.; Zeng, X. Effect of ultrasound on different qualityparameters of apple juice. Ultrason. Sonochem. 2013, 20, 1182–1187. [CrossRef] [PubMed]
10. Tiwari, B.K.; O’Donnell, C.P.; Cullen, P.J. Effect of non thermal processing technologies on the anthocyanincontent of fruit juices. Trends Food Sci. Technol. 2009, 20, 137–145. [CrossRef]
11. Wang, C.Y.; Huang, H.W.; Hsu, C.P.; Yang, B.B. Recent Advances in Food Processing Using High HydrostaticPressure Technology. Crit. Rev. Food Sci. Nutr. 2016, 56, 527–540. [CrossRef] [PubMed]
12. Berardini, N.; Carle, R.; Schieber, A. Characterization of gallotannins and benzophenone derivatives frommango (Mangifera indica L. cv. ‘Tommy Atkins’) peels, pulp and kernels by high-performance liquidchromatography/electrospray ionization mass spectrometry. Rapid Commun. Mass Spectrom. 2004, 18,2208–2216. [CrossRef] [PubMed]
13. Middleton, E. Effect of plant flavonoids on immune and inflammatory cell function. Adv. Exp. Med. Biol.1998, 439, 175–182. [PubMed]
14. Wang, H.; Cao, G.; Prior, R.L. Oxygen Radical Absorbing Capacity of Anthocyanins. J. Agric. Food Chem.1997, 45, 304–309. [CrossRef]
15. Cai, Q.; Rahn, R.O.; Zhang, R. Dietary flavonoids, quercetin, luteolin and genistein, reduce oxidative DNAdamage and lipid peroxidation and quench free radicals. Cancer Lett. 1997, 119, 99–107. [CrossRef]
16. Pool-Zobel, B.L.; Bub, A.; Schröder, N.; Rechkemmer, G. Anthocyanins are potent antioxidants in modelsystems but do not reduce endogenous oxidative DNA damage in human colon cells. Eur. J. Nutr. 1999, 38,227–234. [CrossRef] [PubMed]
17. Boyle, S.P.; Dobson, V.L.; Duthie, S.J.; Kyle, J.A.; Collins, A.R. Absorption and DNA protective effects offlavonoid glycosides from an onion meal. Eur. J. Nutr. 2000, 39, 213–223. [CrossRef]
43

Foods 2019, 8, 298
18. Pedersen, C.B.; Kyle, J.; Jenkinson, A.M.; Gardner, P.T.; Mcphail, D.B.; Duthie, G.G. Effects of blueberry andcranberry juice consumption on the plasma antioxidant capacity of healthy female volunteers. Eur. J. Clin. Nutr.2000, 54, 405–408. [CrossRef]
19. Masibo, M.; He, Q. Major mango polyphenols and their potential significance to human health. Compr. Rev.Food Sci. Food Saf. 2008, 7, 309–319. [CrossRef]
20. Nemec, M.J.; Kim, H.; Marciante, A.B.; Barnes, R.C.; Hendrick, E.D.; Bisson, W.H.; Mertens-Talcott, S.U.Polyphenolics from mango (Mangifera indica L.) suppress breast cancer ductal carcinoma in situ proliferationthrough activation of AMPK pathway and suppression of mTOR in athymic nude mice. J. Nutr. Biochem.2017, 41, 12–19. [CrossRef]
21. Macdonald, L.; Schaschke, C.J. Combined effect of high pressure, temperature and holding time onpolyphenoloxidase and peroxidase activity in banana (Musa acuminata). J. Sci. Food Agric. 2000, 80, 719–724.[CrossRef]
22. Tong, L.-T.; Liu, L.-Y.; Zhong, K.; Wang, Y.; Guo, L.-N.; Zhou, S.-M. Effects of Cultivar on Phenolic Contentand Antioxidant Activity of Naked Oat in China. J. Integr. Agric. 2014, 13, 1809–1816. [CrossRef]
23. Sulaiman, S.F.; Ooi, K.L. Polyphenolic and Vitamin C Contents and Antioxidant Activities of AqueousExtracts from Mature-Green and Ripe Fruit Fleshes of Mangifera sp. J. Agric. Food Chem. 2012, 60, 11832–11838.[CrossRef]
24. Li, F.h.; Yuan, Y.; Yang, X.l.; Tao, S.y.; Ming, J. Phenolic Profiles and Antioxidant Activity of Buckwheat(Fagopyrum esculentum Moench and Fagopyrum tartaricum L. Gaerth) Hulls, Brans and Flours. J. Integr. Agric.2013, 12, 1684–1693. [CrossRef]
25. Walkling-Ribeiro, M.; Noci, F.; Cronin, D.A.; Lyng, J.G.; Morgan, D.J. Shelf life and sensory evaluation oforange juice after exposure to thermosonication and pulsed electric fields. Food Bioprod. Process. 2009, 87,102–107. [CrossRef]
26. Villamiel, M.; Jong, P.D. Influence of high-intensity ultrasound and heat treatment in continuous flow on fat,proteins, and native enzymes of milk. J. Agric. Food Chem. 2000, 48, 472–478. [CrossRef]
27. Netsanetshiferaw, T.; Mala, G.; Kamaljit, V.; Lloyd, S.; Raymond, M.; Cornelis, V. The kinetics of inactivationof pectin methylesterase and polygalacturonase in tomato juice by thermosonication. Food Chem. 2009, 117,20–27.
28. Ercan, S.S.; Soysal, C. Effect of ultrasound and temperature on tomato peroxidase. Ultrason. Sonochem. 2011,18, 689–695. [CrossRef]
29. Abid, M.; Jabbar, S.; Wu, T.; Hashim, M.M.; Hu, B.; Lei, S.; Zeng, X. Sonication enhances polyphenoliccompounds, sugars, carotenoids and mineral elements of apple juice. Ultrason. Sonochem. 2014, 21, 93–97.[CrossRef]
30. Rawson, A.; Tiwari, B.K.; Patras, A.; Brunton, N.; Brennan, C.; Cullen, P.J.; O’Donnell, C. Effect ofthermosonication on bioactive compounds in watermelon juice. Food Res. Int. 2011, 44, 1168–1173. [CrossRef]
31. Liu, F.; Wang, Y.; Li, R.; Bi, X.; Liao, X. Effects of high hydrostatic pressure and high temperature short timeon antioxidant activity, antioxidant compounds and color of mango nectars. Innov. Food Sci. Emerg. Technol.2014, 21, 35–43. [CrossRef]
32. Oliveira, B.G.; Costa, H.B.; Ventura, J.A.; Kondratyuk, T.P.; Barroso, M.E.; Correia, R.M.; Romao, W. Chemicalprofile of mango (Mangifera indica L.) using electrospray ionisation mass spectrometry (ESI-MS). Food Chem.2016, 204, 37–45. [CrossRef]
33. Xu, B.; Chang, S.K.C. Total Phenolic, Phenolic Acid, Anthocyanin, Flavan-3-ol, and Flavonol Profiles andAntioxidant Properties of Pinto and Black Beans (Phaseolus vulgaris L.) as Affected by Thermal Processing.J. Agric. Food Chem. 2009, 57, 4754–4764. [CrossRef]
34. Buchner, N.; Krumbein, A.; Rohn, S.; Kroh, L.W. Effect of thermal processing on the flavonols rutin andquercetin. Rapid Commun. Mass Spectrom. 2006, 20, 3229–3235. [CrossRef]
© 2019 by the authors. Licensee MDPI, Basel, Switzerland. This article is an open accessarticle distributed under the terms and conditions of the Creative Commons Attribution(CC BY) license (http://creativecommons.org/licenses/by/4.0/).
44

foods
Article
The Application of Combined Pre-Treatment withUtilization of Sonication and Reduced Pressure toAccelerate the Osmotic Dehydration Process andModify the Selected Properties of Cranberries
Malgorzata Nowacka *, Artur Wiktor, Magdalena Dadan, Katarzyna Rybak,
Aleksandra Anuszewska, Lukasz Materek and Dorota Witrowa-Rajchert
Department of Food Engineering and Process Management, Faculty of Food Sciences, Warsaw University of LifeSciences, Nowoursynowska 159c, 02-776 Warsaw, Poland* Correspondence: [email protected]; Tel.: +48-22-593-75-79
Received: 30 June 2019; Accepted: 22 July 2019; Published: 24 July 2019
Abstract: The aim of this study was to investigate the effect of a pretreatment, performed by acombined method based on blanching, ultrasound, and vacuum application, on the kinetics of osmoticdehydration and selected quality properties such as water activity, color, and bioactive compound(polyphenols, flavonoids, and anthocyanins) content. The pretreatment was carried out usingblanching, reduced pressure, and ultrasound (20 min, 21 kHz) in various combinations: Blanching atreduced pressure treatment conducted three times for 10 min in osmotic solution; blanching withreduced pressure for 10 min and sonicated for 20 min in osmotic solution; and blanching with20 min of sonication and 10 min of reduced pressure. The osmotic dehydration was performed indifferent solutions (61.5% sucrose and 30% sucrose with the addition of 0.1% of steviol glycosides) toensure the acceptable taste of the final product. The changes caused by the pretreatment affectedthe osmotic dehydration process by improving the efficiency of the process. The use of combinedpretreatment led to an increase of dry matter from 9.3% to 28.4%, and soluble solids content from21.2% to 41.5%, lightness around 17.3% to 56.9%, as well as to the reduction of bioactive compoundsconcentration until even 39.2% in comparison to the blanched sample not subjected to combinedtreatment. The osmotic dehydration caused further changes in all investigated properties.
Keywords: cranberries; reduced pressure; sonication; color; bioactive compounds
1. Introduction
Cranberries are known as fruits rich in bioactive compounds, which provide positive effects andhealth benefits to the human body. The abundance of bioactive compounds contained in cranberriesare also used in a medicine to treat urinary tract infections, gastrointestinal diseases, and support theneurological and cardiovascular conditions. Moreover, cranberries exhibit antivirus, anti-inflammation,and anticancer effects [1]. However, fresh cranberry is very sour, which is why its direct consumptionand application is limited. Therefore, a sugar addition is required during processing in order to improvethe taste of the fruit and to achieve consumers’ acceptance. On the one hand, osmotic dehydration(OD) is a process in which sugars are used to partially remove water from the material, and as anintroduction of ingredients of the osmotic solution, usually sucrose, which has a beneficial effect onchanging the flavor profile of the product. On the other hand, one of the main disadvantages of OD istime consumption [2].
Non-thermal methods such as pulsed electric fields, sonication, or high hydrostatic pressure havethe potential to accelerate the OD kinetics. Among these methods, sonication is one of the technologies
Foods 2019, 8, 283; doi:10.3390/foods8080283 www.mdpi.com/journal/foods45

Foods 2019, 8, 283
which can be used in OD intensification. It could be introduced as a pretreatment step or directlyduring the process [3–6]. Ultrasounds are series of vibrations at frequency varying between 20 kHzand 100 MHz, which spread in a given medium, i.e., in liquids, solids, or gases. The use of high powerultrasound leads to emergence of acoustic waves, which produce a direct (so-called “sponge effect”)and an indirect effect (cavitation) on solid food matrices [4,7,8]. Ultrasonic waves have an impact onnutritional and physico-chemical parameters of food, which are related to good extraction and therecovery of bioactive compounds [9–13]. It has been reported that high power ultrasound has beenused to accelerate processes of mass exchange such as OD [5,14–16]. Moreover, ultrasound can be usedalone or combined with different techniques [10].
Another promising method of OD facilitation is vacuum impregnation/infusion technology,which can also be described as a reduced pressure treatment. This method allows the air presentin the plant pores to be replaced by acting solution in an instant. Due to the use of reducedpressure, mass transfer occurs faster, which is related to a hydrodynamic mechanism [17] anddeformation-relaxation phenomena [18]. Isotonic or hypertonic solutions and other solutions containingvaluable compounds beneficial for human health can be used for vacuum impregnation [19]. Similarly,OD might be performed under low-pressure conditions, which have a positive effect on shorteningthe process time in comparison to normal conditions. The use of low pressure during the treatmentdegasses the tissue, which increases the contact surface of the osmotic substance with the product,and the process of dehydration takes place faster [20].
In recent years, an increase in the number of obese people has been observed, therefore it is advisableto design production processes that enable reduction or replacement of sugar in food products [21].Consumers poorly perceive the use of synthetic sweeteners, which is why food manufacturers areincreasingly willing to use natural sweeteners, for example, steviol glycosides extracted from stevialeaves (Stevia rebaudiana). These leaves also contain nutritional and antioxidant compounds suchas vitamin C, polyphenols, carotenoids, chlorophylls, and other macro and micronutrients [22–24].Thanks to the application of steviol glycosides, it is possible to reduce sugar content while maintainingproper sweetness of the product [25–27]. However, it is usually used as an addition to sucrose due tothe bitter aftertaste of steviol glycosides [28] and high molecular weight.
The aim of this study was to investigate the effect of pretreatment performed by a combinedmethod based on blanching, ultrasound, and vacuum application on the kinetics of osmotic dehydrationin two solutions (61.5% sucrose solution and 30% sucrose solution with the addition of 0.1% of steviolglycosides). Moreover, selected quality properties of osmodehydrated cranberries as water activity,color and polyphenols, flavonoids, and anthocyanins content were evaluated.
2. Materials and Methods
2.1. Material
Swamp cranberry (Vaccinium oxycoccus) bought at the local market (Bronisze, Poland) was usedas targeted matrix. Due to seasonality of the matrix, and to ensure reproducible results, cranberries fromone batch, harvested in October 2017, have been frozen in a blast cabinet Irinox Shock Freezer HCM51.20 (Irinox, Treviso, Italy) at a temperature of −25 ◦C for 5 h. Frozen fruits were stored at −18 ◦C nolonger than 3 months. Only intact fruits of dark red coloring were used in the research.
2.2. Processing
2.2.1. Blanching
Cranberries are a difficult material to process due to their hard peel. In order to ensure propermass transfer during OD, the material was blanched until the peel broke. Blanching was performed ata temperature of 90 ◦C for 5 min [29]. The frozen material, weighed on a laboratory scale (RADWAG,Radom, Poland) with an accuracy of ± 0.01 g, and a distilled water were prepared in a ratio of 2:1 (w/w).
46

Foods 2019, 8, 283
After bringing the water to boiling, frozen cranberry fruits were placed in the water, which allowedthem to reach the process temperature. During blanching, temperature was controlled by measuringthe temperature. After 5 min of blanching, cranberry fruits were drained, dried on a filter paper,and re-weighed.
2.2.2. Combined Pretreatment
Prior to the unconventional processing, cranberry fruits were weighed on a laboratory scale(RADWAG, Radom, Poland) with an accuracy of ±0.01 g and placed in beakers. Blanched cranberrieswere flooded with osmotic solution in 1:4 ratio. Afterwards, fruits followed unconventionalpretreatment with the use of: Sonication—ultrasounds at 21 kHz frequency and 180 W power(ultrasound intensity equal to 3.6 W/g) generated by ultrasonic bath (MKD-3 ULTRASONIC) wereapplied [30]. Time of sample treatment amounted to 20 min [5,14], and during the ultrasoundapplication changes in temperature of surrounding solution were below 1 ◦C. Reduced pressure—aspecifically prepared desiccator was used in pretreatment to lower the pressure by 300 mmHg (~40 kPa)by vacuum pump. After reducing the pressure (lowering the pressure down to abovementioned valuelasted for 20 s), the pretreatment took 10 min and then the vacuum was cut, which took around 5 s.
The unconventional treatment was carried out in duplicate and applied in three variants:
1. A blanched material was placed in osmotic solution and the pressure was lowered three times in10 min intervals (BL_3 × 10 v),
2. A blanched material was placed in osmotic solution and subjected to lowered pressure for 10 min,then sonicated for 20 min (BL_10 v 20 us),
3. A blanched material was placed in osmotic solution and sonicated for 20 min, afterwards it wassubjected to lowered pressure for 10 min (BL_20 us 10 v).
All analyzed samples were summarized in Table 1 with their related abbreviations.
Table 1. Abbreviations of all researched samples of cranberries.
Treatment Abbreviations
After treatment, before osmotic dehydration
Blanched material BLOsmotic solution
Sucrose 61.5%(s)
Sucrose 30% with 0.1% steviolglycosides addition (s + g)
Blanched material in osmotic solution under the pressure loweredthree times in 10 min intervals (BL_3 × 10v) BL_3 × 10 v_s BL_3 × 10 v_s + g
Blanched material in osmotic solution subjected to lowered pressurefor 10 min and sonicated for 20 min (BL_10 v 20us) BL_10 v 20 us_s BL_10 v 20 us_s + g
Blanched material in osmotic solution subjected to sonication for 20min and to lowered pressure for 10 min (BL_20 us 10 v) BL_20 us 10 v_s BL_20 us 10 v_s + g
After osmotic dehydration
Blanched material subjected to osmotic dehydration for 72 h (BL_72 h) BL_s_72 h BL_s + g_72 hBlanched material in osmotic solution under the pressure lowered
three times in 10 min intervals, and then subjected to osmoticdehydration for 72 h (BL_3 × 10 v_72 h)
BL_3 × 10 v_s_72 h BL_3 × 10 v_s + g_72 h
Blanched material in osmotic solution subjected to lowered pressurefor 10 min and sonicated for 20 min, and then osmotic dehydration for
72 h (BL_10 v 20 us_72 h)BL_10 v 20 us_s_72 h BL_10 v 20 us_s + g_72 h
Blanched material in osmotic solution subjected to sonication for 20min and to lowered pressure for 10 min, and then osmotic
dehydration for 72 h(BL_20 us 10 v_72 h)
BL_20 us 10 v_s_72 h BL_20 us 10 v_s + g_72 h
BL - blanched material.
47

Foods 2019, 8, 283
2.2.3. Osmotic Dehydration (OD)
OD was conducted in two solutions: 61.5% sucrose solution and 30% sucrose solution withaddition of 0.1% steviol glycosides. A sucrose solution of 61.5% concentration was chosen since it isusually used as a standard solution [2,5,31]. However, a solution with the addition of steviol glycosideswas used to reduce sugar content in dehydrated fruits. Due to the fact that steviol glycosides are upto 300 times sweeter than sucrose, the addition of little amount (0.1%) of this sweetener is enough tomaintain its sweetness comparable with fruits dehydrated in a standard solution [25,32].
The pretreated fruits were placed in beakers and poured with osmotic solution in 1:4 ratio. OD wasapplied at a temperature of 40 ◦C for 72 h in a water bath with a stirrer at a rotation rate of 100 rotationsper minute and at amplitude of 4. During OD, the process kinetics were determined after 1, 3, 6, 24,48, and 72 h, measuring the mass changes, dry matter content, and water soluble solids. OD wasperformed in duplicate.
The analysis of cranberry fruits’ osmotic dehydration kinetics were determined based on waterloss WL (kg H2O/kg of cranberry) and dry matter mass gain SG (kg d.m./kg of cranberry) [5]:
WL = (moXwo −mtXw
o )/mo (1)
SG =(mtXST
t −moXSTo
)/mo (2)
where mo—initial mass of cranberry prior to dehydration [kg], mt—final mass of cranberry afterdehydration [kg], Xo
w, XoST—water and dry matter content prior to dehydration [kg/kg], Xt
w,Xt
ST—water and dry matter content after dehydration [kg/kg].
2.3. Cranberries Analysis
2.3.1. Dry Matter Content
Dry matter content was determined by weighing differently pretreated cranberries at 70 ◦C for 20h [33]. The analysis was performed in triplicate.
2.3.2. Water Soluble Solids (Brix Index)
Water soluble solids were determined by squeezing the juice out of fruits with linen material.Squeezed extract was placed in refractometer glass ATAGO PAL-3, and results were in Brix degrees(◦Bx) [2]. The measurement was done in a triplicate.
2.3.3. Water Activity
Water activity of cranberries were determined after a given time of OD. The measures were heldwith hygrometer Aqua Lab CX-2 (Decagon Devices Inc., United States) at 25 ◦C in three repetitions fora few randomly selected fruits [34].
2.3.4. Color
The color test of pretreated and dehydrated samples were performed with the use of chromameterof CM-5 type by Konica Minolta (Japan), with a reflection method in CIE L*a*b* system of the followingparameters: Light source D65, angle 8 ◦C, standard observer CIE 2◦. In CIE system L*, parameter refersto sample lightness, while a* coordinate denotes share of green (-) and red color (+), and b* coordinatedescribes share of blue (-) and yellow color (+). Prior to measurement the apparatus was black andwhite calibrated [35]. The measurement was repeated five times for each sample.
The absolute color difference was calculated based on the following equation:
ΔE =
√(ΔL∗)2 + (Δa∗)2 + (Δb∗)2 (3)
48

Foods 2019, 8, 283
where ΔL*, Δa*, Δb* — indicator of color difference in comparison to blanched cranberry fruits.
2.3.5. Bioactive Compounds
Bioactive compounds as polyphenols, flavonoids, and anthocyanins content were measuredusing spectrophotometric methods according to Nowacka et al. [30]. The analyses were performed intriplicate. Polyphenolic content was expressed in mg of gallic acid in 100 g dry matter, flavonoid contentin mg of quercetin in 1 g of dry matter, and anthocyanin content in mg of cyanidin-3-glucoside per100 g of fresh mass.
2.4. Statistical Analysis
One-way analysis of variance (ANOVA) was performed in order to determine the impact ofpretreatment and osmotic solution on the physical and chemical properties of blanched cranberryfruits. A detailed comparison allowed for a split of samples into homogenic groups. For this purpose,Duncan test was used with confidence interval of 95% (significance level α = 0.05). Moreover,all investigated variables were used to perform cluster analysis using Ward method as a criterion foragglomeration and expressing the results using Euclidean distance. The analyses were carried out inStatistica 2013 software.
3. Results and Discussion
3.1. Kinetics of Osmotic Dehydration
OD causes two different types of mass changes. The first one is linked with water removal fromdehydrated material towards solution with a higher osmotic potential. The second phenomenonoccurring simultaneously is impregnation of the osmotic substance into the processed material [36,37].Along with the progress of the OD, the mass transfer is hindered, due to the equalization of chemicalpotentials between material and solution. The intensity of this phenomenon is described by ODkinetics, by the means of water loss (WL) and soluble solid gain (SG) in osmodehydrated materialduring the process [5].
During OD, an increase of WL was observed for both osmotic solutions—sucrose and sucrosewith the addition of steviol glycosides (Figures 1 and 2). In 61.5% of sucrose solution during thewhole dehydration process a decrease of the water content in cranberries was observed (Figure 1).The WL was in the range of 0.35 kg H2O/kg (when sonication and reduced pressure treatmentwere used—BL_20 us 10 v_s) to 0.38 kg H2O/kg (when vacuum treatment was repeated threetimes—BL_3 × 10 v_s). The utilization of combined pretreatment significantly influenced the courseof OD. The highest WL after 72 h of OD was noted after combined pretreatment with blanching andtriplicate lowering of the pressure (BL_3 × 10 v_s). In turn, Nowacka et al. [32] reported that USapplied as a pretreatment before OD increases the WL during OD, irrespective of the osmotic solution.
The use of 30% of sucrose with the addition of steviol glycosides caused a loss of water, which after72 h of the process ranged from 0.19 to 0.25 kg H2O/kg, depending on the combined treatmentused (Figure 2). The highest WL in the final stage of the OD was noted in the case of cranberryfruits subjected to triple vacuum treatment before the OD process (BL_3 × 10 v_s + g) and toonly blanching (BL_s + g). However, in the case of combined methods in which US was used(BL_10 v 20 us_s + g; BL_20 us 10 v_s + g) a statistically lower water loss after 72 h of the OD wasnoted. Also, Sulistyawati et al. [38] noted statistically unchanged WL after reduced pressure treatment,compared with classical OD. A reverse dependence was noted by Feng et al. [39] for garlic butfor a different osmotic solution—25% NaCl. The authors reported a significant increase in waterloss as a result of both single vacuum (VOD) and ultrasound pretreatments (UOD), as well as forcombined method—vacuum treatment with ultrasonic-assisted osmotic dehydration (VUOD) ofgarlic. As they have shown, the impact of vacuum treatment was more noticeable than the effectof sonication. However, when the combined method VUOD was used, the highest water loss was
49

Foods 2019, 8, 283
noted. Koubaa et al. [13] stated that US pretreatment accelerate the mass and heat transfer, which islinked with a cavitation effect provoked by sonication. Goula et al. [40] also observed a higher WLafter US treatment before OD and US-assisted OD of potatoes in NaCl solution. Their findings andthe results obtained herein suggest that the impact of the treatment was connected with the utilizedosmotic solution.
Figure 1. Water loss (WL) and solid gain (SG) as a function of the osmotic dehydration time of differenttreated cranberries in 61.5% sucrose solution. Different letter means significant difference by the Duncantest (p < 0.05).
With the progressing of the OD process, the content of dry matter increases, which is relatedto the penetration of substances from osmotic solution to material [36]. A solid gain (SG) after 72 hof the process performed in 61.5% sucrose was in the range of 0.22 kg d.m./kg of cranberry forBL_20 us 10 v_s to 0.27 kg d.m./kg of cranberry for BL_s (Figure 1). In turn, in the case of the osmoticsolution with a lower sugar content (s+ g) a lower solid gain was noted (Figure 2), which was connectedwith a lower driving force of the OD [38]. Similarly, as in the case of 61.5% sucrose, when s + gsolution was used (Figure 2), the highest SG was observed for sample blanched before OD (BL_s + g),which reached the value of 0.17 kg d.m./kg of cranberry. Simultaneously, the lowest solid gain after OD,amounted to 0.13 kg d.m./kg of cranberry, and was characterized for material treated with US followedby reduced pressure treatment (BL_20 us 10 v_s + g). Statistical analysis revealed significant changes inSG as a result of both the time of OD and the type of different pretreatments. Contrary, Feng et al. [39]noted an irrelevant increase of SG in garlic dehydrated in NaCl after vacuum and the majority of UStreatments [32]. Similar results were presented also in our study for cranberry pretreated by US anddehydrated in different osmotic solutions. Allahdad et al. [41] concluded that the impact of US-assistedOD of pomegranate arils on the SG was dependent on the applied US frequency. When the 40 kHzwas used the SG was significantly higher than in the case of both 21 kHz and material without US
50

Foods 2019, 8, 283
treatment. This suggests that the treatment type and the treatment parameters should be adjusted foreach material individually.
Figure 2. Water loss (WL) and solid gain (SG) as a function of the osmotic dehydration time of differenttreated cranberries in 30% sucrose solution with 0.1% addition of steviol glycosides. Different lettermeans significant difference by the Duncan test (p < 0.05).
3.2. Physical Properties—Dry Matter Content, Water Activity, Water Soluble Compounds, and Color
Depending on the variety, fresh cranberry fruits are characterized by a dry substance rangingfrom 12.1% to 14.5%, and water-soluble compounds are from 7 to 9.4 ◦Bx [42]. In the case of blanchedfruits, similar results of water-soluble compounds (9.3 ± 0.2 ◦Bx) and dry matter content (14.6 ± 0.1%)were observed (Table 2). However, the combined pretreatment, consisting of the application of reducedpressure or combining reduced pressure with ultrasound conducted in an osmotic solution, caused asignificant increase in the dry matter and Brix index in all cases. The increase in these parameters wasrelated to the penetration of the components in the osmotic solution used during the pretreatment [36].Pretreatment in a sucrose solution resulted in an increase in the dry matter content by 32.2% to 39.7%,depending on the combination used, whereas in the solution with the addition of steviol glycosides by10.3% to 13.7%, compared to blanched cranberries. For water soluble compounds, a greater increase ofbrix index in cranberry fruits was observed while a higher concentration of sucrose solution was used.Blanched fruits treated with ultrasound before or after the application of reduced pressure treatment insucrose solution (BL_20 us 10 v and BL_10 v 20 us_s) were characterized by the highest water-solublecompounds of 15.9 ± 0.4 and 15.9 ± 0.5◦ Bx, respectively. The higher increase in the brix index inthe ultrasound-treated tissue could be related to the intensification of the OD process enhanced withultrasound waves [42] and with the changes of the plant tissue subjected to sonication [43]. However,such changes were not noticed during the OD process in the solution with a lower sucrose contentwith the addition of steviol glycosides.
After 72 h of OD process a significant increase in the dry matter content and Brix index wasobserved, in the range from 28.9% to 45.9% and from 22.4 to 43.1 ◦Bx, respectively. The highest contentof these parameters after the OD process was found in the blanched material (BL_s_72 h), and then
51

Foods 2019, 8, 283
in the tissue subjected to reduced pressure treatment (BL_3 × 10 v_s_72 h). In the case of combinedpretreatment, the dry matter content was slightly lower and it was 45.2% for BL_10 v 20 us_s_72 h and41.9% for BL_20 u s10 v_s_72 h. The similar effect, with lower values, was observed for cranberriessubjected to the OD process in sucrose solution with the addition of steviol glycosides, which waslinked to the lower driving force of the process [36].
Water activity is one of the key parameters determining the durability of food, affecting thesurvival and growth of microorganisms, enzymatic reactions, and oxidation. Water activity for mostfood products of plant origin is close to 1 [44]. For blanched and differently treated cranberries,water activity was in the range from 0.934 to 0.966 (Table 1). After the OD process a significant decreasein water activity for both solutions was noticed. In a solution with a higher concentration of sugar(61.5%) the water activity was in the range of 0.862 (BL_3 × 10 v_s_72 h) to 0.896 (BL_20 us 10 v_s_72 h).OD allowed reducing the water activity which limits only the growth of bacteria [44]. However,in the case of OD in a 30% sucrose solution with the addition of steviol glycosides, a smaller decreasewas observed and the water activity reached a value from 0.914 (BL_3 × 10 v_s + g_72 h) to 0.919(BL_20 us 10 v_s + g_72 h).
Table 2. Dry matter content, water activity, water soluble compounds, and color parameters indifferent treated cranberries, different letters in columns means significant difference by the Duncantest (p < 0.05).
MaterialDry MatterContent [%]
Water Activity[−]
Water SolubleCompounds
[◦Bx]
Color Parameters
L * a * b *Total Color Difference
ΔE
BL 14.6 ± 0.1a 0.952 ± 0.009 fg 9.3 ± 0.2 a 9.1 ± 0.7 a 51.8 ± 0.6 i 15.7 ± 0.7 bc −After treatment
s solution
BL_3 × 10 v_s 19.3 ± 0.1 c 0.937 ± 0.006 de 14.5 ± 0.2 c 16.1 ± 0.8 h 40.7 ± 0.7 f 17.2 ± 0.6 efg 13.2 ± 0.8 c
BL_10 v 20 us_s 20.4 ± 0.1 c 0.950 ± 0.004 f 15.9 ± 0.5 d 21.1 ± 0.7 i 35.0 ± 0.6 cd 13.8 ± 0.7 a 20.8 ± 0.5 h
BL_20 us 10 v_s 19.3 ± 0.1 c 0.934 ± 0.005 e 15.9 ± 0.4 d 13.8 ± 1.3 d 35.5 ± 0.6 d 14.5 ± 0.8 a 17.1 ± 0.7 ef
s + g solution
BL_3 × 10 v_s + g 16.6 ± 0.1 b 0.952 ± 0.007 fg 11.8 ± 0.2 b 14.7 ± 0.4 e 43.0 ± 0.9 g 14.1 ± 0.4 a 10.7 ± 0.6 b
BL_10 v 20 us_s + g 16.3 ± 0.3 b 0.963 ± 0.003 g 11.9 ± 0.1 b 12.9 ± 0.8 c 46.5 ± 0.8 h 16.4 ± 0.7 bcd 6.6 ± 0.8 a
BL_20 us 10 v_s + g 16.1 ± 0.1 b 0.966 ± 0.002 fg 11.9 ± 0.1 b 11.0 ± 0.5 b 47.3 ± 0.7 h 18.6 ± 0.6 h 5.8 ± 0.6 a
After osmotic dehydration
s solution
BL_s_72 h 45.9 ± 0.6 h 0.898 ± 0.018 b 43.1 ± 0.4 g 14.8 ± 0.7 e 34.2 ± 0.9 bc 16.7 ± 0.8 cde 18.6 ± 0.8 g
BL_3 × 10 v_s_72 h 45.2 ± 0.8 h 0.862 ± 0.014 a 42.5 ± 0.5 g 16.2 ± 0.5 h 34.0 ± 0.8 b 17.7 ± 0.7 g 19.3 ± 0.7 g
BL_10 v 20 us_s_72 h 43.1 ± 0.7 g 0.895 ± 0.002 b 36.1 ± 0.8 h 15.6 ± 0.7 fgh 31.9 ± 1.1 a 16.4 ± 0.5 bcd 21.0 ± 1.0 h
BL_20 u s10 v_s_72 h 41.9 ± 0.7 g 0.896 ± 0.009 b 36.1 ± 0.4 h 15.4 ± 1.1 ef 31.8 ± 0.8 a 15.9 ± 1.0 bc 21.0 ± 0.7 h
s + g solution
BL_s + g_72 h 34.2 ± 1.1 f 0.916 ± 0.009 c 22.4 ± 0.2 e 12.9 ± 0.7 c 37.5 ± 1.0 e 15.6 ± 0.9 b 14.9 ± 0.9 d
BL_3 × 10 v_s + g_72 h 32.9 ± 0.9 f 0.914 ± 0.004 c 26.5 ± 0.8 g 16.1 ± 0.1 gh 37.3 ± 2.9 e 15.6 ± 2.3 b 16.3 ± 2.6 e
BL_10 v 20 us_s + g_72 h 28.9 ± 1.0 d 0.928 ± 0.005 d 23.0 ± 1.5 e 15.9 ± 0.3 fgh 35.7 ± 0.5 d 17.5 ± 0.3 fg 17.6 ± 0.8 f
BL_20 us 10 v_s + g_72 h 31.0 ± 0.9 e 0.919 ± 0.005 c 25.6 ± 0.9 f 15.4 ± 0.2 efg 34.0 ± 0.9 b 16.6 ± 1.6 cde 19.0 ± 0.5 g
Color is one of the most important features of the product, which consumers pay special attentionto [35]. Cranberry is characterized by a red color, which changes during processing [33]. The blanchedfruits were characterized by L*, a*, and b* parameters equal to 9.1, 51.8, and 15.7, respectively. The colorchanges were not unambiguous (Table 1). The use of reduced pressure treatment and combinedtreatment with US, and lowered pressure resulted in a significant increase in lightness (L*) and adecrease in the share of red color (a*), compared to the only blanched sample. OD processing causedfurther lightening and lower value of a* parameter, which is related to mass transfer form tissueto the surrounding solution. What is worth mentioning is that higher changes were observed forcombined treatment, which could be linked to the acceleration of OD processes by the application ofreduced pressure treatment and US [13,35]. Moreover, a significant increase in the total color differenceΔE was found with the value higher than five, which confirms that the treatment performed had asignificant effect on the overall change in the color of the product. However, higher changes werenoted for the samples processed in 61.5% sucrose solution, probably due to the higher driving forceof OD process. The changes of color of OD fruits pretreated by blanching and blanching combined
52

Foods 2019, 8, 283
with reduced pressure in comparison to intact, blanched material are also related to higher sugarconcentration. The presence of sugar affects the light reflection and thus changes the lightness, redness,and the yellowness of the material. Moreover, as described and discussed further, dehydrated samplescontained less of the pigment compounds such as anthocyanins or flavonoids, which explains thesmaller values of a* parameter when compared to the reference (BL) material. The sequence ofapplication of reduced pressure treatment and ultrasound did not play a significant role in shaping thecolor of fruits after OD.
3.3. Bioactive Compounds
Cranberries contain a lot of different bioactive compounds [21]. Figure 3 presents the totalphenolic content of cranberry fruits subjected to different pretreatment before and after OD. The highesttotal phenolic content (5241 ± 179 mg/100g d.m.) was stated for blanched samples. Combination ofblanching with other pretreatment methods like reduced pressure treatment or sonication led to adecrease of phenolic compounds in comparison to the blanched material. In general, processingperformed with 61.5% sucrose solution lead to smaller phenolic content of cranberries in comparisonto fruits processed in a ternary solution composed of sucrose and steviol glycosides. Such situationsare associated with higher leakage of polar phenolics to the surroundings during treatment in a moreconcentrated solution. The difference in phenolic content between samples processed with concentratedsucrose and ternary solution varied from 22.7% to 39.2% for material coded as BL_3 × 10 v_s andBL_20 us 10 v_s, respectively. The introduction of additional processing steps like reduced pressuretreatment and sonication contributed to a significant reduction of phenolics in investigated fruits incomparison to less complicated operations. One of the possible explanations of such behavior is relatedto a sonoporation phenomenon which increases cell membrane permeability [45]. On the one hand,the sonoporation leads to degradation of the cellular structure and thus it may enhance the extractabilityof bioactive compounds. On the other hand, it implies improved mass transfer between fruits andosmotic medium which can positively impact on water loss but negatively influence to the phenolicphase promoting its leaching. Another explanation of smaller phenolic content of samples subjected totreatment with sonication is associated with the free radical formation during US application whichcan lead to degradation of antioxidants [46,47]. The impact of ultrasound on enzymatic activity isambiguous and the effect of US on enzymes seems to depend on the matrix, treatment parameters,and type of the enzyme alike [48,49]. For instance, it has been reported that the combination ofascorbic acid with ultrasound was successful in the inactivation of polyphenoloxidase and peroxidase,whereas individual application of ascorbic acid and sonication did not give the desired inactivationof abovementioned enzymes in apples [50]. In turn, ultrasound treatment of diluted avocado pureeincreased activity of polyphenols oxidase by 180% depending on treatment [51]. Based on the resultspresented in the current study it can be stated that ruptured cellular structure and liberated chemicalswere more susceptible for enzymatic degradation as the activity of enzymes was modified by sonication.This explanation is also supported by the fact that the phenolics content of fruits subjected only toblanching and reduced pressure treatment before OD was lower when compared to samples treatedby a combination of blanching, vacuum treatment, and sonication. It is, furthermore, reported thatultrasounds can provoke conformation changes of enzymes, lead to dissociation of enzyme aggregates,promote collisions between substrate-enzyme, or activate latent enzymes of the tissue [49]. However,when ultrasound was used as treatment for 30 min for blanched cranberries it resulted in higher totalphenolic content [52] than when combined methods with reduced pressure were used. OD for 72 hled to a further decrease of phenolics. Combined treatment in most cases did not cause significantdifferences in comparison to blanched osmodehydrated samples. Only fruits subjected to reducedpressure combined with sonication and dehydrated in 61.5% sucrose solution exhibited significantlyhigher phenolic content (1802 mg GAE/100 g d.m.) in comparison to the blanched material processedin the same osmotic medium (1465 mg GAE/100 g d.m.).
53

Foods 2019, 8, 283
Figure 3. Total phenolic content in different treated cranberries: Blanched (BL), reduced pressure(BL_3 × 10 v), reduced pressure with sonication treatment (BL_10 v 20 us), sonication treatment withreduced pressure (BL_20 us 10 v), and after osmotic dehydration (OD) in 61.5% sucrose solution (s) andin 30% sucrose solution with 0.1% addition of steviol glycosides (s+ g). Different lowercase letters meanssignificant difference by the Duncan test (p < 0.05) for samples after treatment, and different capital lettermeans significant difference by the Duncan test (p < 0.05) for samples after 72 h osmotic dehydration.
Flavonoids content of investigated cranberries ranged from 30.0 to 45.8 mg/g d.m. and from 10.5 to16.7 mg/g d.m. before and after 72 h of OD, respectively (Figure 4). The highest flavonoids content wasstated for blanched samples before OD. The use of combined treatment decreased flavonoids contentfrom 16% to 35% in the case of samples treated by sonication combined with reduced pressure in61.5% sucrose solution (BL_20 us_10 v_s) and by reduced pressure treatment combined with sonicationin 30% sucrose solution with addition of steviol glycosides (BL_10 v_20_us_s + g). As in the caseof phenolic compounds, OD for 72 h significantly decreased flavonoids content regardless of thetreatment protocol. In general, samples osmodehydrated in ternary solution (s + g) were characterizedby higher flavonoids content than the samples processed in 61.5% sucrose solution (s). For instance,flavonoids content of fruits treated by reduced pressure followed by sonication in 30% sucrose solutionwith the addition of steviol glycosides was 26.2% higher in comparison to the material processedby the same method but in 61.5% sucrose solution. Such difference was most probably linked tothe worse mass transfer of less concentrated solution [53]. It is worth emphasizing that samplessubjected to sonication exhibited a higher concentration of flavonoids in comparison to the fruitstreated only by reduced pressure treatment. What is more, when sonication was preceded by reducedpressure application, the retention of flavonoids was higher. Similar results were obtained for blanchedcranberries treated with ultrasound for 30 min in sucrose solution [52]. These results point out that theeffect of ultrasound on improvement of extractability is more pronounced when air in the extracellularspace is replaced by liquid. This explanation fits to the data reported by Liu et al. [54] who found outthat cavitation is enhanced in degassed water.
Figure 5 presents the anthocyanins content of fruits subjected to different treatments.Samples before OD were characterized by higher anthocyanins content, which ranged from 638to 985 mg c3g/100 g f.m. The use of combined treatment decreased anthocyanins content in comparisonto blanched material. Samples subjected to triple pressure reduction were characterized by significantlyhigher concentration of anthocyanins in comparison to samples treated by reduced pressure andsonication, regardless of the type of osmotic solution. However, longer sonication (30 min) of blanchedcranberries resulted in higher content of anthocyanins, as mentioned in our previous study [52]. What isinteresting is that after OD the trend was reversed, which indirectly confirms the ambiguous character
54

Foods 2019, 8, 283
of sonication either to improve extractability of bioactive compounds or to cause their degradation.The utilization of 61.5% sucrose solution resulted in better anthocyanins preservation than the use oflow concentrated (30%) sucrose solution with the addition of steviol glycosides. These findings fallinto place with a protective role of sugar on anthocyanins stability due to the decreased water mobilityas demonstrated by Tsai et al. [55] and Watanabe et al. [56].
Figure 4. Flavonoids content in different treated cranberries: Blanched (BL), reduced pressure(BL_3 × 10 v), reduced pressure with sonication treatment (BL_10 v 20 us), sonication treatment withreduced pressure (BL_20 us 10 v), and after osmotic dehydration (OD) in 61.5% sucrose solution (s) andin 30% sucrose solution with 0.1% addition of steviol glycosides (s+ g). Different lowercase letters meanssignificant difference by the Duncan test (p< 0.05) for samples after treatment, and different capital lettersmeans significant difference by the Duncan test (p < 0.05) for samples after 72 h osmotic dehydration.
Figure 5. Anthocyanins content in different treated cranberries: Blanched (BL), reduced pressure(BL_3 × 10 v), reduced pressure with sonication treatment (BL_10 v 20 us), sonication treatment withreduced pressure (BL_20 us 10 v), and after osmotic dehydration (OD) in 61.5% sucrose solution (s) andin 30% sucrose solution with 0.1% addition of steviol glycosides (s+ g). Different lowercase letters meanssignificant difference by the Duncan test (p< 0.05) for samples after treatment, and different capital lettersmeans significant difference by the Duncan test (p < 0.05) for samples after 72 h osmotic dehydration.
55

Foods 2019, 8, 283
3.4. Cluster Analysis
Figures 6 and 7 present the results of cluster analysis performed on the basis of all investigatedvariables for samples not subjected and subjected to OD, respectively. Samples before OD were dividedinto three groups. The first cluster was composed of only blanched material, whereas second and thirdgroup was built by samples subjected to treatment performed in ternary (30% of sucrose with theaddition of steviol glycosides) and 61.5% sucrose solution, respectively. Based on the cluster analysisresults it can be stated that samples subjected to dehydration in less concentrated solutions were moresimilar to blanched material than samples processed in a concentrated sucrose solution. For materialsafter dehydration, clusters were formed upon the type of osmotic medium as well. It means thatall fruits dehydrated in 61.5% sucrose solution formed one group while processing in 30% sucrosesolution with the addition of steviol glycosides resulted in formation of a separate group.
Figure 6. The results of cluster analysis (considering all analyzed variables) for samples not subjectedto osmotic dehydration (BL - blanched material).
Figure 7. The results of cluster analysis (considering all analyzed variables) for samples subjected toosmotic dehydration.
56

Foods 2019, 8, 283
4. Conclusions
Unconventional pretreatment of cranberries caused a significant increase of osmotic dehydrationeffectiveness, particularly in the case of a material dehydrated in 61.5% sucrose solution,previously blanched, submitted to 20 min sonication, followed by low pressure application.
Cranberries subjected to combined treatment, in particular to ultrasounds, had comparable orhigher polyphenolic, anthocyanin and flavonoids content than a blanched tissue subjected to osmoticdehydration. Taking into account evaluated physical and chemical properties of dehydrated cranberriesand the osmotic dehydration process it has been concluded that the best combined pretreatmentmethod was a 20 min sonication followed by a 10 min lowered pressure treatment. However, furtheroptimization studies are required.
Author Contributions: Conceptualization, M.N. and D.W.-R.; Methodology, A.W., M.N., K.R., A.A., and M.D.;Validation, K.R., A.A., and L.M.; Formal analysis, M.N. and A.W.; Investigation, M.N., K.R., L.M., and A.A.;Writing—original draft preparation, M.N., A.W., M.D., and D.W.-R.; Writing—review and editing, M.N., A.W.,M.D., and D.W.-R.; Visualization, M.N. and A.W.; Supervision, M.N., A.W. and D.W.-R.
Funding: This research was funded by MINISTRY OF SCIENCE AND HIGHER EDUCATION within a frameworkof Iuventus Plus programme in the years 2015–2018, grant number IP2014 033173. The work was also co-financedby a statutory activity subsidy from the Polish Ministry of Science and Higher Education for the Faculty of FoodSciences of Warsaw University of Life Sciences.
Conflicts of Interest: The authors declare no conflict of interest.
References
1. Jeszka-Skowron, M.; Zgoła-Grzeskowiak, A.; Stanisz, E.; Waskiewicz, A. Potential health benefits and qualityof dried fruits: Goji fruits, cranberries and raisins. Food Chem. 2017, 221, 228–236. [CrossRef] [PubMed]
2. Rzaca, M.; Witrowa-Rajchert, D.; Tylewicz, U.; Dalla, R.M. Mass exchange in osmotic dehydration process ofKiwi fruits. ZYWNOSC Nauk Technol Jakosc. 2009, 6, 140–149. (in Polish).
3. Bromberger, S.M.; Schmaltz, S.; Wesz, R.F.; Salvalaggio, R.; Lisiane, d.M.T. Effects of pretreatment ultrasoundbath and ultrasonic probe, in osmotic dehydration, in the kinetics of oven drying and the physicochemicalproperties of beet snacks. J. Food Process. Preserv. 2018, 42, 13393. [CrossRef]
4. Witrowa-Rajchert, D.; Wiktor, A.; Sledz, M.; Nowacka, M. Selected emerging technologies to enhance thedrying process: A review. Dry Technol. 2014, 32, 1386–1396. [CrossRef]
5. Nowacka, M.; Tylewicz, U.; Laghi, L.; Dalla, R.M.; Witrowa-Rajchert, D. Effect of ultrasound treatment onthe water state in kiwifruit during osmotic dehydration. Food Chem. 2014, 144, 18–25. [CrossRef] [PubMed]
6. Misra, N.N.; Koubaa, M.; Roohinejad, S.; Juliano, P.; Alpas, H.; Inácio, R.S.; Saraiva, J.A.; Barba, F.J.Landmarks in the historical development of twenty first century food processing technologies. Food Res. Int.2017, 97, 318–339. [CrossRef] [PubMed]
7. Cárcel, J.A.; García-Pérez, J.V.; Benedito, J.; Mulet, A. Food process innovation through new technologies:Use of ultrasound. J. Food Eng. 2012, 110, 200–207. [CrossRef]
8. Awad, T.S.; Moharram, H.A.; Shaltout, O.E.; Asker, D.; Youssef, M.M. Applications of ultrasound in analysis,processing and quality control of food: A review. Food Res. Int. 2012, 48, 410–427. [CrossRef]
9. Roselló-soto, E.; Galanakis, C.M.; Brncic, M.; Orlien, V.; Francisco, J.; Mawson, R.; Knoerzer, K.; Tiwari, B.K.;Barba, F.J. Clean recovery of antioxidant compounds from plant foods, by-products and algae assisted byultrasounds processing. Modeling approaches to optimize processing conditions. Trends. Food Sci. Technol.2015, 42, 134–149. [CrossRef]
10. Zinoviadou, K.G.; Galanakis, C.M.; Brn, M.; Grimi, N.; Boussetta, N.; Mota, M.J.; Saraiva, J.A.; Patras, A.;Tiwari, B.; Barba, F.J. Fruit juice sonication: Implications on food safety and physicochemical and nutritionalproperties. Food Res. Int. 2015, 77, 743–752. [CrossRef]
11. Barba, F.J.; Brianceau, S. Effect of alternative physical treatments (ultrasounds, pulsed electric fields,and high-voltage electrical discharges) on selective recovery of bio-compounds from fermented grapepomace. Food Bioprocess. Technol. 2015, 8, 1139–1148. [CrossRef]
57

Foods 2019, 8, 283
12. Zhu, Z.; Wu, Q.; Di, X.; Li, S.; Barba, F.J.; Koubaa, M.; Roohinejad, S.; Xiong, X.; He, J. Multistage recoveryprocess of seaweed pigments: investigation of ultrasound assisted extraction and ultra-filtration performances.Food Bioprod. Process. 2017, 104, 40–47. [CrossRef]
13. Koubaa, M.; Barba, F.J.; Grimi, N.; Mhemdi, H.; Koubaa, W.; Boussetta, N.; Vorobiev, E. Recovery of colorantsfrom red prickly pear peels and pulps enhanced by pulsed electric field and ultrasound. Innov. Food Sci.Emerg. Technol. 2016, 37, 336–344. [CrossRef]
14. Nowacka, M.; Tylewicz, U.; Romani, S.; Dalla Rosa, M.; Witrowa-Rajchert, D. Influence of ultrasound-assistedosmotic dehydration on the main quality parameters of kiwifruit. Innov. Food Sci. Emerg. Technol. 2017, 41,71–78. [CrossRef]
15. Amami, E.; Khezami, W.; Mezrigui, S.; Badwaik, L.S.; Bejar, A.K.; Perez, C.T.; Kechaou, N. Effect of ultrasound-assisted osmotic dehydration pretreatment on the convective drying of strawberry. Ultrason. Sonochem. 2017,36, 286–300. [CrossRef] [PubMed]
16. Corrêa, J.L.G.; Rasia, M.C.; Mulet, A.; Cárcel, J.A. Influence of ultrasound application on both the osmoticpretreatment and subsequent convective drying of pineapple (Ananas comosus). Innov. Food Sci. Emerg.Technol. 2017, 41, 284–291. [CrossRef]
17. Fito, P.; Andrés, A.; Chiralt, A.; Pardo, P. Coupling of hydrodynamic mechanism and deformation-relaxationphenomena during vacuum treatments in solid porous food-liquid systems. J. Food Eng. 1996, 27, 229–240.[CrossRef]
18. Castelló, M.L.; Igual, M.; Fito, P.J.; Chiralt, A. Influence of osmotic dehydration on texture, respiration andmicrobial stability of apple slices (var. Granny Smith). J. Food Eng. 2009, 91, 1–9. [CrossRef]
19. Tappi, S.; Tylewicz, U.; Romani, S.; Siroli, L.; Patrignani, F.; Dalla, R.M.; Rocculi, P. Optimization ofvacuum impregnation with calcium lactate of minimally processed melon and shelf-life study in real storageconditions. J. Food Sci. 2016, 81, E2734–E2742. [CrossRef] [PubMed]
20. Deng, Y.; Zhao, Y. Effect of pulsed vacuum and ultrasound osmopretreatments on glass transition temperature,texture, microstructure and calcium penetration of dried apples (Fuji). LWT - Food Sci. Technol. 2008, 41,1575–1585. [CrossRef]
21. Kowalska, K.; Olejnik, A. Beneficial effects of cranberry in the prevention of obesity and related complications:Metabolic syndrome and diabetes—A review. J. Funct. Foods. 2016, 20, 171–181. [CrossRef]
22. Kovacevic, D.B.; Maras, M.; Barba, F.J.; Granato, D.; Roohinejad, S.; Mallikarjunan, K.; Montesano, D.;Lorenzo, J.M.; Putnik, P. Innovative technologies for the recovery of phytochemicals from Stevia rebaudianaBertoni leaves: A review. Food Chem. 2018, 268, 513–521. [CrossRef] [PubMed]
23. Koubaa, M.; Area, F.S. Current and new insights in the sustainable and green recovery of nutritionallyvaluable compounds from Stevia rebaudiana Bertoni. J. Agric. Food Chem. 2015, 63, 6835–6846. [CrossRef][PubMed]
24. José, F.; Nieves, M.; Belda-galbis, C.M.; José, M.; Rodrigo, D. Stevia rebaudiana Bertoni as a naturalantioxidant/antimicrobial for high pressure processed fruit extract: Processing parameter optimization.Food Chem. 2014, 148, 261–267.
25. Nowacka, M.; Fijalkowska, A.; Wiktor, A.; Rybak, K.; Dadan, M.; Witrowa-Rajchert, D. Changes of mechanicaland thermal properties of cranberries subjected to ultrasound treatment. Int. J. Food Eng. 2017, 13, 1–12.[CrossRef]
26. Oliveira, F.I.P.; Rodrigues, S.; Fernandes, F.A.N. Production of low calorie Malay apples by dual stage sugarsubstitution with Stevia-based sweetener. Food Bioprod. Process. 2012, 90, 713–718. [CrossRef]
27. Carbonell-Capella, J.M.; Barba, F.J.; Esteve, M.J.; Frígola, A. High pressure processing of fruit juice mixturesweetened with Stevia rebaudiana Bertoni: Optimal retention of physical and nutritional quality. Innov. FoodSci. Emerg. Technol. 2013, 18, 48–56. [CrossRef]
28. Chranioti, C.; Chanioti, S.; Tzia, C. Comparison of spray, freeze and oven drying as a means of reducingbitter aftertaste of steviol glycosides (derived from Stevia rebaudiana Bertoni plant) — Evaluation of the finalproducts. Food Chem. 2016, 190, 1151–1158. [CrossRef]
29. Wiktor, A.; Sledz, M.; Nowacka, M.; Rybak, K.; Chudoba, T.; Lojkowski, W.; Witrowa-Rajchert, D. The impactof pulsed electric field treatment on selected bioactive compound content and color of plant tissue. Innov. FoodSci. Emerg. Technol. 2015, 30, 69–78. [CrossRef]
58

Foods 2019, 8, 283
30. Nowacka, M.; Wiktor, A.; Anuszewska, A.; Dadan, M.; Rybak, K.; Witrowa-Rajchert, D. The application ofinnovative technologies as pulsed electric field, ultrasound and microwave-vacuum drying in the productionof dried cranberry snacks. Ultras. Sonochem. 2019, 56, 1–13. [CrossRef]
31. Ciurzynska, A.; Kowalska, H.; Czajkowska, K.; Lenart, A. Osmotic dehydration in production of sustainableand healthy food. Trends. Food Sci. Technol. 2016, 50, 186–192. [CrossRef]
32. Nowacka, M.; Tylewicz, U.; Tappi, S.; Siroli, L.; Lanciotti, R.; Romani, S.; Witrowa-Rajchert, D.Ultrasound assisted osmotic dehydration of organic cranberries (Vaccinium oxycoccus): Study on qualityparameters evolution during storage. Food Control 2018, 93, 40–47. [CrossRef]
33. AOAC International. Official Methods of Analysis of AOAC International. Available online:https://www.aoac.org/aoac_prod_imis/AOAC/Publications/Official_Methods_of_Analysis/AOAC_Member/Pubs/OMA/AOAC_Official_Methods_of_Analysis.aspx (accessed on 10 June 2015).
34. Nowacka, M.; Fijalkowska, A.; Wiktor, A.; Dadan, M.; Tylewicz, U.; Dalla, R.M.; Witrowa-Rajchert, D.Influence of power ultrasound on the main quality properties and cell viability of osmotic dehydratedcranberries. Ultrasonics 2018, 83, 33–41. [CrossRef] [PubMed]
35. Fijalkowska, A.; Nowacka, M.; Witrowa-Rajchert, D. The physical, optical and reconstitution properties ofapples subjected to ultrasound before drying. Ital. J. Food Sci. 2017, 29, 343–356.
36. Kowalska, H.; Lenart, A. Mass exchange during osmotic preteatment of vegetables. J. Food Eng. 2001, 49,137–140. [CrossRef]
37. Waliszewski, K.; Delgado, J.; Garcia, M. Equilibrium concentration and water and sucrose diffusivity inosmotic dehydration of pineapple slabs. Dry Technol. 2002, 20, 527–553. [CrossRef]
38. Sulistyawati, I.; Dekker, M.; Fogliano, V.; Verkerk, R. Osmotic dehydration of mango: Effect of vacuumimpregnation, high pressure, pectin methylesterase and ripeness on quality. LWT - Food Sci. Technol. 2018, 98,179–186. [CrossRef]
39. Feng, Y.; Yu, X.; Yagoub, A.E.G.A.; Xu, B.; Wu, B.; Zhang, L.; Zhou, C. Vacuum pretreatment coupled toultrasound assisted osmotic dehydration as a novel method for garlic slices dehydration. Ultrason Sonochem.2018, 50, 363–372. [CrossRef]
40. Goula, A.M.; Kokolaki, M.; Daftsiou, E. Use of ultrasound for osmotic dehydration. The case of potatoes.Food Bioprod. Process. 2017, 105, 157–170. [CrossRef]
41. Teleszko, M. American cranberry (Vaccinium macrocarpon L.)—possibility of using it to produce bio-food.ZYWNOSC Nauk. Technol. Jakosc. 2011, 6, 132–141. (in Polish).
42. Fernandes, F.A.N.; Oliveira, F.I.P.; Rodrigues, S. Use of ultrasound for dehydration of papayas. Food Bioprocess.Technol. 2008, 1, 339–345. [CrossRef]
43. Fijalkowska, A.; Nowacka, M.; Wiktor, A.; Sledz, M.; Witrowa-Rajchert, D. Ultrasound as a pretreatmentmethod to improve drying kinetics and sensory properties of dried apple. J. Food Process. Eng. 2016, 39,256–265. [CrossRef]
44. Sen, F.; Karaçali, I.; Erogul, D. Effects of storage conditions and packaging on moisture content, water activityand tissue hardness of dried apricots. Meyve. Bilim. Sci. 2015, 2, 45–49.
45. Wang, M.; Zhang, Y.; Cai, C.; Tu, J.; Guo, X.; Zhang, D. Sonoporation-induced cell membrane permeabilizationand cytoskeleton disassembly at varied acoustic and microbubble-cell parameters. Sci. Rep. 2018, 8, 3885.[CrossRef] [PubMed]
46. Bonnafous, P.; Vernhes, M.C.; Teissié, J.; Gabriel, B. The generation of reactive-oxygen species associatedwith long-lasting pulse-induced electropermeabilisation of mammalian cells is based on a non-destructivealteration of the plasma membrane. Biochim. Biophys. Acta (BBA)-Biomembr. 1999, 1461, 123–134. [CrossRef]
47. Okitsu, K.; Iwasaki, K.; Yobiko, Y.; Bandow, H.; Nishimura, R.; Maeda, Y. Sonochemical degradation of azodyes in aqueous solution: A new heterogeneous kinetics model taking into account the local concentrationof OH radicals and azo dyes. Ultrason. Sonochem. 2005, 12, 255–262. [CrossRef] [PubMed]
48. Delgado-Povedano, M.M.; De Castro, M.L. A review on enzyme and ultrasound: A controversial but fruitfulrelationship. Anal. Chim. Acta 2015, 889, 1–21. [CrossRef] [PubMed]
49. Rojas, M.L.; Hellmeister Trevilin, J.; Augusto, D.; Esteves, P. The ultrasound technology for modifyingenzyme activity. Sci. Agropecu. 2016, 7, 145–150. [CrossRef]
50. Jang, J.H.; Moon, K.D. Inhibition of polyphenol oxidase and peroxidase activities on fresh-cut apple bysimultaneous treatment of ultrasound and ascorbic acid. Food Chem. 2011, 124, 444–449. [CrossRef]
59

Foods 2019, 8, 283
51. Bi, X.; Hemar, Y.; Balaban, M.O.; Liao, X. The effect of ultrasound on particle size, color, viscosity andpolyphenol oxidase activity of diluted avocado puree. Ultrason Sonochem. 2015, 27, 567–575. [CrossRef]
52. Nowacka, M.; Fijalkowska, A.; Dadan, M.; Rybak, K.; Wiktor, A.; Witrowa-Rajchert, D. Effect of ultrasoundtreatment during osmotic dehydration on bioactive compounds of cranberries. Ultrasonics 2018, 83, 18–25.[CrossRef] [PubMed]
53. Scibisz, I.; Mitek, M. Antioxidant activity and phenolics compound capacity in dried highbush blueberries(Vaccinium corymbosum L.). ZYWNOSC Nauk. Technol. Jakosc. 2006, 4, 68–76. (in Polish).
54. Liu, L.; Yang, Y.; Liu, P.; Tan, W. The influence of air content in water on ultrasonic cavitation field.Ultrason. Sonochem. 2014, 21, 566–671. [CrossRef] [PubMed]
55. Tsai, P.J.; Hsieh, Y.Y.; Huang, T.C. Effect of sugar on anthocyanin degradation and water mobility in a roselleanthocyanin model system using 17O NMR. J. Agric. Food Chem. 2004, 52, 3097–4009. [CrossRef] [PubMed]
56. Watanabe, Y.; Yoshimoto, K.; Okada, Y.; Nomura, M. Effect of impregnation using sucrose solution on stabilityof anthocyanin in strawberry jam. LWT - Food Sci. Technol. 2011, 44, 891–905. [CrossRef]
© 2019 by the authors. Licensee MDPI, Basel, Switzerland. This article is an open accessarticle distributed under the terms and conditions of the Creative Commons Attribution(CC BY) license (http://creativecommons.org/licenses/by/4.0/).
60

foods
Article
Improved Physicochemical and Structural Propertiesof Blueberries by High HydrostaticPressure Processing
Maria Paciulli 1, Ilce Gabriela Medina Meza 2,*, Massimiliano Rinaldi 1, Tommaso Ganino 1,3,
Alessandro Pugliese 1, Margherita Rodolfi 1, Davide Barbanti 1, Michele Morbarigazzi 4 and
Emma Chiavaro 1
1 Department of Food and Drug, University of Parma, Parco Area delle Scienze 27/A, 43124 Parma, Italy2 Department of Biosystems and Agricultural Engineering, Michigan State University, East Lansing,
MI 48824-1323, USA3 Consiglio Nazionale delle Ricerche, Istituto per la Valorizzazione del Legno e delle Specie Arboree (IVaLSA),
50019 Sesto Fiorentino, Italy4 HPP Italia, Via E. Carbognani 6, Traversetolo, 43029 PR, Italy* Correspondence: [email protected]; Tel.: +1-517-884-1971
Received: 15 June 2019; Accepted: 18 July 2019; Published: 21 July 2019
Abstract: The use of high pressure on fruits and vegetables is today widely studied as an alternativeto the traditional thermal preservation techniques, with the aim of better preserving nutritionaland organoleptic properties. The use of high hydrostatic pressures (400–600 MPa; 1–5 min; roomtemperature) was tested on the physicochemical and structural properties of blueberries, in comparisonto raw and blanched samples. High hydrostatic pressures led to higher tissue damages than blanching,related to the intensity of the treatment. The cellular damages resulted in leakage of intracellularcomponents, such as bioactive molecules and enzymes. As a consequence, among the high pressuretreatments, the resulting antioxidant activity was higher for samples treated for longer times (5 min).Pectinmethyl esterase (PME), deactivated by blanching, but strongly barotolerant, was more activein blueberries treated with the more intense high pressure conditions. Blueberry texture wasbetter retained after high pressure than blanching, probably because of the PME effect. Blueberrycolor shifted towards purple tones after all of the treatments, which was more affected by blanching.Principal component analysis revealed the mild impact of high pressure treatments on the organolepticproperties of blueberries.
Keywords: high pressure; blanching; fruit; microscopy; pectin methyl esterase; texture; color;antioxidant activity
1. Introduction
Blueberries are nowadays a very popular fruit because of their sensory and health related properties.Blueberries, indeed, in addition to being appreciated for their color, flavor, texture, and juiciness, arealso a natural source of bioactive compounds. The so-called polyphenols, including anthocyanins, themolecules responsible for blueberry color, are powerful antioxidants with recognized anti-inflammatoryand antihypertensive properties, in addition to being involved in many cell regulation pathways [1].
Blueberries are often consumed fresh, but untreated fruit show short storage life, usually due toboth microbial and enzymatic spoilage. The presence of enzymes such as peroxidase (POD), polyphenoloxidase (PPO), lipoxygenase (LOX), and lipase may be responsible for color and flavor changes, whilepectin-methylesterase (PME) and polygalacturonase (PG) are involved in texture modifications [2].The application of preservation processes, in order to guarantee consumer safety and extend shelf
Foods 2019, 8, 272; doi:10.3390/foods8070272 www.mdpi.com/journal/foods61

Foods 2019, 8, 272
life, thus, became necessary. Blueberries are generally sold frozen, dehydrated, or heat treated. Suchtreatments induce important modifications in the product quality. Traditional thermal preservationmethods, such as canning, make them susceptible to significant losses in their natural sensorial (i.e.,aroma, flavor) and nutritional (bioactive compounds) properties [3]. Moreover, freezing and dryinghave a huge effect on fruit structure and texture [4].
Retention of nutritional value and freshness of fruit and vegetables (F&V) is a major challengefor the food industry. Novel processing technologies can address these issues. Among them, highhydrostatic pressure (HHP) is an attractive technology, because of the use of low temperatures duringprocessing (i.e., room temperature), combined with high hydrostatic pressures (100–1000 MPa) andshort time (a few seconds or minutes). HHP belongs to the so-called “non-thermal technologies”, whichare capable of retaining low molecular weight food compounds (i.e., flavoring agents, pigments, andvitamins) by not affecting covalent bonds [5,6]. Additionally, recent attention has been paid to the effectsof HHP on the color attributes of F&V, since HHP can increase the intensity of color characteristicsbecause of cell lysis and subsequent leakage of pigments [7]. The effect of high hydrostatic pressure(HHP) on the improvement of the technological functionalities of polymers, such as proteins andpolysaccharides, has been recently studied [8,9]. Texture is an important quality attribute in F&V, andindicates freshness from a consumer point-of-view. The structural integrity and texture of F&V isattributed mainly to the primary cell wall, the middle lamella, and the turgor generated within cells byosmosis [10]. The primary cell wall basic structure consists of a cellulose–hemicellulose network [11].The firmness developed by these two polysaccharides is not affected by processing or storage; however,pectin is affected by both enzymatic and non-enzymatic reactions. Pectin is the main constituent of themiddle lamella, and gives firmness and elasticity to tissues [12]. All of these positive results indicatethat HHP may be useful for retaining major structural quality characteristics of F&V.
Based on our knowledge, the application of HHP on whole blueberries has mainly been used toinvestigate microbial inactivation [13] or biomolecule extraction [14]. No studies are available on theeffect of high hydrostatic pressure on the physicochemical and structural properties of whole blueberryfruit. The aim of this study was to evaluate the related properties affecting blueberry structure,color quality, and antioxidant capacity after HHP treatments in comparison with conventionalthermal processing.
2. Material and Methods
2.1. Sample Preparation
Blueberries (Vaccinium corymbosum, cv. Duke) were purchased from a local market (Parma,Italy). After washing and draining, whole samples from the same batch and with similar dimensions(10 ± 0.1 mm) were selected and used for the study.
2.2. Treatments
For each sample, six conditions were analyzed: Raw (R), Blanched (BL), and treated with highhydrostatic pressure under four different conditions, as described later.
2.2.1. Blanching
Blueberries were blanched in a Combi-Steam SL (V-Zug, Zurich, Switzerland) oven, whichpresented an internal volume of 0.032 m3, an air speed of 0.5 m s−1, and a steam injection rate of0.03 kg min−1, at 95 ◦C for two min in accordance with Sablani et al. [15]. Nine samples were arrangedin a circle and one was placed at the center to ensure uniform heating conditions. The treatment wasconducted in triplicate.
62

Foods 2019, 8, 272
2.2.2. High Hydrostatic Pressure
The treatments were conducted in a 300 L high pressure plant (Avure Technologies Inc., Kent, WA,USA), at the “HPP Italia” of Traversetolo (Italy). Ten blueberries were vacuum sealed inside flexible(75 mm thickness) plastic pouches (Ultravac Solutions, Kansas City, MO, USA). Cold water (4 ◦C)was used as pressure medium. HHP treatments were conducted at 400 and 600 MPa, both for 1 and5 min; the samples were, thus, called 400-1, 400-5, 600-1, and 600-5. These conditions were chosen onthe basis of preliminary experiments performed on the same types of samples [16]. Treatments wereconducted at room temperature (20 ± 1 ◦C). Temperature increase due to compression was not higherthan 2–3 ◦C/100 MPa. Three pouches were processed and analyzed for each treatment condition.
2.3. Moisture Content
Moisture content was determined according to the Association of Official Agricultural Chemists(AOAC) method [17] on both raw and treated samples. Almost 5 g of homogenized sample (as triplicate)were dried in a convection oven (ISCO NSV 9035, ISCO, Milan, Italy) at 105 ◦C for at least 16 h untilconstant weight was reached. The samples were stored at 4 ◦C and their moisture content wasdetermined one day after HHP and thermal treatments.
2.4. Histological Analysis
The samples were fixed in formalin, acetic acid, alcohol (FAA) solution (formalin: acetic acid:60% ethanol solution, 2:1:17 v/v) [18]. After two weeks, they were dehydrated using increasinglyconcentrated alcoholic solutions. The inclusion was made in a methacrylate resin (Technovit 7100,Heraeus Kulzer and Co., Wehrheim, Germany) and the resulting blocks were sectioned with transversalcuts at 3 μm thickness using a semithin Leitz 1512 microtome (Leitz, Wetzlar, Germany). Thesections were stained with Toluidine Blue (TBO) and with a solution containing FeSO4 for the tanninanalysis [18]. Four pieces of fruit were sampled for each treatment. Sections were observed with aLeica DM 4000B optical microscope (Leica Imaging Systems Ltd., Wetzlar, Germany) equipped with aLeica DMC 2900 digital camera (Leica Imaging Systems Ltd., Wetzlar, Germany). The tissues weremeasured using an image analysis system (LAS v4.10.0, Leica Application Suite, Wetzlar, Germany).The microscopic observations were carried out by observing at least ten slides carrying ten sectionseach, for each specimen. The image analyses were carried out using a manual configuration of theimage analysis system.
2.5. DPPH Free Radical Scavenging Activity Test
Antioxidant molecules were extracted from 1 g of ground sample, using 5 mL of a methanol/water(70:30 v/v) solution, kept under motion for 60 min at room temperature, and then paper filtered. Thesolvent was evaporated, and the extract was then dissolved in 10 mL of methanol, thus centrifugedat 5040× g for 15 min at 4 ◦C. Analyses were performed in triplicate mixing 100 μL of surnatant and1 mL of 2,2-Diphenyl-1-picrylhydrazyl (DPPH) methanolic solution (0.2 mm), bringing the mix toa final volume of 2.4 mL with methanol. The absorbance of the solution was recorded at 517 nmby a Perkin Elmer UV-Visible spectrophotometer after an incubation time of 30 min in the dark atroom temperature. Blank was prepared and analyzed following the same procedure, using 100 μL ofmethanol instead of sample. The radical scavenging activity was calculated as follows:
I% = ((Abs0 − Abs1)/Abs0) × 100, (1)
where Abs0 was the absorbance of the blank and Abs1 was the absorbance of the sample. The TroloxEquivalent Antioxidant Capacity value (TEAC) expressed as μmol Trolox equivalents/gram of dryweight (μmol TE/g of dw) of the samples was calculated from the calibration curve obtained bymeasuring the absorbance at 517 nm of Trolox methanolic solutions at different concentrations. Threereplicates were analyzed for each treatment condition.
63

Foods 2019, 8, 272
2.6. Pectin Methylesterase (PME) Activity
The enzyme extraction and the determination of its activity were conducted according to the methodof Vicente et al. [19]. Five grams of sample were ground with 15 mL of 1 M NaCl (1:3, w/v) containing1% (w/v) of polyvinylpolypyrrolidone (PVPP). The suspension obtained was stirred for 4 h and thencentrifuged at 10,000× g for 30 min. The supernatant was collected, adjusted to pH 7.5 with 1 N NaOH,and used for assaying the enzyme activity. The activity was assayed in a mixture containing 600 μL of0.5% (w/v) pectin, 150 μL of 0.01% bromothymol blue pH 7.5, 100 μL of water pH 7.5, and 150 μL ofenzymatic extract. PME activity results in a progressive discoloration of the blue solution. The reductionof the absorbance at 620 nm was measured every 15 s for two minutes. The PME activity was calculatedusing the slope of a linear segment absorbance-time [20]. Percentage variations were calculated incomparison to the raw sample. Three replicates were analyzed for each treatment condition.
2.7. Texture Analysis
The texture of raw and treated samples was analyzed using a TA.XT2i Texture Analyzer equippedwith a 25 kg load cell (Stable Micro Systems, Godalming, UK), a force resolution equal to 0.01 N, andan accuracy value of 0.025%. Puncture test (trigger force 0.05 N) was performed using a 2 mm diameterstainless steel needle probe, driven up in a radial direction to the center of the samples at a speed of1 mm s−1, following the method proposed by Paciulli et al. [21].
The following parameters were determined from the force vs. time curves: first peak force (FP1
given in N), which indicates the resistance opposed by external cell layers to needle penetration [21];maximum puncture force (Fmax given in N), which indicates the resistance opposed by the pulp toneedle penetration; and Area under the force/time curve (Area given in N*s), which represents the totalwork carried out by the needle probe to penetrate the sample. The parameters were quantified usingthe application software provided (Texture Exponent for Windows, version 6.1 10.0). Ten blueberriesunits were analyzed for each treatment.
2.8. Color
Color determination was carried out using a Minolta Colorimeter (CM2600d, Minolta Co., Osaka,Japan) equipped with a standard illuminant D65, which simulates natural noon daylight in order tomimic the vision of the human eye. The measurement was performed on two opposite points onthe blueberries epidermis. The instrument was calibrated before each analysis with white and blackstandard tiles. L* (lightness; black = 0,white = 100), a* (redness > 0, greenness < 0), b* (yellowness > 0,blue < 0), C (chroma, 0 at the centre of the color sphere), and h◦ (hue angle, red = 0◦, yellow = 90◦,green = 180◦, blue = 270◦) were quantified on each fruit using a 10◦ position of the standard observer(Commission Internationale de l’eclairage), [22]). The ΔE for all the treated samples in comparison tothe raw vegetables was also calculated. 10 determinations were performed for each treatment.
2.9. Statistical Analysis
One-way analysis of variance (ANOVA) among all the different treated samples and twoway-ANOVA among the HHP treated samples, using pressure and time as independent variables,were performed using Statistical Package for Social Science (SPSS) software (Version 25.0, SPSS Inc.,Chicago, IL, USA). A Least Significant Difference (LSD) post-hoc test at a 95% confidence level (p ≤ 0.05)was performed to further identify differences among treatments.
Pearson correlation coefficients were calculated among all variables considering 95% and 99%confidence levels (p < 0.05 and p < 0.01).
Principal component analysis (PCA) was performed using the normalized variables, as reportedby Medina Meza et al. [23]. Before running PCA, factor analysis (FA) was applied to exclude thevariables that showed low contribution to explain the variance. FA was carried out on 10 independent
64

Foods 2019, 8, 272
variables and only parameters with factor loadings higher than 0.70 were used for PCA, plotting themversus all cases (samples).
3. Results and Discussion
3.1. Histological Analysis
Raw blueberries fruits showed an epidermis composed of a single layer of cells (Figure 1A),with abundant tannin inclusions (Figure 1B). The subdermis, located immediately under the skin,was composed of 2 or 3 layers of cells, and showed multiple solid tannin inclusions (Figure 1B).The epidermis and subdermis exhibited thickened cell walls. These layers contain the pigments.Mesocarp, composed of parenchymatic cells, showed thin layers and large vacuoles (Figure 1A). Fromthe observation of the transversal section stained with Tannin Solution, the presence of tannins wasperceived mainly in the epidermis and subdermis (Figure 1B). In these cellular layers, tannins weresolid and crystalline, while in the mesocarp parenchymatic tissue, tannins appeared as single inclusionsor “crystalline powder”. Zifkin and collaborators [24], in a study on blueberries, revealed that flavonols(condensed tannins) are among the major antioxidant compounds in epidermis and subdermis.
Figure 1. Transverse sections of blueberries samples: (A) raw or uncooked stained with Toluidine Blue(TBO); (B) raw or uncooked stained with tannin solution; (C) blanched stained with Toluidine Blue(TBO). Legend: e = epidermis; t = tannins; cs = cell separation; d = dehydration.
65
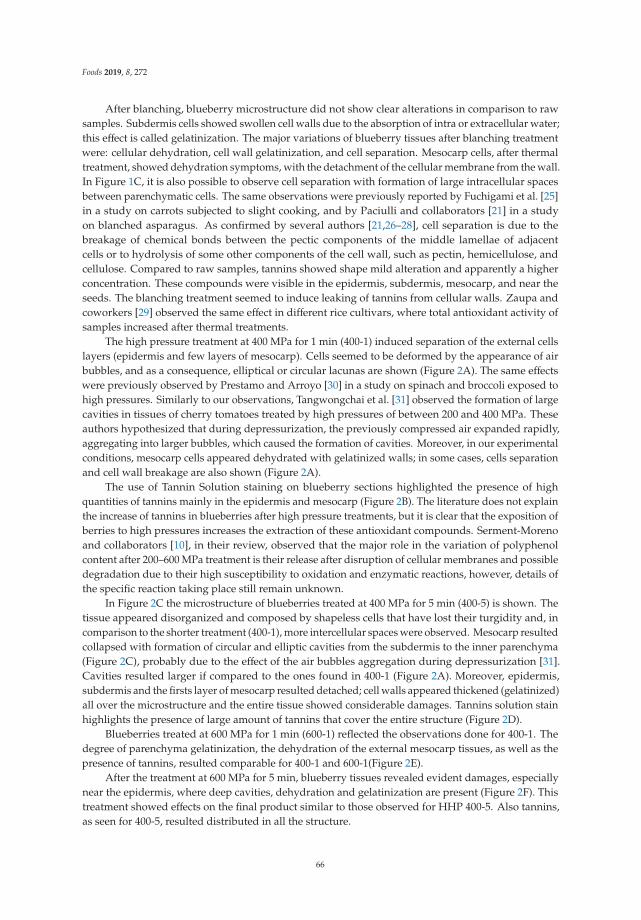
Foods 2019, 8, 272
After blanching, blueberry microstructure did not show clear alterations in comparison to rawsamples. Subdermis cells showed swollen cell walls due to the absorption of intra or extracellular water;this effect is called gelatinization. The major variations of blueberry tissues after blanching treatmentwere: cellular dehydration, cell wall gelatinization, and cell separation. Mesocarp cells, after thermaltreatment, showed dehydration symptoms, with the detachment of the cellular membrane from the wall.In Figure 1C, it is also possible to observe cell separation with formation of large intracellular spacesbetween parenchymatic cells. The same observations were previously reported by Fuchigami et al. [25]in a study on carrots subjected to slight cooking, and by Paciulli and collaborators [21] in a studyon blanched asparagus. As confirmed by several authors [21,26–28], cell separation is due to thebreakage of chemical bonds between the pectic components of the middle lamellae of adjacentcells or to hydrolysis of some other components of the cell wall, such as pectin, hemicellulose, andcellulose. Compared to raw samples, tannins showed shape mild alteration and apparently a higherconcentration. These compounds were visible in the epidermis, subdermis, mesocarp, and near theseeds. The blanching treatment seemed to induce leaking of tannins from cellular walls. Zaupa andcoworkers [29] observed the same effect in different rice cultivars, where total antioxidant activity ofsamples increased after thermal treatments.
The high pressure treatment at 400 MPa for 1 min (400-1) induced separation of the external cellslayers (epidermis and few layers of mesocarp). Cells seemed to be deformed by the appearance of airbubbles, and as a consequence, elliptical or circular lacunas are shown (Figure 2A). The same effectswere previously observed by Prestamo and Arroyo [30] in a study on spinach and broccoli exposed tohigh pressures. Similarly to our observations, Tangwongchai et al. [31] observed the formation of largecavities in tissues of cherry tomatoes treated by high pressures of between 200 and 400 MPa. Theseauthors hypothesized that during depressurization, the previously compressed air expanded rapidly,aggregating into larger bubbles, which caused the formation of cavities. Moreover, in our experimentalconditions, mesocarp cells appeared dehydrated with gelatinized walls; in some cases, cells separationand cell wall breakage are also shown (Figure 2A).
The use of Tannin Solution staining on blueberry sections highlighted the presence of highquantities of tannins mainly in the epidermis and mesocarp (Figure 2B). The literature does not explainthe increase of tannins in blueberries after high pressure treatments, but it is clear that the exposition ofberries to high pressures increases the extraction of these antioxidant compounds. Serment-Morenoand collaborators [10], in their review, observed that the major role in the variation of polyphenolcontent after 200–600 MPa treatment is their release after disruption of cellular membranes and possibledegradation due to their high susceptibility to oxidation and enzymatic reactions, however, details ofthe specific reaction taking place still remain unknown.
In Figure 2C the microstructure of blueberries treated at 400 MPa for 5 min (400-5) is shown. Thetissue appeared disorganized and composed by shapeless cells that have lost their turgidity and, incomparison to the shorter treatment (400-1), more intercellular spaces were observed. Mesocarp resultedcollapsed with formation of circular and elliptic cavities from the subdermis to the inner parenchyma(Figure 2C), probably due to the effect of the air bubbles aggregation during depressurization [31].Cavities resulted larger if compared to the ones found in 400-1 (Figure 2A). Moreover, epidermis,subdermis and the firsts layer of mesocarp resulted detached; cell walls appeared thickened (gelatinized)all over the microstructure and the entire tissue showed considerable damages. Tannins solution stainhighlights the presence of large amount of tannins that cover the entire structure (Figure 2D).
Blueberries treated at 600 MPa for 1 min (600-1) reflected the observations done for 400-1. Thedegree of parenchyma gelatinization, the dehydration of the external mesocarp tissues, as well as thepresence of tannins, resulted comparable for 400-1 and 600-1(Figure 2E).
After the treatment at 600 MPa for 5 min, blueberry tissues revealed evident damages, especiallynear the epidermis, where deep cavities, dehydration and gelatinization are present (Figure 2F). Thistreatment showed effects on the final product similar to those observed for HHP 400-5. Also tannins,as seen for 400-5, resulted distributed in all the structure.
66

Foods 2019, 8, 272
Figure 2. Transverse sections of blueberries samples treated using HHP technology: (A) 400-1 stainedwith Toluidine Blue (TBO); (B) 400-1 stained with tannin solution; (C) 400-5 stained with Toluidine Blue(TBO); (D) 400-5 stained with tannin solution; (E) 600-1 stained with Toluidine Blue (TBO); (F) 600-5stained with Toluidine Blue (TBO). Abbreviations: l = lacuna; sw = swelling; t = tannins.
Blanching and high pressures caused changes in the cellular structure of blueberries under theeffect of different phenomena: chemical and mechanical, respectively. Indeed, while blanching mainlyled to hydrolysis of pectin chemical bonds, causing cell separation, high pressures brought to localizedair bubbles explosions, breaking groups of cells. Blanching appeared thus less invasive than highpressure, although it involves widespread changes in the entire structure. On the other hand highpressures treatments, despite their strength, provoked localized damages. The extent of the cellulardamages due to high pressures resulted more influenced by treatment time than pressure intensity.
67

Foods 2019, 8, 272
3.2. Antioxidant Activity (DPPH)
In Table 1 are reported the values of blueberries antioxidant activity measured by DPPH assay.According to Zifkin et al. [24], the molecules responsible for antioxidant activity in blueberries areflavonols (condensed tannins), proantocyanidins and anthocyanins in epidermis and subdermis,anthocyanins in mesocarp, flavanols in placenta. These molecules act as radical scavengers [32].
Table 1. Water content, antioxidant activity and residual PME activity of raw and treated blueberries †.
R BL 400-1 400-5 600-1 600-5 P t P × t
DPPH (TEμmol/gdw) 103.4 ± 18.6 a 79.1 ± 5.1 ab 67.8 ± 6.5 b C 79.0 ± 4.1 ab AB 75.5 ± 7.5 b B 84.9 ± 2.1 ab A n.s. * n.s.
PME (%) 100 a 9.1 ± 2.14 c 64.8 ± 3.7 b C 95.7 ± 5.2 a A 83.5 ± 9.0 ab B 87.2 ± 14.2 a AB n.s. * *
Watercontent (%) 90.7 ± 1.9 a 88.4 ± 0.3 a 87.0 ± 0.8 a C 88.0 ± 0.7 a B 88.2 ± 1.1 a B 89.2 ± 0.2 a A * * n.s
† Data are expressed as means ± standard deviations of 3 samples. Means in row followed by different lowercaseletters are significantly different according to the post-hoc analysis after one-way analysis of variance (ANOVA)(p ≤ 0.05). Means in row, of high pressure treated samples, followed by different uppercase letters are significantlydifferent according to post-hoc comparisons after two-way ANOVA (p ≤ 0.05), performed considering pressure(P) and time (t) as independent variables. The p values were corrected for multiple comparisons use LSD method.Abbreviations: R = raw/untreated; BL = blanched; 400-1 = HHP at 400 MPa for 1 min; 400-5 = HHP at 400 MPa for5 min; 600-1 = HHP at 600 MPa for 1 min; 600-5 = HHP at 600 MPa for 5 min; TE = Trolox equivalent; PME = pectinmethylesterase; n.s. = not significant (p ≥ 0.05); * = significant (p ≤ 0.05).
Raw samples showed values of about 105 μmolTE/gdw; this value is in line with the results ofLohachoompol et al. [32], with slight differences attributable to the different blueberries varieties.
All the treatments affected blueberries antioxidant activity in comparison to raw samples.Blanching decreased it slightly, despite tannins, resulted better extracted from the cell walls (Par.3.1).Brownmiller et al. [3] registered a decrease of the total antioxidant activity after blueberries blanching,despite they didn’t observe any anthocyanins reduction, probably because of other antioxidantmolecules losses. Conversely, Rossi et al. [33] observed higher antioxidant activity in blueberries juiceafter fruits blanching, probably because of the rapid polyphenoloxidase inactivation and/or increase inextraction yield, due to heat induced skin permeability [34].
The high pressure treated samples showed behaviors similar to the blanched ones (Table 1). Onthe other hand, in comparison to R, 400-1 and 600-1 showed a significantly lower antioxidant activity,with losses of around 34 and 27%, respectively. 600-5 resulted instead the less impacting treatmentwith around 82% retention of the total activity. Two-way ANOVA, conducted among the HHPtreated samples, revealed a time-dependent behavior: the longer the time, the higher the antioxidantactivity. The retention of the antioxidant activity with the increase of the pressure holding time may beexplained as a better extraction of the bioactive molecules from the broken cells, as suggested by otherauthors [20] and confirmed by the histological observations (Figure 2). Moreover it’s known that thetotal antioxidant activity in blueberries is due to several classes of molecules, differently distributedamong the tissues [24], that can thus be extracted under different conditions. The highest loss ofantioxidant activity registered for 400-1 and 600-1 may be also attributable to the poor inactivation ofPPO and POD, the main enzymes responsible for phenol decay [35].
3.3. Pectin Methylesterase (PME) Activity
Pectin methyl esterase (PME) is the enzyme responsible for the demethylesterification of plantcell walls pectin. This enzyme, in combination with polygalacturonase, affects texture of fruit andvegetables during postharvest storage [35].
In Table 1, the blueberry PME activity is reported as percentage variation in comparison to theraw sample. Among treatments, blanching, with a residual activity of 10%, was the most effective onPME inactivation, because of the protein thermal denaturation [36]. On the other hand, high pressuretreatments had lower effect on PME inactivation. HHP400-1, leading to a residual PME activity of
68

Foods 2019, 8, 272
around 65%, resulted the most effective high-pressure treatment. The high PME baro-resistance isreported for many fruit and vegetables [37]. It has been shown that, among many studied products,tomato PME is the most pressure-resistant, even being inactivated at ambient conditions up to800 MPa [37]. The two-way ANOVA, performed among the four HHP treatments, revealed a timedependence for blueberry PME inactivation by high pressure—the higher the pressure holding time,the lower the inactivation. Similarly, Paciulli et al. [20] reported increased enzymatic activity for longerpressure exposure times on beetroot slices. These authors explained this phenomenon with enzymesleaking from the broken cells, which leading to easier contact with the substrates, results in higheractivities. This hypothesis follows the same trend of the antioxidant activity and is supported bythe histological observations that show 400-5 and 600-5 as the most damaged tissues (Figure 2C–F).Phenomena of enzyme activation, under the effect of high pressure, due to conformational changeshave also been reported [38]. A significant interaction of time and pressure was also revealed by thetwo-way ANOVA; indeed, 400-5 showed almost no effect on PME. In contrast, in a study on twodifferent varieties of pumpkin, Paciulli et al. [39] reported high-pressure treatment at 400 MPa for5 min as the most effective against PME, with a residual activity of 20–25%; this demonstrates that thePME barotolerance is specie dependent.
3.4. Texture
Figure 3 reports the texture analysis profiles of blueberries in all the studied conditions, obtainedby puncture test. In the same figure, the parameters Fp1, Fmax, and Area are shown, and their valuessummarized in Table 2. The absence of significant differences in water content (Table 1) between rawand treated samples indicates that the observed texture differences were not related to the cellularturgidity, but they strictly depend on the tissues structure, as modified by the treatments.
Figure 3. Texture analysis profiles of raw and treated blueberries obtained by puncture test.Abbreviations: R = raw or untreated; BL = blanched; 400-1 =HHP at 400 MPa for 1 min; 400-5 =HHP at400 MPa for 5 min; 600-1=HHP at 600 MPa for 1 min; 600-5=HHP at 600 MPa for 5 min; FP1 =maximumforce first peak; Fmax = absolute maximum force; Area = area under the force/time curve.
69

Foods 2019, 8, 272
Table 2. Texture parameters † for raw and treated blueberries.
Samples FP1 (N) Fmax (N) Area (N*s)
R 0.30 ± 0.03 a 0.32 ± 0.06 a 0.79± 0.14 a
BL 0.19 ± 0.03 c 0.10 ± 0.03 b 0.22 ± 0.03 c
400-1 0.22 ± 0.04 bc AB 0.10 ± 0.03 b B 0.26 ± 0.04 bc B
400-5 0.20 ± 0.04 bc B 0.10 ± 0.03 b B 0.28 ± 0.06 bc B
600-1 0.20 ± 0.04 bc B 0.10 ± 0.03 b B 0.27 ± 0.05 bc B
600-5 0.25 ± 0.05 ab A 0.14 ± 0.04 b A 0.36 ± 0.08 b A
P t P × t P t P × t P t P × tn.s. n.s. * n.s. n.s. n.s. n.s. * n.s.
Note: † Data are expressed as means ± standard deviations of 10 samples. Means in columns followed by differentlowercase letters are significantly different according to the post-hoc analysis after one-way analysis of variance(ANOVA) (p ≤ 0.05). Means in columns of high-pressure treated samples followed by different uppercase letters aresignificantly different according to post-hoc comparisons after two-way ANOVA (p ≤ 0.05), performed consideringpressure (P) and time (t) as independent variables. The p values were corrected for multiple comparisons use LSDmethod. Abbreviations: R = raw/untreated; BL = blanched; 400-1 = HHP at 400 MPa for 1 min; 400-5 = HHP at400 MPa for 5 min; 600-1 =HHP at 600 MPa for 1 min; 600-5 =HHP at 600 MPa for 5 min; FP1 =maximum forcefirst peak; Fmax = absolute maximum force; Area = area under the force/time curve; n.s. = not significant (p ≥ 0.05);* = significant (p ≤ 0.05).
The first peak force (Fp1) was generated in blueberries by epidermal and subdermal cells,characterized by cutinization and thickened cell walls (Figure 1A, Section 3.1). It is visible howuntreated blueberries showed the highest FP1 (~0.30 N) among all samples. Blanching led to thehighest FP1 drop among all treatments. This phenomenon, already reported for other blanchedvegetables [21], may be ascribable to the external cell wall swelling (Figure 1C, Par.3.1) and pectinthermal degradation, with consequent softening. HHP treated samples showed Fp1 values significantlylower than R, with the exception of 600-5, which showed values of Fp1 around 0.25 N, slightly higherthan BL. Fp1 reduction under high pressure can be justified by the detachment of the epidermis,subdermis, and first mesocarp layers, as well as cell wall swelling, as observed from the histologicalanalysis (Figure 2). The two-way ANOVA performed among the high-pressure treated samples (Table 1)showed a synergistic effect of pressure and time on Fp1. Texture recovery during pressure holding timewas already reported by other authors [20,40] and associated to the insufficient inactivation of PME,whose reaction product is the low-methoxy pectin, that forms a gel-networkwith divalent ions such asCa and Mg, contributing to the enhanced hardness value. This hypothesis, more evident at 600 MPa, issupported by the PME activity results (Table 1). At 400 MPa, the effect of the tissue damage prevails.
Comparing Fmax with Fp1 (Table 2), it is visible how, after treatments, Fp1 was almost 50%higher than Fmax, indicating that the skin had the major effect on blueberries mechanical properties.Moreover, Fmax of all the treated samples was significantly lower than the raw ones (Table 2); thisphenomenon may be justified by an easier penetration of the needle probe across the dehydrated andgelled parenchyma of the blanched (Figure 1C, Section 3.1) and HHP treated blueberries (Figure 2,Par.3.1). Among the HHP treated samples, 600-5 was significantly firmer than the others. Texturerecovery after prolonged exposures to high pressure has already been reported [40]. This phenomenon,as discussed for Fp1, can be justified with the high PME activity.
Area values comprise both the effect of skin and pulp penetration. It has been confirmed thatall of the treatments were detrimental for blueberry texture, showing significantly lower Area valuesin comparison to the untreated samples. Despite BL samples showing the lowest values among allsamples (~0.22 N*s), only 600-5 (~0.36 N*s) was significantly higher than BL. The two-way ANOVAconfirmed a time dependence of the Area values under the effect of pressure—the higher the exposuretime, the higher the Area values. This phenomenon, already reported in previous studies, was justifiedeither with tissue recovery during the holding time [41], or with the still high PME activity [42].Confirming the last hypothesis, a positive correlation was found between Area values and PME(R = 0.498; p < 0.05); with increasing PME activity, the firmness of blueberries increased.
70

Foods 2019, 8, 272
3.5. Color
The bluish blueberry skin color is affected by anthocyanin content, as well as by the presenceof surface waxes [43]. L*, a*, and b* values, measured on raw samples (Table 3), are in line withdata already reported for different varieties of blueberries [43]. After blanching, blueberries wereslightly darker than the raw samples, with lower L* values (Table 3); this may be related to melting ofblueberries’ cutaneous wax [44]. At the same time, a* and b* increase, indicating enhancement of theperceived red and blue colors. The slight increase of the color intensity C may be instead ascribed toalterations of the surface reflecting properties. Similarly, Mazzeo et al. [45] found an enhancement ofthe asparagus, green bean, and zucchini green color after blanching; they associated it to a change of thecolor perception due to the air replacement with water and cell juices. The shift of h◦ from about 270 to350 degrees confirms the shift to a red-purple color. According to ΔE values, blanching was the moreaffecting treatment. According to previous studies, thermal treatments are more detrimental than highpressure on the anthocyanin content of fruits, with consequent higher color changes [46]. Focusingon the HHP samples, while a* behaved similar to the blanched samples, L*, b*, and consequently Cwere influenced by the time/pressure interaction. Among the HHP treatments, HHP600-1 was themost affecting treatment, leading to brighter and more intense blue tones, as also confirmed by theshift of h◦ to values around 300 degrees. On the other hand, HHP600-5 was the least affecting HHPtreatment; this may be due to better anthocyanins extraction [46], associated in our study with the highantioxidant activity of these samples.
Table 3. Color parameters for raw and treated blueberries †.
L* a* b* C h◦ ΔE
R 31.50 ± 2.00 ab 0.08 ± 0.02 b −1.66 ± 0.53 ab 1.66 ± 0.53 c 272.72 ± 1.94 c -BL 28.30 ± 3.96 b 2.67 ± 0.98 a −0.41 ± 0.18 a 2.72 ± 0.95 bc 349.49 ± 7.50 a 5.64 ± 1.10 a
400-1 30.15 ± 3.46 ab B 2.52 ± 0.96 a A −1.74 ± 1.08 ab A 3.19 ± 1.08 ab B 326.41 ± 18.48 a A 4.18 ± 1.66 abc AB
400-5 31.05 ± 2.79 ab B 2.01 ± 1.07 a A −2.37 ± 1.50 bc A 3.42 ± 1.02 ab B 312.02 ± 24.83 ab AB 3.56 ± 1.23 bc B
600-1 34.80 ± 1.69 a A 2.30 ± 0.47 a A −3.61 ± 1.04 c B 4.43 ± 0.53 a A 304.62 ± 14.43 b B 4.72 ± 1.01 ab A600-5 30.86 ± 1.44 ab B 2.06 ± 0.80 a A −1.95 ± 0.73 bc A 2.93 ± 0.73 b B 317.06 ± 16.23 ab AB 2.60 ± 0.73 c C
P t P × t P t P × t P t P × t P t P × t P t P × t P t P × tn.s. n.s. * n.s. n.s. n.s. n.s. n.s. * n.s. n.s. * n.s. n.s. n.s. n.s * n.s.
Note: † Data are expressed as means ± standard deviations of 10 samples. Means in columns followed by differentlowercase letters are significantly different according to the post-hoc analysis after one-way analysis of variance(ANOVA) (p ≤ 0.05). Means in columns of high-pressure treated samples followed by different uppercase letters aresignificantly different according to post-hoc comparisons after two-way ANOVA (p ≤ 0.05), and were performedconsidering pressure (P) and time (t) as independent variables. The p values were corrected for multiple comparisonsusing LSD method. Abbreviations: R = raw or untreated; BL = blanched; 400-1 = HHP at 400 MPa for 1 min;400-5 = HHP at 400 MPa for 5 min; 600-1 = HHP at 600 MPa for 1 min; 600-5 = HHP at 600 MPa for 5 min;L = lightness; a* = redness; b* = blueness; C = chroma; h◦ = hue angle; n.s. = not significant (p ≥ 0.05); * = significant(p ≤ 0.05).
3.6. Principal Component Analysis
Based on the obtained results, Principal Component Analysis (PCA) (Figure 4) was performedtoenable an overview of the variables that mainly influenced the final quality of blueberries under theeffect of the different studied treatments. Starting from 10 variables (DPPH, PME, Fp1, Fmax, Area, L,a*, b*, C, h◦), factor analysis excluded DPPH because it showed low contribution to the total variance.
Nine variables were selected, generating a score plot in which the first two principal components(PC) explained 86.66% of the total variance. The first and more discriminating component (PC1) wasrelated to texture and color parameters; in particular, Fp1, Fmax, and Area showed positive loadings onPC1, being inversely related to a*. On the second component (PC2), the color parameters L* and b*showed high positive factor loadings. The variables PME and h◦ resulted in opposite positions onthe plan, having respectively positive and negative factor loadings, both on PC1 and PC2. The colorparameter C showed positive loadings on PC1 and negative on PC2. Based on this distribution, thesamples were grouped into three clusters: Raw, Blanched, and HHP treated samples. Raw samples
71

Foods 2019, 8, 272
were directly related with all of the texture parameters, being instead inversely related to the redcomponent a*, indicating a more turgid structure with an opaque red color. Blanched samples wereinversely related to PME and with the color parameters L and b*, having instead a positive relationwith h◦. The wide distance between raw and blanched samples on the factor plan confirmed thatthe blanched blueberries were the ones that deviated most from raw fruit in terms of organolepticproperties, however being the most effective treatment on PME inactivation. HHP treated samplesclustered together in the middle zone between raw and blanched samples, indicating high pressure asa mild treatment if compared to the thermal one. Among the HHP treatments, 600-1 slightly differedfrom the other samples, mainly in relation to the color parameters L and b*.
Figure 4. Principal Component Analysis (PCA) results obtained for the two principal components:Projection of the variables and of the cases on the factor plane (1 × 2). Abbreviations: R = raw/untreated;BL = blanched; 400-1 = HHP at 400 MPa for 1 min; 400-5 = HHP at 400 MPa for 5 min; 600-1 = HHP at600 MPa for 1 min; 600-5 =HHP at 600 MPa for 5 min; FP1 =maximum force first peak; Fmax = absolutemaximum force; Area = area under the force/time curve; PME = pectin methylesterase; L = lightness;a* = redness; b* = blueness; C = chroma; h◦ = hue angle; PC = Principal Component.
4. Conclusions
The application of high pressure as a fruit preservation technique has shown mild effects onthe organoleptic properties of blueberries if compared to blanching, despite the more severe tissuedamage. Focusing on the high-pressure treatments, an interesting effect of the pressure holding timewas observed on almost all of the investigated variables. Indeed, less PME deactivation, higher textureand color retention, and better antioxidant activity were observed by increasing the treatment time forboth of the tested pressures. These phenomena, probably related to an easier extraction of intracellularmolecules from the broken cells, were particularly visible for 600-5, the sample subjected to the mostintense high-pressure treatment. Almost no effect of the pressure level was evidenced in this study.The high PME activity, considered a defect of the high pressure treated samples, was, however, relatedto a better texture recovery during treatment. A shelf life study will be necessary to evaluate theevolution of these parameters over time.
72

Foods 2019, 8, 272
Author Contributions: Conceptualization, P.M., I.G.M.M., R.M., and E.C.; methodology, P.M., R.M., T.G., A.P.,M.R., and M.M.; validation, P.M., R.M., T.G., and E.C.; formal Analysis, P.M., A.P., and M.R.; investigation, P.M.,A.P., and M.R.; data Curation, P.M. and I.G.M.M.; writing—original draft preparation, P.M., I.G.M.M., and T.G.;writing—review and editing, M.P., I.G.M.M., T.G., and E.C.; visualization, D.B. and E.C.; supervision, D.B., M.M.and E.C.
Funding: This research received no external funding.
Conflicts of Interest: The authors declare no conflict of interest.
References
1. Kalt, W.; Joseph, J.A.; Shukitt-Hale, B. Blueberries and human health: A review of current research. J. Am.Pomol. Soc. 2007, 61, 151–160.
2. Toivonen, P.M.; Brummell, D.A. Biochemical bases of appearance and texture changes in fresh-cut fruit andvegetables. Postharvest Boil. Technol. 2008, 48, 1–14. [CrossRef]
3. Brownmiller, C.; Howard, L.R.; Prior, R.L. Processing and storage effects on monomeric anthocyanins, percentpolymeric color, and antioxidant capacity of processed blueberry products. J. Food Sci. 2008, 73, H72–H79.[CrossRef] [PubMed]
4. Zielinska, M.; Sadowski, P.; Błaszczak, W. Freezing/thawing and microwave-assisted drying of blueberries(Vaccinium corymbosum L.). LWT Food Sci. Technol. 2015, 62, 555–563. [CrossRef]
5. Guerrero-Beltrán, J.A.; Barbosa-Cánovas, G.V.; Swanson, B.G. High hydrostatic pressure processing of fruitand vegetable products. Food Rev. Int. 2005, 21, 411–425. [CrossRef]
6. Medina-Meza, I.G.; Barnaba, C.; Barbosa-Cánovas, G.V. Effects of high pressure processing on lipid oxidation:A review. Innov. Food Sci. Emerg. Technol. 2014, 22, 1–10. [CrossRef]
7. Medina-Meza, I.G.; Barnaba, C.; Villani, F.; Barbosa-Cánovas, G.V. Effects of thermal and high pressuretreatments in color and chemical attributes of an oil-based spinach sauce. LWT Food Sci. Technol. 2015, 60,86–94. [CrossRef]
8. Tejada-Ortigoza, V.; García-Amezquita, L.E.; Serna-Saldívar, S.O.; Welti-Chanes, J. The dietary fiber profileof fruit peels and functionality modifications induced by high hydrostatic pressure treatments. Food Sci.Technol. Int. 2017, 23, 396–402. [CrossRef]
9. Tejada-Ortigoza, V.; Garcia-Amezquita, L.E.; Serna-Saldívar, S.O.; Martín-Belloso, O.; Welti-Chanes, J. Highhydrostatic pressure and mild heat treatments for the modification of orange peel dietary fiber: Effects onhygroscopic properties and functionality. Food Bioprocess Tech. 2018, 11, 110–121. [CrossRef]
10. Serment-Moreno, V.; Jacobo-Velázquez, D.A.; Torres, J.A.; Welti-Chanes, J. Microstructural and physiologicalchanges in plant cell induced by pressure: Their role on the availability and pressure-temperature stability ofphytochemicals. Food Eng. Rev. 2017, 9, 314–334. [CrossRef]
11. Harris, P.J.; Smith, B.G. Plant cell walls and cell-wall polysaccharides: Structures, properties and uses in foodproducts. Int. J. Food Sci. Technol. 2006, 41, 129–143. [CrossRef]
12. Voragen, A.G.; Coenen, G.J.; Verhoef, R.P.; Schols, H.A. Pectin, a versatile polysaccharide present in plant cellwalls. Struct. Chem. 2009, 20, 263. [CrossRef]
13. Huang, R.; Ye, M.; Li, X.; Ji, L.; Karwe, M.; Chen, H. Evaluation of high hydrostatic pressure inactivation ofhuman norovirus on strawberries, blueberries, raspberries and in their purees. Int. J. Food Microbiol. 2016,223, 17–24. [CrossRef] [PubMed]
14. Altuner, E.M.; Tokusoglu, Ö. The effect of high hydrostatic pressure processing on the extraction, retentionand stability of anthocyanins and flavonols contents of berry fruits and berry juices. Int. J. Food Sci. Technol.2013, 48, 1991–1997. [CrossRef]
15. Sablani, S.S.; Andrews, P.K.; Davies, N.M.; Walters, T.; Saez, H.; Syamaladevi, R.M.; Mohekar, P.R. Effect ofthermal treatments on phytochemicals in conventionally and organically grown berries. J. Sci. Food Agric.2010, 90, 769–778. [CrossRef]
16. Oey, I.; Lille, M.; Van Loey, A.; Hendrickx, M. Effect of high-pressure processing on colour, texture andflavour of fruit-and vegetable-based food products: A review. Trends Food Sci. Technol. 2008, 19, 320–328.[CrossRef]
17. AOAC. Official Methods of Analysis, 16th ed.; Association of Official Analytical Chemists: Arlington, VA,USA, 2002.
73

Foods 2019, 8, 272
18. Ruzin, S. Plant Microtechnique and Microscopy; Oxford University Press: Oxford, UK, 1999; Volume 198.19. Vicente, A.R.; Costa, M.L.; Martínez, G.A.; Chaves, A.R.; Civello, P.M. Effect of heat treatments on cell wall
degradation and softening in strawberry fruit. Postharvest Biol. Technol. 2005, 38, 213–222. [CrossRef]20. Paciulli, M.; Medina-Meza, I.G.; Chiavaro, E.; Barbosa-Cánovas, G.V. Impact of thermal and high pressure
processing on quality parameters of beetroot (Beta vulgaris L.). LWT Food Sci. Tech. 2016, 68, 98–104.[CrossRef]
21. Paciulli, M.; Ganino, T.; Pellegrini, N.; Rinaldi, M.; Zaupa, M.; Fabbri, A.; Chiavaro, E. Impact of the industrialfreezing process on selected vegetables—Part I. Structure, texture and antioxidant capacity. Food Res. Int.2015, 74, 329–337. [CrossRef]
22. Commission Internationale de l’eclairage (CIE). Recommendations on Uniform Colourspaces-Colour Equations,Psychometric Colour Terms. Supplement no. 2 to CIE Publ. No. 15 (E-1.3.L) 1971/9TC-1-3; CIE: Paris, France,1978.
23. Medina-Meza, I.G.; Aluwi, N.A.; Saunders, S.R.; Ganjyal, G.M. GC–MS profiling of triterpenoid saponinsfrom 28 quinoa varieties (Chenopodium quinoa Willd.) grown in Washington State. J. Agric. Food Chem. 2016,64, 8583–8591. [CrossRef]
24. Zifkin, M.; Jin, A.; Ozga, J.A.; Zaharia, I.; Schernthaner, J.P.; Gesell, A.; Abrams, S.R.; Kennedy, J.A.;Constabel, C.P. Gene expression and metabolite profiling of developing highbush blueberry (Vacciniumcorymbosum L.) fruit indicates transcriptional regulation of flavonoid metabolism and activation of abscisicacid metabolism. Plant Physiol. 2012, 158, 200–224. [CrossRef] [PubMed]
25. Fuchigami, M.; Hyakumoto, N.; Miyazaki, K. Programmed freezing affects texture, pectic composition andelectron microscopic structures of carrots. J. Food Sci. 1995, 60, 137–141. [CrossRef]
26. Sila, D.N.; Smout, C.; Elliot, F.; Loey, A.V.; Hendrickx, M. Non-enzymatic depolymerization of carrot pectin:Toward a better understanding of carrot texture during thermal processing. J. Food Sci. 2006, 71, E1–E9.[CrossRef]
27. Lecain, S.; Ng, A.; Parker, M.L.; Smith, A.C.; Waldron, K.W. Modification of cell-wall polymers of onionwaste—Part I. Effect of pressure-cooking. Carbohydr. Polym. 1999, 38, 59–67. [CrossRef]
28. Van Marle, J.T.; Stolle-Smits, T.; Donkers, J.; van Dijk, C.; Voragen, A.G.; Recourt, K. Chemical and microscopiccharacterization of potato (Solanum tuberosum L.) cell walls during cooking. J. Agric. Food Chem. 1997, 45,50–58. [CrossRef]
29. Zaupa, M.; Ganino, T.; Dramis, L.; Pellegrini, N. Anatomical study of the effect of cooking on differentlypigmented rice varieties. Food Struct. 2016, 7, 6–12. [CrossRef]
30. Prestamo, G.; Arroyo, G. High hydrostatic pressure effects on vegetable structure. J. Food Sci. 1998, 63,878–881. [CrossRef]
31. Tangwongchai, R.; Ledward, D.A.; Ames, J.M. Effect of high-pressure treatment on the texture of cherrytomato. J. Agric. Food Chem. 2000, 48, 1434–1441. [CrossRef]
32. Lohachoompol, V.; Mulholland, M.; Srzednicki, G.; Craske, J. Determination of anthocyanins in variouscultivars of highbush and rabbiteye blueberries. Food Chem. 2008, 111, 249–254. [CrossRef]
33. Rossi, M.; Giussani, E.; Morelli, R.; Scalzo, R.L.; Nani, R.C.; Torreggiani, D. Effect of fruit blanching onphenolics and radical scavenging activity of highbush blueberry juice. Food Res. Int. 2003, 36, 999–1005.[CrossRef]
34. Kalt, W.; McDonald, J.E.; Donner, H. Anthocyanins, phenolics, and antioxidant capacity of processed lowbushblueberry products. J. Food Sci. 2000, 65, 390–393. [CrossRef]
35. Cao, S.; Zheng, Y.; Wang, K.; Rui, H.; Tang, S. Effect of methyl jasmonate on cell wall modification of loquatfruit in relation to chilling injury after harvest. Food Chem. 2010, 118, 641–647. [CrossRef]
36. Duvetter, T.; Sila, D.N.; Van Buggenhout, S.; Jolie, R.; Van Loey, A.; Hendrickx, M. Pectins in processed fruitand vegetables: Part I—Stability and catalytic activity of pectinases. Compr. Rev. Food Sci. Food Saf. 2009, 8,75–85. [CrossRef]
37. Terefe, N.S.; Buckow, R.; Versteeg, C. Quality-related enzymes in fruit and vegetable products: Effects ofnovel food processing technologies, Part 1: High-pressure processing. Crit. Rev. Food Sci. Nutr. 2014, 54,24–63. [CrossRef] [PubMed]
38. Hendrickx, M.; Ludikhuyze, L.; Van den Broeck, I.; Weemaes, C. Effects of high pressure on enzymes relatedto food quality. Trends Food Sci. Technol. 1998, 9, 197–203. [CrossRef]
74

Foods 2019, 8, 272
39. Paciulli, M.; Rinaldi, M.; Rodolfi, M.; Ganino, T.; Morbarigazzi, M.; Chiavaro, E. Effects of high hydrostaticpressure on physico-chemical and structural properties of two pumpkin species. Food Chem. 2019, 274,281–290. [CrossRef] [PubMed]
40. Basak, S.; Ramaswamy, H.S. Effect of high pressure processing on the texture of selected fruits and vegetables.J. Texture Stud. 1998, 29, 587–601. [CrossRef]
41. Araya, X.I.T.; Hendrickx, M.; Verlinden, B.E.; Van Buggenhout, S.; Smale, N.J.; Stewart, C.; Mawson, A.J.Understanding texture changes of high pressure processed fresh carrots: A microstructural and biochemicalapproach. J. Food Eng. 2007, 80, 873–884. [CrossRef]
42. Kaushik, N.; Kaur, B.P.; Rao, P.S. Application of high pressure processing for shelf life extension of litchi fruits(Litchi chinensis cv. Bombai) during refrigerated storage. Food Sci. Technol. Int. 2014, 20, 527–541. [CrossRef]
43. Saftner, R.; Polashock, J.; Ehlenfeldt, M.; Vinyard, B. Instrumental and sensory quality characteristics ofblueberry fruit from twelve cultivars. Postharvest Biol. Technol. 2008, 49, 19–26. [CrossRef]
44. Lacombe, A.; Niemira, B.A.; Gurtler, J.B.; Fan, X.; Sites, J.; Boyd, G.; Chen, H. Atmospheric cold plasmainactivation of aerobic microorganisms on blueberries and effects on quality attributes. Food Microbiol. 2015,46, 479–484. [CrossRef] [PubMed]
45. Mazzeo, T.; Paciulli, M.; Chiavaro, E.; Visconti, A.; Fogliano, V.; Ganino, T.; Pellegrini, N. Impact of theindustrial freezing process on selected vegetables-Part II. Colour and bioactive compounds. Food Res. Int.2015, 75, 89–97. [CrossRef] [PubMed]
46. Patras, A.; Brunton, N.P.; Da Pieve, S.; Butler, F. Impact of high pressure processing on total antioxidantactivity, phenolic, ascorbic acid, anthocyanin content and colour of strawberry and blackberry purées. Innov.Food Sci. Emerg. Technol. 2009, 10, 308–313. [CrossRef]
© 2019 by the authors. Licensee MDPI, Basel, Switzerland. This article is an open accessarticle distributed under the terms and conditions of the Creative Commons Attribution(CC BY) license (http://creativecommons.org/licenses/by/4.0/).
75

foods
Article
Convective Drying of Fresh and Frozen Raspberriesand Change of Their Physical and Nutritive Properties
Zoran Stamenkovic 1, Ivan Pavkov 1, Milivoj Radojcin 1,*, Aleksandra Tepic Horecki 2,
Krstan Kešelj 1, Danijela Bursac Kovacevic 3 and Predrag Putnik 3
1 Faculty of Agriculture, University of Novi Sad, Trg Dositeja Obradovica 8, 21000 Novi Sad, Serbia2 Faculty of Technology, University of Novi Sad, Bulevarcara Lazara 1, 21000 Novi Sad, Serbia3 Faculty of Food Technology and Biotechnology, University of Zagreb, Pierottijeva 6, 10000 Zagreb, Croatia* Correspondence: [email protected]; Tel.: +381-214853431; Fax: +381-21459989
Received: 7 June 2019; Accepted: 4 July 2019; Published: 11 July 2019
Abstract: Raspberries are one of Serbia’s best-known and most widely exported fruits. Due tomarket fluctuation, producers are looking for ways to preserve this fresh product. Drying is a widelyaccepted method for preserving berries, as is the case with freeze-drying. Hence, the aim was toevaluate convective drying as an alternative to freeze-drying due to better accessibility, simplicity,and cost-effectiveness of Polana raspberries and compare it to a freeze-drying. Three factors were inexperimental design: air temperature (60, 70, and 80 ◦C), air velocity (0,5 and 1,5 m·s−1), and state ofa product (fresh and frozen). Success of drying was evaluated with several quality criteria: shrinkage(change of volume), color change, shape, content of L-ascorbic acid, total phenolic content, flavonoidcontent, anthocyanin content, and antioxidant activity. A considerable influence of convective dryingon color changes was not observed, as ΔE was low for all samples. It was obvious that fresh raspberrieshad less physical changes than frozen ones. On average, convective drying reduced L–ascorbic acidcontent by 80.00–99.99%, but less than 60% for other biologically active compounds as compared tofresh raspberries. Convective dried Polana raspberry may be considered as a viable replacement forfreeze-dried raspberries.
Keywords: raspberry; convective drying; freeze-drying; bioactive compounds; shrinkage;color change
1. Introduction
Raspberries (Rubus idaeus) are one of the most important fruits in Serbian agriculture. It hasbeen recently reported that raspberry production in 2017 was 109,742 t, which positions Serbia as onefrom the three leading countries in raspberry world production [1]. Over 90% of produced Serbianraspberries are commonly frozen, while only 10% is immediately used for processing or sold on openmarkets [2]. At their full maturity, raspberries have high moisture content (84% w.b.), L-ascorbic acidcontent, and potassium, as well as proteins, fibers, and minerals [3–7]; moreover, they contain variousbiologically active compounds (BACs) with high antioxidant activity. BACs found in raspberriesinclude anthocyanins (cyanidin-3-sambubioside, cyanidin-3-glucoside, cyanidin-3-xylosylrutinoside,and cyanidin-3-rutinoside), ellagic acid, hydrolysable tannins (derivatives of gallic and ellagicacid), proanthocyanidins, vecetin, quercetin and rutin [8–10], carotenoids (lutein, zeaxanthin, alphacarotene, and beta carotene), chlorophyll derivatives, and tocopherols [11], with antioxidative andanti-inflammatory potential [12,13].
In Serbia, raspberries are often processed to jelly, diary, or confectionery products able to be storedfor a longer time [6,14–17], however it is difficult to preserve this berries with high level of naturalproperties. In industry, this problem is commonly tackled with some form of drying, where one ofthe most popular procedures is convective drying that is done at high temperatures and for a long
Foods 2019, 8, 251; doi:10.3390/foods8070251 www.mdpi.com/journal/foods76

Foods 2019, 8, 251
processing time. This often leads to chemical and biochemical changes and loss of native quality ofthis fruits with changes of color, taste, aroma, and nutritive value [18]. Previous studies showed thatconvective drying of red raspberries changed their volume, color, shape, and the content of BACs,this is especially true for contents of L–ascorbic acid, flavonoids, anthocyanins, and others [6,19–21].Therefore, freeze-drying has been established as a standard process in the industry, to preserve nutritivevalue and extend the shelf life. A downside, however, is that freeze-drying is an expensive technology,not only in terms of the initial investment, but also during processing, even though previous reportsshowed that freeze-dried fruits, in comparison to convective dried ones, have better preserved theirphysiochemical, nutritive, and sensory properties [22,23]. The choice of the drying method for aparticular food product is a crucial step as the drying procedure and operating conditions have impacton the quality of the dried product and its cost [24]. Despite its simplicity and low investment cost,convective drying is the most common dehydration technique in the food industry with a focus onminimizing economic and environmental impacts. Energy consumption and energy saving potential ofconvective drying may be tempered by combining new technologies with traditional drying procedures.Bórquez et al. [6] evaluated quality changes during osmotic dehydration of raspberries in sucrosesolution with vacuum pretreatment, and followed by microwave-vacuum drying. Obtained resultsshowed acceptable results regarding the preservation of color, taste and structure of these berries.Unfortunately, L-ascorbic acid content decreased 5-fold (220 to 41 mg/100 g), therefore reutilization ofsucrose solution with higher initial concentration of L-ascorbic acid is recommended to reduce thelosses to 60%.
Kowalski et al. [20] tested different drying techniques of raspberries, i.e., hot air drying vs.combined hybrid drying consisting of simultaneous hot air, microwave, and ultrasound drying, on thekinetics, energy consumption, and product quality. Results revealed that combined hybrid dryingsignificantly improved the drying kinetics and the energy utilization. However, the total CIELabcolor difference (ΔE) ranged from 12 to 15, which implies significant degradation of color in driedraspberries. In addition, when final product was compared to fresh raspberry, considerable volumetricshrinkage was recorded with slight changes in the shape, but only after convective drying.
Bustos et al. [25] studied the impact of convective drying at various temperatures onphenolic characterization in both, raspberries (Rubus idaeus var. Autumn Bliss) and boysenberries(Rubus ursinus × Rubus idaeus var. Black Satin). Berries were applied to different convective dryingconditions: 50 ◦C for 48 h, 65 ◦C for 20 h or 130 ◦C for 2 h until a moisture content was below15%. Obtained results indicated that drying regime at 65 ◦C during 20 h was optimum for thebest preservation of color, polyphenol content and antioxidant activity in dried berries. Moreover,authors argued that conventional drying is more economical than freeze-drying, and with considerableincrease of total polyphenolic content due to depolymerization of native polyphenols which lead toimproved antioxidant activity. Different raspberry cultivars, have different sensitivity to convectivedrying mostly evident by changes in their physical (e.g., reduced rehydration), mechanical (e.g., initialshape), nutritive (e.g., loss of nutrients), and sensory properties (e.g., formation of unpleasant aroma).Furthermore, Pavkov et al. [17] found that physiochemical properties and rehydration capacity ofPolana and Polka varieties could be partially preserved after convective drying.
Therefore, the aim of this research was to investigate the influence of convective drying onphysiochemical properties and quality parameters of red Polana raspberry for fresh and frozen samples.Evaluated quality parameters included changes in volume and shape, color, L-ascorbic acid, totalphenolic content, flavonoid content, anthocyanin content, and antioxidant activity. All results werecontrolled against freeze-dried raspberries.
77

Foods 2019, 8, 251
2. Materials and Methods
2.1. Plant Material
Polana variety samples of red raspberries at full maturity were taken from the local farmersduring August and October, 2017, at area of Novi Sad, Republic of Serbia. The raspberry fruits wereharvested few hours prior to each experiment. The selected samples were approximately equal in size,volume, color, mass, and humidity. Average values of these properties were obtained from raspberryfruits subsample (n = 500) that were as following; (i) moisture content Xd.b = 5.45 ± 0.45 kgw/kgd.b.;(ii) mass m = 3.30 ± 0.24 g; (iii) length a = 21.26 ± 0.74 mm, width b = 20.08 ± 0.56 mm, and thicknessc = 18.63 ± 0.62 mm; (iv) volume V = 3.17 ± 0.22 cm3; and (iv) water activity aw = 0.979 ± 0.001, at thetemperature of 20 ◦C, total soluble solids of 6.6% and pH = 3.26 ± 0.02.
2.2. Convective Drying and Freeze-Drying of Raspberries
Raspberry fruits were dried as fresh or as frozen (with commercial freezer at −20 ◦C) with lab-scaleconvective dryer, designed and constructed to control for air flow (through the layer of processingmaterial), air drying temperature, and continuous monitoring of the sample mass in processing [26].The dryer chamber door was made up of glass, hence light could have some minimal impact onthe quality drying products. In order to compare all results with controls, part of fresh fruits wasfreeze-dried with Martin Christ, Alpha 2-4 LDplus, without heating of the plates. Drying conditionswere −83.8 ◦C on an ice condenser, with vacuum pressure of 0.0088 mbar in a drying chamber. Sampleswere dried for 48 h until average humidity at the end of the drying process of Xd.b = 0.07 kgw/kgd.b.
2.3. Experimental Design and Statistical Analysis
Convective raspberry drying was three-factor experiment with one qualitative and two quantitativefactors. The qualitative factor represented the initial state of the raspberry fruit before drying with twolevels (fresh and frozen raspberries). Quantitative factors of the experiment were drying temperatures(60, 70, to 80 ◦C) and air velocity (0.5 to 1.5 m·s−1). The absolute air humidity was approximatelyconstant in the experiments with average value 0.011 ± 0.002 kgw/kgd.air. For each experimental run,the initial mass of the raspberries was approximately 500 g. Raspberry samples were set on perforatedsieve in a thin stagnant layer and placed in a drying chamber. Air flew along or across the surfaceof the material in the dryer, and the samples were dried until the same value of moisture content ofapproximately Xd.b = 0.152 kgw/kgd.b. The experiment was conducted with three repetitions for eachexperimental run.
2.4. Measuring of Volume and Shrinkage Determination
When drying some biomaterial, volume shrinkage (Vsh) is one of the most common physical andquality indicators of the final product. Shrinkage is expressed by the ratio between the change ofvolume after drying and volume of sample before drying. The samples volume (n = 45) were measuredby immersing the raspberries into 96% concentration of ethanol [27] according to
V0 = (m0 −ml)/ρt (1)
where m0 is the mass of liquid and the immersed sample (kg), ml is the mass of liquid, and ρt is theliquid density (kg/m3). The volumetric shrinkage of raspberries (Vsh) was based on the followingequation [28].
Vsh = ((V0 − Vi)/V0) × 100 (2)
where V0 is initial average volume and Vi is volume of each raspberry after drying.
78

Foods 2019, 8, 251
2.5. Determination of Heywood Shape Factor
If observed independently, the volumetric shrinkage is not a sufficient indicator of the changes indried material. For this reason, an additional indicator was used to monitor changes of shape, i.e.,Heywood shape factor (k), able to detect the changes after drying [29–31]. This factor k = 0.523 andwas calculated from the relation
k = Vp/da3 (3)
where Vp is the particle volume with equivalent diameter of the projected area of the particles. Thiswas obtained by assigning the area of an equivalent circle with the same greater diameter as that of thefruit [32].
2.6. Color Measurement and Total Color Difference
Before and after each drying regime, CIELab color parameters were assessed for raspberry samples(n = 45) by colorimeter Konica Minolta CR400(C-light source and the observer angle of 2◦). Where L*was whiteness/brightness, a* was redness/greenness, and b* represented yellowness/blueness. The totalcolor difference (ΔE), hue angle (ho) and chromaticity (C*) were calculated by Equations (4)–(6) [33,34]:
ΔE = ((L* − L0)2+(a* − a0)2 + (b* − b0)2)1/2 (4)
h0 = arctan (b*/a*) (5)
C* = ((a*)2 − (b*)2)1/2 (6)
where, L0, a0, and b0 are the color values before drying, while L*, a*, and b* are the color valuesafter drying.
2.7. Analysis of Nutritiveproperties
2.7.1. Extraction Procedure
Methanol extract was prepared from the fresh/dried raspberry samples to determine the contentsof total phenols, flavonoids, and radical scavenging capacity. Briefly, 50 mL of an extraction solvent(methanol, 99.8%) (Fisher Scientific, UK) was poured over the raspberry sample into an Erlenmeyerflask. The flasks were covered and placed on a laboratory stirrer for 24 h (in a dark place). Afterthe extraction, the samples were transferred to volumetric flasks of determined volume, filtered, andstored in a dark and cool place until the analysis was carried out.
2.7.2. Determination of Total Phenolic Content (TPC)
The TPC in methanol extracts of fresh and dried raspberries was determined by Folin–Ciocalteuspectrophotometric method [35]. In a 50 mL volumetric flask with V = 0.5 mL of extract, 0.25 mLof Folin–Ciocalteu was mixed and 0.75 mL of 20% Na2CO3 (m/v). After 3 min of stirring, distilledwater was added and made up to volume of 50 mL. Reaction mixture was left to stand at roomtemperature for 2h and absorbencies were measured at 765 nm by UV–Vis spectrophotometer. Basedon the measured absorbance, the concentration (mg/mL) of TPC was calculated from the calibrationcurve of the standard solution of gallic acid. The results are expressed in g of gallic acid equivalents(GAE) per 100 g of fruit dried basis (gGAE/100gd.b).
2.7.3. Determination of Total Flavonoids Content (TFL)
The TFL was determined by previously described colorimetric method [36]. In short, the reactionmixture was prepared by mixing 1 mL of an extract with 4 mL of distilled water and 0.3 mL of a 5%NaNO2 solution (m/v). Then mixture was incubated at room temperature for five minutes, and then0.3 mL of 10% AlCl3 (m/v) was added. After six minutes, when the solution became very yellow, 2 mL
79

Foods 2019, 8, 251
of NaOH was added. Distilled water was added to the reaction mixture and made up the volumeto 10 mL in a volumetric flask. The absorbance was measured at 510 nm. The TF were calculatedaccording to the catechin standard calibration curve and expressed in mg of catechin equivalents (CAE)per 100 g of fruit dried basis (mgCAE/100gd.b).
2.7.4. Determination of Radical Scavenging Capacity
The free radical scavenging capacity (RSC) of raspberry extracts was determined using a simpleand fast spectrophotometric method described by Espin et al. [37]. Briefly, the prepared extracts weremixed with methanol (95%) and 90 μM 2,2-diphenyl-1-picryl-hydrazyl (DPPH) to give different finalconcentrations of extract. After 60 min at room temperature, the absorbance was measured at 517 nm.RSC was calculated according to Equation (7) and expressed as IC50 value, which represents theconcentration of extract solution required for obtaining 50% of RSC.
RSC (%) = 100 − (Asample × 100)/Ablank (7)
where Ablank is the absorbance of the blank and Asample is the absorbance of the sample. The obtainedresults were presented as a mass of dry sample material that is necessary for inhibition of 50% of DPPH(IC50 (mgd.b/mL)).
2.7.5. Determination of Monomeric Anthocyanin Content (AC)
The sample preparation for the content of total AC was conducted by previously describedmethod [38]. Here an extraction solvent (ethanolic acid solution) [39] was poured over the samples(fresh or dried raspberries) and the mixture was thoroughly homogenized in a glass beaker. Afterwards,the beaker was covered with paraffin film and left to sit at 4 ◦C. After 24 h, the extraction mixture waskept at room temperature, filtered, and transferred to volumetric flask and made up to the volume of100 mL with an extraction solvent. An aliquot of an extract was transferred into two volumetric flaskswith added buffers at pH = 1.0 and pH = 4.5. After 15 min, the absorbencies were measured at 510 and700 nm against distilled water as a blank. The content of AC was recalculated to cyanidin-3-glucoside by
AC = (A ×Mw × Df × Vm × 1000)/(ε×m) (8)
A = (A510 − A700)pH1,0 − (A510 − A 700)pH4,5 (9)
where AC = anthocyanin content (mg/100g); A510 = sample absorbance at λ = 510nm; A700 = sampleabsorbance at λ = 700nm; Mw = molecular weight of cyanidin-3-glucoside (449.2), Df = dilutionfactor = original solution volume; ε = molar extraction coefficient of cyanidin-3-glucoside (26900);and m = sample weight (g). The content of AC was expressed in mg per 100 g of fruit driedbasis (mg/100gd.b).
2.7.6. Determination of Vitamin C Content
Separations and quantifications of vitamin C were performed by HPLC equipment (ThermoScientific™ UltiMate 3000) on Nucleosil 100-5C18, 5 μm (250 × 4.6 mm I.D.) column (Phenomenex,Los Angeles, CA). Separation was performed with standard method BS EN 14130:2003 (Foodstuffs.Determination of vitamin C by HPLC). The content of AC was expressed in mg ascorbic acid (the sum ofascorbic acid and its oxidative form of dehydroascorbic acid) per 100 g of fruit dried basis (mg/100gd.b).
2.8. Statistical Analysis
For the purposes of statistical tests, analysis of variance was performed (ANOVA) with Statistica13(Stat Soft, Inc., Oklahoma, United States). In order to define homogenous groups of samples anadditional Duncan test was performed with statistical significance at p < 0.05.
80

Foods 2019, 8, 251
3. Results and Discussion
3.1. Volume Shrinkage
Comparison of convective and freeze-drying technique for fresh vs. frozen samples revealedthat the least changes in volume had freeze-drying (Vsh = 16.49 ± 2.75%). For convective drying, theleast changes in volume had fresh raspberry samples dried at T = 60 ◦C and air velocity of 1.5 m·s−1
(Vsh = 35.74 ± 6.78%). Pavkov et al. 2017 [17] reported results of air drying red Polana raspberry,dried at air temperature of 50, 60, 70, and 80 ◦C and constant air velocity of 1 m·s−1. Judging by thevolume shrinkage during convective drying, air temperature of 50 ◦C will lead to a total collapse andloss of the product shape. Interestingly, the least volume shrinkage (23.17%) was achieved with airtemperature at 70 ◦C. Drying with air temperature at 60 ◦C provoked shrinkage of 28.74%, what is stilllower than it was obtained in the current study. Samples dried with air temperature of 80 ◦C reachedvolume shrinkage of 43.13%. Results obtained from these two experiments revealed that higher airtemperatures do not necessarily lead to higher changes in volume shrinkage. This may be explainedby the fact that higher air temperature have tendency to lean towards mechanical stabilization of theraspberry surface, thus limiting the degree of shrinkage.
Air temperature and initial state of the raspberry, prior to convective drying significantly changedthe volume of dried raspberry. On the other hand, the air velocity did not have any impact on thechange in raspberry volume (Table 1). The most considerable changes in volume occurred when dryingfrozen raspberries at T = 80 ◦C and air velocity of 0.5 m·s−1 (Vsh = 79.07 ± 4.07%). As previouslyreported, drying temperature of 80 ◦C had similar trend on volume shrinkage [17].
Table 1. Statistical analysis of convective drying factor effect on all determined quality indicators.
Dep
en
d.
Valu
e
Sta
tist
ical
Ind
icato
rs Effect
Intercept AT AV RS AT*AV AT*RS AV*RS AT*AV*RS Error
Volu
me
shri
nkag
e SS 1687039 96255 11 3834 2874 1686 2743 103 28630MS 1687039 48127 11 3834 1437 843 2743 51 59F 28814.82 822.02 0.20 65.49 24.54 14.40 46.85 0.88p 0.0000 0.0000 0.6587 0.0000 0.0000 0.0000 0.0000 0.4166
Hey
woo
dsh
ape
fact
or
SS 0.208363 0.0044 0.0001 0.0015 0.0000 0.0000 0.0001 0.0001 0.0094MS 0.208363 0.0022 0.0001 0.0015 0.0000 0.0000 0.0001 0.0000 0.0000F 10773.36 115.30 10.08 79.20 1.59 1.16 7.79 4.55p 0.0000 0.0000 0.0015 0.0000 0.2057 0.3129 0.0054 0.0110
Col
orch
ange
SS 17759.28 576.41 16.78 68.15 31.92 56.31 0.57 1.77 654.85MS 17759.28 288.20 16.78 68.15 15.96 28.15 0.57 0.89 2.74F 6481.604 105.186 6.126 24.871 5.825 10.275 0.207 0.323p 0.000000 0.000000 0.014017 0.000001 0.00330 0.000052 0.649312 0.724239
Asc
orbi
cac
id
SS 1689.955 1357.504 640.217 6.840 430.577 91.156 0.008 7.249 8.575MS 1689.955 678.752 640.217 6.840 215.289 45.578 0.008 3.625 0.357F 4729.853 1899.694 1791.841 19.144 602.551 127.564 0.024 10.144p 0.000000 0.000000 0.000000 0.000203 0.000000 0.000000 0.879336 0.000641
Tota
lph
enol
icco
nten
t SS 40829272 96596 58924 52597 8089 23366 65802 46258 10129MS 40829272 48298 58924 52597 4044 11683 65802 23129 422F 96744.51 114.44 139.62 124.63 9.58 27.68 155.92 54.80p 0.0000 0.0000 0.0000 0.0000 0.0008 0.0000 0.0000 0.0000
Tota
lfla
vono
idco
nten
t SS 3799457 6538 2505 1149 8042 1435 6 4362 5100MS 3799457 3269 2505 1149 4021 718 6 2181 213F 17879.73 15.38 11.79 5.40 18.92 3.38 0.03 10.26p 0.000000 0.000050 0.002170 0.028864 0.000012 0.051007 0.863581 0.000602
Ant
hocy
anin
cont
ent
SS 2163673 22925 715 2014 711 2315 782 9184 18331MS 2163673 11463 715 2014 355 1157 782 4592 764F 2832.821 15.008 0.936 2.637 0.465 1.515 1.024 6.012
p 0.0000 0.0000 0.3428 0.117456 0.6334 0.2400 0.3215 0.0076
Rad
ical
scav
engi
ng SS 0.696911 0.003357 0.000115 0.011585 0.027292 0.008212 0.009029 0.015719 0.00044MS 0.696911 0.001678 0.000115 0.011585 0.013646 0.004106 0.009029 0.007860 0.00001F 37390.89 90.05 6.18 621.55 732.14 220.29 484.40 421.69p 0.000000 0.000000 0.020259 0.000000 0.000000 0.000000 0.000000 0.000000
AT—Air Temperature; AV—Air Velocity; RS—Raspberry state before drying; SS—Sum of Squares; MS—Meansquare; F—Fisher’s F-ratio; p— p-value.
81

Foods 2019, 8, 251
Additional for convective drying, some reports indicated variations in volume shrinkages withregards to raspberry varieties. Sette et al. [29] dehydrated with convective drying previously frozenAutumn Bliss raspberry, at T = 60 ◦C and air velocity of 1–1.5 m·s−1. Here they found higher volumeshrinkage (Vsh = 81 ± 3%) than what was reported in the current study.
Initial raspberry state effected the shrinkage, which was not surprising as creation of the icecrystals tends to destabilize cellular structures and this is particularly emphasized with drying airvelocity of 0.5 m·s−1. On the contrary, Duncan’s test revealed that there are no significant differences inthe volume shrinkage of the samples which were dried at the same temperature and with velocityof1.5 m·s−1. The reason for this may be the faster drying rate in the first drying period, which can leadto a faster mechanical stabilization of the surface, hence the preservation of the volume. As expected,initial raspberry state had an effect on volume shrinkage, and the results after drying are presented inFigure 1. Figure 2 shows the shrinkage and the changes in fruit size after convective and freeze-dryingof fresh raspberry at T = 60 ◦C and air velocity of 1.5 m·s−1.
Figure 1. Volume shrinkage after convective drying of raspberry variety Polana. Different lowercaseletters indicate significant differences (p < 0.05).
Figure 2. Red raspberry, variety Polana: (a) fresh (af = 20.74±2.45mm; bf = 20.04 ± 1.96 mm;cf = 18.88 ± 1.72 mm), (b) after convective drying of fresh raspberry at T = 60 ◦C and air velocityof 1.5 m·s−1 (acd = 16.97 ± 1.86 mm; bcd = 15.37 ± 1.65 mm; ccd = 15.34 ± 1.43 mm), and (c) afterfreeze-drying (afd = 20.62 ± 1.98 mm; bfd = 20.62 ± 2.66 mm; cfd = 18.58 ± 1.78 mm).
82

Foods 2019, 8, 251
3.2. Heywood Shape Factor Results
The referent Heywood shape factor before drying of fresh raspberry was k = 0.3323 (Figure 3), andall three experimental factors were significant for the changes in Heywood shape factor. As comparedto k of a fresh raspberry, the factor after freeze-drying equaled to k = 0.27. In case of convective drying,the lowest deviation from k occurred for fresh raspberries at T = 60 ◦C and air velocity of 1.5 m·s−1
(k = 0.2694 ± 0.003). Results showed that under the same experimental conditions, the convectivedried frozen raspberries had greater deviation of size as compared to the fresh raspberries. Hence,Heywood shape factor corresponded with the results for volume shrinkage.
Figure 3. Of Heywood shape factor after convective drying of Polana raspberry. Different lowercaseletters indicate significant differences (p < 0.05).
3.3. Color Change
CIE Lab color parameters L*, a*, b*, C*, h*, and ΔE* measured on fresh and dried raspberries atdifferent drying conditions are shown in Table 2. Any considerable influences on color caused by thedrying of raspberry was not detected, as total color change was roughly 10, except for freeze driedsamples, and essentially lightness (L) remained similar to those of a fresh samples. Hence, changesin color were driven by the parameters a* and b*. Generally, convective dried raspberry samplesslightly shifted towards maroon color, which can originate from decomposition of carotenoid pigments.Moreover, high temperature induces nonenzymatic Maillard browning with formation of brownishpigmentations [40]. Alternatively, this may be the consequences of high concentrations of preservedanthocyanins in dried samples [3]. A slight increase of a* and b* will have positive repercussions,as it will lean towards more saturated color of products, which corresponds well with increasedchroma values.
Air temperature, air velocity, and initial state of raspberry before drying had statistically significanteffect on color change (p < 0.05) (Table 1). The least color change (ΔE = 5.18) was observed withconvective drying at T = 60 ◦C and air velocity of 1.5 m·s−1. This temperature remained optimalchoice regarding ΔE, as it was not modified by different air velocities and initial state of material(fresh and frozen). The largest color change for this drying type was at T = 80 ◦C and air velocity of0.5 m·s−1 for both frozen and fresh raspberry when ΔE was 11.17 and 10.12, respectively. Unexpectedly,freeze-dried raspberries had the largest color changes (ΔE = 19.60) that were caused by increase in all ofthe three-color parameters, and especially for a* (Δa = 18.04). Bustos et al. [25] reported similar findingsfor freeze-dried berries with higher values for redness (Δa = 25.62) as compared to convective samples.Also, study by Sette et al. [3] reported an increase of a* and emphasized that besides pigmentation,differences of internal structures should be considered among convective and freeze dried raspberries.
83

Foods 2019, 8, 251
For instance, after freeze-drying, free water from raspberry is replaced by air, so shifts in red color andlightness can be a consequence of different diffusion of light that passes throughout a material. Thiseffect is likely more pronounced for fruits with defined and vibrant hues, as for the raspberries [3,41].During the conventional air-drying, increasing drying temperatures reduce the drying time, whereasshorter drying times may result in reduced risks of food quality deterioration [23]. Increasing hotair temperature for convective drying of Cassia alata from 40 ◦C to 60 ◦C reduced drying time from180 min to 120 min [42]. Consequently, from data obtained, it can be assumed that as the temperatureand the drying time increase, the color change of dried raspberries will increased too.
Table 2. Results of CIE Lab parameters before and after all drying treatments: L* (whiteness/brightness),a* (redness/greenness), b* (yellowness/blueness), and ΔE (color change).
Experiment Factors
Measured Values ΔE
Before Drying (Fresh Samples) After Drying (Dried Samples)
L0 a0 b0 h0o C0* L* a* b* ho C*
Fres
hdr
ied
0.5
m·s−
1
Dry
ing
air
tem
pera
ture
[◦C
] 60 24.829 22.172 11.091 26.575 24.791 23.848 27.570 11.924 23.388 30.038 5.549 ± 1.67 h
70 24.768 20.932 10.134 25.833 23.256 25.799 29.650 13.448 24.397 32.557 9.383 ± 1.66 def
80 26.225 22.251 9.5562 23.242 24.216 22.608 30.589 14.021 24.625 33.649 10.12 ± 1.10 bc
1.5
m·s−
1 60 24.407 22.009 10.553 25.617 24.408 23.058 26.982 11.101 22.363 29.176 5.181 ± 0.95 h
70 24.372 22.513 10.886 25.805 25.006 24.194 30.224 13.100 23.433 32.940 8.024 ± 1.16 efg
80 25.212 22.125 10.084 24.502 24.314 22.029 30.390 14.193 25.033 33.540 9.763 ± 1.21 cde
Froz
endr
ied
0.5
m·s−
1 60 24.491 21.032 10.397 26.305 23.461 24.264 28.325 12.834 24.375 31.096 7.692 ± 1.23 g
70 24.078 20.509 9.414 24.655 22.566 24.094 29.314 12.897 23.747 32.025 9.468 ± 1.62 def
80 26.368 22.380 10.172 24.442 24.583 26.329 32.674 14.529 23.973 35.758 11.17 ± 1.38 b
1.5
m·s−
1 60 25.147 21.106 9.865 25.051 23.297 24.514 28.904 12.892 24.038 31.648 8.38 ± 1.43 fg
70 25.122 21.477 10.321 25.667 23.828 23.603 29.665 13.733 24.841 32.689 8.99 ± 0.80 def
80 25.785 22.719 10.593 24.997 25.067 21.991 30.368 13.977 24.714 33.430 9.18 ± 1.27 cd
Freeze dried 24.557 22.367 9.779 23.615 24.411 28.144 40.412 16.562 22.285 43.674 19.608 ± 1.63 a
Different lowercase letters indicate significant differences (p < 0.05).
3.4. Ascorbic Acid Reduction
The average amount of L-ascorbic acid in fresh samples before drying was 118.27 mg/100gd.b.
(18.92 mg/100gw.b.) (Table 4), which was similar to quantities reported by Bobinaite et al. [12]. Thiscontent of L-ascorbic acid was significantly reduced during convective drying under all experimentalconditions. This is expected as prolonged exposure to heightened temperatures and oxygen hastendency to reduce the content of this acidin fruits [21,43–47]. Figure 4 shows temperature kinetics ofraspberry samples during convective drying from a fresh state. Type K thermocouple probes wereused to monitor and control product temperature during the process, by placing probes inside thedrupelet. For all experiments, the temperature at the beginning of the process is approximately 35 ◦C,but after 10 minutes of the drying, the raspberry temperature can reach 50 ◦C. Due to the reducedmoisture content, during the last quarter of drying all samples have the same temperature as dryingair. This means that drying time at T = 80 ◦C is 6–8 h, and depending of the air velocity can last almostthree times longer at T = 60 ◦C. However, the highest content of L-ascorbic acid was after the shortestconvective drying with air velocity of 1.5 m·s−1. This was regardless of the fact that the raspberrytemperature reached T = 80 ◦C, and equaled to 27.46 ± 1.12 mg/100gd.b. and 22.54 ± 1.28 mg/100d.b.,after drying of frozen and fresh raspberry, respectively (Table 4). Conversely, the degradation of99% L-ascorbic acid was detected for longest drying with T = 60 ◦C and air velocity of 0.5 m·s−1.Accordingly, this might mean that L-ascorbic acid degradation is more induced by longer exposure tohigher oxygen levels during the convective drying than to the drying temperature itself.
This reasoning is in accordance with Verbeyst et al. [43] research with thermal and high-pressureeffects on vitamin C degradation in strawberries and raspberries. Here it was shown that ascorbicacid degradation from strawberry and raspberry is slightly temperature dependent for temperaturerange of 80 to 90 ◦C, and that oxygen presence plays the key role. As expected, the highest levels of
84

Foods 2019, 8, 251
L-ascorbic acid preservation was achieved by freeze-drying (115.48 ± 2.29 mg/100gd.b.), since therewas neither thermal nor oxygen degradation involved.
yg g
Figure 4. Raspberry temperature kinetics during convective drying from a previously fresh state.
3.5. Total Phenols Reduction
The average values for relevant nutritive profile of fresh raspberries are presented in Table 3.Average total amount of polyphenols in fresh raspberry was 1.63 g GAE/100gd.b. All three individualexperimental factors had influence on the content of total phenols (Table 1).
When these samples were dried convectively the best preserved polyphenolic content was atT = 70 ◦C and air velocity of 1.5 m·s−1 (1.28 gGAE/100gd.b.). On the contrary, they were least preservedat 60 ◦C and air velocity of 0.5 m·s−1(0.92 gGAE/100gd.b.). Freeze-drying preserved 1.10 g GAE/100gd.b.of total phenols, and, as expected, convective drying reduced polyphenolic content in the samples. Theexceptions were the samples freshly dried at air velocity of 1.5 m·s−1 and drying temperatures of 70 ◦C;and 80 ◦C in which higher total phenolic content was observed in comparison to freeze-dried samples.Similar results were recently reported where higher phenolic content was found in convectively hotair-dried Cassia alata in comparison to freeze-dried samples [42]. Hossain et al. has suggested thatfreeze-drying may not have completely deactivated degradative enzymes due to the low-temperatureprocess. Therefore, reactivation of this degradative enzymes could be further occurred in freeze-driedsamples thus result in lower phenolic content [48].
Vasco et al. [49] made classification of 17 fruit types from Ecuador based on their content of totalphenols and according to this classification there are three main groups: one with low levels of totalphenols (<0.1 gGAE/100gw.b.), one with medium level (0.2–0.5 gGAE/100gw.b.), and the third with highlevels (>1.0 gGAE/g100gw.b.). This classification was accepted by others [50,51], and states that freshPolana raspberry belongs to a high content group, as do freeze-dried and convectively dried samplesfrom this study (under all experimental conditions).
Table 3. The content of BACs and radical scavenging capacityin fresh raspberry sample.
Compound mg/100gd.b.
L-ascorbic acid 118.27Total phenolic content 1,635.60Flavonoid content 386.19Anthocyanin content 513.55Antioxidative activity IC50 [mgd.b./mL] 0.0534
85
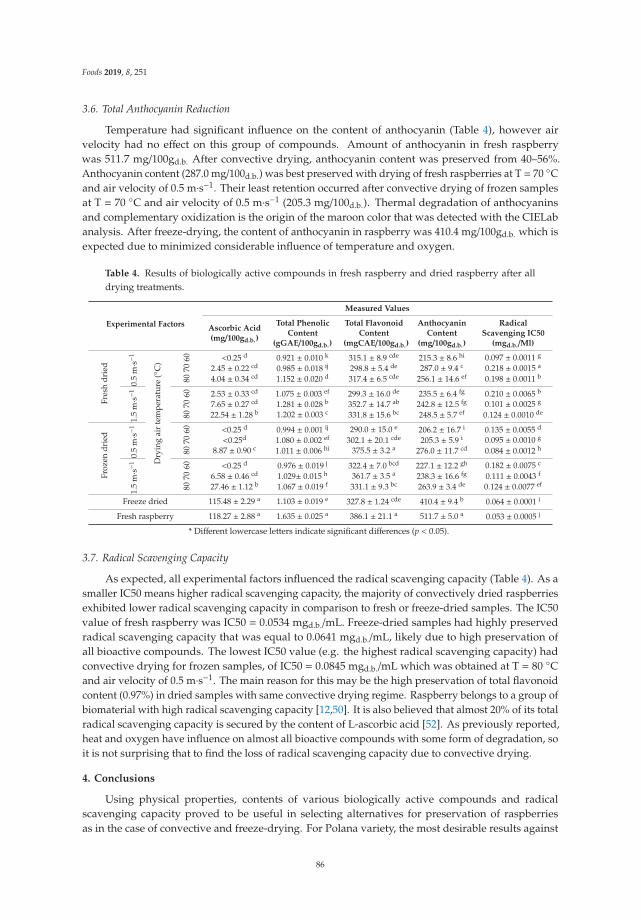
Foods 2019, 8, 251
3.6. Total Anthocyanin Reduction
Temperature had significant influence on the content of anthocyanin (Table 4), however airvelocity had no effect on this group of compounds. Amount of anthocyanin in fresh raspberrywas 511.7 mg/100gd.b. After convective drying, anthocyanin content was preserved from 40–56%.Anthocyanin content (287.0 mg/100d.b.) was best preserved with drying of fresh raspberries at T = 70 ◦Cand air velocity of 0.5 m·s−1. Their least retention occurred after convective drying of frozen samplesat T = 70 ◦C and air velocity of 0.5 m·s−1 (205.3 mg/100d.b.). Thermal degradation of anthocyaninsand complementary oxidization is the origin of the maroon color that was detected with the CIELabanalysis. After freeze-drying, the content of anthocyanin in raspberry was 410.4 mg/100gd.b. which isexpected due to minimized considerable influence of temperature and oxygen.
Table 4. Results of biologically active compounds in fresh raspberry and dried raspberry after alldrying treatments.
Experimental Factors
Measured Values
Ascorbic Acid(mg/100gd.b.)
Total PhenolicContent
(gGAE/100gd.b.)
Total FlavonoidContent
(mgCAE/100gd.b.)
AnthocyaninContent
(mg/100gd.b.)
RadicalScavenging IC50
(mgd.b./Ml)
Fres
hdr
ied
0.5
m·s−
1
Dry
ing
air
tem
pera
ture
(◦C
) 60 <0.25 d 0.921 ± 0.010 k 315.1 ± 8.9 cde 215.3 ± 8.6 hi 0.097 ± 0.0011 g
70 2.45 ± 0.22 cd 0.985 ± 0.018 ij 298.8 ± 5.4 de 287.0 ± 9.4 c 0.218 ± 0.0015 a
80 4.04 ± 0.34 cd 1.152 ± 0.020 d 317.4 ± 6.5 cde 256.1 ± 14.6 ef 0.198 ± 0.0011 b
1.5
m·s−
1 60 2.53 ± 0.33 cd 1.075 ± 0.003 ef 299.3 ± 16.0 de 235.5 ± 6.4 fg 0.210 ± 0.0065 b
70 7.65 ± 0.27 cd 1.281 ± 0.028 b 352.7 ± 14.7 ab 242.8 ± 12.5 fg 0.101 ± 0.0025 g
80 22.54 ± 1.28 b 1.202 ± 0.003 c 331.8 ± 15.6 bc 248.5 ± 5.7 ef 0.124 ± 0.0010 de
Froz
endr
ied
0.5
m·s−
1 60 <0.25 d 0.994 ± 0.001 ij 290.0 ± 15.0 e 206.2 ± 16.7 i 0.135 ± 0.0055 d
70 <0.25d 1.080 ± 0.002 ef 302.1 ± 20.1 cde 205.3 ± 5.9 i 0.095 ± 0.0010 g
80 8.87 ± 0.90 c 1.011 ± 0.006 hi 375.5 ± 3.2 a 276.0 ± 11.7 cd 0.084 ± 0.0012 h
1.5
m·s−
1 60 <0.25 d 0.976 ± 0.019 j 322.4 ± 7.0 bcd 227.1 ± 12.2 gh 0.182 ± 0.0075 c
70 6.58 ± 0.46 cd 1.029± 0.015 h 361.7 ± 3.5 a 238.3 ± 16.6 fg 0.111 ± 0.0043 f
80 27.46 ± 1.12 b 1.067 ± 0.019 f 331.1 ± 9.3 bc 263.9 ± 3.4 de 0.124 ± 0.0077 ef
Freeze dried 115.48 ± 2.29 a 1.103 ± 0.019 e 327.8 ± 1.24 cde 410.4 ± 9.4 b 0.064 ± 0.0001 i
Fresh raspberry 118.27 ± 2.88 a 1.635 ± 0.025 a 386.1 ± 21.1 a 511.7 ± 5.0 a 0.053 ± 0.0005 j
* Different lowercase letters indicate significant differences (p < 0.05).
3.7. Radical Scavenging Capacity
As expected, all experimental factors influenced the radical scavenging capacity (Table 4). As asmaller IC50 means higher radical scavenging capacity, the majority of convectively dried raspberriesexhibited lower radical scavenging capacity in comparison to fresh or freeze-dried samples. The IC50value of fresh raspberry was IC50 = 0.0534 mgd.b./mL. Freeze-dried samples had highly preservedradical scavenging capacity that was equal to 0.0641 mgd.b./mL, likely due to high preservation ofall bioactive compounds. The lowest IC50 value (e.g. the highest radical scavenging capacity) hadconvective drying for frozen samples, of IC50 = 0.0845 mgd.b./mL which was obtained at T = 80 ◦Cand air velocity of 0.5 m·s−1. The main reason for this may be the high preservation of total flavonoidcontent (0.97%) in dried samples with same convective drying regime. Raspberry belongs to a group ofbiomaterial with high radical scavenging capacity [12,50]. It is also believed that almost 20% of its totalradical scavenging capacity is secured by the content of L-ascorbic acid [52]. As previously reported,heat and oxygen have influence on almost all bioactive compounds with some form of degradation, soit is not surprising that to find the loss of radical scavenging capacity due to convective drying.
4. Conclusions
Using physical properties, contents of various biologically active compounds and radicalscavenging capacity proved to be useful in selecting alternatives for preservation of raspberriesas in the case of convective and freeze-drying. For Polana variety, the most desirable results against
86

Foods 2019, 8, 251
freeze-drying as standard in terms of color, volume shrinkage, and Heywood shape factor changewas achieved with convective drying of fresh raspberry at T = 60 ◦C with air velocity of 1.5 m·s−1.Convective drying of raspberry had influenced all measured biologically active compounds. Incomparison to fresh samples, in convectively dried raspberries 60–78% of total phenols was preservedas well as 75–97% of flavonoids and 40–56% of anthocyanins. Consequently, lower radical scavengingcapacity was found in convectively dries samples as compared to fresh or freeze-dried. The largestshortcoming for convective drying was observed in difference between freeze-dried for preservationlevels of L-ascorbic acid. Freeze-drying preserved more than 97% of L–ascorbic acid, while convectivedrying samples had degradation of over 80% of this compound. This might not be as relevant whereL–ascorbic acid is added in processing of raspberries (e.g., confectionery products, biscuits, cookies,dairy product etc.). In conclusion, Polana raspberry dried convectively with air temperature of 60 ◦Cand air velocity of 1.5 m·s−1, may be considered as sufficient alternative to freeze-drying.
Author Contributions: Conceptualization, I.P., M.R., and Z.S.; Methodology, I.P., M.R., A.T.H., and Z.S.; Formalanalysis, Z.S. and K.K.; Contributions to sample and analysis experiments, Z.S. and K.K.; writing—original draftpreparation, Z.S.; writing—review and editing, I.P., M.R., A.T.H., P.P., and D.B.K.; supervision, P.P. and D.B.K.
Funding: This manuscript is a result of the research within the national project TR31058, 2011-2020, supported bythe Ministry of Education, Science and Technology, Republic of Serbia.
Conflicts of Interest: The authors declare no conflicts of interest.
References
1. Statistical Office of the Republic of Serbia. Statistical Yearbook; Statistical Office of the Republic of Serbia:Belgrade, Serbia, 2018; 51, p. 214.
2. Paraušic, V.; Simeunovic, I. Market analysis of Serbia’s raspberry sector and cluster development initiatives.Econ. Agricult. 2016, 63, 1417–1431.
3. Sette, P.; Franceschinis, L.; Schebor, C.; Salvatori, D. Fruit snacks from raspberries: Influence of dryingparameters on colour degradation and bioactive potential. Int. J. Food Sci. Technol. 2017, 52, 313–328.[CrossRef]
4. Szadzinska, J.; Łechtanska, J.; Pashminehazar, R.; Kharaghani, A.; Tsotsas, E. Microwave- andultrasound-assisted convective drying of raspberries: Drying kinetics and microstructural changes.Dry Technol. 2018, 37, 1–12. [CrossRef]
5. Rodriguez, A.; Bruno, E.; Paola, C.; Campañone, L.; Mascheroni, R.H. Experimental study of dehydrationprocesses of raspberries (Rubus Idaeus) with microwave and solar drying. Food Sci. Technol. 2018, 39.[CrossRef]
6. Bórquez, R.M.; Canales, E.R.; Redon, J.P. Osmotic dehydration of raspberries with vacuum pretreatmentfollowed by microwave-vacuum drying. J. Food Eng. 2010, 99, 121–127. [CrossRef]
7. Wang, S.Y.; Lin, H.-S. Antioxidant activity in fruits and leaves of blackberry, raspberry, and strawberry varieswith cultivar and developmental stage. J. Agr. Food Chem. 2000, 48, 140–146. [CrossRef]
8. Verbeyst, L.; Crombruggen, K.V.; Van der Plancken, I.; Hendrickx, M.; Van Loey, A. Anthocyanin degradationkinetics during thermal and high pressure treatments of raspberries. J. Food Eng. 2011, 105, 513–521.[CrossRef]
9. Summen, M.A.; Erge, H.S. Thermal degradation kinetics of bioactive compounds and visual color in raspberrypulp. J. Food Process Preserv. 2014, 38, 551–557. [CrossRef]
10. Nile, S.H.; Park, S.W. Edible berries: Bioactive components and their effect on human health. Nutrition 2014,30, 134–144. [CrossRef]
11. Carvalho, E.; Fraser, P.D.; Martens, S. Carotenoids and tocopherols in yellow and red raspberries. Food Chem.2013, 139, 744–752. [CrossRef]
12. Bobinaite, R.; Viškelis, P.; Venskutonis, P.R. Variation of total phenolics, anthocyanins, ellagic acid and radicalscavenging capacity in various raspberry (Rubus spp.) cultivars. Food Chem. 2012, 132, 1495–1501. [CrossRef][PubMed]
87

Foods 2019, 8, 251
13. Szymanowska, U.; Baraniak, B.; Bogucka-Kocka, A. Antioxidant, anti-inflammatory, and postulated cytotoxicactivity of phenolic and anthocyanin-rich fractions from polana raspberry (Rubus idaeus L.) fruit andjuice—In vitro study. Molecules 2018, 23, 1812. [CrossRef] [PubMed]
14. Giuffrè, A.M.; Louadj, L.; Rizzo, P.; Poiana, M.; Sicari, V. Packaging and storage condition affect thephysicochemical properties of red raspberries (Rubus idaeus L., cv. Erika). Food Control 2019, 97, 105–113.[CrossRef]
15. Tamer, C.E. A research on raspberry and blackberry marmalades produced from different cultivars. J. FoodProcess Preserv. 2012, 36, 74–80. [CrossRef]
16. Rajkovic, A.; Smigic, N.; Djekic, I.; Popovic, D.; Tomic, N.; Krupezevic, N.; Uyttendaele, M.; Jacxsens, L. Theperformance of food safety management systems in the raspberries chain. Food Control 2017, 80, 151–161.[CrossRef]
17. Pavkov, I.; Stamenkovic, Z.; Radojcin, M.; Babic, M.; Bikic, S.; Mitrevski, V.; Lutovska, M. Convective andfreeze drying of raspberry: Effect of experimental parameters on drying kinetics, physical properties andrehydration capacity. In Proceedings of the INOPTEP 5th International Conference Sustainable Postharvestand Food Technologies, Vršac, Serbia, 23–28 April 2017; pp. 261–266.
18. Mierzwa, D.; Szadzinska, J.; Pawłowski, A.; Pashminehazar, R.; Kharaghani, A. Nonstationary convectivedrying of raspberries, assisted by microwaves and ultrasound. Dry Technol. 2019, 37, 988–1001. [CrossRef]
19. Ratti, C. Hot air and freeze-drying of high-value foods: A review. J. Food Eng. 2001, 49, 311–319. [CrossRef]20. Kowalski, S.J.; Pawłowski, A.; Szadzinska, J.; Łechtanska, J.; Stasiak, M. High power airborne ultrasound
assist in combined drying of raspberries. Innov. Food Sci. Emerg. 2016, 34, 225–233. [CrossRef]21. López, J.; Uribe, E.; Vega-Gálvez, A.; Miranda, M.; Vergara, J.; Gonzalez, E.; Di Scala, K. Effect of air
temperature on drying kinetics, vitamin c, antioxidant activity, total phenolic content, non-enzymaticbrowning and firmness of blueberries variety O´Neil. Food Bioprocess Technol. 2010, 3, 772–777. [CrossRef]
22. Zoric, Z.; Pedisic, S.; Kovacevic, D.B.; Ježek, D.; Dragovic-Uzelac, V. Impact of packaging material andstorage conditions on polyphenol stability, colour and sensory characteristics of freeze-dried sour cherry(Prunus cerasus var. Marasca). J. Food Sci. Technol. 2015, 53, 1247–1258. [CrossRef]
23. Sun, Y.; Zhang, M.; Mujumdar, A. Berry drying: Mechanism, pretreatment, drying technology, nutrientpreservation, and mathematical models. Food Eng. Rev. 2019, 11, 61–77. [CrossRef]
24. Sabarez, H.T. Airborne ultrasound for convective drying intensification. In Innovative Food ProcessingTechnologies —Extraction, Separation, Component Modification and Process Intensification; Knoerzer, K., Juliano, P.,Smithers, G., Eds.; CSIRO Food and Nutrition: Werribee, Australia, 2016; pp. 361–386.
25. Bustos, M.C.; Rocha-Parra, D.; Sampedro, I.; de Pascual-Teresa, S.; León, A.E. The influence of differentair-drying conditions on bioactive compounds and antioxidant activity of berries. J. Agric. Food Chem. 2018,66, 2714–2723. [CrossRef] [PubMed]
26. Pavkov, I. Combined Technology of Fruit Tissue Drying. Ph.D. Thesis, Faculty of Agriculture, University ofNovi Sad, Serbia, Novi Sad, 2012.
27. Mohsenin, N.N. Physical Properties of Plant and Animal Materials; Gordon and Breach Sci. Publ.: New York,NY, USA, 1986.
28. Radojcin, M.; Babic, M.; Pavkov, I.; Stamenkovic, Z. Osmotic drying effects on the mass transfer and shrinkageof quince tissue. PTEP J. Process Energy Agric. 2015, 19, 113–119.
29. Sette, P.; Salvatori, D.; Schebor, C. Physical and mechanical properties of raspberries subjected to osmoticdehydration and further dehydration by air- and freeze-drying. Food Bioprod. Process. 2016, 100, 156–171.[CrossRef]
30. Panyawong, S.; Devahastin, S. Determination of deformation of a food product undergoing different dryingmethods and conditions via evolution of a shape factor. J. Food Eng. 2007, 78, 151–161. [CrossRef]
31. Michelis, A.D.; Pirone, B.N.; Vullioud, M.B.; Ochoa, M.R.; Kesseler, A.G.; Márquez, C.A. Cambios devolumen, área superficial y factor de forma de Heywood durante la deshidratación de cerezas (Prunus avium).Ciência Tecnol. Aliment. 2008, 28, 317–321. [CrossRef]
32. De Michelis, A. Effect of structural modifications on the drying kinetics of foods: Changes in volume, surfacearea and product shape. Int. J. Food Stud. 2013, 2, 188–211. [CrossRef]
33. Radojcin, M.; Babic, M.; Babic, L.; Pavkov, I.; Stojanovic, C. Color parameters change of quince duringcombined drying. PTEP J. Process Energy Agric. 2010, 14, 81–84.
88

Foods 2019, 8, 251
34. Maskan, M. Kinetics of colour change of kiwifruits during hot air and microwave drying. J. Food Eng. 2001,48, 169–175. [CrossRef]
35. Singleton, V.L.; Rossi, J.A.J. Colorimetry of total phenolics with phosphomolybdic-phosphotungstic acidreagents. Am. J. Enol. Viticult. 1965, 16, 144–158.
36. Harborne, J.B.; Williams, C.A. Advances in flavonoid research since 1992. Phytochemistry 2000, 55, 481–504.[CrossRef]
37. Espín, J.C.; Soler-Rivas, C.; Wichers, H.J. Characterization of the total free radical scavenger capacity ofvegetable oils and oil fractions using 2,2-diphenyl-1-picrylhydrazyl radical. J. Agric. Food Chem. 2000, 48,648–656. [CrossRef] [PubMed]
38. Giusti, M.M.; Wrolstad, R.E. Characterization and measurement of anthocyanins by UV-visible spectroscopy.Curr. Protoc. Food Anal. Chem. 2001, 00, F1.2.1–F1.2.13. [CrossRef]
39. Fuleki, T.; Francis, F.J. Quantitative methods for anthocyanins. 1. Extraction and determination of totalanthocyanin in cranberries. J. Food Sci. 1968, 33, 72–77. [CrossRef]
40. Si, X.; Chen, Q.; Bi, J.; Yi, J.; Zhou, L.; Wu, X. Infrared radiation and microwave vacuum combined dryingkinetics and quality of raspberry. J. Food Process Eng. 2016, 39, 377–390. [CrossRef]
41. Saarela, J.M.S.; Heikkinen, S.M.; Fabritius, T.E.J.; Haapala, A.T.; Myllylä, R.A. Refractive index matchingimproves optical object detection in paper. Meas. Sci. Technol. 2008, 19, 055710. [CrossRef]
42. Chua, L.Y.; Chua, B.L.; Figiel, A.; Chong, C.H.; Wojdyło, A.; Szumny, A.; Lech, K. Characterisation of theconvective hot-air drying and vacuum microwave drying of Cassia alata: Antioxidant activity, essential oilvolatile composition and quality studies. Molecules 2019, 24, 1625. [CrossRef]
43. Verbeyst, L.; Bogaerts, R.; Van der Plancken, I.; Hendrickx, M.; Van Loey, A. Modelling of vitamin Cdegradation during thermal and high-pressure treatments of red fruit. Food Bioprocess. Technol. 2012, 6,1015–1023. [CrossRef]
44. Rodríguez, Ó.; Gomes, W.; Rodrigues, S.; Fernandes, F.A.N. Effect of acoustically assisted treatments onvitamins, antioxidant activity, organic acids and drying kinetics of pineapple. Ultrason Sonochem 2017, 35,92–102. [CrossRef]
45. Herbig, A.-L.; Renard, C.M.G.C. Factors that impact the stability of vitamin C at intermediate temperaturesin a food matrix. Food Chem. 2017, 220, 444–451. [CrossRef]
46. Santos, P.H.S.; Silva, M.A. Retention of vitamin C in drying processes of fruits and vegetables—A Review.Dry Technol. 2008, 26, 1421–1437. [CrossRef]
47. Arancibia-Avila, P.; Namiesnik, J.; Toledo, F.; Werner, E.; Martinez-Ayala, A.L.; Rocha-Guzmán, N.E.;Gallegos-Infante, J.A.; Gorinstein, S. The influence of different time durations of thermal processing onberries quality. Food Control 2012, 26, 587–593. [CrossRef]
48. Hossain, M.B.; Barry-Ryan, C.; Martin-Diana, A.B.; Brunton, N.P. Effect of drying method on the antioxidantcapacity of six Lamiaceae herbs. Food Chem. 2010, 123, 85–91. [CrossRef]
49. Vasco, C.; Ruales, J.; Kamal-Eldin, A. Total phenolic compounds and antioxidant capacities of major fruitsfrom Ecuador. Food Chem. 2008, 111, 816–823. [CrossRef]
50. De Souza, V.R.; Pereira, P.A.P.; da Silva, T.L.T.; de Oliveira Lima, L.C.; Pio, R.; Queiroz, F. Determination of thebioactive compounds, antioxidant activity and chemical composition of Brazilian blackberry, red raspberry,strawberry, blueberry and sweet cherry fruits. Food Chem. 2014, 156, 362–368. [CrossRef] [PubMed]
51. Alibabic, V.; Skender, A.; Bajramovic, M.; Šertovic, E.; Bajric, E. Evaluation of morphological, chemical, andsensory characteristicsof raspberry cultivars grown in Bosnia and Herzegovina. Turk. J. Agric. For. 2018, 42,67–74. [CrossRef]
52. Beekwilder, J.; Hall, D.R.; Ric de Vos, C.H. Identification and dietary relevance of antioxidants from raspberry.Biofactors 2005, 23, 197–205. [CrossRef]
© 2019 by the authors. Licensee MDPI, Basel, Switzerland. This article is an open accessarticle distributed under the terms and conditions of the Creative Commons Attribution(CC BY) license (http://creativecommons.org/licenses/by/4.0/).
89

foods
Article
Phenolic and Antioxidant Analysis of Olive LeavesExtracts (Olea europaea L.) Obtained by High VoltageElectrical Discharges (HVED)
Irena Žuntar 1, Predrag Putnik 2, Danijela Bursac Kovacevic 2, Marinela Nutrizio 2,
Filip Šupljika 2, Andreja Poljanec 2, Igor Dubrovic 3, Francisco J. Barba 4
and Anet Režek Jambrak 2,*1 Faculty of Pharmacy and Biochemistry, University of Zagreb, 10000 Zagreb, Croatia2 Faculty of Food Technology and Biotechnology, University of Zagreb, 10000 Zagreb, Croatia3 Teaching Institute for Public health of Primorje-Gorski Kotar County, 51000 Rijeka, Croatia4 Nutrition and Food Science Area, Preventive Medicine and Public Health, Food Sciences,
Toxicology and Forensic Medicine Department, Faculty of Pharmacy,Universitat de València, Avda. Vicent Andrés Estellés, s/n, Burjassot, 46100 València, Spain
* Correspondence: [email protected]; Tel.: +385-1460-5287
Received: 6 June 2019; Accepted: 5 July 2019; Published: 8 July 2019
Abstract: Background: The aim of this study was to evaluate high voltage electrical discharges (HVED)as a green technology, in order to establish the effectiveness of phenolic extraction from olive leavesagainst conventional extraction (CE). HVED parameters included different green solvents (water,ethanol), treatment times (3 and 9 min), gases (nitrogen, argon), and voltages (15, 20, 25 kV). Methods:Phenolic compounds were characterized by ultra-performance liquid chromatography-tandem massspectrometer (UPLC-MS/MS), while antioxidant potency (total phenolic content and antioxidantcapacity) were monitored spectrophotometrically. Data for Near infrared spectroscopy (NIR)spectroscopy, colorimetry, zeta potential, particle size, and conductivity were also reported. Results:The highest yield of phenolic compounds was obtained for the sample treated with argon/9 min/20kV/50% (3.2 times higher as compared to CE). Obtained results suggested the usage of HVEDtechnology in simultaneous extraction and nanoformulation, and production of stable emulsionsystems. Antioxidant capacity (AOC) of obtained extracts showed no significant difference uponthe HVED treatment. Conclusions: Ethanol with HVED destroys the linkage between phenoliccompounds and components of the plant material to which they are bound. All extracts werecompliant with legal requirements regarding content of contaminants, pesticide residues and toxicmetals. In conclusion, HVED presents an excellent potential for phenolic compounds extraction forfurther use in functional food manufacturing.
Keywords: high voltage electrical discharge; olive leaves extracts; green solvents; eco-extraction;sustainability
1. Introduction
Plant extracts obtained from fruits, leaves, flowers, woods, roots, resins or seeds of knownmedicinal properties are responsible for many health benefits, like reduction of hypertension,prevention of cardiovascular disease, suppression of different types of cancer and viral disease, etc.Classical/conventional extraction (CE) methods are not only time and energy demanding, but are alsoprone to usage of solvents, resulting with overall hazardous/toxic effects on the environment. Therefore,there is a growing interest to utilize plant extracts with “green chemistry“ in science-based productionof functional foods, food supplements, cosmetics, perfumes, nutraceuticals, and pharmaceuticalsin a sustainable ways [1–7].
Foods 2019, 8, 248; doi:10.3390/foods8070248 www.mdpi.com/journal/foods90

Foods 2019, 8, 248
Olive tree (Olea europaea L.) is cultivated from antiquity in many parts of the world, but Mediterraneanregion is the main agricultural area for its production. Mediterranean region is also known for its dietwith olives containing nutritional, health and antioxidant benefits, while being rich in with phenolsnaturally originated from olive plant [8–10]. Olive leaves (OLs) which may be considered as both,waste from olive oil production and medicinal and aromatic herbs, contain a large variety of phenolsincluding oleuropeosides (oleuropein and verbascoside); flavonols (rutin); flavones (luteolin-7-glucoside,apigenin-7-glucoside, diosmetin-7-glucoside, luteolin and diosmetin); flavan-3-ols (catechin), substitutedphenols (tyrosol, hydroxytyrosol, vanillin, vanilic acid and caffeic acid), oleoside and secoiridoid glycoside(oleuricine A and oleuricine B) [1,2,9–13].
It is well known that polyphenols as antioxidants may prevent or minimize oxidative damage/stressat cellular levels, resulted from generated concentration imbalance between reactive oxygen (ROS)and nitrogen (RNS) species and cell antioxidants. Numerous phenolics in OLs have strong radicalscavenging activity, showing that olive phenolics exhibit more beneficial effects in form of a mixture(e.g., olive leaves extract; OLE) than isolated as a single phenolic compound. Olive leaves extracthave a synergistic capacity in the elimination of free radicals, that is more superior to the antioxidantcapacity of the vitamin C and E [3,7–12]. Consequently, OLE as an antioxidant may reduce the risksfor harmful health effects [3,10,11]. Also, recent studies on OLE confirmed potential coadjuvant usefor cervical cancer treatments [12], inhibitory effects on the obesity [13], suppression of inflammatorycytokine production and the activation of NLRP3 inflammasomes in human placenta [14], potential aspreventive therapy for neurodegenerative diseases [15], protective quality of testis and sperms [16],protection against intoxication of liver by carbon tetrachloride, kidney by cadmium, and brain bylead poisoning [17–19].
Furthermore, OLE polyphenols are useful as natural food additives that have antimicrobial andantioxidant properties. For instance, OLE are good for fermentation and oxidative processes of tableolives and for improving their nutritional properties [20], i.e., as replacement of synthetic additives andthe shelf life extension of fish patties [21] and salmon burgers [22]. OLs as by-products/waste generatedduring olive oil production contains even higher amounts of polyphenols than appreciated olive oil.Therefore, there is a great interest for their extraction from OLs and especially with application ofeco-friendly and sustainable processes [2,23–25].
However, green chemistry only applies in a part of the life cycle of a single natural product [4]which also includes food safety aspects. Therefore, OLEs must be safe with respect to contaminants,pesticide residues and toxic metals (Pb, Hg, Cd, etc) [26,27]. Nonetheless, it is important to note thatOLs are a rich source of various minerals (Ca, K, Na, P, S, Cl, Mg, Al, Si, K, Mn, Fe) and trace elements(Ni, Cu, Sr, Ba, Cr, Zn, Rb, Th, Co, Ng, Cs, La, Ce, V, Nd) [28].
In a context of the Chemat’s principles of green chemistry, an extraction is defined as:
“Green extraction is based on the discovery and design of extraction processes which will reduceenergy consumption, allows use of alternative solvents and renewable natural products, and ensurea safe and high-quality extract/product” [4].
Current regulations including REACH (Registration, Evaluation, Authorization and Restrictionof Chemicals, CLP (Classification, Labelling and Packaging of substances and mixtures), IPPC(Integrated Pollution Prevention and Control) [29], and notation of BAT (Best Available Technology)have direct progressive impact in diminishing the consumption of organic solvents and Volatile OrganicCompounds (VOC) [4]. Hence, they aim to save human health and environment, both in researchand development (R&D), as well as in production. Among green solvents, the agro- or bio-solventsplay an important role for the replacement of organic solvents. Ethanol is a well-known, commonbio-solvent, classified as environmentally preferable. It is obtained by the fermentation of sugar-richmaterials such as sugar beet and cereals. Although it is flammable and potentially explosive, ethanol isused on a large scale due to synthesis in high purity, low price, and complete biodegradability [4].
91

Foods 2019, 8, 248
In order to improve CE, modern non-conventional extractions were developed to reduce themass transfer limitations and to increase yields in shorter time with minimal consumption of solvents.These advanced techniques include ultrasound-assisted extraction (UAE), microwave-assisted extraction(MAE), sub- and super-critical fluid extraction (SFE), pressurized liquid extraction (PLE), pulsed electricfields (PEF), and high voltage electrical discharges (HVED) [1,30,31]. Although there are limitations ofinnovative technologies for industrial implementations (e.g., high costs, control of process variables, lack ofregulatory approval, and consumer acceptance) [32], HVED (cold plasma) is promising green technique forthe extraction of biologically active compounds (BACs) with green solvents. Thus, it has the potential fordevelopment of green chemical engineering and sustainable production [25]. PLE, in example, would yieldthe greatest possible amounts of flavonoids (25.66 mg/g) in one extraction cycle, that lasts for 15 min at 100 ◦C.If extraction, for PLE, would be-taken to obtain the most of flavonols (9.22 mg/g), that can be achieved withone extraction cycle, that lasts for 5 min at 87 ◦C [23].
Developments of non-thermal technologies, such PEF and HVED, have been advancements forindustry and academia in meeting the challenges of producing safe and high-quality food [1,2]. HVEDis an emerging technology and broad designation for pulsed mode plasma systems, but it is mainlyknown as “corona discharge” due to its discharge reminiscent of crown that surrounds the cathodewire with pulsed DC power supply [33].
It is well known that HVED extraction is one of the applications of the liquid phase dischargetechnology where a phenomenon of electrohydraulic discharge might occur in the water by theeffect of high voltage pulsed electric field which is accompanied by several secondary phenomena.Additionally, UV light can lead cell inactivation by damaging to the DNA, shock waves and strongliquid turbulence can cause products fragmentation as well as mechanical destruction of cell tissues,and the high density of radicals can damage to the cell by cell oxidation. These are reasons why HVEDmay destruct cellular structure and enhance mass transfer from the cell to the solution, thus greatlyimproving the yields of BACs [34]. Pioneers of HVED extraction summarized many aspects of HVEDextraction, but recent review puts emphasis on introducing different extraction devices, including batch,continuous and circulating extraction systems, generalizing the critical processes factors and recentapplications, discussing the advantages and disadvantages of HVED extraction as well as the futuretrends of HVED assisted extraction technique. Although HVED is very potent extraction method withso many advantages, the authors also discussed some disadvantages and problems needed to be solvedfor its future development that will benefit various fields such as food and medical industries [34].
Therefore, the aim of this study is to evaluate HVED in the extraction efficiency of phenolic componentsfrom autochthonous Mediterranean OLs by varying: (i) concentrations of ethanol; (ii) voltages applied;and (iii) treatment times. Phenolic content in OLE was characterized by ultra-performance liquidchromatography-tandem mass spectrometer (UPLC-MS/MS), while antioxidant tests were conductedto analyze the antioxidant potency. Near infrared spectroscopy (NIR) was used for the prediction ofan extract quality and analyzed by principal component analysis (PCA) and all results were controlledagainst CE as standard.
2. Materials and Methods
2.1. Plant Material
Dried olive leaves (Olea europaea L.) were provided locally from Mediterranean area (Zadar county,Croatia). Herbs were stored in polyethylene bags in a dark and dry place until extractions. Herbs weremilled using knife mill (Grindomix GM 300 – RETSCH; Retsch GmbH, Haan, Germany) before HVEDtreatment. Plant particle size distribution was: d(0.9) ≤ 330.563 μm; d(0.5) ≤ 118.540 μm; d(0.1) ≤ 23.105μm measured by the laser particle size analyzer (Malvern, Mastersizer 2000, Germany). Prior to HVEDextraction, leaves were weighted (1 g) and mixed with 50 mL of extracting solvent, as distilled water,25% and 50% aqueous ethanol (v/v) at room temperature (22 ◦C).
92

Foods 2019, 8, 248
2.2. Conventional and HVED Assisted Extraction
The CE was used as a control procedure to compare the efficiency of HVED under the sameconditions with respect to solvent type and treatment time. Therefore, the CE was conducted byvarying: (i) solvent type (0, 25 and 50% of ethanol (v/v)); (ii) stirring time (3 and 9 min) at roomtemperature (22 ◦C). Magnetic stirring was used to provide effective stirring of herb and extractionsolvent during CE. HVED assisted extraction (plasma) generator “IMP-SSPG-1200” (Impel group,Zagreb, Croatia) was used for rectangular pulses from direct current (DC) as high voltage (HV)generator. Maximum adjustable current was 30 mA up to voltage of 25 kV. Frequency was 100 Hz;pulse width was 400 μs; voltage was 15 kV and 20 kV for argon gas; and 20 kV and 25 kV for nitrogen.
Parameters were chosen based on conducted preliminary experiments with different HVEDparameters (frequency, voltage, pulse length, distance between electrodes), as well as mass to solventratio. From more than 100 experiments, mentioned parameters were chosen. Regarding gases: it isimportant to have significant voltage to obtain discharge, if too low, there will be no discharge. For thatreason, 15 kV and 20 kV were chosen for argon, and 20 kV and 25 kV for nitrogen. For ethanolconcentration, pharmacopeia regulations were followed. The mixture of leaves and solvent wastransferred to beaker shaped reactor V = 100 mL. This reactor was opened on both sides and fittedwith silicone tops (diameter 1 cm). They were used for easier mounting of the electrode from the topand needle form the bottom. Both, argon or nitrogen were introduced through the needle with a flowof 5 L min−1. The gap between electrodes was 15 mm, while the set-up of generator and reactor isshown in Figure 1. The high voltage probe (Tektronix P6015A) connected to the oscilloscope (HantekDS05202BM) was used to measure the output voltage (data not shown). Physical properties as pH,conductivity (μs/cm), temperature and power consumption of the instrument were monitored beforeand after HVED treatment and modified CE.
(A) (B)
Figure 1. Set-up of generator and reactor for high voltage electrical discharges (HVED) treatments.(A) HVED and plasma generator “IMP-SSPG-1200” (Impel group, Zagreb, Croatia); (B) Beakershaped reactor.
Experimental Design and Statistical Analysis
The experiment was designed in STATGRAPHICS Centurion (StatPoint Technologies, Inc,Warrenton, VA, USA) software. Multifactorial design consisting of 12 experimental trials usingper each gas (argon and nitrogen). The three chosen independent variables were: (i) concentration of
93

Foods 2019, 8, 248
ethanol (0, 25 or 50%), voltage applied (15 kV or 20 kV for argon, and 20 kV or 25 kV for nitrogen)and treatment time (3 and 9 min) (Table 1). Both extractions, HVED and CE were performedin duplicates. The model was fitted by multiple linear regressions (MLR). Calculations were done at95% of confidence level.
Table 1. Denotation of sample for high voltage electrical discharges (HVED) treatments.
ID SampleTreatment Time
(min)Voltage
(kV)Ethanol Content
(%)Stirring
(min)Extraction
Type
1 3 OL0 0 0 0 3
CE
2 9 OL0 0 0 0 93 3 OL25 0 0 25 34 9 OL25 0 0 25 95 3 OL50 0 0 50 36 9 OL50 0 0 50 9
7 OLN1 3 20 50 /
HVED
8 OLN2 9 20 0 /9 OLN3 3 20 0 /
10 OLN4 3 25 0 /11 OLN5 9 25 25 /12 OLN6 9 20 25 /13 OLN7 9 20 50 /14 OLN8 9 25 50 /15 OLN9 3 25 25 /16 OLN10 9 25 0 /17 OLN11 3 25 50 /18 OLN12 3 20 25 /19 OLA1 3 15 50 /20 OLA2 9 15 0 /21 OLA3 3 15 0 /22 OLA4 3 20 0 /23 OLA5 9 20 25 /24 OLA6 9 15 25 /25 OLA7 9 15 50 /26 OLA8 9 20 50 /27 OLA9 3 20 25 /28 OLA10 9 20 0 /29 OLA11 3 20 50 /30 OLA12 3 15 25 /
OL = olive leaf, N = nitrogen, A = argon. For HVED, numbers 1–12 are the order of conducted treatment. For CEtreatments, 3 and 9 are referred to treatment time (min) while 0, 25, and 50 stands for concentration of an ethanolsolvent (%).
Statistical analysis was done in STATGRAPHICS Centurion software (StatPoint Technologies, Inc,Warrenton, VA, USA).
2.3. Determination of Total Phenolic Content (TPC)
Total Phenolic Content (TPC) of OLE was determined using Folin-Ciocalteu method (FC) aspreviously described [35] with slight modification. Briefly, a volume of 0.1 mL of extract (appropriatelydiluted) was mixed with 0.2 mL of FC reagent. After 3 minutes 1 mL of 20% Na2CO3 (m/v) was added.After thorough mixing by vortex, the reaction mixtures were incubated at 50 ◦C for 25 min, followed byabsorbance reading at 765 nm against blank. The blank contained 0.1 mL of extraction solvent insteadof an extract. The calibration curve was prepared by gallic acid standard solutions (50–500 mg/L)solubilized in ethanol. The absorbance was measured for each standard solution following the sameprocedure as for extracts. The concentration of TPC was expressed in mg of gallic acid equivalentsper g of sample (mg GAE/g of sample).
94

Foods 2019, 8, 248
2.4. Determination of Antioxidant Capacity (AOC)
2.4.1. DPPH (2,2-Diphenyl-2-Picrylhydrazyl) Free Radical Assay
DPPH assay of OLEs was determined according to the previously reported procedure [36].An aliquot (0.75 mL) of OLEs (appropriately diluted) was mixed with 1.5 mL of 0.5 mM DPPHmethanolic solution. After mixing, the solutions were stored in the dark for 20 min at room temperatureand then, the absorbance was measured at 517 nm against 100% methanol as a blank. The methanolsolution of Trolox (25–200 μM) was used for the calibration curve. The absorbance values for theextracts were subtracted from the control sample (0.75 mL of 100% methanol and 1.5 mL of 0.5 mMDPPH). The results were calculated using the calibration curve for Trolox and expressed as μmol ofTrolox equivalents per gram of samples (μmol TE/g of sample).
2.4.2. Ferric Reducing Antioxidant Power (FRAP) Assay
The FRAP assay was conducted according to the literature [37]. Prior to analysis, the FRAPreagent was prepared by mixing 0.3 M acetate buffer (pH = 3.6), 10 mM 2,4,6-tri(2-pyridyl)-1,3,5-triazine(TPTZ) solution in 40 mM hydrochloric acid and 20 mM FeCl3 in ratio 10:1:1. Furthermore, the FRAPreagent (2080 μL) was mixed with 240 μL of distilled water and 80 μL of appropriately diluted OLE.The mixture was vortexed and allowed to stand for 5 min at 37 ◦C prior to absorbance measurement at595 nm. The amount of extract was substituted by the same amount of extraction solvent in blank.The calibration curve was made by preparing a standard aqueous solution of FeSO4·7H2O (25–750 μM)where absorbance was measured following the same procedure as described for extracts. FRAP valueswere calculated according to the calibration curve for FeSO4·7H2O and expressed as μmol of Fe2+
equivalents (FE) per g of sample (μmol FE/g of sample).
2.5. NIR
NIR spectroscopy were conducted using the Control Development Inc. (South Bend, IN, USA),NIR-128-1.7-USB/6.25/50 μm to record extract spectra using the SPEC 32 Control Development software.NIR spectra was recorded in the wavelength range of 904 nm to 1699 nm. Each sample was recordedin triplicate and afterwards was calculated the average spectrum which was used for further processing.Since NIR spectra provide a large amount of data of one sample, PCA analysis was used to recognizeand extract the most important information from the measurements, thus reducing the amount ofdata [38]. The PCA analysis was carried out on a part of spectrum that shows the difference betweenthe samples (absorbance from 1350 to 1699 nm). This method was implemented in XLStat (MS Excel2010, Microsoft, Redmond, WA, USA; XLStat by Addinsoft, Paris, France).
2.6. UPLC-MS/MS
Determination of phenolic compounds was carried out on UPLC-MS/MS system Eskigent ExpertUltra LC 110 and SCIEX 4500 QTRAP. Separation of the phenolic fraction of olive leaves were performedby a Luna Omega 3μm Polar C18 100Å, 100 × 4.6 mm (column), thermostat column temperature 40 ◦C,automatic sampling temperature 4 ◦C, and injection volume 10 μL. Mobile phases consisted of: A 100%H2O with 0.1% HCOOH (v/v) and B 100% ACN with 0.1% HCOOH (v/v) with mobile phase flow0.40 mL/min. Gradient was set as follows: 1 min 10% B, 2 min 10% B, 15 min 90% B, 25 min 90% B,27 min 10% B, 30 min 10% B. Determination conditions for MS/MS detector were: negative atmosphericpressure ionization mode (API); ionization temperature: 500 ◦C, Ion Spray voltage: −4500V, drying gastemperature 190 ◦C and drying gas flow 9.0 L/min. Determination of phenolic compounds contentin extracts was carried out once. Quantitation of phenolic compounds was processed using Multiquant3.6 (SCIEX, Darmstadt, Germany) software. Partial validation of method was carried out by measuring6 replicas of added (spiked) standard (10 ng/mL) of oleuropein and oleanolic acid in two differentextracts with no trace of these compounds. Average recovery was 92.3% for oleuropein, 91.1% for
95

Foods 2019, 8, 248
oleanolic acid, standard deviation 1.108 ng/mL for oleuropein, standard deviation 0.956 ng/mL foroleanolic acid, RSD 1.20% for oleuropein and RSD 1.05% for oleanolic acid.
2.7. Colorimetric Evaluation of OLEs
Color parameters for all trials (pure extract) was measured by Konica Minolta colorimeter (ModelCM 3500d, Konica Minolta, Tokyo, Japan) at CIE Standard Illuminant D65 by 8 mm thick plate.All measurements were conducted in the Specular Component Included (SCI) mode as previouslyreported [39]. Colorimetric values (L*, a*, b*) were measured and color change after HVED treatment(ΔC, ΔH and ΔE) against untreated extracts (CE) was calculated. ΔL, Δa and Δb presents the differencebetween colorimetric value of HVED extracts and untreated (CE) extracts. Hue (H) was calculated from:
H = arctan(
b∗a∗
)(1)
Chroma (C) and the differences in tone color (ΔC) are calculated based on the following formula:
C =√
a2 + b2 (2)
ΔC = CHVED extract − Cuntreated extract (3)
The total color difference (ΔE) was calculated on the basis of the measured parameters:
ΔE =√
ΔL2 + Δa2 + Δb2 (4)
Saturation (ΔH) was determined based on the formula below:
ΔH =√
ΔE2 − ΔL2 − ΔC2 (5)
2.8. Electrophoretic Light Scattering (ELS)
ELS measures the electrophoretic mobility of particles in dispersion or molecules in solutionin the way that combines light scattering with electrophoresis. The OLE is introduced into the cellcontaining two electrodes. When an electric field is applied across the electrodes every charged particleor molecule will migrate towards its oppositely charged electrode with velocity which is dependentupon its charge. The measured electrophoretic mobility is converted to zeta potential using establishedtheories. Zeta-potential measurements of all extracts were made on a Malvern Zetasizer Ultra (MalvernPanalytical, Malvern, UK) in a disposable folded capillary cells, thermostatted to 25 ◦C, at the forwardangle (13◦).
2.9. Dynamic Light Scattering (DLS)
DLS is a non-invasive analytical technique for measuring the size of particles and moleculesin suspension which undergo Brownian motion (random movement of particles). It requires accurateand stable temperature because of sample viscosity. The velocity of the Brownian motion is definedthrough a property known as the translational diffusion coefficient (D). The size of a particle(hydrodynamic diameter) is calculated from the translational diffusion coefficient by using theStokes-Einstein equation. Measurements of all extracts were made on a Malvern Zetasizer Ultrafrom Malvern Panalytical, UK in a disposable folded capillary cells, thermostatted to 25 ◦C, at thenon-invasive back scatter (NIBS, 173◦).
2.10. Determination of Pesticides and Metals in OLs
The content of the pesticides was measured by modified procedures with following nationalregulations HRN EN ISO 12393-1,12393-2 and 12393-3: 2013, i.e., extraction with petroleum
96

Foods 2019, 8, 248
ether/dichloromethane and determination using the GC-ECD Varian CP-3800 instrument. Metaltrace content was determined according to the HRN EN ISO 14084: 2005 procedure, or by wet sampledigestion by HNO3 (microwave digestion) with Microwave reaction system Anton Paar, Multiwave3000. Determination of metals were conducted on the Perkin Elmer AAS Analyst 800 and ICP-MSPerkin Elmer NexION 300X (PerkinElmer, Inc. 940, Waltham, MA, USA), while Hg traces weredetermined by the Leco AMA 254 Hg analyzer (LECO, St. Joseph, MI, USA).
3. Results and Discussion
3.1. Influence of HVED Treatment on Physical Parameters of OLEs
HVED was applied as an emerging non-thermal technology, with the aim to reduce extractiontime and enhance extraction efficiency at lower temperatures than it is usual for CE. Data for pH,electrical conductivity, temperature, and power are given in Table 2.
Table 2. Average values of pH, conductivity (μS/cm) for untreated and HVED treated samples, startingtemperature (◦C), final temperature (◦C) and power (kW) after HVED treatments.
ID Sample pHConductivity
(μS/cm)Starting Temperature
(◦C)Final Temperature
(◦C)Power(kW)
ExtractionType
1 3 OL0 5.54 ± 0.21 516.0 ± 4 20.8 ± 0.9 20.8 ± 0.5 /
CE
2 9 OL0 5.45 ± 0.11 349.0 ± 3 19.7 ± 0.4 19.7 ± 0.4 /3 3 OL25 6.07 ± 0.09 139.2 ± 2.3 20.1 ± 0.2 20.1 ± 0.6 /4 9 OL25 6.21 ± 0.15 141.6 ± 3.2 20.0 ± 0.5 20.0 ± 0.6 /5 3 OL50 6.88 ± 0.12 36.6 ± 1.1 21.0 ± 0.4 21.0 ± 0.4 /6 9 OL50 6.51 ± 0.11 41.3 ± 1.2 21.0 ± 0.7 21.0 ± 0.2 /
7 OLN1 6.46 ± 0.22 51.4 ± 1.2 26.4 ± 0.8 26.7 ± 0.8 12 ± 1
HVED
8 OLN2 5.80 ± 0.16 242.4 ± 3.3 24.2 ± 0.6 24.9 ± 0.3 12 ± 19 OLN3 5.87 ± 0.14 272.1 ± 2.3 25.2 ± 0.5 25.6 ± 0.6 12 ± 1
10 OLN4 5.65 ± 0.21 224.3 ± 3.2 24.8 ± 0.6 26.2 ± 0.6 19 ± 111 OLN5 5.93 ± 0.19 124.7 ± 1.2 23.4 ± 0.3 23.6 ± 0.5 17 ± 012 OLN6 5.85 ± 0.18 126.5 ± 2.5 24.3 ± 0.4 23.8 ± 0.4 12 ± 113 OLN7 6.11 ± 0.17 63.4 ± 1.3 23.5 ± 0.5 23.3 ± 0.6 10 ± 114 OLN8 6.09 ± 0.21 57.9 ± 1.1 22.7 ± 0.7 23.3 ± 0.3 20 ± 115 OLN9 6.00 ± 0.15 93.4 ± 1.2 25.5 ± 0.3 25.7 ± 0.4 19 ± 116 OLN10 5.78 ± 0.11 275.6 ± 3.1 23.3 ± 0.2 28.4 ± 0.6 22 ± 117 OLN11 6.10 ± 0.12 51.9 ± 1.1 28.2 ± 0.5 26.7 ± 0.7 19 ± 018 OLN12 5.99 ± 0.17 104.6 ± 1.2 25.9 ± 0.4 26.1 ± 0.6 14 ± 119 OLA1 6.45 ± 0.16 53.2 ± 1.1 23.7 ± 0.6 23.8 ± 0.6 7 ± 120 OLA2 5.30 ± 0.15 268.3 ± 3.4 23.6 ± 0.7 25.6 ± 0.6 9 ± 121 OLA3 5.21 ± 0.12 250.6 ± 4.5 23.6 ± 0.7 24.7 ± 0.5 10 ± 122 OLA4 5.28 ± 0.19 233.3 ± 3.2 23.7 ± 0.5 25.1 ± 0.4 14 ± 123 OLA5 5.77 ± 0.12 126.4 ± 2.3 24.3 ± 0.3 26.1 ± 0.3 16 ± 024 OLA6 5.88 ± 0.11 127.5 ± 2.3 24.0 ± 0.4 24.2 ± 0.6 7 ± 025 OLA7 6.32 ± 0.12 61.9 ± 1.6 23.9 ± 0.6 23.1 ± 0.6 9 ± 126 OLA8 6.25 ± 0.13 59.0 ± 1 23.2 ± 0.4 24.4 ± 0.5 13 ± 127 OLA9 6.00 ± 0.15 94.6 ± 2.0 23.8 ± 0.6 24.5 ± 0.6 14 ± 128 OLA10 5.18 ± 0.16 285.7 ± 3.8 24.5 ± 0.7 29.9 ± 0.4 16 ± 129 OLA11 6.36 ± 0.17 49.6 ± 1.3 24.5 ± 0.6 24.6 ± 0.7 12 ± 030 OLA12 5.88 ± 0.19 105.9 ± 2.8 24.2 ± 0.5 24.0 ± 0.6 7 ± 1
OL = olive leaf, N = nitrogen, A = argon. For HVED, numbers 1–12 are the order of conducted treatment. For CEtreatments, 3 and 9 are referred to treatment time (min) while 0, 25, and 50 stands for concentration of an ethanolsolvent (%).
3.2. Influence of HVED Treatment on TPC and Antioxidant Activity of OLEs
The influence of individual process parameters (treatment time, applied voltage, ethanol content)and their interaction were evaluated for significance (p ≤ 0.05). It is important to emphasize that during3 and 9 min of treatment time; temperature did not exceed 30 ◦C. In Table 3, results for extractionyield, TPC and antioxidant activity (DPPH and FRAP) for CE and HVED extracts were given. It canbe seen that by using 50% ethanol (v/v) and HVED with argon for 9 min, high extraction yields were
97

Foods 2019, 8, 248
achieved as compared to CE-extracts. Also, 20 kV treatment for 3 min, with nitrogen gas gave 2,5-foldhigher yield in comparison to CE extracts. A recent study confirmed HVED as an extraction techniquewith significant increase in yield due to disruptions of sample cells under electrical breakdown andenhanced mass transfer [40].
All HVED treated samples resulted with higher TPC values than CE samples which implies thatHVED could be considered as an effective extraction tool at room temperature. The phenomena behindHVED is electroporation, where strength of electric field is directly proportional to the poration of plantcell membrane [1]. Moreover, it was found that higher ethanol/water ratio promote better polyphenolicextraction, thus gave extracts with higher TPC content. Similar results were observed by Garcia-Castello et al.,who found that higher ethanol concentration favored flavonoids’ extraction from grapefruit (Citrus paradisi L.)solid wastes [41]. Authors explained that reduced dielectric constant of the solvent caused by ethanol couldled to enhanced solubility and diffusion of polyphenols from plant matrix. With respect to pure water asan extraction solvent, it is clear that 2-6 times higher TPC values were determined for HVED extractionsystems (OLN2, 3, 4 and 10; OLA2, 3, 4 and 10) in comparison to CE samples.
Table 3. Concentrations of total phenolic content (TPC) values, antioxidant capacity (AOC) (2,2-Diphenyl-2-Picrylhydrazyl - DPPH) and ferric reducing antioxidant power (FRAP)) and extraction yield in extractsproduced by conventional extraction (CE) and HVED.
ID SampleTPC
(mg GAE/g)DPPH
(μmol TAE/g)FRAP
(μmol FE/g)Yield(%)
ExtractionType
1 3 OL0 5.32 ± 0.02 27.06 ± 0.01 63.36 ± 2.24 0.53 ± 0.002 9 OL0 15.85 ± 0.11 31.10 ± 0.08 146.93 ± 3.54 1.58 ± 0.013 3 OL25 13.35 ± 0.08 24.78 ± 0.05 150.50 ± 4.57 1.33 ± 0.01 CE4 9 OL25 16.04 ± 0.10 30.46 ± 0.07 179.07 ± 6.09 1.60 ± 0.015 3 OL50 14.06 ± 0.09 32.71 ± 0.06 159.79 ± 5.42 1.41 ± 0.016 9 OL50 20.61 ± 0.14 33.31 ± 0.08 221.93 ± 6.99 2.06 ± 0.01
7 OLN1 49.21 ± 0.10 31.49 ± 0.07 266.21 ± 7.53 4.92 ± 0.018 OLN2 29.82 ± 0.07 28.60 ± 0.05 208.36 ± 4.28 2.98 ± 0.019 OLN3 18.08 ± 0.08 25.96 ± 0.06 197.64 ± 2.00 1.81 ± 0.0110 OLN4 33.12 ± 0.12 27.46 ± 0.08 199.79 ± 5.22 3.31 ± 0.0111 OLN5 24.17 ± 0.05 31.31 ± 0.04 374.79 ± 6.74 2.42 ± 0.0112 OLN6 26.95 ± 0.08 30.14 ± 0.09 308.36 ± 4.45 2.69 ± 0.0113 OLN7 45.47 ± 0.06 30.49 ± 0.10 209.79 ± 2.01 4.55 ± 0.0114 OLN8 47.21 ± 0.09 31.81 ± 0.08 229.79 ± 5.82 4.72 ± 0.01
HVED
15 OLN9 29.99 ± 0.07 28.35 ± 0.01 301.21 ± 4.68 3.00 ± 0.0116 OLN10 28.95 ± 0.11 29.99 ± 0.08 256.21 ± 5.74 2.89 ± 0.0117 OLN11 45.82 ± 0.16 27.96 ± 0.07 561.93 ± 9.11 4.58 ± 0.0218 OLN12 35.03 ± 0.10 31.53 ± 0.02 284.07 ± 3.21 3.50 ± 0.0119 OLA1 39.56 ± 0.08 30.78 ± 0.15 234.07 ± 2.66 3.96 ± 0.0120 OLA2 32.69 ± 0.05 26.53 ± 0.08 145.50 ± 2.87 3.27 ± 0.0021 OLA3 9.82 ± 0.04 29.71 ± 0.11 97.64 ± 1.15 0.98 ± 0.0022 OLA4 26.69 ± 0.02 25.53 ± 0.08 169.07 ± 5.92 2.67 ± 0.0023 OLA5 36.17 ± 0.04 29.60 ± 0.17 315.50 ± 4.00 3.62 ± 0.0024 OLA6 31.21 ± 0.09 30.64 ± 0.02 321.21 ± 6.38 3.12 ± 0.0125 OLA7 53.64 ± 0.14 29.85 ± 0.12 443.36 ± 5.21 5.36 ± 0.0126 OLA8 65.99 ± 0.06 31.53 ± 0.01 237.64 ± 3.73 6.60 ± 0.0127 OLA9 30.77 ± 0.05 26.81 ± 0.08 326.21 ± 2.16 3.08 ± 0.0128 OLA10 21.21 ± 0.04 29.67 ± 0.05 196.21 ± 2.97 2.12 ± 0.0029 OLA11 42.60 ± 0.11 32.53 ± 0.10 343.36 ± 3.01 4.26 ± 0.0130 OLA12 26.43 ± 0.01 30.03 ± 0.08 354.07 ± 5.36 2.64 ± 0.00
OL = olive leaf, N = nitrogen, A = argon. For HVED, numbers 1–12 are the order of conducted treatment. For CEtreatments, 3 and 9 are referred to treatment time while 0, 25, and 50 stands for concentration of an ethanol solvent(%). Percentage of yield was calculated as (g GAE/g of sample) × 100.
3.3. Influence of HVED Treatment on Soluble Phenolic Compounds in OLEs Analyzed by UPLC-MS/MS
A UPLC-MS/MS analysis of individual phenolic compounds has shown that main constituentsof phenolics in OLEs were as follows: apigenin, diosmetin, hydroxytyrosol, luteolin, oleanolic acid,oleuropein, and quercentin (Table 4). It is obvious that there is an increase in content of phenolics
98

Foods 2019, 8, 248
with increase in ethanol concentration, likely due to increased solubility of phenolic compounds [42].Oleuropein is the main constituent of OLE. Similar trend is shown for HVED treatment, with 50% ethanol(v/v), where higher concentrations of hydroxytyrosol and oleuropein were observed Hydroxytyrosol,which is a precursor of oleuropein, is scavenger of superoxide anions, and inhibitor of neutrophilsand hypochlorous acid-derived radicals [29]. It is also important to emphasize that the highest valuesof phenolics in OLEs for HVED treated samples, were shown for OLA8 (argon gas, 9 min treatment,20 kV, 50% ethanol) sample and OLN1 (nitrogen gas, 3 min, 20 kV, 50% ethanol). HVED extractionat the highest voltage (25 kV) and 9 min extraction time, resulted in degradation of oleanolic acidin OLE. This HVED technology with pulsed rapid discharge voltages (from 20 to 80 kV/cm electricfield intensity) is based on the phenomenon of electrical breakdown in liquids which induces physicaland chemical processes that affect both the cell walls and the membranes, while freeing intracellularcomponents [43]. Moreover, HVED generates hot and localized plasma during photonic dissociation ofwater, with emission of the UV light and -OH radicals. At the same time, HVED will create shockwavesand pyrolysis caused by electrohydraulic cavitation [44]. HVED or other electrically assisted extractionsare less thermally destructive than CE, and they are useful for extraction of specific thermolabileBACs. With increased effectiveness, such extracts are obtained at lower temperatures in a shorterperiod [45]. Another study found HVED as and efficient pre-treatment technique that intensifies pectinrecovery from sugar beet pulp without modification of pectin structure and chemical composition [46].For extraction of proteins and polyphenols from olive pit, HVED was found to be faster as comparedto UAE or PEF [47]. This treatment retained more proteins and polyphenols in processing, thusdemonstrating a promising technique for production of essential oils from oilseeds and herbs [48].With generating electric fields and electrical discharges of up to 25 kV, there is additional formation offree radical species (ROS and RNS). This can be negative and destabilizing effect for sensitive bioactivecompounds, especially in a long non-controlled treatment, where they can deteriorate [30]. This can beavoided by optimizing HVED treatment and shorter treatment time, as well to use gases in HVEDtreatments to reduce oxidation of phenolics and another compound of antioxidant potential.
UPLC-MS/MS analysis chromatograms of untreated and HVED treated OLs samples are shownin Figure 2a,b, Figure 3a,b, Figure 4a,b).
Figures 2a, 3a and 4a represent total ion chromatogram (TIC) of certain extract and in thesechromatograms all MRM (multiple reaction monitoring) transitions of the method are included. On thex axis is intensity and on the y axis is time of elution or retention time (RT) of certain analyte.
Figures 2b, 3b and 4b represent extracted ion chromatogram (XIC) of certain extract and in thesechromatograms only certain MRM-s transitions of the compounds are included. On the x axis is intensityand on the y axis is time of elution or retention time (RT) of certain analyte. In Figure 2b (Apigenin,Hydroxytyrosol, Oleanolic acid and Oleuropein), Figure 3b (Apigenin, Hydroxytyrosol, Oleanolicacid, Oleuropein and Luteolin) and Figure 4b Apigenin, Hydroxytyrosol, Diosmetin, Oleuropeinand Luteolin).
99

Foods 2019, 8, 248
Ta
ble
4.
Con
cent
rati
onof
indi
vidu
alph
enol
icco
mpo
unds
inC
Ean
dH
VED
oliv
ele
aves
extr
acts
(OLE
s)(n
g/m
L).
IDS
am
ple
Ap
ige
nin
Dio
sme
tin
Hy
dro
xy
tyro
sol
Lu
teo
lin
Ole
an
oli
cA
cid
Ole
uro
pe
inQ
ue
rce
nti
nE
xtr
act
ion
Ty
pe
13
OL0
156
124
9.17
2356
.64.
4550
.4N/A
CE
29
OL0
172
121
11.6
71.5
2.12
56.2
0.05
43
3O
L25
125
112
494
550
0.66
3959
0.14
04
9O
L25
144
132
125
580
0.79
825
0.12
45
3O
L50
31.9
14.5
4120
154
3918
2348
524
76
9O
L50
193
154
13.0
80.8
8.37
108
3.01
7O
LN1
58.6
47.0
3016
353
3386
1764
69.
07
HV
ED
8O
LN2
157
118
86.6
138
8.84
99.3
N/A
9O
LN3
109
101
97.5
96.3
3.65
76.1
0.04
810
OLN
412
798
.196
.512
2N/A
74.2
0.04
211
OLN
511
611
980
.436
11.
8316
30.
109
12O
LN6
134
127
67.5
424
2.92
165
0.11
513
OLN
738
.930
.030
9025
528
0317
311
7.17
14O
LN8
44.3
33.0
3294
265
2705
1841
39.
015
OLN
914
915
910
837
58.
5716
80.
179
16O
LN10
111
94.2
192
252
3.76
178
0.10
317
OLN
1110
610
697
.540
32.
0042
40.
121
18O
LN12
56.8
49.2
3426
386
2851
1738
88.
5419
OLA
153
.659
.929
6435
720
0416
103
5.27
20O
LA2
198
76.6
10.1
29.8
5.74
57.4
0.04
321
OLA
312
413
011
221
52.
4197
.90.
032
22O
LA4
113
100
64.0
113
N/A
52.5
0.02
123
OLA
511
012
312
848
7N/A
247
0.14
624
OLA
611
512
214
545
7N/A
315
0.21
825
OLA
760
.160
.636
6043
118
4417
127
6.43
26O
LA8
48.2
41.5
3682
334
2043
1789
515
.627
OLA
911
111
614
948
06.
2246
50.
189
28O
LA10
94.2
85.3
139
166
N/A
102
0.06
129
OLA
1151
.451
.029
6737
221
9316
695
5.79
30O
LA12
142
141
77.2
459
7.51
166
0.19
1
OL=
oliv
ele
af,N=
nitr
ogen
,A=
argo
n.Fo
rH
VE
D,n
umbe
rs1–
12ar
eth
eor
der
ofco
nduc
ted
trea
tmen
t.Fo
rC
Etr
eatm
ents
,3an
d9
are
refe
rred
totr
eatm
entt
ime
(min
)whi
le0,
25,
and
50st
ands
for
conc
entr
atio
nof
anet
hano
lsol
vent
(%).
100

Foods 2019, 8, 248
a
Fig
ure
2.
Con
t.
101

Foods 2019, 8, 248
b
Fig
ure
2.
(a)U
PLC
-MS/
MS
anal
ysis
chro
mat
ogra
mof
untr
eate
dO
LE(3
OL5
0)—
tota
lion
curr
ent(
TIC
).(b
)UPL
C-M
S/M
San
alys
isch
rom
atog
ram
ofun
trea
ted
OLE
(3O
L50)
.
102

Foods 2019, 8, 248
a
Fig
ure
3.
Con
t.
103

Foods 2019, 8, 248
b
Fig
ure
3.
(a)U
PLC
-MS/
MS
anal
ysis
chro
mat
ogra
mof
HV
EDtr
eate
d(w
ithni
trog
en)O
LE(O
LN1)
—to
tali
oncu
rren
t(TI
C).
(b)U
PLC
-MS/
MS
anal
ysis
chro
mat
ogra
mof
HV
EDtr
eate
d(w
ith
nitr
ogen
)OLE
(OLN
1).
104

Foods 2019, 8, 248
a
Fig
ure
4.
Con
t.
105

Foods 2019, 8, 248
b
Fig
ure
4.
(a)U
PLC
-MS/
MS
anal
ysis
chro
mat
ogra
mof
HV
EDtr
eate
d(w
ithar
gon)
OLE
(OLA
1)—
tota
lion
curr
ent(
TIC
).(b
)UPL
C-M
S/M
San
alys
isch
rom
atog
ram
ofH
VED
trea
ted
(wit
har
gon)
OLE
(OLA
1).
106

Foods 2019, 8, 248
3.4. Influence of HVED Treatment on Color Parameters of OLEs
OLEs color parameters did not change significantly after the HVED treatments (Table 5). HVEDtreated OLEs had higher values of colorimetric variables a* (more red), b* (more yellowish), C (moretone color) and H (more saturated) than CE extracts, while average L* parameter was lower (darkersamples) for HVED OLEs. Total difference in tone color (ΔC), saturation (ΔH) and total color (ΔE)after HVED treatment was lower when using nitrogen gas comparing to argon. The highest differencein tone color (ΔC) and total color difference (ΔE) was observed for HVED samples with 50% ethanol(v/v) (OLN1, OLA1) and 9 min treatment (OLN6 and OLA5). The highest change in saturation (ΔH)was noted for HVED treated samples for 9 min (OLN7 and OLA5). Due to the electroporation effect ofplant cells, there is a possibility of an extraction of different molecules depending on the diameter ofthe pore on electroporated plant membrane [29].
Table 5. CIELab color parameters of CE and HVED treated OLEs.
ID Sample L* a* b* C H ΔC ΔH ΔEExtraction
Type
1 3 OL0 81.86 4.96 42.70 42.99 1.46 / / /
CE
2 9 OL0 82.06 6.59 46.76 47.22 1.43 / / /3 3 OL25 89.56 0.06 30.53 30.53 1.57 / / /4 9 OL25 91.02 −0.37 31.26 31.26 −1.56 / / /5 3 OL50 94.12 −3.82 27.89 28.15 −1.43 / / /6 9 OL50 91.03 −3.82 38.68 38.87 −1.47 / / /
7 OLN1 80.34 −2.69 45.25 45.33 −1.51 17.18 2.74 22.19
HVED
8 OLN2 79.75 7.78 44.90 45.57 1.40 −1.65 1.46 3.209 OLN3 81.28 6.06 42.60 43.03 1.43 0.04 1.10 1.2510 OLN4 80.38 4.01 40.60 40.80 1.47 −2.19 0.72 2.7411 OLN5 82.35 1.17 29.06 29.08 1.53 −2.18 1.57 9.0812 OLN6 81.25 −2.59 45.68 45.75 −1.51 14.49 1.69 17.5613 OLN7 84.44 2.87 36.30 36.41 1.49 −2.45 6.66 9.6914 OLN8 86.03 −3.34 42.78 42.91 −1.49 4.04 0.84 6.4815 OLN9 83.26 0.59 26.29 26.30 1.55 −4.23 0.58 7.6116 OLN10 80.90 6.73 47.19 47.67 1.43 0.45 0.08 1.2517 OLN11 88.01 −3.70 40.73 40.90 −1.48 12.75 1.54 14.2218 OLN12 85.42 0.55 27.78 27.79 1.55 −2.74 0.52 4.9919 OLA1 84.82 −2.01 41.69 41.74 −1.52 13.59 3.01 16.7420 OLA2 78.28 10.44 52.28 53.31 1.37 6.09 2.86 7.7221 OLA3 86.90 3.20 41.42 41.54 1.49 −1.44 1.63 5.4922 OLA4 80.40 8.10 48.30 48.97 1.40 5.99 2.32 6.5823 OLA5 80.45 4.78 47.39 47.63 1.47 16.37 4.33 19.9624 OLA6 83.55 2.67 41.24 41.33 1.51 10.06 2.75 12.8325 OLA7 83.12 −1.37 43.09 43.11 −1.54 4.24 2.73 9.3826 OLA8 85.95 −2.71 38.36 38.46 −1.50 −0.41 1.08 5.2127 OLA9 82.62 2.21 37.57 37.63 1.51 7.10 1.92 10.1228 OLA10 78.98 9.06 50.87 51.67 1.39 4.45 1.79 5.7029 OLA11 84.57 −2.25 36.37 36.44 −1.51 8.29 2.38 12.8730 OLA12 82.27 2.50 36.80 36.88 1.50 6.35 2.21 9.92
OL = olive leaf, N = nitrogen, A = argon. For HVED, numbers 1–12 are the order of conducted treatment. For CEtreatments, 3 and 9 are referred to as treatment time while 0, 25, and 50 stands for concentration of an ethanol solvent(%). L*—lightness from black to white; a* from green to red, and b* from blue to yellow; C—chroma/tone color;H—hue angle; ΔC—total tone color difference; ΔH—total saturation difference; ΔE—total color difference.
3.5. Influence of HVED Treatment and Electroporation Phenomena on Particle Size and Zeta Potential of OLEs
Immediately after electroporation, plant cells swell in four stages with leakage of ions to theouter cellular area. That is the period for the extraction of different molecules (including phenolics)that depends on the pore size. HVED treatment inflicts damage to the membranes by generatingshock waves that are characteristic for the discharge. Hence, HVED has an important contribution to
107

Foods 2019, 8, 248
the mechanical damages, disintegration of cellular walls, homogenization and aggregation of cells.The results from electroporation on OLs are shown in Table 6.
Table 6. Results of particle size and zeta potential analysis for CE and HVED treated samples.
ID SampleZ Average Mean
(d·nm)PI
Zeta potential(mV)
ExtractionType
1 3 OL0 541.55 ± 6.38 0.62 ± 0.01 −9.31 ± 0.47
CE
2 9 OL0 370.60 ± 4.57 0.69 ± 0.06 −7.96 ± 0.253 3 OL25 270.45 ± 3.65 0.63 ± 0.11 −11.30 ± 2.444 9 OL25 303.25 ± 4.56 0.68 ± 0.08 −8.98 ± 1.125 3 OL50 333.10 ± 4.58 0.54 ± 0.00 −10.43 ± 0.816 9 OL50 166.50 ± 2.92 0.56 ± 0.06 −18.07 ± 0.12
7 OLN1 394.60 ± 3.81 0.41 ± 0.03 −27.13 ± 1.46
HVED
8 OLN2 672.00 ± 7.83 0.48 ± 0.06 −15.77 ± 0.309 OLN3 751.35 ± 9.64 0.73 ± 0.04 −17.79 ± 0.6610 OLN4 1545.50 ± 15.01 0.65 ± 0.04 −18.87 ± 1.4511 OLN5 139.30 ± 2.45 0.32 ± 0.04 −53.77 ± 0.2712 OLN6 203.70 ± 3.65 0.53 ± 0.05 −45.99 ± 5.5213 OLN7 653.15 ± 6.83 0.95 ± 0.14 −22.21 ± 0.3714 OLN8 378.15 ± 3.63 0.59 ± 0.07 −33.25 ± 1.4615 OLN9 279.15 ± 3.72 0.28 ± 0.01 −28.09 ± 0.8816 OLN10 952.40 ± 9.43 0.71 ± 0.10 −16.43 ± 0.1017 OLN11 193.50 ± 1.23 0.36 ± 0.08 −31.94 ± 2.4818 OLN12 304.05 ± 4.72 0.32 ± 0.04 −36.44 ± 2.4419 OLA1 452.90 ± 6.74 0.60 ± 0.06 −23.81 ± 0.7520 OLA2 1551.50 ± 16.63 0.85 ± 0.13 −19.76 ± 0.3721 OLA3 318.20 ± 3.74 0.42 ± 0.05 −16.96 ± 0.4022 OLA4 846.95 ± 8.72 0.71 ± 0.15 −17.53 ± 0.2323 OLA5 177.25 ± 1.53 0.43 ± 0.04 −54.14 ± 2.7224 OLA6 183.25 ± 1.74 0.26 ± 0.00 −36.95 ± 0.2625 OLA7 447.40 ± 2.82 0.50 ± 0.11 −29.91 ± 0.0326 OLA8 369.40 ± 2.76 0.63 ± 0.06 −35.07 ± 0.7327 OLA9 198.45 ± 1.34 0.31 ± 0.03 −41.08 ± 4.0128 OLA10 506.95 ± 5.45 0.69 ± 0.06 −19.41 ± 0.1029 OLA11 522.55 ± 6.28 0.48 ± 0.10 −23.29 ± 1.5330 OLA12 164.70 ± 1.28 0.46 ± 0.00 −35.08 ± 5.12
OL = olive leaf, N = nitrogen, A = argon. For HVED, numbers 1–12 are the order of conducted treatment. For CEtreatments, 3 and 9 are referred to treatment time (min) while 0, 25, and 50 stands for concentration of an ethanolsolvent (%).
Physical properties of obtained extracts were tested for polydispersity index (PI) and zeta potential(mV). Data indicate possible usage of HVED technology in industry for simultaneous extraction andnanoformulation, i.e., for production of stable emulsion systems. From values of zeta potential, it isshown that the initial average diameter of particles in CE samples with ethanol are >300 nm. For HVEDsamples with argon or nitrogen and 25% ethanol content (v/v) (OLN 5, 6, 9, 12 and OLA5, 6, 9, 12)droplet diameter decreases, which is directly linked with negative zeta potential of −30 mV, indicatinggood stability against coalescence [49]. Zeta potential is often used as an indicator for droplet stability,where positive values above +30 mV and below negative −30 mV indicate good stability againstcoalescence are electrochemical balance. Therefore, by using OLs, in systems with 25% ethanol content(v/v) it is possible to produce stable emulsion systems and nanoparticles.
The PI, which is a measure of homogeneity, was above 0.3. Ideally, PI should be <0.3, while valueshigher than 0.3 implicate broad distribution size and suggested particles are not monodispersed.Values for statistical analysis (Tables 7 and 8) are indicating there was a statistically significant effect ofethanol content on ELS for argon samples, and for DLS for nitrogen. Also, it should be mentioned that
108

Foods 2019, 8, 248
HVED samples with water (OLA2, 3, 4, 10 and OLN2, 4, 10) had increased zeta potential and averagediameter of particles, where surface charge of particles indicates formation of unstable particle systems.
3.6. Statistical Analysis of HVED Treatment Parameters and Ethanol Influence in Extraction of BioactiveCompound Form OLEs
Table 7. Statistical significance for pH, conductivity, temperature difference, power, dynamic lightscattering (DLS), polydispersity index (PI), electrophoretic light scattering (ELS), L*, a*, b*, total phenoliccontent (TPC), ferric reducing antioxidant power (FRAP), DPPH and yield of extraction. The MANOVAtable decomposes the variability of each parameter into contributions due to various factors for OLEtreated with argon.
Source
Main Effects Interactions
A: TreatmentTime
B: VoltageC: Ethanol
ContentAB AC BC
p-value
pH 0.1751 0.4805 0.0037 0.2276 0.5162 0.7081Conductivity 0.0431 0.5992 0.0017 0.2722 0.3039 0.8873Temperature
difference 0.0867 0.0588 0.0564 0.1082 0.1968 0.6541
Power 0.2380 0.0099 0.2097 0.3828 0.8125 0.2500DLS 0.6704 0.7696 0.3177 0.3569 0.6945 0.8880PI 0.4634 0.6328 0.2114 0.9126 0.7919 0.9259
ELS 0.0703 0.1162 0.0163 0.2681 0.4337 0.1984L* 0.3500 0.5867 0.3631 0.5392 0.4922 0.6159a* 0.2793 0.6684 0.0474 0.5779 0.5319 0.7388b* 0.1225 0.8636 0.1252 0.8647 0.5679 0.3522
TPC 0.1972 0.4714 0.1067 0.6437 0.6604 0.9387FRAP 0.6781 0.9773 0.1791 0.4250 0.8373 0.7394DPPH 0.7467 0.8024 0.2450 0.2872 0.6684 0.4903
Yield of extraction 0.1982 0.4710 0.1072 0.6450 0.6633 0.9392
Where A determines treatment time, B stands for voltage and C stands for ethanol content. The p-values present thestatistical significance of each of the factors.
Table 8. Statistical significance for pH, conductivity, temperature difference, power, DLS, PI, ELS, L*,a*, b*, TPC, FRAP, DPPH and yield of extraction. The MANOVA table decomposes the variability ofeach parameter into contributions due to various factors for OLs treated with nitrogen.
Source
Main Effects Interactions
A: TreatmentTime
B: VoltageC: Ethanol
ContentAB AC BC
p value
pH 0.1610 0.1516 0.0255 0.1209 0.2870 0.2384Conductivity 0.3678 0.7244 0.0128 0.4040 0.8518 0.9879Temperature
Difference 0.1782 0.1677 0.0829 0.1081 0.2583 0.1489
Power 0.5736 0.0046 0.4091 0.1835 0.1957 0.1552DLS 0.4132 0.3820 0.0277 0.3044 0.1810 0.0969PI 0.2785 0.4608 0.2353 0.7913 0.3141 0.5596
ELS 0.2004 0.3594 0.0295 0.2676 0.1189 0.4675L* 0.6960 0.4382 0.2718 0.9382 0.6644 0.4497a* 0.4285 0.4968 0.0706 0.9572 0.5046 0.4027b* 0.4367 0.5694 0.2359 0.9952 0.4904 0.5976
TPC 0.7034 0.8342 0.0652 0.7084 0.5300 0.5030FRAP 0.5573 0.2974 0.3888 0.6255 0.3050 0.6206DPPH 0.1798 0.8050 0.1974 0.1946 0.6913 0.4720
Extraction Yield 0.7026 0.8341 0.0650 0.7089 0.5312 0.5062
Where A determines treatment time, B stands for voltage and C stands for ethanol content. The p-values present thestatistical significance of each of the factors.
109

Foods 2019, 8, 248
3.7. NIR and PCA Analysis of HVED Treated OLEs
NIR spectra were recorded in the wavelength range of 904–1699 nm for OLEs treated withargon and nitrogen for 3 and 9 min (Figures 5 and 6). Based on their absorbance, they show nosignificant differences. However, in the ranges 904–928 and 1350–1699 nm, wavelength shifts are visible,indicating changes in the third and second overtone of the C–H and O–H relations. These relationsare also associated with the hydroxyl group (–OH) bound directly to aromatic hydrocarbon group.The PCA was used for identifying patterns and highlighting similarities and differences in the data foran individual set of experiments. The goal of PCA was to extract the important information from thedata table and express it as a set of new orthogonal variables, called principal components or factors.Figures 7 and 8 show spatial projections defined by the first two main components labeled with F1and F2 for HVED treated and untreated samples. Although several input variables described thevariability of the whole system, often a large part of that variability is described by a small number ofvariables that are the main components. If this is met, the main components contain the same amountof information as input variables. In this case, the main components F1 and F2 comprise 93.36%variance of the original data for all the samples. Analysis of major components reveals connectivityamong variables and allows interpretation that is otherwise difficult. The PCA analysis implies findingthe values of the covariance matrix samples. The input data for the analysis of the main componentsare p variables and n observations (individual) and have a matrix shape p × n. The analysis begins withp variables data for n measurements (observations) using k main components (k < p) without losingsystem information. Main components represent the direction of maximum variability and providea simpler description of the structure data set. The first principal component is the linear combinationof the Y variables that accounts for the greatest possible variance, i.e., F1 (61.31%), while the othercontains 32.05% variance.
Figure 7 shows the distribution of samples with respect to the extraction parameters for argontreated and untreated samples, while Figure 8 shows the distribution for nitrogen treated and untreatedsamples. With higher proportion of ethanol in the solvent and with the longer treatment time, largerinfluence on the chemical compounds and origin of changes can be detected by NIR analysis (3thand 4th quadrant). For both PCA analysis, in the 1st and 2nd quadrant, there are samples extractedwith pure water (0% ethanol) and 25% ethanol (v/v) or extracted for a shorter treatment time withor without HVED treatment. It can be seen the trend of motion patterns by the “strength” of thetreatment in clockwise direction. Thus, in Figure 7, in 1st quadrant, samples were subdivided into0 or 25% ethanol (v/v), treated for 3 or 9 minutes and a voltage of 15 or 20 kV. In the 4th quadrantthere are samples extracted with 25 or 50% ethanol solution, treated for 3 or 9 minutes, 15 or 20 kV,while in 3rd quadrant there are samples that had powered treatment, meaning the extraction with 50%ethanol, untreated or HVED treated for 3 minutes at 20 kV. In Figure 8, in the 1st quadrant, sampleswere subdivided into 0 or 25% ethanol, treated for 3 minutes and with a voltage of 20 or 25 kV. In the4th quadrant there are samples extracted with 25 or 50% ethanol, treated for 3 or 9 minutes, and 20 or25 kV. In the 3rd quadrant is placed powered treated samples, meaning extraction with 25% or 50%ethanol, CE or HVED treatment for 3 or 9 minutes and voltages of 20 kV or 25 kV. The conclusion isthat ethanol and applied HVED voltage have strong association with the extraction and correspondingchanges in plant material. When ethanol is combined with HVED this destroys the linkage betweenphenolic compounds and components of the plant material to which they are bound.
110

Foods 2019, 8, 248
Figure 5. NIR spectra recorded in the wavelength range of 904 nm to 1699 nm for OLEs treated withargon for 3 and 9 min (NL: untreated olive leaves).
111

Foods 2019, 8, 248
Figure 6. NIR spectra recorded in the wavelength range of 904 nm to 1699 nm for OLEs treated withnitrogen for 3 min and 9 min (NL: untreated olive leaves).
112

Foods 2019, 8, 248
Figure 7. The PCA of untreated and HVED treated samples. The data is denoting untreated OLEs (CE),and OLEs treated with HVED using argon. Q stands for quadrant.
Figure 8. The PCA of untreated and HVED treated samples. The data is denoting untreated OLEs (CE),and OLEs treated with HVED using nitrogen. Q stands for quadrant.
3.8. Analysis of Pesticides and Metals in OL Samples
Tables 9 and 10 show the content of pesticides and metals in initial samples taken for extraction.It is evident that samples have lower levels than set as maximum levels in REGULATION (EC)
113

Foods 2019, 8, 248
No 396/2005 on maximum residue levels (MRLs) of pesticides in or on food and feed of plant andanimal origin and amending Council Directive 91/414/EEC and for metals according to COMMISSIONREGULATION (EC) No 1881/2006. All extracts were compliant regarding content of contaminants,pesticide residues and toxic metals.
Table 9. Residue levels and maximum residue levels (MRLs) of pesticides (mg/kg) in olive leaves(OLs) samples.
Pesticides MRL mg/kg Content mg/kg
Alachlor 0.02 <0.005Aldrin and Dieldrin (Aldrin and dieldrin combined expressed as dieldrin) 0.01 <0.002Captan (Sum of captan and THPI, expressed as captan) 0.06 <0.020DDT (sum of p,p´-DDT, o,p´-DDT, p-p´-DDE and p,p´-TDE (DDD)expressed as DDT) 0.05 <0.004Endosulphan (sum of alpha- and beta-isomers andendosulphan-sulphate expresses as endosulphan) 0.05 <0.002Endrin 0.01 <0.004Heptachlor (sum of heptachlor and heptachlor epoxide expressedas heptachlor) 0.01 <0.002Hexachlorobenzene 0.01 <0.002Hexachlorocyclohexane (HCH), alpha-isomer 0.01 <0.002Hexachlorocyclohexane (HCH), beta-isomer 0.01 <0.002Iprodione 20 <0.010Lindane (Gamma-isomer of hexachlorocyclohexane (HCH)) 0.01 <0.002Methoxychlor 0.01 <0.010Tolylphluanid (Sum of tolylphluanid anddimethylaminosulphotoluidide expressed as tolylphluanid) 0.05 <0.020Vinclozolin 0.02 <0.002
Table 10. Residue levels and MRLs of metals.
Metals MRL mg/kg Content mg/kg
Lead (Pb) 3.00 <0.050Cadmium (Cd) 1.00 0.011Mercury (Hg) 0.50 0.023Arsenic (As) - <0.005Chromium (Cr) - 0.240Nickel (Ni) - 1.82Manganese(Mn) - 52.0
Iron (Fe) - 101Copper (Cu) - 9.70Zinc (Zn) - 15.0
3.9. Critical Consideration on Costs of Equipment and Application of HVED for Extraction
The nonthermal processing market, was valued at USD 760.7 Million in 2016. It is projected toreach USD 1224.2 million by 2022, at a CAGR of 8.4% from 2017 reported by Markets and Markets™.
This aim of this paper and extensive analysis was to propose the possible application of HVED forthe extraction of bioactive compounds from OLs. The aim was also, to emphasize use of water andethanol as green solvents for efficient extraction of phenolic compounds. However, there should becritical discussion of the obtained results regarding costs of equipment and analysis, as well as short-and long-term improvements and possibilities of use of nonthermal technology like HVED. Regarding,nonthermal processing techniques like ultrasound, high pressure processing, pulsed electric fields,moderate electric fields, supercritical CO2 and subcritical water extraction, as extraction techniques,the high installation cost is a major restraining factor for this market. Inability to shift from conventionalthermal technologies by large players is a major challenge for the nonthermal processing market.
114

Foods 2019, 8, 248
Therefore, there should be extensive research studies of environmental, economic and energy efficientnonthermal processing.
The most used extraction techniques are the conventional techniques, like Soxhlet, heat reflux,boiling and distillation. These techniques are mostly based on the use of mild/high temperatures(50–90 ◦C) that can cause thermal degradation. The extraction efficiency is dependent of the correctsolvent choice, and the agitation intensity in order to increase the solubility of materials and the masstransfer rate. CE is being reflected on long extraction times, high costs, usage of organic solvents andlow extraction efficiency consequent low extraction yields. Also, there is potential for overheating ofthe matrix (herbs), high energy consumption and general cost.
The principal advantages of HVED against thermal conventional extraction procedures are relatedwith the increased mass transfer, improved extraction yield, decreased processing time, decreasedintensity of the conventional extraction parameters (i.e., extraction temperature, selection of solventsand solvent concentration), reduction of heat-sensitive compounds degradation (flavors etc.), facilitationof purified extract and reduction of energy costs and environmental impact.
For the highest energy inputs, in this study, there is a significant increase in conductivity,antioxidant activity and total phenolic compounds when compared with the control (a mixture ofsolvent in the same conditions as treated samples).
Therefore, a short-term overview is that HVED is an effective, but expensive technology, regardingthe cost of equipment, high input cost due to the input feed gas (Ar, N2, He), and chemical residues andtoxicological effects have not been studied yet. Possible application to scale-up of HVED to industryrequires high capital cost and high energy consumption. Also, there are unresearched risks of corrosionrates of electrodes (the low-cost stainless steel has the highest corrosion rates).
However, long term potential is that there is low operational cost about electricity consumption(i.e., 90 kW/h × 0.05$/kW/h = 4.5 $/h). Advanced application of nonthermal techniques, like HVED,is that they can operate at room temperature ensuring that compound denaturation is avoided or atleast decreased. HVED technology involves the application of short duration pulses (from severalnanoseconds to several milliseconds) of high electric field strengths (20–80 kV cm−1) and relativelylow energy (1–10 kJ/kg). HVED equipment comprises a high-voltage pulse generator, a treatmentchamber with a suitable fluid handling system, system of gas delivery and a monitoring and controllingsystem. The herb (sample) is exposed to the electric field pulses in a static or continuous chamberwith at least two electrodes, one on high voltage and the other at ground potential. The sample issubmitted to a force per unit charge (the electric field) that is responsible for the cell disintegration(electroporation phenomena).
Therefore, there is long term sustainable application of electrotechnologies like HVED in pharma,food, cosmetics industry etc.
4. Conclusions
The purpose of this extensive study was to evaluate and standardize advanced food technology,as HVED cold plasma-based tech, while accounting for green chemistry and modern sustainability andusing autochthonous Mediterranean OLs (Olea europaea L.), so their extracts can be further availablefor industrial production. Such green extracts are abundant in antioxidants and phenolic componentsand are beneficial for human health and industrial production (food additives).
HVED extraction resulted in effective extraction of phenolic components from leaves whencomparing to CE. Highest values of phenolics in OLEs, were shown for HVED treatment with argongas, 9 min treatment, 20 kV and 50% ethanol; and HVED treatment with nitrogen gas, 3 min, 20 kVand 50% ethanol. HVED extraction at the highest voltage (25 kV) and 9 min extraction time, resultedin the degradation of oleanolic acid in OLEs. This study confirmed that HVED is an extractiontechnique with significant yield due to disruptions of sample cells under electrical breakdown andenhanced mass transfer. For total phenolic content, all HVED samples had higher values (mg GAE/g)than untreated samples at the same temperature. The conclusion is that ethanol and applied HVED
115

Foods 2019, 8, 248
voltage, have strong linkage with changes caused by the treatment. Ethanol in combination withHVED, destroys the bond between phenolic compounds and plant material to which they are bound.From values of zeta potential, it is shown that the initial average diameter of particles in untreatedsamples with ethanol are around or below 300 nm. Hence, data indicate possible usage of HVEDtechnology for simultaneous extraction and production of nanoemulsions.
In conclusion, green OLEs obtained by green solvents (water/ethanol) and green technology withenergy saving (HVED), matched the principles of green engineering and modern sustainability whilehaving high nutritive value, e.g., they were rich in antioxidants and phenolic components [2,4,50].
Author Contributions: I.Ž.—researched prior studies, prepared graphic, drafted and revised the manuscript,P.P.—researched prior studies, revised the manuscript, D.B.K.—researched prior studies, revised the manuscript,M.N.—drafted and revised the manuscript, carried out the experimental work, F.Š.—carried out the experimentalwork, A.P.—carried out the experimental work, I.D.—carried out the experimental work, F.J.B.—researched priorstudies, revised the manuscript, A.R.J.—designed the study, researched prior studies, prepared graphic, draftedand revised the manuscript.
Funding: This work was supported by grant from the Croatian Science Foundation: “High voltage dischargesfor green solvent extraction of bioactive compounds from Mediterranean herbs (IP-2016-06-1913)”. The workof doctoral student Marinela Nutrizio has been fully supported by the “Young researchers' career developmentproject – training of doctoral students” of the Croatian Science Foundation funded by the European Union fromthe European Social Fund.
Acknowledgments: Authors would like to thank Mara Banovic for herb donation and professional support.Authors would like to thank Croatian Science Foundation for funding the project “High voltage dischargesfor green solvent extraction of bioactive compounds from Mediterranean herbs (IP-2016-06-1913)”. MarinelaNutrizio and Anet Režek Jambrak would like to thank to “Young researchers’ career development project—trainingof doctoral students” of the Croatian Science Foundation funded by the European Union from the EuropeanSocial Fund.
Conflicts of Interest: The authors declare no conflict of interest.
References
1. Putnik, P.; Lorenzo, J.; Barba, F.; Roohinejad, S.; Režek Jambrak, A.; Granato, D.; Montesano, D.; BursacKovacevic, D. Novel food processing and extraction technologies of high-added value compounds fromplant materials. Foods 2018, 7, 106. [CrossRef] [PubMed]
2. Giacometti, J.; Bursac Kovacevic, D.; Putnik, P.; Gabric, D.; Bilušic, T.; Krešic, G.; Stulic, V.; Barba, F.J.;Chemat, F.; Barbosa-Cánovas, G.; et al. Extraction of bioactive compounds and essential oils frommediterranean herbs by conventional and green innovative techniques: A review. Food Res. Int. 2018, 113,245–262. [CrossRef] [PubMed]
3. Sahin, S.; Bilgin, M. Olive tree (olea europaea L.) leaf as a waste by-product of table olive and olive oil industry:A review. J. Sci. Food Agric. 2018, 98, 1271–1279. [CrossRef] [PubMed]
4. Chemat, F.; Vian, M.A.; Cravotto, G. Green extraction of natural products: Concept and principles.Int. J. Mol. Sci. 2012, 13, 8615–8627. [CrossRef] [PubMed]
5. Watson, W.J.W. How do the fine chemical, pharmaceutical, and related industries approach green chemistryand sustainability? Green Chem. 2012, 14, 251–259. [CrossRef]
6. Soni, M.G.; Burdock, G.A.; Christian, M.S.; Bitler, C.M.; Crea, R. Safety assessment of aqueous olive pulpextract as an antioxidant or antimicrobial agent in foods. Food Chem. Toxicol. 2006, 44, 903–915. [CrossRef][PubMed]
7. Japón-Luján, R.; Luque-Rodríguez, J.M.; Luque de Castro, M.D. Dynamic ultrasound-assisted extraction ofoleuropein and related biophenols from olive leaves. J. Chromatogr. A 2006, 1108, 76–82. [CrossRef]
8. Benavente-García, O.; Castillo, J.; Lorente, J.; Ortuño, A.; Del Rio, J.A. Antioxidant activity of phenolicsextracted from olea europaea l. Leaves. Food Chem. 2000, 68, 457–462. [CrossRef]
9. Ferreira, I.C.F.R.; Barros, L.; Soares, M.E.; Bastos, M.L.; Pereira, J.A. Antioxidant activity and phenolic contents ofOlea europaea l. leaves sprayed with different copper formulations. Food Chem. 2007, 103, 188–195. [CrossRef]
10. Lockyer, S.; Rowland, I.; Spencer, J.P.E.; Yaqoob, P.; Stonehouse, W. Impact of phenolic-rich olive leaf extracton blood pressure, plasma lipids and inflammatory markers: A randomised controlled trial. Eur. J. Nutr.2016, 56, 1421–1432. [CrossRef]
116

Foods 2019, 8, 248
11. Wainstein, J.; Ganz, T.; Boaz, M.; Bar Dayan, Y.; Dolev, E.; Kerem, Z.; Madar, Z. Olive leaf extract as a hypoglycemicagent in both human diabetic subjects and in rats. J. Med. Food 2012, 15, 605–610. [CrossRef] [PubMed]
12. Vizza, D.; Lupinacci, S.; Toteda, G.; Puoci, F.; Ortensia, I.P.; De Bartolo, A.; Lofaro, D.; Scrivano, L.;Bonofiglio, R.; Russa, A.L.; et al. An olive leaf extract rich in polyphenols promotes apoptosis in cervicalcancer cells by upregulating p21cip/waf1 gene expression. Nutr. Cancer 2019, 71, 320–333. [CrossRef] [PubMed]
13. Jung, Y.-C.; Kim, H.W.; Min, B.K.; Cho, J.Y.; Son, H.J.; Lee, J.Y.; Kim, J.-Y.; Kwon, S.-B.; Li, Q.; Lee, H.-W.Inhibitory effect of olive leaf extract on obesity in high-fat diet-induced mice. In Vivo 2019, 33, 707–715.[CrossRef] [PubMed]
14. Kaneko, Y.; Sano, M.; Seno, K.; Oogaki, Y.; Takahashi, H.; Ohkuchi, A.; Yokozawa, M.; Yamauchi, K.; Iwata, H.;Kuwayama, T.; et al. Olive leaf extract (Olea Vita) suppresses inflammatory cytokine production and NLRP3inflammasomes in human placenta. Nutrients 2019, 11, 970. [CrossRef] [PubMed]
15. Sarbishegi, M. Antioxidant effects of olive leaf extract in prevention of Alzheimer’s disease and Parkinson’sdisease. Gene. Cell Tissue 2018, 5, e79847. [CrossRef]
16. Ganjalikhan Hakemi, S.; Sharififar, F.; Haghpanah, T.; Babaee, A.; Eftekhar-Vaghefi, S.H. The effects of oliveleaf extract on the testis, sperm quality and testicular germ cell apoptosis in male rats exposed to busulfan.Int. J. Fertil. Steril. 2019, 13, 57–65. [PubMed]
17. Vidicevic, S.; Tošic, J.; Stanojevic, Ž.; Isakovic, A.; Mitic, D.; Ristic, D.; Dekanski, D. Standardized Oleaeuropaea L. leaf extract exhibits protective activity in carbon tetrachloride-induced acute liver injury in rats:The insight into potential mechanisms. Arch. Physiol. Biochem. 2019, 11, 1–9.
18. Ranieri, M.; Di Mise, A.; Difonzo, G.; Centrone, M.; Venneri, M.; Pellegrino, T.; Russo, A.; Mastrodonato, M.;Caponio, F.; Valenti, G.; et al. Green olive leaf extract (OLE) provides cytoprotection in renal cells exposed tolow doses of cadmium. PLoS ONE 2019, 14, e0214159. [CrossRef] [PubMed]
19. Wang, Y.; Wang, S.; Cui, W.; He, J.; Wang, Z.; Yang, X. Olive leaf extract inhibits lead poisoning-inducedbrain injury. Neural. Regen. Res. 2013, 8, 2021–2029.
20. Caponio, F.; Difonzo, G.; Calasso, M.; Cosmai, L.; De Angelis, M. Effects of olive leaf extract addition onfermentative and oxidative processes of table olives and their nutritional properties. Food Res. Int. 2019, 116,1306–1317. [CrossRef] [PubMed]
21. Martínez, L.; Castillo, J.; Ros, G.; Nieto, G. Antioxidant and antimicrobial activity of rosemary, pomegranateand olive extracts in fish patties. Antioxidants 2019, 8, 86. [CrossRef] [PubMed]
22. Khemakhem, I.; Fuentes, A.; Lerma-García, M.J.; Ayadi, M.A.; Bouaziz, M.; Barat, J.M. Olive leaf extracts forshelf life extension of salmon burgers. Food Sci. Technol. Int. 2018, 25, 91–100. [CrossRef] [PubMed]
23. Putnik, P.; Barba, F.J.; Španic, I.; Zoric, Z.; Dragovic-Uzelac, V.; Bursac Kovacevic, D. Green extractionapproach for the recovery of polyphenols from Croatian olive leaves (Olea europea). Food Bioprod. Process.2017, 106, 19–28. [CrossRef]
24. Žugcic, T.; Abdelkebir, R.; Alcantara, C.; Collado, M.C.; García-Pérez, J.V.; Meléndez-Martínez, A.J.; RežekJambrak, A.; Lorenzo, J.M.; Barba, F.J. From extraction of valuable compounds to health promoting benefitsof olive leaves through bioaccessibility, bioavailability and impact on gut microbiota. Trends Food Sci. Technol.2019, 83, 63–77. [CrossRef]
25. Chemat, F.; Rombaut, N.; Meullemiestre, A.; Turk, M.; Perino, S.; Fabiano-Tixier, A.-S.; Abert-Vian, M. Reviewof green food processing techniques. Preservation, transformation, and extraction. Innov. Food Sci. Emerg.2017, 41, 357–377. [CrossRef]
26. Madej, K.; Kalenik, T.K.; Piekoszewski, W. Sample preparation and determination of pesticidesin fat-containing foods. Food Chem. 2018, 269, 527–541. [CrossRef] [PubMed]
27. Zaanouni, N.; Gharssallaoui, M.; Eloussaief, M.; Gabsi, S. Heavy metals transfer in the olive tree andassessment of food contamination risk. Environ. Sci. Pollut. Res. 2018, 25, 18320–18331. [CrossRef]
28. Alcázar Román, R.; Amorós, J.A.; Pérez de los Reyes, C.; García Navarro, F.J.; Bravo, S. Major and traceelement content of olive leaves. OLIVAE 2014, 119, 1–7.
29. Batista Napotnik, T.; Miklavcic, D. In vitro electroporation detection methods—An overview. Bioelectrochemistry2018, 120, 166–182. [CrossRef]
30. Režek Jambrak, A.; Donsì, F.; Paniwnyk, L.; Djekic, I. Impact of novel nonthermal processing on food quality:Sustainability, modelling, and negative aspects. J. Food Qual. 2019, 2019, 2. [CrossRef]
31. Režek Jambrak, A.; Vukušic, T.; Donsi, F.; Paniwnyk, L.; Djekic, I. Three pillars of novel nonthermal foodtechnologies: Food safety, quality, and environment. J. Food Qual. 2018, 2018, 18. [CrossRef]
117

Foods 2019, 8, 248
32. Chemat, F.; Zill, E.H.; Khan, M.K. Applications of ultrasound in food technology: Processing, preservationand extraction. Ultrason. Sonochem. 2011, 18, 813–835. [CrossRef] [PubMed]
33. Attri, P.; Arora, B.; Choi, E.H. Retracted article: Utility of plasma: A new road from physics to chemistry.Rsc Adv. 2013, 3, 12540–12567. [CrossRef]
34. Li, Z.; Fan, Y.; Xi, J. Recent advances in high voltage electric discharge extraction of bioactive ingredientsfrom plant materials. Food Chem. 2019, 277, 246–260. [CrossRef] [PubMed]
35. Shortle, E.; O’Grady, M.N.; Gilroy, D.; Furey, A.; Quinn, N.; Kerry, J.P. Influence of extraction technique on theanti-oxidative potential of hawthorn (Crataegus monogyna) extracts in bovine muscle homogenates. Meat. Sci.2014, 98, 828–834. [CrossRef] [PubMed]
36. Achat, S.; Tomao, V.; Madani, K.; Chibane, M.; Elmaataoui, M.; Dangles, O.; Chemat, F. Direct enrichment ofolive oil in oleuropein by ultrasound-assisted maceration at laboratory and pilot plant scale. Ultrason Sonochem.2012, 19, 777–786. [CrossRef] [PubMed]
37. Benzie, I.F.F.; Strain, J.J. The ferric reducing ability of plasma (FRAP) as a measure of “antioxidant power”:The FRAP assay. Anal. Biochem. 1996, 239, 70–76. [CrossRef] [PubMed]
38. Williams, P.J.; Geladi, P.; Britz, T.J.; Manley, M. Near-infrared (NIR) hyperspectral imaging and multivariateimage analysis to study growth characteristics and differences between species and strains of members ofthe genus Fusarium. Anal. Bioanal. Chem. 2012, 404, 1759–1769. [CrossRef]
39. Bursac Kovacevic, D.; Putnik, P.; Dragovic-Uzelac, V.; Pedisic, S.; Režek Jambrak, A.; Herceg, Z. Effects ofcold atmospheric gas phase plasma on anthocyanins and color in pomegranate juice. Food Chem. 2016, 190,317–323. [CrossRef]
40. Xi, J.; He, L.; Yan, L.-G. Continuous extraction of phenolic compounds from pomegranate peel using highvoltage electrical discharge. Food Chem. 2017, 230, 354–361. [CrossRef]
41. Garcia-Castello, E.M.; Rodriguez-Lopez, A.D.; Mayor, L.; Ballesteros, R.; Conidi, C.; Cassano, A. Optimizationof conventional and ultrasound assisted extraction of flavonoids from grapefruit (Citrus paradisi L.) solidwastes. LWT-Food Sci. Technol. 2015, 64, 1114–1122. [CrossRef]
42. Bellumori, M.; Innocenti, M.; Binello, A.; Boffa, L.; Mulinacci, N.; Cravotto, G. Selective recovery of rosmarinicand carnosic acids from rosemary leaves under ultrasound- and microwave-assisted extraction procedures.C. R. Chim. 2016, 19, 699–706. [CrossRef]
43. Boussetta, N.; Vorobiev, E. Extraction of valuable biocompounds assisted by high voltage electrical discharges:A review. C. R. Chim. 2014, 17, 197–203. [CrossRef]
44. El Kantar, S.; Boussetta, N.; Rajha, H.N.; Maroun, R.G.; Louka, N.; Vorobiev, E. High voltage electricaldischarges combined with enzymatic hydrolysis for extraction of polyphenols and fermentable sugars fromorange peels. Food Res. Int. 2018, 107, 755–762. [CrossRef] [PubMed]
45. Barba, F.J.; Brianceau, S.; Turk, M.; Boussetta, N.; Vorobiev, E. Effect of alternative physical treatments(ultrasounds, pulsed electric fields, and high-voltage electrical discharges) on selective recovery ofbio-compounds from fermented grape pomace. Food Bioprocess. Technol. 2015, 8, 1139–1148. [CrossRef]
46. Almohammed, F.; Koubaa, M.; Khelfa, A.; Nakaya, M.; Mhemdi, H.; Vorobiev, E. Pectin recovery from sugarbeet pulp enhanced by high-voltage electrical discharges. Food Bioprod. Process. 2017, 103, 95–103. [CrossRef]
47. Roselló-Soto, E.; Barba, F.J.; Parniakov, O.; Galanakis, C.M.; Lebovka, N.; Grimi, N.; Vorobiev, E. Highvoltage electrical discharges, pulsed electric field, and ultrasound assisted extraction of protein and phenoliccompounds from olive kernel. Food Bioprocess. Technol. 2015, 8, 885–894. [CrossRef]
48. Sarkis, J.R.; Boussetta, N.; Tessaro, I.C.; Marczak, L.D.F.; Vorobiev, E. Application of pulsed electric fieldsand high voltage electrical discharges for oil extraction from sesame seeds. J. Food Eng. 2015, 153, 20–27.[CrossRef]
49. Nyström, M.; Aimar, P.; Luque, S.; Kulovaara, M.; Metsämuuronen, S. Fractionation of model proteins usingtheir physiochemical properties. Colloids Surf. A Phys. Eng. Asp. 1998, 138, 185–205. [CrossRef]
50. Anastas, P.T.; Warner, J.C. Green Chemistry: Theory and Practice; Oxford University Press: Oxford, UK, 2000.
© 2019 by the authors. Licensee MDPI, Basel, Switzerland. This article is an open accessarticle distributed under the terms and conditions of the Creative Commons Attribution(CC BY) license (http://creativecommons.org/licenses/by/4.0/).
118

foods
Article
The Impact of Pulsed Electric Field on the Extractionof Bioactive Compounds from Beetroot
Malgorzata Nowacka 1, Silvia Tappi 2, Artur Wiktor 1,*, Katarzyna Rybak 1,
Agnieszka Miszczykowska 1, Jakub Czyzewski 1, Kinga Drozdzal 1, Dorota Witrowa-Rajchert 1
and Urszula Tylewicz 2,3
1 Department of Food Engineering and Process Management, Faculty of Food Sciences,Warsaw University of Life Sciences, Nowoursynowska 159c, 02-776 Warsaw, Poland
2 Interdepartmental Centre for Agri-Food Industrial Research, University of Bologna, Via Quinto Bucci 336,47521 Cesena, Italy
3 Department of Agricultural and Food Sciences, University of Bologna, Piazza Goidanich 60,47521 Cesena, Italy
* Correspondence: [email protected]; Tel.: +48-22-593-75-60
Received: 2 June 2019; Accepted: 2 July 2019; Published: 5 July 2019
Abstract: Beetroot is a root vegetable rich in different bioactive components, such as vitamins,minerals, phenolics, carotenoids, nitrate, ascorbic acids, and betalains, that can have a positive effecton human health. The aim of this work was to study the influence of the pulsed electric field (PEF)at different electric field strengths (4.38 and 6.25 kV/cm), pulse number 10–30, and energy input0–12.5 kJ/kg as a pretreatment method on the extraction of betalains from beetroot. The obtainedresults showed that the application of PEF pre-treatment significantly (p < 0.05) influenced theefficiency of extraction of bioactive compounds from beetroot. The highest increase in the content ofbetalain compounds in the red beet’s extract (betanin by 329%, vulgaxanthin by 244%, compared tothe control sample), was noted for 20 pulses of electric field at 4.38 kV/cm of strength. Treatment ofthe plant material with a PEF also resulted in an increase in the electrical conductivity compared tothe non-treated sample due to the increase in cell membrane permeability, which was associated withleakage of substances able to conduct electricity, including mineral salts, into the intercellular space.
Keywords: pulsed electric field; extraction; bioactive compounds; red beet
1. Introduction
Beetroot (Beta vulgaris L.) is part of the Chenopodiaceae family and has originated in Asia andEurope. The red beetroot variety, a cultivated form of Beta vulgaris subsp. vulgaris (conditiva), is widelyused all over the world to produce pickles, salad, or juice [1]. Beetroot contains many functionalcomponents, such as vitamins, minerals (potassium, sodium, phosphorous, calcium, magnesium,copper, iron, zinc, manganese), phenolics, carotenoids, nitrate, and ascorbic acids that promote healthbenefits [2]. In fact, polyphenols, carotenoids, and vitamins present in beetroot have been recognized tohave antioxidant, anti-inflammatory, anticarcinogenic, and hepato-protective activities, which can helpin the prevention of many diseases, such as cardiovascular disease or hypertension and diabetes [3].
The characteristic red purple color of beetroot derives from betalain, water soluble pigmentsfound in plants of the Caryophyllales order [4]. Depending on their chemical structure, betalains canbe divided into red-purple and violet betacyanins (betanin, isobetanin, probetanin, and neobetanin)or yellow betaxanthins (vulgaxanthin, miraxanthin, portulaxanthin, and indicaxanthin) [5]; and theredness of beetroot depends on the ratio between the two classes [6]. For example, it was observedthat the intact beetroot plant extracts contain about 40 mg/g dm of betalains, from which 20.75 mg/gdm are betacyanins and 19.01 mg/g dm are betaxanthins [2]. Slavov et al. [3] studied the individual
Foods 2019, 8, 244; doi:10.3390/foods8070244 www.mdpi.com/journal/foods119

Foods 2019, 8, 244
betalain compounds content in pressed juice from beetroot, showing that the most abundant werebetanin, followed by vulgaxanthin and isobetanin.
Betalain pigments can generally exhibit health benefits as antioxidants, anti-cancer, anti-lipidemic,and antimicrobial agents [5,7]. They are mostly used as food dyes due to non-precarious, non-toxic,non-carcinogenic, and non-poisonous nature [2]. Therefore, there is an increasing interest of foodindustries in the extraction of this natural food colorant. In order to extract the pigments fromplant material, the disruption of membranes is necessary, and this is usually obtained through theapplication of detergents, solvents, or thermal treatments [8]. The latter is the preferred method forcolor concentrates production; however, betalain is highly sensitive to heat. Therefore, alternativemethods are necessary in order to prevent the discoloration of the pigments [9]. In recent years, the useof novel and mild methods has been investigated, including, among others, the microwave [9,10] andultrasound [11,12] assisted extraction . Another promising technique could be application of pulsedelectric field (PEF) that, applied as a pre-treatment for the extraction, allows the selective recovery ofbioactive compounds, at the same time reducing the energy and time required in the process.
PEF is the application of short time pulsed with high voltage into the food product placed betweentwo electrodes [13,14], thus promoting the modification of membrane permeability and the increase ofthe extraction yield [15,16].
Recently, PEF treatment has been applied in order to recover pigments from beetroot.Fincan et al. [17] observed a release of about 90% of total red coloring from beetroot subjectedto 270 rectangular pulses of 10 μs at 1 kV/cm field strength and total energy of 7 kJ/kg. López et al. [18]and Luengo et al. [19] studied the influence of different PEF parameters, such as electric field strength,pulse number, pulse duration, and specific energy applied on the extractability of betanin from thebeetroot cylinders. Similarly, Chalermchat et al. [20] evaluated the impact of PEF treatment on the redpigment in beetroot discs. However, in the cited works, PEF was applied only on a single geometry(cylinder or disc), while we assumed that this parameter could also have an influence on the extraction.Moreover, in most cases, the efficiency of extraction was assessed only by measuring the differencein the color of the extracts. Hence, our goals in the present research were to compare (i) the impactof mechanical preparation (cylinders or pulp) and (ii) the impact of PEF pre-treatments on differentgeometric forms on extractability of beetroot pigments. For these aims, beetroot was subjected tocutting into cylinders or pulping and different PEF conditions (electric field strength between 4.38and 6.25 kV/cm, pulse number in the range of 10–30, energy input in the range of 0–12.5 kJ/kg) aspre-treatments for the extraction of selected red (betanin) and yellow (vulgaxanthin) pigments.
2. Materials and Methods
2.1. Preparation of Samples
Beetroot (Beta vulgaris L.) was purchased from a local market (Warsaw, Poland). Products witha similar degree of maturity and characterized by similar dimensions were selected for the study.The raw materials were stored at 4 ◦C until the start of the experiments (not longer than one week).Before each experiment, the vegetables were removed from the cooling chamber, allowed to reachroom temperature, and then washed. The beetroot was cut into 7 mm height slices, and then cylinderswith a diameter of d = 15 mm were obtained using a cork borer. An electric mill was used to crush thecylinders to obtain a pulp.
2.2. PEF Treatement
A prototype PEF generator ERTEC-RI-1B (ERTEC, Wroclaw, Poland) with output high-voltageimpulse up to 30 kV and capacitance of 0.25 μF reactor was used. The generator provided monopolar,exponential shaped pulses with an average width of 10 μs and an interval between pulses equalto 2 s, which allows minimization of the temperature increase during the electric field application.The treatment chamber (diameter of 40 mm, height of 16 mm), made of dielectric material (Corian) and
120

Foods 2019, 8, 244
two stainless-steel lids, consists of a spark gap controlling the flow of electrical impulses and a setof electrodes (stationary and mobile). Both stationary and mobile electrodes were connected to thePEF generator.
Beetroot samples (8 cylinders) were placed in the treatment chamber. Next, to ensure a goodcontact between the electrodes and the tested material, the chamber was filled with a phosphatebuffer at pH = 6.5 and closed using a mobile electrode. In the case of pulp, the entire volume of theelectrical processing chamber (20 cm3) was carefully filled with the sample without additional solvent.PEF application was carried out using two different electric field intensities (4.38 and 6.25 kV/cm)and three pulse numbers (10, 20, 30). Each combination of the experiment was performed in threerepetitions. The specific energy intake was calculated according to the following equation [14]:
Ws = (V2Cn)/(2m), (1)
where V (V) is the voltage, C (F) is a capacitance of the energy storage capacitor, n is number of pulses,and m (kg) is mass of the sample in the treatment chamber.
The energy values (Ws) supplied to the sample are shown in Table 1. After PEF treatment, cylindersamples were dried on filter paper. Directly after PEF application, the temperature increase of thesamples did not exceed 9.2 ◦C.
Table 1. Parameters of pulsed electric field (PEF) treatment: electric field intensity, pulse number,and energy delivered to the sample used in the investigation.
Sample Code Electric Field Intensity (kV/cm) Pulse Number (-) Energy (kJ/kg)
0_0 0 0 04.38_10 4.38 10 2.434.38_20 4.38 20 4.864.38_30 4.38 30 7.286.25_10 6.25 10 4.966.25_20 6.25 20 9.926.25_30 6.25 30 14.88
2.3. Electrical Conductivity
The electrical conductivity of the sample was measured using a conductometer (CPC-505, Elmetron,Gliwice, Poland) with a platinum dual-needle probe, and it was used to evaluate the effectiveness ofelectroporation. The electrical conductivity was measured continuously for at least 5 min at roomtemperature. The measurements were conducted in five repetitions [21].
2.4. Color Determination
The color of the beetroot cylinders and extracts were measured in the CIE L*a*b* color systemusing a Konica Minolta CR-5 Chroma Meter (Osaka, Japan) with D65 light source and standard2º observer. The L* parameter defines the lightness of the sample, the a* chromatic coordinatedetermines the green (−) and red (+) component, and the b* coordinate describes the blue (−) andyellow (+) component [22]. The measurements were conducted at sixteen repetitions. Moreover,the supernatant (solution remaining after extraction) was subjected to the color measurements in thetransmittance mode.
2.5. Betalain Content
The betalain content in raw and PEF-treated material was determined by the chemical method,which is based on the extraction of dyes using phosphate buffer (pH 6.5) and the simultaneousdetermination of red and yellow dyes measured spectrophotometrically [23]. In the case of raw(untreated) material and beetroot pulp, 0.5 g of sample was weighted and then quantitatively
121

Foods 2019, 8, 244
transferred to a falcon tube, added a 50 cc phosphate buffer, and placed on a Vortex shaker for 20 minat 2000 rpm. After shaking, the obtained supernatant was filtered and the absorbance of the solutionwas measured in a spectrophotometer Heλios ThermoSpectronic γ (Thermo Electron Corporation,USA) at 476, 538, and 600 nm using a phosphate buffer solution as standard. In the case of PEF-treatedmaterial, a single beetroot cylinder along with the phosphate buffer was quantitatively transferred tothe falcon. Each time, the PEF chamber was rinsed three times with buffer and added to the falconin order to avoid betalain losses. The falcon was filled with a buffer to the 50 cc volume and thenanalyzed as described above. The assay was performed three times.
The absorbance value for red dyes (B)] at λ = 538 nm including light absorption due to the presenceof impurities was calculated as:
EB = 1.095 × (E538 − E600), (2)
where E538 absorbance at λ= 538 nm, E600 absorbance at λ= 600 nm, and 1.095 is a absorption coefficientat λ = 538 nm resulting from impurities present.
The content of red dyes (B) (mg betanin/100 g dm) was calculated as:
B = (c × EB)/(1120 × a × b), (3)
where c (mg) mass of the sample with buffer, 1120 (-) value resulting from the absorbance of a 1%betanin solution measured at 538 nm in a 1 cm cuvette, a (g) sample weight, and b (g/g dm) is drymatter content.
The absorbance value for yellow dyes (W) at λ = 476 nm including light absorption due to thepresence of impurities and red dyes and was calculated as:
EW = E476 − E358 + 0.667 × EB, (4)
where E476 absorbance at λ = 476 nm, E538 absorbance at λ = 538 nm, and EB is the absorbance valuefor red pigments.
The content of yellow dyes (W) (mg vulgaxanthin /100 g dm) was calculated as:
W = (c × EW)/(750 × a × b), (5)
where c (mg) mass of the sample with buffer, 750 (-) value resulting from the absorbance of a 1%betanin solution measured at 476 nm in a 1 cm cuvette, a (g) sample weight, and b (g/g dm) is drymatter content.
The content of red and yellow dyes ware quantified as mg of betanin and vulgaxanthin, respectively,in 100 g dry material.
2.6. Statitical Analysis—PCA and Pearson’s Correlation
The ANOVA and the Tukey test (α = 0.05) were applied to evaluate significant differences betweeninvestigated samples. The two-way ANOVA and comparison of obtained partial η2 values have beenused to assess the effect size of the analyzed variables on the electrical conductivity. The Pearson’scorrelation coefficient was calculated in order to evaluate the dependence between selected parametersof analyzed tissue. Hierarchical Cluster Analysis (HCA) with Ward’s agglomeration method was donefor complex assessment of obtained data. Euclidian distance was used to express obtained results bythe means of relative distance. All calculations were performed using STATISTICA 13 (StatSoft Inc.,Washington, DC, USA) and Excel (Microsoft, New York, NY, USA) software.
122

Foods 2019, 8, 244
3. Results and Discussion
3.1. Electical Conductivity
Electrical conductivity measurement is used to evaluate the effectiveness of PEF treatment inbiological tissue [24]. Following electroporation and intracellular content leakage, electrical conductivityof plant materials rises, indicating cell membrane rupture [25]. Figure 1 shows the results of bothelectrical conductivity and energy input delivered to the beetroot samples. As expected, all PEFpre-treated samples exhibited higher electrical conductivity in comparison to intact tissue. For instance,material treated by 10 pulses at 4.38 kV/cm was characterized by electrical conductivity equal to9.05 × 10−4 S/m. When the number of pulses increased to 30 (hence increasing the energy input) at thesame electric field intensity, the electrical conductivity rose significantly (p < 0.05) to 14.2 × 10⁻⁴ S/m.The application of the higher electric field intensity (6.25 kV/cm) lead to a further increase of electricalconductivity. However, in this case, the difference between samples pre-treated by 10, 20, and30 pulses were statistically insignificant (p > 0.05). In other words, despite the energy input increase,the electroporation efficiency did not grow because of the saturation of the electroporation phenomenonthat was previously observed in the literature for materials other than beetroot [14,26,27].
Figure 1. Electrical conductivity S/m (bars) and total energy input kJ/kg (dots) of differently treatedbeetroot samples. The same letter on the same column means no significant difference between electricalconductivities by the Tukey test (p < 0.05).
The performed statistical analysis showed that electric field intensity and number of pulsessignificantly (p < 0.05) influenced the electrical conductivity of the beetroot samples. Moreover,the interaction of these parameters, which could be interpreted as the influence of energy input, alsohad a significant (p < 0.05) impact on the electroporation efficiency measured by electrical conductivitymeasurement. However, comparing the partial η2 values, it can be stated that the biggest size effectwas found for electric field intensity (η2 = 0.753). For comparison, partial η2 was equal to 0.0114 and0.113, for number of pulses and the interaction between electric field intensity and number of pulses,respectively. Similar results were obtained previously by Wiktor et al. [21], suggesting that the celldisintegration index could be influenced not only by electric field strength and total energy input but
123
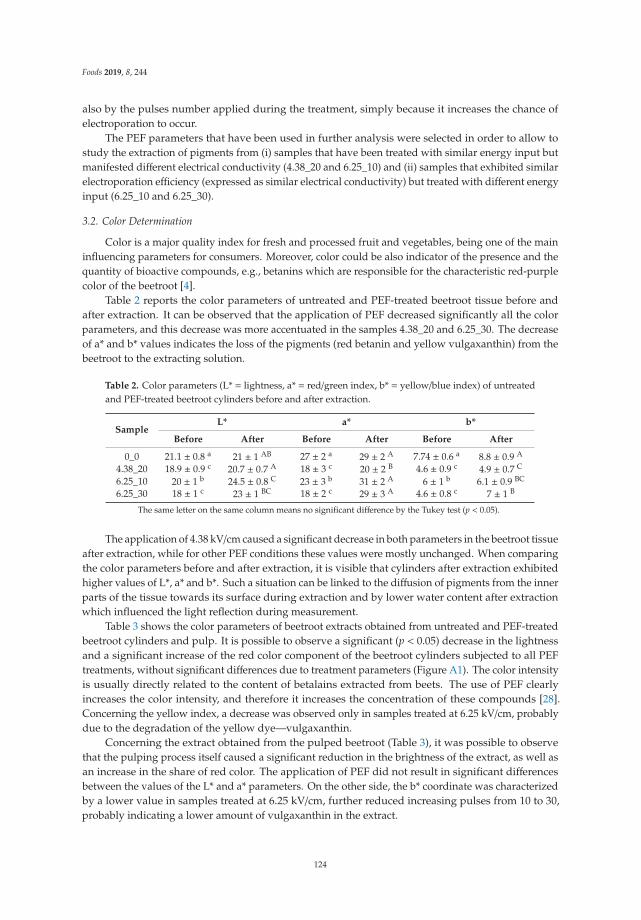
Foods 2019, 8, 244
also by the pulses number applied during the treatment, simply because it increases the chance ofelectroporation to occur.
The PEF parameters that have been used in further analysis were selected in order to allow tostudy the extraction of pigments from (i) samples that have been treated with similar energy input butmanifested different electrical conductivity (4.38_20 and 6.25_10) and (ii) samples that exhibited similarelectroporation efficiency (expressed as similar electrical conductivity) but treated with different energyinput (6.25_10 and 6.25_30).
3.2. Color Determination
Color is a major quality index for fresh and processed fruit and vegetables, being one of the maininfluencing parameters for consumers. Moreover, color could be also indicator of the presence and thequantity of bioactive compounds, e.g., betanins which are responsible for the characteristic red-purplecolor of the beetroot [4].
Table 2 reports the color parameters of untreated and PEF-treated beetroot tissue before andafter extraction. It can be observed that the application of PEF decreased significantly all the colorparameters, and this decrease was more accentuated in the samples 4.38_20 and 6.25_30. The decreaseof a* and b* values indicates the loss of the pigments (red betanin and yellow vulgaxanthin) from thebeetroot to the extracting solution.
Table 2. Color parameters (L* = lightness, a* = red/green index, b* = yellow/blue index) of untreatedand PEF-treated beetroot cylinders before and after extraction.
SampleL* a* b*
Before After Before After Before After
0_0 21.1 ± 0.8 a 21 ± 1 AB 27 ± 2 a 29 ± 2 A 7.74 ± 0.6 a 8.8 ± 0.9 A
4.38_20 18.9 ± 0.9 c 20.7 ± 0.7 A 18 ± 3 c 20 ± 2 B 4.6 ± 0.9 c 4.9 ± 0.7 C
6.25_10 20 ± 1 b 24.5 ± 0.8 C 23 ± 3 b 31 ± 2 A 6 ± 1 b 6.1 ± 0.9 BC
6.25_30 18 ± 1 c 23 ± 1 BC 18 ± 2 c 29 ± 3 A 4.6 ± 0.8 c 7 ± 1 B
The same letter on the same column means no significant difference by the Tukey test (p < 0.05).
The application of 4.38 kV/cm caused a significant decrease in both parameters in the beetroot tissueafter extraction, while for other PEF conditions these values were mostly unchanged. When comparingthe color parameters before and after extraction, it is visible that cylinders after extraction exhibitedhigher values of L*, a* and b*. Such a situation can be linked to the diffusion of pigments from the innerparts of the tissue towards its surface during extraction and by lower water content after extractionwhich influenced the light reflection during measurement.
Table 3 shows the color parameters of beetroot extracts obtained from untreated and PEF-treatedbeetroot cylinders and pulp. It is possible to observe a significant (p < 0.05) decrease in the lightnessand a significant increase of the red color component of the beetroot cylinders subjected to all PEFtreatments, without significant differences due to treatment parameters (Figure A1). The color intensityis usually directly related to the content of betalains extracted from beets. The use of PEF clearlyincreases the color intensity, and therefore it increases the concentration of these compounds [28].Concerning the yellow index, a decrease was observed only in samples treated at 6.25 kV/cm, probablydue to the degradation of the yellow dye—vulgaxanthin.
Concerning the extract obtained from the pulped beetroot (Table 3), it was possible to observethat the pulping process itself caused a significant reduction in the brightness of the extract, as well asan increase in the share of red color. The application of PEF did not result in significant differencesbetween the values of the L* and a* parameters. On the other side, the b* coordinate was characterizedby a lower value in samples treated at 6.25 kV/cm, further reduced increasing pulses from 10 to 30,probably indicating a lower amount of vulgaxanthin in the extract.
124

Foods 2019, 8, 244
Table 3. Color parameters (L* = Lightness, a* = red/green index, b* =yellow/blue index) of extractsobtained from untreated and PEF-treated beetroot cylinders and pulp.
SampleL* a* b*
Cylinders Pulp Cylinders Pulp Cylinders Pulp
0_0 96.2 ± 0.2 a 72 ± 1 A 7.2 ± 0.4 a 52 ± 2 A −0.6 ± 0.1 a −1.7 ± 0.4 A
4.38_20 76 ± 3 b 70 ± 2 A 43 ± 5 b 55 ± 4 A 1.5 ± 1.6 a −1.4 ± 0.5 A
6.25_10 81 ± 2 b 70 ± 1 A 36 ± 4 b 57 ± 2 A −5 ± 2 b −6.16 ± 0.06 B
6.25_30 79 ± 2 b 70 ± 2 A 41 ± 3 b 58 ± 4 A −5.1 ± 0.7 b −9.3 ± 06 C
The same letter on the same column means no significant difference by the Tukey test (p < 0.05).
3.3. Betalain Content
Betanin and vulgaxanthin are the most abundant betalains in beetroot [3]. Figure 2 shows thebetanin content, while Figure 3 shows the vulgaxanthin content of differently treated beetroot samples.The application of PEF to beetroot cylinders allowed to increase the extraction of betanin in a similarway (of about 3-fold) for all the PEF conditions applied. The use of PEF at the intensity of 4.38 kV/cmsignificantly (p < 0.05) increased the yield of betanin and vulgaxanthin extraction from beetrootcylinders by 329% and 244%, respectively, compared to the control samples. This increase indicatesthat PEF facilitates their extraction by increasing cell membrane permeability, which is also confirmedby the color parameters. While the values of the red and yellow color components decreased inthe cylinders after extraction, an increase was recorded in the post-extraction solution. In addition,the electrical conductivity of beet tissue after application of 20 pulses at 4.38 kV/cm was significantlyhigher compared to the untreated sample (Figure 1).
Figure 2. Betanin concentration of differently treated beetroot cylinders and pulp. The same letter (andthe same letter size) on the same column means no significant difference by the Tukey test (p < 0.05).
In the case of beetroot pulp, an increase in betanin content (Figure 2), even if not statisticallysignificant, can be observed, as well as a decrease in vulgaxanthin extractability (statistically significant)with increasing intensity of the electric field (Figure 3). In addition, the fragmentation of the rawmaterial tissue significantly increased the content of both betanin and vulgaxanthin in the extract,compared to their content in the beetroot cylinders. The highest content of vulgaxanthin was observedin the extract of untreated pulp (control), while the lowest was after the treatment with the electricfield of 6.25 kV/cm and 30 pulses, which caused statistically significant (p < 0.05) drop in vulgaxanthincontent by 27%. In turn, in the case of betanin, an inverse relationship was demonstrated, in the PEF
125

Foods 2019, 8, 244
application with the parameters E = 6.25 kV/cm, n = 30 promoted the higher extraction efficiency,increased by 16% in relation to the reference sample; however, this was not statistically significant.
Information on the influence of PEF on the vulgaxanthin content in the literature is really scarce.Nevertheless, the decrease in its content in the beetroot pulp, along with the increasing intensity of theelectric field, could be related to the physicochemical properties of this pigment. Vulgaxanthin is lessstable in an acid environment and at room temperature (and higher) compared to betanin. The solventused in the test was a slightly acidic buffer (pH = 6.5), and in addition, although PEF treatmentis a non-thermal method, the temperature was slightly risen during its application. In addition,the fragmentation of the material facilitated the extraction of pigment from the tissue, which resultedin longer exposure of vulgaxanthin to a temperature higher than room temperature, thus it could causeits degradation [29].
Figure 3. Vulgaxanthin concentration of differently treated beetroot cylinders and pulp. The sameletter (and the same letter size) on the same column means no significant difference by the Tukey test(p < 0.05).
The use of electrical treatment allows achievement of a high degree of disintegration of cellswith only small temperature increases (up to 9.1 ◦C). Two examples in the literature deal with theidentification of the optimal amount of energy to maximize pigment extraction from beetroot tissue(between 2.5 and 7 kJ/kg obtained using a different electric field intensity). For example, a PEF treatmentat 1 kV/cm (270 pulses, 10 μs, 7 kJ/kg) allowed to release about 90% of the total red pigment after1 h of extraction compared to less than 5% in the untreated samples [17,30]. López et al. [18] insteadobserved that the application of 7 kV/cm (5 pulses of 2 μs, 2.5 kJ/kg) caused a release of about 90%of total betanin from beetroot samples in 300 min. This release was 5-fold quicker than the controlsamples, while the application of higher electric field strength (9 kV/cm) decreased the extraction yieldof the betanin. In this case, the energy supplied to the beetroot was lower than in the present studyand in the work of Fincan et al. [17].
3.4. HCA and Pearson’s Correlation
Figure 4 presents the results of HCA, which was carried out using normalized color data (L*,a* and b*) and concentration of betanin and vulgaxanthin. Performed analysis allowed the samplesto be grouped in two big clusters. The first group consisted of most of the samples in cylindricalform (C_0_0; C_6.25_10; C_6.25_30), whereas the second group included all samples in pulp form andone cylindrical sample—the one treated with 20 pulses at 4.38 kV/cm. This sample formed a smaller
126

Foods 2019, 8, 244
aggregation that included untreated pulp form beetroot (P_0_0) and the pulp form material treated bythe same parameters. Hence, it can be stated that PEF treatment can lead to similar changes in thetissue brought about by PEF influencing extraction are similar to the changes due to the mechanicaldisintegration obtained by pulping. Beetroot samples treated with 6.25 kV/cm were grouped in twoseparate aggregates depending on their physical form, cylinder or pulp. This information is veryvaluable because it indicates that increasing the number of pulses does not bring additional benefits.Such a behavior in literature is defined as ‘saturation level of electroporation’, meaning that no morechanges can be achieved by PEF treatment despite of utilization of higher energy input [31].
Figure 4. The results of hierarchical cluster analysis (HCA) performed using color parameters(L*, a*, b*) and concentration of betanin and vulgaxanthin. (C_0_0 = untreated beetroot cylinders;C_4.38_20 = beetroot cylinders treated by 20 pulses at 4.38 kV/cm; C_6.25_10 = beetroot cylinderstreated by 10 pulses at 6.25 kV/cm; C_6.25_30 = beetroot cylinders treated by 30 pulses at 6.25 kV/cm;P_0_0 = untreated beetroot pulp; P_4.38_20 = beetroot pulp treated by 20 pulses at 4.38 kV/cm;P_6.25_10 = beetroot pulp treated by 10 pulses at 6.25 kV/cm; P_6.25_30 = beetroot pulp treated by 30pulses at 6.25 kV/cm).
The results of Pearson’s correlation analysis of selected variables are presented in Table 4.Significant correlation has been found between lightness (L*) and a* coordinate. What is moreinteresting is that both L* and a* values presented a significant relationship with betanin andvulgaxanthin concentration. However, higher values of Pearson’s correlation coefficient were foundbetween color parameters and betanin concentration. Similar observations were also reported byAntigo et al. [32], who examined the betanin content of microcapsules of beetroot extract obtained byspray drying and freeze-drying.
127

Foods 2019, 8, 244
Table 4. The results of Pearson’s correlation analysis.
Variable L* a* b* BC VC
L* - r = −0.9977 r = 0.3593 r = −0.9760 r = −0.8853p < 0.001 p = 0.382 p < 0.001 p = 0.003
a*r = −0.9977 - r = −0.4214 r = 0.9821 r = 0.8594
p < 0.001 p = 0.298 p < 0.001 p = 0.006
b*r = 0.3593 r = −0.4214 - r = −0.4692 r = 0.0077p = 0.382 p = 0.298 p = 0.241 p = 0.986
BCr = −0.9760 r = 0.9821 r = −0.4692 - r = 0.8623
p < 0.001 p<0.001 p = 0.241 p = 0.006
VCr = −0.8853 r = 0.8594 r = 0.0077 r = 0.8623 -
p = 0.003 p = 0.006 p = 0.986 p = 0.006
p-Values lower than 0.05 indicate the significant character of the correlation between normalized variables. L*, a*,b* = color parameters of the extracts; BC = betanin concentration in the sample; VC = vulgaxanthin concentration inthe sample.
4. Conclusions
The use of PEF led to an increase of the electrical conductivity of beetroot tissue, thus leading toan increase of the cell membrane permeability. When lower electric field intensity (4.38 kV/cm) wasapplied, the electrical conductivity increased proportionally to the pulse number applied, whereaswith the higher intensity (6.25 kV/cm) this effect was negligible, showing an effect of saturation level ofelectroporation. PEF treatment caused changes in the color of red beetroot tissue that were associatedwith a better extraction of pigments as a result of the electroporation. The use of PEF with an intensityof 4.38 kV/cm and 20 impulses and energy consumption of 4.10 kJ/kg, allowed an increase in the yield ofbetanin and vulgaxanthin extraction from beetroot cylinders by 329% and 244%, respectively, comparedto the control. Furthermore, the fragmentation of the tissue (pulping) resulted in an increased extractionof pigments from the plant tissue; however, the use of PEF did not bring additional advantages.
Author Contributions: Conceptualization, A.W. and D.W.R.; methodology, A.W., M.N., K.R.; validation, K.R.,A.M. and J.C.; formal analysis, U.T., S.T., M.N. and A.W.; investigation, K.R., A.M., A.W., J.C.; writing—originaldraft preparation, U.T., S.T., M.N., K.D., and A.W.; writing—review and editing, U.T., S.T., M.N. and A.W.;visualization, U.T., S.T., M.N. and A.W.; supervision, A.W., D.W.R.
Funding: This research received no external funding.
Conflicts of Interest: The authors declare no conflict of interest.
Appendix A
0_0 4.38_20 6.25_10 6.25_30
Figure A1. Changes in the color of the extract from the beetroot slices depending on the parameters ofthe applied pulsed electric field treatment.
References
1. Wruss, J.; Waldenberger, G.; Huemer, S.; Uygun, P.; Lanzerstorfer, P.; Müller, U.; Höglinger, O.; Weghuber, J.Compositional characteristics of commercial beetroot products and beetroot juice prepared from sevenbeetroot varieties grown in Upper Austria. J. Food Compos. Anal. 2015, 42, 46–55. [CrossRef]
2. Chhikara, N.; Kushwaha, K.; Sharma, P.; Gat, Y.; Panghal, A. Bioactive compounds of beetroot and utilizationin food processing industry: A critical review. Food Chem. 2019, 272, 192–200. [CrossRef]
3. Slavov, A.; Karagyozov, V.; Denev, P.; Kratchanova, M.; Kratchanov, C. Antioxidant activity of red beet juicesobtained after microwave and thermal pretreatments. Czech J. Food Sci. 2013, 31, 139–147. [CrossRef]
128

Foods 2019, 8, 244
4. Strack, D.; Vogt, T.; Schliemann, W. Recent advances in betalain research. Phytochemistry 2003, 62, 247–269.[CrossRef]
5. Gengatharan, A.; Dykes, G.A.; Choo, W.S. Betalains: Natural plant pigments with potential application infunctional foods. LWT—Food Sci. Technol. 2015, 64, 645–649. [CrossRef]
6. Szopinska, A.A.; Gaweda, M. Comparison of yield and quality of red beet roots cultivated using conventional,integrated and organic method. J. Hort. Res. 2013, 21, 107–114. [CrossRef]
7. Tanabtabzadeh, M.S.; Javanbakht, V.; Golshirazi, A.H. Extraction of Betacyanin and Betaxanthin Pigmentsfrom Red Beetroots by Chitosan Extracted from Shrimp Wastes. Waste Biomass Valoriz. 2019, 10, 641–653.[CrossRef]
8. Celli, G.B.; Brooks, M.S.-L. Impact of extraction and processing conditions on betalains and comparison ofproperties with anthocyanins—A current review. Food Res. Int. 2017, 100, 501–509. [CrossRef]
9. Singh, A.; Ganesapillai, M.; Gnanasundaram, N. Optimizaton of extraction of betalain pigments frombeta vulgaris peels by microwave pretreatment. In IOP Conference Series: Materials Science and Engineering;IOP Publishing: Bristol, UK, 2017.
10. Cardoso-Ugarte, G.A.; Sosa-Morales, M.E.; Ballard, T.; Liceaga, A.; San Martín-González, M.F.Microwave-assisted extraction of betalains from red beet (Beta vulgaris). LWT—Food Sci. Technol. 2014, 59,276–282. [CrossRef]
11. Ramli, N.S.; Ismail, P.; Rahmat, A. Influence of conventional and ultrasonic-assisted extraction on phenoliccontents, betacyanin contents, and antioxidant capacity of red dragon fruit (Hylocereus polyrhizus). The Sci.World J. 2014, 2014, 964731. [CrossRef]
12. Laqui-Vilca, C.; Aguilar-Tuesta, S.; Mamani-Navarro, W.; Montaño-Bustamante, J.; Condezo-Hoyos, L.Ultrasound-assisted optimal extraction and thermal stability of betalains from colored quinoa (Chenopodiumquinoa Willd) hulls. Ind. Crop. Prod. 2018, 111, 606–614. [CrossRef]
13. Tylewicz, U.; Tappi, S.; Mannozzi, C.; Romani, S.; Dellarosa, N.; Laghi, L.; Ragni, L.; Rocculi, P.; Dalla Rosa, M.Effect of pulsed electric field (PEF) pre-treatment coupled with osmotic dehydration on physico-chemicalcharacteristics of organic strawberries. J. Food Eng. 2017, 213, 2–9. [CrossRef]
14. Wiktor, A.; Sledz, M.; Nowacka, M.; Rybak, K.; Chudoba, T.; Lojkowski, W.; Witrowa-Rajchert, D. Theimpact of pulsed electric field treatment on selected bioactive compound content and color of plant tissue.Innov. Food Sci. Emerg. Technol. 2015, 30, 69–78. [CrossRef]
15. Vorobiev, E.; Lebovka, N.I. Enhanced extraction from solid foods and biosuspensions by pulsed electricalenergy. Food Eng. Rev. 2010, 2, 95–108. [CrossRef]
16. Barba, F.J.; Parniakov, O.; Pereira, S.A.; Wiktor, A.; Grimi, N.; Boussetta, N.; Saraiva, J.A.; Raso, J.;Martin-Belloso, O.; Witrowa-Rajchert, D.; et al. Current applications and new opportunities for the use ofpulsed electric fields in food science and industry. Food Res. Int. 2015, 77, 773–798. [CrossRef]
17. Fincan, M.; DeVito, F.; Dejmek, P. Pulsed electric field treatment for solid-liquid extraction of red beetrootpigment. J. Food Eng. 2004, 64, 381–388. [CrossRef]
18. López, N.; Puértolas, E.; Condón, S.; Raso, J.; Alvarez, I. Enhancement of the extraction of betanine from redbeetroot by pulsed electric fields. J. Food Eng. 2009, 90, 60–66. [CrossRef]
19. Luengo, E.; Martinez, J.M.; Álvarez, I.; Raso, J. Comparison of the efficacy of pulsed electric fields treatmentsin the millisecond and microsecond range for the extraction of betanine from red beetroot. In Proceedingsof the 1st World Congress on Electroporation and Pulsed Electric Fields in Biology, Medicine and Food &Environmental Technologies (WC 2015), Portorož, Slovenia, 6–10 September 2015; pp. 375–378.
20. Chalermchat, Y.; Fincan, M.; Dejmek, P. Pulsed electric field treatment for solid-liquid extraction of redbeetroot pigment: mathematical modelling of mass transfer. J. Food Eng. 2004, 64, 229–236. [CrossRef]
21. Wiktor, A.; Iwaniuk, M.; Sledz, M.; Nowacka, M.; Chudoba, T.; Witrowa-Rajchert, D. Drying kinetics of appletissue treated by pulsed electric field. Dry Technol. 2013, 31, 112–119. [CrossRef]
22. Fijalkowska, A.; Nowacka, M.; Witrowa-Rajchert, D. The physical, optical and reconstitution properties ofapples subjectes to ultrasound before drying. Ital. J. Food Sci. 2017, 29, 343–356.
23. Fijalkowska, A.; Nowacka, M.; Witrowa-Rajchert, D. The influence of ultrasound pre-treatment on dryingkinetics and the colour and betalains content in beetroot. Zeszyty Problemowe Postepów Nauk Rolniczych 2015,581, 11–20.
24. Lebovka, N.; Bazhal, M.; Vorobiev, E. Estimation of characteristic damage time of food materials in pulsedelectric fields. J. Food Eng. 2002, 54, 337–346. [CrossRef]
129

Foods 2019, 8, 244
25. Tylewicz, U.; Aganovic, K.; Vannini, M.; Toepfl, S.; Bortolotti, V.; Dalla Rosa, M.; Oey, I.; Heinz, V. Effect ofpulsed electric field treatment on water distribution of freeze-dried apple tissue evaluated with DSC andTD-NMR techniques. Innov. Food Sci. Emerg. Technol. 2016, 37, 352–358. [CrossRef]
26. Lebovka, N.I.; Bazhal, M.I.; Vorobiev, E. Simulation and experimental investigation of food material breakageusing pulsed electric field treatment. J. Food Eng. 2000, 44, 213–223. [CrossRef]
27. Bazhal, M.; Lebovka, N.; Vorobiev, E. Optimisation of pulsed electric field strength for electroplasmolysis ofvegetable tissues. Biosyst. Eng. 2003, 86, 339–345. [CrossRef]
28. Puértolas, E.; Saldaña, G.; Raso, J. Pulsed electric field treatment for fruit and vegetable processing. In Handbookof Electroporation; Miklavcic, D., Ed.; Springer International Publishing AG: Basel, Switzerland, 2017.
29. Manchali, S.; Murthy, K.N.C.; Nagaraju, S.; Neelwarne, B. Stability of Betalain Pigments of Red Beet. In RedBeet Biotechnology: Food and Pharmaceutical Applications; Neelwarne, B., Ed.; Springer Science and BusinessMedia: New York, NY, USA, 2013.
30. Donsì, F.; Ferrari, G.; Pataro, G. Applications of pulsed electric field treatments for the enhancement of masstransfer from vegetable tissue. Food Eng. Rev. 2010, 2, 109–130. [CrossRef]
31. Canatella, P.J.; Karr, J.F.; Petros, J.A.; Prausnitz, M.R. Quantitative study of electroporation-mediatedmolecular uptake and cell viability. Biophys. J. 2001, 80, 755–764. [CrossRef]
32. Antigo, J.L.D.; Bergamasco, R.D.C.; Madrona, G.S. Effect of pH on the stability of red beet extract(Beta vulgaris L.) microcapsules produced by spray drying or freeze drying. Food Sci. Technol. 2018,38, 72–77. [CrossRef]
© 2019 by the authors. Licensee MDPI, Basel, Switzerland. This article is an open accessarticle distributed under the terms and conditions of the Creative Commons Attribution(CC BY) license (http://creativecommons.org/licenses/by/4.0/).
130

foods
Article
Valorization of Tomato Surplus and Waste Fractions:A Case Study Using Norway, Belgium, Poland, andTurkey as Examples
Trond Løvdal 1,*, Bart Van Droogenbroeck 2, Evren Caglar Eroglu 3, Stanislaw Kaniszewski 4,
Giovanni Agati 5, Michel Verheul 6 and Dagbjørn Skipnes 1
1 Department of Process Technology, Nofima—Norwegian Institute of Food,Fisheries and Aquaculture Research, N-4068 Stavanger, Norway
2 ILVO—Institute for Agricultural and Fisheries Research, Technology and Food Science Unit,9090 Melle, Belgium
3 Department of Food Technology, Alata Horticultural Research Institute, 33740 Mersin, Turkey4 Department of Soil Science and Vegetable Cultivation, InHort—Research Institute of Horticulture,
96-100 Skierniewice, Poland5 Consiglio Nazionale delle Ricerche, Istituto di Fisica Applicata ‘Nello Carrara’, 50019 Sesto Fiorentino, Italy6 NIBIO—Norwegian Institute of Bioeconomy Research, N-4353 Klepp Stasjon, Norway* Correspondence: [email protected]
Received: 1 June 2019; Accepted: 24 June 2019; Published: 27 June 2019
Abstract: There is a large potential in Europe for valorization in the vegetable food supply chain.For example, there is occasionally overproduction of tomatoes for fresh consumption, and a fractionof the production is unsuited for fresh consumption sale (unacceptable color, shape, maturity, lesions,etc.). In countries where the facilities and infrastructure for tomato processing is lacking, thesetomatoes are normally destroyed, used as landfilling or animal feed, and represent an economicloss for producers and negative environmental impact. Likewise, there is also a potential in thetomato processing industry to valorize side streams and reduce waste. The present paper provides anoverview of tomato production in Europe and the strategies employed for processing and valorizationof tomato side streams and waste fractions. Special emphasis is put on the four tomato-producingcountries Norway, Belgium, Poland, and Turkey. These countries are very different regards forexample their climatic preconditions for tomato production and volumes produced, and representthe extremes among European tomato producing countries. Postharvest treatments and applicationsfor optimized harvest time and improved storage for premium raw material quality are discussed,as well as novel, sustainable processing technologies for minimum waste and side stream valorization.Preservation and enrichment of lycopene, the primary health promoting agent and sales argument,is reviewed in detail. The European volume of tomato postharvest wastage is estimated at >3million metric tons per year. Together, the optimization of harvesting time and preprocessing storageconditions and sustainable food processing technologies, coupled with stabilization and valorizationof processing by-products and side streams, can significantly contribute to the valorization of thisunderutilized biomass.
Keywords: tomato; valorization; sustainable production; processing; lycopene; waste reduction;vegetables; postharvest physiology; healthy food
Foods 2019, 8, 229; doi:10.3390/foods8070229 www.mdpi.com/journal/foods131

Foods 2019, 8, 229
1. Introduction
The tomato (Solanum lycopersicum (L.)), which is neither a vegetable nor a fruit but botanicallyspeaking a berry, is currently spread across the world and is a key element in most cultures cuisines.The tomato originated in South America, from where it was imported to Mexico. Tomato came toEurope from the Spanish colonies in the 1500s along with several other “new” plants such as maize,potato, and tobacco. The tomato plant was immediately cultivated in the Mediterranean countries, butwas initially poorly received further north in Europe. The skepticism of the tomato was due to that itwas long suspected to be poisonous. As a curiosity, the tomato was not found in Norwegian groceryshelves until well into the 1950s, and was thus more exotic than oranges and bananas. Nowadays,however, tomatoes have definitely become an essential ingredient also in the North European and theNordic cuisine. For example, in Norway, tomatoes have in recent years been the most sold productin the fresh vegetable segment, with a total turnover of approximately 15 million € and an annualconsumption of 7.3 kg per capita, of which 1/3 is produced in Norway [1]. Including also processedtomato products, annual per capita consumption in Norway increases to 16.3 kg, whereas it is 23.5and 27.5 kg in Poland and Belgium, respectively. These are however still low values compared to theMediterranean diet; annual per capita consumption in Turkey, Armenia, and Greece is 94, 85, and77 kg, respectively, whereas in Italy, Spain, Portugal, and Ukraine it is approximately 40 kg [2]. For adetailed list of European tomato production and consumption, see Supplementary Table S1.
A joint FAO/WHO Expert Consultation report on diet, nutrition and the prevention of chronicdiseases, recommended several years ago the intake of a minimum of 400 g of fruit and vegetablesper day (excluding potatoes and other starchy tubers), for the prevention of chronic diseases such ascardiovascular diseases (CVD), diabetes, and obesity, as well as for the prevention and alleviation ofseveral micronutrient deficiencies [3]. However, in the western world, the consumption of vegetablesis still far less than recommended. There is thus a socioeconomic gain if one succeeds in stimulatingincreased consumption of tomato-based products high in lycopene and β-carotene that may lead toreduced incidents of cancers and CVD. To increase the consumption of vegetables, it is important toprovide raw materials with high quality, diversity, and availability. Fruit and vegetables are importantcomponents of a healthy diet, and their sufficient daily consumption could help prevent major diseasessuch as CVD and certain cancers. According to the World Health Report 2002, low fruit and vegetableintake is estimated to cause ~31% of ischemic heart disease and 11% of stroke worldwide [4]. Overall,it is estimated that up to 2.7 million lives could potentially be saved each year if fruit and vegetableconsumption were sufficiently increased.
There is a large potential in Europe for optimization in valorization of crop biomass in thevegetable food supply chain. For example, there is occasionally overproduction of tomatoes for freshconsumption, and a fraction of the production is unsuited for fresh consumption sale (unacceptablecolor, shape, maturity, lesions, etc.). These tomatoes are normally destroyed and used as landfilling oranimal feed, which represents an economic loss for producers and negative environmental impact.In Norway and Belgium, this surplus/waste fraction amounts to about 200 (Unpublished data fromRennesøy Tomat & Fruktpakkeri AS (2012), the biggest tomato packaging station in Norway) and500 tons per year [5], respectively. A conservative estimate of € 4 per kg price increase for this rawmaterial will thus yield a potential of 0.8 and 2.0 million € per year, respectively, for Norway andBelgium alone. Besides overproduction, part of the tomatoes produced in the greenhouse might notreach the market because they do not reach the local market standards. This can be due to cosmeticdefects such as color, shape, size, etc.
Additionally, there is loss of fresh tomato at the retailer’s level. In Norway, the general retailerloss is 10% for cluster tomatoes, 3–6% for single retail (“ordinary round”) tomatoes, and approximately1% for cherry tomatoes, but it can be substantially higher in the peak of the growing season [6]. In thecase of Norway, assuming a mean loss at retailers level of 5%, and that this loss can be halved byimproved market regulation, there is a value increasing potential of a further 0.8 million € per year,again with a conservative price estimate of € 4 per kg. It is assumed that the total loss fraction is
132

Foods 2019, 8, 229
approximately the same in the other European countries, implying a much higher value potential incountries producing more tomatoes than Norway, considering that Norway is indeed a small tomatoproducer by European standards (Supplementary Table S1). An estimate for the total European market,based on a total waste fraction assuming a 15% waste in the tomato processing industry (includingwhat is left in the field), and 5% waste in fresh market tomato, the waste fraction amounts to 3 millionmetric tons per year (Supplementary Table S1). The tomato processing waste quantities worldwide in2010 was estimated to be between 4.3 and 10.2 million metric tons [7]. Based on this, it is beneficial todevelop processing technology for the best possible utilization of this resource to improve economicsustainability of tomato production.
2. Tomato Production in Norway, Belgium, Poland and Turkey
2.1. Norway
Tomato production in Norway has been stable for the last 15 years with volumes between 9000and 12,000 tons per year. Ninety percent of the production takes place in the county of Rogaland,on the southwest coast. Practically all tomatoes produced in Norway are destined for the domesticfresh market. The production is costly because the Norwegian climate necessitates the use of heatedglass houses and artificial light for year-round production. Because of the high production costs,Norwegian tomatoes have traditionally not been subject to processing. Recently, some tomato farmershave found ways to alleviate the energy expenses by innovative solutions. One example of this is the‘Miljøgartneriet’ which can be translated as ‘the Environmental plant nursery’ [8]. This glass house wasbuilt in 2010, covers 77,000 m2, and employs 70–85 workers in the high season. The innovations consistof amongst others the use of surplus CO2 and warm wastewater from a nearby dairy plant for plantfeed and heating, respectively. Combined with other energy-efficient solutions in the construction ofthe glass house and recirculation of water, the production becomes more sustainable and with a lowcarbon footprint. An optimized year-round cultivation system achieved a yield of over 100 kg m−2 incommercial production, with an estimated maximum potential of 125–140 kg m−2 [9]. In Norway, thesurplus fraction resulting from high-season overproduction amounts to 200 tons per year, correspondingto approximately 2% of total production. Total waste, i.e., combined with the waste at the retailerlevel and in the greenhouses, is estimated at ~6%. One of the main reasons for waste at the retailerlevel was found to be due to packaging. Comparing packaged cluster tomatoes to loose, unpackedsingle tomatoes revealed, contrary to expectation, that the former had significantly more wastage [6].It was speculated that this was because packaging may lead to condensation and subsequent growthof molds. Therefore, packaging of warm tomatoes should be avoided [6]. Temperature abuse duringtransport and in the stores was also considered as main factors leading to waste [6].
Efforts have been made to produce tomato sauce of the surplus tomatoes. However, due to smallvolumes and high production costs, this turned out not to be economically viable and productionstopped. At present, the fraction is primarily used as cattle feed, so that costs for disposal can beminimized. In order to overcome the seasonality problem, tomato surplus and waste fractions may besorted and stored frozen in order to collect volumes for subsequent processing and perhaps to add thisto batches of imported tomatoes for processing. A project is now starting up in Norway to look intothis possibility for valorization and to identify and overcome the challenges related to this strategy.
2.2. Belgium
Belgian tomato production takes predominantly place in Flanders, where some 250 growersproduced 220 to 260,000 tons per year on about 500 hectares between 2006 and 2016. Tomato is thesecond biggest crop under glass after lettuce, but generates the biggest economic return, ~180 million€ per year, leaving the second and third place to strawberry and bell pepper, respectively. Belgiantomato growers deliver tomatoes for the internal fresh market during a period of about nine monthseach year. There are three areas in Flanders where the tomato growers cluster together, that is around
133

Foods 2019, 8, 229
Mechelen, Hoogstraten, and Roeselare. Roughly, half of the production is on the vine and the otherhalf are loose tomatoes [10]. Also in Belgium, practically all tomatoes are produced in greenhousesand for fresh consumption. The average price the growers get for their tomatoes (loose and on thevine) is about € 0.75 per kg. As opposed to Norway, Belgian tomato export volumes are considerable.Today, approximately 70% of all tomatoes produced in Belgium are exported [10]. According to Lava,the cooperative of all Belgian fruit and vegetable auctions, the main exporting partners are France,Germany, the Netherlands, the UK, and the Czech Republic [11]. The tomato surplus fraction inBelgium makes up about 500 tons per year, corresponding to approximately 2% [5], as in Norway, andtotal waste (retailers, etc.) is estimated at approximately 5%. A recent study in Belgium estimated thelosses of tomato that cannot be marketed due to cosmetic reasons to be ~1–2% only. Similar numberswere recorded for bell pepper and cucumber. This is very low compared to the percentages of othercrops (e.g., zucchini 11.5% and lettuce 9.1%) [12].
2.3. Poland
Polish tomato production is different from Norwegian and Belgian production in several ways.First, the polish production volume is 3 times the Belgian and >60 times the Norwegian with ayearly production amounting to ~920,000 tons (~250,000 tons in the field and ~670,000 tons ingreenhouses) [13], placing them among the top eight in Europe (Supplementary Table S1). Moreover,the production is carried out both in open field and under cover. The cultivation area under cover isapproximately 27% of the total, but it is increasing [14]. Approximately 70% of the production takes placein Greater Poland, Kuyaivan-Pomeranian, Mazovian, and Switokrzyskie Provinces. Since Poland’sentry into the EU in 2004, fresh tomato exports have doubled, and accounts now for about 11% ofproduction [14]. Approximately 1/3 of the total production is processed domestically, mainly intotomato paste and canned tomatoes (approximately 40,000 tons per year), and ketchup and tomatosauce (approximately 135,000 tons per year), whereof ~50% are exported [13]. The production ofgreenhouse tomatoes is intended for the fresh market and nearly 80% of production is sold on theinternal market. The remaining 20% is export, and the main recipients are Ukraine, Belarus, the CzechRepublic, Germany and the United Kingdom. The processing waste value can be assumed to be up toapproximately 8.5%. This value consists of 1–3% seed waste, 2.8–3.5% skin, and up to 2% as whole fruitwaste. Measures to reduce losses like choosing correct harvest time, avoiding damage during harvest,storage of crops protected from sunlight and immediate cool storage, the removal of damaged fruit, andusing clean packaging material and proper transport are also important in Poland. The results obtainedin open field tomato production in Poland depend very much on weather conditions. In some years,maturation is delayed and the quality of the fruits is poor, and it is very important to protect plantsfrom diseases. These detrimental effects can be increased through improper nitrogen fertilization,which can delay the maturity of the fruits. In addition, the growing season in some years may beshorter due to the occurrence of early autumn frosts. In these conditions, unripen tomato fruits remainin the field and is lost. To reduce losses, proper nitrogen fertilization, early varieties with concentratedfruiting, and the use of ethylene to accelerate ripening are proposed.
2.4. Turkey
Turkey is the fourth largest tomato producer after China, India and the United States, yieldingmore than 7.2% of the world tomato production. The production amount was ~11.8 million tons in2014 and 12.7 million tons in 2017. Sixty-seven percent of total production was evaluated as tabletomato and 33% were industrially processed. More than 25% of the total production and 40% of tabletomato is cultivated in greenhouses. Three-and-a-half-million tons (~28%) of the tomato production isbeing processed into paste, while 500,000 tons (4%) is used as sun-dried and canned (whole peeled,cubic chopped, puree, etc.). Due to the climate advantage, sun-dried tomatoes have great potentialand almost all (97%) of them are exported. Tomato is the undisputed and clear leader product ofthe vegetable industry in Turkey. Tomato export is almost 40% of total fresh vegetable exportation
134

Foods 2019, 8, 229
of Turkey. From 10 to 18% of the total processing raw material is gone to waste [15]. Skin, seeds,fiber, etc. make up ~7% of this fraction, and the rest is mainly due to bad transportation in the tomatopaste industry. Between 2010 and 2017, the average losses during harvesting were 3.5% and loss afterharvesting was 10 to 15%. In 2017, pre- and postharvest losses were more than 2.1 million metric tons,corresponding to 16.5% of the total production [16]. Occurrences of exceptional high tomato wastageof up to 28% in specific regions have been reported [17]. Measures to reduce losses are summarizedas choosing correct harvest time, avoiding damage during harvest, storage of crops protected fromsunlight and immediate cool storage, the removal of damaged fruit, and using clean packaging materialand proper transport [18]. The following precautions were proposed in order to reduce loss betweenharvesting and processing or wholesale: Choosing an earlier harvest time, using better packagingmaterial at the farm stage instead of only traditional wooden or plastic cases, and refrigerated transportto the packaging or processing facilities [19].
3. The Significance of Lycopene in Tomato
Consumers are increasingly demanding naturally nutritious and healthy products that areproduced without the use of genetic modification or additives and pesticide residues. It is therefore alarge potential for developing processed products based on the part of the tomato production that doesnot go to fresh consumption. It turns out that the willingness to pay among the modern consumerincreases when positive health effects attributed to the products can be documented. Most of the adultconsumers are aware of the health benefits attributed to lycopene and other phytonutrients foundin tomato, and thus lycopene is the second most important driver for consumer preferences, afterprice [20].
Lycopene is a member of the carotenoid family of compounds and is a key intermediate in thebiosynthesis of many carotenoids. Lycopene is a pigment found in small amounts in many fruitsand vegetables, and which, like carotene, gives rise to red color. Tomatoes are the main source oflycopene, while chili peppers may contain comparable amounts, and watermelon, red bell pepper,carrot, spinach, guava, papaya, and grapefruit contain relatively moderate amounts [21,22]. Lycopeneoccurs in several forms (isomers), some of which are taken up more easily by the human body thanothers [22–24]. The all-trans form is predominating in fresh tomato (~90%) [25], whereas it is the cisisomer that is most easily bioavailable to the human body [26–28]. Besides being an important nutrient,lycopene is also a very potent and sought after natural colorant with many applications in industrialfood processing [29].
Research has shown that by means of processing it is possible to increase the proportion of themost bioavailable forms and stabilize these to thereby provide an increased health benefit. There isevidence that heat treatment and the addition of vegetable oils in tomato products increases thebody’s absorption of lycopene compared with corresponding consumption of fresh tomato [25,27,30].For lycopene to be absorbed in the duodenum, it must be dissolved in fat. The fat should not containcomponents which compete with lycopene for absorbing, such as vitamin E and K [25,31]. Althoughthe biochemical mechanisms that make lycopene so beneficial to health are largely unknown, there ismuch to suggest that antioxidant and provitamin A properties can be crucial.
3.1. Lycopene Content in Tomato
The lycopene range (0.03–20.2 mg/100 g) as reviewed in Table 1 is comparable to original resultspresented by Adalid et al. [32] where 49 diverse accessions of tomato from 24 countries on fourcontinents displayed a span from 0.04 to 27.0 mg lycopene/100 g. In some wild species of tomato(S. pimpinellifolium), the lycopene concentration can be as high as 40 mg/100 g [33]. As shown in Table 1,the type and variety of tomato is also crucial for lycopene. Even the origin and the geographic locationof their cultivation appears to play a major role [34,35]. This is probably due to different growingconditions and the degree of maturity [36,37], storage and transport conditions, etc.
135

Foods 2019, 8, 229
Table 1. Lycopene content in tomato varieties (converted to mg/100 g fresh weight (FW)). Literaturereview. Values in italics are obtained by spectrophotometry, otherwise high-performance liquidchromatography (HPLC).
Variety Total Lycopene Type Origin Growth Conditions Reference
Ministar 3.11 plumSW Norway Greenhouse, soil free
This studyJuanita 10.51 cherry
Dometica 4.08 saladVolna 8.15 salad Skierniewice,
PolandFieldCalista 10.75 processing
Pearson 10.77 N/A California, USA Field [38]DX-54 ~12 N/A Utah, USA Field [39]
Unknown 15.8 N/A Florida, USA Unknown [40]Amico 7.73
processing
Gödöllö, Hungary
Field [41]
Casper 6.61Góbé 5.92
Ispana 6.22Pollux 5.14
Soprano 8.65Tenger 7.66
Uno 7.09Zaphyre 6.95
Draco 6.87Jovanna 11.61
K-541 9.95Nivo 8.46
Simeone 9.88Sixtina 10.51Monika 7.22
salad
Delfine 6.51Marlyn 5.53Fanny 5.26Tiffany 6.23
Alambra 5.40Regulus 6.59Petula 6.68
Diamina 6.48Brillante 8.47Furone 5.18Linda 5.69
Early Fire 10.1–14.0
processing Field [42]Bonus 8.5–12.7
Falcorosso 8.0–11.1Korall 8.1–11.3Nívó 9.7–15.5
Strombolino 5.3–10.3 cherry, processing Gödöllö, Hungary Field [43]12 unnamed
local varieties 5.04–13.46 N/A
SE Spain Field [44]ACE 55 VF 6.38 Flattened globeMarglobe 8.46 Round
Marmande 7.01 Flattened globeCIDA-62 6.23 cherry
Spain Organic, field [45]
CIDA-44A 2.95roundCIDA-59A 2.70
BGV-004123 5.50BGV-001020 3.66 flattened and ribbed
Baghera 4.64 roundCXD277 15.33
processing Spain Field [46]
H9661 12.21H9997 14.96H9036 11.36
ISI-24424 17.01Kalvert 16.71Kalvert 20.2
processing Lecce, Italy Field [47]Hly18 19.5Donald 9.5
Incas 9.3
136

Foods 2019, 8, 229
Table 1. Cont.
Variety Total Lycopene Type Origin Growth Conditions Reference
143 9.47
N/A San Marzano, Italy Field [48]
Stevens 10.2Poly20 16.0Ontario 6.54
Sel6 9.73Poly56 14.21447 5.61977 10.01513 9.21988 14.1
Cayambe 13.5Heline 9.461512 3.251438 6.35
Motelle 16.9Momor 13.3
981 2.33Poly27 11.0Shasta 6.7–7.7
Early-season varieties
California, USA Field [49]
H9888 8.9–9.7Apt410 9.1–10.0CXD179 9.2–10.4
Mid-season varietiesCXD254 10.5–12.0H8892 8.7–10.1
CXD222 9.8–13.2Late-season varietiesH9665 8.7–12.2
H9780 9.2–13.0Bos3155 14.92
Red varieties
California, USA Field [50]
CXD510 15.37CXD514 11.80
CXD276 2.47 Light color Tangerinevariety
CX8400 0.08 Yellow varietyCX8401 0.68 Orange varietyCX8402 0.03 Green varietySEL-7 3.23 N/A Haryana, India [51]
ARTH-3 4.03Laura 12.20 N/A New Jersey, USA Greenhouse [52]
Brigade 12.9 Processing Salerno, Italy N/A [53]PC 30956 18.7 High lycopene
experimental hybrid,Cheers 3.7 N/A Southern France Greenhouse [54]
Lemance 3.7–6.9 N/A N/A Greenhouse [36]Ohio-8245 9.93
Tomato pulp fraction Ontario, Canada N/A [55]92-7136 7.7692-7025 6.46H-9035 10.19CC-164 10.70Dasher 3.98
Plum Italy Greenhouse [56]
Iride 4.45Navidad 4.89
Sabor 5.22292 4.57738 4.77
Cherubino 3.43 CherryCrimson,
green, 0.52Salad Ohio, USA Purchased from local
market[57]
Crimson,breaker 3.84
Crimson, red 5.09Unknown 10.14 Cherry
California, USAPurchased from local
supermarket [58]Unknown 5.98 On-the-vineRoma 8.98 ProcessingJennita 1.60–5.54 Cherry SW Norway Greenhouse, soil free [59] a
Naomi 7.1–12.0 Cherry Sicily, Italy Cold greenhouse [60] b
Naomi 12.4–13.3 CherryItaly Cold greenhouse [34]Ikram 8.5–8.9 Cluster
Eroe 2.1–2.8 SaladCorbarino 6.8–14.6 Cherry Battipaglia, Italy Field grown [61] c
(a) Harvested twice monthly from May to October. (b) Harvested at six different times throughout the year. (c) Asan effect of N and P fertilization load.
137

Foods 2019, 8, 229
It is well known that tomato lycopene is concentrated in the skin and the water-insoluble fractiondirectly beneath the skin [53]. Table 2 demonstrates this partitioning and underpins that the tomatoskin waste fractions is a good source of lycopene. Since lycopene and other carotenoids are mostconcentrated in and just inside the skin, lycopene is often higher per volume in small tomatoes ofcherry type, because they have a relatively high peel to volume ratio.
Table 2. Lycopene content in peel versus pulp in some tomato varieties (converted to mg/100 g FW).Literature review. Values in italics are obtained by spectrophotometry, otherwise HPLC.
Cultivar
Total Lycopene(Converted to mg/100 g FW) Comment Reference
Peel Pulp
HLT-F61 89.3 28.0Field grown, Northern Tunisia [62]HLT-F62 50.8 16.7
Rio Grande 42.4 10.1
8-2-1-2-5 14.3 6.7
Harvested at mature green stage(Ludhiana, India) and stored at
20 ◦C until ripe[37]
Castle Rock 13.1 6.2IPA3 10.2 4.0
Pb Chhuhra 8.6 4.6UC-828 6.5 3.7
WIR 4285 6.5 3.1WIR-4329 8.1 4.3
818 cherry 14.1 6.9
Field grown, New Delhi, India [63]
DT-2 8.1 5.2BR-124 cherry 10.2 4.9
5656 10.7 4.57711 9.0 4.4
Rasmi 10.8 4.3Pusa Gaurav 10.2 4.0T56 cherry 12.0 3.8
DTH-7 4.8 2.7FA-180 7.6 2.5FA-574 6.1 2.2R-144 6.2 2.0
Grapolo 6.0 1.2
Purchased in supermarket oropen-air market, Zagreb, Croatia, [64]
Italian cherry tomato 7.2 2.0Croatian cherry tomato 5.3 1.6
Croatian large size tomato 3.5 1.3Turkish large size tomato 3.3 1.2
FW: fresh weight.
Since lycopene is the pigment responsible of the red hue of tomatoes, it can be derived thatunripe tomatoes and light color tangerine varieties and green, orange and yellow varieties are lower inlycopene than mature red tomatoes [47,62]. Tomatoes with lower lycopene can be stored under speciallight and temperature so that they may accumulate lycopene before processing. Figure 1 illustrates thecorrelation between maturity stage, color, and lycopene content.
138

Foods 2019, 8, 229
Figure 1. Lycopene evolution in processing tomatoes, cv. Calista, as measured during ripening in the fieldby a nondestructive optical method as previously described in Ciaccheri et al., 2019 [65]. FW: fresh weight.
Sikorska-Zimny et al., 2019 [66] proposed that, although tomatoes harvested at the full-ripe stagemaintained 90% of their lycopene content for three weeks of storage, a compromise between firmnessand storability may be found by harvesting at an earlier stage in order to balance the organolepticand nutraceutical quality of the fruit. This means, at least for fresh-market tomatoes, that they canbe harvested un-ripe in order to obtain storability without compromising neither on sensory ornutraceutical qualities, as long as proper storage conditions are obtained.
3.2. Effect of Processing
Processing strategies for tomatoes range from the very simple, as for fresh-market tomatoes, tocomplicated, as for the production of, e.g., tomato paste which includes multiple steps and severalheat treatments such as drying, hot-break, and pasteurization [67]. Conclusions in relation to lycopeneare that it is only slowly broken down by boiling (100 ◦C), and therefore constitutes no restrictionfor the heat treatment (Table 3) [67–71]. On the contrary, boiling for around two hours results inbreakdown of carotenoid-associated protein structures so that lycopene is released, isomerizationoccurs and bioavailability increases [69,72]. Interestingly, Seybold et al., 2004 [70] found that lycopeneisomerization occurred readily as an effect of thermal treatment in a standard lycopene solution, butthis was not the case in tomatoes treated at the similar time/temperature conditions. Nevertheless,in freeze-dried lycopene powder, it was found that high temperatures (120 ◦C) and relatively shortexposure time resulted in profound isomerization in both water and oil medium, but that loss oflycopene was significantly less in oil medium, presumably because oxidation was avoided [73,74].Effects of thermal treatment on a range of health-beneficial antioxidants in tomato are reviewed inCapanoglu et al., 2010 [67], and it may seem that most of the other antioxidants (e.g., vitamin C andtocopherols, phenolics and flavonoids) are less heat-stable than lycopene. Mechanical and thermaltreatment have significant effects on the consistency of tomatoes, the former mainly due to the releaseof pectin [75]. Mechanical treatment does not seem to affect the content of lycopene to any significantdegree, but it may enhance bioavailability, especially when combined with thermal treatment [75].Factors such as light, pH, and temperature is very critical to the stability of lycopene and carotenes [76].Wrong processing or storage (i.e., exposure to light and oxygen) may, therefore, affect the ratio betweenisomers or totally degrade the beneficial compounds. However, when optimal storage criteria aremet, lycopene is a very stable molecule [77]. Traditional processing methods have only little effect onthe level of lycopene or isomerization [25]. In fact, thermal processing may generally increase the
139

Foods 2019, 8, 229
bioavailability of lycopene despite decrease of the total concentration of lycopene [27,57]. Studiesthat have followed the evolution of lycopene through the different processing steps of commercialtomato paste production are inconclusive, either reporting a small increase [41] or a significantdecrease [78] as the tomatoes are processed into paste. Comparing rapid industrial scale continuousflow microwave pasteurization to conventional thermal processing of tomato juice, revealed that thisnovel energy-efficient technology resulted in a product with a higher antioxidant capacity and similarorganoleptic, physiochemical and microbiological qualities [79]. High pressure processing (HPP) mayincrease lycopene extractability compared to conventional processing and result in higher carotenoidcontent, including lycopene, in tomato purées [80,81]. HPP also results in less lycopene cis-isomerscompared to thermal processing [82].
Table 3. Effects of heat treatment on tomato products.
Processing Heat Treatment Effect Texture Taste Lycopene Color
Chopping rawMild < 80 ◦C
Enzymes arereleased, pectindegraded and
hexanal/hexanolformed
Thick beforeheating, then
soup
Vivid Green Unchanged Poor, controlledby pH
Strong > 80 ◦C Moderategreen Increased Acceptable
Chopping raw,waiting forthickening
before cooking,for example 2 h
Instantly to 100◦C, medium
shortly, tothicken
Slightly thickand thickens
with increasedcooking time
Vivid Green Somewhatincreased Acceptable
Choppingcooked
Mild < 80 ◦CEnzymes
inactivated onlypartially
Thin Moderategreen Unchanged Poor, controlled
by pH
Strong > 80 ◦C Enzymesinactivated Thick Green aroma Unknown Acceptable
Puree, unpeeled2 h 100 ◦C
Carotenoid contentmaximum after 2 h. Unknown A little green Most after 2 h * Most after 2 h
Puree, peeledCarotenoid content
low and stableunaffected by time
Less thanunpeeled
Less thanunpeeled
* Carotenoid associated protein structures are broken down so that lycopene is released and isomerization occurs sothat the bioavailability increases.
Regarding lycopene and processing, the challenge is to limit the breakdown and stimulate thedesired isomerization. In order to optimize the contents of isomerized lycopene, the kinetics of bothisomerization and breakdown have to be known for the specific process. Experiments including a highnumber of time/temperature combinations should be done for a number of situations, e.g., aerobe vs.anaerobe processing and at different pH. It is only highly concentrated (e.g., dried powder) and, to acertain extent, concentrated and sterilized (canned) products that generally exhibit enlarged lycopeneconcentration compared to fresh tomato (Tables 4 and 5). However, a heavy heat treatment is veryenergy intensive, and often leads to undesirable sensory properties.
Table 4. Lycopene content in tomato products (converted to mg/100 g FW). Literature review. Values initalics are obtained by spectrophotometry, otherwise HPLC.
Product Total Lycopene Comment Reference
Pulp 10.6–18.7 Commercial products, Salerno, Italy [53]Purée 12.7–19.6
Paste 57.87
Commercial products, California, USA [58]Purée 23.46Juice 10.33
Ketchup 12.26–14.69
Juice, heat concentrated 2.34Experimentally processed from
Crimson-type tomatoes purchased fromlocal markets, Ohio, USA
[57]Paste, heat concentrated 9.93Soup, retorted 10.72Sauce, retorted 10.22
140

Foods 2019, 8, 229
Table 4. Cont.
Product Total Lycopene Comment Reference
Juice 7.83
Experimentally processed from tomatoespurchased from local markets and heat
treated according to standardized industrialfood processing requirements
[25]
Soup, condensed 7.99Canned whole tomato 11.21
Canned pizza sauce 12.71Paste 30.07
Powder, spray dried 126.49Powder, sun dried 112.63
Sun dried in oil 46.50Ketchup 13.44
Tangerine tomato sauce 4.86 Experimentally processed from tomatoesgrown at the Ohio State University, USA [30]Tangerine tomato juice 2.19
Red tomato juice 7.63
Regular salad tomatoes,Gran Canaria, Spain
1.15 Fresh
[69]
1.09 Boiled 10 min0.99–1.18 LTLT, 60 ◦C 40 min1.07–1.23 HTST, 90 ◦C 4 min
Bella Donna on the vine,Netherlands
3.80 Fresh3.06 Boiled 20 min
3.91–4.31 LTLT, 60 ◦C 40 min3.43–4.15 HTST, 90 ◦C 10 min
Daniella, Spain 2.37 Fresh purée [81]
Daniella, Spain
0.99 Fresh
[80]1.48 HP (400 MPa, 25 ◦C, 15 min)0.86 Pasteurization (70 ◦C, 30 s)0.95 Pasteurization (90 ◦C, 60 s)
Torrito, Spain39.67 Fresh
This study
26.39 HTST (90 ◦C, 15 min)23.77 HP (400 MPa, 90 ◦C, 15 min)
Torrito, the Netherlands
11.44 Fresh7.57 HTST (90 ◦C, 15 min)
10.10 HP (400 MPa, 90 ◦C, 15 min)10.00 HP (400 MPa, 20 ◦C, 15 min)5.41 HP (600 MPa, 90 ◦C, 15 min)4.08 HP(600 MPa, 20 ◦C, 15 min)
Heinz purée, USA
6.62 Puré, fresh
[83]6.61 Boiled 5 min6.57 Boiled 10 min6.48 Boiled 30 min6.39 Boiled 60 min
Double concentratedcommercial canned
tomato purée,Netherlands
39 Unheated
[68]
31 Autoclaved 100 ◦C, 20 min29 Autoclaved 100 ◦C, 60 min29 Autoclaved 100 ◦C, 120 min28 Autoclaved 120 ◦C, 20 min30 Autoclaved 120 ◦C, 60 min29 Autoclaved 120 ◦C, 120 min31 Autoclaved 135 ◦C, 20 min33 Autoclaved 135 ◦C, 60 min32 Autoclaved 135 ◦C, 120 min
Experimental purée
3.79 Unheated
[84]5.93 Steam retorted, 90 ◦C, 110 min5.20 Steam retorted, 100 ◦C, 11 min4.74 Steam retorted, 110 ◦C, 1.1 min3.37 Steam retorted, 120 ◦C, 0.11 min
FG99-218, USA
16.04 Juice, fresh
[85]
16.05 Juice, hot break17.95 Juice, HP (700 Mpa/45 ◦C/10 min)17.12 Juice, HP (600 Mpa/100 ◦C/10 min)15.50 Juice, TP (100 ◦C/35 min)
OX325, USA
9.84 Juice, fresh10.22 Juice, hot break10.88 Juice, HP (700 Mpa/45 ◦C/10 min)10.29 Juice, HP (600 Mpa/100 ◦C/10 min)8.49 Juice, TP (100 ◦C/35 min)
LTLT: Low Temperature, Long Time; HTST: High Temperature, Short Time; HP: High Pressure processing.
141

Foods 2019, 8, 229
Table 5. Lycopene content (mg/100 g FW) in tomato and tomato products including the fractions oftrans- and cis-isomers.
Produkt Total LycopeneAll Trans Lycopene
(% of Total)Cis Lycopene(% of Total)
Reference
Conesa tomato paste, Spain, 0.16% fatBatch 1 (2014) 32.1 29.2 (91.0) 2.9 (9.0)
This study
Conesa tomato paste Spain, 0.16% fatBatch 2 (2015) 26.6 23.6 (88.7) 3.0 (11.3)
Conesa tomato paste Spain, 0.16% fatBatch 2 (2015)—Autoclaved 22.8 19.9 (87.3) 2.9 (12.7)
Conesa tomato paste Spain, 0.16% fatBatch 2 (2015)—Microwaved 22.9 20.1 (87.8) 2.8 (12.2)
Conesa tomato fine chopped, Spain,0.04% fat 6.5 5.9 (90.8) 0.6 (9.2)
Heinz ketchup 0.1% fat 11.0 9.4 (85.5) 1.6 (14.5)Eldorado tomato puree, Italy, 1% fat 32.1 29.4 (91.6) 2.7 (8.4)
Cherry tomatoes 10.14 8.91 (87.9) 1.23 (12.1)
[58]
On-the-vine tomatoes 5.98 5.00 (83.6) 0.98 (16.4)Roma tomatoes 8.98 7.88 (87.7) 1.10 (12.3)Tomato paste 57.87 45.94 (79.4) 11.93 (20.6)Tomato purée 23.46 17.85 (76.1) 5.61 (23.9)Tomato juice 10.33 8.47 (82.0) 1.86 (18.0)
Tomato ketchup 12.26–14.69 9.40–9.47 (64.4–76.7) 2.86–5.22(23.3–35.6)
4. Utilization of Tomato Side Streams and By-Products
The valorization strategies for tomato waste biomass may be different depending on whether theprimary production is originally intended for the fresh market or for industrial processing. For theformer case, the biomass may mainly consist of surplus tomato due to seasonal overproductionor fractions perceived as unmarketable for cosmetics reasons, and in the latter of side streams andbyproducts from the processing. Thus, the remainder of this chapter is divided into ‘Fresh tomato’and ‘Processing’. However, the strategies described are not understood to be necessarily fixed inthese categories, and can be interchanged (i.e., postharvest ripening can also be applied for processingtomatoes). Nevertheless, chosen strategies will depend on the available technologies and the volumesof the available biomass, and type of by-product/side stream fraction, which varies considerably in thecountries subject to this case study.
4.1. Fresh Tomato
In Norway and Belgium, as mentioned above, domestically grown tomatoes are at presentpredominantly meant for the fresh market. Hence, processing by-products and side streams is not abig issue. However, mainly due to seasonal overproduction and, to a lesser extent, that a fraction of thetomatoes is not suitable for fresh market sale (wrong color, maturity level, shape, and injuries), therehave been attempts to develop processing technology for this fraction. The valorization of this biomassis currently mainly impeded by the high moisture content and corresponding fast decay. The smallvolumes, geographical dispersity, and the seasonality make it even more challenging to process byconventional processing technologies. Alternatively, flexible and mobile processing technologies maybe looked upon to valorize the underutilized tomato biomass. An example is the proposed novelspiral-filter press technology to refine horticultural by-products including tomato [86]. This technologyalleviates the need of stabilizing the biomass by using expensive drying technology, and besides, it isflexible and may be used to produce a range of volumes as well as handle a multitude of differenttextures [87]. This implies that it may be used for, e.g., apple, berries, and carrot processing after thehigh-season tomato processing is over.
Regards the surplus tomato fraction that is predominantly made up of unripe or underpigmentedtomatoes, research has shown that these tomatoes can be turned into marketable tomatoes veryeffectively by simple means. In the SusFood1 era-net project ‘SUNNIVA’ [88], a range of elicitortreatments were tested in postharvest trials to identify efficient elicitor treatments as tools to influencethe content of health-beneficial phytochemicals (HBPC) in tomato raw material and waste fractions.
142

Foods 2019, 8, 229
Products both for industry use and fresh market use were targeted. Results showed that the wastefractions of tomato could be utilized as valuable sources of HBPC, and also provide better raw materialutilization when subjected to efficient postharvest elicitor treatments. Among the most promisingelicitor treatments for tomatoes were ethylene treatments for pink and waste fractions (Figure 2).An important point of attention to maximize health benefits of industrial tomato products as well astomatoes for fresh consumption is that different types or cultivars of tomatoes reach their maximumlevel of the HBPC at different maturity stages.
Figure 2. Example of ethylene treatment. Examples of Calista (a) and Volna (c) varieties that werenot ripe at the time of harvesting and the respective varieties after six days of storage under ethyleneatmosphere (b,d). Adapted from Grzegorzewska et al., 2017 [89], with permission.
Studies have shown that hormic dosage of ultraviolet radiation (UV-C) can be applied to delay thesenescence of fruit and vegetables, suggesting that photochemical treatment may have the potentialfor postharvest preservation of tomato [90]. The effects of UV-C and temperature on postharvestpreservation of tomato are summarized in Tjøstheim, 2011 [91], and long-term controlled atmosphereand temperature storage in Batu, 2003 [92] and Dominguez et al., 2016 [93]. In short, temperaturesfrom 12.8 to 15 ◦C appear to be optimal, but there are large variations between different cultivars.An example of postharvest lycopene evolution in pink tomatoes at different storage temperatures isshown in Figure 3.
Figure 3. Lycopene increase (%) in pink harvested processing tomatoes, cv. Calista, during storage inthe dark at 3 different temperatures (12, 20, and 25 ◦C) and 80% relative humidity. The initial level oflycopene was about 6.5 mg/100g fresh weight (FW). Rearranged from data previously published inSikorska-Zimny et al., 2019 [66], with permission.
A completely different way of valorizing the fraction of tomatoes in the sub-optimal food (SOF)category, i.e., tomatoes with a color or shape that may be considered undesirable, is to target theconsumers and try to get them more aware of the consequences of food waste. Consumers appear
143

Foods 2019, 8, 229
receptive to discounts on vegetables with imperfections [94]. Since October 2013, under its own brand“Wunderlinge” (translated as ‘odds’) such fruit and vegetables have been offered in Austria, and similaractions rapidly spread to neighboring countries [95]. Depending on season, and what is available, thesefruits and vegetables, which, despite their idiosyncratic appearance is flawless in taste, are offered at acheaper price. Similar campaigns and the establishments of ‘food-banks’ is becoming more commonthroughout Europe, but many actions are still at an experimental stage.
Then there will still be left fractions that are not suitable for recycling into the food chain.Upon extraction, both tomato fruit waste and vegetative by-products may be utilized as sources ofcompounds with pharmaceutical and therapeutic benefits (e.g., phenolic compounds like quercetins,kaempferol, and apigenin) or cosmetics ingredients (e.g., lactic acids) [96]. Side-flows and waste fromvegetable processing can also be recirculated back to the field in the form of compost and used asgrowth substrates. Tomato waste compost may be used to replace partially peat-based substrate usedfor vegetable transplants production in nurseries [97]. Tomato side streams may also be used as rawmaterial for the production of organic fertilizer or soil amendment. However, more research is neededto document the bio-stimulating effect of tomato waste streams for its potential use as an input sourcefor such products [88].
4.2. Processing
During tomato processing, three to seven percent of the raw material is lost as waste [7,98].The press cake resulting from tomato juice and sauce production consists of skin and seeds [99].The seeds constitute approximately 10% of the fruit and 60% of the total waste, and is a source ofprotein and fat [100].
The chemical composition of tomato processing waste fractions was characterized by Al-Wandawiet al., 1985 [101]. The seed fraction was rich in oleic and palmitic acids, a high protein content withthreonine and lysine as the dominating amino acids, and K, Mg, Na, and Ca as the dominating elements.Whereas the skin fraction was also rich in proteins with lysine, valine, and leucine as the predominatingessential amino acids, and Ca, K, Na, and Mg as the major elements [101].
Pure lycopene has traditionally been extracted from tomatoes through processes using chemicalsolvents. Innovative supercritical fluid extraction (SFE) methods do not leave behind the chemicalresidues associated with other forms of lycopene extraction and were demonstrated by researchers atthe University of Florida to be very efficient and with a greater yield than conventional methods [102].Supercritical CO2 extraction using ethanol as a solvent is an efficient method to recover lycopeneand β-carotene from tomato skin by-products [103]. Lenucci et al., 2015 [104] performed studies onenzymatic treatment of tomato biomass prior to supercritical CO2 extraction of lycopene, and theresults showed that the enzymatic pretreatment could increase the yield of lycopene extractionby 153% as compared to solvent extraction. Besides enzymatic pretreatment, ultrasound andmicrowave-assisted extraction methods, on their own or combined, have been developed for theextraction of lycopene, resulting in higher extraction yield. Lianfu & Zelong, 2008 [105] comparedcombined ultrasound/microwave-assisted extraction (UMEAE) and ultrasonic assisted extraction oflycopene from tomato paste and achieved a yield of 97.4% and 89.4% for UMAE and UAE, respectively.UMEAE has thus shown to be highly effective and may also provide rapid extraction (367 s in thementioned study [105]). The use of UAE was reviewed by Chemat et al., 2017 [106], who concluded thatthe process can produce extracts in concentrate form, free from any residual solvents, contaminants,or artifacts, and one of the most promising hybrid techniques is UMAE. Supercritical CO2 extractionhas recently been optimized by modelling and resulted in a lycopene yield of 1.32 mg of extract perkg of raw material obtained by a peel/seed ratio of 70/30 [107], opening for a very promising future.Similarly, the use of pulsed electric fields (PEF) to improve carotenoid extraction from tomato wasdemonstrated [108]. The recent developments in carotenoid extraction methods was recently reviewedby Saini & Keum, 2018 [109], comparing enzyme-assisted extraction to the methods mentioned aboveand Soxhlet extraction.
144

Foods 2019, 8, 229
Lycopene is a high-value compound, costing on the order of 2000 €/kg in its pure form. Nevertheless,at a 10 mg lycopene per 100 g FW basis, it takes 10,000 kg of tomato fruit to produce 1 kg of purelycopene even at 100% yield. Hence, in order to be economically sustainable, large volumes of thetomato raw material are needed. Consequently, this would hardly be feasible in Norway and Belgium,but may be proposed as a viable valorization strategy in countries like Poland and Turkey. Somestrategies for valorization of tomato side streams and by-products are exemplified in Table 6.
Table 6. Proposed utilization of tomato side streams and by-products from food processing.
Product Active Ingredients Fraction Reference
Color pigments,Antioxidants Lycopene Skin, pomace, whole fruit [72,102,110]
Tomato seed oil Unsaturated fatty acids (linoleic acid) Seeds [111,112]Thickening agent Pectin Dried Pomace [113,114]
Comminuted and vegetarian sausages Dried and bleached tomato pomace Dried Pomace [115]Tomato seed meals Protein, polyphenols, etc. Seeds, pomace [116]
Nutrient supplements Vitamin B12 Pomace [117]
Cosmetics Phenolic compounds, antioxidants,lactic acid, etc. Whole plant [96]
Compost, growth substrates, fertilizer Phytochemicals Whole plant [97]
5. Conclusions
Tomato side streams, by-products and surplus fractions are underutilized resources estimatedto amount to in excess of 3 million metric tons per year in Europe. The ratios of this biomass that isconsisting of whole fruit versus the processing side-streams are largely unknown. However, in regionswhere production is largely dependent on greenhouse production for fresh market sale due to climaticpreconditions (e.g., Norway and Belgium), the fraction is predominantly whole fruit, and the oppositeis the case where tomato processing constitutes a larger industry (e.g., Poland and Turkey). For theformer case, strategies to prolong the postharvest storability of the fruit by, e.g., controlled atmosphere,elicitor, light, and temperature to overcome surplus tomatoes due to seasonal over production forthe fresh market may be proposed, combined with novel, sustainable, low-energy, flexible processingtechnologies. For the latter case, where volumes of the side fractions make more sophisticated andtargeted technologies economically and environmentally sustainable, several options for bioeconomicalvalorization exists, including utilization of by-products in comminuted hybrid and vegetarian fooditems, and the extraction of valuable health-beneficial compounds for the production of functionalingredients, protein-dense meals, and nutrient supplements. Strategies for utilization of inediblefractions, including the vegetative parts of the tomato plants may be found in the production of organicfertilizers, biobased materials such as paper, fiberboard, or extracts used in the cosmetics industries.
The notion that modern consumers are becoming more aware of the health beneficial propertiesof tomato and tomato products, and lycopene in particular, should not go unnoticed. Cultivation andprocessing practices may be further designed to meet consumer demands and preferences related tohealth and nutritional issues, and consequently add value to the tomato supply chain, also through thefabrication of functional and nutraceutical ingredients from biomass traditionally considered as waste.
Supplementary Materials: The following are available online at http://www.mdpi.com/2304-8158/8/7/229/s1,Table S1: Tomato production Europe.
Author Contributions: T.L. performed the literature review and wrote the original draft. B.V.D., E.C.E., S.K.,G.A., M.V., and D.S. provided critical feedback on the draft, edited the text, and helped compile figures andtables. All authors contributed to the final version of the manuscript, reviewed the final version, and approvedthe submission.
Funding: This research was funded by the Research Council of Norway (RCN), grant numbers 238207, 284235,and 255613. Nofima funded the APC.
Acknowledgments: This study was financed through the two SusFood era-net projects SUNNIVA and InProVeand RCN project BIOFRESH. T.L. and D.S. acknowledge funding from RCN (project no. 238207 and 284235).B.V.D. acknowledges funding from the Agency for Innovation by Science and Technology (IWT)—Belgium. E.C.E.acknowledges funding from the General Directory of Agricultural Research and Policies (GDAR)—Republic of
145

Foods 2019, 8, 229
Turkey. S.K. acknowledges funding from the National Centre for Research and Development (NCBiR)—Poland.G.A. acknowledges funding from the Daniel and Nina Carasso Foundation (DNCF) and the Ministry ofAgricultural, Food and Forestry Policies (MiPAAF)—Italy. M.V. acknowledges funding from RCN (projectNo. 255613). The authors wish to thank Rune Slimestad (NIBIO) and Romain Larbat (INRA, Nancy) for conductingHPLC analysis of lycopene, and the remaining SUNNIVA consortium for fruitful collaboration.
Conflicts of Interest: The authors declare no conflict of interest.
References
1. Total Overview 2004–2014; Fresh Fruit, Berries, Vegetables, and Potatoes; Opplysningskontoret for Frukt og Grønt:OSLO, Norway, 2015.
2. Tomato Production and Consumption by Country. Available online: Http://Chartsbin.Com/View/32687(accessed on 30 May 2019).
3. World Health Organization. Diet, nutrition and the prevention of chronic diseases. Report of a jointFAO/WHO expert consultation. In WHO Technical Report Series; World Health Organization: Geneva,Switzerland, 2003.
4. World Health Organization. The World Health Report 2002; Reducing Risks, Promoting Healthy Life; WorldHealth Organization: Geneva, Switzerland, 2002.
5. Kips, L.; Van Droogenbroeck, B. Valorisation of Vegetable and Fruit by-Products and Waste Fractions: Bottlenecksand Opportunities; Instituut voor Landbouw, Visserij-en Voedingsonderzoek: Melle, Belgium, 2014.
6. Vold, M.; Møller, H.; Hanssen, O.J.; Langvik, T.Å. Value-Chain-Anchored Expertise in Packaging/Distribution ofFood Products; Stiftelsen Østfoldforskning: Fredrikstad, Norway, 2006.
7. Van Dyk, S.J.; Gama, R.; Morrison, D.; Swart, S.; Pletschke, B.I. Food processing waste: Problems, currentmanagement and prospects for utilisation of the lignocellulose component through enzyme synergisticdegradation. Renew. Sustain. Energy Rev. 2013, 26, 521–531. [CrossRef]
8. Miljøgartneriet. Available online: http://miljogartneriet.no/hjem (accessed on 30 May 2019).9. Verheul, M.; Maessen, H.; Grimstad, O.S. Optimizing a year round cultivation system of tomato under
artificial light. Acta Hortic. 2012, 956, 389–394. [CrossRef]10. Belgian Tomatoes’ Strong Focus on Exports. Eurofresh. 2016. Available online: https://www.eurofresh-
distribution.com/news/belgian-tomatoes%E2%80%99-strong-focus-exports (accessed on 30 May 2019).11. Lava. Available online: https://www.lava.be/ (accessed on 30 May 2019).12. Gellynck, X.; Lambrecht, E.; de Pelsmaeker, S.; Vandenhaute, H. The Impact of Cosmetic Quality Standards
on Food Loss—Case Study of the Flemish Fruit and Vegetable Sector; Department of Agriculture and Fisheries:Flandern, Belgium, 2017.
13. Statistics Poland. Statistical Yearbook of Agriculture-2018; Rozkrut, D., Ed.; Agricultural Department: Warsaw,Poland, 2018.
14. Greenhouse Tomatoes: A Greater Role on the Polish Scene. Eurofresh. 2016. Available online: https://www.eurofresh-distribution.com/news/greenhouse-tomatoes-greater-role-polish-scene (accessed on 30 May 2019).
15. Sarisacli, E. Tomato Paste; The Prime Ministry Foreign Trade Undersecretariat of the Turkey Republic: Ankara,Turkey, 2007.
16. TUIK. Crop Products Balance Sheet, Vegetables. 2000/01–2017/18. Available online: www.tuik.gov.tr(accessed on 29 May 2019).
17. Tatlidil, F.; Kiral, T.; Gunes, A.; Demir, K.; Erdemir, G.; Fidan, H.; Demirci, F.; Erdogan, C.; Akturk, D.Economic Analysis of Crop Losses during Pre-Harvest and Harvest Periods in Tomato Production in the Ayas andNallihan Districts of the Ankara Province; TUBITAK-TARP: Ankara, Turkey, 2003.
18. Celikel, F. Maintaining the postharvest quality of organic horticultural crops. Turk. J. Agric. Food Sci. Technol.2018, 6, 175–182.
19. Buyukbay, O.E.; Uzunoz, M.; Bal, H.S.G. Post-Harvest Losses in Tomato and Fresh Bean Production in TokatProvince of Turkey. Sci. Res. Essays 2011, 6, 1656–1666.
20. Simonne, H.A.; Behe, B.K.; Marshall, M.M. Consumers Prefer Low-Priced and High-Lycopene-ContentFresh-Market Tomatoes. HortTechnology 2006, 16, 674–681. [CrossRef]
21. Fadupin, T.G.; Osadola, O.T.; Atinmo, T. Lycopene Content of Selected Tomato Based Products, Fruits andVegetables Consumed in South Western Nigeria. Afr. J. Biomed. Res. 2012, 15, 187–191.
22. Nguyen, M.; Schwartz, S.J. Lycopene: Chemical and Biological Properties. Food Technol. 1999, 53, 38–45.
146

Foods 2019, 8, 229
23. Kin-Weng, K.W.; Khoo, H.E.; Prasad, K.N.; Ismail, A.; Tan, C.P.; Rajab, N.F. Revealing the Power of theNatural Red Pigment Lycopene. Molecules 2010, 15, 959–987.
24. Agarwal, S.; Rao, A.V. Tomato Lycopene and Low Density Lipoprotein Oxidation: A Human DietaryIntervention Study. Lipids 1998, 33, 981–984. [CrossRef]
25. Nguyen, M.; Schwartz, S.J. Lycopene Stability During Food Processing. Proc. Soc. Exp. Biol. Med. 1998, 218,101–105. [CrossRef]
26. Story, N.E.; Kopec, R.E.; Schwartz, S.J.; Harris, G.K. An Update on the Health Effects of Tomato Lycopene.Annu. Rev. Food Sci. Technol. 2010, 1, 187–210. [CrossRef] [PubMed]
27. Stahl, W.; Sies, H. Uptake of Lycopene and Its Geometrical-Isomers Is Greater from Heat-Processed Thanfrom Unprocessed Tomato Juice in Humans. J. Nutr. 1992, 122, 2161–2166. [CrossRef] [PubMed]
28. Cooperstone, L.J.; Ralston, R.A.; Riedl, K.M.; Haufe, T.C.; Schweiggert, R.M.; King, S.A.; Timmers, C.D.;Francis, D.M.; Lesinski, G.B.; Schwartz, S.J. Enhanced Bioavailability of Lycopene When Consumed asCis-Isomers from Tangerine Compared to Red Tomato Juice, a Randomized, Cross-over Clinical Trial.Mol. Nutr. Food Res. 2015, 59, 658–669. [CrossRef] [PubMed]
29. Papaioannou, H.E.; Liakopoulou-Kyriakides, M.; Karabelas, A.J. Natural Origin Lycopene and Its GreenDownstream Processing. Crit. Rev. Food Sci. Nutr. 2016, 56, 686–709. [CrossRef]
30. Cooperstone, L.J.; Francis, D.M.; Schwartz, S.J. Thermal Processing Differentially Affects Lycopene and OtherCarotenoids in Cis-Lycopene Containing, Tangerine Tomatoes. Food Chem. 2016, 210, 466–472. [CrossRef]
31. Graziani, G.; Pernice, R.; Lanzuise, S.; Vitaglione, P.; Anese, M.; Fogliano, V. Effect of Peeling and Heating onCarotenoid Content and Antioxidant Activity of Tomato and Tomato-Virgin Olive Oil Systems. Eur. FoodRes. Technol. 2003, 216, 116–121. [CrossRef]
32. Adalid, M.A.; Rosello, S.; Nuez, F. Evaluation and Selection of Tomato Accessions (Solanum SectionLycopersicon) for Content of Lycopene, Beta-Carotene and Ascorbic Acid. J. Food Compos. Anal. 2010, 23,613–618. [CrossRef]
33. Porter, W.J.; Lincoln, R.E. Lycopersicon Selections Containing a High Content of Carotenes and ColorlessPolyenes. II. The Mechanism of Carotene Biosynthesis. Arch. Biochem. 1950, 27, 390–403.
34. Zanfini, A.; Dreassi, E.; la Rosa, C.; D’Addario, C.; Corti, P. Quantitative Variations of the Main Carotenoidsin Italian Tomatoes in Relation to Geographic Location, Harvest Time, Varieties and Ripening Stage. Ital. J.Food Sci. 2007, 19, 181–190.
35. Aherne, S.A.; Jiwan, M.A.; Daly, T.; O’Brien, N.M. Geographical Location has Greater Impact on CarotenoidContent and Bioaccessibility from Tomatoes than Variety. Plant Foods Hum. Nutr. 2009, 64, 250–256.[CrossRef]
36. Brandt, S.; Pék, Z.; Barna, É.; Lugasi, A.; Helyes, L. Lycopene content and colour of ripening tomatoes asaffected by environmental conditions. J. Sci. Food Agric. 2006, 86, 568–572. [CrossRef]
37. Kaur, D.; Sharma, R.; Wani, A.A.; Gill, B.S.; Sogi, D. Physicochemical Changes in Seven Tomato(Lycopersicon esculentum) Cultivars During Ripening. Int. J. Food Prop. 2006, 9, 747–757. [CrossRef]
38. Yamaguchi, M.; Howard, F.D.; Luh, B.S.; Leonard, S.J. Effect of Ripeness and Harvest Dates on the Qualityand Composition of Fresh Canning Tomatoes. Proc. Am. Soc. Horticult. Sci. 1960, 76, 560–567.
39. Wu, M.T.; Jadhav, S.J.; Salunkhe, O.K. Effects of Sub-atmospheric pressure storage on ripening of tomatofruits. J. Food Sci. 1972, 37, 952–956. [CrossRef]
40. Sadler, G.; Davis, J.; Dezman, D. Rapid Extraction of Lycopene and B-Carotene from Reconstituted TomatoPaste and Pink Grapefruit Homogenates. J. Food Sci. 1990, 55, 1460–1461. [CrossRef]
41. Abushita, A.A.; Daood, H.G.; Biacs, P.A. Change in Carotenoids and Antioxidant Vitamins in Tomato asa Function of Varietal and Technological Factors. J. Agric. Food Chem. 2000, 48, 2075–2081. [CrossRef][PubMed]
42. Helyes, L.; Pék, Z.; Brandt, S.; Lugasi, A. Analysis of Antioxidant Compounds and Hydroxymethylfurfuralin Processing Tomato Cultivars. HortTechnology 2006, 16, 615–619. [CrossRef]
43. Pék, Z.; Szuvandzsiev, P.; Daood, H.; Neményi, A.; Helyes, L. Effect of irrigation on yield parameters andantioxidant profiles of processing cherry tomato. Open Life Sci. 2014, 9, 383–395. [CrossRef]
44. Gómez, R.; Costa, J.; Amo, M.; Alvarruiz, A.; Picazo, M.; Pardo, J.E. Physicochemical and ColorimetricEvaluation of Local Varieties of Tomato Grown in SE Spain. J. Sci. Food Agric. 2001, 81, 1101–1105.
147

Foods 2019, 8, 229
45. Gonzalez-Cebrino, F.; Lozano, M.; Ayuso, M.C.; Bernalte, M.J.; Vidal-Aragon, M.C.; González-Gómez, D.Characterization of traditional tomato varieties grown in organic conditions. Span. J. Agric. Res. 2011, 9, 444.[CrossRef]
46. Lahoz, I.; Leiva-Brondo, M.; Martí, R.; Macua, J.I.; Campillo, C.; Roselló, S.; Cebolla-Cornejo, J. Influence ofhigh lycopene varieties and organic farming on the production and quality of processing tomato. Sci. Hortic.2016, 204, 128–137. [CrossRef]
47. Lenucci, S.M.; Caccioppola, A.; Durante, M.; Serrone, L.; de Caroli, M.; Piro, G.; Dalessandro, G. CarotenoidContent During Tomato (Solanum Lycopersicum L.) Fruit Ripening in Traditional and High-Pigment Cultivars.Ital. J. Food Sci. 2009, 21, 461–472.
48. Frusciante, L.; Carli, P.; Ercolano, M.R.; Pernice, R.; Di Matteo, A.; Fogliano, V.; Pellegrini, N. Antioxidantnutritional quality of tomato. Mol. Nutr. Food Res. 2007, 51, 609–617. [CrossRef] [PubMed]
49. Akbudak, B. Effects of harvest time on the quality attributes of processed and non-processed tomato varieties.Int. J. Food Sci. Technol. 2010, 45, 334–343. [CrossRef]
50. Akbudak, B. Comparison of Quality Characteristics of Fresh and Processing Tomato. J. Food Agric. Environ.2012, 10, 133–136.
51. Gupta, A.; Kawatra, A.; Sehgal, S. Physical-Chemical Properties and Nutritional Evaluation of NewlyDeveloped Tomato Genotypes. Afr. J. Food Sci. Technol. 2010, 2, 167–172.
52. Arias, R.; Lee, T.-C.; Logendra, L.; Janes, H. Correlation of Lycopene Measured by HPLC with the L*, a*, b*Color Readings of a Hydroponic Tomato and the Relationship of Maturity with Color and Lycopene Content.J. Agric. Food Chem. 2000, 48, 1697–1702. [CrossRef] [PubMed]
53. Giovanelli, G.; Pagliarini, E. Antioxidant Composition of Tomato Products Typically Consumed in Italy.Ital. J. Food Sci. 2009, 21, 305–316.
54. Georgé, S.; Tourniaire, F.; Gautier, H.; Goupy, P.; Rock, E.; Caris-Veyrat, C. Changes in the Contents ofCarotenoids, Phenolic Compounds and Vitamin C During Technical Processing and Lyophilisation of Redand Yellow Tomatoes. Food Chem. 2011, 124, 1603–1611. [CrossRef]
55. Sharma, K.S.; LeMaguer, M. Lycopene in Tomatoes and Tomato Pulp Fraction. Ital. J. Food Sci. 1996, 8,107–113.
56. Muratore, G.; Licciardello, F.; Maccarone, E. Evaluation of the Chemical Quality of a New Type of Small-SizedTomato Cultivar, the Plum Tomato (Lycopersicon lycopersicum). Ital. J. Food Sci. 2005, 17, 75–81.
57. Nguyen, M.; Francis, D.; Schwartz, S. Thermal isomerisation susceptibility of carotenoids in different tomatovarieties. J. Sci. Food Agric. 2001, 81, 910–917. [CrossRef]
58. Toma, R.B.; Frank, G.C.; Nakayama, K.; Tawfik, E. Lycopene content in raw tomato varieties and tomatoproducts. J. Foodserv. 2008, 19, 127–132. [CrossRef]
59. Slimestad, R.; Verheul, M.J. Seasonal Variations in the Level of Plant Constituents in Greenhouse Productionof Cherry Tomatoes. J. Agric. Food Chem. 2005, 53, 3114–3119. [CrossRef] [PubMed]
60. Raffo, A.; La Malfa, G.; Fogliano, V.; Maiani, G.; Quaglia, G. Seasonal variations in antioxidant componentsof cherry tomatoes (Lycopersicon esculentum cv. Naomi F1). J. Food Compos. Anal. 2006, 19, 11–19. [CrossRef]
61. Di Cesare, L.F.; Migliori, C.; Viscardi, D.; Parisi, M. Quality of Tomato Fertilized with Nitrogen andPhosphorous. Ital. J. Food Sci. 2010, 22, 186–191.
62. Ilahy, R.; Tlili, I.; Riahi, A.; Sihem, R.; Ouerghi, I.; Hdider, C.; Piro, G.; Lenucci, M.S. Fractionate analysisof the phytochemical composition and antioxidant activities in advanced breeding lines of high-lycopenetomatoes. Food Funct. 2016, 7, 574–583. [CrossRef] [PubMed]
63. George, B.; Kaur, C.; Khurdiya, D.; Kapoor, H. Antioxidants in tomato (Lycopersium esculentum) as a functionof genotype. Food Chem. 2004, 84, 45–51. [CrossRef]
64. Markovic, K.; Krbavcic, I.P.; Krpan, M.; Bicanic, D.; Vahcic, N. The lycopene content in pulp and peel of fivefresh tomato cultivars. Acta Aliment. 2010, 39, 90–98. [CrossRef]
65. Ciaccheri, L.; Tuccio, L.; Mencaglia, A.A.; Mignani, A.G.; Hallmann, E.; Sikorska-Zimny, K.; Kaniszewski, S.;Verheul, M.J.; Agati, G. Directional versus total reflectance spectroscopy for the in situ determination oflycopene in tomato fruits. J. Food Compos. Anal. 2018, 71, 65–71. [CrossRef]
66. Sikorska-Zimny, K.; Badelek, E.; Grzegorzewska, M.; Ciecierska, A.; Kowalski, A.; Kosson, R.; Tuccio, L.;Mencaglia, A.A.; Ciaccheri, L.; Mignani, A.G.; et al. Comparison of Lycopene Changes betweenOpen-Field Processing and Fresh Market Tomatoes During Ripening and Post-Harvest Storage by Using aNon-Destructive Reflectance Sensor. J. Sci. Food Agric. 2019, 99, 2763–2774. [CrossRef] [PubMed]
148

Foods 2019, 8, 229
67. Capanoglu, E.; Beekwilder, J.; Boyacioglu, D.; De Vos, R.C.; Hall, R.D. The Effect of Industrial Food Processingon Potentially Health-Beneficial Tomato Antioxidants. Crit. Rev. Food Sci. Nutr. 2010, 50, 919–930. [CrossRef][PubMed]
68. Luterotti, S.; Bicanic, D.; Markovic, K.; Franko, M. Carotenes in processed tomato after thermal treatment.Food Control 2015, 48, 67–74. [CrossRef]
69. Svelander, C.A.; Tibäck, E.A.; Ahrné, L.M.; Langton, M.I.; Svanberg, U.S.; Alminger, M.A. Processing oftomato: Impact on in vitro bioaccessibility of lycopene and textural properties. J. Sci. Food Agric. 2010, 90,1665–1672. [CrossRef] [PubMed]
70. Seybold, C.; Fröhlich, K.; Bitsch, R.; Otto, K.; Böhm, V. Changes in Contents of Carotenoids and Vitamin Eduring Tomato Processing. J. Agric. Food Chem. 2004, 52, 7005–7010. [CrossRef] [PubMed]
71. Zanoni, B.; Pagliarini, E.; Giovanelli, G.; Lavelli, V. Modelling the effects of thermal sterilization on thequality of tomato puree. J. Food Eng. 2003, 56, 203–206. [CrossRef]
72. Kaur, D.; Sogi, D.; Wani, A.A. Degradation Kinetics of Lycopene and Visual Color in Tomato Peel Isolatedfrom Pomace. Int. J. Food Prop. 2006, 9, 781–789. [CrossRef]
73. Kessy, H.H.; Zhang, H.W.; Zhang, L.F. A Study on Thermal Stability of Lycopene in Tomato in Water and OilFood Systems Using Response Surface Methodology. Int. J. Food Sci. Technol. 2011, 46, 209–215. [CrossRef]
74. Chen, C.J.; Shi, J.; Xue, S.J.; Ma, Y. Comparison of Lycopene Stability in Water-And Oil-Based Food ModelSystems under Thermal-and Light-Irradiation Treatments. Food Sci. Technol. 2009, 42, 740–747. [CrossRef]
75. Tibäck, E.A.; Svelander, C.A.; Colle, I.J.; Altskär, A.I.; Alminger, M.A.; Hendrickx, M.E.; Ahrné, L.M.;Langton, M.I. Mechanical and Thermal Pretreatments of Crushed Tomatoes: Effects on Consistency and InVitro Accessibility of Lycopene. J. Food Sci. 2009, 74, E386–E395. [CrossRef]
76. Kaur, C.; George, B.; Deepa, N.; Singh, B.; Kapoor, H.C. Antioxidant Status of Fresh and Processed Tomato—AReview. J. Food Sci. Technol.-Mysore 2004, 41, 479–486.
77. Spigno, G.; Maggi, L.; Amendola, D.; Ramoscelli, J.; Marcello, S.; De Faveri, D.M. Bioactive Compounds inIndustrial Tomato Sauce after Processing and Storage. Ital. J. Food Sci. 2014, 26, 252–260.
78. Takeoka, G.R.; Dao, L.; Flessa, S.; Gillespie, D.M.; Jewell, W.T.; Huebner, B.; Bertow, D.; Ebeler, S.E. ProcessingEffects on Lycopene Content and Antioxidant Activity of Tomatoes. J. Agric. Food Chem. 2001, 49, 3713–3717.[CrossRef] [PubMed]
79. Stratakos, A.C.; Delgado-Pando, G.; Linton, M.; Patterson, M.F.; Koidis, A. Industrial scale microwaveprocessing of tomato juice using a novel continuous microwave system. Food Chem. 2016, 190, 622–628.[CrossRef] [PubMed]
80. Sanchez-Moreno, C.; Plaza, L.; de Ancos, B.; Cano, M.P. Impact of High-Pressure and Traditional ThermalProcessing of Tomato Puree on Carotenoids, Vitamin C and Antioxidant Activity. J. Sci. Food Agric. 2006, 86,171–179. [CrossRef]
81. Sánchez-Moreno, C.; Plaza, L.; de Ancos, B.; Cano, M.P. Effect of Combined Treatments of High-Pressureand Natural Additives on Carotenoid Extractability and Antioxidant Activity of Tomato Puree(Lycopersicum esculentum Mill). Eur. Food Res. Technol. 2004, 219, 151–160. [CrossRef]
82. Knockaert, G.; Pulissery, S.K.; Colle, I.; Van Buggenhout, S.; Hendrickx, M.; Van Loey, A. Lycopene degradation,isomerization and in vitro bioaccessibility in high pressure homogenized tomato puree containing oil: Effectof additional thermal and high pressure processing. Food Chem. 2012, 135, 1290–1297. [CrossRef] [PubMed]
83. Shi, J.; Maguer, M.; Bryan, M.; Kakuda, Y. Kinetics of lycopene degradation in tomato puree by heat and lightirradiation. J. Food Process. Eng. 2003, 25, 485–498. [CrossRef]
84. Anese, M.; Falcone, P.; Fogliano, V.; Nicoli, M.; Massini, R. Effect of Equivalent Thermal Treatments on theColor and the Antioxidant Activity of Tomato Puree. J. Food Sci. 2002, 67, 3442–3446. [CrossRef]
85. Gupta, R.; Balasubramaniam, V.M.; Schwartz, S.J.; Francis, D.M. Storage Stability of Lycopene in TomatoJuice Subjected to Combined Pressure–Heat Treatments. J. Agric. Food Chem. 2010, 58, 8305–8313. [CrossRef]
86. Kips, L.; De Paepe, D.; Bernaert, N.; Van Pamel, E.; De Loose, M.; Raes, K.; Van Droogenbroeck, B. Usinga novel spiral-filter press technology to biorefine horticultural by-products: The case of tomato. Part I:Process optimization and evaluation of the process impact on the antioxidative capacity. Innov. Food Sci.Emerg. Technol. 2016, 38, 198–205. [CrossRef]
87. Siewert, N. Vaculiq—The System for Juice, Smoothie and Puree? Fruit Process. 2013, 2, 54–57.88. Løvdal, T.; Vågen, I.; Agati, G.; Tuccio, L.; Kaniszewski, S.; Grzegorzewska, M.; Kosson, R.; Bartoszek, A.;
Erdogdu, F.; Tutar, M.; et al. Sunniva-Final Report; Nofima: Tromsø, Norway, 2018.
149

Foods 2019, 8, 229
89. Grzegorzewska, M.; Badelek, E.; Sikorska-Zimny, K.; Kaniszewski, S.; Kosson, R. Determination of the Effectof Ethylene Treatment on Storage Ability of Tomatoes. In Proceedings of the XII International Controlled &Modified Atmosphere Research Conference, Warsaw, Poland, 18 June 2017.
90. Maharaj, R.; Arul, J.; Nadeau, P. Effect of photochemical treatment in the preservation of fresh tomato(Lycopersicon esculentum cv. Capello) by delaying senescence. Postharvest Biol. Technol. 1999, 15, 13–23.[CrossRef]
91. Tjøstheim, I.H. Effekten Av Forskjellige Lagringsforhold På Tomatenes Kvalitet (Lycopersicon esculentum Mill.)Fra Høsting Til Konsum. Master’s Thesis, Universitetet for Miljø-og Biovitenskap, Ås, Norway, 2011.
92. Batu, A. Effect of Long-Term Controlled Atmosphere Storage on the Sensory Quality of Tomatoes. Ital. J.Food Sci. 2003, 15, 69–77.
93. Domínguez, I.; Lafuente, M.T.; Hernández-Muñoz, P.; Gavara, R. Influence of modified atmosphere andethylene levels on quality attributes of fresh tomatoes (Lycopersicon esculentum Mill.). Food Chem. 2016, 209,211–219.
94. Aschemann-Witzel, J. Waste Not, Want Not, Emit Less. Science 2016, 352, 408–409. [CrossRef]95. Blanke, M. Challenges of Reducing Fresh Produce Waste in Europe—From Farm to Fork. Agriculture 2015, 5,
389–399. [CrossRef]96. Mukherjee, P.K.; Nema, N.K.; Maity, N.; Sarkar, B.K. Phytochemical and therapeutic potential of cucumber.
Fitoterapia 2013, 84, 227–236. [CrossRef]97. Abdel-Razzak, H.; Alkoaik, F.; Rashwan, M.; Fulleros, R.; Ibrahim, M. Tomato Waste Compost as an
Alternative Substrate to Peat Moss for the Production of Vegetable Seedlings. J. Plant Nutr. 2019, 42, 287–295.[CrossRef]
98. Otto, K.; Sulc, D. Herstellung Von Gemüsesaften. In Frucht-Und Gemüsesäfte; Schobinger, U., Ed.; Ulmer:Stuttgart, Germany, 2001.
99. Avelino, A.; Avelino, H.T.; Roseiro, J.C.; Collaço, M.A. Saccharification of tomato pomace for the productionof biomass. Bioresour. Technol. 1997, 61, 159–162. [CrossRef]
100. Schieber, A.; Stintzing, F.; Carle, R. By-products of plant food processing as a source of functionalcompounds—Recent developments. Trends Food Sci. Technol. 2001, 12, 401–413. [CrossRef]
101. Al-Wandawi, H.; Abdul-Rahman, M.; Al-Shaikhly, K. Tomato processing wastes as essential raw materialssource. J. Agric. Food Chem. 1985, 33, 804–807. [CrossRef]
102. University of Florida. Lycopene-Extraction Method Could Find Use for Tons of Discarded Tomatoes. Availableonline: https://www.sciencedaily.com/releases/2004/05/040505064902.htm (accessed on 30 May 2019).
103. Baysal, T.; Ersus, S.; Starmans, D.A.J. Supercritical CO2 extraction of beta-carotene and lycopene from tomatopaste waste. J. Agric. Food Chem. 2000, 48, 5507–5511. [CrossRef] [PubMed]
104. Lenucci, M.S.; De Caroli, M.; Marrese, P.P.; Iurlaro, A.; Rescio, L.; Böhm, V.; Dalessandro, G.; Piro, G.Enzyme-aided extraction of lycopene from high-pigment tomato cultivars by supercritical carbon dioxide.Food Chem. 2015, 170, 193–202. [CrossRef] [PubMed]
105. Lianfu, Z.; Zelong, L. Optimization and comparison of ultrasound/microwave assisted extraction (UMAE)and ultrasonic assisted extraction (UAE) of lycopene from tomatoes. Ultrason. Sonochem. 2008, 15, 731–737.[CrossRef] [PubMed]
106. Chemat, F.; Rombaut, N.; Sicaire, A.-G.; Meullemiestre, A.; Fabiano-Tixier, A.-S.; Abert-Vian, M. UltrasoundAssisted Extraction of Food and Natural Products. Mechanisms, Techniques, Combinations, Protocols andApplications. A Review. Ultrason. Sonochem. 2017, 34, 540–560. [CrossRef] [PubMed]
107. Hatami, T.; Meireles, M.A.A.; Ciftci, O.N. Supercritical carbon dioxide extraction of lycopene from tomatoprocessing by-products: Mathematical modeling and optimization. J. Food Eng. 2019, 241, 18–25. [CrossRef]
108. Luengo, E.; Álvarez, I.; Raso, J. Improving Carotenoid Extraction from Tomato Waste by Pulsed ElectricFields. Front. Nutr. 2014, 1, 12. [CrossRef] [PubMed]
109. Saini, R.K.; Keum, Y.-S. Carotenoid extraction methods: A review of recent developments. Food Chem. 2018,240, 90–103. [CrossRef]
110. Østerlie, M.; Lerfall, J. Lycopene from tomato products added minced meat: Effect on storage quality andcolour. Food Res. Int. 2005, 38, 925–929. [CrossRef]
111. Roy, B.C.; Goto, M.; Hirose, T. Temperature and pressure effects on supercritical CO2 extraction of tomatoseed oil. Int. J. Food Sci. Technol. 1996, 31, 137–141. [CrossRef]
150

Foods 2019, 8, 229
112. Shao, D.; Venkitasamy, C.; Li, X.; Pan, Z.; Shi, J.; Wang, B.; Teh, H.E.; McHugh, T. Thermal and storagecharacteristics of tomato seed oil. LWT Food Sci. Technol. 2015, 63, 191–197. [CrossRef]
113. Farahnaky, A.; Abbasi, A.; Jamalian, J.; Mesbahi, G. The use of tomato pulp powder as a thickening agent inthe formulation of tomato ketchup. J. Texture Stud. 2008, 39, 169–182. [CrossRef]
114. Grassino, A.N.; Brncic, M.; Vikic-Topic, D.; Roca, S.; Dent, M.; Brncic, S.R. Ultrasound assisted extraction andcharacterization of pectin from tomato waste. Food Chem. 2016, 198, 93–100. [CrossRef] [PubMed]
115. Savadkoohi, S.; Hoogenkamp, H.; Shamsi, K.; Farahnaky, A. Color, sensory and textural attributes ofbeef frankfurter, beef ham and meat-free sausage containing tomato pomace. Meat Sci. 2014, 97, 410–418.[CrossRef]
116. Sarkar, A.; Kaul, P. Evaluation of Tomato Processing By-Products: A Comparative Study in a Pilot ScaleSetup. J. Food Process. Eng. 2014, 37, 299–307. [CrossRef]
117. Haddadin, M.; Abu-Reesh, I.; Haddadin, F.; Robinson, R. Utilisation of tomato pomace as a substrate for theproduction of vitamin B12-A preliminary appraisal. Bioresour. Technol. 2001, 78, 225–230. [CrossRef]
© 2019 by the authors. Licensee MDPI, Basel, Switzerland. This article is an open accessarticle distributed under the terms and conditions of the Creative Commons Attribution(CC BY) license (http://creativecommons.org/licenses/by/4.0/).
151

foods
Article
Understanding the Properties of Starch in Potatoes(Solanum tuberosum var. Agria) after Being Treatedwith Pulsed Electric Field Processing
Setya B.M. Abduh 1,2,3, Sze Ying Leong 1,3, Dominic Agyei 1 and Indrawati Oey 1,3,*
1 Department of Food Science, University of Otago, Dunedin 9016, New Zealand;[email protected] (S.B.M.A.); [email protected] (S.Y.L.);[email protected] (D.A.)
2 Department of Food Technology, Diponegoro University, Semarang 50275, Indonesia3 Riddet Institute, Palmerston North 4442, New Zealand* Correspondence: [email protected]; Tel.: +64-3-479-8735
Received: 26 April 2019; Accepted: 9 May 2019; Published: 10 May 2019
Abstract: The purpose of this study was to investigate the properties of starch in potatoes (Solanumtuberosum cv. Agria) after being treated with pulsed electric fields (PEF). Potatoes were treatedat 50 and 150 kJ/kg specific energies with various electric field strengths of 0, 0.5, 0.7, 0.9 and1.1 kV/cm. Distilled water was used as the processing medium. Starches were isolated from potatotissue and from the PEF processing medium. To assess the starch properties, various methods wereused, i.e., the birefringence capability using a polarised light microscopy, gelatinisation behaviourusing hot-stage light microscopy and differential scanning calorimetry (DSC), thermal stabilityusing thermogravimetry (TGA), enzyme susceptibility towards α-amylase and the extent of starchhydrolysis under in vitro simulated human digestion conditions. The findings showed that PEF didnot change the properties of starch inside the potatoes, but it narrowed the temperature range ofgelatinisation and reduced the digestibility of starch collected in the processing medium. Therefore,this study confirms that, when used as a processing aid for potato, PEF does not result in detrimentaleffects on the properties of potato starch.
Keywords: potato starch; pulsed electric fields; birefringence; thermal properties; enzymesusceptibility
1. Introduction
Pulsed electric field (PEF) processing has been reported to have a capability in modifying themicrostructure of solid plant foods [1]. This leads to the reduction of the cutting force for potatotuber [2] and sweet potato [3] and the oil uptake of these commodities during frying. Another studyby [4] has also found that PEF processing in combination with calcium chloride and trehalose solutionscould retain the textural properties of frozen potatoes. Due to these benefits to improve product quality,this technology has been used in the commercial potato French fries or chips industries [5].
Giteru, Oey and Ali [6] have recently reported that PEF could affect either the stability or thefunctional properties of biomacromolecules such as polysaccharides and proteins. Especially onpolysaccharides, PEF could affect their microstructure, conformation, solubility, swelling effect, particlesize, viscoelastic properties, structural transition and thermal stability [6]. Moreover, other studieshave reported that PEF processing applied at an electric field strength up to 50 kV/cm can changethe properties of starches dispersed in water, such as the structural properties and the digestibilityof waxy rice starch [7]; the microstructure, thermal properties and viscosity of tapioca starch [8];the microstructure and thermal properties of maize starch [9]; the thermal properties and microstructure
Foods 2019, 8, 159; doi:10.3390/foods8050159 www.mdpi.com/journal/foods152

Foods 2019, 8, 159
of potato starch [10]; and the thermal properties and microstructure of corn starch [11]. So far, limitedstudies have been conducted to understand the fate of starch inside the potatoes after the tubersare PEF-treated. Starch is the major component in potato [12] that contributes to its nutritionalquality [13,14]. Although food processing techniques [14,15], including boiling, cooling, reheating [16],conventional frying and air frying [17], have been shown to change the digestibility of starch, it is stillnot known whether PEF processing affects the inherent properties of starch in potatoes. In addition,the adoption of PEF technique in potato processing is fairly recent, compared with, say, the use of PEFin the processing of liquid foods, such as in juice extraction, bacterial inactivation in milk, etc. It isalso known that consumer perception regarding the safety of PEF-processed foods is a key to theiracceptance [18] and this perception is often influenced by information on the effect of PEF technologyon the products themselves [19]. A similar phenomenon would potentially happen in the adoption ofPEF in potato processing.
Therefore, the purpose of this study was to investigate the properties of starch in potatoes afterbeing treated by PEF. The native state of starch isolated from potatoes after PEF treatment was examinedusing polarised light microscopy, combined with hot-stage optical microscopy. The gelatinisationbehaviour, thermal stability and thermal properties of starch isolated from potatoes after PEF treatmentwere studied using thermogravimetric analysis (TGA) and differential scanning calorimetry (DSC).The susceptibility of the isolated starch towards heat stable α-amylase as well as the degree of starchhydrolysis during in vitro simulated human oral-gastro-intestinal digestion were studied. In this study,the effects of electric field strength and specific energy for PEF on these properties were investigated.In addition, the properties of any starch found in the PEF processing medium (SPM) (e.g., leached outof the potato due to cutting during sample preparation) were examined to allow a direct comparisonwith the properties of starch obtained from the same potatoes after being treated with PEF. To theauthors’ knowledge, this research is the first work to study the properties of starch relevant to PEFprocessing of potatoes.
2. Materials and Methods
2.1. Chemicals and Reagents
Potassium iodate (KI), iodine (I2), potassium hydroxide (KOH), sodium hydroxide (NaOH) andhydrochloric acid (HCl), were purchased from Merck (Darmstadt, Germany). Sodium chloride (NaCl)was purchased from BDH Chemicals (Poole, UK). Potassium chloride (KCl) was purchased from FisherScientific (Norcross, GA, USA). Sodium bicarbonate (NaHCO3) was purchased from (Riedel-de Haën,Seelze, Germany). Heat stable α-amylase from Bacillus licheniformis (3000 U/mL), amyloglucosidasefrom Aspergillus niger (3300 U/mL), glucose oxidase peroxidase (GOPOD) kit and D-glucose standard(1 mg/mL) were purchased from Megazyme (Wicklow, Ireland). Alpha amylase from Aspergillus oryzae(30 U/mg) and pancreatin from porcine pancreas (4 × USP) were purchased from Sigma (St. Louis, MO,USA). Pepsin was purchased from PanReac AppliChem (Barcelona, Spain). Porcine bile extract waspurchased from Santa Cruz Biotechnology (Dallas, TX, USA).
2.2. Preparation of Samples
A batch of potato tubers (Solanum tuberosum cv. Agria) harvested in August 2017 were obtainedfrom Pyper’s Produce (Invercargill, New Zealand). In this study, the Agria cultivar was selected as amodel system due to its high starch content. Upon arrival, tubers were sorted according to their weight,size and dimensions while any tubers with cuts, bruises or damage were discarded. Fifty potato tuberswith uniform size and dimension were selected and randomly divided into five groups (10 tubersper group) which was later used as replicates. Each group of ten potatoes was peeled and shredded(2.79 mm × 2.79 mm) using an MX 260 food processor (Kenwood, Beijing, China) at medium speed.The shredded potato from 10 tubers were pooled together to attain a homogenous sample set andkept in an ice-water bath for no longer than 30 min. The samples were immediately treated with PEF
153

Foods 2019, 8, 159
(see Section 2.3) at different electric field strength and energy combinations (Table 1) following theexperimental protocol presented in Figure 1. In total, five independent replicates were conducted forthis study.
Figure 1. Schematic overview of the experimental design and sample collection followed by preparation.
Table 1. Summary of PEF treatment parameters on potato and the treatment impact on the changes inelectrical conductivity, temperature and browning index of the PEF processing medium.
PEF (kV/cm, kJ/kg)Electric Field
Strength(kV/cm)
SpecificEnergy Input
(kJ/kg)
ConductivityIncrease
(mS/cm) *
TemperatureIncrease (◦C) **
Browning Index
Untreated (No PEF) 0.00 0.00 0.25 ± 0.16 b 1.56 ± 2.32 c 218.30 ± 33.80 c
PEF 1 (0.5, 50) 0.50 50.48 ± 1.10 0.61 ± 0.17 ab 6.42 ± 1.25 b 279.74 ± 24.23 ab
PEF 2 (0.7, 50) 0.70 49.25 ± 0.44 0.44 ± 0.33 b 5.90 ± 0.53 b 268.36 ± 34.47 ab
PEF 3 (0.9, 50) 0.90 49.63 ± 0.31 0.54 ± 0.08 ab 6.08 ± 0.99 b 294.73 ± 15.97 a
PEF 4 (1.1, 50) 1.10 50.10 ± 0.39 0.53 ± 0.07 ab 5.86 ± 0.39 b 269.13 ± 27.05 ab
PEF 5 (0.7, 150) 0.70 151.81 ± 1.72 0.91 ± 0.25 a 15.22 ± 1.49 a 290.23 ± 32.06 a
PEF 6 (0.9, 150) 0.90 153.09 ± 0.77 0.53 ± 0.19 ab 14.00 ± 0.60 a 252.93 ± 50.83 bc
One-way ANOVAresult
F(8,39) = 4.91 F(8,39) = 108.47 F(6,98) = 9.42p = 0.00 p = 0.00 p = 0.00
PEF, pulsed electric fields. * Initial conductivity: 1.61 ± 0.25 mS/cm. ** Initial temperature: 7.22 ± 1.46 ◦C. All thePEF treatments were carried out at a 20 μs pulse width at 100 Hz. Results are expressed as the mean ± standarddeviation of five independent PEF processing experiments. Values in the same column not sharing the same letterare significantly different at p < 0.05 analysed with one-way ANOVA and Tukey’s post hoc test.
154

Foods 2019, 8, 159
2.3. Pulsed Electric Fields Treatment
PEF processing was performed using an ELCRACK® HVP 5 PEF system (German Institute ofFood Technologies, Quakenbruck, Germany) in the batch treatment configuration. The PEF treatmentchamber (total volume of 400 mL with dimensions of 100 mm length, 80 mm width and 50 mm depth),consisted of two parallel stainless-steel electrodes (80 mm electrode gap). For each treatment, 125 g ofpotato samples were placed inside the PEF treatment chamber and then submerged in 125 g of distilledwater, which served as the PEF processing medium. The pulse shape generated by the PEF unit wasmonitored in real-time using an oscilloscope (UTD2042C, Uni-Trend Group Ltd., Dongguan, China).Output parameters, such as electric field strength (kV/cm), pulse voltage (kV), pulse current (A), pulsepower (kW), pulse energy (J), total energy (kJ), pulse number (dimensionless) and pulse resistance(ohm), were recorded for each PEF run.
In this study, different field strengths, i.e., 0.5, 0.7, 0.9 and 1.1 kV/cm, accompanied with twospecific energy input intensities averaged at 49.87 ± 0.54 and 153 ± 0.91 kJ/kg were used. The specificenergy input was calculated using Equation (1):
Wspeci f ic (kJ/kg) =V2·(n·m)
R·W (1)
where V is the pulse voltage (kV), n is the pulse number (dimensionless), m is the pulse width (μs), R isthe pulse resistance (ohm) and W is the total weight of the sample and PEF processing medium.
All tested PEF process conditions were achieved by applying a 20 μs pulse width at 100 Hzfrequency with the pulse number ranging from 900–6250. Each PEF treatment was carried out infive replicates with each replicate utilising shredded potatoes from 10 tubers. The process of treatingpotatoes with PEF for each run was standardised and took no more than 3 min. For every PEF run, theuntreated sample (i.e., potato samples without PEF treatment) was prepared by soaking the potatosamples in distilled water at a ratio of 1:1 for 3 min and afterwards the sample was handled as describedin Figure 1.
To test whether PEF causes changes in cell permeability, both conductivity and temperature ofthe processing medium were first measured just before and immediately after PEF treatment using aCyberScanCON11 (Eutech Instruments, Singapore, Singapore) hand-held conductivity meter to havean indication of increased ion leakage due to PEF treatment. Subsequently, the PEF processing mediumwas separated from the potato sample using a kitchen sieve and transferred into plastic containers(1000 mL volume). Secondly, the colour of the PEF processing medium was immediately measured onthe tristimulus colour combination L*a*b* scale using a MiniScan XEPlus 45/0-L colorimeter (Hunterlab,Reston, VA, USA) in triplicate. The tristimulus colour combination of L*a*b* were then converted intoa browning index (BI) using Equations (2) and (3):
BI =100(X − 0.31)
0.17(2)
with:X =
a + 1.75L5.645L + a− 3.012b
(3)
2.4. Isolation of Starch after PEF Treatment
Immediately after PEF treatment, both untreated and PEF-treated potato samples were separatedfrom the processing medium using a kitchen sieve. Potato samples (approximately 125 g) andthe processing medium were transferred into separate plastic containers for starch isolation asdescribed below.
Potato starch was isolated from 100 g potato samples according to [20] with modifications. Potatosamples, either untreated or PEF-treated, were placed into a plastic container containing 300 mLdistilled water and, afterwards, the samples were gently macerated by hand for 1 min. The mixture
155

Foods 2019, 8, 159
of potato and distilled water was then filtered using a kitchen sieve and the filtrate was collected.The maceration process on the potato samples was repeated with another fresh 300 mL of distilledwater. The final filtrate was combined and kept at room temperature for 2 h to allow the starch tosettle to the bottom. After 2 h, the water layer on the top of the starch suspension was discardedand replaced with fresh distilled water. This step was repeated twice until clear water was obtained.The starch sediments were then oven dried (Eurotherm 3216, Steridium, Queenstown, Australia) at30 ◦C overnight or longer until the starch was completely dry (indicated by no further weight loss).The dried powder, referred as “isolated starch” (later coded as “IS”), was transferred into 1.5 mL tubesand stored in a desiccator filled with silica gel at ambient temperature (17–20 ◦C) until further analysis.
PEF processing medium (approximately 125 mL) was transferred into a plastic container followedby the addition of 300 mL distilled water. The mixture was kept at room temperature for 2 h toallow the starch to settle. After 2 h, the water layer on the top of starch suspension was discardedand replaced with fresh distilled water. This step was repeated twice until clear water was finallyachieved. The starch sediments were then oven dried (Steridium with Eurotherm 3216 controller) at30 ◦C overnight or longer until the starch was completely dry (indicated by no further weight loss).The dried powder obtained was referred as “starch from PEF processing medium” (later coded as“SPM”). The sample was kept in 1.5 mL tubes and stored in a desiccator filled with silica gel at ambienttemperature (17–20 ◦C) until analysis.
The remaining potato samples (approximately 25 g) was transferred into plastic bags and keptfrozen at −20 ◦C (Fisher and Paykel, Auckland, New Zealand) for no more than 2 weeks, followed byfreeze drying (Labconco Freezone, Kansas City, MO, USA). Subsequently, the freeze-dried sampleswere homogenised into powder form (thereafter referred as “potato powder or PP” sample) using alaboratory blender (32BL80 Waring, Torrington, CT, USA) for 10 s at high speed. They were sealedtightly inside polypropylene vials under ambient temperature (17–20 ◦C) until analysis.
2.5. Study on the Birefringence Capability of Starch Granule after PEF Treatment
The native form of starch typically exhibiting birefringence capability is associated with thecrystalline structure of starch. The birefringence capability of starch isolated from PEF-treated potatoeswas studied by mean of light microscopy and polarised microscopy. Starch suspension was preparedby gentle mixing of 2 mg dried sample and 250 μL deionised water. A drop of starch dispersion wastransferred onto a glass slide (LabServ, Waltham, MA, USA) and a small amount of Lugol’s iodine dye(5% (w/v) potassium iodate and 0.5% (w/v) iodine at a ratio of 1:1) was added. After the cover slip wasplaced, the specimen was observed under a BX-50 microscope (Olympus, Tokyo, Japan) with a polariser(U-POT U-P110 model, Olympus, Tokyo, Japan) under a magnification of 400×. The observationsunder the microscope were captured using a Camedia C4040 Zoom digital camera (Olympus, Tokyo,Japan). The images were saved as TIFF files and later standardised for their brightness using WindowsPhotos (Microsoft, Redmond, WA, USA).
2.6. Study on the Gelatinisation Behaviour of Starch Using Hot-Stage Microscopy
A light microscope, Motic BA300Pol (OPTIKA SrL, Ponteranica, Italy), complete with polariser, ata magnification of 200×was used. Starch dispersions (2 mg/250 μL deionised water) were preparedand then transferred onto glass slides with cavities, covered with a coverslip and put onto a hot stage(FP82HT model, Mettler Toledo, Columbus, OH, USA) connected with a Mettler Toledo FP90 centralprocessor to control the heating setting of the hot stage. The specimen was heated from 30–80 ◦C at arate of 5 ◦C/min. Live pictures of the specimen were automatically recorded every 15 s which wasequal to a temperature increment of 1.25 ◦C. The pictures were captured using a Nikon Optiphot PFXmicroscope camera (Nikon, Tokyo, Japan) and the files were saved as BMP files with Image-Pro Plusversion 2.7 software (Media Cybernatics Inc., Rockville, MD, USA). The captured images were resizedusing Windows Photos (Microsoft).
156

Foods 2019, 8, 159
2.7. Study of the Thermal Stability of Starch
Thermogravimetric analysis (TGA) was used to determine the moisture content and the thermalstability of the starch-containing dried samples. Dried sample, about 10 mg, were transferred onto a100 μL platinum TGA pan (TA Instruments, New Castle, DE, USA). Subsequently, the sample washeated from room temperature to 400 ◦C inside the TGA 550 unit (TA Instruments). The TGA operationand the data analysis to determine the weight loss and derivative weight loss of the sample duringheating were performed using TRIOS software V4.3 (TA Instruments).
2.8. Study on the Gelatinisation Temperature of Starch Using Differential Scanning Calorimetry
Starch-containing samples were weighed closed to 3.0 ± 0.5 mg (in dry basis as predefined usingTGA) on Tzero DSC pan (TA Instruments). Adequate amount of distilled water was added to achieve70% moisture in the sample and the pan was sealed tightly using Tzero hermetic lid with the assistanceof a Tzero press with blue die set (TA Instruments). Samples were then allowed to equilibrate to roomtemperature for 1.5 h prior to analysis in a DSC 250 unit (TA instruments) calibrated with indium(purity >99.9%) and heated from 20–100 ◦C at a 10 ◦C/min heating rate. The DSC operation and analysison the temperatures at which the starch underwent phase transition during heating, i.e., temperature ofonset gelatinisation To, temperature of peak gelatinisation Tp, temperature of conclusion gelatinisationTc, range of gelatinisation temperature R and enthalpy change of gelatinisation ΔH were performedusing TRIOS software V4.3 (TA Instruments).
2.9. Study on the Susceptibility of Starch towards Enzymes
2.9.1. Starch Susceptibility towards Heat Stable α-Amylase
Twenty milligrams of sample was transferred into a 50 mL falcon tube, added with 980 μL distilledwater and equilibrated to room temperature for 10 min. The dispersion was then vortexed and placedon a magnetic stirrer followed by the addition of 1 mL KOH (2M) to dissolve any resistant starch inthe sample. The mixture was allowed to stir for 20 min in an ice water bath over the magnetic stirrer.Another 4 mL of sodium acetate buffer (1.2 M; pH 3.8) was then added to neutralise the pH of themixture. Then, 50 μL of heat stable α-amylase and 50 μL amyloglucosidase were added, followed byincubation at 50 ◦C in a water bath for 1 h with intermittent vortexing at every 10 min to hydrolyseinsoluble starch into soluble branched and dextrin and to hydrolyse the dextrin into D-glucose. Afterthat, the mixture volume was brought up to 40 mL with deionised water, vortexed and centrifuged(Beckman GPR, Beckman, Indianapolis, IN, USA) with an acceleration of 1613× g for 10 min. Fiftymicroliters of the supernatant was then added with 1.5 mL GOPOD reagent and heated at 50 ◦C for20 min. Afterwards, the absorbance was measured at wavelength of λ = 510 nm and temperature of20 ◦C using a UV–VIS spectrophotometer (Ultraspec 3300 Pro, Amersham Biosciences, Amersham, UK)with D-glucose (1 mg/mL) solution as the external standard solution. Values were expressed as percent(w/w) hydrolysed starch per sample using a conversion factor of 0.9, which is generally calculated fromthe molecular weight of starch monomer/molecular weight of glucose (162/180 = 0.9) [21,22].
2.9.2. Starch Hydrolysis under In Vitro Simulated Human Digestion System
In vitro simulated human digestion of starch-containing dried samples consisted of three phases,namely oral, gastric and small intestinal phases, was carried out as outlined in [23] with modifications.Forty milligrams of sample were transferred into glass vials and added with 1960 μL deionisedwater. Afterwards the mixture was mixed gently with a vortex and equilibrated for 10 min at 20 ◦C.Subsequently, 2 mL simulated salivary fluid containing NaCl (2 mM), KCl (2 mM) and NaHCO3
(25 mM) and 1 mL α-amylase from Aspergillus oryzae (12.5 mg/mL) was added. The mixture wasthen incubated for 5 min at 37 ◦C (LabServ, Contherm Scientific Ltd., Wellington, New Zealand) withshaking at 55 strokes per min using a rocking shaker (DLAB Scientific Inc., Beijing, China). Incubationwith shaking was carried out for the next 2 h after the pH was adjusted to about 3 with HCl (1 M) and
157

Foods 2019, 8, 159
4 mL simulated gastric juice (1 mM HCl) containing 40 mg/mL pepsin, 151 mM NaCl and 28 mM KClwas added. Upon completion of gastric digestion, the pH was adjusted to pH 7 using NaOH (1 M) andsimulated intestinal fluid of NaHCO3 (0.1 M) containing pancreatin from porcine pancreas (10 mg/mL)and bile extract (8.45 mg/mL) was added and incubated with shaking for another 2 h. During the entirecourse of simulated intestinal digestion, 1 mL digest was withdrawn at time 0, 20, 60, 90 and 120 minand immediately transferred into a 15 mL tube containing 5 mL ethanol (80%). Individual digests werethen centrifuged with an acceleration of 1613 g for 10 min at 5 ◦C and the entire supernatant was usedfor further analysis.
The supernatant of digested samples was added with 50 μL amyloglucosidase (3300 U/mL) andafterwards incubated at 50 ◦C for 1 h with an intermittent vortexing for every 10 min. Fifty microlitersfrom the mixture were added with 1.5 mL GOPOD reagent, incubated at 50 ◦C for 20 min, and theabsorbance was measured wavelength of λ = 510 nm and temperature of 20 ◦C using a UV–VISspectrophotometer (Ultraspec 3300 Pro, Amersham Biosciences). D-glucose solution (1 mg/mL) wasused as the external standard solution. Values were expressed as mean values with standard deviationsof mg glucose per mL digest.
2.10. Statistical Data Analysis
In this study, results are expressed as the mean ± standard deviation of five independent treatmentreplicates. Statistical analyses were performed with IBM SPSS Statistics version 24 (IBM Corporation,New York, NY, USA) using one-way analysis of variance (ANOVA) followed by the Tukey’s HSDpost hoc test. Differences between the means were considered significant when p < 0.05. Independentsamples t-test was used to assess the significant differences of the thermal stability, gelatinisationtemperature, α-amylase susceptibility and the degree of starch digestibility between untreated andPEF-treated samples.
3. Results and Discussion
3.1. Monitoring the Impact of PEF Treatment on Potatoes
In this study, the changes in the temperature and the conductivity of the product were evaluated toindicate whether all the PEF conditions applied to the potato samples led to cellular damage [1,24,25].Table 1 clearly showed a considerable increment in the temperature and product conductivity for allthe PEF treatment conditions applied. The increase in temperature after PEF treatment at specificenergies of 50 and 150 kJ/kg was averaged at 6.07 ◦C and 14.61 ◦C, respectively. The temperatureincrease was due to the external energy generated from the PEF treatment while the increase in productconductivity were at least 0.44 to 0.91 mS/cm higher after PEF treatments than untreated samples (i.e.,0.25 mS/cm, see Table 1) indicating the leaching of ionic species inside the cells from the minerals ionsand other soluble solids into the processing medium. The same ionic species were presumably freedduring preparation of untreated (No PEF) samples but in the lower concentration which led to anincrease in conductivity at a lower value, 0.25 mS/cm.
Browning index in the PEF processing medium was also considered in the present study owing tothe possibility of enzymatic reaction occurring between polyphenoloxidase and phenolic compoundsreleased from their cell localisation inside potato tissues [25] into the PEF processing medium afterPEF treatment. Result showed that the browning index in the processing medium increased up to294.73 ± 15.97 after the PEF treatments compared to that of untreated samples (i.e., 218.30 ± 33.80; seeTable 1) indicating the leaching of phenolic compounds and polyphenoloxidase. It is important to notethat phenolic compounds in potato tissues are localised in the vacuole while polyphenol oxidases areaccumulated in the plastids [26]. Therefore, it is likely that the applied PEF treatments had effectivelyresulted in cellular damage, i.e., microstructural modification due to the formation of cell pores thatfacilitated the substrate-enzyme interaction in the processing medium. As a consequence, this triggered
158

Foods 2019, 8, 159
the enzymatic browning reaction, producing reddish-brown o-quinones compounds that contributetowards the browning of the PEF processing medium.
3.2. Comparison on the Birefringence Capacity of Potato Starch Granules after PEF Treatment
Starch granules have a semi-crystalline structure [27] which exhibits birefringence with a “Maltesecross” feature under a polarised microscope. The starch birefringence has been used as a good indicatorto assess the native state of starch [28–30]. Figure 2 presents the microscopy images of starch granulesisolated from potatoes after being treated with PEF (i.e., IS samples) and starch found in the PEFprocessing medium (i.e., SPM samples) using visible and polarised microscopes.
Under polarised microscopy, both starch granules isolated from potatoes (IS) without PEFtreatment and from processing medium (SPM) exhibit birefringence with the typical “Maltese cross”feature. In comparison, the same birefringence pattern distinct for native granules was observed forboth IS and SPM samples isolated from potatoes PEF-treated at an electric field strength of 0.5 kV/cmwith specific energies of 50 kJ/kg (PEF 1) in conjunction with PEF at 0.7 kV/cm with a specific energy of150 kJ/kg (PEF 5) and also when the electric field strength was increased from 0.5 to 1.1 kV/cm andfrom 0.7 to 0.9 kV/cm, respectively, at constant specific energies of 50 (PEF 4) and 150 kJ/kg (PEF 5).This study clearly showed that PEF treatment at the processing intensities used in the current studydid not influence the molecular crystallinity of starch granules from their native state.
3.3. Understanding the Gelatinisation Behaviour of Starch Isolated from PEF-Treated Potatoes
One of the unique properties of starch is its ability to undergo gelatinisation under sufficient heatand moisture [28]. The starch granules gradually swell with increasing temperature, followed by a lossof crystallinity and the birefringence of the starch [31].
Figure 3 presents the selected microscopy images of starch dispersion being heated at differenttemperatures. A representative video (Video S1) of gelatinisation behaviour of starch is attached as asupplementary material. Being heated at temperatures of 30, 40, 50 and 55 ◦C, all starch granules fromuntreated potato samples continuously showed the existence of birefringence. At 60 ◦C, most of thestarch granules started to lose their birefringence and the birefringence was completely lost at 65 ◦C.For starch isolated from potato samples treated with PEF at specific energies of 50 (PEF 2) and 150 kJ/kg(PEF 5) with an electric field strength of 0.7 kV/cm, it was found that birefringence of starch was lostextensively at 60 ◦C, compared with starch from untreated samples that lost birefringence at 65 ◦C.With respect to PEF treatments on potato samples involving electric field strengths of 1.1 kV/cm and0.9 kV/cm at specific energies of 50 (PEF 4) and 150 kJ/kg (PEF 6), respectively, there was no obviousindication of the loss of starch birefringence at temperature lower than 60 ◦C. Likewise, a completeloss of birefringence occurred at a similar temperature as all other starches, i.e., around 65 ◦C for bothuntreated and PEF-treated samples. Overall, it was clear that starch isolated from PEF-treated potatoeswere retaining the same gelatinisation behaviour as starch from untreated potatoes. It is important tonote that it is rather challenging to predict precisely the starting gelatinisation temperatures for thestarch under hot-stage microscopy and, hence, the differential scanning calorimetry (DSC) method(Section 3.5), being a more reliable approach, was used to exhibit the onset, peak and conclusiontemperatures of the starch gelatinisation process.
159

Foods 2019, 8, 159
Fig
ure
2.
Sele
cted
light
(to
p)a
ndpo
lari
sed
(bo
tto
m)m
icro
grap
hsat
am
agni
ficat
ion
of40
0×of
isol
ated
star
ch(I
S)an
dst
arch
from
PEF
proc
essi
ngm
ediu
m(S
PM)o
fun
trea
ted
and
PEF-
trea
ted
pota
toes
.
160

Foods 2019, 8, 159
Fig
ure
3.
Sele
cted
phot
omic
rogr
aphs
,ata
mag
nific
atio
nof
200×
,ofi
sola
ted
star
ches
from
untr
eate
dan
dPE
F-tr
eate
dpo
tato
es,d
ispe
rsed
inw
ater
and
heat
edfr
om30
to70◦ C
ata
rate
of5◦ C/m
in.
161

Foods 2019, 8, 159
3.4. Effect of PEF on the Thermal Stability of Potato Starch Granules
Figure 4 presents the typical curves of weight (%) and its derivative over the temperature (%/◦C)of thermogravimetric analysis (TGA) of starch isolated from potatoes (IS) and starch leached out in theprocessing medium (SPM). In this study, potato powder (PP) was used as a reference to represent theoriginal sources of the isolated starch.
a b
c
Figure 4. Typical TGA thermograms and their derivative weight of isolated starch (a), starchfrom processing medium (b), and potato powder (c) from untreated and PEF-treated potatoes.The thermograms are similar for each fraction among PEF treatments analysed in triplicate.
In this study, these three types of samples exhibited similar TGA profiles, which are characterisedby two steps of weight loss occurring at similar temperatures. The first step represented the loss ofmoisture, occurred at about 30 ◦C and continued until the weight remained constant at about 235 ◦C.However, compared with those of IS and SPM samples, the initial weight loss on the PP sampleoccurred slower prior to achieving the constant weight. This indicated that the moisture in the PPsample was bound at a stronger level due to the presence of potato tissue which highly contains waterbinding compounds, such as pectin, amounting up to 52% of potato cell walls [32].
The second step of weight loss, which occurred at about 260 ◦C, represents the decomposition ofstarch polymer resulting in the formation of CO, CO2 and H2O due to the degradation C-O and C-Cbonds [33]. The most intensive decomposition of polymer was found to occur at a similar temperatureacross IS, SPM and PP samples, indicating that these three types of samples have polymers withthe same properties from where those potato starch granules were extracted. The most intensivedecomposition temperatures, indicated as Tpdw in Table 2, were 278.35 ± 1.21 ◦C, 279.78 ± 1.55 ◦C,and 276.78 ± 3.77 ◦C, respectively, for IS, SPM and PP.
162

Foods 2019, 8, 159
Ta
ble
2.
The
rmal
stab
ility
and
gela
tini
sati
onte
mp
erat
ure
ofis
olat
edst
arch
(IS)
,sta
rch
from
PE
Fp
roce
ssin
gm
ediu
m(S
PM
),an
dp
otat
op
owd
er(P
P)f
rom
PE
Ftr
eate
dpo
tato
es.
Th
erm
al
Pro
pert
ies
PE
F(k
V/c
m,k
J/k
g)
FV
alu
e(6
,14)
p-V
alu
eU
ntr
eate
d(N
oP
EF
)P
EF
1(0
.5,50)
PE
F2
(0.7
,50)
PE
F3
(0.9
,50)
PE
F4
(1.1
,50)
PE
F5
(0.7
,150)
PE
F6
(0.9
,150)
Isol
ated
star
ch(I
S)
Tpdw
(◦C
)27
8.35±1
.21
278.
89±1
.60
277.
13±1
.16
279.
06±2
.20
277.
36±1
.13
277.
82±1
.68
274.
25±3
.62
0.94
0.50
To(◦
C)
56.6
7±0
.57
56.8
5±0
.79
56.8
6±0
.45
56.5
2±0
.47
56.5
5±0
.37
56.7
3±0
.41
56.6
7±0
.45
0.21
0.97
Tp(◦
C)
59.8
1±0
.50
60.0
7±0
.62
59.9
4±0
.31
59.5
6±0
.33
59.7
0±0
.24
59.8
2±0
.17
59.8
8±0
.23
0.58
0.74
Tc(◦
C)
64.8
3±1
.90
66.1
3±0
.81
65.6
8±0
.31
64.8
8±0
.70
65.2
1±1
.46
65.7
5±0
.61
66.0
2±0
.01
0.80
0.59
R(◦
C)
8.16±1
.87
9.28±0
.50
8.81±0
.45
8.36±0
.40
8.67±1
.60
9.02±0
.88
9.35±0
.45
0.55
0.76
ΔH
(J/g
)33
.37±7
.09
38.0
3±1
.15
37.7
4±2
.67
39.3
7±0
.50
35.5
6±6
.36
37.6
9±1
.89
39.4
3±0
.21
0.96
0.49
Star
chfr
omPE
Fpr
oces
sing
med
ium
(SPM
)
Tpdw
(◦C
)27
9.78±1
.55
280.
03±1
.35
278.
83±1
.47
278.
02±3
.48
276.
65±3
.00
280.
50±0
.69
282.
30±3
.43
1.76
0.18
To(◦
C)
57.6
9±0
.72
57.5
9±0
.54
57.9
4±0
.42
57.9
7±0
.15
58.2
3±0
.13
58.3
4±0
.07
58.2
3±0
.10
1.67
0.20
Tp(◦
C)
60.9
6±0
.67
60.8
3±0
.55
61.0
9±0
.20
60.9
5±0
.19
61.2
1±0
.12
61.2
0±0
.03
61.1
9±0
.03
0.56
0.76
Tc(◦
C)
67.0
8±0
.57
66.5
6±0
.76
66.7
4±0
.25
66.5
0±0
.02
66.5
7±0
.81
66.3
3±0
.07
66.5
1±0
.24
0.72
0.64
R(◦
C)
9.39±0
.20
a8.
97±0
.23
ab8.
80±0
.63
ab8.
53±0
.16
ab, *
8.34±0
.70
ab7.
98±0
.05
b,*
8.27±0
.32
b,*
4.33
0.01
ΔH
(J/g
)37
.32±1
.97
38.5
5±1
.58
40.0
8±1
.92
40.9
8±0
.51*
38.8
9±2
.86
38.5
0±4
.09
39.4
3±0
.41
0.84
0.56
Pota
topo
wde
r(P
P)
Tpdw
(◦C
)27
6.78±3
.77
274.
40±6
.90
273.
31±4
.63
277.
72±1
.78
275.
21±6
.72
276.
10±2
.69
276.
80±4
.70
0.31
0.92
To(◦
C)
57.4
5±0
.53
56.9
9±0
.18
56.5
7±0
.57
57.1
6±0
.34
57.4
2±0
.77
56.6
9±1
.06
57.1
6±0
.49
0.88
0.53
Tp(◦
C)
62.0
8±0
.10
61.3
3±0
.10
*61
.10±0
.25
*61
.44±0
.46
61.6
1±0
.58
61.5
1±0
.64
61.3
4±0
.25
*1.
820.
17Tc
(◦C
)67
.75±0
.42
67.2
8±0
.35
66.6
4±0
.55
*66
.92±0
.65
66.8
6±0
.52
66.9
6±0
.91
66.8
6±0
.62
1.13
0.39
R(◦
C)
10.3
0±0
.47
10.2
9±0
.52
10.0
7±0
.87
09.7
6±0
.55
09.4
4±1
.25
10.2
6±0
.76
09.7
0±0
.34
0.65
0.69
ΔH
(J/g
)26
.26±0
.23
b28
.21±0
.19
a,*
28.3
1±0
.50
a,*
27.4
1±1
.01
ab20
.68±0
.87
c,*
28.4
9±1
.09
a,*
26.5
8±0
.25
ab46
.87
0.00
Res
ulte
xpre
ssed
asm
eans±s
tand
ard
devi
atio
nof
thre
ein
depe
nden
tbat
ches
ofpo
tato
sam
ple
(10
pota
toes
per
batc
h).M
eans
inth
esa
me
row
nots
hari
ngth
eal
phab
ets
are
sign
ifica
ntly
diff
eren
tatp<
0.05
anal
ysed
wit
hon
e-w
ayA
NO
VA
and
Tuke
y’s
post
hoc
test
.Mea
nsin
the
sam
ero
ww
ith
aste
risk
*ar
esi
gnifi
cant
lyd
iffer
entf
rom
untr
eate
d/N
oPE
Fsa
mpl
e(9
5%in
terv
alco
nfid
ence
)an
alys
edw
ith
ind
epen
den
tt-
test
.T
pdw
:te
mp
erat
ure
ofp
eak
wei
ght
loss
,To:
tem
per
atu
reof
onse
tge
lati
nisa
tion
,Tp:
tem
per
atu
reof
pea
kge
lati
nisa
tion
,Tc:
tem
pera
ture
ofco
nclu
sion
gela
tini
sati
on,R
:gel
atin
isat
ion
tem
pera
ture
rang
e,Δ
H:e
ntha
lpy
chan
geof
gela
tini
sati
on.
163

Foods 2019, 8, 159
The typical TGA curve in the current study was consistent with the work carried out on cornstarch with two steps of weight losses [34]. However, on the aforementioned study, the Tpdw was foundto be about 300 ◦C, similar to that of maize starch [9]. Therefore, Tpdw can be directly and uniquelyattributed to the type of crystalline structure of the starch. Starch from cereals is characterised by theA-type crystalline structure while starch granules from tubers are usually characterised by the B-typeof crystalline structure [35]. A similar TGA profile was also found in another potato starch study [36].Furthermore, the slower weight loss occurring at the first step of weight loss on Agria cultivar in thecurrent study is similar with those of Agata and IAPAR Cristina cultivars [37]. However, the latterstudy showed higher Tpdw, i.e., 300 ◦C and 298 ◦C, respectively, for Agata and IAPAR Cristina. Thus,thermal stability of potato can also be dependent on the biological origins of samples.
The IS, SPM and PP samples obtained from potatoes treated with PEF at increasing specificenergies from 50–150 kJ/kg, as well as at increasing electric field strengths from 0.5–1.1 kV/cm werefound to have negligible influence on the Tpdw. In other words, the Tpdw values for all starch samplesobtained from PEF-treated potatoes were not significantly different from their untreated counterparts.This finding is consistent with the work of Han with his co-workers [9] who reported that thermalstability of maize starch remained unchanged (Tpdw at about 300 ◦C) even after PEF treatment at highintensity electric field strengths between 30 and 50 kV/cm.
3.5. Study on the Effect of PEF on the Gelatinisation Temperature of Potato Starch Granules
Temperatures at the onset (To), peak (Tp) and concluding stage of gelatinisation (Tc), as well asthe temperature range (R = Tc–To) and enthalpy change during gelatinisation (ΔH), are importantparameters in investigating the gelatinisation behaviour of starch. These parameters can be obtainedusing the method of differential scanning calorimetry (DSC) [20,30,38,39]. Figure 5 presents the DSCthermograms for IS, SPM and PP with the corresponding temperature values are presented in Table 2.In the same manner as TGA assay, potato powder (PP) was used as a reference in this DSC assay torepresent the original sources of the isolated starch. The IS, SPM, and PP samples from untreatedpotatoes gelatinised at To of 56.67–57.69 ◦C followed by Tp between 59.81 and 62.08 ◦C, and finallyreached Tc between 64.83 and 67.75 ◦C. The corresponding temperature range (R) was narrow forIS samples (8.16 ± 1.87 ◦C), followed by SPM samples at 9.39 ± 0.20 ◦C and the widest for PP at10.30 ± 0.47 ◦C. Overall, it was demonstrated that IS, SPM and PP samples from untreated potatoesshared some similarities in the gelatinisation temperatures, but DSC thermograms also showed thatPP samples experienced the lowest ΔH (26.26 ± 0.23 J/g) compared to IS (33.37 ± 7.09 J/g) and SPM(37.32 ± 1.97 J/g) samples.
The present study found that starches isolated from any PEF-treated potatoes (IS), either atincreasing electric field strengths up to 1.1 kV/cm and increasing specific energies up to 150 kJ/kg, weregelatinised in a similar matter as starch isolated from untreated potatoes. It indicated that starch inpotato tissue was not prone to PEF treatment probably due to its location in potato tissue. The PEFenergy delivered to the potato tissue lead to pore formation on the cell membrane as indicated bythe increase in conductivity and browning index, but it was not sufficient to cause the change in thestarch structure.
With respect to the starch from PEF processing medium (SPM), those samples derived fromPEF-treated potatoes were found to share similar values for gelatinisation temperatures of To, Tp andTc. However, there was a significant difference in the gelatinisation temperature range (R) amongthe SPM samples owing to the intensity of PEF initially applied to the potato samples. In particular,SPM samples from potatoes after PEF treatment at higher specific energies of 150 kJ/kg (PEF 5 and PEF6) were found to have a narrower gelatinisation temperature range compared to SPM sample fromuntreated potatoes, i.e., R decreased from 9.39 to 7.98 ◦C. Since the range of gelatinisation temperatureis inversely proportional to the degree of cohesion between crystallites of starch [40], a narrow rangeof gelatinisation temperature reflects a stronger cohesion between crystallites, particularly after PEFtreatment at high specific energy. Moreover, a narrow gelatinisation temperature range exhibited by
164

Foods 2019, 8, 159
SPM samples at high-energy PEF treatment could be due to no potato tissue was present to protect thestarch granules from the PEF energy. Hence, the starch was more prone to the PEF treatment. It isimportant to note that the starch found in the processing medium is generally represented by starchgranules available at the surface of potato tissue which were washed out into the PEF processingmedium during the process.
(a) (b)
(c)
Figure 5. DSC thermograms of isolated starch (a), starch from processing medium (b), and potatopowder (c) from untreated (No PEF) and PEF-treated potatoes at 50 kJ/kg specific energy with fieldstrengths (kV/cm) of 0.5 (PEF 1), 0.7 (PEF 2), 0.9 (PEF3), 1.1 (PEF 4) and at 150 kJ specific energywith field strength (kV/cm) of 0.7 (PEF 5) and 0.9 (PEF 6). To: temperature of onset gelatinisation,Tp: temperature of peak gelatinisation, Tc: temperature of conclusion gelatinisation, R: gelatinisationtemperature range, ΔH: enthalpy change of gelatinisation.
On PP samples, apparent changes were found on PEF-treated samples such as in Tp of PEF 1, PEF2, PEF 6 and ΔH of all PEF treatments. These changes were presumably associated with the variationin the amount of starch in PP sample during DSC analysis considering that the sample size is limited toabout 2.45 mg dry sample whereas, in fact, a lesser amount of starch in the sample matters in loweringthe peak height of Tpdw in the thermal stability of PP sample compared with those of IS and SPMsamples, as shown by the finding in TGA analysis.
The effect of PEF on the narrower temperature range of gelatinisation (R) of SPM sample in thecurrent study was different from the work carried out on 8% (w/w) potato starch in water dispersionand PEF-treated at intensities up to 50 kV/cm [10]. In the Han and co-workers study [10] thetemperature range of gelatinisation was slightly broadened with increasing field strength from 30 to
165

Foods 2019, 8, 159
50 kV/cm indicating less structuring of the resulted starch granule after PEF treatment. Furthermore,the previous study did not mention whether specific energy was also important in the change ofgelatinisation temperature range. The different phenomenon observed in this study and that of Hanand co-workers [10] could also be due to the differences in the potato cultivar and PEF processingparameters used.
3.6. Susceptibility of Starch Granules from PEF-Treated Potatoes towards Heat Stable α-Amylase
The susceptibility of starch to heat stable α-amylase is an important property of starch [41].This indicates the starch damage [42] occurring in the development of porous starch granule [43] anddamage found on the starch due to processing [44] which influence starch functionalities. Unlike cornstarch and starch from cereal sources, potato starch is described as a very large and smooth granule [45]with a relatively well-ordered and dense structure. For this reason, potato granules are consideredto be relatively resistant to hydrolytic enzymes such as amyloglucosidase and α-amylase [12,46].As was done for the TGA and DSC assays, potato powder (PP) was used as a reference in the enzymesusceptibility assay to represent the original sources of the isolated starch.
Table 3 presents the susceptibility of IS, SPM, and PP from PEF-treated potatoes and untreatedsamples expressed as total hydrolysed starch. The total hydrolysed starch found in the current studywere on average 68.62% ± 4.08%, 73.09% ± 2.65%, and 62.83% ± 6.16%, respectively, for IS, SPM andPP from untreated potatoes. These values are comparable with the hydrolysed starch reported in otherpotato cultivars which range from about 68–73% [47]. Moreover, PP samples, regardless of the levelof PEF-treatment, consistently showed a lower enzyme susceptibility towards heat stable α-amylasecompared to their corresponding IS and SPM samples. This could be due to a lower starch contentavailable in the PP samples. Results from TGA (Table 2) further support this assumption since it wasfound that the height of Tpdw peak of the PP samples was typically lower than IS and SPM samples.
With respect to PP samples, it was clear that any PEF treatments applied on the potatoes didnot significantly impact their enzyme susceptibility towards heat stable α-amylase. Likewise, forstarch inside the potatoes (IS samples), this study showed that PEF treatments led to no statisticallysignificant effect on their susceptibility towards heat stable α-amylase. However, it was interesting tofind that IS samples from PEF-treated potatoes at an electric field strength of 0.7 kV/cm regardless ofthe specific energy applied (PEF 2 and PEF 5) consistently exhibited higher susceptibility towards heatstable α-amylase compared with those of IS samples from untreated samples and those from potatoestreated at other electric field strengths. Such finding indicated that 0.7 kV/cm could be an optimumelectric field strength to be applied on potatoes in order to improve the susceptibility of starch in thePEF-treated potatoes towards heat stable α-amylase leading to a better digestibility.
With respect to the starch found in the processing medium (SPM samples), the impact of PEFtreatment on their enzyme susceptibility was also not statistically different. However, it is importantto note that SPM samples from potatoes treated at an electric field strength of 0.9 kV/cm combinedwith a specific energy of 50 (PEF 3) showed a significant improvement in the susceptibility towardsheat stable α-amylase compared to SPM sample from untreated potatoes. Another interesting findingwas that when applying a higher intensity of specific energy (from 50 to 150 kJ/kg) on potatoes ateither electric field strength of 0.7 or 0.9 kV/cm resulted in the corresponding SPM samples (PEF 2vs. PEF 5, PEF 3 vs. PEF 6) to be more susceptible towards heat stable α-amylase. This phenomenonrelated to the improved enzyme susceptibility as the result of the application of increasing specificenergy for potatoes was only observed for SPM starches. IS or PP starches could not be associated withthe disruption of starch granules and the crystalline structure responsible for gelatinisation remainedunchanged. An enhancement effect on enzyme susceptibility with increasing specific energy for theSPM was consistent with the structural disruption found for PEF-treated potato starch dispersed inwater [10,48].
166

Foods 2019, 8, 159
3.7. Enzyme Susceptibility of Starch from PEF-Treated Potatoes under In Vitro Simulated Human DigestionCondition
The in vitro simulated human digestion assay was used to assess the susceptibility of the starchesin potatoes after being treated with PEF towards digestive enzymes. Table 4 summarises the glucoserelease per volume digest (mg/mL) of simulated human intestine phase at different digestion periodi.e., 0, 20, 60, 90 and 120 min from IS and SPM isolated from PEF-treated potatoes and untreated control,compared to its reference, PP samples.
This study found that PEF at all treatments did not significantly change the in vitro simulateddigestibility of IS but did pose some major influence on selected SPM and PP samples. After undergoing120 min of in vitro simulated human digestion during the intestinal phase, it was found that SPMsamples from potatoes treated with PEF, particularly PEF 4 and 6, showed a slight reduction in starchdigestibility and a prominent reduction was found for that of PEF 4 treatment (i.e., a lower amount ofglucose released compared to SPM samples from untreated potatoes). With respect to PP samples,the most distinct difference in the starch digestibility was found after these samples had undergone90 min of in vitro simulated human digestion during the intestinal phase. PP samples from potatoestreated with PEF, particularly PEF 1 and 6, showed a considerable improvement in starch digestibility(i.e., a higher amount of glucose released compared to PP samples from untreated potatoes).
Some general findings can be seen in the starch digestibility. PEF-treated samples of SPM tend toconsistently decrease in starch digestibility. It is presumably due to the disruption in starch structure asindicated by the change in narrowed temperature range of gelatinisation R, as shown by DSC analysis.PEF treated samples of PP tend to be consistently higher in starch digestibility than those of non-PEFtreated materials. This indicated that potato tissue was more prone than starch to PEF treatment asalready proven by the fact that no change was found in starch properties of IS samples after PEFtreatment. Consequently, pores on cell membranes were formed after PEF treatment [1] leading tofacilitation of enzyme diffusion to reach the starch. Furthermore, the trend of PEF effect on digestibilityof SPM and PP samples was consistently found after the most intensive PEF (PEF 6) which shows themost extreme change in starch digestibility compared with their untreated counterparts.
The finding in starch digestibility of PEF-treated potato gave an indication that concern tonutritional attributes and safety of starch from PEF treated potato is unwarranted, as already shownthat starch in potato remained unchanged after PEF treatment. The increase in starch digestibility ofpotato (powder) is an additional impact of modification in microstructure of solid plant food after PEFtreatment [1] from other impacts that has been previously studied, such as the reduction of cutting forcefor potato [2] and sweet potato [3], the oil uptake during frying and retaining the textural properties [4].Furthermore, PEF treatment at a proper condition without leading to excessive external energy couldpotentially be used on starch to decrease its digestibility.
Regarding the nutritional status of starch, a decrease in starch digestibility is considered ashealthy for some cohorts of consumers. In this context, starch digestibility [22] is divided into (a)rapidly digestible starch (RDS): starch digested within 20 min; (b) slowly digestible starch (SDS): starchdigested between 20 and 120 min; and (c) resistant starch (RS): starch digested after over 120 min.The health benefit of decreased digestibility of starch can be attributed either to SDS [49] or RS [50].SDS is considered as healthy to lower the risk of drastic increase of postprandial blood sugar while RSis considered as healthy to feed the colon microbiome leading to colonic health of the host [50]. Thus,RS has been considered as prebiotic [51] and adopted as a functional ingredient [52].
Therefore, a decrease in digestibility of starch is an intended outcome of food processing to produceresistant starch [53]. Some processing techniques that have been used to lower starch digestibilityare gamma irradiation of corn starch [54], high pressure treatment of starch from wheat, tapioca,potato, corn, and waxy corn [55], heat moisture treatment of mung beans [56] and rice starch [57],dual autoclaving-retrogradation of rice starch [58] and annealing of common buckwheat starch [59].The outcome of the present study shows that PEF can be considered as a technology that contributes tolowering starch resistance.
167

Foods 2019, 8, 159
Ta
ble
3.
Susc
eptib
ility
,exp
ress
edas
%(w/w
)hyd
roly
sed
star
ch,o
fiso
late
dst
arch
,sta
rch
from
PEF
proc
essi
ngm
ediu
m,a
ndpo
tato
pow
der
from
PEF-
trea
ted
pota
toes
tow
ards
heat
-sta
bleα
-am
ylas
ean
dam
ylog
luco
sida
se.
Sam
ple
sP
EF
Tre
atm
en
ts(k
V/c
m,k
J/k
g)
FV
alu
e(6
,14)
p-V
alu
e
Un
treate
d(N
oP
EF
)P
EF
1(0
.5,
50)
PE
F2
(0.7
,50)
PE
F3
(0.9
,50)
PE
F4
(1.1
,50)
PE
F5
(0.7
,150)
PE
F6
(0.9
,150)
Isol
ated
star
ch(I
S)68
.62±4
.08
65.4
5±4
.39
74.7
0±3
.65
71.2
3±6
.42
67.9
5±7
.91
70.1
8±6
.46
67.8
6±5
.96
0.80
0.58
Star
chfr
omPE
Fpr
oces
sing
med
ium
(SPM
)73
.09±2
.65
78.6
6±8
.74
68.9
4±3
.56
78.7
8±1
.92
*75
.80±3
.79
74.5
3±6
.33
83.2
5±1
0.9
1.64
0.21
Pota
topo
wde
r(P
P)62
.83±6
.16
58.7
3±1
0.21
61.1
0±6
.55
60.3
1±5
.33
62.2
8±4
.23
58.3
7±5
.71
62.7
7±8
.39
0.22
0.97
Res
ulte
xpre
ssed
asm
ean±s
tand
ard
devi
atio
n(n=
3).V
alue
sin
the
sam
ero
wno
tsha
ring
the
sam
esu
pers
crip
tare
sign
ifica
ntly
diff
eren
tatp<
0.05
anal
ysed
with
one-
way
AN
OVA
and
Tuke
y’s
post
hoc
test
.Mea
nsin
the
sam
ero
ww
ith
aste
risk
*ar
esi
gnifi
cant
lydiff
eren
tfro
mun
trea
ted/
No
PEF
sam
ple
(95%
inte
rval
confi
denc
e)an
alys
edw
ith
inde
pend
entt
-tes
t.
Ta
ble
4.
Dig
esti
bilit
y,ex
pre
ssed
asm
illig
ram
amou
ntof
glu
cose
rele
ased
per
mL
dig
est,
ofis
olat
edst
arch
(IS)
,sta
rch
from
PE
Fp
roce
ssin
gm
ediu
m(S
PM
),an
dpo
tato
pow
der
(PP)
from
PEF-
trea
ted
pota
toes
.
Tim
e(m
in)
PE
FT
reatm
en
ts(k
V/c
m,k
J/k
g)
FV
alu
e(6
,35)
p-V
alu
e
Un
treate
d(N
oP
EF
)P
EF
1(0
.5,
50)
PE
F2
(0.7
,50)
PE
F3
(0.9
,50)
PE
F4
(1.1
,50)
PE
F5
(0.7
,150)
PE
F6
(0.9
,150)
Iso
late
dst
arc
h(I
S)
04.
53±0
.49
4.75±0
.69
4.63±0
.25
4.57±0
.17
4.55±0
.21
4.88±0
.50
4.69±0
.13
0.61
0.72
204.
67±0
.24
4.81±0
.48
4.62±0
.26
4.75±0
.28
4.67±0
.14
5.14±0
.41*
4.59±0
.21
2.24
0.06
604.
74±0
.14
4.83±0
.32
4.86±0
.40
4.70±0
.14
4.92±0
.38
5.06±0
.29*
4.92±0
.31
1.01
0.43
904.
68±0
.40
4.82±0
.48
4.57±0
.29
4.52±0
.33
4.54±0
.25
4.71±0
.41
4.60±0
.12
0.59
0.74
120
4.46±0
.22
4.53±0
.30
4.65±0
.29
4.49±0
.24
4.50±0
.21
4.64±0
.42
4.46±0
.20
0.51
0.80
Sta
rch
fro
mP
EF
pro
cess
ing
med
ium
(SP
M)
04.
45±0
.23
4.26±0
.27
4.36±0
.40
4.48±0
.19
4.41±0
.39
4.09±0
.29*
4.24±0
.28
1.24
0.31
204.
47±0
.41
4.37±0
.23
4.46±0
.21
4.43±0
.15
4.34±0
.33
4.32±0
.20
4.33±0
.26
0.34
0.91
604.
61±0
.38
4.27±0
.14
4.36±0
.20
4.45±0
.16
4.31±0
.26
4.37±0
.31
4.43±0
.13
1.32
0.28
904.
55±0
.17
4.29±0
.30
4.35±0
.17
4.33±0
.16
4.24±0
.15*
4.29±0
.06*
4.21±0
.25*
2.00
0.09
120
4.35±0
.18
a4.
16±0
.10
ab4.
17±0
.21
ab4.
10±0
.23
ab3.
92±0
.22
b,*
4.11±0
.20
ab4.
06±0
.23
ab, *
2.60
0.04
Po
tato
po
wd
er
(PP
)
04.
71±0
.18
b5.
04±0
.64
ab5.
13±0
.55
ab5.
01±0
.30
ab4.
94±0
.26
ab5.
02±0
.30
ab5.
58±0
.39
a,*
2.57
0.04
204.
71±0
.57
4.90±0
.43
5.05±0
.32
4.95±0
.54
5.16±0
.28
5.13±0
.50
5.38±0
.50
1.30
0.28
605.
25±0
.26
4.97±0
.39
5.09±0
.49
5.31±0
.48
5.17±0
.19
5.23±0
.17
5.41±0
.24
1.06
0.40
904.
88±0
.29
b5.
33±0
.09
a,*
4.98±0
.25
ab5.
13±0
.26
ab5.
15±0
.27
ab5.
09±0
.07
ab5.
30±0
.23
a,*
3.02
0.02
120
4.84±0
.36
5.18±0
.31*
5.01±0
.42
5.06±0
.15
5.16±0
.21
4.96±0
.26
5.28±0
.30*
1.49
0.21
Res
ult
exp
ress
edas
the
mea
n±s
tand
ard
dev
iati
onof
six
test
s(t
rip
licat
esa
mp
les
wit
hd
up
licat
eas
say)
.M
eans
inth
esa
me
row
nots
hari
ngth
esa
me
sup
ersc
rip
tare
sign
ifica
ntly
diff
eren
tatp<
0.05
anal
ysed
wit
hon
e-w
ayA
NO
VA
and
Tuke
y’s
post
hoc
test
.Mea
nsin
the
sam
ero
ww
ith
aste
risk
*ar
esi
gnifi
cant
lyd
iffer
entf
rom
untr
eate
d/N
oPE
Fsa
mpl
e(9
5%in
terv
alco
nfide
nce)
anal
ysed
wit
han
inde
pend
entt
-tes
t.
168

Foods 2019, 8, 159
4. Conclusions
This study confirmed that the starch inside potatoes after being treated with PEF remained inits native state as indicated by the presence of birefringence properties under a polarised microscope.The thermal stability, gelatinisation behaviour, susceptibility of starch in potato to heat-stable α-amylaseand digestive enzymes under in vitro simulated human digestion conditions remained unchangedafter PEF treatment. However, starch on the surface of potato (that leached into the medium, as SPM)apparently was found to be more prone to PEF treatment as indicated by a narrow range of thegelatinisation temperature especially after PEF treatment at 150 kJ/kg, leading to less digestible starch.Since PEF processing did not change the properties of starch in potatoes as shown in this study itis suggested that the phenomena previously reported in the literature, such as reduced processingintensities for frying or changes in sensory properties after frying, is driven more by other factors, suchas structural changes of the potato tissues, and not by modification of potato starch granules.
Supplementary Materials: The following are available online at http://www.mdpi.com/2304-8158/8/5/159/s1,Video S1: Gelatinisation behaviour of starch from potatoes treated with PEF at an electric field strength of 1.1kV/cm and energy input of 50.1 kJ/kg (PEF 4) observed under a hot-stage microscopy (at a magnification of 200×)from 30–80 ◦C at a rate of 5 ◦C/min.
Author Contributions: I.O. and S.B.M.A. conceived and designed the experiments; S.B.M.A. and S.Y.L. performedthe experiments; and S.B.M.A. analysed the data; S.B.M.A. wrote the paper with the contribution from S.Y.L., D.A.and I.O.
Funding: Abduh thanks the Indonesia Endowment Fund for Education (LPDP) for providing a PhD scholarship.This research was supported by Riddet Institute, a New Zealand Centre of Research Excellence funded by theNew Zealand Tertiary Education Commission.
Conflicts of Interest: The authors declare no conflict of interest.
References
1. Faridnia, F.; Burritt, D.J.; Bremer, P.J.; Oey, I. Innovative approach to determine the effect of pulsed electricfields on the microstructure of whole potato tubers: Use of cell viability, microscopic images and ionicleakage measurements. Food Res. Int. 2015, 77, 556–564. [CrossRef]
2. Ignat, A.; Manzocco, L.; Brunton, N.P.; Nicoli, M.C.; Lyng, J.G. The effect of pulsed electric field pre-treatmentsprior to deep-fat frying on quality aspects of potato fries. Innov. Food Sci. Emerg. Technol. 2015, 29, 65–69.[CrossRef]
3. Liu, T.; Dodds, E.; Leong, S.Y.; Eyres, G.T.; Burritt, D.J.; Oey, I. Effect of pulsed electric fields on the structureand frying quality of “kumara” sweet potato tubers. Innov. Food Sci. Emerg. Technol. 2017, 39, 197–208.[CrossRef]
4. Shayanfar, S.; Chauhan, O.; Toepfl, S.; Heinz, V. The interaction of pulsed electric fields andtexturizing—Antifreezing agents in quality retention of defrosted potato strips. Int. J. Food Sci. Technol. 2013,48, 1289–1295. [CrossRef]
5. Fauster, T.; Schlossnikl, D.; Rath, F.; Ostermeier, R.; Teufel, F.; Toepfl, S.; Jaeger, H. Impact of pulsed electricfield (PEF) pretreatment on process performance of industrial French fries production. J. Food Eng. 2018, 235,16–22. [CrossRef]
6. Giteru, S.G.; Oey, I.; Ali, M.A. Feasibility of using pulsed electric fields to modify biomacromolecules:A review. Trends Food Sci. Technol. 2018, 72, 91–113. [CrossRef]
7. Zeng, F.; Gao, Q.Y.; Han, Z.; Zeng, X.A.; Yu, S.J. Structural properties and digestibility of pulsed electric fieldtreated waxy rice starch. Food Chem. 2016, 194, 1313–1319. [CrossRef]
8. Han, Z.; Zeng, X.A.; Fu, N.; Yu, S.J.; Chen, X.D.; Kennedy, J.F. Effects of pulsed electric field treatments onsome properties of tapioca starch. Carbohydr. Polym. 2012, 89, 1012–1017. [CrossRef] [PubMed]
9. Han, Z.; Yu, Q.; Zeng, X.A.; Luo, D.H.; Yu, S.J.; Zhang, B.S.; Chen, X.D. Studies on the microstructure andthermal properties of pulsed electric fields (PEF)-treated maize starch. Int. J. Food Eng. 2012, 8. [CrossRef]
10. Han, Z.; Zeng, X.A.; Yu, S.J.; Zhang, B.S.; Chen, X.D. Effects of pulsed electric fields (PEF) treatment onphysicochemical properties of potato starch. Innov. Food Sci. Emerg. Technol. 2009, 10, 481–485. [CrossRef]
169

Foods 2019, 8, 159
11. Han, Z.; Zeng, X.; Zhang, B.; Yu, S. Effects of pulsed electric fields (PEF) treatment on the properties of cornstarch. J. Food Eng. 2009, 93, 318–323. [CrossRef]
12. Bertoft, E.; Blennow, A. Structure of potato starch. In Advances in Potato Chemistry and Technology, 2nd ed.;Academic Press: Cambridge, MA, USA, 2016; pp. 57–73.
13. Burlingame, B.; Mouillé, B.; Charrondière, R. Nutrients, bioactive non-nutrients and anti-nutrients in potatoes.J. Food Compos. Anal. 2009, 22, 494–502. [CrossRef]
14. Singh, J.; Kaur, L. Chemistry, processing, and nutritional attributes of potatoes—An introduction. In Advancesin Potato Chemistry and Technology, 2nd ed.; Academic Press: Cambridge, MA, USA, 2016.
15. Yang, Y.; Achaerandio, I.; Pujolà, M. Effect of the intensity of cooking methods on the nutritional and physicalproperties of potato tubers. Food Chem. 2016, 197, 1301–1310. [CrossRef]
16. Tian, J.; Chen, S.; Wu, C.; Chen, J.; Du, X.; Chen, J.; Liu, D.; Ye, X. Effects of preparation methods on potatomicrostructure and digestibility: An in vitro study. Food Chem. 2016, 211, 564–569. [CrossRef]
17. Tian, J.; Chen, S.; Shi, J.; Chen, J.; Liu, D.; Cai, Y.; Ogawa, Y.; Ye, X. Microstructure and digestibility ofpotato strips produced by conventional frying and air-frying: An in vitro study. Food Struct. 2017, 14, 30–35.[CrossRef]
18. Nielsen, H.B.; Sonne, A.-M.; Grunert, K.G.; Banati, D.; Pollák-Tóth, A.; Lakner, Z.; Olsen, N.V.; Žontar, T.P.;Peterman, M. Consumer perception of the use of high-pressure processing and pulsed electric fieldtechnologies in food production. Appetite 2009, 52, 115–126. [CrossRef]
19. Lee, P.Y.; Lusk, K.; Mirosa, M.; Oey, I. Effect of information on Chinese consumers’ perceptions and purchaseintention for beverages processed by high pressure processing, pulsed-electric field and heat treatment.Food Qual. Prefer. 2015, 40, 16–23. [CrossRef]
20. Singh, J.; Singh, N. Studies on the morphological, thermal and rheological properties of starch separatedfrom some Indian potato cultivars. Food Chem. 2001, 75, 67–77. [CrossRef]
21. Bordoloi, A.; Singh, J.; Kaur, L. In vitro digestibility of starch in cooked potatoes as affected by guar gum:Microstructural and rheological characteristics. Food Chem. 2012, 133, 1206–1213. [CrossRef]
22. Goñi, I.; Garcia-Alonso, A.; Saura-Calixto, F. A starch hydrolysis procedure to estimate glycemic index.Nutr. Res. 1997, 17, 427–437. [CrossRef]
23. Minekus, M.; Alminger, M.; Alvito, P.; Ballance, S.; Bohn, T.; Bourlieu, C.; Carrière, F.; Boutrou, R.;Corredig, M.; Dupont, D.; et al. A standardised static in vitro digestion method suitable for food—Aninternational consensus. Food Funct. 2014, 5, 1113–1124. [CrossRef]
24. Leong, S.Y.; Oey, I. Effect of pulsed electric field treatment on enzyme kinetics and thermostability ofendogenous ascorbic acid oxidase in carrots (Daucus carota cv. Nantes). Food Chem. 2014, 146, 538–547.[CrossRef]
25. Oey, I.; Faridnia, F.; Leong, S.Y.; Burritt, D.J.; Liu, T. Determination of Pulsed Electric Fields Effect on theStructure of Potato Tubers. In Handbook of Electroporation; Springer International Publishing: New York, NY,USA, 2017; pp. 1–20.
26. Busch, J.M. Enzymic browning in potatoes: A simple assay for a polyphenol oxidase catalysed reaction.Biochem. Educ. 1999, 27, 171–173. [CrossRef]
27. Bertoft, E. Understanding starch structure: Recent progress. Agronomy 2017, 7, 56. [CrossRef]28. Liu, Q.; Charlet, G.; Yelle, S.; Arul, J. Phase transition in potato starch-water system I. Starch gelatinization at
high moisture level. Food Res. Int. 2002, 35, 397–407. [CrossRef]29. Maache-Rezzoug, Z.; Zarguili, I.; Loisel, C.; Doublier, J.L.; Buléon, A. Investigation on structural and
physicochemical modifications of standard maize, waxy maize, wheat and potato starches after DICtreatment. Carbohydr. Polym. 2011, 86, 328–336. [CrossRef]
30. Svensson, E.; Eliasson, A.C. Crystalline changes in native wheat and potato starches at intermediate waterlevels during gelatinization. Carbohydr. Polym. 1995, 26, 171–176. [CrossRef]
31. Parada, J.; Aguilera, J.M. Effect of native crystalline structure of isolated potato starch on gelatinizationbehavior and consequently on glycemic response. Food Res. Int. 2012, 45, 238–243. [CrossRef]
32. Jarvis, M.C.; Hall, M.A.; Threlfall, D.R.; Friend, J. The polysaccharide structure of potato cell walls: Chemicalfractionation. Planta 1981, 152, 93–100. [CrossRef] [PubMed]
33. Chakraborty, M.; McDonald, A.G.; Nindo, C.; Chen, S. An α-glucan isolated as a co-product of biofuel byhydrothermal liquefaction of Chlorella sorokiniana biomass. Algal Res. 2013, 2, 230–236. [CrossRef]
170

Foods 2019, 8, 159
34. Liu, X.; Yu, L.; Liu, H.; Chen, L.; Li, L. In situ thermal decomposition of starch with constant moisture in asealed system. Polym. Degrad. Stab. 2008, 93, 260–262. [CrossRef]
35. Srichuwong, S.; Sunarti, T.C.; Mishima, T.; Isono, N.; Hisamatsu, M. Starches from different botanical sourcesI: Contribution of amylopectin fine structure to thermal properties and enzyme digestibility. Carbohydr.Polym. 2005, 60, 529–538. [CrossRef]
36. Fang, J.; Fowler, P.; Tomkinson, J.; Hill, C.A. The preparation and characterisation of a series of chemicallymodified potato starches. Carbohydr. Polym. 2002, 47, 245–252. [CrossRef]
37. Leivas, C.L.; da Costa, F.J.O.G.; de Almeida, R.R.; de Freitas, R.J.S.; Stertz, S.C.; Schnitzler, E. Structural,physico-chemical, thermal and pasting properties of potato (Solanum tuberosum L.) flour. J. Therm. Anal.Calorim. 2013, 111, 2211–2216. [CrossRef]
38. Pravisani, C.I.; Califano, A.N.; Calvelo, A. Kinetics of starch gelatinization in potato. J. Food Sci. 1985, 50,657–660. [CrossRef]
39. Karlsson, M.E.; Eliasson, A.C. Gelatinization and retrogradation of potato (Solanum tuberosum) starch in situas assessed by differential scanning calorimetry (DSC). LWT—Food Sci. Technol. 2003, 36, 735–741. [CrossRef]
40. Maache-Rezzoug, Z.; Zarguili, I.; Loisel, C.; Queveau, D.; Buléon, A. Structural modifications and thermaltransitions of standard maize starch after DIC hydrothermal treatment. Carbohydr. Polym. 2008, 74, 802–812.[CrossRef]
41. Marchal, L.M.; Jonkers, J.; Franke, G.T.; de Gooijer, C.D.; Tramper, J. The effect of process conditions on theα-amylolytic hydrolysis of amylopectin potato starch: An experimental design approach. Biotechnol. Bioeng.1999, 62, 348–357. [CrossRef]
42. Morgan, J.E.; Williams, P.C. Starch damage in wheat flours: A comparison of enzymatic, iodometric, andnear-infrared reflectance techniques. Cereal Chem. 1995, 72, 209–212.
43. Jung, Y.S.; Lee, B.H.; Yoo, S.H. Physical structure and absorption properties of tailor-made porous starchgranules produced by selected amylolytic enzymes. PLoS ONE 2017, 12, e0181372. [CrossRef] [PubMed]
44. Vallons, K.J.R.; Arendt, E.K. Effects of high pressure and temperature on the structural and rheologicalproperties of sorghum starch. Innov. Food Sci. Emerg. Technol. 2009, 10, 449–456. [CrossRef]
45. Dhital, S.; Shrestha, A.K.; Gidley, M.J. Relationship between granule size and in vitro digestibility of maizeand potato starches. Carbohydr. Polym. 2010, 82, 480–488. [CrossRef]
46. Sujka, M.; Jamroz, J. α-Amylolysis of native potato and corn starches—SEM, AFM, nitrogen and iodinesorption investigations. LWT—Food Sci. Technol. 2009, 42, 1219–1224. [CrossRef]
47. Pinhero, R.G.; Waduge, R.N.; Liu, Q.; Sullivan, J.A.; Tsao, R.; Bizimungu, B.; Yada, R.Y. Evaluation ofnutritional profiles of starch and dry matter from early potato varieties and its estimated glycemic impact.Food Chem. 2016, 203, 356–366. [CrossRef] [PubMed]
48. Li, Q.; Wu, Q.-Y.; Jiang, W.; Qian, J.-Y.; Zhang, L.; Wu, M.; Rao, S.-Q.; Wu, C.-S. Effect of pulsed electric fieldon structural properties and digestibility of starches with different crystalline type in solid state. Carbohydr.Polym. 2019, 207, 362–370. [CrossRef] [PubMed]
49. Lehmann, U.; Robin, F. Slowly digestible starch—Its structure and health implications: A review. Trends FoodSci. Technol. 2007, 18, 346–355. [CrossRef]
50. Nugent, A.P. Health properties of resistant starch. Nutr. Bull. 2005, 30, 27–54. [CrossRef]51. Topping, D.L.; Fukushima, M.; Bird, A.R. Resistant starch as a prebiotic and synbiotic: State of the art.
Proc. Nutr. Soc. 2003, 62, 171–176. [CrossRef]52. Fuentes-Zaragoza, E.; Riquelme-Navarrete, M.J.; Sánchez-Zapata, E.; Pérez-Álvarez, J.A. Resistant starch as
functional ingredient: A review. Food Res. Int. 2010, 43, 931–942. [CrossRef]53. Thompson, D.B. Strategies for the manufacture of resistant starch. Trends Food Sci. Technol. 2001, 11, 245–253.
[CrossRef]54. Lee, J.S.; Ee, M.L.; Chung, K.H.; Othman, Z. Formation of resistant corn starches induced by gamma-irradiation.
Carbohydr. Polym. 2013, 97, 614–617. [CrossRef] [PubMed]55. Papathanasiou, M.M.; Reineke, K.; Gogou, E.; Taoukis, P.S.; Knorr, D. Impact of high pressure treatment on
the available glucose content of various starch types: A case study on wheat, tapioca, potato, corn, waxycorn and resistant starch (RS3). Innov. Food Sci. Emerg. Technol. 2015, 30, 24–30. [CrossRef]
56. Li, S.; Ward, R.; Gao, Q. Effect of heat-moisture treatment on the formation and physicochemical properties ofresistant starch from mung bean (Phaseolus radiatus) starch. Food Hydrocoll. 2011, 25, 1702–1709. [CrossRef]
171

Foods 2019, 8, 159
57. Van Hung, P.; Vien, N.L.; Lan Phi, N.T. Resistant starch improvement of rice starches under a combination ofacid and heat-moisture treatments. Food Chem. 2016, 191, 67–73. [CrossRef] [PubMed]
58. Ashwar, B.A.; Gani, A.; Wani, I.A.; Shah, A.; Masoodi, F.A.; Saxena, D.C. Production of resistant starch from riceby dual autoclaving-retrogradation treatment: In vitro digestibility, thermal and structural characterization.Food Hydrocoll. 2016, 56, 108–117. [CrossRef]
59. Liu, H.; Guo, X.; Li, W.; Wang, X.; Lv, M.; Peng, Q.; Wang, M. Changes in physicochemical properties andin vitro digestibility of common buckwheat starch by heat-moisture treatment and annealing. Carbohydr.Polym. 2015, 132, 237–244. [CrossRef]
© 2019 by the authors. Licensee MDPI, Basel, Switzerland. This article is an open accessarticle distributed under the terms and conditions of the Creative Commons Attribution(CC BY) license (http://creativecommons.org/licenses/by/4.0/).
172
foods
Article
Selection and Evaluation of 21 Potato(Solanum Tuberosum) Breeding Clones for ColdChip Processing
Benjamin Opuko Wayumba 1,2, Hyung Sic Choi 1,2 and Lim Young Seok 1,2,*
1 Department of Bio-Health Technology, Kangwon National University, Chuncheon 200-701, Korea;[email protected] (B.O.W.); [email protected] (H.S.C.)
2 KPBR (Korea Potato Breeding Resource Bank), Kangwon National University, Chuncheon 200-701, Korea* Correspondence: [email protected]
Received: 11 February 2019; Accepted: 11 March 2019; Published: 14 March 2019
Abstract: Quality evaluations in potatoes are of necessity to meet the strict demands of the chipprocessing industry. Important parameters assessed include specific gravity, dry matter content, chipcolor, reducing sugars, and glycoalkaloids. This study was designed with the purpose of identifyingspecialized potato clones with acceptable qualities for processing chips, in comparison with twoselected control varieties, Dubaek and Superior. As a result, high dry matter and specific gravitywere observed for three potato clones, and the quantified -solanine levels ranged from 0.15 to15.54 mg·100 g−1 fresh weight (FW). Significant variations (p < 0.05) in reducing sugar levels wereobserved in clones stored at different temperature conditions. After reconditioning of the tubers at22 ◦C for 21 days, a significant drop in reducing sugar levels was recorded. In addition, fried chips foreach potato clone were evaluated, and the color measured on the basis of the Snack Food Association(SFA) chip color score standard. Reconditioned tubers exhibited much lighter and better chip colorcompared to their counterparts cold-stored at 4 ◦C. This study observed that for quality processingof potato chips, clones with combined traits of high dry matter, low levels of glycoalkaloids andreducing sugars, and acceptable chip color should be used as raw materials.
Keywords: chip processing; cold storage; reconditioning; reducing sugar; potato
1. Introduction
The importance of potatoes as food includes their use as processed products, since they can beprocessed into many value-added food items like chips (crisps), dried flakes, French fries, and varioussnacks. Processing of potatoes into chips and other products has a great potential in ensuring reducedloss and waste post-harvesting, in handling and storage.
The industry requirements for processing chips in terms of tuber appearance should be of shalloweyes, appropriate weight, and round-oval shape [1], whereas long-oval-shaped tubers are preferredfor processing French fries. In addition, tubers should be free from cracks, hollow heart, secondarydamage, rusty spots, and greening. The peel color, flesh color, and flour content should also satisfy thenational consumer preference of any given country.
In the recent years, there has been increasing demand for food convenience, and potato chips meetthese requirements. Potato chips are one of the most convenient ways to serve potatoes, with minimalpreparation needed. Potato chips can be made flavored, plain, with chili, cheese, or seasoning. Theirslicing can be plain, regular, wavy, or waffle-cut. They are a very popular food item for picnics andparties and can be served conveniently any time as a snack. This withstanding, the quality variationof the raw materials used to produce chips has led to large differences in their culinary value andconsumer acceptance. Therefore, it is important to address this issue prior to processing in order to
Foods 2019, 8, 98; doi:10.3390/foods8030098 www.mdpi.com/journal/foods173

Foods 2019, 8, 98
maintain taste and flavor. Potato flavor results from the combination of taste, aroma, and texture [2].However, the resultant flavor after processing is sometimes altered because of the effects of cold storage.Although the storage of potato tubers at low temperature (4 ◦C) minimizes tuber respiration andsprouting [3], low-temperature storage also activates a process known as low-temperature sweeteningthat results in the conversion of starch to reducing sugars. High levels of reducing sugars (glucoseand fructose) lead to undesirable non-enzymatic browning reactions and the formation of aminegroups of free amino acids [4] that cause off-flavors and darkening of the processed potato products [5]during frying.
In order to mitigate this problem, it is necessary to develop and identify cultivars with first-ratequalities that can be a game changer in the chip processing industry. In this regard, this study wasdesigned with the purpose of identifying specialized potato clones with acceptable tuber qualities forprocessing chips with respect to tuber specific gravity, dry matter content, chip frying tests, solaninecontent, and reducing sugar profiles under different temperature storage regimes.
2. Materials and Methods
2.1. Plant Materials
Among potato breeding clones grown in 2017 spring season in South Korea, Gangwon-doProvince, 21 breeding clones and 2 control varieties (Dubaek & Superior) were finally selected forfurther evaluation for chip processing. A criterion of fully mature and healthy tubers of high yield wereused to select the tubers. The selected tubers from each clone were stored at different temperatures:22 ◦C at harvest, 4 ◦C during cold storage, and 10 ◦C for 3 weeks before experimental analysis. Thecold-stored tubers were then reconditioned at 22 ◦C for additional three weeks and re-evaluated.
2.2. Dry Matter (DM) Content
Clean, dry, standard-size aluminum foil boats were used as crucibles. Sliced samples, 3 mm thin,(10 g) of each potato clone were weighed in the foil boat, and the initial weight measured in grams.The samples were dried in an electric oven overnight for 16 h at 105 ◦C to a constant weight. The totalsolid content of each clone was calculated as a percentage. Four 10 g samples were measured for eachclone. (DM % = (final dried weight/initial weight) × 100).
2.3. Specific Gravity (SG)
Six (80–130 g) tubers from each potato clone were weighed in air and under water. Tubers were allweight-matched to ensure uniformity per clone. Average underwater weights were used to calculatethe specific gravity.
SG = (weight in air/ weight in water × density water (g·cm−3))
2.4. Reducing Sugar
The reducing sugar was quantified by the dinitrosalicylic acid (DNS) method [6]. For theprocedure, 1 g of freeze-dried powdered sample was added to 50 mL of distilled water and shaken for1 h. The supernatant was centrifuged at 3000 rpm for 30 min. In the experiment, 2 mL of DNS wasadded to 1 mL of sample in a glass tube (15 × 100) and incubated at 99 ◦C in a water bath for 10 min.After cooling, the absorbance was measured at 550 nm in a microplate reader. The experiment wasreplicated twice. The samples were analyzed against glucose standards of known concentrations.
2.5. Chip Frying Test
Potato tubers of different clones were washed clean and sliced from apical to basal ends. Thinslices (1 mm) were cut using a hand-held slicer. The slices were then rinsed in water to remove excessstarch and blot-dried on paper towels. A deep-fryer machine containing vegetable oil was used to
174

Foods 2019, 8, 98
prepare the chips. At a constant temperature of 180 ◦C, the chips were fried for 2 min and then placedon a paper towel to drain off excess oil. The chips were then photographed after cooling, using ahigh-resolution Canon EOS 5D Digital SLR Camera (Chuncheon, Korea), and their color measured onthe basis of the Snack Food Association (SFA) chip color measurement standard.
2.6. Glycoalkaloid Analysis
Tubers of 21 clones and 2 control varieties were used. The samples were sliced whole with theskin intact and freeze-dried (ilshin Lab Co., LTD, Chuncheon, Korea) prior to glycoalkaloid contentanalysis to determine -solanine. All reagents for the analysis were prepared in HPLC-grade deionizedwater. The -solanine standard and acetonitrile HPLC-grade were purchased form Sigma Aldrich(Chuncheon, Korea). All other chemicals used were of standard analytical grade.
Analysis was carried out according to Hellenas et al., 1995a [7], with some modifications. Inthe experiment, 10 g powder extracted from a whole tuber was mixed with 20 mL water/aceticacid/sodium bisulphate (NaHSO3) in the ratio 95:5:0.5 (v/v/w) in a blender. The mixture was dilutedup to 50 mL using the same extraction solvent and vacuum-filtered through Whatman filter paperNo.1. The filtrate was further cleaned up by centrifugation at 6500 rpm for 10 min. A volume of 5 mLof supernatant was obtained which was further cleaned up by extraction with 1mL acetonitrile, 1 mLwater/acetic acid/NaHSO3 solvent, 0.8 mL water/acetonitrile, 0.8 mL acetonitrile/0.022 M potassiumphosphate buffer, pH 7.6, 55:45 (v/v), all preconditioned and filtered.
-solanine was quantified using High-performance liquid chromatography (HPLC) apparatus(Shimadzu Corp, Tokyo, Japan) consisting of a 250 × 4.6 mm NH2 analytical column; mobile phase ofacetonitrile/0.022 M potassium dihydrogenphosphate (KH2PO4) buffer, pH 4.7, 75:25 (v/v), at a flowrate of 1.5 mL/min, UV absorption of 200 nm wavelength, and 0.05 Absorbance units full scale (AUFS)sensitivity. The injection volume used was 20 μL. The retention time for -solanine was approximately5.7 min, and sample extracts were quantified by comparing their corresponding peak areas with thoseof known amounts of standard. All samples were replicated twice and read against solanine standardsof known concentrations.
2.7. Statistical Analysis
The samples’ mean variations were analyzed by analysis of variance (ANOVA) software usingIBM Corp. IBM SPSS Statistics for Windows, Version 23.0 Armonk, NY, USA. Significant differenceswere evaluated using Tukey’s test at a 95% confidence interval.
3. Results and Discussion
3.1. Dry Matter Content and Specific Gravity
The potato clones varied with respect to dry matter content and specific gravity (Table 1). Tuberdry matter ranged from 18.37 ± 1.08 to 25.10 ± 0.88%, and specific gravity from 1.079 ± 0.006 to1.096 ± 0.005. For both parameters, four specific clones (V50, V48, N109-35, N357) performed betterthan the control variety Dubaek (DM 23.22%, SG 1.088) with p < 0.05, while other 11 cultivars showeda similar trend, with significantly higher total solids and specific gravity levels compared to Superior(DM 21.92%, SG 1.078).
175

Foods 2019, 8, 98
Table 1. Tuber dry matter content and specific gravity of potato clones.
Clones Dry Matter (%) Specific Gravity
V50 25.10 ± 0.88 a 1.096 ± 0.005 a
V48 24.84 ± 0.30 a 1.093 ± 0.008 ab
N109-35 24.75 ± 0.63 ab 1.092 ± 0.006 abc
N357 24.02 ± 0.42 abc 1.091 ± 0.005 a–d
Dubaek 23.22 ± 0.41 a–d 1.088 ± 0.006 a–e
V93 23.14 ± 0.51 a–d 1.082 ± 0.005 a–g
A165-4 23.06 ± 0.74 a–d 1.076 ± 0.010 d–g
N2-6 22.77 ± 0.44 a–d 1.086 ± 0.010 a–f
N96-29 22.43 ± 1.19 b–e 1.074 ± 0.008 efg
Gogu 22.36 ± 0.57 cde 1.073 ± 0.003 fg
V18 22.27 ± 0.25 cde 1.079 ± 0.008 b–g
N189 22.26 ± 0.72 cde 1.079 ± 0.004 b–g
V17 22.22 ± 1.60 cde 1.086 ± 0.008 a–f
V16 21.97 ± 0.85 cde 1.081 ± 0.004 b–g
A188-10 21.84 ± 0.74 cde 1.069 ± 0.008 g
A9 21.77 ± 0.24 cde 1.082 ± 0.007 a–g
Superior 21.92 ± 0.69 cde 1.078 ± 0.005 c–g
N69-2 21.67 ± 2.50 cde 1.083 ± 0.008 a–g
V63 21.64 ± 0.36 cde 1.082 ± 0.008 a–g
A27 21.60 ± 0.74 de 1.080 ± 0.009 b–g
A186-23 20.33 ± 0.51 ef 1.074 ± 0.006 efg
A12-5 20.20 ± 0.93 ef 1.071 ± 0.005 g
A35-6 18.37 ± 1.08 g 1.079 ± 0.006 b–g
Table results expressed as mean ± standard deviation. The means with different letters in each column aresignificantly different with p < 0.05 in Tukey’s test.
The observed differences in dry matter and specific gravity among potato clones may be mainlydue to genetic constitution, since all clones were grown and tested in one location with similarmanagement. Tuber dry matter content is the most important attribute that determines the quality andyield of fried and dehydrated products. Higher dry matter or total solids result in higher recovery ofthe processed products, lower oil absorption, less energy consumption, and crispier texture [8,9].
Based on Pearson correlation test (r = 0.696) performed in the study, it was observed that cloneswith high specific gravity exhibited significantly (p < 0.01) high dry matter content, which is animportant feature in the selection for processing chips. Tuber specific gravity is often used in theprocessing industry as a means for a quick estimation of total solids, as the two parameters are highlycorrelated [10,11].
3.2. Reducing Sugar
Significant (p < 0.05) variations in the reducing sugar content of the potato clones were observedunder different temperature storage regimes. Overall, the reducing sugar content across the threetemperature storage conditions ranged from 2.24 to 40.84 mg·g−1 dry weight (DW) (Table 2).
176

Foods 2019, 8, 98
Table 2. Tuber reducing sugar contents in different cold storage conditions.
Reducing Sugar (mg·g−1 dry weight (DW))
Clones At Harvest (22 ◦C) Cold Storage (4 ◦C) Cold Storage (10 ◦C)
V50 2.43 ± 0.07 a 7.02 ± 0.10 c 2.64 ± 0.01 ab
V93 2.69 ± 0.04 ab 3.43 ± 0.04 b 2.83 ± 0.04 abc
Dubaek 2.77 ± 0.03 ab 2.56 ± 0.17 a 2.24 ± 0.02 a
V48 2.79 ± 0.06 abc 2.61 ± 0.03 a 2.98 ± 0.01 bc
Superior 3.37 ± 0.03 cd 7.01 ± 0.15 c 6.75 ± 0.07 gh
N109-35 2.63 ± 0.01 ab 17.36 ± 0.26 j 3.33 ± 0.10 c
N2-6 5.58 ± 0.26 f 10.27 ± 0.23 e 8.70 ± 0.23 k
A9 4.66 ± 0.10 e 12.73 ± 0.30 g 3.37 ± 0.14 c
A165-4 9.86 ± 0.02 i 9.96 ± 0.20 e 7.24 ± 0.46 hij
V17 3.13 ± 0.02 bcd 8.99 ± 0.24d 2.52 ± 0.10 ab
A12-5 5.15 ± 0.06 ef 37.92 ± 0.12 o 4.97 ± 0.03 d
V63 2.36 ± 0.04 a 11.19 ± 0.04 f 2.81 ± 0.08 abc
N357 2.42 ± 0.05 a 6.94 ± 0.07 c 2.32 ± 0.27 a
V18 2.85 ± 0.10 abc 21.96 ± 0.04 m 6.93 ± 0.09 ghi
N69-2 7.05 ± 0.10 g 28.49 ± 0.31 n 6.46 ± 0.09 fg
N96-29 8.58 ± 0.27 h 16.42 ± 0.10 i 13.93 ± 0.23 m
A35-6 6.65 ± 0.00 g 12.41 ± 0.08 g 6.07 ± 0.04 ef
Gogu 3.71 ± 0.10 d 18.71 ± 0.08 k 9.68 ± 0.12 l
N189 2.65 ± 0.44 ab 15.40 ± 0.24 h 4.61 ± 0.01 d
A186-23 12.82 ± 0.28 k 28.75 ± 0.34 n 19.18 ± 0.04 n
A188-10 11.36 ± 0.00 j 37.87 ± 0.00 o 7.47 ± 0.10 ij
V16 2.82 ± 0.02 abc 40.84 ± 0.47 p 5.78 ± 0.2 7e
A27 5.70 ± 0.03 f 21.11 ± 0.06 l 7.62 ± 0.22 j
Mean 4.96 ± 0.09 16.52 ± 0.16 6.11 ± 0.11
Table results expressed as mean ± standard deviation. The means with different letters in each column aresignificantly different with p < 0.05 in Tukey’s test. The Bold is used to contrast the average mean againstindividual values
For the tubers analyzed at harvest, three clones (V63, N357, V50) exhibited significantly lowerlevels of total reducing sugars compared to the main control variety ‘Dubaek’, while another set ofgenotypes (N109-35, N189, V93, V48, V16, V18) showed just as great processing aptitude potential atharvest, with similar sugar levels as the control.
At 4 ◦C cold storage, the clones (V93 & V48) exhibited the desired low reducing sugar levelsalongside the control variety ‘Dubaek’. Such cultivars with cold chipping properties are of greatimportance to the chip processing industry as they can provide high-quality material for processing allyear round and thus increase industry efficiency.
At 10 ◦C cold storage, the overall mean reducing sugars of the genotypes were considerably low(Table 2), and many clones (N357, V17, V50, V63, V93, V48, A9) showed great aptitude for processingin terms of the desired total reducing sugar levels. This could be attributed to the fact that, in general,potato tubers for chip processing are stored at temperatures of about 8 to 12 ◦C in order to avoid anincrease in sugar content [12].
At harvest, the potato clones’ mean levels of reducing sugars (Table 2) were lower than thoseof their counterparts cold-stored at 4◦ and 10 ◦C. This has also been noted by Hayes and Thill [13]and Meena et al. [14] who observed that ‘tubers have low levels of reducing sugars and producelight-colored chips directly after harvest’. The high levels of sugars in 4 ◦C stored tubers occurredas a result of low-temperature sweetening (LTS). During LTS, potato tubers accumulate sucrose andreducing sugars (glucose and fructose). This accumulation of sugars at low temperature causes areduction in starch content and ultimately affects the quality of the fried products [15].
Among other parameters, the reducing sugar level is considered one of the most limitingfactors in cold chip processing. The sugars in tubers react with proteins and free amino acids in
177

Foods 2019, 8, 98
the cytoplasm during the frying process, producing dark pigments with a bitter taste that devaluethe final product [16]. Therefore, the importance of using material with low sugar contents is furtheremphasized by our study results.
3.3. Reconditioning Effect on Potato Clones
After cold storage at 4 ◦C, the potato clones were put at ambient temperature of 22 ◦C for 21 daysin order to evaluate their reconditioning ability. During reconditioning, accumulated sugars areeliminated in the increased storage temperature. The decrease in sugar levels results from respirationas well as reconversion of sugars to starch [17].
From the results (Table 3), it was seen that two genotypes (V50, V93) that had performed relativelypoorly in 4 ◦C cold storage were able to recondition well enough alongside the main control variety.Another set of genotypes (V48, N109-35, N2-6, A9) also showed high reconditioning ability, with theclone V48 showing the lowest and safest reconditioning ratio (Table 3) among the top performers.A genotype with safe reconditioning ratio would be desirable for the chip processing industry asit exhibits consistent reducing sugar levels both in cold storage and in reconditioned states. Thereconditioning ratios were calculated and expressed as a percentage of reconditioned tubers againstnon-reconditioned ones.
Recondition Ratio (%) = 100 − (Reconditioned state/cold-storage state × 100)
Table 3. Reducing sugar levels after cold storage and after reconditioning.
Reducing Sugar (mg·g−1 DW)
Clones Cold Storage (4 ◦C) Reconditioned (22 ◦C) Recondition Ratio (%)
V50 7.02 ± 0.10 c 1.73 ± 0.06 a 75.4V93 3.43 ± 0.04 b 1.85 ± 0.03 a 46.1
Dubaek 2.56 ± 0.17 a 1.92 ± 0.08 a 25.0V48 2.61 ± 0.03 a 2.18 ± 0.01 ab 16.7
Superior 7.01 ± 0.15 c 2.23 ± 0.13 ab 68.2N109-35 17.36 ± 0.26 j 2.42 ± 0.00 abc 86.1
N2-6 10.27 ± 0.23 e 2.43 ± 0.15 abc 76.3A9 12.73 ± 0.30 g 2.72 ± 0.03 abc 78.6
A165-4 9.96 ± 0.20 e 3.34 ± 0.01 abc 66.4V17 8.99 ± 0.24 d 3.58 ± 0.08 abc 60.2
A12-5 37.92 ± 0.12 o 3.94 ± 0.04 bc 89.6V63 11.19 ± 0.04 f 4.22 ± 0.01 cd 62.3
N357 6.94 ± 0.07 c 6.05 ± 0.09 de 12.8V18 21.96 ± 0.04 m 6.60 ± 0.11 e 69.9
N69-2 28.49 ± 0.31 n 6.96 ± 0.06 e 75.6N96-29 16.42 ± 0.10 i 7.27 ± 0.06 e 55.8A35-6 12.41 ± 0.08 g 7.38 ± 0.24 e 40.5Gogu 18.71 ± 0.08 k 13.99 ± 0.16 f 25.2N189 15.40 ± 0.24 h 15.05 ± 0.24 f 2.2
A186-23 28.75 ± 0.34 n 17.01 ± 2.11 g 40.8A188-10 37.87 ± 0.00 o 18.45 ± 0.13 g 51.3
V16 40.84 ± 0.47 p 20.53 ± 0.23 h 49.7A27 21.11 ± 0.06 l 21.97 ± 0.74 h −4.0
Table results expressed as mean ± standard deviation. The means with different letters in each column aresignificantly different with p < 0.05 in Tukey’s test.
On the basis of the reconditioning trends, we observed that not all potato cultivars reconditionedpositively, and although some clones (A165-4, V17, A12-5) showed a great come-back ability, theirreducing sugar levels were still not within the acceptable range. This is a confirmation that the degreeto which quality can be restored with reconditioning varies with cultivar [18].
178

Foods 2019, 8, 98
3.4. Chip Frying Test
A major indicator of chip quality after frying is the resultant chip color. This attribute can beadequately measured on the SFA color scale (Figure 1), with the lighter color (score 1.0) being highlydesirable, and the darker color (score 5.0) considered as unacceptable. The SFA chip color scores of thefried potato clones stored at different temperature conditions were evaluated and recorded (Table 4).
Figure 1. Snack Food Association (SFA) chip color measurement standard.
For tubers fried after 4 ◦C cold storage, four clones (A9, V93, V48, A165-4) exhibited acceptablelight chip color alongside the control ‘Dubaek’. Among these, only two clones (V93, V48) showedconsistency in chip color and their corresponding reducing sugar content (Table 2, Figure 2).
Figure 2. Fry chip color of samples prepared from clones cold-stored at 4 ◦C: V50, V93, Dubeak, V48,Superior, N109-35, N2-6, A9, A165-4 and V17 from left to right respectively.
179

Foods 2019, 8, 98
Table 4. Potato chip color scores after frying tests in relation to different storage conditions.
Snack Food Association (SFA) Chip Color measurement z
Clones Cold Storage (4 ◦C) Cold Storage (10 ◦C) Reconditioned (22 ◦C)
A9 2.0 2.5 2.5A188-10 4.5 4.0 4.0
V16 3.0 3.5 4.0A12-5 4.0 3.5 3.0V17 3.0 2.5 2.5V93 1.0 2.0 1.5
N357 3.0 1.5 2.5V48 2.5 1.5 1.5
Superior 2.5 2.5 1.5Dubaek 1.5 1.5 1.0
V63 3.0 3.0 3.0V18 3.5 3.5 3.5
A165-4 2.5 4.5 2.0V50 3.0 1.5 1.5N2-6 3.0 2.5 2.0N189 3.5 3.0 3.5N69-2 3.0 3.0 3.0N96-29 4.0 3.5 3.5
A27 3.5 3.5 4.5Gogu 4.5 4.5 4.5
N109-35 3.0 1.5 3.5A35-6 3.0 3.0 3.0
A186-23 4.5 5.0 4.5Z SFA scores measured on a scale of 1–5, with 1 = light color, and 5 = dark color.
The study observed that reconditioning tubers at 22 ◦C for 21 days had a positive effect on manyclones (A9, V93, N357, V48, A165-4, V50, N2-6, N69-2) alongside the experimental controls Dubaekand Superior. Among these, five clones (A9, V93, V48, V50, N2-6) were graded as acceptable on thebasis of the corresponding light chip color and low reducing sugar levels (Table 2, Figure 3).
Figure 3. Fry chip color of clone samples reconditioned at 22 ◦C: V50, V93, Dubeak, V48, Superior,N109-35, N2-6, A9, A165-4 and V17, from left to right.
3.5. Glycoalkaloids
The isolation of glycoalkaloids from tubers is based on the fact that the major alkaloids aresoluble in slightly acidified water [19]. The glycoalkaloid ( -solanine) contents in tubers showed widevariation among the potato genotypes, ranging from 0.15 to 15.54 mg·100 g−1 fresh weight (FW). In thestudy, one cultivar (V50) exhibited undetectable levels of -solanine alongside the control variety, andalthough only one of the major glycoalkaloids ( -solanine) was quantified, the levels were generallyconsidered acceptable with regards to potato chip processing, on the basis that the total glycoalkaloidcontent considered safe for consumption should not exceed 20 mg·100 g−1 FW [20]. The variationsobserved in solanine contents (Figure 4) could be attributed to genetically inherited differences of thepotato clones and, on a broader perspective, to environmental factors during growth and storage.
180

Foods 2019, 8, 98
Figure 4. Solanine content in potato clones. Significant mean differences shown with p < 0.05 inTukey’s test.
While thermal processing of tubers such as boiling potatoes in water and frying partly eliminateglycoalkaloids, processes such as baking, rinsing, cooking, slicing, and pulsed electric field have nosignificant effect on glycoalkaloid reduction [21]. Therefore, it is of utmost importance in processingchains that glycoalkaloid levels be kept low, especially when introducing new cultivars in the market.
4. Conclusions
The reconditioning of potato clones at 22 ◦C for up to 21 days was seen to be effective for eightpotato clones. We observed that for quality processing of potato chips, clones that possess combinedtraits of high dry matter, low levels of reducing sugars, and low levels of glycoalkaloids with acceptablelight chip color should be used as raw materials. On the basis of these parameters, we identified threeclones (V93, V48, A9) that exhibited an outstanding chip processing aptitude both in cold storage andin reconditioned states. These clones were finally selected for recommendation to the chip processingindustry in Korea and beyond.
Author Contributions: B.O.W.: designed the experiments, performed analysis and interpretation of data, andauthored the manuscript. H.S.C.: support in experimental design, supervised the study, and edited the manuscript.L.Y.S.: proofreading, supervision of the study, and revision of the manuscript.
Funding: This study was funded by a 2015 research grant from Kangwon National University (Fund #: 520150312)in collaboration with the Korea Potato Breeding Resource Bank (KPBRB), Kangwon National University.
Conflicts of Interest: The authors declare no conflict of interest.
References
1. Nacheva, E.; Pevicharova, G. Potato breeding lines for processing. Genet. Breed. 2008, 37, 3–4.2. John Wiley and Sons, Inc. Handbook of Fruit and Vegetable Flavors; Hui, Y.H., Ed.; Lebensmittelchemie:
Garching, Germany, 2010; Volume 64, pp. 171–172.3. Blenkinsop, R.; Copp, L.; Yada, R.; Marangoni, A. Changes in Compositional Parameters of Tubers of Potato
(Solanum tuberosum) during Low-Temperature Storage and Their Relationship to Chip Processing Quality.J. Agric. Food Chem. 2002, 50, 4545–4553. [CrossRef] [PubMed]
4. Habib, A.T.; Brown, H.D. Role of reducing sugars and amino acids in the browning of potato chips.Food Technol. 1957, 11, 85–89.
5. Marquez, G.; Añon, M.C. Influence of reducing sugars and amino acids in the color development of friedpotatoes. J. Food Sci. 1986, 51, 157–160. [CrossRef]
6. Miller, G. Use of dinitrisalicylic acid reagent for determination of reducing sugar. Anal. Chem. 1959, 31,426–428. [CrossRef]
181

Foods 2019, 8, 98
7. Hellenas, K.E.; Branzell, C.; Johnsson, H.; Slanina, P. High levels of glycoalkaloids in the established Swedishpotato variety Magnum Bonum. J. Sci. Food Agric. 1995, 68, 249–255. [CrossRef]
8. Marwaha, R.S.; Pandey, S.K.; Singh, S.V.; Khurana, S.M.P. Processing and nutritional qualities of Indian andexotic potato cultivars as influenced by harvest date, tuber curing, pre-storage holding period, storage andreconditioning under short days. Adv. Hortic. Sci. 2005, 19, 130–140.
9. Marwaha, R.S.; Kumar, D.; Singh, S.V.; Pandey, S.K. Nutritional and qualitative changes in potatoes duringstorage and processing. Process. Food Ind. 2008, 11, 22–30.
10. Grewal, S.S.; Uppal, D.S. Effect of dry matter and specific gravity on yield, color and oil content of potatochips. Indian Food Pack. 1989, 43, 17–20.
11. Killick, R.; Simmonds, N. Specific gravity of potato tubers as a character showing smallgenotype-environment interactions. Heredity 1974, 32, 109–112. [CrossRef]
12. Matsuura-Endo, C.; Ohara-Takada, A.; Chuda, Y.; Ono, H.; Yada, H.; Yoshida, M.; Kobayashi, A.; Tsuda, S.;Takigawa, S.; Noda, T.; et al. Effects of Storage Temperature on the Contents of Sugars and Free AminoAcids in Tubers from Different Potato Cultivars and Acrylamide in Chips. Biosci. Biotechnol. Biochem. 2006,70, 1173–1180. [CrossRef] [PubMed]
13. Hayes, R.; Thill, C. Selection for Potato Genotypes from Diverse Progenies that Combine 4 ◦C Chipping withAcceptable Yields, Specific Gravity, and Tuber Appearance. Crop Sci. 2002, 42, 1343–1349. [CrossRef]
14. Meena, R.; Manivel, P.; Bharadwaj, V.; Gopal, J. Screening potato wild species for low accumulation ofreducing sugars during cold storage. Electron. J. Plant Breed. 2009, 56, 89–92.
15. Satish Datir, S. Researcharchive.lincoln.ac.nz. Available online: http://researcharchive.lincoln.ac.nz/bitstream/handle/10182/4266/datir_phd.pdf?sequence=5&isAllowed=y (accessed on 24 November 2017).
16. Araújo, T.; Pádua, J.; Spoto, M.; Ortiz, V.; Margossian, P.; Dias, C.; Melo, P. Productivity and quality of potatocultivars for processing as shoestrings and chips. Hortic. Bras. 2016, 34, 554–560. [CrossRef]
17. Iritani, W.; Weller, L. Factors influencing reconditioning of Russet Burbank potatoes. Am. Potato J. 1978, 55,425–430. [CrossRef]
18. Kumar, D.; Singh, B.; Kumar, P. An overview of the factors affecting sugar content of potatoes. Ann. Appl.Biol. 2004, 145, 247–256. [CrossRef]
19. Rodriguez-Saona, L.; Wrolstad, R.; Pereira, C. Glycoalkaloid Content and Anthocyanin Stability to AlkalineTreatment of Red-Fleshed Potato Extracts. J. Food Sci. 1999, 64, 445–450. [CrossRef]
20. Sarquís, J.; Coria, N.; Aguilar, I.; Rivera, A. Glycoalkaloid Content in Solanum species and hybrids from abreeding program for resistance to late blight (Phytophthora infestans). Am. J. Potato Res. 2000, 77, 295–302.[CrossRef]
21. Zarins, R.; Kruma, Z. Glycoalkaloids in Potatoes: A Review. Available online: http://llufb.llu.lv/conference/foodbalt/2017/Zarins_Kruma_FoodBalt2017.pdf (accessed on 1 February 2018).
© 2019 by the authors. Licensee MDPI, Basel, Switzerland. This article is an open accessarticle distributed under the terms and conditions of the Creative Commons Attribution(CC BY) license (http://creativecommons.org/licenses/by/4.0/).
182

MDPISt. Alban-Anlage 66
4052 BaselSwitzerland
Tel. +41 61 683 77 34Fax +41 61 302 89 18
www.mdpi.com
Foods Editorial OfficeE-mail: [email protected]
www.mdpi.com/journal/foods


MDPI St. Alban-Anlage 66 4052 Basel Switzerland
Tel: +41 61 683 77 34 Fax: +41 61 302 89 18
www.mdpi.com ISBN 978-3-03928-087-2