Safe storage of CO 2 in a depleted gas field -the CO2CRC Otway Project
37
1 Safe storage of CO 2 in a depleted gas field - the CO2CRC Otway Project C.R. Jenkins 1,* , P.J. Cook 2 , J. Ennis-King 3 , J. Undershultz 4 , C. Boreham 5 , T. Dance 4 , P. de Caritat 5 , D.M. Etheridge 6 , B.M. Freifeld 7 , A. Hortle 4 , D. Kirste 8 , L. Paterson 3 , R. Pevzner 9 , U. Schacht 10 , S. Sharma 11 , L. Stalker 4 , M. Urosevic 9 One-sentence summary: The Otway Project has demonstrated that CO 2 storage in depleted gas fields can be safe and effective. Author affiliations: 1. CO2CRC, CSIRO Earth Science and Resource Engineering, Pye Laboratory, Black Mountain, Canberra, Australia. 2. CO2CRC, NFF House, 14-16 Brisbane Avenue, Canberra, Australia. 3. CO2CRC, CSIRO Earth Science and Resource Engineering, Ian Wark Laboratory, Bayview Ave, Clayton, Victoria, Australia 4. CO2CRC, CSIRO Earth Science and Resource Engineering, 26 Dick Perry Avenue, Technology Park, Kensington, Perth, Australia 5. Geoscience Australia, GPO Box 378, Canberra ACT 2601, Australia 6. CO2CRC. CSIRO Marine and Atmospheric Research, Aspendale, Victoria, Australia 7. CO2CRC, Lawrence Berkeley National Laboratory, MS 90-1116, One Cyclotron Road, Berkeley CA, 94720, USA. 8. CO2CRC, Earth Sciences, Simon Fraser University, Burnaby, BC, Canada. 9. CO2CRC, Department of Exploration Geophysics, Curtin University, GPO Box U1987, Perth, Australia. 10. CO2CRC, Australian School of Petroleum, University of Adelaide, Adelaide, Australia 11. CO2CRC, Schlumberger Carbon Services, Perth, Australia * To whom correspondence should be addressed: [email protected]
-
Upload
independent -
Category
Documents
-
view
1 -
download
0
Transcript of Safe storage of CO 2 in a depleted gas field -the CO2CRC Otway Project

1
Safe storage of CO 2 in a depleted gas field - the CO2CRC Otway Project C.R. Jenkins1,*, P.J. Cook2, J. Ennis-King3, J. Undershultz4, C. Boreham5, T. Dance4, P. de Caritat5, D.M. Etheridge6, B.M. Freifeld7, A. Hortle4, D. Kirste8, L. Paterson3, R. Pevzner9, U. Schacht10, S. Sharma11, L. Stalker4, M. Urosevic9 One-sentence summary: The Otway Project has demonstrated that CO2 storage in depleted gas fields can be safe and effective. Author affiliations:
1. CO2CRC, CSIRO Earth Science and Resource Engineering, Pye Laboratory, Black Mountain, Canberra, Australia.
2. CO2CRC, NFF House, 14-16 Brisbane Avenue, Canberra, Australia. 3. CO2CRC, CSIRO Earth Science and Resource Engineering, Ian Wark
Laboratory, Bayview Ave, Clayton, Victoria, Australia 4. CO2CRC, CSIRO Earth Science and Resource Engineering, 26 Dick Perry
Avenue, Technology Park, Kensington, Perth, Australia 5. Geoscience Australia, GPO Box 378, Canberra ACT 2601, Australia 6. CO2CRC. CSIRO Marine and Atmospheric Research, Aspendale,
Victoria, Australia 7. CO2CRC, Lawrence Berkeley National Laboratory, MS 90-1116, One
Cyclotron Road, Berkeley CA, 94720, USA. 8. CO2CRC, Earth Sciences, Simon Fraser University, Burnaby, BC,
Canada. 9. CO2CRC, Department of Exploration Geophysics, Curtin University,
GPO Box U1987, Perth, Australia. 10. CO2CRC, Australian School of Petroleum, University of Adelaide,
Adelaide, Australia 11. CO2CRC, Schlumberger Carbon Services, Perth, Australia
* To whom correspondence should be addressed: [email protected]
2
Abstract Carbon capture and storage (CCS) is vital to reduce CO2 emissions to the atmosphere, potentially providing 20% of the needed reductions in global emissions. Research and demonstration projects are important to increase scientific understanding of CCS, and making processes and results widely available helps to reduce public concerns which may otherwise block this technology. The Otway Project provides verification of the underlying science of CO2 storage in a depleted gas field, and shows that the support of all stakeholders can be earned and retained. The monitoring and verification program has resulted in a direct measurement of storage efficiency, confirming that CO2 storage in depleted gas fields can be safe and effective, and that these structures could store globally significant amounts of CO2.
Introduction Increasing atmospheric CO2, and the resulting climate risk, is a critical issue. Fossil fuels will continue to be burned for decades (1), so capture and geological storage are vital to reduce the current ~ 30 Gt yr-1 of CO2 emitted to atmosphere (2,3). Many aspects of CCS are well understood in chemical engineering and the oil and gas industries. Globally, there appears to be sufficient storage volume for decades to come (2), with depleted oil and gas reservoirs being obvious early targets for CCS projects. CO2 has been injected into oil reservoirs for decades to enhance recovery (4). Large US operations of this type, at Weyburn (5), Cranfield (6), and Rangely (7), are monitored as CCS case studies. The Sleipner (8), Snøvit (9) and In Salah (10) projects store 1-3 Mt CO2 each per year from gas processing, and the similar Gorgon project in NW Australia is under construction (11). Smaller R&D storage projects have been completed or are in progress (12-16). Subsurface storage of natural gas has a long and successful history (17). Hazardous waste, in large volumes (currently 30 Mt yr-1 in the USA) is injected into deep saline aquifers (18), and in Canada ~ 5 Mt of acid gas (CO2 and H2S) has been safely stored, in several cases into depleted gas reservoirs (19). Despite a successful record, CCS remains controversial. Technical concerns are long-term leakage, global capacity, engineering feasibility and the scale of deployment. Public opposition focuses on perceived risks from leakage. Development of some onshore sites for commercial CCS has been blocked. Pathfinding projects in the Netherlands (Shell: Barendrecht) and Germany (Vattenfell: Altmark), which aimed to use onshore depleted gas fields for storage, have foundered on political opposition at many levels. The higher costs of offshore storage, or transport to remote areas, may mean that an issue with the viability of CCS is emerging. However smaller demonstration projects in Germany (EU-funded: Ketzin, 15) and France (Total: Lacq 20), the latter in a depleted gas field, are progressing. Depleted gas fields are an important target for R&D because they could store many years’ of emissions from the some of world’s largest point sources (2, 21-23). Depleted gas fields thus may represent a globally significant storage resource, but there have been few direct measurements to date to support this conclusion.

3
In this environment, non-commercial storage demonstration projects are important in building public confidence, confirming and extending our scientific understanding and building technical capacity. The CO2CRC Otway Project, located in onshore SE Australia, is a mid-scale demonstration utilizing a depleted gas field for storage. Being in a populated area, a key objective was to set an example of working successfully with all stakeholders, with an open approach to communication at all levels and extensive monitoring to provide the fullest assurance that risks are low, well understood and manageable. The monitoring is also used to test models and develop robust measurement procedures. 65,445 tonnes have now been stored at Otway, with no safety issues arising and monitoring results showing that there is sound understanding of the storage process. Good relationships have been built and maintained with all stakeholders. Direct measurements of storage capacity have provided an early confirmation of important estimates of large global capacity in depleted gas fields.
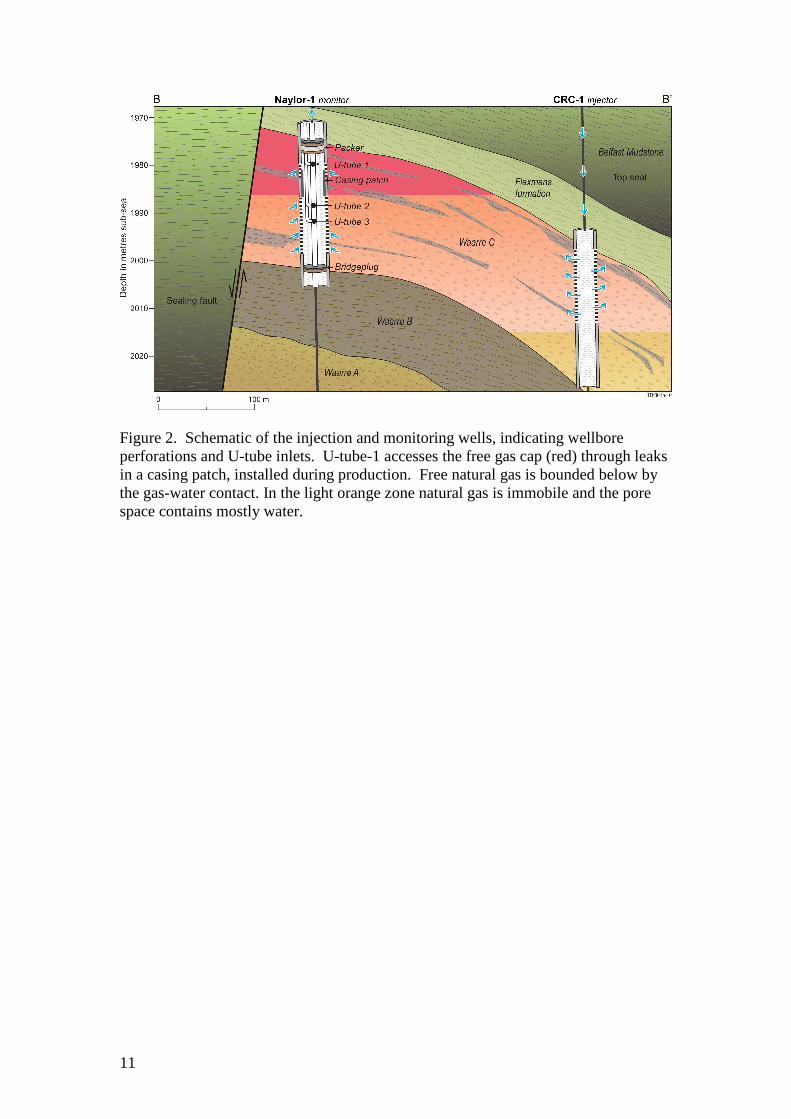
The Project Site The CO2CRC (24) began searching in 2004 for a CO2 source close to geological storage. A site was located in a mature hydrocarbon province, the Otway Basin of Victoria (25, Figure 1a). Two adjacent petroleum tenements were purchased. One contained the Buttress well, source of the CO2-rich gas for injection (26). The other contained the production well Naylor-1, located near the crest of the depleted reservoir structure and suitable for conversion for monitoring. A new well, CRC-1 was planned for injection. Natural gas was produced from the Naylor field in 2002-2003, and these operations provided useful data. The gas reservoir (Late Cretaceous Waarre-C Formation) is fault-bounded on three sides against the 300 m thick Belfast Mudstone, forming a structural trap (Figure 1b). The reservoir sandstone is 25 to 30 m thick and contains post-production immobile gas with free gas at the crest of the structure. Overlying the reservoir is the low-permeability Flaxmans Formation and the Belfast Mudstone (Figure 2). Bounding faults terminate within the Belfast, preventing fluid migration into overlying aquifers. Naylor-1 presents the only long-term risk of wellbore leakage. Although the Waarre is heterogeneous, much has excellent reservoir quality, with 20% porosity and multi-Darcy permeability. Estimated capacity, 150 kt of CO2, comfortably exceeds project targets. The structural trapping would ensure that the stored CO2 plume would be confined within a 0.5 km2 footprint. The site thus had excellent capacity, injectivity, and containment. The dip of the reservoir structure suggested a design with gas from Buttress (referred to as “injected CO2”, 26) being injected at CRC-1 and migrating up-dip by buoyancy to the Naylor-1 monitoring well (Figure 2). It was vital to site CRC-1 so migration to Naylor-1 would happen within the project lifetime. Initial geological models were created from available well and seismic data (27). These incorporated estimates of porosity, permeability, pressure, and geometry including faults, sedimentary layers, and facies distribution. Preliminary dynamic models were then created and calibrated against the Naylor-1 production history (28). Migration times were estimated to be 4-

4
8 months. No problems were expected from pressure build-up in the reservoir, and the planned injection volumes were too small to exceed the reservoir’s spill point. Based on initial modeling, CRC-1 was drilled 308 m down-dip from Naylor-1, with injection at a depth of 2003–2014 m (sub-sea-level) into the Waarre-C. At this depth the density of the injected CO2 is about 500 kg m-3. Geological uncertainties were later reduced significantly with data obtained during the drilling of CRC-1 (29), and the dynamic model was refined. This initial phase of the project followed well-established methods in the oil and gas industry. Injection of the Buttress-1 gas into the Waarre-C commenced on 18 March 2008 and 65,445 tonnes were stored between March 2008 and August 2009, when injection ceased.
Risk Assessment Leakage rates of less than 0.1% yr-1 to the atmosphere are needed to ensure effective climate abatement (30, 31) by CCS. The IPCC assessed 0.001 % yr-1 as “likely” (2) for well-designed storage; this was the benchmark for the risk assessment. An expert panel considered both the engineered and natural systems (32). Probabilities were assigned to a range of scenarios and the associated leakage rates or volumes were estimated. Scenarios were combined by Monte Carlo simulation. The combined leakage rate from all risks was estimated to be below 0.001% yr-1. The risk assessment was repeated using data from the drilling of CRC-1, with little change (26).
Regulation and Community At the start of the project no regulations existed in Australia for storage of CO2 and it was necessary to work with regulators using existing petroleum, water, environmental and planning legislation to assemble an appropriate regulatory regime. A crucial approval was obtained under the research provisions of EPA Victoria, the state environmental protection agency. Key performance indicators were agreed with EPA, based on comprehensive monitoring. The process of permitting the Otway Project was an example that had an important influence on the development of CCS legislation in Australia (33). Securing and maintaining the consent of the community was vital. The CO2CRC developed a communications strategy, based on market research of the area, and was proactive in engaging with communities and decision-makers, both face to face and also through leafleting, media releases, and a comprehensive web site (34). Key principles were a willingness to listen to the public, to be open about all aspects of the project, and to ensure “no surprises” – any news about the project was communicated first by the CO2CRC directly to those affected. This outreach effort was aided by familiarity in the area with oil and gas operations. Evaluation shows a generally positive attitude has persisted in the local community, and wider media coverage has been generally balanced and positive over the period where the CO2CRC has been active (34).
5
Monitoring Design A wide range of monitoring was carried out in the Otway Project as part of its research objectives: a commercial project might rely on a smaller number of well-developed techniques. Measurements were necessary to confirm containment of injected CO2 in the reservoir and provide assurance that groundwater, soil and air are unaffected (35). These measurements were often technically challenging, and complicated by access to farmers’ land requiring frequent negotiation and compromise. The assurance measurements compare pre- and post-injection properties, and began well before CO2 injection commenced. Seismic measurements investigate an overlying aquifer, while groundwater, soil gas and atmospheric monitoring provide assurance at increasing distances from the reservoir. These measurements will only show changes if leakage out of the reservoir occurs. This is very unlikely and it is impractical to characterize the ~2 km of overburden and model hypothetical leak pathways through it. Interpretation of results is therefore based on conditional sensitivities: if CO2 were to enter this zone, then the following effects are predicted. Simple ingressions, usually point sources, are modeled to understand the sensitivity of the assurance measurements. Even if the sensitivity is ill-defined, an important public assurance objective is achieved if no changes are detected. Anomalies in an assurance measurement would not be decisive in isolation, but would initiate a cascade of investigations by successively more precise and expensive techniques (26). It was vital to the community to confirm that potable aquifers were unaffected by CO2. The composition and chemistry of water in deep and shallow water wells was measured twice a year (36). Samples were collected from 24 existing wells, mostly within 5 km radius of CRC-1. Vadose zone soil gas composition was also measured annually during summer (37). Typically 150 samples were collected on a 4 km × 3 km grid over the expected location of the subsurface plume, the area in which major faults terminate close to surface, and natural CO2 accumulations. Atmospheric concentrations and fluxes of CO2, isotopic composition (δ13C CO2) and tracers of injected gas (SF6, CH4) or of combustion (CO) were monitored 700m northeast of the injection well (38) and compared to the undisturbed background measured at the long-established Cape Grim site (Tasmania). CO2 atmospheric analyzers were also located nearer the injection site to monitor for larger anomalies and deep soil fluxes (39). Direct measurements of reservoir fluids at Naylor-1 are the primary confirmation of containment in this project. Naylor-1 was instrumented with a complex bottom-hole assembly (Figure 2, 35), including U-tube fluid sampling apparatus (40) that recovered pressurized reservoir fluids. Three sampling points in the wellbore straddle the pre-injection gas-water contact, marking the boundary between residual and free CH4. Shortly after injection commenced at CRC-1, tracers (deuterated methane CD4, Kr and SF6) were added to ensure unambiguous detection of injected CO2 at Naylor-1 (41). The small amounts of CO2 originally present in the Naylor reservoir have a distinct 13C signature, so this isotope is also a tracer. The reservoir models are tested directly through a comparison of predicted with measured molecular, isotopic, and tracer compositions (26).

6
To detect injected CO2 within the reservoir, or leakage that might occur into overlying aquifers, conventional time-lapse seismic surveying methods were used. Detection of changes in the acoustic reflectivity caused by injected CO2 at around 2 km depth requires a significant difference in reflectivity, excellent survey repeatability and a high signal-to-noise ratio (42,43). Modeling predicted that injection into the depleted Waarre-C reservoir would produce small changes, because of the significant amounts of residual CH4 (44). Land seismic generally has poor repeatability, and it was judged unlikely that any seismic effects would be detected in the Waarre-C. If injected CO2 entered overlying aquifers, reflectivity changes should however be very pronounced (43). A baseline survey was shot in January 2008, and repeats were acquired in early 2009 and 2010 after 35,000 and 65,445 tonnes of CO2 had been injected. These surveys produced data that could be combined to form time-lapse images of the Waarre-C and overlying aquifers (26).
Reservoir modeling The core and wire-line logs obtained from CRC-1 (29) showed that the Waarre-C reservoir comprised stacked sandstone bodies of varying grain sizes, with thin shale baffles and streaks deposited in near-shore, tidally-influenced channel settings. Four revised geological models were created stochastically, representing short- and long range correlations in the shale baffles. Hysteric and non-hysteretic relative permeability curves were estimated from laboratory core tests (45) to give a total of 8 models. These models are equiprobable, and capture the uncertainty in geological structure and rock properties. A set of dynamical fluid-flow models for the reservoir was then computed (26). Comparison with these models is the metric for evaluating predicted storage performance. The relevant data are the seismic response and details of arrival of injected CO2 and tracer at Naylor-1. The models predict that the injected CO2 will remain above the pre-production gas-water contact, which is presumed to be the spill point for the reservoir. Thus assurance measurements are not expected to show injected CO2. Figure 3 shows vertical cross-sections of the reservoir model. The high saturation region is the remaining gas cap, with the injected CO2 accumulating below. The injected gas is cooler than the reservoir as it leaves CRC-1, causing a region of localized cooling. Tracers are most concentrated beneath the gas cap.
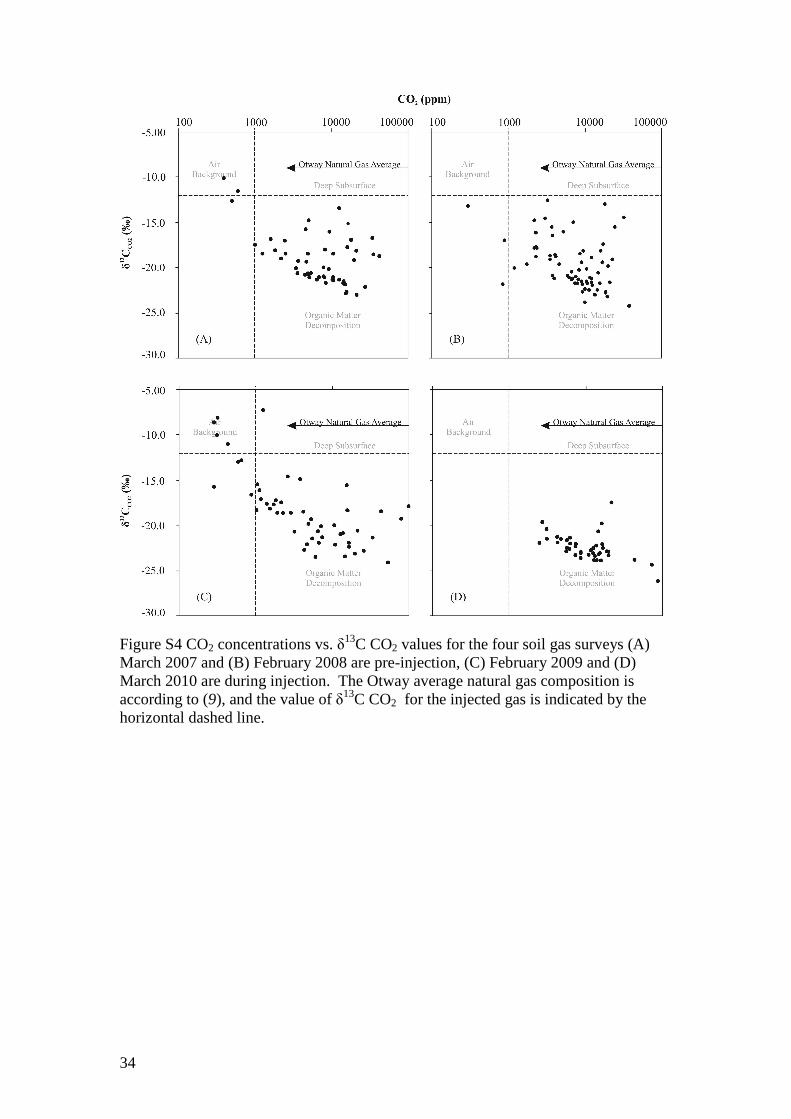
Monitoring results Aggregated groundwater data from the widely-used shallow limestone aquifer show no statistically significant pre-to-post-injection changes in bicarbonate or electrical conductivity, with a very small increase (0.05 units, p<0.01) in median pH. This demonstrates that overall water quality is unaffected to within natural variability. Aggregated soil gas data show a consistent correlation between δ13C and CO2 concentration. Data were obtained for three summers before injection and two after, and all follow this correlation, which results from decomposition of organic matter (26, 37). Most δ13CO2 values are also lower than those of the injected CO2, so there is no indication of changes that could be attributed to injection. The groundwater and soil gas results provide assurance by showing that water and soils are practically unaffected; this was the objective of this monitoring.

7
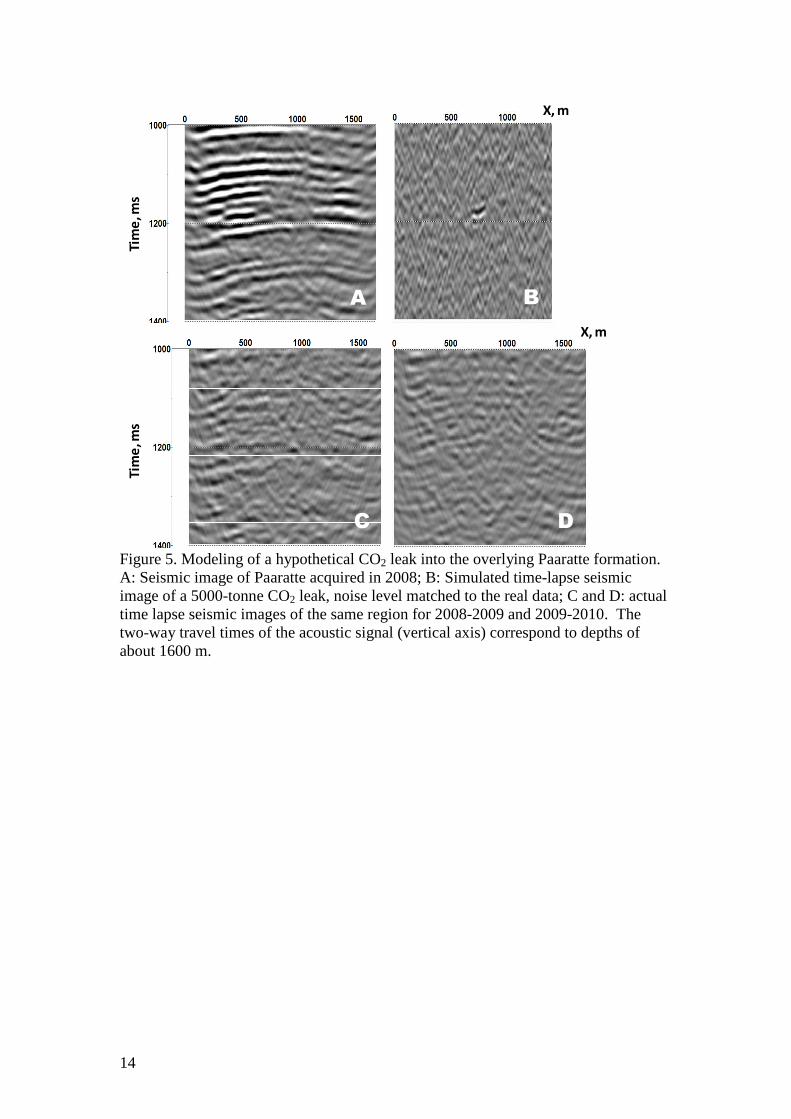
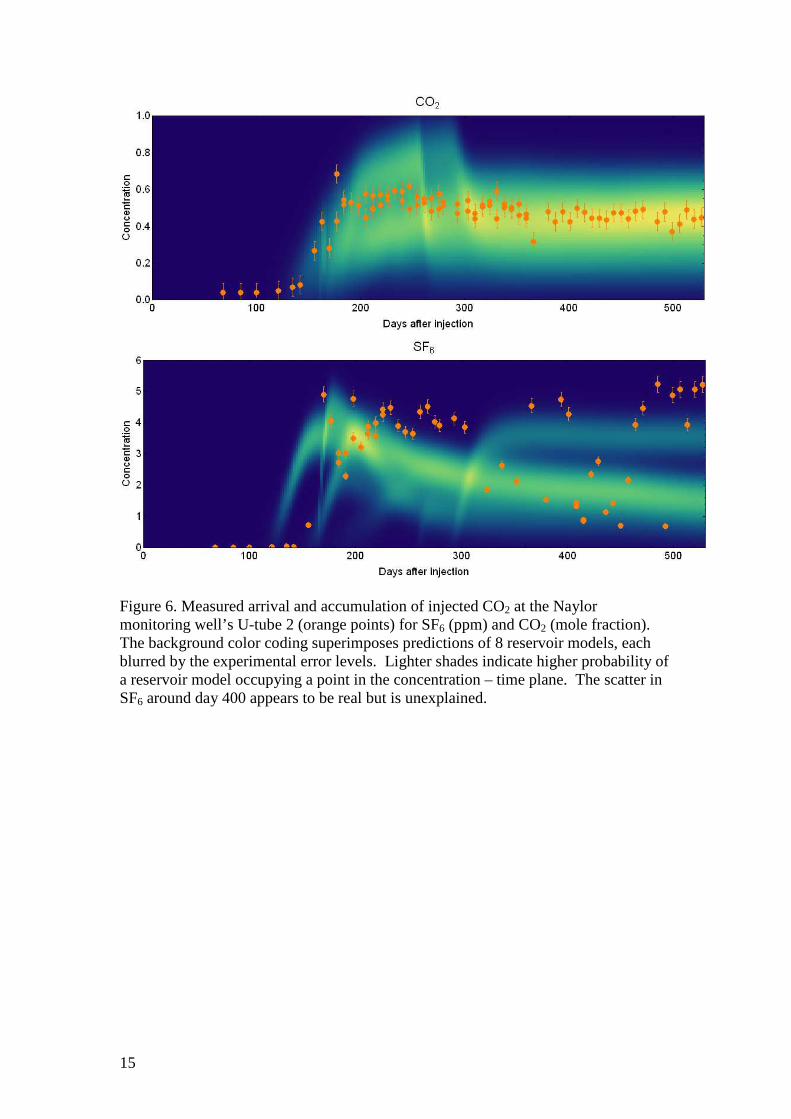
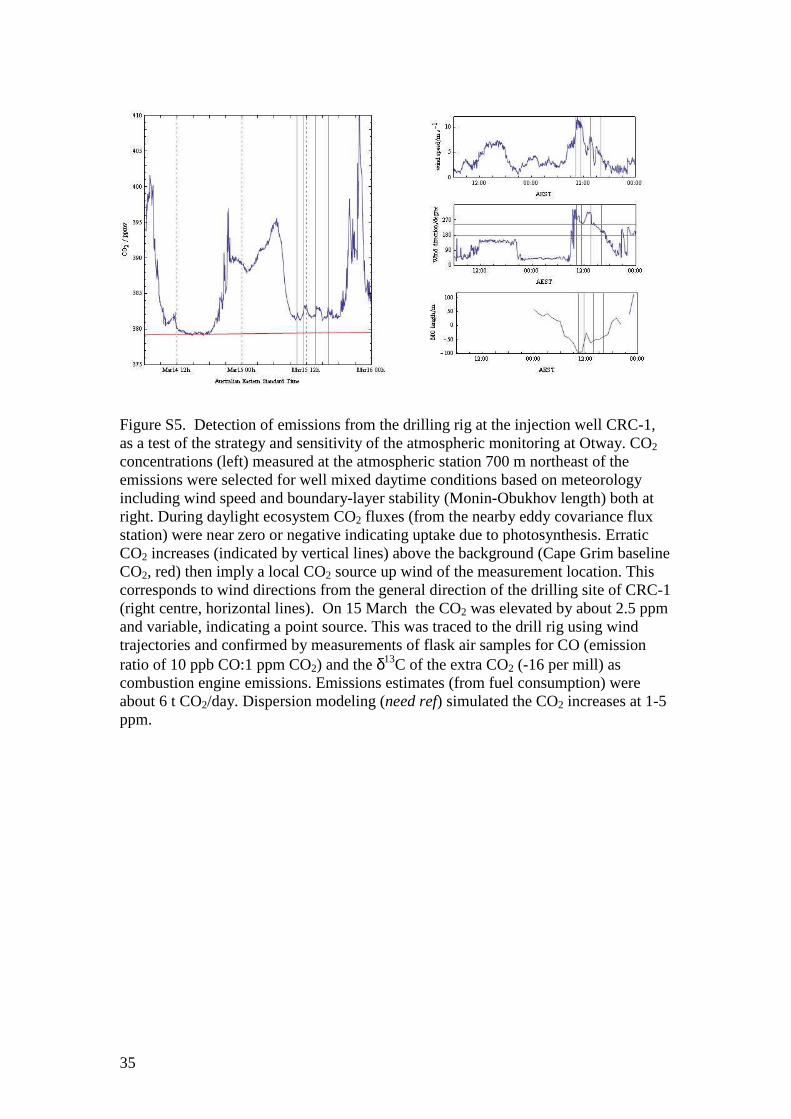
Considerably more data-gathering and modeling would be needed to bound quantitatively the amounts of CO2 that could have entered these zones of investigation and yet remain undetected. For example, modeling shows that ingress of CO2 might only affect small volumes of the aquifer and so is unlikely to reach the monitoring wells (26). More detailed interpretation of soil-gas data is difficult because of the very variable permeability of the vadose zone. Attempting to characterize the sensitivity of soil-gas and groundwater monitoring may not be cost-effective. The atmospheric concentrations and fluxes of CO2 show large diurnal and seasonal variations, reflecting the effects of plant respiration, photosynthesis and atmospheric dispersion. Much of this variability can be modeled (26, 46). By day, in windy conditions, the CO2 concentrations often settle at a steady baseline. In these favorable conditions small emissions of CO2 (equivalent to about 2 kt yr-1) from surface activities near the wells were identified, confirmed by tracers and quantified with dispersion modeling (Figure 4). Other nearby industrial sources have also been detected. These measurements confirm useful sensitivity to spatially small emitters. Injected gas at reservoir level was detected in the 2008-2009 seismic survey (43) but not confirmed in 2010. Modeling predicts that changes would be below the noise level on the time-lapse seismic images (26). From an assurance perspective, simulations for the immediately overlying Paaratte aquifer show that 5 kt of injected CO2 in a small accumulation would have been detectable (43) but no changes were observed (Figure 5). No anomalies that would indicate injected CO2 have been detected by any of these assurance-monitoring techniques. The sensitivity of some assurance techniques to leakage has been estimated, conditional upon there being a leakage route to aquifer or atmosphere, where effects of CO2 become apparent. For the seismic and atmospheric monitoring, such conditional sensitivities to CO2 of a few kt, or kt yr -1, have been demonstrated for point sources. Such sources might result from a small fault acting as a conduit into an aquifer, or an unmapped wellbore transferring CO2 to the surface. Turning to containment, at reservoir level, injected CO2 (dissolved in the water phase) arrived 121 days after injection at the Naylor U-tube-2 sampling port (26, 28, 47, Figure 6). This is located just below the gas-water contact. By 177 days concentrations had peaked and the arriving CO2 was mostly in the free gaseous phase, the gas-water contact having been displaced downwards by the injected CO2. Tracers arrived with the CO2 and their concentrations followed a similar pattern. The breakthrough curves agree with predictions, although the CO2 arrived about 50 days before than the mid-range of predictions. This difference is not significant compared to the spread in the predictions resulting from uncertainties in geology and relative permeabilities. Results from U-tube-3 (located 5 m deeper) are similar to U-tube-2, showing a slower and more irregular progression to arrival of free CO2 This arrival is again slightly early but not significantly so. The timing discerepancies, multiplied by the injection rate, correspond to uncertainty of only 5-10 kt in the implied amount of injected CO2 that is needed to fit models to data. This and the steady CO2 concentrations at later times are consistent with containment in the reservoir. Water samples from U-tube-2 and U-tube-3 were collected from pre-injection to self-lift. The pH decreased sharply with increasing CO2 content and changes in the water
8
composition are consistent with minor dissolution of carbonate and silicate minerals. However, the dominant process affecting the water composition was determined to be mixing within the reservoir and well bore. There was no evidence for significant mobilization of trace metal species. The geochemical results show that the behavior of CO2 in the subsurface is understood so that the storage model is realistic. Reservoir heterogeneity was adequately characterized and the main uncertainties are from poorly-known relative permeabilities. These could have been more constrained with core analysis techniques better adapted to the highly permeable samples from CRC-1. Containment is demonstrated by the consistency of the geochemical data with forward models at CO2 mass levels close to those that were actually injected. The clear absence of CO2 in the overlying aquifer (shown by repeat seismic) adds credibility to this conclusion. Because of the simple geometry of the reservoir, lateral and vertical movement of the CO2 plume are predicted to be very limited. Direct confirmation of containment is difficult because the amount of CO2 stored is relatively small. A minimalist climate abatement target (27,28) of 0.1% yr-1 leakage to atmosphere is 65 tonne yr-1 for the amount we have stored. This is comparable to the night-time respiration rate for 1 km2 of nearby pasture. However the sensitivity of our seismic or atmospheric techniques would remain the same for industrial scale storage and so correspond to much smaller fractional sensitivity. The sensitivity of our fluid sampling method (injection rate × timing uncertainty) would scale with storage size. An industrial site might store 100× more CO2 than Otway. A point leakage rate of 6500 tonne yr-1 (0.1% yr-1) from such a site would be detectable by the atmospheric and seismic methods we have trialed. However the IPCC estimates (2) of “likely” leakage rates (1% in 1000 years) would be very hard to confirm, amounting again to only 65 tonne yr-1.
Reservoir storage efficiency There is uncertainty regarding the extent to which the pore space previously occupied by gas (primarily CH4, accumulated over geological time) can be reoccupied by CO2 injected in only a few years. Global estimates of capacity depend on applying average assumptions to a wide range of different circumstances and need to be checked by experience (23). The IEAGHG estimated that 160 Gt of practical capacity in depleted gas fields, matched to point sources, will be cumulatively available by 2050 (22). Emissions from such sources are 11 Gt yr-1, accumulating to 279 Gt by 2050 at present growth rates (2.5% yr-1). This potential capacity is globally significant. With our sampling system we can measure the dynamic storage capacity of the reservoir as it was re-filled with injected CO2 (28). “Self lift” occurs when our U-tube samples become mostly CO2 and CH4, and hence the contents of the U-tube are of sufficiently low density to be forced to surface by reservoir pressure alone (26). Detailed modeling of the sampling process verified that the transition to self-lift reliably indicates the passage of the gas-water contact (GWC) (Figure 2, 26). The amount of injected CO2 that was stored between self-lift at U-Tube-2 and U-Tube-3 is then compared to the available pore space, which is estimated both from the

9
geological model and from the production data of natural gas. Detailed calculations (26) predict that 56%-84% of the space originally occupied by recoverable CH4 is re-occupied by CO2, taking account of uncertainties in the pore volume, post production residual CH4 saturation and the possible range of movement of the GWC. Generic estimates used to calculate global capacity in depleted gas fields (22,23) have assumed 75%. This is the first measurement of this type, and is consistent with extensive experience of natural gas storage (48). While dependent on detailed circumstances (26), for example rock type or timing of storage after production, our datum adds weight to the conclusion that depleted gas fields have enough storage capacity to make a significant contribution to reducing global emissions (22).
Conclusions The CO2CRC Otway Project has demonstrated that the storage of CO2 in a depleted gas field can be designed and safely achieved. Monitoring showed that that there has been no measureable effect of stored CO2 on soil, groundwater or atmosphere. Good relations with the local community, and decision-makers at various levels of government, were established and maintained. Seismic imagery and fluid sampling confirmed dynamic and geochemical models. Sensitivity of monitoring techniques to surface leakage rates at the few kt yr-1 level, or subsurface accumulations at the kt level, was demonstrated. This shows that commercial scale storage programs could be effectively monitored to ensure climate abatement was being achieved. Overall the project shows that our level of knowledge of subsurface processes involving CO2, and our ability to forecast its behavior, is adequate to proceed with large-scale geological storage of CO2 in depleted gas fields, and the capacity of these structures could be of global significance for carbon capture and storage.

10
Figures
Figure 1a. location of the Otway site with detail on an aerial photograph. CRC-1 is at 142o.81151 E -38o.53057 S. Lines A-A' and B-B' match profiles in Figures 1b and 2. PPL denotes petroleum tenements. (1b) Schematic geological cross-section along A-A'. The reservoir unit is the Waarre Sandstone and the regional seal is the Belfast Mudstone. Major faults are denoted as black lines and minor units are omitted.
11
Figure 2. Schematic of the injection and monitoring wells, indicating wellbore perforations and U-tube inlets. U-tube-1 accesses the free gas cap (red) through leaks in a casing patch, installed during production. Free natural gas is bounded below by the gas-water contact. In the light orange zone natural gas is immobile and the pore space contains mostly water.
12
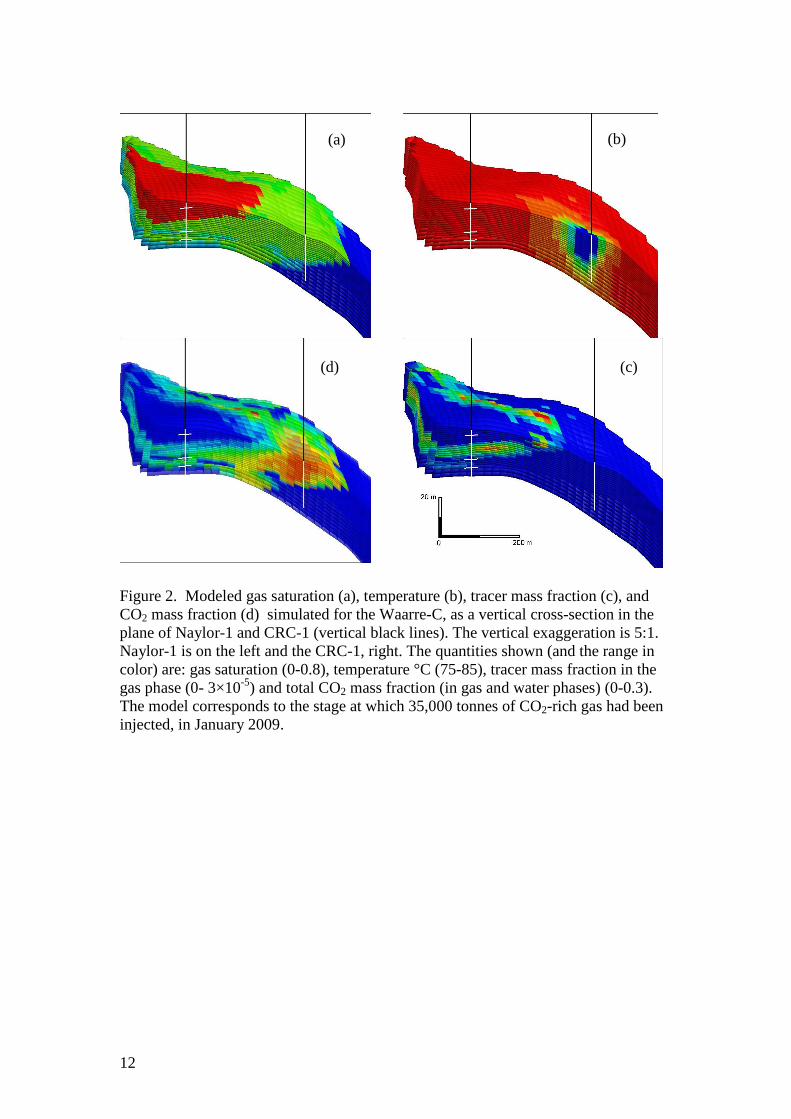
Figure 2. Modeled gas saturation (a), temperature (b), tracer mass fraction (c), and CO2 mass fraction (d) simulated for the Waarre-C, as a vertical cross-section in the plane of Naylor-1 and CRC-1 (vertical black lines). The vertical exaggeration is 5:1. Naylor-1 is on the left and the CRC-1, right. The quantities shown (and the range in color) are: gas saturation (0-0.8), temperature °C (75-85), tracer mass fraction in the gas phase (0- 3×10⁻⁵) and total CO2 mass fraction (in gas and water phases) (0-0.3). The model corresponds to the stage at which 35,000 tonnes of CO2-rich gas had been injected, in January 2009.
(a) (b)
(c) (d)
13
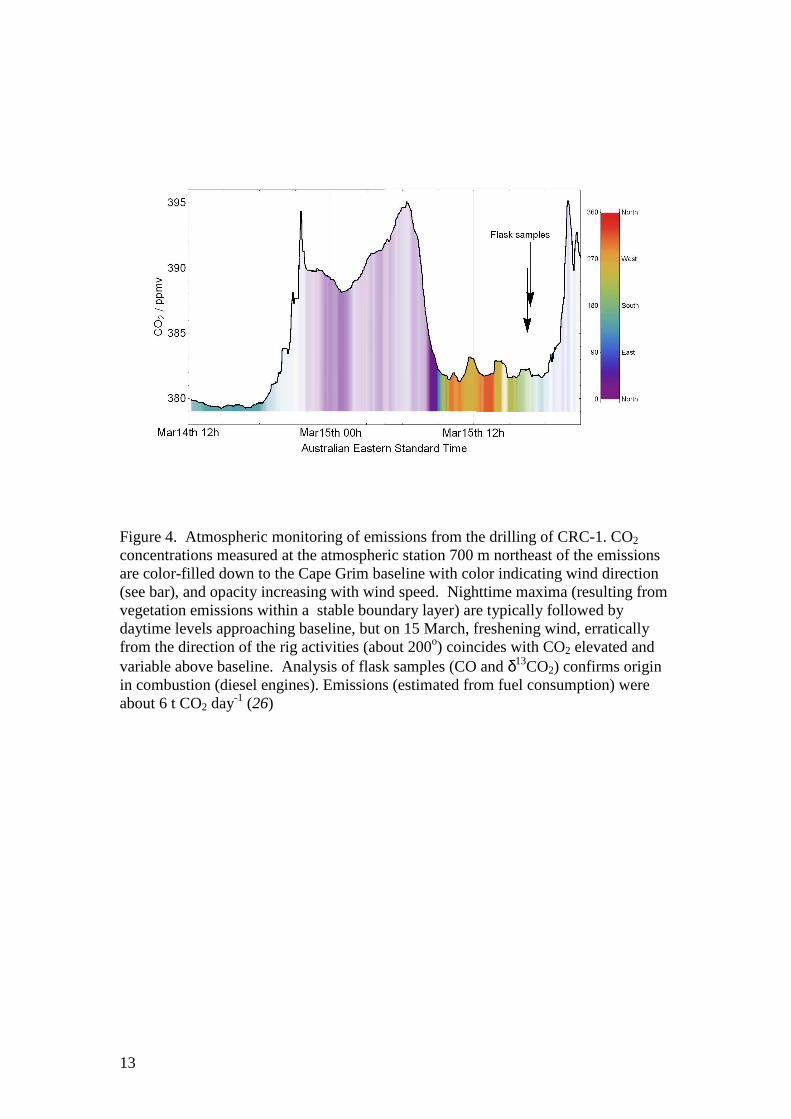
Figure 4. Atmospheric monitoring of emissions from the drilling of CRC-1. CO2 concentrations measured at the atmospheric station 700 m northeast of the emissions are color-filled down to the Cape Grim baseline with color indicating wind direction (see bar), and opacity increasing with wind speed. Nighttime maxima (resulting from vegetation emissions within a stable boundary layer) are typically followed by daytime levels approaching baseline, but on 15 March, freshening wind, erratically from the direction of the rig activities (about 200o) coincides with CO2 elevated and variable above baseline. Analysis of flask samples (CO and δ13CO2) confirms origin in combustion (diesel engines). Emissions (estimated from fuel consumption) were about 6 t CO2 day-1 (26)
14
A B
C D
Tim
e, m
s
X, m
Tim
e, m
s
X, m
Figure 5. Modeling of a hypothetical CO2 leak into the overlying Paaratte formation. A: Seismic image of Paaratte acquired in 2008; B: Simulated time-lapse seismic image of a 5000-tonne CO2 leak, noise level matched to the real data; C and D: actual time lapse seismic images of the same region for 2008-2009 and 2009-2010. The two-way travel times of the acoustic signal (vertical axis) correspond to depths of about 1600 m.
15
Figure 6. Measured arrival and accumulation of injected CO2 at the Naylor monitoring well’s U-tube 2 (orange points) for SF6 (ppm) and CO2 (mole fraction). The background color coding superimposes predictions of 8 reservoir models, each blurred by the experimental error levels. Lighter shades indicate higher probability of a reservoir model occupying a point in the concentration – time plane. The scatter in SF6 around day 400 appears to be real but is unexplained.
16
References (1) S. Pacala, R. Socolow, Stabilization wedges: solving the climate problem for the next 50 years with current technologies, Science, 305, 968-972 (2004). (2) S. Benson, P.J. Cook, in Carbon Dioxide Capture and Storage, B. Metz et al., Eds. (Cambridge 2005). (3) D.P. Schrag, Preparing to capture carbon, Science 315, 812-813 (2007) (4) R.B. Grigg, in Carbon Dioxide Capture for Storage in Deep Geologic Formations, S.M Benson, C. Oldenburg, M. Hoverstein, S. Imbus. Eds. (Elsevier 2005). (5) S. Whittaker, D. White, D. Law, R. Chalaturnyk, IEAGHG Weyburn CO2 Monitoring and Storage Project Summary Report 2000-2004, M. Wilson, M. Monea, Eds. (Petroleum Technology Research Centre 2004). (6) T.A. Meckel, S.D. Hovorka, Results From Continuous Downhole Monitoring (PDG) at a Field-Scale CO2 Sequestration Demonstration Project, Cranfield, MS. In SPE International Conference on CO2 Capture, Storage, and Utilization, (Society of Petroleum Engineers 2009) DOI 10.2118/127087-MS (7) R.W. Klusman, Rate measurements and detection of gas microseepage to the atmosphere from an enhanced oil recovery/sequestration project, Rangely, Colorado, USA, App. Geochem., 18, 1839-1852 (2003). (8) P. Zweigel, R. Arts, A.E. Lothe, E.B.G. Lindeberg, in Geological Storage of Carbon Dioxide, S.J. Baines, R.H. Worden, Eds. (Geological Society, London), Special Publications 233, 165–180 (2004). (9) T. Maldal, I. M. Tappel, CO2 underground storage for Snøhvit gas field development, Energy, 29, 1403-1411 (2004) DOI:10.1016/j.energy.2004.03.074 (10) I.W. Wright, The In Salah Gas CO2 Storage Project, in Proceedings of the International Petroleum Technology Conference, Dubai (2007). SPE, DOI: 10.2523/11326-MS (11) M. Flett et al., Gorgon Project: Subsurface evaluation of carbon dioxide disposal under Barrow Island, in SPE Asia-Pacific Oil and Gas Conference and Exhibition, Perth, Australia. SPE 1163722008 (2008). (12) L.G.H. van der Meer, E. Kreft, C. Geel, J. Hartman K12-B a Test Site for CO2
Storage and Enhanced Gas Recovery, in 67th EAGE Conference & Exhibition (2005) DOI:10.2118/94128-MS (SPE94128) (13) K. Kikuta, S. Hongo, D. Tanase and T. Ohsumi, Field test of CO2 injection in Nagaoka, Japan, in Proceedings of the 7th International Conference on Greenhouse

17
Gas Control Technologies, E.S. Rubin, D.W. Keith and C.F. Gilboy, Eds, (Elsevier 2005) 1367–1372 (14) S.D. Hovorka et al., Measuring permanence of CO2 storage in saline formations: the Frio experiment. Environmental Geosciences 13, 105–121 (2006). (15) F. Schilling et al, Status Report on the First European on-shore CO2 Storage Site at Ketzin, Energy Procedia 1, 2029-2035 (2009). (16) ww.netl.doe.gov/technologies/carbon_seq/partnerships/validation.html (17) K.F. Perry, in Carbon Dioxide Capture for Storage in Deep Geologic Formations, S.M.Benson, C. Oldenburg, Hoverstein, S. Imbus, Eds (Elsevier2005). (18) J.A. Apps, in Carbon Dioxide Capture for Storage in Deep Geologic Formations, S.M. Benson, C. Oldenburg, M. Hoverstein, S. Imbus, Eds (Elsevier 2005). (19) S. Bachu, K. Haug, in Carbon Dioxide Capture for Storage in Deep Geologic Formations, S.M. Benson, C. Oldenburg, M. Hoverstein, S. Imbus, Eds (Elsevier), 867-876 (2005). (20) N. Aimard, M. Lescanne, G. Mouronval, C. Prebende, The CO2 pilot at Lacq: An integrated oxycombustion CO2 capture and geological storage project in the South West of France, International Petroleum Technology Conference 2007, (IPTC), 1717-1724. (2007). (21) M. Loizzo, B. Lecampion, T. Berard, A. Harichandran, L. Jammes, Reusing O&G Depleted Reservoirs for CO2 Storage: Pros and Cons, in SPE Offshore Europe Oil & Gas Conference, Aberdeen (2009). DOI:10.2118/124317-MS (22) IEA Greenhouse Gas R&D Programme, Report 2009/01, CO2 Storage in depleted gas fields (2009). Available at www.ieaghg.org (23) S. Bachu et al., CO2 storage capacity estimation: Methodology and gaps, Int J. Greenhouse Gas Control, 1, 430-443 (2007). (24) www.co2crc.com.au (25) S. Sharma, P.J.Cook, T. Berly, C. Anderson, Australia's first geosequestration demonstration project - the CO2CRC Otway Basin Pilot Project. APPEA Journal, 47, 257–268. (2007) (26) See online Materials and Methods (27) L. Spencer, F. La Pedalina, Otway Basin Pilot Project Naylor Field, Waarre Formation Unit C; Reservoir Static Models. CO2CRC Internal Report RPT05-0123, (2006). DOI:10.5341/RPT05-0123. Available at www.co2crc.com.au/publications
18
(28) J. Underschultz et al., CO2 storage in a depleted gas field: an overview of the CO2CRC Otway Project and initial results, in press, Int. J. Greenhouse Gas Control (2010) (29) T. Dance, L. Spencer, Q. Xu, Geological characterization of the Otway pilot site: what a difference a well makes. Energy Procedia 1, 2871-2878 (2009) (30) I.G. Enting, D.M. Etheridge, M.J Fielding, A perturbation analysis of the climate benefit from geosequestration of carbon dioxide, Int. J. Greenhouse Gas Control 2, 289–296 (2008). (31) P.M. Haugan, F. Joos, Metrics to assess the mitigation of global warming by carbon capture and storage in the ocean and in geological reservoirs. Geophys. Res. Lett. 31, L18202, (2004) DOI.10:1029/2004GL020295 (32) A. Bowden, A. J. Rigg, Assessing risk in CO2 storage projects, APPEA Journal 44, 677-701. (2004) (33) N. Ranasinghe, Regulating Carbon Dioxide Capture and Storage in Australia. Masters thesis, School of Engineering, Griffith University (2008). (34) P. Ashworth, S. Rodriguez, A. Miller 2010. Case Study of the CO2CRC Otway Project. EP 103388 CSIRO: Pullenvale, Australia. (2010). DOI:10.5341/RPT10-2362 (35) K. Dodds et al., Developing a monitoring and verification plan with reference to the Australian Otway CO2 pilot project. The Leading Edge, 28, 812-818, (2009). (36) P. de Caritat, D. Kirste, A. Hortle, Composition and levels of groundwater in the CO2CRC Otway Project area, Victoria, Australia: establishing a pre-injection baseline, in Proceedings of the 24th International Applied Geochemistry Symposium, D. R. Lentz, K. G. Thorne, K-L Beal, Eds. (Association of Applied Geochemists, 2009) 667–670. (37) U. Schacht, C.J. Boreham, M. N. Watson, Soil Gas Baseline characterisation Study - Methodology and summary. CO2CRC Internal Report RPT09-1714. (2010). DOI: 10.5341/RPT09-1714 (38) R. Leuning, D.M. Etheridge, A. K. Luhar, B. L. Dunse, Atmospheric monitoring and verification technologies for CO2 geosequestration, Int. J. Greenhouse Gas Control, 2, 401–414 (2008). (39) C. Bernardo, D.F.de Vries, Permanent shallow subsoil CO2 flux chambers for monitoring of onshore CO2 geological storage sites, Int. J. Greenhouse Gas Control (2010), DOI:10.1016/j.ijggc.2010.05.011 (40) B.M Freifeld et al., The U-Tube: A novel system for acquiring borehole fluid samples from a deep geologic CO2 sequestration experiment, J. Geophys. Res. 110, B10203, (2005). DOI:10.1029/2005JB003735.

19
(41) L. Stalker et al., Geochemical monitoring at the CO2CRC Otway Project: Tracer injection and reservoir fluid acquisition Energy Procedia. 1, 2119-2125 (2009) (42) R. Pevzner, V. Shulakova, A. Kepic, M. Urosevic, Repeatability analysis of land time-lapse seismic data: CO2CRC Otway pilot project case study. Geophysical Prospecting, 59, 66-77 (2010) DOI: 10.1111/j.1365-2478.2010.00907.x (43) M. Urosevic et al., Time-lapse seismic monitoring of CO2 injection into a depleted gas reservoir: Naylor Field, Australia. The Leading Edge, 29, 164-169 (2010). (44) R. Li, K. Dodds, A.F. Siggins, M. Urosevic, A rock physics simulator and its application for CO2 sequestration process. Exploration Geophysics 37, 67–72 (2006) DOI:10.1071/EG06067 (45) J-C. Perrin, S. Benson, An experimental study on the influence of sub-core scale heterogeneity on CO2 distribution in reservoir rocks, Transport in Porous Media, 82, 93-109, (2010). (46) A.K. Luhar et al., Modelling Carbon Dioxide Fluxes and Concentrations Around the CO2CRC Otway Geological Storage Site, in 19th International Clean Air and Environment Conference (Clean Air Society of Australia and New Zealand, 2009). Available at www.casanz.org.au (47) C. Boreham et al., Monitoring of CO2 storage in a depleted natural gas reservoir: gas geochemistry from the CO2CRC Otway Project, Australia, in press, Int J. Greenhouse Gas Control (2010). (48) D. L. Katz, R. L. Lee, “Natural Gas Engineering. Production and Storage”, McGraw Hill, (1990). (49) The Otway Project was supported by the Australian Government through the Co-Operative Research Centre programme, by the Victorian Department of Primary Industry, the US Department of Energy and by the industrial and institutional partners in the CO2CRC. The conclusions reported here depend on work, published and unpublished, by many participants in the CO2CRC.

20
Supporting on-line material for “Safe geological st orage of CO 2 - the CO2CRC Otway Project” C.R. Jenkins1,*, P.J. Cook2, J. Ennis-King3, J. Undershultz4, C. Boreham5, T. Dance4, P. de Caritat5, D.M. Etheridge6, B.M. Freifeld7, A. Hortle4, D. Kirste8, L. Paterson3, R. Pevzner9, U. Schacht10, S. Sharma11, L. Stalker4, M. Urosevic9 Author affiliations:
12. CO2CRC, CSIRO Earth Science and Resource Engineering, Pye Laboratory, Black Mountain, Canberra, Australia.
13. CO2CRC, NFF House, 14-16 Brisbane Avenue, Canberra, Australia. 14. CO2CRC, CSIRO Earth Science and Resource Engineering, Ian Wark
Laboratory, Bayview Ave, Clayton, Victoria, Australia 15. CO2CRC, CSIRO Earth Science and Resource Engineering, 26 Dick Perry
Avenue, Technology Park, Kensington, Perth, Australia 16. Geoscience Australia, GPO Box 378, Canberra ACT 2601, Australia 17. CO2CRC. CSIRO Marine and Atmospheric Research, Aspendale,
Victoria, Australia 18. CO2CRC, Lawrence Berkeley National Laboratory, MS 90-1116, One
Cyclotron Road, Berkeley CA, 94720, USA. 19. CO2CRC, Earth Sciences, Simon Fraser University, Burnaby, BC,
Canada. 20. CO2CRC, Department of Exploration Geophysics, Curtin University,
GPO Box U1987, Perth, Australia. 21. CO2CRC, Australian School of Petroleum, University of Adelaide,
Adelaide, Australia 22. CO2CRC, Schlumberger Carbon Services, Perth, Australia
* To whom correspondence should be addressed: [email protected]
21
Geological Setting The Otway Basin is a large, northwest trending basin located on the southern Australian passive margin. It formed during the Jurassic to Cainozoic (from 140 to 6 million years before the present). During rifting and continental breakup of what is now Australia and Antarctica, large sedimentary depocentres opened up which were subsequently faulted and inverted during multiphases of rift, sag and compression. These episodes resulted in complex fault structures and compartments providing traps and anticlines for hydrocarbon accumulations where reservoirs are juxtaposed to seals. Commercial gas discoveries include the offshore Thylacine, Geographe, Minerva and Casino fields, and numerous smaller onshore gas fields. Several of these are rich in CO2, derived from a late phase of volcanism.
Gas compositions Commercially-purchased CO2 is extremely expensive for a large injection, so that finding a natural source close to an injection site was very fortunate. The gas from Buttress (the “injected CO2”) has a molar composition of 75±2% CO2 and 21±2% CH4. The remaining 4% is mostly heavier hydrocarbons. The CO2 is of magmatic origin and has an isotopic value δ
13C = -6.67±0.007. It proved too expensive to purify the gas stream, but at the pressures and temperatures involved the mixture closely models pure CO2. Our detailed modeling takes account of the composition, which affects physical properties such as the viscosity, compressibility, and the equation of state. At Naylor, the composition in the gas cap is of 86±2% CH4 and 1.4±0.4% CO2, with about 6% N2 and the remainder again being heavier hydrocarbons. The isotopic value of the CO2 in Naylor is δ13C = -11±1. (1) The initial downhole injection pressures and temperatures were 17.8 MPa and 63 C; by the end of injection the necessary pressure was 19.3 MPa and the injection temperature had fallen slightly to 61 C (2).
Risk assessment The updated quantitative risk assessment, conducted after drilling of CRC-1 but prior to injection, is described in (3). The main risks that were identified were leakage along fault planes or up well bores, but all risks were considered to be very low. Key elements in the risk assessment included assessment of the seal by mercury injection capillary pressure analysis, geomechanical modelling to bound injection pressures (4), and detailed examination of tectonic risk (5), as well as conventional geological and dynamical modelling.
Monitoring Design and Interpretation

22
The design and interpretation of assurance monitoring in a CCS context raises some difficult issues. Consider for definiteness the case of groundwater monitoring. Interpretation, and hence design, involves three nested problems. Firstly, there is the question of the statistical significance of a particular measurement – is it real, or is it an artifact of measurement error or natural variability? Secondly, there is an inverse problem. We necessarily make measurements sparsely in time and space. What can we infer about the aquifer as a whole from our limited suite of measurements? This involves assumptions about the location and geometry of the hypothetical ingress of CO2 into the aquifer, and geological and hydrological modeling. Subsurface information is always limited and so there will be much uncertainty in the inversion from point measurements to aquifer-wide conclusions. Finally there is a second inverse problem; if we are confident that we have detected ingress of CO2 into the aquifer, how did it get there? And what can we conclude about where else it may have gone, and how much has left reservoir containment and why? This will involve yet more modeling, subject again to uncertain assumptions and limited knowledge of the sub-surface. The statistical aspects are of themselves not straightforward. If measurements are subject to uncontrolled fluctuations, there is a risk of a false alarm and ideally the probability of false alarms would be understood. This does require good understanding of the statistics of the data and points to the need for a substantial pre-injection campaign to characterize CCS sites. There is also the question of the sensitivity of the measurements: what size of contamination or leakage will give a signal that we will regard as being statistically significant? Clearly these false-alarm rates and sensitivities will themselves be subject to significant modeling uncertainty and may even accidentally not include consideration of what turns out to be the actual leakage mechanism. We therefore distinguish two types of interpretation. Pure assurance means that the asset in question – say groundwater – has not changed, to within natural variability. Knowing sensitivity means that upper limits on changes can be translated into upper limits on the amounts of CO2 that could have entered the zone of investigation. The notion of a conditional sensitivity is useful: it is the sensitivity given that CO2 has entered the zone in some simple way, typically as a temporally constant point source. Conditional sensitivities could be chained together for a range of scenarios for leakage up through the overburden. Very similar discussions could be given of all of the monitoring techniques we have used, both for assurance and containment. Because of the difficulty in interpreting monitoring data, there is safety in numbers, in two ways. Firstly we may hope than an unforeseen leakage event will manifest itself in several ways and the combined information will be easier to assess. Secondly, it is clear that more detailed investigations can be initiated on the basis of initial, albeit uncertain clues. One may envisage a cascade of investigations, becoming successively more detailed, precise, and of course expensive. In the case of the Otway project, being a research and demonstration project, the monitoring design approach was to monitor as many domains as possible, aiming for a good understanding of natural variability over hours, days, months and seasons. Analytical errors were kept low enough confidently to detect these variations or (in
23
the case of the reservoir measurements) to detect the expected effects of filling with CO2. This approach was particularly important for the seismic programme: early calculations showed that it would not be possible to detect CO2 in the reservoir, but nonetheless the highest possible data quality was aimed at, and proved very useful in demonstrating the absence of CO2 above the reservoir at small mass levels.
The Naylor-1 Bottom-Hole Assembly The bottom-hole assembly (depicted schematically in Figure 2) that was deployed in Naylor-1 for monitoring included hydrophones and geophones that were intended for microseismic sensing, vertical seismic profiling, and travel time measurements. Many of these failed shortly after deployment, as did the pressure and temperature sensors. This is thought to be due to corrosion at downhole electrical connections. Pressure data were available from the production phase of Naylor-1, and a downhole gauge was installed to monitor temperature and injection pressure in CRC-1. Surface pressures were available at Naylor-1, which could be corrected to reservoir pressure once the composition of the borehole fluids was known. A backup microseismic system was installed in a shallow water well close to Naylor-1. The U-tube sampling system was also part of the bottom-hole assembly.
Naylor Fluid Sampling Methods Fluid samples were collected weekly to fortnightly. Pressurized reservoir fluids were brought to surface by U-tube either under self-lift within the gas cap or using N2 pressure for formation water (Figure 2). Pressure assistance was initially required for water samples because of the depressurization of the reservoir during earlier commercial natural gas production. The arrival of injected CO2 caused a transition to “self lift”, as the composition changed to lighter injected fluid which flowed to surface under reservoir pressure. The upper sampling point (U-tube-1, in the remnant gas cap) always returned gas. The lower sampling points (U-tube-2 and U-tube-3) initially returned reservoir water later transitioning to a CO2/CH4 mixture with very little water. Chemical analysis was done after controlled depressurization. Fluid samples were analyzed for concentrations of CO2, hydrocarbons, tracers, and carbon isotopic composition (1).
The Seismic Surveys To optimize the seismic monitoring program, we conducted several test surveys (pre-baseline) in the period 2006-2008. Since the area is actively farmed there were restrictions on access and the type of seismic source that could be used. The highly variable water table in the surface karst restricted surveys to the dry months. The seismic program was designed to maximize signal-to-noise ratio (minimize non-repeatability) by employing very high fold and keeping source-receiver lines close together (6,7). A baseline 3D survey was shot in January 2008, using a weight-drop source. The survey area was 1.6x1.9 km, average fold about 100. The first repetition (the first monitor survey) was acquired in 2009, using a vibroseis source. The second monitor survey was acquired in 2010, also with vibroseis. These surveys were shot after
24
35,000 and 65,445 tonnes of CO2 had been injected. Despite the use of different sources, processing of all the three surveys produced similar results; the best time-lapse signal-to-noise ratio was achieved with 2009/2010 data.
Detailed Static and Dynamic Modeling Prior to injection, the reservoir was characterized by a three dimensional geological model which incorporated geological details such as porosity, permeability, pressure, and the geometry of the reservoir including faults, sedimentary layers, and facies (rock types) distribution. These are the primary characteristics controlling the behavior of stored CO2. The core and wire-line logs gathered during drilling of the CRC-1 injection well showed the heterogeneous nature of the Waarre-C reservoir. It comprises a series of stacked sandstone bodies of varying grain sizes and thin (1 m - 3 m) shale baffles. The distinct sedimentary structures suggest tidally influenced channels in a near-shore marine setting. This also accounts for the presence of marine biota. Deposition of the Waarre-C Formation was probably affected by synchronous structural control, which had an important influence over the position of channel feeder systems and valley incision. The stacked nature of incised valleys interpreted from core observations can be related to river courses forced to conform to topographic troughs related to underlying tectonic and structural control. The resulting present day arrangement of permeability streaks and low flow baffles within the reservoir can be stochastically modeled between the injector and monitoring wells by using ranges obtained from depositional analogues appropriate to this type of setting. Shale barriers to flow for example are not expected to be greater than 80 m to 100 m wide, and permeability conduits within channels are expected to be highly connected over the distance of 300 m between the injector and monitoring well. Within the plausible geological scenarios, uncertainty associated with this modeling, was captured by multiple models to span likely porosity and permeability. Extreme cases were specifically modeled to attempt to bracket minimum and maximum migration times. The multiphase flow simulation software TOUGH2 (8) was used for the dynamic model (9). For the original production phase, production rates and wellhead pressure were available. The location of the post-production gas-water contact was obtained from by logging Naylor-1. During the injection phase, surface data on CO2 injection rates, and reservoir data from downhole pressure and temperature gauges in CRC-1 were also used (2). This dynamical model was adjusted to match pressure history from the production and post-production phases. It was mainly sensitive to the aquifer parameters, which largely determine pressure recovery after depletion. Two months before injection started, downhole pressure data from CRC-1 became available and the model was calibrated with these. The main sensitivity was to the bulk permeability, which had to be adjusted separately for each permeability realization considered. Bulk reservoir permeability had to be constrained by pressure history and core observations, because of the failure of an injectivity test. This test failed because the wellbore was not successfully perforated on the first attempt, and could not be repeated because of cost. Figure S1 shows the underlying detail of the reservoir model predictions that are represented in Figure 6 of the main text. The

25
eight curves correspond to four geological models (two with long correlation lengths in the shale baffles, and two with short) and two models for reservoir relative permeability (hysteric and non-hysteric) based on core measurements (10).
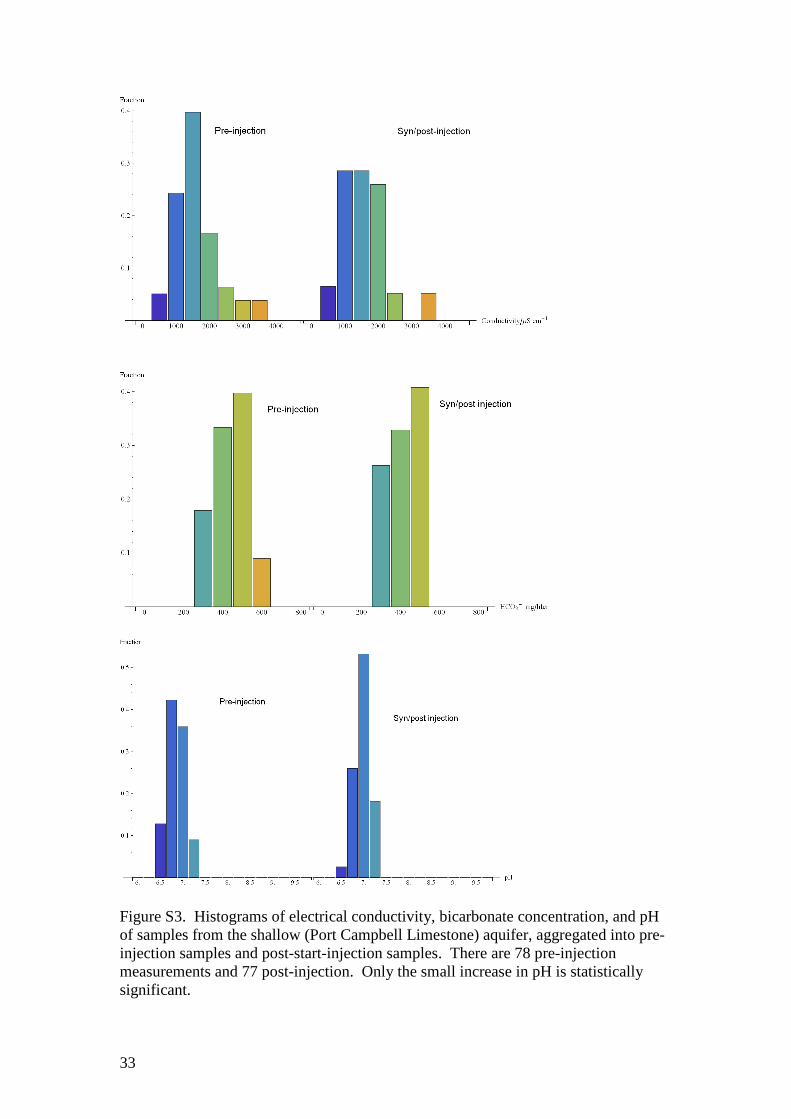
Groundwater, soil gas, and atmospheric measurements The locations at which these assurance measurements were made is shown in Figure S2a and S2b. Groundwater was sampled twice yearly from 21 shallow (<100 m) bores in the unconfined Port Campbell Limestone and from 3 deeper bores (>800 m) in the confined Dilwyn Formation. A wide range of measurements were made, including pH, electrical conductivity, redox potential, and the concentration of reduced iron (Fe2+), bicarbonate (HCO3
- ) and various major, minor and trace inorganic species. Isotopic compositions of hydrogen and oxygen in water, carbon in dissolved bicarbonate and sulfur in dissolved sulfate were also determined. Vadose zone soil gas composition (CO2, CH4, He, H2, δ
13CO2, 14C – in 2007) was also measured annually during summer. It proved impractical for the soil gas sampling to revisit the same grid of sampling points, although substantially the same area was covered each season. Both groundwater and soil gas samples were checked for the presence of the added tracers. Comparisons of pre- and syn-/post injection data for soil gas and groundwater are in Figures S3 and S4. The only statistically significant change is a small rise in median pH for the aggregated water samples, combining all bores and comparing data collected before and after injection started. We modelled ingress of CO2 into the Port Campbell limestone as a point source at the base of the aquifer, to gain some insight into the conditional sensitivity of the groundwater measurements. The plume of CO2-rich water that forms is quite narrow and sharp-edged, essentially because of the limited solubility at these shallow depths; most of the transport of CO2 upward is simply in the gas phase. Only at horizontal barriers does the CO2 spread out appreciably. These results are in accord with other modeling (e.g. 11). We know rather little about the Port Campbell Limestone and very little about its heterogeneity, but for a range of plausible parameters (horizontal permeability 1-10 darcy, vertical permeability 1 – 10 darcy, porosity 0.3, 1000 tonnes yr-1 ingress rate) we find that the plume is about 10 to 20 m in radius. Aquifer flow rates are low (about 0.14 m/day). If we assume that a leak such as this could be anywhere within a square kilometer of the injection site, and has lasted a year, it follows that the area affected by the plume is only 0.5% of the square kilometer. The chance of a single well intersecting the hypothetical plume is very low, unless there are significant barriers to vertical flow. These would cause much wider spreading of the plume, but in a thin layer that then might not coincide with screened intervals in the wells. The groundwater measurements therefore tell us little about containment although they are very important for assurance. In general an aquifer would have to be

26
well-characterized, and probably also penetrated by a large number of wells, before measurements of water chemistry would be useful guides to leakage. The atmospheric composition measurements comprise continuous CO2 and concentrations of CO2, quasi-monthly samples for other tracers (including CO and the injected tracers SF6 and HFC134a). Initially only CO2 was measured continuously but the system has been gradually upgraded to include continuous measurements of CH4 and the carbon-13 isotopic ratio of CO2. Ecosystem CO2 fluxes were measured continuously with an eddy-correlation flux tower and during six campaigns with a portable soil flux chamber. Figure S5 gives more detail on the drilling rig detection discussed in the main text. It is possible to predict much of the variability in the atmospheric composition using an environmental model, which greatly increases the detectability of changes (12). The use of tracers increases the ability to discriminate anomalies in atmospheric composition potentially caused by leakage from emissions from other sources. For example, CH4 is naturally present in the injection stream and SF6 was injected as a tracer. Both have background atmospheric concentrations that are lower and steadier than CO2. CO identifies combustion sources of CO2, unrelated to geological storage. The magmatic origin of the CO2 from Buttress gives it a 13C isotopic signature that distinguishes it from that produced by the local ecosystem, agricultural and anthropogenic sources (13,14). Such 13C isotopes in CO2 have the advantage of being naturally occurring and acting as conservative tracers. However, most anthropogenic CO2 (for example, from coal combustion) will be less distinct from ecosystem CO2 in its isotopic signature. Tracers are also useful markers in soil gas and water monitoring, although all the tracers used (except CD4) are present in the environment to some degree. Our atmospheric measurements are made at a single location and hence can only be inverted to find the strength of a source if its location and geometry are assumed (15); the technique is nonetheless valuable for monitoring the most likely sites of leakage – the wells – and could be extended by using a network of strategically located sensors (16).
Forward modelling of seismic response Realizations of the numerical flow simulations at the times of the two surveys were used to predict the expected seismic time-lapse result. These realizations were based on the various equiprobable geological models. Apart from rock properties and the fluid distribution from simulation, an accurate representation of the bulk modulus of gas mixtures was needed. The open source software Delivery (17) was then used for forward prediction of the time-lapse seismic response. These simulations compared to Otway time-lapse seismic data repeatability analysis showed that the noise level was significantly greater than the predicted signal level, a conclusion that was consistent with earlier results obtained using simple 1D modeling (18). To evaluate sensitivity of time-lapse seismic for leakage detection a synthetic feasibility study was carried out. Using finite-difference modeling we computed ‘baseline’ and ‘monitor’ seismic surveys with similar parameters to real surveys acquired in the area. To simulate leakage between ‘baseline’ and ‘monitor’ survey a
27
CO2 plume was introduced into the seismic model at the depth of ~1.5 km. This depth interval corresponds to a saline aquifer which can hold secondary gas accumulation generated by the leakage. Parameters of the plume, such as size and gas saturation, were obtained from hydrodynamic modeling. Changes in seismic properties of the plume were predicted using a fluid substitution technique based on the Gassmann equation (19). The detection of leakage is not only a matter of the presence of time-lapse signal, it is also limited by the ratio of these signal to noise and by the repeatability of seismic data. To take this into account we introduced to the simulated seismograms the same amount of random noise as was measured in real data, with the same frequency content. By gradually decreasing plume seize we determined minimum detectable leakage, assuming a point leakage at this level, to be 5000 tonnes of injected CO2 (Figure 5b).
Fluid sampling details The results from the fluid samples are robust despite the lack of physical isolation between the three U-tube inlets. Because the reservoir is produced at low rates during sampling (about 25 kg hr-1 of gas), buoyancy effects isolate U-tubes from each other when they are producing fluids of different densities . This accounts for the similarity between U-tube-2 and U-tube-3 when both are producing water or gas, and the obvious differences in CO2 and tracer content during the period while U-tube-3 is transitioning to self-lift and U-tube-2 has already done so. U-tube-1 is always isolated, being 15 m above U-tube-2. The predicted isolation of U-tube-2 and U-tube-3 from each other during the self-lift transition gives confidence in the timing of self-lift as an indicator of the location of gas-water contact during this period. This isolation was confirmed by two different (simplified) models of the fluid extraction process. In one, the wellbore was modeled as a very high permeability cylinder, albeit with slow continuous production of reservoir fluids. The second model used near-wellbore parameters from the reservoir models, but explicitly tracked fluid flow and mixing within the wellbore, using a simple advective model. These models agreed in identifying the buoyancy isolation mechanism, and the second was able to calibrate the location of the gas-water contact in the model against the density of sampled fluid; this makes the connection to the observed phenomenon of self-lift. U-tube-1 (Figure 2), located in the gas cap, always flowed without assistance. The injected CO2 was detected 233 days post-injection and appears to have reached the upper perforations by a different pathway to that seen at the lower U tubes. This probably results from the variable lateral extent of shale baffles in this reservoir. Extending one of these baffles somewhat in the geological model results in an “attic” effect that channels injected CO2 and tracer into upper compartments of the reservoir, and hence towards U-tube-1, at the observed time and concentration.
Timing of passage of gas-water contact The rate of filling of the Waarre-C reservoir can be assessed from the timing of self-lift at the two lower sampling points in the Naylor-1 observation well. U-tube-2 transitioned to self lift on September 11th, 2008 after 21,100 tonnes injection. U-tube-3 transitioned to self lift on January 15th, 2009 after 38,100 tonnes injection, although

28
there was a period of some weeks beforehand in which sampling produced a mixture of gas and water. However, 21,100 tonnes is not equal to the effective storage capacity of the reservoir between the GWC and U-tube-2 elevation because there is a portion of that volume which is “in-transit” between the injection and observation wells. Since the daily injection rate is reasonably constant, the volume of gas injected between the times that U-tube-2 and 3 transitioned to self lift (17,000 tonnes) should represent a reasonable estimate of the effective storage capacity of the pore space between the elevations of U-tube-2 and U-tube-3. The elapsed time interval is 126 days, and the sampling interval is 7 days, so the uncertainty in the timing is at least 10-15%, and perhaps more due to the transition period at U-tube-3. Thus the volume of gas has a proportional uncertainty of 17,000 ± 2000 tonnes. Although the depths of the U-tubes are accurately known, each samples from an interval of finite width, of around 0.6m. U-tube-2 and U-tube-3 are not packed off from each other, and are adjacent to the same interval of perforations. Sampling from a U-tube induces a flow into the U-tube at the reservoir level, and the origin of this fluid will depend on the productivity (i.e. the product of permeability and thickness) of the reservoir section near the perforations, as well as possible flow within the wellbore. Since each sampling operation removes a fluid volume comparable to the free volume within the wellbore, there is also some dependence of the history of fluid withdrawal due to sampling. The difference in depth between the two U-tubes is 4.5m. Detailed modeling of the wellbore flow suggests that the movement of the gas-water contact (GWC) between the two transitions to self-lift is likely in the range 3.5 ± 0.5 m. Here the GWC is used as shorthand for the complex distribution of saturation as the reservoir fills, which depends on local porosity and permeability and fluid-rock properties such as capillary pressure and relative permeability.
Details of capacity measurement The effective storage capacity in a region of the reservoir depends on the residual gas saturation Sgr upon imbibition (when the field is depleted and is being repressurised by water influx), and the maximum gas saturation Sgmax upon drainage (when the injected gas displaces some of the water that has occupied the pore space). Sgmax should be less than the 1-Slr, where Slr is the original residual water saturation. The efficiency of filling due to hysteresis, which will be denoted by Chyst, is then given by
grlr
grghyst SS
SSC
−−−
=1
max
If there is no hysteresis, then Sgmax=1- Slr and Chyst=1. Note that this is only the local hysteresis, and does not take account of reservoir pore volume that is invaded by formation water that is not ultimately displaced. This calculation also implicitly assumes that the endpoints of the relative permeability curves are independent of pressure, and that the reservoir is nearly back to its discovery pressure. In fact there are more complex considerations, where gas that is trapped at residual saturation will increase in density as the reservoir pressure recovers, reducing the saturation further. From the static geological model, the pore volume that is filled between the two transitions to self-lift can be estimated at 0.7 x 10⁵ m3 – 1.3 x 10⁵ m3 using the estimated range of movement of the GWC between the transitions. It has been estimated from logs that Slr=0.11 and Sgr=0.20. Using the lower value for the vertical

29
movement of the GWC (3.0 m) gives Chyst=0.75 to 0.84. These in turn imply Sgmax=0.72-0.78. For the upper value of vertical movement (4.0 m) the range is Chyst=0.56 to 0.62, and so Sgmax=0.58-0.63. Although there is still a considerable range of values, these measurements provide evidence that in this case Chyst< 1. The values of the relative permeability endpoints (Slr, Sgr and Sgmax) are a fluid-rock property, and so specific to particular sites. However it is likely that hysteretic effects, on top of pore volume loss due to aquifer influx, will further reduce the effective storage capacity of depleted gas fields with moderate aquifer drive. Interpretation of capacity measurement Estimates of the amount of CO2 that can be stored in depleted gas fields globally are by nature very approximate, since they depend on applying average assumptions to a wide range of different circumstances. The most recent IEA study (20) discusses the methodology in detail. The reduction in storage capacity from the theoretical capacity to the effective capacity depends on the strength of the aquifer drive, the rate at which formation water is able to re-enter the reservoir. For a field with a weak aquifer drive, the reservoir behaves more or less like a “tank”. In depleted fields with weak or non-existent aquifer support, the same pore space in the reservoir is still available for gas, and so in returning to the original reservoir pressure, one can store the same subsurface volume as originally produced. This would be the case for depletion drive reservoirs, where the gas cap provides the needed pressure for production. In depleted gas fields with strong aquifer support, two related phenomena limit the storage capacity. The first is that as production proceeds, formation water occupies some of the pore space previously occupied by gas. If the injection pressure exceeds the aquifer pressure, then it should be possible to displace some of this formation water and recover some of the pore space. Also, during gas injection, the residual water saturation after drainage will generally be larger than it was pre-production, and this is observed as hysteresis in the relative permeability curves. Laboratory studies show that with repeated cycles of imbibition (water inflow) and drainage (gas displacement of water), more formation water is trapped in the pore space. Thus not all the pore space previously occupied by gas can be recovered. The storage efficiencies used (20) attempted to account for the variations in aquifer support by reducing the theoretical capacity by factors derived from modeling. For a depleted gas field with strong aquifer support, the amount of influx of formation water must be also influenced by the timing of injection. For example, production from the Waarre-C in the Naylor field ceased at the end of October 2003, when the formation pressure was around 10 MPa. For the CO2CRC Otway project, injection began in March 2008, by which time the reservoir pressure had recovered to around 17.8 MPa. This indicates a substantial influx of formation water from the aquifer system, and a consequent reduction in capacity. Thus effective storage capacity of a depleted gas field with a strong aquifer drive will depend upon the timing of injection relative to production, and the limitations on the maximum injection pressure.

30
For the Waarre-C in the Naylor field, the observations have so far only constrained the efficiency of filling between U-tube-2 and U-tube-3. An estimate of the effective storage capacity of the whole reservoir unit depends on taking some of the ensemble of numerical models matched to the observations, and simulating the effect of continued injection until a suitable stopping criterion is reached. This criterion might be economic or technical in nature. A more detailed calculation would take into account the possibility of enhanced recovery of natural gas caused by the injection of CO2, plus effects such as the increasing pressure and consequent change in size of the free gas cap.
31
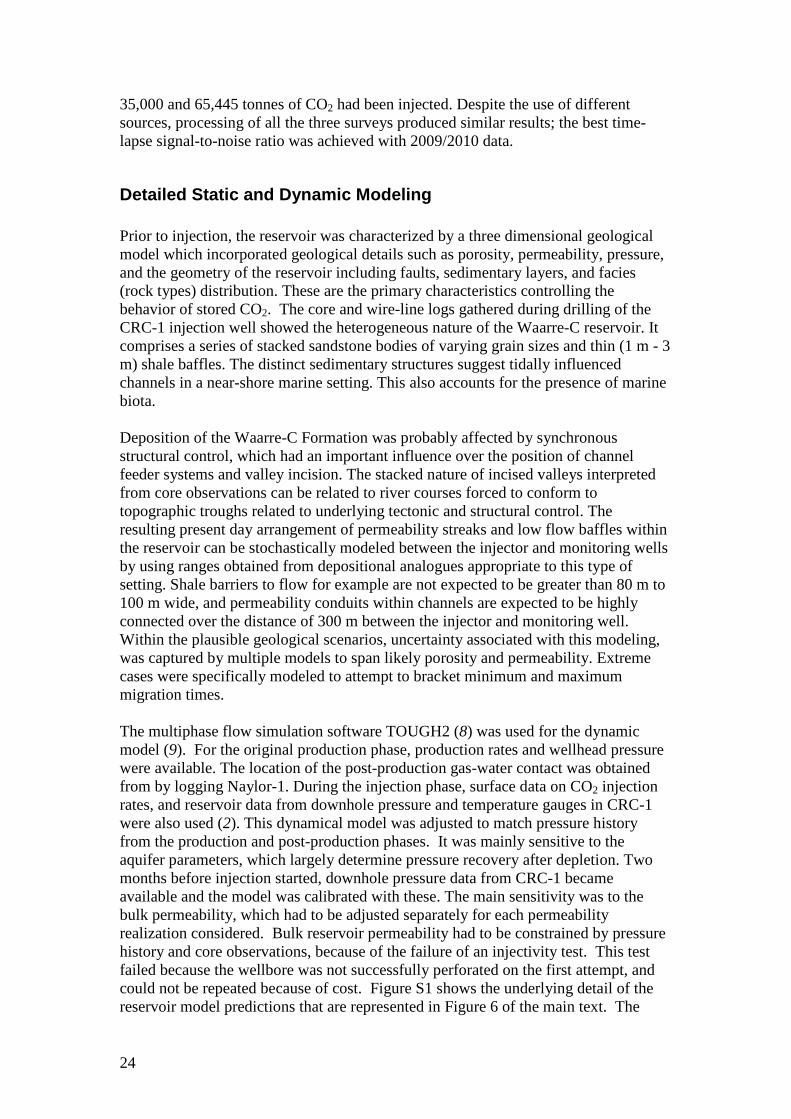
Figure S1. Detailed comparison of measured and predicted breakthrough curves, for CO2 (top) and SF6 (bottom). The flow models are based on geological models with long and short correlation lengths (c1 and c2 in the key) with r1… indexing different statistical realizations. Two relative permeability curves were used, non-hysteric (nh) and hysteretic (hy). The renditions in the main text were created by blurring the model curves with a Gaussian of standard deviation twice the nominal s.d. of the data (5%,). This estimate accounts only for analytical error, not error associated with the sampling process.
32
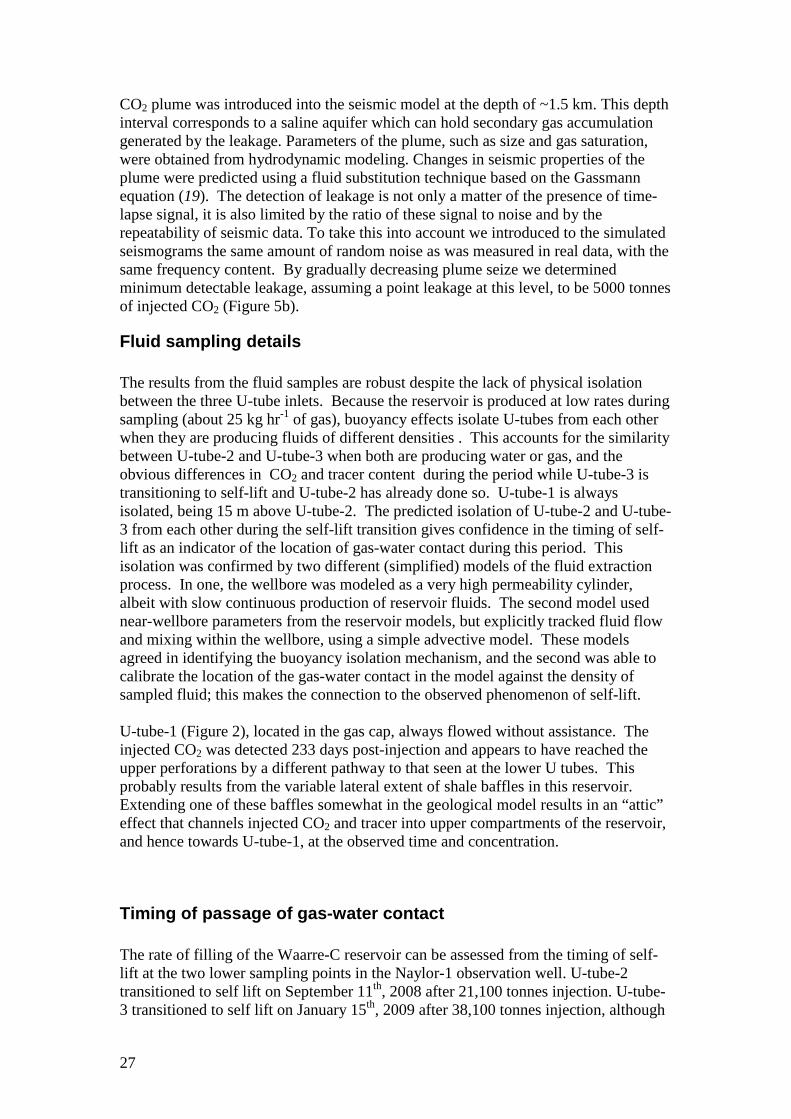
Figure S2 (a) General map of the Otway site area, showing the location of soil gas surveys, monitored water bores, and atmospheric monitoring stations. (b) Detail of locations of assurance monitoring activities, including the CEGEM deep soil flux monitoring stations.
33
Figure S3. Histograms of electrical conductivity, bicarbonate concentration, and pH of samples from the shallow (Port Campbell Limestone) aquifer, aggregated into pre-injection samples and post-start-injection samples. There are 78 pre-injection measurements and 77 post-injection. Only the small increase in pH is statistically significant.
34
Figure S4 CO2 concentrations vs. δ13C CO2 values for the four soil gas surveys (A) March 2007 and (B) February 2008 are pre-injection, (C) February 2009 and (D) March 2010 are during injection. The Otway average natural gas composition is according to (9), and the value of δ13C CO2 for the injected gas is indicated by the horizontal dashed line.
35
Figure S5. Detection of emissions from the drilling rig at the injection well CRC-1, as a test of the strategy and sensitivity of the atmospheric monitoring at Otway. CO2 concentrations (left) measured at the atmospheric station 700 m northeast of the emissions were selected for well mixed daytime conditions based on meteorology including wind speed and boundary-layer stability (Monin-Obukhov length) both at right. During daylight ecosystem CO2 fluxes (from the nearby eddy covariance flux station) were near zero or negative indicating uptake due to photosynthesis. Erratic CO2 increases (indicated by vertical lines) above the background (Cape Grim baseline CO2, red) then imply a local CO2 source up wind of the measurement location. This corresponds to wind directions from the general direction of the drilling site of CRC-1 (right centre, horizontal lines). On 15 March the CO2 was elevated by about 2.5 ppm and variable, indicating a point source. This was traced to the drill rig using wind trajectories and confirmed by measurements of flask air samples for CO (emission ratio of 10 ppb CO:1 ppm CO2) and the δ13C of the extra CO2 (-16 per mill) as combustion engine emissions. Emissions estimates (from fuel consumption) were about 6 t CO2/day. Dispersion modeling (need ref) simulated the CO2 increases at 1-5 ppm.

36
References for Supplementary Material (1) C. Boreham et al., Monitoring of CO2 storage in a depleted natural gas reservoir: gas geochemistry from the CO2CRC Otway Project, Australia, in press, Int J. Greenhouse Gas Control (2010). (2) L. Paterson, J. Ennis-King, S. Sharma, Observations of thermal and pressure transients in carbon dioxide wells, SPE paper 134881, 2010 SPE Annual Technical Conference and Exhibition, Florence, Italy (2010). (3) M. Watson, 2007. The CO2CRC Otway Project: quantitative risk assessment with newly acquired data and updated interpretation. Cooperative Research Centre for Greenhouse Gas Technologies, Canberra, Australia, CO2CRC Publication Number RPT07-0787, (2007). www.co2crc.com.au/publications (4) P. van Ruth, , E. Tenthorey, S. Vidal-Gilbert. Geomechanical Analysis of the Naylor Structure, Otway Basin, Australia. Pre-Injection. Cooperative Research Centre for Greenhouse Gas Technologies, Canberra, Australia, CO2CRC Publication Number RPT07-0966, (2007). www.co2crc.com.au/publications (5) M. Stirling, N. Litchfield, M. Gerstenberger, D. Clark, B.Bradley, J. Beavan, G. Verry, R. Van Dissen, A. Nicol, L. Wallace, R. Buxton, Probabilistic Tectonic Hazard Analysis of the Otway Basin, Australia: Groundwork for the CO2CRC Otway Project, submitted to Bulletin of the Seismological Society of America (2011). (6) R. Pevzner, V. Shulakova, A. Kepic, M. Urosevic, Repeatability analysis of land time-lapse seismic data: CO2CRC Otway pilot project case study. Geophysical Prospecting, DOI: 10.1111/j.1365-2478.2010.00907.x. (2010) (7) M. Urosevic et al., Time-lapse seismic monitoring of CO2 injection into a depleted gas reservoir: Naylor Field, Australia. The Leading Edge, February, 164-169 (2010). (8) K. Pruess, The TOUGH codes - A family of simulation tools for multiphase flow and transport processes in permeable media. Vadoze Zone Journal, 3,738-746 (2004). (9) J. Ennis-King, T. Dance, J. Xu, C. Boreham, B. Freifeld et al, The role of heterogeneity in CO2 storage in a depleted gas field: history matching of simulation models to field data for the CO2CRC Otway Project, Australia, Energy Procedia in press (2011) (10) J-C. Perrin, S. Benson, An experimental study on the influence of sub-core scale heterogeneity on CO2 distribution in reservoir rocks, Transport in Porous Media, 82, 93-109, (2010). (11) S. Carroll, Y. Hao, R. Aines Transport and detection of carbon dioxide in dilute aquifers, Energy Procedia 1 2111–2118 (2009).

37
(12) A.K. Luhar et al., in 19th International Clean Air and Environment Conference (Clean Air Society of Australia and New Zealand, 2009). Available at www.casanz.org.au (13) C. J. Boreham, J. M. Hope, B. Hartung-Kagi, Understanding source, distribution and preservation of Australian natural gas: a geochemical perspective, The APPEA Journal, 41, 523 – 48, (2001). (14) R. Leuning, D.M. Etheridge, A. K. Luhar, B. L. Dunse, Atmospheric monitoring and verification technologies for CO2 geosequestration, Int. J. Greenhouse Gas Control, 2, 401–414 (2008). (15) Z. M. Loh, R. Leuning, S. J. Zegelin, D. M. Etheridge, M. Bai, T. Naylor, D. Griffith, Testing Lagrangian atmospheric dispersion modelling to monitor CO2 and CH4 leakage from Geosequestration, Atmospheric Environment. 43, 2602-2611 (2009). (16) C.R. Jenkins, R. Leuning, Z.M. Loh, Atmospheric tomography to locate CO2 leakage at storage sites, Energy Procedia in press (2011) (17) J. Gunning, M. E. Glinsky, Comput. Geosci. 30, 619 ( 2004). (18) R. Li, K. Dodds, A.F. Siggins, M. Urosevic, A rock physics simulator and its application for CO2 sequestration process. Exploration Geophysics 37, 67–72 (2006) DOI:10.1071/EG06067 (19) T. M. Smith, C. H. Sondergeld, C. S. Rai, Geophysics 68, 430 (2003). (20) IEA Greenhouse Gas R&D Programme, Report 2009/01, CO2 Storage in depleted gas fields (2009). Available at www.ieaghg.org