Sacrifice ratio dispersion within the Euro Zone - Archive ...
31
HAL Id: hal-01462338 https://hal.archives-ouvertes.fr/hal-01462338 Submitted on 30 May 2020 HAL is a multi-disciplinary open access archive for the deposit and dissemination of sci- entific research documents, whether they are pub- lished or not. The documents may come from teaching and research institutions in France or abroad, or from public or private research centers. L’archive ouverte pluridisciplinaire HAL, est destinée au dépôt et à la diffusion de documents scientifiques de niveau recherche, publiés ou non, émanant des établissements d’enseignement et de recherche français ou étrangers, des laboratoires publics ou privés. Sacrifice ratio dispersion within the Euro Zone: what can be learned about implementing a single monetary policy Jean-Jacques Durand, Marilyne Huchet, Julien Licheron To cite this version: Jean-Jacques Durand, Marilyne Huchet, Julien Licheron. Sacrifice ratio dispersion within the Euro Zone: what can be learned about implementing a single monetary policy. Interna- tional Review of Applied Economics, Taylor & Francis (Routledge), 2008, 22 (5), pp.601-621. 10.1080/02692170802287672. hal-01462338
-
Upload
khangminh22 -
Category
Documents
-
view
0 -
download
0
Transcript of Sacrifice ratio dispersion within the Euro Zone - Archive ...

HAL Id: hal-01462338https://hal.archives-ouvertes.fr/hal-01462338
Submitted on 30 May 2020
HAL is a multi-disciplinary open accessarchive for the deposit and dissemination of sci-entific research documents, whether they are pub-lished or not. The documents may come fromteaching and research institutions in France orabroad, or from public or private research centers.
L’archive ouverte pluridisciplinaire HAL, estdestinée au dépôt et à la diffusion de documentsscientifiques de niveau recherche, publiés ou non,émanant des établissements d’enseignement et derecherche français ou étrangers, des laboratoirespublics ou privés.
Sacrifice ratio dispersion within the Euro Zone: whatcan be learned about implementing a single monetary
policyJean-Jacques Durand, Marilyne Huchet, Julien Licheron
To cite this version:Jean-Jacques Durand, Marilyne Huchet, Julien Licheron. Sacrifice ratio dispersion within theEuro Zone: what can be learned about implementing a single monetary policy. Interna-tional Review of Applied Economics, Taylor & Francis (Routledge), 2008, 22 (5), pp.601-621.10.1080/02692170802287672. hal-01462338

Ver
sion
pre
prin
t
Comment citer ce document :Durand, J.-J., Huchet-Bourdon, M., Licheron, J. (2008). Sacrifice ratio dispersion within the
Euro Zone: what can be learned about implementing a single monetary policy. International Reviewof Applied Economics, 22 (5), 601-621. DOI : 10.1080/02692170802287672
1
Sacrifice ratio dispersion within the Euro Zone:
What can be learned about implementing a Single Monetary Policy?
Jean-Jacques DURANDa, Marilyne HUCHET-BOURDONb,c* and Julien LICHERONa
Abstract: This article focuses on the comparison of sacrifice ratios as an indicator for structural
dispersion within the euro area over the period 1972-2003. Estimates of the sacrifice ratio, defined as
the cumulative output cost arising from permanent inflation reduction, are obtained using structural
VAR models. Results from sub-period analysis as well as ten-year-period rolling estimates lead to two
main conclusions. Firstly empirical evidence displays a recent increase in the average sacrifice ratio,
which can be linked to the simultaneous decrease in the average inflation rate: this negative
relationship between the initial level of inflation and the cost of disinflation can be seen as a
justification for the choice of an inflation objective close to 2% for the European Central Bank (ECB)
rather than a target of perfect price stability, potentially very damaging. Secondly, we can't provide
evidence of any reduction in European sacrifice ratio dispersion, which would suggest that the
nominal convergence triggered by the Maastricht Treaty didn't involve a true reduction of structural
differences. It is likely to be a problem in the stance of a single monetary policy, since structural
differences imply asymmetric responses of real national economies to the same monetary impulse.
Keywords: Sacrifice ratio; monetary policy; convergence; Economic and Monetary Union (EMU)
_____________________________________
a University Rennes 1, CREM, CNRS, UMR 6211, Faculty of Economics, 7 place Hoche, CS 86514, 35065
Rennes cedex, France. E-mail : [email protected], [email protected] bAGROCAMPUS OUEST , UMR1302, F-35000 Rennes, France c CREM CNRS UMR6211
*Corresponding Author : Marilyne Huchet-Bourdon, AGROCAMPUS OUEST, UMR SMART, 65 rue de St
Brieuc, CS 84215, 35042 Rennes cedex, France. E-mail : [email protected]

Ver
sion
pre
prin
t
Comment citer ce document :Durand, J.-J., Huchet-Bourdon, M., Licheron, J. (2008). Sacrifice ratio dispersion within the
Euro Zone: what can be learned about implementing a single monetary policy. International Reviewof Applied Economics, 22 (5), 601-621. DOI : 10.1080/02692170802287672
2
1. Introduction
The disinflation policies implemented throughout the 1980s and 1990s have led many observers to
wonder about the true cost, in terms of real activity, resulting from a significant and permanent
reduction of inflation. The issue of the transitory output cost associated with a restrictive monetary
policy remains an endless debate among economists. Recent theoretical studies have focused on the
key determinants of disinflation costs: the lack of central bank credibility, slow adjustments of
inflation expectations to changes in monetary policy, imperfect information, and wages and prices
stickiness, can all lead to high adjustment costs during a disinflation process. This would explain the
benefit of evaluating these short-term costs through the estimation of a "sacrifice ratio", typically
defined as the cumulative output loss, measured as a percent of one-year real Gross Domestic Product
(GDP), arising from a one-percentage-point permanent reduction in the inflation rate. Empirical results
from the literature confirm that sacrifice ratios may differ widely from one country to another (for a
given calculation method and over the same period). Sacrifice ratios can therefore be viewed as
indicators of structural differences between countries.
The present paper investigates this topic for the twelve countries belonging to the Economic and
Monetary Union (EMU). The single monetary policy led by the European Central Bank (ECB) and
adopted in 1999 has been assigned the aim of maintaining price stability within the euro area taken as
a whole (i.e. maintaining the aggregate inflation rate below 2%). One of the chief concerns lies in the
effects of such a policy on national economies. It can easily be understood that if sacrifice ratios were
to differ broadly among EMU member states, the common monetary policy would then produce
asymmetric effects on national outputs. Such asymmetries would complicate the task of the ECB. Has
the nominal convergence required for candidate countries to participate in the euro currency (as
enforced by the convergence criteria defined in the 1992 Maastricht Treaty) translated into a structural
convergence that could reduce these asymmetries? An analysis of sacrifice ratio dynamics within the
euro area should help answer these questions.
In this paper, we try to calculate and use the dispersion of sacrifice ratios among the twelve EMU

Ver
sion
pre
prin
t
Comment citer ce document :Durand, J.-J., Huchet-Bourdon, M., Licheron, J. (2008). Sacrifice ratio dispersion within the
Euro Zone: what can be learned about implementing a single monetary policy. International Reviewof Applied Economics, 22 (5), 601-621. DOI : 10.1080/02692170802287672
3
countries as an indicator for structural convergence. Our paper is therefore related to the works from
Andersen & Wascher (1999), Boone & Mojon (1998) and Cuñado & de Gracia (2003), but our
contribution is twofold. Firstly, we focus on EMU countries and try to assess the evolution of
structural dispersion looking at the dynamics of sacrifice ratios dispersion both across countries and
over time. The analysis of a long period 1973-2003 and the use of ten-year rolling estimates should
clearly provide some insights. Secondly, we use a structural VAR methodology inspired from
Cecchetti (1994) and Cecchetti & Rich (2001) to calculate sacrifice ratios, since this methodology is
suitable for international comparisons.
The remainder of this paper is structured as follows. The next section focuses on the concept of a
sacrifice ratio. Section 3 presents our empirical modelling approach, and Section 4 discusses the
pertinent results. Section 5 provides some concluding remarks.
2. The Sacrifice Ratio
The sacrifice ratio can be defined as the cumulative output cost resulting from a-one percentage-point
reduction in the inflation rate. This definition of the sacrifice ratio may be illustrated simply. Figure 1
shows one possible path for output and inflation following a tightening in monetary policy that
ultimately lowers the inflation rate by one percentage point. The sacrifice ratio is equal to the sum of
output gaps (i.e. the gaps between actual and potential output) expressed as a percent of GDP. This
sum is equivalent to the output loss in the shaded area.
Ver
sion
pre
prin
t
Comment citer ce document :Durand, J.-J., Huchet-Bourdon, M., Licheron, J. (2008). Sacrifice ratio dispersion within the
Euro Zone: what can be learned about implementing a single monetary policy. International Reviewof Applied Economics, 22 (5), 601-621. DOI : 10.1080/02692170802287672
4
Figure 1. Hypothetical responses of output and inflation during a disinflation process
(inspired by Filardo, 1998)
Output loss
Potential output
Inflation rate
Output
Time
Time
1
Effective output
The sacrifice ratio is now widely used in theoretical as well as empirical analyses of real monetary
policy effects. It appears to be a useful concept capable of synthesizing complex economic phenomena
into a single-digit informative cost measure1. Although the sacrifice ratio is a simple concept, its
estimation proves however a much more difficult exercise. It requires both identifying changes in
monetary policy stance (to enable distinguishing between disinflations and episodes of accelerating
inflation) and evaluating their impacts on output and inflation. Several methods have already been
proposed and applied.
Early empirical studies (Okun, 1978) are based on the estimation of "Phillips curve" models, which
express a relationship between the output gap and inflation variation over a long time series. Okun
reports an average sacrifice ratio of 10% for the United States. In other words, he finds that a
permanent one-percentage-point reduction in inflation rate should be associated with a cumulative
10% loss in real Gross National Product (GNP). Gordon & King (1982) refine Okun's approach (using

Ver
sion
pre
prin
t
Comment citer ce document :Durand, J.-J., Huchet-Bourdon, M., Licheron, J. (2008). Sacrifice ratio dispersion within the
Euro Zone: what can be learned about implementing a single monetary policy. International Reviewof Applied Economics, 22 (5), 601-621. DOI : 10.1080/02692170802287672
5
both traditional and VAR models) to obtain estimates of U.S. sacrifice ratios that range from 0 to 8,
with a mean of about 5% (less than half of Okun's value). Cuñado & de Gracia (2003) also use a
Phillips curve modelling to estimate individual and common sacrifice ratios for EMU countries over
the period 1960-2001. The values of the estimated sacrifice ratios range from 0.55 in Portugal to 1.96
in Finland. They also test the hypothesis that all EMU countries face the same sacrifice ratio and reject
this hypothesis over the whole period. Finally, they show that sacrifice ratios take higher values in
sub-periods of low inflation rates, suggesting that the Phillips curve is a non-linear function of actual
inflation. The paper from Cuñado & de Gracia (2003) will therefore provide a very interesting
comparison with our results for two reasons. Firstly, we will be able to compare the results reached
using two alternative methodologies: theirs based on the Phillips curve and ours based on a structural
VAR. Secondly, we will provide additional insights regarding the evolution of sacrifice ratios
dispersion over time using ten-year rolling estimates, which will provide a useful test for their
hypothesis of a non-linear ouput-inflation trade-off.
However, Ball (1994) points out several shortcomings of the Phillips curve approach: the output-
inflation trade-off is assumed to remain constant throughout the business cycle (i.e. assumed to be the
same during disinflation and accelerating inflation episodes). This approach also constraints the output
cost of fighting inflation to be the same for all disinflations during a given time series. These
assumptions are not consistent with recent theoretical and empirical macroeconomic insights2.
In light of the Phillips curve limitations, Ball (1994) proposes a methodology based on a specific
identification of disinflation episodes, obtained by locating "peaks" and "troughs" in the inflation trend
(defined as a centred nine-quarter moving average of actual inflation). He then calculates the
cumulative output loss (i.e. the sum of output gaps) over each predefined episode, and obtains in this
manner an estimate of the sacrifice ratio for each disinflation. These estimates range from below 0 to
about 3.5%, with an average close to 1.4% (i.e. much lower than previous estimates)3. Ball's approach
to constructing sacrifice ratios has generated many refinements and applications4, but this episode-
specific method, like early estimates based on Phillips curves, is not devoid of limitations. Cecchetti &
Rich (2001) criticize Ball's approach for assuming each disinflation episode to be generated only by a

Ver
sion
pre
prin
t
Comment citer ce document :Durand, J.-J., Huchet-Bourdon, M., Licheron, J. (2008). Sacrifice ratio dispersion within the
Euro Zone: what can be learned about implementing a single monetary policy. International Reviewof Applied Economics, 22 (5), 601-621. DOI : 10.1080/02692170802287672
6
monetary policy shift and for neglecting the impact of supply shocks and other demand shocks (such
as money demand shocks or fiscal shocks) on the behaviour of inflation and output during these
disinflation episodes. The sacrifice ratio estimates could thus be biased, i.e. they could constitute a
noisy measure of the effects of monetary contraction. Furthermore, Cecchetti & Rich (2001) take issue
with Okun's (1978) and Gordon & King's (1982) modelling approach for their incapacity to
distinguish between those monetary policy impulses resulting from a true shift in policy and those that
simply reflect an endogenous response to changes in the economic situation. This kind of breakdown
between exogenous monetary policy shocks and endogenous authority reactions is yet essential in
order to correctly evaluate the real effects of disinflation.
That is why Cecchetti & Rich (2001), relying on Cecchetti (1994), construct sacrifice ratio estimates
based on structural VAR models: this approach permits the derivation of a distinction between
structural supply shocks and structural demand shocks. Above all, it enables the effects of monetary
policy to be broken down into a systematic component and a stochastic component. The former can be
considered as a reaction function that describes the responses of the monetary policy authorities to
fluctuations in some variables, while the latter contains actions from the central bank that can't be
explained by the reaction function (i.e. monetary policy shocks). The aim then is to estimate the
impact of these monetary shocks on both output and inflation. In computing cumulative impulse
response functions for a given time horizon (presumed to be five years), Cecchetti & Rich (2001)
obtain estimates of U.S. sacrifice ratios over the period 1959-1997 that range from around 1% to
nearly 10%. Their estimates seem to be highly sensitive to the VAR model specification, a conclusion
that many other studies using the structural VAR modelling approach have since confirmed.
In our case specifically, this method catches our attention since the aim of this paper is to draw
comparisons both across countries and over time. It enables us especially to calculate rolling estimates
of the sacrifice ratio in order to better evaluate the evolution of this indicator.

Ver
sion
pre
prin
t
Comment citer ce document :Durand, J.-J., Huchet-Bourdon, M., Licheron, J. (2008). Sacrifice ratio dispersion within the
Euro Zone: what can be learned about implementing a single monetary policy. International Reviewof Applied Economics, 22 (5), 601-621. DOI : 10.1080/02692170802287672
7
3. Structural VAR Methodology
Two procedures for estimating the sacrifice ratio appear to have won favour recently: on the one hand,
the methodology introduced by Ball (1994), which entails calculating the output cost of fighting
inflation on previously-identified disinflation episodes; and on the other hand, the structural VAR
modelling approach in use since Cecchetti (1994).
The choice between these two methods depends on the purpose of the study. Ball's methodology
delivers simple and meaningful estimates of the sacrifice ratio, appropriate when isolating inflation
and output dynamics during specified disinflation episodes and when analysing the determinants of the
output cost of inflation decreases. Nevertheless, it only provides point estimates of the sacrifice ratio,
calculated for particular and country-specific disinflations, thereby making it difficult to draw
conclusions from sacrifice ratio dynamics or from international comparisons of estimates. Moreover,
Ball's methodology doesn't permit the effects of monetary policy shocks to be isolated.
Since the aim of this paper is to study sacrifice ratios dynamics within the euro area over the past
thirty years and examine whether the gradual course towards a common monetary policy has triggered
a process of convergence in these ratios, Cecchetti's (1994) structural VAR modelling approach would
seem to be more appropriate, since it provides an "uninterrupted" estimate of the sacrifice ratio. The
potential instability of results depending on model specifications (as reported in many empirical
studies) naturally constitutes a drawback to this approach, and this feature will be taken into account
by choosing the same model specification for each country within the euro zone. Our analysis thus lies
along the same lines as recent empirical studies from Cecchetti (1994), Cecchetti & Rich (2001), or
Boone & Mojon (1998).
We start with the following bivariate unrestricted Vector Auto Regression (VAR) model:

Ver
sion
pre
prin
t
Comment citer ce document :Durand, J.-J., Huchet-Bourdon, M., Licheron, J. (2008). Sacrifice ratio dispersion within the
Euro Zone: what can be learned about implementing a single monetary policy. International Reviewof Applied Economics, 22 (5), 601-621. DOI : 10.1080/02692170802287672
8
+∆Φ+∆Φ=∆
+∆Φ+∆Φ=∆
∑ ∑
∑ ∑
= =−−
= =−−
n
i
n
itit
iit
it
t
n
i
n
iit
iit
it
y
yy
1 1
22221
1
1 11211
..
..
µππ
µπ Tt ,...,1= (1)
where ty is the log of GDP at time t, tπ the inflation rate between time t-1 and time t expressed on an
annual basis, and [ ]′= 21, ttt µµµ the vector of innovations, which contains the shocks that affect the
vector of endogenous variables [ ]′∆∆= ttt yX π, at time t.
It is assumed that ),0( Σ≈ Niidtµ , where ∑ (variance-covariance matrix of the innovation vector)
is a diagonal matrix.
In this unrestricted representation, the innovations 1tµ and 2
tµ can't be ascribed any economic
interpretation. Since the purpose here is to explicitly evaluate the impact of a demand shock on both
inflation and real GDP, we must link the unrestricted VAR model to its underlying structural form.
That's why we seek to estimate the following structural VAR model, as extracted from Cecchetti
(1994):
+∆+∆+∆=∆
+∆+∆+∆=∆
∑ ∑
∑ ∑
= =−−
= =−−
n
i
n
itit
iit
itt
n
i
n
i
ytit
itit
it
bybyb
bbyby
1 12221
021
1 112
01211
...
...
πεππ
εππ Tt ,...,1= (2)
where [ ]′= πεεε ty
tt , is the vector innovation process, which contains the shocks to aggregate supply
ytε and aggregate demand πε t . The demand disturbance is assumed to be a monetary shock: this quite
restrictive assumption is the natural counterpart of the choice of a simple bivariate VAR model instead
of more complicated models, which are found in Cecchetti & Rich (2001) to generate a very high
imprecision in the sacrifice ratio estimates5. It is also assumed that ),0( Ω≈ Niidtε , where
Ω (variance-covariance matrix of the vector innovation process) is a diagonal matrix.

Ver
sion
pre
prin
t
Comment citer ce document :Durand, J.-J., Huchet-Bourdon, M., Licheron, J. (2008). Sacrifice ratio dispersion within the
Euro Zone: what can be learned about implementing a single monetary policy. International Reviewof Applied Economics, 22 (5), 601-621. DOI : 10.1080/02692170802287672
9
Considering the structural disturbances as exogenous variables and applying Wold's decomposition
theorem yields the infinite Vector Moving Average (VMA) representation of the structural model,
which will allow us first to compute the system impulse responses to structural shocks and thus to
estimate sacrifice ratios:
+=∆
+=∆
∑ ∑
∑ ∑∞
=
∞
=−−
∞
=
∞
=−−
0 02221
0 01211
..
..
i iit
iyit
it
i iit
iyit
it
aa
aay
π
π
εεπ
εε Tt ,...,1= (3)
In order to move from the reduced model form in (1) to the structural representation (2), a set of
identification rules is required. To derive estimates of the effects of structural disturbances ytε and
πε t , we must assume that the vector of innovations tµ is a linear combination of the simultaneous
structural shocks tε . Furthermore, the structural shocks are presumed to be uncorrelated and have unit
variances, which translates into I=Ω , where I is the identity matrix. To complete the identification
of the structural VAR model, we must adopt additional assumptions regarding the value of n.(n-1)/2
parameters (where n is the number of endogenous variables). In our case, n = 2; we thus need one
"identifying restriction", which can be taken from economic theory.
Following Blanchard & Quah's (1989) empirical work as well as Cecchetti & Rich's (2001) estimates
of sacrifice ratios, our additional identifying restriction is that aggregate demand shocks (denoted as
πε t up until now) have no permanent effect on the level of real GDP, unlike aggregate supply shocks
( ytε ). In other words, the cumulative long-run effect of a demand shock on real GDP is assumed to be
zero. Going back to the VMA representation from our structural VAR model (3), the long-run
identifying restriction can then be written as:
00
12 =∑∞
=i
ia (4)
We are aware that long-run neutrality of money is a questionable hypothesis: several theoretical as
well as empirical papers focusing on the euro area have shown recently that monetary policy should

Ver
sion
pre
prin
t
Comment citer ce document :Durand, J.-J., Huchet-Bourdon, M., Licheron, J. (2008). Sacrifice ratio dispersion within the
Euro Zone: what can be learned about implementing a single monetary policy. International Reviewof Applied Economics, 22 (5), 601-621. DOI : 10.1080/02692170802287672
10
have an effect on potential output due to "hysteresis" effects6. That is why we also try an alternative
identifying assumption to distinguish between the supply and demand shocks: we assume that demand
shocks do not have an instantaneous effect on inflation, unlike supply shocks. In other words, the
contemporaneous effect of a demand shock on inflation is assumed to be zero7. This short-run
identifying restriction translates into:
0022 =a (5)
Under the (quite restrictive) assumption that the aggregate demand shocks identified in the structural
VAR correspond to shifts in the stance of monetary policy, an estimate of the sacrifice ratio can be
obtained rather easily using the VMA representation (3). Computing the impulse response functions
yields estimates of parameters ia11, ia12 , ia21 and ia22. These coefficients will allow us to calculate the
sacrifice ratio )(τS over a given time horizon τ.
The denominator of this ratio is the cumulative final effect of a monetary policy shock πε t undertaken
at time t on the inflation rate level at time t+τ, while the numerator of the sacrifice ratio would be
defined as the cumulative output loss between times t and t+τ following the same monetary shock πε t :
it is not just the cumulative effect of this disturbance on the real GDP level at time t+τ, but the sum of
its effects through the first τ periods as well. The sacrifice ratio can thus ultimately be written as a
function of the time horizon τ, and computed as follows:
∑
∑ ∑∑
=
= =
+
=+
== τ
τ
πτ
τπ
δεδπ
δεδτ
022
0 012
0
)(
)(
)(
i
i
i
i
j
i
tt
jtjt
a
ay
S (6)
This statistical definition perfectly matches the literal one given previously: the sacrifice ratio can in
fact be seen as the cumulative impact on GDP level from a monetary policy shock that would
eventually reduce inflation by one percentage point between times t and t+τ.

Ver
sion
pre
prin
t
Comment citer ce document :Durand, J.-J., Huchet-Bourdon, M., Licheron, J. (2008). Sacrifice ratio dispersion within the
Euro Zone: what can be learned about implementing a single monetary policy. International Reviewof Applied Economics, 22 (5), 601-621. DOI : 10.1080/02692170802287672
11
4. Empirical Results
4.1. Preliminary Data Analysis
The purpose of this paper is to estimate a sacrifice ratio for each of the twelve EMU countries over the
period 1972:1-2003:4, which would allow us to evaluate the degree of structural dispersion among
these countries. We use quarterly data on real Gross Domestic Product (GDP) and inflation rate,
defined as the annual growth rate of the Consumer Price Index (CPI). GDP data have been converted
into logarithms (and denoted LGDP). Appendix A1 describes these data in further details.
A preliminary stationarity analysis of the series (correlograms, Augmented Dickey-Fuller (ADF) and
Phillips-Perron tests) suggests that real GDP and inflation rate are both I(1) processes (i.e. real GDP
and inflation rate both contain a unit root) in each of our twelve countries. In other words, it appears
that neither of the two series is stationary. This finding provides support for the definition of sacrifice
ratio as well as for our model specification. The denominator of the sacrifice ratio does in fact
correspond to the cumulative effect of a monetary shock on the inflation rate: in order to avoid a zero
denominator, deviations in the inflation rate from its initial level must be permanent (i.e. not just
transitory). Moreover, our long-run identifying restriction requires non-stationarity of the real GDP
series, since we are assuming that the aggregate supply shock exerts a permanent impact on the output
path. Lastly, real GDP and inflation are assumed to contain a unit root within our specification model;
this assumption perfectly suits our data.
That's why our structural VAR models are constructed with both the quarterly change in the log of real
GDP (first difference of log real GDP, denoted DLGDP) and the quarterly change in annual inflation
rate (first difference of annual inflation rate, denoted DINF).
4.2. Sacrifice Ratios Computations and Sub-Period Analyses
The first step in our estimation procedure entails choosing the optimal lag length in each country's
VAR model; this lag length must be sufficient to generate a vector of white-noise innovations, yet
must not be too high with respect to our sample length (only 128 quarters in each country). For this
choice, we make use of both information criteria (Akaike and Schwarz criteria) and likelihood ratio

Ver
sion
pre
prin
t
Comment citer ce document :Durand, J.-J., Huchet-Bourdon, M., Licheron, J. (2008). Sacrifice ratio dispersion within the
Euro Zone: what can be learned about implementing a single monetary policy. International Reviewof Applied Economics, 22 (5), 601-621. DOI : 10.1080/02692170802287672
12
tests (starting with a maximum of 12 lags and then testing whether or not the last lag is significant).
The various criteria suggest that four lags are to be taken for each of the twelve countries, which
would seem reasonable given the sample length and data frequency. This result also appears to be
consistent with the theoretical lags in the influence of monetary policy on output and prices8.
Another preliminary remark must be forwarded before turning our attention to the calculation of
sacrifice ratios: in order to take into account the effects of German reunification, a dummy variable is
introduced in the German system over the period 1991:1-1991:4. We have also added exogenous
variables in order to take into account the influence of the external environment. More precisely, we
use two exogenous variables: the change in the U.S. dollar price of oil and the change in the nominal
exchange rate versus the dollar (e.g. in the French VAR model, we have used the franc/dollar
exchange rate until 1999, and the euro/dollar exchange rate since then).
The second step in our estimation procedure consists of computing the impulse response functions of
the system to both a supply shock and a demand shock. The impulse response functions reached using
the long-run identifying restriction are reported in Appendix A29.
Aggregate supply shocks carry the series of GDP growth and inflation variation in opposite directions
over the short run. Moreover, the cumulative impulse response functions show that the effect of such a
shock on real output is permanent, while the effect on the inflation rate varies depending on the
country: for some countries (Austria, France, Germany, Greece, Luxembourg and the Netherlands) the
cumulative effect may prove to be permanent and negative, while for others (Belgium, Finland,
Ireland, Italy, Portugal and Spain) it may be a transitory negative effect offset thereafter by an inflation
acceleration linked to the simultaneous output growth acceleration.
As for aggregate demand shocks, presumed to be monetary policy shocks, our identifying restriction
precludes any long-run effects of such disturbances on real GDP. Besides, aggregate demand shocks
have permanent effects on the inflation rate. On the whole, the impact of monetary policy shocks on
the output path and inflation seems to be consistent with our definition of a sacrifice ratio.

Ver
sion
pre
prin
t
Comment citer ce document :Durand, J.-J., Huchet-Bourdon, M., Licheron, J. (2008). Sacrifice ratio dispersion within the
Euro Zone: what can be learned about implementing a single monetary policy. International Reviewof Applied Economics, 22 (5), 601-621. DOI : 10.1080/02692170802287672
13
The last step in our procedure then calls for calculating sacrifice ratios using the empirical
methodology explained in Section 3. Table 1 presents the estimates of these sacrifice ratios for a time
horizon set at five years in each EMU member country, when the long-run identifying restriction
suggested in Blanchard & Quah (1989) is employed.
Table 1. Sacrifice ratios in the euro area over the whole period (for a time horizon set to 5 years)
1972:1 - 2003:4
Austria 0,50014
Belgium -0,02035
Finland 0,22811
France 0,46404
Germany 0,75666
Greece 0,6095
Ireland 0,63086
Italy 0,46701
Luxembourg 2,06767
Netherlands 0,35528
Portugal 0,396
Spain 0,35907
Average 0,5678
Standard deviation 0,5131
Table 1 first reveals that the sacrifice ratio estimates are positive over the entire period 1972-2003 in
each country (except for Belgium), which indicates the presence of a short-run trade-off between
output and inflation. It may be observed that the structural VAR methodology employed in this paper,
unlike Ball’s (1994) episode-specific technique, leads to estimates of a linear combination of a true
sacrifice ratio during disinflations and a “benefit ratio” (according to Cecchetti, 1994) during
accelerating inflation episodes. The information content from episodes during which inflation and
output increase following a positive monetary policy shock is indeed as useful as any disinflation
episode can be10.
Moreover, our estimates of European sacrifice ratios are, on average, lower than those derived by
Cecchetti & Rich (2001) for the U.S. using the same model specification. For example, our
computations suggest that a one-percentage-point permanent reduction in the yearly inflation rate

Ver
sion
pre
prin
t
Comment citer ce document :Durand, J.-J., Huchet-Bourdon, M., Licheron, J. (2008). Sacrifice ratio dispersion within the
Euro Zone: what can be learned about implementing a single monetary policy. International Reviewof Applied Economics, 22 (5), 601-621. DOI : 10.1080/02692170802287672
14
entails a 0.46% cumulative output loss in France, over a five-year time horizon. Our results are
however very close to those reached by Cuñado & de Gracia (2003) with a Phillips Curve approach
over the extended period 1960-2001.
The sacrifice ratio estimates seem reasonably similar across euro area countries over the whole sample
period. In eight of the twelve cases, the sacrifice ratio lies within a range between 0.35 and 0.63%.
Only Germany and Luxembourg have higher sacrifice ratios, while Finland and Belgium exhibit lower
values (almost zero, yet negative in the case of Belgium).
Lastly, we can compare these results with those reached using bivariate structural VAR models with
the short-run identifying restriction to evaluate the robustness of our results to the specification of the
model. Results are reported in Appendix A3. It appears that the estimates of EMU sacrifice ratios are
somewhat higher when the short-run constraint is employed, which is perfectly consistent since the
cumulative effect of the monetary shock on the GDP level is not compelled to be nil in the long-run
any more.
A sub-period analysis however shows considerable variability in sacrifice ratios both over time and
across countries. The whole period has been split here into two sub-periods corresponding to
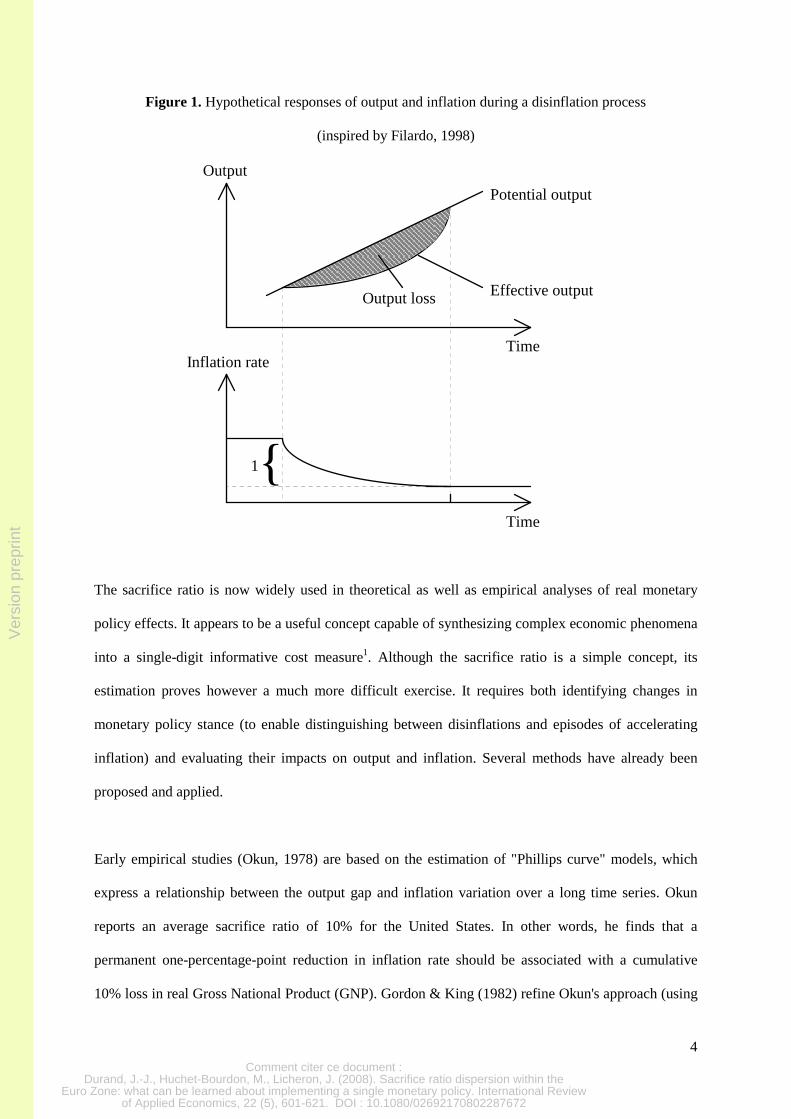
dissimilar economic conditions. The first one (1972:1-1993:4) exhibits sizeable fluctuations in
inflation rates during a high inflation regime: there is an inflation acceleration following the oil price
shocks of 1973 and 1979, and then a fast disinflation. The second sub-period (1994:1-2003:4) pertains
to a low inflation-variability period, with slow disinflation during a low inflation regime, which
illustrates the effects of the Maastricht Treaty and the move towards the EMU. Figures 2 and 3 display
these striking trends in the average euro area inflation rate and national inflation rates dispersion over
the period 1972-2003.

Ver
sion
pre
prin
t
Comment citer ce document :Durand, J.-J., Huchet-Bourdon, M., Licheron, J. (2008). Sacrifice ratio dispersion within the
Euro Zone: what can be learned about implementing a single monetary policy. International Reviewof Applied Economics, 22 (5), 601-621. DOI : 10.1080/02692170802287672
15
Figure 2. Average inflation rate within the euro area over the period 1972-2003
1972 1975 1978 1981 1984 1987 1990 1993 1996 19 99 20020.000
0.025
0.050
0.075
0.100
0.125
0.150
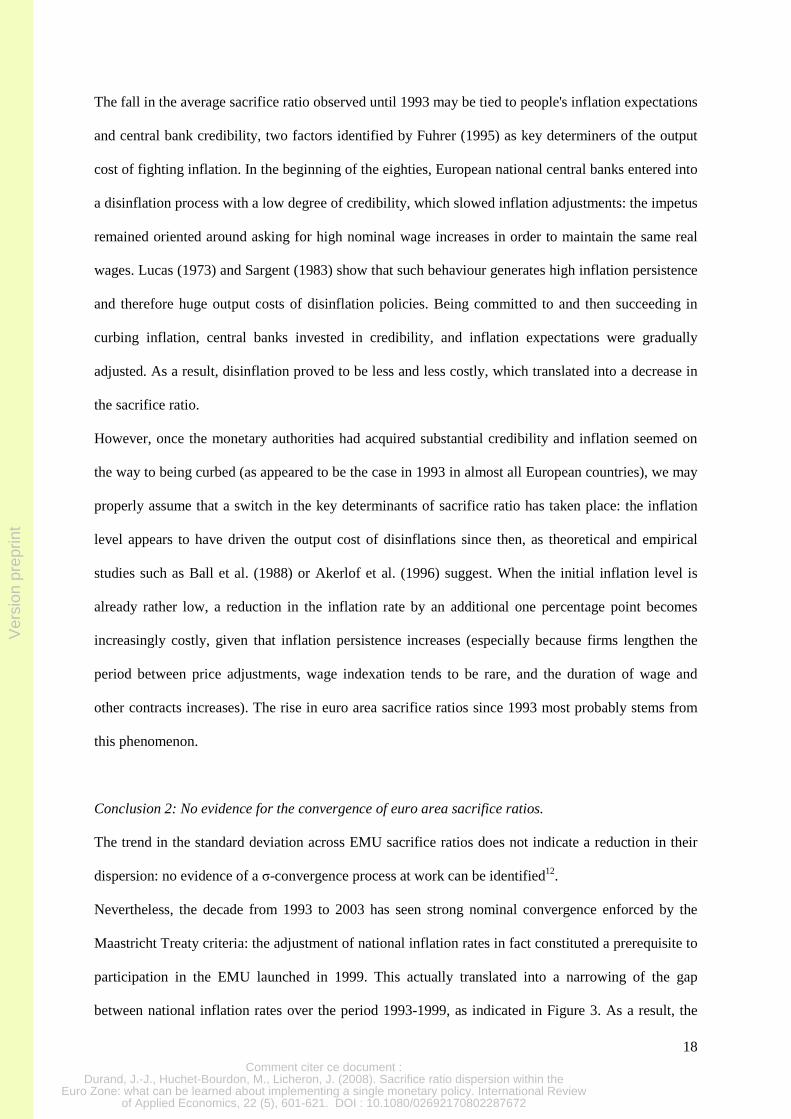
Figure 3. Standard deviation among euro area national inflation rates between 1972 and 2003
1972 1975 1978 1981 1984 1987 1990 1993 1996 19 99 20020.000
0.025
0.050
0.075
0.100
Table 2 provides evidence on significant differences in the sacrifice ratio estimates over the two sub-
periods. On average, sacrifice ratios are much higher during the second sub-period (1994-2003) than
during the first (1972-1993), while inflation rates clearly decrease. This finding would suggest the
existence of a negative relationship between the average level of inflation and the output cost of
disinflation: this relationship has been emphasized in many early studies, such as Ball (1994),
Andersen & Wascher (1999) and Cuñado & de Gracia (2003). This observation is also consistent with
the results reached using the short-run identifying restriction, displayed in Appendix A3. We will
focus specifically on this point in the subsequent discussion.

Ver
sion
pre
prin
t
Comment citer ce document :Durand, J.-J., Huchet-Bourdon, M., Licheron, J. (2008). Sacrifice ratio dispersion within the
Euro Zone: what can be learned about implementing a single monetary policy. International Reviewof Applied Economics, 22 (5), 601-621. DOI : 10.1080/02692170802287672
16
Sub-period estimates also show quite considerable differences in sacrifice ratios among European
countries, and the standard deviation associated with sacrifice ratios estimates clearly increases from
the first sub-period to the second.
Nevertheless, it must be noted that two out of the twelve countries exhibit negative sacrifice ratios
over each sub-period (yet often very close to zero). This result is rather disturbing and suggests that
disinflation can imply a gain in output or, conversely, that an increase in inflation rate can involve an
output loss.
Table 2. Sacrifice ratios in the euro area over the sub-periods (for a time horizon set to 5 years)
1972:1 - 1993:4 1994:1 - 2003:4
Austria 0,26187 2,31753
Belgium -0,13056 0,40801
Finland -0,00832 0,35287
France 0,5226 1,30708
Germany 0,98923 0,92066
Greece 0,60499 -0,38867
Ireland 0,57673 -0,00542
Italy 0,43662 0,37499
Luxembourg 1,60656 4,37024
Netherlands 0,25109 3,20054
Portugal 0,01349 0,89562
Spain 0,21989 0,8984
Average 0,4453 1,2210
Standard deviation 0,4805 1,4004
Finally, the calculation of standard deviations across European sacrifice ratios over sub-periods cannot
provide evidence of a convergence process within the euro area. In order to analyse with greater
precision the dynamics of sacrifice ratio dispersion within this area, we construct ten-year rolling
estimates over the period 1972-2003.
4.3. Rolling Estimates of the Sacrifice Ratio
The first step in this procedure is to estimate a sacrifice ratio for each country over each ten-year sub-
period. The first estimate refers to the period 1972:1-1981:4, and the sacrifice ratio obtained using our

Ver
sion
pre
prin
t
Comment citer ce document :Durand, J.-J., Huchet-Bourdon, M., Licheron, J. (2008). Sacrifice ratio dispersion within the
Euro Zone: what can be learned about implementing a single monetary policy. International Reviewof Applied Economics, 22 (5), 601-621. DOI : 10.1080/02692170802287672
17
bivariate VAR model with the long-run identifying restriction11 for a five-year horizon is given at the
date 1981:4. Similarly, the result for the date 1982:1 consists of the sacrifice ratio estimate over the
period 1972:2-1982:1. We proceed in this way until the period 1994:1-2003:4, with the result reported
in 2003:4. A measurement of the sacrifice ratio is therefore obtained for each quarter over the period
1981:4-2003:4.
The second step then seeks to evaluate the sigma-convergence (σ-convergence) process using the
standard deviation of sacrifice ratios across countries as a dispersion indicator. This step leads us to
computing the average euro area sacrifice ratio and the standard deviation across European countries
for each quarter over the period 1981:4-2003:4. Figure 4 displays the trends in these two indicators
within the EMU.
Figure 4. Average and standard deviation of European sacrifice ratios,
obtained using ten-year rolling estimates
1981 1983 1985 1987 1989 1991 1993 1995 1997 1999 2001 2003-2
-1
0
1
2
3
4
5
6SD DEVIATION AVERAGE
A detailed analysis of these trends would appear to entail two main findings.
Conclusion 1: A recent increase in the euro area average sacrifice ratio.
Figure 4 confirms and refines the trend in the average sacrifice ratio suggested by means of sub-period
analysis: this average ratio decreases until 1993, moving from 1.0 in 1981:4 (an estimate over the
period 1972:1-1981:4) to -0.80 in 1993:2 (an estimate over the period 1983:3-1993:2), and tends to
increase since.
Ver
sion
pre
prin
t
Comment citer ce document :Durand, J.-J., Huchet-Bourdon, M., Licheron, J. (2008). Sacrifice ratio dispersion within the
Euro Zone: what can be learned about implementing a single monetary policy. International Reviewof Applied Economics, 22 (5), 601-621. DOI : 10.1080/02692170802287672
18
The fall in the average sacrifice ratio observed until 1993 may be tied to people's inflation expectations
and central bank credibility, two factors identified by Fuhrer (1995) as key determiners of the output
cost of fighting inflation. In the beginning of the eighties, European national central banks entered into
a disinflation process with a low degree of credibility, which slowed inflation adjustments: the impetus
remained oriented around asking for high nominal wage increases in order to maintain the same real
wages. Lucas (1973) and Sargent (1983) show that such behaviour generates high inflation persistence
and therefore huge output costs of disinflation policies. Being committed to and then succeeding in
curbing inflation, central banks invested in credibility, and inflation expectations were gradually
adjusted. As a result, disinflation proved to be less and less costly, which translated into a decrease in
the sacrifice ratio.
However, once the monetary authorities had acquired substantial credibility and inflation seemed on
the way to being curbed (as appeared to be the case in 1993 in almost all European countries), we may
properly assume that a switch in the key determinants of sacrifice ratio has taken place: the inflation
level appears to have driven the output cost of disinflations since then, as theoretical and empirical
studies such as Ball et al. (1988) or Akerlof et al. (1996) suggest. When the initial inflation level is
already rather low, a reduction in the inflation rate by an additional one percentage point becomes
increasingly costly, given that inflation persistence increases (especially because firms lengthen the
period between price adjustments, wage indexation tends to be rare, and the duration of wage and
other contracts increases). The rise in euro area sacrifice ratios since 1993 most probably stems from
this phenomenon.
Conclusion 2: No evidence for the convergence of euro area sacrifice ratios.
The trend in the standard deviation across EMU sacrifice ratios does not indicate a reduction in their
dispersion: no evidence of a σ-convergence process at work can be identified12.
Nevertheless, the decade from 1993 to 2003 has seen strong nominal convergence enforced by the
Maastricht Treaty criteria: the adjustment of national inflation rates in fact constituted a prerequisite to
participation in the EMU launched in 1999. This actually translated into a narrowing of the gap
between national inflation rates over the period 1993-1999, as indicated in Figure 3. As a result, the
Ver
sion
pre
prin
t
Comment citer ce document :Durand, J.-J., Huchet-Bourdon, M., Licheron, J. (2008). Sacrifice ratio dispersion within the
Euro Zone: what can be learned about implementing a single monetary policy. International Reviewof Applied Economics, 22 (5), 601-621. DOI : 10.1080/02692170802287672
19
divergence of sacrifice ratios among EMU countries observed since 1993 cannot be explained by
inflation differentials, nor can it stem from huge differences in the credibility of monetary authorities,
particularly since 1999 (i.e. since the creation of the ECB). Consequently, persistent differences in the
output cost of fighting inflation could certainly be explained by structural disparities, especially
differences in wage and price rigidities on European markets.
5. Conclusions
Computing sacrifice ratios for the twelve euro area countries and analysing their dynamics over the
period 1972:1-2003:4 would suggest two main conclusions.
First, the level of inflation seems to play nowadays an essential role in the output cost of fighting
inflation: the sacrifice ratio appears to be particularly high within a low-inflation environment. This
result is perfectly in line with the findings reached in recent theoretical and empirical studies (Ball et
al., 1988; Ball, 1994; Akerlof et al., 1996; Andersen and Wascher, 1999; Cuñado and de Gracia, 2003;
Zhang, 2005). It also proves to be quite a robust result despite the instability in sacrifice ratio
estimates. Besides, the negative relationship between the inflation level and the value of the sacrifice
ratio in conditions of low inflation can be seen as another justification for the clarification of the
ECB's monetary policy strategy that was announced in May 2003: the ECB's Governing Council made
clear that, in the pursuit of price stability, it aims to "maintain inflation rates below, but close to, 2%
over the medium term" (European Central Bank, 2003, p. 79). This clarification appeared as an
explicit recognition of the risks and costs associated with a zero inflation target. The ECB identified
four potential arguments for tolerating small positive inflation rates: the risk of deflation, the
possibility of an upward measurement bias in the inflation rate, the presence of downward nominal
rigidities in prices and wages13, and finally the existence of structural inflation differentials. Our
results provide an additional argument for small positive inflation rates, since they indicate that an
objective of perfect price stability should give rise to huge output costs14.
Second, our results suggest that the nominal convergence observed since 1993 did not trigger a true
convergence process of European sacrifice ratios. Following Boone & Mojon (1998), i.e. using the
comparison of these sacrifice ratios as an indicator for structural proximity, we cannot provide

Ver
sion
pre
prin
t
Comment citer ce document :Durand, J.-J., Huchet-Bourdon, M., Licheron, J. (2008). Sacrifice ratio dispersion within the
Euro Zone: what can be learned about implementing a single monetary policy. International Reviewof Applied Economics, 22 (5), 601-621. DOI : 10.1080/02692170802287672
20
evidence of a reduction in structural differences among EMU countries. More precisely, differences in
European sacrifice ratios could partly come from differences in European goods and labour markets.
Many empirical studies, such as Ball (1994), show that wage rigidity is an essential determinant of the
sacrifice ratio. Recent macroeconomic comparisons of European countries precisely emphasize
remaining differences in nominal wage rigidities, resulting from disparities in wage-setting institutions
(frequency of wages adjustment, degree of indexation, synchronisation of adjustment across sectors).
These disparities may still remain for a long time, implying persistent differences in European
sacrifice ratios. Such differences are likely to raise an important issue within the single monetary
policy framework, since they imply that the same monetary impulse should entail various reactions
from one country to another.
Nevertheless, our results do not allow for a quantification of the relationship between labour market
rigidities and the output cost of fighting inflation. Future research should try to assess with more
precision the influence of remaining disparities between European labour markets in the dispersion of
sacrifice ratios.

Ver
sion
pre
prin
t
Comment citer ce document :Durand, J.-J., Huchet-Bourdon, M., Licheron, J. (2008). Sacrifice ratio dispersion within the
Euro Zone: what can be learned about implementing a single monetary policy. International Reviewof Applied Economics, 22 (5), 601-621. DOI : 10.1080/02692170802287672
21
Appendix A1: Description and Preliminary Analysis of the Data
We construct sacrifice ratios estimates from structural VAR models using quarterly inflation and
output data for the twelve EMU countries over the sample period 1972:1-2003:4. Inflation is measured
by the annual growth rate of the Consumer Price Index (CPI). For output, we use real Gross Domestic
Product (GDP), in 1995 U.S. dollars expressed in Purchasing Power Parity (PPP). These series are
extracted from the OECD Economic Outlook
A preliminary stationarity analysis of the series is essential. Standard stationarity tests are
implemented: Augmented Dickey-Fuller (ADF) tests (introduced in Dickey & Fuller, 1981), and
Phillips-Perron tests (Phillips & Perron, 1988). For each country within the euro area, the series of real
GDP and inflation rates prove to be non-stationary (i.e. variables contain a unit root). These findings
are indeed consistent with our model specification: the first differences of real GDP and inflation rate
can be introduced into our VAR model, which requires stationary variables.
Since we have shown that both real GDP and inflation rate contain a unit root, we must also check that
these two series do not cointegrate. In order to grasp the cointegration hypothesis, we employ the
methodology and tests proposed in Engle & Granger (1987). Computation of the CRDW
(Cointegration Regression Durbin Watson) statistic associated with the cointegration relation, as well
as the use of ADF tests on the series of estimated residuals, leads to the same result in each of twelve
euro area countries: we cannot reject the null hypothesis of non-stationarity. In the end, real GDP and
the inflation rate clearly do not cointegrate. We can note that this finding reinforces the key identifying
restriction from our structural VAR model, which implies that monetary policy shocks do not exert
permanent long-run effects on the real GDP level.

Ver
sion
pre
prin
t
Comment citer ce document :Durand, J.-J., Huchet-Bourdon, M., Licheron, J. (2008). Sacrifice ratio dispersion within the
Euro Zone: what can be learned about implementing a single monetary policy. International Reviewof Applied Economics, 22 (5), 601-621. DOI : 10.1080/02692170802287672
22
Appendix A2: Cumulative Impulse Response Functions of Bivariate Structural VAR
Models over the Period 1972-2003
AUSTRIA
Res
po
nse
s o
f
DLGDP
DINF
Supply Shock Demand Shock
0 2 4 6 8 10 12 14 16 18 20 22-0.002
0.000
0.002
0.004
0.006
0.008
0.010
0.012
0.014
0 2 4 6 8 10 12 14 16 18 20 22-0.002
0.000
0.002
0.004
0.006
0.008
0.010
0.012
0.014
0 2 4 6 8 10 12 14 16 18 20 22-0.0075
-0.0050
-0.0025
0.0000
0.0025
0.0050
0.0075
0 2 4 6 8 10 12 14 16 18 20 22-0.0075
-0.0050
-0.0025
0.0000
0.0025
0.0050
0.0075
BELGIUM
Res
po
nse
s o
f
DLGDP
DINF
Supply Shock Demand Shock
0 2 4 6 8 10 12 14 16 18 20 22-0.002
0.000
0.002
0.004
0.006
0.008
0.010
0.012
0 2 4 6 8 10 12 14 16 18 20 22-0.002
0.000
0.002
0.004
0.006
0.008
0.010
0.012
0 2 4 6 8 10 12 14 16 18 20 22-0.004
-0.002
0.000
0.002
0.004
0.006
0.008
0 2 4 6 8 10 12 14 16 18 20 22-0.004
-0.002
0.000
0.002
0.004
0.006
0.008
FINLAND
Res
po
nse
s o
f
DLGDP
DINF
Supply Shock Demand Shock
0 2 4 6 8 10 12 14 16 18 20 22-0.005
0.000
0.005
0.010
0.015
0.020
0.025
0.030
0.035
0.040
0 2 4 6 8 10 12 14 16 18 20 22-0.005
0.000
0.005
0.010
0.015
0.020
0.025
0.030
0.035
0.040
0 2 4 6 8 10 12 14 16 18 20 22-0.0100
-0.0075
-0.0050
-0.0025
0.0000
0.0025
0.0050
0.0075
0.0100
0.0125
0 2 4 6 8 10 12 14 16 18 20 22-0.0100
-0.0075
-0.0050
-0.0025
0.0000
0.0025
0.0050
0.0075
0.0100
0.0125

Ver
sion
pre
prin
t
Comment citer ce document :Durand, J.-J., Huchet-Bourdon, M., Licheron, J. (2008). Sacrifice ratio dispersion within the
Euro Zone: what can be learned about implementing a single monetary policy. International Reviewof Applied Economics, 22 (5), 601-621. DOI : 10.1080/02692170802287672
23
FRANCER
esp
on
ses
of
DLGDP
DINF
Supply Shock Demand Shock
0 2 4 6 8 10 12 14 16 18 20 22-0.002
0.000
0.002
0.004
0.006
0.008
0.010
0.012
0 2 4 6 8 10 12 14 16 18 20 22-0.002
0.000
0.002
0.004
0.006
0.008
0.010
0.012
0 2 4 6 8 10 12 14 16 18 20 22-0.0050
-0.0025
0.0000
0.0025
0.0050
0.0075
0 2 4 6 8 10 12 14 16 18 20 22-0.0050
-0.0025
0.0000
0.0025
0.0050
0.0075
GERMANY
Res
po
nse
s o
f
DLGDP
DINF
Supply Shock Demand Shock
0 2 4 6 8 10 12 14 16 18 20 22-0.002
0.000
0.002
0.004
0.006
0.008
0.010
0.012
0 2 4 6 8 10 12 14 16 18 20 22-0.002
0.000
0.002
0.004
0.006
0.008
0.010
0.012
0 2 4 6 8 10 12 14 16 18 20 22-0.003
-0.002
-0.001
0.000
0.001
0.002
0.003
0.004
0.005
0.006
0 2 4 6 8 10 12 14 16 18 20 22-0.003
-0.002
-0.001
0.000
0.001
0.002
0.003
0.004
0.005
0.006
GREECE
Res
po
nse
s o
f
DLGDP
DINF
Supply Shock Demand Shock
0 2 4 6 8 10 12 14 16 18 20 22-0.008
-0.004
0.000
0.004
0.008
0.012
0.016
0.020
0.024
0.028
0 2 4 6 8 10 12 14 16 18 20 22-0.008
-0.004
0.000
0.004
0.008
0.012
0.016
0.020
0.024
0.028
0 2 4 6 8 10 12 14 16 18 20 22-0.020
-0.015
-0.010
-0.005
0.000
0.005
0.010
0.015
0.020
0.025
0 2 4 6 8 10 12 14 16 18 20 22-0.020
-0.015
-0.010
-0.005
0.000
0.005
0.010
0.015
0.020
0.025

Ver
sion
pre
prin
t
Comment citer ce document :Durand, J.-J., Huchet-Bourdon, M., Licheron, J. (2008). Sacrifice ratio dispersion within the
Euro Zone: what can be learned about implementing a single monetary policy. International Reviewof Applied Economics, 22 (5), 601-621. DOI : 10.1080/02692170802287672
24
IRELANDR
esp
on
ses
of
DLGDP
DINF
Supply Shock Demand Shock
0 2 4 6 8 10 12 14 16 18 20 22-0.005
0.000
0.005
0.010
0.015
0.020
0.025
0.030
0 2 4 6 8 10 12 14 16 18 20 22-0.005
0.000
0.005
0.010
0.015
0.020
0.025
0.030
0 2 4 6 8 10 12 14 16 18 20 22-0.0025
0.0000
0.0025
0.0050
0.0075
0.0100
0.0125
0.0150
0.0175
0 2 4 6 8 10 12 14 16 18 20 22-0.0025
0.0000
0.0025
0.0050
0.0075
0.0100
0.0125
0.0150
0.0175
ITALY
Res
po
nse
s o
f
DLGDP
DINF
Supply Shock Demand Shock
0 2 4 6 8 10 12 14 16 18 20 22-0.0025
0.0000
0.0025
0.0050
0.0075
0.0100
0.0125
0.0150
0 2 4 6 8 10 12 14 16 18 20 22-0.0025
0.0000
0.0025
0.0050
0.0075
0.0100
0.0125
0.0150
0 2 4 6 8 10 12 14 16 18 20 22-0.006
-0.004
-0.002
0.000
0.002
0.004
0.006
0.008
0.010
0.012
0 2 4 6 8 10 12 14 16 18 20 22-0.006
-0.004
-0.002
0.000
0.002
0.004
0.006
0.008
0.010
0.012
LUXEMBOURG
Res
po
nse
s o
f
DLGDP
DINF
Supply Shock Demand Shock
0 2 4 6 8 10 12 14 16 18 20 22-0.005
0.000
0.005
0.010
0.015
0.020
0.025
0.030
0 2 4 6 8 10 12 14 16 18 20 22-0.005
0.000
0.005
0.010
0.015
0.020
0.025
0.030
0 2 4 6 8 10 12 14 16 18 20 22-0.0050
-0.0025
0.0000
0.0025
0.0050
0.0075
0 2 4 6 8 10 12 14 16 18 20 22-0.0050
-0.0025
0.0000
0.0025
0.0050
0.0075

Ver
sion
pre
prin
t
Comment citer ce document :Durand, J.-J., Huchet-Bourdon, M., Licheron, J. (2008). Sacrifice ratio dispersion within the
Euro Zone: what can be learned about implementing a single monetary policy. International Reviewof Applied Economics, 22 (5), 601-621. DOI : 10.1080/02692170802287672
25
NETHERLANDSR
esp
on
ses
of
DLGDP
DINF
Supply Shock Demand Shock
0 2 4 6 8 10 12 14 16 18 20 22-0.0025
0.0000
0.0025
0.0050
0.0075
0.0100
0.0125
0 2 4 6 8 10 12 14 16 18 20 22-0.0025
0.0000
0.0025
0.0050
0.0075
0.0100
0.0125
0 2 4 6 8 10 12 14 16 18 20 22-0.006
-0.004
-0.002
0.000
0.002
0.004
0.006
0.008
0 2 4 6 8 10 12 14 16 18 20 22-0.006
-0.004
-0.002
0.000
0.002
0.004
0.006
0.008
PORTUGAL
Res
po
nse
s o
f
DLGDP
DINF
Supply Shock Demand Shock
0 2 4 6 8 10 12 14 16 18 20 22-0.006
0.000
0.006
0.012
0.018
0.024
0.030
0.036
0.042
0 2 4 6 8 10 12 14 16 18 20 22-0.006
0.000
0.006
0.012
0.018
0.024
0.030
0.036
0.042
0 2 4 6 8 10 12 14 16 18 20 22-0.010
-0.005
0.000
0.005
0.010
0.015
0.020
0 2 4 6 8 10 12 14 16 18 20 22-0.010
-0.005
0.000
0.005
0.010
0.015
0.020
SPAIN
Res
po
nse
s o
f
DLGDP
DINF
Supply Shock Demand Shock
0 2 4 6 8 10 12 14 16 18 20 22-0.005
0.000
0.005
0.010
0.015
0.020
0.025
0 2 4 6 8 10 12 14 16 18 20 22-0.005
0.000
0.005
0.010
0.015
0.020
0.025
0 2 4 6 8 10 12 14 16 18 20 22-0.0075
-0.0050
-0.0025
0.0000
0.0025
0.0050
0.0075
0.0100
0.0125
0 2 4 6 8 10 12 14 16 18 20 22-0.0075
-0.0050
-0.0025
0.0000
0.0025
0.0050
0.0075
0.0100
0.0125

Ver
sion
pre
prin
t
Comment citer ce document :Durand, J.-J., Huchet-Bourdon, M., Licheron, J. (2008). Sacrifice ratio dispersion within the
Euro Zone: what can be learned about implementing a single monetary policy. International Reviewof Applied Economics, 22 (5), 601-621. DOI : 10.1080/02692170802287672
26
Appendix A3: Results with a short-run identifying restriction in our bivariate SVAR
1972:1 - 2003:4 1972:1 - 1993:4 1994:1 - 2003:4
Austria 1,19266 1,06486 4,16593
Belgium 0,94466 0,64578 -1,78837
Finland 0,53685 0,50535 2,38611
France 1,49168 1,36303 2,33001
Germany 1,23477 1,11272 -2,29423
Greece 0,37302 0,38398 7,67982
Ireland 0,811838 -7,94239 9,93875
Italy 0,52069 0,55895 0,66125
Luxembourg 2,8273 1,0876 1,3602
Netherlands 0,67632 0,5465 -3,26618
Portugal 4,93517 6,43298 2,05215
Spain 0,38437 0,3352 0,78658
Average 1,3274 0,5079 2,0010
Standard deviation 1,3222 3,1381 3,8663
Ver
sion
pre
prin
t
Comment citer ce document :Durand, J.-J., Huchet-Bourdon, M., Licheron, J. (2008). Sacrifice ratio dispersion within the
Euro Zone: what can be learned about implementing a single monetary policy. International Reviewof Applied Economics, 22 (5), 601-621. DOI : 10.1080/02692170802287672
27
References
Akerlof, G.A., Dickens, W.T. & Perry, G.L. (1996) The Macroeconomics of Low Inflation, Brookings
Papers on Economic Activity, 1, pp. 1-59.
Akerlof, G.A., Dickens, W.T. & Perry, G.L. (2000) Near-Rational Wage and Price Setting and the
Long-Run Phillips Curve, Brookings Papers on Economic Activity, 1, pp. 1-44.
Andersen, P.S. & Wascher, W.L. (1999) Sacrifice Ratios and the Conduct of Monetary Policy in
Conditions of Low Inflation, BIS Working Paper 82.
Ball, L. (1994) What Determines the Sacrifice Ratio? , in: N.G. Mankiw (Ed.), Monetary Policy, pp.
155-182 (Chicago, Chicago University Press).
Ball, L. (1999) Aggregate Demand and Long-Run Unemployment, Brookings Papers on Economic
Activity, 2, pp. 189-251.
Ball, L., & Mankiw, N.G. (2002) The NAIRU in Theory and Practice, Journal of Economic
Perspectives, 16 (4), pp. 115-136.
Ball, L., Mankiw, N.G. & Romer, D. (1988) The New Keynesian Economics and the Output-Inflation
Trade-off, Brookings Papers on Economic Activity, 1, pp. 1-65.
Blanchard, O.J. & Quah, D. (1989) The Dynamic Effects of Aggregate Demand and Supply
Disturbances, American Economic Review, 79 (4), pp. 655-673.
Boone, L. & Mojon, B. (1998) Sacrifice Ratios in Europe: a Comparison, CEPII Working Paper 07.
Cecchetti, S.G. (1994) Comment, in: N. G. Mankiw (Ed.), Monetary Policy, pp. 188-193 (Chicago,
Chicago University Press).
Cecchetti, S.G. & Rich, R.W. (2001) Structural Estimates of the U.S. Sacrifice Ratio, Journal of
Business and Economic Statistics, 19 (4), pp. 416-427.
Cuñado, J. & de Gracia, F.P. (2003) Sacrifice Ratios: Some Lessons from EMU Countries, 1960-2001,
International Review of Applied Economics, 17(3), pp. 327-337.
Dickey, D.A. & Fuller, W.A. (1981) Likelihood Ratio Statistics for Autoregressive Time Series with a
Unit Root, Econometrica, 49 (4), pp. 1057-1072.

Ver
sion
pre
prin
t
Comment citer ce document :Durand, J.-J., Huchet-Bourdon, M., Licheron, J. (2008). Sacrifice ratio dispersion within the
Euro Zone: what can be learned about implementing a single monetary policy. International Reviewof Applied Economics, 22 (5), 601-621. DOI : 10.1080/02692170802287672
28
Engle, R.F. & Granger, C.W.J. (1987) Cointegration and Error Correction: Representation, Estimation
and Testing, Econometrica, 55 (2), pp. 251-276.
European Central Bank (2003) The Outcome of the ECB's Evaluation of its Monetary Policy Strategy,
Monthly Bulletin, June, pp. 79-92.
Filardo, A.J. (1998) New Evidence on the Output Cost of Fighting Inflation, Federal Reserve Bank of
Kansas City Economic Review, 83 (3), pp. 33-61.
Fuhrer, J.C. (1995) The Persistence of Inflation and the Cost of Disinflation, New England Economic
Review, January/February, pp. 3-16.
Gordon, R.J. & King, S.R. (1982) The Output Cost of Disinflation in Traditional and Vector
Autoregressive Models, Brookings Papers on Economic Activity, 1, pp. 205-242.
Jordan, T.J. (1997) Disinflation Costs, Accelerating Inflation Gains and Central Bank Independence,
Review of World Economics /Weltwirtschaftliches Archiv, 133 (1), pp. 1-21.
Logeay, C. & Tober, S. (2006) Hysteresis and the Nairu in the Euro Area, Scottish Journal of Political
Economy, 53 (4), pp. 409-429.
Lucas, R.E. (1973) Some International Evidence on Output-Inflation Tradeoffs, American Economic
Review, 63 (3), pp. 326-334.
Neely, C.J. & Waller, C.J. (1997) A Benefit-Cost Analysis of Disinflation, Contemporary Economic
Review, 15 (1), pp. 50-64.
Okun, A.M. (1978) Efficient Disinflationary Policies, American Economic Review, 68 (2), pp. 348-
352.
Phillips, P.C.B. & Perron, P. (1988) Testing for a Unit Root in Time Series Regression, Biometrika,
75, pp. 335-346.
Sargent, T.J. (1983) Stopping Moderate Inflations: the Methods of Poincaré and Thatcher, in: R.
Dornbusch and M.H. Simonsen (Eds.), Inflation, Debt and Indexation (Cambridge, Mass.: MIT
Press).
Zhang, L.H. (2005) Sacrifice Ratios with Long-Lived Effects, International Finance, 8 (2), pp. 231-
262.
Ver
sion
pre
prin
t
Comment citer ce document :Durand, J.-J., Huchet-Bourdon, M., Licheron, J. (2008). Sacrifice ratio dispersion within the
Euro Zone: what can be learned about implementing a single monetary policy. International Reviewof Applied Economics, 22 (5), 601-621. DOI : 10.1080/02692170802287672
29
Notes
We are indebted to two anonymous referees for insightful comments. We also wish to thank the participants at
seminars at the 22nd Symposium on Banking and Monetary Economics (France, Strasbourg, June 2005) for
helpful comments on a earlier version of this paper.
1 Two key comments need to be made regarding the definition of a sacrifice ratio. First, this ratio is not a
measure of the net cost of disinflation: it does not take into account the long-term benefits associated with lower
inflation. Second, the output cost is only one cost among others resulting from disinflation, as Filardo (1998)
notes. Recessions associated with large inflation reductions not only lower GDP but also induce other costs that
are much more difficult to measure: personal costs borne by the unemployed, failed businesses, or a widening of
the income distribution.
2 As Filardo (1998) notes, Okun's (1978) empirical works, as well as Gordon & King's (1982), are based on the
implicit assumption of a linear Phillips curve, an assumption that is quite restrictive and questionable. We will
see later on that this assumption of linearity is also one of the limitations of the structural VAR methodology.
However, unlike the Phillips curve approach, structural modelling allows for a distinction between exogenous
shocks and endogenous reactions of the system.
3 Ball (1994) applies his episode-specific methodology to 19 OECD member countries using annual data over
the period 1960-1991, and then to a sub-group of 9 of these countries using quarterly data over the same period.
4 See, for example, Jordan (1997), Neely & Waller (1997) or Zhang (2005).
5 As emphasized by an anonymous referee, assuming the demand disturbance to be a monetary shock for the
considered period is a strong assumption. However, preliminary attempts using a three-variable model (including
the short-term nominal interest rate) have reached the same conclusions as with our bivariate model. Besides,
Cecchetti & Rich (2001) however show that the imprecision in sacrifice ratio estimates increases with the
number of endogenous variables. For these reasons, we concentrate solely on a two-variable system, and
associate shifts in monetary policy with the aggregate demand shock.
6 Demand shocks, especially monetary policy shocks, should distort the path of potential output and thus have an
impact on the Nairu (Non-Accelerating Inflation Rate of Unemployment). In the case of EMU countries, Logeay
& Tober (2006) stress the dependence of the Nairu on actual unemployment, which entails the existence of
"hysteresis effects". This hysteresis phenomenon implies the possibility of a long-run non-neutrality of monetary
policy, as described in Ball (1999), Ball & Mankiw (2002) and Zhang (2005).

Ver
sion
pre
prin
t
Comment citer ce document :Durand, J.-J., Huchet-Bourdon, M., Licheron, J. (2008). Sacrifice ratio dispersion within the
Euro Zone: what can be learned about implementing a single monetary policy. International Reviewof Applied Economics, 22 (5), 601-621. DOI : 10.1080/02692170802287672
30
7 This assumption is also questionable since we have quarterly data: several recent empirical studies suggest that
monetary impulses would affect the inflation rate with a lag of two to three months in the euro area.
8 We should note however that the hypothesis of five optimal lags has proved relevant in some cases, which is
why the VAR models have also been estimated using five lags. Results are not reported here, but they are close
to those obtained using four lags, which attest to a certain amount of robustness in our results.
9 Impulse response functions obtained with the short-run identifying restriction are available upon request from
the authors. The responses of inflation and output to the supply shock are in line with those reached using the
decomposition proposed by Blanchard & Quah (1989). However, the cumulative response of output to the
demand shock appears to be significantly positive in most countries, which would entail the existence of
"hysteresis effects".
10 Provided that we assume symmetry in the real short-run effects of monetary policy, i.e. equivalence between
the positive effects of monetary expansion and the negative effects of restrictive monetary policy. This
questionable assumption represents one of the limitations inherent in the VAR modelling approach.
11 If we employ the short-run constraint described above, we get higher estimates of the average sacrifice ratio as
well as higher values for their standard deviation. However, the evolution of the average sacrifice ratio and the
dynamics of the standard deviation of rolling estimates over the period 1972:1-2003:4 are very similar to the
conclusions reached with the long-run constraint.
12 We have also used other indicators to evaluate the degree of dispersion within euro area sacrifice ratios: the
simple spread (which measures the difference between the highest and lowest estimates of the sacrifice ratio at
each date), or the spread between the average of the three countries with the highest and lowest sacrifice ratios
(in order to adjust for the sensitiveness of the simple spread to outliers). Results are not reported herein, but these
two alternative dispersion indicators broadly exhibit the same behaviour as the unweighted standard deviation:
there is no clear evidence of a decrease in the dispersion of sacrifice ratios.
13 Many theoretical and empirical studies, such as Akerlof et al. (1996, 2000), show that a moderate level of
inflation could provide some "grease" to the price and wage setting process.
14 Of course, our findings say nothing about the optimal rate of inflation, since we only analyse the short-term
output costs of fighting inflation. Further empirical analysis should try to balance more precisely the relative
costs and benefits of a zero inflation target versus a small positive inflation rate.