Sa/c~ * ~f Capita/ js~cti Individital - Internal Revenue Service
160
STATISTICS OF INCOME 0 M , 1962 Supplemental Report Sa /c~ * ~f Cap ita / js~ct i reported on ' Individital INCOME TAX. RETURNS, U. S. TREASURY DEPARTMENT - ONTERNAL REVENUE SERVOCE
-
Upload
khangminh22 -
Category
Documents
-
view
0 -
download
0
Transcript of Sa/c~ * ~f Capita/ js~cti Individital - Internal Revenue Service

STATISTICS OF INCOME 0 M , 1962
Supplemental Report
Sa/c~ * ~f Capita/ js~ctireported on'
IndividitalINCOME TAX.RETURNS,
U. S. TREASURY DEPARTMENT - ONTERNAL REVENUE SERVOCE
Statistics of Income / 1962Supplemental Report
Sales of CapitalAssetsreported on
IndividualINCOME TAX
RETURNS
L
111111
Prepared vnder the direction of the
Commissioner of Internal Revenue
by the Statistics Division
U. S. TREASURY DEPARTMENT Intrrnal Reveizzie Strvice - Publication No. 458 (10-66)

. INTERNAL REVENUE SERVICE
SHELDON S. COHEN Commissioner
WILLIAM H. SMITH Deputy Commissioner
ALBERT W. BRISBIN Assistant Commissioner (Planni7W and Research)
VITO NATRELLADirector
JAMES M. JARRETTAssistant Director
THOMAS F. McHUGHSTATISTICS Chief, Income, Finance, and Wealth BranchDIVISION TED E. McHOLD
Chief, Statistical Techniques BranchHERMAN E. GUTERMAN
Associate Chief, Statistical Techniques BranchROBERT J. TOLLIVER
Chief, Program Management Branch
This report on sales of capital assets by individualswas prepared under the direction of Norman Adler, SupervisoryStatistician in the Income, Finance, and Wealth Branch, assistedby Frank M. Malanga.
Other branches of the Statistics Division assisted indevelopment of the sample design and the computer systems de-sign, the preparation of processing procedures, and the post-tabulation review of the data. Statistical and computer processingof the data were conducted by the service centers at Ogden, Utah;Kansas City, Missouri; Lawrence, Massachusetts; and Chamblee,Georgia.
For sale by the Superintendent of Documents, U. S. Government Printing Office,
Washington, D. C. 20402 - Price $1 (paper covers)
i

Letter of Transmittal
Treasury Department,Office of Commissioner of Internal Revenue,
Washington, D. C., September 6, 1966.
Dear Mr. Secretary:I am transmitting Statistics of Income--1962, Supplemental Report on Sales
of Capital Assets Reported on Individual Income Tax Returns. This report Wasprepared in partial fulfillment of the requirements of Section 6108 of the InternalRevenue Code of 1954, which specifies that statistics be published annually withrespect to the operation of the income tax laws, including classifications of income,and other facts deemed pertinent and valuable.
The statistics in this report relate to the nearly 6 million individual income taxreturns filed for 1962, with gain or loss from the sales of capital assets. The reportpresents detailed data on gross sales price, cost and expense of sale, depreciation,and gross gain or loss, for 25 different types of property or capital distributions.Among the types of property covered are corporate stock, securities other thancorporate stock, business assets, livestock, and residences. Capital distributionsinclude capital gain dividends from regulated investment companies, share of capitalgain or loss from partnerships and fiduciaries, capital gain distributions from smallbusiness corporations, liquidation distributions, and retirement plan distributions.Historical tables present data on net capital gains and losses for the period 1942to 1962.
Classifications are by size of adjusted gross income, size of current-year netgain or loss before statutory limitation, period held, and State. The classificationsby size of adjusted gross income include adjusted gross income modified to includeor exclude all capital gain or loss as well as adjusted gross income as reported.Data on sales of all asset types, corporate stock, securities other than corporatestock, and residences by taxpayers age 65 or over are shown separately.
Although the pilot project, Sales of Capital Assets Reported on IndividualIncome Tax Returns for 1959, presented a limited amount of data, this studyrepresents the first time that all of the detailed information has been obtainedon the capital asset transactions that underlie the net gain or net loss included inadjusted gross income.
Commissioner of Internal Revenue.
Hon. Henry F. Fowler,Secretary of the Treasury.
III

Contents
Introduction, I
Relationship of the supplemental report to Statistics ofIncome--1962, IndividualIncome Tax Returns, 1
Summary of the data, 3
The effect of the tax treatment of capital gains and losses on adjusted grossincome., 3
Types of assets defined as or treated as capital assets, 3Short- and long-term capital gains and losses, 5Net capital gain or loss included in adjusted gross income, 5Alternative tax on capital gains, 6
Description of the sample, 7
Limitations of the data, 9
Missing transactions, 9Missing transaction detail, 9Reporting of current-year installment sales, 9Difficulties in coding by asset type, 10Taxpayer reporting, 10
Explanation of classifications and terms, 11
Classifications, 11
Types of capital assets, 12Capital asset transaction terms, 15Schedule D summary items, 16Source of income and loss, other than netgain or loss from the sales of capital
assets, comprising adjusted gross income, 17Tax items, 18
Sales of capital asset tables compiled from all individual incometax returns,1962, 20
Sales of capital assets tables compiled from individual income tax returns oftaxpayers, age 65 and over, 1962, 135
Historical tables, individual returns with net capital gain or loss, 1942-1962, 141
Synopsis of the law, 145
Facsimiles of 1962 forms and instructions, 149

Guide to Tables . . . by Subject
SIZE DISTRIBUTIONS
Returns with net capital gain or loss
Adjusted gross income:
I As reported, 21
2 Less capital gain or loss included, 2812 01%P I lus capital gain or loss excluded, 35
15 sales of livestock, by adjusted gross inccclasses, 119
16 Sales of real estate, by adjusted gross inccclasses, 121
17 Sales of residences, by adjusted gross inccclasses, 123
Current year net gain or net loss before limitation:
4 By adjusted gross income classes, 42
5 By asset type, 46
Returns with net capital gain
Adjusted gross income:
6 As reported, 60
7 Less capital gain or loss included, 70
8 Plus capital gain or loss excluded, 78
Returns with net capital loss
Adjusted gross income:
9 As reported, 86
10 Less capital gain or loss included, 96
11 Plus capital gain or loss excluded, 104
MONTH OF SALE
13 Sales of corporate stock, by adjusted gross incomeclasses, 114
LENGTH OF PERIOD HELD
12 Sales of corporate stock, by adjusted gross incomeclasses, 112
14 Sales of securities other than corporate stock, byadjusted gross income classes, 117
SELECTED SOURCES OF INCOME AND LOSS
18 Reported on returns with sales of a specified aEtype, 124
STATE
19 All capital asset transactions, corporate st,transactions, and securities other than corporstock transactions, 133
TAXPAYERS AGE 65 AND OVER
20 Sales of capital assets, by adjusted gross inccclasses, 136
21 Sales of corporate stock, by adjusted gross inccclasses, 137
22 Sales of securities other than corporate stock,adjusted gross income classes, 138
23 Sales of residences, by adjusted gross inccclasses, 139
HISTORICAL STATISTICS
24 Net capital gain or loss, short and long-te21942-1962, 143
25 Net capital gain or loss, by adjusted gross inccclasses, 1950-1962, 144
vi

Introduction
This report presents detailed information on the capitaldistributions and sales of property covered by the sectionsof the 1954 Internal Revenue Code dealing with capitalgains and losses. For simplicity and consistency in tabletitling, these distributions and sales have been classifiedunder the heading of "asset types. " Technically speaking,however, many of these are distributions of net capitalgain or loss from such sources as regulated investmentcompanies, small business corporations, partnerships,or fiduciaries. For the precise definition of terms andthe nature of anv limitations, the sections "Limitations ofthe Data, I and ''Explanation of Classifications and Terms"should be referred to.
Certain sections of the 1954 Code have been amended bysubsequent acts. For the purposes of this study, onlyamendments prior to January 1, 1963, are applicable.An important amendment, applicable after December 31,1963 and therefore not covered by this report, is thatcovering the gain on a sale of a residence by a taxpayerage 65 and over. Under this provision, the capital gain istax free if the adjusted sales price is $20,000 or less andthe property was owned and used for five years, as a prin -cipal residence, within the eight years before the sale orexchange. If the adjusted sales price is more than$20,000 the gain excluded is that portion which bears thesame ratio to total gain as $20,000 bears to the total ad-justed sales price. The election can be made only oncein a lifetime.
Although this provision is not applicable to the datapresented in the report, information on'sales of a resi-dence by taxpayers age 65 and over is presented in theseparate section on page 135, devoted to this importantsegment of the taxpaying population. For the purposes ofthis report, taxpayers age 65 and over are importantnot only because of the special provisions of the Code but,also, because they represent a large portion of those re-porting sales of capital assets - -approximately 1/5 of thetotal. The separate section for taxpayers age 65 and overcovers, in addition to sales of residences, sales of allasset types, corporate stock, and securities other thancorporate stock.
The major portion of the report deals with the sale orexchange of 25 capital asset types by all taxpayers, clas -sified by the amount ofadjusted gross income as reported,and adjusted gross income modified to include or excludeall capital gains. Data are presented for both those tax -payers with a net capital gain and those with a net capitalloss. Data by length -of-period held are presented forsales of corporate stock, securities other thancorporatestock, real estate, residences, and livestock. State dataare presented for sales of all asset types, corporate stock,and securities other than corporate stock.
RELATIONSHIP OF THE SUPPLEMENTAL REPORTTO STATISTICS OF INCOME--1962, INDIVIDUAL
INCOME TAX RETURNS
from the sales of capital assets. For the income year1962, the transaction information underlying the net gainor net loss reflected in adjusted gross income has beenobtained for this supplemental report by abstracting thedetail provided in Schedule D--Gains and Losses fromSales or Exchanges of Property, Part 1--Capital Assets.Provision is made in the Schedule D for the taxpayer toreport the asset description, date acquired anddatesold,gross sales price, depreciation, cost, and gain or loss,from each sale or exchange of a capital asset.
The transaction data from Schedule D and the sales ofcapital assets data published in Statistics of Income--1962, Individual Income Tax Returns were obtained fromthe same sample. However, the summary data in the an-nual Statistics of Income report represent all returns witha net gain or net loss from the sale of capital assets,whereas the supplemental report was designed to repre-sent only returns with one or more current-year capitalasset transactions. Therefore, the supplemental reportexcluded returns that had only a prior year capital losscarrvover and included returns which had transactionsthat netted out to zero. As shown in table A, these inclu -sions and exclusions account for any substantive dif-ference in the summary totals shown in the two reports.
Table A. -RETURNS WITH NET CAPITAL GAIN OR LOSS: COMPARISON OF DATAIN THE SUPPLE24ENTAL REPORT ON SALES OF CAPITAL ASSETS WITH DATA INSTATISTICS OF INCOME-1962 INDIVIDUAL INCOME TAX RETURNS
(Number of Returns, Adjusted Gross Income. Net Loss and Net Gain, by Si-of Adjusted Gross Income)
Adjusted gr... income.1....a
KUPER OF RETURNS
Grand total ...........
Taxable returns, total ......
Under $10,000 .............$10,000 under $50,000.. ...$50,000 =d- $100,000 ....$100,000 or more ..........
Nontaxable returns ..........
ADJUSTED GROSS INCONE
Grand total ...........
Taxable returns , total ......
Under $10,000 .............$10,000 under $50,000 .....$50,000 under $100,000 ....$100,000 or more ..........
Nontaxable returns...... ....
NET LOSS
Grand total ...........
Taxable returns, total ......
Under $10,000 .............$10,000 -der $50,000 .....$50,000 -der tlOO,000 ....$100,000 or mor...........
Nontaxable returns ..........
NET GAIN
Grand total ...........
Taxable returns, total ......
Under $10,000 .............$10,000 -der $50,000 .....$50,000 -der UOO,000 ....,IklOO,OO0 or more ..........
Ncntaxable returns . .........
The annual Statistics of Income reports regularlypro-vide statistics on the net gains and net losses resulting
Suppleme talReport
(I)
5,8CY7,945
4,783,672
2,755,8161,907,571
95,96324,322
1,024,273
64,038,764
62,304,881
16,208,451.34,774,1416,347,8764,9?4,412
1,733,883
938,403
804,679
372,869401,82625,754'4,230
133,724
6,621,578
6,114,812
1,337,274
21367,318736,570
1,673,651
706,766
Returnswith
catital1;s.
carryoveronly
(2)
131,285
111,405
67,93241,521
1,709243
19,880
Returnswhere
r"s_actionsn ttedout tozero
(3)
17,367
12,370
8,8613,360
ill17
4,996
(7~.-d d.11...)
1,333,587
1,312,214
398,750764,780109,47239,212
21,373
115,632
113,968
48,61855,0447,3142,992
1,664
65,256,719
63,503,127
16,558,58335,483,8776,450,0345,010,632
1,753,592
111,998
91,032
56,08033,3151,430
207
20,965
SupplementalReport,adjusted
(Col.1 plus..1. 2 minuss
.ol. 3)
5,921,663
4,882,707
2,814,8871,945,712
97,56124,549
1,039,155
1,050,401
895,711
428,949435,141
27,1844,437
1154,689
statisticsof Income
19621
(5)
5,921,955
4,882,706
2,814,8481,945,748
97,56024,550
1,039,249
65,256,439
63,503,690
16,558,46335,484,324
6,450,0375,010,866
1,752,749
1,050,393
895,590
428,980435,10627,0654,439
154,803
6,821,421
6,114,690
1,337,1422,367,325
735,5621,673,661
706,731
'Statistics of Income-1962 Individual Income Tax Returns, tables 10 and 11.NOTE: Detail my not add to total due to rounding.


Summary of the Data
THE EFFECT OF THE TAX TREATMENT OF CAPITALGAINS AND LOSSES ON ADJUSTED GROSS INCOME
Under the provisions of the 1954 Internal Revenue Code,special treatment is accorded to gains and losses fromthe sale or exchange of property which qualify as capitalassets. In 1962* nearly 6 million of the 63 million indi-vidual income tax returns reported gain or loss fromsuch sales and these taxpayers reported adjusted grossincome of over $64 billion. If capital gains and losseshad been considered ordinary gains and losses in 1962,table B shows that the adjusted gross income of these tax -payers would have been $5 billion greater than thatreported. On the other hand, if capital gains and losseshad been nontaxable, the adjusted gross income of thesetaxpayers would have been $6 billion less. As adjustedgross income increases, the effect of capitalgainor losstreatment became more pronounced. For example, ifgains and losses were included in their entirety in ad-justed gross income, taxpayers with adjusted grossincome of $100,000 or more would have increased theirincome by 33 percent whereas taxpayers with adjustedgross income of $10,000 or less would have increasedsuch income by only 5 percent.
Table B. -RETURNS WITH NET CAPITAL GAIN OR LOSS: ADJUSTED GROSS INCOME
AS REPORTED, MODIFIED TO EXCLUDE ALL CAPITAL GAINS, AND MODIFIED TO
INCLUDE ALL CAPITAL GAINS, BY SIZE OF ADJUSTED GROSS INCOME
Adjusted gross 4nc
Size of adjusted gross income
Grar~d total ..............................
Taxable returns, total .........................
Under $10,000 ................................$10,ODO under $50,000 ........................$50,000 under $100,000.......................$100,000 or more .............................
Nontaxable returns .............................
As reported
(1)
64,039
62,305
16,20834,7746,3484,974
1,734
Modified to
exclu~e all
capita~ga~ns-
(2)
(Milli- ~11-)
58,156
56,995
15,24432,8095, 6373,305
1,161
.e
Modifiedtoinclude all
capital
gains'
(3)
69,172
67,040
16,95936,4846,9906, 6CY7
2,132
'For the precise definition, see adjusted gross income less capital gain or lossincluded and adjusted gross income plus capital gain or loss excluded in the"Explanation of Class' fications and Is=."
TYPES OF ASSETS DEFINED OR TREATED ASCAPITAL ASSETS
When an individual sells a capital asset, he reports thetransaction in Part I of Schedule D of the Form 1040 (see"Facsimiles of 1962 Forms and Instructions"). Theterm "capital assets" means property held by the tax-payer (whether or not connected with his trade or busi-ness), but does not include--.
(a) stock in trade or other property of a kind properlyincludible in his inventory if on hand at the close of thetaxable year;
(b) property held by the taxpayer primarily for sale
t
tO customers in the ordinary course of his trade orbusiness;
(c) property used in the trade or business of acharacter which is subject to the allowance for deprecia-tion provided in section 167;
(d) real property used in the trade or business ofthe taxpayer;
(e) certain Government obligations issued on or afterMarch 1, 1941, at a discount, payable without interest andmaturing at a fixed date not exceeding one year from dateof issue;
(f) certain copyrights, literary, musical, orartisticcompositions, etc-, or
(g) accounts and notes receivable acquired in theordinary course of trade or business for services rend-ered or from the sale of property referred to in (a) or(b) above.
Chart 1 shows that corporate stock was the asset typemost frequently reported, with nearly 37 percent of thereturns with sales of capital assets reporting sales ofcorporate stock. The 2,122,000 returns with sales ofcorporate stock filed in 1962 represented anincrease of373,000 over the number reporting such sales in 1959, anincrease of 21 percent. Capital gain dividends, the secondmost frequently reported item, appeared on 1,609,000 re-turns in 1962 or 28 percent of the returns with sales ofcapital assets. This is an increase of approximately 56percent over the 1.0 million returns showing capitalgaindividends in 1959. Returns reporting a distributive shareof capital gain or loss from partnerships and fiduciariesincreased by approximately 40,000 returns.
Gains and losses from transactions described in Section1231 of the Internal Revenue Code are also treated as
Chart I. -NUMBER OF RETURNS WITH SALES OF CAPITAL ASSETS: ALLASSET TYPES AND SELECTED ASSET TYPES, 1962 AND 1959
(Thousands of returns)
ALL ASSET TYPES
Fl-9-621
2,122
5,808
2709 4,902
Corporate stock
0
1,749
Capital gain dividends
1,609
1,031
Share of capital gain goss) from partnerships and fiduciaries
387
345
Nonbusiness real estate
349
336
Residences
177
1~~211
Real estate subdivided
148
183


SALES OF CAPITAL ASSETS ON INDIVIDUAL RETURNS, 1962
SHORT- AND LONG-TERM CAPrrAL GAINSAND LOSSES
Table D. -RETURNS WITH NET CAPITAL GAIN OR LOSS: AMOUNT OF GROSS
GAIN AND GROSS LOSS, BY SHORT- AND LONG-TERM PERIOD AND SELECTED
TYPE OF CAPITAL ASSET, 1962
Gains and losses from sales or exchanges of capitalassets held 6 months or less are considered to be short-term. Such gains and losses for the current year and thecapital loss carryovers from the 5 preceding years (usedas short-term losses), are combined in the first sectionof Part I of schedule D to obtain the net short-term gainor loss. In this combination, the net s
'hort-term capital
gain or loss from partnerships and the net short-termcapital gain from fiduciaries are also included.
Gains and losses from sales or exchanges of capitalassets held more than 6 months are considered to belong-term. Such current gains and losses are combinedin the second section of Part I of schedule D with the netlong-term capital gain or loss received from partner-ships, the net long-term gain received from fiduciaries,and any long-term capital gain dividends to obtain thenet long-term gain or loss for the year.
Table C shows that approximately four out of every fivereturns with sales of capital assets, both in 1959 and1962, had sales of long-term capital assets only. In 1962,approximately 69 percent of the returns with sales ofcorporate stock and 80 percent of the returns with salesof securities other than corporate stock (U. S. Govern-ment obligations, State and local securities, and Otherbonds, notes, and debentures) had only long-term salesof these assets, whereas 95 percent of the returns withsales of real estate (Residences, Nonbusiness real estate,Real estate subdivided, Farmland with unharvested crops,and Other farmland) had only long-term sales of suchproperty. Only sales of "options to buy or sell" and,,commodities including future contracts" showed morereturns with only short-term sales of these assets.
Table D shows that approximately 96 percent of theamount of gross gain and 79 percent of the amount ofgross loss on sales of capital assets in 1962 was onlong-term sales. Over 40 percent of the gross capitalgain and 65 percent of the gross capital loss occurredon sales of corporate stock. Approximately 29percentofthe gross gain on sales of corporate stock, but only 3 per -cent of the gross loss, occurred on stock held 10 years ormore.
NET CAPITAL GAIN OR LOSS INCLUDED INADJUSTED GROSS INCOME
In computing the taxable net gain, the net short-termgain or loss is combined with net long-term gain or loss.The amount of net gain in adjusted gross income is oneof the following: (a) On returns withanet long-term gaingreater than net short-term loss, 50 percent of the ex-cess net long-term gain over net short-term loss; (b) onreturns with only a net long-term gain, 50 percentthereof; (c) on returns with both net short- and long-termgain, the entire amount of net short-term gain combinedwith 50 percent of the net long-term gain; (d) on returnsonly a net short-term gain, the entirenetgain; and (e) onreturns with net short-term gain greater than net long-term loss, the entire excess of net short-term gain overnet long-term loss.
Type of capital asset and length of' period held
All asset types ......................................Short-term .........................................Long-term ..........................................
Corporate stock ....... : ....................................Short-t.rm ...............................................
Under 3 M-Ins ...................................... ...
3 months wider o months ................................
Period held not a,ailabl ...............................
Long-te.................................................
6 months under 12 montns ...............................
1 year under 2 years. ..................................
2 years unaer 5 years... ...............................
5 years under 10 years .................................
10 year. or more .......................................
Period held not available ..............................
securities other than corporate stock' .....................
Short-tem.. ........................ __ .................
Leng-L~- ............... ................................
Realestats2.: .... ...................... .................
Short-terii ...............................................
Long-term ................................................
Assets used in liade or business ...........................
Sh.ri-term ...............................................
Long-term. ...............................................
Share of capital gaiii (loca) from Darinersbips and fids-i-
aries. ....................................................
Short-term.. .............................................
Lon,,-tem. ................................................
Livest-1 ..................................................
Short-tem ...............................................
Lone-te.................................................
I iqiiid.tion distributions ..................................
Sh.rt-teem ...............................................
Long-tem ................................................
Proceeds from prior year installment sales .................
Short-term ............................................ :..
Long-term ................................................
All other type assets ......................................
Snort-term ...............................................
L-g-ter .............................................. .
Grossfain
Grossloss
(Th...-d d.11 ...)
17,292,60360o~322
16,.8C;,280
5
u,2?5,7551,348,2944.927,461
7,138,366388,19522,,290103,85756,048
6,750,171426,779588,776
1,304,7181,439,0402,03S,96-,
949,87U
117,5767,625
109,9-,o
2,763,2.5830,182
2,733,276
1,052,1t,91~,012
11036,157
1, 064, 33,32,049
1,032i28~
750,9795,0~)l
7445,8S9
57,~,935470
5-75,466
1,530,70210,05
1,520,06.
2,299,083116,063
2,193,019I
4,086,448871,423340, 952415,015115:45~
3,215,02.887,469
1,035,625'713,616273,54-111,670193,102
133,42542,38591,0-'0
209,3369.659
199,679
168,61222,408
14,,203
138,43046,81.91,614
32,71952,828
29,95(,
C--, 9478,150
57,3417
21,8431,626
20,21,
1,419,377342,9r
1.07.,3,-
'Securities other th3n corporate stock includes U. S. Government obligations; Stateand local s"uritie-: and other bonds, notes, and debentures.
2R_1 estate includes Residences; Nonbusiness real estate; Real estate subdivided;Farmland with unharvested crop,,; and Other farmland.
NOTEt For the precise definition of tems and the na-,ure of' any limitations, seathe "Description of the Sample." "Limitations of the Data," and 'Explanationof Classifications and Temr" in the tax,.
DdLa4l may not add to totals because of rounding.
If the merging of net short-term gain or loss and netlong-term gain or loss is a net loss, the amount of lossdeductible from adjusted gross income is limited to thesmallest of (1) amount of capital loss; (2)taxable incomecomputed without regard to capital gains and losses andthe deduction for personal exemptions; or (3) $1,000.Any -part of the capital loss incurred in the current yearwhich is not deductible because of the limitationcould becarried forward 5 succeeding years as a short-termcapital loss. If the capital loss carryover was not elimi-nated in the 5-year period, the remaining loss could notbe used.'
Although a greater number of returns withgainor lossfrom sales of capital assets were filed in 1962 than in anyprevious year--an increase of 126,000 returns over the5,796,000 returns filed for 1961--table E shows that thenumber of returns showing a net gain decreased from4,698,000 returns for 1961 to 4,323,000 returns for 1962.Reflecting the break in stock prices in the spring of 1962,C,
'Under Section 230(a)(2) of Public Law 88-272, Feb. 1964, any net capi-tal loss sustained in one of five tax years immediately preceding the tax yearbeginning on or after January 1, 1964, or in a tax year beginning on or afterJanuary 1, 1964, may in effect, be carried over indefinitely until absorbed.For capital losses sustained in tax years beginning on or after January 1,1964, unabsorbed capital losses will retain their original character as long-term or short-term losses when carried over. Since this section of the taxcode was passed after December 31, 1962, the data in this report are not af-fected by the change.


Description of the Sample
The returns on which the estimates in this report arebased are those returns in the regular Statistics ofIncomesample with a current year sale of capital asset or withproceeds from a prior-year installment sale. The Sta-tistics of Income sample is a stratified random sample,selected before audit, of all Forms 1040 and 1040A filedduring 1963. The total sample for 1962 consisted of484,952 returns, of which, 155,812 returns had sales ofcapital assets. The Statistics qf Income sample _iSdescribed below.
under $10,000, nonbusiness, were selected according tothe prescribed rate of 2 in 1,000, by drawing returnshaving account numbers ending in Ill and 777.
Table G shows the number of returns filed, the numberof returns in the sample and the prescribed samplingrate by sampling strata. Also shown is the estimatednumber of returns filed with sales of capital assets andthe number of returns in the sample withsales of capitalassets.
SAMPLE SELECTION
Returns in the Statistics ofIncome sample were groupedby type of return, presence or absence ofbusiness income,size class of adjusted gross income, taxpayment status,and by the 62 district offices and the Office of InternationalOperations in Washington, D. C. The sample design wasadapted to fit regular return sorting and grouping.pro-cedures employed by district. offices to facilitate theprocessing of returns for revenue collection and auditpurposes.
For sample purposes, the groups were combined intosample strata, primarilv on the basis of adjusted grossincome which correlates well with the principal incomeand tax characteristics being estimated.
Within each of the groups, returns were assigned con-secutive account numbers and the sample was selectedsystematically by withdrawing from the various groupsall returns with designated account numbers. For ex-ample, Form 1040 returns with adjusted gross income
Table G. -NUMBER OF INDIVIDUAL INCOME TAX RETURNS FILED, AND NUMBER INTHE SAMPLE: ALL RETURNS AND RETURNS WITH SALES OF CAPITAL ASSETS,By SAMPLING STRATUM, 1962
[Taxable and nontaxable returns]
R.t~; .~111thNiumber of Number of Prescribed capital assets'
_Sampling trat= returns returns sazipling 1~timated Nmberfiled in sam-ple rate n-be- in
filed .=Ple
(1) (?) (3) (4) (5)
Total all retu ............ 62,775,187 484,952 5,807,945 155,612
Form 1040A ....................... 19,211,034 36,791 2/1000 - -
Fom 1040,adjusted gross income-Under $10,000:
ND,business .................. 28,830,099 58,459 211000 2,066,876 4,191Schedules C and F ............ 8,446,088 84,414 1/100 1,712,727 17,117
$10,030 -de, $50,000 on-business ...................... 5,131,334 153,314 3,1100 1,157,192 34,574
$10,030 ~de, $30,000,Sched-alesC and F ....................... 1,466,714 43,886 31100 621,144 18,566
$50,000 under ~100,000 n~n-business ............... I ...... 62,640 17,323 3110 48,316 13,347$30,000 urder $100,000,Schedules C and F ............. 210,053 59,682 3110 150,969 42,839
$lDO,OOO and over:Nonbusiness .................. 14,102 14,102 1/1 12,460 12,460Schedules C and F ............ 13,592. 13,591 I/i 12,324 12,324
Prior year delinquent:Adjusted gross income under$50,ODO ..................... 389p348 3,256 1/100 25,829 216
Adjusted gross income ~50,000and over .................... . 134 134 1 1/1 108 108
Tnese returns are includei is, the counts giver, ir, col,=ns (1) and (2).
METHOD OF ESTIMATION
Estimates for all returns filed were determined bymultiplying the sample data by "weighting factors"obtained by dividing the total number of returns in eachsampling stratum by the number of sample returns re-ceived from that stratum. For instance, the "weightingfactor" of 493.17 for Form 1040 returns with adjusted.gross income under $10,000, nonbusiness, was obtainedby dividing the number of returns in the sample, 58,459,into the total number of returns filed, 28,830,099. Theprimary sources of population data were counts made andsubmitted b-Y the district offices and the Office of Interna-tional Operations showing the number of Form 1040 and1040A returns filed during the calendar year 1963.
One set of "weighting factors" was used for nationaltabulations, and one set for State tabulations. Reportsreceived from each district field office showing the num-ber of returns filed by sampling stratum were used toderive "weighting factors" for the State tabulations.The "weighting factors" for the national tabulationswere based on the aggregate number of returns filed ineach stratum throughout all district offices. The achievedsampling ratios varied sufficiently among districts towarrant using two separate series of weights. The use oftwo separate series of weights resulted in slight dif-ferences between totals in the tables showing distribu-tions by States and corresponding items in the nationaltables.
SAMPLING VARIABILITY
The data from returns showing adjusted gross income of$100,000 or more are for the most part not subject tosampling variability since all such returns were includedin the sample. However, the estimates which include datafrom returns showing adjusted gross income under$100,000 are subject to sampling variability. Table Hshows for each adjusted gross income class the estimatednumber of returns with sales or distributions of the assettypes specified and the relative sampling variability forthese estimates. The relative sampling variability is thesampling variability expressed as a percent of the esti-mate. The sampling variability at the two standarddevi-
7


Limitations of the Data
In processing returns for collection purposes and, later,in processing the sample of such returns for statisticalpurposes, several steps were taken to reduce taxpayer-reporting errors and other errors introduced in the dataprocessing operations. Over 90 percent of all individualreturns filed during 1962 were mathematically verifiedbefore they were made available for sample selection.In transcribing and tabulating the information fromsampled returns, additional checks were imposed to im-prove the quality of the resulting estimates. Mechanicaltranscribing was verified by the process of repeat cardpunching and, prior to tabulating, numerous tests for con-sistency were applied on an electronic computer, to assurethat the proper balance and relationship between items andstatistical classifications were maintained.
However, the controls maintained over the processing ofthe source data did not completely eliminate the possibilityof error. Moreover, practical operating considerationsnecessitated allowance ofreasonable tolerance in control -ling the processing of these data. Listed below arelimitations that are of major importance in the interpre-tation and use of the data.
MISSING TRANSACTIONS
The summary totals presented in Statistics ofIncome--1962, Individual Income Tax Returns, were consistencytested prior to testing the individual transactions thatunderlie the summary data and served as control totalsin consistency testing the individual transactions. Foreach return, if the transactions that were abstracted forthe supplemental report did not add to thenet gain or netloss tabulated for the annual Statistics of Income reportand the difference could not be resolved, this differencewas considered to be due to a missing transaction. Inorder to add to the control total, a transaction was addedfor the amount of the difference and this transaction wastabulated under "Other type assets." As shown in table
J, the 188,000 gain transactions and 154,000 loss trans-actions thereby added accounted for 2 percent of alltransactions.
MISSING TRANSACTION DETAIL
For the asset types listed below, the taxpaver shouldhave provided transaction detail (gross sales price, de-nr,,~intion, and cost', to support the gain or loss reported.If the taxpayer failed to provide the detail for these assettypes, gross sales price was made equal to the gain andcost made equal to the loss during statistical processing.
Corporate stock Farmland with unhar-U. S. Government obli- vested crops
gations Other farmlandState and local securities Personal propertyOther bonds, notes, and Options to
'buy or sell
debentures Insurance and annuitiesLivestock Partnership interestBusiness assets Commodities includingNonbusiness real estate future contractsReal estate subdivided
Although this still understated the amount of gross salesprice, cost, and depreciation, it achieved a desired bal-ance between the gain or loss reported and the transactiondetail, except for current year installment sales whichare explained below.
REPORTING OF CURRENT YEARINSTALLMENT SALES
For a current year installment sale the taxpayer usuallyreported the entire gross sales price, depreciation, andcost but only that part of the gain received in thecurrent year. These sales were tabulated along with theother transactions for the particular asset type. Conse-quently, the gross sales price plus depreciation less cost
Table J. -TRANSACTIONS ADDED TO ACHIEVE A BALANCE WITH SUMMARY TOTALS FROM SCHEDULE D COMPARED TO TRANSACTIONS OF ALL ASSET TYPES ANDTRANSACTIONS OF OTHER TYPE ASSETS, BY LONG- AND SHORT-TERM GAIN OR LOSS
Asset type
All asset typ................ ...............
Other type assets, total ...................
As reported ........... ..................
Added ....................................
Other type azsct.2 total:As a percent of all asset types ............
Other type assets added:Ao . p ... ant of .11 asset typ..............As a percent of other type assets, total.
Gain
Nmber of A-t1~_ (7h...-d
actions d.11 ... )
(1)
9,947~273
340,514
152,792
187,722
(2)
TotalLoss
Nmber-of ZOnnttrans-
,
antis ~11 ...)
(3)
17,292,603
722,340
413,369
308:971
3.4 4.2
1.642.8
324,776
171,049
153,727
5.4
2.547.3
(4)
6,275,755
1,266,859
318,403
948,456
20.2
15.174.9
Gain
N~mber of-
-actZiosns
(5)
8~393,757
287,437
126,873
160,564
3.4
1.955.9
Long-ie=
AMO"`t(Th.-dd~11-)(6)
IE).686,280
650,107
399,245
250,862
- Los,
N~ber of-I -tdta--
(=._
actions bIl ...)(7)
4.126,928
194,614
76,288
116,326
rp-mt)
3.9
1.538.6
4.7
2.859.8
(8)
4,927,461
987,634
151,052
836,632
20.0
17.0&~-7
Gai~
Short-tem
N= er of nh'~t~__ Z_d
actions ~ij ...)
(9)
1,553,516
53,077
25,919
27,158
(10)
606,322
72,233
14,124
56,109
3.4
1.751.2
11.9
89.60.4
Los.
11=~Der oftrans
-actions
(11)
1,935,585
130,162
92,761
37,401
6.7
1.926.7
9
6.062,513
Amnhtr~-d~Ii ...)(12)
1,34E,294
279,176
167,352
111,82,
20.7
8.340.1

10 SALES OF CAPITAL ASSETS ON INDIVIDUAL RETURNS, 1962
does not necessarily equal the gross gain for the assettype categories affected.
DIFFICULTIES IN CODING BY ASSET TYPE
Similarity between taxpayer description for some assettypes made it difficult to distinguish between asset types;for example, to differentiate between a residence and non-business real estate or between farmland with unharvestedcrops and other farm land.
TAXPAYER REPORTING
In general, the tables are based on dataas reported bythe taxpayer. Although the sample returns were subjectto mathematical verification, statistical editing and con-sistency testing, in general, no attempt was made tochange the taxpayer's classification of an entry. Forexample, capital gain dividends were tabulated as shortterm if so reported. - I

Explanation of Classifications and Terms
CLASSIFICATIONS
Capital asset'data in this report are presented for 25different types of assets. Data are classified byadjustedgross income, adjusted gross income less capital gain orloss included, adjusted gross income plus capital gainorloss excluded, taxable and nontaxable returns, size of cur-rent year net gain or net loss before limitation, periodheld, month of sale, and States. Data for taxpayers age 6- 5-or over are shown separately.
Adjusted Gross Income
Adjusted gross income is gross income from all sourcesthat are subject to income tax minus (1) ordinary and nec -essary expenses of operating a trade orbusiness, (2) ex-pense deductions attributable to rents and royalties, (3) ex-penses of outside salesmen attributable toearningsalaryor other compensation, (4) expenses of travel, meals, andlodging while away from home overnight paid by an em-ployee with respect to services rendered, (5) transporta-tion cost related to the performance of services as anemployee, (6) expenses for education required to maintainsalary status, or present employment, (7) ex- nses paid~ s \,/ -e 11or incurred in connection with service as an employeeunder a reimbursed or other expense allowance arrange-ment with the employer, (8) exclusion of allowable sickpay if the sick pay was included in gross salary, (9) de-preciation and depletion allowed life tenants and incomebeneficiaries of property held in -trust, (10) deductiblelosses from sales of property other than capital assets,and (11) net operating loss deduction. Capital gains andlosses are included, subject to the exclusions and limita-tions provided by law. That is, 50 percent of the excessof net long-term capital gains over any net short-termlosses is includible in adjusted gross income, whereas100 percent of any net short-term gain is includible. Upto $1,000 of net -short- or long-term loss or combinationof both can be reflected in adjusted gross income.
Adjusted Gross Income Less Capital Gain or LossIncluded
Adjusted gross income less capital gain or loss in-cluded is the reported amount of adjusted gross incomereduced by any net capital gain included in adjusted grossincome or increased by any net capital loss deducted bythe taxpayer in arriving at the reported amount of ad-justed gross income. In effect, this concept does not re-flect any capital gains or losses in adjusted gross income.
Adjusted Gross Income Plus Capital Gain or LossExcluded
This concept would have the effect of including all cur-C,rent year gains and deducting all current year losses. Itis computed by subtracting from adjusted gross income
the net gain or adding in the net loss, and then adding inthe gross gains and subtracting the gross losses. In effect,this eliminates all limitations contained in the law such asthe 50 percent deduction on net long-term capital gain(less any net short-term capital loss), and the limitationon net loss of $1,000 or taxable income, whichever issmaller. Under this concept, there would be no capitalloss carryover, since all current year losses would bedeductible in full,
Month of Sale
Transactions of corporate stock were classified as soldin one of the 12 months of the vear on the basis of infor-mation on the schedule D on date of sale. Only trans-actions that had the month of sale were tabulated. Theremainder were classified as "not stated."
Period Held
On the basis of information on the schedule D on date ofacquisition and sale, each transaction of corporate stock,securities other than corporate stock, real estate, resi-dences, and livestock was class_ifiied~ -into a short- orlong-term holding period of a specified length of time(months or years). In some instances, where only partialinformation on dates of acquisition and sale was available,the period held was estimated. In other instances ofpartial or no information, period held was considered as"not available." In all instances, the division betweenshort-term and long-term was based on the section ofschedule D in which the taxpayer entered the transaction.
Size of Current-Year Net Gain or Net Lossbefore Limitation
Current-year net gain or net loss before limitation fordistributions by size is defined as all current year gainsless current year losses. In effect, this eliminates alllimitations contained in the law such as the 50 percentdeduction on net long-term capital gain (less any netshort-term capital loss), and the limitation on net lossof $1,000 or taxable income, whichever is smaller.Under this concept, capital loss carryover would not beincluded. Returns were divided into categories accordingto the size of this net gain or net loss for the asset typeor adjusted gross income size specified.
States
Classification by States is based on the district in whichthe returns were filed. Internal Revenue districts, orgroups of districts, are identical with State boundaries,except that the District of Columbia is a part of theBaltimore, Maryland, Internal Revenue District. TheOffice of International Operations had charge of returnswith addresses outside the 50 States. These returns in-
11

il
12 SALES OF CAPITAL ASSETS ON INDIVIDUAL RETURNS, 1962
cluded those from Puerto Rico, Virgin Islands, PanamaCanal Zone, and returns with foreign addresses, all of
t'which were classified as "Other areas."
Taxable and Nontaxable Returns
Taxable returns had an income tax remaining after theallowable tax credits were deducted. If the tax after cred-its was greater than zero, the return was classified as ataxable return.
Nontaxable returns had no income tax remaining aftertax credits. Some nontaxable returns had income taxbefore credits which was eliminated by the tax credits.Many nontaxable returns showed an amount of self-employment tax-, however, the self-employment tax wasdisregarded for this classification.
TYPES OF CAPITAL ASSETS
Corporate Stock
Includes preferred stock, common stock, stock rights,and warrants. Includes worthless stock and stock owner-ship in a cooperative housing development or apartmentprovided the development or apartment is not identifiedas a "residence." Excludes stock retired on liquidationof a corporation; all other types of corporate indebted-ness, such as bonds, notes, debentures, etc.; stock op-tions, or "privileges ... .. calls ... ..puts," "spreads
'"
,,straddles;" and liquidation distributions. If stock be-comes worthless during the year, the loss is consideredas from the sale or exchange of capital assets as of thelast day of such taxable year.
Gain by a dealer in securities from the sale or exchangeof securities is not a capital gain unless the securitiesare clearly identified in his records as held for invest-ment and are not held primarily for sale to customers inthe ordinary course of business. Losses from the sale orother disposition of stocks or securities are not deduc-tible (unless sustained in connection with the taxpayer'strade or business) if, within 30 days before or after thedate of sale or other disposition, the taxpayer has ac-quired, or entered into a contract or option to acquire,substantially identical stock or securities.
Although gain on the sale or exchange of stock in asmall business corporation (as defined in Internal Reve-nue Code Section 1244) by an individual is a capital gain,a loss is treated as an ordinary loss. However, theaggregate amount of such losses, deductible by the tax-payer, may not exceed $25,000 for any taxable year($50,000 if a joint return). Any excess is a capital loss.
U. S. Government Obligations
Includes U. S. Government or U. S. Governmentagencies' bonds, notes, and other evidences of indebt-edness. Federal, State, and municipal obligations, issuedon or after March 1, 1941, on a discount basis and pay-able without interest at a fixed maturity datenot exceed-ing one year from the date of issue, are excluded fromthe definition of a capital asset, so that any gain will beconsidered to be interest and any loss will be ordinaryloss.
State and Local Securities
Includes bonds, bonds retired or distributed, notes anddebentures, worthless bonds, notes, and debentures issuedby State or local governments. Includes State and localsecurities involving short sales and arbitrage operations,and riahts. Excludes options or privileges, including"calls," "puts," "straddles," and "spreads." See''U. S.,Government Obligations" above regarding specialprovisions.
Other Bonds, Notes and Debentures
Includes evidences of indebtedness such as mortgagebonds, income bonds, equipment trust certificates, bondretirements --.- distributions, redemptions, notes, bondforfeitures and forfeiture declarations, issued by cor-porations and eleemosynary institutions.
Insurance and Annuities
Includes exchanges of life insurance, endowment, or an-n uity contracts. In general, no gain or loss is recognizedon exchancres of--n
(1) A contract of life insurance for another contractof life insurance or for an endowment or annuity contract;or
(2) A contract of endowment insurance (a) for anothercontract of endowment insurance which provides for regu -lar payments beginning at a date not later than the datepayments would have begun under the contract exchanged,or (b) for an annuity contract; or
(3) An annuity contract for an annuity contract. If,however, the transferor of the old contract receives anymoney or other property with the new contract in suchan exchange, gain is recognized to the extent of the amountof the money or the fair market value of the other prop-erty. The gain is taxed as ordinary income since suchgain generally represents accrued income.
The data shown in the report represent transactions asreported by taxpayers before audit. If the taxpayer re-ported gain or loss on exchanges of life insurance, endow-ment, or annuity policies on his schedule D, they weretabulated as such for this report. However, some trans-actions may have been erroneously transcribed as ex-changes of life insurance, endowment or annuity policiesduring statistical processing.
Options to Buy and Sell
Includes privileges or options to buy or sell property,sometimes designated as calls, hedges, puts, straddlesand spreads. Also includes losses incurred on the failurEto exercise options.
Generally, gain or loss on the sale, exchange, or failurEto exercise an option is treated as capital gain or loss i,the character of the property to which the option relatesis, or would be if acquired, a capital asset. Gain or losEfrom the sale or exchange of an option to buy or selproperty which is not, or would not be, a capital assein the taxpayer's hands, is ordinary gain or loss. Suctgain or loss may, under the circumstances described irsection 1231 of the code, be treated as capital gain or loss

i
SALES OF CAPITAL ASSETS ON INDIVIDUAL RETURNS, 1962
If an option is granted on property owned and the optionis not exercised, the amount received is ordinary incomeeven though the option may have been on a capital asset.If the option is exercised, the payment is added to otherpayments realized on the sale of the property.
Commodities, including Future Contracts
Commodities include mostly crops or staples such asgrains, cotton, vegetable oils, etc., and also hides, wool,rubber, cocoa, etc. Includes short sales and arbitrageoperations and rights. Excluded, however, are hedgingtransactions in commodity futures entered into by flourmillers, producers of cloth, operators of grain elevators,etc., for the purpose of their business.
Capital Gain Dividends
Includes long-term capital gain designated by corpora-tions registered under the Investment Company Act of
.1940, either distributed as dividends or undistributedand retained by the corporation and long-term capitalgain designated by unincorporated trusts and associa-tions operating real estate investment trusts or mutualfunds.
Any dividend which represents a distribution to share-holders of the net long-term capital gain realized byregulated investment companies is designated as suchby the company in a written notice mailed to the share-holders within 45 days after the close of its taxable year.
I'I''here purchases and sales of investment company
shares are made at a loss near the capital gains dividenddate and the stock was held for less than 31 days, the lossis treated as a long-term capital loss to the extent of thecapital gains dividends on the stock.
Share of Capital Gain (Loss) from Partnershipsand Fiduciaries
For the purposes of the Federal income tax, a partner-ship is not a taxpaying entity. Therefore, its capital gainsand losses are imputed to the partners who report theirdistributive shares of capital gains and losses on theirseparate tax returns whether or not such shares havebeen distributed.
Partnerships include syndicates, groups, pools, andjoint ventures. For further information on the incomefrom partnerships see Statistics ofIncome, U. S. BusinessTax Returns.
A fiduciary is an individual, or legal entity such as abank, serving as trustee, guardian, administrator, orexecutor of an estate or trust. An estate or trust is aseparate taxable entity and, in general, its entire incomemust be reported on Form 1041, filed for it by the fiduci-ary. However, those capital gains paid, credited, or re-quired to be distributed to the beneficiaries during thetaxable year are taxed to the beneficiaries and are takenby the fiduciary as a deduction for distribution to bene-ficiaries. Capital losses of an estate ortrustwill reducethe taxable income of an estate or trust, but no part ofthe loss is deductible by the beneficiaries. If the fiduci-ary distributes all of the income of an estate or trust,the capital loss will result in no tax benefit for the yearof the loss. However, on termination of an estate or
13
trust any unused capital loss carryover of the estate ortrust is available to the beneficiaries. Additional infor-mation on fiduciaries can be found in Statistics ofIncome- -Fiduciary, Gift, and Estate Tax Returns.
Capital Gain Distributions from Small BusinessCorporations
Includes individual taxpavers' pro-rata shares of long-term capital gain of small ~usiness corporations electincgunder the provisions of Subchapter S of the Internal Reve-nue Code to be taxed at the shareholder level. The excessof the corporation's net long-term capital gain over itsnet short-term capital loss is treated as long-term capitalgain to the extent that it does not exceed the corpora-tion's raxable income, computed without regard to deduc-tions for net operating loss, dividends received, certaindividends paid, and partially tax-exempt interest.
Liquidation Distributions
In general, cash or other property received by a share-
holder upon liquidation of a corporation is treated in thesame manner as a sale of stock. The gain or loss realizedby the shareholder is a long-term or short-term capitalgain or loss if the stock liquidated was a capital asset.However, gain from the liquidation of stock in a "collap-sible corporation" is usuall)f not allowed capital gain
treatment. Also, a liquidation which is preceded orfollowed by a transfer of all or part of the assets of theliquidating corporation to another corporation in whichmore than a nominal interest is held bythe shareholdersmay have the effect of a dividend or of a transaction inwhich no loss is recognized and gain is recognized onlyto the extent of other property.
There is no time limit on the period of liquidation.If a corporation has ceased all business activities, exceptthose essential to liquidation, distributions are not divi-dends even though they extend over a period of time.Where liquidation distributions are received in install-ments, the stockholder is generally not required to re-port capital gain until the basis of the stock has beenrecovered. Loss can only be reported when the finalliquidation distribution is received.
Retirement Plan Distributions
Includes distributions actually received or made avail -able during the tax year in lump sum from a qualifiedannuity plan or from an exempt trust forming a part of apension, profit sharing or stock bonus plan. The gainrealized is the amount received in excess of employee'scontributions. To qualify for capital gains treatment, thefollowing conditions must be met:
(1) The total distributions payable to the employeemust be made within one tax year.
(2) It must be on account of the employee's deathor other separation from service, or the death of theemployee after his separation from service.
Livestock
Includes animals held as work animals (for draft), forbreeding, and for dairy purposes. "Livestock" is given

14 SALES OF CAPITAL ASSETS ON INDIVIDUAL RETURNS, 1962
a broad interpretation that includes cattle, hogs, horses,.mules, donkeys, sheep, goats, and fur-bearing animalssuch as chinchillas, mink, or foxes. "Livestock" ex-cludes poultry, chickens, turkeys, birds, fish, reptiles,etc. Whether or not livestock is held by the taxpayer fordraft, breeding, and dairy purposes depends upon all ofthe facts and circumstances in each case. Taxpayersmust have held livestock for 12-months or more fromthe date of acquisition in order to have the sale, ex-change, or involuntary conversion qualify for long-termcapital gain treatment.
Timber and Coal
Includes standing timber, mined coal, lignite, etc. if ataxpayer sells timber f rom land that he owns, gain or lossfrom the sale is ordinarily reported as a capital gain orloss if the timber was not held for sale in the ordinarycourse of his business. Sales of timber held for 6months or less are reported as short-term capital gainsand losses. However, special rules apply if the timber isheld for more than 6 months prior to the beginning ofthe tax year and the taxpayer makes an election to treatthe cutting of timber as a sale. If the taxpayer makes suchan election, the gain or loss to be reported is the differ-ence between the fair market value of the standing timberat the beginning of the year in which it is cut and its de-pletion basis at that time. This market value then be-comes the basis for comDutins4 ordinary gain or loss onthe ultimate sale of the products and the gain or lossfrom cutting the timber is treated as from sale of prop-erty used in trade or business which is given preferentialsection 1231 treatment. The election is made inthe yearthe cutting takes place by including the gain or loss on thecutting in income and attaching a statement showing com-putation of gain or loss.
If timber held for more than 6 months before disposal,is disposed of under any form of cutting contract by virtueof which an economic interest in the timber is retained,such as a pay-as-you-cut contract, the gain is treated asreceived from the sale of property used in trade or busi-ness. The date of disposal is the date the timber is cut,but if payment is received before the timber is cut, thetaxpayer may, if he elects, treat the date of payment asthe date of disposal.
An owner who disposes of coal (including lignite) underany form of contract wherein he retains an economic in-terest in such coal must treat the income as though re-ceived from a sale of property. Generally coal is treatedin the same manner as timber sold under a cutting con-tract. Christmas trees also qualify for this treatment ifmore than 6 years old and held for a period of more than6 months when cut.
Oil and Nbneral Interests
Includes sale or exchange of rights, interests, royalties,and leases in oil and other minerals (except coal andlignite); production payments' exploration rights; and oilwell ventures sold at a loss. Only the net proceeds fromthe sale of royalty interests and (subject to certain quali-fications) production payments, are subject to capitalgains treatment.
Section 632 of the Internal Revenue Code limits thesurtax on gain from certain sales of oil and gas prop-erties to an amount equal to 30 percent of the sellingprice. However, this normally results in a higher taxthan would otherwise apply on the sale of long-termcapital assets.
Partnership Interests
The sale or exchange of a partner's interestin a part-nership ordinarily results in capital gain or loss meas-ured by the difference between the amount realized andthe adjusted basis of the partnership interest. If the sell-ing partner is relieved of any liabilities of the partner-ship, he will include such amount in determining theamount realized for his interest. Amounts received bythe selling partner which are attributable to his interestin unrealized receivables or substantially appreciatedinventory items, however, result in ordinary income orloss.
Assets Used in Trade or Business
Includes plant and equipment, real estate, automobilesand other depreciable property used in trade or business;franchises and other rights and leasds; trade names, good-will and similar nondepreciable assets; seats on stockexchanges; and certified emergency facilities to whichInternal Revenue Code Section 168 applies. With respectto certified emergency facilities, capital gain is recog-nized only to the extent to which the gain from the saleor exchange exceeds the adjusted basis of the propertywithout regard to section 168 provisions for amortization.
This asset type refers to business assets with realizedaain or loss subject to capital gain or loss treatment. Itincludes the "Property used in the trade or business"referred to in Section 1231 of the Internal Revenue Codebut is not restricted to section 1231 property. Althoughsection 1231 property does not fall within the definition inthe Internal Revenue Code of 1954 of a capital asset, it ismade eligible for specialized capital gain treatment and,for the purposes of this study, has been grouped underthe heading of capital assets.
Property Held for Personal Use
Includes personal agreements and covenants not relatedto trade or business; automobiles, furniture and otherpersonal property not used in trade or business; andobjects of art including literary, musical or artisticworks. This category does not include rights to any ofthese which are included in "Options to buy and sell,"or personal residences which are included in "Resi-dences.- In addition, sale or exchange of objects of artheld by taxpayers whose personal efforts created theproperty, does not qualify for capital gain treatment.
Loss from the sale or exchange of property held forpersonal use is not deductible. However, the casualtyor theft loss on such property, held for more than sixmonths, should be included in the comparison of gainsand losses from section 1231 property to determinewhether it is capital or ordinary loss.

SALES OF CAPITAL ASSETS ON INDIVIDUAL RETURNS, 1962
Residences
Applies only to the sale of a principal residence. Ahouse which was once used as a residence but which hasbeen converted to rental property is notaprincipal resi-dence and the rules on the sale of a principal residencewill not in general apply. For property only partially aresidence, the special rules on sales of principal resi-dence apply only to that part used as a residence. Sincea principal residence is personal property, loss is notgenerally allowable on that part used as personalresidence.
Payment of tax on realized gain at the time of sale of aprincipal personal residence may be deferred if a newresidence is purchased within the 2-year period com-mencing one year before and ending one year after thesale. Gain is currently recognized only to the extent thatthe adjusted sales price of the old residence exceedsthe cost of the new residence. The cost basis of the oldresidence is carried over and applied to the new resi-dence to provide for eventual taxation of the gain. If thetax on any part of the gain on the sale of a residence ispostponed, the new residence will be considered to havebeen owned for the combined period of ownership of boththe old and the new residence.
This asset type includes residences abandoned for non-payment of taxes and stock ownership and worthless stockin cooperative housing developments and apartments, butonly if the development or apartment is the taxpayer'sresidence. Excludes mortgage on residence.
Nonbusiness Real Estate
Includes unimproved real estate; rights of way onproperty; rental property; and all other real estate otherthan that reported as (a) farmland with unharvestedcrops; (b) other farmland; (c) real estate subdivided;(d) residences; and (e) business assets.
Real Estate Subdivided
Includes real estate subdivided into lots, parcels, andtracts provided:
1. The seller is not a dealer in real estate.2. No substantial improvement that substantially en-
hances the value of the lot, parcel, or tract is made andno such improvement is made a part of the contract ofsale with the buyer.
3. Except for property acquired by inheritances ordevise, the property is held for at least 5 years.
A substantial improvement must be substantial incharacter and also substantially increase the value ofthe lot or parcel sold. Shopping centers, other com
-mercial or residential buildings, land service roads, orutility services (such as sewer, water, gas, or electricity)are some improvements which are substantial in charac-
Jer and usually constitute a substantial improvement.If the property is held for 10 years or more, im-
provements made which are otherwise considered sub-stantial will not be so treated, if:
(1) The improvement consists of the installation ofwater, sewer, or drainage facilities, roads, curbs, andgutters;
15
(2) Without such improvements, the lot would nothave brought the prevailing local price for similar sites;and
(3) It is elected not to adjust basis of the lots sold,or any other property owned, for the cost of such im-provement and not to deduct such cost as an expense.
Farmland with Unharvested Crop
Capital gain or loss treaiment is applicable to the fullamount of gain or loss on the sale of farmland with un-harvested crops if the land is sold or exchanged at thesame time to the same person. Capital gaintreatment isnot available if the taxpayer retains any right or option toreacquire the land the crop is on. Crops include grovesand fruit and nut trees. The cost of producing the cropis not deductible as a current expense.
Other Farmland
Includes farm rental property and farmland abandonedfor nonpayment of taxes, as well as any other farmlandwithout unharvested crops.
Prior Year Installment Sales
Includes installment payments received in the current-year resulting from prior year sales, usually, of realestate and businesses. Excludes current year installmentsales which are classified by the type of asset sold.
The installment method of accounting may not be appliedif the payments received in the taxable year of the sale ex-ceed 30 percent of the selling price. Note that this cate-gory applied to the proceeds received from a prior year'stransaction in property which, if it were not for the in-stallment method, would be classified in other asset typecategories.
Income from installment sales is determined by the useof a gross profit percentage which is the percent thatthe gross profit to be realized is of the total contractprice. This percentage is applied to each payment todetermine the gain for the tax year in which collectedand, once determined, remains the same for all install-ment payments received on the sale.
Other Type Assets
Includes mortgages, foreign currency conversion, non -business bad debts, pension fund dissolved, life interestin an estate, cancellation of lease or distributor's agree -ment, termination payments to employees, patents in-cluding patent royalties, other royalties, and other assetsnot properly classified elsewhere. Also includes assetsnot identified (see "Limitations of the Data").
CAPITAL ASSET TRANSACTION TERMS
Gross Sales Price
The gross sales price realized represents cash and thefair market value of other property received, includincrmortgages, notes, and other evidences of indebtedness.Included at face value are any of the seller's liabilities

16 SALES OF CAPITAL ASSETS ON INDIVIDUAL RETURNS, 1962
assumed by the purchaser and any liabilities to which theproperty is subject, such as real estate taxes or mortgage.
Cost and Expense of Sale
Cost represents the amount or equivalent paid, criven,or charged, or engaged to be paidorgiven, for the asset.The cost of property is increased by the cost for all itemsproperly chargeable to capital account, such as cost ofimprovements having a useful life of more than one vearand costs of purchase commission, title search, andrecording fees. The basis of property acquired by giftafter December 31, 1920, is the cost or other basis to thedonor in the event of a gain, but in the event of a loss, itis either such donor's basis or the fair market value ondate of gift. Generally, the basis of property acquiredby inheritance is the fair market value at the date ofdeath. In the case of sales and exchanues of automobilesand other property not used in trade or business, or notused for the production of income, the basis for deter-mining gain is the original cost plus the cost of per-manent improvements thereto. Commissions and otherexpenses incurred in selling or disposing of anasset aregenerally treated as an offset in computing thegain fromthe sale or disposition. No losses are recognizedfor in-come tax purposes on the sale and exchange of suchproperties.
Dei)reciation
Depreciation is a deduction of a reasonable allowancefor the exhaustion or wear and tear of property used in atrade or business, or of property held for the productionof income. This deduction is computed by a number ofmethods, including depreciating tangible property ac-quired after December 31, 1953, and the additional first -year depreciation allowance taken on property purchasedafter December 31 1957.
action. If one or more of the amounts for gross salesprice, depreciation, cost and expense of sale, and gain orloss were bracketed for an asset type, the grouping wastreated as one transaction. Unless the taxpayer listed thereceipts from more than one source, number of trans-actions for capital gain dividends and partnership andfiduciary shares are counts of the entries on the linesprovided for these asset types in schedule D.
SCHEDULE D SUMMARY ITEMS
Net Gain from Sales of Capital Assets
Such -ain included in adjusted gross income is theamount of gain from sales or exchanges of propertytreated as capital assets. In computing this gain, the netshort-term gain or loss was combined with the net long-term gain or loss. For the determination of net short-and long-term gain and loss, the taxpayer included withhis personal, current year transactions, his 5-year capi-tal loss carryover as a short-term loss, and his share of(1) net short- and long-term gain (or loss) from fiduci-aries and from partnerships and (2) distributed and undis -tributed long-term gain from regulated investment com-panies. The amount of net gain in adjusted gross incomeconforms to one of several conditions, namely; (a) onreturns with net long-term gain greater than net short-term loss, 50 percent of the excess net long-term gainover net short-term loss, (b) on returns with only a netlonLT-term ~zain, 50 percent thereof, (c) on returns withboth net short- and long-term gain, the entire amount ofnet short-term gain combined with 50 percent of the netlong-term gain, (d) on returns with only a net short-term gain, the entire net gain, and(e)on returns with netshort-term gain greater than net long-term loss, theentire excess of net short-term gain over net long-termloss.
Gross Gain or loss
In general, the gross gain or loss is the differencebetween (1) the gross sales price, and (2) cost less theamount of depreciation. However, for current year in-stallment sales the amount of gain reported for that yearis less than the difference between the reported grosssales price and the reported cost less depreciation.Moreover, for the following asset types there is notransaction detail and the taxpayer reports only the gainor loss: Capital gain dividends; partnership and fiduciaryshares,- small business distributions; liquidation distribu-tions; retirement plan distributions; and installment salesfrom prior years. In addition, transaction detail may ormay not be applicable for such assets as timber and coal;oil and mineral interests; and certain assets included inthe category "other assets."
Number of Transactions
Number of transactions is a count of the separate gainDr loss entries on schedule D. When the taxpayer re-)orted a single gain or loss amount for several sales ofn asset type, the sales were counted as a single trans-
Net Loss from Sales of Capital Assets
Net loss deducted from adjusted gross income is thedeductible loss resulting from sales or exchanges ofproperty treated as capital assets. To determine thedeductible loss, all short-term gains and losses weremerged with the long-term gains and losses, and the ex-cess loss was allowed to the extent of the smallest of(1) amount of capital loss, (2) taxable income (adjustedgross income if tax table was used), computed withoutregard to capital gains and losses, and the deduction forpersonal exemptions, or (3) $1,000. In merging thecapi-tal gains and losses, the taxpayer combined his currentyear gains and losses and his 5-year capital loss carry-over with his share of (1) net short- and long-term gain(or loss) from fiduciaries and from partnerships and(2) distributed and undistributed long-term gain fromregulated investment companies. Any part of the capitalloss incurred in the current vear which was not deductiblebecause of the limitation could be carried forward for5 succeeding years as a short-term capital loss to theextent that it was not absorbed
*by capital gains in the
intervening years. If a capital loss carryover was noteliminated in the 5-year period, the remaining loss couldnot be used.

SALES OF CAPITAL ASSETS ON INDIVIDUAL RETURNS, 1962
Net Short-term Capital Gain or Loss
Gains and losses from sales or exchanges of capitalassets held 6 months or less were considered to beshort-term capital assets. Such gains and losses for thecurrent year and the capital loss carryovers from -3preceding years (used as short-term losses) were com-bined to obtain the net short-term gain or loss. In thiscombination, the net short-term capital gain or lossfrom partnerships and the net short-term capital gainfrom fiduciaries were also included.
Net Long-term Capital Gain or Loss
Gains and losses from the sale or exchange of propertytreated as cal)ital assets were considered to be long-termif held more than 6 months. Gain or loss from the sale orexchange of livestock held, for draft, breeding or dairypurposes are covered by the provisions of Section 1231of the Internal Revenue Code and are considered to belong-term if held 12 months or more. Long-term gainsand losses were combined with net long-term capitalgain or loss received through partnerships, the netlong-term gain received through fiduciaries, and anycapital gain dividends received from regulated invest-ment companies to obtain the net long-term gain or lossfor the year.
Capital Loss Carryover from 1957-1961
This carryover was that portion of the net capital loss-sustained in the 5-year period which the taxpayer had beenunable to offset against his capital gains or the $1,000deduction allowed for capital loss in computing adjustedgross income in tax years subsequent to the year in whichthe capital loss arose. The carryover was reported withand treated as a short-term capital loss in the currentyear.
Net Loss from Sales of Capital Assets beforeLimitation
This was the entire loss, resulting from sales ofproperty treated as capital assets, which was reportedon returns having a capital loss in adjusted gross income.The loss was a combination of current year short-termgains and losses, the 5-year capital loss carryover, andthe current year long-term gains and losses, and waswithout regard to the statutory limitation on. the deductibleloss.
Net Gain from Sales of Capital Assets beforeLimitation
This was the entire gain, resulting from sales ofproperty treated as capital assets, which was reportedon returns having a capital gain in adjusted gross in-come. The gain was a combination of current year short -term gains and losses, the 5-year capital loss carryover,and the current year long-term gains and losses, and wasbefore any deduction for 50percentof net long-term capi-tal gain over net short-term capital loss.
17SOURCES OF INCOME AND LOSS, OTHER THAN NETGAIN AND NET LOSS FROM THE SALES OF CAPITAL
ASSETS, COMPRISING ADJUSTED GROSS INCOME
Net Gain or Loss from Sales of Property Other thanCapital Assets
The amount of this source in adjusted gross incomeresulted from sales or exchanges of property which waseither not a capital asset or was not treated as a capitalasset. Each taxpayer included his share of such gain orloss received through partnerships and fiduciaries. Gainfrom these transactions was included in its entirety andthe net loss was fully deducted in computing adjustedgross income.
Business, Farm, or Profession Net Profit or Net Loss
This source was reported by individuals who were soleproprietors of a business or farm, or members of a pro-fession, and who did not elect to be taxed as a corporation.When there were two or more sole proprietorship busi-nesses operated by the taxpayer, the single amount ofprofit or loss included in adjusted gross income repre-sented the combined profits and losses from all businessactivities. The sole proprietor was required to excludedividends from the business receipts and to report themwith dividend income for the purpose of dividendexclusions and tax credit.
Business expenses deductible from business receiptsincluded such items as cost of goods sold, salaries andwages paid employees, interest on business indebtedness,taxes on business and business property, bad debts arisingfrom sales or services, depreciation, obsolescence, de-pletion, casualty losses on business property, rent, re-pairs, supplies, advertising, selling expense, insurance,and other costs of operating the business. Compensationof the sole proprietor was not allowed as a business de-duction and the net operating loss deduction was notreported among the business expenses.
Salaries and Wages (Net)
Net salaries and wages were amounts of compensationfor personal services reported in adjusted gross income.In addition to actual salaries and wages, this source iscomprised of commissions, bonuses, tips, fees, excessreimbursement over employee business expenses, and thevalue of nonmonetary payments for services, e.g., mer-chandise, accommodations, property, etc. Excluded fromthis source were tax exempt portions of both salariesearned abroad and sick pay receipts, and certain expensesconnected with employment that were deductible from totalsalaries and wages in computing adjusted gross income.
Dividends (After Exclusions)
Dividends after exclusions were distributions of cash,property, services, accommodations, etc., by a corpora-tion from its earninas to individual taxpayers, exf:eptingan exclusion of qualifying dividends not exceeding $50
7per taxpayer. On joint returns, if both husband and wife
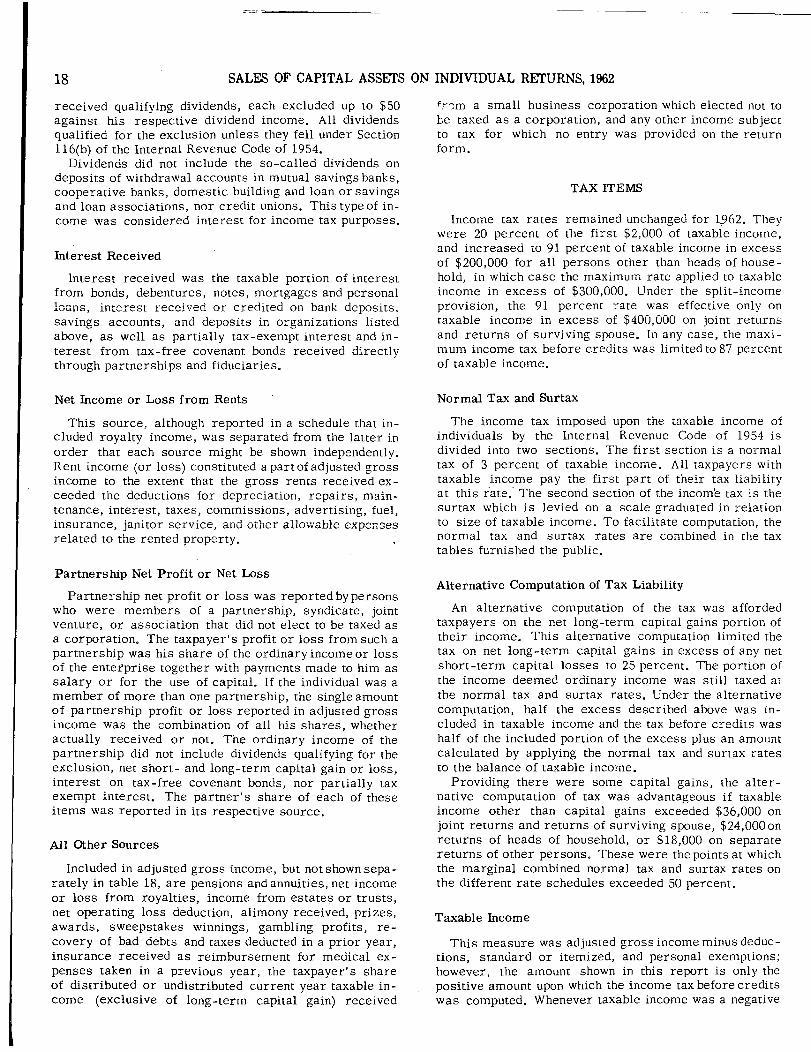
18 SALES OF CAPITAL ASSETS ON INDIVIDUAL RETURNS, 1962
received qualifying dividends, each excluded up to $50against his respective dividend income. All dividendsqualified for the exclusion unless they fell under Section116(b) of the Internal Revenue Code of 1954.
Dividends did not include the so-called dividends ondeposits of withdrawal accounts in mutual savingsbanks,cooperative banks, domestic building and loan orsavingsand loan associations, nor credit unions. This type of in-come was considered interest for income tax purposes.
Interest Received
Interest received was the taxable portion of interestfrom bonds, debentures, notes, mortgages and personalloans, interest received or credited on bank deposits,savings accounts, and deposits in organizations listedabove, as well as partially tax-exempt interest and in-terest from tax-free covenant bonds received directlythrough partnerships and fiduciaries.
Net Income or Loss from Rents
This source, although reported in a schedule that in-cluded royalty income, was separated from the latter inorder that each source might be shown independently.Rent income (or loss) constituted apart of adjusted grossincome to the extent that the gross rents received ex-ceeded the deductions for depreciation, repairs, main-tenance, interest, taxes, commissions, advertising, fuel,insurance, janitor service, and other allowable expensesrelated to the rented property. I
Partnership Net Profit or Net Loss
Partnership net profit or loss was reported by personswho were members of a partnership, syndicate, jointventure, or association that did not elect to be taxed asa corporation. The taxpayer's profit or loss from such apartnership was his share of the ordinary income or lossof the entefprise together with payments made to him assalary or for the use of capital. If the individual was amember of more than one partnership, the singleamountof partnership profit or loss reported in adjusted grossincome was the combination of all his shares, whetheractually received or not. The ordinary income of thepartnership did not include dividends qualifying for theexclusion, net short- and long-term capital gain or loss,interest on tax-free covenant bonds, nor partially taxexempt interest. The partner's share of each of theseitems was reported in its respective source.
All Other Sources
included in adjusted gross income, but not shown sepa-rately in table 18, are pensions and annuities, net incomeor loss from royalties, income from estates or trusts,net operating loss deduction, alimony received, prizes,awards, sweepstakes winnings, gambling profits, re-covery of bad debts and taxes deducted in a prior year,insurance received as reimbursement for medical ex-penses taken in a previous year, the taxpayer's shareof distributed or undistributed current year taxable in-come (exclusive of long-term capital gain) received
f.r-,m a small business corporation which elected not to1~e taxed as a corporation, and any other income subjectto tax for which no entry was provided on the returnform.
TAXITEMS
Income tax rates remained unchanged for 1,962. Theywere 20 percent of the first $2,000 of taxable income,and increased to 91 percent of taxable income in excessof $200,000 for all persons other than heads of house-hold, in which case the maximum rate applied to taxableincome in excess of $300,000. Under the split-incomeprovision, the 91 percent rate was effective only ontaxable income in excess of $400,000 on joint returnsand returns of surviving spouse. In any case, the maxi-mum income tax before credits was limited to 87 percentof taxable income.
Normal Tax and Surtax
The income tax imposed upon the taxable income ofindividuals by the internal Revenue Code of 1954 isdivided into two sections. The first section is a normaltax of 3 percent of taxable income. All taxpayers withtaxable income pay the first part of their tax liabilityat this rate. The second section of the income tax is thesurtax which is levied on a scale graduated in relationto size of taxable income. To facilitate computation, thenormal tax and surtax rates are combined in the taxtables furnished the public.
Alternative Computation of Tax Liability
An alternative computation of the tax was affordedtaxpayers on the net long-term capital gains portion oftheir income. This alternative computation limited thetax on net long-term capital gains in excess of any netshort-term capital losses to 25 percent. The portion ofthe income deemed ordinary income was still taxed atthe normal tax and surtax rates. Under the alternativecomputation, half the excess described above was in-cluded in taxable income and the tax before credits washalf of the included portion of the excess plus an amountcalculated by applying the normal tax and surtax ratesto the balance of taxable income.
Providing there were some capital gains, the alter-native computation of tax was advantageous if taxable
.income other than capital gains exceeded $36,000 onjoint returns and returns of surviving spouse, $24,000onreturns of heads of household, or $18,000 on separatereturns of other persons. These were the points at whichthe marginal combined normal tax and surtax rates onthe different rate schedules exceeded 50 percent.
Taxable Income
This measure was adjusted gross income minus deduc -tions, standard or itemized, and personal exemptions;however, the amount shown in this report is only thepositive amount upon which the income tax before creditswas computed. Whenever taxable income was a negative

SALES OF CAPITAL ASSErS ON INDIVIDUAL RETURNS, 1962
amount (producing no tax), it was disregarded. Thisoccurred on some, but not all, nontaxable returns.
Taxable income was reported on itemized deductionsreturns, and on standard deduction returns with $5,000 ormore adjusted gross income, and transcribed if it was apositive amount. Taxable income was mechanically com-puted for each return which did not show this item, butdisregarded if found to be a negative amount. Returnswhich did not show taxable income were those Form1040 reiurns with adjusted gross income under $5,000on which the tax table was used.
Taxable income for taxpayers who used the tax tablewas computed by (1) using the midpoint of the incomebracket of the tax table into which the taxpayer's adjustedgross income fell as the amount of adjusted gross income,(9) providing a 10 percent standard deduction based on themidpoint, and (3) allowing $600 for each exemptionclaimed. This formula produced the amount of taxableincome upon which the taxpayer's tax was based by wayof the tax table.
Income Tax Before Credits
Tax before credits was based on the taxable incomeand computed at the prescribed rates. it was either theregular combined normal tax and surtax including taxfrom the tax table, or the tax computed under the alter-native method, before such amounts were reduced bytax credits. It did not include the self-employment tax.
Income Tax After Credits
Tax after credits was the income tax liability exclud-ing the self-employment tax and was the criterion uponwhich taxable and nontaxable returns were classified.It was after the deduction for income tax credits, butprior to the year-end adjustments for tax withheld fromwages and payments on declaration which determined theoverpayment of tax due status.
Exemptions
In the computation of taxable income, exemptions wereallowed for the taxpayers and their dependents, and addi -
19
tional exemptions were allowed for taxpayers who were 65or over and for taxpayers who were blind.
A $600 exemption was allowed for the taxpaver, thetaxpayer's spouse, and for each son and daughter(including a stepchild or an adopted child) who wasunder 19 years of age, or who was a student regardlessof age, if the taxpayer furnished more than half thesupport. If the child was 19 or over and not a student,an exemption was allowed only if the child had less than$600 gross income for the year and the taxpayer fur-nished more than half the support.
An exemption of $600 was also allowed for any de-pendent who had less than $600 gross income, and whoreceived more than half his support from the taxpayer ifthe dependent was (1) a close relative as outlined inSection 152 of the internal Revenue Code, or (2) any personwho lives in the taxpayer's home for the entire year andwho was a member of his household, whether or not re-lated to the taxpayer.
An exception to the support test for a dependent pro-vided that where the individual was supported by severalpersons, none of whom contributed more than half thesupport, any one of the group who had contributed morethan 10 percent of the support could claim the exemptionif each of the others who contributed more than, 10 per-cent declared in writing that he would not claim theexemption for the year.
To qualif y as a dependent, an individual must have beeneither a citizen or resident of the United States; a resi-dent of Canada, Mexico, the Republic of Panama, or theCanal Zone; or an alien child adopted by and living witha United States citizen abroad.
The birth or death of a dependent during the year didnot affect the exemption for him, if the support and othertests were met for the part of the year during which thedependent lived.
Besides the "personal" exemption for the taxpayer andspouse, an additional $600 exemption was allowed foreach taxpayer or spouse who was age 65 or over, andeach taxpayer or spouse who was blind. A taxpayer couldfile a separate return and claim the exemptions for thespouse (including those for age and blindness) only if thespouse had no gross income and was not a dependent ofanother taxpayer. Exemptions for age and blindnesswere not allowed for any dependents.
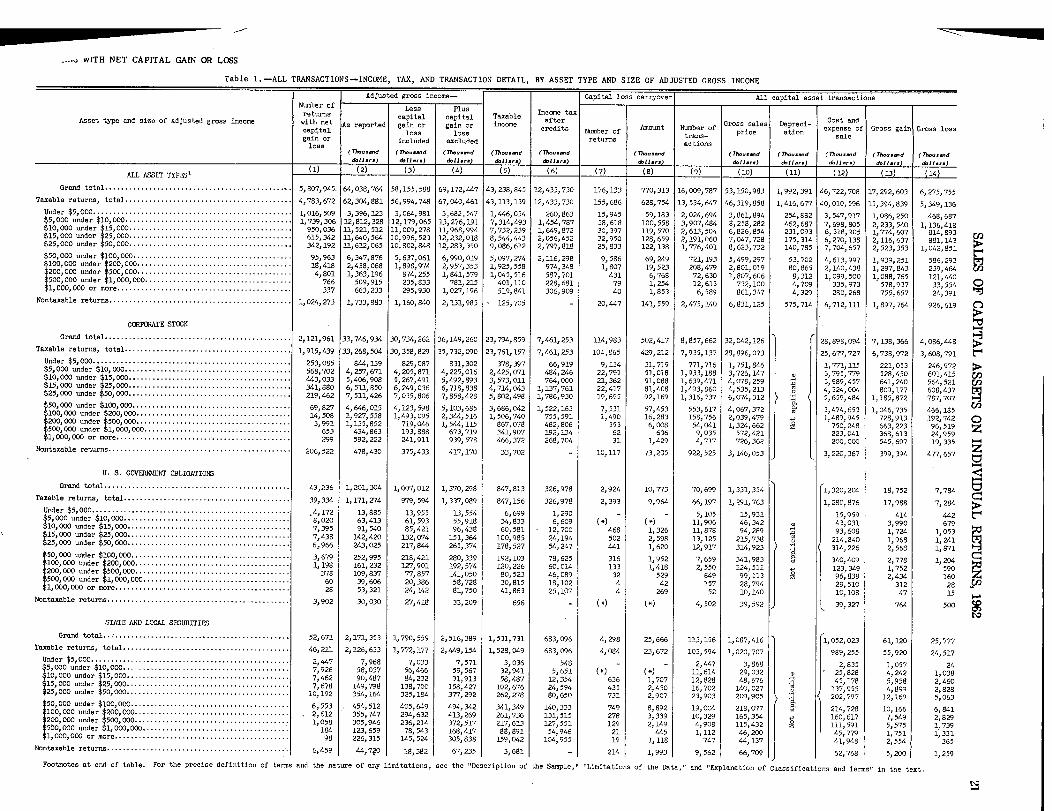
_.- WITH NET CAPITAL GAIN OR LOSS
Table 1. -ALL TRANSACTIONS -INCOME, TAX, AND TRANSACTION DETAIL, BY ASSET TYPE AND SIZE OF ADJUSTED GROSS INCOME
Adjusted gross in oe- Capital loss carryover All capital asset transactionsNumber ofreturns
le acapital
Pl scapital Taxable
Income taxAsset type and size of adjusted gross income with net As reported gain or gain or
inewe
afterGroas sales Deprec
I-Cost and
capital loss lossredits Number of
Amount Number Ofi
pr ce ationexpense of Gross gain Gross loss
gain or included excluded returns trans-actions
sale
Is..(7).-d (7).....d (7h--d (Th-d (TI.-d (Th...-d (77....-d (A.-d (Th--d (Th-d (7?...-dd0l ...) &11.-) _. 6,11-) &11-!~) d.11.,.) d,11 ... ) d.11 ... d.11 ... ~jlarm) d.11.r.) d.11...
ALL ASSET TYPES'(I) - (2) (3) (4) (5) (6) (7) (8) (9) (10) ( 1.1) (12) (13) (14)
Grand total ............................................... 5,807,945. 64,038,764 58,155,588 69,172,447 43,238,845 12,433,730 176,133 770,313 16,009,787 53,150,983 1,992,391 46,722,708 17,292,603 6,275,755Taxable returns, total .......................................... 4,783,672 62,304,881 56,994,748 67,040,461 43,113,139 12,433,730 155,686 628,754 13,534,647 46,319,858 1,416,677 40,010,596 15,394,639 5,349,136
Under $5,000 ..................................................5 000 und $10 000
1,016,509 3,396,123 3,064,981 3,682,54'? 1,446,054 260,863 15,945 59,183 2,024,694 3,861,894 254,882 3,547,917 1,086,250 468,687er, , .......................................... 1,739,306 12,812,328 12,179,065 13,276,191 7,314,493 1,454,787 38,618 100,558 3,907,484 8,258,282 462,687 7,698,805 2,233,540 1,136,41810,000 2de r 15,000 ... ......::::::: 910, .36 11.1521, 512 11,009,278 11,968,994 7,732,239 1,649,872 30,397 119,570 2,613,504 6,826,854 231,093 6,318,905 1,774,607 B14,893d~r 1
15,00025,.0
.................................. 615,342 11,640,564 :10,996,523 12,232,018 8,544,443 2,056,452 32,950 128,659 2,191,060 7,047,728 175,314 6,270,138 2,116,637 881,14325,000 "der 50,000 ......................................... 342,192 11,612,065 10,802,848 12,283,350 9,086,612 2,797,818 25,833 122,138 1,776,401 8,623,732 140,785 7,704,657 2,523,353 1,042,85150,000 under $100,000 ........................................ 95,963 6,347,876 5,637,061 6,990,019 5,097,274 2,116,298 9,586 69,249 721,193 5,499,297 53,702 4,613,997 1,939,251 586,293100,000 under 210,1 ::::::1 ................................. 18,418 2,438,068 1,898,974 2,957,353 1,925,558 974,348 1,807 19,523 208,479 2,801,019 80,865 2,140,438 1,297,843 464239
15 ,0200,000
under CC".................................
1
4,801 1,363,196 874,255 1,841,579 1,045,516 587,701 431 6,768 72,630 1,807,606 8,312 1,099,500 1,088,765,
121 440500,000 under 1,000,000 ..................................... 766 509,915 235,833 781,215 401,110 228,681 79 1,254 12,613 732,100 4,709 335,973 578 937
,
33 5541,000,000 or more ............................................ 337 663,233 295,930 1,027,196 519,841 306,909 40 1,853 6,589 861,347 4,329 280,268,
755,657,
24,391Nontaxable returns .............................................. 1,024,273 1,733,883 1,160,840 2,131,985 125,705 - 20,447 141,559 2,475,140 6,831,125 575,714 6,712,111 1,897,764 926,619
CORPORATE STOCK
Grand total ............................................... 2,121,961 33,746,934 30,734,262 36,149,260 23,794,859 7,461,253 114,983 502,417 8,857,662 32, C)42, 126 28,898,094 7,138,366 4,086,448Taxable returns, total .......................................... 1,915,439 33,268,504 30,358,829 35,732,090 23,761,157 7,461,253 104,865 429,212 7,935,137 29,896,073 25,677,727 6,738,972 3,608,791
Under $5,000 ..................................................5 000 under $10 000 ....
253,085 844,139 829,087 831,302 378,397 66,919 9,134 31,719 771,716 1,751,846 1,771,115 221,053 246,972, , . ....................10 000 under 1 0101
568,70244
4,257,671 4,205,871 4,225,016 2,425,071 484,246 22,791 51,018 1,933,188 3, 726, 147 3,795,779 528,450 601,415, ndcr 1 , :::::::: ................000 u
2"....15
1
3,0314
1,4.6,908 5,267,491 5,492,893 3,573,011 764,000 21,362 91,088 1,639,471 4, 078, 259 3,989,457 641,240 564,521, ...............................25 000 d 0 000
.3 1,880 6,511,850 6,249,036 6,718,838 4,714,043 1,137,761 22,417 81,408 1,493,860 4_535,213 4,324,004 809,177 608,437, un er 5 , ......................................... 219,462 7,511,426 7,035,806 7,858,428 5,802,498 1,786,930 19,695 92,169 1,316,737 6 C 74, 312 5
,
659,484 1,185,872 787,70750,000 under $100,000 ........................................100 000 und r 21)0 000 ....... *
69,8274
4,646,015 4,123,598 5,103,685 3, 686, 042 1,522,163 7,531 57,453 553,617
~
4:
C
67,372 3,474,653 1,046,735 466,185, 15. , . ........................O::::::~..000
urd:r 0200 .. .
1
1 ,508 1,927,558 1,493,095 2,344,516 1,506,740 755,591 1,490 16,263 158,756 2, 039, 479 1,489,945 728,913 192,742,
, . . .........................500 000 under 1 OCO 000.............
3,991 1,135,852 719,046 1,544,115 867,078 482,806 353 6,008 54,041 1,324,662 750,248 663,223 96,519, , , ........................1 000 000 or more
653 434,863 193,888 673,719 341,907 192,134 62 636 9,035 '72,421 223,041 368,613 24,959, ~ ............................................ 299 592,222 241,911 939,578 466,372 268,704 31. 1,429 4,717 726,362 200,000 545,697 19,335Nontaxable returns .............................................. 206,522 478,430 375,433 417,170 33,702 - 10,117 '73,205 922,525 3,146,053 3,220,367 399,394 477,657
U. S. GOVERNAENT OBLIGATIONS
Grand total ............................................... 43,236 1,201,304 1,007,012 1,370,298 847,813 326,978 2,924 10,773 70,699 1,331,354 1,320,204 18,752 7,784Taxable returns, total .......................................... 39,334 1,171,274 979,594 1,337,089 847,156 326,978 2,393 9,964 66,197 1,291,763 1,280,876 17,988 7,284
Under $5,000 ..................................................5 000 under $10 000 .............. ...
4,1728 0
13,885 13,955 13,554 6,699 1,290 - - 5,105 15,931 15,959 414 442, , . ........................10 000 und 15 OOO ... ..
, 20 63,413 61,593 55,918 34,833 6,609 11,906 46,3421
43,031 3,990 679, :; J2,, ::::::::: . ..........................000 und ....15
1
7,3154
91, 540 85,421 96,438 60,561 12,7CO 468 1,326 11,878 94,289.72
93,608 1,724 1,053, ............................25 000 under 50 000 ................ .
7, 38 142,420 132,074 151,364 100,985 24,194 502 2,598 13,125 215 738 214,840 1,968 1,241, , . ....................... 6,966 243,025 217,84.4 265,374 178,527 54,247 441 1,620 12,917 314,923 ~11 314,226 2,568 1,87150,000 under $100,000 ........................................ 3,679 252,995 218,421 28o,339 192,103 78,625 316 1,952 7,659 341,983 340,409 2 778 2041u der Of11,11 under 21, 110: .....0
200 000 n 15 ......... ..
1
1,198 161,232 127,901 192,574 120,226 60,014 133 1, 418 2,550 324
1
511o
123,349,
1,752,590, . .....................
500,000 under 1 000 000 ..... .............................37860
109,83760639
77,857 141,050 80,523 46,089 32 529 849 99 113I Z 96,838 2,434 160, , ...1 000 000 or more ...................... .. 8
, 20,386 58,728 30,815 18,102 4 42 157 28,794 28,510 312 28, , . ................... 2 53,321 24,142 81,750 41,863 25,1.07 4 269 52 10,140 10,108 47 15Nontaxable returns .............................................. 3,902 30,030 27,418 33,209 656 - 4,502 39,592 39,327 764 500
STATE AND LOCAL SECURITIES
Grand total- ............................................ 52,671 2,171,353 1,790,559 2,516,389 1,531,731 683,096 4,298 25,666 113,156 1,C87,416 1,052,023 61,120 25,777Taxable returns, total ........................................... 46,211 2,126,633 1,772,177 2,449,154 1,528,049 683,096 4,084 23,672 103,594 1,020,707 989,255 55,920 24,517
Under $5,000 ..................................................5 000 under $10 000 ...... .
2,447 7,968 7,033 7,571 3,036 548 - - 2,447 3,868 2,835 1,057 24, , . .... .... -- ... * ................10,000 under 15: 0 00 .. .............................
Z
1
7,9267,462
58,03790,487
56,466
84,23259,56791,913
32,94158,487
5,65112,354 636 1,707
11,61412,828
29,03248,676
25,82845 178
4,2425 958
1,0382 460
. , (r 12,................................15,000 ur
25 000 under 50 000 ... ...7,678 149,798 138,700 158,427 102,676 24,594 435 2,430 16,?02 140,027
,
137,955,
4,899,
2,828, , . .................................. 10,192 354,164 325,184 377,292 262,278 80,650 731 2,907 23,903 209,905 202,797 12,169 5,06350,000 under $100,000 ........................................100 000 under 200 000.. . .
6,553 454,512 405,649 494,342 341,349 140,333 749 8,892 19,004 218
,
077 214,728 10,166 6,841, 1 , . . .................................200 000 under 500 000.............
1
2,6120
355,747 294,632 413,269 261,736 131,515 278 3,339 10,329 165,354 160,617 7,549 2,829, , ......................... :500 000 under 1 000 000 ......
1, 58 305,946 236,224 372,517 217,613 127,551 129 2,149 4,908 115,432 111,591 5,575 1,739, , , ...............................1 000 000 or more..
184 123,659 78,543 168,417 88, E391 54,946 21 445 1,112 46,200 45,779 1,751 1,331, , 98 226,315 145,524 305,838 159,042 104,955 19 1,118 747 44
'
137 41,948 2,554 365Nontaxable returns 6,459 44,7~O 18,382 67,235 3,681 - 214 1,993 9,562 66,709 62,768 5,200 1,259
Footnotes at end of table. For the precise definition of te~ and the nature of any limitations, see the "Description of' the Sample,,, "Limitations of the Data," and "Explanation of Classifications and Terms" in the text,

RETURNS WITH NET CAPITAL GAIN OR LOSS
Table I. -ALL TRANSACTIONS - INCOME, TAX, AND TRANSACTION DETAIL, BY ASSET TYPE AND SIZE OF ADJUSTED GROSS INCOME -Continued
Adjusted gross income- Capital loss carryover All capital asset transactions
Number of Less Plus Income tax
Asset type and size of adjusted gross incomereturnswith net As reported
capitalgain or
capitalgain or
Taxableincome
afterAmount N=b of
Gross-sales Depreci-Cost and
ex e a ofn a Gross gain Gross losscapital loss loss
redits Number ofertr_
trars-price ation
p aale
gain or included excluded returns
E
actionsloss
(7h-.-dd0l-) &11 ... d0l.,.) d.11.,.) d.11.,.) d.11 ... 6.11.r.) d.11 ... d.11 ...)
(1) (2) (3) (4) (5) (6) (7) (8) (9) (lo) (11) (12) (13) (14)OTHER BONDS, NOTES, AND DEBENTURES
Grand total ............................................... 46,425 1,233,877 1,005,038 1,363,828 857,155 332,794 4,464 38,898 75,762 669,967 731,820 37,704 99,8&
Taxable returns, total .......................................... 40,286 1,213,699 1,008,419 1,374,949 855,594 332,794 3,219 18,638 65,326 449,659 457,621 34,461 42,72~
Under $5,000 .................................................. 4,324 13,316 13,430 8,113 5,185 896 6,203 4,205 6,032 375 2,20,
5,000 under $10,000 .......................................... 8,487 64,218 65,837 52,964 39,253 7,697 10,200 15,717 1 19,781 1,615 5, 67~10,000 und: r 1 1 000 ..................... , .........
1
7,916 98,218 93,311 99,109 64,306 13,591 535 1,596 12,622 39,613 40,960 3,227 4,59:r 1, ,: .GO15,000 und ............................... 7,670 149,226 137,768 155,552 102,187 24,326 535 2,536 11,788 57,568 63,056 3,127 8,62125,000 -der 50,000 ......................................... 6,843 239,004 219,806 250,392 178,186 54,677 717 2,683 13,994 174,866 178,121 6,334 9,59,
50)000 under $100,000 ........................................ . 3,423 231,184 196,180 260,877 173,177 70,121 400 3,708 6,670 65,409 64,834 6,944 6,4T100)000 und r 201,110 ........................... 1,084 147,341 118,577 172,683 105,199 51,756 85 1,869 2,316 49,505 4?,640 4,656 2,95;1gr 5.,G.0::::::::200,000 un ...............................
1
409 117,526 80,231 152,398 81,355 44,816 35 775 1,209 30,970 26,494 6,367 1,89
500,000 under 1,000,000 ..................................... 85 56,607 30,815 81,559 38,528 22,256 7 110 210 7,700 6,338 1,728 36
1,000,000 or more ............................................ 43 96,972 52,462 141,303 68,219 42,657 5 293 113 4,105 4,366 88 341
Nontaxable returns .............................................. 6,140 20,178 -3,381. -11,121 1,561 - 10,436 220,308 274,200 3,243 57,13
INSURANCE AND ANNUITIES
Grand total ............................................... 8,143 132,514 114,135 148,542 93, 072 28,631 148 654 10,106 37,575 21,474 17,821 1,88'
Taxable returns, total ........................................ 1. 7,339 130,004 112,193 146,082 92,677 28,631 148 654 9,303 37,135 21,156 17,700 1,88
Under $5,000 ..................................................000..........................................5,000 under $10
3,166I
21,279 20,261 22,270 11,166 2,113__
3,659I
3,604 1,711 1,893,
r 1 001 ........... * .......10,000 und:
1
1
,
671 211,717 18,334 23,485 14,101 2,959 2,275 5,799 3,287 2,858 34r J2 ::::::::::15, 000 =d
COG............................... 1,204 23,116 20,681 25,157 16,981 4,180
140 5971
,673 1.1,239 7,635 4,617 1,01
25,000 under 50,000......................................... 994 33,751 30,042 35,967 25,890 7,930 1,226 9,175 4,483 4,847 31
50,000 under $100,000....... 221 14 60`7'
12 356 16,772 11,65i 4,714 329 4 658 2,861 1,950 15100,000 un 211 01 60 7 853 6,363 9,337 6,340 3,249 8 56 105 1 621 o 758 900 4:
1500COG:
200,000 under ...............................
1
18 4,933 2,583 7,254 3,810 2,021 - - 30 931 421 530 2500,000 urider 1,000,000..................................... 2 1,076 125 2,028 1,023 497 - - 3 107 1 1061,000,000 or more ............................................ 1 2,630 1,448 3,813 1,714 967 1 1 2 - - -
Nontaxable returns ............................................
OPTIONS TO BUY OR SELL
Grand total ............................................... 10,631 210,101 177,359 228,W 142,828 46,553 1,358 4,644 38,886 342,547 335,166 17,895 10,51
Taxable returns, total .......................................... 9,462 206,069 174,933 225,458 142,828 46,553 1,357 4,621 36,630 3:36,142 327,761 17,346 8,96
Under $5,000 ...................................... :~ ..........5 000 under $10 000
2,673 17,352 17,465 16,651 7,596 1,448I (-) (.)
20,841I
195,908 196,357 1,902 2,35, , .............
10,000 und. * ... .., * ", " ***, * ... * . ..1"r 0'0
1
2,735 33,548 33j468 30,236 21,417 4,633 335 1,408 8,122 105,473 106,556 1,963 3,04... .. ..0::~:::::~: . .. .. .. .15,000 und: r 121, 0 . 1,773 33,449 30,742 33,246 22,805 5,450 3,747 12,780 9,366 4,426 1,01
25,000 under 50,000 ......................................... 1,693 58,533 52,832 60,591 43,427 13,129 252 1,294 2,841 :Ll, 593 10,400 2,718 1,52
'0 0 derGOO ........................................
$ ~%
430 29,268 23,546 33,898 21,523 8,657 62 592 794 3,690 2,103 2,210 621000 .......................................I. 000tdar 117 16,178 10,769 21,612 11,684 5,646 14 419 205 2 983
10 1,312 1,917 24
200,000 under 500,OCO .......................................
i
30 8,590 4,124 12j999 6,656 3,451 1 4 74 11669 IjI77 628 13l)000,000 .....................................500,000 under 10 6, 607 1,916 11,248 5,270 2,919 - - 14 2, Ov 5 488 1,582 2
1)000,000 or more ............................................ 1 2,524 72 4,976 2,452 1,221 - - I - - -
Nontaxable returns .............................................. 1,169 4,033 2,426 3,111 - - 1 24 2,256 6,405 7,405 549 1,55
COMODITIES INCLUDING FUTURE CONTRACTS
Grand total ......................... ..................... 28,624 396,604 346,962 417,655 281,010 88,004 3,333 20,758 154,211 961,741 976,603 37,621 52,61
Taxable returns, total.......................................... 21,103 388j398 341,862 415,862 279,613 88,004 3,073 17,795 131,804 856,064 869,777 30,577 44,37
Under $5,000 .................................................. 3 8951
12,365 12,475 12,696 5,217 968~*i
14,480 2,473 1,734 1 952
11,21
5,000 under $10,000 ...... 4 1481 33,197 31,531 35,342 20,661 4,231 38,031 193,181 11 193,000 61678 6,49
10,000 under'OGG'
1
4
,751 58,131 59,009 53, CY78 38,673 8,289 636 1,374 27,400 166,351 1 170,316 4,649 8,65ar
25,.0.:::::.::: ................................15,000 und 1 4, M4 78,936 75,208 78,587 56,829 13,719 903 5,174 31,717 143,592 148,890 6,239 11,53
25, 000 under 50, 000......................................... 2,869 99,443 93,466 98,413 74,705 22,625 731 5,61-1 14,752 255,655 259,572 5,682 9,64
50,000 under $100,000 ........ 824 54,972 48,951 58,130 42,970 17,990 183 3,418 4,143 72,014 721093 3,786 3,86200,000 ....... ........... .......100,000 und r 142 19,150 12,677 24,305 13,923 6,694 14 465 913 14,559 1 15jglg 773 2,13: J
200,000 und r 500)000 .......................................
1
41 11,496 6,212 16,312 7,975 4,179 4 69 310 6,295 6,384 618 70500,000 under 1,000,000 ..................................... 10 5,967 970 10,856 5,223 2,607 1 12 49 1,862 1,121) 121 81,000,000 or more ............................................ 5 14,741 1,362 28,143 13,436 6,702 1 67 9 81 49 80 4
Nofitaxable returns .............................................. 7,522 8,206 5,100 1,793 1,396 - 22,407 105,676 106,826 7,044 8,24
Footnotes at end of table. For the precise definition of terms and the nature of any limitations, see the "Description of the Swple," -'Limitations of the Data," and '-Explanation of Classifications and Terms" in the text.

RETURNS WITH NET CAPITAL GAIN OR LOSS
Table 1. -ALL TRANSACTIONS -INCOME, TAX, AND TRANSACTION DETAIL, BY ASSET TYPE AND SIZE OF ADJUSTED GROSS INCOME-Continued
sset type and size of adjusted gross income
Number of
returnswith netcapitalgain orloss
-
Adjusted gross income-
Less Plus
capital capital
As reported gain or gain orloss loss
included excluded
(77--d (A.-d (77....-d
d.1 I ... d.11... dol i ... J
Taxableincome
n-dd.11-)_
Income taxcafterredits
Th-dd,11...
Capital loss carryc~er
mountNumber of
returns
(Th...-dd.11 ...)
All capital asset transactions
Gross sales Depre
0 '_
Cost and
Umber of expense of Gross gain Gross losstrans-
price ationsale
actions
(27--d (n.-d (Th-d (Th--d (Th.-dd.11 ... d.11 ... d.11 ... d.11...
CAPITAL GAIN DIVIDENDSW (2) (3) (4) (5) (6) (7) (8) (9) (10) 11) (12) (13) (14)
Grand total ............................................... 1,609,255 19,707,557 18,663,005 20,719,856 13, 864, 508 3,911,617 41,229 156,627 1,675,593 526,810 17,096Taxable returns, total. .......................................... 1,445,511 19,374,273 18,373,823 20,353,408 13,835,842 3,911,617 37,140 143,777 1,490,198 472,811 14,518
Under $5,000 ..................................................5,000 under $10,000 ..........................................
258,446516,877
859,6473,830,251
829,3023,746,785
890,7613,910,997
410, 17762,336,380
72,506472,082
2,8177 281
21,73517 588
262,918542 924
54,634115
1,712
15,0 ::::::: ... *** ...................00 .........10, 11 ~~d
er15 000 ~
1
319,0~6 3,813,707 3,784,334 3,967,555 2,670,51.4 573,684,
7,334,
20,896,
327,285,599
79 0714,669-4 241
12" 0., e~ ..................................
25,000 under 50,000 .........................................202,977112 685
3,837,2843 808 315
3,716,7374193 643
3,962,9453 959 679
2,861,5803 025 785
688,734930 177
9,0267 5
31,918 206,724,
76,602,
1,192, , , ,, , , , , , , 91 26,933 114,479 1 t applicabl e 73,267 1,50950,000 under $100,000......... I ..............................100 000 under 200 000
29,0104 962
1,903,131 1,750,912 2,047,091 1,549,956 643,249 2,531 17,523 29,335 40,771 685, , .......................................200,000 under 500,000 .......................................
1
,1,220
655,731346,092
537,328241,582
770,616447 864
519,020261 543
264,349148 861
461
825,6611 173
5,0392
17,193 390
500,000 under 1,000,000 ..................................... 183 123,792 61,012,
185,964,
95,089,
55 419 11
,
202
1,39190
10,015 118
1,000,000 or more ............................................ 65 1-36,324 62,411 209,937 105,799,
62,555 6 149 655,022
6381-
Nontaxable returns .............................................. 163,744 333,284 289,182 366,448 28,666 - 4,090 12,850 185,395 53,999 2,578
SHARE OF CAPITAL GAIN (LOSS) FRCIA PARTNERSHIPSAND FIDUCIARIES
Grand total ............................................... 387,233 7,174,902 6,160,615 8,051,264 5,180,936 1,769,638 15,291 92,343 445,707 1,064,335 136,430Taxable returns, total .......................................... 340,607 7,099,129 6,172,694 7,918,113 5,171,716 1,769,638 14,054 82,298 393,904 961,898 114,124
Under $5,000 ..................................................5,000 under $10,000 ....
52,141
87,313170,501645,175
146,043581,668
187,285690,840
80,163368,989
14,09071,262
N1 627
N6 936
58,10898 539 50'
671124 456
15,228810, 000 und 15,000:
5 r: .... . *-- ... * ...... "''
1
64,334 787,294 735,549 836,194 515,322 108,934,
2,211,
11,427,
75,430,
93 4062 ,9719 7121 12"
.
..................,000 d r ..
25,000 under 50 000 ............................ . .61,53149 592
1,184,721
1 729 371
1,094,888
1 585 9211,260,74784 4
857,499 206,054 2,844 16,253 72,643 138,992 ,16,901, . ... ....... , , , , , 1, 1, 80 1, 344, 416,419 3,549 21,063 58,211 1 t applicab e 187,698 26,06050,000 under $100,000 ........................................100 11, 2
000und 01
19,6004 08
1,315,740 1,156,168 1,455,828 1,042,670 430,711 1,625 14,839 23,374 154,018 9,348,d: r 1 ::::: ....... .................200,000 un
'Do, OGG::................................'
1
,51,297
601,783367,717
471,668246,402
725,067484,702
464,510274,228
232,946154,903
38299
4,9817891
5,5571 673
99,17063 49
4,327
500,000 under 1,000,000 ..................................... 207 135,768 71,035 198,206 101,328 58,769 17,294
,261
, 234 254
2,3599511,000,000 or more............................................ 84 161j060 83,352 237,764 122,968 75,550 1.3 429 109
,
15,310 266Nontaxable returns .............................................. 46,626 75,773 -12,080 133,151 9,220 - 1,237 10,045 51,802 102,437 24,306
CAPITAL GAIN DISTRIBUTIONS FROM 34ALL BUSINESS CORPORATIONS
Grand total ............................................... 30,274 539,309 475,207 598,899 394,373 129,390 1,926 5,153 36,014 55,561 4,41,6Taxable returns, total .......................................... 28,088 535,473 472,952 593,517 393,843 129,390 1,926 5,153 33,691 53
,
072 2,881Under $5,000 ..................................................5 000 under $10 000
3,2667 30
7,125 7,550 6,221 3,38? 631 - - 4,253 511 235, , ..........................................10,000 und r 15, 000 .................................:
1
117,393
51,00189,416
47,298
82,39556,60494,657
32,75558,772
6, 0~1212,43 1 626 4 077
1,1166988
7,9667
369.d 1 .r 25, .15,000 1
G::::::::
................................. 5,452 104,866 100,699 108,647 77,638 18,725, , ,
6,623,139
7 72665779725,000 under 50,000 ......................................... 3,178 108,223 99,420 115,403 84,929 26,486 187 528 3,930 t applicab e
,
11,312 33650,000 under $100,000... 1,249 83,880 75,048 92,159 68,083 28,627 88 137 1,515 5 381 371100,000 und:r 21,110 .............................. 318 41,926 32,756 51,034 32,681 16,387 16 119 422
,4 886 86
r 1 ,.0,200,000 und ................................0
1
77 22,243 13,129 31,121 17,333 9,357 5 68 1031 ,
4 350 225 0,000 under 1,000,000 ..................................... 20 13,134 7,129 18,404 7,715 4,123 2 8 25,
1 105 81,000,000 or more ............................................ 5 13,660 7,528 19,068 10,549 6,531 1 216 6,
2,696 -Nontaxable returns .............................................. 2,186 3,836 2,255 5,381 52~ - - - 2,323 2,489 1,534
LIQUIDATION DISTRIBUTIONS
Grand total ............................................... 49,095 1,400,228 979,299 1,775,436 1,043,984 406,826 3,258 27,673 56,654 575,935 65,497Taxable returns, total .......................................... 45,781 1,386,153 1,001,941 1,740,610 1,043,15.5 406,826 2,559 15,372 53,211 510,749 54
,
034Under $5,000 ..................................................5,000 under $10,000 ..................
4,10011,486
13,26086,905
13,02582 265
11,29981 894
4,91447 20:2
7489 440
NN
4 70113,165
3,804 3,854
10,000 rl:" 11,11 ..........:::::::
0
1
8,681 105,226,
98,865,
103,435,
70,68:2,
15,090 435 2,013 9,5508,238
13 89513,91112 698
1 00
ad 25'.15,0 ..................................25 000 under 50 000
8,4037 251
163,424254 0 2
144,858 180,111 117,28.3 28,598 472 4,121 9,611,
22,669,
8,980, , ......................................... , , 9 213,961 292,004 196, 166 62,469 .516 1,841 8,447 N ot applicab e 65,099 7,07950,000 under $100,000 ........................................ 3,783 258,581 203,009 312,051 204,1415 84,115 314 3,591 4
,
702 72 622 4 163100,000 tinder 200,000 ....................................... 1,382 187,754 120,180 254,091 147, 20:3 71,368 87 551 11
9GO
83' 881,
1 427200,000 under 500,000 .......................................
11
533 1-55,150 79,976 228,724 120, 64;? 63,759 31 891 861,
89 258,919500,000 under 1,000,000.. ................................... 109 70,561 24,468 116,307 56,893 30,218 9 120 180
,63 124 3471,000,000 or more ............................................ 53 91,200 21,334 160,694 78,024 41,020 2 205 94
,88,160 656
Nontaxable returns .............................................. 3,314 14,075 -22,643 34,826 821) - N 3,443 65,186 11,464
Footnotes at end of table. For the precise definition of terms and the nature of any limitations, see the "Description of the Semple," "Limitations of the Data," and "Fxplanation of oaS and Term~;" in the text.

i
RETURNS WITH NET CAPITAL GAIN OR LOSS
Table 1. -ALL TRANSACTIONS - INCOME, TAX, AND TRANSACTION DETAIL, BY ASSET TYPE AND SIZE OF ADJUSTED GROSS INCOME-Continued
Adjusted gross income- Capital loss carryo~er All capital asset transactions
Number of Le.. Plus Income tax
Asset type and size of adjusted gross incomereturns~ith net As reported
capitalgain or
capitalgain or
Taxableincome
afterAmount Number of
Gross -i:;ales Depreci-Cost and
expense of Gross gain Gross losscapital loss loss
credits Number oftrans-
price ationsale
gain or included excluded returnsactions
loss (D.....d (Th...-d (Th-d (Th...-d (77...-d (A.-d (77....wd (7h-.-d (Th-d (77....-d
d.11 ... &JI ... d.11-) &H-) &11 ...) &11-) &11 ... d.11 ... d.] I ... &11 ... d.11 ...
(1) (2) (3) (4) (5) (6) (7) (8) (9) (1c) (11) (12) (13) (14)RETIRM,'NT PIAN DISTRIBUTIONS
Grand total ............................................... 61,070 748,362 533,598 955,169 524,791 151,193 540 1,810 64,739 303,822 203
Taxable returns, total .......................................... 54,484 732,261 520,883 935,465 524,584 151,193 420 1,513 57,654 296,869 1Y
Under $5,000 .................................................. 7,805 28,015 18,222 37,812 14,558 2,912 - - 8,791 18,223
5,000 -der $10,000 .......................................... 20,300 151,210 125,623 176,178 88,244 17,973 - - 20,993 50,890,l5,GOO10,000 under 14,827 119,224 148,011 209,200 124,154 26,695 11,461 57,051 1Jder 25'.
..... I ..........................15,000 un 7,600 143,769 108,132 176,955 106,575 25,535 322 830 8,202 63,229 3~
25,000 under 50,000 ......................................... 2,832 90,040 60,629 115,620 70,526 21,309 2,961 t appli.ab 51,965 21
50,000 under $100,000 ........................................ 771 52,949 30,653 75,368 44,436 18,587 64 487 841 30
,
003 5'
................. * ..... , ........100,000 u 201), 000 230 31,758 16,450 47,05-7 26,651 12,786 25 149 264 13,543 11:or J5.)
GO.......................200,000 u= ..........
1
87 25,011 8,453 41,461 21,448 10,855 7 21 106 9,910 1
5OO,OCO under 1,000,000 ..................................... 24 15,385 3,063 27,654 13,942 7,323 1 18 25 1,6431,000,000 or more ............................................ 7 14,900 1,646 28,161 14,050 7,217 1 8 8 412
Nontaxable returns .............................................. 6,587 16,101 12,716 19, 70V, 208 - 7,084 6,953 4:
LIVESTOCK
Grand total ............................................... 689,801 3,259,441 2,712,499 3,805,398 1,660,211 417,250 2,386 10,447 1,376,690 1,017,324 98,128 394,719 750,979 32,78
Taxable returns, total .......................................... 392,361 2,777,025 2,377,808 3,173,066 1,631,833 417,250 1,671 7,180 783,339 6,,01946 59,381 239,339 476,010 16,76
Under $5,000 .................................................. 198,974 657,430 567,460 749,453 244,356 42,89 6 075366 216,727 15,824 71,357 166,513 5,93
5,000 undcr~ $10,000.......................................... 147,086 1,014,940 901,262 1,128,830 559,821 101,477 1,268 3,953
:
308 759 243,217 19,073 82,340 184,754 5,38
10,000 und r15
25,310 298,267 265,634 330,599 208,111 41,259 56,401 50,111 5,994 23,537 44,020 1,52d:,
;.J21 GO
1
12,555 234,526 203,468 264,962 182,363 42,442 27,184 45,578 5,268 20,523 31,197 88
25,000 ner 50,000......................................... 5,581 193,100 164,285 221,168 156,753 48,109 185 778 14,896 :35,761 5,669 18,759 23,70`7 1,10
50yOOO under $lOOpOOO.................
1,933 130 161'
108,271 150,224 103,975 43,161 167 1,247 5,156 ~O, 033 3,919 12,563 11,869 73
100,000 under20"0' .... ..........................
614 ,38784 64,462 104,176 64,394 32,230 36 982 3,030 L1,366 2,OS6 5,610 8,228 47a, 1200,000 Nd 5.0,.0:::::::: ...............................
1
229 66,801 48,528 87,594 49,996 29,025 11 142 1,368 5,387 994 3,035 3,840 54
500,000 under 1,000,000 ..................................... 47 30,004 15,471 44,419 23,254 13,682 1 2 321 2,071 379 1,119 1,447 11
1,000,000 or more ............................................ 31 65,409 38,966 91,642 38,810 22,968 2 76 149 696 174 496 435 6
Nontaxable returns .............................................. 297,441 482,416 334,691 632,332 28,377 - 716 3,268 593,350 376,3?8 38,747 155,380 274,969 16,02
TDBER AND COAL
Grand total ............................................... 63,513 566,235 453,474 678,844 357,875 113,911 875 2,679 69,449 140,720 964 45,512 113,845 4,23
Taxable returns, total .......................................... 43,977 545,632 455,137 637,521 355,690 113,911 775 2,363 47,575 108,030 964 33,030 89,490 2,99
Under $5,000 .................................................. 14,757 46,383 35,441 57,371 17,885 3,321 - - 14,857 17,630 - 2,013 17,191
5,000 under $10,000 ........ 16,165 117, 079 106,158 129,724 65,396 12,814 17,859 23,027 239 8,497 18,240 1,69
10,000 under 15''0
6,211 74,108 65,222 83,333 49,440 10,414 6, 679 18,352 169 7,0?3 14,055 1,00,a,I..::~:~:.: ................................15, 000 un 125, 011
1
3,417 65,630 55,076 75,935 49,104 11,586 3,752 11,728 - 2,483 ll'or'l 7
25,000 under 50,000 ......................................... 2,283 79,069 70,084 87,612 61,581 18,773 76 333 2,791 15,000 39 6,746 8, 497 1
er $100, GOO ........................................50, und 765 50j?65 41,853 59,828 39,722 16,113 36 415 1,035 8,381 67 1,342 8,487 3~~O d1. un
er 2OO'COO .... * .......... * ... ** ... * ......
250 34,197 26,069 42,009 24,958 12,156 23 34 5 412 6,070 48 1,929 5,208 71200, 000 under 500, GOO: ...............................
1
101 30,415 20,190 40,562 21,932 12,240 10 269 154 5,895 402 2,314 5,209 1500,000 under 1,000,000 ..................................... 20 13,351 7,178 19,603 9,172 5,137 1 94 23 1,204 - 414 838
1,000,000 or more ............................................ 8 34,636 27,865 41,545 16,501 11,356 3 180 14 743 - 218 704.
Nontaxable returns.............................................. 19,536 20,603 -1,663 41,323 2jlB,' - 21,873 32,689 - 12,482 24,355 1,24
OIL AND LUNERAL INTERESTS
Grand total .......................... ..................... 26,522 634,201 495,723 751,461 454,043. 177,540 2,243 8,140 38,345 L55,852 11,026 100,638 93,534 18,98
Taxable returns, total........................................... 23,728 638,120 510,574 747,451 453,863 177,540 2,099 7,663 34,041 136,537 lOj6O6 94,210 78,226 17j17
Under $5,000.................................................. 2,147 8,647 9,298 4,078 3,99:3774
2,347 5,121 105 9,951 994 5,34
5,000 under $10,000.......................................... 7,853 60,721 56,548 62,913 35,928 6,146 1,014 2,86,2 10,347 10,534 730 8,138 4,904 2,32
10, 000 under 15, 000 ...............................
1
4,352 12,602 19,883 51,128 35108,'3 7,209 6,527 11,289 510 9,941 4,053 1,47:15, 000
underI.,..
............................... 4,482 85,471 78,999 91,529 60,880 14,570 535 990 6,622 16,528 496 11,991 8,051 3,61
25,000 under 50,000 ......................................... 2,804 98,120 84,826 107,984 75,24B 23,221 '392 2,105 4,821 32,670 3j438 23,900 17j752 1,71
50,000 -der $100,000 ........... .............. 11281 87,751 72,874 100,512 68,861) 28,262 85 508 1,928 14,013 2,606 10,820 8,578 1,95
100,000 und r: 2)00 ...... *--00 '
503 68,141 52,198 83,451 50,16:3 24,378 42 377 811 l9j969 1,248 12,738 10,159 301.d r:200, 000 u: 5. 000:::
1
225 67j618 47, 50`7 87,408 47,51-7 26,584 20 406 492 10,488 519 4,190 8,719 37500,000 under 1,000,000 ................... I ................. 52 34,915 18,894 50,859 26,188 15,307 7 157 100 8,926 772 2j5O8 7, 308 41,000,COO or more ............................................ 30 74,135 39,547 107,589 49,995 30,390 4 259 46 6,998 181 1,133 7,708 1
Nontaxable returns .............................................. 2,793 -3,919 -14,850 4,009 179 - 4,304 19,315 420 6,428 15,308 1,81
6
7
Footnotes at end of table. For the precise definition of terms and the nature of any limitations, see the "Description of the Sample," "Limitations of the Data," and "Explanation of Classifications and Tems" in the text.

RETURNS WITH NET CAPITAL GAIN OR LOSS
Table 1-ALL TRANSACTIONS -INCOME, TAX, AND TRANSACTION DETAIL, BY ASSET TYPE AND SIZE OF ADJUSTED GROSS INCOME-Continued
Adjus ted gross in come- Capital loss carryover All capital asset transactions
Asset type mid size of adjusted gross income
Numtber of
returnsith net
lesscapital
Pluscapital Taxable
Income taxafter Cost and
capitalAs reported gain or gain or .come
c ,redits
Numb r fAmount Number of
Gross -sales Depreci-expense of Gross gain Gross loss
gain orloss
includedloss
excluded
e oreturns
trans- price ationsale
loss actions(A...-d (A...-d (A-.-d (A-.-d (Th...-d (7h,,..-d (71h.-d (7h-.-d (M-.-d (A...-ddoll-) d.11 ... d.11 ... d.11.r. d,11,-) d.11 ... d.11 ... d.11.r.) d.1l.r.) 6.11...
PARTNERSHIP INTERESTS
(1)(2) (3) (4) (5) (6) 1 (7) (8) (9) (10) (11) (12) (13) (14)
Grand total ............................................... 87,451 1,467,538 1,146,540 1,771,357 1,049,333 348,599 4
'
137 18,402 119,428 823,094 30,916 502,380 359,952 31,789Taxable returns, total .......................................... 74,448 1,451,494 1,176,679 1,708,398 1,047,725 348,599 3,600 14,494 102,663 694,329 25,999 394,084 328,758 25 958
Under $5,000 ............ ; .....................................5,000 under $10,000.. ........................................
11,51077819
36,522146 347
27,953126 188
44,6114
15,627 2,948 15,892 55,449 4,188 38,991 21,953
,
4,15310,000 der 15,000 ..................................:::::::
M
1
,14,121
,1130, 638
,110,112
166, 20198 107
81,670119 887
16,06625 265 468 845
27,50718 339
90,744 4,257 54,970 39,791 3,266ar , .01215,000 ..................................25 000 under 50 000 ............... . .
13,874 267,921 237,246,
296,438,
196,198,
48,153 971 4,494,
19,227122,306141,206
4,5685,821
89,75481,995
37,28866 111
4,6577 318, , . . ......................
50 000 -der $100 000
10,127 346,575 298,847 386,599 264,980 81,702 627 2,519 14,946 144,831 4,419 73,988,
75,996,
3,801........................................, ,100,000
r WO"'.......
und .........
3,167850
213,226112 612
175,779 248,771 169,593 69,812 255 2,608 4,751 63,954 1,636 30,585 34,795 1,336I ...:r200?000 und ............
1
244,,
68 96980,43138 590
143,50998 377
86,54550 222
43,80926 84
66 804 1,390 34,046 576 12,846 22,352 1,043500,000 under 1,000&.000 ................................. .... 46
,30,520
,14,552
,46,251
,22 186
, 612 449
127
101177
49675
26,073 160 8,465 16,764 2841,000,000 or more ............................................ 23 48,163 16,983 79,316
,38,818
,21,549 1 67 40
9,9125,809
67307
2,038450
7,9835,724
4258
Nontaxable returns .............................................. 13,003 16,044 -30,139 62,959 1,608 - N 16,765 128,762. 4,916 108,.
297 31,194 5,831
ASSETS USED IN TRADE OR BUSINESS
Grand total ............................................... 448,486 4,060,959 3,281,800 4,807,126 2,685,817 770,591 11,884 59,258 699,264 3,627,716 908,334 3,588,809 1,052,169 168,612Taxable returns, total .......................................... 327,815 3,941,901 3,294,472 4,565,159 2,670,434 770,591 9,056 38,031 502,880 2,731,285 668,344 2,597,720 858,251 105 986
Under $5,000 ..... ............................................5,000 under $10,000 ..........................................
85,698127 158
292,040910 937
250,402
801 90331,134 106,948 19,643 (-) 139,900 3,53,375 125,793 426,300 83,682
,
26,45110,000 un"r 011::::~:::: ................................1 5
1
,13,202
,642,164
, 6566,603
1,008,135280716
492,864432 495
94,10589 159
3,7902041
9,7853 549
192,25580 910
772,7144
237,963 824,634 222,721 43,598125;.15,000
under GO................................
25 000 under 50 000 .........34,221 648,321 560,143
,740,930
,484,033
,
114,078,
1,538,
10,181,
47,53563, 165
4:36,681108,00683,849
445,030370,366
130,996145,168
12,98010 083............................. ., ,
50 000 und $100 000
20,314 681,957 595,640 761,313 544,046 164,389 1,153 4,872 30,024 378, 864 70,940 332,709 118,038,
7,550, er , ........................................
100,000 un': "I" ................................r 25,4431,263
362,377167,635
287,604116 418
433,805218 027
294,800476132
122,19369465
42696
4,1721 137
9,016 143,972 24,622 105,963 60,081 3,185. J50200,000
urd .0:::::::................................
1
399 114,689, .
68,171,
159,891,
85,480,
46,811 33,
1 4862,252744
131,178:39 073
9,0843 357
60,2757
30,166 1,447500)000 under 1,000,000 .....................................1 000 000 or more .......... .
77 51,694 19,770 83,251 41,051 22,340 11,299 139
,18,705
,3,006
1 ,6798,486
25,07113 292
591
68, , .. ............................... 40 70,087 27,815 112,393 56,241 32,179 4 144 105 :33,558 1,725 6,278,
29,036 32Nontaxable returns .............................................. 120,671 119,058 -12,672 241,967 15,383 - 2,828 21,227 196,385 896,430 239,990 991,088 193,918 62,625
PROPERTY ID70 FOR PERSONA.L USE
Grand total ............................................... 51,138 555,215 473,759 638,957 350,157 103,212 1,438 12,514 67,661 193,217 39,264 189,716 49,880 10,770raxable returns, total.......................................... 39,823 525,108 451,156 598,227 348,222 103,212 1,018 6,417 46,845 139,275 32,858 131,367 43,379 6,265
Under $5,000..................................................5,000 under $10 000...................... .
8,65516 315
28,473122 761
21,525109 260
36,187136 639
11,2006
2,192 11,035 22, 738 4,354 21,794 6,143 907, ...................10,000 under 15, 000 ................................
1
,.6,3,4
,77,151
,72,709
,80 823
1,31550 474
11,81310 496
834 4,598 18,8957 257
42,288 11,088 44,580 10,226 2,422dc, 125, .15, 000 tin ................................25 000
4,852 92,476 81,592,
102,771,
68,126,
15,926,
5,55423,101
20, 5055,4496,678
22,92521 245
5,1627 016
1,0221 078, under 50,000......................................... 2,616 90,103 81,843 98,279 70,991 21,880 88 604 2,904 3.1,937 3,061
,
10,932,
4,282, ,458
50,000 under $100,000........................................0
768 52,041 44,412 59,472 41,737 17,468 78 974 860 7,718 1,616 5 760 2 923 1991 0,000 unI r 21,11:::::::: ...............................:200 000
1
177 23,644 17,965 29,306 17,649 8.734 12 174 222 4,043 181,
2 255,
2 072 ill1
undr 'GG,.C,0
...............................,500 000 under 1 000 000 ........
6616
18,63210
12,059 24,905 13,369 7,153 3 23 so 1,892 223,1,064
,1,088 49, , , .............................
1,000,000 or more ............................................ 5,915
8,9054,471
5,31817,365
481127,8825 479
4,3893 160
2-
46 251 3
6834
44 487 257 17
lontaxable returns .............................................. 11, 314. 30,107 22,603
,
40,730
,
1,935
,
- 420
-
6,096
.
20,816
,370
53,942
165
6,406
325
58,351
4,211
6,501
1
4,505
RESIDENCES
Grand total ............................................... 176,794 1,412,614 1,101,986 1,709,451 856,533 212,105 2,118 8,050 180,466 2,746,5?5 109,187 2,259,818 572,680 -raxable returns, total .......................................... 144,104 1,352,976 1, 074, 903 1,618,616 854,252 212,105 1,915 7,551 147,453 2, 3 lil, 496 92,920 1,903,478 502,560 -
Under $5,000 ..................................................5$000 under $10,000 ............ .... **,*,*,* .................
40,66561 683
140,564455 711
91,924370 560
186,913539 876
54,0012 0 8
10,196 41 659'
500,381 12,970 405,113 100,331 -:
10,000 under 15,000 ........... .............................
1
,24,749
,295,801
,249,310
,337,394
5 , 10195,053
49,90041,749 468 1,272
63 170
25 183
880,381455 597
37,68122 191
747,204381 239
167,75291 537
-115,000 under 25 000 .........................................25 000 under 50 000 ........
11,6134
215,534 174,460 255,204 159,397 38,091,
11,881,
282,852,
12,433,
218,374,
75,547
--................................., , ,199 137,973 108,933 164,456 110,788 33,984 1~2 321 4,311 149,717 4,642 107,516 44,419 -
50,000 under $100,000 ........................................100 000 under 200 000 .
976 64,994 51,274 78,494 52,694 21,773 75 430 1,023 44,122 2,457 32,139 15,214 -, .............................., ::200,000 und
ar JCG,.O0
...... I ........................
1
16943
22,37312,636
16,784
343728,025
8731717,2429 356
8,5385 011
197
11231
1744
11,747 399 7,706 4,028 -500,000 under 1,000,000 ..................................... 4 2,810
,2,622
,2,915
,1,456
,1,046 - -
54
6,091553
10253
3,692446
3,5951 32
-1,000,000 or more ............................................ 2 4,580 1,693 7,465 3,456 1,817 2 54 1 50
-5
--
Jontaxable returns .............................................. 32,690 59,638 27,083 90,835 2,281 - N 33,014 415,080 16,267 356,340 70,120 -
ootnotes at end of table. For the precise definition of terms and the nature of any limitations, see the "Description of the Sample,'! "Limitations of the Data," and "Explartation of Classifications mid Terms" in the text.t1DCil

RETURNS WITH NET CAPITAL GAIN OR LOSS
Table 1.-ALL TRANSACTIONS - INCOME, TAX, AND TRANSACTION DETAIL, BY ASSET TYPE AND SIZE OF ADJUSTED GROSS INCOME-Continued
Adjusted gross income- Capital los s carryover All capital asset transactions
Number of- ----Less Plus Income taxreturns capital capital Taxable after Gross-sales Depreci-
Cost andAsset type mid size of adjusted gross income with net As reported gain or gain or income
'
redits Amount Nimber of
bar
of
i tiexpense of Gross gain Gross loss
capital loss lossNumber of
r_-
trans-pr ce a on sale
gain or included excluded returns
.c"ons
actionslose
(Th...-d (Th...-d (7h...-d (A-d (77--d (77--d (M...-d (Th...-d (A-d (Th-d (7?,...-d
&II-) d.11 ... dDII.I.) d.11 ... d.11-) &JI-) d.11ars) d.11 ... dDII.I.) d.11 ... d.11.,.)
(1) (2) (3) (5) (6) (7)
(9)
(9) (10) (11) (12) (13) _ (14)NONBUSINESS REAL ESTATE
Grand total ............................................... 349,206 3,631,967 2,974,916 4,256,930 2,370,670 6a4,057 9,009 61,098 392,930 3,708,058 248,760 2,950,932 1,008,0?1 139,928
Taxable returns, total .......................................... 275,633 3,534,335 2,958,907 4,085,753 2,364,513 684,057 7,280 42,818 311,CV2 3,089,664 210,130 2,420,678 849,956 101,967
Under $5,000 .................................................. 54,379 187,515 160,367 215,724 71,565 13,1207812 4 767
60 161 374 879
,
39 641
:
335,905 66,823 18,483
5,000 under $10,000 .......... 110,317 810,312 740,573 879,924 438,644 88,076, ,
117,260 883 759 65 055 801,488 157,815 43,270
10,000 er 54,248 649,831 571,751 726,903 421,597 89,256 1,539 9,437 62,3?0 588,790 41,590 483,700 149,851 18,459r ~
15,000 wide ..................................
1
32,167 607,475 509,792 698,929 4,40,059 104,945 1,371 6,723 38,788 489,152 30,305 347,854 163,678 10,628
25,000 under 50,000 .......................................... 17,659 598,517 504,115 680,832 463,150 141,795 1,033 13,734 23,268 383,768 22,153 247,025 146,064 7)836
50,000 under $100,000 ........................................ 5,215 345,314 273,672 414,298 274,341 112,719 434 5,491 6,871 187,083 6,772 105,837 81,641 2,053
100,000 und r 201,11. .......... "''-** ....
1,218 161,816 1()9,001 212,469 124,733 61,249 84 1,G42 1,682 117,622 3,439 72,218 46,891 670
200,000
und:r 15.,.C.:::::~ .... . 349 98,579 57,275 139,252 72,404 39,453 31 1,302 529 49,615 1,124 19,845 30,260 299
500,000 under 1,000,000 ..................................... 56 36,270 11,805 60,?49 29,595 15,710 6 71 81 12,727 24 4,962 6,157 147
1,000,000 or more ............................................ 25 38,707 20,556 56,675 28,425 17,735 2 251 33 2,268 29 1,842 576 122
Nontaxable returns .............................................. 73,573 97,632 16,009 171,177 6,157 1,728 18,279 81,888 E.18,395 38,630 530,254 158,115 37,961
REAL ESTATE SUBDIVIDED
Grand total ............................................... 147,991 1,532,082 1,132,667 1,917,843 1,030,517 300,031 3,274 12,951 173,280 1,859,765 170,379 1,317,021 683,128 32,064
Taxable returns, total .......................................... 120,648 1,535,268 1,195,180 1,865,267 1,026,716 300,031 2,739 11,026 139,782 1,568,042 141,990 1,086,508 597,760 25,38C
Under $5 000 .................................................. 25,058 91,115 64,910 114,985 35,006 6,436 28,246 279,811 31,236 234,052 73,786 4,591,
5,000 wider $10,000........ 51,298 375,325 309,566 442,912 205,371 41,050 57,759 494,025 46,555 373,890 163,213 ~11,50C
10,000 under 15,000 ....... 21,267 257,496 212,123 300,495 173,198 37,064 870 2,502 24,779 247,614 23,309 171,793 95,226 3,692
-1
15,000 under 25,000 .........................................
1
12,306 232,605 182,467 277,941 171,763 41,935 535 1,309 15,919 206,062 18,711 118,029 99,704 2,95 -
25,000 under 50,000 ......................................... 7,651 260,761 206,197 313,587 201,313 62,118 385 1,419 9,104 3.99,744 14,697 118,002 91,011 1,31C
50,000 under $100,000 ........................................ 2o347 156,120 121,785 189,811 123,982 50,807 185 2,006 2,998 78,367 4,560 39,837 40,464 49~
100,000 under 200,000 ................................ 529 70,123 48,273 91,963 56,251 27,753 48 850 728 34,226 2,103 17,752 18,527 73(1, ' ::,~:
200,000under .0 "o
................................
1
157 45,548 24,038 66,907 36,098 19,592 7 28 209 22,174 635 9,078 13,665 5;
500,000 under 1,00C,000 ..................................... 25 16,247 6,723 25,892 12,012 6,314 4 277 2? 5,134 11 3,327 1,842 41
1,000,000 or more ............................................ 9 29,927 19,098 40,753 11,721 6,964 1 74 13 886 173 747 322 1(
Nontaxable returns .............................................. 27,342 -3,186 -62,513 52,576 3,801 - 33,497 291,724 28,388 230,513 85,368 6,6&
FAIMAND WITH UNHARVESTED CROPS
Grand total ............................................... 7,665 70,983 49,153 92,437 45,579 13,516 113 632 10,215 120,925 6,349 77,604 50,444 2,81'
Taxable returns, total .......................................... 4,468 63,023 45,778 80,160 44,917 13,516 113 632 7,018 102,846 4,842 (4,446 43,368 1,81:
Under $5,000 .................................................. 1,201 3,503 2,086 4,842 1,135 204 - - 1,201 10,430 100 g,(y79 2,5$8 3Y
5,000 under $10,000 .......................................... 1,201 8,988 7,30`7 10,339 4,690 911 - 2,001 12,154 567 9,012 4,350 64J
1011100 under 5, l......... ** .........1
937 11,528 9,567 13,594 8,355 1,872 2,543 25,203 832 21,306 5,195 5C~
2
GG:n cr " GG.................................15,000 u d 1
1
535 10,414 7,793 13,411 7,712 1,864 635 22,361 1,154 12,527 11,100 15:
25,000 under 50,000......................................... 429 13,931 10,536 17,339 11,509 3,567 447 21,915 1,905 10,309 12,540 6:
50,000 under $100,000........................................ 131 8,881 5,224 12,314 6,773 2,741 149 7,556 145 2,248 5,224 4~
2100,000 under
" 'GO
27 3,445 2,283 4,638 2,818 1,340 2 94 34 2,338 88 741 1,654 1er 1
200,000 und 500,
1
5 1,263 6917 1,829 1,103 614 - - 5 .345 21 105 261
500,000 under 1,000,000..................................... 2 1,070 286 1,854 832 404 2 542 31 117 457
1,000,000 or more ............................................ - - - - - - - - - - -
Nontaxable returns .............................................. 3,197 7,960 3,374 12,276 661 - - - 3,197 18,079 1,508 13,158 7,076 1,0C,
OTHER FARNLAND
Grand total ............................................... 75,163 581,375 370,456 779,190 381,940 110,019 602 2,484 81,218 1,289,760 80,837 864,371 "9,135 34,521
Taxable returns, total .......................................... 50,839 560,737 386,255 733,024 360,126 110,019 368 2,325 53,961 997,122 62,088 613,530 371,494 13,38;
Under $5,000 .................................................. 16,017 52,938 31,406 74,151 19,786 3,752 - - 16,517 163,613 13,712 124,432 51,782 961
5,000 under $10,000 .... ........ 19 346
,
141,200 107,347 174,773 81,339 15,801 19,946 315,001 23,368 208,005 93,943 2,161
10, 000 under .......... .........15, 0011 60571 91,133 65,465 116,665 63,432 13,"3 8,140 151,615 9,033 99,760 54,365 1, 461 .~,:::
15,000
under 25,
................................
1
4,454 85,016 54,010 115,472 64,726 15,727 5,322 165,785 7,040 91,266 68,290 6,90:
25,000 under 50,000 ......................................... 2,365 80,082 60,054 99,601 63,537 19,735 .113 434 2,744 97,502 3,775 1 46,805 45,910 95~
50,000 wider $100,000 ........................................ 768 51,992 33,999 69,469 41,921. 17,549 36 666 934 61,819 3,425 28,111 31,332 7Q
100,000 under 200,000 ....................................... 209 27,983 17,103 38,791 22,358 10,960 11 41 257 23,945 1,122 9,637 13,819 21:
200,000 under 500,000 .......................................
1
1
62 17,747 10,302 25,364 13,664 7,M 4 291 82 12,152 411 3,427 8,263 1:
1,000,000 .....................................500,000 under 11 7,836 3,955 11,733 5,389 3,195 3 55 13 3,301 104 1,237 2,152
1,000,000 or more ............................................ 4 4,809 2,615 7,004 3,971 2,509 1 - 5 2,388 98 850 1,637
Nontaxable returns.. ............................................ 24,324 20,637 -15,798 46,166 1,614 - 27,256 292,637 18,749 250,841 77,641 21o147
Footnotes at end of table. For the precise definition of terms and the nature of any limitations, see the ~Tescription of the Sample," "Limitations of the Data,t' and "Explanation of Classifications and Terms' in the text.

RETURNS WITH NET CAPITAL GAIN OR LOSS
Table 1. -ALL TRANSACTIONS - INCOME, TAX, AND TRANSACTION DETAIL, BY ASSET TYPE AND SIZE OF ADJUSTED GROSS INCOME-Continued
Adjusted gross income- Capital loss carryover All capital asset transactionsN=ber of
returnsLess
capital
Plus
capital Taxable,Income tax
Oost andAsset type and size of adjusted gross income with net As reported gain or gain or incomeafter
credits Amount Number ofGross sales Depreci-
erpe se ofn Gross gain Gross losscapitalloss lose Number of
trarz-price ation
a
alegain or
lossincluded excluded returns
actions
(Th...-d (M-.-d (Th-d (7h...-dd.11 ... d.11... d.11 ... d.11... d,11... d.11 ... &11 ... d0jars) d.11 ... ) d.11 ...
PROCEEDS FROM PRIOR YEAR INSTALLLENT SALES(1) (2) (3) (4) (5) (6) (7) (8) (9) (10) (11) (12) (13) (14)
Grand total ............................................... 426,101 5,065,823 3,924,245 6,166,421 3,451,883 1,062,322 9,294 66,323 536,364 1530,702 21,843
Taxable returns, total .......................................... 331,727 4,886,151 3,878,554 5,849,913 3,439,324 1,062,322 7,542 44,221 419,545 1,341,159 21,412
Under $5,000 .................................................. 76,828 261,459 211,343 310,627 106,438 18,584 1,887 14,449 91,462 92,783 6,1115,000 under $10,000 .......................................... 109,570 808,092 697,724 697,136 465,963 91,258 1,427 3,080 135,994 192,545 10,80910,000 2de ,
1"'0' ..................................
1
60,423 734,824 629,665 838,480 491,031 104,161 1,237 5,101 75,347 167,615 2,114, ,
15,000 .................................. 44,221 647,135 713,015 980,420 619,287 149,219 1,605 7,770 57,839 201,652 92025,000 under 50,000 ......................................... 27,959 959,001 788,469 1,114,744 749,660 233,120 848 6,959 40,018 N t applicable 230,779 494
50,000 under $100,000 ........................................ 9,655 643,589 499,961 783,825 509,626 209,503 427 4,455 14,156 183,493 208100,000 under ................................ 1,260 299,599 191,984 405,970 236,9?l 115,483 86 1,331 3,485 120,905 340200,000
under................................ 660 184,590 97,296 272,122 141,297 75,522 21 976 1,018 78,551 140
500,000 under 11000,000 ..................................... 107 71,139 23,647 118,615 58,865 31,261 3 IOD 171 40,130 266I)0001000 or more ............................................ 44 76,722 25,449 127,974 60,185 34,211 - - 56 32,707 8
Nontaxable returns .............................................. 94,374 179,672 45,691 316,508 12,559 - 1,752 22,102 116,819 189,543 431
OTHER TYPE ASSETS
Grand total ............................................... 565,349 7,531,511 6,501,455 8,291,864 5,066,681 1,631,554 33,855 164,712 665,289 995,253 288,247 1,095,801 722,340 1,266,859
Taxable returns, total........................................... 473,981 7,351,903 6,410,817 8,079,145 5,050,71.6 1,631,554 29,707 124,791 561,855 892,743 106,555 808,034 606,065 1,085,771
Under $5,000.................................................. 82,520 280,228 266,905 281,852 118,726 21,399 4,167 6,481 94,642 71,427 6,960 70,905 46,220 123,3915,000 -der $10,000..............
:-197 369 1,467,630 1,424,030 1,429,999 ?88,527 158,317 8,870 24,058 224,534 282,497 16,110 261,907 118,134 343,888
10,000 unl :r 15 111:: .... ....... .. ................
1
71 121 113 61. 874,346 945,097 610,187 131,019 4,889 16,299 88,008 121,250 9,442 114,584 63,063 153,941d J2, ;. :::::::
15,000 un
GO
................................ 59,247 1,128,930 1,042,382 1,198,760 817,858 198,773 5,416 26,280 74,387 93,132 3,558 67,736 84,394 173,93025,000 under 50,000 ......................................... 39,157 1,352,419 1,219,257 1,447,987 1,034,767 320,146 4,223 23,802 51,729 101,593 6,048 78,881 94,828 166,734
50~000 under $100,000........................................ 14,663 985,471 838,329 1,110,902 766,171 314,615 1,655 16,721 20,344 89,076 1,876 67,111 77,588 75,363100,000 under 200,000.
- - .... --* . .. * .. .. ......
3,753 504,076 377,964 622,791 360,559 188,283 358 5,655 5,645 56,456 60,502 97,192 48,703 26,269200,000 under 500,000.: . .. . .. .. .
.1
1
1,214 347,392 213,058 476,307 251,d75 135,616 92 2,810 2,005 49,348 366 33,452 36,645 14,488500,000 under 1,000,000 ........................
. ..
227 152,884 64,366 239,403 117,967 66,031 28 402 371 9,214 219 4,856 17,579 4,7161,000,000 or more............................... .. ...........
1
110 209,261 90,161 326,047 164,879 97,156 11 282 190 18,751 1,474 11,409 16,911 3,050
itaxable returns.............................................. 91,368 1 179,6081
90,6381
212,?181
15,965 4,1481
39,921
1
103,434 1 102,510
1
181,692 287,767 116,275
1181,088
'Due to the reporting of more than one asset type by some taxpayers, the number of returns, adjusted gross income, taxable income, income tax after credits, and capital loss carryover for "All asset types" will be less than thesum of these items for the specific asset types.
) An asterick in a call denotes that the estimate is not shown separately because of high sampling variability. However, the data are included in the appropriate totals.A dean in a cell indicates that either there are no data for that item or it amounts to less than $500.
NOTE: Detail in the tables may not add to totals because of rowiding.For the precise defiaition of terms and the nature of any limitations, see the "Description of the Sample," "Limitations of the Data," and "Explanation of Classifications and Terms, 11 in the text.

RETURNS WITH NET CAPITAL GAIN OR LOSS
Table 2. -ALL TRANSACTIONS-INCOME, TAX, AND TRANSACTION DETAIL, BY ASSET TYPE AND SIZE OF ADJUSTED GROSS INCOME LESS CAPITAL GAIN OR LOSS INCLUDED
Adjusted gross income- Capital loss carryo~er All capital asset transactions
Number of
returnsLess
capitalPlus
capital TaxableIncome tax
after Cost andAsset type and size of adjusted gross income vith net As reported gain or gain or income
credits Amount Number ofGross-sales Deprec'- expe~ a of
TGross gain Gross loss
less capital gain or loss included capital loss loss Number oftrans-
price onatisale
gain or included excluded returnsactions
10.8(T~.-d (A...-d (71--d (A-.-d (n.-d (TY...-d (77...-d
(
A...-d (A-.-ddollars) d0l.r.) d.11 ...) ~bll-) d.11... d.11 ... d.11 ... ) d.11...
'W (2) (3) (4) (5) (6) (7) (8) (9) (lo) (12) (13) (14)
ALL ASSET TYPES
Grand total............................................... 5,807,945 64,038,764 58,155,588 69,172,447 43,238,845 12,433,730 176,133 770,313 16,009,787 53,150,983 1,992,391 46,722,708 17,292,603 6,275,755
Taxable returns, total .......................................... 4,783,672 62,304,681 56,994,748 67,040,461 43,113,139 12,433,730 155,686 628,754 13,534,647 46,319,858 1,416,677 40,010,596 15,394,839 5,349,136
Under $5,000 .................................................. 1,179,011 4,908,050 3,455,538 6,324,331 2,416,049 498,655 13,474 55,458 2,396,949 7,429,982 521,767 5,567,012 3,444,919 576,12~
5,000 -der $10,000 .......................................... 1,701,020 13,300,202 12,503,094 13,913,583 7,822,336 1,612,894 39,463 96,447 3,910,433 8,884,595 392,337 8,083,621 2,598,238 1,187,753
5,11 ..........................10,000 under .....1 905,523 ll,453,110 10,963,714 11,857,187 7,759,454 11710,962 30,926 128,062 2,564,346 6,711,490 174,559 6,264,593 1,739,632 866,16C~c, , .: : : : : : : ~ : ~12 ,15,000 tinc ...............................
1
578,93-3 11,492,208 10,934,491 11,995,061 8,498,876 2,128,4,47 34,588 136,134 2,155,317 6,751,059 123,241 6,105,496 1,965,784 905,21-
25,000 under 50,000 ......................................... 319,959 11,632,616 10,829,568 12, 311, 987 9,155,596 2,935,308 26,108 120,891 1,696,937 6,370,202 96,196 7,449,099 2,499,334 1, OG6, 914
50,000 under $100,000. 83,235 6,107,702 5,452,195 6,695,707 4,933,134 2,103,890 9,248 67,390 624,629 4,985,893 34,744 4,149,412 1,777,526 534,011
100, 000 und r 20 0, 11: 13,022 2,022,959 1,700,376 2,326,769 1,573,307 626,308 1,523 17,158 142,003 1,899,182 69,745 1,491,599 803,589 177,19E:, 1,.
200,000 und'0.0.
1
2,606 893,657 722,190 1,054,707 634,695 385,327 297 5,013 37,813 935,875 3,164 667,935 406,274 73,75,
500,000 under 1,000,000 ..................................... 273 217,880 180,871 253,888 146,555 100,417 35 726 4,340 178,122 352 -114,733 84,240 11,22~
1,000,000 or more............................................ 110 276,496 242,712 307,241 173,138 131,521 24 1,476 1,879 173,458 572 117,095 75,304 10,77f
Nontaxable returns .............................................. 1,024,273 1,733,883 1,160,840 2,131,985 125,705 - 20,447 141,559 2,475,140 6,831,125 575,714 6,712,111 1,897,764 926,61~
CORPORATE STOCK
Grand total ............................................... 2,121,961 33,746,934 30,734,262 36,149,260 23,794,859 7,461,253 114,983 502,417 8,857,662 32,042,126 28,998,094 7,138,366 4,086,44E
Taxable returns, total.......................................... 1,915,439 33,268,504 30,358,829 35,732,090 23,761,157 7,461,253 104,665 429,212 7,935,137 28,896,073 25,677,727 6,738,972 3, 608, 79:
Under $5,000.................................................. 274,428 1,225,411 805,262 1,628,550 652,842 148,803 7,384 30,735 843,570 2,662,548 2,173,255 713,356 236,45,
5,000 under $10,000.... 584,540 4,623,334 4,379,762 4,782,369 2,714,937 569,519 24,197 54,920 2,004,171 4j413,350 4,226,254 807,388 637,641
10,000 under 15 ,000. . .
436,291 5,539,705 5,333,823 5,685,471 3,692,941 823,259 20,804 87,127 1,668,766 4,347,274 4,201,193 741,616 603,27~1 , :
... ...15,000 under 25 000 : . 335,632 6,724,634 6,373,770 7,015,458 4,919,984 1,246,107 23,764 89,779 1,519,107 4 962,676 4,616,314 990,331 657,93:
25,000 under 50,000 ......................................... 210,786 7,798,990 7,178,697 8,289,069 6,077,924 1,961,759 19,899 90,337 1,279,207 6 331,668 5,689,126 1,435,468 808,08(
50,000 under $100,000 ....... 61,087 4,572,467 4,019,948 5,060,453 3,657,685 1,557,066 7,303 56,280 481,921 3,8,14,198 3,149,174 1,080,816 439, 54;
100,000 und r 21 0,111* ' * .. . -* .. ......
10,235 1,628,735 1,339,273 1,901,20? 1,256,626 654,534 1,237 14,296 107,596 1,435,354 1,039,597 537,388: . 0200,000
und r15
, .:::::: ... . . .. .. .. .
1
2,131 749,739 590,223 900,362 530,534 317,472 237 4,347 26,868 676,345 435,754 300,490 6C,31i
500,000 under 1,000,000 ..................................... 222 182,410 146,674 217,322 122,295 81,568 26 340 2,844 125,951 65,315 69,322 8,78~
1,000,000 or more ............................................ 86 223,079 191,378 251,829 135,389 101,162 15 1,052 1,088 136,709 81,744 ~2,793 7,83,
Nontaxable returns .............................................. 206,522 478,430 375,433 417,170 33,702 - 10,117 73,205 922,525 3,146,053 3,220,3t,7 399,394 477,65'
U. S. GOVERNMENT OBLIGATIONS
Grand total ............................................... 43,236 1,201,304 1,007,01.2 1,370,298 847,813 326,978 2,924 10,773 70,699 1,331,354 1, 320, 204 18,752 7,78,
Taxable returns, total .......................................... 39,334 1,171,274 979,594 1,337,089 847,156 326,978 2,393 9,964 66,197 1,291,763 1,280,876 17,988 7,28-
Under $5,000 .................................................. 5,273 27,551 15,826 38,894 15,968 4,072 N N 8,497 29,726 26,224 3,958 45
5,000 under $10,000 ... 7 670 72,888 60,050 84,880 46,099 10,594 N N 11,635 3,63,275 162,686 1,487 89
r 5, 1110,000 wid.1 .
8349 110,941 101,944 109,469 72,277 16,438 933 1,525 12,629 1,14,243 113,993 1,485 1,24:,d r ::" C.. ..............................15,000 w 12 .
1
7,295 165,895 141,091 . 189,991 119,860 32,956 439 2,570 12,574 134,622 133,950 1,596 1,09
25,000 under 50,000 ......................................... 6,377 258,948 222,975 291,545 194,023 63,607 428 1,695 11,988 345,084 343,244 3,666 1,82
50,000 under $100,000........ 3,214 262,587 218,322 300,314 201,970 86,912 334 2,137 6,584 _322,894 321,382 2,729 1,21
100,000 under 200,000 ....... 890 147,729 116,278 175,021 111,350 57,534 124 1,153 1,756 90,076 88,319 2,172 411200)000 tinder 500,000 .......................................
1
232 85,405 66,431 103,763 59,910 35,877 28 454 456 77,668 76,951 835 11
500,000 under 1,000,000 ................................... 1. 25 19,248 16,486 21,951 12,687 8,977 - - 59 11,023 10,973 52
1,000,000 or more ............................................ 8 20,083 18,190 21,260 13,012 10,012 2 268 19 3,150 3,355 7 1
Nontaxable returns .............................................. 3,902 30,030 27,418 33,209 656 - N 4,502 39,592 39,327 764 50
STATE AND LOCAL SECURITIES
Grand total ............................................... 52,671 2,171,353 1,790,559 2,516,389 1,531,731. 683,096 4,298 25,666 113,156 1,087,416 1,052,023 61,120 25,77
Taxable returns, total ........................................... 46,211 2,126,633 1,772,177 2,449,154 1, 528,049 683,096 4,084 23,672 103,594 1,020,707 989,255 55,920 24,51
Under $5,000 .......... 3,567 24,581 7,952 39,794 14,317 4,511 1 196 1,084 4 960 22 965 19,311 4,006 35
- . . .................................5,000 -der $10,000. 8,790 76,936 66,533 87,969 45, 277 8,835,
12: 354
:36 493 31,792 6,251 1,55
10, 000 5...............................)"r 1 '0'
6,952 97,846 84,966 105,914 65,703. 15,987 402 1,229 14,256 125,635 123,278 5,015 2,65
:::: ::: :: : ...............................15,000 unl:r 125, 0..
1
7,761 176,916 151,275 199,725 124,999 34,190 624 2,690 16,187 1 7188 1 78,008 6,260 2,56
25,000 under 50,000 ......................................... 10,086 421,786 349, 887 487,268 321,970 120,018 746 3,728 24,075 230,660 A 220,649 1-5,641 5,63
50,000 under $100,000 ........................................ 6,058 498,142 417,860 569,296 379,513 162,384 730 8,723 19,100 240,646 237,886 9,452 6,70
100,000 ,,d 210,001...... ..... .. .........'
2,105 351,773 284,018 416,727 261,512 135,349 250 3,318 7,908 134,946 130,994 6,440 2,50, .:::..~ 15 :::: . . ..2.00,000 u d:
1
747 259,587 212,196 303,464 179,556 109,252 107 11456 3,653 99,337 o 98,869 2,429 1,98
500,000 under 1,000,000 .................................... 95 71,671 65,548 77,374 44,656 32,519 14 382 805 24,448 24,564 291 40
1,000,000 or more ............................................ 50 147,396 131,941 161,624 90,5413 70,051 15 1,062 375 23,860 23,884 135 16
Nontaxable returns .............................................. 6,459 44,720 18,382 67,235 3, 681 - 214 1,993 9,562 66,709 62,768 5,200 1,25
2
7
2
7
1
3
9
Footnotes at end of table. For the precise definition of terms and the nature of any limitation., see the "Description of the Sample,1- -'Limitations of the Data,'- and "Explanation of Classificatiom mid Termsl~ in the text.

RETURNS WITH NET CAPITAL GAIN OR LOSS
Table 2. -ALL TRANSACTIONS - INCOME TAX, AND TRANSACTION DETAIL, BY ASSET TYPE AND SIZE OF ADJUSTED GROSS INCOME LESS CAPITAL GAIN OR LOSS INCLUDED-Continued
sset type and size of adjusted gross incomeless capital gain or loss included
Number ofreturnsith netcapitalgain orloss
Adjusted gross income-
Less Plus
capital capital
As reported gain or gain or
loss loss
included excluded
(TY...-d (7~...-d (7h...-d
doll-) d.1.1 ... dll.,.)
Taxableincome
7h...-dd.11 ...
Income taxafterredits
n...-dd.11 ...
Capital loss carryover
umber ofAmount
returns
(TY...-d
d.11.,.)
All capital asset transactions
Cost andGross-sales Depreci-
Number of ense of Gross gain Groso loss
trans-price ation
"Peale
actions
(Th...-d (7h...-d (77--d (Th-d (7?...-d
d'll ... d.11 ... d.11 ... doll ... 11...
W (2) (3) (4) (5) (6) (7) (8) (9) (10) (11) (12) (13) (14)OTHER BONDS, NOTES, AND DEBENTURES
Grand total ............................................... 46,425 1,233,877 1,005,038 1,363,828 857,155 332,794 4,464 38,898 75,762 669,967 731,820 37,704 99,864
Taxable returns, total .......................................... 40,286 1,213j699 1,008,419 1,374,949 855,594 332,794 3,219 18,638 65,326 449,659 457,621 34,461 42j729
Under $5,000.................................................. 4,645 29,446 8,859 49,245 17,263 5,294642 3 230
6,552 10,178 llj051 2,438 3,3135,000 under $10,000 .... 9,129 76j789 69,765 71,556 48,22,2 10,395
, 10,810 20,795 20,654 3,721 3,593
15,11,10,000 under
1
7,426 16,638 90,270 96,953 63,381 14,276 702 3,669 11,529 44,577 48j423 2,929 6,7901.der 25,.,):::.::::
15, 000 u: ................................. 8,446 182,317 160,564 199,485 127j573 33,793 755 3,156 14,011 62,628 67,622 4,372 9,367251000 under 50,000 ......................................... 6,455 264,357 224,272 296,492 200,652 67,578 653 2,963 13,645 180,538
2:180,723 9,795 9,-)87
50,000 under $100,000 ........................................ 3,015 239,573 200,041 273,572 182,980 77,314 360 3,165 5,951 67,067 66,999 ~,842 5,979100,000 gde,
..................................200'000
872 149,414 117,081 178,269 106,0171 53,757 80 1,628 2,019 45,316 a 43,946 3,849 2,545~,r 1:::::~200,000 5.,..0 .................................
1
245 95,425 69,240 118,988 62,831) 36,163 22 669 681 14,040 13,563 1,371 894500,000 under 1,000,000 ..................................... 35 26,949 24,250 33,260 18,030 12,15? 4 100 90 2,002 2,034 128 1601,000,000 or more ............................................ 18 50,790 44,078 57,129 28,566 22,067 2 57 37 2,517 2,604 14 101
Nontaxable returns .............................................. 6,140 20,178 -3,381 -11,121 1,561 - 10,436 220,308 274,200 3,243 57,135
INSURANCE AND ANNUITIES
Grand total ............................................... 6,143 132,514 114,135 148,542 93,072 26,631 148 654 10,106 37,575 21 474 17 821
,
1,889
Taxable returns, total .......................................... 7,339 130,004 112,193 146,082 92,677 28,631 148 654 9,303 37,135 21:156 17 700 1,889
Under $5,000 .................................................. 1,004 4,586 2,517 6,679 2,689 505 1,004 3,226 1,770 1,612 1555,000 under $10,000 ...... 2,812 25,823 22,468 29,178 15,32:1 3,220 - - 3,573 8,328 3,170 5,198 3910,000 W
1d1,356 19,620 16,806 22,661 13,718 3,316 1,634 6,990 11 2,688 4,360 90"0.
................................'r 1215,000 underR 1,124 24,440 22,130 26,406 17,667 4,576 1,681 9,258 7,492 3,001 1,23525,000 under 50,000 ......................................... 803 29,659 27,461 30,671 23,126 7,463 1,062 5,048 3,142 1,990 209
50,000 under $100,000 ........................................ 189 14,741 12,132 17,302 12,096 5,137 31 75 262 3,241 2,372 988 122100,000 under 200,000 .................. 45 6,589 5,754 7,417 5, 0`78 2,669 6 55 76 947 476 493 32ar 00,200,000 -id J5 ................................
1
6 1,716 1,476 1,954 1,264 757 - - 9 96 o 46 57 7500,000 under 1,000,000 ..................................... - - - - - - - - - - - - -I)OOOjOO0 or more ............................................ 1 2,630 1,448 3,e].3 1,714 967 1 1 2 - - -
Nontaxable returns ..............................................
OPTIONS TO BUY OR SELL
Grand total............................................... 10,631 210,101 177,359 228,568 142,828 46,553 1,358 4,644 38,886 :342,547 335,166 17,895 10,518
Taxable returns, total .......................................... 9,462 206,069 174,933 225,458 142,828 46,553 1,357 4,621 36,630 :336,142 327,?61 17,346 8,968
Under $5,000 ....................
859 8,425 121 15,671 4,145 1,434 1,437 4 706 1,570 3,393 2585,000 under $10,000 .......................................... 2,228 20,540 16,610 24,154 11,150 2,703 19,972 195 935 195,638 2,633 2,33610,000 under 15,000 .........................................
1
2,622 34,567 33,159 33,170 22,602 5,155 272 1,392 6,945 90,633 91,639 1,839 2,845115,000 under 25,000......................................... 1,734 34,898 32,356 34,390 24,777 6,406 M 4,666 26,108 24,598 2,697 1,18725,000 under 50,000......................................... 1,576 60,114 54,909 61,581 45,631 14,914 220 1,129 2,778 14,440 11,629 4,511 1,702
50,000 under $100,000........................................ 363 31,288 24,554 37,096 23,758 10,192 58 599 686 3,333 1,732 2,080 478100,000 un 21 01 ................................0
rd:67 11,580 9,068 14,124 8,048 4,006 8 327 105 901
o884 143 1261, 0 :::::::;
rG.
200,000 und ................................
1
11 3,703 3,002 4,338 2,245 1,386 - - 40 80 65 51 36500,000 under 1~0001000..................................... 1 954 955 933 472 358 1 6 6 - -1,000,000 or more ............................................ - - - - - - - - - - - - -
Nontaxable returns.............................................. 1,169 4,033 2,426 3,111 - 1 24 2,256 6,405 7,405 549 1,550
OGYMDITIES INCLUDING FUTURE CONTRACTS
Grand total ......................... I ..................... 28,624 396,604 346,962 417,655 281,010 88,004 3,333 20,758 154,211 961,741 976,603 37,621 52,619
Taxable returns, total .......................................... 21,103 388,398 341,862 415,862 279,613 88,004 3,073 17,795 131,804 856,064 B69,777 30,577 44,375
Under $5,000.................................................. 3,747 16,168 9,637 22,334 7,783 2,0021 642 1 758 6,773 49,390 49,478 3,062 1,151
5,~1 te, $10,000 .......................................... 5,361 44,592 38,095 52,014 28,830 6,475,
48,936 199,126 198,583 8,314 7,7711. Go
der1"0'
1
4,105 52,619 51,205 50,153 35,981 8,038 536 1,280 25,160 144,562 148,172 3,695 7,53515,000
under4,203 82,233 79,473 79,991 58,731 14,640 938 5,249 33,161 171 401
,
177,935 6,144 12,68425,000 wider 50,000 ......................................... 2,807 102,067 95,898 102,031 78,223 24,884 762 6,080 13,467 218 476 221,563 5,933 9,06650,000 -der $100,000... 769 56,021 49,869 59,089 43,044 18,247 181 2,945 3,669 57,878 59,364 2,567 4,073
,Ld:r100,000 , 2 0 0, 0OO : .. ......... ...... 94 21
1
986 12 602 30,294 17,401 8,751 13 417 550 13,723 14,995 397 1,670r J, .0 , . : ...200, 000 1 ...................... .. ......
1
16 91033 4:507 13jlO6 6,458 3,408 - - 84 1,473o
1,688 210 425500,000 under 1,000,000 ..................................... 1 3,680 576 6,650 3,163 1,557 1 67 - 35 - 35 -1,000,000 or more ............................................ - - - - - - - - - - - - -
Noiitaxable returna .............................................. 7,522 8,206 5,100 1,?93 1,396 22,407 105,676 106,826 7,044 8,244
Footnotes at end of table. For the precise definition of terms and the nature of any limitations, see the "Description of the Sample,tt "Limitations of the Data," and "Explanation of Classifications wid Terms" in the text.

RETURNS WITH NET CAPITAL GAIN OR LOSS
Table 2.-ALL TRANSACTIONS - INCOME, TAX, AND TRANSACTION DETAIL, BY ASSET TYPE AND SIZE OF ADJUSTED GROSS INCOME LESS CAPITAL GAIN OR LOSS INCLUDED -Continued
Adjusted gross income- Capital loss carryover All capital asse t transactions
Number of Le a
Le
Plus Income tax
Asset type and size of adjusted gross incomereturnswith net As reported
capital
gain or
capital
gain or
Taxableincome
afterAmount Number f
0
Gross sales Depreci-Cost and
expense of Gross gain Gross lossless capital gain or loss included capital loss loss
credits Number of
trans- price ation sale
gain or included excluded returns actionslose (7)...-d (77-.-d (7h...-d (M...-d (Th...-d (Th-.-d (M.-d (rh...-d
d.11 ... dbilarx) &11 ... d.11 ... &H ... ) d.11... d.H.,.) d.H.,.) d.11 ... d.) I ...
(1) (2) (3) (4) (5) (6) (7) (8) (9) (10) 11) (22) (13) (14)CAPITAL GAIN DIVIDENDS
Grand total ............................................... 1,609,255 19,707,557 18,663,005 20,719,856 13,864,508 3,911,617 41,229 156,627 1,675,593 526,610 17,09C,
Taxable returns, total .......................................... 1,445,511 19,374,273 18,373,823 20,353,408 13,635,842 3,911,617 37,140 143,777 1,490,198 472,811 14,518
Under $5,000 .................................................. 274,798 1,024,343 868,80`7 1,179,202 519,041 98,361 2,396 20,339 279,470 87,611 1,82E
................5,000 -der $10,000 ......................... 523 550 4,011,204 3,865,215 4,149,214 2,484,221 511,807 ?,40? 18,141 550,048 116,776 4,27?:
10,000 der 15,000 ...........
**'' *, '' " ''*, **' * ....
311:035 3,872,512 3,772,719 3,982,010 2,679,339 585,581 7,191 20,429 318,742 77,887 3,725
15,000
nsr125
.0::::::: ............... .. .. .. .. 197,515 3,852,812 3,729,267 3,980,039 2,885,798 711,588 9,521 33,939 201,347 72,732 2 21E
:25,000 wider 50,000 ......................................... 107,926 3,833,830 3,644,792 4,010,943 3,062,574 969,468 7,667 27,165 109,548Not tippli-bi
65,092 1 64C
50,000 under $100,000 ........................................ 26,104 1,854,902 1,700,309 2,001,692 1,514,913 641,949 2,485 17
,
541 26,3117 33,043 66~
r100,000 und 3,754 563,183 489,150 633,840 440,415 231,715 411 51103 3,809 11,329 147,:
200,000 unr
I
736 244,888 205,334 281,699 173,577 106,463 56 1,014 7501
790 2C
500,000 under 1,000,000 ..................................... 72 59,537 48,673 69,974 40,330 28, 076 3 12 76 11090
ls0001000 or more ............................................ 21 57,062 49,557 64,595 35,635 26,589 3 96 21 462
Nontaxable returns .............................................. 163,744 333,284 289,182 366,448 28,666 - 4,090 12,850 185,395 53,999 2,57E
S'VaE OF CAPITAL GAIN (LOSS) FROM PARTIMISHIPSAND FIDUCIARIES
Grand total ............................................... 3S7,233 7,174,902 6,160,615 8,051,264 5,180,936 1,769,638 15,291 92,343 445,707 1, 064, 335 138,43(
Taxable returns, total .......................................... 340,607 7,099,129 6,172,694 7,918,113 5,171,716 1,769,638 14,054 82,298 393,904 961,898 114,121
Und.r $5,000 .................................................. 69,663 356,139 182,01.5 516,954 198,989 47,371 1,969 6,270 77,275 232,598140 241
15,13~30 27~
5,000 under $10,000 ........... 84 559 715 447 626,540 783,729 430,596 90,784 1,717 6,285 95,175 , ,
. . . ..... ............... .., 1_1,G0O000 ur10 60 881 817 915 750,465 885,889 547,?50 . 122,397 1,966 10,602 72,391 103,845 10,65!:::::::::d:r J2,000 ur
"G.................................1.5
1
58,201 1,233,945 1,120,659 1,331,704 910,306 235,349 2,870 16,909 68,835 133,736 15,50,,
25,000 under 50,000 ......................................... 46,212 1,780,598 1,607,901 1,920,896 1,397,165 457,857 3,570 21,153 54,747 159,488 27, 691
50,000 under $100,000. 17
1
006 1,291
1
447 1,131
1
156 1,435,976 1,032,693 441,880 1,557 14~,144 2 1,377Hot appli_
112,401 9,47,
100,000 und r 31232 505,725 425,988 579,538 383,178 199,613 315 Z'184 4 '01,
50,515 3,27:
-:
000 und r 500, 000 .......................................200
1
737 248,882 204,470 290,595 171,073 103,488 171 1,563 945 19,567 1,49,000 under 1,000,000 .....................................500 82 66,301 54,06? 77,506 45,055 30,420
*9 153 98 5 207
1
4T'
,1,000,000 or more............................................ 33 82,730 69,403 95,428 54,910 40,479 9 335 413 4 301 14
Nontaxable returns .............................................. 46,626 75,773 -12,080 133,151 9,220 - 1,237 10,045 51,802 102,437 24,3D
CAPITAL GAIN DISTRIBUT1095 FROM SMALL BUSINESS CORPORATIONS
Grand total ............................................... 30,274 539,309 475,207 598,899 394,373 129,390 1,926 5,153 36,014 55,561 4,41,
Taxable returns, total .......................................... 28,088 535,473 472,952 593,517 393,843 129,390 1,926 5,153 33,691 53,072 2,M
Under $5 000 ............. 5,041 21,708 12,846 30,086 13,542 3,124 6 061 8,647 13'
5,000 under ........................................ 6,940 59,208 51,716 68,823 38,523G.
7,7I
1,358 3,182 8 0991
12,752 62,
15, 000 .........................................000 urds,10 6,484 82,616 78,806 86,549 55,415 12,070 7,532 3,896 561,
15,000 tinder 25,000.........................................
1
5,090 104,210 97,798 108,492 77,189 19,?57 271 948 6 391
,
8,539 78i4 '
25,000 under 50,000......................................... 3,125 115,853 104,729 125,171 92,163 30,010 193 509 88931 7,339 1
50,000 under $100,000........................................ 1,133 85,804 75,530 95,574 70,05-1
30,410 90 186 1,352Not ;.ppii..bl~
5,611 3L
100, 000 der2""
225 34,406 28,678 39,970 26,494 13,788 10 48 295 2,248 Z1f r
: : ~ : : : : ................................200,000 , de
5.0,000
1
43 21,358 12,683 28,922 14,768 8,132 3 64 64 3,731
500,000 under 1,000,000..................................... 6 3,977 3,630 4,314 1,58- 1,050 - - 7 78
1,000,000 or more ............................................ 1 6,334 6,335 5,617 4,11:1 3,350 1 216 1 31
Nontaxable returns .............................................. 2,186 3,836 2,255 5,381 529 - - - 2,323 2,489 1,53
LIQUIDATION DISTRIBUTIONS
Grand total ............................................... 49, 095 1,400,228 979,299 1,775,436 1,043,984 406,826 3,258 27,673 56,654 575,935 65,49
Taxable returns, total .......................................... 45,761 1,386,153 1,001,941 1,740,610 1,043,155 406,826 2,559 15,372 53,211 510,749 54,03
Under $5,000 .................................................. 5,410 51,905 7,211 93,876 34,756 12,537 35 61,318 2,62
5,000 under $10,000 ...... 11,491 111,827 83,430 130,857 69, 1U, 17,746 ?04 2,950 13,414 46 089
,
15 91
10 000 und 15OUG
10,033 143,323 120,583 158,642 100, Ol;! 25,862 353 1,803 10,763 36 2281 14 031,.........15,000 und:r ..................
1
7,750 187,329 148,406 224,215 141, 744 42,097 494 1 832 9 74
:G
63,942 8, 03
25,000 under 50,000... ............................ ......... 7,001 323,258 241,611 402,810 262,269 96,251 451 2 194 8 231 114,974 7,21
50,000 -der $100,000 ........................................ 3,058 301,569 207,624 393,311 243,595 107,833 280 3,596 3 923Not .1y,li-ble
122,079 4,04
100 000 und 210,10 ............,* ... -*- ... * "' 'r
794 154 591
'
104,905 203,177 119,341. 60,551 54 "0 11080 45 776
'
1,19
.r 15 ............:::: .. .200,000 und:
1
222 53085, 63,834 104,967 57,15:3 32,887 10 184 336 i 17 1105 48
500,000 under 1,000,000 ..................................... 14 9,286 8,977 9,528 5,715 4,241 1 2 21 535
1,000,000 or ore ............................................ 7 17,534 15,360 19,225 9,404 6,822 1 20 17
J
704 48
Nontaxable returns .............................................. 3,314 14,075 -22,643 34,926 829 - 3
,
443 65
,
186
11,
4
WCD
Footnotes at end of table. For the precise definition of terms and the nature of any limitations, see the "Description of the Semple," "Limitations of the Data," and "Explanation of and Terms" in the text.

RETURNS WITH NET CAPITAL GAIN OR LOSS
Table 2. -ALL TRANSACTIONS -- INCOME, TAX, AND TRANSACTION DETAIL, BY ASSET TYPE AND SIZE OF ADJUSTED GROSS INCOME LESS CAPITAL GAIN OR LOSS INCLUDED-Concinued
Adjusted gross income- Capital loss carryover All capital asset transactionsNumber ofreturns
Lesscapital
Pluscapital Taxable
Income tax
Asset type and size of adjusted gross income ith netAs reported gain or gain or
income afterA
Gross~sales DleprecCost and
less capital gain or loss included capital loss loss
credits Number of
mount NLunber ofprice ation
expense of Gross gain Gross loss
gain or included excluded returnstr s-actions
L
sale
loes(7?...-d (1)...-d (Th--d (Th-.-d (77~.-d (7)...-d (77m.,-d (Th-d (n.-d (Th...-d
d.11 ... &11 ... d.11 ... d.11 ... d. 1 1-) d'11 ... d.11 ... d.11 ... ) d.11...
RETIREMENT PLAN DISTRIBUTIONS(1) (2) (3) (4) (5) (6) (7) (8) (9) (10) (11) (12) (13) (14)
Grand total............................................... 61,070 748,362 533,598 955,169 524,791 151,193 540 1,810 64,739 - 303,822 202Taxable returns, total .......................................... 54,484 732,261 520,883 935,465 524,584 151,193 420 1,513 57,654 296,669 15~.
Under $5,000.................................................. 14,956 92,237 39,699 141,588 59,196 14 074 15,984 87,317 -5,000 under $10,000 .................. 20 954
1206,650 156,727 255,357 133,634 3.:65"
250 81421,915 87,425
10,000 -der 5 000
1
11 ,605 166,651 138,312 194,468 119,833 28,440 12,463 48,538 11'
under :15,000 , J25 4,654 106,457 85,640 127,650 81,380 22,633 4,799 27,856 4~25,000 -der 50,000 ......................................... 1,848 84,196 58,433 106,347 67,169 24,402 116 457 1,940 27,006 3151,000 under $100,000 ........................................ 354 37,861 23,412 52,379 31,785 14,357 42 133 405
No t applicable11,737 51
lC0,00Ounder
'o"),O:::::: ... - ..... .. ** ....... * ..... .....~91 26,270 11,836 40,663 22,110 11,207 11 104 105 5,622 ic
200,000 under E, . ..~O. ... 19 9,041 4,823 13,246 7,373 4, 0`76 1 4 21 1,293500,000 under 1)000,000 ..................................... 3 2,878 1,999 3,746 2, 099 1,346 - - 3 751,000,000 or more ............................................ - - - - - - - - -
Nontaxable returns .............................................. 6,587 16,101 12,716 19,704 2G3 - 7,084 6,953 4;
LIVESTOCK
Grand total ............................................... 689,801 3,259,441 2,712,499 3,8O5o398 1,660,211L 417,250 2,396 10,447 1,376,690 1,017,324 98,128 394,719 750,979 32,78f
Taxable returns, total .......................................... 392,361 2,777,025 2,377,806 3,173,066 1,631,633 417,250 1,671 7,180 783,339 640,946 59,381 239,339 476,010 16,76(Under $5,000 .................................................. 228,345 856,093 668,210 1,044,843 353,92-5 66,112 439 900 339,480 21,926 103,593 264,032 7,'06(5, 000 -der $10, 000 .......................................... 126,751 942,392 860,311 1,024,614 540,144
1O.",~~1,040 3,178
:257 482 175,447 16,932 68,621 128,569 5,25;
10,000 und 5,000:::::::: .................................:1
1
20,193 213,951 238,957 288,831 168,704. 39,827 44,242 43,559 6,359 21,485 29,918 1,49Erd r15,000 u
25................................... 10,101 207,203 187,513 226,676 164,520 40,707 246 1, 074 21,871 33,923 4,948 17,295 22,370 80~
25,000 under 50,000 ......................................... 4,648 182,623 158,968 205,889 148,965 49,101 186 884 12,024 24,827 4,362 14,375 15,380 79S50,000 under $100,OCO ........................................ 1,678 137,757 110,287 163,641 112,670 48,877 161 1,027 4,376 13,284 2,601 8,021 8,380 6&
2 :::100,000
under 01,11 459 76,820 62,013 91,248 58, 0`78 30,120 29 860 2,115 5,010 1,139 3,017 3,431 30(dcr 1
200,000-un'.., 0,)0
1
153 53,961 43,925 62,813 37,514 22,937 8 131 1,157 4,662 956 2,446 3,441 27E500,OCO under 1,000,000 ..................................... 16 10,456 10,291 10,545 6, 772 5,249 1 2 63 118 50 125 76 X1,000,000 or more ............................................ 17 45,769 37,333 53,965 20,540 13,877 1 24 90 606 110 363 390 3-,
Nontaxable returns .............................................. 297,441 482,416 334,691 632,332 28, 377 - 716 3,268 593,350 376,378 39,747 155,380 274,969 16,02!
TUABER AND COAL
Gra.nd total ............................................... 63,513 566,235 453,474 678, 8" 357,875 113,911 875 2,679 69,449 140,720 964 45,512 113,845 4,23~1Taxable returns, total .......................................... 43,977 545,632 455,137 637,521 355,690 113,911 775 2,363 47,5?5 108,030 964 33,030 89,490 2,99f
Under $5,000 .................................................. 17,698 70,006 43,989 95,939 32,012 6,642 - - 18,306 35,659 9 4,135 34,283 "15,000 under $10,000 .......................................... 15,334 123,047 111,318 136,383 71,590 14,552 16,916 23,329 239 8,673 19,073 1,51(10,000 u,:d
1
5,281 71,119 63,453 ?9,268 48,924 11,049 M 5,422 13,830 203 7,309 6,894 1,191'15,000 ur 2,735 60,114 51, 500 68,595 45,406 lI,?lS 3,335 11,195 2 5,185 7,165 8125,000 under 50,000 ......................................... 2,050 78,532 69,774 86,645 61,511 19,755 76 334 2,374 9,408 47 2,744 7,956 "
50,000 under $100,000 ...... ................................. 633 52,860 42,394 63,646 41,754 17,793 42 564 850 8,168 389 2,860 7,141 4'100,000 L~a' er
2" ')' ................................:174 32,009 23,747 3?,929 23,757 12,114 14 193 286 3,770 24 1,457 2,972 6e
1200,000 L de 50., 0110 ................................
1
63 24,451 18,978 29,956 16,076 9,390 9 353 71 2,080 51 468 1,610500,000 under 1,000,000 ..................................... 5 6,718 3,275 10,224 4,855 2,857 1 67 7 42 - 20 551,000,000 or more ............................................ 5 26,776 26,708 26,937 9,805 8,042 2 113 8 350 178 342
Nontaxable returns.............................................. 19,536 20,603 -1,663 41,323 2,185 - 21,873 32,689 12,482 24,355 1,24C
OIL AND MINERAL INTE"-STS
Grand total ............................................... 26,522 634,201 495,723 751,461 454,041 177,540 2,243 8,140 38,345 155,852 11,026 100,638 93,534 18,98E
Taxable returns, total .......................................... 23,728 638,120 510,574 747,451 453,863 177,540 2,099 7,663 34,041 136,537 10,606 94,210 78,226 17,17-,
Under $5'000 .................................................. 2,796 27,841 3,707 47,146 16,708 5,537 - - 4,779 42,282 2,876 27,676 23,329 1,737
5,000 under $lb,000 .......................................... 8
,
39969,
748 63,887 72,894 44,137 9,215 9,909 12,712 889 11,370 7,402 5,27S10,000 under 15,000 ................................:::::::::
1
41064 13, 848 49,956 55,633 36,551 8,242 306 1,092 6,888 13,589 670 11,355 5,854 2,493125'15,000
under 0.................................. 3,920 85,179 74,489 93,401 62,868 17,234 572 1,168 5,299 20,573 1,327 12,468 12,303 3,756
25,000 under 50,000 ......................................... 2,878 116,658 97,477 133,296 92,156 31,319 365 2,141 4,433 24,069 2,419 17.239 11,707 1,78850,000 -der $100,000 ........................................ 1,107 92,860 75,692 108,686 73,390 31,508 85 726 1,738 11,873 1,535 7,773 8,616 1,555100,000 unde 200 =:::
:::::::1377 68,397 50,730 85,454 49,611 24,901 36 417 650 6,024 647 3,516 4,021 432
:1500 .............................200,000 under
1
150 60,642 43,906 77,003 42,524 24,362 13 201 286 2,607 198 1,799 1,541 91500,000 under 1,000,000 ..................................... 23 20,702 15,193 26,268 13,998 8,686 7 217 37 450 42 308 350 291,000,000 or more ............................................ 15 42,245 35,536 47,671 21,898 16,536 2 8 22 2,358 2 ?05 3,103 15
Nontaxable returns .............................................. 2,793 -3,919 -14,850 4,009 178 1 - 4,334 ~19,315 420 6,428 15,308 1,810
Footnotes at end of table. For the precise definition of terms and the nature of any limitations, see the "Description of the Sample," "Limitations of the Data," and "Explanation of Classifications and Terms-, in the text.
C02
Cc

RETURNS WITH NET CAPITAL GAIN OR LOSS
2. -ALL TRANSACTIONS - INCOME, TAX, AND TRANSACTION DETAIL, BY ASSET TYPE AND SIZE OF ADJUSTED GROSS INCOME LESS CAPITAL GAIN OR LOSS INCLUDED-Continued
Adjusted gross income- Capital los s carryover All capital asse t transactions
Number of Les Plus Income taxreturns
ith t
capital capital Taxable
iafter Gross ..ales Dpre
c'-
Cost and
of ainGross Gross lossAsset type and size of adjusted gross income w ne As reported gain or gain or ncome credits Number ofAmount Umber of
price ationexpense g
less capital gain or loss included capital loss loss traxu~- sale
gain or included excludedreturns
actionsloss
(Th-d (n.-d (77--d (Th-.-d Th...-d (7P...-d (Th...-d (Th.-d (n...-d
d.11 ... d.11 ... &I i ... &11 ... d.11 ...) &IJ.") &I I .. ) __ d.11 ... 6~11 ... d.1i ...) d.1i ...
(2) (4) (5) (6) (7) (8) (9) (lo) (12) (13) (14)
PARTNERSHIP IWERESTS
Grand total ............................................... 87,451 1,467,538 1,146,540 1,771,357 1,049,333 348,599 4,137 18,402 119,428 823,094 30,916 502,380 359,952 31,M
Taxable returns, total .......................................... 74,448 1,451,494 1,176,679 1,708,398 1,047,725 348,599 3,600 14,494 102,663 694,329 25,999 394,084 328,758 25,95f
Under $5,000 .................................................. 17,635 102,660 35j251 168,502 55,053
07 404
14,71001823
(-)1 031 5431
26,548
81723
162,864143,015
8,035
6,574
78,145
83,462
90,920
62,109
3,67,
4,19,
5,000 under $10,000 .......................................... 19 128
94811 1
175,763
184115
146,488
171 525
203,793
217,205
1 j
133,932
,
30,462
,
545
,
2,196
,
17,698 122,423 3,911 89,884 39,217 4, 90r...:: : : :: : : ~: ....... ........~r 510,000 under J21,,OO0
000 und ...............................15
1
,11,898
,
263,478
,
234,486 290,550 197,029 52,399 945 4j3O5 17,039 97,524 3,159 60,206 45,378
7847 4'
7 82(
3:551
o
,
25,000 under 50,000......................................... 8,643 340,178 296,621 376,246 266,857 89,117 611 2,706 12j652 94,251 2,855 50,685 ,
50,000 under $100,000 ........................................ 2,540 209,243 169,654 247,074 168,460 72,808 242 2,258
9
3,860
811
45,76200321
970349
21,238
8 01.0
24,794
13 497
1,21421
100,000 und r
200'OM .... ....... ......
520 89,830 68,038 110,196 70,244 36,442
0
44
7
6 1
75.203
,
5 560 7
,
1 940
j
3,715 9:, r 1
200,000 un, 5.,000:::::::::.. ............................
1
113 45,533 31,501
4 4
58,850
20 266
30,228
12810
17, 66
1486 4 220 22
,
1,851 140
,
446 1,574 2500,000 under 1,000,000..................................... 14 14,860 9, 9 , , ,
428 - 14 75 - 39 75 31,000,000 or more ............................................ 8 14,665 13,621 15,697 8,391 6, -
Nontaxable returns .............................................. 13,003 16,044 -30,139 62,959 1,608 - 16,765 128,764 4,916 108,297 31,194 5,83
ASSETS USED IN TRADE OR BUSINESS
Grand total ............................................... 448,486 4,060,959 3,281,800 4,807ol26 2,6135,817 7?0,591 11,884 59,258 699,264 3,62.7,716 906,3.34 3,588,809 1,052,169 168,61
....................................Taxable returns total . 327,815 3,941,901 3,294,472 4,565,159 2,670,434 770,591 9,056 39,031 502,880 2,731,285 668,344 2,597,720 858,251 105,98, ... ..
000 ..................................................Under $5 109,383 522,394 293,465 747,107 255,951 56,804 1,065 2,757 174,736 937,686 269,178 897,142 317,10652
17,74
57 17,
5 000 under $10 000 .....
* * ........*- , -
122,052 970,186 863,591 1,063,439 556,281 112,860 3,507 11,771 190,956 702,503 185,694 738,558 193,6 ,
63, ,..::: :l5~OOO-.--: --10,000 under 45,096 605,154 544,605 668,604 ' 417,519 92,697 1,441
527
5,376
7 337
63,019
98339
378,681
303 782
75,679
64 334
351,461
277 270
102,993
)0,853
11,
8,54J ,
15,000 under 25 000 .........................................
000
28,904
17 203
604,303
664 781
546,414
580,372
663,500
743,518
457,622
533,360
115,112
174,754
1,
1,044
,
4,915
,
25,358
,260,556
,
51,285
,
233,194 82,153 7,69.........................................25,000 under 50,
50,000 under $100,000 ........................................
,
4,190
,
338,602 274,188 399,931 280,917 122,047 370 3,239
695
6,938
1 434
104,404
24 009
16,761
3 618
75,627
43715
45,959
65212
2,1655
1CO;OOO under 200 000 756 121,362
88
98,953
55 157
143,069
88 076
93,431
50 019
48,464
61229
77
17 1,386
,
386
,
16,457
,
1,394
,
6,955
,11,301 43der 0.:
200,000 un 15 ...............................
000
1
196
22
72,1
17 912
,
14 651
,
20,906
,
10,246
,
6,641, 6 264 27 718 21 291 489 4.....................................500,000 under 1,000,
13
,
25 018
,
23,077 27,010 15,089 11,597 2 . 92 41 2,490 379 1,785 1,0911,000,000 or more ............................................
.................... 120 671
,
119,058 -12,672 241,967 15,383 - 2,828 21,227 196,385 896,430 239,990 991,088 193,918 62,62Nontaxable returns .......................... ,
PHOPERn HELD FOR PERSONAL USE
Grand total ............................................... 51,138 555,215 473,759 638,957 350,157 103,212 1,438 12,514 67,661 193,217 39,264 189,718 49,880 10,T
Taxable returns, total .......................................... 39,823 525,108 451,156 598,227 348,222 103,212 1,018 6,417 46,845 139,275 32,858 131,367 43,379 6,2~
000 ..................................................Under $5 11,313 56,424 25,060 88,047 28,526 7,3 13,773 :,6,728
'
8 ,767 36,627 18,354 1,0,2 T,
5,OCO under $10,000 .......................................... 15,013 120,511 111,764 129,006 62,999
1
2 629 838 4,59817 697
033
I
,
~2 755
60518
,
9 696
5 712
42,981
21 360
11,356
3 680
,8;
:~:::::::: ................. ....10,000 under 5,0,
1
1,111 '11,155 75,633
8 0
83,0?0
89 811
52,741
14663
11,317
34415
7,
4,712
,
:10,832
,
4,029
,
13,046
,
2,787 T~r 125 CG
15,000 und ...............................
000
4,135
2 390
84,586
03892
7 ,5 7
82,709
,
101,663
,
'73,730
,
24,109 96 988 2,690 11,960 3,568 11,330 3,437 1.........................................25,000 under 5 ,0
50,000 under $100,000 .........
.......
,
643
,
50 442 43 149
1
57 354
:
39,436 17,109 71
9
660
125
735
150
4,102
1773
716
338
3,268
1282
1,776
1 435
2:
100,000 unde 2
0" .............. *
122 19,561 16 ,081 22 967 14,271 7,332
4 837 2 2 42
,
1 051 49
,
593
,
5111.. .r "200,000 under 500, ..
1
38 12,847 10,275 15,176 8,451
1
,45 7
,
21 7 10 18500,000 under 1,000,000 ..................................... 4 2,750 2,640 2,867 1,543 1,098 1
6 43 5 23 251,000,000 or more ............................................ 4 6,794 5,339 8,246 3,378 2,103 - -
Nontaxable returns .............................................. 11,314 30,1017 22,603 40,730 1,935 - 420 6,096 20,816 53,942 6,406 58,351 6,501 4,5(
RESIDENCES
Grand total ............................................... 176,794 1,412,614 1,101,986 1,709,451 856,533 212,105 2,118 8,050 180,466 2,746,575 109,187 2,259,818 572,680
.......................T bl r turns total 144,104 1,352,976 1,0`14,903 1,618,616 854,252 212,105 1,915 7,551 147,453 2,331,496 92,920 1,903,478 502,560................... .axa e e ,
000 ..................................................Under $5 61,497 296,153 163,665 423,949 146,752 29,620 63,321 870,083 34,436 662,235 246,0788 1,
000 ..........................................5 000 under $10 52)992 460,011 389,184 530,124 271,133 57
1
425 866 3,559 53,856 820,142 33,245 701,035 13 ,3 .278, )
.............. *1 5,1110,000 under
1
M, 504 250,091 219,902 278,010 171,056 38,101
342 916
18,805
7 5"
344,115
175 927
15,647
1966
296,190
963144
,5 96
32,655do, .0():::::::::12 5
15,000 un ................................ 7,306
3 035
154,712
939113
136,118
99 983
170,665
126,012
114,78790,781
29,225
29,653 173 404
,
3,125
,
86,646
,
2,336
,
72,576 17,41625,000 under 50,000 .........................................
50,000 -der $100,000........................................
,
634
,
49,657
,
42'
250 56,928 40,311 17,451 46 349
8
660
6
26'
1?5
3226
874
114
20
'
023
7544
7:3651 494
100,000 under 200,000....................................... 112 16,644 14,250 19
,
051 12,510 6,435
8
18 8
12
11
21
,
1 730 17
,
1 363 370200,000 under 500,000.......................................
1
1
20 6,499 5,779 71105 3,707 2,1 5 23
,
348 53
,
329 451,000,000 .....................................500,000 under 3 2
1
215 2
1
155 2
,
275 1
,
262 941 - -
9 1 9 -1,000,000 or more............................................. 1 31056 11618 41495 11953 1,070 1
-Nontaxable returns.............................................. 32,690 59,638 27,083 90,835 2,281 - 33
,
014 415,080 16,267 356,3.'0 70,120
M
Footnotes at end of table. For the precise definition of terms and the nature of any limitations, see the "Description of the Semple," "Limitations of the Data," and "Explanation of Classifications and Terms" in the t!xt.

RETURNS WITH N15T CAPITAL GAIN OR LOSS
Table 2. -ALL TRANSACTIONS - INCOME, TAX, AND TRANSACTION DETAIL, BY ASSET TYPE AND SIZE OF ADJUSTED GROSS INCOM
Adjusted gross income- Capital loss carryo~er All capital ass et transacti ons
Asset type and si.e of adjusted gross income
Number ofreturns~ith net
Le.scapital
Pluscapital Taxable Incm6 taxa
after Cost andlea:; capital gain or loss included capital
As reported gain or gain or incomecredits b
Amou~nt Number ofGross -sales Depreci-
expense of Gross gain Gross lossgain or
loss loss Num er oftrans-
price ationsale
lossincluded excluded
J
returnsactions
(Th...-d (M.-d (Th-d (Th-d (7h...-dd.11 ... ) -d.11 ... d.J1 ... d.11.,.) d&11 ... &11 d.11 ... d.11-) d.11 ... ) 6.11...NONBUSINESS REAL ESTATE
W (2) (3) (4) (5) -
(,
(7) (8) (9) (10) (11) (12) (13) (14)
Grand total ............................................... 349,206 3,631,967 2,974,916 4,256,930 2,370$,570 684,057 9,009 61,098 392, 930 3,708,058 248,760 2,950,932 1,008,071 139,92ETaxable returns, total .......................................... 275,633 3,534,335 2,958,907 4,085,753 2,364,513 684,057 7,280 42,818 311,042 3,089,664 210,130 2,420,676 849,956 101,96-e
Under $5,000 ..................................................5 000 under $10 000 ... ..
?4,4868
387,151 194,486 577,888 199,222 46,703 1,203 4,080 83, 504, 893,044 66,210 610,595 301,513 11 49C, , : . . - ........ **,**, ... , .............10,000 under 1 5,000 ...............................
10 ,25918 141
897,855477636
803,121579 795
993,924 512,469 108,643 1,895 3,853 118,140 929,893 ?0,330 827p497 195,149,
45,26CJ2 , ~ ::.:::::::15, 000 und
cr , GG...............................
1
,25p7OO
,
544p695,
485,9"691,175599 862
425,088
402 92895,796
103 7291,4761 291
9p9O3955
54,344 510 438 35 014
,442 716
:
110,0()0 25,508
25,000 under 50,000 ......................................... 14,374 566p563 488,871,
630,527,
442p826,
146,887,933
6,10 411
31,08817 877
323,675269 590
17 763 249 846 93,324 11 251,
50,000 under $100,000 ........................................ 3,784 307, 563 248,660 364,86? 246,502 106,263 396
,
5 257
,
4 926
,
116 200
15 274
4:0
187
,
922 87,889 99251
11,100 under 2 11....... * .. .......
702 114,523 91,184 136,197 85p;?92 43p715 67,
1 038,925
,
39 55213
473P324 42,849 1,77,50 .d~r
200pC0 15 .
1
160 54,366 43,925 64,151 34p912 2Op634 19,
1 071 221
,
54961, 11
1024, 008 16,444 441
500,000 under 1,000,000..................................... 8 6,264 5,466 7,023 3,861 2 684 -,
- 8,363
6 4p222 2,578 2321,000,000 or more ............................................ 10 18p878 17p456 20,140 11,413
,9,002 2 251 10 359
-9
249297
11593
1
Nontaxable returns .............................................. 73,573 97,632 16,009 171,177 6, 157 - 1,726 18,279 81,888 618,395 38,630 530,254 158,115
23
37,961
REAL ESTATE SUBDIVIDED
Grand total ............................................... 147,991 1,532pO82 1,132,667 lp917,843 lp03Op'517 300,031 3,274 12,951 173p280 1,859,765 170,379 '1017,021 683,128 32,064Taxable returns, total .......................................... 120,6~X 1,535,268 1,195,180 1,865p267 1,026,716 300,031 2p739 11,026 139,782 1,5(,8,042 141,990 lpO86p5O8 597,760 25 38C
Under $5,000 ..................................................5 000 under $10 000 ....... .
39p527 217,770 96,816 334,952 114,883 25,651 45p566 627,486 62,398 439,411 237,994
,
7 615p , . .................................10,000 under 11 101 ................................
1
48,01516 167
41,8,175
121 291346,216196 327
491,36025
246,135 53,439 635 2,223 54p432 432,309 38,014 301,601 157,418,
7,3781 :0 :::::::::15,000
~d~r 25 GG........ I .......................
,9p153
,206 753
,171 062
6,655237 206
158,662155 920
36,89042 68
641 1,565 18,176 182,075 17,305 135,346 67,405 6,27525,000 under 50,000 ......................................... 5p 685
,
229,159,
192,002,
266,239,
179,001,1
59,653556405
2,1GO1 486
12,1328326
141,934112 275
11,3208 916
94,071 56,152 2,052
50,000 under $100 000 ....................., p p , 72,720 46,804 742
, ...................100,00C~ unl , 210 1~ ..................................
1,719317
136,52652 780
112,29141 668
160,05963 986
110, _59541;286
47,65643
146 1,904 2,127 49,423 2,684 27,997 23,403 794:, 1, :::::200,OOC
CC: .
..................................
l
56,
20,877,
16p489,18925 14 562
21, 68 881
365
7684
431 16,4?2 1,034 11,425 6,359 487500,000 under 1,000,000..................................... 6 4,744 4,083
,5,452
,1 984
,l 256 1
2197
73 5,746 120 3,?61 2,072 29lpOO0,000 or more ............................................ 3 21p192 18,225 24,169
,3, C-97
p3,000 1 74
67
206114
--
14135
7084
4
Nontaxable returns .............................................. 27,342 -3,186 -62,513 52p576 3,801 - M 33,497 291,724 28,388 230,513 85,368
5
6,684
FARMLAND WITH UNHARVESTED CROPS
Grand total ............................................... 7,665 70p983 49,153 92,437 45,579 13,516 113 632 10,215 120,925 6,349 77,604 50,444 2,817Vaxable returns, total .......................................... 4,468 63,023 45,778 80,160 44,917 13,516 113 632 7,018 102,846 4,842 64,446 43,368 1,813Under $5,000 ..................................................5,000 under $10 000 ................
lp696 9,591 2,503 16,868 5,207 1,397 1,700 26,838 1,135 14,549 12,751 342, ..........................10,000 -der 15 000 .........................................
1
1,186721
11,60310 47?
8,732
8 97714,14412 273
7,5597 8
1,739 -
-1,990 21,672 1,314 12,331 11,098 6411 ,
15,000 under 25 000 ......................................... 542p
12,541,
10,239,
14,635, 62
9 4591,9242 567 -
1,9261 052
23,647 423 18,277 6,310 41625,000 under 50,000 ......................................... 228 9,387 7,968 10,742
,7 341
,2 4?4
,245
19,065 1,735 11,964 9,140 303
50,000 under $100,000 ........................................ 79 6,464 5,142 7 804
,
5 217
,
2 215
7,270 118 5,359 1,993 107
100,000 und r 21,011::::
......... ** ... .... ..........15 2,566 1,849
,
3,316,
1 920,940 1 94
8321
3,29948
75 1,622 1,509 4d , G(
200pOOO un 15
),.Do
.. .. .. .
1
1 373 367 379,353 259
3 41 286 555 -500,000 under 1,000,000 ..................................... - - -
- - 1 20 1 9 121,000,000 or more ............................................ -
-
4ontaxable returns.............................................. 3, 197 7,960 3,374 12,276 661 - - - 3,197 18,079 1,508 13,158 7,076 1,004
OTHER FARMLAND
Grand total ............................................... 75,163 581,375 370,456 779,190 381,940 110,019 602 2,484 81,218 1,289,760 80,837 8 64 p 371 449,135 34 529raxable returns, total .......................................... 50,839 560,737 386,255 733,024 380,126 110,019 368 2,325 53,961 997,122 62,088 613,530 371,494
,
13,382Under $5,000..................................................5,000 under $10,000 ............
...... . * ........
24,40517 130
,
138,335434153
49,462120 940
226,442185 453
77,33697 105
18,30620
25,334 491,594 30,354 292,424 186,874 8,2031 15,000 ..
0"'0 :
1
71141
,71,578
,
56,009,
67,030,
51 911,655
12 69817,948 243,717 19,183 169,186 79,834 2,389
15,000 unl r 12 .................................. 2,354 55,294 45,260 65,628,
42 9?4,
11 7535 2472 1
95,386 5,028 62,3?1 32,242 1,285
25,000 under 50,000 ......................................... 1,588 64,656 53,602 75,118,
51,528,
17,651 79 1877661
1,88380,99146,599
3,4S32,163
41,66127,292
35,60618,948
196946
50,000 =der $100,000 ........................................100 210 IO000
undo'
515103
44,780 34,219 54,571 36,129 15,807 M 613 28,461 1,422 15,715 12,750 172, 1, , C200, 000 under
GG )()0:::
1
2817,6769 308
13,4938517
21,81010 998
13, 624956
6,9593 4 8
8 32 118 7,524 290 3,357 3,911 178
500,000 under 1,000,000 ..................................... 4,
3,001,
2,920,
3,0995,1 666
, 61 259
51
295
4545 1,849 60 955 802 11
1,000,000 or more ............................................ 2 2,683 2,479 2,886,
1, 876,
1,464 1 -52
371629
395
254 149 2
ontaxable returns ............................................... 24,324 20,637 -15,798 46,166 1, 814 - 27,256 292,637
6
18,749
316
250,841
378
77, 641
-l
21,147ootnotes at end of table. Fo
.r the precise definition of terms and the nature of any limitations, see the ~'Description of the Sample,-1 "Limitations of the Data," and "ExPlanation of Classifications and Terms" in the text.
cow

RETURNS WITH NET CAPITAL GAIN OR LOSS
Table 2. -ALL TRANSACTIONS-INCOME, TAX, AND TRANSACTION DETAIL, BY ASSET TYPE AND SIZE OF ADJUSTED GROSS INCOME LESS CAPITAL GAIN OR LOSS INCLUDED-Continued
Adjusted gross income- Capital los s carryover All capital assa t transactions
Number of Le a Plus Income tax
Asset type aivi nize of adj-ted gross incomereturra
with net As reportedcapitalgain or
capitalgain or
Taxableincome
aftercredits Amount Number of
Gross sales DeprecI-
Cost andexpense of Gross gain Gross loss
I..a -pital gain or I... included cap I tal loss loss Number of trens-price ation
salegain or included excluded returns actionsloss
(n,.-d (77...-d (7h...-d (n-.-d (7h...-d (n--d (Th.-d (Th...-d (77--d (Th-d (Th.-dd.1 I... d.11ars) d.11-) d. I I... d.11... dW.r.) dllarx) dil ... d.11-) d.11 ... d.11 ...
(1) (2) (3) (4) (5) (6) (7) (9) (10) (11) (12) (13) (14)PROCEEDS FROM PRIOR YEAR INSTAIIAIENT SALES
Grand total ............................................... 426,101 5,065,823 3,924,245 6,166,421 3,451,883 1,062,322 9,294 66,323 536,364 1,530,702 21,843
Taxable returns, total .......................................... 331,727 4,886,151 3,878,554 5,849,913 3,439,324 1,062,322 7,542 44,221 419,545 1, 341, 159 21,412
Under $5,000 .................................................. 105,406 532,756 284,191 776,233 277,117 61,857 1,798 12,053 129,541 342,116 6,141
5,000 under $10,000 ................... 107,007 941,484 787,310 1,075,302 579,872 123,843 1,770 8,774 134,282 252,025 11,027
der 15 000 ...10,000 _ 51,111 719,047 630,810 846,909 513,567 119,864 1,246 5,732 64,139 163,799 2,204~d ~ r 125: .0: :: : : : : : :15,000 ur ................................
1
35,552 800,312 678,316 921,192 600,5?9 161,733 1,381 4,359 46,092 167,612 910
25,000 under 50,000 ......................................... 23,498 968,074 796,795 1,126,130 768,811 263,055 904 7,894 33,737 N ot applicabl e 219,384 591
50,000 under $100,000 ........................................ 6,885 576,897 453,932 696,987 462,673 201,378 379 3,849 9,720 135
,
388 439
100,000 under 11,11 ................................2 1,137 198,471 1.47,972 248,02,4 152,259 78,409 52 930 1,661 43 9981 83hdcr 1 G.200,000 u
5., 0:::::::......................... I ......
1
241 90,519 66,918 114,276 61,737 35,684 12 630 335 12,821 10
500,000 under 1,000,000 ..................................... 19 15,295 12,737 17,826 10,779 7,058 - - 21 3,166 -
1,000,000 or store ............................................ 12 23,297 19,574 27,016 11,930 9,444 - - 15 850 8
Nontaxable returns .............................................. 94,374 179,672 45,691 316,508 12,559 - 1,752 22,102 116,819 189,543 431
OTHER TYPE ASSETS
Grand total ............................................... 565,349 7,531,511 6,501,455 8,291,864 5,066,681 1,631,554 33,855 164,712 665,289 995,253 288,247 1,095,801 722,340 1,266,859
Taxable returns, total .......................................... 473,981 7,351,903 6,410,817 8,079,145 5,050,716 1,631,554 29,707 124,791 561,855 892,743 106,555 808,034 606,065 1,085,771
Under $5,000. ................................................. 98,184 47?,152 279,442 669,037 253,931 60,058 4,425 8,616 111,968 173,297 16,443 119,821 160,251 249,23,~
5,000 under $10,000 .......................................... 187,738 1,462,979 1,386,791 1,450,623 806,838 169,245 6,862 14,391 212,905 299, 798 10,225 279,479 103,916 339,92,
.................................10,000 under 15,101 71,668 1,017,412 962,548 1,041,082 677,081 154,064 6,536 26,499 94,676 90,996 8,609 77,453 76,992 154,481
::,::,::J215,000
under 5...................................
1
55,441 1,141,705 1,047,335 1,218,449 835,173 217,117 5,872 27,275 70,571 83,226 4,944 71,603 69,232 155,87,
25,000 under 50,000......................................... 37,154 1,433,135 1,272,293 1,560,393 1,110,269 367,558 4,082 23,767 49,129 96,835 2,852 83,589 87,885 110,78f
50,000 under $100,000 ........................................ 12,471 1,007,357 827,740 1,164,856 793,452 340,4-33 1,568 16,521 17,387 75,486 2,506 53,035 68,031 52,27,1
100,000 under
2""' * ........ .... ...... *'*'*'" '2,603 437,808 343,337 525,393 327,166 167,490 281 4,956 3,972 44,223 60,770 94,962 26,448 13,25E
200,000unar J
. ... I500,000:::~:~:
1
620 237,043 174,388 293,928 157,217 90,323 62 2,257 1,065 18,525 204 16,468 11,571 6,79C.
.......500,000 under 1,000~000....................... I ..... 68 56 888 45,613 67,605 37,001 25,148 12 234 108 10,168 - 9,668 1,320 1,23s:
1,000,000 or more .................................... ....... 34
1
80:425 71,330 87,779 52,588 40,119 7 274 55 189 1 1,956 420 1,90',
Nontaxable returns .............................................. 91,368 1 179,608 1 90,638 1 212,718 1 15,965 1- 1
4,148 39,921 1 103,2,34 1 102,510 181,692 1 287,767 1 116,275 1 181,08E
'Due to the reporting of more than one asset type by some taxpayers, the number of returns, adjusted gross income, taxable income, income tax after credits, and capital loss carryover for "All aSSeLS types" will be 1-s than the
sum of these items for the specific asset types.(-
)An asterick in a cell denotes that the estimate is not shown separately because of high
sampling
variability. However, the data are Included in the appropriate totals.
- A dash in a cell Indicates that either there are no data for that item or it mounts to less than $500.
NOTE: Detail in the tables may not add to totals because of rounding.
For the preci~~ definition of terins and the nature of any limitations, see the "Description of the Swple," "Limitations of the Data," and "Explanation of Cl as sificat ions and Terms" in the text.
52
rn
0

RETURNS WITH NET CAPITAL GAIN OR LOSS
Table 3. -ALL TRANSACTIONS-INCOME, TAX, AND TRANSACTION DETAIL, BY ASSET TYPE AND SIZE OF ADJUSTED GROSS INCOME PLUS CAPITAL GAIN OR LOSS EXCLUDED
Adjusted gross income- Capital loss earryo~er All capital asset transactionsNumber of
returnsLess
capital
Plus
capital TaxableIncome tax
Asset type and size of adjusted gross income with net As reported gain or gain or incomeafter
Gross-sales Depreci-Cost and
plus gain or lo,-~ excluded capital loss loss
e
redits Number ofAmount Number of
price ationexpense of Gross gain Gross loss
gain or included excluded returnstrans-
actions
sale
loss(Th..,-d (T~.....d (7h...-d (M-.-d (A.-d (IT.-d (M.-d (Th...-d (Th-d (A-d (7~.-dd.11 ... ) &11 ... ) djl.,.) d.11 ... 'bli-) 6,11 ... d.11 ... &11 ... d.11 ...L d.11...
ALL ASSET TYPES1(1) (2) (3) (4) (5) (6) (7) (9) (10) (11) (12)
_
(13) (14)
Grand total ............................................... 5,807,945 64,038,764 58,155,588 69,1?2,447 43,238,84-, 12,433,730 176,133 770,313 16,009,787 53,150,983 1,992,391 46,722,708 17,292,603 6,275,755
Taxable returns, total .......................................... 4,783,072 62,304,881 56,994,746 67,040,461 43,113,130 12,433,'730 155,686 628,754 13,534,64-c 46,319,858 1,416,677 40,010,596 15,394,839 5,349,136
Under $5,000.................... ! ............................. 934,141 3,28'7,435 3,247,918 2,707,079 1,433,020 269,882 19,534 104,155 2,425,928 5,764,205 183,615 6,321,022 714,002 1,254 81.35,000 under $10,000 .......................................... 1,713,623 12,169,477 11,711,891 12,664,074 6,857,766 1,362,788 34,521 81,169 3,619,238 6,885,195 367,287 6,417,472 1,751,170
,
798,99110,000 nle r 15 ,111 ) ..................................
1
113,4SI 11,345,693 10,891,772 11,833,885 7,552,491) 1,604,498 27,865 88,324 2,432,104 5,769,111 273,701, 5,278,690 1,563,691 621,580r J , ~,e 2,
15,000 .................................. 651,797 11, 675, 694 11,014,153 12,345,408 8, 511,888 2,019,646 33,013 116,314 2,184,420 7,016,732, 216,333 6,163,977 2,083,953 752,69825,000 under 50,000 ......................................... 367,994 11,650,706 10,805,143 12,465,987 9,078,752 2,730,756 27,419 108,151 1,722,635 7,836,991 178,545 6,749,679 2,537,487 876,644
50,000 under $100,000 ........................................ 108,740 6,467,912 5,706,184 7,221,695 5,185,632: 2,090,859 10,216 70,850 755,313 5,482,930 77,070 4,477,757 2,070,732 555,220, 201,11 :::100,000 u"d: 24,200 2,628,986 2,036,507 3,229,019 2,071,52~ 1,015,291 2,298 39,038 255,628 3,063,051 91,010 2,306,067 1,451,846 259,334, 1,. .
200,000 und'0
7,448 1,561,646 965,152 2,158,910 1,207,752 657,583 628 14,660 103,292 2,242,854 16,910 1,401,34r 1,335,209 141,451500,000 under 1,000,000 ..................................... 1,333 590,818 279,351 , 901,534 461,795 258, 041 115 3,553 23,753 920,091 4,370 455,288 672,555 50,3721,000,000 or more ............................................ 707 926,314 336,677 1,512,870 752,513 424,186 76 2,540 12,336 1,338,697 ?,831 439,298 1,214,194 38,002
Nontaxable returns .............................................. 1,024,273 1,733,883 1,160,840 2,131,985 125,705 - 20,447 141,559 2,475,140 6,1331,125 575,714 6,712,111 1,697,764 926,619
CORPORATE ST13CK
Grand total ............................................... 2,121,961 33,746,934 30,?34,262 36,149,260 23,794,859 ?,461,253 114,983 502,417 8,857,662 32,(V,2,126 28,898,094 7,138,366 4,086,448
Taxable returns, total.. ........................................ 1,915,439 33,268,504 30,358,829 35,732,oc)O 23,761,157 7,461,253 1064,865 429,212 7,935,137 28,896,073 25,677,727 6,738,972 3,608,791
Under $5,000 .................................................. 263,281 1,075,435 1,144,994 576,145 506,010 98,400 13,403 76,143 2,306,081 3,959,257 4,468,607 264,964 778,0945,000 under $20,000....................... .......... 551,919 4,124,439 4,118,247 4,138,304 2,346,401 470,74? 21,059 50,149 1,676,639 3,086,846 11 3,130,740 426,571 4?8,05410,000 under 1. 5 000:::::::::: ............ ..................
1
425,120 5,114,960 5,051,116 5,200,877 3,386,802 726,386 17,930 54,235 1,420,047 3 C~44,738 1 2,961,809 486,280 408,6101 5 ;a, 2 .15,000 und ............................... 346,949 6,391,679 6,156,084 6,619,698 4,60?,706 1,102,886 21,842 68,417 1,444,145 4:325,913 4,098,144 751,287 535,67925,000 under 50,000 ......................................... 225,720 7,319,?43 6,895,887 7,710,056 5,640,766 1,706,02? 20,153 74,744 1,225,643 5
,
0?2,367 4,628,388 1,02.1,511 615,563
50,000 under $100,000........................................ 75,961 4,592,949 4,093,413 5,084,122 3,637,590 1,464,533 7,931 55,662 565,205 3,820,659 1 3,235,003 995,136 421,164100,000 under 1 00, 0 11 0::::::: ................................ 143,641 2,043,557 1,592,916 2,498,706 1,590,915 ?74,156 1,868 31,525 194,079 2 206
,
0261
1 1,619,425 770,302 194,279J5. .''.200,000
under 0,................................
1
6,084 1,280,574 794,262 1,768,516 984,245 531,317 522 13,328 76,254 1:556,694.
907,340 748,739 111,833500,000 under 1,000,000 ..................................... 1,141 503,018 234,017 771,840 391,224 215,611 97 3,315 17,993 715,010 326,474 420,704 37,4581,000,000 or more ............................................ 621 822,149 277,892 1,363,827 669,504 371,192 59 1,693 9,050 1,108,561 301,?97 831,478 28,057
Nontaxable returns .............................................. 206,522 478,430 375,433 417,170 33,702 - 10,117 73,205 922,525 3,146,053 13,220,367 399,394 477,657
U.S. GOVERNMENT OBLIGATIOnS
Grand total ............................................... 43,236 1,201,304 1,007,012 1,370,298 847,813 326,978 2,924 10,773 70,669 1,331,354 1,320,204 18,752 7,784
raxable returns, total .......................................... 39,334 1,171,274 979,594 1,337,089 847,156 326,978 2,393 9,964 66,197 1,291,763 1,280,876 17,988 7,284
Under $5,000 .................................................. 5,383 28,182 29,463 9,978 12,689 2 913 &156 3 321
~34,089 477 1 240
5)000 under $10,000 .......................... 7,242 58,154 56,212. 58,277 34,221
: ,
6 6
.
865 1,6511
:
10 835
:
3 542 40,326 3,696
,
47910,000 under 15,000 .........................
1
5,795 71,1?3 70,018 72,089 47,467 9,963 8,427 ~9,838
(
69,333 1,278 7841
15,000 under 25,000 ......................................... 7,925 143,359 133,279 151,700 100,602 23,569 472 2,393 14, 809 226,199 224,820 2,486 1,27425,000 under 50,000 ......................................... 7,022 231,010 212,077 247,953 169,843 50,693 538 1,436 13,073 2 98,637 R 297,879 2,164 1,408
50,000 under $100,000 ........................................ 3,851 239,333 211,514 265,334 180,550 72,372 311 1,833 7,324 323,238
1
321,702 2,635 1,299100,000 under 1,100::::::: ................................2 1,422 161,183 130,040 191,764 120,195 58,139 155 1,415 3,238 115,364 . 1.14,335 1,464 436.d~r J200,000 u
5.0.0.................................
1
545 121,992 84,177 159,628 89,160 49,399 42 589 1,239 128,384 126,705 1,984 305500,000 under 1,000,000 ..................................... 100 47,216 26,534 68,069 35,556 20,467 4 361 249 30,202 28,835 1,399 321,000,000 or more ............................................ 50 69,671 26,278 112,298 56,874 32,803 7 285 118 23,034 22,853 207 26
Nontaxable returns .............................................. 3,902 30,030 27,418 33,209 656 - 4,502 39,592 39,327 '764 500
STATE AND IOCAL SECURITIES
Grand total ............................................... 52,671 2,171,353 1,790,559 2,516,389 1,531,731 683,096 4,298 25,666 113,156 1,087,416 1,052,023 61,120 25,777Taxable returns, total .......................................... 46,211 2,126,633 1,772,177 2,449,154 1,528,D49 683,096 4,064 23,672 103,594 1,020,707 989,255 55,920 24,517
Under $5,000.... ; .............................................
5 000 under $10 000 ...... - * .. .
2,901 19,433 19,741, -152 10,027 2,484 4,372 21, 527 22,538 1,542 2,553, , : : ,~ .. : .. -~ ... - ...........10 000 ur'lel 11 11 .
7,315 52,429 ~1,349 53,953 29,559 5,065 9,937 22,79011 21,350 2,474 1,034
,1 , . ... ...... .................~ 2 G :: : :: :: :
15 000
1
1,069 81,121 12,071 85,803 53,829 11,357 472 1,850 12,094 41,138 37,789 5,061 1,713sr ,, G. . ., un, ............................... 7,534 142,266 134,880 146,931 97,449 23,129 438 1,015 16,6?8 142,058 138,860 6,011 2 613
25,000 under 50,000 ......................................... 10,250 340,869 317,655 360,577 252,04.0 76,?56 778 4,695 22,851 196 615 191,764 9,395
,
4,54650,000 under $100,000........................................ 6,574 425,914 386,216 462,232 319,766 129,579 714 5,025 18,705
1
96:350 189 265 11 587 4 519100,000 und: r 200, 000 .............................. 2,131 344,191 295,503 391,409 251,616 125,029 28B 4,375 10,188 157 260
,
153,482
,
7,151
,
3 397r 1, ,
200,000 undCG
..............................
1
1,309 312,5?3 239,446 385,895 223,634 127,87-7 148 3,369 6,320 138 377 133,600 6556
,
1 882500,000 under 1,000,000 ..................................... 271 137,820 90,837 185,206 98,307 60,253 29 1,1?3 1,472 40,428 39 147,
2 098
,
8191,000,000 or more............................................ 152 266,206 154,276 377,299 191,822 121,567 25 1,339 976 64,164
,
61,460,
3,945 1,242Nontaxable returns.............................................. 6,459 44,720 18,382 67,235 3,681 - 214 1,993 9,562 66,709 62,768 5,200 1,259
Footnotes at end of table. For the precise definition of terms and the nature of any limitations, see the "Description of the Sample," "Limitations of the Data," and "Explanation of Classifications and Tems" in the text.
(LIT
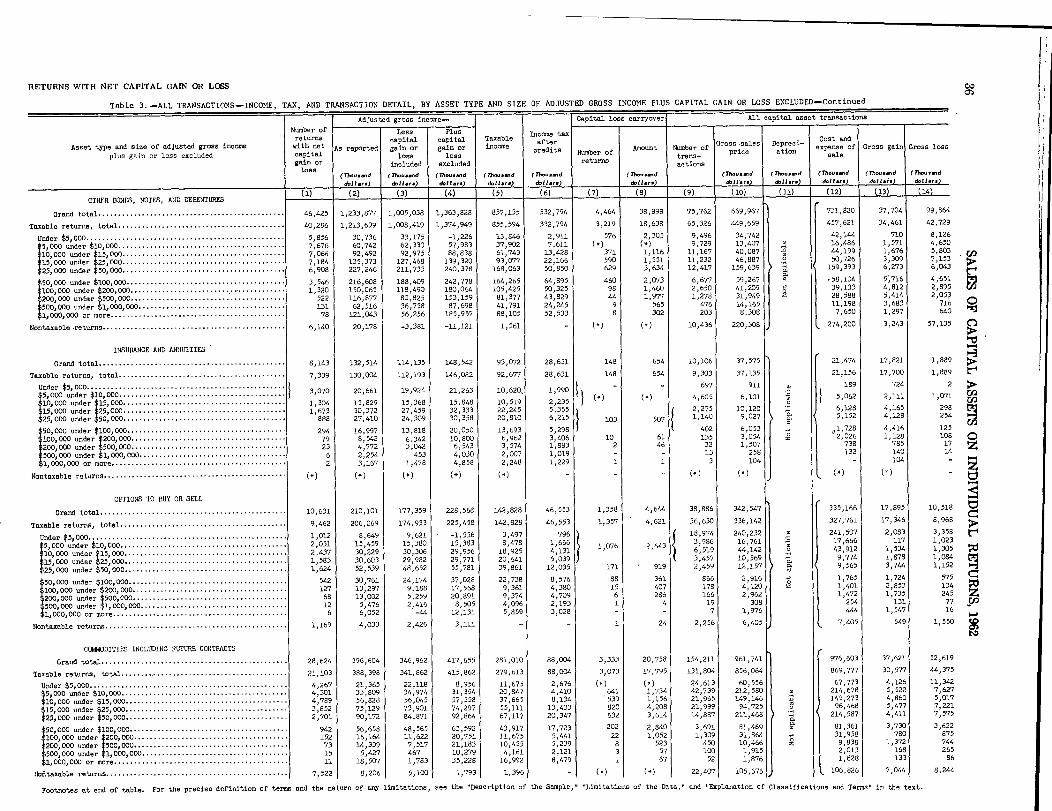
RETURNS WITH NET CAPITAL GAIN OR LOSS
Table 3. -ALL TRANSACTIONS-INCOME, TAX, AND TRANSACTION DETAIL, BY ASSET TYPE AND SIZE OF ADJUSTED GROSS INCOME PLUS CAPITAL GAIN OR LOSS EXCLUDED-Continued
Adjusted gross income- capital 10 a caxryover All capital asse t transactio ns
Number of Less Plus Income taxreturns capital capital Taxable art r Gross-sales Depre
c'_
Cost andAsset type and size of adjusted gross income with net As reported gain or gain or income
'redits Numbe of
Amount Number of price ationexpense of Gross gain Gross loss
plus gain or loss excluded capital loss loser
r_trans- sale
gain or included excludedreturns
.c,I
actionsloss
(7h...-d (7N-.-d (7h...-d (Th...wd ("...-d (Th...-d (Th...-d (Th-.-d (M...d
&11 ... doll-) d.11... d,11.,.) dbil ... d.11 ... d.11 ... dil.i.) &li ...
(1) (2)OTHER BONDS, NOTES, AND DEBENTURES
Grand total ............................................... 46,425 1,233,87? 1,005,038 1,363,828 857,155 332,794 4,464 38,898 75,762 669,967 731,820 37,704 99,864
Taxable returns, total .......................................... 40,286 1,213,699 1,008,419 1,374,949 855,594 332,794 3,219 18,638 65,326 449,659 457,621 34,461 42,729
Under $5,000 .................................................. 5,856 30,736 33,175 -1,226 13,846 2
,
911 576 2,305 9,496 34,742 42,144 710 8,12E
5,000 under $10)GOO .......................................... 7,676 60,742 62,330 57,983 37,902 7,611 (-) 9,729 13,407 11 16,486 1,571 4,65C-
10,000 under1
7,066 92,492 92,975 88,838 61,743 13,428 371 1,116 11,167 40,087 1 44,199 1,676 5,80
15,000 under 125, 7,184 135,373 127,468 139,320 93,077 22,166 590 1,551 11,232 46,887 50,726 3,309 7,15~1
25,000 =der 50)000 ......................................... 6,908 227,246 211,733 240,378 168,063 50,850 629 3,634 12,417 159,639 1P,
159,393 6,273 6,04
000 -der $100,000 ........................................50 3,546 216,608 188,409 242,778 164,265 64,895 460 2,073 6, 677 59,267 18,104 5~116 4,1551,
r100,000 und 2DO"' *
1,320 150,065 118,490 180,064 105,425 50,325 98 1)460 2,650 41,209 1 39,133 4,812 2,89!:rad 1
.............200,000 u 50.,..O::::i::
1
522 116,877 80,825 153,159 81,377 43,829 44 1, 977 1,278 3L,949 28,588 5,414 2,05.
500,000 under 1,000,000 ..................................... 131 62,516 36,758 87,698 41,791 24,245 9 565 476 14,165 11,198 3,683 71(
1,000,000 or more ............................................ 78 121,043 56,256 185,957 88,105 52,533 8 302 203 8,308 7,650 1,297 64C
Nontaxable returns .............................................. 6,140 20,178 -3,381 -11,121 1,561 - 10,436 220,308 274,200 3,243 57,13~
INSURANCE AND ANNUITIES
Grand total ............................................... 8,143 132,514 114,135 148,542 93,072 28,631 148 654 10,106 37,575 21,474 17,821 1,8w
Taxable returns, total .......................................... 7,339 130,004 112,193 146,082 92,677 28,631 148 654 9,303 37,135 21,156 17,700 1,88~
Under $5,000..................................................
5,000 under $10,000 ....... 3,070 20,661 19,924 21,263 10,620, 1,990- - 4, 697
6051
911
6,101
189
5,062
724
2,111 1107:10,000 une
COG
1,3.4 11,121 11,368 15,848 10,519 2,235
15,000 =d::r 5,..: ...............................r 12
1
1,673 30,372 27,459 32,333 22,245 5,355 2,275 3.0,120 6,128 4,165 29~
25,000 under 50,000 ......................................... 888 27,410 24,309 30,358 20,810 6,215 103 507 1,140 9,027 5,152 4,128 25,
50,000 under $100,000 ........................................ 294 16,997 13,818 20,050 13,693 5,298 402 6,053 01,728 4,416 12,
100,000 under 2
000 ....... -* .........* .CO'79 6,542 6,342 10,800 6,962 ~3,406 10 61 135 3,054 o 2,026 1,128 IN
11............................200,000 und
~r50., .0:::::::::
1
23 4,772 3,042 6,543 3,574 1,863 2 46 32 1,507 738 7851
500,000 under l10OOjODO ..................................... 6 2,254 453 4,030 2,007 1,019 - - 13 258 132 140 1,
1,000,000 or more ............................................ 2 3,167 1,478 4,858 2,248 1,229 1 1 3 104 - 104
Nontaxable returns ..............................................
OPTIONS TO BUY OR SELL
Grand total ............................................... 10,631 210,101 177,359 228,568 142,828 46,553 1,358 4,644 38,886 342,547 335,166 17,895 10,51
Taxable returns, total .......................................... 9,462 206,069 174,933 225,458 142,828 46,553 1,35-7 4,621 36,630 336,142 327,761 17,j46 8,96
000..................................................Under $5 1,012 8,649 9,621 -1,556 3,497 796 18 974 240,232 241:507 2,083 3,35,
5,000 under $10,000........ 2,051 15,459 15,380 15,383 8,478 1,666 1,076 2,643
:3 9866 519
16,76144 142
17 66643 912
1175341
1,02
1 3010,000 und:r
:,**--*:!:::::0'
2,437 30,229 30,306 29,956 18,92520 41
4,1310395
,3 457
,10 569 1
,
7749
,1 878
,1 08
15,000 undr
J25,.0O . . 1,563 30,6033
29,982
48 52
29,77155 781
,686139
,03512 171 919
,2 459 12 157
,9 565
,
3,744
,1,15
25,000 under 50,000 ......................................... 1,624 952,5 ,6 , , , , ,
50,000 -der $100,OCO .............. 542 30,761 24,174 37,028 22,738 8,576 88 361 866 2 9161.
1 765
:
1 724
;
57
100,000 und 2- - ,*C0000':r
127 13,297 9,188 1?,568 9,361 4,380 15 40766
178166
4:1202 962
40114 271
2 8535731
1324
1, .0 ........... o .....::::~:: .. ., 51)11200,000 und
1
68 13,002 5,259 20,691 9,374 4,709 6 2 ,308
,254
,131 7
500,000 under 1,000,000 ..................................... 12 5,476 2,416 8,505 4,096 2,193 1 4 197 1 976 444 1 547 1
1,000,000 or more ............................................ 6 6,052 -44 12,131 5,85S, 3,028 - - , ,
Nontaxable returns .............................................. 1,169 4,033 2,426 3,111 - 1 24 2,256 6,405 7,405 549 1,55
C%V0DITIES INCLUDING FUTURE CONTRACTS
Grand total ............................................... 28,624 396,604 346,962 417,655 281,010 88,004 3,333 20,758 154,211 961,741 976,603 37,621 52,61
Taxable returns, total .......................................... 21,103 388,398 341,662 415,862 279,6L3 88,004 3,073 17,795 131,804 856,064 869,777 30,577 44,37
Under $5,000 .................................................. 4,267 21,365 22,118 8,956 11,675 2,676 24,613 60,556 67,773 4,126 11,34
5,000 under $10,000 ...... 4,301 33,809 34,974 31,354 20,84-7 4 410 641 1,734 42,739 212,580 214,678 5,522 7,62
10,000 1-1,11-I r 4,189 56,828 56,045 57,358 37,665 8:134 539 1,156 21,965 149,146 149,273 4,860 5,015nd ()..: ::::.~ :r J2
15,000 % .................................
1
3,652 75,129 73,901 74,297 55,111 13,433 820 4,208 21,999 94,725 96,468 5,477 7,22
25,000 under 50,000 ......................................... 2,701 90,172 84,871 92,864 67,117 20,347 632 3,614 14,887 211,468 214,587 4,411 7,57
under $100,000........................................ 942 56,658 48,565 63,592 43,917 17,723 202 2,840 3,691 81,469 81,361 3,730 3,62
10,000 und r 200,- 152 16,164 11,622 20,751 11,675 5,441 22 1,052 1,309 31,804o
31,958 7801 372
8774
:, 1, ,.200,000 und
GO
1
73 14,339 7,517 21,183 10,455 5,239 8 523 450 10,466 9,838 ,
500,000 under 1,000,000 ..................................... 15 5,427 467 10,279 4,161 2,121 3 57 100 1,915 2,013 168 26
1,000,000 or more ............................................ 11 18,507 1,783 35,226 16,992 8,479 1 67 52 1,876 1,828 133 8
Nofitaxable returns .............................................. 7,522 8,206 5,100 1,793 1, 39~6 - 22,407 105,676 J 106,826 7,044 8,24
CAD(M
9
5
2
2545
Footnotes at end of table. For the precise definition of terms and the nature of any limitations, see the "Description of the Sample,1- "Limitations of the Data," and "Explanation of Classifications and Terms" in the text.

RETURNS WITH NET CAPITAL GAIN OR LOSS
Table 3. -ALL TRANSACTIONS - INCOME, TAX, AND TRANSACTION DETAIL, BY ASSET TYPE AND SIZE OF ADJUSTED GROSS INCOME PLUS CAPITAL GAIN OR LOSS EXCLUDED-
sset type and size of adjusted gross income
plus gain or loss excluded
Number ofreturnswith ne tcapital
gain orloss
Adjusted gross income-
As repo te
.
d
capital capitalLessL
plusgain or gain orl
loss loss
rt
gal
included excluded
(Th.-Td(TY.-d (Th...-d
d.11.,.) d.11 ... d.11-)
Taxablaincome
Th-.-dd.11...J
Income taxaftercredits
M.-d
d.11.,.)
Capital lose carryover
mountNumber ofreturns
d.11.,.)
All capital asset transactions
Gross -sales Depr iCost and
so -Number of expense of Gross gain Gross 1088price ationtrana- saleactions
(7h...-d (A-.-d (Th-.-d (76..-dd,11.r.) d.11.r.) d.11... ) d.11 ...
CAPITAL GAIN DIVIDENDS(1) (2) (3) (4) (5) (6) (7) (8) (9) (11) (12) (1-3) (14)
Grand total ............................................... 1,609,255 19,707,557 18,663,005 ZO,719,856 13,864,506 3,911,617 41,229 156,627 1,675,593 526,810 1?,096
Taxable returns, total .......................................... 1,445,511 19,374,273 18,373,823 20,353,408 13,835,842 3,911,617 37,140 143,777 1,490,198 472,611 14,518
Under $5,cOO .................................................. 246y647 834,302 829,718 784,486 397,769 71,805 3,033 26,063 250,954 46,654 4,6745,000 wider $10,000 .......................................... 513,908 3,740,642 3,675,019 3,815,724 2,268,580 457,358 6,570 17,666 540,792 103,881 3,982
,_5,000 ..................................10,000 under
1
319,401 3,820,766 3,763,553 3,887,945 2, 630,926 565,079 6,858 15,201 326,365 75,594 2,0131 :::::::
15,000
under 2" GOD
I ................................. 207,374 3,805,485 3,693,567 3,927,209 2,832,817 676,592 9,229 24,616 211,556 75,243 1 363
,25,000 under 50,000 ......................................... 118,036 3,818,186 3,648,792 3,988,973 3,018,338 912,657 7,949 27,702 119,885 Not applicab e 88,027 11511
50,000 under $100,000 ........................................ 31,779 1,937,771 1,764,026 2tO93,671 1,579,657 642,666 2,801 20,017 32,163 39,544 78021,COO100,000 under 6,136 694,216 570,835 817,438 548,946 272,976 541 6,560 6,223 22,751 316
1, 0200,000 under .......... I ..................... 1,795 394,363 265,727 524,322 301,063 166,229 129 5,175 1,819 13,200 250500,000 under 1,000,000 ..................................... 286 134,005 70,054 197,395 101,967 58,020 19 550 294 4,581 251,000,000 or more ............................................ 145 194,537 72,532 316,245 155,777 68,036 11 207 147 3,337 -
Nontaxable returns .............................................. 163,744 333,284 289,182 366,"8 28,666 - 4,090 12,850 185,395 J 53,999 2,578
SHARE OF CAPITAL GAIN (LOSS) FROM PARTNERSHIPSAND FIDUCIARIES
Grand total ............................................... 387,233 7,174,902 6,160,63.5 8,051,264 5,180,936 1,769,638 15,291 92,343 445,?Cy? 1,064,335 138,430
Taxable returns, total .......................................... 340,60`7 7,099,129 6,172,694 7,918,113 5,171,716 1,769,638 14,054 82,298 393,904 961,898 114,124Under $5,000 .................................................. 46,254 171,474 167,016 106,950 81,801 16,186 745 3,988 53,662 20,723 46,0185,000 under $10,000 .... 83,663 586,087 549,922 620,256 330,80`7 64,054 2,651 7,474 93,688 75,843 11,34410,000
1
.,129 161,863 122,381 796,939 495,699 104,055 1,894 7,021 76,069 87,172 8,74215,000 und 1 ................................ 64,492 1,158,779 1,072,725 1,239,765 833,473 197,521 2,647 14,661 75,155 144,581 11,29625,000 under 50,000. ........................................ 51,299 1,670,035 1,545,827 1,777,701 1,291,369 390,867 3,523 15,803 59,507 Not pplicab 176tO13 21,868
50,000 under $100,Ooo ........................................ 21,759 1,315,014 1,161,896 1,461,544 1,040,640 417,915 1,911 14,040 25,690 171,876 7,034100,000 ~~d: r 211 01 : : ................................. 5,126 614,963 503,617 767,593 490,466 238,327 476 12,1890 6,979 106,809 3,520
, r 15.0 0:. ::: :200,000 .................................
1
1,964 419,175 272,346 563,717 312,905 170,851 159 5,199 2,495 101,235 2,219500,000 under 1,000,000 ..................................... 356 164,067 84,707 241,545 122,974 69,986 26 622 448 36,889 1,4031,000,000 or more ............................................ 165 217,673 92,257 342,103 171,561 99,876 19 601 211 40,757 681
Nontaxable returns .............................................. 46,626 75,773 -12,080 133,151 9,220 - 1,237 10,045 51,802 102,437 24,306
CAPITAL GAIN DISTRIBUTIONS FROM SMAIL BUSINESS CORPORATIONS
Grand total ............................................... 30,274 539,309 475,207 598,899 394,373 129,390 1,926 5,153 36,014 55,561 4,416
Taxable returns, total .......................................... 28,088 535,473 472,952 593,517 393,643 129,390 1,926 5,153 33,691 53,072 2,881
Under $5,000 .................................................. 3,404 9,491 10,328 4,298 4,511 878 4,424 770 2355,000 wider $10,000 .......................................... 6,600 45,539 43,370 48,227 28,957 5,838 7,586 3,396 37010,000 und
................................:r ' ' ~~: : : : : : : : :
1
6,626 80,186 78,937 81,792 53,146 11,271 7,831 3,121 1,00115, 000 und r 121, ................................ 6,113 107,621 100,160 116,495 78,305 17,987 794 2,355 7,264 12,965 40225,000 under 50,000 ......................................... 3,353 105,423 98,439 112,145 83,057 1 24,955 213 1,126 4,116 N.t appli~ab le
6,839 385
50,000 under $100,000 ........................................ 1,449 86,178 76,350 95,619 69,611 28,715 96 221 1,731 10,100 350100,000 d:r 200 000: : :: .................................
n
388 43,130 33,938 52,204 33,848 16,578 13 112 50? 5,009 54r 0 : 0 : :d J5
0 GO.................................200,000
1
114 24,314 15,012 33,436 18,222 9,557 9 73 158 4,113 73500,000 under 1,000,000 ..................................... 30 14,353 7,478 20,483 9,201 4,915 - - 38 3,415 91,000,000 or more ............................................ 13 19,238 8,943 28,818 14,986 8,695 3 224 16 3,345 3
Nontaxable returns.............................................. 2,186 3,836 2,255 5,381 529 - - - 2,323 2,489 1,534
LIQUIDATION DISTRIBUTIONS
Grand total ............................................... 49,095 1,400,228 979,299 1,775,436 1,043,984 406,826 3,258 2-7,673 56,654 575,935 65,497
Taxable returns, total........................................... 45,781 1,386,153 1,001,941 1,740,610 1,043,155 406,826 2,559 15,372 53,211 510,749 .54,034Under $5,000 .................................................. 5,256 27,174 30,377 -2,292 11,288 2,418 6
,
047 899 29,4205,000 under $10,000.......................................... 10,167 76,879 74,440 79,795 43,054 8,550 1,072 4,128 11,647 6,670 3,37410,000 under 15,01 .............................::: ~: ~: :: :. .
1
8,039 95,495 91,324 96,647 64,037 13,633 8,942 7,549 4,618,.r "..15,000 un, J2 ............................... 7,676 138,884 129,017 148,287 101,365 24,237 379 2,173 8,456 15 547
14 672
25pOOO under 50,000......................................... 7,664 239,019 211,050 264,477 181,059 55,552 629 1,777 8,733t-L Pplic.b
37 ,850 4:88850,000 under $100,000........................................ 4,095 244,624 199,165 289,215 191,286 75,501 264 1,793 4,907 65,903 2,737100,000 under 201,~~0::::::::,: ............................. 1,720 176,600 122,147 232,618 135,918 64,081 149 3,998 2,429 66,064 2,155
,200,000 under
1500,.............................
1
842 168,306 86,125 250,440 130,549 66,703 42 523 1,286 101,485 660500,000 under 1,000,000 ..................................... 206 85,503 31,878 138,752 68,288 36,061 17 581 379 64,058 1,0241,000,000 or more ............................................ 115 133,470 26,419 240,671 116,311 60,091 8 400 184 144,723 485
Nontaxable returns .............................................. 3,314 14, 0`75 -22,643 34,626 829 - (.) 3,443 65,186 11,464
Footnotes at end of table. For the precise definition of terms and the nature of any limitations, see the "Description of the Sample," "Limitations of the Data," and "Explanation of Classifications and Terms" in the text.
coI
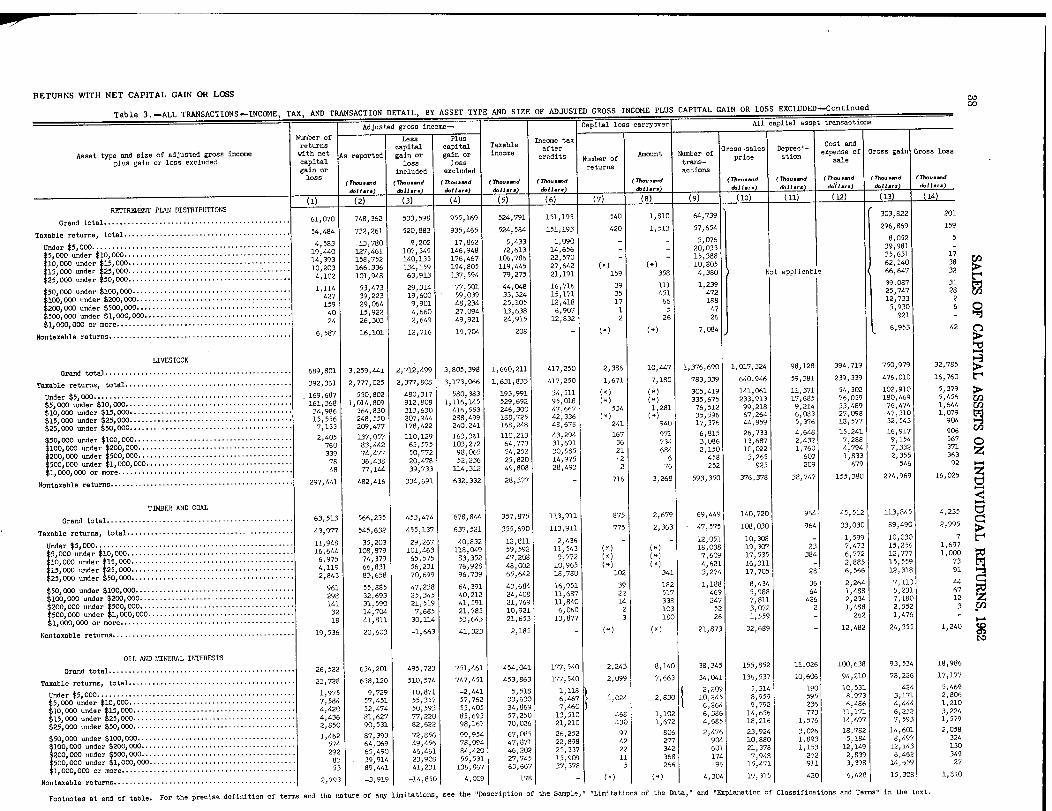
RETURNS WITH NET CAPITAL GAIN OR LOSS
Table 3.-ALL TRANSACTIONS -INCOME, TAX, AND TRANSACTION DETAIL, BY ASSET TYPE AND SIZE OF ADJUSTED GROSS INCOME PLUS CAPITAL GAIN OR LOSS EXCLUDED-Continued
Adjuste d gross income-I
Capital loss carryover All capital assp t traxisactio-
m-
Number ofreturns
Lesscapital capital
Plus
TaxableIncome tax
after
-
Grose-sales Depreci-Cost and
Asset type and size of adjusted gross income with net As reported gain or gain or
income
credits b f
Amount Number ofprice ation
expense of Gross gain Gross loss
plus gain or loss excluded capital loss lossNum er o t mas-
Isale
gain or included excludedreturns actions
lossI", .-d (A...-d (Th-d (77--d (7?--d (7h,,..-d (rh...-d (Th-.-d
'(Th...-d (7h...-d
d.11,
6.11 ... d.11 ... d.J) ... d.11 ... do 11-) d.11 ... ) 6.11...
(I) (2)
RETIRBEiNT PEAN DISTFI13TJTIORS-
61,070 748,362 533,598 955,169 524,791 151,193 540 1,810 64,739 303,822 201
Grand total ..........................................48454 732,261 520,883 935,465 524,584 151,193 420 1,513 57,654 296,869 15q
Taxable returns, total ..........................................
.............................................Und r $5 000
,
4,583 13,780 .9,202 17,862 5,433 1,090 - - 5,0`7603320
8,052
39 981e , .....000 under $10,000 ....5
......
19,440 127,461 107,349 146,948 72,613 14,6565 0
-
-,38815
,35,631,
er 5,000::10,11 Id .... . .... ** ............1
1
14,39310 203
158,752166,336
140,135
134,159
176,467194,805
106,786119,445
22, 7
27,642
- ,10,805 62,140 3E5,CGO.
........ ..........215,000 1 ,4 102 101,948 63,913 137,594 79,275 21,191 159 358 4,380 Not applicable 66,647 3"
.........................25,000 under 50,000................
000 .......................................50 000 under $100
,
1,114 53,473 29,314 77,501 44,04E 16,715 39 ill 1,239472
311 08725:747
312~., ,
2000 und r100.. ..........OO COO ......
427 39,223 19,600 59,039 33,324 15,171 35 451188 73312, :
' :159 29,064 9,901 48,234 -25,105 12,418 17 66 ,
5 9301
..200,000 un 500,110.000
1
40 15,922 4,660 27,094 13,638 6,9017 1 5 47 ,921.....................................500,000 under 1,000,
24 26,303 2,649 49,921 24,91fi 12,832 2 26 261,,000,000 or more ............................................
6,587 16,101 12,716 19,704 208 - 7,084 6,953 4:
Nontaxable returns ..............................................
LIVESTOCK
.... 801689 4413 259 2,712,499 3,805,398 1,660,211 417,250 2,386 10,447 1,376,690 1,017,324 98,128 394,719 979750, 32,78
Grand total ...........................................
....................t t l
,
361392
,,
777,0252 2,377,808 3,173,066 1,631,83:3 417,250 1,671 7,180 783,339 640,946 59,381 239,339 476,010 16,76o a ......................Taxable returns,
.............................................Under $5 000
,
169,687
,
530,602 460,317 580,383 193,991 34,511 305,419 141,061 11,3711
54,3027 039
102,910180 469
5,37455.... .,
5,000 under $10,000.....'"', " '*** .... * '*'* ...," *
161,368 1,014,809 912,608 1,116,145 529,692 95,01881
335,67551276
233,91399 218
,8517,2149
6,48933
,47476
,1,64
:::::::: . ,, * *, 15 ,000,...:: ..10,000 und 34,986 364,830 313,630 416,553 246,300'
47 667~
534 1,2 ,35 596
,67 264
,6 083
,27,098
,47,310 1,07: 1 ,
15,000 und r 25 000 .........................................
1
15,556 246,550 2017,944422178
288,499241240
188,72168 248
42 33648 678 241 940
,17,376
,44,859
,5,376 18,577 32,543 9D
25,000 under 50,000......................................... 7,133 209,477 , ,
1
,
110 21 3
,
29443 167 971 6,815 26,733 4,648 15,241 16,917 90
~50,000 under $100,000 ........................................ 2,405 137,057 110,1295 5
163,36272103
, .64 77')
,31 691 36 734 3, 086 13,68? 2,432 7,288 9,154 56
2100,000 under00 'GO
760 83,44274 477
63, 750 772
,
06598
,~,4 258
,58530 21 684 2,150 10,022 1,760 4,794 7,332 371
200 000 und.... -:::* - * , *- , - * - ..
39378
,43836
,47820
,52 236
,25,820
,14,975 .2 6 458 3,265 603 1,833 2,355 36
.. ..... . . . . .. . .500:000 under 1,000,000 .........
148
,144'77
,39,733
,114,312 49,803 28,493 2 76 252 925 209 679 54( 9
1,000,000 or more ............................................
....... * ...... ... 441297
,
482,416 334,691 632,332 28,377 - 716 3,268 593,350 371,378 38,747 155,380 274,969 16,02
Nontaxable returns ...................... ,
TD&ER AND COAL
63 513 566 235 453,474 678,844 357,875 11.3,911 875 2,679 69,449 140,720 964 45,5i2 113,845 4,23
Grand total ............................................... ,
43 977
,
545 632 455,137 637,521 355,690 113,911 775 2,363 47,575 108,030 964 33,030 89,490 2,9S
Taxable returns, total .......................................... ,
11 948
,
35 203 26729 40,832 12,811 2~436 - - 12,051 10,308 - 1,599 10,030~1Under $5,000 ..................................................
.......................................000 under $10 0005
,16,644
,108,879
,101,463 118,049 59,592 11,543 18,038 19,307 23
3847,473
772615,25612 777
,60(1...,,
..............000 .0 d 15 6,975 74,379 65,575 83,352 47,208 9 772 7,609 17,535 , ,15 559
,
........................ ..1 ,000 un er ,.000
1
4 119 66,831 56,231 76,928 48,002 10~965 4,621 16,311 - 2,885 ,1........................................15,000 under 25, ,
8432 65883 70,699 96,739 65,642 18,780 102 341 3,274 17,705 28 6,566 12,31825,000 under 50,000 ......................................... ,
961
,
88555 47 2A' 64 391 43,684 16,951 39 182 1,188 8,434 36 2,264 7,110
0 0 -der $ .....'r 298,
32 693,34525
,40,212 24,408 11,667 22 517 469 5,988 64 1,488 5,231
COO .......................................1. . under 2..,
V
141
,31 590
,21 519 41,591 21,769 11,840 14 338 247 7,611 42 6 2,234 7,180
200,000 under 500,000 .......................................32
,
14 704,
7 685 21,785 10,921 6,060 2 103 52 3,072 2 1,488 2,552000,000 .....................................500,000 under
.1is
,
81141
,30,114 53,643 21,653 13,877 3 180 26 1,559 - 262 1,476
1,000,000 or more ...........................................
. 19 536
,
60320 -1,663 41,323 2,lE5 - 21,873 32,689 - 12,482 24,355 1,2,..Nontaxable returns........................................... , ,
OIL AND 1,1INFRAL INTERESTS
Grand total ......................... ..................... 26,522 634,201 495,723 751,461 454,041 177,540 2,243 8,140 38,345 155,852 11,02 6 100,638 93,534 18,9~
'Taxable returns) total ........................................... 23,728 638,120 510,574 '147,451 453,863 177,540 2,099 7,663 34,041 136,537 10, 6% 94,210 78,226 17,1
Under $5,000 .................................................. 1,975 9,?29 10,871 -2,441 5,51.83 630
1is6:4'61 024i 2 830
12,2112450
5,318 95
4 199 59
0 10,5315 8,973
4243,171
5,4t2,8(
5,000 under $10,000 ..........:**::
7,584 57,451 55,35?3
57,76253 405
,334 S(9
'
7 460
, ,,
6,264
,
9,792 236 6,486 4,444 1,2:......10,000 under 115:000:: .......
.........25 000
1
4:4204 436
52 474
81 627
50 5922077' 65 693 057 25
51013, 468 1,102 6,386 14,656 773 11,1?1 126,23 3,2;
'.c
....... .. ....... ...... ....15,000 und r000 .........................................25 000 under 50 2,850 90,531
182,622 98,167 70,026 21,210 430 1,672 4,685 18,216 1,576 14,697 7,593 1, 5
', ,
000 ........................................000 -der $10050 1,462 87,393 72,856 99,954 67,085'
26,252 97 806277
2,476904
23,9210 88
4 3,02
0 1 896 18,782
1843 514,6018,49?
2,031,,
000 ... * ....... ......::::::::100,000 under 200 574 64,0694905
49,4564r 461
78,09484 420
47,8 1146 202
22,89833725
4222 342 601
,
21,37
,
8 1,15,
3 12,149 12,143 l::200, 000
un"lcrJ50.
.0..............................
1
. 29283
,691439
,,
23,908
,55,531
,27,745
,
15,909 11 368 174 7,948 252 2,839 6,462 31500,000 under lyOOO,OO0 .......................... :.: ....... .
53,
89 441 41,231 136,867 53,667 37,378 5 266 9E) 15,47 1 911 3,398 14,l,,591,000)000 or more.... ...........................
.. . ....... 793. 2 3 919 -14 850 4 009 178 4,304 19l31 5 420 6,428 15,308 i's.Nontaxable retums ...................................... ,. - , ,
w00
Footnotes at end of table. For the precise definition of terms and the nature of any limitations, see the "Description of the Semple, 11 "Limitations of the Data," and "Explanation of Classifications and Terms" in the text.

RETURNS WITH NET CAPITAL GAIN OR LOSS
Table 3. -ALL TRANSACTIONS -INCOME, TAX, AND TRANSACTION DETAIL, BY ASSET TYPE AND SIZE OF ADJUSTED GROSS INCOME PLUS CAPITAL GAIN OR LOSS EXCLUDED-Continued
Adjusted gross income- Capital lose carryover All capital asset transactionsNumber ofreturns
Lesscapital
Pluscapital Taxable
Income taxCost andAsset type and size of adjusted gross income
l i l dwith net
As reported gain or gain or incomeafter
dits Amount Number ofGross -sales Depreci-
expen f
se 0
Gross gain Gross lossp us ga n or oss exclu ed capitalloss loss
're Number of
trans-price ation
'ailgain orincluded excluded returns
actionsloss
(TY.-d (7?...-d (7?...-d (Th-d (Th-d (M.-d (Th...-d (Th-d (M.-d (7~.-dd.11 ... d.J1 ... bIl ... d.11 ... ) d.1la-) d.1 I ... &11 ... d.1 f ... d.11 ... ) d. I I...
PARTNERSHIP INTERESTS(1) (2) (3) (4) (5) (6) (7) (8) (9) (10) 11) (12) (13) (.14)_
Grand total ............................................... 87,451 1,467,538 1,146,540 1,771,357 1,049,33~1 348,599 4,137 18,402 119,428 823,094 30,916 502,380 359,952 31,789
Taxable returns, total. ......................................... 74,448 1,451,494 1,175,679 1,708,398 1,104?,72~5 348,599 3,600 14,494 102,663 694,329 25,999 394,084 328,?58 25,958
Under $5,000 .................................................
10 268 41,025 38,800 28,909 19,162 41508 14 179 43,804 1,933 38,947 13,952 9,2635,000 under $10,000 ........................... : .............. 17:515 120,585 108,684 131,545 64,483 12,595 1,477 3,832
:25 105 63 456 4,980 46,046 23,547 2,683
10,000 under 15,101 ................
1
15,533 172,403 155,454 188,525 113,969 23,962,
18 795 111:949 3,812 78,741 35,934 3,1901 ,ndlr15,000 u ................................. 14,576 257,487 229,829 284,663 167,152 44,906 970 3 427 19,608 135,092 5,546 86,703 51,705 4,21825,000 under 50~000 ......................................... 10,863 335,336 301,245 369,219 255,156 75,503 767 3~507 15,836 118,993 5,417 58,831 64,413 3,187
50,000 under $100,000 ........................................ 3,968 221,883 176,082 266,4?4 174,158 68,308 264 1,044 6,253 116,258 1,840 50,140 66,984 1,63611,1"1011,000 : der, 2 l : 1,193 122,394 86,653 158,899 95,987 45,357 93 1,994 1,84? 44,286 1,632 17,321 28,662 ?95., 1,. .
200,000 ,'. ~ 0
412 82,803 44,199 120,884 61,38C 32,116 18 418 825 34,343 455 11,779 22,357 739500,000 under 1,000,000 ..................................... 76 35,045 15,888 53,869 25,161 13,573 9 192 139 12,909 12 3,880 9,221 1801,000,000 or more ............................................ 44 62,535 19,r4!, 105,410 51,117 27,772 3 81 76 13,239 3?3 1,696 11,983 67
Nontaxable returns .............................................. 13,003 16,044 -30,139 62,959 1,608 - 16,765 128,764 4,916 108,297 31,194 5,831
ASSETS USED IN TRADE OR BUSINFSS
Grand total ............................. ! ................. 448,486 4,060,959 3,281,600 4,807,126 2,685,817 '770,591 11,884 59,258 699,264 3,627,716 908,334 3,588,609 1,052,169 168,612
Taxable roturnsj total .......................................... 327,815 3,941,901 3,294,472 4,565,159 2,670,434 770,591 9,056 38,031 502,880 2,731,285 668,344 2,597,720 858,251 105,986
Under $5,000 .................................................. 72,868 249,395 242,949 225,778 89,827 17,101 1,271 6,394 111,587 263,171 89,328 365,806 38 000 53 5425,000 under $10,000 ...................... ! .... I .............. 120,465 795,054 724,870 868,948 415,564 79,249 2,317 5,356 185,181 586,568 176,194 627,674
,148,900
,21,749
'5 '0:::::::: .................................10,000
under 0
1
61,1CS 661.908 589,621 743,587 435,689 88,427 2,023 3,826 94,115 517,234 147,564 523,765 145,284 9,40715,000 under 25:1 1. .................................J 38,865 644,057 554,461 735,125 469,905 106,523 1,274 4,446 59,116 45,1,119 101,688 397,158 149,681 7,27525,000 under 50,000 ......................................... 25,040 734,3,~9 ~26,765 840,9,~O 581,558 163,091 1,448 5,544 36,465 49U,261 92,130 410,253 169,124 8,075
50,000 under $100,000 ........................................ 6,739 37C,369 302,145 449,139 305,416 119,653 478 4,695 11,423 191,245 36,175 142 740 79,317 2,555100,000 11~ nder 200 00::::0 1,644 is-,,008 128,740 24E,006 146,578 69,10J 171 4,887 3,359 103,477 13,486 77:055 41,787 2,370. J, .00:200,000 u d
CC
1
678 134,535 69,453 199,687 102,721 54,755 50 1,975 1,241 56,742 5,263 31,244 30,244 839500,000 under 1,000,000 ..................................... 123 52,338 23,523 81,22' 38,263 20,425 14 530 193 22,255 2,073 9,225 15,220 1361,000,000 or more ............................................ 85 101,867 31,944 171,8,8; 85,011 46,767 11 377 200 49,214 4,244 12,801 40,695 41
Nontaxable returns .............................................. 120,671 119,058 -12,672 241,967 15,383 - 2,828 21,227 196,385 896,430 239,990 991,088 193,918 62,625
FROPERTY HELD FOR PERSONAL ILE
Grand total ............................................... 51,138 555,215 473,759 638,957 350,157 103,212 1,438 12,514 67,661 193,217 39,264 189,718 49,880 10,770
Taxable returns~ total .......................................... 39,823 525,108 451,156 598,227 348,222 103,212 1,018 6,417 46,845 139,275 32,858 131,367 43,379 6,265
Under $5,000 .................................................. 5,715 16,058 14,861 16,315 5,6861 1'
5 7,991 4,982 2,141 5 556 1 912 4065,000 under $10,000 ............ , ..... *, ................ 17,042 117,831 108,971 126,247, 57,181 ll:.8, 19 722 47 813 1739
,37248
,
10 664 3 042::: : ::10,000 under . ....... ................
1
7,512 84,106 77,441 91,&~2 53,295 10,984738 4,547
,
8,315,
26,337,
7,907
,28,628
,6,493
,976d,.r
15,000 un25,C.
........ I ....................... 4,884 82,413 73,522 91,398 59,833 13,551 5,586 18,902 6,175 19,409 4,840 55725,000 under 50,000 ......................................... 3,323 99,896 88,908 110,704 77,812 22,955 181 690 3,653 18,139 4,580 17,191 6,221 767
50,000 under $100,000 ........................................ 967 153,517 44,119 63,047 42,417 16,798 71 476 1,106 7,747 1,506 5,426 3,977 327100,000 und r 21 1::::::: ................................I: 257 2?,667 20,258 34,9t8 21,171 10,086 17 179 299 6,583 896 e4,078 2,646 89
1r ..:nd200,000 u
..................................
1
88 18,780 11,689 2~,,187 i3,658 7,251 8 459 113 2,852 264 1,616 1,539 58500,000 under 1,000,000 ..................................... 22 10,019 5,3?2 14,669 6,591 3,546 2 66 28 893 24 301. 639 261,000,000 or more ............................................ 13 14,818 6,015 23,610 10,579 5,838 1 - 27 5,026 192 786 4,449 1?
Nonta.xable returns .............................................. 11,314 30,107 22,603 40,730 1,935 - 420 6,096 20,816 53,942 6,406 58,351 6,501 4,505
RESIDENCES
Grand total ......................... I ..................... 176,794 1,412,614 1,101,986 1,709,451 856,533 212,105 2,118 8,050 180,466 2,746,575 109,187 2,259,818 5?2,180 -Taxable returns, total .......................................... 144,104 1,352,976 1,074,903 1,618,616 854,252 212,105 1,915 7,551 147,453 2,331,496 92.920 1,903,478 502,560 -
Under $5,000 ..................................................5 000 under $10 000
26,418 85,533 70,265 91,260 32,520 6 325 26 819 293,216 5,183 262oO45 34,101 -) , ..: ... ::*,::::,*,::,:::*,,::* ............. 62, 077 398,253 330,337 465,572 206,507 41:182 1,198 4,232
:63 664 850,788 31,956 721,965 146,957 -
10,000 under 15,000 . ... .. ... . ... ..............
1
32,083 326,898 263,039 - 388,562 203,471 41,752 32,911 537,049 26,804 439,869 118,540 -115,000 under 25,000 ......................................... 15,563 243,969 193,929 293,767 176,064 40,341 401 1,40b 15,898 351,532 16,630 273,998 97,415 -25pOOO under 50~000 ......................................... 6,025 163,235 126,509 199,370 128,549 36,614 171 480 6o160 192,429 7,388 139,874 59,573 -
50,000 wider $100,000 ........................................ 1,577 81,299 56,917 106,319 -~6,852 25,810 101 1,040 1,616 75,034 2, 871 45,166 32,026 -100,000 iindel 210 10 ::: 271 27,887 20,559 35,471 21,423 10,022 34 358 288 16,865 744 10,621 6,842 -:. ,200,000 under 15.
1
74 14,688 8,143 21,154 10,658 5,564 9 32 81 12,371 1,261 6,967 5,032 -500,000 under 1,000,000 ..................................... 14 6,633 3,512 9,674 4,752 2,676 1 3 14 2,157 62 905 2,0691,000pOOO or more ............................................ 2 4,580 1,693 7,4b5 3,456 1,817 - - 2 54 1 50 5 -
Nontaxable returns ................... I .......................... 32,690 59,636 27,083-90,835 2,281 , - (~) 33,014 415,080 16,267 356,340 . 70,120 -
Footnotes at end of table. For the precise definition of terms and the nature of any limitations, see the "Description of the Sample," "Limitations of the Data," and "Explanation of Classifications and Terms" in the text.
0Ind0
0-4
We.0

RETURNS WITH NET CAPITAL GAIN OR LOSS
Table 3.-ALL TRANSACTI DNS- INCOME, TAX, AND TRANSACTION DETAIL, BY ASSET TYPE AND SIZE OF ADJUSTED GROSS INCOME PLUS CAPITAL GAIN OR LOSS EXCLUDED-Continued
Adjusted gross income- Capital lose carryover All capital asset transactions
Nwber of Less Plus Income tax
Asset type and size of adjusted gross income
returns
with net As reported
capital
gain or
capital
gain or
Taxable
incaneafter
Amount N=ber ofGross-sales Dep
me'-
Cost and
expense of Gross gain Gross loseplus gain or loss excluded Capital loss loss
credits Number oftrans-
price ationsale
gain or included excluded returns actionsloss
(TI...-d (Tho-d (Th.-d (Th-d (Th-d (77.-d (Th.-d (Tho-d (Th-d (Th.-d (Th.-d
d.Ji ... &11-) &11-) d.11 ... d.11-) d.11-) dlla-) d.11 ... dbll-) d.1i ...
(1) (2) (3) (4) (5) (6) (7) (8) (9) (10) (11) (12) (1-3) (14)NONBUSINESS REAL ESTATE -
Grand total ............................................... 349,206 3,631,9bl, 2,974,916 4,256,930 2,370,670 684,057 9,009 61,098 392,930 3,708,058 248,760 2,950,932 1, 008, 0`71 139,928
Taxable returns, total .................... I ..................... 275,633 3,534,335 2,958,907 4,085,753 2,364,513 684,057 7,280 42,818 311,042 3,089,664 210,130 2,420,678 849,956 101,967
Under $5,000.................................................. 48,122 179,302 180,447 151,415 74,041 14,427 (-) 53,216 290,799 32,857 319,519 27,364 37,419
5,000 under $10,000 ..... 103,342 719,935 670,890 772,740 375,305 74,832 1,654 1,353 110,226 834,323 58,877 75?,039 127,473 32,373
10,000 under
)DO'
56,351 616,476 555,824 677,466 392,771 82,439 1,140 5,514 61,991 497,099 36,277 422,758 114,768 11,268der
1' ,C0.:::--:: ..................................15,000 U. J21
1
36,716 611,948 526,646 696,878 434,116 100,385 1,572 9,430 44,303 499,469 36,451 360,494 159,011 8,790
25,000 under 50pOOO......................................... 21,603 627,302 512,459 736,806 482,235 139,677 1,286 7,827 28,224 423,429 24,705 257,497 174,651 7,107
50,000 under $100,000........................................ 6,915 371,862 285,767 458,310 293,160 113,195 459 7,993 9,395 250,338 13,444 143,523 111,386 2,835
r 200,'00100,000 d 1,778 178,606 121,850 238,249 137,166 64,484 142 5,148 2,465 148,911 4,840 83,696 66,826 1,423:r . '
200,000 nd 15 ................................. 641 123,885 65,108 183,228 93,818 48,968 46 1,413 959 107,138 2,254 63,409 44,313 39C
500,000 under lpOOOpOOO..................................... 110 45,541 16,424 75,375 35,000 18,663 12 1,025 187 26,888 377 7,774 19,350 232
1,000,000 or more.. .......................................... 54 59,477 23,491 95,285 46,901 26,989 5 272 75 1.1,269 48 4,969 4,814 131
Nontaxable returns ............................... I .............. 73,573 97,632 16,009 171,177 6,157 - 1,728 18,279 81,888 618,395 38,630 530,254 158,115 37,961
REAL ESTATE SUBDIVIDED
Grand total ............................................... 147,991 1,532,082 1,132,667 1,917,843 1,030,517 300,031 3,274 12,951 173,280 1,8.'39,?65 170,379 1,31?,021 683,128 32,062
Taxable returns; total ................ I ......................... 120,648 1,535,268 1,195,180 1,865,267 1,026,716 300,031 2,739 11,026 139,782 1,568,042 141,990 1,086,508 597,760 25,38C
Under $5$DOO.................................................. 15,729 53,587 46,938 50,564 20,640 3,984 17,316 174,C89 24,648 175,598 ~6,844 5,57f
000 under $10,000 ............5 49 340 318,841 277,902 360,356 166,188 32,617 53,536 381,477 32,187 289,428 122,727 7,731,
r 1,, OOD10, 000 und 21:154 260,191 219,213 300,814 163,125 34,272 769 1,930 29,708 243,485 20,590 175,663 82,901 2,82;......... ........: : ......
15,000 und
r 12".. ......
1
'.6
,320 249,721 191,641 308,360 180,387 41,399 635 2,581 20,353 308,194 30,853 193,224 130,365 4,98!
25,000 under 50,000 ......................................... 9,989 282,688 218,592 344,924 215,082 62,426 598 1,378 13,111 240,619 22,262 143,620 116,574 2,82~
50 000 under* -----*--$100'000 ............
3,252 173,208 127,509 218,658 138,392 53,113 160 1,029 4,161 124,895 7,033 64,616 64,282 49~,
:: ::::::000 u r100 2
0 )CO - ** .
821 82,535 57,05q 108,766 63,995 30,179 87 1,943 1,096 47,763 2,360 23,354 25,822 62~1,
.......................... ...nd ) '(000u.d:r 5COO0O):::::::200
1
269 53 861
'
27 692 80 151 42,804 22,537 13 450 414 32,973 1,718 14,879 19,456 23,,
500,000 under 1,000,000 ..................................... 52 21 1546 7 530 35 479 16,696 8,720 2 9 59 10,913 1618
3,262
2 38
7,828
961
4~
2~1,000,000 or more ...................................... 1..... 22 39,090 21,106 57,195 19,407 10,785 4 348 28 3,635 17 , 6
Nontaxable returns .............................................. 27,342 -3,186 -62,513 52,576 3,801 - 33,497 291,724 28,388 230,513 65,368 6,68,
FARMLAND WIT11 UNHARVESTED CROPS
Grand total ............................................... 7,665 70,983 49,153 92,437 45,579 13,516 113 632 10,215 120,925 6,349 77,604 50,444 2,81'
Taxable returns, total .............. I ........................... 4,468 63,023 45,778 80,160 44,91? 13,516 113 632 7,018 102,846 4,842 64,446 43,368 1,81,
Under $5,000 ..................................................
5, ........................................under $10,000.,
(-)1,101 7,098 5,763 8,163 3,462, 664
- -
-(-)
1,801 12,558 300 9,391 4,10`7 64
'rI. O~C
d r 1,036 10,566 9,275 11,903 6,98d, 1,508 2,743 20,613 689 19,377 2,492 56: r
1,1, COO d N:
~1
569 8 749
,
6 971
,
10 474 6,135 1 397
,
- 636 11,886 678 7,089 5,486 15
under 50,000 .........25,000 634 17 1015 12 271 22,160 13,9m 4 1015 681 31,367 2,523 14,416 19,423 6
50,000 under $100,000........................................ 156 8,311 5,857 10,706 6, 59:3 2,483 173 11,501 330 5,712 4,967 4,
100,000 r 21)0 001 ........ 55 5,183 2,560 7,723 3, 991 1,791 2 94 66 5,022 116 1,232 3,911=:, 1,00: 0 ::
200,000
CC..............................
1
16 2,590 817 4,353 2,211) 1,131 - - 16 1,639 75 352 1,329
500,000 under l,OO0jOOO ..................................... 2 1, 070 286 1,854 83;? 404 2 542 31 117-
457-
1,000,000 or more ............................................ - - - - - - - - -
Nontaxable returns ........... I ............ I ..................... 3,197 7,960 3,374 12,276 661 - - - 3,197 18,079 1,508 13,158 7,076 1,00
OTHER FARMIAND
Grand total ............................................... 75,163 581,375 370,456 779,190 381,940 110,019 602 2,484 81,218 1,289,760 80,837 864,371 449,135 34,52
Taxable returns~ total ........................................... 50,839 560,737 386,255 733,024 380,126 110,019 368 2,325 53,961 997,122 62,088 613,530 371,494 13,38
Under $5 000 .................................................. 10,134 31,785 27,195 34,312 12,446 2,462 10,534 88,612 4,550 80,031 13,794 2,28,
5 000 under $10,000 ........ 20 599 125,279 96,868 153,688 65,617 12,614 21,099 235,655 25,232 179,156 79,653 1,65,
d10 000 - 010r
15 .
2368 81
,
917 61,954 101,593 53,5-13 10,972 - - 8,804 148,= 11,170 101,545 51,491 50~', : :
000 ur
,
125
0.::
::::: ................................. .15
1
,
6 167 88,319 58,817 117,774 65,03.9 14,659 6,756 197,041 6,818 98,793 61,507 48,
25,000 under 50,000 ......................................... 4,044 102,437 66,955 137,818 79, 289 22,275 102 390 4,788 182,548 7,543 94,111 83,423 7,53
50 000 under $100,000 ........................................ 1,112 54,299 35,049 73,522 43,809 16,553 36 222 1,358 63,868 3,013 30,085 33,870 15,
000 U100 e r
200 000 .... .........
360 33,833 20,004 47,616 27, 333 12,579 8 14 404 40,003 1,472 15,063 24,723 2, r 1~d a
.......... I ........... I .... ....'200 000 u 5. .0:::::::
1
136 24,230 11,107 37,489 18,652 9,676 13 285 181 29,403 1,558 , 10,961 14,748 74, ,
000 under 1,000,000 ............... I .....................500 23 10,266 5,458 15,309 7,104 3,990 3 330 27 6,775 598 2,207 4,838,
1,000,000 or more ............................................ 9 8,373 2,848 13,904 7,204 4,238 2 6 11 4,896
1 34
577
1
3,445
Nontaxable returns., ..... I ...................................... 24,324 20,637 -15,798 46,166 1,8L4 - (-) 27,256 292,637 4 918, 7
:
1 25 0 941 77,641 21,14
--- ~ -1 ~r +Able. For the precise definition of terms and the nature or any limitationsp see the "Description of the Semple," "Limitations of the Data," and "Explanationof Classifications and Termst' in the text.

RETURNS WITH NET CAPITAL GAIN OR LOSS
Table 3. -ALL TRANSACTIONS-INCOME, TAX, AND TRANSACTION DETAIL, BY ASSET TYPE AND SIZE OF ADJUSTED GROSS INCOME PLUS CAPITAL GAIN OR LOSS EXCLUDED-Continued
Adjus ted gross income- Capital lo ss ca-yover Ali capital ass et transacti ons
Asset type and size of adjusted gross income
Number of
returnswith net
Lesscapital
Plus
capital TaxableIncome taxafter Cost and
plus gain or loss excluded capitalAs reported gain or
lossgain or
loss
incomeredits
Number ofAmount Number of Gross-sales
priceDepreci-ation
expense of Gross gain Gross lossgain orloss
included excluded returnstrans-
actionsale
(7)--dd 11
(TI...-d (T?m..-d (Th-..,d (1h.-d (7~.-d (Th...-d (M.-d (A-.-d (T?-.--d (1)...-d
(1)
. ...)
(2)
-d.11 ...
(3)
&1i ...
(4)
d,,!!ari2_
(5)
1611.,.) d.11 ... )_ d.11-L_ d.11-) &H-) doil ...) d0l.r.)PROC F.P. FROM PRIOR YEAR INSTALIMENT SAT - (6)_ (7) (8) (9) 11) (12) (13) (14)
Grand total ............................................... 426,101 5,065,823 3,924,245 6,166,421 3,451,883 1,062,322 9,294 66,323 536,364 530,702 21,843Taxable returns, total .......................................... 331,727 4,886,151 3,878,554 5,849,913 3,439,324 1,062,322 7,542 44,221 419,545 1,341,159 21 412
Under $5,000 ..................................................3p000 under $10)000 ...
61,627108,081
207,996724 465
187,363644 794
192,249603 946
87,099399 633
17,14276 712
(-)2 291 6 1 4
73,825 56,527
,
17,966
10,000 unde
r11,()0O:
1
11), 10,
671,714,
597 162,
743,022,
440,432,
92,169,903
, 3
1 545
129,819
77 612138,360
906125857J2 .
15,000 under ..............................ooo.25 000 under 50 ..
50,31q33 3
841,553 716,201 963,283 605,713 140,918 1,311,
3,586,
65,609,
201,080360560.,, ..................................... 17, 972,331 604,969 1,135,280 749,565 218,767 1,240 6,362 46,107 N ot aPplictib 235,485 662
50,000 under $100,00o ..................................... .
100,000 under
. .
20G 000 .........
12,7133
692,346 529,137 856,143 545,433 211,271 567 8,337 18,903
I
208,293 200GO .d.r 1...........................200,0 50(),000::: ............ 11 ...............' ......
1
853,1,206
335,675
236,546
217,914
119,220456,578353 763
262,616
183 767121,90694 773
14744
4,974
8115,3351
149,874 152500,000 under 1,000,ooo ... .............................. 197 79,940 30,255
,130,234
,61963
,33 820 6 861
,851313
117 200
,317
1,000,000 or more ill 123,505 31,537 215,413,
101,467,
54 846 2 6 17141 3361 63
Nontaxable returns .............................................. 94,374 179,672 45,691 316,508 12,559
,
- 1,752 22,102 116,819
67,098
1 189
,
543
274
431
OTIER TYPE ASSETS
Grand total ..............................I ................. 565,349 7,531,511 6,501,455 8,291,864 5,066,681 1,631,554 33,855 164,712 665,289 995,253 288,247 1, 095, Sol 722,340 1,266,859
Taxable returns, total .......................................... 473,981 7,351,903 6,410,817 8,079,145 5,050,716 1,631,554 29,707 124,791 561,855 892,743 106,555 808,034 065606 0851 771Under $5,000 .............................................
...
5oOOO under $10,ooo..84,6177 086
11
356,6121,364,967
376,6041, 340, 771
142,543
1 395 795169,168723 5139
34,636
145 2224,8277 146
11,422
15 50298,599
45121490,579
211,315 123,482
,
35,224
, ,
232,120
I0pO0O underer
';.000: ..... :.:15 000 un 1211 GO
1
7 420"0
903,718 860,070, ,944,129
,592, 067
,127,685
,5,935
,23,060
,
90,17312,658
147,08710,0859,056
203,468
131,38077,55074,936
206,364
147 935, ................................25,000 under 50,000.........................................
6 ,28404841
1,089,6621 311 067
1,021,710185 5901
1,151,6344 8
785,585 188,541 4,795 16,474 72,102 88,796 4,439 61,036 68,673,
148,012, ,, ,, 21, 661, 998,965 301,186 4,597 19,752 53,221 98,515 5,018 67,318 109,145 179,0195OpOOO under $100,000........................................
....................r 0 0-2 0100,00o
u'd
16,2184 884
957,680527 655
818,775398 603
1,092,471661 969
744, &,9398 2
295,080 1,680 14,204 21,846 93,000 3,149 65,134 75,347 97,081:, .:::::0; .1, .200,000 tind ....................
P
,1,829
,383,128
,227,593
,538,474
,93279,899
190,857147,688
520152
15,9329166
7,6219242
60,68884455
61,073702
97,92930 679
63,0054
44,701
500j,000 under 1,,000,0GO .....................................
...000 or more ........000368 164,353 77,966 249,529 120,778 66,693 32
,1,117
,579
,20,188 175
,13,404
52,8817,032
17,3277 124................................ ., 227 293,061 103,136 480,736 237, 684 133,767 23 411 379 25,388 1,541 14,185 32,268
,6,089
Nontaxable returns .............................................. 91,3681
179,608 1 90,638 1 212,718 15,965 4,148 39,921 103,434 102,510 181,692 287,767 116,275 181,088Due to tire reporting of more than one asset type by some taxpayers, the number of returns, adjusted gross income, taxable income, income tax after credits, and capital loss carryover for "All asset types" will be less than thea= of these items for the specific asset types.
(*) Air asterisk in a cell denotes that the estimate is riot shown separately because of high sampling variability. 110WE'Ver, the data are included in the appropriate totals.- A dush in a cell indicates that either there are no data for that item or it amounts to lass than $500.NOTE: Detail in the tables may not add to totals because of rounding.
For the precise definition of terms and the nature of any limitations, see the "Description of the Sample," "Limitations of the Data," and "Explarration of Classifications and Terms" in the text.

42 SALES OF CAPITAL ASSETS ON INDIVIDUAL RETURNS, 1962RETURNS WITH NET CAPITAL GAIN OR LOSS
Table 4.-SHORT-TERM GAIN, SHORT-TERM LOSS, LONG-TERM GAIN, AND LONG-TERM LOSS TRANSACTIONS- -INCOME, NET GAIN (LOSS), AND TRANSACTION DETAIL,BY SIZE OF ADJUSTED GROSS INCOME AND CURRENT YEAR NET GAIN OR NET LOSS BEFORE LIMITATION
[Taxable and nontaxable returns]
CurrentShort-term capital asset transactions
Adjustedyear neti
t l iGain transactions LOSS transactions
Size of adjusted gross income and size ofNumber of
ross.9
cap a ga n(loss) b Gross a-D Cost
andGross Number
Gross Depre- Cost andGrosscurrent year net gain or net loss before
returnsincome
beforeerNum
salescpri ti
expens ainof
sales ciationexpense
losslimitationlimitat
.",2
f0trans-
pricec a on of
saleg
tran,s - price of sale
(Th...-d (77--d actions (Th...~d (T~-d (Tho-d (T~--d actions (Tho.-d (Th-wd (T~.-d (n...~dd~!!&-) ~il ...) &liars) ~Jl ... d.11 ...) d.11-s) ~11 ... ) ~11... ) ~11 ... ) ~Ilars)
(2) (3) (4) (5)_
(6) (7) (8) (9) (10) 11) (12) (13)
ALL ADJUSTED GROSS INCOME SIZE CLASSES
Current year net gain or net loss beforelimitation:
Net gain, total ............................. 4,379,820 46,456,378 13,633,516 680,697 3,332,318 2,496 3,053,628 360,309 538,284 2,452,363 764 2,785,275 391,649
Under $50... .............................. 633,984 5,819,901 14,168 56,702 96, 600 51 89,284 6,552 30,857 12?,036 15 133, 04.1 6,29050 -der $100 ............................. 355,120 3,092,949 25,639 32,992 32,286 10 29,675 3,090 13,473 18,908 9 20,996 2,285100 under $500 ........................... 1,176,598 9,702,306 30`7,184 133,102 283,031 1,046 254,003 33,454 73,310 129,645 195 153,178 25,103
$500 under $1,000 ......................... 626,516 5,062,334 451,870 84,859 302,259 439 279,716 28,124 59, W2 125,638 65 145,094 25,030
$1,000 under $5,000 ....................... 1,128,329 10,769,219 2,537,823 196,648 798,766 526 710,958 100, 3306 153,523 530,393 212 6n4,794 83,102T15,0G0 under *10,000 ...................... 241,61-5 3,567,897 1,693,271 58,389 336,756 258 298,360 49,602 57,527 238,213 173 294,283 52,151,10,000 or more ........................... 217,659 8,441,902 8,603,561 116,004 1,482,619 166 1,391,633 139,182 150,523 1,282,531 96 1,443,890 197,688
Net loss, total ............................. 1,428,125 17,582,385 2,616,668 872,819 3,562,02 1,213 3,363,920 246,013 L,397, 301 4,538,719 6,142 5,266,591 956,645
Under $50.... ............................. 130,632 1,236,266 2,546 19,364 30,147 116 27,913 18,120 41,347 58,558 162 67,874 10,090$
")
under $100 ............................ 83,286 819,692 6, 0`77 13,580 15,939 2 14,636 1,473 29,389 26,399 53 29,316 3,21600 under $500 ...........................
1397,015 4,201,808 106,9G4 87,625 205,397 3 190,148 16,606 183,501 217,883 448 249,396 40,352
500 under $1,000 .........................~ 269,835 3,324,257 195,458 95,576 238,486 - 219,843 19,592 170,221 318,305 378 366,639 57,812
1,000 under $5,000 ....................... 443
,
554 6,235
1
133 913
,
640 385,703 1,329,455 461 1,251,566 83,838 546,771 1,357,363 5,068 1,593,073 289,7615,000 under $10,000......................
1
62,732 970,206 427,500 131,599 664,183 30 631,192 33,802 195,792 694,999 3 820,659 164,55610,000 or more. .......................... 41,071 795,023 964,342 139,373 1,099,065 600 1,028,621 72,583 230,279 1,875,211 30 2,139,634 390,858
TOTAL TAXABLE RETURNS
Current year net gain or net loss beforelimitation:
Net gain, total ............................. 3~542,672 45,030,162 12,209,86-1 615,057 3,068,387 1,792 2,822,271 307,326 486,100 2,312,813 640 2,617,354 358,262
Under $50 ................................. 576,164 5,729,806 12,735 54,882 96,075 42 88,833 6,436 29,070 125,363 15 131,084 5,99250 -der $100 ............................ 294 832 2 986 587
'21,229 27,786 26,036. . 7 23,719 2,814 11,026 15,858 9 17,616 1,906
100 under $500 ...........................
1
918"450 9;275 840 238,161 112,173 258235, 539 214,378 23,304 54,191 93,716 166 107,804 15,297500 under $1,000 ......................... 461,765 4,771,295 333,991 75,068 286,976 330 268,151 24,015 50,876 3-15,147 4 132,227 21,607
1, 000 -der $5, 000.......................
V
872,306 10, 271, 840 1,995,312 177,712 740,759 492 662,324 88,800 1-39,763 501,983 178 571, 811 78,247,000 under $10,000 ...................... 217,811 3,535,181 1,529,674 54,569 320,804 217 284,868 40,866 55,250 236,143 172 277,693 46,593S
10, 000 or more ........................... 2QJ_, 344 6,459,612 8,076,760 867112 1,362,478 165 1,279,997 121; 091 145,924 1,224:603 95 1,379,118 188,620,'
Net loss, total ............................. 1,241,000 17,274,719 2,164,149 753,963 3,079,844 1,012 2,890,?62 210,414 1,218, 390 3,737,778 2,105 4,330,188 791,716
Under $50 ................................. 109,099 1, 2W, 606 2,209 16,379 23,267 116 21,562 14,127 35,075 36,922 158 42,729 6,07950 under $100 ............................ 73
'026 802
,
~58 5,345 13,113 14,940 2 13,675 1,436 28,855 25,138 53 28,015 3,1751100 -der $500 ........................... 350,723 411221492 94,870 80,118 193,054 3 179,057 15,404 166,246 190,221 167 218,235 36,859500 -der $1, GOO ......................... 238,970 3,276,469 173,397 87,893 217,195 - 201,306 16,836 L59,760 291,204 304 334,691 52,696
1,000 -der t5,000 ....................... 385,711 6,151,952 785,143 .347,290 1,227,732 313 1,158,315 73,2017 489,908 1,245,047 1,417 1, "S, 778 253,0625,000 under $10,000 ......................
1
50,703 944,685 349,471 93, 803 545,706 30 516,972 27,564 148,404 574,847 3 681,800 127,78210,000 or more ........................... 32,768 768,757 753,715 115,362 857,950 547 797,876 61,840 190,141 1,374,398 3 1,575,940 312,063
TAXABLE RETURNS UNDER $10,000
Current year net gain or net loss beforelimitation:
Net gain, total ............................. 2,128,028 12,346,542 2,648,809 211,228 583,830 781 524,860 69,396 113,954 324,297 132 363,745 44,469
Under $50 ................................. 370,714 2,277,569 8,256 36,514 68,561 41 63,062 4,462 20,942 10`7,203 15 111,465 4,39250 under $100 ............................ 185,969 1,100,161 13,398 15,786 10,481 6 9,523 1,464 5,060 5,413 8 6,030 721100 under $500 ...........................
1
603,210 3,396,la2 157,757 53,253 102,126 17 92,970 9,894 17,576 20,754 8 23,604 3,167500 -der $1,000 ......................... 307,039 1,701,874 222,298 33,571 141,887 321 134,908 11,511 20,027 39,729 2 ", 633 7,572
1,000 under 15,000 ....................... 533,771 3,031,747 1,172,622 63,927 221,540 193 191,429 34,288 43,094 131,797 so 1-55,814 24,4955,000 under 10,000 ......................
1
97,397 619,510 670,765 5,968 34,452 201 29,461 5,043 5,754 16,244 - 18,678 3,77910, 000 or more ........................... 29,930 221,569 403,713 2,208 4,783 2 3,50`7 2,733 1,501 3,155 - 3,471 323
Net loss, total ............................. 627,788 3,859,909 934,117 310,779 893,153 361 843,735 63,014 512,633 1,141,786 1,675 1,325,477 295,028
Under $50 ................................. 65,051 337,350 1,272 9,139 12,919 116 11,988 12,377 20,094 20,661 18 24,785 4,265$50 under $100 ............................ 41,889 249,737 3,054 5,939 3,582 - 3,3?4 284 15,631 10,895 38 11,M5 981100 umder t500 ........................... 195,709 1,213,784 52,522 38,964 94,655 - 88,199 7,302 90,286 73,749 122 85,628 17,609V00 under $1,000......................... 117,285 729,142 83,356 31,550 52,067 - 47,704 4,568 73,320 80,269 224 95,434 20,562
Z1,000.under t5,000....................... 171,266 1,0.38,230 343,453 174,569 546,136 2" 522,728 25,548 213,675 490,722 1,271 568,810 103, 6CY7~5 000 under ~10 000 .....................
. .22,670 144,639 157,653 26,488 57,476 - 52,065 5,420 49,307 164,942 2 201,818 45,200
.....................~ib,000 or more . ... 13,917 87,027 292,806 24,129 124,318 - 2-17,679 7,515 50,330 300,546 - 337,268 102,804
TAXABLE RETURNS $10,000 UNDER $50,000
Current year net gain or net loss beforelimitation:
Net gain, total.. . .......................... 1,327,153 23,936,985 4,736,528 339,496 1,598,910 917 1,463,893 164,012 288,751 1,086,479 474 1,239,132 178,466
Under $50.. ............................... 202,130 3,198,661 4,403 18, 072 26,640 1 24,956 1,899 7,743 16,392 - 17,646 1,360$5C -der MC ............................ 197,002 1,746,883 7,696 11,639 14,646 1 13,378 1,253 5,654 6,317 1 7,301 1,070$10C under S500 ........................... 306,629 5,242,934 78,064 56,679 119,709 523 108,755 32,406 34,432 65,236 151 74,925 10,383$500 under $1,COO ...................... _ 148,965 2,634,605 10`77,433 39,724 135,910 6 124,815 11, 623 28,764 65,337 1 75,867 12,168
$1,000 under t5,000.. ..................... 321,095 5,870,733 777,563 105,384 474,375 286 429,851 49,974 87,388 314,052 96 352,944 45,6555,000 under ~10,000_ ...................
t
111,458 2,189,935 793,898 42,947 222,657 15 197,723 29,294 42,886 171,155 172 201,409 33,126
lO, 000 Or wr ............................ 129,674 3,053,185 2,967,471 65,053 604,974 85 564,414 57,563 81,882 447,991 53 509,039 74,704
Net loss, total ............................. 550,418 LO~837,156 1,060,916 410,866 1,864,398 645 1,742,218 128,550 655,291 2,240,163 404 2,5587,28? 423,696
Under $50 ................................. 42,940 715,869 915 6,986 9,7.34 - 9,030 1,636 14,494 11,681 140 13,062 1,45850 under $100 ............................
130,406 498,968 2,238 6,756 9,352 2 8,436 1, 004 12,6219 11,41-1 8 12,956 1,678
100 under S500 ............................ 150,515 2,581,604 41,045 39,426 90,515 1 83,601 7,340 73,467 105,840 44 120,963 18,031$500 under ~!,COO ....................... _ 116,238 2,140,805 85,912 53,974 155,255 - 144,596 31,293 82,725 195,585 so 221,674 29,570
~1,000 under $5,000 ....................... 199,626 3,985,706 408,127 161,241 541,339 69 502,374 42,024 259,116 674,698 130 786,354 133,3805,000 under $10,000 .......... ........... 24,996 543,503 170,399 62,599 454,907 29 436 032 19 472 91 159 358,280 - 419,285 71,907
SIC, OOC or =re ........................... 15,797 370,7011 352,180 79,883 603,295 544 558:149 J 45,781 121:700 882,669 1 1,012,993 167,673.
Footnotes at end of ~able. For the crec4se definition of terms and the nawre of any limitations.. see the "Description of the Sample," "Limitations- of Lite Data," and"Explanation of Classifications and Tems" in tne text.

SALES OF CAPITAL ASSETS ON INDIVIDUAL RETURNS, 1962RETURNS WITH NET CAPITAL GAIN OR LOSS
Table 4. -SHORT-TERM GAIN, SHORT-TERM LOSS, LONG-TERM GAIN, AND LONG-TERM LOSS TRANSACTIONS -INCOME, NET GAIN (LOSS), AND TRANSACTION DETAIL,BY SIZE OF ADJUSTED GROSS INCOME AND CURRENT YEAR NET GAIN OR NET LOSS BEFORE LIMITATION -Continued
[Taxable and nontaxable returns I
I I,ong-term capital asset transactions
43
Gain transactions Loss transactions
Site.of adjusted gross income and size of current year
i it t I's I es Depm- Got andGross sales Daum-
Co.t andGnet gain or net loss before l m a ion Number of ~
i
.an
af,
s
Number of expense ofross
tr s-
P'ic~ ati.n
salegain
trans-price ci.tio,~
sale loss
actions(T?...-d (T~-d ~ (A .-d actions
(7h...-d (T?...-d (7),-.-d (Th...-d_~11 d.11 ... d~ll ... d.11-) ~11-)
(14) (15) (16) (17) (18) (19) (20) (21) (22) (23)
ALL ADJUSTED GROSS INOCIE SIZE CL&SSES
Current year net gain or net loss before limitation:
Net gain, total ........................................... 7,177,901 26,347,775 1,663,321 16,026,854 15,709,021 1,475,232 3,842,135 77,018 5,156,091 2,044,166
Under $50 ............................................... 656,453 148,283 10,430 140,926 29,466 54,519 51,091 1,64-1 65,787 15,56050 under $100 .......................................... 396,971 147,616 14,599 140,747 40,159 45,189 40,400 2,349 56,002 15,3251,00 under $500... ...................................... 1,555,322 1,517,422 101,313 1,328,638 429,927 242,061 303,523 10,323 404,558 131,093500 under $1,000 ....................................... 1,010,203 1,588,747 104,101 1,268,776 559,501 170,000 271,738 6,322 354,519 110,726
$1,000 under $5,000 ..................................... 2,212,098 7, 070,746 575,398 5,221,491 3,0149,439 481,276 1,03.1,516 29,197 1,349,864 528,S19$5,000 under $10,000 .................................... 589,521 3,725,469 241,930 2,364,081 1,976,852 166,545 474,0G4 7,72? 639,001 281,032$ 10, 000 or more ......................................... 71~7,332 12,149,493 61-5,549 5,572,195 9,623,677 315,623 1,689,862 19,456 2,287,362 961,611
Net lose, w-.1 ............................... ; ............ 1,215,656 3,193,391 41,647 2,417,106 977,259 2,651,696 5,661,609 199,590 8,653,244 2,883,295
Under $50 ............................................... 61,976 80,716 2,504 60,647 30,929 137,163 170,569 7,793 203,264 41,5GI,$50 under $100 .......................................... 42,097 42,981 1,301 33,352 12,414 97,444 108,121 6,466 130,279 16,?461 0 under ~500 ....... .................................0
236,747 380,957 8,875 294,089 107,014 533,154 695,364 34,5?5 901,526 190,17200 under $1,000 .......................................5 212,739 395,082 6,061 310,880 108,029 458,776 767,406 35,691 1,054,545 265,266
$1,000 under $5,000 ..................................... 464,417 1,198,296 12,172 919,742 364,031 988,731 2,224,369 60,531 3,305,538 1,071,948$5,000 under $1i0,000 .................................... 86,866 427,409 2,269 307,797 138,184 204,519 747,2_34 22,392 1,165,290 434,929$10,000 or more ......................................... 109,013 667,952 8,666 490,599 216,659 231,909 1,148,545 12,141 1,892,601 862,727
TOTAL TAXABLE RETURNS
Current y-..av net gain or net loss before limitation:
N~t gain, total ........................................... 5,842,125 23,142,482 1,205,447 13,598,944 14,082,3S6 1,271pl.38 3,472,562 53,03? 4,651,995 1,821,598
Under $50 ............................................... 594,472 125,172 8,484 117,615 26,692 45,463 44,337 1,366 57,770 14,412150 under $100. ......................................... 328,321 2-18,429 11,111 1-13,939 30,999 33,351 33,442 1,391 43p516 10,678100 -der $500 ......................................... 1,189,107 1,210,123 78,116 1,069,691 336,774 180,341 249,499 6,630 330,139 106,620
$500 under $1,000 ....................................... 744,452 1,291,484 76,731 1,054,190 420,672 141,795 240,675 3,953 316,069 89,089
1'000 under $5,000 ..................................... 1,744,137 5,719,400 453,779 4,237,045 2,450,135 411,791 877,564 18,143 1,173,054 465,376
5,000 under $10,000 ....................................
1537,915 3,376,856 202,796 2,117,371 1,799,265 157,981 452,507 6,595 606,778 263,863
10,000 or mom......................................... 703,720 11,301,017 374,430 4,888,994 9,017,849 300,416 1,574,538 14,760 2,124,669 371,560
Net loss, total ........................................... 1,063~957 2,732,660 30,357 2,072,951 794,714 2,283,916 4,773,333 122,267 7,026,232 2,377,561
Under $50 ......................... _ - -- __ .... ... 49, 6CA 67,0',3 1,211 51,701 20,282 2.12,818 145,694 5,917 168,892 30,53950 under $100 .......................................... 33,232 37,621 1,0?5 29,255 10,896 76,187 72,841 5,330 91,643 14,501100 under $500 ........... .............................
1214,919 346,291 7,072 266,649 95,515 466,754 589,592 20,949 763,955 168,929
500 under $1,000 ....................................... 190,331 352,962 ~,018 275,681 98,605 405,155 637,456 23,400 884,882 236,141
1000 under $5,000.. ................................... 417,246 1,101,476 8,773 840,975 306,403 883,932 1,908,888 47,535 2,809,730 913,691
1 000 under $10,oco ....................................
171,297 308,458 2,106 226,682 97,640 163,034 580,625 13,234 905,141 346,693
10,000 or more ......................................... 67,325 518,776 5,102 382,007 163,375 176,037 $38,236 5,921 1,401,990 666,867
TAXABLE RETURNS UNDER $10,000
C,urrent year net gain or net loss before limitation:
Net gain, total ........................................... 3,050,052 6,551,960 604,522 4,730,944 3,013,646 386,172 467,068 18,863 616,741 389,772
Under $50 ............................................... 379,794 67,938 6,755 68,069 12,452 21,104 8,853 774 12,390 4,27350 under $100 ..........................................
12(y., On 65,990 8,695 67,199 17,301 17,902 10,209 931 14,461 4,646
100 -der $500......................................... 761,757 693,033 49,967 618,944 193,780 80,342 76,766 3116a 102,164 42,730$500 under $1,000. ...................................... 473,296 737,296 52,903 610,572 241,891 61,905 75,930 2,116 94,405 23,531
1,000 under ~5,000... ................................. 994,4_34 3,015,836 278,347 2,198,329 1,351,107 165,237 210, 072 9,437 289,787 188,2785,000 -der $10,000....................................
1182,793 1,332,754 113,867 807,917 739,408 25,459 30,584 3,021 41,657 69,909
10, 000 or more ......................................... 53,886 639,113 93,9V 359,914 457,708 14,223 52,655 423 61,977 56,405
Net loss, total ........................................... 375,386 574,295 8,111 440,156 173,734 971,975 1,583,789 83,144 2,401,065 875,637
Under $50 ............................................... 23,784 26,597 762 19,236 10,110 64,980 77,496 3,738 89,285 19,49350 -der $100 .......................................... 14,203 9,875 347 7,455 2,970 41,146 25,354 4,542 -34,785 5,326
1100 under $500 ......................................... 96,571 110,492 2,456 89,760 27,131 242,967 284,807 14,364 363,326 69-347500 under.$1,000.. ................................ .... 67,133 70,881 1,569 54,263 22,953 173,303 268,359 18,126 371,281 90,316
'
0 under $5,000 ... ....... .........................
11 0 0135,788 257,100 2,644 197,038 1 71,124 .342,692 667,202 30,577 1,005,900 336,518
5, 000 under $IJ0,000 .................................... 12,991 42,758 258 24,607 21,487 53,114 140,224 10,944 269,610 139,360~10,000 or more ......................................... 24,916 56,591 75 47,797 17,958 53,773 120,347 853 266,976 215,477
TAXABLE REIMS $10,000 UNDER $50,000
urrent year net gain or net loss before limitation:
Net gain, total ........................................... 2,415,759 9,959,516 459,271 6,131,690 5,666,306 680,591 1,629,256 28,433 2,222,697 915,327
Under $50 ............................................... 210,463 52,888 1,702 46,200 13,007 23,473 31,205 547 40,180 9,14650 under $100 .......................................... 121,160 47,798 2,398 42,896 12,651 14,313 18,674 447 23,832 5,137100 under $500 .........................................
1410,907 476,053 27,146 418,145 131,099 92,700 141,589 3,492 190,302 55,059
500 under $1,000....................................... 257,110 505,500 22,901 405,443 164,092 73,534 136,530 1,720 184,126 56,104$1,000 under $5,000 ..................................... 693,751 2,436,820 110,605 1,782,368 1,001,133 216,397 505,819 9,005 676,822 227,888$5,000 under $10,000.. .................................. 316,348 1,783,339 83,934 1,130,315 950,183 111,245 305,849 3,20D 412,560 152,454$10, 000 or more ......................................... 406,020 4,657,118 210,586 2,306,322 3,394,151 148,931 489,390 10,022 695, D75 409,539
Net loss, total ........................................... 599,066 1,596,554 19,644 1,214,828 455,729 1,191,146 2,523,037 37,404 3,691,754 1,221,399
Under $50. .............................................. 24,542 35,160 431 28,529 8,586 46,177 59,527 1,902 69,447 9,679$50 -der $100.. ........................................ 17,655 22,228 679 17,932 6,046 33,565 42,095 762 49,916 7,609$1
00under $500 ......................................... 110,279 204,744 4,433 153,606 59,477 214,639 273,006 6,449 359,247 89,831
~500 unde~ $1,000....................................... - 304 226,616 3,202 178,488 61,446 217,773 321,828 5,125 449,975 129,082
$1,000 under $5,000 ......... ........................... 244 412 661 313 5,254 508,215 183,984 491,390 1,040,959 16,556 1,529,487 500,75515,000 under $10,000... ...............................
:46~531
1
~ :9", 96 1,514 143,175 51,955 93,617 343,865 2, 070 502,754 169,919
10,000 or ..,a ......................................... 44,344 260,296 4,131 184,883 84,234 93,985 441,753 4,540 730,928 314,525
Footnotes at end of table. For the Precise definition of terms and the nature of any limitations, see the "Description of the Sample," "Limitations of the Data," and"Explanation of Cl&S-ifi-tions and Terms" in the text,

44 SALES OF CAPITAL ASSETS ON INDIVIDUAL RETURNS, 1962
RETURNS WITH NET CAPITAL GAIN OR LOSS
Table 4.-SHORT-TERM GAIN, SHORT-TERM LOSS, LONG-TERM GAIN, AND LONG-TERM LOSS TRANSACTIONS - INCOME, NET GAIN (LOSS), AND TRANSACT10N DETAIL,
BY SIZE OF ADJUSTED GROSS INCOME AND CURRENT YEAR NET GAIN OR NET LOSS BEFORE LIMITATION -Continued[Taxable and nontaxable retwns)
CurrentShort-term capital asset transactions
Adjustedyear net
l iGain transactions Los. transactions
Size of adjusted gross income and size of Number of 5rosscapita ga n
(loss)rN D
Gross Depre- Cost a'd Gross Number Gross Depre-'Pre
Cost andGross
current year net gain or net loss before returns ~ncome beforeefum
alescia
t,.. expensegain of
sal a ciationiat"n expense losslimitation limitation
o
price of sale trans - pri e of sale
(T~-d (T~-dtraus-
actions (7h ..~d (T~-d (n--d 7h..-d actions (7ho-d (n,-d-d (Th..-d (Th-wd~11 ... ) .b1j ... d.] I...) d.11 ...) &11-) &11... d. I I... ~!Jars)
(1) (2)_
(3) (4-) (5) (6) (7) (8) (9) (io) (11) (12) (13)
TAXABLE RETURRS $50,000 UNDER $100,000
Current year net gain or net loss before
limitation:
Net gain, total............................. 67,487 4,493,257 1,479,036 42,760 496,534 20 465,630 39,780 53,277 394,962 42 453,129 66,759
Under $50 ................................. 2,934 186,866 67 255 616 - 567 65 346 973 - 1,149 200
50 under $100 ............................ 1,662 106,466 121 336 853 - 766 91 288 3,986 - 4,085 104
1 0 under $500........................... 7,688 493,459 2,081 2,035 12,016 - 11,322 918 1,956 6,852 7 8,220 1,522
00 under $1,000... ......................M 5,106 333,210 3,783 1,619 8,230 2 7,566 783 1,883 8,901 - 10,337 1,611
$1,000 under ~',5,000 ..............' ' '--
15,050 98~,827 38,643 7,325 36,122 9 32,986 3..663 7,988 36,158 3 41,577 6,217
5,000 under ~10,000 . . .............. 7,568 498,004 54,888 4,734 45_363 1 39,850 5,859 5,482 35,463 - 43,132 a,274
~10,000 or more........................... 27,477 1,892,424 1,379,453 26,456 393,333 8 372,573 28,402 35,334 302,649 32 344,628 48,83C
Net loss, total ............................. 28,476 1,854,620 126, CY78 27,497 264,657 6 250,982 14,489 43,026 271,564 23 318,717 55,598
Under $50 ................................. 957 61,532 19 237 581 - 525 96 460 4,058 - 4,345 337
t5O under $100 ............................ 658 42,134 48 403 1,904 - 1,766 . 139 556 2,369 7 2,863 498
100 under $500........................... 4 087
,
261,702 1,185 1,581 7,007 2 6,482 606 2,276 9,227 1 10,086 1,045
VOO under $1,000 ......................... 4 875 315,590 3,699 2,005 7,803 - 7,107 767 3,217 12,325 - 14,177 2,141
l,oOO under t5,000.. ..................... 12,954 843,829 29,M 10,059 126,270 - 121,983 4,743 14,924 63,144 16 74,768 13,379j5,000 under tlo,000 ...................... 2,533 169,027 17,818 4,048 27,608 - 25,608 2,105 7,018 43,588 - 51,152 8,816
10,000 or more........................... 2,412 160,805 74,261 9,166 93,485 3 87,510 6,034 14,575 136,853 - 161,326 29,382
TAXABLE RETURNS $100,000 OR MORE
Current year net gain or net loss beforelimitation:
Net gain, total............................. 20,004 4,251,378 3,345,490 21,574 389,113 73 367,897 34,138 30,119 507,055 12 561,349 68,56~
Under $50 ................................. 387 66,713 8 42 258 - 247 11 39 794 - 824 4C
50 under $100 ............................ 201 33, 077 15 25 56 - 52 6 24 142 - 151 Ic
100 under $500 ...........................
1
923 143,285 259 206 1,408 - 1,332 85 227 874 - 1,056 20,
500 under $1,000.. ....................... 652 101,606 477 155 950 - 861 97 202 1,179 1 1,390 256
1,000 under $5,000 ....................... 2,391 386:532 6,4a4 1,077 8o722 3 8,058 675 1,293 19,976 - 21,475 1,87S~5, 000 under $10, 000...................... 1,387 227,732 10,124 921 18,332 - 17,834 670 1,129 13,281 - 14,474 1,41E
$10,000 or more ........................... 14, C63 3,292,433 3;328J23 19,150 359,388 70 339,503 32,393 27,207 470,808 11 521,979 64,76~
Net loss, total ............................. 4,318 723,034 43,i38 4,621 57,636 - 53,827 4,361 7,440 84,265 3 96,70`7 17,394
Under $50................................. 152 32,855 3 18 33 - 18 19 37 522 - 537 1~
50 -der $100 ............................ 73 11,919 5 14 102 - 99 9 39 463 - 480 IE100 under 500 ...........................
1
411 65,401 117 147 878 - 775 156 217 1,405 - 1,559 17,'~500 under 1,000 ......................... 572 90,932 430 364 2, 0`70 - 1,900 20`7 498 3,025 - 3,406 422
1,000 under $5,000 ....................... 1,866 294,187 4,515 1,423 11,986 - 11,230 893 2,193 16,483 - 18,846 2,69f
5,000 under $16,000 ......................
1
513 87,517 3,601 672 5,715 - 5,268 566 919 8,036 - 9,5,45 1,85E
10,000 or more ........................... 732 150,223 34,466 2,184 36,852 - 34,538 2,510 3,537 54,330 2 64,334 12,20E
NONTAXABLE RETURNS
Current year net gain or net loss beforelimitation:
Net gain, total ............................. 837,147 1,426,216 1,423,654 65,639 263,931 ?G4 231,358 52,984 52,185 139,550 124 167,921 33,38-,
Under $50.. ............................... 57,819 90,092 1,433 1,820 525 8 451 116 1,787 1,673 - 1,957 295,
50 under $100 ............................ 60,288 106,262 4,410 5,206 6,251 3 5,956 276 2,447 3,050 - 3,380 37S100 under 500 ...........................
1
258,148 426,466 69,024 20,929 47,772 5U7 39,624 10,150 19,119 35,929 29 45,373 9,8a1500 under 1,000 ......................... 164,751 291,009 117,879 9,791 15,283 109 11,565 4,110 8,196 10,491 61 12,867 3,42~
1,000 under $5,000....................... 256
1
023 497
,
378 542,510 18,936 58, OC17 35 48,6_34 11,505 13,760 28,410 34 32,963 4,85f5,000 undr $16,000......................
e1
23,804 32,717 163,597 3,820 15,953 42 13,492 8,736 2,276 2,070 - 6,590 5,551
more ...........................10,000 or 16,314 -17,710 524,801 5,137 120,141 1 111, 635 18,092 4,599 57,928 - 64,772 .9106E
Net loss, total ............................. 187,125 307,667 452,519 118,856 502,829 201 473,157 35,600 178,911 800,941 4,037 936,403 164,92~
Under $50 ................................. 21,533 28,660 337 2,984 6,881 - 6,352 3,992 6,272 21,636 5 25,145 4,011
50 under $100 ............................ 10,260 16,934 733 467 999 - 962 37 534 1,261 - 1,301 4(100 under $500 ...........................
1
46,292 79,316 12,034 7,5017 12,343 - 11,091 1,202 17,255 27,662 281 31,161 3,49~
500 -der $1,000 ......................... 30,865 47,788 22,061 7,683 21,291 - 18,537 2,756 10,461 27,100 74 31,948 5,11E
1,000 -der $5,000....................... 57 842 83,181 128,698 38,413 101,723 146 93,251 10,631 56,863 112,316 3,651 144,295 36,69~5,000 under $16,000......................
1
12:029 25,521 78,029 37,791 US, 477 - 112,219 6,238 47,388 110,153 - 138,859 36,77110,000 or more ........................... 8,303 26,266 210,627 24,011 241,116 53 230,745 10,743 40,138 500,813 26 563,694 78,79!
Footnotes at end of table. For the precise definition of terms and the nature of any limitations, see the "Description of the Sample," "Limitations of the Data," and"Explanation of Cleasifications and Terms I' in the text.
F

SALES OF CAPITAL ASSETS ON INDIVIDUAL RETURNS, 1962RETURNS WITH NET CAPITAL GAIN OR LOSS
Table 4.-SHORT-TERM GAIN, SHORT-TERM LOSS, LONG-TERM GAIN, AND LONG-TERM LOSS TRANSACTIONS -INCOME, NET GAIN (LOSS), AND TRANSACTION DETAIL,BY SIZE OF ADJUSTED GROSS INCOME AND CURRENT YEAR NET GAIN OR NET LOSS BEFORE LIMITATION-Continued[Taxable and nontaxable returns]
I,ong-term capital asset anzactions
45
Gain transactions loss transactions
Size of adjusted gross income and size of current yearnet gain or net loss before limitation Number of Gross sales Depre- f Gros,
N b Gross sales Depre- Cost andGross
rans-t
.price
ci.ti.n
._ oeas
egain
um er oftrans-
.price ciati- expense of
sale lossactions
(Th...-d (Th...-d (Th-.-d actions(Th...-d (T~-d (n-d (Th ..d
d.11!L.) d.11 ... d~ll ... d.IJ ... ~Ij ... ) djj.,.) ~11-)(14) (15) (16) (17) (18) (19) (20) (21) (22) (23)
TAXABLE RETURNS $50,000 UNDER ~100,DOO
Current year net gain or net loss before limitation:
Net gain, total... ........................................ 253,726 2,549,487 46,597 1,295,633 1,774,480 130,675 669,452 3,630 907,355 268,465Under $50 ...............................................50 under $100 ..
3,6735822
3,177 21 2,423 916 690 2,480 36 3,118 7131 .. ......................................10C
, 3,237 14 2,629 832 948 2,897 10 3,558 698under $500 ........ ................................ 14,266 32,269 855 25,245 10,028 6,228 19,581 165 26,636 7 343500 under $1,000....................................... 12,285 39,712 859 31,122 12,192 5,405 20,381 100 27,844,
7,581$1,000 under $5,000.....................................t5 000 under $10 000
46,250 203,419 4,093 148,58-, 78,431 24,817 99,161 563 132,47? 37,233, , ....................................~io o,- r o
31,685 198,901 4,036 133,771 87,793 17, OCV, 83,627 297 109,743 30,490, - - o m re ......................................... 142,986 2,G68,772 36,719 951,856 1,584,287 75,583 461,335 2,461 603,978 184,407Net loss, total .............................. ; ............ 71,725 383,776 2,076 287,526 110,502 98,506 448,845 1, 307 635,025 195,471
Under $50 ...............................................50 under $loO ........ ..
1,148 4,984 16 3,699 1,466 1,391 4,693 196 5,980 1,2441 . ...............................100 "der $500 ..........................................
1,2.347,093
4,67725,499
49174
3,19719,140
1,6787,311
1,3128,135
4,35625,669
6130
5,68933,613
1,3678 057500 under $1,000 ....................................... 10, 070 42,498 232 32,920 11,098 12,202 34,773 147 47,885
,13,422
1,000 under $5,000 .....................................5 000 under $10 000 .
30,667 138,311 734 102,923 39,627 42,105 149,609 325 29?, 490 60,039, , . .. . ...............................$10 000 or more ....
9,095 53,775 214 39,400 16,848 13,061 67,771 169 94,593 27,955, ..................................... 12,418 114,032 657 86,247 32,473 20,299 161,974 3.34 239,775 83,387
TAXABIE RETURNS $100,000 OR MORE
Current year net gain or net loss before limitation:
Net gain, total ................... ........................ 122,588 4,081,518 95,058 1,440,577 3,627,953 73,700 686,787 2,111 905,002 248,0344Under $50 ...............................................50 und $100
543 1,169 6 923 317 196 1,799 9 2,082 280er ..........................................I
V488 1,405 4 1,215 215 198 1,472 3 1,665 1970 -der $5oO ....
0.....................................
$500 und r $1 0002,177 8,768 147 7,357 1,867 1,071 9,563 12 11,038 1,489e , ....................................... 1,762 8,977 69 7,053 2,508 951 7,834 17 9,693 1,872
1
,
000 under $5,000 ........ :,* ....... * ... * ..............6
9,702 63,326 60,734 107,761 19,464 5,340 62, 512 138 73,968 11 97651000 -der $1 ,000 ....... ............................1
7,089 61,861 958 45,368 21,880 4,274 32,448 77 42,817,
11 01010,000 or mom.. ....................................... 100,628 3,936,014 33,138 1,270,901 3,581,702 61,680 571,158 1,854 763,739,
221,209Net loss, total ........................................... 17,780 178,035 526 130,441 54,750 22,289 217,662 432 298,388 84,854
Under $50 ............................................... 134 111 - 11. "1 1 -50 -der $1.00 .......................................... 140 84T) - 672 1,9 ',2'5'2'
122198
J100 under $500 ........ ................................ 975 5,556 8 4,144 1
,
596 1
,
013 6,109 6 7,766 1 694500 under $1,000 ....................................... 1,824 U, 767 16 10,010 31107 11876 12,496 3 15,740
,3,322
1'000 under $5,000 .....................................
5,000 under $lb OOO .......................1
6,3802 680
44,75325 929
1401
32,798 13,667 7,745 51,119 77 66,854 16,379, .............
10,000 or more .........................................,
5,647,
87,85720
23919,50063,080
7,35028,708
3,2417 980
28,761114 162
51195
38,184164 411
9,65947953, , , ,
NONTAXABLE RETURNS
urrent year net gain or net loss before limitation:
Net gain, total........................................... 1,335,776 3,205,293 457,873 2,428,009 1,626,636 204,094 369,573 23,981 504., 097 222,569Under $50...............................................50 under $100
61,981 23,110 1,945 23,311 2,773 9,056 6,755 279 8,016 1,149..........................................100 under $500.........................................
1
68,650366,215
29,186307,299
3,4B823,197
26,80`7258,947
9,16093 153
11,83861 740
6,95854 024
9583 493
12,48574 419
4,64724 4500 under $1,000....................................... 265,750 297,262 2?,370 214,586
,138,829
,28,205
,31,063
,2,369
,38,450
, 7321,637
1'000 under $5,000............. ..........
5 000 under t1b 000 ...1
467,96151
1,351,346 121,619 974,446 599,304 69,485 133,952 11,054 176,809 63,443, , . ................................10 000 or more .
,605 348,613 39,135 246,711 177,587 8,564 21,497 1,133 31,223 17,169, . ....................................... 53,612 848,476 241,118 683,202 605,828 15,207 115,324 4,696 162,693 90,051Net loss, total ........................................... 151,899 460,732 11,490 344,155 182,545 367,781 1,088,276 77,303 1, 627, OU 505,734
Under $50 ........................... ...................50 -der $100 ...
12,368 13,643 1,293 8,946 10,647 24,345 24,875 1,876 34,371 10,966.......................................100 -der $500
1
6,866 5,360 227 4,096 1,518 21,258 35,280 1,136 38,637 2,248.........................................500 under $1,000 .......................................
23,82822 408
34,66642 119
1,8031 043
27,440
35 19911,499 66,400 105,772 13,625 137,572 21,243
, , , , 9,424 53,622 129,950 12,291 169,664 29,125$1, 000 under $5, 000 ...... ..............................$5,000 under $16 000 ..... .
47,17115
96,818 3,399 78,766 55,628 104., 799 315,481 32,996 495,808 158,257, . .............................§10 000 or more ...
,570 116,950 163 81,115 40,544 41,485 166,609 9,158 260,149 88,036, ......................................1
21,688 1 149,176 1 3,564 1 108,592 1 53,285 1 5.5,872 1 3.10,309 6,220 490,611
,
195,860
- A dash in a cell indicates that either there are no date for that item or, it amounts to less than $500.NOTE: Detail in the tables may not add to totals because of rounding. .
For the Precise definition of terms and the nature of any limitations, see the -Tescription of the Sa~ple," "Limitations of the Data," and "Explanation of Classifications,nd Terms" in the text.

r,46 SALES OF CAPITAL ASSETS ON INDIVIDUAL RETURNS, 1962
RETURNS WITH NET CAPITAL GAIN OR LOSS
Table 5.-SHORT-TERM GAIN, SHORT-TERM LOSS, LONO-TERM GAIN, AND LONG-TERM LOSS TRANSACTIONS -INCOME, NET GAIN (LOSS), AND TRANSACTION DETAIL,
BY ASSET TYPE AND SIZE OF CURRENT YEAR NET GAIN OR NET LOSS BEFORE LIMITATION[Taxable and nontaxable retur.~sj
CurrentShort-term capital asset, transactions
Adjustedyear It Gain transactions Loss transactions
size of current year actAsse~ITe
and Number ofgrossi e
ap gairti=)
NumberGross D -,pr
Cost andGross Number Gross D -epre
Cost andGrossl
gain or It
ass before limitation returnsncom befor~
ofsales
eiat.o.
expensegain of sale
.s
cis
tion exDense losslimitation
trans-rieep of sale trars- price of sale
(T~- d (Tbw d actions -d(7h.. (T~-:-d ( Th-:-d T~- actions (D.. -d: (7h...-d (Th-= (n -d:~d.) i
:7d.11 ~)
:d.11
_)
,d.11 )
,d.11 d.11
,.)~z
1d~jl ... &11
-) d.11 ...
W (2) (3) (4) (5) (6) (7) (8) (9) (10) (11) (12) (13)
ALL ASSET TYPES'
Current year net gain or net lo- before
limitation:
..........Net ain total . 4,379,820 46,456,378 13,633,516 680,697 3,332,318 2,496 3,053,628 360,309 538,284 2,452,363 764 2,785,275 391,649..g , ............. ...
Under $5G ................................. 633,984 5,819,901 14,168 56,702 96,600 51 89,284 6,552 30,857 127,036 15 133,041 6,290
550 under $100 ............................ 355,120 3,092,949 25,639 32,992 32,286 10 29,675 3,090 13,473 18,908 9 20,996 2,285
500 ...........................~100 under 1,176,598 9,702,306 307,185 133,102 283,031 1,046 254,003 33,454 73,310 129,645 195 153,178 25,103~
$500 under 1,000. ........................ 626~516 5,062,304 451,870 84,859 302,259 439 279,716 28,124 59,072 125,638 65 145,094 25,030
$1,000 under $5,000 ....................... 1,128,329 10,769,219 2,537.624 196,648 798,766 526 710,958 100,306 153,523 530,393 212 604,794 83.102
5 000 ..er $lb,000 ...................... 241,615 3,567,897 1,693,271 58,389 336,756 259 298,360 49,602 57,527 238.213 173 284,283 52,151,
1G,000 or more ........................... 217,659 8,441,902 6,603,561 118,004 1,482,619 166 1,391,633 139,182 150,523 1,282,531 96 1,443,890 197,688
Net loss, total ........................ a .... 1,428,125 17,582,385 2,616,668 872,819 3,582,672 1,213 3,363,920 246,013 1,397,301 4,538,719 6,142 5,266,591 956,645
Under $50 ...................... .......... 130,632 1,236,266 2,546 19,364 30,147 116 27,913 18,120 41,347 58:558 162 67,674 10,090
50 under $100 ............................ 83,286 819,692 6,077 13,580 15,939 2 14,636 1,473 29,389 26,399 53 29,316 3,216
10C under $500 ...........................
1
3917,015 4,201,808 106,904 87,625 205,397 3 190,148 16,606 183,501 217,883 448 249,396 40,352
500 under $1,000......................... 269,835 3,324,257 195,458 95,576 238,486 - 219,843 19,592 170,221 318,305 376 366,639 57,812
.......... * ...........1,00 und $5 , 0 443,554 6,235,133 913,840 385,703 1,329,455 461 1,251,566 83,838 546,771 1,357,363 5,068 1,593,073 289,761". . ~ . GG' ~ ;
.de~ ...................... 62,732 970,206 427,500 131,599 664,183 30 631,192 33,802 195,792 684,999 3 820,659 164,556
zplO,000 or or ............................ 41,071 795,023 964,342 139,373 1,099,065 6GO 1,028,621 72,583 230,279 1,875,211 30 2,139,634 390,858
CORPORA.TF STOCK
Current year It gain or net loss beforelimitation:
Net gain, total ............................. 1,054,891 17,514,404 5,161,691 444,071 1,889,794 1,711,909 176,744 337,696 1,473,9091 1,
706,6?9 232,770
Under $50 ................................. 133,814 1,689,867 3,019 40,078 28,903 26,512 2,369 9,995 16,042 18,129 2,087
50 under $100 ............................ 74,211 855,926 5,277 22,300 23,117 20,687 2,413 7,231 9,764 10,906 1,142
100 under $500...........................
1
272,141 3,166,276 71,128 97,652 217,897 193,007 24,747 53,521 91,806 109,741 17,935
500 under $1,000 ......................... 147,079 1,817,879 105,892 54,425 219,443 203,582 15,815 35,009 89,862 102,691 12,829
tl.000 under $5,000....................... 289,374 4,226,735 666,621 127,422 482,707 424,643 57,742 104,07? 354,218 414,266 60,048
~5 000 under $10,000 ...................... 64,527 1,458,661 451,965 35,396 250,969 228,279 22,615 38,056 177,9541
208,923 30,969'000 or more ........................... 73,745 4,299,057 3,857,788 66,-799 666,759 615,199 51,043 39, 804 1 734;262 842,022 107,760
Net loss, total.......... .................. 1,067,071 16,232,530 2,109,772 817,150 3,201,460 2,988,313 211,451 1,228,878 4,068,862 4,707,515 638,653
Under $50 ................................. 75,373 885,987 1,711 13,500 26,029 23,665 2,361 30,757 44,000o
48,691 4,691
50 -der $100 ............................ 54,041 615,346 4,015 12,386 18,273 16,665 1,606 23,046 20,188 22,989 2,801lGo
under 500 ........................... 290,425 3,541,210 78,487 83,801 205,077 188,839 16,110 145,124 191,350 219,569 28,220~~500 under 1,000 ......................... 206,776 2,928,767 149,535 84,415 212,090 193,648 18,395 130,579 227,429 266,554 39,125
1,000 under $5,000 ....................... 355,03-2 6,115,368 727,415 353,903 1,155,484 1,085,769 68,849 477,938 1,098,277 1,297,380 199,103
5,000 under $16,000 ......................
1
50,702 1,041,912 346,267 124,074 453,806 423,683 29,914 179,279 592,947 705,091 112,244
10,000 or more... ........................ 34,741 1,193,941 802,342 145,072 1,130,701 1,056,044 74,215 242,155 1,894,772 2,147,241 252,470
U. S. GOVMUOENT OBLIGA.TIONS
Current year It gain or net loss beforelimitation:
Net gain, total ............................. 27,268 665,4~3 18,207 6,737 548,504 546,526 1,977 1,794 55,318 55,510 193
Under $50.'- ... * ............ -* ... * ...
7,478 156,681 173 2,099 18,172 18,120 52 684 1-2,868 12,671 3$50
under i100 ............................. 3,311 73,239 251 487 7,789 7,762 27 273 4,093 4,095 2
500 ...........................~100'a'de r
11 839 224,434 2,517 1,871 36,812 36,586 226 353 9,459 9,466 7
$500 under 1,000 .........................1 1 833: 70,985 1,314 358 26,018 27,925 93 149 3,046 3,061 15
$1,000 under $5,000 ....................... 1,886 94,681 4,103 1,048.76 719 76,122 596 118 12,266 12,402 136
5,000 under $16, 000 ...................... 768 22,459 4,3S6 782 20:748 213,169 579 204 5,544 5,571 2?
110,000 or more.. ......................... 153 23,074 5,464 92 167,246 166,840 406 14 8,041 8,044 3
Net loss, total ............................. 15,968 535,852 7,239 465 10,389 10,349 4-0 6,355 101,141 101,913 772
Under $50................................. 6,042 254,062 77 144 1,33.3 1,329 4 2,935 58 650 58,672 22
50 under $100 ............................ 1,305 44,589 88 59 532 522 10 907 9:035 9,066 31
100 under 500 ...........................
1
5,557 124,513 1,461 135 4,796 4,794 2 1,864 14,572 14,750 17E
500 under ,1,000 ......................... 1,3.34 40,936 910 65 1,589 1,585 3 356 7,785 7,903 lie
ti,000 under $5,OGO ....................... 1,558 59,429 3,007 50 1,939 1,923 15 258 6,398 6,691 294
A~5,000 under $10,000 ...................... 132 .7,646 841 11 200 195 19 31041 3,074 32
$10, 000 or -a ........................... 41 4,676 854 1 -- 17 1,660 1,756 91,
STATE AND LOCAL SECURITIES
Current year net gain or net loss beforelim4tatioc.:
Net gain, total ............................. 34,299 1,340,102 55,767 5.,019 99,672 97,477 2,195 2,180 48,5011
49,174 673
Under $5C .................................. 5 928 174,3143 118 389 2,128 2,116 11 64 1,832 1,834 25C - er $100............................d 2 636 89,954 190 236 635 819 16 24 389 392
_$10C -der $500 ........................... 14,088 389,664 4,098 673 4,683 4,545 138 252 4,951 4,994 ~4
3~560 under $1,000 ......................... 3,472 175,223 2~431 333 6,587 6,459 128 275 5,914 5,966 52
-5 0001, 000 and... * ..........."* . ..e' E , *V
6,483 337 724 15 205 1,524 34,079 11 33,312 ?67 -3400
7,530 11 7,5891293
5S45Cr . . ...000 und " C . 968 65:827 6:859 1,671 3 954
9
39,156 798 1, 96 22,6791,
,2
$10,000 or more ........................... 723 1-7~367 26:867 193 11,406 il,069 337 129 5,205 .1 5,270 61,
Ne-~ loss, total... ................. ........ 18,372 831,251 20,424 ~960 11,535 11,172 363 4,130 71,248. 74,209 2,961
Under $5r ................................. 3,610 214,246 47 39 27-
258 12 671 19,750 19,761 11
~50 under $100 ..... ...................... 1,681 58,490 133 4 6161
254 .3,716 3,731 1~1
1100 under $500 ........................... 6,636 198,214 1,581 440 5,293 5,248 45
1,988 10,460 10,818 35~
$500 under t, 000 ......................... 2,445 101,472 1,793 60 653 639 20 191 3,378 3,489 ill
'l,GW under S5,000 ....................... 3,035 168,574 6,178 345 2,3356 2,202 155 725 22,645 23,658 1,01~
~5,000 under '?10,00C ...................... 526 33.317 3,477 14 109 104 5 62 3,076 3,228 151
$X,000 or more ........................... 240 56,939 7,216 59 2,787 2,660 126 239 8,223 9,524 1,303
Footnotes at end of table For the precise definition of terms and the nature of any limitations, see the "Description of the Sample," "Limitations, of the Data," and-'FxplanaLior. of Class if--' cet ions and Terms" in the text.

SALES OF CAPITAL ASSETS ON INDIVIDUAL RETURNS, 1962RETURNS WITH NET CAPITAL GAIN OR LOSS
Table 5.-SHORT-TERM GAIN, SHORT-TERM LOSS, LONG-TERM GAIN, AND LONG-TERM LOSS TRANSACTIONS- INCOME, NET GAIN (LOSS), AND TRANSACTION DETAIL,BY ASSET TYPE AND SIZE OF CURRENT YEAR NET GAIN OR NET LOSS BEFORE LIMITATION-Continued(Taxable and nontaxable returns]
47
Asset type and size of c-rent year netgain or net loss befon_~ limitation
Long-term capital
Gain transactions
t andGross.sales Depre-
CosGrossNumber of c
e pense oftrars-
price iati..sale
gain
actions(n.-d (7h...-d (Th-d (Th...-d&11 ~11 ... d.11 ...
asset transactions
Loss transactions
Cost andGross sales Depre- GrossNumber oftrans-
price i.ti-expense of
lossactions
sale
(Th...-d (Th-d (Th-d Th...-d&liars) ~11 ...) &liars) ~Ilars)
(14) (15) (16) (17) (29) (20) (2l) (22) (23)ALL ASSET I-PES'
Current year net gain or net loss b,fore limitation:
Net gain, total ........................................... 7,177,901 26,347,775 1,663,321 16,026,854 15,709,021 1,475,232 3,842,135 77,01-8 5,156,091 2,044,166Under $50 ............................... .............111 under $100
656,453396 9
148,283 10,430 140,926 29,466 54,519 51,091 1,644 65,787 15,560J ......................... ................100 under $500 .........................................
, 711,555,322
147,616
1,517,42214,599
101 313140,747
1 328 63940,159
429 9274-5,189
242 08140,400
303 5232 349
10,32356,002 15,325
500 under $1,000.. ..................................... 1,010,203 1,598,747,
104,101, ,
1,268,776,
559,501,
170,000,
271,738 6,322404,558354,519
131,093110,726
$1,000 under 15,000 .....................................d t10 000t5 000
2,212,098 7,07c),746 575,398 5,211,491 3,049,439 481,276 1,011,516 29,197 1,349,864 528,819er .. un ....................................$16 000 or more .
589,52175 33
3,725,46q 241,931 2_164,091 1,976,852 166,5455 474, 004 7.727'
638,001 261,032, . ........................................ 7, 2 12,149,493 615,549 5.572J95 9~623,677 315,623 1,689,862 19, 45-- 2,287,362 961,611Net loss, total .............................. ; ............ 1,215,856 3,193,391 41,847 2,417,106 977,259 2,651,696 5,861,609 199,590 8,653,244 2,883,295
Under $50.. .............................................50 under $100 .........
61,97642 097
80,716 2,504 60,647 30,929 137,163 170, 569 7,793 203,264 41,504.. ...............................100 under $500 .........................................
1
,238,747
42,981380,957
1,3018 675
33,352294 089
12,414014107
97,444533 154
108,121695 364
6,46634 575
130,27990
16,748
500 under $1,000 ....................................... 212,739 395,082,
6,061,
310,880,
108,029,
459,776,
767,406,
35,6911,526
1,054,545190,172265,266
1,000 under $5,000. ....................................15 000 under $10 000 .
464,41786 86
1,198,296 12,172 919,742 364,031 988,731 2,224,369 80,531 3,305,536 1~071,94B, , . ..................................000 or more ....ilO
, 6109 0
427,408 2,269 307,?97 133,184 204,519 747,234 22,392 1,165,290 4-34,929, . .................................... , 13 66?,952 8,666 490,599 216,659 231,909 1,148,545 12,141 1,892,801 862,727
CORPORATE STOCK
Current yc-ar net gain or net loss before limitation:
Net gain, total ........................................... 2,056,361 11,6B9,558 '5,581,915 6,022,385 783,389 2,212,018 1016,687 804,668Under $50 .............. ................................
50 -der $200 ........... ..........134,720 65,612 53,279 12,174 31,215 30,134 39,570 9,4371 ....................
IOG under $500 ........ ................................86,952
363,17170,630
603,12S59,866
480 44510,495
119 89316,651
114 42821,015
244 83327,504
300 46 489
500 under $1,000 ....................................... 240,404 549,907,
396,312,
151,995,
78,4SO,
155,290, 61
204,37855,57849
,088
11,000 under $5,000 ..... ...............................ooo .......OGO under $16 .
682,M4 2,505,9611
1,593,621 895,057 275,312 615,375 841,505 226,130P , . ...........................10 000 or more
211,775 1,247,239 . 678,161 560,328 92,159 274,627 3?4,636 10c), 009, ......................................... 338,655 6,647,080 2,320,232 4,272 444 175 145 870,694.1 1,228,633 357,938
Net loss, total ........................................... 864,332 2,914,42? 2,182,620.
:727 787 2, :323 785 4,592,098 \7,002,455 2,410,357Under $50 ...............................................
50 under $100... .......29,976 57,2175 42,154 14,968 80,048 93,557
1 107,906 14,350................................1 0 under $50001
25,587 43,474 o 30,763 12,707 64,497 77,BS7.1 93 415 15,529....... .................................
500 under tl, 000 .......................................152,577136 894
331,855319 152
254,556242 462
77,1563
420,282 4027321 545854 143,533, , , 76, 36 378,940 465,264 670,405 205,142
ti,000 under $5,000 ............................ ........
5 000 under $16 000 ..343,303 1, 100, 509 S31,192 266,945 914,736 1,672,451 2,536,557 864,105, .. ................................,
000 or more ....11073,849 368,397 276,437 91,481 205,225 587,715 943,133 355,418, ..................................... 102,145 693,765 505,057 188,193 260,056 1~292,904 ~,105,1& 612,2BI
U. S. GOVERNMENT OBLIGATIONS
urrent year net gain or net loss before limitation:
Net gain, total ........................................... 32,680 358,697 341,918 16,598 3,091 28,1081
28 284
,
176Under $50 ...............................................50 under $100 ............... ..
6,884 26,537 26,394 139 932 5,791 5 605 14.. .......................VOO -der $500 ................
3,797 1?,6.70 17,435 232 379 2,676 2 684 6.........................$500 und.r $1 000 ............
13 877 88 254 85 834
'
2 344 769 8,042 8,088 45, ...........................2,316 30,663 29 '330 1,243 89 1,655 1,662 7
1
,
000 under $5.,ooo......... ...........................51000 under $10 000.. .....................
1
3,174 98,222 94,520 3,694 289 4,844 4,895 52, .............10,000 or more .............. ....
2,344 28,908 25,025 3,883 591 3,404 3 453 49. ...................... 288 68,445 C3,381 5,064 41 1,695 1,698 3Net loss, total ...........................................
1,420 10,641 10 704 136 18,1~8 218,356 224,999 6 644Under $50 ...............................................50 under $100 ........................ .
575 3,055 3,030 26 6,550 60,840 10 60,925
,
841 . ................
0under $500 .....
10
73 255 251 3 1~296 13,138 13,209 71....................................5 0 under $1,000 ..............................0
410 2,448 2,431 17 6,242 51,24B 52,550 1,302.........
$1 000 under $5 00096 1,705 1,699 6 1,591 18,390 19,191 801
, .....................................$5, 000 1-d.r $16 Goo...................
252 2,945 2,869 77 2,126 57,601 60,407 2,80E, .................~IU, 000 or more .............. . .
13 420 412 8 250 7,531 8,403 822. . ........ ..............2 13 13 - 103 9,557 10,315 75~~
STATE AND LOCAL SECURITIES
irrent year net gain or net loss before limitation:
Net gain, total ........................ ........ ......... 56,150 471,105 414,651 56,411 10,042 103,290 105 457 2 1Under $50. ..............................................56 under $100 ..........
5,978 7,302 7,133 168 876 5,130 5:192
,
50................................tlOO under Mo ....
4,281 10,200 9,950 250 499 2,934 3,00 73.....................................
$500 under L 000..............17,671 88,207 83,992 4,214 2,724 22,803 23 013 2 10, .........................5,576 41,161 38,649 2,508 1,228 13,651 13,804 1-53
$1,000 under $5,000.....................................S5,000 under S10 00o .............
14,819 146,510 131,231 15,248 3,423 33,411 34,161, .......................S10 00C, or ............
4,023 55,876 49,075 6,800 584 9,135 9,426 291, .... 3,803 121,849 94,621 27,224 709 16,227 16"856 629Net loss, total ........................................... 5,131 43,535 41 379 2,150 29,543 238:530 258,506 19 976
Under $50 ...............................................50 under $10G .....................
346 1,854 1:793 62 4,485 47,046 47.',56
,
109...................VOO -der 1500 .........
673 2,073 1,937 136 2,019 9,780 ic,,- 403 254................................$ CC, under SI,000.. ..............5
790 4,384'
4,235 149 6,054 1 35,533 1,417......... ........
k,000 under t5,000 .................672 4 ,124 3,985 139 4,276 25,661 27,501 1,840
.....5,000 under $10,00C.. ............. *"" ..... ** .... *
1,743 15,095 14,351 744 6,746 52,409 5F,473 064~ ...... ...............10,000 or ...c ...................
482'
9,901 ? 701 200 1,949 29,638 33,167 529......................4 25 6,104
,378 720 2,013 39,979 46 641 '762
C
Footnotes at end of table. For the precise definition of terms and the nature of any limiLations, see the "Descrigtion of the Sample," "Limitations cf the Data, " and"Eyplana--ion of Classifications and 7erms" in the text.

48 SALES OF CAPITAL ASSETS ON INDIVIDUAL RETURNS, 1962
RETURNS WITH NET CAPITAL GAIN OR LOSS
Table 5.-SHORT-TERM GAIN, SHORT-TERM LOSS, LONG-TERM GAIN, AND LONG-TERM LOSS TRANSACTIONS -- INCOME, NET GAIN (LOSS), AND TRANSACTION DETAIL,
BY ASSET TYPE AND SIZE OF CURRENT YEAR NET GAIN OR NET LOSS BEFORE LIMITATION -Continued[Taxable and nontaxable returns)
CurrentShort-tem capital a sset transactions
Adjustedyear net Gain transactions Loss transactions
Asset type and size of current year net Number of5rossincome
capital gain
(loss) Number
Gross
Depre- t~= Gross umbe,Gross
salesDepre-
Cost andexpense
os
Gross
gain or net loss before limitation returns beforeof
sales ciationf sale
gainof
priceciatio.
of saleloss
limitation trans-price o
trans-
(7~.-d (Th-d actions (Th.-d ( 71--d
:
(T~" ~d
I
(D.-d actions (no-d (7?,,..d (TM.,wd (Yh,...d
d.11ars) d.11 ... d,11-) d.11 ...
."
'.) d.11ars) d.1) ... &11 ... 11 ... d.11 ...
(2) (3) (4) (5) (6) (7) (8) (9) (10) 11) (12) (13)
OTIIER BONDS, NOTES, AND DEBENTURES
Current year net gain or net loss before
linitation:
Net gain, total.. ........................... 20,583 604,460 34,530 7,313 96,961 94,497 2,462 1,697 31,649 32,293 643
Under $50 ................................. 4, Ocv. 86,344 68 1,730 3,772 3,720 52 119 96854
986531
is36
50 under $100 ............................ 2,9523316
59,549157 773
2181 734
393
9661
2,3538,304
2,3237,912
30392
500277
91,089 1,125 37
100 under $500 ...........................
500 under $1,000 .........................
,2,742
,91,294
,1,839
,754 3,755 3,540 213 71 2,307 2,321 14
000 ... .............. ---'1 000 nde, $5 3;633 118.164 7.171'
2.308 74,348 72,875 1,472 674 19,290 19,68588
395,
5,000 under $10,000. .....................
1
414 26;782 2 831 33129
7733 655
7194083
54248
1246
3,6373 663
3, 3
3,607
-
14410,000 or more.. ......................... 507 62,576 20,669 , , ,
.............Net loss, total ................ 25,942 629,397 96,690 1,407 11,421
c,
A10,931 587 11,689 177,890 215,034 37,144
Under $50 ................................. 3,396 118,430 39 38 93 o92
15529
632496
5,1592 018
o5,1692 038
1120
$50 under $100 ............................ 1,8630678
37,066514141
132
2,285
146104
164880 857 24 2,629
,7,837
,6,316 482
100 under $500 ...... . ..................
1500 under $1,000 .........................
,2,574
,66,218 1,722 244 519 487 29 1,284 2,131 2,705 574
1'000 under ~5,000 ... ................... 6,784 160,135 14,349 324 2,361 2,240
957
12039
3,6761 425
15,4432 313
20,5698 421
5,1266,109
5, 000 -der $10, 000 ......................
1
1,4826561
43,48662,547
10,88467,279
74476
9966,407 6,043 364
,1,547
,142,991
,'167,813 24,822
10,000 or more ........................... ,
IUSURANCE AND ANNUITIES
Current year net gain or net loss before
limitation:
Net gain, total ............... :. ............ 7,206 108,363 17,587 477 1,512 1,258 255 146 282 339 57
Under $50 ................................. 1,405 13,959 35 106 7 4108
23
--
-
- -
50 under $100 ............................ 7134991
8,35520 678
44370
34149
ill521 491 30 -
100 under $500...........................1500 under $1,000.........................
,1, 092
,14,614 749 104 541 439 102 100 218 270 52
1 000 under $5,000 ....................... 1,728 28,629 3,100 80 320 o204 116
-1
37
--
--
--
5,000 under $10,000 ...................... 444326
8 85713 271
3,05710,231
-5
-
12
-
11 1 7 64 69 5............................,101000
Net loss, total ............................. 937
,
24,151 1,655 499 1,367 1,574 207
Under $50 ................................. 81 2,085 1 3767
3647
3653
-6
50 under $100 ............................ 67420
8449 315
6112 275 515 570 551
100 under $500 ...........................193
,4 930 163 70 269 329 60
500 -der $1,000 .........................
1
'
000 -der $5,000 ... ................... 111
,
4,212 259 134
5210`7
76142
2435
5,000 under 110,000 ......................
i
17 1,3561 409
138976 33 341 368 27
10,000 or more ........................... 48 ,
OPTIONS TO BUY OR SELL
Current year net gain or net loss before
limitation:
Net gain, total ............................. 3,288 78,372 15,147 6,813 92,042 87,880 4,159 12,049 122,605 124,706 2,101
Under $50 ................................. 997 16,216 26 5,493 69,740 66,903 1,837 11,376 113,166 114,986 1,820
N under $100 ............................
100 -der $500 ....... ...................200652
4,82714,144
13163
11803
18,728
-
8,4211
30`7-
610
-
9,413
-
9,686
-
273
500 under $1,000 ......................... 201 5,666 152 4 6 6 1 - - - -
I,OC,O under $5,000 ......... ............. 758 17,541 1,830 343 12,217 11,784 430 59 19 24 53
5,000 under $16,000 ......................
P
239 7,541 1,583 114 637 155 483 4 7 10
0,000 or more ........................... 241 12,437 11,379 46 1,713 612 1,101 - -
-
-
Net loss, total... .......................... 7,343 131,730 7,769 1,863 25,219 24,793 425 10,089 76,574 82,454 5,880
Under $50 ................................. 55 3,158 1 - - 13 450 450416
-
315r under tloo ............................100
under $500 ...........................537
3,432
3,12248,795
34769
-
100
-
762
o -
773
-9
372,933
4135,470 6,070 599
500 under $1,000 ......................... 1,318 29,383 873 409 3,698 3,661 37 1,890 10,412 10,991 579
1'000 under $5,000 ... ................... 1,759 36,951 3,097 910 5,864 5,733 131 4,219 16,509 18,620 2,111
5,000 under $10,000 ......................E
175 6,Z26 1,095 5 15 11 4 366 9,734 10,355 622
0,000 or more ........................... 68 4,094 1,901 438 14,860 14,615 245 631 33,585 35,551 1,966
CCI&ODITIES INCLJJDING FUTIRE CONTRACTS
Current year net gain or net loss beforelimitation:
Net gain, total ............................. 12,961 137,172 17,731 25,620 19.5, C172 181,624 13,157 19,111 164,302 170,931 6,629
Under $50 ................................. 1,638 12,459 42 12,260 61,230 57,329 3,901 14,123 106,545 110,434 3,889
85C under $100 ...... _.. ...... _ .........
(IV
(.) (.) M M
SlGC under $50C ........................... 4~424 36,813 166 5,292 22,750 21,758 943 1,932 7,878 8,294 416
t500 under $1,000......................... 2,515 19,740 1,804 1,013 2,987 2,532 415 221 1,271 1,311 40
~1,000 ..do, ~5,000....................... 3,385 31,176 6,671 5,433 34,560 31,800 2,760 2,237 12,582 13,772 1,189
0000 under 310,000 ......................10, GOO or mole ....................... .... 226 22,443 6,545 499 64,994 o~ 61,533 3,461 269 34,909 35,630 721
Net loss, tazal. .......................... 15,663 259,432 32,729 32,840 184,437, 17,,304 9,090 48,921 302,300 339,458 37,157
Under Sq5O .................................50 under tlOO ............................ 1,078 10,46S
M82 472 2,097
oM2,056 41 669 2,138 o 2,215 77
100 und-- '5CO ......................** ._ " *
4,127 60,512 1,082 5,952 36,382 35,026 1,323 8,300 45;256 47,546
1
2,2909252
......................~1,00 .$500 unde.- O 3,083 45,327 2,156 6,685 19,941 18,922 1,019 11,753 27,346 30,27 ,
1,C1W nder ~5,&DO....................... 51742 95 609 12 748 13 062 62 127 58 739 3,379 18,747 139 990 153 577
513 587
5,00c, under ~IC,000 ......................
1
(~) (-i (*i (*) (~~ (~) (*) (*
10, 000 or more ........................... 507 20,369 12,576 3,150 39,963 1,330 4,380 55,975 69,175 13,200
Foc~-otes at end of table. For the precise definition of terms and the nature of any limitations, see the "D--scription of the Semple, " "Limitationz of the Data," and
"Explanatior. of Classifications and Termsit in trie text.

SALES OF CAPITAL ASSETS ON INDIVIDUAL RETURNS, 1962RETURNS WITH NET CAPITAL GAIN OR LOSS
Table 5.-SRORT-TERM GAIN, SHORT-TERM LOSS, LONG-TERM GAIN, AND LONG-TERM LOSS TRANSACTIONS -INCOME, NET GAIN (LOSS), AND TRANSACTION DETAIL,BY ASSET TYPE AND SIZE OF CURRENT YEAR NET GAIN OR NET LOSS BEFORE LIMITATION -Continued[Taxable and nontaxable returns]
Long-term capital asset transactions
49
Gain transactions Loss transactions
Asset and size of current year net gain or netloss before limitation r oNumb f Gross sales Depre-
Cost andGross Gross sales Deepre-
p
Cost andd~ost
Grosset rice .tion
expense ofain
Number ofrice
I .0
atciatio.
0,e _eexpense of
'
-
rans- sale trans-1
sales
s
lossactions
(n...-d (7)...-d (n-d (7h-.-d actions(D...-d (n-dd
:
(n-dd (Th.-d~11 ... d.11 ... ~11 ... d.11 ... ~11-) ~11 d.11 ...
(.15) (16) (17) (18) (19) (20) (221) (2222) (23)
OTHER BONDS, NOTES, AND DEBEN=
Current year net gain or net loss before limitation:
Net gain, total ........................................... 23,340 168,682 1-34,854 33,590 2,980 32,560 33,439 878Under W ............................................... 2,383 3,557 3,512 45 242 1,719 1 730 1150 under $100 .......................................... 3,344 6,187 5,953 234 316 1,123
,1 134 11100 under $500 ......................................... 6,381 20,741 19,285 1,"2 ?99 2,285
,2 348 63500 under $1,000 ....................................... 3,406 14,712 13,033 1,679 185 725
,
764 39$1,000 under $5,000...... .............................. 5,763 65,364 59,850 6,390 1,164 20
,
990 21 287 297$5,000 under $lQ,C)00 .................................... 565 9,006 6,162 2,841 63 210671
,2 131 640C1_ or more ......................................... 1,499 49,115 28,060 20,9.~9 210 3,652
,4,046 394
Net loss, total .............................. ; ............ 1,856 11,987 10,859 1,065 25,479 138,816 200, 014 61,198Under $50 ...............................................
50 under $100 . ................. .
259
4874
In860 15 3,136 10,374 10,419 45. . .....................
100 under $500 ........... .............................1
3551
1121,961
1101,622
2138
1,8087,130
7,623
22,2817,746
24,247123
1,965500 under $1,000 ....................................... 170 927 861 66 2,165 7,668 8,911 1,243$1,000 under $5,000 .. ..................................$5 000 under $10 000 .................. .
682 4,791 4,343 385 8,218 27,320 37,048 9,728, , . ................$10 000 or more ......... .
54`
1,440 1,146 294 976 18,703 23,813 5,109, . .............................. 107 1,881 1,717 165 2,045 44,847 87,832 42,985
INSURANCE AND ANNUITIES
Current y~.- met gain or net loss before limitation:
Net gain, total ........................................... 8,088 31,552 13,918 17,466 95 351 427 76Under $50 ............................................... 1,827 356 324 32 - - -50 under $100 .......................................... 678 97 55 42 - - -
-
100 -der $500 .........................................
11,392 1,206 865 340 5 9 9
-500 under $1,000 ....................................... 1,159 2,670 1,914 756 37 161 217 561
'000 under .$5, 000 ..................................... 1,935 6,871 3,738 2,999 44 157 11 171 15
5,000 under $10,000 ....................................
1502 4,013 952 3,060 6 6 9 3
10,000 or more ......................................... 596 16,339 6,070 10,237 4 16 20 2Net loss, total ........................................... ill 643 543 100 691 1,667 3,415 1,548
Under $50 ............................................... -50 under $100.......................................... -1100 under t5OO .........................................500 under $1 000
37 5 5 279 172 234 62, ....................................... - - - - 123 232 335 103
1'000 under $5,000... ................................. 8 40 23 17 140 349 600 t2515,000 under $16,000 ....................................
E --
-21 230 333 103
0,000 or more.... ..................................... 67 599 52; 79 85 873 1,901 1,028
OPTIONS TO BUY OR SELL
urrert year net gain or net loss before limitation:
Net gain, total. .......................................... 3,410 20,115 7,012 13,102 280 222 235 13Under $50 ............................................... 543 30 20 9 -50 under $100. ......................................... 230 79 67 12 -
--
-
-
110U under $500 ........ ................................ 576 493 359 132 7 56 -59
-4500 under $1,000 ....................................... 234 404 253 152 - -
-
-I
,
000 under $5,000 ......... ...........................5 000 under $10 000........
1
1,267 2,712 1,306 1,406 268 125 41
125, ............................,10, 000 or more. . .......................................
176384
1,59614,802 .11
4934 514
1,10310 288
-
6
-
41.1
Net loss, total ........................................... 720 1, B-70
,
1,661
,
208 3,663 3,902
.1 51
6,425
10
2,523Under $50.: ............................................. -.50 der $100 .......................................... 493
-
461o
438 2343
5001,374
2811.
1,374335 54-100 under $500 .........................................
1500 under $1,000 .......................................104 295 147 148 691 348 674 326- - - - 706 97
4
27 3301 000 under $5,000.. . ........... _ ...................
15'000 under $16 000. ........104 1,091 1,064 27 1,172 1,598 2,742 1,144, ...........................
~10,000 or more .........................................415
221
-
1229
323 203 683 48027 1 L 190 189
CaMWDITIES INCLUDING FUTURE CONTRACTS
irrent year net gain or net loss before limitation;
Net gain, total ........................................... 13,361 35,492 23,142 12,349 2,681 10,810 11,957 1,147Under $50 ...............................................5C under $100
1,129 196 117 78 401 102 151 49..........................................1100 under $500.. ..... .................................$500 under $1 000 ...........
(.)3,505 3,466 2,673 793 1,13-8 -1,345 -1,500 155-, ............................ 4,489 3,347 1,842 1,505 904 385 461 76
$1,000 under $5,000 .....................................$5,000 under ~10 000 .......
3,631 12,835 7,655 5,180 155 520 598 79, .............................$10 000 or more ........... ., . ............................ 209 14,460. 9,890 4,570 72 8,292 9,057 765
Net loss, total.. ......................................... 4,220 9,013 5,987 3,024 7,457 60,314 68,000 7,686Under $50 ...................................... .........$50 under $100 ...................... ....................$100 -der $500 .................
104 49 39 10 648 311 367 56........................S500 under L,000 ...............
144'
81 51 30 756 1,486 1,631 145........................ 7 28 i3 15 514 804 1,069 265$1,000 -der S'5,000 ....................... ..............$5,000 under $10,000.. ..................... .
3,741 6,700 4,022 2,677 4,580 12,281 17,497 5,217..... ........$10,000 or more .....................
(.)....................
98 948 7.34 214 246 _251 L 4,171
~
920
C
Footnotes
a-, end of table. For the precise definition of terms and the nature of any limitations, see the "Description of the Sample," "Limitations of the Data," and"Explanation of Classifications and Terms" in the text.

50 SALES OF CAPITAL ASSETS ON INDIVIDUAL RETURNS, 1962
RETURNS WITH NET CAPITAL GAIN OR LOSS
Table 5.-SHORT-TERM GAIN, SHORT-TERM LOSS, LONG-TERM GAIN, AND LONG-TERM LOSS TRANSACTIONS -INCOME, NET GAIN (LOSS), AND TRANSACTION DETAIL,BY ASSET TYPE AND SIZE OF CURRENT YEAR NET GAIN OR NET LOSS BEFORE LIMITATION -Continued
(Taxable and nontaxable returns)
CurrentShort-term capital asset transactions
Adjustedyear net
l Gain transactions loss transactions
Asset type and size of current year net gain Number ofgrossinco e
.capita
loss) _ber-N rossG
Depr-
Cost andGross Number
Gross
Depre-ost and
Gross
Gross
or net loss before limitation returnsm
beforef
sales~
e
ciati.nexpense
gain ofsales
ci.tionexpense
-less
limitation
7t
,ceD,of sale trans-
priceof 1
saleof
(7ho. d (Th-d
a t.o_
D-.d (Th-d (77-wd (T~-d actions (7h-md (l)--d (Th...-d (:T)-.-d:d.11 7) d.11 ... &Hars) ~bll ... d.11 ... d.1 J ... ) ~11 ... ) &11 ... ) ~11... &II-)
(2) (3) (4) (5) (6) (7) (8) (9) (10) (11~
( )
(12)
( l)
(1-3)
CAPITAL GAIN DIVIDENDS
Current year net gain or net loss, beforelimitation;
Net gain, total.......... .................. 1,579,689 19,335,772 524,977 5,415 1,410 1,367 17
Under $50 ................................. 566,239 6,078,906 12,118 2,365 35 560 1
$50 under $100 ............................ 265,990 2,929,997 19, 0`74 1,()90 34 594 4
100 under $500 ........................... 525,823 6,338,429 120,507 870 106 148 2
1 SOO under SLOW ......................... 12.5,028 1,764,976 87,737 367 171 45 -
000 urder '5 000 ..................1 86,71-3 1,790,437 163,127 665 920 7 1,5,000 under ~)~,000 .......... ........... 4,493 210,393 31,093 44 82 4 110,000 or more. .......................... 3,404, 222,634 91,321 13 No applica le 62 10 N( L applic~ ble S 7
Net loss, total ............................. 29,566 371,785 15,264 544 123 5,261 3,515
Under $50 ................................. 8,675 103,336 177 104 1 371 4
50 under $100.. .......................... 3,374 49,237 251 - - 334 22
1100 under $500 ........................... 10,639 1-30,152 2,586 71 2 1,606 387
$500 under $1,000 ......................... 3,383 37,549 2,222 67 58 1,416 74E
tl 000 under $5,000 ... ...................'
3, 00`7 42,046 5,847 301 62 1,457 1,779
000 under $10,000 ......................5 148 4,416 883. 1 - 53 311~10,000 or more ........................... 140 5,049 3,299 - - 23 2(~(
S14ARE OF CAPITAL GAIN (LOSS) FROM
PARTNERSHIPS AND FIDUCIARIES
Current year net gain or net loss beforelimitation:
Net gain, total ............................. 305,725 5,612,788 1,054,854 28,323 1,408 9,983 6,341
Under $50 ................................. 4S,104 763,246 988 7,639 203 946 6S50 under $100 ............................ 22,r35 359,972 1,708 1,968 122 497 3,
100 under $500 ....... ...................
1
74,151 1,139,411 19,427 7,363 1,053 1 615
1
16~500 under $1,000......................... 42,631 600,204 30,453 3,635 988 2 ,017 904
1~,000 under $5,000 ... ................... 78,691 1,363,200 180,405 4,744 5,037 2,749 64--
,COO under $10,CInO ...................... 19,559 447,819 138,671 1,008 1,957 1,153 1, 06E
~~0,000 or more ........................... 19,954 938,936 653,202 1,966 app-, <22,047 1,006 Nc t applic +le 3,45~
Net loss, total ............................. 81,508 1,562,114 128,949 7,736 641 26,714 40,47-
Under $50 ................**''*"* .........
is 916 355,452 399 2,161 51 5,236 ilf
~50 under $100 .. ....................... 9 909: 165,595 723 1,561 96 2,481 ll~
100 under $500........................... 26,495 460,345 6,396 2,277 190 8,466 1,26C
500 under $1,000 ......................... 9,530 170,358 6,759 1,075 60 3,IQ2 1, 09E
$1, 000 under 5, 000 ....................... 12,021 274,364 29,271 545 168 4,552 7,26E
51000 under tO,000 ...................... 1,531 48,688 10,242 66 16 720 4,04.4
110,000 or more ........................... 3,107 87,312 75,158 51 61 2,157 26,56S
CAPITAL GAIN DISTRIBUTIONS FROM
SMALL BUSINESS CORPORATIONS
Current year net gain or net loss beforelimitation:
Net gain, total.. ........................... 25,770 464,010 55,366 1,843 1 299 684 1(
Under $50 ................................. 8,737 113,442 196 655 9 493 -
$50 under $100 ............................ 3,309 46,037 241 630 38 -
500 ...........................100 under 6,167 117,347 1,569 200 35 851VOO -der 1,000 ......................... 1,420 37,081 1, CIS 13 1 -
51 000 .......................1, 000 under 3,977 76,833 9,135 311 133 102 l(~5,000 under 10,000 ......................
1
1,192 23,169 9,676 33 73 -
10, 000 or more ........................... 968 50,101 33,531 1 No appli.al le - 4 Nc t applica ble
Ne~ loss, total ............................. 4,504 75,300 4,220 201 20 778 31~
Under $50................................. 1,257 18,094 22 37 - 195 -
50 under $100 ............................ 473 8,194 36 74 - 209 1E
500 ...........................VOC under 1,686 241900 517 70 192 4~1
$500 under 1,000 ......................... 326 51889 218 4 ill 42
k, DOC under $5, 000 ....................... 591 13,905 1,120 8 13 68 6~
5,000 under $10,000 ...................... 23 2,413 143 4 6 6 4!110,000 or more ............................ 147 1,924 2,163 5
J1 8
LIQUIDATION DISTRIBUTIONS
Current year net gain or net loss beforelimitation:
Net gain, tcvtal ............................. 31,413 1,090,311 573,132 337 469 86 51
Under $5C ................................. 4,877 92,190 101 74 2 4~50 under $100 ............................ 2,186 54,878 149 42 3 -~IOC under $500 ........................... 7,241 179,379 1,828 22 6 33
$500 under $1,000 ......................... 2,350 70,293 1,656 12 9 -
Sl 000 nd '5 000 7,860 198,863 20,069 120 183 42 1E000 under 01000 .......... :~ .......... 2,073 67,560 15,306 43 45
$10,000 or =cre ........................... 4,826 427,126 534,022 26 Not applicab le 220 8 No applies le 4;
Net loss, total ............................. 17,682 309,917 62,694 15 3. 4,336
(
8,10(
Under S5D ................................. (-) - - (.)S50 under $100 ............................ 1,022 14,563 66 - - 496
'~100 under S500.. ......................... 4, 421 65,935 1,152 4 - 1,427 36;$50C under ti,000 ......................... 2,816 38,375 1,669 4 - 234 14'
1,000 under ~5,000 .......................
16,159 119,569 12,609 7 - 1,676 2,48
5,000 under $10,OM ...................... 765 18,862 5,309 1 1 284 1,35
~1C, COC or more .......................... 1 2,001 43,199 41,877 - J - - 182 1) 3,75'
Footnotes at end of table. For the precise definition. of terms and the nature of any limitations, see the "Description of the Sample, " "Lind tations of the Data, " and"Explaration of Classifications and Terms" in the text.

SALES OF CAPITAL ASSETS ON INDIVIDUAL RETURNS, 1962RETURNS WITH NET CAPITAL GAIN OR LOSS
Table 5.-SHORT-TERM GAIN, SHORT-TERM LOSS, LONG-TERM GAIN, AND LONG-TERM LOSS TRANSACTIONS -INCOME, NET GAIN (LOSS), AND TRANSACTION DETAIL,BY ASSET TYPE AND SIZE OF CURRENT YEAR NET GAIN OR NET LOSS BEFORE LIMITATION -Continued
(Taxable and nontaxable returns)
Long-term capital asset tracsactio
51
Gain transactions Loss transactions
Asset type and size of current year net gain or netloss before limitation umber of
Gross sales Depre- e Cost anden fx
se 0
rossNumber of
ross sales ep~e- Cosf
ross
trans-p-ce
ei.ti.n p
salegain
t-
.pr-
ci-ia~ioj, expense o
sale lossactions (77--d (Th...-d (Th-.-d (Th...-d actions
(7h...-d (7~.-d (n-d (Th.-d~11 ... ~!!Ars) ~11 ... d~ll ... d.11 ... d.11.-) ~11 ... d.11 ...
(15) (16) (17) (20) (21) (22) (23)
CAPITAL GAIN DIVIDENDS
Current year net gain or net loss before limitation:
Net g.in~ total ........................................... 1,624,462 523,872 2,489 28LI
Under $50. .............................................. 570,447 12,094 238 1050 under $100 ....... .................................. 270,141 19"Oss 694 44
~100 under $500 ......................................... 547,194 120,484 534 81$500 under $1,000 .......... ............................ 132,454 87,704 994 138
$1,000 under $5,000..................................... 95,251 162,215 19 615,000 under $lo,OOO .................................... 5 408
:appli.abl ~
31.013'
4N t appli.abl
-10,000 or more ......................................... 3 568 91 ,274 7 8
Net loss, total .............................. z ............ 6,1_36 1,404 29,919 13,277
Under $50 ............................................... 174 2 8,541 176150 under $100 .......................................... 530 6 3,151 236100 under $500 ....... ................................. 2,328 726 10,725 2,927,500 under $1,000... .................................... 2,585 519 3,326 2,053
$1,000 under $5,000 ... ................................. 477 148 3,915 4,277$5,000 under $10,000 .................................... 34 3 95 575$10,OGO or more.. ....................................... 8 - 165 3,033
SHARE OF CAPITAL GAIN (LOSS) FROM, PARTNERSHIPSAND FIDUCIARIES
Current ycav net gain or net loss before licutation:
Net gain, total........................................... 296,442 1,030,784 2,107 996
Under $50.. ............................................. 44,039 977 938 12350 under $100 .......................................... 21,429 1,632 73 9t
100 under $500... ...................................... 70,678 18,665 478 129$500 under tl,000....................................... 42,404 30,467 75 99
1,000 -der $5,000..................................... 78,177 176,315 444 3045,000 under $10,000 ....................................1 19,627 137,888 59 106
$10,000 or more ......................................... 19,889 I Dt applicabl e664,839 39
N t appli.abl ~226
Net loss, total ........................................... 2,550 11,502 71,65190,619
Under $50 ............................................... 600 62 161292 398
50 under $10c) .......................................... 130 is91OG8 7191
100 under $500 ....... ................................. 1,017 244 23,6?7 5,569500 under $1,000 ....................................... . 186 117 8,857 5,839
1,000 under t5,000 ..................................... 523 471 10,061 22,6415,000 under $10,000 ....................................
172 208 1,074 6,423
10,000 or more ......................................... 21 11 331 2,831 49,031
CAPITAL GAIN DISTRIBUTIONS FROM S9hLL BUSINESS CORPORATIONS
Current year net gain or net loss bLffore limitation:
Net gain, total ........................................... 27,239 55,203 195 11.1
Under $50 ............................................... 9,380 187 5 -50 -der k00 .......................................... 2,995 221 33 17100 under $500. ........................................
16,736 1,611 137 75
500 under $1,000....................................... 1,546 1,018 7 1
I,OD0 under t5 000 ..................................... 4,267 9,028 11 165,000 under 1;,000....................................
1
1,210 9,60310,000 or more ......................................... 1,104
l ot applicabl e33,536 2 NA applicabl e 2
Net loss, total ........................................... 740 49 4,333 3,970
Under $50 ............................................... 544 33 1,135 52$50 under $100 .......................................... 135 9 440 27100 under $500 .........................................
~37 1 1,634 474
500 under $1,000., ..................................... 7 1 330 175
$1,000 under $5,000 ... ................................. 15 4 618 1,068$5,000 inader $10,000 .................................... - - 28 IG44510,000 or more ......................................... 2 1 149 2,069
LIQUIDATION DISTRIBUTIONS
urrent year net gain or net loss before limitation:
Net gain, total ........................................... .34,674 574,521 417 r 1,806
Under $50 ............................................... 4,951 100 70 150 under $100 .......................................... 2,167 176 36 31100 under ~500 .........................................
17,559 1,930 40 106
500 under $1,000 ....................................... 2,543 1,652 42 4$1,1101) under 15, COO .................................... S,71s 20,044 75 152$5
,
000 under 10,000 .................................... 2,384 15,294 6 33$10,000 or ore......................................... 6,353 ~Dt applicable 535,324 146 t applicabl~ 1,480
Net loss, total ........................................... 209
I
945 16,579 55,540
Under $50 ............................................... (-)50 -der $100 .................... : .....................
1- - 11019 65
100under $500 ......................................... 48 59 3,069 849
Z500 under $1,000....................................... 11 8 3,638 1,5.341,000 under $5,000.....................................
V87 4,26 5, 501. 10,552
,000 -der $10,000.................................... 38 158 850 4,116$10,000 or more.. ....................................... 24 291 2,039 38,410
Footnotes at end of table. For the precise definition of terms and the nature of any limitations, see the "Description of the Sample," "Limitations of the Data," and"Explanwion of Classifical.ions and Terms" in the text.

S2 SALES OF CAPITAL ASSETS ON INDIVIDUAL RETURNS, 1962RETURNS WITH NET CAPITAL GAIN OF LOSS
Table 5.-SHORT-TERM GAIN, SHORT-TERM LOSS, LONG-TERM GAIN, AND LONG-TERM LOSS TRANSACTIONS -INCOME, NET GAIN (LOSS), AND TRANSACTION DETAIL,BY ASSET TYPE AND SIZE OF CURRENT YEAR NET GAIN OR NET LOSS BEFORE LIMITATION -Continued
(Taxable and nontaxable returns]
CurmntShort-term capital asset transactions
Adjustedyea, netit l ain
Gain transactions Was transactions
Asset type and size of current year net Number of ~-ols....me
cap a g
(l.s.)Number-
Gross Depre-Cost and
Gross Numb-Gross
Depre-Cost and
rossgain or net loss before limitation returns before
ofsales ciation expense gain
If
salesi.lion lossimic.t
'o' trans-price of sale
"an.- price of sale
(Tho :7d (TY. d actions (A.. d (Th,=d (T~ d (Tho=d actions (T~-d (TI.-d (7)--d (7h-wdjd. 1_
=d.11 d.11aj_ bil
=~11 ~U ~jj ... d.11 ... d.11drs)
W (4) (5) '(6) (7) (6) (9) (10) (11) (12)
RETIRa&'NT PLAN DISTRIBUTIONS
Current year net gain or net 2os~ beforelimitation:
Net [:ain, total .......... __ .............. 60,729 739,194 303,820 1,218 1,334
Under ~50 ................................. 1,556 22,342 39 242 550 unde~ $100 ... ... -.................. 1,511 13,529 97 137 9100 under $500 ........................... 7,419 68,604 2,088 136 30
zp500 -under $1,000. ........................ 6,385 68,753 5,953 530 453
tl 000 under $5,000 .................. _...
'27,625 256,995 63,624 37 61
000 under ZIJO, GOO ......................5 8,175 100,604 56,850 134 776~10,000 or more ........................... 6,058 208,367 175,169 1
Net loss, total ............................. 341 9,168 199 - Not applies Not applicable
Under $50 .................................50 under $100 ............................ 275
I
5,775 65~100 under $500 ...................... ....
$500 under $I,0tx). ........................
000 under $5,000..... .......... ......
1
66 3,394 1335:000 under $lb,ooo ......................10,000 or more ...........................
LIVESTOCK
CUrrent year net gain or net loss beforelimitation:
Net gain, total.. ..................... _ .... 631,433 2,990,008 734,722 17,036 13,222 Iss 6,454 4,939 15,244 2,177 123 3,384 1,065
Under $50 ................................. 26,835 131,254 720 1,007 177 3 153 23 434 36 1 45 8r" ..................... :11 _51 u d 27,704 113,576 2,091 1,623 395 14 339 69 574 143 8 166 16.~~~c 11:'. c
.... - ...... * ... * ....221,576 864,494 60,605 4,456 2,341 53 1,821 565 3,990 399 is 683 266
~500 under 1,000. ........................ 153,406 613,299 110,851 4,156 1,281 26 850 456 5,027 411 42 741 288
1, 000 under151000 ....................... 182
1
716 994,466 353,746 5,010 4,594 70 2,296 2,362 4,659 1,021 15 1,383 3475, 000 under pI0, 000 ......... ..........
1
13,480 158,023 89,927 381 390 11 259 141 531 106 37 281 13910,000 or more ........................... 5,714 114,997 116,782 4P, 4,045 11 2,734 1,322 29 62 3 86 21
Net loss, total ............................. 56,369 269,433 16,528 440 463 59 372 151 9,33? 4,415 12~ 6,285 1,7444
Under $50 ........ ........................ 17,734 75,321 377 100 5 - 5 - 2,017 323 2 391 6650 under $100 ......... .................. 10
'061 43,258 726 141 21 1 16 6 908 100 5 165 60
100 under 1500 ...........................
5
22,064 89,151 5,277 112 36 - 6 31 4,242 916 31 1,422 4760 under +1,000 ........ ............ 6,250 31,606 4,167 35 32 - 29 2 1,352 2,652 37 3,153 464
1,000 under $5,000 ................... ... 2,013 18,013 3,713 45 197 6 135 68 790 300 23 806 4835,0CC under $10,000 ..... ................ 133 5,849 957 - - - - - 17 79 - 171 9210,000 or more ........................... 113 6,236 1,411 7 172 53 182 44 12 46 26 176 104
TIUBER AND COAL
Current year net gain or net loss beforeIimitation:
Net gain, total ............................. 58,511 520,934 113,351 2,458 1,374 - 910 1,328
Under $50 ................................. 2,648 28,255 85 72 64 - 62 3t50 under $100..................... __, 3,428 28,110 245 1,120 236 - 2DO 486100 under $500 ..... __ .......... ......
t
15,008 99,922 4,214 105 50 - 25 265OO under $1,000 ......................... 14,545 92,608 10,417 797 196 - 100 498
2,000 under $5,000.. ..................... 19,124 149,048 42,502 311 554 - 327 2375 000 under ~10,000 ............... ......
i
2,300 47,354 15,176 11 194 - 162 32l~,000 or more .................... ...... 1,457 75,637 40,712 43 76 - 35 47
Net loss, total ............... ; ........... _ 5,002 45,301 3,741 33 378 - 375 3
V~nder $50 ................................. 1,222 7,742 11 - - - - -50 under $100 ..................... .... _
931 11 702 312 33 378 - 375 35OO ...........................100 under
1
,t
500 under 1,000 .............
1,
560 12,165 1,005 - - - - -
1 000 under $5, 000 ........... 2851 13 417 2 356 - -5,000 under $16,000.......... .... ......
1
~ j
20,000 or more .................... ...... 1 116 38
OIL AND MINERAL INTERESTS
Currente
ar~ net gain or re L loss beforeJlimita on:
Net gain, total .............. __ ........... 15,691 431,050 92,230 2,694 15,259 12 11,4.36 3,825 502 769 - 899 137
Under $50 .......................... ...... 2,822 53,202 61 291 457 - 442 15 34 39 - 59 20~50 under $100........ ....... ........... 918 21,626 65 40 165 - 162 3 33 122 - 127 5$100 under $500 .................... ...... 4,079 73,704 1,029 729 1,489 - 1,329 161 268 218 - 260 42$560 under $1,000 ......................... 2,116 43,177 1,521 267 2,298 - 2,161 138 - - - - -
ind- 11, ....... _ .............
I3,910 105,534 10,061 949 4,422 12 2,971 1,402 152 296 - 334 37j
15,teder
...........728 34,009 5,261 226 1,051 - 395 657 - - -
--
;,10,000 or ~T-.......................... 1,118 99,599 74,212 171 5,377 - 3,977 1,449 15 94 - 120 33
Net loss, total ...................... ...... 10,831 203,151 17,682 255 1,580 - 1,532 55 2,488 6,005 39 7,833 2,063
Under $50.......... _ ............... ...... 558 15,918 11 111 265 - 246 19 121 552 39 595 4150 under $100............................
( V (.)(.) - (.) * (.) (.)
100 under $500 ........................... ~~1194 4296;, 039 5 33 - 32I
963 299 - 443 194~500 under t'1,000 ........ .......... 2,000 48,405 1,326 2 3 - 3 - 530 103 - 267 249
1,000 under 5,000 ........... ...........
12,592 44,145 4,960 53 56 - 50 14 714 11632 - 2,460 914
5 000 under ~10,000 ........ ............. 815 12,485 6,515 1 3 - 3 1 9 74 - 92 21t10,000 or more ............... ........... 146 9,569 3,789 50 1,207 - 1,188 19 .118 3,325 - 4,003 679
Footnotes at end of table. For the precise definition of terms and the nature of any limitations, see the "Description of the Semple, " "Limitatic= of the Data, " And-xPlanation of Classifications and Termsn in the text,
C

SALES OF CAPITAL ASSETS ON INDIVIDUAL RETURNS, 1962RETURNS WITH NET CAPITAL GAIN OR LOSS
53
Table 5.-SHORT-TERM GAIN, SHORT-TERM Loss, LONG-TERM GAIN, AND LONG-TERM LOSS TRANSACT IONS- INCOME, NET GAIN (LOSS), AND TRANSACTION DETAIL,BY ASSET TYPE AND SIZE- OF CURRENT YEAR NET GAIN OR NET LOSS BEFORE LIMITATION -Continued(Taxable and nontaxable returns)
Lcng-term capital asset transactions
i",
Gain transactions Loss transactions
Asset type and size of current year net gain or netGross sales Depre-
Cost andGro as Gross sales Depre-
Cost andGloss before limitation Number of
price ciationexpense of .
ga-Number of
ric ~iatiexpense of ross
trans- sale trans- p e onsale loss
actions (7)....-d (T)...-d (Th...-d (77,-.-dactions
(T?--d (Th-.-d (Th-.-d (n,...-dd.llars) d.11mrs) ~11 ... ) ~11 ... ) d0l ... ~11 ...) d.11 ...) ~11 ...)
(14) (15) (16) (17) (18) (19) (20) (21) __T22) -(23)
RETIRRIENT PLAN DISTRIBUTIONS
Current year net gain or net loss before limitation:
Net gain, total ........................................... 63,095 302,489
Under $50 ............................................... 1,314 3450 under $100.......................................... 1,441 88 -I under $500 ............................
i-* ........00
7,321 2,059 -500 under $1,000 ....................................... 7,888 5,500 -
$1,000 under $5,000 ..................................... 30,173 63,565 -$5,000 under $10,000.. .................................. 8,461 56,074 -~p!0,000 or more ......................................... 6,49? 175,169 -
Net loss, total ........................................... - No t applicable- 297
Not appli~abl174
Under W ...............................................50 -der $100 .......................................... - 238 63110 -der $500 .........................................
u500 under $1,000 .......................................
1
1,000 under ~5,000 ... ................................. 59110
5,000 under $10,000 ....................................$10,000 or more .........................................
LIVESTOCK
Current year net gain or net loss before limitation:
Net gain, total ........................................... 1,103,115 924,789 78,244 257,035 743,520 129,403 26,191 8,961 47,805 12,653
Under $50 ............................................... 29,825 6,722 96? 6,241 1,442 9,551 1,558 239 2,535 73850 under $.100 .......................................... 33,557 6,383 1,434 5,288 2,499 6,690 1,063 324 1,848 462J
IGOunder $500 ....... ................................. 321,729 94,439 10, 0'?0 40,363 63,698 39,776 6,704 1,713 11,809 3,392
500 urder $1,000....................................... 278,732 137,360 10,090 34,148 112,720 2
'
5,744 4,910 1,621 8,568 2,037
11000 under ~5,000 ... ................................. 391,587 419,474 31,325 94,009 355,857 41,595 8,867 3,004 15,997 4,1265,000 under $10,000....................................
130,914 112,340 8,397 29,790 90,773 3,403 1,969 740 3,558 849
10,000 or more ......................................... 16,770 148,071 15,962 47,197 116,530 2,445 1,122 1,320 3,490 1,049
Net loss, total ........................................... 19,949 7,592 2,488 7,668 2,369 82,165 38.474 7; Q41 63,717 17'_"-~
Under $50: ; ~ ............................................ 5,621 1;183 371 1,234 315 18,886 5,20? 1,182 7,016 62750 under $100 .......................................... 4,199 1,950 626 2,196 341 13,176 4,359 635 6,006 1, ou1 0 under $500 ....... .................................
RO
6,374 1,697 554 1,560 690 33,064 13,013 2,561 21,097 5,523G under $1,000 ....................................... 2,738 1,057 62 576 562 11,417 7,016 1,114 12,398 4,267
1,000 under t5,000 .....................................5 000 und r $10 000
1
587 1,468 606 1,872 402 4,642 5,219 1,111 10,030 3,700, e , .................................... 416 140 36 145 31 858 2,865 1,240 4,900 79610,000 or more......................................... 15 96 14 83 27 122 794 98 2,270 1,378
TDOER AND COAL
urrent year net gain or net loss before limitation:
Net gain, total ........................................... 59,984 129,030 W4 29,926 112,503 765 3,254 25 3,741 480Under $50 ............................................... 2,580 392 - 311 82 - -
-- -
50 under $100 .......................................... 2 342 483 7 369 178 493 542 23 986 4201 under $500 ....... .................................001
15:182 5,995 - 2,227 4,191 141 2,182 2 2,168 35 00 under $1,000 ....................................... 14,427 1-3,145 20 4,147 9,919 - - - - -
'000 under $5,000 .....................................
1
20
'
590 47
'436 234 9,669 42,268 35 37 - 40 3
5,000
under $16,000 ....................................
1
21653 15,089 17 1,648 15,146 7 3 - 5 2. 10,000 or more ......................................... 2,209 46,491 485 11,356 40,717 88 489 - 523 51
Net loss, total ........................................... 34 11 - - 11 5,386 5,569 175 9,097 3,395Under $50............................................... - - - - - 1,318 561 - 569 1150 under $100. ......................................... - - - - -100 under $500.........................................
1
- - - - - 727 597 - 869 286
500 under $1,000....................................... - - - - - 1, 066 401 - 1,107 725
$1,000 -der $5,000.....................................000 ".de$5 $16 000
34 11 - - 11 2,271 3,990 175 6,478 2,317, r , ....................................
,$10,000 or more.........................................--
--
--
--
-- 36 38
OIL AND AUNERAI, INTERESTS
urrent year net gain or net loss before limitation:
Net gain, total ............................................ 18,647 109,675 9,378 40,828 89,273 1,625 9,738 403 10,948 731
Under $50 ....................................... *,.......
3,127 841 ill 740 235 280 556 155 $81 17050 under $100 .......................................... 1,325 282 58 291
.67 2 - - 1 -1
100 under t500 ......................................... 4,195 5,303 1,099 5,471 948 .345 158 98 295 38500 under $1,000 ....................................... 2,220 2,688 375 1,856 1,396 84 107 7 126 12
$1,000 under $5,000. .................................... 4,428 14,222 1,092 7,011 8,795 418 437 39 572 99$5,000 under $10,000.................................... 1, xg 6,271 1,168 3,557 4,648 66 148 14 186 24$10,000 or more ............... ......................... 2,273 60,068 5,476 21,902 73,194 431 8,332 91 8,789 388
Not loss, total. . .... .................................... 755 1,544 103 1,281 381 11,380 11,282 1,089 25,930 16,056
Under $50 ...............................................50 und r $100
70 143 - ill 31 512 1,166 7 1,250 57e ., .........................................
1(.)
100 under $500 ........................................ 171 136 4 125 15 3,915 1,90-' 286 2,943 861$50C) under $1, 000....................................... 12 4 9 12 4 1,815 1,014 101 2,037 1,062tl,OOO -der ~5,000 .....................................~t5 000 -der $10 000 . .
172 183 9 127 75 3 157 2,358 383 5,934 4,136, , .. ................................
$10 000 or more ...........20916
867193
- 654 2131 11149 3
'
327 30 10,032 6 708
,, ..............................
11 166 36 162 11125 30 3,064
C
3 164
Footnotes at end of table. For the precise definition of terms and the nature Of any limitations, see the "Description of the Sample," "Limitations of the Data," and"Explanation of Classi fi-_at ions and Terms" in the text.

SALES OF CAPITAL ASSETS ON INDIVIDUAL RETURNS, 1962URNS WITH NET CAPITAL GAIN OR LOSS
Table 5.-SliORT-TERM GAIN, SKORT-TERM LOSS, LONG-TERM GAIN, AND LONG-TERM LOSS TRANSACTIONS -INCOME, NET GAIN (LOSS), AND TRANSACTION DETAIL,BY ASSET TYPE AND SIZE OF CURRENT YEAR NET GAIN OR NET LOSS BEFORE LIMITATION -Continued
[Taxable and nontaxable returnsj
Short-term capital asset transactions
Adjustedyear net
ca it I iGain transactions Loss transactions
!t type and size of current year net gain
i tNumb ofer
gross
i co e
p
NumberGross
Depre-Cost and
Gross NumberGross
Dep-Cost and 6,ass
or net loss before l mita iont
re urnsn m
befo7 of sales ciation
axPense
gain Ofsales
ciationexpense
1.8s1
. -im. iiation traris- price
of
saletreis-
price of sale
(D.-d (Tho-d actions (Tho-d (T?,-d (7h ..~d (T~-d actions (Tho-d (Th....d (Dw-d (Th...-d
&III-) d.11 ... &If ... ) dllars) &,11-) d.1 I ... ~lj ... ) &,11 ... ) d,11 ... ) dlf-)
(3) (4) (5) (6) (7) (8) 0 (10) (11)
PARTNERSNIP INIMSrS
rent year net gain or not loan before
aitati..:
at rain, total ........................... 67,962 1,176,067 352,753 5,760 42,736 3 36,773 5,713 2,0?6 4,650 2 5,787 1,135
Under $50 ................................. 4,959 68,990 96 868 131 2 115 17 79 208 - 214 7
s5r under $ICO ............................ 3,609 43,767 268 516 19 - 1? 2 4 -0
under 1,500 ...........................
1C)
14,664 201,212 3,960 1,755 2,147 1 1,697 395 550 76 2 164 86o uncle, $1,000.........................5 O 6,141 126,526 5,907 411 1,612 - 1,348 212 104 44 - 49 5
1
1,000 under $5,000....................... 22,935 335,266 54,794 1,502 10,718 - 8,291 2,282 A- 1 800 1 976 175
5,000 under $16,000.... ................. 6,406 118,132 45,129 202 2,IB3 - 1,648 536 521 1,251 - 1,780 528
$10, 000 or move ........................... 7,250 262,174 242,599 506 25,925 - 23,656 2,270 254 2,270 - 2,605 334
!at loss, total ............................. 19,489 291,470 24,590 596 3,259 - 2,276 916 6,228 26,965 - 30,531 3,565
Under t5C ........................ ........ 3,770 62,646 57 147 19 - 11 8 846 685 - 709 24
85C, under ...................... 1,830 18,029 151 11 - - - - 1,112 439 - 539 201
$IUQ under $500 ........................... 6,194 78,572 1,711 183 72 - 62 10 1,809 887 - 1,182 296
t5QO under $1,000 ......................... 2,799 41,738 2,017 89 43 - 37 6 1,445 23,528 - 24,311 783
~1,000 under ~5,000....................... 4,029 66,739 9,497 1-55 3,122 - 2,166 879 914 980 - 1,766 786
5,000 under $10,000 ...................... 506 12,410 3,335 9 13 13 47 - - 229 229
~10,000 or more ............... ......... 371 11,286 7,823 1 - 55 448 - 1,794 1,346
ASSETS USED IN TRADE OR BUSINESS
rrent year not gain or net loss before
imitation:
Net gain, total ........................... _ 330,965 3,233,695 1,029,708 18,283 1-54,263 693 139,193 15,743 3,440 23,348 219 24,257 691
Under $50. ................................ 28,052 224,594 676 1, 0.10 1,431 59 1,471 19 311 906 1 910 1
50 under $100 ............................ 22,566 191,417 1, 620 1,020 1,529 1 1,482 46 255 278 309 31
VCO under $500 ........................... 92,183 790,434 23,649 4,425 26,892 119 26,076 sli 878 446 15 572 ill
$500 unda,
$1,000 ............... _ ........ 50,293 443,141 35,704 1,343 4,134 338 3,977 495 454 206 1 297 90
~l 8- T,5 OGG
`
95,619 878,179 212,874 7,497 64,491 237 56,309 8,395 722 5,301 74 5,550 174
1000 ..............K000 under ~10 20,375 25--,969 140; 904. 1,043 12,266 ?3 11,203 1,116 516 2,921 123 3,049 5$l&,CGO or more., ............. .... _ .... 21,775 448,962 614,281 1,945 43,520 67 38,674 4,859 303 13..287 4 13,570 278
Net loss, total ............. ............... 117,622 827,264 146,150 947 1,459 2-12 1,301. 270 14,321 38,875 4,700 65,294 21,718
Under $50 ...... .............. .... ___ 20,797 1467588 283 34 94 - 77 17 1,510 6,407 270 6,709 31~50 under $100.......... _ ........ ...... 11,579 73,335 815 40 28 - 21 7 1,461 2,123 69 2,301 109
200 urd.,1500
...........1
34ol85 233,264 8,829 255 444 110 492 62 3,724 4,774 -207 5,903 922
500 under 18,415 125,181 12,981 438 822 - 655 167 2,638 5,70D 189 7,582 1,692
~1, 000 under ' 5, 000 ....................... 25,303 195,600 51,452 68 50 - 37 12 3,973 12,567 558 18,676 5,551
5, COO nder ;10, 000 ...................... 5,526 37,883 37,383 11 21 2 is 5 807 7,249 3,406 15,679 5,023
~10,000 or more. .......................... 1,817 20,214 34,407 1 - - 208 54 1 8,443 8,388
PROPERTY HELD FOR PERSONAL USE
~urrent year net gain or net loss before
limitation:
Net gain, total...................... ...... 36,861 415,167 48,651 3,605 16,444 536 15,261 1,719 41 61 11 82 10
Under $50.,. ..... _ ..... .............. _ 4,505 37,314 1.11 71 11 - 9 2 - - - - -
50 under
$100- .... ................
4,066 43,205 271 597 83 - 50 32 - - - - -
IGO under ~500..... .....................
1
12,617 132,796 2,927 2,0143 7,398 416 7,518 296 1 12 1 13 -
500 under $1,000 ........ ........... 6,M 69,727 4,431 345 1,225 117 1,098 245 - - - - -
1,000 under 5,000 ........... ........... 8,139 79,922 16,433 477 6,638 2 5,860 761 40 49 10 69 10
5,000 unner1
,10,000 ..... ................ ?92 14,8'J7 6,277 67 1,048 - 724 324 - - - - -
,10, 000 or more ..... __ .................. 531 37,416 18,200 3 41 - 2 39 - - - - -
Net loss, total.... ... __ ................ 14,277 140,028 9,541 148 869 116 974 11 1, 608 2,910 103 3,636 624
Under $50.. ............................... 4,327 39,063 37 107 843 116 950 8 590 743 33 780 4~50 under $3.00 ........... ..... __ ....... 873 9,528 59 - - - - - 237 30 3 46 14200 under ~500..... ......................
=
4,689 50,329 1,232 37 1? - 15 2 356 124 63 267 81-der ~1,000 ... ..................... 1,940 18,929 1,341 - - - - - 272 1,886 5 2,067 176
1,000 urder S.5,000...... ................
~
2,228 19,350 4,944 4 9 - 6 1 142 127 - 433 3065,000 under $10,000... ................... (-) - - - - - - - - - -
~Io, OGG or more. . ........ ................ 48 1,953 616 12 43 43
RESIDENCES
Current year net gain or net loss before
liniiatior.:
Net gain, total ............................. 176,795 1,412,614 572,680 6,053 86,582 148 76,045 9,1141
Under $5C................ ................ 3,312 25,732 104 104 1,126 - - 1~5C under Loo ............................ 2,510 19,798 166 137 1,598 - 1,507 8SlCIC ~,der $50C ........................... 26,918 196,776 8,314 2,009 22,696 - 2lo525 663$500 under t1,000 ....... ................. 24,643 151,216 18,061 1,679 12,471 - 10,792 990
1,000 under Z5,000 ..................... 86,378 626,238 202,588 3,834 46,033 148 40,477 6,370E,000 under $10,000. ..................... 23,554 226,378 167,256 288 2,585 - 1,745 1,059
t a li. bleIC
IWO or more ...................... __ 9,480 166,4477 176,169 1 23 - - 23pp
Vet Inc--, total .............................
Under $50 .................................
~5(, under $100 ............................X at ap li obleIGG under ~5CD .......... ................
~
p
500 tnier $1,000 ........... .............
$1,00C unjer ~5,000__. .................
j
t5,6OG nae, l(1'OOC ......................
ZlC,OCfj or more ...........................
Footnotes at end of table. For the Precise definition of cerms and the nature of any limitations, see the "D--cription of the Simple," "Limitations of the Data," and"Expl-tio" of Classifications and Terms" ilz the text,

i
SALES OF CAPITAL ASSETS ON INDIVIDUAL RETURNS, 1962RETURNS WITH NET CAPITAL GAIN OR LOSS
Table 5-SHORT-TERM GAIN, SHORT-TERM LOSS, LONG-TERM GAIN, AND LONG-TERM LOSS TRANSACTIONS- INCOME, NET GAIN (LOSS), AND TRANSACTIONBY ASSET TYPE AND SIZE OF CURRENT YEAR NET GAIN OR NET LOSS BEFORE LIMITATION -Continued
[Taxable and nontaxable returns )
I Long-term capital asset transactions
55
DETAIL,
Gain transactions Loss transactions
Asset type and size of current year net gain or net lossGross sales Depre-
Cpct and Gross Gross sales Depre-
Cost andGrossbefore limitation Number of
.price ciation xa nse of
gainNumber of
price iatio,expense of
trans- sale trans-
1
sale less
actions (7)...-d (7)...-d (Th...-d (Th...-d actions (Th...-d (77...-d (Th-d (T~-d-bil ... ~Uars) ~11 ...) ~11 ... ) ~11 ... ) 6.11 ...) ~11 ...) ~11 )
(24) (15) (16) (27) (IS) 19) (20) (21) (22) (23)
PARTNERSHIP INTERESTS
Current year net gain or net loss before limitation:
Net gain, total ................ : .......................... 79,653 663,818 25,954 314,729 351,897 4,444 15,161 826 19,709 3,721
Under $50 ............................................... 5,080 3,377 158 2,865 670 386 10,178 522 11,285 585:t50 under $100 .......................................... 4,300 9DO 113 728 285 279 182 3 204 19SIGO under $500......................................... 16,992 15,065 1,174 12,146 3,859 1,242 134 13 355 206$500 under $1,000 ....................................... 9,434 19,446 1,094 13,932 5,910 603 930 77 1,217 210
11,000 under $5,000... ................................. 26,747 166,106 10,141 115,866 54,635 1,526 738 68 2,753 1,9475, 000 under $10, 000 .................................... 7,558 87,002 2:321 43;729 45,192 154 3559 - .__
4 ~'
170
$20,000 or more ......................................... 9,541 371,922 10,964 125,464 241,346 255 2,641 143 3,466 682
Net loss, total ........................................... 2,483 3,757 214 2,545 1,426 18,168 62,748 3,916 90,031 23,367
Under $50 ............................................... 387 30 7 27 10 3,154 7,049 371 7,470 50$50 under $100 .......................................... 564 92 15 67 40 1,329 407 5 502 90t100 under $500 ....... ................................. 576 235 13 174 75 5,859 9,063 1,656 12,218 1,500$500 under $1,000. ...................................... 343 204 40 81 163 2,559 la,640 -341 13,394 1,402
$1'000 under $5,000 ... ................................. 436 1,589 22 841 770 4,437 17,910 1, 043 29,313 10,360
$5, 000 under $16, 000. - .................................. 90 1,096 116 1,077 136 490 11, 635 51 14,941 3,255$10,000 or more ......................................... 69 510 - 278 232 340 5,045 448 12,202 6,709
ASSETS USED IN TRADE OR BUSINESS
Current year net gain or net loss before limitation:
Net gain, total ........................................... 453,535 2,888,130 745,899 2,541,901 1,028,759 54,290 86,211 28,448 126,763 14,103
Under $50 ............................................... 29,349 12, 019 6,500 17,463 1,008 5,280 4,367 1,547 6,264 35050 under $100.......................................... 27,410 22,4?6 8,325 28,922 1,864 3,501 980 1,283 2,524 2611100 under $500 ......................................... 113,B31 130,098 68,869 173,147 24,619 13,526 7,727 3,958 13,354 1,670
$500 under $1,000 ........................................ 73,640 139,629 73,535 1?4,930 36,360 8,862 8,554 2,381 11,995 1,060
1,000 under $5,000 ..................................... 147,198.867,143 248,925 889,297 206,441 16o865 41,311 10,969 56,068 3,798
5,000 under S10,000 .................................... 28,135 419,407 104,723 369,099 140,945 2,816 3,438 1,786 6,377 1,153~10,000 or more ......................................... 33,972 1,297,358 235,021 889,043 615,521 3,441 19,835 6,525 32,10 5,821
Net loss, total.. ......................................... 21,112 29,199 9,418 31,125 7,398 133,435 406,229 118,645 656,975 132,100
Under .1K50_ - - ................................... 3,014 592 i,4P8 314 22,094 27,597 12,097 40,277 58350 un~cr S100... .... ** ........... ... 2,856 717 698 1,132 228 12,621 8,524 3,955 13,420 9411100 under $500 ......................................... 6,632 3,717 3,031 5,634 1,113 38,895 61,327 20,351 90,761 9,OB2500 under $1,000 ....................................... 4,410 3,586 2,136 5,014 705 22,482 74,112 25,005 11.1,278 12,161
1'000 under $5,000 ... ................................. 3,815 8,339 2,764 8,762 2,308 30,480 151,840 39, 081 239,143 48,222
5, 000 under $16, 000 ....................................
1
227 261 150 284 127 5,145 59,602 14,913 107,006 32,49110,000 or .0.......................................... 159 11,429 47 6,871 2,602 1,720 23,227 3,244 55,091 28,621
PROPERTY NET FUR PERSONAL USE
urrent Year net gain or net loss before limitation:
Net gain, total ........................................... 38,497 147,201 32,107 128,688 47,668 1,995 2,430 2,202 5,358 726
Under $50 ............................................... 4,535 1,725 1,243 2,858 109 100 16 14 30 -50 under $100 .......................................... 3,569 3,782 1,820 5,231 371 208 713 509 1,353 132100
under $500 ......................................... 11,595 18,333 6,448 22,015 2,693 1,186 258 160 450 62$500 under $1,00C ....................................... 8,771 29,032 4,897 29,563 4,193 12 15 37 59 7
I,
000 under $5,000 ..... ............................... 8,631 48,979 12,732 45,470 16,139 473 1,305 1,479 3,260 47651000 under $16,000 ....................................
i792 13,573 971 8,591 5,953 - - - - -
10,000 or more ......................................... 606 31,77S 3,995 15,161 16,209 16 124 4 176 48
Net loss, total ........................................... 5,733 1,624 355 597 482 16,0_34 21,679 3,8.34 34,923 9,410
Under $50 ............................................... 100 15 - 13 3 3,751 5,346 897 6,288 440, under $100.......................................... 11 5 1 5 1 673 802 248 1 096
,46
100 under $500 ......................................... 483 027 ~q 3 474 90 4,412 3,163,0082 6 3931 1,222
500 under $1,000.. ..................................... 206 94 61 100 56 1,911 3,319 418 4,956 1,221
S1,000 under S5,000 ..................................... 4,934 1,239 - 6 333 5,066 6,613 261 11,946 4,972,~5,000 ~inder $10,000.................................... - - - - - (.)00,000 or more ......................................... 50 653 2 1,227 572
RESIDENCES
urrent Year net gain or net loss before limitation:
Net gain, total ........................................... 172,41-4 2o659,994 109,039 2,183,773 563,567
Under $50............................................... 3,209 36,583 520 35,939 104$5C under $10G. ......................................... 2,899 21,340 1,149 21,092 160100 under S500 ......................................... 25,042 277,058 l0o173 275,060 7,651
~500 under $1,000.. ..................................... 23,165 310,620 7,346 295,668 17,071
$1,000 under $5,000 ..................................... 84,614 1,212,446 45,CY79 1,(Y.6,477 196,218$5,000 under tIC,0jO .................................... 23,626 454,669 23,727 312,447 166,197
-$10,OOC Or more......................................... 9,659 347,279 21,043 197,101 176,167Not apv-,iOablc
Net I.sv, total ................ .......................... .
Under $50 ...............................................50 under $lOG ..........................................
1 50C.--*""* ...-100 undOr 4
t$500 under 1,000.................... I ........... ...... ot applica
11,000 under $5,000......... ...........................~,000 under ~10,000....................................,
IC~,000 Or more. ........................................
C
FOOtnO tes at end of table. For the precise definition of terms"Explana~ion of Cl.-ficat4ons and Terms-- in the tax*,.
-- any limiLations, see the "Description of the Sample,' t4ons of the Data," and

SALES OF CAPITAL ASSETS ON INDIVIDUAL RETURNS, 1962TURNS WITH NET CAPITAL GAIN OR LOSS
Table 5. -SHORT-TERM GAIN, SHORT-TERM DOSS, LONG-TERM GAIN, AND LONG-TERM LOSS TRANSACTIOLS-INCOME, NET GAIN (WSS), AND TRANSACTION DETAIL,BY ASSET TYPE AND SIZE OF CURRENT YEAR NET GAIN OR NET LOSS BEFORE LIMITATION -Continued
ITaxable and nontaxable returns]
Current Short-term capital asset transactions
Adjusted year netca ital ain
Gain transactions Loss transactions
Asset type and size of current year net Number of5ross
income
p g
('~S)
-
NumberGross
Depre-Cost and
Gross Number. Gross Depr- Cost and
Grossgain or net loss before limitation return6 before of
sales ciatio. e,pen,,gain f
salesclation
expenselose
imit'tion trahe_ price of salezra,,s-
price of sale
(T~-d (T~-.d actions (1h,-d (7?.,..d (P.-d (Th.-d actions (7)--d (77..,.d (Tho-d (Th-wdd.11 ... &II-) &jj ... 6.41mr.) d.1 lars) d.1 I ... ) ~bll- d,11.1.) ~11...
(2) (3) (4)_ (5) (6)N_ _(8)_ (9) (10) ( 11) (12) (n)
NONDTISINESS REAL ESTATE
rrent year net gain or hot los~ beforeimitation: .
Net gain, totaJ ............................. 253,626 2,774,62? 996,330 15,300 96,112 373 81,787 13,285 1,174 12,853 11 13,432 567
Under $50 ................ ................ 7 129
,
62 445
,
177 802 692 - 756
17 --
- -t50 under $100 ............ ............... 6 712 561 787 499 488 2,356 - 2, 328 28 1 30 - 32 2tlOC under $500 ... ....................... 58,235 479,424 15,936 4,840 11,222 27 9,837 1,286 70 723 11 789 55$500 under $1,000.. ....................... 45,704 401,483 33,945 2,144 12,964 68 11,786 1,238 19 166 - 170 3
~1,000 under 5,000 ....................... 92,871 945,900 217,640 5,311 51,243 10 43,899 6,680 932 7,981 - 8,380 399~5
1000 under 110,000... __ ............. 23,106 315,107 165,485 1,278 8,277 245 5,976 1,993 77 942 - 989 47
10,001) or mo e ........................... 19,869 513,581 564,648 437 9,359 23 7,286- 1,843 74 3,012 - 3,072 60
Net loss, total.... ......................... 95,580 857,340 130,187 366 4,991 - 4,706 285 8,561 54,994 319 62,353 7,040
Under $50.. ......... __. ............... 10,478 107,804 93 - - - - - 1,131 7,709 15 7,737 13~50 under $100 ............................ 6,090 47,893 417 - - - - - 712 418 7 464 60
00 nder $500 ...........................
~ 1 u1
23,162 20?,044 6,481 38 396 - 393 3 3,001 12,425 8 13,234 8025 00 under $1,000.. .................. __ 16,290 131,609 11,523 134 748 - 666 62 2,446 21,525 159 23,210 1,526
1,000 under $5,000 ....................... 35,339 298,461 73,638 190 3,692 - 3,478 214 993 7,841 128 lo, 131 2,1615,000 under ............. 2,953 39,091 20,277 - - - - - 224 3,437 2 4,876 1,43710,000 or more ........................... 1,268 25,449 17,756 5 156 - 149 7 53 1,638 - 2,681 1,042
REAL ESTATE SUBDIVIDED
rrent year net gain or net loss beforeimitation:
Net gain, total ........................ .... 127,938 1,349,298 675,271 3,754 20,646 1 15,894 4,611 130 149 - 328 178
Under $50................................. 1,622 17,541 44 33 136 - 136 - - - - - -50 under $100 ............................
12,009 23,219 133 48 27 - 23 4 - - - - -
100 under $500. .......................... 21,298 178,891 6,387 720 1,600 1 1,351 246 4 37 41 4$500 under $1,000 ......................... 20,711 173,890 15,014 652 3,894 - 3,350 493 - - - -
ti,WO under t5. 000 .......... ....... .... 48,975 445,275 116,481 1,483 6,262 - 4,844 1,418 121 66 166 1205,000 under $Ib,000... .............. ....
1v'925 191,727, 1-23,13! 393 2.799
'
- 1,672 1,092 - - - -10,000 or more ........................... 15,399 318,755 414,080 224 5 ,929 - 4,519 1,358 2 47 101 54
Net loss, tct.l~ ............... ............ 20,052 182,784 24,206 1 3 - 3 - 1,585 8,741 167 9,881 972
Under $5D ........ _... ....... _ .......... 1,327 22,136 11 - - - - - 143 422 - 445 2450 under $100 ............................
11,133 8,619 90 - I - -
100 under $500 ........................... 7,121 48,332 1,926 - - - 1,139 5,039 166 5,507 302$500 under $1,000 .............. _........ 4,387 35,028 3,464 - - - 143 36 - 130 94
1,000 under $5,000 .......... ....... .... 5,126 65,463 11,246 1 3 - 3 - 117 2,330 - 2,631 301
5,CoO under $10,000 ...... _.. ...........
1911 17 6,106 - - - - - 42 989 1 1,128 238
lO,000 or more ...... _ .................. 47 3,190 1,363 - - - - - 1 25 - 39 14
FAJaUMD WITH UNHARVESTED CROPS
7rent year net gain or net loss beforeWitation:
Net gain, total. ....... .................... 6,238 59,528 50,101 504 2,240 - 2,069 171 400 2,063 - 2,201 139
Under $50 ..... _ ... _ ....... ............50 under $100............... ............1100 under $500 ............ .............. 2,287 13,313 662 500 2,222 - 2,069 153 400 2,063 - 2,201 139
$500 under $1,000 .........................
1,000 under ~5,000 ....................... 2,091 14,267 5,468 - - - - - - - - - -5,000 under ............
1805 9,739 4,719 4 18 - - is -
10,000 or more ........................... 1,056 22,210 39,252 - - - - - -
et loss, total. ............................ 1,428 11,454 2,475 837 6,661 - 6,503 159 1,147 9,646 - 9,931 285
Under $50__ ........ ....................56 under $100 ............................100 under MO .........................
1
852 7,653 236 669 5,408 - .5,266 142 843 7,735 - 7,964 230
500 under y~1,000 .................
~1,00C under ~5,000......................5,000 under $10,COO ......................
t577 3,802 2,237 167 1,253 - 1,237 16 303 1,912 - 1,967 55
10,000 or more ...........................
OTHER FARMIAUD
-rent year at gain or net I ... beforen1tation:
let E.in' total ............................. 66,196 523,246 4.48,949 2,393 14,310 148 11,583 2,542 7 71 ?9 6Under $5C.
' ' - '
724 6,134 20 1 - - - - - - - -$5C under ~1 0 0 .. . 978 7,843 61 - - - - - - -$,C,C ~
der $50C ........................... 7,670 40,000 2,212 405 999 - 827 63 - -$5GO under tI,COO ............... ....... _ B,531 51,643 5,829 41 433 - 257 23 - -
1,000 .,,d.r ~5,000 ............. ......... 29,611 179,792 70,793 1,924 1.2,246 148 9,950 2,353 - -5,000 under SIC'OOO .... .................
1
8,9eB 70,455 62,759 18 576 - 508 68 - - - -10,000 or more.... ....................... 9,714 167,379 307,274 5 56 - 41 15 7 71 79 8
iet loss, total ............................. 8,967 58,129 34,342 3? 226 - 213 14 893 5,699 59 6,227 4C9
Under ... _ ............... _ ........ 2,047 15,379 13 - - - - - 113 625 - 629 4t5G under $100 ................... ......... 237 1,551 16 - - -
-- - - - - -
~100 'wder -5CC'
1,392 10,502 295 4 30 - 27 3 567 4,040 - 4,126 Be~500 ~nder 1,328 7,142 888 - - - - - 106 1,025 - 1,1()0 74
~!,CLG under ~5,000 .......... : ........... 3,048 15,508 7,684 33 197 - 186 11 107 9 59 373 305~5, COG '_,.ndor 320, 000 ...................... 380 3,074 2,455 - - - - - - - - - -Z10,000 a, more ........................... 535 4,974 22,986 - - -
N
CuI
Cu~14
I
I
Footnotes at end of table. For the precise definition of terms and the nature of any limitation~s, see the "Description of the Sample," "Limitations of the Data," and'1E.pI.na0o:, of Cl... ifi.ati.rz and Terms" ih the tax,.
I

I SALES OF CAPITAL ASSETS ON INDIVIDUAL RETURNS, 1962RETURNS WITH NET CAPITAL GAIN OR LOSS
Table 5.-SHORT-TERM GAIN, SHORT-TERM LOSS, LONG-TERM GAIN, AND LONG-TERM LOSS TRANSACTIONS -INCOME, NET GAIN (LOSS), AND TRANSACTION DETAIL,BY ASSET TYPE AND SIZE OF CURRENT YEAR NET GAIN OR NET LOSS BEFORE LIMITATION -Continued
[Taxable and nontaxable returns]
57
Gain transactions Loss transactionsAsset type and size of current year net
Cost and Cost andgain or net loss before limitation
Number ofGross sales Depre-
expense ofGross
Numb r ofGross sales Depre-
expense ofGross
trans-price
ciation
salegain
trans-price iatio.
saleloss
actions (7)...-d (77...-d (T~-d (P--d actions(7h...-d (Th-.-d (Th-.-d (n--d
d.11 ... ~jlars) ~Ijars) d.11srs) d.11 ... ~11-) ~11 ... ) ~Ijsrs)(14) (15) _(16)_ (17) (is) (19) (20) - (21) (22) (23)
NONBUSINESS REAL ESTATE
-
Current year net gain or net loss before limitation:
Net gain, total ........................................... 269,840 2,685,551 184,357 1,740,328 993,586 6,462 39,201 2,151 49,329 7,976
Under $50. .............................................. 6,360 29,650 4,421 33,904 164 201 55 - 59 450 under $100 .......................................... 6,369 31,701 3,045 33,992 716 343 1,776 145 2,165 2441100 under $500 ......................................... 55,385 172,949 16,81? 168,760 15,196 1,546 9,259 379 10,128 490500 under $1,000....................................... 46,238 219,413 17,216 197,503 33,053 S34 3,254 113 3,710 343
$1,000 under ~5,000 ..................................... 102,186 747,217 61,180 566,282 211,816 2,029 12,566 746 13,968 656$5,000 under $10,000 .................................... 27,375 437,458 28,337 256,103 164,212 493 2,673 i53 3,498 672tio, 000 or more. ...................................... d~,926 1,047,163 53,340 483,794 568,431 1,016 91619 615 15,8oo 5,567
Net loss, total ...............................* ............ 1,252 9,378 580 8,708 913 89,975 804,976 60,968 990,290 124,345
Under $50. .............................................. 101 669 - 655 34 9,597 74,015 2,401 76,530 11450 under $100 .......................... I ............... 4 22 4 26 - 5,377 28,266 1,183 29,806 357J100 under $500 ......................................... .345 2,169 186 2,152 203 20,275 170,315 10,639 186,839 5,886500 -der $1,000 ....................................... 219 1,405 102 1,428 79 13,991 121,654 6,845 138,637 10,138
1,000 -der $5,000 ..... ............................... 364 3,887 192 3,508 352 36,084 341,676 30:155 443,874 72,0435 CQ0 -der tlb,000 .................................... 36 137 20 126 30 3,313 41,246 5,471 65,586 18,870
$10,000 or more ......................................... 183 1,068 75 810 215 1,338 27,805 4,275 49,018 16,938
REAL ESTATE SUBDIVIDED
Current year net gain or net loss before limitation:
Net gain, total ........................................... 144,980 1,616,520 150,690 1,029,203 678,091 2,595 45,879 673 53,805 7,252
Under $50.. ............................................. 1,588 6,965 80 6,997 4.4 - - -
-
-50 -der $100 .......................................... 2
,
067 4,510 104 4,482 130 107 11 12 1100 under $500 ........ ................................
1
21,401 63,211 2,360 58,353 6,277 225 294 426 132500 under $1,000 ....................................... 21,409 125,851 3,426 112,375 14,524 7 13 16 3
1,000 -der 15 000 ..................................... 57,441 373,391 39,302 282,420 115,493 684 3,155 129 3,593 310,5, 000 -der I , 000 ........................... ........
1
21,521 292,806 29,714 186,396 122,050 117 514 - 526 1110,GOO or more ......................................... 19,553 751,787 75,704 376,180 419,574 1,454 41,891 544 49,232 6,796
Net loss, total ........................................... 468 1,759 1 1,334 427 19,767 164,067 18,846 206,574 23,661
Under t50 ................ ...... ...................... 71 111. - 77 66 1,361 5,743 262 6,059 5450 under $100. ......................................... - - - - 1,133 5,599 331 6,019 90100 under $500 ......................................... 107 24 - 8 16 6,034 38,209 3,059 42,908 1,640500 under $1,000 ....................................... 41 101 1 96 6 4,256 31,641 4,650 39,667 3,376
$1000 under ~5,000 .. .................................. 247 1,485 - 1,151 334 5,551 66,067 9,286 86,632 11,2W
15,00~ -der $10,000 .................................... - - - - 1,366 13,841 490 20,199 5,86810,000 or more ......................................... 2 6 - 2 4 66 2,967 768 5,088 1,353
FAMEAND WITH UNHARVESTED CROPS
Current year net gain or net loss before limitation:
Net gain, total ........................................... 6,202 88,013 5,455 41,310 50,114
Under $50 ...............................................50 under $100 ..........................................11 0 -der $500 .........................................0
2,036 5,848 18? 5,003 648
S5 00 unde, $1,000 .......................................
I
,
000 under 15,000 ..................................... 2,202 13,011 451 7,640 5,4685,000 under 10,000 ....................................
1805 10,677 315 6,145 4,746
10,000 or more ........... ............................. 1,109 58,478 4,501 22,522 39,252
Net loss, total ........................................... - - - - - 1,119 12,249 895 15,492 2,348
Under $50 ...............................................50 under $100 ..........................................100 -der ~500 .........................................
1
579 5,262 59 5,470 150
500 under $1,000.......................................
I COO under $5,000 ... .................................1 5,000 ~.der $16,000 ................................. 542 6,986 836 10,021 2,198~10,000 or more .........................................
OTHER FATNIAND
urrent year net gain or net loss before limitation:
Net gain, total .................... ...................... 69,285 1,149,123 73,593 684,891 446,537 402 1,290 173 1,586 123
Under $50 ............................................... 723 3,322 123 3,421 20 - - - - -50 under $lGC. ......................................... 976 3,680 188 3,773 86 100 205 35 265 25100 -der S500 .........................................
17~369 31,595 873 30,250 2,128 - - - - -
500 under $1,000 ....................................... 8,899 51,528 -3,567 47,931 5,612 144 195 76 278 6tl,000 under ~5,000 ..................................... 30,718 262,730 12,891 196,239 68,455 113 504 62 581 15$5,000 under $10,000 .................................... 9,467 184,787 13,135 127,829 62,752 .34 252 - 313 61S10,000 or o.......................................... 11,132 611,480 42,815 275,448 307,283 11 133 - 149 16
Net loss, total.. ......................................... 14 837 86 881 42 8,187 118,204 6,778 158,911 33,929Under $5C ...............................................$50 "der $100.. ...........
- - - - - 2,034 24,922 361 25,293 10..............................
$100 -der $500 ........- - - - - 237 1,107 23 1,148 is
.................................$500 under S1 00C
11 802 86 851 37 829 9,206 259 9,714 249, .. ..................................... - - - - - 1,222 13,378 1,792 15,984 614
~1,000 under $5,000 ..................................... - 2,948 36,598 3,036 47 024 7,390$5,000 under $16,000 ....................................$lo 000 or more ..........
- - - - 382 5,846 273,
' 8,574 2,455, ............................... 4 35 30 5 535 27,146 1,034 51,174 22,993
Foo-~notea
at end of table. For the precise definition of terms and the nature of any limitations, see the "Description of the Sample," "Limitations of the Data," and,.Expl.-.,i- of Classifications and Terms" in the text.
Long-term capital asset transactions
k

58 SALES OF CAPITAL ASSETS ON INDIVIDUAL RETURNS, 1962RETURNS WITH NET CAPITAL GAIN OR LOSS
Table S.-SHORT-TERM GAIN, SHORT-TERM LOSS, LONG-TERM GAIN, AND LONG-TERM LOSS TRANSACTIONS -INCOME, NET GAIN (LOSS), AND TRANSACTION DETAIL,BY ASSET TYPE AND SIZE OF CURRENT YEAR NET GAIN OR NET LOSS BEFORE LIMITATION -Continued
(Taxable and nontaxable retuxzsj
currentShort-term capital asset transactions
Adjustedyear net
ca ital ainGain tranaactions, Los. transactions
Asset type and size of current year net gain Number ofigr.s.income
p g(loss)
NmberGr... Depre- Cost and Gross Number Gross
D~p"_Cost and
Grossor net loss before limitation returns before
of
sales tioncia
expense gain ofsales
ciation expense losslimitation
"
rans-price of sale trans- price of sale
(7?...-d (D--d a~tio- (Th...-d C 77...-d (7h...-d (Th..-1 actions (7h..--d (71~--d (T~-d (n--d&11 ... d~llars) d-Ijars) d.11 ... d.11 ... d.11 ... d.11.r.) &11 ... ~U-)
(3) (4) (5) (6) (10) 01) (12) (13)
PROCEEDS FROM PRIOR YEAR I~IsTALUMT SALES
Current year net gain or net loss beforelimitation:
Net gain, Lctal_ ...... ................... 421,589 5,010,081 1,529,799 20,674 10,635 30
Under $50... __ ...... ................... 18,831 161,991 552 1,534 45 -50 under $100.. ... __ ................ 28,779 253,020 2,113 1,552 95 -100 under $500 ...........................
1
123,839 1,012,299 34,023 7,535 1,143 4500 under $1,000.. ....................... 64,525
1592,317 46,499 2,869 1, Goo 11
I'000 ~nder $5,000 .......... ............ 127,499 1,439,586 298,613 5,560 2,959 -
5,000 under $16,000 ... ...........1
28,101 481,690 194,905 838 No applica le 1,054 1-1-1No applies le
I10,000 or more ........... _ ............. 30,014 1,069,189 953,095 787 4,338 2
Net loss, total ..... ...... _ .......... 4,513 55,742 20,940 - - 832 1,61)
Under $50 .................... ...........t5C under $100.. ..........................100 under $50L_ ..... ...... ...........
2,430 33,280 673 616 16,
500 under $1,000.... ....... ...........
$1 000 under $5,000 .......................
'11
.000 under $10,000 ..................... 2,082 22,461 20,267 214 1,44410, 000 or move....... ...... ............
OTHER TYPE ASSETS
Current year net gain or nst loss beforelimitation:
Net gain, total._. ........... ...... 286,288 3,862,735 626,092 41,494 38,166 506 33,926 49,123 ?,751 26,503 - 27,942 15,77(
Under $50 ............................... 76,927 848,369 1,544 7,456 1,503 - 1,480 633 1,266 38 - 46 38(50 under $100. ~ ..........................
V
33,067 369,292 2,366 5,348 1,184 32 1,130 349 227 6 - 13 1~
C0under $500........................... 70,365 877,951 17,561 11,385 6,165 is 5,377 2,570 1,463 550 - 648 29-
$500 under $1,000. ........................ 28,107 354,826 20,214 4,627 3,321 - 2,927 4,653 1,100 96 - 100 2,44i
2 000 under ~5, 000.......... ............ 57;162 737,618 137,282 10,126 10,054 - 7p623 12,918 2,489 4,676 - 5,169 3,9525:000 under $16,000 ......... ............
i
10,747 213,505 74,504 1,066 1,542 455 1,429 3,428 425 2,511 - 2,561 1,891lO, 000 or more. . . ~ ....................... 9,913 460,975 372,621 1,486 14,398 1 13,961 24,522 "181 !8,624 - 19,394 6,SO2
Net loss, total.._ ...... ........... ..... 279,0(a 3,668,775 1, 170, 611 11,583 25,730 612 23,629 23,110 122,411 63,134 1,028 108,203 26.3,40,'
Lde
$50- .................... .....
35,775 425,070 640 4,895 261 - 247 14,937 9,589 557 5 1,493 4,434r5,,dr $loo ............................ 17,747 205,252 1,236 176 143 - 143 104 8,673 5,483 - 5,586 53,'
2 00
under 500 ...........................
~
66,434 798,134 17,314 1,253 1,650 5 1,556 323 32,398 4,608 19 6,386 7,81`-
$500 usd
or 1,000 ............ ...... ..... 36,344 462,950 25,477 1,086 17,265 - 16,624 816 21,182 33,207 - 36,798 12,52 I
1,000 under $5,000 ..... ............ .... 75,867 1,041,997 169,91-1 3,265 4,877 63 4,199 3,067 37,473 11,021 1,0()4 25,054 68,8485,000 under $10,000 ................
121,054 272,350 146,632 419 717 - 663 494 7,918 4,140 11,259 43,57~
10,000 ormore ........................... 1 25,841 463,023 1 609,401 1 488 83.7 1 544 397 1 3,369 1 5,179 4,118 21,625 125,675
Footnotes at end of table. For the precise definition of terms and the nature of any limitations, see the "Description of the Sample," "Limitations of the Data," and"Explanation of Classifications and Terms" in the text.

SALES OF CAPITAL ASSETS ON INDIVIDUAL RETURNS, 1962RETURNS WITH NET CAPITAL GAIN OR LOSS
Table 5. -SHORT-TERM GAIN, SHORT-TERM LOSS, LONG-TERM GAIN, AND LONG-TERM LOSS TRANSACTIONS -INCOME, NET GAIN (LOSS), AND TRANSACTION DETAIL,BY ASSET TYPE AND SIZE OF CURRENT YEAR NET GAIN OR NET LOSS BEFORE LIMITATION -Continued[Taxable and nontaxable returns)
LonC-term capital asset tra,sactiont,
59
Gain transactions losr transecions
Asset type and size of current year net gain or net lossGross sales Depre-
Cost andGr as Cr
-
C.S1 ard3before limitation Number of
price ciati.expense of
gai~,Mum.bor of
p
experse of "
tr s-sale !-- sale 1-r
actions(7~.-d (7h...-d (7),-.-d (Th...-d
actions(Th-d (Th..-d
d.11... ) ~11 ...) ~11 ... )- - - d.11 ... )
(14) (15) 1 (Is)- (17) (20 (21) (22) (23)
PROCEIA FROM PRIOR YEAR INSTALUdENT SALES
Current year net gain or net loss before limitation:
Net gain, total ........................................... 506,857 1,519,969 1,106 18~
Under $5C.: ............................................. 17,344 5CY7 - -150 under $100.......................................... 28,614 2,018 - -,100 under $50C, ......................................... 147,102 32,884 49 4S500 under $1,000.. ..................................... 77,576 45,683 597 151.$1,000 under $5,000..................................... 158,906 295,770 312 11,~5,000 under $10,000.................................... 36,774 193,894 79 2110,00C, or mo-.............. .......... - .............. 1-2,341
Ne t applicabl,949,223 70 N )t applicabl e 463
Net losc, total. ............................. ; ............ 779 98 4,067 19,427,
Under s50 ...............................................150 under $100 ..........................................
1 0 ttnder.$500. ........................................0
506 57 2,081 563
5 00 under $1,000 .......................................
$1,000 under t5,000 ...............................$5,000 under $10,000 .............................. 274 41 2,005 12,865$10,000 or more .........................................
OTHER TYPE ASSETS
Current ycaz, net gain or net loss before limitationt
Net gain, total ........................................... 274,149 639,333 273,434 615,918 633,853 6,744 17,689 213 19,243 41,114
Under $50 ............................................... 71,806 1,164 66 985 1,947 751 1,008 6 1,125 7Cri$50 under $100 .......................................... 29,417 2,112 259 2,152 2,066 114 207 3 235 38$100 under $500. ........................................ 63,467 44,538 61,997 100,582 17,521 1,445 765 5 843 2,236$500 under $1,000 ....................................... 27,500 55,311 3,734 47,313 19,074 512 363 6 472 1,072
1,000 under $5,000 ..................................... 59,381 216,466 12,737 1,-,567 138,841 2,619 13, D34 19 13,372 10,5245,000 under $10,000 .................................... ll, 549 57,559 177,913 26~,502 74,953 302 827 165 1,031 1,986,C)
000 or more ................................ ........ la,009 262,183 16,728 106,817 379p452 1,002 1,516 9 2,114 24p551
Net loss, total ........................................... 13,288 14,770 3o010 9,929 16,254 187,870 169,927 9,444 256,812 946,570
Under $50............................................... 2.5nA 656 - 47" 2,6S6 2?,896 3119-'
96 32,336 13,62950 under $100 .......................................... 1 265 313 31 32~ 45 1
,621
08182 1,445 4,497 6501
,onunder $500 ........ ................................ 2 252 2,135 291 1 686 664 5 2673 , 76712: 742 16,662 10,489
500 under $1,000 ....................................... 1,512 1,415 47 1
,
211 474 22,6215 26,656 420 32,419 14,245
1,000 -der ~51000 ..................................... 4,437 5,631 66 4,474 6,847 48,057 52,028 3,360 92,221 110,9775,000 under 10,000.. ..................................
1
234 153 22 61 690 16,489 19,269 1,093 31,605 104,23810,000 or more.. ....................................... 1,082 4,468
12,716 1,695 4,849 23,915 24,422 2,269 57,021 691,943
'Die to the reporting of more than one asset type by some taxpayers, the number of returns and adjusted gross income for tIA-11 asset types" will be less thar. the sum of theseitems for the specific asset types.
(*) An asterisk in a cell denotes that the estimate is not shown separately because of high sampli- variability. However, the data are included in the appropriate totals.- A dash in a cell indicates that either there are no data for that item or it amounts to less -than $50C).NM
: Detail in the tables may not add to totals because of rounding.Forthe precise definition of terms and the nature of any limitations, see the '-Description of the S=ple," "Limitations of the Data," and "Explanation of Classifications
and Terms" in the text.

RETURNS WITH NET CAPITAL GAIN
Table 6. -ALL, SHORT-TERM, AND LONG-TERM TRANSACTIONS-INCOME, TAX, NET GAIN, AND TRANSACTION DETAIL, BY ASSET TYPE AND SIZE OF ADJUSTED GROSS INCOME
Asset type and size of adjustedgross income
Number ofreturns.ith netcapital
gain
Adjustedgross
income
.11 ...
Taxable
income
Th...-ddAl ...
Incomestax'aft r
redits
.11...
Net capital
gain
77....-d~11 ...
Capital loss carryover
AmountNumber ofreturns
(Th...-d&11 ...
All capital asset transactions
Gross gain Gross lossGross sales
Cost andNumber of Depreciation expe e oftrans-
price.Sale Number of Amount
Number of Amountactions
(Th...-d (Th...-dreturns returns
d.11 ... &11 ... &11 ...) d~11-) ~11 ...)
(1) (2) (3) (4) (5) (6) (7) (8) (10) (11) (12) (13) (14) (15)ALL ASSETS TYPES'
Grand total .......................... 4,322,520 45,476,669 30,718,562 8,849,836 6,821,578 36,009 63,036 9,712,544 35,442,480 1,732,439 26,548,181 4,322,520 15,922,373 732,186 2,385,867
Taxable returns, total ..................... 3,494,57? 44,066,948 30,615,306 8,849,836 6,114,812 32,3~ 74,645 8,073,199 31,522,646 1,251,235 23,262,654 3,494,577 14,2?3,230 60`7,354 2,136,3?2
Under $10,000 ............................ 2,110,110 12,236,360 6,694,?63 1,303,890 1,337,274 8,271 9, 04.1 3,72?,979 7,863,514 620,768 6,176,914 2,110,110 3,064,062 255,944 427,49510,000 under $50,000. 1,300 205
'
23,373,826 17,154,917 4,368,909 2,367,318 19, 951 42,226 3,634,817 13,989,846 483,465 10,804,701 1,300,205 5,760,306 306,266 1,069,70750,000 under
1
64 ?89 4,313,764 3,481,302 1,440,671 736,570 2, 992 12,876 466,005 4,045,581 49,683 3,044,294 64,?89 1,794,759 32,916 326,478100,000 or more.... ..................... 19,473 4,142,997 3,284,324 1,736,365 1,673,651 1,151 10,502 244,389 5,623,704 97,119 3,236,744 19,4?3 3,654,103 12,227 312,702
taxable returns ......................... 827,943 1,409,722 103p255 - 706,766 3, 646 8,391 1,639,355 3,919,834 481,204 3,285,52? 827,943 1,649,143 124,832 249,495
CORPORATE STOCK
Grand total .......................... 1,127,835 19,378,364 13,875,761 4,569,590 3,668,744 24,044 58,050 3,946,089 18,378,459 r13,434,273 lpO56,679 6,200,882 440,935 1,340,233
Taxable returns, total ..................... IjOO51309 19~0?7,564 13,850,502 4,569,590 3,504,453 22,335 54,361 3,613,889 1?,299,834 2.2,546,155 940,915 5,922,211 404,436 1,249,296
Under $10,000 ............................ 427,342 2,630,441 1,473,336 285,404 304,437 4,857 4,352 1,043,095 2,322,219 1
1
871
,
981 405,768 578,543 129,380 135,21310,000 under $50,000.
:, -*- -* ,*:*-519 657
1
10,158,682 7,402,329 1,938,679 1,208,656 14,149 29,944 2,048,002 7,888,259 61322,336 481,117 2,153p818 237,280 623,80650,000 under $l0O,OO0 . .. .
1
43 ,015 2,896,861 2,299,801 943,842 545,087 2,328 10,493 340,617 2,857,303 2,156,279 39,646 934,312 27,540 244,624100,000 or more ......................... 15,295 3,391,580 2,675,036 1,401,665 1,446,272 1,()Ol 9,572 182,185 4,232,053 1 2,195,558 14o383 2,255,538 10,236 245,653
Nontaxable returns ......................... 122,526 300,800 25,259 - 164,291 1, 709 3,689 332,200 1,078,6250
888,118 115,764 278,671 36,499 90,937
U. S. GOVMDAENT OBLIGATION9
Grand total .......................... 30,115 884,661 629,885 245,890 202,923 (501 2,333 51,910 1,014,109 1,000,914 23,598 16,671 8,539 3,656
Taxable returns, total ..................... 27,782 661,096 629,309 245,890 199,376 597 2,188 48,983 979,911 1 967,259 21,537 15,92? 8,080 3,455Under $10,000 ............................ 9p126 57,905 32,977 6,226 3,437 - - 13,451 47,148 43,022 6,692 4,28410,11 1 51,~~I;::: ................~~ :r t 11,710 321,442 229,789 61p714 46,498 407 831 26,903 413 953 410,788 10,385 5,118 5,405 2,131., GO d50 0
, G.................
1
2,619 180,497 137,760 56,079 35,437 307 326 5,644 284,749 283,156 1,697 2,188 1,163 595100,000 or more ......................... lp32? 300,252 228,782 121,871 114,003 83 1,030 2,986 234,061 230,294 924 4,336 552 570
taxable returns ......................... 2,334 23,565 576 - 3,547 5 145 2,926 34,198o
33,655 2,011 744 459 202
STATE AND ILCAL SECURITIES
Grand total .......................... 36,021 1,594,913 1,129,143 507,049 391,771 1,702 6,141 78,244 801,951 761,447 29,625 53p757 10,894 13,301
Taxable returns, total..................... 31,222 1,558,733 1,126,450 507, 049 364,830 1,-,;98 5,231 70,699 741,932H
705,755 24,719 48,788 9,559 12,660Under $10,000............................ 7,066 45,941 25,512 4,572 3,965 9,061 20,232 15,861 6,373 4,92310,000 under ~50,000 ............. 16,729 398,766 281,871 78,756 52,627 676 1,311 35,712 ,8C6278
BOB263,26? 12,80? 19,458 5,546 3,919
50,000 under $100,000.............I ......
1
4,361 304,117 229,579 93,731 50,70`7 213 1,302 12,571:7
137,312'37 2
132,579 3,257 8,218 1,834 3,510100,000 or more......................... 3,066 8()9,910 589,488 329,989 257,532 215 2,336 13,356 301,1~. 294 048 2 282 16 189 1 386
,
4,677
Nontaxable returns......................... 4,799 36,180 2,693 - 26,941 ?,545 60,019 55,691 3,906 4:968 1 335 640
OTHER BONDS, NOTES, AND DEBENTURES
Grand total .......................... 25,077 826,959 584,966 239,835 246,072 1,366 6,753 40,010 287,514 278,500 15,472 30,874 12,270 22,005
Taxable returns, total ..................... 21,565 618,081 583,990 239,835 220,062 748 3,356 33,562 229,194 .1 215,532 13,431 27,898 9,648 14,380
Under $10,000 ............................ 5,366 29,472 18,951 3,494 3,795 - - 7,073 7 030 6,361 3,300 967 2,266 2992.0,000 under $50,000 .................... 12,578 276,618 195,772 52,509 43,628 528 965 18,870 103,765 101 822 7 868 8,851 5,693 6,92650,000 under $100,000 ...................
1
2,361 161,081 119,526 47,916 35,933 3.46 1,420 4,691 46
,
756 43,902 11489 6,025 1,08C 3,202100~000 or more ......................... 1,260 350,910 249,741 135,915 136,706 73 971 2,929 71
,
643 63,446 774 12,054 609 3,953
Nontaxable returns ......................... 3,513 8,878 976 - 26,011 6,448 58,320 62,968 2,0410 2,976 2,622 7,624
INSURANCE AND ANNUITIES
Grand total .......................... 6,943 103,317 72,076 22,139 19,230 18 109 8,191 32,086 15,562 6,644 16,9017 355 424
Taxable returns, total ..................... 6,140 100,949 71,681 22,139 18,662 18 109 7,389 31,646 15,245 5,842 16,785 355 424
Under $10,000 ............................ 3,066 20,763 10,821 2,045 1,038 - - 3,559 3,530 1,711 3,066 1,869 - -20,000 under ~50,000 .................... 2,842 54,322 40,532 10,604 9,343 3,453 21
1
493 10,248 2,579 11,516 306 30350,000 under $100,000 ................... 160 10,765 8,620 3,470 2,300 M 250 31982 2,169 135 1,678100,000 or more ......................... 72 15,098 ll,?O8 6,020 5,981 7 51 12? 2,592 1,117 61 1,523 16 56
Nontaxable returns ......................... . 802 2,369 395 - 568 - - 802 440 318 802 122 - -
Footnotes at end of table. For the precise definition of terms and the nature of any limitations, see the --Description of the Sample," "limitations of the Data," and "Explanation of Class i fications and Teims-1 in the text.

RETURNS WITH NEI' CAPITAL GAIN
Table 6.-ALL, SHORT-TERM, AND LONG-TERM TRANSACTIONS -INCOME, TAX, NET CAIN, AND TRANSACTION DETAIL, BY ASSET TYPE AND SIZE OF ADJUSTED GROSS INCOME -Continued
Short-term capital asset transactions Long-term capital asset translactions
Asset type and size of adjusted Number Number ofGross
lprea
'.D
Cost andGross short-term
gainGross short-t
lossIGross
Depreol- Cost and Gross long-term gain Gross long-term lossgross income of trans-
asa e
price
t: ion
expenseof sale - --- - Number of
Number of salesation
expe as
returns actionsNumber Amount Number Amount returns trans- price of sale
Number ofAmount
fAmount
Nu bb
f
(Th--dofret
7h.-dUrns
ofreturns
(M.-d
~
action.(7)...-d (Th...-d (Th-d returns (77...-d
m er oreturns (Th... md
etur-aar o
d.11 ...) d,11 ... ) d,11-) d.11 ... _&11-) &11... ) d.1 I ... &11
ALL ASSET TY '(16) (17) (18) (19) (20) (21) (22) (23) (24) (25) (26) (27) (28) (29) (30) (31) (322))
F
(33)PES
Grand total ......................... 448,631 1,175,620 5,627,914 3,215 5,683,685 333,026 335,313 204,983 379,832 4,21.9,740 8,536,924 29,814,566 1,729,221, 20,864,495 4,212,008 15,587,059 645,099 2,006,035Taxable returns, total ..................... 393,741 1,062,298 5,236,523 2,386 5,295,831 291,677 292,235 182,178 347,196 3,405,958 7,010,891 26,286,122 1,248,849 17,966,822 3,399,020 13,980,995 532,111 1,789,176
Under $10,000 ...........................10 000 under 00 000
164,522200 8 3
318,127 894,321 888 875,071 130,438 65,994 55,738 41,733 2,055,494 3,409,852 6,969,193 619,881 5,301,843 2,053,273 2,998,068 226,061 385 752, , ...................50 000 under $100 000 ... . ..
1
, 220 398
600,37992
2,590,2318
1,352 2,608,881 143,475 154,764 105,753 172,614 1,266,692 3,034,438 11,399,615 482,113 8,195,820 1,262,155 5,605,522 265,331,
897,093, , . . ..........100 000 or more .........
,7 999
,611 65,082 61 691,998 12,764 37,866 14,567 64,665 64,338 373,394 3,180,499 49,822 2,152,295 64,181 1,756,892 29,597 261,614, ............... , 51,182 886,889 86 919,881 5,000 33,590 6,100 67,985 19,433 193,207 4,736,815 97,033 2,316,864 19,411 3,620,513 11,122 244,717Nontaxable returns ........................ 54,890 113,322 391,391 829 387,854 41,349 43,079 22,805 32,635 813,782 1,526,033 3,528,443 480,375 2,897,673 812,988 1,606,064 112,988 216,860
CORPORATE STOCK
Grand total ......................... 277,437 865,779 3,607,157 3,900,808 207,826 186,233 142,593 281,070 1,045,895 3,080,310 14,571,301 533,465 969,682 6,014,649 391,533 1,059,164Taxable returns, total .................... 260,008 808,169 3,598,862 3,690,067 194,200 169,052 133,280 261,351 928,466 2,805,720 13,700,972
18,856,087 659,360 5,753,160 357,532 987 945
Under $10,000...........................10,000 under $50,000. ....
92,898145 650
197,096490 453
529,1901 681 935
528,5791 916 435
74,899105 983
31,5069
35,833 30,963 389,460 845,989 1 793 029
'
w.1. 1 343,402 367,439 547,038 114,027
,
104,250:50,000 under $100,000 .... ..... . .. .
115:280
,77,497
,559'202 1585:961
,6309
6,03423 390
81,38711 330
131,23150 325
482,28841 708
1,557,549263 121
6 0,0,6:13.242 2 2
4:405,901
1 5439,681 2,057,765 208,682 492 575
100,000 or more ........................ 5,980 43,124 628,5 659,093,
3,688,
18,122,
4,731,
48,832,
15,010,
139,061 3 603,5180
1
, 70,3181,536,465
38,18114,059
910,9222,237,416
25,3509,473
194,300196,820
Nontaxable returns ........................ 17,429 57,610 208,2 210,740 13,626 17,181 9,312 19,719 117,429 274,590 870,3300
677,378 110,322 261,489 34,001 71,218
U. S. GOVERNMENT OBLIGATIONS
Grand total ......................... 5,977 10,765 550,026 549,061 3,765 1,514 2,302 550 27,215 41,145 464,082 451,853 21,625 15,157 6,952 3,107Taxable returns, total .................... 5,918 10,677 546,049 545,098 3,723 1,499 2,287 549 24,690 38,307 433,863 422,162 19,616 14,42? -6,507 2 905
Under $10,000 ...........................,
10 000 under $50,000 ...................50 000 b
1
3,121 6,123 224,335 223,891 1,541 739 1,666 2978,532
13,07611,67120,779
43,429189,619
39,384186 897
8,1999 346
4,1974 378 4 306 1 835, ..do, $10 ,000 ..................
100 000 or more ...........764 1,764 209,49 5 209,221 453 363 329 89 2,217 3,880 75,2
5/545'
,73,935
,
1,406,
1,825,
930
,
506, ............. 453 1,010 108,500 0 08 347 250 310 192 157 1 066 1,976 121,561 o 121 946 666 4,027 411 412Nontaxable returns ........................ 59 88 3,978 3:963 42 15 15 - 2,325 2,839 30,220 29:692 2,009 730 445 201
STATE AND LOCAL SECURITIES
Grand total ......................... 3,154 7,669 175,575 175,419 1,599 1,925 1,707 1,770 34,140 70,575 626,376 586,027 27,721 51,831 9,523 11,531Taxable returns, total .................... 2,405 6,899 165,647 165,322 1,458 1,917 1,102 1,592 30,044 63,800 576,285 10 540,433
f
23,918 46,872 8,791 11,068Under $10,000 ...........................
*~'7,066 8,760 20 098 15,794 6 373 4 858 M10 000 under $50,000 ...................
01,393 4,545 8 146 5 85 590 896 1,140 625 585 15,896 31,167 192 663 c, 177 676
,12,224
,18,318 5 079 3 33450,000 under $10 ,000 ..................
1
469 904 15 726
~
16:054 232 307 256 635 4,184 11,667 121,587 116:525 3,137 7,911
,1 667
,2 875100,000 or more ........................ 443 1,150 63 643
0Z
63,610 229 404 221 371 2,896 12,206 241,937 10 230,438 2,184 15,785
,
1,251,
4,306Nontaxable returns ........................ 749 770 9,928 10,097 4,096 6,775 50,091 k, 45,594 3,804 4,960 M
OTHER BONDS, NOTES, AND DEBENTURES
Grand total ......................... 4,601 7,229 57,810 64,700 1,897 1,342 2,985 8,235 22,120 32,781 229,704 213,800 13,993 29,532 9,795 13,770Taxable returns~ total .................... 3,423 5,503 55,264 57,760 1,754 1,045 1,943 3,565 19,248 28,059 173,930 157,751 12,058 26,853 8,206 10,815
Under $10,000 ...........................10,000 under $50,000 ................... 2,326 3,713 25,491 26,700 1,278 568 1,236 1,780
5,13310,923
6,73915,156
6,95678 2 74
6 2825 1227 :
3,2006 833
9598 283
2,0334 816
2845 14650,000 under $100,OCC ..................
1482 801 9,128 9 918
'246 304 293 1,094 2,085 3,890
, 2837,62 33,984
,1,329
,5 721
,868
,2 108100~000 or more................. I ...... 262 656 20,571 1
0 21 083 129 164 181 676 1,108 2,274 51,0 42,363 697,
11,891 489,
3,277ontaxable returns ........................ 1,178 1,726 2,547 6,920 1,042 4,670 2,872 4,722 55,7 56,049 1,935 2,680
INSURANCE AND ANNUITIESGrand total ......................... 425 433 1,295 1,226 297 141 126 71 6,579 7,759 30,791 14,336 6,357 16,766 231 353
a.xable returns, total.................... 325 333 1,293 1,226 197 138 128 71 5,877 7,056 30,353 14,018 5,655 16,647 231 353Under $10,000...........................10 0 under 50, 000.
00 * -- -* . .....1
316 324 1 233 1 150 192 135 125 51,1112 3,459 3
,
164 1,316 2,966
"84'1 0
000 under 10 OCO:50, . . .1
, ,'
2 690 3,254 20,821 9 631 2,502 11,411, 217 316
100,000 or more ........................ 8 9 60 1 76 5 4 3 2015071
225118
3 8372:532 o
2:031I
,041
12859
1181
1,519)
14 37Nontaxable returns ........................
M
N
T
.Footnotes at end of table. For the precise definition of terms and the nature of any limitations, see the "Description of the Semple,-, "Limitations of the Data," and "Explanation of Classifications and Tems" in the text.

RETUBNS wiTH NET CAPITAL GAIN
Table 6. -ALL, SHORT-TERM, AND LONG-TERM TRANSACTIONS -INCOME, TAX, NET GAIN, M TRANSACTION DETAIL, BY ASSET TYPE AND SIZE OF ADJUSTED GROSS INCOME-
Asset type and size of adjustedgross income
Number ofreturns
ith netcapitalgain
Adjustedgross
income
Taxableincome
(A...-d)
Incomectaxaft r
credits
Th ...~d)
Net capitalgain
(M...-d)
Capital loss carryover
Number ofAmount
returns
All capital asset transactions
Cost and Gross gain Gross lossNumber of Gross,sales
Depreciation expense oftrans-
pr ccsale Number of Amount Number of Amount
actions(7),...-d Th.-d
returns(7h...-d
returns(rh-..-d
- dil ... ) d. I I ...) d.11 ...
OPTIONS TO BUY OR SELL(5) (6) (7) (8) (10) (11) (12) (13) (14) (15)
Grand total .......................... 4,715 115,110 80,887 28,990 3?,085 243 489 9,355 40,028 28,156 2,761 14,332 2,623 2,46~Taxable returns, total ..................... 3,753 111,691 80,887 28,990 35,274 ~242 465 7,306 138,963 1
26,676 2,425 14,033 1,996 1,74EUnder $10,000 ............................10,000 under $50,000 ....................
62,515 55,637 40,015 10,658 11,579 .218 298 3,864 5 2421 8,356 1,465 665? 1 097 78C50,000 under $10 ,000 ...................
1
308 21,379 15,629 6,295 5,851 598, 5E,
3,581 1,779"5 '
182,
2 191,144 392100,000 or more ......................... 137 30,053 23,616 11,789 17,038 9 132 257 61192 1
o 2,436 85,
4,107 62 35CNontaxable returns ......................... Z
COWODITIES INCLUDING FUTURE CONTRACTS
Grand total .......................... 13j758 183,982 130,850 45,220 60,921 435 1,268 62,203 441,843 432,224 11,850 22,307 5,696 12,7413raxable returns, total ..................... 8,637 177,196 129,904 45,220 56,302 :316 1,231 51j373 391,870 385,779 6,938 18,387 3,989 12,301
Under $10,000 ............................
10,000 under ~50,000 ....................4,4883,522
25,79575,218
14,39654 731
2,859
14 1363,935
15 85733,843
14 5D9170,332 166,9601 3
4,088 7,659 1,394 4,286
50,000 under ~100,000 ...................
1472 30,906
,24,088
,9,981
,6,333 44 641
,2 034
6 ,3.~,721 162,7244 41 331
2,438322
6,4392 927
2,161322
5,441
100,000 or more ......................... 154 45,277 36,688 18,244 30,176 12 227,987
"
,1 14,765 90
,1,363 113
1,32?1,24?
9ontaxable returns ......................... 5,121 6,786 946 - 4,619 10,829 4o
46,445 4,913 3,920 1,706 442
CAPITAL GAIN DIVIDENDS
Grand total .......................... 1,378,286 16,005,539 llj225,C?76 3,126,732 1,196,529 7,754 16,255 1,42-7,765 374,219 47?,109 6,487 3,70-Paxable returns, total. .................... 1,231,525 15,711,243 11,200,039 3,126,?32 1,140,119 7, 256 15,134 1,262,906 1:227,528 428j671 5,825 2,44CUnder $10,000 ............................ 693,356 4,176,859 2,477,381 491,531 163,?12 '716,238 691 777 158 02910,000 under $50,000....................50 000 d 0 0
1
511,860 9,065,744 6,742,129 1,711,580 456,951 5,690 7,110 521,0168 Net -Ppli..ble,
509,734,
202 684 2 615 1 209j
un er $1 0, 00 ................... 21,019 1,386,703 1,134,026 470,301 158,825 762JS
3,1112, ,2,921,219 20 784
,36 651
,275
,438100,000 or more ......................... 5,290 1,081,938 646,503 453,320 360,630 271
972,597
5 SC5
,380
,5,234
,31,307 69 392
lontaxable returns ......................... 146,761 294,295 25,037 - 56,410 164,859 146,692 48,439 662 1,265
SHARE OF CAPITAL GAIN (LOSS) FROMPARTNERSHIPS AND FIDUCIARIES
Grand total .......................... 293,167 5,365,980 3,914,263 1,351,627 1,069,585 4,-,il8 13,080 324,971 280,580 1,034,560 24,884 22,023~axable returns, total ..................... 256,892 5,321,434 3,90`7,065 1,351,627 974j856 4,473 12,811 285,891 245,064 935,277 23,009 18,46?Under $10,000 ............................$10,000 under ~50,000 ....................
113,878123,410
661,2532 598 808
372,3?81 921 509
?0,534515 315
99,347317 111
(.)5232 4 9 9
12,4,7971 t li
112 443
,
172,713 5,521 1,750
50,000 under $100,000 ...................
1
14,490, ,
975,546, ,?78,753
j320,850
,
163,673,569
6'052 7
37 72816 978
o app cable 114 885 403,983 14,129 7,505
100,000 or more......................... 5,114 1,085,827 834,424 444,928 394,724 287,
2,917,
6,38913
,198
4 536148,519210 062
2,319
1 0403,3245 888
lonta-xable returns......................... 36,275 44,546 7,198 - 94,?30 39,079
,
35,516
,
99,284
,
1,875
,
3,557CAPITAL GAIN DISTRIBUTIONS FROM SMALL
BUSINESS CORPORATIONS
Grand total .......................... 22,897 407,307 300,659 98,504 68,?51 ?68 2,372 26,151 22,111 52,918 1,613 2,463axable returns, total ..................... 20,878 404,136 300,129 98,504 67,005 ?68 2,372 24,029 20,192 50,656 1,513 %28Under $10,000 ............................ 7,723 41,778 26,339 4j662 4,644 8,709 7 719 8 405 (.)10 000 under $50,000............! ........ 11,829 221,?ll 163,321 42,427 22,818 299 215 13,695 Not applicable
,11 238
,24 087 887 46550,000 under $100,000...................
i
959 64,477 52,?23 22,107 9,075 55 34 1,150,891
,
5 249 101 289lCO,000 or more ......................... 367 76,170 .57j746 29,309 30,467 17 ill 474 344,
12,915 28 1004ontaxable returns.... ..................... 2,019 3,171 529 - 1,747 - - 2,123 1,919 2,262
LIQUIDATION DISTRIBUTIOUS
Grand total .......................... 30,510 1,079,492 828,149 337,500, 434,969 1,33? 5,484 34,230 28,593 568,D72 2,336 7,967'axable returns, total ..................... 29,023 lj 0`73, 634 827,422 33?j5OO 396,551, 1,336 5,484 32,622 27,110 504,447 2,329 7,919Under $10,000 ............................ 9,046 5?,Bll 30,754 5,724 9,479 (.) 9,146 8 846 11 846 (.)10
,000 under $50,000 ....................
50,000 under $106 000...................1
15,0153 080
337,450210 596
251,688
166 86871,21068 649
72,00756 181
60613
3,474 16,857 Not appli.abl !
,13
,
654,
99,075 1,611 4,191,100,000 or more .........................
,1,882
,467,?7?
,378,113
,191,917
,258j884
6101
496492,
1 327
3,."2"643,1112 764
21861 70,646 313 1,486,
1 l
1,749 322,878 205 2,042ontaxable returns .........................
I(.) - (.)
T
ootnotes at end of table. For the precise definition of terms and the nature of any limitations, see the "Description of the Semple,-- "Limitations of the Data," and '-Explanation of Classifications and Terms" in the text.

- CAPITAL GAIN
Table 6. -ALL, SHORT-TERM, AND LONG-TERM TRANSACTIONS -INCOME, TAX, NET GAIN, AND TRANSACTION DETAIL, BY ASSET TYPE AND SIZE OF ADJUSTED GROSS INCOME-Continued
Short-term capital asset transactions Long-term capital asset transactions
Asset type and size of adjusted Number Numb r ofGross
Depreci-Cost and
Gross short-termgain
Gross short-termloss
GrossDepreci-
Cost and Gross long-term gain Gross long-term loss
gr= income ofe
trans-sale
spriceation
expense
of saleNumber f
Number of salesi
ationexpense
returns actionsNumber Amount Amount11~be returns trans- pr ce of sale Amount
Number ofAmount
Number of(A.-d (Th...-d (77....-d
f
0returns
fof
(A.-dreturns
actions(77--d (77--d (lh-.-d returns (n.-d returns (A.-d
d.11.,.) d.11... d.11-)d,11 ...
d.11 ... d.11 ... &11 ... d.11 ... d.11 ...(16) (17) (18) (19) (20) (21) (22) (23) (24) (25) (26) (27) (28) (29) (30) (31) (32) (33)
OPTT,)i.F TO 13UY OR SELL
Grand total ......................... 1,871 4,409 17,581 17,863 419 1,545 1,578 1,829 2,997 4,946 22,44? 10,293 2,353 12,787 1,111 636
Taxable returns, total .................... 1,243 2,795 17,400 16,978 418 1,532 951 1 113 2,662 4,511 21,564 9,698 2,019 12,501 1, ill 636
Under $10,000 ........................... N10,000 under ~50,000 ................... 869 984 2,536 1,881 162 1,135 731 480 1,740 2,880 12,705 6
'
475 1,303 6,530 410 30050,000 under $100,000 ..................
1100 307 537 577 36 258 78 300 237 291 3,044 1,202 153 1,933 83 91
.100, 000 or mor............ - ..... * ... 54 103 1,106 1,245 20 91 42 231 92 154 5,087
:2 1,190 69 4,015 24 119
Nontaxable returns ........................ N N N N N N N N N N H N
- -
COWODITIES INCLUD114G FUTURE CONTRACTS
Grand total ......................... 5,799 46,366 401,560 401,491 4,518 11,244 3,834 11,229 8,596 15,836 40,283 30,734 7,791 11,063 2,099 1,514
Taxable returns, total .................... 4,300 42,569 366,288 1 366,98-1 3,127 10,371 3,028 lIj071 4,870 8,805 25,5821
18,795 4,166 8,016 1,194 1,230
Under $10,000 ...........................1 N N N 3,595 6,997 6,514 3,088 3,295 3,628 N N
10,000 under $50,OOC).:,*,*,,*,,*,** .... 2,813 13,147 154,414
1
155,047 1,934 4,225 1,945 4,862 1,049 1,362 9 3~2 7,677 699 2,214 391 57950,000 under $100,000 .................
1367 1,744 37,559
9:37,199 227 1,553 292 1,192 175 290 1,3 w 4,132 141 1,373 77 134
100,000 or more ........................ 127 832 10, 4S 7o
10, ~~,6 72 562 98 933 51 155 4 1 3,898 31 801 26 315
Nontaxable returns ........................ 1,499 3,798 35,272 34,507 N N 806 158 3,726 7,032 14 11,938 3,625 3,046 905 264
CAPITAL GAIN DIVIDENDS
Grand total ......................... 4,769 4,978 3,518 378 1,251 589 1,375,784 1,422,786 1,371,975 476,731 5,334 3,116Taxable returns, total .................... 4,176 4,385 2,924 337 1,251 589 ]:,229,123 1,258,521 1,225,383 428,334 4,672 1,852
Under $10,000........................... N No applica le N N (*) (.) 692,463 714,351N t applicable 690,783 157,948 N N
10,000 under $50,000 ................... 2,229 2,337 1,546 159 683 434 . 510,422 517,732 508,624 202,525 2,016 77450,000 under $100,000 ..................
1132 132 71 95 61 129 20,959 21,088 20,748 36,556 225 309
100,000 or more ........................ 28 30 14 2 14 25 5,280 5,350 5,228 31,305 58 367Nontaxable returns ........................ N N - - 146,660 164,266 146,592 48,398 662 1,265
SHARE OF CAPITAL GAIN (LOSS) FRCMPARTNERSHIPS AND FIDUCIARIES
Grand total ......................... 38,703 38,806 -5,756 29,675 12,963 9,994 284,149 286,164 27C,583 1,004,885 14,142 12,029
Taxable returns, total .................... 35,038 35,141 23,241
~
28,364 11,813 9,083 248,742 250,750 235,941 906,912 13,376 1),383Under $10,000 ........................... 13,506 13,506
No 10,507 2,848 3,000 1,300 110,597 111,290N t applicabl e
208,176 169,86610 000 under ~50,CCO ................... 17,412 17,493
I
10,374 10,297 7,048 3,170 111,223 120,236"0
110,697 393,686 8,806 4,33550,000 under $100,OM .................
12,773 2,791 1,571 5,076 1,206 1,556
.1114, 11
0
'l1-4 117 12,710 143,441 1,361 1,768
100,000 or more........................ 1,346 lj351 790 , 410 1 2 560 3,058 4,9 11 75 037 4,358 199,920 588 2,8 31Nontaxable returns........................ 3,665 3,665 2,515 1,311 1,150 910 35,407 35,414 34,642 97,973 N N
CAPITAL GAIN DISTRIBUTIONS FROMSAALL BUSINE55 CORPORATION
Grand total ......................... 1,656 2,050 908 252 831 189 22,515 24,101 21,816 52,666 859 2,273
Taxable returns, total .................... 1,656 2,050 908 252 831 189 20,496 21,979 19,897 50,404 759 731)Under $10,000 ........................... N (.) N (.) N 7,723 7 723 7,719 8,401 N N10,000 under $50,000 ................... 576 951 No applicable 366 224 280 44 11,503 12,?44 No t applicabl e 10,986 23,864 665 42250,000 under $100,000 ..................
182
9,
43 21 50 133 909 1,C53 852 0 5,228 65 155.100,000 or more........................ 12 16 6 4 8 11 361 458 34 Q 12,911 25 88
Nontaxable returns ........................ - -- - - - 2,019 2,123
1'
919 2,262
LIQUIDATION DISTRIBUTIONS
Grand total ......................... 430 486 187 303 248 1,668 30,192 33,744 28,439 567,770 21115 6,299
Taxable returns, total .................... 423 479 179 227 248 1,668 28,712 32
'
143 26 963 5C4,220 2,108 6,250Under $10,000 ...........................10 000 -d.r $50,000....
... ...
-
322
-
359th , Dplicable 9
,
04614 58
'7
9,14616,497
No t applicib~846
13 52911,84899 C30
N1 435 2C43
50,000 under $100,000 ...................... .....
1
46 60153
101 3 821 1,171
3 052 3 795 2 847 7 587C
,288
,1,302
100,000 or more ........................ 54 59
]
26 123 29 498 1,857 21705 2, 741 32 2,755 185 1,541-
Nontaxable returns ........................ N N (-) N - - N N N N N
v at end of table. For the precise definition of terms and the nature of any limitations, see the "Description of the Semple, 11 "Limitations of the Data, " iation of Classificatiotis and Te-1- in the text.
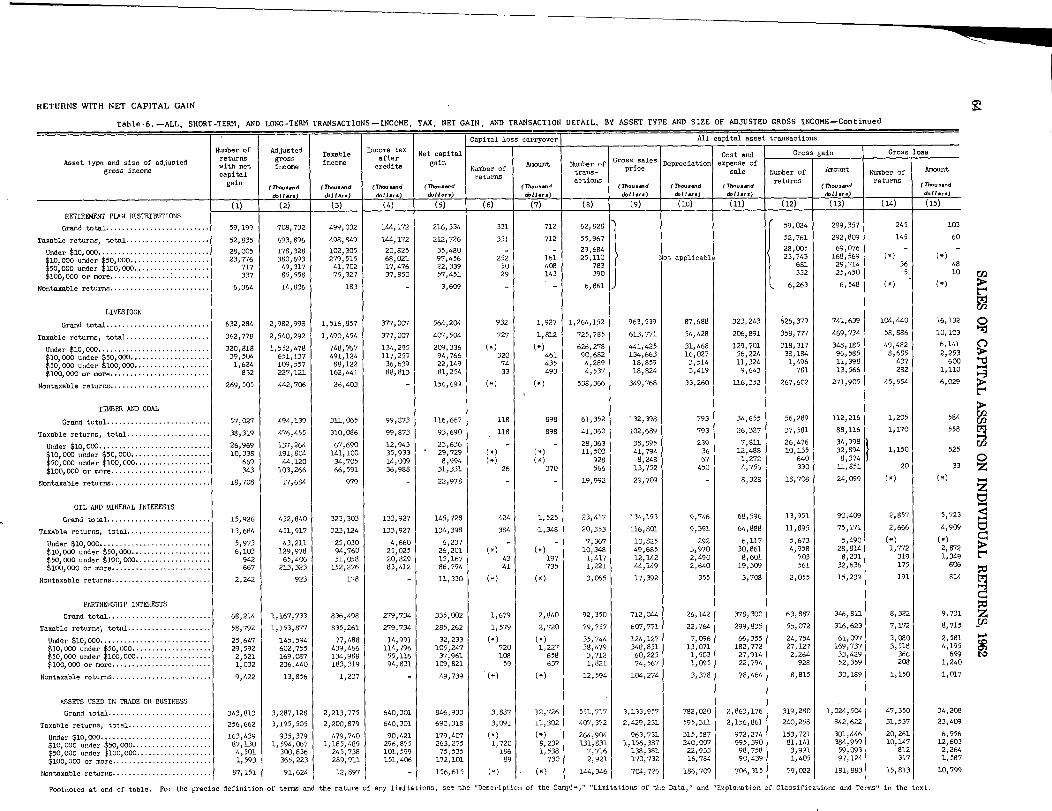
RETURNS WITH NET CAPITAL GAIN
Table 6. -ALL, SHORT-TERM, AND LONG-TERM TRANSACTIONS -INCOME, TAX, NET GAIN, AND TRANSACTION DETAIL, BY ASSET TYPE AND SIZE OF ADJUSTED GROSS INCOME-Continued
Asset type and size of adjustedgross income
Number of
returns.ith net
capital
gain
Adjusted
grossincome
(Tf ...~d&11 ...)
Taxableincome
(7~.-d~bl 1-)
Income taxafterredits
(Th--d&11 ... )
Net capital
gain
(T'h-.-d
d.14 ... )
Capital loss carryover
AmountNumber ofreturns
(D.-d
All capital asset transactions
Cost and Gross gain Gross lossGross,sales
Number of Depreciation expense of
trans-pr ce
sale Number of Amount Number of Amount
actions(A.-d (7h...-d (A--d
returns(Th-d
returns(Th ... ~d
dolls-) d,11-) ~hll-) &II-) d.11 ...
(1) (2) (3) (4) (5) (6) (7) (8) (9) (10) (11) (12) (13) (14) (15)
RETIRDENT PLAN DISTRIBUTIONS
Grand total .......................... 59,199 708,732 499,032 144,172 216,334 331 712 62,828 59,024 299,357 245 103
Taxable returns, total ..................... 52,835 693,896 498,949 144,172 212,726 331 712 55,967 52,761 292,809 145 60
Under $10,000 ............................ 28,005 178,328 102,305 20,825 35,480-
- 29,684 28,005 69,076 - -
10 000 under $50,000 .................... 23,776 360,693 279,515 68,021 97,456 252 161 25,110 14 t applicable 23,743 168,569 (-),000 under $100,000 .........50
... --1
717 49,317 41,702 17,476 22,339 50 408 783 681 29,714 36 48,
7100,000 or more ......................... 337 85,556 75,327 37,850 57,451 29 143 390 332 25,450 5 10
Nontaxable returns ......................... 6,364 14,836 183 - 3,609 - - 6,861 6,263 6,548
LIVESTOCK
Grand total .......................... 632,284 2,982,998 1,516,857 377,00-1 564,204 932 1,927 1,264,152 963,539 87,688 323,243 626,379 741,639 104,440 16,132
Taxable returns, total ..................... 362,778 2,540,292 1,490,454 377,00? 407,504 727 1,812 725,785 613,771 54,428 206,891 358,777 469,734 58,886 10,103
000 ............................Under $10 320,818 1,552,478 748,767 134,295 209,336 626,278 441,425 31,468 129,701 318,317 348,185 49,482 6,141,
000 under ~50,000 ....................10 39,504 651,137 491,124 117,259 94,766 320 461 90,682 134,663 16,027 56,224 38,184 96,565 8,685 2,253,
50,000 under $100,000 ...................
1
1,624 109,557 88,122 36,639 22,149 74 435 4,289 18,859 3,514 11,324 1,496 11,398 437 600
100,000 or more ......................... 832 227,121 162,441 88,813 81,254 33 493 4,537 18,824 3,419 9,643 781 13,566 282 1,110
Nontaxable returns ......................... 269,505 442,706 26,403 - 156,699 538,366 349,768 33,260 11.6,352 267,602 271,905 45,554 6,029
TIMER AND COAL
Grand total .......................... 57,027 494,139 311,065 99,873 116,667 lis 898 61,352 132,398 793 34,655 56,269 112,216 1,205 584
Taxable returns, total.. ................... 38,319 476,455 310,W 99,873 93,690 118 898 41,360 102,689 793 26,327 37,581 88,116 1,170 558
Under $10 000 ............................ 26,969 137,264 67,690 12,943 23,636- -
28,363 38,895 239 7,811 26,476 14:19 1,
10 000 under ~50,000.................... 10,338 191,804 141,100 35,933 29,729 11,503 41,794 36 12,486 10,135 432 89
1,150 525,
50,000 under $100,000 ...................
1
669 44,120 34,705 14,009 8,994 928 8,248 67 1,272 640 8,37420 33
100,000 or more ......................... 343 103,266 66,591 36,988 31,331 26 370 566 13,752 450 4,756 330 11,851
Nontaxable returns ......................... 18,708 17,684 979 - 22,978 - - 19,992 29,709 - 8,326 18,708 24,099
OIL AND MINERAL INTERESTS
Grand total .......................... 15,c)26 452,840 323,303 133,927 145,728 424 1,525 23,417 134,193 9,746 68,596 13,951 90,409 2,857 5,723
Taxable returns, total ..................... 13,684 451,91-7 323,124 133,927 134,398 384 1,348 20,353 116,801 9,391 64,888 11,895 75,171 2,666 4,909
Under $10
'
000
............................
5,973 43,211 25,030 4,660 6,237 - - 7,367 10,625 292 6,117 5,673 5,490 (.)
$10,000 under $50,000 .................... 6,103 129,978 94,760 25,025 26,201 10,348 49,685 3,970 30,861 4,958 28,814 1,772 2,872
50,000 under $106,000 ................... 942 65,406 51,058 20,829 15,167 43 197 1,417 12,142 2,490 8,601 703 8,231 319 1,349
V00,000 or more ......................... 667 213,323 152,276 83,412 86,794 41 735 1,221 44,149 2,640 19,309 561 32,636 175 6106
Nontaxable returns ......................... 2,242 923 178 - 11,330 3,065 17,392 355 3,708 2,055 15,239 191 814
PARTNERSHIP INTERESTS
Grand total .......................... 68,214 1,167,733 836,498 279,734 335,002 1,679 2,840 92,350 712,044 26,142 378,30C 63,887 346,811 8,322 9,731
Taxable returns, total ..................... 58,792 1,153,877 835,261 279,734 285,262 1,579 2,720 79,757 607,771 22, 761, 299,835 55,072 316,623 7,172 8,715
Under $10,000............................ 25,647 145,594 77,488 14,991 32,233 35,744 124,127 7,096 66,355 24,754 61,097 3,080 2,581
10,000 under 00,000 .................... 29,592 602,755 439,466 114,796 105,247 720 1,227 38,479 346,851 13,071 182,772 27,127 169,737 3,518 4,195
50,000 under $100,000 ...................
1
2,521 169,087 134,988 55,116 37,961 108 658 3,712 60,225 1,503 27,914 2,264 33,429 366 699
100,000 or more ......................... 1,032 236,440 183,319 94,831 109,821 59 637 1,821 74,567 1,095 22,794 928 52,359 208 1,24C
Nontaxable returns ......................... 9,422 13,856 1,237 - 49,739 12,594 104,274 3,378 78,464 8,815 30,189 1,150 I'm,
ASSETS USED IN TRADE OR BUSINESS
Grand total .......................... 343,813 3,287,128 2,213,775 640,301 846,933 3,887 12,726 551,717 3,133,957 782,020 2,863,176 319,280 1,024,504 47,350 34,208
Taxable returns, tolal ..................... 256,662 3,195,505 2,200,879 640,301 690,316 3,091 11,302. 407,372 2,429,231 595,311 2,156,861 240,258 842,622 31,537 23,409
Under $10,000 ............................ 163,439 935,379 479,740 90,421 179,407 (~) 264,904 963,731 315,587 972,274 153,721 301,446 20,261 6,956
10,000 under ~50,000 ........ . * .....
87 130
,
1,594,067 1,185,489 296,875 263,275 1,720 8,232 131,831 1,156,387 240,007 995,390 81,141 384,959 10,147 12,603
50,000 under $100,000 ... .
1
4 501 300,836 245,738 101,599 75,535 166 1,53& 7,716 138,383. 22,933 98,758 3,991 59,093 812 2,264-
100,000 or more ......................... 1,593 365,223 289,911 151,406 172,101 89 730 2,921 170,732 16,784 90,439 1,405 97,3_24 317 1,58 ,
Nontaxable returns ......................... 87,151 91,624 12,897 - 156,615 . (.) 144,346 704,726 186,709 1 706,315 79,022 181,883 15,813 10,79~
9!
Footnotes at and of table. For the precise definition of terms and the nature of any limitations, see the "Description of the Semple," "Limitationa of the Data," and "ExpLanation of Classifications and Terms" in the text.

RETURNS WITH NET CAPITAL GAIN
Table 6. -ALL, SHORT-TERM, AND LONG-TERM TRANSACTIONS -INCOME, TAX, NET GAIN, AND TRANSACTION DETAIL, BY ASSET TYPE AND SIZE OF ADJUSTED GROSS INCOME -Cont inued
Short-term capital asset transactions Long-term capital asset transactions
Gro;s Cost and Gross Short-term Gross short-termGAsset type and size of adjusted Number Number of Sal:. Depreci- a ensex
gain loss rossDepreci- Cost and Gross long-term gain Gross long-term loss
gross income of trans- priceation p
of sale Number of Number of salesation expense
returns actions Number Amount Umber Amountreturns
trans- price of sale Amount Amount(Th--d (Th...-d (A--d of (Th...-d
returnsof
(T~.-dreturns
actions(Tho-d (A.-d (77....,-d
11:b.r aflturn (77...-d
Number oflreturns (T~.-dd-i1-L)__ d.11... ) d.11
...&11 ...)
d~ll ... d.11-) &11 ... d.11&-) d.11 ...
RETIRBAENT PLAN DISTRIBUTIONS(16) (17) (18) (19) (20) (21) (22) (23) (24) (25) 6) (27) (28) (29) (30) (31) (32) 1 (33)
Grand total ......................... 1,159 1,196 1,075 1,155 58,118 61,632 57,950 298,203 167 80Taxable returns, total .................... 1,159 1,196 1,075 1,155 51,754 54,770 51,687 291,654 67 38
Under $10,000 ...........................10 000 under $50 000 ..........
(.)643 676 No applicable (.) (-) 27,511 29,191 N~t ppli.ab 27,511 68,647 - -, , .........50,000
under slobooo .................
1
(.)572
(*)713
-)23,204 24,433 23,171 167,856 (.).
100,000 or more ........................ 2 2 2( 703 758 674 29,700 29 28
- 336 388 331 25,450 5 10Nontaxable returns ........................ - -
6,364 6,861 6,263 6,548
LIVESTOCK
Grand total ......................... 23,572 33,339 17,432 348 14,130 12,494 4,922 13,044 1,288 628,339 1,230,812 946, l(Y7 87,339 309,113 622,975 736,718 95,403 14,844raxable returns, total .................... 13,628 18,857 11,946 202 9,410 6,853 3,698 7,740 951 359,868 706,928 601,825 54,226 197,482 356,307 466,047 54,152 9,153
Under $10,000...........................10 000 under $50 000 .....
11,4262 054
15,3282733
4,7964 917
52137
3,6709983
5,723 1,847 6,504 669 318,298 610,950 436,629 31,415 126,031 316,096 346,339 45,680 5, 472, ..............,50) 000 under $100 000..................
i
,96
,
179 1 844, 4,3741
1,04954
1,278494
1,15356
2230
39,167 87,408 129,745 15,890 52,226 37,966 95,307 7,810 2,029,100,000 or more ....................... 52 77
1389 9
,367 27 70 2
2 1,584 4,110 17,015 3,509 9,950 1,473 10,905 395 580. 6 39 818 4,460 18,436 3, 411 9,276 772 13,496 267 1,070Nontaxable returns ........................ 9,944 14,482 5,486 146 4,720 5,641 1,234 5,304 338 268,471 523,884 344,282 33,113 111,631 266,668 270,671 41,251 5,691
TDOER AND COAL
Grand total ......................... 2,260 2,369 1,446 - 990 2,207 1,321 55,586 58,963 130,951 793 33,665 54,397 110,895 1,167 578Caxable returns, total .................... 1,467 1,476 1,209 871 1,413 801 37,571 39,885 101,480 793 25,455 36,382 87,316 1,132 552Under $10,000 ...........................10,000 under 50 000 ................
(*)348 352 482 364
(.)308
(.) 26,476 27,277 38,442 239 7,517 25,490 34,3-9
t , ...50,000 under 100 000 ......
1(.) (*)
127
(.)10,097 11,151 41,312 36 12,125 9,931 32,767 1,113 520......,
100,000 or more ............ 7 9 44 13 5 37658340
900557
8,01913,708
67450
1,0724,743
633328
6,34511,813 19 32
lontaxable returns ........................ 18,015 19,098 29,471 8,209 18,015 23,579
OIL AND MINIMAL INTEREST
Grand total ......................... 1, Bw 3,126 16,974 19 13,967 1,479 3,591 565 619 14,798 20,292 117,219 9,727 54,629 13,132 86,818 2,374 5,105'axable returns, total .................... 1,518 2,682 15,488 19 12,869 1,175 3,159 525 573 12,793 17,671 101,313 9,372 52,018 11,277 72,012 2,220 4,336Under $10,000 ...........................10,000 tinder $50,000 ...................
(.)980 1,973 11,424 12 9,754
(*)791
(*)1,843
(~)366
(.)264
5,8735 382
6,8678 375
7,787
38 262292
3 9584,053
21 10`75,6734
4,501 (.)
50,000 under $100,000 ..................
1
86 128 475 8 309 50 249 39 35,894
,1,290
,11,667
,2 482
,8 292
,382678
26,9717 982
1;472283
2,6061 314100,000 or more ........................ 51 P1 5 5,! - 743 34 78 19 259 643 1,140 43,597
,2, 640
,
18,566 543,
32,559 164,347
ontaxable returns ........................ 344 444 1,486 - 1,097 2,005 2,620 15,906 355 2,611 1,855 14,806 154 768
PARTNERSKPS INTEREST
Grand total ......................... 7,010 8,919 48,603 5 45, CY77 4,703 5,411 2,478 2,116 65,009 83,431 663,441 26,137 333,223 61,495 341,401 6,405 7,615'axable returns, total .................... 6,502 8,411 24,444 3 21,921 4,303 4,382 2,370 2, 093 55,687 71,346 583,326 22,762. 277,914 52,780 312,241 5,359 6,621Under $10,000 ...........................10
1
000 under $50,000 ...................3,266
218223,7674 043
4,29816 117
21
4,17387313
2,1801 888
1,0192 545
(*)1 090
(-) 24,060 31,977 119,829 7,094 62,182 23,660 60,079 2,094 1,690
50,000 under $10b.000 ..................1
270,400
,2 166 -
,
1 861,154
,582
,
12653228
28,179 34,436 332,734 13,069 168,899 26,014 167,192 2,609 3,663
100,000 or Store ........................ 144 202,
1 863 -,
2 014.81 237 68
2388
2,4499
3,312 58,060 1,50 26,053 2,207 32,847 297 416, , 99 1,620 72,704 1,()95 20,780 899 52,123 160 852ontaxable returns ........................ 9,322 12,G65 80,115 3,376 55,309 8,715 29,160 1,046 993
ASSETS USED IN TRADE OR BUSINESS
Grand total .........................
'
16,296 23,913 166,904. 1,440 155,454 11,853 15,546 3,629 2,877 334,711 527,804 2,967,053 780,581 2,707,722 312,009 1,008,958 44,576 31,331axnble returns, total .................... 12, ICV. 18,002 1.14,163 1,205 106,229 8,768 11,615 2,814 2,677 249,199 389,370 2,315,068 594,106 2,050,632 234,325 831,006 29,266 20,732Under $10,000 ...........................10,000 under $50 000 ...................
6,8604 849
10,8276 637
56,65038 752
588515
51,86935 402
5,2263 4
5,9574
1,534 588 158,880 254'
077 907'080 315,000 920,406 149,996 295,490 19,027 6,368,
50,000 under $100,000 ..................i
,285
,
405,
3 989 38,
4 147,3 2149
,904
4711,118 1,181 84,443 125,194 1,117,635 239,492 959,988 79 057 380,055 9,251 11,422
100,000 or more ........................ 110 133,
14 772 65,
14 812 51 28311052
649 4,344 7,311 134,392 22";~
14,612 3:891 58,622 716 1,615, , 259 1,532 2,788 155,960 16 ,lq
1
7".71,381 96,841 273 1,327
ontaxable returns ........................ 4,193 5,911 52,741 234 49,225 3,085 3,931 85,511 136,4341 651,985 186,475 657,090 77,683 177,951 15,310 10,599
N
N
notes at end of table. For the precise definition of,terms and the nature of any limitations, see the "Description of the Swple," "Limitations of the Data," and "Explanation of Classifications and Temsl- in the text.

RETURNS WITH NET CAPITAL GAIN
Table 6. -ALL, SHORT-TERM, AND LONG-TERM TRANSACTIONS -INCOME, TAX, NET GAIN, AND TRANSACTION DETAIL, By ASSET TYPE AND SIZE OF ADJUSTED GROSS INCOME-Continued
Number ofreturnswith netcapitalgain
(1)
Adjustedgross
. income
(7)...-dd.11 ...
(2)
Taxableincome
(77--d&H ... )
(3)
Income taxafterredits
(V,.....ddllaj.(4)
Net capitalgain
(Th...-dd.11 ...(5)
Capital los
Number ofreturns
(6)
Asset type and size of adjustedgross Income
PROPERTY HELD MR PERSONAL USE
Grand total ..........................
Taxable returns, total .....................
Under $10,000 ............................10,000 under ~50,000..; .................50,000 tinder $100,000 ...................
1100,000 or more .........................
Nontaxable returns .........................
RESIDENCES
Grand total ..........................
Taxable returnsp total .....................
Under $10,000 ........................ : ...10,000 under ~50,000..50,000 under $l00,OOO.::*.'--..-
1100,000 or are .........................
Nontaxable returns .........................
NONBUSINESS REAL ESTATE
Grand total ..........................
Taxable returns, total .....................
Under $10,000 ............................10,000 under $50,000.50,000 under $100,000:,..--.*. ....
1100,000 or more .........................
Nontaxable returns .........................
REAL ESTATE SUBDIVIDED
Grand total ..........................
Taxable returns, total.. ...................
Under $10,000 ............................$10,000 under $50,000 ....................50,000 under $100,000 ...................V00,000 or more .........................
Nontaxable returns .........................
rAlOkLAND WITH UNHARVESTED CROPS
Grand total ..........................
Taxable returns, total .....................
Under $10,000 ............................10,000 under $50,000 ....................50,000 under $100,COO ...................
1100,000 or more .........................
Nontaxable returns .........................
OTHER FARMULND
Grand total ..........................
Taxable returns, total .....................
Under $10,000 ............................10
'000 tinder $50,OCO ....................
50,000 tnide, $106,000...................1100,000 or move .........................
Nontaxable returns.. .......................
40,312
31,424
20,16210,452
573237
8,888
171,629
139,858
100,53938,219
901200
31,770
255,222
202,342
116,99379,5644,2921,493
52,880
127,406
105,204
65,85736,6362,056
655
22,202
6,578
3,681
2,1011,426
12133
2,897
65,971
46,056
31,97513,123
689270
19,915
443,815
418,099
121,917199,70339,26057,220
25,716
1,350,748
1,290,962
586,564605,61660,13038,650
59,?86
2,787,269
2,726,235
690,0021,443,124
284,945308,163
61,034
1,347,869
1,357,624
402,861670,009137,153147,601
-
62,357
54,299
11,08029,2738,2705,676
8,058
525,221
510,793
177,116231,89147,02554,761
14,428
279,394
277,597
58,206145,78232,23041,376
1,797
813,629
811,582
299,130434,46248,97629,014
2,247
1,870,211
1,865,675
358,4231,042,440
226,917237,894
4,536
918,757
915,445
210,884488,578109,373106,610
3,311
39,92?
39,266
5,47822,8196,2544,716
661
349,347
347,823
91,965174,33838131143,209
1,524
83,661
83,661
11,19937,16613,57021,726
200,133
200,133
58,957106,01420,27714,885
553,426
553,426
70,595265,66992,988
124,174
-
-
-
267,197.
267,197
41,657126,12644,64054,574
-
12,114
12,114
1,0486,1862,5362,344
-
100,936
100,936
17,76444,36016,09722,715
-
87,741
78,006
22,30225,6007,796
22,310
9,733
315,108
281,558
135,410118,36513,79013,972
33,550
722,142
625,756
128,788287,66072,431
136,877
96,386
413,163
349,547
97,445153,73934,58763,775
63,616
22,630
17,835
3,3358,3173,6682,514
4,796
216,813
176,874
56,77077,63218,05724,414
39,940
314
306
294
12
3,808
2,788
(.)1,410
21074
(.)1,114
11837
1
660
556
3776019
1,807
1,473
78
78
-
-
132
99
-65
15
Number oftrans-actions
(8)
Gross salesprice
(A.-dd.11-)
(9)
Depreciation
(7h-dd.11 ...
All capital asset trarisactions
Cost andexpense of
sale
(D.--d&11 ...J
Gross gain
Number ofreturns
(12)
Amount
(lh-.-d
(13)
Gross
Number ofreturns
(14)
~11...
s carryover
Amount
(Th...-dd.11 ...
(7)
1,265
942
192
150
1,629
1,450
1,10222083
13,310
9,188
(.)6,2181,5091,005
462
462
-
-
-
960
953-
286
331
54,103
36,230
23:311 9423~650309
17,872
175,259
143,166
103,01938,993
947206
32,094
293,420
232,660
127,23797,5495,7452,129
60,759
4,113 150,395
3,251 122,505
(.) . 74,2191,918 44,739
834 2,664240 882
27,890
7,450
4,553
2,9021,477
13836
2,897
71,426
49,071
32,97514,906
849341
22,354
167,200
123,694
58,10447,8416,923
10,826
43,506
2,654,963
2,249,710
1,347,906841,50942,26818,027
405,253
2,833,664
2,402,890
877,6461,177,57?
169,137178,529
430,974
1,652,042
1,427,284
696,793597,31174,34458,836
224,759
94,549
80,721
18,97351,2677,2633,218
13,828
1,169,025
944,008
442,221400,37660,02041,391
225,016
35,422
29,574
14,41213,1131,446
603
5,847
107,481
91,881
50,65238,2582,429
542
15,600
183,534
158,503
75,14972,6186,2544,482
25,030
146,164
129,963
72,27450,8104,1382,740
16,201
5,455
4,525
6263,615
145139
930
73,937
59,782
35,43219,3283,3181,704
14,155
155,719
110,490
57,3801A,3424,7713,997
45,229
2,176,161
1,829,147
1,122,6696,54,39530,52711,556
34?,014
1,939,803
1,627,057
6-71,194770,22189,86995,773
312,746
1,089,307
929,124
516,450349,57335,91427,188
160,183
48,050
40,705
12,64225,1052,002
956
7,345
722,830
559,616
293,872224,44226,47414,828
163,213
35,385
27,828
18,0759,080
484189
7,557
171,586
139,816
100,53938,185
897195
31,770
242,752
192,809
112,80874,8763,8271,297
49,944
123,890
102,123
64,26735,3581,910
589
21,767
6,189
3,392
1,9011,348
11429
2,797
64,271
44,860
31,27412,672
665249
19,411
48,302
42,260
16,04015,8152,6277,577
6,041
561,527
492,490
265,003205,06114,7697,656
69,037
970,635
826,807
221,744442,78279,28182,999
143,828
656,819
585,377
234,412277,25739,77733,931
71,442
50,244
43,168
6,93828,6715,1892,371
7,076
445,322
368,909
144,810167,25931,07525,764
1 76,413
4,743
3,612
2,2871,176
9554
(.)
13,997
10,956
4,9855,283486202
3,041
5,416
3,969
2,2841,430
176so
1,448
390
290
288
2
loss
Footnotes at end of table. For the precise definition of terms and the nature of any limitations, see the "Description of the Sample," "Limitations of the Data," and "Explanation of Classifications and Terms" in the text.
Amount
("...-d
4,146
2,229
1,05893075
166
22,564
15,848
2,64311,0651,0711,070
61A6
9,860
6,200
4,5083,032
291449
1,580
322
302
297
4
13,587
9,079
7,778603222

RETURNS WITH NET CAPITAL GAIN
Table 6. -ALL, SHORT-TERM, AND LONG-TERM TRANSACTIONS -INCOME, TAX, NET GAIN, AND TRANSACTION DETAIL, BY ASSET TYPE AND SIZE OF ADJUSTED GROSS INCOME-Continued
Short-tem capital asset transactions Long-tem capital asset transactions
Asset type and size of adjustedGross
Depreci.Cost and Gross short-term
ain
Gross short-tem
l Gross Cost and Gross long-term gain Gross long-term lossNumber Number of sales expenseg oss
Number of salesDe reci-p xgross income of trans- price
ationof sale N b A -
Number oft i
atione pense
returns actionsum er mount Number Amount
returnsrars- pr ce of sale f
Number oI Amount
Number ofAmount
(7h...-d (77...-d (n, -do
returns1
f
ournere(n.-d
actions(n...-d (A.-d (77--d returns (Th...-d
t
returns (Th...-dd.11... 1 d11 ...) &JI ... ) d.11.,.) d.11 ... ) d.11... ) &11 ... ) _11-1
(16) (17) (18) (19) (20) (21) (22)-
(23) (24) (25) (26) (27) (28) (29).
(30) (31)
P
(32) (33)PROPERTY HELD FOR PERSONAL USE
Grand total ......................... 3,915 4,050 12,032 561 11,270 3,310 1,572 261 249 36,615 50,053 155,167 34,860 144,449 32,255 46,729 4,516 3,89-,Taxable returns, total .................... 3,021 3,156 5,681 186 4,634 2,716 1,432 161 198 28,521 33,074 118,012 29,38E 105,856 25,191 40,828 3,485 2,031
Under $10,000 ...........................
10 000 under $50 000 ..
(*)
849
1(.) (.) - - 18,183 21,363 56,340 14,382 56,175 16,196 15,451 2,287 1,05E, . ................
'50 000 d $10b 000
1
,102 3,669 149 3,218 803 782158 194
9,576 10,826 44,172 12,963 41,124 8,347 15,033 1,065 74~, un er , ..................
0036 50 138 3 144 (.) (.) 537 600 6,785 1,443 4,627 466 2,817 81 621 ,000 or more ........................ 22 25 109 3 67 16 50 2 4 226 284 10,717 600 3,930 182 7,527 52 16,
Nontaxable returns ........................8,095 16,979 37,155 5,472 38,593 7,064 5,901
RESIDENCES
Grand total ......................... 7,278 7,719 80,955 148 70,786 7,278 8,933 - - 164,988 167,540 2,574,007 107,333 2,105,375 164,945 552,593
Taxable returns, total .................... 5,591 6,032 66,669 148 58,519 5,591 7,605 - - 134,904 137,133 2,183,041 91,733 1,770,628 134,862 484,885
Under $10,000 ...........................
10 000 under $50 000.
.
4,467
44,767 44,056 140 37,774 4,467 5,547 - - 96,665 98,252 1,303,850 50,512 1,084,895 96,665 259,457
, ,
50,000 under $100 000: ..... *..-:-**..:
1
1,10
(.)
1,241 22,038 7 20 216 1 104
,-
2 009 - - 37,159 37,752 819,471 38,251 644,179 37,125 203,052,
100 000 or more ......... . 3( ) (.) - - 883 926 41,605 2,428 30,105 880 14,725, . ............. 3 112 - 108 3 5 - - 197 203 17,914 542 11,449 192 7,651
Nontaxable returns ........................ - 30,084 30,407 390,966 15,600 334,747 30,084 67,709
NONBUSINESS REAL ESTATE
Grand total ......................... 14,703 17,428 125,357 147 113,772 12,210 12,194 2,30B 1,367 244,217 275,992 2,708,507 183,387 1,826,031 233,246 958,441 11,772 21,19-,Taxable returns, total .................... 11,286 13,873 10`7,284 86 97,657 9,092 10,109 2,006 1,296 194,117 218,787 2,295,606 158,418 1,529,399 185,983 816,698 9,030 14,552
Under $10,000........................... 6,502 7,202 49,182 15 45,952 5,308 3,764 (.) (.) 112,219 120,035 826,464 75,134 625,242 108,827 217,960 3,892 2,12410,000 under $50,000 ......... 4,493 6,286 46,270 58 40,609 3,609 5,513 820 656 76,308 91,263 1,131,308 72,560 729,613 72,149 437,269 4,536 10,40-350,000 under $100,000 ........
1
213 276 6,945 4 6,349 138 634 57 47 4,147 5,469 162,192 6,250 83,520 3,728 78,647 433 1 024100,000 or more ........................ 78 108 4,887 9 4,748 37 198 37 74 1,444 2,021 173,642 4,473 91,025 1,278 82,801 170
,
996Nontaxable returns ........................ 3,418 3,555 18,074 61 16,115 3,117 2,085 50,100 57,205 412,901 24,969 296,631 47,263 141,743 2,741 6,64.~
REAL ESTATE SUBDIVIDED
Grand total .......................... 2,119 3,263 21,483 2 17,492 1,914 4,143 325 291 125,877 147,132 1,630,559 146,162 1,071,815 122,460 652,6?6 5,091 9,569Taxable returns, total ................ I ... 1,599 2,145 18,007 2 14,943 1,395 3,095 206 171 103,995 120,360 1,409,276 129,961 914,181 101,013 582,281 3,763 8, lor,
Under $10,000 ........................... (*) - (*) (.) (.) (.) (-) 65,357 73,419 694,402 72,274 514,534 63,766 233,913 2,184 4 48410,000 under ~50,000 ................... 924 1,250 12,382 1 9,946 850 2,358 35,985 43,490 584,928 50,809 339,627 34,777 274,899 1,352
,
3 00250,000 under $100,000 ..................
1
54 68 1,403 - 1,186 32 225 2,016 2,596 72,941 4,138 34,728 1,692 39,552 158
,
25C100,000 or more ........................ 21 27 1,831 - 1,895 12 14 10 77 637 855 57,005 2,740 25,293 578 33,917 70 372Nontaxable returns........................
21,682 26,772 221,283 16,201 157,634 21,448 70,395 1,328 1,46C
FARMIAND WITH UNHARVESTED CROPS
Grand total ......................... 246 947 4,733 - 4,715 143 153 6,332 6,503 89,816 5,455 43,335 5,985 50,073raxable returns, total .................... 246 947 4,733 - 4,715 143 153 3,434 3,606 75,988 4,525 35,990 3,188 2.2,997
Under $10,000 ...........................
10,000 under ~50 000 ...................1,901 2,001 14,689 626 8,372 1,701 6,785,
50,060 under $100 000..................
1
1,392 1,443 51,048 3,615 24,879 1,348 28,671,
100 000 or more.... .. 2 2110 128 7,145 145 1,899 110 5,171, . ................. 115 2 4 31 34 3,106 139 841 29 2,3?1
Nontaxable returns. . ...................... - - - - - 2,897 2,897 13,828 930 7,345 2,?97 7,076
OTHER FARMLAND
Grand total ......................... 1,586 1,630 12,048 59 10,254 1,365 1,833 216 312 64,463 69,795 1,156,976 73,878 712,576 62,943 443,489 1,354 13,275r"able returns, total .................... 1,249 1,293 10,199 59 8,746 1,132 1,485 113 306 44,886 47,778 933,809 59,723 550,870 43,766 367,424 954 8,774
Under $10,000 ...........................
10,000 -der $50,0)0. . ... * ... *, * ...
(.)
329 373 3 238 2 505(.)
322(.) (.) (*) 31,074 32,0175 435,508 35,373 287,876 30 472
~
143 832: :: :
50,000 -der $100 000 .... ...... ....
1
(. - ,
(*)
499 12,871 14,533 397,138 19,328 221,937 12,36 166:761 404 7,769,
100,000 or more ........................ 5 5 40
-
36 2
-
5675 835 59,812 3,318 26
,
265 658 31,0`72 35 5982 1 266 336 41,351 1,704 14,792 248 25,?59 14 221
Nontaxable returns ........................ (*) (.) (*) (.) (*) 19,578 22,017 223,167 14,155 161,706 19,177 76, 065
Footnotes at end of table. For the precise definition of terms and the nature of any limitations, see the "Description of the Sample," "Limitations of the Data," and "Explanation of Classifications and Tems" in the text.
23

...vURNS WITH NET CAPITAL GAIN
Table 6. -ALL, SHORT-TERM, AND LONG-TERM TRANSACTIONS -INCOME, TAX, NET GAIN, AND TRANSACTION DETAIL, BY ASSET TYPE AND SIZE OF ADJUSTED GROSS INCOME -Continued
Asset type and size of adjusted
gross income
Number ofreturnswith net
capitalgain
Adjustedgross
Income
(Th..... d
d. I I -)
Taxableincome
(Th...-dd. i 1 ars)
Incomectaxcart r
redits
(71.....dd. I I ...
Net capitalgain
(77 .....dd.11mrs)
Capital loss carryover
AmountNumber ofreturns
(Th...-d&H ... )
All capital asset transactions
Cost and Gross gain Gross loss
Number ofGross sales
Depreciation expense oftrans-
pricesale Number of Amount Number of Amount
actiol's(Th...-d (Th...-d (Th...-d
returns(Th.-d
returns(TM.-d
d.11-) d~ll ... &11 ... &11.r.)(2) (3) (4) (5) (6) (7) (8) (9) (10) (11) (12) (13) (14) ~15)
PROCEEDS FRCM PRIOR YEAR INSTAIAIENT SALES
Grand total ..................... .... 399,914 4,673,959 3,185,706 979,868 1,162,020 2,458 10,189 505,577 398,884 1,469,826 2,154 7,343
Taxable returns, total ..................... 309,899 4,505,805 3,174,051 979,868 1,024,527 2,425 9,557 393,711 308,870 1,311,216 1,657 7,176
Under $10,000 ............................ 176,9G4 1,015,435 546,989 105,019 167,909 (.) 217,161 176,211 273,243 (.)10,000 under $50,000 ............. 121 383 2,300,619 1,684,002 437,145 418,354 1,609 6,568 159,053 N ot applicaul. 121,088 586,757 646 FIB?50,000 under $100,000 ............ 8:682 580,267 460,969 189,498 144,462 233 1,421 12,938 8,661 180,412 75 140100,000 or more ......................... 2,930 609,483 482,091 248,207 293,802 82 1,171 4,560 2,911 270,804 43 733
Nontaxable returns ......................... 90,015 168,154 11,655 - 137,493 111,866 90,015 178,610
OTHER TYPE ASSETS
Grand total ........................ - 339,650 4,819,714 3,289,003 1, 106, 045 1,188,885 8,037 21,202 389,981 798,717 274,058 797,264 241,501 596,371 112,390 830,578
Taxable returns, total ............... ..... 279,239 4,690,157 3,279,509 1,106,045 1,074,935 6,652 16,693 322,049 710,726 94,319 549,311 200,358 534,848 90,603 7~1,683
Under $10,000...................... ..... 165,254 1,025,587 540,180 106,065 131,259 2,670 767 163,234 258,379 17,540 200,448 126,366 132,267 43,981 253,6561.0,1101) und:, ~50,000.................... 99,948 1,972,163 1,431,703 375,765 323,390 3,099 9,698 118,559 257,340 12,612 169,346 65,016 212,452 40,133 367,45850
,000 und r 100, 000 ...................
1
9,729 662,394 518,004 211,835 151,322 605 3,183 13,621 71,156 1,646 45,675 6,124 72,386 4,699 60,024100,000 or more ............ ............ 4,308 1,030,014 789,622 412,359 468,964 278 3,045 6,635 123,851 62,520 133,842 2,852 117,743 1,990 40,544
Nontaxable returns ......................... 1 60,411 129,556 9,493 1 -1
113,950 1 1,385 1 4,509 1 67,932 87,991 179,739 247,9531
41,143 61,5231
21,5671
108,895
Footnotes at end or table. For the precise definition or terms a-,d the nature of any limitations, see the t'Description of the Sample.1t "Limitations of the Data,tt and "Explanation of' Classifications and Terms" In the text.
0
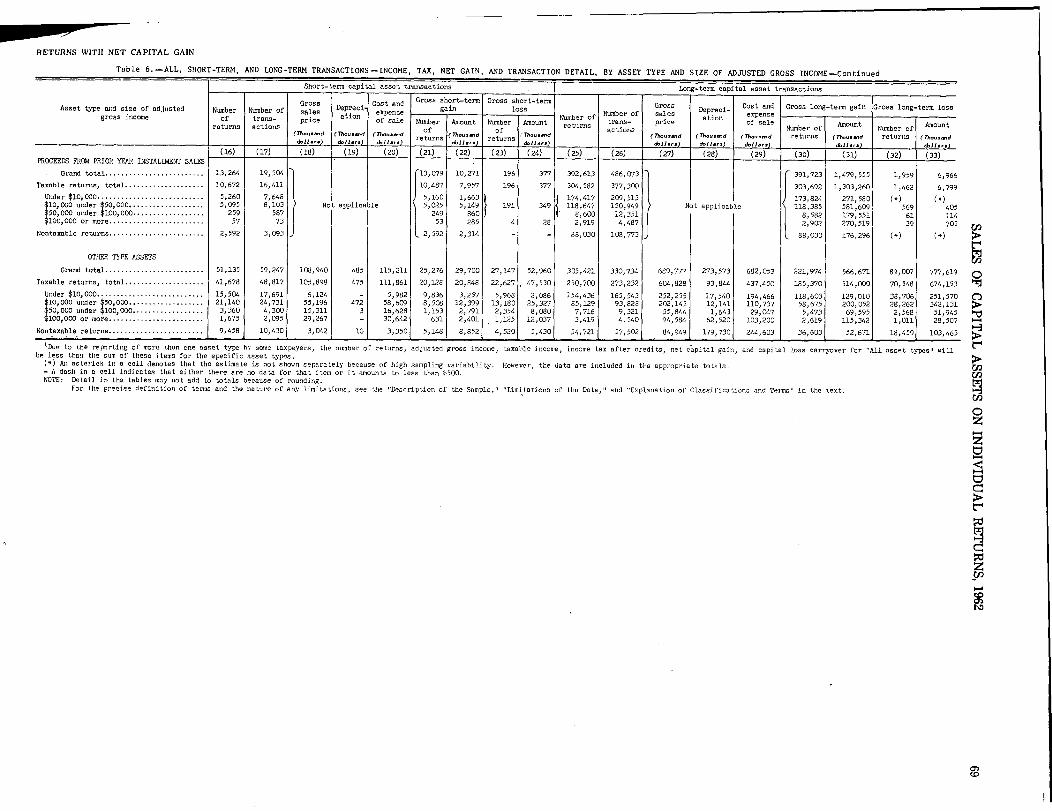
RETURNS WITH NET CAPITAL GAIN
Table 6. -ALL, SHORT-TERM, AND LONG-TERM TRANSACTIONS -INCOME, TAX, NET GAIN, AND TRANSACTION DETAIL, BY ASSET TYPE AND SIZE OF ADJUSTED GROSS INCOME-Continued
Short-term capital asset transactions Long-tem capital asset transactions
Asset type and size of adjusted Number Number ofC as
Depreci-Cost and Gross a ort-term
in9
Gross short-term
loss GrossDepreci- Cost and Gross long-term gain Gross long-te- loss
gross income f trans-
a as
iceation
expense
of s lNumber of
Number of salesati.n
exp nse
re
t.
ran0 actionsp a e Numbe Amount i
r
I
f
Numbe Amount returnstrans-
cti s
price of sale AmountNumber of
AmountNumber of
bar
of
(A.-d (A.-d (Th.-d :returns(?h*" -d0
f 'n,.-dr.'turns
a on(7?...-d (A.-d (A.-d returns (Th...-d returns (771...-d
turnsdbil-) d.)l ... &11 ...
d." _
d~ll ... &11 ...) d.11 ...J d.1i ... &11...(16) (17) (18) (19) (20) (21) (22) (23) (24) 25) (26) (2T (28) (29) (30) (31) (32) (33)
PROCEEDS FROM PRIOR YP~AR INSTALLMENT SAILS
. Grand total .................... .... 13,264 19,504 13,079 10,271 196 377 392,613 486,073 391,?23 1,479,555 1,959 6,966
Taxable returns, total..................... 10,672 16,411 10,487 7,957 196 377 304,582 3?7,3DO 303,692 1,303,260 1,462 6,799
Under $10,000 ........................... 5,260 7,648 5,160 1,613 171,41, 2111,113 173,824 271,58010,000 under 00,000 ................... 5,095 8,103 No t applica ble 5,025 5
'9
191 349 118,647 150,949 N t applicable 118,385 581,609 569 40550,000 under $100,000 .................. 259 587 249 860 8,600 12,351 8,582 179,551 61 114100,000 or more ........................ 57 73 53 285 4 28 2,919 4,487 2,902 270,519 39 705
Nontaxable returns ........................ 2,592 3,093 2,592 2,312, - - 88,030 108,773 68,030 176,296
OTHER TYPE ASSETS
Grand total ......................... 51,135 59,247 108,940 48,1 115,211 25,276 29,700 27,147 52,960 305,421 330,734 689,777 273,5?3 682,053 221,974 566,671 89,007 777,619
Taxable returns, total .................... 41,678 48,817 105,898 475 111,861 20,128 20,848 22,627 47,530 250,?00 273,232 604,828 93,844 437,450 185,370 514,000 70,5/X 674,153
Under $10,000 ........................... 15,504 17,691 6,124 - 5,982 9,836 3,257 5,968 2,086 154,436 165,543 252,255 17,540 194,46 118,603 129,010 38,706 251,57Cio,000 under $50,000 ................... 21,140 24,731 55,196 472 58,609 8,508 12,399 13,180 25,327 85,129 93,828 202,145 12,141 110,737 58,675 200,052 28,262 342,131l
50,000 under $100,000 .................. 3,360 4,300 15,311 3 16,628 1,153 2,791 2,354 8,080 7,716 9,321 55,844 1,643 29,047 5,473 69,595 2,568 51,945100,000 or more ........................ 1,6?5 2,095 29,267 - 30,642 631 2,401 1,125 12,037 3,419 4,540 94,584 62,520 103,200 2,619 115,342 1,011 28,507
NontIaxable
- returns ........................ [ 9,458 10,4301
3,0421
101 3,3501
5,1481
8,8521 4,5201
5,4301 54,7211 5?,502 84,949 179, ?30 244,603 1 36,6031 52,6711 18,459 1 103,465
'Due to the reporting of more than one asset type by some taxpayers, the number of returns, adjusted gross income, taxable income, income tax after credits, net c~pital gain, and capital loss carryover for "All asset types" willbe less that, the sum of' these items for the specific asset types.
) An asterick in a cell denotes that the estimate is not shown separately because of high sampling variability. However, the data are included in the appropriate totals.A dash in a cell indicates that either there are no data for that item or it amounts to less than ~,500.
NOTE: Detail in the tables may not add to totals because of rounding.For the precise definition of terms and the nature of any limitations, see the "Description of the Sampla," `a.i
Itations; of the Data," and "Explanation of Class! fications and Terms-' in the text.
En
(M1.0
I
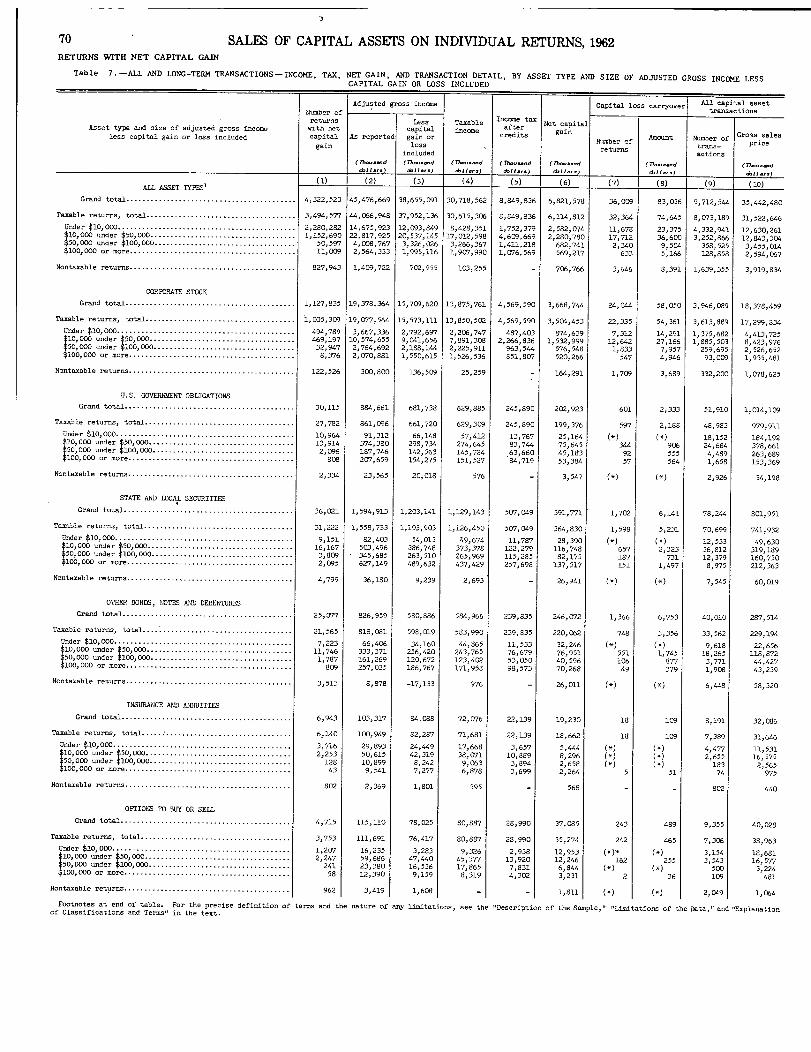
3
70 SALES OF CAPITAL ASSETS ON INDIVIDUAL RETURNS, 1962RETURNS WITH NET CAPITAL GAIN
Table 7. -ALL AND LONG-TERM TRANSACTIONS-INCOME, TAX, NET GAIN, AND TRANSACTION DETAIL, BY ASSET TYPE AND SIZE OF ADJUSTED GROSS INCOME LESSCAPITAL GAIN OR LOSS INCLUDED
Number ofAdjusted gross income Capital loss carrywer All capital asset
transactions
returns Less Taxable Income taxNet capital
Asset type and size of adjusted gross income with net capital income aftergain
less capital gain or loss included capital
reported
gain or cred itsNumber of
Amount Number of Gross.sales
gain
J
loss returns trans- pr..e
ncluded actions
_d
A-d (7h...-d (7~--d (Tho-d (M--d (77...-d
11. _)
J.11 ... d.11-) . d.11 ... d.11 ...
ALL ASSET TYFESI(1) (2) (3) (4) (5) (6) (7) (10)
Grand total .......................................... 4,322,520 45,476,669 38,655,091 30,718,562 8,849,836 6,821,578 36,009 83,036 9,712,544 35,442,480
Taxable returns, total ..................................... 3,494,577 44,066,948 37,952,136 30,615,306 8,649,836 6,114,812 32,364 74,645 8,0173,189 31,522,646
Under $10,000 ............................................ 2,280,282 14,675,923 12,093,849 8,428,351 1,752,379 2,582,074 11,678 23,375 4,332,941 12,630,2610
'
000 under $50,000 ......
: ... * ........ - ........... -P
1,152,690 22,817,925 20,53?,145 17,012,598 4,609,669 2,280,780 17,712 36,600 3,252,866 12,a43,30450,000 under $100,000 ..... ............................. 50,597 4,008,767 3,326,026 3,266,367 1,411,218 682,741 2,340 9,5C4 358,525 3,455,014
$100,000 or more ......................................... 11,009 2,564,333 1,995,116 1, 90`7, 990 1, 0`76, 569 569,217 633 5,166 128,858 2,594,067
Nontaxable returns ......................................... 827,943 1,409,722 702,955 IQ3,255 - 706,766 3,646 8,391 1,639,355 3,919,834
CORPORATE STOCK
Grand total .......................................... 1,127,835 19,378,364 15,709,620 13,875,761 4,569,590 3,668,744 24,044 58,050 3,946,089 18,378,459
Taxable returns, total ..................................... i,005,309 19, 077, 564 15,573,111 13,850,502 4,569,590 3,504,453 22,335 54,361 3,613,889 17,2-9,834
Under $10,000 ............................................ 494,789 3,667,336 2,792,697 2,206,747 487,403 874,639 7,312 14,291 1,375,682 4,413,72510
'
000 under $50,000.................................... 469,197 10,574,655 9,041,656 7,891,308 2,266,836 1,532,999 12,642 27,166 1,685,503 8,423,97650,000 under $106,000 ...................................
1
32,947 2,764,692 2,188,144 2,225,911 963,544 576,548 1,333 7,957 259,695 2,526,652100,000 or more ......................................... 8,376 2, 070, 881 1,550,615 1,526,536 851, SO7 520,266 547 4,946 93,009 1,935,481
Nontaxable returns ......................................... 122,526 300,800 136,509 25,259 164,291 1,709 3,669 332,200 1, 0`76, 625
U.S. GOVERWENT OBLIGATIONS
Grand total .......................................... 30,115 884,661 681,738 629,885 245,890 202,923 601 2,333 51,910 1,014,109
Taxable returns, total ..................................... 27,782 861,096 661,720 629,309 245,890 199,376 597 2,188 48,983 979,911
Under $10,000 ............................................ 10,964 91,312 66,148 57,412 13,767 25,164 18,152 164,19210,000 under $50,000 ........
....... - ..... ** ... **'*'**:13,914 374,380 298,734 274,645 83,744 75,645 344 906 24,684 378,661
50,000 under $10b,000 ....... ...........................
1
2,096 187,746 142,563 145,724 .63,660 45,183 92 555 4,489 263,689100,000 or more......................................... 808 20`7,659 154,275 151,527 84,719 53,384 57 564 1,658 153,369
Nontaxable returns. . . . ..................................... 2,334 23,565 20,018 576 - 3,547 2,926 34,198
STATE AND LOCAL SECURITIES
Grand total .......................................... 36,021 1,594,913 1,203,141 1,129,143 507,049 391,771 1,702 6,141 78,244 801,951
Taxable returns, total ..................................... __ ___......
- --- --- - --- ---1,1vJ,')UJ 1,126,450 507,049 364,830 1,598 5,231 70,699 741,932
Under $10,000............................................ 9,151 82,403 54,013 Z9,674 11,787 28,390 12,533 49,63010,000 under $50,000 .................................... 16,167 503,496 386,748 373,378 1-22,279 116,748 657 2,323 36,812 319,18950,000 under $100,000 ...................................
1
3,809 .345,685 263,510 265,969 115,285 82,175 167 731 12,379 160,750100,000 or more ......................................... 2, 095 627,149 489,632 437,429 257,698 137,517 151 1,497 8, 975 212,363
Nontaxable returns ......................................... 4,799 36,180 9,239 2,693 - 26,941 7,545 60,019
OTHER BONDS, NOTES AND DEBENTURES
Grand total .......................................... 25,0`77 826,959 580,686 584,966 239,835 246, 0`72 1,366 6,753 40,010 287,514
axable returns, total .....
...........
21,565 818,081 598, Dig 563,990 239,835 220,062 748 3,356 33,562 229,194
Under $10,OC)O ............................................ 7,223 66,406 34,160 44,865 11,533 32,246 9,618 22 65610,000 under $50,000 .................................... 11
,
746 333
,
371 256,420 243,765 76,679 76,951 551 1,745 18,265
,
118,87250,000 under $100,000 ...................................
1
11787 161,269 120,672 123,402 53,050 40,596 106 977 3,771 44,427100,000 or more ......................................... 809 257,035 186,767 171,958 98,573 70,268 49 379 1,908 43,239
ontaaable returns.. ....................................... 3,513 8,878 -17,133 976 - 26,011 6,"8 58,320
INSURANCE AND ANNUITIES
Grand total .......................................... 6,943 103,317 64,088 72, 0`76 22,139 19,230 18 109 8,191 32,086
axable returns, total ..... : ............................... 6,140 100,949 82,287 71,681 22,139 18,662 is 109 7,389 31,646Under $10,000 ............................................ 3,716 29,893 24,449 17,668 3,657 5,444 4,477 11,53110,000 under $50,000.................................... 2,253 50,615 42,319 38, 071 10,869 8,296 2,655 16,57550,000 under $100,000...................................
1128 10,899 8,242 9,063 3,894 2,658 183 2,565100,000 or more ......................................... 43 9,541 7,277 6,878 3,699 2,264 5 51 74 975
ontaxable returns ......................................... 802 2,369 1,801 395 - 568 - - 802 440
OFTIORS TO BUY OR SELL
Grand total .......................................... 4,715 115,110 78,025 80,887 28,990 37,085 243 489 9,355 40,028
axable returns, total ..................................... 3,753 111,691 76,417 80,897 28,990 35,274 242 465 7,306 38,9163Under $10,000............................................ 1,207 16,235 3,283 9,326 2,938 12,953 (.), 3,154 18,68110
'
000 under $50,000 .................................... 2,247 59,686 47,440 45,377 13,920 12,246 162 255 3,543 16,57750,000 under $100,000 ...................................
1
241 23,360 16,536 17,665 ?,831 6,844 500 3,224100,000 or more ......................................... 58 12,390 9,159 8,319 4,302 3,231 2 36 109 481
ontaxable ret~trns .......................................... 962 3,419 1,608 - - 1,811 2,049
r
l
1,064
T
N
Footnotescat end of table. For the Precise definition of terms and the nature Of anY limitations, see the "Description of the Smple," "Limitations of the Data," and "FaplaxationofClass
ifi
at,ons and Terms" in the text.

SALES OF CAPITAL ASSETS ON INDIVIDUAL RETURNS, 1962 71RETURNS WITH NET CAPITAL GAIN
Table 7 .-ALL AND LONG-TERM TRANSACTIONS -INCOME. TAX. NET GAIN, AND TRANSACTION DETAIL, BY ASSET TYPE AND SIZE OF ADJUSTED GROSS INCOME LESSCAPITAL GAIN OR LOSS INCLUDED -Continued
Asset type and size of adjusted gross income
less capital gain or loss included
All capital asset tranaactions-Continued
Depreei-Cost and
ationexpense of Gross gain Gross loss
sale
(T?m..-d (Th-.-d (Th-.-d (A-.-d
d.11 ... ) ~11 ...)
Long-term capital asset transactions
Gross sales Depreci-
Cost and Gross GrossNumber of. price ation
expense of long-tem long-termtrans, - 'ale gain lossactions
(Th-.-d (n...-d (A...-d (7h...-d (Th...-d, &11 ... ) d.11 ... d~ll ... &11 ...)
.(11) (12) (13) (14) (1-5) (16) (17) (18) (19) (20)
ALL ASSET TYPES'_
Grand total .......................................... 1,732,439 26,548,181 15,922,373 2,385,867 8,536,924 29,814,566 1,729,224 20,864,495 15,587,059 2,OC6,035
Taxable returns, total ..................................... 1,251,235 23,262,654 14,273,230 2,136,372 7,010,891 26,296,122 1,248,849 17,966,822 13,980,995 1,789,176
Under $10,000
............................................
624,143 9,252,586 5,831,424 730,245 3,900,575 10,927,802 822,901 7,570,214 5,706,371 635,97C
10000 under 150,000 .................................... 323,499 9,758,260 5,511,191 977,994 2,713,262 10,484,827 322,437 7,360,470 5,385,502 809,812
50,000 under 100,000 ................................... 30,857 2,494,796 1,629,613 263,174 290,714 2,711,239 30,782 1,726,164 1,604,740 211,95C100,000or more ......................................... 72,736 1,757,Ml 1,301,002 164,958 106,341 2,162,254 72,729 1,309,974 1,284,383 131,443
Nontaxable returns ......................................... 4B1,204 3,285o527 1,649,143 249,495 1,526,033 3,528,443 480,375 2,697,673 1,606,064 216,86C
CORPORATE STOCK.
Grand total ..........................................1
13,434,273 6,200,892 1,340,233 3,080,310 14,571,301 9,533,465 6,014,649 1,059,164
Taxable returns, total ...................................... 1 12,546,155 5,922,211 1,249,296 2,805,720 13,700,972 1. 8,856,087 5,753,160 987,945
Under $10,000 ............................................ 3,272,643 1,373,776 259,568 1,085,542 3,364oO421
2 4 0861
1,316,029 192,67910,000 under $50,OOC ....................................
s,6 371,291 2,664,548 645,226 1,442,264 6,641,986 ~ 543 7-34 2,579,626 514,056
50,000 under $100,000...................................
1
11756,201 965,866 208,325 203,516 2,047o943 255,436 948,622 168,940100,000 or more .........................................
1-1,146,020 918,021 136,177 74,398 1, 647, 001 842,831 908,884 112,271
Nontaxable returns ......................................... 888,118 278,671 90,937 274,590 870,330 677,378 261,469 71,218
U.S. GOVERMENT OBLIGATIONS
Grand total .......................................... 000,914 16,671 3,656 41,145 464,082 451,853 .15,157 3,10`7
Taxable returns, total ..................................... 967,259 15,927 3,455 38,307 433,863 422,162 14,427 2,905
Under $10,000 ............................................ 179,320 5,380 5(X7 14,733 65,489 61 013,
4,929 45310,000 under $50,000 .................................... 374 963
'
5 560
,
2, 04,2 19,127 193,375 891. , 098 4,936 1,71950,000 under $106,000 ..........
1
51.4262 2 128 584 3,280 78,945 77,535 1,676 467
100,000 or more ................10
150,831 2,858 321 1,167 96,054 93,634 2,686 267
Nontaxable returns......................................... . 33,655 744 202 2,839 30,220 29,692 730 201
STATE AND DXALT SECURITIES
Grand total .......................................... 761,447 53,757 L3,301 70o575 626,376 586,027 51,831 11,531
raxable returns, total ..................................... 705,755 46,788 12,660 63,800 576o285 540,433 46,672 11,068
Under '$10, 000 ............................................ 41,114 9,917 1,402 11,925 44 506 36, 0`74 9,805 lo37410,000 -der $50,OGO .................................... 300,201 23,4BI 4,514 31,955 223:534 205,148 22,054 3,68950,000 under $100,000 ...................................
1
156,674 7,345 3,279 11,520 139,231 134,804 7,173 2,756100, 000 or more ......................................... 20`7,766 8,046 3,465 8,399 169,013
o164,407 7,839 3,249
Nontaxable returns ......................................... 55,691 4,968 640 6,775 50,091 45,594 4,960 462
OTBER BONDS, NOTES, AND DEBENTURES
Grand total ......................................... 278,500 30,674 22,005 32,781 229,704 213,800 29,532 13,770
raxable returns, total ..................................... 215,532 27,898 14,380 28,059 173,930 157,751 26,853 10,815
Under $10,000............................................ ~11 18,927 5,826 2,112 8,642 20,463 16,090 5,702 1,34110,000 under $50,000 .................................... 113,808 12,581 7,521 14,759 89,477 83,246 11,990 5,76350,000 under $100,000 ...................................
1
42,039 4,913 2,651 3,099 33,495 30,598 4,667 1,895100,000 or more.........................................
1. 40,757 4,577 2,096 1,559 30,495 27,818 4,494 1,817
iontaxable returns................................ ........ . 62,%8 2,976 7,624 4,722 55,774 56,049 2,680 2,955
INSURANCE AND ANNUITIES
Grand total .......................................... 15,562 16,907 424 7,759 30,791 14,336 16,766 353
raxable returns, total..................................... 15,245 16,785 424 7,056 30,353 14,018 16,647 353
Under $10,000 ............................................ 4,940 6,786 195 4,377 11,115 4,545 6,765 19510,000 under $50,000 .................................... 8 164 8,547 168 2,441 15 84
9
1~ 7,489 8,445 118J un50,000 der $106,000................................... 1,680 917 32 169 2:45 9 1,585 904 30100,000 or more ......................................... 460 536 30 69 931 o 400 533 11
Jontaxable returns.. ................................ 318 122 - 702 437 318 119 -
OPTIONS TO BUY OR SELL
Grand total .......................................... 28,156 14,332 2,464 41,
9
2 447 10,293 12,787 636
axable returns, total ..................................... 26,676 14,033 1,748
11
4:5
:1:
9,698 12,501 636
Under $10,000 ............................................ 14,957 4,195 471 1,582 4,206 917 3,499 20010,000 -der 150,000 ....................................
V9,9()0 7,605 930 2,589 14,154 7,512 6,900 257
O 000 -der 100,000 ...................................~
.41 1,4Cr7 2,061 244 264 2,914 1,031
1,990 lCr7$10,OOO or more ......................................... 413 172 1041 76 290 238 123 71
on~xable returns ......................................... 1,480 299 716 435 883 595 286 -
Footnotes at end of table. For the precise definition of terms and the nature of any limitations, see the -'D~cription of the Sample," "Limitations of the Data," and '-Explanationof classi fi cat ons and Terns" in the text.

72 SALES OF CAPITAL ASSETS ON INDIVIDUAL RETURNS, 1962RETURNS WITH NET CAPITAL GAIN
Table 7. -ALL AND LONG-TERM TRANSACTIONS- INCOME, TAX, NET GAIN, AND TRANSACTION DETAIL, BY ASSET TYPE AND SIZE OF ADJUSTED GROSS INCOME LESSCAPITAL GAIN OR LOSS INCLUDED -Continued
sset type and size of adjusted gross income
less capital gain or loss included
Number of
returns
ith net
capital
gain
Adjusted gross income
ress
capital
As reported gain or
loss
included
(7?...-d
d.11 ...
Taxable
income
Th.-d
d.11-)
Income taxafter
credits
(77-d
&11 ...
Net capital
gain
Th-~
~11 ...)
Capital loss carrymer
mountNumber of
returns
(n--d
&11 ...)
All capital assettransactions
GrossNumber of
sales
trans-price
actions
(Th...-d
d.11 ...
W (2) (3) (4) (5) (6) (7) (8) (9) (10)COWDDITIES INCIUDING FUTURE CONTRACTS
Grand total .......................................... 13,758 183,982 123,061 130,850 45,220 60,921 435 1,268 62,203 441,94~-
Taxable returns, total ..................................... 8,637 177,196 120,894 129,9G4 45,220 56,302 316 1,231 51,373 391,87C
Under $10,000 ............................................ 5,220 40,994 25,587 25,131 6,137 15
,
4(Y7 37 ,042 223,194
10,000 under $50,000..' ' *V
2,998 78,848 61,538 59,267 17,622 17,311 310 1,133,
12 559 136,654
O, 000 under $100, COO. : . . . 356 29,093 22,570 22,674 9,837 6
,
524 1,499 26,133$
100,000 or more ......................................... 63 28,261 11,200 22,832 11,623 17,061. 6 98 273 5'a9l
Nontaxable returns ......................................... 5,121 6,766 2,167 946 - 4,619 10,829 49,971
CAPITAL GAIN DIVIDENDS
Grand total .......................................... 1,378,286 16,005,539 14,809,010 11,225,0`76 3,126,732 1,196,529 7,754 16,255 1,427,765
Taxable returns, total ...... : .............................. 1,231,525 15,711,243 14,571,125 11,200,039 3,126,732 1,140,119 7,256 15,134 1,262,906
Under $10,000 ............................................ 723,122 4,587,0173 4,241,522 2,771,294 564,775 345,551 746,754
10,000 under $50,000 ...................... ............. 487 205 9 058 743 8,558,694 6,788,279 1,782,809 500,049 5,140 8,182 494,735
50,000 under $100,000 ................................... 17,799 11325,038 1,163,541 1,088,901 465,806 161,498 629 2,754 17,957
100,000 or more ......................................... 3,399 740,389 607,368 551,565 313,342 133,021 162 1,439 3,460
Nontaxable returns......................................... 146,761 294,295 237,885 25,037 - 56,410 164,859
SHARE OF CAPITAL GAIN (T ) FROM PARTNERSHIPS
AND FIDUCIARIES
Grand total .......................................... 293,167 5,365,980 4,296,394 3,914,263 1,351,627 1,069,585 4,518 13,080 324,971
Taxable returns, total ..................................... 256,892 5,321,434 4,346,579 3,997,065 1,351,627 974,856 4,473 12,811 285,891
Under $10,000............................................ 129,972 930, CY75 656,516 559,310 124,768 273,559 1,566 4,481 142,553
1 000 under ~50,000 ....................................
0
112,123 2,727,031 2,340,860 2,061,277 601,341 386,171 2,261 4,711 1.25,724
50,000 under $100,000................................... 11,722 944,014 779,476 762,293 329,656 164,538 476 1,992 13,753
100,000 or more......................................... 3, 074 720,314 569,726 523,684 295,863 150,588 170 1,626 3, 861
Nontaxable returns......................................... 36,275 44,546. -50,184 7,198 - 94,730 39, 0`79
CAPITAL GAIN DISTRIBUTIONS FROM SMALL BUSINESS CORPORATIONS
Grand total .......................................... 22,897 407,30`7 i38,555 300, 659 98,504 68,751 768 2,372 26,151
Taxabic .....................................
Under $10,000 ............................................
-
9,408 65,562
-------
47,864
-------
42,704 8,853
......
17 698
,
---
709 2,288
211,-_9
0 601
10,000 -der 150 ,000 .................................... 10,408 221,067 196,8?6 166,463 46,588 24 191 12,160.50
,
000 under 10 000...................................
1
839 66,226 55,705 54,536 23,832 10,522 54 56 983
100,000 or mo .......................................... 222 51,261 36,687 36,427 19,231 14,594 5 28 285
Nontaxable returns ......................................... 2, 019 3,171 1,424 529 - 1,747 - - 2,123
LIQUIDATION DISTRIBUTIONS
Grand total .......................................... 30,510 1, D79,02 644,523 828,149 337,500 434,969 1,337 5,484 34,230
Taxable returns, total ..................................... 29,023 1,0`73,634 677,083 827,422 337,500 396,551 1,336 5,484 32,622
Under $10,000 ............................................ 12,042 137,600 60,834 91,855 27,752 76,?66 12,72510,000 under $50,000 .................................... 13,835 454,924 303,764 363,553 127,708 151,140 494 1,332 15,75550,000 under $100,000 ...................................
1
2,309 251,618 157,019 205,551 92,256 94,599 98 649 2,964100,000 or more ......................................... 836 229,492 155,445 166,464 89,?84 74,047 38 207 1,177
Nontaxable returns ......................................... 1,487 5,858 -32,560 727 - 38,417 1,608
RETIRUM4T PLAN DISTRIBUTIONS
Grand total .......................................... 59,199 708,732 492,398 499,032, 144,172 216,334 331 712 62,828
Taxable returns, total ..................................... 52,835 693,896 481,170 498,849 144,172 212,726 331 712 55,967
Under $10,000 ............................................ 35,810 297,990 195,429 192,334 44,672 102,561 37,799
10,000 under $50,000 ..................... 16,624 324,%3 248,851 246,641 69,955 76,112 259 576 17,706
50,000 under $100,000. 300 34,249 19,736 29,051 13,246.
14,51-3 347
100,000 or more ....... 101 36,694 17,154 30,823 16,299 19,540 7 56 115 o
Nontaxable returns ......................................... 6,364 14,836 11,227 183 - 3,609 - - 6,861
LrMTnCK
Grand total .......................................... 632,284 2,962,998 2,418,795 1,516,857 377,007 564,204. 932 1,927 1,264,152 963,539
Taxable returns, total ..................................... 362,778 2,540,292 2,132,788 1,490,454 377,007 407,504 727 1,812 725,785 613,771
Under $10,000 ............................................ 330,255 1,682,403 1,40`7,025 840,802 156,934 275,378638 1,289 650,127 4%,551
10,000 under $50,000 ...... 30,643 577,403 506,550 445,957 115,3T7 70,853 69,080 95,436
50,000 -der $100,000 .....
1
1,325 114,960 87,211 94,803 41,584 27,750 68 215 3,464 12,084
100,000 or more ......................................... 556 165,526 132,001 108,891 63,092 33,524 22 308 3,114 9,700
Nontaxable returns ......................................... 269,505 442,706 286,007 26,403 - 156,699 538,366 349,768
Footnotes at end of table. For the precise definition of terms and the nature of any limitations, see the "Description of the Sample," "Limitations of the Data," and"Explanationof Classifications and Terms" in the text.

SALES OF CAPITAL ASSETS ON INDIVIDUAL RETURNS, 1962 73RETURNS WITH NET CAPITAL GAIN
Table 7.-ALL AND LONG-TERM TRANSACTIONS -INCOME. TAX. NET GAIN, AND TRANSACTION DETAIL, BY ASSET TYPE AND SIZE OF ADJUSTED GROSS INCOME LESSCAPITAL GAIN OR LOSS INCLUDED -Continued
Asset type and size of adjusted gross income
less capital gain or loss included
All capital asset transactions-Continued
Depreci-Cost and
sation
expense of Gross gain Gross los
sale
(7h...-d (n-.-d (7),-.-d
&11 ... ) dliara) d.1J.-)
Long-tem capital asset transactions
N=be * ofGross.sales Depreci-
Cost and Gross Grossr expense of long-term long-ters
tran~-price ation
sale gain lossactions
(Th...-d (Th.-d (n...-d fD,.-d (7h...-d~11... ) d.1 I ... ~11-) &11... ) d. 1 1 ar 2)
. (1:0 (12) (13) (14) (15) (16) (17) (18) (19) (20)CMMDITIES INCLUDING FUTURE CONTRACTS -
Grand total .... ......... ...................... 432,224 22,307 1-1,743 15,8_36 40,283 30,734 11,063 1,514
Taxable returns, total ..................................... 385,779 18,387 12,301 6,805 25,582 1 18,795 8,016 1,230
Under $10,000 ............................... ............ 218,286 10,405 5,497 7,342 9,698 4,860 5,253 41510 000 under $50,000 .. ................................. 'o. 135,283 5,856 5,490 1, 071 7
'
804 1 7,121 1,196 51350,000 der $106,000 ................................... 25,351 1,731 951 331 6,248 5,056 1,382 190100,000 or more....... .................................. 5,859 395 364 61
1, ~3
31 1,759 185 112
Nontaxable returns ...................................... 46,445 3,920 442 7,032 14,701 11,938 3,046 264
CAPITAL GAIN DIVIDENDS
Grand total.. ........................................ 47?,109 3,705 1,422,786 476,731 3,116
Taxable returns, total. ........... .............. ___ ... 428,671 2,440 1,256,521 428,3.34 1,851
Under $10,000 ............................. .............. 193,609 606 744,641 193,518 44610
,
000 under $50
',
000 ........... ..................... _ Not app licable 188,335 1,364 492,575 Not applicable 188,123 1,01450,GOO under $100, 000 ................................... 28,634 420 17,865 28,601 358.100,000 or more ......................................... 16,093 50 3,440 16,092 32
Nontaxable returns ........................ __ ....... J 46,439 1,265 164,266 48,398 1,265
SHARE OF CAPITAL GAIN (LaSS) FORM PARTNERSHIPS
AND FIDUCIARM
.Grand total .......................................... 034,560 22, 02~3 286,164 1, 004,685 12,Q29
Taxable returns, total .................. _ ................. 935,277 18,4E 906,912 9,363
Under $10,000.......... ............................. k 370,651 3,594 127 141. 359,735 1,72310, 000 under ~50, 000 ................... _ .............. Not applicable 360,909 8 116 109,105 Not applicable 371,963 4,44850,000 under $100,000................................... lC6
,
900 3;381 11
,
476 103
,
746 1,592100,000 or more.., ...................................... 76 816 3,375 3
,
027 71 469 1,621
Nontaxable returns .............. _. ....................... 99,284 3,557 35,414, 97,973 2,646
APITAL GAIN DISTRIBUTIONS FRCPA SUALL RTLSIMESS CaRPDRATIGNS
Grand total ....... .................................. 52,918 2,463 24,101 52,666 2,273
Taxable returns, total .... __........................... 50,656 928 21,979 50,40v 739
Under ................................ 21,327 253 9,548 21,310 23810,000 "der $50,000.: .... __ ........................ Not app icable 17
,
684 425 11,262 ot applicab 17,472 34350 000 under $100,000 ..................
;51678 229 690 5,655 147
10 , 000 or more
...................
5,966 21 279 5,966 12
Nontaxable returns.... _ ................................... 2,262 1,534 2,123 2,262 1,534
LIQUIDATION DISTRIBUTIONS
Grand total .......... ............................ 568, 0`72 7,967 33,744 567,770 6,299
axable returns, total............... ..................... 5014,447 7,919 32,143 504,220 6,250
Under $10,000 ............ ...............................
I
w
,
218 2
1
021 12
,
621 107,218 1,17610,000 under $50,000 ......................... I ... : ....... Not applicable 214,595 31?22 15,443 Not applicable 214,473 3,319_50~000 under $106,000........... __ ........... .......
1120,059 1,330 2,924 119,9?5 1,082
100,000 or more ................................... 62,575 646 1,154 62,554 674
ontaxable returns ......................................... 63,626 48 1,601 63,550 46
RETIR12EM PLAN DISTRIBUTIONS
Grand total, ................................ _ .......
299,357 103 61,632 298,203 so
axable returns, total ......... ............................ 292,809 60 54,770 291,654 38
Under $10,000 ........................................ 4
,
704 - -17,172
173"'C3 -10,000 under $50,000 ................................ ... Not appl icable 99,724 18 17,160 Not applicable 99,471 1550,000 =der $10b,000.
: ....... ..1
11 448
,
41 326 11 "S 21100,000 or more....... . 9326 2 113 6 932 2
ontaxable returns ......................................... . 6,548 42 6,861 6,548 42
IXVESTOCK
Grand total .................. ......... ............. 87,688 323,243 741,639 16,132 1,230,63.2 946,197 67,339 309,113 736,718 14,944
axable returns, total ..................................... 54,428 206,691 469,734 10,103 706,928 601,825 54,226 19-7,482 466,047 9,153
Under $10 ODC .... - ...Z ' * ' * ... ... .... .
35,513 148,477 36,623 7,262 634,008 488,667 35,439 142,326 387,111 6,55710, 000 ~~cr j50, .. . . ......... 14,684 46,321 65,256 1,726 66,511 92,212 14,567 43,757 64,281 1,52650 000 -der ~100,000 ...................................
;'2,193 6,761 7,900 550 3,346 11,434 2,185 6,234 7,746 527
~10 ,000 or more... ........... __ ...................... 2oO39 5,333 6,956 563 3,063 9,511 2,035 5,165 6,910 543
Dntaxable returns ............ ............................ 33,260 116,352 271~905 6,029 523,684 344,282 33,11-3 111,631 270,671
F
l
5,691
T
11
Footnotes at end of table. For the precise definition of terms and the nature of any limitations, see the "Description of the Sample," "Limitations of the Data," and -'Explanationof Classifications and Terms" in the text.

3
74 SALES OF CAPITAL ASSETS ON INDIVIDUAL RETURNS, 1962RETURNS WITH NET CAPITAL GAIN
Table 7. -ALL AND LONG-TERM TRANSACTIONS -INCOME, TAX, NET GAIN, AND TRANSACTION DETAIL, BY ASSET TYPE AND SIZE OF ADJUSTED GROSS INCOME LESSCAPITAL GAIN OR LOSS INCLUDED-Continued
Adjusted gross income Capital loss carryo~erAll capital asset
Number of-et urns Less Taxable
Income taxNet .-ital
Asset type and size of adjusted gross income with net capital income aftercr dits gain Gross sales
less capital gain or loss included capital As reported gain or eNumber of
Amount Number ofrigain loss returns t ans-
p ce
included actions
(7~.-d (Th-.-d (Th...-d (7).--d (T?...-d (7?.-.-d (n...-d~11 ... ~11 ... d.11... bll ... ~11...) 1~~ d*llar3)(2) (4) (5) (6) (7) (10)
TIMBER AND COAL
Grand total .......................................... 57,027 494,139 377,471 311,065 99,873 116,667 118 898 61,352 132,398
Taxable returns, total ..................................... 38,319 476,455 382,765 310,086 99,873 93,690 lis 898 41,360 102,689
Under $10,000 ............................................ 29,572 171,725 132,426 91,106 18,644'9
211 31,363 57,9350,000 under $50,000 ....................
:"*,* ... .. * ....4
8,006 178,242 151,683 133,977 37,125 26 102 6908,927
_0,7360,000 under $100,000 ................... .. 530 45,866 35,313 36,482 15,604 10,553 736 7,936
$100,000 or more ......................................... 211 80,622 63,343 48,521 28,500 17,279 15 208 335 6,080
Nontaxable retu.......................................... 18,708 17,684 -5,294 979
-
22,978 - - 19,992 29,709
OIL AND MINERAL INTERESTS
Grand total .......................................... 15,926 452,840 307,112 323,303 133,927 145,728 424 1,525 23,417 1-34,193
Taxable returno-, total ..................................... 13,684 451,917 317,519 323,124 133,927 134,398 384 1,348 20,353 116,801
Under $10,000............................................ 7,368 73,320 40,811 46,750 11,966 32,509 - - 10,161 51,99410,000 -der $50,000 ........... ........................ 5,134 147,934 110,262 114,616 36,758 37,672 319 564 8,204 45,7G450,000 -der $100,000................................... 760 70,164 52,699 55,313 23,964 17,465 39 405 1,221 9,997100,000 or more ......................................... 423 1160,499 113,748 106,445 61,238 46,752 26 379 768 9,207
Nontaxable returns ......................................... 2,242 923 -10,406 178 - 11,330 3,065 17,392
PARTNERSHIP INTERESTS
Grand total .......................................... 68,214 1,167,733 832,731 836,498 279,734 335,002 1,679 2,840 92,350 ?12,044
Taxable returns, total..................................... 58,792 1,153,877 868,614 835,261 279,734 285,262 1,579 2,720 79,757 607,?71
Under $10,000 ............................................ 31,522 244,649 145,053 144,530 34,1100 99,797 902 543 43,210 287,74610 000 under $50,000 .................................... 24,867 603,560 500,554 454,928 131,494 103,006 562 1,410 32,880 250,90750:000 under $100,000...................................
11,883 164,763 1.24,652 133,493 58,002 40,111 87 294 2,811 41,900
100,000 or more ......................................... 520 140,705 98,356 102,311 56,139 42,349 28 474 955 27,218
Nontaxable returns ......................................... 9,422 13,856 -35,883 1,237 - 49,739 J-) 12,594 104,274
ASSETS TEED IN TRADE OR BUSINESS
Grand total .......................................... -343,813 3,287,128 2,440,195 2,213,775 640,301 846,933 3,887 12,726 551,717 3,133,957
Taxable returns, total ..................................... 256,662 3,195,505 2,505,187 2,200,879 640, 301 690,318 3,091 11,302 407,,72 2,429,231Under $10,000 ............................................ 183,573 1,239,734 877,158 699,704 147,829 362,576 1,398 4,585 300,295 1,473,61810,000 under $50,000.. ................................. 69,077 1,482,856 1,265,135 1,127,444 310,960 217,721 1,524 5,831 99,911 815,02750,000 under $106,000 ...................................
13,220 276,034 210,833 230,822 101,085 65,201 122 585 5,604 98,694
100,000 or more ......................................... 793 196,881 152,060 142,910 80,427 44,820 47 300 1,562 41,892
Nontaxable returns ......................................... 87,151 91,624 -64,991 12,897 - 156,615 144,346 704,726
PROPERTY HELD MR PERSONAL USE
Grand total .......................................... 40,312 443,815 356,074 279,394 83,661 87,741 314 1,265 54,103 167,200
Taxable returns, total ...................................:*
31,424 418,099 340,092 277,597 83,661 78,008 306 942 36,230 123,694Under $10,000
-*--* .... *** ......... **"**............ 21,652 148,913 107,079 78,207 17,365 41,634 25 ,016 82,919
10,000 under $50,000 ...................................1 9,192 194,750 173,782 145,092 39,534 20,969 298 862,
10 523 33,33850,000 under $100,000 ...................................
1440 37,360 29,799 29,657 13,104 7,561 518 3,307
100,000 or more......................................... 141 37,075 29,431 24,640 13,659 7,644 7 80 174 4,130
Nontaxable returns ......................................... 8,888 25,716 15,983 1,797 - 9,733 17,872 43,506
RESIDENCES
Grand total .......................................... 171,629 1,350,74S 1,035t640 813,629 200,133 315,108 660 1,629 175,259 2,654,963
raxable returns, total ..................................... 139,858 1,290,962 1,009,404 811,582 200,133 281,556 556 1,450 143,166 2,249,710Under $10,000 ............................................
000 0112,679 746,452 541,518 412,204 85,907 204,935 115 367 1,657,369
under $510, ,000 .................................... 26,503 475,051 410,532 345,849 89,167 64,519 543 1,4101 ,
27 092 560,03050,000 under $100,000...................................
1559 44,793 37,316 36,593 15,955 7,477 594 24,322
100,000 or more ......................................... 118 24,665 20,038 16,936 9,105 4,626 13 40 122 7,990
qontaxable retu.......................................... 31,770 59,786 26,235 2,247 - 33,550 32,094 405,253
NONBUSINESS REAL ESTATE
Grand total.......................................... 255,222 2,787,269 2,065,127 1,870,211 553,426 722,142 3,808 13,310 293,420 2,833,864
axable returns, total ..................................... 202,342 2,726,235 2,100,479 1,865,675 553,426 625,756 2,788 9,188 232,660 2,402,890Under $10,000 ............................................. 138,309 1,007,997 691,997 590,114 128,941 316,000 (.) (.) 154,728 1,468,731
under1501000 ....................................r
60,474 1,305,615 1,091,716 969,397 272,299 21.3,698 1,077 2,993 73,214 793,375.
under100,000 ................................... 2,833 245,801 186,085 197,948 36,123 59,715 161 1,237 3,751 97,664
100,000 or more ......................................... 725 166,823 130,680 118,216 66,064 36,143 39 699 966 43,120
taxable returns ......................................... 52,880 61,034 -35,351 4,536 - 96,386 (.) 60,759
r
430,974
Footnotes at end of table. For the precise definition of terms and the mature of any limitations, see the "Description of the Sample," "Limitations of the Data," and 'Explanationof Classifications and Terms" in the text.

SALES OF CAPITAL ASSETS ON INDIVIDUAL RETURNS, 1962RETURNS WITH NET CAPITAL GAIN
Table 7. -ALL AND LONG-TERM TRANSACTIONS -INCOME, TAX. NET GAIN, AND TRANSACTION DETAIL, BY ASSET TYPE AND SIZE OF ADJUSTED GROSS INCOME LESSCAPITAL GAIN OR LOSS INCLUDED -Continued
75
Asset type and size of adjusted gross incomeless capital gain or loss included
All capital asset tran,sactions-Continued
Depreci-Cost and
ationexpense of Gross gain Gross loss
sale
(7b-.-d (n--d (T~.-d (7h-.-d~11 ... ~11 ... d.11-) d.11 ...
long-term capital asset transactions
Cost and Gross GrossNumber of
Gross.sales Deprcc-
trans-price ation
expense of long-term long-termsale gain loss
actions
(7h...-d (Th-.-d (Th...-d (7?...-d (77...-dd.11.,.) d.11 ... ~11-) &!jars) ~11...
(in) (12) (13) (14) (1-5) (16) (17) (18) (1.9) (20)TROER AND GOAL
Grand total ................................ I.......... 793 34,655 112,216 564 58,983 130,951 793 33,665 110,895 578
Taxable returns, total ..................................... 793 26,327 88,116 558 39,885 101,480 793 25,455 87,316 552
Under $10,000 ............................................ 248 10,839 52,921 463 30,071 57,397 248 10,479 52,290 45710,000 under $50,OW .................................... 81 10
,
696 23
,
398 56 8,774 30,328 81 10,392 23,290 5550,000 under $100,000 ................................... 389 2,790 6,927 23 711 7,714 369 2,590 6,903 23100,000 or more ......................................... 75, 2,003 4,870 17 328 6,041 75 1,994 4,833 17
Nontaxable returns ......................................... - 8,328 24,099 26 19,098 29,471 - 9, 209 23,579 26
OIL AND hUNERAL INTERESTS
Grand total.. ........................................ 9,746 68,596 90,409 5,723 20,292 117,219 9,727 54,629 86,818 5,105
Taxable returns, total ..................................... 9,391 64,888 75,171 4,909 17,671 101,313 9,372 52,018 72,012 4,336
Under $10,000 ............................................ 3,223 29,734 30,529 466 9,344 43,116 3,222 23,234 28,192 40210,000 -der $50,000 .................................... 3 940
'
24 624 28 628 3,060 6 487 39 693 3,928 19,086 27,938 2,84050,000 under $100,000 ...................................
11 '419 5~460 8 256 945 1121: 9 563 1,412 5,104 8,166 895
100,000 or more ......................................... 809 5,069 7,757 439 729 8,941 809 4,595 7,716 199
Nontaxable returns ......................................... 355 3,708 15,239 814 2,620 15,906 355 2,611 14,806 768
PARTNERSHIP INTERESTS
Grand total .......................................... 26,142 378,300 346,811 9,731 83,431 663,441 26,137 333,223 341,401 7,615
Taxable returns, total ..................................... 22,764 299,835 316,623 8,715 71,346 583,326 22,761 277,914 312,241 6,621
Under $10,000 ............................................ 13,291 138,431 152,463 3,576 38,870 276,261 13,289 127,885 150,311 2,36510, ~00 nd,r $50`000 .................................... 8,170 133,502 122,366 4,159 29,167 239,665 6,169 124,027 120,351 3,675150 , .
'er $100,000 ................................... 822 18,472 23,396 600 2,512 40,782 822 17,204 23,321 376100,000 or more ......................................... 461 9,430 18,396 379 777 26,618 481 8,798 18,258 206
Nontaxable returns......................................... 3,376 78,464 30,189 1,017 12,085 80,115 3,376 55,309 29,160 993
ASSETS USED IN TRADE OR BLOINESS
Grand total .......................................... 782,020 2,863,176 1,024,504 -34,208 527,864 2,967,053 780,581 2,707,722 1,008,958 31,331
Taxable returns, total ..................................... 595,311 2,156,861 842,622 23,409 389,370 2,315,066 594,106 2,050,632 831,006 20,732
Under $10,000 ............................................ 408,760 1,365,484 506,517 13,133 287
,
852 1,401 457
,
407,882 1,299,908 498,067 12,14610 000 under $50,000 ......... :- .... *,**,** ............ 166
,
4 19
700,877 266,087 8,553 94,677 723786 166,208 673,952 263,183 7,11450: 000 under $106, ODO........ ..........................
115,0 36 68,311 44,926 1,243 5,324 85,714 14,992 55,219 44,824 1,067
100,000 or more ......................................... 5,025 22,188 25,091 480 1,517 41,174 5,024 21,553 24,932 405
ontaxable returns ......................................... 196,709 706,315 181,983 10,799 138,4_34 651,985 186,475 657,090 177,951 10,599
PROPERTY HEI FOR PERSONAL USE
Grand total .......................................... 35,422 155,719 48,302 4,146 50,053 155,167 34,860 14.4,449 46,729 3,897
axable returns, total.. ................................... 29,574 110,4.90 42,260 2,229 33,074 118,012 29,388 105,856 40,628 2,031Under $10,000 ............................................ 17,516 71,193 29,381 1,678 22,823 79,620 17,472 68,714 26,374 1,53610,000 under $50,000.... ............:- .... **,*** ...... 11,158 .34 410 9 26G 361 9,593 31 113 11,021 32,374 8,882 30950,000 under $100,000 ............... ...................
1541 21265 1,681 98 495 3,216 537 2,178 1,668 94
100,000 or more ......................................... 360 2,622 1,938 92 163 4,064 359 2,590 1,904 92
ontaxable returns ......................................... 5~847 45,229 6,041 1,917 16,979 37,155 5,472 38,593 5,901 1,866
RESIDENCES
Grand total .......................................... 107,481 2,176,161 561,527 - 167,540 2,574,007 107,333 2,105,375 552,593 -
-able returns, total ..................................... 91,881 1,829,147 492,490 - 137,133 2,183,041 91,733 1,770,628 494,885Under $10,000. 67,681 1,333,622 381,340 - 110,061 1,602,943 67,541 1,286,444 374,61010,000 -der 50,000 .................................... 23,171 470,I)V6 102,424 - 26,377 548,146 23,164 460,001 101,564 -50 000 under
;846 16,411 6,919 - 573 23,963 845 18,065 6 905 -
10 1000 or more......................................... 183 6,118 1,805 - 122 7,990 183 6,118,
1,805 -
ontaxable returns......................................... 15,600 347,014 69,037 - 30,407 390,966 15,600 334,747 67,709 -
NONBUSINESS REAL ESTATE
Grand total .......................................... 183,534 1,939,803 970,635 22,564 275,992 2,708,507 183,387 1,B26,031 958,441 21,197
-able returns, total..................................... 158,503 1,627,057 826,807 15,848 218,787 2,295,606 158,418 1,529,399 816,698 14,552
Under $10,000 ............................................ 111,580 1,011,468 494,161 6,240 145,328 1,400,799 111,555 949,535 487,733 5,57010,000 under $50,0CO .................................... 42
,
037 533,0178 274,090 8,302 68,956 760,370 41,989 503,407 270,765 7,76250,WO under Z106,000...................................
1
31494 56,829 40,210 777 3,574 92,592 3,483 52,039 39,898 719100,000 or more ......................................... 1,392 25,682 18,346 529 929 41,845 1,391 24,420 18,303 500
antaxable returns .... ..............* ...................... 25,030 312,746 143,628 6,716 57,205 412,901 24,969 296,631 141,743
N
N
6,645
N
T
N
Footnotes at 'end of table. For the precise definition of terms and the nature of any limitations, see the "Description of the Sample," "Limitations of the Data," and I'Expl~tionof Classifications and Terms" in the text.

76 SALES OF CAPITAL ASSETS ON INDIVIDUAL RETURNS, 1962RETURNS WITH NET CAPITAL GAIN
Table 7. -ALL AND LONG-TERM TRANSACTIONS- INCOME, TAX, NET GAIN, AND TRANSACTION DETAIL, BY ASSET TYPE, AND SIZE OF ADJUSTED GROSS INCOME LESSCAPITAL GAIN OR LOSS INC LUDED -Continued
b
Adjusted gross income Capital. loss carryo~erAll capital asset
transactionsNum er ofreturns less Taxable
Income taxNet capital
Asset type and size of adjusted gross income with net capital. incomeafter
credits gainAmount Number of
Gross sales
less capital gain or loss included capital As reported gain or Number oftrans-
pricegain loss
includedreturns
actions
d(7~.- (Th-d (Th...-d (77..-d (7~-d (n-d (77...-d:~d.11 d.11.,.) d.11 ... d.IJ ... d.11 ... d.1 I ...
(1) (2) (3) (4) (5) (6) (7) (9) (10)
REAL ESTATE SUBDIVIDED
Grand total .......................................... 127,406 1,347,889 934,726 918,757 267,197 413,163 1,807 4,113 150,395 1,652,042
Taxable returns, total ..................................... 105,2044 1,357,624 1,008,077 915,445 267,197 349,547 1,473 3,251 122,505 1,427,284
000............................................Under $1077,635 577,947 . 380, 079 333,943 73,740 197, 868 88,805 993,113
,000 under $50,000 ......... ..........................10
25,869 578,938 471,006 435,347 124, 074 107,932 928 1,839 31,528 370,685,000 under $100,000 ...................................50 1,383 115,391 90,834 94,109 40,857 24,557 79 732 1,749 44,530
,
$10Q 000 or more ......................................... 317 85,349 66,158 52,CV6 28,526 19,190 20 75 423 18,955
Nontaxable returns .........................................22,202 -9,735 -73,352 3,311 - 63,616 27,890 224,759
FAMEAND WITH UNHARVESTED CROPS
Grand total .......................................... 6,578 62,357 39,727 39,927 12,114 22,630 7,450 94_549
Taxable returns, total ..................................... 3,681 54,299 36,464 39,266 12,114 1?,835 4,553 80,721
Under $10,000 ............................................ 2,582 19,783 9, 567 12,428 3,069 10,196 3,389 44,900
10
,
000 -der $50,000 ............ ........................ 1,016 25,806 20,244 19,9C4 5,849 5,562 1, Cr74 31,970
50,000 -der $100,000................................... 68 5,8?3 4,520 4,698 2,010 1,352 73 3,006
100~000 or more ......... ............................... 15 2,837 2,114 2,235 1,186 724 17 946
Nontaxable returns ......................................... 2,897 8,058 3,262 661 - 4,796 2,897 13,828
OTHER FARMLAND
Grand total .......................................... 65,971 525,221 308,40`7 349,347 100,936 216,813 132 960 71,426 1,169,025
Taxable returns, total ..................................... 46,056 510,793 333,919 .347,823 100,936 176,874 99 953 49, 0`71 944,008
Under $10,000 ............................................ 38,247 275,676 153,044 165,996 37,321 122,132 39 ,8. 7.,
ON,
10,000 under ~50,000 .................................... 7,255 166,425 128,752 128,512 37,465 37,6 3 88 637
,18 499 20713&7
50,000 -der $100,000 ...................................
1
433 39,637 29,008 32,366 14,297 10,629 524 26,659
100,000 or more .......................................... 121 29,055 23,116 20,949 11,653 5,939 11 316 154 9,978
Nontaxable returns ......................................... 19,915 14,428 -25,512 1,524 - 39,940 22,354 225,016
FROCEEDS PROW PRIOR YEAR ill-STALUE'NT SA1_-
Grand total .......................................... 399,914 4,673,959 3,511,939 3,185,706 979,866 1,162,020 2,458 10,169 505,577
Taxable returns, total ..................................... 309,899 4,505,805 3,481,278 3,174,051 979,868 1,024,527 2,425 9,557 393,711
Under $10,000............................................ 203,052 1,421,439 1,011,358 832,386 181,042 410,081 788 3,729 253,662
10,000 under ~50,000 .................................... 99,701 2,267,521 1,857,410 1, 707, 522 495,608 410,110 1,427 4,736 129,724
50,000 under $100,000 ...................................t 5,881 512,180 388,358 412,941 181,024 123,922 178 801 8,467
$100, 000 or more ......................................... 1,265 304,665 224,152 221,202 122,193 80,514 32 291 1,859
Nontaxable returns ......................................... 90,015 168,154 30,661 11,655 - 137,493 111,866
OTHER TYPE ASSETS
Grand total .......................................... 339,650 4,819,714 3,630,829 3,289,003 1,106,045 1,188,685 6,037 21,202 389,981 798,717
Taxable returns, total ..................................... 279,239 4,690,157 3,615,222 3,279,509 1,106,045 1,074,935 6,652 16,693 322,049 710,726
Under $10,000 ............................................ 183,331 1,332,901 995,986 759,618 169,269 336,915 3,346 5,258 205,834 391,772
10'000 under $50,000 .................................... 86
1175 2,051
1004 1,675,325 1,530,643 452,835 375,679 2,658 6,917 102,110 198,226
50,000 under $100,000 ...................................
1
71419 679,117 495,202 541,196 236,258 183,916 500 2,905 10,502 57,576
100,000 or more ......................................... 2,314 627,134 448,709 448,052 247,664 178,425 148 1,613 3,602 63,152
Nontaxable returns .......................................... 60,411 129,556 15,606 9,493 - 113,950 1,385 4,509 67,932 87,991
Footnotes at end of table. For the precise definition of terms and the nature of any limitationn, see the "Description of the Sample," "Limitations of the Data," and I-Explanatio
of Classifications and Terms" in the text.

SALES OF CAPITAL ASSETS ON INDIVIDUAL RETURNS, 1962 77RETURNS WITH NET CAPITAL GAIN
Table 7. -ALL AND LONG-TERM TRANSACTIONS -INCOME , TAX. NET GAIN, AND TRANSACTION DETAIL, BY ASSET TYPE AND SIZE OF ADJUSTED GROSS INCOME LESSCAPITAL GAIN OR LOSS INCLUDED-Continued
Asset type and size of adjusted gross incomeless capital gain or loss included
All capital asset transactions-Continued
De Cost and
placl-expense of Gross gain Gross loss
ati.nsale
(n,... d (n...-d (n-.-d (Th-.-d&11 ... d.11 ... d.11-) d.11-)
Long-term capital asset transactions
Gross Cost and Gross GrossNumber of
sales Depreci-
trans-price ation
expense of long-tem long-termsale gain less
actions
(7?-..-d (Th...-d (A...-d (rh...-d (77-..-d~11 ...) ~11 ...) ~11-) ~11 ... d.11 ...
REA.L ESTATE SUBDIVIDED(11) (12) (.13) (14) (15) (16) (17) (18) (19) (20)
Grand total .......................................... 146,164 1,089,30`7 656,819 9,860 147,132 1,630,559 146,162 1,071,815 . 652,676 9,569
Taxable returns, total ..................................... 129,963 929,124 585,377 8,280 120,360 1,409,276 129,961 914,181 582,281 8,109Under $10,000 ............................................ 94,895 661,344 392,824 4,874 87,440 983,904 94,895 654,527 390,5CY7 4 650000 under $50,000 ....................................
1 ()1
31,642 233,166 161,677 2,906 30,795 363,692 31,640 226,837 160,940,
2 79650,000 und-r $100,000 ...................................1
2,454 22,968 22,716 366 1,715 43,000 2,454 21,455 22,682,345100,000 or more ......................................... 972 11,646 8,159 135 411 18,681 972 11,361 8,153 118
Nontaxable returns ......................................... 16,201 160,163 71,442 1,580 26,772 221,283 16,201 157,634 70,395 1,460
FARMIAND WITH UNHARVESTED CROPS
Grand total. ......................................... 5,455 48,050 50,244 322 6,503 B9,816 5,455 43,335 50,073 169
Taxable returns, total ... ; ................................. 4,525 40,705 43,168 302 3,606 75,988 4,525 35,990 42,997 149Under $10,000............................................10 000 -der $50 000.....
2,4092 000
22,480 23,849 164 2,485 40,602 2,409 IB,194 23,696 43, , ...............................50 000 under $100 000.......
1
,75
16,562 17,279 114 1,037 31,733 2,000 16,336 17,261 106, , ............................100 000
1,375 1,474 4 6? 2,807 75 1,173 1,474 -, or more ......................................... 42 288 566 - 17 846 42 299 566 -
Nontaxable returns ......................................... 930 7,345 7, CY76 20 2,897 13,828 930 7,345 7, 076 20
OTHER FATALAND
Grand total .......................................... 73,937 722,830 445,32-1 1-3,587 69,795 1,156,976 73,878 712,576 443,469 13, Z75
Taxable returns, total ..................................... 59,782 559,616 368,909 9,079 47,778 933,809 59,723 550,870 367,424 8,774Under $10,000............................................ 47,669 424,263 265,793 8,069 36,886 692,880 47,830 417,946 264,724 7 77810
'000 under $50,000.. .................................
50 000 under $106 000.......
1
10,155 116,718 85,491 752 8,228 204,525 10,155 114,526 85, U76,743, , ............................
100 000 or more ...1,315 14,076 12,492 70 513 26,462 1,315 13,875 12,491 65, ...................................... 424 4,560 5,133 188 150 9,943 .424 4,524 5,133 188
Nontaxable returns ......................................... 14,155 163,213 76,413 4,507 22,017 223,167 14,155 161,706 76,065 4,501
PROCEEDS FRCM PRIOR YEAR IUSTALIMENT SALES
Grand total .......................................... 1,489,826 7,343 486, 073 1,479,555 6,966
Taxable returns, total ..................................... 1,311,216 7,176 377,300 1,303,260 6,799Under $10,000 ................................ - ..........10,000 under $50 000 .. .................... .
582,0651
5,964 244,389 577,641 5,676, .. ..........50,000 under $10b 000 ........................
1
No, applicable 537,555 763 123,090 Not applicable 534,311 691, ...........100,000 or more ........................... ..
132 253
:370 7 981
:13 987
1356
.. .......... 59 344 79 1 839 59:321 76
Nontaxable returns ......................................... 178,610 167 108,773 176,296 167
OTHER TYPE ASSETS
Grand total .......................................... 274,058 797,264 596,'371 830,578 330,734 689,777 273,573 682,053 566,671 777,619
Taxable returns, total ..................................... 94,319 549,311 534,848 721,683 273,232 604,828 93,844 437,4~O 514,000 674,153Under $10,000 ............................................10,000 under $50 000 . ............. . .
21,139 285,063 246,161 402,111 183,751 340,638 21,120 233,438 235,559 388,352, . . .................50,000 -der $100,000...................................
1
9,9712,275
122,70031,583
188,25362 784
267,70436 662
79,7997 128
170,44952 754
9,5162 274
91,54924 982
181,0118
246,94229100,000 or me .......................................... 60,934 109,966
,37,650
,15,206
,2,553
,40,987
,60,934
,87,482
60,6336,792
,9018,959
Nontaxable returns ..........................................
1
179,739 247,953 61,523 108,895 57,502 84,949 179,730, 244,603, 52,671, 103,46
Die to the reporting of more than one asset type by some taxpayers, the number of returns, adjusted gross income, t able income, income tax after credits, net capital gain,and capital loss carryover for "All asset types" will be less than the s= of these items for the specific asset types~(*) An asterisi- in a cell denotes that the estimate is not shown separately because of high sampling -iability. However, the data are included in the appropriate totals.- A dash in a cell indicates that either there are no data for that item or it amounts to less than ~500,NOTE: For the precise definition of terms and the nature of any limitations, see the "Description of the S=ple," I-Limitations of the Data," and "Explanationof Classificationsand Terms" in the text.
Detail in the tables may not add to totals because of rounding.

78 SALES OF CAPITAL, ASSETS ON INDIVIDUAL RETURNS, 1962RETURNS WITH NET CAPITAL GAIN
Table 8.-ALL AND LONG-TERM TRANSACTIONS- INCOME, TAX, NET GAIN, AND TRANSACTION DETAIL, BY ASSET TYPE AND SIZE OF ADJUSTED GROSS INCOME PLUSCAPITAL GAIN OR LOSS EXCLUDED
N b fAdjusted gross income Capital loss carrywer
All capital atransactiomsset
um er oreturns Plus Taxable
I-Mtax Net capital
Asset type and size of adjusted gross income with net capital incomeafterredits
gainAmount Number of Gross sales
plus capital gain or loss excluded capital As reported gain or Number oft~axs- price
gain loss returns actionsexcluded
(T~. d (T~-d (7hou-d (Thu-d (77--d (Th--d (TM..-dd.11:7
ALL ASSET TYPES'
Grand total..........:,*''* ..... * .... * .... * .... * ... "
4,322,520 45,476,669 52,191,607 30,718,562 8,849,836 6,821,578 36, OW 83,036 9,712,544 35,442,48(
Taxable returns, total ..................................... 3,494,577 44,066,948 50,089,003 30,615,306 8,849,836 6,U4,812 32,364 74,645 8,073,189 31,522,64(
Under $10,000............................................. 1,966,253 10,982,255 11,846,915 5,918,978 1,149,478 906,331 5,687 2,526 3,395,082 6,112,11.
10,000 under $50,000 ................................... 1,419,386 23,618,261 25,895,881 17,127,859 4,248,190 2,329,278 21,111 32,956 3,785,250 13,925,98(
50,000 -der $100,000 ................................... 79,813 4,550,728 5,332,456 3,655,492 1,444,572 785,189 3,725 14,493 545,712 4,369,06,
100,000 or more ......................................... 29,124 4,915,704 7,013,752 3,912,977 2,007,596 2,094,014 1,840 24,670 347,146 7,115,48(
Nontaxable returns ......................................... 827,943 1,409,722 2,102,604 103,255 - 706,766 3,646 8,391 1,639,355 3,919,83~
CORPORATE STOCK
Grand total .......................................... 1,127,835 19,378,364 22,996,006 13,875,761 4,569,590 3,668,744 24,044 58,050 3,946,089 18,378,45~
Taxable returns, total ...................................... 1,005,309 19,0`77,564 22,5.34,339 13,850,502 4,569,590 3,504,453 22,335 54,361 3,613,889 17,299,8-U
Under $10,000 ............................................ 390,282 2,304,314 2,489,776 1,265,220 243,391 204,777 3,466 2,015 930,005 1,916,19E
10 000 under $50,000 .................................... 541,061 9,829,903 10,824,015 7,096,651 1,804,120 1,026,062 14,376 20,826 2,030,186 7,213,85E
50:000 under $lOOOOO...................................
1
51,385 2,958,860 3,476,846 2,336,6?1 915,660 519,938 2,954 12,176 393,642 2,904,47(
100,000 or more ......................................... 22,581 3,964,487 5,741,702 3,151,960 1,6G6,420 1,753,676 1,539 19,344 260,056 5,265,3N
Nontaxable returns ......................................... 122,526 300,600 461,667 25,259 - 164,291 1,709 3,689 332,200 1, 078, 62'
U. S. GOVDUOENT OBLIGATIONS
Grand total .......................................... 30,115 884,661 1,085,676 629,885 245,890 202,923 601 2,333 51,910 1,014,101.
Taxable returns, total ..................................... 27,782 861, 096 1,058,649 629,309 245,890 199,376 597 2,188 48,983 979,91J
Under $10,000 ............................................ 8,992 56,914 59,705 32,34.6 6, 118 2,913 - - 13,317 46,63~
l 000 -der $50,000 .......... **- *--*-' '-***0
14,107 292,764 326,514 208,681 54,753 34,566 396 790 25,763 385,82~i:0,000 -der $100,000 ..... : . ..5 2,872 171,113 199,060 128,492 50,180 28,601 89 220 5,617 274,62;
100,000 or more ......................................... 1,81a 340,306 473,369 259,790 1.34,839 133,296 ill 1,178 4,286 272,62!
Nontaxable returns ......................................... 2,334 23,565 27,027 576 - 3,547 2,926 34,191
STATE AND IDCAL SECURITIE-q
Grand total .......................................... 36,021 1,594,913 1,967,013 1,129,143 507,049 391,771 1,702 6,141 78,244 801,951
Taxable returns, total ..................................... 31,222 1,558,733 1,923,457 1,126,450 507,049 364,830 1,598 5,231 70,699 741,93~
Under $10,000............................................ 6,273 38,526 41,629 21,311 3,736, 2,863 ?,166 15,9610,000 under ~50,000 .................................... 16,582 366,462 404,732 257,526 70,124 38,814 618 1,093 35,079 250,W
50,000 under $100,000 ...................................
1
4,624 286,153 327, 0`77 214,636 84,656 41,300 242 701. 13,W 137,15-
100,000 or more ......................................... 3,743 867,591 1,150,019 632,977 348,533 281,853 245 3,152 15,405 337,92:
Nontaxable retur,as ......................................... 4,799 36,180 63,557 2,693 - 26,941 7,545 60,01~
OTHER BONDS, NOTES, AND DEBENTURES
Grand total ...................................... 1 ... 25,077 826,959 1,074,686 584,966 239,835 246,0`72 1,366 6,753 40,010 287,51,
.21,565 818,081 1,037,143 583,990 239,835 220,062 748 3,356 33,562 229,19,
.................Taxable returns, total ....................
Under $10,000 ............................................ 5,166 27,605 30,001 17,592 3,255 2,423 - - 6,772 6,7Y
10,000 under $50,000 .............. 12,012 247,778 277,095 174,043 45,259 30,213 414 803 17,904 94,73(
50,000 under $lOOsOOO .............
i
2,644 153,061 181, 704 1.15,551 44,300 28,969 236 457 5,013 44,80(lOO,000 or more......................................... 1,743 389,6.36 548,34,2 276,804 147,022 158,457 98 2,095 3,873 82,92!
Nontaxable returns ......................................... 3,5L3 8,878 37,544 976 - 26,011 618 3,396 6,448 58,32(
INSURANCE AND ANNUITIES
Grand total .......................................... 6,943 103,317 122,304 72, 076 22,139 19,230 18 109 8,191 32,08(
Taxable returns, total ..................................... 6,140 100,949 119,373 71,681 22,139 18,662 18 109 7,389 31,64(
Under $10,000 ............................................ 2,966 20,018 20,732 10,211 1,907 761 - - 3,459 2, 61'10, 000 under $50, 000 .................................... 2,832 50,060 57,105 37,005 9,291 7,253 3,426 19, 4-8~50,000 under $100$000 ...................................
1
238 13,189 16,360 10,566 3,970 3,224 327 5, 65~100,000 or more.. ....................................... 104 17,681 25,176 13,899 6,972 7,425 11 102 177 4,88E
Nontaxable returns ......................................... 802 2,369 2,931 395 - 568 - - 802 44(
OPTIONS TO BUY OR SELL
Grand total .......................................... 4,715 115,110 150,934 80,887 28,990 37,085 243 489 9,355 40,021~
Taxable returns, total ..................................... 3,753 112,691 145,680 80,887 28,990 35,274 242 465 7,306 38,96:
Under $10,000 ............................................ (-) - - (.)10,000 under ~50,000.................................... 2,42-1 49,444 55,596 35,420 9,348 7,060 3,847 13,57~50,000 under $100,000...................................
1
447 24,418 30,752 17,789 6,538 6,669 51 162 737 2,81;
100,000 or more ......................................... 190 34,093 55,094 26,321 12,906 21,031 13 135 336 8, 62(
Nontaxable returns ......................................... 962 --,419 5,254 - - 1,M 2,049 1,06,
Footnotes at end of table. For the precise definition of terms and the nature of any limitations, see the "Description of the Sample," "Limitations of the Data," and-Expl-ation
of Classifications and Terms" in the text.

SALES OF CAPITAL ASSETS ON INDIVIDUAL RETURNS, 196279
RETURNS WITH NET CAPITAL GAIN
Table 8. -ALL AND LONG -TERM TRANSACTIONS -INCOME. TAX. NET GAIN, AND TRANSACTION DETAIL, BY ASSET TYPE AND SIZE OF ADJUSTED GROSS INCOME PLUSCAPITAL GAIN OR LOSS EXCLUDED-Continued
Asset t~,~ and size of adjusted gross incomeplus capital gain or loss excluded
All capital asset trazaactions-Continued
Depre.i-Cost and
ationexpense of Gross gain Gross loss
sale
(77--d (Th...-d (Th-.-d (M-.-dd.1) ... &11 ... d~ll ... d.11 ...
Long-term capital asset transactions
Gross sales DepreciCost and Gross Gross
Numberof
trans-price ation
expense of long-term long-term,sale gain loss
actions
(Th...-d (77--d (71--d (7h-..-d (Th...-dd.11 ... d.1f...) ~Ii ... ) d.11 ...
'(11) (12) (13) (14) (1-5) (16) (17) (is) (19) (20)ALL ASSET TYPES
, -
Grand total .......................................... 1,732,439 26,548,181 15,922,373 2,385 867 8,536,924 29,814,566 1,729,224 20,664,495 15,587,059 2,006,03,'
Taxable returns, total ..................................... 1,251,235 23,262,654 14,273,230 2,136,372 7,010,891 26,296,122 1,248,849 17,966,822 13,980,995 1,789,176
Under $10,000 ............................................ 441,088 5,006,782 2,096,883 325,900 3,094,774 5,264,789 440,451 4,179,021 2,034,638 288,03--10,000 under $50,000 ......... .......................... 617,632 10,812,221 5,620,736 1,013,841 3,208,230 11, 544, 001 616,074 8,426,397 5,478,380 S68,69550, 000 under $160, 000 ...................................
1
73,216 3,302,302 1,946,744 379,827 437,091 3,498,026 73,132 2,400,451 1,906,667 307,86?100,000 or more ......................................... 129,299 4,141,349 4,608,867 416,805 270,796 5,979,306 119,191 2,960,954 4,561,310 324,582
Nontaxable returns......................................... 481,204 3,285,527 1,649,143 249,495 1,526,033 3,528,443 480,375 2,897,673 1,606,064 216,86C
CORPORATE STOCK
Grand total ..........................................1
13,434,273 6,200,882 1,340,233 3,080,310 14,571,301 9,533,465 6,014,649 1,059,164
Taxable returns, total ..................................... 12,546,155 5,922,211 1,249,296 2,805,720 13,700,972 8,856,087 5,753,160 987,945
Under $10,000 ............................................ 1,610,890 420,049 120,705 744,412 1,418 773 1 1,U5,819 389,196 92,138000 under $50,000....................................
10
5,851,944 1,879,647 549,954 1,563,178 5,494,445 4,111,274 1,789,631 438,24350:000 under $100,000......................
... -*" .. -1
2,260,547 900,538 267,712 302,545 2,341 293 1,665,141 876,5~6 211,339.. ..100,000 or more ............................ 2,822,774 2,721,977 310,925 195,586 4,446,462
101,963,854 2,697,536 246,225
Nontaxable returns ......................................... 888,1.18 278,671 90,937 274,590 870,330 677,378 261,489 71,218
U. S. GOVERNH.NT OBLIGATIONS
Grand total .......................................... 000,914 16,671 3,656 41,145 464,082 451,853 15,157 3, 107
Taxable returns, total ..................................... 967,259 15,927 3,455 38,30`7 433,863 422,162 14,427 2,905
Under $10,000 ............................................ 43,00? 3,991 159 11,538 43,120 39,369 3,904 15210,000 under $50,000 ........... 382,64B 4,738 1,740 20,136 171,175 168,412 4,041 1,45750,000 under $100,000 ...................................
1
273,190 Z,336 904 3,846 75,079 73,854 2,030 806100,000 or more .........................................
w1
268,415 4,W 652 2,797 144,489 o 140,526 4,453 491
Nontaxable returns ..................................o
33,655 744 202 2,839 30,220 29,692 730 201
AND LOCAL SECURITIES
Grand total ............ _........................... 761,447 53,757 13,301 70,575 626,376 586,027 51,631 2-1,531
Taxable returns, total.......................... I .......... 705,755 48,788 12,660 63,600 576,285 11 540,433 46,872 11,068
Under $10,000 ............................................ -1 13,497 2,694 425 7,166 15 967 13,497 2,894 42510,000 under $50,000 . .................................. 237,517 16,991 3,623 30,475 170:319 1 157,562 15,810, 3,05550,000 under $100,000...................................
1
129,533 10,246 2,639 12,085 122,056 1
1114,416 10,046 2,423
100,000 or more .........................................1. 325,208 18,657 5,974 14, 0`74 267,943 . 254,959 18,121 5,165
Nontaxable returns .................................. ...... 55,691 4,968 640 6,775 50,091 45,594 4,960 462
OTHER BONDS, NOTES, AND DEBENTURES
Grand total .......................................... 278,500 30,874 22,005 32,781 229,704 213,800 29,532 13,770
raxable returns, total ..................................... 215,532 27,898 14,380 26,059 173,930 157,751 26,853 10,815
Under $10,000 ................................ ............ 6,214 825 299 6,439 6,666 6,134 816 28410,000 under ~50,000 . .................................. 92,957 7,368 5,612 14,650 71,4.34 69,097 6,845 4,52450,000 under $100,000 ...................................
142,540 5,207 2,977 4,012 36,223 33,219 4,943 1,970
100,000 or more .........................................o
73,822 14,498 5,491 2,959 59,608 49,301 14,249 4,037
4ontaxable returns ......................................... 62,968 2,976 7,624 4,722 55,774 J 56,049 2,660 2,955
INSURANCE AND ANNUITIES
Grand total .......................................... . 15,562 16,90`7 424 7,759 30,791 14,336 16,766 353
'axable returns, total..................................... 15,245 16,785 424 7,056 30,353 14,018 16,647 353
Under $10,000 ............................... ............ 1,302 1,315 - 3,359 2 2 01 907 1,294 -10,000 under ~50,000 . .................................. 9,689 8,983 194 3,230 17,817 9,D72 8,883 13950,000 under $100,000 ................................... m 1,389 4, 340 108 299 5,508 1,251 4,326 101100,000 or more ......................................... 2,864 2,147 133 168 4,828 2,789 2,143 113
ontaxable returns ......................................... 318 122 - 702 437 318 119 -
OPTIONS TO BUY OR SELL
Grand total. - ........................................ 28,156 14,332 2,464 4,946 22,447 10,293 12,797 636
axable returns, total ..................................... 26,676 14,033 1,748 4,512. 21,564 z 9,698 12,501 636
Under $10,000.............................................1 000 under $50,000
-....................................
08,091 6,218 731 2,952 11 067 6,302 5,0?1 325
50,000 -der $100,000 ...................................
1
1,551 1,705 447 358 21438 1,127 1,440 128100,000 or more......................................... 3,001 6,039 415 215 7,331 1,512 5,948 129
.ontaxable returns ..................... .................... 1,480 299 1 716 1 435 , 883 595 1 286 -
N
Footnotes at end of table. For the precise definition of terms and the nature of any limitations, see the "Description of the Sample," "Limitations of the Data," and "Explanationof Classifications and Terms" in the text.

80 SALES OF CAPITAL ASSETS ON INDIVIDUAL RETURNS, 1962RETURNS WITH NET CAPITAL GAIN
Table 8. -ALL AND LONG-TERM TRANSACTIONS -INCOME, TAX, NET GAIN, AND TRANSACTION DETAIL, BY ASSET TYPE AND SIZE OF ADJUSTED GROSS INCOME PLUSCAPITAL GAIN OR LOSS EXCLUDED-Continued
sset type and size of adjusted gross incmeplus capital gain or loss excluded
N~ber ofreturn.with netcapitalgain
Adjusted gross ineme
PlusCapital
As reported gain orloss
excluded
(Th-.-d (Th---dd.1) ... ~bjl-)
axablein.oee
T~-d~11-)
n.me taxafter
credits
7h..-d~11 ...
et capital
gain
7bw.-dd.11 ...
Capital loss carryover
cuntX=ber ofreturns
7h-.-d&liars)
Al1 capital
assettransactions
Gross sale.Number ftrans-0 price
actions
(Th...-dd.11.r.)
(2) (3) (4) (5) (6) (7) (8) (9) (lo)
COMMODITIES INCLUDING FUTURE CONTRACTS
Grand total .......................................... 13,?58 183,962 241,542 130,850 45,220 60,921 435 1,268 62,203 441,843
Taxable returns, total ......... -- ....................... 8,637 177,196 230,839 129,904 45,220 56,302 316 1,231 51,373 391,870
Under $10,000 ..................................... ...... 3,595 17,977 19,436 9,812 1,9441'
547 32,549 164,319
10,000 under $50,000....; ................. --.......... 4,198 74,599 66,164 53,289 13,276 31303 14,971 136,116
50,000 under $100,000 ................................... 632 34,931 42,722 26,780 10,349 8,365 83 319 2,194 52,994
$100,000 or mo- ...................... -................ 212 49,669 82,517 40,024 19,651 33,097 20 766 1,659 38,451
Nontaxable returns ......................................... 5,121 6,786 10,702 946 - 4,619 10,829 49,973
CAPITAL GAIN DIVIDENDS -
Grand total ... ...................................... 1,378,286 16,005,539 17,194,696 11,225,076 3,126,732 1,196,529 7,754 16,255 1,427,765
Taxable returns, total ........ .................... 1,231,525 15,711,243 16,843,653 11,200,039 3,126,732 1,140,119 7,256 15,134 1,262,906
Under $10,000................................ ........... 673,124 3,987,959 4,109,923 2,352,351 465,964 125,675 695,972
0,000 under $50,000....................................
1
526,942 9,035,940 9,447,978 6,689,305 1,675,215 415,550 5,634 7,306 535,097
50,000 under $100,000..................... .............
1
24,190 1,443,560 1,604,068 1,181,336 475,994 159,944 1,008 3,354 24,455
100,000 or more ......................................... 7,269 1,243o764 1,682,585 977,047 509,559 439,950 380 4,441 7,381
Nontaxable returns ......................................... 146,761 294,295 351,043 25,037 - 56,410 164,859
SHARE OF CAPITAL GAIN ( LOSS) FRCM PARTNERSHIPSAND FIDUCIARIES
Grand total .......................................... 293,167 5o365,960 6,410,752 3,914,263 1,351,627 1,069,595 4,518 13,080 324,971
Taxable returns, total ..................................... 256,892 5,321,434 6,272o647 3,9017,065 1,351,627 974,656 4,473 12,811 285,891
Under $10,000....................................... .... 101,623 555,606 609,071 306,935 57,883 54,820 111,942
10,000 under t5O,OOO ....... 130,974 2,508,359 2,779,460 1,934,956 476,707 279,441 2,297 4,619 145,158
50,000 uhder $100,000 ......
1
17,038 995,453 lol47,204 790,711 312,537 156,822 870 2,563 19,823
100,000 or ore .............. .......................... 7,257 1,262o017 1,737,891 974,464 504,500 483,773 412 4,514 8,968
Nontaxable returns ............ ...... ..................... 36,275 ~4o --'6 1-181105 7,196 - 94,730 39, 079
CAPITAL GAIN DISTRIBUTIONS FRCM SMALL BUSINFSS CORPORATIONS
Grand total................. .............. - ....... 22,697 407,307 476,850 300,659 96,504 68,751 76B 2,372 26,151
Taxable returns, total ..................................... 20,878 404,136 471,966 300,129 98,504 67,005 768 2,372 24,029
Under $10,000... ................ ........................ 7,126 36,046 38,949 22,336 4,362 2,903 - - 8,112
20,000 under $50,000 .................................... 12,095 214,637 2.34,656 157,572 39,200 18,326 696 2,227 13,907
50,000 under $100,000 .......... ........................
i
1,161 66,693 76,691 54,148 22,122 10,069 55 34 1,367
100,000 or wre .............. - ................ ....... 497 86,759 121,667 66, 073 32,820 35,7CY7 17 111 643
Nontaxable returns ................................. ....... 2,019 3,171 4,884 529 - 1,747 - - 2,123
LIQUIDATION DISTRIBUTIONS
Grand total .......................... ............... 30,510 1,079,~92 1,514,290 828,149 337,500 434,969 lo33? 5,484 34,230
Taxable returns, total ..................................... 29,023 1,(Y73,634 1,470,512 827,422 337,500 396,551 1,336 5,484 32,622
Under $10,000 ............................................ 8,053 50,032 54,720 25,801 4,761 4,652 8 153
10,000 under 050,000. ... ....... 14,837 296,227 342,094 216,933 59,356 48,198 551 654 16,319:50,000 under $100,000 ........... .............. . .....
i
3,422 197,414 243,271 154,405 59,956 46,237 103 332 4,110
100,000 or =re ......................................... 2,711 529,%2 830,427 428,283 213,428 297,464 188 4,465 4,040
Nontaxable returns. ~ ............. -- ....................... 1,487 5,658 43,778 727 - 38,417 1,608
RETIREMENT PIAN DISTRIBUTIONS
Grand total .......................... ......... - ... 59,199 708,732 920,751 499,032 144,172 216,334 331 712 62,828
Taxable returns, total ..................................... 52,835 693,6% 902,310 498,849 144,172 212,726 331 712 55,967
Under $10,000 ..................... ..................... 23,852 139,535 163,979 77,035 15,577 24,861 - - 24,938
- ....................10,000 -der ~50,000 ............. 27 278 395,133 491,205 284,027 6,,914 89,959 248 159 29' '
:
50,000 under $100,000 ............ ......................
1
1:062 49,640 73,734 41,260 15,563 24,200 1 1113
100,000 or mor..................... .................... 643 109,537 163,393 96,527 47,119 73,706 54 501 1.
Nontaxa.ble returns -.... ........... ................. ..... 6,364 14,836 18,441 183 - 3,609 - - 6
LIVESTOCK
Grand tota3 .......................................... 632,284 2,982,998 3,542,135 1,516,857 377,007 5&4,204 932 1,927 1,264,152 963,539
Taxable returns, total ..................................... 362,778 2,540,292 2,943,782 1,490,454 377,007 407,504 727 1,812 725,785 613,771
Under $10,000 ............................................ 305,59? 1,421,669 1,577,782 665,646 118,748 158,390 - - 592,146 355,406
000 under 150,000 ............................. ......10
53,919 749,660 873,802 548,267 124,237 124,937 610 862 121,961 205,166
,000 under ;pI00,000 ............................... ...1-. 2,117 117,727 144,151 95,241 37, 073 27,166 74 159 51953 25,765
100~000 or mre ...................... -- ............. 1,146 2511,235 _346,046 181,300 96,949 97,012 44 791 5,725 27,415
Nontaxable ret~ ....................................... - _ 269,505 442,706 598,352 26,403 . - 156,699 538,366 3419,7CS
Footnotes at end of table. For the precise definition of terms and the nature of any limitations, see the "Description of the Sample," -'Limitations of the Date," and 11Eplansti.n
of Classifications and Te~" in the text.

RETURNS WITH NET CAPITAL GAIN81
SALES OF CAPITAL ASSETS ON INDIVIDUAL RETURNS, 1962
Table 8 .-ALL AND LONG-TERM TRANSACTIONS -INCOME, TAX. NET GAIN, AND TRANSACTION DETAIL, BY ASSET TYPE AND SIZE OF ADJUSTED GROSS INCOME PLUSCAPITAL GAIN OR LOSS EXC LUDED- - Continued
k
Asset type and size of adjusted gross incomeplus capital gain or loss excluded
All capital asset transactions-Continued
DeCost and
p7ci-
ationexpense of Gross gain Gross loss
sale
(Th-d (T~-d (7h.-d (7h-.-d~1) ...) ~11 ... ) ~11 ...) ~11-)
Long-term capital asset transactions
Cost and Gross GrossGross sales DepreNumber of c'- expense of long-term long-termt--
price ationsale gain loss
actions
(Th...-d (T~-d (Th...-d (Th...-d (T~-d~11 ...) &II-) &11-) &11 ... ) &11... )
CCWUDITIES INCLUDING FUTURE CONTRACTS(n) (12). (13) (14) (15) (16) (17) (18) (19) (20)
Grand total ........................................... 432,224 22,307 12,743 15,836 40,283 30,734 11,063 1,514
Taxable returns, total ..................................... 385,779 18,387 12,301 8,805 25,582 18,795 8,016 1,230Under $10,000.. .......................................... 162,328 6,037 4,046 6, OG4 2,637 714 2,057 13410,000 under $50,000 .................................... 133 340 7 156 4,383 2,263 11,532 8,296 3,646 41050,000 =der $100,000 ...................................
152:201 31008 2,225 353 5,932 4,774 1,482 323
100,000 or more......................................... 37,910 2,187 1,648 185 5,481 5,012o
832 362
Nontaxable returns ......................................... 1, 46,445 3,920 442 7,032 14,701 11,938 3,046 264
CAPITAL GAIN DIVIDENDS
Grand total .......................................... 477,109 3,705 1,422,786 476,731 3,116
Taxable returns, total ..................................... 428,671 2,440 1,258,521 428,334 1,851Under $10,000 ............................................10,000 under $50,000 ....................................
Not app ieable 136,375214 171
400989
694,185532 725
1-36,353213 953
399
50,000 under $100,000 ...................................1
,35,721 533
,24,280
,35,626
715321
100,000 or more ......................................... 42,403 518 7,330 42,401 416
Nontaxable returns......................................... 48,439 1,265 164,266 48,398 1,265
SHARE OF CAPITAL GAIN (IOSS) FRCM PARTNERSHIPSAND FIDUCIARIES
Grand total .......................................... 034,560 22,023 286,164 004,885 12,029
Taxable returns, total ..................................... 935,277 18,467 250,750 906,912 9,383Under $10,000 ............................................ 92,304 1,621 99,036 89 757 37310 000 -der $50,000 ....................................50'000 -der $100 000
-** - -1
Not applicabl,, 393,049 6,775 127,960Not applicable
383,419 4,143,7 ! 1* 1- .... 111,111,111*1
100 000 or more ................166 926
,
3 211
,
16 613 162
,
143 1,579, ......................... 282 998 6 859 71141 271
,
593 3,289
Nontaxable returns ......................................... 99,294 3,557 35,414 97
,
973 2,646
G~LIN DISM-IBUTIONS FROM SMALL BUSI_1-SS
Grand total .......................................... . 52,918 2,463 24,101 52,666 2,273
raxable returns, total ..................................... 50,656 928 21,979 50,404 739Under $10,000 ............................................ 3,494 - 7,126 3,490 -
10000 under $50,000 ....................................
50,000 -der $100 000 ....... Not applicable21
,
401 538 12,973N, 21
,179 4951 , ............................
00 000 or more .91962 265 1,260 91959 131, . ........................................ 15,780 125 620 15,775 113
ontaxable returns .......................................... 2,262 1,534 2,123 2,262 1,534
LIQUIDATION DISTRIBUTIONS
Grand total .......................................... . 568,Cr72 7,96? 33,744 567,770 6,299
axable returns, total ..................................... 504,447 7,919 32,143 504,220 6,250Under $10,000... .........................................
7,017 200 8,153 7 017 20010,000 under $50,000 ...................50,000 under $106 000 ................ . ....
1
Not applicable58 562
,
3~006 16 056Not applicable
,58,517 2,827, ..
100,000 or more ..................... * ........ - '' " '63 843 1,355 41049 63,785 1,195... . . .. 375,025 3,357 3,883 374,902 2,028
Dntaxable returns .........................................63,626 48 1,601 63,550 48
RETIRDJENT PIAN DISTRIBUTIONS
Grand total .......................................... .299,357 103 61,632 298,203 so
uable returns, total ..................................... 292,809 60 54,770 291,654 38Under $10,000 ............................................
47,957 - 24,445 47 529 -10,000 under $50,000 ....................................50,000 under $100 000 ................
1
Not applicable 160 742'
3 28,444Not appli cable
,160,029 -, ...................
100,000 or more ..............38, 786 30 1,156 3B
,
772 10...........................45,324 28 723 45,324 26
)ntaxable returns.... .....................................6,546 42 6,861 6,548 42
LIVESTOCK
Grand total .......................................... 87,688 323~243 741,639 16,132 1,230,812 946,107 87,339 309,113 736,718 14,844
Lxable returns, total ..................................... 54,428 206,891 469,734 10,103 706,928 601,825 54,226 197,482 466,047 9,153Under $10,000 ............................................$10,000 wider ~50,000................. .
25,355 105 146 279,937 5,424 577,516 350,643 25,305 101,672 278,195 4,822. .................50 000 -der $100 000 ................
19,732 73, 176 154,146 2,537 119,142 200,458 19,617 69,300 152,924 2,281, ...................M~,OOO or more ......................
4,442 14,368 16,516 806 5,662 23,609 4,428 12,786 15,880 755................... 4,899 14,201 19,135 1,336 5,606 26,915 4,877 13,725 19,048 1,295
ntaxable returns .........................................33,260 116,352 . 271,905 6~029 . 523,884 3441282 33,113 111,631 270,671
i5,691
T
N
T
N
T
Footnotea.
end of table. For the precise definition of terms and the nature of any limitations, see the "Description of the Sample," "Limitations of the Data," and --Explanationof ClaSsifi.ations and Terms-- in the text.
C

I
82 SALES OF CAPITAL ASSETS ON INDIVIDUAL RETURNS, 1962RETURNS WITH NET CAPITAL GAIN
Table 8. -ALL AND LONG-TERM TRANSACTIONS -INCOME, TAX, NET GAIN, AND TRANSACTION DETAIL, BY ASSET TYPE AND SIZE OF ADJUSTED GROSS INCOME PLUSCAPITAL GAIN OR LOSS EXCLUDED -Continued
Adjusted gross income Capital loss carryover All capital asset
Number of transactions
returns Plus TaxableIncome
taxMet capital
Asset type and size of adjusted gross income with net capitalincome
aftercredits gain ~ales-ross
plus capital gain or loss excluded capital As reported gain orNumber of
Amount Number o .rice
gain lossreturns
t ans- p
T
excluded actions
(Th...-d (Th-.-d (Th ... ~d (7h..-.d (7h-.-d (Th-...d (T~-dd.11 ... ~11 ...) ~11 ...) ~11 ... ) . bil-) ~11 ... )
(1) (2) (3) (4) (5) (6) (7) (S) (9) (10)TIMBER AND COAL
Grand total .......................................... 57,027 494,139 610,073 311,06, 99,873 116,667 118 898 61,352 132,398
Taxable returns, total ..................................... 38,319 476,455 570,065 310,086 99,873 93,690 118 898 41,360 102,689
Under $10,000 ............................................ 24,635 117,643 132,627 56,705 10,756 15,129 --
25,728 27,84610,000 under $50,000 ....... ,*,*,,* .... ** ...............V
12,359 197,616 231,226 141,644 34,611 33,671 13,786 48,263:0,000 -der $100,000...... ............................ 871 49,446 58,088 38,825 14,877 6,724 1,087 8,310
$100,000 or more.. ....................................... 454 111,751 148,124 72,913 39,628 36,166 30 621 759 18,269
Nontaxable returns .......................................... 18,708 17,684 40,008 979 - 22,978 - - 19,992 29,709
OIL AND MINERAL INTERESTS
Grand total .......................................... 15,926 452,840 593,472 323,303 133,927 145,728 424 1,525 23,417 134,193
Taxable returns, total ..................................... 13,684 451,917 581,473 323,2_24 133,927 134,398 384 1,348 20,353 116,801
Under $10,000 ............................................ 5,180 35,445 37,655 20,868 3,855 4,020 - - 6,474 7,685
10000 -der $50,000 .................................... 6,476 121,168 137,396 87,008 22,211 17,6U7 285 408 10,286 33,287
50,000 -der $100,000 ...................................
1
1,153 65,917 79,278 50,158 19,042 14,800 51 151 2,021 22,089100,000 or more. ........................................ 876 229,387 327,143 165, 090 88,820 97,972 48 790 1,573 53,540
Nontaxable returns .......................................... 2,242 923 12,000 176 - 11,330 3,065 17,392
PARTMERSRIP INTERESTS -
Grand total .......................................... 68,214 1,167,733 1,496,910 836,498 279,7.34 335,002 1,679 2,840 92,350 712,044
Taxable returns, total ..................................... 58,792 1,153,377 1,434,146 835,261 279,734 285,262 1,579 2,720 79,757 60`7,771
Under $10,000.. .......................................... 21,488 110,875 128,392 54,627 10,223 18,117 (-) 30,865 81,90110,000 ~der $50,000 ........ 32,318 581,594 662,570 421,094 105,955 84,402 1,252 1,048 40,870 308,64450 000 -der $100,000 ....... 3,385 180,924 226,760 141,599 54,2B4 46,249 141 458 5,336 113,894100,000 or more ......................................... 1,602 280,483 416,423 217,941 109,352 1.36,494 87 1,155 2,686 103,332
Nontaxable returns .......................................... 9,422 13,856 62,764 1,237 - 49,739 12,594 104,274
ASSETS USED IN TRADE OR BUSINESS
Grand total .......................................... 343,813 3,287,128 4,121,035 2,213,775 640,301 846,933 3,887 12,726 551,717 3,133,957
Taxable returns, total.. ................................... 256;662 3;19%505 3, LZ771380 2,2C)0)8?9 ~~n ini on 119 1 -1 11, 302 4 07, 37 2 2,429,231
Under $10,000 ............................................ 142,847 760,918 860,119 374,255 70,363 106,514 228,098 665,66310,000 under $50,000 .................................... 105,378 1,676,817 1,959,920 1,218,844 293,365 286,652 2,356 3,959 164,311 1,346,SG450,000 under $100,000...................................
1
5,880 318,958 393,457 259,362 100,032 74,906 248 2,473 10,250 186,741100,000 or more ......................................... 2,557 438,812 663,884 348,418 176,541 222,246 186 4,633 4,713 230,023
Nontaxable returns ......................................... ~7,151 91,624 243,655 12,89? - 156,615 144,346 704,726
PROPERTY HELD FOR PERSORAL USE
Grand total .......................................... 40,312 443,615 530,387 279,394 83,661 87,741 314 1,265 54,103 167,200
Taxable returns, total..I... ............................... 31,424 418,099 494,786 277,597 83,661 78,008 306 942 36,230 123,694
Under $10,000............................................ 17,775 101,623 113,331 46,920 9,034 12,086 20,956 45,233$10
,
000 under $50,000 .................................... 12,513 208,406 235,512 148,167 36,537 28,394 162 59 13,931 56,31850,000 under $100,000.. .................................
17e2 41,451 50,985 33,322 1.2,986 9,551 907 6,941
100,000 or to.......................................... 354 66,619 94,959 49,187 25,105 27,976 23 61-2 437 15,202
Nontaxable returns......................................... 8,888 25,716 35,600 1,797 - 9,733 17,872 43,506
RESIDENCES
Grand total... ....................................... 171,629 1,350,748 1,656,742 813,829 200,133 315,108 660 1,629 175,259 2,654,963
raxable returns, total ..................................... 139,856 1,290,962 1,564,795 811,582 200,133 281,558 556 1,450 143,166 2,249,710
Under $10,000 ............................................ 66,213 466,994 547,538 229,125 45,394 85,277 88,200 1,101,12A10 000 under $50,000.. .................................. 51,795 697,011 845,297 481,192 111,749 151,939 333 242 53,052 1,044,05150:000 -der $100,000 ...................................
1
1,510 77,025 102,139 63,502 24,432 24,445 90 1, OoO 1,549 73,531100,000 or more ......................................... 341 49,931 69,822 37,763 18,559 19,898 33 163 365 31,004
gontaxable retu.......................................... 31,770 59,786 91,946 2,247 - 33,550 32,094 405,253
NONBUSINESS REAL ESTATE
Grand total .......................................... 255,222 2,787,269 3,496,942 1,670,211 553,426 722,142 3,608 13,310 293,420 2,833,864
raxable returns, total ...........................--*-
202,342 2,726,235 3,341,256 1,865,675 553,426 625,756 2,788 9,188 232,660 2,402,890
Under $10,000 ............................................ 101,353 557,525 636,314 278,399 54,379 82,239 110,530 703,34710,006under 50,000 ....................................
1
92,515 1,471,219 1,737,711 l,G42,513 255,130 275,906 1,435 2,75/ 110,301 1,175,24650,000 under 100,000 ...................................
16,033 315,091 400,189 248,150 94,311 86,844 210 769 8,321 233,596
100,000 or more ......................................... 2,441 382,399 567,042 296,613 149,606 180,767 150 5,400 3, 50`7 290,701
lontaxable returns ......................................... 52,880 61,034 155,686 4,536 - 96,386 (-) , 60,759 430,974
Footnotes at end of table. For the precise definition of terms and the nature of any limitations, see the "Description of the Sample," "Limitations of the Data," and --Explanationof Classifications and Terms's in the text.

SALES OF CAPITAL ASSETS ON INDIVIDUAL RETURNS, 1962 8RETURNS WITH NET CAPITAL GAIN
Table 8. -ALL AND LONG-TERM TRANSACTIONS -INCOME, TAX, NET GAIN, AND TRANSACTION DETAIL, BY ASSET TYPE AND SIZE OF ADJUSTED GROSS INCOME PLUSCAPITAL GAIN OR LOSS EXCLUDED -Continued
All capital asset transactions-Continued Long-term capital asset transactions
Asset type and size of adjusted gross income Dpre.i-Cost and
Gross salesDeprec'-
Cost and Gross Grossplus capital gain or loss excluded ation expense of Gross gain Gross loss Number of
price ation expense of long-term long-termsale trans- sale gain loss
actions
(M- -d lh-,-d lh- -d (M-.-d (7h-.-d (Th...-d (n.-d (n.--d (77...-d&11 ...) ~11 ...) d.11 ... d.11 ... &liars) &11 ... &11...
TDEER AND OAL(11) (12) (23) (14) (15) (16) (17) (18) (19) (20)
C
Grand total.......................................... 793 34,655 11.2,216 534 58,983 130,951 793 33,665 110,895 57
Taxable returns, total ..................................... 793 26,327 88,116 558 39,885 101,480 793 25,455 87,316 55
Under $10,000 ............................................ 23 6,370 24,847 423 24,642 27,393 23 6, CY75 24,240 4210,000 under $50,000 . .................................. 241 12,403 39,940 79 13,441 47,789 241 12,047 39,817 750,000 under $100,000 ...................................
1
36 2,202 6,997 24 1,066 8,237 36 2ol32 6,991 2100,000 or more ......................................... 492 5,352 16,332 33 ?36 16,062 492 5,201 16,266 3
Nontaxable returns ......................................... - 8,328 24,099 26 19,098 29,471 - 8,209 23,579 2(
OIL AND )E'-~ 1NIa?ESTS
Grand total .......................................... 9,746 68,596 9Oj4O9 5,723 20,292 117,219 9,727 54,629 86,819 5,1a
Taxable returns, total..... ................................ 9,391 64j888 75,171 4,909 17,671 101,313 9,372 52jO18 72,012 4,33~
Under $10,000 ............................................ 158 5,470 3,056 77 6, 0`73 5,364 15S 3,572 2,418 6110,000 -der $50,000 .... ............................... 2,179 20,333 17,264 2,524 6,327 24,886 2,168 13,291 15,758 2,29~1,0,
000 under $106,000 ................................... 2,891 16,655 14,284 1,591 1,814 18,342 2,884 13,566 13,531 1,52,100,000 or more ......................................... 4,162 22,429 40,567 717 1,457 52,721 4,162 21,590 40,305 45~
Nontaxable returns ......................................... 355 3,708 15,239 814 2,620 15,906 355 2,611 14,806 76t
PARTNERSHIP INTERESTS
Grand total .......................................... 26,142 378,300 346,811 9,731 83,431 663,441 26,137 333,223 341,401 7,61,'
Taxable returns, total ..................................... 22,764 299,935 316,623 8,715 71,346 583,326 22,761 277,914 312,241 6,622
Under $10,000 ............................................ 5,408 50,328 35,559 2,206 27,691 78,093 5,406 46,526 35,031 1,68110, 000 under 5 , 000 ....................................
VC
13,197 168,015 143,266 3,867 36,440 292,638 13,196 154,356 140,409 3,12~50,000 under 1000 ............. I ...............
.. ***"DO1
1,698 47,901 66,249 1,164 4,786 111,542 1,698 45,923 65,608 692., ................................ ......100,000 or .0- 2,461 33,591 71,549 1,478 2,426 101,054 2,4.61 31,109 71,193 911,
Nontaxable returns ......................................... 3,378 78,464 30,189 1,017 12,085 80,115 3,376 55,309 29,160 99--.
ASSETS USED IN TRADE OR BUSINESS
Grand Lotal. - ........................................ 782,020 2,863,176 1,024,504 34,208 527,804 2,967,053 780,581 2,707,722 1,008,958 31,331
Taxable returns, total ..................................... 595,311 2,156,861 842,622 23,409 389,370 2,315,068 594,106 2,050,632 831,006 20,732
Under $10,OOC ............................................ 216,874 697,311 181,395 6,229 217,6?5 611J60 216,394 647,893 175,622 5,83210 000 under $50,000 .. .................................. 318,955 1,194,147 455,122 12,142 157,462 1, 307, 855 318,360 1,158,400 450,289 10,98C50:000 under $100,000...................................
1
34,746 137,209 78,524 2,155 9,764 181,467 34,692 132,269 77,835 1,779100,000 or more ......................................... 24,737 128,195 127,581 2,683 4,469 214,385 24,670 112, U70 127,260 2,141
ontax:able returns ......................................... 186,709 706,315 181,893 10,799 138,434 651,985 186,475 657,090 177,951 10,599
PROPERTY HELD FOR PERSONAL USE
Grand total .......................................... 35,422 155,719 46,302 4,146 50,053 155,167 34,860 144,449 46,729 3,897
axable returns, total ..................................... 29,574 110,490 42,260 2,229 33,074 118,012 29,388 105,856 40,828 2,031
Under $10,000............................................ 10,122 43,837 12,171 806 19,076 43,519 10,091 42,682 11,581 8060,000 under $50,000.. .................................
l16,784 55,546 17,018 1,022 12,790 52,638 16,6.34 52,454 16,2,42 9830,00() under $106,000 ...................................
I 1,302 4,445 3,648 221. 810 6,803 1,299 4,170 3,832 71100,000 or more ......................................... 1,3167 6,662 9,223 179 398 15,052 1,363 6,551 9,173 170
ontaxable returns.. ....................................... 5,847 45,229 6,041 1,917 16,979 37,155 5,472 38,593 5,901 1,866
RESIDENCES
Grand total .......................................... 107,481 2,176,161 561,527 - 167,540 2,574,007 ICY7, 333 2,105,375 552,593
axable returns, total ..................................... 91,881 1,829,147 492,490 - 137,133 2,183,041 91,733 1,770,628 484,885
Under $10,000 ............................................ 36,901 945,461 176,747 - 84,126 1,064,677 36,901 914,404 172,043$10,000 under $50,000 ................................... 50,051 819,608 270,121 - 51,121 1,014,4-34 49,904 792,705 267,268
-50,000 under $100,000 ...................................
V2,643 43,829 31,847 - 1,525 73,038 2,842 43,378 31,802
-00,000 or more......................................... 2,086 20,249 13,776 - 362 30,992 2,086 20,142 13,771
-
ontaxable returns......................................... 15,600 347,014 69,037 - 30,4C7 390,966 15,600 334,747 67,709-
NON13USINESS REAL ESTATE
Grand total ...................... _.................. 183,534 1,939,803 970,635 22,564 275,992 2,708,5CF7 183,387 1,826,031 956,441 21,197
axable returns, total ..................................... 158,503 1,627,057 826,607 15,848 218,787 2,295,606 158,418 1,529,399 816,698 14,552
Under $10,ODO..... ; ,* ... ** ... -* .... * .... *,"*** ........ 57,775 558,725 150,395 2,594 103,762 655,878 57,771 514,301 146,831 2,069~10, 000 under $50, 0.......... ......................... 80,997 783,168 433,009 9,207 103,777 1,130,637 80,931 743,801 427,717 8,58350,000 under $106,000 ...................................
i12,276 128,015 109,024 1,961 7,902 226,875 12,272 122,503 107,985 1,900
lOO,ODO or more ......................................... 7,455 157,149 134,379 2,095 3,346 282,215 7,443 148,795 134,165 2,000
ant&xable returns ......................................... 25,030 312,746 143,628 6,716 57,205 412,901 24,969 296,631 141,743
N
6,645
T
N
Footnotes at-end of table. For the precise definition of terms and the nature of any limitatiom, see the "Description of the Semple," -'Limitations of the Data," and "Explanation
of Classifications and Terms" in the text.

84RETURNS WITH NET CAPITAL GAIN
SALES OF CAPITAL ASSETS ON INDIVIDUAL RETURNS, 1962
Table 8. -ALL AND LONG-TERM TRANSACTIONS- INCOME, TAX, NET GAIN, AND TRANSACTION DETAIL, BY ASSET TYPE AND SIZE OF ADJUSTED GROSS INCO14E PLUSCAPITAL GAIN OR LOSS EXCLUDED-Continued
Adjusted gross inc ome Capital loss carryover All capital assetNumber of transactions
returns Plus TaxableIncome tax Net c~pital
Asset type and size of adjusted gross income ~ith net capital income aftergain
plus capital gain or loss excluded capital As reported gain or
credit.
Number ofAmount Number of
Gross sales
gain lossreturns
trans- price
excluded actions(n.. (Th-.-d (77...-d (77..-d (Th-.-d (7h- -d (T~-d
dli ... d.11 ... ~U ...:,
~11
REAL ESTATE SUBDIVIDED(2) (3)- (4) (5) (6) (7) (9) (10)
Grand total .......................................... 127,406 1,347,689 1,756,958 916,757 267,197 413,163 1,80`7 4,113 150,395 1,652,042
Taxable returns, total ..................................... 105,204 1,357,624 1,703,573 915,445 267,197 -149,547 1,473 3,251 122,505 1,427,284Under $10,000 ............................................ 54,258 303,940 356,365 154,712 30,174 53,381 (.) 58,754 470 4841 000 under $50,000 ....................................
000 under $100 000 ........V00 .46 8592:994
714,9378
878,453 502,586 123,339 166,534 1,197 1,683 58,393,
743,188, , . .........................$100 000 or more............. . 1 092
156,2 648
202,123 125,160 47,696 45,917 103 497 3,853 122,006, . .......................... , 2, 611 266,632 132,988 65,987 83,714 73 1,020 1,505 91,605
Nontaxable returns ......................................... 22,202 9,735 53,385 3,311 - 63,616 27,890 224,759
FARE-AND WITH UNHARVESTED CROP
Grand total.. ........................................ 6,578 62,357 85,106 39,927 12,114 22,630 7,450 94,549
Taxable returns, total.. ................................... 3,661 54,299 72,251 39,266 12,114 17,835 4,553 80,721Under $10,000 ....................................... .... 1,701 8,128 10,149 3,847 718 2,035 2,401 16 66610,000 "der $50,000 .................................... 1,759 29,530 38,017 22,184 5,744 8,157 1,907
,45 64850,000 -der $100,000 ...................................
1149 7,901 10,305 6,238 2,336 2,462 166
,
11 212100,000 or more ......................................... 72 8,741 13,780 6,997 3,314 5,181 78,
7,194
Nontaxable returns ......................................... 2,897 8,058 12,855 661 - 4,796 2,897 13,828
OTHER FAFOH.ILND
Grand total .......................................... 65,971 525,221 740,09 349,347 100,936 216,813 132 960 71,426 1,169,025
Taxable returns, total ..................................... 46,056 510,793 636,221 347,823 100r,936 176,874 99 953 49,071 944,008Under $10,000 ............................................ 27,167 137,720 171,142 67,596 12
1967 34
'563 -
-
27,967 286 20410,000 under $50,000.................................... 17,327 249,602 334,630 161,191 43,462 85,716'912 0'
,514 52250,000 under $100,000 ...................................
11,051 50,384 69,708 40,918 15,321 19,295 77 315 ., 9.2 ,
62,599100,000 or more ......................................... 511 73,097 13.0,742 58,119 29,187 37,299 22 579 608 80,683
4ontaxable returns ......................................... 19,915 14,4,28 53,872 1,524 - 39,940 22,354 225,016
PROCEEDS FROM PRIOR YEAR INSTALLUENT SAT
Grand total .......................................... 339,914 4,673,959 5,822,551 3,185,706 979,868 1,162,020 2,458 10,189 505,577
raxable returns, total ..................................... 309.899 4,505,805 5;51 .251) 1_174_n~l .1. -- --------- 711
Under $10,000 ............................................ 159,188 860,490 966,156 "9,722 85,511 108,762 191,80710,000 under ~50,000.................................... 134,206 2,259,605 2,625,454 1,628,985 405,004 374,866 1,549 3,064 176,68850,000 -der $100,000 ...................................
111,737 631,352 793,159 498,529 192,022 164,042 310 934 17,698100, 000 or mo .......................................... 4,768 754,358 1,1-34,489 596,815 297,331 376,857 165 5,262 7,518
lontaxable returns ......................................... 90,015 166,154 303,292 11,655 - 137,493 111,866
OTHER TYPE ASSETS
Grand total..... ..................................... 339,650 4,819,714 5,989,629 3,289,003 1,106,045 1,188,885 8,037 21,202 389,981 798,717
'axable returns, total .................... I ................ 279,239 4,690,157 5,745,676 3,279,509 1,106,045 1,074,935 6,652 16,693 322,049 710,726Under $10,000 ............................................10 000 -der $50 000 ........
150,202 894,152 974,427 459,824 89,339 85,435 (-) 166,381 183,729, ............................50:000 under $106,000 ...................................
1
wlll'784
1,936,025660 174
2,211,213801 614
1,384,428514 0`72
349,816198 237
285,18042 8
3,938 4,896 129,782 291,345
100,000 or mo ......................................... 6,391,
1,197,807,
1,758,422,
921,186,
468,6531 ,5 2561,738
662472
3,8817,821
15,76310,123
79,883155,768
lontaxable returns.......................................... 60,411, 129,556, 243,952, 9,493, -1
113,9501
1,385 4,509 67,932 87,991
Footnotes at end of table. For the precise definition of terms and the nature of any limitations, see the t'Description of the Semple," "Limitations of the Data," and "Explanationof Classifications and Terms" in the text.

RETURNS WITH NET CAPITAL GAIN
85SALES OF CAPITAL ASSETS ON INDIVIDUAL RETURNS, 1962
Table 8. -ALL AND LONG-TERM TRANSACTIONS -INCOME. TAX. NET GAIN, AND TRANSACTION DETAIL, BY ASSET TYPE AND SIZE OF ADJUSTED GROSS INCOME PLUSCAPITAL GAIN OR LOSS EXCLUDED -Continued
k
Asset type and size of adjusted gross incomeplus capital gain or loss excluded
All capital asset transactions-Continued
Depre.i- Cost and
ationexpense of Gross gain Gross loss
sale
(7)...-d (Th...d
d.11 ... ~11 ... ~11 ... ~11...
Long-term capital asset transactions
Gross sales Depre.
Cost and Gros. Gros.Number of 0'- expense of long-term long-termtrans-
trice ationsale gain loss
actions
(77,...-d (7~.-d (Th...-d (7h...-d (Th...-dd.11ars) d.11ar.) d.11 ... &11 ... ) d.11ars)
(.1].) (12) (13) (14) (15) (16) (17) (18) (19) (20)REAL ESTATE SUBDIVIDED_
Grand total .......................................... 146,164 1,089,3D7 656,919 9,860 147,132 ls630,559 146,162 1,C)?1,8.15 652,676 9,569
Taxable returns, total ..................................... 129,963 929,124 585,377 8,280 120,360 1,409,276 129,961 914,181 582,281 8,109
Under $10,000 ............................................ 49,692 363,474 145,96-1 310 57,953 468,093 49,692 361,556 145,463 28610,000 under ~50,000 .................................... 69..275 463,315 321,957 7,096 57,186 731,129 69,273 453,630 319,652 7,07050,000 under $100,000 ...................................
1
6,761 61,800 63,810 323 3,750 120,551 6,761 60,574 63,584 279100,000 or more ......................................... 4,235 40,535 53,648 550 1,471 89,503 4,235 38,420 53,583 473
Nontaxable returns ......................................... 16,201 160,183 71,442 1,580 26,772 221,283 16,201 157,634 70,395 1,460
FAFMAND WITH UNHARVESTED CROPS
Grand total .......................................... 5,455 48,050 50,244 322 6,503 89,816 5,455 43,335 50,073 169
Taxable returns, total ..................................... 4,525 40,705 43,168 302 3,606 75,988 4,525 35,990 42,997 149
Under $10,000 ............................................ 359 11,701 5,305 181 1,501 12,382 359 7,431 5,152 4310 000 under $50, 000 ...................................
1 13,614 21,845 27,233 63 1,873 45,429 3,614 21,618 27,233 61
000 under $100,000 ...................................50, 330 5,466 4,936 46 159 11,107 330 5,379 4,918 45~100,000 or more ............................... ......... 222 1,694 5,695 7 73 7,0170 222 1,563 5,695 -
Nontaxable returns ......................................... 930 7,345 7,076 20 2,897 13,928 930 7,345 7,076 20
OTHER FARKUAND
Grand tolal .......................................... 73,937 722,830 445,322 13,597 69,795 1~156,976 73,878 712,576 443,489 13,275
Taxable returns, total ..................................... 59,782 559,616 368,909 9,079 47,778 933,809 59,723 550,870 367,424 8,774
Under $10,000 ............................................ 27,931 218,131 92,346 476 27,067 279,491 27,872 212,134 91,368 18510
'000 under $50,000 .................................... 25
,
149 263
,
106 195,141 7,773 18,840 511,380 25,149 280,675 194,665 7,76450,000 under $100,000 ...................................
121971 29,894 33 775 62 1,272 62,306 2,971 28, 619 33,752 57
100,000 or more ......................................... 3s731 29,435 47,r47 768 599 80,632 3,731- 29,441 47,640 767
Nontaxable returns ......................................... 14,155 163,213 76,413 4,507 22,017 223,167 14,155 161y706 76,065 4,501
PROCEEDS FROIA PRIOR YEAR INSTA-LTW.NT .5AT.r.9
Grand total.. ................... _ .................. 1,489,826 7,343 486,073 1,479,555 6,966
Taxable returns, total ..................................... 1,311,216 7,176 377,300 1,303,260 6,799
Under $10,000 ............................................ 9I I
181,255 5,616 184,360applicabl e
179,626 5,575under $50,000 .. ...................
* ......
1', 0,,0
" 550,887 643 168,775 547s792 36250,000 under $106,000.....................
** ....... ...1204,320 132 16,833 203,588 105
100 000 or more ........................... ... o o374,754 785 7s332 372,254 757
Nontaxable returns ......................................... 178,610 167 108,773 176,296 167
OTHER TYPE ASSETS
Grand total .......................................... 274,058 797,264 596,371 830,578 330,7.34 r89,777 273,573 632,053 566,671 777,619
Taxable returns, total. .................................... 94,319 549,312 534,848 721,683 273,232 604,828 93,844 437,4~O 514, GOO 6?4,153
Under $10,000.. .......................................... 10,489 149,558 85,582 173,556 150,481 177,605 10,489 143,577 82,738 172,086
10000 under $50,000 .................................... 17
1459 201,374 216,606 389,344 105,009 236,939 16,987 144,104 207,371 368,782
50,000 under $100,000 ...................................
1
21920 50,567 69,975 88,934 10,889 65,621 2,919 35,372 66,211 80,110100,000 or more ......................................... 63,451 147,812 162,694 69,850 6,853 124,663 63,449 114,397 157,679 53,175
Nontaxable returns ......................................... 1 3.79,739 1 247,9531 6:L,523 1 108,895 1 57,5021 84,949 1 179,730] 244,6031 52,671 103,465
IDue to the reporting of more than one asset type by some taxpayers, the number of returns, adjusted gross income, taxable income, income tax after credits, net capital gain,
and capital loss carryover for '-All asset types" will be less than the sum of these item for the specific asset types.(*) An asterick in a cell denotes that the estimate is not shown separately because of high sampl. ing variability. However, the data are included in the appropriate totals.- A dash in a cell indicates that either there are no data for that item or it amounts to less than $500.NOTE: Detail in the tables may not add to totals because of rounding.
For the precise definition of terms and the nature of any limitations, see the "Description of the Sample," "Limitations of the Data," and "Explanation of Classificationsand Terms', in the text.

RETURNS WITH NET CAPITAL LOSS
Table 9. -ALL, SHORT-TERM, AND LONG-TERM TRANSACTIONS-INC~ME, TAX, NET LOSS AND TRANSACTION DETAIL, BY ASSET TYPE AND SIZE OF ADJUSTED GROSS INCOME
Asset type and size of adjusted
gross income
Umber of
returns
with net
capital
loss
Adjusted
gross
income
(Th...-d
&11 ...)
Taxableincome
(7h.-d
~bll ...
Income tax
afte~a
credit
(Th..... d
d.11 ...
Net capital
loss
(A...-d
~11 ...)
Capital loss carryover
AmountNumber of
returns
(A...-d
~11 ...)
All capital asset transactions
Cost =d Gross gain Gross loss
Number ofGrossissles
Depreciation expense ofpr cc Number of Amount Amounttra rs- sale Umber of
actions(7)....-d (Th...-d (7)-.-d
returns(Th-.-d
returns(Tho-d
~11 ...) d~ II—) ~11 ... d,11.,.) d.11 ...
(2) (3) (4)* (5) (6) (7) (8) (9) (10) (11) (12) (13) (14) (15)
ALL ASSET TYPES'
Grand total .......................... 1,485,425 18,562,094 12,520,283 3,583,894 938,403 140,124 687,278 6,297,243 17,708,503 259,952 20,174,527 711,317 1,370,230 1,435,141 3,889,BBE
Taxable returns, total ..................... 1,289,095 18,237,933 12,497,833 3,583,894 804,679 123,322 554,109 5,461,458 14,797,213 165,442 16,747,943 62?,260 1,121,609 1,248,599 3,212,76~
Under $10,000............................ 645,706 3,972,091 2,065,784 411,760 372,869 46,292 150,700 2,204,199 4,256,662 96,800 5,069,808 261,460 255,728 626,994 1,177,623
10,000 under $50,000 .................... 607,366 11,400,315 8,208,376 2,135,233 401,826 69,230 328,140 2,946,149 8,508,468 63,726 9,488,998 338,484 654,291 587,419 1,669,18C
50,000 under $100,000 ................... 31,174 2,034,112 1,615,972 675,627 25,754 6,594 56,373 255,188 1,453,716 3,819 1,569,703 23,341 144,492 29,629 259,81.'
100,000 or more ......................... 4,849 831,415 607,701 361,275 4,230 1,206 18,896 55,922 578,366 1,09'7 619,434 3,974 67,098 4,557 106,14',
Nontaxable returns ......................... 196,331 324,161 22,450 - 133,724 16,802 133,169 835,785 2,911,290 94,510 3,426,584 84,05? 248,621 186,542 67?,122
CORPORATE STOCK
Grand total .......................... 994,126 14,368,570 9, 919, M8 2,891,662 656,072 90,939 444,368 4,911,573 13,663,667 15,463,821 463,282 937,484 961,288 2,746,21!
Taxable returns, total ..................... 910,131 14,190,940 9,910,655 2,891,662 594,777 82,531 374,851 4,321,248 11,596,239 13,131,572 415,187 816,761 682,370 2,359,49!
Order $10,000 ............................ 394,445 2,471,369 1,330,132 265,761 237,585 27,W 78,385 1,661,818 3
'l
55,774 3,694,914 165,056 170,960 383,605 713,1W
10 000 under ~50,000 .................... 484,718 9,271,502 6,687,222 1,750,011 330,805 49,324 234,721 2,402,066 6 799,525 7,650,609 229,742 482,470 469,486 1,336,85~
50,000 under $100,000 ...................
1
26,812 1,749,154 1,386,241 578,321 22,670 5,203 46,961 213,000 1,210,068 1,316,374 17,309 112,423 25,449 221,56(
100,000 or more ......................... 4,156 698,916 507,060 297,570 3,717 936 14,784 44,364 430,872 467,675 3,080 50,908 3,830 87,901
Nontaxable returns ......................... 83,996 177,630 8,443 - 61,294 8,408 69,516 590,326 2,067,428 2,332,248 48,095 120,723 78,919 386,72(
U.S. GOVERMENT OBLIGATIONS
Grand total .......................... 13,121 316,644 217,928 81,088 8,630 2,322 8,440 18,789 317,246 319,290 5,069 2,081 8,195 4,12~
Taxable returns, total ..................... 11,553 310,178 21?,847 81,088 7,696 1,796 7,776 17,214 311,851 313,617 4,56'? 2,061 7,259 3,82~
Under $10,000 ............................ 3,066 19,394 8,555 1,673 1,687 3,559 15,125 15,968
10,000 under $50,000 .................... ?,089 154,543 110,304 29,428 4,852 1,004 4,712 11,017 210 996 211,886 3,025 1,142 4,363 2,03,
50,000 under $100,000 ...................
1
1,060 72,498 54,343 22,546 863 209 1,625 2,015 57,233 57,253 587 590 554 60
100,000 or nore ......................... 337 63,743 44,645 27,441 294 90 1,228 622 28,4960
28,511 161 209 169 22
taxable returns ......................... 1,568 6,465 80 - 935 1,576 5,394 5,673 936 291
STATE AND LOCAL SECURITIES
Grand total .......................... 16,650 5?6,441 402,588 176,047 10,977 2:,596 19,525 34,912 285,465 290,577 8,880 7,363 10,254 12,471
Taxable returns, total ..................... 14,989 56?,900 401,599 176,047 10,374 2, 486 18,441 32,894 278,775 283,500 8,?83 7,132 8,641 11,85'
Under $10,000.................. : ......... 3,30`7 20,064 10,465 1,626 1,459 5,001 12,669 12,801 2,180 376
$10,000 under ~50,000 .................... 8,604 195,684 141,570 38,841 6,294 1,125 5,733 17,720 119 800 122,662 4,621 3,568 5,520 6,43:
50,000 under $100,000 ...................
V
2,192 150,395 111, 770 46,601. 1,844 536 7,589 6,433 80:765 82,148 1,400 1,946 1,202 3,33~
00,000 or more ......................... 886 201,758 137,794 88,979 777 232 4,715 3,740 65,542o
65,888 582 1,240 492 1, 581
Nontaxable returns ......................... 1,660 8,540 989 - 603 2,017 6,689 7,077 96 231
OTHER BONDS, NOTES, AND DEBENTURES
Grand total .......................... 21,348 406,919 272,189 92,959 17,233 098 32,145 35,751 382,453 453 3211 ?,211 6,830 15,588 77,85~
Taxable returns, total ..................... 18,721 395,618 271,604 92,959 14,782 2,02 15,181 31,763 220,465
: 9
242 6,646 6,563 13,488 28,341
Under $10,000............................ 7,444 48,062 25,486 5,099 5,528 9,331 12 893 19 451
(* ' )
5,171 7,58
10,000 under $50,000 .................... 9,853 209,910 148,907 40,085 7,986 1,259 5,850 19,535 168:282 lp~ 180:315 3, 180 3 837 7,433 15,88'
50,000 under $100,000 ...................
1
1,062 70,103 53,651 22,205 929 253 2,288 1,979 18
,
653 20,932 496 918 674 3,271
100,000 or more ......................... 361 67,543 43,560 25,5?0 339 59 2, 0176 919 20,637 10
21,390 199 785 211 1, 60,
Nontaxable returns ......................... 2,627 11,301 585 - 2,451 3,988 161,988 211,232 2,099 49,51:
INSURANCE AND ANNUITIES
Grand total .......................... 1,200 29,196 20,996 6,491 851 131 545 1,915 5,489 5,912 638 915 684 1,46,
Taxable reLurns, total ..................... 1,199 29,056 20,996 6,491 850 131 545 1,914 5,4891
5,911 637 915 684 1,46,
Under $10,000 ............................
10 00 under $50,000 .................... 1,029 23,304 16,440 4,466 774 1,722 4,722 1 5,157 496 805 652 1,360
50,000 under $106,000...................
1
61 3,842 3,033 1,244 49 79 676 692 36 72100,000 or more ......................... 9 1,394 1,179 ?14 8 2 5 13 6? 62 5 14 4 1
Nontaxable returns ......................... . M
00
Footnotes at end of table. For the precise definition of terms and the nature of any limitations, see the 1-Dese.ription of the Sample," "Limitations of the Data,-' and "Explanation of Classifications and Terms" in the text.

RETURNS WITH NET CAPITAL LOSS
Table 9. -ALL, SHORT-TERM, AND LONC-TERM TRANSACTIONS -INCOME, TAX, NET LOSS, AND TRANSACTION DETAIL, BY ASSET TYPE'AND SIZE OF ADJUSTED CROSS INCOME-Continued
Short-term capital asset transactions Long-term capital asset transactions
Asset type and size of adjusted Number Number ofGross
Be preci-Cost and Gross sb~rt-term
galnj Gross'short-temloss
GrossDepreci-
Cost and Gross long-term gain Gross long-term loss
gross income of trans-sales
priceation
expenseof sale =bar of
O
Number of salesation
exp nse
returns actionsNumber
=
Number Amount returnstrans- price of sale
Number ofAmount
r ofAmount
Numb(Th--d (7h...-d (n.-d
ofreturns ~' '
1ofreturn.
Th.-dactions
(M.....d (77--d - (7h-.-d returns (7~.-de
returns (n.-dd.11.,.) d.11 ... ) &11 ...) d
&11 ... ) d.11 ...) &11 ... ) d.11 ... ) d.11-) &H ...
'(16) (17) (18) (19) (20) (21) (22) (23) (24) (25) (26) (27) (28) (29) (30) (.31) (32) (33)
ALL ASSETS TYPES
Grand total ......................... 548,764 2,313,481 8,278,156 7,400 8,785,728 249,357 271,009 467,614 968,462 1,333,075 3,983,761 9,430,345 252,552 11,388,799 614,695 1,099,221 1,245,067 2,921,426Taxable returns, ~otal .................... 490,760 2,011,213 6,962,298 3,162 7,364,743 219,206 225,505 419,331 802,781 1,153,889 3,450,245 7,834,914 162,280 9,383,199 541,238 896,105 1,077,761 2,409,983
Under $10,000 ........................... 221 258
:
830,466 2, M,744 2,041 2,182,746 85,153 66,416 194,090 297,764 564 6491
1 373,733,
2,207,918 94,759 2,887,062 221,745 169,312 528,M 879 65710
'
000 under $50,000 ................... 829252 1,094,025 4,199,720 1,088 4,423,648 125,219 137,778 211,343 429,547, 806554, 852,12411 4,308,748 62,638 5,065,349 293,465 516,513 517,670,
1,239,63350,000 ,.do, $106,000 .................. 14,423 73,949 562,655 30 596,459 7,575 16,403 12,064 57,493 29,721 181,239 891,061 3,789 973,244 22,205 128,090 26,937 202,322100,000 or more ........................ 2,251 12,772 151,179 3 161,890 1,259 4,908 1,8_34 17,976 4,712 43,150 427,187 1,094 457,544 3,823 62,190 4,277 88,171
Nontaxable returns ........................ 58,004 302,268 1,315,860 4,238 1,420,985 30,151 45,505 48,283 165,681 179,186 533,516 1,595,431 90,272 2,005,600 73,456 203,117 167,3017 511,443
CORPORATE STOCK
Grand total ......................... 389,309 1,9621017 6,826,867 7,213,609 213,299 201,962 323,393 590,353 900,556 2,949,556 6,836,800 8,250,212 361,687 735,522 856,757 2,155,862Taxable returns, total .................... 352,841 1,698,738 5,745,583 11 6,077,047 188,109 174,290 293,614 506,932 823,702 2,622,510 5,850,656 .1 7,054,525 323,0?0 642,471 785,600 1,852,563
Under $10,000.. ......................... 144, 709 690,835 1,782,616 1,891,519 72,158 45,463 123,596 154,733 351,926 970,983 1 373,158 1,803,395 124,562 125,497 335,339 558 44110,000 under $50,000 ................... 195,252 931,981 3,347
1
860'
3'532
'640 108,506 111,733 159,422 297,154 442,327 1,470,085 31451,665 4,117,969 179,813 370,737 422,912
,1 039 70550,000 under $100,000 ..................
111,151 65,041 497,181 o 526,554 6,425 13,568 9,202 43,091 25,422 147,959 712,887 791,820 15,777 98,855 23,694
, ,
178,469100,000 or more........................ 1,729 10,881 117,926 126,334 1,020 31,525 1,394 11)954 4,027 33,482 312,946 ~o 341,341 2,917 47,383 3,655 75,948Nontaxable returns........................ 36,468 263,279 1,081,284 136,W 25,189 27,672 29,779 83,421 76,854 327, 04,7 986,144 1,195,687 38,617 93,051 , 71,157 303,299
U. S. GOVERMENT OBLIGATIONS
Grand total ......................... 2,680 4,586 165,326 165,237 1,093 504 1,518 414 11,032 14,203 151,919 154,053 4,119 1,577 6,952 3,713Taxable returns, total .................... 2,604 4,507 164,096 164,000 1,078 487 1,481 341 9,536 12,70`7 147,755 149,617 3,621 1,574 6,053 - 3,438
Under $10,000 ...........................10,000 under $50,OCO ................... 1,623 2,764 44911 7
9~1 137,306 763 384 842 241 5,913 8,253 73,548 74,580 2,351 759 3,743 1,793
50,000 under $100,000..................1
301 507, 0,
15,021 14,988 173 57 ill 20 865 1,508 42,209 42,265 446 533 487 590100,000 or more ........................ 87 149 9,250 9,237 42 27 36 14 285 473 19,246 19,274 131 181 143 209
Nontaxable returns ........................ 1,497 1,497 4,164 4,436 275
STATE AND LOCAL SECURITIES
Grand total ......................... 2,408 4,620 55,381 56,612 1,116 633 1,609 1,864 15,005 30,291 230,084 233,965 8,078 6,730 8,863 10,612Taxable returns, total .................... 2,229 4,431 53,959 55y173 1,041 572 1,501 1,786 13y482 28,463 224,817 11 228,327 8,015 6,560 7,355 10,071
Under $10,G00 ........................... (-) (.) M 2,973 3,767 10,159 10,05310,000 under $50,000 ................... 1,377 2,440 31,814 32,407 750 350 812 942 7,611 15,281 87 6
'9890,256 4,063 3y219 4,830 5,489
50,000 under $100,000 ..................
1
311 541 14,772 15yO68 142 176 201 472 2,054 5,892 65,993 67,081 1,312 1,772 1,0`73 2 859100,000 or more ........................ 108 216 4,863 4,950 49 46 55 133 844 3,524 60,679 60,938 559 1,194 459
,1,453
Nontaxable returns ........................540
OTHER BONDS, NOTES, AND DEBENTURES
Grand total ......................... 8,744 14,877 260,111 287,954 3,287 1,707 6,009 29,552 14,366 20,874 122,341 165,366 4,835 5,123 10,376 48, 30`7Taxable returns, total .................... 7,517 12,994 126,522 11 136,774 2,792 1,517 5,276 11,771 12,472 18,769 93,943 105,315 4,273 5,046 9,009 16,577
Under $10,000 ........................... 4,070 4,664 5,975 11,624 2,864 5,685 3,674 4,667 6,918 7,627 2,587 1,0610,000 under $50,OCO.
: . .. ... ..... .... .3,167 7,801 111,312 115,064 1,503 1,388 2,164 5,142 7y557 11,734 5 6 7 09 65,251 2,364 2,449 5,694 10,74550,000 under $100,COO .. . .. .. ..
1
186 333 2,013 2,644 63 43 141 674 927 1,646,,1 :
6 18,287 451 876 557 2,602100,000 or more ........................ 94 196
27,222
~o7,441 40 50 66 270 314 723 13,415
1013,949 172 735 170 1,334
Nontaxable returns ........................ 1,895 2,105 28,398 60,051 1,367 31,730
INSURANCE AND ANNUITIES
Grand total ......................... 452 689 1,866 1,945 376 193 84q 1,226 3,623 3,966 562 801 409 1,271Taxable returns, total .................... 451 688 1,866 1,945 376 193 649 226
1
3,623 lo 3
,
966 562 801 409 1 271Under $10,000 ...........................
--
- - - -M ( ~
,
10, 000 under $50, OCO. .... 439 673 1,1113 1,894 372 918 691 1,049 2,909 3,263 429 696 380 1 17750,000 under $100,000 .................
150 68 642 o 659
,
100,000 or more ........................ 2 4 is~o 18 1 3 8 9 49 44 4 11 4 7
Nontaxable returns ........................
Footnotes at end of table. For the precise definition of terms and the nature of any limitations, see the "Description of the Sample," "Limitations of the Data " -d - 11---1i- - 1-11 1, - - , 00

RETURNS WITH NET CAPITAL LOSS
Table 9. -ALL, SHORT-TERM, AND LONG-TERM TRANSACTIONS -INCOME, TAX,'NET LOSS, AND TRANSACTION DETAIL, BY ASSET TYPE AND SIZE OF ADJUSTED GROSS INCOME-ConLinued
sset type and size of adjusted
gross income
Number of
returns
with net
capital
loss
Adjusted
gross
income
(A.....d
d. I i -)
Taxable
income
(A.-d
&11 ...
Income tax
after
credits
d.11 ...
Net capital
77--d
d.11 ... )
Capital loss carryover
umber ofAmount
returns
(7h...-d
&11 ... )
All capital asset transactions
Gross gain Gross loss
Gr ...Cost and
Number ofsales
Depreciation expense of
trans-pr ce
sale Number ofAmount
Number of Amount
actions
(7h...wd (Th...-d (Th...-d
returns
(7h...-d
returns
(Th...-d
d.11-) dDII ... &11 ... d~llars) d.11.,1)
M (2) (3) (4) (5) (6) (7) (9) (10) (11) (12) (13) (14) (15)
OPTIONS TO BUY OR SELL
Grand total .......................... 5,916 94,991 61,942 17,563 4o343 1,115 4,155 29,531 302,519 1 307,010 1,517 3,563 5,299 8,053
Taxable returns, total ..................... 5,709 94,377 61,942 17,563 4,139 1,115 4,155 29,324 297,178 301,085 1,417 3,313 5,191 7,219
Under $10,000 ............................ N N N N N N N N10
'
000 under $50,000 .................... 3,686 69,893 47,633 12,554 3,092 569 3,209 10,847 114,604 117,967 894 1 442 3,200 4,80450,000 Under $100,000 ...................
1
123 7,908 5,893 2,362 109 48 557 186 109 325 101 234100,000 or more ......................... 21 3,947 2,446 1,448 20 6 291 37 505
o542 9 21 10 58
Nontaxable returns ......................... N - - N - N N N N
CCLUODTTIES IIJOLUDING FUTURE CONTRACTS
Grand total .......................... 14,867 212,622 150,159 42,784 11,279 2, E398 19,490 92,008 519,898 544,379 8,075 15,314 13,547 39,876
Taxable returns, total ...................... 12,466 211,202 149,709 42,784 9o766 2,757 16,564 80,430 464,194 483,998 6o702 12,190 11,285 32,074
Under $10,000 ............................ 3,888 19,767 11,482 2,340 2,379 N N 18,669 25,321R
27 775'
2,187 971 3,488 3,42410, 000 under 00, 000 ....................
00 00
8,182 l6lo292 115,477 30,497 7,031 2,110 11,831 59,359 401,873
1"73
0 416 055 4,310 10,130 7,461 24,39250,0 -der $100, 0 ...................
1
351 24,065 1B,882 8,009 313 :139 2,777 2,109 29,.84 30,762 180 859 298 2,538100,000 or more ......................... 45 6,0?7 3,869 1,938 44 8 385 294 7,916 9,407 25 229 39 1,720
Nontaxable returns.. ....................... 2,401 1,420 450 - 1,513 N 11,578 55,704 60,381 1,373 3,124 2,262 7,802
CAPITAL GAIN DIVIDENDS
Grand total .......................... 230,969 3,702,018 2,639,432 784,88~ 151,9?7 33,475 140,372 247,828 209,731 49,700 25,835 13,391
Taxable returns, total ..................... 213,986 3,663,030 2,635,803 784,885 139,668 29, 884 128,643 227,292
19" ?,
44,140 23,752 12,078
Under $10,000 ............................ 81,966 513,039 269,175 53,057 49,901 9, 564 37,654 89,604 71,781 12,203 12,784 5,98010,000 wider $50,000 .................... 122,888 2,453,561 1,815,750 481,015 82,137 18, 261 11,191 128,421 ot applicabl e 113,088 26,256 10,688 5,7340
o
000 under $100,000 ...................5
1
7,991 516,429 415,930 172,948 6,606 -1,769
5G5
14,515
8,1,5
8 115 7,765 4,120 247 247100,000 or more ......................... 1,141 180,001 134,949 77,864 1,024 2189 4,587
1,1,31,153 1,110 2,561 33 117
Nonta.xable returns ......................... 16,983 38,988 3,629 - 12,308 3,591 11,729 20,536 15,986 5,560
SHARE OF CAPITAL GAIN (LOSS) FRGA
PARTNERSHIPS AND FIDUCIARIES
Grand total .......................... 94,067 1,808,922 1,266,673 418,011 55,299 "),773 79,262 120,736 35,154 29,774 68,685 116,407
Taxable returns, total ..................... 83,716 1,777,695 1,264,651 416,011 48,421. 9,581 69,487 108,013 32,198 26,621 60,551 95,658
Under $10,000 ............................ 25,577 154,422 76,773 14,818 11,383 2,221 8,357 31,850 6,854 2,414 21,622 42,44910,000 under ~50,000.
:: ' -- * ----52,046 1,102,57B 795,351 216,093 32,084 6,081 43,773 68,556 ot applicable 21,688 16,113 35,859 45,169
50
,
000 under $100,000 . . . .
1
5,110 340,193 263,917 109,861 4,101 1,056 12,782 6,396 3,002 5,499 2,629 6,024100,000 or more ......................... 982 160,501 128,609 77,239 853 224 4,575 1,211 654 2,595 440 2,016
Nontaxable re.turns ......................... 10,351 31,227 2,022 - 6,878 N N 12,723 2,955 3,2.53 8,134 20,749
CAPITAL GAIN DISTRIBUTIONS FRGM 34AII
BUSINESS CORPORATIONS
Grand total .......................... 7,377 132,002 93,714 30,986 4,649 1, L58 2,781 9,863 4,547 2,643 3,727 1,953
Taxable returns, total ..................... 7,210 131,337 93,714 30,886 4,484 1,1158 2,781 9,662 4,380 2,416 3,727 1,953
Under $10,000 ............................ 2,673 16,348 9,805 2,061 1,366 (-) 3,659 Nlooooo Under : 50,000..
i* ...
4, 194 80,793 58,018 15,217 2,828 523 2,215 5,555 ot applicable 2,412 2,090 2,167 1,32550,000 under ~100,000.
1
290 19 403 15,359 6,520 243 33 102 366 240 132 64 83100,000 or more ......................... 53 14,793 10,531 7,088 46 300 82 48 122 9 16
Nontaxable returns ......................... N - - N N
LIQUIDATION DISTRIBUTIONS
Grand total .......................... 18,586 320,736 215,835 69,327 14,040 1,921 22,189 22,424 3,015 7,863 15,792 57,530
Taxable returns, total ..................... 16,758 312,519 215,733 69,327 12,340 1, 223 9,888 20,589
I
2,762 6,302 14,21.3 46,115
Under $10,000 ............................ 6,540 42,354 22,363 4,464 4,603 (.) N N N
10
000 wider $50,000 ....................
"9,320 185,292 132,443 34,947 6,950 83.7 4,502 10,?51 Not applicable 1,852 2,587 7,649 24,566
1510 000 under $100,000 ................... 704 4?,985 37,278 15,467 610 1-119 2,942 all? 362 1,976 370 2,678100,000 or more ......................... 196 36,888 24,649 14,449 177 28 440 272
I I
149 1,544 54 1,307
Nontaxable returns ......................... 1,827 8,217 102 - 1,700 N N 1,834 , I (.)
Footnotes at end of table. For the precise definition of terms and the nature of any limitations, see the "Description of the Sample," "Limitatio- - Me Data,'- and "Explanation of Classifications and Terms" in the text.
0000
0

RETURNS WITH NET CAPITAL LOSS
Table 9. -ALL, SHORT-TERM, AND LONG-TERM TRANSACTIONS -INCOME, TAX, NET LOSS, AND TRANSACTION DETAIL, BY ASSET TYPE AND SIZE OF ADJUSTED GROSS INCOME -Continued
Short-term capital asset transactions Long-term capital asset transactions
Asset type and size of adjusted Number Number ofGross
Depreci-Cost and
Gross short-termgain
Gross short-termloss
G ossDe ipree - Cost and Gross long-term gain Gross long-term loss
gross income of trans-salesprice
ationexpenseof sale Number mountA lumber Amount
Number ofNumber of
trans-
salesprice
ation expensef sale0 Amount Amount
returns actionsJ
of
of returnsactions Number of Number of
ber
of
(77....-d (T).-d (Th...-d
'na '
retu
retur
(M.-das
(T~.-d (7)....-d (A-d returns (TIN.-d returns (7h...-d
t-r
-
d.11.,.)_ d.11 ... &I)... d.11 ... _dWI-) d.11 ... d.11-) dolla-) dbil-) &11-1(16) (17) (18) (19) (20) (21) (22) (23) (24) (25) (26) (27) (28) (29)
_
(30) (31)
r
(32) (33)OPTIONS TO BUY OR SELL
Grand total ............. I ........... 4,409 26,404 298,857 301,970 1,022 3,400 4,153 6,153 1,849 3,127 3,662 5,039 532 523 1,417 1,901
Ta.xable returns, total.. .................. 4,201 26,197 293,516 I1 296,045 ~22 2,790 4,046 5,319 1,849 3,127 3,662I10 5,039 532 523 1,417 1,901
Under $10,000 ...........................10,000 under ~50,000 ................... 2,338 8,015 111,08' 113,198 419 946 2 193 3 058 1,683 2,832 3,519 4,769 508 496 1,275 1,74650,000 under $100,000 .................. 75 118 B 137 N N 55 67 101 188 37 102100,000 or more ........................ 9 9 1 471 3 10 5 117 12 28 42 71 6 12 5 40
Nontaxable returns ........................ N N N - --
- - - - -
COMMODITIES INCLUDING FUTURE CONTRACTS
Grand total ......................... 12,272 80,127 444,551 466,026 6,807 11,003 11,216 32,557 3,757 11,882 75,346 78,353 1,701 4,311 3,129 7,319
Taxable returns, total .................... 10,665 73,536 392,041 ~J0 409,953 6,028 10,269 9,748 28,259 2,922 6,894 72,153
I74,045 1,103 1,921 2,295 3,815
Under $10,000.. ......................... 3,088 17,068 23,878 ~11 1 26,016 1,887 943 2,787 3,081 1,001 1,601 1 443 ~1 1175910,OCO under $50,000 ................... 7,235 54,377 333,421 346,520 3,973 8,434 6,662 21,611 1,814 4,982 68:452 s.
c, 69,534 752 1,696 1,417 2,78050,000 under $100,000 ..................
1
305 1,841 27,278 28,?32 146 671 265 2,126 86 268 1,806 2,030 43 188 61 412100,000 or more ........................ 39 251 7,464 8,665o 20 220 34 1,441 23 44 452 1
o 722 8 9 17 278
Nontaxable returns ........................ 835 4,98-7 3,193 4,307
CAPITAL GAIN DIVIDENDS
Grand total ......................... 6,601 7,608 2,070 1,155 4,598 2,942 227,007 240,220 207,895 0 48,545 22,899 10,449
Taxable returns, total .................... 6,501 7,508 1,970 1,082 4,598 2,942 210,123 219,785 192,009 43,058 20,816 9,136
Under $10,000........................... 4,246 4,246 No ' applica le (-) (-) (-) (~) 79,300 85,359 N. t applicabl e 70,695 11,406 10,712 4,07810,000 tinder $50,000 ................... 2,146 3,149 834 220 1,379 869 121,782 125,271 112,469 26,036 9,885 4,86550,000 under $100,000 ..................
1100 103 46 64 53 136 7,909 8,012 7,737 4,056 193 ill
100,000 or more ........................ 10 10 3 1 7 35 1,133 1,143 1,108 1,559 26 82
Nontaxable returns ........................ 16,883 20,436 15,886 5,487
SHARE OF CAPITAL GAIN (LOSS) FROMPARTNERSHIPS AND FIDUCIARIES
Grand total ......................... 33,402 33,950 10,091 2,374 23,416 36,822 85,900 86,786 26,895 27,401 59,450 79,585Taxable returns, total.. .................. 30,396 30,944 9,324 2,225 21,177 30,532 76,187 77,069 24,667 24,396 51,961 65,126
Under $10,000 ........................... 7,793 7,793No applicable
2,799 339 4,994 10 326 23,957 24,057N t applicabl e 4,155 2,075 19,902 32,123
10,000 under ~50,000 ................... 20,680 21,223 5,880 1,236 14,904 17:549 46,621 47,333 17,291 14,877 29,649 27,62050,000 under $100,000..................
11,640 1,644 525 316 1,115 1,824 4,702 4,752 2,634 5,183 2,082 4,200
100,000 or more ........................ 282 284 120 335 164 833 907 927 587 2,261 328 1,183
Nontaxable returns ........................ 3,006 3,006 N N N 9,713 9,717 2,228 3,005 7,489 14,459
CAPITAL GAIN DISTRIBUTIONS FROM SMALLBUSINESS CORPORATIONS
Grand total ......................... 1,408 1,457 830 57 583 145 6,447 8,406 3,731 2,586 3,397 1,807
Taxable returns, total .................... 1,408 1,457
]
830 5? 583 145 6,280 8,205
1
3,564 2,359 3,397 1,607
Under $10,000 ........................... (.) NI
applicable NNo t applicable N
10,000 under $50,000 ................... 789 836 225 21 567 134 3,868 4,719 2,197 2,068 1,852 1,19150,000 under $100,000 ..................
1N 280 343 233 132 50 71
100,000 or more ........................ 4 5 3 1 2 52 77 47 121 a 16
Nontaxable returns ........................ - -
LIQUIDATION DISTRIBUTIONS
G,and total ......................... 3,747 4,288 159 167 3,596 6,482 15,628 18,135 2,897 7,696 12,869 51,048
Taxable returns, total .................... 3,547 4,088 59 13 3,495 5,751 14,001 16,501 2,745 6,289 11,391 40,364
Under $10,000........................... (,,) I I - - (.) (*)10 000 under $50,000 ................... 1,093 1,234 No
I
t ppli.able 1,056 3,892 8,504 9, 517 No
I
t applicabl e 1,845 2, 5 14 6,' 1 6 7, 21) 674
50:000 under $106,000 ..................
1
68 68 5? 132 650? 79
3549 7
1,2 3 , ,
2:546100,000 or more ........................ 13 13
I
4
I
4 9 216 187
I
146 1,540 47 1 091
Nontaxable returns ........................ N N N (~) N M N
~ :
Footnotes at end of table. For the precise definition of terms and the nature of any limitations, see the "Description of the Semple," "Limitations of the Data," - tation of Classifications and Terms " in the text.
950

RETURNS WITH NET CAPITAL LOSS
Table 9. -ALL, SHORT-TERM, AND LONG-TERM TRANSACTIONS -INCOME, TAX, NET LOSS, AND TRANSACTION DETAIL, BY ASSET TYPE AND SIZE OF ADJUSTED GROSS INCOME-Continued
Capital loss carryover All capital asset transactions
Number of AdjustedTaxable
Income taxNet capital Cost and Gross gain Gross loss
Asset type and size of adjustedreturns
with net
gross
incomeincome
after
credits loss Amount Number ofGross sales
Depreciation expense of
gross incomecapital
Number oftrans-
pricesale Number of Amount Number of Amount
lossreturns actions returns returns
(Th...-d (A.-d (7).....d (A.-d (Th...-d (7h...-d (A...-d (n...-d Th .... d
~11 ...) ~11 ... ) d.1 I ... d.1 lars) d~jj ...) d.11ars) &H-) d~ll ... d.11 ...
(1) (2) (3) (4) (5) (6) (7) (9) (10) (11) (12) (13) (14) (15)
RETIREMENT PLAN DISTRIBUTIONS
Grand total .......................... 1,872 39,630 25,760 7,021 1,571 209 1,098 1,911 1,7115 4,465 167 99
Taxable returns, total ..................... 1,649 38,365 25,735 7,021 1,347 89 801 1,688
4~,2
4,060 167 99
Under $10,OOC ............................ (.) - - (.)- -10,000 under $50,000 .................... 1,483 32,340 21,741 5,519 1,194 1,516 Not pplicabl. 1,332 3,676
50,000 under $100,000 ................... 54 3,632 2,734 1,111 43 14 80 58 40 289
100,000 or more.. ........................ 12 1,495 764 330 10 5 52 14 11 58
taxable returns .........................
LIVESTOCK
Grand total .......................... 57, 517 276,442 143,354 40,242 17,262 1,455 8,520 112,538 53,785 10,440 71,4?6 18,913 9,340 51,926 16,653
Taxable returns, total ..................... 29,582 236,732 141,380 40,242 8,288 944 5,367 57,554 27,175 4,953 32,448 10,693 6,276 25,703 6,65?
Under $10,000............................ 25,241 119,892 5.5,411 10,078 5,688 48,555 18,519 3,428 23,996 7,905 3,081 23,140 5,173
10
1
000 under $50,000.................... 3,943 74,756 56,103 14,551 -2,261 433 1,913 7,800 6,?87 9G4 6,595 2,456 2,339 2,415 1,26C
50,000 under $10b,000 ...................
1
309 20,60, 15,853 6,521 260 93 812 86? 1,174 406 1,239 249 471 116 131
100,000 or more ......................... 89 21,481 14,013 9,092 79 17 709 331 696 215 618 83 385 31 92
Nontaxable returns ......................... 27,935 39,710 1,9?4 - 8,9?4 54,984 26,610 5,487 39,028 8,220 3,064 26,223 9,99E
TIMBER AND COAL
Grand total .......................... 6,487 72,096 46,810 14,038 3,906 758 1,781 8,097 8,322 171 10,85? 2,290 1,630 4,228 3,651
Taxable returns, total ..................... 5,659 69,177 45,604 14,038 3,195 658 1,465 6,215 5,341 1?1 6,703 2,055 1,374 3,601 2,43-,
Under $10,000 ............................ 3,952 26,197 15,591 3,192 1,?74 4,353 1,762 - 2,700 (.)
10,000 under $50,000 .................... 1,5?4 27,003 19,024 4,841 1,304 129 460 1,719 3,286 171 3,813 658 719 916 1,0&
50,000 under $100,000 ...................
1
96 6,644 5,018 2,103 82 1(y? 133 - 71 78 113
100,000 or more ......................... 36 9,332 5,971 3,902 34 11 518 37 160 120 32 109 5 5(
Nontaxable returns .........................
OIL AND MINERAL INTERESTS
Grand total .......................... 10,595 181,361 130,738 43,613 7,251 1,818 6,616 14,92? 21,659 1, 279 32,042 2,348 3,125 8,937 13,26~
Taxable returns, total ..................... 10,044 186,203 130,?38 43,613 6,852 1,715 6,315 13,688 19,736 1,21~ 29,322 2,301 3,055 8,393 12,26~
Under $10,000............................ 4,027 26,157 14,891 2,959 2,714 5,328 4,830 542 11,9'?3 (.) 3,82? 7,581
$10,000 under $50,000 .................... 5,535 106,214 76,450 19,975 3,717 828 3,146 7,622 10,803 476 13,871 1,556 1,042 4,297 3,94;
50,000 under $100,000 .................... 340 22,345 17,811 7,432 291 43 312 510 1,870 116 2,219 3.40 347 217 601.
VOO,000 or more ......................... 143 31,487 21,586 13,247 130 32 464 228 2,233 80 1,259 105 1,258 52 22E
Nontaxable returns ......................... 551 -4,842 - - 398 1,240 1,923 65 2,720
PARTNERSHIP INTERESTS
Grand total .......................... 19,236 299,804 212,835 68,865 14,004 2,458 15,562 27,078 111,049 4,774 124,081 6,495 13,141 14,650 22,05~
Taxable returns, total ..................... 15,656 297,617 212,464 68,865 10,448 2,020 11,774 22,90`7 86,559 3,235 94,249 5,762 12,135 11,579 17,24,
Under $10,000 ............................ 5,642 3?,275 19,809 4,022 3,505 (~) 7,655 22,067 1,35C 27,607 1,361 648 5,108 4,831
10
000 under $50,000 .................... 9,237 192,379 141,599 40,325 6,318 1,34.6 6,630 14,033 59,491, 1,737 62,965 3,886 9,658 6,116 11,58:
50,000 under $100,000 ...................
1
646 44,139 34,6C5 14,696 514 147 1,950 1,039 3,729 134 2,671 419 1,366 305 63~
100,000 or more ......................... 131 23,825 16,451 9,822 112 27 512 180 .1,272ill
1,006 96 464 50 18,
Nontaxable returns ......................... 3,581 2,18? 371 - 3,556 4,1?1 24,491 1,538 29,832 3,070 4,81,
ASSETS USED 114 TRADE OR BUSINESS
Grand total .......................... 104,673 773,831 472,041 130,290 67,775 7,99? 46,532 147,54? 493,759 126,314 '725,633 24,240 27,665 86,192 134,40:
Taxable returns, total ..................... ?1,153 746,396 469,556 130,290 42,890 5,965 26,729 95,508 302,055 73,03:3 440,859 16,862 1.5,629 57,9~3 82,57'
Under $10,000 ............................ 49,416 267,599 120,071 23,327 28,738 3,493 11,389 67,252 ~172,358 48,169 278,660 8,844 4,957 43,681 63,01),
10,000 under $50,000 .................... 20,608 378,374 275,084 70,751 13,220 2,176 10,371 26,638 122,324 22,787 152,716 7,267 9,243 13,835 18,01(
50,000 under $100,000 ...................
1
942 61,541 49,061 20,594 762 241 2,634 1,300 5,591 1,689 7,205 619 988 363 92
100,000 or more ......................... 187 38,882 25,338 15,618 170 56 2,336 319 1,782 388 2,279 132 441 74 55:
Nontaxable returns.... ..................... 33,520 27,435 2,486 - 24,885 2,032 , 19,803 , 52,039 191,704 53,281 284,773 7,378 12,036 28,239 51,82~
Footnotes at end of table. For the p-cise definition of terms and the nature of any limitations, see the "Description of the Simple," "Limitations of the Data," and "Explanation of Classifications and Terms'- in the text.

RETURNS WITH NET CAPITAL LOSS
Table 9.-ALL, SHORT-TERM, AND LONG-TERM TRANSACTIONS -INCOME, TAX, NET LOSS, AND TRANSACTION DETAIL, BY ASSET TYPE AND SIZE OF ADJUSTED GROSS INCOME-Continued
Asset type and size of adjustedgross income
RETIRWNT PLAN DISTRIBUTIONS
Grand total .........................
Taxable returns, total .....................
Under $10,000.. .........................10y000 under t5o.000.~.. ...............50,000 under $100,000 ..................
1100,000 or more ........................
Nontaxable returns ........................
LTMMGK
Grand total .........................
Taxable returns, total ....................
Under $10,000 ...........................10,000 under $50,Ooo ..................50,000 under $100,000 ................. i
1100,000 or more........................
Nontaxable returns........................
TRIBER A14D COAL
Grand total .........................
Taxable returns, total ....................
Under $10,000 ...........................10,000 under $50,000 ...................50,000 under $100,000 ..................
1100,000 or more ........................
Nontaxable returns ........................
OIL AND LUNERAL INTERESTS
Grand total .........................
Taxable returns, total ....................
Under $10,000 ...........................10:010 un'd 1,%.: .................r 15us~:r50
1.01 .................
1100,000 or -ore ........................
Nontaxable returns. '.-1-11111111-11111
PARTNERSHIP INTERESTS
Grand total .........................
Taxable returns, total ....................
Under $10,000 ...........................10,000 under $50,000.50,000 under $l001000:,..-.'.'.:*-'.*.
1100,000 or more ........................
Nontaxable returns, .......................
ASSETS USED IN TRADE OR BUSINESS
Grand total .........................
Taxable returns, total ....................
Under $10,000 ...........................10,000 under $50,000.50, 000 under $100, 000: *.....................
1100,000 or more ........................
Nontaxable returns ........................
Numberof
returns
N
5,786
3,178
2,702,436364
2,609
843
710
2
2,192
1,951
(*)1,198
3914
(.)
4,923
4,316
(-)2,346
13126
10,976
7,825
5,5212,207
8413
3,151
Number oftrans-actions
(17)
8,717
4,994
4,3036186410
3,723
2
2,813
2,5~2
(-)1,893
5326
(-)
5,761
5,153
(.)3,065
24827
910
777
12,978
9,023
6,4212,493
9117
3,956
Short-term capital asset transactions
Grosssalesprice
d.11 ...)(18)
2,846
1,630
67569222142
1,216
1,410
1,328
6,639
5,490
4,83262
129
N
29,006
28,833
28,016438148
51,042
36,408
9101127,115
24140
14,634
Depreciation
d.11 ...)
(19)
Not applicable
147
59
506-1
88
-
32
32
-32-
-
1
1-
-
4,484
682
436244
11
3,802
Cost andxpersea
of sale
dcb11.,wJ
(20)
4,364
2,195
1,20074520843
2,169
1,759
1,617
7,785
6,501
(-)5,256
307143
30,290
29,991
(*)28,725
629120
74,590
44,295
13,50030,389
32086
30,295
Gross short-termgain
476
472
469
3
648
645
(-)433
8
779
676
(-)5726010
1,371
1,034
(-)49238
Amount
(22)
7
289
282
(-)234
4
1,219
1,195
(*)1,080
6347
(.)174151
169
125
119
466
287
Gross sl~ort-termloss
Number
ofreturns
(23)
5,485
2,877
2,875
2
2,609
1,,590
1,353
(-)1,009
368
9,360
6,432
4,8211,549
53
2,948
Amount
(A -d~bll ...
(24)
1,540
632
625
7
909
1,581
1,439
(-)?6926218
2,584
2,436
(*)1,871
25419
19,531
7,492
4,1493,204
9346
3.2,039
Number oreturns
(25)
1,723
1,500
(.)1,342
4711
54,871
28,140
24 0413:721
29187
26,731
5,780
5,052
3,4591,474
85.34
8,835
8,387
3,5274,415
311135
17,525
14,448
5,4428,275
611121
3, Cr77
95,220
64,314
44,39618,857
883179
30,906
Number oftrans-actions
(26)
1,761
1,538
1,3755112
103,821
52,560
44 2537:183
803321
51,261
7,187
5,438
3,7601,551
9235
12,115
11,115
4,7275,730457202
21,317
17,753
5,84210,968
791153
3,564
134,569
86,485
60,83024,1451,209
302
48,084
Grosssalesprice
(n..-dd.11...(27)
50,939
25,545
17 8436:095
953654
25,393
6,91.1
4,014
1,4302,303121160
15,020
14,246
4,3645,9701,8082,104
82,043
57,726
21,83631,4763,2911,124
24,317
442,717
265,647
163,34795,2095,3501,742
177,070
Long-term capital asset transactions
Depreci-ation
(7h...-dd.11 ...)(28)
Not applicable
10,293
4,894
3,379896405214
5,399
171
171
-171-
1,247
1,183
5424441-1680
4,773
3,235
1,3501,737
13315
1,538
121,830
72,351
47,73222,5431,688
387
49,479
Cost andexpenseof sale
(Th.u.-dd.11 ...(29)
67,111
30,252
22,7965,8501,031
575
36,859
9,099
5,066
2,0902,820
56120
24,257
22,821
11,1788,6151,9121,116
93,791
64,257
27,09034,2402, 042
885
29,534
651,042
396,564
265,160122,327
6,8842,193
254,479
Gross long-term gain
Number ofreturns
(30)
1,596
1,373
1,2283610
18,619
10,399
7,7052,386
22781
8,220
2,215
1,980
(.)5927131
1,807
1,763
(.)1,227
136100
5,931
5,301
1,3273,499
38491
23,134
15,990
8,4446,826
592128
7,145
Amount
(T?...-d...
(31)
4,286
3,881
N3,497
28858
9,171
6,150
3,0462,277
449378
3,020
1,619
1,363
M714109109
2,836
2,774
808347
1,254
11,922
10,940
6428,5781,303
417
27,199
15,343
4,8609,069
973440
11,856
Gross long-term loss
Number ofreturns
(32)
126
126
48,827
24,112
21,8392,130
11330
24,715
3,563
3,036
849(*)
4
7,568
7,15?
3,5273,395
18947
12,265
91618
4,3155, 008
25540
2,667
77,377
51,752
36,96112,402
32069
25,625
Footnotes at end of table. For the precise definition of terms and the nature of any limitations, see the "Description of' the Sample," "Limitations of the Data," and "Explanation of Classifications and Terms" in the text.
Amount
(Th,.Iwdd11...(33)
93
93
15,112
6,025
4,6631,154
12386
9,087
3,297
2,142
1,072
48
11,682
10,828
7,1963,174
347110
19,474
14,803
4,5479,710
383168
4,666
114,872
'75,084
58,94514,806
828506
39,786

RETURNS WITH NET CAPITAL LOSS
Table 9.-ALL, SHORT-TERM, AND LONG-TERM TRANSACTIONS -INCOME, TAX, NET LOSS, AND TRANSACTION DETAIL, BY ASSET TYPE AND SIZE OF ADJUSTED GROSS INCOME -Continued
Asset type and size of adjustedgross income
Number of
returns
with net
capital
loss
Adjustedgrossincome
(Th.....dd.11 ...
Taxable
income
7h.-d~11 ...
Income.tax,
caftirred ts
(Th ... ~dd.1 I ...
Net capitalloss
77...-d~11 ...
Capital loss carryover
AmountNumber ofreturns
(7h...-d
AJA capital asset transactions
Number ofGross sales
Cost and Gross gain Gross loss
Depreciation expense of
trans-price
sale Number of AmountNumber of Amount
actions(7h...-d (7h...-d (77~.-d
returns(Th...-d
returns( Th ... ~d
d.11-) &II-) &H ... d.1 I-) d.11-(15)
PROPERTY HELD FOR PERSONAL USE
Grand total .......................... 10,826 111,400 70,763 19,551 6,285 1,124 11,249 13,559 26,017 3,842 33,999 3,240 1,579 7,508 6,624Taxable returns, total ..................... 8,399 l(y7, 009 70,626 19,~51 4,056 712 5,475 10,615 15,581 3,283 20,877 2,628 1,119 5,590 4,036
Under $10,000 ............................ 4,808 29,317 14,307 2,806 1,853 6,587 6,922 1,030 8,994 (.) 3,514 2,27210
,
000 under $50,000 ...................b :
3,369 60,034 43,808 11,136 2,008 260 1,516 3,786 7,702 2,075 10,760 1,172 645 2,026 1,62850,000 under $10 ,000 ............. I ....
1
196 12,782 9,507 3,898 167 46 444 210 796 170 990 143 95 43 124100,000 or more ......................... 27 4,876 3,00.1, 1,711 27 5 92 31 162 10 133 20 50 7 11Nontaxable returns ......................... 2,426 4,391 138 - 2,229 2,944 10,436 559 13,122 1,918 2,587
RESIDENCES
Grand total .......................... 5,166 61,866 42,704 11,9?2 4,480 1,459 6,422 5,207 91,613 1,706 83,657 5,127 11,154 - -
Taxable returns, total ..................... 4,245 62,014 42,6?0 11,972 3,485 1,359 6,101 4,287 81,786 1,039 74,331 4,207 10,071 - -Under $10,000 ................. P.......... 1,810 9,711 5,680 1,138 1,619 1,810 32,856 - 29,647 1,810 3, (y/9 - -10;000 under ~50,000 .................... 2,342 43
,
691 30
,
775 7
,
811 1,?79 544 1,962 2,383 46,658 1,OOB 42,734 2,309 6,443 - -50,000 under $100,000 ...................
1
75 4,863 31719 11496 71 75 1,853 28 1,612 ?2 445 - -100,000 or more ......................... 18 3,748 2,496 1,527 16 7 60 19 418 3 338 17 103 - -
Nontaxable returns .........................
NONBUSINESS REAL ESTATE
Grand total .......................... 93,984 844,698 500,459 130,631 65,091 5,200 47,788 99,511 874,194 65,227 1,011,129 12,112 37,436 80,384 117,364
Taxable returns, total ..................... 73,291 808,100 498,838 130,631 50,329 4,492 33,630 78,382 686,774 51,627 793,621 9,715 23,149 62,674 86,119
Under $10,000 ............................ 47,703 3(Y?, 625 151,786 30,601 31,901 (~,) 50,183 380,991 29,547 466,200 (.) 44,?15 59,11110,111 -1 51, 1:r ;: .................. 24,111 112 698 282 366 70 328 17,496 2, 533 23,677 26,877 284,133 21,429 308,358 6,766 16,811 17,527 25,856und r D~)50 1 ..................
1
923 60:369 47:424 19:731 789 224 3,982 1,126 17,946 51? 15,968 550 2,560 383 983100,000 or more ......................... 155 27,209 17,263 9,972 143 49 1,661 196 3,703 133 3,095 105 885 48 168
Nontaxable returns ......................... 20,693 36,598 1,621 - 14,762 21,129 187,420 13,600 217,508 2,397 14,287 17,710 31,245
REAL ESTATE SUBDIVIDED
Grand total .......................... 20,585 184,193 111,760 32,834 13,748 1,467 8,939 22,885 207,723 24,214 227,713 4~408 26,309 16,247 22,204
Taxable returns, total ..................... 15,444 177,644 111,271 32,834 9,459 1,266 ?,775 17,277 140,758 12,023 157,384 3,480 12,383 12,034 17,100Under $10,000 ............................ 10,499 63,580 29,493 5,829 5,481 11,786 77,042 5,51? 91,492 1,301 2,58? 9,199 11,58310,000 under $50,000.
: * -- ....4,587 80 853 5?,697 14,991 3,664 675 3,313 5,062 56,109 5,907 58,252 1,937 8,684 2,728 4,925
50,000 under ~100,000 . .
1
292 18:967 14,608 5,967 252 68 1,172 334 4,023 421 3,923 198 687 86 202100,000 or more ......................... 66 14,245 9,472 6,048 62 23 989 95 3,584 182 3,716 45 426 21 390
4ontaxable returns ......................... 5,141 6,549 490 - 4,290 5,608 66,965 12,187 70,329 4,213 5, icv,
FARMLAND WITH UN11ARVESTED CROPS
Grand total .......................... 1,086 8,626 5,651 1,402 800 2,765 26,3?5 895 29,553 183 200 1,039 2,495Taxable returns, total ..................... 787 8,724 5,651 1,402 590 2,465 22,125 31? 23,741 183 200 739 1,511
Under $10,000 ............................ (.) - - (.) (.
10000 under $50,000. ................... 476 6
,
600 4 757 1 117 341 2,149 18,213 276 19,038- - )
439 71350,000 under $100,000 ...................100,000 or more .........................
Nontaxable returns .........................
OT11ER FARIALAND
Grand total .......................... 9,192 56,154 32,593 9,083 5,895 470 1,524 9,792 120,735 6,900 141,541 1,970 3,812 6,144 20,942Taxable returns, total ..................... 4,783 49,945 32,303 9,083 2,391 270 1,372 4,890 53,114 2,306 53,914 968 2,585 3,13? 4,302
Under $10,000 ............................ 3,388 17,023 9,160 1,790 1,38 4883 39416 1,643 38,566 (-) 2,394 2,65610 000 under $50,000 .........6 :'
1,301 24 340 17 359
,
4,544 93D 266 1,315:
1 301:
14 526 52D 13,389 502 1,306 711 1 542000 under $10 ,000 ........ ..........50,
178 4:968 3 610 1,453 64 85 1,799 1(y? 1,637 53 256 29
,102100,000 or more ......................... 16 3,614 2,174 1,297 13 4 56 16 395 31 322 13 107 3 3
Nontaxable returns ......................... 4,409 6,210 290 - 3,504 4,902 67,621 4,595 87,628 (.) 3, OC? 16,640
Footnotes at end of table. For the precise definition of terms and the nature of any limitations, see the "Description of the Semple," '-Limitations of the Data," and "Explanation of Classifications and Terms" in the text.

RETURNS WITH NET CAPITAL LOSS
Table9. -ALL, SHORT-TERM, AND LONG-TERM TRANSACTIONS -INCOME, TAX, NET LOSS, AND TRANSACTION DETAIL, BY ASSET TYPE AND SIZE OF ADJUSTED GROSS INCOME-Continued
Short-term capital asset transactions Long-term capital asset transactions
Gross .D r
Cost andGross short-term
iGross short-term
Gross Cost and Gross long-term gain Gross long-term lossAsset type mid size of adjusted Number Number of sales
ep eci-expense
ga n los';Number of sales
Depreci-expense
gross income of trars- riceation
of sale Number f
oi
tion
returns actionsp Number Amount Number ~mourt return.
trans- pr ce of saleNumber of
AmountN=ber of
Amount
(A.-d (n.-d -d(Thofreturn. (77.1, -d
of
returnsI *-d
actions(77.....d (77--d (77--d returns (77--d returns (n,,ulmd
d.11-) &11 ...) &11 ... ~bll ... d.11...) d6ilerx) d.11 ... d.Ji ... ~11...
(16) (17) (18) (19) (20) (21) (22) (23) (24) (25) (26) (27) (28) (29) (30) (31)
F
(32) (33)PROPERTY HELD FOP, PERSONAL USE
Grand total ......................... 1,241 1,352 8,250 204 8,682 292 158 816 385 9,729 12,207 17,766 3,638 25,317 2,948 1,421 6,733 6,239
Taxable returns, total .................... 941 1,052 3,082 242 3,532 192 49 61-5 357 7,603 9,563 12,499 3,141 17,344 2,436 1,070 5,015 3,680
Under $10,000........... ; ............... (-) N (-) (-) (-) (-) N 4,508 6,187 5,855 893 7,753 N N 3,314 2,22710,000 under ~50,000..:..... ... :*,,* ... 509 617 1 950 6 2 191
,
74 21 402 256 2,904 3,169 5,751 2,069 8,569 1,098 624 1 665 1 37250,000 under $100,000. ........ .......
1
(
( .j (-) (.) (-) (-) 168 178 730 169 898 125 74100~000 or more ........................ 3 3 8 - - 3 8 24 28 162 10 125 20 50 4 4
Nontaxable returns ........................ N N N 2,126 2,644 5,267 497 7,972
RE31DINCES
Grand total~ ........................ N N N N 4,865 4,873 85,986 1,706 78,398 4,827 10,973 - -
Taxable returns, total .................... N N N N 4,045 4,053 77,482 1,039 70,305 4,00'7 9,911 - -
Under $10,000 ........................... - - 1 810
'
1,810 32,856 - 29,647 1,810 3,079 - -10,000 under $50,000 ................... N N 2 143 2,150 42,377 1,008 38,*8 2,109 6,306 - -50,000 under $10b,000 ..................
1
- - 75 75 1,853 28 1,612 72 445 - -100,000 or more ........................ N N 17 18 395 3 338 16 81 - -
Nontaxable returns ........................ N N (4)
NONBUSINESS R11AL ESTATE
Grand total ......................... 7,534 7,974 43,594 557 48,506 989 1,376 6,604 (5,240 86,763 91,537 830,600 64,670 962,623 11,346 36,060 73,824 111,125Taxable returns, total .................... 6,867 7,206 35,823 557 38,718 855 1,340 6,071 4, 187 66,637 71,175 650,951 51,070 754,903 8,982 21,809 56,648 81,932
Under $10,000........................... 4,653 4,753 23,574 414 1-5,199 N (-) 4,553 2, 258 43,150 45,430 367,418 29,133 451,000 (*) 40,163 56,85310,000 under $50,000 ................... 2,093 2,289 19,103 129 20,302 588 689 1,465 1, 759 22,502 24,588 265,030 21,300 288,056 6,181 16,122 16,102 24,09950,000 under $100,000..................
1
ill 154 2,557 1.3 2,594 64 113 47 1.36 837 972 15,389 505 13,375 504 2,448 340 846100,000 or more ........................ 10 11 589 2 623 3 1 6 33 148 185 3,114 132 2,472 103 984 43 135
Nontaxable returns ........................ N N N N N 20,126 20,362 179,650 13,600 207,720 2,363 -14,252 17,176 29,193
REU ESTATE SUBDIVIDED
Grand total ......................... 2,132 2,207 8,056 166 8,613 819 469 1,312 859 18,532 20,678 199,667 24,049 219,100 3,629 25,841 14,936 21,344
Taxable returns, total .................... 1,112 1,154 2,689 33 3,079 326 180 786 538 14,411 16,124 138,069 11,995 154,304 3,195 12,203 11,250 16,562
Under $10,000 ........................... (*) N N (.) (*) N N 9
'
706 10,993 76,762 5,517 91,149 1,101 2,506 8,605 11,43910,000 under ~50,000 . ................. 296 329 2,203 33 2,543
84,365 4,733 53,906 5,875 55,709 1,863 8,608 2 543 4 54250,000 under $100,000 ..................
1
18 21 107 - 92 125 92 1 9 384278 313 3,916 421 3,832 188 670
,
83
,
201100,000 or more ........................ 5 10 99 - 102 1 7 4 10 62 85 3,485 182 3,615 44 418 is 380
Nontaxable returns ........................ N N N 4,121 4,554 61,598 12,054 64,796 N 3,686 4,782
FAWAND WITH UNHARVESTED CROPS
Grand total ......................... N 820 824 10,499 895 13,564 '771 2,224
Taxable returns, total .................... N 520 524 6,248 317 7,752 N 471 1,~40
Under $10,000 ...........................
lojOOO under $50,000. ...
::"* '' *'"' '*'308 3C6 3 996 276 4 733 N N50,000 under $100,000 .. .. .. ...
100,000 or more ........................
Nontaxable returns ........................
OTHER FAIMAND
Grand total ......................... 1,203 1,699 8,259 148 7,848 N N 7,989 8,093 112,477 6,753 133,693 1,439 3,089 5,476 20,776
Taxable returns, total .................... 710 713 5,669 - 5,768 N N 4,073 4,177 47,445 2,306 48,11.6 930 2,518 2,469 4,137Under $10,000 ........................... N N 2~795 2,895 32,187 1,648 34,227 N N 1,801 2,52410,000 under $50,000.
:i- **-* .... -N N N N 1,194 1,194 13 590 520 12,496 468 1,242 644 1 52250,000 under $l001000 .
I
N
(:)
71 75 1:300 107 1,129 50 253 N100,000 or more ........................ 2 2 28 29 ( ) 14 14 367 31 293 12 107 2 2
Nontaxable returns ........................ N N N N N 3,916 3,916 65,033 4,447 85,547 3,007 16,640
Footnotes at end of table. For the precise definition of terms and the nature of any limitations, see the "Description of the Semple," "Limitations of the Data," and "Explanation of Classifications and Terms" in the text.

RETURNS WITH NET CAPITAL LOSS
Table 9.-ALL, SHORT-TERM, AND LONG-TERM TRANSACTIONS -INCOME, TAX, NET LOSS, AND TRANSACTION DETAIL, BY ASSET TYPE AND SIZE OF ADJUSTED GROSS INCOME-Concinued
sset type and size of adjustedgross income
Ilumber of
returns
ith net
capital
loss
Adjustedgross
income
(A....~d
Taxableincome
(7h...-d&I lars)
Income taxafter
credits
Th....~dd.11 ...
Net capitalloss
(Th.-d
Capital. loss"carryover
AmcuxttNumber ofreturns
(Th...-dd~jl ...
All capital asset transactions
Cost ~d Gross gain Gross loss
GrossNumber of
sales Depreciation expense of
tr-s-price sale Number of Amount Number of Amount
Gr
.. Salesactior's
(n.-d (7h...-d (Th.-dreturns
(Th...-dre turns
Th .... dprice--d
&11 ...) d.11,rz) d~! d.11 ...
(2) (2) (3) (4) (5) (6) (7) (9) (10) (11) (12) (23) (24) (2,5)
PROCEEDS FROM PRIOR YEAR INSTALLAMIT SALES
Grand total .......................... 26,188 391,864 266,177 82,454 20,442 6,B36 56,134 30,787 23,049 40,876 3,384 14,500
Taxable returns, total ..................... 21,828 380,347 265,273 82,454 16,929 5,117 34,664 25,834 18,95'7 29,943 3,117 24,236
Under $10,000 ............................ 9,495 54,116 25,413 4,824 7,425 2,314 17,131 10,295 7,?74 12,084 1,820 11,304
10,000 under $50,000 .................... 11,220 240,341 175,976 49,355 8,543 2,082 13,262 14,151 Not applicabl e 10,120 13,288 1,241 2,842
50,000 under $100,000 ................... 973 63,322 48,657 20,005 833 194 3,034 1,218 930 3,081 46 69
100,000 or more ......................... 141 22,568 15,227 8,271 128 28 1,237 170 133 1,489 9 22
taxable returns ......................... 4,359 11,517 904 - 3,513 1,719 21,470 4,953 4,D92 10,933
OTHER TYPE ASSETS
Grand total .......................... 225,699 2,711,797 L,777,679 525,510 153,829 25,818 143,509 275,308 196,536 14,189 298,537 65,864 125,969 176,618 436,280
Taxable returns, total ..................... 194,?42 2,661,745 1,771,20`7 525,510 133,849 23,055 108,098 239,806 182,01? 12,236 258,723 56,237 '71,217 153,988 364,088
Under $10,000 ............................ 114,635 722,271 367,073 73,650 74,337 10,36? 31,772 135,941 95,546 5,529 132,364 29,159 34,086 93,602 213,623
10,000 under $50,000 .................... 74,177 1,432,797 1,031,108 274,153 54,414 11,428 56,683 95,565 58,634 6,435 91,856 24,445 29,832, 56,358 127,147
50,000 under $100,000 .......... I ........
1
4,934 323,078 248,168 102,780 4,180 1,049 13,538 6,724 1?,921 231 21,436 2,108 5,202 3,417 15,338
100,000 or more ......................... 996 183,600 124,858 74,927 918 211 6,105 1,576 9,917 41 13,067 525 2,095 612 7,979
Nontaxable returns .........................1
30,957 1 50,051 1 6,472 1-
24,980 2,7631-
35,412 35,5021
14,519 1,953 39,815 9,627 54,7521
22,629 72,19)
Footnutes at erid of table. For the precise definition of terms and the nature of any limitations, see the 'Tescription of the Sample," ',Limitations of the Data," and ItExplanation of Classifications and Termst' in the text.

RETURNS WITH NET CAPITAL LOSS
Table 9. -ALL, SHORT-TERM, AND LONG-TERM TRANSACTIONS -INCOME, TAX, NET LOSS, AND TRANSACTION DETAIL, BY ASSET TYPE AND SIZE OF AI)JUSTED GROSS INCOME -Con t inued
Short-term capital asset transactions Long-term capital asset transactions
Asset type and size of adjusted Numb r Number ofGross
DepreII.
Cost and Gross s ort-termgain
Gross short-termloss
GrossDepreci-
Cost and Gross long-term gain Gross long-term loss
gross incomee
of trains-salesprice
t
a onexpenseof sale l
Number ofNumber oft
salesi
titiolla enseXPf l
returns actionsf umber
=
1,17b,r Amount returnsrans- pr ce o sa e
Number ofAmount
Number ofAmount
(Th'-d
of
dreturns
(
f
returnslactions
(7~.....d (Th.-d (Th.-d returns (T~-d returns (T~.-dd.11-) d.11...) d.11 ... bil-) d.11... d.11 ... d.11... &11 ... hJ1...
(16) (1.7) (is) (19) (20) (21) (22) (23) (24) (25) (26) (27) (28) (29) (30) (31) (32) (33)PROCEEDS FROM PRIOR YEAR INSTALLAENT SALES
Grand total ......................... 1,991 2,031 1,369 364 622 1,251 24,617 28,756 22,063 40,511 2,799 13,249
Taxable returns, total..., ................ 1,331 1,371
I I
775 239 555 1, 107 20,918 24,462 18,564 29,704 2,598 13,129
Under $10,000 ........................... (,,) (.) (.) (.) (*) (.) 9,294 9,995 7,774 12,027 (.)
10,000 under $50,000 ................... 970 1,010 No t applicab le 625 156 345 1,01,8 10,549 13,140 No t applicab le 9,757 13,132 933 1,79450,000 tinder $106,000 ..................
1
50 50 43 20 941 1,168 905 3,062 39 66100,000 or ore ........................ 11 11 8 6 3 7 133 159 127 1,483 6 15
Nontaxable returns ........................ 3,699 4,293 3,499 10,807
OTRER TYPE ASSETS
Grand total.. ....................... 108,948 123,991 44,593 1,662 78,689 20,497 42,533 91,110 226,216 137,565 151,317 151,943 12,528 219,849 48,531 83,436 93,636 210,065
Taxable returns, total .................... 96,658 109,786 43,583 1,657 68,094 17,389 27,817 81,727 3,89,834 116,706 130,020 138,434 10,5?9 190,629 41,971 43,400 79,302 174,254
Under $10,000 ........................... 55,195 61,449 17,933 1,006 26,704 7,867 16,088 48,522 2.09,785 68,353 ?4,492 77,613 4,524 105,660 22,579 17,999 48,740 103,83810,000 under $50,000 ....... I ........... 38 346 44 ?30 20,635 636 34,251 8,721 9,921 30,784 69,085 44,494 50,835 37,999 5,799 57,605 17,243 19,914 28,640 58,06350,000 under $100,000..................
1
2:617 2~974 2,141 15 3,539 642 1,219 2,055 8,052 3,153 3,750 15,779 216 17,897 1,701 3,983 1,620 7,286100,000 or ore ........................ 500 633 2,874 - 3,601 159 590 367 2,912 706 943 7,042 41 9,466 448 1,505 303 5,067
Nontaxable returns ........................ 1 12,2901 14,206 1 1,010 1 5 1 10,595 1 3,107 1 14,716 1 9,383 1 36,382 1 20,859 1 21,297 13,509 1 1,92.9 29,220 6, 560 1 40,036 1 14,333 35,81.1.
'Duq to the reporting of more than one asset type li~ some taxpayers, the number of returns, adjusted gross income, taxable income, income tax after credits, net capital loss, and capital loss carryover for "All asset t-.pes" willbe leas the n the sum of these Items for the specific. asset types.)
An asterisk in a cell denotes that Uie estimate is not shown separately because of high sampling variability. Howeyer, the data are included in the appropriate totals.A
'last,in a c
c11 1 udlea tea that eilther there are no data for that item or it amounts to less than $500.
NOTE: Dotail in the tables ma~ not add to totals because of' rounding.
For the precise definition of terms and the nature of an~ limitations, see tile "Description of the Sample," "Limitations of-the Data," and I-Explanation of Classifications and Terms" in the text.


SALES OF CAPITAL ASSETS ON INDIVIDUAL RETURNS, 1962 97RETURNS VVITH NET CAPITAL LOSS
Table 10 . -ALL AND LONG-TERM TRANSACTIONS -INCOME, TAX NET LOSS AND TRANSACTION DETAIL, BY ASSET TYPE AND SIZE OF ADJUSTED GROSS INCOME LESSCAPHAL GAIN Oi LOSS INCLUDED -Continued
Asset type and size of adjusted gross incomeless capital gain or loss included
All capital asset transactions-Continue d
Depre '. Cost and
ti .n11 expe e of Gross gain Gross los s
2sal e
(77,- .-d (Th- .-d (77,-.-d (Th-.- d
d.11 .. . ~11.. . ~Ilnrs) bll . . . )
long-term capital asset transactions
Cost and Gross GrossN=ber of Grossisales Depreci-pr ce expense of long-tem long-term
trans- ation sale gain lossactions
(Tho ..-d (7h.. .-d (7h. ..-d (T~-d (Th .. .-d- ~11... ) 6.11 . . . ~11-) d.1i . . . d.11 .. .
ALL ASSET TYPES'(1-1) (12) (13) (14) (15) (16) (17) (18) (19) (20)
. . . . . . . . . . . . . . . . . . . . . . . . . . . . . . . . . . . .Grand total . . . . . . . 259,952 20,174,527 1,370,230 3,989,888 3,983,761 9,430,345 252,552 11,386,799 1,099,221 2,921,42~
.Taxable returns, total . . . . . . . . . . . . . . . . . . . . . . . . . . . . . . . . . . . . . 165,442 16,747,943 1,121,609 3,212,764 3,450,245 7,834,914 162,280 9,383,199 896,105 2,409,98--
Under $10,000 . . . . . . . . . . . . . . . . . . . . . . . . . . . . . . . . . . . . . . . . . . . 89,960 4,398,047 211,732 1,033,637 1,243,534 1,952,674 87,927 2,550,606 167,360 773,03(10 000 -der $50,000 . . . . . . . . . . . . . . . . . . . . . . . . . . . . . . . . . . . . 70,497 10,060,929 693,559 1,800,295 1,973,661 4,513,463 69,401 5,344,920 534,343 1,336,67-,5,0, 000 -der $100, 000 . . . . . . . . . . . . . . . . . . . . . . . . . . . . . . . . . . .
1
3,888 1,654,616 147,913 270,839 188,895 929,719 3,858 1,017,455 130,964 210,43E100,000 or more . . . . . . . . . . . . . . . . . . . . . . . . . . . . . . . . . . . . . . . . . 1,097 6-34,351 68,406 107,993 44,155 439,058 1,094 470,019 63,439 89,84 (
Nontaxable returns . . . . . . . . . . . . . . . . . . . . . . . . . . . . . . . . . . . . . . . . . 94,510 3,426,584 248,621 677,124 533,516 1,595,431 90,272 2,005,600 203,117 511,44-
CORPORATE STOC K
Grand total . . . . . . . . . . . . . . . . . . . . . . . . . . . . . . . . . . . . . . . . . . 5,463,821 937,484 2,746,215 2,949,556 6,636,800 8,250,212 735,522 2,155,86~
Taxable returns, total . . . . . . . . . . . . . . . . . . . . . . . . . . . . . . . . . . . . . 13,131,572 816,761 2,359,495 2,622,510 5,850,656 7,054,525 642,471 1,852,56 -
Under $10,000 . . . . . . . . . . . . . . . . . . . . . . . . . . . . . . . . . . . . . . . . . . . . 3,126,866 146,967 614,534 867,757 1,187,567 1,557,428 110,153 482,72 110,000 under $50,000. . . . . . . . . . . . . . . . . . . . . . . . . . . . . . . . . . . 8,135,342 502,866 1,424,063 1,566,121 3,596,208 4,318,677 383,059 1,106,18 :50,000 -der $100,000. . . . . . . . . . . . . . . . . . . . . . . . . . . . . . . . . . .
1
1,392,973 114,950 231,217 154,296 744,838 829,388 100,848 186,08~
100,000 or more . . . . . . . . . . . . . . . . . . . . . . . . . . . . . . . . . . . . . . . . .1
~
476,391 51,977 89,681 34,335 320,043 349,032 48,411 77,57 C
Nontaxable returns . . . . . . . . . . . . . . . . . . . . . . . . . . . . . . . . . . . . . . . . . .
2
332,248 120,723 386,720 327,347 986,144 ~1,195,687 93,051 303,29 5
U . S . GOVERMENT OBLIGATIOUS
Grand total . . . . . . . . . . . . . . . . . . . . . . . . . . . . . . . . . . . . . . . . . . . 319,290 2,081 4,126 14,203 151,919 154,053 1,577 3,713-
Taxable returns, total . .. . . . . . . . . . . . . . . . . . . . . . . . . . . . . . . . . . . . 313,617 2,061 3,629 12,70`7 147,755 149,617 1,574 3,43 E
Under $10,000 . . . . . . . . . . . . . . . . . . . . . . . . . . . . . . . . . . . . . . . . . . . .10,000 under 50,000 . . . . . . . . . . . . . . . . . . . . . . . . . . . . . . . . . . . .
V216,224 1,167 2,123 6,667 76,557 77,540 786 1,771
50,000 under 00,000 . . . . . . . . . . . . . . . . . . . . . . . . . . . . . . . . . . .
159,237 601 634 1,576 43,091 43,158 542 609
100,000 or more . . . . . . . . .. . . . . . . . . . . . . . . . . . . . . . . . . . . . . . . . . 28,566 209 226 484 19,299 1.0 19,329 181 21 1
Nontaxable returns. . . . . . . . . . . . . . . . . . . . . . . . . . . . . . . . . . ..
. . . . . .Z
r
5,673 20 298 1,497 4,164 k_ 4,436 3 275
STATE AND TMAT. SECURITIES
Grand total . . . . . . . . . . . . . . . . . . . . . . . . . . . . . . . . . . . . . . . . . 290,577 7,363 12,476 30,291 230,084 233,965 6,730 10,612
Taxable returns, total . . . . . . . . . . . . . . . . . . . . . . . . . . . . . . . . . . . . . 283,500 7,132 11,857 28,463 224,617 228,327 6,560 10, 071Under $10,000 . . . . . . . . . . . . . . . . . . . . . . . . . . . . . . . . . . . . . . . . . . . . 9,989 .340 500 3,667 7,871 7,801 340 27C10 000 under $50,000 . . . . . . . . . . . . . . . . . . . . . . . . . . . . . . . . . . . .
1
121,733 3,435 6,345 15,078 86,569 88,877 3,092 5,40150,000 -der $100,000 . . . . . . . . . . . . . . . . . . . . . . . . . . . . . . . . . . .
181,211 2,107 3,423 6,169 65,013 66,032 1,925 2,944
0,000 or more . . . . . . . . . . . . . . . . . . . . . . . . . . . . . . . . . . . . . . . . .10 70,566 1,249 1,589 3,550 65,364 65,616 1,203 1,457
Nontaxable returns . . . . . . . . . . . . . . . . . . . . . . . . . . . . . . . . . . . . . . . . ... 7,077 231 619 1,829 5,267 5,638 170 54C
OTHER BONDS, NOTES, AND DEBENTURES
Grand total . . . . . . . . . . . . . . . . . . . . . . . . . . . . . . . . . . . . . . . . . . 453,320 6,830 77,859 20,874 122_341 165,366 5,123 48,30r?
Taxable returns, total . . . . . . . . . . . . . . . . . . . . . . . . . . . . . . . . . . . . . 242,099 6,563 28,349 18,769 93,943 105,315 5,046 16,57?
Under $10,000. . . . . . . . . . . . . . . . . . . . . . . . . . . . . . . . . . . . . . . . . . . . 12,778 333 4,794 4,267 5,217 6,780 297 1,86 010,000 under $50,000. . . . . . . . . . . . . . . . . . . . . . . . . . . . . . . . . . . .
'182,961 4,515 18,623 12,025 54,885 62,495 3,132 10,75 7
0,000 . . . . . . . . . . . . . . . . . . . . . . . . . . . . . . . . . . .50,000 -der $10
124,960 930 3,328 1,755 ;~1 425 22,091 882 2,62 7
100,000 or more. . . . . . . . . . . . . . . . . . . . . . . . . . . . . . . . . . . . . . . . .o
21,390 785 1,604 723, 41,
13,949 735 1,334
lontaxable returns . . . . . . . . . . . . . . . . . . . . . . . . . . . . . . . . . . . . . . . . . .. 211,232 267 49,511 2,105 28,398 60,051 77 31,73 0
1 INSURANCE AND ANNUITIES
Grand total . . . . . . . . . . . . . . . . . . . . . . . . . . . . . . . . . . . . . . . . . . . 5,912 915 1,464 1,226 3,623 3,966 801 1,27 1
exable returns, total . . . . . . . . . . . . . . . . . . . . . . . . . . . . . . . . . . . . . 5,911 915 1,464 1,226 3,623 3,966 801 1,27 1
Under $10,000 . . . . . . . . . . . . . . . . . . . . . . . . . . . . . . . . . . . . . . . . . . . .10,000 -der $50,000 . . . . . . . . . . . . . . . . . . . . . . . . . . . . . . . . . . . 5,157 805 1,366 1,049 2,908 3,263 696 1,17750,000 under $106,000 . . . . . . . . . . . . . . . . . . . . . . . . . . . . . . . . . . .
1692 72 89 68 642 659 69 86
100,000 or more . . . . . . . . . . . . . . . . . . . . . . . . . . . . . . . . . . . . . . . . . 62 14 9 9 49 44 11 7
lontaxable returns . . . . . . . . . . . . . . . . . . . . . . . . . . . . . . . . . . . . . . . . .
OPTIONS TO BUY OR SELL
Grand total . . . . . . . . . . . . . . . . . . . . . . . . . . . . . . . . . . . . . . . . . 307, 010 3,563 6,053 7 662 5,039 523 1,901
exable returns, total . . . . . . . . . . . . . . . . . . . . . . . . . . . . . . . . . . . . 301,095 3,313 7,219
~ ::
662 5,039 523 1,901
Under $10,000 . . . . . . . . . . . . . . . . . . . . . . . . . . . . . . . . . . . . . . . . . . . .
10,000 under $50,000. . . . . . . . . . . . . . . . . . . . . . . . . . . . . . 117,967 1,442 4,804 2,832 3,519 1. 4,769 496 1,74650,000 under $106,000 . . . . . . . . . . . . . . . . . . . . . . . . . . . . . . 325 19 234 67 101
1188 15 102
100,000 or more . . . . . . . . . . . . . . . . . . . . . . . . . . . . . . . . . . . . 542 21 58 28 42 - 71 12 4 0
ontaxable returns . . . . . . . . . . . . . . . . . . . . . . . . . . . . . . . . . . . . . . . . ..
T
T
N
Footnotes at end of table . For tbe precise definition of terms and the nature of any limitations, see the "Description of the Sample," -'Limitations of the Data," and -'Explanationof Classifications and Terms" in the text .

98 SALES OF CAPITAL ASSETS ON INDIVIDUAL RETURNS, 1962RETURNS WITH NET CAPITAL LOS S
Table W . -ALL AND LONG-TERM TRANSACTIONS- INCOME, TAX, NET LOSS, AND TRA14SACTION DETAIL, BY ASSET TYPE AND SIZE OF ADJUSTED GROSS INCOME LESSCAPITAL GAIN OR LOSS INCLUDED -Continue d
sset type and size of adjusted gross incomeless capital gain or loss included
Number o f
returns
with a t
capital
loss
Adjusted gross incom e
les s
capital
As reported gain or
loss
include d
(T).. : .d (Th- : d
d~ll
Taxabl e. income
7ho.-d~11 . ..
Income taxcafterredits
7h.-d~11 . ..
Net capital
loss
h. . ...dbil .. .
Capital loss carvjove r
mountNumber o freturns
(Th- .-d&11 .. .
All capital asse t
transactions
Gros sNumber of sale
s
trans- price
actions
(Th. . .-d
d.1 I .. .
COMMODITIES INCLUDING FUTURE CONTRACTS
Grand total . . . . . . . . . . . . . . . . . . . . . . . . . . . . . . . . . . . . . . . . . . 14,867 212,622 223,901 150,159 42,784 11,279 2,398 19,490 92,008 519,89 8
Taxable returns, total . . . . . . . . . . . . . . . . . . . . . . . . . . . . . . . . . . . . . 12,466 211,202 220,968 149,709 42,784 9,766 2,757 16,564 60,430 464,19 4
Under $10,000 . . . . . . . . . . . . . . . . . . . . . . . . . . . . . . . . . . . . . . . . . . . . 3,888 19,767 22,146 11,482 2,340 2,379 (-) 18,669 25,32 110 000 under $50,000 . . . . . . . . . . . . . . . . . .
. . . .. . . . . . . . . . . . . . 8,117 158, Wl 165,036 113,667 29,940 6,967 2,100 11,763 59,229 397,78 6
50:000 under $100,000 . . . . . . . . . . . . . . . . . . . . . . . . . . . . . . . . . . . 413 26,927 27,299 20,370 8,410 372 149 2,845 2,170 31,74 7$100,000 or more . . . . . . . . . . . . . . . . . . . . . . . . . . . . . . . . . . . . . . . . . 48 6,437 6,485 4,190 2,094 47 8 385 363 9,314 0
Nontaxable returns . . . . . . . . . . . . . . . . . .. . . . . . . . . . . . . . . . . . . . . . . . 2,401 1,420 2,933 450 1,513 M 11,578 55,734
CAPITAL GAIN DIVIDENDS
Grand total . . . . . . . . . . . . . . . . . . . . . . . . . . . . . . . . . . . . . . . . . . 230,969 3,702,018 3,653,995 2,639,432 784,885 151,977 33,475 140,372 247,82 8
Taxable returns, total . . . . . . . . . . . . . . . . . . . . . . . . . . . . . . . . . . . . . 213,986 3,663,030 3,802,698 2,635,803 784,885 139,668 29,884 122,643 227,29 2
Under $10,000 . . . . . . . . . . . . . . . . . . . . . . . . . . . . . . . . . . . . . . . . . . . . 75,226 448,474 492,500 231,968 45,393 44,026 8,478 35,720 82,76410 000 under $50,000 . . . . . . . . . . . . . . . . . . . . . . . . . . . . . . . . . . . . 129,271 2,500,412 2,568,G84 1,839,432 483,828 87,673 19,239 73,350 134,902
50 :000 under $100,000 . . . . . . . . . . . . . . . . . . . . . . . . . . . . . . . . . . .
1
8,305 529,864 536,769 426,012 176,143 6,905 1,857 14,787 8,43 0
100,000 or more . . . . . . . . . . . . . . . . . . . . . . . . . . . . . . . . . . . . . . . . . 1,134 184,281 185,346 138,392 ?9,522 1,065 310 4,785 1,196
Nontaxable returns . . . . . . . . . . . . . . . . . . . . . . . . . . . . . . . . . . . . . . . . . 16,963 38,988 51,297 3,629 - 12,308 3,591 11,729 20,536
SHARE OF CAPITAL GAIN (IOSS) FROM PARTNERSHIPSAND FIDUCIARIES
Grand total . . . . . . . . . . . . . . . . . . . . . . . . . . . . . . . . . . . . . . . . . . 94,067 1,808,922 1,864,220 1,266,673 418,011 55,299 10,773 79,262 120,736
Taxable returns, total . . . . . . . . . . . . . . . . . .. . . . . . . . . . . . . . . . . . . . 83,716 1,777,695 1,826,116 1,264,651 418,011 48,421 9,561 69,487 108,013
Under $10,000 . . . . . . . . . . . . . . . . . . . . . . . . . . . . . . . . . . . . . .. . . . . . . 24,250 141,511 152,069 69,775 13,388 10,558 2,120 8, 0`74 29,89610,000 -der $50,000 . . . . . . . . . . . . . . . . . . . . . . . . . . . . . . . . . . . 53,171 1,105,427 1,138,164 793,944 214,263 32,738 6,146 43,953 70,24950,000 -der $100,000 . . . . . . . . . . . . . . . . . . . . . . . . . . . . . . . . . . .
1
5,284 347,433 351,680 270,400 112,224 4,247 1,080 12,852 6,624100,000 or more . . . . . . . . . . . . . . . . . . . . . . . . . . . . . . . . . . . . . . . . . 1,010 163,324 164,203 130,532 78,137 879 234 4,609 1,243
Nontaxable returns . . . . . . . . . . . . . . . . . . . . . . . . . . . . . . . . . . . . . . . . . 10,351 31,227 38,105 2,022 - 6,878 12,723
CAPITAL GAIN DISTRIBUTIONS FROM %U~LL BUSINESS CORPORATIONS
Grand total . . . . . . . . . . . . . . . . . . . . . . . . . . . . . . . . . . . . . . . . . . 7,377 132,002 136,652 93,714 30,886 4,649 1,158 2,781 9,863
Taxable returns, total . . . . . . . . . . . . . . . . . . . . . . . . . . . . . . . . . . . . . 7,210 131,337 135,621~ 93,714 30,886 4,484 1,158 2,781 9,662
Under $10,000 . . . . . . . . . . . . . . . . . . . . . . . . . . . . . . . . . . . . . . . . . . . . 2,573 15,354 16,699 9,361 1,971 1,345 3,559000 -der $50,000 . . . . . . . . . . . . . . . . . . . . . . .
10
4,290 81,612 84,458 58,304 15,249 2,646 519 2,187 5,65250,000 -der $100,000 . . . . . . . . . . . . . . . . . . . . . . . . . . . . . . . . . .
1
294 19,578 19,825 15,516 6,577 247 37 130 369100, 000 or more . . . . . . . . . . . . . . . . . . . . . . . . . . . . . . . . . . . . . . . . . 53 14,793 14,840 10,531 7,088 46 9 300 82
Nontaxable returns . . . . . . . . . . . . . . . . . . . . . . . . . . . . . . . . . . . . . . . . . .z
LIQUIDATION DISTRIBUTIONS
Grand total . . . . . . . . . . . . . . . . . . . . . . . . . . . . . . . . . . . . . . . . . . 18,586 320,736 334,776 215,835 69,327 14,040 1,921 22,189 22,424
Taxable returns, total . . . . . . . . . . . . . . . . . . . . . . . . . . . . . . . . . . . . . 16,758 312,519 324,858 215,733 69,327 12,340 1,223 9,888 20,589
Under $10,000 . . . . . . . . . . . . . . . . . . . . . . . . . . . . . . . . . . . . . . . . . . . . 4,860 26,133 29, 80`7 12,066 2,531 3,674 7,04 010,000 under $50,000.
*** . . . . . . . . . . . .10,948 198,986 206,815 140,473 36,502 7,829 614 4,497 12,313
50,000 under $100,000 : . .
1
749 49,951 50,605 38,045 15,577 653 162 2,947 95 9100,000 or more . . . .. . . . . . . . . . . . . . . . . . . . . . . . . . . . . . . . . . . . . . 2 Ol 37,449 37,631 25,149 14,717 183 28 440 277
10
Nontaxable returns . . . . . . . . . . . . . . . . . . . . . . . . . . . . . . . . . . . . . . . . . 1,827 8,217 9,917 102 - 1,7c)o 1,83 4
RETIREMENT PIAN DISTRIBUTIONS
Grand total . . . . . . . . . . . . . . . . . . . . . . . . . . . . . . . . . . . . . . . . . . 1,872 39,630 41,201 25,760 7,021 1,571 209 1,098 1,91 1
Taxable returns, total . . . . . . . . . . . . . . . . . . . . . . . . . . . . . . . . . . . . . 1,649 38,365 39,712 25,735 7,021 1,347 89 801 1,68 8
Under $10,000 . . . . . . . . . . . . . . . . . . . . . . . . . . . . . . . . . . . . . . . . . . . .10 000 under $50,000 . . . . .
. . . . . .'1,483 32,340 33,534 21,741 5,519 1,194 1,51 6
000 under $3.00,000. . . . :50, . .1
54 3,632 3,675 2,734 1,111 43 5 8100,000 or more . . . . . . . . . . . . . . . . . . . . . . . . . . . . . . . . . . . . . . . . . 12 1,495 1,505 764 330 10 5 52 14
Nontaxable returns . . . . . . . . . . . . . . . . . . . . . . . . . . . . . . . . . . . . . . . . .
LIVESTOCK
Grand total . . . . . . . . . . . . . . . . . . . . . . . . . . . . . . . . . . . . . . . . . . 57,517 276,442 293,704 143,354 40,242 17,262 1,455 8,520 112,538 53,78 5
Taxable returns, total . . . . . . . . . . . . . . . . . . . . . . . . . . . . . . . . . . . . 29,582 236,732 245,020 141,380 40,242 8,288 944 5,367 57,554 27,175
U~der $10,000 . . . . . . . . . . . . . . . . . . . . . . . . . . . . . . . . . . . . . . . . . . . . 24,841 116, W2 121,4% 53,267 9,620 5,414 47,255 18,37710 ' 000 under $50,000. . . . . . . . . . . .
* . . . . . **** . . . * . . . . . . . .4,299 76,374 78,888 56,233 14,238 2,514 433 1,913 9,057 6,903
: :50,000 undc~ $100,000. . . . . . . . . . . . . . . . . . . . . . . . . . . . . . . . .
1353 22,796 23,076 17,867 7,293 280 93 812 911 1,199
100,000 or more . . . . . . . . . . . . . . . . . . . . . . . . . . . . . . . . . . . . . . . . . 89 21,481 21,560 14,013 9,092 79 17 709 331 696
Nontaxable returns . . . . . . . . . . . . . . . . . . . . . . . . . . . . . . . . . . . . . . . . . 27,935 39,710 48,684 1,974 - 8,974 54,994 26,610
Footnotes at end of table . For the precise definition of terms and the nature of any limitations, see the "Description of the Sample," "Limitations of the Da~," and -'ExPlanationof Classifications and Terms" in the text .

SALES OF CAPITAL ASSETS ON INDIVIDUAL RETURNS, 1962 99RETURNS WITH NET CAPITAL LOS S
Table 10 . -ALL AND LONG-TERM TRANSACTIONS -INCOME, TAX NET LOSS, AND TRANSACTION DETAIL BY ASSET TYPE AND SIZE OF ADJUSTED GROSS INCOME LESSCAPHAL GAIN OR LOSS INCLUDED -Con t inu~ d
Asset type and size of adjusted gross incomeless capital gain or loss included
All capital asset transactions-Continue d
Depmci- Costand
ation expense of Gross gain Gross los ssal e
(M.-d (n.-d (7h .. .-d (7h .. .- d~611 .. &J1. . . ~11 . .. &11. . .
long-term capital asset transactions
Cost and Gross Gros sNumber of Gro8s .sales Depreci -tr-s- pr,ce ation expense
of long-term long-termsale gain los s
actions
(7h. ..-d (7h.. .-d (n. ..-d (Th...-d (7~.-d~11.. . d.11 . .. &11.. . ) &11.. . ) ~11. ..)
(11) (12) (13) (14) (3-5) (16) (17) (18) (2-9) (20)COWDDITIFS INCWDING FUTURE CONTRACTS
Grand total . . .. . . . . . . . . . . . . . . . . . . . . . . . . . . . . . . . . . . . . . . 544,379 15,314 39,876 11,882 75_346 78,353 4,311 7,319
Ta~xable returns, total . . . . . . . . . . . . . . . . . . . . . . . . . . . . . . . . . . . . . 483,998 12,190 32,074 6,894 72,153 1 74,045 1,921 3,81 5
Under $10,000 . . . . . . . . . . . . . . . . . . . . . . . . . . . . . . . . . . . . . . . . . . . . 3 27,775 971 3,424 1,601 1,443 1,759 28 34410,000 under $50,000 . . . . . . . . . . . . . . . . . . . . . . . . . . . . . . . . . . .
c411,366 10,116 23,796 4,942 66,541 67,467 1,696 2,624
50,000 under $100,000 . . . . . . . . . . . . . . . . . . . . . . . . . . . . . . . . . . .
1
.34,013 856 3,122 306 3,716 4,097 188 569
100,000 or more. . . . . . . . . . . . . . . . . . . . . . . . . . . . . . . . . . . . . . . . . 10,824 247 1,731 44 452 722 9 278
Nontaxable returns . . . . . . . . . . . . . . . . . . . . .- - . . . . . . . . . . . . . . . . . . 60,381 3,124 7,802 4,987 3,193 4,307 2,390 3,504
CAPITAL GAIN DIVIDENDS .
Grand total . . . . . . . . . . . . . . . . . . . . . . . . . . . . . . . . . . . . . . . . . . . 49,70() 13,391 240,220 48,545 10,449
Taxable returns, total . . . . . . . . . . . . . . . . . . . . . . . . . . . . . . . . . . . . . 44,140 12, 078 219,785 43,058 9,136
Under $10,000. . . . . . . . . . . . . . . . . . . . . . . . . . . . . . . . . . . . . . . . . . . . 10,778 5,497 79,112 10,769 3,59 810 ' 000 under $50,000. . . . . . . . . . . . . . . . . . . . . . . . . . . . . . . . . . .
icable27,376 6,217 131,160
applicable26,368 5,34 5
50,000 under $100,000 . . . . . . . . . . . . . . . . . . . . . . . . . . . . . . . . . . .
1
4,409 247 8,326 4,345 il l100,000 or more . . . . . . . . . . . . . . . . . . . . . . . . . . . . . . . . . . . . . . . . . 1,577 117 1,186 1,576 8 2
Nontaxable returns . . . . . . . . . . . . . . . . . . . . . . . . . . . . . . . . . . . . . . . . . 5,560 1,313 20,436 5,487 1,31 3
SHARE OF CAPITAL GAIN (LOSS) FROM PARTNERSHIPSAND FIDUCIARIES
Grand total . . . . . . . . . . . . . . . . . . . . . . . . . . . . . . . . . . . . . . . . . . 29,774 116,407 86,786 27,401 79,58 5
Taxable returns, total . . . . . . . . . . . . . . . . . . . . . . . . . . . . . . . . . . . . . 26,621 95,658 77,069 24,396 65,126
Under $10,000 . . . . . . . . . . . . . . . . . . . . . . . . . . . . . . . . . . . . . . . . . . . . 2,187 41,811 22,830 1,862 31,66650,1100 . . . . . . . . . . . . . . . . . . . . . . . . . . . . . . . . . . . .
'0 OCOunder t
' Not app licable 16,160 45,739 48,364No t applicable
14,911 28,04 0, ,...
ander. 000 . . . . . . . . . . . . . . . . . . . . . . . . . . . . . . . . . . .150, 5,502 6,092 4,919 5,186 4,237
100,000 or more . . . . . . . . . . . . . . . . . . . . . .. . . . . . . . . . . . . . . . . . . . 2,773 2,016 955 2,438 1,183
Nontaxable returns . . . . . . . : . . . . . . . . . . . . . . . . . . . . . . . . . . . . . . . . . 3,153 20,749 9,717 3,005 14,459
CAPITAL GAIN DISTRIBUTIONS FROM EMALL BUSINESS CORPORATIONS
Grand total . . . . . . . . . . . . . . . . . . . . . . . . . . . . . . . . . . . . . . . . . . 2,643 1,953 8,406 2,586 1, Bw
Taxable returns, total . . . . . . . . . . . . . . . . . . . . . . . . . . . . . . . . . . . . . 2,416 1,953 6,205 2,359 1,807Under $10,000 . . . . . . . . . . . . . . . . . . . . . . . . . . . . . . . . . I . . . . . . . . . . . 72 508 2,966 38 50810 000 under $50,000.
. * . . . . . . . . ** . . . . . . . . . . . . . . . . . . Not appl icable2,090 1,346 4,915
Not applicable 2,068 1,21250, 000 under $100, 000.
1132 83 347 132 71
100,000 or o e . . . . . . . . . . . . . . . . . . . . . . . . . . . . . . . . . . . . . . . . . 122 16 77 121 1 6
Nontaxable returns . . . . . . . . . . . . . . . . . . . . . . . . . . . . . . . . . . . . . . . . .
LIQUIDATION DISTRIBUTIONS
Grand total . . . . . . . . . . . . . . . . . . . . . . . . . . . . . . . . . . . . . . . . . . 7,863 57,530 18,135 7,696 51,04 8
Taxable returns, total . . . . . . . . . . . . . . . . . . . . . . . . . . . . . . . . . . . . . 6,302 46,115 16,501 6,289 40,364
Under $10,000 . . . . . . . . . . . . . . . . . . . . . . . . . . . . . . . . . . . . . . . . . . . . 188 16,522 5,253 188 15,88 010 ' 000 under $50,000 . . . . . . . . . . . . . . . . . . . . . . . . . . . . . . . . . . .
b Not app icable 2,550 25,562 10,126 No t applicable 2
,
546 20'80 4,000 . . . . . . . . . . . . . . . . . . . . . . . . . . . . . . . . . . .
50,000 under$10
12 02 0
,
2,714 858 21015 2,579100,000 or mom . . . . . . . . . . . . . . . . . . . . . . . . . . . . . . . . . . . . . . . . . 1 544 1,317 264 1 , 540 1,101
ontaxable returns. . . . . . . . . . . . . . . . . . . . . . . . . . . . . . . . . . . . . . . . . 1,561 11,415 1,634 1,406 10,684
RETITUIONT PLAN DISTRIBUTIONS
Grand total . . . . . . . . . . . . . . . . . . . . . . . . . . . . . . . . . . . . . . . . . . 4,465 99 1,761 4,266 93
axable returns, total . . . . . . . . . . . . . . . . . . . . . . . . . . . . . . . . . . . . 4,060 99 1,538 3,881 93
Under $10,000 . . . . . . . . . . . . . . . . . . . . . . . . . . . . . . . . . . . . . . . . . . . . - ( .) -10 GOO under $50,000 . . . . . . . . . . . . . . . . . . . . . . . . . . . . . . . . . . . .
Not applicable3,676 81 1,375
Not applicable3,497 76
50,000 under $100,000. . . . . . . . . . . . . . . . . . . . . . . . . . . . . . . . . . . 289 9 51 288 9100,000 or more . . . . . . . . . . . . . . . . . . . . . . . . . . . . . . . . . . . . . . . . . 58 8 12 58 8
ontaxable returns . . . . . . . . . . . . . . . . . . . . . . . . . . . . . . . . . . . . . . . .
LIVESTOCK
Grand total . . . . . . . . . . . . . . . . . . . . . . . . . . . . . . . . . . . . . . . . . . 10,440 71,476 9,340 16,653 103,821 50,939 10,293 67,111 9,171 15,11 2
axable returns, total . . . . . . . . . . .. . . . . . . . . . . . . . . . . . . . . . . . . . . 4,953 32,449 6,2?6 6,657 52,560 25,545 4,894 30,252 6,150 6,02 5
Under $10,000 . . . . . . . . . . . . . . . . . . . . . . . . . . . . . . . . . . . . . . . . . . . . 3,345 23,736 2,999 5,056 43,252 17,701 3,304 22,559 2,963 4,560under $50,000 . . . . . . . . . . . . . . . . . . . . . . . . . . . . . . . . . . . . 985 6,833 2,412 1,374 8,139 6,211 969 6,065 2,350 1,253under $100,000 . . . . . . . . . . . . . . . . . . . . . . . . . . . . . . . . . . . 408 1,261 481 135 647 979 408 1,053 459 126
100,000 or more. . . . . . . . . . . . . . . . . . . . . . . . . . . . . . . . . . . . . . . . . 215 618 395 92 321 654 214 575 378 86
ontaxable returns . . . . . . . . . . . . . . . . . . . . . . . . . . . . . . . . . . . . . . . . . 5,487 39,026 3,064 9,9 96 51,261 25,393 5,399 36,859 3,02 0
N
9,097
T
N
T
N
Footnotes at-end of table . For the. precise definition of terms and the nature of any li-itations, see the "Description of the Sample," "Limitations of the Data," and "Explanationof Classifications and Terms-1 in the text .


SALES OF CAPITAL ASSErS ON -INDIVIDUAL RETURNS, 1962 101RETURNS WITH NET CAPITAL LOSS
Table 10 . -ALL AND LONG-TERM TRANSACTIONS -INCOME . TAX . NET LOSS, AND TRANSACTION DETAIL, BY ASSET TYPE AND SIZE OF ADJUSTED GROSS INCOME LESSCAPITAL GAIN OR LOSS INCLUDED -Continue d
All capital asset transactions-Continued Long-term capital asset transaction s
Asset type and size of adjusted gross income Dep7c'-
Cost andGross sales Depreci-
Cost and Gross Gross
less capital gain or loss included,tion
expense of Gross gain Gross loss Number ofprice atio.
expense of long-tem long-termsale trans- sale gain loss
actions
(Th (7h .., .d (M-d (Thw-d (M-d (77~.-d (T~-d (Th. ..-d (Tho-d&11 . .. ) &11 . .. ) - - _d.H .. . d.11 . .. ) &liars) &11 .. . ) ~11&rs)
0-1) ( .12) (13) (14) (15) (16) (17)_ (is) (19) (20 )TWER AND COAL
Grand total . . . . . . . . . . . . . . . . . . . . . . . . . . . . . . . . . . . . . . . . . . 171 10,857 1,630 3,651 7,187 6,911 171 9,099 1,619 3,297
Taxable returns, total . . . . . . . . . . . . . . . . . . . . . . . . . . . . . . . . . . . . . 171 6,703 1,374 2,437 5,438 4,014 171 5,086 1,363 2,114 2Under $10,000 . . . . . . . . . . . . . . . . . . . . . . . . . . . . . . . . . . . . . . . . . . . . - 1,970 4-34 1,()60 3,266 922 - 1,361 433 78 210,000 under $50,000. . . . . . . . . . . . . . . . . . . . . . . . . . . . . . . . . . . . 171 4,543 617 1,307 2,037 2,714 171 3,550 613 1,29 350,000 under $100,000 . . . . . . . . . . . . . . . . . . . . . . . . . . . . . . . . . . .
1
- ?1 214 20 99 217 - 56 209 1 8100,000 or more. . . . . . . . . . . . . . . . . . . . . . . . . . . . . . . . . . . . . . . . . 120 109 50 35 160 120 109 4 8
Nontaxable returns. . . . . . . . . . . . . . . . . . . . . . . . . . . . . . . . . . . . . . . . .
OIL AND K(INERAL INTERESTS
Grand total . . . . . . . . . . . . . . . . . . . . . . . . . . . . . . . . . . . . . . . . . . 1,279 32,042 3,125 13,263 12,115 15,020 1,247 24,257 2,936 11,682
Taxable returns, total . . . . . . . . . . . . . . . . . . . . . . . . . . . . . . . . . . . . 1,215 29,322 3,055 12,267 11,115 14,246 1,183 22,821 2,774 10,826
Under $10,000 . . . . . . . . . . . . . . . . . . . . . . . . . . . . . . . . . . . . . . . . . . . 542 9,312 202 6,551 4,127 2,612 542 8,634 158 6,19910,000 under ~50,000 . . . . . . . . . . . . . . . . . . . . . . . . . . . . . . . . . . .
. .476 16,438 1,236 4,978 6,327 7,623 444 11, CY71 1,002 4,171
. . . . . . . . . . . . . . . . .50,000 under $100,000 . . . . . . . . . . . . . . . . . .
1116 2,313 359 610 460 1,908 116 2,000 359 347
100,000 or more . . . . . . . . . . . . . . . . . . . . . . . . . . . . . . . . . . . . . . . . . so 1,259 1,258 128 202 2,104 so 1,116 1,254 110
Nontaxable returns . . . . . . . . . . . . . . . . . . . . . . . . . . . . . . . . . . . . . . . . .
PARTNERSHIP INTERESTS.. . . . . . . . . . . . . . . . . . . . . . . .Grand total . . . . . . . . . . . . . . . . . 4,774 124,081 13,141 22,056 21,317 82, Cv,3 4,773 93,791 11,922 19,474
faxable returns, total . . . . . . . . . . . . . . . . . . . . . . . . . . . . . . . . . . . . . 3,235 94,249 12,135 17,244 17,753 57,726 3,235 64,257 10,940 14,808
Under $10,000. . . . . . . . . . . . . . . . . . . . . . . . . . . . . . . . . . . . . . . . . . . . 1,318 23,177 566 4,292 5,342 17,902 1,318 22,660 560 4,00110,000 under $50,000. . . . . . . . . . . . . . . . . . . . . . . . . . . . . . . . . .. . . 1,754 67,273 9,707 12,120 11,447 35,276 1,754 38,554 8,627 10,25 650,000 -der $106,000 . . . . . . . . . . . . . . . . . . . . . . . . . . . . . . . . . . .
1
148 2,766 1,398 616 797 3,424 149 2,130 1,335 35 5100,000 or more . . . . . . . . . . . . . . . . . . . . . . . . . . . . . . . . . . . . . . . . . 15 1,034 464 215 167 1,124 15 913 417 196
qontaxable returns . . . . . . . . . . . . . . . . . . . . . . . . . . . . . . . . . . . . . . . . . 1,538 29,832 1,006 4,814 3,564 24,317 1,538 29,534 982 4,66 6
ASSETS USED IN TR_1DE 1-1, DUSSINESS
Grand total . . . . . . . . . . . . . . . . . . . . . . . . . . . . . . . . . . . . . . . . . 126,314 725,633 27,665 134,403 134,569 442,717 121,830 651,042 27,199 114,872
'axable returns, total . . . . . . . . . . . . . . . . . . . . . . . . . . . . . . . . . . . . . 73,033 440,859 15,629 S2,577 86,485 265,647 72,351 396,564 15,343 75,084
Under W,000 . . . . . . . . . . . . . . . . . . . . . . . . . . . . . . . . . . . . . . . . . . . . 46,113 270,215 4,243 61,778 59,176 157,612 45,677 256,863 4,150 57,72910,006 under $50,000 . . . . . . . . . . . . . . . . . . . . . . . . . . . . . . . . . . . . 24,8017 161,048 9,912 19,323 25,756 100,825 24,563 130,510 9,734 16,01950,000 under $106,000 . . . . . . . . . . . . . . . . . . . . . . . . . . . . . . . . . . .
1
1,725 7,316 1,033 923 1,244 5,468 1,724 6,996 1,018 830100,000 or more . . . . . . . . . . . . . . . . . . . . . . . . . . . . . . . . . . . . . . . . . 388 2,280 441 553 309 1,742 387 2,194 440 507
lontaxable returns . . . . . . . . . . . . . . . . . . . . . . . . . . . . . . . . . . . . . . . . . 53,281 284,773 12,036 51,827 48,084 177,070 49,479 254,479 11,856 39,788
PROPERTY HELD FOR PERSONAL USE
Grand total . . . . . . . . . . . . . . . . . . . . . . . . . . . . . . . . . . . . . . . . . . 3,642 33,999 1,579 6,624 12,207 17,766 3,638 25,317 1,421 6,239
axable return-, total . . . . . . . . . . . . . . . . . . . . . . . . . . . . . . . . . . . . . 3,293 20,877 1,119 4,036 9,563 12,499 3,141 17,34.4 1,070 3,68 0
Under $10,000 . . . . . . . . . . . . . . . . . . . . . . . . . . . . . . . . . . . . . . . . . . . 947 8,415 329 2,133 6,054 5,498 81.1 7,173 323 2, 08 8000 . . . . . . . . . . . . . . . . . . . . . . . . . . . . . . . . . . . .Ln
'00' )00 'er1 C d2,152 11,326 645 1,760 3,299 6,109 2,146 9,139 624 1,50 8
5., 00 er 1. 000 . . . . . . . . . . . . . . . . . . . . . . . . . . . . . . . . . . .; 175 1,003 95 132 182 730 175 907 74 s o$100,000 or more . . . . . . . . . . . . . . . . . . . . . . . . . . . . . . . . . . . . . . . . . 10 133 50 11 28 162 10 125 50 4
ontaxable returns . . . .. . . . . . . . . . . . . . . . . . . . . . . . . . . . . . . . . . . . . . 559 13,122 460 2,587 2,644 5,267 497 7,972 351 2,559
RESIDENCES
Grand total . . . . . . . . . . . . . . . . . . . . . . . . . . . . . . . . . . . . . . . . . . 1,706 83,657 11,154-
4,873 85,986 1,706 78,398 10, 973-
axable returns, total . . . . . . . . . . . . . . . . . . . . . . . . . . . . . . . . . . . . . 1,039 74,331 10,071 - 4,053 7?,482 1,039 70,305 9,911 -
Under $10,000 . . . . . . . . . . . . . . . . . . . . . . . . . . . . . . . . . . . . . . . . . . . . - 29,647 3,079 - 1,810 32,856 - 29,647 3,079-
a, J5O OO . . . . . . . . .. -** . . . . . . . . . . .
' 0
1,006 42,734 6,443 - 2,150 42,377 1,008 38,708 6,306 -Cr '.
El ,-0 le 000 . . . . . . . . . . . . . . . . . . . . . . . . . . . . . . . . . . . 28 1,612 445 - 75 1,853 28 1,612 445~100,000 or more . . . . . . . . . . . . . . . . . . . . . . . . . . . . . . . . . . . . . . . . . 3 338 103 - is 395 3 338 81
ontaxable returns . . . . . . . . . . . . . . . . . . . . . . . . . . . . . . . . . . . . . . . . .
NONBUSINESS REAL ESTATE
Grand total . . . . . . . . . . . . . . . . . . . . . . . . . . . . . . . . . . . . . . . . . . 65,227 1,011,129 37,436 117,364 91,537 830,600 64,670 962,623 36,060 111,12 5
axable returns, total . . . . . . . . . . . . . . . . . . . . . . . . . . . . . . . . . . . . . 51,627 793,621 23,149 86,119 71,175 650,951 51, G70 754,903 21,809 81,93 2
Under $10,000 . . . . . . . . . . . . . . . . . . . . . . . . . . . . . . . . . . . . . . . . . . . . 24,960 426,624 2,501 50,516 42,163 340,632 24,547 411,425 1,964 48,25710,000 under $50,000 . . . . . . . . . . . . . . . . . . . . . . . . . . . . . . . . . . . . 26,014 347,406 17,124 .34,438 27,820 291,400 25,885 327,289 16,435 32,68850,000 under $106,000 . . . . . . . . . . . . . . . . . . . . . . . . . . . . . . . . . . .
1
519 16,4% 2,639 997 1, OCY7 15,605 506 1-3 71 8,
2,526 95 1100,000 or more. . . . . . . . . . . . . . . . . . . . . . . . . . . . . . . . . . . . . . . . . 133 3,095 885 168 185 3,114 132 2 472 894 135
~ntaxable returns. . . . . . . . . . . . . . . . . . . . . . . . . . . . . . . . . . . . . . . . . 13,600 217,503 1 14,287 , 31,245 , 20,362 179,650 J 1.3,600 , 207,720 14,252 29,193
T
N
T
N
T
Footnotes at end of table . For the precise definition of terms and the nature of any limitations, see the "Description of the Sample," "Limitations of the Data," and "Explanationof Classifications and Terms" in the text .
C. *

3
102 SALES OF CAPITAL ASSETS ON INDIVIDUAL RETURNS, 1962RETURNS WITH NET CAPITAL LOS S
Table 10 . -ALL AND LONG-TERM TRANSACTIONS- INCOME, TAX, NET LOSS, AND TRANSACTION DETAIL, BY ASSET TYPE AND SIZE OF ADJUSTED GROSS INCOME LESSCAPITAL GAIN OR LOSS INCLUDED -Continue d
Number of
Adjusted gross income Capital loss carnjmerAll capital asset
transacticns
returns Less TaxableIncome tax
Net capital
Asset type and size of adjusted gross income ~ith net capital income cafte rredits
gainAmount r ofNumbe
Gross salesless capital gain or loss included capital As reported gain or Number of price
gain loss returnstr
ess'included actions
(7~.-d (77..~ (77- .-d (7?.- .-d (7~.-d&11 .. . d,11-) ~11-) ~11. . . ) &11 .. . ) I ~Jz- )
(1) (2) (3) (4) (5) (6) (7) (8) (9) (10)
REAL ESTATE SUBDIVIDED
Grand total . . . . . . . . . . . . . . . . .. . . . . . . . . . . . . . . . . . . . . . . . . . 20,585 184,193 197,941 111,760 32,834 13,748 1,467 8,839 22,885 20`7,72--
Taxable returns, total . . . . . . . . . . . . . . . . . . . . . . . . . . . . . . . . . . . . . 15,444 177,644 187,103 111,271 32,834 9,459 1,266 7,775 17,277 140,75 E
Under $10,000 . . . . . . . . . . . . . . . . . . . . . . . . . . . . : . . . . . . . . . . . . . . . 9,906 57,998 62,953 27,075 5,350 4,954 11,193 66,68 2
0 000 -der $50,000 . . . . . . . . . . . . . . . . . . . . . . . . . . . . . . . . . . . .'
5,137 84 266 88 387 58 23 6
,
14 637 4,120 675 3,313 5,612 65,59 S
000 -der $100,000 . . . . . . . . . . . . . . . . . . . . . . . . . . . . . . . . . . .50,V 336 21;135 21,457 16 486 6799 322 68 1,172 378 4,89 -
$100,000 or more . . . . . . . . . . . . . . . . . . . . . . . . . . . . . . . . . . . . . . . . . 66 14,245 14,306 9,472 6,048 62 23 989 95 3,58 4
Nontaxable returns . . . . . . . . . . . . . . . . . . . . . . . . . . . . . . . . . . . . . . . . . 5,141 6,549 10,839 490 - 4,290 5,608 66,96,'
FARMLAND WITH UNHARVESTED CROPS
Grand total . . . . . . . . . . . . . . . . . . . . . . . . . . . . . . . . . . . . . . . . . . 1,088 8,626 9,426 5,651 1,402 800 2,765 26,37,'
Taxable returns, total . . . . . . . . . . . . . . . . . . . . . . . . . . . . . . . . . . . . . 787 8,724 9,314 5,651 1,402 590 2,465 22,12,'
Under $10,000 . . . . . . . . . . . . . . . . . . . . . . . . . . . . . . . . . . . . . . . . . . . . (-) ( . )
10 , 000 under $50,000 . . . . . . . . . . . . . . . . . . . . . . . . . . . . . . . . . . . 476 6,600 6,941 4,?57 1,1_17 341 2,149 18,21--
50,000 under $100,000 . . . . . . . . . . . . . . . . . . . . . . . . . . . . . . . . . . .
1
(-) (- )
100,000 or more . . . . . . . . . . . . . . . . . . . . . . . . . . . . . . . . . . . . . . . . . 1 102 103 37 13 1 5 E
Nontaxable returns . . . . . . . . . . . . . . . . . . . . . . . . . . . . . . . . . . . . . . . .
OTHER FARMLAND
Grand total . . . . . . . . . . . . . . . . . . . . . . . . . . . . . . . . . . . . . . . . . . 9,192 56,154 62,049 32,593 9,093 5,895 470 1,524 9,792 120,73 5
Taxable returns, total . . . . . . . . . . . . . . . . . . . . . . . ..
. . . . . . . . . . . . . 4,783 49,945 52,336 32,303 9,083 2,391 270 1,372 4,890 53,114
Under $10,000 . . . . . . . . . . . . . . . . . . . . . . . . . . . . . . . . . . . . . . . . . . . . 3,288 16,094 17,379 8,445 1,641 1,2115 3,1811 35 30 ?
10 000 -der $50,000. .* . . . . ***''***'**
1,397 25,094 26,120 17,921 4,636,
1 026 166 1,311 1 , 397,
15 60S
:50,000 -der $100,000 . : . . . . . . . . . . . . . . . .
1
82 5,143 5,210 3,763 1,510 67 89 1,802100,000 or more . . . . . . . . . . . . . . . . . . . . . . . . . . . . . . . . . . . . . . . . . 16 3,614 3,627 2,174 1,297 13 4 56 16 39,5
Nontaxable returns . . . . . . . . . . . . . . . . . . . . . . . . . . . . . . . . . . . . . . . . . 4,409 6,210 9,714 290 - 3,504 M . 4,902 67,621
PROCEEDS FROM PRIOR YEAR INSTALLMENT SALES
Grand total . . . . . . . . . . . . . . . . . . . . . . . . . . . . . . . . . . . . . . . . . . 26,188 391,864 412,306 266,177 82,454 20,442 6,836 56,134 30,787
Taxable returns, total. . . . . . . . . . . . . . . . . . . . . . . . . . . . . . . . . . . . . 21,828 380,347 397,276 265,273 82,454 16,929 5,117 34,664 25,834
Under $10,000 . . . . . . . . . . . . . . . . . . . . . . . . . . . . . . . . . . . . . . . . . . . . 9,361 52,801 60,143, 24,604 4,657 7,343 2,780 17,097 10,16110,000 under $50,000. . . . . . . . . . . . . . . . . . . . . . . . . . . . . . . . . . . . 11 1 318 . 239 , 912 248 , 510 175 1 435 49,043 8,598 2,105 13,250 14,246150,000 -der $100,000. . . . . . . . . . . . . . . . . . . . . . . . . . . . . . . . . . . 11004 64,717 65,574 49,732 20,354 858 201 3,048 1,253
100,000 or more . . . . . . . . . . . . . . . . . . . . . . . . . . . . . . . . . . . . . . . . . 145 22,917 23 , 048 15, 502 8,401 131 32 1,269 174 o
Nontaxable returns . . . . . . . . . . . . . . . . . . . . . . . . . . . . . . . . . . . . . . . . . 4,359 11,517 15,030 904 - 3,513 1,719 21,470 4,953
OTHER TYPE ASSETS
Grand total . . . . . . . . . . . . . . . . . . . . . . . . . . . . . . . . . . . . . . . . . . 225,699 2,711,797 2,870,626 1,777,679 525,510 158,829 25,818 143,509 275,308 196,53 6
Taxable returns, total . . . . . . . . . . . . . . . . . . . . . . . . . . . . . . . . . . . . . 194,742 2,661,745 2,795,595 1,771,207 525,510 133,849 23,055 106,098 239,806 182, 01'~
Under $10,000 . . . . . . . . . . . . . . . . . . . . . . . . . . . . . . . . . . . . . . . . . . . . 102,591 6017,230 670,247 301,151 60,014 63,017 7,941 17,750 119,059 81,323
10 000 -der $50,000 . . . . . . . . . . . . . . . . . . . . . . . . . . . . . . . . . . . . 86 C68 1,541 248 1,606 851 1,091 a80 258,904 65,603 13,831 70,624 112,265 72,832
50,000 under $100,000. . . . . . . . . . . . . . . . . . . . . . . . . . . . . . . . . . .
1
0535; 328 240 332 538 252 256 104,175 4,298 1,068 13,616 6,885 17,91C
100,000 or more. . . . . . . . . . . . . . . . . . . . . . . . . . . . . . . . . . . . . . . . . 1,011 185 , 028 185,959 125,920 75,416 931 215 6,108 1,598 9,952
Nontaxable returns ..
. . . . . . . . . . . . . . . . . . . .. -1 30,957 1 50,051 1 75,032 6,472 - 1 24,980 2,763 1 35,412 1 35,502 14,519
Footnotes at end of table . For the precise definition of terms and the nature of any limitations, see the "Description of the Semple," "Limitations of the Data," and "Explanationof Classifications and Terms" in the text .

RETURNS WITH NET CAPITAL LOSS
SALES OF CAPITAL ASSETS ON INDIVIDUAL RETURNS, 1962
Table 10 . -ALL AND LONG-TERM TRANSACTIONS -INCOME . TAX . NET LOSS, AND TRANSACTION DETAIL, BY ASSET TYPE AND SIZE OF ADJUSTED GROSS INCOME LESSCAPITAL GAIN OR LOSS INCLUDED-Continued
Asset type and size of adjusted gross incomeless capital gain or loss included
All capital asset traaaactions-Contimed
Dpreci- Cost and
ti expense of Gross gain Gross lossa on
sale
(A .. d (77,- .-d (Th- .-d (7h- .-d
~11 .. . ~11-) d.11 . ..
Long-term capital asset transactions
Cost and Gross GrossNumber of Gross
.sales Depreci-
price ation expense of long-term long-termtrans - -ale gain lossactions
(n.-d (7)....-d (7h ...-d (Th.-d (77. . .-d&11 . . . &11~rc) &11 . .. b I I
(1-1) ( .12) (1-3) (14) (15) (16) (17) (18) (19) (20 )REAL ESTATE SUBDIVIDED _ _
Grand total . . . . . . . . . . . . . . . . . . . . . . . . . . . . . . . . . . . . . . . . . . 24,214 227,713 26,309 22,204 20,678 199,667 24,049 219,100 25,841 21,344
Taxable returns, total . . . . . . . . . . . . . . . . . . . . . . . . . . . . . . . . . . . . . 12,028 157,384 12,383 17,100 16,124 138,069 11,995 154,304 12,203 16,56-1
Under $IO,OUO . . . . . . . . . . . . . . . . . . . . . . . . . . . . . . . . . . . . . . . . . . . . 5,517 79,668 2,587 10,1_19 10,399 66,402 5,517 79,325 2,506 9,9751 000 under $50,000 . . . . . . . . . . . . . . . . . . . . . . . . . . . . . . . . . . . .
1 0
5,898 68,971 8,684 6,163 5,316 64,032 5,866 67,250 8,605 5,96650,000 under $106,000 . . . . . . . . . . . . . . . . . . . . . . . . . . . . . . . . . .
1
430 5,029 687 428 324 4,150 430 4,115 670 241100,000 or more . . . . . . . . . . . . . . . . . . . . . . . . . . . . . . . . . . . . . . . . . 182 3,716 426 390 85 3,485 182 3,61 .5 418 380
Nontaxable returns . . . . . . . . . . . . . . . . . . . . . . . . . . . . . . . . . . . . . . . . . 12,187 70,329 13,926 5,1CL4 4,554 61,598 12,054 64,796 13,638 4,782
FARMLAND WITH UNHARVESTED CROPS
Grand total . . . . . . . . . . . . . . . . . . . . . . . . . . . . . . . . . . . . . . . . . . 895 29,553 200 2,495 824 10,499 895 13,564 41 2,22 4
Taxable returns, total . . . . . . . . . . . . . . . . . . . . . . . . . . . . . . . . . . . . . 317 23,741 200 1,511 524 6,248 31? 7,752 41 1,24 0
Under $10,000 . . . . . . . . . . . . . . . . . . . . . . . . . . . . . . . . . . . . . . . . . . . . ( .) - ( .) -10,000 under $50,000. . . . . . . . . . . . . . . . . . . . . . . . . . . . . . . . . . . . 276 19,038 164 713 308 3,996 276 4,733 5 46 750,000 under $100,000 . . . . . . . . . . . . . . . . . . . . . . . . . . . . . . . . . . . - (.) - ( .) - H100,000 or more . . . . . . . . . . . . . . . . . . . . . . . . . . . . . . . . . . . . . . . . . - 7 1 - 5 8 - 7 1 -
Nontaxable returns . . . . . . . . . . . . . . . . . . . . . . . . . . . . . . . . . . . . . . . . . H -
OTHER FARMLAND
Grand total . . . . . . . . . . . . . . . . . . . . . . . . . . . . . . . . . . . . . . . . . . 6,900 141,541 3,812 20,942 8,093 112,477 6,753 133,693 3,089 20,776
Taxable returns, total . . . . . . . . . . . . . . . . . . . . . . . . . . . . . . . . . . . . . 2,306 53,914 2,585 4,302 4,177 47,445 2,306 48,146 2,518 4,137
Under $10, 000 . . . . . . . . . . . . . . . . . . . . . . . . . . . . . . . . . . . . . . . . . . . 1,648 37,347 915 2,523 2,795 31,101 1,648 33,009 915 2,39110,000 under $50,000 . . . . . . . . . . . . . . . . . . . . . . . . . . . . . . . . . . . 520 14,606 1,305 1,674 1,290 14,673 520 13,713 1,241 1,65450,000 "der $100,000 . . . . . . . . . . . . . . . . . . . . . . . . . . . . . . . . . . .
1107 1,639 258 102 78 1,304 107 1,132 254 90
100,000 or more . . . . . . . . . . . . . . . . . . . . . . . . . . . . . . . . . . . . . . . . . 31 322 107 -3 14 367 31 293 107 2
Nontaxable returns . . . . . . . . . . . . . . . . . . . . . . . . . . . . . . . . . . . . . . . . . 4,595 87,628 1,228 16,640 3,916 65,033 4,447 111~ f177 572 16,E40
PROCEEDS FROM PRIOR YEAR INSTALIMENT SALES
Grand total . . . . . . . . . . . . . . . . . . . . . . . . . . . . . . . . . . . . . . . . . . . 40,876 14,500 28,756 40,511 13,24 9
Taxable returns, total . . . . . . . . . . . . . . . . . . . . . . . . . . . . . . . . . . . . . 29,943 14,236 24,462 29,704 13,12 9
Under $10,000 . . . . . . . . . . . . . . . . . . . . . . . . . . . . . . . . . . . . . . . . . . .. Not app licable
12,076 11,204 9,861Not applicable
12,019 21,15 310,000 under $50,000 . . . . . . . . . . . . . . . . . . . . . . . . . . . . . . . . . . . 13,240 2,942 13,239 13,094 1,89 550,000 under $100,000 . . . . . . . . . . . . . . . . . . . . . . . . . . . . . . . . . . .
13,135 69 1,200 3,115 6 6
100,000 or more . . . . . . . . . . . . . . . . . . . . . . . . . . . . . . . . . . . . . . . . .
,
.1,492 22 163 1,486 1 5
Nontaxable returns . . . . . . . . . . . . . . . . . . . . . . . . . . . . . . . . . . . . . . . . . 10,933 263 4,293 10,807 120
OTHER TYPE ASSETS
Grand total . . . . . . . . . . . . . . . . . . . . . . . . . . . . . . . . . . . . . . . . . . 14,189 298,537 125,696 436,280 151,317 151,943 12,528 219,849 83,436 210,065
Taxable returns, total . . . . . . . . . . . . . . . . . . . . . . . . . . . . . . . . . . . . . 12,236 258,723 71,217 364,038 130,020 138,434 10,579 190,629 43,400 174,254
Under $10,000 . . . . . . . . . . . . . . . . . . . . . . . . . . . . . . . . . . . . . . . . . . . . 5,529 114,23? 16,006 187,047 65,255 66,553 4,524 92,013 14,489 87,416101000 under $50 `000 . . . . . . . . . . . . . . . . . . . . . . . . . . . . . . . . . . . 6,435 109,945 45,855 153,438 59,979 49,041 5,799 71,251 23,365 74,37250 , 000 under $100,000. . . . . . . . . . . . . . . . . . . . . . . . . . . . . . . . . . .
1
231 21,452 5,247 15,613 3,828 15,762 216 17,87B 4,027 7,397100,000 or more . . . . . . . . . . . . . . . . . . . . . . . . . . . . . . . . . . . . . . . . . 41 13,088 2,103 7,989 958 7,077 41 9,487 1,519 5,069
Nontaxable returns . . . . . . . . . . . . . . . . . . . . . . . . . . . . . . . . . . . . . . . . . 1 1,953 1 39,615 1 54,752 72,193 1 21,29? 1 13,509 1,949 29,220 40,036 35,81 1
103
'Die to the reporting of more than one'asset type by some taxpayers, the number of returns, adjusted gross income, taxable income, income tax after credits, net capital loss,and capital loss carryover for "All asset types" will be less than the sum of these items for the specific asset types .
) An azterisk in a cell denotes that the estimate is not shown separately because of high sampling variability . However, the data are included in the appropriate -totals .A dash in a cell indicates that either there are no data for that item or it amounts to less than $500 .
NOTE ; For the orecise definition of terms and the nature of any limitations, see the "Description of the Sample," "Limitations of the Data," and "Explanation of Classificationsand Terr8 " in the teXt .
Detail in the t ablvs may not add to totals because of rounding .
L

104 SALES OF CAPITAL ASSETS ON INDIVIDUAL RETURNS, 1962RETURNS WITH NET CAPITAL LOSS
Table 11 --ALL AND LONG-TERM TRANSACTIONS -INCOME, TAX, NET LOSS, AND TRANSACTION DETAIL, BY ASSET TYPE AND SIZE OF ADJUSTED GROSS INCOME PLUSCAPITAL GAIN OR LOSS EXCLUDE D
Adjusted gross income Capital loss carryo~ercapital asset
A"Number of
transaction s
returns Plus Taxable Income taxNet capital
Asset type and size of adjusted gross income ith net capital income afte rcredits
loss Gross sale splus capital gain or loss excluded capi,tal As reported gain or
Number ofAmount Number of
priceloss loss
returnst ans-
excluded actions(7). ..-d (Th-.-d (7h ...-d (7?-d (7h--d (Th- .-d (77. ..-dd.11.. . bil . .. d.11-.) 6.11.. . ~11 . .. bIl .. . d.11ars)
'(1) (2 )
ALL ASSET TYPES
Grand total . . . . . . . . . . . . . . . . . . . . . . . . . . . . . . . . . . . . . . . . . . 1,485,425 18,562,094 16,980,839 12,520,283 3,583,894 938,403 140,124 687,278 6,297,243 17,708,50:
Taxable returns, total . . . . . . . . . . . . . . . . . . . . . . . . . . . . . . . . . . . . . 1,289,095 18,237,933 16,951,458 1-2,497,833 3,583,894 804,679 123,322 554,109 5,461,458 14,797,21-
Under $10,000 . . . . . . . . . . . . . . . . . . . . . . . . . . . . . . . . . . . . . . . . . . . . 681,711 4,474,657 3,524,238 2, 371, 809 483,191 409,228 48,368 182,798 2,650,085 6,537,26-10 000 under $50,000 . . . . . . . . . . : . . . . . . . . . . . . . . . . . . . . . . . . . 573,894 11,054,032 10,749,399 8,015,280 2,106,911 368,053 67,186 279,833. 2,553,9D9 6,696,85(50:000 under $100,000 . . . . . . . . . . . . . . . . . . . . . . . . . . . . . . . . . . .
1
28,926 1,917,184 1,889,239 1,530,140 646,267 23,461 6,490.56,357 209,601 1,113,86-,
100,000 or more . . . . . . . . . . . . . . . . . . . . . . . . . : . . . . . . . . . . . . . . . 4,564 792,060 788,581 580,605 347,505 3,937 1,278 35,121 47,863 449,212,
Nontaxable returns . . . . . . . . . . . . . . . . . . . . . . . . . . . . . . . . . . . . . . . . . 196,331 324,161 29,381 22,450 133,724 16,802 133,169 835,785 2,911,29C
CORPORATE STOC K
Grand total . . . . . . . . . . . . . . . . . . . . . . . . . . . . . . . . . . . . . . . . . . 994,126 14,368,570 13,153,254 9,919,098 2,891,662 656, 0`72 90,939 444,368 4,911,573 13,663,665
Taxable returns, total . . . . . . . . . . . . . . . . . . . . . . . . . . . . . . . . . . . . . 910,131 14,190,940 13,11Y7,751 9,910,655 2,891,662 594,777 82,531 374,851 4,321,248 11,596,23S
Under $10,000 . . . . . . . . . . . . . . . . . . . . . . . . . . . . . . . . . . . . . . . . . . . . 424,918 2,895,560 2,224,673 1,587,191 325,756 268,144 30,996 124,277 2,052,715 5,129,90510 ' 000 under $50,000 . . . . . . . . . . . . . . . . . . . . . . . . . . . . . . . . . . . 456,727 8,996,478 8,706,616 6,538,623 1,731,178 302,768 45,550 176,571 2,059,649 5,229,16 (50, 000 under $100, 000. . . . . . . . . . . . . . . . . . . . . . . . . . . . . . . . . . . 24,577 1,634,089 1,605,276 1,300,919 548,873 20,402 4,Tn 43,487 171,563 916,18 S100,000 or more . . . . . . . . . . . . . . . . . . . . . . . . . . . . . . . . . . . . . . . . . 3,909 664,813 661,166 483,922 265,855 3,464 1,008 30,517 37,320 320,98 f
Nontaam.ble returns . . . . . . . . . . . . . . . . . . . . . . . . . . . . . . . . . . . . . . . . . 83,996 177,630 497 8,443 - 61,294 8,408 69,516 590,3126 2,067,42 E
U .S . GOVERNMENT OBLIGATIONS
Grand total . . . . . . . . . . . . . . . . . . . . . . . . . . . . . . . . . . . . . . . . . . 13,121 316,644 284,622 217,928 81,088 6,630 2,322 8,440 18,789 317,24 6
Taxable returns, total . . . . . . . . . . . . . . . . . . . . . . . . . . . . . . . . . . . . . 11,553 310,178 278,440 217,847 81,088 7,696 1,796 7,776 17,214 311,85 1
Under $10,000 . . . . . . . . . . . . . . . . . . . . . . . . . . . . . . . . . . . . . . . . . . . . 3,633 29,422 8,550 14,564 3,436 2,254 4,403 30,02 910,000 -der 50,000 . .
*-* - . . . . . . . . . . . .16,635 152,780 145,227 109,232 29,492 4,398 914 4, 0`73 10,546 208,84 9
lOO,0OO . : :50,000 under
1979 68,219 66,274 52,056 22,192 782 221 1,613 1,70`7 ~8,616
100,000 or more . . . . . . . . . . . . . . . . . . . . . . . . . . . . . . . . . . . . . . . . . 306 59,757 58,389 41,994 25,968 262 97 1,473 558 24,35 8
Nontaxable returns . . . . . . . . . . . . . . . . . . . . . . . . . . . . . . . . . . . . . . . . . 1,568 6,465 6,182 80 - 935 1,576 5,394
STATE AND LOCAL SECURITIES
Grand total . . . . . . . . . . . . . . . . . . . . . . . . . . . . . . . . . . . . . . . . . . 16,650 576,441 529,375 402,588 176, 047 10,9?7 2,596 19,525 34,912 285,465
Taxable returns, total - -- ------- --------------------- IL qpq SA17 qnn 925Aq7 Lni-sqq 17A-(U7 1 n- w/. 249A 18~441 32~994 278~775
Under $10,000. . . . . . . . . . . . . . . . . . . . . . . . . . . . . . .. . . . . . . . . . . . . . 3,943 33,335 12,li2 18,276 3,813 2,095 7,142 28,35110,000 under $50,000 . . . . . . . . . . . . . . . . . . . . . . . . . . . . . . . . . . . . 8,271 201,197 188,580 145,792 41,118 5,961 1, 0`70 6,467 16,544 128,92350,000 under $100,000 . . . . . . . . . . . . . . . . . . . . . . . . . . . . . . . . . . .
1
1,950 139,761 135,154 105,130 44,923 1,602 473 4,321 5,657100, 000 or more . . . . . . . . . . . . . . . . . . . . . . . . . . . . . . . . . . . . . . . . . 826 193,6CF7 189,791 132,401 86,193 717 245 7,123 3,551 62,308
Nontaxable returns . . . . . . . . . . . . . . . . . . . . . . . . . . . . . . . . . . . . . . . . . 1,660 8,540 3,678 969 - 603 2,017 6,689
OnIER BONDS, NOTES, AND DEBENTURES
Grand total . . . . . . . . . . . . . . . . . . . . . . . . . . . . . . . . . . . . . . . . . . 21,348 406,919 289,142 272,189 92,959 17,233 3,098 32,145 35,751 382,453
Taxable returns, total . . . . . . . . . . . . . . . . . . . . . . . . . . . . . . . . . . . . . 18,721 395,618 337,806 271,604 92,959 14,762 2,472 15,281 31,763 220,465
Under $10,000. . . . . . . . . . . . . . . . . . . . . . . . . . . . . . . . . . . . . . . . . . . . 8,365 63,873 26,756 34,155 7,268 6,450 1,010 5,959 12,453 41,40910 ' 000 under $50,000. . . . . . . . . . . . . . . . . . . . . . . . . . . . . . . . . . . 9,145 20`7,333 191,441 148,840 41,185 7,277 1,177 5,498 16,913 151,88350,000 under $100,000 . . . . . . . . . . . . . . . . . . . . . . . . . . . . . . . . . . .
i
902 63,547 61,074 48,715 20,596 769 224 1,616 1,663 14,467100,000 or more. . . . . . . . . . . . . . . . . . . . . . . . . . . . . . . . . . . . . . . . . 308 60,864 58,535 39,894 23,910 286 61 2,208 734 12,705
Nontaxable returns. . . . . . . . . . . . . . . . . . . . . . . . . . . . . . . . . . . . . . . . . 2,627 11,301 -48,665 585 - 2,451 3,988 161,988
INSURANCE AND ANNUITIES
Grand total . . . . . . . . . . . . . . . . . . . . . . . . . . . . . . . . . . . . . . . . . . 1,200 29,196 26,238 20,9% 6,491 851 131 545 1,915 5,489
Taxable returns, total . . . . . . . . . . . . . . . . . . . . . . . . . . . . . . . . . . . . . 1,199 29,056 26,709 20,996 6,491 850 131 545 1,914 5,489
Under $10,000 . . . . . . . . . . . . . . . . . . . . . . . . . . . . . . . . . . . . . . . . . . . .
( *10 000 under $50,000. . . . . . . . . . . . . . . . . . . . . . . . . . . . . . . . . . .:
1,033 23,550 21,434 16,568 4,515 778129 539
~72 91 4,96 650 000 under $106,000. . . . . . . . . . . . . . . . . . . . . . . . . . . . . . . . . . .
157 3,607 3,690 3,127 1,328 45 75 400
100,000 or more . . . . . . . . . . . . . . . . . . . . . . . . . . . . . . . . . . . . . . . . . 6 1,054 1,055 892 565 5 2 5 6 3 5
Nontaxable returns . . . . . . . . . . . . . . . . . . . . . . . . . . . . . . . . . . . . . . . . .
OPTIONS TO BUY OR SELL
Grand total . . . . . . . . . . . . . . . . . . . . . . . . . . . . . . . . . . . . . . . . . . 5,916 94,991 77,635 61,942 17,563 4,343 1,115 4,155 29,531 302,51 9
Taxable returns, total . . . . . . . . . . . . . . . . . . . . . . . . . . . . . . . . . . . . . 5,?09 94,377 79,777 61,942 17,563 4,139 1,115 4,155 29,324 297,17 8
Under $10,000 . . . . . . . . . . . . . . . . . . . . . . . . . . . . . . . . . . . . . . . . . . 2,369 20,372 9,588 10,618 2,266 1,408 20,572 243,044~ t 5O ~O . . . . . . . . . . . . . . . . . . . . . . . . . . . . . . . . . . .10 ' d
= =3,222 63,928 59,912 44,005 11,858 2,628 435 2,292 8,588 53,29 0:~ , .(~ :I COG
. . . . . . . . . . . . . . . . . . . . . . . . . . . . . . . . . .50,
1
95 6,343 6,276 4,950 2,037 82 37 199 129 105100,000 or more . . . . . . . . . . . . . . . . . . . . . . . . . . . . . . . . . . . . . . . . . 23 3,735 4,001 2,369 1,402 21 10 562 35 74 0
Nontaxable returns . . . . . . . . . . . . . . . . . . . . . . . . . . . . . . . . . . . . . . . . . ( .) - - ( .) - - ( . )
Footnotes at end of table . For the precise definition of terms and the nature of any limitations, see the '-Description of the Sample," "Limitations of the Data, " and "Explanationof Classifications and Terms" in the text .

RETURNS WITH NET CAPITAL LOSS
SALES OF CAPITAL ASSETS ON INDIVIDUAL RETURNS, 1962 10,
Table 11 . -ALL AND LONG-TERM TRANSACTIONS -INCOME . TAX, NET LOSS, AND TRANSACTION DETAIL, BY ASSET TYPE AND SIZE OF ADJUSTED GROSS INCOME PLUSCAPITAL GAIN OR LOSS EXCLUDED -Continued
Asset type and size of adjusted gross incomeplus capital gain or loss excluded
A21 capital asset transactions-Continued
Depre i- Costand
ationc expense of Gross gain Gross los ssal e
(lh- .-d (Th .. .-d (7b. ..-d (M-d6.11 . . . ~11 . . ~11-3 d.11 . ..
Long-term capital asset transaction s
ci- Gast and Gross GrossNumber of Gross .sales Depretrans- price ation expense Of long-term long-term
sale gain los sactions
(Th...-d (r~-d (Th...-d (n.-d r T~.-dd.11 . .. &11.. . &Ji-) d.11-3 d.11 .. .
ALL ASSET TYPES'(11) (12) (1-3) (14) (15) 1 (16) (17) (is) (19) (20 )
Grand total . . . . . . . . . . . . . . . . . . . . . . . . . . . . . . . . . . . 259,952 20,174,527 1,370,230 3,889,888 3,983,761 9,430,345 252,552 11,388,799 1,099,221 2,921,426
Taxable returns, total . . . . . . . . . . . . . . . . - . . . . . . . . . . . . . . . . . . 165,442 16,747,943 1,121,609 3,212,764 3,450,245 7,834,914 162,280 9,383,199 996,105 2,409,983Under $10,000 . . . . . . . . . . . . . . . . . . . . . . . . . . . . . . . . __ . . . . . . . 109,815 7,731,712 368,288 1,727,9,35 1,571,776 3,025,899 107,145 3,995,323 264,733 1,255,85 410,000 under $50,000 . . . . . . . . . . . . . . . . . . . . __ . . . . . . . . . . . 50,951 7,380,125 564,396 1,237,081 1,686,3BB 3,760,080 50,486 4,290,B94 460,080 953, Ooo50,000 under $100,000 . . . . . . . . . . . . . . . . . . . . . . . . . . . . . . . . . . .
13,854 1,175,455 123,988 175,394 154,296 698,750 3,828 740,962 110,767 139,74 6
100,000 or more. . . . . . . . . . . . . . . . . . . . . . . . . . . . . . . . . . . . . . . . 822 460,651 64,938 72,354 3?,786 350,165 920 356;019 60,525 61,38 3
Nontaxable returns . . . . . . . . . . . . . . . . . . . . . . . . . . . . . . . . . . . . . . . . 94,510 31426,5B4 246,621 677,124 533,516 1,595,431 90.272 2,005,600 203,117 511,44 3
CORPORATE STOCK
Grand total . . . . . - . . . . . . . . . . . . . . . . . . . . . . . . . . . . . . . . 15,463,821 937,464 2,746,215 2,949,556 6,636,600 8,250,212 735,522 2,155,862
Taxable returns, total . . . . . . . . . . . . . . . . . . . . . . . . . _ . . . . . . . . . . 13,131,572 816,761 2,359,495 2,622,510 5,850,656 11 7,054,525 642,471 1,852,563Under $10,000 . . . . . . . . . . . . . . . . . . . . . . . . . . . . . . . . . . . . . . . . . . . 5,988,457 273,466 1,135,443 1,143,108 2,071,906 2 752 663
,
185,065 72286610,000 under ~50,000. . . . . . . . . . . . . . . . . . . . . . . . . . . . . . .
V5,836,397 399 , 431 1,DD9,899 1,326,890 2,974,1(,2 3 1449 :940 325,7?1
,
1658040,000 under $100,000. . . . . . . . . . . . . . . . . . . . . . . . . . . . . . . . . . .$100 000 or more . . . . . . . . . . . . . . . . .
~974
,456
3 294,598 153,451 123,662 557,660 W, 598 836 84 899
,126 621
,, . . . . . . . . . . . . . . . . . . . . . . . ,2613 49,247 60,701 28,850 246,929 253,086 46,735 05 45 3
Nontaxable returns . . . . . . . . . . . . . . . . . . . . . . . . . . . . . . . . . . . . . .
2
332,246 120,723 386,720 327,047 986,144 L1,195,68? 93,051 303,299
U .S . GOVERWENT OBLIGATIONS
Grand total . . . . . . . . . . . . . . . . . . . . . . . . . . . . . . . . . . . . . 319,290 2,081 4,128 14,203 151,919 151,053 1,577 3,713
Taxable returns, total . . . . . . . . . . . . . . . . . . . . . . . . . . . . . . . . . . . . . 31.3,617 2,061 3,829 12,797 147,755 149,61? 1,574 3,438Under $10,000. . . . . . . . . . . . . . . . . . . . . . . . . . . . . . . . . . . . . . . . . . . . 31,408 181 1,561 2,956 22,963 24,264 142 1 44310,000 =der $50,000__ . . . . . . . . . . . . . . . . . . . . . . . . . . . . . .
6209 364 1,189 1,?26 7,979 72,391 73,054 816
,
1 48050,000 und- $10 ,000 . . . . . . . . . . . . . . . . . . . . . . . . . . . . . . . . .
148 :512 499 395 1,325 36,085 36, O(Y. 450
,3721001000 or more . . . . . . . . . . . . . . . . . . . . . . . . . . . . 24,313 192 147 447 16,316 16,293 165 142
Nontaxable returns . . . . . . . . . . . . . . . . . . . . . . . . . . . . . . . . . . . . . . . . 5,673 20 298 1,4w 4,164 4,436 3 275
STATE AND LOCAL SECURITIES
Grand total . . . . . . . . . . . . . . . . . . . . . . . . . . . . . . . . . . . . . . 290,577 7,363 12,476 30,291 230,094 233,965 6,730 10,612
Caxable returns, total . . . . . . . . _ . . . . . . . . . . . . . . . . . . . . . . . . . . . 283,500 7,132 11,857 28,463 224,61? 228,327 6,560 10,07 1Under $10,000 . . . . . . . . . . . . . . . . . . . . . . . . . . . . . . . . . . . . . . . . . . . . 30,391 1,122 3,162 5,342 20,061 21,679 967 2 58 410 000 under $50,000 . . . . . . . . . .50:000 und~ $100 000 . . . . *** . . . . . * *
1
130,896 3,476 5,449 14,~Ol 95 79 8
:97 327 3 141
1
,4 67 1
, , . . . . . . . __ . . . . . . . . . . . . . . . 59,732 1,341 1,880 5,261 51 3.34 51,577 1 ,292 1153 5100,000 or more . . . . . . . . . . . . . . . . . . . . . . . . . . . . . . . . . . . . . . . . .
1.62,461 1,193 1,366 3,359 57,623 57,745 1,160 1,2a2
iontaxable returns. . . . . . . . . . . . . . . . . . . . . . . . . . . . . . . . 7,077 231 619 1,828 5,267 5,638 170 54 0
OTIM BONM, LUTES, AND DEBENTURES
Grand total . . . . . . . . . . . . . . . . . I . . . . . . . . . . . . . . . . . . . . . . ..
453,320 6,630 77,859 20,874 122,341 165,366 5, 123 46,30?
axable returns, total . . . . . . . . . . . . . . . . . . . . . . . . . . . . . . . . . . . . 242,089 6,563 26,349 16,769 93,943 105,315 5,046 16,57 7Under $10,000. . . . . . . . . . . . . . . . . . . . . . . . . . . . . . . . . . . . . 52,417 1,456 12,478 5,902 15,611 19 1 220 1,220 4 84 310,000 under ~50,000 . . . . . . . . . . . . . . . . . . . . 161,361 3,891 13,386 10,905 55,948 62,881 2,696
,9,644
50~000 under $100,000 . . . . . . . . . . . . . . . . . . .
115,%4 509 1,674 1,360 12,340 13 , 260 478 1,46 5100,000 or more . . . . . . . . . . . . . . . . . . . . . . . . . . . . . . . . . . . . . . . .
1012,747 707 812 603 10,0" 9,954 652 62 5
ontaxable returns . . . . . . . . . . . . . . . . . . . . . . . . . . . . . . . . . . . . 211,232 267 49,511 2,103 28,398
o
60,051 77 31,73 0
INSURANCE AND ANNUITIES
Grand total . . . . . . . . . . . . . . . . . . . . . . . . . . . . . . . . . ..
. . . . . . 5,912 915 1,464
1
6 3,966 801 1,271
axable returns, toted . . . . . . . . . . . . . . . . . . . . . . . . . . . . . . . . . . . . 5,92d 915 1,464 1: .6
::
::6 3,966 801 1,271Under $10, 000 . . . . . . . . . . . . . . . . . . . . . . . . . . . . . . . . . . . . . . . . . .
~(10, 000 under $50, 000 . . . . . . . . . . . . . . . . . . . . . . . . . . . . . . . . .6
- 4755 605 1,439 1,059 3,2171A 3,647 696 25 2150,000 under $10 ,000 . . . . . . . . . . . . : . . . . . . . . . . . . . . . . . . . . .
1 1339 76 17 61 347 288 71
,1 3200,000 or more . . . . . . . . . . . . . . . . . . . . . . . . . . . _ . . . . . . . . . . . 31 10 6 6 35 1. 31 10 6
ontaxable returns . . . . . . . . . . . . . . . . . . . . _ . . . . . . . . . . . . . . . . . . .
OPTIO14S TO BUY OR SELL
Grand total . . . . . . . . . . . . . . . . _ . . . . . . . . . . . . . . . . . . . . . . . . 3071010 3,563 8,053 3 127 3,662 5,039 523 1,901
axab2e returns, total. . . . . . . . . . . . . . . . . . . . . . . . . . . . . 301,085 3,313 7,219 3,127 3,662 5,039 523 1,901Under $10,000. . . . . . . . . . . . . . . . __ . . . . . . . . . . . . . . . . . . . . . . . . 245,141 2,129 4,226 559 1,162 1 676 16 53210,000 under $50,000. . . . . . . . . . . . . . I . . . . . . I . . . . . . . . . . . . . 55,160 938 2,809 2,492 2,38-1
,3 189 484 1 28 7
50,DDO -der $looom . . . . . . . . . . . . . . . . . . . . . . .. . . . . . . . . . . . .
1213 19 127 53 101
,127 15
,
/ 1100,000 or more . . . . . . . . . . . . . . . . . . . . . . . . . . . . . . . . . . . . . . . . 1o 570 227 57 23 12 47 6 4 0
~ntaxable returns . . . . . . . . . . . . . . . . . . . . . . . . . . . . . . . . . . . . . . .(.) (~) I ( .)
o
T
N
T
T
Footnows, at end of table . For the pr~ise definition of terms and the nature of any limitations, see the ,Description of the Sample," "Limitations of the Data," and -'Explanationof Classifications and Terms,, in the text .

3
106 SALES OF CAPITAL ASSETS ON INDIVIDUAL RETURNS, 1962RETURNS WITH NET CAPITAL LOSS
Table 11 . -ALL AND LONG-TERM TRANSACTIONS - INCOME, TAX, NET LOSS, AND TRANSACTION DETAIL, BY ASSET TYPE AND SIZE OF, ADJUSTED GROSS INCOME PLUSCAPITAL GAIN OR LOSS EXCLUDED -Continued
.sset type and size of adjusted gross incom eplus capital gain or loss excluded
Number o f
return s
with ne t
capital
loss
Adjusted gross income
Plu scapital
As reported gain or
los s
exclude d
(Th.. :-d (T~- d
d.11 d.11.. .
Taxableincome
77...-d
Income taxaftercredits
(Th--.dd.11 . ..
Net capital
loss
(Th...- d~11 . .. )
Capital loss carryover
.-tNumber ofreturns
(7h- .-d&11 .. . )
All capital assettransactions
Number of Gross.sale s
trans- pr..e
actions
(n. ..- dd.11srs )
(3) (4) (5) (6) (7) (8) (9) (10)CaAWDITIES INCLUDING FUTURE CONTRACTS
Grand total . . . . . . . . . . . . . . . . . . . . . . . . . . . . . . . . . . . . . . . . . . 14,867 212,622 176,113 150,159 42,784 11,279 2,898 19,490 92,008 519,896
Taxable returns, total . . . . . . . . . . . . . . . . . . . . . . . . . . . . . . . . . . . . . 12,466 211,202 185,022 149,709 42,784 9,766 2,757 16,564 80,430 464,194
Under $10,000 . . . . . . . . . . . . . . . . . . . . . . . . . . . . . . . . . . . . . . . . . . . . . 4,973 37,197 20,874 22,710 5,141 3,464 (.) 34,603 108,816000 under . . . . . . . . . . . . . . . . . . . . . . . . . .tlO 7,143 147,530 138,355 106,604 28,638 5,992 1,880 8,866 43,a79 319,22 2,
50 000 -der 100,000 . . . . . . . . . . . . . . . . . . . . . . . . . . . . . . . . . . . 311 21,727 20,869 17,137 7,374 272 118 2,521 1,497 28,48 5$100,GOO or more . . . . . . . . . . . . . . . . . . . . . . . . . . . . . . . . . . . . . . . . . 39 4,748 4,925 3,258 1,630 38 13 933 252 7,67 0
Nontaxable returns . . . . . . . . . . . . . . . . . . . . . . . . . . . . . . . . . . . . . . . . . 2,401 1,420 -8,909 450 - 1,513 11,578 55,704
CAPITAL GAIN DIVIDENDS
Grand total . . . . . . . . . . . . . . . . . . . . . . . . . . . . . . . . . . . . . . . . . . 230,969 3,702,018 3,525,160 2,639,432 784,685 151,977 33,475 140,372 247,828
Taxable returns, total . . . . . . . . . . . . . . . . . . . . . . . . . . . . . . . . . . . . . 213,986 3,663,030 3,509,755 2,635,803 784,885 139,668 29,8S4 128,643 227,292
Under $10,000 . . . . . . . . . . . . . . . . . . . . . . . . . . . . . . . . . . . . . . . . . . . . 87,431 586,984 490,287 313,999 63,199 55,468 9,369 43,716 95,77410 ' 000 under $50,000 . . . . . . . . . . . . . . . . . . . . . . . . . . . . . . . . . . . 117,872 2,408,497 2,357,050 1,792,776 479,312 77,025 18,403 60,213 122,70950,000 der $100,000 . . . . . . . . . . . . . . . . . . . . . . . . . . . . . . . . . . .
1
?,589 494,212 489,604 398,322 166,671 6,199 1,792 16,664 7,708100,000 or ore . . . . . . . . . . . . . . . . . . . . . . . . . . . . . . . . . . . . . . . . . 1,093 173,338 172,814 1.30,707 75,702 976 319 8,051 1,102
Nontaxable returns . . . . . . . . . . . . . . . . . . . . . . . . . . . . . . . . . . . . . . . . . 16,983 38,988 15,405 3,629 - 12,308 3,591 11,729 20,536
SHARE OF CAPITAL GAIN (IOSS) FEW PARTNERSHIPSAND FIDUCIARIES
Grand total . . . . . . . . . . . . . . . . . . . . . . . . . . . . . . . . . . . . . . . . . . 94,067 1,808,922 1,640,512 1,266,673 418,011 55,299 10,773 79,262 120,736
Taxable returns, total . . . . . . . . . . . . . . . . . . . . . . . . . . . . . . . . . . . . . 83,716 1,777,695 1,645,466 1,264,651 418,011 48,421 9,581 69,487 108,01-3
Under $10,000. . . . . . . . . . . . . . . . . . . . . . . . . . . . . . . . . . . . . . . . . . . . 28,294 201,955 119,135 105,673 22,357 14,198 35,4080,000 -der $50,000. .
-***- . . .--- *
1
49,747 1,082,318 1,034,925 785,585 2a5,737 29,69? 5,767 32,865 65,573:50~000 under $100,000 . :
1
4,721 319,561 314,339 249,928 105,377 3,704 1, 041 11,477 5,867100,000 or more . . . . . . . . . . . . . . . . . . . . . . . . . . . . . . . . . . . . . . . . . 955 173,861 177,067 123,464 74,539 822 270 14,797 1,16 5
Nontaxable returns . . . . . . . . . . . . . . . . . . . . . . . . . . . . . . . . . . . . . . . . . 10,351 31,227 -4,954 2, 022 - 6,878 12,72 3
CAPITAL GAIN DISTRIBUTIONS FROM 2AALL BUSINESS CORPORATIONS
Grand total . . . . . . . . . . . . . . . . . . . . . . . . . . . . . . . . . . . . . . . . . . 7,377 132,002 122,048 93,714 30,886 4,649 1,158 2,781 9,86 3
Taxable returns, total . . . . . . . . . . . . . . . . . . . . . . . . . . . . . . . . . . . . . 7,210 131,337 121,551 93,714 30,886 4,484 1,158 2,781 9,662
Under $10,000 . . . . . . . . . . . . . . . . . . . . . . . . . . . . . . . . . . . . . . . . . . . . 2,877 18,984 13,576 11,132 2,355 1,571 3,89710 000 under $50,000 . . . . . . . . . . . . . . . . . . . . . . . . . . . . . . . . . . . 3,997 78,593 75,774 56,935 15,013 2,631 516 2,134 5,32 550,000 -der $100,000. . . . . . . . . . . . . . . . . . . . . . . . . . . . . . . .
1
288 19,464 18,928 15,463 6,593 241 41 186 36 5100,000 or more . . . . . . . . . . . . . . . . . . . . . . . . . . . . . . . . . . . . . . . . . 48 14,276 13,274 10,184 6,925 41 8 297 76
Nontaxable returns . . . . . . . . . . . . . . . . . . . . . . . . . . . . . . . . . . . . . . . . .
LIQUIDATION DISTRIBUTIONS
Grand total . . .. . . . . . . . . . . . . . . . . . . . . . . . . . . . . . . . . . . . . . . . 18,586 320,736 261,146 215,835 69,327 14,040 1,921 22,189 22,424
Taxable returns, total . . . . . . . . . . . . . . . . . . . . . . . . . . . . . . . . . . . . . 16,758 312,519 270,098 215,733 69,327 12,340 1,223 9,888 20,589
Under $10,000 . . . . . . . . . . . . . . . . . . . . . . . . . . . . . . . . . . . . . . . . . . . . 7,371 54,021 22,783 28,542 6,206 5,417 9,74010,000 under $50,000 .
*** . . . . . . . . ---***-- *- *
6,542 177,171 169,316 127,527 34,066 6,191 728 3,687 9,81 250,000 under $lOOOOO : . . .
1
673 47,410 45,943 36,880 15,546 578 160 1,461 797100,000 or more . . . . . . . . . . . . . . . . . . . . . . . . . . . . . . .. . . . . . . . . . . 173 33,917 32,055 22,783 13,509 154 28 1,036 240
Nontaxable returns . . . . . . . . . . . . . . . . . . . . . . . . . . . . . . . . . . . . . . . . . 1,827 9,217 -8,952 102 - 1,700 1,834
RETIRRMn PLAN DISTRIBUTIONS
Grand total . . . . . . . . . . . . . . . . . . . . . . . . . . . . . . . . . . . . .. . . .. . . 1,872 39,630 34,418 25,760 7,021 1,571 209 1,098 1,91 1
Taxable returns, total . . . . . . . . . . . . . . . . . . . . . . . . . . . . . . . . . . . . . 1,649 38,365 33,154 25,735 7,021 1,347 1,68 8
Under $10,000 . . . . . . . . . . . . . . . . . . . . . . . . . . . . . . . . . . . . . . . . . . . .
lO,OD0 under $50,000 . . . . . . . . . . . . . . . . . . . . . . . . . . . . . . . . . . . . 1,420 31,902 27,661 21,480 5,489 1,131 1,45 350,000 =der $10b,000 . . . . . . . . . . . . . . . . . . . . . . . . . . . . . . . . . . .
1
52 3,932 3,767 2,788 1,154 41 56100,000 or more . . . . . . . . . . . . . . . . . . . . . . . . . . . . . . . . . . . . . . . . . 6 924 894 457 209 5 8
Nontaxable returns . . . . . . . . . . . . . . . . . . . . . . . . . . . . . . . . . . . . . . . . . Z,
LIVESTOCK
Grand total. . . . . . . . . . . . . . . . . . . . . . . . . . . . . . . . . . . . . . . . . . 57,517 276,442 263,264 143i354 40,242 17,262 1,455 8,520 112,533 53,785
rax,able returns, total . . . . . . . . . . . . . . . . . . . . . . . . . . . . . . . . . . . . . 29,582 236,732 229,283 141 ;3SO 40,242 8,288 944 5,367 57,554 27,175
Under $10,000. . . . . . . . . . . . . . . . . . . . . . . . . . . . . . . . . . . . . . . . . . . . 25,458 123,9411
118,746 58,036 10,782 5,904 48,949 19,56910 ' 000 under $50,000 . . . . . . . . . . . . . . . . . . . . . . . . . . . . . . . . . . . . 3,756 73,197 71,491 55, 00`7 14,445 2, 076 433 1,913 7,522 6,15550,000 under $106,000 . . . . . . . . . . . . . . . . . . . . . . . . . . . . . . . . . . .
1288 19,330 19,209 14,972 6,221 238 93 812 862 968
100~ 000 or more . . . . . . . . . . . . . . . . . . . . . . . . . . . . . . . . . . . . . . . . . so 20,264 19,837 13,365 8,795 70 17 709 221 484
Nontaxable returns. . . . . . . . . . . . . . . . . . . . . . . . . . . . . . . . . . . . . . . . . 27,935 39,710 33,960 1,974 - 8,974 54,984 26,610
Footnotes at end of table . For the precise definition of terms and the nature of any limitations, see the "Description of the Sample," "Limitations of the Data," and "Explanationof Classifications and Terms- in the text .


3
108RETURNS WITH NET CAPITAL LOSS
SALES OF CAPITAL ASSETS ON INDIVIDUAL RETURNS, 1962
Table II .--ALL AND LONG-TERM TRANSACTIONS - INCOME, TAX, NET LOSS, AND TRANSACTION DETAIL, BY ASSET TYPE AND SIZE OF ADJUSTED GROSS INCOME PLUSCAPITAL GAIN OR LOSS EXCLUDED -Continue d
Adjusted gross income Capital loss carrymer All capital asse t
Number of transactions
ireturns Plus Taxable Income tax
Net capitalAsset type and size of adjusted gross mcomc~ with net capital income after
plus capital gain or loss excluded capital As reported gain or credits lossAmount N-ber of
Gmss sale s
loss lossNumber o freturns tr -
.pric e
excluded actions(Th- .-d (n...-d (77.-d (Th--d (Th_.~ (7h-.-d (T~-d
b11 . .. d.11-) ~11-) d.11.,.) bli . . . ) ~11 ... )
R AIM COAL (8) (9) (10)TIMBE
Grand total. . . . . . . . . . . . . . . . . . . . . . . . . . . . . . . . . . . . . . . . . . 6,487 72,096 68,772 46,810 14,038 3,906 758 1,781 8,097 8,322
Taxable returns, total. . . . . . . . . . . . . . . . . . . . . . . . . . . . . . . . . . . . . 5,659 69,177 67,456 45,604 14,038 3,195 658 1,465 6,215 5,341Under $10,000 . . . . . . . . . . . . . . . . . . . . . . . . . . . . . . . . . . . . . . . . . . . . 3,957 26,439 26,253 15,699 3,223 71 4,361 1,76910 000 under $50,000 . . . . . . . . . . . . . . . . . . . . . .
: :*~' -- . . . . .V1,578 27,253 25,793 19,208 4,906 -1 3 647 947 1,719 3 2880 000 der $100,000 . . . . . . . . . . . . . . . . . . . . . . . 90 6,440 6,303 4,859 2, V74 76 100
,125$100,000 or more . . . . . . . . . . . . . . . . . . . . . . . . . . . . . . . . . . . . . . . . . 34 9,046 9,107 5,838 3,836 32 11 518 35 160
Nontaxable returns . . . . . . . . . . . . . . . . . .. . . . . . . . . . . . . . . . . . . . . . . .
OIL AND MINERAL INTERESTS
Grand total . . . . . . . . . . . . . . . . . . . . . . . . . . . . . . . . . . . . . . . . . . 10,595 181,361 157,989 130,738 43,613 7,251 1 1,818 6,616 14,927 21,65 9
Taxable returns, total . . . . . . . . . . . . . . . . . . . . . . . . . . . . . . . . . . . . . 10,044 186,203 165,979 130,738 43,623 6,852 1,7L5 6,315 13,688 19,736Under $10,000 . . . . . . . . . . . . . . . . . . . . . . . . . . . . . . . . . . . . . . . . . . . . 4,379 31,736 17,666 18,280 32730 3,067 N 5,981 6,38810,000 -der ~50,000 . . . . . . . . . . . . . . . . . . . . . . . . . . . . . . . . . . . . 5,230 103,464 99,869 75,136 19,970 3,409 750 2,622 7,049 9,37750,000 under $100,000 . . . . . . . . . . . . . . . . . . . . . . . . . . . . . . . . . . .
1309 21,476 20,676 16,9Z7 7,210 264 4-6 655 455 1,835
100,000 or more . . . . . . . . . . . . . . . . . . . . . . . . . . . . . . . . . . . . . . . . . 126 29,527 27,768 20,395 12,703 113 32 464 203 2,136
Nontaxable returns . . . . . . . . . . . . . . . . . . . . . . . . . . . . . . . . . . . . . . . . .N N N N
PARTNERSHIP INTERESTS
Grand total . . . . . . . . . . . . . . . . . . . . . . . . . . . . . . . . . . . . . . . . . . 19,236 299,804 274,447 22.2,835 68,865 14,004 2,458 15,562 27,078 111,04 9
Taxable returns, total . . . . . . . . . . . . . . . . . . . . . . . . . . . . . . . . . . . . . 1-5,656 297,617 274,252 212,464 68,865 10,448 2,020 11,774 22,907 86,55 9Under $10,000 . . . . . . . . . . . . . . . . . . . . . . . . . . . . . . . . . . . . . . . . . . . . 6,295 50,735 32,062 29,018 6,881 4,192 N 8,420 25 35 9: 10,000 ~~d r t5O ;~o. . . . . . . . . . . . . . . . . . . . . . . . . . . . . . . . . . . .: 8,655 183,631 179,837 135,183 38,415 5,704 1,379 7,249 1 .3,369
,57 390
1 0,0. ~( r '..00 . . . . . . . . . . . . . . . . . . . . . . . . . . . . . . . . . . . 583 40,959 39,714 32,559 14,104 448 123 586 917
,2 364~100,000 or more . . . . . . . . . . . . _ . . . . . . . . . . . . . . . . . . . . . . . . . . . 123 22,293 22,639 15,704 9,465 103 36 1,529 202,
1,445
Nontaxable returns . . . . . . . . . . . . . . . . . . . . . . . . . . . . . . . . . . . . . . . . . 3,581 2,187 195 371 - 3,556 N N 4,171 24,49 1
ASSETS USED IN TRADE OR BUS
Grand total . . . . . . . . . . . . . . . . . . . . . . . . . . . . . . . . . . . . . . . . . . 104,673 773,831 686,091 472,041 130,290 67,775 7,997 46,532 147,547 493,75 9
Taxable returns, total . . . . . . . . . . . . . . . . . . . . . . . . . . . . . . . . . . . . . 71,153 746,396 687,779 469,556 130,290 42,890 5,965 26,729 95,508 302,05 5Under $10, 000 . . . . . . . . . . . . . . . . . . . . . . . . . . . . . . . . . . . . . . . . . . . . 50,486 283,531 234,607 .131,136 25,987. 29,884 3,288 11,514 68,669 184 07 610,000 under $50,000. . . . . . . . . . . . . . . . . . . . . . . . . . . . . . . . . . . . 19,634 368,517 359,773 268,209 69,675 12,166 2,388 9,857 25 386
,111 8 9
050,000 under $100,000 . . . . . . . . . . . . . . . . . . . . . . . . . . . . . . . . . . .
1859 57,411 56,482 46,054 19,621 682 229 2,222 1,173
,4 5 04100,000 or more . . . . . . . . . . . . . . . . . . . . . . . . . . . . . . . . . . . . . . . . . 174 36,937 36,917 24,156 15,006 157 60 3,136 280
,1,666
Nontaxable returns . . . . . . . . . . . . . . . . . . . . . . . . . . . . . . . . . . . . . . . . . 33,520 27,435 -1,688 2,486 - 24,885 2,032 19,803 52,039 191,704
PROPERTY HEI, FOR PERSONAL US E
Grand total . . . . . . . . . . . . . . . . . . . . . . . . . . . . . . . . . . . . . . . . . . 10,826 Ul, 400 108,571 70,763 19,551 6,285 1,124 11,249 1-3,559 26,017
axable returns, total . . . . . . . . . . . . . . . . . . . . . . . . . . . . . . . . . . . . . 8,399 107, 009 103,441 70,626 19,551 4,056 712 5,475 10,615 15,581Under $10,000. . . . . . . . . . . . . . . . . . . . . . . . . . . . . . . . . . . . . . . . . . . . 4,982 32,266 29,231 15,947 3,171 2,028 N 6 762 7 56210,000 under $50,000 . . . . . . . . . . . . . . . . . . . . . . . . . . . . . . . . . . . . 3,206 58,011 57,652 42,772 10,952 1,848 353 2,211
,3 623
,7 06150,000 under $100,000 . . . . . . . . . . . . . . . . . . . . . . . . . . . . . . . . . . .
1)85 12,066 12,062 9,095 3,812 153 50 409
,200
,806100,000 or more. . . . . . . . . . . . . . . . . . . . . . . . . . . . . . . . . . . . . . . . .
.26 4,665 4,495 2,811 1,616 26 5 92 30 1-5 3
lontaxable returns. . . . . . . . . . . . . . . . . . . . . . . . . . . . . . . . . . . . . . . . . 2,426 4,391 5,130 138 - 2,229 N 2,944 iO,43 6
RESIDENCES
Grand total . . . . . . . . . . . . . . . . . . . . . . . . . . . . . . . . . . . . . . . . . . 5,166 61,866 52,709 42,704 11,972 4,480 1,459 6,422 5,207 91,613
axable returns, total. . . . . . . . . . . . . . . . . . . . . . . . . . . . . . . . . . . . . 4,245 62,014 53,820 42,670 1.1,972 .3,485 1,359 6,101 4,287 81,786Under $10,000 . . . . . . . . . . . . . . . . . . . . . . . . . . . . . . . . . . . . . . . . . . . .10 000 under $50,000 . . . . . . . . . . . . . . . . . . . . . . . . . . . . . . . . . . . .
2,2821,Tn
16,79237,090
9,29436,403
9,90126,692
2, 1136 958
2,09 21 314
N540
(-)2 789
2,2821 918
42,880
36 96050:000 under $106,000. . . . . . . . . . . . . . . . . . . . . . . . . . . . . . . . . . .
167 4 274 4 180 3 351
,8
, , , ,
100,000 or more . . . . . . . . . . . . . . . . . . . . . . . . . . . 20, , , 1,37 62 67 1,504. . . . . . . . . . . . . . 3,857 3,943 2,526 1,523 17 11 231 21 442
lontaxable returns . . . . . . .. . . . . . . . . . . . . . . . . . . . . . . . . . . . . . . . . . .N N N N N N
NONBUS REA1 ESTATE
Grand total . . . . . . . . . . . . . . . . . . . . . . . . . . . . . . . . . . . . . . . . . . 93,984 844,698 759,989 500,459 130,631 65,091 5,200 47,788 99,511 874,194
eXable returns, total . . . . . . . . . . . . . . . . . . . . . . . . . . . . . . . . . . . . . 73,291 808,100 744,498 498,838 130,631 50,329 4,492 33,630 78,382 686,774Under $10,000. . . . . . . . . . . . . . . . . . . . . . . . . . . . . . . . . . . . . . . . . . .10,000 under $50 OGO . . . . . . .
50,111 341,712 287,841 170,947 34,880 34,339 1,625 3, 931 52,912 421,77 5, . . . . . . . . . . . . . . . . . . . . . . . . . . . . .50,000 und r $10b OW . . . . . .
1
22,155 384,507 373,441 266,609 67,370 15,110 2,563 20 0 6' 1
24,217 244,752, . . . . . . . . . . . . . . . . . . . . . . . . . . . . .100 000 oroMore
882 56,770 58,121 45,010 18,884 749 249 7 224 1,074 16,742, . . . . . . . . . . . . . . . . . . . . . . . I . . . . . . . . . . . . . . . . . 142 25,111 25,095 16,272 9,497 131 55 2,459 179 3,505
ontaxable returns . . . . . . . . . . . . . . . . . . . . . . . . . . . . . . . . . . . . . . . . . 20,693 36,598 1.5,491 1,621 - 14,762 N 21,129
T
187,420
T
N
Footnotes at end of table . For the precise definition of terms and the nature of any limitations, see the 'Tescription of the Sample," "Limitations of the Data," and "ExplanationOf Classifications and Terms" in the text .


110RETURNS WITH NET CAPITAL LOSS
SALES OF CAPITAL ASSETS ON INDIVIDUAL RETURNS, 1962
Table 11 . -ALL AND LONG-TERM TRANSACTIONS -INCOME, TAX, NET LOSS, AND TRANSACTION DETAIL, BY ASSET TYPE AND SIZE OF ADJUSTED GROSS INCOME PLUSCAPITAL GAIN OR LOSS EXCLUDED -Continue d
Adjusted gross income Capital loss carryover All capital asse t
Number oftransactions
returns Plus TaxableIncome tax
Net capitalAsset type and size of adjusted gross income with net capital income
aft!rloss Gross sale splus capital gain or loss excluded capital
As e
ported gain or reditsNumber of
Amount Number of
loss loss returnstrana- pric e
excluded actions
(Th~ :wd (A-,.d (Tho-d (T? ..-d 7h- .-d (7~--d (T~-d~11 ... ) d,11 . .. ~!!Ars)
(6) (7) (8) (9) (10)REAL ESTATE SUBDIVIDED
Grand total . . . . . . . . . . . . . . . . . . . . . . . . . . . . . . . . . . . . . . . . . . 20,585 194,193 160,885 111,760 32,834 13,746 1,467 8,839 22,885 207,72 3
Taxable returns, total . . . . . . . . . . . . . . . . . . . . . . . . . . . . . . . . . . . . 15,444 177,644 161,694 111,271 32,834 9,459 1,266 7,775 17,277 140,75 8
Under $10,000 . . . . . . . . . . . . . . . . . . . . . . . . . . . . . . . . . . . . . . . . . . . . 10,812 68,488 54,554 132,116 6,426 5,793 12,098 85,08210,000 under $50,000 . . . . . . . . . . . . . . . . . . . . . . . . . . . . . . . . . . . . 4,304 77,663 75,645 56,008 14,758 3,380 805 4,205 4,779 49,11 050,000 under $100,000. . . . . . . . . . . . . . . . . . . . . . . . . . . . . . . . . . .
1
258 16,922 16,535 13,232 5,417 218 57 532 306 2,88 9100,000 or more . . . . . . . . . . . . . . . . . . . . . . . . . . . . . . . . . . . . . . . . . 71 14,571 14,960 9,914 6,234 67 33 1,729 92 3,67 9
Nontaxable returns . . . . . . . . . . . . . . . . . . . . . . . . . . . . . . . . . . . . . . . . . 5,141 6,549 -810 490 - 4,290 5,608 66,96 5
FARMLAND VITH UKHARVFZTED CROPS
Grand total . . . . . . . . . . . . . . . . . . . . . . . . . . . . . . . . . . . . . . . . . . 1,088 8,626 7,330 5,651 1,402 800 2,765 26,375
Taxable returns, total . . . . . . . . . . . . . . . . . . . . . . . . . . . . . . . . . . . . . 797 8,724 7,909 5,651 1,402 590 2,465 22,12 5
Under $10,000 . . . . . . . . . . . . . . . . . . . . . . . . . . . . . . . . . . . . . . . . . . . .10 000 under $50,000 . . . . . . . . . . . . . . . . . . . . . . . . . . . . . . . . . . . .
'479 6 801 6,520 4,922 1 177 345 2,153 18,21 7
000 under $100,000 . . . . . . . . . . . . . . . . . . . . . . . . . . . . . . . . . . .50 ( .i( -
- (* )100,000 or more . . . . . . . . . . . . . . . . . . . . . . . . . . . . . . . . . . . . . . . . . 1 102 151 37 13 1 5 6
Nontaxable returns. . . . . . . . . . . . . . . . . . . . . . . . . . . . . . . . . . . . . . . . . - -
OTHER FARULAND
Grand total . . . . . . . . . . . . . . . . . . . . . . . . . . . . . . . . . . . . . . . . . . 9,192 56,154 39,097 32,593 9,083 5,895 470 1,524 9,792 120,73 5
Taxable returns, total . . . . . . . . . . . . . . . . . . . . . . . . . . . . . . . . . . . . . 4,783 49,945 46,803 32,303 9,083 2,391 270 1,372 4,890 53,114
Under $10,000 . . . . . . . . . . . . . . . . . . . . . . . . . . . . . . . . . . . . . . . . . . . . 3,566 19,345 16,858 10,527 2,110 562 3 666 38,06310,000 under $50,000. . .
. * . . . . . . . *- .. . . . . . . . . : : . . . . . . . . 1,141 23,0171 22,555 16,651 4,444 77
.266 1,315
:1 141 13,386
50,000 under $106,000 . . . . . . . . . . . . . . . . . . . . . . . . . . . . . . . . .
160 3,915 3,814 2,951 1,233 46 67 1,269
100,000 or more . . . . . . . . . . . . . . . . . . . . . . . . . . . . . . . . . . . . . . . . . 16 3,614 3,5?6 2,174 1,297 13 4 56 16 395
Nontaxable returns . . . . . . . . . . . . . . . . . . . . . . . . . . . . . . . . . . . . . . . . . 4,409 6,210 -7,705 290 - 3,504 4,902 67,62 1
PROCEEDS FROM PRIOR YEAR INSTALIMENT SALES
Grand total . . . . . . . . . . . . . . . . . . . . . . . . . . . . . . . . . . . . . . . . . . 26,188 391,864 343,870 266,177 82,454 20,442 6,836 56,134 30,787
Taxable returns, total . . . . . . . . . . . . . . . . . . . . . . . . . . . . . 21,828 380,3477 330,654 265,273 82,454 16,929 5,117 34,664 25,834
Under $10,000 . . . . . . . . . . . . . . . . . . . . . . . . . . . . . . . . . . . . . . . . . . . . 10,521 71,971 30,040-37,009 6,343 8,459 2,921 17,442 11,836
10 000 under $50,000 . . . . . . . . . . . . . . . . . . . . . . . . . . . . . . . . . . . . 10,201 226,072 216,130 166,725 46,850 7,520 1,905 8,429 12,64150,000 under $100,000 . . . . . . . . . . . . . . . . . . . . . . . . . . . . . . . . . . .
1976 60,995 62,984 46,884 19,249 833 257 7,403 1,205
100, 000 or more . . . . . . . . . . . . . . . . . . . . . . . . . . . . . . . . . . . . . . . . . 131 21,309 21,500 14,654 8,013 118 34 1,390 152
Nontaxable returns . . . . . . . . . . . . . . . . . . . . . . . . . . . . . . . . . . . . . . . . . 4,359 11,517 13,216 904 - 3,513 1,719 21,470 4,953
OTHER TYPE ASSETS
Grand total. . . . . . . . . . . . . . . . . . . . . . . . . . . . . . . . . . . . . . . . . . 225,699 2,711,797 2,302,235 1,777,679 525,510 158,829 25,816 143,509 275,308 196,536
Taxable returns, total . . . : . . . . . . . . . . . . . . . . . . . . . . . . . . . . . . . . . 194,742 2,661,745 2,333,469 1,771,20`7 525,510 133,849 23,055 108,098 239,806 182,01 7Under $10,000. . . . . . . . . . . . . . . . . . . . . . . . . . . . . . . . . . . . . . . . . . . . 121,500 627,427 563,911 432,933 90,519 61,230 10,394 26,829 146,668 119,50810,000 under $50,000 . . . . . . . . . . . . . . . . . . . . . . . . . . . . . . . . . . . . 67 1 890 1,366,422 1,306,416 992,189 267,595 48,102 11,389 54,391 85,674 43,05 350,000 under $106,000. . .
:,** . . . . . . * . . . . . . . *" -* -' ' * . . .E41435 297,506 290,857 229,978 96,842 3,678 1,018 10,323 6,084 13,11 7
00,000 or more . . . . . . . . . . . . . . . 917 170,390 172,285 116,107 70,553 839 255 16,555 1,380 6,33 9
Nontaxable returns . . . . . . . . . . . . . . . . . . . . . . . . . . . . . . . . . . . . . . . .. 1
30,957J
50,051 k -31,234 6,472 24,980 2,763 1 35,412 1 35,502 14,51 9
Footnotes at end of table . For the precise definition of terms and the nature of any limitations, see the "Description of the Sample," "Limitations of the Data," and "Explanationof Msifications and Terms" in the text .


RETURNS WITH SALES OF CORPORATE STOC K
Table 12 . -SHORT-TERM AND LONG-TERM TRANSACTIONS OF CORPORATE STOCK - TRANSACTION DETAIL, BY SIZE OF ADJUSTED GROSS INCOME AND LENGTH OF PERIOD HEL D
Length of period held
All period . . . . . . . . . . . . . . . . . . . . . . . . . . . . . . . . . . . .
Short-term, total . . . . . . . . . . . . . . . . . . . . . . . . . . . . . . . . . .
Under 1 month . . . . . . . . . . . . . . . . . . . . . . . . . . . . . . . . . . . .1 wider 2 months . . . . . . . . . . . . . . . . . . . . . . . . . . . . . . . . .2 under 3 months . . . . . . . . . .. . . . . . . . . . . . . . . . . . . . . . . .3 under 4 months . . . . . . . . . . . . . . . . . . . . . . . . . . . . . . . . .4 under 5 months . . . . . . . . . . . . . . . . . . . . . . . . . . . . . . . . .5 to 6 months . . . . . . . . . . . . . . . . . . . . . . . . . . . . . . . . . . . .Not available . . . . . . . . . . . . . . . . . . . . . . . . . . . . . . . . . . . .
Long-term, total . . . . . . . . . . . . . . . . . . . . . . . . . . . . . . . . . . .Over 6 under 7 months . . . . . . . . . . . . . . . . . . . . . . . . . . . .7 under 8 months . . . . . . . . . . . . . . . . . . . . . . . . . . . . . . . . .8 wider 9 months . . . . . . . . . . . . . . . . . . . . . . . . . . . . . . . . .9 under 10 months . . . . . . . . . . . . . . . . . . . . . . . . . . . . . . . .10 under 11 months . . . . . . . . . . . . . . . . . . . . . . . . . . . . . . .11 wider 12 months . . . . . . . . . . . . . . . . . . . . . . . . . . . . . . .
1 wider 2 years . . . . . . . . . . . . . . . . . . . . . . . . . . . . . . . . . .2 under 3 years . . . . . . . . . . . . . . . . . . . . . . . . . . . . . . . . . .3 under 4 years . . . . . . . . . . . . . . . . . . . . . . . . . . . . . . . . . .4 under 5 years . . . . . . . . . . . . . . . . . . . . . . . . . . . . . . . . . .5 wider 10 years . . . . . . . . . . . . . . . . . . . . . . . . . . . . . . . . .
10 under 15 years . . . . . . . . . . . . . . . . . . . . . . . . . . . . . . . .15 under 20 years . . . . . . . . . . . . . . . . . . . . . . . . . . . . . . . .20 years or more . . . . . . . . . . . . . . . . . . . . . . . . . . . . . . . . .Not available . . . . . . . . . . . . . . . . . . .. . . . . . . . . . . . . . . . .
All periods . . . . . . . . . . . . . . . . . . . . . . . . . . . . . . . . . .
Sbort-te-, total . . . . . . . . . . . . . . . . . . . . . . . . . . . . . . . . . .
[hider I month. . . . . . . . . . . . . . . . . . . . . . . . . . . . . . . . . . . .1 -der 2 months . . . . . . . . . . . . . . . . . . . . . . . . . . . . . . . . .2 under 3 months . . . . . . . . . . . . . . . . . . . . . . . . . . . . . . . . .3 under 4 months . . . . . . . . . . . . . . . . . . . . . . . . . . . . . . . . .4 under 5 months . . . . . . . . . . . . . . . . . . . . . . . . . . . . . . . . .5 to 6 months . . . . . . . . . . . . . . . . . . . . . . . . . . . . . . . . . . . .Not available . . . . . . . . . . . . . . . . . . . . . . . . . . . . . . . . . . . .
Long-term, total . . . . . . . . . . . . . . . . . . . . . . . . . . . . . . . . . . .
Over 6 under 7 months . . . . . . . . . . . . . . . . . . . . . . . . . . . .7 wider 8 months . . . . . . . . . . . . . . . . . . .. . . . . . . . . . . . . . .8 -der 9 montbs . . . . . . . . . . . . . . . . . . . . . . . . . . . . . . . . .9 under 10 months . . . . . . . . . . . . . . . . . . . . . . . . . . . . . . . .10 under 11 months . . . . . . . . . . . . . . . . . . . . . . . . . . . . . . .11 under 12 months . . . . . . . . . . . . . . . . . . . . . . . . . . . . . . .
I under 2 years . . . . . . . . . . . . . . . . . . . . . . . . . . . . . . . . . .2 under 3 years . . . . . . . . . . . . . . . . . . . . . . . . . . . . . . . . . .3 under 4 years . . . . . . . . . . . . . . . . . . . . . . . . . . . . . . . . . .4 under 5 years . . . . . . . . . . . . . . . . . . . . . . . . . . . . . . . . . .5 under 10 years . . . . . . . . . . . . . . . . . . . . . . . . . . . . . . . . .
10 under 15 years . . . . . . . . . . . . . . . . . . . . . . . . . . . . . . . .15 -der 20 years . . . . . . . . . . . . . . . . . . . . . . . . . . . . . . . .20 years or more . . . . . . . . . . . . . . . . . . . . . . . . . . . . . . . . .Not available . . . . . . . . . . . . . . . . . . . . . . . . . . . . . . . . . . . .
Nuab- orreturn s
with salesf corporate
stock '
2,121,95 7
666,746
229,573221,7402G4,663187,6?2183,146203,472120,65 5
1,946,451226,019176o397181,386161,529168,5?2159,852
718,503431,141322,850192,092434,069
150,19367,59975,820
340,?53
821,787
237,607
'79,90775,01763,60360,47265,23369,61637,968
741,386
70,39656,35057,40544,78256,20746,034
247,093143,535101,98 563,345
149,874
48,87822,06825,08 3
126,590
Grosssale .price
(Th. ..dd.11.. .
32,042,12 4
10,634,024
4,037,6101,452,5301,081,67 6
917,202?34,810933,35 7
1,476,83 9
21,408,1011,025,25 6
667,808674,728594,121614,282561,410
4,196,6492,175,3761,670,9811,086,8883,188,280
1,313,34 6703,996950,587
1,984,19 3
5,477,993
2,311,806
987,613281,296207,834150,129153,467141,344390,123
3,166,18?
162,77 596,098
126,55381,983101,15 377,045
726,425402,998268,405186,407512,349
124,04547,33396, 509
156,119
Cost ardexpense of
sale(Th-dd.11- 0
All aijusted
28,698,09 1
11,114,417
4,047,8911 ;492,9441,144,36 6
997,324823,406
1,0?5,0081,533,47 8
17,783,6771,093,15 6
741,2?9769,790666,465688,546642,49 6
4,638,3212,032,3?91,470,889
821,9422,001,192
536,985219,871261,991
1,208,375
Corporate stoc k
Gross
Number of atransaction
gross income
4,183,914
1,261,221
446,810210,102140,678111,61890,78291,476169,?5 5
2,922,693134,92 575,97367,97963,61568,04663,447
535,?5'7335,149248,017165,429450,264
167,62779,89090,208381,26 6
Taxable returns wide r
5,566,895
2,420,098
986,803290,829220,820165,3691?6,187165,500414,590
1, 293, 075
412,608
157,86669,54343,98635,37630,81?26,85548,164
3,146,797
177,199109,236146,36991,414
131,59095,712
844,178410,870259,151157,188403,044
81,66325,39559,946
153,844
880,466
45,94824,26418,56016,29720,9111?,796
163,093101,25 ?71,01248,643144,279
45,31526,10426,029
110,959
transactions
gain
Amount
d.11.. .)
size classes
?,138,36 6
388,195
109,79 969,00247,48935,19531,97436,68858,048
6,750,1?l216,18162,55457,85566,15269,83156,20 6
588,778484,28?462,78035?,651
1,439,040
819,234497,082722,670949,870
$10,00 0
7490503
76,§69
2?,26912,1699,6316,2006,1447,6227,93 4
6?2,535
16,3938,3857,87 9
11,8897,5936,45 2
81,17469,U?459,32549,524
172,31 2
52,88923,93957,6824?,825
Gross los s
tNumber ofran"a"tiOns
4,673,747
I'mcuct(Th- .-d
d.11- 0
4,036,448
1,566,574
3?3,188242,293217,456186,936182,?28215,470148,50 3
3,107,174228,393160,780174,110146,300151,125140,819
929,271335,933231,98596,156
259,679
43,20317,39116,468175,56 5
1,411,829
475,323
116,13075,15566,38353,09360,25260,99843,311
936,506
72,82544,25452,07?3?, 90948,61439,74 3
282,89498,49165,05828,09281,632
15,9614,6943,4? 4
60,788
871,423
120,496110,041110,415115,633120,743178,639115,456
3,215,026175,459.136,116153,680139,568144,269138,377
1,035,625346,318268,66998,629
273,544
51,92417,14342,603
193,102
848,38 ?
185,696
26,55421,95622,66921,44028,86931,80632,403
662,690
31,26821,53327,70821,32038,12925,12 3
199,57377,09850,93820,30866,210
14,1572,00121,3"45,981
NwMier ofreturns
with salesof corporate
stock '
1,915,43 5
612,849
210,540201,339181,230167,981165,942184,611108,671
1,752,168203,762162,185161,654147,831154,675145,120
65-7,602392,405291,282175,349390,317
135,60260,07265,067
305,148
1,034,375
341,102
117,935114,387106,08595,79389,597
101,81 164,13 6
924,615
117,16792,71291,39190,39286,06486,781
369,119220,720166,14596,491209,736
72,33530,19931,554
155,826
Grosssalespric e
(Th-...ddoli-)
28,896,071
9,344,445
3,565,2881,273,06 1
935,515?47,333652,599846,402
1,324,2,4 7
19,551,628939,019598,3?5600,8?0535,009545,082504,326
3,702,4241,982,5741,527,532
997,2222,947)714
1,264,618663,059897,066
1,846,738
14,687,784
5,229,795
2,000,88 6756,636539,356427,029348,175442,?63714,95 0
9,457,989
504,752337,?07327,246305,029302,260289,477
1,969,1851,034,564
811,519509,739
1,362,787
544,911231,684220,881706,248
Cost andexpense o f
sale
(Th~ .. .dd.11 ... )
Corporate stock transactions
Gross gain
Number of Amountt . Itraiisac ion (rh .. . .~d
d.11. . .
Gross
Number oftrwisaction s
Total
25,677,72 5
9,767,114
3,570,2311,309,29 3
990,597814,001733,900972,039
1,377,05 3
15,910,612986,425662,479681,343601,742613,4915??,7?9
4,071,6001,836,2281,313,685
739,7601,791,202
505,547193,267236,617
1,099,448
taxable returns
3,746,391 6,738,972 4,188,74 5
1,124,449
408,114190,645126,042IJO,48 279,29780,632
139,237
2,621,942125,40270,64359,99856,96261,19258,01 7
4172,202300,343223,332151, 0"411,212
153,80871,304-/8,422328,061
343,342
99,8?158,01340,87632,18227,40832,84452,148
6,395,631107,54659,36653,65561,74963,23554,08 1
523,430451,431426,310342,69?
1,374,176
799,543480,711689,400906,299
Taxable returns $10,000 under $50,00 0
13,972,945
5,449,0175
2,005,72 9774,739568,933462,601387,337514,621734,915
8,523,8?0
539,449379,?86372,090350,708330,070336,261
2,193,644982,164729,590401,386943,949
253,98291,15064,953534,688
2,066,996
629,625
221,192107,24 972,30957,11342,81247,13481,817
1,437,371
66,91739,35334,998.34,57934,166.34,203
259,390169,074127,38284,892
21?,743
85,51434,11137,959
177,092
2,636,288
209,76?
55,82237,32023,85019,87916,18018,35936,35 7
2,428,522
51,25029,56330,52130,99136,38026,560
258,158211,822200,892156,295539,959
308,535149,320144,V6253,900
1,382,456
326,517213,5iO189,118164,222163,014192,087133,98 9
2,806,299207,325145,024151,783134,685135,963127,372
842,935302,366206,11486,638
232,22 8
39,22015,?4513,284
165,605
2,393,07 1
792,806
186,918122,202107,41395,62287,664
111,48281,504
1,590,266
114,81765,85284,71582,53173,99074,602
473,253173,261120,70249,823
130,000
18,~939,1218,02390,582
loss
Am-td
d.11...
3,608,79 1
768,283
105,16494,78396,16899016?
108,856158,782105,36 3
2,840,508156,066123,563134,891128,902131,818126,018
897,957310,071220,31 491,155
238,704
49,0131501053?,479
177,452
1,960,665
428,385
60,82855,67053,54855,89055,44190,40456,604
1,532,280
86,30371,70676,0?376,95964,24673,773
486,3431620492121,41253,129
129,020
19,1999,284
12,17190,170
to
Footnote at end of table . For the precise definition of terms and the nature of any limitations, see the --Description of the Sample,-1 "Limitations of the Data" and "Explanation of Classifications and Teriwill in the text .
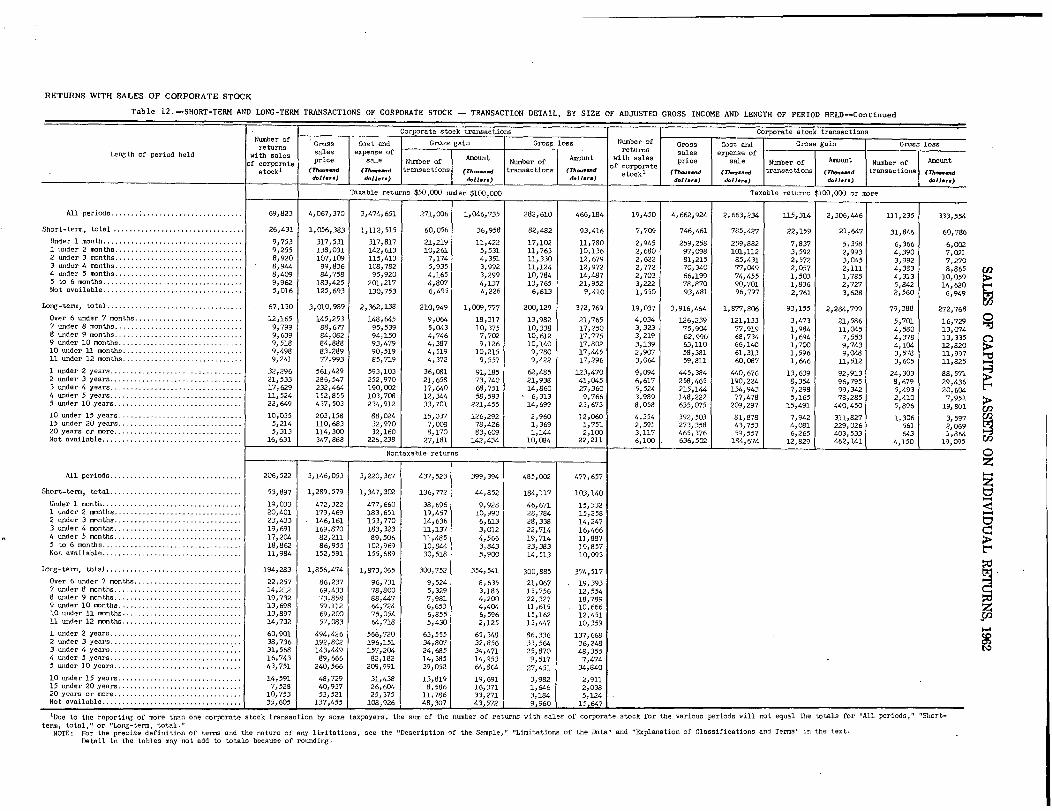
RETURNS WITH SALES OF CORPORATE STOCK
Table 12 . -SHORT-TERM AND LONG-TERM TRANSACTIONS OF CORPORATE STOCK - TRANSACTION DETAIL, BY SIZE OF ADJUSTED GROSS INCOME AND LENGTH OF PERIOD HELD-Continued
Loneth of period held
Number ofreturns
with salesf corporate
0 stock'
Gross los s
Number oftransactions
Amount(n--dd.11-0
Number ofreturns
with salesf corporate
sto.ki
Grosssalesprice
(n- .. .dd.11.r .)
Cost andexpense o f
sal e
(Th--dd.IJ . .. )
Corporate stock transaction s
Number oftransactions
Gross loss
Number oftransactions
Amount
(71--dd.11 .,.)
Taxable returns $100,000 or more
All periods . . . . . . . : . . . . . . . . . . . . . . . . . . . . . . . . .
Short-trrm, total . . . . . . . . . . . . . . . . . . . . . . . . . . . . . . . . .
Under I month . . . . . . . . . . . . . . . . . . . . . . . . . . . . . . . . . . .1 wider 2 months . . . . . . . . . . . . . . . . . . . . . . . . . . . . . . . .2 wider 3 months . . . . . . . . . . . . . . . . . . . . . . . . . . . . . . . .3 widel, 4 month . . . . . . . . . . . . . . . . . . . . . . . . . . . . . . . .4 -der 5 months . . . . . . . . . . . . . . . . . . . . . . . . . . . . . . . .5 to 6 months . . . . . . . . . . . . . . . . . . . . . . . . . . . . . . . . . . .Not available . . . . . . . . . . . . . . . . . . . . . . . . . . . . . . . . . . .
Long-term, total . . . . . . . . . . . . . . . . . . . . . . . . . . . . . . . . . .
Over 6 -der 7 months . . . . . . . . . . . . . . . . . . . . . . . . . . .7 under 8 months . . . . . . . . . . . . . . . . . . . . . . . . . . . . . . . .8 ,der 9 months . . . . . . . . . . . . . . . . . . . . . . . . . . . . . . . .9 wider 10 months . . . . . . . . . . . . . . . . . . . . . . . . . . . . . . .10 under 11 months . . . . . . . . . . . . . . . . . . . . . . . . . . . . . .11 wider 12 months . . . . . . . . . . . . . . . . . . . . . . . . . . . . . .
1 under 2 years . . . . . . . . . . . . . . . . . . . . . . ; . . . . . . . . . .2 =der 3 years . . . . . . . . . . . . . . . . . . . . . . . . . . . . . . . . .3 under 4 years . . . . . . . . . . . . . . . . . . . . . . . . . . . . . . . . .4 wider 5 years, . . . . . . . . . . . . . . . . . . . . . . . . . . . . . . . .5 under 10 yearn . . . . . . . . . . . . . . . . . . . . . . . . . . . . . . . .
10 under 15 years . . . . . . . . . . . . . . . . . . . . . . . . . . . . . . .15 under 20 years . . . . . . . . . . . . . . . . . . . . . . . . . . . . . . .20 yenre or more . . . . . . . . . . . . . . . . . . . . . . . . . . . . . . . .Not available . . . . . . . . . . . . . . . . . . . . . . . . . . . . . . . . . . .
69,823
26,431
9,7539,2558,9208,9448,4099,9625,01 6
67,130
12,1659,7999,6399,5189,4989,241
32,29621,53317,62911,52422,649
10,0355,2145,313
16,631
Nontaxable return s
All periods . . . . . . . . . . . . . . . . . . . . . . . . . . . . . . . . .
Short-term, total . . . . . . . . . . . . . . . . . . . . . . . . . . . . . . . . .
Under 1 month . . . . . . . . . . . . . . . . . . . . . . . . . . . . . . . . . . .1 -der 2 months . . . . . . . . . . . . . . . . . . . . . . . . . . . . . . . .2 wider 3 mliths . . . . . . . . . . . . . . . . . . . . . . . . . . . . . . . .3 under 4 montbs . . . . . . . . . . . . . . . . . . . . . . . . . . . . . . . .4 under 5 months . . . . . . . . . . . . . . . . . . . . . . . . . . . . . . . .5 to 6 months . . . . . . . . . . . . . . . . . . . . . . . . . . . . . . . . . . .Not available . . . . . . . . . . . . . . . . . . . . . . . . . . . . . . . . . . .
Long-term, total . . . . . . . . . . . . . . . . . . . . . . . . . . . . . . . . . .
Over 6 wider 7 months . . . . . . . . . . . . . . . . . . . . . . . . . . .7 under 6 months . . . . . . . . . . . . . . . . . . . . . . . . . . . . . . . .8 wider 9 months . . . . . . . . . . . . . . . . . . . . . . . . . . . . . . . .9 -der 10 months . . . . . . . . . . . . . . . . . . . . . . . . . . . . . . .10 under 11 months . . . . . . . . . . . . . . . . . . . . . . . . . . . . . .11 under 12 months . . . . . . . . . . . . . . . . . . . . . . . . . . . . . .
1 wider 2 years . . . . . . . . . . . . . . . . . . . . . . . . . . . . . . . . .2 wider 3 yeais . . . . . . . . . . . . . . . . . . . . . . . . . . . . . . . . .3 wider 4 years . . . . . . . . . . . . . . . . . . . . . . . . . . . . . . . . .4 wider 5 years . . . . . . . . . . . . . . . . . . . . . . . . . . . . . . . . .5 wider 10 years . . . . . . . . . . . . . . . . . . . . . . . . . . . . . . . .
10 wider 15 years . . . . . . . . . . . . . . . . . . . . . . . . . . . . . . .15 wider 20 years . . . . . . . . . . . . . . . . . . . . . . . . . . . . . . . .20 years or more . . . . . . . . . . . . . . . . . . . . . . . . . . . . . . . .Not available . . . . . . . . . . . . . . . . . . . . . . . . . . . . . . . . . . .
206,52 2
53,897
19,03320,40123,43319,69117,20418,86211,984
194,283
22,25714,21219,73213,69813,89714,732
60,903,33,73631,56816,74343,751
14,5917,52 8
10 , 75335,605
3,146,05 3
1,289,579
4?2,322179,469146,161169,87 082,21186,955
152,591
1,856,474
86,23769,43373,85859,11269,20057,08 3
494,426192,802143,44989,66 6
240,566
48,72940,93753,521
137,455
Corporate stock transaction s
3,220,367
1,347,302
477,660183,651153,770183,32389,506
102,969155,689
1,873,065
96,73178,80088,44764,72475,05464,718
566,720196,151157,20482,182209,99 1
31,4362 6, 60425,375108,926
282,610
82,482
17,JQ211,76311,33011,12410,78413,7656,61 3
200,129
13,98210,33810,61210,1409,7809,422
62,48521,93814,8606,313
14,699
2,9601,3691,144
10,08 4
485,002
184,117
46,67128,78428,33822,71419,71423,38314,51 3
300,885
21,067L5,756.22,32711,61515,16213,447
86,336.33,56425,8709,51727,451
3,9821,6463,1849,960
466,184
93,416
11,78010,13612,67912,97214,48721,9529,41 0
372,769
21,76517,2501-7,77517,80217,44517,296
123,47041,04527,3609,766
23,673
12,0601,?512,100
22,21 1
477,657
103,140
15,33215,25814,24716,46611,88'719,85710,093
374,517
19,39312,55418,78910,66612,45110,35 9
137,66836,24848,35 57,474
34,840
2,9112,0385,124
15_647
19,450
7,709
2,9452,6802,6222,7722,7033,2221,55 0
19,037
4,0343,3233,2193,1392,90`73,064
~,0946,6175,5243,9898,058
4,3542,5913,1176,100
4,662,924
746,461
259,25897,09881,21570,34066,19978,87093,48 1
3,916,464
126,23975,90462,99063,11058,38159,811
445,384256,465215,144148,222635,075
392,503273,358465,376636,502
2,663,234
785,427
259,882101 11265 1,43177 04974:45590 , 70196 , 79 7
1,877,806
121,13377,91968,73466,14061,31360,087
440,676190,224134,94377,478
209,297
81,87843,75359,557184,674
115,314
22,159
7,8373,5922,5722 0571:5031 , 8362,76 1
93,155
3,4731,9841,6941,7001,5961,646
13,6398,3547,2985,165
15,491
7,9424,0816,265
12,829
Gross gain
Amount
(77--dd.11 ., .)
2,306,44 6
21,647
5,3582,9933,0452 ill117852,7273,628
2,284,799
21,58611,0457,5539,7439,048
11,512
92,91396,79599,34278,285
440,450
311,827229,026403,533462,141
111,235
31,846
6,3664,3903,9924,3834,3135,8422,560
79,388
5,7014,5804,3784,1043,5783,605
24,3038,6795,4932,4105,896
1,306561643
4,150
333,554
60,786
6,0027,0217,2708,865
10,05914,6206,94 9
272,768
16,72913,07413,33512,82011,99711,825
88,57129,43620,6047,951
19,801
3,5972,0691,864
19,09 5
'Due to the reporting of more than one corporate stock transaction by some taxpayers, the sum of the number of returns with sales of corporate stock for the various periods will not equal the totals for "All periods," "Short-term, total," or "Long-term, total . "
NOTE : For the precise definition of terms and the nature of any 1~mitationsl see the "Description of the Sample," "Limitations of the Data'- and "Explanation of Classifications and Terms" in tile text .Detail in the tables may not add to totals because of rounding .

RETURNS WITH SALES OF CORPORATE STOC K
Table 13 . -SHORT-TERM AND LONG-TERM TRANSACTIONS OF CORPORATE STOCK-TRANSACTION DETAIL, BY MONTH OF SALE AND SIZE OF ADJUSTED GROSS INCOME
Month of sale and size of adjusted gross income Number o freturnsl
Short-tam corporate stock transaction s
Gross sales Cost andGross gai n
price expense o f
sale Number of Amoun t
(Th- .. .d (Thw-d transactions (Th-and
d.Jl .,.) d.11.,.) . ~11 .. .
Gross los s
Number of Amount
transactions (Thm-dd0l . ..
umber ofreturnsl
L
Gross salespric e
(7h-.-dd.11. ..
ong-tam cor p
Cost an d
expense o f
sal e
(Aw-dd.11-)
orate stock transactions
Gross gain Gross loss-
Number of Amount Number of Amount
transactions (Th-d! transactions (Th--d
d.11 .. .
(1) (2) (3) (6) (7) (14 )ALL MONTHS
Grand total . . . . . . . . . . . . . . . . . . . . . . . . . . . . . . . . . 666,746 10,634,024 11,114,417 1,261,221 388,195 1,566,574 871,423 1,946,451 21,408,101 17,783,67-7 2,922,693 6,750,171 3, 107, 174 3,215,02 6
Taxable returns, total . . . . . . . . . . . . . . . . . . . . . . . . . . . . 612,849 9,344,445 9,767,114 1,124,449 343,342 1,382,456 768,283 1,752,168 19,551,628 15,910,612 2,621,942 6,395,631 2,806,299 2,840,508Under $10,000 . . . . . . . . . . . . . . . . . . . . . . . . . . . . . . . . . . . 237,6D7 2,311,806 2,420,098 412,60B 76,969 475,323 185,696 741,386 3,166,187 3,146,797 880,466 672,535 935,506 662,69010 000 under $50,000 . . . . . . . . . . . . . . . . . . . . . . . . . . 341,102 5,229,795 5,449,CY75 629,625 207,767 792,806 428,385 924,615 9,457,939 8,523,870 1,437,371 2,428,522 1,590,266 1,532,28050,000 under $100,000 . . . . . . . . . . . . . . . . . . . . . . . . . . 26,431 1,056,383 1,112,515 60,056 36,958 82,482 93,416 67,130 3,020,989 2,362,138 210,949 1,009,777 200,129 372,769100,000 or more. . . . . . . . . . . . . . . . . . . . . . . . . . . . . . . . 7,709 746,461 785,427 22,159 21,647 31,846 60,786 19,037 3,916,464 1,877,806 93,155 2,284,799 79,388 2?2,769
Nontaxable returns . . . . . . . . . . . . . . . . . . . . . . . . . . . . . . . . 53,897 1,289,579 1,347,302 136,772 44,853 184,117 103,140 194,283 1,856,474 1,873,065 300,752 354,541 3DO,885 3?4,517
JANUARY
Grand total . . . . . . . . . . . . . . . . . . . . . . . . . . . . . . . . . 142,364 912,152 904,349 151,299 48,652 131,337 41,142 285,964 1,994,495 1,33~,601. 320,528 767,989 138,694 117,18 5
axable returns, total . . . . . . . . . . . . . . . . . . . . . . . . . . . . 126,704 75?,666 754,255 130,326 38,662 112,071 35,470 261,765 1, 891, O .)o 1,212,523 297,905 749,733 123,636 76,25 5
Under $10,000. . . . . . . . . . . . . . . . . . . . . . . . . . . . . . . . . . . 42,797 164,546 164,691 43,125 ?,094 41,094 7,333 94,685 291,642 250,446 88,679 58,632 42,044 17,62410~000 under $50,000. . . . . . . . . . . . . . . . . . . . . . . . . . . 76,216 475,676 472,996 77,684 - 25,01? 62,734 22,415 145,852 936,8!j8 662,735 172,222 315,502 70,847 44,34 350,000 under $100,000. . . . . . . . . . . . . . . . . . . . . . . . . .
16,015 73,975 73,482 7,239 4,260 6,132 3,774 15,701 287,736 172,977 25,550 123,148 8,075 9,064
100,000 or more . . . . . . . . . . . . . . . . . . . . . . . . . . . . . . . . 1,676 43,468 43,086 2,279 2,292 2,112 1,949 5,523 374,8~S5 226,366 11,454 252,451 2,670 5,224
ontaxable returns . . . . . . . . . . . . . . . . . . . . . . . . . . . . . . . . 15,660 154,486 150,094 20,973 9,990 19,266 5,672 24,199 103,405 126,979 22,623 18,257 15,058 40,93 0
FEBRUARY
Grand total . . . . . . . . . . . . . . . . . . . . . . . . . . . . . . . . . 131,908 669,308 668,616 128,460 36,357 95,930 35,888 265,688 1,531,598 1,063,007 276,723 548,278 130,653 84,672
axable returns, total . . . . . . . . . . . . . . . . . . . . . . . . . . . . 120,955 595,271 594,675 116,34? 32,172 87,902 31,798 241,336 1,394,876 953,966 253,?65 515,122 117,918 78,461
Under $10,000 . . . . . . . . . . . . . . . . . . . . . . . . . . . . . . . . . . . 46,898 187,441 192,813 46,671 7,354 32,609 12,735 91,726 251,30? 208,963 86,514 '74,610 46,526 32,57 810,000 under $50,000 . . . . . . . . . . . . . . . . . . . . . . . . . . . 65 , 317 318,162 312,670 62,369 20,382 49,282 15,090 131,193 703,9?6 526,696 140,336 210,353 62,36? 34,92 250,000 under $100,000 . . . . . . . . . . . . . . . . . . . . . . . . . .
1
5,280 53,135 57,732 5,582 3, 04.3 4,635 2,6?2 13,626 198,663 . 126,122 18,846 78,395 6,548 6,52 0100,000 or more . . . . . . . . . . . . . . . . . . . . . . . . . . . . . . . . 1,461 31,533 31,459 1,726 1,393 1,3?5 1,321 4,?92 240,926 92,185 8, cylo 151,764 2,476 4,44 1
ontaxable returns . . . . . . . . . . . . . . . . . . . . . . . . . . . . . . . . 10,953 74,037 73,942 12,113 8,029 4,091 24,351 136,721 109,041 22,958 33,15? 12,735 6,21 1
MARC H
Grand total . . . . . . . . . . . . . . . . . . . . . . . . . . . . . . . . . 139,929 7CV,,840 706,566 124,977 38,055 119,262 40,089 298,903 1,646,343 1,163,382 309,?65 568,103 160,005 93,53 1
axable returns, total . . . . . . . . . . . . . . . . . . . . . . . .. . . . . 127,475 608,587 609,905 114,491 33,972 lCr?, 308 35,598 271,821 1,520,861 1,056,680 283,171 540,733 142,415 84,307Under $10,000 . . . . . . . . . . . . . . . . . . . . . . . . . . . . . . . . . . . 46,503 143,770 140,702 43,339 8,347 38,592 5,304 104,?86 282,974 233,613 100,615 69,616 53,965 21,21 110,000 under $50,000 . . . . . . . . . . . . . . . . . . . . . . . . . . .U
73,787 350,748 353,437 63,782 20,526 61,389 23,378 147,723 759,510 577,095 152,934 227,723 78,352 49,58 90,000 under $100,000 . . . . . . . . . . . . . . . . . . . . . . . . . . 5,631 70,307 71,691 5,530 3,579 5,633 5,064 14,338 211, 547 137,093 20,709 92,350 7,439 8 , 477
~100,000 or more . . . . . . . . . . . . . . . . . . . . . . . . . . . . . . . . 1,556 43,762 44,076 1,840 1,520 1,693 1,853 4,974 266,931 108,879 8,914 161, 044 2,659 5,02 9
ontaxable returns . . . . . . . . . . . . . . . . . . . . . . . . . . . . . . . . 12,454 96,252 96,661 10,486 4,C82 11,954 4,491 27,083 125,482 106,702 26,594 27,370 17,590 9 , 224
APRIL
Grand total . . . . . . . . . . . . . . . . . . . . . . . . . . . . . . . . . 124,872 678,071 711,748 83,353 25,038 145,207 58,856 258,562 1,634,812 1,151,030 257,655 603,239 156,876 126,012
exable returns, total . . . . . . . . . . . . . . . . . . . . . . . . . . . . 112,301 580,606 607,380 75,227 22,864 124,471 49,?78 235,508 1,530,522 1,046,484 237,466 579,025 140,831 1.01,522
Under $10,COO . . . . . . . . . . . . . . . .j* . . . . . . .
41 733 125,100 132,853 24,389 6,231 44,445 14,032 86,500 269,128 234,127 79,649 66,285 49,689 31 . 28 510,000 under $50,000 . . . . . . . . . . . . . . . . . . . . . . . . . . . 63 :417 346,355 361,365 44,629 12,852 70,722 27,916 129,453 680,270 535,039 128,488 195,760 78,650 52 :41050,000 under $100,000 . . . . . . . . . . . . . . . . . . . . . . . . . .
1
5 , 574 ~6,121 68,829 4,663 2,352 7,020 5,098 14,463 237,267 154,971 20,460 92,410 9,384 11,326100,000 or more . . . . . . . . . . . . . . . . . . . . . . . . . . . . . . . . 1,577 43,031 44,3~2 1,527 1,430 2,284 2,733 5,093 343,656 122,346 8,872 224,570 3,108 6,503
ontaxable returns . . . . . . . . . . . . . . . . . . . . . . . . . . . . . . . . 12,571 97,465 104,368 8,126 2, 174 20,?36 9,078 23,054 104,291 104,546 20,187 24,215 16, 04.5 24,489
MAY
Grand total . . . . . . . . . . . . . . . . . . . . . . . . . . . . . . . . . 131,625 1,114,183 1,230,999 72,549 25,817 212,532 142,821 271,354 2,234,983 1,800,688 281,181 659,781 265,402 229,589
axable returns, total . . . . . . . . . . . . . . . . . . . . . . . . . . . . 117,724 972,601 1,072,569 62,690 23,408 185,866 123,494 245,983 2,032,023 1,593,950 258, 000 623,795 233,581 189,23 0Under $10,000 . . . . . . . . . . . . . . . . . . . . . . . . . . . . . . . . . . . 42,959 248,243 279,169 21,?01 4, 198 62,29-7 35,129 89,353 322,2017 297,575 75,769 68,537 82,264 44,00 110,000 under $50,000 . . . . . . . . . . . . . . . . . . . . . . . . . . . 66 647 538,980 589,073 35,692 15,136 107,902 65,319 137,867 1,C,65,56? 914,115 151,172 260,599 130,920 109,85 450,000 under $100,000 . . . . . . . . . . . . . . . . . . . . . . . . . .
16 :213 113,238 125,534 3,794 2,556 11,610 14,863 13,967 297,729 219,829 22,CV,5 99,669 15,019 21 12 7100,000 or more . . . . . . . . . . . . . . . . . . . . . . . . . . . . . . . . 1,905 72,139 78,793 1,503 1,51 .9 4,057 8,183 4,797 346,520 163,431 9,014 194,990 5,378
,14,24 7
antaxable returns . . . . . . . . . . . . . . . . . . . . . . . . . . . . . . . . 13,901 141,582 158,430 9,859 2,409 26,666 19,327 25,370 202,960 206,737 23,181 35,986 31,82 1
T
N
N
T
40,35 9
T
N
T
N
t7'
8i
Footnote at end of table . For,the precise definition of terms and the nature of any limitations, see the "Des-iption of the Sample," "Limitations of the Data," and "Explanution of Classifications wid Terms" in the text .

RETURNS WITH SALES OF CORPORATE STOCK
Month of sale pmd size of adjusted gross ineome
JUNE
Grand total . . . . . . . . . . . . . . . . . . . . . . . . . . . . . . . . .
Taxable returns, total . . . . . . . . . . . . . . . . . . . . . -- . . .
Under $10,000. . . . . . . . . . . . . . . . . . . . . . . . . . . . . . . . . . .10,000 under $50,000 . . . . . . . . . . . . . . . . . . . . . . . . . . .50,000 under $106,000. . . . . . . . . . . . . . . . . . . . . . . . . .
1100,000 or more . . . . . . . . . . . . . . . . . . . . . . . . . . . . . . . .
Nontaxable returns . . . . . . . . . . ---- . . . . . .
JULY
Grand total . . . . . . . . . . . . . . . . . . . . . . . . . . . . . . . . .
Taxable returns, total . . . . . . . . . . . . . . . . . . . . . . . . . . . . .
Under $10,000. . . . . . . . . . . . . . . . . . . . . . . . . . . . . . . . . . .10,000 under ~50 ' 000 . . . . . . . . . . . . . . . . . . . . . . . . . . .50,000 under 100,000. . . . . . . . . . . . . . . . . . . . . . . . . .
1100,000 or more . . . . . . . . . . . . . . . . . . . . . . . . . . . . . . . .
Nontaxable returns . . . . . . . . . . . . . . . . . . . . . . . . . . . . . . . .
Taxable returns, total . . . . . . . . . . . . . . . . . . . . . . . . . . . .
Under $10,000 . . . . . . . . . . . . . . . . . . . . . . . . . . . . . . . . . . .10,000 under $50,000 . . . . . . . . . . . . . . . . . . . . . . . . . . .50,000 under $100,000 . . . . . . . . . . . . . . . . . . . . . . . .
1100,000 or more . . . . . . . . . . . . . . . . . . . . . . . . . . . . . . . .
AUGUST
Grand total . . . . . . . . . . . . . . . . . . . . . . . . . . . . . . . . .
Taxable returns, total . . . . . . . . . . . . . . . . . . . . . . . . . . . .
Under $10,000 . . . . . . . . . . . . . . . -- . . . . . . . . . . . . . .10,000 under t50,00O . . . . . . . . . . . . . . . . . . . . . . . . . .50,000 under $100,000 . . . . . . . . . . . . . . . . . . . . . . . . . .
1100,000 or more . . . . . . . . . . . . . . . . . . . . . . . . . . . . . . .
Nontaxable returns . . . . . . . . . . . . . . . . . . . . . . . . . . . . . . . .
Nontaxable returns . . . . . . . . . . . . . . . . . . . . . . . . . . . . . . .
Table 13 . -SHORT-TERM AND LONG-TERM TRANSACTIONS OF CORPORATE STOCK-TRANSACTIO14 DETAIL, BY MONTH OF SALE AND SIZE OF ADJUSTED GROSS INCOME-ConLinue d
SEPTUMER
Grand total . . . . . . . . . . . . . . . . . . . . . . . . . . . . . . . . .
OCTOBER
Grand total . . . . . . . . . . . . . . . . . . . . . . . . . . . . . . . . .
Ta~able returns, total . . . . . . . . . . . . . . . . . . . . - . . . . . .
Under $10,000 . . . . . . . . . . . . . . . . . . . . . . . . . . . . . . . . . .10,000 under ~50,000. . . . . . . . . . . . . . . . . . . . . . . . . . .50,000 under $100,000 . . . . . . . . . . . . . . . . . . . . . . . . . .
1100,000 or more . . . . . . . . . . . . . . . . . . . . . . . . . . . . . . . .
Nontaxable returns . . . . . . . . . . . . . . . . . . . . . . . . . . . . . .
NOVMER
Grand total . . . . . . . . . . . . . . . . . . . . . . . . . . . . . . . . .
Taxable returns, total . . . . . . . . . . . . . . . . . . . . . . . . . . .
Under $10,000 . . . . . . . . . . . . . . . . . . . . . . . . . . . . . . . . . .10,000 under $50pD00 . . . . . . . .50,000 under $106,000. . . . . . .
13,00,000 or more . . . . . . . . . . . . . . . . . . . . . . . . . . . . . . . .
Nontaxable returns . . . . . . . . . . . . . . . . . . . . . . . . . . . . . . . .
Numbs, ofreturns I
Gross salesprice
(Th--dd~11-)
(2)
Short-term. corporate stock transactions Long-te- corporate stock transactions
Cost andaxPense ofsale
(rh-..dd.11...
)
(3)(1) (4)
Gross gain Gross-los s
.=ber of Amount..t, .. It'Nub~,,.ti (7h- :..d ansac t on.
I d.11'.) d.11- )
(5) (6) (7)
Number ofreturn . ,
(8)
pr,,~ .Gros s
(Th.-d*11 .. .
(9)
st ands ~s~ s
a,TI-e.dd.11. ..L~
(lo) 1
Number ofstran action s
~,,,s ~a Gross
Amount Number o f(Th-and
d.11..
. )Itransaction s
(12) (13 )
113,864
102,356
32,54661,5146,2622,035
11,508
109,608
100,937
38,68655,1075,2711,874
8,671
116,851
10~,297
3?,28056,9695,2921,755
13,554
97,102
87,596
32,06449 1 2064180.41,522
9,506
102,346
92,419
.34,69651,5314,4361,55 5
9,92 7
119,5-18
107,601
4D,88060,1654,9491,607
11,93 7
Footnote at end of table . For the precise definition of terms
1,001,693
883,428
115,0835?0,020117,78580,540
118,265
972,126
795,033
173,398472,36977,910-,1,357
177,093
842,766
748,975
245,684374,07274,54454,67 5
93,79 0
734,17 4
652,622
149,509372 99 664;38765,930
81,352
897,31 1
804,990
183,923421,053146,26 353,75 1
92,32 1
999,429
905,380
203,9025~7,90382,17491,400
94,050
1,153,228
1,015,629
138,438645,709137,51593,968
137,599
1,026,382
943,762
178,625502,03386,04677,056
182,62 0
861,137
761,409
250,551381,46777,63157,?6D
93,72 8
754,091
668,010
151,768381 993661,36667,683
86,08 1
957,399
855,848
197,907448, 607151,58 357,55 1
101,55 1
986,2"
896,950
200,984521,12082,04692,800
91,295
51,037
44,996
8,69431,2863,5771,440
6,041
91,445
85,719
34,63044,7814,4211,887
5,72 6
120,775
106,249
42,57556,27 05,4131,99 1
14,52 6
77,71 0
69,016
26,13837,3223,9471,61 0
8,69 4
60,469
54,704
21,79728,7122,9751,22 1
5,764
151,965
132,377
49,68273,5336,4412,521
19,588
16,190
11,611
1,51310,0681,7471,483
1,379
27,090
24,856
7,05713,8352,3821,581
2,234
32,036
27,325
7,63915,3032,8231,559
4,71 2
26,87 0
23,945
5,14614,7512,1601,88 8
2,92 5
18,64 9
17,486
3,03 510,6792,840
93 2
1,163
43,013
37,825
9,39 522,4133,9332,083
5,188
193,646
165,656
44,681103,24312,6045,L27
27,992
122,81 4
109,?59
36,50662,8577,2323, 1 ~55
13,05 5
103,7 - 03
92,145
35,94348,29 35,3852, 52 7
11, 55 8
97,94 9
85,992
27,89050,6375,1752,29 0
11,95 7
137,61 2
120,802
39,4?971,8996,6032162 1
16,810
82,554
74,291
24,97343,0644,4181,836
8,263
167,833
147,119
24,86785,82621,49014,936
20,714
81,502
73,741
12,28443,60510,5527,300
7,761
50,782
46,092
12,72722,8005,9124,65 4
4,69 0
46,85 3
39,200
7,40523,8014,1513,84 3
7,65 4
79,24 3
68,550
17,02036,6278, 1(~B4,73 6
10,69 3
32,047
29,614
6,51015,7663,8453,493
2,433
253,373
228,086
84,596124,20914,2405,051
25,287
184,73 7
165,251
56,44192,,60411,6414,565
19,48 6
213,864
191,900
72,909103,62411,2764,0? 0
21,96 5
191,6E2
169,612
56,27896,71710,78 53,83 2
22,051
245,569
219,122
83,538119,06 312,2014,321
26,467
282,520
254,736
62,687150,65115,8775,321
27,783
2,123,117
1,934,503
303,452996,147298,203336,700
188,61 4
1,295,95 2
1,162,343
129,304544,608191,892296,53 9
133,608
1,312,95 0
1,117,130
188,777515,481175,371237,502
195,81 9
1,064,241
972,958
163,114489,765147,313172,76 6
91,28 3
1,292,869
1,180,419
215,33759?,217164,507203,359
112,45 0
1,420,50 6
1,287,085
181,277636,314197,519271,976
133,421
1,913,37 0
1,712,214
327,224935,733249,757199,49 9
201,15 6
1,087,80 ,
943,963
128,066509,55-7156,072150,26 9
143,84 0
1,167,08 3
970,073
205,934490,09151,129122,551
197,010
970,07 6
867,483
155,853461,767126,440103,424
102,593
1,347,76 5
1,224,974
262,331650,5473.61,953150,144
122,791
1,416,127
1,281~249
200,165710,301200,866169,917
134,878
223,85 8
201,053
62,59 0111,03118,5298,903
22,804
127,25 0
113,994
32,86364,18711,00 75,91 8
13,256
144,718
127,383
44,31167,3~210,8774,86 3
17,33 5
125,501
108,925
35,27959,6739,7884,184
16,577
133,544
113,170
36,53963,5219,8794,230
20,374
156,769
136,938
46,81874,?6510"7114,643
551,988
524,074
52,622223,89285,026
162,534
27,914
393,539
374,965
22,79 9124,13061,270
166,76 6
18,574
378,290
337,555
35,257116,13151,414
134,,753
40,735
275,597
264,793
26,996106,82940,85488,114
10,604
262,293,
263,108
25,768111,60242,10283,637
19,185
338,705
313,458
26,868104,00845,339
137,243
302,11 1
26~,660
95,08 1144,96020,1368,48 4
)3,451
182,578
156,457
44,15393,16013,1925,95 2
26,12 2
206,84 5
184,480
63,527101,10314,1935,657
22,36 5
191,077
169,171
52,54396,28112,9515,39 6
21,905
305,600
272,658
100,047146,14018,2938,177
33,142
316,566
293,272
73,668183,98525,01310,605
19,831 1 25,247 1 23,294
loss
and the nature of any limitations, see the "Description of the ST.Mple," "Limitations of the Data," and "Explanation of Classifications and Terms" in the text .
Amount
(7~~...dd.11. ..
(14 )
347,59 9
307,080
76,47 5165,35137,23628,017
40,509
194,813
165,255
22,88194,16427,20521,00 5
29,55 8
236,46 7
194,542
52,42094,49727,41720,20 7
41,92 5
187,030
164,917
21,736100,98723,26418,929
22,113
342,698
313,172
73,256167,34340, 0`7032,504
29,52 6
343,996
317,231
49,469180,7604B,82139,161
26,765

RETURNS WITH SALES OF CORPORATE STOC K
Table 13 .-SHORT-TERM AND LONG-TERM TRANSACTIONS OF CORPORATE STOCK-TRANSACTION DETAIL, BY MONTH OF SALE AND SIZE OF ADJUSTED GROSS INCOME -Con t inue d
Short-term corporate stock transactions Long-term corp orate stock transaction s
Cost and Gross gain Gross loss Cost and Gross gain Gross los s
Month of sale and size of adjusted gross incomeNumber of
Gross sicle s
pr ceexpense o f
sale Amount Amount Number ofG ross
.sales
priceexpense o f
as] e Amount Amountreturns I Number of Number
0f returns I
. Number of Number o f(Th-.-d (rhm-d transactions (Th-d transactions (Th--d
,(A-d (rhousmd transactions (Th-d transactions (rhms nd
d.11 .,.) d.11. .. d.11. .. d.11 . . . d.11. .. d.11 .. . d.11.. .
D ER(2) (3) (4) (5) (6) (7) (8) (9) (10) (11) (12) (13) (14 )
ECEMB
Grand total . . . . . . . . . . . . . . . . . . . . . . . . . . . . . . . . . 103,206 683,841 677,777 lG6, 066 35,492 65,487 29,540 430,929 1,748,014 2,018,688 186,298 375,905 542,658 654,47 3
Taxable returns, total . . . . . . . . . . . . . . . . . . . . . . . . . . . . 92,436 623,629 620,015 92,436 31,9 ;!o 60,305 28,401 398,800 1,618,477 1,671,437 167,051 355,7 .34 513,662 616,572
Under $10,000 . . . . . . . . . . . . . . . . . . . . . . . . . . . . . . . . . . . 33,188 150,462 149,906 32,191 6,51.2 18,929 5,958 138,419 290,796 383,105 59,820 44,626 152,209 137,01 510,000 under $50,000 . . .
. . . . - . . . . . . . . . . . . . .
52,988 348,453 345,998 53,065 19, 087 35,673 16,669 230,063 793,997 993,734 88,826 130,267 303,941 332,516:50,000 under $100,000 . . : : . . . . 4,679 72,026 71,733 5,214 4, 168 4,049 3,904 23, 063 251,045 281,206 12,615 52,777 41,491 84,312
100,000 or more . . . . . . . . . . . . . . . . . . . . . . . . . . . . . . . . 1,581 52,688 52,379 1,967 2, 1,53 1,654 1,871 7,255 282,638 213,392 5,791 128,064 16,021 62,728
Nonts~xable returns . . . . . . . . . . . . . . . . . . . . . . . . . . . . . . . . 10,770 60;212 57,762 13,630 3,572 5,182 1,139 32,129 129,537 147,252 19,247 20,171 28,995 3?, 901,
NOT STATED
Grand total . . . . . . . . . . . . . . . . . . . . . . . . . . . . . . . . . 61,278 424,130 4?3,879 41,115 14,936 58,539 64,626 390,985 2,108,222 1,346,057 378,902 1,006,463 207,909 256,971
Taxable returns, total . . . . . . . . . . . . . . . . . . . . . . . . . . . . 57,946 415,457 460,708 39,866 14,096 55,893 59,428 341,532 1,909,341 1,175,616 323,121 953,537 189,544 231,965
Under $10,000 . . . . . . . . . . . . . . . . . . . . . . . . . . . . . . . . . . . 24,476 220,?44 241,692 17,476 3,448 27,888 24,395 155,589 276,972 259,396 130,855 97,918 80,790 83,73810,000 under $50,000 . . . . . . . . . . . . . . . . . . . . . . . . . . . 30,690 113,008 132,407 20,500 7,715 25,111 27,194 165,861 738,280 536,091 162,997 301,726 97,560 105,52450,000 under $100,000 . . . . . . . . . . . . . . . . . . . . . . . . . .
1
2,0?4 39,518 42,32? 1,240 1,116 1,986 3,924 15,030 352,192 224,724 20,949 155,024 8,395 27,929100,000 or more . . . . . . . . . . . . . . . . . . . . . . . . . . . . . . . . 707 42,186 44,283 647 1,817 905 3,914 5oO52 54lo896 155,405 8,319 398,869 2,805 14, 774
Nontaxable returns . . . . . . . . . . . . . . . . . . . . . . . . . . . . . . . . 3,332 8,673 13,171 1,249 840 2,646 5,398 49,453 198,882 170,441 55,781 52,926 18,365 25,006
'Due to the reporting of more than corporate stock transaction by some taxpayers, the number of returns with sales of corporate stock for "All Months" will be less than the sum for the specific months .NOTE: For the precise definition of terms and the nature of any limitations see the "Description of the Sample," "Limitations of the Data," and "Explwiation of Classifications and Terms" in the text .
Detail in the tables may not add to totals because of rounding .

RETURNS WITH SALES OF SECURIFIES OTHER THAN CORPORATE STOC K
Table 14 .. -SHORT-TERM AND LONG-TERM TRANSACTIONS OF SECURITIES OTHER THAN CORPORATE STOCK-TRANSACTION DETAIL, BY SIZE OF ADJUSTED GROSS INCOME AND LENGTH OF PERIOD HELD
Number ofreturns with
sales ofsecuritiesother thancorporatestock '
131,250
26,574
5,6903,9374,7633,8333,4144,1488,429
11.4,662
5,5874,6153,4193,9422,8594,21 2
24,68617,11212,2899,877
22,882
11,5524,9533,268
21,97 8
34,082
6,910
2,14 7
~9 3
3,57 0
28,85 8
3,006
6,4522,893
2,947
5,539
3,366
2 , 806
6,666
Gross salespric e
(7h ...-dd.11 .. .
3,088,737
1,264,229
554,330138,93394,430
. 71,03540,750
171,962192,789
1,624,506
143,47158,23146,38193,32449,29353,501
297,237244,531150,0()4110,349255,006
106,47737,29325,917
153,49 1
115,096
14,783
8,222
6,053
5 (Y7
100,31 3
9,492
19,10011,889
13,906
13,512
18,649
5,232
8,332
Securities other than corporate stock t
Cost andexpense o f
sale(Thma-f
d.11...)
All adjusted gross income size classe s
3,104,048
1,298,983
552,899139,16194,41971,54341,141
175,690224,130
1,805,064
142,83059,25446,63296,11050,60552,901)
293,969241,180143,326105,888245,948
I(Y, 11635,34219,290
167,665
Taxable returns under $10,000
113,465
20,62?
8,57 5
7,56 3
4,490
92,83 8
9,82 5
18,83011,128
13,441
10,533
18,727
2,963
?,390
Gross gai n
Number oftransactions
142,478
21,911
6,5592,8503,0582,4891,3871,6503,91 8
120,567
3,0212,8511,5773,4061,'?962,657
19,46517,77311,7919,228
17,998
6,2232,9332,29417,55 3
30,417
3,366
1,286
49 3
1,587
27,05 0
1,486
4,4922,707
2,947
4,846
2,180
2,419
5,973
Amount
(Tt--dd.11. .. )
117,576
7,625
2,806680924633386745
1,451
109,950
2,1451,0351, 0831,990
8981,8D6
11,49813,01 79,6997,359
19,171
6,6694,8017,960
20,81 9
11,694
218
36
9
17 3
11,47 6
222
807840
498
3,161
811
2,269
2,868
Length of period held
A-11 periods . . . . . . . . . . . . . . . . . . . . . . . . . . . . . . . . .
Short-Lem, total . . . . . . . . . . . . . . . . . . . . . . . . . . . . . . . . .
Under 1 month . . . . . . . . . . . . . . . . . . . . . . . . . . . . . . . . . . .1 under 2 months . . . . . . . . . . . . . . . . . . . . . . . . . . . . . . . .2 under 3 months . . . . . . . . . . . . . . . . . . . . . . . . . . . . . . . .3 under 4 months . . . . . . . . . . . . . . . . . . . . . . . . . . . . . . . .4 tinder 5 months . . . . . . . . . . . . . . . . . . . . . . . . . . . . . . . .5 to 6 months . . . . . . . . . . . . . . . . . . . . . . . . . . . . . . . . . . .Not available . . . . . . . . . . . . . . . . . . . . . . . . . . . . . . . . . . .
Long-term, total . . . . . . . . . . . . . . . . . . . . . . . . . . . . . . . . . .
Over 6 under 7 months . . . . . . . . . . . . . . . . . . . . . . . . . . .7 under 8 months . . . . . . . . . . . . . . . . . . . . . . . . . . . . . . . .8 under 9 morths . . . . . . . . . . . . . . . . . . . . . . . . . . . . . . . .9 under 10 months . . . . . . . . . . . . . . . . . . . . . . . . . . . . . . .10 under 11 months . . . . . . . . . . . . . . . . . . . . . . . . . . . . . .11 under 12 months . . . . . . . . . . . . . . . . . . . . . . . . . . . . . .
1 under 2 years . . . . . . . . . . . . . . . . . . . . . . . . . . . . . . . . .2 under 3 years . . . . . . . . . . . . . . . . . . . . . . . . . . . . . . . . .3 under 4 years . . . . . . . . . . . . . . . . . . . . . . . . . . . . . . . . .4 tinder 5 years . . . . . . . . . . . . . . . . . . . . . . . . . . . . . . . . .5 under 10 years . . . . . . . . . . . . . . . . . . . . . . . . . . . . . . . .
10 under 15 years . . . . . . . . . . . . . . . . . . . . . . . . . . . . . . .15 tinder 20 years . . . . . . . . . . . . . . . . . . . . . . . . . . . . . . .20 years or more . . . . . . . . . . . . . . . . . . . . . . . . . . . . . . . .Not available . . . . . . . . . . . . . . . . . . . . . . . . . . . . . . . . . . .
All periods . . . . . . . . . . . . . . . . . . . . . . . . . . . . . . . . .
Short-term, total . . . . . . . . . . . . . . . . . . . . . . . . . . . . . . . . .
Under I month . . . . . . . . . . . . . . . . . . . . . . . . . . . . . . . . . . .1 under 2 montlis . . . . . . . . . . . . . . . . . . . . . . . . . . . . . . . .2 under 3 months . . . . . . . . . . . . . .
.. . . . . . . . . . . . . . . . .
3 under 4 months . . . . . . . . . . . . . .. . . - . . . . . -* . . .4 under 5 months . . . . . . . . . . . . . .. . . . . . . . . . .5 to 6 months . . . . . . . . . . . . . . . . .
Not available . . . . . . . . . . . . . . . . . . . .
Long-term, total . . . . . . . . . . . . . . . . . . . . . . . . . . . i . . . . . .
Over 6 under 7 months . . . . . . . . . . . . . . . . . . . . . . . . . . .7 under 8 months . . . . . . . . . . . . . . . . . . . . . . . . . . . . . . . .8 under 9 months . . . . . . . . . . . . . . . . . . . . . . . . . . . . . . . .9 tinder 10 months . . . . . . . . . . . . . . . . . . . . . . . . . . . . . . .10 under 11 months . . . . . . . . . . . . . . . . . . . . . . . . . . . . . .11 under 12 months . . . . . . . . . . . . . . . . . . . . . . . . . . . . . .
1 under 2 years . . . . . . . . . . . . . . . . . . . . . . . . . . . . . . . . .2 under 3 years . . . . . . . . . . . . . . . . . . . . . . . . . . . . . . . . .3 under 4 years . . . . . . . . . . . . . . .
.. . . . . . . . . . . . . . . : .
4 under 5 years . . . . . . . . . . . . . .. * . . . ** . . . . . . *- ,5 under 10 years . . . . . . . . . . . . . . . . . . . . . . . . . . . . . . . .
10 under 15 years . . . . . . . . . . . . . . . . . . . . . . . . . . . . . . .15 under 20 years . . . . . . . . . . . . . . . . . . . . . . . . .20 years or more . . . . . . . . . . . . . . . . . . . . . . . . . .Not available . . . . . . . . . . . . . . . . . . . . . . . . . . . . . . . . . . .
Footnotes at end of table . For the precise definition of terms and the
ransaction s
Gros s
Number oftransactions
117,138
27,835
5,3802,796:2,8262,8862,7523,7937,401
81),3034,491~,150Z, 5712,7281,3512, 064
14,006~,6925,1394,51 6
16,437
9,9264,1662,17611,89 1
17,058
6,031
1,554
2,677
11~,027
loss.
Amount
(T'bm,&,dd.11 .. .
133,424
42,385
1,378908913
1,142778
4,47332,794
91,039
1,6912,0581,3354,7602,2111,215
8,2519,6743,0242,983
10,228
4,3082,8561,34 0
35,08 5
10,064
6,06 2
38 9
1,517
4,156
4,002
57
5
53779
33
183
688--
1,926
Number ofreturns wit h
sales ofsecuritiesother tha ncorporatestock '
115,582
23,121
5,1463,7784,1873,2813,2623,5916,96 1
101,225
5,0314,1093,4142,8092,3293,212
21,30716,86910,9169,24 6
21,448
10,4054,6CY73,115
18,28 8
64, Cr78
12,494
2 ' 9322,.9
2,4932,2612,2282,4722,772
56,473
3,4172 , 6302,5311,7171,5801,405
11,22610,661,6 , 8995,398
10,825
4,6692 5381,4819,313
Gross a 'aspric e
(Th-.. .ddt,11 .. .
1,295,60 5
616,546
410,38368,75640,97422,33913,98323,68536,42 6
679,060
65,50419,54224,36512,24919,73915,098
110,039101,56560,01344,67299,770
29,20412,6977,184
53,449
Securities other than corporate stock transaction s
Cost andexpense ofr
'al e(Thm-ndd.11.,. )
2,762,129
1,111,537
552,007132,83490,46867,99437,887
167,02663,321
1,650,593
139,92 456,44546,03940,36647,90644,328
271,037213,354139,920105,349247,71 3
98,81135,64722,157141,597
Tota l
2,727,752
1,124,147
550,571133,03790,55768,47038,262
170,61872,63 2
1,603,605
139,46 657,51446,33141,44349,23343,942
268,855204,836133,944100,5962,18,098
96,46533,45518,366
131,06 1
1,290,740
620,958
409, 01368,C4341, 09722,66214,15825,50439,881
669,782
65,76720,42824,53012,61520,38115,144
110,()89102,1258,11843,66697,?L8
28,59613,3544,781
51,953
Gross gai n
Amoun tNumber oftransactions I (Thm-d
doll . .
taxable ret u
129,463
20,460
6,5132,7412,5281,9821,3421,5943,78 1
108,893
2,4792,3471, 5721,4261,2681,66 2
16,14317,60310,37 38,872
17,742
5,9012,9312,263
16,401
Taxable returns $10,000 under $50,000
Gros s
Number oftransactions
rns -
108,36 9
7,037
2,77 067280056138267 0
1,18 2
101,332
1,95 6943
1,041943867
1,585
9,94412,8828,9157,18118,896
6,5314,7755,093
19,780
105,653
24,530
4,8692,7362,7732,7932,6333,2825,44 3
81,123
4,4562,1472,5682,0961,3422,05 3
13,2705,5644,7054,160
1/.,919
8,9663,7482,0209,108
69,989
13,682
5,1961,4751,5091,457
9741,1641,908
56,308
1,5021, 3031,1581,010
786711
8,20911), 8096,1654,9637,806
2,221696840
8,128
41,974
4,566
2,283364353317210336682
37,408
737392564207335679
4,0255,8723,6502,4706,241
2,02 6633
2,7666,812
59,767
13,704
2,9211,5991,7081,5141,5122,2692,180
46,064
3,1541,5271,9031,246
908966
?,5413,7412,9362,8677,776
3,8872,3271,0594,22 7
1,8()0
1,520
2,873387
400
1,287
1,587
2,973
los s
nature of any limitations, see the "Description of the Sample," -'Limitations of the Data," and Explanation of Classifications and Terms" in the text .
Amount
(rh-dd.11 .,.)
V,530
19,655
1,336875889
1,037758
4,26210,498
54,875
1,6852,0131,3352,0242,1941,200
7,7824,3?12,9412,5149,396
4,1852,5901,3099,33 7
37,328
8,988
915271475~641386
2,1554,14 4
28,341
1,0901,278
729773976725
4,0902,7511,7551,4814,194
1,4171,289371
5,421
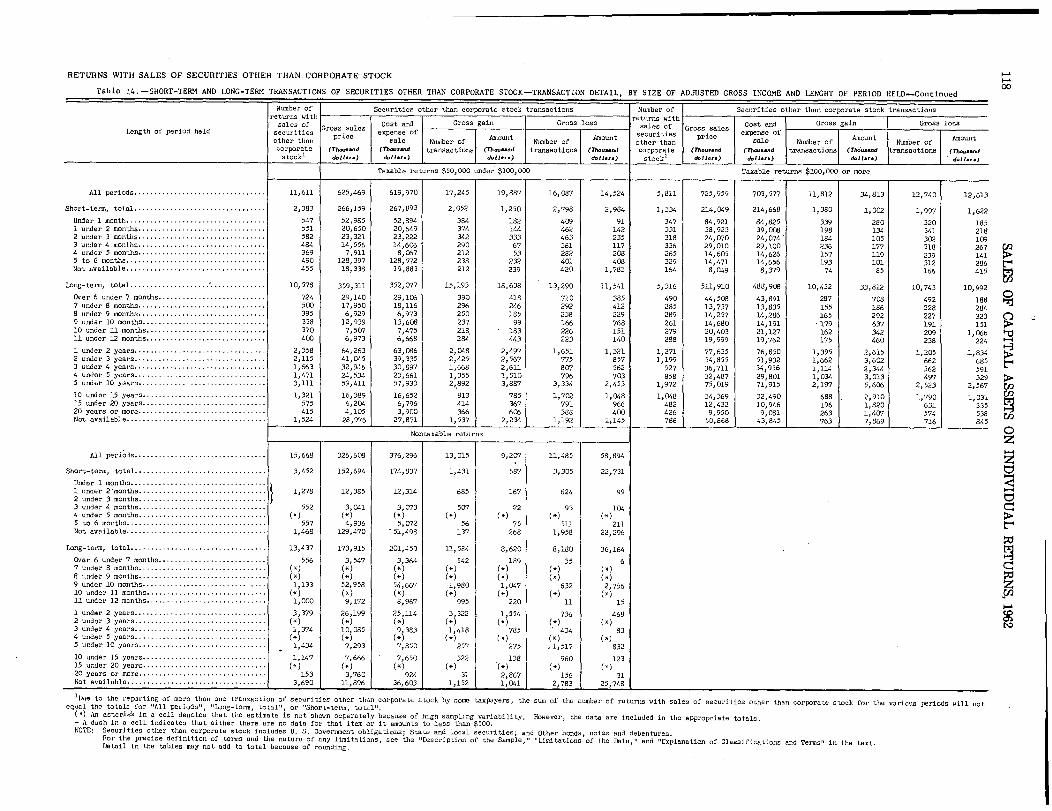
Length of period b*ld
Nmber ofreturns wit h
sales ofa ecuritiesother thancorporatestock'
(Th- .-dd.11-)
Cost andexpense of
sale(Th-.. .d
d.11 .,.)
Amount
(Amsendd.11-.)
Gross los s
Number oftransactions
Amoinr
(M. . ..dd.11. ..
rder $100,000
All periods . . . . . . . . . . . . . . . . . . . . . . . . . . . . . . . . .
Short-term, total . . . . . . . . . . . . . . . . . . . . . . . . . . . . . . . . .
Under I month . . . . . . . . . . . . . . . . . . . . . . . . . . . . . . . . . .1 under 2 Months . . . . . . -- . . . . . . . . . . . . . . . . . . . .2 under 3 months . . . . . . . . . . . . . . . . . . . . . . . . . . . . . . . .3 under 4 month . . . . . . . . . . . . . . . . . . . . . . . . . . . . . . . . .4 under 5 months . . . . . . . . . . . . . . . . . . . . . . . . . . . . . . . .5 to 6 month . . . . . . . . . . . . . . . . . . . . . . . . . . . . . . . . . . .Not available . . . . . . . . . . . . . . . . . . . . . . . . . . . . . . . . . . .
Long-terrii, total . . . . . . . . . . . . . . . . . . . . ,. . . . . . . . . . . . . .
Over 6 under 7 montJis . . . . . . . . . . . . . . . . . . . . . . . . . . .7 under 8 months . . . . . . . . . . . . . . . . . . . . . . . . . . . . . . . .8 under 9 months . . . . . . . . . . . . . . . . . . . . . . . . . . . . . . . .9 under 10 months . . . . . . . . . . . . . . . . . . . . . . . . . . . . . . .10 under 11 months . . . . . . . . . . . . . . . . . . . . . . . . . . . . . .11 under 12 months . . . . . . . . . . . . . . . . . . . . . . . . . . . . . .
1 under 2 years . . . . . . . . . . . . . . . . . . . . . . . . . . . . . . . . .2 under 3 years . . . . . . . . . . . . . . . . . . . . . . . . . . . . . . . .3 under 4 years . . . . . . . . . . . . . . . . . . . . . . . . . . . . . . . . .4 under 5 years . . . . . . . . . . . . . . . . . . . . . . . . . . . . . . . . .5 tinder 10 years . . . . . . . . . . . . . . . . . . . . . . . . . . . . . . . .
10 under 15 years . . . . . . . . . . . . . . . . . . . . . . . . . . . . . . .15 under 20 y3ars . . . . . . . . . . . . . . . . . . . . . . . . . . . . . . .20 years or more . . . . . . . . . . . . . . . . . . . . . . . . . . . . . . . .Not available . . . . . . . . . . . . . . . . . . . . . . . . . . . . . . . . . . .
11,61 1
2,383
54755158248436949045 5
10,578
72450039533837040 0
2,3582,1151,6631,4?13,111
1,32 1575415
1,524
625,469
266,159
52,98520,65023,32114,5567,911
128,39718,338
359,311
29,14017,9506,92912,9397,5076,973
64,26341,0032,94624,53459,411
16,3896,2044,10528,976
619,970
267,89 3
52,89420,64923,22214,6068,067
128,57219,88 3
352,077
29,10618,1166,97313,6087,4756,668
63,08639,33530,89?23,66157,933
16,6526,7963,900
27,871
porate stock transactions
gain
1?,245
2,05 2
38437434229021223822 2
15,193
390296250237218.284
2,0482,425-1,668lp3552, .892
813414366
1,53 7
Nontaxable returns
All periods . . . . . . . . . . . . . . . . . . . . . . . . . . . . . . . . .
Short-term, total . . . . . . . . . . . . . . . . . . . . . . . . . . . . . . . . .
Under 1 months . . . . . . . . . . . . . . . . . . . . . . . . . . . . . . . . . .I under 2 months . . . . . . . . . . . . . . . . . . . . . . . . . . . . . . . .2 tinder 3 months . . . . . . . . . . . . . . . . . . . . . . . . . . . . . . . .3 under 4 months . . . . . . . . . . . . . . . . . . . . . . . . . . . . . . . .4 under 5 montli5 . . . . . . . . . . . . . . . . . . . . . . . . . . . . . . . .5 to 6 months . . . . . . . . . . . . . . . . . . . . . . . . . . . . . . . . . . .Not available . . . . . . . . . . . . . . . . . . . . . . . . . . . . . . . . . . .
Long-terni, total . . . . . . . . . . . . . . . . . . . . . . . . . . . . . . . . . .
Over 6 under 7 months . . . . . . . . . . . . . . . . . . . . . . . . . . .7 under 8 months . . . . . . . . . . . . . . . . . . . . . . . . . . . . . . . .8 under 9 months . . . . . . . . . . . . . . . . . . . . . . . . . . . .. . . . .9 under 10 months . . . . . . . . . . . . . . . . . . . . . . . . . . . . . . .10 under 11 months . . . . . . . . . . . . . . . . . . . . . . . . . . . . . .11 under 12 months . . . . . . . . . . . . . . . . . . . . . . . . . . . . . .
2 under 2 years . . . . . . . . . . . . . . . . . . . . . . . . . . . . . . . . .2 under 3 years . . . . . . . . . . . . . . . . . . . . . . . . . . . . . . . . .3 under 4 years . . . . . . . . . . . . . . . . . . . . . . . . . . . . . . . . .4 under 5 years . . . . . . . . . . . . . . . . . . . . . . . . . . . . . . . . .5 tinder 10 years . . . . . . . . . . . . . . . . . . . . . . . . . . . . . . . .
10 under 15 years . . . . . . . . . . . . . . . . . . . . . . . . . . . . . . .15 under 20 years . . . . . . . . . . . . . . . . . . . . . . . . . . . . . . .20 years or more . . . . . . . . . . . . . . . . . . . . . . . . . . . . . . . .Not available . . . . . . . . . . . . . . . . . . . . . . . . . . . . . . . . . . .
15,668
3,45 2
1,278
552( .)
5571,468
13,437
556
1,133( . )1,0()0
3,3?9(* )1,374
( . )1,434
1,14 7( .)
1533,690
326,606
152,694
12,385
3,041
4,936129,470
173,915
3,547
52,958
9,172
26,199
10 085
7,293
7,666
3,76011,896
376,296
174,83 7
12,314
3, Cr73
5,07 2151,498
201,459
3,364
54,667
8,967
25,114
9 383
7,850
7,650
92436,603
13,015
1,43 1
685
507
56137
11,584
542
1,980
995
3,322
1,418
257
322
311,152
19,887
1,250
1821443336?5 3
232239
16,08?
2,79 8
40946246336128240142 0
18,638 13,290
418 ?10246 292185 23899 166183 226443 22 3
2,49? 1,6512,567 7752,611 80`71,510 7963,887 3,334
785 1,702367 791606 388
2,234 1,19 2
9,207
587
11,485
3,30 5
167
.72
7526 8
8,620
IS9
1,047
22 0
1,554
78 5
275
136
2,8671, (Y~l
624
93
5111,958
8,180
35
632
11
736
434
1,517
960
1562,783
14,524
2,964
9 114223511720840 8
1,78 3
11,541
38541222976815114 0
1,321857562703
2,453
1,CV,896640 0
1,14 5
58,894
22,731
Number ofeturns wit hsales of
securitiesother thancorporat estock ,
5,81 1
1,334
347331318336265329164
5,316
490285289261279288
1,2711,199
927858
1,972
1,04848242678 6
99
104
21 122,296
36,164
6
2,756M
15
468
83(,i)
832
123
31.25,748
Gross salesp ir a s
(Thm.. . dd.11 .. .
725,959
214,049
84,92138,92324,07029,01014,60514,471.8,G4 9
511,910
44,50813,73714,25714,68020,40-119,999
77,63554,85536,71132,48775,019
34,36912,43 29,950
50,868
Securities other than corporate stock transaction s
Cost andexpense o f
sale(nw-d
d. I I—)
Gross gain
Number oftransactions
Amount
(Tisdu-dd. I I— )
Taxable returns $100,000 or more
703,57?
214,668
84,62539,00824,07429,10014,62614,6568,379
488,908
43,89113,83514,28614,19121,12719,762
76,85051,93234,95629,80171,915
32,49010,9469,08143,845
11,812
1,38 0
339198184236157193
7 4
10,432
28715516 5
.17916217 5
1,3951,6621,1141,0342,197
688196263763
34,813
1,002
28013410517711910185
33,812
708186292637342460
2,6153,6022,3443,0135,606
2,9101,8201,4077,869
Gros s
Nurriber oftransactions
12,74 0
1,997
320341302318239312166
10,743
492228227191209238
1,20566256249 7
2,523
lp790631574716
los s
Amount
(Thws,,dd.11. . .
12,613
1,622
18521810926714128641 5
10,992
188284323151
2,066224
1,83468559132 9
2,567
lp03l33553884 5
'Due to the reporting of more than one transaction of securities other than corporate stock by come taxpayers, the a= of the number of returns with sales of securities other than corporate stock for the various periods will riotequal the totals for "All periods", "Long-term, total", or "Short-term, total" .
*) An asterisk in a sell denote . that the estimate is not shown separately because of high sarialing variability . However, the data are included in the appropriate totals .A dash in a cell indicates that either there are no data for that item or it amounts to less 11taxi $500 .NOTE : Securities other than corporate stock includes U . S . Government obligatioim ; State and local securities ; and Other bonds, notes and debentures .
ror tire precise definition of terms and the naturn of any limitations, see the "Dcscription of the Sample," '-Limitations of the Data," and "Explanation of Classifications and Temsl- in the text .Detail in the tables may not add to total because of rourding .
RETURNS WITH SALES OF SECURITIES OTHER THAN . CORPORATE STOC K
Table 14 . -SHORT-TERM AND LONG-TERM TRANSACTIONS OF SECURITIES OTHER THAN CORPORATE STOCE.-TRANSACTION DETAIL, BY SIZE OF ADJUSTED GROSS INCOME AND LENGHT OF PERIOD HELD-Continued
Gross isalespr cc
00

RETURNS WITH SALES OF LIVESTOC K
Length of period held
All periods . . . . . . . . . . . . . . . . . . . . . . . .
Short-term, total . . . . . . . . . . . . . . . . . . . . . . . . . . . . . . . . .
Under 1 .=th . . . . . . . . . . . . . . . . . . . . . . . . . . . . . . . . . . .1 under 2 months . . . . . . . . . . . . . . . . . . . . . . . . . . . . . . .2 under 3 months . . . _ . . . . . . . . . . . . . . . . . . . . . . . .3 under 4 montlis . . . . . . . . . . . . . . . . . . . . . . . . . . . . . . . .4 under 5 months . . . . . . . . . . . . . . . . . . . . .. . . . . . . . . . . .
5 under 6 months . . . . . . . . . . . . . . . . . . . . . . . . . . . . . . .6 under 7 months . . . . . . . . . . . . . . . . . . . . . . . . . . . . . . . .7 under 8 months . . . _ . . . . . . . . . ____ . . . . _8 under 9 months . . . . . . . . . . . . . . . . . . . . . . . . . . . . . _9 under 10 months . . . . . . . . . . . . . . . . . . . . . . . . . . . . . . .
10 under 11 months . . . . . . . . . . . . . . . . . . . . . . . . . . . . . .11 'u'der 12 months . . . . . . . . . . . . . . . . . . . . . . . . . . . . . .Not available___ . . . ____ . . . . . . . . . . . .
Long-te=, total . . . . . . . . . . . . . . . . . . . . . . . . . . . . . . . . . .
1 under 2 year . . . . . . . . . . . . . . . . . . . . . . . . . . . . . . . . . .2 tinder 3 years . . . . . . . . . . . . . . . . . . . . . . _ . . . . . . . .3 under 4 years . . . . . . . . . . . . . . . __ . . . . . _ . : . . . .4 under 5 years . . . . . . . . . . . . . . . . . . . . . . . . . . . . . . . .5 under 10 yenrs . . . . . . . . . . . . . . . . . . . . . . . . . . . . . . . .
10 years or more . . . . . . . . . . . . . . . . . . . . . . . . . . . . . . . .Not available . . . . . . . . . . . . . . . .
All period. . . . . . . . . . . . . . . . . . . . .
Short-term, total . . . . . . . . . . . . . . . . . . . . . . . . . . . . . . . . .
Under I months . . . . . . . . . . . . . . . . . . . . . . . . . . . . . . . . . .I under 2 months . . . . . . . . . . . . . . . . . . . . . . . . . . . . . . .2 unde, 3 wnth. . ~ _ . ~ . . . . . . . . . . . . . . . . . . . . _ . . .3 under 4 months . . . . . . . . . . . . . . . . . . . . . . . . . . . . . . . .4 under 5 months . . . . . . . . . . . . . . . . . . . . . . . . . . . . . . . .
5 under 6 months . . . . . . . . . . . . . . . . . . . . . . . . . . . . . . . .6 wider 7 months . . . . . . . . . . . . . . . . . . . . . . . . . . . . . . . .7 under 8 . . . . . . . . __8 under 9 months . . . . . . . . . . . . . . . . . . . . . . . . . . . . . .9 under 10 months . . . . . . . . . . . . . . . . . . . . . . . . . . . . . . .
10 under 11 months . . . . . . . . . . . . . . . . . . . . . . . . . . . . . .11 under 12 mouth . . . . . . . . . . . . . . . . . . . . . . . . . . . . . .Not available . . . . . . . . . . . . . . . . . . . . . . . . . . . . . . . . . . .
L.ng-te,m, total . . . . . . . . . . . . . . . . . . . . . . . . . . . .
1 under 2 years . . . . . . . . . . . . . . . . . . . . . . . . . . . . . . . .2 under 3 years . . . . . . . . . . . . . . . . . . . . . . . . . .3 under 4 years . . . . . . . . . . . . . . . . . . . . . . . . . . . . . . . . .4 under 5 year. . . . . . __ . . . . . . ___ . . . . . . . . _5 under 10 years . . . . . . . . . . . . . . . . . . . . . . . . . . . . . . .
10 years or more . . . . . . . . . . . . . . . . . . . . . . . . . . . . . . _Not available . . . . . . 1 . . . . . . . . . . . . . . . . . . . . . . . . . . . .
Table L5~ -SHORT-TERM AND LONG-TERM TRANSACTIONS OF LIVESTOCK-TRANSACTION DFTAIL, BY SIZE OF ADJUSTED GROSS INCOME AND LENGTH OF PERIOD HELD
Numberofreturns ith
sales ofLivestock '
689,801
29,358
2, GOO2, W92,7402,5521,699
2,8041,7671,51 5
7211,322
1,4761,555
12,956
683,210
1?3,013131,24589,84568,780
127,697
29,664354,051
346,060
14,128
1,394
1 600
1,401I,ool
1,594
200
1,300
1,2016,037
342,339
91,17267,15747,55532,61364,044
16,749170,845
Gross salesprice
(Tl-...ddo) I-)
1,017,324
20,278
1,1562,4401,1492,536
545
1,622884469
1,0281,126
322570
6,410
997,046
1'~9,477106,82975,18?52,968
120,271
16,903495,410
459,94 4
5,471
863
492
440251
953
297
905
2691,002
454,472
62,18951, SC1735,62220,27954,016
10,OD7220,553
Cost andxperse 0
sale(7hw.. .dd.IJ .. .)
All adjusted
394,719
18,495
7031,9541,3232,?1 3
561
1, "5927321608886
328531
6,053
376,224
73,36659,21852,12838,83650,831
6,64295,202
Taxable
153,697
4,8?0
296
391
517247
836
362
493
3441,364
148,827
30,29223,54324,19612,03819,164
4,04335,551
ivestock transaction s
Gros s
lAmber oftransactions
g oss income
1,140,54,0
17,476
1,349697
1,269735668
1,801783674483545
73?517
7,218
1,123,064
155,418128,93986,52671,276
150,402
31,896498,607
eturns taide
567,302
7,524
993
600
2004DO
893
400
600
3003,135
559,779
83,86968,11147,22134,(,1474,450
17,769233,745
gain
size classes
Amount
(TIms-nddoll. .. )
750,979
5,091
6936736179879
745,689
73,09066,03642,53432,86693,739
14,078423,547
0,000
240151208441299
125178
1,818
351,267
1,882
649
199
2137
158
1 2
484
48273
349,365
37,25234,99420,17113,59443,302
8,~46191,725
N=b.:r oftransac tion~a
Gross loss
236,149
24,58 1
1 .11591,5711,8791,8721,138
1,3161,28 5
675339980
77 21,152
10,24 3
211,~69
74, E~7842,-i4 5
'26,11014,(56416,301
2,98134,69 9
I(Y7,53 2
12,10?
700
1,200
1,201700
700
1,00D
1,00n
1,00) .4,60,1
95,424
35,95917,50712,64 15,1037,404
1,50115,109
Amount
(71-s-of,dollars)
32,78 5
2,829
2401?924723787
141106301343
84103
1,320
29,956
8,8196,7713,7522,2141,79 5
2836,32 2
11,314
1,17 9
82
96
943 4
4 2
6 9
6 0
95605
10,136
2,7561,4611,68 9
80257 6
1512,702
Numberoftii,n. it)
sales oflivestock ,
392,36 1
16,806
1,5961,0881,1351,7521,395
1,89 9763714321620
67 51,4507,01 9
388,007
103,1,1476,43854,36637,59073,409
18,530193,94 6
43,44 6
2,490
( .)26230831636 3
29 2
25 6
21 9
311
92 0
42,888
11,1018,6676,2104,3906,773
1,64621,767
Grossisale8pr ce
(Th--ofdoll.. .
640,94 6
13,576
1,0802,166
466719505
1,163499304983589
202469 ~
4,431
627,370
82,10066,74648,90426,9257?,896
12,916309,88 2
141,44 9
5,609
58718516619 1
19 2
49 3
74 4
266
2,68 9
135,640
16,30811,0947,5706,51 5
16,928
2,32573,101
Cost andxpense of
sale
(M-arddollar .)
239,33 9
11,605
1,77 452579348 5
1,037505173569395
22552 7
4,08 8
227,734
42,53332,53634,26318,15331,496
5,37063,3BP
62,819
4,74 3
638226169176
161
307
55 9
288
2,11 2
58,076
9,3116,3655,8944,5629,75 4
89621,293
Livestock transactions
Number oftransactions
Gross gain e
Total taxable returns
655,72 5
9,426
1,14 929756433556 8
1,097183374263144
33741 3
3,68 2
646,299
96,96479,33954,74939,56086,781
19,827269,079
80,485
1,72 1
77137114152
195
148
11 0
141
507
78,765
11,8979,9956,5404,404
11,163
1,85232,912
Amount
(Thweanddollar .)
476,010
3,913
683526507573
18485
14642323 1
9481
1,16 1
472,197
48,25344,26827,86219,05460,808
10,788261,16 5
Taxable returns $10,000 under $50,000
98,924
1,339
17123527
25
213
19 5
91
71 3
97,584
9,1476,8304,1594,05513,76 5
1,96157,667
Number oftransactions
Gross los s
127,61 4
14,425
75297167 8
1,472934
814781375139660
37 21,1515,307
113,189
41,85120,89514,6926,3459,386
1,88118,139
17,996
2,17 0
259171252218
107
140
108
204
67 0
15,826
5,1983,0131,6501,0291,86 6
3452,72 4
Footnote at end of table . For the precise definition of terms and the nature of any limitations, see the "Deseription of the Sample," "Limitations of the Data" and "EXPiRnOtiOil Of Qlassifications anO Temsl~ in the text .
Amoun t
(rhoo-ddoll . . .
16,76 0
1,562
113127917
1394 5
526514729
7 710371 5
15,176
4,3922,4662,3911,0461,038
2243,619
3,513
33 0
47
8 7
3,183
975517404172349
65700

RETURNS WITH SALES OF LIVESTOCK
Length of period held
Table 15 . -SHORT-TERM AND LONG-TERM TRANSACTIONS OF LIVESTOCK-TRANSACTION DETAIL, BY SIZE OF ADJUSTED GROSS INCOME AND LENGTH OF PERIOD HELD-Continued
All period . . . . . . . . . . . . . . . . . . . . . . . . . . . . . . . . . .
Short-term, total . . . . . . . . . . . . . . . . . . . . . . . . . . . . . . . . .
Under 1 month. . . . . . . . . . . . . . . . . . . . . . . . . . . . . . . . . .1 under 2 months . . . . . . . . . . . . . . . . . . . . . . . . . . . . . . . .2 under 3 months . . . . . . . . . . . . . . . . . . . . . . . . . . . . . . . .3 under 4 Rion ths . . . . . . . . . . . . . . . . . . . . . . . . . . . . . . . .4 under 5 months . . . . . . . . . . . . . . . . . . . . . . . . . . . . . . . .
5 under 6 months . . . . . . . . . . . . . . . . . . . . . . . . . . . . . . . .6 under 7 months . . - - . . . . . . . . . . . . . . . . . . . . . . . . . . . .7 under 8 months . . . . . . . . . . . . . . . . . . . . . . . . . . . . . . . .8 order 9 months . . . . . . . . . . . . . . . . . . . . . . . . . . . . . . . .9 under 10 months . . . . . . . . . . . . . . . . . . . . . . . . . . . . . . .
10 under 11 months . . . . . . . . . . . . . . . . . . . . . . . . . . . . . .11 under 12 months . . . . . . . . . . . . . . . . . . . . . . . . . . . . . .Hot available . . . . . . . . . . . . . . . . . . . . . . . . . . . . . . . . . . .
All periods . . . . . . . . . . . . . . . . . . . . . . . . . . . . . . . . .
Short-term, total . . . . . . . . . . . . . . . . . . . . . . . . . . . . . . . . .
Under I month . . . . . . . . . . . . . . . . . . . . . . . . . . . . . . . . . . .I under 2 months . . . . . . . . . . . . . . . . . . . . . . . . . . . . . . . .2 under 3 months . . . . . . . . . . . . . . . . . . . . . . . . . . . . . . . .3 under 4 months . . . . . . . . . . . . . . . . . . . . . . . . . . . . . . . .4 under 5 months . . . . . . . . . . . . . . . . . . . . . . . . . . . . . . . .
5 under 6 months . . . . . . . . . . . . . . . . : . . . . . . . . . . . . . . .6 under 7 months . . . . . . . . . . . . . . . . . . . . . . . . . . . . . . . .7 under 8 months. . . . . . . . . . . . . . . . . . . . . . . . . . . . . . . .8 under 9 months . . . . . . . . . . . . . . . . . . . . . . . . . . . . . . . .9 under 10 months . . . . . . . . . . . . . . . . . . . . . . . . . . . . . . .
10 under 11 months . . . . . . . . . . . . . . . . . . . . . . . . . . . . . .11 under 12 months . . . . . . . . . . . . . . . . . . . . . . . . . . . . . .Not available . . . . . . . . . . . . . . . . . . . . . . . . . . . . . . . . . . .
Long-term, total . . . . . . . . . . . . . . . . . . . . . . . . . . . . . . . . . .
1 under 2 years . . . . . . . . . . . . . . . . . . . . . . . . . . . . . . . . .2 under 3 years . . . . . . . . . . . . . . . . . . . . . . . . . . . . . . . . .3 under 4 years . . . . . . . . . . . . . . . . . . . . . . . . . . . . . . . . .4 under 5 years . . . . . . . . . . . . . . . . . . . . . . . . . . . . . . . . .5 under 10 years . . . . . . . . . . . . . . . . . . . . . . . . . . . . . . . .
10 years or more . . . . . . . . . . . . . . . . . . . . . . . . . . . . . . . .Not available . . . . . . . . . . . . . . . . . . . . . . . . . . . . . . . . . . .
Number oflet... s W to
sales oflivestock '
1,933
132
47
60
42
46
long-term, total . . . . . . . . . . . . . . . . . . . . . . . . . . . . . . . . . . 1,875
1 under 2 years . . . . . . . . . . . . . . . . . . . . . . . . . . . . . . . . . 5262 under 3 years . . . . . . . . . . . . . . . I! . . . . . . . . . . . . . . . . . 3593 under 4 years . . . . . . . . . . . . . . . . . . . . . . . . . . . . . . . . . 4084 under 5 years . . . . . . . . . . . . . . . . . . . . . . . . . . . . . . . . . 2185 under 10 years . . . . . . . . . . . . . . . . . . . . . . . . . . . . . . . . 331
20 years or more . . . . . . . . . . . . . . . . . . . . . . . . . . . . . . . . 60Not available . . . . . . . . . . . . . . . . . . . . . . . . . . . . . . . . . . . 905
297,441
12,552
(-)1,0011,604
1,104
9051,004
1,200
1,606
5,937
295,202
69,87954,80735,45931,19054,268
11,13 4160,105
Grossiselepr cc
(n. ..dd.il .. .
20,033
2,065
1,25 0
131
4 3
64 0
17,968
1,3802,1713,1711,1352,263
857,762
376,378
6,703
27468 2
1,85 7
460384
23 1
759
1,979
369,675
47,37740,08226,28324,04342,37 5
3,987185,528
Cost andexpense o f
sale(Th- .-dd.11. . .)
Taxable returns $50,000 under $100,COO
12,563
1,58 2
922
125
30
50 5
10,981
1,1751,4852,724
9021,173
1163,407
155,380
6,890
N180798
1,997
548422
188
599
1,965
148,490
30,83526,68217,86420,68319,33 5
1,27231,819
Livestock transaction s
Number oftransactions
Gross gai n
4,006
144
50
36
31
28
3,862
467580513236497
601,511
Nontaxable returns
484,815
8,050
400704
500
704600
500
995
3,536
476,76
58,45349,60031,77631,71663,621
12,069229,529
Amount
(Thms .ndd.11-I-)
11,869
5 L5
334
20
3.8
14 4
11,354
6331,3751,729
6801,566
785,294
274,969
1~27 5
14537
29
5666
79
196
65~1
273,69J.
24,83?21, 76814, 67213,81-32, 93c,
3, 290162, 382"
Number oftransactions,
Gross los s
1,150
99
12
33
30
2 8
1,051
3671881 9316 560
14165
108,535
10,156
6001,201
604
501504
700
701
4,936
98,380
32,82721,85011,4188,3206,91 5
50016,549
Amount
(Th-d&11. . .
73 1
28
2
8
703
224259924027
60
16,025
1,246
52149
140
8941
22
21
605
14,778
4,4264,3051,3611,167
75 7
592,703
Number ofeturns wit hsales of
livestock '
921
56
101094
10
33331
14
16
905
338256213169261
75429
Grossisalespr cc
(Th--dd.J1. ..
19,520
431
50158521829
141-5
2]Do
19,090
2,2231,6742,541
9962,690
4998,466
Cost andexpense o f
sale(Th-ndd.11-)
Livestock transactions
Number oftransactions
Gross gain
Amount(Th-.-dd.11.r. )
Taxable returns $100,000 or more
10,261
410
4714 1581729
171163
287
9,851
1,7561,1431,45 0
6501,406
3153,132
3,932
3844535
-
-
11 2
3,894
732653475306671
146911
13,95 0
76
23335
13 1
13,B74
2,2201,0701,80 2
7242,176
4036,478
Number oftransactions
Gross loss
936
I36
887
3291871084755
2i141
Amountff~--dd.11 .r. )
'Due to the reporting of more than one livestock transaction by some taxpayers, the sum of the number of returns with sales of livestock for the various periods will not equal the totals for "All periods," "Short-tam, total,"or "Long-term, total .'-
(*) An asterisk in a cell denotes that the estimate is n;t shown separately because of high sampling variability . However, the data are included in the appropriate totals .- A dash in 3 cell indicates that either there are no data for that item or it amounts to less than $500 .NOTE ; For the precise definition of tems and the nature of any limitations, see the "Description of the Sample," "Liitations of the Data" and "Explanation of Classifications and Terms" in the text.
Detail in the tables may not add to totals because of rounding .
1,202
46

RETURNS WITH SALES OF REAL ESTAT E
Table 16 . -SHORT-TERM AND LONG-TERM TRANSACTIONS OF REAL ESTATE-TRANSACTION DETAIL, BY SIZE OF ADJUSTED GROSS INCOME AND LENGTH OF PERIOD HELD
Length of period held
All periods . . . . . . . . . . . . . . . . . . . . . . . . . . . . . . . . .
Short-term, total . . . . . . . . . . . . . . . . . . . . . . . . . . . . . . . . .
Under I month . . . . . . . . . . . . . . . . . . . . . . . . . . . . . . . . . . .1 tinder 2 months . . . . . . . . . . . . . . . . . . . . . . . . . . . . . . .2 wider 3 months . . . . . . . . . . . . . . . . . . . . . . . . . . . . . . . .3 under 4 months . . . . . . . . . . . . . . . . . . . . . . . . . . . . . . . .4 wider 5 months . . . . . . . . . . . . . . . . . . . . . . . . . . . . . . . .5 to 6 months . . . . . . . . . . . . . . . . . . . . . . . . . . . . . . . . . . .Not availnble . . . . . . . . . . . . . . . . . . . . . . . . . . . . ! . . . . . .
Long-term, total . . . . . . . . . . . . . . . . . . . . . . . . . . . . . . . . . .
over 6 wider 7 months . . . . . . . . . . . . . . . . . . . . . . . . . . .7 under 8 month. . . . . . . . . . . . . . . . . . . . . . . . . . . . . . . . .8 wider 9 months . . . . . . . . . . . . . . . . . . . . . . . . . . . . . . . .9 wider 10 months . . . . . . . . . . . . . . . . . . . . . . . . . . . . . . .10 tinder 11 months . . . . . . . . . . . . . . . . . . . . . . . . . . . . . .11 under 12 months . . . . . . . . . . . . . . . . . . . . . . . . . . . . . .
1 under 2 years . . . . . . . . . . . . . . . . . : . . . . . . . . . . . . . . .2 under 3 years . . . . . . . . . . . . . . . . . . . . . . . . . . . . . . . . .3 tinder 4 years . . . . . . . . . . . . . . . . . . . . . . . . . . . . . . . . .4 wider 5 years . . . . . . . . . . . . . . . . . . . . . . . . . . . . . . . . .5 wider 10 years . . . . . . . . . . . . . . . . . . . . . . . . . . . . . . . .
10 wider 15 yoors . . . . . . . . . . . . . . . . . . . . . . . . . . . . . . .15 under 20 years . . . . . . . . . . . . . . . . . . . . . . . . . . . . . . .20 years or more . . . . . . . . . . . . . . . . . . . . . . . . . . . . . . . .Not available . . . . . . . . . . . . . . . . . . . . . . . . . . . . . . . . . . .
All periods . . . . . . . . . . . . . . . . . . . . . . . . . . . . . . . . .
Short-term . total . . . . . . . . . . . . . . . . . . . . . . . . . . . . . . . . .
Under 1 ..nth . . . . . . . . . . . . . . . . . . . . . . . . . . . . . . . . . . .1 wider 2 months . . . . . . . . . . . . . . . . . . . . . . . . . . . . . . . .2 -der 3 months . . . . . . . . . . . . . . . . . . . . . . . . . . . . . . . .3 under 4 months . . . . . . . . . . . . . . . . . . . . . . . . . . . . . . . .4 under 5 months . . . . . . . . . . . . . . . . . . . . . . . . . . . . . . . .5 to 6 months . . . . . . . . . . . . . . . . . . . . . . . . . . . . . . . . . . .Not available . . . . . . . . . . . . . . . . . . . . . . . . . . . . . . . . . . .
L,ong-term, total . . . . . . . . . . . . . . . . . . . . . . . . . . . . . . . . .
Over 6 wider 7 months . . . . . . . .7 wider 8 months . . . . . . . . . . . . . . . . . . . . . . . . . . . . . . . .8 wider 9
.,,ths . . . . . . . . . . . . .. . . . . . . . . . . . . . . . . . .
9 wider 10 months . . . . . . . . . . . . . . . . . . . . . . . . . . . . . . .10 under 11 months . . . . . . . . . . . . . . . . . . . . . . . . . . . . .11 under 12 months . . . . . . . . . . . . . . . . . . . . . . . . . . . . . .
1 .,der 2 year. - ~ . . . . . . . . . . . . . . . . . . . . . . . . . . . . . . .2 under 3 years . . . . . . . . . . . . . . . . . . . . . . . . . . . . . . . . .3 wider 4 years . . . . . . . . . . . . . . . . . . . . . . . . . . . . . . . . .4 under 5 year . . . . . . . . . . . . . . . . . . . . . . . . . . . . . . . . . .5 tinder 10 year. . . . . . . . . . . . . . . . . . . . . . . . . . . . . . . . .
10 under 15 years . . . . . . . . . . . . . . . . . . . . . . . . . . . . . . .15 tinder 20 years . . . . . . . . . . . . . . . . . . . . . . . . . . . . . . .20 years or more . . . . . . . . . . . . . . . . . . . . . . . . . . . . . . . .Not available . . . . . . . . . . . . . . . . . . . . . . . . . . . . . . . . . . .
Number ofreturnsith salesof realestate l
732,288
36,676
4,4414,3553,8265,1383,5947,27410,253
703,743
7,2565,4866,344r,,4165,4404,805
57,05151,41049,74646,773
153,693
93,16474,215
102,39880,03 8
371,671
18,409
1,8942,3212,2873,3741,5943, (Y734,46 7
356,676
2,2282,4873,7003,8701,7942,280
28,42625,16525,74125,73175,417
46,84235,84954,66936,941
Gross salespric e
(Th-- ..ddoll. ..
9,725,08 3
325,987
47,01731,73126,47546,01243,70673,33157,715
9,399,094
99,76459,60490,74367,01056,74450,069
782,234647,782567,933570,034
1,917,45?
1,119,095995,31 2
1,500,471874,842
3,914,434
126,346
11,2688,1888,46 8
24,83424,62930,49518,46 4
3,788,087
19,92415,29543,12027,39616,01412,897
355,324258,130209,915254,114739,132
420,885443,187667,658305,096
Cost andexpense of
sale
dollar. )
All adjusted
7,469,746
303,234
41,97828,96925,31442,03841,48169,67553,77 9
7,166,510
90,15749,10077,10459,92249,36946,987
722,287566,95?497,938497,64 0
1,614,795
822,226632,957859,312579,759
Real estate transaction s
Gross gai n
Number oftraritactions
gross income
695,699
31,246
4,4783,2502,5683,8242,8975,1929,03 8
664,453
4,9874,5414,6885,3033,9282,40 5
43,02340,37141,46037,323
130,848
90,91669,28 0
106,97276,408
Amount(Th__d
doll.. .)
size classes
2,763,459
30,180
3,6523,0502,7624,2342,7915,7117,98 1
2,733,278
13,4389,60313,82111,1308,3745,194
92,874106,14998,34 4
110,239466,373
383,849415,891646,460351,537
Taxable returns under $10,00 0
3,247,18 1
117,472
9,0407,4418,13 1
21,95424,34830,01416,544
335,60 2
13,(Y77
1,8941,4271,4942,5801,1941,3943,095
882,383
11,559
1,137967
1,4272,9011,1411,4292,557
3,129,706
19,98812,71839,82327,34213,86213,390
Yl, 353233,973197,055244,013663,145
346,758331,893411,964232,431
322,525
1,1342,28?2, 9073,1731,39 4
693
21,08018,13221,23618,46661,172
45,62232,39657,67634,954
870,823
6172,4012,6863,2032,34 8
190
24,08635,19725,89931,064
138,621
105,503151,491251,61395,504
Gross loss
Number oftransactions
Amount
(Th . .. .ddoll.. .
142,410
13,896
1,0051,4431,3591,534840
3,6434, Cr72
128, 514
2,5311,1811,6591,1171,5122,415
16,83113,55110,44911,50634,061
9,58 7.8,5473,5869,98 0
7 .2,31 8
7,733
100993793893500
2, 0802, 37 3
64,585
1,09440079369740 0
1,387
.8,1467,5335,1988,358
16,965
4,3004,846
6003,867
209,338
9,658
562545846437
1,2342,1943,82 1
199,680
3,440962
1,0894,110
8401,877
28,03316,04511,69714,87363,691
11,12810,9063,766
27,22 4
81,95 6
3,531
3 5220353196853
1,21266 1
78,425
452246247
3,016266554
8,?695,3745,155
.10,01321,686
3,1616,814
57212,099
Number ofreturn s
with salesof realestate l
578,035
28,534
3,8483,6183,4594,7342,8015,0347,06 0
555,601
5,3514,4885,90175,7084,1544,175
46,26042,79641,74038,621
124,088
72,77554,73377,71659,29 7
194,79 4
9,566
1,8381,2161,0881,3121,1351,8652,45 9
187,710
2,8961,8722,1001,7362,2431,775
16,83316,63815,10212,13446,119
24,44517,85921,26220,339
Gross asal epr c e
(M... dd.11. ..
8,089,170
271,253
45,52322,31322,66643,26935,75554,36647,36 1
7,817,915
77,56745,83085,55257,1514?,35536,587
654,667565,538476,576471,72 6
1,603,035
949,653637,73 8
1, 2(Y,, 033704,90`7
3,487,67 9
124,887
28,14110,17011,56417,0889,522
21,70826,694
3,362,792
44,19025,90738,03726,31927,19118,754
256,376266,102227,766187,584752,053
426,382329,66643B,664297,601
Cott andexpe se o fan
le I(7doll... )
Real estate transactions
Gross gain
Number ofransactions
Amount(rhoo-d
doll .. .
Total taxable returns
6,088,640
252,160
40,82820,49921,50439,39835,02751,40643,498
5,836,4?8
68,04936,72172,17851,22939,71833,086
595,914487,631410,491411,43 4
1,310,730
692,767523,010642,017461,483
550,430
23,360
3,8852,5492,3343,6162,1033,1335,739
527,069
3,6823,8434,5514,6963,2352,26 8
35,90033,53335,45029,776
107, 041
71,15051,66482,54357,737
2,365,138
24,370
3,3072,1602,6074,0981,9854,1716,042
2,340,767
10,2987,947
13,3999,4458,2604,74 8
76,52994,69588,53292,054410,457
325,659360, 0'74548,801289,867
Gross loss
Number oftransections
Amount
dollar, )
108,826
12,179
1,0051,4061,2261,334
8402,6493,71 8
96,647
1,73 1881
1,3591,01 7
9191,922
12,59111,2036,351
10,56625,126
?,0625,6511,5996,670
142,542
7,087
582535689398
1,2341,6911,95 9
Taxable returns $10,000 under $50,000
2,475,509
115,571
25,6899,09911,01016,2289,13319,46624,92 6
2,359,93?
.37,40620,22829,17621,27122,60515,46 3
222,502224,032186,839148,615586,841
289,665171,558200, 098183,638
201,11 1
9,719
1,9381, 068
7871,001
8571,6372,530
191,292
2,3841,4601,5701,4471,7641,262
13,99814,53313,37110,56743,151
23,97818,16023,06220,583
1,154,437
11,503
2,0611,06 1
8771,02174 3
2,4853,25 5
1,142,935
7,5524,5629,5445,4315,0013,543
41,04046,99848,53148,908
218,257
172,616163,727230,179137,046
34,325
4,16 3
83137039641831953 5
1,294
30,162
560445534289479516
4,1503,4162,9962,0957,855
2,628771903
2,526
135,455
90576399 0
3,599635
1,01 3
14,27810,2979,140
12,63636,527
8,7619,8012,037
24,07 3
54,981
3,11 0
427180314158342447
1,24 2
51,871
3761,41584522.33230 5
5,0214,4213,4812,457
14,074
5,3022,9421,272
10,340
Footnotesat end of table, For the precise definition of terms and the nature of any limitations, see the "Description of the Sample," -'Limitations of the Date," and "Explanation of Classifications and Terms" in the text .
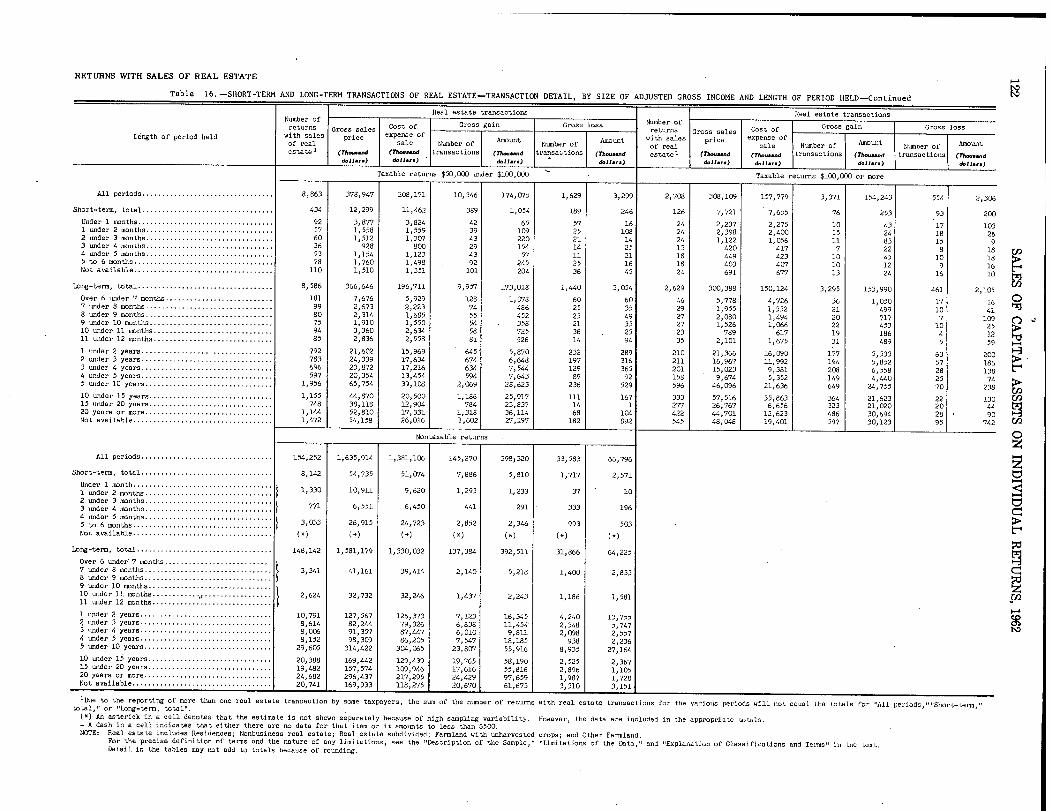
Table 16 . -SHORT-TERM AND LONG-TERM TRANSACTIONS OF REAL ESTATE-TRANSACTLON DETAIL, BY SIZE OF ADJUSTED GROSS INCOME AND LENGTH OF PERIOD HELD-Continued
Length of period held
All periods . . . . . . . . . . . . . . . . . . . . . . . . . . . . . . . . .
Short-term, total . . . . . . . . . . . . . . . . . . . . . . . . . . . . . . . . .
Under I months . . . . . . . . . . . . . . . . . . . . . . . . . . . . . . . . . .1 under 2 months . . . . . . . . . . . . . . . . . . . . . . . . . . . . . . . .2 under 3 months . . . . . . . . . . . . . . . . . . . . . . . . . . . . . . . .3 -der 4 months . . . . . . . . . . . . . . . . . . . . . . . . . . . . . . . .4 undcr 5 months . . . . . . . . . . . . . . . . . . . . . . . . . . . . . . . .5 to 6 months . . . . . . . . . . . . . . . . . . . . . . . . . . . . . . . . . . .Not available . . . . . . . . . . . . . . . . . . . . . . . . . . . . . . . . . . .
Long-term, total . . . . . . . . . . . . . . . . . . . . . . . . . . . . . . . . . .
Over 6 wider ? months . . . . . . . . . . . . . . . . . . . . . . . . . . .7 under 8 months . . . . . . . . . . . . . . . . . . . . . . . . . . . . . . . .8 order 9 months . . . . . . . . . . . . . . . . . . . . . . . . . . . . . . . .9 -der 10 months . . . . . . . . . . . . . . . . . . . . . . . . . . . . . . .10 -der 11 months . . . . . . . . . . . . . . . . . . . . . . . . . . . . . .11 wider 12 months . . . . . . . . . . . . . . . . . . . . . . . . . . . . . .
1 under 2 years . . . . . . . . . . . . . . . . . . . . . . . . . . . . . . . . .2 under 3 years . . . . . . . . . . . . . . . . . . . . . . . . . . . . . . . . .3 wider 4 years . . . . . . . . . . . . . . . . . . . . . . . . . . . . . . . . .4 -der 5 years . . . . . . . . . . . . . . . . . . . . . . . . . . . . . . . . .5 under 10 years . . . . . . . . . . . . . . . . . . . . . . . . . . . . . . . .
10 under 15 years . . . . . . . . . . . . . . . . . . . . . . . . . . . . . . .15 under 20 years . . . . . . . . . . . . . . . . . . . . . . . . . . . . . . .20 years or more . . . . . . . . . . . . . . . . . . . . . . . . . . . . . . . .Not avaflable . . . . . . . . . . . . . . . . . . . . . . . . . . . . . . . . . . .
Number ofreturn s
with salesof realestate l
8,86 3
434
92576036537811 0
8,586
181998075948 5
792783696597
1,956
1,155748
1,1441,472
Gross salesprice
(Tb-. ..dd.11.. .
378,947
.12,299
3,87?1,5581,512928
1,1541,7601,51 0
366,646
7,6762,6732,3141,9103,3602,836
21,60224,33923,87220,35465,754
44,87038,11852,81054,158
Cost ofexpense of
sale(Th-ddoll,,,)
Real estat e
Gross
Number oftransactions
ransactions
gain
Amoun t
Th-d(~11. .. )
Taxable returns $50,000 order $100,001)
208,171
11,462
3,8241,5591, 3C,7
Boo1,1231,4981,351
196,711
5,9292,2231,6851,5502,6342,55 8
15,96917,63417,21613,45439,108
20,50012,90417,33126,016
10,34 6
389
423943294392
101
9,957
128745554588 1
645674634594
2,069
1,186?84
1,3181,602
174,0`7 5
1,054
6510922015457
24520 4
173,013
1, M,486452353725526
5,8706,6437, 5447,64 3
.28,623
25,91-723,83-736, 11427,19-7
Nontaxable returns
All periods . . . . . . . . . . . . . . . . . . . . . . . . . . . . . . . . .
Short-term, total . . . . . . . . . . . . . . . . . . . . . . . . . . . . . . . . .
Under 1 month . . . . . . . . . . . . . . . . . . . . . . . . . . . . . . . . . . .I under 2 months . . . . . . . . . . . . . . . . . . . . . . . . . . . . . . . .2 under 3 months . . . . . . . . . . . . . . . . . . . . . . . . . . . . . . . .3 -der 4 months . . . . . . . . . . . . . . . . . . . . . . . . . . . . . . . .4 wider 5 months . . . . . . . . . . . . . . . . . . . . . . *5 to 6 months . . . . .
. * :*,* . . . . . . . . . . .. .. . . . .Not available . . . . . . . . . . . . . . . . . .
Long-term, total . . . . . . . . . . . . . . . . . . . . . . . . . . . . . . . . . .over 6 under 7 months . . . . . . . . . . . . . . . . . . . . . . . . . . .7 under 8 months . . . . . . . . . . . . . . . . . . . . . . . . . . . . . . . .8 -der 9 months . . . . . . . . . . . . . . . . . . . . . . . . . . . . . . . .9 =der 10 months . . . . . . . . . . . . . . . . . . . . . . . . . . . . . . .10 -der 11 months . . . . . . . . . . . .. . . . . . . . . . . . . . . . . .11 wider 12 months . . . . . . . . . . . . . . . . . . . . . . . . . . . . . .1 order 2 years . . . . . . . . . . . . . . . . . . . . . . . . . . . . . . . . .R under 3 years . . . . . . . . . . . . . . . . . . . . . . . . . . . . . . . . .3 under 4 years . . . . . . . . . . . . . . . . . . . . . . . . . . . . . . . . .4 under 5 years . . . . . . . . . . . . . . . . . . . . . . . . . . . . . . . . .5 wider 10 years . . . . . . . . . . . . . . . . . . . . . . . . . . . . . . . .10 under ij years . . . . . . . . . . . . . . . . . . . . . . . . . . . . . . .15 under 20 years . . . . . . . . . . . . . . . . . . . . . . . . . . . . . . .20 years or more . . . . . . . . . . . . . . . . . . . . . . . . . . . . . . . .Not available . . . . . . . . . . . . . . . . . . . . . . . . . . . . . . . . . . .
154,252
8,142
1,330
771
3,033
148,14 2
3,34 1
2,62 4
10,7918,6148,0066,15 2
29,605
20,38819,48224,68220,741
1,635,914
54,?35
10,911
6,55 1
26,91 5
1,581,17 9
41,16 1
32,73 2
127,56782,24491,35-798,309
314,422
169,442157,574296,437169,933
1,381,106
51,0174
9,620
6,450
24,723
1,330,032
39,414
32,24 6
126,37379,32687,44786,205
304,065
129,439109,946217,295118,275
145,270
7,886
1,293
441
2,852
137,38 4
2,14 0
1,43 7
7,1236,8386,0107,54723,807
19,?6517,61624,42920,670
398)321)
5, 810
1,23 3
291
2, 346
392,51 A
5,21 8
2,24 :3
16, 34511, 454'9,811
18,18555,916
58,19o55,81697,65961,673
Gross loss
Number oftransactions
Amoun t
(Th-.-dd.11 .. .
1,62 9
189
57252114112536
1,440
602525213614
23219712989
236
ill1468
182
33,583
1,717
37
333
99 3
31,86 6
1,400
1,18 6
4,2402,3482,098
9388,935
2,5252,8961,9873,310
3,29 9
246
1 6108142521164 5
3,054
603549352594
28931636592529
167
104892
66,796
2,571
10
196
503
64,22 5
2,83 3
1,58 1
13,7555,7472,55?2,236
27,164
2,3671,1051,?283,151
Number ofreturn s
with salesof realestate l
2,708
126
24242413is1824
2,629
4629272?233 5
210211201158596
333277422545
Gross salespric e
(T)-.-dd.lla, .)
308,109
7,721
2,2372,3981,12 242044940369 1
300,388
5,7781,9552,0801,526
7892,101
21,36616,96715,0239,674
46,096
57,51626,76?44,70148, M
Cost ofexpense o f
sale
ff1w ....dd.11 . ..
Real estate transactionsGros . gai n
Number oftransactions
Amount
(Thm-dd.11.. .
Taxable returns $100,000 or more
157,779
7,655
2,2752,4001,056417423407677
150,124
4,7261,5521,4941,066
6171,675
16,09011,9929,3815,352
21,636
35,8636,656
12,62319,401
3,37 1
76
1015117
101013
3,295
362120221931
177194208149649
364323486597
154,24 3
253
4324832245122 4
153,990
1,05 04997174531.8648 9
5,5335,8526,5584,440
24,755
21,62321,02030,69430,123
Grosz los s
Number of
trsaSaC ti Ons
554
93
1718158
10
Amount
(Thw-dd.11 .,.)
36
461
11710
710
4
63572625?0
2220289 5
1Dje to the reporting of more than one real estate transaction by some taxpayers, the am of the nuriber of returns with real estate transactions for the various periods will riot equal the totals for -'All periods, -1 "Short- Lem, "total," or "Long-term, total" .(*) An asterick in a cell denotes that the estimate is not shown separately because of high sampling variability . However, the data are included in the appropriate total . .- A dash in a cell indicates that either there are no data for that item or it amounts to less than $500 .NOTE : Real estate includes Residences ; Noribusiness real estate ; Real estate subdivided ; Farmland with unharvested crops ; and Other Famland .
For the precise definition of terms and the nature of any limitations, see the '-Description of the SaMplE," "Limitations of the Drita,-, and "Explanation of Claosifications and Terms" in the text .Detail in the tables may riot add to totals because of rounding .
RETURNS WITH SALES OF REAL ESTATE

SALES OF CAPITAL ASSETS ON INDIVIDUAL RETURNS, 1962RE I URNS WITH SALES OF RESIDENCES
Table 17 . -SHORT-TERM AND LONG-TERM TRANSACTIONS OF RESIDENCES -TRANSACTION DETAIL, BY SIZE OF ADJUSTED GROSS INCOME AND LENGTH OF PERIOD HELD
Length ot' period held
All periods . . . . . . . . . . . . . .
Sbort-te- . tot,l . . . . . . . . . . . . . . .
Under I month . . . . . . . . . . . . . . . . .1 under 2 month. . . . . . . . . . . . . . .se
der 3 month.._ . . . . . . . . . .
3 under 4 months . . . . . . . . . . . . . .4 unaer 5 mnth. . . . . . . . . . . . . . .5 to 6 months .
. . * . .. . I . . . . . . 1 .
Net vail.ble_ . . . . . I . . . . . . . .
Long-tem, total, . . . . . . . . . . . - . .
Over 6 under 7 months . . . . . . . . .7 under 8 months . . . . . . . . . . . . . .8 ~de, 9 month . . . . . . . . .9 under 10 months . . . . . . . . . . . . .10 under 11 months_ . . . . . . . . . .11
sader 12 months . . . . . . . . . . . .
I under 2 years ., . . . . . .2 under 3 years ., . . . . . . . . . . . . .3 under 4 years . . . . . . . . . . . . . . .4 under 5 year. . . . . . . . . . . . . . . .5 under 10 Years, . . . . . . . . . . . . .
10 under 15 years . . . . . . . . . . . . .15 -der 20 years . . . . . . . . . . . . .20 years or more . . . . . . . . . . . . . .Not available . . . . . . . . . . . . . . . .
Long-tem, total . . . . . . . . - . . . . . .
0'er 6 under 7 month . . . . . . . . . .
7 -der 8 month . ~ . . . . . . . . . . _8 under 9 months . . . . . . . . . . . . .9 under 10 months . - ~ . . . . . . . . . .10 under 11 months . . . . . . . . . . . .11 under 12 months . . . . . . . . . . . .
1 -der 2 years . . . . . . . . . . . . . .2 under 3 year . . . . . . . . . . . . . . .3 under 4 years . . . . . . . . . . . . . . .4 under 5 years . . . . . . . . . . . . . . .5 under 10 year. . . . . . . . . . . . . . .
11) under 15 year. . . . . . . . . . . . . .15 under 20 years ., . . . . . . . . . . .20 years or more . . . . . . . . . . . . . .Not available . . . . . . . . . . . . . . . . .
All periods . . . . . . . . . . . . . . .
Short-term, toial ., . . . . . . . . . . . . .
Under 1 month . . . . . _ . . . . . . . . . .I under 2 =nths . . . . . . . _ . . . .2 under 3 months . . . . . . . . . . . . . .3 under 4 month . . . . . . . . . . . . . . .4 under 5 months . . . . . . . . . . . . .5 to 6 months . . . . . . . . . . . . . . . .Not available . . . . . . . . . . . . . . _
long-term, total . . . . . . . . . . . . . . .
Over 6 under 7 months . . . . . . . . .7 -der 8 onths__ . . . . . . . . .8 under 9 months . . . . . . . I . . . . . .9 -der 10 months . . . . . . . . . . . . .10 under 11 mo~,tb . . . . . . . . . . . .11 under 12 months . . . . . . . . . . . .
1 under 2 years__ . . . . . . . . . . .2 under 3 years . . . . . . . . . . . . . .3 under 4 years . . . . . . . . . . . . . . .4 under 5 years . . . . . . . . . . . . . . .5 under 10 years . . . . . . . . . . . . . .
10 -der 15 year . . . . . . . . . . . . . .15 under 20 years . . . . . . . . . . . . .20 years or more . . . . . . . . . . . . . .Not available . . . . . . . . . . . . . . . . .
]=be, ofeturnswith
~asi_d.. . al l
All
176,79 4
7,612
1,505
8992,1841,16 3497
1,00 0
169,853
1,0221,2231,8731,74 6
621834
12,71812,56512,35310,56431,942
20,24316,18927,68119,95 3
All periods . . . . . . . . . . . . . . 40, 561
Short-term, total . . . . . . . . . . . . . . . 1,336
Under 1 month . . . . . . . . . . . . .. . . .I under 2 months . . . . . . . . . .
664
2 under 3 month. . . . . . . . . . . . . . .3 under 4 mo.,Lbs_ . . . . . . . . . . .4 under 5 months, . . . . . . . . . . . . . 1855 to 6 -nth. . . . . . . . . . . . . . . . . . 292
11iul available . . . . . . . . . . . . . . . . 296
39,302
505420449245412
( .)
2, S422,7882,6542,4719,313
4,4993,6944,4104,888
32,690
1 2,78 7
1,8021,3942,3072,5105,195
4,7533,3876,2423,03~
Residence transectio- .0, .
Gross Cost Gross gain returns Grossexpen with sale
.pS ar 'I ~e Se of sale uObe, of Amount sales of pri es
trans-'1~_ -d (Tt---d e,,ions (Th--d are
n, lai% (Th-.-dd.,,= en ces'rd.1 I. . .
adjuste d
2,746,575
86,581
15 984
7,36521,73214,2159,9-98,259
2,659,993
13,75614,11628,34226,38410,2218,992
208,97120(,.,060180,674184,276527,903
306,65627F,~409456,449214,7B 6
888,167
26,318
14",7
1
3 ~145 :4162 41 7
861,848
9,2397,6326,55410,2227 1 356
59,60865,25658,39G59, 654
200,556
111,88978,491
101,912?9,95 5
415,060
15,609
17,55716,89842,7614!,77475,175
50,64449,77375,99721,324
grosn income size classes
2,259,618
76,C45
13,595N6,91116,76912,7769,2836,62 7
2,183,773
12,20011,63624,05623,70 18,6538,729
192,121181,493165,439169,132459,108
253,427196,056316,66?160,95 7
707,129
24,24 2
13,835
3,4595 ' 0001,947
682,887
8,7436,6247,5269,212e , /92
54,13157,84953, 044~1,299
170,529
63,66951,49762,356.56,934
Nontaxable returns
356,340
1.3,500
342,640
15,61814,86339,64437,93967,050
4C,57742,93762,82115,251
180, 466
8,053
1,539N899
2,1841,183
50 1I,IU7
72,413
2,0221,2231,6731,746
621834
12,72912,66612,~8810,56432,013
20,37616,18927,68620,484
Taxable ret-,,- $10,WO under $50,000
41,376
1,474
697
185292299
39,902
50542044924543.2N
2 :8452,7882,6872,4719,384
4,5333,6944,4104,92 5
33,014
1,78 7
1,8021,3942,3072,5105,159
4,7533,3876,2423,033
572,680
9,113
1,117
1,2242,774
749713
1,600
563,567
1 7271,8313,2322,7071,623372
18,12724,24820,25421,60480,424
73,28682,553
151,83579,746
~'ll, 504
2,146
955
2.55414622
209,358
62C,1,0272, 074
955919
(-)
6,2226,7687,6799,72,5
34,969
33,72728,42442,63732,171
70,120
1,35 0
1,8312,0793,7264,5039,557
15,3046,14115,1606,826
144,104
5,825
1,012
7992,084
59C497900
138,949
8221,1231,7391,538621834
10,91711,17110,0476,05426,783
15,49012,80321,43916,919
Taxable returns ~50,000 under $100,000
976
95 8
39
58555337
170
13791
154198
2,331,496
70,972
2,260,523
12,12913,0626,67923,18710,2219,992
191,414163,162137,913142,502452,727
256,012228,636380,453193,460
Total Is
14,997
5,21420,9566,6149, 99c)8,01 0
44,122
43,65 8
1-83 5
2,5692,6021,324.1,3147,671
7,7203,9?89,3465,125
Residence transactions
cost andcxpensof sal,e
(Th .. .-ddli-
1,903,476
ble return
62,545
12~8566)4,864
18,069S,2149,2836,422
,840,933
11,214IC,92522,72120,9928,653S,?29
176,303166, 630125, ?95132,192392,057
212,849153,120254,046145,707
32,139
31,717
1, .50 7
2,1342,2171,1641,2625,927
5,3092,5865,8053,835
Gross C.-
ber O ftrana-
runactions
147,45 3
6,266
1 04 5
7992
'. 084590501
1,007
141,186
6221,1231,7391,53 8
621634
10,92811,27210,08 18,0~4
26,853
15,62312,80321,44417,45 0
1,02 3
1,001
3 9
65555337
170
13791
157197
Amount
(n d
02,560
7,764
931
1,1212,69 9
399713
1,55 5
494,797
1,C471,6612,9052,24411,623
372
16,29622,16916,52817,1()l70,866
57,98274,412
136,67572,920
15, 2
15,171
3 3
4486732126 5
2,100
2,8321,6344,7422,115
N_tE I, ofreturns
ith of.sales
resl-ienceS 2
102, 3,~'9
4,467
98, 4475
2,28 0
2,180
8,0128,3127,3305,539
17,259
10, 8269,006
16,84211,78 4
218
4
1
2144
234
23
516107
41
28123 550
GrossSal aP_ 1.e
(Tb-.-ddoll ._)
Taxable returns under $10,000
1,3S(,76 2
44,05 6
336, ?0
2 .5,076
20,728
128,998112,64577,90881,304
241,821
133,594145,299265,391103,973
16,445
135
Re.4d ..c. transaction s
35
8714-
18,310
8510890-
64
2382,45 9
295230
2,680
2,809868
3,8024,438
Cast andexpenseof sale
(7h,-.-d
1,152,31 6
37,774
1,114,54 2
20,850
16,838
119,810104,61371,38778,428
213,708
122,37198,500184,16481,674
11,894
108
10-
8513-
11,766
769983-
5 6156 1 14 5
2281,750201204
1,893
1,502537
1,7213,292
Gross gai n
ber oftrans-
actions
104,829
4,76 7
100,062
2,280
2,180
6,0128,4127,3305,539
17,259
10,9269,00616,84112,277
Taxable returns $100,000 or mor e
225
4-
-
im
Amount
(7~'--d
266,082
5,54 7
262 :536
2,627
1,99 8
9,62011,7136,544?,24832,906
20,31744,02287, 06036,46 1
7,760
28
-
25-21-
7,732
998
811
61,015
9252
692
1,106333
2,0362,153
'Die 10 the reporting of more than one sale Of a residence by some taxpayers, the s~, of the number of returns with sales of a residence for the various periods will net equalthe tot~ls for "All periods," "Short-term, totaly" or
.Long-tero, total . "
*An asterisk in a cell denotes the, the estimate is net shown separately because of high sampling variability . However, the data are included in the appropriate tatals .-A dash im a cell indicates that either there are no data for that item or it amounts to less than t500 .NOTE: For the precise definition of terms and the nature of any limitations, see the 'Description of the Sample," "Llnitations of the Data," and "Explanation of Classificatiocn ;
and Terms" in the text .Detail in the tables may not add to total. because of rounding .
-


SALES OF CAPITAL ASSETS ON INDIVIDUAL RETURNS, 1962RETURNS WITH NET CAPITAL GAIN OR LOS S
Table 18 . -:SELECTED SOURCES OF INCOME AND LOSS, EXEMPTIONS, TAXABLE INCOME AND INCOME TAX, REPORTED ON RETURNS WITH SALE OF CAPITALASSET TYPE SPECIFIED-NUMBER OF RETURNS AND AMOUNT, BY SIZE OF ADJUSTED GROSS INCOME -Continued
125
Salaries and wages Dividends (afterInterest received
Rents Partnership-
A et t d i f
(net) exclusion)Net income
.Net less Net profit Net loss
ss ype an s ze o adjus -gross income Number of Am~t Number of Amount Number of
AmountNumber of Amount N=ber of Amc~~t Number of Amount Number of Z~t
returns (Th- .-d returns (n ...-d returns (Th..-.d ratUrnS (Th .-d returns (71-d returns (Th . .~d returns (T~.-ddAl . . . ~11 .. . _ djiars) _ d.11ars) _ d~llars)_ &liars) - ~"_)
ALL RETURNS WITH SAT OF(15) (16) (17) (is) Uq) (20) (21) (22) (23) (24) (25) (26) (27) (28 )
CAPITAI, ASSETS '
Grand total . . . . . . . . . . . . . . . . . . . . 3,661,304 31,546,366 2,625,883 7,81 .,704 3,830,990 3,305,980 1,052,468 1,504,954 473,988 444,751 580,255 5,194,147 176,680 557,359Taxable returns total . . . . . . . . . . . .
* :3,356,403 30,944,428 2,493,664 7,395,349 3,319,761 2,935~535 852,875 1,329,437 397,437 311,996 525,980 5,076,782 144,240 363,920
*Under $10,000. . . . . . . . . . . . . . . . . . . . . 1,860,054 9~728,263 1~165,417 1,060,079 1,728,499 993,8?4 465,445 373,689 214 0861 108,538 191,063 618,393 50,163 65,457$10,000 =der ~50,000 . . . . . . . . . . . . . . 1,418,476 18,286,824 1,217,981 3,335,598 1,485,215 1,526,734 357,063 760,764 170,612 155,499 296,666 3,109,037 81,425 174 297$50,000 under $100,000 . . . . . . . . . . . . . 62,167 2,111,518 87,084 1,268,437 84,269 261,576 24,142 134,Z79 9,575 23,149 30,975 929,193 9,196
,54,596
$100,000 or more . . . . . . . . . . . . . . . . . . . 15,706 817,923 23,182 1,731,235 21,779 163,350 6,224 60,705 3,164 24,611 7,276 420,158 3,456 69,571Nontaxable returns . . . . . . . . . . . . . . . . . . . 304,901 601,938 332,219 421,355 511,228 370,446 199,593 175,517 76,552 132,755 54~275 117,365 32,439 193,43 9
RETURNS WITH SALES OF CORPORATESTOCK
Grand total . . . . . . . . . . . . . . . . . . . . 1,482,849 16,"0,697 1,517,632 5,751,345 1,585,860 1,523,231 326,937 621,793 155,444 171,985 231,761 2,626,654 84,609 304,06 9
Taxable returns, total . . . . . . . . . . . . . . . 1,413,974 16,24~,876 1,360,523 5,493,281 1,442,658 1,411 .207 286,344 580,699 137,766 143,545 220 .225 2~597,107 76,352 223,276Under $10,000 . . . . . . . . . . . . . . . . . . . . . . 589,701 3,333,132 519,007 587,772 563,993 295,869 105,993 97,837 52,323 30,147 51 ' 660 176,066 19,478 21,81 8$10,000 -der $50,000 . . . . . . . . . . . . . . 764,896 10,630,984 756,24B 2,448,392 799,181 602,905 161,058 357,475 75,959 75,158 141,734 1,496,703 46,888 100,46 7$50,000 under $100,000 . . . . . . . . . . . . . 46,531 1,609,023 66,316 1,022,694 61,888 182,466 16,488 66,433 6,926 17,538 21,179 612,715 7,068 42,641$100,000 or more . . . . . . . . . . . . . . . . . . . 12,&47 672,737 18,952 1,434,423 17,597 129,967 4,804 38,954 2,55S 20,702 5,652 311,623 2,918 58,350
Nontaxable returns . . . . . . . . . . . . . . . . . . . 68,875 195,021 157,109 258,064 143,202 112,025 38,593 41,099 17,679 28,441 11,536 29,547 8,456 80,793
RETURNS WITH SAT OF U.S. GOVERNIEN TOBLIGATION S
Grand total . . . . . . . . . . . . . . . . . . . . 24,600 294,421 36,074 "3, 528 39,591 102,819 9,136 23,794 2,533 4,505 4,531 64,017 1,400 10,379
Faxable returns, total . . . . . . . . . . . . . . . 22,991 286~865 33,359 420,639 35,792 96,462 7,811 22,027 2,213 3,695 3,729 63,486 1,225 9,463Under $10,000 . . . . . . . . . . . . . . . . . . . . . . 7,512 34,OG4 8,039 15,651 9,526 10,571 2,414 2,401 ( .) (*) ( .) H ( .)$10,000 under $50,000 . . . . . . . . . . . . . . 12,319 146,691 20,049 148,635 21,063 51,587 4,091 11,565 1,394 1,643 2,392 22,279 591 1,545$50,000 -der $100,000 . . . . . . . . . . . . . 2,161 60,557 3~618 98,654 3,569 17,267 886 4,808 391 ?59 847 20,461 301 3,536~100,000 or more . . . . . . . . . . . . . . . . . . . 999 45,614 1,652 157,699 1,633 17,037 421 3,252 228 1,239 391 20,710 233 4,271
lontaxable returns . . . . . . . . . . . . . . . . . . . 1,609 7,556 2,715 22,890 3,800 6,357 1,326 1,768 802 53 1
RETURNS WITH SXLFS OF STATE AND L0CA.LSECURITIES
Grand total . . . . . . . . . . . .. . . . . . . . . 26,289 430,441 48,109 1,020,421 46,371 117,461 10,696 36,791 4,694 31,631 6,469 130,978 3,691 39,67 6
Taxable returns, total . . . . . . . . . . . . . . . 25,748 424,737 42,777 969,605 41,018 102,981 9,759 32,263 4,094 10 .222 6,421 130,111 2,749 26,01 6Under $10,000. . . . . . . . . . . . . . . . . . . . . . 5,480 23,034 8,486 21,097 8,587 6,631 2,180 1,436 ( .) ( .) (.) (*) (~ )$1 0,000 under $50,000 . . . . . . . . . . . . . .. 14,232 164,411 23,877 198,999 22,670 42,846 4,970 13,640 2,000 2,527 3,567 38,084 1,243 5, 9"$50~ 000 under $100, 000 . . . . . . . . . . . . . 3,821 114,764 6,485 191,033 6
'.130 22,326 1, ~54 7,619 714 1,659 1,605 3?,939 574 5,33 8
$!00,000 cor rorc . . . . . . . . . . . . . . . . . . . lU2,528 3,929 558,477 3,632 31,178 1,055 9,568 586 5,826 949 53 :615 632 15,403
ontaxable returns . . . . . . . . . . . . . . . . . . . N H 5,331 50,816 5,352 14,430 937 4,528 H 942 11,660
RETURNS WITH SAT OF OTHER BONDS ,NOTES, AND DEBENTURES
GGrand total . . . . . . . . . . . . . . . . . . . . 27,980 358,744 3?,055 390,528 39,605 91,965 11,629 33,304 4,787 31,775 7,533 106,536 3,340 28,75 8
'axable returns, total . . . . . . . . . . . . . . . 26,776 351,291 33,003 364,568 -34,564 76,451 10,163 24,964 4,035 9,056 6,868 104,304 2,570 19,324Under $10,000 . . . . . . . . . . . . . . . . . . . . . . 9,230 46,721 8,536 11,832 9,237 6,507 3,574 2,369 (*) (*) ( .) (~) ( . )$10,000 under $50,000 . . . . . . . . . . . . . . 14,404 189,689 19,576 102,801 20,518 37,433 5,305 13,639 1,977 3,115 3,651 40,953 1,457 7,197$50,DOO -der $100,000 . . . . . . . . . . . . . 2,089 61,569 3,288 66,392 3,246 14,619 88~ 5,770 451 1,379 1,121 26,265 377 3,60 1$100,000 or more . . . . . . . . . . . . . . . . . . . 1,054 53,312 1,603 183,544 1,563 17,886 399 3,166 237 4,100 502 32,274 337 7,06 6
ontaxable returns . . . . . . . . . . . . . . . . . . . 1,204 7,453 4,052 25,960 5,042 15,514 1,466 E,340 752 22,719 . 769 9,434
RETURNS WITH INSURANCE AND AIMUITIES
Grand total . . . . . . . . . . . . . . . . . . . . 5,529 58,823 6,054 21,570 6,098 6,492 2,659 4,364 372 661 706 9,794 286 1,389
axable returns total . . . . . . . . . . . . . . . 5,425 58,781 5,943 21,120 5,495 6,125 .2,160 3,607 3?l 661 705 9,762 279 925Under $10,000 . . . . . . . . . . . . . . . . . . . . . . 2,273 13,807 2,766 3,57 1$10,000 under $50,0C)o . . . . . . . . . . . . . .
.2,936 37,450 2,880 10,091 2,943 4,430 880 1,894 327 .592 501 6 45
9$50,000 under $100,000 . . . . . . . . . . . . . 161 4,725 218 2,411 207 812 75 610 H 79 1 :831265 68 9
$100,000 or more. . . . . . . . . . . . . . . . . . . 56 2,798 so 5,047 72 536 19 199 12 30 25 1,288 14 136
ontaxable returns . . . . . . . . . . . . . . . . . . .
RETURNS WITH OPTIONS TO BLU OR SELL
Grand total . . . . . . . . . . . . . . . . . . . . 7,476 102,115 6,425 25,264 8,265 13,247 1,899 7,649 777 2,432 1,471 20,165 842 4,335
axable -turns, total* . . . . . . . . . . . . . . 7,167 101,552 5,689 24 349 7,330 9,654 1,531 6,384 670 1,440 1,466 20,015 841 4,33 3Under $10,000 . . . . . . . . . . . . . . . . . . . . . .$10,000 -der $50,000 . . . . . . . . . . . . .. . 4,B78 72,845 3,660 9,390 4,833 5,368 1,251 4,539 608 828 1,164 13,624 623 998$50,000 ,der $100,000 . . . . . . . . . . . . . 302 10,714 398 4,674 369 2 :212 132 709 37 144 146 3,577 91 2,02 8$100,000 or more . . . . . . . . . . . . . . . . . . . 107 5,609 144 8,304 148 1,424 49 537 25 469 57 2,435 28 1,305
ontaxable returns . . . . . . . . . . . . . . . . . . . N H H
RETURNS WITH COMMODITIES INCLUDINGFUTURE CONTRACTS
Grand total . . . . . . . . . . . . . . . . . . . . 17,902 178,526 12,491 47,097 17,209 1,-,559 4,580 11,400 1,488 1,907 4,502 46,655 1,228 7,39 9
xable returns total-
. . . . . . . . . . . . . 14,668 172,966 10~785 43,851 13,915 16,171 3 , 0629 ,
133 1,387 1,794 3,648 44,787 1,119 6,364Under $10,000 . . . . . .
. **- . .. . . . . . . . 5,075 25,739 2,294 1,541 4,281 1,938 (*) (-) ( .) ( .) ( .) ( .) ( . )
$10,000 under $50,000 . . . . . . . . . . . . . . 8,877 120,148 7,568 21,820 8,636 10,278 2,059 6,783 1,036 1,308 2,644 30,182 878 3,101$50,000 under $100,000 . . . . . . . . . . . . . 587 21,515 729 8,155 713 2,208 245 1,131 117 158 327 10,078 91 1,080$100,000 or more . . . . . . . . . . . . . . . . . . . 130 5,564 193 12,335 185 1,747 57 273 35 255 76 3,465 50 2,032
ntaxable returns . . . . . . . . . . . . . . . . . . . 3,234 5,560 1,705 3,246 3,393 2,388 1,519 2,266 853 1,868
L'I'URNS 'WITH CAPITAL GAIN DIVIDENDS
Grand total . . . . . . . . . . . . . . . . . . . . 1,069,283 9,985,886 1,220,359 2,612,994 1 .297~093 968,203 267,093 327,225 104,851 79,657 158,267 1,579,236 38,924 98,60~3
able returns, total . . . . . . . . . . . . . . . 1,046,326 9,914,159 1,OS6,023 2,499,517 1,173,374 888,528 250,496 358,210 91,778 63,956 151,469 1,564,076 35,427 79,Z73Under $10,000 . . . . . . . . . . . . . . . . . . . . . . 546,760 2,970,627 558,485 445,021 602,643 292,907 129,578 106,776 41,187 17,418 49,547 171,443 10,902 12,547~10,000 -der $50,000. . . . . . . . . . . . . . 477,390 6,135,435 492 .955 1,175,905 536,011 479,370 112 .023 205,273 47,025 35,409 90,813 986,725 21,078 37,56 6$50,000 under $100,000 . . . . . . . . . . . . . 18,072 595,301 28,191 399,492 26,564 70 .088 7,208 32,382 2,791 5,547 9,177 289,160 2,533 13,450sIOO,OOO or more . . . . . . . . . . . . _ . . . . . 4,105 212,596 6,391 480,099 5,955 40,163 1,687 13,779 775 5 ..581 1,931 116,748 914 15,709
ntaxable rEturns . . . . . . . . . . . . . . . . . . . 42,956 71,727 134 ..336 113,477 123,719 79,675 36,597 29,025 13,073 15,701 6,799 15,160 3,497
a
19,333
N
Footnotes at end of table . For the precise definition of terms and the nature of any limitations, see "Description of the Samele," "Limitations of the Data," and "Explanationof Classifications and Terms" in the text .

126 SALES OF CAPITAL ASSETS ON INDIVIDUAL RETURNS, 1962RETURNS WITH NET CAPITAL GAIN OR LOS S
Table 18 . -SELECTED SOURCES OF INCOME AND LOSS, EXEMPTIONS, TAXABLE INCOME AND INCOME TAX, REPORTED ON RETURNS WITH SALE OF CAPITALASSET TYPE SPEC IFIED-NUMBER OF RETURNS AND AMOUNT, BY SIZE OF ADJUSTED GROSS INCOME -C ont inued
Income tax before credits _Income tax afte rExemptions Taxable income
Normal tax and surtax Alternati~e tax credit s
As~set type and size of adjusted gross incomeNumber of Amoun t Number of Amount Number of Amount Number of Amount Number
of
Amount
exemptions (Th...-d returns (Th ...-d returns (Th. . .-d returns (Th .. .-d returns (Th.. .-d.bJ1 . .. ) d.11 .11) d.1 I .. . ) ~11-) ~11 . . . )
1(29) (30) (31) (32) (33) (34) (35) (36) (37) 08)
ALL RETURNS WITH AAI OF CAPITAL ASSETS -
Grand total . . . . . . . . . . . . . . . . . . . . . . . . . . . . . . . . . . . . . . . . . . 18,346,512 11,007,907 4,926,534 43,238,845 4,836,103 9,71-9,537 90,431 3,186,856 4,783,672 12,433,73 0
Taxable returns, total . . . . . . . . . . . . . . . . . . . . . . . . . . . . . . . . . . . . . 14,876,780 8,926,068 4,783,672 43,113,139 4,694,188 9,693,889 89,484 3,186,132 4,783,672 12,433,73 0Under $10,000 . . . . . . . . . . . . . . . . . . . . . . . . . . . . . . . . . . . . . . . . . . . . 7,676,664 4,605,999 2,755,815 8,760,547 2,755,815 1,818,807 -. - 2,755,815 1,115,65 0$10,000 under $50,000 . . . . . . . . . . . . . . . . . . . . . . . . . . . . . . . . . . . . 6,750,079 4,050,048 1,90?,571 25,363,294 1,883,590 6,393,134 23,981 314,286 1,907,571 6,504,14 2$50,000 -der $100,000 . . . . . . . . . . . . . . . . . . . . . . . . . . . . . . . . . . . 363,109 217,865 95,963 5,097,274 48,489 1,021,035 47,475 1,157,36-1 95,963 2,116,29 8$100,000 or more . . . . . . . . . . . . . . . . . . . . . . . . . . . . . . . . . . . . . . . . . 86,927 52,156 24,322 3,892,025 6,295 460,912 18,028 1,714,484 24,322 2,097,64 0
Nontaxable returns . . . . s . .. . . . . . . . . . . . . . . . . . . . . . . . . . . . . . . . . . . 3,469,732 2,081,839 142,862 325,705 141,915 25,648 948 724 - -
RETURNS WITH SALES OF CORPORATE STOCK
Grand total . . . . . . . . . . . . . . . . . . . . . . . . . . . . . . . . . . . . . . . . . . 6,661,231 3,996,739 1,947,946 23,794,859 1,896,497 5,366,199 61,449 2,372,720 1,915,439 7,461,25 3
Taxable returns, total . . . . . . . . . . . . . . . . . . . . . . . . . . . . . . . . . . . . . 6,059,283 3,635,570 1,915,439 23,761,157 1,854,034 5,359,174 61,405 2,372,351 1,915,439 7,461,25 3Under $10, GOO . . . . . . . . . . . . . . . . . . . . . . . . . . . . . . . . . . . . . . . . . . . . 2,180,516 1,308,310 821,787 2,803,468 821,787 586,963 - - 821,787 551,165$lQ.OOO under $50,000 . . . . . . . . . . . . . . . . . . . . . . . . . . . . . . . . . . . . 3,545,625 2,127,375 1,004,375 14,089,551 989,7G7 3,621,299 14,668 189,912 1,004,375 3,688,69 0$50,000 -der $100,000 . . . . . . . . . . . . . . . . . . . . . . . . . . . . . . . . . . . 263,438 158,063 69,827 3,686,0442 37,370 782,110 32,457 787,511 69,627 1,522,16 3$100,000 or more . . . . . . . . . . . . . . . . . . . . . . . . . . . . . . . . . . . . . . . . . 69,704 41,823 19,451 3,182,097 5,171 368,802 14,280 1,394,928 19,451 1,699,23 5
Nontaxable returns . . . . . . . . . . . . . . . . . . . . . . . . . . . . . . . . . . . . . . . . . 601,948 361,169 32,506 33,702 32,463 7,02 5
RETURNS WITH SAT OF U .S . GOVERNIAINT OBLIGATION S
-Grand total . . . . . . . . . . . . . . . . . . . . . . . . . . . . . . . . . . . . . . . . . . 128,658 77,195 39,944 847,813 36,037 167,177 3,906 178,077 39,334 326,97 8
Taxable returns, total . . . . . . . . . . . . . . . . . . . . . . . . . . . . . . . . . . . . . 117,457 70,474 39,334 847,156 35,428 167,004 3,906 178, 0`77 39,3_34 326,97 8
Under $10,000 . . . . . . . . . . . . . . . . . . . . . . . . . . . . . .. - . . . ** ,*"
31,855 19,113 12,192 41,533 12,192 8,809 - - 12,192 7,89 9
$10 000 -der $50,000 . . . . . . . . . . . . . . . . . . . . . . . . . . . . . . . . . .: : 67,182 40,309 21,799 340,093 21,121 89,329 678 8,413 21,799 91,14-1$50:000 under $100,000 . . . . . . . . . . . . . . . . . . . . . . . . . . . . . . . . . . . 12,616 7,570 3,679 192,103 1,690 35,018 1,989 48,040 3,679 78,62 5$100,000 or more . . . . . . . . . . . . . . . . . . . . . . . . . . . . . . . . . . . . . . . . . 5,803 3,482 1,664 273,428 425 33,848 1,240 121,624 1,664 149,31 2
Nontaxable returns . . . . . . . . . . . . . . . . . . . . . . . . . . . . . . . . . . . . . . . . . 3-1,200 6,720 609 656 609 172 - - - -
RETURNS WITH SALES OF STATE AND LOCAL SECURITIES
Grand total . . . . . . . . . . . . . . . . . . . . . . . . . . . . . . . . . . . . . . . . . . 161,947 97,166 4S,870 1,531,731 40,754 287,838 8,115 433,993 46,211 683,09 6
Taxable returns, total . . . . . . . . . . . . . . . . . . . . . . . . . . . . . . . . . . . . . 143,962 86,377 46,211 1,528,049 38,589 287,241 7,622 433,849 46,211 683,09 6Under $10,000 . . . . . . . . . . . . . . . . . . . . . . . . . . . . . . . . . . . . . . . . . . . . 25,795 15,477 10,373 35,977 10,373 7,572 - - 10,373 6,19 8$10,000 under $50,000 . . . . . . . . . . . . . . . . . . . . . . . . . . . . . . . . . . . . 81,526 48,916 25,332 423,441 24,018 3 .10, IC? 1,314 15,528 25,332 117,59 7$50,000 -der $100,000 . . . . . . . . . . . . . . . . . . . . . . . . . . . . . . . . . . . 22,986 1-3,792 6,553 341,349 3,135 64,605 3,418 83,414 6,553 140,33 3$100,000 or more . . . . . . . . . . . . . . . . . . . . . . . . . . . . . . . . . . . . . . . . . 13,655 8,193 3,952 727,282 1,062 104,958 2,890 3--V. , 9 0`7 3,952 418,968
Nontaxable returns . . . . . . . . . . . . . . . . . . . . . . . . . . . . . . . . . . . . . . . . . 17,984 10,791 2,658 3,681 2,165 596
RETURNS WITH SAT OF OTHER BONDS, NOTES, ANDDEBENTURES
Grand total . . . . . . . . . . . . . . . . . . . . . . . . . . . . . . . . . . . . . . . . . . 145,940 87,564 40,895. 857,155 37,504 164,746 3,391 184,676 40,286 332,?9 4
Taxable returns, total . . . . . . . . . . . . . . . . . . . . . . . . . . . . . . . . . . . . . 127,103 76,262 40,286 855,594 36,894 164,371 3,391 184,676 40,286 332,794Under $10,000 . . . . . . . . . . . . . . . . . . . . . . . . . . . . . . . . . . . . . . . . . . . . 31,715 19,029 12,910 44,437 12,810 9,391 - - 12,810 8,59 3$10,000 under $50,000 . . . . . . . . . . . . . . . . . . . . . . . . . . . . . . . . . . . . 77,119 46,271 22,431 344,679 21,903 90,763 528 6,697 22,431 92,594
$50,000 under $100,000 . . . . . . . . . . . . . . . . . . . . . . . . . . . . . . . . . . . 12,500 7,500 3,423 173,177 1,720 33,079 1,704 40,178 3,423 70,121$100,000 or more . . . . . . . . . . . . . . . . . . . . . . . . . . . . . . . . . . . . . . . . . 5,769 3,462 1,62.1 293,301 462 31,139 1,159 137,801 1,621 161,48 6
Nonts,xable returns . . . . . . . . . . . . . . . . . . . . . . . . . . . . . . . . . . . . . . . . . 18,837 11,302 609 1,561 609 375 - - - -
RETURNS WITH INSURANCE AND ANNUITIES
Grand total . . . . . . . . . . . . . . . . . . . . . . . . . . . . . . . . . . . . . . . . . . 26,335 15,601 7,933 93,072 7,702 20,454 230 9,376 7,339 28,63 1
Texable returns, total . . . . . . . . . . . . . . . . . . . . . . . . . . . . . . . . . . _ 24,104 14,462 7,339 92,677 7,109 20,375 230 9,376 7,339 28,631Under $10,DDO . . . . . . . . . . . . . . . . . . . . . . . . . . . . . . . . . . . . . . . . . . . . 9,992 5,995 3,166 11,166 3,166 2,387 - - 3,166 2,11 3$10,000 -der $50,000 . . . . . . . . . . . . . . . . . . . . . . . . . . . . . . . . . . . . 12,934 7,761 3,871 56,972 3,809 14,684 3,871 15,069$50,000 -der $100,000. . . . . . . . . . . . . . . . . . . . . . . . . . . . . . . . . . . 896 537 221 11,653 122 2,431 100 2,432 221 4,714$100,000 or more . . . . . . . . . . . . . . . . . . . . . . . . . . . . . . . . . . . . . . . . . 282 169 81 12,887 12 872 69 6,066 81 6,734
Nontaxable returns . . . . . . . . . . . . . . . . . . . . . . . . . . . . . . . . . . . . . . . . . 2,231 1,339
RETURNS WITH OPTIONS TO BUY OR SELL
Grand total . . . . . . . . . . . . . . . . . . . . . . . . . . . . . . . . . . . . . . . . . . 39,328 23,597 9,462 142,828 9,097 31,333 364 16,672 9,462 46,55 3
Taxable returns, total . . . . . . . . . . . . . . . . . . . . . . . . . . . . . . . . . . . . . .34,393 20,636 9,462 142,828 9,097 31,333 364 16,672 9,462 46,55-1Under $10,000 . . . . . . . . . . . . . . . . . . . . . . . . . . . . . . . . . . . . . . . . . . . . 8,705 5,223 2,673 7,596 2,673 1,544 - - 2,673 1,448$10,000 under $50,000 . . . . . . . . . . . . . . . . . . . . . . . . . . . . . . . . . . . . 23,418 14,051 6,200 97,648 6,3_32 22,943 6,200 23,212$50,000 under $100,000 . . . . . . . . . . . . . . . . . . . . . . . . . . . . . . . . . . . 1,647 988 430 21,523 256 4,779 175 4,143 430 8,65 7$100,000 or more . . . . . . . . . . . . . . . . . . . . . . . . . . . . . . . . . . . . . . . . . 623 374 158 26,061 37 2,068 121 11,564 1513 13,237
Nontaxable returns . . . . . . . . . . . . . . . . . . . . . . . . . . . . . . . . . . . . . . . . . 4,935 2,961 - - - - - - - -
RETURNS WITH COXWDITIES INCLUDING FUTURE CONTRACTS
Grand total . . . . . . . . . . . . . . . . . . . . . . . . . . . . . . . . . . . . . . . . . . 91,940 55,164 22,371 281,010 21,830 64,230 541 26,694 21,103 88, OCV,
Taxable raturns, total . . . . . . . . . . . . . . . . . . . . . . . . . . . . . . . . . . . . . 67,932 40,?59 21,103 279,613 20,562 63,939 .541 26,694 21,103 88, O(y~Under $10,000 . . . . . . . . . . . . . . . . . . . . . . . . . . . . . . . . . . . . . . . . . . . . 22,249 13,350 8,377 25,878 6,377 5,408 - - 8,377 5,199$10,000 under $50,000 . . . . . . . . . . . . . . . . . . . . . . . . . . . . . . . . . . . . 41,955 25,173 11,704 170,208 11,618 45,021 86 1,111 11, 704 444,63_3$50,000 -der $100,000 . . . . . . . . . . . . . . . . . . . . . . . . . . . . . . . . . . . 2,949 1,770 824 42,970 503 10,801 320 7,579 824 17,99 0$100, 000 or more . . . . . . . . . . . . . . . . . . . . . . . . . . . . . . . . . . . . . . . . . 778 467 198 40,557 64 2,708 134 16,003 198 20,182
Non~axable returns . . . . . . . . . . . . . . . . . . . . . . . . . . . . . . . . . . . . . . . . . 24,008 14,405 1,269 1,396 1,269 291 - - - -
RETUMIS WITH CAPITAL GAIN DIVIDENDS
Grand total . . . . . . . . . . . . . . . . . . . . . . . . . . . . . . . . . . . . . . . . . . 4,707,396 2,824,438 1,484,756 13,864,508 1,455,099 3,108,209 2-,657 946,335 1,445,511 3,911,617
Taxable returns, total . . . . . . . . . . . . . . . . . . . . . . . . . . . . . . . . . . . . . 4,241,961 2,545,177 1,445,511 13,835,842 1,415,955 3,102,330 29,556 946,096 1,44,,511 3,911,617Under $10,000 . . . . . . . . . . . . . . . . . . . . . . . . . . . . . . . . . . . . . . . . . . . . 1,922,689 1,153,613 ??5,322 2,746,556 775,322 576,294 - - 775 :322 544,589$10 ' 000
-der $50,000 . . . . . . . . . . . . . . . . . . . . . . . . . . . . . . . . . . . . 2,185,036 1,312,022 634,749 9,557,879 625,733 2,139,165 9,015 118,712 634,749 2,192,595~50:000 under $100,0DO ._ . . . . . . . . . . . . . . . . . . . . . . . . . . . . . _ 111,356 66,814 29,010 1,549,956 13,382 284,036 15,628 378,1(A 29, DID 643,249$100,000 or more . . . . . . . . . . . . . . . . . . . . . . . . . . . . . . . . . . . . . . . . . 22,881 13,729 6,430 9S1,45I 1,518 102,635 4,912 449,219 6,430 531,184
Nontaxable reLuxns . . . . . . . . . . . . . . . . . . . . . . . . . . . . . . . . . . . . . . . . . 465,435 279,261 39,244 28,666 39,143 5,879 (-) - -
Footnotes at end of table . For the ~ezise definition of terms and the nature of any limitations, see I'Descripti on of the Sexiiple, Lim! tations of the Data, 11 and "Explanationof Classifications, and Term" in the text .

SALES OF CAPITAL ASSETS ON INDIVIDUAL RETURNS, 1962RETURNS WITH NET CAPITAL r-AIN OR LOS S
Table 18 . -SELECTED SOURCES OF INCOME AND LOSS, EXEMPTIONS, TAXABLE INCOME AND INCOME TAX, REPORTED ON RETURNS WITH SALE OF CAPITALASSET TYPE SPECIFIED-NUKBER OF RETURNS AND AMOUNT, BY SIZE OF ADJUSTED GROSS INCOME-Continued
12 7
Adjusted Sales of capital assetsSales of property other tha
ncapital assets Business, farm, or professio n
Asset type and size of adju~ted Number ofgros sincome
Net gain Net loss Net gain Net los sI Net profit lossgross income
returns Number of Amount Number of AmountNun~ her of Amount Number o f Amount Number of Amount
-
Number o f Amountreturns (7~.-d returns (Tho-d returns returns (Th.. .-d returns (Th-.-d returns (M. .- d
d~ll . . . ~11 ... ~11 . .. d.11 .,. ) d.11 ... ) ~11- )
RETUICIS WITH SHARE OF CAPITAL(1) (2) (3) (4) (5) (6) (7) (8) (9) (10) (11) (12) (13) (14 )
GAIN (LOSS) FROM PARTNERSHIPSA14D FIDUCIARIES ,
Grand total . . . . . . . . . . . . . . . . . . . . 387,233 7,174,902 293,167 1,069,585 93,786 55,299 1,741 4,080 8,014 17,768 65,725 6M, 148 25,436 152,62-3Taxable returns, total . . . . . . . . . . . . . . .
Under $10 000340,607139 4
7,099,129 256,892 974,856 83,635 48,421 1,338 3,572 6,783 12,775 59,778 6,22,959 18,816 99 127, . . . . . . . . . . . . . . . . . . . . . .$10,000 under $50,000 . . . . . . . . . . . . . .
, 55175,457
815,67 53,701,386
113,9781-23,410
99,347317,111
25,57751,973
11,38332 OS4
(.)840
(- )2 859
(- )87 83
( . )5 769
21,73 034
70,686 8,138,
16,473$50,000 under $100,000 . . . . . . . . . . . . . 19,600 1,315,740 14,490 163,673 5,103
,4,101 142
,366
,860
,2 581
- ,1623 192
421,11 7103 715
S,2721 46
37,451$100,000 or more . . . . . . . . . . . . . . . . . . . 6,096 1,266,328 5,114 394,724 982 853 57 327 551
,3,479
,695
,
27,442
, 1926
15,55029,654
Nontaxable returns . . . . . . . . . . . . . . . . . . . 46,626 75,773 36,275 94,730 10,151 6,678 1,231 4,993 5,947 15,189 6,620 53,48 6
RETURNS WITH CAPITAL GAI NDISTRIBUTIONS FROM SMALL BUSINESS
CORPORIATIONS
Grand total . . . . . . . . . . . . . . . . . . . . 30,274 539o309 22,897 68,751 7,377 4,649 123 33 326 1,339 5,721 64,789 2,167 12,102Taxable returns, total . . . . . . . . . . . . . . .
Under $10 OGO28,08810 396
535,47 35
20,878 67,005 7,210 4,484 23 32 322 1,339 5,587 63,977 1,502 8,488, . . . . . . . . . . . . . . . . . . . . . .$10,000 under $50,000 . . . . . . . . . . . . . .
,16,023
8,12 5302,505
7,72 311,629
4,644
22,6182,6734 194
1,36 682 82 N - -213 -6
1 301
:
4 362 (- )$50,GOO under $100 .000 . . . . . . . . . . . . . 1,249 83,880 959 9,075
,290
,
243 7467 3 937 45,588 837 3,469
$100,000 or more . . . . . . . . . . . . . . . . . . . 420 90,963 367 30,467 53 46 5 8 3191 301 11,325 99 881
6 280 49 2,703 67 2,034Nontaxable returns . . . . . . . . . . . . . . . . . . . 2,186 3,836 2,019 1,74? M M 665 3,61 4
RETURNS WITH LIQUIDATIONDISTRIBUTION S
Grand total . . . . . . . . . . . . . . . . . . . . 49,095 1,400,228 30,510 4 .34,969 18,585 14,040 723 1,287 1,122 6,262 8,310 85,685 3,950 40,10 6Taxable returns, total . . . . . . . . . . . . . . .
Under $10,G00 . . . . . . . . . . . . . . . . . . . . . .45,76115 586
1,386,15 3100 165
29,023
9 046396,551 16,757 12,340 716 1,2841 944 2,990 8,099 65,379 2,684 30,580
$10,000 -der $50,000 . . . . . . . . . . . . . .,
24,334,
522,742,
15,0159,47 9
72,0076 54 09 :320
4 ' 6036,950 692 888 -597 -1 087
2 5024:803
9,668
52 93 1( .)
40$50,000 under $100,000 . . . . . . . . . . . . . 3,783 258,581 3,060 56,181 704 610 169,672 569
, -15 287
1,2377
9,388$100,000 or more . . . . . . . . . . . . . . . . . . . 2, Cr77 504,665 1,862 258,884 195 177 24 395 178 1,232 226
,7,513 368
6,796l4o464
ontaxable returns . . . . . . . . . . . . . . . . . . . 3,314 14,0?5 1,827 1,700 N 1,266 9,52 6
RETURNS WITH RETIREMENT PLANDISTRIBUTIONS
Grand total . . . . . . . . . . . . . . . . . . . . 61,070 748,362 59,199 216,334 1,872 1,571 40 165 156 511 4,837 18,065 3,196 7,61 9axable returns, total . . . . . . . . . . . . . . . 54,484 732,261 52,835 212,726 1,649 1,347 40 165 156 511 1 1Under $10,000 . . . . . . . . . . . . . . . . . . . . . .$10,000 =der $50,000 . . . . . . . . . . . . . .
28,IU525,259
179,22 5413,034
28,00523,776
35,48 097,456
(. )1 483
(- )1 194 - M - -125
- I , 901 4,033 1,334 95 6$50,000 -der $100,000 . . . . . . . . . . . . . 771 52,949 717 22,339
,54
,43 -
247 2,396 11 335
:1,045 3,091
$100,000 or more . . . . . . . . . . . . . . . . . . . 348 87,053 337 57,451 12 10 3-2 17 51
9 525
1 29 9350
6057
3121 23
ontaxable returns . . . . . . . . . . . . . . . . . . . 6,587 16,101 6,364 3,609 M
, 7
RETURNS WITH SALES OF LIVESTOCK
Grand total . . . . . . . . . . . . . . . . . . . . 689,801 3,259,441 632,284 564,204 56,212 17,262 11,065 3,877 26,322 5,829 518,777 1,576,789 145,328 371,31 3axable returns, total . . . . . . . . . . . . . . .Under $10 000 . . . . . . .
392 , 361346 060
2,77~,02 51 6/2 370
362,778 40`7, 504 28,977 8,288 7,562 3,088 14,686 3,294 309,013 1,240,321 66,222 188,621 6, . . . . . . . . . . . . . . .$10,000 -der $50,000 . . . . . . . . . . . . . .
,43o446
, ,725,893
320,91839,504
209,33 694,766
24,64 13 942
5,68 82 261
6,5071 C)OO
2,029676
13,2081 430
1,822 276,113 891,967 56,146 70,947$50,000 -der $100,000 . . . . . . . . . . . . . 1,933 130,161 1,624 22,149
,306
,260
,
32 292,17
542 31,991 315,425 6,511 61,682$100,000 or more . . . . . . . . . . . . . . . . . . . 921 248,601 832 81,254 89 79 23 91
177
355 710 22,469 930 20,255575 200 10,459 635 35,741
ontaxable returns . . . . . . . . . . . . . . . . . . . 297,441 482,416 269,505 156,699 27,235 6,974 3,503 789 11,435 2,534 2D9,764 336,469 79, IC? 182,68 8
RETURNS WITH SALES OF TRIBER AND COAL
Grand total . . . . . . . . . . . . . . . . . . . . 63,513 566,235 57,02? 1-16,667 6,450 3,906 436 313 605 680 24,702 85,091 16,027 64,99 5axable returns, total . . . . . . . . . . . . . . .Under $10 000 . . . . . . . . . . . . . . . . . . . . . .
43,97730 922
545,63 2163 462
38,319 93,690 5,622 3,195 432 30`7 597 663 16,690 78,825 10,631 34,804,$10,000 under $50,00C ., . . . . . . . . . . . .
,11,912
,218,807
26,96910,338
23,63 629 729
3 , 952
1 5371,774
3.
1 425 275 ( .)232 (~)12,041 28,646 7,597 15,423
$50,000 under $100,0001 . . . . . . . . . . . . . 765 50,765 669,
8 994,96
,
82282 4,368 40,669 2,688 11,115
$100,000 or more . . . . . . . . . . . . . . . . . . . 379 112,598 343,
31,331 36 34 7 323629
218105
21072
6,683 205 2,984
ontaxable returns . . . . . . . . . . . . . . . . . . . 19,536 20,603 18,708 22,978 828 711 8,012
2,82 6
6,266
141
5,396
5,28 2
30,191
RETURNS WITH SALES OF OIL ANDMINERAL INTERESTS
Grand total . . . . . . . . . . . . . . . . . . . . 26,522 634,201 15,926 145,728 10,525 7,251 100 156 791 1,643 7,407 61,543 3,620 46,38 5xable returns, total . . . . . . . . . . . . . . .Under $10 000
23,728 638,120 13,684 1-34,398 9,973 6,852 96 153 590 1,503 6,392 59,566 2 465 28 331, . . . . . . . . . . . . . . . . . . . . . .$10,000 under $50,000 . . . . . . . . . . . . . .
10,00011,637
69,367236 192
5,9736 103
6,23 726 201
4,02 75 464
2,7143 71?
- - N (-) 2,655 6,408,
1, lol,
2," 5$50,000 under $100,000 . . . . . . . . . . . . . 1,281
,87,751
,942
, .16715
,340
,291
345 190 3,355 39,546 993 10,11 6$100,000 or more . . . . . . . . . . . . . . . . . . . 810 244,810 667
,86,794 143 130 7 8
5 986
677627
25 8124
8,9944 618
167204
3,50612 263
ntaxable returns . . . . . . . . . . . . . . . . . . . 2,793 -3,919 2,242 11,330 551 398 1,016
,
1,977 1,155
,
16,054RETURNS WITH SALES OF PARTNERSHI P
INTERESTS
Grand total . . . . . . . . . . . . . . . . . . . . 87,451 1,467,538 68,214 335,002 19,029 14,004 770 833 2,357 7,894 29,474 210,602 8,454 74,208aable returns, to-~al . . . . . . . . . . . . . . .Under $10 000
74,448 1,451,494 58,7925
285,262 15,448 10,448 469 699 11,921 6,556 24,759 201,631 6,044 45 902, . . . . . . . . . . . . . . . . . . . . . .$10,000 under $50,ODO . . . . . . . . . . . . . .
31,28938,829
182,869795 134
25 ,64 729 592
32,23 3105 247
5,54 29 13
3,505 .) (-) (.) (-) 12,327 39,551 2,860,
8,218$50,000 under $100,000 . . . . . . . . . . . . . 3,167
,213,226
,2 521
,37 961
, 6639
6,31 8514
3189
524 846 5,009 11,613 135,072 2,583 20,750$lDO,OOO or more . . . . . . . . . . . . . . . . . . . 1,163 260,265
,1,032
,109,821 131 112
312
8562
17 599
658 660 20,911 369 5,95 3
rtaxable returns - . . . . . . . . . . . . . . . . . . 13,003 16, O?_' 9,422 49,739 3,581 3,556 M
59 1
N
160
4,715
6,097
8,971
23 2
2,410
10,980
28,307
RETURNS WITH SALES OF ASSETS U13EDIN TRADE OR BUSINESS
Grand total . . . . . . . . . . . . . . . . . . . . 448,486 4,060,959 343,813 846,933 100,764 67,775 6,336 8,139 8,597 16,864 244,332 1 ,363,669 96,672 -342,38 3xable returns , total . . . . . . . . . . . . 4 . .Under $10 000 . . . . . .
327,815 3,941,901 256,662 690,318 69,483 42,890 4,599 7,340 5,596 8,287 190,432 1 ,266,139 49,511 143,903, . . . . . . . . . . . . . . . .$10,000 under $50,000 . . . . . . . . . . . . . .
212,S5 6107 737
1,202,97 81 972 441
163,43987 130
179,407263 275
48,39 69
28,738 3,322 l,O:L8 3,402 1,050 125,258 405,344 37,528 52,345
$50,000 -der $100,000 . . . . . . . . . . . . .,
5,443, ,362,377
,4 501
,75 535
1 ,97 4928
13,22 0762
1,184 5,309 1,876 5,516 62,300 738,348 10,547 47,578
$100,000 or more . . . . . . . . . . . . . . . . . . . 1,779 404,105, 1
1,593,
172 101 165 1706133
769243
202 954 2,4-00474
93,938 875 17,319
ntaxable returns . . . . . . . . . . . . . . . . . . . 120,671 1-19,058 87,151
,
156,615 . 31,280 24,885 . 1,736 Soo
11 7
3,001 1
767
8,577 53,9DD
29,510
97 .530
560
47 .162 .
26,661
198 .48 0
T
N
T
N
I
N
T
No
Footnotes a-~ end of table . For the precise definition of terms and the nature of any limita-~ions, see "Description of the Sample,'- "Limitations of the Data," and "Explanationof Classifications and Terms" in the tax-, .

128 SALES OF CAPITAL ASSETS ON INDIVIDUAL RETURNS, 1962RETURNS WITH NET CAPITAL GAIN OR LOSS
Table 18 . -SELECTED SOURCES OF INCOME AND LOSS, EXEMPTIONS, TAXABLE INCOME AND INCOME TAX, REPORTED ON RETURNS WITH SALE OF CAPITALASSET TYPE SPEC IFIED -NUMBER OF RETURNS AND AMOUNT, BY SIZE OF ADJUSTED GROSS INCOME -Continue d
Salaries and wages Dividends (afterI Rents Partnershi p
fA t t i d td d
(net) exclusion)Int erest received
Net income Net loss Net profit Neu los sze o a.sse ype an s jus e
Number of Amo~t Nmber of Amount Number of Amount Number of AmountN-ber of
A-untNumber of Amount Number of Amoun t
returns (7h.. .-d returns (n.-d returns (n--d returns (Th.-d raturns (Thl.l .d returns (7h,-d returns (7h.-d~11 .. . ) ~Ij-) d.1 I . .. ) ~11 . .. ) ~Jl . . . d.11 . . . &Hars)
RETURNS WITH SHARE OF CAPITAL(15) (16) (17) (18) Uq) (20) (21) (22) (23) (24) (25) (26) (27) (28 )
GAIN (LOSS) FROM PARTNERSHIPSAND FIDUCIARIES
Grand total . . . . . . . . . . . . . . . . . . . . 209,216 2,22.1,868 214,179 1,251,682 256,424 328,172 64,490 162,707 32,636 56,316 180,608 1,800,164 59,353 216,542
Taxable returns, total . . . . . . . . . . . . . . . 197,490 2,171,568 200,463 1,206,257 237,967 30`7,130 58,663 135,619 29,020 43,252 161,316 1,757,870 46,796 150,566Under $10,000. . . . . . . . . . . . . . . . . . . . . . 72,569 325,694 62,693 79,005 82,108 52,059 17,784 13,226 9,875 5,543 60,677 200,934 16,084 26,405$10,OOC) -der $50,000 . . . . . . . . . . . . . . 109,309 1,325,793 114,319 432, "? 133,248 15S,470 34,529 82,266 16,012 22,137 86,230 977,027 26,095 66,673$50,000 under $100,000 . . . . . . . . . . . . . 11,938 354,094 17,608 253,271 17,131 53,942 4,771 25,242 2,250 5,516 11,230 357,640 3,266 24,811$100,000 or more . . . . . . . . . . . . . . . . . . . 3,674 165,997 5,843 441,534 5,481 42,659 1,578 14,865 882 10,057 3,180 222,268 1,351 32,677
Nontaxable retarns . . . . . . . . . . . . . . . . . . . 11,725 40,300 13,716 45,425 18,457 21,041 5,827 27,088 3,616 13,064 19,492 42,294 12,557 65,977
RETURNS WITH CAPITAL GAI NDISTRIBUTIONS FROM SMALL BUSINESS
CORPORATIONS
Grand total . . . . . . . . . . . . . . . . . . . . 20,605 232,677 17,705 79,732 21,965 20,863 5,117 11,606 2,266 2,730 4,720 50,769 1,988 7,09 2
Taxable returns, total . . . . . . . . . . . . . . . 20,260 230,652 16,666 77,861 20,626 19,901 4,979 11, 534 1,961 2,454 4,313 50,555 1,682 6,05 9Under $10,000 . . . . . . . . . . . . . . . . . . . . . . 6,929 40,149 4,453 5,199 7,029 2,283 ( .) ( .) ( .) (.) ( .) (-) ( . )$10,OCO -der $50,000 . . . . . . . . . . . . . . 12,189 150,202 10,679 26,92? 12,108 10,228 2,919 6,915 1,542 1,296 3,337 29,772 1,134 2,303$50,000 -der $100,000 . . . . . . . . . . . . . 838 25,202 1,142 14,867 1,107 3,456 344 1,747 154 54-4 530 11,682 164 1,16 1$100,000 or more . . . . . . . . . . . . . . . . . . . 303 15,099 393 30,86? 381 3,934 130 1,426 62 522 146 ?,239 84 2,13 3
Nontaxable returns . . . . . . . . . . . . . . . . . . . 1,039 1,871 1,340 962
RETURNS WITH LIQUIDA.TIONDISTRIBUTIONS
Grand total . . . . . . . . . . . . . . . . . . . . 34,605 "2,556 31,452 306,239 38,249 81,400 10,271 49,112 3,971 10,917 7,733 126,513 3,617 34,31 1
Taxable returns, total.
. . . . . . . . . . 33,093 434,230 29,489 294,184 35,421 ?3,210 9,715 30,461 3,724 9,229 7,586 115,989 3,372 29,392Under $10,000 . . . . . .
. *. . . . . . . . . . 2.1,312 64,249 7,033 10,254 9,120 4,495 2,580 2,556 ( .) (-) (-) (- )
$10,000 -der $50,000 . . . . . . . . . . . . . . 17,823 235,721 16,969 62,882 20,861 33,552 5,258 15,082 2,416 3,428 4,641 45,392 1,796 12,884$50,000 -der $100,000 . . . . . . . . . . . . . 2,518 72,316 3,531 64,513 3,510 14,124 1,200 6,614 396 1,738 1,372 33,572 477 4,11 5$100,000 or more . . . . . . . . . . . . . . . . . . . 1,439 61,944 1,957 136,535 1,929 21,039 677 6,209 319 3,800 671 32,388 406 10,063
Nontaxable returns . . . . . . . . . . . . . . . . . . . 1,712 8,326 1,963 12,054 2,828 8,190 556 18,652 245 4,918
RETURNS WITH RETIREMENT PLANDISTRIBUTIONS
Grand total . . . . . . . . . . . . . . . . . . . . 54,282 437,115 17,669 40,519 31,166 19,456 4,560 4,813 4,465 2, 298 1 , 810 11,066 938 10,40 5
Taxable returns, total . . . . . . . . . . . . . . . 50,482 426,316 16,321 39,299 28,375 19,184 4 , 560 4,813 3,259 2, 0`74 1,80`7 11,052 903 10 .380Under $10,000 . . . . . . . . . . . . . . . . . . . . . . 25,532 128,251 5,766 3,162 10,018 3,958 2,217 1,020 ( .) (-) (-) (- )$10,000 -der $50,000 . . . . . . . . . . . . . . 23,993 268,552 9,500 14,902 17,345 10,887 2,155 2,876 1,760 1,475 1,246 6,977 689 8,960$50,000 under $100,000 . . . . . . . . . . . . . 650 16,890 725 7,731 694 1,816 105 3017 76 . 142 101 1,570 54 482$100,000 or more . . . . . . . . . . . . . . . . . . . 308 12,623 331 13,504 319 2,523 83 610 36 368 60 1,679 58 91 4
Nontaxable returns . . . . . . . . . . . . . . . . . . 3,800 10,799 1,348 1,220 2,790 272 - -
RETURNS WITH SAT OF LIVESTOCK
Grand total . . . . . . . . . . . . . . . . . . . . 255,114 855,783 77,308 229,548 212,514 133,125 97,248 102,178 15,555 11,156 23,383 125,609 4,786 23,35 6Taxable returns, total . . . . . . . . . . . . . . . 176,499 749,990 57,865 205,853 152,054 110,037 64,168 81,370 10,393 7,840 17,269 115,048 2,905 15,569Under $IO,OGO . . . . . . . . . . . . . . . . . . . . . . 153,579 501,867 37,101 12,062 121,929 53,889 49,951 37,968 7,497 2,299 10,106 23,257 ( .) M$10,000 =der $50,000 . . . . . . . . . . . . . . 21,136 172,483 18,254 48,968 27,734 39,918 13,125 34,488 2,502 2,272 6,299 56,766 1,332 3,509$50,000 under $100,000 . . . . . . . . . . . . . 1,204 40,560 1,648 30,968 1,574 7-342 745 5,053 237 927 606 14,416 246 1,85 1$100,000 or more . . . . . . . . . . . . . . . . . . . 580 35, 079 862 113,856 816 8,887 .347 3,861 157 2,340 259 20,609 2017 6,707
Nontaxable returns . . . . . . . . . . . . . . . . . . . 78,616 105,794 19,444 23,694 60,460 23,088 33,081 20,809 5,162 3,316 6,114 10,561 1,881 7,787
RETURNS WITH SAT OF TIMBER AND COAL
Grand total . . . . . . . . . . . . . . . . . . . . 32,168 213,127 18,261 109,950 35,139 36,564 19,013 27,393 4,076 3,794 5,202 35,871 1,645 6,419
Taxable returns, total . . . . . . . . . . . . . . . 28,393 205,107 15,219 102,614 27,357 32,082 13,555 22,745 3,343 3,397 4,731 35,172 1,404 5, "8Under $10,000 . . . . . . . . . . . . . . . . . . . . . . 19,598 96,821 7,355 4,161 17,564 9,955 7,717 6,176 2,094 1,168 2,187 7,715 ( . )$10,000 under $50,000. . . . . . . . . . . . . . 8,026 83,127 6,801 23,098 8,748 14,873 5,249 12,984 1,075 807 2,138 17,026 641 85 0$50,000 -der $100,000 . . . . . . . . . . . . . 519 13,119 701 11,1()4 690 3,194 418 1,645 100 206 298 7,356 83 531$100,000 or more . . . . . . . . . . . . . . . . . . . 250 12,041 362 64,452 355 4,059 173 2,040 73 1,216 108 3,074 1 80 3,853
Nontaxable returns . . . . . . . . . . . . . . . . . . . 3,775 B,Q20 3,042 7,136 7,782 4,482 5,458 4,647 M
RETURNS WITH SAT OF OIL AND
LUNERA1 INTERESTS
Grand total . . . . . . . . . . . . . . . . . . . . 16,834 217,578 16,626 175, 0`77 18,083 30,745 5,986 16,779 2,790 5,147 4, 0`72 60,682 2,426 28,932
Taxable returns, total . . . . . . . . . . . . . . . 15,769 213,069 15,774 171,114 16,700 28,905 4,762 13,092 2,464 4,870 3,662 59,141 1,604 18,490Under $10,000 . . . . . . . . . . . . . . . . . . . . . . 6,266 37,900 5,847 10,671 5,726 4,636 1,394 1,182 1,0416 762 (-) (- )$10,000 -der $50,000 . . . . . . . . . . . . . . 8,()90 112,282 7,950 25,488 9,095 11,409 2,749 6,025 1,135 1,504 2,209 22,915 815 3,644$50,000 -der $100,000 . . . . . . . . . . . . . 865 29,646 1,192 18,484 1,141 4,509 3?5 2,290 169 544 464 11,931 251 2,461$100,000 or more . . . . . . . . . . . . . . . . . . . 548 33,261 786 116,471 737 8,151 244 3,595 134 2,060 270 20,454 238 11,272
Nontaxable returns . . . . . . . . . . . . . . . . . . . 1,065 4,4.88 852 3,964 1,383 1,839
RETURNS WITH SALES OF PARTNERSHI PINTERESTS
Grand total . . . . . . . . . . . . . . . . . . . . 47,962 446,374 35,103 185,724 56,634 85,211 22,281 71,337 10,735 16,651 32,000 303,847 9,104 50,73 0
Taxable returns, total . . . . . . . . . . . . . . . 43,743 434,423 32,996 178,685 51,931 77,060 16,981 51,058 9,438 13,604 28,112 292,031 7,477 37,914Under $10,000 . . . . . . . . . . . . . . . . . . . . . 17, C-17 66,627 7,841 9,383 18,972 13,676 6,089 7,033 3,434 1,480 9,623 30,176 1,887 3,461$10,ODO und- $50,000 . . . . . . . . . . . . . . 24,036 275,897 21,317 60,486 28,694 39,924 11,285 26,769 5,383 8,960 16,102 178,526 4,757 18,564~50, DOD nader $100, ODO, . . . . . . . . . . . . 1,948 56,266 2,746 31,(S7 2,875 11,825 1,183 7,148 416 1,356 1,789 49,736 541 3,654$100, ODD or more . . . . . . . . . . . . . . . . . . . 743 35,633 1, 094 77,129 1,090 11,435 423 8,108 206 1,80`7 597 33,594 292 12,23 5
Nontaxable re-,_,rns . . . . . . . . . . . . . . . . . . . 4,219 11,951 2,10,- 7,038 4,803 8,151 ~,300 20,278 1,297 3,C~8 3,888 11,815 1,627 12,61 6
RETURNS WITH SALES OF ASSETS USEDIN TRADE OR BUSINESS
Grand total . . . . . . . . . . . . . . . . . . . . . 236,129 1,372,269 84,871 296,Or75 218,816 241,594 110,947 206,686 56,390 99,187 39,124 300,026 15,396 75,031
Taxable returns, total . . . . . . . . . . . . . . . 169,921 1,271,226 73,4" 266,122 173,409 196,454 80,339 150,510 ",266 45,832 32,360 283,533 10,900 40,603Under $10,000. . . . . . . . . . . _ . . . . . . . . 125,234 537,934 27,394 17,205 94,035 59,922 ", 723 43,736 23,922 11,305 11,996 35,358 3,435 5,779$10,000 uade- $50,000. . . . . . . . . . . . . . 60,605 603,731 40,199 82,499 73,067 98,749 32,614 75,036 19,093 25,689 17,810 167,645 6,405 15,720$50,000 under $100,000. . . . . . . . . . . . . 2,961 77,169 4,253 46,210 4,673 20,576 2,259 17,717 925 3,488 1,949 46,140 678 7,9D9$100, 000 or more . . . . . . . . . . . . . . . . . . . 1,121 52,392 1,598 120,218 1,635 18,206 743 14,019 328 5,350 604 .32,389 382 11,195
Nontaxable returns . . . . . . . . . . . . . . . . . . . 46,208 101,044 11,427 29,953 45,407 45,141 30,608 56,176 12,122 53,355 6,764 16,494 4,496 34,428
.,Fwtnotes at end of table . For the precise definition of terms and the nature of any limitations, see "Description of the Sample," "Limitations of the Data," and "ExplanationI Cicasifications and T-11 in the text .

SALES OF CAPITAL ASSETS ON INDIVIDUAL RETURNS, 1962RETURNS WITH NET CAPITAL GAIN OR LOS S
Table 18 .-SELECTED SOURCES OF INCOME AND LOSS, EXEMPTIONS, TAXABLE INCOME AND INCOME TAX, REPORTED ON RETURNS WITH SALE OF CAPITAL-ASSET TYPE SPEC IFI ED -NUMBER OF RETURNS AND AMOUNT, BY SIZE OF ADJUSTED GROSS INCOME -Continued
129
E em tio T bl iIncome tax before credits
Income tax afte rx p ns axa e ncomeNormal tax and surtax Alternative tax credit s
Asset type and size of adjusted gross incomeNumber of Amount Number of Amount Number of Amount Number of Amount Number of Amountexemptions (7),.. .-d returns (Th.. .-d returns (Th-d
r't
urns (7).. .-d returns (Th. .-d_ d.11ars) ~11 .. .) d.11 . . . d.11 .. . ) d~11-)
RETURNS WITH SHARE OF CAPITAL GAIN (LOSS) FROM(29) (30) (31) (32) (33) (34) (35) (36) (37) (38 )
PARTNERSHIPS AND FIDUCIARIES-
Grand total . . . . . . . . . . . . . . . . . . . . . . . . . . . . . . . . . . . . . . . . . . 1,263,488 758,093 348,232 5,180,936 328,219 1,078,429 20,014 765~043 340,607 1,769,63 6Taxable returns , total . . . . . . . . . . . . . . . . . . . . . . . . . . . . . . . . . . . . . 1,119,941 671,965 340,607 5,171,716 320,603 1,076,605 20,005 764,689 340 607 7691 63 8Under $10,000 . . . . . . . . . . . . . . . . . . . . . . . . . . . . . . . . . . . . . . . . . . . .
$10 000 -der $50 000372,491 223,495 139,455 449,152 139,455 93,272
--
,139,455
,,85,352, , . . . . . . . . . . . . . . . . . . . . . . . . . . . . . . . . . . . .
$50,000 -der $100 000 . . . . .649,433 389,660 175,457 2 .716,860 171 152
:
702,236 4,305 58,386 175,457 731,408, . . . . . . . . . . . . . . . . . . . . . . . . . . . . . .$100 000 or =re
75,676 45,406 19,600 1,042,670 8 631 177 263 10,969 266,978 19,600 430,711, . . . . . . . . . . . . . . . . . . . . . . . . . . . . . . . . . . . . . . . . . 22,341 13~405 6,096 963,034 1,365 103 :834 4,731 439,425 6,096 522,168Nontaxable retilras . . . . . . . . . . . . . . . . . . . . . . . . . . . . . . . . . . . . . . . . . 143,547 86,128 7,625 9,220 7,616 1,82 4
RETURNS WITH GA-PiTAL GAIN DISTRIBUTIONS FROM qVJ-LBUSINESS CORPORATIONS
Grand total . . . . . . . . . . . . . . . . . . . . . . . . . . . . . . . . . . . . . . . . . . 94,624 56,774 28,685 394,3?3 27,461 94,702 1,224 49,783 28,08C 129,390Taxable returns, total . . . . . . . . . . . . . . . . . . . . . . . . . . . . . . . . . . . . . 88,905 53,343 28,088 393,843 26,864 84 .590 -.,224 49,783 28,088 129 390Under $10,000 . . . . . . . . . . . . . . . . . . . . . . . . . . . . . . . . . . . . . . . . . . . .$10,000 -der $50,000 . . . . . . . . . . . . . . . . . . . . . . . . . . . . .
23,497 14,098 10,396 36,144 10,396 7,515 - - 10,396,
6,72 3. . . . . . .$50,000 under $100 000 . . . . . . . . . . . . . . . . . . . . . . .
59,039 35~423 16,023 221,339 15,807 56,471 21. 3,135 16,023 57,64 3~ . . . . . . . . . . . .000 or more$100
4,833 2,900 1,249 68,083 585 12,604 664 16,864 1,249 28,62 7, . . . . . . . . . . . . . . . . . . . . . . . . . . . . . . . . . . . . . . . . . 1,536 921 420 68,277 76 8,000 344 29,785 420 36,397Nontaxable returns . . . . . . . . . . . . . . . . . . . . . . . . . . . . . . . . . . . . . . . . . 5,719 3,432
REITHINS WITH LIQUIDATION DISTRIBUTIONS
Grand total . . . . . . . . . . . . . . . . . . . . . . . . . . . . . . . . . . . . . . . . . . 160,230 96,138 46,285 1,043,984 41,373 159,575 4,912 262,085 45,?Sl 406,82 6Taxable returns, total . . . . . . . . . . . . . . . . . . . . . . . . . . . . . . . . . . . . .
Under $10 000. . . . . . . . . . . . . .150,481 90,289 45,781 1,043,155 40,869 159,326 4,912 262,085 45,781 406,82 6, . . . . . . . . . . . . . . . . . . . . . . . . . . . . . .
000 -der $50 000 . . . . . . .$1047,392 28,435 15,586 52,116 15,586 10,884 - - 15,586 10,188, . . . ., . . . . . . . . . . . . . . . . . . . . . . . . .
$50 000 under $100 000 . . . . .82,014 49,209 24,334 384,131 23,499 9F,639 835 11,540 24,334 106,157, ~ . . . . . . . . . . . . . . . . . . . . . . . . . . . . . .
$100 000 or more13,674 8,204 3,783 204,145 1,460 29,212 2,323 58~001 3,783 84,115, . . . . . . . . . . . . . . . . . . . . . . . . . . . . . . . . . . . . . . . . . 7,402 4,441 2,077 402,762 324 20,591 1,754 192,544 2,077 206,366
Nontaxable returns . . . . . . . . . . . . . . . . . . . . . . . . . . . . . . . . . . . . . . . . . 9,748 5,849 N - - - -
RETURNS WITH RETIREMENT PIAN DISTRIBUTION S
Grand total . . . . . . . . . . . . . . . . . . . . . . . . . . . . . . . . . . . . . . . . . . 202,144 121~286 54,688 524,791 53,754 100,815 935 52,607 54,484 151,193Taxable returns, total . . . . . . . . . . . . . . . . . . . . . . . . . . . . . . . . . . . . .
Under $10 000 . . .180,055 108,033 54,484 524,584 53,553 100,806 931 52,544 54,484 151,193, . . . . . . . . . . . . . . . . . . . . . . . . . . . . . . . . . . . . . . . . .
$10 000 -der $50 OGO . .85,462 51,277 28,105 102,802 28,105 21,092 - - 28,105 20,88 5, . . . . . . . . . . . . . . . . . . . . . . . . . . . . . . . . . .
$50,000 under $100 000 .90,649 54,389 25,259 301,256 25,127 72,082 132 2,381 25,259 73,540, . . . . . . . . . . . . . . . . . . . . . . . . . . . . . . . . . .
$100 000 or more2,652 1,591 771 44,436 292 5,732 480 13,206 771 18,58 7, . . . . . . . . . . . . . . . . . . . . . . . . . . . . . . . . . . . . . . . . . 1,292 775 348 76,091 29 1,900 319 36,958 348 38~18 0
Nontaxable returns . . .. . . . . . . . . . . . . . . . . . . . . . . . . . . . . . . . . . . . . . . 22,C69 13,253 M - -
RETURNS WITH SAT OF LIVESTOCK.
Grand total . . . . . . . . . . . . . . . . . . . . . . . . . . . . . . . . . . . . . . . . . 2_513,132 1,50?,879 429,759 1,660,211 427,066 331,719 2,693 124,766 392,361 417,250Taxable returns, total . . . . . . . . . . . . . . . . . . . . . . . . . . . . . . . . . . . . .
Under $10 0001,280,314 769,188 392,361 1,631,833 389,968 326,05? 2,393 124,743 392,361 417,250, . . . . . . . . . . . . . . . . . . . . . . . . . . . . . . . . . . . . . . . . . . . .$10
000 under $50 0001,107,149 664,289 346 :060 804,177 346,060 163 .126 - - 346,060 144,3?3, , . . . . . . . . . . . . . . . . . . . . . . . . . . . . . . . . . . . .
$50,000 under $100 000. . . . . .162,664 97,598 43,446 547,227 42,963 133,543 493 7,100 43,446 131,811, . . . . . . . . . . . . . . . . . . . . . . . . . . . . .
$100 000 or more7,198 4,319 1,933 103y975 781 15,457 1,153 29,326 1,933 43,161, . . . . . . . . . . . . . . . . . . . . . . . . . . . . . . . . . . . . . . . . . 3,303 119S2 921 176,454 164 13,932 757 88,317 921 9?,905
Nontaxable returns . . . . . . . . . . . . . . . . . . . . . . . . . . . . . . . . . . . . . . . . . 1,232,818 739,691 37,398 28,37? 37,093 5y662
RETURNS WITH SAIES, OF TI]MBER AND COAL
Grand total . . . . . . . . . . . . . . . . . . . . . . . . . . . . . . . . . . . . . . . . . . 197,388 118,433 45,3.34 357,875 44,261 67,276 1,074 52,509 43,977 113,91 1Taxable returns, total . . . . . . . . . . . . . . . . . . . . . . . . . . . . . . . . . . . . . 133,703 80,222 43,977 355,690 42,904 66,831 1,074 52,509 43,977 113,911
Under $10,000. . . . . . . . . . . . . . . . . . . . . . . . . . . . . . . . . . . . . . . . . . . . 87,962 52,777 30,922 83,281 30,922 16,929 - - 30,922 16,13 5$10,000 -der $50,000 . . . . . . . . . . . . . . . . . . . . . . . . . . . . . . . . . . . . 41,493 24,896 11,912 160,124 11,639 39,091 273 3,596 11,912 40,77 3~50,000 -der $lOOyOOO . . . . . . . . . . . . . . . . . . . . . . . . . . . . . . . . . . . 2,660 1,716 765 39,722 280 5,353 485 11,540 765 16 113$100,000 or more . . . . . . . . . . . . . . . . . . . . . . . . . . . . . . . . . . . . . . . . . 1,388 833 379 72,563 63 5,458 316 37,374 379
,40,89 0
ontaxable returns . . . . . . . . . . . . . . . . . . . . . . . . . . . . . . . . . . . . . . . . . 63,684 38,211
RETURNS WITH SALES OF OIL AND MINERAL INTERESTS
Grand total . . . . . . . . . . . . . . . . . . . . . . . . . . . . . . . . . . . . . . . . . 85,889 51,533 23,763 454,041 22,277 82 .190 1,486 104,206 23,728 177,540axable returns, total . . . . . . . . . . . . . . . . . . . . . . . . . . . . . . . . . . . . . 75,572 45,343 23,728 453,863 22,242 82,154 1,486 104,206 23 728 177 540Under $10,000 . . . . . . . . . . . . . . . . . . . . . . . . . . . . . . . . . . . . . . . . . . . . 25,488 15,293 10, COO 39,921 10,000 8,507 -
-
,10 000
,7 620
$10,000 under $50,000 . . . . . . . . . . . . . . . . . . . . . . . . . . . . . . . . . . . . 42,271 25,363 11,637 171,210 11,436 44,068 ( .),
11 637,
45 000$50,000 under $100,000 . . . . . . . . . . . . . . . . . . . . . . . . . . . . . . . . . . . 4 839 2 904 1,261 68,869 616 12,519 663 16,774 1~281
,28 26 2
$100,000 or more . . . . . . . . . . . . . . . . . . . . . . . . . . . . . . . . . . . . . . . . . 2:975 11785 810 173,863 188 17,060 622 84,674 810,
96,659bntaxable returns . . . . . . . . . . . . . . . . . . . . . . . . . . . . . . . . . . . . . . . . . 10,316 6,190
RETURNS WITH SALES OF PARTNERSHIP INTERESTS
Grand total . . . . . . . . . . . . . . . . . . . . . . . . . . . . . . . . . . . . . . . . . . 290,119 174,071 76,134 1,049,333 ?2,727 214,205 3,407 147,225 74,448 348,59 9exable returns, total . . . . . . . . . . . . . . . . . . . . . . . . . . . . . . . . . . . . . 246,260 147,756 74,443 1,047,725 71,041 213,866 3,407 147,225 74 448 34B 59 9Under $10,000. . . . . . . . . . . . . . . . . . . . . . . . . . . . . . . . . . . . . . . . . . . .
000 under $5 0$10 00087,744
14 1 0
52,647 31,289 97,297 31,289 2C,372 - -,
31,289,
19,014, , . . . . . . . . . . . . . . . . . . . . . . . . . . . . . . . . . . . .
$50 000 under t100 0002, 7 85,302 38,829 561,065 38,256 152,483 573 8,037 38,829 155,121
, , , . . . . . . . . . . . . . . . . . . . . . . . . . . . . . . . . . . .0 000
12,106 7,263 3,167 169,593 1,286 26,208 1,861 45,703 3,167 69,812$1 0, or more . . . . . . . . . . . . . . . . . . . . . . . . . . . . . . . . . . . . . . . . . 4,240 .2,544 1,163 199,771 210 14,803 953 93,486 1,163 104,653
ontaxable returns . . . . . . . . . . . . . . . . . . . . . . . . . . . . . . . . . . . . . . . . . 43,659 26,315 H - - - -
RETURNS WITH SAT OF ASSETS USED IN TRADE OR BUSINESS
Grand total . . . . . . . . . . . . . . . . . . . . . . . . . . . . . . . . . . . . . . . . . . 1,554,249 932,549 341,139 2,685,817 335,243 563,304 5,896 245,442 327,815 770,591axable returns, total . . . . . . . . . . . . . . . . . . . . . . . . . . . . . . . . . . . . 1,102,461 661,468 327,815 2,670,434 321,927 560,143 .5,888 245,316 815327 770,591Under $10,000 . . . . . . . . . . . . . . . . . . . . . . . . . . . . . . . . . . . . . . . . . . . .$10,ODO under $50 000
677,306 406,333 212,856`
599,612 212,856 122,446 - -,
212,856 113,748, . . . . . . . . . . . . . . . . . . . . . . . . . . . . . . . . . . . .$50,000 -der $100 000
396,173 238,9049
10 7,737 1,460,574 106,365 365 .880 1,372 lq,647 107,737 367,626, . . . . . . . . . . . . . . . . . . . . . . . . . . . . . . . . . . .
$100 000 or =e20,499 12,29 5,443 294, BOO 2,362 48,086 2,081 77,678 5,443 122,193
, . . . . . . . . . . . . . . . . . . . . . . . . . . . . . . . . . . . . . . . . . c,503 3,902 1,779 315,249 344 23,731 1,435 148,991 1,779 167,02 4DnLaxable returns . . . . . . . . . . . . . . . . . . . . . . . . . . . . . . . . . . . . . . . . . 451,763 271,061 13,324 15,3S3 . 1-3,316 . 3,161 H I (.) I
- I-
N
T
N
Footnotes at end of table . For the precise definition of terms and the nature of any limitations, see "Description of the Sample,-, "Limitations of the Data," and "Explanationof
Classifications and Terms" in the text .

130RETURNS WITH NET CAPITAL GAIN OR LOSS
Table 18 . -SELECTED SOURCES OF INCOME AND LOSS, EXEMPTIONS, TAXABLE INCOME AND INCOME TAX, REPORTED ON RETURNS WITH SALE OF CAPITALASSET TYPE SPECIFIED-NUMBER OF RETURNS AND AMOUNT, BY SIZE OF ADJUSTED GROSS INCOME -Continued
N-ber ofreturns
Adjustedgross-o.e
(Th. . .-d
Sales of capital asset s
Net gai n
Number ofreturns
Amount
(T~-d
~1 I . ..
Net loss
N=ber ofreturns
Amunt(n.-d
Sales of.property other thanc pital assets
Net gai n
N~~ber ofreturns
Amount(7h.. .. .dd.11 .. .
Net loss
Number ofreturns
A~_t(Th-d
Number ofreturns
Business, fam, or p-fes s
Net profii
Amount(Th.-dd.11 ...
Numbetor ofre rn .
(2 1 (5) 1 (6) 1 (7) 1 (8) 1 (10) 1 (11)(3) 1 (4) (12) (13)
Net los sAsset type and size of adjustedgross inc-
RETURNS WITH SALES OF PROPERITNET FOR PERSONAL US E
Grand total . . . . . . . . . . . . . . . . . . . .
Taxable returns, total . . . . . . . . . . . . . . .Under $10,000 . . . . . . . . . . . . . . . . . . . . . .$10,000 under $50,000 . . . . . . . . . . . . . .$50,000 -der $100,000 . . . . . . . . . . . . .$100,000 or or . . . . . . . . . . . . . . . . . . . .
Nontaxable returns . . . . . . . . . . . . . . . . . . .
RETURNS WITH SAI~E OF RESIDENCES
Grand total . . . . . . . . . . . . . . . . . . . .
Taxable returns, total . . . . . . . . . . . . . . .Under $!O~QOO . . . . . . . . . . . . . . . . . . . . . .$10, 000 und- $50, 000 . . . . . . . . . . . . . .$50,000 under $100~000 . . . . . . . . . . . . .$100, 000 or mre . . . . . . . . . . . . . . . . . . .
Nontaxable returns . . . . . . . . . . . . . . . . . . .
RETURNS WITH SALES OF NONDUSINESSREAL ESTATE
Grand total . . . . . . . . . . . . . . . . . . . .
Taxable ret=s, total . . . . . . . . . . . . . . .Under $10,000 . . . . . . . . . . . . . . . . . . . . . .$10,000 under $50,000. . . . . . . . . . . . . .$50,000 -der $100,000 . . . . . . . . . . . . .$100, GOO or mre . . . . . . . . . . . . . . . . . . .
Nontaxable returns . . . . . . . . . . . . . . . . . . .
RETURNS WITH SAT OF REAL ESTATESUBDIVIDEED
Grand total . . . . . . . . . . . . . . . . . . . .
Taxable returns, total . . . . . . . . . . . . . . .Under $10,000. . . . . . . . . . . . . . . . . . . . . .$10,000 under $50,000 . . . . . . . . . . . . . .$50,000 -der $100,ODO . . . . . . . . . . . . .$100,000 or more . . . . . . . . . . . . . . . . . . .
Nontaxable returns . . . . . . . . . . . . . . . . . . .
RETURNS WITH SALES OF FARIIIAN_~ WITHUNHARVESTED CROP S
Grand total . . . . . . . . . . . . . . . . . . . .
Taxable returns, total . . . . . . . . . . . . . . .Under $10,000 . . . . . . . . . . . . . . . . . . . . . .$10,000 -der $50,000 . . . . . . . . . . . . . .$50,000 -der $100,000. . . . . . . . . . . . .$100,000 or uor . . . . . . . . . . . . . . . . . . . .
Nontaxable returns . . . . . . . . . . . . . . . . . . .
RErURNS WITH SAT OF OTHER FARMLAND
Grand total . . . . . . . . . . . . . . . . . . . .
Taxable returns, total . . . . . . . . . . . . . . .Under $10,000 . . . . . . . . . . . . . . . . . . . . . .$10,000 -der $50,000 . . . . . . . . . . . . . .$50,000 -der $100,000 . . . . . . . . . . . . .$100,000 or wre . . . . . . . . . . . . . . . . . . .
Nontaxable returns . . . . . . . . . . . . . . . . . . .
RETURNS WITH PROCEEDS FROM PRIORYEAR INSTALLM14T SALE S
Grand total . . . . . . . . . . . . . . . . . . . .
Taxable returns , total . . . . . . . . . . . . . . .Under $10,000 . . . . . . . . . . . . . . . . . . . . . .$10,000 -der $50,000 . . . . . . . . . . . . . .$50,000 -der $100,000 . . . . . . . . . . . . .$100,000 or oore . . . . . . . . . . . . . . . . . . .
Nontaxable returns . . . . . . . . . . . . . . . . . . .
RETURNS WITH RAT OF OTHER TYPEASSETS
Grand total . . . . . . . . . . . . . . . . . . . .
Taxable returns, total . . . . . . . . . . . . . . .Under ~10,000 . . . . . .$10,000 -der $50,666 . . . . -. : . . . . . . .$50,000 -der $100,000 . . . . . . . . . . . . .$100,000 or oor. . . . . . . . . . . . . . . . . . . .
Nontaxable returns . . . . . . . . . . . . . . . . . . .
SALES OF CAPITAL ASSETS ON INDIVIDUAL RETURNS, 196 2
(1 )
51,138
39,82324,97013,82 1
?68264
11,31 4
176,794
144,104102,34940,56 1
9?621 8
32,69 0
349,206
275,633164,696104,075
5,2151~648
73,573
147,991
120,64876,35641,22 42,347
720
27,342
7,665
4,4682,4011,901
13134
3,197
75,163
50,83935~36314,42 3
768286
24,324
426,101.
331,727186,399132,603
9,6553,071
94,374
565,349
473,981279,889174,12 514,663-304
91,366
555,215
'525,108151,234259,73652,04162,0%
30,107
1,412,614
1,352,97659.,275649,30864,99442,399
59,638
.3,631,967
3,534,33 5997,827
1,855,822345,314335~372
917,632
1,532,082
1,535,26 8466,441750,862156~120161,64 6
-3,18 6
70,983
63,02312,49135,8738,8815,778
7,96 0
581,375
560,737194,139256,23 151,99258,375
20,637
5,065,623
4,886,1511,069,5522,540,96 0
643,589632,050
179,67 2
7,531,511
7,351,9031,747,6583,404,9oO
985,4711,213,614
179,608
40,312
31,42420 .16210,45 2
57323 7
8,88 3
171,629
139,6~100, 53938,21 9
90i200
31,77 0
255,222
202,342116,99379,5644,2921,493
52,880
127,406
105,20465,8573b,6362,056
655
22,202
6,578
3,6812,1011,426
12133
2,897
65,971
46,05631,97513,12 3
689270
19,915
399,914
309,899176,904121,383
8,6822,930
90,015
339,650
279,239165,25499,9469,7294,308
60,411
87,741
78,00822,30225,6007,796
22,310
9,733
315,108
281,558135,410118,38513,79013,9'~2
3-3,550
722,142
625,756128,788287,66072,431
136,877
96,366
413,163
349,54797,445
153,73934,58763,775
63,,616
22,630
17,8353,3358,3173,6682,514
4,796
216,613
176,87456,77077,63218,05724,414
39,940
1,162,020
1,024,52 7167,909418,35414A,462293,802
137,49 3
1,188,885
1,074,93 5131,259323,390151,322468,964
113,950
9,888
7,5624 .1143,232
1892 7
2,32 6
5,02S
4,1081, 7102,30 5
75i s
91,909
71,6694 .,81023,78 9
91615 5
20 .24 0
19,609
14,56 99,7064,513
28 56 5
5,040
1,088
78 7( .)476111
8,254
4,1462,7951,25 7
?S1 6
4,109
25,847
21,5919,294
11,18397314 1
4,256
219,180
190,107111,06273,1494,901
995
29,073
6,285
4,0561,8532?
0081672 7
2,22 9
4,480
3,4851,6191,779
711 6
65,091
50,32931,90117,496
789143
14,762
13,748
9,4595,4813,664
25262
4,290
5,895
2,3911,38 5
9306413
3,504
20,442
16,92 97,4258,543
83312 8
3,513
158,829
133,a4974,33754,4144,180
918
24,980
884
357
35f~
2
3,552
3,3472,38 0
9024619
--
643
540( . )
232
8
2,814
2,5101,0011,37 1
1033 5
3,642
3,1062,19 1
772ill3 3
( .)
612
4
499
453(- )211
-
796
617
72
5,010
4,7412,0682,428
17174
2,251
2,140(,)1,03 5
9 3
( .)
3
3---3
875
837(~ )
734
34
4,942
4,77 9629
3,1947,1204
5,337
5,1071,0622,9101,06 8
66
453(-)
1863629
88 6
54S(- )31F1514
6,003
3,7971,8471, 700
137113
2,20?
2,066
1,067(-)
79-91102 8
213
9--
72
5,056
3,714H2,19 4
409210
1,342
9,597
7,4102,4213,73 9
767463
2,187
797
797(~)
%26331 2
3,005
56 0(-)
295404 .
19,230
5,6702,0402,62 3
40760 0
13,56 0
11,521
2,567(~)1,88 5
46213 6
35 2
62--
511 1
2,904
33 6(~)
2-0
-102
8,886
6,938( .)3,6781,4431,1513
1,94 8
35,776
19,7323,8309,87.53,0063,02 1
16,043
19 :049
15 4098,4056,59 2
3654 7
3,64 0
29,060
24,10016,2137,59 2
2524 2
4,96 0
92,370
76,74045,21329,65 01,560
31 7
15,63 1
36~735
31,93819,48811,588
740122
4,797
2,477
1,9771,301
6194611
26,863
19,61813,5085,738
28687
7,245
102 :223
87,87646,41438,6542,301
507
14,347
116,399
99,96650,39645,6193,286
b65
_16,434
137 :5b4
130 17127,61984,55415,1252,873
7,39 3
116,~lo5
112,91541,13-,62,34 08,0501,389
6,05 0
506,875
491,039121,059294,54 052,54812,89-1
.25,83 6
200,267
192,73 153,157
112,66322,6944,217
7,53 6
11,428
10,6403,7~65,0781,32 0
47.
88,749
81,77230,11840,1787,62S3,849
6,977
609,806
567,113113,514382,855.67,31423,429
22,693
918,035
883,46216~,004569,245110,7023?,511
34,572
6,82C
4,2563,0351,05 5
9 .7 0
2,57 0
11,602
6,4284,42-2"S7 3
1013 2
5,17 4
42,423
24,66616,2407,601
51131 5
17,75 7
lu,80-1
10,0696,5712,799
28913 0
6,71 5
1,940
1,216( . )
266391 1
72 4
17,558
10,2777,5172,52 5
14293
7,28 1
48,669
29,07516,30011,1031,11 S
555
19,593
43,507
25,94513,9429,7251,389
89 0
17,562
io n
Amun t(1h,,, :~d~ 1
(14 )
29 87?
1? :531-2745,1651,7535,338
12,34 7
23,542
9,3044,0313 .52 3
6611,070
14,238
178,602
69,80S26~32825~4697,410
10, C,01
108,794
201~432
110,52329,S2648,29014 .22018,168
9'-',909
217,777
108,31716,46641,43019,09229,309
109,460
Footnotes at end of table . For the precise definition of te~ and the octure of arK, limitations, see "Description of the Sample ." "Limitations of the Data," and "Explanationof Classifications and Terais" in the text .
93,371
32,29?11,75111,8934,4424,212
61,074
5,157
3,058
839913144
2,098
74,849
30,5371,,57510,0004,0911,872
44,312
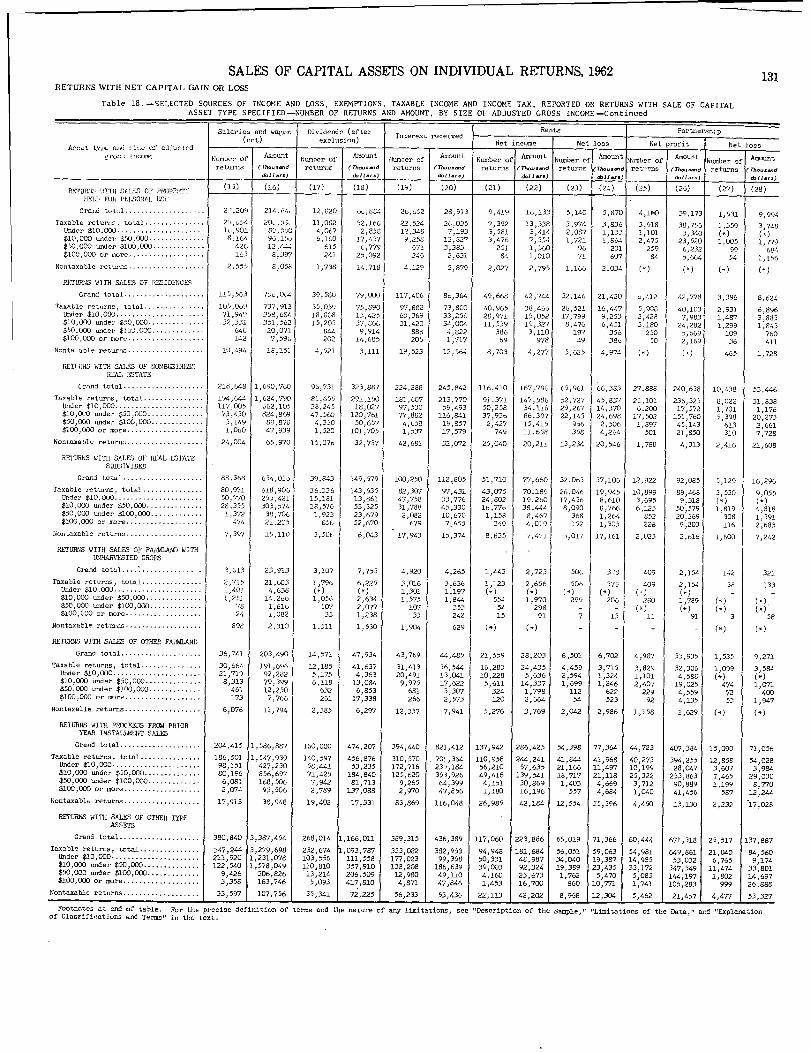
SALES OF CAPITAL ASSETS ON INDIVIDUAL RETURNS, 1962RETURNS WITH NET CAPITAL GAIN OR LOSS
Table 18 . -SELECTED SOURCES OF INCOME AND LOSS, EXEMPTIONS, TAXABLE INCOME AND INCOME TAX, REPORTED ON RETURNS WITH SALE OF CAPITALASSET TYPE SPEC IFI ED -NUMBER OF RETURNS AND AMOUNT, BY SIZE OF ADJUSTED GROSS INCOME -Continued
13 1
Sala,io. and W~eo Civi lends (after
I
Interest recei~edRents Partnershi p
(-t) exclusi .") N 4 N - -7 I-Aps- -t kyl, au-3 sit , of aet neome
-et loss Net prof- Net I .._ . d_. . _
,!-- .!=- Naj-e, ofAto"
tl Number ofA-unt
Number of Amoun t o fNumber AmountNumber of
Aw-t
_
Number ofant
~:
l be, ofAmoun t
returns (Th.. .-d -Inrur (1h. . .d returns (Th.-d re turns
[
7~.-d returns (n. . -d -t-nS
( -d t
turns (Th .., . d~bll .. 6.11 .. .
, :
d.1 ~1 1
RETUR1i: : !1111 E:ALSS OF PROPERTY(1-5) 0.6) (1,7) (18) (19) (20) (21) (22) (23) (24) 6 (27) (28 )
HELP Fol, PhI .SOtMI, USS L
Cra~ .d total . . . . . . . . . . . . . . . . . . . . 2 1,209 214, ~~4, 12,820 884 2~,6,2 28,913 9,419 1~,133 5,140 5,670 4,160 39,173 1,531 9,99,
Taxable returns . total . . . . . . . . . . . . . . . 25,,54 20,,'
'
.3. 11,082 52,166 22,524 26 .035 ?,392 13,338 3,974 3,836 3,918 38 .756 1 35 91
3 748Under $10,000 . . . . . . . . . . . . . . . . . . . . . . l"901 8" . !11A) 4,067 2,858 12,348 7,193 3 ..5SI 3,414 2,087 1,133 1,101 31340 ( .)
,
N$10,000 .,der $50~000 . . . . . . . . . . . . . . 8,164 6 .160 17~431 9,25S 12,827 3,476 -,,3,4 1,721 1,864 2,475 23 520 1,005 1,779$50,000 under $100,000 . . . . . . . . . . . . . 42C 12, 1-14~ 615 C"779 671 3,383 251 1,560 96 231 259 6"232 99 684$100,000 or more . . . . . . . . . . . . . . . . . . . I,_,3 8,397 24-- 2 5, 092 246 2,631 84 1,010 71 607 84 5,664 54 1,156
Nontaxable re-turnn . . . . . . . . . . . . . . . . . . . 2,555 8,058 1,738 14,?18 4,129 2,879 2,027 2,795 1, 16c, 2,03 4
RETURNS WITH SALES OF RE-SIDENCES
Grand total . . . . . . . . . . . . . . . . . . . . 115,50 ?~,,,O,4 39,58U 79,000 117,406 8o,3G4 49,668 42,744 32 ..14C 21,420 ~,412 42,778 3,396 8,624'
Taxable returns, total . . . . . . . . . . . . . . . 105,0,,~ '737,913 35,051) ?~,Sqo 97,882 73,800 40 .965 36~4~6 2-,521 16,447 1 .9G . 40,103 2~931 6 89 6Undcr $10,000 . . . . . . . . . . . . . . . . . . . . . . 71,949 3f,8,oS' 18, BOB 13,425 6f,,369 33,256 28,971 15,052 17,799 9 .253 2,428 7' .8, 1,487
,
3,88 3$10,000 under $50,000 . . . . . . . . . . . . . . 32,3311 3 .51-62 15,205 37,86t, 31,420 34,004 11,539 19,327 8,47C, 61t5l 3,180 24,282 1,299 1,84 3$50 .000 under $1~fi_),OOO . . . . . . . . . . . . . 648 20,071 844 9,914 888 4,822 386 3,110 197 -56 250 5,669 109 760$100,000 or more . . . . . . . . . . . . . . . . . . . 142 7,59U 202 14,685 205 1,71-7 69 978 49 36. 50 2,169 36 41 1
Nonta able returns . . . . . . . . . . . . . . . . . . . 10,494 ls,151 4,521 3,111 19,523 12,564 8~703 4,277 5,625 4,974 465 1,728
RETHOIS WITH SAI,I~S 01' NONBUSINESS
RF,~L ESTATE
Crand total . . . . . . . . . . . . . . . . . . . . 218,648 1,690,7W 96,731 323,887 224,288 245,842 116,410 167,796 65,961 .66,383 27,888 240,638 10,438 53,446
Taxable returns, total . . . . . . . . . . . . . . . 194,644 1,624,790 el,655 291,150 181,(,07 213,770 91,371 147,586 52,727 45,83? 2C,101 236,325 8,022 31,838Under $10,000 . . . . . . . . . . . . . . . . . . . . . . 117,005 662,105 28,245 18,027 97,530 59,493 50,258 34,116 29,267 14,370 6,200 17,572 1,701 1,176$10,OC'O und ., $50,000 . . . . . . . . . . . . 1 . 73,430 824,81,9 47,~,&O 120,761 77,862 116,841 37,936 86,397 22,145 24,698 17,502 1 .51,760 5,398 20~273$50,0&0 -der $100,000 . . . . . . . . . . . . . 3,149 89,878 4,330 50,657 2.,(,58 19,857 2,427 15,415 956 2,50o 1,897 45,143 613 2,66 1$100,000 or mor . . . . . . . . . . . . . . . . . . . . 1 .060 47,939 1,520 101,705 1,537 17,579 749 358 4,264 501 21,S50 310 7,72 8
Nontaxable returns . . . . . . . . . . . . . . . . . . . 24,004 65,970 lf,,07. 32,737 42,681 32,072 25,040 20,211 13,234 20,546 1,788 4,313 2,416 21,60 8
RETURNS WITH SALES OF HFAL ESTATL
SUBDIVIDED
Glauj total . . . . . . . . . . . . . . . . . . . . 88,368 634,01o 39,843 149,579 100,250 112,805 -51,710 77,660 32,0s3 37,106 12,922 92,085 5,129 16,296
Taxable returns, total . . . . . . . . . . . . . . . 80,971 618,906 3b,336 143,535 82,307 97,431 43,075 70,189 26,046 19,94.5 10,899 89,468 3,530 9,0,- 5Under $10,000 . . . . . . . . . . . . . . . . . . . . . . 50,770 255,421 15,181 13,861 47,758 33,776 24,801 19,260 17,436 8,610 3 .695 9,318 ( . )$10,000 -der $50,000 . . . . . . . . . . . . . . 26,355 303,574 18,576 53,325 31,788 45,330 lb,77. 39,444 8,090 8,766 6,123 50,579 1,819 4,81 8$50,000 under $100,000 . . . . . . . . . . . . . 1,372 38,706 1,923 23,679 2,082 10,670 1,15C S, 46? 368 1,264 852 20,369 308 1 .391$100,000 or more . . . . . . . . . . . . . . . . . . . 474 21,205 6_56 52,670 679 7~6551 11~1 ."C,-- 152 1,305 228 9,203 116 2,68 3
Nontaxable returns . . . . . . . . . . . . . . . . . . . 7,397 15,11o 3,506 6,043 17,943 15,374 8,635 4', 1 ,,017 17,161 2,023 2,61 . 1,600 7,24 2
RETURNS WITH SAT, OF FAMALAND WIT H
UNHARVESTED CROPS
Grand total . . . . . . . . . . . . . . . . . . . 3,,,13 23,913 3,107 7,755 4,920 4,265 1,443 2,723 50t~ 3 409 2,154 142 32 1
Taxable returns, total . . . . . . . . . . . . . . . 2,715 21,CC3 1,796 6,225 3,016 3,636 1,123 2,656 506 37,'~ 409 2,154 38 13 3Under $10,000 . . . . . . . . . . . . . . . . . . . . . . 1,401 4,638 ( .) 1,301 1,19'? N ( .) ( .) (~) H -
-
$10,000 -der $50,000 . . . . . . . . . . . . . . 1,211 14,2 .e 1,056 2,634 1,575 1,844 554 1,970 299 206 2~;O 1,789$50,M) under $100,000 . . . . . . . . . . . . . 118 i 6 ,
1
1017 2,077 107 353 54 298 - - (~) ( . )$!OO,GJO ., more . . . . . . . . . . . . . . . . . . . 24 1 :0 82 33 1,238 33 242 15 91 7 13 11 91 3 58
Nontaxable returns . . . . . . . . . . . . . . . . . . . 898 2,310 1,311 1,530 1,9C4 629
RETURNS WITH SAIRS OF OTHER FAA&MD
Grand total . . . . . . . . . . . . . . . . . . . . 36~741 203,490 14,571 47,934 43,769 44,485 21,559 28,203 6,501 6,702 4,967 33,935 1,535 9,271
Taxable returns , total . . . . . . . . . . . . . . . 30,6C, 191, 6oc~ 12,185 41,637 31,413 36,544 16,283 24,435 4,459 3,715 3,829 32,306 1,099 3,584Under $10,000 . . . . . . . . . . . . . . . . . . . . . . 21,711) 92,282 5,175 4,363 20,491 13,041 10,228 5,636 2,594 1,324 1,101 4,588 ( . )$10, DOC)
under $50,000 . . . . . . . . . . . . . . 8,313 79,399 6,118 . 13,084 9,975 17,622 5,611 14,337 1,699 1,246 2,407 19,025 474 1 071$50,000 under $1nO,OO0 . . . . . . . . . . . . . 461 12,250 632 6,853 681 3,307 324 1,798 112 622 229 4,559 '12
,
400$100,000 or more . . . . . . . . . . . . . . . . . . . 173 7,766 261 17,338 266 2,573 120 2,664 54 523 92 4,135 53 1,94 7
Nontaxable returns . . . . . . . . . . . . . . . . . . . 6,076 11,794 2,385 6,297 12,357 7,941 5,276 3,769 2,042 2,986 1,158 1,62 9
RETURNS WITH PROCEEDS FROM PRIOR
YEAR INSTALLMENT SALES
Grand total . . . . . . . . . . . . . . . . . . . . 204,415 1,566,887 160,000 474,207 394,440 821,412 137,942 286,425 .54,396 77,364 44,723 407,384 15,090 71,056
Taxable returns , total . . . . . . . . . . . . . . . 186,501 1,547,939 140,597 456,976 310,570 70',364 110,958 24-4,241 41,844 41,966 40,273 394,255 12,858 54 028Under $10,000 . . . . . . . . . . . . . . . . . . . . . . 98,151 427,230 58,441 53,235 172,716 231,,184 56,210 57,635 21,166 11,497 10,199 28 047 3 607
,
3 984$10 000 -der $50,000 . . . . . . . . . . . . . . 80,196 856,697 71,425 184,840 125~620 35.3,926 49,416 139,541 18,717 21,118 25,322
,
233,863
,
4657
,
29 030$50,000 under $100,000 . . . . . . . . . . . . . 6,081 168,50C 7,942 81,713 9,265 64,399 4,151 30,869 1,403 4,669 3,712 90,889
,
1,199
,
8,770$100,000 or or. . . . . . . . . . . . . . . . . . . . 2,074 95,506 2,769 137,088 2,970 47,856 1,1BO 16,196 557 4,684 1,040 41,456 587 12~244
Nontaxable returns . . . . . . . . . . . . . . . . . . . 17 .913 39,948 19,402 17,331 63,869 l16,048 26,985 42,184 12,554 35,396 4,450 13,130 2,232 '17,02 8
RETURNS WITH SALES OF OTHER TYPE
ASSETS
Grand total . . . . . . . . . . . . . . . . . . . . 380,840 3,387,454 268,014 1,166,011 389,315 436,389 117,060 223,866 65,019 71,366 60,444 671,318 25,517 137,88 7
Taxable returns, total . . . . . . . . . . . . . . . 347,244 3,279,698 232,674 1,093,787 333,032 332,953 94,948 181,684 56,051 59,063 54,981 649,861 21 040 84 56 0Under $10,000 . . . . . . . . . . . . . . . . . . . . . . 211,920 1,231,078 103,556 111,558 177,023 99,358 50,331 46,987 34,040 19,387 14,985 53,032
,
6 765
,
1749$10,000 under W 000 . . . . . . . . . . . . . . 122,540 1,578,049 110,810 357,910 138,208 186,639 39,003 92,324 19,389 23,435 33,172 347,349
,
11,474,
33 80 1$50,000 -der $100,000 . . . . . . . . . . . . . 9,426 306,826 13,214 206,509 12,980 49,110 4,160 23,673 1,762 5,470 5,083 144,197 1,802
,
14 69 7~100,000 or more . . . . . . . . . . . . . . . . . . . 3,358 163,746 5,093 417,810 4,871 47,&46 1,453 16,700 860 10,771 1,741 105,283 999
,
26,888
Nontaxable returns . . . . . . . . . . . . . . . . . . . 33,597 1 107,756 35,341 1 72,225 1 56,233 1 53,436 1 22,113 1 42,202 1 e,968 1 2-2,304 1 5,462 1 21,457 1 4,477 1 53,327
. .Footn.te. at end of table . For the precise definition of Terma and the nature of any limitations, see "Description of the Sample," "Limitations of the Data," and "ExplanationClassifieations and Termd, in the text .

132 SALES OF CAPITAL ASSETS ON INDIVIDUAL RETURNS, 1962
RETURNS WITH NET CAPITAL GAIN OR LOSS
Table 18 . -SELECTED SOURCES OF INCOME AND LOSS, EXEMPTIONS, TAXABLE INCOME AND INCOME TAX, REPORTED ON RETURNS WITH SALE OF CAPITAL
ASSET TYPE SPEC IFIED -NUMBER OF RETURNS AND AMOUNT, BY SIZE OF ADJUSTED GROSS INCOME -Continued
iIncome tax before credits Income tax after
Exemptions Taxable ncomeNormal ~ax and surtax Alternative tax crediis
Asset type and size of adjusted gross incomeNumber of
Amount Number of Amo=t Number of Amount Number of Amoun t
exemption . (7h-.-d returns (Th-.-d returns (Th. ..-d retums (7h.. .- d
d.11 . .. ) ~11 . .. ) d.11 . .. )
(29) (30) (31) (32) (33) (344) (35) (36) (37) (38 )
RETURNS WITH SALES OF PROPERTY HELD FOR PERSONAL USE
Grand total . . . . . . . . . . . . . . . . . . . . . . . . . . . . . . . . . . . . . . . . . . 174,522 104,713 41,315 350,157 40,43 8
-0
71,682
'W
877 36,300 39,823 103,212
Taxable returns, total . . . . . . . . . . . . . . . . . . . . . . . . . . . . . . . . . . . . . 137,011 82,206 39,823 348,222 1 7,94 738
1
71,278 877 36,300 39,823 103,22 2
Under $10,000 . . . . . . . . . . . . . . . . . . . . . . . . . . . . . . . . . . . . . . . . . . . . 84, 0`76 50,446 24,970 72,515 24,970 14,77442 - - 24,970 14,005
$10,000 -der $50,000 . . . . . . . . . . . . . . . . . . . . . . . . . . . . . . . . . . . . 49,140 29,484 13,821 189,591 13,604 47,198 217 3,041 13,621 48,302
$50,000 -der $100,000 . . . . . . . . . . . . . . . . . . . . . . . . . . . . . . . . . . . 2,833 1,700 768 41,737 316 6,086 452 1.1,837 768 17,468
$100,000 or mora . . . . . . . . . . . . . . . . . . . . . . . . . . . . . . . . . . . . . . . . . 961 577 264 4-4,380 56 3,252 208 21,422 264 23,437
Nontaxable returns . . . . . . . . . . . . . . . . . . . . . . . . . . . . . . . . . . . . . . . . . 37,512 22,507 1,491 1,935 1,491 404 - - - -
RETURNS WITH SALES OF RESIDENCES
Grand total . . . . . . . . . . . . . . . . . . . . . . . . . . . . . . . . . . . . . . . . . . 544,995 326,997 147,270 856,533 146,023 182,402 1,247 36,972 144,104 212,105
Taxable raturns, total . . . . . . . . . . . . . . . . . . . . . . . . . . . . . . . . . . . . . 440,810 264,486 144,104 854,252 142,857 181,944 1,247 36,972 144,104, 212,105
Under $!O,OOJ . . . . . . . . . . . . . . . . . . . . . . . . . . . . . . . . . . . . . . . . . . . . 298,226 178,936 102,3149 304,610 102,349 62,788 - - 102,349 60,09 5
$10,000 under $50,000 . . . . . . . . . . . . . . . . . . . . . . . . . . . . . . . . . . . . 138,541 83,125 40,561 465,237 40,193 111,790 367 4,943 40,561 113,825
$50,000 under $100,000 . . . . . . . . . . . . . . . . . . . . . . . . . . . . . . . . . . . 3,286 1,971 976 52,694 287 5,435 ('89 16,965 976 21,?73
$100,000 or more . . . . . . . . . . . . . . . . . . . . . . . . . . . . . . . . . . . . . . . . . 756 454 218 31,510 28 1,931 190 15,064 218 16,412
Nontaxable returns . . . . . . . . . . . . . . . . . . . . . . . . . . . . . . . . . . . . . . . . . 104,185 62,512 3,166 2,281 3,166 458 - - - -
RETURNS WITH SAT OF NONBUSIMFSS REAL ESTAT E
Grand total . . . . . . . . . . . . . . . . . . . . . . . . . . . . . . . . . . . . . . . . . . 1,153,382 692,029 281,243 2,370,670 275,433 494,179 5,810 211,430 275,633 684,057
Taxable returns, total . . . . . . . . . . . . . . . . . . . . . . . . . . . . . . . . . . . . . 908,471 545,083 275,633 2,364,513 269,627 492,684 5,605 211,154 275,633 684,057
Under $10,000 . . . . . . . . . . . . . . . . . . . . . . . . . . . . . . . . . . . . . . . . . . . . 501,950 301,170 164,696 510,209 164,696 104,347 - - 164,696 101,195
$10,000 under $5%000 . . . . . . . . . . . . . . . . . . . . . . . . . . . . . . . . . . . . 381,090 228,654 104,075 1,324,806 102,632 327,401 1,443 18,284 104,075 335,99?
$50,000 under $100,000 . . . . . . . . . . . . . . . . . . . . . . . . . . . . . . . . . . . 19,519 11,73a 5,215 274,341 2,205 42,664 3,010 72,797 5,215 112,719
$100,000 or more . . . . . . . . . . . . . . . . . . . . . . . . . . . . . . . . . . . . . . . . . 5,913 3,548 1,648 255,157 295 16,272 1,353 120,073 1,648 134,146
Nontaxable returns . . . . . . . . . . . . . . . . . . . . . . . . . . . . . . . . . . . . . . . . . 244,910 146,946 5,6.10 6,157 5,605 1,496
RETURNS WITH SALES OF REAL ESTATE SUBDIVIDED
3-d total . . . . . . . . . . . . . . . . . . . . . . . . . . . . . . . . . . . . . . . . . . 478,016 286,810 125,268 1,030,517 122,459 210,726 2,809 99,168 120,648 300,031
Taxable returns, to-~al . . . . . . . . . . . . . . . . . . . . . . . . . . . . . . . . . . . . . 393,863 236,318 120,648 1,026,716 117,839 209,960 2,609 99,168 120,648 300,031
Under $10,000 . . . . . . . . . . . . . . . . . . . . . . . . . . . . . . . . . . . . . . . . . . . . 239,638 143,783 76,356 240,377 76,356 49,262 - - 76,356 47,486
$10,000 under $5%000 . . . . . . . . . . . . . . . . . . . . . . . . . . . . . . . . . . . . 142,937 85,762 41,224 546,275 40,512 135,867 712 9,369 41,224 141,117
$50,000 -der $100,000 . . . . . . . . . . . . . . . . . . . . . . . . . . . . . . . . . . . 8,758 5,255 2,347 123,982 860 16,115 1,487 36,108 2,347 50,807
$100,000 or more . . . . . . . . . . . . . . . . . . . . . . . . . . . . . . . . . . . . . . . . . 2,530 1,518 720 116,083 Ill 8,716 610 53,691 720 60,622
Nontaxable returns . . . . . . . . . . . . . . . . . . . . . . . . . . . . . . . . . .. . . . . . . . 84,154 50,492 4,620 3,801 4,620 767 - - - -
RETURNS WITH SAT OF FARMIAND WITH UNHARVESTED CROPS
Grand total . . . . . . . . . . . . . . . . . . . . . . . . . . . . . . . . . . . . . . . . . . 24,273 14,564 5,265 45,579 5,141 9,785 124 4,345 4,468 13,51 6
Taxable returns, total . . . . . . . . . . . . . . . . . . . . . . . . . . . . . . . . . . . . 13,587 8,152 4,468 44,917 4,344 9,653 124 4,345 4,468 13,51E
Under $10,000 . . . . . . . . . . . . . . . . . . . . . . . . . . . . . . . . . . . . . . . . . . . . 6,904 4,142 2,401 5,815 2,401 1,212 - - 2,401 1,115
$10,000 under $50,000 . . . . . . . . . . . . . . . . . . . . . . . . . . . . . . . . . . . 6,114 3,668 1,901 27,576 1,873 7,071 1,901 7,303
$50,000 -der $100,000 . . . . . . . . . . . . . . . . . . . . . . . . . . . . . . . . . . . 461 277 131 6,773 67 1,320 64 1,553 131 2,741
$100,000 or more . . . . . . . . . . . . . . . . . . . . . . . . . . . . . . . . . . . . . . . . . 108 65 34 4,753 2 50 32 2,384 34 2,35?
Nontaxable returns . . . . . . . . . . . . . . . . . . . . . . . . . . . . . . . . . . . . . . . . . 10,686 6,412 661
RETURNS WITH SLUS OF OTHER FARhUAND
Grand total . . . . . . . . . . . . . . . . . . . . . . . . . . . . . . . . . . . . . . . . . 244,684 146,930 52,970 381,940 52,103 77,670 867 36,690 50,839 110,019
Taxable returns, total . . . . . . . . . . . . . . . . . . . . . . . . . . . . . . . . . . . . . 160,711 96,427 50,839 380,126 49,972 77,304 867 36,690 50,839 llo'.019
Under $10,000 . . . . . . . . . . . . . . . . . . . . . . . . . . . . . . . . . . . . . . . . . . . . 107, 0`75 61,245 35,363 101,126 35,363 20,687 - - 35,363 19,553
$10,000 under $50,000 . . . . . . . . . . . . . . . . . . . . . . . . . . . . . . . . . . . . 49,816 29,891 14,423 191,697 14,240 47,887 183 2,685 14,423 48,905
$50,000 under $100,000 . . . . . . . . . . . . . . . . . . . . . . . . . . . . . . . . . . . 2,768 1,661 768 41,921 332 6,405 436 11,564 768 17,549
$100,000 or more . . . . . . . . . . . . . . . . . . . . . . . . . . . . . . . . . . . . . . . . . 1,050 630 286 45,382 37 2,325 249 22,441 296 24,012
Nontaxable returns . . . . . . . . . . . . . . . . . . . . . . . . . . . . . . . . . . . . . . . . . 84,173 50,504 2,131 1,614 2,131 366 - - - -
RETURNS WITH PROCEEDS FROM PRIOR YEAR INST&LUAENT SA T
Grand total . . . . . . . . . . . . . . . . . . . . . . . . . . . . . . . . . . . . . . . . . . 1,271,758 763,055 343,190 3,451,883 332,021 679,930 12,169 422,076 331,727 1,062,322
Taxable returns, total . . . . . . . . . . . . . . . . . . . . . . . . . . . . . . . . . . . . . 981,303 588,782 331,727 3,439,324 320,559 677,402 11,168 422,056 331,727'
1,062,322
Under $10,000 . . . . . . . . . . . . . . . . . . . . . . . . . . . . . . . . . . . . . . . . . . . . 486,557 291,934 186,399 572,402 186,399 118,217 - - 186,399 109,842
$10,000 -der $50,000 . . . . . . . . . . . . . . . . . . . . . . . . . . . . . . . . . . . . 448,310 268,986 132,603 1,859,978 130,212 469,983 2,392 32,565 132,603 486,50C
$50,000 under $100,000 . . . . . . . . . . . . . . . . . . . . . . . . . . . . . . . . . . . 35,373 21,224 9,655 509,626 3,573 65,767 6,082 148,792 9,655 209,503-
$100,000 or more . . . . . . . . . . . . . . . . . . . . . . . . . . . . . . . . . . . . . . . . . 11,063 6,638 3, 0`71 497,319 376 23,435 2,694 240,699 3, C171 256,478
Nontaxable returns . . . . . . . . . . . . . . . . . . . . . . . . . . . . . . . . . . . . . . . . . 290,455 174,273 11,463 12,559 11,462 2,528 1 19 - -
RETURNS WITH SAT OF OTHER TYPE ASSETS
Grand total . . . . . . . . . . . . . . . . . . . . . . . . . . . . . . . . . . . . . . . . . : 1,783,507 1,070,104 486,479 5,066,681 472,286 1,0`76,717 14,193 617,961 473,981 1,631,554
Taxable returns, total . . . . . . . . . . . . . . . . . . . . . . . . . . . . . . . . . . . . . 1$489,136 893,482 473,981 5,050,716 460,282 1, 0`73, 590 13,698 617,577 473,981 1,631,554
Under $10,000 . . . . . . . . . . . . . . . . . . . . . . . . . . . . . . . . . . . . . . . . . . . . 807,520 484,512 279,899 907,253 279,889 187,794 - - 279,889 179,71 5
$10,000 -der $50,000 . . . . . . . . . . . . . . . . . . . . . . . . . . . . . . . . . . . . 606,651 363,991 174,125 2,462,82-1 171,508 636,737 2,617 35,232 174,125 649,93E
$50,000 -der $100,000. . . . . . . . . . . . . . . . . . . . . . . . . . . . . . . . . . . 55,948 33,569 14,663 766,171 7,533 151,284 7,129 173,637 14,663 314,61 5
~100,000 or more . . . . . . . . . . . . . . . . . . . . . . . . . . . . . . . . . . . . . . . . . 19 017 11,410 5,304 914 480 1 352
,
97,775 3,952 408,708 5,304 487,28 f
Nontaxable returns . . . . . . . . . . . . . . . . . . . . . . . . . . . . . . . . . . . . . . . . .1
294,M
1 1
76,622 12,498 1 15 965 12 003 3,12 7
'Due to the reporting of more than me asset type by some 1~pay-s, the number of returns and amounts for each item for "All returns with sales of capital assets'~ will be less
than the am for the specific - .at types .(*) An asterick in a cell denotes that the estimate is not shown separately because of high sampling variability . However, the data are included in the appropriate totalS .
- A dash in a cell indicates that either there are no data for that item as it amounts to less than T500 .
NOTE : Detail in the tables may not add to totals because of rounding .For the precise definition of terms and the nature of any limitations, see ~'Description of the S~ple,ll "Limitations of the Data," and "Explanation of Classifications
and Terms" in the text .

SALES OF CAPITAL ASSETS ON INDIVIDUAL RETURNS, 1962 133STArE DAT A
Table 19 . -ALL CAPITAL ASSET TRANSACTIONS, CORPORATE STOCK TRANSACTIONS, AND SECURITIES OTHER THAN CORPORATE STOCK TRANSACTIONS -NUMBER OF RETURNS,ADJUSTED GROSS INCOME, GROSS SALES PRICE, GROSS GAIN, AND GROSS LOSS, BY STATE
[Taxable and nontaxable returns )
All capital asset transactions Corporate sta~k ~rana actions
dGross gain Gross loss Number o f
Number of A j~tedGross sales
---returns
Adj,stedGross sales
State returns.4 th sale .
Cros5income
priceNu b r of Amount Number of Amount with sales .
gros sincome price
of capita2tr2salcto..
transactions o fcorporate
assets (Ih-.. .d (T~-d (Th- d (TI...-dstock
(T7--.dd.11 . .. d,11-) d.11 ...
d.11. ..d.11 .. . d.11. ..
(1) (2) (3) (4) (5) (6) (7 )
United StaL..1 . . . . . . . . . . . . . . . . . . . . . . . . . . . . . . . . . . . . 5,81~1,200 64,060,261 53,269,171 9,960,697 17,318,248 6,U75,107 6,294,534 2,124,822 33,761,791 32,102,682
Al.b. . . . . . . . . . . . . . . . . . . . . . . . . . . . . . . . . . . . . . . . . . . . . . . . . . . . . . 45,458 476,543 249,832 67,988 109,652 32,635 22,294 12,246 203,499 118,08 1Alaska . . . . . . . . . . . . . . . . . . . . . . . . . . . . . . . . . . . . . . . . . . . . . . . . . . . . . 3,795 50,123 22,644 4,386 10,233 3,270 5,295 633 12,374 7,194
A,i .o..__ . . . . . . . . . . . . . . . . . . . . . . . . . . . . . . . . . . . . . . . . . . . . . . . 42,231 462,499 410,922 67,261 168,346 33,096 54,385 15,248 203,579 145,803
Ark asas . . . . . . _ . . . . . . . . . . . . . . . . . . . . . _ . . . . . . . . . . . . . . . . . . . . 26,306 256,927 152,356 36,848 89,058 12,897 17,524 6,541 102,461 75,83 7
California . . . . . . . . . . . . . . _ . . . . . . . . _ . . . . . . . . _ . . . . . . . . . . 733,368 8,611,828 9,020,141 1,211,508 2,938,289 880,977 1,116,381 295,634 4,356,420 4,548,99?
Colorado . . . . . . . . . . . . . . . . . . . . . . . . . . . . . . . . . . . . . . . . . . . . . . . . . . 83,853 833,572 609,676 132,423 258,157 68,166 75,859 25,497 3143,976 235,264
Connecticut . . . . . . . . . . . . . . . . . . . . . . . . . . . . . . . . _ . . . . . . . . . . . . . . 92,196 1,320,363 1,091,977 180,007 33/,001 1-,4~6 116,370 49,685 882,018 805,71 5
Delaware . . . . . . . . . . . . . . . . . . . . . . . . . . . . . . . . . . . . . . . . . . . . 2) (2) (2) (2) (2)0~ (2)
(2) (2) (2 )
District of C .luff.i . . . . . . . . . . . . . . . . . . . . . . . . . . . . . . . . . . . . . . . . 13,149 240,556 192,337 28,574 81,123 20,979 16,262 7,981 166,595 119,97 7
Florid. . . . . . . . . . . . . . . . . . . . . . . . . . . . . . . . . . . . . . . . . . . . . . . . . . . 186,290 1,871,382 2,188,401 353,770 718,797 237,062 265,958 77,138 973,665 1,351,57 5
Georgia . . . . . . . . . . . . . . . . . . . . . . . . . . . . . . . . . . . . . . . . . . . . . . . . . . . 66,908 769,471 529,966 ID4,459 195,522 54,206 55,439 23,001 385,912 266,36 7Hawaii . . . . . . . . . . . . . _ . . . . . . . . . . . . . . . . . . . . . . . . . . . . . . . . . . . . . 22, 085 275,094 123,108 33,648 60,386 16,714 14,244 7,747 126,912 76,366Idaho . . . . . . . . . . . . . . . . . . . . . . . . . . . . . . . . . . . . . . . . . . . . . . . . . . . . . 32,465 206,266 111,165 44,622 61,479 15,619 24,777 ~,697 52,230 27,28 6
Illinois . . . . . . . . . . . . . . . . . . . . . . . . . . . . . . . . . . . . . . . . . . . . . . . . . 330,742 4,033,228 3,084,189 577,821 1, 068,553 371,95~ 380,508 139,199 2,361,765 2,100,88 2
Indian. . . . . . . . . . . . . . . . . . . . . . . . . . . . . . . . . . . . . . . . . . . . . . . . . . 124,977 1,182,213 666,718 205,469 261,106 61,885 66,890 31,014 509,955 329,101
1 . . . . . . . . . . . . . . . . . . . . . . . . . . . . . . . . . . . . . . . . . . . . . . . . . . . . . . . 187,355 1,116,068 606, Cv, 2 299,105 271,874 79,157 63,509 16,596 230,189 106,47 7Keasa. . . . . . . . . . . . . . . . . . . . . . . . . . . . . . . . . . . . . . . . . . . . . . . . . . . . . . 95,610 807,214 465,952 144,525 188,785 51,882 51,547 15,30`7 238,541 153,58 6Kentucky . . . . . . . . . . . . . . . . . . . . . . . . . . . . . . . . . . . . . . . . . . . . . . . . . . . 65,228 572,916 355,?96 92,021 129,097 38,287 31,305 16,217 228,890 153,97 0Louisiana . . . . . . . . . . . . . . . . . . . . . . . . . . . . . . . . . . . . . . . . . . . . . . . . . . 51,9_34 636,371 554,589 73,888 241,037 41,124 82,537 16,786 288,86? 229,577
Maine . . . . . . . . . . . . . . . . . . . . . . . . . . . . . . . . . . . . . . . . . . . . . . . . . . . . . 21,407 193,614 145,430 38,125 49,522 21,514 16,939 9,610 - 106,205 111,14 2
Maryland . . . . . . . . . . . . . . . . . . . . . . . . . . . . . . . . . . . . . . . . . . . . . . . . . 100, 835 1,346,767 1,031,9S9 191,167 304,795 143,B84 99,165 51,135 803,432 540,45 6
Massachusetts . . . . . . . . . . . . . . . . . . . . . . . . . _ . . . . . . . . . . . . . . . . _ 146,990 1,892,732 1,266,673 238,140 393,66S 157,270 161,577 72,940 1,130,979 912,794
Mi chi gan . . . . . . . . . . . . . . . . . . . . . . . . . . . . . . . . . . . - . . . . . . . . . . . . . 206,800 2,434,768 1,376,565 323,049 483,358 195,496 136,811 76,819 1,268,533 737,402
Minnesota . . . . . . . . . . . . . . _ . . . . . . . . . . . . . . . . . . . . . . . . . . . . . . . . 174,545 1,225,786 744,189 28.,?60 346,449 123,014 135,572 36,902 535,476 37S,39 5Mississippi . . . . . . . . . . . . . . . . . . . . . . . . . . . . . . . . . . . . . . . . . . . . . . . . 29,1510 295,306 198,968 44,820 82,432 13,107 11,881 5,129 95,083 71,404
Missouri . . . . . . . . . . . . . . . . I . . . . . . . . . . . .. . . . . ... . . . . . . . . . . . . . . . . 176,923 1,547,722 981,1?1 282,109 341,603 119,692 118,565 4 5, 076 696,093 568,017 3
Montana . . . . . . _ . . . . . . . . . . . . . . . . . . . . . . . . . . . . . . . . . . . . . . . . . . 38,118 242,532 167,327 54,614 73,704 19,715 23,992 6,406 71,548 47,76 1Nebraska . . . . . . . . . . . . . . . . . . . . . . . . . . . . . . . . . . . . . . . . . . . . . . . . .87,251 587,649 36?,556 150,146 149,070 45,403 24,981 9,602 150,059 92,37 6
Ne~ada . . . . . . . . . . . . . . . . . . . . . . . . . . . . . . . . . . . . . . . . . . . . . . . . . . . . . 14,533 158,608 231,144 24,005 81,340 14,722 33,443 4 :830 66,qn 102,23 2
New Hampshire . . . . . . . . . . . . . . . . . . . . . . . . . . . . . . . . . . . . . . . . . . . . . 14,966 145,542 lol : ;r2 31,101 32,9GS 20,135 12,503 7,969 79,301? 68,151
New Jersey . . . . . . . . . . . . . . . . . . . . . . . . . . . . . . . . . . . . . . . _ . . . . . . . 192,012 2,583,604 2,294,463 364,422 573,951 285,930 272,643 102,421 1,626,545 1,612,886New Mexico . . ., . . . . . . . . . . . . . . . . . . . . . . . . . . . . . . . . . . . . . . . . . . . _ 24,755 248,416 178,283 32,741 84,684 15,912 27,327 5_562. 78,718 58,59 0
Me. York . . . . . . . . . . . . . . . . . . . . . . . . . . . . . . . . . . . . . . . . . . . . . . . . . . . 657,740 9,730,881 11,D65,639 1,430,499 2,48,,168 1,262,198 1,314,650 379,507 6,741,046 8,526,291
:~.rth C-olin. . . . . . . . . . . . . . . . . . . . . . . . . . . . . . . . . . . . . . . . . . . _ 71,979 82,8,968 760,724 123,842 189,697 91,031 67,962 25,492 452,358 357,116
!;orth Dakota . . . . . . . . . . . . . . . . . . . . . . . _ . . . . . . . . . . . . . . . . . . . . . 36,593 216,309 89,937 50,686 57,502 14,600 10,199 3,654 50,572 24,17 0
Ohio . . . . . . . . . . . . . . . . . . . . . . . . . . . . . . . . . . . . . . . . . . . . . . . . . . . . - 247,031 2,861,389 2,048,914 4,47,953 582,625 236,253 212,405 67,378 1,494,076 1,275,31 6
Oklahoma . . . . . . . . . . . . . . . . . . . . . . . . . . . . _ . . . . . . . . . . . . . . . . . . . . . 56,168 509,996 443,200 88,571 217,535 48,899 50,784 13,999 213,931 214,197
Oregon . . . . . . . . . . . . . . . . . . . . . . . . . . . . . . . . . . . __ . . . . . . . . . . . _ 79,M 681,396 519,119 124,511 205,392 49,851 54,469 20,165 255,734 257,752
Pennsylvani a . . . . . . . . . . . . . . . . . . . . . . . . . . . . . . . . . . . . . . . . . . . . . 296,835 3,385,834 2,3513,792 502,037 744,860 310,656 284,953 124,246 1,899,715 1,739,823
Rhode Island . . . . . . . . . . . . . . . . . . . . . . . . . . . . . . . . . . . . . . . . . . . . _ 21,712 270,363 233,045 47,623 66,503 21,515 19,9c)8 10,204 164,839 151,235
South Carolina . . . . . . . . . . . . . . . . . . . _ . . . . . . . . . . . . . . . . . . . . . . . 31,032 338,450 195,414 44,798 74,785 20,871 17,392 11,033 157,574 10`7,197South Dakota . . . . . . . . . . . . . . . . . . . . . . . . . . . . . . . . . . . . . . . . . . . _ . . 56,304 279,321 121,589 88,570 74,111 28,610 10,782 2,2,62 35,128 12,713
Tennessee . . . . . . . _ . . . . . . . . . . . . . . . . . . . . . . . . . . . . . . . . . . . . . . . . 60,173 716,266 475,429 96,614 168,694 48,044 43,378 23,315 377,645 308,022
Texas . . . . . . . . . . . . . . . . . . . . . . . . . . . . . . . . . . . . . . . . . . . . . . . . . . . . . 256,323 2,880,786 2,299,461 413,902 1,110,567 225,203 286,136 79,314 1,360,401 1,169,281
Utah . . . . . . . . . . . . . . . . . . . . . . . . _ . . . . . . . . . . . . . _ . . . . . . . . . . . . 30,959 269,6Z3 137,020 36,285 64,021 19,314 32,735 8,296 104,248 51,160
Vermont . . . . . . . . . . . . . . . . . . . . . . . . . . . . . . . . . . . . . . . . . . . . . . . . . . . . 13,783 102,215 92,418 19,658 25,247 10,696 7,976 4,576 48,52? 54,49 5
. . . . . . . . . . . . . . . . . . . . . . . . . . . . . . . . . . . . . __ . . . . 86,599 995,893 632,469 143,340 231,477 66,019 55,687 33,092 512,966 3SI,866
Washington . . ~ . . . . . . . . . . . . . . . . . . . . . . . . . . . . . . . . . . . . . . . . . . . . . 115,274 1,132,011 647,480 156,770 258,332 71,534 68,122 30,302 422,562 283,99 0
West Virginia . . . . . . . . . . . . . . . . . . . . . . . . . . . . . . . . . . . . . . . . . . . . 26,617 262,204 151,027 40,284 52,496 17,781 13,32e 10,08D 137,963 74,764
Wisconsin . . . . . . . . . . . . . . . . . . . . . . . . . . . . . . . . . . . . . . . . . . . . . . . . 170,783 1,328,541 738,951 281,663 271,655 109,95e 92,725 38,116 562,037 328,081
Wyoming . . . . . . . . . . . . . . . . . . . . . . . . . . . . . . . . . . . . . . . . . . . . . . . . . . 16,456 135,911 72,671 22,?54 34,530"9'1~ "'91
2,896 36,507 2,4,29 5Other r .. . I . . . . . . . . . . . . . . . . . . . . . . . . . . . . . . . . . . . . . . . . . . . . . .
1 23,477 171,931 , 434,960 , 49,089 92,228, 1,,1411 1 71, 016 10,16 01 , 92,916 . 369,216
Footnotes at end of table . For the precise definition of terms and the nature of an5 limitations, see the ~T~rription of the Sample, 11 "Limitations of the Data," and "Explanation
of Classifications and Torns" in the text .
I

134
STATE DArA
SALES OF CAPITAL ASSETS ON INDIVIDUAL RETURNS, . 1962
Table 19 . -ALL CAPITAL ASSET TRANSACTIONS, CORPORATE STOCK
ADJUSTED GROSS INCOME, GROSS
TRANSACTIONS, AND SECURITIES OTHER THAN CORPORATE STOCK TRANSACTIONS -NUMBER OF RETURNS,SALES PRICE, GROSS GAIN, AND GROSS LOSS, BY STATE-Continue d
[Taxable and nontaxable returns j
Corporate steel,. transactions-Continued Securiti es other tha n corporat~ stock transactions
Gross gain Gross loss Number of Gross gain Gross los sreturns with Adjusted
Gross sale sState
Number ofAmount Number of
Amountsale . of
..c.,itie .-gros sincome
priceNumber of
Amoun tNumber of'
Amount
Lransactions(T~-d
transactions(Tb-d
other than
corporate (Th--d (Th-. ..dtransactions
(rh-dtransactions
d.11-) &ZI-) stock &II-) d.1) ... ) d.11-) d.11.. .
(11) (12) (13) (14) (15) (16) (17) (18) (19) (20) (21 )
United States . . . . . . . . . . . . . . . . . . . . . . . . . . . . 4,190,887 7,143,616 4,683,048 4,094,465 131,368 3,926,335 3, 101,676 1433, 202 117,780 117,919 134,771
Alabama . . . . . . . . . . . . . . . . . . . . . . . . . . . . . . . . . . . . . . . . If' 3, 461 29 , 098 23,180 17,612 1,669 28,148 12,998 1,275 585 1,3140 2841
Alas ka . . . . . . . . . . . . . . . . . . . . . . . . . . . . . . . . . . . . . . . . . 557 21112 1,591 1,625 4 130 36 - - 4 3
Ari zona . . . . . . . . . . . . . . . . . . . . . . . . . . . . . . . . . . . . . . . . 22,027 44,206 21,705 17,895 1,033 22,238 9,517 1,267 1,171 272 147
Arkars s . . . . . . . . . . . . . . . . . . . . . . . . . . . . . . . . . . . . . . . 8,716 32,833 5,572 4,825 324 9,012 2,727 238 524 253 83
California . . . . . . . . . . . . . . . . . . . . . . . . . . . . . . . . . . . . . 555,101, 958,913 705,921 530,747 13,429 320,493 263,908 17,394 14,660 9,578 6,986
Colorado . . . . . . . . . . . . . . . . . . . . . . . . . . . . . . . . . . . . . . . 40, Cv, 5 74,368 43,276 27,3D6 1,797 -34,730 23,517 1,008 814 1,821 2,267
Go-ecticut . . . . . . . . . . . . . . . . . . . . . . . . . . . . . . . . . . . . 113,514 193,129 109 449 87 702 3,774 111, 1CY7 66,527 4,378 2,209 3,802 2,662
Dsla are . . . . . . . . . . . . . . . . . . . . . . . . . . . . . . . . . . . . . . . (2) (21 (2 (2) 2) (2 2 (2 ( 2D,
strict of
Columbia . . . . . . . . . . . . . . . . . . . . . . . . . . . 16,799 37,773 17,435 14,249 628 30,225 14,121 823 691 937 376
Florida . . . . . . . . . . . . . . . . . . . . . . . . . . . . . . . . . . . . . . . . 171,527 275,886 195,847 179,812 6,539 126,767 104,191 6,025 3,162 6,951 16,126
G~.rgi. . . . . . . . . . . . . . . . . . . . . . . . . . . . . . . . . . . . . . . . . 38,343 67,863 44,201 33,347 1,552 39,814 14,634 1,488 661 1,061 47 5
Hawaii . . . . . . . . . . . . . . . . . . . . . . . . . . . . . . . . . . . . . . . . . 14,116 21,104 14,093 8,500 230 5,739 1,338 288 76 75 42I
dah . . . . . . . . . . . . . . . . . . . . . . . . . . . . . . . . . . . . . . . . . . 5,000 8,436 6,069 6,103 ( .) . ( . )Ill
inois . . . . . . . . . . . . . . . . . . . . . . . . . . . . . . . . . . . . . . . 251,154 530,598 292,777 287,030 6,413 312,510 160,996 10,704 8,814 7,510 4,227
Indiana . . . . . . . . . . . . . . . . . . . . . . . . . . . . . . . . . . . . . . . . 46,900 102,737 43,462 36,766 1,98c) 56,633 24,146 1,937 2,797 1,630 1,43 5
low . . . . . . . . . . . . . . . . . . . . . . . . . . . . . . . . . . . . . . . . . . . 20,54S 33,654 21,845 16,020 932 24,151 8,871 884 .342 868 740
Kansas . . . . . . . . . . . . . . . . . . . . . . . . . . . . . . . . . . . . . . . . 20,395 37,806 24,560 18,737 637 22, 073
7 ,
841 512 418 394 20 5
Kentucky . . . . . . . . . . . . . . . . . . . . . . . . . . . . . . . . . . . . . . . 24,790 32,874 20,607 18,635 1,401 36,341 10,380 1,483 629 582 1,39 0
Iouisiana . . . . . . . . . . . . . . . . . . . . . . . . . . . . . . . . . . . . . 23,528 80, 094 21,875 21,092 1,099 2?,860 12,412 806 1,662 973 317
Wine . . . . . . . . . . . . . . . . . . . . . . . . . . . . . . . . . . . . . . . . . . 17,524 29,599 17,682 15,353 761 10,967 8,318 1,836 826 1,133 12 5
Maryland . . . . . . . . . . . . . . . . . . . . . . . . . . . . . . . . . . . . . . . 105,515 128,824 11-5,555 82,232 3,536 63,629 45,321 4,150 2,326 3,552 2,87 C
Massachusetts . . . . . . . . . . . . . . . . . . . . . . . . . . . . . . . . . . 132,951 225,619 133,223 116,050 5,040 139,455 64,864 3,72? 4,507 4,151 25,28 9
Michigan . . . . . . . . . . . . . . . . . . . . . . . . . . . . . . . . . . . . . . . 124,968 220,133 136,606 99,845 5,243 151,542 45,080 4,108 2,351 4,062 2,27 5
Minn . .ta . . . . . . . . . . . . . . . . . . . . . . . . . . . . . . . . . . . . . 59,553 96,699 79,006 8_~,883 1,711 48,415 22,583 1,550 687 1,133 582
Mississippi . . . . . . . . . . . . . . . . . . . . . . . . . . . . . . . . . . . . 10,198 19,977 9,233 8,822 410 8,002 2,846 284 139 241 14 8
Missouri . . . . . . . . . . . . . . . . . . . . . . . . . . . . . . . . . . . . . . . 78, 006 117,459 72,661 65,369 1,938 70,076 32,,446 1,696 1,482 2,129 1,08 3
Montana . . . . . . . . . . . . . . . . . . . . . . . . . . . . . . . . . . . . . . . . 9,497 11,358 9,530 5,916 ( . )
Nebraska . . . . . . . . . . . . . . . . . . . . . . . . . . . . . . . . . . . . . . . 12,070 24,282 11,468 6,830 430 13,093 23,407 889 938 164 14 6
Nevad . . . . . . . . . . . . . . . . . . . . . . . . . . . . . . . . . . . . . . . . . 8,450 22,109 8,961 11,068 270 9,448 12,613 215 392 370 304'! -
-
,
ew Hampshire . . . . . . . . . . . . . . . . . . . . . . . . . . . . . . . . 19,231 17,444 17,181 11,1?9 381 8,729 2,769 226 60 343 102
New Jersey . . . . . . . . . . . . . . . . . . . . . . . . . . . . . . . . . . . . . 225,634 322,387 254,285 215,346 5,183 150,348 237,552 6,799 4,159 4,031 2,50 5
New Mexico . . . . . . . . . . . . . . . . . . . . . . . . . . . . . . . . . . . . . 5,388 16,504 6,824 6,890 106 3,195 851 93 28 115 15 4
New Y ork . . . . . . . . . . . . . . . . . . . . . . . . . . . . . . . . . . . . . . . 952,250 1,583,388 1,126,575 1,115,429 22,486 937,054 1,307,861 30,043 26,753 26,275 25,13 5
North Carolina . . . . . . . . . . . . . . . . . . . . . . . . . . . . . . . . . 46,193 64,170 61,766 45,201 1,690 35,316 20,050 1,120 805 1,495 83 9
North Dakota . . . . . . . . . . . . . . . . . . . . . . . . . . . . . . . . . . . 3,911 7,515 4,161 2,930 ( .) H H
Oh.
. . . . . . / . . . . . .
. . . . . . . . . . . . . . . . . . . . . . . . . . . . . . 214,937 251,263 175,835 159,459 8,563 226,070 100,718 7,604 6,111 6,693 4,958
Oklahoma . . . . . . . . . . . . . . . . . . . . . . . . . . . . . . . . . . . . . . . 24,641 42,534 30,402 22,635 831 12,815 12,434 1,634 1,538 617 1,24 2
Grego . . . . . . . . . . . . . . . . . . . . . . . . . . . . . . . . . . . . . . . . . 35,854 54,795 31,420 19,469 1,150 27,640 6,243 997 671 637 384
Pennsylvania . . . . . . . . . . . . . . . . . . . . . . . . . . . . . . . . . . . 247,738 402,400 263,434 222,299 9,316 314,395 166,648 9,856 11,198 9,501 16,64 3
Rhode Island . . . . . . . . . . . . . . . . . . . . . . . . . . . . . . . . . . . 30,271 40,426 17,301 16,708 539 20,350 .10,559 465 124 428 21 2
South Carolina . . . . . . . . . . . . . . . . . . . . . . . . . . . . . . . . . 15,344 28,231 17,294 12,368 434 12,096 5,255 222 182 396 52 C
S-uth Dakota . . . . . . . . . . . . . . . . . . . . . . . . . . . . . . . . . . . 2,693 5,005 2,351 1,699 182 3,170 765 179 27 22 3 6
Tennessee . . . . . . . . . . . . . . . . . . . . . . . . . . . . . . . . . . . . . . 40,366 82,054 35,220 33,542 991 33,972 25,203 985 621 878 36 1
Texas . . . . . . . . . . . . . . . . . . . . . . . . . . . . . . . . . . . . . . . . . . 134,187 341,015 154,102 133,042 3,880 113,845 100,609 4,100 5,290 3,115 5,41 4
U Lah . . . . . . . . . . . . . . . . . . . . . . . . . . . . . . . . . . . . . . . . . . . 8,498 16,932 12,331 8,097 247 5,364 8,237 17,S 129 13F. 101
V- nt . . . . . . . . . . . . . . . . . . . . . . . . . . . . . . . . . . . . . . . . 6,461 13,012 7,514 5,976 590 6,903 7,766 126 485 1,122 24 2
Virginia . . . . . . . . . . . . . . . . . . . . . . . . . . . . . . . . . . . . . . . 60,345 92,382 54,793 44,981 2,710 66,031 16,853 2,813 1,162 1,999 2,28 3
Washington . . . . . . . . . . . . . . . . . . . . . . . . . . . . . . . . . . . . . 42,592 73,391 44,524 38,354 1,564 40,890 15,224 1,339 899 768 45 2
West V ;rginia . . . . . . . . . . . . . . . . . . . . . . . . . . . . . . . . . . 12,672 15,309 13,787 11,756 695 11,765 6,011 657 174 126 22 5
Wisconsin . . . . . . . . . . . . . . . . . . . . . . . . . . . . . . . . . . . . . . 60,545 81,643 67,455 65,302 3,190 74,368 28,812 2,563 1,425 2, 80`7 1,38 3
Wyoming . . . . . . . . . . . . . . . . . . . . . . . . . . . . . . . . . . . . . . . . 2,396 4,101 8,569 3,599 59S 7,324 2,1_34 639 19 .5 86 li s
Other areas' . . . . . . . . . . . . . . . . . . . . . . . . . . . . . . . . . . . . 31,475 , 59,925 , 50,525 , 5MI6, (.) I (.) I (.) . (.) . ( .) I (. )
'The use of two separate series of weights resulted in slight differences between totals in the tables showing distributions by States and corresponding items in the national
tables . See IlDsscription of the Sample" .2Estimale is not shown separately because a large proportion of the high income returns for the Wilmington (Delaware) Dis~rict office were missing from the Statist~cs of Income
sample . Delaware data are, however, included in the national totals .3Rsturrz, of bona fide residents of Puerto Rico, whether U .S . citizens or aliens, and U .S . citizens residing in Panama Canal Zone, Virgin Islands, or abroad .
(*) An asterisk in a cell denotes that the estimate is not shown sevarately because of high sampling variability . However, the data are included in the appropriate totals .
NOTE : Detail in the tables may not add to totals because of rounding .For -he Precise definition of terms and the nature of any limitations see the "Description of the Sample ." "Limitations of the Data," and "Explanation of Classifications
and Terms" in the text .

Returns of Taxpayers Age 65 and Over
TABLE CONTENTS
Taxpayers Age 65 And Over With Sales of Capital Assets20 . All and long-term capital asset transactions- -Nurn -
ber of returns, adjusted gross income, net gain lessnet loss, and transaction detail, by size of adjustedgross income, 136
Taxpayers Age 65 And Over With Sales of CorporateStock21 . All capital asset transactions, long-term capital
asset transaction, all corporate stock transactions,and long-term corporate stock transactions- -Nurn -ber of returns, adjusted gross income, netgainlessnet loss, and transaction detail, by size of adjustedgross income, 137
Taxpayers Age 65 And Over With Sales of SecuritiesOther Than Corporate Stock22. All capital asset transactions, long-term capital as-
set transactions, all securities other than corporatestock transactions, and long-term securities otherthan corporate stock transactions --Number of re-turns, adjusted gross income, net Igain .ess net loss,and transaction detail, by size of adjusted grossincome, 138
Taxpayers Age 65 And Over With Sales of Residences23. All capital asset transactions, long-term capital as-
set transactions, all residence transactions, andlong-term residence transactions- -Number of re-turns, adjusted gross income, net gain less net loss,and transaction detail, by size of adjusted grossincome, 139
includible income from these sales comprised approxi-mately 1/3 of their total adjusted gross income .
Chart 3 . -NUMBER OF RETURNS FILED BY ALL TAXPAYERS ANDTAXPAYERS AGE 65 AND OVER, AND PERCENT WITH SALESOF CAPITAL ASSETS, 196 2
All taxpayers (62 .712,000 )
Taxpayers age 65 or over (5,559,000 )
Chart 4 . -AMOUNT OF GROSS CAPITAL GAIN AND LOSS, AND PERCENTREPORTED BY TAXPAYERS AGE 65 AND OVER, BY SELECTED ASSETTYPES, 1962
In order to distinguish returns filed by taxpayers age 65and over from other returns, the additional exemption forage was used whenever claimed . In the case of joint re-turns of husbands and wives, some had only one additionalexemption for age 65 or over while others had two addi-tional exemptions for age, indicating that both husbandand wife were over 65 years of age . Whether one or twoage exemptions were claimed, -the return was considereda return of a taxpayer 65 years or more of age .
Chart 3 shows that over 22 percent of the returns fortaxpayers age 65 and over reported a gain or loss on thesale of capital asset, whereas only 9 percent of all tax-payers reported such gain or loss . Chart 4 shows thatapproximately 30 percent of the amount of gross gain and22 percent of the amount of gross loss on sales of capitalassets was reported on returns filed with the additionalexemption for age. Over 1/3 of the taxpayers age 65 andover with sales of capital assets reported sales of cor-porate stock and they accounted for 29 percent of thegross gain and 21 percent of the gross loss on sales of2orporate stock. Taxpayers age 65 and over with sales:)f residences accounted for 4S percent of the gross gain-eported for these sales and Table 23 shows that their
All a ssettypes($17,293,000,000)
Corporate stock($7,138,000,000)
Securitiesother thancorporate stock(S118,000,000)
Residences(S573,000,000 )
All asset types(S6,276,000,000)
Corrorate stock(S4,086,000,000 )
Securitiesother thancorporate stoc($133,000,000)
29 .9%
28 .9 %
LK~
ff&
20 .9 %
32 .497o
Gross Gai n
FaGross Los s
TAXPAYERS AGE65 AND OVER
Percent with salesof capital assets
100 %
1 )
_0100%
All other taxpayers
I

TAXPAYERS AGE 65 AND OVER WITH SALES OF CAPITAL ASSET S
Table 20 . -ALL AND LONG-TERM CAPITAL ASSET TRANSACTIONS-NUMBER OF RETURNS, ADJUSTED GROSS INCOME, NET GAIN LESS NET LOSS, AND TRANSACTION DETAIL, BY SIZE OF ADJUSTE .D GROSS INCOME
Number of Net gain less net loss All asset type sreturns oftaxpayers
Adj- ted Included in All capital asset transactions Long-term capital asset trani ;actiou s
Adjusted gross income classes age 65 andgros sincome
Bef o
statutor yreadjusted Gross Gross gain Gross loss Gross Gross gain Gross los s
wer ithlimitation
gross sales sale ssales of income price Number of Amount Numb, of Amount price Number of Amount Number of Amoun tcapital
assets(Th- ...d (M- .. .d (n--d (7h- ...d transactions (n__d
trans sctioos ~
(Th-d (n-d transactions (Thw-d transactions (Tho ...dd.11 .. . d.11 .. . d,11-s) d.11., .) d.11 .11 d.11 .1 .) d.11.. . d.11 .. .
RETURNS WITH NET GAIN OR NET LOSS ON SALES OF ALL CAPITAL ASSETS(5) (6) (7) (13 )
t
(14 )
Grand total . . . . . . . . . . . . . . . . . . . . . . . . . . . . . . . . . . . . . . . . . . . . . . 1,208,384 11,794,318 3,589,559 1,954,673 13,119,975 2,284,049 5,165,948 1,031,211 1,367,819 10,939,729 2,034,793 5,061,301 765,480 1,168,704Taxable returns, total . . . . . . . . . . . . . . . . . . . . . . . . . . . . . . . . . . . . . . . . . . 775,068 10,943,523 3,268,076 1,744,240 10,511,712 1,590,201 4,489,813 739,017 1,085,028 8,999,972 1,432,546 4,414,600 570,660 941,09 3
Under $10,000 . . . . . . . . . . . . . . . . . . . . . . . . . . . . . . . . . . . . . . . . . . . . . . . . .$10 000 under $50 000
487,54 0257 2
2,619,284 678,897 383,6?0 2,805,632 783,082 1,057,630 267,406 333,773 2,392,329 717,869 1,025,415 209,281 295,109, , . . . . . . . . . . . . . . . . . . . . . . . . . . . . . . . . . . . . . . . . .$50 000 under $100 000
,7621 559
5,083,753 1,157,342 622,006 4,313,268 656,547 1,710,7017 363,242 483,761 3,674,351 581,900 1,683,324 278,182 418,574, , . . . . . . . . . . . . . . . . . . . . . . . . . . . . . . . . . . . . . . . .$100 000 or more
, 1,456,243 395,941 209,612 1,410,215 96,494 546,832 68,300 138,360 1,193,169 84,769 539,490 52,411 118,075, . . . . . . . . . . . . . . . . . . . . . . . . . . . . . . . . . . . . . . . . . . . . . . 8,227 1,784,243 1,035,897 528,951 1,982,598 54,080 1,174,642 40,069 129,133 1,740,124 48,007 1,166,371 30,786 1D9,335
Nontaxabit, returns . . . . . . . . . . . . . . . . . . . . . . . . . . . . . . . . . . . . . . . . . . . . . . 433,297 850,795 321,482 21 .0,433 2,608,262 693,849 676,135 292,195 302,791 1,939,757 602,246 646,701 194,819 227,611
RETURNS WIT11 NET GAIN ON SALES OF ALL CAPITAL ASSETS
Grand total . . . . . . . . . . . . . . . . . . . . . . . . . . . . . . . . . . . . . . . . . . . . . . . 1,010,540 9,452,967 4,148,291 2,089,122 9,761,674 1,885,231 4,840,412 431,946 668,589 8,800,731 1,778,895 4,786,934 350,560 598,36 4
Taxable returns, total . . . . . . . . . . . . . . . . . . . . . . . . . . . . . . . . . . . . . . . . . . 641,639 8,729,773 3,650,488 1,837,547 8,391,264 1,322,985 4,243,014 356,632 572,600 7,500,599 1,237,642 4,202,275 286,154 510,87 7Under $10,000 . . . . . . . . . . . . . . . . . . . . . . . . . . . . . . . . . . . . . . . . . . . . . . . . .$10 000 under $50 000
416,484202 2
2,226,665 848,932 429,369 2,160,170 676,140 972,512 94,539 120,361 1,982,520 644,131 959,887 60,777 116,62 9, , . . . . . . . . . . . . . . . . . . . . . . I . . . . . . . . . . . . . . . . . .$50 000 under $100 000
, 6716 2 8
3,926,000 1,318,663 663,855 3,308,614 524,634 1,600,936 187,803 271,472 2,953,309 484,277 1,584,878 148,842 239,607, , . . . . . . . . . . . . . . . . . . . . . . . . . . . . . . . . . . . . . . . .$100 000 or more
, 6 1,099,6404
425,808 213,982 1,122,657 75,827 516,569 43,264 87,896 974,754 67,621 511,590 33,067 76,74 8, . . . . . . . . . . . . . . . . . . . . . . . . . . . . . . . . . . . . . . . . . . . . . . 6,620 1, 77,468 1,057,085 530,341 1,799,823 46,385 1,152,996 31,025 92,870 1,590,017 41,412 1,145,920 23,468 77,89 3
Nontaxable returns . . . . . . . . . . . . . . . . . . . . . . . . . . . . . . . . . . . . . . . . . . . . . . 368,902 ?23,194 497,803 251,575 1,370,409 562,247 597,398 75,315 95,989 1,300,132 541,253 584,659 64,405 87,48 7
RETURNS WIT11 NET LOSS ON SALES OF ALL CAPITAL ASSETS
Grand total . . . . . . . . . . . . . . . . . . . . . . . . . . . . . . . . . . . . . . . . . . . . . . . 197,844 2,341,351 558,732 134,449 3,358,301 398,818 325,536 599,265 ?19,230 2,138,998 255,898 274,367 414,920 570,34 0
Taxable returns, total . . . . . . . . . . . . . . . . . . . . . . . . . . . . . . . . . . . . . . . . . . 133,449 2,213,750 382,412 93,307 2,120,448 267,216 246,799 382,385 512,428 1,499,373 194,904 212,325 284,506 2,30,216Under $10,000 . . . . . . . . . . . . . . . . . . . . . . . . . . . . . . . . . . . . . . . . . . . . . . . . .~;10 000 under $50 000
71,05 6
55 4392,619 170,035 45,699 645,462 106,942 85,118 172,867 213,412 409,809 73,738 65,528 128,504 178,48 0, , . . . . . . . . . . . . . . . . . . . . . . . . . . . . . . . . . . . . . . . . .
$50 000 under $100 000, 9 5
5 2911,157,75 3
35 0161,321 41,849 1,004,654 131,913 109,771 175,439 212,289 721,042 97,623 98,446 129,340 176,967, , . . . . . . . . . . . . . . . . . . . . . . . . . . . . . . . . . . . . . . . .
$100 000 or more,
1 076,6 3 29,867 4,370 287,558 20,667 30,263 25,036 50,464 218,415 16,948 27,900 19,344 41,327, . . . . . . . . . . . . . . . . . . . . . . . . . . . . . . . . . . . . . . . . . . . . . . ,6 306,775 21,188 1,390 182,775 7,695 21,646 9,044 36,263 150,ICY7 6,595 20,451 7,318 31,442
Nontaxable returns . . . . . . . . . . . . . . . . . . . . . . . . . . . . . . . . . . . . . . . . . . . . . . 1 64,395 1 127,601 1 176, 321 1 41,14211,237,853 1 131,602
178,737 216,880 206,802 1 639,625 1 60,993 1 62,042 1 130,414 1 140,124
NOTE : Detail in the tables may riot add to totals because of rounding .Far the precise definition of terms and the nature of any limitations, see the "Description of the Sample," "limitations of the Data," and "Explanation of Classifications and Terms" in the text .
I
02
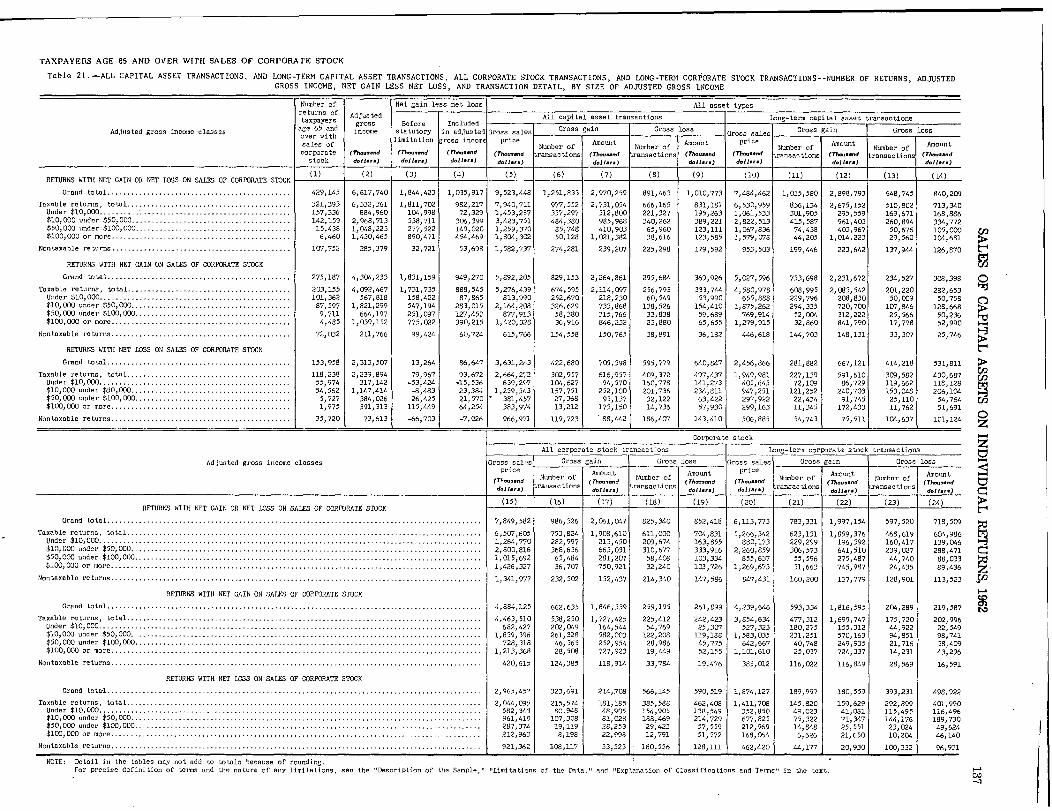
TAXPAYERS AGE 65 AND OVER wim SALES OF CORPORArE STOC K
Table 21 . -ALL CAPITAL ASSET TRANSACTIONS, AND LONG-TERM CAPITAL ASSET TRANSACTIONS, ALL CORPORATE STOCK TRANSACTIONS, AND LONG-TERM CORPORATE STOCK TRANSACTIONS-NUMBER OF RETURNS, ADJUSTEDGROSS INCOME, NET GAIN LESS NET LOSS, AND TRANSACTION DETAIL, BY SIZE OF ADJUSTED GROSS INCOM E
Number ofreturns Oftaxpayer s
andage 65olter ithsales ofcorporat e
stoc k
429,145
321,393157,336142,15915,4386,460
107,752
275,167
203,155101,36287,5979,7114,485
72,032
153,958
118,23855,97454,5625,7271,975
35,720
AdjustedgrossIncome
- . ..d(Thd.11. ..
6,617,740
6,332,361884,960
2,968,7131,048,2231,430,465
285,379
4,302,,233
4,092,467567,818
1,821,299664,197
1,039,152
211,766
2,313,507
2,239,894317,142
1,147,414384,026391,313
73,613
Net gain less net los s
a ta tulr'Der',orylimits
"o n
(Th- . -ddolla- )
(3 )
1,844,423
1,811,702104,998538,711277,522890,471
32,721
1,831,159
1,731,735158,422547,194251,097775,022
99,424
13,264
79,967-53,424-8,48326,425
115,449
-66,703
1,035,917
982,21772,329
306,399149,020454,469
53,698
949,270
889,54587,865
283,015127,450390,215
60,724
16,6472
93,67-15,53623,38421,57064,254
-7,02 6
Adjusted gross income classe s
RETURNS WITH NET GAIN OR NET LOSS ON SALES OF CORPORATE STOCK
Grand total . . . . . . . . . . . . . . . . . . . . . . . . . . . . . . . . . . . . . . . . . . . . . .
Taxable returns, total . . . . . . . . . . . . . . . . . . . . . . . . . . . . . . . . . . . . . . . . .Under $10,000 . . . . . . . . . . . . . . . . . . . . . . . . . . . . . . . . . . . . . . . . . . . . . . . .$10,000 under $50,000 . . . . . . . . . . . . . . . . . . . . . . . . . . . . . . . . . . . . . . . .$50,000 under $100,000 . . . . . . . . . . . . . . . . . . . . . . . . . . . . . . . . . . I . . . .$100,000 or more . . . . . . . . . . . . . . . . . . . . . . . . . . . . . . . . . . . . . . . . . . . . .
Nontaxable returns . . . . . . . . . . . . . . . . . . . . . . . . . . . . . . . . . . . . . . . . . . . . .
RETURNS WITH NET GAIN ON SALES OF CORPORATE STOC K
Grand total . . . . . . . . . . . . . . . . . . . . . . . . . . . . . . . . . . . . . . . . . . . . . .
Taxable returns, totaJ .. . . . . . . . . . . . . . . . . . . . . . . . . . . . . . . . . . . . . . . . .Under $10,000 . . . . . . . . . . . . . . . . . . . . . . . . . . . . . . . . . . . . . . . . . . . . . . . .$10,000 under $50,000 . . . . . . . . . . . . . . . . . . . . . . . . . . . . . . . . . . . . . . . .$50,000 under $100,000 . . . . . . . . . . . . . . . . . . . . . . . . . . . . . . . . . . . . -$100,000 or more . . . . . . . . . . . . . . . . . . . . . . . . . . . . . . . . . . . . . . . . . . . . .
Nontaxable returns . . . . . . . . . . . . . . . . . . . . . . . . . . . . . . . . . . . . . . . . . . . . .
RETURNS WITH NET LOSS ON SALES OF CORPORATE STOCK
Grand total . . . . . . . . . . . . . . . . . . . . . . . . . . . . . . . . . . . . . . . . . . . . . .
Taxable returns, total . . . . . . . . . . . . . . . . . . . . . . . . . . . . . . . . . . . . . . . . .Under $10,000 . . . . . . . . . . . . . . . . . . . . . . . . . . . . . . . . . . . . . . . . . . . . . . . .$10,000 under $50,000 . . . . . . . . . . . . . . . I . . . . . . . . . . . . . . . . . . . . . . . .$50,000 wide, $100,000 . . . . . . . . . . . . . . . . . . . . . . . . . . . . . . . . . . . . . . .$100,000 or more . . . . . . . . . . . . . . . . . . . . . . . . . . . . . . . . . . . . . . . . . . . . .
Nont,nxable returns . . . . . . . . . . . . . . . . . . . . . . . . . . . . . . . . . . . . . . . . . . . . .
Adjusted gross income classes
RETURNS WITH NET GAIN OR NET LOSS ON SALES OF CORPORATE STOCK
Grand total . . . . . . . . . . . . . . . . . . . . . . . . . . . . . . . . . . . . . . . . . . . . . . . . . . . . . . . . . . . . . . . . . . . . . . . . . . . . . . . . . . . . . . . . . . . . . .
Taxable returns, total . . . . . . . . . . . . . . . . . . . . . . . . . . . . . . . . . . . . . . . . . . . . . . . . . . . . . . . . . . . . . . . . . . . . . . . . . . . . . . . . . . . . . . . . .Under $10,000. . . . . . . . . . . . . . . . . . . . . . . . . . . . . . . . . . . . . . . . . . . . . . . . . . . . . . . . . . . . . . . . . . . . . . . . . . . . . . . . . . . . . . . . . . . . . . . .$10,000 under $50,000. . . . . . . . . . . . . . . . . . . . . . . . . . . . . . . . . . . . . . . . . . . . . . . . . . . . . . . . . . . . . . . . . . . . . . . . . . . . . . . . . . . . . . . .$50,000 under $100,000 . . . . . . . . . . I . . . . . . I . . . . . . . . . . . . . . . . . . . . . . . . . . . . . . I . . . . . . . . . . . . . . . . . . . . . . . . . . . . . . . . . . . . . .$100,000 or more . . . . . . . . . . . . . . . . . . . . . . . . . . . . . . . . . . . . . . . . . . . . . . . . . . . . . . . . . . . . . . . . . . . . . . . . . . . . . . . . . . . . . . . . . . . . .
Nontaxable returns . . . . . . . . . . . . . . . . . . . . . . . . . . . . . . . . . . . . . . . . . . . . . . . . . . . . . . . . . . . . . . . . . . . . . . . . . . . . . . . . . . . . . . . . . . . . .
RETURNS WITH NET GAIN ON SALES OF CORPORATE STOCK
Grand total . . . . . . . . . . . . . . . . . . . . . . . . . . . . . . . . . . . . . . . . . . . . . . . . . . . . . . . . . . . . . . . . . . . . . . . . . . . . . . . . . . . . . . . . . . . . . .
Taxable returns, total . . . . . . . . . . . . . . . . . . . . . . . . . . . . . . . . . . . . . . . . . . . . . . . . . . . . . . . . . . . . . . . . . . . . . . . . . . . . . . . . . . . . . . . . .Under $10,000 . . . . . . . . . . . . . . . . . . . . . . . . . . . . . . . . . . . . . . . . . . . . . . . . . . . . . . . . . . . . . . . . . . . . . . . . . . . . . . . . . . . . . . . . . . . . . . . .$10,000 wider $50,000. . . . . . . . . . . . . . . . . . . . . . . . . . . . . . . . . . . . . . . . . . . . . . . . . . . . . . . . . . . . . . . . . . . . . . . . . . . . . . . . . . . . . . . .$50,000 wide, $100,000 . . . . . . . . . . . . . . . . . . . . . . . . . . . . . . . . . . . . . . . . . . . . . . . . . I . . . . . . . . . . . . . . . . . . . . . . . . . . . . . . . . . . . . .$100,000 or more . . . . . . . . . . . . . . . . . . . . . . . . . . . . . . . . . . . . . . . . . . . . . . . . . . . . . . . . . . . . . . . . . . . . . . . . . . . . . . . . . . . . . . . . . . . . .
Nontaxable returns . . . . . . . . . . . . . . . . . . . . . . . . . . . . . . . . . . . . . . . . . . . . . . . . . . . . . . . . . . . . . . . . . . . . . . . . . . . . . . . . . . . . . . . . . . . . .
RETURNS WITH NET LOSS ON SALES OF CORPORATE STOC K
Grand total . . . . . . . . . . . . . . . . . . . . . . . . . . . . . . . . . . . . . . . . . . . . . . . . . . . . . . . . . . . . . . . . . . . . . . . . . . . . . . . . . . . . . . . . . . . . . .
Taxable returns, total . . . . . . . . . . . . . . . . . . . . . . . . . . . . . . . . . . . . . . . . . . . . . . . . . . . . . . . . . . . . . . . . . . . . . . . . . . . . . . . . . . . . . . . . .Under $10,000 . . . . . . . . . . . . . . . . . . . . . . . . . . . . . . . . . . . . . . . . . . . . . . . . . . . . . . . . . . . . . . . . . . . . . . . . . . . . . . . . . . . . . . . . . . . . . . .$10,000 wid" . $50,000 . . . . . . . . . . . . . . . . . . . . . . . . . . . . . . . . . . . . . . . . . . . . . . . . . . . . . . . . . . . . . . . . . . . . . . . . . . . . . . . . . . . . . . . .$ 50, 000 wide, $100, 000 . . ~ . . . . . . . . . . . . . . . . . . . . . . . . . . . . . . . . . . . . . . . . . . . . . . . . . . . . . . . . . . . . . . . . . . . . . . . . . . . . . . . . . . . .$100,000 or more . . . . . . . . . . . . . . . . . . . . . . . . . . . . . . . . . . . . . . . . . . . . . . . . . . . . . . . . . . . . . . . . . . . . . . . . . . . . . . . . . . . . . . . . . . . . .
Nontaxable returns . . . . . . . . . . . . . . . . . . . . . . . . . . . . . . . . . . . . . . . . . . . . . . . . . . . . . . . . . . . . . . . . . . . . . . . . . . . . . . . . . . . . . . . . . . . . .
salespric e
rh .... ~dd.11 .. .
(5 )
9,523,448
7,940,7111,453,2373,423,7511,259,3701,804,302
1,582,737
5,892,205
5,276,439813,990
2,164,2()8877,913
1,420,328
615,766
3:6341,,22132 66 ":2
639,2971,259,543
381,457383, 9-,'4
966,971
Gross salrzspr(
fe e
T,* -d
d.," '" ,
(15 )
7,849,582
6,507,6051,264,?702,800,8161,015,6921,426,327
1,341,977
4,684,125
4,463,510682,42-7
1,839,396728,31 3
1, 213, 368
420,61 5
2,965,45?
2, 0", 09 5582,343961,419287,374212,960
921,362
All asset types
All capital asset transactions Long-term capital asset transaction s
~ Number ofransactions
(6 )
Gross gain Gross los s
"-tTh- . .,dd.11a,. )
(7 )
1,251,833 2,970,259
977,552 2,731,054357,297 312,800484,380 985,96685,748 410,90350,128 1,021,382
274,281 239,207
829,153 2,264,861
674,595 2,114,097252 670 218 230326:629 733 :86858,380 315,76636,916 846,232
154,558 150,765
42)2,680 705,3983(
2,957 616,957104,627 94,570157,751 252,10027,368 95,13713,212 175,150
119,723 88,442
Number ofransaction s
(8 )
691,463
666,165221,327340,26265,96038,61 6
225,29 8
295,684
256,79360,549
138,52633,83823,880
38,89 1
595,779
409,372160,778201,73 632,12214,736
186,407
Amount
(77mu-andd.11. . .
(9 )
1,010,773
831,181195,263389,221123,111123,585
179,59 2
369,926
333,74 453,990
154,41059,68965,655
36,18 2
640,847
497,437141,273234,81 163,42257,930
143,410
Gross sillprice
Th--dd.11-. )
(10 )
7,484,462
6,530,9591,061,5332,822,5131,067,8361, 5?9, 017 8
953,503
5,027,596
4,580,97 8655,888
1,8?5,262769,91 4
1,279,915
446,61 8
2,456,866
1,949,98 1405,645947,251297,922299,163
506,885
Number ofransactions,
1,035,580
836,134301,905415,58 774,43844,205
199,44 6
753,698
608,995229,796294,33 552,OG432,860
144,?03
281,882
227,13972,109121,25222,43411,345
54,74 3
Gross gain Gros s
Amount(Th-dd.J I. ..
(12 )
2,898,793
2,675,15 2295,559961,403403,96 7
1,014,223
223,64 2
2,231,672
2,083,54 2208,830720,700312,222841,790
148,13 1
667,121
591,61086,?29
240,70391,745172,433
75,511
Number oftransactions
(13 )
648,745
510,802169,671260,89 450,67629,560
137,944
234,52?
201,22 050,009
107,84625,56617,798
33,30'7
414,218
309,582119,662153,04825,11011,762
104,63 7
Corporate stoc k
NOTE : Detail in tile tables may not add to totals because of rounding .For precise definition of terms and the nature of any limitations, see the "Description of the Sample,-' "Limitations of the Data," and "Explanation of Classifications and Terms,, in the text .
los s
Amount(TA-.dd.11.r .)
los s
(14 )
840,209
713,340168,886334,772105,000104,681
126,87 0
308,398
292,65 350,758
128,66850,23652,990
25,74 6
531,811
430,687118,128206,10454,?6451,691
101,12 4
All corporate stock t rGross gain
-tNumber of ' oTh-...d
ransac tionsdo]J,,,)
(16 )
986,326
753,824282,997368,63665,48436,70?
232,502
662,635
538,250202,049261,32846,36528,508
124,38 5
323,691
215,57 480,948
107,30819,1198,198
108,117
(17 )
2,061,047
1,908,61 0213,450663,031281,2U7?50,921
152,437
1,646,339
1,727,42 5164,544582,003252,954727,923
118,91 4
214,708
181,18548,90581,02828,25322,996
33,523
ansaction sGross los
s
Numb,ellfof0 ons IransE
&11. ..
(16 )
825,340
611,000209,674310,67 758,40832,240
214,34 0
259,195
225,41 254,769
122,20828,98619,449
33,78 4
566,145
385,588154,905188,46929,42312,791
180,556
(19 )
852,418
704,831163,855333,916103,334103,726
147,58 6
261,899
242,42 325,30`7
119,18845,77552,155
19,47 6
590,519
462,408138,549214,72957,55951,572
128,111
Lo
(20 )
6,113,773
5,266,34 2860,173
2,260,859855,63 7
1,269,673
847,43 1
4,239,646
3,854,63 4527,323
1,583,035642,66 7
1,101,610
385,01 2
1,874,127
1,411,70 8352,850677,825212,969168,062,
462,420
ng-term corporate stoc k
Gross gain
"Number of =.t,ak-lisactioi
d.11. ..
(21 )
783,331
623,131229,299306,5?355,59631,663
160,200
593,334
477,312180,275231,25140,74825,037
116,022
189,997
145,82049,02375,32214,8486,626
44,177
(22 )
1,997,154
1,859,37 6196,392641,510275,487745,987
137,77 9
1,816,595
1~699,74 7155,312570,163249,935724,337
116,84 9
180,559
159,62941,08171,34725,55121,650
20,930
transactions
Gros s
N ar ofr.:b.ctions
(23 )
597,520
468,619160,417239,02744,74024,435
128,901
204,289
175,72044,92294,85121,71614,231
28,56 9
393,231
292,899115,495144,17623,02410,204
100,332
Amount(Th-dd,,,,,,
)
(24 )
718,5D9
60,4,986139,046288,47188,03389,436
113,52 3
219,587
202,99 622,54998,74138,40943,296
16,59 1
498,922
401,990116,496189,73049,62446,140
96,931
CC
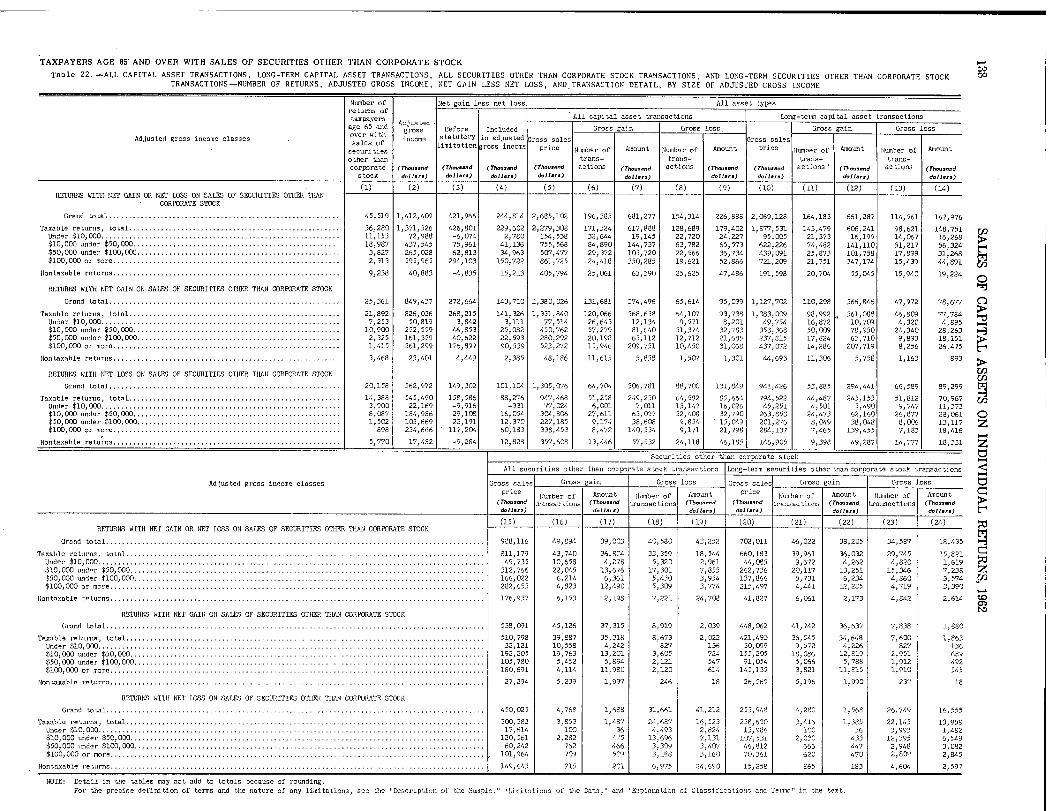
TAXPAYERS AGE 65* AND OVER WITH SALES OF SECURITIES OTHER THAN CORPORATE STOC K
Table 22 . -ALL CAPITAL ASSET TRANSACTIONS, LONC-TERM CAPITAL ASSET TRANSACTIONS, ALL SECURITIES OTHER THAN CORPORATE STOCK TRANSACTIONS, AND LONG-TERM SECURITIES OTHER THAN CORPORATE STOCKTRANSACTIONS -NUMBER OF RETURNS, ADJUSTED GROSS INCOME, NET CAIN LESS NET LOSS, AND .TRANSACTION DETAIL, BY SIZE OF ADJUSTED GROSS INCOM E
Number of Net gain le ss not loss All asse t typesreturns o ftaxpayers All capital asset transactions Long-term ca pital asset transactions
age 65 andAdjustedgross Before Included Gross gain Gross loss . Gross gain Gross less
Adjusted gross income classeso~er ithsales of
income statutory i n adjusted G ross sales Gross sales -
securitieslimitation g ross income price Number of Amount Nuilber of Amount p,!,.e Number of Amount Number of Amoun t
other that, trans- trails- trails- trails -corporate (Th. .-d (Th- ...d (Th--d (7hm,,,d actions (Th. ...~d act ions (Th- .-d (Th. .. .nd actions ' (Th .. .-d actions (Th- . ..d
stock d.11. . . ) d.11-) d.11. . . d.11. .. d.11-) d.11. . . d.11. .. d.11... d.11.. .
(1) (2) (3) (4)_ (5) (6) (7) (8) (11) (12) (13) (14 )REMUS WITH NET GAIN OR NET LOSS ON SALES OF SECURITIES OTHER THAN
.CORPORATE STOCK
Grand total . . . . . . . . . . . . . . . . . . . . . . . . . . . . . . . . . . . . . . . . . . . . . . . . . . . . . . . . . . 45,519 1,412,409 421,966 244,814 2,685,102 196,385 681,277 1~4,314 226,888 2,069,128 164,18 3 661,287 114,561 167,976
Taxable returns, total . . . . . . . . . . . . . . . . . . . . . . . . . . . . . . . . . . . . . . . . . . . . . . . . . . . . . 36,280 1,371,526 426,801 229,602 2,279,308 171,324 617,888 128,689 179,402 1,877,531 143,479 606,241 98,621 148,751Under $10,000 . . . . . . . . . . . . . . . . . . . . . . . . . . . . . . . . . . . . . . . . . . . . . . . . . . . . . . . . . . . . 11,153 72,988 -6,0174 2,780 154,538 32,644 19,145 22,720 24,227 95,005 21,37 3 16,199 14,067 16,268$10,000 under $50,000 . . . . . . . . . . . . . . . . . . . . . . . . . . . . . . . . . . . I . . . . . . . . . . . . . . . . 16,987 437,545 75,961 41,136 755,568 84,890 144,737 63,782 65 .57 3
'622,226 74,482 141,110 51,217 56,324
$50,000 under $100,000 . . . . . . . . . . . . . . . . . . . . . . . . . . . . . . . . . . . . . . . . . . . . . . . . . . . 3,827 265,028 62,813 34,963 507,477 29,372 103,720 22,566 36 .734 439,091 25,87 3 101,758 1-,,899 31,268$100,000 or more . . . . . . . . . . . . . . . . . . . . . . . . . . . . . . . . . . . . . . . . . . . . . . . . . . . . . . . . . 2,313 595,965 294,1103 150,722 861,725 24,418 350,285 1 9,621 52 .,866 721,209 21,75 1 347,174 15,439 44,691
Nontaxable returns . . . . . . . . . . . . . . . . . . . . . . . . . . . . . . . . . . . . . . . . . . . . . . . . . . . . . . . . . 9,238 40,863 -4,835 15,213 405,794 25,061 63,390 25,625 47,486 191,598 20,704 55,04 5 15,940 19,224
RETURNS WITH NET GAIN ON SALES OF SECURITIES OTHER THAN CORPORATE STOCK
Grand Wtal . . . . . . . . . . . . . . . . . . . . . . . . . . . . . . . . . . . . . . . . . . . . . . . . . . . . . . . . . . 25,361 849,437 272,664 143,710 1,380,026 131,681 374,496 65,614 95,039 1,127,702 110,29 8 366,846 47,972 78,67-7
Taxable returns, total . . . . . . . . . . . . . . . . . . . . . . . . . . . . . . . . . . . . . . . . . . . . . . . . . . . . . 21,892 826,036 268,215 141,326 1,331,840 120,066 368,638 64,107 93,738 1,083,009 98,992 361,088 46,809 77,784Under $10,000 . . . . . . . . . . . . . . . . . . . . . . . . . . . . . . . . . . . . . . . . . . . . . . . . . . . . . . . . . . . . 7,253 50,819 3,842 3,111 77,514 26,643 12,134 9,571 8,201 49,754 16,672 10, 7C)q 4,320 4,895$10,000 under $50,000 . . . . . . . . . . . . . . . . . . . . . . . . . . . . . . . . . . . . . . . . . . . . . . . . . . . . 10,900 252,559 46,853 25,082 450,762 57,279 61,640 31,374 32,783 358,368 50,009 78,950 24~340 28,263$50,000 under $100,000 . . . . . . . . . . . . . . . . . . . . . . . . . . . . . . . . . . . . . . . . . . . . . . . . . . . 2,325 161,359 40,622 22,593 280,292 20,199 65,112 1 2,712 21,685 237,815 17,824 63,710 9,893 18,151$100,000 or more . . . . . . . . . . . . . . . . . . . . . . . . . . . . . . . . . . . . . . . . . . . . . . . . . . . . . . . . . 1,415 361,299 176,899 90,539 523,272 15,946 209,751 1 0,450 31,068 437, 072 14,286 2017,719 8,256 26,475
Nontaxable returns . . . . . . . . . . . . . . . . . . . . . . . . . . . . . . . . . . . . . . . . . . . . . . . . . . . . . . . . . 3,468 23,401 4,449 2,385 48,186 Il'cI5 .5,858 1,507 I,3C1 44,693 11, 306 5,756 1,163 893
RETURNS WITH NET LOSS ON SALES OF SECURITIES OTHER TILUI CORPCRATE STOCK
Grand total . . . . . . . . . . . . . . . . . . . . . . . . . . . . . . . . . . . . . . . . . . . . . . . . . . . . . . . . . . 20,158 562,972 149,302 101,104 1,305,076 64,704 306,781 86,700 131,849 941,426 53,88 ' 294,441 66,529 89,29 9
Taxable returns, total . . . . . . . . . . . . . . . . . . . . . . . . . . . . . . . . . . . . . . . . . . . . . . . . . . . . . 14,388 545,490 156,586 88,276 947,468 51,258 249,250 64,582 85 .66, 794,522 44,487 245,153 51,812 70,967Under $10,000 . . . . . . . . . . . . . . . . . . . . . . . . . . . . . . . . . . . . . . . . . . . . . . . . . . . . . . . . . . . . 3,900 22,169 -9,916 -331 '77, G24 6,001 7,011 1 3,149 16 .026 45,251 4,501 5,49 0 9,747 11,37 3$10,000 under $50,000 . . . . . . . . . . . . . . . . . . . . . . . . . . . . . . . . . . . . . . . . . . . . . . . . . . . . 8,087 184,9S6 29,108 16,054 304,806 27,611 63,097 32,408 32 ..'790 263,858 24,47 3 62,110 26,877 28,06 1$50,000 under $100,000 . . . . . . . . . . . . . . . . . . . . . . . . . . . . . . . . . . . . . . . . . . . . . . . . . . . 1,502 103,669 22,191 12,370 227,185 9,174 38,608 9,854 15,049 201,276 8,049 38,048 8,006 13,11 7$100,000 or more . . . . . . . . . . . . . . . . . . . . . . . . . . . . . . . . . . . . . . . . . . . . . . . . . . . . . . . . . 698 234,6r6 117,204 60,183 338,453 8,472 140,534 9,171 21,798 284,137 7,46 5 139,455 7,183 18,416
Nontaxable returns . . . . . . . . . . . . . . . . . . . . . . . . . . . . . . . . . . . . . . . . . . . . . . . . . . . . . . . . . 5,770 17,482 -9,284 12,828 357,608 13,446 57,532 24,118 46,195 146,905 9,39 8 49,287 14,777 18,33 1
Securities other than corporate stoc k
All s-urities other than corporate stoc? transactions Long-term securities other than corporate stock transactions,
Adjusted Fross income classes Gross cal~ a ___ Gros s gain Gross loss Gr,.ss sales Gross gain Cross los s
priceNumber
af Alioull t Number of Amount price
Number of ourt Number of Amoun t(n-1-1 ~ransactia,, S (Thousa.d trawactions, (nw-d (Th-.,.d ti-sil"ti-F (Th-2-nd transactions (Th .... .d
d.11 . . . d. II-) d.11 . . . d.11 . . .
1
d.11 . . . ) d. II- )
(15) (16) (17) (18) (19) (20) (21) (22) (23) (24 )RETURNS WITH NET GAIN OR NET IOSS ON SALES OF SECURITIES OTHER THAN CORPORATE STOCK
_
Grand total . . . . . . . . . . . . . . . . . . . . . . . . . . . . . . . . . . . . . . . . . . . . . . . . . . . . . . . . . . . . . . . . . . . . . . . . . . . . . . . . . . . . . . . . . . . . . . . 988,1115 49,894 39,003 40,580 431,252 702,011 46,022 38,205 34,587 18,43 5
Taxable returns . total . . . . . . . . . . . . . . . . . . . . . . . . . . . . . . . . . . . . . . . . . . . . . . . . . . . . . . . . . . . . . . . . . . . . . . . . . . . . . . . . . . . . . . . . . . 1211,17) 43,740 36,804 33,359 660,183 39,961 36,032 29,745 15,82 1Under $10,000 . . . . . . . . . . . . . . . . . . . . . . . . . . . . . . . . . . . . . . . . . . . . . . . . . . . . . . . . . . . . . . . . . . . . . . . . . . . . . . . . . . . . . . . . . . . . . . . . . 49,735 10,658 4,276 5,320 2,961 44,085 9,672 4,262 4,820 1,61 9$10,000 under T-50,001) . . . . . . . . . . . . . . . . . . . . . . . . . . . . . . I . . . . . . . . . . . . . . . . . . . . . . . . . . . . . . . . . . . . . . . . . . . . . . . . . . . . . . . - 312,766 22,045 13,676 17,301 7,855 262,736 20,117 13,251 15,346 7,23 8$50,000 under $lCO,OOO . . . . . . . . . . . . . . . . . . . . . . . . . . . . . . . . . . . . . . . . . . . . . . . . . .. . . . . . . . . . . . . . . . . . . . . . . . . . . . . . . . . . . . . . . 166,02:2 6,214 6,361 5,430 3,954 137,866 5,731 6,2_14 4,860 3,57 4$100,000 or more . . . . . . . . . . . . . . . . . . . . . . . . . . . . . . . . . . . . . . . . . . . . . . . . . . . . . . . . . . . . . . . . . . . . . . . . . . . . . . . . . . . . . . . . . . . . . . 282,655 4,823 12,490 5,309 3,774 215,49? 4,441 12,285 4,719 3,39 C
Nontaxable returns . . . . . . . . . . . . . . . . . . . . . . . . . . . . . . . . . . . . . . . . . . . . . . . . . . . . . . . . . . . . . . . . . . . . . . . . . . . . . . . . . . . . . . . . . . . . . . 176,93-7 6,153 2,198 -1,221 24,708 41,627 6, Or'l 2,173 4,842 2,61 4
RETURNS WITH NET GAIN ON SALES OF SECURITIES OTHER THA14 CORPORATE STOCK
Grand total . . . . . . . . . . . . . . . . . . . . . . . . . . . . . . . . . . . . . . . . . . . . . . . . . . . . . . . . . . . . . . . . . . . . . . . . . . . . . . . . . . . . . . . . . . . . . . . 538,09L 45,126 37,315 8,919 2,039 448,062 41,742 36,637 7,838 I'86 C
Taxable returns, total . . . . . . . . . . . . . . . . . . . . . . . . . . . . . . . . . . . . . . . . . . . . . . . . . . . . . . . . . . . . . . . . . . . . . . . . . . . . . . . . . . . . . . . . . . 510,793 39,~87 35,318 8,673 2,022 421,493 3rj,,45 34,648 7,600 1,86 3Under $10,000 . . . . . . . . . . . . . . . . . . . . . . . . . . . . . . . . . . . . . . . . . . . . . . . . . . . . . . . . . . . . . . . . . . . . . . . . . . . . . . . . . . . . . . . . . . . . . . . . . 32,121 10,558 4,242 827 136 30,099 9,572 4,226 827 13 6$10,000 under $50,000 . . . . . . . . . . . . . . . . . . . . . . . . . . . . . . . . . . . . . . . . . . . . . . . . . . . . . . . . . . . . . . . . . . . . . . . . . . . . . . . . . . . . . . . . . 192,205 19,763 13,201 3,605 724 155,205 13,066 12,819 2,951 68 9$50,000 under $100,0100 . . . . . . . . . . . . . . . . . . . . . . . . . . . . . . . . . . . . . . . . . I . . . . . . . . . . . . . . . I . . . . . . . . . . . . . . . . . . . . . . . . . . . . . . 105,781) 5,452 5,894 2,121 547 91,054 5,06" 5,788 1,912 49 2$100,000 or more . . . . . . . . . . . . . . . . . . . . . . . . . . . . . . . . . . . . . . . . . . . . . . . . . . . . . . . . . . . . . . . . . . . . . . . . . . . . . . . . . . . . . . . . . . . . . . 180,691 4,114 11,980 2,120 614 14,1,1.35 3,821 li'm 1,910 54 5
Nontaxable returns . . . . . . . . . . . . . . . . . . . . . . . . . . . . . . . . . . . . . . . . . . . . . . . . . . . . . . . . . . . . . . . . . . . . . . . . . . . . . . . . . . . . . . . . . . . . . . 27,294 5,239 1,997 246 is 26,569 5,196 1,990 237 i s
RETURNS WITH NET LOSS ON SALES OF SECURITIES OTHER TILAN CORPURATE STOC K
Grand total . . . . . . . . . . . . . . . . . . . . . . . . . . . . . . . . . . . . . . . . . . . . . . . . . . . . . . . . . . . . . . . . . . . . . . . . . . . . . . . . . . . . . . . . . . . . . . . 450,025 4,76S 1"mg 31,661 41,212 253,94F~ 4~280 1,568 26,74c) 16,55 5
Taxable returns . total . . . . . . . . . . . . . . . . . . . . . . . . . . . . . . . . . . . . . . . . . . . . . . . . . . . . . . . . . . . . . . . . . . . . . . . . . . . . . . . . . . . . . . . . . . 300, 31 62 3,853 1,487 24,687 16,523 236,6~0 3,416 1,385 22,145 13,950Under $10,000 . . . . . . . . . . . . . . . . . . . . . . . . . . . . . . . . . . . . . . . . . . . . . . . . . . . . . . . . . . . . . . . . . . . . . . . . . . . . . . . . . . . . . . . . . . . . . . . . . 17,614 1~_ 36 4 :/,93 2,824 13,986 100 36 3,993 1~482$10,000 und- $50,000 . . . . . . . . . . . . . . . . . . . . . . . . . . . . . . . . . . . . . . . . . . . . . . . . . . . . . . . . . . . . . . . . . . . . . . . . . . . . . . . . . . . . . . . . . 120,561 2,282 13,696 7,131 107, _-'31 2,030 433 12,395 6-49
$50,000 under $100,000 . . . . . . . . . . . . . . . . . . . . . . . . . . . . . . . . . . . . . . . . . . . . . . . . . . . . . . . . . . . . . . . . . . . . . . . . . . . . . . . . . . . . . . . . 60, 242 762 466 3,3(?) 3,407 46,812 666 44'? 2,948 3,082$100,000 or more . . . . . . . . . . . . . . . . . . . . . . . . . . . . . . . . . . . . . . . . . . . . . . . . . . . . . . . . . . . . . . . . . . . . . . . . . . . . . . . . . . . . . . . . . . . . . . 101,964 7rt9 5~1 3,IqS 3,160 70,361 620 470 2,80- 2,84 5
Nontaxable returns . . . . . . . . . . . . . . . . . . . . . . . . . . . . . . . . . . . . . . . . . . . . . . . . . . . . . . . . . . . . . . . . . . . . . . . . . . . . . . . . . . . . . . . . . . . . . . t 149,6431
9151
201 6,975 , 24,690 , 15,258 1 -151
1831
4,604 1 2,59-7
00
140TE : Detail in the tables may not add to totals because of rounding .For the precise definition of torms and the nature of any limitations, see the "D~.vription of the Sample ." 1-1dinitationr of the Data," and "Explanation of Classificatioii~ and Te-c" in the text .

TAXPAYERS AGE 65 AND OVER WITH SALES OF RESIDENC E
Table 23 . -ALL CAPITAL ASSET TRANSACTIONS, LONG-TERM CAPITAL ASSET TRANSACTIONS, ALL RESIDENCE TRANSACTIONS, AND LONG-TERM RESIDENCE TRANSACT IONS -NUMBER OF RETURNS, ADJUSTED GROSSINCOME, NET GAIN LESS NET LOSS, AND TRANSACTION DETAIL, BY SIZE OF ADJUSTED GROSS INCOME
Net gain less net loss All ass et types Residence s
Number o fretu ns of Adju ted All capital asset transactions Long-tem capital asset transactions All residence transactions
Long-term residenc ey s
BeforeIncluded in
.transactions
Adjusted gross income classestaxpayer sage 65 and
gros sincome statutory
adj uztedGross Gross gain Gross loss Gross
GrosS
Gross gain Gr... loss Gm .s Gross gain Gross Gross gai noi~er ith
l f
limitationgro si- .me
salesrice Number Amount Number Amount sales. .l a
iNumber tATT.wi NITTITbe,
Amount
sales "-~-r in
leaHumber Amoun tsa es o p
of of
Fpr'aa
pr ceof of price
it
priceo fresidence
(Th-d (Th-d (A--d (n-nd trans- (Th. ..d tr-TIS (nw.. .d (Thms-d trans (7,hw,-nd trans- (Thw._ d ,Th- t , ..s- , (Thm,@,d trans- (77-2-ddoll-) d.1 I-) d.11 .,.) dj t,,,) actions dll,,,) actions
d.11-) d, I I-) cc tiOTIS d,11... ) action, d.11. .. d,11-)
ti.. Sactions
.. ... ..
d,11-) doii-) actions doils- )
(4) (5) (6) (7) (8) (9) (10) (11) (12) (13) (14) (15) (1,,) (18) (19) (20 )
Grand total . . . . . . . . . . . . . . . . . . . . . . 54,670 334,743 274,813 141,264 988,731 82,252 313,504 10,791 37,930 965,336 78,867 310,?67 9,295 35,757 965,443 56,059 259,637 851,220 53,532 257,498
Tousable retturns, total . . . . . . . . . . . . . . . . . 34 .241 295,717 232,602 119,654 719,778 55,396 256,215 7,743 23,073 702,305 53,098 254,065 6,2181 20,911 614,544 35,510 210,140 606,243 34,069 208,58?
Under $10,000 . . . . . . . . . . . . . . . . . . . . . . . . 27,048 141,782 138,548 70,177 441,485 38,846 146,699 2,180 8,105 434,849 37,560 145,368 2,180 8,105 410,450 28,235 133,1153 1,03 .814 26,948 131,832$10,000 wider $50,000 . . . . . . . . . . . . . . . . 6,858 121,023 74,980 39,809 229,602 14,931 87,737 4,774 12,576 222 .172 14,002 87,105 3,468 10,623 181,418 6,928 66,823 179, a'70 6,777 60,027$50,000 wider $100,000 . . . . . . . . . . . . . . . 260 17,928 10,573 5,294 24,330 1,043 11,601 412 979 24,119 1,014 11,581) 372 951 15,319 270 7,123 15,319 270 7,123$100,000 or more . . . . . . . . . . . . . . . . . . . . . 75 14,984 8,702 4,374 24,161 576 10,178 378 1,413 21,105 522 10,003 260 1,232 7,357 117 3,031 7,234 74 3,005
Nontaxable returns . . . . . . . . . . . . . . . . . . . . . 20,429 39,026 42,012 21,609 268,952 26,856 57,289 1 3,047 14,857 263,C31 25,7159 . 56,703 1 3,014 14,846 250,699 20,549 49,497 244,977 19,462 48,911
NOTE : Detail in the tables may not add to totals because of rounding .For the precice definition of terms and the nature of any limitations, See the "Description of the Ssmple," "Limitations of the D,ta," and 'Explanation of Class ifica tious and Terms,- in the text .


Historical Summary
TABLE CONTENTS
24. Net capital gain or loss, short and long-term andcapital loss carryover, for returns with normaltax and surtax and returns with alternative tax,1942 - 1962, 143
25. Net capital gain or loss included in adjusted grossincome--Number of returns and amount, by ad-justed gross income classes, 1950 - 1962, 144
The historical data for years 1942 through 1962 are notprecisely comparable among all years, for the data spana period of years during which there were changes in law,return forms, and methods of obtaining data . Informationon the changes in the law can be found in table L, Synopsisof the Law . Significant changes in the methods of obtain-ing data are footnoted . Additional information on thelaw, return forms, and methods of obtaining data for aspecific year can be found in the Statistics of IncomePublic--tion for that year.
INCREASED NUMBER OF RETURNS WITH CAPITALGAIN OR LOSS
In step with the general increase of property values andnational income since the 1940's, and the liberalization ofthe tax law to provide capital gain treatment to the sale orexchange of many assets excluded by definition as being-capital assets," capital gains and losses have becomea significantly more important feature of the individualincome tax .
During the period 1942-1962, the number of individualincome tax returns with capital gain or loss increasedat a much greater rate than the total number of individualreturns filed . As shown in chart 5 the number of individ-ual returns rose from approximately 37 million in 1942to nearly 63 million in 1962, an increase of 72 percent .In contrast, the number of returns with capital gain orloss rose from approximately 800 thousand in 1942 toalmost 6 million in 1962, an increase 10 times greaterthan the increase for all individual income tax returns .In 1942, approximately 2 percent of all individual re-turns showed capital gain or loss ; in 1962, approximately9 percent of all individual returns showed capital gain orloss .
Chart 5.-TOTAL INDIVIDUAL INCONIE TAX RETURNS FILED, INDIVIDUAL RETURNS WITH CAPITAL GAIN OR LOSS, AND INDIVIDUA LRETURNS WITR CAPITAL GAIN OR LOSS AS A PERCENT OF TOTAL RETURNS, 1942-196 2
Maitona of iewns 71D
TOTAL RETURNS FILED'A 60
so
40
30 6
4 M7 14~Fr 7-7 RETURNS WITH CAPITAL GAIN OR LOSS~ 7
2
2 1 L.JiA LC_2~ 4 .4 4 .1 8
6
As a percent of total re S
L.-A M-5 M M6 . L66 ~6 t - JJ 1942 1943 1944 1945 1946 1947 1949 1949 1950 1951 1952 1953 1954 1955 1956 1957 1958 1959 1960 1961 1962
I
INCREASE IN AMOUNTS OF NET CAPITALGAIN AND LOS S
As these data regarding the increased number of re-turns suggest, amounts of capital gain and loss have
risen considerably during the period 1942-1962 . Chart 6shows that, even after the falloff from 1961, the amountof net gain in adjusted gross income .was more than 21times as great in 1962 as it had been in 1942 . Although,net capital losses increased for the period 1942-1962 ,
141

142 SALES OF CAPITAL ASSETS ON INDIVIDUAL RETURNS, HISTORICAL SUMMARY
Chart 6. --NET GAIN OR LOSS INCLUDED IN ADJUSTEDGROSS INCOME, 1942-1962
Billion dollar s
1 0
9
8
7
6
5
4
3
2
I
0
A
Net Gain in AG I
Net Less in AG I
1942 '43 '44 '45 '46 '47 '48 '49 '50 '51 '52 '53 '54 '55 '56 '57 '58 '59 '60 '61 '6 2
the increase was less substantial than that for net capitalgains. Moreover, the rise in both net capital gain and netcapital loss has not been a steady one but has fluctuatedwidely, with net capital gain showing considerably morefluctuation than net caDital loss .
As table K shows, during the period 1950-1962, netcapital gain less net capital loss as a percentage of ad-
1 1
"I
Table K . -NET CAPITAL GAIN LESS NET CAPITAL LOSS AS A PERCENTAGE OFADJUSTED GROSS INCOME, BY ADJUSTED GROSS INCOME CLASSES, 1950-1962
Yea r
1950 . . . . . . . . . . . . . .1951 . . . . . . . . . . . . . .
1952 '*'*'*''* . . . . .1953 . . . . . . . . . . . . . .19,14 . . . . . . . . . . . . . .
1955 . . . . . . . . . . . . . .1956 . . . . . . . . . . . . . .1957 . . . . . . . . . . . . . .
1958''-- . . . . . .1959 . . . . . . . . . . . . . .
1960 . . . . . . . . . . . . . .1961 . . . . . . . . . . . . . .1962 . . . . . . . . . . . . . .
(I)
l .b1 .51 .10 .91 .5
1 .91 .7' .21 .52 .1
1 .72 .31 .7
(2)
1 .7i .51 .i0 .91 .5
1 .91 .71 .21 . ~'2 .0
1 .62 .31 .6
Adjwited gross -ircome classe s
T"able rettirns;
Under.$10,0()0
$10,0()0
wider
~5C) 000
$50,000wider
$100,000
(3)
0-0_50 .40 . 30 .4
0 .50 .50 .40 .50 .6
0 .50 .60 .4
(P--)
3 .93 .42 .72 .13 .5
4 .33 .32 .22 .63 . 1
2 .33 . 1
i-9 I
(5)
7 .1o . 9u . 5~ .78 . 4
11 .29 .?7 .08 . 7
10 . 4
9 .U12 . 4
8 .9
$100 1 Cal
(6 )
18 .417 .41-41-022 .8
27 .425 .820 .423 .129 . 0
2? .236 .031 .0
(7)
0 .81 .71 .31 .21 . ~'
1 .82 .01 .72 .03 .0
2 .92 .53 . 1
justed gross income did not change substantially fortax-payers with adjusted gross income of less than $50,000 .However, capital gain has become an increasingly moreimportant determinant of adjusted gross income for tax-payers with adjusted gross income greater than $ 100,000 .
Insofar as returns with net capital gain are concerned,table 24 shows that the greatest increases were in thearea of long-term gain, rising from $0.3 billion in 1942to $13.6 billion in 1962 . On the other hand, the amount ofnet long-term loss on returns with net capital loss showedless of an increase for the 21-year period than the amountof net short-term loss--an increase of $1 .5 billion in netlong-term capital loss in contrast to an increase of $2 .0billion in net short-term capital loss.

RETURNS WITH NEI' CAPITAL GAIN OR LOSS
Table 24 .-NET CAPITAL GAIN AND LOSS, SHORT AND LONG-TERM, AND CAPITAL LOSS CARRYOVER, FOR RETURNS WITH NORMAL TAX AND SURTAX AND RETURNS WITH ALTERNATIVE TAX, 1942-1962
[Taxable and nontaxable returns )
Returns with net gain from sales of capital asset s
Number of Total Returns with normal tax and surtaxreturns with
i lNet gain in
Short-term( ft )
Long-term Net gainShort-term
Long-tcr.Year
ga n or ossadjusteO
a er carryover Capitaladjusted
(after car~yover) Capitalfrom salesof capital
Number of gross Net capital Net capital Net capital Net capits'10 a
rNumber of gross
-
Net capital Net capital Not cap ital Net capitalloss
-asset&
returns income' gainIoss
gain, l ,1)ss
carryove returns income, gain loss gain, losscarr yove r
(77--d (TM..-d (n.-d (Th. ..-d (n,--d (Th. ..-d (Th. . . .. d (7~.-d (n--d (n. . .-d (Th.-d (7).. .-dd.11 .. . d.11. . . ~J I .r.) d.11 .. . dllsrs) d~ll.. . d.11 .. . d.11-) d~ll .. . ~blj . . . ~11 . . . d.11 .r .)
(1) (2) (3) (4) (5) (6) 0) (8) (9) (10) (11) (12) (13) (14) (15 )
1942 . . . . . . . . . . . . . . . . . . . . . . . . . . . . . . . . . 785,555 318,824 323,254 34,750 1,257 293,588 3,828 (4) (4) (4)(1)
(4)(1) (1) (1 )1943 . . . . . . . . . . . . . . . . . . . . . . i . . . . . . . . . . 1,079,559 673,258 794,970 '125,953 37,217 699,103 5,810 17,059 (4) (4) (4) (4) (4)
(4) (1 )1944 . . . . . . . . . . . . . . . . . . . . . . . . . . . . . . . . . 1,473,155 1,040,701 1,142,016 114,240 23,740 1,053,835 2,318 11,972 931,499 719,011 89,486 10,955 642,720 2,240 5,09 91945 . . . . . . . . . . . . . . . . . . . . . . . . . . . . . . . . . 2,062,753 1,671,192 2,309,033 279,142 46,361 2,078,807 3,550 27,225 1,494,862 1,409,156 216,953 23,154 1,218,700 3,344 14,04 71946 . . . . . . . . . . . . . . . . . . . . . . . . . . . . . . . . . 2,747,395 2,244,936 3,318,561 246,041 199,685 3,278,122 5,906 19,624 1,891,084 2,215,815 209,248 100,177 2,112,502 5,749 9,8311,947 . . . . . . . . . . . . . . . . . . . . . . . . . . . . . . . . . 2,477,202 1,866,853 2,452,297 148,660 51,618 2,361,244 5,989 14,861 1,555,487 1 600,203 121,470 21,758 1,506,155 5,657 7,4181948 . . . . . . . . . . . . . . . . . . . . . . . . . . . . . . . . . 2,280,353 1,694,230 2,499,662 1167,117 347,140 2,406,520 6,837 20,001 1,333,801 1:707,411 '131 499
,325,424 1,618,789 5,188 12,26 5
1949 . . . . . . . . . . . . . . . . . . . . . . . . . . . . . . . . . 2,136,231 1,439,221 1,955,520 1123,946 320,356 1,877,493 5,386 20,186 1,109,402 1,301,739 395 4561 112,600 1,236,041 4,835 12,12 91950. . . . . . . . . . . . . . . . . . . . . . . . . . . . . . . . . 2,564,001 1,895,963 3,259,571 32? .3,388 349,821 3,095,93g 7,833 53,110 1,506,703 2,036,381 3217,096 127,596 1,886,609 6,543 33,2031951 . . . . . . . . . . . . . . . . . . . . . . . . . . . . . . . . . 2,71:4,450 2,132,037 3,282,421 . 3229,152 372,930 3,164,684 4,029 34,452 1,624,870 1,910,172 3173,385 331,777 1,790,461 3,554 18,34 61952 . . . . . . . . . . . . . . . . . . . . . . . . . . . . . . . . . 2,699,923 2,034,196 2,835,865 177,319 72,869 5,398,466 4,253 42,561 1,535,376 1,668,124 138,947 38,379 3,104,866 4,079 26,4421953 . . . . . . . . . . . . . . . . . . . . . . . . . . . . . . . . . 2,777,093 1,987,723 2,538,526 137,015 68,838 4,881,078 4,608 23,224 1,507,242 1,515,259 99,777 39,343 2,879,258 4,477 13,4821954 . . . . . . . . . . . . . . . . . . . . . . . . . . . . . . . . . 3,075,231 2,411,147 3,731,862 318,760 1.15,230 6,963,?14 11,144 88,092 1,869,685 2,192,346 247,369 68,946 3,9?9,448 10,281 56,1691955 . . . . . . . . . . . . . . . . . . . . . . . . . . . . . . . . . 3,554,002 2,899,881 5,126,350 385,492 159,975 9,669,971 14,054 80,109 2,193,770 2,9l3,876 300,256 105,535 5,500,656 13,891 54,40C1956 . . . . . . . . . . . . . . . . . . . . . . . . . . . . . . . . . 3,932,056 3,148,460 4,991,131 306,162 182,598 9,567,268 7,361 65,709 2,379,782 2,993,015 236,914 120,97? 5,647,852 7,343 46,93 31957 . . . . . . . . . . . . . . . . . . . . . . . . . . . . . . . . . 3,974,772 -!, 936,564 4,128,228 153,963 218,157 8,181,152 7,219 52,273 2,204,980 2,5103,062 123,303 129,285 4,896,968 7,077 30,87 61958 . . . . . . . . . . . . . . . . . . . . . . . . . . . . . . . . . 4,399,642 ,469,C64 4,879,114 343,039 149,367 9,269,789 241,142 99,811 2,7021,771 2,978,849 272,860 93,695 5,552,893 23,610 62,57 61959 . . . . . . . . . . . . . . . . . . . . . . . . . . . . . . . . . 4,907,129 4, 00'7, Oil 6,796,602 476,283 224,704 12,904,675 19,654 111,757 3,096,666 4,052,712 3 64 , 044 6 143,018 7,559,067 19,359 76,6241960 . . . . . . . . . . . . . . . . . . . . . . . . . . . . . . . . . 4,996,033 3,841,694 6,003,859 290,409 215,637 11,701,229 19,336 69,485 2,971,653 3,460,738 224,590 139,907 6,650,176 19,036 43,7091961 . . . . . . . . . . . . . . . . . . . . . . . . . . . . . . . . . 5,795,954 4,698,499 8,290,879 628,434 263,357 15,702,293 47,010 116,072 3,805,241 4,815,232 506,1(,l 176,271 8,681,713 43,645 74,3331962 . . . . . . . . . . . . . . . . . . . . . . . . . . . . . . . . . 5,921,955 4,322,510 6,821,421 206,322 335,928 13,595,5136 14,689 93,033 3,405,089 3,)32,148 156,519 214,449 7,792,106 13,181 55,49C
Returns with net gain from sales of capital assets-Continued Retuams with net loss from sales of capital asset s
Returns with alterna tive tax Snort-termL
Short-termO
Net loss (after carryover)ong-term
(after carryover)ne-halft
excess estafter
atut r]let
C it lNet gainN C i
o ybefore ap a
Year adjustedet long -
tt l
ap tall
long-termNumber of limitation s
tatutOry fl t it l 17-t i i1 i 11los s
Number of gross Net capital Net ca italern ~a~~ a oss
c
apital gainreturns
(deducted limitatione cap -a cap tal st cap tal
'~t capital carryove r
returns income' gain Pless ga,n carryover over net from gross gain loss gain les sshort-term income )
capital lo . . '(Th.. .-d (n.-d (Th-d (77--d (Th...-d (11--d (Th.-d (Th..-d (n.-d (77-1-d (Th .-d (Th ...-d (Th-wd
d.11-0 doll-) d.11 .. . d.11 . . . d.1J-) &11 .. . ~bll . . . d.11 . .. d.11 . .. d.1 I . . . d.11- )
(16) (17) (18) (19) (20) 21) (22) (23) (24) (25) (26) (27) (28) (29) (30 )
1942 . . . . . . . . . . . . . . . . . . . . . . . . . . . . . . . . .1943
12,50731 850
(1 )(4)
(1 )4
(4 )4
(4 )
4 4127,552 466,731 252,614 502,518 9,120
321,630 1,676 491,683 (4 )
. . . . . . . . . . . . . I . . . . . . . . . . . . . . . . . . . , ( ) ( ) )267,856 406,301 199,783 446,345 10,641 142,901 19,565 291,120 142,530
1942 . . . . . . . . . . . . . . . . . . . . . . . . . . . . . . . . . 51,993 390,332 21,979 12,212 380,566 6,608 368,354 432,454 224,403 581,772 3, 62 6 25-7,357 29,165 357,206 190,3961945 . . . . . . . . . . . . . . . . . . . . . . . . . . . . . . . . . 88,485 836,422 57,310 22,300 801,416 12,789 779,116 391,561 193,525 514,232 3,177 306,173 34,089 245,325 251,34 61-46 . . . . . . . . . . . . . . . . . . . . . . . . . . . . . . . . 84,021 941,994 19,234 97,614 1,020,372 9,472 922,758 502,457 250,130 656,510 5,346 531,685 111,404 241,581 278,2281947 . . . . . . . . . . . . . . . . . . . . . . . . . . . . . . . . . 1 69,444 690,503 12,765 26,521 704,259 6,661 677,738 610,349 297,595 759,969 7,534 94,62 74 60,310 333,2DO 331,6961948 . . . . . . . . . . . . . . . . . . . . . . . . . . . . . . . . . 30,896 555,472 31C,96? 3 16,371 566,577 5,702 550,206 586,123 298,569 911,625 115,569
3
202,646 55,931 350,023 430,4491949 . . . . . . . . . . . . . . . . . . . . . . . . . . . . . . . . . 25,139 412 , 573 311,599 35,609 411,517 4,931 405, 908 697,010 350,693 1,097,225 '16 438 3159,322 40,098 411,451 582,98919~0 . . . . . . . . . . . . . . . . . . . . . . . . . . . . . . . . . 4 13,316 064964, 3 33 1
2?6 3
20,589 969,851 18,474 949,262 668,038 330,628 965,220 '2317.52 3206,598 89,457 339,184 532,6581951 . . . . . . . . . . . . . . . . . . . . . . . . . . . . . . . . . 70,655 11010 , 2~43 330,604 335,166 1,028,791 13,766 993,605 582,413 285,175 845,024 33.-,,Slg
3207,64C 64,645 262,253 477,601195. . . . . . . . . . . . . . . . . . . . . . . . . . . . . . . . . . 801-110 869,979 21,657 28,043 1,724,297 14,463 846,127 665,727 365,462 1,217,329 9,608 605,930 49,493 6?0,696 440,33 01953 . . . . . . . . . . . . . . . . . . . . . . . . . . . . . . . . . 6~,665 733,032 11,137 25,769 1,469,560 9,148 721,896 789,370 462,737 1,658,128 19,569 882,725 54,692 849,668 633,3691954 . . . . . . . . . . . . . . . . . . . . . . . . . . . . . . . . . ?3,618 1,167,153 46,215 36,508 2,278,394 29,702 1,120,943 664,084 379,446 1,213,921 14,790 774,769 90,759 5",704 625,6671955 . . . . . . . . . . . . . . . . . . . . . . . . . . . . . . . . . 91,014 1,728,377 60,314 47,326 3,383,470 21,435 1,668,0`70 654,121 375,213 1,201,611 10,581 738,056 69,393 543,555 567,83 71956 . . . . . . . . . . . . . . . . . . . . . . . . . . . . . . . . . 86,499 1,562,992 29,356 49,569 3,116,856 11,419 1,533,633 783,596 438,465 1,287,123 13,494 779,118 109,355 629,654 . 508,46 61957 . . . . . . . . . . . . . . . . . . . . . . . . . . . . . . . . . 76,4L3 1,221,210 14,338 63,899 2,477,643 12,006 1,206,672 1,038,208 642,695 2,036,866 21,224 1,134,549 117,749 1,01,1,290 806,11 71958 . . . . . . . . . . . . . . . . . . . . . . . . . . . . . . . . . 88,941 1,427,111 41,675 48,177 2,818,643 33,511 1,385,232 920,578 50,110 1,997,692 31,990 1,277,820 132,232 894,113 1,041,25 91959 . . . . . . . . . . . . . . . . . . . . . . . . . . . . . . . . . 110,296 2,132,561 56,415 68,924 4,221,212 28,939 2,076,144 900,1.16 522,115 1,865,761 22,573 1,241,226 149,342 796,466 950,76 01960 . . . . . . . . . . . . . . . . . . . . . . . . . . . . . . . . . 91,81's 1,901,276 31,643 61,809 3,801,079 20,556 1,669,05 1,154,339 704,284 2,440,818 33,983 1,426,134 123,969 1,172,650 1,001,68 .31961 . . . . . . . . . . . . . . . . . . . . . . . . . . . . . . . . . ic-Q, 759 2,874,679 88,259 86,486 5,659,328 33,921 2,786,367 1,097,455 670,085 2,305,400 52,37 :3 1,460,547 163,343 1,060,579 940,79 61962 . . . . . . . . . . . . . . . . . . . . . . . . . . . . . . . . 89,484 2,182,542 2 5, ta:X, 99,006 4,412,803 19,152 2,156,894 1,599,445 1,050,393 3,771,612 45,223 1,994,500 186,594 2,008,916 1,251,735
Includes both short and long-term capital gains with net long-tern capital vain in excess of a short-term ca i al loss sd ed " 50 tI ny p - r ue percen .'For years 1942-51, the figure shown represents 50 percent of the net long-term capital gain and for years 1952-62 , the figure shown is 100 percent of the net long-term capital gain This is the neumer in which data were re rted
in the Statistics of Income reports for those years . PO
'Data shown before carryover .414ot available .
'For years 1952-60, the figure reported as net long-term capital gain in excess of any net short-term capital loss had to be divided in half because the data were shown at 100 percent ; for all other years, they were shown at50 percent .
SOURCE : Statistics of Income--1942-1962, Individual Income Tax Returns .

144RETURNS WITH NET CAPITAL GAIN OR LOS S
Table 25 .-NET CAPITAL GAIN OR LOSS INCLUDED IN ADJUSTED GROSS INCOME-NUMBER OF RETURNS AND AMOUNT, BY ADJUSTED GROSS INCOME CLASSES, 1950-196 2
Net gai n
Number ofreturns
1950
1,895,963
1,556,019
652,946491,512153,179122,57189,993
33,20710,01?2,953
481160
339,944
1,937,723
1,611,659
660,470524,259173,5141159,220'54,485
28,8898,5511,902
2709 9
376,064
A-unt
(Th...-dd0l . ..)
3,258,571
3,000,445
438,104548,260271,947312,852376,266
304,552254,854229,949132,378131,28 3
258,12 6
2,533,52 6
2,266,958
353,05342?,SS3240,322
1324,334'212,650
238,378183,084147,12 269,32670,806
271,568
Net los s
N-ber ofreturn s
668,038
521,098
230,844156,77747,78241,82729,823
10,5292,674
68811341
146,940
Aoun t
(Th . . .-d~bll .. .)
330,62 8
245,392
96,67169,55225,48624,4371%041
7,5062,006
5649133
65,236
1953
-789,370
664,698
23S,784219,29578,394180,579129,194
14,2383,527
5627540
124,682
462,737
390,116
131,952122,41046,274'53,707'21,494
10,7562,955
4646539
72,621
1956
Net gain
N=ber ofreturn s
2,132,03 7
1,732,266
754,101520,984169,740136,158100,188
36,91910,6332,980
43412 4
399,771
2,411,147
1,943,303
659,096680,77324?,265'222,930'77,293
42,21510,6032,592
372164
467,844
k-unt
(Th. . .-d&11 .. . )
1951
3,282,421
2,938,955
435,282526,485268,752313,615389,496
319,090250,516236,17 999,022
100,51 8
343,46 6
3,731,862
3,359,499
351,242540,382370,790
1549,877'336,954
398,766293,3_34243,357107,300166,997
372,363
Net loss
Number ofreturn s
582,413
487,888
208,0411148,52648,53240,68229,16 5
9,8632, 41 45
5296738
94,5~ 5
664,094
526,571
181,079187,61 261,848161,801)'21,651
10,03 71,882
375463 2
137,513
Amoun t
(T~-dd.11-)
285,175
234,787
91,15170,37824,21822,51417,724
6,5501,752
4125335
50,388
1954
379,446
299,537
100,84698,09436,192
'39,886115,11-1
7,6171,429
3033930
79,909
1957
Net gai n
N-ber ofreturns
2,034,196
1,648,372
692,951516,613173,3771165,986'62,764
34,7039,1772,347
333ill
385,824
2,899,881
2,284,784
708,103603,785312,044231,919160,542
50,98513,1553,454
564233
615,097
Aoun t
(Tho-d&1J . . .)
2,835,865
2,558,877
405,976445,218'245 563, 379'18524-1,771
290,963211,637176,56886,99174,0)5
276,988
5,126,350
4,712,255
409,689720,892503,864557,286750,659
583 893416,438351,310171,633246,67 6
414,095
N=ber ofreturns
1952
Net los s
665,727
563,243
223,399183,76459 626
'59'638~22,83-_-
10,9692,447
47461.34
102,434
lq~,5
654,121
513,564
182,212180,14962,84447,37530,593
8,3281,694
306412 2
140,55 7
195 8
Size of adjusted gross ineme
Grand total . . . . . . . . . . . . . . . . . . .
Taxable returns, total . . . . . . . . . . . . . .
Under $5,000 . . . . . . . . . . . . . . . . . . . . 1 .$5 , 000 under $10,000 . . . . . . . . . . . . . .$10,000 under $15~000 . . . . . . . . . . . . .$15,030 -der $25,000 . . . . . . . . . . . . .$25,000 under $50,000 . . . . . . . . . . . . .
$50,000 wider $100,0DO . . . . . . . . . . . .$100,000 -der $200,000 . . . . . . . . . . .$203,000 -der ~5'10,000 . . . . . . . . . . .$500,000 -der $1,030,000 . . . . . . . . .$1, GOO, 000 or -e . . . . . . . . . . . . . . . .
Nontaxable ret~rns . . . . . . . . .. . . . . . . . . .
Grand total . . . . . . . . . . . . . . . . . . .
Taxable returns, total . . . . . . . . . . . . . .
Under $5,003 . . . . . . . . . . . . . . . . . . . . . .$5,000 under $10,00D . . . . . . . . . . . . . .$10,000 under $15,000 . . . . . . . . . . . . .$15,000 -der $25,000 . . . . . . . . . . . . .$25,D:)O -der $50,0-30 . . . . . . . . . . . . .
$50,000 under $1GJ,0O :) . . . . . . . . . . . .$100,000 wider $200,000 . . . . . . . . . . .$200,000 under $500,GGO . . . . . . . . . . .$500,000 =der $1,000,00Q . . . . . . . . .$1,000,00-3 or -re . . . . . . . . . . . . . . . .
Nontaxable returns . . . . . . . . . . . . . . . . . .
Grand total . . . . . . . . . . . . . . . . . . .
Taxable returns, total . . . . . . . . . . . . . .
Under $5,000 . . . . . . . . . . . . . . . . . . . . . .15 :003 under 110 .000 . . . . . . . . . . . . . .$10,000 ander $15,000 . . . . . . . . . . . . .$15,000 -der $25,030 . . . . . . . . . . . . .$25,000 wider $50,QOO . . . . . . . . . . . . .
$50,000 -der $100,000 . . . . . . . . . . . .~100,000 -der $200,000 . . . . . . . . . . .$200,000 under $503,000 . . . . . . . . . . .$500,000 -der $1,000,000 . . . . . . . . .$1,000,000 or aore . . . . . . . . . . . . . . . .
Nontaxable returns . . . . . . . . . . . . . . . . . .
Grand total . . . . . . . . . . . . . . . . . . .
Taxable ret=s, total . . . .. . . . . . . . . .
Under $5,000 . . . . . . . . . . . . . . . . . . . . . .$5 , 000 under ~10,0:)O . . . . . . . . . . . . . .$10,000 -der $15,000 . . . . . . . . . . . . .$15,000 under $25,0 :)0 . . . . . . . . . . . . .$25,000 under $50,000 . . . . . . . . . . . . .
$50,ODO -der $100,000. . . . . . . . . . . .$100,000 under ~20:),00-3 . . . . . . . . . . .$200,00D -der $503,000 . . . . . . . . . . .$503,000 under $1,000,000 . . . . . . . . .$1,000,000 or more . . . . . . . . . . . . . . . .
Nontaxable returns . . . . . . . . . . . . . . . . . .
Grand total . . . . . . . . . . . . . . . . . . .
Taxable returns, total . . . . . . . . . . . . . .
Under $5,003 . . . . . . . . . . . . . . . . . . . . . .$5,000 -der $10,D30. . . . . . . . . . . . . .$10,000 under $15,000 . . . . . . . . . . . . .$15,000 under $25,000 . . . . . . . . . . . . .$25,ODD under $50,000. . . . . . . . . . . . .
$50,000 -der $100,000. . . . . . . . . . . .$100,000 under $200,000 . . . . . . . . . . .$200)000 under $503,C)DO . . . . . . . . _$500,000 under $1,000,ooo . . . . . . . . .$1,000,000 or mre. . . . . . . . . . . . . . . .
Nontaxable returns . . . . . . . . . . . . . . . . . z
SALES OF CAPITAL ASSETS ON INDIVIDUAL RETURNS, HISTORICAL SUMMAR Y
3,148,46 0
2,466,281
782,49 5875,479337,22 3240,036160,03 0
53,81713,1803,304
49921 8
682,17 9
4,037,01 1
3,206,962
856,4081,154~602
531,294356,689213,270
73,50116,37 03,972
63422 2
800, 04 9
4,322,51 0
3,494,573
810,3661,299,706
666,3612411,547222,330
64,78914,3514,12 1
695306
827,937
4,991,131
4,556,007
422,238711,88 3481,549539,82 5673, GDO
582,157429,936320,046154,239241,131,
435,12 4
6,796,602
6,185,273
529,937952,727683,540777,396919,590
799,610586,168457,432220,874257,999
611,329
6,821,421
6,114,690
449,273887,869662,952782,975901,398
736,562542,641489,546274,143367,331
706,731
195 9
1962
783,59 6
645,418
196,47 6227,25188,10569,71147,605
13,36 02,372435663 7
138,17 8
900,11 8
755,089
178,157280,962123,70493,48857,069
17,87 53,226
515613 2
145,02 9
1,599,44 5
1,388,133
228,223476,553302,113216,111127,28 5
32,7714,256
7167431
?11,312
438,46 5
357,817
100,819121,3?748,95242,15432,15 9
9,9401,95 5
369593 3
80,64 8
522,11 5
431,318
99,35 0148,31568,90658,01539,908
13,6692,621
449572 3
90,79 7
1,050,39 3
895,590
140,758288,222186,749149,70393,649
27,0653,710
63?6428
154,803
2,936,564
2,281,39 3
730,01 8614,598313,809219,433140,43 7
47,93811,6192,91 3
464164
655,17 1
3,841,694
3,063,671
812,8131,102,180
525,122346,152200,49 7
59,05413,0103,961
628254
778,023
'For years 1952, 1953, and 1954 These classes are $15,000 un6er $30,GGO and $30,G00 under $50,003,SOURCE : Statistics of Income-1950-1962, Individual Income Tax Returns .
4,128,228
3,721,272
382,537635,579406,966465,94?498,628
449,862332,559266,283150,480132,431
406,95 6
6,003,859
5,362,014
443,325823,163599,596660,452763,341
652,978452,210452,134239,450285,36 5
641,845
1960
1,038,208
882,437
211,875317,352135,44 1111,03078,362
23,49 93,930
776so42
155,77
1,154,339
984,642
201,804355,538184,465135,75182,067
21,0793,270
5657033
169,697
642,69 5
543,65 0
116,05 5183,62083,2?777,52559,528
19,44 63,394
6897 64 0
99,04 5
704,28 4
588,748
117,665198,055104,32 488,48759,973
16,9342,72 5
4975830
115,536
3,469,064
2,791,712
852,29 11,015,295403,680280,054169,412
54,80912,42~73,11 3
43919 3
677,35 2
4,698,49 9
3,914,000
946,21 01,413,655
713,805472,016269,33 3
74,88617,5175,337
894347
784,499
4,879,114
4,405,960
495,675747,651472,881537,852625,149
540,191360,929287,425130,9072(Y7,300
473,154
8,290,87 9
7,689,911
561,57 41,085,725
8044,384990,15 3
1,157,830
909,975709,025690,934357,113434,29 8
600,968
961
9~0,57 8
732,580
186,701296,444125,10494,17453,958
17,54 72,996
5566634
137,99 8
1,097,45 5
927,720
187,13-4351,310179,738119,90269,832
16,6222,669
4545326
169,735
Amun t
(77--dd.11 . . .
365,462
306,431
115,53393,580134,07637,402
'15,51 0
7,9701,908
366503 1
59,03 1
375,213
295,944
103,04199,1-'735,87329,36-120,505
6,1001,312
24 63919
79,269
549,1_10
461,753
106,710167,20069,61460,05141,650
13,5192,439
4795932
87,357
670,035
539,650
111,202192,15198,31573,34549,397
12,5602,215
392472 6
130,435

Synopsis of the Law
The legislative history of capital gain and loss provi-sions, summarized in table L, presents a record offrequent change, embracing one or more of the followingfeatures :
1 . Treatment of capital gains like other income, withno deduction for losses .
2 . Same as (1) with full allowance for losses .3 . Reduction of gains and losses by percentages de-
pendent upon the length of time the assets have been heldby the taxpayer .
4. Application of maximum rates .S . Provision for the carryover of losses not cur-
rently usable to offset future gains .6 . Special treatment of particular types of gains but
with losses deductible only against gains of a similartype .
From initial enactment of the income tax, following theadoption of the 16th amendment in 1913, through 1921,individual capital gains were taxed like ordinaryincome,with no provision made for the deduction of capital lossesuntil 1916 . From 1916 to 1918 capital losses could beoffset against capital gains, and from 1918 through 1923it was possible to offset such losseswithoutlimit against .taxable income of any kind .
The Revenue Act of 1921 was the firstto define capitalassets and provide for special treatment for capital gainsby individuals . From 1921 until 1933, capital assets weredefined as property held more than 2 years (whetheror not connected with a trade or business), but excludingstock in trade or property included in inventory . Duringthe period 1922-33 the taxpayer had the option of segre-gating long-term capital gains from ordinary income andapplying a flat rate of 12 1/2 percent to the segregatedgains. Long-term capital losses were deductible in fullin 1922 and 1923, but between 1924 and 1933 deductibilityof losses was limited to the same 12 1/2 percent ratethat was applied to gains .
The Revenue Act of 1934 redefined capital assets toinclude all property, whether or not connected with atrade or business except stock in trade or other property
included in inventory and property held primarily for saleto customers . In place of the alternative flat rate Con-gress substituted provisions for taking progressivelysmaller percentages of capital gains into account thelonger capital assets had been held, declining to 30percent on assets held more than 10 years . Net capitallosses could be deducted from ordinary income up to$2,000 .
The Revenue Act of 1938 continued the 1934 definitionof capital assets with the further exception of propertyused in trade or business . In addition, the 5-step sched-ule for recognizing various percentages of gain or losswas reduced to a 3-step schedule . The 1938 act reintro-duced parallel treatment o f long-termlosses butprovidedthat long-term and short-term capital losses be keptseparate, each might be offset only against its own typeof gain .
In 1942, the capital gain and loss provisions began toassume their present form . The definition of capitalasset was continued but excepted real property used'inthe trade of business of the taxpayer, introducing thespecial provisions now known as section 1231 trans-actions. The act distinguished between long- and short-term capital assets, depending on whether ~eld for moreor less than 6 months . Short-term capital gains of indi-viduals were included in income but only 50 percent ofthe long-term gains . The regular rates were applied butan election could be made to be taxedat an effective rateof not more than 25 percent on long-term capital gain . Indetermining net capital losses, all capital gains and losses(long- and short-term) were considered together . Indi-viduals were permitted to deduct net capital losses againstordinary income up to $1,000 and carry forward anybalance of capital loss to be applied againstcapital gainsof the succeeding 5 years plus $1,000 of other income .
The Revenue Act of 1951 temporarily increased thealternative tax rate on capital gains to 26 percent. Inaddition, the 2-for-1 offset of short-term loss againstlong-term gain was eliminated . The numerous changesmade in the Internal Revenue Code of 1954 were mostlyof a technical and definitional character .
145

Federal.tax law
Revenue Actof :
1921
1924 . . . . .1926 . . . . .
1928 . . . . .1932 . . . . .
1931936 . . . . .
1938In ternalRevenueCode of193 9
RQverueAc tsamendingCode :
19111
Incomcyear
1913-2 1
1922-23
1924-251926-271928-311932-33
1934-351936-3 7
19381939-4 0
1941
Definition of capital assets '
Property held for profit or invest-mmiL for more than 2 years (whetheror not connected with trade orbusiness) but does not includeproperty held for the personal useor consumption of the taxpayer orhis family, stock in trade, orother property which would be in-
cluded in inventory .
Property held for more than 2 years(whether or not connected withtrade or business) but does notinclude stock in trade or otherproperty of a kind which wouldproperly be incLuded in inventory,or property held primarily for salein the course of trade or business .
All property, whether or not con-
re~ted with trade or business ,re ardless of period hold, excepj( 1~ stock in trade or other prop-arty of a kind which would properlybe included in inventory, and (2)pr~operty held primarily for sale tocustomers in the ordbiary course oftrade or business .
Same as 1934-37 with the additionof : except (3) property used intrade or bu,~iness of a characterwhich is subject to allowance fordepreciation .
Same as 1938 with the addition of :excep~ (4) an obligation of theUnited States or any of its posses-sions, or of a State or Territory,or any political sub,5ivisionthereof, or of the District ofColumbia, issued on or after Mar .1,1941, on a discount basic mid pay-able without interest at a fixodmaturity date not exceeding I yearfrom date of issue .
Table L . -SYNOPSIS OF FEDERAL TAX LAWS PERTAINING TO SALES OF CAPITAL ASSETS, 1913-196 2
Period held
More than 2years .
More than 2
years .
I year or less . .
Over 1 year, not
over 2 years . . .
Over 2 years,not
over 5 years . . .
Over 5 years,not
over 10 years . .
Over 10 years . . .
Short-term : 18
months or less .
Long- term :
More than 18
months but not
.one than 24
months . . . . . . . .
More than 24
months . . . . . . . .
Same as 1938 .
Percentageof gain orlos s take n
into account
100
100
100
80
60
4030
100
66-213
. 50
Same as1938 .
Treatment of capital gain '
Net capital gain is taxed at 12-1/2percent, if the taxpayer elected tobe so taxed, provided the total tax(normal tax and surtax on ordinarytaxable income plus 12-1/2 percentof capital net gain) is not less
than, 12-1/2 percent of the totalnet income . (Loss in ordinary tax-able income cannot be deducted fromcapital net gain . )
Net capital gain is taxed at 12-1/2percent, if the taxpayer elected tobe so taxed . The total tax will bethe a= of the normal tax end sur-tax on ordinary taxable income and12-1/2 percent of capital net gain .(Loss in ordinary taxable incomemay be deducted from capital netgain . )
Net capital gain is included in tax-able income and taxed at the normaltax mid surtax rates .
Net short-term capital gain is fully
taxable at the norml. tax mil sur-
tax rates .
Net long-term capital gain is taxed
at 30 percent, if such tax plus thetax computed on taxable income re-duced by the net long-term capitalgain is less than the regLLIa.r taxan taxable income ; otherwise netlong-term capital gain is taxed atnormal tax and surtax rates .
Same as 1938 .
Treatment of capital loss '
No provision is made for what inlater acts, is termed "capital net
loss ." Such loss under the RevenueAct of 1921 is treated as ordinaryloss, i .e ., deductible from ordi-nary taxable income .
A credit ci~ 12-1/2 percent of thecapital net loss may be deductedfrom the s= of the normal tax andsurtax on ordinary taxable incomeprovided the tax thus produced isnot less than the a= of the normaltax and surtax on taxable incomeafter deducting the capital netloss .
Net capital loss or $2,000, which-
ever is less, is deducted from
ordinary income . 4
Net short-term capital loss is notdeductible from any income for thecurrent year . It may be carriedforward to the succeeding taxable
year (in ani amount not in excess ofthe net income for the year inwhich sustained) and appliedagainst the net short-term capitalgain of such succeeding year . Anyexcess of the current year netshort-term capital loss over the
net short-term capital gain of thesucceeding year is not deductible .
A credit of 30 percent of the netlong-term capital loss is deduc-tible from the tax on taxableincome increased by such loss, ifthe result is an amount greaterthan the regular tax on taxableincome ; otherwise net-Iong-termcapital loss is treated as a dedue-tion from total income .
Same as 1938 .
Other provisions '
Prior to the Revenue Act of 1921, gain from the sale of capitalassets was taxed as ordinary incomc . Loss from such sale wasnot recognized for 1913-15 ; for 1916 mid 1917, such loss wasdeductible to the extent of such gain, and for 1918-21 was de-dtictible in full .
Losses from the sale or exchange of securities are not deduc-tible when substantially identical securities are acquired orreacquired within 30 days before or after such transaction .
(1) Gains or losses from short sales of property are considered
as from sales or exchanges of capital assets, (2) gains or
losses attributable to the failure to exercise privileges or
options to buy or sell property are considered as gains or
losses from sales or exchanges of capital assets held for 1
year or less under the 1934 mid 1936 acts and as short-term
zapital gains or losses under the 1938 and subsequent acts,
and (3) amounts received by the holder upon the retiremen tof corporate (including Goverm :int) evidences of indebtedness
are considered as received in exchange therefor .
(1) If shares of stock in a corporation on rights to subscribefor on to receive such shares become worthless during thetaxable year and are capital assets, the loss resulting there-from is considered as a loss from the sale or exchange, on thelast day of the taxable year, of capital assets, and (2) ifevidences of indebtedness issued by a corporation (includinga Goverment) with interest coupons or in registered form areascertained to be worthless and charged off during the tax-
able year, and are capital assets, the loss resulting there-from is considered as a loss from the sale or exchange, onthe last day of the taxable year, of capital assets .
Footnotes at end of table .

Table L . --SYNOPSIS OF FEDERAL TAX LAWS PERTAINING TO SALES OF CAPITAL ASSETS, 1913 -1962 --Continue d
FederalLax law
Incom eyour
D2firiltion of capital assets' Period held
Percentag eof.gain or10 z taken
into account
Treatment of capital gain2 Treatment of capital IOSS2Other provisions '
1942 1942-43 Same as 1941 with the addition of : Shiort-teim : 6 100 Net short-term capital gain it; fully Net loss from sales of capital (1) If gains from sales at- exchanges of "property used iti tradeSx~2Et (5) real property used in months or less taxable at the normal tax arrH air- assets resultirg from the combine- or business, whether depreciable or not," held for more thar ,the trade or business of the tax- tax rates . tion of net short- and lol-term 6 months, plus the gains from the compulsory or involuntar ypayer .
Long-term : More 50 Net long-term capital gain or thegain arl loss is allowable as a conversion of such property and capital assets held for more
than 6 month. excess of get long-term capital
e
dedu tion for the current year to than 6 months, exceed the losses from such sales, exchanges ,
gain over net short-term capitalthe extent of $1~000 or the iiet in- and conversions, such gains and losses shall be considered a s
loss is taxed at 50 percent ifcome (computed withouTregard to from sales or exchanges of cdpital assets held for more tha n
,such tax plus the tax on taxable
capital gain or loss), whichever is 6 montlis . If such gains are less than such losses, ordinary
i d d b h i ismaller . The mount not allowable loss treatment was accorded the net loss . For the purpose o f
ncome re uce y suc cap tal ga nin the current year i~-Tthc "nct this provision neither the percentage limitation on gain sis less than the regular tax oncapital loi;s'l to be carried forward
,and losses taken iji~.o account nor the limitation regardingtaxable income ; otherwise such
as a short-term capital loss fit allowable losses is applicable ; and losses upon the destrtic -capital gain is taxed at normal taxc
ea h of the five succeeding years,
tion, in whole or in part, theft or seizure or requisitionand surtax rates .to the extent that such carryover
,or condemnation of "property used in trade or business" or
exceeds the total net capital capital assets held for more than 6 montlis are considere dgairS5 of any taxable years inter- losses from a compulsory or involuntary conversion .vening between the year in which (2) If the total distribution from an employee's trust formingthe net capital loss amse mid such a part of a stock bonus, pension, or profit-sharing plan ofsucceeding years . at) employer (for the exclusive benefit of employees or bone-
ficiaries) is paid or made available to the dis-tributec withinhis taxable year oil account of the employee's separation fromservice, the amomlt of such distribution which exceeds th eamount contributed by the employee Is considered a gain fro msale or exchange of a capital asset held for more than 6months .
(3) Effective in 1943, if a nont,111siness debt becomes totall yworthless within the taxable year, the loss resulting there -from is considered a loss from tile sale or exchange, duringg
the taxable year, of a capital asset held for not more tha n6 moriths .
Individual 19.V.-50 f3arto as 1942 . Same as 1942 . Same as Same as 1942 . Same as 1942 . If the tax is deter- At the election of the taxpayer, the cutting of timber (forIncome Tax 1942 . mi.red from optional tax table, ad- sale or use in trade or b-iness) by the taxpayer who owns orAct of 1944 justel gross income is substituted has the contract right to cut the timber (provided he owne d
for net income for the limitation or had such right for a period of more than 6 months prior toon capital loss deduction mid for the beginning of the taxable year) is considered a sale o rthe computation of net capital exchange of capital assets .gains . ,
Revenue 1951 ~,ame as 1944 with the addition of : Sam. a. 1944 . .9arbe as Same as 1944 . Same as 1944 . (1) To tile extent that they represent the difference betwee nAct of except (6) a copyright, a literary, 1944 . special amortication deductions and ordinary depreciation ,1950 musical, or artistic composition, gain from sale or exchange of property accruing from the
or similar property (hut not a amortization of emergency facilities are no', considered aspatent or invention) created by the from capital assets .taxpayer . (2) Certain gains from the sale or exchange of stock of a
collapzi~ile corporation are list considered as from capita lassets .3) Capital gains tax treatment for certain "restricted" stoc koptions Provided .
Footnotes at end of table .

Table L .-SYNOPSIS OF FEDERAL TAX LAWS PERTAINING TO SALES OF CAPITAL ASSETS, 1913-1962 -Continue d
Federa ltax law
Incom eyear
Definition of capital assets' Period held
Percentag e
ofsgain o rlo a taken
into account
Treatment of capital gainz Treatment of capital loSS2 Other provisions3
Revenue 1952-53 Same as 1950 . Short-term Same as Same as 1950 . Same as 1950 . (1) Payment of tax on any gain realized at the time of the sal e
Act of Same as 1950 . 1950 . of a personal residence may be deferred if a new residence wa s
1951 Ecrig-tem : Same as The entire excess lon,-term capital Same as 1950 .purchased within one year of the date of sale (the Revenne Ac t
Same as 1950 1950 . gain (the amount by which the netof 1954 extended the period for members of the Armed Service s
.long-tem capital gain exceed5 the
to four years) . A gain is currently recognized only to th eextent that the adjusted sales price of the old residence ex-
net short-teris capital loss) is ceeds the cost of the new residence .taxed at 26 percent if the alterra- (2) Capital gains treatment was extended to coal royalties fo rtive tax is less than the normal
coal held more than six months prior to disposal .tax and surtax ; otherwise, 50 per-
(3) The sale or exchange of livestock used for draft, breeding, ,cent of the excess long-tc7 gain
or dairy purposes, if owned for 12 months or more, is con -is taxed at normal tax and surtax sidered a sale or exchange of a capital asset .rates . (4) Provisions of the law regarding the short sale of stock s
Alternative tax is computed on ordi- were amended so as to include commodity futures .nary taxable income at normal tax (5) Gains and losses by a dealer from the sale or exchange o fand surtax rates plus 26 percent of securities are considered as from capital assets if clearlythe entire excess long-term capital identified in the daaler's records as held for investment an dgain .
rot for sale to customers in the ordinary course of trade o rbusiness .(6) In the case of an unharvested crop on land used in the trad eor business and held for more than 6 months, if the crop andthe land are sold or exchanged at the same time and to th esame person, the crop shall be considered as "property used i ntrade or business . "
(7) Gains from the sale or exchange of depreciable propert y
between spouses or between an individual and a controlled cor-poration are not considered as from capital assets .(8) Upon terniiination of employment or upon death, amounts re -ceived from the assignment or release by an employee, afte rmore than 20 years' employment, of all his rights to receive apercentage of future profits or receipts of his employer shal l
be considered an~ amourt received from the sale or exchange o f
a capital asset held for move than 6 months .
Internal 1954-62 Same as 1951 with the addition of : Short-term : Same as Same as 1951 . Same as 1951 . (1) A transfer of property consisting of all substantial right s
Revenue except (7) accounts or notes re- Same as 1951 . 1951 . to a patent, or an "divided interest therein which includes a
Code of ceivable acquired in the ordinary Long-term : Same a. The entire excess long-tern capital Same as 1951 . part of all such rights, by any holder shall be considered th e
1954 course of trade or business for Same as 1951 . 1951 . gain is taxod at 25 percent if the sale or exchange of a capital asset held more than 6 month s
services rendered or from the sale alternative tax is less than the regardless of the form in which the purchase price is received .
of property which would properly be normal tax and surtax ; otherwise, (2) Sal" of subdivided real estate held by the taxpayer for a
included in inventory or held pri- 50 percent of the excess long-term period of five years-if not held primarily for sale to cus -
marily for sale to customers . gain is taxed at normal tax and tomers in the ordinary course of trade or business and if n o
surtax rates . substantial improvements enhancing the value of the lots o r
Alternative tax is computed on ordi- parcels sold are made by the taxpayer-are considered as from
nary taxable income2 at normal tax capital assets .
and surtax rates plus 25 percent of (3) Amounts received by a lessee for the cancellation of a
the entire excess long-terin capital lease by a distributor of goods for the cancellation of a dis -
gain . tributor's agreement (if the distributor has a substantia l
capitat. investment in the distributorship), shall be con -
sidered as amounts received from the sale or exchange o fcapital assets .
(4) For taxable years beginning after September 2, 1958, losseson stock in a small business inve stment compaiiy operatin gunder the Small Business Investment Act of~1958, and losses o n
stock issued by small business corporations as defined i nSection 1244 of the Gods are not considered as from capita lassets . Maximuai loss for any taxable year under the latterprovisipe may not exceed $25,000 or $50,000 in the case of ajoint return .
'Includes only the definition for capital assets per as . See "Other
provisions" for assets given capital gain or loss treatment although
they are excluded by definition .
~The term "Ordinary taxable income" used in the explanation means the
taxable income exclusive of all items of capital gain and capital loss .
Taxable income is defined as adjusted gross income less deductions and
exemptions . This concept is not comparable for all years due to change
fit the tax law .
'Covers only the more important provisions relating to the sales of
capital assets with emphasis on those provisions that extend capital
asset treatment to other types of assets . In addition, many of the
provisions have been amended and extended by subsequent legislation .
For example, the Revenue Act of 1954 extended the election regardingcapital gains treatment of timber operations to income from the sales ofChristmas trees at least six years old when cut .
41n the case of a joint return, husbands and wives are treated as
separate taxpayers and separate capital transactions are reporteq .
Accordingly, the limitation on the allowances of losses of one spouse
is computed without regard to gains and losses of the other spouse .
Thus, the net capital loss deduction is limited to $4,000 in a jointreturn . (In 1940, the Supreme Court reversed this ruling but such re-versal is not reflected in Statistics of Income . )'Net apli gain, in this case, would be the excess of (1) the a=
of the gains from sales or exchanges of capital assets plus net incomeof the taxpayer or $1~000, whichever is smaller, over (2) the lossesfrom such sales or exchanges .
I
oo

1962 Forms and Instruction s
FORM 1040U .S . Tre" sury DepartmentInternal Revenve Service
U .S . INDIVIDUAL INCOME TAX RETURN-1962or taxable year beginning ------------------------------- 1962, ending ------------------------------ 19 ------
Firs! name and initial Last nam e0
-------------------------------- ------------------------------------------- I -------------------------------------------------------(It joint return of husband and wits, use first names and middle initials of both )
Homeaddress --------------------------------------------
~h umb-e- r- -a-r.-d- -siree-t- or -r-u-ra I -ro- ute)---------------------------------------------------
----------------------------------------- ------------------------------------------- -----------iown, or post office)~&il i0ostal zone number)
Your Social Smunrity Nurnbe r
Occupatio n
Wife's Social Sacuarity Nurn
Occupation
Check p Single; [:] Unmarried "Head of Household"; [] Surviving widow or widower with dependent child ; 0 Married Filing joint return (even ifone : I only one had income) ;0 Married filing separate return-li wife or husband also Filing separately, give nome --------------------------------------
INCOME-Of joint return, include all income of both husband and wife)1 . Wages, salaries, tips, etc., and excess of allowances over business expenses .
Employer' ; name Where employed (city and state) (a) Wages, etc .
------------------------------------------------------------------------------------------------------------ $ ------------------- ------
--------------------------------------------------------------------------------------------------------- I----------------------
(b) Federal income taxwithheld
$ ------------------- 1:---------------- - ---
if either you or your wife worked for more than one employer, see pace 4 of instructions t
----------------------2 . Total s
C\I 3 . "Sick pay" if included in line I (attach required statement) . . . . . .4 . Subtract line 3 from total wages . . . . . . . . . . . . . . . . . . . . ---------------------- ------5a.Dividends (Schedule B) ------EI bAnterest (Schedule B or other l ist) ------0
t c. Rents, royalties, pensions, etc . (Schedule B) . . . . . . . . . . . . . . . . . . . .0 D C L_J I rN I ----------------------
not itemize deductions- If line 9 is $5,000 or more and you do not itemize, enter 10%a'
11line 9 but not more than $1,000 ($500 if married and filing sep-Complete page 2 exemption schedule . ara'e return). i
Q . usiness Income k c u e . . . . . . . . . . . . . . . . . . . . . . . . .7 . Sale or exchange of Property (Schedule D) . ~ = a . . . . . . . . . . . . . . . .
d 8 . Form income (Schedule F) . . . . . . . . . . . . . . . . . . . . . . . . . .9 . Total (add lines 4 through 8) . . . . . . . . . . . . . . . . . . . . . . . . 0
f--FIGURE YOUR TAX BY USING EITHER 10 OR 11--l
10 . Tax Table 11 - Tax Rate Schedu! eIf line 9 is less than $5,000 and you do a . IF you itemize deductions, enter total from Page 2 . . . . . I
Copy total exemptions here -------- 6. Subtract line 11 a from I ine 9 . . . . . . . . . . . .Find your tax in table on page 10 a,' C. Copy total exemptions from page 2 here -------- multiply by $600 .instructions .
d . Subtract line 11c from line 11b . . . . . . . . . .Do not use lines 11 a, b, c, or d . Figure you . tax on this amount by using tax rate schedule on pageEnter tax on line 1 2 . 9 of instructions and enter tax on line 12 .
1 2 . Tax (from either tax table or tax rate schedule) . . . . . . . . . . . . . . . . . 013 . Self-employment tax (Schedule C-3 or F-1 ) . . . . . . . . . . . . . . . . . . .14 . Total (add lines 12 and 13) . . . . . . . . . . . . . . . . . . . . . . . .
--------------------- ------
---------------------- ------
---------------------- ------------ - -----
I09.Total (add lines a, 6, C, cl, e, and f) . . . . . . . . . . . . . . . . .X0
W District Director's office where amount on line 156 was paid --------------- - -------------------------------------
01 PAYMENTS AND CREDITS0 15a .Tax withheld (line 2, col . (6) above) . A+tach Forms W-2 . . . . . . .
laPaynients and credits on 1962 Declaration of Estimated Tax i,01,2 c .Div;dends received credit . . . . . . . . . . . . . . . . . . is0irement income credit . . . . . . . . . . . . . . . . . . .d .Refi
CC, e . Investment credit (Form 3468) . . . . . . . . . . . . . . . .2 f . Otn'et credits (Specify--see page 5 of instructions) . . . . . . . . . .
TAX DUE OR REFUN D16. If payments and credits (line 159) are less than tax (line 14), enter Balance Due here .
Pay In full with this retuorn to -1 Internal Pevenue Seirvice.'? File with your District Dimetor.
---------------------- ------
---------------------
----------------------
---------------------
---------------------:
19 . SL-6~rocf line IS from Nre 17. Apply this balance to : El U .S . Savings Bonds; or E3 Refund . . .
17 . If payments and credits (line 15g) are larger than tax (line 14),enierOverpaymeril here18 . Amount or line 17 you wish credited to 1963 Estimated Tax . . . . . . . . . . . . . .
~59-113-77172-1 List your exemptions and sign on other sid e
I
149

150 FACSIMILES OF TAX RETURNS, 1962
FORM 1040-1962 SCHEDUL E A.-EXEMPTIONS (See page 6 of instructions) Page 21 . Exemptions for yourself-and wife (only if all her income is included in this return, or she had no income )
Check (a) Regular $600 exemption . . . . . . . . . . . . . . . . . 0 Yourself El Wife Enter numberboxes of boxeswhich (b) Additional $600 exemption if 65 or over at end of 1962 . . . . . . Yciuriie f El Wi e checked
I
~, ~apply . (c) Additional $600 exemption if blind at end of 1962 . . . . . . . . . . . El Youre 0 Wi e 02. Exemptions for your children and other dependents (list below)9 11 an exemption is based on a multiple-support agreement of a group of Persons, attach the declarations described on page 6 of instructions.
NAME 1 11 ANSWER ONLY FOR DEPENDENTS OTHER THAN YOUR CHILDRE NEnter figure I in the lasl,column to right Relationship lived in yourI I Amount YOU furnished ifor each name sted Did dependent have A I I nished by'nome. If born or 1 for dependent's sup .f Surmoun
, income o $600 OTHER i cl .d,n gdied it . port . It 100%writ e(Give address if different from yours) , ~ngyear.also of more? . .ALL "wr le B or D" depencen t
------------------------------- - ------------------------- --------------------- --------------------
--------------------
$ ------- ------------ $ ------- --------- -- ----- -
------------------------------------ --------------------- --------------------- I -------------------------
-------------------- -
---------------------
------------------ -
----- - - - - - - --------
------------------- -
--- -- - - ------------
---------------------- -
-------------- -- - - - --- -
----------------- -
------------ ------
---
--- ----- -
----------------------------------------------------------- -
----------------------------------------------------------- -
-------------------------------- ---------------------------
------------- -
-------------------- -
----------------
- - - - - - -
------------------- -
---- ---------------
- - -- -
------------------ -
--------------------
- - - - -
- --------------------
--
----------- ----------
------------ -
----------------- -
---------------- -
------------------------------------------------------------ I
3 . Total exemptions (lines 1 and 2 above).
--------------- -
(Enter here and
-------------- ------ I
on line 10 or 1
------------------- -
1 c, page 1 ) .
---------------------- -
. . . . . .
----------------- -
. . .
----- -
ITEMIZED DEDUCTIONS-if you do not use fax table or standard deductio nIf husband and wife inot legally separatedi file separate returns and one itemizes deductions, the other must also itemiz e
If necessary.. write more than one item on a line or attach additional sheets . Put name, address and Social Security number on all attachments
Contributions ---------------------------------------------------------------------- -
-----
-
(If other than ----------------------------- --------- ------------------------------------- -money, submi tdescription of ---------------------------------------------- -
property, including --------------------------- ----------------------------------------------------------------------------------------------- -cost or other basis ,date of acquisition i
---------- ------------------------------ -------------------- ----------------------------------------------------------- -
and method o fvaluation) Total paid (not to exceed 20% of line 9, page 1, except as described on page 7 of instructions) $ -------------- ---- -
--------------------- -------------------------------------------------------------------------------------------------------------------------- ------------------------------------------- * --------------------------------------------------------- -
Interest expense ! .----------------------------------------------------------------------- --
-
-
--------------- ---------------------------- ----------- ---------------- -------------------------------------------- -
Total interest 0
Real estate taxes ------------------------------ State income taxes ---------------------------- -
Taxes Stale and local sales taxes ------------------- Other taxes (specify) __ . ----------------------- -
--------- -------------------- --- --------------------------------------------------------------- Tot-a-1-tax-es ------- 31 --
NOTE : If you or your wife ate 65 or over, or if either has a dependent parent--------------------- -
65 or over, see page 8 of Instructions for possible larger deduction .Medical and $dental expense 1 . Total cost of medicine and drugs . . . . . . . . .
. - ---------------------- ----- -1 2 . Enter 1% of line 9 page 1 . . . . . . . . .,(Submit itemized ilist . Do not enter 3 . Subtract line 2 from line 1 . . . . . . . . . .. . .any expense 4 Otkermedical, dental expenses (Include Hospital insuran ce premiums) -compensated by
insurance or 5 . Total (add lines 3 and 4) . . . . . . . . . . . . . .
-otherwise) 6 . Enter 3% of line 9, page 1 (see note above) - - - $ 7
7 . Subtract line 6 from line 5 ; see page 8 of instructions for maximut limitation - - -
Othercleductions --- ------------- ----- -- -------------------- ----------------- -------- -------------------- ------------- __ ------------------------- ----- -
(See page 8 of ------------------------------------ __ ------------------ --------------------------------------------------------------- -instructions) Total
Total deductions (Enter here and on line 11 a, page 1 ) . . . . . .EXPENSE Did you receive an expense allowance a, reimbursement, or charge expenses to your employer? Yes 0 No See page 4,ACCOUNT
INFORMATION If "Yes," did you submit itemized accounting of all such expenses to your employer? Yes 0 No instructions .
Did you file a return lost year' L] Yes L' No . If name or address on lost year's returns was different from this year, enter name and address used last year .
I declare under penalties of perjury that I have examined this return (including accompanying schedules and statements) and to the best Of my knowledge an dbelief it is true, correct, and complete . if prepared by a person other than taxpayer, his declaration is based on all information of which he has any knowledge .
Sign here ------- --------------- -------- ------------------------------------------ _ --------------------------- : ----------- ---------- ----------- ----- - - ------------ -(Taxpayer's signature and date) (it joint return, BOTH HUSBAND AND WIFE MUST SIGN) i Wife's signature and date )
Sign here ---------------------------------------------------------------------------- ----------------------------------------------------------- ----------------- -(Signature of preparer other than taxpayer) Gpo .59-16- 77172-1 (Address) (Date)

FACSIMMES OF TAX RETURNS, 1966 2
SCHEDULE DU.S. Treasury Department-Internal Revenue Servic e
1GAINS AND LOSSES FROM SALES OR EXCHANGES OF PROPERTY 1962(Form 1040)
Attach this schedule to your income tax return, Form 104 0
Name and address as shown on page I of Form 1040 Your smiall Security Numla~
Part I-CAPITAL ASSETS
Short-term capital gains and losses-assets hold not more than 6 months
a . Depreciation 1. Cost or othef basis,
a. Kind of property (if necessary, attach state- b. Date acquired c. Date sold d' Gross sales Priceall-ed (or
Sllo*abie) sincecost of subsequen t
impro'ement~ (41 not i . Gain or los jment of descriptive details not shown below) (me .. day, yr .) (me., day, Y1 .) (contract price) acquisition or pa,chased. attach (it plus a less f)
M ,chI . " 13
expuirtabon) an d:(aft ch schedule) expense of sale
- --------- - ------- ~t------------------------- -------~L------ X ------X --------- -------- X----------- -------- X ----------- --------- X----- - -----
-------- -------------- X ------------------------- ------- X -------- ------ X -------- -------- X --------- -------- X----------- ------- -
-- - ------------------- X ------- - ---- - ---------- -- - --- X-------- -- - --- X -------- ---------X---------- -- X __X ---- - -- ----------
- --------------------- X ------------------------- ------- X------- ------- X -------- ---------X X
--- X - - --------
- X
-- - -------------------X- - ---------------------- -------X------- X ____X ---------- --------- 2~----- X --- - -- -- - ----- Y,
---------------------- ------------------ - ----- ------- X X X X -- ----- ------- X-------- ----------------- --------------------- ------- ------------- X--------------- - -
----------------------- X ------------------------- ------- X-------- ------- X -------- ---------X----------- -------- X ----------- --------X ----------- --------- X-----------
2 . Enter your share of net short-term gain (or loss) from partnerships and fiduciaries . . . . . . . . . . . . . . . . . . . . . . . . . . . . . . . . .. .. X
-----V3 . Enter unused capital loss carryover from 5 preceding taxable years (Attach statement) . . . . . . . . . . . . . . . . . . . . . . . . .4 . Net short-term gain (or loss) from lines 1, 2, and 3 . . . . . . . . . . . . . . . . . . . . . . . . . . . . . . . . . . . . . . . . . . . . . . . . . . . . . . . . . . . V/
Long-term capittd gains and losses-assets hold more than 6 month s
- ------------ - -------------------- ------ ~s -------- ------ i -------- --------- E ------- - ------- :S ------- - -- -------i------------ --------- Z~ ---------- -
--------------- ------- X ------------------- ----- ------- X -------- ------- X -------- -------- X----------- -------- X ----------- -------- X ------ - --- --------
X X X X X X------------------------------------------ - ----- ------ - --------- ----------------- ------------------- - --------------------- --------------------- X-------- - ----- - ----- -X X X X X X------------------ - -------------- - ----- ----------------- ----------------- --------------------- --------------------- --------------------- X---------------- - ---- -X X X X X X-------------------------------------- - - - - ----- ----------------- ----- - ---------- --------------------- --------------------- ---------- ---------- X------ --------------- -
-----------------------X ----------------- ------- ------- X -------- ----- - X -------- -------- X----------- -------- X ----------- ------ - X X
X X X X X :-- - ------------------ ------------------------- ------- -------- ------- -------- -------- ------------ --------------------- ------ ------------ - --
-----------------------X ------------------------- ------- X -------- -------X -------- -- X----------- -------- X ------------ --------X------------ --------- X
X X V i- ---------------- - ------------------------ ----------------- I ------
~t
--------- X -------- X -------- - - ----------- --------- ----------- -
Total long-term gross sales price . .
S . Enter the full amount of your share of net long-term gain (or loss) from partnerships and fiduciaries . . . . . . . . . . . . . . . . . . . .. ... . X
T . Capital gain dividends . . . . . . . . . . . . . . . . . . . . . . . . . . . . . . . . . . . . . . . . . . . . . . . . . . . . . . . . . . . . . . . . . . . . . . . X
B. Net long-term gain (or loss) from lines 5, 6, and 7 . . . . . . . . . . . . . . . . . __ . . . . . . . . . . . . . . . . . . . . . . . . . . . . . . . . . . . . . 0 V
9. Combine the amounts shown on lines 4 and 8, and enter the net gain (or loss) here . . . . . . . . . . . . . . . . . . . . . . . . . . . .
10a . If line 9 shows a GAIN-Enter 50% of line 8 or 50% of line 9, whichever is smaller . (Enter zero if there is aVloss or no entry on line 8 .) (See reverse side for computation of alternative tax) . . . . . . . . . . . . . . . . . . . . . . . . . . .
If. Subtract line 10c, from line 9 . . . . . . . . . . . . . . . . . . . . . . . . . . . . . . . . . . . . . . . . . . . . . . . . . . . . . . . . . . . . . . . . . . . . . . . . . . . . V
It . If line 9 shows a LOSS-Enter here the smaRest of the following: (a) the amount on line 9 ; (b) taxable incom e
computed without regard to capital gains and losses and the deduction for exemptions ; or (c) $1,000 . . . . . . . . . . . .
Part 11-PROPERTY OTHER THAN CAPITAL ASSETS
a. Depreciation
Co"'"'n" basis'a. rind of propetty(it necessary, attach stale- b . Date acquired c . Date sold d . Gross sales lid ce
allowed (o rallowable) since
_s' "' .."tie" tofGain or loss
ment of descriptive details not shown below) (Mo, day, yr .) (mo ., day, yr .) (contract price) acquisition or purchased h plus a less 0.March 1 . 1913 explanation) an d
(a ch schedule) expense of sale
-------------------------------------- -
------------------------------------------------- -
--------------------------------------------------
---------------- -
---------------- -
-----------------
-- - ------------ -
---------------- -
-----------------
---------------------
---------------------
----------------
---------------------
---------------------
---------------------
-------------------- -
---------------------
---------------------
-----------------------
---------------------- -
---------------------- -
-- - --------------------------------------------- -
----------------------------------------- -
-------------- I ------------------- -------------- -
13 . Enter your share of non-capital gain
---------------- -
---------------- -
-----------------
(or loss) from
---------------- -
---------------- -
---------------- -
partnerships
-------------------- -
---------------------
---------------------
and fiduciaries . .
------- ------------ -
---------------------
---------------------
. . . . . . . . . . . . . . .
------------------
-------------------- -
----------- -------- -
. . . . . . . . . . . . . . . . .
-------------- - ----- -
---------------------- -
--------- ------------ -
14. Net gain (or loss) from lines 12 and 1 .3 . . . . . . . . . . . . . . . . . . . . . . . . . . . . . . . . . . . . . . . . . . . . . . . . . . . . . . . . . . . . . . . . . . V
Part. III-TOTAL GAINS OR LOSSES FROM SALE OR EXCHANGE OF PROPERTY
15 . Net gain (or loss) from either line I Ob or 11 . . . . . . . . . . . . . . . . . . . . . . . . . . . . . . . . . . . . . . . . . . . . . . . . . . . . . . . . . .. . . . . . .. . . . .. . .. .. . . . . . . . . .. .16. Net gain (or loss) from line 14 . . . . . . . . . . . . . . . . . . . . . . . . . . . . . . . . . . . . . . . . . . . . . . . . . . . . . . . . . . . . . . . . . . . . . . . . . . . . .
17. Total net gain (or loss), combine lines 15 and 16. Enter here and on line 7, page I of Form 1040 . ~ . . . . . . . . . . .
Viteris abstracted for Statistics of income- 1962, Individual Income Tax Return sx Items abstracted for Statistics of Income Supplemental ReDort--Sales of Capital Assets Reported
on 1962 Individual Income Tax Returns
15 1
I

152 FACSIMILES OF TAX RETURNS, 1962
Schedule D (Form j040) 1962 Page 2
3. Subtract line 2 from line 1 . . . . . . . . . . . . . . . . . . . . . . . . . . . . . . . . . . . . . . . . . . . . . . . . . . . . . . . . . . . . . . . . . . . . . . . . . . . . . . . . .
4. Enter tax on amount on line 3 (use applicable tax rate schedule on page 9 of Form 1040 instructions) . . . . . . . . . . . . . . .
S. Enter 50% of line 2 . . . . . . . . . . . . . . . . . . . . . . . . . . . . . . . . . . . . . . . . . . . . . . . . . . . . . . . . . . . . . . . . . . . . . . . . . . . . . . . . . . . . . . .
6 . Alternative tax (add lines 4 and 5) . If smaller than the tax figured on the amount on line I ld, page 1 of Form
1040, enter this alternative tax on line 12, page 1 of Form 1040 . . . . . . . . . . . . . . . . . . . . . . . . . . . . . . . . . . . . . . . . . . . . . . .
I COKPUTATION OF ALTERNATIVE TAX
It will usually be to youf advantage to use the alternative tax if the netIong-term. capital gain exceeds the net short-term capital loss, or if thereis a net long-term capital gain only, and you are filing (a) a separate return with taxable income exceeding $18,000, or (b) a joint return, or asa surviving husband or wife, with taxable income exceeding $36,000, or (c) as a head of household wit:a taxable income exceeding $24,000 .
1 . Enter the amount from line I I d, page I of Form 1040 . . . . . . . . . . . . . . . . . . . . . . . . . . . . . . . . . . . . . . . . . . . . . . . . . . . . . . ---------------- -- ---2. Eater amount from line 10a on reverse side . . . . . . . . . . . . . . . . . . . . . . . . . . . . . . . . . . . . . . . . . . . . . . . . . . . . . . . . . . . . . . .
. INSTRUCTION"References are to the Internal Revenue Code )
GAINS AND LOSSES rROrvl SALES OR EXCHANGES OF and depreciable property if they are used in the trade or
PROPERTY.-Repori details in schedule on other side . business and held for more than 6 months ,
-Capitcd assets" defined .-The term "capital assets" meansproperty held by the taxpayer (whether or not connected with histrade or business) but does NOT include-
(a) stock in trade or other property of a kind properly includiblein his inventory if on hand at the close of the taxable year,
(b) property held by the taxpayer primarily for sale to cus-tomers in the ordinary course of his trade or business ;
(c) property used in the trade or business of a character whichis subject to the allowance for depreciation provided insection 167;
(d) real property used in the trade or business of the taxpayer
(e) certain government obAgntions issued on or after March 1,1941, at a. discount, payable without interest and maturingat a fixed date not exceeding one year from date of issue ;
(f) certain copyright., literary, musical, or artistic composi-tions, etc . ; or
(g) accounts and notes receivable acquired in the ordinarycourse of trade or business for services rendered or fromthe sale of property referred to in (a) or (b) above.
Special rules apply to dealers in securities for determining capitalgain or ordinary loss on the sale or exchange of securities. Certainreal property subdivided for sale may be treated as capital assets .Sections 1236 and 1237 .
If the total distributions to which an employee is entitled underan employees' pension, bonus, or profit-sharing trust plan, which isexempt from tax under section 501 (o), are paid to the employee inone taxable year, on account of the employee's separation fromservice, the aggregate amount of such distribution, to the extent itexceeds the amounts contributed by the employee, shall be treatedcis a long-term capital gaiii. (See section 402(a)) .
Gain on sale of depreciable property between husband and wifeor between a shareholder and a -controlled corporation*' shall betreated as ordinary gain .
Gains and losses from transactions described in section 1231(ree below) shall be treated as gains and losses from the sale orexchange of capital assets held for more than 6 months if the totalof these gains exceeds the total of these losses . If the total of thesegains does not exceed the total of these losses, such gains and lossesshall not be treated as gains and losses from the sale or exchangeof capital assets. Thus, in the event of a net gain, all these trans-actions should be entered in Part I of Schedule D . In the event ofa net loss, all these transactions should be entered in Part II ofSchedule D, or in other applicable schedules on Form 1040,
Section 1231 deals with gains and losses arising from-
(a) sale, exchange, or involuntary conversion, of land (includ-ing in certain cases unharvested crops sold with the land)
(b) sale, exchange, or involuntary conversion of livestock heldfor draft, breeding, or dairy purposes (but not includingpoultry) and held for 1 year or more,
(c) the cutting of timber or the disposal of timber or coal towhich section 631 applies, and
(d) the involuntary conversion of capital assets held more than6 months .
See sections 1231 and 631 for specific conditions applicable .
Basis.-In determining gain or loss in case of property acquiredafter February 28, 1913, use cost except as specially provided.The basis of property acquired by gift after December 31, 1920, isthe cost or other basis to the donor in the event of gain, but, in theevent of loss, it is the lower of either such donor's basis or the fairmarket value on date of gift. If a gift tax was paid with respectto property received by gift, see section 10 15 (d) . Generally, thebasis of property acquired by inheritance is the fair market valueat the date of death. For special cases involving property acquiredfrom a decedent, see section 1014 . In the case of sales and ex-changes of automobiles and other property not used in your tradeor business, or not used for the production~of income, the basis fordetermining gain is the original cost plus the cost oi permanent im-provements thereto. No losses are recognized for income tax pur-poses on the sale and exchange of such properties .
Sale of a personal residence-General rule.-You musireport any gains from the sale or exchange of your residence orother nonbusiness property, but you may not claim any loss fromthe sale of a home or other asset which was not held for the purposeof producing income . Your gain is the difference between (1) thesales price and (2) your original cost plus the cost oi permanentimprovements . If depreciation was allowed or allowable duringany period because you rented the house or used part of it forbusiness purposes, the original cost must be reduced by the amountof depreciation which was allowed or allowable .
Special Rule-Deferring gain when buying new residence .-You may defer being taxed on the gain from the sale of your princi-pal residence until the final disposition of the property if all of thefollowing conditions apply:
(a) You sell or exchange your principal residence at a gain,(b) Within 1 year after (or before) the sale, you purchase
another residence and use it as your principal residence,
W The cost of the new residence equals or exceeds the adjustedsales price of the old residence .
If, instead of purchasing another residence, you begin construc-tion of a new residence (either 1 year before or within 1 year afterthe sale of your old residence) and use it as your principal residencenot later than 18 months after the sale, the gain on the sale maybe deferred until the final disposition of the property if your costs
(Instructions continued an reverse side of duplicate) .70-16-77171-1

FACSIMILES OF TAX RETURNS, 1962
INSTRUCTIONS (Continued from reverse side of original)
attributable to construction during, plus the cost of land acquiredwithin, the period beginning I year before the sale and ending18 months after the sale equals or exceeds the adjusted sales priceof the old residence. if the adjusted sales price of your old resi-dence exceeds the cost of your new residence, the gain on the saleis taxable to the extent of such excess.
The adjusted sale price is the gross selling price less commissions,selling expenses, and the expenses for work perforrne .d on theresidence in order to assist in its sule, such as redecorating ex-penses . Redecorating expenses must be for work performedduring the 90-day period ending on the day ori which a contractto sell is entered into, and must be parid ric later than 30 daysafter date of sale .
If you have acquired your new residence and uqed it ce yourprincipal residence, enter in column (g) only the amount of taxablegain, if any, and attach statement showing the purchase price,date of purchase, and date of occupancy .
If you have decided to replace, but have not done so, or if youare undecided, you should enter "None" in column (q) . When youdo replace within the required period, you must advise the DstrictDirector, giving full details . When you decide not to replace, orthe period has passed, you must file an amended return, it youpreviously filed a return . Since any additional tax due will bearinterest from the due date of the original return until paid . it it;advisable io tile the amended return for the year of sale as promptlyas possible. Form 2119 is available at any Internal RevenueService office for reporting the sale or exchange of your residenceor for figuring your new basis.
Losses on securities becoming worLhless.-Jf'(a) shares ofstock become worthless during the year or (b) corporate securitieswith interest coupons or in registered form become worthless duringthe year, and are capital assets, the loss therefrom shall be con-sidered as from the sale or exchange of capital assets as a,' the lastday of such taxable year .
Losses on small business stock .-If you hod a loss on section1244 stock which would (but for that section) be treated as a lossfrom the sale or exchange of a capital asset, it shall be treatedas a loss from the sale or exchange of an Qsset which is not acapital asset to the extent provided in that section .
Nonbusiness; debts .-If a debt, such as a personal loan, becomestotally worthless within the taxable year, the loss resulting therefromshall be considered a loss from the sale or exchQnge, during thetaxable year, of a Capitol asset held for not more than 6 months .Enter such loss in column (9) and describe in column (a) in theschedule of short-term capital gains and losses on other side . This
does not apply to : (a) a debt evidenced by a corporate security withinterest coupons or in registered form and (b) a debt acquired inyour trade or business.
Limitation on allowable capital losses .-If line 9 shows .net loss, the loss shall be allowed as a deduction, only to the extentof the smaller of (1) taxable income of the current year (or adjustridgross income if tax table is used) or (2) $1,000 . For this purposetaxable income is computed without regard to capital gains orlosses or the deduction for exemptions . The excess of such allow .able loss over the lesser of items (1) and (2) above is called "capitalloss carryover." The capital loss carryover of each year shouldbe kept separate, since the low limits the use of such carryover tcthe five succeeding years . In offsetting your capital gain andincome of 1962 by prior year loss carryovers, use any capital losscarryover from 1957 before using any such carryover from 1958or subsequent years. Any 1957 caTryover which cannot be usedin 1962 must be excluded in determining total loss cQrryover to1963 and subsequent years .
"Wash sales" losses .-Losses from the sale or other dispositionof stocks or securities are not deductible (unless sustained in con .nection with the taxpayer's trade or business) if, within 30 daysbefore or after the date of sale or other disposition, the taxpayerhas acquired (by purchase or by an exchange upon which theentire amount of gain or loss was recognized by law), or has enteredinto a contract or option to acquire, substantially identical stockor securities .
Losses in transactions between certain persons .-No deduc-tion is allowable for losses from sales or exchanges of propertydirectly or indirectly between (a) members of a family, (b) a car-poration and an individual (or a fiduciary) owning more than 50percent of the corporation's stock (liquidations excepted), (c) agranior and Liduciary of any trust, (d) a fiduciary and a beneficiaryof the same trust, (e) a fiduciary and a fiduciary or beneficiary ofanother trust created by the same grantor, or W an individual anda tax-exempt organization controlled by the individual or hisfamily . Partners and partnerships see Section 707(b) .
Long-term capital gains from regulated investment com-panies .-Include in income cis a long-term capital gain the amountyou are notified on Form 2439 which constitutes your share of theundistributed capital gains of a regulated investment company .You are entitled to a credit of 25 percent of this amount which shouldbe claimed on line 1, page 1, Form 1040. Enter such amountin column (b) and write "Credit from regulated investment com-pany" in the "Where employed" column. The remaining 75percent should be added to the basis of your stock .
15 3
U .S . GOVERNMENT PRINTING OFFICE : 1966 O-Z36-349