Fenomeni di plastificazione lessicale: il caso di "tema/tematica", "problema/problematica" ecc.
Upload
khangminh22Category
view
0download
0
CAPITA
Produced in association with ECC Ltd
Pay and Labour Market Report Summer 2006 Issue 1

Quarterly Pay & Labour Market Report – Issue 1
Produced by Capita August 2006 2
Quarterly Pay & Labour Market Report – Issue 1
Produced by Capita August 2006 3
Contents 1 Introduction 1
2 Craft/Maintenance Roles 3
3 Professional Construction Roles 9
4 Executive Assistant 14
5 Accountants 21
6 Librarian 26
Glossary and Notes on Sources of Information 33

Quarterly Pay & Labour Market Report – Issue 1
Produced by Capita August 2006 1
1 Introduction The first Quarterly Labour Market Report contains information on the following groups of jobs: • Craft/maintenance roles • Professional construction roles such as architect and building surveyor • Executive assistants • Accountants • Librarians This first set of jobs were chosen by conducting a short survey of members to determine the jobs for which there was the most urgent need for pay and labour market information. The jobs are quite diverse and subsequent reports may cover a smaller group of inter-related jobs so that there is scope to provide a more in-depth view of the pay and conditions, and labour market, for these jobs. The content of this first report is also slightly different to future reports because it does not contain data collected from higher education institutions (HEIs); it only provides data on the pay being offered by other employers. Future reports will be informed by a data collection survey and will contain pay and benefits data from HEIs to allow comparisons to be made between HEIs as well as with other sectors. The survey was not conducted for this initial report because it was felt that HEIs may struggle to complete the survey because of the pressure of work associated with implementation of the Framework Agreement. This first report is also very much a pilot or trial exercise and we are looking for feedback on both the format and the content to improve the usefulness of future reports. We have tried to use a standard format for this report so that for each job or group of jobs there is: • Background labour market information on trends in the factors affecting recruitment
and retention. • An overview of some of the general sources of pay information such as the Annual
Survey of Hours and Earnings (ASHE) to provide some context. • Details of pay data from other relevant published salary surveys. • Details of the pay scales or pay bands for selected other major employers such as local
authorities and the NHS.

Quarterly Pay & Labour Market Report – Issue 1
Produced by Capita August 2006 2
• Information from our monitoring of advertised salaries. • Information on the terms and conditions and benefits typically being offered. In compiling the report we have sought to strike a balance between using data from a variety of sources to overcome problems with unrepresentative or biased samples, to get an accurate and detailed a picture as possible; and at the same time to avoid providing too much data and detail. In particular we have sought to use the most relevant and reliable sources of data available. In most cases a lot more detailed information is available. If therefore you would like more detailed information on a particular job, or a particular location or situation, please call the Helpdesk on 01423 720200. Notes on some of the main sources used are contained at the end of this report.

Quarterly Pay & Labour Market Report – Issue 1
Produced by Capita August 2006 3
2 Craft/Maintenance Roles 2.1 Factors affecting recruitment and retention The latest report produced by the Construction Skills Network1 forecasts that the UK construction industry will continue to experience strong growth between 2006 and 2010, and it will require some 348,000 additional employees to meet expected demand. The report estimates that more than 11,000 additional wood trade workers, 8,000 electricians and 5,000 plumbers will be required each year from 2006 to 2010 to meet this expected demand. The particularly strong forecast for wood trade workers is the result of the strength of the housing sector within construction. Construction growth is also expected to shift from the North to the South and East of the country, driven by strong growth in the new build sector that includes a number of high profile large projects. This means that recruiting craft/maintenance staff is likely to remain difficult for the foreseeable future, although the construction industry has also seen an increase in the use of migrant labour – particularly following the expansion of the European Union – to fill skills gaps. The pay rates for craft workers in the NHS, local authorities and higher education institutions appear to be lower, in terms of hourly rates, than the hourly rate set by national industry agreements (although other terms and conditions are better), and there is evidence that public sector employers are experiencing recruitment problems for this staff group, although retention problems appear less serious. In the Recruitment and Retention Survey for June 2005, undertaken by the Local Government Employers’ Organisation, the craft groups found to be the most difficult to recruit were electricians (15.3% of councils), plumbers (12.9% of councils) and joiners/carpenters (11.2% of councils). Retention problems were less common, although 10% of council experienced difficulties retaining plumbers and 9.4% retaining electricians. The NHS pays a national recruitment and retention premia, currently worth £2,808 to qualified maintenance craft operatives and technicians, already this is under review. Many institutions (31) in the 2005 UCEA recruitment and retention survey reported having difficulties in recruiting maintenance staff but fewer reported having difficulties in retaining these staff.
1 Construction Skills Network Blueprint for UK Construction Skills 2006-2010. Available to download from www.constructionskills.net

Quarterly Pay & Labour Market Report – Issue 1
Produced by Capita August 2006 4
2.2 Pay levels This section summarises a number of sources of pay data for skilled craft or maintenance roles such as electrician and plumber. The next section looks at professional building and construction roles such as those of building surveyor and architect. The table below shows how the average earnings of selected building and construction workers vary across the country. Average gross full-time earnings (excluding overtime) for selected building & construction related occupations by geographical area as at April 2005 (£)
Source: ASHE data table 15.2a showing weekly pay excluding overtime converted into annual salaries by multiplying by 52.14. This data is not available on the ONS website but can be requested. While earnings are generally higher in London and the South East, there is relatively little difference in earnings between different geographical areas. This is probably because pay levels for building and craft workers in the construction sector are dominated by national industry agreements, which either set national minimum or actual pay rates. For example, the plumbing and electrical contracting industry national agreements set actual pay rates, while the building and construction industry national agreements set minimum pay rates. The following table shows the national industry agreements’ basic hourly pay rates for craft and advanced craft grades. For many of these agreements most workers are employed on the advanced or approved grades.
£0
£5,000
£10,000
£15,000
£20,000
£25,000
£30,000
National London South East East of England
EastMidlands
WestMidlands
North East NorthWest
Yorks &Humber
South West
Wales Scotland
Electricians Plumbers, Heating & Vent Engineers Carpenters & Joiners

Quarterly Pay & Labour Market Report – Issue 1
Produced by Capita August 2006 5
Industry Agreement Craft Rates £ph
Building & Allied Trades £9.67 min Construction Industry £9.32 min Electrical Contracting (site rates) £11.33 or 11.98* (electrician)
£12.69 or 13.42* (approved electrician) Engineering construction £10.36 or 11.66** (craft)
£10.87 or 12.17** (advanced craft) £11.37 or 12.69** skilled working chargehand
Heating, Ventilating & Domestic Engineering £10.00 (craft) £10.90 (senior craft) £13.20 (foreman)
Plumbing Mechanical Engineering (E&W) £9.60 (trained plumber & gas service engineer); £11.20 (advanced plumber & gas service engineer) £12.44 (technician plumber & gas service engineer)
Plumbing (Scotland & NI) £9.80 (plumber & gas service fitter); £11.16 (advanced plumber & gas service engineer) £12.36 (technician plumber & gas service technician)
* Lower rate applies where transport to site is provided; higher rate applies for own transport ** Lower rate applies for category 4 sites involving general engineering and construction work. Higher rates apply for other sites involving major new projects or major repair and maintenance sites. The industry agreements also contain additional payments. For example, the Plumbing Mechanical Engineering Services agreement also provides for responsibility/incentive allowances paid as an additional amount on basic grade rates for work that involves extra responsibility, productivity or flexibility (these can be as high as 65 pence to 84 pence per hour), plumbers’ welding supplements for possession of gas and arc certificates, and daily travel time allowances. The normal working week is 37.5 hours and overtime is payable after 43 hours are worked at T+50% up to 8pm and double time after 8pm. Annual holiday entitlement is 21 days. The ASHE data shows the relative significance of overtime as part of overall earnings. Electricians and plumbers have higher basic pay but they also earn more from working overtime than the other occupations listed below. Average gross earnings for full-time employees in selected construction occupations at April 2005 Job Example Average gross earnings excluding
overtime £pa Average gross earnings including
overtime £pa
Bricklayers, masons 19,709 21,148 Carpenters & joiners 19,865 22,113 Electricians 23,015 26,748 Painters & decorators 18,713 20,011 Plumbers, heating & ventilating engineers 22,535 25,064
The rates payable under national industry agreements will usually apply to staff working on construction sites and are paid by many building companies and contractors. NHS Partners’ monitoring of pay rates confirms that the pay rates set by national agreements are generally followed.

Quarterly Pay & Labour Market Report – Issue 1
Produced by Capita August 2006 6
Organisations such as the NHS, local authorities and indeed higher education institutions tend to employ craft workers on rates of pay that are lower, in terms of hourly rates, than these agreements. These organisations will generally offer better terms and conditions and benefits that compensate for the lower pay levels. This will include a permanent contract rather than shorter term contracts, and a final salary pension scheme. 2.3 Local Government The national pay rates for craft workers employed by local authorities, effective from 1 April 2006, are shown in terms of weekly rates and annual salaries below. We have also calculated the appropriate hourly rates based on a 37-hour week. Job Salary £pa Weekly Rate £pw Hourly Rate £ph (based on
37-hour week)*
Building craft operative 13,635 261.51 7.06 Plumber 14,601 280.03 7.56 Engineer, electrician 15,072 289.07 7.81 * Staff work 36 hours in London.
Workers also receive additional skills payments of between 37 and 74 pence per hour. Rates exclude Greater London allowance of £2,268 and fringe allowances of £750 (inner fringe) and £522 (outer). Tool allowances of between £2.96 and £6.69 are also paid. These additional payments can add significantly to total earnings. The Local Government Employers database of advertised salaries2 shows a median minimum salary of £18,600 and a median maximum salary of £19,700 for plumbers in local employers, based on a sample of 36 posts. 2.4 NHS As part of the introduction of the Agenda for Change pay system in the NHS national job profiles were prepared. A brief summary of the profiles for the full range of estates and maintenance posts, their pay bands and salary ranges is included below. Further details of the roles are available from the NHS Partners helpdesk or can be downloaded from the NHS Employers website. Qualified maintenance and building craft workers are paid a salary range of £14,037 to £16,799, equivalent to hourly pay rates of £7.18 to £8.59, based on a 37.5 hour working week. Multi-skilled maintenance technicians are paid £16,405 to £19,730, equivalent to an
2 Local Government Employers, Local Government Digest April 2006.

Quarterly Pay & Labour Market Report – Issue 1
Produced by Capita August 2006 7
Hourly rate of £8.39 to £10.09. These groups also receive a national recruitment and retention premia (as detailed below), currently worth nearly £1.44 per hour. National Profile (Job Title(s)) Pay Band Salary Range £
Estates Support Worker (Maintenance Assistant) Band 1 11,782 - 12,853 Estates Support Worker Higher Level (Maintenance Assistant)
Band 2 12,177 - 15,107
Estates Maintenance Worker (Maintenance craft worker (gas or electrical or mechanical), building craft worker)
Band 3 14,037 - 16,799
Estates Maintenance Worker Higher Level (Multi-skilled maintenance technician)
Band 4 16,405 - 19,730
Maintenance Supervisor Band 4 16,405 - 19,730 Estates Officer Entry Level Band 5 19,166 - 24,803 Estates Maintenance Worker Specialist Band 5 19,166 - 24,803 Estates Maintenance Worker Team Leader Band 5 19,166 - 24,803 Estates Officer (Operations); Estates Officer (Specialist Service); Estates Officer (Projects)
Band 6 22,886 - 31,004
Estates Officer Specialist (Specialist Services) Band 7 27,622 - 36,416 Estates Manager (Operations); Estates Manager (Projects) Band 7 27,622 - 36,416 Estates Manager, Higher Level (Operations); Estates Manager, Higher Level (Projects)
Band 8a-8b 35,232 - 42,278 41,038 - 50,733
Head of Estates Band 8d 59,189 - 73,281 Director of Estates & Facilities Band 8d-9 59,189 - 73,281
69,899 - 88,397
NHS Qualified Maintenance Craft Operatives & Technicians and Estates Officers/Works Officers are among the staff groups who receive a national recruitment & retention premia – agreed to ensure their position was maintained during the transitional period when the new pay system was introduced. This is worth up to 30% for Estates Officers/Works Officers (and other Groups), but the premia for Maintenance Staff is £2,808 although this is currently under review. The pay rates quoted above exclude High Cost Area supplements payable in London and the South East. 2.5 Summary Building craftsmen will continue to be in demand for the foreseeable future, especially in the South East. Pay rates are heavily influenced by national, industry agreements, but these apply mostly to the construction industry and pay rates in the public sector seem to be below these, although there are other benefits such as job security and pensions, to compensate for the lower pay. Rates of pay are considerably increased by a number of allowances and overtime, so that basic pay levels may bear little relation to total earnings. The highest paid trade is electricians, followed by plumbers, and then joiners. Gross annual earnings, including other

Quarterly Pay & Labour Market Report – Issue 1
Produced by Capita August 2006 8
payments such as allowances, but excluding overtime, average £23,015 for electricians, £22,535 for plumbers and £19,865 for carpenters and joiners. There is not that much regional variation in earnings. Electricians in London earn the most (£28,083) but elsewhere rates only range from £21,299 in the South West to £24,208 in the East of England, a difference of only £2,909. There is more variation in the earnings of joiners. They earn the most (£23,427) in London. Elsewhere earnings range from £16,059 in Wales to £22,259 in the North East.
Craft/Maintenance Roles: Summary of Survey Data Sources (£'000 pa)
ASHE 2005 Electrician (ave)
ASHE 2005 Plumbers etc (ave)
ASHE 2005 Carpenters/joiners (ave)
Building & Allied Trade Craft Rate (min)
Electrical Contracting Electrician
Plumbing Ind. Trained Plumber
Local Govt Electrician Basic
Local Govt Plumber Basic
Local Govt Plumbers Advertised Salaries
NHS Maintenance/building craft worker
NHS Multi-skilled craft technician
10 20 30£000s
InterquartileRangeMedian

Quarterly Pay & Labour Market Report – Issue 1
Produced by Capita August 2006 9
3 Professional Construction Roles 3.1 Factors affecting recruitment and retention The Construction Skills Network has forecast that the UK construction industry will continue to experience strong growth between 2006 and 2010, and that over 40% of the 348,000 additional staff required are likely to be professional staff such as managers, architects, engineers, and other design and technical professionals. The number of extra architects, technical engineers and other design and technical professionals required is estimated to be over 9,000 a year between 2006 and 2010. There are already shortages of these professional staff. The Royal Institute of British Architects (RIBA) describes the UK architectural employment market is very buoyant, particularly for architects with five years’ post registration experience and experienced architectural technicians. The Recruitment and Retention Survey for June 20053, undertaken by the Local Government Employers’ Organisation found that 37% of local authorities had difficulties recruiting building surveyors and 21% had problems retaining them. Planners and building control staff were even harder to recruit and retain. The Incomes Data Services Local Government Pay Benchmarking Survey4 also found examples of councils paying market supplements to recruit and retain planners, building control officers, building surveyors and architects. Construction Skills, the Sector Skills Council for the construction industry, launched the three-year Inspire Scholarship Scheme worth a total of £9,000, in 2005, for students looking for a career in the construction industry. University & College Admissions Service (UCAS) data shows a dramatic rise in acceptances for construction-related degrees in 2005, and applications for 2006 are also up. While this creates increased demand for academic staff to deliver construction-related degrees, in the longer-term, it also increases the potential supply of staff for universities to recruit from to fill academic or professional posts such as building surveyors, project managers and architects they employ to undertake and manage building, construction and maintenance projects. 3.2 Pay levels ASHE provides the following information on how pay levels for architects and chartered surveyors vary across the country.
3 The 2005 Recruitment & Retention Survey Summary Findings report published by the Local Government Employers’ Organisation, January 2006 4 IDS Pay Report 945, January 2006.

Quarterly Pay & Labour Market Report – Issue 1
Produced by Capita August 2006 10
Average gross full-time earnings (excluding overtime) for selected building & construction related occupations as at April 2005 (£) Geographical Area Architects Chartered Surveyors
National 37,520 35,022 London 45,362 44,840 South East n/a 36,618 East of England 28,484 31,863 East Midlands n/a 29,454 West Midlands 33,964 33,046 North East 37,077 23,119 North West 32,707 28,239 Yorkshire & the Humber 31,727 31,889 South West 28,656 30,283 Wales n/a 26,696 Scotland 35,596 38,745 Source: ASHE data table 15.2a showing weekly pay excluding overtime converted into annual salaries by multiplying by 52.14. This data is not available on the ONS website but can be requested. The data suggests that earnings are significantly higher in London. Earnings also appear relatively high in Scotland and earnings for architects in the North-East are high although they are very low for chartered surveyors (the earnings figure of £23,119 is very low, compared to the other geographical areas, and is not supported by other sources of data on surveyors). 3.3 Architects The RIBA Architects Employment & Earnings Annual Survey for 2005 showed that in August 2005 median earnings for qualified architects were £36,500, and the table below shows the earnings data for architects employed in local and central government. Employment Sector Lower quartile earnings
£pa Median earnings £pa Upper quartile earnings
£pa
Local government 30,948 33,963 39,350 Central government 30,850 36,215 49,000
The RIBA website contains a rough salary guide for salaries in London, and this suggests newly registered architects can earn £29,000 to £32,000 and architects with three to five years’ post-registration experience, between £34,000 and £40,000. Architects with three or four years’ post-registration experience working as a `job architect’ typically earn £32,000 to £35,000 with a small firm and £33,000 to £38,000 with a larger or commercial firm. Architects working as a Team Leader with a larger/commercial firm typically earn £37,000 to £40,000, while those working as an Associate may earn £38,000 to £45,000. The Architects Online Salary Survey for July 2006 shows the following national average salaries, and high and low salaries. The survey notes that regional variations may apply.

Quarterly Pay & Labour Market Report – Issue 1
Produced by Capita August 2006 11
Architect Details Low salary £pa High salary £pa Average salary £pa
Associate 39,750 47,500 43,625
Senior (outside practice) 39,000 48,750 43,875
Project architect 35,750 40,500 38,125
Team leader 30,000 40,250 35,125
Junior architect 25,500 35,250 30,375
Source: Architects Online Salary Survey – July 2006. This can be viewed at www.architects-online.co.uk/salarysurvey.asp
The Hays Architecture Guide to Salaries for 20055 shows a national average salary of £23,423 for newly qualified, part 3 architects (typical salaries range from £21,000 in Scotland up to £29,000 in Central London). Architects with six years’ experience have an average salary of £32,231 (typical salaries range from £28,000 in the North West to £35,000 in Central London, Home Counties and North East). Architects working as an associates earn an average salary of £37,692 and partners/directors, £45,077. 3.4 Building Surveyors The 2006 Royal Institute of Chartered Surveyors and MacDonald & Company Salary & Benefits Survey6 shows the average salary, excluding bonuses, for surveyors is £29,100 (based on a sample of 888 participants) and for senior surveyors is £38,400 (based on a sample of 1,206 participants) in the UK. Average salaries vary by geographical location Area Surveyor £pa Senior Surveyor £pa
London/South East 31,500 41,300 South West/Wales 27,600 37,100 Midlands/East Anglia 28,000 35,300 North West/North East 27,400 36,400 Scotland 25,100 34,600
The survey includes data on over 5,000 survey professionals (including partners) working in different sectors. Those working in central/local government (£39,700) and non-profit making organisations (£38,000) earn the lowest average salaries. Average salaries within the education sector are higher at £41,500. Building surveyors in the survey earn an average salary of £36,860.
5 Available to download or order from www.hays.com 6 Available to download from the Royal Institute of Chartered Surveyors website www.rics.org

Quarterly Pay & Labour Market Report – Issue 1
Produced by Capita August 2006 12
Some 91% of all participants to the survey receive additional benefits, and the most frequently cited are a mobile phone (58%), contributory pension scheme (56%), health insurance (48%) and performance-related bonus (43%). Just over a quarter of all participants (27%) receive a company car and 30% receive a company car allowance. Bonuses are highest and most common in the investment, financial services and surveyor practices and consultancy sectors. The average bonus for a building surveyor is £2,482. Academics are the group least likely to receive a bonus (28%) and the average bonus is just £902. According to the Hays Property & Surveying Guide to Salaries for 20057, the average typical salary for graduate building surveyor is £17,923; and this rises to £19,923 for a building surveyor aged 22 with an HND and 2 years’ experience. A building surveyor, aged 28 with membership of the Royal Institute of Chartered Surveyors earns £30,462. 3.5 Summary The labour market for building professionals is tight with organisations experiencing recruitment problems, and this situation looks set to continue with the strong growth in construction. Salaries for architects are higher than those of surveyors. Median earnings for architects are around £36,500 with more senior architects working as associates earning between £38,500 to £45,000. Average salaries for surveyors are £29,100 and £38,400 for senior surveyors. Surveyors in central and local government earn lower salaries and in addition do not receive the bonuses that are paid to those working in the private sector.
7 Available to download or order from www.hays.com

Quarterly Pay & Labour Market Report – Issue 1
Produced by Capita August 2006 13
The following chart summarises the data for architects:
Architects - Summary of Survey Data Sources (£'000 pa)
ASHE 2005
RIBA 2005
RIBA 2005 Local Govt
RIBA 2005 Cent Govt
Architects Online Project Architect
Hays 2005 Architect (6 years) (ave)
Hays 2005 Associate (ave)
10 20 30 40 50£000s
InterquartileRangeMedian

Quarterly Pay & Labour Market Report – Issue 1
Produced by Capita August 2006 14
4 Executive Assistant 4.1 Factors affecting recruitment and retention The emergence of the role of executive assistant with increased responsibility and higher skill levels than traditionally associated with personal assistant or secretarial roles has been the result of factors such as changes in information technology, flatter organisational structures and increased pressure of work on managers creating opportunities for executive assistants to take on senior managers’ responsibilities. Hays Secretarial reports that competition and the number of personal assistants has increased as the role has developed, and many graduates are now opting for a career as a personal assistant/executive assistant. Post holders are increasingly dealing with HR and recruitment matters, managing staff, assisting in marketing/PR activity, liaising with key clients and dealing with issues in the absence of the director or senior manager. The personal assistant/secretarial market in the areas surrounding London is gradually expanding, as candidates relocate from London and more higher skilled candidates enter local labour markets, creating a demand for their skills. Hays reports that the market is particularly strong at the senior end (salaries of £27,000 and more). There is great demand for candidates with a versatile skills base, especially those that have managed staff or have some experience of HR/recruitment or marketing. Hays says retention rarely comes down to money with staff looking for posts that offer varied and challenging work. Staff turnover tends to be higher at the lower end of the market. Most senior PAs and secretaries will generally demand the attractive benefits package associated with larger companies – healthcare, pension, gym membership and more generous holiday entitlement. Hays reports that major clients including the public sector are offering flexitime, shorter hours, 25 days’ holiday, pension, free car parking and childcare/creche facilities. With the development and progression of the PA position, employers are offering more dynamic positions. Split roles – the traditional PA role combined with either office management, HR, administrative, marketing, or facilities management – are currently popular. 4.2 Pay levels In looking at the pay of executive assistants/personal assistants, we have also included data on executive secretaries and other personal assistants and senior secretaries. This is because the role of executive assistant is relatively new and there is overlap with the more traditional roles of personal assistant and senior secretaries.

Quarterly Pay & Labour Market Report – Issue 1
Produced by Capita August 2006 15
The Annual Survey of Hours & Earnings (ASHE) shows median average annual gross earnings for all full-time personal assistants and other secretaries April 2005 were £19,025. Average Earnings for Full-Time Personal Assistants & Other Secretaries (£) Occupation (Code) Lower Quartile Median Upper Quartile Mean
Personal assistant & other secretaries (4215)
15,690 19,025 23,701 20,994
There is quite a difference between the lower and upper quartile average earnings, and this is because the range of jobs included in this category is wide. Executive assistants and personal assistants to executives, directors or senior managers are likely to be in this occupational group – probably around or beyond the upper quartile levels of earnings. The following chart summarises the average full-time earnings for personal assistants and other secretaries by geographical area.
Average Full-Time Earnings for Personal Assistants/Other Secretaries by geographical area
17,827
19,792
17,675
18,463
16,080
18,687
18,426
17,149
19,208
20,048
25,705
0 5,000 10,000 15,000 20,000 25,000 30,000
Scotland
Wales
South West
Yorks & Humber
North East
North West
West Midlands
East Midlands
East of England
South East
London
Geo
grap
hica
l Are
a
£s
Earnings are significantly higher in London, and there are some significant differences in the earnings levels between regions. According to Incomes Data Services, the greatest levels of differences in pay by region are found for clerical and secretarial staff groups.

Quarterly Pay & Labour Market Report – Issue 1
Produced by Capita August 2006 16
The Hays Secretarial Salary Guide 2005/68 shows national average salaries of £19,922 for personal assistants to managers, £22,938 for personal assistants for directors, and £26,438 for executive assistants. The guide also provides information on the typical salaries and salary ranges for these posts by geographical area, which is summarised below. There are significant variations in the salary levels by geographical area, with London and the South East paying the highest salaries. Typical salaries (£) Geographical Area Manager Level PA Director Level PA Executive Assistant
London 26,000 32,000 37,000 Outer London 23,250 26,000 31,000 Surrey 23,000 25,000 28,000 Thames Valley 22,000 26,000 32,000 North Home Counties 23,000 25,000 30,000 East Anglia 17,500 20,000 23,000 West Midlands 18,000 20,000 25,000 East Midlands 18,000 20,000 25,000 South West 18,000 20,000 25,000 South Coast 23,000 27,000 32,000 North West 17,000 20,000 26,000 North East 17,000 20,000 21,000 Yorkshire 21,000 23,000 25,000 Wales 17,000 22,000 22,000 Scotland 18,000 22,000 24,000 Northern Ireland 17,000 19,000 17,000 National Average 19,922 22,938 26,438
The data in other salary surveys seems to generally confirm these pay levels: • The Croner Reward Clerical & Operatives Reward Survey shows a median basic salary
of £20,811 and median total earnings of £21,195 (at August 2005) for the post of Director’s Secretary.
• The Elizabeth Hunt Executive Secretarial/Senior Administration Salary Survey and
Employment Outlook for 2006 shows salaries paid to Executive Assistants generally range from £32,000 to £40,000 in the City of London and from £28,000 to £38,000 for the West End of London. Salaries range from £19,000 to £25,000 in Leeds, and from £17,000 to £28,000 in Manchester.
• The Joslin Rowe Salary Survey 2005/2006 for Scotland shows a salary range of
£19,000 to £24,000 and a typical salary of £20,000 for Executive Assistant/PA posts in Scotland.
8 Available to order from www.hays.com

Quarterly Pay & Labour Market Report – Issue 1
Produced by Capita August 2006 17
4.3 Advertised Salaries NHS Partners’ monitoring of Executive Assistant posts advertised by local authorities, charities and public sector organisations suggests the most common salary range for Executive Assistants in these sectors is from around £25,000 to £30,000. Most of these advertised posts were for posts based in London but there were examples of these and higher pay levels outside London. 4.4 Local authorities Data from the Employer’s Organisation for Local Government’s database of advertised salaries (as published in the Local Government Employment Digest, April 2006) shows:
• The median minimum salary for Personal Assistant posts is £18,200 and the median
maximum salary is £21,200 in all councils (based on a sample of 224 posts). The median minimum and maximum salaries are £24,100 and £25,400 respectively for local authorities in London (based on a sample of 82 posts).
• Median salaries ranged from a minimum of £15,200 to a maximum of £17,000 for
secretaries in all councils (based on a sample of 230 posts) and £17,800 to £19,900 in London (based on a sample of 46 posts).
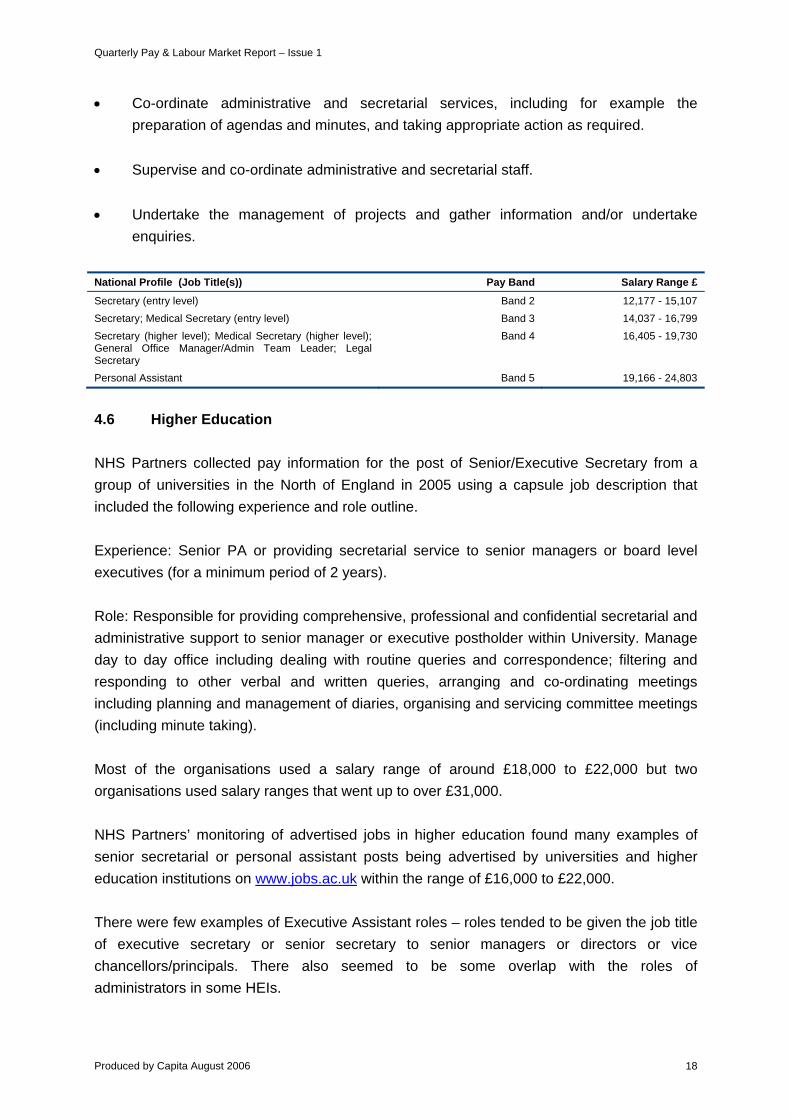
A recent advertisement placed by Northampton Borough Council illustrated the differences in pay levels for posts. It advertised three posts as part of its Chief Executive’s team: an Executive Assistant post paying £31,653 to £34,986; an Executive Secretary role at £25,437 to £26,928; and a Secretary to the Chief Executive at £20,895 to £22,293. Only just under 5% of local authorities reported difficulties recruiting and just under 2% difficulties retaining secretaries in the June 2005 survey by the Employers Organisation. 4.5 NHS The following national job profiles were developed as part of the implementation of the new Agenda for Change pay system. Details of the appropriate pay band and salary ranges are summarised below and full details of the profiles can be obtained from the NHS Partners helpdesk or NHS Employers website. Higher level secretaries are in pay band 4, with a salary range of £16,405 to £19,730, while personal assistants are in pay band 5, with a salary range of £19,166 to £24,803. The job statement for the personal assistant profile states that the post holder will:
Quarterly Pay & Labour Market Report – Issue 1
Produced by Capita August 2006 18
• Co-ordinate administrative and secretarial services, including for example the preparation of agendas and minutes, and taking appropriate action as required.
• Supervise and co-ordinate administrative and secretarial staff. • Undertake the management of projects and gather information and/or undertake
enquiries. National Profile (Job Title(s)) Pay Band Salary Range £
Secretary (entry level) Band 2 12,177 - 15,107 Secretary; Medical Secretary (entry level) Band 3 14,037 - 16,799 Secretary (higher level); Medical Secretary (higher level); General Office Manager/Admin Team Leader; Legal Secretary
Band 4 16,405 - 19,730
Personal Assistant Band 5 19,166 - 24,803
4.6 Higher Education NHS Partners collected pay information for the post of Senior/Executive Secretary from a group of universities in the North of England in 2005 using a capsule job description that included the following experience and role outline. Experience: Senior PA or providing secretarial service to senior managers or board level executives (for a minimum period of 2 years). Role: Responsible for providing comprehensive, professional and confidential secretarial and administrative support to senior manager or executive postholder within University. Manage day to day office including dealing with routine queries and correspondence; filtering and responding to other verbal and written queries, arranging and co-ordinating meetings including planning and management of diaries, organising and servicing committee meetings (including minute taking). Most of the organisations used a salary range of around £18,000 to £22,000 but two organisations used salary ranges that went up to over £31,000. NHS Partners’ monitoring of advertised jobs in higher education found many examples of senior secretarial or personal assistant posts being advertised by universities and higher education institutions on www.jobs.ac.uk within the range of £16,000 to £22,000. There were few examples of Executive Assistant roles – roles tended to be given the job title of executive secretary or senior secretary to senior managers or directors or vice chancellors/principals. There also seemed to be some overlap with the roles of administrators in some HEIs.

Quarterly Pay & Labour Market Report – Issue 1
Produced by Capita August 2006 19
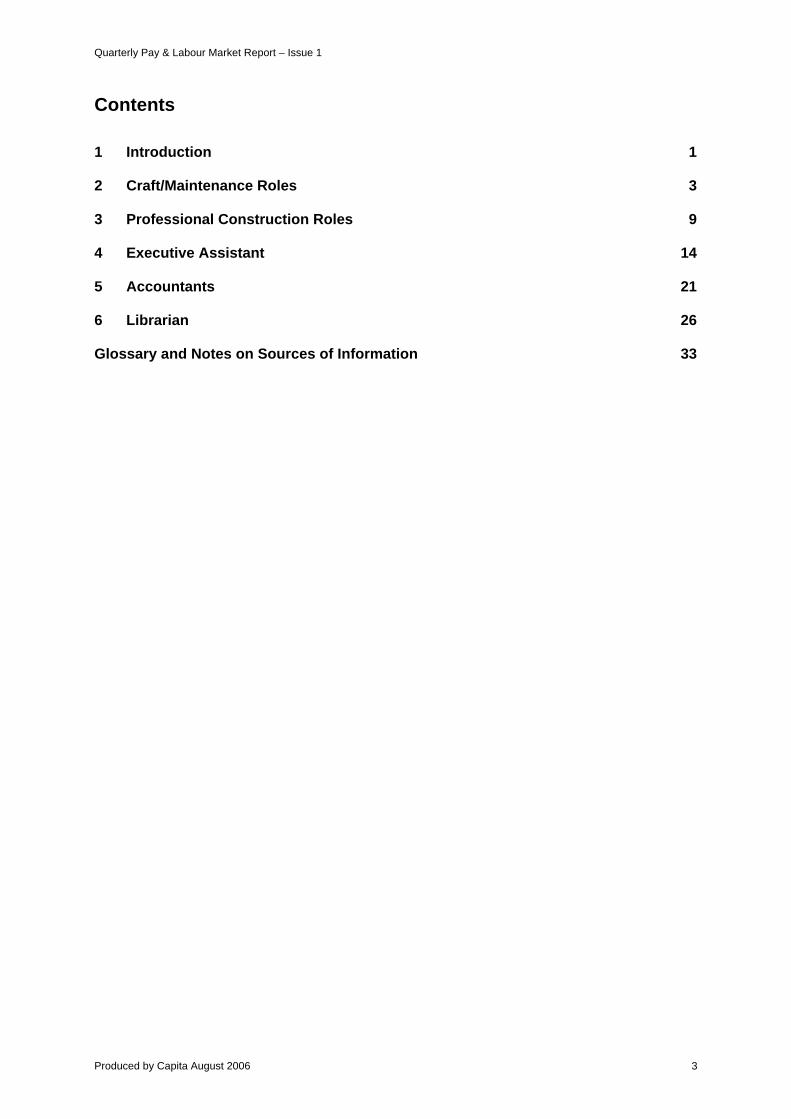
In the recent UCEA survey, retention was not perceived to be a problem overall, although HR staff in the South East reported some issues relating to the retention of support staff in secretarial positions. 4.7 Summary for Executive Assistants
Executive Assistants/PA/Secretaries: Summary of Survey Data Sources (£'000 pa)
ASHE 2005 PA/Secretaries
Hays 2005 Manager PA (ave)
Hays 2005 Director PA (ave)
Hays 2005 Exec Asst (ave)
NHS Secretary
NHS Secretary (higher level)
NHS Personal assistant
Local Govt PAs (median range)
10 20 30 40 50£000s
InterquartileRangeMedian
This section has looked at the labour market and salaries being paid for Executive Assistants, including PAs and senior secretaries who typically have a wider range of responsibilities than the traditional secretary. Some recruitment organisations report strong demand for executive assistants. In overall terms, ASHE data shows salaries for PAs and Other Secretaries typically range between £15,690 and £23,701, with a median of £19,025. Executive Assistants and PAs to directors would be at the upper end of this range. In more detailed terms, salaries for: • Managers’ PAs average £19,922 • Directors’ PAs average £22,938 • Executive Assistants average £26,438.

Quarterly Pay & Labour Market Report – Issue 1
Produced by Capita August 2006 20
Salaries however vary considerably. Outside London and the South East for example salaries for Directors’ PAs range from £20,000 in the North East to £27,000 on the South Coast – a difference of 35%. Salaries in the NHS for senior secretaries and PAs under the new pay system range from • £16,405 to £19,730 for Higher Level Secretaries (typically those with supervisory
responsibilities). • £19,166 to £24,803 for PAs. Salaries for Senior Secretaries and PAs in Higher Education appear to be around a similar level to those found within the NHS. The job title of executive assistant appears to be rare in the sector with other titles being used.

Quarterly Pay & Labour Market Report – Issue 1
Produced by Capita August 2006 21
5 Accountants 5.1 Introduction This section of the report looks at the labour market and pay levels for accountants. There are a wide range of accountancy posts (which we will look at in greater depth in future reports), and we have focused in this report on the salaries paid for those who are newly qualified and those with two years’ post-qualification experience. 5.2 Factors affecting recruitment and retention Demand for accountants has been growing in recent years, thanks to new legislation and changes to auditing and accounting rules. Despite this, the recent Accountancy Age/Robert Half Survey of around 1,200 professional accountants generally reports fairly modest pay increases, in line with inflation, over the past year. There also appears to be less movement in the jobs market, and promotion and career development seem to be more important factors in encouraging accountants to move jobs than simply being paid more. 5.3 Pay levels Overall, the Annual Survey of Hours & Earnings (ASHE) shows median average annual gross earnings for full-time chartered and certified accountants at April 2005 were £36,059. Average Earnings for Full-Time Charted & Certified Accountants (£) Occupation (Code) Lower Quartile Median Upper Quartile Mean
Chartered/ Certified accountants (2421
27,777 36,059 44,816 39,666
There is a significant difference between the lower and upper quartile average earnings of accountants. This is because the jobs included in this category range from newly qualified accountants to highly experienced accountants. The salary surveys discussed below provide a more detailed analysis of pay levels according to years of experience. The following chart summarises the average full-time earnings for chartered and certified accountants by geographical area from ASHE.

Quarterly Pay & Labour Market Report – Issue 1
Produced by Capita August 2006 22
Average Full-Time Earnings for Accountants by geographical area
32,410
31,498
37,087
35,648
32,363
35,492
38,495
37,885
36,154
39,772
47,595
0 5,000 10,000 15,000 20,000 25,000 30,000 35,000 40,000 45,000 50,000
Scotland
Wales
South West
Yorks & Humber
North East
North West
West Midlands
East Midlands
East of England
South East
London
Geo
grap
hica
l Are
a
£s
5.4 Salary Survey Data The Martin Anderson 2006 Salary Survey shows newly qualified CIMA/ACCA accountants earning £37,000 to £40,000 in a small/medium company and £38,000 to £46,000 in large company in the commerce and industry sector (excluding banking) in London. The salary ranges rise to £40,000 to £47,000 and £45,000 to £52,000 respectively with two years’ post qualification experience. Salary levels are slightly higher for ACA qualified accountants because the ACA qualification is generally more sought after by employers. Salaries in Large Companies in Commerce & Industry by Location Location CIMA/ACCA ACA
Newly Qualified Two Years PQE Newly Qualified Two Years PQE
London 38-46,000 45-52,000 42-46,000 48-55,000 Middlesex 38-42,000 43-52,000 38-45,000 45-55,000 Thames Valley 40-42,000 45-50,000 38-42,000 50-55,000 Southern Home Counties
48-40,000 45-50,000 40-45,000 50-55,000
South Coast 33-38,000 38-45,000 35-40,000 40-46,000 Northern Home Counties
36-42,000 42-48,000 40-46,000 45-50,000
North Bucks, Beds & Northants
34-40,000 42-50,000 38-44,000 44-50,000
Midlands 28-34,000 34-45,000 30-36,000 35-45,000 North of England 30-35,000 35-45,000 30-36,000 36-45,000 Scotland 30-34,000 32-38,000 29-35,000 40-45,000 Source: Martin Anderson

Quarterly Pay & Labour Market Report – Issue 1
Produced by Capita August 2006 23
The table above shows that salaries vary considerably between locations and, in particular, that salaries in the Midlands and North of England are around £10,000 less than in London and the South East. The survey shows salaries for newly qualified accountants in the not for profit and public sectors in London are generally between £30,000 to £40,000, rising to £35,000 to £45,000 for qualified accountants with up to two years’ post qualification experience. The Joslin Rowe salary Survey 2005/6 for Scotland shows a salary range of £28,000 to £36,000 and typical salary of £32,000 for ACA, CIMA and ACCA qualified financial accountants. The Hays Accountancy & Finance Public Services Guide 2006 provides details of salary ranges and typical salaries for newly qualified accountants by different types of public sector organisation. Hays defines newly qualified accountants as fully qualified CCAB accountants with up to 2 years post qualification experience. Typical Salaries for Newly Qualified Accountants (£pa)
Location Charities Central Government/ Government
Agencies
District/ Borough Councils
Metropolitan/ County/ Unitary
Councils
Higher Education
Greater London
34,500 36,000 36,000 36,500
South East 30,000 30,000 32,000 33,000 32,500 East of England 25,500 27,000 29,000 30,000 30,000
East Midlands 26,000 30,000 27,500 28,500 29,500 West Midlands 28,000 28,500 31,500 32,000 31,000
South West 27,000 27,000 27,000 28,000 28,500 North West 25,500 30,500 28,000 29,000 28,000 North East 25,500 30,000 27,750 29,000 26,500
Yorkshire & the Humber
25,250 28,000 27,500 28,000 28,500
Wales 25,000 25,000 26,000 27,000 27,000 Scotland 23,500 27,500 27,000 27,500
Northern Ireland 20,000 22,000 23,000 25,250 National Average 25,568 28,458 27,841 30,500 29,229
The table above shows that salaries are broadly comparable across the public sector but are lower in charities. With staff generally on national terms and conditions, there is much less of a difference in salaries between locations than the private sector.

Quarterly Pay & Labour Market Report – Issue 1
Produced by Capita August 2006 24
5.5 Local Government The Local Government Employers’ database of advertised salaries shows a median minimum salary of £29,100 and a median maximum salary of £33,600 for accountant posts in all councils, based on a sample size of 247 posts. Nearly one-third of councils in the June 2005 Recruitment & Retention Survey undertaken by the Local Government Employers’ Organisation reported problems recruiting accountancy staff and 18% problems retaining them. There is some evidence of local authorities paying market supplements to recruit and retain accountants. 5.6 NHS The NHS Partners NHS Salary Club Survey for 2005/6 found the following basic salaries for financial accountants in NHS organisations. Lower Quartile
£pa Median
£pa Upper Quartile
£pa Average
£pa Sample Size
Financial Accountant 31,013 36,822 41,246 36,075 41
The national NHS job profile for financial staff includes profiles for specialist and advanced finance analysts for which professional accountancy qualifications are required. Specialist Finance Analysts are in pay band 6, with a salary range of £22,886 to £31,004, and Advanced Finance Analysts are in pay band 7, with a salary range of £27,622 to £36,416. 5.7 Benefits The Accountancy Age/Robert Half Finance & Accounting Salary Survey published in Spring 2006 shows an average salary of £38,861 for accountants. The survey covers a range of accountancy professionals, and the survey found 49% were satisfied with their current salary. The most popular benefits included in remuneration packages were life assurance, health benefits, bonuses and pensions. The survey found long working hours were common, with an average working week of 45 hours, and most participants had been in the current jobs for one to three years. 5.8 Summary The chart above/below summarises the data obtained on accountants salaries.

Quarterly Pay & Labour Market Report – Issue 1
Produced by Capita August 2006 25
Accountants: Summary of Survey Data (£'000 pa)
ASHE 2005
Martin Anderson Newly Qualified London
Martin Anderson 2yrs PQE London
Martin Anderson Newly Qualified London (nfp/public
Martin Anderson 2yrs PQE London (nfp/public)
Hays Newly Qualified (ave) Charities
Hays Newly Qualified (ave) Cental Govt
Hays Newly Qualified (ave) Local Govt
Hays Newly Qualified (ave) Higher Education
NHS Finance Analyst
NHS Advanced Financial Analyst
10 20 30 40 50 60£000s
InterquartileRangeMedian
In overall terms ASHE data shows the inter-quartile range of earnings for qualified accountants is from £27,777 to £44.816, with a median of £36,059, but this will include a very wide range of types of accountants, from the newly qualified to those with several years’ experience working in the City. Data from the Martin Anderson survey shows that salaries in the private sector vary by around £10,000 between regions, such as London and the South East and Midlands and the North. Salaries in not for profit organisations are also considerably lower than in commerce and industry. Data from the Hays survey shows that there is very little difference between salaries for newly qualified accountants across the public sector, and that these are higher than those paid by charitable organisations. Salaries in the NHS under the new pay system range from £22,886 to £31004 for a Specialist Financial Analyst, to £27,622 to £36,416 for an Advanced Finance Analyst.
Quarterly Pay & Labour Market Report – Issue 1
Produced by Capita August 2006 26
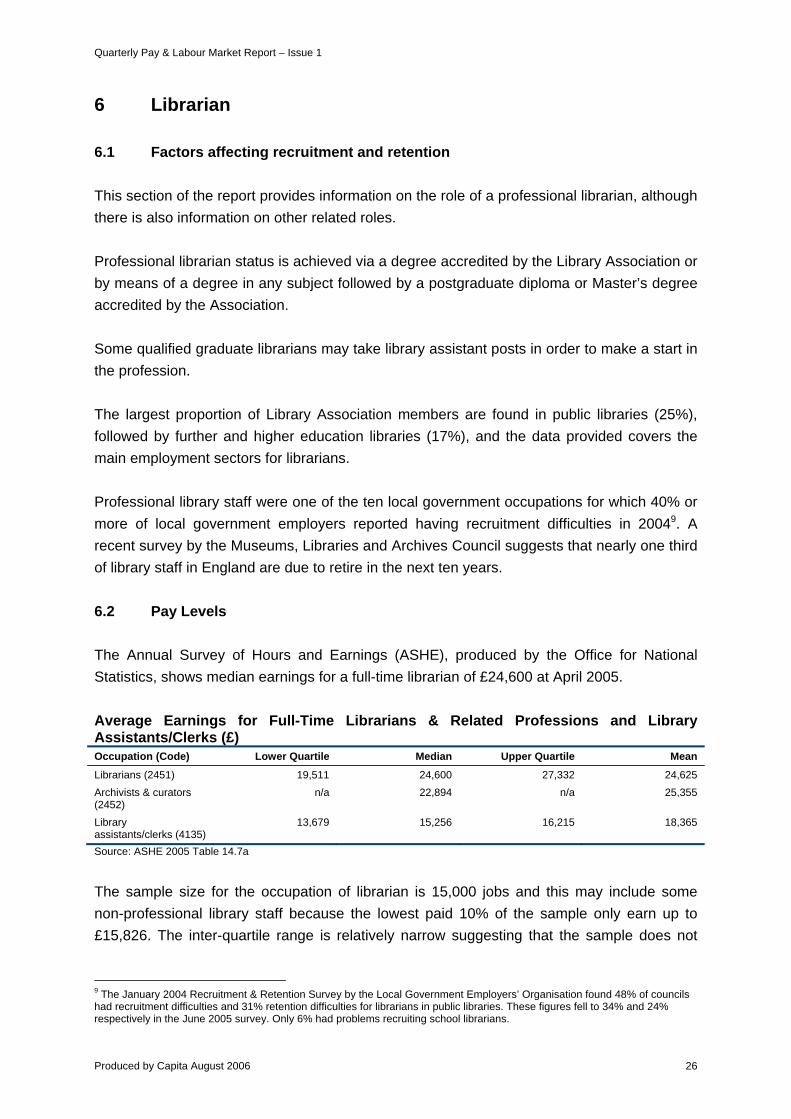
6 Librarian 6.1 Factors affecting recruitment and retention This section of the report provides information on the role of a professional librarian, although there is also information on other related roles. Professional librarian status is achieved via a degree accredited by the Library Association or by means of a degree in any subject followed by a postgraduate diploma or Master’s degree accredited by the Association. Some qualified graduate librarians may take library assistant posts in order to make a start in the profession. The largest proportion of Library Association members are found in public libraries (25%), followed by further and higher education libraries (17%), and the data provided covers the main employment sectors for librarians. Professional library staff were one of the ten local government occupations for which 40% or more of local government employers reported having recruitment difficulties in 20049. A recent survey by the Museums, Libraries and Archives Council suggests that nearly one third of library staff in England are due to retire in the next ten years. 6.2 Pay Levels The Annual Survey of Hours and Earnings (ASHE), produced by the Office for National Statistics, shows median earnings for a full-time librarian of £24,600 at April 2005. Average Earnings for Full-Time Librarians & Related Professions and Library Assistants/Clerks (£) Occupation (Code) Lower Quartile Median Upper Quartile Mean
Librarians (2451) 19,511 24,600 27,332 24,625 Archivists & curators (2452)
n/a 22,894 n/a 25,355
Library assistants/clerks (4135)
13,679 15,256 16,215 18,365
Source: ASHE 2005 Table 14.7a
The sample size for the occupation of librarian is 15,000 jobs and this may include some non-professional library staff because the lowest paid 10% of the sample only earn up to £15,826. The inter-quartile range is relatively narrow suggesting that the sample does not
9 The January 2004 Recruitment & Retention Survey by the Local Government Employers’ Organisation found 48% of councils had recruitment difficulties and 31% retention difficulties for librarians in public libraries. These figures fell to 34% and 24% respectively in the June 2005 survey. Only 6% had problems recruiting school librarians.

Quarterly Pay & Labour Market Report – Issue 1
Produced by Capita August 2006 27
include a wide range of different types or levels of librarian or that the number of more highly paid librarians is small. The following chart summarises the average full-time earnings for librarians by geographical area.
Average Full-Time Earnings for Librarians by geographical area
26,211
25,277
22,540
19,912
19,088
30,841
24,313
25,210
26,972
0 5,000 10,000 15,000 20,000 25,000 30,000 35,000
Scotland
Wales
Yorks & Humbers
North West
West Midlands
East Midlands
East of England
South East
London
Geo
grap
hica
l Are
a
£s
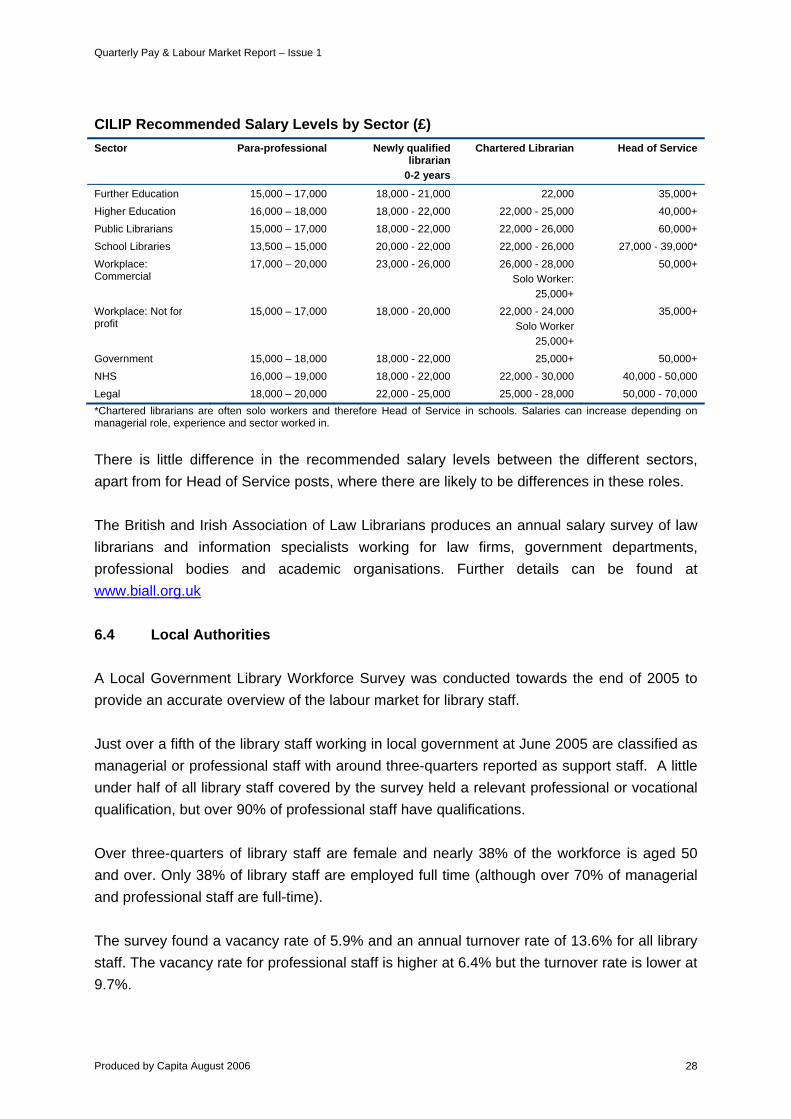
It is difficult to explain why the figure for the East Midlands should be so high and the figure for West Midlands so low. With the majority of librarians employed by local authorities and education sectors, where national pay rates tend to apply, such variations seem unlikely. No figure is available for the North East because there is insufficient data. 6.3 Chartered Institute of Library and Information Professionals The Chartered Institute of Library and Information Professionals (CILIP) recommends that posts requiring the employment of a Chartered Librarian should be graded to provide a salary of no less than £22,000. The CILIP produces salary guidelines for librarians working in law firms, schools, public libraries, further and higher education and the NHS. The table below summarises the recommended salary guidelines, which do not take account of special allowances such as London weighting or other benefits. Further details are available on the CILIP website www.cilip.org.uk
Quarterly Pay & Labour Market Report – Issue 1
Produced by Capita August 2006 28
CILIP Recommended Salary Levels by Sector (£) Sector Para-professional Newly qualified
librarian 0-2 years
Chartered Librarian Head of Service
Further Education 15,000 – 17,000 18,000 - 21,000 22,000 35,000+ Higher Education 16,000 – 18,000 18,000 - 22,000 22,000 - 25,000 40,000+ Public Librarians 15,000 – 17,000 18,000 - 22,000 22,000 - 26,000 60,000+ School Libraries 13,500 – 15,000 20,000 - 22,000 22,000 - 26,000 27,000 - 39,000* Workplace: Commercial
17,000 – 20,000 23,000 - 26,000 26,000 - 28,000 Solo Worker:
25,000+
50,000+
Workplace: Not for profit
15,000 – 17,000 18,000 - 20,000 22,000 - 24,000 Solo Worker
25,000+
35,000+
Government 15,000 – 18,000 18,000 - 22,000 25,000+ 50,000+ NHS 16,000 – 19,000 18,000 - 22,000 22,000 - 30,000 40,000 - 50,000 Legal 18,000 – 20,000 22,000 - 25,000 25,000 - 28,000 50,000 - 70,000 *Chartered librarians are often solo workers and therefore Head of Service in schools. Salaries can increase depending on managerial role, experience and sector worked in. There is little difference in the recommended salary levels between the different sectors, apart from for Head of Service posts, where there are likely to be differences in these roles. The British and Irish Association of Law Librarians produces an annual salary survey of law librarians and information specialists working for law firms, government departments, professional bodies and academic organisations. Further details can be found at www.biall.org.uk 6.4 Local Authorities A Local Government Library Workforce Survey was conducted towards the end of 2005 to provide an accurate overview of the labour market for library staff. Just over a fifth of the library staff working in local government at June 2005 are classified as managerial or professional staff with around three-quarters reported as support staff. A little under half of all library staff covered by the survey held a relevant professional or vocational qualification, but over 90% of professional staff have qualifications. Over three-quarters of library staff are female and nearly 38% of the workforce is aged 50 and over. Only 38% of library staff are employed full time (although over 70% of managerial and professional staff are full-time). The survey found a vacancy rate of 5.9% and an annual turnover rate of 13.6% for all library staff. The vacancy rate for professional staff is higher at 6.4% but the turnover rate is lower at 9.7%.
Quarterly Pay & Labour Market Report – Issue 1
Produced by Capita August 2006 29
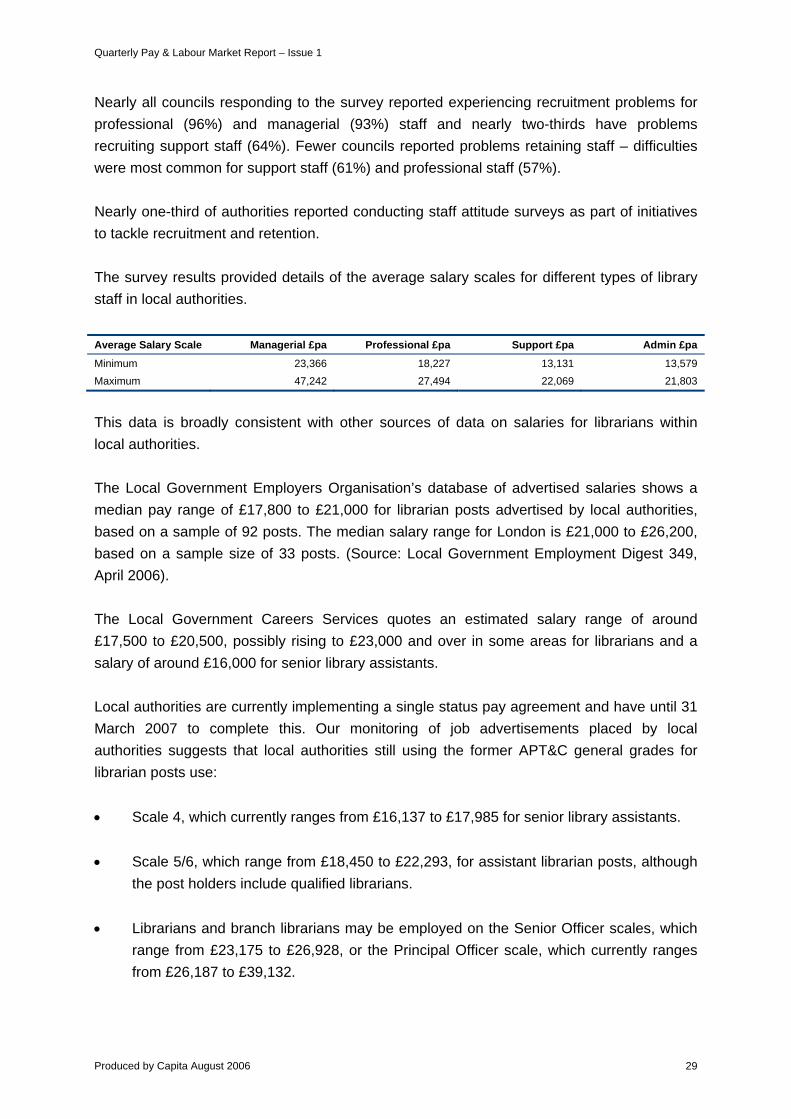
Nearly all councils responding to the survey reported experiencing recruitment problems for professional (96%) and managerial (93%) staff and nearly two-thirds have problems recruiting support staff (64%). Fewer councils reported problems retaining staff – difficulties were most common for support staff (61%) and professional staff (57%). Nearly one-third of authorities reported conducting staff attitude surveys as part of initiatives to tackle recruitment and retention. The survey results provided details of the average salary scales for different types of library staff in local authorities. Average Salary Scale Managerial £pa Professional £pa Support £pa Admin £pa
Minimum 23,366 18,227 13,131 13,579 Maximum 47,242 27,494 22,069 21,803
This data is broadly consistent with other sources of data on salaries for librarians within local authorities. The Local Government Employers Organisation’s database of advertised salaries shows a median pay range of £17,800 to £21,000 for librarian posts advertised by local authorities, based on a sample of 92 posts. The median salary range for London is £21,000 to £26,200, based on a sample size of 33 posts. (Source: Local Government Employment Digest 349, April 2006). The Local Government Careers Services quotes an estimated salary range of around £17,500 to £20,500, possibly rising to £23,000 and over in some areas for librarians and a salary of around £16,000 for senior library assistants. Local authorities are currently implementing a single status pay agreement and have until 31 March 2007 to complete this. Our monitoring of job advertisements placed by local authorities suggests that local authorities still using the former APT&C general grades for librarian posts use: • Scale 4, which currently ranges from £16,137 to £17,985 for senior library assistants. • Scale 5/6, which range from £18,450 to £22,293, for assistant librarian posts, although
the post holders include qualified librarians. • Librarians and branch librarians may be employed on the Senior Officer scales, which
range from £23,175 to £26,928, or the Principal Officer scale, which currently ranges from £26,187 to £39,132.

Quarterly Pay & Labour Market Report – Issue 1
Produced by Capita August 2006 30
Data on the pay rates for librarians in local authorities with their own local pay structures shows Buckinghamshire County Council pays £20,664 to £22,368 or £22,776 to £24,735 to an assistant librarian; £25,229 to £27,867 for an assistant district librarian in charge of a small library and £28,587 to 31,818 if they are in charge of a large library. It pays £37,317 to £41,655 for the district librarian. Surrey County Council pays librarians on three grades of its pay structures and salaries range from £15,162 to £23,562. Senior librarians are paid on two grades, and salaries range from £23,118 to £31,128. 6.5 NHS The national job profiles used to match posts as part of the new Agenda for Change pay system in the NHS shows the following pay bands and salary ranges for Librarian posts in the NHS. Further details of these job profiles are available from NHS Partners or can be downloaded from NHS Employers website. The job statement for the librarian profile, for example, says that that the librarian: • Assists in the delivery of the full range of services within the library and information
service. • Provides professional assistance to the library site/service manager. • Takes specific responsibility for discrete areas of the service such as collection
management, information skills training, enquiry services, website development, electronic resources, cataloguing and classification of resources, current awareness services.
Job Profile Pay Band 1 April 2006 Salary Range £
Librarian Band 5 19,166 to 24,803 Librarian Specialist Band 6 22,886 to 31,004 Librarian Team Leader Band 6 22,886 to 31,004 Librarian Service Manager Band 7 27,622 to 36,416 Professional Manager Library Services Band 8a-8b 35,232 to 42,278
41,038 to 50,733
There are also three pay bands for library technicians: Job Profile Pay Band 1 April 2006 Salary Range £
Library Technician Entry Level Band 2 12,177 to 15,107 Library Technician Band 3 14,037 to 16,799 Library Technician Higher Level Band 4 16,405 to 19,730

Quarterly Pay & Labour Market Report – Issue 1
Produced by Capita August 2006 31
6.6 Government Departments & Agencies The salaries paid to librarians by Government departments and agencies generally fall within the following ranges: • Assistant librarian: £18,000 to £26,000 • Librarian: £21,000 to £30,000 • Senior librarian: £27,000 to £38,000. The BBC pays its librarians between £16,186 and £25,611 outside London and £19,772 to £28,824 in London. 6.7 Summary for Librarians
Librarians (£'000 pa)
ASHE 2005
Local Govt Survey: Professional Staff
NHS Pay Band for Librarian
Government Departments/Agencies: Librarian
CILIP Rec Salaries: Chartered Lib (HE)
CILIP Rec Salaries: Chartered Lib (Public Libs)
CILIP Rec Salaries: Chartered Lib (Workplace)
CILIP Rec Salaries: Chartered Lib (Legal)
10 20 30 40£000s
The main employers of librarians are local authorities (in public libraries) and further and higher education. In general, there appears to be broad consistency in the salaries paid to library staff. In overall terms ASHE data shows:

Quarterly Pay & Labour Market Report – Issue 1
Produced by Capita August 2006 32
• Earnings for library assistants typically range from £13,679 to £16,215 with a median of £15,256.
• Earnings for librarians typically range from £19,511 to £27,332, with a median of
£24,600. • The median earnings of a curator or archivist are £22,894. Because the vast numbers of librarians work for local authorities and in the education sector, there should be little variation in pay levels. While the ASHE data does show salaries being very high in the East Midlands and very low in the West Midlands and North West it is hard to explain these differences other than by a statistical aberration. The Chartered Institute of Library and Information Professionals (CILIP) recommends that Chartered Librarians should not be paid less than £22,000; and £22,000 to £25,000 in Higher Education. Newly qualified librarians should be paid £18,000 to £22,000 and Heads of Service should be paid more than £40,000. It does not recommend very different salaries between different sectors. Pay rates in local authorities and the NHS are broadly consistent with these guidelines as are salaries paid by Government Departments and Agencies.

Quarterly Pay & Labour Market Report – Issue 1
Produced by Capita August 2006 33
Glossary and Notes on Sources of Information Glossary ACA Association of Chartered Accountants ACCA Association of Chartered Certified Accountants CCAB Consulting Committee of Accounting Bodies CIMA Chartered Institute of Management Accountants CILIP Chartered Institute of Library and Information Professionals Notes on Sources ASHE The Annual Survey of Hours & Earnings Survey is based on earnings data drawn from a 1% random sample of Pay As You Earn (PAYE) employees provided by employers. The sample sizes are generally large and the source is considered a useful indicator of pay levels for particular occupations, although there are some important limitations. The data contained in this report relates to April 2005, and data for April 2006 is due to be published in Autumn 2006. We have used data for occupations as identified by 4-digit SOC codes. In most cases this gives a reasonably tight definition of an occupation but there are some occupations (such as accountant) where the sample will include a wide range of posts, such as from newly qualified accountant to experienced accountant, and these individuals are paid very different salaries. With such occupations, there will usually be a significant difference between the lower and upper deciles (where these are provided) or lower and upper quartiles, and this greatly reduces the usefulness of the data. The appropriate commentary will highlight such occupations. The data for 4-digit occupations is only available at national level and at a regional level within England and for Scotland and Wales10. These are large geographical areas, which are likely to cover a number of different labour markets, and this may have the effect of averaging out or reducing differences between different locations. For example, the data for Scotland will include posts in areas such as Aberdeen, Edinburgh and Glasgow, where pay levels are likely to be higher, and areas such as Dumfries & Galloway where pay levels may be lower. Similarly, the South West of England will include Bristol and areas such as Devon or Cornwall. 10 This data is available as table 15 from the Office for National Statistics, although it is not published on the website.
Quarterly Pay & Labour Market Report – Issue 1
Produced by Capita August 2006 34
Some of the variations in average earnings for some occupations in different geographical areas seem to be a little surprising, and where there are significantly different figures outside London and the South East it is important to use other sources of data to confirm these figures. Local Government Employers Database The Employers’ Organisation for Local Government has processed advertised salary data from a number of local government websites to create a database to provide a source of pay data for a range of key jobs found within local authorities. The database covers around 50 managerial, professional, administrative and manual roles, and the sources used include data on around 10,000 different jobs each quarter. However, Local Government Employers highlights some limitations of the data (some of these limitations are similar to those discussed for ASHE). Jobs are grouped only according to job title, and different councils may use the same title for different jobs or different titles for similar jobs. Jobs are reviewed to try to address these problems. The median minimum and maximum salaries are quoted for the given sample. The median is used, rather than the mean, because it is felt that this gives a more reliable indicator of the typical salary for a given role. Data is collected for 10 standard geographical areas or regions in England plus Wales. For some geographical areas, particularly the North East and Wales, the dataset has fewer jobs. Data is only included for each area where there is a sample of 20 or more jobs to ensure that the data is representative. The Employers’ Organisation says that care should be taken when interpreting the results of its Market Pay Survey data because of the following factors: • Size of sample. • The location of jobs (labour market pressures vary within as well as between regions). • Seniority analysis is not undertaken for the data (although it may be possible to do this
separately) – so data should be viewed as a useful indicator of current market rates for specific groups of jobs.
Copyright © 2022 FDOKUMEN