SAB Events Survey 2019 Report
14
1 SAB Events Survey 2019 Report
-
Upload
khangminh22 -
Category
Documents
-
view
3 -
download
0
Transcript of SAB Events Survey 2019 Report
1
SAB Events Survey 2019 Report

2
Section 1: Perceptions
Have you heard of SAB (the Student Activities Board)?
Count
Yes No0
100
170
23
AnalysisApproximately 12% of students (based on the survey) have not heard of the Student Activities Board. It seems likely that the number of individuals who are not aware of SAB is actually higher, given that this is a SAB-hosted survey. A
fair estimate would be between 75-85% of the student body is familiar with SAB.
What best describes your overall perception of the Student Activities Board?
Count
ExtremelyPositive
Positive Neutral Negative ExtremelyNegative
I do not knowwhat SAB's is
0
5291
312 0 17
AnalysisVery few students (who responded) have a less-than-neutral opinion of SAB. The vast majority of respondents have a positive+ perception of SAB. Assuming this data is relatively reflective of the student body at-large, our positive image is perhaps one of our greatest strengths. This also suggests that the reason SAB events are not well attended probably does not have any connection to what students think of SAB overall. In other words, it is
seemingly not because we are perceived poorly that events are under-attended.

3
Do you live in the Residence Halls on campus?
Count
Yes No0
50
100
42
128
AnalysisAbout one quarter (25%) of respondents live in the residence halls; this is important to note that SAB's reach seems
to extend to off-campus students more than it has been assumed in the past. Given that the occupancy of the residence halls was approximately 300 students this past year, SAB only reached about 15%-20% of those students
with this survey. This could be an area of increased focus in the future.
Have you attended a SAB event this semester?
Yes No0
50
95 98
Residence Hall Students: Have you attended a SAB event this semester?
Yes No0
10
20
3033
9

4
Off-Campus Students: Have you attended a SAB event this semester?
Yes No0
20
40
60
80
46
82
AnalysisNote the nearly even split: respondents were only slightly more likely (51%) to not have attended a SAB event during
the spring of 2019.
Residence Hall students were far more likely than off-campus students to have attended a SAB Event: 72% compared to 35%.

5
Section 2: Event Attendence
Events Attended
Did Attend Did Not Attend Did NOT Attend Because I Didn't Know About It
Jackets,Java,and ...
Avenger'sEndgameShowing
Sip &Paint
ComedyNight
(Jose ...
Price isRight
Party atthe PubStation
BowlingDay
VideoGameNight
LaserTag inthe ...
0
5028 38 46 43 52 57 56 59 59
7 7 13 18 10 5 12 10 19
5342
30 27 27 25 20 19 9
AnalysisUnexpectedly, the best-attended event was the Jackets, Java, and Jams SERIES. In fact, this was the only event
for which more respondents attended than not. It is likely that the multiple dates in the series accounted for its high attendance.
If one adds the blue (didn't know) and red (attended) columns above, and then subtracts the purple column (didn't
attend), the following events have a net-positive attendance rating: Jackets, Java, and Jams; Avengers Endgame; Comedy Night. These events would have needed better advertising to make them net-positive.All
remaining events were net-negative with regard to attendance.
Residence Hall Students: Events Attended
Did Attend Did Not Attend Did NOT Attend Because I Didn't Know About It
Jackets,Java,and ...
Avenger'sEndgameShowing
ComedyNight
(Jose ...
Price isRight
VideoGameNight
Sip &Paint
Party atthe PubStation
LaserTag inthe ...
BowlingDay
0
204
12 15 15 17 19 23 21 22
0 1 1 1 1 0 0 4 3
2718 15 15 13 12 8 6 6
AnalysisThe best attended events among residence hall students were: Jackets, Java, and Jams (27); Avengers Endgame (18); Comedy Night (15); and Price is Right (15). The least attended events among residence hall students were: Party at the Pub Station (-23); Bowling Day (-22); Laser Tag (-21); and Sip & Paint (-19).
If one adds the red(didn't know) and orange (attended) columns above, and then subtracts the grey column (didn't attend), the following events have a net-positive attendance rating among residence hall students: Jackets, Java, and Jams; Avengers Endgame; Comedy Night; Price is Right. These events would have needed better

6
advertising to make them net-positive.All remaining events were net-negative with regard to attendance among residence hall students.
Off-Campus Students: Events Attended
Did Attend Did Not Attend Did NOT Attend Because I Didn't Know About It
Avenger'sShowin
Jackets,Java, ...
Party atthe ...
Sip &Paint
BowlingDay
Price isRight
ComedyNight ...
VideoGame ...
LaserTag in ...
0
19 19 25 20 25 26 2034 26
5 6 5 13 8 8 145 1317 17 11 10 9 9 8 3 2
AnalysisThe best attended events among off-campus students were:Avengers Endgame (17); Jackets, Java, and Jams (17); and Party at the Pub Station (11). The least attended events among off-campus were: Laser Tag (2); Video Game Night (3); and Comedy Night (8).
If one adds the orange(didn't know) and green(attended) columns above, and then subtracts the yellow column (didn't attend), the following events have a net-positive attendance rating among off-campus students:
Jackets, Java, and Jams; Avengers Endgame; Comedy Night; Sip & Paint. These events would have needed better advertising to make them net-positive. All remaining events were net-negative with regard to attendance
among off-campus students.
How have you heard about SAB Events?(All that apply)
Posters Facebook
Campus Leak
Wordof ...
"FreeTonight
JacketJournal
Flyers/Sheet
Sandwich ...
Centerfor ...
InClass
0
50
100107 103 93
6754
41 32 25 16 14 14
AnalysisThe best method of reaching students from this year were: posters (107); Facebook (103); and Campus Leak (93). A surprising number of students paid attention to print methods of advertising (posters & campus leak). It is also interesting to note the relative success of items like the "Free Event Tonight" signs and the Jacket Journal

7
newsletter, especially when compared to the relative ineffectiveness of the Instagram, Flyers, and Sandwich Boards. SAB could have a much stronger presence in the classroom based on these results
What makes you want to attend a SAB event?
In this free response section, students were asked to share their motivations for attending a SAB Event. The most common responses included:
• If the event sounds fun or relates to their interests (48)• if friends are going or to spend time with friends (36)
• If the event is free (24)• Number of people attending (18)
• To meet new people (18)• General socialization (17)
• Free food or other give-aways (17)
8
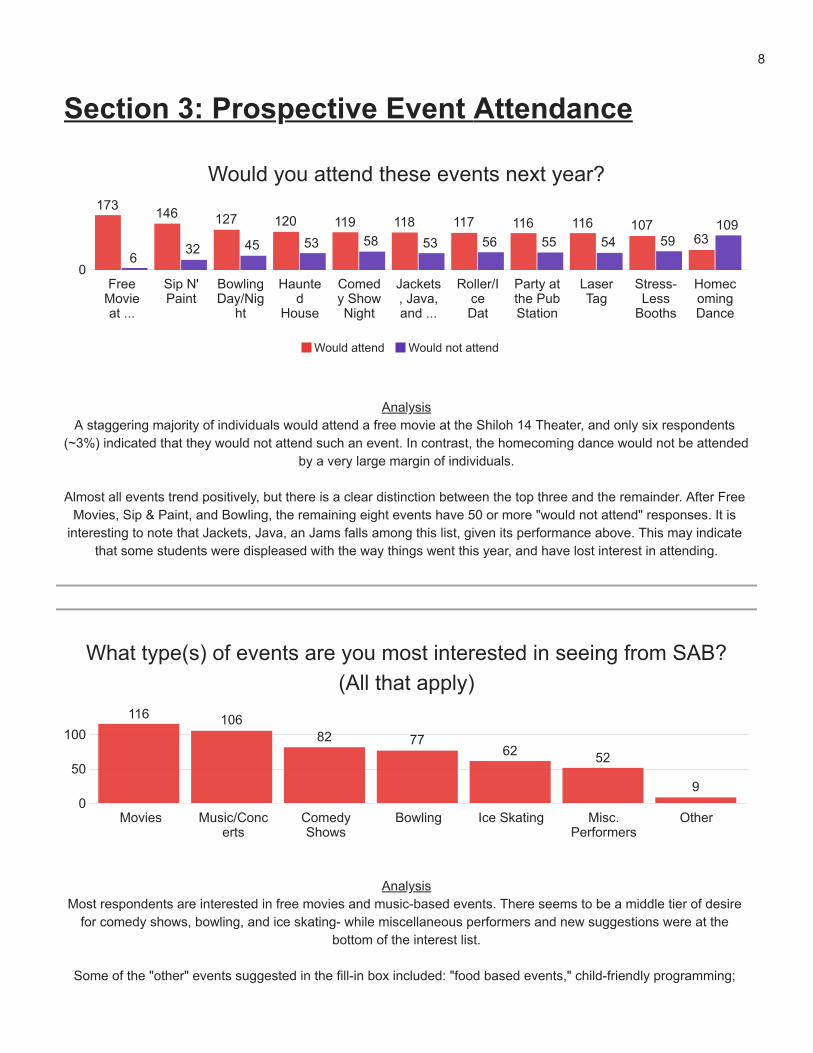
Section 3: Prospective Event Attendance
Would you attend these events next year?
Would attend Would not attend
FreeMovieat ...
Sip N'Paint
BowlingDay/Nig
ht
Haunted
House
Comedy ShowNight
Jackets, Java,and ...
Roller/IceDat
Party atthe PubStation
LaserTag
Stress-Less
Booths
HomecomingDance
06 32 45 53 58 53 56 55 54 59
109173 146 127 120 119 118 117 116 116 107
63
AnalysisA staggering majority of individuals would attend a free movie at the Shiloh 14 Theater, and only six respondents
(~3%) indicated that they would not attend such an event. In contrast, the homecoming dance would not be attended by a very large margin of individuals.
Almost all events trend positively, but there is a clear distinction between the top three and the remainder. After Free
Movies, Sip & Paint, and Bowling, the remaining eight events have 50 or more "would not attend" responses. It is interesting to note that Jackets, Java, an Jams falls among this list, given its performance above. This may indicate
that some students were displeased with the way things went this year, and have lost interest in attending.
What type(s) of events are you most interested in seeing from SAB?(All that apply)
Movies Music/Concerts
ComedyShows
Bowling Ice Skating Misc.Performers
Other0
50
100116 106
82 7762 52
9
AnalysisMost respondents are interested in free movies and music-based events. There seems to be a middle tier of desire
for comedy shows, bowling, and ice skating- while miscellaneous performers and new suggestions were at the bottom of the interest list.
Some of the "other" events suggested in the fill-in box included: "food based events," child-friendly programming;

9
and things to attend as an individual (not in a group). There were also some responses advocating for more Sip & Paint style events.
What type(s) of events are you most interested in seeing from SAB?
AnalysisIn a separate, free-response question, students were asked to provide their suggestions for new programs. Some of
the most frequently suggested items included
• Concerts and Music-based events (13)• Free food/BBQ (9)
• Interaction with dogs/animals (7)• Family events (5)• Yoga/zumba (5)
• Skiing/outdoor adventures (5)• Free movies (5)• Board games (5)
In this section, SAB also received many comments about continuing what it has been doing, as well as several comments regarding the need for better advertising of events.
How likely are you to attend an off-campus event purchased/sponsored by SAB?
Extremelylikely
Moderatelylikely
Slightlylikely
Neitherlikely nor ...
Slightlyunlikely
Moderatelyunlikely
Extremelyunlikely
0
20
40
60
6976
30
82 1 1

10
How likely are you to attend an on-campus event hosted by SAB?
Extremelylikely
Moderatelylikely
Slightlylikely
Neitherlikely nor ...
Slightlyunlikely
Moderatelyunlikely
Extremelyunlikely
0
20
40
6041
67
45
188 6 2
AnalysisRespondents seem overall more likely to attend an off-campus event than an on-campus event. Overall, 175
respondents listed "slightly likely" or better to attend an off-campus event, and only 4 respondents listed "slightly unlikely" or worse. For on-campus events, the numbers are slightly poorer, with 153 "slightly likely" or better, and 16
"slightly unlikely" or worse. Based on these responses, off-campus events seem to be superior for garnering attendance.
Off-campus Event (Off-Campus Students)
Extremelylikely
Moderatelylikely
Slightlylikely
Neitherlikely nor ...
Slightlyunlikely
Moderatelyunlikely
Extremelyunlikely
0
20
40
46 50
20
61 1 0
Off-campus Event (Residence Hall Students)
Extremelylikely
Moderatelylikely
Slightlylikely
Neitherlikely nor ...
Slightlyunlikely
Moderatelyunlikely
Extremelyunlikely
0
10
15 17
62 1 0 0

11
On-campus Event (Off-Campus Students)
Extremelylikely
Moderatelylikely
Slightlylikely
Neitherlikely nor ...
Slightlyunlikely
Moderatelyunlikely
Extremelyunlikely
0
20
40
21
45
32
146 4 2
On-campus Event (Residence Hall Students)
Extremelylikely
Moderatelylikely
Slightlylikely
Neitherlikely nor ...
Slightlyunlikely
Moderatelyunlikely
Extremelyunlikely
0
5
10
15 1416
8
2 1 0 0
AnalysisInterestingly, students who live in the residence halls are just as likely to attend an off-campus event as an off-
campus student, according to these responses.
However, off-campus students are less likely to attend an on-campus event than their residence hall counterparts.
12
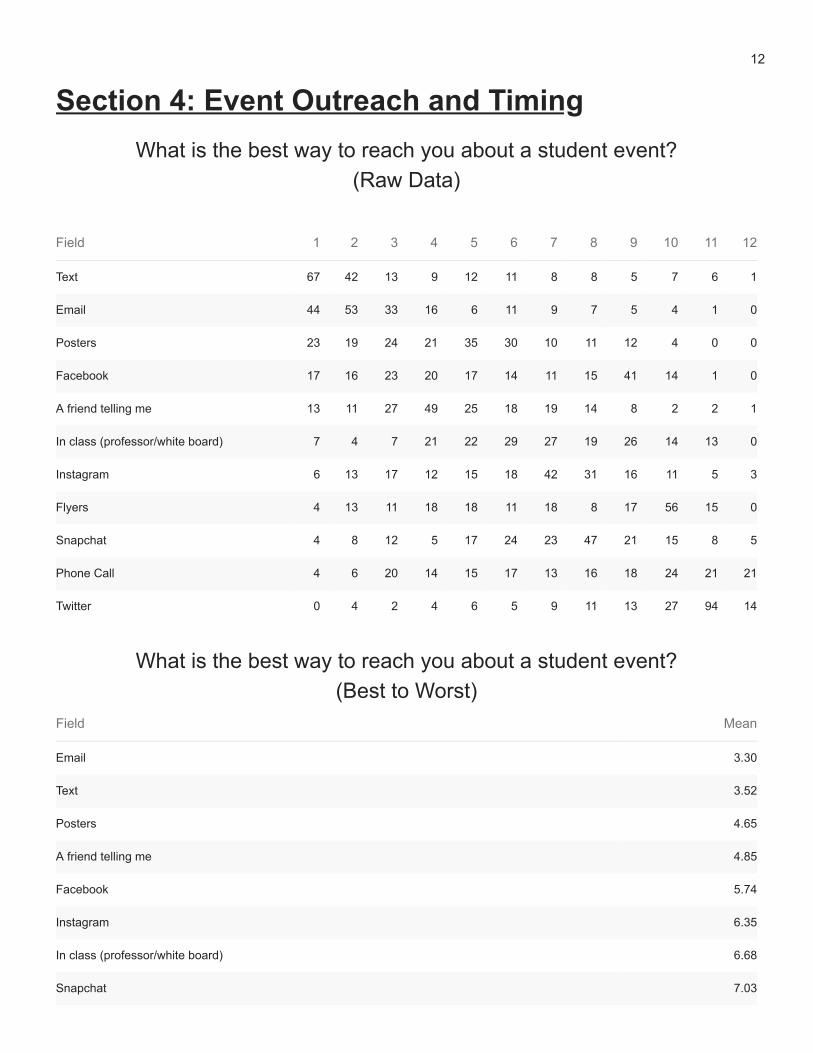
Section 4: Event Outreach and TimingWhat is the best way to reach you about a student event?
(Raw Data)
Field 1 2 3 4 5 6 7 8 9 10 11 12
Text 67 42 13 9 12 11 8 8 5 7 6 1
Email 44 53 33 16 6 11 9 7 5 4 1 0
Posters 23 19 24 21 35 30 10 11 12 4 0 0
Facebook 17 16 23 20 17 14 11 15 41 14 1 0
A friend telling me 13 11 27 49 25 18 19 14 8 2 2 1
In class (professor/white board) 7 4 7 21 22 29 27 19 26 14 13 0
Instagram 6 13 17 12 15 18 42 31 16 11 5 3
Flyers 4 13 11 18 18 11 18 8 17 56 15 0
Snapchat 4 8 12 5 17 24 23 47 21 15 8 5
Phone Call 4 6 20 14 15 17 13 16 18 24 21 21
Twitter 0 4 2 4 6 5 9 11 13 27 94 14
What is the best way to reach you about a student event?(Best to Worst)
Field Mean
Email 3.30
Text 3.52
Posters 4.65
A friend telling me 4.85
Facebook 5.74
Instagram 6.35
In class (professor/white board) 6.68
Snapchat 7.03

13
Flyers 7.19
Phone Call 7.48
Twitter 9.68
Other 11.54
AnalysisIn this section, students were asked to drag and rank their preferred methods of communication regarding an event.
The mean of these responses is displayed, and as such, a lower-mean indicates that students consistently ranked that as a higher preference.
From this data, it may be surprising to note that email is the best way to communicate with students about an event. This is followed by texting, and then there is a rather significant gap between the first two preferences and the next
best options. Twitter is unequivocally the least useful method for communicating with students. It is worth noting that at least one student respondent listed each method of communication as his/her top preference (excluding Twitter). This
indicates that all methods are worth attempting, though some may deserve more resources than others.
Which day(s) are the best for you to attend a SAB event?(Raw Data)
Field 1 2 3 4 5 6 7
Monday 21 17 35 46 20 27 21
Tuesday 13 20 25 37 60 25 7
Wednesday 8 24 17 37 44 44 13
Thursday 22 16 28 33 28 27 33
Friday 75 30 25 7 19 16 15
Saturday 42 53 23 10 8 39 12
Sunday 6 27 34 17 8 9 86
Which day(s) are the best for you to attend a SAB event?(Best to Worst)
Field Mean
Friday 2.86
Saturday 3.29
Monday 4.03
Tuesday 4.14
Thursday 4.29
Wednesday 4.44

14
Which times(s) are the best for you to attend a SAB event?(Raw Data)
Field 1 2 3 4 5 6
Early Morning (5am-9am) 8 18 21 13 16 111
Morning (9am-11am) 6 12 23 34 91 21
Afternoon (12pm-3pm) 19 16 22 87 37 6
Late Afternoon (3-5pm) 24 31 76 27 18 11
Early Evening (5-7pm) 76 61 15 13 11 11
Later Evening (8pm+) 54 49 30 13 14 27
Which times(s) are the best for you to attend a SAB event?(Best to Worst)
Field Mean
Early Evening (5-7pm) 2.22
Later Evening (8pm+) 2.81
Late Afternoon (3-5pm) 3.09
Afternoon (12pm-3pm) 3.67
Morning (9am-11am) 4.36
Early Morning (5am-9am) 4.84
AnalysisIn this section, students were asked to rank their preferences for timing to attend a SAB event. The best times were early evening and later evenings for the majority of respondents. The Early mornings and mornings, as anticipated,
were the least viable options for events.
Sunday 4.95
AnalysisIn this section, students were asked to rank their preferences for the day of the week to attend a SAB event. The best
day is clearly Friday, by a large margin- and Sunday was nearly universally listed as the worst day for students to attend an event.
In general, Fridays, Saturdays, and Mondays appear to be the best days for events, while Sundays, Wednesdays, and
Thursdays appear to be the worst.