
saaransh-july 2016.pmd - RKGIT
96
-
Upload
khangminh22 -
Category
Documents
-
view
4 -
download
0
Transcript of saaransh-july 2016.pmd - RKGIT


FROM THE DESK OF THE EDITOR �����
Success & failures are the outcome of efficiency of resource management. ‘Vinicius’, the mascot of RioOlympic left us with smiles & tears. From the entire world 206 countries participated in mega sport fair.India participated in 71 scheduled events of Rio Olympic-2016, with 120 athletes. Securing 67th positionwith Winning of two prestigious medals in this event is a matter of pride for all Indians.
But is this really remarkable? Countries which are economically similar or even weaker than Indiaperformed better than us. Iran finished at 25th, Thailand at 35, Ethiopia at 44 and Fiji at 54th position.Indian athlete could not earn single gold medal, where Michael Phelps won 05 gold medals alone. But,if we consider it as failure of our athletes, we are wrong. It could be better managed, through properResource Management as India has largest youth population.
Resource management reefers to managing the resource of country. This can mean many differentthings. This can mean managing resources such as finances, human skills, information technology andall other natural resources. The approach to resource management is a concept that has been aroundfor centuries and has maintained popularity because of its success. The resource management is a five-step process which includes the initiation stage, planning or design stage, execution or production stage,monitoring and controlling and the completion stage along with the scheduled road map.
This issue of SAARANSH, emphasized on effective & efficient quality management of available resources.Whether it may be banking practices or Human Resource of Pharmaceutical organizations. Journalincludes the research work over identifying the service quality effective factors of banking industry,Customer Service Quality, Employee Quality improvement and Quality of Life of workers. Simultaneously,it also includes the research works, inclining towards, management of financial assets & processes toperform desirably, which cover- Financials of Infrastructure, FDIs and Financial Problems of WomenEntrepreneurs.
We hope, this issue of SAARANSH, will certainly motivate management practitioners to get more involvedin assessing their current assets & utilize them effectively. Moreover, I am thankful to all the researchscholars & other management practitioners to share their valuable suggestion & guideline to improvethe impact of SAARANSH. I extend my heartiest gratitude for valuable support/ suggestions and expectingyour patronage in future.
–Dr Arvind Singh

EXPERT’S-COMMENTSfor
“SAARANSH” RKG Journal of Management
Dr Rita Bahuguna Joshi, President, U. P. Congress Committee
� ‘It is very informative and useful.’
Prof. Jagdish Prakash, Ex Vice Chancellor, University of Allahabad� SAARANSH is a very standard journal in the area of management which includes empirical articles
by national and international authors’
Prof. R. C. Saraswat, Vice Chancellor, Dr. Ram Manohar Lohiya Avadh University, Faizabad� ‘I am pretty sure that the professionals and faculty of various colleges will contribute in the forthcoming
issue of the journal.’
Prof. R. L. Tamboli, Professor & Head, Deptt of ABST, ML Sukhadia University, Udaipur� ‘The journal will be getting commanding heights in India, and thereafter abroad, positively.’
Dr. A. K. Bajpai, Professor, Mechanical Engineering Dept, M.M.M. Engineering College, Gorakhpur� The outcome of this Journal from your Institution helps in development better academic environment
in your College. The Engineering & Management community; Business and Industry and Society allare going to be benefited by your efforts.’
Prof. Prithul Chakraborti, Head, CMS, JIS College of Engineering, Kalyan, Nadia� ‘I appreciate the quality of the contents of the journal.’
Prof. V. Vijay Durga Prasad, Professor and Head, MBA, PS College of Engineering & Technology,Vijayawada
� ‘The significant point which I liked is the feedback form about the articles published in the issue.’
Prof. (Dr). G. K. Upadhyay, Director, Sri Sri Institute of Technology & Management, Kasganj� ‘It proves to be a result of great hard work & creativity’
Dr R. K. Singh, Faculty, MONIRBA, University of Allahabad, Allahabad� ‘The journal is overall an excellent attempt’

CONTENTS
● A COMPARATIVE ANALYSIS OF DIVIDEND POLICY OF SELECTED NEW AND OLDGENERATION PRIVATE BANKS IN INDIA 1Souvik Banerjee
● A CRITICAL EVALUATION OF HRD PRACTICES ADOPTED BY PHARMACEUTICALINDUSTRY 6Prof. A. K. Sarkar, Dr. Prabodh N. Gour, Mr. Avinash Saxena
● FACTORS AFFECTING ON SERVICE QUALITY OF BANKS AND CUSTOMERSATISFACTION: A STUDY WITH SPECIAL REFERENCE TOJORHAT DISTRICT OF ASSAM 11Raju Roy
● AN APPLICATION STUDY OF CUSTOMER EXPERIENCE MODEL 20Dr. Ashish Sharma, Amit Philora
● IDENTIFY THE NEED FOR DEVELOPING A NEW SERVICE QUALITY MODELIN TODAY’S SCENARIO: A REVIEW OF SERVICE QUALITY MODELS 26Ankit Agarwal, Gulshan Kumar
● THE IMPACT OF TRAINING AND DEVELOPMENT PROGRAMS ONEMPLOYEE’S PRODUCTIVITY: WITH REFERENCE TOMANUFACTURING FIRMS OF MATHURA REGION 40Dr. Mini Jain, Parul Garg
● A REFLECTION ON FINANCIAL PROBLEMS OF WOMEN ENTREPRENEURS INPONDICHERRY 48Dr. K. Lavanya Latha
● A STUDY ON FINANCIALS OF INFRASTRUCTURE SECTOR: A COMPARISONBETWEEN DLF LTD & OMAXE LTD 56Vikas Gupta, Nitin Saxena
● AN EMPIRICAL ANALYSIS OF THE IMPACT OF FOREIGN DIRECT INVESTMENTAND FOREIGN INSTITUTIONAL INVESTMENT ON INDIAN STOCK MARKET 66Dr. Nitin Tanted, Shirin Khan
● A STUDY ON THE EFFECT OF WORK STRESS ON QUALITY OF WORK LIFEIN RETAIL SECTOR-WITH SPECIAL REFERENCE TO NCR 79Ms. Abha Sharma, Dr.A.K Tyagi, Dr Vibhuti Tyagi


1
INTRODUCTIONDistribution of profit to shareholders is termed asdividend (Pandey, 2004). Profit earned bycompanies can be retained by them for futureusage, or can be returned to shareholders asdividends. Each business organization, has theirown unique circumstances to take a very strategicdecision with regards to the money generatedthrough profit, i.e. whether to keep retain it or toreturn it to the shareholders. A number ofconflicting theories have also been developed withrespect to dividend (Alkuwari, 2009). The pertinentin this respect to note that
“The harder we look at the dividend picture themore it seems like a puzzle, with pieces that justdo not fit together” (Black 1976). There are differenttheories on dividend payment, and they deal withwhether dividend payment increases or decreasesthe valuation of the company. It is not difficult toidentify the variables which affect the dividendpayment decisions, however, what is difficult todetermine is how these factors interact amongthemselves (Ross, 2009).
Most of the existing researches have focussed ondeveloped Western Europe and the NorthernAmerican regions. Whereas emerging economiesas a whole attracted very little attention in thisrespect (Musiega et al, 2013).
Models developed in the western world, may ordue to their unique social as well as corporateculture, regulations and nature of investors maynot be applicable to emerging markets, (Musiega
et al, 2013). Decisions to pay dividend and itsimpact on valuation of shares, is also widelydebated in the literature of corporate finance. Oneset of argument put forth says that, dividendpayment and increase in its amount, increasesthe valuation of the firm, whereas another line ofargument says that, it decreases the valuation ofthe firm. Still there are other researchers who think,dividend payment decisions have no impact onthe valuation of the shares (Anupam, 2012).Modigliani and Miller (1961) proposed thatdividend payment decisions are irrelevant from theequity valuation perspective.
Dividend payment decisions are signals toinvestors regarding, what the incumbentmanagement thinks about the future of thecompany. According to Bishop et al (2000), profitsearned can be ploughed back into the businessor kept by the management for investment forcapital expenditure in future projects. In takingthese decisions, what is pertinent to consider isnot only how much money is needed for freshcapital expenditure, but also, what effect the capitalexpenditure will have on the share price of thecompany. Also firms should not drastically change,their dividend pay-out ratio, as it will impact theplanned future investments (Abdullahi, 2011).
LITERATURE REVIEWKrishman (1963) propagated a bird in the handtheory, regarding dividend distribution. Accordingto this theory investors are risk averse by theirvery nature. Linter (1962), Gordon and Shapiro
A Comparative Analysis of Dividend Policy ofSelected New and Old Generation
Private Banks in IndiaSouvik Banerjee*
ABSTRACT
Determinants of Dividend Distribution are one of the warm debated topics in corporate finance. In this researchpaper fourteen private banks in India are taken into account, for analysis. Out of these, six are new generationprivate banks, whereas eight are old generation private banks. The statistical analysis showed that there isno significant difference in Dividend Pay-out Ratio of public and private banks. The data is considered for twofinancial years, i.e. 2013-14, and 2014-15.
Key Words: Dividend Pay-out Ratio, Public, Private, Banks JEL Classification: G35
* Souvik Banerjee. Assistant Professor, Acharya Bangalore Business School, Bangalore, India

2
SAARANSHVol. 8 No. 1 JULY 2016● ●
RKG JOURNAL OF MANAGEMENT
(1956) got support for this theory, through theirresearch. The underlying logic for this behaviourwas that returns from the equity market isuncertain, also there is considerable informationasymmetry in the system. As a result, investorswill like dividend payment, as it transfers moneyfrom the company to the investors.
On the other hand ‘Agency Theory’, propagatedby Jensen (1986), argues that the dividendpayment restricts the fund available to managers,as far as investment in new projects is concerned.
Lintner (1956) focussed on the behavioural sideof the policy regarding Dividend PaymentDecisions. He concluded that the managers takethe decisions to increase the proportion ofDividend Payment, only when they are certain thatthe firm’s earnings have increased permanently.Brittain (1966) studied the Dividend PaymentPolicy and tax structure, over a long period (1919-1960) and concluded that, the principaldeterminant of Dividend Payment Policy decisionsis Cash Flow of firms, not the Net Profit figure. Onthe other hand Fama and Babiak (1968),concluded that Net Profit is a better determinantof Dividend Payment, than either the Cash Flowfigures or the Net Profit, on the basis of dataanalysed of 392 major firms, on a timeframe of1946 to 1964.
In the Indian context, there are certain studies, inthis regard. Rao and Sarma (1971) concluded thatLintner model can explain the Dividend PaymentDecisions, in industries such as coal mining,sugar, jute textiles, chemical, and cementindustries.
Bhattacharya (1979) was of the view that bird inhand hypothesis is not proper. Moreover, it wasfurther suggested, that the firm’s level of riskassumption affects the level of dividend. Bhat andPandey (1994) found support of Lintner’s modelin the Indian context, which proved that Indianmanagers increased the level of dividend, onlywhen they became absolutely certain about theincrease in profitability.
Mishra and Narender (1996) tested the Lintner’smodel of Dividend Payment on Public Sector Units(PSUs) in India. The study concluded that, thenumber of, Dividend Paying PSUs, compared tothe total number of PSUs is quite small. The studyalso came to the conclusion that, the DividendPayment Ratio (DPR), remain constant for mostof the companies, even if the Earning per Share
(EPS) figure shows a constant improvement. Onthe other hand Saxena (1999) found that, pastrevenue growth rate and future earnings forecast,how many shareholders a company has, andsystematic risk act as the Determinants ofDividend Pay-out Policy.
Naceur, Goaied and Belanes (2006) testedLintner’s model in the context of Tunisiancompanies. This research found that, Tunisianfirms follow a stable dividend policy; it also foundthat the primary determinant of Dividend Paymentdecisions is current earnings, instead of pastDividend Payment decisions.
Husam et al (2007) examined the determinantsof corporate dividend policy in the context ofJordanian companies. This research endeavourfound that, the proportion of ownership by insidersand the government are important determinantsof Dividend Payment decisions; otherdeterminants are size, age, and profitability of thefirm.
Naeem and Nasr (2007) concluded on the basisof their research on Pakistan based companies,the companies are either reluctant to paydividends or pay very less amount of dividend.The main determinants of Dividend are Profitabilityof the companies and their previous year’sDividend Pay-out Ratio.
Kapoor (2008) examined the determinants ofDividend payment decision in the India’sInformation Technology (IT) sector. The time periodof this study was 2000-2006. This study found thatonly liquidity and year to year variation in profitare the only two determinants of this decision.
Musa (2009) in his study in the context of Nigerianfirms came to the conclusion that current year’searnings, previous year’s dividend, as well as cashflow act as the Determinant of Dividend Paymentdecisions.
Okpara and Godwin Chigozie (2010) found thatin the context of Nigeria, three factors act as thedeterminant of Dividend Pay-out Ratio. They arecurrent year’s Profitability, Current Ratio andprevious year’s Dividend Pay-out Ratio.
Asif et al (2011) found that there is a negativerelationship between Leverage of firms and theirDividend Pay-out Ratio. This conclusion wasreached on the basis of research done onPakistani firms, in the time period of 2002-2008.
Bose and Husain (2011), explored the Dividend

3
A Comparative Analysis of Dividend Policy of SelectedNew and Old Generation Private Banks in India
● Souvik Banerjee
Pay-out policy of five sectors in India. These fivesectors were Software, Finance, Steel, ElectricalMachinery, and Pharmaceutical. Profitability of thecompanies is found to be the sole Determinant ofDividend Pay-out decisions.
Summinder and Prabhjot (2012) concluded thatIndian Manufacturing MSMEs Dividend policy isin accordance with Lintner’s model, Britain s firstmodel and Darling s model hold good in case ofIndian Manufacturing MSMEs.
Kuwari (2009) researched on Determinants ofDividends in the context of Gulf Co-operationCouncil (GCC) countries, this particular studyfound that, the primary intention of paying dividendis reduction of agency cost. This study also foundthat, the firms do not look for long term target asfar as Dividend Pay-out Ratio is concerned. Thestudy concluded that, Dividend Pay-out Ratioshave strong positive correlation with OwnershipStructure, Firm Size, Firm Profitability, andnegative correlation with the Leverage Ratio.
OBJECTIVE OF THE RESEARCHIn this research endeavour, the objective is tocheck whether the Dividend Pay-out Ratio (DPR)of the listed Public and Private banks differsignificantly.
HYPOTHESISES OF THERESEARCH:The null hypotheses of the research are depictedbelow
H01- There is no difference between public andprivate banks, as far as Dividend Pay-out Ratio(DPR) is concerned for the financial year 2014-15.
H02- There is no difference between public andprivate banks, as far as Dividend Pay-out Ratio(DPR) is concerned for the financial year 2013-14.
RESEARCH METHODOLOGYIn this research endeavour Dividend Pay-out Ratioof banks vis. a vis. their ownership structure(whether private or public) is analysed.
Dividend Pay-out Ratio = Dividend Paid/FaceValue per Share *100
The following new generation private banks are
considered:
1. Axis Bank
2. HDFC Bank
3. ICICI Bank
4. IndusInd Bank
5. Kotak Mahindra Bank
6. Yes Bank
The following private banks are considered:
1. City Union Bank
2. Dhanlaxmi Bank
3. Federal Bank
4. J&K Bank
5. Karnataka Bank
6. Karur Vysya Bank
7. Lakshmi Vilas Bank
8. South Indian Bank
The DPR for two financial years i.e.2013-14, and2014-15 are taken into account.
DATA USEDThe source of the data for this research has beenCapital Market database. The classification of theBanks is done, as per the Capital Market databaseclassification. The period of the study, which istaken into account, is two financial years, i.e.financial year 2014-15, and 2013-14. In total sixnew generation private banks and eight oldgeneration private banks are taken into account.
TOOLS USEDData regarding DPR of Banks is put through Q-QPlot to understand, whether the data is normallydistributed. The results showed that the data isnot normally distr ibuted; as a result, non-parametric statistical tool ‘Kruskal-Wallis’ Test isused.
EMPIRICAL RESULTSThe empirical results depicted above clearlyshows that, there is no statistically significantdifference, as far as DPR of New Generation andOld Generation Private sector banks areconcerned. As the p-value for both the NullHypotheses is way above, 0.05 level, fail to rejectboth of them.

4
SAARANSHVol. 8 No. 1 JULY 2016● ●
RKG JOURNAL OF MANAGEMENT
CONCLUSIONSThe present research endeavour shows that, NewGeneration and Old Generation Private sectorbanks do not differ as far as DPR is concerned.This result may not be surprising, as bankingremains a highly regulated sector, and the key
parameters of Bank profitability like reserverequirements, priority sector lending etc. remainssame for the both public as well as private sectorbanks.
However, more comprehensive analysis can bedone on the basis of size of the banks.
REFERENCESAl-Twaijry, A.A. (2007).Dividend policy and Payout Ratio: Evidence from the Kuala Lumpur Stock Exchange. The
Journal of Risk Finance, Vol. 8, No. 4, pp. 349-363.
Al-Kuwari, D. (2009).Determinants of the Dividend Payout Ratio of Companies Listed on Emerging Stock Exchanges:The Case of the Gulf Cooperation Council (GCC) Countries. Global Economy & Finance Journal, Vol. 2, No.2, pp. 38-63.
Al-Malkawi, H. (2007). Determinants of Corporate Dividend Policy in Jordan: An Application of the Tobit Model.Journal of Economics and Administrative Sciences, Vol. 23, No. 2, pp. 44-70.
Asif, Rasool and Kamal (2011).Impact of Financial Leverage on Dividend Policy: Empirical Evidence from KarachiStock Exchange-Listed Companies. African Journal of Business Management, Vol. 5, No. 4, pp.1312-1324.
Amidu, M. and Abor, J. (2006). Determinants of Dividend Payout Ratios in Ghana. Journal of Risk Finance, Vol. 7,pp. 136-145.
Brittain, J. A. (1966). The Tax Structure and Corporate Dividend Policy. American Economic Review, Vol. 54, No. 3,pp. 1-10,
Husam – A.N. and Al-Malkawi (2007). Determinants of Corporate Dividend Policy in Jordon: An Application of theTobit Model. Journal of Economic and Administrative Sciences Vol. 23, No. 2, pp. 44-70.
Kania, S.L. and Bacon, F.W. (2005). What factors motivate the corporate dividend decision? American Society ofBusiness and Behavioral Sciences E-Journal, Vol. 1, No. 1, pp. 97-107.
Kanwal, A. and Kapoor, S. (2008). Determinants of Dividend Payout Ratios—A Study of Indian Information TechnologySector. International Research Journal of Finance and Economics, Issue 15, pp. 63-71.
Mehta, A. (2012). An Empirical Analysis of Determinants of Dividend Policy—Evidence from the UAE Companies.Global Review of Accounting and Finance, Vol. 3, No. 1, pp. 18-31
Miller, M. H. and Modigliani, F. (1961). Dividend Policy, Growth and the Valuation of Shares.The Journal of Business,Vol. 34, No. 4, pp. 411-433.
Musa, I. (2009).The Dividend Policy of firms quoted on the Nigerian Stock Exchange: An Empirical Analysis.African Journal of Business Management, Vol. 3, No. 10, pp. 555-566.
Naceur, S.B., Goaied, M. and Belanes, A. (2006). In the Determinants and Dynamics of Dividend Policy. InternationalReview of Finance, Vol. 6, No. 1-2, pp. 1-23.
Naeem, S., and Nasr, M. (2007). Dividend Policy of Pakistani Firms: Trends and Determinants. International Reviewof Business Research Papers, Vol. 3, No. 3, pp. 242-254.
Okpara, A. Godwin C. (2010). A Diagnosis of the Determinants of Dividend Pay-Out Policy in Nigeria: A FactorAnalytical Approach.American Journal of Scientific Research, Vol. 8, No. 1, pp. 57-67.
Pandey, M. (2004). Financial Management. Vikas publishing house Private Limited.
Ross, S.A., Westerfield, RW and Jaffe, J.F. (2009). Corporate Finance Fundamentals, Eighth. Edition, McGrawHill.

5
A Comparative Analysis of Dividend Policy of SelectedNew and Old Generation Private Banks in India
● Souvik Banerjee
Table 1: Kruskal-Wallis Test(for financial year 2014-15)
Ranks
1 = PSU Banks,2 = Private Sector Banks N Mean Rank
DPR 1 6 23.98
2 8 29.12
Total 14
Test Statisticsa,b
DPR
Chi-Square .307
Df 1
Asymp. Sig. .504
a. Kruskal Wallis Testb. Grouping Variable: 1 = New Generation Private Sector Banks 2 =Old Generation Private Sector Banks
Table 2: Kruskal-Wallis Test(for financial year 2013-14)
Ranks
1=PSU Banks,2=Private Sector Banks N Mean Rank
DPR 1 6 28.68
2 8 19.32
Total 14
Test Statisticsa,b
DPR
Chi-Square .307
Df 1
Asymp. Sig. .403
a. Kruskal Wallis Test
b. Grouping Variable: 1=New Generation Private Sector Banks 2=Old Generation Private Sector Banks

6
SAARANSHVol. 8 No. 1 JULY 2016● ●
RKG JOURNAL OF MANAGEMENT
INTRODUCTIONPharmaceutical industry: The modernPharmaceutical industry is a highly competitiveindustry which is not assembled globally. It wasorigined in late nineteenth century in the UpperRhine Valley, Switzerland. Many Pharmaceuticalcompanies started as a part of Rhine Valley family,in which most are still performing very well in theirmarket respectively. This industry is also famousfor its Research & Development (R&D) activities.The Pharmaceutical industry was rapidly boostedup in sixties; during this period healthcare industrywas boomed globally. The major developmentscame in this industry in the seventies with tighterregulatory frameworks. In India the Pharmaindustry has been classified in various categoriessuch as; Anti-Infective, Gastrointestinal, Cardiac,Respiratory, Vitamins/Minerals/Nutrient, Pain,Dermatologic, Gynecology, Neuro Psychiatry, Ant
diabetics, Opthologicals, etc.
When we discuss about global Pharma industry,it is a combination of various point of views in theprotection of intellectual assets by doing Patents,acquiring laws, effective cooperation working, etc.
Human Resource Development: The HumanResource Development (HRD) is a long termprocess to direct the employees towardsimprovements related to his future jobs. Thedevelopment programmes are designed toeducate the employee and make him morecompatible towards his organization’s futureneeds.
HRD in Pharmaceutical industry: Theorganizational design and development processof Pharma industry provides inputs for the HRDfunctions. In Pharmaceutical business HRDprocess includes the various points which areconnected with every individual employee. In this
A Critical Evaluation of HRD PracticesAdopted by Pharmaceutical Industry(A Case Study of Selected Pharmaceutical Industry)
Prof. A. K. Sarkar*Dr. Prabodh N. Gour**Mr. Avinash Saxena***
ABSTRACT
The modern Pharmaceutical industry is highly growth oriented industry, which origined in late nineteenthcentury in Upper Rhine Valley near Basel, Switzerland. In present scenario the presence of Herbal medicalcomponents in the Modern Pharmaceutical industry has amazingly changed the effectiveness of medicines.In this scenario a competition has arise among all the pharmaceutical companies to gain more market shareand increase profits. Because of the extensive research and searching more opportunities, there is a war toget the suitable talent in this industry. Various researchers have stressed on improving morale, productivity &retention and to develop new professionals to gain needed requirements to perform their duties &responsibilities.
The current study is concerning in the context of getting various HRD practices, its need, organizationaldevelopment, knowledge and skills required for various job positions and job satisfaction of employees,adopted by Pharmaceutical industry. To fill the knowledge gap, a quantitative study was conducted to explorethe relationship between the growth of Pharmaceutical companies and HRD practices adopted by themwithin a sample of 450 employees of Ranbaxy Pharma, Mankind Pharma and Systopic Pharma, by casestudy method, mostly through personal interaction and questionnaire covering various aspects of HRDpractices within the above study population.
Key words: Pharmaceutical industry, talent, professionals, HRD practices, knowledge, skills.
* Prof. A. K. Sarkar, Head & Dean, Department of Business Administration, M. J. P. R. University, Bareilly** Dr. Prabodh N. Gour, Head, Department of Commerce, Khandelwal College Bareilly*** Mr. Avinash Saxena, Assistant Professor, Department of Commerce, Khandelwal College Bareilly

7
industry HRD consist of various sub systems suchas Performance Appraisal system, TrainingModule system, Career system, Work systems,Cultural systems, Self-Renewal system etc, tosupport the HRD process for the development ofevery employee. The HRD process in Pharmaindustry consists of several practices such asRecruitment practices, Retention practices,Training and Development practices, ManagementDevelopment Programs, Trade Union practices,Grievance Redressing practices for the smoothrunning of organization.
LITERATURE REVIEWFor doing in-depth study of any topic properfundamental review is necessary to gain therequired knowledge. Therefore the survey ofliterature has been conducted based upon theinformation with reference to each category in thesample.
Regarding the HRD practices Joseph Bruccoleri(2007), concluded that almost all the innovativecompanies are using the best HRD practices toimprove morale, productivity and retention of theemployees. He also commented on what workedfor those companies and did not work. VolkerMahnke (2007) concluded that HR Practioners arethe think tank of any organization which suggestthe pros and cons of any practice to achievesuccess.
Discussing about the various HRD practices inPharma industry, Taylor Crook & Kevin Mckenna(2008) concluded that during establishing an HRDplan Pharma companies are taking the help ofrecruitment agencies. Willium Broofs (2009)concluded that mentor program for skilled &unskilled employees in Pharma industry is a goodway to create more Pharma professionals. JohnDe Warrow (2010) concluded, on the basis of hisresearch that HR practices create the positive aswell as negative exchanges in the Pharmaindustry. The low morale and dull attitude towardswork is negative exchange while low stress, highmorale and motivation towards work are positiveexchanges in this industry.
OBJECTIVES OF STUDY� To go through various HRD practices adopted
in Pharmaceutical industry.
� To understand and evaluate the system andsub system of HRD practices adopted byselected Pharmaceutical units.
� To suggest ways and means for improvingactivities of HRD practices in Pharmaceuticalindustry as remedial measures.
RESEARCH METHODOLOGYResearch design: The selection of researchdesign is generally outcome of the literaturereview; the researcher has made the researchdesign to make an attempt to satisfy the objectivesof study and to identify a proper platform for theresearch. For micro level study of the topic theresearcher has selected three Pharma companiesfrom this industry:-
� Ranbaxy
� Mankind
� Systopic
Collection of data: To do an in-depth study ofthe topic the researcher has collected data fromprimary as well as secondary sources. The datacollection is totally based on the objectives of thestudy. The primary sources of information areinteraction and questionnaire survey with thesenior managers in the Pharma industry. Thesecondary data sources are published businessreports, websites of Pharma companies, literaturepublished by Pharmacy Human ResourceCouncil, circulars of Govt. of India, and variousother regulatory and business related issued inthe context of HRD for Pharma industry.
LIMITATIONS OF STUDYThe researcher had faced the following problemsduring his research work:
� The employees were unaware of the HRDpractices.
� Unavailability of the officials.
� Due to shortage of time the researcher couldcover only three Pharma companies.
� Some company officials were unable to revealthe HRD practices information regarding theircompany.
A Critical Evaluation of HRD Practices Adopted by Pharmaceutical Industry● Prof. A. K. Sarkar
● Dr. Prabodh N. Gour● Mr. Avinash Saxena

8
SAARANSHVol. 8 No. 1 JULY 2016● ●
RKG JOURNAL OF MANAGEMENT
DATA ANALYSIS &INTERPRETATIONThe evaluation of the data for the Pharma industrywas done by the researcher through followingcategories:
� Recruitment Practices
Internet resources: Websites are the medium foradvertisement with the print media. VariousPharma companies are using internet forrecruitment process. Through this method thosecompanies are able to save time in sorting outthe appropriate resumes. 56% respondents sayoften and remaining fall in the category always,sometimes and rarely.
Campus selection: This method is alwaysfollowed by 27%, often followed by 17%,sometimes followed by 6%, and rarely followedby 50%. This method consists of makingassociation with institutions. The advantage of thismethod is that it is easy to evaluate the level ofeducation and training of institution but there is adifficulty in this method is that it has a vast marketand every institution has its own limitations.
Recruit trainees: Trainees are often recruited bymore than 50% of the companies. Therespondents who responded always are 33%. Thedata collected for recruitment of trainees, from thecompanies when analyzed, showed that the rangeof technical trainees is from 85% to 95%. Nontechnical functions like marketing, HR, finance arecovered by only 5% to 15%. The analysis indicatesthat the proportion of non technical trainees incaparison with technical trainees are marginal.
Temporary or contract staff: This method isfollowed by about 23% respondents and about40% respondents companies follow it sometimes.
Employment agencies or consultants: Thismethod is used by 54% respondent companiesfollowed by 13% often and 33% sometimes usedthis method. This is used occasionally because itmay be more expansive than in-house recruitment.
In-house recruitment: As a policy matter 70%respondent companies follow this and 10% oftenuse this method. This is done on the basis of needof the organization and with the consent of HR.
Personal contacts or Recommendations:About 36% respondents responded Personalcontact method, 50% often, and 7% sometimes.This method is generally considered as more
effective.
Newspaper or Journal advertisement: About50% respondents always use newspaper orjournal advertisement method, followed by 30%often respondents.
Professional Associations: 49% respondentsfollow this method always; 20-23% respondentsuse this method as often.
� Retention Practices
Subsidizes food at unit canteen: More than 90%of the respondents provide this facility. Provisionof food, during lunch or dinner break, breakfast,beverages etc. Provision of good canteen facilityat the workplace has very positive effect onreduction and employee turnover reduction.
Recreation facility at unit: 70% of Pharmacompanies provide recreation facilities. Recreationfor 10 minutes in the form of a game, walk etc. arethe good measures for stress management. Itprovides an opportunity for people to meetinformally and in a stress free environment.
Subsidized transport facility: If workforce ispicked up for work, dropped at workplace and thenagain back home, it’s a good solution to theproblem, of commutation. 90% of the respondentcompanies provide this facility at subsidized rates.
Family welfare schemes: In Pharma industry thefamily members of the employees are also coveredunder welfare measures like communitydevelopment, prizes and recognitions formeritorious students and get together functionsprovide a chance for socialization and increasingintegrity. 80% of companies have reported suchschemes.
Medical insurance: Insurance againstunpredictable events is an accepted way of life.Work situation provides an opportunity for groupmedical insurance. 90% companies havesubscribed for this.
� Educational benefits
Complete fee reimbursement: 80% ofcompanies provide the facility for advancing inPharma, technical and managerial education. 20%companies provide par tial facility in feereimbursement.
Reimbursement for workshops: For variousadvanced knowledge and research basedworking, workshops and seminars provide good

9
opportunity for advance learning and networkingoutside the company. 80% of companies practicethis and for R&D based companies this expensehas value.
Complete paid leave/Sabbatical: In Pharmaindustry most scientists may be required to workin research institutions on research of latest originsrelated to the industry. 60% of companies haveprovision for this, which is a career booster for theemployees.
� Training and Development practices:Pharmaceutical training program is defined as aprocess of changing employee behavior patternthrough some structured activities. 95% Pharmacompanies conduct many training programs forthe employees within and outside the organization.These activities may be short term trainingprogram and may be new product related trainings.
� MDPs practice: The MDPs (ManagementDevelopment Program) are threefold-
i) Development practices focused oneffectiveness.
ii) Effective learning processiii) Effective managerial behavior.
The internal training programs by in house facultyreported by 80% of companies. Almost 100%companies were conducting in house program byexternal faculties. Outside organized programswith external faculty were conducted by 90%companies, 10% rely on external consultants forsuch matters.
� Appraisal practices: Pharma organizationsperformance appraisal may be the form of periodicinterview. 80% Pharma companies follow annualperiodic records to record the performance ofemployees while 15% Pharma companies followsemiannual periodic record to record employees’standards.
� Grievance redressing practices: In Indiancontext 90% companies have proper grievancehandling system while 10% do not have propergrievance handling system.
� Trade union practices: 100% existence oftrade union is found in Pharma companies. But itis not compulsory to be a part of any state ornational level trade union body for an employee.In research only 79% Pharma employees wereaccepted that are member of any state/nationaltrade union while 21% Pharma employee refusedthat they are member of any trade union body.
FINDINGSThere is no special source of recruitment inPharma industry although the environment andtechnology of Pharma business is different fromengineering or chemical and such otherestablished businesses. Employee welfarepractices are sufficient in Pharma industry forretaining employees. These practices aresubsidized food at unit canteen, recreation facility,health club at unit, subsidized transport facility,family welfare schemes and medical insurance.The educational benefits offered by Pharmacompanies are considerable. 80-90% Pharmacompanies follow the employee educationpractices. In Pharma industry the training anddevelopment facility is well structured whether itis on job or off job. Pharma product related oremployee enhancement related trainings aresufficient in this industry. All the companies followthe practices of short term skills development andproduct information. The MDPs (ManagementDevelopment Programs) are organized by all theorganizations on the basis of specificrequirements. All the companies have specificprogram for behavioral modifications and stressmanagement. Pharma companies follow thepractice of performance appraisal in the form ofperiodic interview. Pharma HR followed 55% MBO(Management By Objectives), 35% 360 degreeappraisal and rest 10% focuses towards selfappraisal method. 90% Pharma companies haveproper grievance handling system. The findingsshow that only 86% Pharma employees admittedthat they had never faced any unrest condition inthe Pharma organization while 14% admitted thatthey had unrest in the organization. Trade unionsexist in all Pharma companies but it is notcompulsory to be a part of any state or nationallevel trade union body for an employee. Thefindings show that 60% of respondents are sayingthat organizational development is one of the mostimportant needs. 80% respondents agree thatmanagement skills development program isnecessary for better understanding of the job forthe managers. 70% of the respondents havecommunicated that Pharma business isparticularly technology driven business. Thesuggestions by 30% of respondents that in IndianPharma industry there must be improvement incompensation and welfare measures practices ofPharma employees.
A Critical Evaluation of HRD Practices Adopted by Pharmaceutical Industry● Prof. A. K. Sarkar
● Dr. Prabodh N. Gour● Mr. Avinash Saxena

10
SAARANSHVol. 8 No. 1 JULY 2016● ●
RKG JOURNAL OF MANAGEMENT
CONCLUSIONSThe Pharma business is peculiar in terms ofresources, products, business organizations andorganization. This required a highly skilledworkforce. Peculiarity of modern Pharma productsis that they can be designed using modernPharma technology for obtaining predictableresults. Pharma business is technology drivenbusiness. It begins with R&D activities and highlyspecialized knowledge and skills are required. Thecommercialization of Pharma products involvesproprietary and regulatory issues. Pharmabusiness operations require strong orientation oftechnology for effective performance. This industryrequires highly knowledgeable workforce withskills and capabilities of handling operationsrelated to R&D and products and services. It has
become a global phenomenon that Pharma is afast growing industrial sector. Proper educationand training is required for preparation ofworkforce with r ight type of skills andcompetencies. In the case of almost all Pharmacompanies the manpower is increasing. The HRDpractices are complex and subject to rapidchanges because of advent in technologies indifferent areas of Pharma. The manpowerrequirements and related issues are not yet verysatisfactorily addressed because of lack ofinformation and experimental phase of thebusiness. There is a need for creation ofawareness and facilities for developing humanresource from the viewpoint of technical as wellas managerial capabilities.
BIBLIOGRAPHY� H Weihrich & H Koontz, 2003, Management: A Global Perspective, 11th edition Tata McGraw Hill p.71-78.
� Hutchison, S., Purcell, J., & Kinnie (2003). Evolving high commitment management and the experience ofRAC call centre. Human Resource Management Journal, 10(1):63-78
� John Bratton and Jeffrey Gold, Human Resource Management – Theory and Practice, 3rd edition, 2003, p.63-65. Palgrave MacMillan, Houndmills, Basingstock.
� John K Galbraith, The New Industrial State, Boston: Houghton – Mifflin, 1967 p. 71.
� Kathy Monds and John McMackin (2001), Designing and aligning an HR system, Human ResourceManagement, 11(2), pp. 57-72
� Kothari.C.R. (2003) Research Methodology, Wishwa Prakashan N.D. p. 98.
� Maybey, C., Skinner, D., & Clark, D. (eds) (1998). Experiencing Human Resource Management, London:Sage. P .83-85.
� Mcshane, S.L.(2001), Canadian Organization Behavior (4th edn), Boston: Irvin. p. 65-68
· Purcell, J.(1989), Best practice and best fit: chimera or cul-de-sac? Human Resource Management Journal,9(3):26-41.
� Schonberger, R. (1982), Japanese Manufacturing Techniques: Nine Hidden Lessons in Simplicity. London:CollierMacmillan. p. 88-96
� Schultz, T.W. (1981), Investing in People: The Economics of Population and Quality, Berkeley, CA: Universityof California Press. pP. 75-89
� Sharp, John 1992: Quality Rules: Interpharm Press,Buffalo Grove, IL. p. 67-78
� Storey, J. (ed.) (1989): New Perspective on Human Resource Management London: Routledge. p. 105-110

11
INTRODUCTIONService quality is a focused evaluation that reflectsthe customer’s perception of specific dimensionsof service: tangibility, reliability, responsiveness,assurance and empathy and it includes providingright service, to the right people, at the right time,at the right place and at the right price for attainingfor ultimate consumer satisfaction. Success of aservice firm depends on the quality of service itdelivers to its customers. Service quality basicallyis a function of two things. i.e. customers’expectations and perceived reality. Customer builttheir expectations regarding a service providerthrough word of mouth communications regarding,from their past experiences and to some extentbecause of their personal needs as well. Theseexpectations are later on matched with theperceived reality when a customer comes in touchwith the service facility. This matching ofexpectations with perception at the point ofdelivery reveals the quality of service deliveredwith resultant customer satisfaction.
Need To Measure Customer Satisfaction
Customers are viewed as a group whosesatisfaction with the enterprise must beincorporated in strategic planning efforts. Forwardlooking companies are finding value in directlymeasuring and tracking customer satisfaction asan important strategic success indicator. Customersatisfaction measurement helps to promote anincreased focus on customer and stimulateimprovements in the work practise and processesused within the company. SERVQUAL model(Parasuraman et al) has been used widely atnational and international levels to measure thecustomer satisfaction which focus on differentdimensions of this model.
REVIEW OF LITERATUREJayaraman Munusamy et.al (2010) in her studyfocused on the measurement of the customersatisfaction on through delivery of service qualityin banking sector in Malaysia, Their studyhighlights the parameters in banking industry for
Factors Affecting on Service Quality of Banks andCustomer Satisfaction: A Study with Special
Reference to Jorhat District of AssamRaju Roy*
ABSTRACT
Customer satisfaction is essential for the success of service industry like bank. The quality of service hasbecome an important aspect of customer satisfaction. Day by day it has been proven that better servicequality is enhance to customer satisfaction. This paper analyses the various factor affecting the servicequality and customer satisfaction in State Bank of India, Nationalise Bank and Private sector banks in Jorhatdistrict of Assam. The present study used five dimensions service quality for measuring customer satisfactionof banks such as tangibility, reliability, responsiveness, assurance and empathy (Parasuraman, Zeithaml, &Berry, 1985). A structured questionnaire with 5 point Likert scale has been used to collect the data byconducting survey. The sample size is 384 and is chosen by using convenience sampling. Data has beenanalysed by using SPSS software (version: 16). Delivering quality services is the best possible strategy togain success in competitive environment. On the other hand bank wise varying the dimension of servicequality affect the customer satisfaction, responsiveness gap is higher in State bank of India, Tangibility gap innationalised banks and assurance in case of private banks which indicates that respondents are dissatisfieddue to service quality provided by bank but tangibility gap is lower in State banks of India, Assurance in caseof nationalised bank and Reliability of Private bank indicates that the respondents are satisfied with theservice quality of bank. The overall study shows that customer’s satisfaction is affected by the dimensions ofservice quality.
Key Words: Service Quality, Customer Satisfaction, dissatisfaction and SERVQUAL
* Raju Roy, Asstt.Professor, CKB Commerce College Jorhat, [email protected], M-9435181734
Factors Affecting on Service Quality of Banks and Customer Satisfaction:A Study with Special Reference to Jorhat District of Assam
● Raju Roy
12
SAARANSHVol. 8 No. 1 JULY 2016● ●
RKG JOURNAL OF MANAGEMENT
improvement in delivery of service quality and alsogives a some appropriate methods that have beenused for the measurement of customersatisfaction. The methodology followed was datacollection from random respondents of the generalpopulation. Considering the fact that differentbackground have different expectation level, alarge respondent’s population was targeted for theresearch. The questionnaire was collected from117 respondents from different backgrounds. Thestudy found that assurance has a positiverelationship with customer satisfaction, but withoutsignificant effect. Reliability is the timeliness andaccuracy in service provided, and says reliabilityis the timeless and accuracy in service provided,and says reliability does not have much impacton customer satisfaction. Tangible includes theappearance of the company and study found thatthere is no much relation between empathy andsatisfaction. Responsiveness is the timelyresponses, which the customer get from theirservice providers. The study suggested thatresponsiveness factor is highly related to customersatisfaction.
Fatima et. al (2011) in her article explained thatservice quality is important mainly in the serviceenterprises. For growth and development of theenterprise depends on the service quality. Asservice quality is the only way to satisfy majoritycustomers. Hence enterprise concentrates moreon the service quality today. Quality in service isalso interrelated to other behavioural outcomesof the customers. The study understands thevarious customers’ perceptions about the servicequality factor like Tangibility, Reliability.Responsiveness, Assurance and Empathy in thebanking industry and the satisfaction level towardsthe banks. It also analysis the impact of theseservice quality factors on the satisfaction levelbased on the demographic differences. The studycollects the perceptions about the various servicequality factors through purposive sampling methodand analysis the impact of the service qualityfactors. The data were collected on the basis ofthe various demographic variables and finallystudy concludes saying about the existence of aclose bond between the service quality factors andthe customer satisfaction level. And also it is foundthat the impact of the service quality factors oncustomer satisfaction was varying with thedemography of the customers.
Mrs, G.Santhiyavalli (2011) states in his researcharticle by using convenience sampling techniqueand SERVQUAL Model used to determine qualityof customer satisfaction. He also states thatrecognition of service quality now acts as acompetitive weapon. The Factor analysis clearlyindicates that among five dimensions Reliability,Responsiveness, Empathy and Tangibility are themajor factor responsible for customer satisfaction.
Hereinto et.al (2011) in his study focuses on howthe influence of service quality affects thesatisfaction of the banking customers. The samplesize taken for the study is 100 savings customersof the bank. Data was collected from thepopulation by random sampling technique. Asimple regression model is fitted to the data. Thepaper defines the various dimension of servicequality like assurance, reliability, Responsiveness,Tangibility and Empathy. And the customersatisfaction factors like speed, accuracy, safe andcomfort. The characteristics of the respondentswere considered based on their demographicprofile like sex, age, income, occupation etc. Andthe profile perception about the customersatisfaction were analysed from the indicators ofthe same. Service quality has 17 indicators andcustomer satisfaction has 12 indicators. Thevarious indicators of both the service quality andcustomer satisfaction are measured using thescores from the questionnaire given to the samplepopulation on a 5 point Likert Scale. And then theregression model was estimated using SPSS tool.From the analysis, the study concludes that thereis a significant relation between the service qualityand customer satisfaction and service quality isvery important and consists of actions like quickresponse, commitment, staff availability, and rightservice at right time, complaint solution.Competency and capability of the staff in the bank.
Pamita Mehata (2012) et al. in their study aim isthe measurement of the service quality in thebanking sector .Segmentation of the customerbased on their perception about the high and lowservice quality factors and identifying the relationbetween both and find the importance of variousdimensions of service quality and its influence oncustomer satisfaction. For this study, public sectorbank, Private sector banks and co-operative bankswere choosen.To understand the relationshipbetween the two segments of the customer s Chi-square was used. The study also defines thevarious dimensions on service quality and used

13
regression analysis to understand relativeimportance between the dimensions. The samplepopulation was counted to be total 293respondents from 6 banks using purposivesampling and personal interview was conducted.To perform segmentation analysis, the customerswere classified based on their service qualityscores. The report found that the type of accountheld by the customers has more influence on theservice quality segment. Hence the studysuggests that the type of account is a significantdemographic variable in measuring the servicequality perception. Multiple regression analysiswas carried out to analysis the relative importanceof the various dimensions influencing the overallservice quality, overall customer satisfaction loyaltyin term of likelihood communication. The studyconcludes saying the highest shortfall andassurance shows the lowest, when comparedcustomer expectations and also suggest that typeof account is a significant variable in profiling thetwo segments.
Vibhor Jain et. al (2012) in her study wasconducted to understand the perception of servicequality in the banking sector and also to evaluatehow it helps in enhancing the reputation and attractcustomer loyalty. With the increased competitionamong the private sector bank, this study wouldhelp in defining a strategy to achieve thecompetitive edge and also satisfied customers.Hence service quality has been used to positionthe banks in the tough market. The study wasadministered through private banks. The study hastaken the SERVQUAL tool for measurement ofthe service quality offered by the private playersin the banking industry .The main assumption isService quality is multi-dimensional concept andthese dimension help in measuring the servicequality. The responses were collected based onfive dimensions namely, assurance, reliability,Responsiveness, Tangibility and Empathy. Findingof the study that Reliability and Responsivenessare the most relevant factor for the service qualityperception and they have computed the individualscores with the average mean value scored bythe private banks under the study. The study foundthat among the four banks under the study, HDFCbanks has the highest quality perception in termsof the various dimensions. The study concludeswith suggestions for the private banks to be verycompetitive in the industry.
OBJECTIVES OF STUDY� To analysis the various dimensions of service
quality of banks operating in Jorhat district ofAssam
� To analyse the factors that affects the level ofsatisfaction and dissatisfaction of bankcustomers in Jorhat District of Assam
HYPOTHESIS OF THE STUDY� Ho: There is no significance impact of service
quality on customer satisfaction of banks.
� Ho: There is no significance difference in qualityof services in banks.
METHODOLOGY OF THE STUDY
Bank Group Total Respondents
A State Bank Group 106B Nationalized Bank 213C Private Bank 65
Total 384
The sample size of the respondents were selectedfrom the sample banks branches based ondifferent parameters like, semi-urban rural banks,savings bank account, term deposit account,current account, loan account, transaction period,income level, occupation, age and qualification ofcustomer. A total of 384 respondents wereselected representing employees, students,professional and business community by usingconvenience sampling method. Here, sample sizeof bank customer was determined according tosample table given by Research Advisors andrelated review of literature (Alreek & Settle andKrisanan, A.K. Kochu). Data Collected with thehelp of 5 point Likert Scale 5-Strongly agree, 4-agree, 3- neutral, 2-disagree and 1- stronglydisagree. Data was analysed with the help ofvarious statistical techniques like mean, standarddeviation, and t-test. Service qualities in bankswere measured with the help of SERVQUALmodel. Analysis of variance (ANOVA) was usedto test the significance of difference among morethan two sample means. The collected data hasbeen analyzed through SPSS 16 version.
Factors Affecting on Service Quality of Banks and Customer Satisfaction:A Study with Special Reference to Jorhat District of Assam
● Raju Roy

14
SAARANSHVol. 8 No. 1 JULY 2016● ●
RKG JOURNAL OF MANAGEMENT
DATA ANALYSIS ANDINTERPRETATIONReliability Assessment
To test the reliability of the set of items formingthe scale, a measure of construct reliability wascomputed. Cronbach’s Alpha coefficient measuresthe reliability of various factors influencing theservice quality expectation and perception levelof the respondents of both the banks.
In any social science research a reliabilitycoefficient of .70 or higher is considered asacceptable, suggesting that the items haverelatively high internal consistency. But in few studyif reliability coefficient is more than .50 it is alsoacceptable. The table 1 shows that, in SBI, theExpectation level of the respondents is .852 andperception level is .906, in nationalised bank theCronhbach’s alpha for expectation level of therespondents is at .569 and for the perception levelis .836. On the other hand in private sector bank,expectation level of respondents is .768 andperception level is .816. Hence it is inferred thatfor expectations and perception level of all thefactors namely Tangibility, Assurance,responsibility and empathy and have high reliableand in case of nationalised bank expectationreliability is average level. (Salman Atif at el)
Dimensions of service quality of Banks
In the past service quality was measured only ontangibles services because of more dominancewere from manufacturing and trading industry inIndia. But now, due to the increasing importanceof service sector in the economy, themeasurement of service quality has now becomeimportant. Therefore this analysis part was anattempt to find out the various dimensions ofservice quality among the undertaken threegroups of banks.
Analysis: From the above table it is seen thecomparative view about the service quality of fivedimensions in three bank groups. It is clear that agap between perceptions and expectations issignificant for all the factors in three categories ofbanks.
In case of state bank of India tangibility is betterwhere responsiveness is the poorest among allthe factors because customers have moreexpectations regarding responsiveness of thebanks but their demands are not fulfilled up to the
expectation. In case of Nationalised bankassurance is better where tangibility is the poorestamong all the factors because customers havemore expectations regarding tangibility of banksbut they failed to fulfill their demands. On the otherhand in private sector bank responsiveness is thebetter and assurance is the poorest among all thefactors because customers have moreexpectations regarding assurance of the banksbut their demands are not fulfilled.
Table No. 1 reveals that reliability is the fourthfactor, with lower gap in all category of bankbranches. It also identified. There is a need toimprove the service quality by this bank. If empathyis the second factors with lower gap in all the bankcategory .Overall, it can be concluded thatnationalised banks show more gap as comparedto state bank of India and private sector banksand there is terrible need to improve the servicequality by these banks in terms of responsivenessin State Bank of India, followed by tangibility innationalised bank and assurance in private sectorbanks demands more attention to improve.Overall, all factors demands greater attention toimprove as survival factors in the changingenvironment of service sector. On the other way itis also reveals that from above table t-test showstheir significance value at 5% less than 0.05 forall dimension of service quality in three categoriesof bank .Therefore there is perception differenceon service quality for different bank customers.
Interpretations: From the above analysis, gapindex of service quality among the five dimensions,three dimensions of service quality like tangibility,assurance and responsiveness are shown in poorcategory of the banks. It is also seen that servicequality of nationalised banks is much lower fromthe expectations level of customers, which showstotal dissatisfaction among the customers. Theonly way to survive is to provide servicesaccording to customer needs. Delivering qualityservices is the best possible strategy to gainsuccess in competitive environment.
Factors affecting customer’s satisfactionand dissatisfaction of service quality
The study aimed at bringing out the service qualitygaps perceived by customer regarding theservices provided by various Banks in India. Thesegaps were measured on various dimensions ofservices quality as given in the servqual tooldeveloped by Parasuraman et.al. Parusuraman,

15
Zeithami and Berry (1985, 1988) advanced andoperationalized services quality as a differencebetween customer expectations of what they wantand their perceptions of what they get. Based onthis conceptualization and operationalization, aservice quality measurement scale calledSERVQUAL was proposed .Under the rule ofServqual the larger the gap score is, the more isdissatisfaction-Parsuraman (1988).
Analysis
It is seen from above fig. The gap score is thedifference between the mean score of perceptionsand mean score of expectation. We observed incase of nationalised bank that Tangibility gap ishigher (1.76) followed by Empathy gap (1.63)responsiveness gap (1.43), reliability gap (1.39)and leas gap assurance (1.14) gap. On the otherhand in State bank of India there areresponsiveness gap is highest gap (1.27) followedby empathy (1.04), assurance (.80), reliability (.75)and least gap on tangibility gap (0.62). But in caseof private sector banks it is observed thatassurance gap is higher (1.03) followed byempathy gap (.80), tangibility gap (.77), reliabilitygap (.77) and lest gap on responsibility gap (0.17).
Interpretation: From the above analysis it isinterpret that respondent of private sector banksare more satisfied than other bank. In privatesector banks, services are up to expectation of
respondents. As far as state bank of Indiarespondents are more or less satisfied regardingbanking service but nationalised bank group failto provide best quality service up to expectationof customer of bank. The Tangibility dimension (upto date equipment, branch location, employeesdressing, printing materials and visually appealinglayout) holds a least Servqual gap between thecustomers’ expectations and perceptions in statebank of India other than nationalised bank andprivate sector bank. It is very oblivious thatirrespective type of bank, the gap between thecustomer expectations and Perception on theresponsiveness dimensions (information toinnovative product and service, prompt service tocustomer, willing to help customer and responseto customer request) is the highest other thanprivate sector bank. The above analysis showsthat all the dimension of service quality, banks arefar behind from the expectation than the customerrequirement. However, the gap score on reliability,assurance and empathy dimension seems to bemore or less the same. It is advisable that thebanks should focus more on responsivenessdimension to win the customers in State bank ofIndia and nationalised bank. Banks also have tolook into aspects like assurance, and empathy indelivering their services. On the other handNationalised banks should focus more on alldimensions of service quality dimensions to winthe customer satisfaction.
Source: Data Computed
Fig.1: Gap score on Service Quality Dimension
Factors Affecting on Service Quality of Banks and Customer Satisfaction:A Study with Special Reference to Jorhat District of Assam
● Raju Roy

16
SAARANSHVol. 8 No. 1 JULY 2016● ●
RKG JOURNAL OF MANAGEMENT
Multiple Regression Analysis
To measure the factors affecting satisfying servicequality, multiple regression analysis tools wasapplied and also includes a regression model totest the hypotheses. Five extracted dimensionswere taken as independent variables againstoverall satisfaction of the customers as dependentvariable in a multiple regression model. For all thehypothesis of the study below hypothesis test wasused at 95% confidence interval.
From table 2 it has been seen that in case of StateBank of India, R value is 0.998. Therefore, R value(.998) for the overall service quality dimensionnamely tangibility, reliability, responsiveness.Assurance and empathy suggested that there isa strong effect of these five independent variableson customer satisfaction. From the table 2- it canalso be observed that the coefficient ofdetermination i.e. the R-square (R2) value is .996,which representing that 99.6% variation of thedependent variable (Average CustomerSatisfaction) is due to the independent variables(Service Quality), which in fact, is a strongexplanatory power of regression.
In case of Nationalised Bank of India, R value is0.998. Therefore, R value (.995) for the overallservice quality dimension namely tangibility,reliability, responsiveness. Assurance andempathy suggested that there is a strong effect ofthese five independent variables on customersatisfaction. From the table 2- it can also observedthat the coefficient of determination i.e. the R-square (R2) value is .990, which representing that99.0% variation of the dependent variable(Average Customer Satisfaction) is due to theindependent variables (Service Quality), which infact, is a strong explanatory power of regression.
On the other hand Private sector Bank, R value is0.997. Therefore, R value (.993) for the overallservice quality dimension namely tangibility,reliability, responsiveness. Assurance andempathy suggested that there is a strong effect ofthese five independent variables on customersatisfaction. From the table 2- it can also observedthat the coefficient of determination i.e. the R-square (R2) value is .99.3, which representing that99.0% variation of the dependent variable(Average Customer Satisfaction) is due to theindependent variables (Service Quality), which infact, is a strong explanatory power of regression.
From the table 4, it is identify that in case of State
Bank of India, the value of F- statistics 5.154 andis significant is the level of significance is less than5%(p).This indicates that overall model wasreasonable fit and there was statistically significantassociation between service quality dimensionsand customer satisfaction. Additionally, this alsoindicated that the null hypothesis is rejected andalternative hypothesis is accepted. Hence it canbe concluded that service quality dimensions havesignificant impact on customer satisfaction of StateBank of India.
In case of Nationalised Bank, the value of F-statistics 4.070 and is significant is the level ofsignificance is less than 5%(p).This indicates thatoverall model was reasonable fit and there wasstatistically significant association between servicequality dimensions and customer satisfaction.Additionally, this also indicated that the nullhypothesis is rejected and alternative hypothesisis accepted. Hence it can be concluded thatservice quality dimensions have significant impacton customer satisfaction of Nationalised Bank.
On the other hand, the value of F-statistics 1.717and is significant is the level of significance is lessthan 5%(p).This indicates that overall model wasreasonable fit and there was statistically significantassociation between service quality dimensionsand customer satisfaction. Additionally, this alsoindicated that the null hypothesis is rejected andalternative hypothesis is accepted. Hence it canbe concluded that service quality dimensions havesignificant impact on customer satisfaction ofPrivate sector Bank.
It is revels from table 2 that, Unstandardizedcoefficient indicates how much dependent variablevaries with an independent variable, when all otherindependent variables are held constant. The betacoefficient indicates that how and to what extentServqual dimensions such as tangibility, reliability,responsiveness, assurance and empathyinfluence customer’s satisfaction of bank. It hasbeen found that in case of, State bank of Indiaresponsiveness (beta= .333, t=31.047, p<.001)have the highest influenced or significant customersatisfaction. Whereas, tangibility (beta=.233,t=31.144, p<.001., reliability (beta=.218, t=23.048,p<0.001), assurance (beta=.220, t=20.994,p<.001) and) empathy (beta=.235, t=27.284,p<.001, have a relatively lower impact on customersatisfaction of a bank. In case of NationalisedBank, responsiveness (beta= .329, t=34.657,

17
p<.001), empathy (beta=.283, t=32.307, p<.001whereas, have the highest influenced or significantcustomer satisfaction of a bank. Whereas,Tangibility (beta=.254, t=27.641, p<.001), reliability(beta=.216, t=23.321, p<0.001) and assurance(beta=.240, t=23.058, p<.001) and, have arelatively lower impact on customer satisfactionof a bank. In case of Private sector bank, tangibility(beta=.322, t=25, 200, p<.001), assurance(beta=.313, t=19.180, p<.001, andresponsiveness (beta= .310, t=24.183, p<.001),p<.001 whereas, have the highest influenced orsignificant customer satisfaction of a bank.Whereas, reliability (beta=.233, t=15.021,p<0.001) and empathy (beta=.231, t=17.348,p<.001) and have a relatively lower impact oncustomer satisfaction of a bank.
CONCLUSIONThe research paper concluded that the servicequality Private Sector banks is the highest servicequality among the three types of banks wherenationalised bank of India failure to fulfil up toexpectation of respondent. By analysis, gap indexof service quality regarding five factor especially
tangibility, assurance and responsiveness is poorin three category of banks namely State bank ofIndia, Nationalised bank and private sector banksbut nationalised banks draw an attention becausethe service quality is much lower from theexpectations level of customers, which shows totaldissatisfaction among the customers. The only wayto survive is to provide services according tocustomer needs. Delivering quality services is thebest possible strategy to gain success incompetitive environment. On the other hand bankwise varying the dimension of service quality affectin customer satisfaction, responsiveness gap ishigher in State bank of India, Tangibility gap innationalised banks and assurance in case ofprivate banks which indicates that respondentsare dissatisfied due to service quality provided bybank but tangibility gap is lower in State banks ofIndia, Assurance in case of nationalised bank andReliability of Private bank indicates that therespondents are satisfied since satisfactoryservice quality of bank. The overall study showsthat customer’s satisfaction is affected by thedimensions of service quality as it is proved byregression model.
REFERENCESA. Ajimon Gerorge (2013), “Customer Centric study on internet Banking in Kerala”.p 12.
B. Krisanan, A.K. Kochu. (2013). “A Study on Measuring service quality and its impact on Customer Satisfactionin banking and insurance sector” Department of Business Administration, Maharaja KrishnakumarsinhjiBhavnagar University, Bhavnagar.
C. Fatima Holy Ghost et.al (2011) ‘Impact of service quality in commercial banks on the customer satisfaction:An Empirical Study ‘International Journal of Multidisciplinary Research Vol I Issue 6 october 2011, ISSN 22315780, 19-37.
D. Heryanto (2011), Effects of service quality on customer satisfaction with bank, Nigeria, MainBr.Padang.International Journal of Business and Management Tomorrow Vol. no. 2011, ISSN 2249-9962, 1-14.
E. Vibhor Jain, Gupta, Sonia Jain, Smita (2012) Customer perception on service quality in banking sector: Withspecial reference to Indian Private Banking sector in Moradabad Region.IJRFM Volume 2, ISSN 2231-5985597-610
F. Musamy, S Jayaraman, Shankar Chelliah and Man Hor Wai(2010) Service quality delivery and its impact oncustomer satisfaction in the banking sector in Malaysia, International Journal of Innovation, Management andTechnology Vol I, No 4, october 2010,ISSN-2210-0248,398-404..Pamita, Mehata (2012).Measuring servicequality in Retail Banking Sector in context of Gujarat, Ninth AIMS international Conference of Management,January 2012 38-46.
G. Parasuram, A, Zethamal V.A and Berry LL (1985),A Conceptual Model of Service Quality and its implicationsfor Further research, Journal of Marketing Vol 9, full pp-41-50.
Factors Affecting on Service Quality of Banks and Customer Satisfaction:A Study with Special Reference to Jorhat District of Assam
● Raju Roy

18
SAARANSHVol. 8 No. 1 JULY 2016● ●
RKG JOURNAL OF MANAGEMENT
H. Parasuram, A,Zethamal V.A and Berry LL (1988) Servqual A multiple Item of scale for measuring customerperceptions of service quality Journal of Retailing Vol.64 no- pp 12-40
I. Nair R. Suja, (2004),”Consumer Behaviour And Marketing Research”, Himalaya Publishing House,Bombay-400004,
J. Uppal K.R.(2011),Service The Competitive Edge in Banking, Kunal Books, New Delhi-110002, India.
K. Mrs.G.Santhiyavalli customer Perception of Service Quality of State Bank of India-A Factor Analysis. IJMBSVol.I Issue 3 September 2011
L. Salman et al (2014) ‘Factors Affecting on Employees Retention in Banking Sector: An Investigation fromKarachi’ European Journal of Business and Management www.iiste.org ISSN 2222 1905 (Paper) ISSN 2222-2839 (Online) Vol.6, No.37, 2014
Table 1: Reliability analysis
Service Quality evaluation No. of items SBI NB PSB
Cronbach’s alpha Cronbach’s alpha Cronbanh’s alpha
Expectation Level 22 .852 .569 .768
Perceptions level 22 .906 .836 .816
Source: Data computed
Table 2: Group Wise Service Qualities of Bank
Bank Dimensions Perceptions’ Expectations’ Gap T-test Sig. Gap BasedGroup Mean Mean Index Ranking
SBI Tangibility 3.77 4.4 116.71 9.76 .000 V
Reliability 3.56 4.31 121.07 9.21 .000 IV
Responsiveness 3.09 4.36 141.1 12.46 .000 I
Assurance 3.54 4.33 122.32 9.31 .000 III
Empathy 3.07 4.11 133.88 11.43 .000 II
NB Tangibility 2.75 4.51 164 37.13 .000 I
Reliability 3.06 4.44 145.10 32.59 .000 IV
Responsiveness 3.05 4.48 146.89 25.81 .000 III
Assurance 3.22 4.36 135.40 24.23 .000 V
Empathy 2.88 4.51 156.6 32.00 .000 II
PSB Tangibility 3.8 4.57 120.26 12.28 .000 III
Reliability 4.05 4.55 112.35 7.79 .000 IV
Responsiveness 4.26 4.43 103.99 1.81 .074 V
Assurance 3.54 4.57 129.1 10.76 .000 I
Empathy 3.65 4.45 121.92 10.96 .000 II
Source: Computed Primary Data
Table:3 Model Summary
Name of Model R R Adjusted Std. Error Change Statisticsthe bank Square R Square of the R Square F Change df1 df2 Sig. F
Estimate Change Change
SB! 1 .998 .996 .996 .18626 .996 5154.282 5 100 .000
NB 1 .995 .990 .990 .24381 .990 4070.371 5 207 .000
PB 1 .997 .993 .993 .16179 .993 1717.346 5 59 .000
Source: Data Computed.
Predictor: (Constant), Tangibility, reliability, responsiveness, assurance and empathy.

19
Table 4: ANOVA
Name of Bank Model Sum of Square df Mean Score F Sig.
SBI Regression 894.081 5 178.816 5.154 .000
Residual 3.469 100 .035
Total 897.551 105
NB Regression 1209.803 5 241.961 4.070 .000
Residual 12.305 207 .059
Total 1222.303 212
PSB Regression 224.758 5 44.952
Residual 1.544 59 .026 1.717 .000
Total 226.303 64
Predictors: (Constant) EMP, TAN, REL, RES, and ASS.
Dependent Variables: Avg. Satisfaction.
Table 5: Coefficient
Model Unstandardized Coefficient Standardized t Sig.B S.E Coefficient Beta
SBI 1 (Constant) .094 .133 .705 .483
Tangibility .243 .008 .233 31.144 .000
Reliability .194 .008 .218 23.048 .000
Responsiveness .268 .009 .333 31.047 .000
Assurance .241 .011 220 20.994 .000
Empathy .244 .009 .235 27.284 .000
NB 1 (Constant) .140 .110 1.270 .206
Tangibility .249 .009 .254 27.641 .000
Reliability .191 .008 .216 23.321 .000
Responsiveness .265 .008 .329 34.657 .000
Assurance .228 .010 .240 23.058 .000
Empathy .259 .008 .283 32.307 .000
PSB 1 (Constant) .373 .253 1.471 .146
Tangibility .233 .009 .322 25.200 .000
Reliability .213 .014 .233 15.021 .000
Responsiveness .291 .012 .310 24.831 .000
Assurance .240 .013 .313 19.180 .000
Empathy .190 .001 .231 17.348 .000
a. Dependent Variable: Average Customer satisfaction
Factors Affecting on Service Quality of Banks and Customer Satisfaction:A Study with Special Reference to Jorhat District of Assam
● Raju Roy

20
SAARANSHVol. 8 No. 1 JULY 2016● ●
RKG JOURNAL OF MANAGEMENT
INTRODUCTIONLoyal customers are the best base for survival andgrateful in business, the basic understanding canbe maintained that satisfaction will automaticallylead to the retention and profitability. Thecompetitive differentiation will be main driver ofmarketing for surviving so the customerexperience management will lend to achieve thisgoal. Experience can be mater furt for thepreparation large chunk of loyal customers. Thecustomer experience directly affects the cognitiveaspect of customer.
Customer experience also work for the descriptionof lea internal and Subjective response andemotions attached with the brands. The perceptualaspects also play an important role. More andmore companies have understood an importanceof Customer Experience. Which they present withtheir service offerings. The popularity of theconcept has also compelled traditional companiesto focus on Customer Experience for valueaddition .
Customer Experience Management (CEM) is nowworking as marketing strategy for winningsuccess.
The concept has become an important tool for
understanding the purchaser’s behaviour((Addis&Holbrook, 2001). Marketing and consumerbehaviour experts have defined it in differentperspectives. Consumer behaviour hasinterpreted it as a stimuli linked with product orservice (Holbrook and Hirschman)). Marketingexperts have defined it as an interaction situationbetween service providers and customers (Caru& Cova, 2003). Customer experience has alsopossessed a dimension called internal andsubjective response (Meyer and Schwager ).
Components of CUSTOMER EXPERIENCE
The following are the components of CUSTOMEREXPERIENCE
� People� Product� Process� Policy
The role of people may bring following issues into consideration
� Strategic insights� Loyalty drivers� Location Preferences� Brand advocacy by Customers and Employees
An Application Study ofCustomer Experience Model
Dr. Ashish Sharma*Amit Philora**
ABSTRACT
Customer experience is not a new phenomenon in India. We translate experience as anubhav in Hindi whichdescribe the greater emphasis on its working. In India whenever any middle class is going to buy luxuryproduct they take consultation from family friends and relative. The best known person is most trusted for anymiddle class customer as he can watch and experience physically before taking a buying decision. Theexperience has been a key of success or failure both if it would not be conceptualized or strategized on time.
The Customer experience can be a provider of economic value as well as managerial learning. The ToyotaCompany is a fine example of this. The customer not only shares an experience but share learning, personalityand attitude in this form.
Social Environment, Service interface, Retail Atmosphere, Assessment and Price
The present paper will examine an application of variables in buying situations of various luxury products.The preliminary statistical and multivariable analysis tools are applied in this regard.
Keywords: Learning, Attitude, Retail Atmosphere, Assessment, Price, Social Environment
* Dr. Ashish Sharma, Sr. Lecturer, University Institute of Management, R.D. University, Jabapur and** Amit Philora, Research Scholar, A.P.S. University, Rewa (M.P.)

21
The role of product can also be very important as per following model
(d) Codestruction
(e) Service Personnel
Service Interface
(a) Service person
(b) Technology
(c) Customization
Retail Atmosphere
(a) Design
(b) Scents
(c) Temperature
(d) Music
Assortment
(a) Variety
(b) Uniqueness
(c) Quality
Price
a. Loyalty Programs
Product Manager sit in the centre of manyconversations
Reproduced from www.allankelly.net/static/writing/OnManagement/OnMngm5-Product byAllan Kelly
The role of process also plays an importantrole for generation of customer value. After theunderstanding of customer experience theprocess map preparation is very important (Grant,2007).
The policies may be the creation of end result ofcustomer experience management.
Conceptual Framework: Verhoef andLeeflang (2009) has proposed followingmodel
Social environment
(a) Reference group
(b) Reviews
(c) Tribes
An Application Study of Customer Experience Model● Dr. Ashish Sharma
● Amit Philora

22
SAARANSHVol. 8 No. 1 JULY 2016● ●
RKG JOURNAL OF MANAGEMENT
b. Promotions
c. Situational Moderators
d. Type of store
e. Location
f. Culture
g. Economic
h. Climate
i. Season
j. Competition/ Entrance
k. Consumer Moderators
l. Goals: experiential
m. Risk orientation
n. Socio-demographic
o. Consumer attitude
(Price sensitivity, involvement, innovativeness)
This model will be applied through appropriateresearch Process
Review of Literature
Schmitt (2010) has described CEM as visionaryapproach. Puccinelli, (2009) has proved that CEMcan increased retail performance. Meyer andSchwager (2007) has presented the differencebetween customer experience and customerrelationship. Palmer (2010) has given thedescription of customer experience as aninterpersonal relationship with service and brandand also presented the conceptual validity ofcustomer experience concept. Gentile and Noci(2007) has described the role of customerexperience in successful launching of any offer
The review of literature has given the existence ofthe paper topic and gaps which can be covered inthe proposed paper.
RESEARCH OBJECTIVESThis paper will be for following objectives
� To apply the factors of PC Verhoef model whichare responsible for the customer purchasedecision in the category of Luxury products
� To prepare the qualitative profile of thesefactors as they may be operational for differentstrata of the society and customer groups
RESEARCH METHODOLOGY
Research Philosophy
The option for selection of research philosophy isan important. Proper research Philosophy worksfor the whole research work. Research Philosophyis here for identifying inherent features ofconsumer influence through selected factors.
Research Approach
The approach selected for this research isinductive as it is based on the data collectedthrough customers and based on the response’sinterpretation emerged factors.
Research Design and Strategy
The research design is the whole structure of theresearch. It gives the entire path for the conductof research. Here both qualitative and exploratoryresearch design has been selected. To executethe purpose of exploratory research three stageswill be launched as follows
� Factors exploration
� Qualitative research design
Research Method
A research method for exploratory design wasfocus group and Depth Interview with customersat various Customers buying experiences onbuying of Luxury Product.
The factor Analysis method was applied at thisstage. The researchers were contacted at differentmalls, cinema houses and other public places ofJabalpur City.Some variable selected forexploratory stage and some selected forqualitative research stage. The basis of selectionwas nature of variables in terms of continuous andcategorical aspect.
The researcher has worked on 30 customerswhere the qualitative research design has applied.Phenomenological and Ethnography ResearchDesign has been applied. The methods whichhave been employed here are -
� Interactive, interviewing
� Observations

23
The respondents have been given the list offollowing variables :
Variables Interpretation
Type of Store FormatLocation ConvenienceCulture Country & community
specificEconomic climate Economic classSeason Opportunity to buyCompetition Brand choicesGoals Experience Clarity on buyingTask orientation Planned or impulseSocio Demographic Professional statusConsumer Attitude Favorite
The researchers were contacted at different malls,cinema houses and other public places of JabalpurCity.
SAMPLING I STAGEFactor Analysis stageDemographic Profile at a glance (N=250)
Number Percentage
GenderMale 150 60Female 100 40
Age21-30 50 2031-50 100 40Over 50 100 40
32
Marital StatusSingle 160 64Married 90 36
Income (Annual)Up to 5 Lakh 20 85-10 Lakh- 30 1210-15 Lakh 200 80
Students 10 4Professionals 150 60Self Employed 90 36
SAMPLING II STAGE
Qualitative research Profile
DEMOGRAPHIC PROFILE AT A GLANCE(N=30)
Number Percentage
GenderMale 20 66Female 10 34Age21-30 10 3331-50 15 50Over 50 5 40
17Marital StatusSingle 12 40Married 18 60Income (Annual)Up to 5 Lakh 20 665-10 Lakh 5 1710-15 Lakh 5 17Students 15 50Professionals 10 33Self Employed 15 17
ANALYSIS AND FINDINGS(a) Factor analysis is applied for the selection of
the final responsible factors of purchasingunder the influence of store ambience. Thevariables selected for factor analysis are onceagain presented here i.e. (1) Reference groupReviews
(b) Tribes
(c) Service Personnel
(d) Service person
(e) Technology
(f) Customization
(g) Design
(h) Scents
(i) Temperature
(j) Music
(k) Loyalty Programs
(l) Promotions
An Application Study of Customer Experience Model● Dr. Ashish Sharma
● Amit Philora

24
SAARANSHVol. 8 No. 1 JULY 2016● ●
RKG JOURNAL OF MANAGEMENT
2. The result of factor analysis is as follows :
KMO AND BARTLETT’S TEST
Kaiser-Meyer-Olkin Measure of Sampling Adequacy. .570
Bartlett’s Test of Sphericity Approx. Chi-Square 203.605
df 45
Sig. .000
Measure of Sampling Adequacy is .570 andBartlett’s Test of Sphericity is 203.605. These twoare the indicators about the strength of Factoranalysis. KMO is above 0.5 which is satisfactoryin itself.
Presentation of Factors—After employingFactor loadings in Varimax method thefollowing details are here:Factors Variables Included Interpretation
1. Social Reference group May change withenvironment Reviews time
TribesCodestructionService Personnel
2. Service Service person Customer friendlyInterface Technology behaviour required
Customization
3. Retail Design Determining factorAtmosphere Scents
TemperatureMusic
4. Assortment Variety Strategic factorUniquenessQuality
Price Loyalty Programs Economy decidePromotions the sensitivity
The following data has emerged fromrespondents-
Type of Store
Important 60%
Unimportant 40%
Selection of store plays an important role
Location
Considerable factor 70%
Sometime only 20%
Not a factor 10%
Location plays as an important experience factor.
Culture
Important factor 80%
Unimportant factor 20%
Majority approves culture as important experience
measure.
Economic factor
Important factor 70%
Unimportant factor 30%
The economic aspect plays an important role forexperience providence.
Competition
Impact on brand decision 30%
No impact on brand decision 70%
Customer may overlook the brand decision
On many occasion.
Goals experiences
Same brand and same store 40%
Same brand and different store 20%
Different brand same store 30%
Different brand and different store 10%
Same brand and same store in majority work as majorgoal achiever for customer
Task Orientation
Proper analysis of survey 30%
Others suggestion 20%
No decisions 50%
Customer present an experience on the basis of surveywhich work as touch point for him/ her.
Socio-demographic decision
Some times 20%
Nonissue 60%
Always work 20%
This was not a major issue for the people.
Consumer attitude
Previous experience 40%
Ad effect 30%
Always work 30%
Previous attitude always carry till next purchase.
Source: Field resource
SUGGESTIONS1. Institutional frame work for customer
experience data and insight.
2. Continuous market research in qualitativemanner.
3. Customer club concept and loyalty programmeshould be restructured.
4. Cultural input should be assessed.

25
5. The customer meet with brand experiencecould be organized at retail level.
6. Flexibility in product design could be accepted.
CONCLUSIONThe study identified location, Economic limitations& culture, Economic climate & Task oriantation animportant factors for better customs experience.
REFERENCEPuccinelli, N. M., Goodstein, R. C., Grewal, D., Price, R., Raghubir, P., & Stewart, D. (2009). Customer experience
management in retailing: understanding the buying process. Journal of Retailing, 85(1)
Anne Roggeveen, Michael Tsiros, Leonard A. Schlesinger(2009) Customer Experience Creation: Determinants,Dynamics and Management Strategies, Journal of Retailing 85 (1) 31–41
A Palmer - Journal of Services Marketing, 2010 - emeraldinsight.com
C Gentile, N Spiller, G Noci(2007) - How to Sustain the Customer Experience:: An Overview of ExperienceComponents that Co-create Value With the Customer European Management Journal, Elsevier Volume 25,Issue 5, Pages 395–410
Addis, M., & Holbrook, M. B. (2001). On the conceptual link between mass customisation and experientialconsumption: an explosion of subjectivity. Journal of Consumer Behaviour, 1(1), 50-66.
Holbrook, M. B., & Hirschman, E. C. (1982). The experiential aspects of consumption: consumer fantasies, feelings,and fun. Journal of consumer research, 132-140.
Carù, A., & Cova, B. (2006). How to facilitate immersion in a consumption experience: appropriation operationsand service elements. Journal of Consumer Behaviour, 5(1), 4-14.
An Application Study of Customer Experience Model● Dr. Ashish Sharma
● Amit Philora

26
SAARANSHVol. 8 No. 1 JULY 2016● ●
RKG JOURNAL OF MANAGEMENT
A conceptual model attempts to show therelationships that exist between silent variables(Ghobadian et al, 1994). It is a simplifieddescription of the actual situations. It is said thatconceptual models in service quality enablemanagement to identify quality problems and thushelp in planning for the launch of a qualityimprovement program thereby improving theefficiency, profitability and overall performance.
This paper makes an attempt to study variousservice quality models covering the aspects ofconventional services to web interacted services.The primary aim of these models is to enable themanagement to understand and enhance thequality of the organization and its offering.Nineteen conceptual service quality modelsreported during the period (1984-2003) arereviewed in this paper. Each of them isrepresentative of a different point of view aboutservices.
NEED OF THE STUDYToday globalization and liberalization are affectingeconomies of not only developing but alsodeveloped countries. The focus areas fororganizations are also changing from profit to
Identify The Need for Developing A New ServiceQuality Model in Today’s Scenario: A Review of
Service Quality ModelsAnkit Agarwal1, Gulshan Kumar2
ABSTRACT
The service industries are mostly customer driven and their survival in the competitive environment largelydepends on quality of the services provided by them. Due to the increasing competition in the service sector,customer service is an important part of the organizational growth. The key lies in improving the serviceselectively, paying attention to more critical attributes as a part of improved customer satisfaction. A largenumber of research studies for service quality take place in the context of developing countries. There arevarious models suggested by many authors in relation to service quality but no model take all attributes ofservice quality. The main objective of this paper is to critically appraise various service quality models andidentify issues for future research based on the critical analysis of literature. This study aims at evaluating thedifferent service quality models given by different authors and identifies the need for developing a new modelin today’s scenario. This study examines 19 models of service quality. Findings of the study explore newmodel and direction in service quality improvement for different sectors. Data for this study is collected fromsecondary sources. The empirical findings not only priorities different parameters of service quality but alsoprovide guidelines to focus on the other parameters on which the marketer need to improve.
Key Words: Competitive Environment, Service Industries, Service Quality Models, India.
INTRODUCTIONDuring the past few decades service quality hasbecome a major area of attention to practitioners,managers and researchers owing to its strongimpact on business performance, lower costs,customer satisfaction, customer loyalty andprofitability (Leonard and Sasser, 1982; Croninand Taylor, 1992; Gammie, 1992; Hallowell, 1996;Chang and Chen, 1998; Gummesson, 1998;Lasseretai, 2000; Silvestro and Cross, 2000;Newman, 2001; Sureshchander et aL, 2002; Guru,2003 etc.). There has been a continued researchon the definition, modeling, measurement, datacollection procedure, data analysis etc., issues ofservice quality, leading development of soundbase for the researchers. This documentedknowledge base through several studies on thesubject can be of great use to researchers andpractitioners in providing a direction on how toexplore/modify the existing service qualityconcepts with the changing world scenario (shiftfrom conventional personalized services to webenabled services). In this context model gainsspecific importance as it not only help in learningthe factors associated with it but also will providea direction for improvements.
1. Research Scholar, Uttarakhand Technical University, Dehradun. Email Id: [email protected],2. Research Scholar, Kumau University, Nainitaal

27
maximizing profits through increased customersatisfaction. The pressures of competition areforcing the organizations to not only look on theprocesses but also on the way they are delivered.During past two decades business scenario haschanged drastically.
Some of the key changes that have taken placein the business are:
● Greater sharing of information with allconnected links and customers.
● Greater emphasis on organizational andprocess flexibility.
● Necessity to coordinate processes acrossmany sites.
● Competitive pressure to introduce new service/ products more quickly.
● Integrated customer driven processes.
● Quick response to customers needs.
● Worldwide relationships between various tradepartners, suppliers etc.
● Easily accessible information through internet.
● Flexible and efficient service/productcustomization.
Owing to the factors like opening up of markets,increase in use of IT, increased customerknowledge and awareness etc., it becomes a mustto deliver’ the services better then its competitorat agreed price. In this context, the subject ofservice quality needs a fresh understanding in thecurrent business scenario. This study can help toidentify the research gaps and thus attempts toprovide benefits to practicing managers andresearchers.
FRAME WORK OF THE STUDYThe subject of service quality is very rich in contextof definitions, models and measurement issue.The following factors seem to be suitable forcomparative evaluations of the models:
● Identification of factors affecting service quality.
● Suitability for variety of services inconsideration.
● Directions for improvement in service quality. -
● Suitability to develop a link for measurementof customer satisfaction.
● Flexible enough for modifications as per thechanges in the environment/conditions.
● Suggests suitable measures for improvementsof service quality both upstream and downstream the organization in focus.
● Identifies future needs (infrastructure,resources) and thus provide help in planning.
With these issues as focus this present study isundertaken to understand the service qualitymodels in the above light.
SERVICE QUALITY MODELSThe present study is an attempt to review 19service models in the light of the changedbusiness scenario and analyze the models for thesuitability/need for modification in the currentcontext. The models are presented using astandard structure, i.e. covering brief discussionand the major observations on the models. Thenext section covers the evaluation of these modelsfor above parameters. The brief discussions onthe models are as under:
SQ1. Technical and functional qualitymodel (Gronroos, 1984)
A firm in order to compete successfully must havean understanding of consumer perception of thequality and the way service quality is influenced.Managing perceived service quality means thatthe firm has to match the expected service andperceived service to each other so that consumersatisfaction is achieved. The researcher identifiedthree components of service quality, namely:technical quality; functional quality; and image:
(1) Technical quality is the quality of whatconsumer actually receives as a result of his/herinteraction with the service firm and is importantto him/her and to his/her evaluation of the qualityof service.
(2) Functional quality is how he/she gets thetechnical outcome. This is important to him and
Identify The Need for Developing A New Service Quality Model in Today’s Scenario:A Review of Service Quality Models
● Ankit Agarwal● Gulshan Kumar

28
SAARANSHVol. 8 No. 1 JULY 2016● ●
RKG JOURNAL OF MANAGEMENT
to his/her views of service he/she has received.
(3) Image is very important to service firms andthis can be expected to build up mainly bytechnical and functional quality of service includingthe other factors (tradition, ideology, word ofmouth, pricing and public relations).
SQ2: GAP model (Parasuraman et al.,1985)
Parasuraman et al (1985) proposed that servicequality is a function of the differences betweenexpectation and performance along the qualitydimensions. They developed a service qualitymodel based on gap analysis. The various gapsvisualized in the model are:
Gap 1: Difference between consumers’expectation and management’s perceptions ofthose expectations, i.e. not knowing whatconsumers expect.
Gap 2: Difference between management’sperceptions of consumer’s expectations andservice quality specifications, i.e. improperservice-quality standards.
Gap 3: Difference\ between service qualityspecifications and service actually delivered i.e.the service performance gap.
Gap 4: Difference between service delivery andthe communications to consumers about servicedelivery, i.e. whether promises match delivery.
Gap 5: Difference between consumer’sexpectation and perceived service. This gapdepends on size and direction of the four gapsassociated with the delivery of service quality onthe marketers side.
According to this model, the service quality is afunction of perception and expectations.
SQ3. Attribute service quality model(Haywood-Farmer, 1988)
This model states that a service organization has“high quality” if it meets customer preferences andexpectations consistently. According to this, theseparation of attributes into various groups is thefirst step towards the development of a servicequality model. In general, services have threebasic attributes: physical facilities and processes;people’s behavior; and professional judgment.Each attribute consists of several factors. Theresearcher tried to map different type of servicesettings as per degree of contact and interaction,degree of labour intensity and degree of servicecustomization in to this model.
SQ4. Synthesized model of service quality(Brogowicz et al., 1990)
A service quality gap may exist even when acustomer has not yet experienced the service butlearned through word of mouth, advertising orthrough other media communications. Thus thereis a need to incorporate potential customers’perceptions of service quality offered as well asactual customers’ perceptions of service qualityexperienced. This model attempts to integratetraditional managerial framework, service designand operations and marketing activities. Thepurpose of this model is to identify the dimensionsassociated with service quality in a traditionalmanagerial framework of planning,implementation and control. The synthesizedmodel of service quality considers three factors,viz. company image, external influences andtraditional marketing activities as the factorsinfluencing technical and functional qualityexpectations.
SQ5. Performance only model (Cronin andTaylor, 1992)
The researcher investigated the conceptualizationand measurement of service quality and itsrelationship with consumer satisfaction andpurchase intentions; they compared computeddifference scores with perception to conclude thatperceptions only are better predictor of servicequality. They argued on the framework ofParasuraman et al (1985), with respect toconceptualization and measurement of servicequality and developed performance onlymeasurement of service quality called

29
SERVPERF by illustrating that service quality isa form of consumer attitude and the performanceonly measure of service quality is an enhancedmeans of measuring service quality. They arguedthat SERVQUAL confounds satisfaction andattitude. They stated that service quality can beconceptualized as “similar to an attitude”, and canbe operationalized by the adequacy-importancemodel. In par ticular, they maintained thatPerformance instead of “Performance-Expectation” determines service quality.
SQ6 Ideal value model of service quality(Mattsson, 1992)
The model argues for value approach to servicequality, modeling it as an outcome of satisfactionprocess. This value-based model of service qualitysuggests the use of a perceived ideal standardagainst which the experience is compared. Itshows that implicit negative disconfirmation on apre-conscious value level, is then hypothesizedto determine satisfaction on a “higher” attitudelevel. This negative disconfirmation is the majordeterminant of consumer satisfaction, moreattention should be given to cognitive processesby which consumers’ service concepts are formedand changed.
SQ7. Evaluated performance and normedquality model (Teas, 1993)
According to the author the conventionaldisconfirmation model has conceptual, theoreticaland measurement problems. He pointed out thosefollowing issues in the measurement of servicequality, i.e. SERVQUAL (Parasuraman et al., 1988)as: conceptual definition ambiguity; theoreticaljustification of expectations in the measurementof service quality; the usefulness of the probabilityspecification in the evaluated performance (EP)measurement; and link between service qualityand consumer satisfaction/dissatisfaction.
SQ8. IT alignment model (Berkley andGupta, 1994)
This model links the service and the informationstrategies of the organization. It describes the useof IT for improving service quality through anumber of case studies from variety of sectors(banking, courier, and transpor tation,manufacturing and services industries). This
model describes in detail where IT had been usedor could be used to improve specific service qualitydimensions including reliability, responsiveness,competence, access, communications, andsecurity, understanding and knowing thecustomers. According to the model, it is importantthat service quality and information system (IS)strategies must be tightly coordinated and aligned.The model explains the process of aligning serviceand aligning strategies.
SQ9. Attribute and overall affect model(Dabholkar, 1996)
The attribute model is based on what consumerswould expect from such option. It is based oncognitive approach to decision making, whereconsumers would use a compensatory processto evaluate attr ibutes associated with thetechnology based self service option in order toform expectations of service quality. The overallaffect model is based on the consumers’ feelingtowards the use of technology. It is based on anaffective approach to decision making whereconsumers would use overall predispositions toform expectation self service quality for atechnology-based self-service option. In both themodels expected service quality would influenceintentions to use technology-based self-serviceoption.
SQ10. Model of perceived service qualityand satisfaction (Spreng and Mackoy,1996)
This model attempts to enhance theunderstanding of the constructs perceived servicequality and consumer satisfaction. This model ismodification to Oliver’s model. The modelhighlights the effect of expectations, perceivedperformance desires, desired congruency andexpectation disconfirmation on overall servicequality and customer satisfaction. These aremeasured through set of ten attributes of advising(convenience in making an appointment,friendliness of the staff, advisor listened to myquestions, the advisor provided accurateinformation, the knowledge of the advisor, theadvice was consistent, advisor helped in long-range planning, the advisor helped in choosingthe right courses for career, advisor was interestedin personal life, and the offices were professional).
Identify The Need for Developing A New Service Quality Model in Today’s Scenario:A Review of Service Quality Models
● Ankit Agarwal● Gulshan Kumar

30
SAARANSHVol. 8 No. 1 JULY 2016● ●
RKG JOURNAL OF MANAGEMENT
SQ11. PCP attribute model (Philip andHazlett, 1997)
The researcher proposes a model that takes theform of a hierarchical structure – based on threemain classes of attributes – pivotal, core andperipheral. According to the model, every serviceconsists of three, overlapping, areas where thevast majority of the dimensions and conceptswhich have thus far been used to define servicequality. These ranked levels are defined as –pivotal (outputs), core and peripheral (jointlyrepresenting inputs and processes). The pivotalattributes, located at the core, are consideredcollectively to be the single most determininginfluence on why the consumer decided toapproach a particular organization and exert thegreatest influence on the satisfaction levels. Theyare defined as the “end product” or “output” fromthe service encounter; in other words, what theconsumer expects to achieve and receive, perhapseven “take away, when the service process is dulycompleted.
Core attributes, centered on the pivotal attributes,can best be described as the amalgamation ofthe people, processes and the serviceorganizational structure through which consumersmust interact and/or negotiate so that they canachieve/receive the pivotal attribute. Peripheralattributes which can be defined as the “incidentalextras” or frills designed to add “roundness” to theservice encounter and make the whole experiencefor the consumer a complete delight. When aconsumer makes an evaluation of any serviceencounter, he is satisfied if the pivotal attributesare achieved, but as the service is used morefrequently the core and peripheral attributes maybegan to gain importance.
SQ12. Retail service quality and perceivedvalue model (Sweeney et al., 1997)
The influence of service quality on value andwillingness to buy in a specific service encountersthrough two alternative models. Value can bedefined as a comparison between whatconsumers get and what they give, suggesting thatvalue is a comparison of benefits and sacrifices.(Zeithaml et al., 1988). Value construct used inthis model is “value for money”.
Model 1: This model highlights that in addition toproduct quality and price perceptions, functionalservice quality and technical service quality
perceptions both directly influence valueperceptions.
Model 2: This model highlights that in additionfunctional service quality perceptions directlyinfluence consumers’ willingness to buy.Functional service quality perceptions alsoinfluence technical service quality perceptions,which in turn influence product quality perceptionsand neither of the two directly influence valueperceptions.
On analysis, of modification indices for model 2(being superior to model 1) it is possible to makesignificant improvement in this model by allowingtechnical service quality to influence perceivedvalue directly.
SQ13. Service quality, customer value andcustomer satisfaction model (Oh, 1999)
The researcher proposed an integrative model ofservice quality, customer value and customersatisfaction. The proposed model focuses mainlyon post purchase decision process. Arrows in themodel indicate causal directions. The modelincorporates key variables such as perceptions,service quality, consumer satisfaction, customervalue and intentions to repurchase. The modelprovides evidence that customer value has asignificant role in customer’s post-purchasedecision-making process.
SQ14. Antecedents and mediator model(Dabholkar et al., 2000)
A comprehensive model of service quality includesan examination of its antecedents, consequences,and mediators to provide a deeper understandingof conceptual issues related to service quality. Thismodel examines some conceptual issues inservice quality as: the relevant factors related toservice quality better conceived as componentsor antecedents and the relationship of customersatisfaction with behavioral intentions.
SQ15. Internal service quality model (Frostand Kumar, 2000)
The researcher has developed an internal servicequality model based on the concept of GAP model(Parasuraman et al., 1985). The model evaluatedthe dimensions, and their relationships, thatdetermine service quality among internalcustomers (front-line staff) and internal suppliers(support staff) within a large service organization.

31
The internal gap 1 shows the difference in supportstaff’s perception (internal supplier) of front-linestaff’s expectation (internal customers). Internalgap 2 is the significant difference between servicequality specifications and the service actuallydelivered resulting in an internal serviceperformance gap. Internal gap 3 is the gap whichfocuses on the front-line staff (internal customers).The gap is based on the difference between front-line staff’s expectations and perceptions of supportstaff’s (internal supplier) service quality.
SQ16. Internal service quality DEA model(Soteriou and Stavrinides, 2000)
The researcher presented a service quality modelthat can be used to provide directions to a bankbranch for optimal utilization of its resources. Themodel does not aim to develop the service qualitymeasures, rather guides how such measures canbe incorporated for service quality improvements.The model points out resources that are notproperly utilized. The inputs to the model consistof two sets: consumable resources such aspersonnel, space, time etc. and the number ofaccounts in different categories. The output of themodel is the level of service quality perceived bythe personnel of the branch. The data envelopeanalysis (DEA) model compares branches on howwell they transform these resources (inputs) toachieve their level of service quality (output) giventhe client base. The DEA model will identify underperformers and suggest ways for theirimprovement. The input minimization DEAmodel will provide information on how much couldthe consumables resources be reduced whiledelivering the same level of service quality, whilethe output maximization DEA model will provideinformation on how much service quality can beimproved using the same consumable resources.
SQ17. Internet banking model (Broderickand Vachirapornpuk, 2002)
One of the key challenges of the internet as aservice delivery channel is how service firms canmanage service quality as these remote formatsbring significant change in customer interactionand behavior. This study proposes and tests aservice quality model of internet banking. Theresearch uses par ticipant observation andnarrative analysis of UK internet web sitecommunity to explore how internet banking
customers perceive and elements of this model.In the context of internet, five key elements aretreated as central influences on perceived servicequality: They are: customer expectations of theservice; the image and reputation of the serviceorganization; aspects of the service setting; theactual service encounter; and customerparticipation.
SQ18. IT-based model (Zhu et al., 2002)
This model highlights the impor tance ofinformation technology (IT)-based service options.Service providers are using IT to reduce costs andcreate value-added services for their customers.It proposes a service quality model that linkscustomer perceived IT-based service options totraditional service dimensions. The modelattempts to investigate the relationship betweenIT-based services and customers’ perceptions ofservice quality. The model focuses on the linkagesamong the service dimensions as measured bySERVQUAL, the constructs representing the IT-based service quality, preferences towardstraditional services, experiences in using IT-basedservices, and perceived IT policies.
SQ19. Model of e-service quality (Santos,2003)
This study proposes a conceptual model of e-service quality with its determinants. It is proposedthat e-service quality have incubative (properdesign of a web site, how technology is used toprovide consumers with easy access,understanding and attractions of a web site) andactive dimensions (good support, fast speed, andattentive maintenance that a web site can provideto its customers) for increasing hit rates, stickiness,and customer retention.
OBSERVATION & EVALUATIONOF SERVICE QUALITY MODELS
Owing to the importance of service quality, therehas been a systematic development of a varietyof concepts and models.
● Gronroos (1984) (SQ1) observed that word-of-mouth (WOM) has a more substantial impacton potential customers then traditionalmarketing activities, and also highlighted theneed for service quality research based onconsumers’ views.
Identify The Need for Developing A New Service Quality Model in Today’s Scenario:A Review of Service Quality Models
● Ankit Agarwal● Gulshan Kumar

32
SAARANSHVol. 8 No. 1 JULY 2016● ●
RKG JOURNAL OF MANAGEMENT
● Later Parasuraman et al. (1985) (SQ2)modeled service quality as a gap betweenconsumer and marketer sides at differentlevels, using WOM as a key contributor to theexpected service. Later Parasuraman et al.(1988; 1991) developed and revised servicequality measurement tool, SERVQUAL. Thisgap model and SERVQUAL as a base wasused (Frost and Kumar, 2000) (SQ15), forinternal service quality modeling.
The measurement of service quality through gapmodel and SERVQUAL was criticized by:
● Cronin and Taylor (1992) (SQ5) and Teas(1993) (SQ7) and they proposed SERVPERF(a service quality tool for measuringperceptions only) and EP (EvaluatedPerformance) model respectively. This wasagain criticized by Parasuraman et al. (1994),and further counter-acted by Cronin and Taylor(1994) and Teas (1994).
● Cronin and Taylor (1992) pointed out thatservice quality is an antecedent of consumersatisfaction, which has a significant onpurchase intentions. This led to thedevelopment of model of perceived servicequality and satisfaction (Spreng and Mackoy,1996) (SQ10).
● Cronin and Taylor (1992) pointed out thatconsumers don’t always buy best qualityservice, they might instead purchase on thebasis of their assessment of value of service.This highlighted the importance of “value” andthus acts as a motivating point for researchersto include/model value for improvement/understanding of service quality.
● In this liberalized economy, to remaincompetitive, service providers are increasinglyoffering their customers IT-based serviceoptions. Service providers are using IT toreduce costs and create value-added servicesfor their customers. Furey (1991) suggests thatIT can help enhance service quality byincreasing convenience, providing extraservices, and collecting service performanceinformation for management use.
● This led the related developments of modelsby Berkley and Gupta (1994) (SQ8); Dabholkar(1996) (SQ9); Broderick and Vachirapornpuk(2002) (SQ17); Zhu et al. (2002) (SQ18) andSantos (2003) (SQ19).
● It seems that practitioners required anapproach to maximize service quality withavailable inputs, and this led to thedevelopment of DEA-based model (Soteriouand Stavrinides (2000) (SQ16).
From the review, it is clear that there does notseem to be a well-accepted conceptual definitionand model of service quality nor there is anygenerally accepted operational definition of howto measure service quality. However majority ofmodels and definitions support the view ofevaluating service quality by comparing theirservice quality expectation with their perceptionsof service quality they have experienced.
Category A. Gap model / SERQUAL-based:
The models under this category are those models,which are developed either using gap model orits modification as base or scale using SERVQUALitems or its modification for measurement ofservice quality.

33
The evaluation of the models as identifying their findings and weaknesses are presented:
Model No. / Type Key Findings / Applications Weaknesses / Limitations
SQ1. Technical andfunctionalqualitymodel
SQ2. Gap model
SQ3. Attribute servicequalitymodel
SQ4. Synthesized modelofservice quality
SQ5. Performance onlymodel
SQ6. Ideal value model ofservice quality
SQ7. EP and NQ model
SQ8. IT alignment model
SQ9. Attribute and overallaffect model
1. Service quality depends on technical quality, functionalquality and corporate image of the organization inconsideration.2. Functional quality is more important than the technicalquality.
1. The model is an analytical tool. It enables themanagement to identify systematically service qualitygaps between a numbers of variables affecting thequality of the offering.2. This model is externally focused. It is capable ofassisting the management to identify the relevant servicequality factors from the viewpoint of the consumer.
1. This model provides a base of segregating serviceorganization on three dimensions for better managementof quality.2. The model has the potential to enhance understandingof the Concepts of service quality and help to guide abouttargeting towards the right customer segment.3. This model is useful both in the design stage andperiodically as the service and possibly customer tasteevolve.
1. This model identifies variables that require systematicmgt. attention in planning & implementation controllingservice–marketing strategies that minimize servicequality gap.
1. Service quality should be conceptualized andmeasured as an attitude.2. The performance-based SERVPERF is efficient incomparison with SERVQUAL, as it directly reduces thenumber of items by 50 per cent and the results are better.3. Service quality is an antecedent of consumersatisfaction and may have a better effect on purchaseintentions than service quality.
1. This model provides a new learning perspective onhow an ideal standard can be formed and how it can besustained mentally.2. The model highlights attention to the importance ofnegative disconfirmation experience as a determinantfor satisfaction outcome.
1. The model raised a number of issues pertaining toconceptual and operational definitions of expectation andrevised expectation.2. The criterion and construct validity of the EP modelwas higher than both the SERVQUAL and NQ model.
1. This model describes how IT can be used to improvecustomer service along key service quality dimensionsincluding reliability, responsiveness, competence,access, communication, security and understanding thecustomer.2. Allows managers to understand the commonly usedtechnologies in their industry and determine appropriatetechnology suiting their requirements.
1. The attribute-based model is favored in forming theevaluations of service quality for technology-based self-service options.2. The overall affect model is also supported but it does
1. The model does not offer anexplanation on how to measurefunctional and technical quality.
1. The model does not explain theclear measurement procedure Forthe measurement of gaps atdifferent levels.
1. It does not offer the measure-ment of service quality.2. It does not offer a practicalprocedure capable of helpingmanagement to identify servicequality problems or practicalmeans of improving servicequality.
1. Needs empirical validation.2. Need to be reviewed for differenttype of service settings.
1. Need to be generalized for alltypes of service settings.2. Quantitative relationshipbetween consumer satisfactionandService quality need to beestablished.
1. Fewer number of items used forvalue and customer satisfactionNeeds to be defined for all typesof service settings.
1. This model was tested for limitedsample size and for narrow servicesetting.
1. It only highlights the impact ofIT on service quality. The modelDoes not offer a way to measureand monitor service quality.2. The model is silent about thelevel of IT use for particularServicesettings.
1. Needs to be generalized fordifferent self-service options.2. Effect of demographic variables,price, physical environment etc. is
Identify The Need for Developing A New Service Quality Model in Today’s Scenario:A Review of Service Quality Models
● Ankit Agarwal● Gulshan Kumar

34
SAARANSHVol. 8 No. 1 JULY 2016● ●
RKG JOURNAL OF MANAGEMENT
SQ10. Model of perceivedquality andsatisfaction
SQ11. PCP attribute model
SQ12. Retail service qualityandperceived value
SQ13. Service quality,customervalue andcustomer satisfac-tion model
SQ14. Antecedents andmediator model
SQ15. Internal servicequality model
SQ16. Internal servicequality DEA model
SQ17. Internet bankingmodel
not add further explanatory power to the attribute-basedmodel.
1. This model shows that service quality and satisfactionare distinct and desires congruency does influencesatisfaction.2. A key determinant of service quality and customersatisfaction is meeting customer desires. Risingexpectations have a positive effect on customersatisfaction perceptions of performance, but they alsohave a negative effect on satisfaction throughdisconfirmation.
1. Provides a simple, effective and general frameworkof assessing Service quality for any service sector.2. Highlights the area of improvements for service qualityDepending on the frequency of encounter.3. The dimensions to these three levels of attributes areindividual sector-dependent and with reference toconsumer.
1. The technical service quality is an importantcontributor to product quality and value perceptions andhence influences willingness to buy.2. Functional service quality has indirect influence onwillingness to buy through product quality and valueperception; however. it has influence on willingness tobuy that is independent of product assessment (poorstaff manners).
1. The model can be used as a framework forunderstanding consumer decision process as well asevaluating company performance.2. This model provides directions and targets forcustomer-oriented company efforts.
1. Consumers evaluate different factors related to theservice butAlso form a separate overall evaluation ofthe service quality.2. The antecedent’s model can provide completeunderstanding ofService quality and how theseevaluations are formed.3. Customer satisfaction is a better predictor ofbehavioral intentions.4. A strong mediating role was found, confirming that itis important to measure customer satisfaction separatelyfrom service quality when trying to determine customerevaluations of service.
1. The perceptions and expectations of internalcustomers and internal suppliers play a major role inrecognizing the level of internal service quality perceived.
1. Indicates the resources, which can be better utilizedto produce higher service quality levels.
1. Implication for the management of quality in internetbanking service arises in two areas a) within the serviceinterface and b) with the management of increasedcustomer role.2. The level and nature of customer participation hadthe greatest impact on the quality of service experienceand issues such as customers’ “zone of tolerance” andthe degree of role understanding by customers andperceived service quality..
not considered.
1. The model does not highlighthow the service quality is achievedand operationalized.2. The model is weak in providingdirections for improvements inservice quality.
1. The model is lacking in providinggeneral dimensions to three levelsof attributes (Lacks empiricalvalidation).
1. The model considers only onevalue construct, i.e. valueforMoney.2. Fewer number of items perconstruct is taken in this study.
1. Model needs to be generalizedfor different types of serviceSettings.2. Model variables are measuredthrough relatively fewer items.
1. Antecedents of customersatisfaction have not beenexplored.2. The model measures behavioralintention rather than actualbehavior.3. Needs to be generalized fordifferent service settings.
1. Need to be generalized for alltypes of internal environments.2. Effect of changes in externalenvironment on model is notConsidered.
1. Does not provide themeasurement of service quality.2. Model ignores other bankperformance measures.
1. Not much empirical work carriedout.2. The model is based on theexperience of one web site only,needs to be validated with otherexperiences

35
SQ18. IT-based model
SQ19. Model of e-servicequality
1. Fewer number of items chosento measure the feeling of self-control and comfort in using IT-based services.2. Does not provide a measure ofservice quality of IT-basedTransactions.
1. Model did not provide specificmeasurement scales.2. No statistical analysis carriedout
1. IT-based services have a direct impact on the reliability,responsiveness and assurance dimensions and an indirectimpact on customer satisfaction and perceived servicequality.2. IT can help service providers achieve higher level ofcustomer Satisfaction.3. The customer evaluation of IT-based services is affectedby preference towards traditional services, past experiencein IT-based services and perceived IT policies.
1. It provides a better understanding of e-service qualityand, therefore, to achieve high customer retention,customer satisfaction, and profitability.2. This e-service quality model can be of assistance to allcompanies that engage e-commerce or plan to do so..
Category I: Relation between VariousAttributes of Service
Quality of service is affected by and affects anumber of variables such as value, attitude,expectations and aspirations etc. These variablesmay also guide purchasing behavior, financialperformance etc. In this regard it may beinteresting to develop a theoretical framework toestablish clear linkages between various variables.Similarly, it needs to be explored if variousattributes of service quality are independent.
Category II: Role of Technology Such asIT
Technology plays an important role in improvingquality of service. IT initiatives such as EDI(electronic data interchange), POS (point of sales)information systems and systems such as ERP(enterprise resource planning) may act as anenabler for value enhancement. The followingissues may need further attention:
● What type of information system architectureis needed for effective delivery of qualityservice?
Category III: Measurement Issues
It is interesting to study measurement-relatedissues. Often, the behavior and outcomes may beguided by the way quality of service is beingmeasured. The following issues are important inthis regard:
● How to quantify and measure quality ofservice?
● How to link quality of service and businessperformance? Is there any evidence to say thatimproved quality of service has enhancedfinancial performance of the organization?
● How does one benchmark on variousdimensions of services?
Category B. Other models:
The other models which are different from the gapmodel. Following tables summarizescategorization of the earlier discussed modelsalong with the salient features of each of thesemodels. These tables also presents an attempt tomap the models based on the factors given in theearlier section “Frameworks for study”. It is clearfrom the review that none of the models caters tothe factors highlighted in that section, and so thisdemands research in this direction. Another issueemerging from the review is the identification ofinternal and external customers. From servicedelivery point of view, one needs to clearlyunderstand distinction between these two classesof customers. This issue further gains strength,as it is expected that the key to the success ofany organization depends on the dedicatedemployee base represented by the internalcustomers. Unless internal customers aresatisfied, it may be difficult to visualize good qualityservice for the external customers. The role andcommitment of top management in deliveringquality service to its customer also gainsimportance in the light of growing competitivepressure and globalization of services.
RESEARCH ISSUESBased on the survey of literature, some researchissues are identified which require attention fromresearchers and practitioners. These researchissues may be categorized into the followingcategories for better understanding of the subject:
Category I: Relation between various attributesof service.
Category II: Role of technology such as IT.
Category III: Measurement issues.
Following tables attempts to highlight these issueswith reference to 19 models surveyed. A briefaccount of these issues is given below.
Identify The Need for Developing A New Service Quality Model in Today’s Scenario:A Review of Service Quality Models
● Ankit Agarwal● Gulshan Kumar

36
SAARANSHVol. 8 No. 1 JULY 2016● ●
RKG JOURNAL OF MANAGEMENT
Model No. / Type Category Select research issues
SQ1. Technical and functional quality model I How technical and function quality influences a service deliveredand how the customer perceives these dimensions?
SQ2. GAP model III How to measure the gaps at different levels using a standardmeasurement tool. What are the factors affecting? Whether thesegaps differ from industry to industry?
SQ3. Attribute service quality model III How to measure service quality in a particular service encounterusing this model. On what attributes it depends and how to determinerelative importance of attributes for a service encounter?
SQ4. Synthesized model of service quality I What factors contribute to the information and feedback, design,implementation and communication gaps? How service managerscan minimize the gaps through the performance of planning,implementation and control tasks?
SQ5. Performance only model I What is the role of value in the determination of a service? Howvalue affects the purchase decision
SQ6. Ideal value model I What is the cognitive process by which consumer service are formedand changed?
SQ7. EP and NQ model I How to generalize the EP model results for all types of servicesettings, whether change in the type of service needs re-examinationof model?
SQ8. IT alignment model II How IT can enhance customer satisfaction. Whether the investmentin IT depends on competition, market growth and other similar factors.How much to invest and up to what level IT should be used?
SQ9. Attribute and overall affect model II What is the role of attitude and behavior towards using a technologyon expectations of service quality?
SQ10. Model of perceived quality and satisfaction I How to determine the balance between positive and negative effectof expectations?
SQ11. PCP attribute model III What should be weighing of these levels of attributes? On what factorsit depends. Whether this changes with the type of service settings?
SQ12. Retail service qualityand perceived value I What is the impact of functional value, emotional value and socialvalue on product quality, service quality, perceived price, value formoney and willingness to buy?
SQ13. Service quality, customer value and III What are the measurement issues associated with perceivedcustomer satisfaction model value and customer satisfaction? Whether the determinants of
perceived value and customer satisfaction change with type of servicesetting?
SQ14. Antecedents and mediator model I What is the role of actual behavior and actual repurchase on predictivepower of service quality and customer satisfaction evaluation? Whatare the antecedents of customer satisfaction, whether these arecorrelated with antecedents of service quality?
SQ15. Internal service quality model III Which of the SERVQUAL dimensions is most important inmeasurement of internal service quality? Whether responsivenessplays a bigger role than reliability for all types of service settings?
SQ16. Internal service quality DEA model I Can data envelope analysis be used as a tool to derive thelinkagebetween service quality, profitability and operating efficiency? Whatwill be impact on model of other performance measures included asoutput?
SQ17. Internet banking model II Whether the model can be applied to other internet serviceencounters. Whether the interrelation of entities will change with thechange in demographic variables?
SQ 18: IT-based model II & III How to measure service quality of IT-based transactions?
SQ19. Model of e-servicequality II & III What are the items of the determinants considered in the model andhow to measure e-service quality? Whether the there will be changein the study with type of business (goods, different types of sitesetc.)?
Notes: Category I: general relation between various attributes of service; Category II: role of technology such as IT; CategoryIII: measurement issues

37
existing models and remodel / test the findings.
The review of these 19 service quality modelshighlighted various issues, debates, strengths andweaknesses pertaining to the models. It is notedthat the models have a focus on only one link (i.e.either marketer to consumer or front-line staff tosupporting staff). On other side, researchers(Caruana and Pitt, 1997; Reynoso and Moores,1995 etc.) have continuously pointed out thepositive correlation of internal service quality(considering all the processes and operationsassociated in delivery of product or service) withbusiness performance and the service qualitydelivered to the customer (including thedistribution, marketing and other suppor tfunctions). From the study of these models, itappears that the key ingredients to service qualityimprovements are:
● Clear market and customer focus.
● Motivated staff.
● Clear understanding of concepts of servicequality and factors affecting the same.
● Effective measurement and feedback system.
● Effective implementation system.
● Efficient customer care system.
Researchers and practitioners view the subject inthe context of service under consideration. It isclear from the review that none of the modelscurrently satisfies the set framework, this clearlyhighlights the need for further research. Thisreview highlighted some of the research agendafrom the review of service quality models.
CONTRIBUTIONS ANDCONCLUDING REMARKSAn attempt is made in this paper to review variousservice quality models. The models aresummarized in above Tables. The models coverthe domain from conventional personalizedservices to the internet-enabled services includingthe organizational and behavioral aspects. Thesemodels provide a useful framework for quality ofservice. It is further observed that the servicequality outcome and measurement is dependenton type of service setting, situation, time, need,etc. factors. This further adds to the complexity ofthe subject. In addition to this even the customer’sexpectations towards a particular services are alsochanging with respect to factors like time, increasein the number of encounters with a particularservice, competitive environment, etc. Thesedemands for a continuous effort to learn andvalidate, modify the existing concepts of servicequality. The present paper is an attempt toenhance the understanding of the subject.
This review of models clearly highlighted thefollowing research streams in this field:
● General Service quality model developed withdifferent types of service encounters.
● Refinement of these models with the newsituations.
● Modeling based on new concepts (derived outof weaknesses / leanings from the existingmodels).
● Considering new variables/situations with
REFERENCES● Asubonteng, P., McCleary, K.J. and Swan, J.E. (1996), “SERVQUAL revisited: a critical review of service
quality”, The Journal of Services Marketing, Vol. 10 No. 6, pp. 62-81.
● Avkiran, N.K. (1994), “Developing an instrument to measure customer service quality in branch banking”,International Journal of Bank Marketing, Vol. 12 No. 6, pp. 10-18.
● Babakus, E. and Boller, G.W. (1992), “An empirical assessment of the SERVQUAL scale”, Journal of BusinessResearch, Vol. 24, pp. 253-68.
● Berkley, B.J. and Gupta, A. (1994), “Improving service quality with information technology”, InternationalJournal of Information Management, Vol. 14, pp. 109-21.
● Bojanic, D.C. (1991), “Quality measurement in professional service firms”, Journal of Professional ServicesMarketing, Vol. 7 No. 2, pp. 27-36.
● Broderick, A.J. and Vachirapornpuk, S. (2002), “Service quality in internet banking: the importance of customerrole”, Marketing Intelligence & Planning, Vol. 20 No. 6, pp. 327 35.
● Brogowicz, A.A., Delene, L.M. and Lyth, D.M. (1990), “A synthesized service quality model with managerialimplications”, International Journal of Service Industry Management, Vol. 1 No. 1, pp. 27-44.
Identify The Need for Developing A New Service Quality Model in Today’s Scenario:A Review of Service Quality Models
● Ankit Agarwal● Gulshan Kumar

38
SAARANSHVol. 8 No. 1 JULY 2016● ●
RKG JOURNAL OF MANAGEMENT
● Buttle, F. (1996), “SERVQUAL: review, critique, research agenda”, European Journal of Marketing, Vol. 30 No.1, pp. 8-32.
● Carman, J.M. (1990), “Consumer perceptions of service quality”, Journal of Retailing, Vol. 66, pp. 33-55.
● Caruana, A. and Pitt, L. (1997), “INTQUAL: an internal measure of service quality and the link betweenservice quality and business performance”, European Journal of Marketing, Vol. 31 No. 8, pp. 604-16.
● Chang, T.Z. and Chen, S.J. (1998), “Market orientation, service quality and business profitability: a conceptualmodel and empirical evidence”, Journal of Services Marketing, Vol. 12 No. 4, pp. 246-64.
● Cronin, J.J. and Taylor, S.A. (1994), “SERVPERF versus SERVQUAL: reconciling performance-based andperception-minus-expectations measurement of service quality”, Journal of Marketing, Vol. 58 No. 1, pp. 125-31.
● Dabholkar, P.A. (1996), “Consumer evaluations of new technology-based self-service operations: aninvestigation of alternative models”, International Journal of Research in Marketing, Vol. 13 No. 1, pp. 29-51.
● Dabholkar, P.A., Shepherd, C.D. and Thorpe, D.I. (2000), “A comprehensive framework for service quality: aninvestigation of critical conceptual and measurement issues through a longitudinal study”, Journal of Retailing,Vol. 76 No. 2, pp. 131-9.
● Furey, T.R. (1991), “How information power can improve service quality”, Planning Review, Vol. 19 No. 3, pp.24-6.
● Ghobadian, A., Speller, S. and Jones, M. (1994), “Service quality concepts and models”, International Journalof Quality & Reliability Management, Vol. 11 No. 9, pp. 43-66.
● Grönroos, C. (1984), “A service quality model and its marketing implications”, European Journal of Marketing,Vol. 18 No. 4, pp. 36-44.
● Gummesson, E. (1998), “Productivity, quality and relationship marketing in service operations”, InternationalJournal of Contemporary Hospitality Management, Vol. 10 No. 1, pp. 4-15.
● Hallowell, R. (1996), “The relationships of customer satisfaction, customer loyalty and profitability: an empiricalstudy”, International Journal of Service Industry Management, Vol. 7 No. 4, pp. 27-42.
● Haywood-Farmer, J. (1988), “A conceptual model of service quality”, International Journal of Operations &Production Management, Vol. 8 No. 6, pp. 19-29.
● Johns, N. and Tyas, P. (1996), “Use of service quality gap theory to differentiate between food service outlets”,The Service Industries Journal, Vol. 16 No. 3, pp. 321-46.
● Lasser, W.M., Manolis, C. and Winsor, R.D. (2000), “Service quality perspectives and satisfaction in privatebanking”, Journal of Services Marketing, Vol. 14 No. 3, pp. 244-71.
● Mattsson, J. (1992), “A service quality model based on ideal value standard”, International Journal of ServiceIndustry Management, Vol. 3 No. 3, pp. 18-33.
● Oh, H. (1999), “Service quality, customer satisfaction and customer value: a holistic perspective”, InternationalJournal of Hospitality Management, Vol. 18, pp. 67-82.
● Oliver, R.L. (1993), “A conceptual model of service quality and service satisfaction: compatible goals, differentconcepts”, Advances in Service Marketing and Management, Vol. 2, pp. 65-85.
● Parasuraman, A., Zeithaml, V.A. and Berry, L.L. (1985), “A conceptual model of service quality and itsimplications for future research”, Journal of Marketing, Vol. 49 No. 3, pp. 41-50.
● Parasuraman, A., Zeithaml, V.A. and Berry, L.L. (1988), “SERVQUAL: a multiple item scale for measuringconsumer perception of service quality”, Journal of Retailing, Vol. 64 No. 1, pp. 12-37.
● Parasuraman, A., Zeithaml, V.A. and Berry, L.L. (1994), “Reassessment of expectations as a comparisonstandard in measuring service quality: implications for further research”, Journal of Marketing, Vol. 58 No. 1,pp. 111-24.
● Philip, G. and Hazlett, S.A. (1997), “The measurement of service quality: a new P-C-P attributes model”,International Journal of Quality & Reliability Management, Vol. 14 No. 3, pp. 260-86.
● Reynoso, J. and Moores, B. (1995), “Towards the measurement of internal service quality”, InternationalJournal of Service Industry Management, Vol. 6 No. 3, pp. 64-83.

39
● Rosen, L.D. and Karwan, K.R. (1994), “Prioritizing the dimensions of service quality”, International Journal ofService Industry Management, Vol. 5 No. 4, pp. 39-52.
● Rust, R.T. and Lemon, K.N. (2001), “E-service and the consumer”, International Journal of ElectronicCommerce, Vol. 5 No. 3, pp. 85-101.
● Santos, J. (2003), “E-service quality: a model of virtual service quality dimensions”, Managing Service Quality,Vol. 13 No. 3, pp. 233-46.
● Soteriou, A.C. and Stavrinides, Y. (2000), “An internal customer service quality data envelope analysis modelfor bank branches”, International Journal of Bank Marketing, Vol. 18 No. 5, pp. 246-52.
● Spreng, R.A. and Mackoy, R.D. (1996), “An empirical examination of a model of perceived service quality andsatisfaction”, Journal of retailing, Vol. 722, pp. 201-14.
● Sureshchander, G.S., Rajendran, C. and Anatharaman, R.N. (2002), “The relationship between service qualityand customer satisfaction: a factor specific approach”, Journal of Services Marketing, Vol. 16 No. 4, pp. 363-79.
● Teas, K.R. (1993), “Expectations, performance evaluation, and consumers’ perceptions of quality”, Journal ofMarketing, Vol. 57, October, pp. 18-34.
● Teas, R.K. (1994), “Expectations: a comparison standard in measuring service quality: an assessment of areassessment”, Journal of Marketing, Vol. 58 No. 1, pp. 132-9.
● Zeithaml, V.A., Berry, L.L. and Parasuraman, A. (1988), “Communication and control processes in the deliveryof service quality”, Journal of Marketing, Vol. 52 No. 2, pp. 35-48.
● Zhu, F.X., Wymer, W.J. and Chen, I. (2002), “IT-based services and service quality in consumer banking”,International Journal of Service Industry Management, Vol. 13 No. 1, pp. 69-90.
Identify The Need for Developing A New Service Quality Model in Today’s Scenario:A Review of Service Quality Models
● Ankit Agarwal● Gulshan Kumar

40
SAARANSHVol. 8 No. 1 JULY 2016● ●
RKG JOURNAL OF MANAGEMENT
The Impact of Training and Development Programson Employee’s Productivity: With reference to
Manufacturing Firms of Mathura RegionDr. Mini Jain1
Parul Garg2
ABSTRACT
Training has become the buzz word in the dynamic competitive market environment. It is a very vital aspectnow days in making the organization profitable. Human resources differentiate a vast organization from asuperior one. Organizations spend an enormous amount of time and money on training and development todirectly enhance the human capital of the firm and to achieve both short and long term benefits. This studypresents a literature review on the significant of training and development on employee productivity. Humancapital tends to become complete, and therefore creating the need to acclimatize to the permanent andcontinuous learning and updating of the skill and knowledge precious, due to the organizational, technologicaland social dynamics. Hence, in order for organizations or manufacturing firms to accomplish best returnsfrom their investment, there is crucial need to efficiently manage training and development programs. Though,the most essential asset of every organization under rigid and vibrant competition is its human capital.Training and development is a tool that supports human capital in exploring their agility. Therefore trainingand development is very important to the productivity of organization’s workforce.
Keywords: Training, Development and Employee’s Productivity
organizations must have human capital that haspotential of adjusting to rapid dynamic businessenvironment. Paradise, (2007) in his statementaffirmed that U.S. organizations alone spend morethan $126 billion annually on employee trainingand development. In an environment where thereis high insecurity tends to present organizationswith high risk, the information of business andmarket intelligence present organizations with areliable competitive advantage over those that donot have such (Jelena, 2007). Hence knowledgeis revolving to basic capital that tr iggersdevelopment. The achievement of organizationsis however dependent on its educated,experienced as well as knowledgeable workforce.Therefore in order to sustain, organizations mustsee continuous and constant employee trainingand development as invaluable. Training anddevelopment is very important at all employee
1. Mrs. Parul Garg– Research Scholar, Mewar University, Chittorgarh, [email protected], Ph. No.: +91-9457374854Parul Garg is pursuing his Ph.D in Management from Mewar University, Rajasthan. Her mailing address is 15Brij Enclave, Junction Road, Mathura – 281001 (U.P.)
2. Dr. Mini Jain – Research Guide & Assistant Professor, G.L.A. University, [email protected], Ph. No.: +91-9897455810Dr. Mini Jain is the Assistant Professor at G.L.A. University, Mathura. She is Ph.D in Commerce (Accounts &Law group) in 2004 from Dr. B.R. Ambedkar University, Agra (formerly Agra University). Her mailing address isSec. 3, H. No. 62, Radha Puram Estate, NH#2, Mathura – 281001 (U.P.)
INTRODUCTIONPresent Scenario of business world ischaracterized by a growing competitiveness,globalization and technological advancements inorganization. In order to survive in the vibrantmarket, main emphasis must be given to humancapital in order to be competitive and economicallysolvent. However, there are also some otherfactors that influence organizations’ success;organizations must possess productive (i.e.effective and efficient) employees. The knowledgeand skills of an organization’s employees havebecome increasingly important to its performance,competitiveness and development. In addition,organizations differentiating on the basis ofintangible characteristics of workforce such asknowledge, skills and attitudewhich increasinglysee it as invaluable in order to remain sustainablein the competitive environment. Thus

41
levels, due to the reason that skills get outmodedover a period of time and has to be replenished(Nishtha and Amit (2010).
Fig 1: Relationship Cycle
Training
Training is the learning process in whichorganizations provide development and enhancequality of new and existing employees. It involvesthe acquisition of knowledge, developing of skills,concepts and changing of attitudes and behaviorsto enhance the performance of employees.Training is viewed as a systematic approach oflearning and development that improve individual,group and organization (Goldstein& Ford, 2002)in Khawaja & Nadeem (2013). Thus it is thesequence of activities by which employee actuallygets the knowledge and get to know how he orshe can perform well in the organization forgrowing purposes. Assessments of employee andorganizational needs as well as companystrategies should be conducted and then used inselecting training methods and participants(Goldstein, 1991). According to Manju& Suresh(2011), training serves as an act of interventionto improve organization’s goods and servicesquality in stiff the competition by improvements intechnical skills of employees.
Development
Development means encouraging employees toacquire new and advanced skills and knowledgeby providing training facilities. Most of theorganizations provide employees withdevelopment programs in order to boost their skillsand capabilities. Employee development throughtraining, sharpening the skills and view point ofan employee and advancing his/her existingknowledge and abilities. In a layman’s language,employee development helps in developing andfostering employees for them to becomeconsistent resources and ultimately benefit the
organization. Thus organizations need to investin continuous employee development in order tokeep employees abreast with the latestdevelopments in the industry to survive the fiercecompetition.
Employees Productivity
Employee’s Productivity is the record of net salesover total employees. Its measures may beexamined across the whole economy or viewedindustry by industry. ‘Productive’ means profitable,beneficial and cost-effective. In this perspective,productivity is synonymous with output. In scientificliterature, ‘productivity’ is defined as therelationship between output and input; betweenresults or proceeds and sacrifices. Productivity asdefined in Oxford dictionary (2007) is the efficiencywith which things are being produced. Employeeproductivity however is the measure of output perunit of input economically.
Review of Literature
Thurow Lester (1992) identified that organizationscan buy skills through hiring, or they can developskills through training and development (T&D)activities. This paper focuses on strategicallyaligned training and development systems thatadvance and sustain the organization’scompetitive position in its market. Traditionally,T&D systems were relegated to narrowly definedsupport roles, where individuals were trainedaround current job-based deficiencies or predictedknowledge and skill needs. A few exemplaryorganizations, however, view a workforce withsuperior skills as a primary source of sustainablecompetitive advantage. In these organizations,T&D becomes the critical means for creatingreadiness and flexibility for change across allorganizational levels, and there are strong linkagesbetween all facets of the T&D system and thestrategic leadership and planning processes of thebusiness. Readiness and flexibility are achievedlargely through supervisory, management, andexecutive training, as these individuals set theboundaries for modification and continuousimprovement of existing organizational practices.
Hedges Patricia (1996) formed the first part of atwo-part study reporting on the cost-effectivenessof specific training programs within Parcel forceUK. They have assessed the effectiveness of adriver training program in a major Parcel force
The Impact of Training and Development Programs on Employee’s Productivity:With reference to Manufacturing Firms of Mathura Region
● Dr. Mini Jain● Parul Garg

42
SAARANSHVol. 8 No. 1 JULY 2016● ●
RKG JOURNAL OF MANAGEMENT
region, measured the cost-effectiveness of thetraining performance in terms of vehicle-maintenance costs, accident rates and fuelconsumption and discussed the difficulties inmeasuring the cost-effectiveness of training.
Sadler-Smith Eugene (1999) explored theevaluation practices of a sample of organizationsin England and Wales who had signaled somecommitment to training and evaluation byembarking on the UK’s Investors in People (IIP)standard. A questionnaire survey was sent to1,000 firms and usable responses were receivedfrom 394 organizations. It was found that formativeand delayed evaluations were used less frequentlythan immediate and context evaluations. In themajority of cases, the responsibility for evaluationwas that of managers and the most frequentlyused methods were informal feedback andquestionnaires. Operational reasons for evaluatingtraining were cited more frequently than strategicones. Information derived from evaluations wasused mostly for feedback to individuals and toinform the training process and less for return oninvestment decisions. There were somestatistically significant effects of organizational sizeon evaluation practice. The results were discussedin terms of their implications for evaluation theory& research and HRD practice & policy.
Yadapadithaya, P.S. (2003) reported on theexisting corporate training and development (T&D)policies and practices in India and Britain. The datawere collected from written questionnaires mailedto 252 Indian and 174 British companies. Theresults and discussions were based on the mostprominent comparative and internationaldimensions of T&D such as key responsibility forT&D function, corporate commitment to T&D,major drivers and key result areas of T&D;purposes, levels, instruments, timing, and designsof evaluation; major perceived deficiencies andchallenges of T&D function. The two-countrycomparisons revealed that while some of thefindings related to corporate T&D policies andpractices exhibited differences, others alsoreflected similarity. As compared to India, moretraining in Britain, more movement to delegatingresponsibilities or involving line managers in T&Din Britain, there also seems to be more focusedon and involvement of individual employees inBritain. British organizations seem to be moreconcerned with business results from T&D. It mayalso be argued that the greater importance
attached to business results brings about agrowing involvement of employees and managersas opposed to HRD practitioners and that it is thegreater movement in this direction in Britaincompared to India that accounts for most if not allof the differences in the results of the two surveys.
Eguiguren Marcos (2006) described the status oftraining in Catalonia’s large companies, from aneconomic and organizational point of view. Theresults are based on empirical-descriptiveresearch conducted with a sample of large andmedium-sized businesses. It analyses theorganizational structure of the businesses and thetype of organizational structure in relation totraining. Researches like Colombo and Stanca(2008), Sepulveda (2005) and Konings &Vanormelingen, (2009), showed that training is anessential and effective instrument inaccomplishment of the firm’s goals which resultingin higher productivity. Identification of trainingneeds, propose and accomplishment of trainingpractices,transfer of training, and evaluation ofprogram benefits are key activities (Krishnaveni& Sripirabaa, 2008) in addition to studying generaltraining variables such as types of training, choiceof trainees, selection criteria, evaluationinstruments etc.
OBJECTIVESThe study aims at achieving following objectives:
● To measure the effect of Training Program onEmployee Productivity.
● To identify the underlying factors of TrainingProgram.
RESEARCH METHODOLOGYThe Study
The study was descriptive in nature with surveymethod being used to collect the data.
Sampling Design
Universe: The workers of manufacturingorganizations of Mathura region.
Sampling Unit: Individual worker of variousorganization were the part of the study.
Sampling Technique: Non-probability judgmentalsampling technique was used.
Sample Size: 150 workers of different

43
manufacturing firms like Plumber industries andGinni Filaments.
TOOLS FOR DATA ANALYSIS● Regression test was applied in the research
to find out the impact of Training Program onEmployee Productivity.
● Reliability test was applied to check whetherdata items in the questionnaires are reliableor not through Cronbach alpha & Split-half.
● Factor analysis test was applied to identify theunderlying dominant factors responsible forEmployees Productivity.
● Internal consistency was established throughitem to total correlation.
ANALYSIS & RESULTSTRAINING PROGRAMConsistency Measure
First of all, consistency of all the items waschecked through item to total correlation. Underthis, total of every item with total of all the itemswas measured and the computed value iscompared with standard value (i.e., 0.15905). Ifcomputed value is found less than standard valuethan whole statement is dropped and was termedas inconsistent. No item was dropped, as thecomputed value was more than standard value.
Reliability Measure
Reliability test was carried out using SPSSsoftware and the reliability test measures are givenbelow:
Alpha 0.707
Split Half 0.804
The value of reliability test was more than thestandard value 0.7, hence the reliability ofquestionnaire was considerably acceptable.
Factor Analysis
Factor Analysis test was conducted through SPSSsoftware to find out the underlying factors.
Description of factors
The raw scores of 15 items were subjected tofactor analysis to find out the factors that contributetowards Training Program. After factor analysis,7 factors were identified -
1. Responsibility - This factor has emerged asthe most important determinant of TrainingProgram with total variance of 16.008%. Itincludes training session, through sports &culture, participation, recommendation andsomething new should be added to trainingprogram. This measurement framework hasbeen used to develop Training Program.Designing training program systems is all aboutdeciding which measures to select, and justas importantly, which measures to ignore.
2. Personal Achievement - This is the secondimportant factor of training Program with totalvariance of 10.687%. This factor of TrainingProgram includes reducing the stress, andestablishing employee’s performance. This isalso an important factor because everyemployee who works in an organization wantspersonal satisfaction.
3. Working Condition - This factor of TrainingProgram includes the right atmosphere andclimate with total variance of 6.646%. Murphy(1986) in their study found that WorkingCondition affect performance and assesses theextent to which they have delivered on theirpromise.
4. Evaluation - This is the second importantfactor of Training Program with total varianceof 5.582%. This factor of Training Programincludes job requirement and effective learning.During the research, I found that effectivelearning helps in increasing performance onjob.
5. Self Confidence - This factor has emerged asthe most important determinant of selfconfidence with total variance of 5.115%. Itincludes self confidence. Goold, 1986;suggests that Training Program is a techniquefor firms that aim at improving problem-solvingactivities as well as increasing Self Confidence.Cooper (2001) suggested that self- confidencewere best suited for developmental rather thanevaluative purposes, and that self- Confidencecan improve future performance by creating aself-fulfilling prophecy.
6. Applying Efforts - This factor of TrainingProgram includes the considerable importanceand applying skills with total variance of4.818%. Ittner et al 1997 define that employeesmust give importance in applying efforts in the
The Impact of Training and Development Programs on Employee’s Productivity:With reference to Manufacturing Firms of Mathura Region
● Dr. Mini Jain● Parul Garg

44
SAARANSHVol. 8 No. 1 JULY 2016● ●
RKG JOURNAL OF MANAGEMENT
organization so as to achieve a desired levelof performance at work.
7. Job Accomplishment - This factor of TrainingProgram includes the efforts of organization intraining program and job satisfaction with totalvariance of 6.649%. Employee involvementpractices affect performance and assess theextent to which they have delivered on theirpromise.
EMPLOYEE PRODUCTIVITY
Consistency Measure
First of all, consistency of all the items waschecked through item to total correlation. Underthis, total of every item with total of all the itemswas measured and the computed value iscompared with standard value (i.e., 0.15905).
Reliability Measure
Reliability test was carried out using SPSSsoftware and the reliability test measures are givenbelow
Alpha 0.800
Split Half 0.787
Factor Analysis
Description of factors
The raw scores of 10 items were subjected tofactor analysis to find out the factors that contributetowards Employee Productivity. After factoranalysis, 4 factors were identified:-
1. Content of Personal Achievement - Thisfactor has emerged as the most importantdeterminant of Employee Productivity with totalvariance of 43.417%. It includes Activeparticipation, more confidence, Productivity,more comfortable, evaluate your self andopinion have changed. Schneiderman (1990)talks about a ‘good scorecard’ it is a strategyor success map to which he refers thePerformance Prism Designing TrainingProgram measurement systems is all aboutdeciding which measures to select, and justas importantly, which measures to ignore.
2. Skills and Ability - This is the secondimportant factor of Training Program with totalvariance of 8.016%. This factor of Training
Program includes only skills and ability ofemployee’s performance. Cooper (2001)suggested that skills and ability were bestsuited for developmental rather than evaluativepurposes, and that skills and ability canimprove future performance by creating aTraining Program.
3. Job involvement - This factor of TrainingProgram includes the job of employee with totalvariance of 7.149%. Murphy (1986) in theirstudy found that Training Program helps to dojob well. Employee’s involvement practicesaffect performance and assess the extent towhich they have delivered on their promise.
4. Ability to maintain Balance - This factor ofTraining Program includes the position andopinion of employee with total variance of10.771%. Training Program helps the employeeto increase their mental ability and alsoincrease their position in an organization.
Regression Analysis
The regression was calculated by taking the totalof Training Program and Employee’s Productivityby using SPSS software. In this, the TrainingProgram was taken as an independent variableand employee Productivity as a dependentvariable. Therefore, regression was calculated bytaking dependent and independent variable.
Null hypothesis (Ho): It states that there is nosignificant impact of Training Program onemployee Productivity.
Alternative Hypothesis (Ha): It states that thereis significant impact of Training Program onemployee Productivity.
Y = a + bx
Y = 61.503 + (-0.502)x
X = Training Program (independent variable)
Y = Employee Productivity (dependent variable)
The linear regression was applied between“Training Program” (independent variable),“Employee Productivity” (dependent variable). Theresult of regression indicates the independentvariable Training Program has an impact on thedependent variable employee Productivitysignified by the coefficient beta factor of -0.502.Also the T value is significant.
As the value of T is 9.369, which is acceptable at0.001 level of significance, so we accept the

45
hypothesis that there is a significant impact ofTraining Program on employee Productivity.
CONCLUDING REMARKSThis research has concluded that in today’sscenario the Training Program is an importantfactor for every manufacturing organization. Theobjective of the study was to study the TrainingPrograms’ impact on employee Productivity. Withthe help of primary and secondary data,
researchers have applied the item to
total correlation, factor analysis, and multipleregressions to identify the impact. During theresearch, researchers found that personalachievement is very important factor in TrainingProgram which is highly effective on TrainingProgram. In this study, researchers tried to findout the impact of training Program on employee’sProductivity. At last regression has been appliedand the alternative hypothesis was accepted.
REFERENCESAddison, John T. (2005) “The determination of firm performance unions works council and employee involvement/
high-performance work practice”, Scottish Journal of Political Economy, Vol. 52, No 3, pp 406-450
Al-Khayyat, Ridha (1998) Journal of European Industrial Training, Vol. 22, No 1, pp 18-27
Arnold, John, Davey, Kate M. (1999) Sociological Quarterly Journal, Vol. 48, No. 2, pp 211-238
Bartel, A. P. (1994) “Productivity gains from the implementation of employee training programs”, Industrial Relations,Vol. 33, No. 4, pp 411-425
Belfield, Clive R and Addison John T. (2001) “Updating the determinants of firm performance: Estimation using the1998 UK workplace employee relations survey”, British Journal of Industrial Relations, Vol. 39, No. 3, pp 341-366
D’Arcimoles, C.H. (1997) “Human resource policies and company performance: A quantitative approach usinglongitudinal data”, Organization Studies, Vol. 18, No. 5, pp 857-874
Olusegun Agboola and Sogunro (1997) “Impact of training on leadership development”, Evaluation Review, Vol.21, No. 6, pp 713-737
Payne Maya (2007) “Time out for training”, Cleveland Business, Vol. 28 No. 19, pp 21-21
Reich, M. and Clair, B. (1993) The International Journal of Human Resource Management, Vol. 4, No. 2, pp 247-275
Sadler-Smith Eugene (1999) Human Resource Development International, Vol. 2, No. 4, pp 369-390
Santos, Amalia (2003) “Employee perceptions and their influence on training effectiveness”, Vol. 13, No. 1, pp 27-45
Yadapadithaya, P.S. (2003) International Journal of Training and Development, Vol. 7, No. 2, pp 108-123
Yamnill, Siriporn and McLean, Gary N. (2001) “Human resource development quarterly ergonomists”, Training andOccupational Health and Safety, Vol. 23, Nos. 2-3, pp 133-143
Zagelmeyer Stefan and Cox Annette (2006) “Embedding employee involvement and participation at work”, HumanResource Management Journal, Vol. 16, No. 3, pp 250-267
The Impact of Training and Development Programs on Employee’s Productivity:With reference to Manufacturing Firms of Mathura Region
● Dr. Mini Jain● Parul Garg

46
SAARANSHVol. 8 No. 1 JULY 2016● ●
RKG JOURNAL OF MANAGEMENT
Table 1: Item to Total Correlation
Items Computed Correlation value Consistency Accepted/Dropped
1. Company’s effort in organizing training program. 0.165201 Consistent Accepted
2. Considerable importance to training program. 0.324034 Consistent Accepted
3. Keeping your job requirement 0.37692 Consistent Accepted
4. Training program Effective in learning 0.343783 Consistent Accepted
5. Able to apply skills in job 0.252235 Consistent Accepted
6. Company provide you right atmosphere & climate 0.333155 Consistent Accepted
7. Helps to reduce the stress 0.282442 Consistent Accepted
8. Increase job satisfaction and industrial relations 0.453765 Consistent Accepted
9. New should be added to the training program 0.460534 Consistent Accepted
10. Training establishment 0.415719 Consistent Accepted
11. Training recommendation 0.424165 Consistent Accepted
12. Encouraged through sports and cultural activities 0.49305 Consistent Accepted
13. Participation of Employees is encouraged 0.479919 Consistent Accepted
14. Competent to conduct a training session 0.531341 Consistent Accepted
15. Creates self confidence 0.327953 Consistent Accepted
Note: - All the items of questionnaire of Training Program were more than the standard value (0.15095). Therefore, all statementswere accepted and termed as consistent.
Table 2: Table of Factor Analysis
Factor name Eigen value Variable convergence Loading valueTotal %age of Variance
1. Responsibility 2.401 16.008 14. Conduct a training session 0.673
12. Through sports and cultural 0.606
13. Participation 0.582
11. Recommendation 0.561
9. Added to the training program 0.522
2. Personal Achievement 2.351 10.687 7. Reduce the stress 0.547
10. Establishment 0.514
3. Working Condition 1.462 6.646 6. Right atmosphere & climate 0.488
4. Evaluation 1.228 5.582 3. Job requirement 0.524
4. Effective in learning 0.490
5. Self Confidence 1.125 5.115 15. Self confidence 0.682
6. Applying Efforts 1.060 4.818 2. Considerable importance 0.662
5. Apply skills 0.642
7. Job Accomplishment 1.592 6.649 1. Effort in organizing training program 0.606
8. Job satisfaction 0.495

47
Table 3: Item to Total Correlation
Items Computed Correlation value Consistency Accepted/Dropped
1. Productivity on the work place has increased. 0.634496 Consistent Accepted
2. Actively participation in goal setting 0.663386 Consistent Accepted
3. Evaluate yourself better 0.58561 Consistent Accepted
4. More confidence and zeal than before 0.650918 Consistent Accepted
5. Opinion have changed positively 0.559733 Consistent Accepted
6. More comfortable in working 0.504311 Consistent Accepted
7. Good use of your skill and ability 0.472803 Consistent Accepted
8. Helps you to do job well 0.525406 Consistent Accepted
9. Opinions and perspectives 0.358758 Consistent Accepted
10. Satisfied with the your position 0.402831 Consistent Accepted
Table 4: Table of Factor Analysis
Factor name Eigen value Variable convergence Loading valueTotal %age of Variance
1. Content of personal achievement 6.513 43.417 2. Actively participation 0.743
4. More confidence 0.688
6. More comfortable 0.625
3. Evaluate yourself 0.625
5. Opinions have changed positively 0.608
2. Skills and ability 1.202 8.016 7. Skill and ability 0.705
3. Job involvement 1.072 7.149 8. Job well 0.716
4. Ability to maintain Balance 1.060 10.771 10. Position 0.727
9. Opinions 0.516
Table 5: Coefficients
Model Unstandardized Coefficients Standardized Coefficients t Sig.
B Std. Error Beta
(Constant) 61.503 5.196 11.836 0.001
VAR00001 -0.089 0.068 -0.502 -1.314 0.191
Dependent Variable: VAR00002
The Impact of Training and Development Programs on Employee’s Productivity:With reference to Manufacturing Firms of Mathura Region
● Dr. Mini Jain● Parul Garg

48
SAARANSHVol. 8 No. 1 JULY 2016● ●
RKG JOURNAL OF MANAGEMENT
A Reflection on Financial Problems of WomenEntrepreneurs in Pondicherry
*Dr. K. Lavanya Latha
ABSTRACT
In recent years for a developing country, micro-entrepreneurial ventures are considered the most criticalfactor that would by the foundation in an economically struggling third would develop. There entrepreneurialventures will help both the urban and rural population through creation of jobs, a rescue out of unemploymentand poverty and there by impact upon developing skills, self- esteem and self-sufficiency. This will certainlycontribute to the overall development of the economy. Women are almost one half of the world’s populationhaving enormous potential but being underutilized or unutilized for the economic development of the nation.There is need to strengthen and streamline the role of women in the development of various sectors byharnessing their power towards nation building and to attain accelerated economic growth. Entrepreneurshipamong women is a recent phenomenon. In a developing country like India, most of women both urban andrural areas are coming out with latent entrepreneurial talents to start micro-ventures. However, we do observecertain unfavorable conditions that often hinder the emergence of such entrepreneurial talents. In this context,the present paper is attempt to study financial problems of women entrepreneurs in Puducherry, India.
among women is a recent phenomenon. In adeveloping country like India, most of women bothurban and rural areas are coming out with latententrepreneurial talents to start micro-ventures.However, we do observe certain unfavorableconditions that often hinder the emergence of suchentrepreneurial talents. In this context, the presentpaper is attempt to study financial problems e ofwomen entrepreneurs in Puducherry, India.
CONCEPT OF WOMENENTREPRENEURSWomen Entrepreneurs may be defined as thewomen or a group of women who initiate, organizeand operate a business enterprise. TheGovernment of India has defined womenentrepreneurs as ¯an enterprise owned andcontrolled by women having a minimum financialinterest of 51 per cent of the capital and giving atleast 51 per cent of the employment generated inthe enterprise to women. Women entrepreneursengaged in business due to push and pull factorswhich encourage women to have an independentoccupation and stands on their own legs. A sensetowards independent decision-making on their lifeand career is the motivational factor behind thisurge. Saddled with household chores anddomestic responsibilities women want to getindependence. Under the influence of thesefactors the women entrepreneurs choose a
*Assistant Professor in Department of Management Studies, Pondicherry University, Pondicherry
INTRODUCTIONMany developing countries are experiencing astate of transition. They are striving to move froma subsistence-oriented, tightly integrated and aninward looking local economy to a surplus seeking,market led and outward looking economy. Onestrategy that could make this possible is theemergence of a multitude of small scale and microenterprises. This requires building up of a widebase of population capable of exhibiting enhancedentrepreneurial behavior.
In recent years for a developing country, micro-entrepreneurial ventures are considered the mostcritical factor that would by the foundation in aneconomically struggling third would develop. Thereentrepreneurial ventures will help both the urbanand rural population through creation of jobs, arescue out of unemployment and poverty andthere by impact upon developing skills, self-esteem and self-sufficiency. This will certainlycontribute to the overall development of theeconomy.
Women are almost one half of the world’spopulation having enormous potential but beingunderutilized or unutilized for the economicdevelopment of the nation. There is need tostrengthen and streamline the role of women inthe development of various sectors by harnessingtheir power towards nation building and to attainaccelerated economic growth. Entrepreneurship

49
profession as a challenge and as an urge to dosomething new. Such a situation is described aspull factors. While in push factors women engagedin business activities due to family compulsion andthe responsibility is thrust upon them
REVIEW OF LITERATUREOrhan (1999), Women entrepreneurs often feelthat they are victims of discrimination. Thisstatement was also emphasized that one of themost interesting issues with regard to womenentrepreneurship is the different ways women arediscriminated against in concealed ways.According to Kuratko and Welsch (1994), womenentrepreneurs have long felt that they have beenvictims of discrimination. Various studies examinedthe types of discrimination and some have beenattempted to document them. This argument issupported by De Bruin, Brush and Welter (2007)Researchers Sexton and Bowman-Upton suggestthat female business owners are subject togender-related discrimination. In addition, from thestudies we emphasize that this discriminationagainst women seems to be even worse in Cities,such as East and South East states of India, wherethe financial sector is male oriented. The argumentis further supported by Marlow (1997), whocommented that discrimination remains a problemfor women in self employment, for example, theyexperience particular difficulties in gaining bankfinance for their ventures. According to Minniti andArenius (2003) and Kock (2008), governmentsshould address factors such as education, trainingand family-work reconciliation. Policies should thuscreate and guarantee the existence of underlyingconditions favorable to an entrepreneurialenvironment rather than being active promotersof start-up activities. Bridge, O’Neill & Cromie,(2003) although men and women both experiencepersonal problems, women recorded moredifficulties. This is especially true with regard to alack of self-confidence and not being takenseriously by providers of funds when applying forfunds (It is widely acknowledged that Indianwomen have access to fewer resources than men.For example, relative to men, they tend to havelower access to land, credit facilities, educationand training facilities (Katepa-Kalala, 1999:7).Winn (2004) argued that the critical factors forwomen to succeed in independent businessesneed to be understood to provide a bettereducation and support system. Governments can
provide female entrepreneurs with special loans,subsidies, funds, enterprise centers,entrepreneurship awards, counseling, training,advisory support, information products and webportals. Richardson, Howarth and Finnegan(2004) commented that women entrepreneurssuffer from significant material constraints throughto unhelpful attitudes arising from society’snegative attitudes towards women in business.Heilman and Chen (2003) as well as Botha (2006)argued that various push-and-pull factors exist thatcan motivate women to start their own businesses.Botha (2006) has revealed in previous research,it is important to determine the factors thatmotivate women to start their own businesses. Thisknowledge regarding the profile of the womanentrepreneur might enable policy-makers to createan encouraging environment for womenentrepreneurs to start their own businesses. Maasand Herrington (2006) defined push factors as themore negative factors, such as unemployment andretrenchment, which force people to becomeentrepreneurial in order to survive. They regardpull factors to be the more positive factors, suchas government support and role models, whichmight influence people to choose entrepreneur-ship as a career option.
Shelton (2006) advised that in order to improvethe survival and performance of women-ownedventures, programmes should be implemented toassist women in selecting appropriate work-familymanagement strategies. If work-family conflict isaddressed, a potential stumbling block for womenbusiness owners will be removed and theeffectiveness of other programmes will beenhanced. Ghosh and Cheruvalath (2007) foundthat only one-fifth of women are drawn intoentrepreneurship by pull factors. The rest areforced into entrepreneurship by push factors.Ghosh & Cheruvalath, (2007) Challenges towomen entrepreneurs cover a wide spectrum,including level of education, inter-role conflictsemanating from greater parenting responsibilities,a dearth of financial assistance and socio-culturalconstraints. Abimbola, Emmanuel and Ahmadu(2007), however, found that in most cities manyprogrammes and legislation have beenimplemented to improve life for womenentrepreneurs, but have not yielded results. Thishappened because most of the facilitiesembedded in the programmes do not reach thosein need to them, but are used to service political
A Reflection on Financial Problems of Women Entrepreneurs in Pondicherry● Dr. K. Lavanya Latha

50
SAARANSHVol. 8 No. 1 JULY 2016● ●
RKG JOURNAL OF MANAGEMENT
and other loyalties. These researchers believe thatthe dispensation of facilities should rather be donethrough community-based associations or groups,rather than through political affiliations. Effectivemonitoring mechanisms should also be put intoplace to ensure that facilities are put into properuse and to prevent the misapplication of funds.Kock (2008) argued that many women want post-start-up support that is accessible after trying outthe skills learned in earlier training. Mentoring isone method of providing this support, which canbe very effective as it addresses the specificproblems faced by the individual entrepreneur. Thesupport can include individual as well as group-based assistance directed at specific problemswhere mentors serve as role models.
CHARACTERISTICS OF WOMENENTREPRENEURSEntrepreneur believe that they can change theenvironment in their own capacity. In thedevelopment of entrepreneurship an individual isthe most important factor. An individual is expectedto possess certain qualities that are necessary tobecome successful in light of this. The followingare the characteristics of women entrepreneurswhich has an urge to become successful.
� Confidence
� Goal oriented
� Desires feedbacks and learns from experience,recognizing errors
� Drive for independence but can co-operatewhen necessary for her goals
� Hardworking (on things she want to do)
� Calculated risk-taking
� Takes personal responsibility
� See goals and realistic step by step sub goals
� Ability to grasp quickly
� Mentally hyperactive
� Sensitive and perceptive of people andenvironment
� Higher tolerance of ambiguities
� Family and friend second to business
� Pleasant personality
� Likes to excel in work.
AIM OF THE PAPERThe present paper is mainly focusing on to studythe problems of women in micro-entrepreneurshipin Puducherry. India.
METHODOLOGY AND DESIGNPondicherry region has two municipalities—Pondicherry Municipality Corporation andOulgaret Municipality Corporation. OulgaretMunicipality has four constituencies with a highestnumber of micro-enterprise running by women.In that Oulgaret, Lawspet and Reddiyarpalayamwere chosen for the present study. Around 1120micro-enterprises are working in thesemunicipalities. For the present study 296 womenwere selected randomly taken from these threeregions.
This study is compiled with the help of the primarydata and was collected with the help of speciallyprepared interview schedule. The scheduleincluded the questions related to the generalinformation and about the financial problems. Thisis purely a descriptive study. Therefore, nocomplicated models and tools were used. Onlysimple average, chi-square were used for theanalysis. Secondary data was collected fromvarious websites and journals.
AGE-GROUP OF WOMENENTREPRENEURSAge and socio-economic activities are inter-related. The middle age group people can activelyinvolve in entrepreneurship. Table 1.0 deal withthe age-group of sample respondents for the study.
From the above table it is observed that 35.2percent of women entrepreneurs belong to age-group of 40-50, 29 percent belong to 30-40 agegroups and 18.9 percent belong to 20-30. Itindicates that middle age group are activelyinvolving in micro-entrepreneurship.
REASONS FOR ENTERING MIRO-ENTREPRENEURSHIPThe main aim of entrepreneurship is to promotesavings, family support and to get credit for theproductive and consumption purposes. The Table2.0 shows the reasons for entering intoentrepreneurship by the sample respondents.
It is observed that the most of the respondents in

51
the study have entered into entrepreneurship forfinancial security (37.8 per cent) and getting loan(20.3 per cent) from the Government. And 16.9per cent of them are to promote their personalsavings in addition to get social status.
EDUCATIONAL QUALIFICATIONSEducation is one of the inputs for empowerment.It enables the women to gather information fromdifferent sources and helps them to analyzeproperly and think innovatively inentrepreneurship. The education level of theselected women for the study are represented inthe Table 3.0.
From the above table, it is clearly indicated thatmost of the women entrepreneurs are high school(37.2 percent), 27 per cent were graduates and18.5 per cent studied up to S.S.C. The data reflectsthat educational qualification is influencing to startenterprise.
Problems of women Entrepreneurs
Some of the problems generally faced by thewomen entrepreneurs are financial, raw material,sales / marketing, labour/employee, infrastructural,operational problems and lack of knowledge oftechnical know-how on the part of the personnel.Apart from lack of entrepreneurial zeal of thepeople, particularly youth, lack of skilled labour inthe region, poor marketing and governmentsupport, lack of encouragement of/from thefinancial institutions and very limited R&D facilitiesalso are the problems being faced by the womenentrepreneurs. In addition to that lack ofawareness among the entrepreneurs aboutvarious new schemes launched by thegovernment for developing the womenentrepreneur is also a serious problem. In thepresent paper, only financial problem has beentaken into consideration.
Financial Problems
Finance is one of the most important problemfaced by entrepreneurs. As finance is the life bloodof a business organization, no businessorganization can function properly in the absenceof adequate funds. Generally, most entrepreneursface the problem of finance at the time of makingthe initial investment as well as during the courseof management of the enterprise (Kharbanda,2001). Poor financial situations and low levels of
R&D are the reasons for the inability of MSMEsin identifying their needs. Patnaik (1991) in hisstudy found that almost all enterprises faceddifficulties in raising term loans and workingcapital. Sinha (1991) in a study of 100 smallenterprises in Patna city of Bihar State found that85 per cent enterprises face the problem offinance. Finance is not easy to come by as theentrepreneurs have to depend mostly on merethan one source and pay heavy investmentcharges and pass through many an ordeal andsubsequent delay. Similarly, enterprises which areancillary to other large enterprises do not receivetimely payments from the mother enterprises fortheir supply. Besides this, lack of access to finance,inadequate working capital, non-availability ofcredit at the right time, delays in sanctioning anddispersing loans and huge rates of interest onloans raised are the other problems faced by smalland micro-entrepreneurs.
Area-wise Financial Problems
The response to financial problems ofentrepreneurs/enterprises in the study area hasbeen presented in the table no. 4.0
The table 4.0 shows that, 66.2 per cententrepreneurs (196 of 296 enterprises) are facingthe financial problem and 33.8 per cent enterprises(100 of 296) are not. Among the 196 Lawspet area-entrepreneurs facing the problem of finance, 130are from Lawspet area, 63 are from Oulgaret areaenterprises and 3 are from Reddiyarpalayamenterprises having the financial problem.. It isconcluded that 66.2 per cent of womenentrepreneurs were facing the financial problemsin all the study area.
The different kinds of financial problems faced bythe micro-entrepreneurs in the study area havebeen presented in the table no. 5.0.
The table no. 5.0 lucidly portrays that, out of thesample enterprises, 15.50 per cent enterprises(46 out of 296 ) faced the problems of shortage offixed capital, 33.80 per cent enterprises (100 outof 296) faced the shortage of working capital,17.60 per cent enterprises (52 out of 296) facedthe high rates of interest problem, 23.0 per cententerprises (68 out of 296) received meagreassistance from government agencies and 1.7 percent enterprises (5 out of 296) faced other financialproblems such as delay in getting the finance andinstallments of credit availability.
A Reflection on Financial Problems of Women Entrepreneurs in Pondicherry● Dr. K. Lavanya Latha

52
SAARANSHVol. 8 No. 1 JULY 2016● ●
RKG JOURNAL OF MANAGEMENT
Regarding the problems of finance, with respectto Lawspet area, 13.50 per cent (28 out of 207)faced the problems of shortage of fixed capital,33.3 per cent enterprises (69 out of 207) facedthe shortage of working capital, 15.9 per cententerprises (33 out of 207) faced the high rates ofinterest as a problem, and 24.2 per cententerprises (50 out of 207) received meagreassistance from government agencies.
With regard to the Oulgaret area enterprises facingthe problems of finance, 20.70 per cent (17 out of82) faced the problems of shortage of fixed capital,36.6 per cent enterprises (30 out of 82) faced theshor tage of working capital, 23.2 per cententerprises (19 out of 82) faced the problem ofhigh rates of interest, 20.7 per cent enterprises(17 out of 82) received meagre assistance fromgovernment agencies and 6.1 per cent (5 out of82) faced other financial problems such as delayin getting the finance and installments of creditavailability from financial institutions. Similarly,from the Reddiyarpalayam area enterprises, 14.30per cent (1 out of 7) faced the problems of shortageof fixed capital, 14.30 per cent enterprises each(1 out of 7) faced the shortage of working capitaland meagre assistance from governmentagencies. These figures reveal that the shortageof working capital is a major problem of the sampleentrepreneurs in the study area.
Enterprise Group-wise Financial Problems
The financial problems faced by the sampleentrepreneurs/enterprises in the study areaenterprise group wise are presented in the tableno. 6.0.
The table 6.0 reveals that, out of the 296 sampleentrepreneurs/enterprises, 196 entrepreneurs /enterprises (66.2%) have faced the financialproblems with various enterprise groups in thestudy area. Among them, 35 out of 44 (79.5%)are Agro, Forest and Animal based, 19 out of 32enterprises (59.4 %) are Textile based, 30 out of48 enterprises (62.5 %) are Mineral based, 22 outof 39 enterprises (56.4 %) are Engineering based,22 out of 33 enterprises (66.7 %) are Chemicalbased enterprises and 68 out of 100 enterprises(68.0 %) of other nature category enterprises facefinancial problems. Additionally, Chi-Square testreveals that there is no significant associationbetween the category of the enterprises and levelof financial problems faced as the Chi-squarevalue is insignificant (Chi squire value =6.282 and
p-value=0.280).
Form of Organisation-wise FinancialProblems
The below table 7.0 presents that the financialproblems faced by the sample entrepreneurs/enterprises organisation wise in the study area.
The table 7.0 reveals that, out of the 296 sampleentrepreneurs/enterprises, 196 entrepreneurs /enterprises (66.2%) have faced the financialproblems. Among them, 118 out of 170 enterprises(69.4%) are maintained by Sole Proprietorship,53 out of 82 enterprises (64.6%) are maintainedby Partnership firms and 25 out of 44 enterprises(56.8%) are Private Ltd., companies which facefinancial problems. The Chi-Square test revealsthat there is no significant association betweenthe form of organization maintained byentrepreneurs and level of financial problemsfaced by the entrepreneurs /enterprises as the Chi-square value is insignificant (Chi squire value=2.605 and p-value=0.272).
Nature of Activity-wise Financial Problems
The table 8.0 reveals the financial problems facedby the sample entrepreneurs/ enterprises in thestudy area, on the basis of nature of activity.
The table 8.0 shows that, out of the 296 sampleentrepreneurs/enterprises, 196 entrepreneurs /enterprises (66.2%) have faced the financialproblems by nature of activity wise in the studyarea. Among them, 62 out of 94 enterprises(66.0%) were Manufacturing enterprises, 28 outof 42 enterprises (66.7%) were Assemblingenterprises, 35 out of 54 enterprises (64.8%) wereProcessing enterprises, 16 out of 28 enterprises(57.1 %) were Repairing and Maintenanceenterprises and 55 out of 78 enterprises (70.5%)Service enterprises. Since the Chi-Square valueis insignificant (Chi squire value =1.728 and p-value=0.786), it can be inferred that there is nosignificant relation between the nature of theenterprise activities and level of financial problemsfaced by the entrepreneurs/enterprises.
CONCLUSIONIn India, here are many problems involved instarting new enterprises and many problems arefaced by the existing entrepreneurs also.Generally, the entrepreneurs would prefer wage/salary employment rather than being entrepreneur.

53
There is a common belief that ‘all business is risky’,and of course, there is much truth in it. Becausethe entrepreneur has to take countless decisionsfrom among several possible alternatives inperforming his task successfully. If the planningor estimation about the future were to go wrongthe entrepreneur will surely land in trouble. Now-a-day’s entrepreneurs are facing several problems,which are of individual, group and institutionalnature. However, ultimately it rests on theindividual because it is he who has to take theinitiative to take a decision to start and managehis enterprise. But he also needs the approval andsupport of his kin, group or community.
Some of the problems likely to be encounteredare lack of motivation, shyness and inhibition onhis part, lack of finance for initial investment, lack
of confidence in one’s own abilities, ignorance ofopportunities that he can avail himself of, lack ofrequisite managerial and technical skills to startand manage his/her enterprise. Understandably,many enterprises are scared of the cumbersomeand time-consuming process in establishing anenterprise. Similarly, they may have to face someproblems from the group to which they belongsuch as, preference for traditional occupations andprofessions, lack of awareness or ignorance oftheir own potential, managerial and human,ignorance of alternative avocations; lack offreedom to choose on account of the influence ofthe local elite or the dominant caste. Besides, thegroup is likely to be tradition bound, and its valuesare likely to continue with its institutionalizedfamiliar occupations.
REFERENCES1. Aldrich, E. H. and Zimmer, C. (1986), Entrepreneurship through Social Networks, pp. 3-23 in Donaldn Sexton
and Raymond Smilor (Eds.). The Art and Science of Entrepreneurship. New York: Ballinger.
2. Abimbola, O.H., Emmanuel, C.O. & Ahmadu, F.O. 2007. Women entrepreneurship: Challenges and prospectsfor quality of life. Gender and Behavior, 5(1): 1089-1102.
3. Affholder, J. & Box, D.M. 2004. Struggles of female entrepreneurs. Allied Academics International Conference.Proceedings of the Academy of Entrepreneurship, 10(1).
4. Ahl, H. 2006. Why research on women entrepreneurs needs new directions. Entrepreneurship Theory andPractice, 30(5): 595-621.
5. Botha, M. 2006. Measuring the effectiveness of the women entrepreneurship programme, as a trainingintervention, on potential, start-up and established women entrepreneurs in South Africa. Pretoria: Universityof Pretoria. (Unpublished PhD thesis).
6. Bradley, F. & Boles, K. 2003. Female entrepreneurs from ethnic backgrounds: an exploration of motivationsand barriers. Manchester: Manchester Business School.
7. Carter, S. and Anderson, S. (2001). On the move: Women and men business owners in the United Kingdom,University of Strathclyde, Washington DC: NFWBO and IBM. Pg. 12-13.
8. Capowski, G.S. (1994), Anatomy of a leader: Where are the leaders of tomorrow? Management Review,March, 12.
9. Clark, S. (2000). The Home-Based Business Boom Brings Problems and Opportunities. Houston BusinessJournal.
10. Dhameja S K (2002), Women Entrepreneurs: Opportunities, performance, problems, Deep publications (p)Ltd, New Delhi, p 11.
11. Gay, J. (1994), getting a grip, The Financial Post Magazine, p.6.
12. Gregory, S. L. and Kleiner, H.B. (1991). Women in Business: Fast Track Derailment. Equal opportunitiesinternational 10: 1-4. Vol.10 No. 6, pp. 1-4.
13. Gundry, L.K., Ben-Yoseph, M. & Posig, M. Contemporary perspectives on women’s entrepreneurship: A reviewand strategic recommendations. Journal of Enterprising Culture, 10(1): 67-86.
14. Review of Professional Management, Vol. 7. Issue 8 (July-December 2009).
15. Rajendran N (2003), “Problems and prospects of women Entrepreneurs” SEDME, Vol. 30 no.4 Dec.
16. Rao Padala Shanmukha (2007) “Entrepreneurship Development among Women: A case study of self helpGroups inSrikakulam District, Andhra Pradesh” The Icfai.[16] Journal of Entrepreneurship Development Vol.1V
A Reflection on Financial Problems of Women Entrepreneurs in Pondicherry● Dr. K. Lavanya Latha

54
SAARANSHVol. 8 No. 1 JULY 2016● ●
RKG JOURNAL OF MANAGEMENT
No. 1.
17. Tanguchi, H. 2002. Determinants of women entry into self-employment. Social Science Quarterly, 83(3): 875-894.
18. Van Vuuren, J.J. & Groenewald, D. 2007. A critical analysis of the influence of start-up factors in small businessesand entrepreneurial ventures in South Africa. Act a Commercial, 7: 269-280.
19. Verheul, I., Van Stel, A. & Thurik, R. 2004. Explaining female and male entrepreneurship across 29 countries.SCALES Working Paper, May.
20. Welter, F. 2004. The environment for female entrepreneurship in Germany. Journal of Small Business andEnterprise Development, 11(2): 212-221.
Table No. 4.0Response to Financial Problem - Area-wise
DistributionResponse Area
to Financial Lawspet Oulgaret Reddiyar- TotalProblem palayam
Yes 130 63 3 196(62.8) (76.8) (42.9) (66.2)
No 77 19 4 100(37.2) (23.2) (57.1) (33.8)
Total 207 82 7 296(100.0) (100.0) (100.0) (100.0)
Source: Source: Researcher’s CompilationNote: Figures in parentheses indicate percentages to totals.
Table No. 5.0Financial Problems of Enterprises/
Entrepreneurs (Multiple Responses)
Sl. EnterpriseNo. Problems Laws- Oul- Reddiyar- Total
pet garet palayam
1. Shortage of 28 17 1 46Fixed Capital (13.50) (20.70) (14.30) (15.50)
2. Shortage of 69 30 1 100Working Capital (33.3) (36.6) (14.3) (33.8)
3. High Rate of 33 19 0 52Interest (15.9) (23.2) (0.0) (17.6)
4. Meagre Assis- 50 17 1 68tance from Govt. (24.2) (20.7) (14.3) (23.0)Agencies
5. Others 0(0.0) 5(6.1) 0(0.0) 5(1.7)
Source: Researcher’s Compilation. Percentages computed fromSample size (N).Note : Figures in parentheses indicate percentages to totals.
Table 1.0Age-group of Members
Sl.No. Age-Group No. of % ofRespondents Respondents
1. Less than 20 5 1.7
2. 20-30 56 18.9
3. 30-40 86 29.0
4. 40-50 104 35.2
5. 50-60 30 10.2
6. Above 60 15 5.0
Total 296 100
Table 2.0Reasons for Joining Micro-entreprenuership
Sl. Reasons No. of % of No. Respondents Respondents
1. For family support 26 8.8
2. For promoting savings 50 16.9
3. For social status 48 16.2
4. For financial security 112 37.8
5. For getting loan 60 20.3
Total 296 100
Table 3.0 Educational Qualifications of Women
Entrepreneurs
Sl. Education No. of % of No. Respondents Respondents
1. Illiterates 20 6.8
2. Below SSC 31 10.5
3. Up to SSC 55 18.5
4. Higher school 110 37.2
5. Graduation 80 27
Total 296 100

55
Table No.6.0Response to Financial Problems—Enterprise Group wise
Sl. No Enterprise Group Financial Problems TotalYes No
1 Agro, Forest and Animal based 35(79.5) 9(20.5) 44(100.0)
2 Textiles based 19(59.4) 13(40.6) 32(100.0)
3 Mineral based 30(62.5) 18(37.5) 48(100.0)
4 Engineering based 22(56.4) 17(43.6) 39(100.0)
5 Chemical based 22(66.7) 11(33.3) 33(100.0)
6 Others 68(68.0) 32(32.0) 100(100.0)
7 Total 196(66.2) 100(33.8) 296(100.0)
Chi-square value 6.282
p-value 0.280
Source: Researcher’s Compilation.
Note : Figures in parentheses indicate percentages to totals.
Table No. 7.0Response to Financial Problems - Form of Organisation-wise
Sl. No Form of Organisation Financial Problems TotalYes No
1. Sole Proprietorship 118(69.4) 52(30.6) 170(100.0)
2. Partnership 53(64.6) 29(35.4) 82(100.0)
3. Private Ltd, Company 25(56.8) 19(43.2) 44(100.0)
Total 196(66.2) 100(33.8) 296(100.0)
Chi-square value 2.605
p-value 0.272
Source: Researcher’s Compilation.
Note : Figures in parentheses indicate percentages to totals.
Table No. 8.0Response to Financial Problems - Nature of Enterprise Activity wise
Sl. No Nature of Activity Financial Problems TotalYes No
1. Manufacturing 62(66.0) 32(34.0) 94(100.0)
2. Assembling 28(66.7) 14(33.3) 42(100.0)
3. Processing 35(64.8) 19(35.2) 54(100.0)
4. Repairing & Maintenance 16(57.1) 12(42.9) 28(100.0)
5. Services 55(70.5) 23(29.5) 78(100.0)
Total 196(66.2) 100(33.8) 296(100.0)
Chi-square value p-value
1.728 0.786
Source: Researcher’s Compilation.
Note : Figures in parentheses indicate percentages to totals.
A Reflection on Financial Problems of Women Entrepreneurs in Pondicherry● Dr. K. Lavanya Latha

56
SAARANSHVol. 8 No. 1 JULY 2016● ●
RKG JOURNAL OF MANAGEMENT
A Study on Financials of Infrastructure Sector: AComparison between DLF Ltd & Omaxe Ltd
Vikas Gupta1
Nitin Saxena2
ABSTRACT
Now-a-days Initial Public Offer (IPO) has become one of the preferred investments for the investor. In therecent years many companies has come up with IPO to raise funds to their requirements. Investing in IPO isconsidered as one of the risky investments. It is because the market behavior is not known especially involatile share market. Performance of the IPO varies in accordance with the market i.e. bullish to bearish.Interests of the investors are influenced by the market trend and thus the performance of the IPO. IPOs canbe a risky investment.
This research paper examines the strong cycles in the no. of IPOs that have existed in the Indian IPOmarkets since 1991 and the level of underpricing that has been observed during such cycles. It even tries toestablish a reason behind the hot and cold IPO markets observed in India. It concentrates on two keyvariables, namely, IPO volume and initial returns and analyses their nature and interrelation.
Key words: IPO, Ratio, Stock Market, Offer Price, InvestorsIntroduction
PREPARATORY WORK INVOLVEDBY THE COMPANY FOR AN IPOA company that is thinking about going publicshould start preparing detailed financial resultson a regular basis, and developing a business planif they do not already have one, as much as twoyears in advance of the desired IPO. Soonthereafter, it needs to put its IPO team together,consisting of the lead investment bank, anaccountant, and a law firm. The IPO processofficially begins with what is typically called an “all-hands” meeting. At this meeting, which usuallytakes place six to eight weeks before a companyofficially registers with the Securities andExchange Commission, all the members of theIPO team plan a timetable for going public andassign certain duties to each member.
The most important and time-consuming taskfacing the IPO team is the development of theprospectus, a business document that basicallyserves as a brochure for the company. Theprospectus includes all financial data for a
1. Professor, Gitarattan International Business School, Rohini Delhi2. Research Scholar, Mewar University Chittorgarh Rajasthan
Initial Public Offer (IPO) refers to the offering ofstock in a company to the public through a publicmarket. When a company sells stock o the publicfor the first time it is called an initial public offer.Stock is sold in the primary market at an offer pricedetermined by the IPO team. Following thefinancing, the shares are traded in the secondarymarket. Selling stock in the primary market isassisted with investment bankers or underwritersthat help promote the potential offering. Investorspurchasing stock in IPOs generally must beprepared at accept very large risks for thepossibility of large gains. An Initial Public Offer(IPO) is the selling of securities to the public inthe primary market. It is the largest source of fundswith long or indefinite maturity for the company. Acorporate may raise capital in the primary marketby way of an initial public offer, right issue or privateplacement. An initial public offering, or IPO, is thefirst sale of stock by a company to the public. Acompany can raise money by issuing either debtor equity. If the company has never issued equityto the public, it’s known as an IPO.
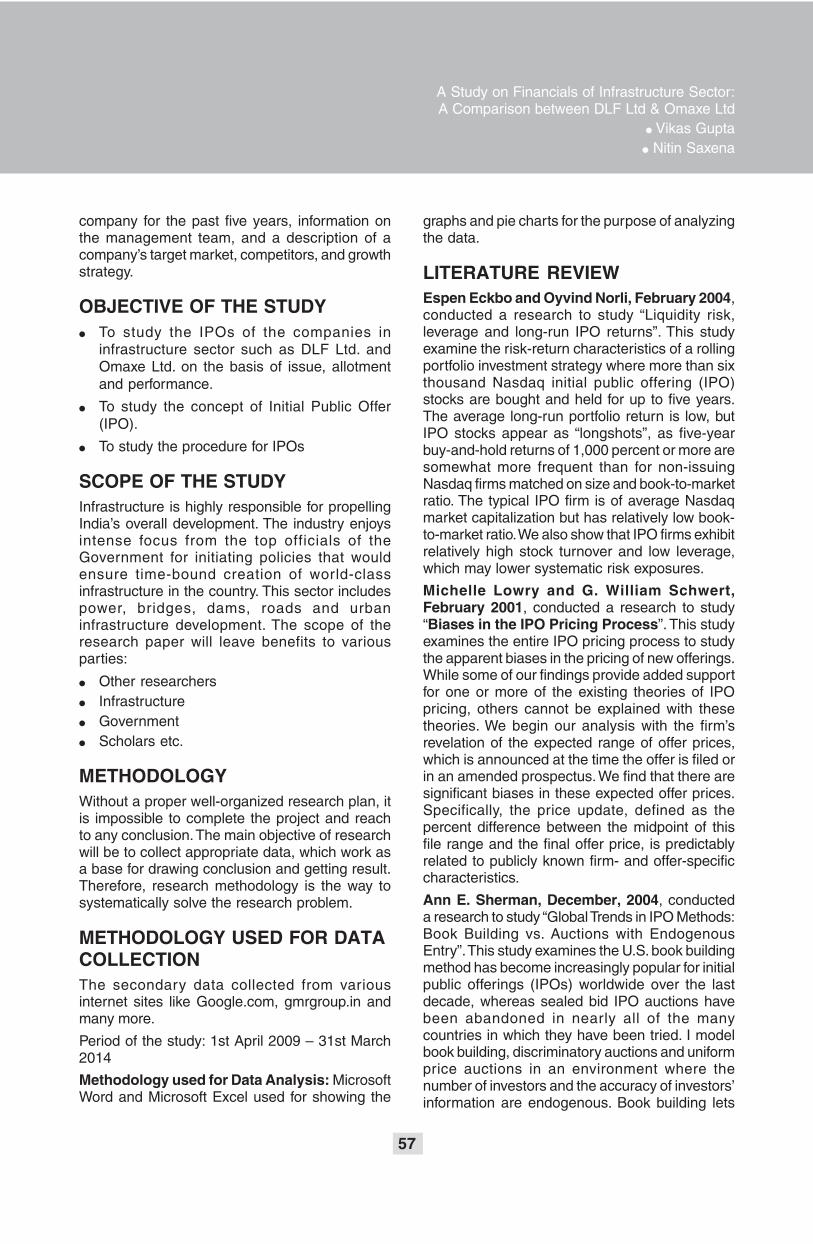
57
company for the past five years, information onthe management team, and a description of acompany’s target market, competitors, and growthstrategy.
OBJECTIVE OF THE STUDY● To study the IPOs of the companies in
infrastructure sector such as DLF Ltd. andOmaxe Ltd. on the basis of issue, allotmentand performance.
● To study the concept of Initial Public Offer(IPO).
● To study the procedure for IPOs
SCOPE OF THE STUDYInfrastructure is highly responsible for propellingIndia’s overall development. The industry enjoysintense focus from the top officials of theGovernment for initiating policies that wouldensure time-bound creation of world-classinfrastructure in the country. This sector includespower, bridges, dams, roads and urbaninfrastructure development. The scope of theresearch paper will leave benefits to variousparties:
● Other researchers● Infrastructure● Government● Scholars etc.
METHODOLOGYWithout a proper well-organized research plan, itis impossible to complete the project and reachto any conclusion. The main objective of researchwill be to collect appropriate data, which work asa base for drawing conclusion and getting result.Therefore, research methodology is the way tosystematically solve the research problem.
METHODOLOGY USED FOR DATACOLLECTIONThe secondary data collected from variousinternet sites like Google.com, gmrgroup.in andmany more.
Period of the study: 1st April 2009 – 31st March2014
Methodology used for Data Analysis: MicrosoftWord and Microsoft Excel used for showing the
graphs and pie charts for the purpose of analyzingthe data.
LITERATURE REVIEWEspen Eckbo and Oyvind Norli, February 2004,conducted a research to study “Liquidity risk,leverage and long-run IPO returns”. This studyexamine the risk-return characteristics of a rollingportfolio investment strategy where more than sixthousand Nasdaq initial public offering (IPO)stocks are bought and held for up to five years.The average long-run portfolio return is low, butIPO stocks appear as “longshots”, as five-yearbuy-and-hold returns of 1,000 percent or more aresomewhat more frequent than for non-issuingNasdaq firms matched on size and book-to-marketratio. The typical IPO firm is of average Nasdaqmarket capitalization but has relatively low book-to-market ratio. We also show that IPO firms exhibitrelatively high stock turnover and low leverage,which may lower systematic risk exposures.
Michelle Lowry and G. William Schwert,February 2001, conducted a research to study“Biases in the IPO Pricing Process”. This studyexamines the entire IPO pricing process to studythe apparent biases in the pricing of new offerings.While some of our findings provide added supportfor one or more of the existing theories of IPOpricing, others cannot be explained with thesetheories. We begin our analysis with the firm’srevelation of the expected range of offer prices,which is announced at the time the offer is filed orin an amended prospectus. We find that there aresignificant biases in these expected offer prices.Specifically, the price update, defined as thepercent difference between the midpoint of thisfile range and the final offer price, is predictablyrelated to publicly known firm- and offer-specificcharacteristics.
Ann E. Sherman, December, 2004, conducteda research to study “Global Trends in IPO Methods:Book Building vs. Auctions with EndogenousEntry”. This study examines the U.S. book buildingmethod has become increasingly popular for initialpublic offerings (IPOs) worldwide over the lastdecade, whereas sealed bid IPO auctions havebeen abandoned in nearly all of the manycountries in which they have been tried. I modelbook building, discriminatory auctions and uniformprice auctions in an environment where thenumber of investors and the accuracy of investors’information are endogenous. Book building lets
A Study on Financials of Infrastructure Sector:A Comparison between DLF Ltd & Omaxe Ltd
● Vikas Gupta● Nitin Saxena

58
SAARANSHVol. 8 No. 1 JULY 2016● ●
RKG JOURNAL OF MANAGEMENT
underwriters manage investor access to shares,allowing them to: 1) reduce risk for both issuersand investors; and 2) control spending oninformation acquisition, thereby limiting eitherunderpricing or aftermarket volatility.
Vikram Nanda and Rajdeep Singh, November6, 2003, conducted a research to study “HotMarkets, Investor Sentiment, and IPO Pricing”.This study examines that an IPO company’soptimal response to the presence of sentimentinvestors and short sale constraints. Givenregulatory constraints on price discrimination, theoptimal mechanism involves the issuer allocatingstock to `regular’ institutional investors forsubsequent resale to sentiment investors, at pricesthe regulars maintain by restricting supply.
Ivo Welch and Jay Ritter, February 8, 2002,conducted a research to study “A Review of IPOActivity, Pricing, and Allocations”. This studyexamines on three areas of current research onIPOs: reasons for going public, the pricing andallocation of shares, and long-run performance.There are myriad theoretical reasons for firmswanting to go public, but only sparse evidence dueto a general lack of data on the pool of privatefirms. Still, the evidence of large variation in thenumber of IPOs suggests that market conditionsare the most important factor in the decision to gopublic.
Ambrish Gupta 2013, conducted a research tostudy “The IPO Market in India: perspective,prospects, and growth strategies”. Themethodology was adopted to achieve the objectiveof this research by analysis last five year IPO bycalculating profit and loss ratio and has discussedabout the present state of the primary capitalmarket in India, main reasons responsible forcontinuing gloom and its likely future outlook.
Seshadev Sahoo and Prabina Rajib 2010,conducted a research to study “After marketpricing performance of initial public offerings(IPOs): Indian IPO market 2002-2006”. Themethodology was adopted to achieve the objectiveof this research by using benchmark-adjusted buy-and- hold return (BHAR) and wealth relative (WR)are used to evaluate the long- run after marketreturns for IPOs. This paper present freshevidence on IPO performance i.e., short-run underpricing and long run underperformance for 92Indian IPO issued during period 2002-2006.
DATA COLLECTION ANDINTERPRETATIONA. Data Presentation
Ratio analysis
Ratio analysis facilitates comparison between twocompanies. It reflects the financial efficiency &financial position of a company. Ratio analysis isfruitful in preparing plans for the future. Ratioanalysis is process of comparison of one figureagainst another, which makes a ratio, andappraisal of the ratios to make proper analysisabout the strength and weakness of the firmsoperation. Ratio analysis is extremely helpful inproviding valuable insight into a company sfinancial picture. Ratios provide an easy way tocompare present performance of businesses.
Ratios depict the areas in which a particularbusiness competitively advantaged ordisadvantaged through comparing ratios to thoseof other businesses within the same industry.
Ratio analysis of DLF Ltd. and Omaxe ltd1. Current ratioCurrent Ratio = Current Assets / Current LiabilitiesHypothesis:Ho = there is no significant difference between currentratios of DLF Ltd. and Omaxe Ltd.H1 = there is significant difference between currentratios of DLF Ltd. and Omaxe Ltd.
DLF LTD. Omaxe LTDFY Current ratioCurrent ratio2006-07 2.12 2.512007-08 2.30 3.872008-09 2.78 3.242009-10 2.59 2.882010-11 2.37 2.762011-12 1.49 1.672012-13 1.46 1.652013-14 1.59 1.57
Analysis
The significance value for t-test for the relationshipbetween the current ratio of the DLF Ltd. andOmaxe is 0.040 that is less than 0.05.
Interpretation
This indicates there was a significant relationshipbetween the current ratio of the DLF Ltd. andOmaxe which is 0.040 that is less than 0.05.
Hence, the null hypothesis stands rejected.

59
2. Quick ratioQuick ratio= Quick Assets/Current Liabilities
Hypothesis:
Ho = there is no significant difference between quickratios of DLF Ltd. and Omaxe Ltd.
H1 = there is significant difference between quick ratiosof DLF Ltd. and Omaxe Ltd.
DLF LTD Omaxe LTDFY Quick ratio Quick ratio
2006-07 1.54 0.762007-08 2.36 1.752008-09 2.60 1.822009-10 1.60 1.432010-11 1.37 1.322011-12 1.06 1.032012-13 0.98 1.032013-14 1.04 1.09
Analysis
The significance value for t-test for the relationshipbetween the quick ratio of the DLF Ltd. and Omaxeis 0.096 that is more than 0.05.
InterpretationThis indicates there was no significant relationshipbetween the quick ratio of the DLF Ltd. andOmaxe, which is 0.040 that is more than 0.05.Hence, the null hypothesis stands accepted.
3. Operating profitOperating Profit = Operating Revenue - COGS -Operating Expenses - Depreciation and AmortizationHypothesis:Ho = there is no significant difference betweenoperating profit of DLF Ltd. and Omaxe Ltd.H1 = there is significant difference between operatingprofit of DLF Ltd. and Omaxe Ltd.
DLF LTD Omaxe LTDFY Operating ratio Operating ratio
2006-07 56.27 29.172007-08 67.89 36.622008-09 56.41 19.382009-10 48.42 21.472010-11 39.25 14.762011-12 40.54 14.542012-13 33.78 13.402013-14 29.94 16.29
Figure 1: Figure showing current ratios of both the companies in different years
Figure 2: Figure showing quick ratios of both the companies in different years
A Study on Financials of Infrastructure Sector:A Comparison between DLF Ltd & Omaxe Ltd
● Vikas Gupta● Nitin Saxena
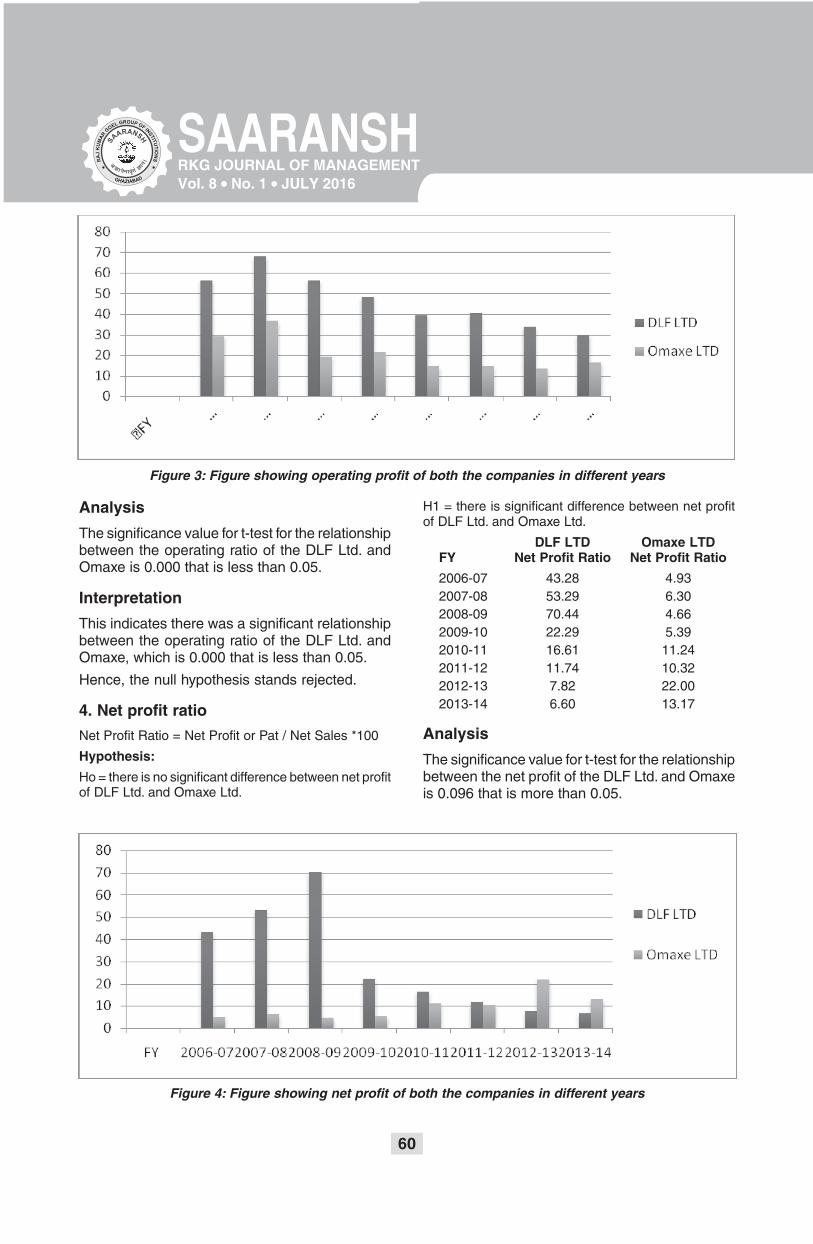
60
SAARANSHVol. 8 No. 1 JULY 2016● ●
RKG JOURNAL OF MANAGEMENT
Analysis
The significance value for t-test for the relationshipbetween the operating ratio of the DLF Ltd. andOmaxe is 0.000 that is less than 0.05.
Interpretation
This indicates there was a significant relationshipbetween the operating ratio of the DLF Ltd. andOmaxe, which is 0.000 that is less than 0.05.
Hence, the null hypothesis stands rejected.
4. Net profit ratio
Net Profit Ratio = Net Profit or Pat / Net Sales *100
Hypothesis:
Ho = there is no significant difference between net profitof DLF Ltd. and Omaxe Ltd.
H1 = there is significant difference between net profitof DLF Ltd. and Omaxe Ltd.
DLF LTD Omaxe LTDFY Net Profit Ratio Net Profit Ratio
2006-07 43.28 4.932007-08 53.29 6.302008-09 70.44 4.662009-10 22.29 5.392010-11 16.61 11.242011-12 11.74 10.322012-13 7.82 22.002013-14 6.60 13.17
Analysis
The significance value for t-test for the relationshipbetween the net profit of the DLF Ltd. and Omaxeis 0.096 that is more than 0.05.
Figure 3: Figure showing operating profit of both the companies in different years
Figure 4: Figure showing net profit of both the companies in different years

61
Interpretation
This indicates there was no significant relationshipbetween the net profit of the DLF Ltd. and Omaxe,which is 0.040 that is more than 0.05.
Hence, the null hypothesis stands accepted.
B. Data Analysis
1. Issue details
Interpretation of the table
● DLF Limited came up first with the IPO in thisstudy and it had largest number of shares.
● The lowest price band is of Omaxe Limited Rs.265 to Rs. 310 and that of DLF Limited wasRs. 500 to Rs.550.
● As the price band of Omaxe was low a retailercould apply for a maximum of 320 shares, andfor DLF 180 shares.
● Minimum application was lowest in DLF 10shares and Omaxe was 20 shares.
● Both companies DLF Limited and OmaxeLimited adopted the book building method forthe issue.
Findings of the Study
● The Outlook for Infrastructure developmentremains stronger in the current and comingfuture.
● Infrastructure Realty projects are on the risewith Construction companies opting to go onfor rental of equipments as not to block theirfunds required for equipments as they can beutilized only at one site-if purchased outright.
● Looking into this factor the Companies havehuge growth prospects in respect of hiring ofequipments.
● There is high deviation between DLF ltd. AndOmaxe Ltd., where Omaxe spread is higher.
Suggestions and Scope for Further Study
DLF Limited came up first with the IPO in this studyand it had largest number of shares i.e. the sizeof issue was largest amongst the two companies.This gave an advantage to the company. Its priceband was also high. The price band of OmaxeLimited was low as compared to others. TheQualified Institutional Buyers were allotted highestnumber of shares in all the companies as theirsubscription was high. In DLF Limited the NonInstitutional buyers and Retailers were allotted anequal number of shares. But Omaxe Limited Noninstitutional buyers were allotted much more thanretailers. The employees were allotted very smallamount as there was a low subscription from themin both the companies.
Recommendations of the Study
1. DLF Limited came up first with the IPO in thisstudy and it had largest number of shares.
2. Net profit ratio is an indicator of overallefficiency of the business. After analyzing Netprofit ratio of DLF Ltd. Is decreasing andOmaxe Ltd. is increasing. Therefore DLF Ltd.needs to maintain reserves in order to meetits long term liability
Hence, it was found that all both the companiesDLF Limited and Omaxe Limited went throughmany fluctuations in the stock market, their priceswere very high and also very low. In DLF Limitedthe volume traded was very high on the first daylater on it reduced. But in case of Omaxe Limitedthe highest traded quantity was not on the firstday. Thus both the companies can perform well inthe future and have a lot of scope as theinfrastructure sector is booming.
BIBLOGRAPHY/REFERENCES1. Deepak R. and Swati Gowda 2013 “ Informational Asymmetry Between Informed and Retail Investors while
investing in the Indian IPO market” Indian journal of finance,Vol.8,No 9,Pp 32-43.
2. Harendra Singh and C.G.Sastry 2014, “Grading and Risk-Adjusted performance of the Indian IPOs” Indianjournal of finance, Vol. 8, No 8, Pp 57-65-43.
3. Garima Baluja and Balwinder Singh 2011 “The Determinants of Survival of Initial Public Offerings in India: anempirical study”, The IUP journal of financial risk management, Vol. XI, No 4, Pp 7-27-43.
4. Ambrish Gupta 2013, “The IPO Market in India: Perspective, Prospects, and Growth Strategies”, Indian journalof finance, Vol. 7, No 12, Pp 7-18.
A Study on Financials of Infrastructure Sector:A Comparison between DLF Ltd & Omaxe Ltd
● Vikas Gupta● Nitin Saxena

62
SAARANSHVol. 8 No. 1 JULY 2016● ●
RKG JOURNAL OF MANAGEMENT
5. Neeta Jain 2013, “Regulatory Framework and Research: a Review of IPO Research Conducted in the U.S.,China, and India”, Indian journal of finance, Vol. 7, No 7, Pp 43-52.
6. Rekha Handa and Balwinder Singh, “Gender Diversity on Corporate Boards: A Study on Indian IPOs”, TheIndian journal of commerce, Vol. 66, No 3, Pp 210-221.
7. Neeta Jain and C, Padmavathi 2012,”Under Pricing of Initial Public Offerings in Indian Capital Market” Vikalpathe Journal of Decision Makers, Vol. 37, No 1, Pp 83-95.
8. Seshadev Sahoo and Prabina Rajib 2010, “After Market Pricing Performance of Initial Public Offerings (IPOs):Indian IPO market 2002-2006”, Vikalpa The Journal of Decision Makers, Vol. 35, No 4, Pp 27-43
9. Ann E. Sherman, December, 2004, “Global Trends in IPO Methods: Book Building vs. Auctions with EndogenousEntry”, pp 1-50.
10. B. Espen Eckbo and Oyvind Norli, 2004, “Liquidity risk, leverage and long-run IPO returns”. Journal of CorporateFinance, Pp 1-44.
11. Vikram Nanda and Rajdeep Singh, 2003, “Hot Markets, Investor Sentiment, and IPO Pricing”, pp 1-51.
12. Ivo Welch and Jay Ritter 2002, “A Review of IPO Activity, Pricing, and Allocations”. Yale ICF Working PaperNo. 02-01.
13. Michelle Lowry and G. William Schwert, 2001, “Biases in the IPO Pricing Process”. The Bradley Policy ResearchCentre Financial Research and Policy, Working PaperNo.FR 01-02 pp 1-40.
14. Jay R. Ritter 1998, “initial public offerings” Contemporary finance digest, Vol. 2, No1, and Pp 5-30.
15. Jay R. Ritter 1998, in their article “The Long run under performance Initial public offerings” The journal offinance Vol. XLVI, No 1, Pp 3-26.
16. www.dlf.in
17. www.omaxe.com
18. www.economictimes.com
19. www.bseindia.com
20. www.nseindia.com
Table 1: Table representing current ratios of both the companies in different years
Paired T-test:Descriptive Statistics
Mean Std. Deviation N
DLF Ltd. 2.0875 .51497 8Omaxe 2.5188 .83752 8
Correlations
DLF Ltd. Omaxe
DLF Ltd. Pearson Correlation 1 .848**
Sig. (2-tailed) .008N 8 8
Omaxe Pearson Correlation .848** 1Sig. (2-tailed) .008N 8 8
**. Correlation is significant at the 0.01 level (2-tailed).
Paired Samples Statistics
Mean N Std. Deviation Std. Error Mean
Pair 1 Dlf 2.0875 8 .51497 .18207Omaxe 2.5188 8 .83752 .29611

63
Paired Samples Correlations
N Correlation Sig.
Pair 1 DLF Ltd. & Omaxe 8 .848 .008
Paired Samples Test
Paired Differences
Mean Std. Std. Error 95% Confidence IntervalDeviation Mean of the Difference t df Sig. (2-tailed)
Lower Upper
Pair 1 DLF Ltd.- Omaxe -.43125 .48490 .17144 -.83664 -.02586 -2.515 7 .040
Table 2: Table representing quick ratios of both the companies in different yearsPaired T-test:
Descriptive Statistics
Mean Std. Deviation N
DLF Ltd. 1.5688 .61131 8
Omaxe 1.2788 .37188 8
Correlations
Dlf Omaxe
DLF Ltd. Pearson Correlation 1 .827*
Sig. (2-tailed) .011
N 8 8
Omaxe Pearson Correlation .827* 1
Sig. (2-tailed) .011
N 8 8
*. Correlation is significant at the 0.05 level (2-tailed).
Paired Samples Statistics
Mean N Std. DeviationStd. Error Mean
Pair 1 DLF Ltd. 1.5688 8 .61131 .21613
Omaxe 1.2787 8 .37188 .13148
Paired Samples Correlations
N Correlation Sig.
Pair 1 DLF Ltd.& Omaxe 8 .827 .011
Paired Samples Test
Paired Differences
Mean Std. Std. Error 95% Confidence IntervalDeviation Mean of the Difference t df Sig. (2-tailed)
Lower Upper
Pair 1 DLF Ltd. - Omaxe .29000 .36905 .13048 -.01854 .59854 2.223 7 .062
A Study on Financials of Infrastructure Sector:A Comparison between DLF Ltd & Omaxe Ltd
● Vikas Gupta● Nitin Saxena

64
SAARANSHVol. 8 No. 1 JULY 2016● ●
RKG JOURNAL OF MANAGEMENT
Table 3: Table representing operating profit of both the companies in different years
Paired T-test:Descriptive Statistics
Mean Std. Deviation N
DLF Ltd. 46.5625 12.97781 8
Omaxe 20.7038 8.22444 8
Correlations
DLF Ltd. Omaxe
DLF Ltd. Pearson Correlation 1 .880**
Sig. (2-tailed) .004
N 8 8
Omaxe Pearson Correlation .880** 1
Sig. (2-tailed) .004
N 8 8
**. Correlation is significant at the 0.01 level (2-tailed).
Paired Samples Statistics
Mean N Std. Deviation Std. Error Mean
Pair 1 DLF Ltd. 46.5625 8 12.97781 4.58835
Omaxe 920.7038 8 8.22444 2.90778
Paired Samples Correlations
N Correlation Sig.
Pair 1 DLF Ltd. & Omaxe 8 .880 .004
Paired Samples Test
Paired Differences
Mean Std. Std. Error 95% Confidence IntervalDeviation Mean of the Difference t df Sig. (2-tailed)
Lower Upper
Pair 1 DLF Ltd. - Omaxe 25.85875 6.94647 2.45595 20.05136 31.66614 10.529 7 .000
Table 4: Table representing net profit of both the companies in different years
Paired T-test:Descriptive Statistics
Mean Std. Deviation N
DLF Ltd. 29.0088 23.77872 8
Omaxe 9.7512 5.90831 8
Correlations
DLF Ltd. Omaxe
DLF Ltd. Pearson Correlation 1 -.710*
Sig. (2-tailed) .048
N 8 8
Omaxe Pearson Correlation -.710* 1
Sig. (2-tailed) .048
N 8 8

65
*. Correlation is significant at the 0.05 level (2-tailed).
Paired Samples Statistics
Mean N Std. Deviation Std. Error Mean
Pair 1 DLF Ltd. 29.0087 8 23.77872 8.40705
Omaxe 9.7513 8 5.90831 2.08890
Paired Samples Correlations
N Correlation Sig.
Pair 1 DLF Ltd.& Omaxe 8 -.710 .048
Paired Samples Test
Paired Differences
Mean Std. Std. Error 95% Confidence IntervalDeviation Mean of the Difference t df Sig. (2-tailed)
Lower Upper
Pair 1 DLF Ltd. - Omaxe 19.25750 28.28347 9.99972 -4.38807 42.90307 1.926 7 .096
Table 5: Table representing issue details of both the companies
COMPANY NAME DETAILS DLF Ltd. OMAXE Ltd.
Type of Issue - Book built Book built
Issue Dates Issue Opens 11-06-07 17-07-07
Issue Closes 14-06-07 20-07-07
Total Issue Size No. of Shares 17,50,00,000 1,77,96,520
Price Bands Lower (Rs) 500 265
Upper (Rs) 550 310
Total Amt (Rs) 9625 552
Issue Allocation QIB 104400000 10500000
Non-Institutional 17400000 1750000
Retail 52200000 5250000
Max Shares For Retail 180 320
Application Min & Multiple Shares 10 20
Registrar Name - Karvy Stock Intime SpectrumBroking limited Registry Ltd
Lead Manager - Kotak, DSP Merrill Lynch DSP Merrill Lynch
A Study on Financials of Infrastructure Sector:A Comparison between DLF Ltd & Omaxe Ltd
● Vikas Gupta● Nitin Saxena

66
SAARANSHVol. 8 No. 1 JULY 2016● ●
RKG JOURNAL OF MANAGEMENT
of FDI is much more important. Prominently, FDIis often more crucial and significant than thecapital itself.
FII is defined as an institution organized outsideIndia for the purpose of making investments intothe Indian securities market under the regulationsprescribed by SEBI. An investor or investment fundthat is from or registered in a country outside ofthe one in which it is currently investing is knownas Foreign Institutional Investment. Institutionalinvestors include hedge funds, insurancecompanies, pension funds and mutual funds. FIIis allowed to enter into our country only throughstock exchange either in the form of equity or debt.Thus it makes an impact on rise or fall of majorstock market indices, since FII is allowed to bepurchased or sold daily. The daily transaction ofFII is the reason behind the volatility in the stockmarkets and has strong impact on the variousmacro-economic variables and the economy as awhole. One of the most important features of thedevelopment of stock market in India in the last20 years has been the growing participation ofFIIs.
Foreign investment is also seen as an emergingmeasure of growing economic globalization.Investment has always been an issue for thedeveloping economies such as India and so thosecountries have drafted measures to liberalize their
*Associate Professor and HOD Economics PIMR, Indore**Alumini PIMR Indore
1.1 CONCEPTUAL FRAMEWORKSince 1990-1991, the government of Indiaembarked on liberalization and economic reformswith a view of bringing about rapid and substantialeconomic growth and move towards globalizationof economy. As a part of reforms process, thegovernment under its new industrial policyrevamped its foreign investment policy bypermitting portfolio investment from abroad byforeign institutional investors and foreign directinvestment in the Indian capital. The foreigninvestor’s participation increases the liquidity oflocal markets, makes the base of investor broader,increases risk sharing, and thus lowers the costof capital for investment.
Foreign Direct Investment (FDI) is a directinvestment into production or business in a countryby an individual or company from another country,either by purchasing company in the target countryor by expanding operations of an existing businessin that country. FDI is considered to be the mostattractive type of capital flow for emergingeconomies as it is expected to bring latesttechnology and enhance production capabilitiesof the economy. FDI brings better technology andmanagement, access to marketing networks andoffers competition, the latter help Indiancompanies to improve, quite apart from beinggood for consumers. This efficiency contribution
An Empirical Analysis of the Impact of ForeignDirect Investment and Foreign Institutional
Investment on Indian Stock MarketDr. Nitin Tanted*
Shirin Khan**
ABSTRACT
The present research aims to understand the impact of FII and FDI on stock market indices .Firstly in orderto test the stationarity of data and search for the nature of the relationship between these variables, the unitroot test and Granger Causality test are implemented. The empirical analysis reveals that the lagged valuesof FDI inflows however do not Granger cause Indian Stock market, But FII inflows have Granger causeIndian Stock market. This indicates that FDI’s does not influence the stock market but FII have impact overit.From the current study it is also evident that there is a weak correlation between FDI & sensex and FDI &nifty and moderate positive correlation between FII & sensex and FII& Nifty.

67
policies for welcoming investment from countrieswhich are abundant in capital resources. The flowof FDI & FII accelerated the Indian economy andalso gave opportunities to Indian industry fortechnological up-gradation, gaining access toglobal managerial skills and practices, optimizingutilization of human and natural resources andglobal competitive advantage with greaterefficiency.. Thus FDI and FII have becomeimportant instruments for international economicalliance and stimulation. Capital markets (NSE andBSE) are financial markets for the buying andselling of long-term debt- or equity-backedsecurities. These markets help in mobilizing themoney in the economy.
1.2 REVIEW OF LITERATUREThe present study is an effort based on theconcept of impact of FII on Indian stock marketwith the support of empirical data. The studyconsidered some research work already done bythe different scholars and researchers as follows:
Suhal Quasim Mir and Ishaq Ahmad Bhat (2014)stated that, the Indian stock markets have reachednew heights and became more volatile makingthe research work in this dimension of establishingthe link between FIIs and stock market volatility.This paper makes an attempt to develop anunderstanding of the dynamics of the tradingbehaviour of FIIs and effect on the Indian stockmarket especially in selected sectors, in additionto comparative analysis of preferred investmentstock of FII.
Anubha Shrivastav (2013) stated that FIIs are themajor players in the Indian stock market and theirimpact on the domestic market is increasing.Trading activities of FIIs and the domestic stockmarket turnover indicates that FII’s are becomingmore important at the margin as an increasinglyhigher share of stock market turnover is accountedfor by FII trading in India.
Dr. Syed Tabassum Sultana, Prof. SPardhasaradhi (July 2012) stated the casualrelationship between FII and FDI investment & theIndian stock market represented by marketcapitalization of NSE. The objective of theirresearch is to find the trends & patterns in theFDI and FII & Influence of FDIs and FIIs onmovement of Indian stock exchange.
Rahul Dhiman and Preeti Sharma (November2013) has analyzed the impact of FDI on India
Capital market. The inflow of capital in terms offoreign direct investment (FDI) has definitelyimpacted the economy as well as the capitalmarkets. Foreign direct Investment has providedample opportunities as far as technological upgradation is concerned. From the study it is quiteevident that there is strong degree of correlationbetween FDI and Nifty.
Maram Srikanth and Braj Kishore (March 2012)discussed about as to how the financial sector ofan economy plays a vital role in attracting theForeign Institutional Investment inflows. The studytries to examine the extent of the large volume ofthese flows and their impact on domestic effect ofsignificant macroeconomic variables; inflation andexchange rate, money supply, WPI, Foreignexchange reserves, Index of Industrial Productionon the flows of Foreign Institutional Investment inIndia. Author has tried to analyze the inter-relationbetween Foreign Institutional Investment andmacro-economic variables.
Karan Walia, Dr.Rimpi Walia and Monika Jai(2012) studied the impact of market opening toFIIs on Indian stock market behaviour. Theyempirically analyze the change of market returnand volatility after the entry of FIIs to Indian capitalmarket and found that while there is no significantchange in the Indian stock market average returns;volatility is significantly reduced after Indiaunlocked its stock market to foreign investors.
Saurabh Singh, Dr. L.K Tripathi and Kirti Lalwani(2012) examine the primary factors responsiblefor affecting Bombay Stock Exchange (BSE) inIndia. Further paper attempts to investigate therelative influence of the factors affecting BSE andthereby categorizing them. It shows that dollarprice or money exchange rate and Inflation has agreat influence on BSE Sensex therefore, theresearch identifies the level of influence ofexchange rate and rate of inflation on BSE Sensex.
Rajesh Chakrabarti (2001) concluded in theirstudy that in the pre-Asian crisis period anychange in FII was found to have a positive impacton the equity returns, whereas in the post- Asiancrisis the reverse relationship was noticed. FII’swere a major portion of investments and their rolesin determining the movement of share price andindices is considerably high. The movement ofindices in India depends only on the trade donein limited number of stocks. Thus, when the FII’sfrequently buy and sell stocks, it leads to volatilityof the market.
An Empirical Analysis of the Impact of Foreign Direct Investment andForeign Institutional Investment on Indian Stock Market
● Dr.Nitin Tanted● Shirin Khan

68
SAARANSHVol. 8 No. 1 JULY 2016● ●
RKG JOURNAL OF MANAGEMENT
Mihir Dash (2011) stated the presence of seasonaleffects in monthly returns has been reported inseveral developed and emerging stock markets.The study indicates a highly significant negativeimpact of market crashes on stock market returns.The study suggests that the incidence of marketcrashes reduces the seasonal effects.
1.3 RATIONALE OF THE STUDYThe Foreign institutional investors (FIIs) and FDIhave emerged as important players in the Indiancapital market over the period .However, theeminent concern in the matter is whether theseforeign investors direct the movement of Indianstock market or not. This paper makes an attemptto understand the impact of FII and FDI on Indianstock market with the support of empirical datafor the period 2009-2014.
The present study also focuses on FIIs and FDIinvestment pattern in the Indian stock market. Itexamines the factors expected to affect theinvestment decisions of FIIs and FDI. In thisdirection the present study has been carried outto analyze the impact of FII on Indian stock marketby studying relationship between FIIs and FDIsand NSE (National Stock Exchange).
1.4 OBJECTIVE OF THE STUDY● To determine the relationship between FII’s and
FDI’s and Indian stock market index (Nifty).
● To study the impact of Foreign InstitutionalInvestment (FII) on Indian stock market (Nifty).
● To study the impact of Foreign DirectInvestment (FDI) on Indian stock market (Nifty).
RESEARCH METHODOLOGY
2.1 The Study
The study is empirical in nature. The study is anattempt to understand the impact on FDIs and FIIson Indian stock market.
2.2 The Sample
The data taken for the study is secondary in nature.The sample size is limited and constitutes ofmonthly FII and FDI flows data and the returns ofNIFTY and Sensex for 5 years.
2.3 Tools for data collection
This study is based on secondary data. Therequired data related to FDI and FII have beencollected from website of SEBI and DIPP. The BSESensex and CNX Nifty data is collected from thewebsites of bseindia and nseindia respectively.Daily closing index value are taken and averagedto get the index value for each year, which isconsidered as more representative figure of indexfor the entire year rather any one day’s/month’sclosing figure of the index. The present studyconsiders 5 years data starting from 2009 to 2014.
2.4 Tools for Data Analysis
In the course of analysis in the study, descriptivestatistics, correlation statistics, regressionstatistics, ADF and unit root test and grangercausality test have been used. The uses of allthese tools at different places have been made inthe light of requirement of analysis.
EVIEWSEviews (Econometric Views) is a statisticalpackage for Windows, used mainly for time-seriesoriented econometric analysis. Eviews can beused for general statistical analysis andeconometric analyses, such as cross-section andpanel data analysis and time series estimation andforecasting. Eviews combines spreadsheet andrelational database technology with the traditionaltasks found in statistical software, and uses aWindows GUI. Eviews can be useful include:scientific data analysis and evaluation, financialanalysis macroeconomic forecasting, simulation,sales forecasting, and cost analysis.
1. Augmented Dickey-Fuller
In statistics and econometrics, an AugmentedDickey–Fuller test (ADF) is a test for a unit root ina time series sample. It is an augmented versionof the Dickey–Fuller test for a larger and morecomplicated set of time series models.
A Granger causality test:
The Granger causality test is a statisticalhypothesis test for determining whether one timeseries is useful in forecasting another. Ordinarily,regressions reflect correlations, but Grangerargued that causality in economics could be

69
reflected by measuring the ability of predicting thefuture values of a time series using past values ofanother time series.
B. Unit Root Test:Unit Root Test is used to examine the stationarityof each individual time series data that, whether itis a stationary or not.
2. Correlation
The correlation is one of the most common andmost useful statistics. A correlation is a singlenumber that describes the degree of relationshipbetween two variables. The correlation coefficientmay take on any value between plus and minusone. -1.00 < r <+1.00 the sign of the correlationcoefficient (+, -) defines the direction of therelationship, either positive or negative. A positivecorrelation coefficient means that as the value ofone variable increases, the value of the othervariable increases; as one decreases the otherdecreases. A negative correlation coefficientindicates that as one variable increases, the otherdecreases, and vice-versa. Taking the absolutevalue of the correlation coefficient measures thestrength of the relationship.
3. Regression
Regression is a statistical measure that attemptsto determine the strength of the relationshipbetween one dependent variable (usually denotedby Y) and a series of other changing variables(known as independent variables). In the currentstudy to study the linear relationship betweenvariables such as FDI & FII and Sensex & Niftycorrelation is applied. The multiple regressionanalysis is a statistical technique used to evaluatethe effects of two or more independent variableson a single dependent variable. In the currentpaper attempt is made to study the impact of FDI& FII on Sensex and Nifty. So FDI & FII areconsidered as the two independent variables andthe dependent variables are Sensex and Nifty.
RESULT AND ANALYSISThe trends and relationship between FDI and FII’sand Indian Stock was measured on the basis ofvarious metrics.
3.1 Unit root test
Prior to implementing the Granger causality test,
econometric methodology needs to examine thestationarity for each individual time series sincemost macro economic data are non-stationary, i.e.,they tend to exhibit a deterministic and/orstochastic trend. A series is said to be (weakly orcovariance) stationary if the mean and varianceare time-invariant and the autocovariances of theseries between two time periods depend only onthe interval.. Any series that is not stationary issaid to be non stationary. A non stationary timeseries will have a time dependent mean or avariance or both. It is important to make sure thatthe variables are stationary, because if they arenot, the standard assumptions for asymptoticanalysis in the Granger test will not be valid.
The study uses the Augmented Dickey-Fuller toconduct unit root test on the variables i.e. FDI,FII, NIFTY and SENSEX and the lag lengthschose was 2 based on Schwarz InformationCriterion (SIC).
Unit root test of FDI:
The ADF test is conducted for FDI to test thestationary of the series. The results of the ADFtest are exhibited in Table below:
The above Table 1 reflects the result of ADFimplies that, the ADF test statistic value (-13.48)is less than the test critical values at 1%(-3.52),5% (-2.90) and 10%(-2.58) respectively with theprobability value less than 5%. Hence, the nullhypothesis is rejected.
The result of the unit root test shows that all thevariables are stationary at 5 percent level ofsignificance.Since the data is stationary, mean andvariance are time-invariant and the auto-covariances of the series between two timeperiods depend only on the interval. Reliability ofthe data will ensure further evaluation throughdifferent test and tools.
Unit root test of FII:
The ADF test is conducted for FII to test thestationary of the series. The results of the ADFtest are exhibited in Table 2:
The above table 2 reflects the result of ADF impliesthat, the ADF test statistic value (-8.05) is lessthan the test critical values at 1%(-3.52), 5% (-2.90) and 10%(-2.58) respectively with theprobability value less than 5%. Hence, the nullhypothesis is rejected.
Based on the results it can be concluded that datais stationary in nature. Since the data is stationary,
An Empirical Analysis of the Impact of Foreign Direct Investment andForeign Institutional Investment on Indian Stock Market
● Dr.Nitin Tanted● Shirin Khan

70
SAARANSHVol. 8 No. 1 JULY 2016● ●
RKG JOURNAL OF MANAGEMENT
mean and variance are time-invariant and theautocovariances of the series between two timeperiods depend only on the interval. Reliability ofthe data will ensure further evaluation throughdifferent test and tools.
Unit root test of NIFTY:
The ADF test is conducted for NIFTY to test thestationary of the series. The results of the ADFtest are exhibited in Table 3:
The above table 3 reflects the result of ADF impliesthat, the ADF test statistic value (-6.61) is lessthan the test critical values at 1%(-3.52), 5% (-2.90) and 10%(-2.58) respectively with theprobability value less than 5%. Hence, the nullhypothesis is rejected.
Based on the results it can be concluded that datais stationary in nature. Since the data is stationary,mean and variance are time-invariant and theautocovariances of the series between two timeperiods depend only on the interval. Reliability ofthe data will ensure further evaluation throughdifferent test and tools.
Unit root test of SENSEX:
The ADF test is conducted for SENSEX to testthe stationary of the series. The results of the ADFtest are exhibited in Table 1.
The above table 4 reflects the result of ADF impliesthat, the ADF test statistic value (-7.91) is lessthan the test critical values at 1%(-3.52), 5% (-2.90) and 10%(-2.58) respectively with theprobability value less than 5%. Hence, the nullhypothesis is rejected.
The result of the unit root test shows that all thevariables are stationary at 5 percent level ofsignificance.Since the data is stationary, mean andvariance are time-invariant and theautocovariances of the series between two timeperiods depend only on the interval. Reliability ofthe data will ensure further evaluation throughdifferent test and tools
3.2 Granger Causality Test
Once the stationarity of data is tested, the nextlogical step for study purpose is to examine theGranger-causal relationship among the variables.This causality test proposed by Granger (1969)assumed that the information relevant to theprediction of the respective variables is containedsolely in the time series data variables. X is saidto “Granger-cause” Y if and only if the forecast of
Y is improved by using the past values of Xtogether with the past values of Y, Grangercausality distinguishes between unidirectional andbi directional causality. Unidirectional causality issaid to exist from X to Y if X causes Y but Y doesnot cause X. If neither of them causes the other,then the two time series are statisticallyindependent.
Granger Causality Test between Nifty andFDI
Granger Causality Test Results:Since the reliability of results of the Grangercausality test depends on whether the variablesare stationary or not, the study first tested unitroot of the variables using Augmented Dickey-Fuller test. The result of the unit root test showsthat all the variables are stationary.
The results of pair-wise Granger Causality testsare reported in Table 5. It is observed that Niftydoes not Granger Cause the FDI because theprobability value is greater than 5% (0.98330). Thisimplies that the NIFTY is not influenced by thetrend of FDI in the country. It signals that thereturns expected from this market will not have tobe analyzed and accounted for after carefullyunderstanding the investment pattern of FDI inthe market. So it is clear that the trend of FDI doesnot influence Nifty and its returns . Similarly, theFDI and the Nifty Index does not have relationshipbetween each other since the probability value(0.94) is greater than 5%. So, as per the rule ofthumb, the null hypothesis is accepted that thereis no relationship between the FDI and Nifty Index.
Granger Causality Test between Nifty andFIIGranger Causality Test Results:The results of pair-wise Granger Causality testsare reported in Table 6. It is observed that FIIGranger Cause Nifty because the probability valueis less than 5 % (0.04). This implies that the NIFTYis influenced by the trend of FII in the country. Itsignals that the returns expected from this marketwill have to be analyzed and accounted for aftercarefully understanding the investment pattern ofFII in the market. It is a clear trend of FII beingattracted into the Indian stock market andinfluencing the returns generated from it. But,NIFTY does not Granger Cause FII means FII isnot influenced by the stock market trend since the

71
probability value (0.94) is greater than 5%. So, asper the rule of thumb, the null hypothesis isaccepted that there is no impact of Nifty Index onFII’s.
Granger Causality Test between FDI andSENSEXGranger Causality Test Results:
The results of pair-wise Granger Causality testsare reported in Table 7. It is observed thatSENSEX does not Granger Cause the FDIbecause the probability value is greater than 5%(0.9901). This implies that the SENSEX is notinfluenced by the trend of FDI in the country. Itsignals that the returns expected from this marketwill not have to be analyzed and accounted forafter carefully understanding the investmentpattern of FDI in the market. So it is clear thattrend of FDI does not influence Sensex and returnsgenerated from it. Similarly, the FDI and theSENSEX does not have relationship betweeneach other because the probability value (0.99) isgreater than 5%. So, as per the rule of thumb, thenull hypothesis is accepted that there is norelationship between the FDI and SENSEX.
Granger Causality Test between FII andSENSEXGranger Causality Test Results:
The results of pair-wise Granger Causality testsare reported in Table 8. It is observed that FIIGranger Cause Sensex because the probabilityvalue is less than 5% (0.03). This implies that thesensex is influenced by the trend of FII in thecountry. It signals that the returns expected fromthis market will have to be analyzed and accountedfor after carefully understanding the investmentpattern of FII in the market. It is a clear trend of FIIbeing attracted into the Indian stock market andinfluencing the returns generated from it. But,Sensex does not Granger Cause FII means FII isnot influenced by the stock market trend becausethe probability value (0.25) is greater than 5%. So,as per the rule of thumb, the null hypothesis isaccepted that there is no impact of Sensex onFII’s.
3.3 Correlation
Correlation coefficient is a statistical measure thatdetermines the degree to which two variable’smovements are associated. Correlation coefficient
value ranges from –1 to 1. Negative value ofcorrelation indicates: if one variable increases inits values, the other variable decreases in its valueand positive value indicates: if one variableincreases in its values the other variable alsoincreases in its value.
Correlation between FDI and NIFTY
Amount of FDI inflows (In Rs. Crore) CNX Nifty
Amount of FDI inflows 1(In Rs. Crore)
CNX Nifty 0.190208667 1
Correlation statistics in table point out that FDI’sare weakly positively correlated with nifty index inthe period under study. In positive correlation,values of two variables changes in the samedirection. Both are moving in the same direction,i.e. If the FDI increases, NIFTY index alsoincreases. Hence based on result it can beconcluded that there is very weak positivecorrelation between FDI and NIFTY(0.190208667).
Correlation between FDI and SENSEX
Amount of FDI inflows (In Rs. Crore) SENSEX
Amount of FDI inflows 1
SENSEX 0.21488 1
Correlation statistics in table point out that FDI’sare weakly positively correlated with SENSEXindex in the period under study. In positivecorrelation, values of two variables change in thesame direction. Both are moving in the samedirection, i.e. If the FDI increases, NIFTY indexalso increases .Hence based on result it can beconcluded that there is very weak positivecorrelation between FDI and SENSEX(0.21488).
Correlation between FII and NIFTY
Amount of FII inflows (In Rs. Crore) CNX Nifty
Amount of FII inflows 1
CNX Nifty 0.363302 1
Correlation statistics in table point out that FII’sare positively correlated with nifty index in theperiod under study. In positive correlation, valuesof two variables change in the same direction. Bothare moving in the same direction, i.e. if the FIIincreases NIFTY index also increases .Hencebased on result it can be concluded that there ismoderate positive correlation between FII andNIFTY (0.363302).
An Empirical Analysis of the Impact of Foreign Direct Investment andForeign Institutional Investment on Indian Stock Market
● Dr.Nitin Tanted● Shirin Khan

72
SAARANSHVol. 8 No. 1 JULY 2016● ●
RKG JOURNAL OF MANAGEMENT
Correlation between FII and SENSEX
Amount of FII inflows (In Rs. Crore) SENSEX
Amount of FII inflows 1
SENSEX 0.371618711 1
Correlation statistics in table point out that FII’sare positively correlated with SENSEX index inthe period under study. In positive correlation,values of two variables change in the samedirection. Both are moving in the same direction,i.e. If the FII increases SENSEX index alsoincreases. Hence based on result it can beconcluded that there is moderate positivecorrelation between FII and SENSEX(0.371618711).
3.4 Regression
Impact of FDI on NIFTY
Regression Statistics
Multiple R 0.190208667R Square 0.036179337Adjusted R Square 0.02241047Standard Error 1105.401476Observations 72
Independent Variable: FDIDependent Variable: NIFTY
The table is the model summary which reportsthe strength of the relationship between the modeland the dependent variable. R, correlationcoefficient, is the linear correlation between theobserved and model predicted value of thedependent variable. Its large value indicates astrong relationship. R Square, the coefficient ofdetermination, is the squared value of thecorrelation coefficients. The value of R2 is 0.036.In other words the dependent variables FDI is ableto only explain around 3% variation of thedependent variable (NIFTY)
ANOVA
Df SS MS F Significance F
Regression 1 3210720.419 3210720 2.6276191 0.11Residual 70 85533869.69 1221912
Total 71 88744590.1
Coefficients Standard Error t Stat P-value Lower 95% Upper 95% Lower 95.0% Upper 95.0%
Intercept 5124.4674 312.5607671 16.39511 0.00 4501.084614 5747.85019 4501.084614 5747.850185
X Variable 1 0.042458125 0.02619266 1.620993 0.11 -0.009781488 0.09469774 -0.009781488 0.094697738
Ha1:T.here is significant impact of FDI on NIFTYindex
The p-value related to FDI shown in table 5, is.000 more than 0.05 so null hypothesis H01 is notaccepted. Hence it is concluded that Flow of FDIsin to India and NIFTY trend are independent. Andthere is no significant impact of FDI on Nifty Index.
Impact of FDI on SENSEX
Regression Statistics
Multiple R 0.214880066R Square 0.046173443Adjusted R Square 0.032547349Standard Error 3748.009873Observations 72
Independent Variable: FDIDependent Variable: SENSEX
The ANOVA table, tests the acceptability of themodel from a statistical perspective. TheRegression row displays information about thevariation accounted for by the model. The Residualrow displays information about the variation thathas not been accounted by the model. Theregression much is less than residual sums ofsquares, which indicates that around 3% of thevariation in NIFTY is explained by the model.However, F statistic is not found significant, sincethe p value (0.000) more than 0.05.
Testing of Hypothesis
The null hypothesis and alternative hypothesiswith respect to NIFTY and FDI can be stated asfollows:
H01There is no significant impact of FDI on NIFTYindex.
73
The table is the model summary which reportsthe strength of the relationship between the modeland the dependent variable. R, correlationcoefficients, is the linear correlation between theobserved and model predicted value of thedependent variable. Its large value indicates a
strong relationship. R Square, the coefficient ofdetermination, is the squared value of thecorrelation coefficients. The value of R2 is 0.04.In other words the dependent variables FDI is ableto only explain around 4% the variation of thedependent variable (SENSEX).
ANOVA
Df SS MS F Significance F
Regression 1 47601686.32 47601686.3 3.388604519 0.07
Residual 70 983330460.5 14047578
Total 71 1030932147
Coefficients Standard Error t Stat P-value Lower 95% Upper 95% Lower 95.0% Upper 95.0%
Intercept 16956.05857 1059.778611 15.9996233 0.00 14842.39681 19069.7203 14842.39681 19069.72034
X Variable 1 0.163482299 0.088809678 1.84081626 0.07 -0.013643016 0.34060761 -0.013643016 0.340607614
and there is no significant impact of FDI on SensexIndex.
Impact of FII on NIFTY
Regression Statistics
Multiple R 0.363302023
R Square 0.13198836
Adjusted R Square 0.119588193
Standard Error 1049.022247
Observations 72
Independent Variable: FIIDependent Variable: NIFTY
The table is the model summary reports thestrength of the relationship between the model andthe dependent variable. R, correlation coefficients,is the linear correlation between the observed andmodel predicted value of the dependent variable.Its large value indicates a strong relationship. RSquare, the coefficient of determination, is thesquared value of the correlation coefficients. Thevalue of R2 is 13. In other words the dependentvariables FII is able to only explain around 13%the variation of the dependent variable (NIFTY).
The ANOVA table, tests the acceptability of themodel from a statistical perspective. TheRegression row displays information about thevariation accounted for by the model. The Residualrow displays information about the variation thathas not been accounted by the model. Theregression much is less than residual sums ofsquares, which indicates that around 3% of thevariation in SENSEX is explained by the model.However, F statistic is not found significant, sincethe p value (0.000) more than 0.05.
Testing of HypothesisThe null hypothesis and alternative hypothesiswith respect to SENSEX and FDI can be statedas follows:
H02There is no significant impact of FDI onSENSEX index.
Ha2:T.here is significant impact of FDI onSENSEX index
The p-value related to FDI shown in table 5, is.000 more than 0.05 so null hypothesis H01 is notaccepted. Hence it is concluded that Flow of FDIsin to India and SENSEX trend are independent
ANOVA
Df SS MS F Significance F
Regression 1 11713252.89 11713252.89 10.64408 0.00Residual 70 77031337.22 1100447.675
Total 71 88744590.1
Coefficients Standard Error t Stat P-value Lower 95% Upper 95% Lower 95.0% Upper 95.0%
Intercept 5270.872124 156.7028665 33.63609258 0.00 4958.338116 5583.406133 4958.338116 5583.406133
X Variable 1 0.028641447 0.008778916 3.262526601 0.00 0.011132451 0.046150443 0.011132451 0.046150443
An Empirical Analysis of the Impact of Foreign Direct Investment andForeign Institutional Investment on Indian Stock Market
● Dr.Nitin Tanted● Shirin Khan

74
SAARANSHVol. 8 No. 1 JULY 2016● ●
RKG JOURNAL OF MANAGEMENT
The ANOVA table, tests the acceptability of themodel from a statistical perspective. TheRegression row displays information about thevariation accounted for by the model. The Residualrow displays information about the variation thathas not been accounted by the model. Theregression much is less than residual sums ofsquares, which indicates that around 13% of thevariation in NIFTY is explained by the model.However, F statistic is found significant, since thep value (0.000) less than 0.05.
Testing of Hypothesis
The null hypothesis and alternative hypothesiswith respect to NIFTY and FII can be stated asfollows:
H03There is no significant impact of FII on NIFTYindex.
Ha3:T.here is significant impact of FII on NIFTYindex
The p-value related to FII shown in table 5, is .000more than 0.05 so null hypothesis H01 is notrejected. Hence it is concluded that Flow of FIIs
in to India and NIFTY trend are dependent andthere is significant impact of FII’s on Nifty.
Impact of FII on SENSEX
Regression Statistics
Multiple R 0.371618711R Square 0.138100466Adjusted R Square 0.125787616Standard Error 3562.823793Observations 72
Independent Variable: FIIDependent Variable: SENSEX
The table is the model summary reports thestrength of the relationship between the model andthe dependent variable. R, correlation coefficients,is the linear correlation between the observed andmodel predicted value of the dependent variable.Its large value indicates a strong relationship. RSquare, the coefficient of determination, is thesquared value of the correlation coefficients. Thevalue of R2 is 13. In other words the dependentvariables FII is able to only explain around 13%the variation of the dependent variable (SENSEX).
ANOVA
Df SS MS F Significance F
Regression 1 142372210.2 142372210.2 11.21596 0.00Residual 70 888559936.6 12693713.38
Total 71 1030932147
Coefficients Standard Error t Stat P-value Lower 95% Upper 95% Lower 95.0% Upper 95.0%
Intercept 17634.15074 532.2143575 33.13354946 0.00 16572.68268 18695.61879 16572.68268 18695.61879X Variable 1 0.099854769 0.02981608 3.349024075 0.00 0.040388474 0.159321064 0.040388474 0.159321064
follows:
H04: There is no significant impact of FII onSENSEX index.
Ha4:T.here is impact significant of FII on SENSEXindex
The p-value related to FII shown in table 5, is .000more than 0.05 so null hypothesis H01 is notrejected. Hence it is concluded that Flow of FIIsin to India and SENSEX trend are dependent.
Means there is significant impact of FII on SensexIndex and sensex is influenced by the FII’s Flowsin India.
The ANOVA table, tests the acceptability of themodel from a statistical perspective. TheRegression row displays information about thevariation accounted for by the model. The Residualrow displays information about the variation thathas not been accounted by the model. Theregression much is less than residual sums ofsquares, which indicates that around 13% of thevariation in SENSEX is explained by the model.However, F statistic is found significant, since thep value (0.000) less than 0.05.
Testing of HypothesisThe null hypothesis and alternative hypothesiswith respect to SENSEX and FII can be stated as

75
SUGGESTIONS ANDCONCLUSIONS4.1 Suggestions
This empirical study has been undertaken toidentify whether there is a relationship with FDI,FII’S and NIFTY and SENSEX index along withcorrelation co-efficient, ADF, regression andanalysis of variance (ANOVA) on the basis ofanalysis and findings, the following suggestionscan be made to the investors.
A detailed understanding of the nature anddeterminants of FII flows to Indian stock marketwould help investors to evaluate the risks andbenefits of foreign portfolio investment in India inbetter way.
Government should set a minimum limit as wellas maximum limit, within which FII invest. In India,in order to avoid volatility in Indian stock market(sensex & nifty). The traders should not enter whenthe market will have volatility condition.
The investors must know the trend of market andshould analyze the amount and trend of FDI’s andFII’s when the securities are purchased for betterreturn and safety.
Investment in the stock market has higher risk butwhen the returns are compared, it brings highreturns comparatively to other source ofinvestment.
The extent of FII participation in Indian marketshas helped in lowering cost of capital in Indianindustries.
4.2 Conclusion
The flow of FDI & FII accelerated the Indianeconomy and also gave opportunities to Indianindustry for technological up-gradation, gainingaccess to global managerial skills and practices,optimizing utilization of human and naturalresources and global competitive advantage withgreater efficiency. Most importantly FDI is centralfor India’s integration into global production chainswhich involves production by MNCs spread acrosslocations all over the world.
The study observed that investments by FIIs andthe movements of Sensex are quite closelycorrelated in India and FIIs wield significantinfluence on the movement of sensex and nifty.According to findings and results, study concluded
that FII did have significant impact on the Indiancapital market. Therefore, the alternate hypothesisis accepted. FII’S have significant impact on BSESensex and Nifty. However there are other majorfactors that influence the stock market, but FII isdefinitely one of the factors. This signifies thatmarket rise with increase in FII’s and collapsewhen FII’s are withdrawn from the market.Moreover, the findings of this study also indicatethat Foreign Institutional Investors have emergedas the most dominant investor group in thedomestic stock market in India.
The present research aims to understand theimpact of FII and FDI on stock market indices.Firstly in order to test the stationarity of data andsearch for the nature of the relationship betweenthese variables, the unit root test and GrangerCausality test are implemented. The empiricalanalysis reveals that the lagged values of FDIinflows however do not Granger cause IndianStock market. But FII inflows have Granger causeIndian Stock market. This indicates that FDI’s doesnot influence the stock market but FII have impactover it. From the current study it is also evidentthat there is a weak correlation between FDI &sensex and FDI & nifty and moderate positivecorrelation between FII & sensex and FII& Nifty.Hence it can be concluded that the impact of flowof FDI on Indian stock market is not significantwhere as FII has a significant impact on Indianstock market.
4.3 Implications
Apart from the money that is brought in, FIIinvestment is a testament of increasing globalinvestor confidence in a particular economy andstock market. For a country like India this moneybrought in by the FIIs adds to the foreign reserveswhich can be used to import oil, machinery etc.With increased FII investment in a country andthe increased confidence about the economy, FDI(Foreign Direct Investors) follow suit. FII is thusan important economic indicator which can helpus analyze a particular stock and the whole stockmarket in a better manner. FIIs are beneficial forIndian economy and also for stock market.
Investors can consider this study and analyzedifferent effects of FDI and FII on Indian stockmarket while making investment decision. Itespecially helps those investors who are not willingto take much risk and are more concerned about
An Empirical Analysis of the Impact of Foreign Direct Investment andForeign Institutional Investment on Indian Stock Market
● Dr.Nitin Tanted● Shirin Khan

76
SAARANSHVol. 8 No. 1 JULY 2016● ●
RKG JOURNAL OF MANAGEMENT
returns.
The study can also helps the government todecide whether it is beneficial or not for thedevelopment of our country to allow FDI and FIIin other sectors.
4.4 Limitations
Since for the study, data taken is only of 5 yearswhich is a limited tenure to explain the investorsthe effect of study matter.
The subject is very vast and the data is takenmainly from various websites. It does not containinformation from magazines, articles, journals, etc.
As the study is purely based on past yearsperformances, It does not contain any currentupdates related to FDI and FII on stock market.
Study is only considering the impact of FDI andFII on Indian stock market. These are not only thefactors which can affect Indian stock market. Thereare more other factors like GDP, exchange rate,interest rate, gold and silver price, crude oil price,
etc.
The study is based on secondary data which isconsidered as a quantitative aspect and notqualitative aspect.
4.5 Scope
It is a continuous study as the data is ever-changing because the flow of FDI and FII’schanges every year and its impact as well.
The comparative study of pre and postliberalization can also be done in order to analyzethe impact of FDI and FII on pre liberalizationperiod and post liberalization period.
The Indian economy is highly volatile which isinfluenced by number of factors like GDP, inflation,exchange rate, gold prices, silver prices, and FIIetc. Present study only shows impact of FDI andFII. Hence there is a scope that further study canbe done of other factors (GDP, inflation, andexchange rate, gold and silver price) whichinfluence stock market.
REFERENCES● SUHAL QUASIM MIR AND ISHAQ AHMAD BHAT “Empirical analysis of the impact of foreign institutional
investment on the Indian stock market: evidence from NSE” “International journal of management researchand review Vol. 4 Issue 4 (April 2014) ISSN: 2249-7196.
● ANUBHA SHRIVASTAV “A Study of Influence of FII Flows on Indian Stock Market” “GYANPRATHA – ACCMANJournal of Management” Volume 5 Issue 1 (2013).
● MARAM SRIKANTH AND BRAJ KISHORE “Net FII Flows into India: A Cause and Effect Study” ASCI Journalof Management, Vol. 41 No. 2 March 2012 ISSN: 107–120.
● DR. SYED TABASSUM SULTANA, PROF. S PARDHASARADHI “Impact of Flow of FDI & FII on Indian StockMarket”- Finance Research, Vol1 No3 July 2012 ISSN:2165-8226
● KARAN WALIA, DR.RIMPI WALIA AND MONIKA JAI (2012) “impact of foreign institutional investment onstock market” International Journal Of Computing and Corporate Research, vol.2,ISSN: 2249054X
● RAHUL DHIMAN AND PREETI SHARMA “Impact of Flow of FDI on Indian Capital Market” VSRD InternationalJournal of Business and Management Research, Vol. III Issue XI November 2013 / 487e-ISSN: 2231-248X,p-ISSN: 2319-2194.
● RAJESH CHAKRABARTI (2001)”FII Flows to India: Nature and Causes”, Journal of Stock market volatility,Vol: 34. Publisher: MCB UP Ltd.
● MIHIR DASH (2011) “Seasonality and Market Crashes in Indian Stock Markets” Asian Journal of Finance &Accounting Vol. 3, No,ISSN 1946-052X
● SAURABH SINGH, DR. L.K TRIPATHI AND KIRTI LALWANI (June 2012) “An Empirical Study Of Impact OfExchange Rate & Inflation Rate On Performance Of BSE Sensex” A Journal of Multidisciplinary ResearchVol.1 Issue 3, ISSN 2278 0637
BIBLIOGRAPHY/WEBLIOGRAPHYwww.nseindia.comwww.bseindia.comwww.moneycontol.comwww.sebi.org.inwww.dipp.nic.in

77
Table 1
Null Hypothesis: FDI has a unit root t-Statistic Prob.*
Augmented Dickey-Fuller test statistic -13.48573 0.0001Test critical values: 1% level -3.527045
5% level -2.90356610% level -2.589227
Variable Coefficient Std. Error t-Statistic Prob.
FDI(-1) -1.450094 0.107528 -13.48573 0C -0.215336 0.065596 -3.282767 0.0016
Table 2
Null Hypothesis: FII has a unit root t-Statistic Prob.*
Augmented Dickey-Fuller test statistic -8.055013 0
Test critical values: 1% level -3.527045
5% level -2.903566
10% level -2.589227
Variable Coefficient Std. Error t-Statistic Prob.
FII(-1) -0.976633 0.121245 -8.055013 0
C -0.261027 0.326737 -0.798891 0.4271
Table 3
Null Hypothesis: NIFTY has a unit root t-Statistic Prob.*
Augmented Dickey-Fuller test statistic -6.619729 0.0000
Test critical values: 1% level -3.527045
5% level -2.903566
10% level -2.589227
Variable Coefficient Std. Error t-Statistic Prob.
NIFTY(-1) -0.783838 0.118409 -6.619729 0
C -0.013142 0.006256 -2.100549 0.0394
Table 4
Null Hypothesis: SENSEX has a unit root t-Statistic Prob.*
Augmented Dickey-Fuller test statistic -7.91422 0
Test critical values: 1% level -3.527045
5% level -2.903566
10% level -2.589227
Variable Coefficient Std. Error t-Statistic Prob.
SENSEX(-1) -0.955191 0.120693 -7.91422 0
C 0.017255 0.00777 2.220835 0.0297
Table 5
Null Hypothesis: Obs F-Statistic Prob.
NIFTY does not Granger Cause FDI 69 0.0168 0.9833
FDI does not Granger Cause NIFTY 0.05776 0.9439
An Empirical Analysis of the Impact of Foreign Direct Investment andForeign Institutional Investment on Indian Stock Market
● Dr.Nitin Tanted● Shirin Khan

78
SAARANSHVol. 8 No. 1 JULY 2016● ●
RKG JOURNAL OF MANAGEMENT
Table 6
Null Hypothesis: Obs F-Statistic Prob.
NIFTY does not Granger Cause FII 69 0.58886 0.5579
FII does not Granger Cause NIFTY 0.44351 0.0437
Table 7
Null Hypothesis: Obs F-Statistic Prob.
SENSEX does not Granger Cause FDI 69 0.00996 0.9901
FDI does not Granger Cause SENSEX 0.74054 0.4809
Table 8
Null Hypothesis: Obs F-Statistic Prob.
SENSEX does not Granger Cause FII 71 1.37898 0.259
FII does not Granger Cause SENSEX 2.43254 0.0357

79
A Study on the Effect of Work Stress onQuality of Work Life in Retail Sector-with Special
Reference to NCRMs. Abha Sharma*
Dr.A.K Tyagi**Dr Vibhuti Tyagi***
ABSTRACT
The business world today is changing at the speed of light and so is competition. If organization is to surviveand grow, they have to adapt fast to the changing environment. Work stress plays an important role in theorganization. People are stressed from overwork, job insecurity, information overload, and the increasingpace of life, which influences the Quality of Work Life and decides the performance of the individuals withoutwhich the organization cannot achieve their targets. Organizations are required to adopt a strategy to improvethe employees “Quality of Work Life” to satisfy both the organizational objectives and employee needs. Thesuccess of any organization is highly dependent on how it attracts, recruits, motivates and retains its workforce.People want meaningful work that enhances their overall well-being. This study focus to analyze the Effectsof Work Stress on the Quality of Work Life in Retail Sectors in NCR.
* Research Scholar, Teerthankar Mahaveer University, U.P.** Associate Professor, Doon Business School, Dehradun, UK*** Professor, Raj Kumar Goel Institute of Technology, Ghaziabad
employees are under pressure to find ways toimprove the Quality of Work Life. Occupationalstress is a widespread construction where jobrelated issues interact with the operator to eitherenhance or disrupt the physiological orpsychological conditions.
Factors causing Work Stress
These variables are considered as the factorswhich causes stress at workplace.
Factor 1:- Work Pressure
Factor 2:- Discrimination at Workplace.
Factor 3:- Interpersonal relation betweenmanagers and employees
Factor 4:- Extended working hours withoutcompensation
1.2 Quality of work life
Human resource is an asset to the organization;an unsatisfied employee is the first enemy of theorganization. To sustain in the competitive market,organizations have to maintain skilled employees.Employees have to be treated as an asset notliability and this is possible only through thehumanized job design process, known as Qualityof Work Life. The success and survival of any
1. INTRODUCTION
1.1 Work Stress
We are living in an era of high competition alongwith lots of expectations from ourselves as wellas from our surroundings, and when we are notable to fulfill it or get it, we feel frustrated and itcreates a stage of Stress. Stress is a condition ofstrain that has direct bearing on emotions, thoughtprocess and physical condition of a person.Organized retailing is highly manpower intensiveas employees have to balance the expectationsof management and customers. For employees,stress regularly contributes to the burnout, risk ofaccidents and illness like hypertension, coronaryheart disease and severe depression. This alsoleads to poor quality of performance, lower jobsatisfaction, high turnover and increased workabsence or lack of concentration on the job. Workstress challenges (workforce aging, increasinglycompetitive labour market, information technologyand rising benefit costs etc create new possibilitiesfor employers to achieve organizationalperformance goals while numerous employees areexperiencing a reduced Quality of Work-Life. Thisis reflected most prominently in work-lifeimbalance and job stress. Both employers and

80
SAARANSHVol. 8 No. 1 JULY 2016● ●
RKG JOURNAL OF MANAGEMENT
organization depend upon the potential and themotivation of the employees working in it. Themotivation of the employees is directly associatedwith the Quality of Work Life (QWL) theyexperience in the organization. With the increasingshift of the economy towards knowledge economy,the meaning and Quality of Work-Life hasundergone a drastic change. Quality of Work Lifeis basically quality of life that the employeesexperiences at their work place. In an organization,a high level of Quality of Work-Life is necessaryto continue to attract and retain employees. It refersto the favorableness or unfavorableness of a jobenvironment for the people working in anorganization. QWL like programs usuallyemphasize employee skill development, thereduction of occupational stress and developmentof more cooperative labour management relations.Quality of Work Life deals with various aspects ofwork environment, which facilitates the humanresource development efficiently. Thus, Quality ofWork Life helps in the development of humanresources.
In the present scenario, needs and aspirations ofthe employees are changing. Employers are nowredesigning jobs for better QWL. Government andorganization are doing various effor ts likeproviding a salary increase, paying an annualbonus, giving grace to the brilliant workers in jobsand providing various facilities for workers. Butthese efforts are still not able to fulfill the will ofsome workers, because each worker has adifferent assessment in assessing their respectiveinterests
“The overriding purpose of QWL is to change theclimate at work so that the human technological-organizational interface leads to a better qualityof work life.”- Luthans .In the service sector, theQuality of Work Life depends on the satisfactionin a job, autonomy to prioritize the work,challenging task, motivation by the organisationand organisational commitment. Serviceindustries are becoming increasingly important tothe economies of developed nations (S. S. Tzafrir2007). Walton (1974) suggested eight majorconceptual areas for understanding Quality ofWork Life. These were adequate and faircompensation, safe and healthy workingconditions, development of human competencies,growth and security, social integration,constitutionalization and total life space and socialreliance.
1. Fred Luthans, 1978, Organisation Behaviour,TataMc Graw Hill, New Delhi
2. S. S. Tzafrir, and A. B. (2007) HRM practicesand perceived service quality: The role of trustas a mediator. Research and Practice inHuman Resource Management, 15(2), 1-20.
3. R. E. Walton(1974), Improving the quality ofwork life. Harvard Business Review.
2. LITERATURE REVIEWQuality of Work Life was the term actuallyintroduced in the late 1960’s. From that period tillnow the term is gaining more and moreimportance everywhere, at every work place.Initially Quality of Work Life was focusing on theeffects of employment on the general well beingand the health of the workers. But now its focushas been changed. QWL is a concept that makesan environment which motivates the employeestowards work and obviously it makes a reasonabout employee, work and its organization. Variousauthors and researchers have proposed modelsof Quality of Working Life which include a widerange of factors.
Baba and Jamal (1991) listed what theydescribed as typical indicators of Quality ofWorking Life, including: job satisfaction, jobinvolvement, work role ambiguity, work roleconflict, work role overload, job stress,organizational commitment and turn-overintentions. Baba and Jamal also exploredreutilization of job content, suggesting that thisfacet should be investigated as part of the conceptof Quality of Working Life.
Thomas Wyatt and Chat Yue Wah (2001)examined the perception of QWL with a samplesize of 332 managerial executives. Results fromFactor analysis suggest four dimensions which arenamed favorable work environment, personalgrowth and autonomy, nature of job andstimulating opportunities and co-workers. Theoverall findings support the conceptualizations offactors involved in perception of QWL.
W.N. Thalang et al (2010) studied on Quality ofWork Life indicators as a corporate socialresponsibility of electrical and electronics privateOrganizations in Thailand. Objective of theresearch was to find out the Quality of Work LifeIndicators as a Corporate Social Responsibility. Itis a documentary research and data was collected

81
by the in-depth interview with experts andspecialist and multiple research method. Healthenvironment, total life span, work life balance,adequate and fair compensation, social integrationsupport used as dimensions of QWL and fourmajor dimensions of CSR, namely: economic,environmental, social and ethics were used as aparameters. The result showed that QWL indicatesperception about for a more effective CSR,developing a good Quality of Work Life (QWL) iscrucial.
Aketch et al. (2012) explained that QWL is aphilosophy, a set of principles, which holds thatpeople are the most important resource in theorganization as they are trustworthy, responsible,and capable of making valuable contributions, andthey should be treated with dignity and respect.
Noor, S.M. and Abdullah, M.A. (2012) studyindicates that there is a significant relationshipbetween job satisfaction and Quality of Work Life.Job satisfaction is found to carry more weightagein explaining the relationship among jobsatisfaction, job involvement and job security withQuality of Work Life.
Jerome. S. (2013) studied on Quality of Work Lifeof employees at Jeppiaar cement private Ltd. tofind out the factors measurements of QWL. 50 %respondents from 200 sample size respondentswere selected from the workman categories sothe researcher adopted the simple randomsampling technique using the lottery method.Variables used for this study: were compensation,work environment, social relation, job satisfaction,safety and healthy environment, welfare andOpportunities for use and Development of Skillsand Ability. For the data analysis researcher usedKarl Pearson coefficient. Result showed that thereis no significant relationship between educationaland QWL and no significant relation between theincome and QWL. There is no significantrelationship between the age of the respondentsand their overall quality of work life and nosignificant relationship between the educationqualification of the respondents and their overallQuality of Work Life
G. Vijayakrishna (2013) assessed empirically onvarious factors contributing to quality of work lifein the retail sector. Big bazaar and 6 retail outletsat TSR complex at Visakhapatnam were selected.The factors considered are working conditions,Atmosphere, Illumination, Work schedule, Rest
pauses. In this study it was found that in selectedretail organizations concern authorities areformulate optimum combination of process, socialand other approaches that will maximizeperformance while creating high Quality of WorkLife climate for employees in the retailorganizations. viz: Big bazaar, various retailoutlets.
S.Khodadadi et al (2014) Investigated the QWLdimensions effect on the employees’ jobsatisfaction. In this study independent variableswere permanent security providing, salary andbenefits payment policies, development andpromotion opportunity, and job independence, jobsatisfaction as the dependent variables. 114employees selected randomly for this study andtwo questionnaires of “Quality of Work Life” and“Job Satisfaction” were used for data collectionand Data analysis was done by using SPSS andLISREL software. The results of the study showedthat the salary and benefits’ policies have asignificant and positive effect on Shuhstar’sShohola Hospital employees’ job satisfaction.
Rethinamand Ismail reviewed different researchesabout definitions and constructs of QWL anddesignated that quality of work life is a multi-dimensional construct and is made of a numberof inter-related factors.
From the literature review it can be revealed thatjob satisfaction, self esteem, job security andgrowth and physical illness are the primaryindication of quality of work life.
3. OBJECTIVES● To identify the various factors causing stress
in retail sector.
● To identify the effect of these factors on theQuality of Work-Life.
● To identify the suitable measures for improvingQuality of Work-Life.
4. HYPOTHESISAs the factors causing stress affect the Quality ofWork Life therefore to achieve the objectives ofthe study the following hypothesis have beenformulated:
H1: -Work Pressure causing stress affects Qualityof Work Life in Retail Sector.
H2: -Discrimination at workplace causing stress
A Study on the Effect of Work Stress on Quality of Work Life inRetail Sector-with Special Reference to NCR
● Ms. Abha Sharma● Dr. A.K Tyagi
● Dr. Vibhuti Tyagi

82
SAARANSHVol. 8 No. 1 JULY 2016● ●
RKG JOURNAL OF MANAGEMENT
affects Quality of Work Life in Retail Sector.
H3:- Interpersonal relation between managers andemployees causing stress affects Quality of WorkLife in Retail Sector.
H4:- Extended working hours withoutcompensation causing stress affects Quality ofWork Life in Retail Sector.
5. RESEARCH METHODOLOGY5.1 Data collection
The study is empirical in nature and data iscollected through primary and secondary sources.The primary data is collected through theconstructive questionnaires on effects of factorscausing stress on Quality of Work Life in RetailSector. Secondary data was collected fromresearch studies, books, various publishedjournals, magazines websites and online articles.Simple random sampling technique is used toselect the sample for study. Sample size for theanalysis was 50 sales people from the variousretail outlets in NCR.
5.2 Research Design
Since work stress plays crucial roles in life ofindividuals and sustainable development oforganizations. Hence, keeping in view itsparamount importance following four factors i.e.Work Pressure, Discrimination at Work place,Interpersonal relation, and Extended workinghours causing stress are considered andcompared as the factors influencing the Qualityof Work Life. Work stress is used as anindependent variable in this study. The study gavean opportunity to discover the relationshipbetween the two variables; Quality of Work Lifeand work stress that affect the Quality of WorkLife in Retail Sector in NCR.
5.3 Data Analysis
The collected data was analyzed usingappropriate statistical techniques. The descriptivestatistics such as frequencies, percentages andChi-square test were used to analyze data. Thecalculated values of Chi-square test werecompared with the Table value of Chi-square testfor testing the hypothesis. The data is alsopresented using charts.
The collected data in the study shows that 17%respondent are male and 8% are female in which19% employees are between the ages of 20 yrsto 29 yrs, 5% employees are between 30yrs to 39yrs and only 1% employees are between the agesof 40 to 49yrs. The Educational background ofrespondent are 10.5% Graduate, 7.5%Intermediate and only 4.5% are Post graduate.The High school background respondents are verylow 2.5%.
It is identified that 16% population are unmarried.Regarding the monthly income of respondents,nearly 12.5% respondents are drawing their salarybetween 5001 to 8000. 7.5% respondent drawingsalary between 3001-5000 and 4.0% respondentdrawing their salary between 8001-12000.Thereis only 1.0% respondent drawing their salaryabove 12000. Majority of the respondent 11.0%have 1 to 5 yrs work experience, 6.0% respondenthave less than 1yr experience and 5.0%respondent have 5 to 10yrs experience. Only 3.0%respondent has more than 10yrs experience inpresent job profile. The other demographic factorconsider for study is Product dealing in which 3.5%respondent are dealing with Grocery Product,9.0% respondent deals in Dress Material and2.5% respondent dealing in Electronic Items. Themost of the respondent10.0% deals in Gifts andOthers. So, majority of the respondent areunmarried male who are graduates under the ageof 20-29 and drawing salary between 5001-8000with 1 to 5 yrs work experience.

83
Factor 1 : Work Pressure causes stress in RetailSector
Frequency Percent %
Always 31 15.5Very Often 14 7.0Some time 3 1.5Never 2 1.0
Total 50 25.0
Factor 1 : Work Pressure causes stress
Interpretation:-The above data shows that 15.5%respondent always feel stress due to WorkPressure at their work place.7.0% respondent feelvery often and 1.5 % feel some time, only 1.0%respondent never feel pressure at work place. Itcan be seen from the data that Work Pressure atwork place causes stress for employees workingin Retail Sector in NCR.
H1: - Work Pressure causing stress affects Qualityof work life in Retail Sector
Interpretation:-Excessive workload and workingconditions causes’ job stress that decreasesemployee’s job satisfaction level. For testing H Chi-square test was done on the collected data. Thecalculated value of Chi-square is 4.02 which aremore than the table value of x2 i.e. 3.84 at 5%level of significance shows that stress causes workpressure decline the job satisfaction level ofemployees that always affects Quality of Work Lifeof Retail Sector. So, that H1 is accepted.
Factor 2 : Discrimination at workplace causesstress in Retail Sector.
Interpretation:- The data shows 10.0%respondent feel discrimination at work place causestress some time, 6.0% respondent very often and5.0% respondent always feel stress fromdiscrimination at work place. Only 3.0%respondent never feels discrimination at workplace. So, the majority of respondent some timefeel Factor 2 is another cause of stress at workplace in Retail Sector in NCR.
H2:- Discrimination at workplace causingstress affects Quality of Work Life in RetailSector.
Interpretation:- Interventions with youngpopulation should consider the underlying issuesof stress and dis-crimination which contribute tonegative self-evaluations and hurt their self-esteem. The calculated value of Chi-square is 3.21which is less than the table value of x2 i.e. 3.84 at5% level of significance shows that discriminationat work place not always affects Quality of WorkLife in Retail Sector. Therefore, H2 is rejected.
Factor 3 : Interpersonal relation between managerand employees causes stress in Retail Sector
Interpretation:- The data reveals that 11.0%respondent thinks Interpersonal Relation between
A Study on the Effect of Work Stress on Quality of Work Life inRetail Sector-with Special Reference to NCR
● Ms. Abha Sharma● Dr. A.K Tyagi
● Dr. Vibhuti Tyagi

84
SAARANSHVol. 8 No. 1 JULY 2016● ●
RKG JOURNAL OF MANAGEMENT
Manager and Employees is cause of stress at workplace.10% respondent some time and 3.0%always think Interpersonal Relation creates stressat work. Only 1.0% respondent thinks it neveraffect their work in Retail Sector in NCR.
H3: -Interpersonal relation between manager andemployees causing stress affects Quality of WorkLife in Retail Sector.
Interpretation: - Stress due to interpersonalrelation between manager and employees createfear of job insecurity and lack of future growthopportunity. The calculated value of Chi-squaretest is 3.96 which are more than the table value ofx2 i.e. 3.84 at 5% level of significance shows thatInterpersonal relation between manager andemployees causing stress always affects Qualityof Work Life in Retail Sector. Therefore H3 isaccepted.
Factor 4 : Extended working hours withoutcompensation causes stress in Retail Sector.
Interpretation:- The data showing majority ofrespondent 12.5% some time feels Extendedworking hours without compensation createsstress at work place, 5.0% respondent feels veryoften and 3.0 respondent always feels stress from(Factor 4). 4.5% respondents never feel that thisfactor creates stress at work place in Retail Sector.From the above data this factor is some time causeof stress in Retail Sector in NCR.
H4:- Extended working hours withoutcompensation causing stress affects Quality ofWork Life in Retail Sector
Interpretation: - Extended working hours orunusual work shifts may be more stressfulphysically, mentally, and emotionally. Thecalculated value of Chi-square is 2.86 which isless than the table value of x2 i.e. 3.84 at 5% levelof significance shows that Extended working hours
causes stress not always affects the Quality ofWork Life in Retail Sector in NCR. Therefore, H4is rejected.
6. CONCLUSIONThe main focus of this study was to find how workstress is affecting the Quality of Work Life in RetailSector in NCR. Four factors were identified thatcaused stress at work place and their effect onQuality of Work Life was studied. The study showsthat:-
In service providing organization excessiveworkload on employees, contradicting demands,causes job stress that decreases employee’s jobsatisfaction. QWL has positive significantrelationship with Job satisfaction (Md. ZohurulIslam et al 2006). The analysis shows that workpressure always affects Quality of Work Life inRetail Sector in NCR.
● “Discrimination due to age, disability, genderor sexual orientation, unfair treatment,contributes to stress and health Problems.” Itleads to lower self-esteem or a reduced senseof personal efficiency. The present study showsthat the employee does not always facediscrimination at workplace and it does notaffect Quality of Work Life in Retail Sector inNCR.
● Job security is another factor that is of concernto employees. Interpersonal conflicts increasethe fear of job insecurity and loosing futuregrowth opportunity at work place. The abovefindings show the existence of Interpersonalconflicts between management and employeesthat affect Quality of Work Life in Retail Sectorin NCR.
● Individual differences like age, gender,tolerance, physical fitness affects theperformance when they work extra from theirnormal working hours. Our findings showsmajority of employees working in Retail Sectorin NCR are male under the age of 30 and asper the job profile of Retail employees theyhave to stay longer hours during holidays andweekends and it does not affect Quality of WorkLife in Retail Sector in NCR.
It can be concluded from the analysis that onlytwo independent variables of stress i.e. workpressure and Interpersonal relations are positivelyrelated with the quality of work life of employees

85
in Retail Sector in NCR.
4. Md. Zohurul Islam et al (2006), Quality of worklife and organizational performance: Empiricalevidence from Dhaka Export Processing Zone,International Labour Office, Geneva.
7. SUGGESTIONS● Proper communication between manager and
employees is necessary to reduce uncertaintyabout their jobs and futures.
● Management should clearly define each taskand responsibilities according to employee’s
capacity, knowledge and skills.
● Work appreciation and incentives can motivateemployees under work pressure. Hencemanagers should adopt various employeeappraisal techniques. It will motivate theemployee for giving their best and reducestress.
● Permanent employment provides security tothe employees and improves their QWL.
● Job of a sales man is physically exhaustive.Restroom, proper canteen service, recreationrooms to the staffs is a must.
REFERENCES1. Aloys.N.K (2013), Working Environment Factors that Affect QWL among Attendants in petrol Stations in
Kitale Town in Kenya, International Journal of Academic Research in Business and Social Sciences, 3(5).
2. Aswathappa. K., (1999). Human Resource and Personnel Management ‘New Delhi: Tata McGraw Hill publishing
3. Baba. VV and Jamal. M (1991). Reutilization of Job context and content as related to employee quality ofworking life: a study of psychiatric nurses. Journal of organisatinal behavior. 12. 379-386.
4. Chen, T.Y., Chang, P.L., & Yeh, C.W. (2004). A Study of career needs, career development programs, jobsatisfaction and the turnover intention of R&D personnel. Journal of Career development International. 9(4):424-437.
5. Fred Luthans, 1978, Organisation Behaviour,TataMc Graw Hill, New Delhi
6. G.Vijayakrishna. (2013, July 11). A Study on factors contributing to Quality of Work Life in the Retail Sector.Social Science Research Network .
7. K. M. Nalwade & S. R. Nikam (2013), Quality of Work Life in Academic: A Review of Literature, Internationaljournal of scientific research, volume 2 issue 2.
8. K. S. Sathyanarayana and Dr. K. Maran, “Job Stress Of Employees” International Journal of Management(IJM), Volume 2, Issue 2, 2011, pp. 93-102, Published by IAEME
9. Levine, M., Taylor, J., & Davis, L. (1984), Defining quality of work life. Human Relations. 37, 81-104.
10. Md. Zohurul Islam et al (2006), Quality of work life and organizational performance: Empirical evidence fromDhaka Export Processing Zone, International Labour Office, Geneva .
11. Memoria, C.B.& Ganakar.S.K.,(2000).‘Personnel Management –Text and cases.
12. Noor, S. M., & Abdullah, M. A. (2012). Quality Work Life among Factory Workers in Malaysia. Procedia - Socialand Behavioral Sciences, 35, 739-745.
13. R. E. Walton, Improving the quality of work life. Harvard Business Review.1974.
14. Rao Subba.P.,(1996).‘Human Resource Management in the New Millennium. New.Delhi: Himalaya publishinghouse.
15. Robins, S. P. (1989). Organizational Behavior: Concepts, Controversies, and Applications. New Jersey: PrenticeHall.
16. S. Jerome, (2013),A Study on Quality of Work Life of Employees at Jeppiaar Cement Private Ltd: Perambalur,International Journal of Advance Research in Computer Science and Management Studies., September,Volume 1, Issue 4,
17. S. Khodadadi et al (2014) investigating the QWL dimensions effect on the employees’ job satisfaction, Appliedmathematics in Engineering, Management and Technology, 2 (1).
18. S. S. Tzafrir, and A. B. HRM practices and perceived service quality: The role of trust as a mediator. Researchand Practice in Human Resource Management, 15(2), 2007, 1-20.
A Study on the Effect of Work Stress on Quality of Work Life inRetail Sector-with Special Reference to NCR
● Ms. Abha Sharma● Dr. A.K Tyagi
● Dr. Vibhuti Tyagi

86
SAARANSHVol. 8 No. 1 JULY 2016● ●
RKG JOURNAL OF MANAGEMENT
19. Saklani, D. R. (2004). Quality of Work Life in The Indian Context: An Empirical Investigation. Decision, (21): 2,212-223.
20. W.N. thalang et al (2010),Quality of Work Life Indicators as a Corporate Social Responsibility (CSR) of Electricaland Electronics Private Organizations in Thailand, 4th Asian Rural Sociology Association (ARSA) InternationalConference.
Table: 1 Demographic Factor wise Classification of respondents
S. No. Variable Categories No. of Employees Percentage
1. Gender Male 34 17.0
Female 16 8.0
2. Age 20-29 38 19.0
30-39 10 5.0
40-49 2 1.0
3. Education High school 5 2.5
Intermediate 15 7.5
Graduate 21 10.5
Post graduate 9 4.5
4. Marital Status Married 18 9.0
Unmarried 32 16.0
5. Monthly Income 3000-5000 15 7.5
5001-8000 25 12.5
8001-12000 8 4.0
12001 or above 2 1.0
6. Experience Less than 1 years 12 6.0
1 to 5 years 22 11.0
5 to 10 years 10 5.0
More than 10 years 6 3.0
7. Product Dealing Grocery products 7 3.5
Dress material 18 9.0
Electronic goods & appliances 5 2.5
Gifts and others 20 10.0
Source: Primary Data

87
Journal Subscription FormI wish to subscribe to the “SAARANSH-RKG JOURNAL OF MANAGEMENT” for the period of:
One Year Two Years Three Years
I am enclosing Demand Draft/Cheque number .......................................................................................
dated .......................................... drawn in favour of ‘Raj Kumar Goel Institute of Technology’ for
Rs. ................................................... payable at Ghaziabad.
1. Name ...............................................................................................................................................
2. Name of the Organization ...............................................................................................................
........................................................................................................................................................
3. Mailing Address ..............................................................................................................................
4. City ..................................... State ........................................... Pin Code......................................
5. Phone .......................................................... Mobile ......................................................................
6. E-mail ..............................................................................................................................................
7. Current Subscription No. (For renewal orders only) .......................................................................
8. Subscription Rate
One Year Two Years Three Years
Individual Rs. 500 Rs. 900 Rs. 1200
Institutional Rs. 1000 Rs. 1800 Rs. 2500
Individual (Overseas) US $ 50 US $ 90 US$ 120
Institution (Overseas) US $ 75 US $ 100 US $ 125
Rs. 50/- should be added of outstation cheques in India.
Mail to:
Dr. Vishal SrivastavaEditor ‘SAARANSH’
Raj Kumar Goel Institute of Technology
5 km Stone. Delhi-Meerut Road, Ghaziabad (U.P.) 201003, INDIA
Tel.: 0120-2788273, 6517163, 2788409, Fax: 0120-2788350/447
Email: [email protected] Website: http://www.rkgit.edu.in
�

88
SAARANSHVol. 8 No. 1 JULY 2016● ●
RKG JOURNAL OF MANAGEMENT
Guidelines For ContributorsThe author should follow the following instructions while preparing the manuscript.
● The paper should be about 8000-10000 words in length. The author(s) should submit two copies ofthe manuscript, typed in two space on A4 size bond paper allowing 1-inch margin on all sides, shouldbe submitted with a soft copy in CD in PC compatible MS-word document format. CD is not requiredif the manuscript is e-mailed at [email protected] however, in this case two hard copies ofmanuscripts have to be sent separately.
● The author should provide confirmation that– The article is the original work of the author(s). It hasnot been earlier published and has not been sent for publication elsewhere.
● The paper should begin with an Abstract of not more than 100-150 words, which encapsulate theprinciple topics covered by the paper. Abstracts should be informative, giving a clear indication of thenature and range of results contained in the paper. Do not include any reference in your abstract.
● Figures, charts, tables and diagrams– All figures, diagrams, charts and tables should be on separatepapers and numbered in a single sequence in the order in which they are referred to in the paper.Please mention their number at appropriate places within the text.
● References must be kept to a bare minimum. The references must be quoted in the text using Americanpsychological style of referencing. You must make sure that all references which appear in the textare given in full. Where there is more than one reference to the same author for the same year, theyshould be listed as 2009a, 2009b etc. The references section should be a continuous alphabeticallist. Do not divide the list into different sections.
Books The order of information should be as in the following examle:
Srivastava, V (2011), Marketing Research Theory & Concept, New Delhi, ABP Publication.
Journal papers and book chapters The order for reference to articles/chapters of books should beas in these examples:
Prakash. J. (ed), Privatization of Public Enterprises in India, Mumbai, Himalya Publishing House, p212.
● All manuscripts received for publication in SAARANSH are acknowledged by the Editor. This helpsauthors know the status of their paper from time to time.
● The Editors reserve the right to accept or refuse the paper for publication, and they are under noobligation to assign reasons for their decision. Authors will receive a complimentary copy of thejournal in which their articles are published.
● The works published in the journal should not be reproduced or reprinted in any form, without theprior permission from the editor.
Research Paper Selection Process
Authors can send their paper up to October and April for the issue of January and July respectively.When a manuscript is received, the editor first completes a preliminary screening of the manuscript. Forthe initial review, the editor assigns two reviewers to each manuscript. The editor makes publicationdecisions about it. However, these decisions are made in conjuction with recommendations given bymembers of the Editorial Board or other qualified reviewers. All submissions will be blind reviewed.